U.S. Bancorp Fund Services, LLC
615 E. Michigan Street
| KINETICS MUTUAL FUNDS, INC. |
| Table of Contents |
| June 30, 2016 |
| | Page |
| Shareholders' Letter | 2 |
| Year 2016 Semi-Annual Investment Commentary | 4 |
| KINETICS MUTUAL FUNDS, INC. — FEEDER FUNDS | |
| Expense Example | 10 |
| Statements of Assets & Liabilities | 16 |
| Statements of Operations | 20 |
| Statements of Changes in Net Assets | 24 |
| Notes to Financial Statements | 35 |
| Financial Highlights | 52 |
| KINETICS PORTFOLIOS TRUST — MASTER INVESTMENT PORTFOLIOS | |
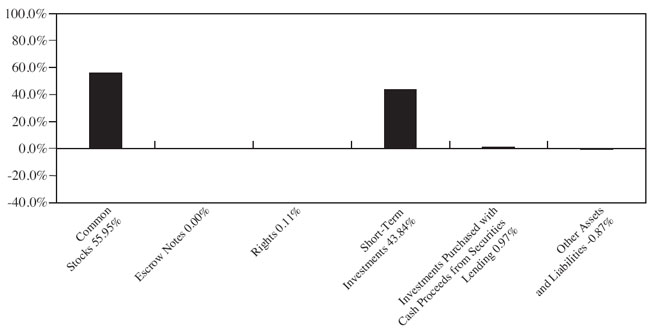
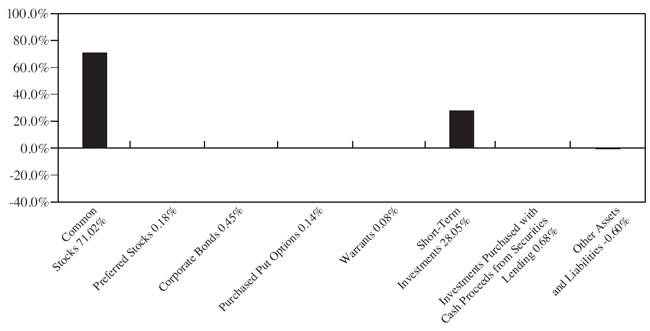
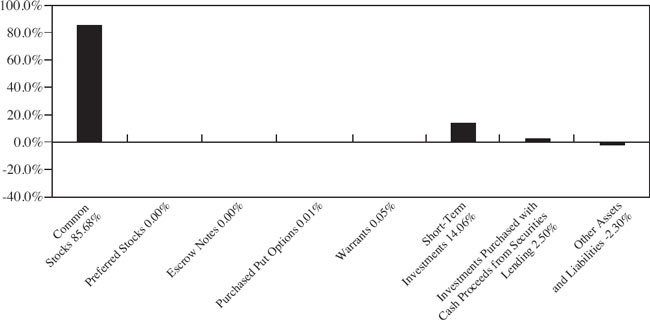
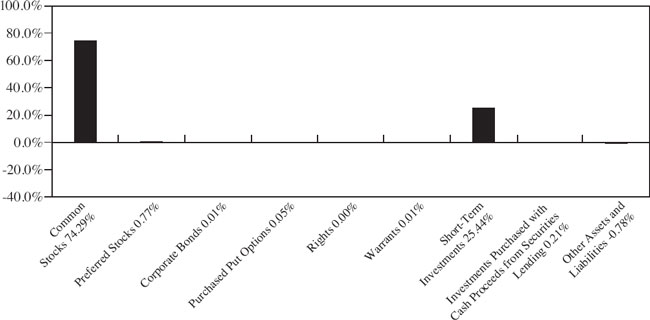
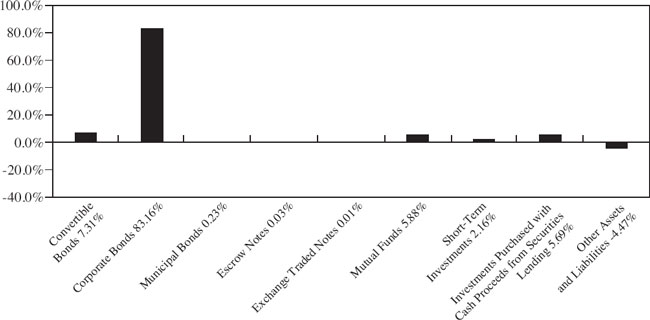
| Allocation of Portfolio Assets | 81 |
| Portfolio of Investments – The Internet Portfolio | 89 |
| Portfolio of Investments – The Global Portfolio | 93 |
| Portfolio of Investments – The Paradigm Portfolio | 97 |
| Portfolio of Investments – The Medical Portfolio | 102 |
| Portfolio of Investments – The Small Cap Opportunities Portfolio | 105 |
| Portfolio of Investments – The Market Opportunities Portfolio | 110 |
| Portfolio of Investments – The Alternative Income Portfolio | 114 |
| Portfolio of Investments – The Multi-Disciplinary Income Portfolio | 118 |
| Portfolio of Options Written – The Alternative Income Portfolio | 125 |
| Portfolio of Options Written – The Multi-Disciplinary Income Portfolio | 131 |
| Statements of Assets & Liabilities | 132 |
| Statements of Operations | 136 |
| Statements of Changes in Net Assets | 140 |
| Notes to Financial Statements | 144 |
1
| KINETICS MUTUAL FUNDS, INC. |
| Shareholders' Letter |
Dear Fellow Shareholders,
We are pleased to present the Kinetics Mutual Funds ("Funds") Report for the six-month period ended June 30, 2016. The mid-year returns of various equity market indexes would suggest another year of gradual, modest advances in asset prices against a backdrop of similarly modest economic data. In reality, the path taken to arrive at the mid-year returns has been far more complex and volatile, with large divergences across sectors and asset classes. The S&P 500 Index declined over 10.5% to begin the year, while the Russell 2000 Index declined over 16%. These indexes subsequently rose over 14% and 20%, respectively, off their low levels through the end of June. This corresponded with the yield on the 10-year U.S. Treasury Bond declining from 2.30% on January 1st, to 1.47% on June 30th. In response to the declining interest rate environment, income oriented industries within the S&P 500 Index drove the index higher, with Utilities increasing 23.4%, Telecom companies rising 24.8%, Consumer Staples companies increasing 10.5% and Real Estate Investment Trusts rising 11.2%.
It is apparent that investors have bid up income generating assets in response to declining interest rates. However, this largely ignores the fact that rates have fallen as a result of economic weakness, with Federal Open Market Committee estimates for 2016 and 2017 GDP growth declining from 2.4% to 2.0%, and from 2.2% to 2.0% since the beginning of the year. While lower rates in isolation should increase financial asset values, the offsetting lower future cash flows should have a commensurate impact on valuations. This concept appears lost in the current marketplace, with yield seeking investors accepting considerable capital impairment risk in exchange for dividends ranging from 2%-3%. There is an asymmetry favoring downside risk relative to profit expectations that is not appealing to long-term value investors such as ourselves.
We are far more concerned with the implications of a weaker economy than we are with the relative value of assets due to declining interest rates. Two years ago the consensus 2016 earnings estimate for S&P 500 Index earnings was nearly $140 per share; it now stands at $120— nearly 15% lower. However, the S&P 500 Index has returned nearly 12% during the last two years ended June 30, 2016, which equates to valuation multiple expansion of approximately
2
30%. Corporations have certainly not increased their intrinsic value over this time, and with rates currently pressing all time low levels (as reflected by the 10-year Treasury Bond yield), catalysts for further gains appear lacking.
The Funds have always been managed with a contrarian tilt, reflecting our belief that original thinking often unearths investment opportunities with a margin of safety embedded in the purchase price. The importance of unique investment thinking is at least as important now as it has ever been, with exchange traded fund flows and interest rates driving consensus favorite stocks to ever stretched valuations. In the Funds, we seek to find investments that are not contingent on low rates, economic strength or index fund flows to maintain and grow valuations. We believe that we are able to achieve this through our emphasis on fundamental analysis and idiosyncratic business attributes.
Despite the challenging backdrop for fundamental equity investing, the Funds generated satisfactory results during the first half of the year. Over time, we expect and hope for our returns to decouple from the broader markets. The Funds generated returns as follows during the six-month period ended June 30, 2016 (No-Load Class): The Paradigm Fund +4.51%, The Multi-Disciplinary Income Fund +5.75%, The Small Cap Opportunities Fund +6.37%, The Market Opportunities Fund +5.01%, The Internet Fund -3.89%, The Medical Fund -8.33%, The Alternative Income Fund +1.95% and The Global Fund +6.97%. This compares to returns of +3.84% for the S&P 500 Index and +1.23% for the MSCI All Country World Index.
3
| KINETICS MUTUAL FUNDS, INC. |
| Investment Commentary |
Dear Fellow Shareholders,
At certain points of the investment cycle, investors face a decision as to whether to conform and follow the consensus, or take a divergent path. Conformity all but guarantees suboptimal investment returns over a reasonably long time period, and while contrarian investing does not guarantee superior returns, it improves an investor's chance of outperforming. However, the question arises as to when it is logical to be contrarian, as opposed to simply being contrarian for the sake of being so. Furthermore, there is usually a temptation to try to time a current but unsustainable trend, hoping that you will have the foresight to reallocate ahead of the eventual reckoning. We believe that this dynamic is currently underway in the form of the indexation and exchange-traded funds ("ETF") trends.
Although various attempts have been made, the ultimate impact of indexation and ETF investing appears to be beyond quantification. However, there is an undeniable impact, as total ETF assets under management have risen from $2 billion in 1996 to $2.1 trillion in 2015, a multiple of over 2,000x. Similarly, the mutual fund industry has expanded from approximately $3.5 trillion in 1996 to over $15.6 trillion in 2015, a multiple of less than 4.5x. While some may cite the current size advantage of mutual funds over ETFs as evidence of the muted impact of indexation, we believe that this fails to incorporate not only indexed mutual funds, but also, more importantly, the net fund flows.
Index domestic equity mutual funds and ETFs received $1.2 trillion in net new cash and reinvested dividends between 2007 and 2015, while actively managed domestic mutual funds have shed over $800 billion over this period. Thus, active managers are net sellers of domestic stocks, while passive index products have been net buyers. The fund flows are likely far more influential on marginal stock prices than are existing assets under management; hence, we believe that this phenomenon has contributed considerably to the underperformance of active managers over the past nine years.
This has undoubtedly created an opportunity for value investors that embrace stocks which are not well represented in indexation strategies, although this course of action continues to be a painful experience, as index constituents have continued to rise with fund flows. However, we believe that we may have reached a tipping point this year, as the net issuance of equity ETFs through the
4
first 6 months of the year was $3.5 billion, which compares to $72.7 billion during the same period last year. Perhaps a reversal in fund flow trends is not even a requisite for this dynamic to shift, and merely a slowing or cessation of flows can have a similar result.
In the wake of the global financial crisis, it was easy and perhaps advisable to embrace a broad market based approach to equity allocations. Stocks were quantifiably inexpensive, and the economy was more likely to improve than to deteriorate. However, seven years removed, it is equally obvious that stocks are richly valued, and the economy is more likely to slow than accelerate rapidly. Thus, investors who embraced indexation early in the recovery and have, thus far, reaped substantial gains, must consider whether this is the time to diverge from the consensus and embrace stocks on the other side of the "ETF divide." We argue that this path logically makes sense, given the lower valuations and general lower sensitivity to the economy and fund flows, although this environment has been a trying experience for several years now.
The Kinetics Mutual Funds all maintain a very high active share, which denotes portfolio holdings that do not significantly overlap with holdings in the indexes. This strategy has been swimming upstream for an extended period of time now, and those following the trend into indexation have benefitted. Never ones to follow a temporary trend, we have remained steadfast in our allocations. It appears as though the confluence of fund flow patterns and valuations are poised to finally stall or reverse the passive indexation trend. We believe that our approach continues to make logical sense and are particularly keen to embrace investments with the potential to perform in a manner uncorrelated with the broader markets.
Shareholders can continue to access additional information from our website, www.kineticsfunds.com. This website provides a broad array of information, including recent portfolio holdings, quarterly investment commentaries, conference call transcripts, newsflashes, recent performance data, and online access to account information.
5
Kinetics offers the following funds to investors:
The Paradigm Fund focuses on companies that we believe are valued attractively and currently have, or are expected to soon have, sustainable high business returns. The Fund has produced attractive risk adjusted returns since its inception, while maintaining amongst the lowest turnover rates in the industry. The Paradigm Fund is Kinetics' flagship fund.
The Multi-Disciplinary Income Fund seeks to utilize stock options and fixed-income investments in order to provide investors with equity-like returns, but with more muted volatility. At times, the options strategies of the Fund may cause the manager to purchase equity securities.
The Small Cap Opportunities Fund focuses on undervalued and special situation small capitalization equities that we believe have the potential for rewarding long-term investment results. The same investment fundamentals employed by The Paradigm Fund are used to identify such opportunities.
The Medical Fund is a sector fund, offering an investment in scientific discovery within the promising field of medical research, particularly in the development of cancer treatments and therapies. As a sector fund, The Medical Fund is likely to have heightened volatility.
The Internet Fund is a sector fund that focuses on companies engaged in the evolution of Internet-related developments. As such, this Fund has been, and is likely to continue to be, quite volatile. The Internet Fund is not designed to be a major component of one's equity exposure. More recently, this Fund has been focusing on content companies, which we believe will be the winners in the next generation of Internet development.
The Global Fund's mandate is focused on selecting long life cycle international companies that we believe can generate long-term wealth through their business operations. This Fund is presently identifying what we believe to be exciting opportunities in the more developed markets.
6
The Market Opportunities Fund focuses on those companies that benefit from increasing transactional volume or throughput, such as publicly-traded exchanges and credit card processors, or companies that act as facilitators, such as gaming companies, airports and publicly-traded toll roads.
The Alternative Income Fund seeks to provide current income and gains, with a secondary objective of obtaining long-term growth of capital. The Fund utilizes stock options and fixed-income investments and seeks to generate a total return that exceeds most short-term U.S. fixed income indexes, with limited market value variability.
7
Disclosure
This material is intended to be reviewed in conjunction with a current prospectus, which includes all fees and expenses that apply to a continued investment, as well as information regarding the risk factors, policies and objectives of the Funds. Read it carefully before investing.
Mutual Fund investing involves risk. Principal loss is possible. Because The Internet Fund, The Medical Fund and The Market Opportunities Fund invest in a single industry or geographic region, their shares are subject to a higher degree of risk than funds with a higher level of diversification. Internet, biotechnology and certain capital markets or gaming stocks are subject to a rate of change in technology, obsolescence and competition that is generally higher than that of other industries, hence they may experience extreme price and volume fluctuations.
International investing [for all Funds] presents special risks including currency exchange fluctuation, government regulations, and the potential for political and economic instability. Accordingly, the share prices for these Funds are expected to be more volatile than that of U.S.-only funds. Past performance is no guarantee of future performance.
Because smaller companies [for The Small Cap Opportunities Fund] often have narrower markets and limited financial resources, they present more risk than larger, more well established, companies.
Non-investment grade debt securities [for all Funds], i.e., junk bonds, are subject to greater credit risk, price volatility and risk of loss than investment grade securities.
Further, options contain special risks including the imperfect correlation between the value of the option and the value of the underlying asset. Investments [for The Multi-Disciplinary Income Fund and The Alternative Income Fund] in futures, swaps and other derivative instruments may result in loss as derivative instruments may be illiquid, difficult to price and leveraged so that small changes may produce disproportionate losses to the Funds. To the extent the Funds segregate assets to cover derivative positions, they may impair their ability to meet current obligations, to honor requests for redemption
8
and to manage the investments in a manner consistent with their respective investment objectives. Purchasing and writing put and call options and, in particular, writing "uncovered" options are highly specialized activities that entail greater than ordinary investment risk.
As non-diversified Funds, except The Global Fund, The Alternative Income Fund and The Multi-Disciplinary Income Fund, the value of Fund shares may fluctuate more than shares invested in a broader range of industries and companies. Unlike other investment companies that directly acquire and manage their own portfolios of securities, the Kinetics Mutual Funds pursue their investment objectives by investing all of their investable assets in a corresponding portfolio series of the Kinetics Portfolios Trust.
The information concerning the Funds included in the shareholder report contains certain forward-looking statements about the factors that may affect the performance of the Funds in the future. These statements are based on Fund management's predictions and expectations concerning certain future events and their expected impact on the Funds, such as performance of the economy as a whole and of specific industry sectors, changes in the levels of interest rates, the impact of developing world events, and other factors that may influence the future performance of the Funds. Management believes these forward-looking statements to be reasonable, although they are inherently uncertain and difficult to predict. Actual events may cause adjustments in portfolio management strategies from those currently expected to be employed.
The MSCI All Country World Index (MSCI ACWI) and the Standard & Poor's 500 Index (S&P 500) each represent an unmanaged, broad-basket of stocks. They are typically used as a proxy for overall market performance.
Distributor: Kinetics Funds Distributor LLC is not an affiliate of Kinetics Mutual Funds, Inc. Kinetics Funds Distributor LLC is an affiliate of Kinetics Asset Management LLC, Investment Adviser to Kinetics Mutual Funds, Inc.
For more information, log onto www.kineticsfunds.com. July 1, 2016 — Kinetics Asset Management LLC ®
9
| KINETICS MUTUAL FUNDS, INC. — THE FEEDER FUNDS |
| Expense Example |
| June 30, 2016 (Unaudited) |
Shareholders incur two types of costs: (1) transaction costs, including sales charges (loads) on purchase payments, reinvestments of dividends or other distributions made by a Fund, redemption fees, and exchange fees, and (2), ongoing costs, including management fees, distribution and/or service (12b-1) fees, and other Fund expenses. This example is intended to help investors understand the ongoing costs (in dollars) of investing in a series of Kinetics Mutual Funds, Inc. (each a "Feeder Fund" and collectively the "Feeder Funds"), and to compare these costs with the ongoing costs of investing in other mutual funds. The example is based on an investment of $1,000 invested on January 1, 2016 and held for the entire period from January 1, 2016 to June 30, 2016.
Actual Expenses
The first line item of the table below provides information about actual account values and actual expenses before and after expense reimbursement. Unlike other mutual funds that directly acquire and manage their own portfolio securities, each Feeder Fund invests all or generally all of its investable assets in a corresponding series of The Kinetics Portfolios Trust (each, a "Master Portfolio", and together the "Master Portfolios"), a separately registered investment company. The Master Portfolio, in turn, invests in securities. With this type of organization, expenses can accrue specifically to the Master Portfolio or the Feeder Fund or both. Each Feeder Fund records its proportionate share of the Master Portfolio's expenses, including directed brokerage credits, on a daily basis. Any expense reductions include Fund-specific expenses as well as the expenses allocated from the Master Portfolio.
The Feeder Funds will charge shareholder fees for outgoing wire transfers, returned checks, and exchanges executed by telephone between a Feeder Fund and any other Feeder Fund. The Feeder Funds' transfer agent charges a $5.00 transaction fee to shareholder accounts for telephone exchanges between any two Feeder Funds. The Feeder Funds' transfer agent does not charge a transaction fee for written exchange requests. IRA accounts are assessed a $15.00 annual fee. Finally, as a disincentive to market-timing transactions, the Feeder Funds will assess a 2.00% fee on the redemption or exchange of Fund shares held for less than 30 days. These fees will be paid to the Feeder Funds to help offset transaction costs. The Feeder Funds reserve the right to waive the redemption fee, subject to their sole discretion, in instances deemed not to be disadvantageous to the Feeder Funds or shareholders as described in the Feeder Funds' prospectus.
10
| KINETICS MUTUAL FUNDS, INC. — THE FEEDER FUNDS |
Expense Example — (Continued) |
| June 30, 2016 (Unaudited) |
You may use the information provided in the first line, together with the amounts you invested, to estimate the expenses that you paid over the period. Simply divide your account value by $1,000 (for example, an $8,600 account value divided by $1,000 = 8.6), then multiply the result by the number in the first line under the heading entitled "Expenses Paid During Period" to estimate the expenses you paid on your account during this period.
Hypothetical Example for Comparison Purposes
The second line item of the table below provides information about hypothetical account values and hypothetical expenses before and after expense reimbursements based on the Feeder Funds' actual expense ratios and an assumed rate of return of 5% per year before expenses, which are not the Feeder Funds' actual returns. The hypothetical account values and expenses may not be used to estimate the actual ending account balance or expenses one paid for the period. You may use this information to compare the ongoing costs of investing in the Feeder Funds and other funds. To do so, compare this 5% hypothetical example with the 5% hypothetical examples that appear in the shareholder reports of the other funds. Please note that the expenses shown in the table are meant to highlight one's ongoing costs only and do not reflect any transactional costs, such as sales charges (loads), redemption fees, or exchange fees. Therefore, the second line of the table is useful in comparing ongoing costs only, and will not help one determine the relative total costs of owning different funds. If these transactional costs had been included, one's costs would have been higher.
11
| KINETICS MUTUAL FUNDS, INC. — THE FEEDER FUNDS |
Expense Example — (Continued) |
| June 30, 2016 (Unaudited) |
| | | | | | | | | | | | | Expenses Paid | |
| | | | Beginning | | | Ending | | | | | | During | |
| | | | Account | | | Account | | | Annualized | | | Period* | |
| | | | Value | | | Value | | | Expense | | | (1/1/16 | |
| | | | (1/1/16) | | | (6/30/16) | | | Ratio | | | to 6/30/16) | |
| | | | | | | | | | | | | | |
| The Internet Fund | | | | | | | | | | | | | |
| No Load Class Actual | | $ | 1,000.00 | | $ | 961.10 | | | 1.87 | % | $ | 9.12 | |
| No Load Class Hypothetical (5% return | | | | | | | | | | | | | |
| before expenses) | | $ | 1,000.00 | | $ | 1,015.60 | | | 1.87 | % | $ | 9.37 | |
| Advisor Class A Actual | | $ | 1,000.00 | | $ | 960.10 | | | 2.12 | % | $ | 10.33 | |
| Advisor Class A Hypothetical (5% return | | | | | | | | | | | | | |
| before expenses) | | $ | 1,000.00 | | $ | 1,014.36 | | | 2.12 | % | $ | 10.62 | |
| Advisor Class C Actual | | $ | 1,000.00 | | $ | 957.60 | | | 2.62 | % | $ | 12.75 | |
| Advisor Class C Hypothetical (5% return | | | | | | | | | | | | | |
| before expenses) | | $ | 1,000.00 | | $ | 1,011.87 | | | 2.62 | % | $ | 13.11 | |
| | | | | | | | | | | | | | |
| The Global Fund | | | | | | | | | | | | | |
| No Load Class Actual — after | | | | | | | | | | | | | |
| expense reimbursement | | $ | 1,000.00 | | $ | 1,069.70 | | | 1.39 | % | $ | 7.15 | |
| No Load Class Hypothetical (5% return | | | | | | | | | | | | | |
| before expenses) — after | | | | | | | | | | | | | |
| expense reimbursement | | $ | 1,000.00 | | $ | 1,017.99 | | | 1.39 | % | $ | 6.97 | |
| Advisor Class A Actual — after | | | | | | | | | | | | | |
| expense reimbursement | | $ | 1,000.00 | | $ | 1,067.80 | | | 1.64 | % | $ | 8.43 | |
| Advisor Class A Hypothetical (5% return | | | | | | | | | | | | | |
| before expenses) — after | | | | | | | | | | | | | |
| expense reimbursement | | $ | 1,000.00 | | $ | 1,016.74 | | | 1.64 | % | $ | 8.22 | |
| Advisor Class C Actual — after | | | | | | | | | | | | | |
| expense reimbursement | | $ | 1,000.00 | | $ | 1,065.80 | | | 2.14 | % | $ | 10.99 | |
| Advisor Class C Hypothetical (5% return | | | | | | | | | | | | | |
| before expenses) — after | | | | | | | | | | | | | |
| expense reimbursement | | $ | 1,000.00 | | $ | 1,014.26 | | | 2.14 | % | $ | 10.72 | |
12
| KINETICS MUTUAL FUNDS, INC. — THE FEEDER FUNDS |
Expense Example — (Continued) |
| June 30, 2016 (Unaudited) |
| | | | | | | | | | | | | Expenses Paid | |
| | | | Beginning | | | Ending | | | | | | During | |
| | | | Account | | | Account | | | Annualized | | | Period* | |
| | | | Value | | | Value | | | Expense | | | (1/1/16 | |
| | | | (1/1/16) | | | (6/30/16) | | | Ratio | | | to 6/30/16) | |
| | | | | | | | | | | | | | |
| The Paradigm Fund | | | | | | | | | | | | | |
| No Load Class Actual — after | | | | | | | | | | | | | |
| expense reimbursement | | $ | 1,000.00 | | $ | 1,045.10 | | | 1.64 | % | $ | 8.34 | |
| No Load Class Hypothetical (5% return | | | | | | | | | | | | | |
| before expenses) — after | | | | | | | | | | | | | |
| expense reimbursement | | $ | 1,000.00 | | $ | 1,016.74 | | | 1.64 | % | $ | 8.22 | |
| Advisor Class A Actual — after | | | | | | | | | | | | | |
| expense reimbursement | | $ | 1,000.00 | | $ | 1,043.90 | | | 1.89 | % | $ | 9.60 | |
| Advisor Class A Hypothetical (5% return | | | | | | | | | | | | | |
| before expenses) — after | | | | | | | | | | | | | |
| expense reimbursement | | $ | 1,000.00 | | $ | 1,015.50 | | | 1.89 | % | $ | 9.47 | |
| Advisor Class C Actual — after | | | | | | | | | | | | | |
| expense reimbursement | | $ | 1,000.00 | | $ | 1,041.40 | | | 2.39 | % | $ | 12.13 | |
| Advisor Class C Hypothetical (5% return | | | | | | | | | | | | | |
| before expenses) — after | | | | | | | | | | | | | |
| expense reimbursement | | $ | 1,000.00 | | $ | 1,013.02 | | | 2.39 | % | $ | 11.96 | |
| Institutional Class Actual — after | | | | | | | | | | | | | |
| expense reimbursement | | $ | 1,000.00 | | $ | 1,046.60 | | | 1.44 | % | $ | 7.33 | |
| Institutional Class Hypothetical (5% return | | | | | | | | | | | | | |
| before expenses) — after | | | | | | | | | | | | | |
| expense reimbursement | | $ | 1,000.00 | | $ | 1,017.74 | | | 1.44 | % | $ | 7.22 | |
| | | | | | | | | | | | | | |
| The Medical Fund | | | | | | | | | | | | | |
| No Load Class Actual — after | | | | | | | | | | | | | |
| expense reimbursement | | $ | 1,000.00 | | $ | 916.70 | | | 1.39 | % | $ | 6.62 | |
| No Load Class Hypothetical (5% return | | | | | | | | | | | | | |
| before expenses) — after | | | | | | | | | | | | | |
| expense reimbursement | | $ | 1,000.00 | | $ | 1,017.99 | | | 1.39 | % | $ | 6.97 | |
| Advisor Class A Actual — after | | | | | | | | | | | | | |
| expense reimbursement | | $ | 1,000.00 | | $ | 915.50 | | | 1.64 | % | $ | 7.81 | |
| Advisor Class A Hypothetical (5% return | | | | | | | | | | | | | |
| before expenses) — after | | | | | | | | | | | | | |
| expense reimbursement | | $ | 1,000.00 | | $ | 1,016.74 | | | 1.64 | % | $ | 8.22 | |
| Advisor Class C Actual — after | | | | | | | | | | | | | |
| expense reimbursement | | $ | 1,000.00 | | $ | 913.30 | | | 2.14 | % | $ | 10.18 | |
| Advisor Class C Hypothetical (5% return | | | | | | | | | | | | | |
| before expenses) — after | | | | | | | | | | | | | |
| expense reimbursement | | $ | 1,000.00 | | $ | 1,014.26 | | | 2.14 | % | $ | 10.72 | |
13
| KINETICS MUTUAL FUNDS, INC. — THE FEEDER FUNDS |
Expense Example — (Continued) |
| June 30, 2016 (Unaudited) |
| | | | | | | | | | | | | Expenses Paid | |
| | | | Beginning | | | Ending | | | | | | During | |
| | | | Account | | | Account | | | Annualized | | | Period* | |
| | | | Value | | | Value | | | Expense | | | (1/1/16 | |
| | | | (1/1/16) | | | (6/30/16) | | | Ratio | | | to 6/30/16) | |
| | | | | | | | | | | | | | |
| The Small Cap Opportunities Fund | | | | | | | | | | | | | |
| No Load Class Actual — after | | | | | | | | | | | | | |
| expense reimbursement | | $ | 1,000.00 | | $ | 1,063.70 | | | 1.64 | % | $ | 8.41 | |
| No Load Class Hypothetical (5% return | | | | | | | | | | | | | |
| before expenses) — after | | | | | | | | | | | | | |
| expense reimbursement | | $ | 1,000.00 | | $ | 1,016.74 | | | 1.64 | % | $ | 8.22 | |
| Advisor Class A Actual — after | | | | | | | | | | | | | |
| expense reimbursement | | $ | 1,000.00 | | $ | 1,062.40 | | | 1.89 | % | $ | 9.69 | |
| Advisor Class A Hypothetical (5% return | | | | | | | | | | | | | |
| before expenses) — after | | | | | | | | | | | | | |
| expense reimbursement | | $ | 1,000.00 | | $ | 1,015.50 | | | 1.89 | % | $ | 9.47 | |
| Advisor Class C Actual — after | | | | | | | | | | | | | |
| expense reimbursement | | $ | 1,000.00 | | $ | 1,059.90 | | | 2.39 | % | $ | 12.24 | |
| Advisor Class C Hypothetical (5% return | | | | | | | | | | | | | |
| before expenses) — after | | | | | | | | | | | | | |
| expense reimbursement | | $ | 1,000.00 | | $ | 1,013.02 | | | 2.39 | % | $ | 11.96 | |
| Institutional Class Actual — after | | | | | | | | | | | | | |
| expense reimbursement | | $ | 1,000.00 | | $ | 1,064.80 | | | 1.44 | % | $ | 7.39 | |
| Institutional Class Hypothetical (5% return | | | | | | | | | | | | | |
| before expenses) — after | | | | | | | | | | | | | |
| expense reimbursement | | $ | 1,000.00 | | $ | 1,017.74 | | | 1.44 | % | $ | 7.22 | |
| | | | | | | | | | | | | | |
| The Market Opportunities Fund | | | | | | | | | | | | | |
| No Load Class Actual — after | | | | | | | | | | | | | |
| expense reimbursement | | $ | 1,000.00 | | $ | 1,050.10 | | | 1.64 | % | $ | 8.36 | |
| No Load Class Hypothetical (5% return | | | | | | | | | | | | | |
| before expenses) — after | | | | | | | | | | | | | |
| expense reimbursement | | $ | 1,000.00 | | $ | 1,016.74 | | | 1.64 | % | $ | 8.22 | |
| Advisor Class A Actual — after | | | | | | | | | | | | | |
| expense reimbursement | | $ | 1,000.00 | | $ | 1,048.50 | | | 1.89 | % | $ | 9.63 | |
| Advisor Class A Hypothetical (5% return | | | | | | | | | | | | | |
| before expenses) — after | | | | | | | | | | | | | |
| expense reimbursement | | $ | 1,000.00 | | $ | 1,015.50 | | | 1.89 | % | $ | 9.47 | |
| Advisor Class C Actual — after | | | | | | | | | | | | | |
| expense reimbursement | | $ | 1,000.00 | | $ | 1,045.70 | | | 2.39 | % | $ | 12.16 | |
| Advisor Class C Hypothetical (5% return | | | | | | | | | | | | | |
| before expenses) — after | | | | | | | | | | | | | |
| expense reimbursement | | $ | 1,000.00 | | $ | 1,013.02 | | | 2.39 | % | $ | 11.96 | |
| Institutional Class Actual — after | | | | | | | | | | | | | |
| expense reimbursement | | $ | 1,000.00 | | $ | 1,051.70 | | | 1.44 | % | $ | 7.35 | |
| Institutional Class Hypothetical (5% return | | | | | | | | | | | | | |
| before expenses) — after | | | | | | | | | | | | | |
| expense reimbursement | | $ | 1,000.00 | | $ | 1,017.74 | | | 1.44 | % | $ | 7.22 | |
14
| KINETICS MUTUAL FUNDS, INC. — THE FEEDER FUNDS |
Expense Example — (Continued) |
| June 30, 2016 (Unaudited) |
| | | | | | | | | | | | | Expenses Paid | |
| | | | Beginning | | | Ending | | | | | | During | |
| | | | Account | | | Account | | | Annualized | | | Period* | |
| | | | Value | | | Value | | | Expense | | | (1/1/16 | |
| | | | (1/1/16) | | | (6/30/16) | | | Ratio | | | to 6/30/16) | |
| | | | | | | | | | | | | | |
| The Alternative Income Fund | | | | | | | | | | | | | |
| No Load Class Actual — after | | | | | | | | | | | | | |
| expense reimbursement | | $ | 1,000.00 | | $ | 1,019.50 | | | 0.95 | % | $ | 4.77 | |
| No Load Class Hypothetical (5% return | | | | | | | | | | | | | |
| before expenses) — after | | | | | | | | | | | | | |
| expense reimbursement | | $ | 1,000.00 | | $ | 1,020.18 | | | 0.95 | % | $ | 4.77 | |
| Advisor Class A Actual — after | | | | | | | | | | | | | |
| expense reimbursement | | $ | 1,000.00 | | $ | 1,018.30 | | | 1.20 | % | $ | 6.02 | |
| Advisor Class A Hypothetical (5% return | | | | | | | | | | | | | |
| before expenses) — after | | | | | | | | | | | | | |
| expense reimbursement | | $ | 1,000.00 | | $ | 1,018.93 | | | 1.20 | % | $ | 6.02 | |
| Advisor Class C Actual — after | | | | | | | | | | | | | |
| expense reimbursement | | $ | 1,000.00 | | $ | 1,015.70 | | | 1.70 | % | $ | 8.52 | |
| Advisor Class C Hypothetical (5% return | | | | | | | | | | | | | |
| before expenses) — after | | | | | | | | | | | | | |
| expense reimbursement | | $ | 1,000.00 | | $ | 1,016.45 | | | 1.70 | % | $ | 8.52 | |
| Institutional Class Actual — after | | | | | | | | | | | | | |
| expense reimbursement | | $ | 1,000.00 | | $ | 1,020.50 | | | 0.75 | % | $ | 3.77 | |
| Institutional Class Hypothetical (5% return | | | | | | | | | | | | | |
| before expenses) — after | | | | | | | | | | | | | |
| expense reimbursement | | $ | 1,000.00 | | $ | 1,021.17 | | | 0.75 | % | $ | 3.77 | |
| | | | | | | | | | | | | | |
| The Multi-Disciplinary Income Fund | | | | | | | | | | | | | |
| No Load Class Actual — after | | | | | | | | | | | | | |
| expense reimbursement | | $ | 1,000.00 | | $ | 1,057.50 | | | 1.49 | % | $ | 7.62 | |
| No Load Class Hypothetical (5% return | | | | | | | | | | | | | |
| before expenses) — after | | | | | | | | | | | | | |
| expense reimbursement | | $ | 1,000.00 | | $ | 1,017.49 | | | 1.49 | % | $ | 7.47 | |
| Advisor Class A Actual — after | | | | | | | | | | | | | |
| expense reimbursement | | $ | 1,000.00 | | $ | 1,056.20 | | | 1.74 | % | $ | 8.90 | |
| Advisor Class A Hypothetical (5% return | | | | | | | | | | | | | |
| before expenses) — after | | | | | | | | | | | | | |
| expense reimbursement | | $ | 1,000.00 | | $ | 1,016.25 | | | 1.74 | % | $ | 8.72 | |
| Advisor Class C Actual — after | | | | | | | | | | | | | |
| expense reimbursement | | $ | 1,000.00 | | $ | 1,053.30 | | | 2.24 | % | $ | 11.44 | |
| Advisor Class C Hypothetical (5% return | | | | | | | | | | | | | |
| before expenses) — after | | | | | | | | | | | | | |
| expense reimbursement | | $ | 1,000.00 | | $ | 1,013.76 | | | 2.24 | % | $ | 11.22 | |
| Institutional Class Actual — after | | | | | | | | | | | | | |
| expense reimbursement | | $ | 1,000.00 | | $ | 1,058.40 | | | 1.29 | % | $ | 6.60 | |
| Institutional Class Hypothetical (5% return | | | | | | | | | | | | | |
| before expenses) — after | | | | | | | | | | | | | |
| expense reimbursement | | $ | 1,000.00 | | $ | 1,018.49 | | | 1.29 | % | $ | 6.47 | |
| Note: | Each Feeder Fund records its proportionate share of the respective Master Portfolio's expenses on a daily basis. Any expense reductions include Feeder Fund-specific expenses as well as the expenses allocated for the Master Portfolio. |
| * | Expenses are equal to the Feeder Fund's annualized expense ratio after expense reimbursement multiplied by the average account value over the period, multiplied by 182/366. |
15
| KINETICS MUTUAL FUNDS, INC. — THE FEEDER FUNDS |
| Statements of Assets & Liabilities |
| June 30, 2016 (Unaudited) |
| | | | The Internet | | | The Global | |
| | | | Fund | | | Fund | |
| ASSETS: | | | | | | | |
| Investments in the Master Portfolio, at value* | | $ | 114,416,742 | | $ | 7,133,140 | |
| Receivable from Adviser | | | — | | | 2,904 | |
| Receivable for Master Portfolio interest sold | | | 46,249 | | | — | |
| Receivable for Fund shares sold | | | 41,073 | | | 25,781 | |
| Prepaid expenses and other assets | | | 31,596 | | | 30,963 | |
| Total Assets | | | 114,535,660 | | | 7,192,788 | |
| LIABILITIES: | | | | | | | |
| Payable for Master Portfolio interest purchased | | | — | | | 11,645 | |
| Payable to Directors | | | 3,080 | | | 173 | |
| Payable to Chief Compliance Officer | | | 207 | | | 13 | |
| Payable for Fund shares repurchased | | | 87,322 | | | 14,136 | |
| Payable for shareholder servicing fees | | | 23,662 | | | 1,438 | |
| Payable for distribution fees | | | 1,266 | | | 1,784 | |
| Accrued expenses and other liabilities | | | 55,525 | | | 16,183 | |
| Total Liabilities | | | 171,062 | | | 45,372 | |
| Net Assets | | $ | 114,364,598 | | $ | 7,147,416 | |
| NET ASSETS CONSIST OF: | | | | | | | |
| Paid in capital | | $ | 69,251,604 | | $ | 6,533,530 | |
| Accumulated net investment income (loss) | | | (824,523 | ) | | 41,037 | |
| Accumulated net realized gain on investments and foreign currency | | | 9,508,277 | | | 129,864 | |
| Net unrealized appreciation on: | | | | | | | |
| Investments and foreign currency | | | 36,429,240 | | | 442,985 | |
| Net Assets | | $ | 114,364,598 | | $ | 7,147,416 | |
| CALCULATION OF NET ASSET VALUE PER SHARE — NO LOAD CLASS: | | | | | | | |
| Net Assets | | $ | 110,942,199 | | $ | 5,027,441 | |
| Shares outstanding | | | 2,769,161 | | | 1,023,651 | |
| Net asset value per share (offering price and redemption price) | | $ | 40.06 | | $ | 4.91 | |
| CALCULATION OF NET ASSET VALUE PER SHARE — ADVISOR CLASS A: | | | | | | | |
| Net Assets | | $ | 2,610,164 | | $ | 325,813 | |
| Shares outstanding | | | 67,857 | | | 66,790 | |
| Net asset value per share (redemption price) | | $ | 38.47 | | $ | 4.88 | |
| Offering price per share ($38.47 divided by .9425 and $4.88 divided by .9425) | | $ | 40.82 | | $ | 5.18 | |
| CALCULATION OF NET ASSET VALUE PER SHARE — ADVISOR CLASS C: | | | | | | | |
| Net Assets | | $ | 812,235 | | $ | 1,794,162 | |
| Shares outstanding | | | 22,756 | | | 381,566 | |
| Net asset value per share (offering price and redemption price) | | $ | 35.69 | | $ | 4.70 | |
| * | Each Feeder Fund invests all or generally all its assets directly in the corresponding Master Portfolio. The financial statements for the Master Portfolios, along with the portfolio of investments in securities, are contained elsewhere in this report and should be read in conjunction with the Feeder Funds' financial statements. |
The accompanying notes are an integral part of these financial statements.
16
| KINETICS MUTUAL FUNDS, INC. — THE FEEDER FUNDS |
Statements of Assets & Liabilities — (Continued) |
| June 30, 2016 (Unaudited) |
| | | | The Paradigm | | | The Medical | |
| | | | Fund | | | Fund | |
| ASSETS: | | | | | | | |
| Investments in the Master Portfolio, at value* | | $ | 738,089,776 | | $ | 24,394,177 | |
| Receivable from Adviser | | | 52,190 | | | 8,986 | |
| Receivable for Fund shares sold | | | 2,713,422 | | | 3,024 | |
| Prepaid expenses and other assets | | | 65,827 | | | 25,357 | |
| Total Assets | | | 740,921,215 | | | 24,431,544 | |
| LIABILITIES: | | | | | | | |
| Payable for Master Portfolio interest purchased | | | 1,517,121 | | | 3,024 | |
| Payable to Directors | | | 19,762 | | | 656 | |
| Payable to Chief Compliance Officer | | | 1,298 | | | 43 | |
| Payable for Fund shares repurchased | | | 1,196,301 | | | — | |
| Payable for shareholder servicing fees | | | 108,097 | | | 4,962 | |
| Payable for distribution fees | | | 105,603 | | | 1,271 | |
| Accrued expenses and other liabilities | | | 220,417 | | | 19,690 | |
| Total Liabilities | | | 3,168,599 | | | 29,646 | |
| Net Assets | | $ | 737,752,616 | | $ | 24,401,898 | |
| NET ASSETS CONSIST OF: | | | | | | | |
| Paid in capital | | $ | 1,137,372,012 | | $ | 16,431,151 | |
| Accumulated net investment income (loss) | | | (10,731,151 | ) | | 180,582 | |
| Accumulated net realized gain (loss) on investments and foreign currency | | | (580,341,794 | ) | | 845,177 | |
| Net unrealized appreciation on: | | | | | | | |
| Investments and foreign currency | | | 191,453,549 | | | 6,944,988 | |
| Net Assets | | $ | 737,752,616 | | $ | 24,401,898 | |
| CALCULATION OF NET ASSET VALUE PER SHARE — NO LOAD CLASS: | | | | | | | |
| Net Assets | | $ | 264,371,593 | | $ | 19,522,200 | |
| Shares outstanding | | | 8,096,506 | | | 695,467 | |
| Net asset value per share (offering price and redemption price) | | $ | 32.65 | | $ | 28.07 | |
| CALCULATION OF NET ASSET VALUE PER SHARE — ADVISOR CLASS A: | | | | | | | |
| Net Assets | | $ | 102,780,296 | | $ | 4,381,109 | |
| Shares outstanding | | | 3,224,629 | | | 161,837 | |
| Net asset value per share (redemption price) | | $ | 31.87 | | $ | 27.07 | |
| Offering price per share ($31.87 divided by .9425 and $27.07 divided by .9425) | | $ | 33.81 | | $ | 28.72 | |
| CALCULATION OF NET ASSET VALUE PER SHARE — ADVISOR CLASS C: | | | | | | | |
| Net Assets | | $ | 107,899,161 | | $ | 498,589 | |
| Shares outstanding | | | 3,571,686 | | | 18,944 | |
| Net asset value per share (offering price and redemption price) | | $ | 30.21 | | $ | 26.32 | |
| CALCULATION OF NET ASSET VALUE PER SHARE — INSTITUTIONAL CLASS: | | | | | | | |
| Net Assets | | $ | 262,701,566 | | | N/A | |
| Shares outstanding | | | 8,019,574 | | | N/A | |
| Net asset value per share (offering price and redemption price) | | $ | 32.76 | | | N/A | |
| * | Each Feeder Fund invests all or generally all its assets directly in the corresponding Master Portfolio. The financial statements for the Master Portfolios, along with the portfolio of investments in securities, are contained elsewhere in this report and should be read in conjunction with the Feeder Funds' financial statements. |
The accompanying notes are an integral part of these financial statements.
17
| KINETICS MUTUAL FUNDS, INC. — THE FEEDER FUNDS |
Statements of Assets & Liabilities — (Continued) |
| June 30, 2016 (Unaudited) |
| | | | The Small Cap | | | The Market | |
| | | | Opportunities | | | Opportunities | |
| | | | Fund | | | Fund | |
| ASSETS: | | | | | | | |
| Investments in the Master Portfolio, at value* | | $ | 198,584,243 | | $ | 38,543,059 | |
| Receivable from Adviser | | | 4,997 | | | 6,030 | |
| Receivable for Master Portfolio interest sold | | | 122,335 | | | 12,230 | |
| Receivable for Fund shares sold | | | 141,615 | | | 489 | |
| Prepaid expenses and other assets | | | 40,886 | | | 35,268 | |
| Total Assets | | | 198,894,076 | | | 38,597,076 | |
| LIABILITIES: | | | | | | | |
| Payable to Directors | | | 5,283 | | | 1,037 | |
| Payable to Chief Compliance Officer | | | 349 | | | 73 | |
| Payable for Fund shares repurchased | | | 263,950 | | | 12,719 | |
| Payable for shareholder servicing fees | | | 32,948 | | | 7,665 | |
| Payable for distribution fees | | | 9,417 | | | 3,599 | |
| Accrued expenses and other liabilities | | | 65,815 | | | 23,362 | |
| Total Liabilities | | | 377,762 | | | 48,455 | |
| Net Assets | | $ | 198,516,314 | | $ | 38,548,621 | |
| NET ASSETS CONSIST OF: | | | | | | | |
| Paid in capital | | $ | 324,685,488 | | $ | 50,257,078 | |
| Accumulated net investment loss | | | (5,012,417 | ) | | (804,465 | ) |
| Accumulated net realized loss on investments and foreign currency | | | (92,448,866 | ) | | (16,010,706 | ) |
| Net unrealized appreciation (depreciation) on: | | | | | | | |
| Investments and foreign currency | | | (28,707,891 | ) | | 5,106,714 | |
| Net Assets | | $ | 198,516,314 | | $ | 38,548,621 | |
| CALCULATION OF NET ASSET VALUE PER SHARE — NO LOAD CLASS: | | | | | | | |
| Net Assets | | $ | 127,874,183 | | $ | 28,738,254 | |
| Shares outstanding | | | 3,682,791 | | | 1,805,239 | |
| Net asset value per share (offering price and redemption price) | | $ | 34.72 | | $ | 15.92 | |
| CALCULATION OF NET ASSET VALUE PER SHARE — ADVISOR CLASS A: | | | | | | | |
| Net Assets | | $ | 12,611,239 | | $ | 3,960,371 | |
| Shares outstanding | | | 372,318 | | | 251,055 | |
| Net asset value per share (redemption price) | | $ | 33.87 | | $ | 15.77 | |
| Offering price per share ($33.87 divided by .9425 and $15.77 divided by .9425) | | $ | 35.94 | | $ | 16.73 | |
| CALCULATION OF NET ASSET VALUE PER SHARE — ADVISOR CLASS C: | | | | | | | |
| Net Assets | | $ | 7,897,229 | | $ | 4,097,027 | |
| Shares outstanding | | | 241,283 | | | 267,399 | |
| Net asset value per share (offering price and redemption price) | | $ | 32.73 | | $ | 15.32 | |
| CALCULATION OF NET ASSET VALUE PER SHARE — INSTITUTIONAL CLASS: | | | | | | | |
| Net Assets | | $ | 50,133,663 | | $ | 1,752,969 | |
| Shares outstanding | | | 1,425,438 | | | 109,044 | |
| Net asset value per share (offering price and redemption price) | | $ | 35.17 | | $ | 16.08 | |
| * | Each Feeder Fund invests all or generally all its assets directly in the corresponding Master Portfolio. The financial statements for the Master Portfolios, along with the portfolio of investments in securities, are contained elsewhere in this report and should be read in conjunction with the Feeder Funds' financial statements. |
The accompanying notes are an integral part of these financial statements.
18
| KINETICS MUTUAL FUNDS, INC. — THE FEEDER FUNDS |
Statements of Assets & Liabilities — (Continued) |
| June 30, 2016 (Unaudited) |
| | | | The | | | The Multi- | |
| | | | Alternative | | | Disciplinary | |
| | | | Income | | | Income | |
| | | | Fund | | | Fund | |
| ASSETS: | | | | | | | |
| Investments in the Master Portfolio, at value* | | $ | 26,466,536 | | $ | 83,861,092 | |
| Receivable from Adviser | | | 12,830 | | | 21,800 | |
| Receivable for Fund shares sold | | | 62,204 | | | 138,560 | |
| Prepaid expenses and other assets | | | 41,998 | | | 38,413 | |
| Total Assets | | | 26,583,568 | | | 84,059,865 | |
| LIABILITIES: | | | | | | | |
| Payable for Master Portfolio interest purchased | | | 53,648 | | | 115,478 | |
| Payable to Directors | | | 704 | | | 2,229 | |
| Payable to Chief Compliance Officer | | | 45 | | | 150 | |
| Payable for Fund shares repurchased | | | 8,556 | | | 23,082 | |
| Payable for shareholder servicing fees | | | 2,503 | | | 6,710 | |
| Payable for distribution fees | | | 2,169 | | | 7,430 | |
| Accrued expenses and other liabilities | | | 20,226 | | | 35,495 | |
| Total Liabilities | | | 87,851 | | | 190,574 | |
| Net Assets | | $ | 26,495,717 | | $ | 83,869,291 | |
| NET ASSETS CONSIST OF: | | | | | | | |
| Paid in capital | | $ | 32,192,252 | | $ | 88,930,514 | |
| Accumulated net investment income | | | 27,691 | | | 15,282 | |
| Accumulated net realized loss on investments and foreign currency | | | (5,993,641 | ) | | (1,383,166 | ) |
| Net unrealized appreciation (depreciation) on: | | | | | | | |
| Investments and foreign currency | | | 46,555 | | | (3,697,146 | ) |
| Written option contracts | | | 222,860 | | | 3,807 | |
| Net Assets | | $ | 26,495,717 | | $ | 83,869,291 | |
| CALCULATION OF NET ASSET VALUE PER SHARE — NO LOAD CLASS: | | | | | | | |
| Net Assets | | $ | 4,826,909 | | $ | 5,432,427 | |
| Shares outstanding | | | 51,640 | | | 508,685 | |
| Net asset value per share (offering price and redemption price) | | $ | 93.47 | | $ | 10.68 | |
| CALCULATION OF NET ASSET VALUE PER SHARE — ADVISOR CLASS A: | | | | | | | |
| Net Assets | | $ | 2,316,485 | | $ | 5,853,566 | |
| Shares outstanding | | | 24,994 | | | 550,689 | |
| Net asset value per share (redemption price) | | $ | 92.68 | | $ | 10.63 | |
| Offering price per share ($92.68 divided by .9425 and $10.63 divided by .9425) | | $ | 98.33 | | $ | 11.28 | |
| CALCULATION OF NET ASSET VALUE PER SHARE — ADVISOR CLASS C: | | | | | | | |
| Net Assets | | $ | 1,532,131 | | $ | 8,395,006 | |
| Shares outstanding | | | 17,052 | | | 797,521 | |
| Net asset value per share (offering price and redemption price) | | $ | 89.85 | | $ | 10.53 | |
| CALCULATION OF NET ASSET VALUE PER SHARE — INSTITUTIONAL CLASS: | | | | | | | |
| Net Assets | | $ | 17,820,192 | | $ | 64,188,292 | |
| Shares outstanding | | | 188,083 | | | 6,000,843 | |
| Net asset value per share (offering price and redemption price) | | $ | 94.75 | | $ | 10.70 | |
| * | Each Feeder Fund invests all or generally all its assets directly in the corresponding Master Portfolio. The financial statements for the Master Portfolios, along with the portfolio of investments in securities, are contained elsewhere in this report and should be read in conjunction with the Feeder Funds' financial statements. |
The accompanying notes are an integral part of these financial statements.
19
| KINETICS MUTUAL FUNDS, INC. — THE FEEDER FUNDS |
| Statements of Operations |
| For the Period Ended June 30, 2016 (Unaudited) |
| | | | The Internet | | | The Global | |
| | | | Fund | | | Fund | |
| INVESTMENT INCOME (LOSS) ALLOCATED FROM MASTER PORTFOLIOS: | | | | | | | |
| Dividends† | | $ | 38,090 | | $ | 67,886 | |
| Interest | | | 41,268 | | | 3,449 | |
| Income from securities lending | | | 21,157 | | | 1,625 | |
| Expenses allocated from Master Portfolio | | | (804,271 | ) | | (53,262 | ) |
| Net investment income (loss) from Master Portfolio | | | (703,756 | ) | | 19,698 | |
| EXPENSES: | | | | | | | |
| Distribution fees — Advisor Class A | | | 3,424 | | | 397 | |
| Distribution fees — Advisor Class C | | | 2,929 | | | 6,177 | |
| Shareholder servicing fees — Advisor Class A | | | 3,424 | | | 397 | |
| Shareholder servicing fees — Advisor Class C | | | 976 | | | 2,059 | |
| Shareholder servicing fees — No Load Class | | | 141,351 | | | 5,818 | |
| Transfer agent fees and expenses | | | 60,611 | | | 9,029 | |
| Reports to shareholders | | | 12,636 | | | 693 | |
| Administration fees | | | 24,811 | | | 2,305 | |
| Professional fees | | | 10,020 | | | 4,372 | |
| Directors' fees | | | 5,815 | | | 312 | |
| Chief Compliance Officer fees | | | 1,248 | | | 74 | |
| Registration fees | | | 17,662 | | | 17,430 | |
| Fund accounting fees | | | 2,846 | | | 152 | |
| Other expenses | | | 2,855 | | | 158 | |
| Total expenses | | | 290,608 | | | 49,373 | |
| Less, expense reimbursement | | | — | | | (50,060 | ) |
| Net expenses | | | 290,608 | | | (687 | ) |
| Net investment income (loss) | | | (994,364 | ) | | 20,385 | |
| REALIZED AND UNREALIZED GAIN (LOSS) ON INVESTMENTS ALLOCATED FROM MASTER PORTFOLIOS: | | | | | | | |
| Net realized gain on: | | | | | | | |
| Investments and foreign currency | | | 6,367,582 | | | 214,072 | |
| Net change in unrealized appreciation (depreciation) of: | | | | | | | |
| Investments and foreign currency | | | (10,289,058 | ) | | 216,946 | |
| Net gain (loss) on investments | | | (3,921,476 | ) | | 431,018 | |
| Net increase (decrease) in net assets resulting from operations | | $ | (4,915,840 | ) | $ | 451,403 | |
| † Net of foreign taxes withheld of: | | $ | — | | $ | 11,501 | |
The accompanying notes are an integral part of these financial statements.
20
| KINETICS MUTUAL FUNDS, INC. — THE FEEDER FUNDS |
Statements of Operations — (Continued) |
| For the Period Ended June 30, 2016 (Unaudited) |
| | | | The Paradigm | | | The Medical | |
| | | | Fund | | | Fund | |
| INVESTMENT INCOME (LOSS) ALLOCATED FROM MASTER PORTFOLIOS: | | | | | | | |
| Dividends† | | $ | 1,971,874 | | $ | 329,782 | |
| Interest | | | 96,807 | | | 1,440 | |
| Income from securities lending | | | 443,485 | | | 8,394 | |
| Expenses allocated from Master Portfolio | | | (5,130,012 | ) | | (175,586 | ) |
| Net investment income (loss) from Master Portfolio | | | (2,617,846 | ) | | 164,030 | |
| EXPENSES: | | | | | | | |
| Distribution fees — Advisor Class A | | | 135,046 | | | 6,120 | |
| Distribution fees — Advisor Class C | | | 398,737 | | | 1,957 | |
| Shareholder servicing fees — Advisor Class A | | | 135,046 | | | 6,120 | |
| Shareholder servicing fees — Advisor Class C | | | 132,912 | | | 652 | |
| Shareholder servicing fees — No Load Class | | | 325,451 | | | 24,337 | |
| Shareholder servicing fees — Institutional Class | | | 272,304 | | | — | |
| Transfer agent fees and expenses | | | 124,085 | | | 12,913 | |
| Reports to shareholders | | | 62,310 | | | 2,424 | |
| Administration fees | | | 159,313 | | | 5,339 | |
| Professional fees | | | 41,680 | | | 5,357 | |
| Directors' fees | | | 36,396 | | | 1,283 | |
| Chief Compliance Officer fees | | | 7,803 | | | 273 | |
| Registration fees | | | 28,495 | | | 18,076 | |
| Fund accounting fees | | | 18,224 | | | 622 | |
| Other expenses | | | 19,627 | | | 580 | |
| Total expenses | | | 1,897,429 | | | 86,053 | |
| Less, expense waiver for Institutional Class shareholder servicing fees | | | (204,228 | ) | | — | |
| Less, expense reimbursement | | | (436,074 | ) | | (80,594 | ) |
| Net expenses | | | 1,257,127 | | | 5,459 | |
| Net investment income (loss) | | | (3,874,973 | ) | | 158,571 | |
| REALIZED AND UNREALIZED GAIN (LOSS) ON INVESTMENTS ALLOCATED FROM MASTER PORTFOLIOS: | | | | | | | |
| Net realized gain on: | | | | | | | |
| Investments and foreign currency | | | 41,261,752 | | | 911,988 | |
| Net change in unrealized depreciation of: | | | | | | | |
| Investments and foreign currency | | | (10,156,953 | ) | | (3,561,192 | ) |
| Net gain (loss) on investments | | | 31,104,799 | | | (2,649,204 | ) |
| Net increase (decrease) in net assets resulting from operations | | $ | 27,229,826 | | $ | (2,490,633 | ) |
| † Net of foreign taxes withheld of: | | $ | 131,545 | | $ | 17,717 | |
The accompanying notes are an integral part of these financial statements.
21
| KINETICS MUTUAL FUNDS, INC. — THE FEEDER FUNDS |
Statements of Operations — (Continued) |
| For the Period Ended June 30, 2016 (Unaudited) |
| | | | The Small Cap | | | The Market | |
| | | | Opportunities | | | Opportunities | |
| | | | Fund | | | Fund | |
| INVESTMENT INCOME (LOSS) ALLOCATED FROM MASTER PORTFOLIOS: | | | | | | | |
| Dividends† | | $ | 502,495 | | $ | 109,374 | |
| Interest | | | 19,281 | | | 12,336 | |
| Income from securities lending | | | 176,037 | | | 3,602 | |
| Expenses allocated from Master Portfolio | | | (1,352,955 | ) | | (281,116 | ) |
| Net investment loss from Master Portfolio | | | (655,142 | ) | | (155,804 | ) |
| EXPENSES: | | | | | | | |
| Distribution fees — Advisor Class A | | | 16,227 | | | 5,140 | |
| Distribution fees — Advisor Class C | | | 30,008 | | | 14,926 | |
| Shareholder servicing fees — Advisor Class A | | | 16,227 | | | 5,140 | |
| Shareholder servicing fees — Advisor Class C | | | 10,003 | | | 4,975 | |
| Shareholder servicing fees — No Load Class | | | 161,545 | | | 36,760 | |
| Shareholder servicing fees — Institutional Class | | | 48,866 | | | 2,015 | |
| Transfer agent fees and expenses | | | 32,670 | | | 14,113 | |
| Reports to shareholders | | | 16,661 | | | 2,864 | |
| Administration fees | | | 41,912 | | | 9,346 | |
| Professional fees | | | 13,841 | | | 6,068 | |
| Directors' fees | | | 9,425 | | | 1,962 | |
| Chief Compliance Officer fees | | | 2,023 | | | 419 | |
| Registration fees | | | 22,657 | | | 21,209 | |
| Fund accounting fees | | | 4,465 | | | 972 | |
| Other expenses | | | 5,456 | | | 985 | |
| Total expenses | | | 431,986 | | | 126,894 | |
| Less, expense waiver for Institutional Class shareholder servicing fees | | | (36,649 | ) | | (1,511 | ) |
| Less, expense reimbursement | | | (118,423 | ) | | (64,148 | ) |
| Net expenses | | | 276,914 | | | 61,235 | |
| Net investment loss | | | (932,056 | ) | | (217,039 | ) |
| REALIZED AND UNREALIZED GAIN ON INVESTMENTS ALLOCATED FROM MASTER PORTFOLIOS: | | | | | | | |
| Net realized gain on: | | | | | | | |
| Investments and foreign currency | | | 5,167,097 | | | 802,100 | |
| Net change in unrealized appreciation of: | | | | | | | |
| Investments and foreign currency | | | 6,992,868 | | | 1,329,398 | |
| Net gain on investments | | | 12,159,965 | | | 2,131,498 | |
| Net increase in net assets resulting from operations | | $ | 11,227,909 | | $ | 1,914,459 | |
| † Net of foreign taxes withheld of: | | $ | 20,466 | | $ | 7,189 | |
The accompanying notes are an integral part of these financial statements.
22
| KINETICS MUTUAL FUNDS, INC. — THE FEEDER FUNDS |
Statements of Operations — (Continued) |
| For the Period Ended June 30, 2016 (Unaudited) |
| | | | | | | The Multi- | |
| | | | The Alternative | | | Disciplinary | |
| | | | Income | | | Income | |
| | | | Fund | | | Fund | |
| INVESTMENT INCOME (LOSS) ALLOCATED FROM MASTER PORTFOLIOS: | | | | | | | |
| Dividends | | $ | 39,125 | | $ | 231,443 | |
| Interest | | | 86,945 | | | 2,135,423 | |
| Income from securities lending | | | — | | | 67,013 | |
| Expenses allocated from Master Portfolio | | | (147,761 | ) | | (590,450 | ) |
| Net investment income (loss) from Master Portfolio | | | (21,691 | ) | | 1,843,429 | |
| EXPENSES: | | | | | | | |
| Distribution fees — Advisor Class A | | | 2,629 | | | 9,014 | |
| Distribution fees — Advisor Class C | | | 5,642 | | | 32,489 | |
| Shareholder servicing fees — Advisor Class A | | | 2,629 | | | 9,014 | |
| Shareholder servicing fees — Advisor Class C | | | 1,881 | | | 10,830 | |
| Shareholder servicing fees — No Load Class | | | 5,770 | | | 7,233 | |
| Shareholder servicing fees — Institutional Class | | | 18,629 | | | 63,306 | |
| Transfer agent fees and expenses | | | 12,716 | | | 18,208 | |
| Reports to shareholders | | | 3,498 | | | 13,136 | |
| Administration fees | | | 6,773 | | | 19,206 | |
| Professional fees | | | 5,399 | | | 8,276 | |
| Directors' fees | | | 1,321 | | | 4,022 | |
| Chief Compliance Officer fees | | | 279 | | | 855 | |
| Registration fees | | | 22,163 | | | 25,567 | |
| Fund accounting fees | | | 640 | | | 1,874 | |
| Other expenses | | | 688 | | | 2,343 | |
| Total expenses | | | 90,657 | | | 225,373 | |
| Less, expense waiver for Institutional Class shareholder servicing fees | | | (13,971 | ) | | (47,480 | ) |
| Less, expense reimbursement | | | (107,256 | ) | | (157,139 | ) |
| Net expenses | | | (30,570 | ) | | 20,754 | |
| Net investment income | | | 8,879 | | | 1,822,675 | |
| REALIZED AND UNREALIZED GAIN (LOSS) ON INVESTMENTS ALLOCATED FROM MASTER PORTFOLIOS: | | | | | | | |
| Net realized gain (loss) on: | | | | | | | |
| Investments and foreign currency | | | (30,869 | ) | | (929,891 | ) |
| Written option contracts expired or closed | | | 383,663 | | | — | |
| Net change in unrealized appreciation (depreciation) of: | | | | | | | |
| Investments and foreign currency | | | 166,275 | | | 3,827,216 | |
| Written option contracts | | | (1,959 | ) | | 3,807 | |
| Net gain on investments | | | 517,110 | | | 2,901,132 | |
| Net increase in net assets resulting from operations | | $ | 525,989 | | $ | 4,723,807 | |
The accompanying notes are an integral part of these financial statements.
23
| KINETICS MUTUAL FUNDS, INC. — THE FEEDER FUNDS |
| Statements of Changes in Net Assets |
| | | The Internet Fund | | The Global Fund | |
| | | | For the | | | | | | For the | | | | |
| | | | Period | | | For the | | | Period | | | For the | |
| | | | Ended | | | Year Ended | | | Ended | | | Year Ended | |
| | | | June 30, 2016 | | | December 31, | | | June 30, 2016 | | | December 31, | |
| | | | (Unaudited) | | | 2015 | | | (Unaudited) | | | 2015 | |
| OPERATIONS: | | | | | | | | | | | | | |
| Net investment income (loss) | | $ | (994,364 | ) | $ | (2,189,641 | ) | $ | 20,385 | | $ | (38,520 | ) |
| Net realized gain (loss) on sale of investments and foreign currency | | | 6,367,582 | | | 29,301,430 | | | 214,072 | | | (13,187 | ) |
| Net change in unrealized appreciation (depreciation) of investments and foreign currency | | | (10,289,058 | ) | | (34,664,097 | ) | | 216,946 | | | (1,093,822 | ) |
| Net increase (decrease) in net assets resulting from operations | | | (4,915,840 | ) | | (7,552,308 | ) | | 451,403 | | | (1,145,529 | ) |
| DISTRIBUTIONS TO SHAREHOLDERS — | | | | | | | | | | | | | |
| NO LOAD CLASS: | | | | | | | | | | | | | |
| Net realized gains | | | — | | | (26,681,831 | ) | | — | | | (2,696 | ) |
| Total distributions | | | — | | | (26,681,831 | ) | | — | | | (2,696 | ) |
| DISTRIBUTIONS TO SHAREHOLDERS — | | | | | | | | | | | | | |
| ADVISOR CLASS A: | | | | | | | | | | | | | |
| Net realized gains | | | — | | | (694,561 | ) | | — | | | (214 | ) |
| Total distributions | | | — | | | (694,561 | ) | | — | | | (214 | ) |
| DISTRIBUTIONS TO SHAREHOLDERS — | | | | | | | | | | | | | |
| ADVISOR CLASS C: | | | | | | | | | | | | | |
| Net realized gains | | | — | | | (208,100 | ) | | — | | | (950 | ) |
| Total distributions | | | — | | | (208,100 | ) | | — | | | (950 | ) |
| CAPITAL SHARE TRANSACTIONS — | | | | | | | | | | | | | |
| NO LOAD CLASS: | | | | | | | | | | | | | |
| Proceeds from shares sold | | | 645,567 | | | 2,001,938 | | | 236,283 | | | 629,971 | |
| Redemption fees | | | 81 | | | 280 | | | 20 | | | 16 | |
| Proceeds from shares issued to holders in reinvestment of dividends | | | — | | | 26,075,719 | | | — | | | 2,651 | |
| Cost of shares redeemed | | | (7,279,951 | ) | | (22,965,971 | ) | | (274,738 | ) | | (1,850,431 | ) |
| Net increase (decrease) in net assets resulting from capital share transactions | | | (6,634,303 | ) | | 5,111,966 | | | (38,435 | ) | | (1,217,793 | ) |
| CAPITAL SHARE TRANSACTIONS — | | | | | | | | | | | | | |
| ADVISOR CLASS A: | | | | | | | | | | | | | |
| Proceeds from shares sold | | | 200,444 | | | 498,273 | | | 9,934 | | | 32,700 | |
| Proceeds from shares issued to holders in reinvestment of dividends | | | — | | | 486,647 | | | — | | | 144 | |
| Cost of shares redeemed | | | (447,692 | ) | | (2,255,954 | ) | | (80,507 | ) | | (88,790 | ) |
| Net decrease in net assets resulting from capital share transactions | | | (247,248 | ) | | (1,271,034 | ) | | (70,573 | ) | | (55,946 | ) |
The accompanying notes are an integral part of these financial statements.
24
| KINETICS MUTUAL FUNDS, INC. — THE FEEDER FUNDS |
Statements of Changes in Net Assets — (Continued) |
| | | The Internet Fund | | The Global Fund | |
| | | | For the | | | | | | For the | | | | |
| | | | Period | | | For the | | | Period | | | For the | |
| | | | Ended | | | Year Ended | | | Ended | | | Year Ended | |
| | | | June 30, 2016 | | | December 31, | | | June 30, 2016 | | | December 31, | |
| | | | (Unaudited) | | | 2015 | | | (Unaudited) | | | 2015 | |
| CAPITAL SHARE TRANSACTIONS — | | | | | | | | | | | | | |
| ADVISOR CLASS C: | | | | | | | | | | | | | |
| Proceeds from shares sold | | $ | 166,994 | | $ | 64,898 | | $ | 111,162 | | $ | 376,565 | |
| Proceeds from shares issued to holders in reinvestment of dividends | | | — | | | 184,873 | | | — | | | 913 | |
| Cost of shares redeemed | | | (162,997 | ) | | (244,020 | ) | | (41,518 | ) | | (95,637 | ) |
| Net increase in net assets resulting from capital share transactions | | | 3,997 | | | 5,751 | | | 69,644 | | | 281,841 | |
| TOTAL INCREASE (DECREASE) | | | | | | | | | | | | | |
| IN NET ASSETS: | | | (11,793,394 | ) | | (31,290,117 | ) | | 412,039 | | | (2,141,287 | ) |
| NET ASSETS: | | | | | | | | | | | | | |
| Beginning of period | | | 126,157,992 | | | 157,448,109 | | | 6,735,377 | | | 8,876,664 | |
| End of period* | | $ | 114,364,598 | | $ | 126,157,992 | | $ | 7,147,416 | | $ | 6,735,377 | |
* Including undistributed net investment income (loss) of: | | $ | (824,523 | ) | $ | 169,841 | | $ | 41,037 | | $ | 20,652 | |
| CHANGES IN SHARES OUTSTANDING — | | | | | | | | | | | | | |
| NO LOAD CLASS: | | | | | | | | | | | | | |
| Shares sold | | | 16,261 | | | 36,786 | | | 51,078 | | | 120,133 | |
| Shares issued in reinvestments of dividends and distributions | | | — | | | 626,220 | | | — | | | 579 | |
| Shares redeemed | | | (182,171 | ) | | (423,965 | ) | | (61,271 | ) | | (358,003 | ) |
| Net increase (decrease) in shares outstanding | | | (165,910 | ) | | 239,041 | | | (10,193 | ) | | (237,291 | ) |
| CHANGES IN SHARES OUTSTANDING — | | | | | | | | | | | | | |
| ADVISOR CLASS A: | | | | | | | | | | | | | |
| Shares sold | | | 5,184 | | | 10,165 | | | 2,146 | | | 5,948 | |
| Shares issued in reinvestments of dividends and distributions | | | — | | | 12,157 | | | — | | | 32 | |
| Shares redeemed | | | (11,661 | ) | | (42,328 | ) | | (17,804 | ) | | (17,182 | ) |
| Net decrease in shares outstanding | | | (6,477 | ) | | (20,006 | ) | | (15,658 | ) | | (11,202 | ) |
| CHANGES IN SHARES OUTSTANDING — | | | | | | | | | | | | | |
| ADVISOR CLASS C: | | | | | | | | | | | | | |
| Shares sold | | | 4,647 | | | 1,442 | | | 25,281 | | | 72,350 | |
| Shares issued in reinvestments of dividends and distributions | | | — | | | 4,964 | | | — | | | 208 | |
| Shares redeemed | | | (4,631 | ) | | (5,004 | ) | | (9,487 | ) | | (18,599 | ) |
| Net increase in shares outstanding | | | 16 | | | 1,402 | | | 15,794 | | | 53,959 | |
The accompanying notes are an integral part of these financial statements.
25
| KINETICS MUTUAL FUNDS, INC. — THE FEEDER FUNDS |
Statements of Changes in Net Assets — (Continued) |
| | | The Paradigm Fund | | The Medical Fund | |
| | | | For the | | | | | | For the | | | | |
| | | | Period | | | For the | | | Period | | | For the | |
| | | | Ended | | | Year Ended | | | Ended | | | Year Ended | |
| | | | June 30, 2016 | | | December 31, | | | June 30, 2016 | | | December 31, | |
| | | | (Unaudited) | | | 2015 | | | (Unaudited) | | | 2015 | |
| OPERATIONS: | | | | | | | | | | | | | |
| Net investment income (loss) | | $ | (3,874,973 | ) | $ | (10,293,286 | ) | $ | 158,571 | | $ | 55,412 | |
| Net realized gain on sale of investments and foreign currency | | | 41,261,752 | | | 126,371,030 | | | 911,988 | | | 1,638,460 | |
| Net change in unrealized depreciation of investments and foreign currency | | | (10,156,953 | ) | | (195,382,777 | ) | | (3,561,192 | ) | | (49,483 | ) |
| Net increase (decrease) in net assets resulting from operations | | | 27,229,826 | | | (79,305,033 | ) | | (2,490,633 | ) | | 1,644,389 | |
| DISTRIBUTIONS TO SHAREHOLDERS — | | | | | | | | | | | | | |
| NO LOAD CLASS: | | | | | | | | | | | | | |
| Net investment income | | | — | | | — | | | — | | | (84,526 | ) |
| Net realized gains | | | — | | | — | | | — | | | (1,347,587 | ) |
| Total distributions | | | — | | | — | | | — | | | (1,432,113 | ) |
| DISTRIBUTIONS TO SHAREHOLDERS — | | | | | | | | | | | | | |
| ADVISOR CLASS A: | | | | | | | | | | | | | |
| Net investment income | | | — | | | — | | | — | | | (15,037 | ) |
| Net realized gains | | | — | | | — | | | — | | | (399,324 | ) |
| Total distributions | | | — | | | — | | | — | | | (414,361 | ) |
| DISTRIBUTIONS TO SHAREHOLDERS — | | | | | | | | | | | | | |
| ADVISOR CLASS C: | | | | | | | | | | | | | |
| Net investment income | | | — | | | — | | | — | | | (1,491 | ) |
| Net realized gains | | | — | | | — | | | — | | | (39,592 | ) |
| Total distributions | | | — | | | — | | | — | | | (41,083 | ) |
| CAPITAL SHARE TRANSACTIONS — | | | | | | | | | | | | | |
| NO LOAD CLASS: | | | | | | | | | | | | | |
| Proceeds from shares sold | | | 8,389,488 | | | 17,121,608 | | | 398,075 | | | 1,611,927 | |
| Redemption fees | | | 268 | | | 3,163 | | | 6 | | | 167 | |
| Proceeds from shares issued to holders in reinvestment of dividends | | | — | | | — | | | — | | | 1,415,177 | |
| Cost of shares redeemed | | | (46,112,746 | ) | | (219,664,621 | ) | | (1,244,764 | ) | | (2,631,095 | ) |
| Net increase (decrease) in net assets resulting from capital share transactions | | | (37,722,990 | ) | | (202,539,850 | ) | | (846,683 | ) | | 396,176 | |
The accompanying notes are an integral part of these financial statements.
26
| KINETICS MUTUAL FUNDS, INC. — THE FEEDER FUNDS |
Statements of Changes in Net Assets — (Continued) |
| | | The Paradigm Fund | | The Medical Fund | |
| | | | For the | | | | | | For the | | | | |
| | | | Period | | | For the | | | Period | | | For the | |
| | | | Ended | | | Year Ended | | | Ended | | | Year Ended | |
| | | | June 30, 2016 | | | December 31, | | | June 30, 2016 | | | December 31, | |
| | | | (Unaudited) | | | 2015 | | | (Unaudited) | | | 2015 | |
| CAPITAL SHARE TRANSACTIONS — | | | | | | | | | | | | | |
| ADVISOR CLASS A: | | | | | | | | | | | | | |
| Proceeds from shares sold | | $ | 2,624,535 | | $ | 12,953,817 | | $ | 72,241 | | $ | 2,509,621 | |
| Redemption fees | | | 227 | | | 288 | | | 57 | | | 36 | |
| Proceeds from shares issued to holders in reinvestment of dividends | | | — | | | — | | | — | | | 342,177 | |
| Cost of shares redeemed | | | (31,744,415 | ) | | (42,179,329 | ) | | (1,383,331 | ) | | (965,699 | ) |
| Net increase (decrease) in net assets resulting from capital share transactions | | | (29,119,653 | ) | | (29,225,224 | ) | | (1,311,033 | ) | | 1,886,135 | |
| CAPITAL SHARE TRANSACTIONS — | | | | | | | | | | | | | |
| ADVISOR CLASS C: | | | | | | | | | | | | | |
| Proceeds from shares sold | | | 2,650,899 | | | 9,780,718 | | | — | | | 124,759 | |
| Redemption fees | | | 354 | | | 14 | | | — | | | — | |
| Proceeds from shares issued to holders in reinvestment of dividends | | | — | | | — | | | — | | | 26,746 | |
| Cost of shares redeemed | | | (12,915,321 | ) | | (19,394,054 | ) | | (55,576 | ) | | (169,942 | ) |
| Net decrease in net assets resulting from capital share transactions | | | (10,264,068 | ) | | (9,613,322 | ) | | (55,576 | ) | | (18,437 | ) |
| CAPITAL SHARE TRANSACTIONS — | | | | | | | | | | | | | |
| INSTITUTIONAL CLASS: | | | | | | | | | | | | | |
| Proceeds from shares sold | | | 22,103,227 | | | 70,078,418 | | | N/A | | | N/A | |
| Redemption fees | | | 4,791 | | | 3,111 | | | N/A | | | N/A | |
| Proceeds from shares issued to holders in reinvestment of dividends | | | — | | | — | | | N/A | | | N/A | |
| Cost of shares redeemed | | | (72,338,227 | ) | | (86,840,860 | ) | | N/A | | | N/A | |
| Net decrease in net assets resulting from capital share transactions | | | (50,230,209 | ) | | (16,759,331 | ) | | N/A | | | N/A | |
| TOTAL INCREASE (DECREASE) | | | | | | | | | | | | | |
| IN NET ASSETS: | | | (100,107,094 | ) | | (337,442,760 | ) | | (4,703,925 | ) | | 2,020,706 | |
| NET ASSETS: | | | | | | | | | | | | | |
| Beginning of period | | | 837,859,710 | | | 1,175,302,470 | | | 29,105,823 | | | 27,085,117 | |
| End of period* | | $ | 737,752,616 | | $ | 837,859,710 | | $ | 24,401,898 | | $ | 29,105,823 | |
* Including undistributed net investment income (loss) of: | | $ | (10,731,151 | ) | $ | (6,856,178 | ) | $ | 180,582 | | $ | 22,011 | |
The accompanying notes are an integral part of these financial statements.
27
| KINETICS MUTUAL FUNDS, INC. — THE FEEDER FUNDS |
Statements of Changes in Net Assets — (Continued) |
| | | The Paradigm Fund | | The Medical Fund | |
| | | | For the | | | | | | For the | | | | |
| | | | Period | | | For the | | | Period | | | For the | |
| | | | Ended | | | Year Ended | | | Ended | | | Year Ended | |
| | | | June 30, 2016 | | | December 31, | | | June 30, 2016 | | | December 31, | |
| | | | (Unaudited) | | | 2015 | | | (Unaudited) | | | 2015 | |
| CHANGES IN SHARES OUTSTANDING — | | | | | | | | | | | | | |
| NO LOAD CLASS: | | | | | | | | | | | | | |
| Shares sold | | | 271,624 | | | 493,728 | | | 14,203 | | | 48,158 | |
| Shares issued in reinvestments of dividends and distributions | | | — | | | — | | | — | | | 45,725 | |
| Shares redeemed | | | (1,523,809 | ) | | (6,455,849 | ) | | (45,562 | ) | | (80,322 | ) |
| Net increase (decrease) in shares outstanding | | | (1,252,185 | ) | | (5,962,121 | ) | | (31,359 | ) | | 13,561 | |
| CHANGES IN SHARES OUTSTANDING — | | | | | | | | | | | | | |
| ADVISOR CLASS A: | | | | | | | | | | | | | |
| Shares sold | | | 88,567 | | | 383,607 | | | 2,733 | | | 76,179 | |
| Shares issued in reinvestments of dividends and distributions | | | — | | | — | | | — | | | 11,452 | |
| Shares redeemed | | | (1,112,612 | ) | | (1,285,358 | ) | | (51,953 | ) | | (30,673 | ) |
| Net increase (decrease) in shares outstanding | | | (1,024,045 | ) | | (901,751 | ) | | (49,220 | ) | | 56,958 | |
| CHANGES IN SHARES OUTSTANDING — | | | | | | | | | | | | | |
| ADVISOR CLASS C: | | | | | | | | | | | | | |
| Shares sold | | | 95,281 | | | 301,266 | | | — | | | 3,988 | |
| Shares issued in reinvestments of dividends and distributions | | | — | | | — | | | — | | | 918 | |
| Shares redeemed | | | (453,963 | ) | | (615,520 | ) | | (2,160 | ) | | (5,439 | ) |
| Net decrease in shares outstanding | | | (358,682 | ) | | (314,254 | ) | | (2,160 | ) | | (533 | ) |
| CHANGES IN SHARES OUTSTANDING — | | | | | | | | | | | | | |
| INSTITUTIONAL CLASS: | | | | | | | | | | | | | |
| Shares sold | | | 737,196 | | | 2,051,253 | | | N/A | | | N/A | |
| Shares issued in reinvestments of dividends and distributions | | | — | | | — | | | N/A | | | N/A | |
| Shares redeemed | | | (2,368,987 | ) | | (2,559,551 | ) | | N/A | | | N/A | |
| Net decrease in shares outstanding | | | (1,631,791 | ) | | (508,298 | ) | | N/A | | | N/A | |
The accompanying notes are an integral part of these financial statements.
28
| KINETICS MUTUAL FUNDS, INC. — THE FEEDER FUNDS |
Statements of Changes in Net Assets — (Continued) |
| | | The Small Cap | | The Market | |
| | | Opportunities Fund | | Opportunities Fund | |
| | | | For the | | | | | | For the | | | | |
| | | | Period | | | For the | | | Period | | | For the | |
| | | | Ended | | | Year Ended | | | Ended | | | Year Ended | |
| | | | June 30, 2016 | | | December 31, | | | June 30, 2016 | | | December 31, | |
| | | | (Unaudited) | | | 2015 | | | (Unaudited) | | | 2015 | |
| OPERATIONS: | | | | | | | | | | | | | |
| Net investment loss | | $ | (932,056 | ) | $ | (2,872,798 | ) | $ | (217,039 | ) | $ | (495,653 | ) |
| Net realized gain on sale of investments and foreign currency | | | 5,167,097 | | | 40,425,317 | | | 802,100 | | | 5,054,165 | |
| Net change in unrealized appreciation (depreciation) of investments and foreign currency | | | 6,992,868 | | | (72,350,360 | ) | | 1,329,398 | | | (8,992,319 | ) |
| Net increase (decrease) in net assets resulting from operations | | | 11,227,909 | | | (34,797,841 | ) | | 1,914,459 | | | (4,433,807 | ) |
| CAPITAL SHARE TRANSACTIONS — | | | | | | | | | | | | | |
| NO LOAD CLASS: | | | | | | | | | | | | | |
| Proceeds from shares sold | | | 945,357 | | | 6,489,018 | | | 67,701 | | | 452,522 | |
| Redemption fees | | | 2,877 | | | 5,582 | | | — | | | — | |
| Cost of shares redeemed | | | (25,220,549 | ) | | (90,933,245 | ) | | (4,007,365 | ) | | (3,387,672 | ) |
| Net decrease in net assets resulting from capital share transactions | | | (24,272,315 | ) | | (84,438,645 | ) | | (3,939,664 | ) | | (2,935,150 | ) |
| CAPITAL SHARE TRANSACTIONS — | | | | | | | | | | | | | |
| ADVISOR CLASS A: | | | | | | | | | | | | | |
| Proceeds from shares sold | | | 399,632 | | | 4,354,298 | | | 109,826 | | | 464,968 | |
| Redemption fees | | | 74 | | | 164 | | | — | | | 4 | |
| Cost of shares redeemed | | | (3,325,704 | ) | | (12,725,934 | ) | | (831,067 | ) | | (4,206,822 | ) |
| Net decrease in net assets resulting from capital share transactions | | | (2,925,998 | ) | | (8,371,472 | ) | | (721,241 | ) | | (3,741,850 | ) |
| CAPITAL SHARE TRANSACTIONS — | | | | | | | | | | | | | |
| ADVISOR CLASS C: | | | | | | | | | | | | | |
| Proceeds from shares sold | | | 175,295 | | | 1,540,034 | | | 49,290 | | | 147,771 | |
| Redemption fees | | | 99 | | | — | | | — | | | — | |
| Cost of shares redeemed | | | (1,545,108 | ) | | (4,144,013 | ) | | (212,943 | ) | | (727,287 | ) |
| Net decrease in net assets resulting from capital share transactions | | | (1,369,714 | ) | | (2,603,979 | ) | | (163,653 | ) | | (579,516 | ) |
The accompanying notes are an integral part of these financial statements.
29
| KINETICS MUTUAL FUNDS, INC. — THE FEEDER FUNDS |
Statements of Changes in Net Assets — (Continued) |
| | | The Small Cap | | The Market | |
| | | Opportunities Fund | | Opportunities Fund | |
| | | | For the | | | | | | For the | | | | |
| | | | Period | | | For the | | | Period | | | For the | |
| | | | Ended | | | Year Ended | | | Ended | | | Year Ended | |
| | | | June 30, 2016 | | | December 31, | | | June 30, 2016 | | | December 31, | |
| | | | (Unaudited) | | | 2015 | | | (Unaudited) | | | 2015 | |
| CAPITAL SHARE TRANSACTIONS — | | | | | | | | | | | | | |
| INSTITUTIONAL CLASS: | | | | | | | | | | | | | |
| Proceeds from shares sold | | $ | 8,254,104 | | $ | 37,700,129 | | $ | 167,843 | | $ | 277,363 | |
| Redemption fees | | | 66 | | | 5,630 | | | — | | | — | |
| Cost of shares redeemed | | | (12,385,138 | ) | | (40,526,909 | ) | | (875,401 | ) | | (772,372 | ) |
| Net decrease in net assets resulting from capital share transactions | | | (4,130,968 | ) | | (2,821,150 | ) | | (707,558 | ) | | (495,009 | ) |
| TOTAL DECREASE IN NET ASSETS: | | | (21,471,086 | ) | | (133,033,087 | ) | | (3,617,657 | ) | | (12,185,332 | ) |
| NET ASSETS: | | | | | | | | | | | | | |
| Beginning of period | | | 219,987,400 | | | 353,020,487 | | | 42,166,278 | | | 54,351,610 | |
| End of period* | | $ | 198,516,314 | | $ | 219,987,400 | | $ | 38,548,621 | | $ | 42,166,278 | |
* Including undistributed net investment loss of: | | $ | (5,012,417 | ) | $ | (4,080,361 | ) | $ | (804,465 | ) | $ | (587,426 | ) |
| CHANGES IN SHARES OUTSTANDING — | | | | | | | | | | | | | |
| NO LOAD CLASS: | | | | | | | | | | | | | |
| Shares sold | | | 29,440 | | | 176,696 | | | 4,392 | | | 26,996 | |
| Shares redeemed | | | (789,834 | ) | | (2,482,816 | ) | | (259,168 | ) | | (204,096 | ) |
| Net decrease in shares outstanding | | | (760,394 | ) | | (2,306,120 | ) | | (254,776 | ) | | (177,100 | ) |
| CHANGES IN SHARES OUTSTANDING — | | | | | | | | | | | | | |
| ADVISOR CLASS A: | | | | | | | | | | | | | |
| Shares sold | | | 12,538 | | | 120,018 | | | 7,337 | | | 27,989 | |
| Shares redeemed | | | (106,214 | ) | | (356,455 | ) | | (55,614 | ) | | (260,043 | ) |
| Net decrease in shares outstanding | | | (93,676 | ) | | (236,437 | ) | | (48,277 | ) | | (232,054 | ) |
The accompanying notes are an integral part of these financial statements.
30
| KINETICS MUTUAL FUNDS, INC. — THE FEEDER FUNDS |
Statements of Changes in Net Assets — (Continued) |
| | | The Small Cap | | The Market | |
| | | Opportunities Fund | | Opportunities Fund | |
| | | | For the | | | | | | For the | | | | |
| | | | Period | | | For the | | | Period | | | For the | |
| | | | Ended | | | Year Ended | | | Ended | | | Year Ended | |
| | | | June 30, 2016 | | | December 31, | | | June 30, 2016 | | | December 31, | |
| | | | (Unaudited) | | | 2015 | | | (Unaudited) | | | 2015 | |
| CHANGES IN SHARES OUTSTANDING — | | | | | | | | | | | | | |
| ADVISOR CLASS C: | | | | | | | | | | | | | |
| Shares sold | | | 5,742 | | | 44,364 | | | 3,305 | | | 9,142 | |
| Shares redeemed | | | (50,687 | ) | | (122,629 | ) | | (14,422 | ) | | (45,272 | ) |
| Net decrease in shares outstanding | | | (44,945 | ) | | (78,265 | ) | | (11,117 | ) | | (36,130 | ) |
| CHANGES IN SHARES OUTSTANDING — | | | | | | | | | | | | | |
| INSTITUTIONAL CLASS: | | | | | | | | | | | | | |
| Shares sold | | | 253,734 | | | 999,079 | | | 10,985 | | | 16,350 | |
| Shares redeemed | | | (380,098 | ) | | (1,134,556 | ) | | (55,925 | ) | | (47,445 | ) |
| Net decrease in shares outstanding | | | (126,364 | ) | | (135,477 | ) | | (44,940 | ) | | (31,095 | ) |
The accompanying notes are an integral part of these financial statements.
31
| KINETICS MUTUAL FUNDS, INC. — THE FEEDER FUNDS |
Statements of Changes in Net Assets — (Continued) |
| | | The Alternative | | The Multi- | |
| | | Income Fund | | Disciplinary Income Fund | |
| | | | For the | | | | | | For the | | | | |
| | | | Period | | | For the | | | Period | | | For the | |
| | | | Ended | | | Year Ended | | | Ended | | | Year Ended | |
| | | | June 30, 2016 | | | December 31, | | | June 30, 2016 | | | December 31, | |
| | | | (Unaudited) | | | 2015 | | | (Unaudited) | | | 2015 | |
| OPERATIONS: | | | | | | | | | | | | | |
| Net investment income | | $ | 8,879 | | $ | 38,206 | | $ | 1,822,675 | | $ | 4,426,691 | |
| Net realized gain (loss) on sale of investments, foreign currency and written options and distributions received from other investment companies | | | 352,794 | | | 1,242,092 | | | (929,891 | ) | | (1,550,562 | ) |
| Net change in unrealized appreciation (depreciation) of investments, foreign currency and written options | | | 164,316 | | | (331,341 | ) | | 3,831,023 | | | (4,902,242 | ) |
| Net increase (decrease) in net assets resulting from operations | | | 525,989 | | | 948,957 | | | 4,723,807 | | | (2,026,113 | ) |
| DISTRIBUTIONS TO SHAREHOLDERS — | | | | | | | | | | | | | |
| NO LOAD CLASS: | | | | | | | | | | | | | |
| Net investment income | | | — | | | — | | | (123,175 | ) | | (191,179 | ) |
| Net realized gains | | | — | | | — | | | — | | | (7,624 | ) |
| Total distributions | | | — | | | — | | | (123,175 | ) | | (198,803 | ) |
| DISTRIBUTIONS TO SHAREHOLDERS — | | | | | | | | | | | | | |
| ADVISOR CLASS A: | | | | | | | | | | | | | |
| Net investment income | | | — | | | — | | | (131,201 | ) | | (227,693 | ) |
| Net realized gains | | | — | | | — | | | — | | | (9,565 | ) |
| Total distributions | | | — | | | — | | | (131,201 | ) | | (237,258 | ) |
| DISTRIBUTIONS TO SHAREHOLDERS — | | | | | | | | | | | | | |
| ADVISOR CLASS C: | | | | | | | | | | | | | |
| Net investment income | | | — | | | — | | | (154,093 | ) | | (157,175 | ) |
| Net realized gains | | | — | | | — | | | — | | | (8,371 | ) |
| Total distributions | | | — | | | — | | | (154,093 | ) | | (165,546 | ) |
| DISTRIBUTIONS TO SHAREHOLDERS — | | | | | | | | | | | | | |
| INSTITUTIONAL CLASS: | | | | | | | | | | | | | |
| Net investment income | | | — | | | (19,394 | ) | | (1,439,026 | ) | | (2,377,868 | ) |
| Net realized gains | | | — | | | — | | | — | | | (85,793 | ) |
| Total distributions | | | — | | | (19,394 | ) | | (1,439,026 | ) | | (2,463,661 | ) |
| CAPITAL SHARE TRANSACTIONS — | | | | | | | | | | | | | |
| NO LOAD CLASS: | | | | | | | | | | | | | |
| Proceeds from shares sold | | | 1,362,385 | | | 1,687,199 | | | 78,243 | | | 471,133 | |
| Redemption fees | | | 83 | | | 3,409 | | | — | | | 40 | |
| Proceeds from shares issued to holders in reinvestment of dividends | | | — | | | — | | | 112,894 | | | 186,758 | |
| Cost of shares redeemed | | | (1,197,621 | ) | | (5,521,196 | ) | | (1,066,942 | ) | | (4,348,492 | ) |
| Net increase (decrease) in net assets resulting from capital share transactions | | | 164,847 | | | (3,830,588 | ) | | (875,805 | ) | | (3,690,561 | ) |
The accompanying notes are an integral part of these financial statements.
32
| KINETICS MUTUAL FUNDS, INC. — THE FEEDER FUNDS |
Statements of Changes in Net Assets — (Continued) |
| | | The Alternative | | The Multi- | |
| | | Income Fund | | Disciplinary Income Fund | |
| | | | For the | | | | | | For the | | | | |
| | | | Period | | | For the | | | Period | | | For the | |
| | | | Ended | | | Year Ended | | | Ended | | | Year Ended | |
| | | | June 30, 2016 | | | December 31, | | | June 30, 2016 | | | December 31, | |
| | | | (Unaudited) | | | 2015 | | | (Unaudited) | | | 2015 | |
| CAPITAL SHARE TRANSACTIONS — | | | | | | | | | | | | | |
| ADVISOR CLASS A: | | | | | | | | | | | | | |
| Proceeds from shares sold | | $ | 1,060,827 | | $ | 761,205 | | $ | 381,996 | | $ | 886,482 | |
| Redemption fees | | | 82 | | | — | | | — | | | 367 | |
| Proceeds from shares issued to holders in reinvestment of dividends | | | — | | | — | | | 106,394 | | | 215,606 | |
| Cost of shares redeemed | | | (358,570 | ) | | (775,056 | ) | | (3,644,726 | ) | | (4,138,991 | ) |
| Net increase (decrease) in net assets resulting from capital share transactions | | | 702,339 | | | (13,851 | ) | | (3,156,336 | ) | | (3,036,536 | ) |
| CAPITAL SHARE TRANSACTIONS — | | | | | | | | | | | | | |
| ADVISOR CLASS C: | | | | | | | | | | | | | |
| Proceeds from shares sold | | | 250,696 | | | 151,620 | | | 120,700 | | | 516,516 | |
| Redemption fees | | | — | | | 488 | | | — | | | — | |
| Proceeds from shares issued to holders in reinvestment of dividends | | | — | | | — | | | 148,186 | | | 154,744 | |
| Cost of shares redeemed | | | (101,980 | ) | | (331,488 | ) | | (1,424,180 | ) | | (1,365,971 | ) |
| Net increase (decrease) in net assets resulting from capital share transactions | | | 148,716 | | | (179,380 | ) | | (1,155,294 | ) | | (694,711 | ) |
| CAPITAL SHARE TRANSACTIONS — | | | | | | | | | | | | | |
| INSTITUTIONAL CLASS: | | | | | | | | | | | | | |
| Proceeds from shares sold | | | 1,009,499 | | | 3,555,305 | | | 5,634,213 | | | 29,981,522 | |
| Redemption fees | | | — | | | 1,283 | | | 8 | | | 804 | |
| Proceeds from shares issued to holders in reinvestment of dividends | | | — | | | 19,163 | | | 1,436,366 | | | 2,462,293 | |
| Cost of shares redeemed | | | (3,801,042 | ) | | (10,871,931 | ) | | (11,216,975 | ) | | (64,984,222 | ) |
| Net decrease in net assets resulting from capital share transactions | | | (2,791,543 | ) | | (7,296,180 | ) | | (4,146,388 | ) | | (32,539,603 | ) |
| TOTAL DECREASE IN NET ASSETS: | | | (1,249,652 | ) | | (10,390,436 | ) | | (6,457,511 | ) | | (45,052,792 | ) |
| NET ASSETS: | | | | | | | | | | | | | |
| Beginning of period | | | 27,745,369 | | | 38,135,805 | | | 90,326,802 | | | 135,379,594 | |
| End of period* | | $ | 26,495,717 | | $ | 27,745,369 | | $ | 83,869,291 | | $ | 90,326,802 | |
* Including undistributed net investment income of: | | $ | 27,691 | | $ | 18,812 | | $ | 15,282 | | $ | 40,102 | |
The accompanying notes are an integral part of these financial statements.
33
| KINETICS MUTUAL FUNDS, INC. — THE FEEDER FUNDS |
Statements of Changes in Net Assets — (Continued) |
| | | The Alternative | | The Multi- | |
| | | Income Fund | | Disciplinary Income Fund | |
| | | | For the | | | | | | For the | | | | |
| | | | Period | | | For the | | | Period | | | For the | |
| | | | Ended | | | Year Ended | | | Ended | | | Year Ended | |
| | | | June 30, 2016 | | | December 31, | | | June 30, 2016 | | | December 31, | |
| | | | (Unaudited) | | | 2015 | | | (Unaudited) | | | 2015 | |
| CHANGES IN SHARES OUTSTANDING — | | | | | | | | | | | | | |
| NO LOAD CLASS: | | | | | | | | | | | | | |
| Shares sold | | | 14,831 | | | 18,558 | | | 7,564 | | | 43,279 | |
| Shares issued in reinvestments of dividends and distributions | | | — | | | — | | | 10,714 | | | 17,449 | |
| Shares redeemed | | | (13,035 | ) | | (60,805 | ) | | (101,431 | ) | | (405,296 | ) |
| Net increase (decrease) in shares outstanding | | | 1,796 | | | (42,247 | ) | | (83,153 | ) | | (344,568 | ) |
| CHANGES IN SHARES OUTSTANDING — | | | | | | | | | | | | | |
| ADVISOR CLASS A: | | | | | | | | | | | | | |
| Shares sold | | | 11,737 | | | 8,362 | | | 35,983 | | | 82,960 | |
| Shares issued in reinvestments of dividends and distributions | | | — | | | — | | | 10,153 | | | 20,254 | |
| Shares redeemed | | | (3,932 | ) | | (8,696 | ) | | (347,651 | ) | | (393,862 | ) |
| Net increase (decrease) in shares outstanding | | | 7,805 | | | (334 | ) | | (301,515 | ) | | (290,648 | ) |
| CHANGES IN SHARES OUTSTANDING — | | | | | | | | | | | | | |
| ADVISOR CLASS C: | | | | | | | | | | | | | |
| Shares sold | | | 2,869 | | | 1,735 | | | 11,624 | | | 48,420 | |
| Shares issued in reinvestments of dividends and distributions | | | — | | | — | | | 14,260 | | | 14,642 | |
| Shares redeemed | | | (1,144 | ) | | (3,794 | ) | | (138,949 | ) | | (129,094 | ) |
| Net increase (decrease) in shares outstanding | | | 1,725 | | | (2,059 | ) | | (113,065 | ) | | (66,032 | ) |
| CHANGES IN SHARES OUTSTANDING — | | | | | | | | | | | | | |
| INSTITUTIONAL CLASS: | | | | | | | | | | | | | |
| Shares sold | | | 10,847 | | | 38,472 | | | 534,142 | | | 2,758,151 | |
| Shares issued in reinvestments of dividends and distributions | | | — | | | 206 | | | 135,993 | | | 229,675 | |
| Shares redeemed | | | (40,925 | ) | | (118,650 | ) | | (1,073,581 | ) | | (6,066,130 | ) |
| Net decrease in shares outstanding | | | (30,078 | ) | | (79,972 | ) | | (403,446 | ) | | (3,078,304 | ) |
The accompanying notes are an integral part of these financial statements.
34
| KINETICS MUTUAL FUNDS, INC. — THE FEEDER FUNDS |
| Notes to Financial Statements |
| June 30, 2016 (Unaudited) |
1. Organization
Kinetics Mutual Funds, Inc. (the "Company") is registered under the Investment Company Act of 1940, as amended (the "1940 Act"), and is incorporated in the State of Maryland. The Company is an open-end management investment company issuing its shares in series. One billion shares are authorized for the Company with a par value of $0.001 per share. The series of the Company presently authorized are The Internet Fund ("Internet"), The Global Fund ("Global"), The Paradigm Fund ("Paradigm"), The Medical Fund ("Medical"), The Small Cap Opportunities Fund ("Small Cap"), The Market Opportunities Fund ("Market Opportunities"), The Alternative Income Fund ("Alternative Income"), and The Multi-Disciplinary Income Fund ("Multi-Disciplinary Income"). Investment operations of the Company began on October 21, 1996 (Internet), September 30, 1999 (Medical), December 31, 1999 (Global and Paradigm), March 20, 2000 (Small Cap), January 31, 2006 (Market Opportunities), June 29, 2007 (Alternative Income), and February 11, 2008 (Multi-Disciplinary Income). Each series, unlike many other investment companies which directly acquire and manage their own portfolios of securities, seeks to achieve its investment objective by investing all of its investable assets in a corresponding portfolio series (each a "Master Portfolio" and collectively the "Master Portfolios") of Kinetics Portfolios Trust (the "Trust").
On April 28, 2000 (January 31, 2006, with respect to Market Opportunities, June 29, 2007, with respect to Alternative Income, and February 11, 2008, with respect to Multi-Disciplinary Income), each series in the Company entered into a master-feeder fund structure. By entering into this structure, each series (each a "Feeder Fund" and collectively, the "Feeder Funds") invested all of its assets in a corresponding Master Portfolio which had the same investment objective as the Feeder Fund. Each Master Portfolio has multiple feeder funds. Each Feeder Fund receives a proportionate amount of interest in the Master Portfolio equal to its relative contribution of capital. Thus, each Feeder Fund is allocated its portion of income, gains (losses) and expenses from the Master Portfolio.
35
| KINETICS MUTUAL FUNDS, INC. — THE FEEDER FUNDS |
Notes to Financial Statements — (Continued) |
| June 30, 2016 (Unaudited) |
Each Feeder Fund's respective interest in the corresponding Master Portfolio as of June 30, 2016, is as follows:
| | Interest in |
| | Master Portfolio |
| The Internet Fund | 99.985 | % |
| The Global Fund | 99.907 | % |
| The Paradigm Fund | 98.596 | % |
| The Medical Fund | 99.870 | % |
| The Small Cap Opportunities Fund | 99.981 | % |
| The Market Opportunities Fund | 99.961 | % |
| The Alternative Income Fund | 99.547 | % |
| The Multi-Disciplinary Income Fund | 99.807 | % |
Prior to the conversion to a master-feeder fund structure on April 28, 2000, each then existing series conducted its own investment operations.
As of June 30, 2016, each of the Feeder Funds offers Advisor Class A shares. Advisor Class A shares are subject to an annual Rule 12b-1 fee of 0.25% of average daily net assets and a shareholder servicing fee of 0.25% of average daily net assets. The Advisor Class A shares are also subject to a front-end sales charge of 5.75%.
As of June 30, 2016, each of the Feeder Funds offers Advisor Class C shares. Advisor Class C shares are subject to an annual Rule 12b-1 fee of 0.75% of average daily net assets and a shareholder servicing fee of 0.25% of average daily net assets. If you sell your Advisor Class C shares within 12 months of purchase, you will have to pay a contingent deferred sales charge of 1.00%, which is applied to the NAV of the shares on the date of original purchase or on the date of redemption, whichever is less.
As of June 30, 2016, each of the Feeder Funds offers No Load Class shares. No Load Class shares are subject to a shareholder servicing fee of 0.25% of average daily net assets but do not have 12b-1 fees or a sales charge.
As of June 30, 2016, the Paradigm, Small Cap, Market Opportunities, Alternative Income, and Multi-Disciplinary Income Funds offer Institutional Class shares. Institutional Class shares are subject to a shareholder servicing fee of 0.20% of average daily net assets but do not have 12b-1 fees or a sales
36
| KINETICS MUTUAL FUNDS, INC. — THE FEEDER FUNDS |
Notes to Financial Statements — (Continued) |
| June 30, 2016 (Unaudited) |
charge. The Adviser has voluntarily agreed to waive the portion of the Institutional Class shareholder servicing fee in excess of 0.05%.
Each class of shares for each Fund has identical rights and privileges except with respect to the Rule 12b-1 fees paid by the Advisor Class A and Advisor Class C shares, the front-end sales charge on the Advisor Class A shares, the contingent deferred sales charge on Class C, the shareholder servicing fees paid by the Advisor Class A, Advisor Class C, No Load Class and Institutional Class shares, voting rights on matters pertaining to a single class of shares and the exchange privileges of each class of shares. Shares of each Feeder Fund will assess a 2.00% redemption fee (with exceptions) on shares redeemed or exchanged within 30 days of purchase. Income, expenses (other than expenses attributable to a specific class), and realized and unrealized gains or losses on investments are allocated to each class based on its relative net assets.
Refer to the Master Portfolios' financial statements to obtain information about the investment objective of the corresponding Feeder Fund. The financial statements of the Master Portfolios, including the portfolios of investments, are contained elsewhere in this report and should be read in conjunction with the Feeder Funds' financial statements.
2. Significant Accounting Policies
Security Valuation
Master Portfolio securities that are listed on a U.S. securities exchange for which market quotations are readily available are valued at the last quoted sale price on the day the valuation is made. Price information on listed securities is taken from the exchange where the security is primarily traded. All equity securities, including exchange-traded funds, that are traded using the National Association of Securities Dealers' Automated Quotation System ("NASDAQ") are valued using the NASDAQ Official Closing Price ("NOCP"). Foreign securities are valued by an independent pricing service. In the event market quotations are not readily available or if events occur that may materially affect the value of a particular security between the time trading ends on a particular security and the close of regular trading on the New York Stock Exchange ("NYSE"), "fair value" will be determined. Unlisted U.S. securities and listed U.S. securities not traded on the valuation date for which market quotations are readily available are valued at the last bid price. Exchange traded options are
37
| KINETICS MUTUAL FUNDS, INC. — THE FEEDER FUNDS |
Notes to Financial Statements — (Continued) |
| June 30, 2016 (Unaudited) |
valued at the composite price, using the National Best Bid and Offer quotes ("NBBO"). NBBO consists of the highest bid price and lowest ask price across any of the exchanges on which an option is quoted, thus providing a view across the entire U.S. options marketplace. Composite option pricing calculates the mean of the highest bid price and the lowest ask price across the exchanges where the option is traded. If the composite option price is not available, the mean between the highest bid and the lowest asked quotations at the close of the exchanges will be used. If none of the above are available, exchange traded options are valued at a quote provided by third party pricing agents. Non-exchange traded options for which over-the-counter quotations are not readily available are valued at the mean of the current bid and asked prices. If none of the third party pricing agents publish a price and it is the day of expiration, expiring options will be priced at intrinsic value. Debt obligations (including convertible securities) that are either investment grade or non-investment grade and irrespective of days to maturity will be valued as follows: Debt securities are valued at evaluated mean by one of the authorized third party pricing agents which rely on various valuation methodologies such as matrix pricing and other analytical pricing models as well as market transactions and dealer quotations. Investments in registered open-end investment companies, including money market funds, other than exchange-traded funds are valued at their reported net asset value ("NAV"). Certain instruments, such as repurchase agreements and demand notes, do not have values from third parties and are valued at amortized cost.
Other assets and securities for which no quotations are readily available (including restricted securities) will be valued in good faith at fair value using methods determined by the Board of Trustees of the Master Portfolios. In determining the fair value of a security, the Board of Trustees shall take into account the relevant factors and surrounding circumstances, which may include: (i) the nature and pricing history (if any) of the security; (ii) whether any dealer quotations for the security are available; (iii) possible valuation methodologies that could be used to determine the fair value of the security; (iv) the recommendation of the portfolio manager of the Portfolios with respect to the valuation of the security; (v) whether the same or similar securities are held by other funds managed by the Advisor or other funds and the method used to price the security in those funds; (vi) the extent to which the fair value to be determined for the security will result from the use of data or formula produced by third parties independent of the Advisor; and (vii) the liquidity or illiquidity of the market for the security; and (viii) the value of a foreign
38
| KINETICS MUTUAL FUNDS, INC. — THE FEEDER FUNDS |
Notes to Financial Statements — (Continued) |
| June 30, 2016 (Unaudited) |
security traded on other foreign markets. At June 30, 2016, 0.00%, 0.72%, 0.00%, 2.59% and 3.04% of the net assets of The Internet Portfolio, The Global Portfolio, The Paradigm Portfolio, The Small Cap Opportunities Portfolio and The Market Opportunities Portfolio, respectively, were fair valued securities. The other Master Portfolios did not hold any fair valued securities at June 30, 2016.
Repurchase Agreements
Each Master Portfolio may enter into repurchase agreements with banks that are members of the Federal Reserve System or securities dealers who are members of a national securities exchange or are primary dealers in U.S. Government Securities. In connection with transactions in repurchase agreements, it is the Trust's policy that the Master Portfolios receive, as collateral, securities whose market value, including accrued interest, at all times will be at least equal to 102% of the amount invested by the Master Portfolio in each repurchase agreement. If the seller defaults and the value of the collateral declines, realization of the collateral by the Master Portfolio may be delayed or limited.
Written Option Accounting
The Master Portfolios may write (sell) call or put options for trading or hedging purposes. When a Master Portfolio writes an option, an amount equal to the premium received by the Master Portfolio is included in the Statement of Assets and Liabilities as an asset and an equivalent liability. The amount of the liability is subsequently marked-to-market to reflect the current value of the option written. By writing the option, the Master Portfolio may become obligated during the term of the option to deliver or purchase the securities underlying the option at the exercise price if the option is exercised. When an option expires on its stipulated expiration date or the Master Portfolio enters into a closing purchase transaction, the Master Portfolio realizes a gain or loss if the cost of the closing transaction differs from the premium received when the option was sold, without regard to any unrealized gain or loss on the underlying security, and the liability related to such option is eliminated. When an option is exercised, the premium originally received decreases the cost basis of the underlying security (or increases the proceeds on the security sold short) and the Master Portfolio realizes a gain or loss from the sale of the security (or closing of the short sale). As collateral for uncovered written options, the Master Portfolio is required under the 1940 Act to maintain assets consisting of cash, cash equivalents or liquid securities. This collateral is required to be adjusted
39
| KINETICS MUTUAL FUNDS, INC. — THE FEEDER FUNDS |
Notes to Financial Statements — (Continued) |
| June 30, 2016 (Unaudited) |
daily to reflect the exercise price of the purchase obligation for put options or the market value of the instrument underlying the contract for call options.
Foreign Currency Translations
The books and records of the Master Portfolios are maintained in U.S. dollars. For the Master Portfolios, foreign currency transactions are translated into U.S. dollars on the following basis: (i) market values of investment securities and other assets and liabilities are translated at the exchange rate of such currencies against the U.S. dollar, as provided by an approved pricing service, and (ii) purchases and sales of investment securities, dividend and interest income and certain expenses at the rates of exchange prevailing on the respective dates of such transactions. The Master Portfolios do not isolate and treat as ordinary income that portion of the results of operations arising as a result of changes in the exchange rate from the 3uctuations arising from changes in the market prices of securities held during the period. Such fluctuations are included with the net realized and unrealized gain or loss from investments. However, for federal income tax purposes, the Master Portfolios do isolate and treat as ordinary income the effect of changes in foreign exchange rates arising from actual foreign currency transactions and the effect of changes in foreign exchange rates arising between trade date and settlement date.
Restricted and Illiquid Securities
The Master Portfolios may invest in restricted securities. These securities are valued by the Master Portfolios after giving due consideration to pertinent factors including recent private sales, market conditions and the issuer's financial performance. The Master Portfolios have no right to require registration of unregistered securities. At June 30, 2016, the following Master Portfolios held securities restricted to institutional investors (144A securities):
| | | | | | | Percentage of |
| | | | Market Value | | | Net Assets |
| The Alternative Income Portfolio | | $ | 450,889 | | | 1.70 | % |
| The Multi-Disciplinary Income Portfolio | | | 22,779,649 | | | 27.11 | % |
An illiquid asset is any asset which may not be sold or disposed of in the ordinary course of business within seven days at approximately the value at
40
| KINETICS MUTUAL FUNDS, INC. — THE FEEDER FUNDS |
Notes to Financial Statements — (Continued) |
| June 30, 2016 (Unaudited) |
which a Master Portfolio has valued the investment. At June 30, 2016, the following Master Portfolios held illiquid securities:
| | | | | | | Percentage of |
| | | | Market Value | | Net Assets |
| The Internet Portfolio | | $ | — | * | | 0.00 | % |
| The Paradigm Portfolio | | | — | * | | 0.00 | % |
| The Market Opportunities Portfolio | | | — | * | | 0.00 | % |
| The Multi-Disciplinary Income Portfolio | | | 192,500 | | | 0.23 | % |
| * | Amount is less than $0.50 |
When-Issued Securities
The Master Portfolios may purchase securities on a when-issued or delayed delivery basis. Although the purchase amounts of these securities are established at the time the purchaser enters into the agreement, these securities may be delivered and paid for at a future date. The Master Portfolios record purchases of when-issued securities and reflect the values of such securities in determining net asset value in the same manner as other portfolio securities. The Master Portfolios maintain at all times cash or other liquid assets in an amount at least equal to the amount of outstanding commitments for when-issued securities.
Securities Lending
Each Master Portfolio may lend its portfolio securities to broker-dealers by entering directly into lending arrangements with such broker-dealers or indirectly through repurchase agreements with respect to no more than 331/3% of the total assets of each Master Portfolio (including any collateral posted) or 50% of the total assets of each Master Portfolio (excluding any collateral posted). Securities lending and repurchase transactions will be fully collateralized at all times with cash and/or short-term debt obligations. The Master Portfolios receive interest on the collateral received as well as a fee for the securities loaned.
41
| KINETICS MUTUAL FUNDS, INC. — THE FEEDER FUNDS |
Notes to Financial Statements — (Continued) |
| June 30, 2016 (Unaudited) |
Expense Allocation
Common expenses incurred by Feeder Funds are allocated among the Feeder Funds (i) based upon relative average net assets, (ii) as incurred on a specific identification basis, or (iii) equally among the Feeder Funds, depending on the nature of the expenditure.
Each Feeder Fund records its proportionate share of the corresponding Master Portfolio's expenses on a daily basis. In addition, each Feeder Fund accrues its own separate expenses. Any cap on expenses includes Feeder Fund-specific expenses as well as the expenses allocated from the Master Portfolio.
Federal Income Taxes
Each Master Portfolio will be treated as a partnership for federal income tax purposes. As such, each investor in the Master Portfolio via its investment in a Feeder Fund will be subject to taxation on its share of the Master Portfolio's ordinary income and capital gains. It is intended that the Master Portfolio's assets will be managed so an investor in the Master Portfolio via its investment in a Feeder Fund can satisfy the requirements of subchapter M of the Internal Revenue Code.
It is the Feeder Funds' policy to meet the requirements of the Internal Revenue Code applicable to regulated investment companies and the Feeder Funds intend to distribute investment company net taxable income and net capital gains to shareholders. Therefore, no federal income tax provision is recorded.
Dividends from net investment income and distributions of net realized capital gains, if any, will be declared and paid at least annually. The character of distributions made during the year from net investment income or net realized gains may differ from the characterization for federal income tax purposes due to differences in the recognition of income, expenses and gain items for financial statement and tax purposes. Additionally, the Feeder Funds may utilize earnings and profits distributed to shareholders on redemption of shares as part of the dividends paid deduction for income tax purposes. Where appropriate, reclassifications between capital accounts are made for such differences that are permanent in nature.
There is no tax liability resulting from unrecognized tax benefits relating to uncertain income tax positions taken or expected to be taken in future tax
42
| KINETICS MUTUAL FUNDS, INC. — THE FEEDER FUNDS |
Notes to Financial Statements — (Continued) |
| June 30, 2016 (Unaudited) |
returns. As of June 30, 2016, open tax years include the tax years ended December 31, 2012, through 2015. The Funds are also not aware of any tax positions for which it is reasonably possible that the total amounts of unrecognized tax benefits will significantly change in the next six months.
Use of Estimates
The preparation of financial statements in conformity with U.S. generally accepted accounting principles ("GAAP") requires management to make estimates and assumptions that affect the reported amounts in the financial statements. Actual results could differ from those estimates.
Other
Realized gains and losses on the sale of investments are calculated on the identified cost basis. Dividend income is recorded on the ex-dividend date. Interest income is accounted for on the accrual basis and includes amortization of premiums and discounts on the effective interest method. Other noncash dividends are recognized as investment income at the fair value of the property received. Withholding taxes on foreign dividends have been provided for in accordance with the Company's understanding of the applicable country's tax rules and rates.
3. Investment Adviser
The Trust has entered into Investment Advisory Agreements (the "Agreements") with Kinetics Asset Management LLC (the "Adviser"), with whom certain officers and trustees of the Trust are affiliated, to furnish investment advisory services to the Master Portfolios. The Adviser is a wholly-owned subsidiary of Horizon Kinetics LLC. Under the terms of the Agreements, the Master Portfolios, except the Alternative Income Portfolio, compensate the Adviser for its management services at the annual rate of 1.25% of each Master Portfolio's average daily net assets. The Alternative Income Portfolio compensates the Adviser for its management services at the annual rate of 0.90% of the Master Portfolio's average daily net assets.
The Adviser has agreed to waive a portion of its advisory fee and/or reimburse certain operating expenses as deemed appropriate through at least May 1, 2017. The Adviser may discontinue the waiver/reimbursement at any time after
43
| KINETICS MUTUAL FUNDS, INC. — THE FEEDER FUNDS |
Notes to Financial Statements — (Continued) |
| June 30, 2016 (Unaudited) |
May 1, 2017; these waivers/reimbursements are not subject to recapture. Below are operating expense limitations by Feeder Fund and share class:
| | | | The Internet | | The Global |
| | | | Fund | | Fund |
| No Load Class | | | 1.89 | % | | 1.39 | % |
| Class A | | | 2.14 | % | | 1.64 | % |
| Class C | | | 2.64 | % | | 2.14 | % |
| | | | The Paradigm | | The Medical |
| | | | Fund | | Fund |
| No Load Class | | | 1.64 | % | | 1.39 | % |
| Class A | | | 1.89 | % | | 1.64 | % |
| Class C | | | 2.39 | % | | 2.14 | % |
| Institutional Class | | | 1.44 | % | | NA | |
| | | | The Small Cap | | The Market |
| | | | Opportunities | | Opportunities |
| | | | Fund | | Fund |
| No Load Class | | | 1.64 | % | | 1.64 | % |
| Class A | | | 1.89 | % | | 1.89 | % |
| Class C | | | 2.39 | % | | 2.39 | % |
| Institutional Class | | | 1.44 | % | | 1.44 | % |
| | | | The Alternative | | The Multi- |
| | | | Income | | Disciplinary |
| | | | Fund | | Income Fund |
| No Load Class | | | 0.95 | % | | 1.49 | % |
| Class A | | | 1.20 | % | | 1.74 | % |
| Class C | | | 1.70 | % | | 2.24 | % |
| Institutional Class | | | 0.75 | % | | 1.29 | % |
For the six-month period ended June 30, 2016, the rate earned by the Adviser from the Master Portfolios and the waived fees/reimbursed expenses for the Feeder Funds are as follows:
| | | | The Internet | | | The Global |
| | | | Fund | | | Fund |
| Annual Advisory Rate | | | 1.25 | % | | | 1.25 | % |
| Expenses Reimbursed by Adviser through | | | | | | | | |
| voluntary waiver | | $ | — | | | $ | 50,060 | |
44
| KINETICS MUTUAL FUNDS, INC. — THE FEEDER FUNDS |
Notes to Financial Statements — (Continued) |
| June 30, 2016 (Unaudited) |
| | | | The Paradigm | | | The Medical |
| | | | Fund | | | Fund |
| Annual Advisory Rate | | | 1.25 | % | | | 1.25 | % |
| Expenses Reimbursed by Adviser through voluntary waiver | | $ | 436,074 | | | $ | 80,594 | |
| Expenses Reimbursed by Adviser through institutional class shareholder servicing fee waiver | | $ | 204,228 | | | | N/A | |
| | | | The Small Cap | | | The Market |
| | | | Opportunities | | | Opportunities |
| | | | Fund | | | Fund |
| Annual Advisory Rate | | | 1.25 | % | | | 1.25 | % |
| Expenses Reimbursed by Adviser through voluntary waiver | | $ | 118,423 | | | $ | 64,148 | |
| Expenses Reimbursed by Adviser through institutional class shareholder servicing fee waiver | | $ | 36,649 | | | $ | 1,511 | |
| | | | The Alternative | | | The Multi- |
| | | | Income | | | Disciplinary |
| | | | Fund | | | Income Fund |
| Annual Advisory Rate | | | 0.90 | % | | | 1.25 | % |
| Expenses Reimbursed by Adviser through voluntary waiver | | $ | 107,256 | | | $ | 157,139 | |
| Expenses Reimbursed by Adviser through institutional class shareholder servicing fee waiver | | $ | 13,971 | | | $ | 47,480 | |
The Adviser receives the shareholder servicing fees from the No Load Class, Advisor Class A and Advisor Class C shares of a Feeder Fund pursuant to a Shareholder Servicing Agreement in the amount equal to 0.25% of the Feeder Fund's average daily net assets attributable to No Load Class, Advisor Class A and Advisor Class C shares, respectively. For the Institutional Class, the Adviser receives a shareholder servicing fee pursuant to a shareholder servicing agreement in the amount equal to 0.20% of a Feeder Fund's average daily net assets attributable to Institutional Class shares. At this time, the Adviser has contractually agreed to waive and/or reimburse the portion of the Institutional Class shareholder servicing fee in excess of 0.05% of a Feeder Fund's average daily net assets attributable to Institutional Class shares until at least May 1, 2017. For the six-month period ended June 30, 2016, the Adviser waived amounts depicted in the above table in shareholder servicing fees for the Institutional Class of the Paradigm, Small Cap, Market Opportunities, Alternative Income, and Multi-Disciplinary Income Funds.
45
| KINETICS MUTUAL FUNDS, INC. — THE FEEDER FUNDS |
Notes to Financial Statements — (Continued) |
| June 30, 2016 (Unaudited) |
| | | | Shareholder Servicing | |
| | | | Expenses for | |
| | | | the period ended | |
| | | | June 30, 2016 | |
| The Internet Fund | | $ | 145,751 | |
| The Global Fund | | | 8,274 | |
| The Paradigm Fund | | | 865,713 | |
| The Medical Fund | | | 31,109 | |
| The Small Cap Opportunities Fund | | | 236,641 | |
| The Market Opportunities Fund | | | 48,890 | |
| The Alternative Income Fund | | | 28,909 | |
| The Multi-Disciplinary Income Fund | | | 90,383 | |
The Adviser is responsible for paying a portion of these shareholder servicing fees to various agents that have a written shareholder servicing agreement with the Adviser and that perform shareholder servicing functions and maintenance of shareholder accounts on behalf of their clients who own shares of the Feeder Funds.
For the six-month period ended June 30, 2016, the Feeder Funds were allocated $13,000 for the services of the Chief Compliance Officer employed by the Adviser.
The Company, on behalf of the Feeder Funds, has adopted two Retail Distribution Plans pursuant to Rule 12b-1 under the 1940 Act (the "12b-1 Plans"). One 12b-1 Plan is for Advisor Class A shares, while the other 12b-1 Plan is for Advisor Class C shares. Under the 12b-1 Plan for Advisor Class A shares, Advisor Class A shares may pay up to an annual rate of 0.50% of the average daily net asset value of Advisor Class A shares to the Distributor or other qualified recipients under the 12b-1 Plan. During the six-month period ended June 30, 2016, payments under the 12b-1 Plan for the Advisor Class A shares of the Internet, Global, Paradigm, Medical, Small Cap, Market Opportunities, Alternative Income, and Multi-Disciplinary Income Funds were limited to 0.25% of the average daily net asset value of such shares of such Funds. Under the second 12b-1 Plan, Advisor Class C shares pay an annual rate of 0.75% of the average daily net asset value of such shares.
| | | 12b-1 Expenses
for the period
ended June 30, 2016 | |
| | | | Advisor Class A | | | Advisor Class C | |
| The Internet Fund | | $ | 3,424 | | $ | 2,929 | |
| The Global Fund | | | 397 | | | 6,177 | |
| The Paradigm Fund | | | 135,046 | | | 398,737 | |
| The Medical Fund | | | 6,120 | | | 1,957 | |
| The Small Cap Opportunities Fund | | | 16,227 | | | 30,008 | |
| The Market Opportunities Fund | | | 5,140 | | | 14,926 | |
| The Alternative Income Fund | | | 2,629 | | | 5,642 | |
| The Multi-Disciplinary Income Fund | | | 9,014 | | | 32,489 | |
46
| KINETICS MUTUAL FUNDS, INC. — THE FEEDER FUNDS |
Notes to Financial Statements — (Continued) |
| June 30, 2016 (Unaudited) |
Kinetics Funds Distributor, LLC (the "Distributor") acts as the Funds' principal underwriter in a continuous public offering of the Funds' shares. The Distributor is an affiliate of the Adviser.
| | | | Distributor Sales | |
| | | | Load Fees for | |
| | | | the period | |
| | | | ended | |
| | | | June 30, 2016 | |
| The Internet Fund | | $ | 30 | |
| The Global Fund | | | — | |
| The Paradigm Fund | | | 3,081 | |
| The Medical Fund | | | 322 | |
| The Small Cap Opportunities Fund | | | 289 | |
| The Market Opportunities Fund | | | 108 | |
| The Alternative Income Fund | | | 1,384 | |
| The Multi-Disciplinary Income Fund | | | 30 | |
4. Reclassification of Capital Accounts
GAAP requires that certain components of net assets relating to permanent differences be reclassified between financial and tax reporting. These reclassifications have no effect on net assets or net asset value per share. For the year ended December 31, 2015, each Feeder Fund recorded the following reclassifications to the accounts listed below:
| | | INCREASE/(DECREASE) | |
| | | | Accumulated | | | | | | | |
| | | | Net | | | Accumulated | | | | |
| | | | Investment | | | Net Realized | | | | |
| | | | Income | | | Gain | | | | |
| | | | (Loss) | | | (Loss) | | | Paid In Capital | |
| The Internet Fund | | $ | 2,205,656 | | $ | (2,139,478 | ) | $ | (66,178 | ) |
| The Global Fund | | | 43,769 | | | 8,661 | | | (52,430 | ) |
| The Paradigm Fund | | | 10,674,501 | | | (192,848 | ) | | (10,481,653 | ) |
| The Medical Fund | | | 381 | | | (190,958 | ) | | 190,577 | |
| The Small Cap Opportunities Fund | | | 356,747 | | | (189,473 | ) | | (167,274 | ) |
| The Market Opportunities Fund | | | 524,460 | | | (314,309 | ) | | (210,151 | ) |
| The Alternative Income Fund | | | — | | | 2 | | | (2 | ) |
| The Multi-Disciplinary Income Fund | | | (587,388 | ) | | 585,143 | | | 2,245 | |
47
| KINETICS MUTUAL FUNDS, INC. — THE FEEDER FUNDS |
Notes to Financial Statements — (Continued) |
| June 30, 2016 (Unaudited) |
5. Income Taxes
At December 31, 2015, the components of accumulated earnings (losses) on a tax basis were as follows:
| | | | Internet | | | Global | | | Paradigm | | | Medical | |
| Net Unrealized Appreciation | | $ | 46,499,771 | | $ | 211,369 | | $ | 181,372,344 | | $ | 10,439,369 | |
| Undistributed Ordinary Income | | | — | | | — | | | — | | | 22,011 | |
| Undistributed Long-Term Capital Gains | | | 3,753,798 | | | — | | | — | | | — | |
| Total Distributable Earnings | | $ | 3,753,798 | | $ | — | | $ | — | | $ | 22,011 | |
| Other Accumulated Loss | | | (224,735 | ) | | (48,886 | ) | | (608,221,566 | ) | | — | |
| Total Accumulated Gain (Loss) | | $ | 50,028,834 | | $ | 162,483 | | $ | (426,849,222 | ) | $ | 10,461,380 | |
| | | | | | | | | | | | | Multi- | |
| | | | Small Cap | | | Market | | | Alternative | | | Disciplinary | |
| | | | Opportunities | | | Opportunities | | | Income | | | Income | |
| Net Unrealized Appreciation (Depreciation) | | $ | (38,966,793 | ) | $ | 3,405,512 | | $ | 86,289 | | $ | (6,841,228 | ) |
| Undistributed Ordinary Income | | | — | | | — | | | 18,812 | | | 40,102 | |
| Undistributed Long-Term Capital Gains | | | — | | | — | | | — | | | — | |
| Total Distributable Earnings | | $ | — | | $ | — | | $ | 18,812 | | $ | 40,102 | |
| Other Accumulated Loss | | | (98,430,290 | ) | | (17,028,429 | ) | | (6,327,625 | ) | | (1,136,409 | ) |
| Total Accumulated Loss | | $ | (137,397,083 | ) | $ | (13,622,917 | ) | $ | (6,222,524 | ) | $ | (7,937,535 | ) |
At December 31, 2015, the Feeder Funds had accumulated net realized capital loss carryforwards expiring in the following years:
| | | | 2018 | | | 2017 | | | 2016 | | | Total | |
| The Internet Fund | | $ | — | | $ | — | | $ | — | | $ | — | |
| The Global Fund | | | — | | | (27,489 | ) | | — | | | (27,489 | ) |
| The Paradigm Fund | | | (115,786,082 | ) | | (445,505,345 | ) | | (45,902,125 | ) | | (607,193,552 | ) |
| The Medical Fund | | | — | | | — | | | — | | | — | |
| The Small Cap Opportunities Fund | | | (8,224,702 | ) | | (86,316,846 | ) | | — | | | (94,541,548 | ) |
| The Market Opportunities Fund | | | (2,108,533 | ) | | (6,623,055 | ) | | (7,913,031 | ) | | (16,644,619 | ) |
| The Alternative Income Fund | | | (2,203,647 | ) | | (4,123,978 | ) | | — | | | (6,327,625 | ) |
| The Multi-Disciplinary Income Fund | | | — | | | — | | | — | | | — | |
As a result of the Regulated Investment Company Modernization Act of 2010 (the "Modernization Act"), losses incurred in this fiscal year and beyond retain their character, short-term or long-term, have no expiration date and are utilized prior to capital loss carryforwards accumulated before the enactment of the Modernization Act.
48
| KINETICS MUTUAL FUNDS, INC. — THE FEEDER FUNDS |
Notes to Financial Statements — (Continued) |
| June 30, 2016 (Unaudited) |
At December 31, 2015, the Global Fund had $15,382 in short-term capital loss carryforwards without expiration and the Multi-Disciplinary Income Fund had $705,331 in long-term capital loss carryforwards without expiration.
For the year ended December 31, 2015, the following Feeder Funds utilized capital loss carryforwards:
| | | | Capital Loss | |
| | | | Carryforward | |
| The Internet Fund | | $ | — | |
| The Global Fund | | | — | |
| The Paradigm Fund | | | 123,223,215 | |
| The Medical Fund | | | — | |
| The Small Cap Opportunities Fund | | | 40,234,429 | |
| The Market Opportunities Fund | | | 4,689,935 | |
| The Alternative Income Fund | | | 1,228,237 | |
| The Multi-Disciplinary Income Fund | | | — | |
At December 31, 2015, the following Feeder Funds deferred, on a tax basis, post-October losses:
| | | | Late Year | | | Post-October | |
| | | | Ordinary | | | Capital Loss | |
| | | | Loss Deferral | | | Deferral | |
| The Internet Fund | | $ | — | | $ | — | |
| The Global Fund | | | (4,192 | ) | | (1,823 | ) |
| The Paradigm Fund | | | (309,091 | ) | | — | |
| The Medical Fund | | | — | | | — | |
| The Small Cap Opportunities Fund | | | (3,345,372 | ) | | — | |
| The Market Opportunities Fund | | | (206,393 | ) | | — | |
| The Alternative Income Fund | | | — | | | — | |
| The Multi-Disciplinary Income Fund | | | — | | | (431,078 | ) |
The tax components of dividends paid during the six-month period ended June 30, 2016, and the year ended December 31, 2015, are:
| | | The Internet Fund | | The Global Fund | |
| | | | Ordinary | | | Long-Term | | | Ordinary | | | Long-Term | |
| | | | Income | | | Capital Gains | | | Income | | | Capital Gains | |
| | | | Distribution | | | Distribution | | | Distribution | | | Distribution | |
| 2016 | | $ | — | | $ | — | | $ | — | | $ | — | |
| 2015 | | $ | — | | $ | 27,584,492 | | $ | — | | $ | 3,860 | |
49
| KINETICS MUTUAL FUNDS, INC. — THE FEEDER FUNDS |
Notes to Financial Statements — (Continued) |
| June 30, 2016 (Unaudited) |
| | | The Paradigm Fund | | The Medical Fund | |
| | | | Ordinary | | | Long-Term | | | Ordinary | | | Long-Term | |
| | | | Income | | | Capital Gains | | | Income | | | Capital Gains | |
| | | | Distribution | | | Distribution | | | Distribution | | | Distribution | |
| 2016 | | $ | — | | $ | — | | $ | — | | $ | — | |
| 2015 | | $ | — | | $ | — | | $ | 1,201,551 | | $ | 686,006 | |
| | | The Small Cap | | The Market | |
| | | Opportunities Fund | | Opportunities Fund | |
| | | | Ordinary | | | Long-Term | | | Ordinary | | | Long-Term | |
| | | | Income | | | Capital Gains | | | Income | | | Capital Gains | |
| | | | Distribution | | | Distribution | | | Distribution | | | Distribution | |
| 2016 | | $ | — | | $ | — | | $ | — | | $ | — | |
| 2015 | | $ | — | | $ | — | | $ | — | | $ | — | |
| | | The Alternative | | The Multi-Disciplinary | |
| | | Income Fund | | Income Fund | |
| | | | Ordinary | | | Long-Term | | | Ordinary | | | Long-Term | |
| | | | Income | | | Capital Gains | | | Income | | | Capital Gains | |
| | | | Distribution | | | Distribution | | | Distribution | | | Distribution | |
| 2016 | | $ | — | | $ | — | | $ | 1,847,495 | | $ | — | |
| 2015 | | $ | 19,394 | | $ | — | | $ | 3,065,268 | | $ | — | |
6. Tax Information
The Medical Fund designates 54% of dividends declared after December 31, 2015, from net investment income as qualified dividend income under the Jobs and Growth Tax Relief Reconciliation Act of 2003.
The Medical, Alternative Income, and Multi-Disciplinary Income Funds hereby designate 64%, 100% and 100%, respectively, as ordinary income distributions and 100%, 100% and 36%, respectively, for the Internet, Global and Medical Funds as long-term capital gain distributions for the purposes of the dividends paid deduction, which include earnings and profits distributed to shareholders on redemptions of Fund shares.
For corporate shareholders in the Feeder Funds, the percentage of ordinary dividend income distributed for the year ended December 31, 2015, which was designated as qualifying for the dividends-received deduction, is 35% for the Medical Fund. The Multi-Disciplinary Income Fund and the Alternative Income Fund designated 100% and 100%, respectively, of their ordinary income distributions for the fiscal year ended December 31, 2015, as interest-related dividends under Internal Revenue Code Section 871(k)(l)(C).
50
| KINETICS MUTUAL FUNDS, INC. — THE FEEDER FUNDS |
Notes to Financial Statements — (Continued) June 30, 2016 (Unaudited) |
The Medical Fund designated 92% of its ordinary income distribution as a short-term capital gain distribution under Internal Revenue Code Section 871(k)(2)(C).
7. Information about Proxy Voting
Information regarding how the Feeder Funds and the Master Portfolios vote proxies relating to portfolio securities is available without charge, upon request by calling toll-free at 1-800-930-3828 or by accessing the Company's website at www.kineticsfunds.com and by accessing the SEC's website at www.sec.gov. Information regarding how the Feeder Funds and the Master Portfolios voted proxies relating to portfolio securities during the most recent twelve month period ended June 30, is available without charge, upon request, by calling toll-free at 1-800-930-3828 or by accessing the SEC's website at www.sec.gov.
8. Information about the Portfolio Holdings
The Feeder Funds file their complete schedule of portfolio holdings for their first and third fiscal quarters with the SEC on Form N-Q. The Feeder Funds' Form N-Q is available without charge, upon request, by calling toll-free at 1-800-930-3828. Furthermore, you can obtain the Form N-Q on the SEC's website at www.sec.gov. Finally, the Form N-Q may be reviewed and copied at the SEC's Public Reference Room in Washington, D.C. Information on the operation of the Public Reference Room may be obtained by calling 1-800-SEC-0330.
9. Subsequent Events
In preparing these financial statements, management has evaluated Fund related events and transactions for potential recognition or disclosure through the date the financial statements were issued. There were no events or translations that occurred during the period that materially impacted the amounts or disclosures in the Funds' financial statements.
51
| KINETICS MUTUAL FUNDS, INC. — THE FEEDER FUNDS |
| Financial Highlights |
| | | The Internet Fund | |
| | | No Load Class | |
| | | | For the
Period
Ended
June 30, 2016
(Unaudited) | | | For the
Year
Ended
December 31, 2015 | | | For the Year
Ended
December 31, 2014 | | | For the
Year
Ended
December 31, 2013 | | | For the
Year
Ended
December 31, 2012 | | | For the
Year Ended
December 31,
2011 | |
PER SHARE DATA:(1) | | | | | | | | | | | | | | | | | | | |
| Net Asset Value, Beginning of Period | | $ | 41.68 | | $ | 56.08 | | $ | 59.27 | | $ | 43.18 | | $ | 36.26 | | $ | 37.25 | |
| Income from Investment Operations: | | | | | | | | | | | | | | | | | | | |
Net investment loss(2) | | | (0.34 | ) | | (0.84 | ) | | (0.77 | ) | | (0.67 | ) | | (0.15 | ) | | (0.37 | ) |
| Net realized and unrealized gain (loss) on investments | | | (1.28 | ) | | (2.21 | ) | | 0.69 | | | 19.78 | | | 8.56 | | | (0.37 | ) |
| Total from Investment Operations | | | (1.62 | ) | | (3.05 | ) | | (0.08 | ) | | 19.11 | | | 8.41 | | | (0.74 | ) |
| Redemption Fees | | | 0.00 | (3) | | 0.00 | (3) | | 0.01 | | | 0.00 | (3) | | 0.00 | (3) | | 0.00 | (3) |
| Less Distributions: | | | | | | | | | | | | | | | | | | | |
| From net realized gains | | | — | | | (11.35 | ) | | (3.12 | ) | | (3.02 | ) | | (1.49 | ) | | (0.25 | ) |
| Total Distributions | | | — | | | (11.35 | ) | | (3.12 | ) | | (3.02 | ) | | (1.49 | ) | | (0.25 | ) |
| Net Asset Value, End of Period | | $ | 40.06 | | $ | 41.68 | | $ | 56.08 | | $ | 59.27 | | $ | 43.18 | | $ | 36.26 | |
| Total return | | | (3.89 | )%(4) | | (5.42 | )% | | (0.16 | )% | | 44.28 | % | | 23.24 | % | | (1.98 | )% |
| | | | | | | | | | | | | | | | | | | | |
| SUPPLEMENTAL DATA AND RATIOS | | | | | | | | | | | | | | | | | | |
| Net assets, end of period (000's) | | $ | 110,942 | | $ | 122,332 | | $ | 151,200 | | $ | 172,332 | | $ | 155,036 | | $ | 103,828 | |
| Ratio of operating expenses to average net assets: | | | | | | | | | | | | | | | | | | | |
| Before expense reimbursement | | | 1.87 | %(5) | | 1.82 | % | | 1.78 | % | | 1.84 | % | | 1.94 | % | | 1.94 | % |
After expense reimbursement(6) | | | 1.87 | %(5) | | 1.82 | % | | 1.78 | % | | 1.84 | % | | 1.89 | % | | 1.89 | % |
| Ratio of net investment loss to average net assets: | | | | | | | | | | | | | | | | | | | |
| Before expense reimbursement | | | (1.69 | )%(5) | | (1.51 | )% | | (1.34 | )% | | (1.30 | )% | | (0.41 | )% | | (0.99 | )% |
After expense reimbursement(6) | | | (1.69 | )%(5) | | (1.51 | )% | | (1.34 | )% | | (1.30 | )% | | (0.36 | )% | | (0.94 | )% |
Portfolio turnover rate(7) | | | 1 | % | | 1 | % | | 1 | % | | 8 | % | | 9 | % | | 32 | % |
| (1) | Information presented relates to a share of capital stock outstanding for each period. |
| (2) | Net investment income per share represents net investment income divided by the average shares outstanding throughout the period. |
| (3) | Amount calculated is less than $0.005. |
| (4) | Not annualized. |
| (5) | Annualized. |
| (6) | See Note #3, Investment Adviser, for the waiver and expense reimbursement discussion. |
| (7) | Portfolio turnover of The Internet Portfolio. |
The accompanying notes are an integral part of these financial statements.
52
| KINETICS MUTUAL FUNDS, INC. — THE FEEDER FUNDS |
Financial Highlights — (Continued) |
| | | The Internet Fund | |
| | | Advisor Class A | |
| | | | For the
Period
Ended
June 30, 2016
(Unaudited) | | | For the
Year
Ended
December 31, 2015 | | | For the Year
Ended
December 31, 2014 | | | For the
Year
Ended
December 31, 2013 | | | For the
Year
Ended
December 31, 2012 | | | For the
Year Ended
December 31,
2011 | |
| | | | | | | | | | | | | | | | | | | | |
PER SHARE DATA:(1) | | | | | | | | | | | | | | | | | | | |
| Net Asset Value, Beginning of Period | | $ | 40.07 | | $ | 54.51 | | $ | 57.84 | | $ | 42.30 | | $ | 35.63 | | $ | 36.69 | |
| Income from Investment Operations: | | | | | | | | | | | | | | | | | | | |
Net investment loss(2) | | | (0.37 | ) | | (0.95 | ) | | (0.89 | ) | | (0.81 | ) | | (0.24 | ) | | (0.46 | ) |
| Net realized and unrealized gain (loss) on investments | | | (1.23 | ) | | (2.14 | ) | | 0.68 | | | 19.36 | | | 8.40 | | | (0.36 | ) |
| Total from Investment Operations | | | (1.60 | ) | | (3.09 | ) | | (0.21 | ) | | 18.55 | | | 8.16 | | | (0.82 | ) |
| Redemption Fees | | | — | | | — | | | 0.00(3 | ) | | 0.01 | | | — | | | 0.01 | |
| Less Distributions: | | | | | | | | | | | | | | | | | | | |
| From net realized gains | | | — | | | (11.35 | ) | | (3.12 | ) | | (3.02 | ) | | (1.49 | ) | | (0.25 | ) |
| Total Distributions | | | — | | | (11.35 | ) | | (3.12 | ) | | (3.02 | ) | | (1.49 | ) | | (0.25 | ) |
| Net Asset Value, End of Period | | $ | 38.47 | | $ | 40.07 | | $ | 54.51 | | $ | 57.84 | | $ | 42.30 | | $ | 35.63 | |
Total return(4) | | | (3.99 | )%(5) | | (5.65 | )% | | (0.41 | )% | | 43.94 | % | | 22.92 | % | | (2.20 | )% |
| | | | | | | | | | | | | | | | | | | | |
| SUPPLEMENTAL DATA AND RATIOS | | | | | | | | | | | | | | | | | | | |
| Net assets, end of period (000's) | | $ | 2,610 | | $ | 2,978 | | $ | 5,143 | | $ | 5,506 | | $ | 1,379 | | $ | 1,050 | |
| Ratio of operating expenses to average net assets: | | | | | | | | | | | | | | | | | | | |
| Before expense reimbursement | | | 2.12 | %(6) | | 2.07 | % | | 2.03 | % | | 2.09 | % | | 2.19 | % | | 2.19 | % |
After expense reimbursement(7) | | | 2.12 | %(6) | | 2.07 | % | | 2.03 | % | | 2.09 | % | | 2.14 | % | | 2.14 | % |
| Ratio of net investment loss to average net assets: | | | | | | | | | | | | | | | | | | | |
| Before expense reimbursement | | | (1.94 | )%(6) | | (1.76 | )% | | (1.59 | )% | | (1.55 | )% | | (0.66 | )% | | (1.24 | )% |
After expense reimbursement(7) | | | (1.94 | )%(6) | | (1.76 | )% | | (1.59 | )% | | (1.55 | )% | | (0.61 | )% | | (1.19 | )% |
Portfolio turnover rate(8) | | | 1 | % | | 1 | % | | 1 | % | | 8 | % | | 9 | % | | 32 | % |
| (1) | Information presented relates to a share of capital stock outstanding for each period. |
| (2) | Net investment income per share represents net investment income divided by the average shares outstanding throughout the period. |
| (3) | Amount calculated is less than $0.005. |
| (4) | The total return calculation does not reflect the 5.75% front end sales charge on Advisor Class A shares. |
| (5) | Not annualized. |
| (6) | Annualized. |
| (7) | See Note #3, Investment Adviser, for the waiver and expense reimbursement discussion. |
| (8) | Portfolio turnover of The Internet Portfolio. |
The accompanying notes are an integral part of these financial statements.
53
| KINETICS MUTUAL FUNDS, INC. — THE FEEDER FUNDS |
Financial Highlights — (Continued) |
| | | The Internet Fund | |
| | | Advisor Class C | |
| | | | For the
Period
Ended
June 30, 2016
(Unaudited) | | | For the
Year
Ended
December 31, 2015 | | | For the Year
Ended
December 31, 2014 | | | For the
Year
Ended
December 31, 2013 | | | For the
Year
Ended
December 31, 2012 | | | For the
Year Ended
December 31,
2011 | |
| | | | | | | | | | | | | | | | | | | | |
PER SHARE DATA:(1) | | | | | | | | | | | | | | | | | | | |
| Net Asset Value, Beginning of Period | | $ | 37.27 | | $ | 51.81 | | $ | 55.38 | | $ | 40.79 | | $ | 34.58 | | $ | 35.79 | |
| Income from Investment Operations: | | | | | | | | | | | | | | | | | | | |
Net investment loss(2) | | | (0.43 | ) | | (1.15 | ) | | (1.11 | ) | | (1.03 | ) | | (0.43 | ) | | (0.63 | ) |
| Net realized and unrealized gain (loss) on investments | | | (1.15 | ) | | (2.04 | ) | | 0.64 | | | 18.64 | | | 8.13 | | | (0.34 | ) |
| Total from Investment Operations | | | (1.58 | ) | | (3.19 | ) | | (0.47 | ) | | 17.61 | | | 7.70 | | | (0.97 | ) |
| Redemption Fees | | | — | | | — | | | 0.02 | | | — | | | — | | | 0.01 | |
| Less Distributions: | | | | | | | | | | | | | | | | | | | |
| From net realized gains | | | — | | | (11.35 | ) | | (3.12 | ) | | (3.02 | ) | | (1.49 | ) | | (0.25 | ) |
| Total Distributions | | | — | | | (11.35 | ) | | (3.12 | ) | | (3.02 | ) | | (1.49 | ) | | (0.25 | ) |
| Net Asset Value, End of Period | | $ | 35.69 | | $ | 37.27 | | $ | 51.81 | | $ | 55.38 | | $ | 40.79 | | $ | 34.58 | |
| Total return | | | (4.24 | )%(3) | | (6.14 | )% | | (0.86 | )% | | 43.20 | % | | 22.32 | % | | (2.67 | )% |
| | | | | | | | | | | | | | | | | | | | |
| SUPPLEMENTAL DATA AND RATIOS | | | | | | | | | | | | | | | | | | | |
| Net assets, end of period (000's) | | $ | 812 | | $ | 848 | | $ | 1,105 | | $ | 913 | | $ | 185 | | $ | 103 | |
| Ratio of operating expenses to | | | | | | | | | | | | | | | | | | | |
| average net assets: | | | | | | | | | | | | | | | | | | | |
| Before expense reimbursement | | | 2.62 | %(4) | | 2.57 | % | | 2.53 | % | | 2.59 | % | | 2.69 | % | | 2.69 | % |
After expense reimbursement(5) | | | 2.62 | %(4) | | 2.57 | % | | 2.53 | % | | 2.59 | % | | 2.64 | % | | 2.64 | % |
| Ratio of net investment loss to average net assets: | | | | | | | | | | | | | | | | | | | |
| Before expense reimbursement | | | (2.44 | )%(4) | | (2.26 | )% | | (2.09 | )% | | (2.05 | )% | | (1.16 | )% | | (1.74 | )% |
After expense reimbursement(5) | | | (2.44 | )%(4) | | (2.26 | )% | | (2.09 | )% | | (2.05 | )% | | (1.11 | )% | | (1.69 | )% |
Portfolio turnover rate(6) | | | 1 | % | | 1 | % | | 1 | % | | 8 | % | | 9 | % | | 32 | % |
| (1) | Information presented relates to a share of capital stock outstanding for each period. |
| (2) | Net investment income per share represents net investment income divided by the average shares outstanding throughout the period. |
| (3) | Not annualized. |
| (4) | Annualized. |
| (5) | See Note #3, Investment Adviser, for the waiver and expense reimbursement discussion. |
| (6) | Portfolio turnover of The Internet Portfolio. |
The accompanying notes are an integral part of these financial statements.
54
| KINETICS MUTUAL FUNDS, INC. — THE FEEDER FUNDS |
Financial Highlights — (Continued) |
| | | The Global Fund | |
| | | No Load Class | |
| | | | For the
Period
Ended June 30, 2016
(Unaudited) | | | For the
Year
Ended
December 31, 2015 | | | For the Year
Ended
December 31, 2014 | | | For the
Year
Ended
December 31, 2013 | | | For the
Year
Ended
December 31, 2012 | | | For the
Year
Ended
December 31, 2011 | |
PER SHARE DATA:(1) | | | | | | | | | | | | | | | | | | | |
| Net Asset Value, Beginning of Period | | $ | 4.59 | | $ | 5.33 | | $ | 6.05 | | $ | 4.71 | | $ | 3.92 | | $ | 4.67 | |
| Income from Investment Operations: | | | | | | | | | | | | | | | | | | | |
Net investment income (loss) (2) | | | 0.02 | | | (0.02 | ) | | (0.02 | ) | | 0.01 | | | 0.03 | | | 0.06 | |
| Net realized and unrealized gain (loss) on investments | | | 0.30 | | | (0.72 | ) | | (0.70 | ) | | 1.34 | | | 0.88 | | | (0.78 | ) |
| Total from Investment Operations | | | 0.32 | | | (0.74 | ) | | (0.72 | ) | | 1.35 | | | 0.91 | | | (0.72 | ) |
Redemption Fees(3) | | | 0.00 | | | 0.00 | | | 0.00 | | | 0.00 | | | 0.00 | | | 0.00 | |
| Less Distributions: | | | | | | | | | | | | | | | | | | | |
| From net investment income | | | — | | | — | | | — | | | (0.01 | ) | | (0.12 | ) | | (0.03 | ) |
| From net realized gains | | | — | | | (0.00 | )(3) | | (0.00 | )(3) | | — | | | — | | | — | |
| Total Distributions | | | — | | | (0.00 | )(3) | | (0.00 | )(3) | | (0.01 | ) | | (0.12 | ) | | (0.03 | ) |
Net Asset Value, End of Period | | $ | 4.91 | | $ | 4.59 | | $ | 5.33 | | $ | 6.05 | | $ | 4.71 | | $ | 3.92 | |
| Total return | | | 6.97 | %(4) | | (13.83 | )% | | (11.89 | )% | | 28.59 | % | | 23.16 | % | | (15.41 | )% |
| | | | | | | | | | | | | | | | | | | | |
| SUPPLEMENTAL DATA AND RATIOS | | | | | | | | | | | | | | | | | | |
| Net assets, end of period (000's) | | $ | 5,027 | | $ | 4,745 | | $ | 6,771 | | $ | 8,705 | | $ | 5,069 | | $ | 3,631 | |
| Ratio of operating expenses to average net assets: | | | | | | | | | | | | | | | | | | | |
| Before expense reimbursement | | | 2.90 | %(5) | | 2.87 | % | | 2.61 | % | | 2.83 | % | | 3.38 | % | | 3.94 | % |
After expense reimbursement(6) | | | 1.39 | %(5) | | 1.39 | % | | 1.39 | % | | 1.39 | % | | 1.39 | % | | 1.39 | % |
| Ratio of net investment income (loss) to average net assets: | | | | | | | | | | | | | | | | | | | |
| Before expense reimbursement | | | (0.70 | )%(5) | | (1.77 | )% | | (1.54 | )% | | (1.22 | )% | | (1.22 | )% | | (1.11 | )% |
After expense reimbursement(6) | | | 0.81 | %(5) | | (0.29 | )% | | (0.32 | )% | | 0.22 | % | | 0.77 | % | | 1.44 | % |
Portfolio turnover rate(7) | | | 7 | % | | 16 | % | | 14 | % | | 15 | % | | 23 | % | | 135 | % |
| (1) | Information presented relates to a share of capital stock outstanding for each period. |
| (2) | Net investment income per share represents net investment income divided by the average shares outstanding throughout the period. |
| (3) | Amount calculated is less than $0.005. |
| (4) | Not annualized. |
| (5) | Annualized. |
| (6) | See Note #3, Investment Adviser, for the waiver and expense reimbursement discussion. |
| (7) | Portfolio turnover of The Global Portfolio. |
The accompanying notes are an integral part of these financial statements.
55
| KINETICS MUTUAL FUNDS, INC. — THE FEEDER FUNDS |
Financial Highlights — (Continued) |
| | | The Global Fund | |
| | | Advisor Class A | |
| | | | For the
Period
Ended
June 30, 2016
(Unaudited) | | | For the
Year
Ended
December 31, 2015 | | | For the
Year
Ended
December 31, 2014 | | | For the
Year
Ended
December 31, 2013 | | | For the
Year
Ended
December 31, 2012 | | | For the
Year
Ended
December 31, 2011 | |
PER SHARE DATA:(1) | | | | | | | | | | | | | | | | | | | |
| Net Asset Value, Beginning of Period | | $ | 4.57 | | $ | 5.31 | | $ | 6.03 | | $ | 4.71 | | $ | 3.92 | | $ | 4.68 | |
| Income from Investment Operations: | | | | | | | | | | | | | | | | | | | |
Net investment income (loss)(2) | | | 0.01 | | | (0.03 | ) | | (0.03 | ) | | (0.00 | )(3) | | 0.02 | | | 0.05 | |
| Net realized and unrealized gain (loss) on investments | | | 0.30 | | | (0.71 | ) | | (0.70 | ) | | 1.33 | | | 0.88 | | | (0.78 | ) |
| Total from Investment Operations | | | 0.31 | | | (0.74 | ) | | (0.73 | ) | | 1.33 | | | 0.90 | | | (0.73 | ) |
| Redemption Fees | | | — | | | — | | | 0.01 | | | 0.00 | (3) | | 0.00 | (3) | | 0.00 | (3) |
| Less Distributions: | | | | | | | | | | | | | | | | | | | |
| From net investment income | | | — | | | — | | | — | | | (0.01 | ) | | (0.11 | ) | | (0.03 | ) |
| From net realized gains | | | — | | | (0.00 | )(3) | | (0.00 | )(3) | | — | | | — | | | — | |
| Total Distributions | | | — | | | (0.00 | )(3) | | (0.00 | )(3) | | (0.01 | ) | | (0.11 | ) | | (0.03 | ) |
Net Asset Value, End of Period | | $ | 4.88 | | $ | 4.57 | | $ | 5.31 | | $ | 6.03 | | $ | 4.71 | | $ | 3.92 | |
Total return(4) | | | 6.78 | %(5) | | (13.89 | )% | | (11.93 | )% | | 28.16 | % | | 22.94 | % | | (15.59 | )% |
| | | | | | | | | | | | | | | | | | | | |
| SUPPLEMENTAL DATA AND RATIOS | | | | | | | | | | | | | | | | | | |
| Net assets, end of period (000's) | | $ | 326 | | $ | 376 | | $ | 497 | | $ | 1,992 | | $ | 1,093 | | $ | 392 | |
| Ratio of operating expenses to average net assets: | | | | | | | | | | | | | | | | | | | |
| Before expense reimbursement | | | 3.15 | %(6) | | 3.12 | % | | 2.86 | % | | 3.08 | % | | 3.63 | % | | 4.19 | % |
After expense reimbursement(7) | | | 1.64 | %(6) | | 1.64 | % | | 1.64 | % | | 1.64 | % | | 1.64 | % | | 1.64 | % |
| Ratio of net investment income (loss) to average net assets: | | | | | | | | | | | | | | | | | | | |
| Before expense reimbursement | | | (0.95 | )%(6) | | (2.02 | )% | | (1.79 | )% | | (1.47 | )% | | (1.47 | )% | | (1.36 | )% |
After expense reimbursement(7) | | | 0.56 | %(6) | | (0.54 | )% | | (0.57 | )% | | (0.03 | )% | | 0.52 | % | | 1.19 | % |
Portfolio turnover rate(8) | | | 7 | % | | 16 | % | | 14 | % | | 15 | % | | 23 | % | | 135 | % |
| (1) | Information presented relates to a share of capital stock outstanding for each period. |
| (2) | Net investment income per share represents net investment income divided by the average shares outstanding throughout the period. |
| (3) | Amount calculated is less than $0.005. |
| (4) | The total return calculation does not reflect the 5.75% front end sales charge on Advisor Class A shares. |
| (5) | Not annualized. |
| (6) | Annualized. |
| (7) | See Note #3, Investment Adviser, for the waiver and expense reimbursement discussion. |
| (8) | Portfolio turnover of The Global Portfolio. |
The accompanying notes are an integral part of these financial statements.
56
| KINETICS MUTUAL FUNDS, INC. — THE FEEDER FUNDS |
Financial Highlights — (Continued) |
| | | The Global Fund | |
| | | Advisor Class C | |
| | | | For the
Period
Ended
June 30, 2016
(Unaudited) | | | For the
Year
Ended
December 31, 2015 | | | For the
Year
Ended
December 31, 2014 | | | For the
Year
Ended
December 31, 2013 | | | For the
Year
Ended
December 31, 2012 | | | For the
Year
Ended
December 31, 2011 | |
PER SHARE DATA:(1) | | | | | | | | | | | | | | | | | | | |
| Net Asset Value, Beginning of Period | | $ | 4.41 | | $ | 5.16 | | $ | 5.90 | | $ | 4.62 | | $ | 3.87 | | $ | 4.64 | |
| Income from Investment Operations: | | | | | | | | | | | | | | | | | | | |
Net investment income (loss) (2) | | | 0.00 | (3) | | (0.05 | ) | | (0.06 | ) | | (0.03 | ) | | 0.00 | (3) | | 0.03 | |
| Net realized and unrealized gain (loss) on investments | | | 0.29 | | | (0.70 | ) | | (0.68 | ) | | 1.32 | | | 0.85 | | | (0.77 | ) |
| Total from Investment Operations | | | 0.29 | | | (0.75 | ) | | (0.74 | ) | | 1.29 | | | 0.85 | | | (0.74 | ) |
| Redemption Fees | | | — | | | — | | | 0.00 | (3) | | — | | | — | | | — | |
| Less Distributions: | | | | | | | | | | | | | | | | | | | |
| From net investment income | | | — | | | — | | | — | | | (0.01 | ) | | (0.10 | ) | | (0.03 | ) |
| From net realized gains | | | — | | | (0.00 | )(3) | | (0.00 | )(3) | | — | | | — | | | — | |
| Total Distributions | | | — | | | (0.00 | )(3) | | (0.00 | )(3) | | (0.01 | ) | | (0.10 | ) | | (0.03 | ) |
Net Asset Value, End of Period | | $ | 4.70 | | $ | 4.41 | | $ | 5.16 | | $ | 5.90 | | $ | 4.62 | | $ | 3.87 | |
| Total return | | | 6.58 | %(4) | | (14.48 | )% | | (12.53 | )% | | 27.84 | % | | 22.04 | % | | (15.94 | )% |
| | | | | | | | | | | | | | | | | | | | |
| SUPPLEMENTAL DATA AND RATIOS | | | | | | | | | | | | | | | | | | |
| Net assets, end of period (000's) | | $ | 1,794 | | $ | 1,614 | | $ | 1,608 | | $ | 1,523 | | $ | 383 | | $ | 111 | |
| Ratio of operating expenses to average net assets: | | | | | | | | | | | | | | | | | | | |
| Before expense reimbursement | | | 3.65 | %(5) | | 3.62 | % | | 3.36 | % | | 3.58 | % | | 4.13 | % | | 4.69 | % |
After expense reimbursement(6) | | | 2.14 | %(5) | | 2.14 | % | | 2.14 | % | | 2.14 | % | | 2.14 | % | | 2.14 | % |
| Ratio of net investment income (loss)to average net assets: | | | | | | | | | | | | | | | | | | | |
| Before expense reimbursement | | | (1.45 | )%(5) | | (2.52 | )% | | (2.29 | )% | | (1.97 | )% | | (1.97 | )% | | (1.86 | )% |
After expense reimbursement(6) | | | 0.06 | %(5) | | (1.04 | )% | | (1.07 | )% | | (0.53 | )% | | 0.02 | % | | 0.69 | % |
Portfolio turnover rate(7) | | | 7 | % | | 16 | % | | 14 | % | | 15 | % | | 23 | % | | 135 | % |
| (1) | Information presented relates to a share of capital stock outstanding for each period. |
| (2) | Net investment income per share represents net investment income divided by the average shares outstanding throughout the period. |
| (3) | Amount calculated is less than $0.005. |
| (4) | Not annualized. |
| (5) | Annualized. |
| (6) | See Note #3, Investment Adviser, for the waiver and expense reimbursement discussion. |
| (7) | Portfolio turnover of The Global Portfolio. |
The accompanying notes are an integral part of these financial statements.
57
| KINETICS MUTUAL FUNDS, INC. — THE FEEDER FUNDS |
Financial Highlights — (Continued) |
| | | The Paradigm Fund | |
| | | No Load Class | |
| | | | For the
Period
Ended
June 30, 2016
(Unaudited) | | | For the
Year
Ended
December 31, 2015 | | | For the
Year
Ended
December 31, 2014 | | | For the
Year
Ended
December 31, 2013 | | | For the
Year
Ended
December 31, 2012 | | | For the
Year
Ended
December 31, 2011 | |
PER SHARE DATA:(1) | | | | | | | | | | | | | | | | | | | |
| Net Asset Value, Beginning of Period | | $ | 31.24 | | $ | 34.08 | | $ | 34.35 | | $ | 23.99 | | $ | 19.81 | | $ | 23.31 | |
| Income from Investment Operations: | | | | | | | | | | | | | | | | | | | |
Net investment income (loss) (2) | | | (0.15 | ) | | (0.32 | ) | | (0.36 | ) | | (0.15 | ) | | 0.05 | | | 0.02 | |
| Net realized and unrealized gain (loss) on investments | | | 1.56 | | | (2.52 | ) | | 0.09 | | | 10.72 | | | 4.25 | | | (3.34 | ) |
| Total from Investment Operations | | | 1.41 | | | (2.84 | ) | | (0.27 | ) | | 10.57 | | | 4.30 | | | (3.32 | ) |
Redemption Fees(3) | | | 0.00 | | | 0.00 | | | 0.00 | | | 0.00 | | | 0.00 | | | 0.00 | |
| Less Distributions: | | | | | | | | | | | | | | | | | | | |
| From net investment income | | | — | | | — | | | — | | | (0.21 | ) | | (0.12 | ) | | (0.18 | ) |
| Total Distributions | | | — | | | — | | | — | | | (0.21 | ) | | (0.12 | ) | | (0.18 | ) |
Net Asset Value, End of Period | | $ | 32.65 | | $ | 31.24 | | $ | 34.08 | | $ | 34.35 | | $ | 23.99 | | $ | 19.81 | |
| Total return | | | 4.51 | %(4) | | (8.33 | )% | | (0.79 | )% | | 44.07 | % | | 21.78 | % | | (14.27 | )% |
| | | | | | | | | | | | | | | | | | | | |
| SUPPLEMENTAL DATA AND RATIOS | | | | | | | | | | | | | | | | | | |
| Net assets, end of period (000's) | | $ | 264,372 | | $ | 292,014 | | $ | 521,738 | | $ | 597,746 | | $ | 416,696 | | $ | 430,528 | |
| Ratio of operating expenses to average net assets: | | | | | | | | | | | | | | | | | | | |
| Before expense reimbursement | | | 1.76 | %(5) | | 1.71 | % | | 1.68 | % | | 1.72 | % | | 1.78 | % | | 1.78 | % |
After expense reimbursement(6) | | | 1.64 | %(5) | | 1.64 | % | | 1.64 | % | | 1.64 | % | | 1.64 | % | | 1.64 | % |
| Ratio of net investment income(loss) to average net assets: | | | | | | | | | | | | | | | | | | | |
| Before expense reimbursement | | | (1.09 | )%(5) | | (0.99 | )% | | (1.06 | )% | | (0.60 | )% | | 0.08 | % | | (0.03 | )% |
After expense reimbursement(6) | | | (0.97 | )%(5) | | (0.92 | )% | | (1.02 | )% | | (0.52 | )% | | 0.22 | % | | 0.11 | % |
Portfolio turnover rate(7) | | | 0 | % | | 2 | % | | 7 | % | | 4 | % | | 6 | % | | 58 | % |
| (1) | Information presented relates to a share of capital stock outstanding for each period. |
| (2) | Net investment income per share represents net investment income divided by the average shares outstanding throughout the period. |
| (3) | Amount calculated is less than $0.005. |
| (4) | Not annualized. |
| (5) | Annualized. |
| (6) | See Note #3, Investment Adviser, for the waiver and expense reimbursement discussion. |
| (7) | Portfolio turnover of The Paradigm Portfolio. |
The accompanying notes are an integral part of these financial statements.
58
| KINETICS MUTUAL FUNDS, INC. — THE FEEDER FUNDS |
Financial Highlights — (Continued) |
| | | The Paradigm Fund | |
| | | Advisor Class A | |
| | | | For the
Period
Ended
June 30, 2016
(Unaudited) | | | For the
Year
Ended
December 31, 2015 | | | For the
Year
Ended
December 31, 2014 | | | For the
Year
Ended
December 31, 2013 | | | For the
Year
Ended
December 31, 2012 | | | For the
Year
Ended
December 31, 2011 | |
PER SHARE DATA:(1) | | | | | | | | | | | | | | | | | | | |
| Net Asset Value, Beginning of Period | | $ | 30.53 | | $ | 33.39 | | $ | 33.74 | | $ | 23.59 | | $ | 19.45 | | $ | 22.95 | |
| Income from Investment Operations: | | | | | | | | | | | | | | | | | | | |
Net investment loss(2) | | | (0.18 | ) | | (0.39 | ) | | (0.43 | ) | | (0.22 | ) | | (0.01 | ) | | (0.03 | ) |
| Net realized and unrealized gain (loss) on investments | | | 1.52 | | | (2.47 | ) | | 0.08 | | | 10.53 | | | 4.18 | | | (3.29 | ) |
| Total from Investment Operations | | | 1.34 | | | (2.86 | ) | | (0.35 | ) | | 10.31 | | | 4.17 | | | (3.32 | ) |
Redemption Fees(3) | | | 0.00 | | | 0.00 | | | 0.00 | | | 0.00 | | | 0.00 | | | 0.00 | |
| Less Distributions: | | | | | | | | | | | | | | | | | | | |
| From net investment income | | | — | | | — | | | — | | | (0.16 | ) | | (0.03 | ) | | (0.18 | ) |
| Total Distributions | | | — | | | — | | | — | | | (0.16 | ) | | (0.03 | ) | | (0.18 | ) |
Net Asset Value, End of Period | | $ | 31.87 | | $ | 30.53 | | $ | 33.39 | | $ | 33.74 | | $ | 23.59 | | $ | 19.45 | |
Total return(4) | | | 4.39 | %(5) | | (8.57 | )% | | (1.04 | )% | | 43.70 | % | | 21.49 | % | | (14.49 | )% |
| | | | | | | | | | | | | | | | | | | | |
| SUPPLEMENTAL DATA AND RATIOS | | | | | | | | | | | | | | | | | | |
| Net assets, end of period (000's) | | $ | 102,780 | | $ | 129,707 | | $ | 171,958 | | $ | 204,548 | | $ | 135,747 | | $ | 146,939 | |
| Ratio of operating expenses to average net assets: | | | | | | | | | | | | | | | | | | | |
| Before expense reimbursement | | | 2.01 | %(6) | | 1.96 | % | | 1.93 | % | | 1.97 | % | | 2.03 | % | | 2.03 | % |
After expense reimbursement(7) | | | 1.89 | %(6) | | 1.89 | % | | 1.89 | % | | 1.89 | % | | 1.89 | % | | 1.89 | % |
| Ratio of net investment loss to average net assets: | | | | | | | | | | | | | | | | | | | |
| Before expense reimbursement | | | (1.34 | )%(6) | | (1.24 | )% | | (1.31 | )% | | (0.85 | )% | | (0.17 | )% | | (0.28 | )% |
After expense reimbursement(7) | | | (1.22 | )%(6) | | (1.17 | )% | | (1.27 | )% | | (0.77 | )% | | (0.03 | )% | | (0.14 | )% |
Portfolio turnover rate(8) | | | 0 | % | | 2 | % | | 7 | % | | 4 | % | | 6 | % | | 58 | % |
| (1) | Information presented relates to a share of capital stock outstanding for each period. |
| (2) | Net investment income per share represents net investment income divided by the average shares outstanding throughout the period. |
| (3) | Amount calculated is less than $0.005. |
| (4) | The total return calculation does not reflect the 5.75% front end sales charge on Advisor Class A shares. |
| (5) | Not annualized. |
| (6) | Annualized. |
| (7) | See Note #3, Investment Adviser, for the waiver and expense reimbursement discussion. |
| (8) | Portfolio turnover of The Paradigm Portfolio. |
The accompanying notes are an integral part of these financial statements.
59
| KINETICS MUTUAL FUNDS, INC. — THE FEEDER FUNDS |
Financial Highlights — (Continued) |
| | | The Paradigm Fund | |
| | | Advisor Class C | |
| | | | For the
Period
Ended
June 30, 2016
(Unaudited) | | | For the
Year
Ended
December 31, 2015 | | | For the
Year
Ended
December 31, 2014 | | | For the
Year
Ended
December 31, 2013 | | | For the
Year
Ended
December 31, 2012 | | | For the
Year
Ended
December 31, 2011 | |
PER SHARE DATA:(1) | | | | | | | | | | | | | | | | | | | |
| Net Asset Value, Beginning of Period | | $ | 29.01 | | $ | 31.88 | | $ | 32.38 | | $ | 22.66 | | $ | 18.76 | | $ | 22.25 | |
| Income from Investment Operations: | | | | | | | | | | | | | | | | | | | |
Net investment loss(2) | | | (0.24 | ) | | (0.53 | ) | | (0.58 | ) | | (0.35 | ) | | (0.11 | ) | | (0.14 | ) |
| Net realized and unrealized gain (loss) on investments | | | 1.44 | | | (2.34 | ) | | 0.08 | | | 10.10 | | | 4.01 | | | (3.17 | ) |
| Total from Investment Operations | | | 1.20 | | | (2.87 | ) | | (0.50 | ) | | 9.75 | | | 3.90 | | | (3.31 | ) |
Redemption Fees(3) | | | 0.00 | | | 0.00 | | | 0.00 | | | 0.00 | | | 0.00 | | | 0.00 | |
| Less Distributions: | | | | | | | | | | | | | | | | | | | |
| From net investment income | | | — | | | — | | | — | | | (0.03 | ) | | — | | | (0.18 | ) |
| Total Distributions | | | — | | | — | | | — | | | (0.03 | ) | | — | | | (0.18 | ) |
Net Asset Value, End of Period | | $ | 30.21 | | $ | 29.01 | | $ | 31.88 | | $ | 32.38 | | $ | 22.66 | | $ | 18.76 | |
| Total return | | | 4.14 | %(4) | | (9.00 | )% | | (1.54 | )% | | 43.01 | % | | 20.85 | % | | (14.90 | )% |
| | | | | | | | | | | | | | | | | | | | |
| SUPPLEMENTAL DATA AND RATIOS | | | | | | | | | | | | | | | | | | |
| Net assets, end of period (000's) | | $ | 107,899 | | $ | 114,008 | | $ | 135,333 | | $ | 138,355 | | $ | 101,405 | | $ | 102,534 | |
| Ratio of operating expenses to average net assets: | | | | | | | | | | | | | | | | | | | |
| Before expense reimbursement | | | 2.51 | %(5) | | 2.46 | % | | 2.43 | % | | 2.47 | % | | 2.53 | % | | 2.53 | % |
After expense reimbursement(6) | | | 2.39 | %(5) | | 2.39 | % | | 2.39 | % | | 2.39 | % | | 2.39 | % | | 2.39 | % |
| Ratio of net investment loss to average net assets: | | | | | | | | | | | | | | | | | | | |
| Before expense reimbursement | | | (1.84 | )%(5) | | (1.74 | )% | | (1.81 | )% | | (1.35 | )% | | (0.67 | )% | | (0.78 | )% |
After expense reimbursement(6) | | | (1.72 | )%(5) | | (1.67 | )% | | (1.77 | )% | | (1.27 | )% | | (0.53 | )% | | (0.64 | )% |
Portfolio turnover rate(7) | | | 0 | % | | 2 | % | | 7 | % | | 4 | % | | 6 | % | | 58 | % |
| (1) | Information presented relates to a share of capital stock outstanding for each period. |
| (2) | Net investment income per share represents net investment income divided by the average shares outstanding throughout the period. |
| (3) | Amount calculated is less than $0.005. |
| (4) | Not annualized. |
| (5) | Annualized. |
| (6) | See Note #3, Investment Adviser, for the waiver and expense reimbursement discussion. |
| (7) | Portfolio turnover of The Paradigm Portfolio. |
The accompanying notes are an integral part of these financial statements.
60
| KINETICS MUTUAL FUNDS, INC. — THE FEEDER FUNDS |
Financial Highlights — (Continued) |
| | | The Paradigm Fund | |
| | | Institutional Class | |
| | | | For the
Period
Ended
June 30, 2016
(Unaudited) | | | For the
Year Ended
December 31, 2015 | | | For the
Year
Ended
December 31, 2014 | | | For the
Year
Ended
December 31, 2013 | | | For the
Year
Ended
December 31, 2012 | | | For the
Year
Ended
December 31, 2011 | |
PER SHARE DATA:(1) | | | | | | | | | | | | | | | | | | | |
| Net Asset Value, Beginning of Period | | $ | 31.30 | | $ | 34.08 | | $ | 34.28 | | $ | 23.93 | | $ | 19.79 | | $ | 23.25 | |
| Income from Investment Operations: | | | | | | | | | | | | | | | | | | | |
Net investment income (loss) (2) | | | (0.12 | ) | | (0.25 | ) | | (0.29 | ) | | (0.09 | ) | | 0.10 | | | 0.07 | �� |
| Net realized and unrealized gain (loss) on investments | | | 1.58 | | | (2.53 | ) | | 0.09 | | | 10.70 | | | 4.24 | | | (3.35 | ) |
| Total from Investment Operations | | | 1.46 | | | (2.78 | ) | | (0.20 | ) | | 10.61 | | | 4.34 | | | (3.28 | ) |
Redemption Fees(3) | | | 0.00 | | | 0.00 | | | 0.00 | | | 0.00 | | | 0.00 | | | 0.00 | |
| Less Distributions: | | | | | | | | | | | | | | | | | | | |
| From net investment income | | | — | | | — | | | — | | | (0.26 | ) | | (0.20 | ) | | (0.18 | ) |
| Total Distributions | | | — | | | — | | | — | | | (0.26 | ) | | (0.20 | ) | | (0.18 | ) |
Net Asset Value, End of Period | | $ | 32.76 | | $ | 31.30 | | $ | 34.08 | | $ | 34.28 | | $ | 23.93 | | $ | 19.79 | |
| Total return | | | 4.66 | %(4) | | (8.16 | )% | | (0.61 | )% | | 44.40 | % | | 21.99 | % | | (14.13 | )% |
| | | | | | | | | | | | | | | | | | | | |
| SUPPLEMENTAL DATA AND RATIOS | | | | | | | | | | | | | | | | | | |
| Net assets, end of period (000's) | | $ | 262,702 | | $ | 302,130 | | $ | 346,273 | | $ | 333,682 | | $ | 192,478 | | $ | 134,309 | |
| Ratio of operating expenses to average net assets: | | | | | | | | | | | | | | | | | | | |
| Before expense reimbursement | | | 1.71 | %(5) | | 1.66 | % | | 1.63 | % | | 1.67 | % | | 1.73 | % | | 1.73 | % |
After expense reimbursement(6) | | | 1.44 | %(5) | | 1.44 | % | | 1.44 | % | | 1.44 | % | | 1.44 | % | | 1.44 | % |
| Ratio of net investment income (loss)to average net assets: | | | | | | | | | | | | | | | | | | | |
| Before expense reimbursement | | | (1.04 | )%(5) | | (0.94 | )% | | (1.01 | )% | | (0.55 | )% | | 0.13 | % | | 0.02 | % |
After expense reimbursement(6) | | | (0.77 | )%(5) | | (0.72 | )% | | (0.82 | )% | | (0.32 | )% | | 0.42 | % | | 0.31 | % |
Portfolio turnover rate(7) | | | 0 | % | | 2 | % | | 7 | % | | 4 | % | | 6 | % | | 58 | % |
| (1) | Information presented relates to a share of capital stock outstanding for each period. |
| (2) | Net investment income per share represents net investment income divided by the average shares outstanding throughout the period. |
| (3) | Amount calculated is less than $0.005. |
| (4) | Not annualized. |
| (5) | Annualized. |
| (6) | See Note #3, Investment Adviser, for the waiver and expense reimbursement discussion. |
| (7) | Portfolio turnover of The Paradigm Portfolio. |
The accompanying notes are an integral part of these financial statements.
61
| KINETICS MUTUAL FUNDS, INC. — THE FEEDER FUNDS |
Financial Highlights — (Continued) |
| | | The Medical Fund | |
| | | No Load Class | |
| | | | For the
Period
Ended
June 30, 2016
(Unaudited) | | | For the
Year
Ended
December 31, 2015 | | | For the
Year
Ended
December 31, 2014 | | | For the
Year
Ended
December 31, 2013 | | | For the
Year
Ended
December 31, 2012 | | | For the
Year
Ended
December 31, 2011 | |
PER SHARE DATA:(1) | | | | | | | | | | | | | | | | | | | |
| Net Asset Value, Beginning of Period | | $ | 30.62 | | $ | 30.67 | | $ | 26.38 | | $ | 17.82 | | $ | 18.75 | | $ | 19.48 | |
| Income from Investment Operations: | | | | | | | | | | | | | | | | | | | |
Net investment income (2) | | | 0.18 | | | 0.08 | | | 0.13 | | | 0.00 | (3) | | 0.33 | | | 0.18 | |
| Net realized and unrealized gain (loss) on investments | | | (2.73 | ) | | 1.96 | | | 4.21 | | | 8.77 | | | 1.32 | | | 0.82 | |
| Total from Investment Operations | | | (2.55 | ) | | 2.04 | | | 4.34 | | | 8.77 | | | 1.65 | | | 1.00 | |
Redemption Fees(3) | | | 0.00 | | | 0.00 | | | 0.00 | | | 0.00 | | | 0.00 | | | 0.00 | |
| Less Distributions: | | | | | | | | | | | | | | | | | | | |
| From net investment income | | | — | | | (0.12 | ) | | — | | | (0.06 | ) | | (0.36 | ) | | (0.25 | ) |
| From net realized gains | | | — | | | (1.97 | ) | | (0.05 | ) | | (0.15 | ) | | (2.22 | ) | | (1.48 | ) |
| Total Distributions | | | — | | | (2.09 | ) | | (0.05 | ) | | (0.21 | ) | | (2.58 | ) | | (1.73 | ) |
Net Asset Value, End of Period | | $ | 28.07 | | $ | 30.62 | | $ | 30.67 | | $ | 26.38 | | $ | 17.82 | | $ | 18.75 | |
| Total return | | | (8.33 | )%(4) | | 6.59 | % | | 16.44 | % | | 49.25 | % | | 8.86 | % | | 5.11 | % |
| | | | | | | | | | | | | | | | | | | | |
| SUPPLEMENTAL DATA AND RATIOS | | | | | | | | | | | | | | | | | | |
| Net assets, end of period (000's) | | $ | 19,522 | | $ | 22,257 | | $ | 21,876 | | $ | 20,489 | | $ | 14,254 | | $ | 16,376 | |
| Ratio of operating expenses to average net assets: | | | | | | | | | | | | | | | | | | | |
| Before expense reimbursement | | | 2.04 | %(5) | | 1.99 | % | | 2.02 | % | | 2.09 | % | | 2.22 | % | | 2.02 | % |
After expense reimbursement(6) | | | 1.39 | %(5) | | 1.39 | % | | 1.39 | % | | 1.39 | % | | 1.39 | % | | 1.39 | % |
| Ratio of net investment income (loss)to average net assets: | | | | | | | | | | | | | | | | | | | |
| Before expense reimbursement | | | 0.69 | %(5) | | (0.35 | )% | | (0.17 | )% | | (0.70 | )% | | 0.83 | % | | 0.24 | % |
After expense reimbursement(6) | | | 1.34 | %(5) | | 0.25 | % | | 0.46 | % | | 0.00 | % | | 1.66 | % | | 0.87 | % |
Portfolio turnover rate(7) | | | 0 | % | | 12 | % | | 3 | % | | 12 | % | | 0 | % | | 5 | % |
| (1) | Information presented relates to a share of capital stock outstanding for each period. |
| (2) | Net investment income per share represents net investment income divided by the average shares outstanding throughout the period. |
| (3) | Amount calculated is less than $0.005. |
| (4) | Not annualized. |
| (5) | Annualized. |
| (6) | See Note #3, Investment Adviser, for the waiver and expense reimbursement discussion. |
| (7) | Portfolio turnover of The Medical Portfolio. |
The accompanying notes are an integral part of these financial statements.
62
| KINETICS MUTUAL FUNDS, INC. — THE FEEDER FUNDS |
Financial Highlights — (Continued) |
| | | The Medical Fund | |
| | | Advisor Class A | |
| | | | For the
Period
Ended
June 30, 2016
(Unaudited) | | | For the
Year
Ended
December 31, 2015 | | | For the
Year
Ended
December 31, 2014 | | | For the
Year
Ended
December 31, 2013 | | | For the
Year
Ended
December 31, 2012 | | | For the
Year
Ended
December 31, 2011 | |
PER SHARE DATA:(1) | | | | | | | | | | | | | | | | | | | |
| Net Asset Value, Beginning of Period | | $ | 29.57 | | $ | 29.71 | | $ | 25.62 | | $ | 17.33 | | $ | 18.29 | | $ | 19.06 | |
| Income from Investment Operations: | | | | | | | | | | | | | | | | | | | |
Net investment income (loss) (2) | | | 0.14 | | | 0.00 | (3) | | 0.06 | | | (0.06 | ) | | 0.27 | | | 0.12 | |
| Net realized and unrealized gain (loss) on investments | | | (2.64 | ) | | 1.90 | | | 4.08 | | | 8.52 | | | 1.29 | | | 0.80 | |
| Total from Investment Operations | | | (2.50 | ) | | 1.90 | | | 4.14 | | | 8.46 | | | 1.56 | | | 0.92 | |
| Redemption Fees | | | 0.00 | (3) | | 0.00 | (3) | | 0.00 | (3) | | 0.01 | | | 0.00 | (3) | | 0.00 | (3) |
| Less Distributions: | | | | | | | | | | | | | | | | | | | |
| From net investment income | | | — | | | (0.07 | ) | | — | | | (0.03 | ) | | (0.30 | ) | | (0.21 | ) |
| From net realized gains | | | — | | | (1.97 | ) | | (0.05 | ) | | (0.15 | ) | | (2.22 | ) | | (1.48 | ) |
| Total Distributions | | | — | | | (2.04 | ) | | (0.05 | ) | | (0.18 | ) | | (2.52 | ) | | (1.69 | ) |
Net Asset Value, End of Period | | $ | 27.07 | | $ | 29.57 | | $ | 29.71 | | $ | 25.62 | | $ | 17.33 | | $ | 18.29 | |
Total return(4) | | | (8.45 | )%(5) | | 6.34 | % | | 16.15 | % | | 48.90 | % | | 8.60 | % | | 4.79 | % |
| | | | | | | | | | | | | | | | | | | |
| SUPPLEMENTAL DATA AND RATIOS | | | | | | | | | | | | | | | | | | |
| Net assets, end of period (000's) | | $ | 4,381 | | $ | 6,241 | | $ | 4,578 | | $ | 3,746 | | $ | 2,583 | | $ | 3,240 | |
| Ratio of operating expenses to average net assets: | | | | | | | | | | | | | | | | | | | |
| Before expense reimbursement | | | 2.29 | %(6) | | 2.24 | % | | 2.27 | % | | 2.34 | % | | 2.47 | % | | 2.27 | % |
After expense reimbursement(7) | | | 1.64 | %(6) | | 1.64 | % | | 1.64 | % | | 1.64 | % | | 1.64 | % | | 1.64 | % |
| Ratio of net investment income (loss) to average net assets: | | | | | | | | | | | | | | | | | | | |
| Before expense reimbursement | | | 0.44 | %(6) | | (0.60 | )% | | (0.42 | )% | | (0.95 | )% | | 0.58 | % | | (0.01 | )% |
After expense reimbursement(7) | | | 1.09 | %(6) | | 0.00 | % | | 0.21 | % | | (0.25 | )% | | 1.41 | % | | 0.62 | % |
Portfolio turnover rate(8) | | | 0 | % | | 12 | % | | 3 | % | | 12 | % | | 0 | % | | 5 | % |
| (1) | Information presented relates to a share of capital stock outstanding for each period. |
| (2) | Net investment income per share represents net investment income divided by the average shares outstanding throughout the period. |
| (3) | Amount calculated is less than $0.005. |
| (4) | The total return calculation does not reflect the 5.75% front end sales charge on Advisor Class A shares. |
| (5) | Not annualized. |
| (6) | Annualized. |
| (7) | See Note #3, Investment Adviser, for the waiver and expense reimbursement discussion. |
| (8) | Portfolio turnover of The Medical Portfolio. |
The accompanying notes are an integral part of these financial statements.
63
| KINETICS MUTUAL FUNDS, INC. — THE FEEDER FUNDS |
Financial Highlights — (Continued) |
| | | The Medical Fund | |
| | | Advisor Class C | |
| | | | For the
Period
Ended
June 30, 2016
(Unaudited) | | | For the
Year
Ended
December 31, 2015 | | | For the
Year
Ended
December 31, 2014 | | | For the
Year
Ended
December 31, 2013 | | | For the
Year
Ended
December 31, 2012 | | | For the
Year
Ended
December 31, 2011 | |
PER SHARE DATA:(1) | | | | | | | | | | | | | | | | | | | |
| Net Asset Value, Beginning of Period | | $ | 28.82 | | $ | 29.15 | | $ | 25.27 | | $ | 17.19 | | $ | 18.15 | | $ | 18.90 | |
| Income from Investment Operations: | | | | | | | | | | | | | | | | | | | |
Net investment income (loss) (2) | | | 0.08 | | | (0.16 | ) | | (0.08 | ) | | (0.16 | ) | | 0.17 | | | 0.02 | |
| Net realized and unrealized gain (loss) on investments | | | (2.58 | ) | | 1.87 | | | 4.01 | | | 8.42 | | | 1.29 | | | 0.80 | |
| Total from Investment Operations | | | (2.50 | ) | | 1.71 | | | 3.93 | | | 8.26 | | | 1.46 | | | 0.82 | |
| Redemption Fees | | | — | | | — | | | — | | | — | | | — | | | 0.00 | (3) |
| Less Distributions: | | | | | | | | | | | | | | | | | | | |
| From net investment income | | | — | | | (0.07 | ) | | — | | | (0.03 | ) | | (0.20 | ) | | (0.09 | ) |
| From net realized gains | | | — | | | (1.97 | ) | | (0.05 | ) | | (0.15 | ) | | (2.22 | ) | | (1.48 | ) |
| Total Distributions | | | — | | | (2.04 | ) | | (0.05 | ) | | (0.18 | ) | | (2.42 | ) | | (1.57 | ) |
Net Asset Value, End of Period | | $ | 26.32 | | $ | 28.82 | | $ | 29.15 | | $ | 25.27 | | $ | 17.19 | | $ | 18.15 | |
| Total return | | | (8.67 | )%(4) | | 5.81 | % | | 15.54 | % | | 48.08 | % | | 8.08 | % | | 4.32 | % |
| | | | | | | | | | | | | | | | | | | |
| SUPPLEMENTAL DATA AND RATIOS | | | | | | | | | | | | | | | | | | |
| Net assets, end of period (000's) | | $ | 499 | | $ | 608 | | $ | 631 | | $ | 531 | | $ | 450 | | $ | 580 | |
| Ratio of operating expenses to average net assets: | | | | | | | | | | | | | | | | | | | |
| Before expense reimbursement | | | 2.79 | %(5) | | 2.74 | % | | 2.77 | % | | 2.84 | % | | 2.97 | % | | 2.77 | % |
After expense reimbursement(6) | | | 2.14 | %(5) | | 2.14 | % | | 2.14 | % | | 2.14 | % | | 2.14 | % | | 2.14 | % |
| Ratio of net investment income (loss)to average net assets: | | | | | | | | | | | | | | | | | | | |
| Before expense reimbursement | | | (0.06 | )%(5) | | (1.10 | )% | | (0.92 | )% | | (1.45 | )% | | 0.08 | % | | (0.51 | )% |
After expense reimbursement(6) | | | 0.59 | %(5) | | (0.50 | )% | | (0.29 | )% | | (0.75 | )% | | 0.91 | % | | 0.12 | % |
Portfolio turnover rate(7) | | | 0 | % | | 12 | % | | 3 | % | | 12 | % | | 0 | % | | 5 | % |
| (1) | Information presented relates to a share of capital stock outstanding for each period. |
| (2) | Net investment income per share represents net investment income divided by the average shares outstanding throughout the period. |
| (3) | Amount calculated is less than $0.005. |
| (4) | Not annualized. |
| (5) | Annualized. |
| (6) | See Note #3, Investment Adviser, for the waiver and expense reimbursement discussion. |
| (7) | Portfolio turnover of The Medical Portfolio. |
The accompanying notes are an integral part of these financial statements.
64
| KINETICS MUTUAL FUNDS, INC. — THE FEEDER FUNDS |
Financial Highlights — (Continued) |
| | | The Small Cap Opportunities Fund | |
| | | No Load Class | |
| | | | For the
Period
Ended
June 30, 2016
(Unaudited) | | | For the
Year
Ended
December 31, 2015 | | | For the
Year
Ended
December 31, 2014 | | | For the
Year
Ended
December 31, 2013 | | | For the
Year
Ended
December 31, 2012 | | | For the
Year
Ended
December 31, 2011 | |
PER SHARE DATA:(1) | | | | | | | | | | | | | | | | | | | |
| Net Asset Value, Beginning of Period | | $ | 32.64 | | $ | 37.21 | | $ | 40.12 | | $ | 25.17 | | $ | 19.85 | | $ | 23.32 | |
| Income from Investment Operations: | | | | | | | | | | | | | | | | | | | |
Net investment income (loss) (2) | | | (0.15 | ) | | (0.35 | ) | | (0.36 | ) | | (0.10 | ) | | 0.01 | | | (0.04 | ) |
| Net realized and unrealized gain (loss) on investments | | | 2.23 | | | (4.22 | ) | | (2.56 | ) | | 15.05 | | | 5.31 | | | (3.15 | ) |
| Total from Investment Operations | | | 2.08 | | | (4.57 | ) | | (2.92 | ) | | 14.95 | | | 5.32 | | | (3.19 | ) |
| Redemption Fees | | | 0.00 | (3) | | 0.00 | (3) | | 0.01 | | | 0.00 | (3) | | 0.00 | (3) | | 0.00 | (3) |
| Less Distributions: | | | | | | | | | | | | | | | | | | | |
| From net investment income | | | — | | | — | | | — | | | — | | | — | | | (0.28 | ) |
| Total Distributions | | | — | | | — | | | — | | | — | | | — | | | (0.28 | ) |
Net Asset Value, End of Period | | $ | 34.72 | | $ | 32.64 | | $ | 37.21 | | $ | 40.12 | | $ | 25.17 | | $ | 19.85 | |
| Total return | | | 6.37 | %(4) | | (12.26 | )% | | (7.28 | )% | | 59.40 | % | | 26.74 | % | | (13.65 | )% |
| | | | | | | | | | | | | | | | | | | | |
| SUPPLEMENTAL DATA AND RATIOS | | | | | | | | | | | | | | | | | | |
| Net assets, end of period (000's) | | $ | 127,874 | | $ | 145,032 | | $ | 251,110 | | $ | 277,816 | | $ | 63,947 | | $ | 67,798 | |
| Ratio of operating expenses to average net assets: | | | | | | | | | | | | | | | | | | | |
| Before expense reimbursement | | | 1.76 | %(5) | | 1.73 | % | | 1.71 | % | | 1.73 | % | | 1.96 | % | | 1.90 | % |
After expense reimbursement(6) | | | 1.64 | %(5) | | 1.64 | % | | 1.64 | % | | 1.64 | % | | 1.64 | % | | 1.64 | % |
| Ratio of net investment income (loss) to average net assets: | | | | | | | | | | | | | | | | | | | |
| Before expense reimbursement | | | (1.06 | )%(5) | | (1.03 | )% | | (0.96 | )% | | (0.38 | )% | | (0.25 | )% | | (0.44 | )% |
After expense reimbursement(6) | | | (0.94 | )%(5) | | (0.94 | )% | | (0.89 | )% | | (0.29 | )% | | 0.07 | % | | (0.18 | )% |
Portfolio turnover rate(7) | | | 1 | % | | 2 | % | | 19 | % | | 6 | % | | 22 | % | | 47 | % |
| (1) | Information presented relates to a share of capital stock outstanding for each period. |
| (2) | Net investment income per share represents net investment income divided by the average shares outstanding throughout the period. |
| (3) | Amount calculated is less than $0.005. |
| (4) | Not annualized. |
| (5) | Annualized. |
| (6) | See Note #3, Investment Adviser, for the waiver and expense reimbursement discussion. |
| (7) | Portfolio turnover of The Small Cap Opportunities Portfolio. |
The accompanying notes are an integral part of these financial statements.
65
| KINETICS MUTUAL FUNDS, INC. — THE FEEDER FUNDS |
Financial Highlights — (Continued) |
| | | The Small Cap Opportunities Fund | |
| | | Advisor Class A | |
| | | | For the
Period
Ended
June 30, 2016
(Unaudited) | | | For the
Year
Ended
December 31, 2015 | | | For the
Year
Ended
December 31, 2014 | | | For the
Year
Ended
December 31, 2013 | | | For the
Year
Ended
December 31, 2012 | | | For the
Year
Ended
December 31, 2011 | |
PER SHARE DATA:(1) | | | | | | | | | | | | | | | | | | | |
| Net Asset Value, Beginning of Period | | $ | 31.88 | | $ | 36.43 | | $ | 39.39 | | $ | 24.77 | | $ | 19.59 | | $ | 22.98 | |
| Income from Investment Operations: | | | | | | | | | | | | | | | | | | | |
Net investment loss(2) | | | (0.19 | ) | | (0.43 | ) | | (0.45 | ) | | (0.18 | ) | | (0.04 | ) | | (0.10 | ) |
| Net realized and unrealized gain (loss) on investments | | | 2.18 | | | (4.12 | ) | | (2.51 | ) | | 14.79 | | | 5.22 | | | (3.08 | ) |
| Total from Investment Operations | | | 1.99 | | | (4.55 | ) | | (2.96 | ) | | 14.61 | | | 5.18 | | | (3.18 | ) |
| Redemption Fees | | | 0.00 | (3) | | 0.00 | (3) | | 0.00 | (3) | | 0.01 | | | 0.00 | (3) | | 0.00 | (3) |
| Less Distributions: | | | | | | | | | | | | | | | | | | | |
| From net investment income | | | — | | | — | | | — | | | — | | | — | | | (0.21 | ) |
| Total Distributions | | | — | | | — | | | — | | | — | | | — | | | (0.21 | ) |
Net Asset Value, End of Period | | $ | 33.87 | | $ | 31.88 | | $ | 36.43 | | $ | 39.39 | | $ | 24.77 | | $ | 19.59 | |
Total return(4) | | | 6.24 | %(5) | | (12.47 | )% | | (7.54 | )% | | 59.02 | % | | 26.44 | % | | (13.85 | )% |
| | | | | | | | | | | | | | | | | | | | |
| SUPPLEMENTAL DATA AND RATIOS | | | | | | | | | | | | | | | | | | |
| Net assets, end of period (000's) | | $ | 12,611 | | $ | 14,857 | | $ | 25,591 | | $ | 21,871 | | $ | 7,558 | | $ | 7,250 | |
| Ratio of operating expenses to average net assets: | | | | | | | | | | | | | | | | | | | |
| Before expense reimbursement | | | 2.01 | %(6) | | 1.98 | % | | 1.96 | % | | 1.98 | % | | 2.21 | % | | 2.15 | % |
After expense reimbursement(7) | | | 1.89 | %(6) | | 1.89 | % | | 1.89 | % | | 1.89 | % | | 1.89 | % | | 1.89 | % |
| Ratio of net investment loss to average net assets: | | | | | | | | | | | | | | | | | | | |
| Before expense reimbursement | | | (1.31 | )%(6) | | (1.28 | )% | | (1.21 | )% | | (0.63 | )% | | (0.50 | )% | | (0.69 | )% |
After expense reimbursement(7) | | | (1.19 | )%(6) | | (1.19 | )% | | (1.14 | )% | | (0.54 | )% | | (0.18 | )% | | (0.43 | )% |
Portfolio turnover rate(8) | | | 1 | % | | 2 | % | | 19 | % | | 6 | % | | 22 | % | | 47 | % |
| (1) | Information presented relates to a share of capital stock outstanding for each period. |
| (2) | Net investment income per share represents net investment income divided by the average shares outstanding throughout the period. |
| (3) | Amount calculated is less than $0.005. |
| (4) | The total return calculation does not reflect the 5.75% front end sales charge on Advisor Class A shares. |
| (5) | Not annualized. |
| (6) | Annualized. |
| (7) | See Note #3, Investment Adviser, for the waiver and expense reimbursement discussion. |
| (8) | Portfolio turnover of The Small Cap Opportunities Portfolio. |
The accompanying notes are an integral part of these financial statements.
66
| KINETICS MUTUAL FUNDS, INC. — THE FEEDER FUNDS |
Financial Highlights — (Continued) |
| | | The Small Cap Opportunities Fund | |
| | | Advisor Class C | |
| | | | For the | | | | | | | | | | | | | | | | |
| | | | Period | | | For the | | | For the | | | For the | | | For the | | | For the | |
| | | | Ended | | | Year Ended | | | Year Ended | | | Year Ended | | | Year Ended | | | Year Ended | |
| | | | June 30, 2016 | | | December 31, | | | December 31, | | | December 31, | | | December 31, | | | December 31, | |
| | | | (Unaudited) | | | 2015 | | | 2014 | | | 2013 | | | 2012 | | | 2011 | |
PER SHARE DATA:(1) | | | | | | | | | | | | | | | | | | | |
| Net Asset Value, Beginning of Period | | $ | 30.88 | | $ | 35.47 | | $ | 38.53 | | $ | 24.35 | | $ | 19.36 | | $ | 22.68 | |
| Income from Investment Operations: | | | | | | | | | | | | | | | | | | | |
Net investment loss(2) | | | (0.26 | ) | | (0.59 | ) | | (0.63 | ) | | (0.34 | ) | | (0.15 | ) | | (0.20 | ) |
| Net realized and unrealized gain (loss) on investments | | | 2.11 | | | (4.00 | ) | | (2.44 | ) | | 14.51 | | | 5.14 | | | (3.04 | ) |
| Total from Investment Operations | | | 1.85 | | | (4.59 | ) | | (3.07 | ) | | 14.17 | | | 4.99 | | | (3.24 | ) |
| Redemption Fees | | | 0.00 | (3) | | — | | | 0.01 | | | 0.01 | | | — | | | — | |
| Less Distributions: | | | | | | | | | | | | | | | | | | | |
| From net investment income | | | — | | | — | | | — | | | — | | | — | | | (0.08 | ) |
| Total Distributions | | | — | | | — | | | — | | | — | | | — | | | (0.08 | ) |
Net Asset Value, End of Period | | $ | 32.73 | | $ | 30.88 | | $ | 35.47 | | $ | 38.53 | | $ | 24.35 | | $ | 19.36 | |
| Total return | | | 5.99 | %(4) | | (12.92 | )% | | (7.97 | )% | | 58.23 | % | | 25.77 | % | | (14.29 | )% |
| | | | | | | | | | | | | | | | | | | | |
| SUPPLEMENTAL DATA AND RATIOS | | | | | | | | | | | | | | | | | | |
| Net assets, end of period (000's) | | $ | 7,897 | | $ | 8,840 | | $ | 12,928 | | $ | 7,178 | | $ | 2,536 | | $ | 2,440 | |
| Ratio of operating expenses to average net assets: | | | | | | | | | | | | | | | | | | | |
| Before expense reimbursement | | | 2.51 | %(5) | | 2.48 | % | | 2.46 | % | | 2.48 | % | | 2.71 | % | | 2.65 | % |
After expense reimbursement(6) | | | 2.39 | %(5) | | 2.39 | % | | 2.39 | % | | 2.39 | % | | 2.39 | % | | 2.39 | % |
| Ratio of net investment loss to average net assets: | | | | | | | | | | | | | | | | | | | |
| Before expense reimbursement | | | (1.81 | )%(5) | | (1.78 | )% | | (1.71 | )% | | (1.13 | )% | | (1.00 | )% | | (1.19 | )% |
After expense reimbursement(6) | | | (1.69 | )%(5) | | (1.69 | )% | | (1.64 | )% | | (1.04 | )% | | (0.68 | )% | | (0.93 | )% |
Portfolio turnover rate(7) | | | 1 | % | | 2 | % | | 19 | % | | 6 | % | | 22 | % | | 47 | % |
| (1) | Information presented relates to a share of capital stock outstanding for each period. |
| (2) | Net investment income per share represents net investment income divided by the average shares outstanding throughout the period. |
| (3) | Amount calculated is less than $0.005. |
| (4) | Not annualized. |
| (5) | Annualized. |
| (6) | See Note #3, Investment Adviser, for the waiver and expense reimbursement discussion. |
| (7) | Portfolio turnover of The Small Cap Opportunities Portfolio. |
The accompanying notes are an integral part of these financial statements.
67
| KINETICS MUTUAL FUNDS, INC. — THE FEEDER FUNDS |
Financial Highlights — (Continued) |
| | | The Small Cap Opportunities Fund | |
| | | Institutional Class | |
| | | | For the | | | | | | | | | | | | | | | | |
| | | | Period | | | For the | | | For the | | | For the | | | For the | | | For the | |
| | | | Ended | | | Year Ended | | | Year Ended | | | Year Ended | | | Year Ended | | | Year Ended | |
| | | | June 30, 2016 | | | December 31, | | | December 31, | | | December 31, | | | December 31, | | | December 31, | |
| | | | (Unaudited) | | | 2015 | | | 2014 | | | 2013 | | | 2012 | | | 2011 | |
PER SHARE DATA:(1) | | | | | | | | | | | | | | | | | | | |
| Net Asset Value, Beginning of Period | | $ | 33.03 | | $ | 37.57 | | $ | 40.44 | | $ | 25.32 | | $ | 19.93 | | $ | 23.45 | |
| Income from Investment Operations: | | | | | | | | | | | | | | | | | | | |
Net investment income (loss) (2) | | | (0.12 | ) | | (0.28 | ) | | (0.28 | ) | | (0.03 | ) | | 0.06 | | | 0.00 | (3) |
| Net realized and unrealized gain (loss) on investments | | | 2.26 | | | (4.26 | ) | | (2.59 | ) | | 15.15 | | | 5.33 | | | (3.17 | ) |
| Total from Investment Operations | | | 2.14 | | | (4.54 | ) | | (2.87 | ) | | 15.12 | | | 5.39 | | | (3.17 | ) |
| Redemption Fees | | | 0.00 | (3) | | 0.00 | (3) | | 0.00 | (3) | | — | | | 0.00 | (3) | | 0.00 | (3) |
| Less Distributions: | | | | | | | | | | | | | | | | | | | |
| From net investment income | | | — | | | — | | | — | | | — | | | — | | | (0.35 | ) |
| Total Distributions | | | — | | | — | | | — | | | — | | | — | | | (0.35 | ) |
Net Asset Value, End of Period | | $ | 35.17 | | $ | 33.03 | | $ | 37.57 | | $ | 40.44 | | $ | 25.32 | | $ | 19.93 | |
| Total return | | | 6.48 | %(4) | | (12.06 | )% | | (7.12 | )% | | 59.72 | % | | 27.04 | % | | (13.51 | )% |
| | | | | | | | | | | | | | | | | | | | |
| SUPPLEMENTAL DATA AND RATIOS | | | | | | | | | | | | | | | | | | |
| Net assets, end of period (000's) | | $ | 50,134 | | $ | 51,258 | | $ | 63,392 | | $ | 41,032 | | $ | 7,482 | | $ | 5,498 | |
| Ratio of operating expenses to average net assets: | | | | | | | | | | | | | | | | | | | |
| Before expense reimbursement | | | 1.71 | %(5) | | 1.68 | % | | 1.66 | % | | 1.68 | % | | 1.91 | % | | 1.85 | % |
After expense reimbursement(6) | | | 1.44 | %(5) | | 1.44 | % | | 1.44 | % | | 1.44 | % | | 1.44 | % | | 1.44 | % |
| Ratio of net investment income (loss) to average net assets: | | | | | | | | | | | | | | | | | | | |
| Before expense reimbursement | | | (1.01 | )%(5) | | (0.98 | )% | | (0.91 | )% | | (0.33 | )% | | (0.20 | )% | | (0.39 | )% |
After expense reimbursement(6) | | | (0.74 | )%(5) | | (0.74 | )% | | (0.69 | )% | | (0.09 | )% | | 0.27 | % | | 0.02 | % |
Portfolio turnover rate(7) | | | 1 | % | | 2 | % | | 19 | % | | 6 | % | | 22 | % | | 47 | % |
| (1) | Information presented relates to a share of capital stock outstanding for each period. |
| (2) | Net investment income per share represents net investment income divided by the average shares outstanding throughout the period. |
| (3) | Amount calculated is less than $0.005. |
| (4) | Not annualized. |
| (5) | Annualized. |
| (6) | See Note #3, Investment Adviser, for the waiver and expense reimbursement discussion. |
| (7) | Portfolio turnover of The Small Cap Opportunities Portfolio. |
The accompanying notes are an integral part of these financial statements.
68
| KINETICS MUTUAL FUNDS, INC. — THE FEEDER FUNDS |
Financial Highlights — (Continued) |
| | | | The Market Opportunities Fund | |
| | | No Load Class | |
| | | | For the | | | | | | | | | | | | | | | | |
| | | | Period | | | For the | | | For the | | | For the | | | For the | | | For the | |
| | | | Ended | | | Year Ended | | | Year Ended | | | Year Ended | | | Year Ended | | | Year Ended | |
| | | June 30, 2016 | | | December 31, | | | December 31, | | | December 31, | | | December 31, | | | December 31, | |
| | | | (Unaudited) | | | 2015 | | | 2014 | | | 2013 | | | 2012 | | | 2011 | |
PER SHARE DATA:(1) | | | | | | | | | | | | | | | | | | | |
| Net Asset Value, Beginning of Period | | $ | 15.16 | | $ | 16.68 | | $ | 17.66 | | $ | 12.08 | | $ | 10.45 | | $ | 11.46 | |
| Income from Investment Operations: | | | | | | | | | | | | | | | | | | | |
Net investment income (loss) (2) | | | (0.08 | ) | | (0.15 | ) | | (0.10 | ) | | 0.00(3 | ) | | 0.03 | | | 0.01 | |
| Net realized and unrealized gain (loss) on investments | | | 0.84 | | | (1.37 | ) | | (0.88 | ) | | 5.65 | | | 1.80 | | | (0.91 | ) |
| Total from Investment Operations | | | 0.76 | | | (1.52 | ) | | (0.98 | ) | | 5.65 | | | 1.83 | | | (0.90 | ) |
| Redemption Fees | | | — | | | — | | | 0.00 | (3) | | 0.00 | (3) | | 0.00 | (3) | | 0.00 | (3) |
| Less Distributions: | | | | | | | | | | | | | | | | | | | |
| From net investment income | | | — | | | — | | | — | | | (0.07 | ) | | (0.20 | ) | | (0.11 | ) |
| Total Distributions | | | — | | | — | | | — | | | (0.07 | ) | | (0.20 | ) | | (0.11 | ) |
Net Asset Value, End of Period | | $ | 15.92 | | $ | 15.16 | | $ | 16.68 | | $ | 17.66 | | $ | 12.08 | | $ | 10.45 | |
| Total return | | | 5.01 | %(4) | | (9.11 | )% | | (5.55 | )% | | 46.74 | % | | 17.52 | % | | (7.85 | )% |
| | | | | | | | | | | | | | | | | | | | |
| SUPPLEMENTAL DATA AND RATIOS | | | | | | | | | | | | | | | | | | |
| Net assets, end of period (000's) | | $ | 28,738 | | $ | 31,230 | | $ | 37,318 | | $ | 47,466 | | $ | 32,929 | | $ | 30,191 | |
| Ratio of operating expenses to average net assets: | | | | | | | | | | | | | | | | | | | |
| Before expense reimbursement | | | 1.96 | %(5) | | 1.90 | % | | 1.86 | % | | 1.88 | % | | 1.97 | % | | 1.93 | % |
After expense reimbursement(6) | | | 1.64 | %(5) | | 1.64 | % | | 1.64 | % | | 1.64 | % | | 1.64 | % | | 1.64 | % |
| Ratio of net investment income (loss) to average net assets: | | | | | | | | | | | | | | | | | | | |
| Before expense reimbursement | | | (1.33 | )%(5) | | (1.17 | )% | | (0.77 | )% | | (0.21 | )% | | (0.10 | )% | | (0.20 | )% |
After expense reimbursement(6) | | | (1.01 | )%(5) | | (0.91 | )% | | (0.55 | )% | | 0.03 | % | | 0.23 | % | | 0.09 | % |
Portfolio turnover rate(7) | | | 1 | % | | 2 | % | | 18 | % | | 21 | % | | 26 | % | | 14 | % |
| (1) | Information presented relates to a share of capital stock outstanding for each period. |
| (2) | Net investment income per share represents net investment income divided by the average shares outstanding throughout the period. |
| (3) | Amount calculated is less than $0.005. |
| (4) | Not annualized. |
| (5) | Annualized. |
| (6) | See Note #3, Investment Adviser, for the waiver and expense reimbursement discussion. |
| (7) | Portfolio turnover of The Market Opportunities Portfolio. |
The accompanying notes are an integral part of these financial statements.
69
| KINETICS MUTUAL FUNDS, INC. — THE FEEDER FUNDS |
Financial Highlights — (Continued) |
| | | The Market Opportunities Fund | |
| | | Advisor Class A |
| | | | For the | | | | | | | | | | | | | | | | |
| | | | Period | | | For the | | | For the | | | For the | | | For the | | | For the | |
| | | | Ended | | | Year Ended | | | Year Ended | | | Year Ended | | | Year Ended | | | Year Ended | |
| | | | June 30, 2016 | | | December 31, | | | December 31, | | | December 31, | | | December 31, | | | December 31, | |
| | | | (Unaudited) | | | 2015 | | | 2014 | | | 2013 | | | 2012 | | | 2011 | |
PER SHARE DATA:(1) | | | | | | | | | | | | | | | | | | | |
| Net Asset Value, Beginning of Period | | $ | 15.04 | | $ | 16.59 | | $ | 17.60 | | $ | 12.07 | | $ | 10.43 | | $ | 11.43 | |
| Income from Investment Operations: | | | | | | | | | | | | | | | | | | | |
Net investment income (loss) (2) | | | (0.09 | ) | | (0.19 | ) | | (0.14 | ) | | (0.03 | ) | | 0.00(3 | ) | | (0.02 | ) |
| Net realized and unrealized gain (loss) on investments | | | 0.82 | | | (1.36 | ) | | (0.87 | ) | | 5.63 | | | 1.80 | | | (0.90 | ) |
| Total from Investment Operations | | | 0.73 | | | (1.55 | ) | | (1.01 | ) | | 5.60 | | | 1.80 | | | (0.92 | ) |
| Redemption Fees | | | — | | | 0.00 | (3) | | — | | | 0.00 | (3) | | 0.00 | (3) | | 0.00 | (3) |
| Less Distributions: | | | | | | | | | | | | | | | | | | | |
| From net investment income | | | — | | | — | | | — | | | (0.07 | ) | | (0.16 | ) | | (0.08 | ) |
| Total Distributions | | | — | | | — | | | — | | | (0.07 | ) | | (0.16 | ) | | (0.08 | ) |
Net Asset Value, End of Period | | $ | 15.77 | | $ | 15.04 | | $ | 16.59 | | $ | 17.60 | | $ | 12.07 | | $ | 10.43 | |
Total return(4) | | | 4.85 | %(5) | | (9.34 | )% | | (5.74 | )% | | 46.36 | % | | 17.26 | % | | (8.08 | )% |
| | | | | | | | | | | | | | | | | | | | |
| SUPPLEMENTAL DATA AND RATIOS | | | | | | | | | | | | | | | | | | | |
| Net assets, end of period (000's) | | $ | 3,960 | | $ | 4,502 | | $ | 8,817 | | $ | 11,742 | | $ | 6,518 | | $ | 8,600 | |
| Ratio of operating expenses to average net assets: | | | | | | | | | | | | | | | | | | | |
| Before expense reimbursement | | | 2.21 | %(6) | | 2.15 | % | | 2.11 | % | | 2.13 | % | | 2.22 | % | | 2.18 | % |
After expense reimbursement(7) | | | 1.89 | %(6) | | 1.89 | % | | 1.89 | % | | 1.89 | % | | 1.89 | % | | 1.89 | % |
| Ratio of net investment loss to average net assets: | | | | | | | | | | | | | | | | | | | |
| Before expense reimbursement | | | (1.58 | )%(6) | | (1.42 | )% | | (1.02 | )% | | (0.46 | )% | | (0.35 | )% | | (0.45 | )% |
After expense reimbursement(7) | | | (1.26 | )%(6) | | (1.16 | )% | | (0.80 | )% | | (0.22 | )% | | (0.02 | )% | | (0.16 | )% |
Portfolio turnover rate(8) | | | 1 | % | | 2 | % | | 18 | % | | 21 | % | | 26 | % | | 14 | % |
| (1) | Information presented relates to a share of capital stock outstanding for each period. |
| (2) | Net investment income per share represents net investment income divided by the average shares outstanding throughout the period. |
| (3) | Amount calculated is less than $0.005. |
| (4) | The total return calculation does not reflect the 5.75% front end sales charge on Advisor Class A shares. |
| (5) | Not annualized. |
| (6) | Annualized. |
| (7) | See Note #3, Investment Adviser, for the waiver and expense reimbursement discussion. |
| (8) | Portfolio turnover of The Market Opportunities Portfolio. |
The accompanying notes are an integral part of these financial statements.
70
| KINETICS MUTUAL FUNDS, INC. — THE FEEDER FUNDS |
Financial Highlights — (Continued) |
| | | The Market Opportunities Fund | |
| | | Advisor Class C | |
| | | | For the | | | | | | | | | | | | | | | | |
| | | | Period | | | For the | | | For the | | | For the | | | For the | | | For the | |
| | | | Ended | | | Year Ended | | | Year Ended | | | Year Ended | | | Year Ended | | | Year Ended | |
| | | | June 30, 2016 | | | December 31, | | | December 31, | | | December 31, | | | December 31, | | | December 31, | |
| | | | (Unaudited) | | | 2015 | | | 2014 | | | 2013 | | | 2012 | | | 2011 | |
PER SHARE DATA:(1) | | | | | | | | | | | | | | | | | | | |
| Net Asset Value, Beginning of Period | | $ | 14.65 | | $ | 16.24 | | $ | 17.32 | | $ | 11.94 | | $ | 10.32 | | $ | 11.30 | |
| Income from Investment Operations: | | | | | | | | | | | | | | | | | | | |
Net investment loss(2) | | | (0.13 | ) | | (0.27 | ) | | (0.22 | ) | | (0.11 | ) | | (0.06 | ) | | (0.08 | ) |
| Net realized and unrealized gain (loss) on investments | | | 0.80 | | | (1.32 | ) | | (0.86 | ) | | 5.56 | | | 1.78 | | | (0.88 | ) |
| Total from Investment Operations | | | 0.67 | | | (1.59 | ) | | (1.08 | ) | | 5.45 | | | 1.72 | | | (0.96 | ) |
| Redemption Fees | | | — | | | — | | | 0.00 | (3) | | 0.00 | (3) | | 0.00 | (3) | | — | |
| Less Distributions: | | | | | | | | | | | | | | | | | | | |
| From net investment income | | | — | | | — | | | — | | | (0.07 | ) | | (0.10 | ) | | (0.02 | ) |
| Total Distributions | | | — | | | — | | | — | | | (0.07 | ) | | (0.10 | ) | | (0.02 | ) |
Net Asset Value, End of Period | | $ | 15.32 | | $ | 14.65 | | $ | 16.24 | | $ | 17.32 | | $ | 11.94 | | $ | 10.32 | |
| Total return | | | 4.57 | %(4) | | (9.79 | )% | | (6.24 | )% | | 45.61 | % | | 16.70 | % | | (8.51 | )% |
| | | | | | | | | | | | | | | | | | | | |
| SUPPLEMENTAL DATA AND RATIOS | | | | | | | | | | | | | | | | | | |
| Net assets, end of period (000's) | | $ | 4,097 | | $ | 4,079 | | $ | 5,109 | | $ | 5,525 | | $ | 3,932 | | $ | 4,233 | |
| Ratio of operating expenses to average net assets: | | | | | | | | | | | | | | | | | | | |
| Before expense reimbursement | | | 2.71 | %(5) | | 2.65 | % | | 2.61 | % | | 2.63 | % | | 2.72 | % | | 2.68 | % |
After expense reimbursement(6) | | | 2.39 | %(5) | | 2.39 | % | | 2.39 | % | | 2.39 | % | | 2.39 | % | | 2.39 | % |
| Ratio of net investment loss to average net assets: | | | | | | | | | | | | | | | | | | | |
| Before expense reimbursement | | | (2.08 | )%(5) | | (1.92 | )% | | (1.52 | )% | | (0.96 | )% | | (0.85 | )% | | (0.95 | )% |
After expense reimbursement(6) | | | (1.76 | )%(5) | | (1.66 | )% | | (1.30 | )% | | (0.72 | )% | | (0.52 | )% | | (0.66 | )% |
Portfolio turnover rate(7) | | | 1 | % | | 2 | % | | 18 | % | | 21 | % | | 26 | % | | 14 | % |
| (1) | Information presented relates to a share of capital stock outstanding for each period. |
| (2) | Net investment income per share represents net investment income divided by the average shares outstanding throughout the period. |
| (3) | Amount calculated is less than $0.005. |
| (4) | Not annualized. |
| (5) | Annualized. |
| (6) | See Note #3, Investment Adviser, for the waiver and expense reimbursement discussion. |
| (7) | Portfolio turnover of The Market Opportunities Portfolio. |
The accompanying notes are an integral part of these financial statements.
71
| KINETICS MUTUAL FUNDS, INC. — THE FEEDER FUNDS |
Financial Highlights — (Continued) |
| | | The Market Opportunities Fund | |
| | | Institutional Class | |
| | | | For the | | | | | | | | | | | | | | | | |
| | | | Period | | | For the | | | For the | | | For the | | | For the | | | For the | |
| | | | Ended | | | Year Ended | | | Year Ended | | | Year Ended | | | Year Ended | | | Year Ended | |
| | | | June 30, 2016 | | | December 31, | | | December 31, | | | December 31, | | | December 31, | | | December 31, | |
| | | | (Unaudited) | | | 2015 | | | 2014 | | | 2013 | | | 2012 | | | 2011 | |
PER SHARE DATA:(1) | | | | | | | | | | | | | | | | | | | |
| Net Asset Value, Beginning of Period | | $ | 15.29 | | $ | 16.80 | | $ | 17.74 | | $ | 12.10 | | $ | 10.46 | | $ | 11.48 | |
| Income from Investment Operations: | | | | | | | | | | | | | | | | | | | |
Net investment income (loss)(2) | | | (0.06 | ) | | (0.12 | ) | | (0.06 | ) | | 0.03 | | | 0.05 | | | 0.03 | |
| Net realized and unrealized gain (loss) on investments | | | 0.85 | | | (1.39 | ) | | (0.88 | ) | | 5.67 | | | 1.81 | | | (0.92 | ) |
| Total from Investment Operations | | | 0.79 | | | (1.51 | ) | | (0.94 | ) | | 5.70 | | | 1.86 | | | (0.89 | ) |
| Redemption Fees | | | — | | | — | | | — | | | 0.01 | | | — | | | — | |
| Less Distributions: | | | | | | | | | | | | | | | | | | | |
| From net investment income | | | — | | | — | | | — | | | (0.07 | ) | | (0.22 | ) | | (0.13 | ) |
| Total Distributions | | | — | | | — | | | — | | | (0.07 | ) | | (0.22 | ) | | (0.13 | ) |
Net Asset Value, End of Period | | $ | 16.08 | | $ | 15.29 | | $ | 16.80 | | $ | 17.74 | | $ | 12.10 | | $ | 10.46 | |
| Total return | | | 5.17 | %(3) | | (8.93 | )% | | (5.36 | )% | | 47.15 | % | | 17.83 | % | | (7.71 | )% |
| | | | | | | | | | | | | | | | | | | | |
| SUPPLEMENTAL DATA AND RATIOS | | | | | | | | | | | | | | | | | | | |
| Net assets, end of period (000's) | | $ | 1,753 | | $ | 2,355 | | $ | 3,108 | | $ | 1,809 | | $ | 229 | | $ | 186 | |
| Ratio of operating expenses to average net assets: | | | | | | | | | | | | | | | | | | | |
| Before expense reimbursement | | | 1.91 | %(4) | | 1.85 | % | | 1.81 | % | | 1.83 | % | | 1.92 | % | | 1.88 | % |
After expense reimbursement(5) | | | 1.44 | %(4) | | 1.44 | % | | 1.44 | % | | 1.44 | % | | 1.44 | % | | 1.44 | % |
| Ratio of net investment income (loss) to average net assets: | | | | | | | | | | | | | | | | | | | |
| Before expense reimbursement | | | (1.28 | )%(4) | | (1.12 | )% | | (0.72 | )% | | (0.16 | )% | | (0.05 | )% | | (0.15 | )% |
After expense reimbursement(5) | | | (0.81 | )%(4) | | (0.71 | )% | | (0.35 | )% | | 0.23 | % | | 0.43 | % | | 0.29 | % |
Portfolio turnover rate(6) | | | 1 | % | | 2 | % | | 18 | % | | 21 | % | | 26 | % | | 14 | % |
| (1) | Information presented relates to a share of capital stock outstanding for each period. |
| (2) | Net investment income per share represents net investment income divided by the average shares outstanding throughout the period. |
| (3) | Not annualized. |
| (4) | Annualized. |
| (5) | See Note #3, Investment Adviser, for the waiver and expense reimbursement discussion. |
| (6) | Portfolio turnover of The Market Opportunities Portfolio. |
The accompanying notes are an integral part of these financial statements.
72
| KINETICS MUTUAL FUNDS, INC. — THE FEEDER FUNDS |
Financial Highlights — (Continued) |
| | | The Alternative Income Fund | |
| | | No Load Class | |
| | | | For the | | | | | | | | | | | | | | | | |
| | | | Period | | | For the | | | For the | | | For the | | | For the | | | For the | |
| | | | Ended | | | Year Ended | | | Year Ended | | | Year Ended | | | Year Ended | | | Year Ended | |
| | | | June 30, 2016 | | | December 31, | | | December 31, | | | December 31, | | | December 31, | | | December 31, | |
| | | | (Unaudited) | | | 2015 | | | 2014 | | | 2013 | | | 2012(1) | | | 2011(1) | |
PER SHARE DATA:(2) | | | | | | | | | | | | | | | | | | | |
| Net Asset Value, Beginning of Period | | $ | 91.68 | | $ | 89.06 | | $ | 87.88 | | $ | 83.31 | | $ | 77.90 | | $ | 83.82 | |
| Income from Investment Operations: | | | | | | | | | | | | | | | | | | | |
Net investment income (loss) (3) | | | (0.01 | ) | | 0.01 | | | (0.12 | ) | | (0.21 | ) | | 1.53 | | | 1.03 | |
| Net realized and unrealized gain (loss) on investments | | | 1.80 | | | 2.56 | | | 1.30 | | | 4.78 | | | 6.09 | | | (5.13 | ) |
| Total from Investment Operations | | | 1.79 | | | 2.57 | | | 1.18 | | | 4.57 | | | 7.62 | | | (4.10 | ) |
| Redemption Fees | | | 0.00 | (4) | | 0.05 | | | 0.00 | (4) | | 0.00 | (4) | | 0.00 | (4) | | 0.00 | (4) |
| Less Distributions: | | | | | | | | | | | | | | | | | | | |
| From net investment income | | | — | | | — | | | — | | | — | | | (2.21 | ) | | (1.82 | ) |
| Total Distributions | | | — | | | — | | | — | | | — | | | (2.21 | ) | | (1.82 | ) |
Net Asset Value, End of Period | | $ | 93.47 | | $ | 91.68 | | $ | 89.06 | | $ | 87.88 | | $ | 83.31 | | $ | 77.90 | |
| Total return | | | 1.95 | %(5) | | 2.94 | % | | 1.50 | % | | 5.22 | % | | 9.90 | % | | (4.88 | )% |
| | | | | | | | | | | | | | | | | | | | |
| SUPPLEMENTAL DATA AND RATIOS | | | | | | | | | | | | | | | | | | | |
| Net assets, end of period (000's) | | $ | 4,827 | | $ | 4,570 | | $ | 8,202 | | $ | 11,848 | | $ | 4,699 | | $ | 5,613 | |
| Ratio of operating expenses to average net assets: | | | | | | | | | | | | | | | | | | | |
| Before expense reimbursement | | | 1.75 | %(6) | | 1.74 | % | | 1.80 | % | | 2.23 | % | | 2.55 | % | | 2.29 | % |
After expense reimbursement(7) | | | 0.95 | %(6) | | 0.95 | % | | 0.95 | % | | 0.95 | % | | 1.64 | % | | 1.64 | % |
| Ratio of net investment income (loss) to average net assets: | | | | | | | | | | | | | | | | | | | |
| Before expense reimbursement | | | (0.81 | )%(6) | | (0.78 | )% | | (0.99 | )% | | (1.52 | )% | | 0.93 | % | | 0.59 | % |
After expense reimbursement(7) | | | (0.01 | )%(6) | | 0.01 | % | | (0.14 | )% | | (0.24 | )% | | 1.84 | % | | 1.24 | % |
Portfolio turnover rate(8) | | | 0 | % | | 6 | % | | 17 | % | | 19 | % | | 56 | % | | 69 | % |
| (1) | Per share data adjusted for 1:10 reverse stock split completed as of May 31, 2013. |
| (2) | Information presented relates to a share of capital stock outstanding for each period. |
| (3) | Net investment income per share represents net investment income divided by the average shares outstanding throughout the period. |
| (4) | Amount calculated is less than $0.005. |
| (5) | Not annualized. |
| (6) | Annualized. |
| (7) | See Note #3, Investment Adviser, for the waiver and expense reimbursement discussion. |
| (8) | Portfolio turnover of The Alternative Income Portfolio. |
The accompanying notes are an integral part of these financial statements.
73
| KINETICS MUTUAL FUNDS, INC. — THE FEEDER FUNDS |
Financial Highlights — (Continued) |
| | | The Alternative Income Fund | |
| | | Advisor Class A | |
| | | | For the | | | | | | | | | | | | | | | | |
| | | | Period | | | For the | | | For the | | | For the | | | For the | | | For the | |
| | | | Ended | | | Year Ended | | | Year Ended | | | Year Ended | | | Year Ended | | | Year Ended | |
| | | | June 30, 2016 | | | December 31, | | | December 31, | | | December 31, | | | December 31, | | | December 31, | |
| | | | (Unaudited) | | | 2015 | | | 2014 | | | 2013 | | | 2012(1) | | | 2011(1) | |
PER SHARE DATA:(2) | | | | | | | | | | | | | | | | | | | |
| Net Asset Value, Beginning of Period | | $ | 91.02 | | $ | 88.69 | | $ | 87.73 | | $ | 83.38 | | $ | 77.76 | | $ | 83.52 | |
| Income from Investment Operations: | | | | | | | | | | | | | | | | | | | |
Net investment income (loss) (3) | | | (0.12 | ) | | (0.22 | ) | | (0.34 | ) | | (0.43 | ) | | 1.31 | | | 0.82 | |
| Net realized and unrealized gain (loss) on investments | | | 1.78 | | | 2.55 | | | 1.30 | | | 4.77 | | | 6.09 | | | (5.13 | ) |
| Total from Investment Operations | | | 1.66 | | | 2.33 | | | 0.96 | | | 4.34 | | | 7.40 | | | (4.31 | ) |
| Redemption Fees | | | 0.00 | (4) | | — | | | 0.00 | (4) | | 0.01 | | | 0.00 | (4) | | 0.01 | |
| Less Distributions: | | | | | | | | | | | | | | | | | | | |
| From net investment income | | | — | | | — | | | — | | | — | | | (1.78 | ) | | (1.46 | ) |
| Total Distributions | | | — | | | — | | | — | | | — | | | (1.78 | ) | | (1.46 | ) |
Net Asset Value, End of Period | | $ | 92.68 | | $ | 91.02 | | $ | 88.69 | | $ | 87.73 | | $ | 83.38 | | $ | 77.76 | |
Total return(5) | | | 1.83 | %(6) | | 2.63 | % | | 1.24 | % | | 4.91 | % | | 9.61 | % | | (5.08 | )% |
| | | | | | | | | | | | | | | | | | | | |
| SUPPLEMENTAL DATA AND RATIOS | | | | | | | | | | | | | | | | | | | |
| Net assets, end of period (000's) | | $ | 2,316 | | $ | 1,565 | | $ | 1,554 | | $ | 2,898 | | $ | 2,597 | | $ | 4,559 | |
| Ratio of operating expenses to average net assets: | | | | | | | | | | | | | | | | | | | |
| Before expense reimbursement | | | 2.00 | %(7) | | 1.99 | % | | 2.05 | % | | 2.48 | % | | 2.80 | % | | 2.54 | % |
After expense reimbursement(8) | | | 1.20 | %(7) | | 1.20 | % | | 1.20 | % | | 1.20 | % | | 1.89 | % | | 1.89 | % |
| Ratio of net investment income (loss) to average net assets: | | | | | | | | | | | | | | | | | | | |
| Before expense reimbursement | | | (1.06 | )%(7) | | (1.03 | )% | | (1.24 | )% | | (1.77 | )% | | 0.68 | % | | 0.34 | % |
After expense reimbursement(8) | | | (0.26 | )%(7) | | (0.24 | )% | | (0.39 | )% | | (0.49 | )% | | 1.59 | % | | 0.99 | % |
Portfolio turnover rate(9) | | | 0 | % | | 6 | % | | 17 | % | | 19 | % | | 56 | % | | 69 | % |
| (1) | Per share data adjusted for 1:10 reverse stock split completed as of May 31, 2013. |
| (2) | Information presented relates to a share of capital stock outstanding for each period. |
| (3) | Net investment income per share represents net investment income divided by the average shares outstanding throughout the period. |
| (4) | Amount calculated is less than $0.005. |
| (5) | The total return calculation does not reflect the 5.75% front end sales charge on Advisor Class A shares. |
| (6) | Not annualized. |
| (7) | Annualized. |
| (8) | See Note #3, Investment Adviser, for the waiver and expense reimbursement discussion. |
| (9) | Portfolio turnover of The Alternative Income Portfolio. |
The accompanying notes are an integral part of these financial statements.
74
| KINETICS MUTUAL FUNDS, INC. — THE FEEDER FUNDS |
Financial Highlights — (Continued) |
| | | The Alternative Income Fund | |
| | | Advisor Class C | |
| | | | For the | | | | | | | | | | | | | | | | |
| | | | Period | | | For the | | | For the | | | For the | | | For the | | | For the | |
| | | | Ended | | | Year Ended | | | Year Ended | | | Year Ended | | | Year Ended | | | Year Ended | |
| | | | June 30, 2016 | | | December 31, | | | December 31, | | | December 31, | | | December 31, | | | December 31, | |
| | | | (Unaudited) | | | 2015 | | | 2014 | | | 2013 | | | 2012(1) | | | 2011(1) | |
PER SHARE DATA:(2) | | | | | | | | | | | | | | | | | | | |
| Net Asset Value, Beginning of Period | | $ | 88.46 | | $ | 86.60 | | $ | 86.10 | | $ | 82.26 | | $ | 76.75 | | $ | 82.53 | |
| Income from Investment Operations: | | | | | | | | | | | | | | | | | | | |
Net investment income (loss) (3) | | | (0.33 | ) | | (0.65 | ) | | (0.77 | ) | | (0.84 | ) | | 0.89 | | | 0.40 | |
| Net realized and unrealized gain (loss) on investments | | | 1.72 | | | 2.48 | | | 1.27 | | | 4.68 | | | 6.00 | | | (5.03 | ) |
| Total from Investment Operations | | | 1.39 | | | 1.83 | | | 0.50 | | | 3.84 | | | 6.89 | | | (4.63 | ) |
| Redemption Fees | | | — | | | 0.03 | | | — | | | — | | | 0.00 | (4) | | 0.01 | |
| Less Distributions: | | | | | | | | | | | | | | | | | | | |
| From net investment income | | | — | | | — | | | — | | | — | | | (1.38 | ) | | (1.16 | ) |
| Total Distributions | | | — | | | — | | | — | | | — | | | (1.38 | ) | | (1.16 | ) |
Net Asset Value, End of Period | | $ | 89.85 | | $ | 88.46 | | $ | 86.60 | | $ | 86.10 | | $ | 82.26 | | $ | 76.75 | |
| Total return | | | 1.57 | %(5) | | 2.15 | % | | 0.74 | % | | 4.46 | % | | 8.96 | % | | (5.51 | )% |
| | | | | | | | | | | | | | | | | | | | |
| SUPPLEMENTAL DATA AND RATIOS | | | | | | | | | | | | | | | | | | | |
| Net assets, end of period (000's) | | $ | 1,532 | | $ | 1,356 | | $ | 1,506 | | $ | 1,862 | | $ | 1,763 | | $ | 2,316 | |
| Ratio of operating expenses to average net assets: | | | | | | | | | | | | | | | | | | | |
| Before expense reimbursement | | | 2.50 | %(6) | | 2.49 | % | | 2.55 | % | | 2.98 | % | | 3.30 | % | | 3.04 | % |
After expense reimbursement(7) | | | 1.70 | %(6) | | 1.70 | % | | 1.70 | % | | 1.70 | % | | 2.39 | % | | 2.39 | % |
| Ratio of net investment income (loss) to average net assets: | | | | | | | | | | | | | | | | | | | |
| Before expense reimbursement | | | (1.56 | )%(6) | | (1.53 | )% | | (1.74 | )% | | (2.27 | )% | | 0.18 | % | | (0.16 | )% |
After expense reimbursement(7) | | | (0.76 | )%(6) | | (0.74 | )% | | (0.89 | )% | | (0.99 | )% | | 1.09 | % | | 0.49 | % |
Portfolio turnover rate(8) | | | 0 | % | | 6 | % | | 17 | % | | 19 | % | | 56 | % | | 69 | % |
| (1) | Per share data adjusted for 1:10 reverse stock split completed as of May 31, 2013. |
| (2) | Information presented relates to a share of capital stock outstanding for each period. |
| (3) | Net investment income per share represents net investment income divided by the average shares outstanding throughout the period. |
| (4) | Amount calculated is less than $0.005. |
| (5) | Not annualized. |
| (6) | Annualized. |
| (7) | See Note #3, Investment Adviser, for the waiver and expense reimbursement discussion. |
| (8) | Portfolio turnover of The Alternative Income Portfolio. |
The accompanying notes are an integral part of these financial statements.
75
| KINETICS MUTUAL FUNDS, INC. — THE FEEDER FUNDS |
Financial Highlights — (Continued) |
| | | The Alternative Income Fund | |
| | | Institutional Class | |
| | | | For the | | | | | | | | | | | | | | | | |
| | | | Period | | | For the | | | For the | | | For the | | | For the | | | For the | |
| | | | Ended | | | Year Ended | | | Year Ended | | | Year Ended | | | Year Ended | | | Year Ended | |
| | | | June 30, 2016 | | | December 31, | | | December 31, | | | December 31, | | | December 31, | | | December 31, | |
| | | | (Unaudited) | | | 2015 | | | 2014 | | | 2013 | | | 2012(1) | | | 2011(1) | |
PER SHARE DATA:(2) | | | | | | | | | | | | | | | | | | | |
| Net Asset Value, Beginning of Period | | $ | 92.84 | | $ | 90.14 | | $ | 88.76 | | $ | 84.00 | | $ | 78.49 | | $ | 84.22 | |
| Income from Investment Operations: | | | | | | | | | | | | | | | | | | | |
Net investment income (loss) (3) | | | 0.09 | | | 0.19 | | | 0.06 | | | (0.04 | ) | | 1.72 | | | 1.21 | |
| Net realized and unrealized gain (loss) on investments | | | 1.82 | | | 2.60 | | | 1.32 | | | 4.80 | | | 6.16 | | | (5.13 | ) |
| Total from Investment Operations | | | 1.91 | | | 2.79 | | | 1.38 | | | 4.76 | | | 7.88 | | | (3.92 | ) |
| Redemption Fees | | | 0.00 | (4) | | 0.00 | (4) | | 0.00 | (4) | | — | | | 0.01 | | | 0.17 | |
| Less Distributions: | | | | | | | | | | | | | | | | | | | |
| From net investment income | | | — | | | (0.09 | ) | | — | | | — | | | (2.38 | ) | | (1.98 | ) |
| Total Distributions | | | — | | | (0.09 | ) | | — | | | — | | | (2.38 | ) | | (1.98 | ) |
Net Asset Value, End of Period | | $ | 94.75 | | $ | 92.84 | | $ | 90.14 | | $ | 88.76 | | $ | 84.00 | | $ | 78.49 | |
| Total return | | | 2.05 | %(5) | | 3.09 | % | | 1.72 | % | | 5.39 | % | | 10.17 | % | | (4.43 | )% |
| | | | | | | | | | | | | | | | | | | | |
| SUPPLEMENTAL DATA AND RATIOS | | | | | | | | | | | | | | | | | | | |
| Net assets, end of period (000's) | | $ | 17,820 | | $ | 20,255 | | $ | 26,874 | | $ | 6,854 | | $ | 1,629 | | $ | 798 | |
| Ratio of operating expenses to average net assets: | | | | | | | | | | | | | | | | | | | |
| Before expense reimbursement | | | 1.70 | %(6) | | 1.69 | % | | 1.75 | % | | 2.18 | % | | 2.50 | % | | 2.24 | % |
After expense reimbursement(7) | | | 0.75 | %(6) | | 0.75 | % | | 0.75 | % | | 0.75 | % | | 1.44 | % | | 1.44 | % |
| Ratio of net investment income (loss) to average net assets: | | | | | | | | | | | | | | | | | | | |
| Before expense reimbursement | | | (0.76 | )%(6) | | (0.73 | )% | | (0.94 | )% | | (1.47 | )% | | 0.98 | % | | 0.64 | % |
After expense reimbursement(7) | | | 0.19 | %(6) | | 0.21 | % | | 0.06 | % | | (0.04 | )% | | 2.04 | % | | 1.44 | % |
Portfolio turnover rate(8) | | | 0 | % | | 6 | % | | 17 | % | | 19 | % | | 56 | % | | 69 | % |
| (1) | Per share data adjusted for 1:10 reverse stock split completed as of May 31, 2013. |
| (2) | Information presented relates to a share of capital stock outstanding for each period. |
| (3) | Net investment income per share represents net investment income divided by the average shares outstanding throughout the period. |
| (4) | Amount calculated is less than $0.005. |
| (5) | Not annualized. |
| (6) | Annualized. |
| (7) | See Note #3, Investment Adviser, for the waiver and expense reimbursement discussion. |
| (8) | Portfolio turnover of The Alternative Income Portfolio. |
The accompanying notes are an integral part of these financial statements.
76
| KINETICS MUTUAL FUNDS, INC. — THE FEEDER FUNDS |
Financial Highlights — (Continued) |
| | | The Multi-Disciplinary Income Fund | |
| | | No Load Class | |
| | | | For the | | | | | | | | | | | | | | | | |
| | | | Period | | | For the | | | For the | | | For the | | | For the | | | For the | |
| | | | Ended | | | Year Ended | | | Year Ended | | | Year Ended | | | Year Ended | | | Year Ended | |
| | | | June 30, 2016 | | | December 31, | | | December 31, | | | December 31, | | | December 31, | | | December 31, | |
| | | | (Unaudited) | | | 2015 | | | 2014 | | | 2013 | | | 2012 | | | 2011 | |
PER SHARE DATA:(1) | | | | | | | | | | | | | | | | | | | |
| Net Asset Value, Beginning of Period | | $ | 10.32 | | $ | 10.79 | | $ | 11.02 | | $ | 11.08 | | $ | 10.09 | | $ | 10.47 | |
| Income from Investment Operations: | | | | | | | | | | | | | | | | | | | |
Net investment income(2) | | | 0.22 | | | 0.37 | | | 0.33 | | | 0.20 | | | 0.34 | | | 0.83 | |
| Net realized and unrealized gain (loss) on investments | | | 0.37 | | | (0.60 | ) | | (0.06 | ) | | 0.28 | | | 1.20 | | | (0.80 | ) |
| Total from Investment Operations | | | 0.59 | | | (0.23 | ) | | 0.27 | | | 0.48 | | | 1.54 | | | 0.03 | |
| Redemption Fees | | | — | | | 0.00 | (3) | | 0.00 | (3) | | 0.00 | (3) | | 0.00 | (3) | | 0.00 | (3) |
| Less Distributions: | | | | | | | | | | | | | | | | | | | |
| From net investment income | | | (0.23 | ) | | (0.23 | ) | | (0.29 | ) | | (0.28 | ) | | (0.43 | ) | | (0.36 | ) |
| From net realized gains | | | — | | | (0.01 | ) | | (0.21 | ) | | (0.26 | ) | | (0.12 | ) | | (0.05 | ) |
| Total Distributions | | | (0.23 | ) | | (0.24 | ) | | (0.50 | ) | | (0.54 | ) | | (0.55 | ) | | (0.41 | ) |
Net Asset Value, End of Period | | $ | 10.68 | | $ | 10.32 | | $ | 10.79 | | $ | 11.02 | | $ | 11.08 | | $ | 10.09 | |
| Total return | | | 5.75 | %(4) | | (2.17 | )% | | 2.46 | % | | 4.28 | % | | 15.38 | % | | 0.24 | % |
| | | | | | | | | | | | | | | | | | | | |
| SUPPLEMENTAL DATA AND RATIOS | | | | | | | | | | | | | | | | | | | |
| Net assets, end of period (000's) | | $ | 5,432 | | $ | 6,108 | | $ | 10,105 | | $ | 19,553 | | $ | 19,566 | | $ | 13,389 | |
| Ratio of operating expenses to average net assets: | | | | | | | | | | | | | | | | | | | |
| Before expense reimbursement | | | 1.86 | %(5) | | 1.79 | % | | 1.79 | % | | 1.83 | %(6) | | 2.00 | % | | 2.38 | % |
After expense reimbursement(7) | | | 1.49 | %(5) | | 1.49 | % | | 1.49 | % | | 1.50 | %(6) | | 1.49 | % | | 1.49 | % |
| Ratio of net investment income to average net assets: | | | | | | | | | | | | | | | | | | | |
| Before expense reimbursement | | | 3.87 | %(5) | | 3.08 | % | | 2.63 | % | | 1.41 | %(8) | | 2.65 | % | | 7.09 | % |
After expense reimbursement(7) | | | 4.24 | %(5) | | 3.38 | % | | 2.93 | % | | 1.74 | %(8) | | 3.16 | % | | 7.98 | % |
Portfolio turnover rate(9) | | | 0 | % | | 10 | % | | 35 | % | | 54 | % | | 41 | % | | 74 | % |
| (1) | Information presented relates to a share of capital stock outstanding for each period. |
| (2) | Net investment income per share represents net investment income divided by the average shares outstanding throughout the period. |
| (3) | Amount calculated is less than $0.005. |
| (4) | Not annualized. |
| (5) | Annualized. |
| (6) | The ratio of expenses includes borrowing expense on securities sold short. The expense ratio excluding borrowing expenses on securities sold short was 1.82% before expense reimbursement and 1.49% after expense reimbursement. |
| (7) | See Note #3, Investment Adviser, for the waiver and expense reimbursement discussion. |
| (8) | The ratio of net investment income includes borrowing expense on securities sold short. |
| (9) | Portfolio turnover of The Multi-Disciplinary Income Portfolio. |
The accompanying notes are an integral part of these financial statements.
77
| KINETICS MUTUAL FUNDS, INC. — THE FEEDER FUNDS |
Financial Highlights — (Continued) |
| | | The Multi-Disciplinary Income Fund | |
| | | Advisor Class A | |
| | | | For the | | | | | | | | | | | | | | | | |
| | | | Period | | | For the | | | For the | | | For the | | | For the | | | For the | |
| | | | Ended | | | Year Ended | | | Year Ended | | | Year Ended | | | Year Ended | | | Year Ended | |
| | | | June 30, 2016 | | | December 31, | | | December 31, | | | December 31, | | | December 31, | | | December 31, | |
| | | | (Unaudited) | | | 2015 | | | 2014 | | | 2013 | | | 2012 | | | 2011 | |
PER SHARE DATA:(1) | | | | | | | | | | | | | | | | | | | |
| Net Asset Value, Beginning of Period | | $ | 10.27 | | $ | 10.75 | | $ | 10.98 | | $ | 11.03 | | $ | 10.05 | | $ | 10.44 | |
| Income from Investment Operations: | | | | | | | | | | | | | | | | | | | |
Net investment income(2) | | | 0.21 | | | 0.34 | | | 0.30 | | | 0.17 | | | 0.31 | | | 0.78 | |
| Net realized and unrealized gain (loss) on investments | | | 0.36 | | | (0.60 | ) | | (0.06 | ) | | 0.29 | | | 1.20 | | | (0.78 | ) |
| Total from Investment Operations | | | 0.57 | | | (0.26 | ) | | 0.24 | | | 0.46 | | | 1.51 | | | — | |
| Redemption Fees | | | — | | | 0.00 | (3) | | 0.00 | (3) | | 0.00 | (3) | | 0.00 | (3) | | — | |
| Less Distributions: | | | | | | | | | | | | | | | | | | | |
| From net investment income | | | (0.21 | ) | | (0.21 | ) | | (0.26 | ) | | (0.25 | ) | | (0.41 | ) | | (0.34 | ) |
| From net realized gains | | | — | | | (0.01 | ) | | (0.21 | ) | | (0.26 | ) | | (0.12 | ) | | (0.05 | ) |
| Total Distributions | | | (0.21 | ) | | (0.22 | ) | | (0.47 | ) | | (0.51 | ) | | (0.53 | ) | | (0.39 | ) |
Net Asset Value, End of Period | | $ | 10.63 | | $ | 10.27 | | $ | 10.75 | | $ | 10.98 | | $ | 11.03 | | $ | 10.05 | |
Total return(4) | | | 5.62 | %(5) | | (2.46 | )% | | 2.17 | % | | 4.15 | % | | 15.12 | % | | (0.01 | )% |
| | | | | | | | | | | | | | | | | | | | |
| SUPPLEMENTAL DATA AND RATIOS | | | | | | | | | | | | | | | | | | | |
| Net assets, end of period (000's) | | $ | 5,854 | | $ | 8,754 | | $ | 12,281 | | $ | 36,170 | | $ | 25,764 | | $ | 4,726 | |
| Ratio of operating expenses to average net assets: | | | | | | | | | | | | | | | | | | | |
| Before expense reimbursement | | | 2.11 | %(6) | | 2.04 | % | | 2.04 | % | | 2.08 | %(7) | | 2.25 | % | | 2.63 | % |
After expense reimbursement(8) | | | 1.74 | %(6) | | 1.74 | % | | 1.74 | % | | 1.75 | %(7) | | 1.74 | % | | 1.74 | % |
| Ratio of net investment income to average net assets: | | | | | | | | | | | | | | | | | | | |
| Before expense reimbursement | | | 3.62 | %(6) | | 2.83 | % | | 2.38 | % | | 1.16 | %(9) | | 2.40 | % | | 6.84 | % |
After expense reimbursement(8) | | | 3.99 | %(6) | | 3.13 | % | | 2.68 | % | | 1.49 | %(9) | | 2.91 | % | | 7.73 | % |
Portfolio turnover rate(10) | | | 0 | % | | 10 | % | | 35 | % | | 54 | % | | 41 | % | | 74 | % |
| (1) | Information presented relates to a share of capital stock outstanding for each period. |
| (2) | Net investment income per share represents net investment income divided by the average shares outstanding throughout the period. |
| (3) | Amount calculated is less than $0.005. |
| (4) | The total return calculation does not reflect the 5.75% front end sales charge on Advisor Class A shares. |
| (5) | Not annualized. |
| (6) | Annualized. |
| (7) | The ratio of expenses includes borrowing expense on securities sold short. The expense ratio excluding borrowing expenses on securities sold short was 2.07% before expense reimbursement and 1.74% after expense reimbursement. |
| (8) | See Note #3, Investment Adviser, for the waiver and expense reimbursement discussion. |
| (9) | The ratio of net investment income includes borrowing expense on securities sold short. |
| (10) | Portfolio turnover of The Multi-Disciplinary Income Portfolio. |
The accompanying notes are an integral part of these financial statements.
78
| KINETICS MUTUAL FUNDS, INC. — THE FEEDER FUNDS |
Financial Highlights — (Continued) |
| | | The Multi-Disciplinary Income Fund | |
| | | Advisor Class C | |
| | | | For the | | | | | | | | | | | | | | | | |
| | | | Period | | | For the | | | For the | | | For the | | | For the | | | For the | |
| | | | Ended | | | Year Ended | | | Year Ended | | | Year Ended | | | Year Ended | | | Year Ended | |
| | | | June 30, 2016 | | | December 31, | | | December 31, | | | December 31, | | | December 31, | | | December 31, | |
| | | | (Unaudited) | | | 2015 | | | 2014 | | | 2013 | | | 2012 | | | 2011 | |
PER SHARE DATA:(1) | | | | | | | | | | | | | | | | | | | |
| Net Asset Value, Beginning of Period | | $ | 10.18 | | $ | 10.65 | | $ | 10.90 | | $ | 10.96 | | $ | 10.00 | | $ | 10.40 | |
| Income from Investment Operations: | | | | | | | | | | | | | | | | | | | |
Net investment income(2) | | | 0.18 | | | 0.28 | | | 0.24 | | | 0.11 | | | 0.26 | | | 0.74 | |
| Net realized and unrealized gain (loss) on investments | | | 0.36 | | | (0.58 | ) | | (0.06 | ) | | 0.29 | | | 1.18 | | | (0.78 | ) |
| Total from Investment Operations | | | 0.54 | | | (0.30 | ) | | 0.18 | | | 0.40 | | | 1.44 | | | (0.04 | ) |
| Redemption Fees | | | — | | | — | | | 0.00(3 | ) | | — | | | — | | | — | |
| Less Distributions: | | | | | | | | | | | | | | | | | | | |
| From net investment income | | | (0.19 | ) | | (0.16 | ) | | (0.22 | ) | | (0.20 | ) | | (0.36 | ) | | (0.31 | ) |
| From net realized gains | | | — | | | (0.01 | ) | | (0.21 | ) | | (0.26 | ) | | (0.12 | ) | | (0.05 | ) |
| Total Distributions | | | (0.19 | ) | | (0.17 | ) | | (0.43 | ) | | (0.46 | ) | | (0.48 | ) | | (0.36 | ) |
Net Asset Value, End of Period | | $ | 10.53 | | $ | 10.18 | | $ | 10.65 | | $ | 10.90 | | $ | 10.96 | | $ | 10.00 | |
| Total return | | | 5.33 | %(4) | | (2.84 | )% | | 1.61 | % | | 3.59 | % | | 14.48 | % | | (0.49 | )% |
| | | | | | | | | | | | | | | | | | | | |
| SUPPLEMENTAL DATA AND RATIOS | | | | | | | | | | | | | | | | | | | |
| Net assets, end of period (000's) | | $ | 8,395 | | $ | 9,266 | | $ | 10,403 | | $ | 11,209 | | $ | 7,485 | | $ | 1,645 | |
| Ratio of operating expenses to average net assets: | | | | | | | | | | | | | | | | | | | |
| Before expense reimbursement | | | 2.61 | %(5) | | 2.54 | % | | 2.54 | % | | 2.58 | %(6) | | 2.75 | % | | 3.13 | % |
After expense reimbursement(7) | | | 2.24 | %(5) | | 2.24 | % | | 2.24 | % | | 2.25 | %(6) | | 2.24 | % | | 2.24 | % |
| Ratio of net investment income to average net assets: | | | | | | | | | | | | | | | | | | | |
| Before expense reimbursement | | | 3.12 | %(5) | | 2.33 | % | | 1.88 | % | | 0.66 | %(8) | | 1.90 | % | | 6.34 | % |
After expense reimbursement(7) | | | 3.49 | %(5) | | 2.63 | % | | 2.18 | % | | 0.99 | %(8) | | 2.41 | % | | 7.23 | % |
Portfolio turnover rate(9) | | | 0 | % | | 10 | % | | 35 | % | | 54 | % | | 41 | % | | 74 | % |
| (1) | Information presented relates to a share of capital stock outstanding for each period. |
| (2) | Net investment income per share represents net investment income divided by the average shares outstanding throughout the period. |
| (3) | Amount calculated is less than $0.005. |
| (4) | Not annualized. |
| (5) | Annualized. |
| (6) | The ratio of expenses includes borrowing expense on securities sold short. The expense ratio excluding borrowing expenses on securities sold short was 2.57% before expense reimbursement and 2.24% after expense reimbursement. |
| (7) | See Note #3, Investment Adviser, for the waiver and expense reimbursement discussion. |
| (8) | The ratio of net investment income includes borrowing expense on securities sold short. |
| (9) | Portfolio turnover of The Multi-Disciplinary Income Portfolio. |
The accompanying notes are an integral part of these financial statements.
79
| KINETICS MUTUAL FUNDS, INC. — THE FEEDER FUNDS |
Financial Highlights — (Continued) |
| | | The Multi-Disciplinary Income Fund | |
| | | Institutional Class | |
| | | | For the | | | | | | | | | | | | | | | | |
| | | | Period | | | For the | | | For the | | | For the | | | For the | | | For the | |
| | | | Ended | | | Year Ended | | | Year Ended | | | Year Ended | | | Year Ended | | | Year Ended | |
| | | | June 30, 2016 | | | December 31, | | | December 31, | | | December 31, | | | December 31, | | | December 31, | |
| | | | (Unaudited) | | | 2015 | | | 2014 | | | 2013 | | | 2012 | | | 2011 | |
PER SHARE DATA:(1) | | | | | | | | | | | | | | | | | | | |
| Net Asset Value, Beginning of Period | | $ | 10.34 | | $ | 10.82 | | $ | 11.06 | | $ | 11.11 | | $ | 10.12 | | $ | 10.50 | |
| Income from Investment Operations: | | | | | | | | | | | | | | | | | | | |
Net investment income(2) | | | 0.23 | | | 0.39 | | | 0.35 | | | 0.22 | | | 0.36 | | | 0.85 | |
| Net realized and unrealized gain (loss) on investments | | | 0.37 | | | (0.59 | ) | | (0.06 | ) | | 0.29 | | | 1.20 | | | (0.80 | ) |
| Total from Investment Operations | | | 0.60 | | | (0.20 | ) | | 0.29 | | | 0.51 | | | 1.56 | | | 0.05 | |
| Redemption Fees | | | 0.00 | (3) | | 0.00 | (3) | | — | | | — | | | — | | | — | |
| Less Distributions: | | | | | | | | | | | | | | | | | | | |
| From net investment income | | | (0.24 | ) | | (0.27 | ) | | (0.32 | ) | | (0.30 | ) | | (0.45 | ) | | (0.38 | ) |
| From net realized gains | | | — | | | (0.01 | ) | | (0.21 | ) | | (0.26 | ) | | (0.12 | ) | | (0.05 | ) |
| Total Distributions | | | (0.24 | ) | | (0.28 | ) | | (0.53 | ) | | (0.56 | ) | | (0.57 | ) | | (0.43 | ) |
Net Asset Value, End of Period | | $ | 10.70 | | $ | 10.34 | | $ | 10.82 | | $ | 11.06 | | $ | 11.11 | | $ | 10.12 | |
| Total return | | | 5.84 | %(4) | | (1.96 | )% | | 2.61 | % | | 4.58 | % | | 15.55 | % | | 0.42 | % |
| | | | | | | | | | | | | | | | | | | | |
| SUPPLEMENTAL DATA AND RATIOS | | | | | | | | | | | | | | | | | | | |
| Net assets, end of period (000's) | | $ | 64,188 | | $ | 66,199 | | $ | 102,590 | | $ | 23,227 | | $ | 6,576 | | $ | 3,878 | |
| Ratio of operating expenses to average net assets: | | | | | | | | | | | | | | | | | | | |
| Before expense reimbursement | | | 1.81 | %(5) | | 1.74 | % | | 1.74 | % | | 1.78 | %(6) | | 1.95 | % | | 2.33 | % |
After expense reimbursement(7) | | | 1.29 | %(5) | | 1.29 | % | | 1.29 | % | | 1.30 | %(6) | | 1.29 | % | | 1.29 | % |
| Ratio of net investment income to average net assets: | | | | | | | | | | | | | | | | | | | |
| Before expense reimbursement | | | 3.92 | %(5) | | 3.13 | % | | 2.68 | % | | 1.46 | %(8) | | 2.70 | % | | 7.14 | % |
After expense reimbursement(7) | | | 4.44 | %(5) | | 3.58 | % | | 3.13 | % | | 1.94 | %(8) | | 3.36 | % | | 8.18 | % |
Portfolio turnover rate(9) | | | 0 | % | | 10 | % | | 35 | % | | 54 | % | | 41 | % | | 74 | % |
| (1) | Information presented relates to a share of capital stock outstanding for each period. |
| (2) | Net investment income per share represents net investment income divided by the average shares outstanding throughout the period. |
| (3) | Amount calculated is less than $0.005. |
| (4) | Not annualized. |
| (5) | Annualized. |
| (6) | The ratio of expenses includes borrowing expense on securities sold short. The expense ratio excluding borrowing expenses on securities sold short was 1.77% before expense reimbursement and 1.29% after expense reimbursement. |
| (7) | See Note #3, Investment Adviser, for the waiver and expense reimbursement discussion. |
| (8) | The ratio of net investment income includes borrowing expense on securities sold short. |
| (9) | Portfolio turnover of The Multi-Disciplinary Income Portfolio. |
The accompanying notes are an integral part of these financial statements.
80
| KINETICS PORTFOLIOS TRUST — MASTER INVESTMENT PORTFOLIOS |
| Allocation of Portfolio Assets |
| June 30, 2016 (Unaudited) |
The Internet Portfolio
| | | | | | | Percentage | |
| | | | Market | | | of Total | |
| Sector Allocation* | | | Value | | | Net Assets | |
| Information | | $ | 35,713,519 | | | 31.2 | % |
| Finance and Insurance | | | 7,874,756 | | | 6.9 | % |
| Management of Companies and Enterprises | | | 7,405,136 | | | 6.5 | % |
| Retail Trade | | | 5,502,158 | | | 4.8 | % |
| Manufacturing | | | 4,109,850 | | | 3.6 | % |
| Administrative and Support and Waste Management and Remediation Services | | | 2,794,292 | | | 2.5 | % |
| Real Estate and Rental and Leasing | | | 367,460 | | | 0.3 | % |
| Arts, Entertainment, and Recreation | | | 361,900 | | | 0.3 | % |
| Petroleum and Gas | | | 16,865 | | | 0.0 | % |
| Professional, Scientific, and Technical Services | | | 4,780 | | | 0.0 | % |
| * | Excludes Short-Term Investments |
81
| KINETICS PORTFOLIOS TRUST — MASTER INVESTMENT PORTFOLIOS |
| Allocation of Portfolio Assets |
June 30, 2016 (Unaudited) — (Continued) |
The Global Portfolio
| | | | | | | Percentage | |
| | | | Market | | | of Total | |
| Country Allocation* | | | Value | | | Net Assets | |
| Canada | | $ | 2,319,094 | | | 32.5 | % |
| United States | | | 1,904,014 | | | 26.7 | % |
| Cayman Islands | | | 323,400 | | | 4.5 | % |
| France | | | 321,556 | | | 4.5 | % |
| United Kingdom | | | 93,349 | | | 1.3 | % |
| Japan | | | 72,832 | | | 1.0 | % |
| Brazil | | | 52,534 | | | 0.7 | % |
| Argentina | | | 25,222 | | | 0.4 | % |
| Netherlands | | | 5,984 | | | 0.1 | % |
| Denmark | | | 5,232 | | | 0.1 | % |
| Spain | | | 4,715 | | | 0.1 | % |
| Sweden | | | 3,320 | | | 0.0 | % |
| * | Excludes Short-Term Investments |
82
| KINETICS PORTFOLIOS TRUST — MASTER INVESTMENT PORTFOLIOS |
| Allocation of Portfolio Assets |
June 30, 2016 (Unaudited) — (Continued) |
| | | | | | | Percentage | |
| | | | Market | | | of Total | |
| Sector Allocation* | | | Value | | | Net Assets | |
| Information | | $ | 146,007,843 | | | 19.5 | % |
| Real Estate and Rental and Leasing | | | 108,347,634 | | | 14.5 | % |
| Petroleum and Gas | | | 103,591,576 | | | 13.8 | % |
| Finance and Insurance | | | 95,062,695 | | | 12.7 | % |
| Management of Companies and Enterprises | | | 61,993,464 | | | 8.3 | % |
| Mining, Quarrying, and Oil and Gas Extraction | | | 33,056,535 | | | 4.4 | % |
| Manufacturing | | | 31,582,317 | | | 4.2 | % |
| Retail Trade | | | 31,373,882 | | | 4.2 | % |
| Arts, Entertainment, and Recreation | | | 27,823,627 | | | 3.7 | % |
| Utilities | | | 2,652,236 | | | 0.4 | % |
| Professional, Scientific, and Technical Services | | | 367,444 | | | 0.0 | % |
| * | Excludes Short-Term Investments |
83
| KINETICS PORTFOLIOS TRUST — MASTER INVESTMENT PORTFOLIOS |
| Allocation of Portfolio Assets |
June 30, 2016 (Unaudited) — (Continued) |
| | | | | | | Percentage | |
| | | | Market | | | of Total | |
| Sector Allocation* | | | Value | | | Net Assets | |
| Manufacturing | | $ | 22,231,704 | | | 91.0 | % |
| Professional, Scientific, and Technical Services | | | 873,544 | | | 3.6 | % |
| Finance and Insurance | | | 3,793 | | | 0.0 | % |
| * | Excludes Short-Term Investments |
84
| KINETICS PORTFOLIOS TRUST — MASTER INVESTMENT PORTFOLIOS |
| Allocation of Portfolio Assets |
June 30, 2016 (Unaudited) — (Continued) |
The Small Cap Opportunities Portfolio
| | | | | | | Percentage | |
| | | | Market | | | of Total | |
| Sector Allocation* | | | Value | | | Net Assets | |
| Real Estate and Rental and Leasing | | $ | 33,424,256 | | | 16.8 | % |
| Petroleum and Gas | | | 32,768,358 | | | 16.5 | % |
| Finance and Insurance | | | 29,738,296 | | | 15.0 | % |
| Manufacturing | | | 27,803,687 | | | 14.0 | % |
| Management of Companies and Enterprises | | | 18,561,954 | | | 9.4 | % |
| Information | | | 16,551,924 | | | 8.3 | % |
| Retail Trade | | | 6,027,767 | | | 3.0 | % |
| Arts, Entertainment, and Recreation | | | 5,957,250 | | | 3.0 | % |
| Accommodation and Food Services | | | 5,003,674 | | | 2.5 | % |
| Utilities | | | 2,772,958 | | | 1.4 | % |
| Mining, Quarrying, and Oil and Gas Extraction | | | 2,009,939 | | | 1.0 | % |
| Wholesale Trade | | | 903,760 | | | 0.5 | % |
| * | Excludes Short-Term Investments |
85
| KINETICS PORTFOLIOS TRUST — MASTER INVESTMENT PORTFOLIOS |
| Allocation of Portfolio Assets |
June 30, 2016 (Unaudited) — (Continued) |
The Market Opportunities Portfolio
| | | | | | | Percentage | |
| | | | Market | | | of Total | |
| Sector Allocation* | | | Value | | | Net Assets | |
| Finance and Insurance | | $ | 14,868,657 | | | 38.6 | % |
| Petroleum and Gas | | | 5,076,365 | | | 13.2 | % |
| Real Estate and Rental and Leasing | | | 4,356,074 | | | 11.3 | % |
| Management of Companies and Enterprises | | | 3,045,600 | | | 7.9 | % |
| Accommodation and Food Services | | | 1,520,992 | | | 3.9 | % |
| Manufacturing | | | 42,469 | | | 0.1 | % |
| Wholesale Trade | | | 25,888 | | | 0.1 | % |
| Industrials | | | 11,752 | | | 0.0 | % |
| Support Activities for Water Transportation | | | 7,044 | | | 0.0 | % |
| Administrative and Support and Waste Management and Remediation Services | | | 6,520 | | | 0.0 | % |
| Retail Trade | | | 5,255 | | | 0.0 | % |
| Mining, Quarrying, and Oil and Gas Extraction | | | 2,353 | | | 0.0 | % |
| * | Excludes Short-Term Investments |
86
| KINETICS PORTFOLIOS TRUST — MASTER INVESTMENT PORTFOLIOS |
| Allocation of Portfolio Assets |
June 30, 2016 (Unaudited) — (Continued) |
The Alternative Income Portfolio
| | | | | | | Percentage | |
| | | | Market | | | of Total | |
| Sector Allocation* | | | Value | | | Net Assets | |
| Finance and Insurance | | $ | 9,317,830 | | | 35.1 | % |
| Manufacturing | | | 4,592,124 | | | 17.3 | % |
| Public Administration | | | 2,105,018 | | | 7.9 | % |
| Retail Trade | | | 751,312 | | | 2.8 | % |
| Mining, Quarrying, and Oil and Gas Extraction | | | 702,935 | | | 2.6 | % |
| Wholesale Trade | | | 500,030 | | | 1.9 | % |
| Information | | | 452,767 | | | 1.7 | % |
| Utilities | | | 401,567 | | | 1.5 | % |
| Accommodations and Food Services | | | 400,572 | | | 1.5 | % |
| Administrative and Support and Waste Management and Remediation Services | | | 383,888 | | | 1.4 | % |
| Transportation and Warehousing | | | 172,101 | | | 0.7 | % |
| * | Excludes Short-Term Investments & Written Options |
87
| KINETICS PORTFOLIOS TRUST — MASTER INVESTMENT PORTFOLIOS |
| Allocation of Portfolio Assets |
June 30, 2016 (Unaudited) — (Continued) |
The Multi-Disciplinary Income Portfolio
| | | | | | | Percentage | |
| | | | Market | | | of Total | |
| Sector Allocation* | | | Value | | | Net Assets | |
| Information | | $ | 17,707,135 | | | 21.1 | % |
| Manufacturing | | | 13,972,169 | | | 16.6 | % |
| Real Estate and Rental and Leasing | | | 12,969,482 | | | 15.4 | % |
| Mining, Quarrying, and Oil and Gas Extraction | | | 6,821,446 | | | 8.1 | % |
| Finance and Insurance | | | 6,786,516 | | | 8.1 | % |
| Retail Trade | | | 6,594,600 | | | 7.9 | % |
| Construction | | | 6,445,850 | | | 7.7 | % |
| Administrative and Support and Waste Management and Remediation Services | | | 4,282,155 | | | 5.1 | % |
| Accommodation and Food Services | | | 3,610,430 | | | 4.3 | % |
| Professional, Scientific, and Technical Services | | | 773,125 | | | 0.9 | % |
| Health Care and Social Assistance | | | 501,418 | | | 0.6 | % |
| Transportation and Warehousing | | | 442,500 | | | 0.5 | % |
| Utilities | | | 271,970 | | | 0.3 | % |
| * | Excludes Short-Term Investments & Written Options |
88
| KINETICS PORTFOLIOS TRUST — MASTER INVESTMENT PORTFOLIOS |
| The Internet Portfolio |
| Portfolio of Investments — June 30, 2016 (Unaudited) |
| COMMON STOCKS — 55.95% | | | Shares | | | Value | |
| Administrative and Support Services — 2.44% | | | | | | | |
| CreditRiskMonitor.com, Inc. | | | 780 | | $ | 1,638 | |
| Ctrip.com International Limited — ADR* | | | 11,600 | | | 477,920 | |
| PayPal Holdings, Inc.* | | | 63,400 | | | 2,314,734 | |
| | | | | | | 2,794,292 | |
| Broadcasting (except Internet) — 3.96% | | | | | | | |
| The E.W. Scripps Company — Class A* | | | 60,000 | | | 950,400 | |
| The Madison Square Garden Company — Class A* | | | 16,366 | | | 2,823,299 | |
| MSG Networks Inc. — Class A* | | | 49,100 | | | 753,194 | |
| | | | | | | 4,526,893 | |
| Cable Distributor — 5.14% | | | | | | | |
| Liberty Broadband Corporation — Series A* | | | 18,000 | | | 1,069,200 | |
| Liberty Broadband Corporation — Series C* | | | 36,000 | | | 2,160,000 | |
| Liberty Global plc — Series C* | | | 73,800 | | | 2,114,370 | |
| Liberty Global plc LiLAC — Series C* | | | 16,497 | | | 535,985 | |
| | | | | | | 5,879,555 | |
| Credit Intermediation and Related Activities — 0.64% | | | | | | | |
| LendingTree, Inc.*^ | | | 8,233 | | | 727,221 | |
| Data Processing, Hosting and Related Services — 0.38% | | | | | | | |
| CoStar Group, Inc.* | | | 2,000 | | | 437,320 | |
| Data Processor — 3.44% | | | | | | | |
| MasterCard, Inc. — Class A | | | 14,800 | | | 1,303,288 | |
| Verisk Analytics, Inc. — Class A* | | | 7,600 | | | 616,208 | |
| Visa, Inc. — Class A | | | 27,200 | | | 2,017,424 | |
| | | | | | | 3,936,920 | |
| Defense — 3.59% | | | | | | | |
| CACI International, Inc. — Class A* | | | 35,000 | | | 3,164,350 | |
| ManTech International Corporation — Class A | | | 25,000 | | | 945,500 | |
| | | | | | | 4,109,850 | |
| E-Commerce — 5.29% | | | | | | | |
| eBay, Inc.* | | | 53,200 | | | 1,245,412 | |
| Liberty Interactive Corporation — Class A* | | | 92,000 | | | 2,334,040 | |
| Liberty Ventures — Series A* | | | 66,800 | | | 2,476,276 | |
| | | | | | | 6,055,728 | |
| Holding Company — 0.82% | | | | | | | |
| Icahn Enterprises LP | | | 17,444 | | | 941,976 | |
The accompanying notes are an integral part of these financial statements.
89
| KINETICS PORTFOLIOS TRUST — MASTER INVESTMENT PORTFOLIOS |
| The Internet Portfolio |
Portfolio of Investments — June 30, 2016 (Unaudited) — (Continued) |
| | | | Shares | | | Value | |
| Internet — 0.02% | | | | | | | |
| Softbank Technology Corp. | | | 1,200 | | $ | 22,695 | |
| Media — 8.85% | | | | | | | |
| Liberty Braves Group — Class A* | | | 8,800 | | | 132,352 | |
| Liberty Braves Group — Class C*^ | | | 14,400 | | | 211,104 | |
| Liberty Media Group — Class A* | | | 21,200 | | | 405,768 | |
| Liberty SiriusXM Group — Class A* | | | 80,000 | | | 2,508,800 | |
| Liberty SiriusXM Group — Class C* | | | 144,000 | | | 4,445,280 | |
| Starz — Class A* | | | 81,000 | | | 2,423,520 | |
| | | | | | | 10,126,824 | |
| Non-Store Retailers — 1.56% | | | | | | | |
| Copart, Inc.* | | | 36,000 | | | 1,764,360 | |
| Overstock.com, Inc.* | | | 1,000 | | | 16,110 | |
| | | | | | | 1,780,470 | |
| Oil and Gas — 0.01% | | | | | | | |
| Texas Pacific Land Trust | | | 100 | | | 16,865 | |
| Other Information Services — 8.83% | | | | | | | |
| Alphabet, Inc. — Class A* | | | 6,000 | | | 4,221,180 | |
| Alphabet, Inc. — Class C* | | | 6,000 | | | 4,152,600 | |
| Yahoo! Inc.* | | | 46,200 | | | 1,735,272 | |
| | | | | | | 10,109,052 | |
| Performing Arts, Spectator Sports, and Related Industries — 0.32% | | | | | | | |
| Live Nation Entertainment, Inc.* | | | 15,400 | | | 361,900 | |
| Professional, Scientific, and Technical Services — 0.00% | | | | | | | |
| Monster Worldwide, Inc.* | | | 2,000 | | | 4,780 | |
| Rental and Leasing Services — 0.21% | | | | | | | |
| Comdisco Holding Company, Inc.* | | | 56,000 | | | 244,160 | |
| Satellite Telecommunications — 7.64% | | | | | | | |
| DISH Network Corp. — Class A* | | | 43,400 | | | 2,274,160 | |
| EchoStar Corporation — Class A* | | | 162,800 | | | 6,463,160 | |
| | | | | | | 8,737,320 | |
| Securities, Commodity Contracts, and Other Financial Investments and | | | | | | | |
| Related Activities — 2.81% | | | | | | | |
| The Bitcoin Investment Trust* | | | 15,700 | | | 1,876,935 | |
| MarketAxess Holdings, Inc.^ | | | 5,700 | | | 828,780 | |
| OTC Markets Group Inc. — Class A | | | 30,600 | | | 504,900 | |
| | | | | | | 3,210,615 | |
The accompanying notes are an integral part of these financial statements.
90
| KINETICS PORTFOLIOS TRUST — MASTER INVESTMENT PORTFOLIOS |
| The Internet Portfolio |
Portfolio of Investments — June 30, 2016 (Unaudited) — (Continued) |
| | | | Shares | | | Value | |
| Telecommunications — 0.00% | | | | | | | |
| ICTC Group Inc.* | | | 149 | | $ | 2,980 | |
| TOTAL COMMON STOCKS | | | | | | | |
| (cost $27,693,447) | | | | | | 64,027,416 | |
| | | | Principal | | | | |
| ESCROW NOTES — 0.00% | | | Amount | | | | |
| Special Purpose Entity — 0.00% | | | | | | | |
| Adelphia Communications Corp. Preferred*+ | | $ | 190,000 | | | — | |
| TOTAL ESCROW NOTES | | | | | | | |
| (cost $0) | | | | | | — | |
| RIGHTS — 0.11% | | | Shares | | | | |
| Rental and Leasing Services — 0.11% | | | | | | | |
| Comdisco Holding Company, Inc.*^# | | | 1,800,000 | | | 123,300 | |
| TOTAL RIGHTS | | | | | | | |
| (cost $21,920) | | | | | | 123,300 | |
| | | | | | | | |
| SHORT-TERM INVESTMENTS — 43.84% | | | | | | | |
| Money Market Funds — 0.00% | | | | | | | |
Fidelity Institutional Government Portfolio — Class I, 0.26%b | | | 3,746 | | | 3,746 | |
| | | | Principal | | | | |
| | | | Amount | | | | |
| U.S. Treasury Obligations — 43.84% | | | | | | | |
| United States Treasury Bills, Maturity Date: 07/14/2016, | | | | | | | |
| Yield to Maturity 0.18% | | $ | 22,622,000 | | | 22,621,050 | |
| United States Treasury Bills, Maturity Date: 08/11/2016, | | | | | | | |
| Yield to Maturity 0.18% | | | 2,033,000 | | | 2,032,551 | |
| United States Treasury Bills, Maturity Date: 08/25/2016, | | | | | | | |
| Yield to Maturity 0.11% | | | 25,517,000 | | | 25,508,732 | |
| | | | | | | 50,162,333 | |
| TOTAL SHORT-TERM INVESTMENTS | | | | | | | |
| (cost $50,169,496) | | | | | | 50,166,079 | |
The accompanying notes are an integral part of these financial statements.
91
| KINETICS PORTFOLIOS TRUST — MASTER INVESTMENT PORTFOLIOS |
| The Internet Portfolio |
Portfolio of Investments — June 30, 2016 (Unaudited) — (Continued) |
| | | | | | | | |
| INVESTMENTS PURCHASED WITH THE CASH | | | | | | | |
| PROCEEDS FROM SECURITIES LENDING — 0.97% | | | Shares | | | Value | |
| Money Market Funds — 0.97% | | | | | | | |
Mount Vernon Securities Lending Trust — Prime Portfolio, 0.56%b | | | 1,117,887 | | $ | 1,117,887 | |
| TOTAL INVESTMENTS PURCHASED WITH THE | | | | | | | |
| CASH PROCEEDS FROM SECURITIES LENDING | | | | | | | |
| (cost $1,117,887) | | | | | | 1,117,887 | |
| TOTAL INVESTMENTS — 100.87% | | | | | | | |
| (cost $79,002,750) | | | | | $ | 115,434,682 | |
| Percentages are stated as a percent of net assets. |
| * — | Non-income producing security. |
| ^ — | This security or a portion of this security was out on loan at June 30, 2016. Total loaned securities had a market value of $1,089,087 at June 30, 2016. The remaining contractual maturities of all of the securities lending transactions were overnight and continuous. |
| + — | Security is considered illiquid and was fair valued. The aggregate value of such securities is $0 or 0.00% of net assets. |
| # — | Contingent value right (contingent upon profitability of company). |
b — | The rate quoted is the annualized seven-day yield as of June 30, 2016. |
| ADR — American Depository Receipt. |
The accompanying notes are an integral part of these financial statements.
92
| KINETICS PORTFOLIOS TRUST — MASTER INVESTMENT PORTFOLIOS |
| The Global Portfolio |
Portfolio of Investments — June 30, 2016 (Unaudited) — (Continued) |
| COMMON STOCKS — 71.02% | | | Shares | | | Value | |
| Asset Management — 9.62% | | | | | | | |
| Brookfield Asset Management Inc. — Class A | | | 5,800 | | $ | 191,806 | |
| JZ Capital Partners Limited | | | 6,600 | | | 35,673 | |
| Onex Corporation | | | 6,900 | | | 421,590 | |
| Partners Value Investments LP* | | | 1,893 | | | 38,037 | |
| | | | | | | 687,106 | |
| Cable Distributor — 0.70% | | | | | | | |
| Altice N.V. — Class A* | | | 400 | | | 5,984 | |
| Liberty Broadband Corporation — Series A* | | | 700 | | | 41,580 | |
| SFR Group SA | | | 100 | | | 2,509 | |
| | | | | | | 50,073 | |
| Crop Production — 0.35% | | | | | | | |
| Cresud S.A.C.I.F.y A. — ADR* | | | 1,785 | | | 25,222 | |
| Global Exchanges — 0.74% | | | | | | | |
| BM&FBovespa SA | | | 9,470 | | | 52,534 | |
| Holding Company — 18.23% | | | | | | | |
| Bollore SA | | | 92,000 | | | 311,397 | |
| Clarke Inc. | | | 33,000 | | | 232,440 | |
| Dundee Corporation — Class A* | | | 17,800 | | | 104,664 | |
| HRG Group, Inc.* | | | 200 | | | 2,746 | |
| Icahn Enterprises LP | | | 5,994 | | | 323,676 | |
| Investor AB — B Shares | | | 100 | | | 3,320 | |
| Siem Industries Inc.* | | | 6,600 | | | 323,400 | |
| | | | | | | 1,301,643 | |
| Insurance Carriers and Related Activities — 5.40% | | | | | | | |
| Fairfax Financial Holdings Limited | | | 715 | | | 385,399 | |
| Internet — 1.01% | | | | | | | |
| Softbank Technology Corp. | | | 3,800 | | | 71,868 | |
| Lessors of Nonresidential Buildings (except Miniwarehouses) — 4.64% | | | | | | | |
| The Howard Hughes Corporation* | | | 2,900 | | | 331,528 | |
The accompanying notes are an integral part of these financial statements.
93
| KINETICS PORTFOLIOS TRUST — MASTER INVESTMENT PORTFOLIOS |
| The Global Portfolio |
Portfolio of Investments — June 30, 2016 (Unaudited) — (Continued) |
| | | | Shares | | | Value | |
| Media — 4.72% | | | | | | | |
| Liberty Braves Group — Class A* | | | 360 | | $ | 5,415 | |
| Liberty Braves Group — Class C*^ | | | 520 | | | 7,623 | |
| Liberty Global plc — Series A* | | | 75 | | | 2,171 | |
| Liberty Global plc — Series C* | | | 183 | | | 5,240 | |
| Liberty Global plc LiLAC — Series A* | | | 9 | | | 301 | |
| Liberty Global plc LiLAC — Series C* | | | 23 | | | 741 | |
| Liberty Media Group — Class A* | | | 900 | | | 17,226 | |
| Liberty Media Group — Class C* | | | 1,300 | | | 24,661 | |
| Liberty SiriusXM Group — Class A* | | | 3,600 | | | 112,896 | |
| Liberty SiriusXM Group — Class C* | | | 5,200 | | | 160,524 | |
| | | | | | | 336,798 | |
| Mining (except Oil and Gas) — 9.50% | | | | | | | |
| Franco-Nevada Corporation | | | 3,600 | | | 273,816 | |
| NovaCopper Inc.* | | | 666 | | | 333 | |
| NovaGold Resources Inc.*^ | | | 4,000 | | | 24,480 | |
| Sandstorm Gold Limited*^ | | | 3,600 | | | 16,056 | |
| Silver Wheaton Corporation | | | 15,450 | | | 363,538 | |
| | | | | | | 678,223 | |
| Oil and Gas — 6.80% | | | | | | | |
| PrairieSky Royalty Limited | | | 100 | | | 1,898 | |
| Texas Pacific Land Trust | | | 2,866 | | | 483,351 | |
| | | | | | | 485,249 | |
| Oil and Gas Extraction — 1.14% | | | | | | | |
| Continental Resources, Inc.* | | | 1,800 | | | 81,486 | |
| Other Information Services — 0.01% | | | | | | | |
| Internet Initiative Japan Inc. — ADR | | | 100 | | | 964 | |
| Pipeline Transportation — 0.11% | | | | | | | |
| Rubis SCA | | | 100 | | | 7,650 | |
| Professional, Scientific, and Technical Services — 0.03% | | | | | | | |
| Brookfield Business Partners LP* | | | 116 | | | 2,214 | |
| Publishing Industries (except Internet) — 0.07% | | | | | | | |
| Promotora de Informaciones S.A. — ADR* | | | 240 | | | 1,286 | |
| Promotora de Informaciones S.A. — Class A* | | | 610 | | | 3,429 | |
| | | | | | | 4,715 | |
The accompanying notes are an integral part of these financial statements.
94
| KINETICS PORTFOLIOS TRUST — MASTER INVESTMENT PORTFOLIOS |
| The Global Portfolio |
Portfolio of Investments — June 30, 2016 (Unaudited) — (Continued) |
| | | | Shares | | | Value | |
| Real Estate — 3.62% | | | | | | | |
| Brookfield Property Partners LP^ | | | 281 | | $ | 6,311 | |
| Dream Unlimited Corp. — Class A* | | | 40,800 | | | 252,010 | |
| | | | | | | 258,321 | |
| Satellite Telecommunications — 1.33% | | | | | | | |
| EchoStar Corporation — Class A* | | | 2,400 | | | 95,280 | |
| Securities, Commodity Contracts, and Other Financial Investments and | | | | | | | |
| Related Activities — 1.84% | | | | | | | |
| The Bitcoin Investment Trust* | | | 1,100 | | | 131,505 | |
| Transportation — 0.66% | | | | | | | |
| Clarkson plc | | | 1,600 | | | 47,009 | |
| Transportation Equipment Manufacturing — 0.43% | | | | | | | |
| HEICO Corporation — Class A | | | 575 | | | 30,849 | |
| Water Transportation — 0.07% | | | | | | | |
| A.P. Moeller-Maersk A/S — Class B — ADR | | | 800 | | | 5,232 | |
| TOTAL COMMON STOCKS | | | | | | | |
| (cost $4,606,878) | | | | | | 5,070,868 | |
| | | | | | | | |
| PREFERRED STOCKS — 0.18% | | | | | | | |
| Asset Management — 0.18% | | | | | | | |
| Partners Value Investments LP — Class A* | | | 515 | | | 12,880 | |
| TOTAL PREFERRED STOCKS | | | | | | | |
| (cost $5,334) | | | | | | 12,880 | |
| | | | | | | | |
| | | | Principal | | | | |
| CORPORATE BONDS — 0.45% | | | Amount | | | | |
| General Merchandise Stores — 0.45% | | | | | | | |
| Sears Holdings Corporation, 8.000%, 12/15/2019 | | $ | 39,500 | | | 32,192 | |
| TOTAL CORPORATE BONDS | | | | | | | |
| (cost $39,500) | | | | | | 32,192 | |
| | | | | | | | |
| | | | | | | | |
| PURCHASED PUT OPTIONS — 0.14% | | | Contractsd | | | | |
| Funds, Trusts, and Other Financial Vehicles — 0.14% | | | | | | | |
| ProShares Ultra VIX Short-Term Futures ETF* | | | | | | | |
| Expiration Date: January 2017, Exercise Price: $20.00 | | | 2 | | | 2,635 | |
| Expiration Date: January 2017, Exercise Price: $25.00 | | | 4 | | | 6,970 | |
| TOTAL PURCHASED PUT OPTIONS | | | | | | | |
| (cost $9,106) | | | | | | 9,605 | |
The accompanying notes are an integral part of these financial statements.
95
| KINETICS PORTFOLIOS TRUST — MASTER INVESTMENT PORTFOLIOS |
| The Global Portfolio |
Portfolio of Investments — June 30, 2016 (Unaudited) — (Continued) |
| WARRANTS — 0.08% | | | Shares | | | Value | |
| Asset Management — 0.00% | | | | | | | |
| Partners Value Investments LP* | | | 1,893 | | $ | 147 | |
| General Merchandise Stores — 0.08% | | | | | | | |
| Sears Holdings Corporation* | | | 1,390 | | | 5,560 | |
| TOTAL WARRANTS | | | | | | | |
| (cost $26,599) | | | | | | 5,707 | |
| | | | | | | | |
| SHORT-TERM INVESTMENTS — 28.05% | | | | | | | |
| Money Market Funds — 0.56% | | | | | | | |
Fidelity Institutional Government Portfolio — Class I, 0.26%b | | | 39,979 | | | 39,979 | |
| | | | | | | | |
| | | | Principal | | | | |
| | | | Amount | | | | |
| U.S. Treasury Obligations — 27.49% | | | | | | | |
| United States Treasury Bills, Maturity Date: 07/14/2016, | | | | | | | |
| Yield to Maturity 0.18% | | $ | 1,898,000 | | | 1,897,920 | |
| United States Treasury Bills, Maturity Date: 08/25/2016, | | | | | | | |
| Yield to Maturity 0.11% | | | 65,000 | | | 64,979 | |
| | | | | | | 1,962,899 | |
| TOTAL SHORT-TERM INVESTMENTS | | | | | | | |
| (cost $2,002,845) | | | | | | 2,002,878 | |
| | | | | | | | |
| INVESTMENTS PURCHASED WITH THE CASH | | | | | | | |
| PROCEEDS FROM SECURITIES LENDING — 0.68% | | | Shares | | | | |
| Money Market Funds — 0.68% | | | | | | | |
Mount Vernon Securities Lending Trust — Prime Portfolio, 0.56%b | | | 48,417 | | | 48,417 | |
| TOTAL INVESTMENTS PURCHASED WITH THE CASH | | | | | | | |
| PROCEEDS FROM SECURITIES LENDING | | | | | | | |
| (cost $48,417) | | | | | | 48,417 | |
| TOTAL INVESTMENTS — 100.60% | | | | | | | |
| (cost $6,738,679) | | | | | $ | 7,182,547 | |
| Percentages are stated as a percent of net assets. |
| * — | Non-income producing security. |
| ^ — | This security or a portion of this security was out on loan at June 30, 2016. Total loaned securities had a market value of $47,749 at June 30, 2016. The remaining contractual maturities of all of the securities lending transactions were overnight and continuous. |
b — | The rate quoted is the annualized seven-day yield as of June 30, 2016. |
d — | 100 shares per contract. |
| ADR — American Depository Receipt. |
| ETF — Exchange Traded Fund. |
The accompanying notes are an integral part of these financial statements.
96
| KINETICS PORTFOLIOS TRUST — MASTER INVESTMENT PORTFOLIOS |
| The Paradigm Portfolio |
Portfolio of Investments — June 30, 2016 (Unaudited) — (Continued) |
| | | | | | | | |
| COMMON STOCKS — 85.68% | | | Shares | | | Value | |
| Asset Management — 6.72% | | | | | | | |
| Associated Capital Group, Inc. — Class A | | | 1,200 | | $ | 34,416 | |
| Brookfield Asset Management Inc. — Class A | | | 956,100 | | | 31,618,227 | |
| Onex Corporation | | | 297,300 | | | 18,165,030 | |
| Partners Value Investments LP* | | | 800 | | | 16,075 | |
| RIT Capital Partners plc | | | 20,600 | | | 451,123 | |
| | | | | | | 50,284,871 | |
| Beverage and Tobacco Product Manufacturing — 0.14% | | | | | | | |
| Brown-Forman Corporation — Class A | | | 450 | | | 48,614 | |
| Crimson Wine Group Limited* | | | 119,000 | | | 994,840 | |
| | | | | | | 1,043,454 | |
| Broadcasting (except Internet) — 0.84% | | | | | | | |
| CBS Corporation — Class B | | | 115,500 | | | 6,287,820 | |
| Cable Distributor — 2.44% | | | | | | | |
| Liberty Broadband Corporation — Series A* | | | 80,800 | | | 4,799,520 | |
| Liberty Broadband Corporation — Series C*^ | | | 223,900 | | | 13,434,000 | |
| | | | | | | 18,233,520 | |
| Chemical Manufacturing — 0.10% | | | | | | | |
| Platform Specialty Products Corporation*^ | | | 83,700 | | | 743,256 | |
| E-Commerce — 2.72% | | | | | | | |
| Liberty Interactive Corporation — Class A* | | | 518,200 | | | 13,146,734 | |
| Liberty Ventures — Series A* | | | 195,600 | | | 7,250,892 | |
| | | | | | | 20,397,626 | |
| Electrical Equipment, Appliance, and Component Manufacturing — 0.00% | | | | | | | |
| Danaher Corporation | | | 100 | | | 10,100 | |
| Food Manufacturing — 0.06% | | | | | | | |
| The Kraft Heinz Company | | | 4,800 | | | 424,704 | |
| Gaming — 1.24% | | | | | | | |
| Las Vegas Sands Corp. | | | 98,000 | | | 4,262,020 | |
| MGM Resorts International* | | | 86,900 | | | 1,966,547 | |
| Wynn Resorts Limited^ | | | 34,000 | | | 3,081,760 | |
| | | | | | | 9,310,327 | |
| General Merchandise Stores — 0.35% | | | | | | | |
| Sears Canada Inc.*^ | | | 271,200 | | | 808,176 | |
| Sears Holdings Corporation*^ | | | 132,600 | | | 1,804,686 | |
| | | | | | | 2,612,862 | |
The accompanying notes are an integral part of these financial statements.
97
| KINETICS PORTFOLIOS TRUST — MASTER INVESTMENT PORTFOLIOS |
| The Paradigm Portfolio |
Portfolio of Investments — June 30, 2016 (Unaudited) — (Continued) |
| | | | Shares | | | Value | |
| Global Exchanges — 0.05% | | | | | | | |
| JSE Limited | | | 28,000 | | $ | 351,749 | |
| Holding Company — 6.83% | | | | | | | |
| Bollore SA | | | 449,400 | | | 1,521,108 | |
| Dundee Corporation — Class A* | | | 141,400 | | | 831,432 | |
| Icahn Enterprises LP | | | 758,500 | | | 40,959,000 | |
| Leucadia National Corporation | | | 376,200 | | | 6,519,546 | |
| Siem Industries Inc.* | | | 26,900 | | | 1,318,100 | |
| | | | | | | 51,149,186 | |
| Insurance Carriers and Related Activities — 2.05% | | | | | | | |
| Markel Corporation* | | | 16,100 | | | 15,339,758 | |
| Lessors of Nonresidential Buildings (except Miniwarehouses) — 11.63% | | | | | | | |
| The Howard Hughes Corporation* | | | 745,300 | | | 85,202,696 | |
| Rouse Properties, Inc. | | | 101,000 | | | 1,843,250 | |
| | | | | | | 87,045,946 | |
| Lessors of Residential Buildings and Dwellings — 1.00% | | | | | | | |
| Equity Lifestyle Properties, Inc. — REIT | | | 93,600 | | | 7,492,680 | |
| Media — 8.03% | | | | | | | |
| Discovery Communications, Inc. — Class A* | | | 178,400 | | | 4,501,032 | |
| Discovery Communications, Inc. — Class C* | | | 90,300 | | | 2,153,655 | |
| Liberty Braves Group — Class A* | | | 43,000 | | | 646,720 | |
| Liberty Braves Group — Class C*^ | | | 70,400 | | | 1,032,064 | |
| Liberty Media Group — Class A* | | | 104,300 | | | 1,996,302 | |
| Liberty Media Group — Class C* | | | 146,600 | | | 2,781,002 | |
| Liberty SiriusXM Group — Class A* | | | 412,900 | | | 12,948,544 | |
| Liberty SiriusXM Group — Class C* | | | 680,100 | | | 20,994,687 | |
| Scripps Networks Interactive — Class A | | | 22,200 | | | 1,382,394 | |
| Starz — Class A* | | | 353,200 | | | 10,567,744 | |
| Viacom Inc. — Class B | | | 26,500 | | | 1,098,955 | |
| | | | | | | 60,103,099 | |
| Mining (except Oil and Gas) — 2.53% | | | | | | | |
| Franco-Nevada Corporation^ | | | 246,100 | | | 18,718,366 | |
| Silver Wheaton Corporation | | | 10,000 | | | 235,300 | |
| | | | | | | 18,953,666 | |
| Motion Picture and Sound Recording Industries — 4.70% | | | | | | | |
| DreamWorks Animation SKG, Inc. — Class A* | | | 861,000 | | | 35,189,070 | |
The accompanying notes are an integral part of these financial statements.
98
| KINETICS PORTFOLIOS TRUST — MASTER INVESTMENT PORTFOLIOS |
| The Paradigm Portfolio |
Portfolio of Investments — June 30, 2016 (Unaudited) — (Continued) |
| | | | Shares | | | Value | |
| Motor Vehicle and Parts Dealers — 2.82% | | | | | | | |
| AutoNation, Inc.* | | | 449,800 | | $ | 21,131,604 | |
| Oil and Gas — 13.84% | | | | | | | |
| PrairieSky Royalty Limited | | | 1,000 | | | 18,741 | |
Texas Pacific Land Trustc | | | 614,240 | | | 103,591,576 | |
| | | | | | | 103,610,317 | |
| Oil and Gas Extraction — 1.70% | | | | | | | |
| Atlas Energy Group LLC* | | | 580,000 | | | 304,500 | |
| Canadian Natural Resources Limited | | | 37,800 | | | 1,165,374 | |
| Continental Resources, Inc.*^ | | | 102,100 | | | 4,622,067 | |
| Tourmaline Oil Corp.* | | | 251,200 | | | 6,612,726 | |
| | | | | | | 12,704,667 | |
| Oil Refining — 0.01% | | | | | | | |
| Par Pacific Holdings, Inc.* | | | 4,000 | | | 61,360 | |
| Other Exchanges — 3.47% | | | | | | | |
| CBOE Holdings Inc. | | | 380,800 | | | 25,368,896 | |
| Urbana Corporation — Class A | | | 363,300 | | | 601,774 | |
| | | | | | | 25,970,670 | |
| Performing Arts, Spectator Sports, and Related Industries — 2.47% | | | | | | | |
| Live Nation Entertainment, Inc.* | | | 787,800 | | | 18,513,300 | |
| Plastics and Rubber Products Manufacturing — 1.88% | | | | | | | |
| Newell Brands, Inc. | | | 289,800 | | | 14,075,586 | |
| Professional, Scientific, and Technical Services — 0.05% | | | | | | | |
| Brookfield Business Partners LP* | | | 19,248 | | | 367,444 | |
| Real Estate — 1.84% | | | | | | | |
| Brookfield Property Partners LP^ | | | 71,064 | | | 1,596,098 | |
| Dream Unlimited Corp. — Class A*^ | | | 306,000 | | | 1,890,073 | |
| Forest City Realty Trust, Inc. — Class A | | | 462,700 | | | 10,322,837 | |
| | | | | | | 13,809,008 | |
| Restaurants — 2.04% | | | | | | | |
| The Wendy's Company | | | 1,588,900 | | | 15,285,218 | |
| Satellite Telecommunications — 3.48% | | | | | | | |
| DISH Network Corp. — Class A* | | | 249,000 | | | 13,047,600 | |
| EchoStar Corporation — Class A* | | | 327,300 | | | 12,993,810 | |
| | | | | | | 26,041,410 | |
The accompanying notes are an integral part of these financial statements.
99
| KINETICS PORTFOLIOS TRUST — MASTER INVESTMENT PORTFOLIOS |
| The Paradigm Portfolio |
Portfolio of Investments — June 30, 2016 (Unaudited) — (Continued) |
| | | | Shares | | | Value | |
| Securities, Commodity Contracts, and Other Financial Investments and | | | | | | | |
| Related Activities — 0.30% | | | | | | | |
| The Bitcoin Investment Trust*^ | | | 18,600 | | $ | 2,223,630 | |
| Utilities — 0.35% | | | | | | | |
| Brookfield Infrastructure Partners LP^ | | | 58,600 | | | 2,652,236 | |
| TOTAL COMMON STOCKS | | | | | | | |
| (cost $439,363,440) | | | | | | 641,420,144 | |
| | | | | | | | |
| PREFERRED STOCKS — 0.00% | | | | | | | |
| Asset Management — 0.00% | | | | | | | |
| Partners Value Investments LP — Class A* | | | 218 | | | 5,443 | |
| TOTAL PREFERRED STOCKS | | | | | | | |
| (cost $1,764) | | | | | | 5,443 | |
| | | | | | | | |
| | | | Principal | | | | |
| ESCROW NOTES — 0.00% | | | Amount | | | | |
| Special Purpose Entity — 0.00% | | | | | | | |
| Adelphia Communications Corp.*+ | | $ | 200,000 | | | — | |
| TOTAL ESCROW NOTES | | | | | | | |
| (cost $0) | | | | | | — | |
| | | | | | | | |
| PURCHASED PUT OPTIONS — 0.01% | | | Contractsd | | | | |
| Funds, Trusts, and Other Financial Vehicles — 0.01% | | | | | | | |
| ProShares Ultra VIX Short-Term Futures ETF* | | | | | | | |
| Expiration Date: January 2017, Exercise Price: $20.00 | | | 18 | | | 23,715 | |
| Expiration Date: January 2017, Exercise Price: $25.00 | | | 18 | | | 31,365 | |
| TOTAL PURCHASED PUT OPTIONS | | | | | | | |
| (cost $52,508) | | | | | | 55,080 | |
| | | | | | | | |
| WARRANTS — 0.05% | | | Shares | | | | |
| Asset Management — 0.00% | | | | | | | |
| Partners Value Investments LP* | | | 800 | | | 62 | |
| General Merchandise Stores — 0.05% | | | | | | | |
| Sears Holdings Corporation*^ | | | 94,631 | | | 378,524 | |
| TOTAL WARRANTS | | | | | | | |
| (cost $1,570,023) | | | | | | 378,586 | |
The accompanying notes are an integral part of these financial statements.
100
| KINETICS PORTFOLIOS TRUST — MASTER INVESTMENT PORTFOLIOS |
| The Paradigm Portfolio |
Portfolio of Investments — June 30, 2016 (Unaudited) — (Continued) |
| SHORT-TERM INVESTMENTS — 14.06% | | Shares | | | Value | |
| Money Market Funds — 0.00% | | | | | | |
Fidelity Institutional Government Portfolio — Class I, 0.26%b | | | 11,372 | | | $ | 11,372 | |
| | | | | | | | | |
| | | Principal | | | | | |
| | | Amount | | | | | |
| U.S. Treasury Obligations — 14.06% | | | | | | | | |
| United States Treasury Bills, Maturity Date: 07/14/2016, | | | | | | | | |
| Yield to Maturity 0.18% | | $ | 34,092,000 | | | | 34,090,568 | |
| United States Treasury Bills, Maturity Date: 08/04/2016, | | | | | | | | |
| Yield to Maturity 0.14% | | | 2,781,000 | | | | 2,780,449 | |
| United States Treasury Bills, Maturity Date: 08/11/2016, | | | | | | | | |
| Yield to Maturity 0.17% | | | 2,829,000 | | | | 2,828,375 | |
| United States Treasury Bills, Maturity Date: 08/25/2016, | | | | | | | | |
| Yield to Maturity 0.11% | | | 65,566,000 | | | | 65,544,757 | |
| | | | | | | | 105,244,149 | |
| TOTAL SHORT-TERM INVESTMENTS | | | | | | | | |
| (cost $105,265,174) | | | | | | | 105,255,521 | |
| | | | | | | | | |
| INVESTMENTS PURCHASED WITH THE CASH | | | | | | | | |
| PROCEEDS FROM SECURITIES LENDING — 2.50% | | Shares | | | | | |
| Money Market Funds — 2.50% | | | | | | | | |
Mount Vernon Securities Lending Trust — Prime Portfolio, 0.56%b | | | 18,731,551 | | | | 18,731,551 | |
| TOTAL INVESTMENTS PURCHASED WITH THE CASH | | | | | | | | |
| PROCEEDS FROM SECURITIES LENDING | | | | | | | | |
| (cost $18,731,551) | | | | | | | 18,731,551 | |
| TOTAL INVESTMENTS — 102.30% | | | | | | | | |
| (cost $564,984,460) | | | | | | $ | 765,846,325 | |
| | |
| Percentages are stated as a percent of net assets. |
| * — | Non-income producing security. |
| ^ — | This security or a portion of this security was out on loan at June 30, 2016. Total loaned securities had a market value of $18,571,069 at June 30, 2016. The remaining contractual maturities of all of the securities lending transactions were overnight and continuous. |
| + — | Security is considered illiquid and was fair valued. The aggregate value of such securities is $0 or 0.00% of net assets. |
b — | The rate quoted is the annualized seven-day yield as of June 30, 2016. |
c — | Affiliated issuer. See note 11. |
d — | 100 shares per contract. |
| ETF — Exchange Traded Fund. |
| REIT — Real Estate Investment Trust. |
The accompanying notes are an integral part of these financial statements.
101
| KINETICS PORTFOLIOS TRUST — MASTER INVESTMENT PORTFOLIOS |
| The Medical Portfolio |
Portfolio of Investments — June 30, 2016 (Unaudited) — (Continued) |
| COMMON STOCKS — 94.58% | | Shares | | | Value | |
| Chemical Manufacturing — 8.75% | | | | | | |
| Agenus, Inc.* | | | 148 | | | $ | 600 | |
| AmpliPhi Biosciences Corp.* | | | 20 | | | | 31 | |
| Gilead Sciences, Inc. | | | 9,000 | | | | 750,780 | |
| Ionis Pharmaceuticals, Inc.* | | | 17,000 | | | | 395,930 | |
| Lonza Group AG | | | 6,000 | | | | 990,476 | |
| | | | | | | | 2,137,817 | |
| Pharmaceutical and Biotechnology — 82.31% | | | | | | | | |
| AbbVie Inc. | | | 14,000 | | | | 866,740 | |
| Alkermes plc* | | | 25,000 | | | | 1,080,500 | |
| Arena Pharmaceuticals, Inc.* | | | 45,000 | | | | 76,950 | |
| AstraZeneca plc — ADR | | | 28,000 | | | | 845,320 | |
| Biogen Inc.* | | | 6,750 | | | | 1,632,285 | |
| Bristol-Myers Squibb Company | | | 34,000 | | | | 2,500,700 | |
| Celgene Corporation* | | | 7,000 | | | | 690,410 | |
| Celldex Therapeutics Inc.* | | | 26,294 | | | | 115,431 | |
| Eli Lilly & Company | | | 23,000 | | | | 1,811,250 | |
| GlaxoSmithKline plc — ADR | | | 24,673 | | | | 1,069,328 | |
| Immune Pharmaceuticals Inc.* | | | 17 | | | | 7 | |
| Johnson & Johnson | | | 15,000 | | | | 1,819,500 | |
| Merck & Co., Inc. | | | 16,000 | | | | 921,760 | |
| Merrimack Pharmaceuticals, Inc.*^ | | | 25,000 | | | | 134,750 | |
| Novartis AG — ADR | | | 18,000 | | | | 1,485,180 | |
| Onconova Therapeutics, Inc.* | | | 2,400 | | | | 13,872 | |
| Osiris Therapeutics, Inc.^ | | | 21,000 | | | | 106,890 | |
| Pfizer, Inc. | | | 46,000 | | | | 1,619,660 | |
| Progenics Pharmaceuticals, Inc.*^ | | | 67,200 | | | | 283,584 | |
| Roche Holding AG Limited — ADR | | | 24,000 | | | | 790,800 | |
| Sanofi — ADR | | | 27,000 | | | | 1,129,950 | |
| Shire plc — ADR^ | | | 6,000 | | | | 1,104,480 | |
| Synta Pharmaceuticals Corp.* | | | 18,000 | | | | 4,683 | |
| | | | | | | | 20,104,030 | |
| Professional, Scientific, and Technical Services — 3.52% | | | | | | | | |
| Albany Molecular Research, Inc.*^ | | | 56,000 | | | | 752,640 | |
| Codexis, Inc.* | | | 5,611 | | | | 22,612 | |
| Pacific Biosciences of California Inc.* | | | 12,000 | | | | 84,420 | |
| | | | | | | | 859,672 | |
| TOTAL COMMON STOCKS | | | | | | | | |
| (cost $16,155,844) | | | | | | | 23,101,519 | |
The accompanying notes are an integral part of these financial statements.
102
| KINETICS PORTFOLIOS TRUST — MASTER INVESTMENT PORTFOLIOS |
| The Medical Portfolio |
Portfolio of Investments — June 30, 2016 (Unaudited) — (Continued) |
| RIGHTS — 0.03% | | Shares | | | Value | |
| Funds, Trusts, and Other Financial Vehicles — 0.02% | | | | | | |
| Ligand Pharmaceuticals Inc. | | | 44,000 | | | $ | 792 | |
| Ligand Pharmaceuticals Inc.* | | | 44,000 | | | | 1,677 | |
| Ligand Pharmaceuticals Inc. | | | 44,000 | | | | 1,148 | |
| Ligand Pharmaceuticals Inc.* | | | 44,000 | | | | 176 | |
| | | | | | | | 3,793 | |
| Pharmaceutical and Biotechnology — 0.01% | | | | | | | | |
| Sanofi* | | | 15,538 | | | | 3,729 | |
| TOTAL RIGHTS | | | | | | | | |
| (cost $0) | | | | | | | 7,522 | |
| | | | | | | | | |
| SHORT-TERM INVESTMENTS — 5.35% | | | | | | | | |
| Money Market Funds — 0.01% | | | | | | | | |
Fidelity Institutional Government Portfolio — Class I, 0.26%b | | | 2,293 | | | | 2,293 | |
| | | | | | | | | |
| | | Principal | | | | | |
| | | Amount | | | | | |
| U.S. Treasury Obligations — 5.34% | | | | | | | | |
| United States Treasury Bills, Maturity Date: 07/14/2016, | | | | | | | | |
| Yield to Maturity 0.18% | | $ | 547,000 | | | | 546,977 | |
| United States Treasury Bills, Maturity Date: 08/25/2016, | | | | | | | | |
| Yield to Maturity 0.11% | | | 758,000 | | | | 757,754 | |
| | | | | | | | 1,304,731 | |
| TOTAL SHORT-TERM INVESTMENTS | | | | | | | | |
| (cost $1,307,130) | | | | | | | 1,307,024 | |
| | | | | | | | | |
| INVESTMENTS PURCHASED WITH THE CASH | | | | | | | | |
| PROCEEDS FROM SECURITIES LENDING — 8.98% | | Shares | | | | | |
| Money Market Funds — 8.98% | | | | | | | | |
Mount Vernon Securities Lending Trust — Prime Portfolio, 0.56%b | | | 2,192,568 | | | | 2,192,568 | |
| TOTAL INVESTMENTS PURCHASED WITH THE CASH | | | | | | | | |
| PROCEEDS FROM SECURITIES LENDING | | | | | | | | |
| (cost $2,192,568) | | | | | | | 2,192,568 | |
| TOTAL INVESTMENTS — 108.94% | | | | | | | | |
| (cost $19,655,542) | | | | | | $ | 26,608,633 | |
The accompanying notes are an integral part of these financial statements.
103
| KINETICS PORTFOLIOS TRUST — MASTER INVESTMENT PORTFOLIOS |
| The Medical Portfolio |
Portfolio of Investments — June 30, 2016 (Unaudited) — (Continued) |
Percentages are stated as a percent of net assets.
| * — | Non-income producing security. |
| ^ — | This security or a portion of this security was out on loan at June 30, 2016. Total loaned securities had a market value of $2,168,276 at June 30, 2016. The remaining contractual maturities of all of the securities lending transactions were overnight and continuous. |
b — | The rate quoted is the annualized seven-day yield as of June 30, 2016. |
| ADR — American Depository Receipt. |
The accompanying notes are an integral part of these financial statements.
104
| KINETICS PORTFOLIOS TRUST — MASTER INVESTMENT PORTFOLIOS |
| The Small Cap Opportunities Portfolio |
Portfolio of Investments — June 30, 2016 (Unaudited) — (Continued) |
| COMMON STOCKS — 90.52% | | Shares | | | Value | |
| Asset Management — 8.24% | | | | | | |
| Associated Capital Group, Inc. — Class A | | | 19,200 | | | $ | 550,656 | |
| GAMCO Investors, Inc. — Class A | | | 19,200 | | | | 629,184 | |
| JZ Capital Partners Limited | | | 190,400 | | | | 1,029,093 | |
| Onex Corporation | | | 133,100 | | | | 8,138,783 | |
| Partners Value Investments LP* | | | 191,000 | | | | 3,837,888 | |
| RIT Capital Partners plc | | | 99,200 | | | | 2,172,398 | |
| Sprott, Inc. | | | 1,680 | | | | 3,342 | |
| | | | | | | | 16,361,344 | |
| Beverage and Tobacco Product Manufacturing — 0.50% | | | | | | | | |
| Crimson Wine Group Limited* | | | 119,600 | | | | 999,856 | |
| Chemical Manufacturing — 2.74% | | | | | | | | |
| Inter Parfums, Inc. | | | 102,600 | | | | 2,931,282 | |
| Platform Specialty Products Corporation*^ | | | 283,600 | | | | 2,518,368 | |
| | | | | | | | 5,449,650 | |
| Construction of Buildings — 1.02% | | | | | | | | |
| Green Brick Partners, Inc.*^ | | | 109,300 | | | | 794,611 | |
| TRI Pointe Group, Inc.* | | | 104,200 | | | | 1,231,644 | |
| | | | | | | | 2,026,255 | |
| Credit Intermediation and Related Activities — 1.24% | | | | | | | | |
| Emergent Capital, Inc.*^ | | | 735,250 | | | | 2,470,440 | |
| Electronics and Appliance Stores — 1.28% | | | | | | | | |
| Sears Hometown and Outlet Stores Inc.*^ | | | 375,700 | | | | 2,532,218 | |
| Forestry and Logging — 0.02% | | | | | | | | |
| Keweenaw Land Association Limited* | | | 380 | | | | 32,490 | |
| Gaming — 2.52% | | | | | | | | |
| Tropicana Entertainment Inc.* | | | 256,600 | | | | 5,003,674 | |
| General Merchandise Stores — 1.24% | | | | | | | | |
| Sears Canada Inc.*^ | | | 613,100 | | | | 1,827,038 | |
| Sears Holdings Corporation*^ | | | 46,500 | | | | 632,865 | |
| | | | | | | | 2,459,903 | |
| Holding Company — 11.67% | | | | | | | | |
| Dundee Corporation — Class A* | | | 854,700 | | | | 5,025,636 | |
| Icahn Enterprises LP | | | 336,294 | | | | 18,159,876 | |
| | | | | | | | 23,185,512 | |
The accompanying notes are an integral part of these financial statements.
105
| KINETICS PORTFOLIOS TRUST — MASTER INVESTMENT PORTFOLIOS |
| The Small Cap Opportunities Portfolio |
Portfolio of Investments — June 30, 2016 (Unaudited) — (Continued) |
| | | Shares | | | Value | |
| Insurance Carriers and Related Activities — 1.03% | | | | | | |
| AmTrust Financial Services, Inc. | | | 49,800 | | | $ | 1,220,100 | |
| Greenlight Capital Re, Limited — Class A* | | | 41,000 | | | | 826,560 | |
| | | | | | | | 2,046,660 | |
| Lessors of Nonresidential Buildings (except Miniwarehouses) — 8.65% | | | | | | | | |
| The Howard Hughes Corporation* | | | 150,200 | | | | 17,170,864 | |
| Machinery Manufacturing — 0.46% | | | | | | | | |
| Colfax Corporation* | | | 34,500 | | | | 912,870 | |
| Manufactured Brands — 0.51% | | | | | | | | |
| Movado Group, Inc. | | | 46,700 | | | | 1,012,456 | |
| Media — 0.98% | | | | | | | | |
| Starz — Class A* | | | 65,000 | | | | 1,944,800 | |
| Merchant Wholesalers, Durable Goods — 0.46% | | | | | | | | |
| Dorman Products, Inc.* | | | 15,800 | | | | 903,760 | |
| Mining (except Oil and Gas) — 0.31% | | | | | | | | |
| McEwen Mining Inc.^ | | | 160,600 | | | | 618,310 | |
| Motion Picture and Sound Recording Industries — 7.06% | | | | | | | | |
| DreamWorks Animation SKG, Inc. — Class A* | | | 343,300 | | | | 14,030,671 | |
| Motor Vehicle and Parts Dealers — 0.50% | | | | | | | | |
| Penske Automotive Group, Inc. | | | 31,700 | | | | 997,282 | |
| Oil and Gas — 17.11% | | | | | | | | |
| Permian Basin Royalty Trust | | | 165,500 | | | | 1,213,115 | |
| Texas Pacific Land Trust | | | 194,298 | | | | 32,768,358 | |
| | | | | | | | 33,981,473 | |
| Oil and Gas Extraction — 0.00% | | | | | | | | |
| Biloxi Marsh Lands Corporation | | | 100 | | | | 1,639 | |
| Oil Refining — 0.70% | | | | | | | | |
| Par Pacific Holdings, Inc.* | | | 90,719 | | | | 1,391,630 | |
| Other Exchanges — 0.58% | | | | | | | | |
| Urbana Corporation — Class A | | | 695,071 | | | | 1,151,323 | |
| Performing Arts, Spectator Sports, and Related Industries — 3.00% | | | | | | | | |
| Live Nation Entertainment, Inc.* | | | 253,500 | | | | 5,957,250 | |
| Pipeline Transportation — 1.40% | | | | | | | | |
| Rubis SCA | | | 36,250 | | | | 2,772,958 | |
| Plastics and Rubber Products Manufacturing — 4.61% | | | | | | | | |
| Newell Brands, Inc. | | | 188,479 | | | | 9,154,425 | |
The accompanying notes are an integral part of these financial statements.
106
| KINETICS PORTFOLIOS TRUST — MASTER INVESTMENT PORTFOLIOS |
| The Small Cap Opportunities Portfolio |
Portfolio of Investments — June 30, 2016 (Unaudited) — (Continued) |
| | | Shares | | | Value | |
| Publishing Industries (except Internet) — 0.24% | | | | | | |
| Promotora de Informaciones S.A. — ADR* | | | 64,644 | | | $ | 346,492 | |
| Value Line, Inc. | | | 7,615 | | | | 124,505 | |
| | | | | | | | 470,997 | |
| Real Estate — 6.93% | | | | | | | | |
| Dream Unlimited Corp. — Class A*^ | | | 2,230,000 | | | | 13,774,062 | |
| Rental and Leasing Services — 0.02% | | | | | | | | |
| Comdisco Holding Company, Inc.* | | | 7,560 | | | | 32,962 | |
| Restaurants — 4.30% | | | | | | | | |
| The Wendy's Company | | | 887,500 | | | | 8,537,750 | |
| Satellite Telecommunications — 0.20% | | | | | | | | |
| Loral Space & Communications Inc.* | | | 11,400 | | | | 402,078 | |
| Securities, Commodity Contracts, and Other Financial Investments and | | | | | | | | |
| Related Activities — 0.08% | | | | | | | | |
| The Bitcoin Investment Trust* | | | 1,300 | | | | 155,415 | |
| Telecommunications — 0.05% | | | | | | | | |
| CIBL, Inc.* | | | 18 | | | | 22,896 | |
| ICTC Group Inc.* | | | 208 | | | | 4,160 | |
| LICT Corporation* | | | 16 | | | | 78,400 | |
| | | | | | | | 105,456 | |
| Transportation Equipment Manufacturing — 0.87% | | | | | | | | |
| American Railcar Industries, Inc.^ | | | 44,000 | | | | 1,736,680 | |
| TOTAL COMMON STOCKS | | | | | | | | |
| (cost $208,059,834) | | | | | | | 179,785,113 | |
| | | | | | | | | |
| PREFERRED STOCKS — 0.66% | | | | | | | | |
| Asset Management — 0.66% | | | | | | | | |
| Partners Value Investments LP — Class A* | | | 51,933 | | | | 1,299,578 | |
| TOTAL PREFERRED STOCKS | | | | | | | | |
| (cost $420,822) | | | | | | | 1,299,578 | |
| | | | | | | | | |
| RIGHTS — 0.19% | | | | | | | | |
| Rental and Leasing Services — 0.19% | | | | | | | | |
| Comdisco Holding Company, Inc.*# | | | 5,634,807 | | | | 385,984 | |
| TOTAL RIGHTS | | | | | | | | |
| (cost $1,088,543) | | | | | | | 385,984 | |
The accompanying notes are an integral part of these financial statements.
107
| KINETICS PORTFOLIOS TRUST — MASTER INVESTMENT PORTFOLIOS |
| The Small Cap Opportunities Portfolio |
Portfolio of Investments — June 30, 2016 (Unaudited) — (Continued) |
| WARRANTS — 0.03% | | Shares | | | Value | |
| Asset Management — 0.01% | | | | | | |
| Partners Value Investments LP* | | | 191,000 | | | $ | 14,784 | |
| General Merchandise Stores — 0.02% | | | | | | | | |
| Sears Holdings Corporation*^ | | | 9,591 | | | | 38,364 | |
| TOTAL WARRANTS | | | | | | | | |
| (cost $662,408) | | | | | | | 53,148 | |
| | | | | | | | | |
| SHORT-TERM INVESTMENTS — 8.71% | | | | | | | | |
| Money Market Funds — 0.00% | | | | | | | | |
Fidelity Institutional Government Portfolio — Class I, 0.26%b | | | 833 | | | | 833 | |
| | | | | | | | | |
| | | Principal | | | | | |
| | | Amount | | | | | |
| U.S. Treasury Obligations — 8.71% | | | | | | | | |
| United States Treasury Bills, Maturity Date: 07/14/2016, | | | | | | | | |
| Yield to Maturity 0.18% | | $ | 13,296,000 | | | | 13,295,442 | |
| United States Treasury Bills, Maturity Date: 08/11/2016, | | | | | | | | |
| Yield to Maturity 0.16% | | | 4,012,000 | | | | 4,011,113 | |
| | | | | | | | 17,306,555 | |
| TOTAL SHORT-TERM INVESTMENTS | | | | | | | | |
| (cost $17,307,248) | | | | | | | 17,307,388 | |
| | | | | | | | | |
| INVESTMENTS PURCHASED WITH THE CASH | | | | | | | | |
| PROCEEDS FROM SECURITIES LENDING — 4.44% | | Shares | | | | | |
| Money Market Funds — 4.44% | | | | | | | | |
Mount Vernon Securities Lending Trust — Prime Portfolio, 0.56%b | | | 8,818,979 | | | | 8,818,979 | |
| TOTAL INVESTMENTS PURCHASED WITH THE CASH | | | | | | | | |
| PROCEEDS FROM SECURITIES LENDING | | | | | | | | |
| (cost $8,818,979) | | | | | | | 8,818,979 | |
| TOTAL INVESTMENTS — 104.55% | | | | | | | | |
| (cost $236,357,834) | | | | | | $ | 207,650,190 | |
The accompanying notes are an integral part of these financial statements.
108
| KINETICS PORTFOLIOS TRUST — MASTER INVESTMENT PORTFOLIOS |
| The Small Cap Opportunities Portfolio |
Portfolio of Investments — June 30, 2016 (Unaudited) — (Continued) |
Percentages are stated as a percent of net assets.
| * — | Non-income producing security. |
| ^ — | This security or a portion of this security was out on loan at June 30, 2016. Total loaned securities had a market value of $8,594,044 at June 30, 2016. The remaining contractual maturities of all of the securities lending transactions were overnight and continuous. |
| # — | Contingent value right (contingent upon profitability of company). |
| b — | The rate quoted is the annualized seven-day yield as of June 30, 2016. |
| ADR — American Depository Receipt. |
The accompanying notes are an integral part of these financial statements.
109
| KINETICS PORTFOLIOS TRUST — MASTER INVESTMENT PORTFOLIOS |
| The Market Opportunities Portfolio |
Portfolio of Investments — June 30, 2016 (Unaudited) — (Continued) |
| COMMON STOCKS — 74.29% | | Shares | | | Value | |
| Asset Management — 10.22% | | | | | | |
| Associated Capital Group, Inc. — Class A | | | 200 | | | $ | 5,736 | |
| Federated Investors, Inc. — Class B | | | 3,600 | | | | 103,608 | |
| Oaktree Capital Group LLC^ | | | 9,600 | | | | 429,696 | |
| Onex Corporation | | | 39,800 | | | | 2,431,780 | |
| Partners Value Investments LP* | | | 43,516 | | | | 874,396 | |
| Senvest Capital Inc.* | | | 120 | | | | 12,632 | |
| Sprott, Inc. | | | 41,155 | | | | 81,867 | |
| | | | | | | | 3,939,715 | |
| Beverage and Tobacco Product Manufacturing — 0.11% | | | | | | | | |
| Crimson Wine Group Limited* | | | 5,080 | | | | 42,469 | |
| Credit Intermediation and Related Activities — 1.75% | | | | | | | | |
| Emergent Capital, Inc.* | | | 200,800 | | | | 674,688 | |
| Data Processor — 5.38% | | | | | | | | |
| MasterCard, Inc. — Class A | | | 7,400 | | | | 651,644 | |
| Visa, Inc. — Class A | | | 19,200 | | | | 1,424,064 | |
| | | | | | | | 2,075,708 | |
| Gaming — 3.94% | | | | | | | | |
| Tropicana Entertainment Inc.* | | | 78,000 | | | | 1,520,992 | |
| Global Exchanges — 2.54% | | | | | | | | |
| JSE Limited | | | 43,600 | | | | 547,723 | |
| London Stock Exchange Group plc | | | 12,800 | | | | 431,285 | |
| | | | | | | | 979,008 | |
| Holding Company — 10.33% | | | | | | | | |
| Clarke Inc. | | | 1,000 | | | | 7,044 | |
| Dundee Corporation — Class A* | | | 158,600 | | | | 932,568 | |
| Icahn Enterprises LP | | | 56,400 | | | | 3,045,600 | |
| | | | | | | | 3,985,212 | |
| Insurance Carriers and Related Activities — 1.57% | | | | | | | | |
| Fairfax Financial Holdings Limited | | | 60 | | | | 32,341 | |
| Markel Corporation* | | | 600 | | | | 571,668 | |
| | | | | | | | 604,009 | |
| Lessors of Nonresidential Buildings (except Miniwarehouses) — 6.91% | | | | | | | | |
| The Howard Hughes Corporation* | | | 23,300 | | | | 2,663,656 | |
| Merchant Wholesalers, Durable Goods — 0.07% | | | | | | | | |
| A-Mark Precious Metals, Inc. | | | 1,600 | | | | 25,888 | |
The accompanying notes are an integral part of these financial statements.
110
| KINETICS PORTFOLIOS TRUST — MASTER INVESTMENT PORTFOLIOS |
| The Market Opportunities Portfolio |
Portfolio of Investments — June 30, 2016 (Unaudited) — (Continued) |
| | | Shares | | | Value | |
| Mining (except Oil and Gas) — 0.01% | | | | | | |
| Silver Wheaton Corporation | | | 100 | | | $ | 2,353 | |
| Oil and Gas — 13.16% | | | | | | | | |
| Texas Pacific Land Trust | | | 30,100 | | | | 5,076,365 | |
| Other Exchanges — 5.65% | | | | | | | | |
| CBOE Holdings Inc. | | | 20,000 | | | | 1,332,400 | |
| NZX Limited | | | 359,002 | | | | 256,327 | |
| Urbana Corporation — Class A | | | 356,004 | | | | 589,689 | |
| | | | | | | | 2,178,416 | |
| Publishing Industries (except Internet) — 0.02% | | | | | | | | |
| Markit Limited* | | | 200 | | | | 6,520 | |
| Real Estate — 4.39% | | | | | | | | |
| Dream Unlimited Corp. — Class A* | | | 274,000 | | | | 1,692,419 | |
| Securities, Commodity Contracts, and Other Financial Investments and | | | | | | | | |
| Related Activities — 7.81% | | | | | | | | |
| The Bitcoin Investment Trust* | | | 5,490 | | | | 656,329 | |
| CME Group, Inc. | | | 4,000 | | | | 389,600 | |
| IntercontinentalExchange Group, Inc. | | | 2,000 | | | | 511,920 | |
| Ladenburg Thalmann Financial Services Inc.* | | | 12,000 | | | | 28,320 | |
| OTC Markets Group Inc. — Class A | | | 86,385 | | | | 1,425,353 | |
| | | | | | | | 3,011,522 | |
| Transportation — 0.03% | | | | | | | | |
| Clarkson plc | | | 400 | | | | 11,752 | |
| U.S. Equity Exchanges — 0.40% | | | | | | | | |
| NASDAQ, Inc. | | | 2,400 | | | | 155,208 | |
| TOTAL COMMON STOCKS | | | | | | | | |
| (cost $23,604,806) | | | | | | | 28,645,900 | |
| | | | | | | | | |
| PREFERRED STOCKS — 0.77% | | | | | | | | |
| Asset Management — 0.77% | | | | | | | | |
| Partners Value Investments LP — Class A* | | | 11,832 | | | | 296,086 | |
| TOTAL PREFERRED STOCKS | | | | | | | | |
| (cost $96,929) | | | | | | | 296,086 | |
The accompanying notes are an integral part of these financial statements.
111
| KINETICS PORTFOLIOS TRUST — MASTER INVESTMENT PORTFOLIOS |
| The Market Opportunities Portfolio |
Portfolio of Investments — June 30, 2016 (Unaudited) — (Continued) |
| | | Principal | | | | |
| CORPORATE BONDS — 0.01% | | Amount | | | Value | |
| General Merchandise Stores — 0.01% | | | | | | |
| Sears Holdings Corporation, 8.000%, 12/15/2019 | | $ | 5,500 | | | $ | 4,483 | |
| TOTAL CORPORATE BONDS | | | | | | | | |
| (cost $5,500) | | | | | | | 4,483 | |
| | | | | | | | |
| PURCHASED PUT OPTIONS — 0.05% | | Contractsd | | | | | |
| Funds, Trusts, and Other Financial Vehicles — 0.05% | | | | | | | | |
| ProShares Ultra VIX Short-Term Futures ETF* | | | | | | | | |
| Expiration Date: January 2017, Exercise Price: $20.00 | | | 6 | | | | 7,905 | |
| Expiration Date: January 2017, Exercise Price: $25.00 | | | 6 | | | | 10,455 | |
| TOTAL PURCHASED PUT OPTIONS | | | | | | | | |
| (cost $17,472) | | | | | | | 18,360 | |
| | | | | | | | | |
| RIGHTS — 0.00% | | Shares | | | | | |
| Asset Management — 0.00% | | | | | | | | |
| W.P. Stewart & Co., Limited*+ | | | 205 | | | | — | |
| TOTAL RIGHTS | | | | | | | | |
| (cost $0) | | | | | | | — | |
| | | | | | | | | |
| WARRANTS — 0.01% | | | | | | | | |
| Asset Management — 0.01% | | | | | | | | |
| Partners Value Investments LP* | | | 43,516 | | | | 3,368 | |
| General Merchandise Stores — 0.00% | | | | | | | | |
| Sears Holdings Corporation* | | | 193 | | | | 772 | |
| TOTAL WARRANTS | | | | | | | | |
| (cost $133,174) | | | | | | | 4,140 | |
| | | | | | | | | |
| SHORT-TERM INVESTMENTS — 25.44% | | | | | | | | |
| Money Market Funds — 0.45% | | | | | | | | |
Fidelity Institutional Government Portfolio — Class I, 0.26%b | | | 175,147 | | | | 175,147 | |
| | | | | | | | | |
| | | Principal | | | | | |
| | | Amount | | | | | |
| U.S. Treasury Obligations — 24.99% | | | | | | | | |
| United States Treasury Bills, Maturity Date: 07/14/2016, Yield to Maturity 0.18% | | $ | 9,490,000 | | | | 9,489,602 | |
| United States Treasury Bills, Maturity Date: 08/25/2016, Yield to Maturity 0.11% | | | 145,000 | | | | 144,953 | |
| | | | | | | | 9,634,555 | |
| TOTAL SHORT-TERM INVESTMENTS | | | | | | | | |
| (cost $9,809,506) | | | | | | | 9,809,702 | |
The accompanying notes are an integral part of these financial statements.
112
| KINETICS PORTFOLIOS TRUST — MASTER INVESTMENT PORTFOLIOS |
| The Market Opportunities Portfolio |
Portfolio of Investments — June 30, 2016 (Unaudited) — (Continued) |
| INVESTMENTS PURCHASED WITH THE CASH | | | | | | |
| PROCEEDS FROM SECURITIES LENDING — 0.21% | | Shares | | | Value | |
| Money Market Funds — 0.21% | | | | | | |
Mount Vernon Securities Lending Trust — Prime Portfolio, 0.56%b | | | 81,900 | | | $ | 81,900 | |
| TOTAL INVESTMENTS PURCHASED WITH THE CASH | | | | | | | | |
| PROCEEDS FROM SECURITIES LENDING | | | | | | | | |
| (cost $81,900) | | | | | | | 81,900 | |
| TOTAL INVESTMENTS — 100.78% | | | | | | | | |
| (cost $33,749,287) | | | | | | $ | 38,860,571 | |
Percentages are stated as a percent of net assets.
| * — | Non-income producing security. |
| ^ — | This security or a portion of this security was out on loan at June 30, 2016. Total loaned securities had a market value of $80,568 at June 30, 2016. The remaining contractual maturities of all of the securities lending transactions were overnight and continuous. |
| + — | Security is considered illiquid and was fair valued. The aggregate value of such securities is $0 or 0.00% of net assets. |
b — | The rate quoted is the annualized seven-day yield as of June 30, 2016. |
d — | 100 shares per contract. |
| ETF — Exchange Traded Fund. |
The accompanying notes are an integral part of these financial statements.
113
| KINETICS PORTFOLIOS TRUST — MASTER INVESTMENT PORTFOLIOS |
| The Alternative Income Portfolio |
Portfolio of Investments — June 30, 2016 (Unaudited) — (Continued) |
| | | Principal | | | | |
| CORPORATE BONDS — 44.54% | | Amount | | | Value | |
| Beverage and Tobacco Product Manufacturing — 0.75% | | | | | | |
| PepsiCo, Inc., 0.950%, 02/22/2017# | | $ | 200,000 | | | $ | 200,273 | |
| Computer and Electronic Product Manufacturing — 1.70% | | | | | | | | |
| Apple, Inc., 1.050%, 05/05/2017# | | | 250,000 | | | | 250,620 | |
| Intel Corp., 1.950%, 10/01/2016 | | | 200,000 | | | | 200,620 | |
| | | | | | | | 451,240 | |
| Consumer Staples — 0.75% | | | | | | | | |
| The Procter & Gamble Company, 0.750%, 11/04/2016 | | | 200,000 | | | | 200,044 | |
| Credit Intermediation and Related Activities — 7.45% | | | | | | | | |
| Branch Banking & Trust Company, 1.450%, 10/03/2016 | | | 180,000 | | | | 180,155 | |
| Capital One Bank (USA), NA, 1.200%, 02/13/2017 | | | 250,000 | | | | 250,162 | |
| Citigroup Inc., 1.300%, 11/15/2016 | | | 350,000 | | | | 350,183 | |
| John Deere Capital Corporation, 1.050%, 12/15/2016 | | | 200,000 | | | | 200,267 | |
| Key Bank NA, 1.100%, 11/25/2016 | | | 250,000 | | | | 250,156 | |
| Manufacturers and Traders Trust Company, 1.400%, 07/25/2017# | | | 300,000 | | | | 300,356 | |
| PNC Bank NA, 1.300%, 10/03/2016 | | | 250,000 | | | | 250,265 | |
| Wells Fargo & Company, 1.250%, 07/20/2016 | | | 200,000 | | | | 200,047 | |
| | | | | | | | 1,981,591 | |
| Electrical Equipment, Appliance, and Component Manufacturing — 0.38% | | | | | | | | |
| Whirlpool Corporation, 1.350%, 03/01/2017 | | | 100,000 | | | | 100,185 | |
| Food and Beverage Stores — 1.13% | | | | | | | | |
| The Kroger Co., 1.200%, 10/17/2016 | | | 300,000 | | | | 300,386 | |
| Food Manufacturing — 1.70% | | | | | | | | |
| Kellogg Company, 1.875%, 11/17/2016 | | | 100,000 | | | | 100,401 | |
| The Kraft Heinz Company, 2.000%, 09/12/2016 | | | 150,000 | | | | 150,142 | |
| William Wrigley Jr. Company, 1.400%, 10/21/2016, | | | | | | | | |
Acquired 10/28/2013 at $200,150■ | | | 200,000 | | | | 200,319 | |
| | | | | | | | 450,862 | |
| Food Services and Drinking Places — 1.51% | | | | | | | | |
| Starbucks Corporation, 0.875%, 12/05/2016 | | | 400,000 | | | | 400,572 | |
| Health and Personal Care Stores — 0.75% | | | | | | | | |
| CVS Health Corporation, 1.200%, 12/05/2016 | | | 200,000 | | | | 200,337 | |
| Holding Company — 0.94% | | | | | | | | |
| Berkshire Hathaway Finance Corp., 0.950%, 08/15/2016# | | | 250,000 | | | | 250,092 | |
| Household and Personal Products — 0.75% | | | | | | | | |
| Colgate-Palmolive Company, 1.300%, 01/15/2017# | | | 200,000 | | | | 200,804 | |
The accompanying notes are an integral part of these financial statements.
114
| KINETICS PORTFOLIOS TRUST — MASTER INVESTMENT PORTFOLIOS |
| The Alternative Income Portfolio |
Portfolio of Investments — June 30, 2016 (Unaudited) — (Continued) |
| | | Principal | | | | |
| | | Amount | | | Value | |
| Insurance Carriers and Related Activities — 3.77% | | | | | | |
| Aetna Inc., 1.750%, 05/15/2017# | | $ | 300,000 | | | $ | 301,679 | |
| American International Group, Inc., 5.450%, 05/18/2017# | | | 400,000 | | | | 414,941 | |
| UnitedHealth Group Inc., 1.875%, 11/15/2016 | | | 285,000 | | | | 286,081 | |
| | | | | | | | 1,002,701 | |
| Machinery Manufacturing — 2.04% | | | | | | | | |
| Cameron International Corporation, 1.400%, 06/15/2017 | | | 242,000 | | | | 242,148 | |
| Illinois Tool Works, Inc., 0.900%, 02/25/2017# | | | 300,000 | | | | 300,225 | |
| | | | | | | | 542,373 | |
| Merchant Wholesalers, Nondurable Goods — 1.13% | | | | | | | | |
| AmerisourceBergen Corporation, 1.150%, 05/15/2017 | | | 300,000 | | | | 299,987 | |
| Miscellaneous Manufacturing — 3.97% | | | | | | | | |
| 3M Co., 1.375%, 09/29/2016 | | | 250,000 | | | | 250,466 | |
| Becton Dickinson and Co. | | | | | | | | |
| 1.450%, 05/15/2017 | | | 300,000 | | | | 300,844 | |
| 1.800%, 12/15/2017 | | | 300,000 | | | | 302,560 | |
| Stryker Corporation, 2.000%, 09/30/2016 | | | 200,000 | | | | 200,595 | |
| | | | | | | | 1,054,465 | |
| Motor Vehicle and Parts Dealers — 0.94% | | | | | | | | |
| AutoZone, Inc., 1.300%, 01/13/2017 | | | 250,000 | | | | 250,589 | |
| Petroleum and Coal Products Manufacturing — 3.40% | | | | | | | | |
| Exxon Mobil Corporation, 0.921%, 03/15/2017# | | | 200,000 | | | | 200,259 | |
| Hess Corporation, 1.300%, 06/15/2017 | | | 350,000 | | | | 347,739 | |
| Phillips 66, 2.950%, 05/01/2017 | | | 350,000 | | | | 355,195 | |
| | | | | | | | 903,193 | |
| Pharmaceutical and Biotechnology — 3.20% | | | | | | | | |
| Johnson & Johnson, 0.700%, 11/28/2016# | | | 300,000 | | | | 299,811 | |
| Medtronic, Inc., 0.875%, 02/27/2017# | | | 250,000 | | | | 249,957 | |
| Pfizer, Inc., 1.100%, 05/15/2017# | | | 300,000 | | | | 300,692 | |
| | | | | | | | 850,460 | |
| Support Activities for Mining — 0.94% | | | | | | | | |
| Schlumberger Investment SA, 1.950%, 09/14/2016, | | | | | | | | |
Acquired 01/10/2014 at $250,518■ | | | 250,000 | | | | 250,570 | |
| Support Activities for Transportation — 0.65% | | | | | | | | |
| GATX Corporation, 3.500%, 07/15/2016 | | | 172,000 | | | | 172,101 | |
The accompanying notes are an integral part of these financial statements.
115
| KINETICS PORTFOLIOS TRUST — MASTER INVESTMENT PORTFOLIOS |
| The Alternative Income Portfolio |
Portfolio of Investments — June 30, 2016 (Unaudited) — (Continued) |
| | | Principal | | | | |
| | | Amount | | | Value | |
| Telecommunications — 1.70% | | | | | | |
| AT&T, Inc., 2.400%, 03/15/2017 | | $ | 250,000 | | | $ | 252,157 | |
| Vodafone Group plc, 1.625%, 03/20/2017 | | | 200,000 | | | | 200,609 | |
| | | | | | | | 452,766 | |
| Transportation Equipment Manufacturing — 2.04% | | | | | | | | |
| Lockheed Martin Corp., 2.125%, 09/15/2016 | | | 250,000 | | | | 250,694 | |
| VW Credit, Inc., 1.875%, 10/13/2016 | | | 290,000 | | | | 290,509 | |
| | | | | | | | 541,203 | |
| Utilities — 1.51% | | | | | | | | |
| Duke Energy Corporation, 2.150%, 11/15/2016 | | | 400,000 | | | | 401,567 | |
| Waste Management and Remediation Services — 1.44% | | | | | | | | |
| Waste Management, Inc., 2.600%, 09/01/2016 | | | 383,000 | | | | 383,888 | |
| TOTAL CORPORATE BONDS | | | | | | | | |
| (cost $11,830,879) | | | | | | | 11,842,249 | |
| | | | | | | | | |
| U.S. TREASURY OBLIGATIONS — 7.92% | | | | | | | | |
| United States Treasury Notes — 7.92% | | | | | | | | |
| 0.625%, 07/15/2016# | | | 250,000 | | | | 250,043 | |
| 0.625%, 10/15/2016# | | | 300,000 | | | | 300,248 | |
| 0.625%, 02/15/2017# | | | 200,000 | | | | 200,235 | |
| 0.750%, 06/30/2017 | | | 500,000 | | | | 501,221 | |
| 0.875%, 08/15/2017# | | | 850,000 | | | | 853,271 | |
| TOTAL U.S. TREASURY OBLIGATIONS | | | | | | | | |
| (cost $2,097,535) | | | | | | | 2,105,018 | |
| | | | | | | | | |
| EXCHANGE TRADED FUNDS — 21.94% | | Shares | | | | | |
| Funds, Trusts, and Other Financial Vehicles — 21.94% | | | | | | | | |
| iShares 1-3 Year Credit Bond ETF | | | 27,000 | | | | 2,864,430 | |
| PIMCO Enhanced Short Maturity ETF | | | 4,700 | | | | 475,499 | |
| SPDR Barclays Short Term Corporate Bond ETF# | | | 24,000 | | | | 738,720 | |
| Vanguard Short-Term Corporate Bond ETF | | | 21,700 | | | | 1,754,228 | |
| TOTAL EXCHANGE TRADED FUNDS | | | | | | | | |
| (cost $5,804,793) | | | | | | | 5,832,877 | |
The accompanying notes are an integral part of these financial statements.
116
| KINETICS PORTFOLIOS TRUST — MASTER INVESTMENT PORTFOLIOS |
| The Alternative Income Portfolio |
Portfolio of Investments — June 30, 2016 (Unaudited) — (Continued) |
| SHORT-TERM INVESTMENTS — 25.55% | | Shares | | | Value | |
| Money Market Funds — 0.89% | | | | | | |
Fidelity Institutional Government Portfolio — Class I, 0.26%#b | | | 237,184 | | | $ | 237,184 | |
| | | | | | | | | |
| | | Principal | | | | | |
| | | Amount | | | | | |
| U.S. Treasury Obligations — 24.66% | | | | | | | | |
| United States Treasury Bills, Maturity Date: 07/14/2016, | | | | | | | | |
| Yield to Maturity 0.18% | | $ | 3,850,000 | | | | 3,849,838 | |
| United States Treasury Bills, Maturity Date: 08/11/2016, | | | | | | | | |
| Yield to Maturity 0.20% | | | 788,000 | | | | 787,826 | |
| United States Treasury Bills, Maturity Date: 08/25/2016, | | | | | | | | |
| Yield to Maturity 0.12% | | | 1,919,000 | | | | 1,918,378 | |
| | | | | | | | 6,556,042 | |
| TOTAL SHORT-TERM INVESTMENTS | | | | | | | | |
| (cost $6,793,396) | | | | | | | 6,793,226 | |
| TOTAL INVESTMENTS — 99.95% | | | | | | | | |
| (cost $26,526,603) | | | | | | $ | 26,573,370 | |
Percentages are stated as a percent of net assets.
| # — | All or a portion of the securities have been committed as collateral for written option contracts. |
■ — | Restricted security restricted to institutional investors (144a securities); the percentage of net assets comprised of 144a securities was 1.70%. |
b — | The rate quoted is the annualized seven-day yield as of June 30, 2016. |
| ETF — Exchange Traded Fund. |
The accompanying notes are an integral part of these financial statements.
117
| KINETICS PORTFOLIOS TRUST — MASTER INVESTMENT PORTFOLIOS |
| The Multi-Disciplinary Income Portfolio |
Portfolio of Investments — June 30, 2016 (Unaudited) — (Continued) |
| | | Principal | | | | |
| CONVERTIBLE BONDS — 7.31% | | Amount | | | Value | |
| Computer and Electronic Product Manufacturing — 0.44% | | | | | | |
| Quantum Corp., 4.500%, 11/15/2017 | | $ | 500,000 | | | $ | 369,062 | |
| Mining (except Oil and Gas) — 6.25% | | | | | | | | |
| Detour Gold Corporation, 5.500%, 11/30/2017, | | | | | | | | |
Acquired 04/01/2013 at $1,006,595■ | | | 1,000,000 | | | | 1,033,125 | |
| Kirkland Lake Gold Inc., 6.000%, 06/30/2017 | | CAD 350,000 | | | | 282,761 | |
| Royal Gold, Inc., 2.875%, 06/15/2019 | | | 3,664,000 | | | | 3,938,800 | |
| | | | | | | | 5,254,686 | |
| Real Estate — 0.62% | | | | | | | | |
| Forest City Enterprises, Inc., 4.250%, 08/15/2018 | | | 446,000 | | | | 516,245 | |
| TOTAL CONVERTIBLE BONDS | | | | | | | | |
| (cost $6,052,697) | | | | | | | 6,139,993 | |
| | | | | | | | | |
| CORPORATE BONDS — 83.16% | | | | | | | | |
| Apparel Manufacturing — 3.60% | | | | | | | | |
| L Brands, Inc. | | | | | | | | |
| 6.625%, 04/01/2021 | | | 200,000 | | | | 226,000 | |
| 5.625%, 02/15/2022 | | | 2,600,000 | | | | 2,800,850 | |
| | | | | | | | 3,026,850 | |
| Broadcasting (except Internet) — 4.69% | | | | | | | | |
| Cablevision Systems Corporation, 5.875%, 09/15/2022 | | | 200,000 | | | | 179,700 | |
| CCO Holdings LLC/Capital Corporation, 5.250%, 09/30/2022 | | | 1,150,000 | | | | 1,183,062 | |
| Sinclair Television Group, Inc., 5.375%, 04/01/2021 | | | 250,000 | | | | 258,438 | |
| Sirius XM Radio, Inc. | | | | | | | | |
5.750%, 08/01/2021, Acquired 02/28/2014-03/20/2014 at $781,717■ | | | 750,000 | | | | 780,938 | |
4.625%, 05/15/2023, Acquired 04/11/2014-07/14/2015 at $1,008,361■ | | | 1,050,000 | | | | 1,022,521 | |
| TEGNA, Inc. | | | | | | | | |
| 5.125%, 10/15/2019 | | | 250,000 | | | | 257,813 | |
| 5.125%, 07/15/2020 | | | 250,000 | | | | 258,437 | |
| | | | | | | | 3,940,909 | |
| Cable Distributor — 1.46% | | | | | | | | |
| Altice Luxembourg SA, 7.750%, 05/15/2022, | | | | | | | | |
Acquired 07/02/2014 at $265,831■ | | | 250,000 | | | | 253,437 | |
| Numericable Group SA, 6.000%, 05/15/2022, | | | | | | | | |
Acquired 06/11/2014-11/04/2014 at $1,041,232■ | | | 1,000,000 | | | | 976,250 | |
| | | | | | | | 1,229,687 | |
The accompanying notes are an integral part of these financial statements.
118
| KINETICS PORTFOLIOS TRUST — MASTER INVESTMENT PORTFOLIOS |
| The Multi-Disciplinary Income Portfolio |
Portfolio of Investments — June 30, 2016 (Unaudited) — (Continued) |
| | | Principal | | | | |
| | | Amount | | | Value | |
| Chemical Manufacturing — 6.72% | | | | | | |
| Ashland Inc., 4.750%, 08/15/2022 | | $ | 3,800,000 | | | $ | 3,795,250 | |
| LSB Industries, Inc., 7.750%, 08/01/2019 | | | 1,850,000 | | | | 1,850,000 | |
| | | | | | | | 5,645,250 | |
| Construction of Buildings — 7.56% | | | | | | | | |
| Lennar Corporation, 4.750%, 11/15/2022 | | | 2,960,000 | | | | 3,022,900 | |
| TRI Pointe Holdings, Inc., 4.375%, 06/15/2019 | | | 3,295,000 | | | | 3,327,950 | |
| | | | | | | | 6,350,850 | |
| Credit Intermediation and Related Activities — 0.22% | | | | | | | | |
| Ally Financial, Inc., 8.000%, 03/15/2020 | | | 161,000 | | | | 181,527 | |
| Dialysis Equipment, Electromedical, Manufacturing — 0.37% | | | | | | | | |
| DaVita HealthCare Partners Inc., 5.750%, 08/15/2022 | | | 300,000 | | | | 315,000 | |
| E-Commerce — 4.68% | | | | | | | | |
| IAC/InterActiveCorp, 4.750%, 12/15/2022 | | | 4,250,000 | | | | 3,931,250 | |
| Food Manufacturing — 6.63% | | | | | | | | |
| Post Holdings, Inc. | | | | | | | | |
6.750%, 12/01/2021, Acquired 04/17/2014-07/14/2015 at $514,524■ | | | 500,000 | | | | 530,000 | |
| 7.375%, 02/15/2022 | | | 4,775,000 | | | | 5,037,625 | |
| | | | | | | | 5,567,625 | |
| Gaming — 4.30% | | | | | | | | |
| MGM Resorts International, 6.625%, 12/15/2021 | | | 756,000 | | | | 825,930 | |
| Wynn Las Vegas LLC | | | | | | | | |
| 5.375%, 03/15/2022^ | | | 2,300,000 | | | | 2,320,125 | |
4.250%, 05/30/2023, Acquired 07/02/2014-07/29/2014 at $488,418■ | | | 500,000 | | | | 464,375 | |
| | | | | | | | 3,610,430 | |
| Holding Company — 1.97% | | | | | | | | |
| Icahn Enterprises, 5.875%, 02/01/2022 | | | 1,750,000 | | | | 1,658,353 | |
| Hospitals — 0.22% | | | | | | | | |
| Community Health System, Inc., 7.125%, 07/15/2020^ | | | 200,000 | | | | 186,418 | |
| Lessors of Nonresidential Buildings (except Miniwarehouses) — 4.10% | | | | | | | | |
| The Howard Hughes Corporation, 6.875%, 10/01/2021, | | | | | | | | |
Acquired 03/05/2014-04/17/2014 at $3,587,447■ | | | 3,400,000 | | | | 3,442,500 | |
The accompanying notes are an integral part of these financial statements.
119
KINETICS PORTFOLIOS TRUST — MASTER INVESTMENT PORTFOLIOS The Multi-Disciplinary Income Portfolio Portfolio of Investments — June 30, 2016 (Unaudited) — (Continued) |
| | Principal | | | | |
| | | Amount | | | Value | |
| Mining (except Oil and Gas) — 1.45% | | | | | | |
| Freeport-McMoRan Inc., 3.550%, 03/01/2022^ | | $ | 1,100,000 | | | $ | 973,500 | |
| Vulcan Materials Co., 7.500%, 06/15/2021 | | | 200,000 | | | | 241,260 | |
| | | | | | | | 1,214,760 | |
| Motor Vehicle and Parts Dealers — 4.25% | | | | | | | | |
| Penske Automotive Group, Inc., 5.750%, 10/01/2022 | | | 3,550,000 | | | | 3,567,750 | |
| Nonmetallic Mineral Product Manufacturing — 0.33% | | | | | | | | |
| USG Corporation, 9.750%, 01/15/2018 | | | 250,000 | | | | 275,313 | |
| Non-Store Retailers — 5.10% | | | | | | | | |
| Sotheby's, 5.250%, 10/01/2022, | | | | | | | | |
Acquired 03/03/2014-10/03/2014 at $4,347,280■ | | | 4,426,000 | | | | 4,282,155 | |
| Oil and Gas Extraction — 0.67% | | | | | | | | |
| Continental Resources, Inc., 5.000%, 09/15/2022 | | | 100,000 | | | | 98,250 | |
| ONEOK Inc., 4.250%, 02/01/2022 | | | 230,000 | | | | 212,750 | |
| QEP Resources, Inc., 6.875%, 03/01/2021 | | | 250,000 | | | | 253,750 | |
| | | | | | | | 564,750 | |
| Pharmaceuticals — 0.33% | | | | | | | | |
| Forest Laboratories, Inc., 5.000%, 12/15/2021, | | | | | | | | |
Acquired 04/01/2014 at $261,908■ | | | 250,000 | | | | 280,106 | |
| Professional, Scientific, and Technical Services — 0.92% | | | | | | | | |
| Lamar Media Corp., 5.000%, 05/01/2023 | | | 500,000 | | | | 517,500 | |
| Nielsen Finance LLC, 4.500%, 10/01/2020 | | | 250,000 | | | | 255,625 | |
| | | | | | | | 773,125 | |
| Rail Transportation — 0.30% | | | | | | | | |
| Florida East Coast Holdings Corporation, 6.750%, 05/01/2019, | | | | | | | | |
Acquired 07/09/2014 at $261,619■ | | | 250,000 | | | | 250,000 | |
| Real Estate — 7.98% | | | | | | | | |
| Brookfield Residential Properties | | | | | | | | |
6.500%, 12/15/2020, Acquired 07/14/2014-06/19/2015 at $6,222,301■ | | | 6,000,000 | | | | 6,015,000 | |
6.125%, 07/01/2022, Acquired 04/09/2015 at $103,750■ | | | 100,000 | | | | 95,000 | |
6.375%, 05/15/2025, Acquired 06/19/2015 at $641,235■ | | | 651,000 | | | | 597,292 | |
| | | | | | | | 6,707,292 | |
| Rental and Leasing Services — 2.85% | | | | | | | | |
| Hertz Corp., 6.750%, 04/15/2019 | | | 200,000 | | | | 204,215 | |
| International Lease Finance Corp., 8.250%, 12/15/2020 | | | 1,850,000 | | | | 2,194,230 | |
| | | | | | | | 2,398,445 | |
The accompanying notes are an integral part of these financial statements.
120
| KINETICS PORTFOLIOS TRUST — MASTER INVESTMENT PORTFOLIOS |
| The Multi-Disciplinary Income Portfolio |
Portfolio of Investments — June 30, 2016 (Unaudited) — (Continued) |
| | | Principal | | | | |
| | | Amount | | | Value | |
| Satellite Telecommunications — 4.72% | | | | | | |
| Crown Castle International Corp., 4.875%, 04/15/2022 | | $ | 723,000 | | | $ | 795,806 | |
| Dish DBS Corp. | | | | | | | | |
| 4.625%, 07/15/2017 | | | 3,000,000 | | | | 3,060,000 | |
| 7.875%, 09/01/2019 | | | 100,000 | | | | 110,500 | |
| | | | | | | | 3,966,306 | |
| Software and Services — 0.85% | | | | | | | | |
| Nuance Communications, Inc., 5.375%, 08/15/2020, | | | | | | | | |
Acquired 02/14/2014-07/29/2014 at $706,105■ | | | 700,000 | | | | 715,750 | |
| Telecommunications — 4.67% | | | | | | | | |
| CenturyLink, Inc., 5.800%, 03/15/2022 | | | 500,000 | | | | 487,345 | |
| Hughes Satellite Systems Corp. | | | | | | | | |
| 6.500%, 06/15/2019 | | | 450,000 | | | | 487,688 | |
| 7.625%, 06/15/2021 | | | 500,000 | | | | 539,937 | |
| Millicom International Cellular SA, 4.750%, 05/22/2020, | | | | | | | | |
Acquired 08/28/2014 at $390,975^■ | | | 390,000 | | | | 393,413 | |
| SoftBank Group Corp., 4.500%, 04/15/2020, | | | | | | | | |
Acquired 04/24/2014-06/19/2015 at $1,412,863■ | | | 1,400,000 | | | | 1,449,000 | |
| Sprint Communications Inc., 9.000%, 11/15/2018, | | | | | | | | |
Acquired 12/30/2013 at $110,766■ | | | 100,000 | | | | 106,875 | |
| T-Mobile USA, Inc., 6.633%, 04/28/2021 | | | 350,000 | | | | 367,063 | |
| Virgin Media Secured Finance plc, 5.375%, 04/15/2021, | | | | | | | | |
Acquired 02/11/2014 at $91,463■ | | | 90,000 | | | | 91,912 | |
| | | | | | | | 3,923,233 | |
| Transportation Equipment Manufacturing — 2.18% | | | | | | | | |
| Dana Holding Corp., 5.375%, 09/15/2021 | | | 250,000 | | | | 257,313 | |
| Lear Corp., 4.750%, 01/15/2023# | | | 500,000 | | | | 516,250 | |
| Navistar International Corp., 8.250%, 11/01/2021 | | | 1,500,000 | | | | 1,061,250 | |
| | | | | | | | 1,834,813 | |
| Utilities — 0.04% | | | | | | | | |
| NRG Energy, Inc., 7.625%, 01/15/2018 | | | 34,000 | | | | 36,720 | |
| TOTAL CORPORATE BONDS | | | | | | | | |
| (cost $71,103,717) | | | | | | | 69,877,167 | |
The accompanying notes are an integral part of these financial statements.
121
| KINETICS PORTFOLIOS TRUST — MASTER INVESTMENT PORTFOLIOS |
| The Multi-Disciplinary Income Portfolio |
Portfolio of Investments — June 30, 2016 (Unaudited) — (Continued) |
| | | Principal | | | | |
| MUNICIPAL BONDS — 0.23% | | Amount | | | Value | |
| Air Transportation — 0.23% | | | | | | |
| Branson Missouri Regional Airport Transportation Development District | | | | | | |
6.000%, 07/01/2025a+ | | $ | 2,000,000 | | | $ | 110,000 | |
6.000%, 07/01/2037a+ | | | 1,500,000 | | | | 82,500 | |
| TOTAL MUNICIPAL BONDS | | | | | | | | |
| (cost $2,245,112) | | | | | | | 192,500 | |
| | | | | | | | | |
| ESCROW NOTES — 0.03% | | | | | | | | |
| Holding Company — 0.03% | | | | | | | | |
Energy Future Intermediate Holdings Co. LLCa | | | 1,000,000 | | | | 22,500 | |
| TOTAL ESCROW NOTES | | | | | | | | |
| (cost $38,520) | | | | | | | 22,500 | |
| | | | | | | | | |
| EXCHANGE TRADED NOTES — 0.01% | | Shares | | | | | |
| Credit Intermediation and Related Activities — 0.01% | | | | | | | | |
| VelocityShares Daily Inverse VIX Medium Term ETN* | | | 100 | | | | 3,872 | |
| TOTAL EXCHANGE TRADED NOTES | | | | | | | | |
| (cost $3,971) | | | | | | | 3,872 | |
| | | | | | | | | |
| MUTUAL FUNDS — 5.88% | | | | | | | | |
| Funds, Trusts, and Other Financial Vehicles — 5.88% | | | | | | | | |
| DoubleLine Opportunistic Credit Fund^ | | | 50,000 | | | | 1,339,000 | |
| Duff & Phelps Select Energy MLP Fund Inc. | | | 400 | | | | 3,152 | |
| Nuveen Energy MLP Total Return Fund | | | 400 | | | | 5,240 | |
| PIMCO Dynamic Income Fund | | | 88,000 | | | | 2,426,160 | |
| PIMCO Income Opportunity Fund | | | 9,000 | | | | 207,000 | |
| PIMCO Income Strategy Fund | | | 10,000 | | | | 102,700 | |
| PIMCO Income Strategy Fund II | | | 10,000 | | | | 92,000 | |
| Special Opportunities Fund Inc. | | | 17,200 | | | | 236,500 | |
| Tortoise Energy Infrastructure Corp.^ | | | 600 | | | | 18,468 | |
| Tortoise MLP Fund Inc. | | | 1,400 | | | | 25,830 | |
| Western Asset Mortgage Defined Opportunity Fund Inc.^ | | | 19,200 | | | | 443,904 | |
| Western Asset/Claymore Infiation-Linked Opportunities & Income Fund | | | 2,200 | | | | 24,442 | |
| Western Asset/Claymore Infiation-Linked Securities & Income Fund | | | 1,600 | | | | 18,368 | |
| TOTAL MUTUAL FUNDS | | | | | | | | |
| (cost $5,434,998) | | | | | | | 4,942,764 | |
The accompanying notes are an integral part of these financial statements.
122
| KINETICS PORTFOLIOS TRUST — MASTER INVESTMENT PORTFOLIOS |
| The Multi-Disciplinary Income Portfolio |
Portfolio of Investments — June 30, 2016 (Unaudited) — (Continued) |
| SHORT-TERM INVESTMENTS — 2.16% | | Shares | | | Value | |
| Money Market Funds — 0.00% | | | | | | |
Fidelity Institutional Government Portfolio — Class I, 0.26%b | | | 843 | | | $ | 843 | |
| | | | | | | | | |
| | | Principal | | | | | |
| | | Amount | | | | | |
| U.S. Treasury Obligations — 2.16% | | | | | | | | |
| United States Treasury Bills, Maturity Date: 07/14/2016, | | | | | | | | |
| Yield to Maturity 0.18% | | $ | 1,000 | | | | 1,000 | |
| United States Treasury Bills, Maturity Date: 08/11/2016, | | | | | | | | |
| Yield to Maturity 0.20% | | | 538,000 | | | | 537,881 | |
| United States Treasury Bills, Maturity Date: 08/25/2016, | | | | | | | | |
| Yield to Maturity 0.11% | | | 1,279,000 | | | | 1,278,585 | |
| | | | | | | | 1,817,466 | |
| TOTAL SHORT-TERM INVESTMENTS | | | | | | | | |
| (cost $1,818,505) | | | | | | | 1,818,309 | |
| | | | | | | | | |
| INVESTMENTS PURCHASED WITH THE CASH | | | | | | | | |
| PROCEEDS FROM SECURITIES LENDING — 5.69% | | Shares | | | | | |
| Money Market Funds — 5.69% | | | | | | | | |
Mount Vernon Securities Lending Trust — Prime Portfolio, 0.56%b | | | 4,781,365 | | | | 4,781,365 | |
| TOTAL INVESTMENTS PURCHASED WITH THE CASH | | | | | | | | |
| PROCEEDS FROM SECURITIES LENDING | | | | | | | | |
| (cost $4,781,365) | | | | | | | 4,781,365 | |
| TOTAL INVESTMENTS — 104.47% | | | | | | | | |
| (cost $91,478,885) | | | | | | $ | 87,778,470 | |
The accompanying notes are an integral part of these financial statements.
123
| KINETICS PORTFOLIOS TRUST — MASTER INVESTMENT PORTFOLIOS |
| The Multi-Disciplinary Income Portfolio |
Portfolio of Investments — June 30, 2016 (Unaudited) — (Continued) |
Percentages are stated as a percent of net assets.
| * — | Non-income producing security. |
| # — | All or a portion of the securities have been committed as collateral for written option contracts. |
| ^ — | This security or a portion of this security was out on loan at June 30, 2016. Total loaned securities had a market value of $4,686,329 at June 30, 2016. The remaining contractual maturities of all of the securities lending transactions were overnight and continuous. |
■ — | Restricted security restricted to institutional investors (144a securities); the percentage of net assets comprised of 144a securities was 27.11%. |
a — | Default or other conditions exist and the security is not presently accruing income. |
| + — | Security is considered illiquid. The aggregate value of such securities is $192,500 or 0.23% of net assets. |
b — | The rate quoted is the annualized seven-day yield as of June 30, 2016. |
| CAD — Canadian Dollars. |
| ETN — Exchange Traded Note. |
The accompanying notes are an integral part of these financial statements.
124
| KINETICS PORTFOLIOS TRUST — MASTER INVESTMENT PORTFOLIOS |
| The Alternative Income Portfolio |
| Portfolio of Options Written — June 30, 2016 (Unaudited) |
| PUT OPTIONS WRITTEN | | Contractsd | | | Value | |
| Accommodation | | | | | | |
| Marriott International Inc. - Class A | | | | | | |
| Expiration: January 2017, Exercise Price: $50.00 | | | 4 | | | $ | 420 | |
| Expiration: January 2017, Exercise Price: $55.00 | | | 9 | | | | 1,485 | |
| Starwood Hotels & Resorts Worldwide, Inc. | | | | | | | | |
| Expiration: January 2017, Exercise Price: $54.35 | | | 12 | | | | 330 | |
| | | | | | | | 2,235 | |
| Administrative and Support Services | | | | | | | | |
| The Priceline Group Inc. | | | | | | | | |
| Expiration: January 2017, Exercise Price: $860.00 | | | 1 | | | | 1,515 | |
| Beverage and Tobacco Product Manufacturing | | | | | | | | |
| The Coca-Cola Company | | | | | | | | |
| Expiration: January 2017, Exercise Price: $35.00 | | | 17 | | | | 638 | |
| Molson Coors Brewing Company - Class B | | | | | | | | |
| Expiration: January 2017, Exercise Price: $60.00 | | | 2 | | | | 100 | |
| PepsiCo, Inc. | | | | | | | | |
| Expiration: January 2017, Exercise Price: $80.00 | | | 3 | | | | 222 | |
| | | | | | | | 960 | |
| Broadcasting (except Internet) | | | | | | | | |
| Twenty-First Century Fox, Inc. - Class A | | | | | | | | |
| Expiration: January 2017, Exercise Price: $25.00 | | | 16 | | | | 2,080 | |
| Building Material and Garden Equipment and Supplies Dealers | | | | | | | | |
| Fastenal Company | | | | | | | | |
| Expiration: January 2017, Exercise Price: $30.00 | | | 4 | | | | 190 | |
| Expiration: January 2017, Exercise Price: $33.00 | | | 16 | | | | 1,200 | |
| | | | | | | | 1,390 | |
| Chemical Manufacturing | | | | | | | | |
| Gilead Sciences, Inc. | | | | | | | | |
| Expiration: January 2017, Exercise Price: $75.00 | | | 1 | | | | 392 | |
| Expiration: January 2017, Exercise Price: $80.00 | | | 6 | | | | 3,420 | |
| Expiration: January 2017, Exercise Price: $85.00 | | | 2 | | | | 1,610 | |
| | | | | | | | 5,422 | |
| Clothing and Clothing Accessories Stores | | | | | | | | |
| DSW Inc. - Class A | | | | | | | | |
| Expiration: January 2017, Exercise Price: $20.00 | | | 35 | | | | 6,300 | |
| Expiration: January 2017, Exercise Price: $22.50 | | | 46 | | | | 14,490 | |
The accompanying notes are an integral part of these financial statements.
125
| KINETICS PORTFOLIOS TRUST — MASTER INVESTMENT PORTFOLIOS |
| The Alternative Income Portfolio |
Portfolio of Options Written — June 30, 2016 (Unaudited) — (Continued) |
| | | Contractsd | | | Value | |
| Clothing and Clothing Accessories Stores (Continued) | | | | | | |
| Nordstrom, Inc. | | | | | | |
| Expiration: January 2017, Exercise Price: $50.15 | | | 8 | | | $ | 10,900 | |
| Tiffany & Co. | | | | | | | | |
| Expiration: January 2017, Exercise Price: $65.00 | | | 2 | | | | 1,630 | |
| Expiration: January 2017, Exercise Price: $70.00 | | | 4 | | | | 4,680 | |
| | | | | | | | 38,000 | |
| Computer and Electronic Product Manufacturing | | | | | | | | |
| Agilent Technologies, Inc. | | | | | | | | |
| Expiration: January 2017, Exercise Price: $30.00 | | | 6 | | | | 174 | |
| Apple, Inc. | | | | | | | | |
| Expiration: January 2017, Exercise Price: $80.00 | | | 6 | | | | 1,257 | |
| Cisco Systems, Inc. | | | | | | | | |
| Expiration: January 2017, Exercise Price: $20.00 | | | 12 | | | | 324 | |
| EMC Corporation | | | | | | | | |
| Expiration: January 2017, Exercise Price: $23.00 | | | 11 | | | | 423 | |
| International Business Machines Corporation | | | | | | | | |
| Expiration: January 2017, Exercise Price: $125.00 | | | 1 | | | | 290 | |
| Expiration: January 2017, Exercise Price: $130.00 | | | 4 | | | | 1,470 | |
| Texas Instruments Inc. | | | | | | | | |
| Expiration: January 2017, Exercise Price: $38.00 | | | 7 | | | | 256 | |
| | | | | | | | 4,194 | |
| Construction of Buildings | | | | | | | | |
| Lennar Corporation - Class A | | | | | | | | |
| Expiration: January 2017, Exercise Price: $30.00 | | | 21 | | | | 788 | |
| Expiration: January 2017, Exercise Price: $33.00 | | | 6 | | | | 339 | |
| TRI Pointe Group, Inc. | | | | | | | | |
| Expiration: January 2017, Exercise Price: $10.00 | | | 75 | | | | 3,750 | |
| | | | | | | | 4,877 | |
| Couriers and Messengers | | | | | | | | |
| FedEx Corp. | | | | | | | | |
| Expiration: January 2017, Exercise Price: $125.00 | | | 6 | | | | 1,905 | |
| Expiration: January 2017, Exercise Price: $130.00 | | | 4 | | | | 1,600 | |
| | | | | | | | 3,505 | |
| Credit Intermediation and Related Activities | | | | | | | | |
| Bank of America Corporation | | | | | | | | |
| Expiration: January 2017, Exercise Price: $13.00 | | | 15 | | | | 1,672 | |
The accompanying notes are an integral part of these financial statements.
126
| KINETICS PORTFOLIOS TRUST — MASTER INVESTMENT PORTFOLIOS |
| The Alternative Income Portfolio |
Portfolio of Options Written — June 30, 2016 (Unaudited) — (Continued) |
| | | Contractsd | | | Value | |
| Credit Intermediation and Related Activities (Continued) | | | | | | |
| Wells Fargo & Company | | | | | | |
| Expiration: January 2017, Exercise Price: $45.00 | | | 3 | | | $ | 708 | |
| | | | | | | | 2,380 | |
| Diversified Financial Services | | | | | | | | |
| The Goldman Sachs Group, Inc. | | | | | | | | |
| Expiration: January 2017, Exercise Price: $150.00 | | | 2 | | | | 2,460 | |
| Electrical Equipment, Appliance, and Component Manufacturing | | | | | | | | |
| Corning Inc. | | | | | | | | |
| Expiration: January 2017, Exercise Price: $15.00 | | | 23 | | | | 655 | |
| Equity Index | | | | | | | | |
| S&P 500 Index | | | | | | | | |
| Expiration: July 2016, Exercise Price: $1,940.00 | | | 15 | | | | 4,190 | |
| Expiration: July 2016, Exercise Price: $1,985.00 | | | 9 | | | | 4,770 | |
| Expiration: July 2016, Exercise Price: $2,005.00 | | | 8 | | | | 3,160 | |
| Expiration: July 2016, Exercise Price: $2,010.00 | | | 7 | | | | 3,045 | |
| Expiration: July 2016, Exercise Price: $2,025.00 | | | 4 | | | | 1,150 | |
| Expiration: July 2016, Exercise Price: $2,030.00 | | | 5 | | | | 7,500 | |
| Expiration: July 2016, Exercise Price: $2,035.00 | | | 2 | | | | 30 | |
| Expiration: July 2016, Exercise Price: $2,040.00 | | | 8 | | | | 9,240 | |
| Expiration: July 2016, Exercise Price: $2,045.00 | | | 4 | | | | 1,540 | |
| Expiration: July 2016, Exercise Price: $2,050.00 | | | 3 | | | | 1,305 | |
| Expiration: July 2016, Exercise Price: $2,055.00 | | | 3 | | | | 1,500 | |
| | | | | | | | 37,430 | |
| Food and Beverage Stores | | | | | | | | |
| Whole Foods Market, Inc. | | | | | | | | |
| Expiration: January 2017, Exercise Price: $28.00 | | | 25 | | | | 3,363 | |
| Food Manufacturing | | | | | | | | |
| Tyson Foods, Inc. - Class A | | | | | | | | |
| Expiration: January 2017, Exercise Price: $28.00 | | | 55 | | | | 825 | |
| Expiration: January 2017, Exercise Price: $30.00 | | | 34 | | | | 680 | |
| | | | | | | | 1,505 | |
| Heavy and Civil Engineering Construction | | | | | | | | |
| Chicago Bridge & Iron Company N.V. | | | | | | | | |
| Expiration: January 2017, Exercise Price: $35.00 | | | 8 | | | | 3,360 | |
| Expiration: January 2017, Exercise Price: $37.50 | | | 19 | | | | 10,735 | |
| | | | | | | | 14,095 | |
The accompanying notes are an integral part of these financial statements.
127
| KINETICS PORTFOLIOS TRUST — MASTER INVESTMENT PORTFOLIOS |
| The Alternative Income Portfolio |
Portfolio of Options Written — June 30, 2016 (Unaudited) — (Continued) |
| | | Contractsd | | | Value | |
| Insurance Carriers and Related Activities | | | | | | |
| Aflac, Inc. | | | | | | |
| Expiration: January 2017, Exercise Price: $47.50 | | | 4 | | | $ | 232 | |
| Machinery Manufacturing | | | | | | | | |
| Baker Hughes Inc. | | | | | | | | |
| Expiration: January 2017, Exercise Price: $40.00 | | | 8 | | | | 2,244 | |
| Eaton Corporation plc | | | | | | | | |
| Expiration: January 2017, Exercise Price: $45.00 | | | 10 | | | | 1,000 | |
| | | | | | | | 3,244 | |
| Merchant Wholesalers, Nondurable Goods | | | | | | | | |
| Express Scripts Holding Company | | | | | | | | |
| Expiration: January 2017, Exercise Price: $60.00 | | | 4 | | | | 470 | |
| Miscellaneous Manufacturing | | | | | | | | |
| 3M Co. | | | | | | | | |
| Expiration: January 2017, Exercise Price: $125.00 | | | 2 | | | | 283 | |
| Intuitive Surgical, Inc. | | | | | | | | |
| Expiration: January 2017, Exercise Price: $340.00 | | | 1 | | | | 87 | |
| Expiration: January 2017, Exercise Price: $370.00 | | | 2 | | | | 295 | |
| Expiration: January 2017, Exercise Price: $390.00 | | | 1 | | | | 190 | |
| | | | | | | | 855 | |
| Motor Vehicle and Parts Dealers | | | | | | | | |
| CarMax, Inc. | | | | | | | | |
| Expiration: January 2017, Exercise Price: $35.00 | | | 6 | | | | 555 | |
| Expiration: January 2017, Exercise Price: $40.00 | | | 10 | | | | 1,750 | |
| | | | | | | | 2,305 | |
| Nonmetallic Mineral Product Manufacturing | | | | | | | | |
| USG Corporation | | | | | | | | |
| Expiration: January 2017, Exercise Price: $20.00 | | | 9 | | | | 675 | |
| Non-Store Retailers | | | | | | | | |
| Sotheby's | | | | | | | | |
| Expiration: January 2017, Exercise Price: $25.00 | | | 8 | | | | 1,800 | |
| Oil and Gas Extraction | | | | | | | | |
| EOG Resources, Inc. | | | | | | | | |
| Expiration: January 2017, Exercise Price: $65.00 | | | 5 | | | | 1,247 | |
The accompanying notes are an integral part of these financial statements.
128
| KINETICS PORTFOLIOS TRUST — MASTER INVESTMENT PORTFOLIOS |
| The Alternative Income Portfolio |
Portfolio of Options Written — June 30, 2016 (Unaudited) — (Continued) |
| | | Contractsd | | | Value | |
| Petroleum and Coal Products Manufacturing | | | | | | |
| Marathon Petroleum Corporation | | | | | | |
| Expiration: January 2017, Exercise Price: $32.50 | | | 18 | | | $ | 4,635 | |
| Phillips 66 | | | | | | | | |
| Expiration: January 2017, Exercise Price: $55.00 | | | 14 | | | | 1,225 | |
| Expiration: January 2017, Exercise Price: $60.00 | | | 3 | | | | 413 | |
| | | | | | | | 6,273 | |
| Pharmaceutical and Biotechnology | | | | | | | | |
| AbbVie Inc. | | | | | | | | |
| Expiration: January 2017, Exercise Price: $45.00 | | | 10 | | | | 1,075 | |
| Expiration: January 2017, Exercise Price: $47.50 | | | 8 | | | | 1,100 | |
| Amgen Inc. | | | | | | | | |
| Expiration: January 2017, Exercise Price: $95.00 | | | 1 | | | | 105 | |
| Expiration: January 2017, Exercise Price: $100.00 | | | 2 | | | | 244 | |
| Expiration: January 2017, Exercise Price: $105.00 | | | 1 | | | | 162 | |
| Expiration: January 2017, Exercise Price: $110.00 | | | 2 | | | | 396 | |
| Expiration: January 2017, Exercise Price: $115.00 | | | 2 | | | | 492 | |
| Expiration: January 2017, Exercise Price: $120.00 | | | 5 | | | | 1,538 | |
| Biogen Inc. | | | | | | | | |
| Expiration: January 2017, Exercise Price: $230.00 | | | 2 | | | | 3,820 | |
| Expiration: January 2017, Exercise Price: $240.00 | | | 3 | | | | 7,065 | |
| Celgene Corporation | | | | | | | | |
| Expiration: January 2017, Exercise Price: $70.00 | | | 3 | | | | 472 | |
| Eli Lilly & Company | | | | | | | | |
| Expiration: January 2017, Exercise Price: $50.00 | | | 7 | | | | 494 | |
| Merck & Co., Inc. | | | | | | | | |
| Expiration: January 2017, Exercise Price: $40.00 | | | 3 | | | | 131 | |
| Expiration: January 2017, Exercise Price: $42.50 | | | 15 | | | | 810 | |
| Expiration: January 2017, Exercise Price: $45.00 | | | 17 | | | | 1,190 | |
| Expiration: January 2017, Exercise Price: $47.50 | | | 3 | | | | 282 | |
| | | | | | | | 19,376 | |
| Publishing Industries (except Internet) | | | | | | | | |
| Autodesk, Inc. | | | | | | | | |
| Expiration: January 2017, Exercise Price: $40.00 | | | 17 | | | | 2,125 | |
| Expiration: January 2017, Exercise Price: $42.50 | | | 4 | | | | 658 | |
| | | | | | | | 2,783 | |
The accompanying notes are an integral part of these financial statements.
129
| KINETICS PORTFOLIOS TRUST — MASTER INVESTMENT PORTFOLIOS |
| The Alternative Income Portfolio |
Portfolio of Options Written — June 30, 2016 (Unaudited) — (Continued) |
| | | Contractsd | | | Value | |
| Securities, Commodity Contracts, and Other Financial Investments | | | | | | |
| and Related Activities | | | | | | |
| Morgan Stanley | | | | | | |
| Expiration: January 2017, Exercise Price: $25.00 | | | 20 | | | $ | 3,990 | |
| Support Activities for Mining | | | | | | | | |
| Halliburton Company | | | | | | | | |
| Expiration: January 2017, Exercise Price: $35.00 | | | 2 | | | | 224 | |
| Schlumberger Limited | | | | | | | | |
| Expiration: January 2017, Exercise Price: $65.00 | | | 2 | | | | 404 | |
| Expiration: January 2017, Exercise Price: $70.00 | | | 12 | | | | 3,690 | |
| | | | | | | | 4,318 | |
| Transportation Equipment Manufacturing | | | | | | | | |
| Johnson Controls, Inc. | | | | | | | | |
| Expiration: January 2017, Exercise Price: $30.00 | | | 13 | | | | 488 | |
| Expiration: January 2017, Exercise Price: $33.00 | | | 6 | | | | 390 | |
| United Technologies Corporation | | | | | | | | |
| Expiration: January 2017, Exercise Price: $75.00 | | | 4 | | | | 374 | |
| | | | | | | | 1,252 | |
| TOTAL PUT OPTIONS WRITTEN | | | | | | | | |
| (premiums received $398,763) | | | | | | $ | 174,886 | |
| | | |
| d | - 100 shares per contract. |
The accompanying notes are an integral part of these financial statements.
130
| KINETICS PORTFOLIOS TRUST — MASTER INVESTMENT PORTFOLIOS |
| The Multi-Disciplinary Income Portfolio |
Portfolio of Options Written — June 30, 2016 (Unaudited) — (Continued) |
| PUT OPTIONS WRITTEN | | Contractsd | | | Value | |
| Mining (except Oil and Gas) | | | | | | |
| Silver Wheaton Corporation | | | | | | |
| Expiration: January 2017, Exercise Price: $8.00 | | | 4 | | | $ | 12 | |
| Oil and Gas Extraction | | | | | | | | |
| Continental Resources, Inc. | | | | | | | | |
| Expiration: January 2017, Exercise Price: $17.50 | | | 16 | | | | 760 | |
| TOTAL PUT OPTIONS WRITTEN | | | | | | | | |
| (premiums received $4,586) | | | | | | $ | 772 | |
| | | |
| d | - 100 shares per contract. |
The accompanying notes are an integral part of these financial statements.
131
| KINETICS PORTFOLIOS TRUST — MASTER INVESTMENT PORTFOLIOS |
| Statements of Assets & Liabilities |
| June 30, 2016 (Unaudited) |
| | | The Internet | | | The Global | |
| | | Portfolio | | | Portfolio | |
| ASSETS: | | | | | | |
Investments, at value(1)(2) | | $ | 115,434,682 | | | $ | 7,182,547 | |
| Receivable for contributed capital | | | 41,073 | | | | 25,781 | |
| Receivable for investments sold | | | 241,859 | | | | — | |
| Dividends and interest receivable | | | 58 | | | | 15,734 | |
| Securities litigation receivable | | | 99,877 | | | | — | |
| Prepaid expenses and other assets | | | 15,028 | | | | 636 | |
| Total Assets | | | 115,832,577 | | | | 7,224,698 | |
| LIABILITIES: | | | | | | | | |
| Payable to Adviser | | | 118,374 | | | | 7,178 | |
| Payable to Trustees | | | 3,050 | | | | 177 | |
| Payable to Chief Compliance Officer | | | 198 | | | | 11 | |
| Payable for securities purchased | | | 35,903 | | | | — | |
| Payable for collateral received for securities loaned | | | 1,117,887 | | | | 48,417 | |
| Payable for withdrawn capital | | | 87,322 | | | | 14,136 | |
| Accrued expenses and other liabilities | | | 35,432 | | | | 14,972 | |
| Total Liabilities | | | 1,398,166 | | | | 84,891 | |
| Net Assets | | $ | 114,434,411 | | | $ | 7,139,807 | |
(1) Cost of investments | | $ | 79,002,750 | | | $ | 6,738,679 | |
(2) Includes loaned securities with a market value of | | $ | 1,089,087 | | | $ | 47,749 | |
The accompanying notes are an integral part of these financial statements.
132
| KINETICS PORTFOLIOS TRUST — MASTER INVESTMENT PORTFOLIOS |
Statements of Assets & Liabilities — (Continued) |
| June 30, 2016 (Unaudited) |
| | | The Paradigm | | | The Medical | |
| | | Portfolio | | | Portfolio | |
| ASSETS: | | | | | | |
| Investments, at value | | | | | | |
Unaffiliated issuers(1) | | $ | 662,254,749 | | | $ | 26,608,633 | |
Affiliated issuers(2) | | | 103,591,576 | | | | — | |
Total investments, at value(3)(4) | | | 765,846,325 | | | | 26,608,633 | |
| Cash | | | 208,247 | | | | — | |
| Receivable for contributed capital | | | 2,713,422 | | | | 3,024 | |
| Receivable for investments sold | | | 577,359 | | | | — | |
| Dividends and interest receivable | | | 82,059 | | | | 46,970 | |
| Prepaid expenses and other assets | | | 82,265 | | | | 2,751 | |
| Total Assets | | | 769,509,677 | | | | 26,661,378 | |
| LIABILITIES: | | | | | | | | |
| Payable to Adviser | | | 768,387 | | | | 24,842 | |
| Payable to Trustees | | | 19,822 | | | | 647 | |
| Payable to Chief Compliance Officer | | | 1,311 | | | | 41 | |
| Payable for securities purchased | | | 22,544 | | | | — | |
| Payable for collateral received for securities loaned | | | 18,731,551 | | | | 2,192,568 | |
| Payable for withdrawn capital | | | 1,196,301 | | | | — | |
| Accrued expenses and other liabilities | | | 167,693 | | | | 17,343 | |
| Total Liabilities | | | 20,907,609 | | | | 2,235,441 | |
| Net Assets | | $ | 748,602,068 | | | $ | 24,425,937 | |
(1) Unaffiliated issuers cost | | $ | 509,649,818 | | | $ | 19,655,542 | |
(2) Affiliated issuers cost | | | 55,334,642 | | | | — | |
(3) Total issuers cost | | $ | 564,984,460 | | | $ | 19,655,542 | |
(4) Includes loaned securities with a market value of | | $ | 18,571,069 | | | $ | 2,168,276 | |
The accompanying notes are an integral part of these financial statements.
133
| KINETICS PORTFOLIOS TRUST — MASTER INVESTMENT PORTFOLIOS |
Statements of Assets & Liabilities — (Continued) |
| June 30, 2016 (Unaudited) |
| | | The Small Cap | | | The Market | |
| | | Opportunities | | | Opportunities | |
| | | Portfolio | | | Portfolio | |
| ASSETS: | | | | | | |
Investments, at value(1)(2) | | $ | 207,650,190 | | | $ | 38,860,571 | |
| Receivable for contributed capital | | | 141,615 | | | | 489 | |
| Receivable for investments sold | | | — | | | | 7,982 | |
| Dividends and interest receivable | | | 128,392 | | | | 17,345 | |
| Securities litigation receivable | | | 20,977 | | | | — | |
| Prepaid expenses and other assets | | | 25,200 | | | | 2,866 | |
| Total Assets | | | 207,966,374 | | | | 38,889,253 | |
| LIABILITIES: | | | | | | | | |
| Payable to Adviser | | | 206,366 | | | | 39,780 | |
| Payable to Custodian | | | — | | | | 173,687 | |
| Payable to Trustees | | | 5,246 | | | | 1,024 | |
| Payable to Chief Compliance Officer | | | 346 | | | | 69 | |
| Payable for collateral received for securities loaned | | | 8,818,979 | | | | 81,900 | |
| Payable for withdrawn capital | | | 263,950 | | | | 12,719 | |
| Accrued expenses and other liabilities | | | 49,325 | | | | 21,949 | |
| Total Liabilities | | | 9,344,212 | | | | 331,128 | |
| Net Assets | | $ | 198,622,162 | | | $ | 38,558,125 | |
(1) Cost of investments | | $ | 236,357,834 | | | $ | 33,749,287 | |
(2) Includes loaned securities with a market value of | | $ | 8,594,044 | | | $ | 80,568 | |
The accompanying notes are an integral part of these financial statements.
134
| KINETICS PORTFOLIOS TRUST — MASTER INVESTMENT PORTFOLIOS |
Statements of Assets & Liabilities — (Continued) |
| June 30, 2016 (Unaudited) |
| | | | | | The Multi- | |
| | | The Alternative | | | Disciplinary | |
| | | Income | | | Income | |
| | | Portfolio | | | Portfolio | |
| ASSETS: | | | | | | |
Investments, at value(1)(2) | | $ | 26,573,370 | | | $ | 87,778,470 | |
| Cash | | | 118,577 | | | | 21,807 | |
| Receivable for contributed capital | | | 62,204 | | | | 138,560 | |
| Receivable for investments sold | | | 6,845 | | | | — | |
| Dividends and interest receivable | | | 48,910 | | | | 996,335 | |
| Prepaid expenses and other assets | | | 1,062 | | | | 13,373 | |
| Total Assets | | | 26,810,968 | | | | 88,948,545 | |
| LIABILITIES: | | | | | | | | |
Written options, at value(3) | | | 174,886 | | | | 772 | |
| Payable to Adviser | | | 19,525 | | | | 86,139 | |
| Payable to Trustees | | | 699 | | | | 2,199 | |
| Payable to Chief Compliance Officer | | | 41 | | | | 140 | |
| Payable for securities purchased | | | 154 | | | | — | |
| Payable for collateral received for securities loaned | | | — | | | | 4,781,365 | |
| Payable for withdrawn capital | | | 8,556 | | | | 23,082 | |
| Accrued expenses and other liabilities | | | 20,103 | | | | 31,249 | |
| Total Liabilities | | | 223,964 | | | | 4,924,946 | |
| Net Assets | | $ | 26,587,004 | | | $ | 84,023,599 | |
(1) Cost of investments | | $ | 26,526,603 | | | $ | 91,478,885 | |
(2) Includes loaned securities with a market value of | | $ | — | | | $ | 4,686,329 | |
(3) Premiums received | | $ | 398,763 | | | $ | 4,586 | |
The accompanying notes are an integral part of these financial statements.
135
| KINETICS PORTFOLIOS TRUST — MASTER INVESTMENT PORTFOLIOS |
| Statements of Operations |
| For the Period Ended June 30, 2016 (Unaudited) |
| | | The Internet | | | The Global | |
| | | Portfolio | | | Portfolio | |
| INVESTMENT INCOME: | | | | | | |
| Dividends† | | $ | 38,099 | | | $ | 67,950 | |
| Interest | | | 41,348 | | | | 3,453 | |
| Income from securities lending | | | 21,086 | | | | 1,626 | |
| Total investment income | | | 100,533 | | | | 73,029 | |
| EXPENSES: | | | | | | | | |
| Investment advisory fees | | | 729,212 | | | | 41,273 | |
| Administration fees | | | 28,585 | | | | 2,178 | |
| Professional fees | | | 9,972 | | | | 4,370 | |
| Fund accounting fees | | | 13,429 | | | | 2,526 | |
| Trustees' fees | | | 6,882 | | | | 380 | |
| Chief Compliance Officer fees | | | 1,239 | | | | 63 | |
| Custodian fees and expenses | | | 12,249 | | | | 2,363 | |
| Other expenses | | | 2,823 | | | | 158 | |
| Total expenses | | | 804,391 | | | | 53,311 | |
| Net investment income (loss) | | | (703,858 | ) | | | 19,718 | |
| REALIZED AND UNREALIZED GAIN (LOSS) ON INVESTMENTS: | | | | | | | | |
| Net realized gain on: | | | | | | | | |
| Investments and foreign currency | | | 6,368,018 | | | | 214,264 | |
| Net change in unrealized appreciation (depreciation) of: | | | | | | | | |
| Investments and foreign currency | | | (10,290,059 | ) | | | 217,164 | |
| Net realized and unrealized gain (loss) on investments | | | (3,922,041 | ) | | | 431,428 | |
| Net increase (decrease) in net assets resulting from operations | | $ | (4,625,899 | ) | | $ | 451,146 | |
| † Net of foreign taxes withheld of: | | $ | — | | | $ | 11,512 | |
The accompanying notes are an integral part of these financial statements.
136
| KINETICS PORTFOLIOS TRUST — MASTER INVESTMENT PORTFOLIOS |
Statements of Operations — (Continued) |
| For the Period Ended June 30, 2016 (Unaudited) |
| | | The Paradigm | | | The Medical | |
| | | Portfolio | | | Portfolio | |
| INVESTMENT INCOME: | | | | | | |
| Dividends† | | $ | 1,809,258 | | | $ | 330,191 | |
| Interest | | | 98,078 | | | | 1,444 | |
| Income from securities lending | | | 449,228 | | | | 8,402 | |
| Dividends from affiliated issuer | | | 189,174 | | | | — | |
| Total investment income | | | 2,545,738 | | | | 340,037 | |
| EXPENSES: | | | | | | | | |
| Investment advisory fees | | | 4,735,093 | | | | 155,779 | |
| Administration fees | | | 184,445 | | | | 6,393 | |
| Professional fees | | | 41,866 | | | | 5,348 | |
| Fund accounting fees | | | 81,057 | | | | 3,756 | |
| Trustees' fees | | | 44,099 | | | | 1,496 | |
| Chief Compliance Officer fees | | | 7,841 | | | | 271 | |
| Custodian fees and expenses | | | 83,255 | | | | 2,195 | |
| Other expenses | | | 19,732 | | | | 566 | |
| Total expenses | | | 5,197,388 | | | | 175,804 | |
| Net investment income (loss) | | | (2,651,650 | ) | | | 164,233 | |
| REALIZED AND UNREALIZED GAIN (LOSS) ON INVESTMENTS: | | | | | | | | |
| Net realized gain on: | | | | | | | | |
| Investments and foreign currency | | | 43,933,210 | | | | 913,038 | |
| Net change in unrealized depreciation of: | | | | | | | | |
| Investments and foreign currency | | | (12,334,834 | ) | | | (3,565,338 | ) |
| Net realized and unrealized gain (loss) on investments | | | 31,598,376 | | | | (2,652,300 | ) |
| Net increase (decrease) in net assets resulting from operations | | $ | 28,946,726 | | | $ | (2,488,067 | ) |
| † Net of foreign taxes withheld of: | | $ | 133,355 | | | $ | 17,739 | |
The accompanying notes are an integral part of these financial statements.
137
| KINETICS PORTFOLIOS TRUST — MASTER INVESTMENT PORTFOLIOS |
Statements of Operations — (Continued) |
| For the Period Ended June 30, 2016 (Unaudited) |
| | | The Small Cap | | | The Market | |
| | | Opportunities | | | Opportunities | |
| | | Portfolio | | | Portfolio | |
| INVESTMENT INCOME: | | | | | | |
| Dividends† | | $ | 502,586 | | | $ | 109,661 | |
| Interest | | | 19,284 | | | | 12,342 | |
| Income from securities lending | | | 176,068 | | | | 3,621 | |
| Total investment income | | | 697,938 | | | | 125,624 | |
| EXPENSES: | | | | | | | | |
| Investment advisory fees | | | 1,244,851 | | | | 247,428 | |
| Administration fees | | | 48,357 | | | | 10,123 | |
| Professional fees | | | 13,746 | | | | 6,055 | |
| Fund accounting fees | | | 21,503 | | | | 5,690 | |
| Trustees' fees | | | 11,353 | | | | 2,332 | |
| Chief Compliance Officer fees | | | 2,006 | | | | 417 | |
| Custodian fees and expenses | | | 5,958 | | | | 8,195 | |
| Other expenses | | | 5,421 | | | | 977 | |
| Total expenses | | | 1,353,195 | | | | 281,217 | |
| Net investment loss | | | (655,257 | ) | | | (155,593 | ) |
| REALIZED AND UNREALIZED GAIN ON INVESTMENTS: | | | | | | | | |
| Net realized gain on: | | | | | | | | |
| Investments and foreign currency | | | 5,168,278 | | | | 801,772 | |
| Net change in unrealized appreciation of: | | | | | | | | |
| Investments and foreign currency | | | 6,994,123 | | | | 1,330,502 | |
| Net realized and unrealized gain on investments | | | 12,162,401 | | | | 2,132,274 | |
| Net increase in net assets resulting from operations | | $ | 11,507,144 | | | $ | 1,976,681 | |
| † Net of foreign taxes withheld of: | | $ | 20,469 | | | $ | 7,192 | |
The accompanying notes are an integral part of these financial statements.
138
| KINETICS PORTFOLIOS TRUST — MASTER INVESTMENT PORTFOLIOS |
Statements of Operations — (Continued) |
| For the Period Ended June 30, 2016 (Unaudited) |
| | | | | | The Multi- | |
| | | The Alternative | | | Disciplinary | |
| | | Income | | | Income | |
| | | Portfolio | | | Portfolio | |
| INVESTMENT INCOME: | | | | | | |
| Dividends | | $ | 39,298 | | | $ | 231,865 | |
| Interest | | | 87,327 | | | | 2,139,352 | |
| Income from securities lending | | | — | | | | 67,138 | |
| Total investment income | | | 126,625 | | | | 2,438,355 | |
| EXPENSES: | | | | | | | | |
| Investment advisory fees | | | 121,164 | | | | 532,123 | |
| Administration fees | | | 8,441 | | | | 21,811 | |
| Professional fees | | | 5,392 | | | | 8,247 | |
| Fund accounting fees | | | 8,567 | | | | 15,069 | |
| Trustees' fees | | | 1,572 | | | | 4,831 | |
| Chief Compliance Officer fees | | | 268 | | | | 840 | |
| Custodian fees and expenses | | | 2,322 | | | | 6,280 | |
| Other expenses | | | 684 | | | | 2,332 | |
| Total expenses | | | 148,410 | | | | 591,533 | |
| Net investment income (loss) | | | (21,785 | ) | | | 1,846,822 | |
| REALIZED AND UNREALIZED GAIN (LOSS) ON INVESTMENTS: | | | | | | | | |
| Net realized gain (loss) on: | | | | | | | | |
| Investments and foreign currency | | | (37,531 | ) | | | (931,071 | ) |
| Written option contracts expired or closed | | | 391,884 | | | | — | |
| Net change in unrealized appreciation (depreciation) of: | | | | | | | | |
| Investments and foreign currency | | | 167,025 | | | | 3,833,871 | |
| Written option contracts | | | (1,943 | ) | | | 3,814 | |
| Net realized and unrealized gain on investments | | | 519,435 | | | | 2,906,614 | |
| Net increase in net assets resulting from operations | | $ | 497,650 | | | $ | 4,753,436 | |
The accompanying notes are an integral part of these financial statements.
139
| KINETICS PORTFOLIOS TRUST — MASTER INVESTMENT PORTFOLIOS |
| Statements of Changes in Net Assets |
| | | The Internet Portfolio | | | The Global Portfolio | |
| | | For the | | | For the | | | For the | | | For the | |
| | | Period Ended | | | Year Ended | | | Period Ended | | | Year Ended | |
| | | June 30, 2016 | | | December 31, | | | June 30, 2016 | | | December 31, | |
| | | (Unaudited) | | | 2015 | | | (Unaudited) | | | 2015 | |
| OPERATIONS: | | | | | | | | | | | | |
| Net investment income (loss) | | $ | (703,858 | ) | | $ | (1,509,847 | ) | | $ | 19,718 | | | $ | (48,686 | ) |
| Net realized gain (loss) on sale of investments and foreign currency | | | 6,368,018 | | | | 29,301,715 | | | | 214,264 | | | | (13,117 | ) |
| Net change in unrealized appreciation (depreciation) of investments and foreign currency | | | (10,290,059 | ) | | | (34,665,263 | ) | | | 217,164 | | | | (1,094,934 | ) |
| Net increase (decrease) in net assets resulting from operations | | | (4,625,899 | ) | | | (6,873,395 | ) | | | 451,146 | | | | (1,156,737 | ) |
| NET DECREASE IN NET ASSETS RESULTING FROM BENEFICIAL INTEREST TRANSACTIONS: | | | | | | | | | | | | | | | | |
| Contributions | | | 60,078 | | | | 125,717 | | | | 346,787 | | | | 712,605 | |
| Withdrawals | | | (7,246,385 | ) | | | (24,551,767 | ) | | | (392,024 | ) | | | (1,701,358 | ) |
| Net decrease in net assets resulting from beneficial interest transactions | | | (7,186,307 | ) | | | (24,426,050 | ) | | | (45,237 | ) | | | (988,753 | ) |
| Total increase (decrease) in net assets | | | (11,812,206 | ) | | | (31,299,445 | ) | | | 405,909 | | | | (2,145,490 | ) |
| NET ASSETS: | | | | | | | | | | | | | | | | |
| Beginning of period | | | 126,246,617 | | | | 157,546,062 | | | | 6,733,898 | | | | 8,879,388 | |
| End of period | | $ | 114,434,411 | | | $ | 126,246,617 | | | $ | 7,139,807 | | | $ | 6,733,898 | |
The accompanying notes are an integral part of these financial statements.
140
| KINETICS PORTFOLIOS TRUST — MASTER INVESTMENT PORTFOLIOS |
Statements of Changes in Net Assets — (Continued) |
| | | The Paradigm Portfolio | | | The Medical Portfolio | |
| | | For the | | | For the | | | For the | | | For the | |
| | | Period Ended | | | Year Ended | | | Period Ended | | | Year Ended | |
| | | June 30, 2016 | | | December 31, | | | June 30, 2016 | | | December 31, | |
| | | (Unaudited) | | | 2015 | | | (Unaudited) | | | 2015 | |
| OPERATIONS: | | | | | | | | | | | | |
| Net investment income (loss) | | $ | (2,651,650 | ) | | $ | (6,650,534 | ) | | $ | 164,233 | | | $ | 71,634 | |
| Net realized gain on sale of investments and foreign currency | | | 43,933,210 | | | | 131,929,769 | | | | 913,038 | | | | 1,640,497 | |
| Net change in unrealized depreciation of investments and foreign currency | | | (12,334,834 | ) | | | (202,056,024 | ) | | | (3,565,338 | ) | | | (49,516 | ) |
| Net increase (decrease) in net assets resulting from operations | | | 28,946,726 | | | | (76,776,789 | ) | | | (2,488,067 | ) | | | 1,662,615 | |
| NET INCREASE (DECREASE) IN NET ASSETS RESULTING FROM BENEFICIAL INTEREST TRANSACTIONS: | | | | | | | | | | | | | | | | |
| Contributions | | | 3,653,081 | | | | 2,767,699 | | | | 227,366 | | | | 3,148,519 | |
| Withdrawals | | | (132,417,314 | ) | | | (269,901,615 | ) | | | (2,452,835 | ) | | | (2,788,288 | ) |
| Net increase (decrease) in net assets resulting from beneficial interest transactions | | | (128,764,233 | ) | | | (267,133,916 | ) | | | (2,225,469 | ) | | | 360,231 | |
| Total increase (decrease) in net assets | | | (99,817,507 | ) | | | (343,910,705 | ) | | | (4,713,536 | ) | | | 2,022,846 | |
| NET ASSETS: | | | | | | | | | | | | | | | | |
| Beginning of period | | | 848,419,575 | | | | 1,192,330,280 | | | | 29,139,473 | | | | 27,116,627 | |
| End of period | | $ | 748,602,068 | | | $ | 848,419,575 | | | $ | 24,425,937 | | | $ | 29,139,473 | |
The accompanying notes are an integral part of these financial statements.
141
| KINETICS PORTFOLIOS TRUST — MASTER INVESTMENT PORTFOLIOS |
Statements of Changes in Net Assets — (Continued) |
| | | The Small Cap | | | The Market | |
| | | Opportunities Portfolio | | | Opportunities Portfolio | |
| | | For the | | | For the | | | For the | | | For the | |
| | | Period Ended | | | Year Ended | | | Period Ended | | | Year Ended | |
| | | June 30, 2016 | | | December 31, | | | June 30, 2016 | | | December 31, | |
| | | (Unaudited) | | | 2015 | | | (Unaudited) | | | 2015 | |
| OPERATIONS: | | | | | | | | | | | | |
| Net investment loss | | $ | (655,257 | ) | | $ | (1,973,202 | ) | | $ | (155,593 | ) | | $ | (326,358 | ) |
| Net realized gain on sale of investments and foreign currency | | | 5,168,278 | | | | 40,437,004 | | | | 801,772 | | | | 5,055,001 | |
| Net change in unrealized appreciation (depreciation) of investments and foreign currency | | | 6,994,123 | | | | (72,366,337 | ) | | | 1,330,502 | | | | (8,994,782 | ) |
| Net increase (decrease) in net assets resulting from operations | | | 11,507,144 | | | | (33,902,535 | ) | | | 1,976,681 | | | | (4,266,139 | ) |
| NET DECREASE IN NET ASSETS RESULTING FROM BENEFICIAL INTEREST TRANSACTIONS: | | | | | | | | | | | | | | | | |
| Contributions | | | 70,848 | | | | 4,181,520 | | | | 283,230 | | | | 626,085 | |
| Withdrawals | | | (33,068,983 | ) | | | (103,323,128 | ) | | | (5,887,062 | ) | | | (8,550,561 | ) |
| Net decrease in net assets resulting from beneficial interest transactions | | | (32,998,135 | ) | | | (99,141,608 | ) | | | (5,603,832 | ) | | | (7,924,476 | ) |
| Total decrease in net assets | | | (21,490,991 | ) | | | (133,044,143 | ) | | | (3,627,151 | ) | | | (12,190,615 | ) |
| NET ASSETS: | | | | | | | | | | | | | | | | |
| Beginning of period | | | 220,113,153 | | | | 353,157,296 | | | | 42,185,276 | | | | 54,375,891 | |
| End of period | | $ | 198,622,162 | | | $ | 220,113,153 | | | $ | 38,558,125 | | | $ | 42,185,276 | |
The accompanying notes are an integral part of these financial statements.
142
| KINETICS PORTFOLIOS TRUST — MASTER INVESTMENT PORTFOLIOS |
Statements of Changes in Net Assets — (Continued) |
| | | The Alternative | | | The Multi-Disciplinary | |
| | | Income Portfolio | | | Income Portfolio | |
| | | For the | | | For the | | | For the | | | For the | |
| | | Period Ended | | | Year Ended | | | Period Ended | | | Year Ended | |
| | | June 30, 2016 | | | December 31, | | | June 30, 2016 | | | December 31, | |
| | | (Unaudited) | | | 2015 | | | (Unaudited) | | | 2015 | |
| OPERATIONS: | | | | | | | | | | | | |
| Net investment income (loss) | | $ | (21,785 | ) | | $ | (68,129 | ) | | $ | 1,846,822 | | | $ | 4,496,480 | |
| Net realized gain (loss) on sale of investments, foreign currency and written options and distributions received from other investment companies | | | 354,353 | | | | 1,248,888 | | | | (931,071 | ) | | | (1,551,198 | ) |
| Net change in unrealized appreciation (depreciation) of investments, foreign currency and written options | | | 165,082 | | | | (334,592 | ) | | | 3,837,685 | | | | (4,910,270 | ) |
| Net increase (decrease) in net assets resulting from operations | | | 497,650 | | | | 846,167 | | | | 4,753,436 | | | | (1,964,988 | ) |
| NET DECREASE IN NET ASSETS RESULTING FROM BENEFICIAL INTEREST TRANSACTIONS: | | | | | | | | | | | | | | | | |
| Contributions | | | 2,596,926 | | | | 3,765,782 | | | | 1,215,661 | | | | 11,325,447 | |
| Withdrawals | | | (4,365,631 | ) | | | (14,984,082 | ) | | | (12,412,052 | ) | | | (54,428,755 | ) |
| Net decrease in net assets resulting from beneficial interest transactions | | | (1,768,705 | ) | | | (11,218,300 | ) | | | (11,196,391 | ) | | | (43,103,308 | ) |
| Total decrease in net assets | | | (1,271,055 | ) | | | (10,372,133 | ) | | | (6,442,955 | ) | | | (45,068,296 | ) |
| NET ASSETS: | | | | | | | | | | | | | | | | |
| Beginning of period | | | 27,858,059 | | | | 38,230,192 | | | | 90,466,554 | | | | 135,534,850 | |
| End of period | | $ | 26,587,004 | | | $ | 27,858,059 | | | $ | 84,023,599 | | | $ | 90,466,554 | |
| The accompanying notes are an integral part of these financial statements. |
| |
| 143 |
| KINETICS PORTFOLIOS TRUST — MASTER INVESTMENT PORTFOLIOS |
| Notes to Financial Statements |
| June 30, 2016 (Unaudited) |
1. Organization
The Kinetics Portfolios Trust (the "Trust") was organized as a Delaware Statutory Trust on March 14, 2000 and is registered under the Investment Company Act of 1940, as amended (the "1940 Act"), as an open-end management investment company issuing its beneficial interests in series, each series representing a distinct portfolio with its own investment objective and policies. The series currently authorized are: The Internet Portfolio, The Global Portfolio, The Paradigm Portfolio, The Medical Portfolio, The Small Cap Opportunities Portfolio, The Market Opportunities Portfolio, The Alternative Income Portfolio and The Multi-Disciplinary Income Portfolio (collectively, the "Master Portfolios"). Pursuant to the 1940 Act, the Master Portfolios, are "non-diversified" series of the Trust, except The Global Portfolio, The Alternative Income Fund and The Multi-Disciplinary Income Portfolio. The Market Opportunities Portfolio commenced operations on January 31, 2006, The Alternative Income Portfolio commenced operations on June 29, 2007 and The Multi-Disciplinary Income Portfolio commenced operations on February 11, 2008. Each of the remaining Master Portfolios commenced operations on April 28, 2000.
Each Master Portfolio is a Master Investment Portfolio in a master-feeder fund structure. Each Master Portfolio has multiple feeder funds invested in the Master Portfolio. By contributing assets to the Master Portfolio, the feeder funds receive a beneficial interest in the Master Portfolio. The Master Portfolio then invests the contributed assets in portfolio securities and allocates income, gains (losses) and expenses to the feeder funds based on the feeder funds' proportionate interests in the Master Portfolio.
Each of the Master Portfolios, except for The Alternative Income Portfolio and The Multi-Disciplinary Income Portfolio, seeks to provide investors with long-term capital growth. The Alternative Income Portfolio seeks to provide current income and gains. The Multi-Disciplinary Income Portfolio seeks to provide investors with total return. The Internet Portfolio invests primarily in the equity securities of U.S. and foreign companies engaged in the Internet and Internet-related activities. The Global Portfolio generally invests in the equity securities of foreign companies that have the ability to facilitate an increase in the growth of their traditional business lines and in U.S. companies benefiting from international economic growth. The Paradigm Portfolio invests primarily in the equity securities of U.S. and foreign companies that the investment adviser believes are undervalued and that have high returns on equity and are well positioned to reduce their costs, extend the reach of their distribution channels
144
| KINETICS PORTFOLIOS TRUST — MASTER INVESTMENT PORTFOLIOS |
Notes to Financial Statements — (Continued) |
| June 30, 2016 (Unaudited) |
and experience significant growth in their assets or revenues. The Medical Portfolio invests primarily in the equity securities of U.S. and foreign companies engaged in medical research, pharmaceutical treatments and related medical technology industries and related technology industries, generally, with a focus on companies engaged in cancer research and drug development. The Small Cap Opportunities Portfolio invests primarily in the equity securities of U.S. and foreign small capitalized companies that provide attractive valuation opportunities due to special situations such as lack of institutional ownership, lack of significant analyst coverage or companies with sound fundamentals that have experienced a short-term earnings shortfall. The Market Opportunities Portfolio invests primarily in the equity securities of U.S. and foreign companies engaged in capital markets or related to capital markets, as well as companies involved in the gaming industry. The Alternative Income and Multi-Disciplinary Income Portfolios utilize a two-part investment strategy, which includes fixed income and derivatives components.
2. Significant Accounting Policies
Security Valuation
Master Portfolio securities that are listed on a U.S. securities exchange for which market quotations are readily available are valued at the last quoted sale price on the day the valuation is made. Price information on listed securities is taken from the exchange where the security is primarily traded. All equity securities, including exchange-traded funds, that are traded using the National Association of Securities Dealers' Automated Quotation System ("NASDAQ") are valued using the NASDAQ Official Closing Price ("NOCP"). Foreign securities are valued by an independent pricing service. In the event market quotations are not readily available or if events occur that may materially affect the value of a particular security between the time trading ends on a particular security and the close of regular trading on the New York Stock Exchange ("NYSE"), "fair value" will be determined. Unlisted U.S. securities and listed U.S. securities not traded on the valuation date for which market quotations are readily available are valued at the last bid price. Exchange traded options are valued at the composite price, using the National Best Bid and Offer quotes ("NBBO"). NBBO consists of the highest bid price and lowest ask price across any of the exchanges on which an option is quoted thus providing a view across the entire U.S. options marketplace. Composite option pricing calculates the mean of the highest bid price and the lowest asked price across the exchanges where the option is traded. If the composite option price is not
145
| KINETICS PORTFOLIOS TRUST — MASTER INVESTMENT PORTFOLIOS |
Notes to Financial Statements — (Continued) |
| June 30, 2016 (Unaudited) |
available, the mean between the highest bid and the lowest asked quotations at the close of the exchanges will be used. If none of the above are available, exchange traded options are valued at a quote provided by third party pricing agents. Non-exchange traded options for which over-the-counter quotations are not readily available are valued at the mean of the current bid and asked prices. If none of the third party pricing agents publish a price and it is the day of expiration, expiring options will be priced at intrinsic value. Debt obligations (including convertible securities) that are either investment grade or non-investment grade and irrespective of days to maturity will be valued as follows: Debt securities are valued at evaluated mean by one of the authorized third party pricing agents which rely on various valuation methodologies such as matrix pricing and other analytical pricing models as well as market transactions and dealer quotations. Investments in registered open-end investment companies, including money market funds, other than exchange-traded funds are valued at their reported net asset value ("NAV"). Certain instruments, such as repurchase agreements and demand notes, do not have values from third parties and are valued at amortized cost.
Other assets and securities for which no quotations are readily available (including restricted securities) will be valued in good faith at fair value using methods determined by the Board of Trustees of the Master Portfolios. In determining the fair value of a security, the Board of Trustees shall take into account the relevant factors and surrounding circumstances, which may include: (i) the nature and pricing history (if any) of the security; (ii) whether any dealer quotations for the security are available; (iii) possible valuation methodologies that could be used to determine the fair value of the security; (iv) the recommendation of the portfolio manager of the Portfolios with respect to the valuation of the security; (v) whether the same or similar securities are held by other funds managed by the Adviser or other funds and the method used to price the security in those funds; (vi) the extent to which the fair value to be determined for the security will result from the use of data or formula produced by third parties independent of the Adviser; (vii) the liquidity or illiquidity of the market for the security; and (viii) the value of a foreign security traded on other foreign markets. At June 30, 2016, 0.00%, 0.72%, 0.00%, 2.59% and 3.04% of the net assets of The Internet Portfolio, The Global Portfolio, The Paradigm Portfolio, The Small Cap Opportunities Portfolio and The Market Opportunities Portfolio, respectively, were fair valued securities. The other Master Portfolios did not hold any fair valued securities at June 30, 2016.
146
| KINETICS PORTFOLIOS TRUST — MASTER INVESTMENT PORTFOLIOS |
Notes to Financial Statements — (Continued) |
| June 30, 2016 (Unaudited) |
Repurchase Agreements
Each Master Portfolio may enter into repurchase agreements with banks that are members of the Federal Reserve System or securities dealers who are members of a national securities exchange or are primary dealers in U.S. Government Securities. In connection with transactions in repurchase agreements, it is the Trust's policy that the Master Portfolio receive, as collateral, securities whose market value, including accrued interest, at all times will be at least equal to 102% of the amount invested by the Master Portfolio in each repurchase agreement. If the seller defaults, and the value of the collateral declines, realization of the collateral by the Master Portfolio may be delayed or limited.
Written Options
The Master Portfolios may write (sell) call or put options for trading or hedging purposes. When a Master Portfolio writes an option, an amount equal to the premium received by the Master Portfolio is included in the Statement of Assets and Liabilities as an asset and an equivalent liability. The amount of the liability is subsequently marked-to-market to reflect the current value of the option written. By writing the option, the Master Portfolio may become obligated during the term of the option to deliver or purchase the securities underlying the option at the exercise price if the option is exercised. When an option expires on its stipulated expiration date or the Master Portfolio enters into a closing purchase transaction, the Master Portfolio realizes a gain or loss if the cost of the closing transaction differs from the premium received when the option was sold, without regard to any unrealized gain or loss on the underlying security, and the liability related to such option is eliminated. When an option is exercised, the premium originally received decreases the cost basis of the underlying security (or increases the proceeds on the security sold short) and the Master Portfolio realizes a gain or loss from the sale of the security (or closing of the short sale). As collateral for uncovered written options, the Master Portfolio is required under the 1940 Act to maintain assets consisting of cash, cash equivalents or liquid securities. This collateral is required to be adjusted daily to reflect the exercise price of the purchase obligation for put options or the market value of the instrument underlying the contract for call options.
Foreign Currency Translations
The books and records of the Master Portfolios are maintained in U.S. dollars. For the Master Portfolios, foreign currency transactions are translated into U.S. dollars on the following basis: (i) market values of investment securities and
147
| KINETICS PORTFOLIOS TRUST — MASTER INVESTMENT PORTFOLIOS |
Notes to Financial Statements — (Continued) |
| June 30, 2016 (Unaudited) |
other assets and liabilities are translated at the exchange rate of such currencies against the U.S. dollar, as provided by an approved pricing service, and (ii) purchases and sales of investment securities, dividend and interest income and certain expenses at the rates of exchange prevailing on the respective dates of such transactions. The Master Portfolios do not isolate and treat as ordinary income that portion of the results of operations arising as a result of changes in the exchange rate from the fluctuations arising from changes in the market prices of securities held during the period. Such fluctuations are included with the net realized and unrealized gain or loss from investments. However, for federal income tax purposes, the Master Portfolios do isolate and treat as ordinary income the effect of changes in foreign exchange rates arising from actual foreign currency transactions and the effect of changes in foreign exchange rates arising between trade date and settlement date.
Restricted and Illiquid Securities
The Master Portfolios may invest in restricted securities. These securities are valued by the Master Portfolios after giving due consideration to pertinent factors including recent private sales, market conditions and the issuer's financial performance. The Master Portfolios have no right to require registration of unregistered securities. At June 30, 2016, the following Master Portfolios held securities restricted to institutional investors (144A Securities):
| | | | | | Percentage of |
| | | Market Value | | | Net Assets |
| The Alternative Income Portfolio | | $ | 450,889 | | | | 1.70 | % |
| The Multi-Disciplinary Income Portfolio | | | 22,779,649 | | | | 27.11 | % |
An illiquid asset is any asset which may not be sold or disposed of in the ordinary course of business within seven days at approximately the value at which the Master Portfolio has valued the investment. At June 30, 2016, the following Master Portfolios held illiquid securities:
| | | | | | Percentage of |
| | | Market Value | | | Net Assets |
| The Internet Portfolio | | $ | — | * | | | 0.00 | % |
| The Paradigm Portfolio | | | — | * | | | 0.00 | % |
| The Market Opportunities Portfolio | | | — | * | | | 0.00 | % |
| The Multi-Disciplinary Income Portfolio | | | 192,500 | | | | 0.23 | % |
| * Amount is less than $0.50. |
148
| KINETICS PORTFOLIOS TRUST — MASTER INVESTMENT PORTFOLIOS |
Notes to Financial Statements — (Continued) |
| June 30, 2016 (Unaudited) |
When-Issued Securities
The Master Portfolios may purchase securities on a when-issued or delayed delivery basis. Although the purchase amounts of these securities are established at the time the purchaser enters into the agreement, these securities may be delivered and paid for at a future date. The Master Portfolios record purchases of when-issued securities and reflect the values of such securities in determining net asset value in the same manner as other portfolio securities. The Master Portfolios maintain at all times cash or other liquid assets in an amount at least equal to the amount of outstanding commitments for when-issued securities.
Securities Lending
Each Master Portfolio may lend its portfolio securities to broker-dealers by entering directly into lending arrangements with such broker dealers or indirectly through repurchase agreements with respect to no more than 33¹/3% of the total assets of each Master Portfolio (including any collateral posted) or 50% of the total assets of each Master Portfolio (excluding any collateral posted). Securities lending and repurchase transactions will be fully collateralized at all times with cash and/or short-term debt obligations. The Master Portfolios receive interest on the collateral received as well as a fee for the securities loaned.
Short-Term Investments
The Portfolios may invest in money market funds and short-term high quality debt securities such as commercial paper, repurchase agreements and certificates of deposit. Money market funds typically invest in short-term instruments and attempt to maintain a stable net asset value. While the risk is low, these funds may lose value. At June 30, 2016, The Internet Portfolio, The Global Portfolio, The Paradigm Portfolio, The Medical Portfolio, The Small Cap Opportunities Portfolio, The Market Opportunities Portfolio, and The Multi-Disciplinary Income Portfolio invested approximately 1%, 1%, 3%, 9%, 4%, 0%, and 6%, respectively, of net assets in the Mount Vernon Securities Lending Trust-Prime Portfolio which normally invests in short-term instruments with an objective of maximizing current income to the extent consistent with the preservation of capital and liquidity. Mount Vernon Securities Lending Trust-Prime Portfolio's financial statements are available on the SEC website www.sec.gov.
149
| KINETICS PORTFOLIOS TRUST — MASTER INVESTMENT PORTFOLIOS |
Notes to Financial Statements — (Continued) |
| June 30, 2016 (Unaudited) |
Expense Allocation
Common expenses incurred by the Master Portfolios are allocated among the Master Portfolios (i) based upon relative average net assets, (ii) as incurred on a specific identification basis, or (iii) equally among the Master Portfolios, depending on the nature of the expenditure. All expenses incurred by the Master Portfolios are allocated to the feeder funds daily based on their proportionate interests in the respective Master Portfolios.
Federal Income Taxes
Each Master Portfolio will be treated as a partnership for federal income tax purposes. As such, each investor in a Master Portfolio will be subject to taxation on its share of the Master Portfolio's ordinary income and capital gains. It is intended that each Master Portfolio's assets will be managed so an investor in the Master Portfolio can satisfy the requirements of subchapter M of the Internal Revenue Code.
There is no tax liability resulting from unrecognized tax benefits relating to uncertain income tax positions taken or expected to be taken in future tax returns. As of June 30, 2016, open tax years include the tax years ended December 31, 2012, through 2015. The Master Portfolios are also not aware of any tax positions for which it is reasonably possible that the total amounts of unrecognized tax benefits will significantly change in the next six months.
Use of Estimates
The preparation of financial statements in conformity with U.S. generally accepted accounting principles ("GAAP") requires management to make estimates and assumptions that affect the reported amounts in the financial statements. Actual results could differ from those estimates.
Other
Realized gains and losses on the sale of investments are calculated on the identified cost basis. Dividend income is recorded on the ex-dividend date. Interest income is accounted for on the accrual basis and includes amortization of premiums and discounts on the effective interest method. Other noncash dividends are recognized as investment income at the fair value of the property received. Withholding taxes on foreign dividends have been provided for in accordance with the Trust's understanding of the applicable country's tax rules and rates.
150
| KINETICS PORTFOLIOS TRUST — MASTER INVESTMENT PORTFOLIOS |
Notes to Financial Statements — (Continued) |
| June 30, 2016 (Unaudited) |
3. Investment Adviser
The Trust has entered into Investment Advisory Agreements (the "Agreements") with Kinetics Asset Management LLC (the "Adviser"), with whom certain officers and trustees of the Trust are affiliated, to furnish investment advisory services to the Master Portfolios. The Adviser is a wholly-owned subsidiary of Horizon Kinetics LLC. Under the terms of the Agreements, the Master Portfolios, except the Alternative Income Portfolio, compensate the Adviser for its management services at the annual rate of 1.25% of each Master Portfolio's average daily net assets. The Alternative Income Portfolio compensates the Adviser for its management services at the annual rate of 0.90% of the Master Portfolio's average daily net assets.
For the six-month period ended June 30, 2016, Master Portfolios incurred the following expenses pursuant to the Agreements:
| | Investment Advisory Fees |
| The Internet Portfolio | | $ | 729,212 | |
| The Global Portfolio | | | 41,273 | |
| The Paradigm Portfolio | | | 4,735,093 | |
| The Medical Portfolio | | | 155,779 | |
| The Small Cap Opportunities Portfolio | | | 1,244,851 | |
| The Market Opportunities Portfolio | | | 247,428 | |
| The Alternative Income Portfolio | | | 121,164 | |
| The Multi-Disciplinary Income Portfolio | | | 532,123 | |
For the six-month period ended June 30, 2016, the Trust was allocated $13,000 for the services of the Chief Compliance Officer employed by the Adviser.
151
| KINETICS PORTFOLIOS TRUST — MASTER INVESTMENT PORTFOLIOS |
Notes to Financial Statements — (Continued) |
| June 30, 2016 (Unaudited) |
4. Approval of Investment Advisory Contracts by Trustees of Kinetics Portfolio Trust
At a meeting of the Board of Trustees of the Trust held on March 23, 2016, the Board, including all of the Trustees who are not interested persons under the 1940 Act (the "Independent Trustees"), approved the Agreements with respect to each Master Portfolio. In reaching a decision to renew the Advisory Agreements, the Board of Trustees, including all of the Independent Trustees, considered, among; (1) the nature, extent and quality of the services provided by the Adviser including, but not limited to, a review of the complexity of the services provided and whether the services are provided in a satisfactory and efficient manner; (2) the performance of the Funds over the one-, three-, five-and ten-year periods, as applicable ended December 31, 2015, and as compared to the relevant Lipper peer group, as well as the performance of the Funds as compared to their respective benchmark indices; (3) the contractual and actual compensation paid under the Agreements as compared to the compensation for the funds in the relevant peer group; (4) the expense ratios of the Funds, after expense waivers, as compared to expense ratios for relevant peer groups, along with relevant alternative methods to calculate fee structures; (5) the experience and qualifications of the Adviser's personnel and the Adviser's portfolio management capabilities and investment methodologies; (6) the extent to which economies of scale are relevant given the current asset size and current asset growth potential; (7) the financial condition of the Adviser; (8) the cost of services provided by the Adviser and the Adviser's profitability from each Fund for the year ended December 31, 2015; (9) the "fall-out" benefits to the Adviser and its affiliates from the relationship with the Companies; (10) the Adviser's operations, compliance program and policies with respect to the Code of Ethics; (11) that each Fund and each Portfolio is designed for long-term investors; and (12) the policies and procedures that are in place to address, among other things, informational and cyber-related security.
The Lipper peer group information was provided by U.S. Bancorp Fund Services, LLC, the Trust's administrator. The Independent Trustees also discussed the continuing viability of the Master Portfolios.
The Board of Trustees, including a majority of the Independent Trustees, concluded that: they were satisfied with the quality of services provided by the Adviser in advising the Master Portfolios, the profits earned by the Adviser were reasonable in light of the nature, extent and quality of the services provided to
152
| KINETICS PORTFOLIOS TRUST — MASTER INVESTMENT PORTFOLIOS |
Notes to Financial Statements — (Continued) |
| June 30, 2016 (Unaudited) |
each Master Portfolio; and that each Master Portfolio was not large enough to attain significant economies of scale. Based on the factors considered, the Board of Trustees, including a majority of the Independent Trustees, concluded that it was appropriate to renew the Agreements.
5. Securities Transactions
Purchases and sales of investment securities, other than short-term investments and short-term options, for the six-month period ended June 30, 2016, were as follows:
| | | Purchases | | | Sales | |
| | | U.S. | | | | | | U.S. | | | | |
| | | Government | | | Other | | | Government | | | Other | |
| The Internet Portfolio | | $ | — | | | $ | 946,224 | | | $ | — | | | $ | 18,341,176 | |
| The Global Portfolio | | | — | | | | 336,695 | | | | — | | | | 596,887 | |
| The Paradigm Portfolio | | | — | | | | 3,077,230 | | | | — | | | | 115,402,315 | |
| The Medical Portfolio | | | — | | | | — | | | | — | | | | 1,456,000 | |
| The Small Cap Opportunities Portfolio | | | — | | | | 2,164,638 | | | | — | | | | 19,641,259 | |
| The Market Opportunities Portfolio | | | — | | | | 266,938 | | | | — | | | | 3,105,551 | |
| The Alternative Income Portfolio | | | — | | | | 103,962 | | | | 1,000,000 | | | | 4,737,362 | |
| The Multi-Disciplinary Income Portfolio | | | — | | | | 44,930 | | | | — | | | | 9,589,468 | |
As of December 31, 2015, the cost of investments and unrealized appreciation (depreciation) on investment securities for federal income tax purposes was as follows:
| | | Internet | | | Global | | | Paradigm | | | Medical | |
| | | | | | | | | | | | | |
| Tax Cost of Investments | | $ | 65,443,117 | | | $ | 6,148,607 | | | $ | 688,716,725 | | | $ | 20,234,169 | |
| Unrealized Appreciation | | | 46,854,237 | | | | 1,154,761 | | | | 288,044,003 | | | | 11,682,057 | |
| Unrealized Depreciation | | | (350,773 | ) | | | (942,307 | ) | | | (95,085,439 | ) | | | (1,230,439 | ) |
| Net Unrealized Appreciation (Depreciation) | | $ | 46,503,464 | | | $ | 212,454 | | | $ | 192,958,564 | | | $ | 10,451,618 | |
| | | | | | | | | | | | Multi- | |
| | | Small Cap | | | Market | | | Alternative | | | Disciplinary | |
| | | Opportunities | | | Opportunities | | | Income | | | Income | |
| Tax cost of investments | | $ | 270,483,090 | | | $ | 35,771,960 | | | $ | 28,019,478 | | | $ | 96,546,637 | |
| Unrealized Appreciation | | | 32,563,528 | | | | 10,394,122 | | | | 277,250 | | | | 1,190,898 | |
| Unrealized Depreciation | | | (71,532,177 | ) | | | (6,984,249 | ) | | | (397,508 | ) | | | (8,042,066 | ) |
| Net Unrealized Appreciation (Depreciation) | | $ | (38,968,649 | ) | | $ | 3,409,873 | | | $ | (120,258 | ) | | $ | (6,851,168 | ) |
153
| KINETICS PORTFOLIOS TRUST — MASTER INVESTMENT PORTFOLIOS |
Notes to Financial Statements — (Continued) |
| June 30, 2016 (Unaudited) |
For the six-month period ended June 30, 2016, the Master Portfolios wrote the following options:
| | | Number of | | | Premium | |
| | | Contracts | | | Amount | |
The Alternative Income Portfolio | | | | | | |
| Outstanding at January 1, 2016 | | | 1,490 | | | $ | 531,242 | |
| Options Written | | | 608 | | | | 1,012,449 | |
| Options Exercised | | | (11 | ) | | | (7,309 | ) |
| Options Expired | | | (401 | ) | | | (110,382 | ) |
| Options Closed | | | (818 | ) | | | (1,027,237 | ) |
| Outstanding at June 30, 2016 | | | 868 | | | $ | 398,763 | |
| | | | | | | | | |
The Multi-Disciplinary Income Portfolio | | | | | | | | |
| Outstanding at January 1, 2016 | | | — | | | $ | — | |
| Options Written | | | 20 | | | | 4,586 | |
| Options Exercised | | | — | | | | — | |
| Options Expired | | | — | | | | — | |
| Options Closed | | | — | | | | — | |
| Outstanding at June 30, 2016 | | | 20 | | | $ | 4,586 | |
6. Portfolio Securities Loaned
As of June 30, 2016, the Master Portfolios had loaned securities that were collateralized by cash. The cash collateral is invested by the custodian in a money market pooled account approved by the Adviser. Although risk is mitigated by the collateral, a Master Portfolio could experience a delay in recovering its securities and possible loss of income or value if the borrower fails to return them. The Master Portfolio receives interest on the collateral received as well as a fee for the securities loaned. The Master Portfolios will continue to receive dividends and interest on all securities loaned. Gain or loss in the fair value of the securities loaned that may occur during the term of the loan will be accounted for by the Master Portfolios. Loans of securities are terminable at any time and the borrower, after notice, is required to return borrowed securities within the standard time period for settlement of securities transactions. As the securities loans are subject to termination by the Funds or the borrower at any time, the remaining maturities of the outstanding securities lending transactions are considered to be overnight and continuous. The value of the securities on loan and the value of the related collateral at June 30, 2016, were as follows:
154
| KINETICS PORTFOLIOS TRUST — MASTER INVESTMENT PORTFOLIOS |
Notes to Financial Statements — (Continued) |
| June 30, 2016 (Unaudited) |
| | | Securities | | | Collateral | |
| The Internet Portfolio | | $ | 1,089,087 | | | $ | 1,117,887 | |
| The Global Portfolio | | | 47,749 | | | | 48,417 | |
| The Paradigm Portfolio | | | 18,571,069 | | | | 18,731,551 | |
| The Medical Portfolio | | | 2,168,276 | | | | 2,192,568 | |
| The Small Cap Opportunities Portfolio | | | 8,594,044 | | | | 8,818,979 | |
| The Market Opportunities Portfolio | | | 80,568 | | | | 81,900 | |
| The Alternative Income Portfolio | | | — | | | | — | |
| The Multi-Disciplinary Income Portfolio | | | 4,686,329 | | | | 4,781,365 | |
7. Selected Financial Highlights
Financial highlights for the Master Portfolios were as follows:
| | | | | | | | | The Internet Portfolio | | | | | | | |
| | | For the | | | For the | | | For the | | | For the | | | For the | | | For the | |
| | | Period Ended | | | Year Ended | | | Year Ended | | | Year Ended | | | Year Ended | | | Year Ended | |
| | June 30, 2016 | | | December 31, | | | December 31, | | | December 31, | | | December 31, | | | December 31, | |
| | | (Unaudited) | | | 2015 | | | 2014 | | | 2013 | | | 2012 | | | 2011 | |
| Total Return* | | | (3.40 | )%(2) | | | (4.95 | )% | | | 0.28 | % | | | 44.75 | % | | | 23.76 | % | | | (1.47 | )% |
| Ratio of expenses to average net assets: | | | 1.38 | %(1) | | | 1.35 | % | | | 1.34 | % | | | 1.37 | % | | | 1.37 | % | | | 1.38 | % |
| Ratio of net investment income (loss) to average net assets: | | | (1.21 | )%(1) | | | (1.05 | )% | | | (0.90 | )% | | | (0.84 | )% | | | 0.16 | % | | | (0.43 | )% |
| Portfolio turnover rate | | | 1 | % | | | 1 | % | | | 1 | % | | | 8 | % | | | 9 | % | | | 32 | % |
| | | | | | | | | The Global Portfolio | | | | | | | |
| | | For the | | | For the | | | For the | | | For the | | | For the | | | For the | |
| | Period Ended | | | Year Ended | | | Year Ended | | | Year Ended | | | Year Ended | | | Year Ended | |
| | June 30, 2016 | | | December 31, | | | December 31, | | | December 31, | | | December 31, | | | December 31, | |
| | | (Unaudited) | | | 2015 | | | 2014 | | | 2013 | | | 2012 | | | 2011 | |
| Total Return* | | | 6.75 | %(2) | | | (14.13 | )% | | | (12.10 | )% | | | 28.25 | % | | | 22.78 | % | | | (16.25 | )% |
| Ratio of expenses to average net assets: | | | 1.61 | %(1) | | | 1.69 | % | | | 1.60 | % | | | 1.73 | % | | | 1.77 | % | | | 2.23 | % |
| Ratio of net investment income (loss) to average net assets: | | | 0.60 | %(1) | | | (0.59 | )% | | | (0.52 | )% | | | (0.12 | )% | | | 0.40 | % | | | 0.61 | % |
| Portfolio turnover rate | | | 7 | % | | | 16 | % | | | 14 | % | | | 15 | % | | | 23 | % | | | 135 | % |
| | | | | | | | | The Paradigm Portfolio | | | | | | | |
| | | For the | | | For the | | | For the | | | For the | | | For the | | | For the | |
| | | Period Ended | | | Year Ended | | | Year Ended | | | Year Ended | | | Year Ended | | | Year Ended | |
| | June 30, 2016 | | | December 31, | | | December 31, | | | December 31, | | | December 31, | | | December 31, | |
| | | (Unaudited) | | | 2015 | | | 2014 | | | 2013 | | | 2012 | | | 2011 | |
| Total Return* | | | 4.78 | %(2) | | | (8.04 | )% | | | (0.48 | )% | | | (44.36 | )% | | | 22.06 | % | | | (14.00 | )% |
| Ratio of expenses to average net assets: | | | 1.37 | %(1) | | | 1.35 | % | | | 1.33 | % | | | 1.35 | % | | | 1.36 | % | | | 1.37 | % |
| Ratio of net investment income (loss) to average net assets: | | | (0.70 | )%(1) | | | (0.63 | )% | | | (0.72 | )% | | | (0.23 | )% | | | 0.50 | % | | | 0.37 | % |
| Portfolio turnover rate | | | 0 | % | | | 2 | % | | | 7 | % | | | 4 | % | | | 6 | % | | | 58 | % |
155
| KINETICS PORTFOLIOS TRUST — MASTER INVESTMENT PORTFOLIOS |
Notes to Financial Statements — (Continued) |
| June 30, 2016 (Unaudited) |
| | | | | | | | | | | | The Medical Portfolio | | | | | | | |
| | | | | | For the | | | For the | | | For the | | | For the | | | For the | | | For the | |
| | | | | | Period Ended | | | Year Ended | | | Year Ended | | | Year Ended | | | Year Ended | | | Year Ended | |
| | | | | | June 30, 2016 | | | December 31, | | | December 31, | | | December 31, | | | December 31, | | | December 31, | |
| | | | | | | (Unaudited) | | | 2015 | | | 2014 | | | 2013 | | | 2012 | | | 2011 | |
| Total Return* | | | | | | | (8.35 | )%(2) | | | 6.58 | % | | | 16.42 | % | | | 49.23 | % | | | 8.81 | % | | | 5.10 | % |
| Ratio of expenses to average net assets: | | | | 1.41 | %(1) | | | 1.40 | % | | | 1.41 | % | | | 1.41 | % | | | 1.44 | % | | | 1.40 | % |
| Ratio of net investment income (loss) to average net assets: | | | | 1.32 | %(1) | | | 0.24 | % | | | 0.44 | % | | | (0.02 | )% | | | 1.62 | % | | | 0.86 | % |
| Portfolio turnover rate | | | | 0 | % | | | 12 | % | | | 3 | % | | | 12 | % | | | 0 | % | | | 5 | % |
| | | | | | | The Small Cap Opportunities Portfolio | | | | | |
| | | For the | | | For the | | | For the | | | For the | | | For the | | | For the | |
| | | Period Ended | | | Year Ended | | | Year Ended | | | Year Ended | | | Year Ended | | | Year Ended | |
| | June 30, 2016 | | | December 31, | | | December 31, | | | December 31, | | | December 31, | | | December 31, | |
| | | (Unaudited) | | | 2015 | | | 2014 | | | 2013 | | | 2012 | | | 2011 | |
| Total Return* | | | 6.65 | %(2) | | | (11.97 | )% | | | (6.98 | )% | | | 59.69 | % | | | 26.94 | % | | | (13.44 | )% |
| Ratio of expenses to average net assets: | | | 1.36 | %(1) | | | 1.35 | % | | | 1.34 | % | | | 1.35 | % | | | 1.44 | % | | | 1.43 | % |
| Ratio of net investment income (loss) to average net assets: | | | (0.66 | )%(1) | | | (0.65 | )% | | | (0.59 | )% | | | 0.01 | % | | | 0.27 | % | | | 0.03 | % |
| Portfolio turnover rate | | | 1 | % | | | 2 | % | | | 19 | % | | | 6 | % | | | 22 | % | | | 47 | % |
| | | | | | | The Market Opportunities Portfolio | | | | | |
| | | For the | | | For the | | | For the | | | For the | | | For the | | | For the | |
| | | Period Ended | | | Year Ended | | | Year Ended | | | Year Ended | | | Year Ended | | | Year Ended | |
| | | June 30, 2016 | | | December 31, | | | December 31, | | | December 31, | | | December 31, | | | December 31, | |
| | | (Unaudited) | | | 2015 | | | 2014 | | | 2013 | | | 2012 | | | 2011 | |
| Total Return* | | | 5.23 | %(2) | | | (8.87 | )% | | | (5.30 | )% | | | 46.98 | % | | | 17.73 | % | | | (7.63 | )% |
| Ratio of expenses to average net assets: | | | 1.42 | %(1) | | | 1.40 | % | | | 1.39 | % | | | 1.40 | % | | | 1.43 | % | | | 1.42 | % |
| Ratio of net investment income (loss) to average net assets: | | | (0.79 | )%(1) | | | (0.66 | )% | | | (0.30 | )% | | | 0.27 | % | | | 0.44 | % | | | 0.30 | % |
| Portfolio turnover rate | | | 1 | % | | | 2 | % | | | 18 | % | | | 21 | % | | | 26 | % | | | 14 | % |
| | | | | | | | | The Alternative Income Portfolio | | | | | | | |
| | | For the | | | For the | | | For the | | | For the | | | For the | | | For the | |
| | | Period Ended | | | Year Ended | | | Year Ended | | | Year Ended | | | Year Ended | | | Year Ended | |
| | June 30, 2016 | | | December 31, | | | December 31, | | | December 31, | | | December 31, | | | December 31, | |
| | | (Unaudited) | | | 2015 | | | 2014 | | | 2013 | | | 2012 | | | 2011 | |
| Total Return* | | | 1.80 | %(2) | | | 2.73 | % | | | 1.23 | % | | | 4.92 | % | | | 10.05 | % | | | (4.66 | )% |
| Ratio of expenses to average net assets: | | | 1.10 | %(1) | | | 1.16 | % | | | 1.22 | % | | | 1.25 | % | | | 1.49 | % | | | 1.42 | % |
| Ratio of net investment income (loss) to average net assets: | | | (0.16 | )%(1) | | | (0.20 | )% | | | (0.40 | )% | | | (0.54 | )% | | | 1.99 | % | | | 1.47 | % |
| Portfolio turnover rate | | | 0 | % | | | 6 | % | | | 17 | % | | | 19 | % | | | 56 | % | | | 69 | % |
156
| KINETICS PORTFOLIOS TRUST — MASTER INVESTMENT PORTFOLIOS |
Notes to Financial Statements — (Continued) |
| June 30, 2016 (Unaudited) |
| | | | | | | The Multi-Disciplinary Income Portfolio | | | | | |
| | | For the | | | For the | | | For the | | | For the | | | For the | | | For the | |
| | | Period Ended | | | Year Ended | | | Year Ended | | | Year Ended | | | Year Ended | | | Year Ended | |
| | | June 30, 2016 | | | December 31, | | | December 31, | | | December 31, | | | December 31, | | | December 31, | |
| | | (Unaudited) | | | 2015 | | | 2014 | | | 2013 | | | 2012 | | | 2011 | |
| Total Return* | | | 5.85 | %(2) | | | (2.05 | )% | | | 2.58 | % | | | 4.39 | % | | | 15.42 | % | | | 0.19 | % |
| Ratio of expenses to average net assets: | | | 1.39 | %(1) | | | 1.37 | % | | | 1.37 | % | | | 1.39 | % | | | 1.45 | % | | | 1.54 | % |
| Ratio of net investment income to average net assets: | | | 4.34 | %(1) | | | 3.50 | % | | | 3.06 | % | | | 1.87 | % | | | 3.23 | % | | | 8.00 | % |
| Portfolio turnover rate | | | 0 | % | | | 10 | % | | | 35 | % | | | 54 | % | | | 41 | % | | | 74 | % |
| * | The returns are calculated by adjusting the corresponding No-Load Feeder returns by Feeder expenses and reimbursements. |
(1) | Annualized. |
(2) | Not annualized. |
8. Summary of Fair Value Exposure
Various inputs are used in determining the value of a Master Portfolio's investments. These inputs are summarized in the three broad levels listed below:
Level 1 — Unadjusted quoted prices in active markets for identical assets or liabilities that a Master Portfolio has the ability to access.
Level 2 — Observable inputs other than quoted prices included in Level 1 that are observable for the asset or liability, either directly or indirectly. These inputs may include quoted prices for the identical instrument on an inactive market, prices for similar instruments, interest rates, prepayment speeds, credit risk, yield curves, default rates and similar data.
Level 3 — Unobservable inputs for the asset or liability, to the extent relevant observable inputs are not available, representing a Master Portfolio's own assumptions about the assumptions a market participant would use in valuing the asset or liability, and would be based on the best information available.
The availability of observable inputs can vary from security to security and is affected by a wide variety of factors, including, for example, the type of security, whether the security is new and not yet established in the marketplace, the liquidity of markets, and other characteristics particular to the security. To the extent that valuation is based on models or inputs that are less observable or unobservable in the market, the determination of fair value requires more
157
| KINETICS PORTFOLIOS TRUST — MASTER INVESTMENT PORTFOLIOS |
Notes to Financial Statements — (Continued) |
| June 30, 2016 (Unaudited) |
judgment. Accordingly, the degree of judgment exercised in determining fair value is greatest for instruments categorized in Level 3.
The inputs used to measure fair value may fall into different levels of the fair value hierarchy. In such cases, for disclosure purposes, the level in the fair value hierarchy within which the fair value measurement falls in its entirety, is determined based on the lowest level input that is significant to the fair value measurement in its entirety.
The Internet Portfolio
The following is a summary of the inputs used to value The Internet Portfolio's net assets as of June 30, 2016:
| Assets^ | | Level 1 | | | Level 2 | | | Level 3 | | | Total | |
| Common Stocks | | $ | 63,778,638 | | | $ | 248,778 | (1) | | $ | — | | | $ | 64,027,416 | |
| Escrow Notes | | | — | | | | — | | | | — | * | | | — | * |
| Rights | | | 123,300 | | | | — | | | | — | | | | 123,300 | |
| Short-Term Investments | | | 3,746 | | | | 50,162,333 | | | | — | | | | 50,166,079 | |
| Investments Purchased with the Cash | | | | | | | | | | | | | | | | |
| Proceeds from Securities Lending | | | 1,117,887 | | | | — | | | | — | | | | 1,117,887 | |
| Total Investments in Securities | | $ | 65,023,571 | | | $ | 50,411,111 | | | $ | — | * | | $ | 115,434,682 | |
| (1) | The Common Stocks Level 2 balance consists of the market value of the associated Level 2 investments in the following industry: |
| | Administrative and Support Services | | $ | 1,638 | |
| | Rental and Leasing Services | | | 244,160 | |
| | Telecommunications | | | 2,980 | |
| | | | $ | 248,778 | |
For the six-month period ended June 30, 2016, there were no transfers into or out of Level 1, Level 2 or Level 3.
Following is a reconciliation of Level 3 assets for which significant unobservable inputs were used to determine fair value:
| Description | Investments in Securities | |
| Balance as of December 31, 2015 | | $ | — | * |
| Accrued discounts/premiums | | | — | |
| Realized gain (loss) | | | — | |
| Change in unrealized appreciation (depreciation) | | | — | |
| Net purchases and/or acquisitions | | | — | |
| Net sales and/or write-offs | | | — | |
| Transfer in and/or out of Level 3 | | | — | |
| Balance as of June 30, 2016 | | $ | — | * |
158
| KINETICS PORTFOLIOS TRUST — MASTER INVESTMENT PORTFOLIOS |
Notes to Financial Statements — (Continued) |
| June 30, 2016 (Unaudited) |
| | Fair Value at | Valuation | | Unobservable | | |
| Description | 6/30/2016 | Techniques | | Input | | Range |
| Escrow Notes | $—* | Conservative Value | | No active | | $0.00-$0.00 |
| | | Assigned Pending | | market | | |
| | | Bankruptcy Litigation | | | | |
| | | Proceedings/Market | | | | |
| | | Comparables | | | | |
There is no active market for the Level 3 securities, so a conservative value is being assigned until such time as a market exists.
| ^ | See Portfolio of Investments for breakout of investments by industry classification. |
| * | Amount is less than $0.50. |
The Global Portfolio
The following is a summary of the inputs used to value The Global Portfolio's net assets as of June 30, 2016:
| Assets^ | | Level 1 | | | Level 2 | | | Level 3 | | | Total | |
| Common Stocks | | $ | 4,358,267 | | | $ | 712,601 | (1) | | $ | — | | | $ | 5,070,868 | |
| Preferred Stocks | | | — | | | | 12,880 | | | | — | | | | 12,880 | |
| Corporate Bonds | | | — | | | | 32,192 | | | | — | | | | 32,192 | |
| Purchased Put Options | | | — | | | | 9,605 | | | | — | | | | 9,605 | |
| Warrants | | | 5,560 | | | | 147 | | | | — | | | | 5,707 | |
| Short-Term Investments | | | 39,979 | | | | 1,962,899 | | | | — | | | | 2,002,878 | |
| Investments Purchased with the Cash | | | | | | | | | | | | | | | | |
| Proceeds from Securities Lending | | | 48,417 | | | | — | | | | — | | | | 48,417 | |
| Total Investments in Securities | | $ | 4,452,223 | | | $ | 2,730,324 | | | $ | — | | | $ | 7,182,547 | |
| (1) | The Common Stocks Level 2 balance consists of the market value of the associated Level 2 investments in the following industries: |
| | Asset Management | | $ | 459,627 | |
| | Other Information Services | | | 964 | |
| | Real Estate | | | 252,010 | |
| | | | $ | 712,601 | |
| | | | | | |
| | Transfers out of Level 1 into Level 2 | | $ | 964 | |
Transfers were made out of Level 1 into Level 2 due to a decrease in market activity. Transfers between levels are recognized at the end of the reporting period.
For the six-month period ended June 30, 2016, there were no investments in Level 3 securities.
159
| KINETICS PORTFOLIOS TRUST — MASTER INVESTMENT PORTFOLIOS |
Notes to Financial Statements — (Continued) |
| June 30, 2016 (Unaudited) |
The Paradigm Portfolio
The following is a summary of the inputs used to value The Paradigm Portfolio's net assets as of June 30, 2016:
| Assets^ | | Level 1 | | | Level 2 | | | Level 3 | | | Total | |
| Common Stocks | | $ | 614,736,240 | | | $ | 26,683,904 | (1) | | $ | — | | | $ | 641,420,144 | |
| Preferred Stocks | | | — | | | | 5,443 | | | | — | | | | 5,443 | |
| Escrow Notes | | | — | | | | — | | | | — | * | | | — | * |
| Purchased Put Options | | | — | | | | 55,080 | | | | — | | | | 55,080 | |
| Warrants | | | 378,524 | | | | 62 | | | | — | | | | 378,586 | |
| Short-Term Investments | | | 11,372 | | | | 105,244,149 | | | | — | | | | 105,255,521 | |
| Investments Purchased with the Cash | | | | | | | | | | | | | | | | |
| Proceeds from Securities Lending | | | 18,731,551 | | | | — | | | | — | | | | 18,731,551 | |
| Total Investments in Securities | | $ | 633,857,687 | | | $ | 131,988,638 | | | $ | — | * | | $ | 765,846,325 | |
| (1) | The Common Stocks Level 2 balance consists of the market value of the associated Level 2 investments in the following industries: |
| | Asset Management | | $ | 18,181,105 | |
| | Oil and Gas Extraction | | | 6,612,726 | |
| | Real Estate | | | 1,890,073 | |
| | | | $ | 26,683,904 | |
For the six-month period ended June 30, 2016, there were no transfers into or out of Level 1, Level 2 or Level 3.
Following is a reconciliation of Level 3 assets for which significant unobservable inputs were used to determine fair value:
| Description | Investments in Securities | |
| Balance as of December 31, 2015 | | $ | — | * |
| Accrued discounts/premiums | | | — | |
| Realized gain (loss) | | | — | |
| Change in unrealized appreciation (depreciation) | | | — | |
| Net purchases and/or acquisitions | | | — | |
| Net sales and/or write-offs | | | — | |
| Transfer in and/or out of Level 3 | | | — | |
| Balance as of June 30, 2016 | | $ | — | * |
160
| KINETICS PORTFOLIOS TRUST — MASTER INVESTMENT PORTFOLIOS |
Notes to Financial Statements — (Continued) |
| June 30, 2016 (Unaudited) |
| | | Fair Value at | | Valuation | | Unobservable | | |
| Description | | 6/30/16 | | Techniques | | Input | | Range |
| Escrow Notes | . | $—* | | Conservative Value | | No active | | $0.00-$0.00 |
| | | | | Assigned Pending | | market | | |
| | | | | Bankruptcy Litigation | | | | |
| | | | | Proceedings/Market | | | | |
| | | | | Comparables | | | | |
There is no active market for the Level 3 securities, so a conservative value is being assigned until such time as a market exists.
| ^ | See Portfolio of Investments for breakout of investments by industry classification. |
| * | Amount is less than $0.50. |
The Medical Portfolio
The following is a summary of the inputs used to value The Medical Portfolio's net assets as of June 30, 2016:
| Assets^ | | Level 1 | | | Level 2 | | | Level 3 | | | Total | |
| Common Stocks | | $ | 23,101,519 | | | $ | — | | | $ | — | | | $ | 23,101,519 | |
| Rights | | | 6,554 | | | | 968 | | | | — | | | | 7,522 | |
| Short-Term Investments | | | 2,293 | | | | 1,304,731 | | | | — | | | | 1,307,024 | |
| Investments Purchased with the Cash | | | | | | | | | | | | | | | | |
| Proceeds from Securities Lending | | | 2,192,568 | | | | — | | | | — | | | | 2,192,568 | |
| Total Investments in Securities | | $ | 25,302,934 | | | $ | 1,305,699 | | | $ | — | | | $ | 26,608,633 | |
| Transfers out of Level 1 into Level 2 | | $ | 968 | |
Transfers were made out of Level 1 into Level 2 due to a decrease in market activity. Transfers between levels are recognized at the end of the reporting period.
For the six-month period ended June 30, 2016, there were no investments in Level 3 securities.
| ^ | See Portfolio of Investments for breakout of investments by industry classification. |
161
| KINETICS PORTFOLIOS TRUST — MASTER INVESTMENT PORTFOLIOS |
Notes to Financial Statements — (Continued) |
| June 30, 2016 (Unaudited) |
The Small Cap Opportunities Portfolio
The following is a summary of the inputs used to value The Small Cap Opportunities Portfolio's net assets as of June 30, 2016:
| Assets^ | | | Level 1 | | | Level 2 | | | Level 3 | | | Total | |
| Common Stocks | | $ | 153,941,872 | | $ | 25,843,241(1 | ) | $ | — | | $ | 179,785,113 | |
| Preferred Stocks | | | — | | | 1,299,578 | | | — | | | 1,299,578 | |
| Rights | | | 385,984 | | | — | | | — | | | 385,984 | |
| Warrants | | | 38,364 | | | 14,784 | | | — | | | 53,148 | |
| Short-Term Investments | | | 833 | | | 17,306,555 | | | — | | | 17,307,388 | |
| Investments Purchased with the Cash Proceeds from Securities Lending | | | 8,818,979 | | | — | | | — | | | 8,818,979 | |
| Total Investments in Securities | | $ | 163,186,032 | | $ | 44,464,158 | | $ | — | | $ | 207,650,190 | |
| (1) | The Common Stocks Level 2 balance consists of the market value of the associated Level 2 investments in the following industries: |
| Asset Management | | $ | 11,976,671 | |
| Forestry and Logging | | | 32,490 | |
| Real Estate | | | 13,774,062 | |
| Rental and Leasing Services | | | 32,962 | |
| Telecommunications | | | 27,056 | |
| | | $ | 25,843,241 | |
| | | | | |
| Transfers out of Level 1 into Level 2 | | $ | 32,490 | |
| Transfers out of Level 2 into Level 1 | | $ | 80,039 | |
Transfers were made out of Level 1 into Level 2 due to a decrease in market activity.
Transfers were made out of Level 2 into Level 1 due to an increase in market activity.
Transfers between levels are recognized at the end of the reporting period.
For the six-month period ended June 30, 2016, there were no investments in Level 3 securities.
| ^ | See Portfolio of Investments for breakout of investments by industry classification. |
162
| KINETICS PORTFOLIOS TRUST — MASTER INVESTMENT PORTFOLIOS |
Notes to Financial Statements — (Continued) |
| June 30, 2016 (Unaudited) |
The Market Opportunities Portfolio
The following is a summary of the inputs used to value The Market Opportunities Portfolio's net assets as of June 30, 2016:
| Assets^ | | | Level 1 | | | Level 2 | | | Level 3 | | | Total | |
| Common Stocks | | $ | 23,634,673 | | $ | 5,011,227 | | $ | — | | $ | 28,645,900 | |
| Preferred Stocks | | | — | | | 296,086 | | | — | | | 296,086 | |
| Corporate Bonds | | | — | | | 4,483 | | | — | | | 4,483 | |
| Purchased Put Options | | | — | | | 18,360 | | | — | | | 18,360 | |
| Rights | | | — | | | — | | | — | * | | — | * |
| Warrants | | | 772 | | | 3,368 | | | — | | | 4,140 | |
| Short-Term Investments | | | 175,147 | | | 9,634,555 | | | — | | | 9,809,702 | |
| Investments Purchased with the Cash Proceeds from Securities Lending | | | 81,900 | | | — | | | — | | | 81,900 | |
| Total Investments in Securities | | $ | 23,892,492 | | $ | 14,968,079 | | $ | — | * | $ | 38,860,571 | |
| (1) | The Common Stocks Level 2 balance consists of the market value of the associated Level 2 investments in the following industries: |
| | Asset Management | | $ | 3,318,808 | |
| | Real Estate | | | 1,692,419 | |
| | | | $ | 5,011,227 | |
For the six-month period ended June 30, 2016, there were no transfers into or out of Level 1, Level 2 or Level 3.
Following is a reconciliation of Level 3 assets for which significant unobservable inputs were used to determine fair value:
| Description | Investments in Securities | |
| Balance as of December 31, 2015 | | $ | — | * |
| Accrued discounts/premiums | | | — | |
| Realized gain (loss) | | | — | |
| Change in unrealized appreciation (depreciation) | | | — | |
| Net purchases and/or acquisitions | | | — | |
| Net sales and/or write-offs | | | — | |
| Transfer in and/or out of Level 3 | | | — | |
| Balance as of June 30, 2016 | | $ | — | * |
| | | | Fair Value at | | | Valuation | | | Unobservable | | | | |
| Description | | | 06/30/16 | | | Techniques | | | Input | | | Range | |
| Rights | | | $—* | | | Market Comparables | | | No active market | | | $0.00-$0.00 | |
There is no active market for the Level 3 securities, so a conservative value is being assigned until such time as a market exists.
| ^ | See Portfolio of Investments for breakout of investments by industry classification. |
| * | Amount is less than $0.50. |
163
| KINETICS PORTFOLIOS TRUST — MASTER INVESTMENT PORTFOLIOS |
Notes to Financial Statements — (Continued) |
| June 30, 2016 (Unaudited) |
The Alternative Income Portfolio
The following is a summary of the inputs used to value The Alternative Income Portfolio's net assets as of June 30, 2016:
| Assets^ | | | Level 1 | | | Level 2 | | | Level 3 | | | Total | |
| Corporate Bonds | | $ | — | | $ | 11,842,249 | | $ | — | | $ | 11,842,249 | |
| U.S. Treasury Obligations | | | — | | | 2,105,018 | | | — | | | 2,105,018 | |
| Exchange Traded Funds | | | 5,832,877 | | | — | | | — | | | 5,832,877 | |
| Short-Term Investments | | | 237,184 | | | 6,556,042 | | | — | | | 6,793,226 | |
| Total Investments in Securities | | $ | 6,070,061 | | $ | 20,503,309 | | $ | — | | $ | 26,573,370 | |
| | | | | | | | | | | | | | |
Liabilities | | | | | | | | | | | | | |
| Put Options Written | | $ | — | | $ | 174,886 | | $ | — | | $ | 174,886 | |
For the six-month period ended June 30, 2016, there were no transfers into or out of Level 1 or Level 2, or investments in Level 3 securities.
| ^ | See Portfolio of Investments for breakout of investments by industry classification. |
The Multi-Disciplinary Income Portfolio
The following is a summary of the inputs used to value The Multi-Disciplinary Income Portfolio's net assets as of June 30, 2016:
| Assets^ | | | Level 1 | | | Level 2 | | | Level 3 | | | Total | |
| Convertible Bonds | | $ | — | | $ | 6,139,993 | | $ | — | | $ | 6,139,993 | |
| Corporate Bonds | | | — | | | 69,877,167 | | | — | | | 69,877,167 | |
| Municipal Bonds | | | — | | | 192,500 | | | — | | | 192,500 | |
| Escrow Notes | | | — | | | 22,500 | | | — | | | 22,500 | |
| Exchange Traded Notes | | | 3,872 | | | — | | | — | | | 3,872 | |
| Mutual Funds | | | 4,942,764 | | | — | | | — | | | 4,942,764 | |
| Short-Term Investments | | | 843 | | | 1,817,466 | | | — | | | 1,818,309 | |
| Investments Purchased with the Cash Proceeds from Securities Lending | | | 4,781,365 | | | — | | | — | | | 4,781,365 | |
| Total Investments in Securities | | $ | 9,728,844 | | $ | 78,049,626 | | $ | — | | $ | 87,778,470 | |
| | | | | | | | | | | | | | |
Liabilities | | | | | | | | | | | | | |
| Put Options Written | | $ | — | | $ | 772 | | $ | — | | $ | 772 | |
For the six-month period ended June 30, 2016, there were no transfers into or out of Level 1 or Level 2, or investments in Level 3 securities.
| ^ | See Portfolio of Investments for breakout of investments by industry classification. |
164
| KINETICS PORTFOLIOS TRUST — MASTER INVESTMENT PORTFOLIOS |
Notes to Financial Statements — (Continued) |
| June 30, 2016 (Unaudited) |
9. Disclosures about Derivative Instruments and Hedging Activities
The Master Portfolios have adopted authoritative standards regarding disclosure of derivatives and hedging activity intended to improve financial reporting of derivative instruments by enabling investors to understand how and why a Master Portfolio uses derivatives, how derivatives are accounted for by the Master Portfolios, and how derivative instruments affect a Master Portfolio's results of operations and financial position. The Master Portfolios utilized options to implement or to gain further exposure to their respective investment strategies.
The following is a summary of the fair value and location of derivative instruments on the Statement of Assets and Liabilities as of June 30, 2016:
| | | | | | Statement of Assets & Liabilities | |
| | | | | | | | | | | | | | | | | |
| | | | Derivative | | | Asset | | | Asset | | | Liability | | | Liability | |
| | | Equity Contracts | | Description | | Fair Value | | Description | | Fair Value | |
| The Global | | | Purchased | | | Investments, | | | | | | | | | | |
| Portfolio | | | Put Options | | | at value | | $ | 9,605 | | | | | $ | — | |
| The Paradigm | | | Purchased | | | Investments, | | | | | | | | | | |
| Portfolio | | | Put Options | | | at value | | | 55,080 | | | | | | — | |
| The Market | | | | | | | | | | | | | | | | |
| Opportunities | | | Purchased | | | Investments, | | | | | | | | | | |
| Portfolio | | | Put Options | | | at value | | | 18,360 | | | | | | — | |
| The Alternative | | | | | | | | | | | | Written | | | | |
| Income | | | Put Options | | | | | | — | | | options, | | | | |
| Portfolio | | | Written | | | | | | | | | at value | | | 174,886 | |
| The Multi- | | | | | | | | | | | | Written | | | | |
| Disciplinary | | | Put Options | | | | | | | | | options, | | | | |
| Income Portfolio | | | Written | | | | | | — | | | at value | | | 772 | |
165
| KINETICS PORTFOLIOS TRUST — MASTER INVESTMENT PORTFOLIOS |
Notes to Financial Statements — (Continued) |
| June 30, 2016 (Unaudited) |
The following is a summary of the transactions in and effect of derivative instruments on the Statement of Operations for the six-month period ended June 30, 2016:
| | | | Statement of Operations | |
| | | | | | | Change in Unrealized | |
| | Derivative Equity Contracts | | Realized Gain (Loss) | | | Appreciation (Depreciation) | |
| The Global | | | | | | | |
| Portfolio | Purchased Put Options | | $ | — | | | $ | 1,540 | |
| The Paradigm | | | | | | | | | |
| Portfolio | Purchased Put Options | | | — | | | | 8,910 | |
| The Market | | | | | | | | | |
| Opportunities | | | | | | | | | |
| Portfolio | Purchased Put Options | | | — | | | | 2,971 | |
| The Alternative | | | | | | | | | |
| Income Portfolio | Purchased Put Options | | | (41,016 | ) | | | 13,122 | |
| The Alternative | | | | | | | | | |
| Income Portfolio | Put Options Written | | | 391,884 | | | | (1,943 | ) |
| The Multi- | | | | | | | | | |
| Disciplinary | | | | | | | | | |
| Income Portfolio | Purchased Put Options | | | (10,651 | ) | | | (3,412 | ) |
| The Multi- | | | | | | | | | |
| Disciplinary | | | | | | | | | |
| Income Portfolio | Put Options Written | | | — | | | | 3,814 | |
The following is a summary of the volume of derivative instrument activity during the six-month period ended June 30, 2016:
| | | | Number of | | | | | | Average | |
| | | | Contracts | | | Premiums | | | Quarterly | |
| | | | Purchased or | | | Paid or | | | Market | |
| | Derivative Equity Contracts | | Written | | | Received | | | Value | |
| The Global | | | | | | | | | | |
| Portfolio | Purchased Put Options | | | — | | | $ | — | | | $ | 8,480 | |
| The Paradigm | | | | | | | | | | | | | |
| Portfolio | Purchased Put Options | | | — | | | | — | | | | 48,308 | |
| The Market | | | | | | | | | | | | | |
| Opportunities | | | | | | | | | | | | | |
| Portfolio | Purchased Put Options | | | — | | | | — | | | | 16,103 | |
| The Alternative | | | | | | | | | | | | | |
| Income Portfolio | Put Options Written | | | 608 | | | | 1,012,449 | | | | 179,352 | |
| The Multi- | | | | | | | | | | | | | |
| Disciplinary | | | | | | | | | | | | | |
| Income Portfolio | Purchased Put Options | | | — | | | | — | | | | 1,080 | |
| The Multi- | | | | | | | | | | | | | |
| Disciplinary | | | | | | | | | | | | | |
| Income Portfolio | Put Options Written | | | 20 | | | | 4,586 | | | | 1,834 | |
166
| KINETICS PORTFOLIOS TRUST — MASTER INVESTMENT PORTFOLIOS |
Notes to Financial Statements — (Continued) |
| June 30, 2016 (Unaudited) |
10. Offsetting Assets and Liabilities
The Master Portfolios are subject to various Master Netting Arrangements, which govern the terms of certain transactions with select counterparties. The Master Netting Arrangements allow a Portfolio to close out and net its total exposure to a counterparty in the event of a default with respect to all the transactions governed under a single agreement with a counterparty. The Master Netting Arrangements also specify collateral posting arrangements at pre-arranged exposure levels. Under the Master Netting Arrangements, collateral is routinely transferred if the total net exposure to certain transactions (net of existing collateral already in place) governed under the relevant Master Netting Arrangement with a counterparty in a given account exceeds a specific threshold depending on the counterparty and the type of Master Netting Arrangement.
The following is a summary of the Assets and Liabilities subject to offsetting in the Master Portfolios as of June 30, 2016:
| | | | | | | | | | Net | | Gross Amounts not Offset | | | | |
| | | | | | | Gross | | | Amounts | | | in the Statement of | | | | |
| | | | | | | Amounts | | | Presented | | | Assets & Liabilities | | | | |
| | | | Gross | | | Offset in the | | | in the | | | | | | | | | | |
| | | | Amount of | | | Statement | | | Statement | | | | | | Collateral | | | | |
| | | | Recognized | | | of Assets & | | | of Assets & | | | Financial | | | Pledged | | | Net | |
| | | Liabilities | | Liabilities | | Liabilities | | Instruments | | (Received) | | Amount | |
| The Internet Portfolio | | | | | | | | | | | | | | | | | | | |
| Securities Lending | | $ | 1,117,887 | | $ | — | | $ | 1,117,887 | | $ | 1,117,887 | | $ | — | | $ | — | |
| | | $ | 1,117,887 | | $ | — | | $ | 1,117,887 | | $ | 1,117,887 | | $ | — | | $ | — | |
| The Global Portfolio | | | | | | | | | | | | | | | | | | | |
| Securities Lending | | $ | 48,417 | | $ | — | | $ | 48,417 | | $ | 48,417 | | $ | — | | $ | — | |
| | | $ | 48,417 | | $ | — | | $ | 48,417 | | $ | 48,417 | | $ | — | | $ | — | |
| The Paradigm Portfolio | | | | | | | | | | | | | | | | | | | |
| Securities Lending | | $ | 18,731,551 | | $ | — | | $ | 18,731,551 | | $ | 18,731,551 | | $ | — | | $ | — | |
| | | $ | 18,731,551 | | $ | — | | $ | 18,731,551 | | $ | 18,731,551 | | $ | — | | $ | — | |
| The Medical Portfolio | | | | | | | | | | | | | | | | | | | |
| Securities Lending | | $ | 2,192,568 | | $ | — | | $ | 2,192,568 | | $ | 2,192,568 | | $ | — | | $ | — | |
| | | $ | 2,192,568 | | $ | — | | $ | 2,192,568 | | $ | 2,192,568 | | $ | — | | $ | — | |
167
| KINETICS PORTFOLIOS TRUST — MASTER INVESTMENT PORTFOLIOS |
Notes to Financial Statements — (Continued) |
| June 30, 2016 (Unaudited) |
| Liabilities (Continued): |
| | | | | | | | | | Net | | Gross Amounts not Offset in the Statement of Assets & Liabilities | | | | |
| | | | | | | Gross | | | Amounts | | | | | | | | | | |
| | | | | | | Amounts | | | Presented | | | | | | | | | | |
| | | | Gross | | | Offset in the | | | in the | | | | | | | | | | |
| | | | Amounts of | | | Statement | | | Statement | | | | | | Collateral | | | | |
| | | | Recognized | | | of Assets & | | | of Assets & | | | Financial | | | Pledged | | | Net | |
| | | Liabilities | | Liabilities | | Liabilities | | Instruments | | (Received) | | Amount | |
| The Small Cap | | | | | | | | | | | | | | | | | | | |
| Opportunities Portfolio | | | | | | | | | | | | | | | | | | | |
| Securities Lending | | $ | 8,818,979 | | $ | — | | $ | 8,818,979 | | $ | 8,818,979 | | $ | — | | $ | — | |
| | | $ | 8,818,979 | | $ | — | | $ | 8,818,979 | | $ | 8,818,979 | | $ | — | | $ | — | |
| The Market | | | | | | | | | | | | | | | | | | | |
| Opportunities Portfolio | | | | | | | | | | | | | | | | | | | |
| Securities Lending | | $ | 81,900 | | $ | — | | $ | 81,900 | | $ | 81,900 | | $ | — | | $ | — | |
| | | $ | 81,900 | | $ | — | | $ | 81,900 | | $ | 81,900 | | $ | — | | $ | — | |
| The Alternative | | | | | | | | | | | | | | | | | | | |
| Income Portfolio | | | | | | | | | | | | | | | | | | | |
| Written Options | | $ | 174,886 | | $ | — | | $ | 174,886 | | $ | — | | $ | 174,886 | | $ | — | |
| | | $ | 174,886 | | $ | — | | $ | 174,886 | | $ | — | | $ | 174,886 | | $ | — | |
| The Multi-Disciplinary | | | | | | | | | | | | | | | | | | | |
| Income Portfolio | | | | | | | | | | | | | | | | | | | |
| Securities Lending | | $ | 4,781,365 | | $ | — | | $ | 4,781,365 | | $ | 4,781,365 | | $ | — | | $ | — | |
| Written Options | | | 722 | | | — | | | 722 | | | — | | | 722 | | | — | |
| | | $ | 4,782,087 | | $ | — | | $ | 4,782,087 | | $ | 4,781,365 | | $ | 722 | | $ | — | |
11. Affiliated Issuers
Under section 2(a)(3) of the 1940 Act, an investment company is defined as being an affiliated person of a company if it owns five percent or more of a company's outstanding voting stock.
Investments in affiliated companies for The Paradigm Portfolio as of June 30, 2016, are shown below:
| | Number of | | | | | | Number of |
| | shares held | | | | | | shares held at |
| | at December 31, | | Gross | | Gross | | June 30, |
| Name of Issuer | 2015 | | Additions | | Reductions | | 2016 |
| Texas Pacific Land Trust | 608,080 | | 6,160 | | — | | 614,240 |
| | | | | | | | | | | |
| | | | Fair value | | | | | | Realized | |
| | | | at June 30, | | | Dividend | | | Capital | |
| Name of Issuer | | 2016 | | Income | | Gain/Loss | |
| Texas Pacific Land Trust | | $ | 103,591,576 | | $ | 189,174 | | $ | — | |
168
| KINETICS PORTFOLIOS TRUST — MASTER INVESTMENT PORTFOLIOS |
Notes to Financial Statements — (Continued) |
| June 30, 2016 (Unaudited) |
12. Information about Proxy Voting
Information regarding how the Feeder Funds and the Master Portfolios vote proxies relating to portfolio securities is available without charge upon request by calling toll-free at 1-800-930-3828 or by accessing the Funds' website at www.kineticsfunds.com and by accessing the SEC's website at www.sec.gov. Information regarding how the Feeder Funds and the Master Portfolios voted proxies relating to portfolio securities during the most recent twelve month period ended June 30, is available without charge, upon request, by calling toll-free at 1-800-930-3828 or by accessing the SEC's website at www.sec.gov.
13. Information about the Portfolio Holdings
The Master Portfolios file their complete schedules of portfolio holdings for its first and third fiscal quarters with the SEC on Form N-Q. The Master Portfolios' Form N-Q is available without charge, upon request, by calling toll-free at 1-800-930-3828. Furthermore, you can obtain the Form N-Q on the SEC's website at www.sec.gov. Finally, the Form N-Q may be reviewed and copied at the SEC's Public Reference Room in Washington, D.C. Information on the operation of the Public Reference Room may be obtained by calling 1-800-SEC-0330.
14. Subsequent Events
In preparing these financial statements, management has evaluated Portfolio related events and transactions for potential recognition or disclosure through the date the financial statements were issued. There were no events or translations that occurred during the period that materially impacted the amounts or disclosures in the Master Portfolios' financial statements.
169
[THIS PAGE INTENTIONALLY LEFT BLANK]
170
[THIS PAGE INTENTIONALLY LEFT BLANK]
171
[THIS PAGE INTENTIONALLY LEFT BLANK]
172
[THIS PAGE INTENTIONALLY LEFT BLANK]
173
Kinetics Mutual
Funds, Inc.
615 East Michigan Street
Milwaukee, WI 53202
INVESTMENT ADVISER AND
SHAREHOLDER SERVICING AGENT
Kinetics Asset Management LLC
470 Park Avenue South
New York, NY 10016
INDEPENDENT REGISTERED
PUBLIC ACCOUNTING FIRM
Tait, Weller & Baker LLP
1818 Market Street
Suite 2400
Philadelphia, PA 19103
DISTRIBUTOR
Kinetics Funds Distributor LLC
470 Park Avenue South
New York, NY 10016
ADMINISTRATOR
FUND ACCOUNTANT AND
TRANSFER AGENT
U.S. Bancorp Fund Services, LLC
615 East Michigan Street
Milwaukee, WI 53202
CUSTODIAN
U.S. Bank, N.A.
Custody Operations
1555 River Center Drive, Suite 302
Milwaukee, WI 53212
THIS MATERIAL MUST BE PRECEDED OR
ACCOMPANIED BY A PROSPECTUS
Not applicable to registrants who are not listed issuers (as defined in Rule 10A-3 under the Securities Exchange Act of 1934).
The Schedule of Investments is included as part of the report to shareholders filed under Item 1 of this Form.
Not applicable to open-end investment companies.
Not applicable to open-end investment companies.
Not applicable to open-end investment companies.
There have been no material changes to the procedures by which shareholders may recommend nominees to the registrant’s board of trustees.
Filed herewith.
(3) Not applicable to open-end investment companies.
Furnished herewith.
Pursuant to the requirements of the Securities Exchange Act of 1934 and the Investment Company Act of 1940, the registrant has duly caused this report to be signed on its behalf by the undersigned, thereunto duly authorized.
Peter B. Doyle, President
Pursuant to the requirements of the Securities Exchange Act of 1934 and the Investment Company Act of 1940, this report has been signed below by the following persons on behalf of the registrant and in the capacities and on the dates indicated.
Peter B. Doyle, President
Leonid Polyakov, Treasurer
* Print the name and title of each signing officer under his or her signature.