
UNITED STATES
SECURITIES AND EXCHANGE COMMISSION
Washington, D.C. 20549
FORM N-CSRS
CERTIFIED SHAREHOLDER REPORT OF REGISTERED
MANAGEMENT INVESTMENT COMPANIES
Investment Company Act file number: 811-09689
Wells Fargo Master Trust
(Exact name of registrant as specified in charter)
525 Market St., San Francisco, CA 94105
(Address of principal executive offices) (Zip code)
C. David Messman
Wells Fargo Funds Management, LLC
525 Market St., San Francisco, CA 94105
(Name and address of agent for service)
Registrant’s telephone number, including area code: 800-222-8222
Date of fiscal year end: February 28
Registrant is making a filing for 3 of its series:
Wells Fargo Diversified Fixed Income Portfolio, Wells Fargo Diversified Stock Portfolio, and Wells Fargo Short-Term Investment Portfolio.
Date of reporting period: August 31, 2016
ITEM 1. REPORT TO STOCKHOLDERS
Semi-Annual Report
August 31, 2016

Dow Jones Target Date Funds

| n | | Wells Fargo Dow Jones Target Today Fund |
| n | | Wells Fargo Dow Jones Target 2010 Fund |
| n | | Wells Fargo Dow Jones Target 2015 Fund |
| n | | Wells Fargo Dow Jones Target 2020 Fund |
| n | | Wells Fargo Dow Jones Target 2025 Fund |
| n | | Wells Fargo Dow Jones Target 2030 Fund |
| n | | Wells Fargo Dow Jones Target 2035 Fund |
| n | | Wells Fargo Dow Jones Target 2040 Fund |
| n | | Wells Fargo Dow Jones Target 2045 Fund |
| n | | Wells Fargo Dow Jones Target 2050 Fund |
| n | | Wells Fargo Dow Jones Target 2055 Fund |
| n | | Wells Fargo Dow Jones Target 2060 Fund |

Reduce clutter. Save trees.
Sign up for electronic delivery of prospectuses and shareholder reports at wellsfargo.com/advantagedelivery
Contents
| * | A complete schedule of portfolio holdings as of the report date may be obtained, free of charge, by accessing the following website: https://www.wellsfargofunds.com/assets/edocs/regulatory/holdings/diversified-fixed-income-semi.pdf or by calling Wells Fargo Funds at 1-800-222-8222. This complete schedule, filed on Form N-CSRS, is also available on the SEC’s website at sec.gov. |
| ** | A complete schedule of portfolio holdings as of the report date may be obtained, free of charge, by accessing the following website: https://www.wellsfargofunds.com/assets/edocs/regulatory/holdings/diversified-stock-semi.pdf or by calling Wells Fargo Funds at 1-800-222-8222. This complete schedule, filed on Form N-CSRS, is also available on the SEC’s website at sec.gov. |
Dow Jones® and Dow Jones Target Date IndexesSM are service marks of Dow Jones Trademark Holdings LLC (Dow Jones); have been licensed to CME Group Index Services LLC (CME Indexes); and have been sublicensed for use for certain purposes by Global Index Advisors, Inc., and Wells Fargo Funds Management, LLC. The Wells Fargo Dow Jones Target Date Funds, based on the Dow Jones Target Date Indexes, are not sponsored, endorsed, sold, or promoted by Dow Jones, CME Indexes, or their respective affiliates, and none of them makes any representation regarding the advisability of investing in such product(s).
The views expressed and any forward-looking statements are as of August 31, 2016, unless otherwise noted, and are those of the Fund managers and/or Wells Fargo Funds Management, LLC. Discussions of individual securities, or the markets generally, or any Wells Fargo Fund are not intended as individual recommendations. Future events or results may vary significantly from those expressed in any forward-looking statements. The views expressed are subject to change at any time in response to changing circumstances in the market. Wells Fargo Funds Management, LLC and the Fund disclaim any obligation to publicly update or revise any views expressed or forward-looking statements.
NOT FDIC INSURED ¡ NO BANK GUARANTEE ¡ MAY LOSE VALUE
| | | | |
| 2 | | Wells Fargo Dow Jones Target Date Funds | | Letter to shareholders (unaudited) |

Karla M. Rabusch
President
Wells Fargo Funds
The combination of steady economic growth and the lack of further Fed rate hikes supported the U.S. stock and bond markets.
Dear Valued Shareholder:
We are pleased to offer you this semiannual report for the Wells Fargo Dow Jones Target Date Funds for the six-month period that ended August 31, 2016. The Dow Jones Target Date Funds diversify investments across equity, fixed-income, and short-term debt securities. During the period, global stocks and bonds benefited from resilient economies and accommodative central-bank policy.
The U.S. economy achieved low but continued growth.
Real U.S. gross domestic product (GDP) growth remained modestly positive during the reporting period, falling below 1% in the first quarter of 2016 and just topping 1% in the second quarter of 2016. The U.S. unemployment rate remained largely unchanged, beginning the period at 5.0% in March 2016 and ending at 4.9% in August 2016.
The U.S. economy was strong enough in December 2015 that the U.S. Federal Reserve (Fed) raised its target interest rate by 25 basis points (bps; 100 bps equals 1.00%) after keeping it near zero for seven years. Throughout the reporting period, investors debated the potential timing of the next Fed rate hike, even as the Fed clarified that future interest-rate increases would be gradual. As of the end of the period, the Fed remained on hold.
The combination of steady economic growth and the lack of further Fed rate hikes supported the U.S. stock and bond markets. The S&P 500 Index,1 a proxy for U.S. large-cap stocks, returned 13.60% for the six-month period. The Bloomberg Barclays U.S. Aggregate Bond Index,2 which measures the investment-grade bond market, returned 3.68% for the reporting period.
Non-U.S. developed markets presented a mixed picture, even as emerging markets maintained strong growth rates.
In Japan, despite the continued implementation of Prime Minister Shinzō Abe’s reform program, the country reported disappointing numbers for exports, factory output, and household spending. The Bank of Japan continued to provide liquidity by purchasing bonds and exchange-traded funds and keeping its key interest rate at -0.1%.
The economic picture was brighter in the European Union (E.U.), whose economy remained resilient despite problems that ranged from fragile banks in Italy, Spain, and Portugal to the June 2016 vote by the United Kingdom to exit the E.U. For the second quarter of 2016, the E.U. achieved a 1.8% real GDP growth rate, year over year, largely on the basis of a growth in exports and a modest increase in household spending. The E.U.’s economy was supported by the European Central Bank (ECB), which pushed its rate for banks’ excess reserves to -0.40% in March 2016 in an effort to encourage lending. Moreover, the ECB kept its main lending rate at zero and continued to provide liquidity through an asset-purchase program.
| 1 | The S&P 500 Index consists of 500 stocks chosen for market size, liquidity, and industry group representation. It is a market-value-weighted index with each stock’s weight in the index proportionate to its market value. You cannot invest directly in an index. |
| 2 | The Bloomberg Barclays U.S. Aggregate Bond Index (formerly known as Barclays U.S. Aggregate Bond Index) is a broad-based benchmark that measures the investment-grade, U.S. dollar–denominated, fixed-rate taxable bond market, including Treasuries, government-related and corporate securities, mortgage-backed securities (agency fixed-rate and hybrid adjustable-rate mortgage pass-throughs), asset-backed securities, and commercial mortgage-backed securities. You cannot invest directly in an index. |
| | | | | | |
| Letter to shareholders (unaudited) | | Wells Fargo Dow Jones Target Date Funds | | | 3 | |
Despite a stagnant Japanese economy, generally favorable European growth and accommodative central banks boosted developed markets stocks and bonds. The Morgan Stanley Capital International (MSCI) Europe, Australasia, Far East (EAFE) Index (Net)3 returned 10.35% for the fiscal period, while the Bloomberg Barclays Global Aggregate ex U.S. Dollar Bond Index4 gained 7.64%.
In emerging economies, China’s second-quarter GDP growth narrowly beat analyst estimates as a result of both fiscal and monetary stimulus. Solid economic performance from both China and India supported the MSCI Emerging Markets (EM) Index (Net),5 which returned 22.69%. Brazil also strongly outperformed as it ended its impeachment process against former President Dilma Rousseff by removing her from office.
Don’t let short-term uncertainty derail long-term investment goals.
Periods of uncertainty can present challenges, but experience has taught us that maintaining long-term investment goals can be an effective way to plan for the future. To help you create a sound strategy based on your personal goals and risk tolerance, Wells Fargo Funds offers more than 100 mutual funds and other investments spanning a wide range of asset classes and investment styles. Although diversification cannot guarantee an investment profit or prevent losses, we believe it can be an effective way to manage investment risk and potentially smooth out overall portfolio performance. We encourage investors to know their investments and to understand that appropriate levels of risk-taking may unlock opportunities.
Thank you for choosing to invest with Wells Fargo Funds. We appreciate your
confidence in us and remain committed to helping you meet your financial needs.
Sincerely,

Karla M. Rabusch
President
Wells Fargo Funds
Despite a stagnant Japanese economy, generally favorable European growth and accommodative central banks boosted developed markets stocks and bonds.
For further information about your Fund, contact your investment professional, visit our website at wellsfargofunds.com, or call us directly at 1-800-222-8222. We are available 24 hours a day, 7 days a week.
| 3 | The Morgan Stanley Capital International (MSCI) Europe, Australasia, Far East (EAFE) Index (Net) is a free-float-adjusted market-capitalization-weighted index that is designed to measure the equity market performance of developed markets, excluding the United States and Canada. The MSCI EAFE Index (Net) consists of the following 21 developed markets country indexes: Australia, Austria, Belgium, Denmark, Finland, France, Germany, Hong Kong, Ireland, Israel, Italy, Japan, the Netherlands, New Zealand, Norway, Portugal, Singapore, Spain, Sweden, Switzerland, and the United Kingdom. You cannot invest directly in an index. |
| 4 | The Bloomberg Barclays Global Aggregate ex U.S. Dollar Bond Index (formerly known as Barclays Global Aggregate ex U.S. Dollar Bond Index) tracks an international basket of government, corporate, agency, and mortgage-related bonds. You cannot invest directly in an index. |
| 5 | The MSCI Emerging Markets (EM) Index (Net) is a free-float-adjusted market-capitalization-weighted index that is designed to measure the equity market performance of emerging markets. The MSCI EM Index (Net) consists of the following 23 emerging markets country indexes: Brazil, Chile, China, Colombia, Czech Republic, Egypt, Greece, Hungary, India, Indonesia, Korea, Malaysia, Mexico, Peru, the Philippines, Poland, Qatar, Russia, South Africa, Taiwan, Thailand, Turkey, and United Arab Emirates. You cannot invest directly in an index. |
| | | | |
| 4 | | Wells Fargo Dow Jones Target Date Funds | | Performance highlights (unaudited) |
Wells Fargo Dow Jones Target Date Funds1
Investment objective
Each Fund’s objective is to approximate, before fees and expenses, the total return of the appropriate Dow Jones Global Target Date Index as specified in the following table:
| | |
Wells Fargo Dow Jones
Target Date Funds | | Corresponding Dow Jones
Global Target Date Index |
| Target Today Fund | | Dow Jones Global Target Today Index |
| Target 2010 Fund | | Dow Jones Global Target 2010 Index |
| Target 2015 Fund | | Dow Jones Global Target 2015 Index |
| Target 2020 Fund | | Dow Jones Global Target 2020 Index |
| Target 2025 Fund | | Dow Jones Global Target 2025 Index |
| Target 2030 Fund | | Dow Jones Global Target 2030 Index |
| Target 2035 Fund | | Dow Jones Global Target 2035 Index |
| Target 2040 Fund | | Dow Jones Global Target 2040 Index |
| Target 2045 Fund | | Dow Jones Global Target 2045 Index |
| Target 2050 Fund | | Dow Jones Global Target 2050 Index |
| Target 2055 Fund | | Dow Jones Global Target 2055 Index |
| Target 2060 Fund | | Dow Jones Global Target 2060 Index |
Manager
Wells Fargo Funds Management, LLC
Subadviser
Global Index Advisors, Inc.
Portfolio managers
Rodney H. Alldredge
James P. Lauder
Paul T. Torregrosa, Ph.D.
The target date represents the year in which investors may likely begin withdrawing assets. The Funds gradually seek to reduce market risk as the target date approaches and after it arrives by decreasing equity exposure and increasing fixed income exposure. The principal value is not guaranteed at any time, including at the target date.
Stock values fluctuate in response to the activities of individual companies and general market and economic conditions. Bond values fluctuate in response to the financial condition of individual issuers, general market and economic conditions, and changes in interest rates. Changes in market conditions and government policies may lead to periods of heightened volatility in the bond market and reduced liquidity for certain bonds held by the Funds. In general, when interest rates rise, bond values fall and investors may lose principal value. Interest-rate changes and their impact on each Fund and its share price can be sudden and unpredictable. The use of derivatives may reduce returns and/or increase volatility. Securities issued by U.S. government agencies or government-sponsored entities may not be guaranteed by the U.S. Treasury. Certain investment strategies tend to increase the total risk of an investment (relative to the broader market). These Funds are exposed to foreign investment risk, mortgage- and asset-backed securities risk, smaller-company investment risk, and allocation methodology risk (risk that the allocation methodology of the Dow Jones Global Target Date Index, whose total returns each Fund seeks to approximate, before fees and expenses, will not meet an investor’s goals). Consult the Funds’ prospectus for additional information on these and other risks.
Please see footnotes on pages 18-19.
| | | | | | |
| Performance highlights (unaudited) | | Wells Fargo Dow Jones Target Date Funds | | | 5 | |
Target Today Fund
Average annual total returns (%) as of August 31, 20162
| | | | | | | | | | | | | | | | | | | | | | | | | | | | | | | | | | |
| | | | | Including sales charge | | | Excluding sales charge | | | Expense ratios3 (%) | |
| | | Inception date | | 1 year | | | 5 year | | | 10 year | | | 1 year | | | 5 year | | | 10 year | | | Gross | | | Net4 | |
| Class A (STWRX) | | 3-1-1994 | | | (1.15 | ) | | | 1.15 | | | | 3.02 | | | | 4.92 | | | | 2.35 | | | | 3.63 | | | | 0.84 | | | | 0.76 | |
| Class B (WFOKX)* | | 8-1-1998 | | | (0.85 | ) | | | 1.20 | | | | 3.08 | | | | 4.15 | | | | 1.58 | | | | 3.08 | | | | 1.59 | | | | 1.51 | |
| Class C (WFODX) | | 12-1-1998 | | | 3.14 | | | | 1.60 | | | | 2.85 | | | | 4.14 | | | | 1.60 | | | | 2.85 | | | | 1.59 | | | | 1.51 | |
| Class R (WFRRX) | | 6-28-2013 | | | – | | | | – | | | | – | | | | 4.57 | | | | 2.15 | | | | 3.51 | | | | 1.09 | | | | 1.01 | |
| Class R4 (WOTRX) | | 11-30-2012 | | | – | | | | – | | | | – | | | | 5.22 | | | | 2.78 | | | | 4.11 | | | | 0.56 | | | | 0.45 | |
| Class R6 (WOTDX) | | 6-30-2004 | | | – | | | | – | | | | – | | | | 5.39 | | | | 2.88 | | | | 4.16 | | | | 0.41 | | | | 0.30 | |
| Administrator Class (WFLOX) | | 11-8-1999 | | | – | | | | – | | | | – | | | | 4.97 | | | | 2.51 | | | | 3.82 | | | | 0.76 | | | | 0.65 | |
| Dow Jones Global Target Today Index5 | | – | | | – | | | | – | | | | – | | | | 5.57 | | | | 3.17 | | | | 4.56 | | | | – | | | | – | |
| Bloomberg Barclays U.S. Aggregate Bond Index6 | | – | | | – | | | | – | | | | – | | | | 5.97 | | | | 3.24 | | | | 4.89 | | | | – | | | | – | |
| Russell 3000® Index7 | | – | | | – | | | | – | | | | – | | | | 11.44 | | | | 14.46 | | | | 7.59 | | | | – | | | | – | |
| * | | Class B shares are closed to investment, except in connection with the reinvestment of any distributions and permitted exchanges. |
Figures quoted represent past performance, which is no guarantee of future results, and do not reflect taxes that a shareholder may pay on fund distributions or the redemption of fund shares. Investment return and principal value of an investment will fluctuate so that an investor’s shares, when redeemed, may be worth more or less than their original cost. Performance shown without sales charges would be lower if sales charges were reflected. Current performance may be lower or higher than the performance data quoted and assumes the reinvestment of dividends and capital gains. Current month-end performance is available on the Fund’s website, wellsfargofunds.com.
Index returns do not include transaction costs associated with buying and selling securities, any mutual fund fees or expenses, or any taxes. It is not possible to invest directly in an index.
For Class A shares, the maximum front-end sales charge is 5.75%. For Class B shares, the maximum contingent deferred sales charge is 5.00%. For Class C shares, the maximum contingent deferred sales charge is 1.00%. Performance including a contingent deferred sales charge assumes the sales charge for the corresponding time period. Class R, Class R4, Class R6, and Administrator Class shares are sold without a front-end sales charge or contingent deferred sales charge.
Please see footnotes on pages 18-19.
| | | | |
| 6 | | Wells Fargo Dow Jones Target Date Funds | | Performance highlights (unaudited) |
Target 2010 Fund
Average annual total returns (%) as of August 31, 20168
| | | | | | | | | | | | | | | | | | | | | | | | | | | | | | | | | | |
| | | | | Including sales charge | | | Excluding sales charge | | | Expense ratios3 (%) | |
| | | Inception date | | 1 year | | | 5 year | | | 10 year | | | 1 year | | | 5 year | | | 10 year | | | Gross | | | Net4 | |
| Class A (STNRX) | | 3-1-1994 | | | (0.65 | ) | | | 1.75 | | | | 2.99 | | | | 5.37 | | | | 2.95 | | | | 3.60 | | | | 0.85 | | | | 0.78 | |
| Class B (SPTBX)* | | 3-1-1997 | | | (0.42 | ) | | | 1.84 | | | | 3.06 | | | | 4.58 | | | | 2.21 | | | | 3.06 | | | | 1.60 | | | | 1.53 | |
| Class C (WFOCX) | | 12-1-1998 | | | 3.61 | | | | 2.19 | | | | 2.83 | | | | 4.61 | | | | 2.19 | | | | 2.83 | | | | 1.60 | | | | 1.53 | |
| Class R (WFARX) | | 6-28-2013 | | | – | | | | – | | | | – | | | | 5.12 | | | | 2.75 | | | | 3.48 | | | | 1.10 | | | | 1.03 | |
| Class R4 (WFORX) | | 11-30-2012 | | | – | | | | – | | | | – | | | | 5.76 | | | | 3.38 | | | | 4.08 | | | | 0.57 | | | | 0.47 | |
| Class R6 (WFOAX) | | 6-30-2004 | | | – | | | | – | | | | – | | | | 5.89 | | | | 3.48 | | | | 4.13 | | | | 0.42 | | | | 0.32 | |
| Administrator Class (WFLGX) | | 11-8-1999 | | | – | | | | – | | | | – | | | | 5.50 | | | | 3.11 | | | | 3.80 | | | | 0.77 | | | | 0.67 | |
| Dow Jones Global Target 2010 Index5 | | – | | | – | | | | – | | | | – | | | | 6.12 | | | | 3.81 | | | | 4.57 | | | | – | | | | – | |
| Bloomberg Barclays U.S. Aggregate Bond Index6 | | – | | | – | | | | – | | | | – | | | | 5.97 | | | | 3.24 | | | | 4.89 | | | | – | | | | – | |
| Russell 3000® Index7 | | – | | | – | | | | – | | | | – | | | | 11.44 | | | | 14.46 | | | | 7.59 | | | | – | | | | – | |
| * | | Class B shares are closed to investment, except in connection with the reinvestment of any distributions and permitted exchanges. |
Figures quoted represent past performance, which is no guarantee of future results, and do not reflect taxes that a shareholder may pay on fund distributions or the redemption of fund shares. Investment return and principal value of an investment will fluctuate so that an investor’s shares, when redeemed, may be worth more or less than their original cost. Performance shown without sales charges would be lower if sales charges were reflected. Current performance may be lower or higher than the performance data quoted and assumes the reinvestment of dividends and capital gains. Current month-end performance is available on the Fund’s website, wellsfargofunds.com.
Index returns do not include transaction costs associated with buying and selling securities, any mutual fund fees or expenses, or any taxes. It is not possible to invest directly in an index.
For Class A shares, the maximum front-end sales charge is 5.75%. For Class B shares, the maximum contingent deferred sales charge is 5.00%. For Class C shares, the maximum contingent deferred sales charge is 1.00%. Performance including a contingent deferred sales charge assumes the sales charge for the corresponding time period. Class R, Class R4, Class R6, and Administrator Class shares are sold without a front-end sales charge or contingent deferred sales charge.
Please see footnotes on pages 18-19.
| | | | | | |
| Performance highlights (unaudited) | | Wells Fargo Dow Jones Target Date Funds | | | 7 | |
Target 2015 Fund
Average annual total returns (%) as of August 31, 20169
| | | | | | | | | | | | | | | | | | | | | | | | | | | | | | | | | | |
| | | | | Including sales charge | | | Excluding sales charge | | | Expense ratios3 (%) | |
| | | Inception date | | 1 year | | | 5 year | | | Since
inception | | | 1 year | | | 5 year | | | Since
inception | | | Gross | | | Net4 | |
| Class A (WFACX) | | 11-30-2012 | | | 0.91 | | | | 2.83 | | | | 2.81 | | | | 7.03 | | | | 4.05 | | | | 3.47 | | | | 0.84 | | | | 0.79 | |
| Class R (WFBRX) | | 6-28-2013 | | | – | | | | – | | | | – | | | | 6.82 | | | | 3.78 | | | | 3.24 | | | | 1.09 | | | | 1.04 | |
| Class R4 (WFSRX) | | 11-30-2012 | | | – | | | | – | | | | – | | | | 7.28 | | | | 4.40 | | | | 3.78 | | | | 0.56 | | | | 0.48 | |
| Class R6 (WFSCX) | | 6-29-2007 | | | – | | | | – | | | | – | | | | 7.53 | | | | 4.50 | | | | 3.84 | | | | 0.41 | | | | 0.33 | |
| Administrator Class (WFFFX) | | 6-29-2007 | | | – | | | | – | | | | – | | | | 7.11 | | | | 4.13 | | | | 3.52 | | | | 0.76 | | | | 0.68 | |
| Dow Jones Global Target 2015 Index5 | | – | | | – | | | | – | | | | – | | | | 7.84 | | | | 4.86 | | | | 4.28 | * | | | – | | | | – | |
| Bloomberg Barclays U.S. Aggregate Bond Index6 | | – | | | – | | | | – | | | | – | | | | 5.97 | | | | 3.24 | | | | 4.99 | * | | | – | | | | – | |
| Russell 3000® Index7 | | – | | | – | | | | – | | | | – | | | | 11.44 | | | | 14.46 | | | | 6.44 | * | | | – | | | | – | |
| * | | Based on the inception date of the oldest class. |
Figures quoted represent past performance, which is no guarantee of future results, and do not reflect taxes that a shareholder may pay on fund distributions or the redemption of fund shares. Investment return and principal value of an investment will fluctuate so that an investor’s shares, when redeemed, may be worth more or less than their original cost. Performance shown without sales charges would be lower if sales charges were reflected. Current performance may be lower or higher than the performance data quoted and assumes the reinvestment of dividends and capital gains. Current month-end performance is available on the Fund’s website, wellsfargofunds.com.
Index returns do not include transaction costs associated with buying and selling securities, any mutual fund fees or expenses, or any taxes. It is not possible to invest directly in an index.
For Class A shares, the maximum front-end sales charge is 5.75%. Class R, Class R4, Class R6, and Administrator Class shares are sold without a front-end sales charge or contingent deferred sales charge.
Please see footnotes on pages 18-19.
| | | | |
| 8 | | Wells Fargo Dow Jones Target Date Funds | | Performance highlights (unaudited) |
Target 2020 Fund
Average annual total returns (%) as of August 31, 20162
| | | | | | | | | | | | | | | | | | | | | | | | | | | | | | | | | | |
| | | | | Including sales charge | | | Excluding sales charge | | | Expense ratios3 (%) | |
| | | Inception date | | 1 year | | | 5 year | | | 10 year | | | 1 year | | | 5 year | | | 10 year | | | Gross | | | Net4 | |
| Class A (STTRX) | | 3-1-1994 | | | 1.08 | | | | 3.78 | | | | 3.55 | | | | 7.28 | | | | 5.02 | | | | 4.17 | | | | 0.83 | | | | 0.81 | |
| Class B (STPBX)* | | 3-1-1997 | | | 1.41 | | | | 3.88 | | | | 3.62 | | | | 6.41 | | | | 4.22 | | | | 3.62 | | | | 1.58 | | | | 1.56 | |
| Class C (WFLAX) | | 12-1-1998 | | | 5.50 | | | | 4.24 | | | | 3.39 | | | | 6.50 | | | | 4.24 | | | | 3.39 | | | | 1.58 | | | | 1.56 | |
| Class R (WFURX) | | 6-28-2013 | | | – | | | | – | | | | – | | | | 7.01 | | | | 4.83 | | | | 4.06 | | | | 1.08 | | | | 1.06 | |
| Class R4 (WFLRX) | | 11-30-2012 | | | – | | | | – | | | | – | | | | 7.62 | | | | 5.43 | | | | 4.65 | | | | 0.55 | | | | 0.50 | |
| Class R6 (WFOBX) | | 6-30-2004 | | | – | | | | – | | | | – | | | | 7.83 | | | | 5.54 | | | | 4.70 | | | | 0.40 | | | | 0.35 | |
| Administrator Class (WFLPX) | | 11-8-1999 | | | – | | | | – | | | | – | | | | 7.41 | | | | 5.17 | | | | 4.38 | | | | 0.75 | | | | 0.70 | |
| Dow Jones Global Target 2020 Index5 | | – | | | – | | | | – | | | | – | | | | 8.12 | | | | 5.91 | | | | 5.11 | | | | – | | | | – | |
| Bloomberg Barclays U.S. Aggregate Bond Index6 | | – | | | – | | | | – | | | | – | | | | 5.97 | | | | 3.24 | | | | 4.89 | | | | – | | | | – | |
| Russell 3000® Index7 | | – | | | – | | | | – | | | | – | | | | 11.44 | | | | 14.46 | | | | 7.59 | | | | – | | | | – | |
| * | | Class B shares are closed to investment, except in connection with the reinvestment of any distributions and permitted exchanges. |
Figures quoted represent past performance, which is no guarantee of future results, and do not reflect taxes that a shareholder may pay on fund distributions or the redemption of fund shares. Investment return and principal value of an investment will fluctuate so that an investor’s shares, when redeemed, may be worth more or less than their original cost. Performance shown without sales charges would be lower if sales charges were reflected. Current performance may be lower or higher than the performance data quoted and assumes the reinvestment of dividends and capital gains. Current month-end performance is available on the Fund’s website, wellsfargofunds.com.
Index returns do not include transaction costs associated with buying and selling securities, any mutual fund fees or expenses, or any taxes. It is not possible to invest directly in an index.
For Class A shares, the maximum front-end sales charge is 5.75%. For Class B shares, the maximum contingent deferred sales charge is 5.00%. For Class C shares, the maximum contingent deferred sales charge is 1.00%. Performance including a contingent deferred sales charge assumes the sales charge for the corresponding time period. Class R, Class R4, Class R6, and Administrator Class shares are sold without a front-end sales charge or contingent deferred sales charge.
Please see footnotes on pages 18-19.
| | | | | | |
| Performance highlights (unaudited) | | Wells Fargo Dow Jones Target Date Funds | | | 9 | |
Target 2025 Fund
Average annual total returns (%) as of August 31, 201610
| | | | | | | | | | | | | | | | | | | | | | | | | | | | | | | | | | |
| | | | | Including sales charge | | | Excluding sales charge | | | Expense ratios3 (%) | |
| | | Inception date | | 1 year | | | 5 year | | | Since
inception | | | 1 year | | | 5 year | | | Since
inception | | | Gross | | | Net4 | |
| Class A (WFAYX) | | 11-30-2012 | | | 1.44 | | | | 4.92 | | | | 2.96 | | | | 7.60 | | | | 6.17 | | | | 3.62 | | | | 0.83 | | | | 0.81 | |
| Class R (WFHRX) | | 6-28-2013 | | | – | | | | – | | | | – | | | | 7.29 | | | | 5.90 | | | | 3.39 | | | | 1.08 | | | | 1.06 | |
| Class R4 (WFGRX) | | 11-30-2012 | | | – | | | | – | | | | – | | | | 7.86 | | | | 6.55 | | | | 3.95 | | | | 0.55 | | | | 0.50 | |
| Class R6 (WFTYX) | | 6-29-2007 | | | – | | | | – | | | | – | | | | 8.01 | | | | 6.64 | | | | 4.00 | | | | 0.40 | | | | 0.35 | |
| Administrator Class (WFTRX) | | 6-29-2007 | | | – | | | | – | | | | – | | | | 7.66 | | | | 6.27 | | | | 3.69 | | | | 0.75 | | | | 0.70 | |
| Dow Jones Global Target 2025 Index5 | | – | | | – | | | | – | | | | – | | | | 8.34 | | | | 7.00 | | | | 4.38 | * | | | – | | | | – | |
| Bloomberg Barclays U.S. Aggregate Bond Index6 | | – | | | – | | | | – | | | | – | | | | 5.97 | | | | 3.24 | | | | 4.99 | * | | | – | | | | – | |
| Russell 3000® Index7 | | – | | | – | | | | – | | | | – | | | | 11.44 | | | | 14.46 | | | | 6.44 | * | | | – | | | | – | |
| * | | Based on the inception date of the oldest class. |
Figures quoted represent past performance, which is no guarantee of future results, and do not reflect taxes that a shareholder may pay on fund distributions or the redemption of fund shares. Investment return and principal value of an investment will fluctuate so that an investor’s shares, when redeemed, may be worth more or less than their original cost. Performance shown without sales charges would be lower if sales charges were reflected. Current performance may be lower or higher than the performance data quoted and assumes the reinvestment of dividends and capital gains. Current month-end performance is available on the Fund’s website, wellsfargofunds.com.
Index returns do not include transaction costs associated with buying and selling securities, any mutual fund fees or expenses, or any taxes. It is not possible to invest directly in an index.
For Class A shares, the maximum front-end sales charge is 5.75%. Class R, Class R4, Class R6, and Administrator Class shares are sold without a front-end sales charge or contingent deferred sales charge.
Please see footnotes on pages 18-19.
| | | | |
| 10 | | Wells Fargo Dow Jones Target Date Funds | | Performance highlights (unaudited) |
Target 2030 Fund
Average annual total returns (%) as of August 31, 20162
| | | | | | | | | | | | | | | | | | | | | | | | | | | | | | | | | | |
| | | | | Including sales charge | | | Excluding sales charge | | | Expense ratios3 (%) | |
| | | Inception date | | 1 year | | | 5 year | | | 10 year | | | 1 year | | | 5 year | | | 10 year | | | Gross | | | Net4 | |
| Class A (STHRX) | | 3-1-1994 | | | 1.41 | | | | 5.85 | | | | 4.19 | | | | 7.58 | | | | 7.11 | | | | 4.81 | | | | 0.83 | | | | 0.82 | |
| Class B (SGPBX)* | | 3-1-1997 | | | 1.82 | | | | 6.01 | | | | 4.26 | | | | 6.82 | | | | 6.32 | | | | 4.26 | | | | 1.58 | | | | 1.57 | |
| Class C (WFDMX) | | 12-1-1998 | | | 5.81 | | | | 6.31 | | | | 4.03 | | | | 6.81 | | | | 6.31 | | | | 4.03 | | | | 1.58 | | | | 1.57 | |
| Class R (WFJRX) | | 6-28-2013 | | | – | | | | – | | | | – | | | | 7.28 | | | | 6.91 | | | | 4.70 | | | | 1.08 | | | | 1.07 | |
| Class R4 (WTHRX) | | 11-30-2012 | | | – | | | | – | | | | – | | | | 7.92 | | | | 7.55 | | | | 5.30 | | | | 0.55 | | | | 0.51 | |
| Class R6 (WFOOX) | | 6-30-2004 | | | – | | | | – | | | | – | | | | 8.09 | | | | 7.65 | | | | 5.35 | | | | 0.40 | | | | 0.36 | |
| Administrator Class (WFLIX) | | 11-8-1999 | | | – | | | | – | | | | – | | | | 7.68 | | | | 7.27 | | | | 5.02 | | | | 0.75 | | | | 0.71 | |
| Dow Jones Global Target 2030 Index5 | | – | | | – | | | | – | | | | – | | | | 8.37 | | | | 7.99 | | | | 5.70 | | | | – | | | | – | |
| Bloomberg Barclays U.S. Aggregate Bond Index6 | | – | | | – | | | | – | | | | – | | | | 5.97 | | | | 3.24 | | | | 4.89 | | | | – | | | | – | |
| Russell 3000® Index7 | | – | | | – | | | | – | | | | – | | | | 11.44 | | | | 14.46 | | | | 7.59 | | | | – | | | | – | |
| * | | Class B shares are closed to investment, except in connection with the reinvestment of any distributions and permitted exchanges. |
Figures quoted represent past performance, which is no guarantee of future results, and do not reflect taxes that a shareholder may pay on fund distributions or the redemption of fund shares. Investment return and principal value of an investment will fluctuate so that an investor’s shares, when redeemed, may be worth more or less than their original cost. Performance shown without sales charges would be lower if sales charges were reflected. Current performance may be lower or higher than the performance data quoted and assumes the reinvestment of dividends and capital gains. Current month-end performance is available on the Fund’s website, wellsfargofunds.com.
Index returns do not include transaction costs associated with buying and selling securities, any mutual fund fees or expenses, or any taxes. It is not possible to invest directly in an index.
For Class A shares, the maximum front-end sales charge is 5.75%. For Class B shares, the maximum contingent deferred sales charge is 5.00%. For Class C shares, the maximum contingent deferred sales charge is 1.00%. Performance including a contingent deferred sales charge assumes the sales charge for the corresponding time period. Class R, Class R4, Class R6, and Administrator Class shares are sold without a front-end sales charge or contingent deferred sales charge.
Please see footnotes on pages 18-19.
| | | | | | |
| Performance highlights (unaudited) | | Wells Fargo Dow Jones Target Date Funds | | | 11 | |
Target 2035 Fund
Average annual total returns (%) as of August 31, 201610
| | | | | | | | | | | | | | | | | | | | | | | | | | | | | | | | | | |
| | | | | Including sales charge | | | Excluding sales charge | | | Expense ratios3 (%) | |
| | | Inception date | | 1 year | | | 5 year | | | Since
inception | | | 1 year | | | 5 year | | | Since
inception | | | Gross | | | Net4 | |
| Class A (WFQBX) | | 11-30-2012 | | | 1.32 | | | | 6.67 | | | | 3.18 | | | | 7.51 | | | | 7.95 | | | | 3.85 | | | | 0.84 | | | | 0.83 | |
| Class R (WFKRX) | | 6-28-2013 | | | – | | | | – | | | | – | | | | 7.25 | | | | 7.66 | | | | 3.57 | | | | 1.09 | | | | 1.08 | |
| Class R4 (WTTRX) | | 11-30-2012 | | | – | | | | – | | | | – | | | | 7.85 | | | | 8.31 | | | | 4.17 | | | | 0.56 | | | | 0.52 | |
| Class R6 (WFQRX) | | 6-29-2007 | | | – | | | | – | | | | – | | | | 8.02 | | | | 8.42 | | | | 4.23 | | | | 0.41 | | | | 0.37 | |
| Administrator Class (WFQWX) | | 6-29-2007 | | | – | | | | – | | | | – | | | | 7.61 | | | | 8.02 | | | | 3.87 | | | | 0.76 | | | | 0.72 | |
| Dow Jones Global Target 2035 Index5 | | – | | | – | | | | – | | | | – | | | | 8.32 | | | | 8.77 | | | | 4.51 | * | | | – | | | | – | |
| Bloomberg Barclays U.S. Aggregate Bond Index6 | | – | | | – | | | | – | | | | – | | | | 5.97 | | | | 3.24 | | | | 4.99 | * | | | – | | | | – | |
| Russell 3000® Index7 | | – | | | – | | | | – | | | | – | | | | 11.44 | | | | 14.46 | | | | 6.44 | * | | | – | | | | – | |
| * | | Based on the inception date of the oldest class. |
Figures quoted represent past performance, which is no guarantee of future results, and do not reflect taxes that a shareholder may pay on fund distributions or the redemption of fund shares. Investment return and principal value of an investment will fluctuate so that an investor’s shares, when redeemed, may be worth more or less than their original cost. Performance shown without sales charges would be lower if sales charges were reflected. Current performance may be lower or higher than the performance data quoted and assumes the reinvestment of dividends and capital gains. Current month-end performance is available on the Fund’s website, wellsfargofunds.com.
Index returns do not include transaction costs associated with buying and selling securities, any mutual fund fees or expenses, or any taxes. It is not possible to invest directly in an index.
For Class A shares, the maximum front-end sales charge is 5.75%. Class R, Class R4, Class R6, and Administrator Class shares are sold without a front-end sales charge or contingent deferred sales charge.
Please see footnotes on pages 18-19.
| | | | |
| 12 | | Wells Fargo Dow Jones Target Date Funds | | Performance highlights (unaudited) |
Target 2040 Fund
Average annual total returns (%) as of August 31, 20162
| | | | | | | | | | | | | | | | | | | | | | | | | | | | | | | | | | |
| | | | | Including sales charge | | | Excluding sales charge | | | Expense ratios3 (%) | |
| | | Inception date | | 1 year | | | 5 year | | | 10 year | | | 1 year | | | 5 year | | | 10 year | | | Gross | | | Net4 | |
| Class A (STFRX) | | 3-1-1994 | | | 1.33 | | | | 7.16 | | | | 4.58 | | | | 7.49 | | | | 8.44 | | | | 5.20 | | | | 0.84 | | | | 0.83 | |
| Class B (SLPBX)* | | 3-1-1997 | | | 1.71 | | | | 7.32 | | | | 4.64 | | | | 6.71 | | | | 7.62 | | | | 4.64 | | | | 1.59 | | | | 1.58 | |
| Class C (WFOFX) | | 7-1-1998 | | | 5.68 | | | | 7.64 | | | | 4.41 | | | | 6.68 | | | | 7.64 | | | | 4.41 | | | | 1.59 | | | | 1.58 | |
| Class R (WFMRX) | | 6-28-2013 | | | – | | | | – | | | | – | | | | 7.22 | | | | 8.24 | | | | 5.09 | | | | 1.09 | | | | 1.08 | |
| Class R4 (WTFRX) | | 11-30-2012 | | | – | | | | – | | | | – | | | | 7.84 | | | | 8.88 | | | | 5.68 | | | | 0.56 | | | | 0.52 | |
| Class R6 (WFOSX) | | 6-30-2004 | | | – | | | | – | | | | – | | | | 8.01 | | | | 9.00 | | | | 5.74 | | | | 0.41 | | | | 0.37 | |
| Administrator Class (WFLWX) | | 11-8-1999 | | | – | | | | – | | | | – | | | | 7.63 | | | | 8.60 | | | | 5.41 | | | | 0.76 | | | | 0.72 | |
| Dow Jones Global Target 2040 Index5 | | – | | | – | | | | – | | | | – | | | | 8.28 | | | | 9.32 | | | | 6.05 | | | | – | | | | – | |
| Bloomberg Barclays U.S. Aggregate Bond Index6 | | – | | | – | | | | – | | | | – | | | | 5.97 | | | | 3.24 | | | | 4.89 | | | | – | | | | – | |
| Russell 3000® Index7 | | – | | | – | | | | – | | | | – | | | | 11.44 | | | | 14.46 | | | | 7.59 | | | | – | | | | – | |
| * | | Class B shares are closed to investment, except in connection with the reinvestment of any distributions and permitted exchanges. |
Figures quoted represent past performance, which is no guarantee of future results, and do not reflect taxes that a shareholder may pay on fund distributions or the redemption of fund shares. Investment return and principal value of an investment will fluctuate so that an investor’s shares, when redeemed, may be worth more or less than their original cost. Performance shown without sales charges would be lower if sales charges were reflected. Current performance may be lower or higher than the performance data quoted and assumes the reinvestment of dividends and capital gains. Current month-end performance is available on the Fund’s website, wellsfargofunds.com.
Index returns do not include transaction costs associated with buying and selling securities, any mutual fund fees or expenses, or any taxes. It is not possible to invest directly in an index.
For Class A shares, the maximum front-end sales charge is 5.75%. For Class B shares, the maximum contingent deferred sales charge is 5.00%. For Class C shares, the maximum contingent deferred sales charge is 1.00%. Performance including a contingent deferred sales charge assumes the sales charge for the corresponding time period. Class R, Class R4, Class R6, and Administrator Class shares are sold without a front-end sales charge or contingent deferred sales charge.
Please see footnotes on pages 18-19.
| | | | | | |
| Performance highlights (unaudited) | | Wells Fargo Dow Jones Target Date Funds | | | 13 | |
Target 2045 Fund
Average annual total returns (%) as of August 31, 201610
| | | | | | | | | | | | | | | | | | | | | | | | | | | | | | | | | | |
| | | | | Including sales charge | | | Excluding sales charge | | | Expense ratios3 (%) | |
| | | Inception date | | 1 year | | | 5 year | | | Since
inception | | | 1 year | | | 5 year | | | Since
inception | | | Gross | | | Net4 | |
| Class A (WFQVX) | | 11-30-2012 | | | 1.35 | | | | 7.50 | | | | 3.46 | | | | 7.51 | | | | 8.78 | | | | 4.13 | | | | 0.85 | | | | 0.83 | |
| Class R (WFNRX) | | 6-28-2013 | | | – | | | | – | | | | – | | | | 7.28 | | | | 8.51 | | | | 3.87 | | | | 1.10 | | | | 1.08 | |
| Class R4 (WFFRX) | | 11-30-2012 | | | – | | | | – | | | | – | | | | 7.84 | | | | 9.17 | | | | 4.46 | | | | 0.57 | | | | 0.52 | |
| Class R6 (WFQPX) | | 6-29-2007 | | | – | | | | – | | | | – | | | | 8.02 | | | | 9.26 | | | | 4.51 | | | | 0.42 | | | | 0.37 | |
| Administrator Class (WFQYX) | | 6-29-2007 | | | – | | | | – | | | | – | | | | 7.58 | | | | 8.88 | | | | 4.19 | | | | 0.77 | | | | 0.72 | |
| Dow Jones Global Target 2045 Index5 | | – | | | – | | | | – | | | | – | | | | 8.25 | | | | 9.60 | | | | 4.74 | * | | | – | | | | – | |
| Bloomberg Barclays U.S. Aggregate Bond Index6 | | – | | | – | | | | – | | | | – | | | | 5.97 | | | | 3.24 | | | | 4.99 | * | | | – | | | | – | |
| Russell 3000® Index7 | | – | | | – | | | | – | | | | – | | | | 11.44 | | | | 14.46 | | | | 6.44 | * | | | – | | | | – | |
| * | | Based on the inception date of the oldest class. |
Figures quoted represent past performance, which is no guarantee of future results, and do not reflect taxes that a shareholder may pay on fund distributions or the redemption of fund shares. Investment return and principal value of an investment will fluctuate so that an investor’s shares, when redeemed, may be worth more or less than their original cost. Performance shown without sales charges would be lower if sales charges were reflected. Current performance may be lower or higher than the performance data quoted and assumes the reinvestment of dividends and capital gains. Current month-end performance is available on the Fund’s website, wellsfargofunds.com.
Index returns do not include transaction costs associated with buying and selling securities, any mutual fund fees or expenses, or any taxes. It is not possible to invest directly in an index.
For Class A shares, the maximum front-end sales charge is 5.75%. Class R, Class R4, Class R6, and Administrator Class shares are sold without a front-end sales charge or contingent deferred sales charge.
Please see footnotes on pages 18-19.
| | | | |
| 14 | | Wells Fargo Dow Jones Target Date Funds | | Performance highlights (unaudited) |
Target 2050 Fund
Average annual total returns11 (%) as of August 31, 2016
| | | | | | | | | | | | | | | | | | | | | | | | | | | | | | | | | | |
| | | | | Including sales charge | | | Excluding sales charge | | | Expense ratios3 (%) | |
| | | Inception date | | 1 year | | | 5 year | | | Since
inception | | | 1 year | | | 5 year | | | Since
inception | | | Gross | | | Net4 | |
| Class A (WFQAX) | | 11-30-2012 | | | 1.37 | | | | 7.53 | | | | 3.46 | | | | 7.53 | | | | 8.83 | | | | 4.13 | | | | 0.84 | | | | 0.83 | |
| Class C (WFQCX) | | 11-30-2012 | | | 5.74 | | | | 8.01 | | | | 3.35 | | | | 6.74 | | | | 8.01 | | | | 3.35 | | | | 1.59 | | | | 1.58 | |
| Class R (WFWRX) | | 6-28-2013 | | | – | | | | – | | | | – | | | | 7.20 | | | | 8.54 | | | | 3.87 | | | | 1.09 | | | | 1.08 | |
| Class R4 (WQFRX) | | 11-30-2012 | | | – | | | | – | | | | – | | | | 7.85 | | | | 9.20 | | | | 4.45 | | | | 0.56 | | | | 0.52 | |
| Class R6 (WFQFX) | | 6-29-2007 | | | – | | | | – | | | | – | | | | 8.02 | | | | 9.31 | | | | 4.51 | | | | 0.41 | | | | 0.37 | |
| Administrator Class (WFQDX) | | 6-29-2007 | | | – | | | | – | | | | – | | | | 7.65 | | | | 8.94 | | | | 4.18 | | | | 0.76 | | | | 0.72 | |
| Dow Jones Global Target 2050 Index5 | | – | | | – | | | | – | | | | – | | | | 8.26 | | | | 9.63 | | | | 4.76 | * | | | – | | | | – | |
| Bloomberg Barclays U.S. Aggregate Bond Index6 | | – | | | – | | | | – | | | | – | | | | 5.97 | | | | 3.24 | | | | 4.99 | * | | | – | | | | – | |
| Russell 3000® Index7 | | – | | | – | | | | – | | | | – | | | | 11.44 | | | | 14.46 | | | | 6.44 | * | | | – | | | | – | |
| * | | Based on the inception date of the oldest class. |
Figures quoted represent past performance, which is no guarantee of future results, and do not reflect taxes that a shareholder may pay on fund distributions or the redemption of fund shares. Investment return and principal value of an investment will fluctuate so that an investor’s shares, when redeemed, may be worth more or less than their original cost. Performance shown without sales charges would be lower if sales charges were reflected. Current performance may be lower or higher than the performance data quoted and assumes the reinvestment of dividends and capital gains. Current month-end performance is available on the Fund’s website, wellsfargofunds.com.
Index returns do not include transaction costs associated with buying and selling securities, any mutual fund fees or expenses, or any taxes. It is not possible to invest directly in an index.
For Class A shares, the maximum front-end sales charge is 5.75%. For Class C shares, the maximum contingent deferred sales charge is 1.00%. Performance including a contingent deferred sales charge assumes the sales charge for the corresponding time period. Class R, Class R4, Class R6, and Administrator Class shares are sold without a front-end sales charge or contingent deferred sales charge.
Please see footnotes on pages 18-19.
| | | | | | |
| Performance highlights (unaudited) | | Wells Fargo Dow Jones Target Date Funds | | | 15 | |
Target 2055 Fund
Average annual total returns (%) as of August 31, 201610
| | | | | | | | | | | | | | | | | | | | | | | | | | | | | | | | | | |
| | | | | Including sales charge | | | Excluding sales charge | | | Expense ratios3 (%) | |
| | | Inception date | | 1 year | | | 5 year | | | Since
inception | | | 1 year | | | 5 year | | | Since
inception | | | Gross | | | Net4 | |
| Class A (WFQZX) | | 11-30-2012 | | | 1.35 | | | | 7.55 | | | | 5.67 | | | | 7.50 | | | | 8.82 | | | | 6.89 | | | | 0.90 | | | | 0.83 | |
| Class R (WFYRX) | | 6-28-2013 | | | – | | | | – | | | | – | | | | 7.22 | | | | 8.46 | | | | 6.51 | | | | 1.15 | | | | 1.08 | |
| Class R4 (WFVRX) | | 11-30-2012 | | | – | | | | – | | | | – | | | | 7.83 | | | | 9.21 | | | | 7.26 | | | | 0.62 | | | | 0.52 | |
| Class R6 (WFQUX) | | 6-30-2011 | | | – | | | | – | | | | – | | | | 8.01 | | | | 9.31 | | | | 7.36 | | | | 0.47 | | | | 0.37 | |
| Administrator Class (WFLHX) | | 6-30-2011 | | | – | | | | – | | | | – | | | | 7.65 | | | | 8.91 | | | | 6.98 | | | | 0.82 | | | | 0.72 | |
| Dow Jones Global Target 2055 Index5 | | – | | | – | | | | – | | | | – | | | | 8.26 | | | | 9.63 | | | | 7.58 | * | | | – | | | | – | |
| Bloomberg Barclays U.S. Aggregate Bond Index6 | | – | | | – | | | | – | | | | – | | | | 5.97 | | | | 3.24 | | | | 3.74 | * | | | – | | | | – | |
| Russell 3000® Index7 | | – | | | – | | | | – | | | | – | | | | 11.44 | | | | 14.46 | | | | 12.09 | * | | | – | | | | – | |
| * | | Based on the inception date of the oldest class. |
Figures quoted represent past performance, which is no guarantee of future results, and do not reflect taxes that a shareholder may pay on fund distributions or the redemption of fund shares. Investment return and principal value of an investment will fluctuate so that an investor’s shares, when redeemed, may be worth more or less than their original cost. Performance shown without sales charges would be lower if sales charges were reflected. Current performance may be lower or higher than the performance data quoted, which assumes the reinvestment of dividends and capital gains. Current month-end performance is available on the Fund’s website, wellsfargofunds.com.
Index returns do not include transaction costs associated with buying and selling securities, any mutual fund fees or expenses, or any taxes. It is not possible to invest directly in an index.
For Class A shares, the maximum front-end sales charge is 5.75%. Class R, Class R4, Class R6, and Administrator Class shares are sold without a front-end sales charge or contingent deferred sales charge.
Please see footnotes on pages 18-19.
| | | | |
| 16 | | Wells Fargo Dow Jones Target Date Funds | | Performance highlights (unaudited) |
Target 2060 Fund
Average annual total returns (%) as of August 31, 201611
| | | | | | | | | | | | | | | | | | | | | | | | | | |
| | | | | Including sales charge | | | Excluding sales charge | | | Expense ratios3 (%) | |
| | | Inception date | | 1 Year | | | Since
inception | | | 1 Year | | | Since
inception | | | Gross | | | Net4 | |
| Class A (WFAFX) | | 7-1-2015 | | | 1.14 | | | | (3.52 | ) | | | 7.33 | | | | 1.49 | | | | 14.46 | | | | 0.83 | |
| Class C (WFCFX) | | 7-1-2015 | | | 5.57 | | | | 0.69 | | | | 6.57 | | | | 0.69 | | | | 15.21 | | | | 1.58 | |
| Class R (WFRFX) | | 7-1-2015 | | | – | | | | – | | | | 7.08 | | | | 1.20 | | | | 14.71 | | | | 1.08 | |
| Class R4 (WFSFX) | | 7-1-2015 | | | – | | | | – | | | | 7.78 | | | | 1.86 | | | | 14.18 | | | | 0.52 | |
| Class R6 (WFUFX) | | 7-1-2015 | | | – | | | | – | | | | 7.85 | | | | 1.91 | | | | 14.03 | | | | 0.37 | |
| Administrator Class (WFDFX) | | 7-1-2015 | | | – | | | | – | | | | 7.47 | | | | 1.61 | | | | 14.38 | | | | 0.72 | |
| Dow Jones Global Target 2060 Index5 | | – | | | – | | | | – | | | | 8.26 | | | | 1.77 | * | | | – | | | | – | |
| Bloomberg Barclays U.S. Aggregate Bond Index6 | | – | | | – | | | | – | | | | 5.97 | | | | 5.57 | * | | | – | | | | – | |
| Russell 3000® Index7 | | – | | | – | | | | – | | | | 11.44 | | | | 5.50 | * | | | – | | | | – | |
| * | | Based on the inception date of the oldest class. |
Figures quoted represent past performance, which is no guarantee of future results, and do not reflect taxes that a shareholder may pay on fund distributions or the redemption of fund shares. Investment return and principal value of an investment will fluctuate so that an investor’s shares, when redeemed, may be worth more or less than their original cost. Performance shown without sales charges would be lower if sales charges were reflected. Current performance may be lower or higher than the performance data quoted, which assumes the reinvestment of dividends and capital gains. Current month-end performance is available on the Fund’s website, wellsfargofunds.com.
Index returns do not include transaction costs associated with buying and selling securities, any mutual fund fees or expenses, or any taxes. It is not possible to invest directly in an index.
For Class A shares, the maximum front-end sales charge is 5.75%. For Class C shares, the maximum contingent deferred sales charge is 1.00%. Performance including a contingent deferred sales charge assumes the sales charge for the corresponding time period. Class R, Class R4, Class R6, and Administrator Class shares are sold without a front-end sales charge or contingent deferred sales charge.
Please see footnotes on pages 18-19.
| | | | | | |
| Performance highlights (unaudited) | | Wells Fargo Dow Jones Target Date Funds | | | 17 | |
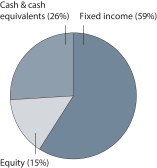
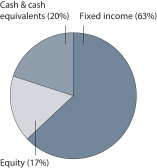
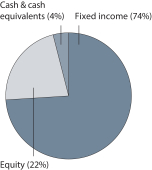
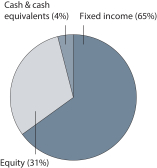
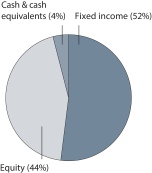
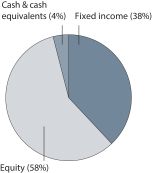
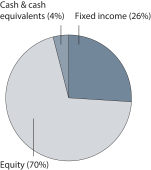
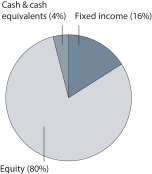
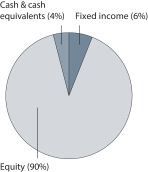
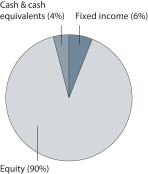
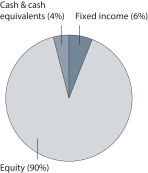
Portfolio allocation as of August 31, 201612
| | | | |
| Target Today Fund | | Target 2010 Fund | | Target 2015 Fund |
| | | |
 | |  | |  |
| | | | |
| Target 2020 Fund | | Target 2025 Fund | | Target 2030 Fund |
| | | |
 | |  | |  |
| | | | |
| Target 2035 Fund | | Target 2040 Fund | | Target 2045 Fund |
| | | |
 | |  | | 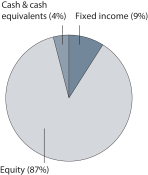 |
Please see footnotes on pages 18-19.
| | | | |
| 18 | | Wells Fargo Dow Jones Target Date Funds | | Performance highlights (unaudited) |
| | | | |
| Target 2050 Fund | | Target 2055 Fund | | Target 2060 Fund |
| | | |
 | |  | |  |
| 1 | The Funds are gateway funds that invest in various affiliated master portfolios which in turn invest in a combination of equity, fixed income, and money market securities using an asset allocation strategy designed to replicate, before fees and expenses, the total return of the Dow Jones Global Target Date Indexes that have the same target year as the Funds. References to the investment activities of the Funds are intended to refer to the investment activities of the affiliated master portfolios in which the Funds invest. |
| 2 | Historical performance shown for Class R shares prior to their inception reflects the performance of the Class A shares and has been adjusted to reflect the higher expenses applicable to Class R shares. Historical performance shown for Class R4 shares prior to their inception reflects the performance of Class R6 shares and includes the expenses applicable to Class R6. Effective June 1, 2013, Institutional Class was renamed Class R6 and modified to assume the features and attributes of Class R6. Historical performance shown for Class R6 shares from inception through May 31, 2013, reflects Institutional Class performance and expenses. |
| 3 | Reflects the expense ratios as stated in the most recent prospectuses. The expense ratios shown are subject to change and may differ from the annualized expense ratios shown in the financial highlights of this report. |
| 4 | The manager has committed through June 30, 2017, to waive fees and/or reimburse expenses to the extent necessary to cap the Fund’s Total Annual Fund Operating Expenses After Fee Waiver at the amounts shown. After this time, the cap may be increased or the commitment to maintain the cap may be terminated only with the approval of the Board of Trustees. Brokerage commissions, stamp duty fees, interest, taxes, acquired fund fees and expenses, and extraordinary expenses are excluded from the expense cap. Net expenses from the affiliated master portfolios are included in the expense cap. Without this cap, the Fund’s returns would have been lower. |
| 5 | The Dow Jones Global Target Date Indexes (each an “index” or collectively the “indexes”) are a series of indexes designed as benchmarks for multi-asset class portfolios with risk profiles that become more conservative over time. The index weightings among the major asset classes are adjusted monthly based on a published set of index rules. The indexes with longer time horizons have higher allocations to equity securities, while the indexes with shorter time horizons replace some of their stock allocations with allocations to fixed income securities and money market instruments. You cannot invest directly in an index. |
| 6 | The Bloomberg Barclays U.S. Aggregate Bond Index (formerly known as Barclays U.S. Aggregate Bond Index) is composed of the Bloomberg Barclays U.S. Government/Credit Index (formerly known as Barclays U.S. Government/Credit Index) and the Bloomberg Barclays U.S. Mortgage-Backed Securities Index (formerly known as Barclays U.S. Mortgage-Backed Securities Index), and includes Treasury issues, agency issues, corporate bond issues, and mortgage-backed securities. |
| 7 | The Russell 3000® Index measures the performance of the 3,000 largest U.S. companies based on total market capitalization, which represents approximately 98% of the investable U.S. equity market. You cannot invest directly in an index. |
| 8 | Historical performance shown for Class R shares prior to their inception reflects the performance of Class A shares and has been adjusted to reflect the higher expenses applicable to Class R shares. Historical performance shown for Class R4 shares prior to their inception reflects the performance of Class R6 shares, and includes the higher expenses applicable to Class R6. If these expenses had not been included, returns would be higher. Effective June 1, 2013, Institutional Class was renamed Class R6 and modified to assume the features and attributes of Class R6. Historical performance shown for Class R6 shares from inception through May 31, 2013, reflects Institutional Class performance and expenses. |
| 9 | Historical performance shown for Class A shares prior to their inception reflects the performance of Class R6 shares and has been adjusted to reflect the higher expenses applicable to Class A shares. Historical performance shown for Class R shares prior to their inception reflects the performance of the former Investor Class shares and has been adjusted to reflect the higher expenses applicable to Class R shares. Historical performance shown for Class R4 shares prior to their inception reflects the performance of Class R6 shares, and includes the higher expenses applicable to Class R6. If these expenses had not been included, returns would be higher. Effective June 1, 2013, Institutional Class was renamed Class R6 and modified to assume the features and attributes of Class R6. Historical performance shown for Class R6 shares from inception through May 31, 2013 reflects Institutional Class performance and expenses. |
| | | | | | |
| Performance highlights (unaudited) | | Wells Fargo Dow Jones Target Date Funds | | | 19 | |
| 10 | Historical performance shown for Class A shares prior to their inception reflects the performance of Class R6 shares and has been adjusted to reflect the higher expenses applicable to Class A shares. Historical performance shown for Class R shares prior to their inception reflects the performance of the former Investor Class shares and has been adjusted to reflect the higher expenses applicable to Class R shares. Historical performance shown for Class R4 shares prior to their inception reflects the performance of Class R6 shares and includes the expenses applicable to Class R6. If these expenses had not been included, returns would be higher. Effective June 1, 2013, Institutional Class was renamed Class R6 and modified to assume the features and attributes of Class R6. Historical performance shown for Class R6 shares from inception through May 31, 2013, reflects Institutional Class performance and expenses. |
| 11 | Historical performance shown for Class A and Class C shares prior to their inception reflects the performance of Class R6 shares and has been adjusted to reflect the higher expenses applicable to Class A and Class C shares. Historical performance shown for Class R shares prior to their inception reflects the performance of the former Investor Class shares and has been adjusted to reflect the higher expenses applicable to Class R shares. Historical performance shown for Class R4 shares prior to their inception reflects the performance of Class R6 shares and includes the expenses applicable to Class R6. If these expenses had not been included, returns would be higher. Effective June 1, 2013, Institutional Class was renamed Class R6 and modified to assume the features and attributes of Class R6. Historical performance shown for Class R6 shares from inception through May 31, 2013, reflects Institutional Class performance and expenses. |
| 12 | Each chart represents the composite of the portfolio allocations of the affiliated master portfolios in which the Fund invests and is calculated based on the total investments of the affiliated master portfolios. Portfolio holdings are subject to change and may have changed since the date specified. See Portfolio of investments or Summary portfolio of investments of each affiliated master portfolio which is also included in this report. |
| | | | |
| 20 | | Wells Fargo Dow Jones Target Date Funds | | Fund expenses (unaudited) |
As a shareholder of the Fund, you incur two types of costs: (1) transaction costs, including sales charges (loads) on purchase payments and contingent deferred sales charges (if any) on redemptions and (2) ongoing costs, including management fees, distribution (12b-1) and/or shareholder servicing fees, and other Fund expenses. This example is intended to help you understand your ongoing costs (in dollars) of investing in the Fund and to compare these costs with the ongoing costs of investing in other mutual funds.
The example is based on an investment of $1,000 invested at the beginning of the six-month period and held for the entire period from March 1, 2016 to August 31, 2016.
Actual expenses
The “Actual” line of the table below provides information about actual account values and actual expenses. You may use the information in this line, together with the amount you invested, to estimate the expenses that you paid over the period. Simply divide your account value by $1,000 (for example, an $8,600 account value divided by $1,000 = 8.6), then multiply the result by the number in the “Actual” line under the heading entitled “Expenses paid during period” for your applicable class of shares to estimate the expenses you paid on your account during this period.
Hypothetical example for comparison purposes
The “Hypothetical” line of the table below provides information about hypothetical account values and hypothetical expenses based on the Fund’s actual expense ratio and an assumed rate of return of 5% per year before expenses, which is not the Fund’s actual return. The hypothetical account values and expenses may not be used to estimate the actual ending account balance or expenses you paid for the period. You may use this information to compare the ongoing costs of investing in the Fund and other funds. To do so, compare this 5% hypothetical example with the 5% hypothetical examples that appear in the shareholder reports of the other funds.
Please note that the expenses shown in the table are meant to highlight your ongoing costs only and do not reflect any transactional costs, such as sales charges (loads) and contingent deferred sales charges. Therefore, the “Hypothetical” line of the table is useful in comparing ongoing costs only and will not help you determine the relative total costs of owning different funds. In addition, if these transactional costs were included, your costs would have been higher.
| | | | | | | | | | | | | | | | |
| Target Today Fund | | Beginning
account value
3-1-2016 | | | Ending
account value
8-31-2016 | | | Expenses
paid during
the period¹ | | | Annualized net
expense ratio | |
Class A | | | | | | | | | | | | | | | | |
Actual | | $ | 1,000.00 | | | $ | 1,046.11 | | | $ | 3.91 | | | | 0.76 | % |
Hypothetical (5% return before expenses) | | $ | 1,000.00 | | | $ | 1,021.32 | | | $ | 3.86 | | | | 0.76 | % |
Class B | | | | | | | | | | | | | | | | |
Actual | | $ | 1,000.00 | | | $ | 1,041.51 | | | $ | 7.70 | | | | 1.50 | % |
Hypothetical (5% return before expenses) | | $ | 1,000.00 | | | $ | 1,017.60 | | | $ | 7.61 | | | | 1.50 | % |
Class C | | | | | | | | | | | | | | | | |
Actual | | $ | 1,000.00 | | | $ | 1,041.39 | | | $ | 7.75 | | | | 1.51 | % |
Hypothetical (5% return before expenses) | | $ | 1,000.00 | | | $ | 1,017.55 | | | $ | 7.66 | | | | 1.51 | % |
Class R | | | | | | | | | | | | | | | | |
Actual | | $ | 1,000.00 | | | $ | 1,044.27 | | | $ | 5.19 | | | | 1.01 | % |
Hypothetical (5% return before expenses) | | $ | 1,000.00 | | | $ | 1,020.06 | | | $ | 5.13 | | | | 1.01 | % |
Class R4 | | | | | | | | | | | | | | | | |
Actual | | $ | 1,000.00 | | | $ | 1,047.89 | | | $ | 2.32 | | | | 0.45 | % |
Hypothetical (5% return before expenses) | | $ | 1,000.00 | | | $ | 1,022.87 | | | $ | 2.29 | | | | 0.45 | % |
Class R6 | | | | | | | | | | | | | | | | |
Actual | | $ | 1,000.00 | | | $ | 1,047.93 | | | $ | 1.54 | | | | 0.30 | % |
Hypothetical (5% return before expenses) | | $ | 1,000.00 | | | $ | 1,023.63 | | | $ | 1.53 | | | | 0.30 | % |
Administrator Class | | | | | | | | | | | | | | | | |
Actual | | $ | 1,000.00 | | | $ | 1,046.10 | | | $ | 3.34 | | | | 0.65 | % |
Hypothetical (5% return before expenses) | | $ | 1,000.00 | | | $ | 1,021.87 | | | $ | 3.30 | | | | 0.65 | % |
Please see footnote on page 26.
| | | | | | |
| Fund expenses (unaudited) | | Wells Fargo Dow Jones Target Date Funds | | | 21 | |
| | | | | | | | | | | | | | | | |
| Target 2010 Fund | | Beginning
account value
3-1-2016 | | | Ending
account value
8-31-2016 | | | Expenses
paid during
the period¹ | | | Annualized net
expense ratio | |
Class A | | | | | | | | | | | | | | | | |
Actual | | $ | 1,000.00 | | | $ | 1,050.60 | | | $ | 4.02 | | | | 0.78 | % |
Hypothetical (5% return before expenses) | | $ | 1,000.00 | | | $ | 1,021.22 | | | $ | 3.96 | | | | 0.78 | % |
Class B | | | | | | | | | | | | | | | | |
Actual | | $ | 1,000.00 | | | $ | 1,046.51 | | | $ | 7.87 | | | | 1.53 | % |
Hypothetical (5% return before expenses) | | $ | 1,000.00 | | | $ | 1,017.44 | | | $ | 7.76 | | | | 1.53 | % |
Class C | | | | | | | | | | | | | | | | |
Actual | | $ | 1,000.00 | | | $ | 1,046.85 | | | $ | 7.87 | | | | 1.53 | % |
Hypothetical (5% return before expenses) | | $ | 1,000.00 | | | $ | 1,017.44 | | | $ | 7.76 | | | | 1.53 | % |
Class R | | | | | | | | | | | | | | | | |
Actual | | $ | 1,000.00 | | | $ | 1,049.36 | | | $ | 5.31 | | | | 1.03 | % |
Hypothetical (5% return before expenses) | | $ | 1,000.00 | | | $ | 1,019.96 | | | $ | 5.23 | | | | 1.03 | % |
Class R4 | | | | | | | | | | | | | | | | |
Actual | | $ | 1,000.00 | | | $ | 1,052.73 | | | $ | 2.43 | | | | 0.47 | % |
Hypothetical (5% return before expenses) | | $ | 1,000.00 | | | $ | 1,022.77 | | | $ | 2.39 | | | | 0.47 | % |
Class R6 | | | | | | | | | | | | | | | | |
Actual | | $ | 1,000.00 | | | $ | 1,053.26 | | | $ | 1.65 | | | | 0.32 | % |
Hypothetical (5% return before expenses) | | $ | 1,000.00 | | | $ | 1,023.53 | | | $ | 1.63 | | | | 0.32 | % |
Administrator Class | | | | | | | | | | | | | | | | |
Actual | | $ | 1,000.00 | | | $ | 1,051.22 | | | $ | 3.45 | | | | 0.67 | % |
Hypothetical (5% return before expenses) | | $ | 1,000.00 | | | $ | 1,021.77 | | | $ | 3.40 | | | | 0.67 | % |
| Target 2015 Fund | | | | | | | | | | | | |
Class A | | | | | | | | | | | | | | | | |
Actual | | $ | 1,000.00 | | | $ | 1,067.12 | | | $ | 4.10 | | | | 0.79 | % |
Hypothetical (5% return before expenses) | | $ | 1,000.00 | | | $ | 1,021.17 | | | $ | 4.01 | | | | 0.79 | % |
Class R | | | | | | | | | | | | | | | | |
Actual | | $ | 1,000.00 | | | $ | 1,065.45 | | | $ | 5.40 | | | | 1.04 | % |
Hypothetical (5% return before expenses) | | $ | 1,000.00 | | | $ | 1,019.91 | | | $ | 5.28 | | | | 1.04 | % |
Class R4 | | | | | | | | | | | | | | | | |
Actual | | $ | 1,000.00 | | | $ | 1,067.92 | | | $ | 2.50 | | | | 0.48 | % |
Hypothetical (5% return before expenses) | | $ | 1,000.00 | | | $ | 1,022.72 | | | $ | 2.44 | | | | 0.48 | % |
Class R6 | | | | | | | | | | | | | | | | |
Actual | | $ | 1,000.00 | | | $ | 1,069.49 | | | $ | 1.72 | | | | 0.33 | % |
Hypothetical (5% return before expenses) | | $ | 1,000.00 | | | $ | 1,023.48 | | | $ | 1.68 | | | | 0.33 | % |
Administrator Class | | | | | | | | | | | | | | | | |
Actual | | $ | 1,000.00 | | | $ | 1,067.50 | | | $ | 3.53 | | | | 0.68 | % |
Hypothetical (5% return before expenses) | | $ | 1,000.00 | | | $ | 1,021.72 | | | $ | 3.46 | | | | 0.68 | % |
Please see footnote on page 26.
| | | | |
| 22 | | Wells Fargo Dow Jones Target Date Funds | | Fund expenses (unaudited) |
| | | | | | | | | | | | | | | | |
| Target 2020 Fund | | Beginning
account value
3-1-2016 | | | Ending
account value
8-31-2016 | | | Expenses
paid during
the period¹ | | | Annualized net
expense ratio | |
Class A | | | | | | | | | | | | | | | | |
Actual | | $ | 1,000.00 | | | $ | 1,077.75 | | | $ | 4.23 | | | | 0.81 | % |
Hypothetical (5% return before expenses) | | $ | 1,000.00 | | | $ | 1,021.06 | | | $ | 4.12 | | | | 0.81 | % |
Class B | | | | | | | | | | | | | | | | |
Actual | | $ | 1,000.00 | | | $ | 1,073.58 | | | $ | 8.13 | | | | 1.56 | % |
Hypothetical (5% return before expenses) | | $ | 1,000.00 | | | $ | 1,017.29 | | | $ | 7.91 | | | | 1.56 | % |
Class C | | | | | | | | | | | | | | | | |
Actual | | $ | 1,000.00 | | | $ | 1,073.81 | | | $ | 8.13 | | | | 1.56 | % |
Hypothetical (5% return before expenses) | | $ | 1,000.00 | | | $ | 1,017.29 | | | $ | 7.91 | | | | 1.56 | % |
Class R | | | | | | | | | | | | | | | | |
Actual | | $ | 1,000.00 | | | $ | 1,076.59 | | | $ | 5.53 | | | | 1.06 | % |
Hypothetical (5% return before expenses) | | $ | 1,000.00 | | | $ | 1,019.81 | | | $ | 5.38 | | | | 1.06 | % |
Class R4 | | | | | | | | | | | | | | | | |
Actual | | $ | 1,000.00 | | | $ | 1,079.50 | | | $ | 2.61 | | | | 0.50 | % |
Hypothetical (5% return before expenses) | | $ | 1,000.00 | | | $ | 1,022.62 | | | $ | 2.54 | | | | 0.50 | % |
Class R6 | | | | | | | | | | | | | | | | |
Actual | | $ | 1,000.00 | | | $ | 1,080.73 | | | $ | 1.83 | | | | 0.35 | % |
Hypothetical (5% return before expenses) | | $ | 1,000.00 | | | $ | 1,023.38 | | | $ | 1.78 | | | | 0.35 | % |
Administrator Class | | | | | | | | | | | | | | | | |
Actual | | $ | 1,000.00 | | | $ | 1,078.35 | | | $ | 3.66 | | | | 0.70 | % |
Hypothetical (5% return before expenses) | | $ | 1,000.00 | | | $ | 1,021.62 | | | $ | 3.56 | | | | 0.70 | % |
| Target 2025 Fund | | | | | | | | | | | | |
Class A | | | | | | | | | | | | | | | | |
Actual | | $ | 1,000.00 | | | $ | 1,093.01 | | | $ | 4.26 | | | | 0.81 | % |
Hypothetical (5% return before expenses) | | $ | 1,000.00 | | | $ | 1,021.06 | | | $ | 4.12 | | | | 0.81 | % |
Class R | | | | | | | | | | | | | | | | |
Actual | | $ | 1,000.00 | | | $ | 1,090.66 | | | $ | 5.57 | | | | 1.06 | % |
Hypothetical (5% return before expenses) | | $ | 1,000.00 | | | $ | 1,019.81 | | | $ | 5.38 | | | | 1.06 | % |
Class R4 | | | | | | | | | | | | | | | | |
Actual | | $ | 1,000.00 | | | $ | 1,094.87 | | | $ | 2.63 | | | | 0.50 | % |
Hypothetical (5% return before expenses) | | $ | 1,000.00 | | | $ | 1,022.62 | | | $ | 2.54 | | | | 0.50 | % |
Class R6 | | | | | | | | | | | | | | | | |
Actual | | $ | 1,000.00 | | | $ | 1,094.35 | | | $ | 1.84 | | | | 0.35 | % |
Hypothetical (5% return before expenses) | | $ | 1,000.00 | | | $ | 1,023.38 | | | $ | 1.78 | | | | 0.35 | % |
Administrator Class | | | | | | | | | | | | | | | | |
Actual | | $ | 1,000.00 | | | $ | 1,093.00 | | | $ | 3.68 | | | | 0.70 | % |
Hypothetical (5% return before expenses) | | $ | 1,000.00 | | | $ | 1,021.62 | | | $ | 3.56 | | | | 0.70 | % |
Please see footnote on page 26.
| | | | | | |
| Fund expenses (unaudited) | | Wells Fargo Dow Jones Target Date Funds | | | 23 | |
| | | | | | | | | | | | | | | | |
| Target 2030 Fund | | Beginning
account value
3-1-2016 | | | Ending
account value
8-31-2016 | | | Expenses
paid during
the period¹ | | | Annualized net
expense ratio | |
Class A | | | | | | | | | | | | | | | | |
Actual | | $ | 1,000.00 | | | $ | 1,107.45 | | | $ | 4.34 | | | | 0.82 | % |
Hypothetical (5% return before expenses) | | $ | 1,000.00 | | | $ | 1,021.01 | | | $ | 4.17 | | | | 0.82 | % |
Class B | | | | | | | | | | | | | | | | |
Actual | | $ | 1,000.00 | | | $ | 1,103.68 | | | $ | 8.30 | | | | 1.57 | % |
Hypothetical (5% return before expenses) | | $ | 1,000.00 | | | $ | 1,017.24 | | | $ | 7.96 | | | | 1.57 | % |
Class C | | | | | | | | | | | | | | | | |
Actual | | $ | 1,000.00 | | | $ | 1,103.45 | | | $ | 8.30 | | | | 1.57 | % |
Hypothetical (5% return before expenses) | | $ | 1,000.00 | | | $ | 1,017.24 | | | $ | 7.96 | | | | 1.57 | % |
Class R | | | | | | | | | | | | | | | | |
Actual | | $ | 1,000.00 | | | $ | 1,105.68 | | | $ | 5.66 | | | | 1.07 | % |
Hypothetical (5% return before expenses) | | $ | 1,000.00 | | | $ | 1,019.76 | | | $ | 5.43 | | | | 1.07 | % |
Class R4 | | | | | | | | | | | | | | | | |
Actual | | $ | 1,000.00 | | | $ | 1,109.23 | | | $ | 2.70 | | | | 0.51 | % |
Hypothetical (5% return before expenses) | | $ | 1,000.00 | | | $ | 1,022.57 | | | $ | 2.59 | | | | 0.51 | % |
Class R6 | | | | | | | | | | | | | | | | |
Actual | | $ | 1,000.00 | | | $ | 1,109.95 | | | $ | 1.91 | | | | 0.36 | % |
Hypothetical (5% return before expenses) | | $ | 1,000.00 | | | $ | 1,023.33 | | | $ | 1.83 | | | | 0.36 | % |
Administrator Class | | | | | | | | | | | | | | | | |
Actual | | $ | 1,000.00 | | | $ | 1,108.00 | | | $ | 3.76 | | | | 0.71 | % |
Hypothetical (5% return before expenses) | | $ | 1,000.00 | | | $ | 1,021.57 | | | $ | 3.61 | | | | 0.71 | % |
| Target 2035 Fund | | | | | | | | | | | | |
Class A | | | | | | | | | | | | | | | | |
Actual | | $ | 1,000.00 | | | $ | 1,120.71 | | | $ | 4.42 | | | | 0.83 | % |
Hypothetical (5% return before expenses) | | $ | 1,000.00 | | | $ | 1,020.96 | | | $ | 4.22 | | | | 0.83 | % |
Class R | | | | | | | | | | | | | | | | |
Actual | | $ | 1,000.00 | | | $ | 1,119.05 | | | $ | 5.75 | | | | 1.08 | % |
Hypothetical (5% return before expenses) | | $ | 1,000.00 | | | $ | 1,019.71 | | | $ | 5.48 | | | | 1.08 | % |
Class R4 | | | | | | | | | | | | | | | | |
Actual | | $ | 1,000.00 | | | $ | 1,122.19 | | | $ | 2.77 | | | | 0.52 | % |
Hypothetical (5% return before expenses) | | $ | 1,000.00 | | | $ | 1,022.52 | | | $ | 2.64 | | | | 0.52 | % |
Class R6 | | | | | | | | | | | | | | | | |
Actual | | $ | 1,000.00 | | | $ | 1,122.96 | | | $ | 1.97 | | | | 0.37 | % |
Hypothetical (5% return before expenses) | | $ | 1,000.00 | | | $ | 1,023.38 | | | $ | 1.88 | | | | 0.37 | % |
Administrator Class | | | | | | | | | | | | | | | | |
Actual | | $ | 1,000.00 | | | $ | 1,120.80 | | | $ | 3.84 | | | | 0.72 | % |
Hypothetical (5% return before expenses) | | $ | 1,000.00 | | | $ | 1,021.52 | | | $ | 3.66 | | | | 0.72 | % |
Please see footnote on page 26.
| | | | |
| 24 | | Wells Fargo Dow Jones Target Date Funds | | Fund expenses (unaudited) |
| | | | | | | | | | | | | | | | |
| Target 2040 Fund | | Beginning
account value
3-1-2016 | | | Ending
account value
8-31-2016 | | | Expenses
paid during
the period¹ | | | Annualized net
expense ratio | |
Class A | | | | | | | | | | | | | | | | |
Actual | | $ | 1,000.00 | | | $ | 1,131.14 | | | $ | 4.45 | | | | 0.83 | % |
Hypothetical (5% return before expenses) | | $ | 1,000.00 | | | $ | 1,020.96 | | | $ | 4.22 | | | | 0.83 | % |
Class B | | | | | | | | | | | | | | | | |
Actual | | $ | 1,000.00 | | | $ | 1,127.18 | | | $ | 8.45 | | | | 1.58 | % |
Hypothetical (5% return before expenses) | | $ | 1,000.00 | | | $ | 1,017.19 | | | $ | 8.01 | | | | 1.58 | % |
Class C | | | | | | | | | | | | | | | | |
Actual | | $ | 1,000.00 | | | $ | 1,127.01 | | | $ | 8.45 | | | | 1.58 | % |
Hypothetical (5% return before expenses) | | $ | 1,000.00 | | | $ | 1,017.19 | | | $ | 8.01 | | | | 1.58 | % |
Class R | | | | | | | | | | | | | | | | |
Actual | | $ | 1,000.00 | | | $ | 1,129.86 | | | $ | 5.78 | | | | 1.08 | % |
Hypothetical (5% return before expenses) | | $ | 1,000.00 | | | $ | 1,019.71 | | | $ | 5.48 | | | | 1.08 | % |
Class R4 | | | | | | | | | | | | | | | | |
Actual | | $ | 1,000.00 | | | $ | 1,133.54 | | | $ | 2.79 | | | | 0.52 | % |
Hypothetical (5% return before expenses) | | $ | 1,000.00 | | | $ | 1,022.52 | | | $ | 2.64 | | | | 0.52 | % |
Class R6 | | | | | | | | | | | | | | | | |
Actual | | $ | 1,000.00 | | | $ | 1,134.33 | | | $ | 1.99 | | | | 0.37 | % |
Hypothetical (5% return before expenses) | | $ | 1,000.00 | | | $ | 1,023.28 | | | $ | 1.88 | | | | 0.37 | % |
Administrator Class | | | | | | | | | | | | | | | | |
Actual | | $ | 1,000.00 | | | $ | 1,131.48 | | | $ | 3.86 | | | | 0.72 | % |
Hypothetical (5% return before expenses) | | $ | 1,000.00 | | | $ | 1,021.52 | | | $ | 3.66 | | | | 0.72 | % |
| Target 2045 Fund | | | | | | | | | | | | |
Class A | | | | | | | | | | | | | | | | |
Actual | | $ | 1,000.00 | | | $ | 1,138.64 | | | $ | 4.46 | | | | 0.83 | % |
Hypothetical (5% return before expenses) | | $ | 1,000.00 | | | $ | 1,020.96 | | | $ | 4.22 | | | | 0.83 | % |
Class R | | | | | | | | | | | | | | | | |
Actual | | $ | 1,000.00 | | | $ | 1,136.86 | | | $ | 5.80 | | | | 1.08 | % |
Hypothetical (5% return before expenses) | | $ | 1,000.00 | | | $ | 1,019.71 | | | $ | 5.48 | | | | 1.08 | % |
Class R4 | | | | | | | | | | | | | | | | |
Actual | | $ | 1,000.00 | | | $ | 1,140.80 | | | $ | 2.80 | | | | 0.52 | % |
Hypothetical (5% return before expenses) | | $ | 1,000.00 | | | $ | 1,022.52 | | | $ | 2.64 | | | | 0.52 | % |
Class R6 | | | | | | | | | | | | | | | | |
Actual | | $ | 1,000.00 | | | $ | 1,140.72 | | | $ | 1.99 | | | | 0.37 | % |
Hypothetical (5% return before expenses) | | $ | 1,000.00 | | | $ | 1,023.28 | | | $ | 1.88 | | | | 0.37 | % |
Administrator Class | | | | | | | | | | | | | | | | |
Actual | | $ | 1,000.00 | | | $ | 1,139.08 | | | $ | 3.87 | | | | 0.72 | % |
Hypothetical (5% return before expenses) | | $ | 1,000.00 | | | $ | 1,021.52 | | | $ | 3.66 | | | | 0.72 | % |
Please see footnote on page 26.
| | | | | | |
| Fund expenses (unaudited) | | Wells Fargo Dow Jones Target Date Funds | | | 25 | |
| | | | | | | | | | | | | | | | |
| Target 2050 Fund | | Beginning
account value
3-1-2016 | | | Ending
account value
8-31-2016 | | | Expenses
paid during
the period¹ | | | Annualized net
expense ratio | |
Class A | | | | | | | | | | | | | | | | |
Actual | | $ | 1,000.00 | | | $ | 1,141.05 | | | $ | 4.47 | | | | 0.83 | % |
Hypothetical (5% return before expenses) | | $ | 1,000.00 | | | $ | 1,020.96 | | | $ | 4.22 | | | | 0.83 | % |
Class C | | | | | | | | | | | | | | | | |
Actual | | $ | 1,000.00 | | | $ | 1,136.64 | | | $ | 8.49 | | | | 1.58 | % |
Hypothetical (5% return before expenses) | | $ | 1,000.00 | | | $ | 1,017.19 | | | $ | 8.01 | | | | 1.58 | % |
Class R | | | | | | | | | | | | | | | | |
Actual | | $ | 1,000.00 | | | $ | 1,139.84 | | | $ | 5.81 | | | | 1.08 | % |
Hypothetical (5% return before expenses) | | $ | 1,000.00 | | | $ | 1,019.71 | | | $ | 5.48 | | | | 1.08 | % |
Class R4 | | | | | | | | | | | | | | | | |
Actual | | $ | 1,000.00 | | | $ | 1,143.25 | | | $ | 2.80 | | | | 0.52 | % |
Hypothetical (5% return before expenses) | | $ | 1,000.00 | | | $ | 1,022.52 | | | $ | 2.64 | | | | 0.52 | % |
Class R6 | | | | | | | | | | | | | | | | |
Actual | | $ | 1,000.00 | | | $ | 1,144.05 | | | $ | 1.99 | | | | 0.37 | % |
Hypothetical (5% return before expenses) | | $ | 1,000.00 | | | $ | 1,023.28 | | | $ | 1.88 | | | | 0.37 | % |
Administrator Class | | | | | | | | | | | | | | | | |
Actual | | $ | 1,000.00 | | | $ | 1,142.69 | | | $ | 3.88 | | | | 0.72 | % |
Hypothetical (5% return before expenses) | | $ | 1,000.00 | | | $ | 1,021.52 | | | $ | 3.66 | | | | 0.72 | % |
| Target 2055 Fund | | | | | | | | | | | | |
Class A | | | | | | | | | | | | | | | | |
Actual | | $ | 1,000.00 | | | $ | 1,141.06 | | | $ | 4.47 | | | | 0.83 | % |
Hypothetical (5% return before expenses) | | $ | 1,000.00 | | | $ | 1,020.96 | | | $ | 4.22 | | | | 0.83 | % |
Class R | | | | | | | | | | | | | | | | |
Actual | | $ | 1,000.00 | | | $ | 1,139.84 | | | $ | 5.81 | | | | 1.08 | % |
Hypothetical (5% return before expenses) | | $ | 1,000.00 | | | $ | 1,019.71 | | | $ | 5.48 | | | | 1.08 | % |
Class R4 | | | | | | | | | | | | | | | | |
Actual | | $ | 1,000.00 | | | $ | 1,143.27 | | | $ | 2.80 | | | | 0.52 | % |
Hypothetical (5% return before expenses) | | $ | 1,000.00 | | | $ | 1,022.52 | | | $ | 2.64 | | | | 0.52 | % |
Class R6 | | | | | | | | | | | | | | | | |
Actual | | $ | 1,000.00 | | | $ | 1,144.27 | | | $ | 1.99 | | | | 0.37 | % |
Hypothetical (5% return before expenses) | | $ | 1,000.00 | | | $ | 1,023.28 | | | $ | 1.88 | | | | 0.37 | % |
Administrator Class | | | | | | | | | | | | | | | | |
Actual | | $ | 1,000.00 | | | $ | 1,140.86 | | | $ | 3.87 | | | | 0.72 | % |
Hypothetical (5% return before expenses) | | $ | 1,000.00 | | | $ | 1,021.52 | | | $ | 3.66 | | | | 0.72 | % |
Please see footnote on page 26.
| | | | |
| 26 | | Wells Fargo Dow Jones Target Date Funds | | Fund expenses (unaudited) |
| | | | | | | | | | | | | | | | |
| Target 2060 Fund | | Beginning
account value
3-1-2016 | | | Ending
account value
8-31-2016 | | | Expenses
paid during
the period¹ | | | Annualized net
expense ratio | |
Class A | | | | | | | | | | | | | | | | |
Actual | | $ | 1,000.00 | | | $ | 1,138.02 | | | $ | 4.46 | | | | 0.83 | % |
Hypothetical (5% return before expenses) | | $ | 1,000.00 | | | $ | 1,020.96 | | | $ | 4.22 | | | | 0.83 | % |
Class C | | | | | | | | | | | | | | | | |
Actual | | $ | 1,000.00 | | | $ | 1,132.71 | | | $ | 8.47 | | | | 1.58 | % |
Hypothetical (5% return before expenses) | | $ | 1,000.00 | | | $ | 1,017.19 | | | $ | 8.01 | | | | 1.58 | % |
Class R | | | | | | | | | | | | | | | | |
Actual | | $ | 1,000.00 | | | $ | 1,135.08 | | | $ | 5.80 | | | | 1.08 | % |
Hypothetical (5% return before expenses) | | $ | 1,000.00 | | | $ | 1,019.71 | | | $ | 5.48 | | | | 1.08 | % |
Class R4 | | | | | | | | | | | | | | | | |
Actual | | $ | 1,000.00 | | | $ | 1,139.10 | | | $ | 2.80 | | | | 0.52 | % |
Hypothetical (5% return before expenses) | | $ | 1,000.00 | | | $ | 1,022.52 | | | $ | 2.64 | | | | 0.52 | % |
Class R6 | | | | | | | | | | | | | | | | |
Actual | | $ | 1,000.00 | | | $ | 1,139.88 | | | $ | 1.99 | | | | 0.37 | % |
Hypothetical (5% return before expenses) | | $ | 1,000.00 | | | $ | 1,023.28 | | | $ | 1.88 | | | | 0.37 | % |
Administrator Class | | | | | | | | | | | | | | | | |
Actual | | $ | 1,000.00 | | | $ | 1,138.36 | | | $ | 3.87 | | | | 0.72 | % |
Hypothetical (5% return before expenses) | | $ | 1,000.00 | | | $ | 1,021.52 | | | $ | 3.66 | | | | 0.72 | % |
| 1 | Expenses paid is equal to the annualized net expense ratio of each class multiplied by the average account value over the period, multiplied by the number of days in the most recent fiscal half-year divided by the number of days in the fiscal year (to reflect the one-half-year period). |
| | | | | | |
| Portfolios of investments—August 31, 2016 (unaudited) | | Wells Fargo Dow Jones Target Date Funds | | | 27 | |
TARGET TODAY FUND
| | | | | | | | | | | | | | | | |
| Security name | | | | | | | | | | | Value | |
|
Investment Companies: 100.22% | |
|
| Affiliated Master Portfolios: 100.22% | |
Wells Fargo Diversified Fixed Income Portfolio | | | | | | | | | | | | | | $ | 373,388,834 | |
Wells Fargo Diversified Stock Portfolio | | | | | | | | | | | | | | | 96,136,731 | |
Wells Fargo Short-Term Investment Portfolio | | | | | | | | | | | | | | | 168,661,432 | |
| | | | |
Total Investment Companies (Cost $585,098,851) | | | | | | | | | | | | | | | 638,186,997 | |
| | | | | | | | | | | | | | | | |
| | | | | | | | |
| Total investments in securities (Cost $585,098,851) * | | | 100.22 | % | | | 638,186,997 | |
Other assets and liabilities, net | | | (0.22 | ) | | | (1,423,008 | ) |
| | | | | | | | |
| Total net assets | | | 100.00 | % | | $ | 636,763,989 | |
| | | | | | | | |
| | | | | | | | |
* | | Cost for federal income tax purposes is $586,825,258 and unrealized gains (losses) consists of: |
| | Gross unrealized gains | | $ | 51,361,739 | | | |
| | Gross unrealized losses | | | 0 | | | |
| | | | | | | | |
| | Net unrealized gains | | $ | 51,361,739 | | | |
TARGET 2010 FUND
| | | | | | | | | | | | | | | | |
| Security name | | | | | | | | | | | Value | |
| | | | |
Investment Companies: 101.18% | | | | | | | | | | | | | | | | |
| | | | |
| Affiliated Master Portfolios: 101.18% | | | | | | | | | | | | | | | | |
Wells Fargo Diversified Fixed Income Portfolio | | | | | | | | | | | | | | $ | 246,625,892 | |
Wells Fargo Diversified Stock Portfolio | | | | | | | | | | | | | | | 65,281,366 | |
Wells Fargo Short-Term Investment Portfolio | | | | | | | | | | | | | | | 79,890,878 | |
| | | | |
Total Investment Companies (Cost $330,515,304) | | | | | | | | | | | | | | | 391,798,136 | |
| | | | | | | | | | | | | | | | |
| | | | | | | | |
| Total investments in securities (Cost $330,515,304) * | | | 101.18 | % | | | 391,798,136 | |
Other assets and liabilities, net | | | (1.18 | ) | | | (4,556,470 | ) |
| | | | | | | | |
| Total net assets | | | 100.00 | % | | $ | 387,241,666 | |
| | | | | | | | |
| | | | | | | | |
* | | Cost for federal income tax purposes is $339,611,014 and unrealized gains (losses) consists of: |
| | Gross unrealized gains | | $ | 52,187,122 | | | |
| | Gross unrealized losses | | | 0 | | | |
| | | | | | | | |
| | Net unrealized gains | | $ | 52,187,122 | | | |
The accompanying notes are an integral part of these financial statements.
| | | | |
| 28 | | Wells Fargo Dow Jones Target Date Funds | | Portfolios of investments—August 31, 2016 (unaudited) |
TARGET 2015 FUND
| | | | | | | | | | | | | | | | |
| Security name | | | | | | | | | | | Value | |
| | | | |
Investment Companies: 100.05% | | | | | | | | | | | | | | | | |
| | | | |
| Affiliated Master Portfolios: 100.05% | | | | | | | | | | | | | | | | |
Wells Fargo Diversified Fixed Income Portfolio | | | | | | | | | | | | | | $ | 493,300,331 | |
Wells Fargo Diversified Stock Portfolio | | | | | | | | | | | | | | | 149,035,476 | |
Wells Fargo Short-Term Investment Portfolio | | | | | | | | | | | | | | | 26,815,475 | |
| | | | |
Total Investment Companies (Cost $574,497,676) | | | | | | | | | | | | | | | 669,151,282 | |
| | | | | | | | | | | | | | | | |
| | | | | | | | |
| Total investments in securities (Cost $574,497,676) * | | | 100.05 | % | | | 669,151,282 | |
Other assets and liabilities, net | | | (0.05 | ) | | | (351,356 | ) |
| | | | | | | | |
| Total net assets | | | 100.00 | % | | $ | 668,799,926 | |
| | | | | | | | |
| | | | | | | | |
* | | Cost for federal income tax purposes is $575,763,308 and unrealized gains (losses) consists of: |
| | Gross unrealized gains | | $ | 93,387,974 | | | |
| | Gross unrealized losses | | | 0 | | | |
| | | | | | | | |
| | Net unrealized gains | | $ | 93,387,974 | | | |
TARGET 2020 FUND
| | | | | | | | | | | | | | | | |
| Security name | | | | | | | | | | | Value | |
| | | | |
Investment Companies: 100.72% | | | | | | | | | | | | | | | | |
| | | | |
| Affiliated Master Portfolios: 100.72% | | | | | | | | | | | | | | | | |
Wells Fargo Diversified Fixed Income Portfolio | | | | | | | | | | | | | | $ | 1,622,824,293 | |
Wells Fargo Diversified Stock Portfolio | | | | | | | | | | | | | | | 782,696,168 | |
Wells Fargo Short-Term Investment Portfolio | | | | | | | | | | | | | | | 100,366,233 | |
| | | | |
Total Investment Companies (Cost $2,147,083,021) | | | | | | | | | | | | | | | 2,505,886,694 | |
| | | | | | | | | | | | | | | | |
| | | | | | | | |
| Total investments in securities (Cost $2,147,083,021) * | | | 100.72 | % | | | 2,505,886,694 | |
Other assets and liabilities, net | | | (0.72 | ) | | | (17,822,130 | ) |
| | | | | | | | |
| Total net assets | | | 100.00 | % | | $ | 2,488,064,564 | |
| | | | | | | | |
| | | | | | | | |
* | | Cost for federal income tax purposes is $2,165,645,030 and unrealized gains (losses) consists of: |
| | Gross unrealized gains | | $ | 340,241,664 | | | |
| | Gross unrealized losses | | | 0 | | | |
| | | | | | | | |
| | Net unrealized gains | | $ | 340,241,664 | | | |
The accompanying notes are an integral part of these financial statements.
| | | | | | |
| Portfolios of investments—August 31, 2016 (unaudited) | | Wells Fargo Dow Jones Target Date Funds | | | 29 | |
TARGET 2025 FUND
| | | | | | | | | | | | | | | | |
| Security name | | | | | | | | | | | Value | |
| | | | |
Investment Companies: 100.08% | | | | | | | | | | | | | | | | |
| | | | |
| Affiliated Master Portfolios: 100.08% | | | | | | | | | | | | | | | | |
Wells Fargo Diversified Fixed Income Portfolio | | | | | | | | | | | | | | $ | 1,203,934,957 | |
Wells Fargo Diversified Stock Portfolio | | | | | | | | | | | | | | | 1,020,723,767 | |
Wells Fargo Short-Term Investment Portfolio | | | | | | | | | | | | | | | 92,745,275 | |
| | | | |
Total Investment Companies (Cost $1,946,949,386) | | | | | | | | | | | | | | | 2,317,403,999 | |
| | | | | | | | | | | | | | | | |
| | | | | | | | |
| Total investments in securities (Cost $1,946,949,386) * | | | 100.08 | % | | | 2,317,403,999 | |
Other assets and liabilities, net | | | (0.08 | ) | | | (1,830,396 | ) |
| | | | | | | | |
| Total net assets | | | 100.00 | % | | $ | 2,315,573,603 | |
| | | | | | | | |
| | | | | | | | |
* | | Cost for federal income tax purposes is $1,951,689,376 and unrealized gains (losses) consists of: |
| | Gross unrealized gains | | $ | 365,714,623 | | | |
| | Gross unrealized losses | | | 0 | | | |
| | | | | | | | |
| | Net unrealized gains | | $ | 365,714,623 | | | |
TARGET 2030 FUND
| | | | | | | | | | | | | | | | |
| Security name | | | | | | | | | | | Value | |
| | | | |
Investment Companies: 101.35% | | | | | | | | | | | | | | | | |
| | | | |
| Affiliated Master Portfolios: 101.35% | | | | | | | | | | | | | | | | |
Wells Fargo Diversified Fixed Income Portfolio | | | | | | | | | | | | | | $ | 1,037,698,560 | |
Wells Fargo Diversified Stock Portfolio | | | | | | | | | | | | | | | 1,572,240,090 | |
Wells Fargo Short-Term Investment Portfolio | | | | | | | | | | | | | | | 108,713,033 | |
| | | | |
Total Investment Companies (Cost $2,245,582,897) | | | | | | | | | | | | | | | 2,718,651,683 | |
| | | | | | | | | | | | | | | | |
| | | | | | | | |
| Total investments in securities (Cost $2,245,582,897) * | | | 101.35 | % | | | 2,718,651,683 | |
Other assets and liabilities, net | | | (1.35 | ) | | | (36,231,907 | ) |
| | | | | | | | |
| Total net assets | | | 100.00 | % | | $ | 2,682,419,776 | |
| | | | | | | | |
| | | | | | | | |
* | | Cost for federal income tax purposes is $2,260,377,423 and unrealized gains (losses) consists of: |
| | Gross unrealized gains | | $ | 458,274,260 | | | |
| | Gross unrealized losses | | | 0 | | | |
| | | | | | | | |
| | Net unrealized gains | | $ | 458,274,260 | | | |
The accompanying notes are an integral part of these financial statements.
| | | | |
| 30 | | Wells Fargo Dow Jones Target Date Funds | | Portfolios of investments—August 31, 2016 (unaudited) |
TARGET 2035 FUND
| | | | | | | | | | | | | | | | |
| Security name | | | | | | | | | | | Value | |
| | | | |
Investment Companies: 100.20% | | | | | | | | | | | | | | | | |
| | | | |
| Affiliated Master Portfolios: 100.20% | | | | | | | | | | | | | | | | |
Wells Fargo Diversified Fixed Income Portfolio | | | | | | | | | | | | | | $ | 355,382,138 | |
Wells Fargo Diversified Stock Portfolio | | | | | | | | | | | | | | | 973,796,301 | |
Wells Fargo Short-Term Investment Portfolio | | | | | | | | | | | | | | | 55,321,293 | |
| | | | |
Total Investment Companies (Cost $1,140,710,376) | | | | | | | | | | | | | | | 1,384,499,732 | |
| | | | | | | | | | | | | | | | |
| | | | | | | | |
| Total investments in securities (Cost $1,140,710,376) * | | | 100.20 | % | | | 1,384,499,732 | |
Other assets and liabilities, net | | | (0.20 | ) | | | (2,725,284 | ) |
| | | | | | | | |
| Total net assets | | | 100.00 | % | | $ | 1,381,774,448 | |
| | | | | | | | |
| | | | | | | | |
* | | Cost for federal income tax purposes is $1,144,443,279 and unrealized gains (losses) consists of: |
| | Gross unrealized gains | | $ | 240,056,453 | | | |
| | Gross unrealized losses | | | 0 | | | |
| | | | | | | | |
| | Net unrealized gains | | $ | 240,056,453 | | | |
TARGET 2040 FUND
| | | | | | | | | | | | | | | | |
| Security name | | | | | | | | | | | Value | |
| | | | |
Investment Companies: 101.76% | | | | | | | | | | | | | | | | |
| | | | |
| Affiliated Master Portfolios: 101.76% | | | | | | | | | | | | | | | | |
Wells Fargo Diversified Fixed Income Portfolio | | | | | | | | | | | | | | $ | 315,416,359 | |
Wells Fargo Diversified Stock Portfolio | | | | | | | | | | | | | | | 1,630,726,912 | |
Wells Fargo Short-Term Investment Portfolio | | | | | | | | | | | | | | | 80,948,140 | |
| | | | |
Total Investment Companies (Cost $1,644,778,475) | | | | | | | | | | | | | | | 2,027,091,411 | |
| | | | | | | | | | | | | | | | |
| | | | | | | | |
| Total investments in securities (Cost $1,644,778,475) * | | | 101.76 | % | | | 2,027,091,411 | |
Other assets and liabilities, net | | | (1.76 | ) | | | (35,133,143 | ) |
| | | | | | | | |
| Total net assets | | | 100.00 | % | | $ | 1,991,958,268 | |
| | | | | | | | |
| | | | | | | | |
* | | Cost for federal income tax purposes is $1,656,093,766 and unrealized gains (losses) consists of: |
| | Gross unrealized gains | | $ | 370,997,645 | | | |
| | Gross unrealized losses | | | 0 | | | |
| | | | | | | | |
| | Net unrealized gains | | $ | 370,997,645 | | | |
The accompanying notes are an integral part of these financial statements.
| | | | | | |
| Portfolios of investments—August 31, 2016 (unaudited) | | Wells Fargo Dow Jones Target Date Funds | | | 31 | |
TARGET 2045 FUND
| | | | | | | | | | | | | | | | |
| Security name | | | | | | | | | | | Value | |
| | | | |
Investment Companies: 100.12% | | | | | | | | | | | | | | | | |
| | | | |
| Affiliated Master Portfolios: 100.12% | | | | | | | | | | | | | | | | |
Wells Fargo Diversified Fixed Income Portfolio | | | | | | | | | | | | | | $ | 72,653,708 | |
Wells Fargo Diversified Stock Portfolio | | | | | | | | | | | | | | | 717,836,560 | |
Wells Fargo Short-Term Investment Portfolio | | | | | | | | | | | | | | | 32,865,780 | |
| | | | |
Total Investment Companies (Cost $684,193,298) | | | | | | | | | | | | | | | 823,356,048 | |
| | | | | | | | | | | | | | | | |
| | | | | | | | |
| Total investments in securities (Cost $684,193,298) * | | | 100.12 | % | | | 823,356,048 | |
Other assets and liabilities, net | | | (0.12 | ) | | | (969,498 | ) |
| | | | | | | | |
| Total net assets | | | 100.00 | % | | $ | 822,386,550 | |
| | | | | | | | |
| | | | | | | | |
* | | Cost for federal income tax purposes is $686,350,726 and unrealized gains (losses) consists of: |
| | Gross unrealized gains | | $ | 137,005,322 | | | |
| | Gross unrealized losses | | | 0 | | | |
| | | | | | | | |
| | Net unrealized gains | | $ | 137,005,322 | | | |
TARGET 2050 FUND
| | | | | | | | | | | | | | | | |
| Security name | | | | | | | | | | | Value | |
| | | | |
Investment Companies: 101.35% | | | | | | | | | | | | | | | | |
| | | | |
| Affiliated Master Portfolios: 101.35% | | | | | | | | | | | | | | | | |
Wells Fargo Diversified Fixed Income Portfolio | | | | | | | | | | | | | | $ | 88,779,674 | |
Wells Fargo Diversified Stock Portfolio | | | | | | | | | | | | | | | 1,306,225,460 | |
Wells Fargo Short-Term Investment Portfolio | | | | | | | | | | | | | | | 57,989,426 | |
| | | | |
Total Investment Companies (Cost $1,202,499,763) | | | | | | | | | | | | | | | 1,452,994,560 | |
| | | | | | | | | | | | | | | | |
| | | | | | | | |
| Total investments in securities (Cost $1,202,499,763) * | | | 101.35 | % | | | 1,452,994,560 | |
Other assets and liabilities, net | | | (1.35 | ) | | | (19,380,719 | ) |
| | | | | | | | |
| Total net assets | | | 100.00 | % | | $ | 1,433,613,841 | |
| | | | | | | | |
| | | | | | | | |
* | | Cost for federal income tax purposes is $1,207,835,500 and unrealized gains (losses) consists of: |
| | Gross unrealized gains | | $ | 245,159,060 | | | |
| | Gross unrealized losses | | | 0 | | | |
| | | | | | | | |
| | Net unrealized gains | | $ | 245,159,060 | | | |
The accompanying notes are an integral part of these financial statements.
| | | | |
| 32 | | Wells Fargo Dow Jones Target Date Funds | | Portfolios of investments—August 31, 2016 (unaudited) |
TARGET 2055 FUND
| | | | | | | | | | | | | | | | |
| Security name | | | | | | | | | | | Value | |
| | | | |
Investment Companies: 100.14% | | | | | | | | | | | | | | | | |
| | | | |
| Affiliated Master Portfolios: 100.14% | | | | | | | | | | | | | | | | |
Wells Fargo Diversified Fixed Income Portfolio | | | | | | | | | | | | | | $ | 17,017,561 | |
Wells Fargo Diversified Stock Portfolio | | | | | | | | | | | | | | | 252,077,269 | |
Wells Fargo Short-Term Investment Portfolio | | | | | | | | | | | | | | | 11,186,064 | |
| | | | |
Total Investment Companies (Cost $251,926,822) | | | | | | | | | | | | | | | 280,280,894 | |
| | | | | | | | | | | | | | | | |
| | | | | | | | |
| Total investments in securities (Cost $251,926,822) * | | | 100.14 | % | | | 280,280,894 | |
Other assets and liabilities, net | | | (0.14 | ) | | | (400,486 | ) |
| | | | | | | | |
| Total net assets | | | 100.00 | % | | $ | 279,880,408 | |
| | | | | | | | |
| | | | | | | | |
* | | Cost for federal income tax purposes is $251,936,500 and unrealized gains (losses) consists of: |
| | Gross unrealized gains | | $ | 28,344,394 | | | |
| | Gross unrealized losses | | | 0 | | | |
| | | | | | | | |
| | Net unrealized gains | | $ | 28,344,394 | | | |
TARGET 2060 FUND
| | | | | | | | | | | | | | | | |
| Security name | | | | | | | | | | | Value | |
| | | | |
Investment Companies: 97.78% | | | | | | | | | | | | | | | | |
| | | | |
| Affiliated Master Portfolios: 97.78% | | | | | | | | | | | | | | | | |
Wells Fargo Diversified Fixed Income Portfolio | | | | | | | | | | | | | | $ | 828,546 | |
Wells Fargo Diversified Stock Portfolio | | | | | | | | | | | | | | | 12,273,070 | |
Wells Fargo Short-Term Investment Portfolio | | | | | | | | | | | | | | | 544,624 | |
| | | | |
Total Investment Companies (Cost $13,345,177) | | | | | | | | | | | | | | | 13,646,240 | |
| | | | | | | | | | | | | | | | |
| | | | | | | | |
| Total investments in securities (Cost $13,345,177) * | | | 97.78 | % | | | 13,646,240 | |
Other assets and liabilities, net | | | 2.22 | | | | 310,390 | |
| | | | | | | | |
| Total net assets | | | 100.00 | % | | $ | 13,956,630 | |
| | | | | | | | |
| | | | | | | | |
* | | Cost for federal income tax purposes is $13,343,552 and unrealized gains (losses) consists of: |
| | Gross unrealized gains | | $ | 302,688 | | | |
| | Gross unrealized losses | | | 0 | | | |
| | | | | | | | |
| | Net unrealized gains | | $ | 302,688 | | | |
The accompanying notes are an integral part of these financial statements.
This page is intentionally left blank.
| | | | |
| 34 | | Wells Fargo Dow Jones Target Date Funds | | Statements of assets and liabilities—August 31, 2016 (unaudited) |
| | | | | | | | | | | | | | | | |
| | | Target Today
Fund | | | Target 2010 Fund | | | Target 2015 Fund | | | Target 2020 Fund | |
| | | | |
Assets | | | | | | | | | | | | | | | | |
Investment in affiliated Master Portfolios, at value (see cost below) | | $ | 638,186,997 | | | $ | 391,798,136 | | | $ | 669,151,282 | | | $ | 2,505,886,694 | |
Receivable for Fund shares sold | | | 1,168,390 | | | | 2,934,701 | | | | 334,254 | | | | 12,623,981 | |
Receivable from manager | | | 0 | | | | 0 | | | | 0 | | | | 0 | |
Prepaid expenses and other assets | | | 66,817 | | | | 61,324 | | | | 64,638 | | | | 68,269 | |
| | | | |
Total assets | | | 639,422,204 | | | | 394,794,161 | | | | 669,550,174 | | | | 2,518,578,944 | |
| | | | |
| | | | |
Liabilities | | | | | | | | | | | | | | | | |
Payable for Fund shares redeemed | | | 2,488,144 | | | | 7,427,533 | | | | 569,495 | | | | 29,754,118 | |
Management fee payable | | | 45,362 | | | | 29,308 | | | | 59,246 | | | | 311,797 | |
Distribution fees payable | | | 1,967 | | | | 1,393 | | | | 10 | | | | 4,588 | |
Administration fees payable | | | 43,789 | | | | 30,904 | | | | 43,275 | | | | 164,539 | |
Shareholder servicing fees payable | | | 51,022 | | | | 38,931 | | | | 50,454 | | | | 200,190 | |
Professional fees payable | | | 10,619 | | | | 9,017 | | | | 10,284 | | | | 9,988 | |
Accrued expenses and other liabilities | | | 17,312 | | | | 15,409 | | | | 17,484 | | | | 69,160 | |
| | | | |
Total liabilities | | | 2,658,215 | | | | 7,552,495 | | | | 750,248 | | | | 30,514,380 | |
| | | | |
Total net assets | | $ | 636,763,989 | | | $ | 387,241,666 | | | $ | 668,799,926 | | | $ | 2,488,064,564 | |
| | | | |
| | | | |
NET ASSETS CONSIST OF | | | | | | | | | | | | | | | | |
Paid-in capital | | $ | 579,674,989 | | | $ | 332,783,954 | | | $ | 570,324,885 | | | $ | 2,129,705,835 | |
Undistributed net investment income | | | 3,615,281 | | | | 458,213 | | | | 1,373,965 | | | | 6,984,385 | |
Accumulated net realized gains (losses) on investments | | | 385,573 | | | | (7,283,333 | ) | | | 2,447,470 | | | | (7,429,329 | ) |
Net unrealized gains on investments | | | 53,088,146 | | | | 61,282,832 | | | | 94,653,606 | | | | 358,803,673 | |
| | | | |
Total net assets | | $ | 636,763,989 | | | $ | 387,241,666 | | | $ | 668,799,926 | | | $ | 2,488,064,564 | |
| | | | |
| | | | |
COMPUTATION OF NET ASSET VALUE AND OFFERING PRICE PER SHARE | | | | | | | | | | | | | | | | |
Net assets – Class A | | $ | 66,058,091 | | | $ | 66,215,778 | | | $ | 71,977,157 | | | $ | 236,274,694 | |
Shares outstanding – Class A1 | | | 6,064,580 | | | | 5,156,005 | | | | 6,862,614 | | | | 15,511,743 | |
Net asset value per share – Class A | | | $10.89 | | | | $12.84 | | | | $10.49 | | | | $15.23 | |
Maximum offering price per share – Class A2 | | | $11.55 | | | | $13.62 | | | | $11.13 | | | | $16.16 | |
Net assets – Class B | | $ | 2,151 | | | $ | 29,841 | | | | N/A | | | $ | 32,840 | |
Shares outstanding – Class B1 | | | 190 | | | | 2,296 | | | | N/A | | | | 2,160 | |
Net asset value per share – Class B | | | $11.29 | | | | $13.00 | | | | N/A | | | | $15.20 | |
Net assets – Class C | | $ | 3,078,631 | | | $ | 2,007,099 | | | | N/A | | | $ | 6,878,033 | |
Shares outstanding – Class C1 | | | 278,062 | | | | 154,545 | | | | N/A | | | | 455,328 | |
Net asset value per share – Class C | | | $11.07 | | | | $12.99 | | | | N/A | | | | $15.11 | |
Net assets – Class R | | $ | 31,159 | | | $ | 54,403 | | | $ | 45,167 | | | $ | 474,596 | |
Shares outstanding – Class R1 | | | 2,871 | | | | 4,263 | | | | 4,249 | | | | 31,279 | |
Net asset value per share – Class R | | | $10.85 | | | | $12.76 | | | | $10.63 | | | | $15.17 | |
Net assets – Class R4 | | $ | 272,489,121 | | | $ | 60,998,911 | | | $ | 118,270,678 | | | $ | 404,139,456 | |
Share outstanding – Class R41 | | | 24,424,718 | | | | 4,700,027 | | | | 11,226,891 | | | | 26,050,212 | |
Net asset value per share – Class R4 | | | $11.16 | | | | $12.98 | | | | $10.53 | | | | $15.51 | |
Net assets – Class R6 | | $ | 235,629,818 | | | $ | 173,260,906 | | | $ | 362,465,886 | | | $ | 1,327,175,210 | |
Shares outstanding – Class R61 | | | 21,134,304 | | | | 13,356,071 | | | | 34,422,051 | | | | 85,582,437 | |
Net asset value per share – Class R6 | | | $11.15 | | | | $12.97 | | | | $10.53 | | | | $15.51 | |
Net assets – Administrator Class | | $ | 59,475,018 | | | $ | 84,674,728 | | | $ | 116,041,038 | | | $ | 513,089,735 | |
Shares outstanding – Administrator Class1 | | | 5,346,890 | | | | 6,524,138 | | | | 10,894,235 | | | | 33,187,427 | |
Net asset value per share – Administrator Class | | | $11.12 | | | | $12.98 | | | | $10.65 | | | | $15.46 | |
| | | | |
Investments in affiliated Master Portfolios, at cost | | $ | 585,098,851 | | | $ | 330,515,304 | | | $ | 574,497,676 | | | $ | 2,147,083,021 | |
| | | | |
| 1 | Each Fund has an unlimited number of authorized shares. |
| 2 | Maximum offering price is computed as 100/94.25 of net asset value. On investments of $50,000 or more, the offering price is reduced. |
The accompanying notes are an integral part of these financial statements.
| | | | | | |
| Statements of assets and liabilities—August 31, 2016 (unaudited) | | Wells Fargo Dow Jones Target Date Funds | | | 35 | |
| | | | | | | | | | | | | | | | | | | | | | | | | | | | | | |
Target 2025 Fund | | | Target 2030 Fund | | | Target 2035 Fund | | | Target 2040 Fund | | | Target 2045 Fund | | | Target 2050 Fund | | | Target 2055 Fund | | | Target 2060 Fund | |
| | | | | | | |
| | | | | | | | | | | | | | | | | | | | | | | | | | | | | | | |
| $ | 2,317,403,999 | | | $ | 2,718,651,683 | | | $ | 1,384,499,732 | | | $ | 2,027,091,411 | | | $ | 823,356,048 | | | $ | 1,452,994,560 | | | $ | 280,280,894 | | | $ | 13,646,240 | |
| | 2,353,826 | | | | 16,110,196 | | | | 1,025,016 | | | | 13,650,722 | | | | 798,345 | | | | 5,761,228 | | | | 274,566 | | | | 254,046 | |
| | 0 | | | | 0 | | | | 0 | | | | 0 | | | | 0 | | | | 0 | | | | 0 | | | | 10,801 | |
| | 87,467 | | | | 61,895 | | | | 70,159 | | | | 63,209 | | | | 67,551 | | | | 62,488 | | | | 66,558 | | | | 63,092 | |
| | |
| | 2,319,845,292 | | | | 2,734,823,774 | | | | 1,385,594,907 | | | | 2,040,805,342 | | | | 824,221,944 | | | | 1,458,818,276 | | | | 280,622,018 | | | | 13,974,179 | |
| | |
| | | | | | | |
| | | | | | | | | | | | | | | | | | | | | | | | | | | | | | | |
| | 3,667,924 | | | | 51,573,766 | | | | 3,410,939 | | | | 48,208,467 | | | | 1,598,168 | | | | 24,809,612 | | | | 677,148 | | | | 4,475 | |
| | 289,222 | | | | 362,168 | | | | 187,401 | | | | 284,009 | | | | 103,909 | | | | 195,803 | | | | 26,315 | | | | 0 | |
| | 131 | | | | 3,370 | | | | 31 | | | | 3,238 | | | | 8 | | | | 664 | | | | 15 | | | | 169 | |
| | 124,748 | | | | 175,256 | | | | 85,050 | | | | 132,791 | | | | 49,801 | | | | 74,877 | | | | 11,892 | | | | 828 | |
| | 128,598 | | | | 210,961 | | | | 94,269 | | | | 155,491 | | | | 55,436 | | | | 78,472 | | | | 9,607 | | | | 1,048 | |
| | 8,212 | | | | 9,953 | | | | 10,276 | | | | 10,390 | | | | 10,207 | | | | 13,955 | | | | 11,115 | | | | 9,989 | |
| | 52,854 | | | | 68,524 | | | | 32,493 | | | | 52,688 | | | | 17,865 | | | | 31,052 | | | | 5,518 | | | | 1,040 | |
| | |
| | 4,271,689 | | | | 52,403,998 | | | | 3,820,459 | | | | 48,847,074 | | | | 1,835,394 | | | | 25,204,435 | | | | 741,610 | | | | 17,549 | |
| | |
| $ | 2,315,573,603 | | | $ | 2,682,419,776 | | | $ | 1,381,774,448 | | | $ | 1,991,958,268 | | | $ | 822,386,550 | | | $ | 1,433,613,841 | | | $ | 279,880,408 | | | $ | 13,956,630 | |
| | |
| | | | | | | |
| | | | | | | | | | | | | | | | | | | | | | | | | | | | | | | |
| $ | 1,928,387,676 | | | $ | 2,179,851,526 | | | $ | 1,125,065,568 | | | $ | 1,594,797,921 | | | $ | 674,647,724 | | | $ | 1,169,275,472 | | | $ | 255,142,768 | | | $ | 13,665,293 | |
| | 6,403,745 | | | | 23,950,782 | | | | 4,228,980 | | | | 5,302,374 | | | | 2,467,948 | | | | 3,990,449 | | | | 1,010,847 | | | | 29,886 | |
| | 10,327,569 | | | | 5,548,682 | | | | 8,690,544 | | | | 9,545,037 | | | | 6,108,128 | | | | 9,853,123 | | | | (4,627,279 | ) | | | (39,612 | ) |
| | 370,454,613 | | | | 473,068,786 | | | | 243,789,356 | | | | 382,312,936 | | | | 139,162,750 | | | | 250,494,797 | | | | 28,354,072 | | | | 301,063 | |
| | |
| $ | 2,315,573,603 | | | $ | 2,682,419,776 | | | $ | 1,381,774,448 | | | $ | 1,991,958,268 | | | $ | 822,386,550 | | | $ | 1,433,613,841 | | | $ | 279,880,408 | | | $ | 13,956,630 | |
| | |
| | | | | | | |
| | | | | | | | | | | | | | | | | | | | | | | | | | | | | | |
| $ | 172,919,022 | | | $ | 238,876,685 | | | $ | 146,577,231 | | | $ | 216,659,352 | | | $ | 81,586,122 | | | $ | 63,051,629 | | | $ | 10,353,180 | | | $ | 266,861 | |
| | 16,272,788 | | | | 14,218,820 | | | | 13,289,332 | | | | 11,505,132 | | | | 7,155,970 | | | | 5,786,066 | | | | 790,259 | | | | 26,659 | |
| | $10.63 | | | | $16.80 | | | | $11.03 | | | | $18.83 | | | | $11.40 | | | | $10.90 | | | | $13.10 | | | | $10.01 | |
| | $11.28 | | | | $17.82 | | | | $11.70 | | | | $19.98 | | | | $12.10 | | | | $11.56 | | | | $13.90 | | | | $10.62 | |
| | N/A | | | $ | 19,938 | | | | N/A | | | $ | 69,142 | | | | N/A | | | | N/A | | | | N/A | | | | N/A | |
| | N/A | | | | 1,208 | | | | N/A | | | | 3,847 | | | | N/A | | | | N/A | | | | N/A | | | | N/A | |
| | N/A | | | | $16.50 | | | | N/A | | | | $17.97 | | | | N/A | | | | N/A | | | | N/A | | | | N/A | |
| | N/A | | | $ | 4,946,204 | | | | N/A | | | $ | 4,781,418 | | | | N/A | | | $ | 1,027,661 | | | | N/A | | | $ | 226,831 | |
| | N/A | | | | 303,168 | | | | N/A | | | | 270,704 | | | | N/A | | | | 94,660 | | | | N/A | | | | 22,631 | |
| | N/A | | | | $16.32 | | | | N/A | | | | $17.66 | | | | N/A | | | | $10.86 | | | | N/A | | | | $10.02 | |
| $ | 618,947 | | | $ | 951,000 | | | $ | 144,998 | | | $ | 350,958 | | | $ | 37,440 | | | $ | 48,316 | | | $ | 70,920 | | | $ | 127,518 | |
| | 58,190 | | | | 56,800 | | | | 13,073 | | | | 18,696 | | | | 3,248 | | | | 4,424 | | | | 5,469 | | | | 12,928 | |
| | $10.64 | | | | $16.74 | | | | $11.09 | | | | $18.77 | | | | $11.53 | | | | $10.92 | | | | $12.97 | | | | $9.86 | |
| $ | 265,135,247 | | | $ | 511,277,427 | | | $ | 223,308,692 | | | $ | 384,952,792 | | | $ | 134,225,642 | | | $ | 229,819,341 | | | $ | 33,172,163 | | | $ | 3,382,691 | |
| | 24,860,218 | | | | 29,969,395 | | | | 20,213,572 | | | | 20,008,690 | | | | 11,723,209 | | | | 21,004,797 | | | | 2,525,048 | | | | 331,982 | |
| | $10.67 | | | | $17.06 | | | | $11.05 | | | | $19.24 | | | | $11.45 | | | | $10.94 | | | | $13.14 | | | | $10.19 | |
| $ | 1,554,977,615 | | | $ | 1,414,233,978 | | | $ | 808,899,200 | | | $ | 1,055,550,266 | | | $ | 481,996,650 | | | $ | 937,043,482 | | | $ | 214,435,144 | | | $ | 6,915,256 | |
| | 145,863,503 | | | | 82,920,152 | | | | 73,214,966 | | | | 54,874,108 | | | | 42,173,254 | | | | 85,681,231 | | | | 16,348,899 | | | | 680,500 | |
| | $10.66 | | | | $17.06 | | | | $11.05 | | | | $19.24 | | | | $11.43 | | | | $10.94 | | | | $13.12 | | | | $10.16 | |
| $ | 321,922,772 | | | $ | 512,114,544 | | | $ | 202,844,327 | | | $ | 329,594,340 | | | $ | 124,540,696 | | | $ | 202,623,412 | | | $ | 21,849,001 | | | $ | 3,037,473 | |
| | 30,135,952 | | | | 30,066,499 | | | | 18,303,212 | | | | 17,162,197 | | | | 10,828,984 | | | | 18,579,232 | | | | 1,667,665 | | | | 302,106 | |
| | $10.68 | | | | $17.03 | | | | $11.08 | | | | $19.20 | | | | $11.50 | | | | $10.91 | | | | $13.10 | | | | $10.05 | |
| | | | | | | |
| $ | 1,946,949,386 | | | $ | 2,245,582,897 | | | $ | 1,140,710,376 | | | $ | 1,644,778,475 | | | $ | 684,193,298 | | | $ | 1,202,499,763 | | | $ | 251,926,822 | | | $ | 13,345,177 | |
| | |
The accompanying notes are an integral part of these financial statements.
| | | | |
| 36 | | Wells Fargo Dow Jones Target Date Funds | | Statements of operations—six months ended August 31, 2016 (unaudited) |
| | | | | | | | | | | | | | | | |
| | | Target Today
Fund | | | Target 2010
Fund | | | Target 2015
Fund | | | Target 2020
Fund | |
| | | | |
Investment income | | | | | | | | | | | | | | | | |
Interest allocated from affiliated Master Portfolios* | | $ | 4,709,141 | | | $ | 3,242,772 | | | $ | 6,004,707 | | | $ | 19,305,508 | |
Dividends allocated from affiliated Master Portfolios** | | | 1,260,774 | | | | 925,383 | | | | 1,991,515 | | | | 9,882,629 | |
Affiliated income allocated from affiliated Master Portfolios | | | 37,779 | | | | 25,069 | | | | 51,338 | | | | 187,814 | |
Securities lending income allocated from affiliated Master Portfolios | | | 36,967 | | | | 27,244 | | | | 58,359 | | | | 286,644 | |
Expenses allocated from affiliated Master Portfolios | | | (492,635 | ) | | | (328,338 | ) | | | (559,034 | ) | | | (2,006,725 | ) |
| | | | |
Total investment income | | | 5,552,026 | | | | 3,892,130 | | | | 7,546,885 | | | | 27,655,870 | |
| | | | |
| | | | |
Expenses | | | | | | | | | | | | | | | | |
Management fee | | | 656,910 | | | | 430,048 | | | | 693,314 | | | | 2,474,420 | |
Administration fees | | | | | | | | | |
Class A | | | 70,884 | | | | 71,535 | | | | 77,823 | | | | 248,905 | |
Class B | | | 3 | | | | 32 | | | | N/A | | | | 37 | |
Class C | | | 3,097 | | | | 2,203 | | | | N/A | | | | 7,127 | |
Class R | | | 32 | | | | 57 | | | | 47 | | | | 465 | |
Class R4 | | | 110,497 | | | | 28,291 | | | | 49,948 | | | | 170,706 | |
Class R6 | | | 37,178 | | | | 29,655 | | | | 55,724 | | | | 189,292 | |
Administrator Class | | | 40,508 | | | | 59,353 | | | | 79,813 | | | | 351,904 | |
Shareholder servicing fees | | | | | | | | | |
Class A | | | 84,386 | | | | 85,161 | | | | 92,647 | | | | 296,316 | |
Class B | | | 3 | | | | 38 | | | | N/A | | | | 45 | |
Class C | | | 3,688 | | | | 2,622 | | | | N/A | | | | 8,484 | |
Class R | | | 38 | | | | 67 | | | | 56 | | | | 553 | |
Class R4 | | | 138,121 | | | | 35,363 | | | | 62,435 | | | | 213,088 | |
Administrator Class | | | 77,900 | | | | 114,140 | | | | 153,140 | | | | 675,840 | |
Distribution fees | | | | | | | | | | | | | | | | |
Class B | | | 10 | | | | 114 | | | | N/A | | | | 134 | |
Class C | | | 11,063 | | | | 7,866 | | | | N/A | | | | 25,452 | |
Class R | | | 38 | | | | 67 | | | | 56 | | | | 553 | |
Custody and accounting fees | | | 13,221 | | | | 8,188 | | | | 13,901 | | | | 47,297 | |
Professional fees | | | 18,612 | | | | 17,783 | | | | 19,162 | | | | 19,464 | |
Registration fees | | | 47,185 | | | | 42,291 | | | | 49,912 | | | | 54,337 | |
Shareholder report expenses | | | 22,985 | | | | 19,949 | | | | 27,090 | | | | 45,242 | |
Trustees’ fees and expenses | | | 11,620 | | | | 11,618 | | | | 11,620 | | | | 11,669 | |
Other fees and expenses | | | 8,143 | | | | 6,196 | | | | 8,697 | | | | 21,059 | |
| | | | |
Total expenses | | | 1,356,122 | | | | 972,637 | | | | 1,395,385 | | | | 4,862,389 | |
Less: Fee waivers and/or expense reimbursements | | | (373,909 | ) | | | (230,294 | ) | | | (331,288 | ) | | | (683,301 | ) |
| | | | |
Net expenses | | | 982,213 | | | | 742,343 | | | | 1,064,097 | | | | 4,179,088 | |
| | | | |
Net investment income | | | 4,569,813 | | | | 3,149,787 | | | | 6,482,788 | | | | 23,476,782 | |
| | | | |
| | |
REALIZED AND UNREALIZED GAINS (LOSSES) ON INVESTMENTS | | | | | | | | | |
Net realized gains on securities transactions allocated from affiliated Master Portfolios | | | 416,743 | | | | 303,713 | | | | 709,464 | | | | 4,603,396 | |
Net change in unrealized gains (losses) on securities transactions allocated from affiliated Master Portfolios | | | 25,333,544 | | | | 18,666,957 | | | | 38,775,311 | | | | 157,490,537 | |
| | | | |
Net realized and unrealized gains (losses) on investments | | | 25,750,287 | | | | 18,970,670 | | | | 39,484,775 | | | | 162,093,933 | |
| | | | |
Net increase in net assets resulting from operations | | $ | 30,320,100 | | | $ | 22,120,457 | | | $ | 45,967,563 | | | $ | 185,570,715 | |
| | | | |
| | | | |
* Net of foreign interest withholding taxes allocated from affiliated Master Portfolios in the amount of | | | $35,034 | | | | $24,807 | | | | $49,649 | | | | $160,845 | |
** Net of foreign dividend withholding taxes allocated from affiliated Master Portfolios in the amount of | | | $81,543 | | | | $60,041 | | | | $128,943 | | | | $642,071 | |
The accompanying notes are an integral part of these financial statements.
| | | | | | |
| Statements of operations—six months ended August 31, 2016 (unaudited) | | Wells Fargo Dow Jones Target Date Funds | | | 37 | |
| | | | | | | | | | | | | | | | | | | | | | | | | | | | | | |
Target 2025
Fund | | | Target 2030
Fund | | | Target 2035
Fund | | | Target 2040
Fund | | | Target 2045
Fund | | | Target 2050
Fund | | | Target 2055
Fund | | | Target 2060
Fund | |
| | | | | | | |
| | | | | | | | | | | | | | | | | | | | | | | | | | | | | | |
| $ | 14,439,314 | | | $ | 12,553,139 | | | $ | 4,284,610 | | | $ | 3,890,988 | | | $ | 921,423 | | | $ | 1,197,368 | | | $ | 214,861 | | | $ | 3,920 | |
| | 13,033,610 | | | | 20,206,984 | | | | 12,328,172 | | | | 20,614,542 | | | | 8,878,101 | | | | 16,119,168 | | | | 2,894,675 | | | | 48,654 | |
| | 167,821 | | | | 189,474 | | | | 93,071 | | | | 132,218 | | | | 52,608 | | | | 92,059 | | | | 17,756 | | | | 864 | |
| | 376,640 | | | | 583,039 | | | | 354,742 | | | | 592,990 | | | | 254,927 | | | | 462,806 | | | | 82,680 | | | | 1,255 | |
| | (1,869,844 | ) | | | (2,209,512 | ) | | | (1,112,029 | ) | | | (1,630,880 | ) | | | (650,092 | ) | | | (1,147,310 | ) | | | (206,620 | ) | | | (3,847 | ) |
| | |
| | 26,147,541 | | | | 31,323,124 | | | | 15,948,566 | | | | 23,599,858 | | | | 9,456,967 | | | | 16,724,091 | | | | 3,003,352 | | | | 50,846 | |
| | |
| | | | | | | |
| | | | | | | | | | | | | | | | | | | | | | | | | | | | | | |
| | 2,308,707 | | | | 2,733,707 | | | | 1,377,856 | | | | 2,023,739 | | | | 807,186 | | | | 1,425,333 | | | | 256,561 | | | | 4,834 | |
| | | | | | | | | | | | | | | | | | | | | | | | | | | | | | |
| | 187,081 | | | | 251,024 | | | | 157,721 | | | | 226,297 | | | | 86,117 | | | | 66,103 | | | | 10,339 | | | | 188 | |
| | N/A | | | | 41 | | | | N/A | | | | 73 | | | | N/A | | | | N/A | | | | N/A | | | | N/A | |
| | N/A | | | | 5,144 | | | | N/A | | | | 5,149 | | | | N/A | | | | 1,044 | | | | N/A | | | | 221 | |
| | 700 | | | | 966 | | | | 118 | | | | 346 | | | | 35 | | | | 43 | | | | 61 | | | | 106 | |
| | 110,805 | | | | 218,491 | | | | 92,183 | | | | 167,301 | | | | 54,644 | | | | 97,575 | | | | 12,441 | | | | 422 | |
| | 229,522 | | | | 212,035 | | | | 119,249 | | | | 156,584 | | | | 69,932 | | | | 136,967 | | | | 29,336 | | | | 329 | |
| | 209,757 | | | | 343,839 | | | | 131,355 | | | | 221,499 | | | | 79,503 | | | | 132,790 | | | | 12,985 | | | | 714 | |
| | | | | | | | | | | | | | | | | | | | | | | | | | | | | | |
| | 222,716 | | | | 298,838 | | | | 187,763 | | | | 269,402 | | | | 102,521 | | | | 78,694 | | | | 12,309 | | | | 224 | |
| | N/A | | | | 49 | | | | N/A | | | | 87 | | | | N/A | | | | N/A | | | | N/A | | | | N/A | |
| | N/A | | | | 6,123 | | | | N/A | | | | 6,130 | | | | N/A | | | | 1,243 | | | | N/A | | | | 263 | |
| | 834 | | | | 1,150 | | | | 141 | | | | 412 | | | | 42 | | | | 51 | | | | 73 | | | | 126 | |
| | 138,507 | | | | 272,404 | | | | 115,229 | | | | 208,328 | | | | 68,305 | | | | 121,473 | | | | 15,552 | | | | 527 | |
| | 403,380 | | | | 661,229 | | | | 252,605 | | | | 425,960 | | | | 152,890 | | | | 255,366 | | | | 24,970 | | | | 1,372 | |
| | | | | | | | | | | | | | | | | | | | | | | | | | | | | | |
| | N/A | | | | 147 | | | | N/A | | | | 261 | | | | N/A | | | | N/A | | | | N/A | | | | N/A | |
| | N/A | | | | 18,370 | | | | N/A | | | | 18,391 | | | | N/A | | | | 3,728 | | | | N/A | | | | 788 | |
| | 834 | | | | 1,150 | | | | 141 | | | | 412 | | | | 42 | | | | 51 | | | | 73 | | | | 126 | |
| | 44,112 | | | | 52,159 | | | | 25,978 | | | | 38,847 | | | | 16,027 | | | | 27,047 | | | | 5,666 | | | | 1,064 | |
| | 17,566 | | | | 19,498 | | | | 18,963 | | | | 18,849 | | | | 19,031 | | | | 18,998 | | | | 17,600 | | | | 16,723 | |
| | 39,663 | | | | 48,370 | | | | 52,135 | | | | 46,844 | | | | 50,563 | | | | 53,899 | | | | 44,508 | | | | 62,205 | |
| | 42,705 | | | | 53,557 | | | | 41,152 | | | | 47,080 | | | | 29,328 | | | | 37,979 | | | | 14,921 | | | | 3,635 | |
| | 11,816 | | | | 11,618 | | | | 11,620 | | | | 12,444 | | | | 12,924 | | | | 7,862 | | | | 8,175 | | | | 7,846 | |
| | 13,914 | | | | 24,106 | | | | 12,847 | | | | 19,045 | | | | 9,548 | | | | 12,277 | | | | 4,479 | | | | 4,733 | |
| | |
| | 3,982,619 | | | | 5,234,015 | | | | 2,597,056 | | | | 3,913,480 | | | | 1,558,638 | | | | 2,478,523 | | | | 470,049 | | | | 106,446 | |
| | (627,570 | ) | | | (604,460 | ) | | | (287,673 | ) | | | (363,449 | ) | | | (210,175 | ) | | | (297,547 | ) | | | (120,889 | ) | | | (96,599 | ) |
| | |
| | 3,355,049 | | | | 4,629,555 | | | | 2,309,383 | | | | 3,550,031 | | | | 1,348,463 | | | | 2,180,976 | | | | 349,160 | | | | 9,847 | |
| | |
| | 22,792,492 | | | | 26,693,569 | | | | 13,639,183 | | | | 20,049,827 | | | | 8,108,504 | | | | 14,543,115 | | | | 2,654,192 | | | | 40,999 | |
| | |
| | | | | | | |
| | | | | | | | | | | | | | | | | | | | | | | | | | | | | | |
|
7,032,476 |
| | | 11,808,731 | | | | 7,522,121 | | | | 12,868,326 | | | | 5,615,755 | | | | 10,223,782 | | | | 1,836,302 | | | | 42,373 | |
|
174,123,735 |
| | | 238,105,515 | | | | 134,265,665 | | | | 213,650,209 | | | | 89,162,994 | | | | 159,925,053 | | | | 28,159,778 | | | | 357,226 | |
| | |
| | 181,156,211 | | | | 249,914,246 | | | | 141,787,786 | | | | 226,518,535 | | | | 94,778,749 | | | | 170,148,835 | | | | 29,996,080 | | | | 399,599 | |
| | |
| $ | 203,948,703 | | | $ | 276,607,815 | | | $ | 155,426,969 | | | $ | 246,568,362 | | | $ | 102,887,253 | | | $ | 184,691,950 | | | $ | 32,650,272 | | | $ | 440,598 | |
| | |
| | | | | | | |
|
$119,680 |
| | | $103,403 | | | | $34,873 | | | | $30,926 | | | | $7,004 | | | | $8,720 | | | | $1,568 | | | | $30 | |
|
$845,778 |
| | | $1,314,597 | | | | $801,620 | | | | $1,342,259 | | | | $578,150 | | | | $1,050,146 | | | | $188,606 | | | | $2,872 | |
The accompanying notes are an integral part of these financial statements.
| | | | |
| 38 | | Wells Fargo Dow Jones Target Date Funds | | Statements of changes in net assets |
| | | | | | | | | | | | | | | | |
| | | Target Today Fund | |
| | | Six months ended
August 31, 2016
(unaudited) | | | Year ended
February 29, 2016 | |
| | | | |
Operations | | | | | | | | | | | | | | | | |
Net investment income | | | | | | $ | 4,569,813 | | | | | | | $ | 8,827,099 | |
Net realized gains on investments | | | | | | | 416,743 | | | | | | | | 3,450,074 | |
Net change in unrealized gains (losses) on investments | | | | | | | 25,333,544 | | | | | | | | (23,144,376 | ) |
| | | | |
Net increase (decrease) in net assets resulting from operations | | | | | | | 30,320,100 | | | | | | | | (10,867,203 | ) |
| | | | |
| | | | |
Distributions to shareholders from | | | | | | | | | | | | | | | | |
Net investment income | | | | | | | | | | | | | | | | |
Class A | | | | | | | 0 | | | | | | | | (212,385 | ) |
Class R | | | | | | | 0 | | | | | | | | (39 | ) |
Class R4 | | | | | | | 0 | | | | | | | | (1,986,228 | ) |
Class R6 | | | | | | | 0 | | | | | | | | (2,057,136 | ) |
Administrator Class | | | | | | | 0 | | | | | | | | (295,420 | ) |
Net realized gains | | | | | | | | | | | | | | | | |
Class A | | | | | | | 0 | | | | | | | | (1,208,132 | ) |
Class B | | | | | | | 0 | | | | | | | | (60 | ) |
Class C | | | | | | | 0 | | | | | | | | (50,563 | ) |
Class R | | | | | | | 0 | | | | | | | | (482 | ) |
Class R4 | | | | | | | 0 | | | | | | | | (4,742,418 | ) |
Class R6 | | | | | | | 0 | | | | | | | | (4,034,298 | ) |
Administrator Class | | | | | | | 0 | | | | | | | | (1,109,624 | ) |
| | | | |
Total distributions to shareholders | | | | | | | 0 | | | | | | | | (15,696,785 | ) |
| | | | |
| | | | |
Capital share transactions | | | Shares | | | | | | | | Shares | | | | | |
Proceeds from shares sold | | | | | | | | | | | | | | | | |
Class A | | | 147,447 | | | | 1,577,814 | | | | 5,647,163 | | | | 60,339,126 | |
Class C | | | 27,463 | | | | 301,094 | | | | 10,570 | | | | 115,474 | |
Class R | | | 103 | | | | 1,094 | | | | 120 | | | | 1,272 | |
Class R4 | | | 1,793,543 | | | | 19,722,945 | | | | 3,730,527 | | | | 40,609,285 | |
Class R6 | | | 3,697,182 | | | | 40,577,351 | | | | 10,259,626 | | | | 111,458,455 | |
Administrator Class | | | 438,839 | | | | 4,794,867 | | | | 1,204,150 | | | | 13,090,822 | |
Investor Class | | | N/A | | | | N/A | | | | 414,797 | 1 | | | 4,533,435 | 1 |
| | | | |
| | | | | | | 66,975,165 | | | | | | | | 230,147,869 | |
| | | | |
Reinvestment of distributions | | | | | | | | | | | | | | | | |
Class A | | | 0 | | | | 0 | | | | 135,261 | | | | 1,409,363 | |
Class B | | | 0 | | | | 0 | | | | 5 | | | | 60 | |
Class C | | | 0 | | | | 0 | | | | 4,686 | | | | 49,810 | |
Class R | | | 0 | | | | 0 | | | | 50 | | | | 521 | |
Class R4 | | | 0 | | | | 0 | | | | 630,358 | | | | 6,728,633 | |
Class R6 | | | 0 | | | | 0 | | | | 563,932 | | | | 6,009,114 | |
Administrator Class | | | 0 | | | | 0 | | | | 131,713 | | | | 1,401,554 | |
| | | | |
| | | | | | | 0 | | | | | | | | 15,599,055 | |
| | | | |
Please see footnote on page 39.
The accompanying notes are an integral part of these financial statements.
| | | | | | |
| Statements of changes in net assets | | Wells Fargo Dow Jones Target Date Funds | | | 39 | |
| | | | | | | | | | | | | | | | |
| | | Target Today Fund | |
| | | Six months ended
August 31, 2016
(unaudited) | | | Year ended
February 29, 2016 | |
| | | | |
| | | Shares | | | | | | Shares | | | | |
| | | | |
Capital share transactions (continued) | | | | | | | | | | | | | | | | |
Payment for shares redeemed | | | | | | | | | | | | | | | | |
Class A | | | (483,240 | ) | | $ | (5,178,523 | ) | | | (818,764 | ) | | $ | (8,571,490 | ) |
Class B | | | (120 | ) | | | (1,327 | ) | | | (654 | ) | | | (7,312 | ) |
Class C | | | (9,457 | ) | | | (103,827 | ) | | | (68,466 | ) | | | (738,149 | ) |
Class R | | | (2 | ) | | | (21 | ) | | | (1 | ) | | | (10 | ) |
Class R4 | | | (2,877,647 | ) | | | (31,635,709 | ) | | | (9,414,225 | ) | | | (102,232,762 | ) |
Class R6 | | | (5,488,600 | ) | | | (60,420,818 | ) | | | (9,625,506 | ) | | | (104,577,784 | ) |
Administrator Class | | | (914,283 | ) | | | (10,024,011 | ) | | | (4,542,886 | ) | | | (49,322,402 | ) |
Investor Class | | | N/A | | | | N/A | | | | (6,369,254 | )1 | | | (69,335,370 | )1 |
| | | | |
| | | | | | | (107,364,236 | ) | | | | | | | (334,785,279 | ) |
| | | | |
Net decrease in net assets resulting from capital share transactions | | | | | | | (40,389,071 | ) | | | | | | | (89,038,355 | ) |
| | | | |
Total decrease in net assets | | | | | | | (10,068,971 | ) | | | | | | | (115,602,343 | ) |
| | | | |
| | | | |
Net assets | | | | | | | | | | | | | | | | |
Beginning of period | | | | | | | 646,832,960 | | | | | | | | 762,435,303 | |
| | | | |
End of period | | | | | | $ | 636,763,989 | | | | | | | $ | 646,832,960 | |
| | | | |
Undistributed (overdistributed) net investment income | | | | | | $ | 3,615,281 | | | | | | | $ | (954,532 | ) |
| | | | |
| 1 | For the period from March 1, 2015 to October 23, 2015. Effective at the close of business on October 23, 2015, Investor Class shares were converted to Class A shares and are no longer offered by the Fund. |
The accompanying notes are an integral part of these financial statements.
| | | | |
| 40 | | Wells Fargo Dow Jones Target Date Funds | | Statements of changes in net assets |
| | | | | | | | | | | | | | | | |
| | | Target 2010 Fund | |
| | | Six months ended August 31, 2016
(unaudited) | | | Year ended February 29, 2016 | |
| | | | |
Operations | | | | | | | | | | | | | | | | |
Net investment income | | | | | | $ | 3,149,787 | | | | | | | $ | 7,103,709 | |
Net realized gains on investments | | | | | | | 303,713 | | | | | | | | 9,701,380 | |
Net change in unrealized gains (losses) on investments | | | | | | | 18,666,957 | | | | | | | | (26,828,269 | ) |
| | | | |
Net increase (decrease) in net assets resulting from operations | | | | | | | 22,120,457 | | | | | | | | (10,023,180 | ) |
| | | | |
| | | | |
Distributions to shareholders from | | | | | | | | | | | | | | | | |
Net investment income | | | | | | | | | | | | | | | | |
Class A | | | | | | | (207,925 | ) | | | | | | | (335,875 | ) |
Class B | | | | | | | (18 | ) | | | | | | | (51 | ) |
Class C | | | | | | | (1,921 | ) | | | | | | | 0 | |
Class R | | | | | | | (133 | ) | | | | | | | (172 | ) |
Class R4 | | | | | | | (284,940 | ) | | | | | | | (788,009 | ) |
Class R6 | | | | | | | (915,442 | ) | | | | | | | (2,051,024 | ) |
Administrator Class | | | | | | | (307,124 | ) | | | | | | | (586,950 | ) |
Net realized gains | | | | | | | | | | | | | | | | |
Class A | | | | | | | 0 | | | | | | | | (3,286,691 | ) |
Class B | | | | | | | 0 | | | | | | | | (1,389 | ) |
Class C | | | | | | | 0 | | | | | | | | (92,831 | ) |
Class R | | | | | | | 0 | | | | | | | | (2,344 | ) |
Class R4 | | | | | | | 0 | | | | | | | | (4,072,646 | ) |
Class R6 | | | | | | | 0 | | | | | | | | (9,055,541 | ) |
Administrator Class | | | | | | | 0 | | | | | | | | (4,393,823 | ) |
| | | | |
Total distributions to shareholders | | | | | | | (1,717,503 | ) | | | | | | | (24,667,346 | ) |
| | | | |
| | | | |
Capital share transactions | | | Shares | | | | | | | | Shares | | | | | |
Proceeds from shares sold | | | | | | | | | | | | | | | | |
Class A | | | 186,022 | | | | 2,345,399 | | | | 4,221,546 | | | | 54,786,333 | |
Class B | | | 0 | | | | 0 | | | | 2,193 | | | | 29,082 | |
Class C | | | 9,264 | | | | 118,443 | | | | 7,041 | | | | 90,916 | |
Class R | | | 9 | | | | 106 | | | | 16 | | | | 212 | |
Class R4 | | | 525,982 | | | | 6,713,468 | | | | 1,712,102 | | | | 22,327,468 | |
Class R6 | | | 2,990,117 | | | | 38,149,016 | | | | 8,059,088 | | | | 104,895,708 | |
Administrator Class | | | 449,889 | | | | 5,741,176 | | | | 1,374,739 | | | | 17,794,276 | |
Investor Class | | | N/A | | | | N/A | | | | 308,626 | 1 | | | 4,041,703 | 1 |
| | | | |
| | | | | | | 53,067,608 | | | | | | | | 203,965,698 | |
| | | | |
Reinvestment of distributions | | | | | | | | | | | | | | | | |
Class A | | | 16,251 | | | | 205,253 | | | | 291,606 | | | | 3,586,673 | |
Class B | | | 2 | | | | 18 | | | | 116 | | | | 1,440 | |
Class C | | | 139 | | | | 1,776 | | | | 7,012 | | | | 87,152 | |
Class R | | | 11 | | | | 133 | | | | 206 | | | | 2,516 | |
Class R4 | | | 22,331 | | | | 284,940 | | | | 390,609 | | | | 4,860,655 | |
Class R6 | | | 70,650 | | | | 900,797 | | | | 878,628 | | | | 10,935,710 | |
Administrator Class | | | 21,923 | | | | 279,745 | | | | 400,560 | | | | 4,980,773 | |
| | | | |
| | | | | | | 1,672,662 | | | | | | | | 24,454,919 | |
| | | | |
Please see footnote on page 41.
The accompanying notes are an integral part of these financial statements.
| | | | | | |
| Statements of changes in net assets | | Wells Fargo Dow Jones Target Date Funds | | | 41 | |
| | | | | | | | | | | | | | | | |
| | | Target 2010 Fund | |
| | | Six months ended August 31, 2016
(unaudited) | | | Year ended February 29, 2016 | |
| | | | |
| | | Shares | | | | | | Shares | | | | |
| | | | |
Capital share transactions (continued) | | | | | | | | | | | | | | | | |
Payment for shares redeemed | | | | | | | | | | | | | | | | |
Class A | | | (578,761 | ) | | $ | (7,318,721 | ) | | | (1,013,261 | ) | | $ | (12,776,658 | ) |
Class B | | | (189 | ) | | | (2,411 | ) | | | (682 | ) | | | (9,045 | ) |
Class C | | | (14,629 | ) | | | (189,320 | ) | | | (62,410 | ) | | | (820,797 | ) |
Class R | | | (1 | ) | | | (6 | ) | | | (1 | ) | | | (17 | ) |
Class R4 | | | (1,544,392 | ) | | | (19,868,086 | ) | | | (7,588,790 | ) | | | (97,975,580 | ) |
Class R6 | | | (5,882,004 | ) | | | (75,485,979 | ) | | | (6,669,142 | ) | | | (86,398,389 | ) |
Administrator Class | | | (1,325,137 | ) | | | (17,007,131 | ) | | | (7,050,419 | ) | | | (91,816,190 | ) |
Investor Class | | | N/A | | | | N/A | | | | (4,828,884 | )1 | | | (63,153,213 | )1 |
| | | | |
| | | | | | | (119,871,654 | ) | | | | | | | (352,949,889 | ) |
| | | | |
Net decrease in net assets resulting from capital share transactions | | | | | | | (65,131,384 | ) | | | | | | | (124,529,272 | ) |
| | | | |
Total decrease in net assets | | | | | | | (44,728,430 | ) | | | | | | | (159,219,798 | ) |
| | | | |
| | | | |
Net assets | | | | | | | | | | | | | | | | |
Beginning of period | | | | | | | 431,970,096 | | | | | | | | 591,189,894 | |
| | | | |
End of period | | | | | | $ | 387,241,666 | | | | | | | $ | 431,970,096 | |
| | | | |
Undistributed (overdistributed) net investment income | | | | | | $ | 458,213 | | | | | | | $ | (974,071 | ) |
| | | | |
| 1 | For the period from March 1, 2015 to October 23, 2015. Effective at the close of business on October 23, 2015, Investor Class shares were converted to Class A shares and are no longer offered by the Fund. |
The accompanying notes are an integral part of these financial statements.
| | | | |
| 42 | | Wells Fargo Dow Jones Target Date Funds | | Statements of changes in net assets |
| | | | | | | | | | | | | | | | |
| | | Target 2015 Fund | |
| | | Six months ended
August 31, 2016
(unaudited) | | | Year ended
February 29, 2016 | |
| | | | |
Operations | | | | | | | | | | | | | | | | |
Net investment income | | | | | | $ | 6,482,788 | | | | | | | $ | 14,276,725 | |
Net realized gains on investments | | | | | | | 709,464 | | | | | | | | 4,048,645 | |
Net change in unrealized gains (losses) on investments | | | | | | | 38,775,311 | | | | | | | | (37,431,296 | ) |
| | | | |
Net increase (decrease) in net assets resulting from operations | | | | | | | 45,967,563 | | | | | | | | (19,105,926 | ) |
| | | | |
| | | | |
Distributions to shareholders from | | | | | | | | | | | | | | | | |
Net investment income | | | | | | | | | | | | | | | | |
Class A | | | | | | | (285,287 | ) | | | | | | | (20,228 | ) |
Class R | | | | | | | (145 | ) | | | | | | | (329 | ) |
Class R4 | | | | | | | (614,617 | ) | | | | | | | (1,703,828 | ) |
Class R6 | | | | | | | (2,075,207 | ) | | | | | | | (4,784,541 | ) |
Administrator Class | | | | | | | (525,665 | ) | | | | | | | (1,475,155 | ) |
Investor Class | | | | | | | N/A | | | | | | | | (758,997 | )1 |
Net realized gains | | | | | | | | | | | | | | | | |
Class A | | | | | | | 0 | | | | | | | | (1,573,386 | ) |
Class R | | | | | | | 0 | | | | | | | | (859 | ) |
Class R4 | | | | | | | 0 | | | | | | | | (2,323,259 | ) |
Class R6 | | | | | | | 0 | | | | | | | | (6,760,642 | ) |
Administrator Class | | | | | | | 0 | | | | | | | | (2,256,193 | ) |
| | | | |
Total distributions to shareholders | | | | | | | (3,500,921 | ) | | | | | | | (21,657,417 | ) |
| | | | |
| | | | |
Capital share transactions | | | Shares | | | | | | | | Shares | | | | | |
Proceeds from shares sold | | | | | | | | | | | | | | | | |
Class A | | | 351,064 | | | | 3,632,742 | | | | 9,344,836 | | | | 94,779,977 | |
Class R | | | 34 | | | | 356 | | | | 67 | | | | 686 | |
Class R4 | | | 1,643,034 | | | | 17,046,207 | | | | 2,312,239 | | | | 23,537,215 | |
Class R6 | | | 5,582,321 | | | | 57,597,528 | | | | 12,758,792 | | | | 129,474,281 | |
Administrator Class | | | 928,880 | | | | 9,655,197 | | | | 1,888,382 | | | | 19,442,817 | |
Investor Class | | | N/A | | | | N/A | | | | 908,576 | 1 | | | 9,440,796 | 1 |
| | | | |
| | | | | | | 87,932,030 | | | | | | | | 276,675,772 | |
| | | | |
Reinvestment of distributions | | | | | | | | | | | | | | | | |
Class A | | | 27,688 | | | | 284,079 | | | | 160,134 | | | | 1,584,498 | |
Class R | | | 14 | | | | 145 | | | | 117 | | | | 1,188 | |
Class R4 | | | 59,672 | | | | 614,617 | | | | 401,199 | | | | 4,027,087 | |
Class R6 | | | 195,749 | | | | 2,014,255 | | | | 1,109,939 | | | | 11,115,010 | |
Administrator Class | | | 49,924 | | | | 520,204 | | | | 366,890 | | | | 3,726,803 | |
Investor Class | | | N/A | | | | N/A | | | | 73,227 | 1 | | | 758,463 | 1 |
| | | | |
| | | | | | | 3,433,300 | | | | | | | | 21,213,049 | |
| | | | |
Please see footnote on page 43.
The accompanying notes are an integral part of these financial statements.
| | | | | | |
| Statements of changes in net assets | | Wells Fargo Dow Jones Target Date Funds | | | 43 | |
| | | | | | | | | | | | | | | | |
| | | Target 2015 Fund | |
| | | Six months ended
August 31, 2016
(unaudited) | | | Year ended
February 29, 2016 | |
| | | | |
| | | Shares | | | | | | Shares | | | | |
| | | | |
Capital share transactions (continued) | | | | | | | | | | | | | | | | |
Payment for shares redeemed | | | | | | | | | | | | | | | | |
Class A | | | (1,095,363 | ) | | $ | (11,257,901 | ) | | | (2,112,945 | ) | | $ | (20,902,388 | ) |
Class R | | | (1 | ) | | | (8 | ) | | | (708 | ) | | | (6,979 | ) |
Class R4 | | | (3,345,113 | ) | | | (34,651,071 | ) | | | (7,113,750 | ) | | | (72,406,836 | ) |
Class R6 | | | (8,430,080 | ) | | | (86,887,845 | ) | | | (17,178,318 | ) | | | (174,145,663 | ) |
Administrator Class | | | (2,291,703 | ) | | | (23,956,283 | ) | | | (7,909,252 | ) | | | (81,427,388 | ) |
Investor Class | | | N/A | | | | N/A | | | | (11,199,953 | )1 | | | (115,605,930 | )1 |
| | | | |
| | | | | | | (156,753,108 | ) | | | | | | | (464,495,184 | ) |
| | | | |
Net decrease in net assets resulting from capital share transactions | | | | | | | (65,387,778 | ) | | | | | | | (166,606,363 | ) |
| | | | |
Total decrease in net assets | | | | | | | (22,921,136 | ) | | | | | | | (207,369,706 | ) |
| | | | |
| | | | |
Net assets | | | | | | | | | | | | | | | | |
Beginning of period | | | | | | | 691,721,062 | | | | | | | | 899,090,768 | |
| | | | |
End of period | | | | | | $ | 668,799,926 | | | | | | | $ | 691,721,062 | |
| | | | |
Undistributed (overdistributed) net investment income | | | | | | $ | 1,373,965 | | | | | | | $ | (1,607,902 | ) |
| | | | |
| 1 | For the period from March 1, 2015 to October 23, 2015. Effective at the close of business on October 23, 2015, Investor Class shares were converted to Class A shares and are no longer offered by the Fund. |
The accompanying notes are an integral part of these financial statements.
| | | | |
| 44 | | Wells Fargo Dow Jones Target Date Funds | | Statements of changes in net assets |
| | | | | | | | | | | | | | | | |
| | | Target 2020 Fund | |
| | | Six months ended August 31, 2016 (unaudited) | | | Year ended February 29, 2016 | |
| | | | |
Operations | | | | | | | | | | | | | | | | |
Net investment income | | | | | | $ | 23,476,782 | | | | | | | $ | 47,559,500 | |
Net realized gains on investments | | | | | | | 4,603,396 | | | | | | | | 25,796,388 | |
Net change in unrealized gains (losses) on investments | | | | | | | 157,490,537 | | | | | | | | (170,875,058 | ) |
| | | | |
Net increase (decrease) in net assets resulting from operations | | | | | | | 185,570,715 | | | | | | | | (97,519,170 | ) |
| | | | |
| | | | |
Distributions to shareholders from | | | | | | | | | | | | | | | | |
Net investment income | | | | | | | | | | | | | | | | |
Class A | | | | | | | (957,681 | ) | | | | | | | (1,204,855 | ) |
Class B | | | | | | | (52 | ) | | | | | | | (108 | ) |
Class C | | | | | | | (13,794 | ) | | | | | | | (6,481 | ) |
Class R | | | | | | | (1,531 | ) | | | | | | | (2,560 | ) |
Class R4 | | | | | | | (2,110,732 | ) | | | | | | | (6,107,482 | ) |
Class R6 | | | | | | | (7,301,676 | ) | | | | | | | (13,668,753 | ) |
Administrator Class | | | | | | | (2,352,441 | ) | | | | | | | (5,002,528 | ) |
Investor Class | | | | | | | N/A | | | | | | | | (494,020 | )1 |
Net realized gains | | | | | | | | | | | | | | | | |
Class A | | | | | | | 0 | | | | | | | | (6,049,652 | ) |
Class B | | | | | | | 0 | | | | | | | | (1,139 | ) |
Class C | | | | | | | 0 | | | | | | | | (138,075 | ) |
Class R | | | | | | | 0 | | | | | | | | (10,129 | ) |
Class R4 | | | | | | | 0 | | | | | | | | (12,325,852 | ) |
Class R6 | | | | | | | 0 | | | | | | | | (27,705,228 | ) |
Administrator Class | | | | | | | 0 | | | | | | | | (13,559,585 | ) |
| | | | |
Total distributions to shareholders | | | | | | | (12,737,907 | ) | | | | | | | (86,276,447 | ) |
| | | | |
| | | | |
Capital share transactions | | | Shares | | | | | | | | Shares | | | | | |
Proceeds from shares sold | | | | | | | | | | | | | | | | |
Class A | | | 612,231 | | | | 9,100,212 | | | | 13,749,128 | | | | 204,800,204 | |
Class C | | | 87,999 | | | | 1,303,953 | | | | 186,108 | | | | 2,690,829 | |
Class R | | | 2,612 | | | | 39,336 | | | | 1,560 | | | | 22,804 | |
Class R4 | | | 3,653,947 | | | | 55,415,788 | | | | 8,587,505 | | | | 129,528,210 | |
Class R6 | | | 21,309,911 | | | | 323,115,545 | | | | 25,570,337 | | | | 385,301,666 | |
Administrator Class | | | 2,834,892 | | | | 42,651,916 | | | | 6,631,029 | | | | 99,603,642 | |
Investor Class | | | N/A | | | | N/A | | | | 1,084,475 | 1 | | | 16,500,298 | 1 |
| | | | |
| | | | | | | 431,626,750 | | | | | | | | 838,447,653 | |
| | | | |
Reinvestment of distributions | | | | | | | | | | | | | | | | |
Class A | | | 63,717 | | | | 943,646 | | | | 498,070 | | | | 7,153,660 | |
Class B | | | 4 | | | | 52 | | | | 87 | | | | 1,247 | |
Class C | | | 878 | | | | 12,908 | | | | 9,259 | | | | 132,096 | |
Class R | | | 104 | | | | 1,531 | | | | 881 | | | | 12,689 | |
Class R4 | | | 140,062 | | | | 2,110,732 | | | | 1,252,971 | | | | 18,433,334 | |
Class R6 | | | 472,278 | | | | 7,112,510 | | | | 2,737,761 | | | | 40,176,324 | |
Administrator Class | | | 149,756 | | | | 2,250,826 | | | | 1,267,785 | | | | 18,559,644 | |
Investor Class | | | N/A | | | | N/A | | | | 32,029 | 1 | | | 494,020 | 1 |
| | | | |
| | | | | | | 12,432,205 | | | | | | | | 84,963,014 | |
| | | | |
Please see footnote on page 45.
The accompanying notes are an integral part of these financial statements.
| | | | | | |
| Statements of changes in net assets | | Wells Fargo Dow Jones Target Date Funds | | | 45 | |
| | | | | | | | | | | | | | | | |
| | | Target 2020 Fund | |
| | | Six months ended August 31, 2016 (unaudited) | | | Year ended February 29, 2016 | |
| | | | |
| | | Shares | | | | | | Shares | | | | |
| | | | |
Capital share transactions (continued) | | | | | | | | | | | | | | | | |
Payment for shares redeemed | | | | | | | | | | | | | | | | |
Class A | | | (1,419,463 | ) | | $ | (21,061,316 | ) | | | (2,245,750 | ) | | $ | (32,588,487 | ) |
Class B | | | (659 | ) | | | (9,712 | ) | | | (4,357 | ) | | | (63,797 | ) |
Class C | | | (84,410 | ) | | | (1,251,091 | ) | | | (107,814 | ) | | | (1,567,416 | ) |
Class R | | | (388 | ) | | | (5,848 | ) | | | (22,506 | ) | | | (336,340 | ) |
Class R4 | | | (6,028,072 | ) | | | (92,027,941 | ) | | | (31,392,856 | ) | | | (469,564,323 | ) |
Class R6 | | | (13,551,327 | ) | | | (206,741,079 | ) | | | (22,890,031 | ) | | | (342,653,004 | ) |
Administrator Class | | | (6,350,787 | ) | | | (96,448,765 | ) | | | (14,750,039 | ) | | | (220,778,164 | ) |
Investor Class | | | N/A | | | | N/A | | | | (14,268,341 | )1 | | | (215,721,640 | )1 |
| | | | |
| | | | | | | (417,545,752 | ) | | | | | | | (1,283,273,171 | ) |
| | | | |
Net increase (decrease) in net assets resulting from capital share transactions | | | | | | | 26,513,203 | | | | | | | | (359,862,504 | ) |
| | | | |
Total increase (decrease) in net assets | | | | | | | 199,346,011 | | | | | | | | (543,658,121 | ) |
| | | | |
| | | | |
Net assets | | | | | | | | | | | | | | | | |
Beginning of period | | | | | | | 2,288,718,553 | | | | | | | | 2,832,376,674 | |
| | | | |
End of period | | | | | | $ | 2,488,064,564 | | | | | | | $ | 2,288,718,553 | |
| | | | |
Undistributed (overdistributed) net investment income | | | | | | $ | 6,984,385 | | | | | | | $ | (3,754,490 | ) |
| | | | |
| 1 | For the period from March 1, 2015 to October 23, 2015. Effective at the close of business on October 23, 2015, Investor Class shares were converted to Class A shares and are no longer offered by the Fund. |
The accompanying notes are an integral part of these financial statements.
| | | | |
| 46 | | Wells Fargo Dow Jones Target Date Funds | | Statements of changes in net assets |
| | | | | | | | | | | | | | | | |
| | | Target 2025 Fund | |
| | | Six months ended August 31, 2016 (unaudited) | | | Year ended February 29, 2016 | |
| | | | |
Operations | | | | | | | | | | | | | | | | |
Net investment income | | | | | | $ | 22,792,492 | | | | | | | $ | 42,396,222 | |
Net realized gains on investments | | | | | | | 7,032,476 | | | | | | | | 31,965,590 | |
Net change in unrealized gains (losses) on investments | | | | | | | 174,123,735 | | | | | | | | (199,079,376 | ) |
| | | | |
Net increase (decrease) in net assets resulting from operations | | | | | | | 203,948,703 | | | | | | | | (124,717,564 | ) |
| | | | |
| | | | |
Distributions to shareholders from | | | | | | | | | | | | | | | | |
Net investment income | | | | | | | | | | | | | | | | |
Class A | | | | | | | (765,715 | ) | | | | | | | (42,829 | ) |
Class R | | | | | | | (2,072 | ) | | | | | | | (5,968 | ) |
Class R4 | | | | | | | (1,498,225 | ) | | | | | | | (3,638,272 | ) |
Class R6 | | | | | | | (9,191,063 | ) | | | | | | | (18,652,274 | ) |
Administrator Class | | | | | | | (1,578,641 | ) | | | | | | | (3,011,839 | ) |
Investor Class | | | | | | | N/A | | | | | | | | (1,645,710 | )1 |
Net realized gains | | | | | | | | | | | | | | | | |
Class A | | | | | | | 0 | | | | | | | | (5,365,512 | ) |
Class R | | | | | | | 0 | | | | | | | | (22,403 | ) |
Class R4 | | | | | | | 0 | | | | | | | | (7,078,806 | ) |
Class R6 | | | | | | | 0 | | | | | | | | (35,607,376 | ) |
Administrator Class | | | | | | | 0 | | | | | | | | (7,606,102 | ) |
| | | | |
Total distributions to shareholders | | | | | | | (13,035,716 | ) | | | | | | | (82,677,091 | ) |
| | | | |
| | | | |
Capital share transactions | | | Shares | | | | | | | | Shares | | | | | |
Proceeds from shares sold | | | | | | | | | | | | | | | | |
Class A | | | 890,367 | | | | 9,206,295 | | | | 22,964,538 | | | | 237,832,126 | |
Class R | | | 1,915 | | | | 19,877 | | | | 7,103 | | | | 73,345 | |
Class R4 | | | 3,401,367 | | | | 35,387,286 | | | | 7,138,606 | | | | 74,121,014 | |
Class R6 | | | 15,580,784 | | | | 161,458,190 | | | | 32,385,111 | | | | 335,503,244 | |
Administrator Class | | | 2,840,173 | | | | 29,358,621 | | | | 5,348,130 | | | | 55,738,366 | |
Investor Class | | | N/A | | | | N/A | | | | 3,079,689 | 1 | | | 32,431,424 | 1 |
| | | | |
| | | | | | | 235,430,269 | | | | | | | | 735,699,519 | |
| | | | |
Reinvestment of distributions | | | | | | | | | | | | | | | | |
Class A | | | 73,991 | | | | 757,664 | | | | 537,272 | | | | 5,363,185 | |
Class R | | | 202 | | | | 2,072 | | | | 2,814 | | | | 28,371 | |
Class R4 | | | 145,884 | | | | 1,498,225 | | | | 1,057,076 | | | | 10,717,065 | |
Class R6 | | | 869,914 | | | | 8,925,315 | | | | 5,206,467 | | | | 52,679,324 | |
Administrator Class | | | 153,173 | | | | 1,576,156 | | | | 1,041,420 | | | | 10,562,155 | |
Investor Class | | | N/A | | | | N/A | | | | 157,908 | 1 | | | 1,643,604 | 1 |
| | | | |
| | | | | | | 12,759,432 | | | | | | | | 80,993,704 | |
| | | | |
Payment for shares redeemed | | | | | | | | | | | | | | | | |
Class A | | | (2,634,708 | ) | | | (27,187,302 | ) | | | (5,857,457 | ) | | | (57,909,133 | ) |
Class R | | | (28,750 | ) | | | (294,890 | ) | | | (21,481 | ) | | | (219,125 | ) |
Class R4 | | | (7,211,466 | ) | | | (75,054,974 | ) | | | (15,075,663 | ) | | | (156,694,774 | ) |
Class R6 | | | (15,219,939 | ) | | | (158,455,868 | ) | | | (31,284,459 | ) | | | (321,990,675 | ) |
Administrator Class | | | (3,241,367 | ) | | | (33,879,390 | ) | | | (8,684,086 | ) | | | (89,814,734 | ) |
Investor Class | | | N/A | | | | N/A | | | | (26,018,686 | )1 | | | (271,321,720 | )1 |
| | | | |
| | | | | | | (294,872,424 | ) | | | | | | | (897,950,161 | ) |
| | | | |
Net decrease in net assets resulting from capital share transactions | | | | | | | (46,682,723 | ) | | | | | | | (81,256,715 | ) |
| | | | |
Total increase (decrease) in net assets | | | | | | | 144,230,264 | | | | | | | | (288,651,370 | ) |
| | | | |
| | | | |
Net assets | | | | | | | | | | | | | | | | |
Beginning of period | | | | | | | 2,171,343,339 | | | | | | | | 2,459,994,709 | |
| | | | |
End of period | | | | | | $ | 2,315,573,603 | | | | | | | $ | 2,171,343,339 | |
| | | | |
Undistributed (overdistributed) net investment income | | | | | | $ | 6,403,745 | | | | | | | $ | (3,353,031 | ) |
| | | | |
| 1 | For the period from March 1, 2015 to October 23, 2015. Effective at the close of business on October 23, 2015, Investor Class shares were converted to Class A shares and are no longer offered by the Fund. |
The accompanying notes are an integral part of these financial statements.
| | | | | | |
| Statements of changes in net assets | | Wells Fargo Dow Jones Target Date Funds | | | 47 | |
| | | | | | | | | | | | | | | | |
| | | Target 2030 Fund | |
| | | Six months ended August 31, 2016 (unaudited) | | | Year ended February 29, 2016 | |
| | | | |
Operations | | | | | | | | | | | | | | | | |
Net investment income | | | | | | $ | 26,693,569 | | | | | | | $ | 49,126,829 | |
Net realized gains on investments | | | | | | | 11,808,731 | | | | | | | | 47,166,634 | |
Net change in unrealized gains (losses) on investments | | | | | | | 238,105,515 | | | | | | | | (304,156,369 | ) |
| | | | |
Net increase (decrease) in net assets resulting from operations | | | | | | | 276,607,815 | | | | | | | | (207,862,906 | ) |
| | | | |
| | | | |
Distributions to shareholders from | | | | | | | | | | | | | | | | |
Net investment income | | | | | | | | | | | | | | | | |
Class A | | | | | | | 0 | | | | | | | | (672,323 | ) |
Class B | | | | | | | 0 | | | | | | | | (317 | ) |
Class C | | | | | | | 0 | | | | | | | | (14,221 | ) |
Class R | | | | | | | 0 | | | | | | | | (5,538 | ) |
Class R4 | | | | | | | 0 | | | | | | | | (9,749,314 | ) |
Class R6 | | | | | | | 0 | | | | | | | | (17,248,094 | ) |
Administrator Class | | | | | | | 0 | | | | | | | | (5,868,441 | ) |
Investor Class | | | | | | | N/A | | | | | | | | (1,506,020 | )1 |
Net realized gains | | | | | | | | | | | | | | | | |
Class A | | | | | | | 0 | | | | | | | | (6,570,826 | ) |
Class B | | | | | | | 0 | | | | | | | | (1,944 | ) |
Class C | | | | | | | 0 | | | | | | | | (130,780 | ) |
Class R | | | | | | | 0 | | | | | | | | (23,231 | ) |
Class R4 | | | | | | | 0 | | | | | | | | (17,160,046 | ) |
Class R6 | | | | | | | 0 | | | | | | | | (33,810,493 | ) |
Administrator Class | | | | | | | 0 | | | | | | | | (14,132,103 | ) |
| | | | |
Total distributions to shareholders | | | | | | | 0 | | | | | | | | (106,893,691 | ) |
| | | | |
| | | | |
Capital share transactions | | | Shares | | | | | | | | Shares | | | | | |
Proceeds from shares sold | | | | | | | | | | | | | | | | |
Class A | | | 566,805 | | | | 9,224,780 | | | | 13,314,397 | | | | 218,134,426 | |
Class B | | | 0 | | | | 0 | | | | 2,962 | | | | 47,267 | |
Class C | | | 4,798 | | | | 76,253 | | | | 61,971 | | | | 996,816 | |
Class R | | | 1,731 | | | | 28,277 | | | | 24,510 | | | | 411,423 | |
Class R4 | | | 3,829,476 | | | | 62,957,421 | | | | 11,129,367 | | | | 184,411,020 | |
Class R6 | | | 12,867,918 | | | | 211,613,836 | | | | 30,536,859 | | | | 503,514,864 | |
Administrator Class | | | 3,495,233 | | | | 57,227,897 | | | | 7,079,870 | | | | 117,060,125 | |
Investor Class | | | N/A | | | | N/A | | | | 1,082,862 | 1 | | | 18,302,900 | 1 |
| | | | |
| | | | | | | 341,128,464 | | | | | | | | 1,042,878,841 | |
| | | | |
Reinvestment of distributions | | | | | | | | | | | | | | | | |
Class A | | | 0 | | | | 0 | | | | 451,373 | | | | 7,108,240 | |
Class B | | | 0 | | | | 0 | | | | 141 | | | | 2,195 | |
Class C | | | 0 | | | | 0 | | | | 8,955 | | | | 137,782 | |
Class R | | | 0 | | | | 0 | | | | 1,822 | | | | 28,769 | |
Class R4 | | | 0 | | | | 0 | | | | 1,666,294 | | | | 26,908,961 | |
Class R6 | | | 0 | | | | 0 | | | | 3,085,435 | | | | 49,653,407 | |
Administrator Class | | | 0 | | | | 0 | | | | 1,242,049 | | | | 19,998,935 | |
Investor Class | | | N/A | | | | N/A | | | | 90,457 | 1 | | | 1,500,603 | 1 |
| | | | |
| | | | | | | 0 | | | | | | | | 105,338,892 | |
| | | | |
Please see footnote on page 48.
The accompanying notes are an integral part of these financial statements.
| | | | |
| 48 | | Wells Fargo Dow Jones Target Date Funds | | Statements of changes in net assets |
| | | | | | | | | | | | | | | | |
| | | Target 2030 Fund | |
| | | Six months ended August 31, 2016 (unaudited) | | | Year ended February 29, 2016 | |
| | | | |
| | | Shares | | | | | | Shares | | | | |
| | | | |
Capital share transactions (continued) | | | | | | | | | | | | | | | | |
Payment for shares redeemed | | | | | | | | | | | | | | | | |
Class A | | | (1,370,113 | ) | | $ | (22,240,784 | ) | | | (2,322,835 | ) | | $ | (36,890,791 | ) |
Class B | | | (4,201 | ) | | | (66,137 | ) | | | (4,678 | ) | | | (75,655 | ) |
Class C | | | (16,833 | ) | | | (263,234 | ) | | | (58,470 | ) | | | (938,684 | ) |
Class R | | | (1,246 | ) | | | (20,028 | ) | | | (5,557 | ) | | | (93,587 | ) |
Class R4 | | | (7,262,642 | ) | | | (121,031,221 | ) | | | (31,558,785 | ) | | | (514,470,177 | ) |
Class R6 | | | (13,519,399 | ) | | | (224,995,790 | ) | | | (19,005,059 | ) | | | (311,167,043 | ) |
Administrator Class | | | (5,855,418 | ) | | | (96,963,810 | ) | | | (13,317,134 | ) | | | (219,101,625 | ) |
Investor Class | | | N/A | | | | N/A | | | | (13,797,898 | )1 | | | (229,181,050 | )1 |
| | | | |
| | | | | | | (465,581,004 | ) | | | | | | | (1,311,918,612 | ) |
| | | | |
Net decrease in net assets resulting from capital share transactions | | | | | | | (124,452,540 | ) | | | | | | | (163,700,879 | ) |
| | | | |
Total increase (decrease) in net assets | | | | | | | 152,155,275 | | | | | | | | (478,457,476 | ) |
| | | | |
| | | | |
Net assets | | | | | | | | | | | | | | | | |
Beginning of period | | | | | | | 2,530,264,501 | | | | | | | | 3,008,721,977 | |
| | | | |
End of period | | | | | | $ | 2,682,419,776 | | | | | | | $ | 2,530,264,501 | |
| | | | |
Undistributed (overdistributed) net investment income | | | | | | $ | 23,950,782 | | | | | | | $ | (2,742,787 | ) |
| | | | |
| 1 | For the period from March 1, 2015 to October 23, 2015. Effective at the close of business on October 23, 2015, Investor Class shares were converted to Class A shares and are no longer offered by the Fund. |
The accompanying notes are an integral part of these financial statements.
| | | | | | |
| Statements of changes in net assets | | Wells Fargo Dow Jones Target Date Funds | | | 49 | |
| | | | | | | | | | | | | | | | |
| | | Target 2035 Fund | |
| | | Six months ended August 31, 2016 (unaudited) | | | Year ended
February 29, 2016 | |
| | | | |
Operations | | | | | | | | | | | | | | | | |
Net investment income | | | | | | $ | 13,639,183 | | | | | | | $ | 23,055,848 | |
Net realized gains on investments | | | | | | | 7,522,121 | | | | | | | | 26,916,539 | |
Net change in unrealized gains (losses) on investments | | | | | | | 134,265,665 | | | | | | | | (179,695,293 | ) |
| | | | |
Net increase (decrease) in net assets resulting from operations | | | | | | | 155,426,969 | | | | | | | | (129,722,906 | ) |
| | | | |
| | | | |
Distributions to shareholders from | | | | | | | | | | | | | | | | |
Net investment income | | | | | | | | | | | | | | | | |
Class A | | | | | | | (697,938 | ) | | | | | | | (301,136 | ) |
Class R | | | | | | | (449 | ) | | | | | | | (372 | ) |
Class R4 | | | | | | | (1,451,464 | ) | | | | | | | (3,545,457 | ) |
Class R6 | | | | | | | (5,517,618 | ) | | | | | | | (10,573,204 | ) |
Administrator Class | | | | | | | (1,072,892 | ) | | | | | | | (2,304,817 | ) |
Investor Class | | | | | | | N/A | | | | | | | | (1,435,192 | )1 |
Net realized gains | | | | | | | | | | | | | | | | |
Class A | | | | | | | 0 | | | | | | | | (4,979,880 | ) |
Class R | | | | | | | 0 | | | | | | | | (1,055 | ) |
Class R4 | | | | | | | 0 | | | | | | | | (6,509,836 | ) |
Class R6 | | | | | | | 0 | | | | | | | | (19,919,240 | ) |
Administrator Class | | | | | | | 0 | | | | | | | | (5,313,366 | ) |
| | | | |
Total distributions to shareholders | | | | | | | (8,740,361 | ) | | | | | | | (54,883,555 | ) |
| | | | |
| | | | |
Capital share transactions | | | Shares | | | | | | | | Shares | | | | | |
Proceeds from shares sold | | | | | | | | | | | | | | | | |
Class A | | | 690,737 | | | | 7,323,212 | | | | 18,552,591 | | | | 201,310,133 | |
Class R | | | 5,757 | | | | 61,673 | | | | 4,089 | | | | 42,241 | |
Class R4 | | | 2,809,733 | | | | 29,981,465 | | | | 6,285,864 | | | | 68,420,704 | |
Class R6 | | | 11,301,250 | | | | 120,284,890 | | | | 27,717,560 | | | | 300,793,731 | |
Administrator Class | | | 2,043,165 | | | | 21,682,742 | | | | 4,092,376 | | | | 44,621,351 | |
Investor Class | | | N/A | | | | N/A | | | | 2,114,487 | 1 | | | 23,609,674 | 1 |
| | | | |
| | | | | | | 179,333,982 | | | | | | | | 638,797,834 | |
| | | | |
Reinvestment of distributions | | | | | | | | | | | | | | | | |
Class A | | | 66,527 | | | | 692,240 | | | | 505,796 | | | | 5,237,691 | |
Class R | | | 43 | | | | 449 | | | | 136 | | | | 1,427 | |
Class R4 | | | 139,432 | | | | 1,451,464 | | | | 954,353 | | | | 10,055,293 | |
Class R6 | | | 513,866 | | | | 5,350,072 | | | | 2,798,657 | | | | 29,409,827 | |
Administrator Class | | | 102,625 | | | | 1,072,892 | | | | 722,417 | | | | 7,618,183 | |
Investor Class | | | N/A | | | | N/A | | | | 129,844 | 1 | | | 1,431,195 | 1 |
| | | | |
| | | | | | | 8,567,117 | | | | | | | | 53,753,616 | |
| | | | |
Please see footnote on page 50.
The accompanying notes are an integral part of these financial statements.
| | | | |
| 50 | | Wells Fargo Dow Jones Target Date Funds | | Statements of changes in net assets |
| | | | | | | | | | | | | | | | |
| | | Target 2035 Fund | |
| | | Six months ended August 31, 2016 (unaudited) | | | Year ended
February 29, 2016 | |
| | | | |
| | | Shares | | | | | | Shares | | | | |
| | | | |
Capital share transactions (continued) | | | | | | | | | | | | | | | | |
Payment for shares redeemed | | | | | | | | | | | | | | | | |
Class A | | | (1,907,365 | ) | | $ | (20,341,360 | ) | | | (4,767,137 | ) | | $ | (48,289,542 | ) |
Class R | | | (95 | ) | | | (1,015 | ) | | | (47 | ) | | | (487 | ) |
Class R4 | | | (5,832,586 | ) | | | (62,270,551 | ) | | | (13,188,251 | ) | | | (143,959,697 | ) |
Class R6 | | | (10,764,964 | ) | | | (115,530,170 | ) | | | (17,913,876 | ) | | | (192,666,848 | ) |
Administrator Class | | | (2,215,215 | ) | | | (23,853,888 | ) | | | (6,437,073 | ) | | | (69,772,390 | ) |
Investor Class | | | N/A | | | | N/A | | | | (20,176,529 | )1 | | | (221,695,444 | )1 |
| | | | |
| | | | | | | (221,996,984 | ) | | | | | | | (676,384,408 | ) |
| | | | |
Net increase (decrease) in net assets resulting from capital share transactions | | | | | | | (34,095,885 | ) | | | | | | | 16,167,042 | |
| | | | |
Total increase (decrease) in net assets | | | | | | | 112,590,723 | | | | | | | | (168,439,419 | ) |
| | | | |
| | | | |
Net assets | | | | | | | | | | | | | | | | |
Beginning of period | | | | | | | 1,269,183,725 | | | | | | | | 1,437,623,144 | |
| | | | |
End of period | | | | | | $ | 1,381,774,448 | | | | | | | $ | 1,269,183,725 | |
| | | | |
Undistributed (overdistributed) net investment income | | | | | | $ | 4,228,980 | | | | | | | $ | (669,842 | ) |
| | | | |
| 1 | For the period from March 1, 2015 to October 23, 2015. Effective at the close of business on October 23, 2015, Investor Class shares were converted to Class A shares and are no longer offered by the Fund. |
The accompanying notes are an integral part of these financial statements.
| | | | | | |
| Statements of changes in net assets | | Wells Fargo Dow Jones Target Date Funds | | | 51 | |
| | | | | | | | | | | | | | | | |
| | | Target 2040 Fund | |
| | | Six months ended August 31, 2016 (unaudited) | | | Year ended
February 29, 2016 | |
| | | | |
Operations | | | | | | | | | | | | | | | | |
Net investment income | | | | | | $ | 20,049,827 | | | | | | | $ | 34,325,202 | |
Net realized gains on investments | | | | | | | 12,868,326 | | | | | | | | 46,674,645 | |
Net change in unrealized gains (losses) on investments | | | | | | | 213,650,209 | | | | | | | | (309,570,864 | ) |
| | | | |
Net increase (decrease) in net assets resulting from operations | | | | | | | 246,568,362 | | | | | | | | (228,571,017 | ) |
| | | | |
| | | | |
Distributions to shareholders from | | | | | | | | | | | | | | | | |
Net investment income | | | | | | | | | | | | | | | | |
Class A | | | | | | | (1,147,269 | ) | | | | | | | (1,363,872 | ) |
Class B | | | | | | | (114 | ) | | | | | | | (427 | ) |
Class C | | | | | | | (12,098 | ) | | | | | | | (21,203 | ) |
Class R | | | | | | | (1,492 | ) | | | | | | | (2,485 | ) |
Class R4 | | | | | | | (2,762,643 | ) | | | | | | | (8,186,005 | ) |
Class R6 | | | | | | | (7,793,062 | ) | | | | | | | (14,332,859 | ) |
Administrator Class | | | | | | | (1,955,670 | ) | | | | | | | (4,465,866 | ) |
Investor Class | | | | | | | N/A | | | | | | | | (1,006,626 | )1 |
Net realized gains | | | | | | | | | | | | | | | | |
Class A | | | | | | | 0 | | | | | | | | (6,639,292 | ) |
Class B | | | | | | | 0 | | | | | | | | (3,025 | ) |
Class C | | | | | | | 0 | | | | | | | | (155,995 | ) |
Class R | | | | | | | 0 | | | | | | | | (8,919 | ) |
Class R4 | | | | | | | 0 | | | | | | | | (15,183,244 | ) |
Class R6 | | | | | | | 0 | | | | | | | | (27,150,983 | ) |
Administrator Class | | | | | | | 0 | | | | | | | | (10,413,294 | ) |
| | | | |
Total distributions to shareholders | | | | | | | (13,672,348 | ) | | | | | | | (88,934,095 | ) |
| | | | |
| | | | |
Capital share transactions | | | Shares | | | | | | | | Shares | | | | | |
Proceeds from shares sold | | | | | | | | | | | | | | | | |
Class A | | | 370,768 | | | | 6,702,739 | | | | 7,832,531 | | | | 145,840,814 | |
Class B | | | 0 | | | | 0 | | | | 3,929 | | | | 71,579 | |
Class C | | | 10,565 | | | | 179,681 | | | | 37,287 | | | | 657,846 | |
Class R | | | 1,303 | | | | 23,483 | | | | 10,378 | | | | 197,802 | |
Class R4 | | | 2,578,894 | | | | 47,639,286 | | | | 8,084,530 | | | | 153,528,934 | |
Class R6 | | | 9,739,815 | | | | 180,439,424 | | | | 22,577,979 | | | | 425,406,090 | |
Administrator Class | | | 2,282,097 | | | | 41,889,070 | | | | 4,962,945 | | | | 93,999,139 | |
Investor Class | | | N/A | | | | N/A | | | | 818,800 | 1 | | | 16,002,580 | 1 |
| | | | |
| | | | | | | 276,873,683 | | | | | | | | 835,704,784 | |
| | | | |
Reinvestment of distributions | | | | | | | | | | | | | | | | |
Class A | | | 63,577 | | | | 1,124,037 | | | | 441,267 | | | | 7,850,956 | |
Class B | | | 6 | | | | 114 | | | | 203 | | | | 3,449 | |
Class C | | | 689 | | | | 11,447 | | | | 10,060 | | | | 168,164 | |
Class R | | | 85 | | | | 1,492 | | | | 640 | | | | 11,404 | |
Class R4 | | | 153,055 | | | | 2,762,643 | | | | 1,271,924 | | | | 23,369,182 | |
Class R6 | | | 425,200 | | | | 7,674,856 | | | | 2,211,178 | | | | 40,536,041 | |
Administrator Class | | | 102,588 | | | | 1,849,664 | | | | 813,092 | | | | 14,878,081 | |
Investor Class | | | N/A | | | | N/A | | | | 52,301 | 1 | | | 1,003,724 | 1 |
| | | | |
| | | | | | | 13,424,253 | | | | | | | | 87,821,001 | |
| | | | |
Please see footnote on page 52.
The accompanying notes are an integral part of these financial statements.
| | | | |
| 52 | | Wells Fargo Dow Jones Target Date Funds | | Statements of changes in net assets |
| | | | | | | | | | | | | | | | |
| | | Target 2040 Fund | |
| | | Six months ended August 31, 2016 (unaudited) | | | Year ended
February 29, 2016 | |
| | | | |
| | | Shares | | | | | | Shares | | | | |
| | | | |
Capital share transactions (continued) | | | | | | | | | | | | | | | | |
Payment for shares redeemed | | | | | | | | | | | | | | | | |
Class A | | | (1,000,261 | ) | | $ | (18,124,386 | ) | | | (1,932,220 | ) | | $ | (34,985,826 | ) |
Class B | | | (1,693 | ) | | | (28,260 | ) | | | (3,253 | ) | | | (58,388 | ) |
Class C | | | (34,677 | ) | | | (591,921 | ) | | | (65,920 | ) | | | (1,132,401 | ) |
Class R | | | (31 | ) | | | (562 | ) | | | (720 | ) | | | (13,176 | ) |
Class R4 | | | (5,259,639 | ) | | | (98,980,257 | ) | | | (20,889,265 | ) | | | (387,340,331 | ) |
Class R6 | | | (9,686,619 | ) | | | (181,649,550 | ) | | | (14,202,963 | ) | | | (266,513,595 | ) |
Administrator Class | | | (3,997,533 | ) | | | (74,244,197 | ) | | | (8,504,025 | ) | | | (159,988,208 | ) |
Investor Class | | | N/A | | | | N/A | | | | (7,811,715 | )1 | | | (148,868,103 | )1 |
| | | | |
| | | | | | | (373,619,133 | ) | | | | | | | (998,900,208 | ) |
| | | | |
Net decrease in net assets resulting from capital share transactions | | | | | | | (83,321,197 | ) | | | | | | | (75,374,243 | ) |
| | | | |
Total increase (decrease) in net assets | | | | | | | 149,574,817 | | | | | | | | (392,879,355 | ) |
| | | | |
| | | | |
Net assets | | | | | | | | | | | | | | | | |
Beginning of period | | | | | | | 1,842,383,451 | | | | | | | | 2,235,262,806 | |
| | | | |
End of period | | | | | | $ | 1,991,958,268 | | | | | | | $ | 1,842,383,451 | |
| | | | |
Undistributed (overdistributed) net investment income | | | | | | $ | 5,302,374 | | | | | | | $ | (1,075,105 | ) |
| | | | |
| 1 | For the period from March 1, 2015 to October 23, 2015. Effective at the close of business on October 23, 2015, Investor Class shares were converted to Class A shares and are no longer offered by the Fund. |
The accompanying notes are an integral part of these financial statements.
| | | | | | |
| Statements of changes in net assets | | Wells Fargo Dow Jones Target Date Funds | | | 53 | |
| | | | | | | | | | | | | | | | |
| | | Target 2045 Fund | |
| | | Six months ended August 31, 2016 (unaudited) | | | Year ended
February 29, 2016 | |
| | | | |
Operations | | | | | | | | | | | | | | | | |
Net investment income | | | | | | $ | 8,108,504 | | | | | | | $ | 12,722,827 | |
Net realized gains on investments | | | | | | | 5,615,755 | | | | | | | | 16,623,481 | |
Net change in unrealized gains (losses) on investments | | | | | | | 89,162,994 | | | | | | | | (125,041,631 | ) |
| | | | |
Net increase (decrease) in net assets resulting from operations | | | | | | | 102,887,253 | | | | | | | | (95,695,323 | ) |
| | | | |
| | | | |
Distributions to shareholders from | | | | | | | | | | | | | | | | |
Net investment income | | | | | | | | | | | | | | | | |
Class A | | | | | | | (451,822 | ) | | | | | | | (268,832 | ) |
Class R | | | | | | | (153 | ) | | | | | | | (252 | ) |
Class R4 | | | | | | | (980,353 | ) | | | | | | | (2,188,948 | ) |
Class R6 | | | | | | | (3,604,294 | ) | | | | | | | (6,523,660 | ) |
Administrator Class | | | | | | | (746,082 | ) | | | | | | | (1,492,836 | ) |
Investor Class | | | | | | | N/A | | | | | | | | (837,020 | )1 |
Net realized gains | | | | | | | | | | | | | | | | |
Class A | | | | | | | 0 | | | | | | | | (2,771,190 | ) |
Class R | | | | | | | 0 | | | | | | | | (817 | ) |
Class R4 | | | | | | | 0 | | | | | | | | (3,688,268 | ) |
Class R6 | | | | | | | 0 | | | | | | | | (11,238,044 | ) |
Administrator Class | | | | | | | 0 | | | | | | | | (3,155,252 | ) |
| | | | |
Total distributions to shareholders | | | | | | | (5,782,704 | ) | | | | | | | (32,165,119 | ) |
| | | | |
| | | | |
Capital share transactions | | | Shares | | | | | | | | Shares | | | | | |
Proceeds from shares sold | | | | | | | | | | | | | | | | |
Class A | | | 528,899 | | | | 5,756,827 | | | | 10,643,641 | | | | 119,886,949 | |
Class R | | | 396 | | | | 4,439 | | | | 251 | | | | 2,795 | |
Class R4 | | | 1,784,875 | | | | 19,588,544 | | | | 4,571,380 | | | | 52,006,760 | |
Class R6 | | | 9,202,082 | | | | 100,951,485 | | | | 20,456,922 | | | | 230,687,584 | |
Administrator Class | | | 1,500,185 | | | | 16,438,614 | | | | 3,086,451 | | | | 35,108,254 | |
Investor Class | | | N/A | | | | N/A | | | | 1,568,639 | 1 | | | 18,347,423 | 1 |
| | | | |
| | | | | | | 142,739,909 | | | | | | | | 456,039,765 | |
| | | | |
Reinvestment of distributions | | | | | | | | | | | | | | | | |
Class A | | | 42,361 | | | | 450,405 | | | | 282,891 | | | | 3,027,399 | |
Class R | | | 14 | | | | 153 | | | | 98 | | | | 1,069 | |
Class R4 | | | 91,865 | | | | 980,353 | | | | 536,817 | | | | 5,877,216 | |
Class R6 | | | 330,622 | | | | 3,522,109 | | | | 1,585,167 | | | | 17,267,672 | |
Administrator Class | | | 69,378 | | | | 744,430 | | | | 423,857 | | | | 4,648,064 | |
Investor Class | | | N/A | | | | N/A | | | | 72,282 | 1 | | | 836,392 | 1 |
| | | | |
| | | | | | | 5,697,450 | | | | | | | | 31,657,812 | |
| | | | |
Payment for shares redeemed | | | | | | | | | | | | | | | | |
Class A | | | (1,065,231 | ) | | | (11,620,073 | ) | | | (3,343,560 | ) | | | (35,251,201 | ) |
Class R | | | (93 | ) | | | (1,000 | ) | | | (2 | ) | | | (18 | ) |
Class R4 | | | (3,183,126 | ) | | | (35,054,200 | ) | | | (8,821,123 | ) | | | (101,240,476 | ) |
Class R6 | | | (7,681,543 | ) | | | (85,217,293 | ) | | | (12,660,032 | ) | | | (140,410,371 | ) |
Administrator Class | | | (1,379,075 | ) | | | (15,328,381 | ) | | | (3,775,671 | ) | | | (42,382,911 | ) |
Investor Class | | | N/A | | | | N/A | | | | (11,149,642 | )1 | | | (127,553,030 | )1 |
| | | | |
| | | | | | | (147,220,947 | ) | | | | | | | (446,838,007 | ) |
| | | | |
Net increase in net assets resulting from capital share transactions | | | | | | | 1,216,412 | | | | | | | | 40,859,570 | |
| | | | |
Total increase (decrease) in net assets | | | | | | | 98,320,961 | | | | | | | | (87,000,872 | ) |
| | | | |
| | | | |
Net assets | | | | | | | | | | | | | | | | |
Beginning of period | | | | | | | 724,065,589 | | | | | | | | 811,066,461 | |
| | | | |
End of period | | | | | | $ | 822,386,550 | | | | | | | $ | 724,065,589 | |
| | | | |
Undistributed net investment income | | | | | | $ | 2,467,948 | | | | | | | $ | 142,148 | |
| | | | |
| 1 | For the period from March 1, 2015 to October 23, 2015. Effective at the close of business on October 23, 2015, Investor Class shares were converted to Class A shares and are no longer offered by the Fund. |
The accompanying notes are an integral part of these financial statements.
| | | | |
| 54 | | Wells Fargo Dow Jones Target Date Funds | | Statements of changes in net assets |
| | | | | | | | | | | | | | | | |
| | | Target 2050 Fund | |
| | | Six months ended
August 31, 2016
(unaudited) | | | Year ended
February 29, 2016 | |
| | | | |
Operations | | | | | | | | | | | | | | | | |
Net investment income | | | | | | $ | 14,543,115 | | | | | | | $ | 23,349,252 | |
Net realized gains on investments | | | | | | | 10,223,782 | | | | | | | | 29,896,358 | |
Net change in unrealized gains (losses) on investments | | | | | | | 159,925,053 | | | | | | | | (225,672,734 | ) |
| | | | |
Net increase (decrease) in net assets resulting from operations | | | | | | | 184,691,950 | | | | | | | | (172,427,124 | ) |
| | | | |
| | | | |
Distributions to shareholders from | | | | | | | | | | | | | | | | |
Net investment income | | | | | | | | | | | | | | | | |
Class A | | | | | | | (361,554 | ) | | | | | | | (186,145 | ) |
Class C | | | | | | | (2,553 | ) | | | | | | | (3,126 | ) |
Class R | | | | | | | (202 | ) | | | | | | | (272 | ) |
Class R4 | | | | | | | (1,738,324 | ) | | | | | | | (4,725,511 | ) |
Class R6 | | | | | | | (7,141,031 | ) | | | | | | | (13,225,354 | ) |
Administrator Class | | | | | | | (1,297,655 | ) | | | | | | | (2,626,389 | ) |
Investor Class | | | | | | | N/A | | | | | | | | (513,873 | )1 |
Net realized gains | | | | | | | | | | | | | | | | |
Class A1 | | | | | | | 0 | | | | | | | | (1,825,085 | ) |
Class C | | | | | | | 0 | | | | | | | | (22,958 | ) |
Class R | | | | | | | 0 | | | | | | | | (847 | ) |
Class R4 | | | | | | | 0 | | | | | | | | (7,749,938 | ) |
Class R6 | | | | | | | 0 | | | | | | | | (21,991,674 | ) |
Administrator Class | | | | | | | 0 | | | | | | | | (5,482,713 | ) |
| | | | |
Total distributions to shareholders | | | | | | | (10,541,319 | ) | | | | | | | (58,353,885 | ) |
| | | | |
| | | | |
Capital share transactions | | | Shares | | | | | | | | Shares | | | | | |
Proceeds from shares sold | | | | | | | | | | | | | | | | |
Class A | | | 586,587 | | | | 6,104,664 | | | | 6,951,910 | | | | 74,657,726 | |
Class C | | | 11,957 | | | | 123,908 | | | | 50,243 | | | | 530,074 | |
Class R | | | 1,097 | | | | 11,536 | | | | 521 | | | | 5,371 | |
Class R4 | | | 3,668,965 | | | | 38,412,648 | | | | 11,348,069 | | | | 122,406,849 | |
Class R6 | | | 15,299,170 | | | | 160,366,894 | | | | 33,537,208 | | | | 360,894,394 | |
Administrator Class | | | 3,526,014 | | | | 36,693,878 | | | | 7,641,132 | | | | 82,336,166 | |
Investor Class | | | N/A | | | | N/A | | | | 895,669 | 1 | | | 9,981,111 | 1 |
| | | | |
| | | | | | | 241,713,528 | | | | | | | | 650,811,691 | |
| | | | |
Reinvestment of distributions | | | | | | | | | | | | | | | | |
Class A | | | 35,554 | | | | 360,712 | | | | 196,059 | | | | 2,006,262 | |
Class C | | | 242 | | | | 2,456 | | | | 2,416 | | | | 24,807 | |
Class R | | | 20 | | | | 202 | | | | 108 | | | | 1,119 | |
Class R4 | | | 170,720 | | | | 1,738,324 | | | | 1,191,982 | | | | 12,475,449 | |
Class R6 | | | 689,988 | | | | 7,021,229 | | | | 3,298,611 | | | | 34,453,143 | |
Administrator Class | | | 123,604 | | | | 1,254,844 | | | | 779,371 | | | | 8,109,102 | |
Investor Class | | | N/A | | | | N/A | | | | 46,705 | 1 | | | 513,287 | 1 |
| | | | |
| | | | | | | 10,377,767 | | | | | | | | 57,583,169 | |
| | | | |
Please see footnote on page 55.
The accompanying notes are an integral part of these financial statements.
| | | | | | |
| Statements of changes in net assets | | Wells Fargo Dow Jones Target Date Funds | | | 55 | |
| | | | | | | | | | | | | | | | |
| | | Target 2050 Fund | |
| | | Six months ended
August 31, 2016
(unaudited) | | | Year ended
February 29, 2016 | |
| | | | |
| | | Shares | | | | | | Shares | | | | |
| | | | |
Capital share transactions (continued) | | | | | | | | | | | | | | | | |
Payment for shares redeemed | | | | | | | | | | | | | | | | |
Class A | | | (951,368 | ) | | $ | (9,925,906 | ) | | | (1,176,375 | ) | | $ | (11,926,737 | ) |
Class C | | | (10,917 | ) | | | (112,596 | ) | | | (24,531 | ) | | | (253,785 | ) |
Class R | | | (46 | ) | | | (482 | ) | | | (2 | ) | | | (29 | ) |
Class R4 | | | (5,559,860 | ) | | | (59,364,797 | ) | | | (21,529,377 | ) | | | (225,930,036 | ) |
Class R6 | | | (13,941,933 | ) | | | (147,816,804 | ) | | | (25,162,016 | ) | | | (272,468,982 | ) |
Administrator Class | | | (4,313,434 | ) | | | (45,401,070 | ) | | | (9,136,641 | ) | | | (97,702,104 | ) |
Investor Class | | | N/A | | | | N/A | | | | (6,875,405 | )1 | | | (74,811,494 | )1 |
| | | | |
| | | | | | | (262,621,655 | ) | | | | | | | (683,093,167 | ) |
| | | | |
Net increase (decrease) in net assets resulting from capital share transactions | | | | | | | (10,530,360 | ) | | | | | | | 25,301,693 | |
| | | | |
Total increase (decrease) in net assets | | | | | | | 163,620,271 | | | | | | | | (205,479,316 | ) |
| | | | |
| | | | |
Net assets | | | | | | | | | | | | | | | | |
Beginning of period | | | | | | | 1,269,993,570 | | | | | | | | 1,475,472,886 | |
| | | | |
End of period | | | | | | $ | 1,433,613,841 | | | | | | | $ | 1,269,993,570 | |
| | | | |
Undistributed (overdistributed) net investment income | | | | | | $ | 3,990,449 | | | | | | | $ | (11,347 | ) |
| | | | |
| 1 | For the period from March 1, 2014 to October 23, 2015. Effective at the close of business on October 23, 2015, Investor Class shares were converted to Class A shares and are no longer offered by the Fund. |
The accompanying notes are an integral part of these financial statements.
| | | | |
| 56 | | Wells Fargo Dow Jones Target Date Funds | | Statements of changes in net assets |
| | | | | | | | | | | | | | | | |
| | | Target 2055 Fund | |
| | | Six months ended August 31, 2016 (unaudited) | | | Year ended February 29, 2016 | |
| | | | |
Operations | | | | | | | | | | | | | | | | |
Net investment income | | | | | | $ | 2,654,192 | | | | | | | $ | 3,348,997 | |
Net realized gains (losses) on investments | | | | | | | 1,836,302 | | | | | | | | (6,950,552 | ) |
Net change in unrealized gains (losses) on investments | | | | | | | 28,159,778 | | | | | | | | (21,701,511 | ) |
| | | | |
Net increase (decrease) in net assets resulting from operations | | | | | | | 32,650,272 | | | | | | | | (25,303,066 | ) |
| | | | |
| | | | |
Distributions to shareholders from | | | | | | | | | | | | | | | | |
Net investment income | | | | | | | | | | | | | | | | |
Class A | | | | | | | (64,257 | ) | | | | | | | (29,658 | ) |
Class R | | | | | | | (341 | ) | | | | | | | (252 | ) |
Class R4 | | | | | | | (251,524 | ) | | | | | | | (378,682 | ) |
Class R6 | | | | | | | (1,691,131 | ) | | | | | | | (2,072,829 | ) |
Administrator Class | | | | | | | (142,351 | ) | | | | | | | (152,082 | ) |
Investor Class | | | | | | | N/A | | | | | | | | (72,053 | )1 |
Net realized gains | | | | | | | | | | | | | | | | |
Class A | | | | | | | 0 | | | | | | | | (24,092 | ) |
Class R | | | | | | | 0 | | | | | | | | (86 | ) |
Class R4 | | | | | | | 0 | | | | | | | | (55,238 | ) |
Class R6 | | | | | | | 0 | | | | | | | | (319,151 | ) |
Administrator Class | | | | | | | 0 | | | | | | | | (31,756 | ) |
| | | | |
Total distributions to shareholders | | | | | | | (2,149,604 | ) | | | | | | | (3,135,879 | ) |
| | | | |
| | | | |
Capital share transactions | | | Shares | | | | | | | | Shares | | | | | |
Proceeds from shares sold | | | | | | | | | | | | | | | | |
Class A | | | 181,759 | | | | 2,276,805 | | | | 1,100,577 | | | | 13,865,874 | |
Class R | | | 1,804 | | | | 22,364 | | | | 1,468 | | | | 17,944 | |
Class R4 | | | 787,120 | | | | 9,876,574 | | | | 1,763,543 | | | | 22,488,266 | |
Class R6 | | | 5,699,660 | | | | 71,427,002 | | | | 9,869,147 | | | | 124,299,082 | |
Administrator Class | | | 782,860 | | | | 9,788,929 | | | | 1,127,506 | | | | 14,089,884 | |
Investor Class | | | N/A | | | | N/A | | | | 320,954 | 1 | | | 4,145,234 | 1 |
| | | | |
| | | | | | | 93,391,674 | | | | | | | | 178,906,284 | |
| | | | |
Reinvestment of distributions | | | | | | | | | | | | | | | | |
Class A | | | 5,177 | | | | 63,119 | | | | 4,195 | | | | 51,885 | |
Class R | | | 28 | | | | 341 | | | | 27 | | | | 338 | |
Class R4 | | | 20,577 | | | | 251,524 | | | | 34,201 | | | | 433,920 | |
Class R6 | | | 125,788 | | | | 1,534,481 | | | | 171,963 | | | | 2,165,166 | |
Administrator Class | | | 11,670 | | | | 142,333 | | | | 14,584 | | | | 183,838 | |
Investor Class | | | N/A | | | | N/A | | | | 5,667 | 1 | | | 71,987 | 1 |
| | | | |
| | | | | | | 1,991,798 | | | | | | | | 2,907,134 | |
| | | | |
Please see footnote on page 57.
The accompanying notes are an integral part of these financial statements.
| | | | | | |
| Statements of changes in net assets | | Wells Fargo Dow Jones Target Date Funds | | | 57 | |
| | | | | | | | | | | | | | | | |
| | | Target 2055 Fund | |
| | | Six months ended August 31, 2016 (unaudited) | | | Year ended February 29, 2016 | |
| | | | |
| | | Shares | | | | | | Shares | | | | |
| | | | |
Capital share transactions (continued) | | | | | | | | | | | | | | | | |
Payment for shares redeemed | | | | | | | | | | | | | | | | |
Class A | | | (169,886 | ) | | $ | (2,114,049 | ) | | | (374,104 | ) | | $ | (4,453,123 | ) |
Class R | | | (23 | ) | | | (296 | ) | | | (191 | ) | | | (2,112 | ) |
Class R4 | | | (628,097 | ) | | | (7,895,571 | ) | | | (1,979,482 | ) | | | (25,237,910 | ) |
Class R6 | | | (3,452,586 | ) | | | (43,558,095 | ) | | | (5,605,399 | ) | | | (70,687,587 | ) |
Administrator Class | | | (401,926 | ) | | | (5,121,164 | ) | | | (807,536 | ) | | | (10,091,281 | ) |
Investor Class | | | N/A | | | | N/A | | | | (938,655 | )1 | | | (11,838,163 | )1 |
| | | | |
| | | | | | | (58,689,175 | ) | | | | | | | (122,310,176 | ) |
| | | | |
Net increase in net assets resulting from capital share transactions | | | | | | | 36,694,297 | | | | | | | | 59,503,242 | |
| | | | |
Total increase in net assets | | | | | | | 67,194,965 | | | | | | | | 31,064,297 | |
| | | | |
| | | | |
Net assets | | | | | | | | | | | | | | | | |
Beginning of period | | | | | | | 212,685,443 | | | | | | | | 181,621,146 | |
| | | | |
End of period | | | | | | $ | 279,880,408 | | | | | | | $ | 212,685,443 | |
| | | | |
Undistributed net investment income | | | | | | $ | 1,010,847 | | | | | | | $ | 506,259 | |
| | | | |
| 1 | For the period from March 1, 2015 to October 23, 2015. Effective at the close of business on October 23, 2015, Investor Class shares were converted to Class A shares and are no longer offered by the Fund. |
The accompanying notes are an integral part of these financial statements.
| | | | |
| 58 | | Wells Fargo Dow Jones Target Date Funds | | Statements of changes in net assets |
| | | | | | | | | | | | | | | | |
| | | Target 2060 Fund | |
| | | Six months ended
August 31, 2016
(unaudited) | | | Year ended
February 29, 20161 | |
| | | | |
Operations | | | | | | | | | | | | | | | | |
Net investment income | | | | | | $ | 40,999 | | | | | | | $ | 9,249 | |
Net realized gains (losses) on investments | | | | | | | 42,373 | | | | | | | �� | (83,369 | ) |
Net change in unrealized gains (losses) on investments | | | | | | | 357,226 | | | | | | | | (56,163 | ) |
| | | | |
Net increase (decrease) in net assets resulting from operations | | | | | | | 440,598 | | | | | | | | (130,283 | ) |
| | | | |
| | | | |
Distributions to shareholders from | | | | | | | | | | | | | | | | |
Net investment income | | | | | | | | | | | | | | | | |
Class A | | | | | | | (866 | ) | | | | | | | (1,105 | ) |
Class C | | | | | | | (1,272 | ) | | | | | | | 0 | |
Class R | | | | | | | (1,661 | ) | | | | | | | (981 | ) |
Class R4 | | | | | | | (1,185 | ) | | | | | | | 0 | |
Class R6 | | | | | | | (4,357 | ) | | | | | | | (1,057 | ) |
Administrator Class | | | | | | | (4,055 | ) | | | | | | | (2,524 | ) |
| | | | |
Total distributions to shareholders | | | | | | | (13,396 | ) | | | | | | | (5,667 | ) |
| | | | |
| | | | |
Capital share transactions | | | Shares | | | | | | | | Shares | | | | | |
Proceeds from shares sold | | | | | | | | | | | | | | | | |
Class A | | | 25,720 | | | | 248,025 | | | | 11,519 | | | | 113,979 | |
Class C | | | 3,087 | | | | 29,333 | | | | 19,544 | | | | 190,494 | |
Class R | | | 2,644 | | | | 26,154 | | | | 10,000 | | | | 100,000 | |
Class R4 | | | 331,622 | | | | 3,318,293 | | | | 39,373 | | | | 372,597 | |
Class R6 | | | 646,794 | | | | 6,457,652 | | | | 64,296 | | | | 622,396 | |
Administrator Class | | | 293,554 | | | | 2,898,256 | | | | 58,746 | | | | 570,470 | |
| | | | |
| | | | | | | 12,977,713 | | | | | | | | 1,969,936 | |
| | | | |
Reinvestment of distributions | | | | | | | | | | | | | | | | |
Class A | | | 93 | | | | 866 | | | | 120 | | | | 1,105 | |
Class C | | | 136 | | | | 1,272 | | | | 0 | | | | 0 | |
Class R | | | 180 | | | | 1,661 | | | | 106 | | | | 981 | |
Class R4 | | | 125 | | | | 1,185 | | | | 0 | | | | 0 | |
Class R6 | | | 456 | | | | 4,330 | | | | 113 | | | | 1,057 | |
Administrator Class | | | 432 | | | | 4,055 | | | | 272 | | | | 2,524 | |
| | | | |
| | | | | | | 13,369 | | | | | | | | 5,667 | |
| | | | |
Payment for shares redeemed | | | | | | | | | | | | | | | | |
Class A | | | (10,493 | ) | | | (103,621 | ) | | | (300 | ) | | | (2,643 | ) |
Class C | | | (35 | ) | | | (329 | ) | | | (101 | ) | | | (947 | ) |
Class R | | | (2 | ) | | | (24 | ) | | | 0 | | | | 0 | |
Class R4 | | | (21,484 | ) | | | (216,027 | ) | | | (17,654 | ) | | | (166,114 | ) |
Class R6 | | | (30,781 | ) | | | (308,776 | ) | | | (378 | ) | | | (3,576 | ) |
Administrator Class | | | (32,266 | ) | | | (322,537 | ) | | | (18,632 | ) | | | (176,713 | ) |
| | | | |
| | | | | | | (951,314 | ) | | | | | | | (349,993 | ) |
| | | | |
Net increase in net assets resulting from capital share transactions | | | | | | | 12,039,768 | | | | | | | | 1,625,610 | |
| | | | |
Total increase in net assets | | | | | | | 12,466,970 | | | | | | | | 1,489,660 | |
| | | | |
| | | | |
Net assets | | | | | | | | | | | | | | | | |
Beginning of period | | | | | | | 1,489,660 | | | | | | | | 0 | |
| | | | |
End of period | | | | | | $ | 13,956,630 | | | | | | | $ | 1,489,660 | |
| | | | |
Undistributed net investment income | | | | | | $ | 29,886 | | | | | | | $ | 2,283 | |
| | | | |
| 1 | For the period from June 30, 2015 (commencement of Fund operations) to February 29, 2016 |
The accompanying notes are an integral part of these financial statements.
This page is intentionally left blank.
| | | | |
| 60 | | Wells Fargo Dow Jones Target Date Funds | | Financial highlights |
| | | | | | | | | | | | | | | | | | | | | | | | |
| Target Today Fund | | Beginning
net asset
value per
share | | | Net
investment
income | | | Net realized
and unrealized
gains (losses)
on investments | | | Distributions
from net
investment
income | | | Distributions
from net
realized gains | | | Ending
net asset
value per
share | |
Class A | | | | | | | | | | | | | | | | | | | | | | | | |
Six months ended August 31, 2016 (unaudited) | | $ | 10.41 | | | | 0.06 | | | | 0.42 | | | | 0.00 | | | | 0.00 | | | $ | 10.89 | |
Year ended February 29, 2016 | | $ | 10.81 | | | | 0.10 | 4 | | | (0.29 | ) | | | (0.03 | ) | | | (0.18 | ) | | $ | 10.41 | |
Year ended February 28, 2015 | | $ | 10.85 | | | | 0.15 | | | | 0.05 | | | | (0.13 | ) | | | (0.11 | ) | | $ | 10.81 | |
Year ended February 28, 2014 | | $ | 10.84 | | | | 0.15 | | | | 0.13 | | | | (0.13 | ) | | | (0.14 | ) | | $ | 10.85 | |
Year ended February 28, 2013 | | $ | 10.86 | | | | 0.15 | 4 | | | 0.08 | | | | (0.17 | ) | | | (0.08 | ) | | $ | 10.84 | |
Year ended February 29, 2012 | | $ | 10.56 | | | | 0.18 | 4 | | | 0.39 | | | | (0.22 | ) | | | (0.05 | ) | | $ | 10.86 | |
Class B | | | | | | | | | | | | | | | | | | | | | | | | |
Six months ended August 31, 2016 (unaudited) | | $ | 10.84 | | | | 0.02 | 4 | | | 0.43 | | | | 0.00 | | | | 0.00 | | | $ | 11.29 | |
Year ended February 29, 2016 | | $ | 11.29 | | | | 0.02 | 4 | | | (0.29 | ) | | | 0.00 | | | | (0.18 | ) | | $ | 10.84 | |
Year ended February 28, 2015 | | $ | 11.30 | | | | 0.06 | 4 | | | 0.06 | | | | (0.02 | ) | | | (0.11 | ) | | $ | 11.29 | |
Year ended February 28, 2014 | | $ | 11.26 | | | | 0.07 | 4 | | | 0.14 | | | | (0.03 | ) | | | (0.14 | ) | | $ | 11.30 | |
Year ended February 28, 2013 | | $ | 11.22 | | | | 0.07 | 4 | | | 0.08 | | | | (0.03 | ) | | | (0.08 | ) | | $ | 11.26 | |
Year ended February 29, 2012 | | $ | 10.87 | | | | 0.10 | 4 | | | 0.41 | | | | (0.11 | ) | | | (0.05 | ) | | $ | 11.22 | |
Class C | | | | | | | | | | | | | | | | | | | | | | | | |
Six months ended August 31, 2016 (unaudited) | | $ | 10.63 | | | | 0.02 | 4 | | | 0.42 | | | | 0.00 | | | | 0.00 | | | $ | 11.07 | |
Year ended February 29, 2016 | | $ | 11.08 | | | | 0.02 | 4 | | | (0.29 | ) | | | 0.00 | | | | (0.18 | ) | | $ | 10.63 | |
Year ended February 28, 2015 | | $ | 11.11 | | | | 0.06 | 4 | | | 0.06 | | | | (0.04 | ) | | | (0.11 | ) | | $ | 11.08 | |
Year ended February 28, 2014 | | $ | 11.09 | | | | 0.06 | 4 | | | 0.14 | | | | (0.04 | ) | | | (0.14 | ) | | $ | 11.11 | |
Year ended February 28, 2013 | | $ | 11.11 | | | | 0.07 | | | | 0.08 | | | | (0.09 | ) | | | (0.08 | ) | | $ | 11.09 | |
Year ended February 29, 2012 | | $ | 10.78 | | | | 0.10 | 4 | | | 0.41 | | | | (0.13 | ) | | | (0.05 | ) | | $ | 11.11 | |
Class R | | | | | | | | | | | | | | | | | | | | | | | | |
Six months ended August 31, 2016 (unaudited) | | $ | 10.39 | | | | 0.04 | | | | 0.42 | | | | 0.00 | | | | 0.00 | | | $ | 10.85 | |
Year ended February 29, 2016 | | $ | 10.80 | | | | 0.07 | | | | (0.29 | ) | | | (0.01 | ) | | | (0.18 | ) | | $ | 10.39 | |
Year ended February 28, 2015 | | $ | 10.85 | | | | 0.11 | | | | 0.06 | | | | (0.11 | ) | | | (0.11 | ) | | $ | 10.80 | |
Year ended February 28, 20145 | | $ | 10.57 | | | | 0.07 | | | | 0.41 | | | | (0.06 | ) | | | (0.14 | ) | | $ | 10.85 | |
Class R4 | | | | | | | | | | | | | | | | | | | | | | | | |
Six months ended August 31, 2016 (unaudited) | | $ | 10.65 | | | | 0.08 | 4 | | | 0.43 | | | | 0.00 | | | | 0.00 | | | $ | 11.16 | |
Year ended February 29, 2016 | | $ | 11.06 | | | | 0.14 | | | | (0.30 | ) | | | (0.07 | ) | | | (0.18 | ) | | $ | 10.65 | |
Year ended February 28, 2015 | | $ | 11.10 | | | | 0.18 | | | | 0.06 | | | | (0.17 | ) | | | (0.11 | ) | | $ | 11.06 | |
Year ended February 28, 2014 | | $ | 11.08 | | | | 0.18 | 4 | | | 0.15 | | | | (0.17 | ) | | | (0.14 | ) | | $ | 11.10 | |
Year ended February 28, 20136 | | $ | 11.24 | | | | 0.05 | 4 | | | (0.06 | ) | | | (0.07 | ) | | | (0.08 | ) | | $ | 11.08 | |
Class R67 | | | | | | | | | | | | | | | | | | | | | | | | |
Six months ended August 31, 2016 (unaudited) | | $ | 10.64 | | | | 0.10 | | | | 0.41 | | | | 0.00 | | | | 0.00 | | | $ | 11.15 | |
Year ended February 29, 2016 | | $ | 11.05 | | | | 0.15 | | | | (0.29 | ) | | | (0.09 | ) | | | (0.18 | ) | | $ | 10.64 | |
Year ended February 28, 2015 | | $ | 11.08 | | | | 0.19 | | | | 0.08 | | | | (0.19 | ) | | | (0.11 | ) | | $ | 11.05 | |
Year ended February 28, 2014 | | $ | 11.07 | | | | 0.20 | 4 | | | 0.14 | | | | (0.19 | ) | | | (0.14 | ) | | $ | 11.08 | |
Year ended February 28, 2013 | | $ | 11.09 | | | | 0.21 | | | | 0.08 | | | | (0.23 | ) | | | (0.08 | ) | | $ | 11.07 | |
Year ended February 29, 2012 | | $ | 10.77 | | | | 0.24 | | | | 0.40 | | | | (0.27 | ) | | | (0.05 | ) | | $ | 11.09 | |
Administrator Class | | | | | | | | | | | | | | | | | | | | | | | | |
Six months ended August 31, 2016 (unaudited) | | $ | 10.63 | | | | 0.07 | | | | 0.42 | | | | 0.00 | | | | 0.00 | | | $ | 11.12 | |
Year ended February 29, 2016 | | $ | 11.03 | | | | 0.12 | 4 | | | (0.29 | ) | | | (0.05 | ) | | | (0.18 | ) | | $ | 10.63 | |
Year ended February 28, 2015 | | $ | 11.07 | | | | 0.16 | | | | 0.06 | | | | (0.15 | ) | | | (0.11 | ) | | $ | 11.03 | |
Year ended February 28, 2014 | | $ | 11.05 | | | | 0.16 | | | | 0.14 | | | | (0.14 | ) | | | (0.14 | ) | | $ | 11.07 | |
Year ended February 28, 2013 | | $ | 11.07 | | | | 0.17 | | | | 0.08 | | | | (0.19 | ) | | | (0.08 | ) | | $ | 11.05 | |
Year ended February 29, 2012 | | $ | 10.75 | | | | 0.20 | | | | 0.40 | | | | (0.23 | ) | | | (0.05 | ) | | $ | 11.07 | |
| 1 | Ratios include net expenses allocated from the affiliated Master Portfolios which were as follows: |
| | | | | | | | | | | | | | | | | | | | | | | | |
| | | Six months ended August 31, 2016
(unaudited) | | | Year ended
February 29, 2016 | | | Year ended February 28 | | | Year ended
February 29, 2012 | |
| | | | | 2015 | | | 2014 | | | 2013 | | |
| | | | |
Class A | | | 0.15 | % | | | 0.15 | % | | | 0.16 | % | | | 0.18 | % | | | 0.25 | % | | | 0.25 | % |
Class B | | | 0.14 | | | | 0.11 | | | | 0.16 | | | | 0.18 | | | | 0.25 | | | | 0.25 | |
Class C | | | 0.15 | | | | 0.15 | | | | 0.16 | | | | 0.18 | | | | 0.25 | | | | 0.25 | |
Class R | | | 0.16 | | | | 0.14 | | | | 0.16 | | | | 0.18 | 5 | | | N/A | | | | N/A | |
Class R4 | | | 0.15 | | | | 0.15 | | | | 0.16 | | | | 0.18 | | | | 0.25 | 6 | | | N/A | |
Class R67 | | | 0.15 | | | | 0.15 | | | | 0.16 | | | | 0.18 | | | | 0.25 | | | | 0.25 | |
Administrator Class | | | 0.15 | | | | 0.15 | | | | 0.16 | | | | 0.18 | | | | 0.25 | | | | 0.25 | |
The accompanying notes are an integral part of these financial statements.
| | | | | | |
| Financial highlights | | Wells Fargo Dow Jones Target Date Funds | | | 61 | |
| | | | | | | | | | | | | | | | | | | | | | |
| Ratio to average net assets (annualized) | | | Total
return2 | | | Portfolio
turnover
rate3 | | | Net assets at
end of period
(000s omitted) | |
Net investment
income | | | Gross
expenses1 | | | Net
expenses1 | | | | |
| | | | | | | | | | | | | | | | | | | | | | |
| | 1.08 | % | | | 0.85 | % | | | 0.76 | % | | | 4.61 | % | | | 16 | % | | $ | 66,058 | |
| | 0.98 | % | | | 0.86 | % | | | 0.77 | % | | | (1.74 | )% | | | 36 | % | | $ | 66,656 | |
| | 1.26 | % | | | 0.98 | % | | | 0.81 | % | | | 1.83 | % | | | 42 | % | | $ | 15,537 | |
| | 1.29 | % | | | 1.01 | % | | | 0.85 | % | | | 2.67 | % | | | 40 | % | | $ | 17,467 | |
| | 1.39 | % | | | 1.08 | % | | | 0.96 | % | | | 2.15 | % | | | 39 | % | | $ | 19,815 | |
| | 1.69 | % | | | 1.08 | % | | | 0.96 | % | | | 5.47 | % | | | 46 | % | | $ | 21,822 | |
| | | | | | | | | | | | | | | | | | | | | | |
| | 0.32 | % | | | 1.54 | % | | | 1.50 | % | | | 4.15 | % | | | 16 | % | | $ | 2 | |
| | 0.21 | % | | | 1.56 | % | | | 1.52 | % | | | (2.39 | )% | | | 36 | % | | $ | 3 | |
| | 0.54 | % | | | 1.71 | % | | | 1.56 | % | | | 1.03 | % | | | 42 | % | | $ | 11 | |
| | 0.62 | % | | | 1.76 | % | | | 1.61 | % | | | 1.90 | % | | | 40 | % | | $ | 51 | |
| | 0.66 | % | | | 1.82 | % | | | 1.71 | % | | | 1.39 | % | | | 39 | % | | $ | 108 | |
| | 0.97 | % | | | 1.82 | % | | | 1.70 | % | | | 4.73 | % | | | 46 | % | | $ | 242 | |
| | | | | | | | | | | | | | | | | | | | | | |
| | 0.33 | % | | | 1.60 | % | | | 1.51 | % | | | 4.14 | % | | | 16 | % | | $ | 3,079 | |
| | 0.19 | % | | | 1.63 | % | | | 1.53 | % | | | (2.44 | )% | | | 36 | % | | $ | 2,763 | |
| | 0.51 | % | | | 1.73 | % | | | 1.56 | % | | | 1.09 | % | | | 42 | % | | $ | 3,471 | |
| | 0.54 | % | | | 1.76 | % | | | 1.60 | % | | | 1.89 | % | | | 40 | % | | $ | 4,287 | |
| | 0.64 | % | | | 1.83 | % | | | 1.71 | % | | | 1.36 | % | | | 39 | % | | $ | 4,945 | |
| | 0.94 | % | | | 1.83 | % | | | 1.71 | % | | | 4.81 | % | | | 46 | % | | $ | 5,100 | |
| | | | | | | | | | | | | | | | | | | | | | |
| | 0.81 | % | | | 1.11 | % | | | 1.01 | % | | | 4.43 | % | | | 16 | % | | $ | 31 | |
| | 0.69 | % | | | 1.12 | % | | | 1.02 | % | | | (2.00 | )% | | | 36 | % | | $ | 29 | |
| | 1.01 | % | | | 1.27 | % | | | 1.06 | % | | | 1.53 | % | | | 42 | % | | $ | 28 | |
| | 1.02 | % | | | 1.27 | % | | | 1.06 | % | | | 4.61 | % | | | 40 | % | | $ | 26 | |
| | | | | | | | | | | | | | | | | | | | | | |
| | 1.39 | % | | | 0.57 | % | | | 0.45 | % | | | 4.79 | % | | | 16 | % | | $ | 272,489 | |
| | 1.27 | % | | | 0.59 | % | | | 0.45 | % | | | (1.40 | )% | | | 36 | % | | $ | 271,674 | |
| | 1.62 | % | | | 0.65 | % | | | 0.45 | % | | | 2.16 | % | | | 42 | % | | $ | 338,108 | |
| | 1.66 | % | | | 0.66 | % | | | 0.45 | % | | | 3.09 | % | | | 40 | % | | $ | 367,184 | |
| | 2.06 | % | | | 0.75 | % | | | 0.45 | % | | | (0.09 | )% | | | 39 | % | | $ | 3,073 | |
| | | | | | | | | | | | | | | | | | | | | | |
| | 1.54 | % | | | 0.42 | % | | | 0.30 | % | | | 4.79 | % | | | 16 | % | | $ | 235,630 | |
| | 1.42 | % | | | 0.43 | % | | | 0.30 | % | | | (1.25 | )% | | | 36 | % | | $ | 243,820 | |
| | 1.77 | % | | | 0.51 | % | | | 0.30 | % | | | 2.41 | % | | | 42 | % | | $ | 240,044 | |
| | 1.79 | % | | | 0.57 | % | | | 0.37 | % | | | 3.23 | % | | | 40 | % | | $ | 233,894 | |
| | 1.90 | % | | | 0.65 | % | | | 0.45 | % | | | 2.63 | % | | | 39 | % | | $ | 671,576 | |
| | 2.20 | % | | | 0.65 | % | | | 0.45 | % | | | 6.09 | % | | | 46 | % | | $ | 700,645 | |
| | | | | | | | | | | | | | | | | | | | | | |
| | 1.19 | % | | | 0.77 | % | | | 0.65 | % | | | 4.61 | % | | | 16 | % | | $ | 59,475 | |
| | 1.07 | % | | | 0.78 | % | | | 0.65 | % | | | (1.56 | )% | | | 36 | % | | $ | 61,887 | |
| | 1.42 | % | | | 0.82 | % | | | 0.65 | % | | | 1.95 | % | | | 42 | % | | $ | 99,638 | |
| | 1.45 | % | | | 0.85 | % | | | 0.69 | % | | | 2.87 | % | | | 40 | % | | $ | 116,854 | |
| | 1.54 | % | | | 0.92 | % | | | 0.80 | % | | | 2.29 | % | | | 39 | % | | $ | 139,771 | |
| | 1.84 | % | | | 0.92 | % | | | 0.80 | % | | | 5.74 | % | | | 46 | % | | $ | 121,886 | |
| 2 | Total return calculations do not include any sales charges. Returns for periods of less than one year are not annualized. |
| 3 | Portfolio turnover rate is calculated by aggregating the results of multiplying the Fund’s investment percentage in the respective affiliated Master Portfolios by the corresponding affiliated Master Portfolio’s portfolio turnover rate. |
| 4 | Calculated based upon average shares outstanding |
| 5 | For the period from June 28, 2013 (commencement of class operations) to February 28, 2014 |
| 6 | For the period from November 30, 2012 (commencement of class operations) to February 28, 2013 |
| 7 | On June 1, 2013, Institutional Class was renamed Class R6. |
The accompanying notes are an integral part of these financial statements.
| | | | |
| 62 | | Wells Fargo Dow Jones Target Date Funds | | Financial highlights |
| | | | | | | | | | | | | | | | | | | | | | | | |
| Target 2010 Fund | | Beginning
net asset
value per
share | | | Net
investment
income | | | Net realized
and unrealized
gains (losses)
on investments | | | Distributions
from net
investment
income | | | Distributions
from net
realized gains | | | Ending
net asset
value per
share | |
Class A | | | | | | | | | | | | | | | | | | | | | | | | |
Six months ended August 31, 2016 (unaudited) | | $ | 12.26 | | | | 0.08 | | | | 0.54 | | | | (0.04 | ) | | | 0.00 | | | $ | 12.84 | |
Year ended February 29, 2016 | | $ | 13.16 | | | | 0.14 | 4 | | | (0.40 | ) | | | (0.06 | ) | | | (0.58 | ) | | $ | 12.26 | |
Year ended February 28, 2015 | | $ | 13.33 | | | | 0.18 | 4 | | | 0.09 | | | | (0.17 | ) | | | (0.27 | ) | | $ | 13.16 | |
Year ended February 28, 2014 | | $ | 13.30 | | | | 0.19 | 4 | | | 0.31 | | | | (0.17 | ) | | | (0.30 | ) | | $ | 13.33 | |
Year ended February 28, 2013 | | $ | 13.26 | | | | 0.19 | 4 | | | 0.19 | | | | (0.21 | ) | | | (0.13 | ) | | $ | 13.30 | |
Year ended February 29, 2012 | | $ | 12.86 | | | | 0.21 | 4 | | | 0.43 | | | | (0.24 | ) | | | 0.00 | | | $ | 13.26 | |
Class B | | | | | | | | | | | | | | | | | | | | | | | | |
Six months ended August 31, 2016 (unaudited) | | $ | 12.43 | | | | 0.03 | 4 | | | 0.55 | | | | (0.01 | ) | | | 0.00 | | | $ | 13.00 | |
Year ended February 29, 2016 | | $ | 13.38 | | | | 0.04 | 4 | | | (0.39 | ) | | | (0.02 | ) | | | (0.58 | ) | | $ | 12.43 | |
Year ended February 28, 2015 | | $ | 13.49 | | | | 0.09 | 4 | | | 0.10 | | | | (0.03 | ) | | | (0.27 | ) | | $ | 13.38 | |
Year ended February 28, 2014 | | $ | 13.43 | | | | 0.08 | 4 | | | 0.32 | | | | (0.04 | ) | | | (0.30 | ) | | $ | 13.49 | |
Year ended February 28, 2013 | | $ | 13.37 | | | | 0.09 | 4 | | | 0.19 | | | | (0.09 | ) | | | (0.13 | ) | | $ | 13.43 | |
Year ended February 29, 2012 | | $ | 12.93 | | | | 0.12 | 4 | | | 0.44 | | | | (0.12 | ) | | | 0.00 | | | $ | 13.37 | |
Class C | | | | | | | | | | | | | | | | | | | | | | | | |
Six months ended August 31, 2016 (unaudited) | | $ | 12.42 | | | | 0.03 | | | | 0.55 | | | | (0.01 | ) | | | 0.00 | | | $ | 12.99 | |
Year ended February 29, 2016 | | $ | 13.36 | | | | 0.04 | 4 | | | (0.40 | ) | | | 0.00 | | | | (0.58 | ) | | $ | 12.42 | |
Year ended February 28, 2015 | | $ | 13.52 | | | | 0.09 | | | | 0.09 | | | | (0.07 | ) | | | (0.27 | ) | | $ | 13.36 | |
Year ended February 28, 2014 | | $ | 13.48 | | | | 0.09 | 4 | | | 0.31 | | | | (0.06 | ) | | | (0.30 | ) | | $ | 13.52 | |
Year ended February 28, 2013 | | $ | 13.44 | | | | 0.09 | | | | 0.19 | | | | (0.11 | ) | | | (0.13 | ) | | $ | 13.48 | |
Year ended February 29, 2012 | | $ | 13.03 | | | | 0.12 | 4 | | | 0.43 | | | | (0.14 | ) | | | 0.00 | | | $ | 13.44 | |
Class R | | | | | | | | | | | | | | | | | | | | | | | | |
Six months ended August 31, 2016 (unaudited) | | $ | 12.19 | | | | 0.06 | | | | 0.54 | | | | (0.03 | ) | | | 0.00 | | | $ | 12.76 | |
Year ended February 29, 2016 | | $ | 13.11 | | | | 0.11 | 4 | | | (0.41 | ) | | | (0.04 | ) | | | (0.58 | ) | | $ | 12.19 | |
Year ended February 28, 2015 | | $ | 13.28 | | | | 0.15 | 4 | | | 0.10 | | | | (0.15 | ) | | | (0.27 | ) | | $ | 13.11 | |
Year ended February 28, 20145 | | $ | 13.08 | | | | 0.10 | 4 | | | 0.58 | | | | (0.18 | ) | | | (0.30 | ) | | $ | 13.28 | |
Class R4 | | | | | | | | | | | | | | | | | | | | | | | | |
Six months ended August 31, 2016 (unaudited) | | $ | 12.38 | | | | 0.10 | 4 | | | 0.55 | | | | (0.05 | ) | | | 0.00 | | | $ | 12.98 | |
Year ended February 29, 2016 | | $ | 13.30 | | | | 0.18 | 4 | | | (0.41 | ) | | | (0.11 | ) | | | (0.58 | ) | | $ | 12.38 | |
Year ended February 28, 2015 | | $ | 13.46 | | | | 0.23 | 4 | | | 0.10 | | | | (0.22 | ) | | | (0.27 | ) | | $ | 13.30 | |
Year ended February 28, 2014 | | $ | 13.43 | | | | 0.24 | 4 | | | 0.31 | | | | (0.22 | ) | | | (0.30 | ) | | $ | 13.46 | |
Year ended February 28, 20136 | | $ | 13.56 | | | | 0.08 | | | | 0.00 | 7 | | | (0.08 | ) | | | (0.13 | ) | | $ | 13.43 | |
Class R68 | | | | | | | | | | | | | | | | | | | | | | | | |
Six months ended August 31, 2016 (unaudited) | | $ | 12.37 | | | | 0.11 | | | | 0.55 | | | | (0.06 | ) | | | 0.00 | | | $ | 12.97 | |
Year ended February 29, 2016 | | $ | 13.29 | | | | 0.19 | | | | (0.40 | ) | | | (0.13 | ) | | | (0.58 | ) | | $ | 12.37 | |
Year ended February 28, 2015 | | $ | 13.45 | | | | 0.27 | | | | 0.08 | | | | (0.24 | ) | | | (0.27 | ) | | $ | 13.29 | |
Year ended February 28, 2014 | | $ | 13.43 | | | | 0.25 | 4 | | | 0.32 | | | | (0.25 | ) | | | (0.30 | ) | | $ | 13.45 | |
Year ended February 28, 2013 | | $ | 13.39 | | | | 0.26 | | | | 0.19 | | | | (0.28 | ) | | | (0.13 | ) | | $ | 13.43 | |
Year ended February 29, 2012 | | $ | 12.97 | | | | 0.28 | | | | 0.45 | | | | (0.31 | ) | | | 0.00 | | | $ | 13.39 | |
Administrator Class | | | | | | | | | | | | | | | | | | | | | | | | |
Six months ended August 31, 2016 (unaudited) | | $ | 12.39 | | | | 0.08 | | | | 0.55 | | | | (0.04 | ) | | | 0.00 | | | $ | 12.98 | |
Year ended February 29, 2016 | | $ | 13.29 | | | | 0.16 | 4 | | | (0.41 | ) | | | (0.07 | ) | | | (0.58 | ) | | $ | 12.39 | |
Year ended February 28, 2015 | | $ | 13.46 | | | | 0.21 | | | | 0.08 | | | | (0.19 | ) | | | (0.27 | ) | | $ | 13.29 | |
Year ended February 28, 2014 | | $ | 13.42 | | | | 0.21 | 4 | | | 0.32 | | | | (0.19 | ) | | | (0.30 | ) | | $ | 13.46 | |
Year ended February 28, 2013 | | $ | 13.38 | | | | 0.21 | 4 | | | 0.19 | | | | (0.23 | ) | | | (0.13 | ) | | $ | 13.42 | |
Year ended February 29, 2012 | | $ | 12.97 | | | | 0.24 | | | | 0.43 | | | | (0.26 | ) | | | 0.00 | | | $ | 13.38 | |
| 1 | Ratios include net expenses allocated from the affiliated Master Portfolios which were as follows: |
| | | | | | | | | | | | | | | | | | | | | | | | |
| | | Six months ended August 31, 2016
(unaudited) | | | Year ended
February 29, 2016 | | | Year ended February 28 | | | Year ended
February 29, 2012 | |
| | | | | 2015 | | | 2014 | | | 2013 | | |
| | | | |
Class A | | | 0.15 | % | | | 0.15 | % | | | 0.16 | % | | | 0.19 | % | | | 0.26 | % | | | 0.26 | % |
Class B | | | 0.14 | | | | 0.14 | | | | 0.16 | | | | 0.19 | | | | 0.26 | | | | 0.26 | |
Class C | | | 0.15 | | | | 0.15 | | | | 0.16 | | | | 0.19 | | | | 0.26 | | | | 0.26 | |
Class R | | | 0.16 | | | | 0.15 | | | | 0.16 | | | | 0.19 | 5 | | | N/A | | | | N/A | |
Class R4 | | | 0.15 | | | | 0.15 | | | | 0.16 | | | | 0.19 | | | | 0.26 | 6 | | | N/A | |
Class R68 | | | 0.15 | | | | 0.15 | | | | 0.16 | | | | 0.19 | | | | 0.26 | | | | 0.26 | |
Administrator Class | | | 0.15 | | | | 0.15 | | | | 0.16 | | | | 0.19 | | | | 0.26 | | | | 0.26 | |
The accompanying notes are an integral part of these financial statements.
| | | | | | |
| Financial highlights | | Wells Fargo Dow Jones Target Date Funds | | | 63 | |
| | | | | | | | | | | | | | | | | | | | | | |
| Ratio to average net assets (annualized) | | | Total
return2 | | | Portfolio
turnover
rate3 | | | Net assets at
end of period
(000s omitted) | |
Net investment
income | | | Gross
expenses1 | | | Net
expenses1 | | | | |
| | | | | | | | | | | | | | | | | | | | | | |
| | 1.18 | % | | | 0.86 | % | | | 0.78 | % | | | 5.06 | % | | | 16 | % | | $ | 66,216 | |
| | 1.11 | % | | | 0.88 | % | | | 0.79 | % | | | (1.99 | )% | | | 36 | % | | $ | 67,826 | |
| | 1.36 | % | | | 0.99 | % | | | 0.83 | % | | | 2.11 | % | | | 41 | % | | $ | 26,753 | |
| | 1.39 | % | | | 1.02 | % | | | 0.87 | % | | | 3.87 | % | | | 40 | % | | $ | 32,012 | |
| | 1.39 | % | | | 1.08 | % | | | 0.99 | % | | | 2.92 | % | | | 37 | % | | $ | 36,462 | |
| | 1.63 | % | | | 1.08 | % | | | 0.99 | % | | | 5.05 | % | | | 43 | % | | $ | 39,691 | |
| | | | | | | | | | | | | | | | | | | | | | |
| | 0.43 | % | | | 1.59 | % | | | 1.53 | % | | | 4.65 | % | | | 16 | % | | $ | 30 | |
| | 0.34 | % | | | 1.59 | % | | | 1.53 | % | | | (2.61 | )% | | | 36 | % | | $ | 31 | |
| | 0.69 | % | | | 1.74 | % | | | 1.58 | % | | | 1.42 | % | | | 41 | % | | $ | 11 | |
| | 0.62 | % | | | 1.77 | % | | | 1.63 | % | | | 3.05 | % | | | 40 | % | | $ | 118 | |
| | 0.67 | % | | | 1.83 | % | | | 1.74 | % | | | 2.12 | % | | | 37 | % | | $ | 341 | |
| | 0.90 | % | | | 1.83 | % | | | 1.74 | % | | | 4.35 | % | | | 43 | % | | $ | 748 | |
| | | | | | | | | | | | | | | | | | | | | | |
| | 0.43 | % | | | 1.61 | % | | | 1.53 | % | | | 4.69 | % | | | 16 | % | | $ | 2,007 | |
| | 0.34 | % | | | 1.65 | % | | | 1.55 | % | | | (2.69 | )% | | | 36 | % | | $ | 1,984 | |
| | 0.61 | % | | | 1.75 | % | | | 1.58 | % | | | 1.39 | % | | | 41 | % | | $ | 2,781 | |
| | 0.64 | % | | | 1.77 | % | | | 1.62 | % | | | 3.07 | % | | | 40 | % | | $ | 2,952 | |
| | 0.64 | % | | | 1.83 | % | | | 1.74 | % | | | 2.10 | % | | | 37 | % | | $ | 3,269 | |
| | 0.88 | % | | | 1.83 | % | | | 1.74 | % | | | 4.28 | % | | | 43 | % | | $ | 3,323 | |
| | | | | | | | | | | | | | | | | | | | | | |
| | 0.93 | % | | | 1.12 | % | | | 1.03 | % | | | 4.94 | % | | | 16 | % | | $ | 54 | |
| | 0.84 | % | | | 1.16 | % | | | 1.05 | % | | | (2.27 | )% | | | 36 | % | | $ | 52 | |
| | 1.09 | % | | | 1.27 | % | | | 1.08 | % | | | 1.92 | % | | | 41 | % | | $ | 53 | |
| | 1.18 | % | | | 1.29 | % | | | 1.08 | % | | | 5.36 | % | | | 40 | % | | $ | 26 | |
| | | | | | | | | | | | | | | | | | | | | | |
| | 1.49 | % | | | 0.58 | % | | | 0.47 | % | | | 5.27 | % | | | 16 | % | | $ | 60,999 | |
| | 1.42 | % | | | 0.61 | % | | | 0.47 | % | | | (1.73 | )% | | | 36 | % | | $ | 70,528 | |
| | 1.73 | % | | | 0.66 | % | | | 0.47 | % | | | 2.55 | % | | | 41 | % | | $ | 148,668 | |
| | 1.79 | % | | | 0.67 | % | | | 0.47 | % | | | 4.24 | % | | | 40 | % | | $ | 199,432 | |
| | 2.03 | % | | | 0.75 | % | | | 0.47 | % | | | 0.63 | % | | | 37 | % | | $ | 5,555 | |
| | | | | | | | | | | | | | | | | | | | | | |
| | 1.64 | % | | | 0.43 | % | | | 0.32 | % | | | 5.33 | % | | | 16 | % | | $ | 173,261 | |
| | 1.57 | % | | | 0.45 | % | | | 0.32 | % | | | (1.59 | )% | | | 36 | % | | $ | 200,168 | |
| | 1.88 | % | | | 0.51 | % | | | 0.38 | % | | | 2.71 | % | | | 41 | % | | $ | 184,812 | |
| | 1.89 | % | | | 0.57 | % | | | 0.48 | % | | | 4.35 | % | | | 40 | % | | $ | 242,218 | |
| | 1.91 | % | | | 0.65 | % | | | 0.48 | % | | | 3.43 | % | | | 37 | % | | $ | 486,113 | |
| | 2.14 | % | | | 0.65 | % | | | 0.48 | % | | | 5.61 | % | | | 43 | % | | $ | 563,343 | |
| | | | | | | | | | | | | | | | | | | | | | |
| | 1.29 | % | | | 0.78 | % | | | 0.67 | % | | | 5.12 | % | | | 16 | % | | $ | 84,675 | |
| | 1.22 | % | | | 0.80 | % | | | 0.67 | % | | | (1.83 | )% | | | 36 | % | | $ | 91,381 | |
| | 1.53 | % | | | 0.86 | % | | | 0.67 | % | | | 2.26 | % | | | 41 | % | | $ | 168,185 | |
| | 1.55 | % | | | 0.92 | % | | | 0.71 | % | | | 4.08 | % | | | 40 | % | | $ | 201,159 | |
| | 1.54 | % | | | 0.92 | % | | | 0.83 | % | | | 3.08 | % | | | 37 | % | | $ | 241,045 | |
| | 1.79 | % | | | 0.93 | % | | | 0.83 | % | | | 5.25 | % | | | 43 | % | | $ | 190,863 | |
| 2 | Total return calculations do not include any sales charges. Returns for periods of less than one year are not annualized. |
| 3 | Portfolio turnover rate is calculated by aggregating the results of multiplying the Fund’s investment percentage in the respective affiliated Master Portfolios by the corresponding affiliated Master Portfolio’s portfolio turnover rate. |
| 4 | Calculated based upon average shares outstanding |
| 5 | For the period from June 28, 2013 (commencement of class operations) to February 28, 2014 |
| 6 | For the period from November 30, 2012 (commencement of class operations) to February 28, 2013 |
| 7 | Amount is less than $0.005. |
| 8 | On June 1, 2013, Institutional Class was renamed Class R6. |
The accompanying notes are an integral part of these financial statements.
| | | | |
| 64 | | Wells Fargo Dow Jones Target Date Funds | | Financial highlights |
| | | | | | | | | | | | | | | | | | | | | | | | |
| Target 2015 Fund | | Beginning
net asset
value per
share | | | Net
investment
income | | | Net realized
and unrealized
gains (losses)
on investments | | | Distributions
from net
investment
income | | | Distributions
from net
realized gains | | | Ending
net asset
value per
share | |
Class A | | | | | | | | | | | | | | | | | | | | | | | | |
Six months ended August 31, 2016 (unaudited) | | $ | 9.87 | | | | 0.08 | | | | 0.58 | | | | (0.04 | ) | | | 0.00 | | | $ | 10.49 | |
Year ended February 29, 2016 | | $ | 10.40 | | | | 0.15 | | | | (0.41 | ) | | | (0.09 | ) | | | (0.18 | ) | | $ | 9.87 | |
Year ended February 28, 2015 | | $ | 10.38 | | | | 0.15 | | | | 0.13 | | | | (0.14 | ) | | | (0.12 | ) | | $ | 10.40 | |
Year ended February 28, 2014 | | $ | 10.13 | | | | 0.15 | 4 | | | 0.40 | | | | (0.14 | ) | | | (0.16 | ) | | $ | 10.38 | |
Year ended February 28, 20135 | | $ | 10.11 | | | | 0.03 | 4 | | | 0.13 | | | | (0.04 | ) | | | (0.10 | ) | | $ | 10.13 | |
Class R | | | | | | | | | | | | | | | | | | | | | | | | |
Six months ended August 31, 2016 (unaudited) | | $ | 10.01 | | | | 0.07 | | | | 0.58 | | | | (0.03 | ) | | | 0.00 | | | $ | 10.63 | |
Year ended February 29, 2016 | | $ | 10.55 | | | | 0.13 | | | | (0.42 | ) | | | (0.07 | ) | | | (0.18 | ) | | $ | 10.01 | |
Year ended February 28, 2015 | | $ | 10.52 | | | | 0.12 | | | | 0.14 | | | | (0.11 | ) | | | (0.12 | ) | | $ | 10.55 | |
Year ended February 28, 20146 | | $ | 10.08 | | | | 0.08 | 4 | | | 0.57 | | | | (0.05 | ) | | | (0.16 | ) | | $ | 10.52 | |
Class R4 | | | | | | | | | | | | | | | | | | | | | | | | |
Six months ended August 31, 2016 (unaudited) | | $ | 9.91 | | | | 0.09 | | | | 0.58 | | | | (0.05 | ) | | | 0.00 | | | $ | 10.53 | |
Year ended February 29, 2016 | | $ | 10.43 | | | | 0.18 | | | | (0.41 | ) | | | (0.11 | ) | | | (0.18 | ) | | $ | 9.91 | |
Year ended February 28, 2015 | | $ | 10.40 | | | | 0.18 | | | | 0.14 | | | | (0.17 | ) | | | (0.12 | ) | | $ | 10.43 | |
Year ended February 28, 2014 | | $ | 10.14 | | | | 0.20 | | | | 0.38 | | | | (0.16 | ) | | | (0.16 | ) | | $ | 10.40 | |
Year ended February 28, 20135 | | $ | 10.11 | | | | 0.05 | 4 | | | 0.13 | | | | (0.05 | ) | | | (0.10 | ) | | $ | 10.14 | |
Class R67 | | | | | | | | | | | | | | | | | | | | | | | | |
Six months ended August 31, 2016 (unaudited) | | $ | 9.90 | | | | 0.11 | | | | 0.58 | | | | (0.06 | ) | | | 0.00 | | | $ | 10.53 | |
Year ended February 29, 2016 | | $ | 10.42 | | | | 0.20 | | | | (0.42 | ) | | | (0.12 | ) | | | (0.18 | ) | | $ | 9.90 | |
Year ended February 28, 2015 | | $ | 10.39 | | | | 0.20 | | | | 0.14 | | | | (0.19 | ) | | | (0.12 | ) | | $ | 10.42 | |
Year ended February 28, 2014 | | $ | 10.13 | | | | 0.21 | | | | 0.39 | | | | (0.18 | ) | | | (0.16 | ) | | $ | 10.39 | |
Year ended February 28, 2013 | | $ | 9.98 | | | | 0.18 | 4 | | | 0.27 | | | | (0.20 | ) | | | (0.10 | ) | | $ | 10.13 | |
Year ended February 29, 2012 | | $ | 9.81 | | | | 0.19 | | | | 0.29 | | | | (0.20 | ) | | | (0.11 | ) | | $ | 9.98 | |
Administrator Class | | | | | | | | | | | | | | | | | | | | | | | | |
Six months ended August 31, 2016 (unaudited) | | $ | 10.02 | | | | 0.08 | | | | 0.60 | | | | (0.05 | ) | | | 0.00 | | | $ | 10.65 | |
Year ended February 29, 2016 | | $ | 10.55 | | | | 0.16 | | | | (0.42 | ) | | | (0.09 | ) | | | (0.18 | ) | | $ | 10.02 | |
Year ended February 28, 2015 | | $ | 10.52 | | | | 0.17 | | | | 0.14 | | | | (0.15 | ) | | | (0.12 | ) | | $ | 10.55 | |
Year ended February 28, 2014 | | $ | 10.24 | | | | 0.16 | | | | 0.42 | | | | (0.14 | ) | | | (0.16 | ) | | $ | 10.52 | |
Year ended February 28, 2013 | | $ | 10.10 | | | | 0.15 | 4 | | | 0.26 | | | | (0.17 | ) | | | (0.10 | ) | | $ | 10.24 | |
Year ended February 29, 2012 | | $ | 9.92 | | | | 0.17 | | | | 0.29 | | | | (0.17 | ) | | | (0.11 | ) | | $ | 10.10 | |
| 1 | Ratios include net expenses allocated from the affiliated Master Portfolios which were as follows: |
| | | | | | | | | | | | | | | | | | | | | | | | |
| | | Six months ended August 31, 2016
(unaudited) | | | Year ended
February 29, 2016 | | | Year ended February 28 | | | Year ended
February 29, 2012 | |
| | | | | 2015 | | | 2014 | | | 2013 | | |
| | | | |
Class A | | | 0.16 | % | | | 0.16 | % | | | 0.16 | % | | | 0.19 | % | | | 0.26 | %5 | | | N/A | |
Class R | | | 0.16 | | | | 0.16 | | | | 0.16 | | | | 0.19 | 6 | | | N/A | | | | N/A | |
Class R4 | | | 0.16 | | | | 0.16 | | | | 0.16 | | | | 0.19 | | | | 0.26 | 5 | | | N/A | |
Class R67 | | | 0.16 | | | | 0.16 | | | | 0.16 | | | | 0.19 | | | | 0.26 | | | | 0.26 | % |
Administrator Class | | | 0.16 | | | | 0.16 | | | | 0.16 | | | | 0.19 | | | | 0.26 | | | | 0.26 | |
| 2 | Total return calculations do not include any sales charges. Returns for periods of less than one year are not annualized. |
| 3 | Portfolio turnover rate is calculated by aggregating the results of multiplying the Fund’s investment percentage in the respective affiliated Master Portfolios by the corresponding affiliated Master Portfolio’s portfolio turnover rate. |
| 4 | Calculated based upon average shares outstanding |
| 5 | For the period from November 30, 2012 (commencement of class operations) to February 28, 2013 |
| 6 | For the period from June 28, 2013 (commencement of class operations) to February 28, 2014 |
| 7 | On June 1, 2013, Institutional Class was renamed Class R6. |
The accompanying notes are an integral part of these financial statements.
| | | | | | |
| Financial highlights | | Wells Fargo Dow Jones Target Date Funds | | | 65 | |
| | | | | | | | | | | | | | | | | | | | | | |
| Ratio to average net assets (annualized) | | | Total
return2 | | | Portfolio
turnover
rate3 | | | Net assets at
end of period
(000s omitted) | |
Net investment
income | | | Gross
expenses1 | | | Net
expenses1 | | | | |
| | | | | | | | | | | | | | | | | | | | | | |
| | 1.55 | % | | | 0.86 | % | | | 0.79 | % | | | 6.71 | % | | | 15 | % | | $ | 71,977 | |
| | 1.55 | % | | | 0.85 | % | | | 0.79 | % | | | (2.54 | )% | | | 36 | % | | $ | 74,807 | |
| | 1.39 | % | | | 0.99 | % | | | 0.84 | % | | | 2.75 | % | | | 39 | % | | $ | 1,947 | |
| | 1.45 | % | | | 0.99 | % | | | 0.84 | % | | | 5.56 | % | | | 38 | % | | $ | 332 | |
| | 1.28 | % | | | 1.05 | % | | | 0.84 | % | | | 1.60 | % | | | 35 | % | | $ | 10 | |
| | | | | | | | | | | | | | | | | | | | | | |
| | 1.30 | % | | | 1.11 | % | | | 1.04 | % | | | 6.55 | % | | | 15 | % | | $ | 45 | |
| | 1.25 | % | | | 1.14 | % | | | 1.06 | % | | | (2.78 | )% | | | 36 | % | | $ | 42 | |
| | 1.16 | % | | | 1.25 | % | | | 1.09 | % | | | 2.51 | % | | | 39 | % | | $ | 50 | |
| | 1.14 | % | | | 1.26 | % | | | 1.09 | % | | | 6.51 | % | | | 38 | % | | $ | 27 | |
| | | | | | | | | | | | | | | | | | | | | | |
| | 1.86 | % | | | 0.58 | % | | | 0.48 | % | | | 6.79 | % | | | 15 | % | | $ | 118,271 | |
| | 1.83 | % | | | 0.59 | % | | | 0.48 | % | | | (2.22 | )% | | | 36 | % | | $ | 127,503 | |
| | 1.78 | % | | | 0.66 | % | | | 0.48 | % | | | 3.15 | % | | | 39 | % | | $ | 180,101 | |
| | 1.76 | % | | | 0.66 | % | | | 0.48 | % | | | 5.90 | % | | | 38 | % | | $ | 189,078 | |
| | 1.90 | % | | | 0.75 | % | | | 0.48 | % | | | 1.72 | % | | | 35 | % | | $ | 2,614 | |
| | | | | | | | | | | | | | | | | | | | | | |
| | 2.01 | % | | | 0.43 | % | | | 0.33 | % | | | 6.95 | % | | | 15 | % | | $ | 362,466 | |
| | 1.97 | % | | | 0.44 | % | | | 0.33 | % | | | (2.12 | )% | | | 36 | % | | $ | 367,041 | |
| | 1.92 | % | | | 0.51 | % | | | 0.33 | % | | | 3.31 | % | | | 39 | % | | $ | 420,676 | |
| | 1.88 | % | | | 0.55 | % | | | 0.38 | % | | | 6.04 | % | | | 38 | % | | $ | 437,620 | |
| | 1.87 | % | | | 0.65 | % | | | 0.49 | % | | | 4.56 | % | | | 35 | % | | $ | 613,945 | |
| | 2.05 | % | | | 0.65 | % | | | 0.49 | % | | | 5.06 | % | | | 40 | % | | $ | 536,453 | |
| | | | | | | | | | | | | | | | | | | | | | |
| | 1.66 | % | | | 0.78 | % | | | 0.68 | % | | | 6.75 | % | | | 15 | % | | $ | 116,041 | |
| | 1.54 | % | | | 0.78 | % | | | 0.68 | % | | | (2.45 | )% | | | 36 | % | | $ | 122,329 | |
| | 1.57 | % | | | 0.83 | % | | | 0.68 | % | | | 2.91 | % | | | 39 | % | | $ | 188,412 | |
| | 1.54 | % | | | 0.85 | % | | | 0.72 | % | | | 5.79 | % | | | 38 | % | | $ | 211,930 | |
| | 1.47 | % | | | 0.92 | % | | | 0.84 | % | | | 4.06 | % | | | 35 | % | | $ | 194,125 | |
| | 1.70 | % | | | 0.92 | % | | | 0.84 | % | | | 4.74 | % | | | 40 | % | | $ | 84,759 | |
The accompanying notes are an integral part of these financial statements.
| | | | |
| 66 | | Wells Fargo Dow Jones Target Date Funds | | Financial highlights |
| | | | | | | | | | | | | | | | | | | | | | | | |
| Target 2020 Fund | | Beginning
net asset
value per
share | | | Net
investment
income | | | Net realized
and unrealized
gains (losses)
on investments | | | Distributions
from net
investment
income | | | Distributions
from net
realized gains | | | Ending
net asset
value per
share | |
Class A | | | | | | | | | | | | | | | | | | | | | | | | |
Six months ended August 31, 2016 (unaudited) | | $ | 14.19 | | | | 0.12 | | | | 0.98 | | | | (0.06 | ) | | | 0.00 | | | $ | 15.23 | |
Year ended February 29, 2016 | | $ | 15.24 | | | | 0.22 | 4 | | | (0.81 | ) | | | (0.10 | ) | | | (0.36 | ) | | $ | 14.19 | |
Year ended February 28, 2015 | | $ | 15.14 | | | | 0.20 | 4 | | | 0.33 | | | | (0.18 | ) | | | (0.25 | ) | | $ | 15.24 | |
Year ended February 28, 2014 | | $ | 14.53 | | | | 0.20 | | | | 0.97 | | | | (0.17 | ) | | | (0.39 | ) | | $ | 15.14 | |
Year ended February 28, 2013 | | $ | 14.25 | | | | 0.20 | | | | 0.50 | | | | (0.21 | ) | | | (0.21 | ) | | $ | 14.53 | |
Year ended February 29, 2012 | | $ | 13.97 | | | | 0.21 | | | | 0.33 | | | | (0.22 | ) | | | (0.04 | ) | | $ | 14.25 | |
Class B | | | | | | | | | | | | | | | | | | | | | | | | |
Six months ended August 31, 2016 (unaudited) | | $ | 14.18 | | | | 0.06 | 4 | | | 0.98 | | | | (0.02 | ) | | | 0.00 | | | $ | 15.20 | |
Year ended February 29, 2016 | | $ | 15.25 | | | | 0.11 | 4 | | | (0.80 | ) | | | (0.02 | ) | | | (0.36 | ) | | $ | 14.18 | |
Year ended February 28, 2015 | | $ | 15.13 | | | | 0.09 | 4 | | | 0.32 | | | | (0.04 | ) | | | (0.25 | ) | | $ | 15.25 | |
Year ended February 28, 2014 | | $ | 14.47 | | | | 0.08 | 4 | | | 0.97 | | | | 0.00 | | | | (0.39 | ) | | $ | 15.13 | |
Year ended February 28, 2013 | | $ | 14.16 | | | | 0.09 | 4 | | | 0.51 | | | | (0.08 | ) | | | (0.21 | ) | | $ | 14.47 | |
Year ended February 29, 2012 | | $ | 13.85 | | | | 0.10 | 4 | | | 0.33 | | | | (0.08 | ) | | | (0.04 | ) | | $ | 14.16 | |
Class C | | | | | | | | | | | | | | | | | | | | | | | | |
Six months ended August 31, 2016 (unaudited) | | $ | 14.10 | | | | 0.06 | | | | 0.98 | | | | (0.03 | ) | | | 0.00 | | | $ | 15.11 | |
Year ended February 29, 2016 | | $ | 15.16 | | | | 0.11 | 4 | | | (0.79 | ) | | | (0.02 | ) | | | (0.36 | ) | | $ | 14.10 | |
Year ended February 28, 2015 | | $ | 15.08 | | | | 0.09 | | | | 0.32 | | | | (0.08 | ) | | | (0.25 | ) | | $ | 15.16 | |
Year ended February 28, 2014 | | $ | 14.49 | | | | 0.08 | | | | 0.97 | | | | (0.07 | ) | | | (0.39 | ) | | $ | 15.08 | |
Year ended February 28, 2013 | | $ | 14.20 | | | | 0.09 | | | | 0.51 | | | | (0.10 | ) | | | (0.21 | ) | | $ | 14.49 | |
Year ended February 29, 2012 | | $ | 13.93 | | | | 0.08 | | | | 0.35 | | | | (0.12 | ) | | | (0.04 | ) | | $ | 14.20 | |
Class R | | | | | | | | | | | | | | | | | | | | | | | | |
Six months ended August 31, 2016 (unaudited) | | $ | 14.14 | | | | 0.10 | | | | 0.98 | | | | (0.05 | ) | | | 0.00 | | | $ | 15.17 | |
Year ended February 29, 2016 | | $ | 15.18 | | | | 0.17 | 4 | | | (0.79 | ) | | | (0.06 | ) | | | (0.36 | ) | | $ | 14.14 | |
Year ended February 28, 2015 | | $ | 15.10 | | | | 0.15 | 4 | | | 0.34 | | | | (0.16 | ) | | | (0.25 | ) | | $ | 15.18 | |
Year ended February 28, 20145 | | $ | 14.48 | | | | 0.10 | 4 | | | 1.10 | | | | (0.19 | ) | | | (0.39 | ) | | $ | 15.10 | |
Class R4 | | | | | | | | | | | | | | | | | | | | | | | | |
Six months ended August 31, 2016 (unaudited) | | $ | 14.44 | | | | 0.14 | | | | 1.01 | | | | (0.08 | ) | | | 0.00 | | | $ | 15.51 | |
Year ended February 29, 2016 | | $ | 15.50 | | | | 0.26 | | | | (0.81 | ) | | | (0.15 | ) | | | (0.36 | ) | | $ | 14.44 | |
Year ended February 28, 2015 | | $ | 15.40 | | | | 0.26 | | | | 0.33 | | | | (0.24 | ) | | | (0.25 | ) | | $ | 15.50 | |
Year ended February 28, 2014 | | $ | 14.77 | | | | 0.19 | | | | 1.06 | | | | (0.23 | ) | | | (0.39 | ) | | $ | 15.40 | |
Year ended February 28, 20136 | | $ | 14.66 | | | | 0.09 | | | | 0.31 | | | | (0.08 | ) | | | (0.21 | ) | | $ | 14.77 | |
Class R67 | | | | | | | | | | | | | | | | | | | | | | | | |
Six months ended August 31, 2016 (unaudited) | | $ | 14.43 | | | | 0.15 | | | | 1.01 | | | | (0.08 | ) | | | 0.00 | | | $ | 15.51 | |
Year ended February 29, 2016 | | $ | 15.50 | | | | 0.27 | | | | (0.80 | ) | | | (0.18 | ) | | | (0.36 | ) | | $ | 14.43 | |
Year ended February 28, 2015 | | $ | 15.40 | | | | 0.28 | | | | 0.33 | | | | (0.26 | ) | | | (0.25 | ) | | $ | 15.50 | |
Year ended February 28, 2014 | | $ | 14.77 | | | | 0.27 | 4 | | | 1.00 | | | | (0.25 | ) | | | (0.39 | ) | | $ | 15.40 | |
Year ended February 28, 2013 | | $ | 14.47 | | | | 0.27 | | | | 0.52 | | | | (0.28 | ) | | | (0.21 | ) | | $ | 14.77 | |
Year ended February 29, 2012 | | $ | 14.19 | | | | 0.27 | 4 | | | 0.35 | | | | (0.30 | ) | | | (0.04 | ) | | $ | 14.47 | |
Administrator Class | | | | | | | | | | | | | | | | | | | | | | | | |
Six months ended August 31, 2016 (unaudited) | | $ | 14.40 | | | | 0.13 | | | | 1.00 | | | | (0.07 | ) | | | 0.00 | | | $ | 15.46 | |
Year ended February 29, 2016 | | $ | 15.46 | | | | 0.23 | | | | (0.81 | ) | | | (0.12 | ) | | | (0.36 | ) | | $ | 14.40 | |
Year ended February 28, 2015 | | $ | 15.36 | | | | 0.23 | | | | 0.33 | | | | (0.21 | ) | | | (0.25 | ) | | $ | 15.46 | |
Year ended February 28, 2014 | | $ | 14.73 | | | | 0.22 | | | | 0.99 | | | | (0.19 | ) | | | (0.39 | ) | | $ | 15.36 | |
Year ended February 28, 2013 | | $ | 14.44 | | | | 0.21 | | | | 0.52 | | | | (0.23 | ) | | | (0.21 | ) | | $ | 14.73 | |
Year ended February 29, 2012 | | $ | 14.15 | | | | 0.23 | | | | 0.35 | | | | (0.25 | ) | | | (0.04 | ) | | $ | 14.44 | |
| 1 | Ratios include net expenses allocated from the affiliated Master Portfolios which were as follows: |
| | | | | | | | | | | | | | | | | | | | | | | | |
| | | Six months ended August 31, 2016 (unaudited) | | | Year ended February 29, 2016 | | | Year ended February 28 | | | Year ended February 29, 2012 | |
| | | | | 2015 | | | 2014 | | | 2013 | | |
| | | | |
Class A | | | 0.16 | % | | | 0.16 | % | | | 0.16 | % | | | 0.19 | % | | | 0.26 | % | | | 0.26 | % |
Class B | | | 0.15 | | | | 0.16 | | | | 0.16 | | | | 0.19 | | | | 0.26 | | | | 0.26 | |
Class C | | | 0.16 | | | | 0.16 | | | | 0.16 | | | | 0.19 | | | | 0.26 | | | | 0.26 | |
Class R | | | 0.16 | | | | 0.16 | | | | 0.16 | | | | 0.19 | 5 | | | N/A | | | | N/A | |
Class R4 | | | 0.16 | | | | 0.16 | | | | 0.16 | | | | 0.19 | | | | 0.26 | 6 | | | N/A | |
Class R67 | | | 0.16 | | | | 0.16 | | | | 0.16 | | | | 0.19 | | | | 0.26 | | | | 0.26 | |
Administrator Class | | | 0.16 | | | | 0.16 | | | | 0.16 | | | | 0.19 | | | | 0.26 | | | | 0.26 | |
The accompanying notes are an integral part of these financial statements.
| | | | | | |
| Financial highlights | | Wells Fargo Dow Jones Target Date Funds | | | 67 | |
| | | | | | | | | | | | | | | | | | | | | | |
| Ratio to average net assets (annualized) | | | Total
return2 | | | Portfolio
turnover
rate3 | | | Net assets at
end of period
(000s omitted) | |
Net investment
income | | | Gross
expenses1 | | | Net
expenses1 | | | | |
| | | | | | | | | | | | | | | | | | | | | | |
| | 1.59 | % | | | 0.84 | % | | | 0.81 | % | | | 7.78 | % | | | 14 | % | | $ | 236,275 | |
| | 1.49 | % | | | 0.86 | % | | | 0.82 | % | | | (3.86 | )% | | | 34 | % | | $ | 230,667 | |
| | 1.34 | % | | | 0.95 | % | | | 0.86 | % | | | 3.57 | % | | | 36 | % | | $ | 64,808 | |
| | 1.32 | % | | | 0.98 | % | | | 0.90 | % | | | 8.16 | % | | | 35 | % | | $ | 75,871 | |
| | 1.36 | % | | | 1.06 | % | | | 1.01 | % | | | 5.00 | % | | | 32 | % | | $ | 74,720 | |
| | 1.45 | % | | | 1.05 | % | | | 1.01 | % | | | 3.97 | % | | | 35 | % | | $ | 74,955 | |
| | | | | | | | | | | | | | | | | | | | | | |
| | 0.85 | % | | | 1.56 | % | | | 1.56 | % | | | 7.36 | % | | | 14 | % | | $ | 33 | |
| | 0.74 | % | | | 1.63 | % | | | 1.58 | % | | | (4.55 | )% | | | 34 | % | | $ | 40 | |
| | 0.61 | % | | | 1.70 | % | | | 1.61 | % | | | 2.74 | % | | | 36 | % | | $ | 108 | |
| | 0.58 | % | | | 1.74 | % | | | 1.66 | % | | | 7.34 | % | | | 35 | % | | $ | 238 | |
| | 0.63 | % | | | 1.81 | % | | | 1.76 | % | | | 4.27 | % | | | 32 | % | | $ | 599 | |
| | 0.78 | % | | | 1.80 | % | | | 1.76 | % | | | 3.11 | % | | | 35 | % | | $ | 1,048 | |
| | | | | | | | | | | | | | | | | | | | | | |
| | 0.84 | % | | | 1.59 | % | | | 1.56 | % | | | 7.38 | % | | | 14 | % | | $ | 6,878 | |
| | 0.74 | % | | | 1.62 | % | | | 1.58 | % | | | (4.50 | )% | | | 34 | % | | $ | 6,355 | |
| | 0.59 | % | | | 1.70 | % | | | 1.61 | % | | | 2.71 | % | | | 36 | % | | $ | 5,509 | |
| | 0.57 | % | | | 1.73 | % | | | 1.65 | % | | | 7.36 | % | | | 35 | % | | $ | 5,208 | |
| | 0.61 | % | | | 1.81 | % | | | 1.76 | % | | | 4.28 | % | | | 32 | % | | $ | 4,514 | |
| | 0.68 | % | | | 1.81 | % | | | 1.76 | % | | | 3.14 | % | | | 35 | % | | $ | 4,600 | |
| | | | | | | | | | | | | | | | | | | | | | |
| | 1.34 | % | | | 1.09 | % | | | 1.06 | % | | | 7.66 | % | | | 14 | % | | $ | 475 | |
| | 1.25 | % | | | 1.14 | % | | | 1.08 | % | | | (4.08 | )% | | | 34 | % | | $ | 409 | |
| | 1.00 | % | | | 1.21 | % | | | 1.11 | % | | | 3.30 | % | | | 36 | % | | $ | 744 | |
| | 1.07 | % | | | 1.24 | % | | | 1.11 | % | | | 8.37 | % | | | 35 | % | | $ | 27 | |
| | | | | | | | | | | | | | | | | | | | | | |
| | 1.90 | % | | | 0.56 | % | | | 0.50 | % | | | 7.95 | % | | | 14 | % | | $ | 404,139 | |
| | 1.82 | % | | | 0.58 | % | | | 0.50 | % | | | (3.52 | )% | | | 34 | % | | $ | 408,501 | |
| | 1.72 | % | | | 0.62 | % | | | 0.50 | % | | | 3.89 | % | | | 36 | % | | $ | 772,604 | |
| | 1.70 | % | | | 0.63 | % | | | 0.50 | % | | | 8.58 | % | | | 35 | % | | $ | 803,141 | |
| | 1.72 | % | | | 0.73 | % | | | 0.50 | % | | | 2.79 | % | | | 32 | % | | $ | 23,050 | |
| | | | | | | | | | | | | | | | | | | | | | |
| | 2.04 | % | | | 0.41 | % | | | 0.35 | % | | | 8.07 | % | | | 14 | % | | $ | 1,327,175 | |
| | 1.97 | % | | | 0.43 | % | | | 0.35 | % | | | (3.42 | )% | | | 34 | % | | $ | 1,116,419 | |
| | 1.85 | % | | | 0.47 | % | | | 0.35 | % | | | 4.04 | % | | | 36 | % | | $ | 1,114,670 | |
| | 1.88 | % | | | 0.53 | % | | | 0.40 | % | | | 8.72 | % | | | 35 | % | | $ | 1,065,417 | |
| | 1.85 | % | | | 0.63 | % | | | 0.50 | % | | | 5.60 | % | | | 32 | % | | $ | 1,605,032 | |
| | 1.95 | % | | | 0.63 | % | | | 0.50 | % | | | 4.47 | % | | | 35 | % | | $ | 1,540,045 | |
| | | | | | | | | | | | | | | | | | | | | | |
| | 1.70 | % | | | 0.76 | % | | | 0.70 | % | | | 7.84 | % | | | 14 | % | | $ | 513,090 | |
| | 1.62 | % | | | 0.77 | % | | | 0.70 | % | | | (3.72 | )% | | | 34 | % | | $ | 526,327 | |
| | 1.50 | % | | | 0.79 | % | | | 0.70 | % | | | 3.69 | % | | | 36 | % | | $ | 670,893 | |
| | 1.52 | % | | | 0.82 | % | | | 0.74 | % | | | 8.35 | % | | | 35 | % | | $ | 746,910 | |
| | 1.47 | % | | | 0.90 | % | | | 0.85 | % | | | 5.19 | % | | | 32 | % | | $ | 688,261 | |
| | 1.63 | % | | | 0.90 | % | | | 0.85 | % | | | 4.17 | % | | | 35 | % | | $ | 468,494 | |
| 2 | Total return calculations do not include any sales charges. Returns for periods of less than one year are not annualized. |
| 3 | Portfolio turnover rate is calculated by aggregating the results of multiplying the Fund’s investment percentage in the respective affiliated Master Portfolio by the corresponding affiliated Master Portfolio’s portfolio turnover rate. |
| 4 | Calculated based upon average shares outstanding |
| 5 | For the period from June 28, 2013 (commencement of class operations) to February 28, 2014 |
| 6 | For the period from November 30, 2012 (commencement of class operations) to February 28, 2013 |
| 7 | On June 1, 2013, Institutional Class was renamed Class R6. |
The accompanying notes are an integral part of these financial statements.
| | | | |
| 68 | | Wells Fargo Dow Jones Target Date Funds | | Financial highlights |
| | | | | | | | | | | | | | | | | | | | | | | | |
| Target 2025 Fund | | Beginning
net asset
value per
share | | | Net
investment
income | | | Net realized
and unrealized
gains (losses)
on investments | | | Distributions
from net
investment
income | | | Distributions
from net
realized gains | | | Ending
net asset
value per
share | |
Class A | | | | | | | | | | | | | | | | | | | | | | | | |
Six months ended August 31, 2016 (unaudited) | | $ | 9.77 | | | | 0.08 | | | | 0.83 | | | | (0.05 | ) | | | 0.00 | | | $ | 10.63 | |
Year ended February 29, 2016 | | $ | 10.69 | | | | 0.14 | 4 | | | (0.73 | ) | | | (0.08 | ) | | | (0.25 | ) | | $ | 9.77 | |
Year ended February 28, 2015 | | $ | 10.56 | | | | 0.13 | | | | 0.33 | | | | (0.13 | ) | | | (0.20 | ) | | $ | 10.69 | |
Year ended February 28, 2014 | | $ | 9.95 | | | | 0.15 | | | | 0.92 | | | | (0.13 | ) | | | (0.33 | ) | | $ | 10.56 | |
Year ended February 28, 20135 | | $ | 9.83 | | | | 0.04 | | | | 0.33 | | | | (0.05 | ) | | | (0.20 | ) | | $ | 9.95 | |
Class R | | | | | | | | | | | | | | | | | | | | | | | | |
Six months ended August 31, 2016 (unaudited) | | $ | 9.79 | | | | 0.07 | 4 | | | 0.82 | | | | (0.04 | ) | | | 0.00 | | | $ | 10.64 | |
Year ended February 29, 2016 | | $ | 10.71 | | | | 0.13 | | | | (0.73 | ) | | | (0.07 | ) | | | (0.25 | ) | | $ | 9.79 | |
Year ended February 28, 2015 | | $ | 10.57 | | | | 0.11 | | | | 0.33 | | | | (0.10 | ) | | | (0.20 | ) | | $ | 10.71 | |
Year ended February 28, 20146 | | $ | 9.95 | | | | 0.07 | | | | 0.94 | | | | (0.06 | ) | | | (0.33 | ) | | $ | 10.57 | |
Class R4 | | | | | | | | | | | | | | | | | | | | | | | | |
Six months ended August 31, 2016 (unaudited) | | $ | 9.80 | | | | 0.10 | | | | 0.83 | | | | (0.06 | ) | | | 0.00 | | | $ | 10.67 | |
Year ended February 29, 2016 | | $ | 10.72 | | | | 0.18 | | | | (0.73 | ) | | | (0.12 | ) | | | (0.25 | ) | | $ | 9.80 | |
Year ended February 28, 2015 | | $ | 10.58 | | | | 0.17 | | | | 0.33 | | | | (0.16 | ) | | | (0.20 | ) | | $ | 10.72 | |
Year ended February 28, 2014 | | $ | 9.97 | | | | 0.15 | | | | 0.95 | | | | (0.16 | ) | | | (0.33 | ) | | $ | 10.58 | |
Year ended February 28, 20135 | | $ | 9.83 | | | | 0.06 | | | | 0.33 | | | | (0.05 | ) | | | (0.20 | ) | | $ | 9.97 | |
Class R67 | | | | | | | | | | | | | | | | | | | | | | | | |
Six months ended August 31, 2016 (unaudited) | | $ | 9.80 | | | | 0.11 | | | | 0.81 | | | | (0.06 | ) | | | 0.00 | | | $ | 10.66 | |
Year ended February 29, 2016 | | $ | 10.71 | | | | 0.20 | | | | (0.73 | ) | | | (0.13 | ) | | | (0.25 | ) | | $ | 9.80 | |
Year ended February 28, 2015 | | $ | 10.57 | | | | 0.19 | | | | 0.33 | | | | (0.18 | ) | | | (0.20 | ) | | $ | 10.71 | |
Year ended February 28, 2014 | | $ | 9.96 | | | | 0.19 | | | | 0.92 | | �� | | (0.17 | ) | | | (0.33 | ) | | $ | 10.57 | |
Year ended February 28, 2013 | | $ | 9.71 | | | | 0.18 | | | | 0.45 | | | | (0.18 | ) | | | (0.20 | ) | | $ | 9.96 | |
Year ended February 29, 2012 | | $ | 9.79 | | | | 0.17 | 4 | | | 0.16 | | | | (0.18 | ) | | | (0.23 | ) | | $ | 9.71 | |
Administrator Class | | | | | | | | | | | | | | | | | | | | | | | | |
Six months ended August 31, 2016 (unaudited) | | $ | 9.82 | | | | 0.09 | | | | 0.82 | | | | (0.05 | ) | | | 0.00 | | | $ | 10.68 | |
Year ended February 29, 2016 | | $ | 10.74 | | | | 0.16 | | | | (0.73 | ) | | | (0.09 | ) | | | (0.25 | ) | | $ | 9.82 | |
Year ended February 28, 2015 | | $ | 10.60 | | | | 0.15 | | | | 0.33 | | | | (0.14 | ) | | | (0.20 | ) | | $ | 10.74 | |
Year ended February 28, 2014 | | $ | 9.98 | | | | 0.15 | | | | 0.94 | | | | (0.14 | ) | | | (0.33 | ) | | $ | 10.60 | |
Year ended February 28, 2013 | | $ | 9.74 | | | | 0.14 | 4 | | | 0.45 | | | | (0.15 | ) | | | (0.20 | ) | | $ | 9.98 | |
Year ended February 29, 2012 | | $ | 9.81 | | | | 0.14 | 4 | | | 0.17 | | | | (0.15 | ) | | | (0.23 | ) | | $ | 9.74 | |
| 1 | Ratios include net expenses allocated from the affiliated Master Portfolios which were as follows: |
| | | | | | | | | | | | | | | | | | | | | | | | |
| | | Six months ended
August 31, 2016
(unaudited) | | | Year ended
February 29, 2016 | | | Year ended February 28 | | | Year ended
February 29, 2012 | |
| | | | | 2015 | | | 2014 | | | 2013 | | |
| | | | |
Class A | | | 0.16 | % | | | 0.16 | % | | | 0.16 | % | | | 0.19 | % | | | 0.26 | %5 | | | N/A | |
Class R | | | 0.16 | | | | 0.16 | | | | 0.16 | | | | 0.19 | 6 | | | N/A | | | | N/A | |
Class R4 | | | 0.16 | | | | 0.16 | | | | 0.16 | | | | 0.19 | | | | 0.26 | 5 | | | N/A | |
Class R67 | | | 0.16 | | | | 0.16 | | | | 0.16 | | | | 0.19 | | | | 0.26 | | | | 0.26 | % |
Administrator Class | | | 0.16 | | | | 0.16 | | | | 0.16 | | | | 0.19 | | | | 0.26 | | | | 0.26 | |
| 2 | Total return calculations do not include any sales charges. Returns for periods of less than one year are not annualized. |
| 3 | Portfolio turnover rate is calculated by aggregating the results of multiplying the Fund’s investment percentage in the respective affiliated Master Portfolios by the corresponding affiliated Master Portfolio’s portfolio turnover rate. |
| 4 | Calculated based upon average shares outstanding |
| 5 | For the period from November 30, 2012 (commencement of class operations) to February 28, 2013 |
| 6 | For the period from June 28, 2013 (commencement of class operations) to February 28, 2014 |
| 7 | On June 1, 2013, Institutional Class was renamed Class R6. |
The accompanying notes are an integral part of these financial statements.
| | | | | | |
| Financial highlights | | Wells Fargo Dow Jones Target Date Funds | | | 69 | |
| | | | | | | | | | | | | | | | | | | | | | |
| Ratio to average net assets (annualized) | | | Total
return2 | | | Portfolio
turnover
rate3 | | | Net assets at
end of period
(000s omitted) | |
Net investment
income | | | Gross
expenses1 | | | Net
expenses1 | | | | |
| | | | | | | | | | | | | | | | | | | | | | |
| | 1.62 | % | | | 0.84 | % | | | 0.81 | % | | | 9.30 | % | | | 12 | % | | $ | 172,919 | |
| | 1.40 | % | | | 0.84 | % | | | 0.81 | % | | | (5.56 | )% | | | 32 | % | | $ | 175,373 | |
| | 1.25 | % | | | 0.96 | % | | | 0.86 | % | | | 4.46 | % | | | 31 | % | | $ | 3,193 | |
| | 1.28 | % | | | 0.97 | % | | | 0.86 | % | | | 10.99 | % | | | 32 | % | | $ | 1,379 | |
| | 1.01 | % | | | 1.06 | % | | | 0.86 | % | | | 3.92 | % | | | 28 | % | | $ | 159 | |
| | | | | | | | | | | | | | | | | | | | | | |
| | 1.40 | % | | | 1.09 | % | | | 1.06 | % | | | 9.07 | % | | | 12 | % | | $ | 619 | |
| | 1.20 | % | | | 1.13 | % | | | 1.08 | % | | | (5.72 | )% | | | 32 | % | | $ | 830 | |
| | 0.85 | % | | | 1.21 | % | | | 1.11 | % | | | 4.24 | % | | | 31 | % | | $ | 1,032 | |
| | 0.96 | % | | | 1.22 | % | | | 1.11 | % | | | 10.27 | % | | | 32 | % | | $ | 28 | |
| | | | | | | | | | | | | | | | | | | | | | |
| | 1.93 | % | | | 0.56 | % | | | 0.50 | % | | | 9.49 | % | | | 12 | % | | $ | 265,135 | |
| | 1.78 | % | | | 0.58 | % | | | 0.50 | % | | | (5.26 | )% | | | 32 | % | | $ | 279,663 | |
| | 1.65 | % | | | 0.63 | % | | | 0.50 | % | | | 4.87 | % | | | 31 | % | | $ | 379,384 | |
| | 1.60 | % | | | 0.63 | % | | | 0.50 | % | | | 11.29 | % | | | 32 | % | | $ | 354,137 | |
| | 1.51 | % | | | 0.73 | % | | | 0.50 | % | | | 4.13 | % | | | 28 | % | | $ | 4,210 | |
| | | | | | | | | | | | | | | | | | | | | | |
| | 2.08 | % | | | 0.41 | % | | | 0.35 | % | | | 9.44 | % | | | 12 | % | | $ | 1,554,978 | |
| | 1.92 | % | | | 0.43 | % | | | 0.35 | % | | | (5.02 | )% | | | 32 | % | | $ | 1,416,984 | |
| | 1.79 | % | | | 0.48 | % | | | 0.35 | % | | | 5.03 | % | | | 31 | % | | $ | 1,481,264 | |
| | 1.78 | % | | | 0.52 | % | | | 0.39 | % | | | 11.42 | % | | | 32 | % | | $ | 1,409,281 | |
| | 1.83 | % | | | 0.63 | % | | | 0.50 | % | | | 6.74 | % | | | 28 | % | | $ | 1,577,058 | |
| | 1.83 | % | | | 0.64 | % | | | 0.50 | % | | | 3.77 | % | | | 31 | % | | $ | 1,431,120 | |
| | | | | | | | | | | | | | | | | | | | | | |
| | 1.73 | % | | | 0.76 | % | | | 0.70 | % | | | 9.30 | % | | | 12 | % | | $ | 321,923 | |
| | 1.58 | % | | | 0.77 | % | | | 0.70 | % | | | (5.45 | )% | | | 32 | % | | $ | 298,492 | |
| | 1.45 | % | | | 0.80 | % | | | 0.70 | % | | | 4.65 | % | | | 31 | % | | $ | 350,823 | |
| | 1.43 | % | | | 0.82 | % | | | 0.74 | % | | | 11.11 | % | | | 32 | % | | $ | 354,050 | |
| | 1.42 | % | | | 0.90 | % | | | 0.85 | % | | | 6.27 | % | | | 28 | % | | $ | 271,593 | |
| | 1.47 | % | | | 0.91 | % | | | 0.85 | % | | | 3.49 | % | | | 31 | % | | $ | 111,673 | |
The accompanying notes are an integral part of these financial statements.
| | | | |
| 70 | | Wells Fargo Dow Jones Target Date Funds | | Financial highlights |
| | | | | | | | | | | | | | | | | | | | | | | | |
| Target 2030 Fund | | Beginning
net asset
value per
share | | | Net
investment
income | | | Net realized
and unrealized
gains (losses)
on investments | | | Distributions
from net
investment
income | | | Distributions
from net
realized gains | | | Ending
net asset
value per
share | |
Class A | | | | | | | | | | | | | | | | | | | | | | | | |
Six months ended August 31, 2016 (unaudited) | | $ | 15.17 | | | | 0.14 | | | | 1.49 | | | | 0.00 | | | | 0.00 | | | $ | 16.80 | |
Year ended February 29, 2016 | | $ | 16.97 | | | | 0.21 | 4 | | | (1.44 | ) | | | (0.14 | ) | | | (0.43 | ) | | $ | 15.17 | |
Year ended February 28, 2015 | | $ | 16.61 | | | | 0.22 | | | | 0.67 | | | | (0.19 | ) | | | (0.34 | ) | | $ | 16.97 | |
Year ended February 28, 2014 | | $ | 15.31 | | | | 0.20 | | | | 1.83 | | | | (0.19 | ) | | | (0.54 | ) | | $ | 16.61 | |
Year ended February 28, 2013 | | $ | 14.74 | | | | 0.20 | | | | 0.85 | | | | (0.20 | ) | | | (0.28 | ) | | $ | 15.31 | |
Year ended February 29, 2012 | | $ | 14.81 | | | | 0.17 | 4 | | | 0.13 | | | | (0.18 | ) | | | (0.19 | ) | | $ | 14.74 | |
Class B | | | | | | | | | | | | | | | | | | | | | | | | |
Six months ended August 31, 2016 (unaudited) | | $ | 14.95 | | | | 0.08 | 4 | | | 1.47 | | | | 0.00 | | | | 0.00 | | | $ | 16.50 | |
Year ended February 29, 2016 | | $ | 16.75 | | | | 0.10 | 4 | | | (1.42 | ) | | | (0.05 | ) | | | (0.43 | ) | | $ | 14.95 | |
Year ended February 28, 2015 | | $ | 16.36 | | | | 0.09 | 4 | | | 0.66 | | | | (0.02 | ) | | | (0.34 | ) | | $ | 16.75 | |
Year ended February 28, 2014 | | $ | 15.08 | | | | 0.08 | 4 | | | 1.80 | | | | (0.06 | ) | | | (0.54 | ) | | $ | 16.36 | |
Year ended February 28, 2013 | | $ | 14.49 | | | | 0.08 | 4 | | | 0.86 | | | | (0.07 | ) | | | (0.28 | ) | | $ | 15.08 | |
Year ended February 29, 2012 | | $ | 14.53 | | | | 0.07 | 4 | | | 0.12 | | | | (0.04 | ) | | | (0.19 | ) | | $ | 14.49 | |
Class C | | | | | | | | | | | | | | | | | | | | | | | | |
Six months ended August 31, 2016 (unaudited) | | $ | 14.79 | | | | 0.07 | | | | 1.46 | | | | 0.00 | | | | 0.00 | | | $ | 16.32 | |
Year ended February 29, 2016 | | $ | 16.58 | | | | 0.10 | | | | (1.41 | ) | | | (0.05 | ) | | | (0.43 | ) | | $ | 14.79 | |
Year ended February 28, 2015 | | $ | 16.25 | | | | 0.08 | | | | 0.67 | | | | (0.08 | ) | | | (0.34 | ) | | $ | 16.58 | |
Year ended February 28, 2014 | | $ | 15.00 | | | | 0.08 | | | | 1.79 | | | | (0.08 | ) | | | (0.54 | ) | | $ | 16.25 | |
Year ended February 28, 2013 | | $ | 14.45 | | | | 0.08 | | | | 0.85 | | | | (0.10 | ) | | | (0.28 | ) | | $ | 15.00 | |
Year ended February 29, 2012 | | $ | 14.53 | | | | 0.06 | 4 | | | 0.14 | | | | (0.09 | ) | | | (0.19 | ) | | $ | 14.45 | |
Class R | | | | | | | | | | | | | | | | | | | | | | | | |
Six months ended August 31, 2016 (unaudited) | | $ | 15.14 | | | | 0.11 | | | | 1.49 | | | | 0.00 | | | | 0.00 | | | $ | 16.74 | |
Year ended February 29, 2016 | | $ | 16.95 | | | | 0.18 | | | | (1.44 | ) | | | (0.12 | ) | | | (0.43 | ) | | $ | 15.14 | |
Year ended February 28, 2015 | | $ | 16.61 | | | | 0.13 | 4 | | | 0.71 | | | | (0.16 | ) | | | (0.34 | ) | | $ | 16.95 | |
Year ended February 28, 20145 | | $ | 15.39 | | | | 0.10 | | | | 1.75 | | | | (0.09 | ) | | | (0.54 | ) | | $ | 16.61 | |
Class R4 | | | | | | | | | | | | | | | | | | | | | | | | |
Six months ended August 31, 2016 (unaudited) | | $ | 15.38 | | | | 0.17 | | | | 1.51 | | | | 0.00 | | | | 0.00 | | | $ | 17.06 | |
Year ended February 29, 2016 | | $ | 17.20 | | | | 0.28 | | | | (1.47 | ) | | | (0.20 | ) | | | (0.43 | ) | | $ | 15.38 | |
Year ended February 28, 2015 | | $ | 16.83 | | | | 0.26 | | | | 0.70 | | | | (0.25 | ) | | | (0.34 | ) | | $ | 17.20 | |
Year ended February 28, 2014 | | $ | 15.50 | | | | 0.23 | | | | 1.89 | | | | (0.25 | ) | | | (0.54 | ) | | $ | 16.83 | |
Year ended February 28, 20136 | | $ | 15.07 | | | | 0.08 | | | | 0.71 | | | | (0.08 | ) | | | (0.28 | ) | | $ | 15.50 | |
Class R67 | | | | | | | | | | | | | | | | | | | | | | | | |
Six months ended August 31, 2016 (unaudited) | | $ | 15.37 | | | | 0.18 | | | | 1.51 | | | | 0.00 | | | | 0.00 | | | $ | 17.06 | |
Year ended February 29, 2016 | | $ | 17.19 | | | | 0.30 | | | | (1.46 | ) | | | (0.23 | ) | | | (0.43 | ) | | $ | 15.37 | |
Year ended February 28, 2015 | | $ | 16.81 | | | | 0.28 | | | | 0.72 | | | | (0.28 | ) | | | (0.34 | ) | | $ | 17.19 | |
Year ended February 28, 2014 | | $ | 15.49 | | | | 0.29 | 4 | | | 1.84 | | | | (0.27 | ) | | | (0.54 | ) | | $ | 16.81 | |
Year ended February 28, 2013 | | $ | 14.91 | | | | 0.27 | | | | 0.86 | | | | (0.27 | ) | | | (0.28 | ) | | $ | 15.49 | |
Year ended February 29, 2012 | | $ | 14.98 | | | | 0.25 | 4 | | | 0.12 | | | | (0.25 | ) | | | (0.19 | ) | | $ | 14.91 | |
Administrator Class | | | | | | | | | | | | | | | | | | | | | | | | |
Six months ended August 31, 2016 (unaudited) | | $ | 15.37 | | | | 0.15 | | | | 1.51 | | | | 0.00 | | | | 0.00 | | | $ | 17.03 | |
Year ended February 29, 2016 | | $ | 17.19 | | | | 0.25 | | | | (1.47 | ) | | | (0.17 | ) | | | (0.43 | ) | | $ | 15.37 | |
Year ended February 28, 2015 | | $ | 16.82 | | | | 0.23 | | | | 0.70 | | | | (0.22 | ) | | | (0.34 | ) | | $ | 17.19 | |
Year ended February 28, 2014 | | $ | 15.49 | | | | 0.23 | | | | 1.86 | | | | (0.22 | ) | | | (0.54 | ) | | $ | 16.82 | |
Year ended February 28, 2013 | | $ | 14.91 | | | | 0.21 | | | | 0.88 | | | | (0.23 | ) | | | (0.28 | ) | | $ | 15.49 | |
Year ended February 29, 2012 | | $ | 14.98 | | | | 0.20 | 4 | | | 0.13 | | | | (0.21 | ) | | | (0.19 | ) | | $ | 14.91 | |
| 1 | Ratios include net expenses allocated from the affiliated Master Portfolios which were as follows: |
| | | | | | | | | | | | | | | | | | | | | | | | |
| | | Six months ended August 31, 2016
(unaudited) | | | Year ended
February 29, 2016 | | | Year ended February 28 | | | Year ended
February 29, 2012 | |
| | | | | 2015 | | | 2014 | | | 2013 | | |
| | | | |
Class A | | | 0.16 | % | | | 0.16 | % | | | 0.16 | % | | | 0.19 | % | | | 0.27 | % | | | 0.27 | % |
Class B | | | 0.15 | | | | 0.16 | | | | 0.16 | | | | 0.19 | | | | 0.27 | | | | 0.27 | |
Class C | | | 0.16 | | | | 0.16 | | | | 0.16 | | | | 0.19 | | | | 0.27 | | | | 0.27 | |
Class R | | | 0.16 | | | | 0.16 | | | | 0.16 | | | | 0.19 | 5 | | | N/A | | | | N/A | |
Class R4 | | | 0.16 | | | | 0.16 | | | | 0.16 | | | | 0.19 | | | | 0.27 | 6 | | | N/A | |
Class R67 | | | 0.16 | | | | 0.16 | | | | 0.16 | | | | 0.19 | | | | 0.27 | | | | 0.27 | |
Administrator Class | | | 0.16 | | | | 0.16 | | | | 0.16 | | | | 0.19 | | | | 0.27 | | | | 0.27 | |
The accompanying notes are an integral part of these financial statements.
| | | | | | |
| Financial highlights | | Wells Fargo Dow Jones Target Date Funds | | | 71 | |
| | | | | | | | | | | | | | | | | | | | | | |
| Ratio to average net assets (annualized) | | | Total
return2 | | | Portfolio
turnover
rate3 | | | Net assets at
end of period
(000s omitted)3 | |
Net investment
income | | | Gross
expenses1 | | | Net
expenses1 | | | | |
| | | | | | | | | | | | | | | | | | | | | | |
| | 1.63 | % | | | 0.84 | % | | | 0.82 | % | | | 10.74 | % | | | 9 | % | | $ | 238,877 | |
| | 1.32 | % | | | 0.86 | % | | | 0.83 | % | | | (7.37 | )% | | | 30 | % | | $ | 227,928 | |
| | 1.22 | % | | | 0.95 | % | | | 0.87 | % | | | 5.44 | % | | | 26 | % | | $ | 60,747 | |
| | 1.22 | % | | | 0.98 | % | | | 0.91 | % | | | 13.52 | % | | | 29 | % | | $ | 65,634 | |
| | 1.29 | % | | | 1.06 | % | | | 1.02 | % | | | 7.28 | % | | | 25 | % | | $ | 60,857 | |
| | 1.21 | % | | | 1.06 | % | | | 1.02 | % | | | 2.27 | % | | | 26 | % | | $ | 60,087 | |
| | | | | | | | | | | | | | | | | | | | | | |
| | 1.02 | % | | | 1.57 | % | | | 1.57 | % | | | 10.37 | % | | | 9 | % | | $ | 20 | |
| | 0.65 | % | | | 1.62 | % | | | 1.59 | % | | | (8.03 | )% | | | 30 | % | | $ | 81 | |
| | 0.53 | % | | | 1.70 | % | | | 1.62 | % | | | 4.64 | % | | | 26 | % | | $ | 117 | |
| | 0.50 | % | | | 1.74 | % | | | 1.67 | % | | | 12.65 | % | | | 29 | % | | $ | 290 | |
| | 0.57 | % | | | 1.81 | % | | | 1.77 | % | | | 6.54 | % | | | 25 | % | | $ | 463 | |
| | 0.50 | % | | | 1.81 | % | | | 1.77 | % | | | 1.43 | % | | | 26 | % | | $ | 872 | |
| | | | | | | | | | | | | | | | | | | | | | |
| | 0.88 | % | | | 1.59 | % | | | 1.57 | % | | | 10.34 | % | | | 9 | % | | $ | 4,946 | |
| | 0.63 | % | | | 1.63 | % | | | 1.59 | % | | | (8.05 | )% | | | 30 | % | | $ | 4,662 | |
| | 0.45 | % | | | 1.70 | % | | | 1.62 | % | | | 4.67 | % | | | 26 | % | | $ | 5,020 | |
| | 0.47 | % | | | 1.73 | % | | | 1.66 | % | | | 12.64 | % | | | 29 | % | | $ | 4,097 | |
| | 0.53 | % | | | 1.82 | % | | | 1.77 | % | | | 6.52 | % | | | 25 | % | | $ | 3,465 | |
| | 0.45 | % | | | 1.82 | % | | | 1.77 | % | | | 1.47 | % | | | 26 | % | | $ | 3,120 | |
| | | | | | | | | | | | | | | | | | | | | | |
| | 1.38 | % | | | 1.09 | % | | | 1.07 | % | | | 10.57 | % | | | 9 | % | | $ | 951 | |
| | 1.11 | % | | | 1.12 | % | | | 1.08 | % | | | (7.57 | )% | | | 30 | % | | $ | 853 | |
| | 0.72 | 4% | | | 1.22 | % | | | 1.12 | % | | | 5.15 | % | | | 26 | % | | $ | 603 | |
| | 0.87 | % | | | 1.22 | % | | | 1.12 | % | | | 12.19 | % | | | 29 | % | | $ | 28 | |
| | | | | | | | | | | | | | | | | | | | | | |
| | 1.94 | % | | | 0.56 | % | | | 0.51 | % | | | 10.92 | % | | | 9 | % | | $ | 511,277 | |
| | 1.73 | % | | | 0.58 | % | | | 0.51 | % | | | (7.07 | )% | | | 30 | % | | $ | 513,864 | |
| | 1.57 | % | | | 0.62 | % | | | 0.51 | % | | | 5.82 | % | | | 26 | % | | $ | 897,425 | |
| | 1.53 | % | | | 0.63 | % | | | 0.51 | % | | | 13.99 | % | | | 29 | % | | $ | 850,913 | |
| | 1.35 | % | | | 0.73 | % | | | 0.51 | % | | | 5.34 | % | | | 25 | % | | $ | 19,568 | |
| | | | | | | | | | | | | | | | | | | | | | |
| | 2.09 | % | | | 0.41 | % | | | 0.36 | % | | | 11.00 | % | | | 9 | % | | $ | 1,414,234 | |
| | 1.85 | % | | | 0.43 | % | | | 0.36 | % | | | (6.93 | )% | | | 30 | % | | $ | 1,284,324 | |
| | 1.72 | % | | | 0.47 | % | | | 0.36 | % | | | 6.04 | % | | | 26 | % | | $ | 1,185,077 | |
| | 1.76 | % | | | 0.53 | % | | | 0.41 | % | | | 14.08 | % | | | 29 | % | | $ | 1,049,122 | |
| | 1.80 | % | | | 0.64 | % | | | 0.51 | % | | | 7.82 | % | | | 25 | % | | $ | 1,478,163 | |
| | 1.71 | % | | | 0.64 | % | | | 0.51 | % | | | 2.78 | % | | | 26 | % | | $ | 1,335,729 | |
| | | | | | | | | | | | | | | | | | | | | | |
| | 1.75 | % | | | 0.76 | % | | | 0.71 | % | | | 10.80 | % | | | 9 | % | | $ | 512,115 | |
| | 1.52 | % | | | 0.77 | % | | | 0.71 | % | | | (7.27 | )% | | | 30 | % | | $ | 498,554 | |
| | 1.38 | % | | | 0.79 | % | | | 0.71 | % | | | 5.61 | % | | | 26 | % | | $ | 643,336 | |
| | 1.38 | % | | | 0.82 | % | | | 0.75 | % | | | 13.74 | % | | | 29 | % | | $ | 685,421 | |
| | 1.43 | % | | | 0.91 | % | | | 0.86 | % | | | 7.46 | % | | | 25 | % | | $ | 572,735 | |
| | 1.37 | % | | | 0.91 | % | | | 0.86 | % | | | 2.41 | % | | | 26 | % | | $ | 395,067 | |
| 2 | Total return calculations do not include any sales charges. Returns for periods of less than one year are not annualized. |
| 3 | Portfolio turnover rate is calculated by aggregating the results of multiplying the Fund’s investment percentage in the respective affiliated Master Portfolios by the corresponding affiliated Master Portfolio’s portfolio turnover rate. |
| 4 | Calculated based upon average shares outstanding |
| 5 | For the period from June 28, 2013 (commencement of class operations) to February 28, 2014 |
| 6 | For the period from November 30, 2012 (commencement of class operations) to February 28, 2013 |
| 7 | On June 1, 2013, Institutional Class was renamed Class R6. |
The accompanying notes are an integral part of these financial statements.
| | | | |
| 72 | | Wells Fargo Dow Jones Target Date Funds | | Financial highlights |
| | | | | | | | | | | | | | | | | | | | | | | | |
| Target 2035 Fund | | Beginning
net asset
value per
share | | | Net
investment
income | | | Net realized
and unrealized
gains (losses)
on investments | | | Distributions
from net
investment
income | | | Distributions
from net
realized gains | | | Ending
net asset
value per
share | |
Class A | | | | | | | | | | | | | | | | | | | | | | | | |
Six months ended August 31, 2016 (unaudited) | | $ | 9.89 | | | | 0.09 | | | | 1.10 | | | | (0.05 | ) | | | 0.00 | | | $ | 11.03 | |
Year ended February 29, 2016 | | $ | 11.32 | | | | 0.15 | | | | (1.18 | ) | | | (0.11 | ) | | | (0.29 | ) | | $ | 9.89 | |
Year ended February 28, 2015 | | $ | 11.02 | | | | 0.12 | | | | 0.56 | | | | (0.13 | ) | | | (0.25 | ) | | $ | 11.32 | |
Year ended February 28, 2014 | | $ | 9.99 | | | | 0.14 | | | | 1.41 | | | | (0.13 | ) | | | (0.39 | ) | | $ | 11.02 | |
Year ended February 28, 20134 | | $ | 9.60 | | | | 0.02 | 5 | | | 0.58 | | | | (0.05 | ) | | | (0.16 | ) | | $ | 9.99 | |
Class R | | | | | | | | | | | | | | | | | | | | | | | | |
Six months ended August 31, 2016 (unaudited) | | $ | 9.95 | | | | 0.07 | | | | 1.11 | | | | (0.04 | ) | | | 0.00 | | | $ | 11.09 | |
Year ended February 29, 2016 | | $ | 11.39 | | | | 0.11 | | | | (1.17 | ) | | | (0.09 | ) | | | (0.29 | ) | | $ | 9.95 | |
Year ended February 28, 2015 | | $ | 11.09 | | | | 0.10 | | | | 0.55 | | | | (0.10 | ) | | | (0.25 | ) | | $ | 11.39 | |
Year ended February 28, 20146 | | $ | 10.16 | | | | 0.06 | 5 | | | 1.32 | | | | (0.06 | ) | | | (0.39 | ) | | $ | 11.09 | |
Class R4 | | | | | | | | | | | | | | | | | | | | | | | | |
Six months ended August 31, 2016 (unaudited) | | $ | 9.91 | | | | 0.10 | | | | 1.11 | | | | (0.07 | ) | | | 0.00 | | | $ | 11.05 | |
Year ended February 29, 2016 | | $ | 11.33 | | | | 0.18 | | | | (1.17 | ) | | | (0.14 | ) | | | (0.29 | ) | | $ | 9.91 | |
Year ended February 28, 2015 | | $ | 11.03 | | | | 0.17 | | | | 0.54 | | | | (0.16 | ) | | | (0.25 | ) | | $ | 11.33 | |
Year ended February 28, 2014 | | $ | 9.99 | | | | 0.15 | | | | 1.44 | | | | (0.16 | ) | | | (0.39 | ) | | $ | 11.03 | |
Year ended February 28, 20134 | | $ | 9.60 | | | | 0.03 | 5 | | | 0.57 | | | | (0.05 | ) | | | (0.16 | ) | | $ | 9.99 | |
Class R67 | | | | | | | | | | | | | | | | | | | | | | | | |
Six months ended August 31, 2016 (unaudited) | | $ | 9.91 | | | | 0.11 | | | | 1.10 | | | | (0.07 | ) | | | 0.00 | | | $ | 11.05 | |
Year ended February 29, 2016 | | $ | 11.33 | | | | 0.19 | | | | (1.16 | ) | | | (0.16 | ) | | | (0.29 | ) | | $ | 9.91 | |
Year ended February 28, 2015 | | $ | 11.03 | | | | 0.18 | | | | 0.55 | | | | (0.18 | ) | | | (0.25 | ) | | $ | 11.33 | |
Year ended February 28, 2014 | | $ | 9.99 | | | | 0.19 | | | | 1.41 | | | | (0.17 | ) | | | (0.39 | ) | | $ | 11.03 | |
Year ended February 28, 2013 | | $ | 9.50 | | | | 0.17 | | | | 0.65 | | | | (0.17 | ) | | | (0.16 | ) | | $ | 9.99 | |
Year ended February 29, 2012 | | $ | 9.61 | | | | 0.15 | 5 | | | 0.02 | | | | (0.14 | ) | | | (0.14 | ) | | $ | 9.50 | |
Administrator Class | | | | | | | | | | | | | | | | | | | | | | | | |
Six months ended August 31, 2016 (unaudited) | | $ | 9.94 | | | | 0.09 | 5 | | | 1.11 | | | | (0.06 | ) | | | 0.00 | | | $ | 11.08 | |
Year ended February 29, 2016 | | $ | 11.37 | | | | 0.16 | | | | (1.18 | ) | | | (0.12 | ) | | | (0.29 | ) | | $ | 9.94 | |
Year ended February 28, 2015 | | $ | 11.06 | | | | 0.15 | | | | 0.55 | | | | (0.14 | ) | | | (0.25 | ) | | $ | 11.37 | |
Year ended February 28, 2014 | | $ | 10.02 | | | | 0.14 | | | | 1.43 | | | | (0.14 | ) | | | (0.39 | ) | | $ | 11.06 | |
Year ended February 28, 2013 | | $ | 9.53 | | | | 0.13 | | | | 0.66 | | | | (0.14 | ) | | | (0.16 | ) | | $ | 10.02 | |
Year ended February 29, 2012 | | $ | 9.65 | | | | 0.12 | 5 | | | 0.01 | | | | (0.11 | ) | | | (0.14 | ) | | $ | 9.53 | |
| 1 | Ratios include net expenses allocated from the affiliated Master Portfolios which were as follows: |
| | | | | | | | | | | | | | | | | | | | | | | | |
| | | Six months ended
August 31, 2016
(unaudited) | | | Year ended
February 29, 2016 | | | Year ended February 28 | | | Year ended
February 29, 2012 | |
| | | | | 2015 | | | 2014 | | | 2013 | | |
| | | | |
Class A | | | 0.16 | % | | | 0.17 | % | | | 0.16 | % | | | 0.19 | % | | | 0.27 | %4 | | | N/A | |
Class R | | | 0.16 | | | | 0.17 | | | | 0.16 | | | | 0.19 | 6 | | | N/A | | | | N/A | |
Class R4 | | | 0.16 | | | | 0.16 | | | | 0.16 | | | | 0.19 | | | | 0.27 | 4 | | | N/A | |
Class R67 | | | 0.16 | | | | 0.16 | | | | 0.16 | | | | 0.19 | | | | 0.27 | | | | 0.27 | % |
Administrator Class | | | 0.16 | | | | 0.16 | | | | 0.16 | | | | 0.19 | | | | 0.27 | | | | 0.27 | |
| 2 | Total return calculations do not include any sales charges. Returns for periods of less than one year are not annualized. |
| 3 | Portfolio turnover rate is calculated by aggregating the results of multiplying the Fund’s investment percentage in the respective affiliated Master Portfolio by the corresponding affiliated Master Portfolio’s portfolio turnover rate. |
| 4 | For the period from November 30, 2012 (commencement of class operations) to February 28, 2013 |
| 5 | Calculated based upon average shares outstanding |
| 6 | For the period from June 28, 2013 (commencement of class operations) to February 28, 2014 |
| 7 | On June 1, 2013, Institutional Class was renamed Class R6. |
The accompanying notes are an integral part of these financial statements.
| | | | | | |
| Financial highlights | | Wells Fargo Dow Jones Target Date Funds | | | 73 | |
| | | | | | | | | | | | | | | | | | | | | | |
| Ratio to average net assets (annualized) | | | Total
return2 | | | Portfolio
turnover
rate3 | | | Net assets at
end of period
(000s omitted) | |
Net investment
income | | | Gross
expenses1 | | | Net
expenses1 | | | | |
| | | | | | | | | | | | | | | | | | | | | | |
| | 1.65 | % | | | 0.84 | % | | | 0.83 | % | | | 12.07 | % | | | 7 | % | | $ | 146,577 | |
| | 1.19 | % | | | 0.84 | % | | | 0.83 | % | | | (9.28 | )% | | | 28 | % | | $ | 142,817 | |
| | 1.05 | % | | | 0.97 | % | | | 0.88 | % | | | 6.33 | % | | | 22 | % | | $ | 1,677 | |
| | 1.11 | % | | | 0.98 | % | | | 0.88 | % | | | 15.82 | % | | | 26 | % | | $ | 532 | |
| | 1.04 | % | | | 1.07 | % | | | 0.88 | % | | | 6.36 | % | | | 22 | % | | $ | 41 | |
| | | | | | | | | | | | | | | | | | | | | | |
| | 1.36 | % | | | 1.10 | % | | | 1.08 | % | | | 11.90 | % | | | 7 | % | | $ | 145 | |
| | 1.02 | % | | | 1.13 | % | | | 1.09 | % | | | (9.48 | )% | | | 28 | % | | $ | 73 | |
| | 0.90 | % | | | 1.23 | % | | | 1.13 | % | | | 5.97 | % | | | 22 | % | | $ | 36 | |
| | 0.79 | % | | | 1.26 | % | | | 1.13 | % | | | 13.76 | % | | | 26 | % | | $ | 28 | |
| | | | | | | | | | | | | | | | | | | | | | |
| | 1.96 | % | | | 0.56 | % | | | 0.52 | % | | | 12.22 | % | | | 7 | % | | $ | 223,309 | |
| | 1.66 | % | | | 0.59 | % | | | 0.52 | % | | | (8.92 | )% | | | 28 | % | | $ | 228,810 | |
| | 1.51 | % | | | 0.64 | % | | | 0.52 | % | | | 6.63 | % | | | 22 | % | | $ | 329,135 | |
| | 1.45 | % | | | 0.65 | % | | | 0.52 | % | | | 16.28 | % | | | 26 | % | | $ | 297,612 | |
| | 1.30 | % | | | 0.75 | % | | | 0.52 | % | | | 6.38 | % | | | 22 | % | | $ | 1,940 | |
| | | | | | | | | | | | | | | | | | | | | | |
| | 2.10 | % | | | 0.42 | % | | | 0.37 | % | | | 12.30 | % | | | 7 | % | | $ | 808,899 | |
| | 1.80 | % | | | 0.44 | % | | | 0.37 | % | | | (8.78 | )% | | | 28 | % | | $ | 714,884 | |
| | 1.65 | % | | | 0.49 | % | | | 0.37 | % | | | 6.79 | % | | | 22 | % | | $ | 674,926 | |
| | 1.71 | % | | | 0.55 | % | | | 0.41 | % | | | 16.41 | % | | | 26 | % | | $ | 570,482 | |
| | 1.76 | % | | | 0.66 | % | | | 0.52 | % | | | 8.86 | % | | | 22 | % | | $ | 648,345 | |
| | 1.60 | % | | | 0.66 | % | | | 0.52 | % | | | 1.96 | % | | | 22 | % | | $ | 481,784 | |
| | | | | | | | | | | | | | | | | | | | | | |
| | 1.76 | % | | | 0.77 | % | | | 0.72 | % | | | 12.08 | % | | | 7 | % | | $ | 202,844 | |
| | 1.46 | % | | | 0.78 | % | | | 0.72 | % | | | (9.17 | )% | | | 28 | % | | $ | 182,599 | |
| | 1.31 | % | | | 0.81 | % | | | 0.72 | % | | | 6.50 | % | | | 22 | % | | $ | 227,265 | |
| | 1.33 | % | | | 0.85 | % | | | 0.75 | % | | | 15.96 | % | | | 26 | % | | $ | 236,217 | |
| | 1.36 | % | | | 0.93 | % | | | 0.87 | % | | | 8.48 | % | | | 22 | % | | $ | 172,860 | |
| | 1.26 | % | | | 0.93 | % | | | 0.87 | % | | | 1.55 | % | | | 22 | % | | $ | 77,039 | |
The accompanying notes are an integral part of these financial statements.
| | | | |
| 74 | | Wells Fargo Dow Jones Target Date Funds | | Financial highlights |
| | | | | | | | | | | | | | | | | | | | | | | | |
| Target 2040 Fund | | Beginning
net asset
value per
share | | | Net
investment
income | | | Net realized
and unrealized
gains (losses)
on investments | | | Distributions
from net
investment
income | | | Distributions
from net
realized gains | | | Ending
net asset
value per
share | |
Class A | | | | | | | | | | | | | | | | | | | | | | | | |
Six months ended August 31, 2016 (unaudited) | | $ | 16.74 | | | | 0.16 | | | | 2.03 | | | | (0.10 | ) | | | 0.00 | | | $ | 18.83 | |
Year ended February 29, 2016 | | $ | 19.53 | | | | 0.22 | 4 | | | (2.27 | ) | | | (0.20 | ) | | | (0.54 | ) | | $ | 16.74 | |
Year ended February 28, 2015 | | $ | 18.90 | | | | 0.22 | | | | 1.08 | | | | (0.21 | ) | | | (0.46 | ) | | $ | 19.53 | |
Year ended February 28, 2014 | | $ | 16.92 | | | | 0.21 | | | | 2.71 | | | | (0.21 | ) | | | (0.73 | ) | | $ | 18.90 | |
Year ended February 28, 2013 | | $ | 16.07 | | | | 0.21 | | | | 1.19 | | | | (0.21 | ) | | | (0.34 | ) | | $ | 16.92 | |
Year ended February 29, 2012 | | $ | 16.40 | | | | 0.17 | | | | (0.07 | ) | | | (0.16 | ) | | | (0.27 | ) | | $ | 16.07 | |
Class B | | | | | | | | | | | | | | | | | | | | | | | | |
Six months ended August 31, 2016 (unaudited) | | $ | 15.97 | | | | 0.08 | 4 | | | 1.95 | | | | (0.03 | ) | | | 0.00 | | | $ | 17.97 | |
Year ended February 29, 2016 | | $ | 18.68 | | | | 0.09 | 4 | | | (2.19 | ) | | | (0.07 | ) | | | (0.54 | ) | | $ | 15.97 | |
Year ended February 28, 2015 | | $ | 18.06 | | | | 0.09 | 4 | | | 1.01 | | | | (0.02 | ) | | | (0.46 | ) | | $ | 18.68 | |
Year ended February 28, 2014 | | $ | 16.18 | | | | 0.07 | 4 | | | 2.59 | | | | (0.05 | ) | | | (0.73 | ) | | $ | 18.06 | |
Year ended February 28, 2013 | | $ | 15.36 | | | | 0.09 | 4 | | | 1.13 | | | | (0.06 | ) | | | (0.34 | ) | | $ | 16.18 | |
Year ended February 29, 2012 | | $ | 15.67 | | | | 0.05 | 4 | | | (0.06 | ) | | | (0.03 | ) | | | (0.27 | ) | | $ | 15.36 | |
Class C | | | | | | | | | | | | | | | | | | | | | | | | |
Six months ended August 31, 2016 (unaudited) | | $ | 15.71 | | | | 0.08 | 4 | | | 1.91 | | | | (0.04 | ) | | | 0.00 | | | $ | 17.66 | |
Year ended February 29, 2016 | | $ | 18.38 | | | | 0.09 | 4 | | | (2.15 | ) | | | (0.07 | ) | | | (0.54 | ) | | $ | 15.71 | |
Year ended February 28, 2015 | | $ | 17.85 | | | | 0.06 | 4 | | | 1.02 | | | | (0.09 | ) | | | (0.46 | ) | | $ | 18.38 | |
Year ended February 28, 2014 | | $ | 16.03 | | | | 0.07 | 4 | | | 2.57 | | | | (0.09 | ) | | | (0.73 | ) | | $ | 17.85 | |
Year ended February 28, 2013 | | $ | 15.26 | | | | 0.09 | 4 | | | 1.12 | | | | (0.10 | ) | | | (0.34 | ) | | $ | 16.03 | |
Year ended February 29, 2012 | | $ | 15.60 | | | | 0.04 | 4 | | | (0.05 | ) | | | (0.06 | ) | | | (0.27 | ) | | $ | 15.26 | |
Class R | | | | | | | | | | | | | | | | | | | | | | | | |
Six months ended August 31, 2016 (unaudited) | | $ | 16.69 | | | | 0.13 | | | | 2.03 | | | | (0.08 | ) | | | 0.00 | | | $ | 18.77 | |
Year ended February 29, 2016 | | $ | 19.51 | | | | 0.18 | | | | (2.28 | ) | | | (0.18 | ) | | | (0.54 | ) | | $ | 16.69 | |
Year ended February 28, 2015 | | $ | 18.90 | | | | 0.14 | 4 | | | 1.11 | | | | (0.18 | ) | | | (0.46 | ) | | $ | 19.51 | |
Year ended February 28, 20146 | | $ | 17.19 | | | | 0.09 | 4 | | | 2.45 | | | | (0.10 | ) | | | (0.73 | ) | | $ | 18.90 | |
Class R4 | | | | | | | | | | | | | | | | | | | | | | | | |
Six months ended August 31, 2016 (unaudited) | | $ | 17.09 | | | | 0.18 | | | | 2.09 | | | | (0.12 | ) | | | 0.00 | | | $ | 19.24 | |
Year ended February 29, 2016 | | $ | 19.93 | | | | 0.28 | | | | (2.32 | ) | | | (0.26 | ) | | | (0.54 | ) | | $ | 17.09 | |
Year ended February 28, 2015 | | $ | 19.28 | | | | 0.29 | | | | 1.10 | | | | (0.28 | ) | | | (0.46 | ) | | $ | 19.93 | |
Year ended February 28, 2014 | | $ | 17.24 | | | | 0.27 | 4 | | | 2.78 | | | | (0.28 | ) | | | (0.73 | ) | | $ | 19.28 | |
Year ended February 28, 20136 | | $ | 16.52 | | | | 0.09 | | | | 1.06 | | | | (0.09 | ) | | | (0.34 | ) | | $ | 17.24 | |
Class R67 | | | | | | | | | | | | | | | | | | | | | | | | |
Six months ended August 31, 2016 (unaudited) | | $ | 17.09 | | | | 0.20 | | | | 2.09 | | | | (0.14 | ) | | | 0.00 | | | $ | 19.24 | |
Year ended February 29, 2016 | | $ | 19.93 | | | | 0.32 | | | | (2.33 | ) | | | (0.29 | ) | | | (0.54 | ) | | $ | 17.09 | |
Year ended February 28, 2015 | | $ | 19.27 | | | | 0.30 | | | | 1.13 | | | | (0.31 | ) | | | (0.46 | ) | | $ | 19.93 | |
Year ended February 28, 2014 | | $ | 17.24 | | | | 0.31 | 4 | | | 2.75 | | | | (0.30 | ) | | | (0.73 | ) | | $ | 19.27 | |
Year ended February 28, 2013 | | $ | 16.37 | | | | 0.29 | | | | 1.21 | | | | (0.29 | ) | | | (0.34 | ) | | $ | 17.24 | |
Year ended February 29, 2012 | | $ | 16.69 | | | | 0.24 | | | | (0.05 | ) | | | (0.24 | ) | | | (0.27 | ) | | $ | 16.37 | |
Administrator Class | | | | | | | | | | | | | | | | | | | | | | | | |
Six months ended August 31, 2016 (unaudited) | | $ | 17.07 | | | | 0.17 | | | | 2.07 | | | | (0.11 | ) | | | 0.00 | | | $ | 19.20 | |
Year ended February 29, 2016 | | $ | 19.89 | | | | 0.27 | | | | (2.33 | ) | | | (0.22 | ) | | | (0.54 | ) | | $ | 17.07 | |
Year ended February 28, 2015 | | $ | 19.25 | | | | 0.25 | | | | 1.09 | | | | (0.24 | ) | | | (0.46 | ) | | $ | 19.89 | |
Year ended February 28, 2014 | | $ | 17.21 | | | | 0.24 | | | | 2.77 | | | | (0.24 | ) | | | (0.73 | ) | | $ | 19.25 | |
Year ended February 28, 2013 | | $ | 16.34 | | | | 0.22 | | | | 1.22 | | | | (0.23 | ) | | | (0.34 | ) | | $ | 17.21 | |
Year ended February 29, 2012 | | $ | 16.67 | | | | 0.19 | | | | (0.06 | ) | | | (0.19 | ) | | | (0.27 | ) | | $ | 16.34 | |
| 1 | Ratios include net expenses allocated from the affiliated Master Portfolios which were as follows: |
| | | | | | | | | | | | | | | | | | | | | | | | |
| | | Six months ended August 31, 2016
(unaudited) | | | Year ended February 29, 2016 | | | Year ended February 28 | | | Year ended February 29, 2012 | |
| | | | | 2015 | | | 2014 | | | 2013 | | |
| | | | |
Class A | | | 0.16 | % | | | 0.16 | % | | | 0.16 | % | | | 0.19 | % | | | 0.27 | % | | | 0.27 | % |
Class B | | | 0.16 | | | | 0.16 | | | | 0.16 | | | | 0.19 | | | | 0.27 | | | | 0.27 | |
Class C | | | 0.16 | | | | 0.16 | | | | 0.16 | | | | 0.19 | | | | 0.27 | | | | 0.27 | |
Class R | | | 0.16 | | | | 0.17 | | | | 0.16 | | | | 0.19 | 6 | | | N/A | | | | N/A | |
Class R4 | | | 0.16 | | | | 0.16 | | | | 0.16 | | | | 0.19 | | | | 0.27 | 6 | | | N/A | |
Class R67 | | | 0.16 | | | | 0.16 | | | | 0.16 | | | | 0.19 | | | | 0.27 | | | | 0.27 | |
Administrator Class | | | 0.16 | | | | 0.16 | | | | 0.16 | | | | 0.19 | | | | 0.27 | | | | 0.27 | |
The accompanying notes are an integral part of these financial statements.
| | | | | | |
| Financial highlights | | Wells Fargo Dow Jones Target Date Funds | | | 75 | |
| | | | | | | | | | | | | | | | | | | | | | |
| Ratio to average net assets (annualized) | | | Total
return2 | | | Portfolio
turnover
rate3 | | | Net assets at
end of period
(000s omitted) | |
Net investment
income | | | Gross
expenses1 | | | Net
expenses1 | | | | |
| | | | | | | | | | | | | | | | | | | | | | |
| | 1.66 | % | | | 0.84 | % | | | 0.83 | % | | | 13.11 | % | | | 6 | % | | $ | 216,659 | |
| | 1.23 | % | | | 0.87 | % | | | 0.84 | % | | | (10.72 | )% | | | 27 | % | | $ | 202,038 | |
| | 1.11 | % | | | 0.96 | % | | | 0.88 | % | | | 7.01 | % | | | 18 | % | | $ | 111,874 | |
| | 1.15 | % | | | 0.99 | % | | | 0.92 | % | | | 17.54 | % | | | 25 | % | | $ | 114,233 | |
| | 1.25 | % | | | 1.08 | % | | | 1.03 | % | | | 8.99 | % | | | 20 | % | | $ | 104,836 | |
| | 1.06 | % | | | 1.08 | % | | | 1.03 | % | | | 0.85 | % | | | 20 | % | | $ | 103,841 | |
| | | | | | | | | | | | | | | | | | | | | | |
| | 0.93 | % | | | 1.59 | % | | | 1.58 | % | | | 12.72 | % | | | 6 | % | | $ | 69 | |
| | 0.54 | % | | | 1.63 | % | | | 1.60 | % | | | (11.41 | )% | | | 27 | % | | $ | 88 | |
| | 0.49 | % | | | 1.70 | % | | | 1.63 | % | | | 6.20 | % | | | 18 | % | | $ | 87 | |
| | 0.42 | % | | | 1.75 | % | | | 1.68 | % | | | 16.63 | % | | | 25 | % | | $ | 344 | |
| | 0.54 | % | | | 1.83 | % | | | 1.78 | % | | | 8.15 | % | | | 20 | % | | $ | 747 | |
| | 0.34 | % | | | 1.83 | % | | | 1.78 | % | | | 0.12 | % | | | 20 | % | | $ | 1,564 | |
| | | | | | | | | | | | | | | | | | | | | | |
| | 0.92 | % | | | 1.59 | % | | | 1.58 | % | | | 12.70 | % | | | 6 | % | | $ | 4,781 | |
| | 0.54 | % | | | 1.63 | % | | | 1.60 | % | | | (11.39 | )% | | | 27 | % | | $ | 4,621 | |
| | 0.35 | % | | | 1.71 | % | | | 1.63 | % | | | 6.15 | % | | | 18 | % | | $ | 5,747 | |
| | 0.40 | % | | | 1.74 | % | | | 1.67 | % | | | 16.68 | % | | | 25 | % | | $ | 4,813 | |
| | 0.50 | % | | | 1.83 | % | | | 1.78 | % | | | 8.18 | % | | | 20 | % | | $ | 4,040 | |
| | 0.30 | % | | | 1.83 | % | | | 1.78 | % | | | 0.14 | % | | | 20 | % | | $ | 3,623 | |
| | | | | | | | | | | | | | | | | | | | | | |
| | 1.41 | % | | | 1.09 | % | | | 1.08 | % | | | 12.99 | % | | | 6 | % | | $ | 351 | |
| | 0.97 | % | | | 1.12 | % | | | 1.09 | % | | | (10.96 | )% | | | 27 | % | | $ | 289 | |
| | 0.72 | % | | | 1.23 | % | | | 1.13 | % | | | 6.71 | % | | | 18 | % | | $ | 137 | |
| | 0.75 | % | | | 1.24 | % | | | 1.13 | % | | | 14.96 | % | | | 25 | % | | $ | 29 | |
| | | | | | | | | | | | | | | | | | | | | | |
| | 1.97 | % | | | 0.56 | % | | | 0.52 | % | | | 13.35 | % | | | 6 | % | | $ | 384,953 | |
| | 1.64 | % | | | 0.59 | % | | | 0.52 | % | | | (10.45 | )% | | | 27 | % | | $ | 385,259 | |
| | 1.47 | % | | | 0.63 | % | | | 0.52 | % | | | 7.35 | % | | | 18 | % | | $ | 678,944 | |
| | 1.42 | % | | | 0.64 | % | | | 0.52 | % | | | 18.02 | % | | | 25 | % | | $ | 635,241 | |
| | 1.12 | % | | | 0.75 | % | | | 0.52 | % | | | 7.13 | % | | | 20 | % | | $ | 13,651 | |
| | | | | | | | | | | | | | | | | | | | | | |
| | 2.12 | % | | | 0.41 | % | | | 0.37 | % | | | 13.43 | % | | | 6 | % | | $ | 1,055,550 | |
| | 1.75 | % | | | 0.43 | % | | | 0.37 | % | | | (10.32 | )% | | | 27 | % | | $ | 929,672 | |
| | 1.61 | % | | | 0.48 | % | | | 0.37 | % | | | 7.57 | % | | | 18 | % | | $ | 872,914 | |
| | 1.70 | % | | | 0.54 | % | | | 0.42 | % | | | 18.14 | % | | | 25 | % | | $ | 724,856 | |
| | 1.76 | % | | | 0.65 | % | | | 0.52 | % | | | 9.50 | % | | | 20 | % | | $ | 993,528 | |
| | 1.55 | % | | | 0.65 | % | | | 0.52 | % | | | 1.37 | % | | | 20 | % | | $ | 846,499 | |
| | | | | | | | | | | | | | | | | | | | | | |
| | 1.78 | % | | | 0.76 | % | | | 0.72 | % | | | 13.15 | % | | | 6 | % | | $ | 329,594 | |
| | 1.42 | % | | | 0.78 | % | | | 0.72 | % | | | (10.56 | )% | | | 27 | % | | $ | 320,415 | |
| | 1.27 | % | | | 0.80 | % | | | 0.72 | % | | | 7.10 | % | | | 18 | % | | $ | 427,789 | |
| | 1.30 | % | | | 0.83 | % | | | 0.76 | % | | | 17.79 | % | | | 25 | % | | $ | 452,487 | |
| | 1.39 | % | | | 0.92 | % | | | 0.87 | % | | | 9.14 | % | | | 20 | % | | $ | 360,567 | |
| | 1.22 | % | | | 0.92 | % | | | 0.87 | % | | | 1.00 | % | | | 20 | % | | $ | 256,378 | |
| 2 | Total return calculations do not include any sales charges. Returns for periods of less than one year are not annualized. |
| 3 | Portfolio turnover rate is calculated by aggregating the results of multiplying the Fund’s investment percentage in the respective affiliated Master Portfolio by the corresponding affiliated Master Portfolio’s portfolio turnover rate. |
| 4 | Calculated based upon average shares outstanding |
| 5 | For the period from June 28, 2013 (commencement of class operations) to February 28, 2014 |
| 6 | For the period from November 30, 2012 (commencement of class operations) to February 28, 2013 |
| 7 | On June 1, 2013, Institutional Class was renamed Class R6. |
The accompanying notes are an integral part of these financial statements.
| | | | |
| 76 | | Wells Fargo Dow Jones Target Date Funds | | Financial highlights |
| | | | | | | | | | | | | | | | | | | | | | | | |
| Target 2045 Fund | | Beginning
net asset
value per
share | | | Net
investment
income | | | Net realized
and unrealized
gains (losses)
on investments | | | Distributions
from net
investment
income | | | Distributions
from net
realized gains | | | Ending
net asset
value per
share | |
Class A | | | | | | | | | | | | | | | | | | | | | | | | |
Six months ended August 31, 2016 (unaudited) | | $ | 10.07 | | | | 0.09 | 4 | | | 1.30 | | | | (0.06 | ) | | | 0.00 | | | $ | 11.40 | |
Year ended February 29, 2016 | | $ | 11.85 | | | | 0.16 | | | | (1.52 | ) | | | (0.13 | ) | | | (0.29 | ) | | $ | 10.07 | |
Year ended February 28, 2015 | | $ | 11.43 | | | | 0.11 | 4 | | | 0.72 | | | | (0.13 | ) | | | (0.28 | ) | | $ | 11.85 | |
Year ended February 28, 2014 | | $ | 10.17 | | | | 0.12 | 4 | | | 1.73 | | | | (0.14 | ) | | | (0.45 | ) | | $ | 11.43 | |
Year ended February 28, 20135 | | $ | 9.64 | | | | 0.03 | | | | 0.68 | | | | (0.05 | ) | | | (0.13 | ) | | $ | 10.17 | |
Class R | | | | | | | | | | | | | | | | | | | | | | | | |
Six months ended August 31, 2016 (unaudited) | | $ | 10.19 | | | | 0.08 | | | | 1.31 | | | | (0.05 | ) | | | 0.00 | | | $ | 11.53 | |
Year ended February 29, 2016 | | $ | 11.97 | | | | 0.11 | | | | (1.51 | ) | | | (0.09 | ) | | | (0.29 | ) | | $ | 10.19 | |
Year ended February 28, 2015 | | $ | 11.54 | | | | 0.10 | | | | 0.71 | | | | (0.10 | ) | | | (0.28 | ) | | $ | 11.97 | |
Year ended February 28, 20146 | | $ | 10.45 | | | | 0.05 | | | | 1.55 | | | | (0.06 | ) | | | (0.45 | ) | | $ | 11.54 | |
Class R4 | | | | | | | | | | | | | | | | | | | | | | | | |
Six months ended August 31, 2016 (unaudited) | | $ | 10.11 | | | | 0.11 | | | | 1.31 | | | | (0.08 | ) | | | 0.00 | | | $ | 11.45 | |
Year ended February 29, 2016 | | $ | 11.89 | | | | 0.18 | | | | (1.51 | ) | | | (0.16 | ) | | | (0.29 | ) | | $ | 10.11 | |
Year ended February 28, 2015 | | $ | 11.46 | | | | 0.17 | | | | 0.71 | | | | (0.17 | ) | | | (0.28 | ) | | $ | 11.89 | |
Year ended February 28, 2014 | | $ | 10.18 | | | | 0.14 | | | | 1.76 | | | | (0.17 | ) | | | (0.45 | ) | | $ | 11.46 | |
Year ended February 28, 20135 | | $ | 9.64 | | | | 0.06 | | | | 0.66 | | | | (0.05 | ) | | | (0.13 | ) | | $ | 10.18 | |
Class R67 | | | | | | | | | | | | | | | | | | | | | | | | |
Six months ended August 31, 2016 (unaudited) | | $ | 10.10 | | | | 0.12 | | | | 1.29 | | | | (0.08 | ) | | | 0.00 | | | $ | 11.43 | |
Year ended February 29, 2016 | | $ | 11.87 | | | | 0.19 | | | | (1.49 | ) | | | (0.18 | ) | | | (0.29 | ) | | $ | 10.10 | |
Year ended February 28, 2015 | | $ | 11.44 | | | | 0.18 | | | | 0.71 | | | | (0.18 | ) | | | (0.28 | ) | | $ | 11.87 | |
Year ended February 28, 2014 | | $ | 10.17 | | | | 0.19 | | | | 1.71 | | | | (0.18 | ) | | | (0.45 | ) | | $ | 11.44 | |
Year ended February 28, 2013 | | $ | 9.55 | | | | 0.16 | | | | 0.76 | | | | (0.17 | ) | | | (0.13 | ) | | $ | 10.17 | |
Year ended February 29, 2012 | | $ | 9.62 | | | | 0.14 | | | | (0.05 | ) | | | (0.12 | ) | | | (0.04 | ) | | $ | 9.55 | |
Administrator Class | | | | | | | | | | | | | | | | | | | | | | | | |
Six months ended August 31, 2016 (unaudited) | | $ | 10.16 | | | | 0.10 | | | | 1.31 | | | | (0.07 | ) | | | 0.00 | | | $ | 11.50 | |
Year ended February 29, 2016 | | $ | 11.94 | | | | 0.16 | | | | (1.51 | ) | | | (0.14 | ) | | | (0.29 | ) | | $ | 10.16 | |
Year ended February 28, 2015 | | $ | 11.51 | | | | 0.14 | | | | 0.71 | | | | (0.14 | ) | | | (0.28 | ) | | $ | 11.94 | |
Year ended February 28, 2014 | | $ | 10.23 | | | | 0.14 | | | | 1.73 | | | | (0.14 | ) | | | (0.45 | ) | | $ | 11.51 | |
Year ended February 28, 2013 | | $ | 9.59 | | | | 0.12 | | | | 0.77 | | | | (0.12 | ) | | | (0.13 | ) | | $ | 10.23 | |
Year ended February 29, 2012 | | $ | 9.66 | | | | 0.11 | | | | (0.05 | ) | | | (0.09 | ) | | | (0.04 | ) | | $ | 9.59 | |
| 1 | Ratios include net expenses allocated from the affiliated Master Portfolios which were as follows: |
| | | | | | | | | | | | | | | | | | | | | | | | |
| | | Six months ended August 31, 2016 (unaudited) | | | Year ended February 29, 2016 | | | Year ended February 28 | | | Year ended February 29, 2012 | |
| | | | | 2015 | | | 2014 | | | 2013 | | |
| | | | |
Class A | | | 0.16 | % | | | 0.17 | % | | | 0.16 | % | | | 0.19 | % | | | 0.27 | %5 | | | N/A | |
Class R | | | 0.16 | | | | 0.16 | | | | 0.16 | | | | 0.19 | 6 | | | N/A | | | | N/A | |
Class R4 | | | 0.16 | | | | 0.16 | | | | 0.16 | | | | 0.19 | | | | 0.27 | 5 | | | N/A | |
Class R67 | | | 0.16 | | | | 0.16 | | | | 0.16 | | | | 0.19 | | | | 0.27 | | | | 0.27 | % |
Administrator Class | | | 0.16 | | | | 0.16 | | | | 0.16 | | | | 0.19 | | | | 0.27 | | | | 0.27 | |
| 2 | Total return calculations do not include any sales charges. Returns for periods of less than one year are not annualized. |
| 3 | Portfolio turnover rate is calculated by aggregating the results of multiplying the Fund’s investment percentage in the respective affiliated Master Portfolios by the corresponding affiliated Master Portfolio’s portfolio turnover rate. |
| 4 | Calculated based upon average shares outstanding |
| 5 | For the period from November 30, 2012 (commencement of class operations) to February 28, 2013 |
| 6 | For the period from June 28, 2013 (commencement of class operations) to February 28, 2014 |
| 7 | On June 1, 2013, Institutional Class was renamed Class R6. |
The accompanying notes are an integral part of these financial statements.
| | | | | | |
| Financial highlights | | Wells Fargo Dow Jones Target Date Funds | | | 77 | |
| | | | | | | | | | | | | | | | | | | | | | |
| Ratio to average net assets (annualized) | | | Total
return2 | | | Portfolio
turnover
rate3 | | | Net assets at
end of period
(000s omitted) | |
Net investment
income | | | Gross
expenses1 | | | Net
expenses1 | | | | |
| | | | | | | | | | | | | | | | | | | | | | |
| | 1.68 | % | | | 0.86 | % | | | 0.83 | % | | | 13.86 | % | | | 4 | % | | $ | 81,586 | |
| | 1.09 | % | | | 0.86 | % | | | 0.83 | % | | | (11.70 | )% | | | 26 | % | | $ | 77,062 | |
| | 0.96 | % | | | 0.99 | % | | | 0.88 | % | | | 7.41 | % | | | 16 | % | | $ | 793 | |
| | 1.09 | % | | | 1.01 | % | | | 0.88 | % | | | 18.54 | % | | | 24 | % | | $ | 167 | |
| | 1.08 | % | | | 1.10 | % | | | 0.88 | % | | | 7.41 | % | | | 19 | % | | $ | 13 | |
| | | | | | | | | | | | | | | | | | | | | | |
| | 1.43 | % | | | 1.10 | % | | | 1.08 | % | | | 13.69 | % | | | 4 | % | | $ | 37 | |
| | 1.01 | % | | | 1.14 | % | | | 1.09 | % | | | (11.84 | )% | | | 26 | % | | $ | 30 | |
| | 0.83 | % | | | 1.25 | % | | | 1.13 | % | | | 7.11 | % | | | 16 | % | | $ | 31 | |
| | 0.68 | % | | | 1.30 | % | | | 1.13 | % | | | 15.52 | % | | | 24 | % | | $ | 29 | |
| | | | | | | | | | | | | | | | | | | | | | |
| | 1.99 | % | | | 0.57 | % | | | 0.52 | % | | | 14.08 | % | | | 4 | % | | $ | 134,226 | |
| | 1.61 | % | | | 0.60 | % | | | 0.52 | % | | | (11.41 | )% | | | 26 | % | | $ | 131,789 | |
| | 1.44 | % | | | 0.66 | % | | | 0.52 | % | | | 7.79 | % | | | 16 | % | | $ | 199,015 | |
| | 1.39 | % | | | 0.68 | % | | | 0.52 | % | | | 18.99 | % | | | 24 | % | | $ | 174,582 | |
| | 1.29 | % | | | 0.78 | % | | | 0.52 | % | | | 7.55 | % | | | 19 | % | | $ | 1,246 | |
| | | | | | | | | | | | | | | | | | | | | | |
| | 2.13 | % | | | 0.43 | % | | | 0.37 | % | | | 14.07 | % | | | 4 | % | | $ | 481,997 | |
| | 1.73 | % | | | 0.45 | % | | | 0.37 | % | | | (11.21 | )% | | | 26 | % | | $ | 407,094 | |
| | 1.58 | % | | | 0.51 | % | | | 0.37 | % | | | 7.96 | % | | | 16 | % | | $ | 367,164 | |
| | 1.67 | % | | | 0.57 | % | | | 0.42 | % | | | 19.07 | % | | | 24 | % | | $ | 291,293 | |
| | 1.74 | % | | | 0.69 | % | | | 0.52 | % | | | 9.85 | % | | | 19 | % | | $ | 324,476 | |
| | 1.51 | % | | | 0.67 | % | | | 0.52 | % | | | 1.16 | % | | | 19 | % | | $ | 215,067 | |
| | | | | | | | | | | | | | | | | | | | | | |
| | 1.78 | % | | | 0.78 | % | | | 0.72 | % | | | 13.91 | % | | | 4 | % | | $ | 124,541 | |
| | 1.39 | % | | | 0.79 | % | | | 0.72 | % | | | (11.55 | )% | | | 26 | % | | $ | 108,091 | |
| | 1.24 | % | | | 0.83 | % | | | 0.72 | % | | | 7.54 | % | | | 16 | % | | $ | 130,175 | |
| | 1.28 | % | | | 0.87 | % | | | 0.75 | % | | | 18.65 | % | | | 24 | % | | $ | 126,533 | |
| | 1.35 | % | | | 0.96 | % | | | 0.87 | % | | | 9.49 | % | | | 19 | % | | $ | 85,590 | |
| | 1.18 | % | | | 0.94 | % | | | 0.87 | % | | | 0.85 | % | | | 19 | % | | $ | 39,964 | |
The accompanying notes are an integral part of these financial statements.
| | | | |
| 78 | | Wells Fargo Dow Jones Target Date Funds | | Financial highlights |
| | | | | | | | | | | | | | | | | | | | | | | | |
| Target 2050 Fund | | Beginning
net asset
value per
share | | | Net
investment
income | | | Net realized
and unrealized
gains (losses)
on investments | | | Distributions
from net
investment
income | | | Distributions
from net
realized gains | | | Ending
net asset
value per
share | |
Class A | | | | | | | | | | | | | | | | | | | | | | | | |
Six months ended August 31, 2016 (unaudited) | | $ | 9.61 | | | | 0.09 | | | | 1.26 | | | | (0.06 | ) | | | 0.00 | | | $ | 10.90 | |
Year ended February 29, 2016 | | $ | 11.34 | | | | 0.11 | 4 | | | (1.44 | ) | | | (0.12 | ) | | | (0.28 | ) | | $ | 9.61 | |
Year ended February 28, 2015 | | $ | 10.93 | | | | 0.11 | | | | 0.69 | | | | (0.13 | ) | | | (0.26 | ) | | $ | 11.34 | |
Year ended February 28, 2014 | | $ | 9.72 | | | | 0.15 | | | | 1.62 | | | | (0.13 | ) | | | (0.43 | ) | | $ | 10.93 | |
Year ended February 28, 20135 | | $ | 9.29 | | | | 0.03 | | | | 0.65 | | | | (0.05 | ) | | | (0.20 | ) | | $ | 9.72 | |
Class C | | | | | | | | | | | | | | | | | | | | | | | | |
Six months ended August 31, 2016 (unaudited) | | $ | 9.58 | | | | 0.05 | | | | 1.26 | | | | (0.03 | ) | | | 0.00 | | | $ | 10.86 | |
Year ended February 29, 2016 | | $ | 11.30 | | | | 0.06 | | | | (1.46 | ) | | | (0.04 | ) | | | (0.28 | ) | | $ | 9.58 | |
Year ended February 28, 2015 | | $ | 10.91 | | | | 0.04 | | | | 0.68 | | | | (0.07 | ) | | | (0.26 | ) | | $ | 11.30 | |
Year ended February 28, 2014 | | $ | 9.71 | | | | 0.08 | | | | 1.61 | | | | (0.06 | ) | | | (0.43 | ) | | $ | 10.91 | |
Year ended February 28, 20135 | | $ | 9.29 | | | | 0.02 | | | | 0.64 | | | | (0.04 | ) | | | (0.20 | ) | | $ | 9.71 | |
Class R | | | | | | | | | | | | | | | | | | | | | | | | |
Six months ended August 31, 2016 (unaudited) | | $ | 9.63 | | | | 0.07 | | | | 1.27 | | | | (0.05 | ) | | | 0.00 | | | $ | 10.92 | |
Year ended February 29, 2016 | | $ | 11.37 | | | | 0.11 | | | | (1.47 | ) | | | (0.10 | ) | | | (0.28 | ) | | $ | 9.63 | |
Year ended February 28, 2015 | | $ | 10.95 | | | | 0.09 | | | | 0.68 | | | | (0.09 | ) | | | (0.26 | ) | | $ | 11.37 | |
Year ended February 28, 20146 | | $ | 9.91 | | | | 0.05 | | | | 1.48 | | | | (0.06 | ) | | | (0.43 | ) | | $ | 10.95 | |
Class R4 | | | | | | | | | | | | | | | | | | | | | | | | |
Six months ended August 31, 2016 (unaudited) | | $ | 9.64 | | | | 0.10 | 4 | | | 1.28 | | | | (0.08 | ) | | | 0.00 | | | $ | 10.94 | |
Year ended February 29, 2016 | | $ | 11.38 | | | | 0.17 | | | | (1.48 | ) | | | (0.15 | ) | | | (0.28 | ) | | $ | 9.64 | |
Year ended February 28, 2015 | | $ | 10.96 | | | | 0.16 | | | | 0.68 | | | | (0.16 | ) | | | (0.26 | ) | | $ | 11.38 | |
Year ended February 28, 2014 | | $ | 9.73 | | | | 0.15 | 4 | | | 1.67 | | | | (0.16 | ) | | | (0.43 | ) | | $ | 10.96 | |
Year ended February 28, 20135 | | $ | 9.29 | | | | 0.05 | | | | 0.64 | | | | (0.05 | ) | | | (0.20 | ) | | $ | 9.73 | |
Class R67 | | | | | | | | | | | | | | | | | | | | | | | | |
Six months ended August 31, 2016 (unaudited) | | $ | 9.64 | | | | 0.11 | | | | 1.27 | | | | (0.08 | ) | | | 0.00 | | | $ | 10.94 | |
Year ended February 29, 2016 | | $ | 11.37 | | | | 0.18 | | | | (1.46 | ) | | | (0.17 | ) | | | (0.28 | ) | | $ | 9.64 | |
Year ended February 28, 2015 | | $ | 10.95 | | | | 0.17 | | | | 0.68 | | | | (0.17 | ) | | | (0.26 | ) | | $ | 11.37 | |
Year ended February 28, 2014 | | $ | 9.72 | | | | 0.17 | 4 | | | 1.66 | | | | (0.17 | ) | | | (0.43 | ) | | $ | 10.95 | |
Year ended February 28, 2013 | | $ | 9.20 | | | | 0.16 | | | | 0.72 | | | | (0.16 | ) | | | (0.20 | ) | | $ | 9.72 | |
Year ended February 29, 2012 | | $ | 9.50 | | | | 0.14 | | | | (0.07 | ) | | | (0.12 | ) | | | (0.25 | ) | | $ | 9.20 | |
Administrator Class | | | | | | | | | | | | | | | | | | | | | | | | |
Six months ended August 31, 2016 (unaudited) | | $ | 9.61 | | | | 0.09 | | | | 1.28 | | | | (0.07 | ) | | | 0.00 | | | $ | 10.91 | |
Year ended February 29, 2016 | | $ | 11.34 | | | | 0.15 | | | | (1.47 | ) | | | (0.13 | ) | | | (0.28 | ) | | $ | 9.61 | |
Year ended February 28, 2015 | | $ | 10.92 | | | | 0.13 | | | | 0.69 | | | | (0.14 | ) | | | (0.26 | ) | | $ | 11.34 | |
Year ended February 28, 2014 | | $ | 9.70 | | | | 0.13 | 4 | | | 1.65 | | | | (0.13 | ) | | | (0.43 | ) | | $ | 10.92 | |
Year ended February 28, 2013 | | $ | 9.18 | | | | 0.12 | 4 | | | 0.73 | | | | (0.13 | ) | | | (0.20 | ) | | $ | 9.70 | |
Year ended February 29, 2012 | | $ | 9.48 | | | | 0.11 | | | | (0.07 | ) | | | (0.09 | ) | | | (0.25 | ) | | $ | 9.18 | |
| 1 | Ratios include net expenses allocated from the affiliated Master Portfolios which were as follows: |
| | | | | | | | | | | | | | | | | | | | | | | | |
| | | Six months ended
August 31, 2016
(unaudited) | | | Year ended
February 29, 2016 | | | Year ended February 28 | | | Year ended
February 29, 2012 | |
| | | | | 2015 | | | 2014 | | | 2013 | | |
| | | | |
Class A | | | 0.16 | % | | | 0.17 | % | | | 0.16 | % | | | 0.21 | % | | | 0.27 | %5 | | | N/A | |
Class C | | | 0.16 | | | | 0.16 | | | | 0.16 | | | | 0.21 | | | | 0.27 | 5 | | | N/A | |
Class R | | | 0.18 | | | | 0.19 | | | | 0.16 | | | | 0.21 | 6 | | | N/A | | | | N/A | |
Class R4 | | | 0.16 | | | | 0.16 | | | | 0.16 | | | | 0.21 | | | | 0.27 | 5 | | | N/A | |
Class R67 | | | 0.16 | | | | 0.16 | | | | 0.16 | | | | 0.21 | | | | 0.27 | | | | 0.27 | % |
Administrator Class | | | 0.16 | | | | 0.16 | | | | 0.16 | | | | 0.21 | | | | 0.27 | | | | 0.27 | |
| 2 | Total return calculations do not include any sales charges. Returns for periods of less than one year are not annualized. |
| 3 | Portfolio turnover rate is calculated by aggregating the results of multiplying the Fund’s investment percentage in the respective affiliated Master Portfolios by the corresponding affiliated Master Portfolio’s portfolio turnover rate. |
| 4 | Calculated based upon average shares outstanding |
| 5 | For the period from November 30, 2012 (commencement of class operations) to February 28, 2013 |
| 6 | For the period from June 28, 2013 (commencement of class operations) to February 28, 2014 |
| 7 | On June 1, 2013, Institutional Class was renamed Class R6. |
The accompanying notes are an integral part of these financial statements.
| | | | | | |
| Financial highlights | | Wells Fargo Dow Jones Target Date Funds | | | 79 | |
| | | | | | | | | | | | | | | | | | | | | | |
| Ratio to average net assets (annualized) | | | Total
return2 | | | Portfolio
turnover
rate3 | | | Net assets at
end of period
(000s omitted) | |
Net investment
income | | | Gross
expenses1 | | | Net
expenses1 | | | | |
| | | | | | | | | | | | | | | | | | | | | | |
| | 1.68 | % | | | 0.84 | % | | | 0.83 | % | | | 14.10 | % | | | 4 | % | | $ | 63,052 | |
| | 1.05 | % | | | 0.86 | % | | | 0.83 | % | | | (11.93 | )% | | | 26 | % | | $ | 58,749 | |
| | 0.94 | % | | | 0.97 | % | | | 0.88 | % | | | 7.52 | % | | | 16 | % | | $ | 1,629 | |
| | 1.00 | % | | | 0.98 | % | | | 0.88 | % | | | 18.62 | % | | | 23 | % | | $ | 210 | |
| | 1.07 | % | | | 1.05 | % | | | 0.88 | % | | | 7.49 | % | | | 19 | % | | $ | 11 | |
| | | | | | | | | | | | | | | | | | | | | | |
| | 0.93 | % | | | 1.59 | % | | | 1.58 | % | | | 13.66 | % | | | 4 | % | | $ | 1,028 | |
| | 0.49 | % | | | 1.64 | % | | | 1.60 | % | | | (12.56 | )% | | | 26 | % | | $ | 894 | |
| | 0.20 | % | | | 1.72 | % | | | 1.63 | % | | | 6.70 | % | | | 16 | % | | $ | 737 | |
| | 0.39 | % | | | 1.73 | % | | | 1.63 | % | | | 17.68 | % | | | 23 | % | | $ | 163 | |
| | 0.16 | % | | | 1.81 | % | | | 1.63 | % | | | 7.31 | % | | | 19 | % | | $ | 17 | |
| | | | | | | | | | | | | | | | | | | | | | |
| | 1.41 | % | | | 1.12 | % | | | 1.08 | % | | | 13.98 | % | | | 4 | % | | $ | 48 | |
| | 1.00 | % | | | 1.17 | % | | | 1.10 | % | | | (12.21 | )% | | | 26 | % | | $ | 32 | |
| | 0.82 | % | | | 1.25 | % | | | 1.13 | % | | | 7.20 | % | | | 16 | % | | $ | 31 | |
| | 0.69 | % | | | 1.27 | % | | | 1.13 | % | | | 15.67 | % | | | 23 | % | | $ | 29 | |
| | | | | | | | | | | | | | | | | | | | | | |
| | 1.99 | % | | | 0.56 | % | | | 0.52 | % | | | 14.33 | % | | | 4 | % | | $ | 229,819 | |
| | 1.61 | % | | | 0.59 | % | | | 0.52 | % | | | (11.72 | )% | | | 26 | % | | $ | 219,157 | |
| | 1.43 | % | | | 0.64 | % | | | 0.52 | % | | | 7.82 | % | | | 16 | % | | $ | 360,833 | |
| | 1.39 | % | | | 0.65 | % | | | 0.52 | % | | | 19.10 | % | | | 23 | % | | $ | 307,320 | |
| | 1.03 | % | | | 0.76 | % | | | 0.52 | % | | | 7.63 | % | | | 19 | % | | $ | 6,538 | |
| | | | | | | | | | | | | | | | | | | | | | |
| | 2.14 | % | | | 0.41 | % | | | 0.37 | % | | | 14.40 | % | | | 4 | % | | $ | 937,043 | |
| | 1.72 | % | | | 0.44 | % | | | 0.37 | % | | | (11.51 | )% | | | 26 | % | | $ | 806,152 | |
| | 1.58 | % | | | 0.49 | % | | | 0.37 | % | | | 7.98 | % | | | 16 | % | | $ | 818,335 | |
| | 1.66 | % | | | 0.55 | % | | | 0.41 | % | | | 19.28 | % | | | 23 | % | | $ | 693,648 | |
| | 1.75 | % | | | 0.67 | % | | | 0.52 | % | | | 9.94 | % | | | 19 | % | | $ | 754,088 | |
| | 1.53 | % | | | 0.66 | % | | | 0.52 | % | | | 1.11 | % | | | 19 | % | | $ | 651,308 | |
| | | | | | | | | | | | | | | | | | | | | | |
| | 1.79 | % | | | 0.76 | % | | | 0.72 | % | | | 14.27 | % | | | 4 | % | | $ | 202,623 | |
| | 1.39 | % | | | 0.78 | % | | | 0.72 | % | | | (11.86 | )% | | | 26 | % | | $ | 185,008 | |
| | 1.23 | % | | | 0.81 | % | | | 0.72 | % | | | 7.64 | % | | | 16 | % | | $ | 226,405 | |
| | 1.28 | % | | | 0.85 | % | | | 0.75 | % | | | 18.79 | % | | | 23 | % | | $ | 202,276 | |
| | 1.38 | % | | | 0.94 | % | | | 0.87 | % | | | 9.59 | % | | | 19 | % | | $ | 141,212 | |
| | 1.18 | % | | | 0.93 | % | | | 0.87 | % | | | 0.81 | % | | | 19 | % | | $ | 89,984 | |
The accompanying notes are an integral part of these financial statements.
| | | | |
| 80 | | Wells Fargo Dow Jones Target Date Funds | | Financial highlights |
| | | | | | | | | | | | | | | | | | | | | | | | |
| Target 2055 Fund | | Beginning
net asset
value per
share | | | Net
investment
income | | | Net realized
and unrealized
gains (losses)
on investments | | | Distributions
from net
investment
income | | | Distributions
from net
realized gains | | | Ending
net asset
value per
share | |
Class A | | | | | | | | | | | | | | | | | | | | | | | | |
Six months ended August 31, 2016 (unaudited) | | $ | 11.56 | | | | 0.11 | | | | 1.51 | | | | (0.08 | ) | | | 0.00 | | | $ | 13.10 | |
Year ended February 29, 2016 | | $ | 13.28 | | | | 0.14 | 4 | | | (1.71 | ) | | | (0.12 | ) | | | (0.03 | ) | | $ | 11.56 | |
Year ended February 28, 2015 | | $ | 12.63 | | | | 0.13 | | | | 0.80 | | | | (0.14 | ) | | | (0.14 | ) | | $ | 13.28 | |
Year ended February 28, 2014 | | $ | 10.90 | | | | 0.14 | | | | 1.87 | | | | (0.13 | ) | | | (0.15 | ) | | $ | 12.63 | |
Year ended February 28, 20135 | | $ | 10.19 | | | | 0.03 | 4 | | | 0.72 | | | | (0.04 | ) | | | 0.00 | | | $ | 10.90 | |
Class R | | | | | | | | | | | | | | | | | | | | | | | | |
Six months ended August 31, 2016 (unaudited) | | $ | 11.45 | | | | 0.09 | | | | 1.51 | | | | (0.08 | ) | | | 0.00 | | | $ | 12.97 | |
Year ended February 29, 2016 | | $ | 13.16 | | | | 0.12 | | | | (1.71 | ) | | | (0.09 | ) | | | (0.03 | ) | | $ | 11.45 | |
Year ended February 28, 2015 | | $ | 12.51 | | | | 0.11 | | | | 0.79 | | | | (0.11 | ) | | | (0.14 | ) | | $ | 13.16 | |
Year ended February 28, 20146 | | $ | 11.01 | | | | 0.06 | | | | 1.65 | | | | (0.06 | ) | | | (0.15 | ) | | $ | 12.51 | |
Class R4 | | | | | | | | | | | | | | | | | | | | | | | | |
Six months ended August 31, 2016 (unaudited) | | $ | 11.59 | | | | 0.12 | | | | 1.53 | | | | (0.10 | ) | | | 0.00 | | | $ | 13.14 | |
Year ended February 29, 2016 | | $ | 13.32 | | | | 0.20 | | | | (1.74 | ) | | | (0.16 | ) | | | (0.03 | ) | | $ | 11.59 | |
Year ended February 28, 2015 | | $ | 12.65 | | | | 0.18 | | | | 0.81 | | | | (0.18 | ) | | | (0.14 | ) | | $ | 13.32 | |
Year ended February 28, 2014 | | $ | 10.91 | | | | 0.15 | | | | 1.90 | | | | (0.16 | ) | | | (0.15 | ) | | $ | 12.65 | |
Year ended February 28, 20135 | | $ | 10.19 | | | | 0.04 | 4 | | | 0.72 | | | | (0.04 | ) | | | 0.00 | | | $ | 10.91 | |
Class R67 | | | | | | | | | | | | | | | | | | | | | | | | |
Six months ended August 31, 2016 (unaudited) | | $ | 11.57 | | | | 0.13 | | | | 1.53 | | | | (0.11 | ) | | | 0.00 | | | $ | 13.12 | |
Year ended February 29, 2016 | | $ | 13.29 | | | | 0.21 | | | | (1.72 | ) | | | (0.18 | ) | | | (0.03 | ) | | $ | 11.57 | |
Year ended February 28, 2015 | | $ | 12.63 | | | | 0.19 | | | | 0.80 | | | | (0.19 | ) | | | (0.14 | ) | | $ | 13.29 | |
Year ended February 28, 2014 | | $ | 10.90 | | | | 0.19 | | | | 1.87 | | | | (0.18 | ) | | | (0.15 | ) | | $ | 12.63 | |
Year ended February 28, 2013 | | $ | 10.08 | | | | 0.15 | | | | 0.83 | | | | (0.16 | ) | | | 0.00 | | | $ | 10.90 | |
Year ended February 29, 20128 | | $ | 10.00 | | | | 0.08 | 4 | | | 0.00 | 9 | | | 0.00 | | | | 0.00 | | | $ | 10.08 | |
Administrator Class | | | | | | | | | | | | | | | | | | | | | | | | |
Six months ended August 31, 2016 (unaudited) | | $ | 11.57 | | | | 0.11 | | | | 1.51 | | | | (0.09 | ) | | | 0.00 | | | $ | 13.10 | |
Year ended February 29, 2016 | | $ | 13.28 | | | | 0.17 | | | | (1.71 | ) | | | (0.14 | ) | | | (0.03 | ) | | $ | 11.57 | |
Year ended February 28, 2015 | | $ | 12.62 | | | | 0.14 | | | | 0.81 | | | | (0.15 | ) | | | (0.14 | ) | | $ | 13.28 | |
Year ended February 28, 2014 | | $ | 10.90 | | | | 0.14 | | | | 1.87 | | | | (0.14 | ) | | | (0.15 | ) | | $ | 12.62 | |
Year ended February 28, 2013 | | $ | 10.06 | | | | 0.14 | 4 | | | 0.81 | | | | (0.11 | ) | | | 0.00 | | | $ | 10.90 | |
Year ended February 29, 20128 | | $ | 10.00 | | | | 0.06 | 4 | | | 0.00 | 9 | | | 0.00 | | | | 0.00 | | | $ | 10.06 | |
| 1 | Ratios include net expenses allocated from the affiliated Master Portfolios which were as follows: |
| | | | | | | | | | | | | | | | | | | | | | | | |
| | | Six months ended
August 31, 2016
(unaudited) | | | Year ended
February 29, 2016 | | | Year ended February 28 | | | Year ended
February 29, 2012 | |
| | | | | 2015 | | | 2014 | | | 2013 | | |
| | | | |
Class A | | | 0.16 | % | | | 0.17 | % | | | 0.16 | % | | | 0.18 | % | | | 0.27 | %5 | | | N/A | |
Class R | | | 0.16 | | | | 0.20 | | | | 0.16 | | | | 0.18 | 6 | | | N/A | | | | N/A | |
Class R4 | | | 0.16 | | | | 0.16 | | | | 0.16 | | | | 0.18 | | | | 0.27 | 5 | | | N/A | |
Class R67 | | | 0.16 | | | | 0.16 | | | | 0.16 | | | | 0.18 | | | | 0.27 | | | | 0.27 | %8 |
Administrator Class | | | 0.16 | | | | 0.16 | | | | 0.16 | | | | 0.18 | | | | 0.27 | | | | 0.27 | 8 |
| 2 | Total return calculations do not include any sales charges. Returns for periods of less than one year are not annualized. |
| 3 | Portfolio turnover rate is calculated by aggregating the results of multiplying the Fund’s investment percentage in the respective affiliated Master Portfolios by the corresponding affiliated Master Portfolio’s portfolio turnover rate. |
| 4 | Calculated based upon average shares outstanding |
| 5 | For the period from November 30, 2012 (commencement of class operations) to February 28, 2013 |
| 6 | For the period from June 28, 2013 (commencement of class operations) to February 28, 2014 |
| 7 | On June 1, 2013, Institutional Class was renamed Class R6. |
| 8 | For the period from June 30, 2011 (commencement of class operations) to February 29, 2012 |
| 9 | Amount is less than $0.005. |
The accompanying notes are an integral part of these financial statements.
| | | | | | |
| Financial highlights | | Wells Fargo Dow Jones Target Date Funds | | | 81 | |
| | | | | | | | | | | | | | | | | | | | | | |
| Ratio to average net assets (annualized) | | | Total
return2 | | | Portfolio
turnover
rate3 | | | Net assets at
end of period
(000s omitted) | |
Net investment
income | | | Gross
expenses1 | | | Net
expenses1 | | | | |
| | | | | | | | | | | | | | | | | | | | | | |
| | 1.68 | % | | | 0.90 | % | | | 0.83 | % | | | 14.11 | % | | | 4 | % | | $ | 10,353 | |
| | 1.15 | % | | | 0.94 | % | | | 0.84 | % | | | (11.93 | )% | | | 26 | % | | $ | 8,940 | |
| | 0.97 | % | | | 1.07 | % | | | 0.88 | % | | | 7.46 | % | | | 16 | % | | $ | 565 | |
| | 1.10 | % | | | 1.19 | % | | | 0.88 | % | | | 18.69 | % | | | 23 | % | | $ | 66 | |
| | 1.05 | % | | | 1.44 | % | | | 0.88 | % | | | 7.39 | % | | | 19 | % | | $ | 14 | |
| | | | | | | | | | | | | | | | | | | | | | |
| | 1.40 | % | | | 1.14 | % | | | 1.08 | % | | | 13.98 | % | | | 4 | % | | $ | 71 | |
| | 0.98 | % | | | 1.24 | % | | | 1.09 | % | | | (12.16 | )% | | | 26 | % | | $ | 42 | |
| | 0.83 | % | | | 1.36 | % | | | 1.13 | % | | | 7.24 | % | | | 16 | % | | $ | 31 | |
| | 0.73 | % | | | 1.48 | % | | | 1.13 | % | | | 15.66 | % | | | 23 | % | | $ | 29 | |
| | | | | | | | | | | | | | | | | | | | | | |
| | 1.99 | % | | | 0.62 | % | | | 0.52 | % | | | 14.33 | % | | | 4 | % | | $ | 33,172 | |
| | 1.61 | % | | | 0.66 | % | | | 0.52 | % | | | (11.70 | )% | | | 26 | % | | $ | 27,193 | |
| | 1.41 | % | | | 0.74 | % | | | 0.52 | % | | | 7.92 | % | | | 16 | % | | $ | 33,651 | |
| | 1.40 | % | | | 0.86 | % | | | 0.52 | % | | | 19.06 | % | | | 23 | % | | $ | 20,591 | |
| | 1.51 | % | | | 1.09 | % | | | 0.52 | % | | | 7.51 | % | | | 19 | % | | $ | 33 | |
| | | | | | | | | | | | | | | | | | | | | | |
| | 2.13 | % | | | 0.47 | % | | | 0.37 | % | | | 14.43 | % | | | 4 | % | | $ | 214,435 | |
| | 1.72 | % | | | 0.51 | % | | | 0.37 | % | | | (11.52 | )% | | | 26 | % | | $ | 161,764 | |
| | 1.55 | % | | | 0.59 | % | | | 0.37 | % | | | 8.01 | % | | | 16 | % | | $ | 126,822 | |
| | 1.63 | % | | | 0.75 | % | | | 0.40 | % | | | 19.18 | % | | | 23 | % | | $ | 74,427 | |
| | 1.69 | % | | | 1.17 | % | | | 0.52 | % | | | 9.90 | % | | | 19 | % | | $ | 36,345 | |
| | 1.33 | % | | | 4.06 | % | | | 0.52 | % | | | 0.80 | % | | | 19 | % | | $ | 8,963 | |
| | | | | | | | | | | | | | | | | | | | | | |
| | 1.78 | % | | | 0.82 | % | | | 0.72 | % | | | 14.09 | % | | | 4 | % | | $ | 21,849 | |
| | 1.37 | % | | | 0.85 | % | | | 0.72 | % | | | (11.75 | )% | | | 26 | % | | $ | 14,747 | |
| | 1.16 | % | | | 0.91 | % | | | 0.72 | % | | | 7.66 | % | | | 16 | % | | $ | 12,493 | |
| | 1.28 | % | | | 1.05 | % | | | 0.75 | % | | | 18.70 | % | | | 23 | % | | $ | 8,462 | |
| | 1.36 | % | | | 1.45 | % | | | 0.87 | % | | | 9.52 | % | | | 19 | % | | $ | 4,739 | |
| | 0.87 | % | | | 2.14 | % | | | 0.87 | % | | | 0.60 | % | | | 19 | % | | $ | 1,794 | |
The accompanying notes are an integral part of these financial statements.
| | | | |
| 82 | | Wells Fargo Dow Jones Target Date Funds | | Financial highlights |
| | | | | | | | | | | | | | | | | | | | |
| Target 2060 Fund | | Beginning
net asset
value per
share | | | Net
investment
income | | | Net realized
and unrealized
gains (losses)
on investments | | | Distributions
from net
investment
income | | | Ending
net asset
value per
share | |
Class A | | | | | | | | | | | | | | | | | | | | |
Six months ended August 31, 2016 (unaudited) | | $ | 8.84 | | | | 0.08 | 4 | | | 1.14 | | | | (0.05 | ) | | $ | 10.01 | |
Year ended February 29, 20165 | | $ | 10.00 | | | | 0.06 | | | | (1.11 | ) | | | (0.11 | ) | | $ | 8.84 | |
Class C | | | | | | | | | | | | | | | | | | | | |
Six months ended August 31, 2016 (unaudited) | | $ | 8.90 | | | | 0.04 | | | | 1.14 | | | | (0.06 | ) | | $ | 10.02 | |
Year ended February 29, 20165 | | $ | 10.00 | | | | 0.01 | | | | (1.11 | ) | | | 0.00 | | | $ | 8.90 | |
Class R | | | | | | | | | | | | | | | | | | | | |
Six months ended August 31, 2016 (unaudited) | | $ | 8.84 | | | | 0.07 | 4 | | | 1.11 | | | | (0.16 | ) | | $ | 9.86 | |
Year ended February 29, 20165 | | $ | 10.00 | | | | 0.05 | | | | (1.11 | ) | | | (0.10 | ) | | $ | 8.84 | |
Class R4 | | | | | | | | | | | | | | | | | | | | |
Six months ended August 31, 2016 (unaudited) | | $ | 8.97 | | | | 0.09 | 4 | | | 1.16 | | | | (0.03 | ) | | $ | 10.19 | |
Year ended February 29, 20165 | | $ | 10.00 | | | | 0.08 | 4 | | | (1.11 | ) | | | 0.00 | | | $ | 8.97 | |
Class R6 | | | | | | | | | | | | | | | | | | | | |
Six months ended August 31, 2016 (unaudited) | | $ | 8.95 | | | | 0.09 | 4 | | | 1.16 | | | | (0.04 | ) | | $ | 10.16 | |
Year ended February 29, 20165 | | $ | 10.00 | | | | 0.09 | 4 | | | (1.12 | ) | | | (0.02 | ) | | $ | 8.95 | |
Administrator Class | | | | | | | | | | | | | | | | | | | | |
Six months ended August 31, 2016 (unaudited) | | $ | 8.89 | | | | 0.08 | 4 | | | 1.15 | | | | (0.07 | ) | | $ | 10.05 | |
Year ended February 29, 20165 | | $ | 10.00 | | | | 0.07 | | | | (1.12 | ) | | | (0.06 | ) | | $ | 8.89 | |
| 1 | Ratios include net expenses allocated from the affiliated Master Portfolios which were as follows: |
| | | | | | | | |
| | | Six months ended
August 31, 2016
(unaudited) | | | Year ended
February 29, 20165 | |
Class A | | | 0.16 | % | | | 0.15 | % |
Class C | | | 0.16 | | | | 0.16 | |
Class R | | | 0.18 | | | | 0.17 | |
Class R4 | | | 0.16 | | | | 0.16 | |
Class R6 | | | 0.16 | | | | 0.16 | |
Administrator Class | | | 0.16 | | | | 0.16 | |
| 2 | Total return calculations do not include any sales charges. Returns for periods of less than one year are not annualized. |
| 3 | Portfolio turnover rate is calculated by aggregating the results of multiplying the Fund’s investment percentage in the respective affiliated Master Portfolios by the corresponding affiliated Master Portfolio’s portfolio turnover rate. |
| 4 | Calculated based upon average shares outstanding |
| 5 | For the period from June 30, 2015 (commencement of Fund operations) to February 29, 2016 |
The accompanying notes are an integral part of these financial statements.
| | | | | | |
| Financial highlights | | Wells Fargo Dow Jones Target Date Funds | | | 83 | |
| | | | | | | | | | | | | | | | | | | | | | |
| Ratio to average net assets (annualized) | | | Total
return2 | | | Portfolio
turnover
rate3 | | | Net assets at
end of period
(000s omitted) | |
Net investment
income | | | Gross
expenses1 | | | Net
expenses1 | | | | |
| | | | | | | | | | | | | | | | | | | | | | |
| | 1.55 | % | | | 7.02 | % | | | 0.83 | % | | | 13.80 | % | | | 4 | % | | $ | 267 | |
| | 0.97 | % | | | 14.47 | % | | | 0.83 | % | | | (10.59 | )% | | | 26 | % | | $ | 100 | |
| | | | | | | | | | | | | | | | | | | | | | |
| | 0.87 | % | | | 8.44 | % | | | 1.58 | % | | | 13.27 | % | | | 4 | % | | $ | 227 | |
| | 0.21 | % | | | 15.14 | % | | | 1.58 | % | | | (11.00 | )% | | | 26 | % | | $ | 173 | |
| | | | | | | | | | | | | | | | | | | | | | |
| | 1.37 | % | | | 7.93 | % | | | 1.08 | % | | | 13.51 | % | | | 4 | % | | $ | 128 | |
| | 0.72 | % | | | 14.73 | % | | | 1.08 | % | | | (10.66 | )% | | | 26 | % | | $ | 89 | |
| | | | | | | | | | | | | | | | | | | | | | |
| | 1.71 | % | | | 3.89 | % | | | 0.52 | % | | | 13.91 | % | | | 4 | % | | $ | 3,383 | |
| | 1.29 | % | | | 14.19 | % | | | 0.52 | % | | | (10.30 | )% | | | 26 | % | | $ | 195 | |
| | | | | | | | | | | | | | | | | | | | | | |
| | 1.87 | % | | | 4.09 | % | | | 0.37 | % | | | 13.99 | % | | | 4 | % | | $ | 6,915 | |
| | 1.41 | % | | | 14.05 | % | | | 0.37 | % | | | (10.30 | )% | | | 26 | % | | $ | 573 | |
| | | | | | | | | | | | | | | | | | | | | | |
| | 1.54 | % | | | 4.70 | % | | | 0.72 | % | | | 13.84 | % | | | 4 | % | | $ | 3,037 | |
| | 1.10 | % | | | 14.35 | % | | | 0.72 | % | | | (10.50 | )% | | | 26 | % | | $ | 359 | |
The accompanying notes are an integral part of these financial statements.
| | | | |
| 84 | | Wells Fargo Dow Jones Target Date Funds | | Notes to financial statements (unaudited) |
1. ORGANIZATION
Wells Fargo Funds Trust (the “Trust”), a Delaware statutory trust organized on March 10, 1999, is an open-end management investment company registered under the Investment Company Act of 1940, as amended (the “1940 Act”). As an investment company, the Trust follows the accounting and reporting guidance in Financial Accounting Standards Board (“FASB”) Accounting Standards Codification Topic 946, Financial Services – Investment Companies. These financial statements report on the following funds: Wells Fargo Dow Jones Target Today Fund (“Target Today Fund”), Wells Fargo Dow Jones Target 2010 Fund (“Target 2010 Fund”), Wells Fargo Dow Jones Target 2015 Fund (“Target 2015 Fund” ), Wells Fargo Dow Jones Target 2020 Fund (“Target 2020 Fund” ), Wells Fargo Dow Jones Target 2025 Fund (“Target 2025 Fund”), Wells Fargo Dow Jones Target 2030 Fund (“Target 2030 Fund”), Wells Fargo Dow Jones Target 2035 Fund (“Target 2035 Fund”), Wells Fargo Dow Jones Target 2040 Fund (“Target 2040 Fund”), Wells Fargo Dow Jones Target 2045 Fund (“Target 2045 Fund”), Wells Fargo Dow Jones Target 2050 Fund (“Target 2050 Fund”), Wells Fargo Dow Jones Target 2055 Fund (“Target 2055 Fund”), and Wells Fargo Dow Jones Target 2060 Fund (“Target 2060 Fund”) (each, a “Fund”, collectively, the “Funds”). Each Fund is a diversified series of the Trust.
After the close of business on October 23, 2015, Investor Class shares became Class A shares in a tax-free conversion. Shareholders of Investor Class in the applicable Funds received Class A shares at a value equal to the value of their Investor Class shares immediately prior to the conversion. Investor Class shares are no longer offered by the applicable Funds.
Each Fund seeks to achieve its investment objective by investing all investable assets in separate diversified portfolios of Wells Fargo Master Trust, a registered open-end management investment company. Each Fund invests in Wells Fargo Diversified Fixed Income Portfolio (“Diversified Fixed Income Portfolio”), Wells Fargo Diversified Stock Portfolio (“Diversified Stock Portfolio”) and Wells Fargo Short-Term Investment Portfolio (“Short-Term Investment Portfolio”) (each, an “affiliated Master Portfolio”, collectively, the “affiliated Master Portfolios”). Each affiliated Master Portfolio directly acquires portfolio securities, and a Fund investing in an affiliated Master Portfolio acquires an indirect interest in those securities. Each Fund accounts for its investment in the affiliated Master Portfolios as partnership investments and records on a daily basis its share of the affiliated Master Portfolio’s income, expense and realized and unrealized gains and losses. The financial statements of the affiliated Master Portfolios for the six months ended August 31, 2016 are included in this report and should be read in conjunction with each Fund’s financial statements. As of August 31, 2016, the Funds own the following percentages of the affiliated Master Portfolios:
| | | | | | | | | | | | | | | | | | | | | | | | | | | | | | | | | | | | | | | | | | | | | | | | |
| | | Target
Today
Fund | | | Target
2010
Fund | | | Target
2015
Fund | | | Target
2020
Fund | | | Target
2025
Fund | | | Target
2030
Fund | | | Target
2035
Fund | | | Target
2040
Fund | | | Target
2045
Fund | | | Target
2050
Fund | | | Target
2055
Fund | | | Target
2060
Fund | |
Wells Fargo Diversified Fixed Income Portfolio | | | 6 | % | | | 4 | % | | | 8 | % | | | 28 | % | | | 21 | % | | | 18 | % | | | 6 | % | | | 6 | % | | | 1 | % | | | 2 | % | | | 0 | %* | | | 0 | %* |
Wells Fargo Diversified Stock Portfolio | | | 1 | | | | 1 | | | | 2 | | | | 9 | | | | 12 | | | | 18 | | | | 11 | | | | 19 | | | | 9 | | | | 15 | | | | 3 | | | | 0 | * |
Wells Fargo Short-Term Investment Portfolio | | | 21 | | | | 10 | | | | 3 | | | | 12 | | | | 12 | | | | 13 | | | | 7 | | | | 10 | | | | 4 | | | | 7 | | | | 1 | | | | 0 | * |
| * | The amount owned is less than 1%. |
2. SIGNIFICANT ACCOUNTING POLICIES
The following significant accounting policies, which are consistently followed in the preparation of the financial statements of each Fund, are in conformity with U.S. generally accepted accounting principles which require management to make estimates and assumptions that affect the reported amounts of assets and liabilities, disclosure of contingent assets and liabilities at the date of the financial statements, and the reported amounts of revenues and expenses during the reporting period. Actual results could differ from those estimates.
Securities valuation
All investments are valued each business day as of the close of regular trading on the New York Stock Exchange (generally 4 p.m. Eastern Time), although the Funds may deviate from this calculation time under unusual or unexpected circumstances.
Investments in the affiliated Master Portfolios are valued daily based on each Fund’s proportionate share of each affiliated Master Portfolio’s net assets, which are also valued daily. Securities held in the affiliated Master Portfolios are valued as discussed in the Notes to Financial Statements of the affiliated Master Portfolios, which are included elsewhere in this report.
| | | | | | |
| Notes to financial statements (unaudited) | | Wells Fargo Dow Jones Target Date Funds | | | 85 | |
Security transactions and income recognition
Securities transactions are recorded on a trade date basis in each affiliated Master Portfolio. Realized gains or losses in each affiliated Master Portfolio are recorded on the basis of identified cost.
Interest income is accrued daily and bond discounts are accreted and premiums are amortized daily based on the effective interest method by each affiliated Master Portfolio. To the extent debt obligations are placed on non-accrual status, any related interest income may be reduced by writing off interest receivables when the collection of all or a portion of interest has become doubtful based on consistently applied procedures. If the issuer subsequently resumes interest payments or when the collectability of interest is reasonably assured, the debt obligation is removed from non-accrual status.
Dividend income in each affiliated Master Portfolio is recognized on the ex-dividend date, except for certain dividends from foreign securities which are recorded as soon as the custodian verifies the ex-dividend date.
Income from foreign securities is recorded net of foreign taxes withheld where recovery of such taxes is not assured.
Securities transactions are recorded on a trade date basis in each affiliated Master Portfolio. Realized gains or losses in each affiliated Master Portfolio are recorded on the basis of identified cost.
Each Fund records daily its proportionate share of each affiliated Master Portfolio’s interest and dividend income and realized and unrealized gains or losses.
Distributions to shareholders
Distributions to shareholders from net investment income and net realized gains, if any, are recorded on the ex-dividend date. Such distributions are determined in conformity with federal income tax regulations, which may differ in amount or character from net investment income and realized gains recognized for purposes of U.S. generally accepted accounting principles.
Federal and other taxes
Each Fund is treated as a separate entity for federal income tax purposes. Each Fund intends to continue to qualify as a regulated investment company by distributing substantially all of its investment company taxable income and any net realized capital gains (after reduction for capital loss carryforwards) sufficient to relieve it from all, or substantially all, federal income taxes. Accordingly, no provision for federal income taxes was required.
Each Fund’s income and federal excise tax returns and all financial records supporting those returns for the prior three fiscal years are subject to examination by the federal and Delaware revenue authorities. Management has analyzed each Fund’s tax positions taken on federal, state, and foreign tax returns for all open tax years and does not believe that there are any uncertain tax positions that require recognition of a tax liability.
As of February 29, 2016, capital loss carryforwards available to offset future net realized capital gains were as follows:
| | | | | | | | |
| | | No expiration | |
| | | Short-term | | | Long-term | |
Target 2055 Fund | | $ | 244,295 | | | $ | 0 | |
Target 2060 Fund | | | 14,099 | | | | 24,669 | |
At February 29, 2016, current year deferred post-October capital losses and late-year ordinary losses, which were recognized on the first day of the current fiscal year were as follows:
| | | | | | | | | | | | |
| | | Deferred post-October
capital losses | | | Late-year
ordinary losses
deferred | |
| | | Short-term | | | Long-term | | |
Target Today Fund | | $ | 0 | | | $ | 0 | | | $ | 706,386 | |
Target 2010 Fund | | | 0 | | | | 0 | | | | 592,599 | |
Target 2015 Fund | | | 0 | | | | 0 | | | | 1,163,269 | |
Target 2020 Fund | | | 0 | | | | 0 | | | | 1,811,667 | |
Target 2025 Fund | | | 0 | | | | 0 | | | | 1,217,250 | |
Target 2030 Fund | | | 0 | | | | 0 | | | | 207,630 | |
Target 2055 Fund | | | 2,993,109 | | | | 3,714,064 | | | | 0 | |
Target 2060 Fund | | | 19,939 | | | | 24,169 | | | | 0 | |
| | | | |
| 86 | | Wells Fargo Dow Jones Target Date Funds | | Notes to financial statements (unaudited) |
Class allocations
The separate classes of shares offered by each Fund differ principally in applicable sales charges, distribution, shareholder servicing, and administration fees. Class specific expenses are charged directly to that share class. Investment income, common expenses, and realized and unrealized gains (losses) on investments are allocated daily to each class of shares based on the relative proportion of net assets of each class.
3. FAIR VALUATION MEASUREMENTS
As of August 31, 2016, each Fund’s investment in the affiliated Master Portfolios was measured at fair value using the net asset value per share (or its equivalent) as a practical expedient. The Diversified Stock Portfolio and the Diversified Fixed Income Portfolio seek to approximate, before fees and expenses, the total return of the respective equity and fixed income portions of its corresponding Dow Jones Global Target Date Index by investing in the securities that comprise the sub-indexes representing the equity and fixed income asset classes, respectively. The Diversified Stock Portfolio and the Diversified Fixed Income Portfolio use an optimization process, which seeks to balance the replication of index performance and security transaction costs. The Short-Term Investment Portfolio seeks to represent the cash component of the Dow Jones Global Target Date Indexes. At August 31, 2016, the affiliated Master Portfolios do not have a redemption period notice, can be redeemed daily and do not have any unfunded commitments.
At August 31, 2016, aggregate fair value of the affiliated Master Portfolios held in each Fund was as follows:
| | | | |
| | | Fair value of affiliated
Master Portfolios | |
Target Today Fund | | $ | 638,186,997 | |
Target 2010 Fund | | | 391,798,136 | |
Target 2015 Fund | | | 669,151,282 | |
Target 2020 Fund | | | 2,505,886,694 | |
Target 2025 Fund | | | 2,317,403,999 | |
Target 2030 Fund | | | 2,718,651,683 | |
Target 2035 Fund | | | 1,384,499,732 | |
Target 2040 Fund | | | 2,027,091,411 | |
Target 2045 Fund | | | 823,356,048 | |
Target 2050 Fund | | | 1,452,994,560 | |
Target 2055 Fund | | | 280,280,894 | |
Target 2060 Fund | | | 13,646,240 | |
4. TRANSACTIONS WITH AFFILIATES AND OTHER EXPENSES
Management fee
Wells Fargo Funds Management, LLC (“Funds Management”), an indirect wholly owned subsidiary of Wells Fargo & Company (“Wells Fargo”), is the manager of each Fund and provides advisory and fund-level administrative services under an investment management agreement. Under the investment management agreement, Funds Management is responsible for, among other services, implementing the investment objectives and strategies of each Fund, supervising the subadviser, providing fund-level administrative services in connection with each Fund’s operations, and providing any other fund-level administrative services reasonably necessary for the operation of each Fund. As compensation for its services under the investment management agreement, Funds Management is entitled to receive an annual management fee starting at 0.20% and declining to 0.18% as the average daily net assets of each Fund increase. For the six months ended August 31, 2016, the management fee for each Fund was equivalent to an annual rate of 0.20% of each Fund’s average daily net assets.
Funds Management also serves as the adviser to each affiliated Master Portfolio and is entitled to receive a fee from each affiliated Master Portfolio for those services.
Funds Management has retained the services of a subadviser to provide daily portfolio management to the Funds. The fees for subadvisory services are borne by Funds Management. Global Index Advisors, Inc. is the subadviser to each Fund and is entitled to receive a fee from Funds Management at an annual rate starting at 0.06% and declining to 0.04% as the average daily net assets of each Fund increase.
| | | | | | |
| Notes to financial statements (unaudited) | | Wells Fargo Dow Jones Target Date Funds | | | 87 | |
Administration fees
Under a class-level administration agreement, Funds Management provides class-level administrative services to each Fund, which includes paying fees and expenses for services provided by the transfer agent, sub-transfer agents, omnibus account servicers and record-keepers. As compensation for its services under the class-level administration agreement, Funds Management receives an annual fee which is calculated based on the average daily net assets of each class as follows:
| | | | |
| | | Class-level
administration fee | |
Class A, Class B, Class C, Class R | | | 0.21 | % |
Class R4 | | | 0.08 | |
Class R6 | | | 0.03 | |
Administrator Class | | | 0.13 | |
Funds Management has contractually waived and/or reimbursed management and administration fees to the extent necessary to maintain certain net operating expense ratios for the Funds. Waiver of fees and/or reimbursement of expenses by Funds Management were made first from fund level expenses on a proportionate basis and then from class specific expenses. Funds Management has committed through June 30, 2017 to waive fees and/or reimburse expenses to the extent necessary to cap each Fund’s expenses as follows:
| | | | | | | | | | | | | | | | | | | | | | | | | | | | |
| | | Class A | | | Class B | | | Class C | | | Class R | | | Class R4 | | | Class R6 | | | Administrator
Class | |
Target Today Fund | | | 0.76 | % | | | 1.51 | % | | | 1.51 | % | | | 1.01 | % | | | 0.45 | % | | | 0.30 | % | | | 0.65 | % |
Target 2010 Fund | | | 0.78 | | | | 1.53 | | | | 1.53 | | | | 1.03 | | | | 0.47 | | | | 0.32 | | | | 0.67 | |
Target 2015 Fund | | | 0.79 | | | | N/A | | | | N/A | | | | 1.04 | | | | 0.48 | | | | 0.33 | | | | 0.68 | |
Target 2020 Fund | | | 0.81 | | | | 1.56 | | | | 1.56 | | | | 1.06 | | | | 0.50 | | | | 0.35 | | | | 0.70 | |
Target 2025 Fund | | | 0.81 | | | | N/A | | | | N/A | | | | 1.06 | | | | 0.50 | | | | 0.35 | | | | 0.70 | |
Target 2030 Fund | | | 0.82 | | | | 1.57 | | | | 1.57 | | | | 1.07 | | | | 0.51 | | | | 0.36 | | | | 0.71 | |
Target 2035 Fund | | | 0.83 | | | | N/A | | | | N/A | | | | 1.08 | | | | 0.52 | | | | 0.37 | | | | 0.72 | |
Target 2040 Fund | | | 0.83 | | | | 1.58 | | | | 1.58 | | | | 1.08 | | | | 0.52 | | | | 0.37 | | | | 0.72 | |
Target 2045 Fund | | | 0.83 | | | | N/A | | | | N/A | | | | 1.08 | | | | 0.52 | | | | 0.37 | | | | 0.72 | |
Target 2050 Fund | | | 0.83 | | | | N/A | | | | 1.58 | | | | 1.08 | | | | 0.52 | | | | 0.37 | | | | 0.72 | |
Target 2055 Fund | | | 0.83 | | | | N/A | | | | N/A | | | | 1.08 | | | | 0.52 | | | | 0.37 | | | | 0.72 | |
Target 2060 Fund | | | 0.83 | | | | N/A | | | | 1.58 | | | | 1.08 | | | | 0.52 | | | | 0.37 | | | | 0.72 | |
After the expiration date, each expense cap may be increased or the commitment to maintain the cap may be terminated only with the approval of the Board of Trustees.
Distribution fees
The Trust has adopted a Distribution Plan for Class B, Class C, and Class R shares of the applicable Funds pursuant to Rule 12b-1 under the 1940 Act. Distribution fees are charged to the Class B, Class C, and Class R shares and paid to Wells Fargo Funds Distributor, LLC (“Funds Distributor”), the principal underwriter of each Fund, at an annual rate of 0.75% of the average daily net assets of Class B and Class C shares and 0.25% of the average daily net assets of Class R shares.
| | | | |
| 88 | | Wells Fargo Dow Jones Target Date Funds | | Notes to financial statements (unaudited) |
In addition, Funds Distributor is entitled to receive the front-end sales charge from the purchase of Class A shares and a contingent deferred sales charge on the redemption of certain Class A shares. Funds Distributor is also entitled to receive the contingent deferred sales charges from redemptions of Class B and Class C shares. For the six month ended August 31, 2016, Funds Distributor received the following amounts in front-end sales charges.
| | | | |
| | | Front-end
sales charges | |
| | | Class A | |
Target Today Fund | | $ | 338 | |
Target 2010 Fund | | | 63 | |
Target 2015 Fund | | | 339 | |
Target 2020 Fund | | | 539 | |
Target 2025 Fund | | | 185 | |
Target 2030 Fund | | | 1,130 | |
Target 2035 Fund | | | 266 | |
Target 2040 Fund | | | 1,774 | |
Target 2045 Fund | | | 99 | |
Target 2050 Fund | | | 2,264 | |
Target 2055 Fund | | | 608 | |
Target 2060 Fund | | | 716 | |
Shareholder servicing fees
The Trust has entered into contracts with one or more shareholder servicing agents, whereby Class A, Class B, Class C, Class R, and Administrator Class of each applicable Fund are charged a fee at an annual rate of 0.25% of the average daily net assets of each respective class. Class R4 is charged a fee at an annual rate of 0.10% of its average daily net assets.
A portion of these total shareholder servicing fees were paid to affiliates of Wells Fargo.
5. INVESTMENT PORTFOLIO TRANSACTIONS
Purchases and sales of investments, excluding short-term securities, for the six months ended August 31, 2016 were as follows:
| | | | | | | | | | | | | | | | |
| | | Purchases at cost* | | | Sales proceeds* | |
| | | U.S.
Government | | | Non-U.S.
Government | | | U.S.
Government | | | Non-U.S.
Government | |
Target Today Fund | | $ | 78,888,770 | | | $ | 22,585,295 | | | $ | 55,060,929 | | | $ | 20,675,730 | |
Target 2010 Fund | | | 52,106,575 | | | | 14,968,055 | | | | 36,368,123 | | | | 13,806,249 | |
Target 2015 Fund | | | 104,223,406 | | | | 30,460,130 | | | | 72,743,403 | | | | 29,166,539 | |
Target 2020 Fund | | | 342,866,740 | | | | 108,459,510 | | | | 239,306,067 | | | | 120,523,374 | |
Target 2025 Fund | | | 254,364,725 | | | | 92,885,255 | | | | 177,535,511 | | | | 126,394,950 | |
Target 2030 Fund | | | 219,242,665 | | | | 99,606,039 | | | | 153,021,841 | | | | 167,134,810 | |
Target 2035 Fund | | | 75,084,355 | | | | 46,400,956 | | | | 52,405,613 | | | | 93,824,507 | |
Target 2040 Fund | | | 66,640,473 | | | | 62,817,377 | | | | 46,512,151 | | | | 147,682,979 | |
Target 2045 Fund | | | 15,350,115 | | | | 24,129,199 | | | | 10,713,713 | | | | 62,776,182 | |
Target 2050 Fund | | | 18,757,174 | | | | 41,596,054 | | | | 13,091,691 | | | | 112,766,896 | |
Target 2055 Fund | | | 3,595,433 | | | | 8,021,132 | | | | 2,509,456 | | | | 21,758,029 | |
Target 2060 Fund | | | 175,053 | | | | 390,531 | | | | 122,180 | | | | 1,059,349 | |
| * | The Funds seek to achieve their investment objective by investing all of their investable assets in affiliated Master Portfolios. Purchases and sales related to these investments have been calculated by aggregating the results of multiplying each Fund’s ownership percentage of the respective affiliated Master Portfolio by the corresponding affiliated Master Portfolio’s purchases and sales. |
| | | | | | |
| Notes to financial statements (unaudited) | | Wells Fargo Dow Jones Target Date Funds | | | 89 | |
6. BANK BORROWINGS
The Trust is party to a $30,000,000 revolving credit agreement whereby each Fund is permitted to use bank borrowings for temporary or emergency purposes, such as to fund shareholder redemption requests. Interest under the credit agreement is charged to each Fund based on a borrowing rate equal to the higher of the Federal Funds rate in effect on that day plus 1.25% or the overnight LIBOR rate in effect on that day plus 1.25%. In addition, an annual commitment fee equal to 0.175% of the unused balance is allocated to each participating fund. For the six months ended August 31, 2016, there were no borrowings by the Funds under the agreement.
7. INDEMNIFICATION
Under the Trust’s organizational documents, the officers and Trustees have been granted certain indemnification rights against certain liabilities that may arise out of performance of their duties to the Trust. Additionally, in the normal course of business, the Trust may enter into contracts with service providers that contain a variety of indemnification clauses. The Trust’s maximum exposure under these arrangements is dependent on future claims that may be made against the Funds and, therefore, cannot be estimated.
8. SUBSEQUENT DISTRIBUTIONS
On September 26, 2016, the Funds declared distributions from net investment income to shareholders of record on September 23, 2016. The per share amounts payable on September 27, 2016 were as follows:
| | | | | | | | | | | | | | | | | | | | | | | | | | | | | | | | | | | | | | |
| Net investment income | | Target
2010
Fund | | Target
2015
Fund | | | Target
2020
Fund | | | Target
2025
Fund | | | Target
2035
Fund | | | Target
2040
Fund | | | Target
2045
Fund | | | Target
2050
Fund | | | Target
2055
Fund | | | Target
2060
Fund | |
Class A | | $0.03195 | | $ | 0.03235 | | | $ | 0.04784 | | | $ | 0.03306 | | | $ | 0.03568 | | | $ | 0.06576 | | | $ | 0.03833 | | | $ | 0.03745 | | | $ | 0.04234 | | | $ | 0.01993 | |
Class B | | 0.00684 | | | N/A | | | | 0.01663 | | | | N/A | | | | N/A | | | | 0.03295 | | | | N/A | | | | N/A | | | | N/A | | | | N/A | |
Class C | | 0.00523 | | | N/A | | | | 0.02090 | | | | N/A | | | | N/A | | | | 0.03319 | | | | N/A | | | | 0.01786 | | | | N/A | | | | 0.00035 | |
Class R | | 0.02445 | | | 0.02554 | | | | 0.03840 | | | | 0.02679 | | | | 0.03012 | | | | 0.05485 | | | | 0.03193 | | | | 0.03264 | | | | 0.03599 | | | | 0.01499 | |
Class R4 | | 0.04186 | | | 0.04060 | | | | 0.05973 | | | | 0.04163 | | | | 0.04468 | | | | 0.08014 | | | | 0.04704 | | | | 0.04585 | | | | 0.05283 | | | | 0.02714 | |
Class R6 | | 0.04709 | | | 0.04459 | | | | 0.06569 | | | | 0.04555 | | | | 0.04871 | | | | 0.08774 | | | | 0.05115 | | | | 0.05007 | | | | 0.05743 | | | | 0.02971 | |
Administrator Class | | 0.03503 | | | 0.03454 | | | | 0.05114 | | | | 0.03566 | | | | 0.03829 | | | | 0.06985 | | | | 0.04039 | | | | 0.04004 | | | | 0.04554 | | | | 0.02349 | |
These distributions are not reflected in the accompanying financial statements. The final determination of the source of all distributions is subject to change and made after the tax year-end of each Fund.
| | | | |
| 90 | | Wells Fargo Dow Jones Target Date Funds | | Summary portfolio of investments—August 31, 2016 (unaudited) |
DIVERSIFIED FIXED INCOME PORTFOLIO
The Summary portfolio of investments shows the 50 largest portfolio holdings in unaffiliated issuers and any holdings exceeding 1% of the total net assets as of the report date. The remaining securities held are grouped as “Other securities” in each category.
| | | | | | | | | | | | | | | | | | | | |
| Security name | | Interest rate | | | Maturity date | | | Principal | | | Value | | | Percent of net assets | |
| | | | | |
Agency Securities: 26.40% | | | | | | | | | | | | | | | | | | | | |
FHLB | | | 0.88-6.00 | % | | | 9-8-2017 to 11-1-2043 | | | $ | 99,858,099 | | | $ | 105,591,908 | | | | 1.81 | % |
FHLMC | | | 0.75-6.75 | | | | 12-1-2016 to 9-14-2046 | | | | 298,568,649 | | | | 317,897,176 | | | | 5.46 | |
FHLMC | | | 2.50 | | | | 5-1-2031 | | | | 12,710,547 | | | | 13,152,162 | | | | 0.23 | |
FHLMC | | | 3.00 | | | | 8-1-2045 | | | | 11,672,034 | | | | 12,115,254 | | | | 0.21 | |
FNMA | | | 0.00-7.25 | | | | 9-1-2016 to 9-14-2046 | | | | 543,349,651 | | | | 579,298,977 | | | | 9.94 | |
FNMA %% | | | 3.00 | | | | 9-19-2031 | | | | 13,000,000 | | | | 13,606,204 | | | | 0.23 | |
FNMA | | | 3.00 | | | | 5-1-2046 | | | | 13,426,898 | | | | 13,935,459 | | | | 0.24 | |
FNMA | | | 3.00 | | | | 8-1-2046 | | | | 13,988,318 | | | | 14,518,144 | | | | 0.25 | |
FNMA %% | | | 3.00 | | | | 9-14-2046 | | | | 14,625,000 | | | | 15,166,581 | | | | 0.26 | |
FNMA | | | 3.50 | | | | 1-1-2045 | | | | 14,197,359 | | | | 14,956,519 | | | | 0.26 | |
FNMA | | | 3.50 | | | | 2-1-2046 | | | | 12,729,452 | | | | 13,410,120 | | | | 0.23 | |
FNMA | | | 3.50 | | | | 2-1-2046 | | | | 13,166,070 | | | | 13,870,085 | | | | 0.24 | |
GNMA | | | 3.00-7.00 | | | | 11-15-2023 to 7-20-2046 | | | | 292,449,085 | | | | 313,770,318 | | | | 5.38 | |
GNMA %% | | | 3.00 | | | | 9-21-2046 | | | | 16,800,000 | | | | 17,589,469 | | | | 0.30 | |
GNMA | | | 3.50 | | | | 4-20-2043 | | | | 12,024,236 | | | | 12,789,651 | | | | 0.22 | |
GNMA | | | 3.50 | | | | 4-20-2045 | | | | 14,167,295 | | | | 15,148,047 | | | | 0.26 | |
GNMA | | | 3.50 | | | | 4-20-2046 | | | | 15,531,032 | | | | 16,494,183 | | | | 0.28 | |
GNMA %% | | | 3.50 | | | | 9-21-2046 | | | | 24,075,000 | | | | 25,544,892 | | | | 0.44 | |
Other securities | | | | | | | | | | | | | | | 9,587,229 | | | | 0.16 | |
| | | | | |
Total Agency Securities (Cost $1,491,864,872) | | | | | | | | | | | | | | | 1,538,442,378 | | | | 26.40 | |
| | | | | | | | | | | | | | | | | | | | |
| | | | | |
Corporate Bonds and Notes: 20.82% | | | | | | | | | | | | | | | | | | | | |
| | | | | |
Consumer Discretionary: 1.99% | | | | | | | | | | | | | �� | | | | | | | |
| | | | | |
| Auto Components: 0.05% | | | | | | | | | | | | | | | | | | | | |
Other securities | | | | | | | | | | | | | | | 3,180,171 | | | | 0.05 | |
| | | | | | | | | | | | | | | | | | | | |
| | | | | |
| Automobiles: 0.08% | | | | | | | | | | | | | | | | | | | | |
Other securities | | | | | | | | | | | | | | | 4,754,937 | | | | 0.08 | |
| | | | | | | | | | | | | | | | | | | | |
| | | | | |
| Diversified Consumer Services: 0.04% | | | | | | | | | | | | | | | | | | | | |
Other securities | | | | | | | | | | | | | | | 2,379,700 | | | | 0.04 | |
| | | | | | | | | | | | | | | | | | | | |
| | | | | |
| Hotels, Restaurants & Leisure: 0.15% | | | | | | | | | | | | | | | | | | | | |
Other securities | | | | | | | | | | | | | | | 8,950,956 | | | | 0.15 | |
| | | | | | | | | | | | | | | | | | | | |
| | | | | |
| Household Durables: 0.09% | | | | | | | | | | | | | | | | | | | | |
Other securities | | | | | | | | | | | | | | | 4,988,436 | | | | 0.09 | |
| | | | | | | | | | | | | | | | | | | | |
| | | | | |
| Internet & Catalog Retail: 0.10% | | | | | | | | | | | | | | | | | | | | |
Other securities | | | | | | | | | | | | | | | 5,776,351 | | | | 0.10 | |
| | | | | | | | | | | | | | | | | | | | |
| | | | | |
| Leisure Products: 0.01% | | | | | | | | | | | | | | | | | | | | |
Other securities | | | | | | | | | | | | | | | 645,096 | | | | 0.01 | |
| | | | | | | | | | | | | | | | | | | | |
| | | | | |
| Media: 1.06% | | | | | | | | | | | | | | | | | | | | |
Other securities | | | | | | | | | | | | | | | 61,605,668 | | | | 1.06 | |
| | | | | | | | | | | | | | | | | | | | |
The accompanying notes are an integral part of these financial statements.
| | | | | | |
| Summary portfolio of investments—August 31, 2016 (unaudited) | | Wells Fargo Dow Jones Target Date Funds | | | 91 | |
DIVERSIFIED FIXED INCOME PORTFOLIO
| | | | | | | | | | | | | | | | | | | | |
| Security name | | | | | | | | | | | Value | | | Percent of net assets | |
| | | | | |
| Multiline Retail: 0.14% | | | | | | | | | | | | | | | | | | | | |
Other securities | | | | | | | | | | | | | | $ | 8,016,351 | | | | 0.14 | % |
| | | | | | | | | | | | | | | | | | | | |
| | | | | |
| Specialty Retail: 0.25% | | | | | | | | | | | | | | | | | | | | |
Other securities | | | | | | | | | | | | | | | 14,484,445 | | | | 0.25 | |
| | | | | | | | | | | | | | | | | | | | |
| | | | | |
| Textiles, Apparel & Luxury Goods: 0.02% | | | | | | | | | | | | | | | | | | | | |
Other securities | | | | | | | | | | | | | | | 1,406,443 | | | | 0.02 | |
| | | | | | | | | | | | | | | | | | | | |
| | | | | |
Consumer Staples: 2.01% | | | | | | | | | | | | | | | | | | | | |
| | | | | |
| Beverages: 0.66% | | | | | | | | | | | | | | | | | | | | |
Other securities | | | | | | | | | | | | | | | 38,318,026 | | | | 0.66 | |
| | | | | | | | | | | | | | | | | | | | |
| | | | | |
| Food & Staples Retailing: 0.55% | | | | | | | | | | | | | | | | | | | | |
Other securities | | | | | | | | | | | | | | | 32,101,544 | | | | 0.55 | |
| | | | | | | | | | | | | | | | | | | | |
| | | | | |
| Food Products: 0.40% | | | | | | | | | | | | | | | | | | | | |
Other securities | | | | | | | | | | | | | | | 23,150,211 | | | | 0.40 | |
| | | | | | | | | | | | | | | | | | | | |
| | | | | |
| Household Products: 0.12% | | | | | | | | | | | | | | | | | | | | |
Other securities | | | | | | | | | | | | | | | 6,903,258 | | | | 0.12 | |
| | | | | | | | | | | | | | | | | | | | |
| | | | | |
| Personal Products: 0.00% | | | | | | | | | | | | | | | | | | | | |
Other securities | | | | | | | | | | | | | | | 270,273 | | | | 0.00 | |
| | | | | | | | | | | | | | | | | | | | |
| | | | | |
| Tobacco: 0.28% | | | | | | | | | | | | | | | | | | | | |
Other securities | | | | | | | | | | | | | | | 16,380,945 | | | | 0.28 | |
| | | | | | | | | | | | | | | | | | | | |
| | | | | |
Energy: 1.77% | | | | | | | | | | | | | | | | | | | | |
| | | | | |
| Energy Equipment & Services: 0.13% | | | | | | | | | | | | | | | | | | | | |
Other securities | | | | | | | | | | | | | | | 7,411,507 | | | | 0.13 | |
| | | | | | | | | | | | | | | | | | | | |
| | | | | |
| Oil, Gas & Consumable Fuels: 1.64% | | | | | | | | | | | | | | | | | | | | |
Other securities | | | | | | | | | | | | | | | 95,588,600 | | | | 1.64 | |
| | | | | | | | | | | | | | | | | | | | |
| | | | | |
| | | Interest rate | | | Maturity date | | | Principal | | | | | | | |
| Financials: 6.20% | | | | | | | | | | | | | | | | | | | | |
| | | | | |
| Banks: 2.39% | | | | | | | | | | | | | | | | | | | | |
Wachovia Bank NA (l) | | | 5.85 | % | | | 2-1-2037 | | | $ | 1,000,000 | | | | 1,270,804 | | | | 0.02 | |
Wachovia Bank NA (l) | | | 6.60 | | | | 1-15-2038 | | | | 600,000 | | | | 843,014 | | | | 0.01 | |
Wachovia Corporation (l) | | | 5.50 | | | | 8-1-2035 | | | | 700,000 | | | | 829,965 | | | | 0.01 | |
Wachovia Corporation (l) | | | 5.75 | | | | 2-1-2018 | | | | 1,000,000 | | | | 1,061,915 | | | | 0.02 | |
Wells Fargo & Company (l) | | | 1.50 | | | | 1-16-2018 | | | | 1,000,000 | | | | 1,003,727 | | | | 0.02 | |
Wells Fargo & Company (l) | | | 2.15 | | | | 1-30-2020 | | | | 2,500,000 | | | | 2,540,693 | | | | 0.04 | |
Wells Fargo & Company (l) | | | 3.00 | | | | 2-19-2025 | | | | 1,250,000 | | | | 1,284,808 | | | | 0.02 | |
Wells Fargo & Company (l) | | | 3.00 | | | | 4-22-2026 | | | | 1,250,000 | | | | 1,281,340 | | | | 0.02 | |
Wells Fargo & Company (l) | | | 3.30 | | | | 9-9-2024 | | | | 1,500,000 | | | | 1,584,654 | | | | 0.03 | |
Wells Fargo & Company (l) | | | 3.45 | | | | 2-13-2023 | | | | 750,000 | | | | 786,196 | | | | 0.01 | |
Wells Fargo & Company (l) | | | 3.50 | | | | 3-8-2022 | | | | 1,000,000 | | | | 1,067,960 | | | | 0.02 | |
Wells Fargo & Company (l) | | | 3.90 | | | | 5-1-2045 | | | | 600,000 | | | | 635,458 | | | | 0.01 | |
Wells Fargo & Company (l) | | | 4.10 | | | | 6-3-2026 | | | | 1,000,000 | | | | 1,085,518 | | | | 0.02 | |
The accompanying notes are an integral part of these financial statements.
| | | | |
| 92 | | Wells Fargo Dow Jones Target Date Funds | | Summary portfolio of investments—August 31, 2016 (unaudited) |
DIVERSIFIED FIXED INCOME PORTFOLIO
| | | | | | | | | | | | | | | | | | | | |
| Security name | | Interest rate | | | Maturity date | | | Principal | | | Value | | | Percent of net assets | |
| | | | | |
| Banks (continued) | | | | | | | | | | | | | | | | | | | | |
Wells Fargo & Company (l) | | | 4.13 | % | | | 8-15-2023 | | | $ | 1,000,000 | | | $ | 1,090,789 | | | | 0.02 | % |
Wells Fargo & Company (l) | | | 4.60 | | | | 4-1-2021 | | | | 1,250,000 | | | | 1,389,594 | | | | 0.02 | |
Wells Fargo & Company (l) | | | 5.38 | | | | 11-2-2043 | | | | 1,000,000 | | | | 1,201,227 | | | | 0.02 | |
Wells Fargo & Company (l) | | | 5.61 | | | | 1-15-2044 | | | | 1,000,000 | | | | 1,248,846 | | | | 0.02 | |
Wells Fargo & Company (l) | | | 5.63 | | | | 12-11-2017 | | | | 1,500,000 | | | | 1,581,108 | | | | 0.03 | |
Wells Fargo Bank NA (l) | | | 1.65 | | | | 1-22-2018 | | | | 750,000 | | | | 754,318 | | | | 0.01 | |
Wells Fargo Bank NA (l) | | | 5.95 | | | | 8-26-2036 | | | | 350,000 | | | | 449,998 | | | | 0.01 | |
Wells Fargo Capital X (l) | | | 5.95 | | | | 12-1-2086 | | | | 500,000 | | | | 552,500 | | | | 0.01 | |
Other securities | | | | | | | | | | | | | | | 115,471,078 | | | | 2.00 | |
| | | | | |
| | | | | | | | | | | | | | | 139,015,510 | | | | 2.39 | |
| | | | | | | | | | | | | | | | | | | | |
| | | | | |
| Capital Markets: 1.15% | | | | | | | | | | | | | | | | | | | | |
Other securities | | | | | | | | | | | | | | | 66,936,160 | | | | 1.15 | |
| | | | | | | | | | | | | | | | | | | | |
| | | | | |
| Consumer Finance: 0.90% | | | | | | | | | | | | | | | | | | | | |
Other securities | | | | | | | | | | | | | | | 52,455,813 | | | | 0.90 | |
| | | | | | | | | | | | | | | | | | | | |
| | | | | |
| Diversified Financial Services: 0.29% | | | | | | | | | | | | | | | | | | | | |
Other securities | | | | | | | | | | | | | | | 17,171,282 | | | | 0.29 | |
| | | | | | | | | | | | | | | | | | | | |
| | | | | |
| Insurance: 0.78% | | | | | | | | | | | | | | | | | | | | |
Other securities | | | | | | | | | | | | | | | 45,594,954 | | | | 0.78 | |
| | | | | | | | | | | | | | | | | | | | |
| | | | |
| Real Estate Management & Development: 0.01% | | | | | | | | | | | | | | | | | |
Other securities | | | | | | | | | | | | | | | 599,924 | | | | 0.01 | |
| | | | | | | | | | | | | | | | | | | | |
| | | | | |
| REITs: 0.68% | | | | | | | | | | | | | | | | | | | | |
Other securities | | | | | | | | | | | | | | | 39,603,969 | | | | 0.68 | |
| | | | | | | | | | | | | | | | | | | | |
| | | | | |
| Thrifts & Mortgage Finance: 0.00% | | | | | | | | | | | | | | | | | | | | |
Other securities | | | | | | | | | | | | | | | 152,361 | | | | 0.00 | |
| | | | | | | | | | | | | | | | | | | | |
| | | | | |
Health Care: 2.27% | | | | | | | | | | | | | | | | | | | | |
| | | | | |
| Biotechnology: 0.61% | | | | | | | | | | | | | | | | | | | | |
Other securities | | | | | | | | | | | | | | | 35,792,601 | | | | 0.61 | |
| | | | | | | | | | | | | | | | | | | | |
| | | | | |
| Health Care Equipment & Supplies: 0.37% | | | | | | | | | | | | | | | | | | | | |
Other securities | | | | | | | | | | | | | | | 21,315,482 | | | | 0.37 | |
| | | | | | | | | | | | | | | | | | | | |
| | | | | |
| Health Care Providers & Services: 0.61% | | | | | | | | | | | | | | | | | | | | |
Other securities | | | | | | | | | | | | | | | 35,606,500 | | | | 0.61 | |
| | | | | | | | | | | | | | | | | | | | |
| | | | | |
| Life Sciences Tools & Services: 0.05% | | | | | | | | | | | | | | | | | | | | |
Other securities | | | | | | | | | | | | | | | 2,788,189 | | | | 0.05 | |
| | | | | | | | | | | | | | | | | | | | |
| | | | | |
| Pharmaceuticals: 0.63% | | | | | | | | | | | | | | | | | | | | |
Other securities | | | | | | | | | | | | | | | 36,802,450 | | | | 0.63 | |
| | | | | | | | | | | | | | | | | | | | |
| | | | | |
Industrials: 1.52% | | | | | | | | | | | | | | | | | | | | |
| | | | | |
| Aerospace & Defense: 0.43% | | | | | | | | | | | | | | | | | | | | |
Other securities | | | | | | | | | | | | | | | 24,711,551 | | | | 0.43 | |
| | | | | | | | | | | | | | | | | | | | |
The accompanying notes are an integral part of these financial statements.
| | | | | | |
| Summary portfolio of investments—August 31, 2016 (unaudited) | | Wells Fargo Dow Jones Target Date Funds | | | 93 | |
DIVERSIFIED FIXED INCOME PORTFOLIO
| | | | | | | | | | | | | | | | | | | | |
| Security name | | | | | | | | | | | Value | | | Percent of net assets | |
| | | | | |
| Air Freight & Logistics: 0.11% | | | | | | | | | | | | | | | | | | | | |
Other securities | | | | | | | | | | | | | | $ | 6,126,855 | | | | 0.11 | % |
| | | | | | | | | | | | | | | | | | | | |
| | | | | |
| Airlines: 0.05% | | | | | | | | | | | | | | | | | | | | |
Other securities | | | | | | | | | | | | | | | 3,056,131 | | | | 0.05 | |
| | | | | | | | | | | | | | | | | | | | |
| | | | | |
| Building Products: 0.00% | | | | | | | | | | | | | | | | | | | | |
Other securities | | | | | | | | | | | | | | | 227,188 | | | | 0.00 | |
| | | | | | | | | | | | | | | | | | | | |
| | | | | |
| Commercial Services & Supplies: 0.11% | | | | | | | | | | | | | | | | | | | | |
Other securities | | | | | | | | | | | | | | | 6,584,421 | | | | 0.11 | |
| | | | | | | | | | | | | | | | | | | | |
| | | | | |
| Electrical Equipment: 0.09% | | | | | | | | | | | | | | | | | | | | |
Other securities | | | | | | | | | | | | | | | 5,467,505 | | | | 0.09 | |
| | | | | | | | | | | | | | | | | | | | |
| | | | | |
| Industrial Conglomerates: 0.10% | | | | | | | | | | | | | | | | | | | | |
Other securities | | | | | | | | | | | | | | | 5,692,743 | | | | 0.10 | |
| | | | | | | | | | | | | | | | | | | | |
| | | | | |
| Machinery: 0.22% | | | | | | | | | | | | | | | | | | | | |
Other securities | | | | | | | | | | | | | | | 12,615,278 | | | | 0.22 | |
| | | | | | | | | | | | | | | | | | | | |
| | | | | |
| Professional Services: 0.02% | | | | | | | | | | | | | | | | | | | | |
Other securities | | | | | | | | | | | | | | | 1,160,475 | | | | 0.02 | |
| | | | | | | | | | | | | | | | | | | | |
| | | | | |
| Road & Rail: 0.33% | | | | | | | | | | | | | | | | | | | | |
Other securities | | | | | | | | | | | | | | | 19,361,475 | | | | 0.33 | |
| | | | | | | | | | | | | | | | | | | | |
| | | | | |
| Trading Companies & Distributors: 0.06% | | | | | | | | | | | | | | | | | | | | |
Other securities | | | | | | | | | | | | | | | 3,366,066 | | | | 0.06 | |
| | | | | | | | | | | | | | | | | | | | |
| | | | | |
Information Technology: 1.71% | | | | | | | | | | | | | | | | | | | | |
| | | | | |
| Communications Equipment: 0.21% | | | | | | | | | | | | | | | | | | | | |
Other securities | | | | | | | | | | | | | | | 12,201,313 | | | | 0.21 | |
| | | | | | | | | | | | | | | | | | | | |
| | | | | |
| Electronic Equipment, Instruments & Components: 0.06% | | | | | | | | | | | | | | | | | | | | |
Other securities | | | | | | | | | | | | | | | 3,547,658 | | | | 0.06 | |
| | | | | | | | | | | | | | | | | | | | |
| | | | | |
| Internet Software & Services: 0.04% | | | | | | | | | | | | | | | | | | | | |
Other securities | | | | | | | | | | | | | | | 2,362,059 | | | | 0.04 | |
| | | | | | | | | | | | | | | | | | | | |
| | | | | |
| IT Services: 0.35% | | | | | | | | | | | | | | | | | | | | |
Other securities | | | | | | | | | | | | | | | 20,247,825 | | | | 0.35 | |
| | | | | | | | | | | | | | | | | | | | |
| | | | | |
| Semiconductors & Semiconductor Equipment: 0.19% | | | | | | | | | | | | | | | | | | | | |
Other securities | | | | | | | | | | | | | | | 10,825,113 | | | | 0.19 | |
| | | | | | | | | | | | | | | | | | | | |
| | | | | |
| Software: 0.43% | | | | | | | | | | | | | | | | | | | | |
Other securities | | | | | | | | | | | | | | | 25,010,883 | | | | 0.43 | |
| | | | | | | | | | | | | | | | | | | | |
| | | | | |
| Technology Hardware, Storage & Peripherals: 0.43% | | | | | | | | | | | | | | | | | | | | |
Other securities | | | | | | | | | | | | | | | 25,336,727 | | | | 0.43 | |
| | | | | | | | | | | | | | | | | | | | |
The accompanying notes are an integral part of these financial statements.
| | | | |
| 94 | | Wells Fargo Dow Jones Target Date Funds | | Summary portfolio of investments—August 31, 2016 (unaudited) |
DIVERSIFIED FIXED INCOME PORTFOLIO
| | | | | | | | | | | | | | | | | | | | |
| Security name | | | | | | | | | | | Value | | | Percent of net assets | |
| | | | | |
Materials: 0.61% | | | | | | | | | | | | | | | | | | | | |
| | | | | |
| Chemicals: 0.37% | | | | | | | | | | | | | | | | | | | | |
Other securities | | | | | | | | | | | | | | $ | 21,473,980 | | | | 0.37 | % |
| | | | | | | | | | | | | | | | | | | | |
| | | | | |
| Construction Materials: 0.00% | | | | | | | | | | | | | | | | | | | | |
Other securities | | | | | | | | | | | | | | | 133,359 | | | | 0.00 | |
| | | | | | | | | | | | | | | | | | | | |
| | | | | |
| Containers & Packaging: 0.02% | | | | | | | | | | | | | | | | | | | | |
Other securities | | | | | | | | | | | | | | | 1,194,933 | | | | 0.02 | |
| | | | | | | | | | | | | | | | | | | | |
| | | | | |
| Metals & Mining: 0.11% | | | | | | | | | | | | | | | | | | | | |
Other securities | | | | | | | | | | | | | | | 6,032,053 | | | | 0.11 | |
| | | | | | | | | | | | | | | | | | | | |
| | | | | |
| Paper & Forest Products: 0.11% | | | | | | | | | | | | | | | | | | | | |
Other securities | | | | | | | | | | | | | | | 6,439,733 | | | | 0.11 | |
| | | | | | | | | | | | | | | | | | | | |
| | | | | |
Telecommunication Services: 0.90% | | | | | | | | | | | | | | | | | | | | |
| | | |
| Diversified Telecommunication Services: 0.89% | | | | | | | | | | | | | |
Other securities | | | | | | | | | | | | | | | 51,973,130 | | | | 0.89 | |
| | | | | | | | | | | | | | | | | | | | |
| | | | | |
| Wireless Telecommunication Services: 0.01% | | | | | | | | | | | | | | | | | | | | |
Other securities | | | | | | | | | | | | | | | 635,840 | | | | 0.01 | |
| | | | | | | | | | | | | | | | | | | | |
| | | | | |
Utilities: 1.84% | | | | | | | | | | | | | | | | | | | | |
| | | | | |
| Electric Utilities: 1.37% | | | | | | | | | | | | | | | | | | | | |
Other securities | | | | | | | | | | | | | | | 80,020,411 | | | | 1.37 | |
| | | | | | | | | | | | | | | | | | | | |
| | | | | |
| Gas Utilities: 0.09% | | | | | | | | | | | | | | | | | | | | |
Other securities | | | | | | | | | | | | | | | 5,045,919 | | | | 0.09 | |
| | | | | | | | | | | | | | | | | | | | |
| | |
| Independent Power & Renewable Electricity Producers: 0.02% | | | | | | | | | |
Other securities | | | | | | | | | | | | | | | 1,014,874 | | | | 0.02 | |
| | | | | | | | | | | | | | | | | | | | |
| | | | | |
| Multi-Utilities: 0.34% | | | | | | | | | | | | | | | | | | | | |
Other securities | | | | | | | | | | | | | | | 20,105,652 | | | | 0.34 | |
| | | | | | | | | | | | | | | | | | | | |
| | | | | |
| Water Utilities: 0.02% | | | | | | | | | | | | | | | | | | | | |
Other securities | | | | | | | | | | | | | | | 1,111,994 | | | | 0.02 | |
| | | | | | | | | | | | | | | | | | | | |
| | | |
Total Corporate Bonds and Notes (Cost $1,119,059,698) | | | | | | | | 1,213,231,257 | | | | 20.82 | |
| | | | | | | | | | | | | | | | | | | | |
| | | | | |
| | | Interest rate | | | Maturity date | | | Principal | | | | | | | |
| Foreign Government Bonds @: 24.63% | | | | | | | | | | | | | | | | | |
France Government Bond (EUR) | | | 0.00-8.50 | % | | | 10-25-2017 to 5-25-2066 | | | | 99,875,000 | | | | 138,987,681 | | | | 2.38 | |
Italy Buoni Poliennali del Tesoro (EUR) | | | 0.10-9.00 | | | | 11-1-2017 to 3-1-2047 | | | | 101,455,000 | | | | 137,884,341 | | | | 2.37 | |
Japan Government Ten Year Bond (JPY) | | | 0.10-1.80 | | | | 9-20-2017 to 6-20-2026 | | | | 26,139,000,000 | | | | 264,381,974 | | | | 4.54 | |
Japan Government Thirty Year Bond (JPY) | | | 1.70-2.90 | | | | 5-20-2030 to 3-20-2044 | | | | 6,237,500,000 | | | | 83,262,831 | | | | 1.43 | |
Japan Government Twenty Year Bond (JPY) | | | 0.20-3.10 | | | | 9-20-2017 to 6-20-2036 | | | | 18,723,500,000 | | | | 216,243,948 | | | | 3.71 | |
Japan Government Twenty Year Bond Series 148 (JPY) | | | 1.50 | | | | 3-20-2034 | | | | 1,150,000,000 | | | | 13,549,915 | | | | 0.23 | |
The accompanying notes are an integral part of these financial statements.
| | | | | | |
| Summary portfolio of investments—August 31, 2016 (unaudited) | | Wells Fargo Dow Jones Target Date Funds | | | 95 | |
DIVERSIFIED FIXED INCOME PORTFOLIO
| | | | | | | | | | | | | | | | | | | | |
| Security name | | Interest rate | | | Maturity date | | | Principal | | | Value | | | Percent of net assets | |
| | | | |
Foreign Government Bonds @ (continued) | | | | | | | | | | | | | | | | | |
United Kingdom Gilt (GBP) | | | 1.00-8.00 | % | | | 9-7-2017 to 7-22-2068 | | | | 89,270,000 | | | $ | 160,449,911 | | | | 2.75 | % |
Other securities | | | | | | | | | | | | | | | 420,804,521 | | | | 7.22 | |
| | |
Total Foreign Government Bonds (Cost $1,379,786,537) | | | | 1,435,565,122 | | | | 24.63 | |
| | | | | | | | | | | | | | | | | | | | |
| | | | | |
U.S. Treasury Securities: 22.98% | | | | | | | | | | | | | | | | | | | | |
U.S. Treasury Bond | | | 2.25-6.63 | | | | 2-15-2026 to 8-15-2046 | | | $ | 128,150,000 | | | | 159,549,871 | | | | 2.74 | |
U.S. Treasury Bond | | | 2.50 | | | | 2-15-2045 | | | | 17,750,000 | | | | 18,746,361 | | | | 0.32 | |
U.S. Treasury Bond | | | 3.00 | | | | 11-15-2044 | | | | 16,600,000 | | | | 19,320,840 | | | | 0.33 | |
U.S. Treasury Bond | | | 3.63 | | | | 2-15-2044 | | | | 9,750,000 | | | | 12,667,005 | | | | 0.22 | |
U.S. Treasury Bond | | | 3.75 | | | | 11-15-2043 | | | | 10,000,000 | | | | 13,279,300 | | | | 0.23 | |
U.S. Treasury Note | | | 0.63 | | | | 9-30-2017 | | | | 14,000,000 | | | | 13,985,776 | | | | 0.24 | |
U.S. Treasury Note | | | 0.63-9.13 | | | | 9-30-2017 to 8-15-2026 | | | | 564,875,000 | | | | 582,088,491 | | | | 9.99 | |
U.S. Treasury Note | | | 1.00 | | | | 6-30-2019 | | | | 25,000,000 | | | | 25,060,550 | | | | 0.43 | |
U.S. Treasury Note | | | 1.00 | | | | 9-30-2019 | | | | 23,500,000 | | | | 23,531,208 | | | | 0.40 | |
U.S. Treasury Note | | | 1.13 | | | | 4-30-2020 | | | | 15,000,000 | | | | 15,037,500 | | | | 0.26 | |
U.S. Treasury Note | | | 1.13 | | | | 2-28-2021 | | | | 12,500,000 | | | | 12,475,100 | | | | 0.21 | |
U.S. Treasury Note | | | 1.25 | | | | 4-30-2019 | | | | 12,000,000 | | | | 12,113,904 | | | | 0.21 | |
U.S. Treasury Note | | | 1.38 | | | | 4-30-2020 | | | | 15,500,000 | | | | 15,674,980 | | | | 0.27 | |
U.S. Treasury Note | | | 1.50 | | | | 8-31-2018 | | | | 12,000,000 | | | | 12,156,564 | | | | 0.21 | |
U.S. Treasury Note | | | 1.50 | | | | 5-31-2019 | | | | 22,500,000 | | | | 22,858,605 | | | | 0.39 | |
U.S. Treasury Note | | | 1.63 | | | | 11-15-2022 | | | | 12,500,000 | | | | 12,680,663 | | | | 0.22 | |
U.S. Treasury Note | | | 1.63 | | | | 2-15-2026 | | | | 14,000,000 | | | | 14,043,750 | | | | 0.24 | |
U.S. Treasury Note | | | 1.75 | | | | 9-30-2019 | | | | 30,000,000 | | | | 30,715,742 | | | | 0.53 | |
U.S. Treasury Note | | | 1.75 | | | | 2-28-2022 | | | | 15,000,000 | | | | 15,355,080 | | | | 0.26 | |
U.S. Treasury Note | | | 1.75 | | | | 5-15-2023 | | | | 12,500,000 | | | | 12,759,275 | | | | 0.22 | |
U.S. Treasury Note | | | 2.00 | | | | 11-15-2021 | | | | 16,000,000 | | | | 16,595,008 | | | | 0.28 | |
U.S. Treasury Note | | | 2.00 | | | | 2-15-2025 | | | | 16,500,000 | | | | 17,097,482 | | | | 0.29 | |
U.S. Treasury Note | | | 2.00 | | | | 8-15-2025 | | | | 13,500,000 | | | | 13,982,517 | | | | 0.24 | |
U.S. Treasury Note | | | 2.13 | | | | 8-31-2020 | | | | 13,000,000 | | | | 13,505,271 | | | | 0.23 | |
U.S. Treasury Note | | | 2.25 | | | | 11-15-2024 | | | | 18,500,000 | | | | 19,526,898 | | | | 0.34 | |
U.S. Treasury Note | | | 2.25 | | | | 11-15-2025 | | | | 11,500,000 | | | | 12,158,559 | | | | 0.21 | |
U.S. Treasury Note | | | 2.38 | | | | 8-15-2024 | | | | 15,000,000 | | | | 15,965,040 | | | | 0.27 | |
U.S. Treasury Note | | | 2.50 | | | | 8-15-2023 | | | | 14,250,000 | | | | 15,249,167 | | | | 0.26 | |
U.S. Treasury Note | | | 2.50 | | | | 5-15-2024 | | | | 15,500,000 | | | | 16,637,065 | | | | 0.29 | |
U.S. Treasury Note | | | 2.63 | | | | 8-15-2020 | | | | 12,000,000 | | | | 12,693,744 | | | | 0.22 | |
U.S. Treasury Note | | | 2.63 | | | | 11-15-2020 | | | | 15,000,000 | | | | 15,898,830 | | | | 0.27 | |
U.S. Treasury Note | | | 2.75 | | | | 11-15-2023 | | | | 15,500,000 | | | | 16,878,043 | | | | 0.29 | |
U.S. Treasury Note | | | 2.75 | | | | 2-15-2024 | | | | 18,250,000 | | | | 19,901,059 | | | | 0.34 | |
U.S. Treasury Note | | | 3.50 | | | | 5-15-2020 | | | | 25,000,000 | | | | 27,189,450 | | | | 0.47 | |
U.S. Treasury Note | | | 3.63 | | | | 2-15-2020 | | | | 20,500,000 | | | | 22,297,748 | | | | 0.38 | |
U.S. Treasury Note | | | 3.63 | | | | 2-15-2021 | | | | 20,000,000 | | | | 22,110,160 | | | | 0.38 | |
U.S. Treasury Note | | | 7.25 | | | | 8-15-2022 | | | | 13,000,000 | | | | 17,438,278 | | | | 0.30 | |
| | |
Total U.S. Treasury Securities (Cost $1,271,729,003) | | | | 1,339,224,884 | | | | 22.98 | |
| | | | | | | | | | | | | | | | | | | | |
| | | | |
Yankee Corporate Bonds and Notes: 3.97% | | | | | | | | | | | | | | | | | |
| | | | | |
Consumer Discretionary: 0.06% | | | | | | | | | | | | | | | | | | | | |
| | | | | |
| Auto Components: 0.01% | | | | | | | | | | | | | | | | | | | | |
Other securities | | | | | | | | | | | | | | | 274,549 | | | | 0.01 | |
| | | | | | | | | | | | | | | | | | | | |
The accompanying notes are an integral part of these financial statements.
| | | | |
| 96 | | Wells Fargo Dow Jones Target Date Funds | | Summary portfolio of investments—August 31, 2016 (unaudited) |
DIVERSIFIED FIXED INCOME PORTFOLIO
| | | | | | | | | | | | | | | | | | | | |
| Security name | | | | | | | | | | | Value | | | Percent of net assets | |
| | | | | |
| Media: 0.05% | | | | | | | | | | | | | | | | | | | | |
Other securities | | | | | | | | | | | | | | $ | 3,081,828 | | | | 0.05 | % |
| | | | | | | | | | | | | | | | | | | | |
| | | | | |
Consumer Staples: 0.07% | | | | | | | | | | | | | | | | | | | | |
| | | | | |
| Beverages: 0.07% | | | | | | | | | | | | | | | | | | | | |
Other securities | | | | | | | | | | | | | | | 4,182,645 | | | | 0.07 | |
| | | | | | | | | | | | | | | | | | | | |
| | | | | |
Energy: 0.39% | | | | | | | | | | | | | | | | | | | | |
| | | | | |
| Oil, Gas & Consumable Fuels: 0.39% | | | | | | | | | | | | | | | | | | | | |
Other securities | | | | | | | | | | | | | | | 22,634,300 | | | | 0.39 | |
| | | | | | | | | | | | | | | | | | | | |
| | | | | |
Financials: 2.24% | | | | | | | | | | | | | | | | | | | | |
| | | | | |
| Banks: 1.48% | | | | | | | | | | | | | | | | | | | | |
Other securities | | | | | | | | | | | | | | | 86,149,430 | | | | 1.48 | |
| | | | | | | | | | | | | | | | | | | | |
| | | | | |
| Capital Markets: 0.11% | | | | | | | | | | | | | | | | | | | | |
Other securities | | | | | | | | | | | | | | | 6,186,284 | | | | 0.11 | |
| | | | | | | | | | | | | | | | | | | | |
| | | | | |
| Diversified Financial Services: 0.59% | | | | | | | | | | | | | | | | | | | | |
Other securities | | | | | | | | | | | | | | | 34,567,934 | | | | 0.59 | |
| | | | | | | | | | | | | | | | | | | | |
| | | | | |
| Insurance: 0.06% | | | | | | | | | | | | | | | | | | | | |
Other securities | | | | | | | | | | | | | | | 3,483,252 | | | | 0.06 | |
| | | | | | | | | | | | | | | | | | | | |
| | | | | |
Health Care: 0.27% | | | | | | | | | | | | | | | | | | | | |
| | | | | |
| Health Care Equipment & Supplies: 0.03% | | | | | | | | | | | | | | | | | | | | |
Other securities | | | | | | | | | | | | | | | 1,725,791 | | | | 0.03 | |
| | | | | | | | | | | | | | | | | | | | |
| | | | | |
| Pharmaceuticals: 0.24% | | | | | | | | | | | | | | | | | | | | |
Other securities | | | | | | | | | | | | | | | 14,138,489 | | | | 0.24 | |
| | | | | | | | | | | | | | | | | | | | |
| | | | | |
Industrials: 0.19% | | | | | | | | | | | | | | | | | | | | |
| | | | | |
| Industrial Conglomerates: 0.06% | | | | | | | | | | | | | | | | | | | | |
Other securities | | | | | | | | | | | | | | | 3,399,758 | | | | 0.06 | |
| | | | | | | | | | | | | | | | | | | | |
| | | | | |
| Machinery: 0.01% | | | | | | | | | | | | | | | | | | | | |
Other securities | | | | | | | | | | | | | | | 570,026 | | | | 0.01 | |
| | | | | | | | | | | | | | | | | | | | |
| | | | | |
| Road & Rail: 0.06% | | | | | | | | | | | | | | | | | | | | |
Other securities | | | | | | | | | | | | | | | 3,340,566 | | | | 0.06 | |
| | | | | | | | | | | | | | | | | | | | |
| | | | | |
| Trading Companies & Distributors: 0.06% | | | | | | | | | | | | | | | | | | | | |
Other securities | | | | | | | | | | | | | | | 3,894,120 | | | | 0.06 | |
| | | | | | | | | | | | | | | | | | | | |
| | | | | |
Information Technology: 0.11% | | | | | | | | | | | | | | | | | | | | |
| | | | | |
| Communications Equipment: 0.01% | | | | | | | | | | | | | | | | | | | | |
Other securities | | | | | | | | | | | | | | | 430,056 | | | | 0.01 | |
| | | | | | | | | | | | | | | | | | | | |
| | | | | |
| Internet Software & Services: 0.07% | | | | | | | | | | | | | | | | | | | | |
Other securities | | | | | | | | | | | | | | | 3,754,263 | | | | 0.07 | |
| | | | | | | | | | | | | | | | | | | | |
The accompanying notes are an integral part of these financial statements.
| | | | | | |
| Summary portfolio of investments—August 31, 2016 (unaudited) | | Wells Fargo Dow Jones Target Date Funds | | | 97 | |
DIVERSIFIED FIXED INCOME PORTFOLIO
| | | | | | | | | | | | | | | | | | | | |
| Security name | | | | | | | | | | | Value | | | Percent of net assets | |
| | | | | |
| Technology Hardware, Storage & Peripherals: 0.03% | | | | | | | | | | | | | | | | | | | | |
Other securities | | | | | | | | | | | | | | $ | 1,899,340 | | | | 0.03 | % |
| | | | | | | | | | | | | | | | | | | | |
| | | | | |
Materials: 0.25% | | | | | | | | | | | | | | | | | | | | |
| | | | | |
| Chemicals: 0.09% | | | | | | | | | | | | | | | | | | | | |
Other securities | | | | | | | | | | | | | | | 5,130,393 | | | | 0.09 | |
| | | | | | | | | | | | | | | | | | | | |
| | | | | |
| Metals & Mining: 0.15% | | | | | | | | | | | | | | | | | | | | |
Other securities | | | | | | | | | | | | | | | 8,675,856 | | | | 0.15 | |
| | | | | | | | | | | | | | | | | | | | |
| | | | | |
| Paper & Forest Products: 0.01% | | | | | | | | | | | | | | | | | | | | |
Other securities | | | | | | | | | | | | | | | 937,235 | | | | 0.01 | |
| | | | | | | | | | | | | | | | | | | | |
| | | | | |
Telecommunication Services: 0.38% | | | | | | | | | | | | | | | | | | | | |
| | | | | |
| Diversified Telecommunication Services: 0.21% | | | | | | | | | | | | | | | | | | | | |
Other securities | | | | | | | | | | | | | | | 12,407,996 | | | | 0.21 | |
| | | | | | | | | | | | | | | | | | | | |
| | | | | |
| Wireless Telecommunication Services: 0.17% | | | | | | | | | | | | | | | | | | | | |
Other securities | | | | | | | | | | | | | | | 9,646,916 | | | | 0.17 | |
| | | | | | | | | | | | | | | | | | | | |
| | | | | |
Utilities: 0.01% | | | | | | | | | | | | | | | | | | | | |
| | | | | |
| Electric Utilities: 0.00% | | | | | | | | | | | | | | | | | | | | |
Other securities | | | | | | | | | | | | | | | 174,475 | | | | 0.00 | |
| | | | | | | | | | | | | | | | | | | | |
| | | | | |
| Independent Power & Renewable Electricity Producers: 0.01% | | | | | | | | | | | | | | | | | | | | |
Other securities | | | | | | | | | | | | | | | 291,200 | | | | 0.01 | |
| | | | | | | | | | | | | | | | | | | | |
| | | | | |
| Water Utilities: 0.00% | | | | | | | | | | | | | | | | | | | | |
Other securities | | | | | | | | | | | | | | | 268,558 | | | | 0.00 | |
| | | | | | | | | | | | | | | | | | | | |
| | | | | |
Total Yankee Corporate Bonds and Notes (Cost $218,120,030) | | | | | | | | | | | | | | | 231,245,260 | | | | 3.97 | |
| | | | | | | | | | | | | | | | | | | | |
| | | | | |
Yankee Government Bonds: 0.03% | | | | | | | | | | | | | | | | | | | | |
Other securities | | | | | | | | | | | | | | | 2,026,706 | | | | 0.03 | |
| | | | | | | | | | | | | | | | | | | | |
| | | | | |
Total Yankee Government Bonds (Cost $2,000,727) | | | | | | | | | | | | | | | 2,026,706 | | | | 0.03 | |
| | | | | | | | | | | | | | | | | | | | |
| | | | | |
| | | Yield | | | | | | Shares | | | | | | | |
| Short-Term Investments: 3.32% | | | | | | | | | | | | | | | | | | | | |
| | | | | |
| Investment Companies: 3.32% | | | | | | | | | | | | | | | | | | | | |
Securities Lending Cash Investments LLC (l)(r)(u) | | | 0.51 | % | | | | | | | 4,562,280 | | | | 4,562,280 | | | | 0.08 | |
Wells Fargo Government Money Market Fund Select Class (l)(u)## | | | 0.32 | | | | | | | | 188,973,592 | | | | 188,973,592 | | | | 3.24 | |
| | | | | |
Total Short-Term Investments (Cost $193,535,872) | | | | | | | | | | | | | | | 193,535,872 | | | | 3.32 | |
| | | | | | | | | | | | | | | | | | | | |
| | | | | |
| Total investments in securities (Cost $5,676,096,739) * | | | | | | | | | | | | | | | 5,953,271,479 | | | | 102.15 | |
Other assets and liabilities, net | | | | | | | | | | | | | | | (125,420,626 | ) | | | (2.15 | ) |
| | | | | | | | | | | | | | | | | | | | |
| Total net assets | | | | | | | | | | | | | | $ | 5,827,850,853 | | | | 100.00 | % |
| | | | | | | | | | | | | | | | | | | | |
The accompanying notes are an integral part of these financial statements.
| | | | |
| 98 | | Wells Fargo Dow Jones Target Date Funds | | Summary portfolio of investments—August 31, 2016 (unaudited) |
DIVERSIFIED FIXED INCOME PORTFOLIO
| %% | The security is issued on a when-issued basis. |
| (l) | The issuer of the security is an affiliated person of the Portfolio as defined in the Investment Company Act of 1940. |
| @ | Foreign bond principal is denominated in the local currency of the issuer. |
| (r) | The investment is a non-registered investment vehicle purchased with cash collateral received from securities on loan. |
| (u) | The rate represents the 7-day annualized yield at period end. |
| ## | All or a portion of this security is segregated for when-issued securities. |
| * | Cost for federal income tax purposes is $5,679,627,115 and unrealized gains (losses) consists of: |
| | | | |
Gross unrealized gains | | $ | 332,449,793 | |
Gross unrealized losses | | | (58,805,429 | ) |
| | | | |
Net unrealized gains | | $ | 273,644,364 | |
The following table shows the percent of total long-term investments by geographic location as of August 31, 2016:
| | | | |
United States | | | 70.89 | % |
Japan | | | 11.92 | |
United Kingdom | | | 3.64 | |
France | | | 2.69 | |
Italy | | | 2.42 | |
Germany | | | 1.86 | |
Spain | | | 1.38 | |
Canada | | | 1.26 | |
Netherlands | | | 1.05 | |
Other | | | 2.89 | |
| | | | |
| | | 100.00 | % |
| | | | |
The accompanying notes are an integral part of these financial statements.
| | | | | | |
| Summary portfolio of investments—August 31, 2016 (unaudited) | | Wells Fargo Dow Jones Target Date Funds | | | 99 | |
DIVERSIFIED STOCK PORTFOLIO
The Summary portfolio of investments shows the 50 largest portfolio holdings in unaffiliated issuers and any holdings exceeding 1% of the total net assets as of the report date. The remaining securities held are grouped as “Other securities” in each category.
| | | | | | | | | | | | | | | | | | | | |
| Security name | | | | | | | | Shares | | | Value | | | Percent of net assets | |
| | | | | |
Common Stocks: 97.02% | | | | | | | | | | | | | | | | | | | | |
| | | | | |
Consumer Discretionary: 13.31% | | | | | | | | | | | | | | | | | | | | |
| | | | | |
| Auto Components: 0.67% | | | | | | | | | | | | | | | | | | | | |
Other securities | | | | | | | | | | | | | | $ | 57,649,906 | | | | 0.67 | % |
| | | | | | | | | | | | | | | | | | | | |
| | | | | |
| Automobiles: 1.21% | | | | | | | | | | | | | | | | | | | | |
Toyota Motor Corporation | | | | | | | | | | | 428,100 | | | | 25,810,543 | | | | 0.30 | |
Other securities | | | | | | | | | | | | | | | 77,755,163 | | | | 0.91 | |
| | | | | |
| | | | | | | | | | | | | | | 103,565,706 | | | | 1.21 | |
| | | | | | | | | | | | | | | | | | | | |
| | | | | |
| Distributors: 0.26% | | | | | | | | | | | | | | | | | | | | |
Other securities | | | | | | | | | | | | | | | 22,061,240 | | | | 0.26 | |
| | | | | | | | | | | | | | | | | | | | |
| | | | | |
| Diversified Consumer Services: 0.18% | | | | | | | | | | | | | | | | | | | | |
Other securities | | | | | | | | | | | | | | | 15,686,998 | | | | 0.18 | |
| | | | | | | | | | | | | | | | | | | | |
| | | | | |
| Hotels, Restaurants & Leisure: 2.01% | | | | | | | | | | | | | | | | | | | | |
McDonald’s Corporation | | | | | | | | | | | 158,914 | | | | 18,379,993 | | | | 0.22 | |
Other securities | | | | | | | | | | | | | | | 154,101,309 | | | | 1.79 | |
| | | | | |
| | | | | | | | | | | | | | | 172,481,302 | | | | 2.01 | |
| | | | | | | | | | | | | | | | | | | | |
| | | | | |
| Household Durables: 1.10% | | | | | | | | | | | | | | | | | | | | |
Other securities | | | | | | | | | | | | | | | 94,771,604 | | | | 1.10 | |
| | | | | | | | | | | | | | | | | | | | |
| | | | | |
| Internet & Catalog Retail: 1.35% | | | | | | | | | | | | | | | | | | | | |
Amazon.com Incorporated † | | | | | | | | | | | 70,127 | | | | 53,938,883 | | | | 0.63 | |
Other securities | | | | | | | | | | | | | | | 62,109,279 | | | | 0.72 | |
| | | | | |
| | | | | | | | | | | | | | | 116,048,162 | | | | 1.35 | |
| | | | | | | | | | | | | | | | | | | | |
| | | | | |
| Leisure Products: 0.34% | | | | | | | | | | | | | | | | | | | | |
Other securities | | | | | | | | | | | | | | | 29,226,081 | | | | 0.34 | |
| | | | | | | | | | | | | | | | | | | | |
| | | | | |
| Media: 2.08% | | | | | | | | | | | | | | | | | | | | |
Charter Communications Incorporated Class A † | | | | | | | | | | | 123,007 | | | | 31,638,630 | | | | 0.37 | |
Naspers Limited | | | | | | | | | | | 119,631 | | | | 19,577,757 | | | | 0.23 | |
Other securities | | | | | | | | | | | | | | | 126,797,479 | | | | 1.48 | |
| | | | | |
| | | | | | | | | | | | | | | 178,013,866 | | | | 2.08 | |
| | | | | | | | | | | | | | | | | | | | |
| | | | | |
| Multiline Retail: 0.51% | | | | | | | | | | | | | | | | | | | | |
Other securities | | | | | | | | | | | | | | | 44,069,790 | | | | 0.51 | |
| | | | | | | | | | | | | | | | | | | | |
| | | | | |
| Specialty Retail: 2.41% | | | | | | | | | | | | | | | | | | | | |
O’Reilly Automotive Incorporated † | | | | | | | | | | | 55,606 | | | | 15,566,900 | | | | 0.18 | |
The Home Depot Incorporated | | | | | | | | | | | 225,520 | | | | 30,246,742 | | | | 0.35 | |
Other securities | | | | | | | | | | | | | | | 160,779,576 | | | | 1.88 | |
| | | | | |
| | | | | | | | | | | | | | | 206,593,218 | | | | 2.41 | |
| | | | | | | | | | | | | | | | | | | | |
The accompanying notes are an integral part of these financial statements.
| | | | |
| 100 | | Wells Fargo Dow Jones Target Date Funds | | Summary portfolio of investments—August 31, 2016 (unaudited) |
DIVERSIFIED STOCK PORTFOLIO
| | | | | | | | | | | | | | | | | | | | |
| Security name | | | | | | | | Shares | | | Value | | | Percent of net assets | |
| | | | | |
| Textiles, Apparel & Luxury Goods: 1.19% | | | | | | | | | | | | | | | | | | | | |
Other securities | | | | | | | | | | | | | | $ | 101,700,310 | | | | 1.19 | % |
| | | | | | | | | | | | | | | | | | | | |
| | | | | |
Consumer Staples: 7.21% | | | | | | | | | | | | | | | | | | | | |
| | | | | |
| Beverages: 1.67% | | | | | | | | | | | | | | | | | | | | |
Constellation Brands Incorporated Class A | | | | | | | | | | | 101,759 | | | | 16,693,564 | | | | 0.20 | |
PepsiCo Incorporated | | | | | | | | | | | 160,019 | | | | 17,082,028 | | | | 0.20 | |
The Coca-Cola Company | | | | | | | | | | | 431,674 | | | | 18,747,602 | | | | 0.22 | |
Other securities | | | | | | | | | | | | | | | 90,747,400 | | | | 1.05 | |
| | | | | |
| | | | | | | | | | | | | | | 143,270,594 | | | | 1.67 | |
| | | | | | | | | | | | | | | | | | | | |
| | | | | |
| Food & Staples Retailing: 1.16% | | | | | | | | | | | | | | | | | | | | |
Other securities | | | | | | | | | | | | | | | 99,500,814 | | | | 1.16 | |
| | | | | | | | | | | | | | | | | | | | |
| | | | | |
| Food Products: 2.32% | | | | | | | | | | | | | | | | | | | | |
Nestle SA | | | | | | | | | | | 299,651 | | | | 23,855,090 | | | | 0.28 | |
Other securities | | | | | | | | | | | | | | | 175,783,312 | | | | 2.04 | |
| | | | | |
| | | | | | | | | | | | | | | 199,638,402 | | | | 2.32 | |
| | | | | | | | | | | | | | | | | | | | |
| | | | | |
| Household Products: 0.74% | | | | | | | | | | | | | | | | | | | | |
The Procter & Gamble Company | | | | | | | | | | | 295,768 | | | | 25,823,504 | | | | 0.30 | |
Other securities | | | | | | | | | | | | | | | 37,469,911 | | | | 0.44 | |
| | | | | |
| | | | | | | | | | | | | | | 63,293,415 | | | | 0.74 | |
| | | | | | | | | | | | | | | | | | | | |
| | | | | |
| Personal Products: 0.56% | | | | | | | | | | | | | | | | | | | | |
Other securities | | | | | | | | | | | | | | | 48,002,680 | | | | 0.56 | |
| | | | | | | | | | | | | | | | | | | | |
| | | | | |
| Tobacco: 0.76% | | | | | | | | | | | | | | | | | | | | |
Philip Morris International Incorporated | | | | | | | | | | | 171,843 | | | | 17,172,271 | | | | 0.20 | |
Other securities | | | | | | | | | | | | | | | 47,768,576 | | | | 0.56 | |
| | | | | |
| | | | | | | | | | | | | | | 64,940,847 | | | | 0.76 | |
| | | | | | | | | | | | | | | | | | | | |
| | | | | |
Energy: 5.39% | | | | | | | | | | | | | | | | | | | | |
| | | | | |
| Energy Equipment & Services: 0.78% | | | | | | | | | | | | | | | | | | | | |
Schlumberger Limited | | | | | | | | | | | 251,555 | | | | 19,872,845 | | | | 0.23 | |
Other securities | | | | | | | | | | | | | | | 47,291,850 | | | | 0.55 | |
| | | | | |
| | | | | | | | | | | | | | | 67,164,695 | | | | 0.78 | |
| | | | | | | | | | | | | | | | | | | | |
| | | | | |
| Oil, Gas & Consumable Fuels: 4.61% | | | | | | | | | | | | | | | | | | | | |
Chevron Corporation | | | | | | | | | | | 209,116 | | | | 21,032,887 | | | | 0.25 | |
Exxon Mobil Corporation | | | | | | | | | | | 448,552 | | | | 39,086,821 | | | | 0.46 | |
Other securities | | | | | | | | | | | | | | | 334,910,223 | | | | 3.90 | |
| | | | | |
| | | | | | | | | | | | | | | 395,029,931 | | | | 4.61 | |
| | | | | | | | | | | | | | | | | | | | |
| | | | | |
Financials: 21.47% | | | | | | | | | | | | | | | | | | | | |
| | | | | |
| Banks: 7.85% | | | | | | | | | | | | | | | | | | | | |
Bank of America Corporation | | | | | | | | | | | 1,137,245 | | | | 18,355,134 | | | | 0.21 | |
China Construction Bank H Shares | | | | | | | | | | | 26,890,990 | | | | 20,105,284 | | | | 0.24 | |
The accompanying notes are an integral part of these financial statements.
| | | | | | |
| Summary portfolio of investments—August 31, 2016 (unaudited) | | Wells Fargo Dow Jones Target Date Funds | | | 101 | |
DIVERSIFIED STOCK PORTFOLIO
| | | | | | | | | | | | | | | | | | | | |
| Security name | | | | | | | | Shares | | | Value | | | Percent of net assets | |
| | | | | |
| Banks (continued) | | | | | | | | | | | | | | | | | | | | |
Citigroup Incorporated | | | | | | | | | | | 324,432 | | | $ | 15,488,384 | | | | 0.18 | % |
JPMorgan Chase & Company | | | | | | | | | | | 406,393 | | | | 27,431,528 | | | | 0.32 | |
Wells Fargo & Company (l) | | | | | | | | | | | 513,184 | | | | 26,069,747 | | | | 0.30 | |
Other securities | | | | | | | | | | | | | | | 566,494,395 | | | | 6.60 | |
| | | | | |
| | | | | | | | | | | | | | | 673,944,472 | | | | 7.85 | |
| | | | | | | | | | | | | | | | | | | | |
| | | | | |
| Capital Markets: 1.94% | | | | | | | | | | | | | | | | | | | | |
Other securities | | | | | | | | | | | | | | | 166,536,175 | | | | 1.94 | |
| | | | | | | | | | | | | | | | | | | | |
| | | | | |
| Consumer Finance: 0.33% | | | | | | | | | | | | | | | | | | | | |
Other securities | | | | | | | | | | | | | | | 28,290,041 | | | | 0.33 | |
| | | | | | | | | | | | | | | | | | | | |
| | | | | |
| Diversified Financial Services: 0.40% | | | | | | | | | | | | | | | | | | | | |
Other securities | | | | | | | | | | | | | | | 34,384,376 | | | | 0.40 | |
| | | | | | | | | | | | | | | | | | | | |
| | | | | |
| Insurance: 4.02% | | | | | | | | | | | | | | | | | | | | |
Other securities | | | | | | | | | | | | | | | 344,682,697 | | | | 4.02 | |
| | | | | | | | | | | | | | | | | | | | |
| | | | | |
| Real Estate Management & Development: 0.88% | | | | | | | | | | | | | | | | | | | | |
Other securities | | | | | | | | | | | | | | | 75,829,404 | | | | 0.88 | |
| | | | | | | | | | | | | | | | | | | | |
| | | | | |
| REITs: 5.77% | | | | | | | | | | | | | | | | | | | | |
Other securities | | | | | | | | | | | | | | | 494,812,458 | | | | 5.77 | |
| | | | | | | | | | | | | | | | | | | | |
| | | | | |
| Thrifts & Mortgage Finance: 0.28% | | | | | | | | | | | | | | | | | | | | |
Other securities | | | | | | | | | | | | | | | 23,790,157 | | | | 0.28 | |
| | | | | | | | | | | | | | | | | | | | |
| | | | | |
Health Care: 10.19% | | | | | | | | | | | | | | | | | | | | |
| | | | | |
| Biotechnology: 2.28% | | | | | | | | | | | | | | | | | | | | |
Gilead Sciences Incorporated | | | | | | | | | | | 241,100 | | | | 18,897,418 | | | | 0.22 | |
Other securities | | | | | | | | | | | | | | | 176,948,391 | | | | 2.06 | |
| | | | | |
| | | | | | | | | | | | | | | 195,845,809 | | | | 2.28 | |
| | | | | | | | | | | | | | | | | | | | |
| | | | | |
| Health Care Equipment & Supplies: 1.86% | | | | | | | | | | | | | | | | | | | | |
Boston Scientific Corporation † | | | | | | | | | | | 739,078 | | | | 17,604,838 | | | | 0.21 | |
Other securities | | | | | | | | | | | | | | | 141,643,936 | | | | 1.65 | |
| | | | | |
| | | | | | | | | | | | | | | 159,248,774 | | | | 1.86 | |
| | | | | | | | | | | | | | | | | | | | |
| | | | | |
| Health Care Providers & Services: 2.06% | | | | | | | | | | | | | | | | | | | | |
Centene Corporation † | | | | | | | | | | | 224,602 | | | | 15,338,071 | | | | 0.18 | |
Other securities | | | | | | | | | | | | | | | 161,398,625 | | | | 1.88 | |
| | | | | |
| | | | | | | | | | | | | | | 176,736,696 | | | | 2.06 | |
| | | | | | | | | | | | | | | | | | | | |
| | | | | |
| Health Care Technology: 0.17% | | | | | | | | | | | | | | | | | | | | |
Other securities | | | | | | | | | | | | | | | 14,431,033 | | | | 0.17 | |
| | | | | | | | | | | | | | | | | | | | |
| | | | | |
| Life Sciences Tools & Services: 0.64% | | | | | | | | | | | | | | | | | | | | |
Other securities | | | | | | | | | | | | | | | 55,193,003 | | | | 0.64 | |
| | | | | | | | | | | | | | | | | | | | |
The accompanying notes are an integral part of these financial statements.
| | | | |
| 102 | | Wells Fargo Dow Jones Target Date Funds | | Summary portfolio of investments—August 31, 2016 (unaudited) |
DIVERSIFIED STOCK PORTFOLIO
| | | | | | | | | | | | | | | | | | | | |
| Security name | | | | | | | | Shares | | | Value | | | Percent of net assets | |
| | | | | |
| Pharmaceuticals: 3.18% | | | | | | | | | | | | | | | | | | | | |
Allergan plc † | | | | | | | | | | | 71,612 | | | $ | 16,795,878 | | | | 0.20 | % |
Johnson & Johnson | | | | | | | | | | | 297,596 | | | | 35,515,107 | | | | 0.41 | |
Merck & Company Incorporated | | | | | | | | | | | 306,685 | | | | 19,256,751 | | | | 0.23 | |
Novartis AG | | | | | | | | | | | 242,433 | | | | 19,078,150 | | | | 0.22 | |
Pfizer Incorporated | | | | | | | | | | | 673,771 | | | | 23,447,231 | | | | 0.27 | |
Roche Holding AG Genusschein | | | | | | | | | | | 65,222 | | | | 15,901,821 | | | | 0.19 | |
Other securities | | | | | | | | | | | | | | | 142,647,351 | | | | 1.66 | |
| | | | | |
| | | | | | | | | | | | | | | 272,642,289 | | | | 3.18 | |
| | | | | | | | | | | | | | | | | | | | |
| | | | | |
Industrials: 10.76% | | | | | | | | | | | | | | | | | | | | |
| | | | | |
| Aerospace & Defense: 1.32% | | | | | | | | | | | | | | | | | | | | |
Other securities | | | | | | | | | | | | | | | 113,518,825 | | | | 1.32 | |
| | | | | | | | | | | | | | | | | | | | |
| | | | | |
| Air Freight & Logistics: 0.30% | | | | | | | | | | | | | | | | | | | | |
Other securities | | | | | | | | | | | | | | | 25,731,681 | | | | 0.30 | |
| | | | | | | | | | | | | | | | | | | | |
| | | | | |
| Airlines: 0.40% | | | | | | | | | | | | | | | | | | | | |
Other securities | | | | | | | | | | | | | | | 34,541,527 | | | | 0.40 | |
| | | | | | | | | | | | | | | | | | | | |
| | | | | |
| Building Products: 0.63% | | | | | | | | | | | | | | | | | | | | |
Other securities | | | | | | | | | | | | | | | 54,218,910 | | | | 0.63 | |
| | | | | | | | | | | | | | | | | | | | |
| | | | | |
| Commercial Services & Supplies: 0.79% | | | | | | | | | | | | | | | | | | | | |
Other securities | | | | | | | | | | | | | | | 67,408,733 | | | | 0.79 | |
| | | | | | | | | | | | | | | | | | | | |
| | | | | |
| Construction & Engineering: 0.64% | | | | | | | | | | | | | | | | | | | | |
Other securities | | | | | | | | | | | | | | | 54,497,590 | | | | 0.64 | |
| | | | | | | | | | | | | | | | | | | | |
| | | | | |
| Electrical Equipment: 0.73% | | | | | | | | | | | | | | | | | | | | |
Other securities | | | | | | | | | | | | | | | 62,657,362 | | | | 0.73 | |
| | | | | | | | | | | | | | | | | | | | |
| | | | | |
| Industrial Conglomerates: 1.11% | | | | | | | | | | | | | | | | | | | | |
General Electric Company | | | | | | | | | | | 994,738 | | | | 31,075,615 | | | | 0.36 | |
Other securities | | | | | | | | | | | | | | | 64,443,947 | | | | 0.75 | |
| | | | | |
| | | | | | | | | | | | | | | 95,519,562 | | | | 1.11 | |
| | | | | | | | | | | | | | | | | | | | |
| | | | | |
| Machinery: 2.35% | | | | | | | | | | | | | | | | | | | | |
Other securities | | | | | | | | | | | | | | | 201,739,062 | | | | 2.35 | |
| | | | | | | | | | | | | | | | | | | | |
| | | | | |
| Marine: 0.10% | | | | | | | | | | | | | | | | | | | | |
Other securities | | | | | | | | | | | | | | | 8,369,290 | | | | 0.10 | |
| | | | | | | | | | | | | | | | | | | | |
| | | | | |
| Professional Services: 0.43% | | | | | | | | | | | | | | | | | | | | |
Other securities | | | | | | | | | | | | | | | 37,021,638 | | | | 0.43 | |
| | | | | | | | | | | | | | | | | | | | |
| | | | | |
| Road & Rail: 0.95% | | | | | | | | | | | | | | | | | | | | |
Other securities | | | | | | | | | | | | | | | 81,134,613 | | | | 0.95 | |
| | | | | | | | | | | | | | | | | | | | |
| | | | | |
| Trading Companies & Distributors: 0.76% | | | | | | | | | | | | | | | | | | | | |
Other securities | | | | | | | | | | | | | | | 64,822,211 | | | | 0.76 | |
| | | | | | | | | | | | | | | | | | | | |
The accompanying notes are an integral part of these financial statements.
| | | | | | |
| Summary portfolio of investments—August 31, 2016 (unaudited) | | Wells Fargo Dow Jones Target Date Funds | | | 103 | |
DIVERSIFIED STOCK PORTFOLIO
| | | | | | | | | | | | | | | | | | | | |
| Security name | | | | | | | | Shares | | | Value | | | Percent of net assets | |
| | | | | |
| Transportation Infrastructure: 0.25% | | | | | | | | | | | | | | | | | | | | |
Other securities | | | | | | | | | | | | | | $ | 21,781,949 | | | | 0.25 | % |
| | | | | | | | | | | | | | | | | | | | |
| | | | | |
Information Technology: 16.93% | | | | | | | | | | | | | | | | | | | | |
| | | | | |
| Communications Equipment: 0.88% | | | | | | | | | | | | | | | | | | | | |
Cisco Systems Incorporated | | | | | | | | | | | 557,050 | | | | 17,513,652 | | | | 0.21 | |
Other securities | | | | | | | | | | | | | | | 58,461,999 | | | | 0.67 | |
| | | | | |
| | | | | | | | | | | | | | | 75,975,651 | | | | 0.88 | |
| | | | | | | | | | | | | | | | | | | | |
| | | | | |
| Electronic Equipment, Instruments & Components: 1.53% | | | | | | | | | | | | | | | | | | | | |
Other securities | | | | | | | | | | | | | | | 130,893,950 | | | | 1.53 | |
| | | | | | | | | | | | | | | | | | | | |
| | | | | |
| Internet Software & Services: 3.20% | | | | | | | | | | | | | | | | | | | | |
Alibaba Group Holding Limited ADR † | | | | | | | | | | | 303,156 | | | | 29,463,732 | | | | 0.34 | |
Alphabet Incorporated Class A † | | | | | | | | | | | 53,249 | | | | 42,058,723 | | | | 0.49 | |
Alphabet Incorporated Class C † | | | | | | | | | | | 53,555 | | | | 41,079,363 | | | | 0.48 | |
Facebook Incorporated Class A † | | | | | | | | | | | 419,189 | | | | 52,868,117 | | | | 0.62 | |
Tencent Holdings Limited | | | | | | | | | | | 1,447,566 | | | | 37,656,067 | | | | 0.44 | |
Other securities | | | | | | | | | | | | | | | 71,136,385 | | | | 0.83 | |
| | | | | |
| | | | | | | | | | | | | | | 274,262,387 | | | | 3.20 | |
| | | | | | | | | | | | | | | | | | | | |
| | | | | |
| IT Services: 3.20% | | | | | | | | | | | | | | | | | | | | |
International Business Machines Corporation | | | | | | | | | | | 159,846 | | | | 25,396,332 | | | | 0.30 | |
MasterCard Incorporated Class A | | | | | | | | | | | 175,800 | | | | 16,987,554 | | | | 0.20 | |
Visa Incorporated Class A | | | | | | | | | | | 344,794 | | | | 27,893,835 | | | | 0.33 | |
Other securities | | | | | | | | | | | | | | | 204,152,569 | | | | 2.37 | |
| | | | | |
| | | | | | | | | | | | | | | 274,430,290 | | | | 3.20 | |
| | | | | | | | | | | | | | | | | | | | |
| | | | | |
| Semiconductors & Semiconductor Equipment: 3.06% | | | | | | | | | | | | | | | | | | | | |
Intel Corporation | | | | | | | | | | | 523,302 | | | | 18,781,309 | | | | 0.22 | |
NVIDIA Corporation | | | | | | | | | | | 276,000 | | | | 16,929,840 | | | | 0.20 | |
QUALCOMM Incorporated | | | | | | | | | | | 265,897 | | | | 16,770,124 | | | | 0.20 | |
Taiwan Semiconductor Manufacturing Company Limited | | | | | | | | | | | 5,093,298 | | | | 28,251,066 | | | | 0.33 | |
Other securities | | | | | | | | | | | | | | | 181,529,770 | | | | 2.11 | |
| | | | | |
| | | | | | | | | | | | | | | 262,262,109 | | | | 3.06 | |
| | | | | | | | | | | | | | | | | | | | |
| | | | | |
| Software: 2.82% | | | | | | | | | | | | | | | | | | | | |
Microsoft Corporation | | | | | | | | | | | 850,273 | | | | 48,856,687 | | | | 0.57 | |
Other securities | | | | | | | | | | | | | | | 193,563,965 | | | | 2.25 | |
| | | | | |
| | | | | | | | | | | | | | | 242,420,652 | | | | 2.82 | |
| | | | | | | | | | | | | | | | | | | | |
| | | | | |
| Technology Hardware, Storage & Peripherals: 2.24% | | | | | | | | | | | | | | | | | | | | |
Apple Incorporated | | | | | | | | | | | 993,143 | | | | 105,372,472 | | | | 1.23 | |
Samsung Electronics Company Limited | | | | | | | | | | | 16,904 | | | | 24,560,072 | | | | 0.29 | |
Other securities | | | | | | | | | | | | | | | 62,620,136 | | | | 0.72 | |
| | | | | |
| | | | | | | | | | | | | | | 192,552,680 | | | | 2.24 | |
| | | | | | | | | | | | | | | | | | | | |
The accompanying notes are an integral part of these financial statements.
| | | | |
| 104 | | Wells Fargo Dow Jones Target Date Funds | | Summary portfolio of investments—August 31, 2016 (unaudited) |
DIVERSIFIED STOCK PORTFOLIO
| | | | | | | | | | | | | | | | | | | | |
| Security name | | | | | | | | Shares | | | Value | | | Percent of net assets | |
| | | | | |
Materials: 5.23% | | | | | | | | | | | | | | | | | | | | |
| | | | | |
| Chemicals: 2.40% | | | | | | | | | | | | | | | | | | | | |
Other securities | | | | | | | | | | | | | | $ | 205,715,996 | | | | 2.40 | % |
| | | | | | | | | | | | | | | | | | | | |
| | | | | |
| Construction Materials: 0.53% | | | | | | | | | | | | | | | | | | | | |
Other securities | | | | | | | | | | | | | | | 45,158,476 | | | | 0.53 | |
| | | | | | | | | | | | | | | | | | | | |
| | | | | |
| Containers & Packaging: 0.53% | | | | | | | | | | | | | | | | | | | | |
Other securities | | | | | | | | | | | | | | | 45,794,315 | | | | 0.53 | |
| | | | | | | | | | | | | | | | | | | | |
| | | | | |
| Metals & Mining: 1.63% | | | | | | | | | | | | | | | | | | | | |
Other securities | | | | | | | | | | | | | | | 139,930,302 | | | | 1.63 | |
| | | | | | | | | | | | | | | | | | | | |
| | | | | |
| Paper & Forest Products: 0.14% | | | | | | | | | | | | | | | | | | | | |
Other securities | | | | | | | | | | | | | | | 11,788,413 | | | | 0.14 | |
| | | | | | | | | | | | | | | | | | | | |
| | | | | |
Telecommunication Services: 2.60% | | | | | | | | | | | | | | | | | | | | |
| | | | | |
| Diversified Telecommunication Services: 1.62% | | | | | | | | | | | | | | | | | | | | |
AT&T Incorporated | | | | | | | | | | | 684,577 | | | | 27,985,508 | | | | 0.33 | |
Verizon Communications Incorporated | | | | | | | | | | | 452,797 | | | | 23,694,867 | | | | 0.28 | |
Other securities | | | | | | | | | | | | | | | 87,450,004 | | | | 1.01 | |
| | | | | |
| | | | | | | | | | | | | | | 139,130,379 | | | | 1.62 | |
| | | | | | | | | | | | | | | | | | | | |
| | | | | |
| Wireless Telecommunication Services: 0.98% | | | | | | | | | | | | | | | | | | | | |
China Mobile Limited | | | | | | | | | | | 1,508,000 | | | | 18,622,684 | | | | 0.22 | |
Other securities | | | | | | | | | | | | | | | 64,838,544 | | | | 0.76 | |
| | | | | |
| | | | | | | | | | | | | | | 83,461,228 | | | | 0.98 | |
| | | | | | | | | | | | | | | | | | | | |
| | | | | |
Utilities: 3.93% | | | | | | | | | | | | | | | | | | | | |
| | | | | |
| Electric Utilities: 1.65% | | | | | | | | | | | | | | | | | | | | |
Other securities | | | | | | | | | | | | | | | 141,220,415 | | | | 1.65 | |
| | | | | | | | | | | | | | | | | | | | |
| | | | | |
| Gas Utilities: 0.68% | | | | | | | | | | | | | | | | | | | | |
Other securities | | | | | | | | | | | | | | | 58,309,050 | | | | 0.68 | |
| | | | | | | | | | | | | | | | | | | | |
| | | | | |
| Independent Power & Renewable Electricity Producers: 0.26% | | | | | | | | | | | | | | | | | | | | |
Other securities | | | | | | | | | | | | | | | 22,192,279 | | | | 0.26 | |
| | | | | | | | | | | | | | | | | | | | |
| | | | | |
| Multi-Utilities: 1.13% | | | | | | | | | | | | | | | | | | | | |
Other securities | | | | | | | | | | | | | | | 97,209,453 | | | | 1.13 | |
| | | | | | | | | | | | | | | | | | | | |
| | | | | |
| Water Utilities: 0.21% | | | | | | | | | | | | | | | | | | | | |
Other securities | | | | | | | | | | | | | | | 18,517,023 | | | | 0.21 | |
| | | | | | | | | | | | | | | | | | | | |
| | | | | |
Total Common Stocks (Cost $6,135,611,402) | | | | | | | | | | | | | | | 8,323,264,946 | | | | 97.02 | |
| | | | | | | | | | | | | | | | | | | | |
| | | | | |
Preferred Stocks: 0.48% | | | | | | | | | | | | | | | | | | | | |
| | | | | |
Consumer Discretionary: 0.06% | | | | | | | | | | | | | | | | | | | | |
| | | | | |
| Automobiles: 0.05% | | | | | | | | | | | | | | | | | | | | |
Other securities | | | | | | | | | | | | | | | 4,037,716 | | | | 0.05 | |
| | | | | | | | | | | | | | | | | | | | |
The accompanying notes are an integral part of these financial statements.
| | | | | | |
| Summary portfolio of investments—August 31, 2016 (unaudited) | | Wells Fargo Dow Jones Target Date Funds | | | 105 | |
DIVERSIFIED STOCK PORTFOLIO
| | | | | | | | | | | | | | | | | | | | |
| Security name | | | | | | | | | | | Value | | | Percent of net assets | |
| | | | | |
| Multiline Retail: 0.01% | | | | | | | | | | | | | | | | | | | | |
Other securities | | | | | | | | | | | | | | $ | 1,018,787 | | | | 0.01 | % |
| | | | | | | | | | | | | | | | | | | | |
| | | | | |
Consumer Staples: 0.03% | | | | | | | | | | | | | | | | | | | | |
| | | | | |
| Beverages: 0.00% | | | | | | | | | | | | | | | | | | | | |
Other securities | | | | | | | | | | | | | | | 82,961 | | | | 0.00 | |
| | | | | | | | | | | | | | | | | | | | |
| | | | | |
| Household Products: 0.03% | | | | | | | | | | | | | | | | | | | | |
Other securities | | | | | | | | | | | | | | | 2,234,499 | | | | 0.03 | |
| | | | | | | | | | | | | | | | | | | | |
| | | | | |
| Personal Products: 0.00% | | | | | | | | | | | | | | | | | | | | |
Other securities | | | | | | | | | | | | | | | 110,738 | | | | 0.00 | |
| | | | | | | | | | | | | | | | | | | | |
| | | | | |
Energy: 0.07% | | | | | | | | | | | | | | | | | | | | |
| | | | | |
| Oil, Gas & Consumable Fuels: 0.07% | | | | | | | | | | | | | | | | | | | | |
Other securities | | | | | | | | | | | | | | | 5,798,084 | | | | 0.07 | |
| | | | | | | | | | | | | | | | | | | | |
| | | | | |
Financials: 0.22% | | | | | | | | | | | | | | | | | | | | |
| | | | | |
| Banks: 0.22% | | | | | | | | | | | | | | | | | | | | |
Other securities | | | | | | | | | | | | | | | 18,921,256 | | | | 0.22 | |
| | | | | | | | | | | | | | | | | | | | |
| | | | | |
Health Care: 0.01% | | | | | | | | | | | | | | | | | | | | |
| | | | | |
| Biotechnology: 0.01% | | | | | | | | | | | | | | | | | | | | |
Other securities | | | | | | | | | | | | | | | 354,992 | | | | 0.01 | |
| | | | | | | | | | | | | | | | | | | | |
| | | | | |
| Health Care Equipment & Supplies: 0.00% | | | | | | | | | | | | | | | | | | | | |
Other securities | | | | | | | | | | | | | | | 250,297 | | | | 0.00 | |
| | | | | | | | | | | | | | | | | | | | |
| | | | | |
| Life Sciences Tools & Services: 0.00% | | | | | | | | | | | | | | | | | | | | |
Other securities | | | | | | | | | | | | | | | 41 | | | | 0.00 | |
| | | | | | | | | | | | | | | | | | | | |
| | | | | |
Information Technology: 0.04% | | | | | | | | | | | | | | | | | | | | |
| | | | | |
| Technology Hardware, Storage & Peripherals: 0.04% | | | | | | | | | | | | | | | | | | | | |
Other securities | | | | | | | | | | | | | | | 3,527,896 | | | | 0.04 | |
| | | | | | | | | | | | | | | | | | | | |
| | | | | |
Materials: 0.03% | | | | | | | | | | | | | | | | | | | | |
| | | | | |
| Chemicals: 0.01% | | | | | | | | | | | | | | | | | | | | |
Other securities | | | | | | | | | | | | | | | 734,722 | | | | 0.01 | |
| | | | | | | | | | | | | | | | | | | | |
| | | | | |
| Metals & Mining: 0.02% | | | | | | | | | | | | | | | | | | | | |
Other securities | | | | | | | | | | | | | | | 2,479,464 | | | | 0.02 | |
| | | | | | | | | | | | | | | | | | | | |
| | | | | |
Telecommunication Services: 0.02% | | | | | | | | | | | | | | | | | | | | |
| | | | | |
| Diversified Telecommunication Services: 0.02% | | | | | | | | | | | | | | | | | | | | |
Other securities | | | | | | | | | | | | | | | 1,977,515 | | | | 0.02 | |
| | | | | | | | | | | | | | | | | | | | |
| | | | | |
Utilities: 0.00% | | | | | | | | | | | | | | | | | | | | |
| | | | | |
| Multi-Utilities: 0.00% | | | | | | | | | | | | | | | | | | | | |
Other securities | | | | | | | | | | | | | | | 44,203 | | | | 0.00 | |
| | | | | | | | | | | | | | | | | | | | |
| | | | | |
Total Preferred Stocks (Cost $52,987,562) | | | | | | | | | | | | | | | 41,573,171 | | | | 0.48 | |
| | | | | | | | | | | | | | | | | | | | |
The accompanying notes are an integral part of these financial statements.
| | | | |
| 106 | | Wells Fargo Dow Jones Target Date Funds | | Summary portfolio of investments—August 31, 2016 (unaudited) |
DIVERSIFIED STOCK PORTFOLIO
| | | | | | | | | | | | | | | | | | | | |
| Security name | | | | | | | | | | | Value | | | Percent of net assets | |
| | | | | |
Rights: 0.00% | | | | | | | | | | | | | | | | | | | | |
| | | | | |
Health Care: 0.00% | | | | | | | | | | | | | | | | | | | | |
| | | | | |
| Biotechnology: 0.00% | | | | | | | | | | | | | | | | | | | | |
Other securities | | | | | | | | | | | | | | $ | 0 | | | | 0.00 | % |
| | | | | | | | | | | | | | | | | | | | |
| | | | | |
Industrials: 0.00% | | | | | | | | | | | | | | | | | | | | |
| | | | | |
| Industrial Conglomerates: 0.00% | | | | | | | | | | | | | | | | | | | | |
Other securities | | | | | | | | | | | | | | | 0 | | | | 0.00 | |
| | | | | | | | | | | | | | | | | | | | |
| | | | | |
Total Rights (Cost $0) | | | | | | | | | | | | | | | 0 | | | | 0.00 | |
| | | | | | | | | | | | | | | | | | | | |
| | | | | |
Warrants: 0.00% | | | | | | | | | | | | | | | | | | | | |
| | | | | |
Consumer Discretionary: 0.00% | | | | | | | | | | | | | | | | | | | | |
| | | | | |
| Automobiles: 0.00% | | | | | | | | | | | | | | | | | | | | |
Other securities | | | | | | | | | | | | | | | 85,263 | | | | 0.00 | |
| | | | | | | | | | | | | | | | | | | | |
| | | | | |
| Media: 0.00% | | | | | | | | | | | | | | | | | | | | |
Other securities | | | | | | | | | | | | | | | 358 | | | | 0.00 | |
| | | | | | | | | | | | | | | | | | | | |
| | | | | |
Energy: 0.00% | | | | | | | | | | | | | | | | | | | | |
| | | | | |
| Energy Equipment & Services: 0.00% | | | | | | | | | | | | | | | | | | | | |
Other securities | | | | | | | | | | | | | | | 758 | | | | 0.00 | |
| | | | | | | | | | | | | | | | | | | | |
| | | | | |
| Oil, Gas & Consumable Fuels: 0.00% | | | | | | | | | | | | | | | | | | | | |
Other securities | | | | | | | | | | | | | | | 20,511 | | | | 0.00 | |
| | | | | | | | | | | | | | | | | | | | |
| | | | | |
Industrials: 0.00% | | | | | | | | | | | | | | | | | | | | |
| | | | | |
| Industrial Conglomerates: 0.00% | | | | | | | | | | | | | | | | | | | | |
Other securities | | | | | | | | | | | | | | | 1,030 | | | | 0.00 | |
| | | | | | | | | | | | | | | | | | | | |
| | | | | |
Total Warrants (Cost $112,266) | | | | | | | | | | | | | | | 107,920 | | | | 0.00 | |
| | | | | | | | | | | | | | | | | | | | |
| | | | | |
| | | Yield | | | | | | Shares | | | | | | | |
| Short-Term Investments: 3.75% | | | | | | | | | | | | | | | | | | | | |
| | | | | |
| Investment Companies: 3.75% | | | | | | | | | | | | | | | | | | | | |
Securities Lending Cash Investments LLC (l)(r)(u) | | | 0.51 | % | | | | | | | 218,333,728 | | | | 218,333,728 | | | | 2.54 | |
Wells Fargo Government Money Market Fund Select
Class (l)(u) | | | 0.32 | | | | | | | | 103,413,508 | | | | 103,413,508 | | | | 1.21 | |
| | | | | |
Total Short-Term Investments (Cost $321,747,236) | | | | | | | | | | | | | | | 321,747,236 | | | | 3.75 | |
| | | | | | | | | | | | | | | | | �� | | | |
| | | | | |
| Total investments in securities (Cost $6,510,458,466) * | | | | | | | | | | | | | | | 8,686,693,273 | | | | 101.25 | |
Other assets and liabilities, net | | | | | | | | | | | | | | | (107,644,103 | ) | | | (1.25 | ) |
| | | | | | | | | | | | | | | | | | | | |
| Total net assets | | | | | | | | | | | | | | $ | 8,579,049,170 | | | | 100.00 | % |
| | | | | | | | | | | | | | | | | | | | |
The accompanying notes are an integral part of these financial statements.
| | | | | | |
| Summary portfolio of investments—August 31, 2016 (unaudited) | | Wells Fargo Dow Jones Target Date Funds | | | 107 | |
DIVERSIFIED STOCK PORTFOLIO
| † | Non-income-earning security |
| (l) | The issuer of the security is an affiliated person of the Portfolio as defined in the Investment Company Act of 1940. |
| (r) | The investment is a non-registered investment vehicle purchased with cash collateral received from securities on loan. |
| (u) | The rate represents the 7-day annualized yield at period end. |
| * | Cost for federal income tax purposes is $6,583,907,790 and unrealized gains (losses) consists of: |
| | | | |
Gross unrealized gains | | $ | 2,774,571,750 | |
Gross unrealized losses | | | (671,786,267 | ) |
| | | | |
Net unrealized gains | | $ | 2,102,785,483 | |
The following table shows percent of total long-term investments by geographic locations as of August 31, 2016:
| | | | |
United States | | | 63.74 | % |
Japan | | | 6.73 | |
United Kingdom | | | 3.12 | |
China | | | 2.81 | |
Taiwan | | | 1.72 | |
Australia | | | 1.70 | |
Switzerland | | | 1.57 | |
Canada | | | 1.56 | |
India | | | 1.55 | |
Hong Kong | | | 1.47 | |
South Korea | | | 1.37 | |
France | | | 1.34 | |
Germany | | | 1.32 | |
Ireland | | | 1.18 | |
Other | | | 8.82 | |
| | | | |
| | | 100.00 | % |
| | | | |
The accompanying notes are an integral part of these financial statements.
| | | | |
| 108 | | Wells Fargo Dow Jones Target Date Funds | | Portfolio of investments—August 31, 2016 (unaudited) |
SHORT-TERM INVESTMENT PORTFOLIO
| | | | | | | | | | | | | | | | |
| Security name | | Interest rate | | | Maturity date | | | Principal | | | Value | |
| | | | |
Certificates of Deposit: 18.75% | | | | | | | | | | | | | | | | |
Abbey National Treasury Services plc | | | 0.34 | % | | | 9-1-2016 | | | $ | 7,000,000 | | | $ | 7,000,000 | |
ABN AMRO Funding LLC | | | 0.46 | | | | 9-1-2016 | | | | 2,000,000 | | | | 2,000,000 | |
Bank of Montreal | | | 0.44 | | | | 9-1-2016 | | | | 3,000,000 | | | | 3,000,000 | |
Bank of Montreal | | | 0.44 | | | | 9-6-2016 | | | | 2,000,000 | | | | 2,000,020 | |
Bank of Montreal | | | 0.44 | | | | 9-7-2016 | | | | 4,000,000 | | | | 4,000,000 | |
Bank of Montreal | | | 0.66 | | | | 10-4-2016 | | | | 8,000,000 | | | | 8,001,040 | |
Canadian Imperial Bank of Commerce | | | 0.30 | | | | 9-1-2016 | | | | 6,000,000 | | | | 6,000,000 | |
Canadian Imperial Bank of Commerce | | | 0.85 | | | | 9-1-2016 | | | | 3,000,000 | | | | 3,000,030 | |
Cooperatieve Centrale ± | | | 0.85 | | | | 9-7-2016 | | | | 2,000,000 | | | | 2,000,180 | |
Credit Agricole SA | | | 0.32 | | | | 9-1-2016 | | | | 7,000,000 | | | | 7,000,000 | |
DG Bank (New York) | | | 0.75 | | | | 9-12-2016 | | | | 6,000,000 | | | | 6,000,600 | |
DG Bank (New York) | | | 0.90 | | | | 11-18-2016 | | | | 9,000,000 | | | | 9,002,970 | |
DNB Nor Bank | | | 0.30 | | | | 9-1-2016 | | | | 11,000,000 | | | | 11,000,000 | |
HSBC Bank plc | | | 0.34 | | | | 9-1-2016 | | | | 7,000,000 | | | | 7,000,000 | |
KBC Bank | | | 0.32 | | | | 9-1-2016 | | | | 7,000,000 | | | | 7,000,000 | |
Mitsubishi Trust & Bank | | | 0.44 | | | | 9-2-2016 | | | | 4,000,000 | | | | 4,000,040 | |
NBAD Americas NV | | | 0.37 | | | | 9-1-2016 | | | | 7,000,000 | | | | 7,000,000 | |
Nordea Bank AB | | | 0.29 | | | | 9-1-2016 | | | | 7,000,000 | | | | 7,000,000 | |
Norinchukin Bank | | | 0.64 | | | | 9-15-2016 | | | | 2,000,000 | | | | 2,000,240 | |
Oversea Chinese Banking Corporation | | | 0.55 | | | | 9-15-2016 | | | | 10,000,000 | | | | 10,000,400 | |
State Street Bank & Trust Company ± | | | 0.85 | | | | 9-2-2016 | | | | 2,000,000 | | | | 2,000,060 | |
Sumitomo Mitsui Banking Corporation | | | 0.55 | | | | 9-7-2016 | | | | 7,000,000 | | | | 7,000,280 | |
Sumitomo Trust & Banking Corporation | | | 0.65 | | | | 9-23-2016 | | | | 8,000,000 | | | | 8,001,120 | |
Svenska Handlesbanken | | | 0.30 | | | | 9-1-2016 | | | | 9,000,000 | | | | 9,000,000 | |
Swedbank | | | 0.30 | | | | 9-1-2016 | | | | 13,000,000 | | | | 13,000,000 | |
| | | | |
Total Certificates of Deposit (Cost $153,000,213) | | | | | | | | | | | | | | | 153,006,980 | |
| | | | | | | | | | | | | | | | |
| | | | |
Commercial Paper: 45.75% | | | | | | | | | | | | | | | | |
Albion Capital Corporation (p)(z) | | | 0.82 | | | | 10-18-2016 | | | | 10,000,000 | | | | 9,994,100 | |
Alpine Securitization Limited 144A(p)(z) | | | 0.57 | | | | 9-22-2016 | | | | 3,000,000 | | | | 2,999,010 | |
Alpine Securitization Limited 144A(p)(z) | | | 0.60 | | | | 9-6-2016 | | | | 11,000,000 | | | | 10,999,120 | |
Anglesea Funding LLC 144A(p)(z) | | | 0.45 | | | | 9-2-2016 | | | | 4,000,000 | | | | 3,999,920 | |
Anglesea Funding LLC 144A(p)(z) | | | 0.47 | | | | 9-6-2016 | | | | 4,000,000 | | | | 3,999,720 | |
Anglesea Funding LLC 144A±(p) | | | 0.64 | | | | 9-7-2016 | | | | 2,000,000 | | | | 2,000,000 | |
Anglesea Funding LLC 144A±(p) | | | 0.66 | | | | 9-19-2016 | | | | 2,000,000 | | | | 1,999,900 | |
Anglesea Funding LLC 144A±(p) | | | 0.67 | | | | 9-29-2016 | | | | 2,000,000 | | | | 1,999,800 | |
Antalis SA 144A(z) | | | 0.60 | | | | 9-8-2016 | | | | 1,000,000 | | | | 999,900 | |
Antalis SA 144A(z) | | | 0.70 | | | | 9-6-2016 | | | | 1,000,000 | | | | 999,920 | |
Antalis SA 144A(z) | | | 0.70 | | | | 9-9-2016 | | | | 1,000,000 | | | | 999,880 | |
Antalis SA 144A(z) | | | 1.00 | | | | 11-4-2016 | | | | 5,000,000 | | | | 4,993,300 | |
ANZ Banking Group Limited 144A(z) | | | 0.65 | | | | 9-2-2016 | | | | 2,000,000 | | | | 1,999,940 | |
Atlantic Asset Securitization Corporation 144A(p)(z) | | | 0.34 | | | | 9-1-2016 | | | | 4,000,000 | | | | 3,999,952 | |
Atlantic Asset Securitization Corporation 144A±(p) | | | 0.66 | | | | 12-5-2016 | | | | 3,000,000 | | | | 2,999,850 | |
Atlantic Asset Securitization Corporation 144A±(p) | | | 0.66 | | | | 12-9-2016 | | | | 3,000,000 | | | | 2,999,820 | |
Atlantic Asset Securitization Corporation 144A±(p) | | | 0.67 | | | | 12-16-2016 | | | | 3,000,000 | | | | 2,999,790 | |
Australia & New Zealand Banking Group 144A(z) | | | 0.62 | | | | 9-22-2016 | | | | 4,000,000 | | | | 3,998,680 | |
Banco De Credito E Inversiones 144A(z) | | | 0.85 | | | | 10-28-2016 | | | | 8,000,000 | | | | 7,993,920 | |
Bank of Nova Scotia 144A(z) | | | 0.60 | | | | 9-21-2016 | | | | 4,000,000 | | | | 3,999,000 | |
Bank of Nova Scotia 144A(z) | | | 0.75 | | | | 10-20-2016 | | | | 10,000,000 | | | | 9,992,400 | |
Banque et Caisse d’Epargne de l’Etat (z) | | | 0.66 | | | | 9-1-2016 | | | | 1,000,000 | | | | 999,990 | |
The accompanying notes are an integral part of these financial statements.
| | | | | | |
| Portfolio of investments—August 31, 2016 (unaudited) | | Wells Fargo Dow Jones Target Date Funds | | | 109 | |
SHORT-TERM INVESTMENT PORTFOLIO
| | | | | | | | | | | | | | | | |
| Security name | | Interest rate | | | Maturity date | | | Principal | | | Value | |
| | | | |
Commercial Paper (continued) | | | | | | | | | | | | | | | | |
Barclays Bank plc 144A(z) | | | 0.68 | % | | | 9-12-2016 | | | $ | 8,000,000 | | | $ | 7,999,120 | |
Barclays Bank plc 144A(z) | | | 0.80 | | | | 9-6-2016 | | | | 6,000,000 | | | | 5,999,700 | |
Barton Capital Corporation 144A(p)(z) | | | 0.64 | | | | 9-7-2016 | | | | 2,000,000 | | | | 1,999,860 | |
Barton Capital Corporation 144A(p)(z) | | | 0.76 | | | | 9-29-2016 | | | | 2,000,000 | | | | 1,999,320 | |
Bennington Stark Capital Company LLC 144A(p)(z) | | | 0.52 | | | | 9-2-2016 | | | | 2,000,000 | | | | 1,999,960 | |
Bennington Stark Capital Company LLC 144A(p)(z) | | | 0.55 | | | | 9-1-2016 | | | | 2,000,000 | | | | 1,999,980 | |
Bennington Stark Capital Company LLC 144A(p)(z) | | | 0.55 | | | | 9-7-2016 | | | | 2,000,000 | | | | 1,999,820 | |
Caisse Centrale Desjardins du Quebec 144A(z) | | | 0.39 | | | | 9-1-2016 | | | | 6,000,000 | | | | 5,999,941 | |
Caisse Centrale Desjardins du Quebec 144A(z) | | | 0.61 | | | | 9-14-2016 | | | | 5,000,000 | | | | 4,999,250 | |
Caisse Centrale Desjardins du Quebec 144A(z) | | | 0.63 | | | | 9-15-2016 | | | | 3,000,000 | | | | 2,999,520 | |
Caisse Centrale Desjardins du Quebec 144A(z) | | | 0.65 | | | | 9-12-2016 | | | | 2,000,000 | | | | 1,999,740 | |
Caisse Centrale Desjardins du Quebec 144A(z) | | | 0.67 | | | | 9-29-2016 | | | | 1,000,000 | | | | 999,670 | |
Caisse D’amortissement de la Dette Sociale 144A(z) | | | 0.68 | | | | 9-19-2016 | | | | 10,000,000 | | | | 9,997,300 | |
Caisse Des Depots et Consignations 144A(z) | | | 0.66 | | | | 10-3-2016 | | | | 10,000,000 | | | | 9,994,300 | |
CDP Financial Incorporated 144A(z) | | | 0.64 | | | | 9-30-2016 | | | | 12,950,000 | | | | 12,945,856 | |
Chesham Finance Limited 144A(p)(z) | | | 0.48 | | | | 9-1-2016 | | | | 1,000,000 | | | | 999,988 | |
Chesham Finance Limited 144A(p)(z) | | | 0.48 | | | | 9-1-2016 | | | | 1,000,000 | | | | 999,988 | |
Chesham Finance Limited 144A(p)(z) | | | 0.48 | | | | 9-1-2016 | | | | 2,000,000 | | | | 1,999,976 | |
China International Marine Containers Group Limited (z) | | | 1.00 | | | | 9-6-2016 | | | | 4,000,000 | | | | 3,999,760 | |
China International Marine Containers Group Limited (z) | | | 1.00 | | | | 9-7-2016 | | | | 2,000,000 | | | | 1,999,856 | |
China Power International Development (z) | | | 1.00 | | | | 9-7-2016 | | | | 3,000,000 | | | | 2,999,732 | |
China Shipping Container Lines (z) | | | 1.00 | | | | 9-1-2016 | | | | 2,000,000 | | | | 1,999,980 | |
China Shipping Container Lines (z) | | | 1.00 | | | | 9-6-2016 | | | | 5,000,000 | | | | 4,999,700 | |
Commonwealth Bank of Australia 144A(z) | | | 0.62 | | | | 9-6-2016 | | | | 2,000,000 | | | | 1,999,860 | |
Concord Minutemen Capital Company 144A(p)(z) | | | 0.54 | | | | 9-2-2016 | | | | 5,000,000 | | | | 4,999,900 | |
DBS Bank Limited 144A(z) | | | 0.55 | | | | 9-15-2016 | | | | 6,000,000 | | | | 5,999,100 | |
DBS Bank Limited 144A(z) | | | 0.65 | | | | 10-11-2016 | | | | 12,500,000 | | | | 12,494,375 | |
Dexia Credit Local SA (z) | | | 0.65 | | | | 9-12-2016 | | | | 3,000,000 | | | | 2,999,640 | |
Erste Abwicklungsanstalt 144A(z) | | | 0.72 | | | | 10-17-2016 | | | | 8,000,000 | | | | 7,995,760 | |
Gotham Funding Corporation 144A(p)(z) | | | 0.57 | | | | 9-8-2016 | | | | 2,000,000 | | | | 1,999,800 | |
Gotham Funding Corporation 144A(p)(z) | | | 0.59 | | | | 9-13-2016 | | | | 2,000,000 | | | | 1,999,640 | |
Gotham Funding Corporation 144A(p)(z) | | | 0.59 | | | | 9-14-2016 | | | | 1,000,000 | | | | 999,810 | |
Halkin Finance LLC 144A(z) | | | 0.48 | | | | 9-1-2016 | | | | 2,000,000 | | | | 1,999,976 | |
Halkin Finance LLC 144A(z) | | | 0.50 | | | | 9-2-2016 | | | | 1,000,000 | | | | 999,980 | |
HSBC Bank plc 144A(z) | | | 0.63 | | | | 9-9-2016 | | | | 2,000,000 | | | | 1,999,820 | |
HSBC Bank plc 144A(z) | | | 0.65 | | | | 10-5-2016 | | | | 5,000,000 | | | | 4,997,600 | |
Institutional Secured Funding LLC 144A(p)(z) | | | 0.58 | | | | 9-2-2016 | | | | 2,000,000 | | | | 1,999,951 | |
Institutional Secured Funding LLC 144A(p)(z) | | | 0.63 | | | | 9-1-2016 | | | | 5,000,000 | | | | 4,999,950 | |
Institutional Secured Funding LLC 144A(p)(z) | | | 0.69 | | | | 9-19-2016 | | | | 4,000,000 | | | | 3,998,920 | |
Jupiter Securitization Company LLC 144A(z) | | | 0.55 | | | | 9-20-2016 | | | | 1,000,000 | | | | 999,710 | |
Kells Funding LLC 144A(z) | | | 0.64 | | | | 9-20-2016 | | | | 1,000,000 | | | | 999,720 | |
Kells Funding LLC 144A(z) | | | 0.64 | | | | 9-22-2016 | | | | 1,000,000 | | | | 999,690 | |
Legacy Capital Company 144A(z) | | | 0.75 | | | | 10-7-2016 | | | | 9,984,000 | | | | 9,977,810 | |
Lexington Parker Capital Corporation 144A(p)(z) | | | 0.52 | | | | 9-7-2016 | | | | 3,000,000 | | | | 2,999,730 | |
Lexington Parker Capital Corporation 144A(p)(z) | | | 0.54 | | | | 9-1-2016 | | | | 3,000,000 | | | | 2,999,970 | |
LMA Americas LLC 144A(z) | | | 0.55 | | | | 9-2-2016 | | | | 3,000,000 | | | | 2,999,940 | |
Macquarie Bank Limited 144A(z) | | | 0.62 | | | | 9-6-2016 | | | | 3,000,000 | | | | 2,999,580 | |
Macquarie Bank Limited 144A(z) | | | 0.64 | | | | 9-1-2016 | | | | 1,000,000 | | | | 999,980 | |
Macquarie Bank Limited 144A(z) | | | 0.65 | | | | 9-7-2016 | | | | 2,000,000 | | | | 1,999,680 | |
Manhattan Asset Funding Company LLC 144A(p)(z) | | | 0.57 | | | | 9-2-2016 | | | | 1,000,000 | | | | 999,980 | |
The accompanying notes are an integral part of these financial statements.
| | | | |
| 110 | | Wells Fargo Dow Jones Target Date Funds | | Portfolio of investments—August 31, 2016 (unaudited) |
SHORT-TERM INVESTMENT PORTFOLIO
| | | | | | | | | | | | | | | | |
| Security name | | Interest rate | | | Maturity date | | | Principal | | | Value | |
| | | | |
Commercial Paper (continued) | | | | | | | | | | | | | | | | |
Matchpoint Finance plc 144A(p)(z) | | | 0.68 | % | | | 9-1-2016 | | | $ | 1,000,000 | | | $ | 999,990 | |
Mizuho Corporate Bank (z) | | | 0.75 | | | | 9-9-2016 | | | | 2,000,000 | | | | 1,999,820 | |
Mountcliff Funding LLC 144A(p)(z) | | | 0.48 | | | | 9-1-2016 | | | | 5,000,000 | | | | 4,999,950 | |
National Australia Bank Limited 144A(z) | | | 0.68 | | | | 10-21-2016 | | | | 8,000,000 | | | | 7,995,680 | |
Nationwide Building Society 144A(z) | | | 0.70 | | | | 9-2-2016 | | | | 2,000,000 | | | | 1,999,920 | |
Nationwide Building Society 144A(z) | | | 0.92 | | | | 11-15-2016 | | | | 3,000,000 | | | | 2,993,850 | |
Nederlandse Waterschapsbank NV 144A(z) | | | 0.63 | | | | 9-1-2016 | | | | 3,000,000 | | | | 2,999,970 | |
Nederlandse Waterschapsbank NV 144A(z) | | | 0.63 | | | | 9-21-2016 | | | | 10,000,000 | | | | 9,997,800 | |
Nieuw Amsterdam Receivable 144A(z) | | | 0.76 | | | | 10-26-2016 | | | | 5,000,000 | | | | 4,994,600 | |
NRW Bank 144A(z) | | | 0.61 | | | | 9-16-2016 | | | | 4,000,000 | | | | 3,999,280 | |
Ontario Teachers Finance Trust 144A(z) | | | 0.66 | | | | 9-21-2016 | | | | 1,000,000 | | | | 999,650 | |
Regency Markets No. 1 LLC 144A(p)(z) | | | 0.55 | | | | 9-14-2016 | | | | 6,000,000 | | | | 5,998,860 | |
Ridgefield Funding Company LLC 144A±(p) | | | 0.71 | | | | 9-23-2016 | | | | 2,000,000 | | | | 1,999,920 | |
Salt River Agricultural Improvement & Power District Series D-1 (z) | | | 0.55 | | | | 9-8-2016 | | | | 1,000,000 | | | | 999,890 | |
Salt River Agricultural Improvement & Power District Series D-1 (z) | | | 0.55 | | | | 9-9-2016 | | | | 2,000,000 | | | | 1,999,720 | |
Sinochem Capital Company Limited (z) | | | 0.47 | | | | 9-6-2016 | | | | 2,000,000 | | | | 1,999,880 | |
Sinochem Capital Company Limited (z) | | | 0.47 | | | | 9-12-2016 | | | | 2,000,000 | | | | 1,999,760 | |
Sinochem Capital Company Limited (z) | | | 1.00 | | | | 9-2-2016 | | | | 2,000,000 | | | | 1,999,960 | |
Skandinaviska Enskilda Banken AG 144A(z) | | | 0.65 | | | | 10-6-2016 | | | | 10,000,000 | | | | 9,996,200 | |
Starbird Funding Corporation 144A±(p) | | | 0.67 | | | | 9-16-2016 | | | | 2,000,000 | | | | 1,999,940 | |
Starbird Funding Corporation 144A(p)(z) | | | 0.68 | | | | 9-1-2016 | | | | 1,000,000 | | | | 999,990 | |
Suncorp Group Limited 144A(z) | | | 0.74 | | | | 9-6-2016 | | | | 2,000,000 | | | | 1,999,880 | |
Suncorp Group Limited 144A(z) | | | 0.75 | | | | 9-8-2016 | | | | 2,000,000 | | | | 1,999,840 | |
Suncorp Group Limited 144A(z) | | | 0.92 | | | | 11-23-2016 | | | | 4,000,000 | | | | 3,994,920 | |
United Overseas Bank Limited 144A(z) | | | 0.65 | | | | 10-17-2016 | | | | 12,000,000 | | | | 11,993,640 | |
Victory Receivables 144A(p)(z) | | | 0.60 | | | | 9-19-2016 | | | | 1,000,000 | | | | 999,730 | |
Victory Receivables 144A(p)(z) | | | 0.60 | | | | 9-7-2016 | | | | 3,000,000 | | | | 2,999,730 | |
Working Capital Management Company 144A(z) | | | 0.60 | | | | 9-1-2016 | | | | 2,000,000 | | | | 1,999,980 | |
| | | | |
Total Commercial Paper (Cost $373,277,701) | | | | | | | | | | | | | | | 373,322,451 | |
| | | | | | | | | | | | | | | | |
| | | | |
Corporate Bonds and Notes: 0.29% | | | | | | | | | | | | | | | | |
| | | | |
Health Care: 0.23% | | | | | | | | | | | | | | | | |
| | | | |
| Health Care Providers & Services: 0.23% | | | | | | | | | | | | | | | | |
Keep Memory Alive ±§ | | | 0.56 | | | | 5-1-2037 | | | | 920,000 | | | | 920,000 | |
Providence Health & Services ±§ | | | 0.60 | | | | 10-1-2042 | | | | 970,000 | | | | 970,000 | |
| | | | |
| | | | | | | | | | | | | | | 1,890,000 | |
| | | | | | | | | | | | | | | | |
| | | | |
Materials: 0.06% | | | | | | | | | | | | | | | | |
| | | | |
| Metals & Mining: 0.06% | | | | | | | | | | | | | | | | |
SSAB AB Series A ±§ | | | 0.49 | | | | 6-1-2035 | | | | 500,000 | | | | 500,000 | |
| | | | | | | | | | | | | | | | |
| | | | |
Total Corporate Bonds and Notes (Cost $2,390,000) | | | | | | | | | | | | | | | 2,390,000 | |
| | | | | | | | | | | | | | | | |
| | | | |
Municipal Obligations: 24.09% | | | | | | | | | | | | | | | | |
| | | | |
| Alabama: 0.12% | | | | | | | | | | | | | | | | |
Tuscaloosa County AL IDA Gulf Opportunity Zone Hunt Refining Project Series J (Industrial Development Revenue, Bank of Nova Scotia LOC) ø | | | 0.66 | | | | 4-1-2028 | | | | 1,000,000 | | | | 1,000,000 | |
| | | | | | | | | | | | | | | | |
The accompanying notes are an integral part of these financial statements.
| | | | | | |
| Portfolio of investments—August 31, 2016 (unaudited) | | Wells Fargo Dow Jones Target Date Funds | | | 111 | |
SHORT-TERM INVESTMENT PORTFOLIO
| | | | | | | | | | | | | | | | |
| Security name | | Interest rate | | | Maturity date | | | Principal | | | Value | |
| | | | |
| Arkansas: 0.12% | | | | | | | | | | | | | | | | |
Maumelle AR Taxable Variable Kimberly Clark Corporation (Industrial Development Revenue) 144Aø | | | 0.54 | % | | | 8-1-2045 | | | $ | 1,000,000 | | | $ | 1,000,000 | |
| | | | | | | | | | | | | | | | |
| | | | |
| California: 2.32% | | | | | | | | | | | | | | | | |
California CDA Sub Series A (Utilities Revenue, Royal Bank of Canada SPA) ø | | | 0.65 | | | | 11-1-2040 | | | | 5,000,000 | | | | 5,000,000 | |
California HFFA Catholic Healthcare West Series C (Health Revenue, Bank of Montreal LOC) ø | | | 0.60 | | | | 3-1-2047 | | | | 3,000,000 | | | | 3,000,000 | |
JPMorgan Chase PUTTER/DRIVER Trust Series 3841 (Transportation Revenue, Ambac Insured, JPMorgan Chase & Company LIQ) 144Aø | | | 0.68 | | | | 7-1-2024 | | | | 5,000,000 | | | | 5,000,000 | |
Puttable Floating Option Taxable Series PT-4699 (Health Revenue, National Insured, Bank of America NA LIQ) 144Aø | | | 0.73 | | | | 9-1-2028 | | | | 960,000 | | | | 960,000 | |
San Diego County CA Regional Transportation Community Limited Tax Series B (Tax Revenue, JPMorgan Chase & Company SPA) ø | | | 0.58 | | | | 4-1-2038 | | | | 2,000,000 | | | | 2,000,000 | |
San Francisco City & County CA Airports Commission Variable Reference Second Series A-2 (Airport Revenue, Bank of America NA LOC) ø | | | 0.62 | | | | 5-1-2030 | | | | 3,000,000 | | | | 3,000,000 | |
| | | | |
| | | | | | | | | | | | | | | 18,960,000 | |
| | | | | | | | | | | | | | | | |
| | | | |
| Colorado: 1.00% | | | | | | | | | | | | | | | | |
Colorado HFA Catholic Health Initiatives Series 7WE (Health Revenue, Barclays Bank plc LOC) 144Aø | | | 0.71 | | | | 8-1-2018 | | | | 5,000,000 | | | | 5,000,000 | |
Colorado HFA Class I Series A-1 (Housing Revenue, FHLB SPA) ø | | | 0.60 | | | | 10-1-2034 | | | | 1,000,000 | | | | 1,000,000 | |
Colorado HFA MFHR Class I Series A-1 (Housing Revenue, FHLB SPA) ø | | | 0.60 | | | | 10-1-2033 | | | | 890,000 | | | | 890,000 | |
Colorado HFA MFHR Project B-2 (Housing Revenue, FHLB SPA) ø | | | 0.60 | | | | 5-1-2052 | | | | 240,000 | | | | 240,000 | |
Colorado Southern Ute Indian Tribe Reservation Series 2007 (Miscellaneous Revenue) ø | | | 0.56 | | | | 1-1-2027 | | | | 1,000,000 | | | | 1,000,000 | |
| | | | |
| | | | | | | | | | | | | | | 8,130,000 | |
| | | | | | | | | | | | | | | | |
| | | | |
| Connecticut: 2.01% | | | | | | | | | | | | | | | | |
Connecticut HFA Series C-2 (Housing Revenue, Bank of Tokyo-Mitsubishi SPA) ø | | | 0.60 | | | | 5-15-2034 | | | | 3,000,000 | | | | 3,000,000 | |
Connecticut Series C (GO Revenue, Bank of America NA SPA) ø | | | 0.61 | | | | 5-15-2034 | | | | 2,000,000 | | | | 2,000,000 | |
Puttable Floating Option Taxable Series TNP-1013 (Miscellaneous Revenue, Bank of America NA LIQ) 144Aø | | | 0.55 | | | | 4-15-2046 | | | | 11,440,000 | | | | 11,440,000 | |
| | | | |
| | | | | | | | | | | | | | | 16,440,000 | |
| | | | | | | | | | | | | | | | |
| | | | |
| District of Columbia: 1.59% | | | | | | | | | | | | | | | | |
Howard University (Education Revenue) ± | | | 0.60 | | | | 8-1-2031 | | | | 12,000,000 | | | | 12,000,000 | |
Metropolitan Washington District of Columbia Airports Sub Series A-1 (Airport Revenue, Royal Bank of Canada LOC) ø | | | 0.62 | | | | 10-1-2039 | | | | 970,000 | | | | 970,000 | |
| | | | |
| | | | | | | | | | | | | | | 12,970,000 | |
| | | | | | | | | �� | | | | | | | |
| | | | |
| Florida: 1.35% | | | | | | | | | | | | | | | | |
Gainesville FL (Utilities Revenue) | | | 0.65 | | | | 9-1-2016 | | | | 1,000,000 | | | | 1,000,000 | |
Gainesville FL Series B (Utilities Revenue, Bank of Montreal SPA) ø | | | 0.65 | | | | 10-1-2038 | | | | 4,000,000 | | | | 4,000,000 | |
Orlando & Orange County FL Expressway Authority Series 2007 0081 (Transportation Revenue, BHAC/AGM Insured, Citibank NA LIQ) ø | | | 0.60 | | | | 7-1-2042 | | | | 3,000,000 | | | | 3,000,000 | |
West Palm Beach FL Utilities Systems Series C (Water & Sewer Revenue, AGC Insured, JPMorgan Chase & Company SPA) ø | | | 0.64 | | | | 10-1-2038 | | | | 3,000,000 | | | | 3,000,000 | |
| | | | |
| | | | | | | | | | | | | | | 11,000,000 | |
| | | | | | | | | | | | | | | | |
The accompanying notes are an integral part of these financial statements.
| | | | |
| 112 | | Wells Fargo Dow Jones Target Date Funds | | Portfolio of investments—August 31, 2016 (unaudited) |
SHORT-TERM INVESTMENT PORTFOLIO
| | | | | | | | | | | | | | | | |
| Security name | | Interest rate | | | Maturity date | | | Principal | | | Value | |
| | | | |
| Idaho: 0.37% | | | | | | | | | | | | | | | | |
Idaho HFA (Housing Revenue) (z) | | | 0.64 | % | | | 9-2-2016 | | | $ | 3,000,000 | | | $ | 2,999,820 | |
| | | | | | | | | | | | | | | | |
| | | | |
| Illinois: 0.24% | | | | | | | | | | | | | | | | |
Illinois Toll Highway Authority Series A1 (Transportation Revenue, AGM Insured, JPMorgan Chase & Company SPA) ø | | | 0.63 | | | | 1-1-2031 | | | | 2,000,000 | | | | 2,000,000 | |
| | | | | | | | | | | | | | | | |
| | | | |
| Iowa: 0.24% | | | | | | | | | | | | | | | | |
Iowa Finance Authority Midwestern Cargill Incorporated Project Series 2012-A (Industrial Development Revenue) ø | | | 0.64 | | | | 6-1-2039 | | | | 2,000,000 | | | | 2,000,000 | |
| | | | | | | | | | | | | | | | |
| | | | |
| Louisiana: 1.10% | | | | | | | | | | | | | | | | |
Puttable Floating Option Taxable Series TNP-1014 (Miscellaneous Revenue, Bank of America NA LIQ) 144Aø | | | 0.55 | | | | 6-1-2045 | | | | 8,980,000 | | | | 8,980,000 | |
| | | | | | | | | | | | | | | | |
| | | | |
| Maryland: 0.25% | | | | | | | | | | | | | | | | |
Maryland CDA Housing & Community Residential Series B (Housing Revenue, TD Bank NA SPA) ø | | | 0.57 | | | | 9-1-2033 | | | | 2,000,000 | | | | 2,000,000 | |
| | | | | | | | | | | | | | | | |
| | | | |
| Massachusetts: 0.98% | | | | | | | | | | | | | | | | |
Massachusetts Department of Transportation Series A6 (Transportation Revenue, TD Bank NA SPA) ø | | | 0.59 | | | | 1-1-2029 | | | | 5,000,000 | | | | 5,000,000 | |
Massachusetts Department of Transportation Series A7 (Transportation Revenue, Sumitomo Mitsui Banking SPA) ø | | | 0.62 | | | | 1-1-2039 | | | | 3,000,000 | | | | 3,000,000 | |
| | | | |
| | | | | | | | | | | | | | | 8,000,000 | |
| | | | | | | | | | | | | | | | |
| | | | |
| Michigan: 0.24% | | | | | | | | | | | | | | | | |
Michigan Housing Development Authority Series D (Housing Revenue, Bank of Tokyo-Mitsubishi SPA) ø | | | 0.67 | | | | 10-1-2039 | | | | 1,975,000 | | | | 1,975,000 | |
| | | | | | | | | | | | | | | | |
| | | | |
| Minnesota: 0.23% | | | | | | | | | | | | | | | | |
NorthStar Student Loan Trust II (Education Revenue, Royal Bank of Canada LOC) ø | | | 0.60 | | | | 10-1-2042 | | | | 851,000 | | | | 851,000 | |
RBC Municipal Products Incorporated Trust Floater CTFS Series E-69 (Housing Revenue, Royal Bank of Canada LOC) 144Aø | | | 0.60 | | | | 5-31-2018 | | | | 1,000,000 | | | | 1,000,000 | |
| | | | |
| | | | | | | | | | | | | | | 1,851,000 | |
| | | | | | | | | | | | | | | | |
| | | | |
| Nevada: 0.25% | | | | | | | | | | | | | | | | |
Clark County NV Series B-2 (Airport Revenue, Royal Bank of Canada LOC) ø | | | 0.63 | | | | 7-1-2022 | | | | 2,000,000 | | | | 2,000,000 | |
| | | | | | | | | | | | | | | | |
| | | | |
| New York: 4.17% | | | | | | | | | | | | | | | | |
New York City NY Municipal Water Finance Various Subordinated Series F1B-RMKT-06/25/09 (Water & Sewer Revenue, U.S. Bank NA SPA) ø | | | 0.56 | | | | 6-15-2035 | | | | 4,000,000 | | | | 4,000,000 | |
New York HFA 20 River Terrace Series A (Housing Revenue, FNMA LOC, FNMA LIQ) ø | | | 0.65 | | | | 5-15-2034 | | | | 2,000,000 | | | | 2,000,000 | |
New York HFA 605 West 42 Street Series B (Housing Revenue, Bank of China LOC) ø | | | 0.90 | | | | 5-1-2048 | | | | 3,000,000 | | | | 3,000,000 | |
New York HFA Biltmore Tower (Housing Revenue, FNMA LOC, FNMA LIQ) ø | | | 0.68 | | | | 5-15-2034 | | | | 2,000,000 | | | | 2,000,000 | |
New York HFA Series A (Housing Revenue, FHLMC LIQ) ø | | | 0.60 | | | | 11-1-2037 | | | | 1,000,000 | | | | 1,000,000 | |
New York Housing Finance Agency 222 East 44TH Street Series B (Housing Revenue, Bank of China LOC) ø | | | 1.20 | | | | 5-1-2050 | | | | 1,000,000 | | | | 1,000,000 | |
New York Housing Finance Agency Manhattan West Residential Project Series B-2 (Housing Revenue, Bank of China LOC) ø | | | 0.96 | | | | 11-1-2049 | | | | 1,000,000 | | | | 1,000,000 | |
New York Housing HFA Riverside Center 2 Series A-2 (Housing Revenue, Bank of America NA LOC) ø | | | 0.63 | | | | 11-1-2046 | | | | 1,000,000 | | | | 1,000,000 | |
The accompanying notes are an integral part of these financial statements.
| | | | | | |
| Portfolio of investments—August 31, 2016 (unaudited) | | Wells Fargo Dow Jones Target Date Funds | | | 113 | |
SHORT-TERM INVESTMENT PORTFOLIO
| | | | | | | | | | | | | | | | |
| Security name | | Interest rate | | | Maturity date | | | Principal | | | Value | |
| | | | |
| New York (continued) | | | | | | | | | | | | | | | | |
New York Metropolitan Transportation Authority Sub Series G-2 (Transportation Revenue, TD Bank NA LOC) ø | | | 0.57 | % | | | 11-1-2032 | | | $ | 3,000,000 | | | $ | 3,000,000 | |
New York NY Housing Development Corporation Atlantic Court Apartments Series A (Housing Revenue, FHLMC LOC, FHLMC LIQ) ø | | | 0.67 | | | | 12-1-2035 | | | | 1,000,000 | | | | 1,000,000 | |
New York NY Sub Series B-3 (GO Revenue, Citibank NA LOC) ø | | | 0.61 | | | | 4-1-2042 | | | | 6,000,000 | | | | 6,000,000 | |
New York NY Transitional Finance Authority Sub Series C-5 (Tax Revenue, Sumitomo Mitsui Banking LOC) ø | | | 0.57 | | | | 11-1-2041 | | | | 5,000,000 | | | | 5,000,000 | |
New York Urban Development Corporation Series A3D (Tax Revenue, JPMorgan Chase & Company SPA) ø | | | 0.57 | | | | 3-15-2033 | | | | 2,000,000 | | | | 2,000,000 | |
RBC Municipal Products Incorporated Trust Series E-51 for Invesco Van Kampen New York Value Income Trust (Miscellaneous Revenue, Royal Bank of Canada
LOC) 144Aø(i) | | | 0.97 | | | | 7-1-2017 | | | | 2,000,000 | | | | 2,000,000 | |
| | | | |
| | | | | | | | | | | | | | | 34,000,000 | |
| | | | | | | | | | | | | | | | |
| | | | |
| North Carolina: 0.61% | | | | | | | | | | | | | | | | |
Charlotte NC NASCAR Project Series D (Miscellaneous Revenue, Bank of America NA LOC) ø | | | 0.60 | | | | 6-1-2035 | | | | 2,000,000 | | | | 2,000,000 | |
North Carolina Medical Care Commission FirstHealth Carolina Project Series 2008A (Health Revenue, Branch Banking & Trust SPA) ø | | | 0.64 | | | | 10-1-2028 | | | | 3,000,000 | | | | 3,000,000 | |
| | | | |
| | | | | | | | | | | | | | | 5,000,000 | |
| | | | | | | | | | | | | | | | |
| | | | |
| North Dakota: 0.25% | | | | | | | | | | | | | | | | |
North Dakota HFA Mortgage Finance Program Series F (Housing Revenue, FHLB SPA) ø | | | 0.60 | | | | 1-1-2047 | | | | 2,000,000 | | | | 2,000,000 | |
| | | | | | | | | | | | | | | | |
| | | | |
| Ohio: 0.24% | | | | | | | | | | | | | | | | |
Ohio HFA Residential Management Series J (Housing Revenue, JPMorgan Chase & Company SPA) ø | | | 0.62 | | | | 9-1-2035 | | | | 1,950,000 | | | | 1,950,000 | |
| | | | | | | | | | | | | | | | |
| | | | |
| Oklahoma: 0.46% | | | | | | | | | | | | | | | | |
Oklahoma Grand River Dam Authority Series C (Utilities Revenue, Barclays Bank plc LOC) ø | | | 0.61 | | | | 6-1-2039 | | | | 3,750,000 | | | | 3,750,000 | |
| | | | | | | | | | | | | | | | |
| | | | |
| Oregon: 0.12% | | | | | | | | | | | | | | | | |
Tender Option Bond Trust Receipts/Certificates Series 2016-TXG001 (Miscellaneous Revenue, Bank of America NA LIQ) 144Aø | | | 0.77 | | | | 5-1-2035 | | | | 1,000,000 | | | | 1,000,000 | |
| | | | | | | | | | | | | | | | |
| | | | |
| Other: 1.80% | | | | | | | | | | | | | | | | |
Clipper Tax-Exempt Certified Trust Series 2009-54 (Miscellaneous Revenue, State Street Bank & Trust Company LIQ) ø | | | 0.62 | | | | 2-15-2028 | | | | 7,000,000 | | | | 7,000,000 | |
Eagle Tax Exempt Trust Series 2008 0055F (, FHLMC Insured, FHLB LIQ) 144Aø | | | 0.59 | | | | 4-15-2049 | | | | 2,000,000 | | | | 2,000,000 | |
FHLMC MFHR Series M017 Class A (Housing Revenue) 144Aø | | | 0.59 | | | | 9-15-2050 | | | | 4,993,000 | | | | 4,993,000 | |
PFOTER Series TNP-1012 (Miscellaneous Revenue, Bank of America NA LIQ) 144Aø | | | 0.55 | | | | 12-1-2038 | | | | 735,000 | | | | 735,000 | |
| | | | |
| | | | | | | | | | | | | | | 14,728,000 | |
| | | | | | | | | | | | | | | | |
| | | | |
| Pennsylvania: 0.12% | | | | | | | | | | | | | | | | |
Philadelphia PA Series CC-2 (Miscellaneous Revenue) | | | 0.56 | | | | 9-12-2016 | | | | 1,000,000 | | | | 999,940 | |
| | | | | | | | | | | | | | | | |
| | | | |
| South Carolina: 0.61% | | | | | | | | | | | | | | | | |
South Carolina Public Service Commission (Miscellaneous Revenue) | | | 0.48 | | | | 9-9-2016 | | | | 1,000,000 | | | | 1,000,000 | |
York County SC PCR (Miscellaneous Revenue) | | | 0.55 | | | | 9-1-2016 | | | | 4,000,000 | | | | 4,000,000 | |
| | | | |
| | | | | | | | | | | | | | | 5,000,000 | |
| | | | | | | | | | | | | | | | |
The accompanying notes are an integral part of these financial statements.
| | | | |
| 114 | | Wells Fargo Dow Jones Target Date Funds | | Portfolio of investments—August 31, 2016 (unaudited) |
SHORT-TERM INVESTMENT PORTFOLIO
| | | | | | | | | | | | | | | | |
| Security name | | Interest rate | | | Maturity date | | | Principal | | | Value | |
| | | | |
| Tennessee: 0.25% | | | | | | | | | | | | | | | | |
Sevier County TN Public Building AuthorityLocal Government Public Improvement Series 6-A1 (Miscellaneous Revenue, Branch Banking & Trust SPA) ø | | | 0.63 | % | | | 6-1-2029 | | | $ | 2,000,000 | | | $ | 2,000,000 | |
| | | | | | | | | | | | | | | | |
| | | | |
| Texas: 2.80% | | | | | | | | | | | | | | | | |
Brazos Harbor TX Industrial Development Corporation (Industrial Development Revenue) ø | | | 0.75 | | | | 10-1-2036 | | | | 5,000,000 | | | | 5,000,000 | |
Harris County TX Cultural and Educational Facilities Authority Barclays Residual Interest Bonds Trust Series 5WE (Miscellaneous Revenue, Barclays Bank plc LOC) 144Aø | | | 0.71 | | | | 7-1-2018 | | | | 10,000,000 | | | | 10,000,000 | |
Houston TX Adjustable Refunding First Lien B3 (Water & Sewer Revenue, Sumitomo Mitsui Banking LOC) ø | | | 0.58 | | | | 5-15-2034 | | | | 1,000,000 | | | | 1,000,000 | |
Port Arthur TX Navigation District Daily Fina Oil and Chemical Company Project (Industrial Development Revenue) ø | | | 0.70 | | | | 5-1-2033 | | | | 1,000,000 | | | | 1,000,000 | |
Texas Department of Housing & Community Affairs Foundation Asmara (Housing Revenue, FHLMC LIQ) ø | | | 0.64 | | | | 7-1-2033 | | | | 2,000,000 | | | | 2,000,000 | |
Texas Department of Housing & Community Affairs Series A (Housing Revenue, GNMA/FNMA/FHLMC Insured, Texas State Treasurer SPA) ø | | | 0.64 | | | | 9-1-2038 | | | | 865,000 | | | | 865,000 | |
Texas Tollway Authortiy Series D (Transportation Revenue, Royal Bank of Canada LOC) ø | | | 0.61 | | | | 1-1-2049 | | | | 3,000,000 | | | | 3,000,000 | |
| | | | |
| | | | | | | | | | | | | | | 22,865,000 | |
| | | | | | | | | | | | | | | | |
| | | | |
| Utah: 0.25% | | | | | | | | | | | | | | | | |
Utah Water Finance Agency Series B-1 (Water & Sewer Revenue, JPMorgan Chase & Company SPA) ø | | | 0.68 | | | | 10-1-2037 | | | | 2,000,000 | | | | 2,000,000 | |
| | | | | | | | | | | | | | | | |
| | | | |
Total Municipal Obligations (Cost $196,598,946) | | | | | | | | | | | | | | | 196,598,760 | |
| | | | | | | | | | | | | | | | |
| | | | |
Other: 0.98% | | | | | | | | | | | | | | | | |
Nuveen California Dividend Advantage Municipal Fund Variable Rate Demand Preferred Shares Series 6 (Citibank NA LIQ) 144A±§ | | | 0.67 | | | | 8-1-2040 | | | | 1,000,000 | | | | 1,000,000 | |
Nuveen Enhanced Municipal Credit Opportunities Fund Series 1 (Citibank NA LIQ) 144A±§ | | | 0.69 | | | | 3-1-2040 | | | | 3,000,000 | | | | 3,000,000 | |
Western Asset Managed Municipal Fund Incorporated Variable Rate Demand Preferred Shares Series 1 (Citibank NA LIQ) 144A±§ | | | 0.65 | | | | 3-4-2045 | | | | 4,000,000 | | | | 4,000,000 | |
| | | | |
Total Other (Cost $8,000,000) | | | | | | | | | | | | | | | 8,000,000 | |
| | | | | | | | | | | | | | | | |
| | | | |
Repurchase Agreements ^^: 10.09% | | | | | | | | | | | | | | | | |
Bank of America Corporation, dated 8-31-2016, maturity value $21,500,203 (1) | | | 0.34 | | | | 9-1-2016 | | | | 21,500,000 | | | | 21,500,000 | |
Barclays Capital Incorporated, dated 8-31-2016, maturity value $14,000,136 (2) | | | 0.35 | | | | 9-1-2016 | | | | 14,000,000 | | | | 14,000,000 | |
BNP Paribas, dated 8-31-2016, maturity value $20,852,589 (3) | | | 0.33 | | | | 9-1-2016 | | | | 20,852,398 | | | | 20,852,398 | |
GX Clarke & Company, dated 8-31-2016, maturity value $26,000,289 (4) | | | 0.40 | | | | 9-1-2016 | | | | 26,000,000 | | | | 26,000,000 | |
| | | | |
Total Repurchase Agreements (Cost $82,352,398) | | | | | | | | | | | | | | | 82,352,398 | |
| | | | | | | | | | | | | | | | |
| | | | | | | | |
| Total investments in securities (Cost $815,619,258) * | | | 99.95 | % | | | 815,670,589 | |
Other assets and liabilities, net | | | 0.05 | | | | 377,065 | |
| | | | | | | | |
| Total net assets | | | 100.00 | % | | $ | 816,047,654 | |
| | | | | | | | |
The accompanying notes are an integral part of these financial statements.
| | | | | | |
| Portfolio of investments—August 31, 2016 (unaudited) | | Wells Fargo Dow Jones Target Date Funds | | | 115 | |
SHORT-TERM INVESTMENT PORTFOLIO
| ± | Variable rate investment. The rate shown is the rate in effect at period end. |
| (p) | Asset-backed commercial paper |
| (z) | Zero coupon security. The rate represents the current yield to maturity. |
| 144A | The security may be resold in transactions exempt from registration, normally to qualified institutional buyers, pursuant to Rule 144A under the Securities Act of 1933. |
| § | The security is subject to a demand feature which reduces the effective maturity. |
| ø | Variable rate demand notes are subject to a demand feature which reduces the effective maturity. The maturity date shown represents the final maturity date of the security. The interest rate is determined and reset by the issuer daily, weekly, or monthly depending upon the terms of the security. The rate shown is the rate in effect at period end. |
| | (1) | U.S. government securities, 3.00% to 3.50%, 2-1-2043 to 9-1-2045, fair value including accrued interest is $22,145,000. |
| | (2) | U.S. government securities, 1.13% to 3.75%, 4-30-2020 to 5-31-2022, fair value including accrued interest is $14,280,002. |
| | (3) | U.S. government securities, 0.00% to 8.13%, 9-30-2016 to 8-1-2048, fair value including accrued interest is $21,453,672. |
| | (4) | U.S. government securities, 2.50% to 5.50%, 12-1-2017 to 2-1-2046, fair value including accrued interest is $26,780,117. |
| * | Cost for federal income tax purposes is $815,619,258 and unrealized gains (losses) consists of: |
| | | | |
Gross unrealized gains | | $ | 553,826 | |
Gross unrealized losses | | | (2,495 | ) |
| | | | |
Net unrealized gains | | $ | 551,331 | |
The accompanying notes are an integral part of these financial statements.
| | | | |
| 116 | | Wells Fargo Dow Jones Target Date Funds | | Statements of assets and liabilities—August 31, 2016 (unaudited) |
| | | | | | | | | | | | |
| | | Diversified
Fixed Income
Portfolio | | | Diversified
Stock Portfolio | | | Short-Term
Investment
Portfolio | |
| | | |
Assets | | | | | | | | | | | | |
Investments | | | | | | | | | | | | |
In unaffiliated securities (including securities on loan), at value (see cost below) | | $ | 5,736,191,175 | | | $ | 8,338,876,290 | | | $ | 733,318,191 | |
In affiliated securities, at value (see cost below) | | | 217,080,304 | | | | 347,816,983 | | | | 0 | |
In repurchase agreements, at value | | | 0 | | | | 0 | | | | 82,352,398 | |
| | | | |
Total investments, at value (see cost below) | | | 5,953,271,479 | | | | 8,686,693,273 | | | | 815,670,589 | |
Cash | | | 0 | | | | 2,735,808 | | | | 37 | |
Segregated cash | | | 0 | | | | 5,000,610 | | | | 0 | |
Foreign currency, at value (see cost below) | | | 0 | | | | 28,553,426 | | | | 0 | |
Receivable for investments sold | | | 0 | | | | 60,834,844 | | | | 5,318,000 | |
Receivable for dividends and interest | | | 35,646,733 | | | | 15,751,225 | | | | 190,913 | |
Receivable for securities lending income | | | 3,296 | | | | 312,947 | | | | 0 | |
Prepaid expenses and other assets | | | 27,429 | | | | 5,769 | | | | 3,985 | |
| | | | |
Total assets | | | 5,988,948,937 | | | | 8,799,887,902 | | | | 821,183,524 | |
| | | | |
| | | |
Liabilities | | | | | | | | | | | | |
Payable for investments purchased | | | 155,507,346 | | | | 36,448 | | | | 5,000,018 | |
Payable upon receipt of securities loaned | | | 4,562,280 | | | | 218,333,728 | | | | 0 | |
Payable for daily variation margin on open futures contracts | | | 0 | | | | 495,965 | | | | 0 | |
Advisory fee payable | | | 757,337 | | | | 1,032,112 | | | | 69,393 | |
Accrued expenses and other liabilities | | | 271,121 | | | | 940,479 | | | | 66,459 | |
| | | | |
Total liabilities | | | 161,098,084 | | | | 220,838,732 | | | | 5,135,870 | |
| | | | |
Total net assets | | $ | 5,827,850,853 | | | $ | 8,579,049,170 | | | $ | 816,047,654 | |
| | | | |
| | | |
Investments in unaffiliated securities, at cost | | $ | 5,460,872,952 | | | $ | 6,174,265,631 | | | $ | 733,266,860 | |
| | | | |
Investments in affiliated securities, at cost | | $ | 215,223,787 | | | $ | 336,192,835 | | | $ | 0 | |
| | | | |
Investments in repurchase agreements, at cost | | $ | 0 | | | $ | 0 | | | $ | 82,352,398 | |
| | | | |
Total investments, at cost | | $ | 5,676,096,739 | | | $ | 6,510,458,466 | | | $ | 815,619,258 | |
| | | | |
Securities on loan, at value | | $ | 4,467,550 | | | $ | 211,927,377 | | | $ | 0 | |
| | | | |
Foreign currency, at cost | | $ | 0 | | | $ | 28,622,409 | | | $ | 0 | |
| | | | |
The accompanying notes are an integral part of these financial statements.
| | | | | | |
| Statements of operations—six months ended August 31, 2016 (unaudited) | | Wells Fargo Dow Jones Target Date Funds | | | 117 | |
| | | | | | | | | | | | |
| | | Diversified
Fixed Income
Portfolio | | | Diversified
Stock Portfolio | | | Short-Term
Investment Portfolio | |
| | | |
Investment income | | | | | | | | | | | | |
Interest* | | $ | 68,288,436 | | | $ | 19,555 | | | $ | 2,459,760 | |
Income from affiliated securities | | | 492,522 | | | | 555,349 | | | | 0 | |
Securities lending income, net | | | 15,404 | | | | 3,102,889 | | | | 0 | |
Dividends** | | | 0 | | | | 108,184,207 | | | | 0 | |
| | | | |
Total investment income | | | 68,796,362 | | | | 111,862,000 | | | | 2,459,760 | |
| | | | |
| | | |
Expenses | | | | | | | | | | | | |
Advisory fee | | | 4,377,532 | | | | 6,087,242 | | | | 450,223 | |
Custody and accounting fees | | | 231,946 | | | | 749,387 | | | | 48,886 | |
Professional fees | | | 54,882 | | | | 58,617 | | | | 22,380 | |
Shareholder report expenses | | | 6,462 | | | | 10,538 | | | | 972 | |
Trustees’ fees and expenses | | | 12,286 | | | | 11,824 | | | | 11,620 | |
Other fees and expenses | | | 12,994 | | | | 61,526 | | | | 7,549 | |
| | | | |
Total expenses | | | 4,696,102 | | | | 6,979,134 | | | | 541,630 | |
| | | | |
Net investment income | | | 64,100,260 | | | | 104,882,866 | | | | 1,918,130 | |
| | | | |
| | | |
REALIZED AND UNREALIZED GAINS (LOSSES) ON INVESTMENTS | | | | | | | | | | | | |
| | | |
Net realized gains (losses) on: | | | | | | | | | | | | |
Unaffiliated securities | | | (6,448,731 | ) | | | 51,742,888 | | | | 830 | |
Affiliated securities | | | 33,372 | | | | 412,007 | | | | 0 | |
Futures transactions | | | 0 | | | | 17,242,631 | | | | 0 | |
| | | | |
Net realized gain (losses) on investments | | | (6,415,359 | ) | | | 69,397,526 | | | | 830 | |
| | | | |
| | | |
Net change in unrealized gains (losses) on: | | | | | | | | | | | | |
Unaffiliated securities | | | 211,852,888 | | | | 1,060,370,766 | | | | 37,369 | |
Affiiliated securities | | | 809,955 | | | | 1,640,988 | | | | 0 | |
Futures transactions | | | 0 | | | | 3,304,558 | | | | 0 | |
| | | | |
Net change in unrealized gains (losses) on investments | | | 212,662,843 | | | | 1,065,316,312 | | | | 37,369 | |
| | | | |
Net realized and unrealized gains (losses) on investments | | | 206,247,484 | | | | 1,134,713,838 | | | | 38,199 | |
| | | | |
Net increase in net assets resulting from operations | | $ | 270,347,744 | | | $ | 1,239,596,704 | | | $ | 1,956,329 | |
| | | | |
| | | |
* Net of foreign interest withholding taxes in the amount of | | | $576,539 | | | | $0 | | | | $0 | |
** Net of foreign dividend withholding taxes in the amount of | | | $0 | | | | $7,036,626 | | | | $0 | |
The accompanying notes are an integral part of these financial statements.
| | | | |
| 118 | | Wells Fargo Dow Jones Target Date Funds | | Statements of changes in net assets |
| | | | | | | | |
| | | Diversified Fixed Income Portfolio | |
| | | Six months ended
August 31, 2016 (unaudited) | | | Year ended
February 29, 2016 | |
| | |
Operations | | | | | | | | |
Net investment income | | $ | 64,100,260 | | | $ | 141,080,187 | |
Net realized losses on investments | | | (6,415,359 | ) | | | (72,730,886 | ) |
Net change in unrealized gains (losses) on investments | | | 212,662,843 | | | | 5,299,221 | |
| | | | |
Net increase in net assets resulting from operations | | | 270,347,744 | | | | 73,648,522 | |
| | | | |
| |
Capital share transactions | | | | |
Transactions in investors’ beneficial interests | | | | | | | | |
Contributions | | | 743,511,208 | | | | 1,180,576,977 | |
Withdrawals | | | (530,553,373 | ) | | | (1,994,426,845 | ) |
| | | | |
Net increase (decrease) in net assets resulting from capital share transactions | | | 212,957,835 | | | | (813,849,868 | ) |
| | | | |
Total increase (decrease) in net assets | | | 483,305,579 | | | | (740,201,346 | ) |
| | | | |
| |
Net assets | | | | |
Beginning of period | | | 5,344,545,274 | | | | 6,084,746,620 | |
| | | | |
End of period | | $ | 5,827,850,853 | | | $ | 5,344,545,274 | |
| | | | |
The accompanying notes are an integral part of these financial statements.
| | | | | | |
| Statements of changes in net assets | | Wells Fargo Dow Jones Target Date Funds | | | 119 | |
| | | | | | | | |
| | | Diversified Stock Portfolio | |
| | | Six months ended
August 31, 2016
(unaudited) | | | Year ended
February 29, 2016 | |
| | |
Operations | | | | | | | | |
Net investment income | | $ | 104,882,866 | | | $ | 177,947,840 | |
Net realized gains on investments | | | 69,397,526 | | | | 307,932,833 | |
Net change in unrealized gains (losses) on investments | | | 1,065,316,312 | | | | (1,628,567,751 | ) |
| | | | |
Net increase (decrease) in net assets resulting from operations | | | 1,239,596,704 | | | | (1,142,687,078 | ) |
| | | | |
| | |
Capital share transactions | | | | | | | | |
Transactions in investors’ beneficial interests | | | | | | | | |
Contributions | | | 537,300,928 | | | | 1,596,369,458 | |
Withdrawals | | | (1,143,587,541 | ) | | | (2,186,652,936 | ) |
| | | | |
Net decrease in net assets resulting from capital share transactions | | | (606,286,613 | ) | | | (590,283,478 | ) |
| | | | |
Total increase (decrease) in net assets | | | 633,310,091 | | | | (1,732,970,556 | ) |
| | | | |
| | |
Net assets | | | | | | | | |
Beginning of period | | | 7,945,739,079 | | | | 9,678,709,635 | |
| | | | |
End of period | | $ | 8,579,049,170 | | | $ | 7,945,739,079 | |
| | | | |
The accompanying notes are an integral part of these financial statements.
| | | | |
| 120 | | Wells Fargo Dow Jones Target Date Funds | | Statements of changes in net assets |
| | | | | | | | |
| | | Short-Term Investment Portfolio | |
| | | Six months ended
August 31, 2016 (unaudited) | | | Year ended
February 29, 2016 | |
| | |
Operations | | | | | | | | |
Net investment income | | $ | 1,918,130 | | | $ | 1,789,194 | |
Net realized gains on investments | | | 830 | | | | 862 | |
Net change in unrealized gains (losses) on investments | | | 37,369 | | | | 12,131 | |
| | | | |
Net increase in net assets resulting from operations | | | 1,956,329 | | | | 1,802,187 | |
| | | | |
| | |
Capital share transactions | | | | | | | | |
Transactions in investors’ beneficial interests | | | | | | | | |
Contributions | | | 178,353,630 | | | | 410,642,819 | |
Withdrawals | | | (207,698,140 | ) | | | (460,272,218 | ) |
| | | | |
Net decrease in net assets resulting from capital share transactions | | | (29,344,510 | ) | | | (49,629,399 | ) |
| | | | |
Total decrease in net assets | | | (27,388,181 | ) | | | (47,827,212 | ) |
| | | | |
| | |
Net assets | | | | | | | | |
Beginning of period | | | 843,435,835 | | | | 891,263,047 | |
| | | | |
End of period | | $ | 816,047,654 | | | $ | 843,435,835 | |
| | | | |
The accompanying notes are an integral part of these financial statements.
| | | | | | |
| Financial highlights | | Wells Fargo Dow Jones Target Date Funds | | | 121 | |
| | | | | | | | | | | | | | | | | | | | |
| | | Ratio to average net assets (annualized) | | | Total return1 | | | Portfolio turnover rate | |
| | | Net investment income | | | Gross expenses | | | Net expenses | | | |
| | | | | |
Diversified Fixed Income Portfolio | | | | | | | | | | | | | | | | | | | | |
Six months ended August 31, 2016 (unaudited) | | | 2.25 | % | | | 0.16 | % | | | 0.16 | % | | | 4.94 | % | | | 19 | % |
Year ended February 29, 2016 | | | 2.37 | % | | | 0.16 | % | | | 0.16 | % | | | 1.58 | % | | | 39 | % |
Year ended February 28, 2015 | | | 2.28 | % | | | 0.16 | % | | | 0.16 | % | | | 1.54 | % | | | 49 | % |
Year ended February 28, 2014 | | | 2.25 | % | | | 0.19 | % | | | 0.19 | % | | | 0.47 | % | | | 44 | % |
Year ended February 28, 2013 | | | 2.24 | % | | | 0.27 | % | | | 0.26 | % | | | 1.50 | % | | | 43 | % |
Year ended February 29, 2012 | | | 2.66 | % | | | 0.27 | % | | | 0.26 | % | | | 7.41 | % | | | 52 | % |
| | | | | |
Diversified Stock Portfolio | | | | | | | | | | | | | | | | | | | | |
Six months ended August 31, 2016 (unaudited) | | | 2.44 | % | | | 0.16 | % | | | 0.16 | % | | | 15.84 | % | | | 3 | % |
Year ended February 29, 2016 | | | 1.99 | % | | | 0.17 | % | | | 0.17 | % | | | (12.77 | )% | | | 25 | % |
Year ended February 28, 2015 | | | 1.85 | % | | | 0.16 | % | | | 0.16 | % | | | 9.01 | % | | | 14 | % |
Year ended February 28, 2014 | | | 1.92 | % | | | 0.20 | % | | | 0.19 | % | | | 21.82 | % | | | 22 | % |
Year ended February 28, 2013 | | | 2.06 | % | | | 0.33 | % | | | 0.28 | % | | | 11.12 | % | | | 18 | % |
Year ended February 29, 2012 | | | 1.79 | % | | | 0.33 | % | | | 0.28 | % | | | 0.86 | % | | | 17 | % |
| | | | | |
Short-Term Investment Portfolio | | | | | | | | | | | | | | | | | | | | |
Six months ended August 31, 2016 (unaudited) | | | 0.43 | % | | | 0.12 | % | | | 0.12 | % | | | 0.20 | % | | | N/A | |
Year ended February 29, 2016 | | | 0.18 | % | | | 0.12 | % | | | 0.12 | % | | | 0.15 | % | | | N/A | |
Year ended February 28, 2015 | | | 0.07 | % | | | 0.12 | % | | | 0.12 | % | | | (0.03 | )% | | | N/A | |
Year ended February 28, 2014 | | | 0.09 | % | | | 0.12 | % | | | 0.12 | % | | | 0.03 | % | | | N/A | |
Year ended February 28, 2013 | | | 0.14 | % | | | 0.12 | % | | | 0.12 | % | | | 0.11 | % | | | N/A | |
Year ended February 29, 2012 | | | 0.13 | % | | | 0.12 | % | | | 0.12 | % | | | 0.10 | % | | | N/A | |
| 1 | Returns for periods of less than one year are not annualized. |
The accompanying notes are an integral part of these financial statements.
| | | | |
| 122 | | Wells Fargo Dow Jones Target Date Funds | | Notes to financial statements (unaudited) |
1. ORGANIZATION
Wells Fargo Master Trust (the “Trust”), a Delaware statutory trust organized on March 10, 1999, is an open-end management investment company registered under the Investment Company Act of 1940, as amended (the “1940 Act”). As an investment company, the Trust follows the accounting and reporting guidance in Financial Accounting Standards Board (“FASB”) Accounting Standards Codification Topic 946, Financial Services – Investment Companies. These financial statements report on the following funds: Wells Fargo Diversified Fixed Income Portfolio (“Diversified Fixed Income Portfolio”), Wells Fargo Diversified Stock Portfolio (“Diversified Stock Portfolio”), and Wells Fargo Short-Term Investment Portfolio (“Short-Term Investment Portfolio”) (each, a “Portfolio”, collectively, the “Portfolios”).
The Portfolios, which are master portfolios in a master/feeder structure, offer their shares to multiple feeder funds and other affiliated master portfolios rather than directly to the public.
2. SIGNIFICANT ACCOUNTING POLICIES
The following significant accounting policies, which are consistently followed in the preparation of the financial statements of each Portfolio, are in conformity with U.S. generally accepted accounting principles which require management to make estimates and assumptions that affect the reported amounts of assets and liabilities, disclosure of contingent assets and liabilities at the date of the financial statements, and the reported amounts of revenues and expenses during the reporting period. Actual results could differ from those estimates.
Securities valuation
All investments are valued each business day as of the close of regular trading on the New York Stock Exchange (generally 4 p.m. Eastern Time), although the Portfolios may deviate from this calculation time under unusual or unexpected circumstances.
Equity securities and futures that are listed on a foreign or domestic exchange or market are valued at the official closing price or, if none, the last sales price. If no sale occurs on the principal exchange or market that day, the prior day’s price will be deemed “stale” and a fair value price will be determined in accordance with the Portfolio’s Valuation Procedures.
The values of securities denominated in foreign currencies are translated into U.S. dollars at rates provided by an independent foreign currency pricing source at a time each business day specified by the Management Valuation Team of Wells Fargo Funds Management, LLC (“Funds Management”).
Many securities markets and exchanges outside the U.S. close prior to the close of the New York Stock Exchange and therefore may not fully reflect trading or events that occur after the close of the principal exchange in which the foreign securities are traded, but before the close of the New York Stock Exchange. If such trading or events are expected to materially affect the value of such securities, then fair value pricing procedures approved by the Board of Trustees of the Portfolios are applied. These procedures take into account multiple factors including movements in U.S. securities markets after foreign exchanges close. Foreign securities that are fair valued under these procedures are categorized as Level 2 and the application of these procedures may result in transfers between Level 1 and Level 2. Depending on market activity, such fair valuations may be frequent. Such fair value pricing may result in net asset values that are higher or lower than net asset values based on the last reported sales price or latest quoted bid price. On August 31, 2016, such fair value pricing was not used in pricing foreign securities.
Debt securities are valued at the evaluated bid price provided by an independent pricing service or, if a reliable price is not available, the quoted bid price from an independent broker-dealer.
Investments in registered open-end investment companies are valued at net asset value. Interests in non-registered investment vehicles that are redeemable at net asset value are fair valued normally at net asset value.
Investments which are not valued using any of the methods discussed above are valued at their fair value, as determined in good faith by the Board of Trustees. The Board of Trustees has established a Valuation Committee comprised of the Trustees and has delegated to it the authority to take any actions regarding the valuation of portfolio securities that the Valuation Committee deems necessary or appropriate, including determining the fair value of portfolio securities, unless the determination has been delegated to the Management Valuation Team. The Board of Trustees retains the authority to make or ratify any valuation decisions or approve any changes to the Valuation Procedures as it deems appropriate. On a quarterly basis, the Board of Trustees receives reports on any valuation actions taken by the Valuation Committee or the Management Valuation Team which may include items for ratification.
Valuations of fair valued securities are compared to the next actual sales price when available, or other appropriate market values, to assess the continued appropriateness of the fair valuation methodologies used. These securities are fair
| | | | | | |
| Notes to financial statements (unaudited) | | Wells Fargo Dow Jones Target Date Funds | | | 123 | |
valued on a day-to-day basis, taking into consideration changes to appropriate market information and any significant changes to the inputs considered in the valuation process until there is a readily available price provided on an exchange or by an independent pricing service. Valuations received from an independent pricing service or independent broker-dealer quotes are periodically validated by comparisons to most recent trades and valuations provided by other independent pricing services in addition to the review of prices by the adviser and/or subadviser. Unobservable inputs used in determining fair valuations are identified based on the type of security, taking into consideration factors utilized by market participants in valuing the investment, knowledge about the issuer and the current market environment.
Foreign currency translation
The accounting records of the Portfolios are maintained in U.S. dollars. The value of other assets and liabilities denominated in foreign currencies are translated into U.S. dollars at rates provided by an independent foreign currency pricing source at a time each business day specified by the Management Valuation Team. Purchases and sales of securities, and income and expenses are converted at the rate of exchange on the respective dates of such transactions. Net realized foreign exchange gains or losses arise from sales of foreign currencies, currency gains or losses realized between the trade and settlement dates on securities transactions, and the difference between the amounts of dividends, interest and foreign withholding taxes recorded and the U.S. dollar equivalent of the amounts actually paid or received. Net unrealized foreign exchange gains and losses arise from changes in the fair value of assets and liabilities other than investments in securities resulting from changes in exchange rates. The changes in net assets arising from changes in exchange rates and the changes in net assets resulting from changes in market prices of securities are not separately presented. Such changes are included in net realized and unrealized gains or losses from investments.
Repurchase agreements
The Portfolios may invest in repurchase agreements and may participate in pooled repurchase agreement transactions with other funds advised by Funds Management. The repurchase agreements must be fully collateralized based on values that are marked-to-market daily. The collateral may be held by an agent bank under a tri-party agreement. It is the custodian’s responsibility to value collateral daily and to take action to obtain additional collateral as necessary to maintain market value equal to or greater than the resale price. The repurchase agreements are collateralized by instruments such as U.S. Treasury, federal agency, or high-grade corporate obligations. There could be potential loss to a Portfolio in the event that such Portfolio is delayed or prevented from exercising its rights to dispose of the collateral, including the risk of a possible decline in the value of the underlying obligations during the period in which a Portfolio seeks to assert its rights.
Security loans
The Portfolios may lend their securities from time to time in order to earn additional income in the form of fees or interest on securities received as collateral or the investment of any cash received as collateral. The Portfolios continue to receive interest or dividends on the securities loaned. The Portfolios receive collateral in the form of cash or securities with a value at least equal to the value of the securities on loan. The value of the loaned securities is determined at the close of each business day and any additional required collateral is delivered to the Portfolios on the next business day. In a securities lending transaction, the net asset value of the Portfolios will be affected by an increase or decrease in the value of the securities loaned and by an increase or decrease in the value of the instrument in which collateral is invested. The amount of securities lending activity undertaken by the Portfolios fluctuate from time to time, In the event of default or bankruptcy by the borrower, the Portfolios may be prevented from recovering the loaned securities or gaining access to the collateral or may experience delays or costs in doing so. In addition, the investment of any cash collateral received may lose all or part of its value. The Portfolios have the right under the lending agreement to recover the securities from the borrower on demand.
The Portfolios lend their securities through an unaffiliated securities lending agent. Cash collateral received in connection with its securities lending transactions is invested in Securities Lending Cash Investments, LLC (the “Securities Lending Fund”). The Securities Lending Fund is exempt from registration under Section 3(c)(7) of the 1940 Act and is managed by Funds Management and is subadvised by Wells Capital Management Incorporated (“WellsCap”), an affiliate of Funds Management and an indirect wholly owned subsidiary of Wells Fargo & Company (“Wells Fargo”). Funds Management receives an advisory fee starting at 0.05% and declining to 0.01% as the average daily net assets of the Securities Lending Fund increase. All of the fees received by Funds Management are paid to WellsCap for its services as subadviser. The Securities Lending Fund seeks to provide a positive return compared to the daily Fed Funds Open rate by investing in high-quality, U.S. dollar-denominated short-term money market instruments. Securities Lending Fund investments are fair valued based upon the amortized cost valuation technique. Income earned from investment in the Securities Lending Fund is included in securities lending income on the Statements of Operations.
| | | | |
| 124 | | Wells Fargo Dow Jones Target Date Funds | | Notes to financial statements (unaudited) |
When-issued transactions
Each Portfolio may purchase securities on a forward commitment or when-issued basis. A Portfolio records a when-issued transaction on the trade date and will segregate assets in an amount at least equal in value to the Portfolio’s commitment to purchase when-issued securities. Securities purchased on a when-issued basis are marked-to-market daily and the Portfolio begins earning interest on the settlement date. Losses may arise due to changes in the market value of the underlying securities or if the counterparty does not perform under the contract.
Futures contracts
Each Portfolio may enter into futures contracts and may be subject to interest rate risk or equity price risk in the normal course of pursuing its investment objectives. The Portfolio may buy and sell futures contracts in order to gain exposure to, or protect against, changes in security values and interest rates. The primary risks associated with the use of futures contracts are the imperfect correlation between changes in market values of securities held by the Portfolio and the prices of futures contracts, and the possibility of an illiquid market.
The aggregate principal amounts of the contracts are not recorded in the financial statements. Fluctuations in the value of the contracts are recorded in the Statements of Assets and Liabilities as an asset or liability and in the Statements of Operations as unrealized gains or losses until the contracts are closed, at which point they are recorded as net realized gains or losses on futures contracts. With futures contracts, there is minimal counterparty risk to the Portfolio since futures are exchange traded and the exchange’s clearinghouse, as counterparty to all exchange traded futures, guarantees the futures against default.
Mortgage dollar roll transactions
Each Portfolio may engage in mortgage dollar roll transactions through TBA mortgage-backed securities issued by Government National Mortgage Association (GNMA), Federal National Mortgage Association (FNMA) and Federal Home Loan Mortgage Corporation (FHLMC). In a mortgage dollar roll transaction, a Portfolio sells a mortgage-backed security to a financial institution, such as a bank or broker-dealer and simultaneously agrees to repurchase a substantially similar security from the institution at a later date at an agreed upon price. The mortgage-backed securities that are repurchased will bear the same interest rate as those sold, but generally will be collateralized by different pools of mortgages with different pre-payment histories. During the roll period, a Portfolio foregoes principal and interest paid on the securities. A Portfolio is compensated by the difference between the current sales price and the forward price for the future purchase as well as by the earnings on the cash proceeds of the initial sale. Mortgage dollar rolls may be renewed without physical delivery of the securities subject to the contract. A Portfolio accounts for TBA dollar roll transactions as purchases and sales which, as a result, may increase its portfolio turnover rate.
Security transactions and income recognition
Securities transactions are recorded on a trade date basis. Realized gains or losses are recorded on the basis of identified cost.
Dividend income is recognized on the ex-dividend date, except for certain dividends from foreign securities which are recorded as soon as the custodian verifies the ex-dividend date.
Interest income is accrued daily and bond discounts are accreted and premiums are amortized daily based on the effective interest method. To the extent debt obligations are placed on non-accrual status, any related interest income may be reduced by writing off interest receivables when the collection of all or a portion of interest has become doubtful based on consistently applied procedures. If the issuer subsequently resumes interest payments or when the collectability of interest is reasonably assured, the debt obligation is removed from non-accrual status.
Income from foreign securities is recorded net of foreign taxes withheld where recovery of such taxes is not assured.
Federal and other taxes
Each Portfolio is treated as a separate entity for federal income tax purposes. The Portfolios are not required to pay federal income taxes on their net investment income and net capital gain as they are treated as partnerships for federal income tax purposes. All interest, dividends, gains and losses of a Portfolio are deemed to have been “passed through” to the interest holders in proportion to their holdings of the Portfolio regardless of whether such interest, dividends and gains have been distributed by the Portfolio.
Each Portfolio’s income tax returns and all financial records supporting those returns for the prior three fiscal years are subject to examination by the federal revenue authority. Management has analyzed each Portfolio’s tax positions taken on federal, state, and foreign tax returns for all open tax years and does not believe that there are any uncertain tax positions that require recognition of a tax liability.
| | | | | | |
| Notes to financial statements (unaudited) | | Wells Fargo Dow Jones Target Date Funds | | | 125 | |
3. FAIR VALUATION MEASUREMENTS
Fair value measurements of investments are determined within a framework that has established a fair value hierarchy based upon the various data inputs utilized in determining the value of each Portfolio’s investments. The three-level hierarchy gives the highest priority to unadjusted quoted prices in active markets for identical assets or liabilities (Level 1) and the lowest priority to significant unobservable inputs (Level 3). Each Portfolio’s investments are classified within the fair value hierarchy based on the lowest level of input that is significant to the fair value measurement. The inputs are summarized into three broad levels as follows:
| n | | Level 1 – quoted prices in active markets for identical securities |
| n | | Level 2 – other significant observable inputs (including quoted prices for similar securities, interest rates, prepayment speeds, credit risk, use of amortized cost, etc.) |
| n | | Level 3 – significant unobservable inputs (including the Portfolio’s own assumptions in determining the fair value of investments) |
The inputs or methodologies used for valuing investments in securities are not necessarily an indication of the risk associated with investing in those securities.
The following is a summary of the inputs used in valuing each Portfolio’s assets and liabilities as of August 31, 2016:
| | | | | | | | | | | | | | | | |
| Diversified Fixed Income Portfolio | | Quoted prices
(Level 1) | | | Other significant observable inputs (Level 2) | | | Significant unobservable inputs (Level 3) | | | Total | |
Assets | | | | | | | | | | | | | | | | |
Investments in: | | | | | | | | | | | | | | | | |
| | | | |
Agency securities | | $ | 0 | | | $ | 1,538,442,378 | | | $ | 0 | | | $ | 1,538,442,378 | |
| | | | |
Corporate bonds and notes | | | 0 | | | | 1,213,231,257 | | | | 0 | | | | 1,213,231,257 | |
| | | | |
Foreign government bonds | | | 0 | | | | 1,435,565,122 | | | | 0 | | | | 1,435,565,122 | |
| | | | |
U.S. Treasury securities | | | 1,339,224,884 | | | | 0 | | | | 0 | | | | 1,339,224,884 | |
| | | | |
Yankee corporate bonds and notes | | | 0 | | | | 231,245,260 | | | | 0 | | | | 231,245,260 | |
| | | | |
Yankee government bonds | | | 0 | | | | 2,026,706 | | | | 0 | | | | 2,026,706 | |
| | | | |
Short-term investments | | | | | | | | | | | | | | | | |
Investment companies | | | 188,973,592 | | | | 0 | | | | 0 | | | | 188,973,592 | |
Investments measured at net asset value* | | | | | | | | | | | | | | | 4,562,280 | |
Total assets | | $ | 1,528,198,476 | | | $ | 4,420,510,723 | | | $ | 0 | | | $ | 5,953,271,479 | |
| * | Investments that are measured at fair value using the net asset value per share (or its equivalent) as a practical expedient have not been categorized in the fair value hierarchy. The fair value amount presented in the table is intended to permit reconciliation of the fair value hierarchy to the amounts presented in the Statements of Assets and Liabilities. The Portfolio’s investment in Securities Lending Cash Investments, LLC valued at $4,562,280 does not have a redemption period notice, can be redeemed daily and does not have any unfunded commitments. |
| | | | |
| 126 | | Wells Fargo Dow Jones Target Date Funds | | Notes to financial statements (unaudited) |
| | | | | | | | | | | | | | | | |
| Diversified Stock Portfolio | | Quoted prices (Level 1) | | | Other significant
observable inputs (Level 2) | | | Significant
unobservable inputs (Level 3) | | | Total | |
Assets | | | | | | | | | | | | | | | | |
Investments in: | | | | | | | | | | | | | | | | |
| | | | |
Common stocks | | | | | | | | | | | | | | | | |
Consumer discretionary | | $ | 1,141,713,109 | | | $ | 155,074 | | | $ | 0 | | | $ | 1,141,868,183 | |
Consumer staples | | | 618,306,765 | | | | 339,987 | | | | 0 | | | | 618,646,752 | |
Energy | | | 460,001,104 | | | | 2,193,519 | | | | 3 | | | | 462,194,626 | |
Financials | | | 1,841,599,293 | | | | 670,411 | | | | 76 | | | | 1,842,269,780 | |
Health care | | | 874,097,604 | | | | 0 | | | | 0 | | | | 874,097,604 | |
Industrials | | | 922,888,836 | | | | 5,933 | | | | 68,184 | | | | 922,962,953 | |
Information technology | | | 1,452,797,718 | | | | 1 | | | | 0 | | | | 1,452,797,719 | |
Materials | | | 448,091,883 | | | | 295,619 | | | | 0 | | | | 448,387,502 | |
Telecommunication services | | | 221,898,681 | | | | 692,926 | | | | 0 | | | | 222,591,607 | |
Utilities | | | 337,448,220 | | | | 0 | | | | 0 | | | | 337,448,220 | |
| | | | |
Preferred stocks | | | | | | | | | | | | | | | | |
Consumer discretionary | | | 5,056,503 | | | | 0 | | | | 0 | | | | 5,056,503 | |
Consumer staples | | | 2,428,198 | | | | 0 | | | | 0 | | | | 2,428,198 | |
Energy | | | 5,798,084 | | | | 0 | | | | 0 | | | | 5,798,084 | |
Financials | | | 18,921,256 | | | | 0 | | | | 0 | | | | 18,921,256 | |
Health care | | | 605,330 | | | | 0 | | | | 0 | | | | 605,330 | |
Information technology | | | 3,527,896 | | | | 0 | | | | 0 | | | | 3,527,896 | |
Materials | | | 3,214,186 | | | | 0 | | | | 0 | | | | 3,214,186 | |
Telecommunication services | | | 1,977,515 | | | | 0 | | | | 0 | | | | 1,977,515 | |
Utilities | | | 44,203 | | | | 0 | | | | 0 | | | | 44,203 | |
| | | | |
Rights | | | | | | | | | | | | | | | | |
Health care | | | 0 | | | | 0 | | | | 0 | | | | 0 | |
Industrials | | | 0 | | | | 0 | | | | 0 | | | | 0 | |
| | | | |
Warrants | | | | | | | | | | | | | | | | |
Consumer discretionary | | | 0 | | | | 85,621 | | | | 0 | | | | 85,621 | |
Energy | | | 0 | | | | 21,269 | | | | 0 | | | | 21,269 | |
Industrials | | | 0 | | | | 1,030 | | | | 0 | | | | 1,030 | |
| | | | |
Short-term investments | | | | | | | | | | | | | | | | |
Investment companies | | | 103,413,508 | | | | 0 | | | | 0 | | | | 103,413,508 | |
Investments measured at net asset value* | | | | | | | | | | | | | | | 218,333,728 | |
Total assets | | $ | 8,463,829,892 | | | $ | 4,461,390 | | | $ | 68,263 | | | $ | 8,686,693,273 | |
Liabilities | | | | | | | | | | | | | | | | |
Futures contracts | | $ | 495,965 | | | $ | 0 | | | $ | 0 | | | $ | 495,965 | |
Total liabilities | | $ | 495,965 | | | $ | 0 | | | $ | 0 | | | $ | 495,965 | |
| * | Investments that are measured at fair value using the net asset value per share (or its equivalent) as a practical expedient have not been categorized in the fair value hierarchy. The fair value amount presented in the table is intended to permit reconciliation of the fair value hierarchy to the amounts presented in the Statements of Assets and Liabilities. The Portfolio’s investment in Securities Lending Cash Investments, LLC valued at $218,333,728 does not have a redemption period notice, can be redeemed daily and does not have any unfunded commitments. |
| | | | | | |
| Notes to financial statements (unaudited) | | Wells Fargo Dow Jones Target Date Funds | | | 127 | |
| | | | | | | | | | | | | | | | |
| Short-Term Investment Portfolio | | Quoted prices (Level 1) | | | Other significant observable inputs (Level 2) | | | Significant unobservable inputs (Level 3) | | | Total | |
Assets | | | | | | | | | | | | | | | | |
Investments in: | | | | | | | | | | | | | | | | |
| | | | |
Certificates of deposit | | $ | 0 | | | $ | 153,006,980 | | | $ | 0 | | | $ | 153,006,980 | |
| | | | |
Commercial paper | | | 0 | | | | 373,322,451 | | | | 0 | | | | 373,322,451 | |
| | | | |
Corporate bonds and notes | | | 0 | | | | 2,390,000 | | | | 0 | | | | 2,390,000 | |
| | | | |
Municipal obligations | | | 0 | | | | 196,598,760 | | | | 0 | | | | 196,598,760 | |
| | | | |
Other | | | 0 | | | | 8,000,000 | | | | 0 | | | | 8,000,000 | |
| | | | |
Repurchase agreements | | | 0 | | | | 82,352,398 | | | | 0 | | | | 82,352,398 | |
Total assets | | $ | 0 | | | $ | 815,670,589 | | | $ | 0 | | | $ | 815,670,589 | |
Futures contracts are reported at their variation margin at measurement date, which represents the amount due from the Portfolio at that date. All other assets and liabilities are reported at their market value at measurement date.
The Portfolios recognize transfers between levels within the fair value hierarchy at the end of the reporting period. Fair value pricing which was used in pricing certain foreign securities at the previous period end was not used at August 31, 2016. As a result, Diversified Stock Portfolio common stocks valued at $2,393,980,410 and preferred stocks valued at $11,267,327 were transferred from Level 2 to Level 1 within the fair value hierarchy. The Diversified Stock Portfolio had no material transfers into/out of Level 3. At August 31, 2016, the Diversified Fixed Income Portfolio and Short-Term Investment Portfolio did not have any transfers into/out of Level 1, Level 2, or Level 3.
4. TRANSACTIONS WITH AFFILIATES AND OTHER EXPENSES
Advisory fee
The Trust has entered into an advisory contract with Funds Management. The advisor is responsible for implementing investment policies and guidelines and for supervising the applicable subadvisers, who are responsible for day-to-day portfolio management of the Portfolios.
Pursuant to the contract, Funds Management is entitled to receive an annual advisory fee from Diversified Fixed Income Portfolio and Diversified Stock Portfolio starting at 0.20% and declining to 0.10% as the average daily net assets of each respective Portfolio increase. Funds Management is entitled to receive an annual advisory fee of 0.10% of the average daily net assets of Short-Term Investment Portfolio. For the six months ended August 31, 2016, the advisory fee was equivalent to an annual rate for each Portfolio as follows:
| | | | |
| | | Advisory fee | |
Diversified Fixed Income Portfolio | | | 0.15 | % |
Diversified Stock Portfolio | | | 0.14 | |
Short-Term Investment Portfolio | | | 0.10 | |
Funds Management has retained the services of certain subadvisers to provide daily portfolio management to the Portfolios. The fees for subadvisory services are borne by Funds Management. WellsCap is the subadviser to Short-Term Investment Portfolio and is entitled to receive a fee from Funds Management at an annual rate starting at 0.05% and declining to 0.01% as the average daily net assets of Short-Term Investment Portfolio increase. SSgA Funds Management Incorporated is the subadviser to both Diversified Fixed Income Portfolio and Diversified Stock Portfolio and is entitled to receive an annual subadvisory fee from Funds Management starting at 0.07% and declining to 0.025% as the average daily net assets of each Portfolio increase.
5. INVESTMENT PORTFOLIO TRANSACTIONS
Purchases and sales of investments, excluding short-term securities, for the six months ended August 31, 2016 were as follows:
| | | | | | | | | | | | | | | | |
| | | Purchases at cost | | | Sales proceeds | |
| | | U.S. Government | | | Non-U.S. Government | | | U.S. Government | | | Non-U.S. Government | |
Diversified Fixed Income Portfolio | | $ | 1,231,295,484 | | | $ | 310,156,042 | | | $ | 859,390,678 | | | $ | 196,608,387 | |
Diversified Stock Portfolio | | | 0 | | | | 242,163,491 | | | | 0 | | | | 720,961,207 | |
| | | | |
| 128 | | Wells Fargo Dow Jones Target Date Funds | | Notes to financial statements (unaudited) |
6. INVESTMENTS IN AFFILIATES
An affiliated investment is a company which is under common ownership or control of the Portfolio or which the Portfolio has ownership of at least 5% of the outstanding voting shares. The following is a summary of transactions for the long-term holdings of issuers that were either affiliates of the Portfolio at the beginning of the period or the end of the period.
| | | | | | | | | | | | | | | | | | | | | | | | | | | | |
| | | | | Shares, beginning of period | | Shares purchased | | | Shares sold | | | Shares, end of period | | | Value, end of period | | | Income from affiliated securities | | | Realized gains | |
| Diversified Stock Portfolio | | Wells Fargo & Company | | 563,684 | | | 14,700 | | | | 65,200 | | | | 513,184 | | | $ | 26,069,747 | | | $ | 416,157 | | | $ | 412,007 | |
7. DERIVATIVE TRANSACTIONS
During the six months ended August 31, 2016, Diversified Stock Portfolio used uninvested cash to enter into futures contracts to gain market exposure.
At August 31, 2016, Diversified Stock Portfolio had long futures contracts outstanding as follows:
| | | | | | | | | | | | | | |
| Expiration date | | Counterparty | | Contracts | | Type | | Contract value at August 31, 2016 | | | Unrealized gains | |
| 9-16-2016 | | UBS | | 10 Long | | MSCI EAFE Index | | $ | 843,800 | | | $ | 12,505 | |
| 9-16-2016 | | UBS | | 4 Long | | MSCI EM Index | | | 177,580 | | | | 11,440 | |
| 9-16-2016 | | UBS | | 362 Long | | Russell 2000 Index | | | 44,844,560 | | | | 2,060,700 | |
| 9-16-2016 | | UBS | | 245 Long | | S&P 400 E-Mini Index | | | 38,313,100 | | | | 334,460 | |
| 9-16-2016 | | UBS | | 343 Long | | S&P 500 E-Mini Index | | | 37,206,925 | | | | 10,288 | |
Diversified Stock Portfolio had an average notional amount of $146,425,110 in long futures contracts during the six months ended August 31, 2016. As of August 31, 2016, Diversified Stock Portfolio had segregated $5,000,610 as cash collateral for open futures contracts.
The payable for daily variation margin on open futures contracts reflected in the Statements of Assets and Liabilities only represents the current day’s variation margin. The realized gains and change in unrealized gains (losses) on futures contracts are reflected in the Statements of Operations.
For certain types of derivative transactions, the Diversified Stock Portfolio has entered into International Swaps and Derivatives Association, Inc. master agreements (“ISDA Master Agreements”) or similar agreements with approved counterparties. The ISDA Master Agreements or similar agreements may have requirements to deliver/deposit securities or cash to/with an exchange or broker-dealer as collateral and allows the Diversified Stock Portfolio to offset, with each counterparty, certain derivative financial instrument’s assets and/or liabilities with collateral held or pledged. Collateral requirements differ by type of derivative. Collateral or margin requirements are set by the broker or exchange clearing house for exchange traded derivatives while collateral terms are contract specific for over-the-counter traded derivatives. Cash collateral that has been pledged to cover obligations of the Diversified Stock Portfolio under ISDA Master Agreements or similar agreements, if any, are reported separately in the Statements of Assets and Liabilities. Securities pledged as collateral, if any, are noted in the Portfolio of Investments. With respect to balance sheet offsetting, absent an event of default by the counterparty or a termination of the agreement, the reported amounts of financial assets and financial liabilities in the Statements of Assets and Liabilities are not offset across transactions between the Diversified Stock Portfolio and the applicable counterparty. A reconciliation of the gross amounts on the Statements of Assets and Liabilities to the net amounts by derivative type, including any collateral exposure, is as follows:
| | | | | | | | | | | | | | | | | | | | |
| | | Derivative type | | Counterparty | | Gross amounts of liabilities in the Statements of Assets and Liabilities | | | Amounts subject to netting agreements | | | Collateral pledged1 | | | Net amount of liabilities | |
| Diversified Stock Portfolio | | Futures – variation margin | | UBS | | $ | 495,965 | | | $ | 0 | | | $ | (495,965 | ) | | $ | 0 | |
| 1 | Collateral pledged within this table is limited to the collateral for the net transaction with the counterparty. |
| | | | | | |
| Notes to financial statements (unaudited) | | Wells Fargo Dow Jones Target Date Funds | | | 129 | |
8. INDEMNIFICATION
Under the Trust’s organizational documents, the officers and Trustees have been granted certain indemnification rights against certain liabilities that may arise out of performance of their duties to the Trust. Additionally, in the normal course of business, the Trust may enter into contracts with service providers that contain a variety of indemnification clauses. The Trust’s maximum exposure under these arrangements is dependent on future claims that may be made against the Portfolios and, therefore, cannot be estimated.
| | | | |
| 130 | | Wells Fargo Dow Jones Target Date Funds | | Other information (unaudited) |
BOARD OF TRUSTEES AND OFFICERS
Each of the Trustees and Officers1 listed in the table below acts in identical capacities for each fund in the Wells Fargo family of funds, which consists of 139 mutual funds comprising the Wells Fargo Funds Trust, Wells Fargo Variable Trust, Wells Fargo Master Trust and four closed-end funds (collectively the “Fund Complex”). This table should be read in conjunction with the Prospectus and the Statement of Additional Information2. The mailing address of each Trustee and Officer is 525 Market Street, 12th Floor, San Francisco, CA 94105. Each Trustee and Officer serves an indefinite term, however, each Trustee serves such term until reaching the mandatory retirement age established by the Trustees.
Independent Trustees
| | | | | | |
Name and year of birth | | Position held and length of service* | | Principal occupations during past five years or longer | | Current other public company or investment company directorships |
William R. Ebsworth (Born 1957) | | Trustee, since 2015 | | Retired. From 1984 to 2013, equities analyst, portfolio manager, research director and chief financial officer at Fidelity Management and Research Company in Boston, Tokyo, and Hong Kong and retired in 2013 as Chief Investment Officer of Fidelity Strategic Advisers, Inc. where he lead a team of investment professionals managing client assets. Prior thereto, Board member of Hong Kong Securities Clearing Co., Hong Kong Options Clearing Corp., the Thailand International Fund, Ltd., Fidelity Investments Life Insurance Company, and Empire Fidelity Investments Life Insurance Company. Mr. Ebsworth is a CFA® charterholder and an Adjunct Lecturer, Finance, at Babson College. | | Asset Allocation Trust |
Jane A. Freeman (Born 1953) | | Trustee, since 2015 | | Retired. From 2012 to 2014 and 1999 to 2008, Chief Financial Officer of Scientific Learning Corporation. From 2008 to 2012, Ms. Freeman provided consulting services related to strategic business projects. Prior to 1999, Portfolio Manager at Rockefeller & Co. and Scudder, Stevens & Clark. Board member of the Harding Loevner Funds from 1996 to 2014, serving as both Lead Independent Director and chair of the Audit Committee. Board member of the Russell Exchange Traded Funds Trust from 2011 to 2012 and the chair of the Audit Committee. Ms. Freeman is a Board Member of Ruth Bancroft Garden (non-profit organization) and an inactive chartered financial analyst. | | Asset Allocation Trust |
Peter G. Gordon (Born 1942) | | Trustee, since 1998; Chairman, since 2005 | | Co-Founder, Retired Chairman, President and CEO of Crystal Geyser Water Company. Trustee Emeritus, Colby College. | | Asset Allocation Trust |
Isaiah Harris, Jr. (Born 1952) | | Trustee, since 2009 | | Retired. Chairman of the Board of CIGNA Corporation since 2009, and Director since 2005. From 2003 to 2011, Director of Deluxe Corporation. Prior thereto, President and CEO of BellSouth Advertising and Publishing Corp. from 2005 to 2007, President and CEO of BellSouth Enterprises from 2004 to 2005 and President of BellSouth Consumer Services from 2000 to 2003. Emeritus member of the Iowa State University Foundation Board of Governors. Emeritus Member of the Advisory Board of Iowa State University School of Business. Advisory Board Member, Palm Harbor Academy (charter school). Advisory Board Member, Child Evangelism Fellowship (non-profit). Mr. Harris is a certified public accountant (inactive status). | | CIGNA Corporation; Asset Allocation Trust |
Judith M. Johnson (Born 1949) | | Trustee, since 2008; Audit Committee Chairman, since 2008 | | Retired. Prior thereto, Chief Executive Officer and Chief Investment Officer of Minneapolis Employees Retirement Fund from 1996 to 2008. Ms. Johnson is an attorney, certified public accountant and a certified managerial accountant. | | Asset Allocation Trust |
David F. Larcker (Born 1950) | | Trustee, since 2009 | | James Irvin Miller Professor of Accounting at the Graduate School of Business, Stanford University, Director of the Corporate Governance Research Initiative and Senior Faculty of The Rock Center for Corporate Governance since 2006. From 2005 to 2008, Professor of Accounting at the Graduate School of Business, Stanford University. Prior thereto, Ernst & Young Professor of Accounting at The Wharton School, University of Pennsylvania from 1985 to 2005. | | Asset Allocation Trust |
| | | | | | |
| Other information (unaudited) | | Wells Fargo Dow Jones Target Date Funds | | | 131 | |
| | | | | | |
Name and year of birth | | Position held and length of service* | | Principal occupations during past five years or longer | | Current other public company or investment company directorships |
Olivia S. Mitchell (Born 1953) | | Trustee, since 2006 | | International Foundation of Employee Benefit Plans Professor, Wharton School of the University of Pennsylvania since 1993. Director of Wharton’s Pension Research Council and Boettner Center on Pensions & Retirement Research, and Research Associate at the National Bureau of Economic Research. Previously, Cornell University Professor from 1978 to 1993. | | Asset Allocation Trust |
Timothy J. Penny (Born 1951) | | Trustee, since 1996 | | President and Chief Executive Officer of Southern Minnesota Initiative Foundation, a non-profit organization, since 2007 and Senior Fellow at the Humphrey Institute Policy Forum at the University of Minnesota since 1995. Member of the Board of Trustees of NorthStar Education Finance, Inc., a non-profit organization, since 2007. | | Asset Allocation Trust |
Michael S. Scofield (Born 1943) | | Trustee, since 2010 | | Served on the Investment Company Institute’s Board of Governors and Executive Committee from 2008-2011 as well the Governing Council of the Independent Directors Council from 2006-2011 and the Independent Directors Council Executive Committee from 2008-2011. Chairman of the IDC from 2008-2010. Institutional Investor (Fund Directions) Trustee of Year in 2007. Trustee of the Evergreen Funds complex (and its predecessors) from 1984 to 2010. Chairman of the Evergreen Funds from 2000-2010. Former Trustee of the Mentor Funds. Retired Attorney, Law Offices of Michael S. Scofield. | | Asset Allocation Trust |
| * | Length of service dates reflect the Trustee’s commencement of service with the Trust’s predecessor entities, where applicable. |
Officers
| | | | | | |
Name and year of birth | | Position held and length of service | | Principal occupations during past five years or longer | | |
Karla M. Rabusch (Born 1959) | | President, since 2003 | | Executive Vice President of Wells Fargo Bank, N.A. and President of Wells Fargo Funds Management, LLC since 2003. | | |
Jeremy DePalma1 (Born 1974) | | Treasurer, since 2012 | | Senior Vice President of Wells Fargo Funds Management, LLC since 2009. Senior Vice President of Evergreen Investment Management Company, LLC from 2008 to 2010 and head of the Fund Reporting and Control Team within Fund Administration from 2005 to 2010. | | |
C. David Messman (Born 1960) | | Secretary, since 2000; Chief Legal Officer, since 2003 | | Senior Vice President and Secretary of Wells Fargo Funds Management, LLC since 2001. Assistant General Counsel of Wells Fargo Bank, N.A. since 2013 and Vice President and Managing Counsel of Wells Fargo Bank, N.A. from 1996 to 2013. | | |
Michael Whitaker (Born 1967) | | Chief Compliance Officer, since 2016* | | Executive Vice President of Wells Fargo Funds Management, LLC since 2016. Chief Compliance Officer of Fidelity’s Fixed Income Funds and Asset Allocation Funds from 2008 to 2016, Compliance Officer of FMR Co., Inc. from 2014 to 2016, Fidelity Investments Money Management, Inc. from 2014 to 2016, Fidelity Investments from 2007 to 2016. | | |
David Berardi (Born 1975) | | Assistant Treasurer, since 2009 | | Vice President of Wells Fargo Funds Management, LLC since 2009. Vice President of Evergreen Investment Management Company, LLC from 2008 to 2010. Manager of Fund Reporting and Control for Evergreen Investment Management Company, LLC from 2004 to 2010. | | |
| 1 | Jeremy DePalma acts as Treasurer of 68 funds and Assistant Treasurer of 71 funds in the Fund Complex. |
| 2 | The Statement of Additional Information includes additional information about the Trustees and is available, without charge, upon request, by calling
1-800-222-8222 or by visiting the website at wellsfargofunds.com. |
| * | Michael Whitaker became Chief Compliance Officer effective May 16, 2016. |
| | | | |
| 132 | | Wells Fargo Dow Jones Target Date Funds | | Other information (unaudited) |
BOARD CONSIDERATION OF INVESTMENT ADVISORY, INVESTMENT MANAGEMENT AND SUB-ADVISORY AGREEMENTS:
Wells Fargo Dow Jones Target Today Fund, Wells Fargo Dow Jones Target 2010 Fund, Wells Fargo Dow Jones Target 2015 Fund, Wells Fargo Dow Jones Target 2020 Fund, Wells Fargo Dow Jones Target 2025 Fund, Wells Fargo Dow Jones Target 2030 Fund, Wells Fargo Dow Jones Target 2035 Fund, Wells Fargo Dow Jones Target 2040 Fund, Wells Fargo Dow Jones Target 2045 Fund, Wells Fargo Dow Jones Target 2050 Fund, Wells Fargo Dow Jones Target 2055 Fund, Wells Fargo Dow Jones Target 2060 Fund, Wells Fargo Diversified Fixed Income Portfolio, Wells Fargo Diversified Stock Portfolio, Wells Fargo Short-Term Investment Portfolio
Under the Investment Company Act of 1940 (the “1940 Act”), the Board of Trustees (each, a “Board” and collectively, the “Boards”) of each of Wells Fargo Funds Trust (“Funds Trust”) and Wells Fargo Master Trust (“Master Trust”) (collectively, the “Trusts”), must determine annually whether to approve the continuation of the Trusts’ investment management, advisory and sub-advisory agreements, as applicable. In this regard, at an in-person meeting held on May 24-25, 2016 (the “Meeting”) and, the Funds Trust Board, all the members of which have no direct or indirect interest in the investment management, advisory and sub-advisory agreements and are not “interested persons” of the Trusts, as defined in the 1940 Act (the “Independent Trustees”), reviewed and approved for each of the Wells Fargo Dow Jones Target Today Fund, Wells Fargo Dow Jones Target 2010 Fund, Wells Fargo Dow Jones Target 2015 Fund, Wells Fargo Dow Jones Target 2020 Fund, Wells Fargo Dow Jones Target 2025 Fund, Wells Fargo Dow Jones Target 2030 Fund, Wells Fargo Dow Jones Target 2035 Fund, Wells Fargo Dow Jones Target 2040 Fund, Wells Fargo Dow Jones Target 2045 Fund, Wells Fargo Dow Jones Target 2050 Fund, Wells Fargo Dow Jones Target 2055 Fund and Wells Fargo Dow Jones Target 2060 Fund (individually, the “Target Date Fund” and collectively, the “Target Date Funds”) an investment management agreement (the “Target Date Fund Management Agreement”) with Wells Fargo Funds Management, LLC (“Funds Management”).
At the Meeting, the Master Trust Board, all the members of which are Independent Trustees, reviewed and approved for each of Wells Fargo Diversified Fixed Income Portfolio, Wells Fargo Diversified Stock Portfolio and Wells Fargo Short-Term Investment Portfolio (the “Master Portfolios”) an investment advisory agreement (the “Master Portfolio Advisory Agreement”) with Funds Management. The Target Date Funds and the Master Portfolios are collectively referred to as the “Funds.”
The Funds Trust Board also reviewed and approved the following at the Meeting: an investment sub-advisory agreement with Global Index Advisors, Inc. (“GIA”) for the Target Date Funds. The Master Trust Board also reviewed: an investment sub-advisory agreement with (i) SSgA Funds Management, Inc. (“SSgA”) for Wells Fargo Diversified Fixed Income Portfolio and Wells Fargo Diversified Stock Portfolio; and (ii) Wells Capital Management Incorporated (“Wells Capital Management”) for the Wells Fargo Short-Term Investment Portfolio (collectively, the “Sub-Advisory Agreements”).
Wells Capital Management, GIA and SSgA are collectively referred to as the “Sub-Advisers”, and the Target Date Fund Management Agreement and the Sub-Advisory Agreements are collectively referred to as the “Advisory Agreements.” The Target Date Funds are gateway blended funds that each invests all of their assets in the Master Portfolios.
At the Meeting, the Boards considered the factors and reached the conclusions described below relating to the selection of Funds Management and the Sub-Advisers and the approval of the Advisory Agreements. Prior to the Meeting, including at an in-person meeting in April 2016, the Trustees conferred extensively among themselves and with representatives of Funds Management about these matters. Also, the Boards have adopted a team-based approach, with each team consisting of a sub-set of Trustees, to assist the Boards in the discharge of their duties in reviewing performance and other matters throughout the year. The Independent Trustees were assisted in their evaluation of the Advisory Agreements by independent legal counsel, from whom they received separate legal advice and with whom they met separately.
In providing information to the Boards, Funds Management and the Sub-Advisers were guided by a detailed set of requests for information submitted to them by independent legal counsel on behalf of the Independent Trustees at the start of the Boards’ annual contract renewal process earlier in 2016. In considering and approving the Advisory Agreements, the Trustees considered the information they believed relevant, including but not limited to the information discussed below. The Boards considered not only the specific information presented in connection with the Meetings, but also the knowledge gained over time through interaction with Funds Management and the Sub-Advisers about various topics. In this regard, the Boards reviewed reports of Funds Management at each of their quarterly meetings, which included, among other things, portfolio reviews and performance reports. In addition, the Boards and the teams mentioned above confer with portfolio managers at various times throughout the year. The Boards did not identify any particular information or consideration that was all-important or controlling, and each individual Trustee may have attributed different weights to various factors.
| | | | | | |
| Other information (unaudited) | | Wells Fargo Dow Jones Target Date Funds | | | 133 | |
After its deliberations, the Funds Trust Board unanimously approved the continuation of the Target Date Fund Management Agreement for a one-year term. Additionally, after its deliberations, the Master Trust Board unanimously approved the continuation of the Master Portfolio Advisory Agreement and the Sub-Advisory Agreements, each for a one-year term. The Boards also determined that the compensation payable to Funds Management and each of the Sub-Advisers was reasonable. The Boards considered the approval of the Advisory Agreements for the Funds as part of their consideration of agreements for funds across the complex, but their approvals were made on a fund-by-fund basis. The following summarizes a number of important, but not necessarily all, factors considered by the Boards in support of their approvals.
Nature, extent and quality of services
The Boards received and considered various information regarding the nature, extent and quality of services provided to the Funds by Funds Management and the Sub-Advisers under the Advisory Agreements. This information included a description of the investment advisory services and Fund-level administrative services, as well as, among other things, a summary of the background and experience of senior management of Funds Management, and the qualifications, background, tenure and responsibilities of each of the portfolio managers primarily responsible for the day-to-day portfolio management of the Funds.
The Boards evaluated the ability of Funds Management and the Sub-Advisers to attract and retain qualified investment professionals, including research, advisory and supervisory personnel. The Boards further considered the compliance programs and compliance records of Funds Management and the Sub-Advisers. In addition, the Boards took into account the full range of services provided to the Funds by Funds Management and its affiliates.
Fund performance and expenses
The Boards considered the performance results for each of the Funds over various time periods ended December 31, 2015. The Boards considered these results in comparison to the performance of funds in a universe that was determined by Broadridge Inc. (“Broadridge”) to be similar to the respective Funds (each, a “Universe”), and in comparison to each Fund’s benchmark index and to other comparative data. Broadridge is an independent provider of investment company data. The Boards received a description of the methodology used by Broadridge to select the mutual funds in each performance Universe.
The Funds Trust Board noted that the performance of each Target Date Fund (Administrator Class) relative to its respective Universe was as follows: (i) the performance of the Target 2010 Fund was in range of the average performance of its Universe for all periods under review except the three- and five-year periods; (ii) the performance of the Target 2015 Fund was lower than the average performance of its Universe for all periods under review except the one-year period; (iii) the performance of the Target 2020 Fund was higher than or in range of the average performance of its Universe for all periods under review except the three and five-year periods; (iv) the performance of the Target 2025 Fund was lower than the average performance of its Universe for all periods under review except the one-year period; (v) the performance of the Target 2030 Fund was higher than or in range of the average performance of its Universe for all periods under review except the five-year period; (vi) the performance of the Target 2035 Fund was lower than the average performance of its Universe for all periods under review except the one-year period; (vii) the performance of the Target 2040 Fund was higher than or in range of the average performance of its Universe for all periods under review except the one-year period; (viii) the performance of the Target 2045 Fund was lower than the average performance of its Universe for all periods under review except the three-year period; (ix) the performance of the Target 2050 Fund was higher than or in range of the average performance of its Universe for all periods under review except the one-year period; (x) the performance of the Target 2055 Fund was lower than the average performance of its Universe for all periods under review; (xi) the performance of the Target 2060 Fund was lower than the average performance of its Universe for all periods under review; and (xii) the performance of the Target Today Fund was higher than or in range of the average performance of its Universe for all periods under review except the three- and five-year periods. The Funds Trust Board also noted that the performance of each Target Date Fund was lower than the performance of its respective benchmark index for all periods under review except the first quarter of 2015.
The Funds Trust Board received information concerning, and discussed factors contributing to, the underperformance for the periods noted above. Funds Management advised the Funds Trust Board that the nearer-dated Target Date Funds have some of the more conservative glidepaths in the industry, and as a result had a lower allocation to equities compared to funds in each respective Target Date Fund’s Universe. Thus, the Funds Trust Board was advised that underperformance of the nearer-dated Target Date Funds relative to their respective Universes was to be expected during periods in which the equity markets posted strong gains. The Funds Trust Board noted that the Target Date Funds’ underperformance relative to their benchmarks was largely attributable to fees charged to the Target Date Funds (which are not charged to a benchmark index).
| | | | |
| 134 | | Wells Fargo Dow Jones Target Date Funds | | Other information (unaudited) |
The Master Trust Board took note of the performance of the Master Portfolios. The Master Trust Board noted that the performance of the Diversified Stock Portfolio was lower than the average performance of its Universe for all periods under review. The Master Trust Board also noted that the performance of the Diversified Stock Portfolio was in range of the performance of its benchmark, the Dow Jones Stock CMAC Index, for all periods under review. The Master Trust Board was apprised that the underperformance of the Diversified Stock Portfolio relative to its Universe for the periods noted above was largely attributable to sector allocation.
The Master Trust Board noted that the performance of the Diversified Fixed Income Portfolio was lower than the average performance of its Universe for all periods under review. The Master Trust Board also noted that the performance of the Diversified Fixed Income Portfolio was in range of the performance of its benchmark, the Dow Jones Bond CMAC Index, for all periods under review except the five-year period. The Master Trust Board was apprised that the underperformance of the Diversified Fixed Income Portfolio relative to its Universe and benchmark for the periods noted above was largely attributable to sector allocation.
The Master Trust Board also noted that the performance of the Short-Term Investment Portfolio was higher than or in range of the average performance of its Universe for all periods under review except the ten-year period. The Master Trust Board also noted that the performance of the Short-Term Investment Portfolio was higher than the performance of its benchmark, the Barclays U.S. T-Bill 1-3 Month Index, for all periods under review. The Master Trust Board was apprised that the underperformance of the Short-Term Investment Portfolio relative to its benchmark for the periods noted above was largely attributable to the fact that the Short-Term Investment Portfolio is managed using a money market strategy. The Master Trust Board noted that the Short-Term Investment Portfolio experienced a portfolio manager change in 2014.
The Funds Trust Board also received and considered information regarding each Target Date Fund’s net operating expense ratios, which include fees and expenses of the corresponding Master Portfolio, and their various components, including actual management fees assessed at both the Target Date Fund level and the Master Portfolio level, custodian and other non-management fees, and Rule 12b-1 and non-Rule 12b-1 shareholder service fees. The Funds Trust Board considered these ratios in comparison to the median ratios of funds in class-specific expense groups that were determined by Broadridge to be similar to each Target Date Fund (the “Groups”). The Funds Trust Board received a description of the methodology used by Broadridge to select the mutual funds in the expense Groups and an explanation of how funds comprising expense groups may vary from year-to-year. Based on the Broadridge reports, the Funds Trust Board noted that the net operating expense ratios of each Target Date Fund were lower than the median net operating expense ratios of its respective expense Groups for all share classes.
With respect to the Master Portfolios, the Master Trust Board reviewed the fee rates that are payable to Funds Management for investment advisory services (as discussed below), which are the only fees charged at the Master Portfolio level, relative to a corresponding expense Group.
The Boards took into account the Fund performance and expense information provided to it among the factors considered in deciding to re-approve the Advisory Agreements.
Investment management, advisory and sub-advisory fee rates
The Funds Trust Board reviewed and considered the fee rates that are payable by each Target Date Fund to Funds Management under the Target Date Fund Management Agreement, as well as the contractual fee rates payable by each Target Date Fund to Funds Management for class-level administrative services under a Class-Level Administration Agreement, which include class-level transfer agency and sub-transfer agency costs (collectively, the “Management Rates”).
The Master Trust Board reviewed and considered the contractual investment advisory fee rates that are payable by the Master Portfolios to Funds Management for investment advisory services under the Master Portfolio Advisory Agreement (the “Advisory Agreement Rates”). The Master Trust Board also reviewed and considered the contractual investment sub-advisory fee rates that are payable by Funds Management to the Sub-Advisers for investment sub-advisory services (the “Sub-Advisory Agreement Rates”).
Among other information reviewed by the Funds Trust Board was a comparison of each Target Date Fund’s Management Rate, which do not include the advisory fees paid at the Master Portfolio level, with the average contractual investment management fee rates of funds in the expense Groups at a common asset level as well as transfer agency costs of the funds in the expense Groups. The Funds Trust Board noted that the Management Rates of each Target Date Fund were lower than the sum of the management fee rates and transfer agency costs of its respective expense Groups for all share classes. The Funds Trust Board noted that it had recently approved a reduction in the advisory fee schedules for each of the Target Date Funds in February 2015, effective July 1, 2015.
| | | | | | |
| Other information (unaudited) | | Wells Fargo Dow Jones Target Date Funds | | | 135 | |
The Master Trust Board reviewed a comparison of the Advisory Agreement Rates of each Master Portfolio with those of other funds in each Master Portfolio’s respective expense Group at a common asset level. The Master Trust Board noted that the Advisory Agreement Rates of each Master Portfolio were lower than the median rate for the Master Portfolio’s respective expense Group.
The Boards also received and considered information about the portions of the total management fees that were retained by Funds Management after payment of the fees to the Sub-Advisers for sub-advisory services. With respect to the Target Date Funds, the Diversified Fixed Income Portfolio and the Diversified Stock Portfolio, the Boards considered this amount in comparison to the median amount retained by advisers to funds in a sub-advised expense universe that was determined by Broadridge to be similar to the respective Fund. In assessing the reasonableness of these amounts, the Boards received and evaluated information about the nature and extent of responsibilities retained and risks assumed by Funds Management and not delegated to or assumed by the Sub-Advisers, and about Funds Management’s on-going oversight services. With respect to the Short-Term Investment Portfolio, given the current affiliation between Funds Management and Wells Capital Management, the Master Trust Board ascribed limited relevance to the allocation of the advisory fee between them. With respect to GIA and SSgA, the Boards considered that the Sub-Advisory Agreement Rates paid to each of these Sub-Advisers had been negotiated by Funds Management on an arm’s-length basis.
Other than with respect to the Wells Fargo Diversified Stock Porfolio, the Boards also received and considered information about the nature and extent of services offered and fee rates charged by the Sub-Advisers to other types of clients with investment strategies similar to those of the Funds. In this regard, the Boards received information about the significantly greater scope of services, and compliance, reporting and other legal burdens and risks of managing mutual funds compared with those associated with managing assets of non-mutual fund clients such as collective funds or institutional separate accounts.
Based on its consideration of the factors and information it deemed relevant, including those described here, the Funds Trust Board determined that the compensation payable to Funds Management under the Target Date Fund Management Agreement was reasonable in light of the services covered by the Target Date Fund Management Agreement. The Master Trust Board determined that the compensation payable to Funds Management under the Master Portfolio Advisory Agreement and to each Sub-Adviser under each Sub-Advisory Agreement was reasonable, in light of the services covered by the Master Portfolio Advisory Agreement and each Sub-Advisory Agreement, respectively.
Profitability
The Board received and considered information concerning the profitability of Funds Management, as well as the profitability of Wells Fargo as a whole, from providing services to the Funds and the fund family as a whole. The Board also received and considered information concerning the profitability of Wells Capital Management from providing services to the fund family as a whole, noting that Wells Capital Management’s profitability information with respect to providing services to the Funds was subsumed in the Wells Fargo and Funds Management profitability analysis. The Boards did not receive or consider profitability information with respect to GIA or SSgA, as the sub-advisory fees paid to them had been negotiated by Funds Management on an arm’s-length basis.
Funds Management reported on the methodologies and estimates used in calculating profitability. Among other things, the Board noted that the levels of profitability reported on a fund-by-fund basis varied widely, depending on factors such as the size and type of fund. Based on its review, the Board did not deem the profits reported by Funds Management or Wells Fargo from its services to the Funds to be at a level that would prevent it from approving the continuation of the Advisory Agreements.
Economies of scale
With respect to possible economies of scale, the Funds Trust Boards noted the existence of breakpoints in each Target Date Fund’s management fee structure, and the Master Trust Board noted the existence of breakpoints in each Master Portfolio’s advisory fee structure (except the Short-Term Investment Portfolio), which operate generally to reduce the Funds’ expense ratios as the Funds grow in size. They considered that, for a small fund or a fund that shrinks in size, breakpoints conversely can result in higher fee levels. The Boards also considered that fee waiver and expense reimbursement arrangements and competitive fee rates at the outset are means of sharing potential economies of scale with shareholders of the Funds and the fund family as a whole. The Boards considered Funds Management’s view that any analyses of potential economies of scale in managing a particular fund are inherently limited in light of the joint and common costs and investments that Funds Management incurs across the fund family as a whole.
| | | | |
| 136 | | Wells Fargo Dow Jones Target Date Funds | | Other information (unaudited) |
The Boards concluded that the Funds’ fee and expense arrangements, including contractual breakpoints, constituted a reasonable approach to sharing potential economies of scale with the Funds and their shareholders.
Other benefits to Funds Management and the Sub-Advisers
The Boards received and considered information regarding potential “fall-out” or ancillary benefits received by Funds Management and its affiliates, including Wells Capital Management, or GIA or SSgA as a result of their relationships with the Funds. Ancillary benefits could include, among others, benefits directly attributable to other relationships with the Funds and benefits potentially derived from an increase in Funds Management’s and the Sub-Advisers’ business as a result of their relationships with the Funds. The Boards noted that various affiliates of Funds Management may receive distribution-related fees, shareholder servicing payments and sub-transfer agency fees in respect of shares sold or held through them and services provided.
The Boards also reviewed information about fees earned by Funds Management and Wells Capital Management from managing a private investment vehicle for the fund family’s securities lending collateral and commissions earned by an affiliated broker from portfolio transactions.
Based on their consideration of the factors and information they deemed relevant, including those described here, the Boards did not find that any ancillary benefits received by Funds Management and its affiliates, including Wells Capital Management, or GIA or SSgA or were unreasonable.
Conclusion
At the Meeting, after considering the above-described factors and based on its deliberations and its evaluation of the information described above, the Funds Trust Board unanimously approved the continuation of the Target Date Fund Management Agreement for a one-year term. Additionally, after its deliberations, the Master Trust Board unanimously approved the continuation of the Master Portfolio Advisory Agreement and the Sub-Advisory Agreements, each for a one-year term. The Boards also determined that the compensation payable to Funds Management and each of the Sub-Advisers was reasonable.
| | | | | | |
| List of abbreviations | | Wells Fargo Dow Jones Target Date Funds | | | 137 | |
The following is a list of common abbreviations for terms and entities that may have appeared in this report.
| ACA | — ACA Financial Guaranty Corporation |
| ADR | — American depositary receipt |
| ADS | — American depositary shares |
| AGC | — Assured Guaranty Corporation |
| AGM | — Assured Guaranty Municipal |
| Ambac | — Ambac Financial Group Incorporated |
| AMT | — Alternative minimum tax |
| BAN | — Bond anticipation notes |
| BHAC | — Berkshire Hathaway Assurance Corporation |
| CAB | — Capital appreciation bond |
| CCAB | — Convertible capital appreciation bond |
| CDA | — Community Development Authority |
| CDO | — Collateralized debt obligation |
| DRIVER | — Derivative inverse tax-exempt receipts |
| DW&P | — Department of Water & Power |
| DWR | — Department of Water Resources |
| ECFA | — Educational & Cultural Facilities Authority |
| EDA | — Economic Development Authority |
| EDFA | — Economic Development Finance Authority |
| ETF | — Exchange-traded fund |
| FDIC | — Federal Deposit Insurance Corporation |
| FFCB | — Federal Farm Credit Banks |
| FGIC | — Financial Guaranty Insurance Corporation |
| FHA | — Federal Housing Administration |
| FHLB | — Federal Home Loan Bank |
| FHLMC | — Federal Home Loan Mortgage Corporation |
| FICO | — The Financing Corporation |
| FNMA | — Federal National Mortgage Association |
| GDR | — Global depositary receipt |
| GNMA | — Government National Mortgage Association |
| HCFR | — Healthcare facilities revenue |
| HEFA | — Health & Educational Facilities Authority |
| HEFAR | — Higher education facilities authority revenue |
| HFA | — Housing Finance Authority |
| HFFA | — Health Facilities Financing Authority |
| HUD | — Department of Housing and Urban Development |
| IDA | — Industrial Development Authority |
| IDAG | — Industrial Development Agency |
| KRW | — Republic of Korea won |
| LIBOR | — London Interbank Offered Rate |
| LIFER | — Long Inverse Floating Exempt Receipts |
| LLC | — Limited liability company |
| LLLP | — Limited liability limited partnership |
| LLP | — Limited liability partnership |
| MBIA | — Municipal Bond Insurance Association |
| MFHR | — Multifamily housing revenue |
| MSTR | — Municipal securities trust receipts |
| MUD | — Municipal Utility District |
| National | — National Public Finance Guarantee Corporation |
| PCFA | — Pollution Control Financing Authority |
| PCL | — Public Company Limited |
| PCR | — Pollution control revenue |
| PFA | — Public Finance Authority |
| PFFA | — Public Facilities Financing Authority |
| PFOTER | — Puttable floating option tax-exempt receipts |
| plc | — Public limited company |
| PUTTER | — Puttable tax-exempt receipts |
| R&D | — Research & development |
| Radian | — Radian Asset Assurance |
| RAN | — Revenue anticipation notes |
| RDA | — Redevelopment Authority |
| RDFA | — Redevelopment Finance Authority |
| REIT | — Real estate investment trust |
| ROC | — Reset option certificates |
| SAVRS | — Select auction variable rate securities |
| SBA | — Small Business Authority |
| SDR | — Swedish depositary receipt |
| SFHR | — Single-family housing revenue |
| SFMR | — Single-family mortgage revenue |
| SPA | — Standby purchase agreement |
| SPDR | — Standard & Poor’s Depositary Receipts |
| SPEAR | — Short Puttable Exempt Adjustable Receipts |
| STRIPS | — Separate trading of registered interest and |
| TAN | — Tax anticipation notes |
| TIPS | — Treasury inflation-protected securities |
| TRAN | — Tax revenue anticipation notes |
| TTFA | — Transportation Trust Fund Authority |
| TVA | — Tennessee Valley Authority |
This page is intentionally left blank.
This page is intentionally left blank.
This page is intentionally left blank.

For more information
More information about Wells Fargo Funds is available free upon request. To obtain literature, please write, email, visit the Funds’ website, or call:
Wells Fargo Funds
P.O. Box 8266
Boston, MA 02266-8266
Email: fundservice@wellsfargo.com
Website: wellsfargofunds.com
Individual investors: 1-800-222-8222
Retail investment professionals: 1-888-877-9275
Institutional investment professionals: 1-866-765-0778
This report and the financial statements contained herein are submitted for the general information of the shareholders of Wells Fargo Funds. If this report is used for promotional purposes, distribution of the report must be accompanied or preceded by a current prospectus. Before investing, please consider the investment objectives, risks, charges, and expenses of the investment. For a current prospectus and, if available, a summary prospectus, containing this information, call 1-800-222-8222 or visit the Funds’ website at wellsfargofunds.com. Read the prospectus carefully before you invest or send money.
Wells Fargo Asset Management (WFAM) is a trade name used by the asset management businesses of Wells Fargo & Company. Wells Fargo Funds Management, LLC, a wholly owned subsidiary of Wells Fargo & Company, provides investment advisory and administrative services for Wells Fargo Funds. Other affiliates of Wells Fargo & Company provide subadvisory and other services for the funds. The funds are distributed by Wells Fargo Funds Distributor, LLC, Member FINRA, an affiliate of Wells Fargo & Company.
NOT FDIC INSURED ¡ NO BANK GUARANTEE ¡ MAY LOSE VALUE
© 2016 Wells Fargo Funds Management, LLC. All rights reserved.
| | |
 | | 245797 10-16 SOFLD/SAR101 08-16 |
ITEM 2. CODE OF ETHICS
Not applicable.
ITEM 3. AUDIT COMMITTEE FINANCIAL EXPERT
Not applicable.
ITEM 4. PRINCIPAL ACCOUNTANT FEES AND SERVICES
Not applicable.
ITEM 5. AUDIT COMMITTEE OF LISTED REGISTRANTS
Not applicable.
ITEM 6. INVESTMENTS
Wells Fargo Diversified Fixed Income Portfolio and Wells Fargo Diversified Stock Portfolio included a Summary Portfolio of Investments under Item 1. A Portfolio of Investments for each of Wells Fargo Diversified Fixed Income Portfolio and Wells Fargo Diversified Stock Portfolio are filed under this Item.
| | | | | | |
| Portfolio of investments—August 31, 2016 (unaudited) | | Wells Fargo Diversified Fixed Income Portfolio | | | 1 | |
| | | | | | | | | | | | | | | | |
| Security name | | Interest rate | | | Maturity date | | | Principal | | | Value | |
| | | | |
Agency Securities: 26.40% | | | | | | | | | | | | | | | | |
FFCB | | | 1.10 | % | | | 6-1-2018 | | | $ | 3,000,000 | | | $ | 3,009,813 | |
FFCB | | | 3.50 | | | | 12-20-2023 | | | | 400,000 | | | | 450,252 | |
FHLB | | | 0.88 | | | | 3-19-2018 | | | | 3,500,000 | | | | 3,500,567 | |
FHLB | | | 0.88 | | | | 10-1-2018 | | | | 1,500,000 | | | | 1,498,997 | |
FHLB | | | 0.88 | | | | 8-5-2019 | | | | 750,000 | | | | 746,849 | |
FHLB | | | 1.13 | | | | 6-21-2019 | | | | 2,000,000 | | | | 2,006,156 | |
FHLB | | | 1.38 | | | | 2-18-2021 | | | | 1,000,000 | | | | 1,005,094 | |
FHLB | | | 2.50 | | | | 8-1-2027 | | | | 118,112 | | | | 122,248 | |
FHLB | | | 2.50 | | | | 12-1-2027 | | | | 62,779 | | | | 64,982 | |
FHLB | | | 2.50 | | | | 6-1-2028 | | | | 79,432 | | | | 82,228 | |
FHLB | | | 2.50 | | | | 8-1-2028 | | | | 734,344 | | | | 760,121 | |
FHLB | | | 2.50 | | | | 9-1-2028 | | | | 3,346,919 | | | | 3,464,078 | |
FHLB | | | 2.50 | | | | 9-1-2028 | | | | 338,849 | | | | 351,855 | |
FHLB | | | 2.50 | | | | 9-1-2028 | | | | 2,262,644 | | | | 2,341,867 | |
FHLB | | | 2.50 | | | | 10-1-2028 | | | | 705,959 | | | | 730,707 | |
FHLB | | | 2.50 | | | | 10-1-2028 | | | | 117,742 | | | | 121,864 | |
FHLB | | | 2.50 | | | | 11-1-2028 | | | | 2,126,430 | | | | 2,201,036 | |
FHLB | | | 2.50 | | | | 11-1-2028 | | | | 650,144 | | | | 673,033 | |
FHLB | | | 3.00 | | | | 10-1-2042 | | | | 7,795,651 | | | | 8,104,496 | |
FHLB | | | 3.00 | | | | 10-1-2042 | | | | 614,079 | | | | 638,350 | |
FHLB | | | 3.00 | | | | 11-1-2042 | | | | 3,849,829 | | | | 4,001,763 | |
FHLB | | | 3.00 | | | | 11-1-2042 | | | | 368,266 | | | | 386,990 | |
FHLB | | | 3.00 | | | | 11-1-2042 | | | | 201,578 | | | | 210,169 | |
FHLB | | | 3.00 | | | | 12-1-2042 | | | | 198,628 | | | | 206,430 | |
FHLB | | | 3.00 | | | | 12-1-2042 | | | | 95,192 | | | | 98,943 | |
FHLB | | | 3.00 | | | | 1-1-2043 | | | | 7,246,266 | | | | 7,554,336 | |
FHLB | | | 3.00 | | | | 1-1-2043 | | | | 148,484 | | | | 154,290 | |
FHLB | | | 3.00 | | | | 3-1-2043 | | | | 75,061 | | | | 78,004 | |
FHLB | | | 3.00 | | | | 4-1-2043 | | | | 7,331,024 | | | | 7,620,361 | |
FHLB | | | 3.00 | | | | 4-1-2043 | | | | 617,645 | | | | 641,740 | |
FHLB | | | 3.00 | | | | 5-1-2043 | | | | 114,992 | | | | 119,455 | |
FHLB | | | 3.00 | | | | 6-1-2043 | | | | 296,849 | | | | 308,262 | |
FHLB | | | 3.00 | | | | 7-1-2043 | | | | 2,086,237 | | | | 2,166,814 | |
FHLB | | | 3.00 | | | | 7-1-2043 | | | | 154,812 | | | | 160,812 | |
FHLB | | | 3.00 | | | | 7-1-2043 | | | | 156,572 | | | | 162,609 | |
FHLB | | | 3.00 | | | | 7-1-2043 | | | | 594,762 | | | | 618,455 | |
FHLB | | | 3.00 | | | | 8-1-2043 | | | | 70,996 | | | | 73,691 | |
FHLB | | | 3.00 | | | | 8-1-2043 | | | | 278,814 | | | | 289,401 | |
FHLB | | | 3.00 | | | | 8-1-2043 | | | | 132,298 | | | | 137,387 | |
FHLB | | | 3.00 | | | | 8-1-2043 | | | | 168,102 | | | | 174,485 | |
FHLB | | | 3.00 | | | | 8-1-2043 | | | | 77,227 | | | | 80,209 | |
FHLB | | | 3.00 | | | | 8-1-2043 | | | | 22,527 | | | | 23,383 | |
FHLB | | | 3.00 | | | | 8-1-2043 | | | | 581,485 | | | | 603,872 | |
FHLB | | | 3.00 | | | | 8-1-2043 | | | | 1,701,129 | | | | 1,765,725 | |
FHLB | | | 3.00 | | | | 9-1-2043 | | | | 282,275 | | | | 293,075 | |
FHLB | | | 3.00 | | | | 9-1-2043 | | | | 255,614 | | | | 265,354 | |
FHLB | | | 3.00 | | | | 10-1-2043 | | | | 169,523 | | | | 175,999 | |
FHLB | | | 3.00 | | | | 10-1-2043 | | | | 238,883 | | | | 248,057 | |
FHLB | | | 3.00 | | | | 11-1-2043 | | | | 75,275 | | | | 78,152 | |
FHLB | | | 3.50 | | | | 8-1-2020 | | | | 96,826 | | | | 102,447 | |
| | | | |
| 2 | | Wells Fargo Diversified Fixed Income Portfolio | | Portfolio of investments—August 31, 2016 (unaudited) |
| | | | | | | | | | | | | | | | |
| Security name | | Interest rate | | | Maturity date | | | Principal | | | Value | |
| | | | |
Agency Securities (continued) | | | | | | | | | | | | | | | | |
FHLB | | | 3.50 | % | | | 9-1-2020 | | | $ | 27,045 | | | $ | 28,614 | |
FHLB | | | 3.50 | | | | 10-1-2020 | | | | 136,337 | | | | 144,251 | |
FHLB | | | 3.50 | | | | 11-1-2020 | | | | 276,774 | | | | 292,840 | |
FHLB | | | 3.50 | | | | 11-1-2020 | | | | 164,779 | | | | 174,343 | |
FHLB | | | 3.50 | | | | 11-1-2020 | | | | 221,235 | | | | 234,077 | |
FHLB | | | 3.50 | | | | 12-1-2020 | | | | 156,845 | | | | 165,949 | |
FHLB | | | 3.50 | | | | 1-1-2021 | | | | 9,262 | | | | 9,800 | |
FHLB | | | 3.50 | | | | 4-1-2021 | | | | 9,168 | | | | 9,701 | |
FHLB | | | 3.50 | | | | 4-1-2021 | | | | 174,499 | | | | 184,628 | |
FHLB | | | 3.50 | | | | 12-1-2025 | | | | 3,287,751 | | | | 3,518,939 | |
FHLB | | | 3.50 | | | | 1-1-2029 | | | | 4,446,778 | | | | 4,704,894 | |
FHLB | | | 3.50 | | | | 12-1-2042 | | | | 2,416,971 | | | | 2,553,697 | |
FHLB | | | 4.00 | | | | 6-1-2024 | | | | 15,135 | | | | 15,978 | |
FHLB | | | 4.00 | | | | 7-1-2025 | | | | 281,616 | | | | 299,043 | |
FHLB | | | 4.00 | | | | 4-1-2026 | | | | 1,488,486 | | | | 1,583,232 | |
FHLB | | | 4.00 | | | | 11-1-2040 | | | | 2,925,126 | | | | 3,141,729 | |
FHLB | | | 4.00 | | | | 1-1-2041 | | | | 5,021,853 | | | | 5,392,859 | |
FHLB | | | 4.00 | | | | 2-1-2041 | | | | 2,439,539 | | | | 2,634,461 | |
FHLB | | | 4.00 | | | | 4-1-2041 | | | | 3,833,078 | | | | 4,162,339 | |
FHLB | | | 4.50 | | | | 2-1-2024 | | | | 44,199 | | | | 47,505 | |
FHLB | | | 4.50 | | | | 5-1-2024 | | | | 44,092 | | | | 47,060 | |
FHLB | | | 4.50 | | | | 9-1-2024 | | | | 16,725 | | | | 17,875 | |
FHLB | | | 4.50 | | | | 9-1-2024 | | | | 34,674 | | | | 37,302 | |
FHLB | | | 4.50 | | | | 12-1-2024 | | | | 64,181 | | | | 68,663 | |
FHLB | | | 4.50 | | | | 3-1-2039 | | | | 353,274 | | | | 386,898 | |
FHLB | | | 4.50 | | | | 3-1-2039 | | | | 51,050 | | | | 55,740 | |
FHLB | | | 4.50 | | | | 5-1-2039 | | | | 81,318 | | | | 89,034 | |
FHLB | | | 4.50 | | | | 10-1-2039 | | | | 83,803 | | | | 91,513 | |
FHLB | | | 4.50 | | | | 10-1-2039 | | | | 66,690 | | | | 73,170 | |
FHLB | | | 4.50 | | | | 9-1-2040 | | | | 77,829 | | | | 85,343 | |
FHLB | | | 4.50 | | | | 1-1-2041 | | | | 152,177 | | | | 167,097 | |
FHLB | | | 4.50 | | | | 2-1-2041 | | | | 638,266 | | | | 700,754 | |
FHLB | | | 4.50 | | | | 4-1-2041 | | | | 1,778,566 | | | | 1,950,068 | |
FHLB | | | 4.88 | | | | 9-8-2017 | | | | 1,000,000 | | | | 1,042,181 | |
FHLB | | | 5.00 | | | | 11-17-2017 | | | | 4,000,000 | | | | 4,201,560 | |
FHLB | | | 5.00 | | | | 12-1-2034 | | | | 1,828 | | | | 2,014 | |
FHLB | | | 5.00 | | | | 8-1-2035 | | | | 296,206 | | | | 327,732 | |
FHLB | | | 5.00 | | | | 11-1-2035 | | | | 303,281 | | | | 336,039 | |
FHLB | | | 5.00 | | | | 12-1-2035 | | | | 2,293 | | | | 2,526 | |
FHLB | | | 5.00 | | | | 1-1-2036 | | | | 24,480 | | | | 26,972 | |
FHLB | | | 5.00 | | | | 6-1-2036 | | | | 359,110 | | | | 400,157 | |
FHLB | | | 5.00 | | | | 3-1-2037 | | | | 3,596 | | | | 3,975 | |
FHLB | | | 5.00 | | | | 7-1-2037 | | | | 7,563 | | | | 8,373 | |
FHLB | | | 5.00 | | | | 3-1-2038 | | | | 266,463 | | | | 293,627 | |
FHLB | | | 5.00 | | | | 5-1-2038 | | | | 16,470 | | | | 18,172 | |
FHLB | | | 5.00 | | | | 6-1-2038 | | | | 4,186 | | | | 4,612 | |
FHLB | | | 5.00 | | | | 9-1-2038 | | | | 292,336 | | | | 322,203 | |
FHLB | | | 5.00 | | | | 5-1-2039 | | | | 19,294 | | | | 21,434 | |
FHLB | | | 5.00 | | | | 1-1-2040 | | | | 1,142,600 | | | | 1,266,395 | |
FHLB | | | 5.38 | | | | 9-30-2022 | | | | 1,350,000 | | | | 1,650,583 | |
| | | | | | |
| Portfolio of investments—August 31, 2016 (unaudited) | | Wells Fargo Diversified Fixed Income Portfolio | | | 3 | |
| | | | | | | | | | | | | | | | |
| Security name | | Interest rate | | | Maturity date | | | Principal | | | Value | |
| | | | |
Agency Securities (continued) | | | | | | | | | | | | | | | | |
FHLB | | | 5.50 | % | | | 12-1-2035 | | | $ | 459,621 | | | $ | 517,841 | |
FHLB | | | 5.50 | | | | 7-15-2036 | | | | 600,000 | | | | 884,426 | |
FHLB | | | 5.50 | | | | 12-1-2036 | | | | 216,861 | | | | 244,832 | |
FHLB | | | 5.50 | | | | 3-1-2037 | | | | 23,196 | | | | 25,902 | |
FHLB | | | 5.50 | | | | 7-1-2037 | | | | 972,606 | | | | 1,099,254 | |
FHLB | | | 5.50 | | | | 10-1-2037 | | | | 1,803 | | | | 2,036 | |
FHLB | | | 5.50 | | | | 3-1-2038 | | | | 16,173 | | | | 18,225 | |
FHLB | | | 5.50 | | | | 5-1-2038 | | | | 152,055 | | | | 171,217 | |
FHLB | | | 5.50 | | | | 6-1-2038 | | | | 49,987 | | | | 56,286 | |
FHLB | | | 5.50 | | | | 8-1-2038 | | | | 55,388 | | | | 62,451 | |
FHLB | | | 5.50 | | | | 10-1-2038 | | | | 4,011 | | | | 4,478 | |
FHLB | | | 5.50 | | | | 11-1-2038 | | | | 103,706 | | | | 117,327 | |
FHLB | | | 6.00 | | | | 1-1-2032 | | | | 19,757 | | | | 22,479 | |
FHLB | | | 6.00 | | | | 4-1-2033 | | | | 20,331 | | | | 23,526 | |
FHLB | | | 6.00 | | | | 7-1-2036 | | | | 24,056 | | | | 27,723 | |
FHLB | | | 6.00 | �� | | | 9-1-2036 | | | | 137,960 | | | | 158,051 | |
FHLB | | | 6.00 | | | | 11-1-2036 | | | | 185,412 | | | | 213,184 | |
FHLB | | | 6.00 | | | | 11-1-2036 | | | | 13,297 | | | | 15,208 | |
FHLB | | | 6.00 | | | | 5-1-2037 | | | | 101,308 | | | | 115,892 | |
FHLB | | | 6.00 | | | | 6-1-2037 | | | | 51,113 | | | | 58,144 | |
FHLB | | | 6.00 | | | | 8-1-2037 | | | | 122,447 | | | | 139,247 | |
FHLB | | | 6.00 | | | | 9-1-2037 | | | | 1,513 | | | | 1,729 | |
FHLB | | | 6.00 | | | | 9-1-2037 | | | | 56,400 | | | | 64,326 | |
FHLB | | | 6.00 | | | | 10-1-2037 | | | | 11,224 | | | | 12,766 | |
FHLB | | | 6.00 | | | | 10-1-2037 | | | | 8,069 | | | | 9,214 | |
FHLB | | | 6.00 | | | | 11-1-2037 | | | | 33,653 | | | | 38,512 | |
FHLB | | | 6.00 | | | | 11-1-2037 | | | | 44,498 | | | | 50,822 | |
FHLB | | | 6.00 | | | | 12-1-2037 | | | | 30,977 | | | | 35,597 | |
FHLB | | | 6.00 | | | | 12-1-2037 | | | | 19,812 | | | | 22,538 | |
FHLB | | | 6.00 | | | | 12-1-2037 | | | | 85,187 | | | | 97,399 | |
FHLB | | | 6.00 | | | | 6-1-2038 | | | | 53,996 | | | | 61,416 | |
FHLB | | | 6.00 | | | | 7-1-2038 | | | | 26,902 | | | | 30,630 | |
FHLB | | | 6.00 | | | | 12-1-2039 | | | | 43,916 | | | | 50,109 | |
FHLB | | | 6.00 | | | | 5-1-2040 | | | | 811,782 | | | | 925,972 | |
FHLMC | | | 0.75 | | | | 1-12-2018 | | | | 2,000,000 | | | | 1,997,246 | |
FHLMC | | | 0.88 | | | | 3-7-2018 | | | | 2,000,000 | | | | 2,000,104 | |
FHLMC | | | 1.00 | | | | 9-27-2017 | | | | 250,000 | | | | 250,719 | |
FHLMC | | | 1.00 | | | | 9-29-2017 | | | | 2,000,000 | | | | 2,005,450 | |
FHLMC %% | | | 1.07 | | | | 9-6-2018 | | | | 750,000 | | | | 749,079 | |
FHLMC %% | | | 1.10 | | | | 9-13-2018 | | | | 1,000,000 | | | | 998,788 | |
FHLMC | | | 1.13 | | | | 4-15-2019 | | | | 750,000 | | | | 752,574 | |
FHLMC | | | 1.25 | | | | 1-29-2019 | | | | 500,000 | | | | 500,007 | |
FHLMC | | | 1.25 | | | | 8-1-2019 | | | | 2,000,000 | | | | 2,012,030 | |
FHLMC | | | 1.25 | | | | 10-2-2019 | | | | 3,800,000 | | | | 3,821,972 | |
FHLMC | | | 1.30 | | | | 8-28-2019 | | | | 1,500,000 | | | | 1,498,368 | |
FHLMC | | | 2.00 | | | | 7-30-2019 | | | | 100,000 | | | | 102,693 | |
FHLMC | | | 2.38 | | | | 1-13-2022 | | | | 3,580,000 | | | | 3,762,748 | |
FHLMC | | | 2.50 | | | | 10-1-2029 | | | | 6,496,093 | | | | 6,722,084 | |
FHLMC | | | 2.50 | | | | 1-1-2031 | | | | 2,238,153 | | | | 2,315,916 | |
FHLMC | | | 2.50 | | | | 5-1-2031 | | | | 12,710,547 | | | | 13,152,162 | |
| | | | |
| 4 | | Wells Fargo Diversified Fixed Income Portfolio | | Portfolio of investments—August 31, 2016 (unaudited) |
| | | | | | | | | | | | | | | | |
| Security name | | Interest rate | | | Maturity date | | | Principal | | | Value | |
| | | | |
Agency Securities (continued) | | | | | | | | | | | | | | | | |
FHLMC %% | | | 2.50 | % | | | 9-19-2031 | | | $ | 5,000,000 | | | $ | 5,167,774 | |
FHLMC | | | 3.00 | | | | 9-1-2021 | | | | 411,964 | | | | 431,832 | |
FHLMC | | | 3.00 | | | | 4-1-2022 | | | | 373,556 | | | | 391,572 | |
FHLMC | | | 3.00 | | | | 9-1-2026 | | | | 93,311 | | | | 97,839 | |
FHLMC | | | 3.00 | | | | 10-1-2026 | | | | 2,007,393 | | | | 2,105,442 | |
FHLMC | | | 3.00 | | | | 11-1-2026 | | | | 202,188 | | | | 212,056 | |
FHLMC | | | 3.00 | | | | 11-1-2026 | | | | 31,357 | | | | 32,876 | |
FHLMC | | | 3.00 | | | | 11-1-2026 | | | | 544,078 | | | | 570,555 | |
FHLMC | | | 3.00 | | | | 12-1-2026 | | | | 4,004,167 | | | | 4,199,804 | |
FHLMC | | | 3.00 | | | | 12-1-2026 | | | | 14,626 | | | | 15,339 | |
FHLMC | | | 3.00 | | | | 12-1-2026 | | | | 1,093,797 | | | | 1,146,993 | |
FHLMC | | | 3.00 | | | | 1-1-2027 | | | | 1,952,350 | | | | 2,047,311 | |
FHLMC | | | 3.00 | | | | 3-1-2027 | | | | 495,470 | | | | 519,608 | |
FHLMC | | | 3.00 | | | | 8-1-2027 | | | | 1,323,938 | | | | 1,388,559 | |
FHLMC | | | 3.00 | | | | 4-1-2028 | | | | 51,208 | | | | 53,717 | |
FHLMC | | | 3.00 | | | | 7-1-2029 | | | | 4,830,735 | | | | 5,065,238 | |
FHLMC | | | 3.00 | | | | 9-1-2029 | | | | 7,068,366 | | | | 7,411,574 | |
FHLMC %% | | | 3.00 | | | | 9-19-2031 | | | | 3,000,000 | | | | 3,143,116 | |
FHLMC | | | 3.00 | | | | 5-1-2035 | | | | 5,320,504 | | | | 5,577,252 | |
FHLMC | | | 3.00 | | | | 3-1-2043 | | | | 4,531,401 | | | | 4,709,052 | |
FHLMC | | | 3.00 | | | | 8-1-2045 | | | | 11,672,034 | | | | 12,115,254 | |
FHLMC | | | 3.00 | | | | 9-1-2046 | | | | 8,425,000 | | | | 8,744,921 | |
FHLMC %% | | | 3.00 | | | | 9-14-2046 | | | | 11,075,000 | | | | 11,485,121 | |
FHLMC | | | 3.50 | | | | 10-1-2020 | | | | 469,641 | | | | 496,902 | |
FHLMC | | | 3.50 | | | | 1-1-2021 | | | | 660,690 | | | | 699,041 | |
FHLMC | | | 3.50 | | | | 11-1-2021 | | | | 123,928 | | | | 131,121 | |
FHLMC | | | 3.50 | | | | 5-1-2023 | | | | 225,366 | | | | 238,557 | |
FHLMC | | | 3.50 | | | | 11-1-2023 | | | | 408,186 | | | | 431,879 | |
FHLMC | | | 3.50 | | | | 1-1-2024 | | | | 388,928 | | | | 411,553 | |
FHLMC | | | 3.50 | | | | 2-1-2026 | | | | 168,142 | | | | 178,013 | |
FHLMC | | | 3.50 | | | | 4-1-2026 | | | | 584,175 | | | | 618,184 | |
FHLMC | | | 3.50 | | | | 1-1-2030 | | | | 425,481 | | | | 450,624 | |
FHLMC | | | 3.50 | | | | 1-1-2030 | | | | 282,458 | | | | 299,026 | |
FHLMC | | | 3.50 | | | | 2-1-2042 | | | | 10,368,627 | | | | 10,948,579 | |
FHLMC | | | 3.50 | | | | 10-1-2042 | | | | 2,706,635 | | | | 2,849,847 | |
FHLMC | | | 3.50 | | | | 10-1-2042 | | | | 564,743 | | | | 596,659 | |
FHLMC | | | 3.50 | | | | 10-1-2042 | | | | 5,243,319 | | | | 5,538,747 | |
FHLMC | | | 3.50 | | | | 7-1-2043 | | | | 4,319,159 | | | | 4,562,774 | |
FHLMC | | | 3.50 | | | | 8-1-2043 | | | | 6,921,229 | | | | 7,309,888 | |
FHLMC | | | 3.50 | | | | 1-1-2044 | | | | 3,451,227 | | | | 3,643,803 | |
FHLMC | | | 3.50 | | | | 6-1-2044 | | | | 3,296,648 | | | | 3,473,693 | |
FHLMC | | | 3.50 | | | | 10-1-2044 | | | | 9,154,089 | | | | 9,637,549 | |
FHLMC | | | 3.50 | | | | 11-1-2044 | | | | 7,222,249 | | | | 7,603,682 | |
FHLMC | | | 3.50 | | | | 7-1-2045 | | | | 6,585,975 | | | | 6,993,572 | |
FHLMC | | | 3.50 | | | | 10-1-2045 | | | | 8,276,761 | | | | 8,713,886 | |
FHLMC | | | 3.50 | | | | 1-1-2046 | | | | 5,866,821 | | | | 6,176,668 | |
FHLMC | | | 3.50 | | | | 3-1-2046 | | | | 2,413,852 | | | | 2,541,336 | |
FHLMC | | | 3.50 | | | | 4-1-2046 | | | | 5,143,186 | | | | 5,416,751 | |
FHLMC | | | 3.50 | | | | 5-1-2046 | | | | 7,801,688 | | | | 8,218,025 | |
FHLMC %% | | | 3.50 | | | | 9-14-2046 | | | | 6,625,000 | | | | 6,973,847 | |
| | | | | | |
| Portfolio of investments—August 31, 2016 (unaudited) | | Wells Fargo Diversified Fixed Income Portfolio | | | 5 | |
| | | | | | | | | | | | | | | | |
| Security name | | Interest rate | | | Maturity date | | | Principal | | | Value | |
| | | | |
Agency Securities (continued) | | | | | | | | | | | | | | | | |
FHLMC | | | 3.75 | % | | | 3-27-2019 | | | $ | 2,900,000 | | | $ | 3,102,133 | |
FHLMC | | | 4.00 | | | | 5-1-2023 | | | | 32,111 | | | | 33,408 | |
FHLMC | | | 4.00 | | | | 2-1-2024 | | | | 70,851 | | | | 73,632 | |
FHLMC | | | 4.00 | | | | 5-1-2024 | | | | 42,686 | | | | 45,314 | |
FHLMC | | | 4.00 | | | | 5-1-2024 | | | | 72,380 | | | | 76,350 | |
FHLMC | | | 4.00 | | | | 8-1-2024 | | | | 112,223 | | | | 119,144 | |
FHLMC | | | 4.00 | | | | 1-1-2025 | | | | 119,489 | | | | 123,512 | |
FHLMC | | | 4.00 | | | | 2-1-2025 | | | | 167,865 | | | | 178,569 | |
FHLMC | | | 4.00 | | | | 3-1-2025 | | | | 1,068,049 | | | | 1,132,087 | |
FHLMC | | | 4.00 | | | | 5-1-2025 | | | | 440,455 | | | | 463,634 | |
FHLMC | | | 4.00 | | | | 6-1-2025 | | | | 369,170 | | | | 392,523 | |
FHLMC | | | 4.00 | | | | 6-1-2025 | | | | 87,339 | | | | 92,876 | |
FHLMC | | | 4.00 | | | | 7-1-2025 | | | | 11,030 | | | | 11,743 | |
FHLMC | | | 4.00 | | | | 8-1-2025 | | | | 77,711 | | | | 82,643 | |
FHLMC | | | 4.00 | | | | 10-1-2025 | | | | 25,663 | | | | 27,284 | |
FHLMC | | | 4.00 | | | | 3-1-2026 | | | | 232,200 | | | | 244,973 | |
FHLMC | | | 4.00 | | | | 4-1-2026 | | | | 343,022 | | | | 364,806 | |
FHLMC | | | 4.00 | | | | 5-1-2026 | | | | 289,659 | | | | 308,056 | |
FHLMC | | | 4.00 | | | | 5-1-2029 | | | | 204,795 | | | | 220,336 | |
FHLMC | | | 4.00 | | | | 9-1-2031 | | | | 90,454 | | | | 96,719 | |
FHLMC | | | 4.00 | | | | 10-1-2033 | | | | 6,521 | | | | 6,997 | |
FHLMC | | | 4.00 | | | | 8-1-2036 | | | | 6,220 | | | | 6,651 | |
FHLMC | | | 4.00 | | | | 4-1-2039 | | | | 417,005 | | | | 456,451 | |
FHLMC | | | 4.00 | | | | 5-1-2039 | | | | 145,749 | | | | 155,754 | |
FHLMC | | | 4.00 | | | | 6-1-2039 | | | | 157,330 | | | | 168,449 | |
FHLMC | | | 4.00 | | | | 2-1-2040 | | | | 290,551 | | | | 312,161 | |
FHLMC | | | 4.00 | | | | 9-1-2040 | | | | 1,074,623 | | | | 1,153,991 | |
FHLMC | | | 4.00 | | | | 10-1-2040 | | | | 1,232,279 | | | | 1,339,765 | |
FHLMC | | | 4.00 | | | | 10-1-2040 | | | | 357,852 | | | | 384,205 | |
FHLMC | | | 4.00 | | | | 10-1-2040 | | | | 756,076 | | | | 811,820 | |
FHLMC | | | 4.00 | | | | 11-1-2040 | | | | 162,281 | | | | 174,266 | |
FHLMC | | | 4.00 | | | | 12-1-2040 | | | | 3,722,153 | | | | 3,996,845 | |
FHLMC | | | 4.00 | | | | 12-1-2040 | | | | 76,023 | | | | 81,625 | |
FHLMC | | | 4.00 | | | | 4-1-2041 | | | | 19,172 | | | | 20,587 | |
FHLMC | | | 4.00 | | | | 6-1-2041 | | | | 314,145 | | | | 336,672 | |
FHLMC | | | 4.00 | | | | 6-1-2041 | | | | 7,104 | | | | 7,595 | |
FHLMC | | | 4.00 | | | | 10-1-2041 | | | | 32,385 | | | | 34,788 | |
FHLMC | | | 4.00 | | | | 10-1-2041 | | | | 197,093 | | | | 210,711 | |
FHLMC | | | 4.00 | | | | 11-1-2041 | | | | 197,279 | | | | 210,956 | |
FHLMC | | | 4.00 | | | | 11-1-2041 | | | | 47,889 | | | | 51,440 | |
FHLMC | | | 4.00 | | | | 11-1-2041 | | | | 21,494 | | | | 23,088 | |
FHLMC | | | 4.00 | | | | 11-1-2041 | | | | 14,806 | | | | 15,833 | |
FHLMC | | | 4.00 | | | | 11-1-2041 | | | | 281,884 | | | | 302,802 | |
FHLMC | | | 4.00 | | | | 12-1-2041 | | | | 6,648,486 | | | | 7,142,139 | |
FHLMC | | | 4.00 | | | | 1-1-2042 | | | | 1,912,357 | | | | 2,054,566 | |
FHLMC | | | 4.00 | | | | 1-1-2042 | | | | 75,486 | | | | 81,105 | |
FHLMC | | | 4.00 | | | | 2-1-2042 | | | | 33,683 | | | | 36,107 | |
FHLMC | | | 4.00 | | | | 4-1-2042 | | | | 6,730,300 | | | | 7,260,906 | |
FHLMC | | | 4.00 | | | | 5-1-2044 | | | | 4,629,369 | | | | 4,953,532 | |
FHLMC | | | 4.00 | | | | 5-1-2044 | | | | 6,668,305 | | | | 7,126,032 | |
| | | | |
| 6 | | Wells Fargo Diversified Fixed Income Portfolio | | Portfolio of investments—August 31, 2016 (unaudited) |
| | | | | | | | | | | | | | | | |
| Security name | | Interest rate | | | Maturity date | | | Principal | | | Value | |
| | | | |
Agency Securities (continued) | | | | | | | | | | | | | | | | |
FHLMC | | | 4.00 | % | | | 12-1-2045 | | | $ | 3,400,315 | | | $ | 3,636,623 | |
FHLMC | | | 4.00 | | | | 1-1-2046 | | | | 2,946,394 | | | | 3,150,698 | |
FHLMC | | | 4.50 | | | | 4-1-2018 | | | | 11,345 | | | | 11,620 | |
FHLMC | | | 4.50 | | | | 8-1-2018 | | | | 189,805 | | | | 194,406 | |
FHLMC | | | 4.50 | | | | 10-1-2018 | | | | 38,501 | | | | 39,435 | |
FHLMC | | | 4.50 | | | | 4-1-2024 | | | | 53,860 | | | | 55,165 | |
FHLMC | | | 4.50 | | | | 8-1-2024 | | | | 366,541 | | | | 392,278 | |
FHLMC | | | 4.50 | | | | 11-1-2024 | | | | 104,129 | | | | 106,894 | |
FHLMC | | | 4.50 | | | | 2-1-2025 | | | | 397,516 | | | | 423,664 | |
FHLMC | | | 4.50 | | | | 8-1-2035 | | | | 29,585 | | | | 32,425 | |
FHLMC | | | 4.50 | | | | 9-1-2035 | | | | 47,398 | | | | 51,886 | |
FHLMC | | | 4.50 | | | | 1-1-2037 | | | | 44,186 | | | | 48,245 | |
FHLMC | | | 4.50 | | | | 10-1-2038 | | | | 198,858 | | | | 217,128 | |
FHLMC | | | 4.50 | | | | 2-1-2039 | | | | 22,354 | | | | 24,435 | |
FHLMC | | | 4.50 | | | | 5-1-2039 | | | | 38,281 | | | | 41,952 | |
FHLMC | | | 4.50 | | | | 6-1-2039 | | | | 1,479,438 | | | | 1,624,250 | |
FHLMC | | | 4.50 | | | | 9-1-2039 | | | | 992,564 | | | | 1,089,001 | |
FHLMC | | | 4.50 | | | | 10-1-2039 | | | | 180,231 | | | | 197,747 | |
FHLMC | | | 4.50 | | | | 10-1-2039 | | | | 172,703 | | | | 189,541 | |
FHLMC | | | 4.50 | | | | 1-1-2040 | | | | 1,703,203 | | | | 1,889,076 | |
FHLMC | | | 4.50 | | | | 2-1-2040 | | | | 5,027,482 | | | | 5,552,472 | |
FHLMC | | | 4.50 | | | | 3-1-2040 | | | | 2,476,798 | | | | 2,768,126 | |
FHLMC | | | 4.50 | | | | 8-1-2040 | | | | 886,521 | | | | 971,012 | |
FHLMC | | | 4.50 | | | | 9-1-2040 | | | | 2,121,649 | | | | 2,360,417 | |
FHLMC | | | 4.50 | | | | 9-1-2040 | | | | 203,476 | | | | 223,324 | |
FHLMC | | | 4.50 | | | | 2-1-2041 | | | | 55,774 | | | | 61,219 | |
FHLMC | | | 4.50 | | | | 4-1-2041 | | | | 2,512,388 | | | | 2,757,734 | |
FHLMC | | | 4.50 | | | | 7-1-2041 | | | | 4,959,559 | | | | 5,437,549 | |
FHLMC | | | 4.50 | | | | 7-1-2041 | | | | 129,081 | | | | 141,727 | |
FHLMC | | | 4.50 | | | | 10-1-2041 | | | | 823,957 | | | | 902,360 | |
FHLMC | | | 4.88 | | | | 6-13-2018 | | | | 1,700,000 | | | | 1,819,515 | |
FHLMC | | | 5.00 | | | | 7-1-2022 | | | | 177 | | | | 182 | |
FHLMC | | | 5.00 | | | | 6-1-2023 | | | | 6,756 | | | | 7,265 | |
FHLMC | | | 5.00 | | | | 6-1-2023 | | | | 18,980 | | | | 20,382 | |
FHLMC | | | 5.00 | | | | 6-1-2023 | | | | 2,504 | | | | 2,573 | |
FHLMC | | | 5.00 | | | | 10-1-2023 | | | | 2,149 | | | | 2,209 | |
FHLMC | | | 5.00 | | | | 8-1-2033 | | | | 1,043,182 | | | | 1,168,312 | |
FHLMC | | | 5.00 | | | | 11-1-2033 | | | | 93,188 | | | | 103,057 | |
FHLMC | | | 5.00 | | | | 3-1-2034 | | | | 73,563 | | | | 81,756 | |
FHLMC | | | 5.00 | | | | 7-1-2035 | | | | 336,947 | | | | 373,035 | |
FHLMC | | | 5.00 | | | | 8-1-2035 | | | | 95,469 | | | | 105,310 | |
FHLMC | | | 5.00 | | | | 9-1-2035 | | | | 686,554 | | | | 774,211 | |
FHLMC | | | 5.00 | | | | 4-1-2036 | | | | 40,410 | | | | 44,924 | |
FHLMC | | | 5.00 | | | | 12-1-2036 | | | | 27,147 | | | | 30,010 | |
FHLMC | | | 5.00 | | | | 2-1-2037 | | | | 39,284 | | | | 43,361 | |
FHLMC | | | 5.00 | | | | 3-1-2039 | | | | 261,027 | | | | 292,392 | |
FHLMC | | | 5.00 | | | | 8-1-2039 | | | | 604,025 | | | | 671,831 | |
FHLMC | | | 5.00 | | | | 8-1-2039 | | | | 3,070,421 | | | | 3,393,722 | |
FHLMC | | | 5.00 | | | | 9-1-2039 | | | | 924,735 | | | | 1,024,856 | |
FHLMC | | | 5.00 | | | | 12-1-2039 | | | | 1,411,816 | | | | 1,582,630 | |
| | | | | | |
| Portfolio of investments—August 31, 2016 (unaudited) | | Wells Fargo Diversified Fixed Income Portfolio | | | 7 | |
| | | | | | | | | | | | | | | | |
| Security name | | Interest rate | | | Maturity date | | | Principal | | | Value | |
| | | | |
Agency Securities (continued) | | | | | | | | | | | | | | | | |
FHLMC | | | 5.00 | % | | | 6-1-2040 | | | $ | 3,499,490 | | | $ | 3,907,519 | |
FHLMC | | | 5.00 | | | | 6-1-2040 | | | | 2,556,324 | | | | 2,834,701 | |
FHLMC | | | 5.13 | | | | 11-17-2017 | | | | 1,000,000 | | | | 1,051,372 | |
FHLMC | | | 5.50 | | | | 12-1-2016 | | | | 685 | | | | 687 | |
FHLMC | | | 5.50 | | | | 8-1-2017 | | | | 221 | | | | 223 | |
FHLMC | | | 5.50 | | | | 9-1-2017 | | | | 3,843 | | | | 3,911 | |
FHLMC | | | 5.50 | | | | 10-1-2017 | | | | 282 | | | | 287 | |
FHLMC | | | 5.50 | | | | 11-1-2017 | | | | 395 | | | | 396 | |
FHLMC | | | 5.50 | | | | 11-1-2017 | | | | 4,452 | | | | 4,537 | |
FHLMC | | | 5.50 | | | | 12-1-2017 | | | | 115,311 | | | | 117,038 | |
FHLMC | | | 5.50 | | | | 3-1-2018 | | | | 2,490 | | | | 2,502 | |
FHLMC | | | 5.50 | | | | 2-1-2019 | | | | 29,312 | | | | 29,618 | |
FHLMC | | | 5.50 | | | | 12-1-2033 | | | | 71,706 | | | | 80,106 | |
FHLMC | | | 5.50 | | | | 12-1-2034 | | | | 143,176 | | | | 162,589 | |
FHLMC | | | 5.50 | | | | 1-1-2035 | | | | 478,586 | | | | 534,470 | |
FHLMC | | | 5.50 | | | | 6-1-2035 | | | | 354,839 | | | | 399,072 | |
FHLMC | | | 5.50 | | | | 1-1-2036 | | | | 25,403 | | | | 28,366 | |
FHLMC | | | 5.50 | | | | 1-1-2036 | | | | 66,062 | | | | 74,756 | |
FHLMC | | | 5.50 | | | | 2-1-2036 | | | | 84,321 | | | | 95,566 | |
FHLMC | | | 5.50 | | | | 12-1-2036 | | | | 86,301 | | | | 97,632 | |
FHLMC | | | 5.50 | | | | 2-1-2037 | | | | 88,672 | | | | 99,039 | |
FHLMC | | | 5.50 | | | | 3-1-2037 | | | | 77,789 | | | | 87,086 | |
FHLMC | | | 5.50 | | | | 4-1-2037 | | | | 22,699 | | | | 25,677 | |
FHLMC | | | 5.50 | | | | 1-1-2038 | | | | 225,772 | | | | 254,390 | |
FHLMC | | | 5.50 | | | | 2-1-2038 | | | | 339,568 | | | | 381,555 | |
FHLMC | | | 5.50 | | | | 4-1-2038 | | | | 287,062 | | | | 323,576 | |
FHLMC | | | 5.50 | | | | 5-1-2038 | | | | 239,778 | | | | 270,275 | |
FHLMC | | | 5.50 | | | | 5-1-2038 | | | | 957,838 | | | | 1,078,797 | |
FHLMC | | | 5.50 | | | | 5-1-2038 | | | | 39,735 | | | | 44,750 | |
FHLMC | | | 5.50 | | | | 5-1-2038 | | | | 670,624 | | | | 757,507 | |
FHLMC | | | 5.50 | | | | 6-1-2038 | | | | 6,739 | | | | 7,576 | |
FHLMC | | | 5.50 | | | | 7-1-2038 | | | | 131,738 | | | | 148,306 | |
FHLMC | | | 5.50 | | | | 7-1-2038 | | | | 168,311 | | | | 189,481 | |
FHLMC | | | 5.50 | | | | 8-1-2038 | | | | 47,661 | | | | 53,691 | |
FHLMC | | | 5.50 | | | | 8-1-2038 | | | | 227,285 | | | | 256,531 | |
FHLMC | | | 5.50 | | | | 9-1-2038 | | | | 37,530 | | | | 42,159 | |
FHLMC | | | 5.50 | | | | 9-1-2038 | | | | 72,400 | | | | 81,529 | |
FHLMC | | | 5.50 | | | | 1-1-2039 | | | | 118,458 | | | | 133,875 | |
FHLMC | | | 5.50 | | | | 8-1-2039 | | | | 474,517 | | | | 535,879 | |
FHLMC | | | 5.50 | | | | 11-1-2039 | | | | 935,455 | | | | 1,046,660 | |
FHLMC | | | 5.50 | | | | 3-1-2040 | | | | 1,871,120 | | | | 2,097,365 | |
FHLMC | | | 5.50 | | | | 4-1-2040 | | | | 1,490,871 | | | | 1,684,154 | |
FHLMC | | | 6.00 | | | | 9-1-2023 | | | | 58,473 | | | | 65,128 | |
FHLMC | | | 6.00 | | | | 11-1-2033 | | | | 371,566 | | | | 429,515 | |
FHLMC | | | 6.00 | | | | 7-1-2034 | | | | 170,064 | | | | 193,455 | |
FHLMC | | | 6.00 | | | | 1-1-2036 | | | | 31,263 | | | | 36,120 | |
FHLMC | | | 6.00 | | | | 2-1-2036 | | | | 242,533 | | | | 275,811 | |
FHLMC | | | 6.00 | | | | 11-1-2036 | | | | 54,167 | | | | 61,796 | |
FHLMC | | | 6.00 | | | | 12-1-2036 | | | | 22,828 | | | | 26,233 | |
FHLMC | | | 6.00 | | | | 2-1-2037 | | | | 2,042 | | | | 2,345 | |
| | | | |
| 8 | | Wells Fargo Diversified Fixed Income Portfolio | | Portfolio of investments—August 31, 2016 (unaudited) |
| | | | | | | | | | | | | | | | |
| Security name | | Interest rate | | | Maturity date | | | Principal | | | Value | |
| | | | |
Agency Securities (continued) | | | | | | | | | | | | | | | | |
FHLMC | | | 6.00 | % | | | 3-1-2037 | | | $ | 15,347 | | | $ | 17,453 | |
FHLMC | | | 6.00 | | | | 3-1-2037 | | | | 98,285 | | | | 112,767 | |
FHLMC | | | 6.00 | | | | 4-1-2037 | | | | 1,290 | | | | 1,477 | |
FHLMC | | | 6.00 | | | | 8-1-2037 | | | | 16,647 | | | | 18,932 | |
FHLMC | | | 6.00 | | | | 8-1-2037 | | | | 29,228 | | | | 33,257 | |
FHLMC | | | 6.00 | | | | 8-1-2037 | | | | 37,289 | | | | 42,425 | |
FHLMC | | | 6.00 | | | | 8-1-2037 | | | | 12,920 | | | | 14,787 | |
FHLMC | | | 6.00 | | | | 8-1-2037 | | | | 121,475 | | | | 139,395 | |
FHLMC | | | 6.00 | | | | 9-1-2037 | | | | 4,699 | | | | 5,354 | |
FHLMC | | | 6.00 | | | | 9-1-2037 | | | | 18,938 | | | | 21,662 | |
FHLMC | | | 6.00 | | | | 10-1-2037 | | | | 16,699 | | | | 18,990 | |
FHLMC | | | 6.00 | | | | 10-1-2037 | | | | 18,227 | | | | 20,856 | |
FHLMC | | | 6.00 | | | | 10-1-2037 | | | | 316,840 | | | | 360,473 | |
FHLMC | | | 6.00 | | | | 11-1-2037 | | | | 12,749 | | | | 14,506 | |
FHLMC | | | 6.00 | | | | 12-1-2037 | | | | 49,936 | | | | 57,041 | |
FHLMC | | | 6.00 | | | | 12-1-2037 | | | | 244,133 | | | | 278,268 | |
FHLMC | | | 6.00 | | | | 1-1-2038 | | | | 18,125 | | | | 20,725 | |
FHLMC | | | 6.00 | | | | 2-1-2038 | | | | 11,603 | | | | 13,249 | |
FHLMC | | | 6.00 | | | | 2-1-2038 | | | | 44,921 | | | | 51,374 | |
FHLMC | | | 6.00 | | | | 5-1-2038 | | | | 38,141 | | | | 43,766 | |
FHLMC | | | 6.00 | | | | 6-1-2038 | | | | 18,857 | | | | 21,537 | |
FHLMC | | | 6.00 | | | | 6-1-2038 | | | | 24,196 | | | | 27,643 | |
FHLMC | | | 6.00 | | | | 6-1-2038 | | | | 24,108 | | | | 27,421 | |
FHLMC | | | 6.00 | | | | 7-1-2038 | | | | 54,673 | | | | 62,460 | |
FHLMC | | | 6.00 | | | | 7-1-2038 | | | | 269,130 | | | | 307,775 | |
FHLMC | | | 6.00 | | | | 8-1-2038 | | | | 32,924 | | | | 37,614 | |
FHLMC | | | 6.00 | | | | 8-1-2038 | | | | 65,140 | | | | 74,407 | |
FHLMC | | | 6.00 | | | | 9-1-2038 | | | | 31,801 | | | | 36,289 | |
FHLMC | | | 6.00 | | | | 9-1-2038 | | | | 47,195 | | | | 53,671 | |
FHLMC | | | 6.00 | | | | 9-1-2038 | | | | 13,579 | | | | 15,442 | |
FHLMC | | | 6.00 | | | | 10-1-2038 | | | | 25,769 | | | | 29,313 | |
FHLMC | | | 6.00 | | | | 11-1-2038 | | | | 32,549 | | | | 37,224 | |
FHLMC | | | 6.00 | | | | 12-1-2038 | | | | 800 | | | | 910 | |
FHLMC | | | 6.00 | | | | 3-1-2039 | | | | 16,664 | | | | 19,018 | |
FHLMC | | | 6.00 | | | | 6-1-2039 | | | | 2,561 | | | | 2,929 | |
FHLMC | | | 6.25 | | | | 7-15-2032 | | | | 900,000 | | | | 1,374,033 | |
FHLMC | | | 6.50 | | | | 10-1-2037 | | | | 52,239 | | | | 59,866 | |
FHLMC | | | 6.50 | | | | 12-1-2037 | | | | 71,994 | | | | 82,505 | |
FHLMC | | | 6.50 | | | | 3-1-2038 | | | | 27,794 | | | | 31,852 | |
FHLMC | | | 6.50 | | | | 3-1-2038 | | | | 60,325 | | | | 69,132 | |
FHLMC | | | 6.50 | | | | 1-1-2039 | | | | 20,908 | | | | 24,708 | |
FHLMC | | | 6.50 | | | | 4-1-2039 | | | | 173,402 | | | | 198,720 | |
FHLMC | | | 6.50 | | | | 4-1-2039 | | | | 158,656 | | | | 193,224 | |
FHLMC | | | 6.75 | | | | 3-15-2031 | | | | 1,000,000 | | | | 1,555,636 | |
FHMLC | | | 0.75 | | | | 4-9-2018 | | | | 750,000 | | | | 748,423 | |
FICO | | | 9.65 | | | | 11-2-2018 | | | | 500,000 | | | | 593,404 | |
FNMA | | | 5.00 | | | | 12-1-2035 | | | | 4,765 | | | | 5,278 | |
FNMA ¤ | | | 0.00 | | | | 10-9-2019 | | | | 200,000 | | | | 191,523 | |
FNMA | | | 0.75 | | | | 7-27-2018 | | | | 750,000 | | | | 746,983 | |
FNMA | | | 0.88 | | | | 10-26-2017 | | | | 5,250,000 | | | | 5,254,967 | |
| | | | | | |
| Portfolio of investments—August 31, 2016 (unaudited) | | Wells Fargo Diversified Fixed Income Portfolio | | | 9 | |
| | | | | | | | | | | | | | | | |
| Security name | | Interest rate | | | Maturity date | | | Principal | | | Value | |
| | | | |
Agency Securities (continued) | | | | | | | | | | | | | | | | |
FNMA | | | 0.88 | % | | | 12-20-2017 | | | $ | 2,000,000 | | | $ | 2,001,830 | |
FNMA | | | 0.88 | | | | 2-8-2018 | | | | 1,000,000 | | | | 1,000,245 | |
FNMA | | | 0.88 | | | | 3-28-2018 | | | | 750,000 | | | | 750,323 | |
FNMA | | | 0.88 | | | | 5-21-2018 | | | | 1,000,000 | | | | 999,737 | |
FNMA | | | 0.88 | | | | 8-2-2019 | | | | 750,000 | | | | 746,813 | |
FNMA | | | 0.90 | | | | 11-7-2017 | | | | 250,000 | | | | 249,825 | |
FNMA | | | 1.00 | | | | 5-21-2018 | | | | 100,000 | | | | 99,940 | |
FNMA | | | 1.25 | | | | 8-17-2021 | | | | 750,000 | | | | 747,314 | |
FNMA | | | 1.38 | | | | 4-11-2019 | | | | 500,000 | | | | 500,135 | |
FNMA | | | 1.63 | | | | 11-27-2018 | | | | 2,000,000 | | | | 2,031,146 | |
FNMA | | | 1.75 | | | | 1-30-2019 | | | | 200,000 | | | | 203,578 | |
FNMA | | | 1.75 | | | | 5-30-2019 | | | | 2,000,000 | | | | 2,041,426 | |
FNMA | | | 1.75 | | | | 9-12-2019 | | | | 2,000,000 | | | | 2,041,334 | |
FNMA | | | 1.88 | | | | 2-19-2019 | | | | 3,000,000 | | | | 3,065,301 | |
FNMA | | | 2.13 | | | | 4-24-2026 | | | | 750,000 | | | | 767,562 | |
FNMA | | | 2.50 | | | | 10-1-2027 | | | | 2,581,656 | | | | 2,675,580 | |
FNMA | | | 2.50 | | | | 3-1-2028 | | | | 2,887,967 | | | | 2,997,227 | |
FNMA | | | 2.50 | | | | 4-1-2028 | | | | 5,015,662 | | | | 5,184,674 | |
FNMA | | | 2.50 | | | | 7-1-2028 | | | | 4,591,648 | | | | 4,746,331 | |
FNMA | | | 2.50 | | | | 7-1-2028 | | | | 7,206,836 | | | | 7,449,522 | |
FNMA | | | 2.50 | | | | 7-1-2028 | | | | 6,368,683 | | | | 6,583,145 | |
FNMA | | | 2.50 | | | | 10-1-2028 | | | | 5,440,346 | | | | 5,623,629 | |
FNMA | | | 2.50 | | | | 2-1-2030 | | | | 4,162,289 | | | | 4,307,629 | |
FNMA %% | | | 2.50 | | | | 9-19-2031 | | | | 9,000,000 | | | | 9,295,313 | |
FNMA | | | 2.50 | | | | 1-1-2038 | | | | 270,538 | | | | 272,994 | |
FNMA | | | 2.50 | | | | 10-1-2042 | | | | 536,015 | | | | 543,124 | |
FNMA | | | 2.50 | | | | 11-1-2042 | | | | 61,053 | | | | 61,863 | |
FNMA | | | 2.50 | | | | 2-1-2043 | | | | 217,963 | | | | 220,549 | |
FNMA | | | 2.50 | | | | 3-1-2043 | | | | 239,196 | | | | 242,367 | |
FNMA | | | 2.50 | | | | 3-1-2043 | | | | 118,756 | | | | 120,285 | |
FNMA | | | 2.50 | | | | 3-1-2043 | | | | 225,946 | | | | 228,844 | |
FNMA | | | 2.50 | | | | 4-1-2043 | | | | 155,137 | | | | 157,194 | |
FNMA | | | 2.50 | | | | 4-1-2043 | | | | 283,681 | | | | 286,256 | |
FNMA | | | 2.50 | | | | 8-1-2043 | | | | 1,231,775 | | | | 1,245,905 | |
FNMA | | | 2.50 | | | | 8-1-2043 | | | | 319,385 | | | | 322,287 | |
FNMA | | | 2.50 | | | | 8-1-2043 | | | | 610,550 | | | | 616,096 | |
FNMA | | | 2.63 | | | | 9-6-2024 | | | | 1,000,000 | | | | 1,069,599 | |
FNMA | | | 3.00 | | | | 10-1-2021 | | | | 3,526,758 | | | | 3,693,142 | |
FNMA | | | 3.00 | | | | 8-1-2026 | | | | 162,251 | | | | 169,905 | |
FNMA | | | 3.00 | | | | 9-1-2026 | | | | 100,885 | | | | 105,722 | |
FNMA | | | 3.00 | | | | 11-1-2026 | | | | 1,688,210 | | | | 1,769,486 | |
FNMA | | | 3.00 | | | | 11-1-2026 | | | | 156,938 | | | | 164,342 | |
FNMA | | | 3.00 | | | | 2-1-2027 | | | | 92,874 | | | | 97,282 | |
FNMA | | | 3.00 | | | | 2-1-2027 | | | | 948,947 | | | | 994,204 | |
FNMA | | | 3.00 | | | | 4-1-2027 | | | | 190,336 | | | | 199,546 | |
FNMA | | | 3.00 | | | | 5-1-2027 | | | | 225,145 | | | | 235,936 | |
FNMA | | | 3.00 | | | | 6-1-2027 | | | | 150,491 | | | | 157,754 | |
FNMA | | | 3.00 | | | | 7-1-2027 | | | | 260,627 | | | | 273,156 | |
FNMA | | | 3.00 | | | | 7-1-2027 | | | | 331,834 | | | | 347,887 | |
FNMA | | | 3.00 | | | | 8-1-2027 | | | | 1,727,648 | | | | 1,811,295 | |
| | | | |
| 10 | | Wells Fargo Diversified Fixed Income Portfolio | | Portfolio of investments—August 31, 2016 (unaudited) |
| | | | | | | | | | | | | | | | |
| Security name | | Interest rate | | | Maturity date | | | Principal | | | Value | |
| | | | |
Agency Securities (continued) | | | | | | | | | | | | | | | | |
FNMA | | | 3.00 | % | | | 8-1-2027 | | | $ | 1,689,363 | | | $ | 1,770,923 | |
FNMA | | | 3.00 | | | | 8-1-2027 | | | | 10,162,701 | | | | 10,654,241 | |
FNMA | | | 3.00 | | | | 9-1-2027 | | | | 1,338,672 | | | | 1,403,600 | |
FNMA | | | 3.00 | | | | 9-1-2027 | | | | 1,434,596 | | | | 1,504,154 | |
FNMA | | | 3.00 | | | | 9-1-2027 | | | | 5,518,923 | | | | 5,785,157 | |
FNMA | | | 3.00 | | | | 9-1-2027 | | | | 2,112,245 | | | | 2,214,332 | |
FNMA | | | 3.00 | | | | 10-1-2027 | | | | 2,490,120 | | | | 2,610,106 | |
FNMA | | | 3.00 | | | | 8-1-2029 | | | | 6,354,601 | | | | 6,654,396 | |
FNMA %% | | | 3.00 | | | | 9-19-2031 | | | | 13,000,000 | | | | 13,606,204 | |
FNMA | | | 3.00 | | | | 3-1-2036 | | | | 2,359,183 | | | | 2,477,071 | |
FNMA | | | 3.00 | | | | 9-1-2042 | | | | 1,919,240 | | | | 1,995,308 | |
FNMA | | | 3.00 | | | | 9-1-2042 | | | | 36,007 | | | | 37,436 | |
FNMA | | | 3.00 | | | | 9-1-2042 | | | | 601,158 | | | | 624,945 | |
FNMA | | | 3.00 | | | | 9-1-2042 | | | | 381,601 | | | | 396,054 | |
FNMA | | | 3.00 | | | | 10-1-2042 | | | | 3,844,793 | | | | 3,991,645 | |
FNMA | | | 3.00 | | | | 10-1-2042 | | | | 976,937 | | | | 1,015,702 | |
FNMA | | | 3.00 | | | | 10-1-2042 | | | | 3,782,924 | | | | 3,954,100 | |
FNMA | | | 3.00 | | | | 11-1-2042 | | | | 7,367,620 | | | | 7,660,040 | |
FNMA | | | 3.00 | | | | 12-1-2042 | | | | 7,363,725 | | | | 7,691,394 | |
FNMA | | | 3.00 | | | | 1-1-2043 | | | | 7,356,208 | | | | 7,647,284 | |
FNMA | | | 3.00 | | | | 2-1-2043 | | | | 7,847,270 | | | | 8,158,053 | |
FNMA | | | 3.00 | | | | 5-1-2043 | | | | 1,902,039 | | | | 1,976,907 | |
FNMA | | | 3.00 | | | | 5-1-2043 | | | | 7,556,265 | | | | 7,853,278 | |
FNMA | | | 3.00 | | | | 6-1-2043 | | | | 162,615 | | | | 169,029 | |
FNMA | | | 3.00 | | | | 6-1-2043 | | | | 3,773,198 | | | | 3,930,717 | |
FNMA | | | 3.00 | | | | 7-1-2043 | | | | 912,061 | | | | 948,148 | |
FNMA | | | 3.00 | | | | 7-1-2043 | | | | 4,130,896 | | | | 4,294,118 | |
FNMA | | | 3.00 | | | | 7-1-2043 | | | | 7,408,575 | | | | 7,699,820 | |
FNMA | | | 3.00 | | | | 8-1-2043 | | | | 308,817 | | | | 321,014 | |
FNMA | | | 3.00 | | | | 8-1-2043 | | | | 818,955 | | | | 851,147 | |
FNMA | | | 3.00 | | | | 8-1-2043 | | | | 367,541 | | | | 382,010 | |
FNMA | | | 3.00 | | | | 12-1-2043 | | | | 229,718 | | | | 238,419 | |
FNMA | | | 3.00 | | | | 4-1-2044 | | | | 247,285 | | | | 256,800 | |
FNMA | | | 3.00 | | | | 7-1-2044 | | | | 309,688 | | | | 321,633 | |
FNMA | | | 3.00 | | | | 5-1-2046 | | | | 13,426,898 | | | | 13,935,459 | |
FNMA | | | 3.00 | | | | 8-1-2046 | | | | 13,988,318 | | | | 14,518,144 | |
FNMA %% | | | 3.00 | | | | 9-14-2046 | | | | 14,625,000 | | | | 15,166,581 | |
FNMA | | | 3.50 | | | | 11-1-2025 | | | | 1,564,591 | | | | 1,652,823 | |
FNMA | | | 3.50 | | | | 12-1-2025 | | | | 3,804,760 | | | | 4,042,167 | |
FNMA | | | 3.50 | | | | 12-1-2026 | | | | 5,298,441 | | | | 5,597,628 | |
FNMA | | | 3.50 | | | | 10-1-2029 | | | | 6,278,171 | | | | 6,629,647 | |
FNMA | | | 3.50 | | | | 12-1-2035 | | | | 1,390,959 | | | | 1,477,761 | |
FNMA | | | 3.50 | | | | 1-1-2036 | | | | 23,463 | | | | 24,778 | |
FNMA | | | 3.50 | | | | 10-1-2040 | | | | 1,071,340 | | | | 1,129,824 | |
FNMA | | | 3.50 | | | | 12-1-2040 | | | | 156,730 | | | | 165,379 | |
FNMA | | | 3.50 | | | | 1-1-2041 | | | | 964,876 | | | | 1,025,174 | |
FNMA | | | 3.50 | | | | 1-1-2041 | | | | 30,796 | | | | 32,546 | |
FNMA | | | 3.50 | | | | 1-1-2041 | | | | 70,765 | | | | 74,735 | |
FNMA | | | 3.50 | | | | 1-1-2041 | | | | 29,560 | | | | 31,245 | |
FNMA | | | 3.50 | | | | 1-1-2041 | | | | 318,834 | | | | 336,275 | |
| | | | | | |
| Portfolio of investments—August 31, 2016 (unaudited) | | Wells Fargo Diversified Fixed Income Portfolio | | | 11 | |
| | | | | | | | | | | | | | | | |
| Security name | | Interest rate | | | Maturity date | | | Principal | | | Value | |
| | | | |
Agency Securities (continued) | | | | | | | | | | | | | | | | |
FNMA | | | 3.50 | % | | | 2-1-2041 | | | $ | 450,398 | | | $ | 480,172 | |
FNMA | | | 3.50 | | | | 2-1-2041 | | | | 34,944 | | | | 36,812 | |
FNMA | | | 3.50 | | | | 2-1-2041 | | | | 510,939 | | | | 539,343 | |
FNMA | | | 3.50 | | | | 2-1-2041 | | | | 2,185,997 | | | | 2,307,249 | |
FNMA | | | 3.50 | | | | 9-1-2042 | | | | 8,787,176 | | | | 9,285,353 | |
FNMA | | | 3.50 | | | | 9-1-2042 | | | | 6,288,080 | | | | 6,654,196 | |
FNMA | | | 3.50 | | | | 10-1-2042 | | | | 5,218,413 | | | | 5,518,003 | |
FNMA | | | 3.50 | | | | 12-1-2042 | | | | 1,174,302 | | | | 1,252,507 | |
FNMA | | | 3.50 | | | | 4-1-2043 | | | | 5,576,695 | | | | 5,907,110 | |
FNMA | | | 3.50 | | | | 5-1-2043 | | | | 366,523 | | | | 386,771 | |
FNMA | | | 3.50 | | | | 5-1-2043 | | | | 180,496 | | | | 190,161 | |
FNMA | | | 3.50 | | | | 6-1-2043 | | | | 466,515 | | | | 493,091 | |
FNMA | | | 3.50 | | | | 7-1-2043 | | | | 8,650,972 | | | | 9,143,576 | |
FNMA | | | 3.50 | | | | 7-1-2043 | | | | 6,980,663 | | | | 7,375,323 | |
FNMA | | | 3.50 | | | | 8-1-2043 | | | | 1,185,331 | | | | 1,255,079 | |
FNMA | | | 3.50 | | | | 9-1-2043 | | | | 562,385 | | | | 594,139 | |
FNMA | | | 3.50 | | | | 9-1-2043 | | | | 302,449 | | | | 319,522 | |
FNMA | | | 3.50 | | | | 1-1-2044 | | | | 6,931,850 | | | | 7,323,666 | |
FNMA | | | 3.50 | | | | 1-1-2045 | | | | 9,099,542 | | | | 9,586,112 | |
FNMA | | | 3.50 | | | | 1-1-2045 | | | | 14,197,359 | | | | 14,956,519 | |
FNMA | | | 3.50 | | | | 5-1-2045 | | | | 10,313,414 | | | | 10,864,892 | |
FNMA | | | 3.50 | | | | 8-1-2045 | | | | 10,437,323 | | | | 11,062,829 | |
FNMA | | | 3.50 | | | | 11-1-2045 | | | | 8,336,672 | | | | 8,782,450 | |
FNMA | | | 3.50 | | | | 12-1-2045 | | | | 2,193,404 | | | | 2,310,691 | |
FNMA | | | 3.50 | | | | 2-1-2046 | | | | 12,729,452 | | | | 13,410,120 | |
FNMA | | | 3.50 | | | | 2-1-2046 | | | | 9,982,619 | | | | 10,516,409 | |
FNMA | | | 3.50 | | | | 2-1-2046 | | | | 13,166,070 | | | | 13,870,085 | |
FNMA %% | | | 3.50 | | | | 9-14-2046 | | | | 6,500,000 | | | | 6,847,344 | |
FNMA | | | 4.00 | | | | 4-1-2018 | | | | 57 | | | | 59 | |
FNMA | | | 4.00 | | | | 7-1-2018 | | | | 520,891 | | | | 538,772 | |
FNMA | | | 4.00 | | | | 7-1-2018 | | | | 16,708 | | | | 17,282 | |
FNMA | | | 4.00 | | | | 7-1-2018 | | | | 976 | | | | 1,010 | |
FNMA | | | 4.00 | | | | 7-1-2018 | | | | 21,962 | | | | 22,715 | |
FNMA | | | 4.00 | | | | 8-1-2018 | | | | 385,313 | | | | 398,539 | |
FNMA | | | 4.00 | | | | 8-1-2018 | | | | 225,812 | | | | 233,563 | |
FNMA | | | 4.00 | | | | 8-1-2018 | | | | 156,563 | | | | 161,937 | |
FNMA | | | 4.00 | | | | 8-1-2018 | | | | 163,103 | | | | 168,702 | |
FNMA | | | 4.00 | | | | 9-1-2018 | | | | 2,167 | | | | 2,241 | |
FNMA | | | 4.00 | | | | 9-1-2018 | | | | 14,153 | | | | 14,639 | |
FNMA | | | 4.00 | | | | 2-1-2019 | | | | 39,884 | | | | 41,253 | |
FNMA | | | 4.00 | | | | 4-1-2019 | | | | 30,989 | | | | 32,052 | |
FNMA | | | 4.00 | | | | 4-1-2019 | | | | 11,336 | | | | 11,725 | |
FNMA | | | 4.00 | | | | 5-1-2019 | | | | 14,207 | | | | 14,696 | |
FNMA | | | 4.00 | | | | 12-1-2019 | | | | 456,762 | | | | 472,441 | |
FNMA | | | 4.00 | | | | 5-1-2020 | | | | 760,091 | | | | 786,182 | |
FNMA | | | 4.00 | | | | 10-1-2020 | | | | 26,634 | | | | 27,557 | |
FNMA | | | 4.00 | | | | 1-1-2021 | | | | 293,197 | | | | 303,972 | |
FNMA | | | 4.00 | | | | 5-1-2021 | | | | 205,241 | | | | 212,856 | |
FNMA | | | 4.00 | | | | 6-1-2021 | | | | 156,171 | | | | 161,897 | |
FNMA | | | 4.00 | | | | 2-1-2024 | | | | 5,630 | | | | 5,986 | |
| | | | |
| 12 | | Wells Fargo Diversified Fixed Income Portfolio | | Portfolio of investments—August 31, 2016 (unaudited) |
| | | | | | | | | | | | | | | | |
| Security name | | Interest rate | | | Maturity date | | | Principal | | | Value | |
| | | | |
Agency Securities (continued) | | | | | | | | | | | | | | | | |
FNMA | | | 4.00 | % | | | 3-1-2024 | | | $ | 301,445 | | | $ | 320,482 | |
FNMA | | | 4.00 | | | | 4-1-2024 | | | | 534,440 | | | | 568,149 | |
FNMA | | | 4.00 | | | | 5-1-2024 | | | | 22,478 | | | | 23,922 | |
FNMA | | | 4.00 | | | | 6-1-2024 | | | | 187,478 | | | | 199,462 | |
FNMA | | | 4.00 | | | | 6-1-2024 | | | | 52,633 | | | | 55,995 | |
FNMA | | | 4.00 | | | | 6-1-2024 | | | | 44,716 | | | | 47,554 | |
FNMA | | | 4.00 | | | | 6-1-2024 | | | | 117,845 | | | | 125,320 | |
FNMA | | | 4.00 | | | | 9-1-2024 | | | | 44,026 | | | | 46,803 | |
FNMA | | | 4.00 | | | | 10-1-2024 | | | | 41,601 | | | | 44,291 | |
FNMA | | | 4.00 | | | | 2-1-2025 | | | | 380,363 | | | | 404,900 | |
FNMA | | | 4.00 | | | | 3-1-2025 | | | | 1,442,982 | | | | 1,539,650 | |
FNMA | | | 4.00 | | | | 3-1-2025 | | | | 55,649 | | | | 58,744 | |
FNMA | | | 4.00 | | | | 7-1-2025 | | | | 905,430 | | | | 963,348 | |
FNMA | | | 4.00 | | | | 1-1-2026 | | | | 51,429 | | | | 54,800 | |
FNMA | | | 4.00 | | | | 5-1-2026 | | | | 885,109 | | | | 941,491 | |
FNMA | | | 4.00 | | | | 7-1-2026 | | | | 384,390 | | | | 408,846 | |
FNMA | | | 4.00 | | | | 2-1-2039 | | | | 59,373 | | | | 63,744 | |
FNMA | | | 4.00 | | | | 2-1-2039 | | | | 198,855 | | | | 212,804 | |
FNMA | | | 4.00 | | | | 3-1-2039 | | | | 34,242 | | | | 36,644 | |
FNMA | | | 4.00 | | | | 8-1-2039 | | | | 2,682,053 | | | | 2,941,703 | |
FNMA | | | 4.00 | | | | 8-1-2039 | | | | 233,687 | | | | 250,353 | |
FNMA | | | 4.00 | | | | 8-1-2039 | | | | 346,940 | | | | 371,276 | |
FNMA | | | 4.00 | | | | 8-1-2039 | | | | 844,153 | | | | 906,633 | |
FNMA | | | 4.00 | | | | 11-1-2039 | | | | 21,892 | | | | 23,483 | |
FNMA | | | 4.00 | | | | 1-1-2040 | | | | 206,917 | | | | 221,590 | |
FNMA | | | 4.00 | | | | 1-1-2040 | | | | 216,433 | | | | 232,084 | |
FNMA | | | 4.00 | | | | 3-1-2040 | | | | 10,185 | | | | 10,920 | |
FNMA | | | 4.00 | | | | 3-1-2040 | | | | 356,464 | | | | 382,206 | |
FNMA | | | 4.00 | | | | 4-1-2040 | | | | 1,415,162 | | | | 1,519,023 | |
FNMA | | | 4.00 | | | | 8-1-2040 | | | | 57,342 | | | | 61,495 | |
FNMA | | | 4.00 | | | | 8-1-2040 | | | | 893,341 | | | | 959,568 | |
FNMA | | | 4.00 | | | | 8-1-2040 | | | | 709,438 | | | | 762,075 | |
FNMA | | | 4.00 | | | | 8-1-2040 | | | | 296,961 | | | | 319,121 | |
FNMA | | | 4.00 | | | | 9-1-2040 | | | | 15,625 | | | | 16,778 | |
FNMA | | | 4.00 | | | | 9-1-2040 | | | | 15,851 | | | | 17,029 | |
FNMA | | | 4.00 | | | | 9-1-2040 | | | | 54,566 | | | | 58,393 | |
FNMA | | | 4.00 | | | | 10-1-2040 | | | | 29,981 | | | | 32,097 | |
FNMA | | | 4.00 | | | | 10-1-2040 | | | | 34,024 | | | | 36,536 | |
FNMA | | | 4.00 | | | | 10-1-2040 | | | | 184,864 | | | | 198,364 | |
FNMA | | | 4.00 | | | | 10-1-2040 | | | | 412,847 | | | | 442,520 | |
FNMA | | | 4.00 | | | | 11-1-2040 | | | | 2,610,296 | | | | 2,802,883 | |
FNMA | | | 4.00 | | | | 11-1-2040 | | | | 297,496 | | | | 319,611 | |
FNMA | | | 4.00 | | | | 11-1-2040 | | | | 269,381 | | | | 288,276 | |
FNMA | | | 4.00 | | | | 11-1-2040 | | | | 139,801 | | | | 150,146 | |
FNMA | | | 4.00 | | | | 11-1-2040 | | | | 213,267 | | | | 228,226 | |
FNMA | | | 4.00 | | | | 11-1-2040 | | | | 30,954 | | | | 33,254 | |
FNMA | | | 4.00 | | | | 11-1-2040 | | | | 23,532 | | | | 25,289 | |
FNMA | | | 4.00 | | | | 11-1-2040 | | | | 55,834 | | | | 59,964 | |
FNMA | | | 4.00 | | | | 12-1-2040 | | | | 322,104 | | | | 345,978 | |
FNMA | | | 4.00 | | | | 12-1-2040 | | | | 749,714 | | | | 805,084 | |
| | | | | | |
| Portfolio of investments—August 31, 2016 (unaudited) | | Wells Fargo Diversified Fixed Income Portfolio | | | 13 | |
| | | | | | | | | | | | | | | | |
| Security name | | Interest rate | | | Maturity date | | | Principal | | | Value | |
| | | | |
Agency Securities (continued) | | | | | | | | | | | | | | | | |
FNMA | | | 4.00 | % | | | 12-1-2040 | | | $ | 2,513,080 | | | $ | 2,736,630 | |
FNMA | | | 4.00 | | | | 12-1-2040 | | | | 12,223 | | | | 13,135 | |
FNMA | | | 4.00 | | | | 12-1-2040 | | | | 26,059 | | | | 28,000 | |
FNMA | | | 4.00 | | | | 12-1-2040 | | | | 72,171 | | | | 77,247 | |
FNMA | | | 4.00 | | | | 12-1-2040 | | | | 275,664 | | | | 296,089 | |
FNMA | | | 4.00 | | | | 12-1-2040 | | | | 115,761 | | | | 124,327 | |
FNMA | | | 4.00 | | | | 12-1-2040 | | | | 57,391 | | | | 61,658 | |
FNMA | | | 4.00 | | | | 1-1-2041 | | | | 3,265,599 | | | | 3,511,865 | |
FNMA | | | 4.00 | | | | 1-1-2041 | | | | 7,738 | | | | 8,314 | |
FNMA | | | 4.00 | | | | 1-1-2041 | | | | 61,878 | | | | 66,469 | |
FNMA | | | 4.00 | | | | 2-1-2041 | | | | 3,821,979 | | | | 4,107,094 | |
FNMA | | | 4.00 | | | | 2-1-2041 | | | | 270,096 | | | | 290,161 | |
FNMA | | | 4.00 | | | | 2-1-2041 | | | | 147,698 | | | | 158,612 | |
FNMA | | | 4.00 | | | | 3-1-2041 | | | | 98,120 | | | | 105,452 | |
FNMA | | | 4.00 | | | | 3-1-2041 | | | | 1,847,356 | | | | 1,986,342 | |
FNMA | | | 4.00 | | | | 4-1-2041 | | | | 213,881 | | | | 229,283 | |
FNMA | | | 4.00 | | | | 5-1-2041 | | | | 3,787,204 | | | | 4,070,915 | |
FNMA | | | 4.00 | | | | 7-1-2041 | | | | 17,005 | | | | 18,202 | |
FNMA | | | 4.00 | | | | 7-1-2041 | | | | 90,194 | | | | 96,944 | |
FNMA | | | 4.00 | | | | 8-1-2041 | | | | 20,249 | | | | 21,768 | |
FNMA | | | 4.00 | | | | 8-1-2041 | | | | 264,255 | | | | 284,078 | |
FNMA | | | 4.00 | | | | 10-1-2041 | | | | 1,467,975 | | | | 1,577,525 | |
FNMA | | | 4.00 | | | | 10-1-2041 | | | | 1,101,686 | | | | 1,183,976 | |
FNMA | | | 4.00 | | | | 10-1-2041 | | | | 156,185 | | | | 167,747 | |
FNMA | | | 4.00 | | | | 10-1-2041 | | | | 96,411 | | | | 103,587 | |
FNMA | | | 4.00 | | | | 11-1-2041 | | | | 287,676 | | | | 309,304 | |
FNMA | | | 4.00 | | | | 11-1-2041 | | | | 932,889 | | | | 1,002,674 | |
FNMA | | | 4.00 | | | | 12-1-2041 | | | | 312,214 | | | | 335,524 | |
FNMA | | | 4.00 | | | | 12-1-2041 | | | | 161,910 | | | | 174,001 | |
FNMA | | | 4.00 | | | | 12-1-2041 | | | | 201,620 | | | | 216,692 | |
FNMA | | | 4.00 | | | | 1-1-2042 | | | | 7,165 | | | | 7,673 | |
FNMA | | | 4.00 | | | | 1-1-2042 | | | | 42,392 | | | | 45,444 | |
FNMA | | | 4.00 | | | | 2-1-2042 | | | | 54,745 | | | | 58,604 | |
FNMA | | | 4.00 | | | | 2-1-2042 | | | | 14,047 | | | | 15,097 | |
FNMA | | | 4.00 | | | | 2-1-2042 | | | | 112,871 | | | | 121,308 | |
FNMA | | | 4.00 | | | | 2-1-2042 | | | | 2,043,405 | | | | 2,190,190 | |
FNMA | | | 4.00 | | | | 4-1-2042 | | | | 1,197,456 | | | | 1,286,994 | |
FNMA | | | 4.00 | | | | 7-1-2042 | | | | 43,527 | | | | 46,606 | |
FNMA | | | 4.00 | | | | 10-1-2043 | | | | 4,016,697 | | | | 4,299,194 | |
FNMA | | | 4.00 | | | | 10-1-2043 | | | | 5,383,990 | | | | 5,761,639 | |
FNMA | | | 4.00 | | | | 12-1-2043 | | | | 3,777,926 | | | | 4,045,593 | |
FNMA | | | 4.00 | | | | 7-1-2044 | | | | 4,475,369 | | | | 4,789,285 | |
FNMA | | | 4.00 | | | | 9-1-2044 | | | | 9,239,102 | | | | 9,887,160 | |
FNMA | | | 4.00 | | | | 10-1-2044 | | | | 7,317,106 | | | | 7,830,722 | |
FNMA | | | 4.00 | | | | 10-1-2044 | | | | 4,746,215 | | | | 5,079,129 | |
FNMA | | | 4.00 | | | | 5-1-2045 | | | | 9,520,528 | | | | 10,204,367 | |
FNMA | | | 4.00 | | | | 7-1-2045 | | | | 9,877,544 | | | | 10,580,245 | |
FNMA | | | 4.00 | | | | 12-1-2045 | | | | 7,369,184 | | | | 7,894,672 | |
FNMA | | | 4.50 | | | | 3-1-2018 | | | | 6,510 | | | | 6,667 | |
FNMA | | | 4.50 | | | | 4-1-2018 | | | | 32,875 | | | | 33,663 | |
| | | | |
| 14 | | Wells Fargo Diversified Fixed Income Portfolio | | Portfolio of investments—August 31, 2016 (unaudited) |
| | | | | | | | | | | | | | | | |
| Security name | | Interest rate | | | Maturity date | | | Principal | | | Value | |
| | | | |
Agency Securities (continued) | | | | | | | | | | | | | | | | |
FNMA | | | 4.50 | % | | | 12-1-2018 | | | $ | 5,037 | | | $ | 5,161 | |
FNMA | | | 4.50 | | | | 5-1-2019 | | | | 5,833 | | | | 5,974 | |
FNMA | | | 4.50 | | | | 1-1-2020 | | | | 13,777 | | | | 14,220 | |
FNMA | | | 4.50 | | | | 8-1-2020 | | | | 6,722 | | | | 6,944 | |
FNMA | | | 4.50 | | | | 10-1-2020 | | | | 27,374 | | | | 28,391 | |
FNMA | | | 4.50 | | | | 12-1-2020 | | | | 42,470 | | | | 44,057 | |
FNMA | | | 4.50 | | | | 1-1-2021 | | | | 24,988 | | | | 25,744 | |
FNMA | | | 4.50 | | | | 3-1-2022 | | | | 131,307 | | | | 134,809 | |
FNMA | | | 4.50 | | | | 3-1-2022 | | | | 30,937 | | | | 31,705 | |
FNMA | | | 4.50 | | | | 5-1-2022 | | | | 6,115 | | | | 6,266 | |
FNMA | | | 4.50 | | | | 11-1-2022 | | | | 42,062 | | | | 43,682 | |
FNMA | | | 4.50 | | | | 2-1-2023 | | | | 188,798 | | | | 197,049 | |
FNMA | | | 4.50 | | | | 3-1-2023 | | | | 3,487 | | | | 3,680 | |
FNMA | | | 4.50 | | | | 3-1-2023 | | | | 13,438 | | | | 13,759 | |
FNMA | | | 4.50 | | | | 3-1-2023 | | | | 82,521 | | | | 87,800 | |
FNMA | | | 4.50 | | | | 5-1-2023 | | | | 89,344 | | | | 91,497 | |
FNMA | | | 4.50 | | | | 5-1-2023 | | | | 22,173 | | | | 23,160 | |
FNMA | | | 4.50 | | | | 5-1-2023 | | | | 13,684 | | | | 14,649 | |
FNMA | | | 4.50 | | | | 5-1-2023 | | | | 11,081 | | | | 11,458 | |
FNMA | | | 4.50 | | | | 6-1-2023 | | | | 119,601 | | | | 128,431 | |
FNMA | | | 4.50 | | | | 12-1-2023 | | | | 42,312 | | | | 43,346 | |
FNMA | | | 4.50 | | | | 3-1-2024 | | | | 10,104 | | | | 10,667 | |
FNMA | | | 4.50 | | | | 5-1-2024 | | | | 173,939 | | | | 185,642 | |
FNMA | | | 4.50 | | | | 5-1-2024 | | | | 13,409 | | | | 14,252 | |
FNMA | | | 4.50 | | | | 7-1-2024 | | | | 708,883 | | | | 757,638 | |
FNMA | | | 4.50 | | | | 8-1-2024 | | | | 5,031 | | | | 5,343 | |
FNMA | | | 4.50 | | | | 8-1-2024 | | | | 91,445 | | | | 97,470 | |
FNMA | | | 4.50 | | | | 8-1-2024 | | | | 59,078 | | | | 63,275 | |
FNMA | | | 4.50 | | | | 1-1-2025 | | | | 966,261 | | | | 1,030,251 | |
FNMA | | | 4.50 | | | | 3-1-2025 | | | | 52,193 | | | | 54,166 | |
FNMA | | | 4.50 | | | | 3-1-2025 | | | | 949,014 | | | | 1,013,119 | |
FNMA | | | 4.50 | | | | 4-1-2025 | | | | 93,073 | | | | 99,383 | |
FNMA | | | 4.50 | | | | 4-1-2025 | | | | 20,366 | | | | 22,220 | |
FNMA | | | 4.50 | | | | 10-1-2025 | | | | 136,078 | | | | 148,465 | |
FNMA | | | 4.50 | | | | 2-1-2026 | | | | 80,772 | | | | 88,125 | |
FNMA | | | 4.50 | | | | 2-1-2026 | | | | 23,528 | | | | 24,650 | |
FNMA | | | 4.50 | | | | 4-1-2026 | | | | 483,456 | | | | 520,673 | |
FNMA | | | 4.50 | | | | 5-1-2026 | | | | 53,078 | | | | 57,173 | |
FNMA | | | 4.50 | | | | 6-1-2026 | | | | 14,774 | | | | 15,482 | |
FNMA | | | 4.50 | | | | 4-1-2028 | | | | 27,865 | | | | 30,402 | |
FNMA | | | 4.50 | | | | 4-1-2028 | | | | 10,346 | | | | 11,288 | |
FNMA | | | 4.50 | | | | 4-1-2028 | | | | 20,344 | | | | 22,196 | |
FNMA | | | 4.50 | | | | 3-1-2029 | | | | 20,504 | | | | 22,370 | |
FNMA | | | 4.50 | | | | 5-1-2029 | | | | 3,154,264 | | | | 3,441,387 | |
FNMA | | | 4.50 | | | | 10-1-2029 | | | | 210,702 | | | | 229,881 | |
FNMA | | | 4.50 | | | | 9-1-2033 | | | | 243,915 | | | | 267,236 | |
FNMA | | | 4.50 | | | | 4-1-2035 | | | | 80,617 | | | | 87,955 | |
FNMA | | | 4.50 | | | | 5-1-2035 | | | | 16,839 | | | | 18,463 | |
FNMA | | | 4.50 | | | | 7-1-2035 | | | | 2,573 | | | | 2,818 | |
FNMA | | | 4.50 | | | | 8-1-2035 | | | | 3,800 | | | | 4,146 | |
| | | | | | |
| Portfolio of investments—August 31, 2016 (unaudited) | | Wells Fargo Diversified Fixed Income Portfolio | | | 15 | |
| | | | | | | | | | | | | | | | |
| Security name | | Interest rate | | | Maturity date | | | Principal | | | Value | |
| | | | |
Agency Securities (continued) | | | | | | | | | | | | | | | | |
FNMA | | | 4.50 | % | | | 9-1-2035 | | | $ | 328,388 | | | $ | 358,403 | |
FNMA | | | 4.50 | | | | 9-1-2035 | | | | 18,784 | | | | 20,524 | |
FNMA | | | 4.50 | | | | 10-1-2035 | | | | 47,258 | | | | 51,637 | |
FNMA | | | 4.50 | | | | 3-1-2038 | | | | 359,243 | | | | 393,173 | |
FNMA | | | 4.50 | | | | 2-1-2039 | | | | 13,827 | | | | 15,087 | |
FNMA | | | 4.50 | | | | 2-1-2039 | | | | 232,491 | | | | 253,915 | |
FNMA | | | 4.50 | | | | 2-1-2039 | | | | 15,068 | | | | 16,469 | |
FNMA | | | 4.50 | | | | 2-1-2039 | | | | 40,552 | | | | 44,275 | |
FNMA | | | 4.50 | | | | 3-1-2039 | | | | 608,870 | | | | 664,294 | |
FNMA | | | 4.50 | | | | 3-1-2039 | | | | 937,834 | | | | 1,023,705 | |
FNMA | | | 4.50 | | | | 4-1-2039 | | | | 1,067,326 | | | | 1,165,102 | |
FNMA | | | 4.50 | | | | 4-1-2039 | | | | 280,620 | | | | 306,164 | |
FNMA | | | 4.50 | | | | 4-1-2039 | | | | 5,421 | | | | 5,914 | |
FNMA | | | 4.50 | | | | 4-1-2039 | | | | 912,382 | | | | 995,434 | |
FNMA | | | 4.50 | | | | 5-1-2039 | | | | 470,101 | | | | 520,670 | |
FNMA | | | 4.50 | | | | 5-1-2039 | | | | 1,192,548 | | | | 1,309,994 | |
FNMA | | | 4.50 | | | | 6-1-2039 | | | | 659,774 | | | | 720,282 | |
FNMA | | | 4.50 | | | | 9-1-2039 | | | | 1,186,369 | | | | 1,312,628 | |
FNMA | | | 4.50 | | | | 12-1-2039 | | | | 107,620 | | | | 117,663 | |
FNMA | | | 4.50 | | | | 2-1-2040 | | | | 2,506,728 | | | | 2,775,178 | |
FNMA | | | 4.50 | | | | 3-1-2040 | | | | 1,955,259 | | | | 2,177,399 | |
FNMA | | | 4.50 | | | | 5-1-2040 | | | | 721,884 | | | | 794,851 | |
FNMA | | | 4.50 | | | | 5-1-2040 | | | | 1,680,505 | | | | 1,845,569 | |
FNMA | | | 4.50 | | | | 6-1-2040 | | | | 639,501 | | | | 701,205 | |
FNMA | | | 4.50 | | | | 8-1-2040 | | | | 176,622 | | | | 193,643 | |
FNMA | | | 4.50 | | | | 8-1-2040 | | | | 1,599,700 | | | | 1,751,578 | |
FNMA | | | 4.50 | | | | 9-1-2040 | | | | 17,765 | | | | 19,382 | |
FNMA | | | 4.50 | | | | 10-1-2040 | | | | 250,423 | | | | 274,634 | |
FNMA | | | 4.50 | | | | 11-1-2040 | | | | 1,277,127 | | | | 1,401,152 | |
FNMA | | | 4.50 | | | | 2-1-2041 | | | | 4,785,841 | | | | 5,247,636 | |
FNMA | | | 4.50 | | | | 2-1-2041 | | | | 3,719,593 | | | | 4,066,540 | |
FNMA | | | 4.50 | | | | 4-1-2041 | | | | 1,095,389 | | | | 1,199,477 | |
FNMA | | | 4.50 | | | | 5-1-2041 | | | | 1,804,625 | | | | 1,978,908 | |
FNMA | | | 4.50 | | | | 5-1-2041 | | | | 7,666 | | | | 8,367 | |
FNMA | | | 4.50 | | | | 1-1-2042 | | | | 5,228,284 | | | | 5,730,185 | |
FNMA | | | 4.50 | | | | 9-1-2043 | | | | 3,701,774 | | | | 4,052,703 | |
FNMA | | | 5.00 | | | | 12-1-2017 | | | | 81,224 | | | | 83,443 | |
FNMA | | | 5.00 | | | | 6-1-2018 | | | | 69,853 | | | | 71,766 | |
FNMA | | | 5.00 | | | | 10-1-2018 | | | | 50,633 | | | | 52,080 | |
FNMA | | | 5.00 | | | | 11-1-2018 | | | | 18,684 | | | | 19,235 | |
FNMA | | | 5.00 | | | | 6-1-2019 | | | | 52,457 | | | | 54,438 | |
FNMA | | | 5.00 | | | | 9-1-2019 | | | | 158,992 | | | | 163,529 | |
FNMA | | | 5.00 | | | | 10-1-2019 | | | | 72,991 | | | | 75,849 | |
FNMA | | | 5.00 | | | | 11-1-2019 | | | | 58,074 | | | | 59,913 | |
FNMA | | | 5.00 | | | | 6-1-2020 | | | | 30,112 | | | | 31,092 | |
FNMA | | | 5.00 | | | | 5-1-2023 | | | | 251,111 | | | | 267,355 | |
FNMA | | | 5.00 | | | | 5-1-2023 | | | | 50,280 | | | | 53,979 | |
FNMA | | | 5.00 | | | | 6-1-2023 | | | | 129,322 | | | | 137,582 | |
FNMA | | | 5.00 | | | | 6-1-2023 | | | | 37,709 | | | | 40,462 | |
FNMA | | | 5.00 | | | | 9-1-2024 | | | | 76,926 | | | | 85,092 | |
| | | | |
| 16 | | Wells Fargo Diversified Fixed Income Portfolio | | Portfolio of investments—August 31, 2016 (unaudited) |
| | | | | | | | | | | | | | | | |
| Security name | | Interest rate | | | Maturity date | | | Principal | | | Value | |
| | | | |
Agency Securities (continued) | | | | | | | | | | | | | | | | |
FNMA | | | 5.00 | % | | | 3-1-2025 | | | $ | 793,006 | | | $ | 850,900 | |
FNMA | | | 5.00 | | | | 4-1-2034 | | | | 133,999 | | | | 150,838 | |
FNMA | | | 5.00 | | | | 4-1-2034 | | | | 452,790 | | | | 503,938 | |
FNMA | | | 5.00 | | | | 4-1-2035 | | | | 1,210,182 | | | | 1,349,316 | |
FNMA | | | 5.00 | | | | 6-1-2035 | | | | 391,345 | | | | 433,671 | |
FNMA | | | 5.00 | | | | 7-1-2035 | | | | 25,045 | | | | 27,803 | |
FNMA | | | 5.00 | | | | 7-1-2035 | | | | 22,450 | | | | 24,907 | |
FNMA | | | 5.00 | | | | 7-1-2035 | | | | 46,043 | | | | 51,063 | |
FNMA | | | 5.00 | | | | 8-1-2035 | | | | 50,190 | | | | 55,703 | |
FNMA | | | 5.00 | | | | 10-1-2035 | | | | 1,499,231 | | | | 1,663,612 | |
FNMA | | | 5.00 | | | | 11-1-2035 | | | | 377,363 | | | | 418,908 | |
FNMA | | | 5.00 | | | | 2-1-2036 | | | | 1,823,656 | | | | 2,023,966 | |
FNMA | | | 5.00 | | | | 7-1-2036 | | | | 39,727 | | | | 44,058 | |
FNMA | | | 5.00 | | | | 11-1-2036 | | | | 152,803 | | | | 169,042 | |
FNMA | | | 5.00 | | | | 11-1-2036 | | | | 116,836 | | | | 129,401 | |
FNMA | | | 5.00 | | | | 5-1-2037 | | | | 37,105 | | | | 41,044 | |
FNMA | | | 5.00 | | | | 5-1-2037 | | | | 39,360 | | | | 43,539 | |
FNMA | | | 5.00 | | | | 5-1-2037 | | | | 114,307 | | | | 126,442 | |
FNMA | | | 5.00 | | | | 6-1-2037 | | | | 43,108 | | | | 47,684 | |
FNMA | | | 5.00 | | | | 8-1-2037 | | | | 258,049 | | | | 285,446 | |
FNMA | | | 5.00 | | | | 2-1-2038 | | | | 936,646 | | | | 1,038,899 | |
FNMA | | | 5.00 | | | | 3-1-2038 | | | | 565,687 | | | | 625,744 | |
FNMA | | | 5.00 | | | | 4-1-2038 | | | | 29,481 | | | | 32,611 | |
FNMA | | | 5.00 | | | | 5-1-2038 | | | | 146,559 | | | | 162,119 | |
FNMA | | | 5.00 | | | | 5-1-2038 | | | | 105,942 | | | | 117,190 | |
FNMA | | | 5.00 | | | | 5-1-2038 | | | | 54,547 | | | | 60,338 | |
FNMA | | | 5.00 | | | | 7-1-2038 | | | | 3,527 | | | | 3,901 | |
FNMA | | | 5.00 | | | | 7-1-2038 | | | | 5,379 | | | | 5,953 | |
FNMA | | | 5.00 | | | | 11-1-2038 | | | | 143,561 | | | | 158,803 | |
FNMA | | | 5.00 | | | | 11-1-2038 | | | | 83,544 | | | | 92,414 | |
FNMA | | | 5.00 | | | | 11-1-2038 | | | | 5,065 | | | | 5,603 | |
FNMA | | | 5.00 | | | | 4-1-2039 | | | | 163,993 | | | | 181,513 | |
FNMA | | | 5.00 | | | | 4-1-2039 | | | | 224,999 | | | | 248,886 | |
FNMA | | | 5.00 | | | | 6-1-2039 | | | | 383,564 | | | | 424,286 | |
FNMA | | | 5.00 | | | | 7-1-2039 | | | | 269,067 | | | | 297,633 | |
FNMA | | | 5.00 | | | | 8-1-2039 | | | | 2,760,794 | | | | 3,060,877 | |
FNMA | | | 5.00 | | | | 10-1-2039 | | | | 507,529 | | | | 562,813 | |
FNMA | | | 5.00 | | | | 7-1-2040 | | | | 4,524,798 | | | | 5,069,049 | |
FNMA | | | 5.00 | | | | 9-1-2040 | | | | 2,711,104 | | | | 3,006,787 | |
FNMA | | | 5.00 | | | | 4-1-2041 | | | | 1,759,736 | | | | 1,949,050 | |
FNMA | | | 5.00 | | | | 8-1-2041 | | | | 181,252 | | | | 200,686 | |
FNMA | | | 5.45 | | | | 10-18-2021 | | | | 200,000 | | | | 201,279 | |
FNMA | | | 5.50 | | | | 11-1-2016 | | | | 6,178 | | | | 6,190 | |
FNMA | | | 5.50 | | | | 11-1-2016 | | | | 115 | | | | 115 | |
FNMA | | | 5.50 | | | | 1-1-2017 | | | | 5,156 | | | | 5,173 | |
FNMA | | | 5.50 | | | | 2-1-2017 | | | | 3,457 | | | | 3,467 | |
FNMA | | | 5.50 | | | | 2-1-2017 | | | | 113 | | | | 113 | |
FNMA | | | 5.50 | | | | 4-1-2017 | | | | 7,273 | | | | 7,315 | |
FNMA | | | 5.50 | | | | 6-1-2017 | | | | 19,542 | | | | 19,717 | |
FNMA | | | 5.50 | | | | 7-1-2017 | | | | 26,624 | | | | 26,907 | |
| | | | | | |
| Portfolio of investments—August 31, 2016 (unaudited) | | Wells Fargo Diversified Fixed Income Portfolio | | | 17 | |
| | | | | | | | | | | | | | | | |
| Security name | | Interest rate | | | Maturity date | | | Principal | | | Value | |
| | | | |
Agency Securities (continued) | | | | | | | | | | | | | | | | |
FNMA | | | 5.50 | % | | | 8-1-2017 | | | $ | 6,566 | | | $ | 6,646 | |
FNMA | | | 5.50 | | | | 10-1-2017 | | | | 28,421 | | | | 28,869 | |
FNMA | | | 5.50 | | | | 3-1-2018 | | | | 12,746 | | | | 13,021 | |
FNMA | | | 5.50 | | | | 4-1-2018 | | | | 17,464 | | | | 17,853 | |
FNMA | | | 5.50 | | | | 12-1-2018 | | | | 155,859 | | | | 159,550 | |
FNMA | | | 5.50 | | | | 5-1-2021 | | | | 109,219 | | | | 114,865 | |
FNMA | | | 5.50 | | | | 5-1-2023 | | | | 117,686 | | | | 128,553 | |
FNMA | | | 5.50 | | | | 2-1-2024 | | | | 10,838 | | | | 11,883 | |
FNMA | | | 5.50 | | | | 6-1-2024 | | | | 104,141 | | | | 112,755 | |
FNMA | | | 5.50 | | | | 8-1-2025 | | | | 63,952 | | | | 72,514 | |
FNMA | | | 5.50 | | | | 7-1-2033 | | | | 116,884 | | | | 132,490 | |
FNMA | | | 5.50 | | | | 9-1-2033 | | | | 227,639 | | | | 257,539 | |
FNMA | | | 5.50 | | | | 11-1-2033 | | | | 118,231 | | | | 134,213 | |
FNMA | | | 5.50 | | | | 7-1-2034 | | | | 100,781 | | | | 113,114 | |
FNMA | | | 5.50 | | | | 9-1-2034 | | | | 50,011 | | | | 56,812 | |
FNMA | | | 5.50 | | | | 10-1-2034 | | | | 29,181 | | | | 32,753 | |
FNMA | | | 5.50 | | | | 12-1-2034 | | | | 222,930 | | | | 253,077 | |
FNMA | | | 5.50 | | | | 1-1-2035 | | | | 1,339,885 | | | | 1,521,947 | |
FNMA | | | 5.50 | | | | 1-1-2035 | | | | 180,262 | | | | 203,016 | |
FNMA | | | 5.50 | | | | 6-1-2035 | | | | 291,610 | | | | 331,197 | |
FNMA | | | 5.50 | | | | 8-1-2035 | | | | 27,994 | | | | 31,601 | |
FNMA | | | 5.50 | | | | 8-1-2035 | | | | 181,458 | | | | 204,825 | |
FNMA | | | 5.50 | | | | 8-1-2035 | | | | 351,886 | | | | 398,604 | |
FNMA | | | 5.50 | | | | 9-1-2035 | | | | 317,749 | | | | 360,893 | |
FNMA | | | 5.50 | | | | 12-1-2035 | | | | 354,992 | | | | 401,352 | |
FNMA | | | 5.50 | | | | 12-1-2035 | | | | 411,151 | | | | 466,330 | |
FNMA | | | 5.50 | | | | 1-1-2036 | | | | 874,781 | | | | 988,255 | |
FNMA | | | 5.50 | | | | 2-1-2036 | | | | 198,812 | | | | 225,648 | |
FNMA | | | 5.50 | | | | 4-1-2036 | | | | 255,722 | | | | 290,303 | |
FNMA | | | 5.50 | | | | 4-1-2036 | | | | 553,169 | | | | 624,635 | |
FNMA | | | 5.50 | | | | 4-1-2036 | | | | 1,415,519 | | | | 1,601,487 | |
FNMA | | | 5.50 | | | | 9-1-2036 | | | | 18,515 | | | | 20,874 | |
FNMA | | | 5.50 | | | | 2-1-2037 | | | | 152,033 | | | | 175,238 | |
FNMA | | | 5.50 | | | | 3-1-2037 | | | | 44,315 | | | | 50,021 | |
FNMA | | | 5.50 | | | | 5-1-2037 | | | | 59,788 | | | | 67,105 | |
FNMA | | | 5.50 | | | | 6-1-2037 | | | | 144,229 | | | | 162,318 | |
FNMA | | | 5.50 | | | | 7-1-2037 | | | | 44,285 | | | | 49,762 | |
FNMA | | | 5.50 | | | | 7-1-2037 | | | | 13,682 | | | | 15,356 | |
FNMA | | | 5.50 | | | | 2-1-2038 | | | | 421,834 | | | | 473,459 | |
FNMA | | | 5.50 | | | | 2-1-2038 | | | | 46,890 | | | | 52,882 | |
FNMA | | | 5.50 | | | | 2-1-2038 | | | | 55,769 | | | | 62,594 | |
FNMA | | | 5.50 | | | | 3-1-2038 | | | | 14,620 | | | | 16,514 | |
FNMA | | | 5.50 | | | | 4-1-2038 | | | | 487,987 | | | | 551,064 | |
FNMA | | | 5.50 | | | | 5-1-2038 | | | | 42,086 | | | | 47,388 | |
FNMA | | | 5.50 | | | | 5-1-2038 | | | | 665,096 | | | | 750,651 | |
FNMA | | | 5.50 | | | | 5-1-2038 | | | | 321,143 | | | | 363,186 | |
FNMA | | | 5.50 | | | | 6-1-2038 | | | | 162,307 | | | | 183,010 | |
FNMA | | | 5.50 | | | | 8-1-2038 | | | | 34,546 | | | | 39,143 | |
FNMA | | | 5.50 | | | | 9-1-2038 | | | | 180,425 | | | | 203,867 | |
FNMA | | | 5.50 | | | | 11-1-2038 | | | | 398,130 | | | | 450,291 | |
| | | | |
| 18 | | Wells Fargo Diversified Fixed Income Portfolio | | Portfolio of investments—August 31, 2016 (unaudited) |
| | | | | | | | | | | | | | | | |
| Security name | | Interest rate | | | Maturity date | | | Principal | | | Value | |
| | | | |
Agency Securities (continued) | | | | | | | | | | | | | | | | |
FNMA | | | 5.50 | % | | | 11-1-2038 | | | $ | 388,123 | | | $ | 438,061 | |
FNMA | | | 5.50 | | | | 1-1-2039 | | | | 269,288 | | | | 303,743 | |
FNMA | | | 5.50 | | | | 2-1-2039 | | | | 1,436,103 | | | | 1,628,978 | |
FNMA | | | 5.50 | | | | 5-1-2039 | | | | 242,401 | | | | 273,414 | |
FNMA | | | 5.50 | | | | 6-1-2039 | | | | 567,266 | | | | 640,271 | |
FNMA | | | 5.50 | | | | 12-1-2039 | | | | 5,819 | | | | 6,562 | |
FNMA | | | 5.50 | | | | 6-1-2040 | | | | 10,626 | | | | 12,037 | |
FNMA | | | 5.50 | | | | 9-1-2040 | | | | 108,162 | | | | 122,029 | |
FNMA | | | 5.50 | | | | 2-1-2041 | | | | 162,195 | | | | 183,205 | |
FNMA | | | 5.63 | | | | 7-15-2037 | | | | 150,000 | | | | 224,948 | |
FNMA | | | 6.00 | | | | 9-1-2016 | | | | 6 | | | | 6 | |
FNMA | | | 6.00 | | | | 11-1-2017 | | | | 41 | | | | 41 | |
FNMA | | | 6.00 | | | | 11-1-2017 | | | | 38,281 | | | | 38,914 | |
FNMA | | | 6.00 | | | | 1-1-2018 | | | | 13,217 | | | | 13,515 | |
FNMA | | | 6.00 | | | | 5-1-2021 | | | | 68,925 | | | | 74,019 | |
FNMA | | | 6.00 | | | | 5-1-2021 | | | | 84,936 | | | | 91,683 | |
FNMA | | | 6.00 | | | | 9-1-2021 | | | | 40,551 | | | | 43,074 | |
FNMA | | | 6.00 | | | | 8-1-2022 | | | | 23,059 | | | | 24,891 | |
FNMA | | | 6.00 | | | | 10-1-2022 | | | | 64,124 | | | | 69,190 | |
FNMA | | | 6.00 | | | | 9-1-2024 | | | | 6,608 | | | | 7,082 | |
FNMA | | | 6.00 | | | | 11-1-2033 | | | | 20,133 | | | | 23,152 | |
FNMA | | | 6.00 | | | | 8-1-2034 | | | | 87,600 | | | | 101,294 | |
FNMA | | | 6.00 | | | | 9-1-2034 | | | | 41,668 | | | | 47,618 | |
FNMA | | | 6.00 | | | | 10-1-2034 | | | | 79,319 | | | | 91,708 | |
FNMA | | | 6.00 | | | | 11-1-2034 | | | | 94,192 | | | | 108,507 | |
FNMA | | | 6.00 | | | | 3-1-2035 | | | | 29,578 | | | | 33,802 | |
FNMA | | | 6.00 | | | | 1-1-2036 | | | | 249,679 | | | | 287,613 | |
FNMA | | | 6.00 | | | | 3-1-2036 | | | | 29,271 | | | | 33,465 | |
FNMA | | | 6.00 | | | | 9-1-2036 | | | | 2,185 | | | | 2,501 | |
FNMA | | | 6.00 | | | | 9-1-2036 | | | | 107,631 | | | | 123,214 | |
FNMA | | | 6.00 | | | | 9-1-2036 | | | | 48,462 | | | | 55,448 | |
FNMA | | | 6.00 | | | | 11-1-2036 | | | | 633,074 | | | | 723,879 | |
FNMA | | | 6.00 | | | | 1-1-2037 | | | | 319,949 | | | | 366,103 | |
FNMA | | | 6.00 | | | | 2-1-2037 | | | | 1,964 | | | | 2,251 | |
FNMA | | | 6.00 | | | | 2-1-2037 | | | | 1,026,020 | | | | 1,174,349 | |
FNMA | | | 6.00 | | | | 3-1-2037 | | | | 160,332 | | | | 183,711 | |
FNMA | | | 6.00 | | | | 4-1-2037 | | | | 9,395 | | | | 10,766 | |
FNMA | | | 6.00 | | | | 5-1-2037 | | | | 459,813 | | | | 526,661 | |
FNMA | | | 6.00 | | | | 5-1-2037 | | | | 3,286 | | | | 3,763 | |
FNMA | | | 6.00 | | | | 6-1-2037 | | | | 4,435 | | | | 5,078 | |
FNMA | | | 6.00 | | | | 7-1-2037 | | | | 495,153 | | | | 567,194 | |
FNMA | | | 6.00 | | | | 8-1-2037 | | | | 20,516 | | | | 23,490 | |
FNMA | | | 6.00 | | | | 8-1-2037 | | | | 100,959 | | | | 116,316 | |
FNMA | | | 6.00 | | | | 8-1-2037 | | | | 2,334 | | | | 2,672 | |
FNMA | | | 6.00 | | | | 8-1-2037 | | | | 322,206 | | | | 368,217 | |
FNMA | | | 6.00 | | | | 9-1-2037 | | | | 19,018 | | | | 21,734 | |
FNMA | | | 6.00 | | | | 9-1-2037 | | | | 32,614 | | | | 37,314 | |
FNMA | | | 6.00 | | | | 9-1-2037 | | | | 41,726 | | | | 47,685 | |
FNMA | | | 6.00 | | | | 9-1-2037 | | | | 263,109 | | | | 301,067 | |
FNMA | | | 6.00 | | | | 9-1-2037 | | | | 40,790 | | | | 46,739 | |
| | | | | | |
| Portfolio of investments—August 31, 2016 (unaudited) | | Wells Fargo Diversified Fixed Income Portfolio | | | 19 | |
| | | | | | | | | | | | | | | | |
| Security name | | Interest rate | | | Maturity date | | | Principal | | | Value | |
| | | | |
Agency Securities (continued) | | | | | | | | | | | | | | | | |
FNMA | | | 6.00 | % | | | 9-1-2037 | | | $ | 30,086 | | | $ | 34,382 | |
FNMA | | | 6.00 | | | | 9-1-2037 | | | | 25,488 | | | | 29,136 | |
FNMA | | | 6.00 | | | | 9-1-2037 | | | | 2,164 | | | | 2,473 | |
FNMA | | | 6.00 | | | | 9-1-2037 | | | | 26,913 | | | | 30,825 | |
FNMA | | | 6.00 | | | | 10-1-2037 | | | | 73,323 | | | | 83,909 | |
FNMA | | | 6.00 | | | | 10-1-2037 | | | | 592,249 | | | | 676,822 | |
FNMA | | | 6.00 | | | | 10-1-2037 | | | | 114,658 | | | | 131,032 | |
FNMA | | | 6.00 | | | | 10-1-2037 | | | | 20,152 | | | | 23,029 | |
FNMA | | | 6.00 | | | | 10-1-2037 | | | | 1,931 | | | | 2,211 | |
FNMA | | | 6.00 | | | | 10-1-2037 | | | | 375,823 | | | | 429,491 | |
FNMA | | | 6.00 | | | | 10-1-2037 | | | | 1,431 | | | | 1,635 | |
FNMA | | | 6.00 | | | | 11-1-2037 | | | | 16,064 | | | | 18,358 | |
FNMA | | | 6.00 | | | | 11-1-2037 | | | | 12,131 | | | | 13,871 | |
FNMA | | | 6.00 | | | | 11-1-2037 | | | | 19,523 | | | | 22,326 | |
FNMA | | | 6.00 | | | | 11-1-2037 | | | | 3,730 | | | | 4,262 | |
FNMA | | | 6.00 | | | | 11-1-2037 | | | | 3,714 | | | | 4,245 | |
FNMA | | | 6.00 | | | | 12-1-2037 | | | | 17,363 | | | | 19,873 | |
FNMA | | | 6.00 | | | | 1-1-2038 | | | | 25,143 | | | | 28,734 | |
FNMA | | | 6.00 | | | | 1-1-2038 | | | | 15,826 | | | | 18,113 | |
FNMA | | | 6.00 | | | | 1-1-2038 | | | | 212,013 | | | | 242,518 | |
FNMA | | | 6.00 | | | | 2-1-2038 | | | | 65,336 | | | | 74,700 | |
FNMA | | | 6.00 | | | | 2-1-2038 | | | | 1,009 | | | | 1,154 | |
FNMA | | | 6.00 | | | | 2-1-2038 | | | | 29,391 | | | | 33,588 | |
FNMA | | | 6.00 | | | | 2-1-2038 | | | | 43,008 | | | | 49,149 | |
FNMA | | | 6.00 | | | | 6-1-2038 | | | | 17,098 | | | | 19,539 | |
FNMA | | | 6.00 | | | | 7-1-2038 | | | | 47,264 | | | | 54,014 | |
FNMA | | | 6.00 | | | | 7-1-2038 | | | | 4,564 | | | | 5,224 | |
FNMA | | | 6.00 | | | | 7-1-2038 | | | | 155,427 | | | | 177,622 | |
FNMA | | | 6.00 | | | | 7-1-2038 | | | | 40,299 | | | | 46,054 | |
FNMA | | | 6.00 | | | | 8-1-2038 | | | | 37,068 | | | | 42,361 | |
FNMA | | | 6.00 | | | | 8-1-2038 | | | | 12,349 | | | | 14,112 | |
FNMA | | | 6.00 | | | | 8-1-2038 | | | | 3,088 | | | | 3,529 | |
FNMA | | | 6.00 | | | | 8-1-2038 | | | | 32,079 | | | | 36,660 | |
FNMA | | | 6.00 | | | | 8-1-2038 | | | | 18,188 | | | | 20,785 | |
FNMA | | | 6.00 | | | | 8-1-2038 | | | | 1,007 | | | | 1,151 | |
FNMA | | | 6.00 | | | | 9-1-2038 | | | | 29,624 | | | | 33,854 | |
FNMA | | | 6.00 | | | | 9-1-2038 | | | | 19,361 | | | | 22,126 | |
FNMA | | | 6.00 | | | | 9-1-2038 | | | | 28,876 | | | | 33,275 | |
FNMA | | | 6.00 | | | | 9-1-2038 | | | | 22,200 | | | | 25,370 | |
FNMA | | | 6.00 | | | | 9-1-2038 | | | | 10,501 | | | | 12,000 | |
FNMA | | | 6.00 | | | | 9-1-2038 | | | | 40,205 | | | | 45,946 | |
FNMA | | | 6.00 | | | | 9-1-2038 | | | | 3,285 | | | | 3,755 | |
FNMA | | | 6.00 | | | | 9-1-2038 | | | | 1,318 | | | | 1,506 | |
FNMA | | | 6.00 | | | | 9-1-2038 | | | | 6,477 | | | | 7,462 | |
FNMA | | | 6.00 | | | | 9-1-2038 | | | | 8,431 | | | | 9,635 | |
FNMA | | | 6.00 | | | | 9-1-2038 | | | | 31,198 | | | | 35,680 | |
FNMA | | | 6.00 | | | | 9-1-2038 | | | | 1,427 | | | | 1,631 | |
FNMA | | | 6.00 | | | | 9-1-2038 | | | | 81,101 | | | | 92,682 | |
FNMA | | | 6.00 | | | | 10-1-2038 | | | | 44,646 | | | | 51,021 | |
FNMA | | | 6.00 | | | | 10-1-2038 | | | | 18,041 | | | | 20,617 | |
| | | | |
| 20 | | Wells Fargo Diversified Fixed Income Portfolio | | Portfolio of investments—August 31, 2016 (unaudited) |
| | | | | | | | | | | | | | | | |
| Security name | | Interest rate | | | Maturity date | | | Principal | | | Value | |
| | | | |
Agency Securities (continued) | | | | | | | | | | | | | | | | |
FNMA | | | 6.00 | % | | | 10-1-2038 | | | $ | 8,141 | | | $ | 9,303 | |
FNMA | | | 6.00 | | | | 11-1-2038 | | | | 27,090 | | | | 30,959 | |
FNMA | | | 6.00 | | | | 11-1-2038 | | | | 137,227 | | | | 156,823 | |
FNMA | | | 6.00 | | | | 11-1-2038 | | | | 16,520 | | | | 18,888 | |
FNMA | | | 6.00 | | | | 11-1-2038 | | | | 26,398 | | | | 30,168 | |
FNMA | | | 6.00 | | | | 11-1-2038 | | | | 31,301 | | | | 35,771 | |
FNMA | | | 6.00 | | | | 11-1-2038 | | | | 2,143 | | | | 2,449 | |
FNMA | | | 6.00 | | | | 12-1-2038 | | | | 26,111 | | | | 29,840 | |
FNMA | | | 6.00 | | | | 12-1-2038 | | | | 31,008 | | | | 35,436 | |
FNMA | | | 6.00 | | | | 12-1-2038 | | | | 44,007 | | | | 50,291 | |
FNMA | | | 6.00 | | | | 1-1-2039 | | | | 10,766 | | | | 12,320 | |
FNMA | | | 6.00 | | | | 2-1-2039 | | | | 36,548 | | | | 41,785 | |
FNMA | | | 6.00 | | | | 3-1-2039 | | | | 6,310 | | | | 7,234 | |
FNMA | | | 6.00 | | | | 9-1-2039 | | | | 87,237 | | | | 99,828 | |
FNMA | | | 6.00 | | | | 9-1-2039 | | | | 1,322 | | | | 1,514 | |
FNMA | | | 6.00 | | | | 10-1-2039 | | | | 1,561,868 | | | | 1,789,678 | |
FNMA | | | 6.00 | | | | 4-1-2040 | | | | 1,922,244 | | | | 2,203,669 | |
FNMA | | | 6.00 | | | | 6-1-2040 | | | | 9,804 | | | | 11,217 | |
FNMA | | | 6.21 | | | | 8-6-2038 | | | | 200,000 | | | | 314,996 | |
FNMA | | | 6.25 | | | | 5-15-2029 | | | | 500,000 | | | | 725,451 | |
FNMA | | | 6.50 | | | | 7-1-2036 | | | | 123,962 | | | | 144,519 | |
FNMA | | | 6.50 | | | | 9-1-2036 | | | | 62,584 | | | | 73,948 | |
FNMA | | | 6.50 | | | | 9-1-2036 | | | | 4,992 | | | | 5,737 | |
FNMA | | | 6.50 | | | | 12-1-2036 | | | | 288,711 | | | | 331,769 | |
FNMA | | | 6.50 | | | | 3-1-2037 | | | | 12,681 | | | | 14,573 | |
FNMA | | | 6.50 | | | | 4-1-2037 | | | | 12,885 | | | | 14,807 | |
FNMA | | | 6.50 | | | | 5-1-2037 | | | | 1,257 | | | | 1,445 | |
FNMA | | | 6.50 | | | | 5-1-2037 | | | | 53,732 | | | | 61,746 | |
FNMA | | | 6.50 | | | | 6-1-2037 | | | | 55,470 | | | | 63,743 | |
FNMA | | | 6.50 | | | | 6-1-2037 | | | | 59,441 | | | | 68,306 | |
FNMA | | | 6.50 | | | | 8-1-2037 | | | | 9,692 | | | | 11,137 | |
FNMA | | | 6.50 | | | | 9-1-2037 | | | | 460,472 | | | | 537,548 | |
FNMA | | | 6.50 | | | | 9-1-2037 | | | | 2,286 | | | | 2,627 | |
FNMA | | | 6.50 | | | | 9-1-2037 | | | | 361,228 | | | | 426,175 | |
FNMA | | | 6.50 | | | | 10-1-2037 | | | | 34,756 | | | | 39,939 | |
FNMA | | | 6.50 | | | | 10-1-2037 | | | | 541,200 | | | | 621,915 | |
FNMA | | | 6.50 | | | | 10-1-2037 | | | | 2,223 | | | | 2,633 | |
FNMA | | | 6.50 | | | | 10-1-2037 | | | | 85,630 | | | | 98,401 | |
FNMA | | | 6.50 | | | | 11-1-2037 | | | | 38,090 | | | | 43,770 | |
FNMA | | | 6.50 | | | | 11-1-2037 | | | | 154,229 | | | | 177,230 | |
FNMA | | | 6.50 | | | | 11-1-2037 | | | | 11,945 | | | | 13,726 | |
FNMA | | | 6.50 | | | | 1-1-2038 | | | | 22,572 | | | | 25,939 | |
FNMA | | | 6.50 | | | | 1-1-2038 | | | | 90,206 | | | | 103,659 | |
FNMA | | | 6.50 | | | | 3-1-2038 | | | | 6,931 | | | | 8,535 | |
FNMA | | | 6.50 | | | | 7-1-2038 | | | | 12,364 | | | | 14,208 | |
FNMA | | | 6.50 | | | | 9-1-2038 | | | | 8,817 | | | | 10,608 | |
FNMA | | | 6.50 | | | | 9-1-2038 | | | | 6,235 | | | | 7,165 | |
FNMA | | | 6.50 | | | | 10-1-2038 | | | | 35,222 | | | | 40,754 | |
FNMA | | | 6.50 | | | | 1-1-2039 | | | | 347,838 | | | | 405,629 | |
FNMA | | | 6.50 | | | | 2-1-2039 | | | | 38,626 | | | | 44,888 | |
| | | | | | |
| Portfolio of investments—August 31, 2016 (unaudited) | | Wells Fargo Diversified Fixed Income Portfolio | | | 21 | |
| | | | | | | | | | | | | | | | |
| Security name | | Interest rate | | | Maturity date | | | Principal | | | Value | |
| | | | |
Agency Securities (continued) | | | | | | | | | | | | | | | | |
FNMA | | | 6.50 | % | | | 6-1-2039 | | | $ | 23,504 | | | $ | 27,010 | |
FNMA | | | 6.50 | | | | 10-1-2039 | | | | 254,611 | | | | 292,584 | |
FNMA | | | 6.50 | | | | 10-1-2039 | | | | 690,673 | | | | 808,037 | |
FNMA | | | 6.50 | | | | 5-1-2040 | | | | 190,156 | | | | 219,312 | |
FNMA | | | 6.63 | | | | 11-15-2030 | | | | 1,300,000 | | | | 1,993,224 | |
FNMA | | | 7.00 | | | | 8-1-2037 | | | | 15,788 | | | | 17,792 | |
FNMA | | | 7.13 | | | | 1-15-2030 | | | | 500,000 | | | | 783,721 | |
FNMA | | | 7.25 | | | | 5-15-2030 | | | | 1,300,000 | | | | 2,066,726 | |
GNMA | | | 3.00 | | | | 9-15-2042 | | | | 2,850,721 | | | | 2,993,879 | |
GNMA | | | 3.00 | | | | 9-15-2042 | | | | 241,120 | | | | 252,856 | |
GNMA | | | 3.00 | | | | 9-20-2042 | | | | 6,198,883 | | | | 6,508,182 | |
GNMA | | | 3.00 | | | | 11-15-2042 | | | | 3,511,240 | | | | 3,687,569 | |
GNMA | | | 3.00 | | | | 11-20-2042 | | | | 3,143,097 | | | | 3,306,024 | |
GNMA | | | 3.00 | | | | 12-20-2042 | | | | 1,336,553 | | | | 1,403,110 | |
GNMA | | | 3.00 | | | | 1-20-2043 | | | | 6,442,036 | | | | 6,762,560 | |
GNMA | | | 3.00 | | | | 2-20-2043 | | | | 7,433,690 | | | | 7,820,492 | |
GNMA | | | 3.00 | | | | 3-15-2043 | | | | 1,175,158 | | | | 1,234,177 | |
GNMA | | | 3.00 | | | | 3-15-2043 | | | | 1,201,355 | | | | 1,261,688 | |
GNMA | | | 3.00 | | | | 3-20-2043 | | | | 5,009,136 | | | | 5,258,453 | |
GNMA | | | 3.00 | | | | 3-20-2043 | | | | 2,237,154 | | | | 2,353,501 | |
GNMA | | | 3.00 | | | | 4-20-2043 | | | | 1,338,868 | | | | 1,405,505 | |
GNMA | | | 3.00 | | | | 6-15-2043 | | | | 573,395 | | | | 601,941 | |
GNMA | | | 3.00 | | | | 8-20-2043 | | | | 3,657,980 | | | | 3,840,390 | |
GNMA | | | 3.00 | | | | 9-15-2043 | | | | 262,815 | | | | 275,710 | |
GNMA | | | 3.00 | | | | 3-20-2045 | | | | 6,131,398 | | | | 6,428,013 | |
GNMA | | | 3.00 | | | | 4-20-2045 | | | | 4,350,834 | | | | 4,561,312 | |
GNMA | | | 3.00 | | | | 6-20-2045 | | | | 8,087,034 | | | | 8,478,255 | |
GNMA | | | 3.00 | | | | 4-20-2046 | | | | 7,805,517 | | | | 8,183,119 | |
GNMA | | | 3.00 | | | | 7-20-2046 | | | | 3,691,712 | | | | 3,870,303 | |
GNMA %% | | | 3.00 | | | | 9-21-2046 | | | | 16,800,000 | | | | 17,589,469 | |
GNMA | | | 3.50 | | | | 12-15-2040 | | | | 461,290 | | | | 497,999 | |
GNMA | | | 3.50 | | | | 1-15-2041 | | | | 347,453 | | | | 369,238 | |
GNMA | | | 3.50 | | | | 10-15-2041 | | | | 1,745,431 | | | | 1,853,951 | |
GNMA | | | 3.50 | | | | 2-15-2042 | | | | 4,776,402 | | | | 5,091,525 | |
GNMA | | | 3.50 | | | | 3-20-2042 | | | | 1,382,352 | | | | 1,470,337 | |
GNMA | | | 3.50 | | | | 4-20-2042 | | | | 933,379 | | | | 994,516 | |
GNMA | | | 3.50 | | | | 5-15-2042 | | | | 1,897,530 | | | | 2,015,443 | |
GNMA | | | 3.50 | | | | 5-15-2042 | | | | 1,215,672 | | | | 1,290,419 | |
GNMA | | | 3.50 | | | | 6-20-2042 | | | | 1,514,465 | | | | 1,615,055 | |
GNMA | | | 3.50 | | | | 7-15-2042 | | | | 2,373,843 | | | | 2,519,881 | |
GNMA | | | 3.50 | | | | 10-20-2042 | | | | 2,733,926 | | | | 2,913,009 | |
GNMA | | | 3.50 | | | | 3-20-2043 | | | | 3,891,207 | | | | 4,143,019 | |
GNMA | | | 3.50 | | | | 4-15-2043 | | | | 2,477,214 | | | | 2,634,578 | |
GNMA | | | 3.50 | | | | 4-20-2043 | | | | 12,024,236 | | | | 12,789,651 | |
GNMA | | | 3.50 | | | | 10-20-2043 | | | | 3,116,784 | | | | 3,319,022 | |
GNMA | | | 3.50 | | | | 1-20-2044 | | | | 2,977,088 | | | | 3,164,480 | |
GNMA | | | 3.50 | | | | 5-20-2044 | | | | 3,015,723 | | | | 3,200,573 | |
GNMA | | | 3.50 | | | | 10-20-2044 | | | | 10,118,394 | | | | 10,738,510 | |
GNMA | | | 3.50 | | | | 12-20-2044 | | | | 6,115,588 | | | | 6,490,388 | |
GNMA | | | 3.50 | | | | 3-20-2045 | | | | 4,463,765 | | | | 4,737,391 | |
| | | | |
| 22 | | Wells Fargo Diversified Fixed Income Portfolio | | Portfolio of investments—August 31, 2016 (unaudited) |
| | | | | | | | | | | | | | | | |
| Security name | | Interest rate | | | Maturity date | | | Principal | | | Value | |
| | | | |
Agency Securities (continued) | | | | | | | | | | | | | | | | |
GNMA | | | 3.50 | % | | | 4-20-2045 | | | $ | 14,167,295 | | | $ | 15,148,047 | |
GNMA | | | 3.50 | | | | 6-20-2045 | | | | 10,126,818 | | | | 10,748,667 | |
GNMA | | | 3.50 | | | | 10-20-2045 | | | | 8,099,595 | | | | 8,597,672 | |
GNMA | | | 3.50 | | | | 3-20-2046 | | | | 7,453,416 | | | | 7,914,229 | |
GNMA | | | 3.50 | | | | 4-20-2046 | | | | 15,531,032 | | | | 16,494,183 | |
GNMA %% | | | 3.50 | | | | 9-21-2046 | | | | 24,075,000 | | | | 25,544,892 | |
GNMA | | | 4.00 | | | | 6-15-2039 | | | | 209,682 | | | | 224,747 | |
GNMA | | | 4.00 | | | | 7-15-2039 | | | | 67,321 | | | | 72,159 | |
GNMA | | | 4.00 | | | | 7-15-2039 | | | | 327,484 | | | | 350,955 | |
GNMA | | | 4.00 | | | | 8-15-2040 | | | | 2,390,195 | | | | 2,562,885 | |
GNMA | | | 4.00 | | | | 9-15-2040 | | | | 3,858,040 | | | | 4,143,768 | |
GNMA | | | 4.00 | | | | 10-15-2040 | | | | 1,436,150 | | | | 1,562,730 | |
GNMA | | | 4.00 | | | | 12-15-2040 | | | | 2,595,572 | | | | 2,840,226 | |
GNMA | | | 4.00 | | | | 1-15-2041 | | | | 1,032,121 | | | | 1,130,083 | |
GNMA | | | 4.00 | | | | 1-15-2041 | | | | 2,499,151 | | | | 2,735,613 | |
GNMA | | | 4.00 | | | | 7-15-2041 | | | | 600,375 | | | | 645,517 | |
GNMA | | | 4.00 | | | | 10-20-2041 | | | | 1,203,989 | | | | 1,293,335 | |
GNMA | | | 4.00 | | | | 11-20-2041 | | | | 3,382,537 | | | | 3,639,735 | |
GNMA | | | 4.00 | | | | 2-20-2042 | | | | 790,870 | | | | 849,242 | |
GNMA | | | 4.00 | | | | 4-20-2042 | | | | 3,428,188 | | | | 3,686,177 | |
GNMA | | | 4.00 | | | | 5-20-2042 | | | | 2,631,713 | | | | 2,824,974 | |
GNMA | | | 4.00 | | | | 3-20-2043 | | | | 958,503 | | | | 1,030,513 | |
GNMA | | | 4.00 | | | | 8-20-2043 | | | | 4,093,424 | | | | 4,377,524 | |
GNMA | | | 4.00 | | | | 3-20-2044 | | | | 4,656,993 | | | | 4,976,997 | |
GNMA | | | 4.00 | | | | 5-20-2044 | | | | 4,557,933 | | | | 4,871,528 | |
GNMA | | | 4.00 | | | | 6-20-2044 | | | | 3,992,970 | | | | 4,267,177 | |
GNMA | | | 4.00 | | | | 8-20-2044 | | | | 5,158,736 | | | | 5,513,705 | |
GNMA | | | 4.00 | | | | 10-20-2044 | | | | 1,070,027 | | | | 1,143,455 | |
GNMA | | | 4.00 | | | | 12-20-2044 | | | | 6,320,213 | | | | 6,755,035 | |
GNMA | | | 4.00 | | | | 11-20-2045 | | | | 11,313,547 | | | | 12,093,596 | |
GNMA | | | 4.50 | | | | 3-15-2037 | | | | 58,750 | | | | 64,706 | |
GNMA | | | 4.50 | | | | 3-15-2038 | | | | 22,097 | | | | 24,376 | |
GNMA | | | 4.50 | | | | 3-15-2039 | | | | 335,521 | | | | 373,959 | |
GNMA | | | 4.50 | | | | 3-15-2039 | | | | 2,973,906 | | | | 3,277,655 | |
GNMA | | | 4.50 | | | | 4-15-2039 | | | | 276,857 | | | | 304,922 | |
GNMA | | | 4.50 | | | | 5-15-2039 | | | | 617,093 | | | | 683,533 | |
GNMA | | | 4.50 | | | | 6-15-2039 | | | | 333,847 | | | | 367,689 | |
GNMA | | | 4.50 | | | | 7-15-2039 | | | | 427,933 | | | | 471,643 | |
GNMA | | | 4.50 | | | | 7-15-2039 | | | | 740,814 | | | | 817,208 | |
GNMA | | | 4.50 | | | | 9-15-2039 | | | | 294,307 | | | | 324,140 | |
GNMA | | | 4.50 | | | | 10-15-2039 | | | | 618,616 | | | | 681,766 | |
GNMA | | | 4.50 | | | | 12-15-2039 | | | | 764,672 | | | | 851,979 | |
GNMA | | | 4.50 | | | | 1-15-2040 | | | | 840,962 | | | | 926,867 | |
GNMA | | | 4.50 | | | | 4-15-2040 | | | | 92,236 | | | | 101,792 | |
GNMA | | | 4.50 | | | | 5-15-2040 | | | | 1,623,432 | | | | 1,801,795 | |
GNMA | | | 4.50 | | | | 5-15-2040 | | | | 1,584,393 | | | | 1,751,299 | |
GNMA | | | 4.50 | | | | 5-15-2040 | | | | 23,847 | | | | 26,283 | |
GNMA | | | 4.50 | | | | 6-15-2040 | | | | 809,034 | | | | 894,340 | |
GNMA | | | 4.50 | | | | 6-15-2040 | | | | 307,222 | | | | 339,032 | |
GNMA | | | 4.50 | | | | 6-15-2040 | | | | 83,848 | | | | 92,429 | |
| | | | | | |
| Portfolio of investments—August 31, 2016 (unaudited) | | Wells Fargo Diversified Fixed Income Portfolio | | | 23 | |
| | | | | | | | | | | | | | | | |
| Security name | | Interest rate | | | Maturity date | | | Principal | | | Value | |
| | | | |
Agency Securities (continued) | | | | | | | | | | | | | | | | |
GNMA | | | 4.50 | % | | | 9-15-2040 | | | $ | 61,091 | | | $ | 67,283 | |
GNMA | | | 4.50 | | | | 9-15-2040 | | | | 300,907 | | | | 331,531 | |
GNMA | | | 4.50 | | | | 10-15-2040 | | | | 28,317 | | | | 31,188 | |
GNMA | | | 4.50 | | | | 11-15-2040 | | | | 1,274,636 | | | | 1,406,327 | |
GNMA | | | 4.50 | | | | 12-15-2040 | | | | 98,186 | | | | 108,139 | |
GNMA | | | 4.50 | | | | 2-15-2041 | | | | 969,604 | | | | 1,077,776 | |
GNMA | | | 4.50 | | | | 3-15-2041 | | | | 42,793 | | | | 47,131 | |
GNMA | | | 4.50 | | | | 4-15-2041 | | | | 101,334 | | | | 111,606 | |
GNMA | | | 4.50 | | | | 4-15-2041 | | | | 170,514 | | | | 187,798 | |
GNMA | | | 4.50 | | | | 5-15-2041 | | | | 28,479 | | | | 31,406 | |
GNMA | | | 4.50 | | | | 6-15-2041 | | | | 598,615 | | | | 659,296 | |
GNMA | | | 4.50 | | | | 6-15-2041 | | | | 1,279,813 | | | | 1,409,546 | |
GNMA | | | 4.50 | | | | 6-15-2041 | | | | 54,192 | | | | 59,685 | |
GNMA | | | 4.50 | | | | 6-15-2041 | | | | 137,391 | | | | 151,343 | |
GNMA | | | 4.50 | | | | 7-15-2041 | | | | 104,218 | | | | 114,782 | |
GNMA | | | 4.50 | | | | 7-20-2041 | | | | 983,201 | | | | 1,076,508 | |
GNMA | | | 4.50 | | | | 10-15-2041 | | | | 158,950 | | | | 175,241 | |
GNMA | | | 4.50 | | | | 10-15-2041 | | | | 59,187 | | | | 65,187 | |
GNMA | | | 4.50 | | | | 10-15-2041 | | | | 40,400 | | | | 44,495 | |
GNMA | | | 4.50 | | | | 11-20-2041 | | | | 898,054 | | | | 983,282 | |
GNMA | | | 4.50 | | | | 12-20-2043 | | | | 3,624,348 | | | | 3,912,005 | |
GNMA | | | 4.50 | | | | 1-20-2044 | | | | 2,200,375 | | | | 2,375,014 | |
GNMA | | | 4.50 | | | | 4-20-2044 | | | | 2,558,212 | | | | 2,761,251 | |
GNMA | | | 4.50 | | | | 10-20-2045 | | | | 4,555,950 | | | | 4,917,546 | |
GNMA | | | 5.00 | | | | 3-15-2035 | | | | 327,612 | | | | 370,274 | |
GNMA | | | 5.00 | | | | 5-15-2038 | | | | 1,109,671 | | | | 1,241,299 | |
GNMA | | | 5.00 | | | | 8-15-2038 | | | | 764,210 | | | | 854,860 | |
GNMA | | | 5.00 | | | | 8-15-2038 | | | | 134,208 | | | | 150,519 | |
GNMA | | | 5.00 | | | | 8-15-2038 | | | | 6,655 | | | | 7,473 | |
GNMA | | | 5.00 | | | | 12-15-2038 | | | | 375,684 | | | | 421,479 | |
GNMA | | | 5.00 | | | | 3-15-2039 | | | | 450,764 | | | | 505,676 | |
GNMA | | | 5.00 | | | | 3-15-2039 | | | | 62,382 | | | | 69,965 | |
GNMA | | | 5.00 | | | | 5-15-2039 | | | | 190,297 | | | | 213,253 | |
GNMA | | | 5.00 | | | | 7-15-2039 | | | | 27,934 | | | | 31,248 | |
GNMA | | | 5.00 | | | | 9-15-2039 | | | | 3,478,994 | | | | 3,934,199 | |
GNMA | | | 5.00 | | | | 11-15-2039 | | | | 995,395 | | | | 1,125,420 | |
GNMA | | | 5.00 | | | | 1-15-2040 | | | | 1,541,127 | | | | 1,742,246 | |
GNMA | | | 5.00 | | | | 2-15-2040 | | | | 957,086 | | | | 1,082,202 | |
GNMA | | | 5.00 | | | | 3-15-2040 | | | | 2,966,102 | | | | 3,318,600 | |
GNMA | | | 5.00 | | | | 5-15-2040 | | | | 935,219 | | | | 1,046,177 | |
GNMA | | | 5.00 | | | | 7-15-2040 | | | | 918,371 | | | | 1,030,015 | |
GNMA | | | 5.00 | | | | 7-15-2040 | | | | 2,738 | | | | 3,073 | |
GNMA | | | 5.00 | | | | 12-15-2040 | | | | 658,535 | | | | 736,668 | |
GNMA | | | 5.00 | | | | 9-15-2041 | | | | 91,513 | | | | 101,824 | |
GNMA | | | 5.00 | | | | 10-15-2041 | | | | 222,130 | | | | 248,387 | |
GNMA | | | 5.00 | | | | 5-20-2042 | | | | 1,296,769 | | | | 1,410,237 | |
GNMA | | | 5.50 | | | | 9-15-2034 | | | | 141,212 | | | | 162,323 | |
GNMA | | | 5.50 | | | | 11-15-2035 | | | | 208,089 | | | | 236,369 | |
GNMA | | | 5.50 | | | | 12-15-2035 | | | | 185,162 | | | | 209,784 | |
GNMA | | | 5.50 | | | | 2-15-2036 | | | | 86,869 | | | | 98,421 | |
| | | | |
| 24 | | Wells Fargo Diversified Fixed Income Portfolio | | Portfolio of investments—August 31, 2016 (unaudited) |
| | | | | | | | | | | | | | | | |
| Security name | | Interest rate | | | Maturity date | | | Principal | | | Value | |
| | | | |
Agency Securities (continued) | | | | | | | | | | | | | | | | |
GNMA | | | 5.50 | % | | | 3-15-2036 | | | $ | 199,120 | | | $ | 224,956 | |
GNMA | | | 5.50 | | | | 5-15-2036 | | | | 2,955 | | | | 3,345 | |
GNMA | | | 5.50 | | | | 5-15-2036 | | | | 35,219 | | | | 40,453 | |
GNMA | | | 5.50 | | | | 2-15-2037 | | | | 56,070 | | | | 63,071 | |
GNMA | | | 5.50 | | | | 6-15-2037 | | | | 2,981 | | | | 3,353 | |
GNMA | | | 5.50 | | | | 8-15-2037 | | | | 63,610 | | | | 71,553 | |
GNMA | | | 5.50 | | | | 2-15-2038 | | | | 149,254 | | | | 168,064 | |
GNMA | | | 5.50 | | | | 2-15-2038 | | | | 336,201 | | | | 381,009 | |
GNMA | | | 5.50 | | | | 3-15-2038 | | | | 8,068 | | | | 9,085 | |
GNMA | | | 5.50 | | | | 3-15-2038 | | | | 39,303 | | | | 44,327 | |
GNMA | | | 5.50 | | | | 4-15-2038 | | | | 86,839 | | | | 97,803 | |
GNMA | | | 5.50 | | | | 5-15-2038 | | | | 57,204 | | | | 64,415 | |
GNMA | | | 5.50 | | | | 5-15-2038 | | | | 258,047 | | | | 291,036 | |
GNMA | | | 5.50 | | | | 6-15-2038 | | | | 28,682 | | | | 32,297 | |
GNMA | | | 5.50 | | | | 6-15-2038 | | | | 72,000 | | | | 81,198 | |
GNMA | | | 5.50 | | | | 6-15-2038 | | | | 13,172 | | | | 14,817 | |
GNMA | | | 5.50 | | | | 7-15-2038 | | | | 247,395 | | | | 278,578 | |
GNMA | | | 5.50 | | | | 8-15-2038 | | | | 1,468,811 | | | | 1,680,992 | |
GNMA | | | 5.50 | | | | 8-15-2038 | | | | 97,764 | | | | 110,085 | |
GNMA | | | 5.50 | | | | 8-15-2038 | | | | 16,877 | | | | 19,004 | |
GNMA | | | 5.50 | | | | 9-15-2038 | | | | 763,174 | | | | 859,273 | |
GNMA | | | 5.50 | | | | 9-15-2038 | | | | 51,870 | | | | 59,356 | |
GNMA | | | 5.50 | | | | 9-15-2038 | | | | 50,022 | | | | 56,327 | |
GNMA | | | 5.50 | | | | 10-15-2038 | | | | 366,907 | | | | 412,721 | |
GNMA | | | 5.50 | | | | 10-15-2038 | | | | 35,564 | | | | 40,048 | |
GNMA | | | 5.50 | | | | 11-15-2038 | | | | 23,562 | | | | 26,529 | |
GNMA | | | 5.50 | | | | 11-15-2038 | | | | 61,319 | | | | 69,016 | |
GNMA | | | 5.50 | | | | 11-15-2038 | | | | 163,516 | | | | 184,129 | |
GNMA | | | 5.50 | | | | 11-15-2038 | | | | 164,932 | | | | 186,019 | |
GNMA | | | 5.50 | | | | 12-15-2038 | | | | 202,749 | | | | 228,306 | |
GNMA | | | 5.50 | | | | 12-15-2038 | | | | 33,851 | | | | 38,118 | |
GNMA | | | 5.50 | | | | 12-15-2038 | | | | 185,004 | | | | 208,377 | |
GNMA | | | 5.50 | | | | 1-15-2039 | | | | 64,230 | | | | 72,442 | |
GNMA | | | 5.50 | | | | 1-15-2039 | | | | 34,749 | | | | 39,144 | |
GNMA | | | 5.50 | | | | 7-15-2039 | | | | 15,233 | | | | 17,208 | |
GNMA | | | 5.50 | | | | 7-15-2039 | | | | 109,357 | | | | 123,131 | |
GNMA | | | 5.50 | | | | 8-15-2039 | | | | 52,079 | | | | 58,661 | |
GNMA | | | 5.50 | | | | 10-15-2039 | | | | 727,537 | | | | 819,239 | |
GNMA | | | 5.50 | | | | 2-15-2040 | | | | 10,360 | | | | 11,653 | |
GNMA | | | 5.50 | | | | 2-15-2040 | | | | 28,494 | | | | 32,101 | |
GNMA | | | 5.50 | | | | 3-15-2040 | | | | 57,722 | | | | 65,670 | |
GNMA | | | 5.50 | | | | 3-15-2040 | | | | 98,818 | | | | 111,157 | |
GNMA | | | 5.50 | | | | 3-15-2040 | | | | 40,152 | | | | 45,213 | |
GNMA | | | 5.50 | | | | 3-15-2040 | | | | 338,228 | | | | 380,856 | |
GNMA | | | 5.50 | | | | 7-15-2040 | | | | 18,302 | | | | 20,587 | |
GNMA | | | 5.50 | | | | 12-15-2040 | | | | 55,438 | | | | 62,427 | |
GNMA | | | 5.50 | | | | 2-15-2041 | | | | 60,514 | | | | 68,070 | |
GNMA | | | 5.50 | | | | 4-15-2041 | | | | 116,912 | | | | 131,510 | |
GNMA | | | 6.00 | | | | 12-15-2031 | | | | 19,889 | | | | 22,715 | |
GNMA | | | 6.00 | | | | 6-15-2036 | | | | 168,761 | | | | 192,741 | |
| | | | | | |
| Portfolio of investments—August 31, 2016 (unaudited) | | Wells Fargo Diversified Fixed Income Portfolio | | | 25 | |
| | | | | | | | | | | | | | | | |
| Security name | | Interest rate | | | Maturity date | | | Principal | | | Value | |
| | | | |
Agency Securities (continued) | | | | | | | | | | | | | | | | |
GNMA | | | 6.00 | % | | | 8-15-2036 | | | $ | 2,774 | | | $ | 3,182 | |
GNMA | | | 6.00 | | | | 1-15-2037 | | | | 461,778 | | | | 529,601 | |
GNMA | | | 6.00 | | | | 5-15-2037 | | | | 4,467 | | | | 5,102 | |
GNMA | | | 6.00 | | | | 5-15-2037 | | | | 4,618 | | | | 5,291 | |
GNMA | | | 6.00 | | | | 5-15-2037 | | | | 132,813 | | | | 152,294 | |
GNMA | | | 6.00 | | | | 6-15-2037 | | | | 14,421 | | | | 16,645 | |
GNMA | | | 6.00 | | | | 6-15-2037 | | | | 54,098 | | | | 62,734 | |
GNMA | | | 6.00 | | | | 7-15-2037 | | | | 41,055 | | | | 46,889 | |
GNMA | | | 6.00 | | | | 8-15-2037 | | | | 79,759 | | | | 93,006 | |
GNMA | | | 6.00 | | | | 8-15-2037 | | | | 4,863 | | | | 5,614 | |
GNMA | | | 6.00 | | | | 8-15-2037 | | | | 177,933 | | | | 203,215 | |
GNMA | | | 6.00 | | | | 1-15-2038 | | | | 206,837 | | | | 236,227 | |
GNMA | | | 6.00 | | | | 1-15-2038 | | | | 2,332 | | | | 2,664 | |
GNMA | | | 6.00 | | | | 2-15-2038 | | | | 4,096 | | | | 4,678 | |
GNMA | | | 6.00 | | | | 7-15-2038 | | | | 285,086 | | | | 325,594 | |
GNMA | | | 6.00 | | | | 8-15-2038 | | | | 217,245 | | | | 248,113 | |
GNMA | | | 6.00 | | | | 8-15-2038 | | | | 65,945 | | | | 75,329 | |
GNMA | | | 6.00 | | | | 8-15-2038 | | | | 109,068 | | | | 124,565 | |
GNMA | | | 6.00 | | | | 9-15-2038 | | | | 137,234 | | | | 156,733 | |
GNMA | | | 6.00 | | | | 9-15-2038 | | | | 302,558 | | | | 345,549 | |
GNMA | | | 6.00 | | | | 9-15-2038 | | | | 2,283 | | | | 2,608 | |
GNMA | | | 6.00 | | | | 9-15-2038 | | | | 2,030 | | | | 2,321 | |
GNMA | | | 6.00 | | | | 9-15-2038 | | | | 2,071 | | | | 2,365 | |
GNMA | | | 6.00 | | | | 10-15-2038 | | | | 44,162 | | | | 50,446 | |
GNMA | | | 6.00 | | | | 10-15-2038 | | | | 225,411 | | | | 257,440 | |
GNMA | | | 6.00 | | | | 10-15-2038 | | | | 28,719 | | | | 32,799 | |
GNMA | | | 6.00 | | | | 10-15-2038 | | | | 17,474 | | | | 19,961 | |
GNMA | | | 6.00 | | | | 10-15-2038 | | | | 43,581 | | | | 49,805 | |
GNMA | | | 6.00 | | | | 10-15-2038 | | | | 128,530 | | | | 146,793 | |
GNMA | | | 6.00 | | | | 10-15-2038 | | | | 7,787 | | | | 8,894 | |
GNMA | | | 6.00 | | | | 11-15-2038 | | | | 80,163 | | | | 91,572 | |
GNMA | | | 6.00 | | | | 11-15-2038 | | | | 89,730 | | | | 102,501 | |
GNMA | | | 6.00 | | | | 12-15-2038 | | | | 3,162 | | | | 3,611 | |
GNMA | | | 6.00 | | | | 12-15-2038 | | | | 247,884 | | | | 287,117 | |
GNMA | | | 6.00 | | | | 1-15-2039 | | | | 114,850 | | | | 131,190 | |
GNMA | | | 6.00 | | | | 1-15-2039 | | | | 2,790 | | | | 3,187 | |
GNMA | | | 6.00 | | | | 2-15-2039 | | | | 2,158 | | | | 2,465 | |
GNMA | | | 6.00 | | | | 2-15-2039 | | | | 201,972 | | | | 230,670 | |
GNMA | | | 6.00 | | | | 6-15-2039 | | | | 14,147 | | | | 16,157 | |
GNMA | | | 6.00 | | | | 8-15-2039 | | | | 18,974 | | | | 21,670 | |
GNMA | | | 6.00 | | | | 8-15-2039 | | | | 5,306 | | | | 6,162 | |
GNMA | | | 6.00 | | | | 10-15-2039 | | | | 22,047 | | | | 25,331 | |
GNMA | | | 6.00 | | | | 11-15-2039 | | | | 1,815 | | | | 2,073 | |
GNMA | | | 6.00 | | | | 12-15-2039 | | | | 223,656 | | | | 255,435 | |
GNMA | | | 6.00 | | | | 3-15-2040 | | | | 6,801 | | | | 7,767 | |
GNMA | | | 6.00 | | | | 12-15-2040 | | | | 164,925 | | | | 188,359 | |
GNMA | | | 6.00 | | | | 6-15-2041 | | | | 620,345 | | | | 716,882 | |
GNMA | | | 6.00 | | | | 6-15-2041 | | | | 87,837 | | | | 101,154 | |
GNMA | | | 6.00 | | | | 6-15-2041 | | | | 433,986 | | | | 495,651 | |
GNMA | | | 6.50 | | | | 11-15-2023 | | | | 429 | | | | 494 | |
| | | | |
| 26 | | Wells Fargo Diversified Fixed Income Portfolio | | Portfolio of investments—August 31, 2016 (unaudited) |
| | | | | | | | | | | | | | | | |
| Security name | | Interest rate | | | Maturity date | | | Principal | | | Value | |
| | | | |
Agency Securities (continued) | | | | | | | | | | | | | | | | |
GNMA | | | 6.50 | % | | | 12-15-2023 | | | $ | 160 | | | $ | 184 | |
GNMA | | | 6.50 | | | | 10-15-2031 | | | | 93,671 | | | | 110,586 | |
GNMA | | | 6.50 | | | | 3-15-2034 | | | | 197,272 | | | | 226,985 | |
GNMA | | | 6.50 | | | | 9-15-2036 | | | | 33,664 | | | | 41,314 | |
GNMA | | | 6.50 | | | | 2-15-2037 | | | | 27,210 | | | | 31,309 | |
GNMA | | | 6.50 | | | | 12-15-2037 | | | | 61,848 | | | | 72,904 | |
GNMA | | | 6.50 | | | | 1-15-2038 | | | | 65,767 | | | | 75,673 | |
GNMA | | | 6.50 | | | | 4-15-2038 | | | | 5,296 | | | | 6,094 | |
GNMA | | | 6.50 | | | | 5-15-2038 | | | | 5,165 | | | | 5,966 | |
GNMA | | | 6.50 | | | | 5-15-2038 | | | | 60,658 | | | | 69,794 | |
GNMA | | | 6.50 | | | | 8-15-2038 | | | | 29,169 | | | | 34,191 | |
GNMA | | | 6.50 | | | | 8-15-2038 | | | | 2,335 | | | | 2,687 | |
GNMA | | | 6.50 | | | | 8-15-2038 | | | | 50,528 | | | | 60,410 | |
GNMA | | | 6.50 | | | | 9-15-2038 | | | | 56,586 | | | | 65,831 | |
GNMA | | | 6.50 | | | | 9-15-2038 | | | | 183,653 | | | | 218,581 | |
GNMA | | | 6.50 | | | | 10-15-2038 | | | | 31,766 | | | | 36,551 | |
GNMA | | | 6.50 | | | | 10-15-2038 | | | | 68,503 | | | | 78,821 | |
GNMA | | | 6.50 | | | | 10-15-2038 | | | | 466,316 | | | | 536,551 | |
GNMA | | | 6.50 | | | | 11-15-2038 | | | | 2,032 | | | | 2,338 | |
GNMA | | | 6.50 | | | | 11-15-2038 | | | | 8,978 | | | | 10,331 | |
GNMA | | | 6.50 | | | | 12-15-2038 | | | | 90,017 | | | | 103,575 | |
GNMA | | | 6.50 | | | | 2-15-2039 | | | | 2,497 | | | | 2,913 | |
GNMA | | | 6.50 | | | | 5-15-2040 | | | | 97,810 | | | | 112,542 | |
GNMA | | | 6.50 | | | | 7-15-2040 | | | | 97,222 | | | | 116,780 | |
GNMA | | | 6.50 | | | | 7-15-2040 | | | | 407,036 | | | | 480,368 | |
GNMA | | | 7.00 | | | | 3-15-2037 | | | | 5,457 | | | | 5,562 | |
TVA | | | 3.50 | | | | 12-15-2042 | | | | 150,000 | | | | 167,208 | |
TVA | | | 3.88 | | | | 2-15-2021 | | | | 1,320,000 | | | | 1,463,163 | |
TVA | | | 4.50 | | | | 4-1-2018 | | | | 200,000 | | | | 211,079 | |
TVA | | | 4.65 | | | | 6-15-2035 | | | | 200,000 | | | | 255,185 | |
TVA | | | 4.88 | | | | 1-15-2048 | | | | 200,000 | | | | 265,119 | |
TVA | | | 5.25 | | | | 9-15-2039 | | | | 1,500,000 | | | | 2,114,444 | |
TVA | | | 5.88 | | | | 4-1-2036 | | | | 300,000 | | | | 443,699 | |
TVA | | | 6.15 | | | | 1-15-2038 | | | | 400,000 | | | | 613,863 | |
| |
Total Agency Securities (Cost $1,491,864,872) | | | | 1,538,442,378 | |
| | | | | | | | | | | | | | | | |
| | | | |
Corporate Bonds and Notes: 20.82% | | | | | | | | | | | | | | | | |
| | | | |
Consumer Discretionary: 1.99% | | | | | | | | | | | | | | | | |
| | | | |
| Auto Components: 0.05% | | | | | | | | | | | | | | | | |
BorgWarner Incorporated | | | 4.63 | | | | 9-15-2020 | | | | 100,000 | | | | 108,258 | |
Delphi Corporation | | | 4.15 | | | | 3-15-2024 | | | | 1,000,000 | | | | 1,070,160 | |
Johnson Controls Incorporated | | | 3.75 | | | | 12-1-2021 | | | | 500,000 | | | | 531,562 | |
Johnson Controls Incorporated | | | 4.25 | | | | 3-1-2021 | | | | 120,000 | | | | 128,770 | |
Johnson Controls Incorporated | | | 4.63 | | | | 7-2-2044 | | | | 850,000 | | | | 940,793 | |
Johnson Controls Incorporated | | | 5.00 | | | | 3-30-2020 | | | | 100,000 | | | | 109,497 | |
Johnson Controls Incorporated | | | 5.70 | | | | 3-1-2041 | | | | 240,000 | | | | 291,131 | |
| |
| | | | 3,180,171 | |
| | | | | | | | | | | | | | | | |
| | | | | | |
| Portfolio of investments—August 31, 2016 (unaudited) | | Wells Fargo Diversified Fixed Income Portfolio | | | 27 | |
| | | | | | | | | | | | | | | | |
| Security name | | Interest rate | | | Maturity date | | | Principal | | | Value | |
| | | | |
| Automobiles: 0.08% | | | | | | | | | | | | | | | | |
Ford Motor Company | | | 6.63 | % | | | 10-1-2028 | | | $ | 200,000 | | | $ | 253,837 | |
Ford Motor Company | | | 7.45 | | | | 7-16-2031 | | | | 1,000,000 | | | | 1,357,581 | |
General Motors Company | | | 3.50 | | | | 10-2-2018 | | | | 1,000,000 | | | | 1,028,945 | |
General Motors Company | | | 6.25 | | | | 10-2-2043 | | | | 1,250,000 | | | | 1,498,053 | |
General Motors Company | | | 6.60 | | | | 4-1-2036 | | | | 500,000 | | | | 616,521 | |
| |
| | | | 4,754,937 | |
| | | | | | | | | | | | | | | | |
| | | | |
| Diversified Consumer Services: 0.04% | | | | | | | | | | | | | | | | |
Cornell University | | | 5.45 | | | | 2-1-2019 | | | | 100,000 | | | | 109,703 | |
President & Fellows of Harvard College | | | 4.88 | | | | 10-15-2040 | | | | 300,000 | | | | 398,237 | |
Princeton University | | | 5.70 | | | | 3-1-2039 | | | | 500,000 | | | | 732,526 | |
Stanford University | | | 4.75 | | | | 5-1-2019 | | | | 500,000 | | | | 543,740 | |
University of Pennsylvania | | | 4.67 | | | | 9-1-2112 | | | | 500,000 | | | | 595,494 | |
| |
| | | | 2,379,700 | |
| | | | | | | | | | | | | | | | |
| | | | |
| Hotels, Restaurants & Leisure: 0.15% | | | | | | | | | | | | | | | | |
Brinker International Incorporated | | | 3.88 | | | | 5-15-2023 | | | | 150,000 | | | | 149,492 | |
Carnival Corporation | | | 1.88 | | | | 12-15-2017 | | | | 200,000 | | | | 201,418 | |
Carnival Corporation | | | 3.95 | | | | 10-15-2020 | | | | 267,000 | | | | 288,598 | |
Darden Restaurants Incorporated | | | 6.80 | | | | 10-15-2037 | | | | 20,000 | | | | 23,762 | |
Hyatt Hotels Corporation | | | 3.38 | | | | 7-15-2023 | | | | 160,000 | | | | 165,049 | |
Marriott International Incorporated | | | 3.00 | | | | 3-1-2019 | | | | 200,000 | | | | 205,845 | |
Marriott International Incorporated | | | 3.38 | | | | 10-15-2020 | | | | 167,000 | | | | 174,364 | |
McDonald’s Corporation | | | 2.63 | | | | 1-15-2022 | | | | 1,000,000 | | | | 1,029,776 | |
McDonald’s Corporation | | | 3.38 | | | | 5-26-2025 | | | | 350,000 | | | | 368,646 | |
McDonald’s Corporation | | | 3.50 | | | | 7-15-2020 | | | | 200,000 | | | | 213,410 | |
McDonald’s Corporation | | | 3.63 | | | | 5-20-2021 | | | | 100,000 | | | | 107,886 | |
McDonald’s Corporation | | | 3.70 | | | | 1-30-2026 | | | | 750,000 | | | | 810,510 | |
McDonald’s Corporation | | | 3.70 | | | | 2-15-2042 | | | | 500,000 | | | | 503,810 | |
McDonald’s Corporation | | | 5.35 | | | | 3-1-2018 | | | | 400,000 | | | | 424,378 | |
McDonald’s Corporation | | | 5.80 | | | | 10-15-2017 | | | | 100,000 | | | | 105,076 | |
McDonald’s Corporation | | | 6.30 | | | | 10-15-2037 | | | | 300,000 | | | | 400,886 | |
McDonald’s Corporation | | | 6.30 | | | | 3-1-2038 | | | | 600,000 | | | | 797,816 | |
McDonald’s Corporation | | | 4.60 | | | | 5-26-2045 | | | | 250,000 | | | | 282,740 | |
Starbucks Corporation | | | 2.00 | | | | 12-5-2018 | | | | 250,000 | | | | 254,408 | |
Starbucks Corporation | | | 2.10 | | | | 2-4-2021 | | | | 750,000 | | | | 769,325 | |
Starbucks Corporation | | | 2.70 | | | | 6-15-2022 | | | | 200,000 | | | | 209,868 | |
Starbucks Corporation | | | 4.30 | | | | 6-15-2045 | | | | 150,000 | | | | 180,492 | |
Starwood Hotels & Resort Company | | | 3.13 | | | | 2-15-2023 | | | | 226,000 | | | | 230,010 | |
Starwood Hotels & Resort Company | | | 3.75 | | | | 3-15-2025 | | | | 500,000 | | | | 522,343 | |
Wyndham Worldwide Corporation | | | 4.25 | | | | 3-1-2022 | | | | 500,000 | | | | 531,048 | |
| |
| | | | 8,950,956 | |
| | | | | | | | | | | | | | | | |
| | | | |
| Household Durables: 0.09% | | | | | | | | | | | | | | | | |
Leggett & Platt Incorporated | | | 3.40 | | | | 8-15-2022 | | | | 100,000 | | | | 103,623 | |
Mohawk Industries Incorporated | | | 3.85 | | | | 2-1-2023 | | | | 100,000 | | | | 104,859 | |
Newell Brands Incorporated | | | 2.60 | | | | 3-29-2019 | | | | 1,000,000 | | | | 1,022,930 | |
Newell Brands Incorporated | | | 3.15 | | | | 4-1-2021 | | | | 750,000 | | | | 782,452 | |
Newell Brands Incorporated | | | 4.20 | | | | 4-1-2026 | | | | 750,000 | | | | 818,713 | |
| | | | |
| 28 | | Wells Fargo Diversified Fixed Income Portfolio | | Portfolio of investments—August 31, 2016 (unaudited) |
| | | | | | | | | | | | | | | | |
| Security name | | Interest rate | | | Maturity date | | | Principal | | | Value | |
| | | | |
| Household Durables (continued) | | | | | | | | | | | | | | | | |
Newell Brands Incorporated | | | 5.50 | % | | | 4-1-2046 | | | $ | 750,000 | | | $ | 926,090 | |
Newell Rubbermaid Incorporated | | | 2.88 | | | | 12-1-2019 | | | | 200,000 | | | | 205,786 | |
Newell Rubbermaid Incorporated | | | 4.00 | | | | 6-15-2022 | | | | 100,000 | | | | 105,854 | |
Newell Rubbermaid Incorporated | | | 6.25 | | | | 4-15-2018 | | | | 165,000 | | | | 176,324 | |
Tupperware Brands Corporation | | | 4.75 | | | | 6-1-2021 | | | | 250,000 | | | | 270,263 | |
Whirlpool Corporation | | | 4.00 | | | | 3-1-2024 | | | | 125,000 | | | | 136,302 | |
Whirlpool Corporation | | | 4.70 | | | | 6-1-2022 | | | | 200,000 | | | | 223,198 | |
Whirlpool Corporation | | | 4.85 | | | | 6-15-2021 | | | | 100,000 | | | | 112,042 | |
| |
| | | | 4,988,436 | |
| | | | | | | | | | | | | | | | |
| | | | |
| Internet & Catalog Retail: 0.10% | | | | | | | | | | | | | | | | |
Amazon.com Incorporated | | | 1.20 | | | | 11-29-2017 | | | | 350,000 | | | | 350,562 | |
Amazon.com Incorporated | | | 2.50 | | | | 11-29-2022 | | | | 500,000 | | | | 515,930 | |
Amazon.com Incorporated | | | 2.60 | | | | 12-5-2019 | | | | 400,000 | | | | 416,087 | |
Amazon.com Incorporated | | | 3.30 | | | | 12-5-2021 | | | | 400,000 | | | | 430,121 | |
Amazon.com Incorporated | | | 3.80 | | | | 12-5-2024 | | | | 500,000 | | | | 557,904 | |
Amazon.com Incorporated | | | 4.80 | | | | 12-5-2034 | | | | 500,000 | | | | 600,430 | |
Amazon.com Incorporated | | | 4.95 | | | | 12-5-2044 | | | | 600,000 | | | | 754,403 | |
Expedia Incorporated | | | 4.50 | | | | 8-15-2024 | | | | 100,000 | | | | 105,260 | |
Expedia Incorporated | | | 5.95 | | | | 8-15-2020 | | | | 600,000 | | | | 672,548 | |
QVC Incorporated | | | 4.38 | | | | 3-15-2023 | | | | 300,000 | | | | 303,308 | |
QVC Incorporated | | | 4.45 | | | | 2-15-2025 | | | | 500,000 | | | | 497,918 | |
QVC Incorporated | | | 5.13 | | | | 7-2-2022 | | | | 200,000 | | | | 213,190 | |
QVC Incorporated | | | 5.45 | | | | 8-15-2034 | | | | 250,000 | | | | 236,969 | |
QVC Incorporated | | | 5.95 | | | | 3-15-2043 | | | | 125,000 | | | | 121,721 | |
| |
| | | | 5,776,351 | |
| | | | | | | | | | | | | | | | |
| | | | |
| Leisure Products: 0.01% | | | | | | | | | | | | | | | | |
Hasbro Incorporated | | | 6.35 | | | | 3-15-2040 | | | | 155,000 | | | | 191,657 | |
Mattel Incorporated | | | 1.70 | | | | 3-15-2018 | | | | 125,000 | | | | 125,408 | |
Mattel Incorporated | | | 3.15 | | | | 3-15-2023 | | | | 100,000 | | | | 100,683 | |
Mattel Incorporated | | | 4.35 | | | | 10-1-2020 | | | | 100,000 | | | | 108,440 | |
Mattel Incorporated | | | 6.20 | | | | 10-1-2040 | | | | 100,000 | | | | 118,908 | |
| |
| | | | 645,096 | |
| | | | | | | | | | | | | | | | |
| | | | |
| Media: 1.06% | | | | | | | | | | | | | | | | |
21st Century Fox America Incorporated | | | 3.00 | | | | 9-15-2022 | | | | 375,000 | | | | 390,430 | |
21st Century Fox America Incorporated | | | 3.70 | | | | 9-15-2024 | | | | 500,000 | | | | 541,692 | |
21st Century Fox America Incorporated | | | 4.50 | | | | 2-15-2021 | | | | 500,000 | | | | 555,859 | |
21st Century Fox America Incorporated | | | 4.75 | | | | 9-15-2044 | | | | 500,000 | | | | 564,159 | |
21st Century Fox America Incorporated | | | 6.15 | | | | 2-15-2041 | | | | 735,000 | | | | 953,502 | |
21st Century Fox America Incorporated | | | 6.20 | | | | 12-15-2034 | | | | 500,000 | | | | 636,454 | |
21st Century Fox America Incorporated | | | 6.65 | | | | 11-15-2037 | | | | 350,000 | | | | 468,929 | |
21st Century Fox America Incorporated | | | 6.90 | | | | 3-1-2019 | | | | 500,000 | | | | 563,259 | |
21st Century Fox America Incorporated | | | 6.90 | | | | 8-15-2039 | | | | 500,000 | | | | 685,709 | |
21st Century Fox America Incorporated | | | 8.15 | | | | 10-17-2036 | | | | 250,000 | | | | 367,814 | |
CBS Corporation | | | 3.70 | | | | 8-15-2024 | | | | 500,000 | | | | 527,290 | |
CBS Corporation | | | 4.63 | | | | 5-15-2018 | | | | 180,000 | | | | 189,083 | |
CBS Corporation | | | 4.85 | | | | 7-1-2042 | | | | 200,000 | | | | 212,584 | |
| | | | | | |
| Portfolio of investments—August 31, 2016 (unaudited) | | Wells Fargo Diversified Fixed Income Portfolio | | | 29 | |
| | | | | | | | | | | | | | | | |
| Security name | | Interest rate | | | Maturity date | | | Principal | | | Value | |
| | | | |
| Media (continued) | | | | | | | | | | | | | | | | |
CBS Corporation | | | 4.90 | % | | | 8-15-2044 | | | $ | 500,000 | | | $ | 542,419 | |
CBS Corporation | | | 7.88 | | | | 7-30-2030 | | | | 600,000 | | | | 855,730 | |
Charter Communications Operating LLC 144A | | | 4.46 | | | | 7-23-2022 | | | | 3,000,000 | | | | 3,252,552 | |
Charter Communications Operating LLC 144A | | | 6.48 | | | | 10-23-2045 | | | | 2,000,000 | | | | 2,457,580 | |
Comcast Corporation | | | 3.13 | | | | 7-15-2022 | | | | 500,000 | | | | 533,748 | |
Comcast Corporation | | | 3.15 | | | | 3-1-2026 | | | | 1,000,000 | | | | 1,058,087 | |
Comcast Corporation | | | 3.38 | | | | 2-15-2025 | | | | 750,000 | | | | 806,842 | |
Comcast Corporation | | | 3.60 | | | | 3-1-2024 | | | | 500,000 | | | | 548,847 | |
Comcast Corporation | | | 4.20 | | | | 8-15-2034 | | | | 750,000 | | | | 837,943 | |
Comcast Corporation | | | 4.40 | | | | 8-15-2035 | | | | 300,000 | | | | 343,969 | |
Comcast Corporation | | | 4.65 | | | | 7-15-2042 | | | | 548,000 | | | | 642,678 | |
Comcast Corporation | | | 4.75 | | | | 3-1-2044 | | | | 375,000 | | | | 448,975 | |
Comcast Corporation | | | 5.15 | | | | 3-1-2020 | | | | 500,000 | | | | 561,862 | |
Comcast Corporation | | | 5.70 | | | | 7-1-2019 | | | | 1,000,000 | | | | 1,120,020 | |
Comcast Corporation | | | 5.88 | | | | 2-15-2018 | | | | 75,000 | | | | 80,103 | |
Comcast Corporation | | | 6.30 | | | | 11-15-2017 | | | | 500,000 | | | | 530,799 | |
Comcast Corporation | | | 6.40 | | | | 3-1-2040 | | | | 500,000 | | | | 713,958 | |
Comcast Corporation | | | 6.45 | | | | 3-15-2037 | | | | 900,000 | | | | 1,263,377 | |
Comcast Corporation | | | 6.50 | | | | 11-15-2035 | | | | 550,000 | | | | 775,161 | |
Comcast Corporation | | | 6.55 | | | | 7-1-2039 | | | | 650,000 | | | | 935,873 | |
Comcast Corporation | | | 6.95 | | | | 8-15-2037 | | | | 400,000 | | | | 592,923 | |
Discovery Communications LLC | | | 3.30 | | | | 5-15-2022 | | | | 250,000 | | | | 254,579 | |
Discovery Communications LLC | | | 4.38 | | | | 6-15-2021 | | | | 300,000 | | | | 324,665 | |
Discovery Communications LLC | | | 4.95 | | | | 5-15-2042 | | | | 250,000 | | | | 234,428 | |
Discovery Communications LLC | | | 5.05 | | | | 6-1-2020 | | | | 750,000 | | | | 825,027 | |
Discovery Communications LLC | | | 5.63 | | | | 8-15-2019 | | | | 250,000 | | | | 274,017 | |
Discovery Communications LLC | | | 6.35 | | | | 6-1-2040 | | | | 250,000 | | | | 264,640 | |
Interpublic Group of Companies | | | 4.00 | �� | | | 3-15-2022 | | | | 1,000,000 | | | | 1,050,679 | |
NBCUniversal Media LLC | | | 2.88 | | | | 1-15-2023 | | | | 500,000 | | | | 523,855 | |
NBCUniversal Media LLC | | | 4.38 | | | | 4-1-2021 | | | | 800,000 | | | | 894,498 | |
NBCUniversal Media LLC | | | 4.45 | | | | 1-15-2043 | | | | 500,000 | | | | 571,125 | |
NBCUniversal Media LLC | | | 5.95 | | | | 4-1-2041 | | | | 500,000 | | | | 683,609 | |
Omnicom Group Incorporated | | | 3.63 | | | | 5-1-2022 | | | | 250,000 | | | | 265,585 | |
Omnicom Group Incorporated | | | 4.45 | | | | 8-15-2020 | | | | 90,000 | | | | 98,453 | |
Omnicom Group Incorporated | | | 6.25 | | | | 7-15-2019 | | | | 650,000 | | | | 732,408 | |
Scripps Networks Interactive Incorporated | | | 2.80 | | | | 6-15-2020 | | | | 1,500,000 | | | | 1,532,088 | |
TCI Communications Incorporated | | | 7.13 | | | | 2-15-2028 | | | | 350,000 | | | | 496,691 | |
Thomson Reuters Corporation | | | 3.85 | | | | 9-29-2024 | | | | 1,000,000 | | | | 1,071,060 | |
Thomson Reuters Corporation | | | 4.30 | | | | 11-23-2023 | | | | 300,000 | | | | 329,594 | |
Thomson Reuters Corporation | | | 4.70 | | | | 10-15-2019 | | | | 425,000 | | | | 460,531 | |
Thomson Reuters Corporation | | | 5.65 | | | | 11-23-2043 | | | | 200,000 | | | | 238,697 | |
Thomson Reuters Corporation | | | 5.85 | | | | 4-15-2040 | | | | 134,000 | | | | 162,215 | |
Thomson Reuters Corporation | | | 6.50 | | | | 7-15-2018 | | | | 500,000 | | | | 544,381 | |
Time Warner Cable Incorporated | | | 4.00 | | | | 1-15-2022 | | | | 300,000 | | | | 327,268 | |
Time Warner Cable Incorporated | | | 4.13 | | | | 2-15-2021 | | | | 500,000 | | | | 531,925 | |
Time Warner Cable Incorporated | | | 4.50 | | | | 9-15-2042 | | | | 600,000 | | | | 580,474 | |
Time Warner Cable Incorporated | | | 4.70 | | | | 1-15-2021 | | | | 250,000 | | | | 278,789 | |
Time Warner Cable Incorporated | | | 4.88 | | | | 3-15-2020 | | | | 500,000 | | | | 553,011 | |
Time Warner Cable Incorporated | | | 5.00 | | | | 2-1-2020 | | | | 535,000 | | | | 582,715 | |
Time Warner Cable Incorporated | | | 5.50 | | | | 9-1-2041 | | | | 300,000 | | | | 325,555 | |
| | | | |
| 30 | | Wells Fargo Diversified Fixed Income Portfolio | | Portfolio of investments—August 31, 2016 (unaudited) |
| | | | | | | | | | | | | | | | |
| Security name | | Interest rate | | | Maturity date | | | Principal | | | Value | |
| | | | |
| Media (continued) | | | | | | | | | | | | | | | | |
Time Warner Cable Incorporated | | | 6.20 | % | | | 3-15-2040 | | | $ | 300,000 | | | $ | 387,376 | |
Time Warner Cable Incorporated | | | 6.55 | | | | 5-1-2037 | | | | 850,000 | | | | 1,025,643 | |
Time Warner Cable Incorporated | | | 6.63 | | | | 5-15-2029 | | | | 800,000 | | | | 1,054,637 | |
Time Warner Cable Incorporated | | | 6.75 | | | | 7-1-2018 | | | | 750,000 | | | | 817,316 | |
Time Warner Cable Incorporated | | | 6.75 | | | | 6-15-2039 | | | | 500,000 | | | | 616,162 | |
Time Warner Cable Incorporated | | | 7.30 | | | | 7-1-2038 | | | | 550,000 | | | | 714,286 | |
Time Warner Cable Incorporated | | | 7.63 | | | | 4-15-2031 | | | | 825,000 | | | | 1,163,256 | |
Time Warner Cable Incorporated | | | 8.25 | | | | 4-1-2019 | | | | 150,000 | | | | 173,350 | |
Time Warner Cable Incorporated | | | 8.38 | | | | 3-15-2023 | | | | 250,000 | | | | 325,425 | |
Time Warner Cable Incorporated | | | 8.75 | | | | 2-14-2019 | | | | 704,000 | | | | 817,752 | |
Time Warner Cable Incorporated | | | 9.15 | | | | 2-1-2023 | | | | 250,000 | | | | 338,888 | |
Time Warner Entertainment Company LP | | | 8.38 | | | | 7-15-2033 | | | | 300,000 | | | | 410,073 | |
Time Warner Incorporated | | | 3.40 | | | | 6-15-2022 | | | | 100,000 | | | | 106,053 | |
Time Warner Incorporated | | | 4.65 | | | | 6-1-2044 | | | | 750,000 | | | | 831,507 | |
Time Warner Incorporated | | | 4.75 | | | | 3-29-2021 | | | | 500,000 | | | | 560,510 | |
Time Warner Incorporated | | | 4.90 | | | | 6-15-2042 | | | | 51,000 | | | | 57,515 | |
Time Warner Incorporated | | | 6.10 | | | | 7-15-2040 | | | | 400,000 | | | | 514,552 | |
Time Warner Incorporated | | | 6.25 | | | | 3-29-2041 | | | | 500,000 | | | | 657,903 | |
Time Warner Incorporated | | | 6.50 | | | | 11-15-2036 | | | | 252,000 | | | | 327,491 | |
Time Warner Incorporated | | | 7.57 | | | | 2-1-2024 | | | | 250,000 | | | | 324,710 | |
Time Warner Incorporated | | | 7.70 | | | | 5-1-2032 | | | | 700,000 | | | | 1,000,585 | |
Viacom Incorporated | | | 2.75 | | | | 12-15-2019 | | | | 150,000 | | | | 153,276 | |
Viacom Incorporated | | | 3.25 | | | | 3-15-2023 | | | | 200,000 | | | | 199,448 | |
Viacom Incorporated | | | 4.25 | | | | 9-1-2023 | | | | 1,000,000 | | | | 1,059,535 | |
Viacom Incorporated | | | 4.38 | | | | 3-15-2043 | | | | 552,000 | | | | 499,944 | |
Viacom Incorporated | | | 4.50 | | | | 3-1-2021 | | | | 500,000 | | | | 545,071 | |
Viacom Incorporated | | | 4.88 | | | | 6-15-2043 | | | | 175,000 | | | | 163,564 | |
Viacom Incorporated | | | 5.25 | | | | 4-1-2044 | | | | 500,000 | | | | 512,286 | |
Viacom Incorporated | | | 5.50 | | | | 5-15-2033 | | | | 200,000 | | | | 224,518 | |
Viacom Incorporated | | | 5.63 | | | | 9-15-2019 | | | | 150,000 | | | | 165,538 | |
Viacom Incorporated | | | 5.85 | | | | 9-1-2043 | | | | 125,000 | | | | 139,877 | |
Viacom Incorporated | | | 6.13 | | | | 10-5-2017 | | | | 250,000 | | | | 262,209 | |
Viacom Incorporated | | | 6.88 | | | | 4-30-2036 | | | | 340,000 | | | | 397,503 | |
Walt Disney Company | | | 1.10 | | | | 12-1-2017 | | | | 1,000,000 | | | | 1,000,166 | |
Walt Disney Company | | | 2.35 | | | | 12-1-2022 | | | | 500,000 | | | | 518,688 | |
Walt Disney Company | | | 2.55 | | | | 2-15-2022 | | | | 250,000 | | | | 259,927 | |
Walt Disney Company | | | 2.75 | | | | 8-16-2021 | | | | 500,000 | | | | 527,661 | |
Walt Disney Company | | | 3.00 | | | | 2-13-2026 | | | | 500,000 | | | | 531,231 | |
Walt Disney Company | | | 4.13 | | | | 12-1-2041 | | | | 250,000 | | | | 286,527 | |
Walt Disney Company | | | 4.13 | | | | 6-1-2044 | | | | 350,000 | | | | 401,663 | |
Walt Disney Company | | | 4.38 | | | | 8-16-2041 | | | | 250,000 | | | | 297,418 | |
Walt Disney Company | | | 5.50 | | | | 3-15-2019 | | | | 500,000 | | | | 552,504 | |
Walt Disney Company | | | 7.00 | | | | 3-1-2032 | | | | 75,000 | | | | 109,352 | |
| |
| | | | 61,605,668 | |
| | | | | | | | | | | | | | | | |
| | | | |
| Multiline Retail: 0.14% | | | | | | | | | | | | | | | | |
Dollar General Corporation | | | 3.25 | | | | 4-15-2023 | | | | 350,000 | | | | 361,394 | |
Kohl’s Corporation | | | 3.25 | | | | 2-1-2023 | | | | 150,000 | | | | 150,815 | |
Kohl’s Corporation | | | 4.75 | | | | 12-15-2023 | | | | 300,000 | | | | 324,616 | |
| | | | | | |
| Portfolio of investments—August 31, 2016 (unaudited) | | Wells Fargo Diversified Fixed Income Portfolio | | | 31 | |
| | | | | | | | | | | | | | | | |
| Security name | | Interest rate | | | Maturity date | | | Principal | | | Value | |
| | | | |
| Multiline Retail (continued) | | | | | | | | | | | | | | | | |
Macy’s Retail Holdings Incorporated | | | 3.88 | % | | | 1-15-2022 | | | $ | 200,000 | | | $ | 209,136 | |
Macy’s Retail Holdings Incorporated | | | 4.38 | | | | 9-1-2023 | | | | 300,000 | | | | 316,918 | |
Macy’s Retail Holdings Incorporated | | | 6.70 | | | | 7-15-2034 | | | | 500,000 | | | | 566,394 | |
Macy’s Retail Holdings Incorporated | | | 6.90 | | | | 4-1-2029 | | | | 500,000 | | | | 569,738 | |
Macy’s Retail Holdings Incorporated | | | 4.50 | | | | 12-15-2034 | | | | 500,000 | | | | 473,187 | |
Nordstrom Incorporated | | | 4.00 | | | | 10-15-2021 | | | | 250,000 | | | | 267,760 | |
Nordstrom Incorporated | | | 4.75 | | | | 5-1-2020 | | | | 135,000 | | | | 147,297 | |
Nordstrom Incorporated | | | 5.00 | | | | 1-15-2044 | | | | 100,000 | | | | 105,159 | |
Nordstrom Incorporated | | | 6.25 | | | | 1-15-2018 | | | | 500,000 | | | | 532,616 | |
Target Corporation | | | 2.50 | | | | 4-15-2026 | | | | 750,000 | | | | 769,322 | |
Target Corporation | | | 2.90 | | | | 1-15-2022 | | | | 250,000 | | | | 264,407 | |
Target Corporation | | | 3.63 | | | | 4-15-2046 | | | | 300,000 | | | | 313,151 | |
Target Corporation | | | 4.00 | | | | 7-1-2042 | | | | 475,000 | | | | 526,203 | |
Target Corporation | | | 6.00 | | | | 1-15-2018 | | | | 500,000 | | | | 532,821 | |
Target Corporation | | | 6.35 | | | | 11-1-2032 | | | | 300,000 | | | | 414,154 | |
Target Corporation | | | 7.00 | | | | 1-15-2038 | | | | 768,000 | | | | 1,171,263 | |
| |
| | | | 8,016,351 | |
| | | | | | | | | | | | | | | | |
| | | | |
| Specialty Retail: 0.25% | | | | | | | | | | | | | | | | |
Advance Auto Parts Incorporated | | | 4.50 | | | | 1-15-2022 | | | | 100,000 | | | | 107,461 | |
Advance Auto Parts Incorporated | | | 4.50 | | | | 12-1-2023 | | | | 250,000 | | | | 270,114 | |
AutoZone Incorporated | | | 2.88 | | | | 1-15-2023 | | | | 250,000 | | | | 254,874 | |
AutoZone Incorporated | | | 3.13 | | | | 7-15-2023 | | | | 150,000 | | | | 156,019 | |
AutoZone Incorporated | | | 4.00 | | | | 11-15-2020 | | | | 200,000 | | | | 214,167 | |
Bed Bath & Beyond Incorporated | | | 4.92 | | | | 8-1-2034 | | | | 250,000 | | | | 254,985 | |
Bed Bath & Beyond Incorporated | | | 5.17 | | | | 8-1-2044 | | | | 350,000 | | | | 344,591 | |
Home Depot Incorporated | | | 2.25 | | | | 9-10-2018 | | | | 1,000,000 | | | | 1,022,825 | |
Home Depot Incorporated | | | 2.70 | | | | 4-1-2023 | | | | 375,000 | | | | 391,435 | |
Home Depot Incorporated | | | 3.75 | | | | 2-15-2024 | | | | 500,000 | | | | 556,595 | |
Home Depot Incorporated | | | 3.95 | | | | 9-15-2020 | | | | 400,000 | | | | 437,140 | |
Home Depot Incorporated | | | 4.20 | | | | 4-1-2043 | | | | 400,000 | | | | 453,916 | |
Home Depot Incorporated | | | 4.40 | | | | 4-1-2021 | | | | 500,000 | | | | 559,921 | |
Home Depot Incorporated | | | 4.88 | | | | 2-15-2044 | | | | 500,000 | | | | 621,405 | |
Home Depot Incorporated | | | 5.40 | | | | 9-15-2040 | | | | 200,000 | | | | 262,609 | |
Home Depot Incorporated | | | 5.88 | | | | 12-16-2036 | | | | 1,500,000 | | | | 2,067,584 | |
Home Depot Incorporated | | | 5.95 | | | | 4-1-2041 | | | | 500,000 | | | | 692,088 | |
Lowe’s Companies Incorporated | | | 2.50 | | | | 4-15-2026 | | | | 1,000,000 | | | | 1,013,674 | |
Lowe’s Companies Incorporated | | | 3.12 | | | | 4-15-2022 | | | | 200,000 | | | | 212,609 | |
Lowe’s Companies Incorporated | | | 3.75 | | | | 4-15-2021 | | | | 150,000 | | | | 164,190 | |
Lowe’s Companies Incorporated | | | 3.80 | | | | 11-15-2021 | | | | 500,000 | | | | 548,922 | |
Lowe’s Companies Incorporated | | | 3.88 | | | | 9-15-2023 | | | | 250,000 | | | | 277,927 | |
Lowe’s Companies Incorporated | | | 4.25 | | | | 9-15-2044 | | | | 250,000 | | | | 282,365 | |
Lowe’s Companies Incorporated | | | 4.63 | | | | 4-15-2020 | | | | 400,000 | | | | 439,156 | |
Lowe’s Companies Incorporated | | | 4.65 | | | | 4-15-2042 | | | | 500,000 | | | | 591,364 | |
Lowe’s Companies Incorporated | | | 5.80 | | | | 10-15-2036 | | | | 250,000 | | | | 329,973 | |
Lowe’s Companies Incorporated | | | 5.80 | | | | 4-15-2040 | | | | 110,000 | | | | 148,559 | |
Lowe’s Companies Incorporated | | | 6.50 | | | | 3-15-2029 | | | | 75,000 | | | | 102,234 | |
Lowe’s Companies Incorporated | | | 6.65 | | | | 9-15-2037 | | | | 350,000 | | | | 507,719 | |
O’Reilly Automotive Incorporated | | | 3.80 | | | | 9-1-2022 | | | | 150,000 | | | | 159,138 | |
O’Reilly Automotive Incorporated | | | 4.88 | | | | 1-14-2021 | | | | 45,000 | | | | 49,511 | |
| | | | |
| 32 | | Wells Fargo Diversified Fixed Income Portfolio | | Portfolio of investments—August 31, 2016 (unaudited) |
| | | | | | | | | | | | | | | | |
| Security name | | Interest rate | | | Maturity date | | | Principal | | | Value | |
| | | | |
| Specialty Retail (continued) | | | | | | | | | | | | | | | | |
O’Reilly Automotive Incorporated | | | 4.63 | % | | | 9-15-2021 | | | $ | 150,000 | | | $ | 164,993 | |
Staples Incorporated « | | | 4.38 | | | | 1-12-2023 | | | | 200,000 | | | | 205,982 | |
TJX Companies Incorporated | | | 2.75 | | | | 6-15-2021 | | | | 500,000 | | | | 521,383 | |
TJX Companies Incorporated | | | 6.95 | | | | 4-15-2019 | | | | 85,000 | | | | 97,017 | |
| |
| | | | 14,484,445 | |
| | | | | | | | | | | | | | | | |
| | | | |
| Textiles, Apparel & Luxury Goods: 0.02% | | | | | | | | | | | | | | | | |
Nike Incorporated | | | 2.25 | | | | 5-1-2023 | | | | 100,000 | | | | 102,860 | |
Nike Incorporated | | | 3.63 | | | | 5-1-2043 | | | | 100,000 | | | | 107,434 | |
Nike Incorporated | | | 3.88 | | | | 11-1-2045 | | | | 500,000 | | | | 561,107 | |
Ralph Lauren Corporation | | | 2.13 | | | | 9-26-2018 | | | | 50,000 | | | | 50,798 | |
VF Corporation | | | 3.50 | | | | 9-1-2021 | | | | 250,000 | | | | 269,048 | |
VF Corporation | | | 5.95 | | | | 11-1-2017 | | | | 100,000 | | | | 105,354 | |
VF Corporation | | | 6.45 | | | | 11-1-2037 | | | | 150,000 | | | | 209,842 | |
| |
| | | | 1,406,443 | |
| | | | | | | | | | | | | | | | |
| | | | |
Consumer Staples: 2.01% | | | | | | | | | | | | | | | | |
| | | | |
| Beverages: 0.66% | | | | | | | | | | | | | | | | |
Anheuser-Busch Companies Incorporated | | | 5.50 | | | | 1-15-2018 | | | | 200,000 | | | | 211,288 | |
Anheuser-Busch Companies Incorporated | | | 5.75 | | | | 4-1-2036 | | | | 250,000 | | | | 323,335 | |
Anheuser-Busch InBev Finance Company | | | 1.90 | | | | 2-1-2019 | | | | 1,200,000 | | | | 1,212,474 | |
Anheuser-Busch InBev Finance Company | | | 2.63 | | | | 1-17-2023 | | | | 500,000 | | | | 510,268 | |
Anheuser-Busch InBev Finance Company | | | 2.65 | | | | 2-1-2021 | | | | 2,250,000 | | | | 2,318,645 | |
Anheuser-Busch InBev Finance Company | | | 3.30 | | | | 2-1-2023 | | | | 750,000 | | | | 786,989 | |
Anheuser-Busch InBev Finance Company | | | 3.65 | | | | 2-1-2026 | | | | 3,500,000 | | | | 3,736,656 | |
Anheuser-Busch InBev Finance Company | | | 3.70 | | | | 2-1-2024 | | | | 750,000 | | | | 813,878 | |
Anheuser-Busch InBev Finance Company | | | 4.00 | | | | 1-17-2043 | | | | 300,000 | | | | 318,389 | |
Anheuser-Busch InBev Finance Company | | | 4.63 | | | | 2-1-2044 | | | | 350,000 | | | | 406,799 | |
Anheuser-Busch InBev Finance Company | | | 4.70 | | | | 2-1-2036 | | | | 1,500,000 | | | | 1,738,635 | |
Anheuser-Busch InBev Finance Company | | | 4.90 | | | | 2-1-2046 | | | | 3,100,000 | | | | 3,748,706 | |
Anheuser-Busch InBev Worldwide Incorporated | | | 2.50 | | | | 7-15-2022 | | | | 1,750,000 | | | | 1,785,737 | |
Anheuser-Busch InBev Worldwide Incorporated | | | 3.75 | | | | 7-15-2042 | | | | 360,000 | | | | 367,861 | |
Anheuser-Busch InBev Worldwide Incorporated | | | 5.00 | | | | 4-15-2020 | | | | 1,000,000 | | | | 1,109,536 | |
Anheuser-Busch InBev Worldwide Incorporated | | | 6.38 | | | | 1-15-2040 | | | | 750,000 | | | | 1,030,118 | |
Anheuser-Busch InBev Worldwide Incorporated | | | 6.88 | | | | 11-15-2019 | | | | 500,000 | | | | 581,357 | |
Anheuser-Busch InBev Worldwide Incorporated | | | 7.75 | | | | 1-15-2019 | | | | 500,000 | | | | 570,484 | |
Anheuser-Busch InBev Worldwide Incorporated | | | 8.20 | | | | 1-15-2039 | | | | 500,000 | | | | 816,011 | |
Beam Incorporated | | | 1.75 | | | | 6-15-2018 | | | | 250,000 | | | | 250,196 | |
Brown-Forman Corporation | | | 2.25 | | | | 1-15-2023 | | | | 250,000 | | | | 251,025 | |
Brown-Forman Corporation | | | 3.75 | | | | 1-15-2043 | | | | 100,000 | | | | 105,086 | |
Coca-Cola Company | | | 1.15 | | | | 4-1-2018 | | | | 500,000 | | | | 500,822 | |
Coca-Cola Company | | | 1.65 | | | | 3-14-2018 | | | | 1,100,000 | | | | 1,111,238 | |
Coca-Cola Company | | | 2.45 | | | | 11-1-2020 | | | | 1,000,000 | | | | 1,037,804 | |
Coca-Cola Company | | | 2.50 | | | | 4-1-2023 | | | | 350,000 | | | | 362,370 | |
Coca-Cola Company | | | 2.88 | | | | 10-27-2025 | | | | 1,000,000 | | | | 1,052,913 | |
Coca-Cola Company | | | 3.20 | | | | 11-1-2023 | | | | 400,000 | | | | 435,054 | |
Coca-Cola Company | | | 3.30 | | | | 9-1-2021 | | | | 70,000 | | | | 75,466 | |
Coca-Cola Enterprises Incorporated | | | 3.50 | | | | 9-15-2020 | | | | 500,000 | | | | 526,924 | |
Coca-Cola Enterprises Incorporated | | | 4.50 | | | | 9-1-2021 | | | | 100,000 | | | | 110,661 | |
| | | | | | |
| Portfolio of investments—August 31, 2016 (unaudited) | | Wells Fargo Diversified Fixed Income Portfolio | | | 33 | |
| | | | | | | | | | | | | | | | |
| Security name | | Interest rate | | | Maturity date | | | Principal | | | Value | |
| | | | |
| Beverages (continued) | | | | | | | | | | | | | | | | |
Diageo Investment Corporation | | | 2.88 | % | | | 5-11-2022 | | | $ | 600,000 | | | $ | 627,754 | |
Diageo Investment Corporation | | | 4.25 | | | | 5-11-2042 | | | | 250,000 | | | | 282,458 | |
Diageo Investment Corporation | | | 7.45 | | | | 4-15-2035 | | | | 150,000 | | | | 229,141 | |
Dr Pepper Snapple Group Incorporated | | | 3.20 | | | | 11-15-2021 | | | | 250,000 | | | | 263,339 | |
Dr Pepper Snapple Group Incorporated | | | 7.45 | | | | 5-1-2038 | | | | 100,000 | | | | 148,870 | |
Molson Coors Brewing Company | | | 5.00 | | | | 5-1-2042 | | | | 500,000 | | | | 585,610 | |
PepsiCo Incorporated | | | 2.25 | | | | 1-7-2019 | | | | 350,000 | | | | 358,443 | |
PepsiCo Incorporated | | | 2.75 | | | | 3-5-2022 | | | | 370,000 | | | | 388,137 | |
PepsiCo Incorporated | | | 2.75 | | | | 3-1-2023 | | | | 475,000 | | | | 500,975 | |
PepsiCo Incorporated | | | 3.00 | | | | 8-25-2021 | | | | 250,000 | | | | 267,703 | |
PepsiCo Incorporated | | | 3.13 | | | | 11-1-2020 | | | | 1,000,000 | | | | 1,067,937 | |
PepsiCo Incorporated | | | 3.60 | | | | 3-1-2024 | | | | 1,000,000 | | | | 1,097,789 | |
PepsiCo Incorporated | | | 3.60 | | | | 8-13-2042 | | | | 250,000 | | | | 262,148 | |
PepsiCo Incorporated | | | 4.00 | | | | 3-5-2042 | | | | 250,000 | | | | 276,867 | |
PepsiCo Incorporated | | | 4.25 | | | | 10-22-2044 | | | | 200,000 | | | | 230,350 | |
PepsiCo Incorporated | | | 4.50 | | | | 1-15-2020 | | | | 200,000 | | | | 220,358 | |
PepsiCo Incorporated | | | 4.88 | | | | 11-1-2040 | | | | 325,000 | | | | 404,906 | |
PepsiCo Incorporated | | | 5.00 | | | | 6-1-2018 | | | | 1,000,000 | | | | 1,067,031 | |
PepsiCo Incorporated | | | 5.50 | | | | 1-15-2040 | | | | 300,000 | | | | 397,304 | |
PepsiCo Incorporated | | | 7.90 | | | | 11-1-2018 | | | | 500,000 | | | | 571,561 | |
PepsiCo Incorporated Series B | | | 7.00 | | | | 3-1-2029 | | | | 600,000 | | | | 862,620 | |
| |
| | | | 38,318,026 | |
| | | | | | | | | | | | | | | | |
| | | | |
| Food & Staples Retailing: 0.55% | | | | | | | | | | | | | | | | |
Costco Wholesale Corporation | | | 1.13 | | | | 12-15-2017 | | | | 1,000,000 | | | | 1,002,448 | |
Costco Wholesale Corporation | | | 1.70 | | | | 12-15-2019 | | | | 500,000 | | | | 507,330 | |
CVS Caremark Corporation | | | 2.25 | | | | 12-5-2018 | | | | 278,000 | | | | 283,938 | |
CVS Caremark Corporation | | | 2.75 | | | | 12-1-2022 | | | | 500,000 | | | | 516,380 | |
CVS Caremark Corporation | | | 3.38 | | | | 8-12-2024 | | | | 800,000 | | | | 849,817 | |
CVS Caremark Corporation | | | 4.00 | | | | 12-5-2023 | | | | 1,000,000 | | | | 1,106,338 | |
CVS Caremark Corporation | | | 5.30 | | | | 12-5-2043 | | | | 300,000 | | | | 375,217 | |
CVS Health Corporation | | | 1.90 | | | | 7-20-2018 | | | | 750,000 | | | | 759,227 | |
CVS Health Corporation | | | 2.80 | | | | 7-20-2020 | | | | 2,000,000 | | | | 2,082,886 | |
CVS Health Corporation | | | 3.88 | | | | 7-20-2025 | | | | 750,000 | | | | 826,136 | |
CVS Health Corporation | | | 4.88 | | | | 7-20-2035 | | | | 750,000 | | | | 893,618 | |
CVS Health Corporation | | | 5.13 | | | | 7-20-2045 | | | | 1,000,000 | | | | 1,246,720 | |
Delhaize America Incorporated | | | 9.00 | | | | 4-15-2031 | | | | 500,000 | | | | 708,998 | |
Sysco Corporation | | | 3.30 | | | | 7-15-2026 | | | | 1,000,000 | | | | 1,046,523 | |
Sysco Corporation | | | 5.25 | | | | 2-12-2018 | | | | 300,000 | | | | 315,648 | |
Sysco Corporation | | | 6.63 | | | | 3-17-2039 | | | | 200,000 | | | | 274,429 | |
The Kroger Company | | | 2.30 | | | | 1-15-2019 | | | | 200,000 | | | | 203,831 | |
The Kroger Company | | | 3.30 | | | | 1-15-2021 | | | | 500,000 | | | | 530,471 | |
The Kroger Company | | | 3.40 | | | | 4-15-2022 | | | | 250,000 | | | | 265,102 | |
The Kroger Company | | | 3.85 | | | | 8-1-2023 | | | | 250,000 | | | | 273,173 | |
The Kroger Company | | | 5.00 | | | | 4-15-2042 | | | | 250,000 | | | | 302,822 | |
The Kroger Company | | | 5.15 | | | | 8-1-2043 | | | | 150,000 | | | | 186,386 | |
The Kroger Company | | | 6.15 | | | | 1-15-2020 | | | | 800,000 | | | | 912,944 | |
The Kroger Company | | | 6.90 | | | | 4-15-2038 | | | | 300,000 | | | | 426,648 | |
The Kroger Company | | | 7.50 | | | | 4-1-2031 | | | | 75,000 | | | | 106,779 | |
Wal-Mart Stores Incorporated | | | 1.13 | | | | 4-11-2018 | | | | 500,000 | | | | 501,552 | |
| | | | |
| 34 | | Wells Fargo Diversified Fixed Income Portfolio | | Portfolio of investments—August 31, 2016 (unaudited) |
| | | | | | | | | | | | | | | | |
| Security name | | Interest rate | | | Maturity date | | | Principal | | | Value | |
| | | | |
| Food & Staples Retailing (continued) | | | | | | | | | | | | | | | | |
Wal-Mart Stores Incorporated | | | 3.25 | % | | | 10-25-2020 | | | $ | 750,000 | | | $ | 808,689 | |
Wal-Mart Stores Incorporated | | | 3.63 | | | | 7-8-2020 | | | | 1,100,000 | | | | 1,192,666 | |
Wal-Mart Stores Incorporated | | | 4.00 | | | | 4-11-2043 | | | | 400,000 | | | | 454,955 | |
Wal-Mart Stores Incorporated | | | 4.25 | | | | 4-15-2021 | | | | 500,000 | | | | 561,788 | |
Wal-Mart Stores Incorporated | | | 4.30 | | | | 4-22-2044 | | | | 500,000 | | | | 597,676 | |
Wal-Mart Stores Incorporated | | | 4.88 | | | | 7-8-2040 | | | | 250,000 | | | | 314,710 | |
Wal-Mart Stores Incorporated | | | 5.00 | | | | 10-25-2040 | | | | 500,000 | | | | 638,672 | |
Wal-Mart Stores Incorporated | | | 5.25 | | | | 9-1-2035 | | | | 950,000 | | | | 1,268,800 | |
Wal-Mart Stores Incorporated | | | 5.63 | | | | 4-1-2040 | | | | 600,000 | | | | 818,476 | |
Wal-Mart Stores Incorporated | | | 5.63 | | | | 4-15-2041 | | | | 500,000 | | | | 683,495 | |
Wal-Mart Stores Incorporated | | | 5.80 | | | | 2-15-2018 | | | | 700,000 | | | | 748,441 | |
Wal-Mart Stores Incorporated | | | 5.88 | | | | 4-5-2027 | | | | 100,000 | | | | 131,530 | |
Wal-Mart Stores Incorporated | | | 6.50 | | | | 8-15-2037 | | | | 1,000,000 | | | | 1,482,825 | |
Wal-Mart Stores Incorporated | | | 7.55 | | | | 2-15-2030 | | | | 500,000 | | | | 764,397 | |
Walgreen Company | | | 3.10 | | | | 9-15-2022 | | | | 1,000,000 | | | | 1,037,970 | |
Walgreen Company | | | 4.40 | | | | 9-15-2042 | | | | 500,000 | | | | 533,926 | |
Walgreen Company | | | 5.25 | | | | 1-15-2019 | | | | 62,000 | | | | 67,078 | |
Walgreens Boots Alliance Incorporated | | | 2.60 | | | | 6-1-2021 | | | | 750,000 | | | | 766,676 | |
Walgreens Boots Alliance Incorporated | | | 2.70 | | | | 11-18-2019 | | | | 300,000 | | | | 309,570 | |
Walgreens Boots Alliance Incorporated | | | 3.45 | | | | 6-1-2026 | | | | 750,000 | | | | 780,116 | |
Walgreens Boots Alliance Incorporated | | | 3.80 | | | | 11-18-2024 | | | | 1,000,000 | | | | 1,072,363 | |
Walgreens Boots Alliance Incorporated | | | 4.80 | | | | 11-18-2044 | | | | 500,000 | | | | 561,364 | |
| |
| | | | 32,101,544 | |
| | | | | | | | | | | | | | | | |
| | | | |
| Food Products: 0.40% | | | | | | | | | | | | | | | | |
Archer-Daniels-Midland Company | | | 4.02 | | | | 4-16-2043 | | | | 840,000 | | | | 920,470 | |
Archer-Daniels-Midland Company | | | 4.48 | | | | 3-1-2021 | | | | 535,000 | | | | 600,241 | |
Archer-Daniels-Midland Company | | | 4.54 | | | | 3-26-2042 | | | | 250,000 | | | | 293,423 | |
Archer-Daniels-Midland Company | | | 5.45 | | | | 3-15-2018 | | | | 80,000 | | | | 85,239 | |
Campbell Soup Company | | | 2.50 | | | | 8-2-2022 | | | | 121,000 | | | | 123,836 | |
Campbell Soup Company | | | 4.50 | | | | 2-15-2019 | | | | 285,000 | | | | 306,430 | |
ConAgra Foods Incorporated | | | 3.25 | | | | 9-15-2022 | | | | 500,000 | | | | 517,404 | |
ConAgra Foods Incorporated | | | 7.00 | | | | 4-15-2019 | | | | 101,000 | | | | 113,177 | |
ConAgra Foods Incorporated | | | 8.25 | | | | 9-15-2030 | | | | 120,000 | | | | 169,375 | |
General Mills Incorporated | | | 3.65 | | | | 2-15-2024 | | | | 250,000 | | | | 274,409 | |
General Mills Incorporated | | | 5.40 | | | | 6-15-2040 | | | | 345,000 | | | | 439,291 | |
General Mills Incorporated | | | 5.65 | | | | 2-15-2019 | | | | 1,000,000 | | | | 1,102,426 | |
Hershey Company | | | 2.63 | | | | 5-1-2023 | | | | 100,000 | | | | 103,251 | |
Hershey Company | | | 4.13 | | | | 12-1-2020 | | | | 500,000 | | | | 551,654 | |
Hormel Foods Corporation | | | 4.13 | | | | 4-15-2021 | | | | 100,000 | | | | 110,249 | |
Ingredion Incorporated | | | 1.80 | | | | 9-25-2017 | | | | 150,000 | | | | 150,676 | |
Ingredion Incorporated | | | 4.63 | | | | 11-1-2020 | | | | 300,000 | | | | 328,481 | |
J.M. Smucker Company | | | 3.50 | | | | 10-15-2021 | | | | 300,000 | | | | 321,908 | |
J.M. Smucker Company | | | 3.50 | | | | 3-15-2025 | | | | 1,500,000 | | | | 1,615,725 | |
Kellogg Company | | | 3.25 | | | | 5-21-2018 | | | | 65,000 | | | | 67,024 | |
Kellogg Company | | | 4.00 | | | | 12-15-2020 | | | | 221,000 | | | | 242,137 | |
Kellogg Company | | | 4.15 | | | | 11-15-2019 | | | | 300,000 | | | | 323,870 | |
Kraft Foods Group Incorporated | | | 3.50 | | | | 6-6-2022 | | | | 1,000,000 | | | | 1,067,836 | |
Kraft Foods Group Incorporated | | | 5.00 | | | | 6-4-2042 | | | | 750,000 | | | | 874,122 | |
Kraft Foods Group Incorporated | | | 5.38 | | | | 2-10-2020 | | | | 250,000 | | | | 280,041 | |
| | | | | | |
| Portfolio of investments—August 31, 2016 (unaudited) | | Wells Fargo Diversified Fixed Income Portfolio | | | 35 | |
| | | | | | | | | | | | | | | | |
| Security name | | Interest rate | | | Maturity date | | | Principal | | | Value | |
| | | | |
| Food Products (continued) | | | | | | | | | | | | | | | | |
Kraft Foods Group Incorporated | | | 6.13 | % | | | 8-23-2018 | | | $ | 1,000,000 | | | $ | 1,089,717 | |
Kraft Foods Group Incorporated | | | 6.50 | | | | 2-9-2040 | | | | 793,000 | | | | 1,086,923 | |
Kraft Foods Group Incorporated | | | 6.50 | | | | 2-9-2040 | | | | 500,000 | | | | 687,665 | |
Kraft Heinz Foods Company | | | 2.80 | | | | 7-2-2020 | | | | 1,000,000 | | | | 1,039,584 | |
Kraft Heinz Foods Company | | | 3.00 | | | | 6-1-2026 | | | | 1,200,000 | | | | 1,216,142 | |
Kraft Heinz Foods Company | | | 4.38 | | | | 6-1-2046 | | | | 750,000 | | | | 811,186 | |
Kraft Heinz Foods Company | | | 5.20 | | | | 7-15-2045 | | | | 750,000 | | | | 899,065 | |
McCormick & Company | | | 3.50 | | | | 9-1-2023 | | | | 179,000 | | | | 192,221 | |
McCormick & Company | | | 3.90 | | | | 7-15-2021 | | | | 75,000 | | | | 81,632 | |
Mead Johnson Nutrition Company | | | 4.90 | | | | 11-1-2019 | | | | 250,000 | | | | 274,427 | |
Mead Johnson Nutrition Company | | | 5.90 | | | | 11-1-2039 | | | | 100,000 | | | | 125,912 | |
Mondelez International | | | 4.00 | | | | 2-1-2024 | | | | 1,200,000 | | | | 1,324,076 | |
Sara Lee Corporation | | | 4.10 | | | | 9-15-2020 | | | | 266,000 | | | | 280,972 | |
Tyson Foods Incorporated | | | 3.95 | | | | 8-15-2024 | | | | 1,000,000 | | | | 1,082,580 | |
Tyson Foods Incorporated | | | 4.50 | | | | 6-15-2022 | | | | 500,000 | | | | 552,737 | |
Tyson Foods Incorporated | | | 4.88 | | | | 8-15-2034 | | | | 250,000 | | | | 283,879 | |
Unilever Capital Corporation | | | 4.25 | | | | 2-10-2021 | | | | 300,000 | | | | 334,022 | |
Unilever Capital Corporation | | | 4.80 | | | | 2-15-2019 | | | | 350,000 | | | | 379,667 | |
Unilever Capital Corporation | | | 5.90 | | | | 11-15-2032 | | | | 300,000 | | | | 425,109 | |
| |
| | | | 23,150,211 | |
| | | | | | | | | | | | | | | | |
| | | | |
| Household Products: 0.12% | | | | | | | | | | | | | | | | |
Church & Dwight Company Incorporated | | | 2.88 | | | | 10-1-2022 | | | | 107,000 | | | | 109,563 | |
Clorox Company | | | 3.05 | | | | 9-15-2022 | | | | 161,000 | | | | 168,503 | |
Clorox Company | | | 3.50 | | | | 12-15-2024 | | | | 200,000 | | | | 214,876 | |
Clorox Company | | | 5.95 | | | | 10-15-2017 | | | | 90,000 | | | | 94,832 | |
Colgate-Palmolive Company | | | 1.95 | | | | 2-1-2023 | | | | 500,000 | | | | 501,408 | |
Colgate-Palmolive Company | | | 2.30 | | | | 5-3-2022 | | | | 500,000 | | | | 518,285 | |
Colgate-Palmolive Company | | | 2.95 | | | | 11-1-2020 | | | | 200,000 | | | | 212,609 | |
Kimberly-Clark Corporation | | | 2.40 | | | | 6-1-2023 | | | | 150,000 | | | | 154,974 | |
Kimberly-Clark Corporation | | | 3.63 | | | | 8-1-2020 | | | | 750,000 | | | | 808,195 | |
Kimberly-Clark Corporation | | | 5.30 | | | | 3-1-2041 | | | | 245,000 | | | | 329,677 | |
Kimberly-Clark Corporation | | | 6.63 | | | | 8-1-2037 | | | | 200,000 | | | | 301,426 | |
Kimberly-Clark Corporation | | | 7.50 | | | | 11-1-2018 | | | | 100,000 | | | | 113,336 | |
The Procter & Gamble Company | | | 3.10 | | | | 8-15-2023 | | | | 375,000 | | | | 405,255 | |
The Procter & Gamble Company | | | 4.70 | | | | 2-15-2019 | | | | 1,500,000 | | | | 1,631,646 | |
The Procter & Gamble Company | | | 5.50 | | | | 2-1-2034 | | | | 350,000 | | | | 483,986 | |
The Procter & Gamble Company | | | 5.55 | | | | 3-5-2037 | | | | 500,000 | | | | 712,166 | |
The Procter & Gamble Company | | | 5.80 | | | | 8-15-2034 | | | | 100,000 | | | | 142,521 | |
| |
| | | | 6,903,258 | |
| | | | | | | | | | | | | | | | |
| | | | |
| Personal Products: 0.00% | | | | | | | | | | | | | | | | |
Estee Lauder Companies Incorporated | | | 6.00 | | | | 5-15-2037 | | | | 200,000 | | | | 270,273 | |
| | | | | | | | | | | | | | | | |
| | | | |
| Tobacco: 0.28% | | | | | | | | | | | | | | | | |
Altria Group Incorporated | | | 2.63 | | | | 1-14-2020 | | | | 400,000 | | | | 415,324 | |
Altria Group Incorporated | | | 4.00 | | | | 1-31-2024 | | | | 89,000 | | | | 99,880 | |
Altria Group Incorporated | | | 4.25 | | | | 8-9-2042 | | | | 500,000 | | | | 560,837 | |
Altria Group Incorporated | | | 4.50 | | | | 5-2-2043 | | | | 250,000 | | | | 288,382 | |
Altria Group Incorporated | | | 4.75 | | | | 5-5-2021 | | | | 500,000 | | | | 567,705 | |
| | | | |
| 36 | | Wells Fargo Diversified Fixed Income Portfolio | | Portfolio of investments—August 31, 2016 (unaudited) |
| | | | | | | | | | | | | | | | |
| Security name | | Interest rate | | | Maturity date | | | Principal | | | Value | |
| | | | |
| Tobacco (continued) | | | | | | | | | | | | | | | | |
Altria Group Incorporated | | | 5.38 | % | | | 1-31-2044 | | | $ | 750,000 | | | $ | 974,273 | |
Altria Group Incorporated | | | 9.25 | | | | 8-6-2019 | | | | 1,000,000 | | | | 1,220,824 | |
Altria Group Incorporated | | | 9.70 | | | | 11-10-2018 | | | | 355,000 | | | | 417,424 | |
Altria Group Incorporated | | | 9.95 | | | | 11-10-2038 | | | | 226,000 | | | | 414,767 | |
Altria Group Incorporated | | | 10.20 | | | | 2-6-2039 | | | | 161,000 | | | | 302,571 | |
Philip Morris International Incorporated | | | 1.88 | | | | 1-15-2019 | | | | 250,000 | | | | 253,793 | |
Philip Morris International Incorporated | | | 2.50 | | | | 8-22-2022 | | | | 250,000 | | | | 257,086 | |
Philip Morris International Incorporated | | | 2.63 | | | | 3-6-2023 | | | | 175,000 | | | | 180,276 | |
Philip Morris International Incorporated | | | 3.25 | | | | 11-10-2024 | | | | 300,000 | | | | 321,591 | |
Philip Morris International Incorporated | | | 3.88 | | | | 8-21-2042 | | | | 250,000 | | | | 262,939 | |
Philip Morris International Incorporated | | | 4.13 | | | | 3-4-2043 | | | | 300,000 | | | | 327,425 | |
Philip Morris International Incorporated | | | 4.25 | | | | 11-10-2044 | | | | 300,000 | | | | 336,792 | |
Philip Morris International Incorporated | | | 4.38 | | | | 11-15-2041 | | | | 500,000 | | | | 567,308 | |
Philip Morris International Incorporated | | | 4.50 | | | | 3-26-2020 | | | | 750,000 | | | | 825,383 | |
Philip Morris International Incorporated | | | 4.50 | | | | 3-20-2042 | | | | 200,000 | | | | 229,986 | |
Philip Morris International Incorporated | | | 5.65 | | | | 5-16-2018 | | | | 1,300,000 | | | | 1,397,061 | |
Philip Morris International Incorporated | | | 6.38 | | | | 5-16-2038 | | | | 600,000 | | | | 843,625 | |
Reynolds American Incorporated | | | 4.00 | | | | 6-12-2022 | | | | 400,000 | | | | 437,976 | |
Reynolds American Incorporated | | | 4.45 | | | | 6-12-2025 | | | | 500,000 | | | | 561,108 | |
Reynolds American Incorporated | | | 4.85 | | | | 9-15-2023 | | | | 1,500,000 | | | | 1,721,216 | |
Reynolds American Incorporated | | | 5.70 | | | | 8-15-2035 | | | | 300,000 | | | | 372,723 | |
Reynolds American Incorporated | | | 5.85 | | | | 8-15-2045 | | | | 1,000,000 | | | | 1,304,135 | |
Reynolds American Incorporated | | | 6.15 | | | | 9-15-2043 | | | | 125,000 | | | | 167,467 | |
Reynolds American Incorporated | | | 6.88 | | | | 5-1-2020 | | | | 250,000 | | | | 293,071 | |
Reynolds American Incorporated | | | 7.25 | | | | 6-15-2037 | | | | 200,000 | | | | 276,032 | |
Reynolds American Incorporated | | | 8.13 | | | | 6-23-2019 | | | | 155,000 | | | | 181,965 | |
| |
| | | | 16,380,945 | |
| | | | | | | | | | | | | | | | |
| | | | |
Energy: 1.77% | | | | | | | | | | | | | | | | |
| | | | |
| Energy Equipment & Services: 0.13% | | | | | | | | | | | | | | | | |
Baker Hughes Incorporated | | | 5.13 | | | | 9-15-2040 | | | | 500,000 | | | | 573,531 | |
Baker Hughes Incorporated | | | 6.88 | | | | 1-15-2029 | | | | 250,000 | | | | 317,454 | |
Baker Hughes Incorporated | | | 7.50 | | | | 11-15-2018 | | | | 375,000 | | | | 420,320 | |
FMC Technologies Incorporated | | | 3.45 | | | | 10-1-2022 | | | | 100,000 | | | | 95,764 | |
Halliburton Company | | | 2.00 | | | | 8-1-2018 | | | | 500,000 | | | | 502,955 | |
Halliburton Company | | | 3.25 | | | | 11-15-2021 | | | | 200,000 | | | | 207,397 | |
Halliburton Company | | | 3.50 | | | | 8-1-2023 | | | | 500,000 | | | | 516,794 | |
Halliburton Company | | | 3.80 | | | | 11-15-2025 | | | | 1,000,000 | | | | 1,033,527 | |
Halliburton Company | | | 4.50 | | | | 11-15-2041 | | | | 250,000 | | | | 255,732 | |
Halliburton Company | | | 4.75 | | | | 8-1-2043 | | | | 250,000 | | | | 264,253 | |
Halliburton Company | | | 5.00 | | | | 11-15-2045 | | | | 600,000 | | | | 660,486 | |
Halliburton Company | | | 6.15 | | | | 9-15-2019 | | | | 350,000 | | | | 392,378 | |
Halliburton Company | | | 7.45 | | | | 9-15-2039 | | | | 650,000 | | | | 909,640 | |
National Oilwell Varco Incorporated | | | 2.60 | | | | 12-1-2022 | | | | 1,000,000 | | | | 940,682 | |
National Oilwell Varco Incorporated | | | 3.95 | | | | 12-1-2042 | | | | 400,000 | | | | 320,594 | |
| |
| | | | 7,411,507 | |
| | | | | | | | | | | | | | | | |
| | | | |
| Oil, Gas & Consumable Fuels: 1.64% | | | | | | | | | | | | | | | | |
Amerada Hess Corporation | | | 7.13 | | | | 3-15-2033 | | | | 500,000 | | | | 579,901 | |
Anadarko Petroleum Corporation | | | 3.45 | | | | 7-15-2024 | | | | 250,000 | | | | 243,369 | |
| | | | | | |
| Portfolio of investments—August 31, 2016 (unaudited) | | Wells Fargo Diversified Fixed Income Portfolio | | | 37 | |
| | | | | | | | | | | | | | | | |
| Security name | | Interest rate | | | Maturity date | | | Principal | | | Value | |
| | | | |
| Oil, Gas & Consumable Fuels (continued) | | | | | | | | | | | | | | | | |
Anadarko Petroleum Corporation | | | 4.50 | % | | | 7-15-2044 | | | $ | 500,000 | | | $ | 453,407 | |
Anadarko Petroleum Corporation « | | | 5.55 | | | | 3-15-2026 | | | | 500,000 | | | | 553,094 | |
Anadarko Petroleum Corporation | | | 6.20 | | | | 3-15-2040 | | | | 300,000 | | | | 335,024 | |
Anadarko Petroleum Corporation | | | 6.45 | | | | 9-15-2036 | | | | 850,000 | | | | 981,142 | |
Anadarko Petroleum Corporation | | | 8.70 | | | | 3-15-2019 | | | | 450,000 | | | | 513,718 | |
Apache Corporation | | | 3.25 | | | | 4-15-2022 | | | | 362,000 | | | | 370,113 | |
Apache Corporation | | | 3.63 | | | | 2-1-2021 | | | | 500,000 | | | | 524,189 | |
Apache Corporation | | | 4.25 | | | | 1-15-2044 | | | | 250,000 | | | | 244,950 | |
Apache Corporation | | | 5.10 | | | | 9-1-2040 | | | | 575,000 | | | | 599,858 | |
Apache Corporation | | | 5.25 | | | | 2-1-2042 | | | | 100,000 | | | | 105,987 | |
Apache Corporation | | | 6.00 | | | | 1-15-2037 | | | | 500,000 | | | | 574,539 | |
Boardwalk Pipelines LP | | | 3.38 | | | | 2-1-2023 | | | | 100,000 | | | | 93,990 | |
Boardwalk Pipelines LP | | | 5.75 | | | | 9-15-2019 | | | | 150,000 | | | | 159,847 | |
Buckeye Partners LP | | | 4.15 | | | | 7-1-2023 | | | | 250,000 | | | | 253,142 | |
Buckeye Partners LP | | | 4.88 | | | | 2-1-2021 | | | | 560,000 | | | | 597,920 | |
Buckeye Partners LP | | | 5.50 | | | | 8-15-2019 | | | | 150,000 | | | | 160,377 | |
Buckeye Partners LP | | | 5.85 | | | | 11-15-2043 | | | | 200,000 | | | | 208,051 | |
Buckeye Partners LP | | | 6.05 | | | | 1-15-2018 | | | | 100,000 | | | | 105,148 | |
Chevron Corporation | | | 1.10 | | | | 12-5-2017 | | | | 1,000,000 | | | | 1,001,292 | |
Chevron Corporation | | | 1.56 | | | | 5-16-2019 | | | | 750,000 | | | | 754,907 | |
Chevron Corporation | | | 1.72 | | | | 6-24-2018 | | | | 2,000,000 | | | | 2,020,764 | |
Chevron Corporation | | | 2.10 | | | | 5-16-2021 | | | | 750,000 | | | | 763,340 | |
Chevron Corporation | | | 2.19 | | | | 11-15-2019 | | | | 100,000 | | | | 102,195 | |
Chevron Corporation | | | 2.36 | | | | 12-5-2022 | | | | 750,000 | | | | 767,831 | |
Chevron Corporation | | | 2.42 | | | | 11-17-2020 | | | | 500,000 | | | | 516,163 | |
Chevron Corporation | | | 2.95 | | | | 5-16-2026 | | | | 1,000,000 | | | | 1,040,013 | |
Chevron Corporation | | | 3.19 | | | | 6-24-2023 | | | | 1,000,000 | | | | 1,069,629 | |
Chevron Corporation | | | 4.95 | | | | 3-3-2019 | | | | 500,000 | | | | 545,554 | |
Columbia Pipeline Group Incorporated | | | 3.30 | | | | 6-1-2020 | | | | 900,000 | | | | 931,438 | |
Columbia Pipeline Group Incorporated | | | 5.80 | | | | 6-1-2045 | | | | 200,000 | | | | 240,851 | |
ConocoPhillips Company | | | 1.05 | | | | 12-15-2017 | | | | 250,000 | | | | 248,697 | |
ConocoPhillips Company | | | 1.50 | | | | 5-15-2018 | | | | 1,000,000 | | | | 1,000,053 | |
ConocoPhillips Company | | | 2.40 | | | | 12-15-2022 | | | | 500,000 | | | | 498,093 | |
ConocoPhillips Company | | | 3.35 | | | | 11-15-2024 | | | | 750,000 | | | | 772,030 | |
ConocoPhillips Company | | | 3.35 | | | | 5-15-2025 | | | | 500,000 | | | | 509,990 | |
ConocoPhillips Company | | | 4.30 | | | | 11-15-2044 | | | | 300,000 | | | | 307,377 | |
ConocoPhillips Company | | | 4.95 | | | | 3-15-2026 | | | | 500,000 | | | | 566,899 | |
ConocoPhillips Company | | | 5.20 | | | | 5-15-2018 | | | | 250,000 | | | | 265,313 | |
ConocoPhillips Company | | | 5.90 | | | | 10-15-2032 | | | | 250,000 | | | | 293,544 | |
ConocoPhillips Company | | | 5.90 | | | | 5-15-2038 | | | | 100,000 | | | | 122,289 | |
ConocoPhillips Company | | | 6.00 | | | | 1-15-2020 | | | | 750,000 | | | | 847,846 | |
ConocoPhillips Company | | | 6.95 | | | | 4-15-2029 | | | | 300,000 | | | | 383,106 | |
Devon Energy Corporation | | | 3.25 | | | | 5-15-2022 | | | | 500,000 | | | | 496,073 | |
Devon Energy Corporation | | | 4.00 | | | | 7-15-2021 | | | | 200,000 | | | | 208,939 | |
Devon Energy Corporation | | | 4.75 | | | | 5-15-2042 | | | | 500,000 | | | | 464,999 | |
Devon Energy Corporation | | | 5.60 | | | | 7-15-2041 | | | | 200,000 | | | | 199,908 | |
Devon Energy Corporation | | | 7.95 | | | | 4-15-2032 | | | | 500,000 | | | | 612,275 | |
Dominion Gas Holdings LLC | | | 4.80 | | | | 11-1-2043 | | | | 500,000 | | | | 556,415 | |
El Paso Corporation Series MTN | | | 7.75 | | | | 1-15-2032 | | | | 1,000,000 | | | | 1,207,183 | |
El Paso Natural Gas Company | | | 8.38 | | | | 6-15-2032 | | | | 650,000 | | | | 830,751 | |
| | | | |
| 38 | | Wells Fargo Diversified Fixed Income Portfolio | | Portfolio of investments—August 31, 2016 (unaudited) |
| | | | | | | | | | | | | | | | |
| Security name | | Interest rate | | | Maturity date | | | Principal | | | Value | |
| | | | |
| Oil, Gas & Consumable Fuels (continued) | | | | | | | | | | | | | | | | |
El Paso Pipeline Partners Operating LLC | | | 4.70 | % | | | 11-1-2042 | | | $ | 100,000 | | | $ | 92,398 | |
Enable Midstream Partner LP | | | 3.90 | | | | 5-15-2024 | | | | 1,000,000 | | | | 940,916 | |
Enbridge Energy Partners LP | | | 5.20 | | | | 3-15-2020 | | | | 380,000 | | | | 405,360 | |
Enbridge Energy Partners LP | | | 5.50 | | | | 9-15-2040 | | | | 200,000 | | | | 199,748 | |
Enbridge Energy Partners LP | | | 6.50 | | | | 4-15-2018 | | | | 200,000 | | | | 211,503 | |
Enbridge Energy Partners LP | | | 7.50 | | | | 4-15-2038 | | | | 270,000 | | | | 316,440 | |
Enbridge Energy Partners LP | | | 9.88 | | | | 3-1-2019 | | | | 125,000 | | | | 145,836 | |
Energy Transfer Partners LP | | | 3.60 | | | | 2-1-2023 | | | | 300,000 | | | | 295,320 | |
Energy Transfer Partners LP | | | 4.65 | | | | 6-1-2021 | | | | 1,100,000 | | | | 1,171,327 | |
Energy Transfer Partners LP | | | 4.75 | | | | 1-15-2026 | | | | 400,000 | | | | 419,520 | |
Energy Transfer Partners LP | | | 4.90 | | | | 2-1-2024 | | | | 300,000 | | | | 311,369 | |
Energy Transfer Partners LP | | | 5.15 | | | | 2-1-2043 | | | | 200,000 | | | | 185,473 | |
Energy Transfer Partners LP | | | 5.15 | | | | 3-15-2045 | | | | 400,000 | | | | 383,871 | |
Energy Transfer Partners LP | | | 5.20 | | | | 2-1-2022 | | | | 500,000 | | | | 540,757 | |
Energy Transfer Partners LP | | | 5.95 | | | | 10-1-2043 | | | | 200,000 | | | | 207,643 | |
Energy Transfer Partners LP | | | 6.05 | | | | 6-1-2041 | | | | 300,000 | | | | 309,717 | |
Energy Transfer Partners LP | | | 6.13 | | | | 12-15-2045 | | | | 400,000 | | | | 431,997 | |
Energy Transfer Partners LP | | | 6.50 | | | | 2-1-2042 | | | | 500,000 | | | | 539,732 | |
Energy Transfer Partners LP | | | 6.63 | | | | 10-15-2036 | | | | 230,000 | | | | 249,017 | |
Energy Transfer Partners LP | | | 6.70 | | | | 7-1-2018 | | | | 100,000 | | | | 107,174 | |
Energy Transfer Partners LP | | | 7.50 | | | | 7-1-2038 | | | | 100,000 | | | | 117,698 | |
Energy Transfer Partners LP | | | 8.25 | | | | 11-15-2029 | | | | 125,000 | | | | 155,169 | |
Energy Transfer Partners LP | | | 9.00 | | | | 4-15-2019 | | | | 500,000 | | | | 569,290 | |
Eni Lasmo plc | | | 7.30 | | | | 11-15-2027 | | | | 200,000 | | | | 242,750 | |
Enterprise Products Operating LLC | | | 1.65 | | | | 5-7-2018 | | | | 200,000 | | | | 200,306 | |
Enterprise Products Operating LLC | | | 2.55 | | | | 10-15-2019 | | | | 500,000 | | | | 512,056 | |
Enterprise Products Operating LLC | | | 3.35 | | | | 3-15-2023 | | | | 350,000 | | | | 362,321 | |
Enterprise Products Operating LLC | | | 3.90 | | | | 2-15-2024 | | | | 300,000 | | | | 317,573 | |
Enterprise Products Operating LLC | | | 4.05 | | | | 2-15-2022 | | | | 250,000 | | | | 269,638 | |
Enterprise Products Operating LLC | | | 4.45 | | | | 2-15-2043 | | | | 250,000 | | | | 251,519 | |
Enterprise Products Operating LLC | | | 4.85 | | | | 3-15-2044 | | | | 400,000 | | | | 423,587 | |
Enterprise Products Operating LLC | | | 4.90 | | | | 5-15-2046 | | | | 350,000 | | | | 374,443 | |
Enterprise Products Operating LLC | | | 5.20 | | | | 9-1-2020 | | | | 500,000 | | | | 562,338 | |
Enterprise Products Operating LLC | | | 5.25 | | | | 1-31-2020 | | | | 200,000 | | | | 220,807 | |
Enterprise Products Operating LLC | | | 5.70 | | | | 2-15-2042 | | | | 200,000 | | | | 231,567 | |
Enterprise Products Operating LLC | | | 5.95 | | | | 2-1-2041 | | | | 100,000 | | | | 118,972 | |
Enterprise Products Operating LLC | | | 6.13 | | | | 10-15-2039 | | | | 1,000,000 | | | | 1,200,103 | |
Enterprise Products Operating LLC | | | 6.30 | | | | 9-15-2017 | | | | 400,000 | | | | 419,562 | |
Enterprise Products Operating LLC | | | 6.65 | | | | 4-15-2018 | | | | 250,000 | | | | 269,592 | |
Enterprise Products Operating LLC | | | 7.55 | | | | 4-15-2038 | | | | 100,000 | | | | 133,069 | |
Enterprise Products Operating LLC Series D | | | 6.88 | | | | 3-1-2033 | | | | 400,000 | | | | 503,997 | |
EOG Resources Incorporated | | | 2.63 | | | | 3-15-2023 | | | | 450,000 | | | | 448,996 | |
EOG Resources Incorporated | | | 3.90 | | | | 4-1-2035 | | | | 200,000 | | | | 200,489 | |
EOG Resources Incorporated | | | 4.10 | | | | 2-1-2021 | | | | 200,000 | | | | 216,181 | |
EOG Resources Incorporated | | | 4.40 | | | | 6-1-2020 | | | | 300,000 | | | | 322,896 | |
EOG Resources Incorporated | | | 5.63 | | | | 6-1-2019 | | | | 75,000 | | | | 81,935 | |
EOG Resources Incorporated | | | 6.88 | | | | 10-1-2018 | | | | 400,000 | | | | 440,380 | |
EQT Corporation | | | 4.88 | | | | 11-15-2021 | | | | 300,000 | | | | 326,831 | |
EQT Corporation | | | 8.13 | | | | 6-1-2019 | | | | 325,000 | | | | 370,072 | |
Equitable Resources Incorporated | | | 6.50 | | | | 4-1-2018 | | | | 100,000 | | | | 104,985 | |
| | | | | | |
| Portfolio of investments—August 31, 2016 (unaudited) | | Wells Fargo Diversified Fixed Income Portfolio | | | 39 | |
| | | | | | | | | | | | | | | | |
| Security name | | Interest rate | | | Maturity date | | | Principal | | | Value | |
| | | | |
| Oil, Gas & Consumable Fuels (continued) | | | | | | | | | | | | | | | | |
Exxon Mobil Corporation | | | 1.44 | % | | | 3-1-2018 | | | $ | 1,500,000 | | | $ | 1,508,397 | |
Exxon Mobil Corporation | | | 1.71 | | | | 3-1-2019 | | | | 1,000,000 | | | | 1,011,393 | |
Exxon Mobil Corporation | | | 1.82 | | | | 3-15-2019 | | | | 1,000,000 | | | | 1,012,842 | |
Exxon Mobil Corporation | | | 2.71 | | | | 3-6-2025 | | | | 500,000 | | | | 522,218 | |
Exxon Mobil Corporation | | | 2.73 | | | | 3-1-2023 | | | | 1,000,000 | | | | 1,042,932 | |
Exxon Mobil Corporation | | | 3.18 | | | | 3-15-2024 | | | | 500,000 | | | | 534,231 | |
Exxon Mobil Corporation | | | 3.57 | | | | 3-6-2045 | | | | 500,000 | | | | 530,492 | |
Exxon Mobil Corporation | | | 4.11 | | | | 3-1-2046 | | | | 1,000,000 | | | | 1,151,102 | |
Gulf South Pipeline Company LP | | | 4.00 | | | | 6-15-2022 | | | | 200,000 | | | | 193,200 | |
Hess Corporation | | | 5.60 | | | | 2-15-2041 | | | | 300,000 | | | | 304,724 | |
Hess Corporation | | | 6.00 | | | | 1-15-2040 | | | | 350,000 | | | | 365,385 | |
Hess Corporation | | | 7.30 | | | | 8-15-2031 | | | | 384,000 | | | | 445,371 | |
Hess Corporation | | | 7.88 | | | | 10-1-2029 | | | | 280,000 | | | | 340,218 | |
Hess Corporation | | | 8.13 | | | | 2-15-2019 | | | | 500,000 | | | | 564,873 | |
Kerr-McGee Corporation | | | 6.95 | | | | 7-1-2024 | | | | 200,000 | | | | 233,862 | |
Kinder Morgan Energy Partners LP | | | 3.45 | | | | 2-15-2023 | | | | 250,000 | | | | 247,507 | |
Kinder Morgan Energy Partners LP | | | 3.50 | | | | 3-1-2021 | | | | 300,000 | | | | 309,873 | |
Kinder Morgan Energy Partners LP | | | 3.50 | | | | 9-1-2023 | | | | 250,000 | | | | 247,602 | |
Kinder Morgan Energy Partners LP | | | 3.95 | | | | 9-1-2022 | | | | 375,000 | | | | 388,141 | |
Kinder Morgan Energy Partners LP | | | 4.30 | | | | 6-1-2025 | | | | 750,000 | | | | 777,615 | |
Kinder Morgan Energy Partners LP | | | 5.00 | | | | 8-15-2042 | | | | 250,000 | | | | 241,907 | |
Kinder Morgan Energy Partners LP | | | 5.00 | | | | 3-1-2043 | | | | 225,000 | | | | 216,350 | |
Kinder Morgan Energy Partners LP | | | 5.30 | | | | 9-15-2020 | | | | 125,000 | | | | 135,491 | |
Kinder Morgan Energy Partners LP | | | 5.50 | | | | 3-1-2044 | | | | 300,000 | | | | 304,585 | |
Kinder Morgan Energy Partners LP | | | 5.80 | | | | 3-15-2035 | | | | 100,000 | | | | 103,682 | |
Kinder Morgan Energy Partners LP | | | 5.95 | | | | 2-15-2018 | | | | 500,000 | | | | 527,576 | |
Kinder Morgan Energy Partners LP | | | 6.38 | | | | 3-1-2041 | | | | 500,000 | | | | 537,064 | |
Kinder Morgan Energy Partners LP | | | 6.95 | | | | 1-15-2038 | | | | 500,000 | | | | 572,395 | |
Kinder Morgan Incorporated | | | 5.55 | | | | 6-1-2045 | | | | 1,250,000 | | | | 1,289,634 | |
Magellan Midstream Partners LP | | | 5.15 | | | | 10-15-2043 | | | | 200,000 | | | | 219,234 | |
Magellan Midstream Partners LP | | | 6.40 | | | | 7-15-2018 | | | | 100,000 | | | | 108,107 | |
Magellan Midstream Partners LP | | | 6.55 | | | | 7-15-2019 | | | | 575,000 | | | | 647,411 | |
Marathon Oil Corporation | | | 2.80 | | | | 11-1-2022 | | | | 600,000 | | | | 548,458 | |
Marathon Oil Corporation « | | | 3.85 | | | | 6-1-2025 | | | | 350,000 | | | | 327,068 | |
Marathon Oil Corporation | | | 5.20 | | | | 6-1-2045 | | | | 200,000 | | | | 179,201 | |
Marathon Oil Corporation | | | 6.00 | | | | 10-1-2017 | | | | 625,000 | | | | 646,175 | |
Marathon Oil Corporation | | | 6.60 | | | | 10-1-2037 | | | | 450,000 | | | | 463,843 | |
Marathon Petroleum Corporation | | | 3.63 | | | | 9-15-2024 | | | | 500,000 | | | | 506,484 | |
Marathon Petroleum Corporation | | | 4.75 | | | | 9-15-2044 | | | | 500,000 | | | | 458,867 | |
Marathon Petroleum Corporation | | | 5.13 | | | | 3-1-2021 | | | | 35,000 | | | | 38,989 | |
Marathon Petroleum Corporation | | | 6.50 | | | | 3-1-2041 | | | | 545,000 | | | | 612,210 | |
MPLX LP 144A | | | 4.88 | | | | 6-1-2025 | | | | 750,000 | | | | 764,915 | |
Nabors Industries Incorporated | | | 5.00 | | | | 9-15-2020 | | | | 300,000 | | | | 296,828 | |
Nabors Industries Incorporated | | | 6.15 | | | | 2-15-2018 | | | | 500,000 | | | | 518,175 | |
Nabors Industries Incorporated | | | 9.25 | | | | 1-15-2019 | | | | 500,000 | | | | 545,272 | |
Nextera Energy Capital | | | 4.50 | | | | 6-1-2021 | | | | 200,000 | | | | 219,949 | |
Noble Energy Incorporated | | | 3.90 | | | | 11-15-2024 | | | | 300,000 | | | | 306,221 | |
Noble Energy Incorporated | | | 4.15 | | | | 12-15-2021 | | | | 500,000 | | | | 529,608 | |
Noble Energy Incorporated | | | 5.05 | | | | 11-15-2044 | | | | 500,000 | | | | 499,017 | |
Noble Energy Incorporated | | | 6.00 | | | | 3-1-2041 | | | | 565,000 | | | | 615,787 | |
| | | | |
| 40 | | Wells Fargo Diversified Fixed Income Portfolio | | Portfolio of investments—August 31, 2016 (unaudited) |
| | | | | | | | | | | | | | | | |
| Security name | | Interest rate | | | Maturity date | | | Principal | | | Value | |
| | | | |
| Oil, Gas & Consumable Fuels (continued) | | | | | | | | | | | | | | | | |
Noble Energy Incorporated | | | 8.25 | % | | | 3-1-2019 | | | $ | 350,000 | | | $ | 398,452 | |
Northwest Pipeline Corporation | | | 6.05 | | | | 6-15-2018 | | | | 170,000 | | | | 178,716 | |
Occidental Petroleum Corporation | | | 1.50 | | | | 2-15-2018 | | | | 250,000 | | | | 250,922 | |
Occidental Petroleum Corporation | | | 2.70 | | | | 2-15-2023 | | | | 500,000 | | | | 509,424 | |
Occidental Petroleum Corporation | | | 3.50 | | | | 6-15-2025 | | | | 300,000 | | | | 318,714 | |
Occidental Petroleum Corporation | | | 4.10 | | | | 2-1-2021 | | | | 460,000 | | | | 501,904 | |
Occidental Petroleum Corporation | | | 4.63 | | | | 6-15-2045 | | | | 300,000 | | | | 344,254 | |
ONEOK Partners LP | | | 3.20 | | | | 9-15-2018 | | | | 125,000 | | | | 127,135 | |
ONEOK Partners LP | | | 3.38 | | | | 10-1-2022 | | | | 1,000,000 | | | | 1,006,893 | |
ONEOK Partners LP | | | 6.13 | | | | 2-1-2041 | | | | 500,000 | | | | 546,119 | |
ONEOK Partners LP | | | 6.20 | | | | 9-15-2043 | | | | 179,000 | | | | 198,176 | |
ONEOK Partners LP | | | 6.85 | | | | 10-15-2037 | | | | 500,000 | | | | 577,468 | |
ONEOK Partners LP | | | 8.63 | | | | 3-1-2019 | | | | 350,000 | | | | 394,901 | |
Phillips 66 | | | 4.30 | | | | 4-1-2022 | | | | 1,000,000 | | | | 1,101,554 | |
Phillips 66 | | | 4.65 | | | | 11-15-2034 | | | | 200,000 | | | | 218,528 | |
Phillips 66 | | | 4.88 | | | | 11-15-2044 | | | | 200,000 | | | | 224,015 | |
Phillips 66 | | | 5.88 | | | | 5-1-2042 | | | | 750,000 | | | | 945,771 | |
Pioneer Natural Resources Company | | | 3.95 | | | | 7-15-2022 | | | | 1,000,000 | | | | 1,053,144 | |
Plains All American Pipeline LP | | | 2.60 | | | | 12-15-2019 | | | | 200,000 | | | | 201,275 | |
Plains All American Pipeline LP | | | 3.60 | | | | 11-1-2024 | | | | 300,000 | | | | 291,038 | |
Plains All American Pipeline LP | | | 3.65 | | | | 6-1-2022 | | | | 500,000 | | | | 505,294 | |
Plains All American Pipeline LP | | | 3.85 | | | | 10-15-2023 | | | | 500,000 | | | | 497,548 | |
Plains All American Pipeline LP | | | 4.90 | | | | 2-15-2045 | | | | 250,000 | | | | 230,107 | |
Plains All American Pipeline LP « | | | 5.00 | | | | 2-1-2021 | | | | 200,000 | | | | 214,352 | |
Plains All American Pipeline LP | | | 5.15 | | | | 6-1-2042 | | | | 500,000 | | | | 461,470 | |
Plains All American Pipeline LP | | | 6.50 | | | | 5-1-2018 | | | | 150,000 | | | | 160,089 | |
Plains All American Pipeline LP | | | 6.65 | | | | 1-15-2037 | | | | 200,000 | | | | 223,148 | |
Plains All American Pipeline LP | | | 8.75 | | | | 5-1-2019 | | | | 400,000 | | | | 459,621 | |
Southern Natural Gas Company | | | 4.40 | | | | 6-15-2021 | | | | 1,000,000 | | | | 1,070,678 | |
Spectra Energy Capital LLC | | | 3.30 | | | | 3-15-2023 | | | | 200,000 | | | | 197,446 | |
Spectra Energy Capital LLC | | | 4.60 | | | | 6-15-2021 | | | | 100,000 | | | | 107,921 | |
Spectra Energy Capital LLC | | | 7.50 | | | | 9-15-2038 | | | | 100,000 | | | | 121,971 | |
Spectra Energy Capital LLC | | | 8.00 | | | | 10-1-2019 | | | | 100,000 | | | | 115,396 | |
Spectra Energy Partners LP | | | 2.95 | | | | 9-25-2018 | | | | 500,000 | | | | 509,128 | |
Spectra Energy Partners LP | | | 4.75 | | | | 3-15-2024 | | | | 350,000 | | | | 388,964 | |
Sunoco Logistics Partner LP | | | 3.45 | | | | 1-15-2023 | | | | 200,000 | | | | 199,450 | |
Sunoco Logistics Partner LP | | | 4.95 | | | | 1-15-2043 | | | | 150,000 | | | | 147,000 | |
Sunoco Logistics Partner LP | | | 5.30 | | | | 4-1-2044 | | | | 500,000 | | | | 507,135 | |
Sunoco Logistics Partner LP | | | 5.35 | | | | 5-15-2045 | | | | 200,000 | | | | 206,718 | |
Sunoco Logistics Partner LP | | | 6.85 | | | | 2-15-2040 | | | | 250,000 | | | | 287,809 | |
TC Pipelines LP | | | 4.65 | | | | 6-15-2021 | | | | 300,000 | | | | 313,620 | |
Tennessee Gas Pipeline Company | | | 7.00 | | | | 10-15-2028 | | | | 250,000 | | | | 299,955 | |
Texas Eastern Transmission LP | | | 7.00 | | | | 7-15-2032 | | | | 325,000 | | | | 409,056 | |
Transcontinental Gas Pipe Line Corporation | | | 6.05 | | | | 6-15-2018 | | | | 105,000 | | | | 110,383 | |
Valero Energy Corporation | | | 6.13 | | | | 2-1-2020 | | | | 65,000 | | | | 74,229 | |
Valero Energy Corporation | | | 6.63 | | | | 6-15-2037 | | | | 1,000,000 | | | | 1,172,284 | |
Valero Energy Corporation | | | 7.50 | | | | 4-15-2032 | | | | 300,000 | | | | 376,900 | |
Valero Energy Corporation | | | 9.38 | | | | 3-15-2019 | | | | 250,000 | | | | 295,652 | |
Western Gas Partners LP | | | 4.00 | | | | 7-1-2022 | | | | 400,000 | | | | 407,041 | |
Western Gas Partners LP | | | 5.45 | | | | 4-1-2044 | | | | 500,000 | | | | 491,997 | |
| | | | | | |
| Portfolio of investments—August 31, 2016 (unaudited) | | Wells Fargo Diversified Fixed Income Portfolio | | | 41 | |
| | | | | | | | | | | | | | | | |
| Security name | | Interest rate | | | Maturity date | | | Principal | | | Value | |
| | | | |
| Oil, Gas & Consumable Fuels (continued) | | | | | | | | | | | | | | | | |
Williams Partners LP | | | 3.35 | % | | | 8-15-2022 | | | $ | 250,000 | | | $ | 244,355 | |
Williams Partners LP | | | 3.60 | | | | 3-15-2022 | | | | 500,000 | | | | 499,104 | |
Williams Partners LP | | | 4.13 | | | | 11-15-2020 | | | | 300,000 | | | | 311,065 | |
Williams Partners LP | | | 4.30 | | | | 3-4-2024 | | | | 500,000 | | | | 511,865 | |
Williams Partners LP | | | 4.50 | | | | 11-15-2023 | | | | 400,000 | | | | 415,002 | |
Williams Partners LP | | | 5.10 | | | | 9-15-2045 | | | | 1,000,000 | | | | 980,237 | |
Williams Partners LP | | | 5.25 | | | | 3-15-2020 | | | | 640,000 | | | | 688,553 | |
Williams Partners LP | | | 5.80 | | | | 11-15-2043 | | | | 1,000,000 | | | | 1,055,608 | |
Williams Partners LP | | | 6.30 | | | | 4-15-2040 | | | | 390,000 | | | | 425,681 | |
XTO Energy Incorporated | | | 6.50 | | | | 12-15-2018 | | | | 500,000 | | | | 556,121 | |
| |
| | | | 95,588,600 | |
| | | | | | | | | | | | | | | | |
| | | | |
Financials: 6.20% | | | | | | | | | | | | | | | | |
| | | | |
| Banks: 2.39% | | | | | | | | | | | | | | | | |
ABB Finance (USA) Incorporated | | | 2.88 | | | | 5-8-2022 | | | | 1,100,000 | | | | 1,154,571 | |
ABB Finance (USA) Incorporated | | | 4.38 | | | | 5-8-2042 | | | | 37,000 | | | | 42,892 | |
Bank of America Corporation | | | 1.75 | | | | 6-5-2018 | | | | 750,000 | | | | 755,200 | |
Bank of America Corporation | | | 1.95 | | | | 5-12-2018 | | | | 250,000 | | | | 251,799 | |
Bank of America Corporation | | | 2.00 | | | | 1-11-2018 | | | | 1,250,000 | | | | 1,257,550 | |
Bank of America Corporation | | | 2.60 | | | | 1-15-2019 | | | | 554,000 | | | | 566,238 | |
Bank of America Corporation | | | 3.30 | | | | 1-11-2023 | | | | 1,600,000 | | | | 1,661,960 | |
Bank of America Corporation | | | 3.50 | | | | 4-19-2026 | | | | 1,000,000 | | | | 1,043,736 | |
Bank of America Corporation | | | 3.95 | | | | 4-21-2025 | | | | 3,000,000 | | | | 3,122,409 | |
Bank of America Corporation | | | 4.00 | | | | 4-1-2024 | | | | 750,000 | | | | 810,804 | |
Bank of America Corporation | | | 4.13 | | | | 1-22-2024 | | | | 1,250,000 | | | | 1,361,326 | |
Bank of America Corporation | | | 4.20 | | | | 8-26-2024 | | | | 1,700,000 | | | | 1,803,197 | |
Bank of America Corporation | | | 5.00 | | | | 1-21-2044 | | | | 1,200,000 | | | | 1,438,310 | |
Bank of America Corporation | | | 5.49 | | | | 3-15-2019 | | | | 250,000 | | | | 270,568 | |
Bank of America Corporation | | | 5.63 | | | | 7-1-2020 | | | | 1,500,000 | | | | 1,693,307 | |
Bank of America Corporation | | | 5.70 | | | | 1-24-2022 | | | | 1,000,000 | | | | 1,166,534 | |
Bank of America Corporation | | | 5.75 | | | | 12-1-2017 | | | | 1,500,000 | | | | 1,577,130 | |
Bank of America Corporation | | | 5.88 | | | | 1-5-2021 | | | | 500,000 | | | | 576,051 | |
Bank of America Corporation | | | 5.88 | | | | 2-7-2042 | | | | 500,000 | | | | 660,118 | |
Bank of America Corporation | | | 6.00 | | | | 9-1-2017 | | | | 1,000,000 | | | | 1,043,945 | |
Bank of America Corporation | | | 6.00 | | | | 10-15-2036 | | | | 300,000 | | | | 393,830 | |
Bank of America Corporation | | | 7.63 | | | | 6-1-2019 | | | | 2,500,000 | | | | 2,871,998 | |
Bank One Corporation | | | 7.63 | | | | 10-15-2026 | | | | 240,000 | | | | 321,171 | |
Bank One Corporation | | | 8.00 | | | | 4-29-2027 | | | | 550,000 | | | | 746,692 | |
BB&T Corporation | | | 2.05 | | | | 5-10-2021 | | | | 1,000,000 | | | | 1,007,857 | |
Branch Banking & Trust Corporation | | | 1.35 | | | | 10-1-2017 | | | | 1,200,000 | | | | 1,201,804 | |
Branch Banking & Trust Corporation | | | 2.30 | | | | 10-15-2018 | | | | 500,000 | | | | 510,355 | |
Branch Banking & Trust Corporation | | | 3.80 | | | | 10-30-2026 | | | | 400,000 | | | | 437,861 | |
Branch Banking & Trust Corporation | | | 3.95 | | | | 3-22-2022 | | | | 500,000 | | | | 537,275 | |
Branch Banking & Trust Corporation | | | 6.85 | | | | 4-30-2019 | | | | 500,000 | | | | 567,481 | |
Citigroup Incorporated | | | 1.70 | | | | 4-27-2018 | | | | 1,500,000 | | | | 1,501,704 | |
Citigroup Incorporated | | | 1.75 | | | | 5-1-2018 | | | | 100,000 | | | | 100,132 | |
Citigroup Incorporated | | | 1.80 | | | | 2-5-2018 | | | | 2,500,000 | | | | 2,509,098 | |
Citigroup Incorporated | | | 2.50 | | | | 9-26-2018 | | | | 400,000 | | | | 407,002 | |
Citigroup Incorporated | | | 2.50 | | | | 7-29-2019 | | | | 1,000,000 | | | | 1,020,246 | |
Citigroup Incorporated | | | 3.30 | | | | 4-27-2025 | | | | 1,250,000 | | | | 1,290,975 | |
| | | | |
| 42 | | Wells Fargo Diversified Fixed Income Portfolio | | Portfolio of investments—August 31, 2016 (unaudited) |
| | | | | | | | | | | | | | | | |
| Security name | | Interest rate | | | Maturity date | | | Principal | | | Value | |
| | | | |
| Banks (continued) | | | | | | | | | | | | | | | | |
Citigroup Incorporated | | | 3.38 | % | | | 3-1-2023 | | | $ | 632,000 | | | $ | 660,330 | |
Citigroup Incorporated | | | 3.50 | | | | 5-15-2023 | | | | 500,000 | | | | 515,028 | |
Citigroup Incorporated | | | 3.75 | | | | 6-16-2024 | | | | 1,550,000 | | | | 1,645,344 | |
Citigroup Incorporated | | | 3.88 | | | | 10-25-2023 | | | | 850,000 | | | | 918,470 | |
Citigroup Incorporated | | | 4.05 | | | | 7-30-2022 | | | | 400,000 | | | | 425,452 | |
Citigroup Incorporated | | | 4.40 | | | | 6-10-2025 | | | | 1,000,000 | | | | 1,059,864 | |
Citigroup Incorporated | | | 4.45 | | | | 9-29-2027 | | | | 750,000 | | | | 790,703 | |
Citigroup Incorporated | | | 4.50 | | | | 1-14-2022 | | | | 1,500,000 | | | | 1,658,586 | |
Citigroup Incorporated | | | 4.60 | | | | 3-9-2026 | | | | 1,250,000 | | | | 1,343,229 | |
Citigroup Incorporated | | | 4.65 | | | | 7-30-2045 | | | | 1,000,000 | | | | 1,140,214 | |
Citigroup Incorporated | | | 5.50 | | | | 9-13-2025 | | | | 1,000,000 | | | | 1,132,880 | |
Citigroup Incorporated | | | 5.88 | | | | 1-30-2042 | | | | 500,000 | | | | 647,702 | |
Citigroup Incorporated | | | 6.00 | | | | 10-31-2033 | | | | 725,000 | | | | 868,320 | |
Citigroup Incorporated | | | 6.13 | | | | 8-25-2036 | | | | 500,000 | | | | 614,863 | |
Citizens Bank NA | | | 2.55 | | | | 5-13-2021 | | | | 500,000 | | | | 510,590 | |
Citizens Financial Group Incorporated | | | 4.30 | | | | 12-3-2025 | | | | 350,000 | | | | 369,857 | |
City National Corporation | | | 5.25 | | | | 9-15-2020 | | | | 200,000 | | | | 225,375 | |
Comerica Incorporated | | | 3.80 | | | | 7-22-2026 | | | | 250,000 | | | | 258,749 | |
Commonwealth Bank of Australia (New York) | | | 1.90 | | | | 9-18-2017 | | | | 250,000 | | | | 251,497 | |
Commonwealth Bank of Australia (New York) | | | 2.25 | | | | 3-13-2019 | | | | 1,000,000 | | | | 1,016,683 | |
Commonwealth Bank of Australia (New York) | | | 2.50 | | | | 9-20-2018 | | | | 1,500,000 | | | | 1,531,334 | |
Compass Bank | | | 2.75 | | | | 9-29-2019 | | | | 250,000 | | | | 249,522 | |
Compass Bank | | | 6.40 | | | | 10-1-2017 | | | | 250,000 | | | | 260,932 | |
Discover Bank | | | 3.10 | | | | 6-4-2020 | | | | 500,000 | | | | 514,370 | |
Discover Bank | | | 3.20 | | | | 8-9-2021 | | | | 500,000 | | | | 513,626 | |
Discover Bank | | | 4.20 | | | | 8-8-2023 | | | | 500,000 | | | | 535,628 | |
Discover Bank | | | 4.25 | | | | 3-13-2026 | | | | 250,000 | | | | 266,406 | |
Fifth Third Bancorp | | | 2.30 | | | | 3-1-2019 | | | | 1,000,000 | | | | 1,015,807 | |
Fifth Third Bancorp | | | 4.30 | | | | 1-16-2024 | | | | 500,000 | | | | 537,032 | |
Fifth Third Bancorp | | | 8.25 | | | | 3-1-2038 | | | | 750,000 | | | | 1,134,272 | |
Fifth Third Bank | | | 2.88 | | | | 10-1-2021 | | | | 300,000 | | | | 313,238 | |
HSBC Bank USA NA | | | 2.25 | | | | 6-23-2019 | | | | 1,900,000 | | | | 1,914,267 | |
HSBC Bank USA NA | | | 4.88 | | | | 8-24-2020 | | | | 800,000 | | | | 871,377 | |
HSBC Bank USA NA | | | 5.00 | | | | 9-27-2020 | | | | 500,000 | | | | 542,210 | |
HSBC Bank USA NA | | | 5.63 | | | | 8-15-2035 | | | | 225,000 | | | | 269,594 | |
HSBC Bank USA NA | | | 7.00 | | | | 1-15-2039 | | | | 500,000 | | | | 682,817 | |
HSBC USA Incorporated | | | 1.63 | | | | 1-16-2018 | | | | 1,000,000 | | | | 1,000,127 | |
Huntington Bancshares Incorporated | | | 2.60 | | | | 8-2-2018 | | | | 250,000 | | | | 254,317 | |
Huntington Bancshares Incorporated | | | 7.00 | | | | 12-15-2020 | | | | 25,000 | | | | 29,117 | |
Huntington National Bank | | | 2.20 | | | | 11-6-2018 | | | | 1,500,000 | | | | 1,515,887 | |
JPMorgan Chase & Company | | | 1.70 | | | | 3-1-2018 | | | | 750,000 | | | | 753,420 | |
JPMorgan Chase & Company | | | 1.80 | | | | 1-25-2018 | | | | 500,000 | | | | 503,265 | |
JPMorgan Chase & Company | | | 1.85 | | | | 3-22-2019 | | | | 1,000,000 | | | | 1,006,758 | |
JPMorgan Chase & Company | | | 2.25 | | | | 1-23-2020 | | | | 750,000 | | | | 760,097 | |
JPMorgan Chase & Company | | | 2.35 | | | | 1-28-2019 | | | | 500,000 | | | | 510,315 | |
JPMorgan Chase & Company | | | 2.75 | | | | 6-23-2020 | | | | 1,000,000 | | | | 1,029,251 | |
JPMorgan Chase & Company | | | 2.95 | | | | 10-1-2026 | | | | 750,000 | | | | 756,533 | |
JPMorgan Chase & Company | | | 3.13 | | | | 1-23-2025 | | | | 1,000,000 | | | | 1,027,516 | |
JPMorgan Chase & Company | | | 3.20 | | | | 1-25-2023 | | | | 1,000,000 | | | | 1,043,041 | |
JPMorgan Chase & Company | | | 3.25 | | | | 9-23-2022 | | | | 1,500,000 | | | | 1,574,402 | |
| | | | | | |
| Portfolio of investments—August 31, 2016 (unaudited) | | Wells Fargo Diversified Fixed Income Portfolio | | | 43 | |
| | | | | | | | | | | | | | | | |
| Security name | | Interest rate | | | Maturity date | | | Principal | | | Value | |
| | | | |
| Banks (continued) | | | | | | | | | | | | | | | | |
JPMorgan Chase & Company | | | 3.30 | % | | | 4-1-2026 | | | $ | 1,500,000 | | | $ | 1,554,840 | |
JPMorgan Chase & Company | | | 3.38 | | | | 5-1-2023 | | | | 1,000,000 | | | | 1,031,473 | |
JPMorgan Chase & Company | | | 3.63 | | | | 5-13-2024 | | | | 2,000,000 | | | | 2,134,804 | |
JPMorgan Chase & Company | | | 4.13 | | | | 12-15-2026 | | | | 1,000,000 | | | | 1,071,686 | |
JPMorgan Chase & Company | | | 4.25 | | | | 10-15-2020 | | | | 1,000,000 | | | | 1,088,283 | |
JPMorgan Chase & Company | | | 4.40 | | | | 7-22-2020 | | | | 1,500,000 | | | | 1,634,307 | |
JPMorgan Chase & Company | | | 4.50 | | | | 1-24-2022 | | | | 1,500,000 | | | | 1,661,006 | |
JPMorgan Chase & Company | | | 4.63 | | | | 5-10-2021 | | | | 1,500,000 | | | | 1,663,025 | |
JPMorgan Chase & Company | | | 5.40 | | | | 1-6-2042 | | | | 750,000 | | | | 952,139 | |
JPMorgan Chase & Company | | | 5.60 | | | | 7-15-2041 | | | | 1,100,000 | | | | 1,426,924 | |
JPMorgan Chase & Company | | | 5.63 | | | | 8-16-2043 | | | | 200,000 | | | | 250,060 | |
JPMorgan Chase & Company | | | 6.00 | | | | 10-1-2017 | | | | 1,250,000 | | | | 1,310,491 | |
JPMorgan Chase & Company | | | 6.00 | | | | 1-15-2018 | | | | 1,000,000 | | | | 1,061,251 | |
JPMorgan Chase & Company | | | 6.40 | | | | 5-15-2038 | | | | 1,350,000 | | | | 1,885,544 | |
KeyBank NA | | | 1.65 | | | | 2-1-2018 | | | | 400,000 | | | | 401,756 | |
KeyCorp | | | 2.30 | | | | 12-13-2018 | | | | 300,000 | | | | 304,746 | |
KeyCorp | | | 5.10 | | | | 3-24-2021 | | | | 1,500,000 | | | | 1,693,065 | |
Manufacturers & Traders Trust Company | | | 2.25 | | | | 7-25-2019 | | | | 850,000 | | | | 864,942 | |
Manufacturers & Traders Trust Company | | | 6.63 | | | | 12-4-2017 | | | | 500,000 | | | | 532,128 | |
MUFG Americas Holdings Corporation | | | 3.00 | | | | 2-10-2025 | | | | 500,000 | | | | 507,037 | |
PNC Bank NA | | | 1.50 | | | | 10-18-2017 | | | | 500,000 | | | | 501,705 | |
PNC Bank NA | | | 1.60 | | | | 6-1-2018 | | | | 1,000,000 | | | | 1,005,011 | |
PNC Bank NA | | | 2.25 | | | | 7-2-2019 | | | | 750,000 | | | | 763,473 | |
PNC Bank NA | | | 2.70 | | | | 11-1-2022 | | | | 350,000 | | | | 356,152 | |
PNC Bank NA | | | 2.95 | | | | 1-30-2023 | | | | 300,000 | | | | 310,957 | |
PNC Bank NA | | | 3.30 | | | | 10-30-2024 | | | | 500,000 | | | | 533,472 | |
PNC Bank NA | | | 3.80 | | | | 7-25-2023 | | | | 300,000 | | | | 324,062 | |
PNC Bank NA | | | 4.20 | | | | 11-1-2025 | | | | 1,500,000 | | | | 1,682,471 | |
PNC Bank NA | | | 6.00 | | | | 12-7-2017 | | | | 500,000 | | | | 527,328 | |
PNC Bank NA | | | 6.88 | | | | 4-1-2018 | | | | 175,000 | | | | 189,343 | |
Regions Financial Corporation | | | 3.20 | | | | 2-8-2021 | | | | 1,000,000 | | | | 1,036,748 | |
Santander Bank | | | 8.75 | | | | 5-30-2018 | | | | 250,000 | | | | 275,908 | |
Santander Bank | | | 2.70 | | | | 5-24-2019 | | | | 500,000 | | | | 505,515 | |
Santander Holdings USA | | | 4.50 | | | | 7-17-2025 | | | | 500,000 | | | | 523,389 | |
SunTrust Bank Incorporated | | | 6.00 | | | | 9-11-2017 | | | | 750,000 | | | | 783,016 | |
SunTrust Bank Incorporated | | | 7.25 | | | | 3-15-2018 | | | | 500,000 | | | | 540,869 | |
SVB Financial Group | | | 5.38 | | | | 9-15-2020 | | | | 160,000 | | | | 177,720 | |
Union Bank NA | | | 2.63 | | | | 9-26-2018 | | | | 500,000 | | | | 509,620 | |
UnionBanCal Corporation | | | 3.50 | | | | 6-18-2022 | | | | 200,000 | | | | 211,532 | |
US Bancorp | | | 1.95 | | | | 11-15-2018 | | | | 250,000 | | | | 253,792 | |
US Bancorp | | | 2.20 | | | | 4-25-2019 | | | | 1,000,000 | | | | 1,021,557 | |
US Bancorp | | | 2.95 | | | | 7-15-2022 | | | | 575,000 | | | | 598,338 | |
US Bancorp | | | 3.00 | | | | 3-15-2022 | | | | 500,000 | | | | 528,462 | |
US Bancorp | | | 3.10 | | | | 4-27-2026 | | | | 1,000,000 | | | | 1,034,016 | |
US Bancorp | | | 3.60 | | | | 9-11-2024 | | | | 500,000 | | | | 537,548 | |
US Bancorp | | | 4.13 | | | | 5-24-2021 | | | | 500,000 | | | | 555,138 | |
US Bank NA | | | 1.38 | | | | 9-11-2017 | | | | 500,000 | | | | 501,089 | |
Wachovia Bank NA (l) | | | 5.85 | | | | 2-1-2037 | | | | 1,000,000 | | | | 1,270,804 | |
Wachovia Bank NA (l) | | | 6.60 | | | | 1-15-2038 | | | | 600,000 | | | | 843,014 | |
Wachovia Corporation (l) | | | 5.50 | | | | 8-1-2035 | | | | 700,000 | | | | 829,965 | |
| | | | |
| 44 | | Wells Fargo Diversified Fixed Income Portfolio | | Portfolio of investments—August 31, 2016 (unaudited) |
| | | | | | | | | | | | | | | | |
| Security name | | Interest rate | | | Maturity date | | | Principal | | | Value | |
| | | | |
| Banks (continued) | | | | | | | | | | | | | | | | |
Wachovia Corporation (l) | | | 5.75 | % | | | 2-1-2018 | | | $ | 1,000,000 | | | $ | 1,061,915 | |
Wells Fargo & Company (l) | | | 1.50 | | | | 1-16-2018 | | | | 1,000,000 | | | | 1,003,727 | |
Wells Fargo & Company (l) | | | 2.15 | | | | 1-30-2020 | | | | 2,500,000 | | | | 2,540,693 | |
Wells Fargo & Company (l) | | | 3.00 | | | | 2-19-2025 | | | | 1,250,000 | | | | 1,284,808 | |
Wells Fargo & Company (l) | | | 3.00 | | | | 4-22-2026 | | | | 1,250,000 | | | | 1,281,340 | |
Wells Fargo & Company (l) | | | 3.30 | | | | 9-9-2024 | | | | 1,500,000 | | | | 1,584,654 | |
Wells Fargo & Company (l) | | | 3.45 | | | | 2-13-2023 | | | | 750,000 | | | | 786,196 | |
Wells Fargo & Company (l) | | | 3.50 | | | | 3-8-2022 | | | | 1,000,000 | | | | 1,067,960 | |
Wells Fargo & Company (l) | | | 3.90 | | | | 5-1-2045 | | | | 600,000 | | | | 635,458 | |
Wells Fargo & Company (l) | | | 4.10 | | | | 6-3-2026 | | | | 1,000,000 | | | | 1,085,518 | |
Wells Fargo & Company (l) | | | 4.13 | | | | 8-15-2023 | | | | 1,000,000 | | | | 1,090,789 | |
Wells Fargo & Company (l) | | | 4.60 | | | | 4-1-2021 | | | | 1,250,000 | | | | 1,389,594 | |
Wells Fargo & Company (l) | | | 5.38 | | | | 11-2-2043 | | | | 1,000,000 | | | | 1,201,227 | |
Wells Fargo & Company (l) | | | 5.61 | | | | 1-15-2044 | | | | 1,000,000 | | | | 1,248,846 | |
Wells Fargo & Company (l) | | | 5.63 | | | | 12-11-2017 | | | | 1,500,000 | | | | 1,581,108 | |
Wells Fargo Bank NA (l) | | | 1.65 | | | | 1-22-2018 | | | | 750,000 | | | | 754,318 | |
Wells Fargo Bank NA (l) | | | 5.95 | | | | 8-26-2036 | | | | 350,000 | | | | 449,998 | |
Wells Fargo Capital X (l) | | | 5.95 | | | | 12-1-2086 | | | | 500,000 | | | | 552,500 | |
| |
| | | | 139,015,510 | |
| | | | | | | | | | | | | | | | |
| | | | |
| Capital Markets: 1.15% | | | | | | | | | | | | | | | | |
AGL Capital Corporation | | | 4.40 | | | | 6-1-2043 | | | | 200,000 | | | | 215,265 | |
AGL Capital Corporation | | | 5.88 | | | | 3-15-2041 | | | | 570,000 | | | | 720,541 | |
Ameriprise Financial Incorporated | | | 4.00 | | | | 10-15-2023 | | | | 500,000 | | | | 547,533 | |
Ameriprise Financial Incorporated | | | 5.30 | | | | 3-15-2020 | | | | 300,000 | | | | 334,642 | |
Ameriprise Financial Incorporated | | | 7.30 | | | | 6-28-2019 | | | | 65,000 | | | | 74,887 | |
AmeriTech Capital Funding Corporation | | | 6.45 | | | | 1-15-2018 | | | | 300,000 | | | | 318,750 | |
Ares Capital Corporation | | | 3.88 | | | | 1-15-2020 | | | | 400,000 | | | | 414,064 | |
Ares Capital Corporation | | | 4.88 | | | | 11-30-2018 | | | | 100,000 | | | | 104,652 | |
Bank of New York Mellon Corporation | | | 1.35 | | | | 3-6-2018 | | | | 350,000 | | | | 350,740 | |
Bank of New York Mellon Corporation | | | 2.10 | | | | 1-15-2019 | | | | 300,000 | | | | 305,186 | |
Bank of New York Mellon Corporation | | | 2.50 | | | | 4-15-2021 | | | | 500,000 | | | | 514,615 | |
Bank of New York Mellon Corporation | | | 2.60 | | | | 8-17-2020 | | | | 750,000 | | | | 772,888 | |
Bank of New York Mellon Corporation | | | 3.40 | | | | 5-15-2024 | | | | 1,000,000 | | | | 1,079,206 | |
Bank of New York Mellon Corporation | | | 3.55 | | | | 9-23-2021 | | | | 600,000 | | | | 645,280 | |
Bank of New York Mellon Corporation | | | 3.95 | | | | 11-18-2025 | | | | 500,000 | | | | 561,695 | |
Bank of New York Mellon Corporation | | | 4.15 | | | | 2-1-2021 | | | | 100,000 | | | | 109,644 | |
Bank of New York Mellon Corporation | | | 5.45 | | | | 5-15-2019 | | | | 1,000,000 | | | | 1,105,028 | |
Bear Stearns Companies Incorporated | | | 6.40 | | | | 10-2-2017 | | | | 620,000 | | | | 653,110 | |
Bear Stearns Companies Incorporated | | | 7.25 | | | | 2-1-2018 | | | | 1,500,000 | | | | 1,619,625 | |
BlackRock Incorporated | | | 3.38 | | | | 6-1-2022 | | | | 500,000 | | | | 538,545 | |
BlackRock Incorporated | | | 4.25 | | | | 5-24-2021 | | | | 500,000 | | | | 557,064 | |
BlackRock Incorporated | | | 5.00 | | | | 12-10-2019 | | | | 250,000 | | | | 278,305 | |
BlackRock Incorporated | | | 6.25 | | | | 9-15-2017 | | | | 350,000 | | | | 368,417 | |
Charles Schwab Corporation | | | 2.20 | | | | 7-25-2018 | | | | 150,000 | | | | 152,254 | |
Charles Schwab Corporation | | | 3.23 | | | | 9-1-2022 | | | | 425,000 | | | | 451,573 | |
Charles Schwab Corporation | | | 4.45 | | | | 7-22-2020 | | | | 200,000 | | | | 220,733 | |
Eaton Vance Corporation | | | 3.63 | | | | 6-15-2023 | | | | 100,000 | | | | 105,810 | |
Eaton Vance Corporation | | | 6.50 | | | | 10-2-2017 | | | | 30,000 | | | | 31,541 | |
Franklin Resources Incorporated | | | 2.80 | | | | 9-15-2022 | | | | 300,000 | | | | 313,424 | |
| | | | | | |
| Portfolio of investments—August 31, 2016 (unaudited) | | Wells Fargo Diversified Fixed Income Portfolio | | | 45 | |
| | | | | | | | | | | | | | | | |
| Security name | | Interest rate | | | Maturity date | | | Principal | | | Value | |
| | | | |
| Capital Markets (continued) | | | | | | | | | | | | | | | | |
Franklin Resources Incorporated | | | 4.63 | % | | | 5-20-2020 | | | $ | 250,000 | | | $ | 275,034 | |
FS Investment Corporation | | | 4.00 | | | | 7-15-2019 | | | | 250,000 | | | | 253,605 | |
Goldman Sachs Group Incorporated | | | 3.50 | | | | 1-23-2025 | | | | 1,500,000 | | | | 1,557,186 | |
Goldman Sachs Group Incorporated | | | 3.63 | | | | 1-22-2023 | | | | 1,500,000 | | | | 1,589,864 | |
Goldman Sachs Group Incorporated | | | 3.75 | | | | 5-22-2025 | | | | 500,000 | | | | 528,766 | |
Goldman Sachs Group Incorporated | | | 3.75 | | | | 2-25-2026 | | | | 500,000 | | | | 529,279 | |
Goldman Sachs Group Incorporated | | | 4.80 | | | | 7-8-2044 | | | | 1,000,000 | | | | 1,139,935 | |
Goldman Sachs Group Incorporated | | | 5.15 | | | | 5-22-2045 | | | | 750,000 | | | | 826,718 | |
Goldman Sachs Group Incorporated | | | 5.25 | | | | 7-27-2021 | | | | 1,100,000 | | | | 1,248,652 | |
Goldman Sachs Group Incorporated | | | 5.38 | | | | 3-15-2020 | | | | 1,500,000 | | | | 1,668,630 | |
Goldman Sachs Group Incorporated | | | 5.75 | | | | 1-24-2022 | | | | 2,000,000 | | | | 2,319,260 | |
Goldman Sachs Group Incorporated | | | 5.95 | | | | 1-18-2018 | | | | 2,000,000 | | | | 2,119,390 | |
Goldman Sachs Group Incorporated | | | 5.95 | | | | 1-15-2027 | | | | 1,070,000 | | | | 1,264,631 | |
Goldman Sachs Group Incorporated | | | 6.00 | | | | 6-15-2020 | | | | 1,000,000 | | | | 1,141,094 | |
Goldman Sachs Group Incorporated | | | 6.13 | | | | 2-15-2033 | | | | 1,000,000 | | | | 1,259,116 | |
Goldman Sachs Group Incorporated | | | 6.15 | | | | 4-1-2018 | | | | 1,750,000 | | | | 1,873,951 | |
Goldman Sachs Group Incorporated | | | 6.25 | | | | 2-1-2041 | | | | 750,000 | | | | 992,276 | |
Goldman Sachs Group Incorporated | | | 6.45 | | | | 5-1-2036 | | | | 1,000,000 | | | | 1,237,895 | |
Goldman Sachs Group Incorporated | | | 6.75 | | | | 10-1-2037 | | | | 925,000 | | | | 1,186,430 | |
Goldman Sachs Group Incorporated | | | 7.50 | | | | 2-15-2019 | | | | 2,300,000 | | | | 2,618,421 | |
Jefferies Group Incorporated | | | 5.13 | | | | 1-20-2023 | | | | 250,000 | | | | 268,710 | |
Jefferies Group Incorporated | | | 6.25 | | | | 1-15-2036 | | | | 150,000 | | | | 158,398 | |
Jefferies Group Incorporated | | | 6.45 | | | | 6-8-2027 | | | | 150,000 | | | | 168,176 | |
Jefferies Group Incorporated | | | 6.50 | | | | 1-20-2043 | �� | | | 250,000 | | | | 263,658 | |
Jefferies Group Incorporated | | | 6.88 | | | | 4-15-2021 | | | | 150,000 | | | | 172,070 | |
Jefferies Group Incorporated « | | | 8.50 | | | | 7-15-2019 | | | | 700,000 | | | | 803,088 | |
Legg Mason Incorporated | | | 5.63 | | | | 1-15-2044 | | | | 600,000 | | | | 628,687 | |
Morgan Stanley | | | 2.13 | | | | 4-25-2018 | | | | 943,000 | | | | 952,423 | |
Morgan Stanley | | | 2.45 | | | | 2-1-2019 | | | | 600,000 | | | | 611,531 | |
Morgan Stanley | | | 2.65 | | | | 1-27-2020 | | | | 750,000 | | | | 769,282 | |
Morgan Stanley | | | 2.80 | | | | 6-16-2020 | | | | 1,000,000 | | | | 1,028,149 | |
Morgan Stanley | | | 3.70 | | | | 10-23-2024 | | | | 1,000,000 | | | | 1,059,618 | |
Morgan Stanley | | | 3.75 | | | | 2-25-2023 | | | | 1,175,000 | | | | 1,256,671 | |
Morgan Stanley | | | 3.88 | | | | 4-29-2024 | | | | 1,000,000 | | | | 1,074,478 | |
Morgan Stanley | | | 3.95 | | | | 4-23-2027 | | | | 1,000,000 | | | | 1,038,936 | |
Morgan Stanley | | | 4.10 | | | | 5-22-2023 | | | | 750,000 | | | | 795,215 | |
Morgan Stanley | | | 4.30 | | | | 1-27-2045 | | | | 500,000 | | | | 540,508 | |
Morgan Stanley | | | 4.35 | | | | 9-8-2026 | | | | 1,250,000 | | | | 1,337,644 | |
Morgan Stanley | | | 4.88 | | | | 11-1-2022 | | | | 906,000 | | | | 1,004,199 | |
Morgan Stanley | | | 5.00 | | | | 11-24-2025 | | | | 750,000 | | | | 835,998 | |
Morgan Stanley | | | 5.50 | | | | 1-26-2020 | | | | 1,000,000 | | | | 1,111,999 | |
Morgan Stanley | | | 5.50 | | | | 7-24-2020 | | | | 500,000 | | | | 563,935 | |
Morgan Stanley | | | 5.63 | | | | 9-23-2019 | | | | 2,000,000 | | | | 2,223,030 | |
Morgan Stanley | | | 5.75 | | | | 1-25-2021 | | | | 1,250,000 | | | | 1,432,733 | |
Morgan Stanley | | | 6.25 | | | | 8-9-2026 | | | | 300,000 | | | | 376,662 | |
Morgan Stanley | | | 6.38 | | | | 7-24-2042 | | | | 1,000,000 | | | | 1,372,352 | |
Morgan Stanley | | | 6.63 | | | | 4-1-2018 | | | | 2,500,000 | | | | 2,693,533 | |
Morgan Stanley | | | 7.25 | | | | 4-1-2032 | | | | 470,000 | | | | 653,726 | |
Morgan Stanley | | | 7.30 | | | | 5-13-2019 | | | | 400,000 | | | | 456,612 | |
Northern Trust Corporation | | | 3.45 | | | | 11-4-2020 | | | | 500,000 | | | | 534,429 | |
| | | | |
| 46 | | Wells Fargo Diversified Fixed Income Portfolio | | Portfolio of investments—August 31, 2016 (unaudited) |
| | | | | | | | | | | | | | | | |
| Security name | | Interest rate | | | Maturity date | | | Principal | | | Value | |
| | | | |
| Capital Markets (continued) | | | | | | | | | | | | | | | | |
Northern Trust Corporation | | | 3.95 | % | | | 10-30-2025 | | | $ | 250,000 | | | $ | 278,791 | |
Raymond James Financial Incorporated | | | 8.60 | | | | 8-15-2019 | | | | 100,000 | | | | 117,585 | |
S&P Global Incorporated | | | 4.00 | | | | 6-15-2025 | | | | 325,000 | | | | 353,963 | |
S&P Global Incorporated | | | 5.90 | | | | 11-15-2017 | | | | 250,000 | | | | 261,615 | |
Stifel Financial Corporation | | | 4.25 | | | | 7-18-2024 | | | | 200,000 | | | | 203,653 | |
TD Ameritrade Holding Corporation | | | 3.63 | | | | 4-1-2025 | | | | 200,000 | | | | 215,813 | |
TD Ameritrade Holding Corporation | | | 5.60 | | | | 12-1-2019 | | | | 200,000 | | | | 223,140 | |
| | | | |
| | | | | | | | | | | | | | | 66,936,160 | |
| | | | | | | | | | | | | | | | |
| | | | |
| Consumer Finance: 0.90% | | | | | | | | | | | | | | | | |
Ahold Finance USA LLC | | | 6.88 | | | | 5-1-2029 | | | | 300,000 | | | | 390,907 | |
American Express Centurion Bank | | | 6.00 | | | | 9-13-2017 | | | | 500,000 | | | | 524,551 | |
American Express Company | | | 1.55 | | | | 5-22-2018 | | | | 375,000 | | | | 375,925 | |
American Express Company | | | 2.65 | | | | 12-2-2022 | | | | 575,000 | | | | 589,577 | |
American Express Company | | | 4.05 | | | | 12-3-2042 | | | | 905,000 | | | | 964,076 | |
American Express Company | | | 7.00 | | | | 3-19-2018 | | | | 800,000 | | | | 867,115 | |
American Express Company | | | 8.13 | | | | 5-20-2019 | | | | 500,000 | | | | 583,040 | |
American Express Credit Corporation | | | 1.55 | | | | 9-22-2017 | | | | 500,000 | | | | 501,699 | |
American Express Credit Corporation | | | 2.13 | | | | 7-27-2018 | | | | 200,000 | | | | 203,284 | |
American Express Credit Corporation | | | 2.25 | | | | 8-15-2019 | | | | 1,000,000 | | | | 1,020,823 | |
American Express Credit Corporation | | | 2.38 | | | | 5-26-2020 | | | | 250,000 | | | | 255,895 | |
American Honda Finance Corporation | | | 1.55 | | | | 12-11-2017 | | | | 400,000 | | | | 402,754 | |
American Honda Finance Corporation | | | 1.70 | | | | 2-22-2019 | | | | 750,000 | | | | 757,904 | |
American Honda Finance Corporation | | | 2.13 | | | | 10-10-2018 | | | | 300,000 | | | | 305,846 | |
American Honda Finance Corporation | | | 2.25 | | | | 8-15-2019 | | | | 500,000 | | | | 512,980 | |
Anadarko Finance Company Series B | | | 7.50 | | | | 5-1-2031 | | | | 325,000 | | | | 393,891 | |
Bunge Limited Finance Corporation | | | 8.50 | | | | 6-15-2019 | | | | 500,000 | | | | 584,711 | |
Capital One Bank USA NA | | | 2.15 | | | | 11-21-2018 | | | | 250,000 | | | | 251,966 | |
Capital One Bank USA NA | | | 2.25 | | | | 2-13-2019 | | | | 500,000 | | | | 505,960 | |
Capital One Bank USA NA | | | 2.30 | | | | 6-5-2019 | | | | 1,000,000 | | | | 1,012,333 | |
Capital One Bank USA NA | | | 2.40 | | | | 9-5-2019 | | | | 500,000 | | | | 508,900 | |
Capital One Bank USA NA | | | 3.38 | | | | 2-15-2023 | | | | 500,000 | | | | 513,724 | |
Capital One Bank USA NA | | | 8.80 | | | | 7-15-2019 | | | | 750,000 | | | | 882,245 | |
Capital One Financial Corporation | | | 3.75 | | | | 7-28-2026 | | | | 750,000 | | | | 755,760 | |
Capital One Financial Corporation | | | 4.75 | | | | 7-15-2021 | | | | 450,000 | | | | 502,399 | |
Capital One Financial Corporation | | | 6.75 | | | | 9-15-2017 | | | | 283,000 | | | | 297,836 | |
Caterpillar Financial Services Corporation | | | 2.10 | | | | 6-9-2019 | | | | 500,000 | | | | 510,053 | |
Caterpillar Financial Services Corporation | | | 3.30 | | | | 6-9-2024 | | | | 1,000,000 | | | | 1,076,368 | |
Caterpillar Financial Services Corporation | | | 3.75 | | | | 11-24-2023 | | | | 250,000 | | | | 276,294 | |
Caterpillar Financial Services Corporation | | | 7.15 | | | | 2-15-2019 | | | | 250,000 | | | | 284,435 | |
Daimler Finance North America LLC | | | 8.50 | | | | 1-18-2031 | | | | 425,000 | | | | 708,574 | |
Devon Financing Corporation LLC | | | 7.88 | | | | 9-30-2031 | | | | 620,000 | | | | 760,026 | |
Diamond 1 Finance Corporation 144A | | | 3.48 | | | | 6-1-2019 | | | | 1,750,000 | | | | 1,798,920 | |
Diamond 1 Finance Corporation 144A | | | 4.42 | | | | 6-15-2021 | | | | 2,000,000 | | | | 2,092,412 | |
Diamond 1 Finance Corporation 144A | | | 6.02 | | | | 6-15-2026 | | | | 2,500,000 | | | | 2,679,948 | |
Diamond 1 Finance Corporation 144A | | | 8.35 | | | | 7-15-2046 | | | | 1,000,000 | | | | 1,164,744 | |
Discover Financial Services | | | 3.85 | | | | 11-21-2022 | | | | 550,000 | | | | 568,470 | |
Discover Financial Services | | | 5.20 | | | | 4-27-2022 | | | | 600,000 | | | | 657,659 | |
Ford Motor Credit Company LLC | | | 2.38 | | | | 3-12-2019 | | | | 1,000,000 | | | | 1,013,322 | |
Ford Motor Credit Company LLC | | | 3.34 | | | | 3-18-2021 | | | | 1,000,000 | | | | 1,037,530 | |
| | | | | | |
| Portfolio of investments—August 31, 2016 (unaudited) | | Wells Fargo Diversified Fixed Income Portfolio | | | 47 | |
| | | | | | | | | | | | | | | | |
| Security name | | Interest rate | | | Maturity date | | | Principal | | | Value | |
| | | | |
| Consumer Finance (continued) | | | | | | | | | | | | | | | | |
Ford Motor Credit Company LLC | | | 3.66 | % | | | 9-8-2024 | | | $ | 300,000 | | | $ | 310,440 | |
Ford Motor Credit Company LLC | | | 4.25 | | | | 9-20-2022 | | | | 773,000 | | | | 835,370 | |
Ford Motor Credit Company LLC | | | 4.75 | | | | 1-15-2043 | | | | 1,000,000 | | | | 1,081,650 | |
Ford Motor Credit Company LLC | | | 5.88 | | | | 8-2-2021 | | | | 1,250,000 | | | | 1,434,929 | |
General Motors Financial Company | | | 2.40 | | | | 4-10-2018 | | | | 1,000,000 | | | | 1,007,416 | |
General Motors Financial Company | | | 2.40 | | | | 5-9-2019 | | | | 500,000 | | | | 502,274 | |
General Motors Financial Company | | | 3.00 | | | | 9-25-2017 | | | | 500,000 | | | | 506,579 | |
General Motors Financial Company | | | 3.15 | | | | 1-15-2020 | | | | 1,000,000 | | | | 1,021,017 | |
General Motors Financial Company | | | 3.45 | | | | 4-10-2022 | | | | 1,000,000 | | | | 1,018,485 | |
General Motors Financial Company | | | 3.70 | | | | 5-9-2023 | | | | 500,000 | | | | 509,652 | |
General Motors Financial Company | | | 4.00 | | | | 1-15-2025 | | | | 1,400,000 | | | | 1,425,253 | |
General Motors Financial Company | | | 4.20 | | | | 3-1-2021 | | | | 750,000 | | | | 791,388 | |
HSBC Finance Corporation | | | 6.68 | | | | 1-15-2021 | | | | 679,000 | | | | 783,089 | |
John Deere Capital Corporation | | | 1.30 | | | | 3-12-2018 | | | | 550,000 | | | | 551,703 | |
John Deere Capital Corporation | | | 1.95 | | | | 12-13-2018 | | | | 200,000 | | | | 203,450 | |
John Deere Capital Corporation | | | 2.80 | | | | 1-27-2023 | | | | 500,000 | | | | 521,097 | |
John Deere Capital Corporation | | | 3.90 | | | | 7-12-2021 | | | | 300,000 | | | | 329,715 | |
John Deere Capital Corporation | | | 5.75 | | | | 9-10-2018 | | | | 500,000 | | | | 544,918 | |
National City Corporation | | | 6.88 | | | | 5-15-2019 | | | | 500,000 | | | | 564,256 | |
PACCAR Financial Corporation | | | 1.45 | | | | 3-9-2018 | | | | 750,000 | | | | 753,923 | |
Reed Elsevier Capital Incorporated | | | 3.13 | | | | 10-15-2022 | | | | 500,000 | | | | 512,516 | |
Reed Elsevier Capital Incorporated | | | 8.63 | | | | 1-15-2019 | | | | 500,000 | | | | 576,557 | |
Synchrony Financial | | | 3.00 | | | | 8-15-2019 | | | | 750,000 | | | | 766,676 | |
Synchrony Financial | | | 4.25 | | | | 8-15-2024 | | | | 750,000 | | | | 787,022 | |
Toyota Motor Credit Corporation | | | 1.25 | | | | 10-5-2017 | | | | 650,000 | | | | 651,679 | |
Toyota Motor Credit Corporation | | | 1.45 | | | | 1-12-2018 | | | | 1,250,000 | | | | 1,254,665 | |
Toyota Motor Credit Corporation | | | 2.00 | | | | 10-24-2018 | | | | 400,000 | | | | 406,365 | |
Toyota Motor Credit Corporation | | | 2.10 | | | | 1-17-2019 | | | | 350,000 | | | | 356,559 | |
Toyota Motor Credit Corporation | | | 2.13 | | | | 7-18-2019 | | | | 800,000 | | | | 817,376 | |
Toyota Motor Credit Corporation | | | 3.30 | | | | 1-12-2022 | | | | 1,500,000 | | | | 1,606,049 | |
Toyota Motor Credit Corporation | | | 3.40 | | | | 9-15-2021 | | | | 350,000 | | | | 377,368 | |
Toyota Motor Credit Corporation | | | 4.50 | | | | 6-17-2020 | | | | 500,000 | | | | 551,521 | |
| |
| | | | 52,455,813 | |
| | | | | | | | | | | | | | | | |
| | | | |
| Diversified Financial Services: 0.29% | | | | | | | | | | | | | | | | |
Block Financial LLC | | | 5.50 | | | | 11-1-2022 | | | | 200,000 | | | | 216,609 | |
Boeing Capital Corporation | | | 4.70 | | | | 10-27-2019 | | | | 500,000 | | | | 552,467 | |
CME Group Incorporated | | | 5.30 | | | | 9-15-2043 | | | | 300,000 | | | | 397,219 | |
General Electric Capital Corporation | | | 5.63 | | | | 5-1-2018 | | | | 1,000,000 | | | | 1,074,765 | |
General Electric Capital Corporation | | | 5.88 | | | | 1-14-2038 | | | | 716,000 | | | | 979,746 | |
General Electric Capital Corporation | | | 6.15 | | | | 8-7-2037 | | | | 187,000 | | | | 262,106 | |
General Electric Capital Corporation | | | 6.75 | | | | 3-15-2032 | | | | 602,000 | | | | 860,921 | |
General Electric Capital Corporation | | | 6.88 | | | | 1-10-2039 | | | | 430,000 | | | | 657,788 | |
ING US Incorporated | | | 2.90 | | | | 2-15-2018 | | | | 305,000 | | | | 311,040 | |
IntercontinentalExchange Incorporated | | | 2.50 | | | | 10-15-2018 | | | | 225,000 | | | | 230,352 | |
IntercontinentalExchange Incorporated | | | 2.75 | | | | 12-1-2020 | | | | 500,000 | | | | 520,522 | |
IntercontinentalExchange Incorporated | | | 4.00 | | | | 10-15-2023 | | | | 200,000 | | | | 220,558 | |
Leucadia National Corporation | | | 5.50 | | | | 10-18-2023 | | | | 240,000 | | | | 252,076 | |
Leucadia National Corporation | | | 6.63 | | | | 10-23-2043 | | | | 120,000 | | | | 120,177 | |
Mellon Funding Corporation | | | 5.50 | | | | 11-15-2018 | | | | 200,000 | | | | 217,372 | |
| | | | |
| 48 | | Wells Fargo Diversified Fixed Income Portfolio | | Portfolio of investments—August 31, 2016 (unaudited) |
| | | | | | | | | | | | | | | | |
| Security name | | Interest rate | | | Maturity date | | | Principal | | | Value | |
|
| Diversified Financial Services (continued) | |
Merrill Lynch & Company Incorporated | | | 6.11 | % | | | 1-29-2037 | | | $ | 600,000 | | | $ | 746,705 | |
Merrill Lynch & Company Incorporated | | | 6.88 | | | | 4-25-2018 | | | | 1,690,000 | | | | 1,831,641 | |
Merrill Lynch & Company Incorporated | | | 7.75 | | | | 5-14-2038 | | | | 750,000 | | | | 1,106,806 | |
Moody’s Corporation | | | 4.50 | | | | 9-1-2022 | | | | 250,000 | | | | 277,455 | |
Moody’s Corporation | | | 4.88 | | | | 2-15-2024 | | | | 350,000 | | | | 399,082 | |
Moody’s Corporation | | | 5.25 | | | | 7-15-2044 | | | | 300,000 | | | | 373,274 | |
NASDAQ OMX Group Incorporated | | | 5.25 | | | | 1-16-2018 | | | | 60,000 | | | | 62,925 | |
NASDAQ OMX Group Incorporated | | | 5.55 | | | | 1-15-2020 | | | | 500,000 | | | | 554,524 | |
National Credit Union Administration | | | 3.45 | | | | 6-12-2021 | | | | 200,000 | | | | 219,184 | |
National Rural Utilities Cooperative Finance Corporation | | | 2.15 | | | | 2-1-2019 | | | | 100,000 | | | | 101,962 | |
National Rural Utilities Cooperative Finance Corporation | | | 2.30 | | | | 11-15-2019 | | | | 333,000 | | | | 341,740 | |
National Rural Utilities Cooperative Finance Corporation | | | 4.02 | | | | 11-1-2032 | | | | 200,000 | | | | 218,985 | |
National Rural Utilities Cooperative Finance Corporation ± | | | 4.75 | | | | 4-30-2043 | | | | 250,000 | | | | 252,549 | |
National Rural Utilities Cooperative Finance Corporation | | | 10.38 | | | | 11-1-2018 | | | | 700,000 | | | | 830,884 | |
National Rural Utilities Cooperative Finance Corporation Series C | | | 8.00 | | | | 3-1-2032 | | | | 300,000 | | | | 453,294 | |
PNC Funding Corporation | | | 5.13 | | | | 2-8-2020 | | | | 150,000 | | | | 166,659 | |
PNC Funding Corporation | | | 6.70 | | | | 6-10-2019 | | | | 500,000 | | | | 570,348 | |
Private Export Funding Corporation | | | 2.05 | | | | 11-15-2022 | | | | 250,000 | | | | 254,905 | |
Private Export Funding Corporation | | | 2.25 | | | | 3-15-2020 | | | | 750,000 | | | | 773,864 | |
Private Export Funding Corporation | | | 2.45 | | | | 7-15-2024 | | | | 300,000 | | | | 311,496 | |
Private Export Funding Corporation | | | 4.30 | | | | 12-15-2021 | | | | 100,000 | | | | 113,440 | |
TECO Finance Incorporated | | | 5.15 | | | | 3-15-2020 | | | | 65,000 | | | | 71,528 | |
TECO Finance Incorporated | | | 6.57 | | | | 11-1-2017 | | | | 250,000 | | | | 264,314 | |
| |
| | | | 17,171,282 | |
| | | | | | | | | | | | | | | | |
| | | | |
| Insurance: 0.78% | | | | | | | | | | | | | | | | |
ACE INA Holdings Incorporated | | | 3.15 | | | | 3-15-2025 | | | | 1,000,000 | | | | 1,054,920 | |
ACE INA Holdings Incorporated | | | 3.35 | | | | 5-15-2024 | | | | 500,000 | | | | 535,649 | |
ACE INA Holdings Incorporated | | | 5.90 | | | | 6-15-2019 | | | | 500,000 | | | | 555,433 | |
Aegon Funding Corporation | | | 5.75 | | | | 12-15-2020 | | | | 75,000 | | | | 86,420 | |
AFLAC Incorporated | | | 3.63 | | | | 6-15-2023 | | | | 500,000 | | | | 538,585 | |
AFLAC Incorporated | | | 6.90 | | | | 12-17-2039 | | | | 250,000 | | | | 358,131 | |
Alleghany Corporation | | | 5.63 | | | | 9-15-2020 | | | | 100,000 | | | | 110,816 | |
Allied World Assurance | | | 5.50 | | | | 11-15-2020 | | | | 300,000 | | | | 329,116 | |
Allstate Corporation | | | 5.55 | | | | 5-9-2035 | | | | 830,000 | | | | 1,080,459 | |
Allstate Corporation ± | | | 6.50 | | | | 5-15-2067 | | | | 200,000 | | | | 231,000 | |
Allstate Corporation | | | 7.45 | | | | 5-16-2019 | | | | 650,000 | | | | 746,590 | |
American International Group Incorporated | | | 3.90 | | | | 4-1-2026 | | | | 1,000,000 | | | | 1,049,958 | |
American International Group Incorporated | | | 4.50 | | | | 7-16-2044 | | | | 750,000 | | | | 779,367 | |
American International Group Incorporated | | | 4.88 | | | | 6-1-2022 | | | | 500,000 | | | | 559,750 | |
American International Group Incorporated | | | 5.85 | | | | 1-16-2018 | | | | 1,350,000 | | | | 1,427,771 | |
American International Group Incorporated | | | 6.40 | | | | 12-15-2020 | | | | 1,000,000 | | | | 1,176,488 | |
AON Corporation | | | 5.00 | | | | 9-30-2020 | | | | 550,000 | | | | 608,276 | |
AON Corporation | | | 6.25 | | | | 9-30-2040 | | | | 100,000 | | | | 129,300 | |
Arch Capital Group Limited | | | 5.14 | | | | 11-1-2043 | | | | 210,000 | | | | 233,864 | |
Assurant Incorporated | | | 6.75 | | | | 2-15-2034 | | | | 375,000 | | | | 477,540 | |
AXIS Specialty Finance LLC | | | 5.88 | | | | 6-1-2020 | | | | 200,000 | | | | 223,415 | |
Berkshire Hathaway Finance Corporation | | | 1.30 | | | | 5-15-2018 | | | | 200,000 | | | | 200,548 | |
Berkshire Hathaway Finance Corporation | | | 2.00 | | | | 8-15-2018 | | | | 250,000 | | | | 254,426 | |
Berkshire Hathaway Finance Corporation | | | 2.90 | | | | 10-15-2020 | | | | 225,000 | | | | 236,465 | |
| | | | | | |
| Portfolio of investments—August 31, 2016 (unaudited) | | Wells Fargo Diversified Fixed Income Portfolio | | | 49 | |
| | | | | | | | | | | | | | | | |
| Security name | | Interest rate | | | Maturity date | | | Principal | | | Value | |
| | | | |
| Insurance (continued) | | | | | | | | | | | | | | | | |
Berkshire Hathaway Finance Corporation | | | 4.25 | % | | | 1-15-2021 | | | $ | 500,000 | | | $ | 553,560 | |
Berkshire Hathaway Finance Corporation | | | 4.30 | | | | 5-15-2043 | | | | 300,000 | | | | 344,374 | |
Berkshire Hathaway Finance Corporation | | | 4.40 | | | | 5-15-2042 | | | | 500,000 | | | | 580,144 | |
Berkshire Hathaway Finance Corporation | | | 5.40 | | | | 5-15-2018 | | | | 350,000 | | | | 374,776 | |
Berkshire Hathaway Finance Corporation | | | 5.75 | | | | 1-15-2040 | | | | 250,000 | | | | 340,087 | |
Berkshire Hathaway Incorporated | | | 1.55 | | | | 2-9-2018 | | | | 300,000 | | | | 302,183 | |
Berkshire Hathaway Incorporated | | | 2.10 | | | | 8-14-2019 | | | | 300,000 | | | | 306,693 | |
Berkshire Hathaway Incorporated | | | 2.75 | | | | 3-15-2023 | | | | 600,000 | | | | 623,628 | |
Berkshire Hathaway Incorporated | | | 3.00 | | | | 2-11-2023 | | | | 100,000 | | | | 106,241 | |
Berkshire Hathaway Incorporated | | | 3.13 | | | | 3-15-2026 | | | | 750,000 | | | | 796,463 | |
Berkshire Hathaway Incorporated | | | 3.40 | | | | 1-31-2022 | | | | 250,000 | | | | 269,457 | |
Berkshire Hathaway Incorporated | | | 4.50 | | | | 2-11-2043 | | | | 400,000 | | | | 473,504 | |
CHUBB Corporation | | | 5.75 | | | | 5-15-2018 | | | | 250,000 | | | | 268,742 | |
CHUBB Corporation | | | 6.00 | | | | 5-11-2037 | | | | 280,000 | | | | 385,899 | |
CHUBB Corporation | | | 6.50 | | | | 5-15-2038 | | | | 350,000 | | | | 509,431 | |
Cincinnati Financial Corporation | | | 6.92 | | | | 5-15-2028 | | | | 75,000 | | | | 98,158 | |
CNA Financial Corporation | | | 5.88 | | | | 8-15-2020 | | | | 500,000 | | | | 566,020 | |
CNA Financial Corporation | | | 7.35 | | | | 11-15-2019 | | | | 295,000 | | | | 338,554 | |
Endurance Specialty Holdings Limited | | | 7.00 | | | | 7-15-2034 | | | | 200,000 | | | | 243,525 | |
Fidelity National Financial Incorporated | | | 5.50 | | | | 9-1-2022 | | | | 100,000 | | | | 109,447 | |
First American Financial Corporation | | | 4.60 | | | | 11-15-2024 | | | | 100,000 | | | | 103,728 | |
GE Global Insurance Holdings | | | 7.00 | | | | 2-15-2026 | | | | 430,000 | | | | 557,781 | |
Hartford Financial Services Group Incorporated | | | 4.30 | | | | 4-15-2043 | | | | 43,000 | | | | 43,071 | |
Hartford Financial Services Group Incorporated | | | 5.13 | | | | 4-15-2022 | | | | 240,000 | | | | 271,876 | |
Hartford Financial Services Group Incorporated | | | 5.50 | | | | 3-30-2020 | | | | 250,000 | | | | 279,029 | |
Hartford Financial Services Group Incorporated | | | 5.95 | | | | 10-15-2036 | | | | 75,000 | | | | 90,128 | |
Hartford Financial Services Group Incorporated | | | 6.10 | | | | 10-1-2041 | | | | 250,000 | | | | 306,608 | |
Hartford Financial Services Group Incorporated | | | 6.30 | | | | 3-15-2018 | | | | 250,000 | | | | 266,702 | |
Hartford Financial Services Group Incorporated | | | 6.63 | | | | 3-30-2040 | | | | 500,000 | | | | 649,132 | |
Infinity Property & Casualty Corporation | | | 5.00 | | | | 9-19-2022 | | | | 100,000 | | | | 105,317 | |
Lincoln National Corporation | | | 4.00 | | | | 9-1-2023 | | | | 250,000 | | | | 265,744 | |
Lincoln National Corporation | | | 4.85 | | | | 6-24-2021 | | | | 80,000 | | | | 88,272 | |
Lincoln National Corporation | | | 6.15 | | | | 4-7-2036 | | | | 500,000 | | | | 597,087 | |
Lincoln National Corporation | | | 6.25 | | | | 2-15-2020 | | | | 300,000 | | | | 338,002 | |
Lincoln National Corporation | | | 8.75 | | | | 7-1-2019 | | | | 220,000 | | | | 257,204 | |
Loews Corporation | | | 2.63 | | | | 5-15-2023 | | | | 150,000 | | | | 151,521 | |
Loews Corporation | | | 4.13 | | | | 5-15-2043 | | | | 200,000 | | | | 212,057 | |
Markel Corporation | | | 3.63 | | | | 3-30-2023 | | | | 150,000 | | | | 154,925 | |
Markel Corporation | | | 5.00 | | | | 3-30-2043 | | | | 100,000 | | | | 107,996 | |
Markel Corporation | | | 5.35 | | | | 6-1-2021 | | | | 100,000 | | | | 111,904 | |
Marsh & McLennan Companies Incorporated | | | 2.35 | | | | 9-10-2019 | | | | 1,000,000 | | | | 1,016,311 | |
Marsh & McLennan Companies Incorporated | | | 4.80 | | | | 7-15-2021 | | | | 300,000 | | | | 332,654 | |
MetLife Incorporated | | | 1.90 | | | | 12-15-2017 | | | | 250,000 | | | | 251,533 | |
MetLife Incorporated | | | 4.13 | | | | 8-13-2042 | | | | 300,000 | | | | 304,608 | |
MetLife Incorporated | | | 4.37 | | | | 9-15-2023 | | | | 167,000 | | | | 185,213 | |
MetLife Incorporated | | | 4.72 | | | | 12-15-2044 | | | | 250,000 | | | | 274,539 | |
MetLife Incorporated | | | 4.75 | | | | 2-8-2021 | | | | 750,000 | | | | 842,429 | |
MetLife Incorporated | | | 4.88 | | | | 11-13-2043 | | | | 500,000 | | | | 562,685 | |
MetLife Incorporated | | | 5.70 | | | | 6-15-2035 | | | | 400,000 | | | | 492,226 | |
MetLife Incorporated | | | 5.88 | | | | 2-6-2041 | | | | 700,000 | | | | 880,338 | |
| | | | |
| 50 | | Wells Fargo Diversified Fixed Income Portfolio | | Portfolio of investments—August 31, 2016 (unaudited) |
| | | | | | | | | | | | | | | | |
| Security name | | Interest rate | | | Maturity date | | | Principal | | | Value | |
| | | | |
| Insurance (continued) | | | | | | | | | | | | | | | | |
MetLife Incorporated | | | 6.38 | % | | | 6-15-2034 | | | $ | 280,000 | | | $ | 363,587 | |
MetLife Incorporated | | | 6.40 | | | | 12-15-2066 | | | | 800,000 | | | | 898,400 | |
MetLife Incorporated | | | 6.50 | | | | 12-15-2032 | | | | 200,000 | | | | 261,325 | |
MetLife Incorporated Series A | | | 6.82 | | | | 8-15-2018 | | | | 750,000 | | | | 827,301 | |
OneBeacon US Holdings Incorporated | | | 4.60 | | | | 11-9-2022 | | | | 100,000 | | | | 100,866 | |
PartnerRe Finance B LLC | | | 5.50 | | | | 6-1-2020 | | | | 250,000 | | | | 278,302 | |
Principal Financial Group Incorporated | | | 3.30 | | | | 9-15-2022 | | | | 250,000 | | | | 258,321 | |
Principal Financial Group Incorporated | | | 3.40 | | | | 5-15-2025 | | | | 200,000 | | | | 205,175 | |
Principal Financial Group Incorporated | | | 4.63 | | | | 9-15-2042 | | | | 250,000 | | | | 269,643 | |
Principal Financial Group Incorporated ± | | | 4.70 | | | | 5-15-2055 | | | | 500,000 | | | | 497,500 | |
ProAssurance Corporation | | | 5.30 | | | | 11-15-2023 | | | | 200,000 | | | | 215,192 | |
Progressive Corporation | | | 6.25 | | | | 12-1-2032 | | | | 75,000 | | | | 100,850 | |
Protective Life Corporation | | | 7.38 | | | | 10-15-2019 | | | | 500,000 | | | | 577,215 | |
Prudential Financial Incorporated | | | 4.50 | | | | 11-16-2021 | | | | 250,000 | | | | 279,810 | |
Prudential Financial Incorporated ± | | | 5.20 | | | | 3-15-2044 | | | | 250,000 | | | | 259,844 | |
Prudential Financial Incorporated | | | 5.38 | | | | 6-21-2020 | | | | 500,000 | | | | 562,365 | |
Prudential Financial Incorporated | | | 4.60 | | | | 5-15-2044 | | | | 500,000 | | | | 543,681 | |
Prudential Financial Incorporated ± | | | 5.63 | | | | 6-15-2043 | | | | 250,000 | | | | 268,125 | |
Prudential Financial Incorporated | | | 5.70 | | | | 12-14-2036 | | | | 538,000 | | | | 655,072 | |
Prudential Financial Incorporated ± | | | 5.88 | | | | 9-15-2042 | | | | 500,000 | | | | 553,750 | |
Prudential Financial Incorporated | | | 6.20 | | | | 11-15-2040 | | | | 250,000 | | | | 314,355 | |
Prudential Financial Incorporated | | | 6.63 | | | | 12-1-2037 | | | | 65,000 | | | | 85,031 | |
Prudential Financial Incorporated | | | 7.38 | | | | 6-15-2019 | | | | 355,000 | | | | 408,441 | |
Prudential Financial Incorporated ± | | | 8.88 | | | | 6-15-2068 | | | | 200,000 | | | | 222,520 | |
Prudential Financial Incorporated Series B | | | 5.75 | | | | 7-15-2033 | | | | 500,000 | | | | 597,329 | |
Prudential Financial Incorporated Series C | | | 5.40 | | | | 6-13-2035 | | | | 180,000 | | | | 208,246 | |
Reinsurance Group of America Incorporated | | | 4.70 | | | | 9-15-2023 | | | | 300,000 | | | | 325,363 | |
Reinsurance Group of America Incorporated | | | 5.00 | | | | 6-1-2021 | | | | 60,000 | | | | 65,654 | |
Reinsurance Group of America Incorporated | | | 6.45 | | | | 11-15-2019 | | | | 350,000 | | | | 394,598 | |
StanCorp Financial Group Incorporated | | | 5.00 | | | | 8-15-2022 | | | | 100,000 | | | | 106,878 | |
Torchmark Corporation | | | 3.80 | | | | 9-15-2022 | | | | 350,000 | | | | 358,572 | |
Transatlantic Holdings Incorporated | | | 8.00 | | | | 11-30-2039 | | | | 100,000 | | | | 139,548 | |
Travelers Companies Incorporated | | | 5.35 | | | | 11-1-2040 | | | | 350,000 | | | | 456,113 | |
Travelers Companies Incorporated | | | 5.75 | | | | 12-15-2017 | | | | 250,000 | | | | 264,094 | |
Travelers Companies Incorporated | | | 5.90 | | | | 6-2-2019 | | | | 500,000 | | | | 556,753 | |
Travelers Companies Incorporated | | | 6.25 | | | | 6-15-2037 | | | | 365,000 | | | | 512,308 | |
Travelers Property Casualty Corporation | | | 6.38 | | | | 3-15-2033 | | | | 600,000 | | | | 826,015 | |
Unum Group | | | 4.00 | | | | 3-15-2024 | | | | 500,000 | | | | 517,080 | |
WR Berkley Corporation | | | 5.38 | | | | 9-15-2020 | | | | 200,000 | | | | 218,312 | |
WR Berkley Corporation | | | 6.25 | | | | 2-15-2037 | | | | 100,000 | | | | 124,975 | |
XL Capital Limited | | | 6.25 | | | | 5-15-2027 | | | | 100,000 | | | | 120,573 | |
XL Capital Limited | | | 6.38 | | | | 11-15-2024 | | | | 100,000 | | | | 120,079 | |
| |
| | | | 45,594,954 | |
| | | | | | | | | | | | | | | | |
| | | | |
| Real Estate Management & Development: 0.01% | | | | | | | | | | | | | | | | |
CubeSmart LP | | | 4.38 | | | | 12-15-2023 | | | | 250,000 | | | | 272,534 | |
Jones Lang LaSalle Incorporated | | | 4.40 | | | | 11-15-2022 | | | | 100,000 | | | | 107,102 | |
Regency Centers LP | | | 4.80 | | | | 4-15-2021 | | | | 200,000 | | | | 220,288 | |
| |
| | | | 599,924 | |
| | | | | | | | | | | | | | | | |
| | | | | | |
| Portfolio of investments—August 31, 2016 (unaudited) | | Wells Fargo Diversified Fixed Income Portfolio | | | 51 | |
| | | | | | | | | | | | | | | | |
| Security name | | Interest rate | | | Maturity date | | | Principal | | | Value | |
| | | | |
| REITs: 0.68% | | | | | | | | | | | | | | | | |
Alexandria Real Estate Equities Incorporated | | | 2.75 | % | | | 1-15-2020 | | | $ | 750,000 | | | $ | 758,270 | |
Alexandria Real Estate Equities Incorporated | | | 4.50 | | | | 7-30-2029 | | | | 750,000 | | | | 793,060 | |
American Campus Communities Incorporated | | | 3.75 | | | | 4-15-2023 | | | | 100,000 | | | | 104,883 | |
American Tower Corporation | | | 3.45 | | | | 9-15-2021 | | | | 500,000 | | | | 524,354 | |
American Tower Corporation | | | 3.50 | | | | 1-31-2023 | | | | 150,000 | | | | 156,684 | |
American Tower Corporation | | | 4.00 | | | | 6-1-2025 | | | | 500,000 | | | | 534,759 | |
American Tower Corporation | | | 4.50 | | | | 1-15-2018 | | | | 500,000 | | | | 519,664 | |
American Tower Corporation | | | 5.00 | | | | 2-15-2024 | | | | 350,000 | | | | 400,003 | |
American Tower Corporation | | | 5.05 | | | | 9-1-2020 | | | | 500,000 | | | | 554,944 | |
American Tower Corporation | | | 5.90 | | | | 11-1-2021 | | | | 565,000 | | | | 658,539 | |
AvalonBay Communities Incorporated | | | 2.95 | | | | 9-15-2022 | | | | 350,000 | | | | 359,897 | |
AvalonBay Communities Incorporated | | | 3.45 | | | | 6-1-2025 | | | | 200,000 | | | | 210,423 | |
AvalonBay Communities Incorporated | | | 3.50 | | | | 11-15-2024 | | | | 150,000 | | | | 158,223 | |
AvalonBay Communities Incorporated | | | 3.63 | | | | 10-1-2020 | | | | 200,000 | | | | 212,212 | |
AvalonBay Communities Incorporated | | | 4.20 | | | | 12-15-2023 | | | | 250,000 | | | | 274,922 | |
AvalonBay Communities Incorporated | | | 6.10 | | | | 3-15-2020 | | | | 100,000 | | | | 114,080 | |
Boston Properties LP | | | 3.13 | | | | 9-1-2023 | | | | 150,000 | | | | 155,323 | |
Boston Properties LP | | | 3.80 | | | | 2-1-2024 | | | | 300,000 | | | | 322,778 | |
Boston Properties LP | | | 3.85 | | | | 2-1-2023 | | | | 400,000 | | | | 430,655 | |
Boston Properties LP | | | 4.13 | | | | 5-15-2021 | | | | 300,000 | | | | 327,453 | |
Boston Properties LP | | | 5.63 | | | | 11-15-2020 | | | | 500,000 | | | | 569,733 | |
Boston Properties LP | | | 5.88 | | | | 10-15-2019 | | | | 500,000 | | | | 556,823 | |
Brandywine Operating Partnership LP | | | 3.95 | | | | 2-15-2023 | | | | 350,000 | | | | 358,129 | |
Camden Property Trust | | | 2.95 | | | | 12-15-2022 | | | | 150,000 | | | | 151,175 | |
Camden Property Trust | | | 4.25 | | | | 1-15-2024 | | | | 67,000 | | | | 72,459 | |
Camden Property Trust | | | 4.63 | | | | 6-15-2021 | | | | 150,000 | | | | 164,178 | |
Camden Property Trust | | | 4.88 | | | | 6-15-2023 | | | | 100,000 | | | | 111,664 | |
CBL & Associates LP | | | 4.60 | | | | 10-15-2024 | | | | 131,000 | | | | 126,857 | |
CBL & Associates LP | | | 5.25 | | | | 12-1-2023 | | | | 67,000 | | | | 68,055 | |
Commonwealth REIT | | | 5.88 | | | | 9-15-2020 | | | | 100,000 | | | | 110,634 | |
Corporate Office Properties LP | | | 3.60 | | | | 5-15-2023 | | | | 100,000 | | | | 99,819 | |
Corporate Office Properties LP | | | 3.70 | | | | 6-15-2021 | | | | 500,000 | | | | 515,712 | |
Crown Castle International Corporation | | | 3.70 | | | | 6-15-2026 | | | | 500,000 | | | | 524,099 | |
Crown Castle International Corporation | | | 5.25 | | | | 1-15-2023 | | | | 500,000 | | | | 570,940 | |
DDR Corporation | | | 3.38 | | | | 5-15-2023 | | | | 250,000 | | | | 252,092 | |
DDR Corporation | | | 3.50 | | | | 1-15-2021 | | | | 250,000 | | | | 258,502 | |
DDR Corporation | | | 4.63 | | | | 7-15-2022 | | | | 250,000 | | | | 271,531 | |
Digital Realty Trust LP | | | 3.63 | | | | 10-1-2022 | | | | 200,000 | | | | 207,313 | |
Digital Realty Trust LP | | | 3.95 | | | | 7-1-2022 | | | | 200,000 | | | | 211,542 | |
Digital Realty Trust LP | | | 5.25 | | | | 3-15-2021 | | | | 100,000 | | | | 112,711 | |
Digital Realty Trust LP | | | 5.88 | | | | 2-1-2020 | | | | 300,000 | | | | 335,763 | |
Duke Realty LP | | | 3.63 | | | | 4-15-2023 | | | | 125,000 | | | | 131,910 | |
Duke Realty LP | | | 3.75 | | | | 12-1-2024 | | | | 650,000 | | | | 691,517 | |
Entertainment Properties Trust | | | 5.75 | | | | 8-15-2022 | | | | 150,000 | | | | 165,594 | |
EPR Properties Company | | | 5.25 | | | | 7-15-2023 | | | | 113,000 | | | | 120,958 | |
Equity One Incorporated | | | 3.75 | | | | 11-15-2022 | | | | 250,000 | | | | 256,060 | |
ERP Operating LP | | | 4.63 | | | | 12-15-2021 | | | | 598,000 | | | | 670,122 | |
Essex Portfolio LP | | | 3.25 | | | | 5-1-2023 | | | | 100,000 | | | | 102,562 | |
Essex Portfolio LP | | | 3.38 | | | | 1-15-2023 | | | | 500,000 | | | | 517,388 | |
Essex Portfolio LP | | | 5.20 | | | | 3-15-2021 | | | | 65,000 | | | | 72,755 | |
| | | | |
| 52 | | Wells Fargo Diversified Fixed Income Portfolio | | Portfolio of investments—August 31, 2016 (unaudited) |
| | | | | | | | | | | | | | | | |
| Security name | | Interest rate | | | Maturity date | | | Principal | | | Value | |
| | | | |
| REITs (continued) | | | | | | | | | | | | | | | | |
Federal Realty Investment Trust | | | 2.75 | % | | | 6-1-2023 | | | $ | 100,000 | | | $ | 102,211 | |
Federal Realty Investment Trust | | | 3.00 | | | | 8-1-2022 | | | | 100,000 | | | | 103,920 | |
Federal Realty Investment Trust | | | 4.50 | | | | 12-1-2044 | | | | 250,000 | | | | 288,251 | |
HCP Incorporated | | | 3.15 | | | | 8-1-2022 | | | | 100,000 | | | | 100,812 | |
HCP Incorporated | | | 3.75 | | | | 2-1-2019 | | | | 100,000 | | | | 103,722 | |
HCP Incorporated | | | 3.88 | | | | 8-15-2024 | | | | 1,000,000 | | | | 1,023,223 | |
HCP Incorporated | | | 4.00 | | | | 6-1-2025 | | | | 425,000 | | | | 437,332 | |
HCP Incorporated | | | 4.20 | | | | 3-1-2024 | | | | 200,000 | | | | 209,148 | |
HCP Incorporated | | | 4.25 | | | | 11-15-2023 | | | | 279,000 | | | | 293,972 | |
HCP Incorporated | | | 5.38 | | | | 2-1-2021 | | | | 65,000 | | | | 72,905 | |
HCP Incorporated | | | 6.70 | | | | 1-30-2018 | | | | 500,000 | | | | 534,607 | |
HCP Incorporated | | | 6.75 | | | | 2-1-2041 | | | | 65,000 | | | | 82,152 | |
Health Care REIT Incorporated | | | 4.00 | | | | 6-1-2025 | | | | 300,000 | | | | 320,960 | |
Health Care REIT Incorporated | | | 4.13 | | | | 4-1-2019 | | | | 250,000 | | | | 263,391 | |
Health Care REIT Incorporated | | | 4.50 | | | | 1-15-2024 | | | | 200,000 | | | | 219,211 | |
Health Care REIT Incorporated | | | 4.70 | | | | 9-15-2017 | | | | 500,000 | | | | 516,461 | |
Health Care REIT Incorporated | | | 4.95 | | | | 1-15-2021 | | | | 250,000 | | | | 275,007 | |
Health Care REIT Incorporated | | | 5.25 | | | | 1-15-2022 | | | | 100,000 | | | | 113,193 | |
Health Care REIT Incorporated | | | 5.75 | | | | 1-15-2021 | | | | 250,000 | | | | 281,828 | |
Health Care REIT Incorporated | | | 6.13 | | | | 4-15-2020 | | | | 250,000 | | | | 283,612 | |
Health Care REIT Incorporated | | | 6.50 | | | | 3-15-2041 | | | | 200,000 | | | | 262,644 | |
Healthcare Realty Trust Incorporated | | | 3.75 | | | | 4-15-2023 | | | | 125,000 | | | | 128,059 | |
Highwoods Realty LP | | | 3.20 | | | | 6-15-2021 | | | | 500,000 | | | | 506,520 | |
Hospitality Properties Trust | | | 4.65 | | | | 3-15-2024 | | | | 500,000 | | | | 512,643 | |
Host Hotels & Resorts Company | | | 3.75 | | | | 10-15-2023 | | | | 100,000 | | | | 101,600 | |
Host Hotels & Resorts Company | | | 4.75 | | | | 3-1-2023 | | | | 250,000 | | | | 269,116 | |
Host Hotels & Resorts Company | | | 6.00 | | | | 10-1-2021 | | | | 500,000 | | | | 567,391 | |
Kilroy Realty Corporation | | | 3.80 | | | | 1-15-2023 | | | | 250,000 | | | | 260,095 | |
Kilroy Realty Corporation | | | 4.80 | | | | 7-15-2018 | | | | 150,000 | | | | 157,043 | |
Kimco Realty Corporation | | | 6.88 | | | | 10-1-2019 | | | | 100,000 | | | | 114,841 | |
Liberty Property LP | | | 4.40 | | | | 2-15-2024 | | | | 156,000 | | | | 168,709 | |
Liberty Property LP | | | 4.75 | | | | 10-1-2020 | | | | 250,000 | | | | 270,777 | |
Liberty Property LP | | | 6.63 | | | | 10-1-2017 | | | | 150,000 | | | | 157,440 | |
Mack-Cali Realty Corporation | | | 2.50 | | | | 12-15-2017 | | | | 100,000 | | | | 100,418 | |
Mack-Cali Realty Corporation | | | 3.15 | | | | 5-15-2023 | | | | 100,000 | | | | 93,094 | |
Mack-Cali Realty Corporation | | | 7.75 | | | | 8-15-2019 | | | | 150,000 | | | | 168,491 | |
Mid-America Apartments LP | | | 4.30 | | | | 10-15-2023 | | | | 50,000 | | | | 54,196 | |
National Retail Properties Incorporated | | | 3.30 | | | | 4-15-2023 | | | | 100,000 | | | | 102,366 | |
National Retail Properties Incorporated | | | 3.80 | | | | 10-15-2022 | | | | 100,000 | | | | 106,328 | |
National Retail Properties Incorporated | | | 3.90 | | | | 6-15-2024 | | | | 1,000,000 | | | | 1,060,909 | |
National Retail Properties Incorporated | | | 6.88 | | | | 10-15-2017 | | | | 100,000 | | | | 105,408 | |
ProLogis Trust | | | 3.35 | | | | 2-1-2021 | | | | 400,000 | | | | 422,428 | |
ProLogis Trust | | | 4.25 | | | | 8-15-2023 | | | | 1,000,000 | | | | 1,108,678 | |
Realty Income Corporation | | | 2.00 | | | | 1-31-2018 | | | | 150,000 | | | | 150,929 | |
Realty Income Corporation | | | 3.88 | | | | 7-15-2024 | | | | 500,000 | | | | 529,914 | |
Realty Income Corporation | | | 4.65 | | | | 8-1-2023 | | | | 300,000 | | | | 332,183 | |
Realty Income Corporation | | | 5.75 | | | | 1-15-2021 | | | | 300,000 | | | | 342,789 | |
Retail Opportunity Investments Corporation | | | 5.00 | | | | 12-15-2023 | | | | 50,000 | | | | 53,573 | |
Simon Property Group LP | | | 2.15 | | | | 9-15-2017 | | | | 500,000 | | | | 503,842 | |
Simon Property Group LP | | | 2.20 | | | | 2-1-2019 | | | | 500,000 | | | | 509,633 | |
| | | | | | |
| Portfolio of investments—August 31, 2016 (unaudited) | | Wells Fargo Diversified Fixed Income Portfolio | | | 53 | |
| | | | | | | | | | | | | | | | |
| Security name | | Interest rate | | | Maturity date | | | Principal | | | Value | |
| | | | |
| REITs (continued) | | | | | | | | | | | | | | | | |
Simon Property Group LP | | | 3.38 | % | | | 3-15-2022 | | | $ | 500,000 | | | $ | 532,568 | |
Simon Property Group LP | | | 3.75 | | | | 2-1-2024 | | | | 250,000 | | | | 272,922 | |
Simon Property Group LP | | | 4.13 | | | | 12-1-2021 | | | | 300,000 | | | | 331,516 | |
Simon Property Group LP | | | 4.38 | | | | 3-1-2021 | | | | 500,000 | | | | 553,241 | |
Simon Property Group LP | | | 4.75 | | | | 3-15-2042 | | | | 250,000 | | | | 303,718 | |
Simon Property Group LP | | | 5.65 | | | | 2-1-2020 | | | | 200,000 | | | | 224,735 | |
Simon Property Group LP | | | 6.75 | | | | 2-1-2040 | | | | 350,000 | | | | 524,023 | |
Simon Property Group LP | | | 10.35 | | | | 4-1-2019 | | | | 600,000 | | | | 722,277 | |
UDR Incorporated | | | 3.70 | | | | 10-1-2020 | | | | 250,000 | | | | 263,221 | |
UDR Incorporated | | | 4.25 | | | | 6-1-2018 | | | | 150,000 | | | | 156,599 | |
UDR Incorporated | | | 4.63 | | | | 1-10-2022 | | | | 100,000 | | | | 110,270 | |
Ventas Realty LP | | | 2.70 | | | | 4-1-2020 | | | | 200,000 | | | | 204,395 | |
Ventas Realty LP | | | 4.25 | | | | 3-1-2022 | | | | 1,000,000 | | | | 1,077,400 | |
Ventas Realty LP | | | 4.75 | | | | 6-1-2021 | | | | 150,000 | | | | 166,881 | |
Ventas Realty LP | | | 5.70 | | | | 9-30-2043 | | | | 250,000 | | | | 306,881 | |
Vornado Realty LP | | | 2.50 | | | | 6-30-2019 | | | | 500,000 | | | | 506,002 | |
Washington REIT | | | 3.95 | | | | 10-15-2022 | | | | 150,000 | | | | 152,373 | |
Weingarten Realty Investors | | | 3.38 | | | | 10-15-2022 | | | | 150,000 | | | | 153,349 | |
Weingarten Realty Investors | | | 3.50 | | | | 4-15-2023 | | | | 125,000 | | | | 128,084 | |
Weyerhaeuser Company | | | 4.63 | | | | 9-15-2023 | | | | 300,000 | | | | 334,264 | |
Weyerhaeuser Company | | | 6.88 | | | | 12-15-2033 | | | | 150,000 | | | | 191,685 | |
Weyerhaeuser Company | | | 7.38 | | | | 10-1-2019 | | | | 100,000 | | | | 114,289 | |
Weyerhaeuser Company | | | 7.38 | | | | 3-15-2032 | | | | 700,000 | | | | 952,594 | |
WP Carey Incorporated | | | 4.60 | | | | 4-1-2024 | | | | 500,000 | | | | 522,984 | |
| |
| | | | 39,603,969 | |
| | | | | | | | | | | | | | | | |
| | | | |
| Thrifts & Mortgage Finance: 0.00% | | | | | | | | | | | | | | | | |
People’s United Financial Incorporated | | | 3.65 | | | | 12-6-2022 | | | | 150,000 | | | | 152,361 | |
| | | | | | | | | | | | | | | | |
| | | | |
Health Care: 2.27% | | | | | | | | | | | | | | | | |
| | | | |
| Biotechnology: 0.61% | | | | | | | | | | | | | | | | |
AbbVie Incorporated | | | 1.75 | | | | 11-6-2017 | | | | 1,500,000 | | | | 1,506,771 | |
AbbVie Incorporated | | | 2.00 | | | | 11-6-2018 | | | | 300,000 | | | | 302,980 | |
AbbVie Incorporated | | | 2.30 | | | | 5-14-2021 | | | | 500,000 | | | | 505,199 | |
AbbVie Incorporated | | | 2.50 | | | | 5-14-2020 | | | | 2,000,000 | | | | 2,045,756 | |
AbbVie Incorporated | | | 2.90 | | | | 11-6-2022 | | | | 1,000,000 | | | | 1,030,004 | |
AbbVie Incorporated | | | 3.20 | | | | 5-14-2026 | | | | 600,000 | | | | 614,251 | |
AbbVie Incorporated | | | 3.60 | | | | 5-14-2025 | | | | 1,500,000 | | | | 1,586,184 | |
AbbVie Incorporated | | | 4.30 | | | | 5-14-2036 | | | | 350,000 | | | | 369,865 | |
AbbVie Incorporated | | | 4.40 | | | | 11-6-2042 | | | | 500,000 | | | | 532,840 | |
AbbVie Incorporated | | | 4.45 | | | | 5-14-2046 | | | | 600,000 | | | | 642,203 | |
AbbVie Incorporated | | | 4.50 | | | | 5-14-2035 | | | | 1,000,000 | | | | 1,084,344 | |
AbbVie Incorporated | | | 4.70 | | | | 5-14-2045 | | | | 1,000,000 | | | | 1,113,267 | |
Amgen Incorporated | | | 3.63 | | | | 5-15-2022 | | | | 1,000,000 | | | | 1,074,447 | |
Amgen Incorporated | | | 3.63 | | | | 5-22-2024 | | | | 500,000 | | | | 539,183 | |
Amgen Incorporated | | | 3.88 | | | | 11-15-2021 | | | | 2,000,000 | | | | 2,176,042 | |
Amgen Incorporated | | | 4.10 | | | | 6-15-2021 | | | | 100,000 | | | | 109,588 | |
Amgen Incorporated | | | 4.50 | | | | 3-15-2020 | | | | 65,000 | | | | 71,151 | |
Amgen Incorporated | | | 4.95 | | | | 10-1-2041 | | | | 500,000 | | | | 570,179 | |
Amgen Incorporated | | | 5.15 | | | | 11-15-2041 | | | | 350,000 | | | | 401,925 | |
| | | | |
| 54 | | Wells Fargo Diversified Fixed Income Portfolio | | Portfolio of investments—August 31, 2016 (unaudited) |
| | | | | | | | | | | | | | | | |
| Security name | | Interest rate | | | Maturity date | | | Principal | | | Value | |
| | | | |
| Biotechnology (continued) | | | | | | | | | | | | | | | | |
Amgen Incorporated | | | 5.38 | % | | | 5-15-2043 | | | $ | 500,000 | | | $ | 612,659 | |
Amgen Incorporated | | | 5.65 | | | | 6-15-2042 | | | | 1,100,000 | | | | 1,360,280 | |
Amgen Incorporated | | | 5.75 | | | | 3-15-2040 | | | | 80,000 | | | | 100,389 | |
Amgen Incorporated | | | 6.15 | | | | 6-1-2018 | | | | 250,000 | | | | 270,481 | |
Amgen Incorporated | | | 6.38 | | | | 6-1-2037 | | | | 500,000 | | | | 656,902 | |
Amgen Incorporated | | | 6.40 | | | | 2-1-2039 | | | | 250,000 | | | | 329,962 | |
Baxalta Incorporated | | | 2.88 | | | | 6-23-2020 | | | | 400,000 | | | | 406,475 | |
Baxalta Incorporated | | | 3.60 | | | | 6-23-2022 | | | | 200,000 | | | | 205,855 | |
Baxalta Incorporated | | | 4.00 | | | | 6-23-2025 | | | | 650,000 | | | | 694,554 | |
Baxalta Incorporated | | | 5.25 | | | | 6-23-2045 | | | | 400,000 | | | | 469,816 | |
Biogen Incorporated | | | 3.63 | | | | 9-15-2022 | | | | 1,000,000 | | | | 1,069,616 | |
Biogen Incorporated | | | 5.20 | | | | 9-15-2045 | | | | 600,000 | | | | 723,981 | |
Biogen Incorporated | | | 6.88 | | | | 3-1-2018 | | | | 500,000 | | | | 540,049 | |
Celgene Corporation | | | 2.30 | | | | 8-15-2018 | | | | 286,000 | | | | 290,325 | |
Celgene Corporation | | | 2.88 | | | | 8-15-2020 | | | | 1,000,000 | | | | 1,037,836 | |
Celgene Corporation | | | 3.25 | | | | 8-15-2022 | | | | 500,000 | | | | 521,517 | |
Celgene Corporation | | | 3.63 | | | | 5-15-2024 | | | | 500,000 | | | | 529,483 | |
Celgene Corporation | | | 3.88 | | | | 8-15-2025 | | | | 250,000 | | | | 270,012 | |
Celgene Corporation | | | 3.95 | | | | 10-15-2020 | | | | 200,000 | | | | 215,598 | |
Celgene Corporation | | | 4.00 | | | | 8-15-2023 | | | | 250,000 | | | | 271,804 | |
Celgene Corporation | | | 4.63 | | | | 5-15-2044 | | | | 750,000 | | | | 811,597 | |
Celgene Corporation | | | 5.00 | | | | 8-15-2045 | | | | 500,000 | | | | 576,998 | |
Celgene Corporation | | | 5.25 | | | | 8-15-2043 | | | | 150,000 | | | | 173,982 | |
Genzyme Corporation | | | 5.00 | | | | 6-15-2020 | | | | 200,000 | | | | 224,916 | |
Gilead Sciences Incorporated | | | 2.05 | | | | 4-1-2019 | | | | 500,000 | | | | 510,079 | |
Gilead Sciences Incorporated | | | 2.55 | | | | 9-1-2020 | | | | 750,000 | | | | 778,406 | |
Gilead Sciences Incorporated | | | 3.50 | | | | 2-1-2025 | | | | 500,000 | | | | 537,378 | |
Gilead Sciences Incorporated | | | 3.65 | | | | 3-1-2026 | | | | 500,000 | | | | 542,092 | |
Gilead Sciences Incorporated | | | 3.70 | | | | 4-1-2024 | | | | 500,000 | | | | 541,451 | |
Gilead Sciences Incorporated | | | 4.40 | | | | 12-1-2021 | | | | 800,000 | | | | 898,158 | |
Gilead Sciences Incorporated | | | 4.50 | | | | 4-1-2021 | | | | 500,000 | | | | 558,545 | |
Gilead Sciences Incorporated | | | 4.50 | | | | 2-1-2045 | | | | 1,000,000 | | | | 1,118,550 | |
Gilead Sciences Incorporated | | | 4.75 | | | | 3-1-2046 | | | | 500,000 | | | | 581,754 | |
Gilead Sciences Incorporated | | | 4.80 | | | | 4-1-2044 | | | | 500,000 | | | | 578,144 | |
Gilead Sciences Incorporated | | | 5.65 | | | | 12-1-2041 | | | | 400,000 | | | | 506,778 | |
| |
| | | | 35,792,601 | |
| | | | | | | | | | | | | | | | |
| | | | |
| Health Care Equipment & Supplies: 0.37% | | | | | | | | | | | | | | | | |
Becton Dickinson & Company | | | 1.80 | | | | 12-15-2017 | | | | 500,000 | | | | 502,914 | |
Becton Dickinson & Company | | | 2.68 | | | | 12-15-2019 | | | | 500,000 | | | | 517,528 | |
Becton Dickinson & Company | | | 3.13 | | | | 11-8-2021 | | | | 300,000 | | | | 316,123 | |
Becton Dickinson & Company | | | 3.25 | | | | 11-12-2020 | | | | 350,000 | | | | 367,406 | |
Becton Dickinson & Company | | | 3.73 | | | | 12-15-2024 | | | | 750,000 | | | | 814,958 | |
Becton Dickinson & Company | | | 4.69 | | | | 12-15-2044 | | | | 500,000 | | | | 580,418 | |
Becton Dickinson & Company | | | 6.00 | | | | 5-15-2039 | | | | 200,000 | | | | 258,186 | |
Becton Dickinson & Company | | | 6.38 | | | | 8-1-2019 | | | | 500,000 | | | | 566,592 | |
Boston Scientific Corporation | | | 3.85 | | | | 5-15-2025 | | | | 1,000,000 | | | | 1,071,441 | |
Boston Scientific Corporation | | | 6.00 | | | | 1-15-2020 | | | | 350,000 | | | | 395,322 | |
Boston Scientific Corporation | | | 7.38 | | | | 1-15-2040 | | | | 300,000 | | | | 415,168 | |
C.R. Bard Incorporated | | | 1.38 | | | | 1-15-2018 | | | | 100,000 | | | | 100,161 | |
| | | | | | |
| Portfolio of investments—August 31, 2016 (unaudited) | | Wells Fargo Diversified Fixed Income Portfolio | | | 55 | |
| | | | | | | | | | | | | | | | |
| Security name | | Interest rate | | | Maturity date | | | Principal | | | Value | |
| | | | |
| Health Care Equipment & Supplies (continued) | | | | | | | | | | | | | | | | |
C.R. Bard Incorporated | | | 4.40 | % | | | 1-15-2021 | | | $ | 168,000 | | | $ | 184,617 | |
Edwards Lifesciences Corporation | | | 2.88 | | | | 10-15-2018 | | | | 150,000 | | | | 153,536 | |
Medtronic Incorporated | | | 1.38 | | | | 4-1-2018 | | | | 400,000 | | | | 401,410 | |
Medtronic Incorporated | | | 2.75 | | | | 4-1-2023 | | | | 1,000,000 | | | | 1,038,870 | |
Medtronic Incorporated | | | 3.15 | | | | 3-15-2022 | | | | 2,000,000 | | | | 2,123,802 | |
Medtronic Incorporated | | | 3.50 | | | | 3-15-2025 | | | | 1,200,000 | | | | 1,300,513 | |
Medtronic Incorporated | | | 4.38 | | | | 3-15-2035 | | | | 700,000 | | | | 804,192 | |
Medtronic Incorporated | | | 4.45 | | | | 3-15-2020 | | | | 400,000 | | | | 438,158 | |
Medtronic Incorporated | | | 4.50 | | | | 3-15-2042 | | | | 200,000 | | | | 234,279 | |
Medtronic Incorporated | | | 4.63 | | | | 3-15-2044 | | | | 250,000 | | | | 296,410 | |
Medtronic Incorporated | | | 4.63 | | | | 3-15-2045 | | | | 1,250,000 | | | | 1,501,655 | |
Medtronic Incorporated | | | 5.55 | | | | 3-15-2040 | | | | 300,000 | | | | 387,276 | |
St. Jude Medical Incorporated | | | 3.25 | | | | 4-15-2023 | | | | 500,000 | | | | 515,462 | |
St. Jude Medical Incorporated | | | 4.75 | | | | 4-15-2043 | | | | 300,000 | | | | 322,813 | |
Stryker Corporation | | | 1.30 | | | | 4-1-2018 | | | | 225,000 | | | | 225,097 | |
Stryker Corporation | | | 3.50 | | | | 3-15-2026 | | | | 1,000,000 | | | | 1,062,279 | |
Stryker Corporation | | | 4.10 | | | | 4-1-2043 | | | | 250,000 | | | | 261,555 | |
Stryker Corporation | | | 4.38 | | | | 1-15-2020 | | | | 150,000 | | | | 163,339 | |
Stryker Corporation | | | 4.63 | | | | 3-15-2046 | | | | 500,000 | | | | 569,894 | |
Zimmer Holdings Incorporated | | | 2.70 | | | | 4-1-2020 | | | | 1,250,000 | | | | 1,278,933 | |
Zimmer Holdings Incorporated | | | 3.55 | | | | 4-1-2025 | | | | 1,000,000 | | | | 1,041,206 | |
Zimmer Holdings Incorporated | | | 4.45 | | | | 8-15-2045 | | | | 500,000 | | | | 526,738 | |
Zimmer Holdings Incorporated | | | 4.63 | | | | 11-30-2019 | | | | 250,000 | | | | 269,720 | |
Zimmer Holdings Incorporated | | | 5.75 | | | | 11-30-2039 | | | | 250,000 | | | | 307,511 | |
| |
| | | | 21,315,482 | |
| | | | | | | | | | | | | | | | |
| | | | |
| Health Care Providers & Services: 0.61% | | | | | | | | | | | | | | | | |
Aetna Incorporated | | | 1.90 | | | | 6-7-2019 | | | | 400,000 | | | | 403,525 | |
Aetna Incorporated | | | 2.20 | | | | 3-15-2019 | | | | 500,000 | | | | 507,783 | |
Aetna Incorporated | | | 2.40 | | | | 6-15-2021 | | | | 400,000 | | | | 405,840 | |
Aetna Incorporated | | | 2.75 | | | | 11-15-2022 | | | | 300,000 | | | | 304,408 | |
Aetna Incorporated | | | 3.20 | | | | 6-15-2026 | | | | 750,000 | | | | 763,725 | |
Aetna Incorporated | | | 3.95 | | | | 9-1-2020 | | | | 200,000 | | | | 215,240 | |
Aetna Incorporated | | | 4.13 | | | | 6-1-2021 | | | | 200,000 | | | | 215,976 | |
Aetna Incorporated | | | 4.13 | | | | 11-15-2042 | | | | 250,000 | | | | 262,245 | |
Aetna Incorporated | | | 4.38 | | | | 6-15-2046 | | | | 500,000 | | | | 519,879 | |
Aetna Incorporated | | | 6.63 | | | | 6-15-2036 | | | | 650,000 | | | | 896,847 | |
AmerisourceBergen Corporation | | | 3.50 | | | | 11-15-2021 | | | | 300,000 | | | | 320,265 | |
Amerisourcebergen Corporation | | | 4.25 | | | | 3-1-2045 | | | | 250,000 | | | | 276,748 | |
AmerisourceBergen Corporation | | | 4.88 | | | | 11-15-2019 | | | | 250,000 | | | | 273,441 | |
Cardinal Health Incorporated | | | 1.70 | | | | 3-15-2018 | | | | 157,000 | | | | 157,738 | |
Cardinal Health Incorporated | | | 3.20 | | | | 6-15-2022 | | | | 250,000 | | | | 261,826 | |
Cardinal Health Incorporated | | | 3.20 | | | | 3-15-2023 | | | | 225,000 | | | | 235,010 | |
Cardinal Health Incorporated | | | 3.50 | | | | 11-15-2024 | | | | 500,000 | | | | 533,832 | |
Catholic Health Initiatives | | | 4.35 | | | | 11-1-2042 | | | | 250,000 | | | | 248,889 | |
CIGNA Corporation | | | 4.00 | | | | 2-15-2022 | | | | 250,000 | | | | 270,021 | |
CIGNA Corporation | | | 4.38 | | | | 12-15-2020 | | | | 500,000 | | | | 543,434 | |
CIGNA Corporation | | | 4.50 | | | | 3-15-2021 | | | | 100,000 | | | | 109,338 | |
CIGNA Corporation | | | 5.13 | | | | 6-15-2020 | | | | 215,000 | | | | 238,031 | |
CIGNA Corporation | | | 5.38 | | | | 2-15-2042 | | | | 350,000 | | | | 429,928 | |
| | | | |
| 56 | | Wells Fargo Diversified Fixed Income Portfolio | | Portfolio of investments—August 31, 2016 (unaudited) |
| | | | | | | | | | | | | | | | |
| Security name | | Interest rate | | | Maturity date | | | Principal | | | Value | |
| | | | |
| Health Care Providers & Services (continued) | | | | | | | | | | | | | | | | |
CIGNA Corporation | | | 5.88 | % | | | 3-15-2041 | | | $ | 330,000 | | | $ | 418,808 | |
CIGNA Corporation | | | 6.15 | | | | 11-15-2036 | | | | 50,000 | | | | 64,144 | |
Coventry Health Care Incorporated | | | 5.45 | | | | 6-15-2021 | | | | 580,000 | | | | 659,512 | |
Dignity Health | | | 2.64 | | | | 11-1-2019 | | | | 500,000 | | | | 511,028 | |
Express Scripts Holding Company | | | 3.50 | | | | 6-15-2024 | | | | 600,000 | | | | 623,093 | |
Express Scripts Holding Company | | | 3.90 | | | | 2-15-2022 | | | | 500,000 | | | | 538,700 | |
Express Scripts Holding Company | | | 4.75 | | | | 11-15-2021 | | | | 750,000 | | | | 843,343 | |
Express Scripts Holding Company | | | 6.13 | | | | 11-15-2041 | | | | 250,000 | | | | 314,708 | |
Howard Hughes Medical Institute | | | 3.50 | | | | 9-1-2023 | | | | 475,000 | | | | 520,247 | |
Humana Incorporated | | | 3.15 | | | | 12-1-2022 | | | | 300,000 | | | | 311,884 | |
Humana Incorporated | | | 3.85 | | | | 10-1-2024 | | | | 500,000 | | | | 537,005 | |
Humana Incorporated | | | 4.95 | | | | 10-1-2044 | | | | 500,000 | | | | 562,711 | |
Humana Incorporated | | | 7.20 | | | | 6-15-2018 | | | | 500,000 | | | | 548,764 | |
Kaiser Foundation Hospitals | | | 4.88 | | | | 4-1-2042 | | | | 250,000 | | | | 311,620 | |
Laboratory Corporation of America Holdings | | | 3.60 | | | | 2-1-2025 | | | | 500,000 | | | | 524,802 | |
Laboratory Corporation of America Holdings | | | 3.75 | | | | 8-23-2022 | | | | 56,000 | | | | 59,339 | |
Laboratory Corporation of America Holdings | | | 4.00 | | | | 11-1-2023 | | | | 150,000 | | | | 161,062 | |
Laboratory Corporation of America Holdings | | | 4.63 | | | | 11-15-2020 | | | | 500,000 | | | | 546,546 | |
Laboratory Corporation of America Holdings | | | 4.70 | | | | 2-1-2045 | | | | 500,000 | | | | 549,673 | |
Mayo Clinic Rochester | | | 4.00 | | | | 11-15-2047 | | | | 100,000 | | | | 109,998 | |
McKesson Corporation | | | 1.40 | | | | 3-15-2018 | | | | 250,000 | | | | 250,125 | |
McKesson Corporation | | | 2.28 | | | | 3-15-2019 | | | | 500,000 | | | | 509,672 | |
McKesson Corporation | | | 2.85 | | | | 3-15-2023 | | | | 200,000 | | | | 204,541 | |
McKesson Corporation | | | 4.88 | | | | 3-15-2044 | | | | 500,000 | | | | 597,514 | |
McKesson Corporation | | | 6.00 | | | | 3-1-2041 | | | | 250,000 | | | | 327,116 | |
McKesson Corporation | | | 7.50 | | | | 2-15-2019 | | | | 500,000 | | | | 569,367 | |
Medco Health Solutions Incorporated | | | 4.13 | | | | 9-15-2020 | | | | 500,000 | | | | 538,758 | |
Medco Health Solutions Incorporated | | | 7.13 | | | | 3-15-2018 | | | | 1,000,000 | | | | 1,082,105 | |
Novant Health Incorporated | | | 4.37 | | | | 11-1-2043 | | | | 100,000 | | | | 115,486 | |
Quest Diagnostics Incorporated | | | 4.70 | | | | 4-1-2021 | | | | 160,000 | | | | 175,729 | |
Quest Diagnostics Incorporated | | | 4.75 | | | | 1-30-2020 | | | | 590,000 | | | | 643,665 | |
UnitedHealth Group Incorporated | | | 1.63 | | | | 3-15-2019 | | | | 250,000 | | | | 251,482 | |
UnitedHealth Group Incorporated | | | 2.70 | | | | 7-15-2020 | | | | 1,600,000 | | | | 1,668,222 | |
UnitedHealth Group Incorporated | | | 2.88 | | | | 3-15-2022 | | | | 1,000,000 | | | | 1,046,290 | |
UnitedHealth Group Incorporated | | | 2.88 | | | | 3-15-2023 | | | | 500,000 | | | | 522,453 | |
UnitedHealth Group Incorporated | | | 3.75 | | | | 7-15-2025 | | | | 1,000,000 | | | | 1,107,593 | |
UnitedHealth Group Incorporated | | | 3.95 | | | | 10-15-2042 | | | | 500,000 | | | | 546,481 | |
UnitedHealth Group Incorporated | | | 4.25 | | | | 3-15-2043 | | | | 250,000 | | | | 284,190 | |
UnitedHealth Group Incorporated | | | 4.75 | | | | 7-15-2045 | | | | 500,000 | | | | 619,472 | |
UnitedHealth Group Incorporated | | | 5.80 | | | | 3-15-2036 | | | | 250,000 | | | | 334,219 | |
UnitedHealth Group Incorporated | | | 5.95 | | | | 2-15-2041 | | | | 500,000 | | | | 697,958 | |
UnitedHealth Group Incorporated | | | 6.00 | | | | 2-15-2018 | | | | 1,000,000 | | | | 1,068,225 | |
UnitedHealth Group Incorporated | | | 6.63 | | | | 11-15-2037 | | | | 150,000 | | | | 217,314 | |
UnitedHealth Group Incorporated | | | 6.88 | | | | 2-15-2038 | | | | 500,000 | | | | 745,128 | |
WellPoint Incorporated | | | 1.88 | | | | 1-15-2018 | | | | 500,000 | | | | 502,763 | |
WellPoint Incorporated | | | 2.25 | | | | 8-15-2019 | | | | 400,000 | | | | 406,219 | |
WellPoint Incorporated | | | 2.30 | | | | 7-15-2018 | | | | 150,000 | | | | 152,193 | |
WellPoint Incorporated | | | 3.13 | | | | 5-15-2022 | | | | 500,000 | | | | 519,265 | |
WellPoint Incorporated | | | 3.30 | | | | 1-15-2023 | | | | 250,000 | | | | 261,658 | |
WellPoint Incorporated | | | 4.65 | | | | 1-15-2043 | | | | 450,000 | | | | 502,776 | |
| | | | | | |
| Portfolio of investments—August 31, 2016 (unaudited) | | Wells Fargo Diversified Fixed Income Portfolio | | | 57 | |
| | | | | | | | | | | | | | | | |
| Security name | | Interest rate | | | Maturity date | | | Principal | | | Value | |
| | | | |
| Health Care Providers & Services (continued) | | | | | | | | | | | | | | | | |
WellPoint Incorporated | | | 4.65 | % | | | 8-15-2044 | | | $ | 500,000 | | | $ | 554,558 | |
WellPoint Incorporated | | | 5.85 | | | | 1-15-2036 | | | | 725,000 | | | | 911,141 | |
WellPoint Incorporated | | | 7.00 | | | | 2-15-2019 | | | | 500,000 | | | | 561,866 | |
| |
| | | | 35,606,500 | |
| | | | | | | | | | | | | | | | |
| | | | |
| Life Sciences Tools & Services: 0.05% | | | | | | | | | | | | | | | | |
Life Technologies Corporation | | | 5.00 | | | | 1-15-2021 | | | | 150,000 | | | | 165,260 | |
Life Technologies Corporation | | | 6.00 | | | | 3-1-2020 | | | | 250,000 | | | | 279,799 | |
Thermo Fisher Scientific Incorporated | | | 2.40 | | | | 2-1-2019 | | | | 400,000 | | | | 407,515 | |
Thermo Fisher Scientific Incorporated | | | 3.15 | | | | 1-15-2023 | | | | 500,000 | | | | 513,784 | |
Thermo Fisher Scientific Incorporated | | | 3.30 | | | | 2-15-2022 | | | | 300,000 | | | | 314,900 | |
Thermo Fisher Scientific Incorporated | | | 3.60 | | | | 8-15-2021 | | | | 400,000 | | | | 425,198 | |
Thermo Fisher Scientific Incorporated | | | 4.15 | | | | 2-1-2024 | | | | 400,000 | | | | 438,404 | |
Thermo Fisher Scientific Incorporated | | | 5.30 | | | | 2-1-2044 | | | | 200,000 | | | | 243,329 | |
| |
| | | | 2,788,189 | |
| | | | | | | | | | | | | | | | |
| | | | |
| Pharmaceuticals: 0.63% | | | | | | | | | | | | | | | | |
Abbott Laboratories | | | 2.95 | | | | 3-15-2025 | | | | 1,250,000 | | | | 1,287,681 | |
Abbott Laboratories | | | 4.13 | | | | 5-27-2020 | | | | 250,000 | | | | 272,528 | |
Abbott Laboratories | | | 5.13 | | | | 4-1-2019 | | | | 139,000 | | | | 151,825 | |
Abbott Laboratories | | | 5.30 | | | | 5-27-2040 | | | | 250,000 | | | | 301,154 | |
Abbott Laboratories | | | 6.00 | | | | 4-1-2039 | | | | 150,000 | | | | 193,885 | |
Abbott Laboratories | | | 6.15 | | | | 11-30-2037 | | | | 237,000 | | | | 312,950 | |
Allergan Incorporated | | | 1.35 | | | | 3-15-2018 | | | | 50,000 | | | | 49,803 | |
Allergan Incorporated | | | 2.80 | | | | 3-15-2023 | | | | 225,000 | | | | 224,478 | |
Allergan Incorporated | | | 3.38 | | | | 9-15-2020 | | | | 500,000 | | | | 524,423 | |
Bristol-Myers Squibb Company | | | 1.75 | | | | 3-1-2019 | | | | 250,000 | | | | 253,595 | |
Bristol-Myers Squibb Company | | | 2.00 | | | | 8-1-2022 | | | | 250,000 | | | | 252,285 | |
Bristol-Myers Squibb Company | | | 3.25 | | | | 11-1-2023 | | | | 156,000 | | | | 170,623 | |
Bristol-Myers Squibb Company | | | 3.25 | | | | 8-1-2042 | | | | 250,000 | | | | 256,486 | |
Bristol-Myers Squibb Company | | | 4.50 | | | | 3-1-2044 | | | | 605,000 | | | | 761,477 | |
Bristol-Myers Squibb Company | | | 5.88 | | | | 11-15-2036 | | | | 582,000 | | | | 793,740 | |
Eli Lilly & Company | | | 2.75 | | | | 6-1-2025 | | | | 100,000 | | | | 106,411 | |
Eli Lilly & Company | | | 3.70 | | | | 3-1-2045 | | | | 500,000 | | | | 544,310 | |
Eli Lilly & Company | | | 5.50 | | | | 3-15-2027 | | | | 400,000 | | | | 514,681 | |
GlaxoSmithKline Capital Incorporated | | | 2.80 | | | | 3-18-2023 | | | | 200,000 | | | | 209,989 | |
GlaxoSmithKline Capital Incorporated | | | 5.38 | | | | 4-15-2034 | | | | 300,000 | | | | 380,267 | |
GlaxoSmithKline Capital Incorporated | | | 5.65 | | | | 5-15-2018 | | | | 1,650,000 | | | | 1,771,744 | |
GlaxoSmithKline Capital Incorporated | | | 6.38 | | | | 5-15-2038 | | | | 650,000 | | | | 947,606 | |
Johnson & Johnson | | | 1.13 | | | | 11-21-2017 | | | | 350,000 | | | | 350,899 | |
Johnson & Johnson | | | 1.13 | | | | 3-1-2019 | | | | 1,000,000 | | | | 1,000,654 | |
Johnson & Johnson | | | 2.45 | | | | 3-1-2026 | | | | 750,000 | | | | 774,335 | |
Johnson & Johnson | | | 3.70 | | | | 3-1-2046 | | | | 750,000 | | | | 865,609 | |
Johnson & Johnson | | | 4.38 | | | | 12-5-2033 | | | | 583,000 | | | | 711,381 | |
Johnson & Johnson | | | 4.50 | | | | 9-1-2040 | | | | 300,000 | | | | 383,966 | |
Johnson & Johnson | | | 4.85 | | | | 5-15-2041 | | | | 200,000 | | | | 266,231 | |
Johnson & Johnson | | | 4.95 | | | | 5-15-2033 | | | | 180,000 | | | | 233,877 | |
Johnson & Johnson | | | 5.15 | | | | 7-15-2018 | | | | 500,000 | | | | 539,167 | |
Johnson & Johnson | | | 5.85 | | | | 7-15-2038 | | | | 500,000 | | | | 737,531 | |
Johnson & Johnson | | | 6.73 | | | | 11-15-2023 | | | | 300,000 | | | | 400,088 | |
| | | | |
| 58 | | Wells Fargo Diversified Fixed Income Portfolio | | Portfolio of investments—August 31, 2016 (unaudited) |
| | | | | | | | | | | | | | | | |
| Security name | | Interest rate | | | Maturity date | | | Principal | | | Value | |
| | | | |
| Pharmaceuticals (continued) | | | | | | | | | | | | | | | | |
Merck & Company Incorporated | | | 1.30 | % | | | 5-18-2018 | | | $ | 333,000 | | | $ | 334,903 | |
Merck & Company Incorporated | | | 2.40 | | | | 9-15-2022 | | | | 500,000 | | | | 515,963 | |
Merck & Company Incorporated | | | 2.75 | | | | 2-10-2025 | | | | 1,100,000 | | | | 1,149,047 | |
Merck & Company Incorporated | | | 2.80 | | | | 5-18-2023 | | | | 650,000 | | | | 684,260 | |
Merck & Company Incorporated | | | 3.60 | | | | 9-15-2042 | | | | 250,000 | | | | 264,451 | |
Merck & Company Incorporated | | | 3.70 | | | | 2-10-2045 | | | | 1,000,000 | | | | 1,071,979 | |
Merck & Company Incorporated | | | 3.88 | | | | 1-15-2021 | | | | 350,000 | | | | 383,359 | |
Merck & Company Incorporated | | | 4.15 | | | | 5-18-2043 | | | | 500,000 | | | | 572,225 | |
Merck & Company Incorporated | | | 5.00 | | | | 6-30-2019 | | | | 250,000 | | | | 275,975 | |
Merck & Company Incorporated | | | 5.85 | | | | 6-30-2039 | | | | 75,000 | | | | 101,661 | |
Mylan Incorporated | | | 2.55 | | | | 3-28-2019 | | | | 112,000 | | | | 113,376 | |
Mylan Incorporated | | | 2.60 | | | | 6-24-2018 | | | | 1,000,000 | | | | 1,014,275 | |
Mylan Incorporated | | | 5.40 | | | | 11-29-2043 | | | | 33,000 | | | | 37,037 | |
Novartis Capital Corporation | | | 2.40 | | | | 9-21-2022 | | | | 500,000 | | | | 520,102 | |
Novartis Capital Corporation | | | 3.40 | | | | 5-6-2024 | | | | 1,500,000 | | | | 1,648,569 | |
Novartis Capital Corporation | | | 3.70 | | | | 9-21-2042 | | | | 250,000 | | | | 269,054 | |
Novartis Capital Corporation | | | 4.40 | | | | 4-24-2020 | | | | 500,000 | | | | 552,666 | |
Pfizer Incorporated | | | 1.50 | | | | 6-15-2018 | | | | 500,000 | | | | 504,193 | |
Pfizer Incorporated | | | 3.40 | | | | 5-15-2024 | | | | 500,000 | | | | 547,441 | |
Pfizer Incorporated | | | 4.30 | | | | 6-15-2043 | | | | 300,000 | | | | 341,634 | |
Pfizer Incorporated | | | 6.00 | | | | 2-15-2036 | | | | 625,000 | | | | 840,245 | |
Pfizer Incorporated | | | 6.20 | | | | 3-15-2019 | | | | 2,000,000 | | | | 2,237,006 | |
Pfizer Incorporated | | | 6.50 | | | | 2-1-2034 | | | | 500,000 | | | | 689,478 | |
Pfizer Incorporated | | | 7.20 | | | | 3-15-2039 | | | | 750,000 | | | | 1,150,880 | |
Pharmacia Corporation | | | 6.60 | | | | 12-1-2028 | | | | 500,000 | | | | 689,040 | |
Schering-Plough Corporation | | | 6.50 | | | | 12-1-2033 | | | | 250,000 | | | | 353,915 | |
Schering-Plough Corporation | | | 6.55 | | | | 9-15-2037 | | | | 200,000 | | | | 287,199 | |
Teva Pharmaceutical Finance LLC | | | 2.25 | | | | 3-18-2020 | | | | 250,000 | | | | 252,668 | |
Teva Pharmaceutical Finance LLC | | | 6.15 | | | | 2-1-2036 | | | | 400,000 | | | | 513,396 | |
Watson Pharmaceuticals Incorporated | | | 1.88 | | | | 10-1-2017 | | | | 500,000 | | | | 502,217 | |
Watson Pharmaceuticals Incorporated | | | 4.63 | | | | 10-1-2042 | | | | 500,000 | | | | 541,927 | |
Watson Pharmaceuticals Incorporated | | | 6.13 | | | | 8-15-2019 | | | | 130,000 | | | | 145,831 | |
Zoetis Incorporated | | | 3.25 | | | | 2-1-2023 | | | | 600,000 | | | | 617,228 | |
Zoetis Incorporated | | | 4.70 | | | | 2-1-2043 | | | | 500,000 | | | | 533,571 | |
| |
| | | | 36,802,450 | |
| | | | | | | | | | | | | | | | |
| | | | |
Industrials: 1.52% | | | | | | | | | | | | | | | | |
| | | | |
| Aerospace & Defense: 0.43% | | | | | | | | | | | | | | | | |
Boeing Company | | | 0.95 | | | | 5-15-2018 | | | | 150,000 | | | | 149,784 | |
Boeing Company | | | 4.88 | | | | 2-15-2020 | | | | 140,000 | | | | 156,779 | |
Boeing Company | | | 5.88 | | | | 2-15-2040 | | | | 30,000 | | | | 41,697 | |
Boeing Company | | | 6.00 | | | | 3-15-2019 | | | | 300,000 | | | | 334,874 | |
Boeing Company | | | 6.13 | | | | 2-15-2033 | | | | 180,000 | | | | 247,141 | |
Boeing Company | | | 6.88 | | | | 3-15-2039 | | | | 800,000 | | | | 1,213,443 | |
General Dynamics Corporation | | | 1.00 | | | | 11-15-2017 | | | | 500,000 | | | | 499,733 | |
General Dynamics Corporation | | | 2.25 | | | | 11-15-2022 | | | | 500,000 | | | | 512,261 | |
General Dynamics Corporation | | | 3.88 | | | | 7-15-2021 | | | | 200,000 | | | | 219,799 | |
Honeywell International Incorporated | | | 3.35 | | | | 12-1-2023 | | | | 200,000 | | | | 216,278 | |
Honeywell International Incorporated | | | 4.25 | | | | 3-1-2021 | | | | 50,000 | | | | 55,828 | |
Honeywell International Incorporated | | | 5.00 | | | | 2-15-2019 | | | | 750,000 | | | | 817,877 | |
| | | | | | |
| Portfolio of investments—August 31, 2016 (unaudited) | | Wells Fargo Diversified Fixed Income Portfolio | | | 59 | |
| | | | | | | | | | | | | | | | |
| Security name | | Interest rate | | | Maturity date | | | Principal | | | Value | |
| | | | |
| Aerospace & Defense (continued) | | | | | | | | | | | | | | | | |
Honeywell International Incorporated | | | 5.30 | % | | | 3-1-2018 | | | $ | 100,000 | | | $ | 106,154 | |
Honeywell International Incorporated | | | 5.38 | | | | 3-1-2041 | | | | 365,000 | | | | 490,720 | |
Honeywell International Incorporated | | | 5.70 | | | | 3-15-2037 | | | | 250,000 | | | | 338,001 | |
L-3 Communications Corporation | | | 4.95 | | | | 2-15-2021 | | | | 500,000 | | | | 551,693 | |
L-3 Communications Corporation | | | 5.20 | | | | 10-15-2019 | | | | 500,000 | | | | 549,419 | |
Lockheed Martin Corporation | | | 3.35 | | | | 9-15-2021 | | | | 250,000 | | | | 267,175 | |
Lockheed Martin Corporation | | | 3.55 | | | | 1-15-2026 | | | | 1,000,000 | | | | 1,085,837 | |
Lockheed Martin Corporation | | | 3.80 | | | | 3-1-2045 | | | | 500,000 | | | | 519,496 | |
Lockheed Martin Corporation | | | 4.07 | | | | 12-15-2042 | | | | 1,042,000 | | | | 1,126,457 | |
Lockheed Martin Corporation | | | 4.25 | | | | 11-15-2019 | | | | 1,000,000 | | | | 1,086,272 | |
Lockheed Martin Corporation | | | 4.70 | | | | 5-15-2046 | | | | 500,000 | | | | 598,721 | |
Lockheed Martin Corporation Series B | | | 6.15 | | | | 9-1-2036 | | | | 175,000 | | | | 237,632 | |
Northrop Grumman Corporation | | | 1.75 | | | | 6-1-2018 | | | | 300,000 | | | | 302,520 | |
Northrop Grumman Corporation | | | 3.25 | | | | 8-1-2023 | | | | 350,000 | | | | 374,621 | |
Northrop Grumman Corporation | | | 3.50 | | | | 3-15-2021 | | | | 300,000 | | | | 321,021 | |
Northrop Grumman Corporation | | | 4.75 | | | | 6-1-2043 | | | | 500,000 | | | | 607,838 | |
Northrop Grumman Corporation | | | 5.05 | | | | 8-1-2019 | | | | 85,000 | | | | 93,167 | |
Northrop Grumman Corporation | | | 5.05 | | | | 11-15-2040 | | | | 100,000 | | | | 122,348 | |
Northrop Grumman Corporation | | | 7.75 | | | | 2-15-2031 | | | | 300,000 | | | | 447,658 | |
Precision Castparts Corporation | | | 1.25 | | | | 1-15-2018 | | | | 500,000 | | | | 501,252 | |
Precision Castparts Corporation | | | 2.50 | | | | 1-15-2023 | | | | 250,000 | | | | 259,068 | |
Precision Castparts Corporation | | | 3.25 | | | | 6-15-2025 | | | | 300,000 | | | | 322,913 | |
Precision Castparts Corporation | | | 3.90 | | | | 1-15-2043 | | | | 200,000 | | | | 223,330 | |
Raytheon Company | | | 2.50 | | | | 12-15-2022 | | | | 350,000 | | | | 363,869 | |
Raytheon Company | | | 4.40 | | | | 2-15-2020 | | | | 600,000 | | | | 659,348 | |
Raytheon Company | | | 4.70 | | | | 12-15-2041 | | | | 500,000 | | | | 618,273 | |
Raytheon Company | | | 7.20 | | | | 8-15-2027 | | | | 120,000 | | | | 169,786 | |
Rockwell Collins Incorporated | | | 3.70 | | | | 12-15-2023 | | | | 350,000 | | | | 380,906 | |
Rockwell Collins Incorporated | | | 4.80 | | | | 12-15-2043 | | | | 250,000 | | | | 303,660 | |
Rockwell Collins Incorporated | | | 5.25 | | | | 7-15-2019 | | | | 50,000 | | | | 55,514 | |
Textron Incorporated | | | 3.65 | | | | 3-1-2021 | | | | 150,000 | | | | 157,828 | |
Textron Incorporated | | | 4.30 | | | | 3-1-2024 | | | | 200,000 | | | | 215,456 | |
Textron Incorporated | | | 7.25 | | | | 10-1-2019 | | | | 350,000 | | | | 402,091 | |
United Technologies Corporation | | | 3.10 | | | | 6-1-2022 | | | | 839,000 | | | | 899,320 | |
United Technologies Corporation | | | 4.50 | | | | 4-15-2020 | | | | 500,000 | | | | 555,906 | |
United Technologies Corporation | | | 4.50 | | | | 6-1-2042 | | | | 1,033,000 | | | | 1,224,455 | |
United Technologies Corporation | | | 5.38 | | | | 12-15-2017 | | | | 500,000 | | | | 527,531 | |
United Technologies Corporation | | | 5.70 | | | | 4-15-2040 | | | | 500,000 | | | | 678,613 | |
United Technologies Corporation | | | 6.05 | | | | 6-1-2036 | | | | 400,000 | | | | 543,017 | |
United Technologies Corporation | | | 6.13 | | | | 2-1-2019 | | | | 565,000 | | | | 629,907 | |
United Technologies Corporation | | | 6.13 | | | | 7-15-2038 | | | | 500,000 | | | | 691,680 | |
United Technologies Corporation | | | 7.50 | | | | 9-15-2029 | | | | 430,000 | | | | 635,584 | |
| | | | |
| | | | | | | | | | | | | | | 24,711,551 | |
| | | | | | | | | | | | | | | | |
| | | | |
| Air Freight & Logistics: 0.11% | | | | | | | | | | | | | | | | |
FedEx Corporation | | | 2.63 | | | | 8-1-2022 | | | | 482,000 | | | | 495,779 | |
FedEx Corporation | | | 3.88 | | | | 8-1-2042 | | | | 200,000 | | | | 201,868 | |
FedEx Corporation | | | 4.00 | | | | 1-15-2024 | | | | 290,000 | | | | 321,580 | |
FedEx Corporation | | | 4.55 | | | | 4-1-2046 | | | | 500,000 | | | | 555,364 | |
FedEx Corporation | | | 4.90 | | | | 1-15-2034 | | | | 250,000 | | | | 288,864 | |
| | | | |
| 60 | | Wells Fargo Diversified Fixed Income Portfolio | | Portfolio of investments—August 31, 2016 (unaudited) |
| | | | | | | | | | | | | | | | |
| Security name | | Interest rate | | | Maturity date | | | Principal | | | Value | |
| | | | |
| Air Freight & Logistics (continued) | | | | | | | | | | | | | | | | |
FedEx Corporation | | | 5.10 | % | | | 1-15-2044 | | | $ | 300,000 | | | $ | 355,546 | |
FedEx Corporation | | | 8.00 | | | | 1-15-2019 | | | | 400,000 | | | | 460,190 | |
United Parcel Service Incorporated | | | 1.13 | | | | 10-1-2017 | | | | 250,000 | | | | 250,533 | |
United Parcel Service Incorporated | | | 2.45 | | | | 10-1-2022 | | | | 400,000 | | | | 417,528 | |
United Parcel Service Incorporated | | | 3.13 | | | | 1-15-2021 | | | | 900,000 | | | | 960,839 | |
United Parcel Service Incorporated | | | 5.13 | | | | 4-1-2019 | | | | 500,000 | | | | 549,824 | |
United Parcel Service Incorporated | | | 5.50 | | | | 1-15-2018 | | | | 100,000 | | | | 106,124 | |
United Parcel Service Incorporated | | | 6.20 | | | | 1-15-2038 | | | | 795,000 | | | | 1,162,816 | |
| | | | |
| | | | | | | | | | | | | | | 6,126,855 | |
| | | | | | | | | | | | | | | | |
| | | | |
| Airlines: 0.05% | | | | | | | | | | | | | | | | |
American Airlines | | | 4.00 | | | | 1-15-2027 | | | | 510,293 | | | | 546,014 | |
American Airlines | | | 4.95 | | | | 7-15-2024 | | | | 519,424 | | | | 568,120 | |
Continental Airlines Incorporated Series A | | | 4.75 | | | | 7-12-2022 | | | | 346,452 | | | | 373,302 | |
Continental Airlines Incorporated Series A | | | 7.25 | | | | 5-10-2021 | | | | 138,475 | | | | 158,554 | |
Delta Air Lines Incorporated | | | 4.95 | | | | 11-23-2020 | | | | 106,633 | | | | 112,498 | |
Delta Air Lines Incorporated | | | 6.82 | | | | 2-10-2024 | | | | 60,651 | | | | 71,417 | |
Hawaiian Airlines Incorporated | | | 3.90 | | | | 7-15-2027 | | | | 34,691 | | | | 34,951 | |
United Airlines Incorporated | | | 4.00 | | | | 10-11-2027 | | | | 471,365 | | | | 504,360 | |
United Airlines Incorporated | | | 4.30 | | | | 2-15-2027 | | | | 300,418 | | | | 329,709 | |
US Airways Group Incorporated | | | 3.95 | | | | 5-15-2027 | | | | 130,731 | | | | 139,229 | |
US Airways Group Incorporated | | | 4.63 | | | | 12-3-2026 | | | | 199,066 | | | | 217,977 | |
| |
| | | | 3,056,131 | |
| | | | | | | | | | | | | | | | |
| | | | |
| Building Products: 0.00% | | | | | | | | | | | | | | | | |
Owens Corning Incorporated | | | 4.20 | | | | 12-15-2022 | | | | 213,000 | | | | 227,188 | |
| | | | | | | | | | | | | | | | |
| | | | |
| Commercial Services & Supplies: 0.11% | | | | | | | | | | | | | | | | |
Avery Dennison Corporation | | | 5.38 | | | | 4-15-2020 | | | | 350,000 | | | | 382,510 | |
Black & Decker Corporation | | | 3.40 | | | | 12-1-2021 | | | | 400,000 | | | | 427,514 | |
Cintas Corporation No. 2 | | | 3.25 | | | | 6-1-2022 | | | | 100,000 | | | | 106,777 | |
Cintas Corporation No. 2 | | | 4.30 | | | | 6-1-2021 | | | | 60,000 | | | | 66,405 | |
Cintas Corporation No. 2 | | | 6.13 | | | | 12-1-2017 | | | | 200,000 | | | | 211,772 | |
Cintas Corporation No. 2 | | | 6.15 | | | | 8-15-2036 | | | | 50,000 | | | | 64,829 | |
Cooper US Incorporated | | | 3.88 | | | | 12-15-2020 | | | | 200,000 | | | | 214,291 | |
CRH America Incorporated | | | 8.13 | | | | 7-15-2018 | | | | 200,000 | | | | 221,589 | |
Equifax Incorporated | | | 3.30 | | | | 12-15-2022 | | | | 231,000 | | | | 241,706 | |
Equifax Incorporated | | | 7.00 | | | | 7-1-2037 | | | | 50,000 | | | | 65,896 | |
Pitney Bowes Incorporated | | | 4.63 | | | | 3-15-2024 | | | | 500,000 | | | | 525,050 | |
Pitney Bowes Incorporated | | | 5.75 | | | | 9-15-2017 | | | | 16,000 | | | | 16,689 | |
Republic Services Incorporated | | | 3.55 | | | | 6-1-2022 | | | | 1,000,000 | | | | 1,072,224 | |
Republic Services Incorporated | | | 3.80 | | | | 5-15-2018 | | | | 100,000 | | | | 104,071 | |
Republic Services Incorporated | | | 4.75 | | | | 5-15-2023 | | | | 300,000 | | | | 338,279 | |
Republic Services Incorporated | | | 5.25 | | | | 11-15-2021 | | | | 50,000 | | | | 57,646 | |
Republic Services Incorporated | | | 5.50 | | | | 9-15-2019 | | | | 125,000 | | | | 138,846 | |
Waste Management Incorporated | | | 3.13 | | | | 3-1-2025 | | | | 600,000 | | | | 631,732 | |
Waste Management Incorporated | | | 4.10 | | | | 3-1-2045 | | | | 500,000 | | | | 568,766 | |
Waste Management Incorporated | | | 4.60 | | | | 3-1-2021 | | | | 200,000 | | | | 222,000 | |
Waste Management Incorporated | | | 4.75 | | | | 6-30-2020 | | | | 500,000 | | | | 555,282 | |
Waste Management Incorporated | | | 6.10 | | | | 3-15-2018 | | | | 326,000 | | | | 350,547 | |
| |
| | | | 6,584,421 | |
| | | | | | | | | | | | | | | | |
| | | | | | |
| Portfolio of investments—August 31, 2016 (unaudited) | | Wells Fargo Diversified Fixed Income Portfolio | | | 61 | |
| | | | | | | | | | | | | | | | |
| Security name | | Interest rate | | | Maturity date | | | Principal | | | Value | |
| | | | |
| Electrical Equipment: 0.09% | | | | | | | | | | | | | | | | |
Eaton Corporation | | | 1.50 | % | | | 11-2-2017 | | | $ | 500,000 | | | $ | 501,731 | |
Eaton Corporation | | | 2.75 | | | | 11-2-2022 | | | | 1,000,000 | | | | 1,032,048 | |
Eaton Corporation | | | 4.15 | | | | 11-2-2042 | | | | 500,000 | | | | 548,685 | |
Eaton Corporation | | | 6.95 | | | | 3-20-2019 | | | | 200,000 | | | | 225,576 | |
Emerson Electric Company | | | 3.15 | | | | 6-1-2025 | | | | 300,000 | | | | 318,156 | |
Emerson Electric Company | | | 4.25 | | | | 11-15-2020 | | | | 200,000 | | | | 220,161 | |
Emerson Electric Company | | | 4.88 | | | | 10-15-2019 | | | | 200,000 | | | | 221,062 | |
Emerson Electric Company | | | 5.25 | | | | 10-15-2018 | | | | 50,000 | | | | 54,205 | |
Emerson Electric Company | | | 5.25 | | | | 11-15-2039 | | | | 500,000 | | | | 635,633 | |
Emerson Electric Company | | | 5.38 | | | | 10-15-2017 | | | | 200,000 | | | | 208,729 | |
Emerson Electric Company | | | 6.13 | | | | 4-15-2039 | | | | 100,000 | | | | 140,964 | |
Hubbell Incorporated | | | 3.63 | | | | 11-15-2022 | | | | 200,000 | | | | 213,739 | |
Rockwell Automation Incorporated | | | 6.25 | | | | 12-1-2037 | | | | 300,000 | | | | 416,324 | |
Roper Industries Incorporated | | | 2.05 | | | | 10-1-2018 | | | | 500,000 | | | | 505,739 | |
Roper Industries Incorporated | | | 6.25 | | | | 9-1-2019 | | | | 200,000 | | | | 224,753 | |
| |
| | | | 5,467,505 | |
| | | | | | | | | | | | | | | | |
| | | | |
| Industrial Conglomerates: 0.10% | | | | | | | | | | | | | | | | |
3M Company | | | 2.00 | | | | 6-26-2022 | | | | 725,000 | | | | 738,265 | |
3M Company | | | 5.70 | | | | 3-15-2037 | | | | 325,000 | | | | 446,597 | |
GATX Corporation | | | 2.50 | | | | 3-15-2019 | | | | 167,000 | | | | 167,532 | |
GATX Corporation | | | 4.85 | | | | 6-1-2021 | | | | 100,000 | | | | 108,257 | |
General Electric Company | | | 2.70 | | | | 10-9-2022 | | | | 1,000,000 | | | | 1,044,323 | |
General Electric Company | | | 4.13 | | | | 10-9-2042 | | | | 750,000 | | | | 844,465 | |
General Electric Company | | | 4.50 | | | | 3-11-2044 | | | | 1,000,000 | | | | 1,186,096 | |
General Electric Company | | | 5.25 | | | | 12-6-2017 | | | | 1,100,000 | | | | 1,157,208 | |
| |
| | | | 5,692,743 | |
| | | | | | | | | | | | | | | | |
| | | | |
| Machinery: 0.22% | | | | | | | | | | | | | | | | |
Caterpillar Incorporated | | | 3.80 | | | | 8-15-2042 | | | | 150,000 | | | | 157,469 | |
Caterpillar Incorporated | | | 3.90 | | | | 5-27-2021 | | | | 1,000,000 | | | | 1,099,233 | |
Caterpillar Incorporated | | | 4.30 | | | | 5-15-2044 | | | | 500,000 | | | | 565,209 | |
Caterpillar Incorporated | | | 5.20 | | | | 5-27-2041 | | | | 555,000 | | | | 694,249 | |
Caterpillar Incorporated | | | 6.05 | | | | 8-15-2036 | | | | 900,000 | | | | 1,205,483 | |
Crane Company | | | 2.75 | | | | 12-15-2018 | | | | 150,000 | | | | 153,806 | |
Cummins Incorporated | | | 3.65 | | | | 10-1-2023 | | | | 167,000 | | | | 180,827 | |
Cummins Incorporated | | | 4.88 | | | | 10-1-2043 | | | | 86,000 | | | | 104,462 | |
Deere & Company | | | 2.60 | | | | 6-8-2022 | | | | 500,000 | | | | 517,831 | |
Deere & Company | | | 3.90 | | | | 6-9-2042 | | | | 500,000 | | | | 555,450 | |
Deere & Company | | | 4.38 | | | | 10-16-2019 | | | | 1,400,000 | | | | 1,529,905 | |
Deere & Company | | | 5.38 | | | | 10-16-2029 | | | | 300,000 | | | | 385,038 | |
Dover Corporation | | | 4.30 | | | | 3-1-2021 | | | | 500,000 | | | | 547,573 | |
Dover Corporation | | | 5.38 | | | | 10-15-2035 | | | | 200,000 | | | | 249,976 | |
Dover Corporation | | | 5.45 | | | | 3-15-2018 | | | | 100,000 | | | | 106,422 | |
Dover Corporation | | | 6.60 | | | | 3-15-2038 | | | | 60,000 | | | | 87,042 | |
Flowserve Corporation | | | 4.00 | | | | 11-15-2023 | | | | 107,000 | | | | 112,164 | |
IDEX Corporation | | | 4.50 | | | | 12-15-2020 | | | | 100,000 | | | | 107,145 | |
Illinois Tool Works Incorporated | | | 1.95 | | | | 3-1-2019 | | | | 500,000 | | | | 508,859 | |
Illinois Tool Works Incorporated | | | 3.38 | | | | 9-15-2021 | | | | 120,000 | | | | 129,198 | |
| | | | |
| 62 | | Wells Fargo Diversified Fixed Income Portfolio | | Portfolio of investments—August 31, 2016 (unaudited) |
| | | | | | | | | | | | | | | | |
| Security name | | Interest rate | | | Maturity date | | | Principal | | | Value | |
| | | | |
| Machinery (continued) | | | | | | | | | | | | | | | | |
Illinois Tool Works Incorporated | | | 3.90 | % | | | 9-1-2042 | | | $ | 306,000 | | | $ | 343,089 | |
Illinois Tool Works Incorporated | | | 4.88 | | | | 9-15-2041 | | | | 295,000 | | | | 369,212 | |
Illinois Tool Works Incorporated | | | 6.25 | | | | 4-1-2019 | | | | 155,000 | | | | 173,834 | |
Ingersoll-Rand Global Holding Company Limited | | | 4.25 | | | | 6-15-2023 | | | | 1,000,000 | | | | 1,099,900 | |
Ingersoll-Rand Global Holding Company Limited | | | 6.88 | | | | 8-15-2018 | | | | 250,000 | | | | 276,381 | |
Kennametal Incorporated | | | 2.65 | | | | 11-1-2019 | | | | 150,000 | | | | 150,790 | |
Kennametal Incorporated | | | 3.88 | | | | 2-15-2022 | | | | 98,000 | | | | 100,024 | |
Parker Hannifin Corporation | | | 3.50 | | | | 9-15-2022 | | | | 100,000 | | | | 108,427 | |
Parker Hannifin Corporation | | | 5.50 | | | | 5-15-2018 | | | | 135,000 | | | | 144,841 | |
Parker Hannifin Corporation | | | 6.25 | | | | 5-15-2038 | | | | 60,000 | | | | 86,209 | |
Snap-on Incorporated | | | 6.13 | | | | 9-1-2021 | | | | 150,000 | | | | 180,435 | |
Stanley Black & Decker Incorporated | | | 2.90 | | | | 11-1-2022 | | | | 350,000 | | | | 367,473 | |
Stanley Black & Decker Incorporated ± | | | 5.75 | | | | 12-15-2053 | | | | 100,000 | | | | 107,150 | |
Wabtec Corporation | | | 4.38 | | | | 8-15-2023 | | | | 100,000 | | | | 110,172 | |
| |
| | | | 12,615,278 | |
| | | | | | | | | | | | | | | | |
| | | | |
| Professional Services: 0.02% | | | | | | | | | | | | | | | | |
Dun & Bradstreet Corporation | | | 4.38 | | | | 12-1-2022 | | | | 250,000 | | | | 257,306 | |
Verisk Analytics Incorporated | | | 4.00 | | | | 6-15-2025 | | | | 600,000 | | | | 636,561 | |
Verisk Analytics Incorporated | | | 4.13 | | | | 9-12-2022 | | | | 250,000 | | | | 266,608 | |
| |
| | | | 1,160,475 | |
| | | | | | | | | | | | | | | | |
| | | | |
| Road & Rail: 0.33% | | | | | | | | | | | | | | | | |
BNSF Railway Company | | | 5.75 | | | | 5-1-2040 | | | | 550,000 | | | | 737,658 | |
Burlington Northern Santa Fe LLC | | | 3.00 | | | | 3-15-2023 | | | | 300,000 | | | | 317,109 | |
Burlington Northern Santa Fe LLC | | | 3.05 | | | | 3-15-2022 | | | | 500,000 | | | | 529,437 | |
Burlington Northern Santa Fe LLC | | | 3.40 | | | | 9-1-2024 | | | | 300,000 | | | | 325,044 | |
Burlington Northern Santa Fe LLC | | | 3.60 | | | | 9-1-2020 | | | | 200,000 | | | | 215,408 | |
Burlington Northern Santa Fe LLC | | | 3.75 | | | | 4-1-2024 | | | | 500,000 | | | | 552,795 | |
Burlington Northern Santa Fe LLC | | | 4.40 | | | | 3-15-2042 | | | | 1,000,000 | | | | 1,147,336 | |
Burlington Northern Santa Fe LLC | | | 4.45 | | | | 3-15-2043 | | | | 300,000 | | | | 349,871 | |
Burlington Northern Santa Fe LLC | | | 4.55 | | | | 9-1-2044 | | | | 300,000 | | | | 354,572 | |
Burlington Northern Santa Fe LLC | | | 4.70 | | | | 10-1-2019 | | | | 125,000 | | | | 137,701 | |
Burlington Northern Santa Fe LLC | | | 4.90 | | | | 4-1-2044 | | | | 500,000 | | | | 617,139 | |
Burlington Northern Santa Fe LLC | | | 4.95 | | | | 9-15-2041 | | | | 200,000 | | | | 246,397 | |
Burlington Northern Santa Fe LLC | | | 5.05 | | | | 3-1-2041 | | | | 250,000 | | | | 308,407 | |
Burlington Northern Santa Fe LLC | | | 5.15 | | | | 9-1-2043 | | | | 300,000 | | | | 379,034 | |
Burlington Northern Santa Fe LLC | | | 6.15 | | | | 5-1-2037 | | | | 650,000 | | | | 889,004 | |
CSX Corporation | | | 3.40 | | | | 8-1-2024 | | | | 397,000 | | | | 424,973 | |
CSX Corporation | | | 3.70 | | | | 10-30-2020 | | | | 250,000 | | | | 267,200 | |
CSX Corporation | | | 4.10 | | | | 3-15-2044 | | | | 400,000 | | | | 435,121 | |
CSX Corporation | | | 4.25 | | | | 6-1-2021 | | | | 200,000 | | | | 220,165 | |
CSX Corporation | | | 4.50 | | | | 8-1-2054 | | | | 500,000 | | | | 549,302 | |
CSX Corporation | | | 4.75 | | | | 5-30-2042 | | | | 230,000 | | | | 265,567 | |
CSX Corporation | | | 6.00 | | | | 10-1-2036 | | | | 300,000 | | | | 389,650 | |
CSX Corporation | | | 6.15 | | | | 5-1-2037 | | | | 320,000 | | | | 425,842 | |
CSX Corporation | | | 6.22 | | | | 4-30-2040 | | | | 200,000 | | | | 271,629 | |
CSX Corporation | | | 7.38 | | | | 2-1-2019 | | | | 500,000 | | | | 568,463 | |
Kansas City Southern | | | 3.00 | | | | 5-15-2023 | | | | 73,000 | | | | 74,366 | |
| | | | | | |
| Portfolio of investments—August 31, 2016 (unaudited) | | Wells Fargo Diversified Fixed Income Portfolio | | | 63 | |
| | | | | | | | | | | | | | | | |
| Security name | | Interest rate | | | Maturity date | | | Principal | | | Value | |
| | | | |
| Road & Rail (continued) | | | | | | | | | | | | | | | | |
Kansas City Southern | | | 4.30 | % | | | 5-15-2043 | | | $ | 200,000 | | | $ | 212,334 | |
Norfolk Southern Corporation | | | 2.90 | | | | 2-15-2023 | | | | 886,000 | | | | 917,714 | |
Norfolk Southern Corporation | | | 3.00 | | | | 4-1-2022 | | | | 500,000 | | | | 522,948 | |
Norfolk Southern Corporation | | | 3.85 | | | | 1-15-2024 | | | | 200,000 | | | | 218,622 | |
Norfolk Southern Corporation | | | 3.95 | | | | 10-1-2042 | | | | 120,000 | | | | 127,024 | |
Norfolk Southern Corporation | | | 4.84 | | | | 10-1-2041 | | | | 685,000 | | | | 809,278 | |
Norfolk Southern Corporation | | | 5.59 | | | | 5-17-2025 | | | | 53,000 | | | | 64,118 | |
Norfolk Southern Corporation | | | 5.75 | | | | 4-1-2018 | | | | 500,000 | | | | 534,664 | |
Norfolk Southern Corporation | | | 5.90 | | | | 6-15-2019 | | | | 65,000 | | | | 72,480 | |
Norfolk Southern Corporation | | | 6.00 | | | | 5-23-2111 | | | | 500,000 | | | | 619,791 | |
Ryder System Incorporated | | | 2.45 | | | | 11-15-2018 | | | | 350,000 | | | | 355,063 | |
Ryder System Incorporated | | | 2.50 | | | | 5-11-2020 | | | | 200,000 | | | | 201,422 | |
Union Pacific Corporation | | | 2.25 | | | | 2-15-2019 | | | | 200,000 | | | | 204,425 | |
Union Pacific Corporation | | | 3.25 | | | | 1-15-2025 | | | | 250,000 | | | | 268,052 | |
Union Pacific Corporation | | | 3.75 | | | | 3-15-2024 | | | | 200,000 | | | | 220,483 | |
Union Pacific Corporation | | | 4.00 | | | | 2-1-2021 | | | | 500,000 | | | | 546,667 | |
Union Pacific Corporation | | | 4.15 | | | | 1-15-2045 | | | | 250,000 | | | | 281,731 | |
Union Pacific Corporation | | | 4.16 | | | | 7-15-2022 | | | | 437,000 | | | | 491,913 | |
Union Pacific Corporation | | | 4.30 | | | | 6-15-2042 | | | | 250,000 | | | | 285,683 | |
Union Pacific Corporation | | | 4.82 | | | | 2-1-2044 | | | | 947,000 | | | | 1,160,789 | |
Union Pacific Corporation | | | 4.85 | | | | 6-15-2044 | | | | 200,000 | | | | 247,084 | |
| |
| | | | 19,361,475 | |
| | | | | | | | | | | | | | | | |
| | | | |
| Trading Companies & Distributors: 0.06% | | | | | | | | | | | | | | | | |
Air Lease Corporation | | | 2.13 | | | | 1-15-2018 | | | | 500,000 | | | | 500,490 | |
Air Lease Corporation | | | 3.38 | | | | 1-15-2019 | | | | 1,250,000 | | | | 1,287,013 | |
International Lease Finance Corporation 144A | | | 7.13 | | | | 9-1-2018 | | | | 1,000,000 | | | | 1,100,090 | |
W.W. Grainger Incorporated | | | 4.60 | | | | 6-15-2045 | | | | 400,000 | | | | 478,473 | |
| |
| | | | 3,366,066 | |
| | | | | | | | | | | | | | | | |
| | | | |
Information Technology: 1.71% | | | | | | | | | | | | | | | | |
| | | | |
| Communications Equipment: 0.21% | | | | | | | | | | | | | | | | |
Cisco Systems Incorporated | | | 1.60 | | | | 2-28-2019 | | | | 750,000 | | | | 758,543 | |
Cisco Systems Incorporated | | | 2.20 | | | | 2-28-2021 | | | | 1,000,000 | | | | 1,026,153 | |
Cisco Systems Incorporated | | | 2.45 | | | | 6-15-2020 | | | | 600,000 | | | | 622,092 | |
Cisco Systems Incorporated | | | 2.90 | | | | 3-4-2021 | | | | 300,000 | | | | 316,559 | |
Cisco Systems Incorporated | | | 3.00 | | | | 6-15-2022 | | | | 200,000 | | | | 213,283 | |
Cisco Systems Incorporated | | | 3.63 | | | | 3-4-2024 | | | | 500,000 | | | | 555,655 | |
Cisco Systems Incorporated | | | 4.45 | | | | 1-15-2020 | | | | 950,000 | | | | 1,044,266 | |
Cisco Systems Incorporated | | | 4.95 | | | | 2-15-2019 | | | | 800,000 | | | | 871,001 | |
Cisco Systems Incorporated | | | 5.50 | | | | 1-15-2040 | | | | 700,000 | | | | 926,666 | |
Cisco Systems Incorporated | | | 5.90 | | | | 2-15-2039 | | | | 800,000 | | | | 1,101,608 | |
Harris Corporation | | | 4.40 | | | | 12-15-2020 | | | | 300,000 | | | | 325,889 | |
Motorola Incorporated | | | 3.50 | | | | 3-1-2023 | | | | 550,000 | | | | 549,729 | |
Motorola Incorporated | | | 7.50 | | | | 5-15-2025 | | | | 120,000 | | | | 142,615 | |
Qualcomm Incorporated | | | 2.25 | | | | 5-20-2020 | | | | 1,500,000 | | | | 1,542,983 | |
Qualcomm Incorporated | | | 3.45 | | | | 5-20-2025 | | | | 1,000,000 | | | | 1,079,075 | |
Qualcomm Incorporated | | | 4.65 | | | | 5-20-2035 | | | | 400,000 | | | | 441,117 | |
Qualcomm Incorporated | | | 4.80 | | | | 5-20-2045 | | | | 600,000 | | | | 684,079 | |
| |
| | | | 12,201,313 | |
| | | | | | | | | | | | | | | | |
| | | | |
| 64 | | Wells Fargo Diversified Fixed Income Portfolio | | Portfolio of investments—August 31, 2016 (unaudited) |
| | | | | | | | | | | | | | | | |
| Security name | | Interest rate | | | Maturity date | | | Principal | | | Value | |
| | | | |
| Electronic Equipment, Instruments & Components: 0.06% | | | | | | | | | | | | | | | | |
Agilent Technologies Incorporated | | | 3.88 | % | | | 7-15-2023 | | | $ | 150,000 | | | $ | 157,538 | |
Amphenol Corporation | | | 2.55 | | | | 1-30-2019 | | | | 200,000 | | | | 204,676 | |
Amphenol Corporation | | | 4.00 | | | | 2-1-2022 | | | | 300,000 | | | | 320,698 | |
Arrow Electronics Incorporated | | | 5.13 | | | | 3-1-2021 | | | | 300,000 | | | | 325,327 | |
Arrow Electronics Incorporated | | | 6.00 | | | | 4-1-2020 | | | | 100,000 | | | | 110,267 | |
Avnet Incorporated | | | 5.88 | | | | 6-15-2020 | | | | 100,000 | | | | 110,683 | |
Corning Incorporated | | | 1.45 | | | | 11-15-2017 | | | | 400,000 | | | | 399,665 | |
Corning Incorporated | | | 2.90 | | | | 5-15-2022 | | | | 500,000 | | | | 508,515 | |
Corning Incorporated | | | 3.70 | | | | 11-15-2023 | | | | 113,000 | | | | 119,264 | |
Corning Incorporated | | | 4.25 | | | | 8-15-2020 | | | | 250,000 | | | | 269,914 | |
Corning Incorporated | | | 5.75 | | | | 8-15-2040 | | | | 150,000 | | | | 179,798 | |
Corning Incorporated | | | 6.63 | | | | 5-15-2019 | | | | 20,000 | | | | 22,408 | |
Ingram Micro Incorporated | | | 4.95 | | | | 12-15-2024 | | | | 200,000 | | | | 202,132 | |
Keysight Technologies Incorporated | | | 3.30 | | | | 10-30-2019 | | | | 250,000 | | | | 254,562 | |
Keysight Technologies Incorporated | | | 4.55 | | | | 10-30-2024 | | | | 250,000 | | | | 259,844 | |
Tech Data Corporation | | | 3.75 | | | | 9-21-2017 | | | | 100,000 | | | | 102,367 | |
| |
| | | | 3,547,658 | |
| | | | | | | | | | | | | | | | |
| | | | |
| Internet Software & Services: 0.04% | | | | | | | | | | | | | | | | |
Alphabet Incorporated | | | 3.38 | | | | 2-25-2024 | | | | 125,000 | | | | 137,530 | |
Alphabet Incorporated | | | 3.63 | | | | 5-19-2021 | | | | 500,000 | | | | 547,715 | |
eBay Incorporated | | | 2.60 | | | | 7-15-2022 | | | | 350,000 | | | | 354,419 | |
eBay Incorporated | | | 2.88 | | | | 8-1-2021 | | | | 500,000 | | | | 513,866 | |
eBay Incorporated | | | 3.25 | | | | 10-15-2020 | | | | 200,000 | | | | 208,806 | |
eBay Incorporated | | | 3.45 | | | | 8-1-2024 | | | | 350,000 | | | | 364,396 | |
eBay Incorporated | | | 4.00 | | | | 7-15-2042 | | | | 250,000 | | | | 235,327 | |
| |
| | | | 2,362,059 | |
| | | | | | | | | | | | | | | | |
| | | | |
| IT Services: 0.35% | | | | | | | | | | | | | | | | |
Broadridge Financial Solutions Incorporated | | | 3.95 | | | | 9-1-2020 | | | | 100,000 | | | | 106,442 | |
Computer Sciences Corporation | | | 4.45 | | | | 9-15-2022 | | | | 200,000 | | | | 211,617 | |
Fidelity National Information Services Incorporated | | | 2.00 | | | | 4-15-2018 | | | | 114,000 | | | | 114,694 | |
Fidelity National Information Services Incorporated | | | 3.50 | | | | 4-15-2023 | | | | 131,000 | | | | 137,822 | |
Fidelity National Information Services Incorporated | | | 3.63 | | | | 10-15-2020 | | | | 500,000 | | | | 530,249 | |
Fidelity National Information Services Incorporated | | | 5.00 | | | | 3-15-2022 | | | | 300,000 | | | | 310,289 | |
Fidelity National Information Services Incorporated | | | 5.00 | | | | 10-15-2025 | | | | 1,000,000 | | | | 1,146,901 | |
Fiserv Incorporated | | | 2.70 | | | | 6-1-2020 | | | | 400,000 | | | | 412,346 | |
Fiserv Incorporated | | | 3.50 | | | | 10-1-2022 | | | | 400,000 | | | | 424,099 | |
Fiserv Incorporated | | | 3.85 | | | | 6-1-2025 | | | | 300,000 | | | | 324,094 | |
IBM Corporation | | | 1.25 | | | | 2-8-2018 | | | | 500,000 | | | | 502,170 | |
IBM Corporation | | | 1.63 | | | | 5-15-2020 | | | | 500,000 | | | | 503,625 | |
IBM Corporation | | | 1.88 | | | | 5-15-2019 | | | | 500,000 | | | | 508,864 | |
IBM Corporation | | | 1.88 | | | | 8-1-2022 | | | | 400,000 | | | | 399,516 | |
IBM Corporation | | | 1.95 | | | | 2-12-2019 | | | | 500,000 | | | | 509,282 | |
IBM Corporation | | | 3.38 | | | | 8-1-2023 | | | | 400,000 | | | | 432,362 | |
IBM Corporation | | | 4.00 | | | | 6-20-2042 | | | | 500,000 | | | | 533,921 | |
IBM Corporation | | | 5.60 | | | | 11-30-2039 | | | | 900,000 | | | | 1,173,552 | |
IBM Corporation | | | 5.70 | | | | 9-14-2017 | | | | 1,500,000 | | | | 1,572,024 | |
IBM Corporation | | | 5.88 | | | | 11-29-2032 | | | | 250,000 | | | | 337,573 | |
IBM Corporation | | | 7.00 | | | | 10-30-2025 | | | | 300,000 | | | | 408,157 | |
IBM Corporation | | | 7.63 | | | | 10-15-2018 | | | | 500,000 | | | | 565,349 | |
MasterCard Incorporated | | | 3.38 | | | | 4-1-2024 | | | | 1,000,000 | | | | 1,088,975 | |
| | | | | | |
| Portfolio of investments—August 31, 2016 (unaudited) | | Wells Fargo Diversified Fixed Income Portfolio | | | 65 | |
| | | | | | | | | | | | | | | | |
| Security name | | Interest rate | | | Maturity date | | | Principal | | | Value | |
| | | | |
| IT Services (continued) | | | | | | | | | | | | | | | | |
Total System Services Incorporated | | | 2.38 | % | | | 6-1-2018 | | | $ | 205,000 | | | $ | 206,438 | |
Total System Services Incorporated | | | 3.75 | | | | 6-1-2023 | | | | 150,000 | | | | 155,116 | |
Visa Incorporated | | | 1.20 | | | | 12-14-2017 | | | | 500,000 | | | | 501,008 | |
Visa Incorporated | | | 2.20 | | | | 12-14-2020 | | | | 1,000,000 | | | | 1,028,928 | |
Visa Incorporated | | | 2.80 | | | | 12-14-2022 | | | | 1,000,000 | | | | 1,049,241 | |
Visa Incorporated | | | 3.15 | | | | 12-14-2025 | | | | 1,500,000 | | | | 1,601,805 | |
Visa Incorporated | | | 4.30 | | | | 12-14-2045 | | | | 1,000,000 | | | | 1,183,682 | |
Western Union Company | | | 2.88 | | | | 12-10-2017 | | | | 250,000 | | | | 253,378 | |
Western Union Company | | | 5.25 | | | | 4-1-2020 | | | | 80,000 | | | | 87,621 | |
Western Union Company | | | 6.20 | | | | 11-17-2036 | | | | 175,000 | | | | 190,413 | |
Western Union Company | | | 6.20 | | | | 6-21-2040 | | | | 200,000 | | | | 213,666 | |
Xerox Corporation | | | 4.50 | | | | 5-15-2021 | | | | 1,000,000 | | | | 1,044,434 | |
Xerox Corporation | | | 5.63 | | | | 12-15-2019 | | | | 200,000 | | | | 216,446 | |
Xerox Corporation | | | 6.35 | | | | 5-15-2018 | | | | 150,000 | | | | 159,509 | |
Xerox Corporation | | | 6.75 | | | | 12-15-2039 | | | | 100,000 | | | | 102,217 | |
| |
| | | | 20,247,825 | |
| | | | | | | | | | | | | | | | |
| | | | |
| Semiconductors & Semiconductor Equipment: 0.19% | | | | | | | | | | | | | | | | |
Altera Corporation | | | 2.50 | | | | 11-15-2018 | | | | 250,000 | | | | 257,327 | |
Analog Devices Incorporated | | | 2.88 | | | | 6-1-2023 | | | | 150,000 | | | | 150,982 | |
Applied Materials Incorporated | | | 4.30 | | | | 6-15-2021 | | | | 300,000 | | | | 333,723 | |
Applied Materials Incorporated | | | 5.85 | | | | 6-15-2041 | | | | 200,000 | | | | 253,631 | |
Intel Corporation | | | 1.35 | | | | 12-15-2017 | | | | 1,150,000 | | | | 1,155,067 | |
Intel Corporation | | | 2.70 | | | | 12-15-2022 | | | | 550,000 | | | | 575,126 | |
Intel Corporation | | | 3.30 | | | | 10-1-2021 | | | | 847,000 | | | | 913,988 | |
Intel Corporation | | | 3.70 | | | | 7-29-2025 | | | | 1,000,000 | | | | 1,113,199 | |
Intel Corporation | | | 4.00 | | | | 12-15-2032 | | | | 500,000 | | | | 556,275 | |
Intel Corporation | | | 4.25 | | | | 12-15-2042 | | | | 250,000 | | | | 278,325 | |
Intel Corporation | | | 4.80 | | | | 10-1-2041 | | | | 643,000 | | | | 768,863 | |
Intel Corporation | | | 4.90 | | | | 7-29-2045 | | | | 750,000 | | | | 911,183 | |
KLA-Tencor Corporation | | | 4.65 | | | | 11-1-2024 | | | | 1,000,000 | | | | 1,099,344 | |
Lam Research Corporation | | | 2.80 | | | | 6-15-2021 | | | | 500,000 | | | | 512,256 | |
Lam Research Corporation | | | 3.90 | | | | 6-15-2026 | | | | 500,000 | | | | 522,980 | |
Maxim Integrated Product Incorporated | | | 3.38 | | | | 3-15-2023 | | | | 200,000 | | | | 204,871 | |
Texas Instruments Incorporated | | | 1.00 | | | | 5-1-2018 | | | | 200,000 | | | | 199,678 | |
Texas Instruments Incorporated | | | 1.65 | | | | 8-3-2019 | | | | 250,000 | | | | 253,055 | |
Texas Instruments Incorporated | | | 2.25 | | | | 5-1-2023 | | | | 250,000 | | | | 251,759 | |
Xilinx Incorporated | | | 2.13 | | | | 3-15-2019 | | | | 250,000 | | | | 252,541 | |
Xilinx Incorporated | | | 3.00 | | | | 3-15-2021 | | | | 250,000 | | | | 260,940 | |
| |
| | | | 10,825,113 | |
| | | | | | | | | | | | | | | | |
| | | | |
| Software: 0.43% | | | | | | | | | | | | | | | | |
Adobe Systems Incorporated | | | 4.75 | | | | 2-1-2020 | | | | 325,000 | | | | 358,223 | |
Autodesk Incorporated | | | 1.95 | | | | 12-15-2017 | | | | 250,000 | | | | 250,892 | |
Autodesk Incorporated | | | 3.60 | | | | 12-15-2022 | | | | 250,000 | | | | 255,961 | |
CA Incorporated | | | 5.38 | | | | 12-1-2019 | | | | 500,000 | | | | 551,107 | |
Microsoft Corporation | | | 1.63 | | | | 12-6-2018 | | | | 400,000 | | | | 404,770 | |
Microsoft Corporation | | | 2.00 | | | | 11-3-2020 | | | | 700,000 | | | | 713,834 | |
Microsoft Corporation | | | 2.70 | | | | 2-12-2025 | | | | 2,000,000 | | | | 2,068,530 | |
| | | | |
| 66 | | Wells Fargo Diversified Fixed Income Portfolio | | Portfolio of investments—August 31, 2016 (unaudited) |
| | | | | | | | | | | | | | | | |
| Security name | | Interest rate | | | Maturity date | | | Principal | | | Value | |
| | | | |
| Software (continued) | | | | | | | | | | | | | | | | |
Microsoft Corporation | | | 3.00 | % | | | 10-1-2020 | | | $ | 400,000 | | | $ | 425,325 | |
Microsoft Corporation | | | 3.50 | | | | 2-12-2035 | | | | 1,000,000 | | | | 1,035,023 | |
Microsoft Corporation | | | 3.63 | | | | 12-15-2023 | | | | 1,000,000 | | | | 1,103,132 | |
Microsoft Corporation | | | 3.75 | | | | 5-1-2043 | | | | 47,000 | | | | 48,976 | |
Microsoft Corporation | | | 3.75 | | | | 2-12-2045 | | | | 500,000 | | | | 521,282 | |
Microsoft Corporation | | | 4.00 | | | | 2-8-2021 | | | | 500,000 | | | | 554,127 | |
Microsoft Corporation | | | 4.00 | | | | 2-12-2055 | | | | 1,000,000 | | | | 1,053,401 | |
Microsoft Corporation | | | 4.20 | | | | 6-1-2019 | | | | 875,000 | | | | 945,631 | |
Microsoft Corporation | | | 4.45 | | | | 11-3-2045 | | | | 1,000,000 | | | | 1,163,012 | |
Microsoft Corporation | | | 4.50 | | | | 10-1-2040 | | | | 500,000 | | | | 581,024 | |
Microsoft Corporation | | | 4.88 | | | | 12-15-2043 | | | | 200,000 | | | | 244,876 | |
Microsoft Corporation | | | 5.20 | | | | 6-1-2039 | | | | 110,000 | | | | 138,233 | |
Microsoft Corporation | | | 5.30 | | | | 2-8-2041 | | | | 500,000 | | | | 640,840 | |
Oracle Corporation | | | 1.20 | | | | 10-15-2017 | | | | 1,000,000 | | | | 1,002,881 | |
Oracle Corporation | | | 2.38 | | | | 1-15-2019 | | | | 600,000 | | | | 616,291 | |
Oracle Corporation | | | 2.50 | | | | 10-15-2022 | | | | 800,000 | | | | 821,743 | |
Oracle Corporation | | | 2.80 | | | | 7-8-2021 | | | | 1,500,000 | | | | 1,570,340 | |
Oracle Corporation | | | 2.95 | | | | 5-15-2025 | | | | 1,000,000 | | | | 1,035,923 | |
Oracle Corporation | | | 3.63 | | | | 7-15-2023 | | | | 400,000 | | | | 435,816 | |
Oracle Corporation | | | 3.88 | | | | 7-15-2020 | | | | 350,000 | | | | 381,227 | |
Oracle Corporation | | | 3.90 | | | | 5-15-2035 | | | | 500,000 | | | | 527,252 | |
Oracle Corporation | | | 4.30 | | | | 7-8-2034 | | | | 250,000 | | | | 277,282 | |
Oracle Corporation | | | 4.38 | | | | 5-15-2055 | | | | 1,000,000 | | | | 1,088,065 | |
Oracle Corporation | | | 4.50 | | | | 7-8-2044 | | | | 500,000 | | | | 563,799 | |
Oracle Corporation | | | 5.00 | | | | 7-8-2019 | | | | 600,000 | | | | 661,090 | |
Oracle Corporation | | | 5.38 | | | | 7-15-2040 | | | | 600,000 | | | | 752,068 | |
Oracle Corporation | | | 5.75 | | | | 4-15-2018 | | | | 1,000,000 | | | | 1,073,971 | |
Oracle Corporation | | | 6.13 | | | | 7-8-2039 | | | | 200,000 | | | | 274,104 | |
Oracle Corporation | | | 6.50 | | | | 4-15-2038 | | | | 250,000 | | | | 352,809 | |
Symantec Corporation | | | 3.95 | | | | 6-15-2022 | | | | 200,000 | | | | 203,246 | |
Symantec Corporation | | | 4.20 | | | | 9-15-2020 | | | | 300,000 | | | | 314,777 | |
| |
| | | | 25,010,883 | |
| | | | | | | | | | | | | | | | |
| | | | |
| Technology Hardware, Storage & Peripherals: 0.43% | | | | | | | | | | | | | | | | |
Apple Incorporated | | | 1.00 | | | | 5-3-2018 | | | | 2,300,000 | | | | 2,299,094 | |
Apple Incorporated | | | 2.00 | | | | 5-6-2020 | | | | 1,000,000 | | | | 1,020,765 | |
Apple Incorporated | | | 2.25 | | | | 2-23-2021 | | | | 1,000,000 | | | | 1,026,178 | |
Apple Incorporated | | | 2.40 | | | | 5-3-2023 | | | | 3,150,000 | | | | 3,224,302 | |
Apple Incorporated | | | 3.20 | | | | 5-13-2025 | | | | 750,000 | | | | 801,377 | |
Apple Incorporated | | | 3.25 | | | | 2-23-2026 | | | | 1,750,000 | | | | 1,869,175 | |
Apple Incorporated | | | 3.45 | | | | 5-6-2024 | | | | 1,000,000 | | | | 1,085,874 | |
Apple Incorporated | | | 3.45 | | | | 2-9-2045 | | | | 1,000,000 | | | | 983,250 | |
Apple Incorporated | | | 3.85 | | | | 5-4-2043 | | | | 1,000,000 | | | | 1,037,894 | |
Apple Incorporated | | | 4.38 | | | | 5-13-2045 | | | | 500,000 | | | | 560,799 | |
Apple Incorporated | | | 4.65 | | | | 2-23-2046 | | | | 1,250,000 | | | | 1,460,309 | |
EMC Corporation | | | 1.88 | | | | 6-1-2018 | | | | 950,000 | | | | 947,382 | |
EMC Corporation | | | 2.65 | | | | 6-1-2020 | | | | 500,000 | | | | 495,941 | |
EMC Corporation « | | | 3.38 | | | | 6-1-2023 | | | | 100,000 | | | | 97,847 | |
Hewlett Packard Enterprise Company 144A | | | 3.60 | | | | 10-15-2020 | | | | 3,250,000 | | | | 3,395,662 | |
| | | | | | |
| Portfolio of investments—August 31, 2016 (unaudited) | | Wells Fargo Diversified Fixed Income Portfolio | | | 67 | |
| | | | | | | | | | | | | | | | |
| Security name | | Interest rate | | | Maturity date | | | Principal | | | Value | |
| | | | |
| Technology Hardware, Storage & Peripherals (continued) | | | | | | | | | | | | | | | | |
Hewlett Packard Enterprise Company 144A | | | 4.90 | % | | | 10-15-2025 | | | $ | 1,000,000 | | | $ | 1,066,369 | |
Hewlett Packard Enterprise Company 144A | | | 6.35 | | | | 10-15-2045 | | | | 750,000 | | | | 774,025 | |
Hewlett-Packard Company | | | 3.75 | | | | 12-1-2020 | | | | 41,000 | | | | 43,440 | |
Hewlett-Packard Company | | | 4.05 | | | | 9-15-2022 | | | | 250,000 | | | | 262,947 | |
Hewlett-Packard Company | | | 4.30 | | | | 6-1-2021 | | | | 500,000 | | | | 539,436 | |
Hewlett-Packard Company | | | 4.38 | | | | 9-15-2021 | | | | 500,000 | | | | 538,897 | |
Hewlett-Packard Company | | | 4.65 | | | | 12-9-2021 | | | | 500,000 | | | | 547,001 | |
Hewlett-Packard Company | | | 6.00 | | | | 9-15-2041 | | | | 475,000 | | | | 489,954 | |
Lexmark International Incorporated | | | 6.65 | | | | 6-1-2018 | | | | 250,000 | | | | 265,027 | |
NetApp Incorporated | | | 2.00 | | | | 12-15-2017 | | | | 250,000 | | | | 251,214 | |
NetApp Incorporated | | | 3.25 | | | | 12-15-2022 | | | | 250,000 | | | | 252,568 | |
| |
| | | | 25,336,727 | |
| | | | | | | | | | | | | | | | |
| | | | |
Materials: 0.61% | | | | | | | | | | | | | | | | |
| | | | |
| Chemicals: 0.37% | | | | | | | | | | | | | | | | |
Air Products & Chemicals Incorporated | | | 1.20 | | | | 10-15-2017 | | | | 132,000 | | | | 132,394 | |
Air Products & Chemicals Incorporated | | | 3.00 | | | | 11-3-2021 | | | | 250,000 | | | | 266,841 | |
Air Products & Chemicals Incorporated | | | 3.35 | | | | 7-31-2024 | | | | 350,000 | | | | 378,342 | |
Air Products & Chemicals Incorporated | | | 4.38 | | | | 8-21-2019 | | | | 150,000 | | | | 162,997 | |
Airgas Incorporated | | | 2.90 | | | | 11-15-2022 | | | | 500,000 | | | | 503,600 | |
Albemarle Corporation | | | 4.50 | | | | 12-15-2020 | | | | 300,000 | | | | 323,322 | |
Albemarle Corporation | | | 5.45 | | | | 12-1-2044 | | | | 200,000 | | | | 236,692 | |
Celanese U.S. Holdings LLC | | | 4.63 | | | | 11-15-2022 | | | | 170,000 | | | | 185,938 | |
Celanese U.S. Holdings LLC | | | 5.88 | | | | 6-15-2021 | | | | 140,000 | | | | 159,687 | |
CF Industries Incorporated | | | 3.45 | | | | 6-1-2023 | | | | 437,000 | | | | 436,197 | |
CF Industries Incorporated | | | 4.95 | | | | 6-1-2043 | | | | 425,000 | | | | 391,940 | |
CF Industries Incorporated | | | 5.15 | | | | 3-15-2034 | | | | 500,000 | | | | 495,790 | |
CF Industries Incorporated | | | 6.88 | | | | 5-1-2018 | | | | 500,000 | | | | 538,306 | |
Dow Chemical Company | | | 3.50 | | | | 10-1-2024 | | | | 250,000 | | | | 265,120 | |
Dow Chemical Company | | | 4.13 | | | | 11-15-2021 | | | | 500,000 | | | | 546,688 | |
Dow Chemical Company | | | 4.25 | | | | 11-15-2020 | | | | 575,000 | | | | 623,885 | |
Dow Chemical Company | | | 4.25 | | | | 10-1-2034 | | | | 250,000 | | | | 260,277 | |
Dow Chemical Company | | | 4.38 | | | | 11-15-2042 | | | | 500,000 | | | | 517,100 | |
Dow Chemical Company | | | 5.25 | | | | 11-15-2041 | | | | 250,000 | | | | 286,446 | |
Dow Chemical Company | | | 7.38 | | | | 11-1-2029 | | | | 600,000 | | | | 816,440 | |
Dow Chemical Company | | | 8.55 | | | | 5-15-2019 | | | | 655,000 | | | | 772,676 | |
Dow Chemical Company | | | 9.40 | | | | 5-15-2039 | | | | 385,000 | | | | 631,743 | |
E.I. du Pont de Nemours & Company | | | 3.63 | | | | 1-15-2021 | | | | 500,000 | | | | 537,136 | |
E.I. du Pont de Nemours & Company | | | 4.15 | | | | 2-15-2043 | | | | 300,000 | | | | 316,568 | |
E.I. du Pont de Nemours & Company | | | 4.50 | | | | 8-15-2019 | | | | 400,000 | | | | 435,972 | |
E.I. du Pont de Nemours & Company | | | 4.63 | | | | 1-15-2020 | | | | 200,000 | | | | 219,403 | |
E.I. du Pont de Nemours & Company | | | 4.90 | | | | 1-15-2041 | | | | 300,000 | | | | 344,832 | |
E.I. du Pont de Nemours & Company | | | 5.60 | | | | 12-15-2036 | | | | 25,000 | | | | 30,972 | |
E.I. du Pont de Nemours & Company | | | 6.00 | | | | 7-15-2018 | | | | 625,000 | | | | 677,809 | |
E.I. du Pont de Nemours & Company | | | 6.50 | | | | 1-15-2028 | | | | 250,000 | | | | 320,324 | |
Eastman Chemical Company | | | 2.70 | | | | 1-15-2020 | | | | 300,000 | | | | 308,553 | |
Eastman Chemical Company | | | 3.60 | | | | 8-15-2022 | | | | 400,000 | | | | 420,292 | |
Eastman Chemical Company | | | 4.50 | | | | 1-15-2021 | | | | 500,000 | | | | 544,547 | |
Eastman Chemical Company | | | 4.80 | | | | 9-1-2042 | | | | 200,000 | | | | 206,194 | |
| | | | |
| 68 | | Wells Fargo Diversified Fixed Income Portfolio | | Portfolio of investments—August 31, 2016 (unaudited) |
| | | | | | | | | | | | | | | | |
| Security name | | Interest rate | | | Maturity date | | | Principal | | | Value | |
| | | | |
| Chemicals (continued) | | | | | | | | | | | | | | | | |
Ecolab Incorporated | | | 4.35 | % | | | 12-8-2021 | | | $ | 500,000 | | | $ | 561,468 | |
Ecolab Incorporated | | | 5.50 | | | | 12-8-2041 | | | | 300,000 | | | | 377,180 | |
FMC Corporation | | | 3.95 | | | | 2-1-2022 | | | | 125,000 | | | | 130,830 | |
FMC Corporation | | | 4.10 | | | | 2-1-2024 | | | | 250,000 | | | | 264,613 | |
International Flavors & Fragrances Incorporated | | | 3.20 | | | | 5-1-2023 | | | | 100,000 | | | | 102,709 | |
Lubrizol Corporation | | | 8.88 | | | | 2-1-2019 | | | | 250,000 | | | | 293,692 | |
Monsanto Company | | | 3.38 | | | | 7-15-2024 | | | | 1,000,000 | | | | 1,037,654 | |
Monsanto Company | | | 3.60 | | | | 7-15-2042 | | | | 150,000 | | | | 134,774 | |
Monsanto Company | | | 4.40 | | | | 7-15-2044 | | | | 600,000 | | | | 624,314 | |
Monsanto Company | | | 4.70 | | | | 7-15-2064 | | | | 300,000 | | | | 288,470 | |
Monsanto Company | | | 5.50 | | | | 8-15-2025 | | | | 100,000 | | | | 116,635 | |
Mosaic Company | | | 3.75 | | | | 11-15-2021 | | | | 115,000 | | | | 121,269 | |
Mosaic Company | | | 4.25 | | | | 11-15-2023 | | | | 425,000 | | | | 453,220 | |
Mosaic Company | | | 5.45 | | | | 11-15-2033 | | | | 304,000 | | | | 333,263 | |
Mosaic Company | | | 5.63 | | | | 11-15-2043 | | | | 250,000 | | | | 274,219 | |
NewMarket Corporation | | | 4.10 | | | | 12-15-2022 | | | | 50,000 | | | | 51,427 | |
PPG Industries Incorporated | | | 2.30 | | | | 11-15-2019 | | | | 250,000 | | | | 253,888 | |
PPG Industries Incorporated | | | 3.60 | | | | 11-15-2020 | | | | 100,000 | | | | 105,709 | |
PPG Industries Incorporated | | | 5.50 | | | | 11-15-2040 | | | | 150,000 | | | | 186,796 | |
Praxair Incorporated | | | 1.25 | | | | 11-7-2018 | | | | 100,000 | | | | 100,198 | |
Praxair Incorporated | | | 2.20 | | | | 8-15-2022 | | | | 500,000 | | | | 507,587 | |
Praxair Incorporated | | | 2.45 | | | | 2-15-2022 | | | | 200,000 | | | | 205,130 | |
Praxair Incorporated | | | 2.70 | | | | 2-21-2023 | | | | 150,000 | | | | 154,737 | |
Praxair Incorporated | | | 3.55 | | | | 11-7-2042 | | | | 150,000 | | | | 159,257 | |
Praxair Incorporated | | | 4.05 | | | | 3-15-2021 | | | | 200,000 | | | | 219,924 | |
RPM International Incorporated | | | 6.13 | | | | 10-15-2019 | | | | 200,000 | | | | 222,722 | |
RPM International Incorporated | | | 6.50 | | | | 2-15-2018 | | | | 250,000 | | | | 266,679 | |
Sherwin-Williams Company | | | 1.35 | | | | 12-15-2017 | | | | 250,000 | | | | 250,278 | |
Sherwin-Williams Company | | | 4.00 | | | | 12-15-2042 | | | | 132,000 | | | | 131,337 | |
Valspar Corporation | | | 4.20 | | | | 1-15-2022 | | | | 100,000 | | | | 106,291 | |
Valspar Corporation | | | 7.25 | | | | 6-15-2019 | | | | 100,000 | | | | 113,298 | |
Westlake Chemical Corporation | | | 3.60 | | | | 7-15-2022 | | | | 29,000 | | | | 29,389 | |
| |
| | | | 21,473,980 | |
| | | | | | | | | | | | | | | | |
| | | | |
| Construction Materials: 0.00% | | | | | | | | | | | | | | | | |
Martin Marietta Materials Incorporated | | | 6.60 | | | | 4-15-2018 | | | | 125,000 | | | | 133,359 | |
| | | | | | | | | | | | | | | | |
| | | | |
| Containers & Packaging: 0.02% | | | | | | | | | | | | | | | | |
Bemis Company Incorporated | | | 6.80 | | | | 8-1-2019 | | | | 10,000 | | | | 11,283 | |
Packaging Corporation of America | | | 3.65 | | | | 9-15-2024 | | | | 250,000 | | | | 260,143 | |
Packaging Corporation of America | | | 3.90 | | | | 6-15-2022 | | | | 200,000 | | | | 211,006 | |
Packaging Corporation of America | | | 4.50 | | | | 11-1-2023 | | | | 550,000 | | | | 606,357 | |
Sonoco Products Company | | | 4.38 | | | | 11-1-2021 | | | | 100,000 | | | | 106,144 | |
| |
| | | | 1,194,933 | |
| | | | | | | | | | | | | | | | |
| | | | |
| Metals & Mining: 0.11% | | | | | | | | | | | | | | | | |
Barrick Gold Finance Company LLC | | | 4.40 | | | | 5-30-2021 | | | | 600,000 | | | | 655,586 | |
Barrick Gold Finance Company LLC | | | 5.70 | | | | 5-30-2041 | | | | 300,000 | | | | 346,914 | |
Newmont Mining Corporation | | | 3.50 | | | | 3-15-2022 | | | | 600,000 | | | | 623,360 | |
| | | | | | |
| Portfolio of investments—August 31, 2016 (unaudited) | | Wells Fargo Diversified Fixed Income Portfolio | | | 69 | |
| | | | | | | | | | | | | | | | |
| Security name | | Interest rate | | | Maturity date | | | Principal | | | Value | |
| | | | |
| Metals & Mining (continued) | | | | | | | | | | | | | | | | |
Newmont Mining Corporation | | | 4.88 | % | | | 3-15-2042 | | | $ | 500,000 | | | $ | 525,255 | |
Newmont Mining Corporation | | | 6.25 | | | | 10-1-2039 | | | | 475,000 | | | | 556,617 | |
Nucor Corporation | | | 4.00 | | | | 8-1-2023 | | | | 189,000 | | | | 204,076 | |
Nucor Corporation | | | 5.20 | | | | 8-1-2043 | | | | 200,000 | | | | 231,016 | |
Nucor Corporation | | | 5.75 | | | | 12-1-2017 | | | | 500,000 | �� | | | 521,742 | |
Nucor Corporation | | | 5.85 | | | | 6-1-2018 | | | | 150,000 | | | | 160,451 | |
Nucor Corporation | | | 6.40 | | | | 12-1-2037 | | | | 200,000 | | | | 253,094 | |
Reliance Steel & Aluminum Company | | | 4.50 | | | | 4-15-2023 | | | | 150,000 | | | | 154,248 | |
Southern Copper Corporation | | | 5.38 | | | | 4-16-2020 | | | | 90,000 | | | | 98,361 | |
Southern Copper Corporation | | | 5.88 | | | | 4-23-2045 | | | | 500,000 | | | | 507,775 | |
Southern Copper Corporation | | | 6.75 | | | | 4-16-2040 | | | | 440,000 | | | | 487,154 | |
Southern Copper Corporation | | | 7.50 | | | | 7-27-2035 | | | | 600,000 | | | | 706,404 | |
| |
| | | | 6,032,053 | |
| | | | | | | | | | | | | | | | |
| | | | |
| Paper & Forest Products: 0.11% | | | | | | | | | | | | | | | | |
Domtar Corporation | | | 4.40 | | | | 4-1-2022 | | | | 500,000 | | | | 527,649 | |
Georgia-Pacific LLC | | | 7.25 | | | | 6-1-2028 | | | | 325,000 | | | | 444,094 | |
Georgia-Pacific LLC | | | 8.00 | | | | 1-15-2024 | | | | 200,000 | | | | 266,227 | |
Georgia-Pacific LLC | | | 8.88 | | | | 5-15-2031 | | | | 500,000 | | | | 796,134 | |
International Paper Company | | | 3.65 | | | | 6-15-2024 | | | | 500,000 | | | | 527,611 | |
International Paper Company | | | 4.75 | | | | 2-15-2022 | | | | 75,000 | | | | 83,173 | |
International Paper Company | | | 4.80 | | | | 6-15-2044 | | | | 250,000 | | | | 265,303 | |
International Paper Company | | | 6.00 | | | | 11-15-2041 | | | | 535,000 | | | | 643,597 | |
International Paper Company | | | 7.30 | | | | 11-15-2039 | | | | 250,000 | | | | 338,020 | |
International Paper Company | | | 7.50 | | | | 8-15-2021 | | | | 450,000 | | | | 551,801 | |
International Paper Company | | | 7.95 | | | | 6-15-2018 | | | | 1,000,000 | | | | 1,112,438 | |
MeadWestvaco Corporation | | | 7.95 | | | | 2-15-2031 | | | | 50,000 | | | | 67,136 | |
Plum Creek Timberlands LP | | | 3.25 | | | | 3-15-2023 | | | | 275,000 | | | | 274,515 | |
Plum Creek Timberlands LP | | | 4.70 | | | | 3-15-2021 | | | | 500,000 | | | | 542,035 | |
| |
| | | | 6,439,733 | |
| | | | | | | | | | | | | | | | |
| | | | |
Telecommunication Services: 0.90% | | | | | | | | | | | | | | | | |
| | | | |
| Diversified Telecommunication Services: 0.89% | | | | | | | | | | | | | | | | |
AT&T Incorporated | | | 2.45 | | | | 6-30-2020 | | | | 1,250,000 | | | | 1,275,163 | |
AT&T Incorporated | | | 2.63 | | | | 12-1-2022 | | | | 1,000,000 | | | | 1,010,372 | |
AT&T Incorporated | | | 3.00 | | | | 2-15-2022 | | | | 1,500,000 | | | | 1,545,954 | |
AT&T Incorporated | | | 3.40 | | | | 5-15-2025 | | | | 3,000,000 | | | | 3,088,752 | |
AT&T Incorporated | | | 3.80 | | | | 3-15-2022 | | | | 500,000 | | | | 536,303 | |
AT&T Incorporated | | | 3.88 | | | | 8-15-2021 | | | | 45,000 | | | | 48,774 | |
AT&T Incorporated | | | 3.90 | | | | 3-11-2024 | | | | 500,000 | | | | 535,918 | |
AT&T Incorporated | | | 4.13 | | | | 2-17-2026 | | | | 1,500,000 | | | | 1,628,759 | |
AT&T Incorporated | | | 4.30 | | | | 12-15-2042 | | | | 500,000 | | | | 502,264 | |
AT&T Incorporated | | | 4.35 | | | | 6-15-2045 | | | | 1,000,000 | | | | 1,008,012 | |
AT&T Incorporated | | | 4.45 | | | | 5-15-2021 | | | | 650,000 | | | | 715,456 | |
AT&T Incorporated | | | 4.45 | | | | 4-1-2024 | | | | 700,000 | | | | 771,576 | |
AT&T Incorporated | | | 4.60 | | | | 2-15-2021 | | | | 350,000 | | | | 384,750 | |
AT&T Incorporated | | | 4.75 | | | | 5-15-2046 | | | | 2,000,000 | | | | 2,138,696 | |
AT&T Incorporated | | | 5.00 | | | | 3-1-2021 | | | | 700,000 | | | | 786,532 | |
| | | | |
| 70 | | Wells Fargo Diversified Fixed Income Portfolio | | Portfolio of investments—August 31, 2016 (unaudited) |
| | | | | | | | | | | | | | | | |
| Security name | | Interest rate | | | Maturity date | | | Principal | | | Value | |
| | | | |
| Diversified Telecommunication Services (continued) | | | | | | | | | | | | | | | | |
AT&T Incorporated | | | 5.15 | % | | | 3-15-2042 | | | $ | 500,000 | | | $ | 557,262 | |
AT&T Incorporated | | | 5.20 | | | | 3-15-2020 | | | | 330,000 | | | | 367,553 | |
AT&T Incorporated | | | 5.35 | | | | 9-1-2040 | | | | 1,372,000 | | | | 1,567,505 | |
AT&T Incorporated | | | 5.50 | | | | 2-1-2018 | | | | 1,000,000 | | | | 1,056,551 | |
AT&T Incorporated | | | 5.55 | | | | 8-15-2041 | | | | 60,000 | | | | 70,858 | |
AT&T Incorporated | | | 5.60 | | | | 5-15-2018 | | | | 500,000 | | | | 535,209 | |
AT&T Incorporated | | | 5.80 | | | | 2-15-2019 | | | | 800,000 | | | | 880,708 | |
AT&T Incorporated | | | 6.00 | | | | 8-15-2040 | | | | 400,000 | | | | 484,539 | |
AT&T Incorporated | | | 6.15 | | | | 9-15-2034 | | | | 500,000 | | | | 614,521 | |
AT&T Incorporated | | | 6.30 | | | | 1-15-2038 | | | | 500,000 | | | | 632,196 | |
AT&T Incorporated | | | 6.35 | | | | 3-15-2040 | | | | 145,000 | | | | 183,678 | |
AT&T Incorporated | | | 6.38 | | | | 3-1-2041 | | | | 500,000 | | | | 635,845 | |
AT&T Incorporated | | | 6.50 | | | | 9-1-2037 | | | | 970,000 | | | | 1,261,312 | |
AT&T Incorporated | | | 6.55 | | | | 2-15-2039 | | | | 800,000 | | | | 1,039,485 | |
AT&T Incorporated | | | 8.25 | | | | 11-15-2031 | | | | 536,000 | | | | 787,175 | |
Qwest Corporation | | | 6.88 | | | | 9-15-2033 | | | | 255,000 | | | | 253,245 | |
Verizon Communications Incorporated | | | 2.45 | | | | 11-1-2022 | | | | 600,000 | | | | 609,075 | |
Verizon Communications Incorporated | | | 2.63 | | | | 2-21-2020 | | | | 1,000,000 | | | | 1,031,334 | |
Verizon Communications Incorporated | | | 3.00 | | | | 11-1-2021 | | | | 750,000 | | | | 787,487 | |
Verizon Communications Incorporated | | | 3.50 | | | | 11-1-2021 | | | | 1,000,000 | | | | 1,074,796 | |
Verizon Communications Incorporated | | | 3.50 | | | | 11-1-2024 | | | | 750,000 | | | | 804,253 | |
Verizon Communications Incorporated | | | 3.65 | | | | 9-14-2018 | | | | 1,400,000 | | | | 1,464,191 | |
Verizon Communications Incorporated | | | 4.15 | | | | 3-15-2024 | | | | 850,000 | | | | 944,006 | |
Verizon Communications Incorporated | | | 4.27 | | | | 1-15-2036 | | | | 1,387,000 | | | | 1,456,214 | |
Verizon Communications Incorporated | | | 4.50 | | | | 9-15-2020 | | | | 1,029,000 | | | | 1,135,545 | |
Verizon Communications Incorporated | | | 4.52 | | | | 9-15-2048 | | | | 1,569,000 | | | | 1,663,699 | |
Verizon Communications Incorporated | | | 4.60 | | | | 4-1-2021 | | | | 1,000,000 | | | | 1,116,308 | |
Verizon Communications Incorporated | | | 4.67 | | | | 3-15-2055 | | | | 2,365,000 | | | | 2,459,517 | |
Verizon Communications Incorporated | | | 4.75 | | | | 11-1-2041 | | | | 500,000 | | | | 535,595 | |
Verizon Communications Incorporated | | | 4.86 | | | | 8-21-2046 | | | | 830,000 | | | | 922,793 | |
Verizon Communications Incorporated | | | 5.01 | | | | 8-21-2054 | | | | 1,200,000 | | | | 1,315,747 | |
Verizon Communications Incorporated | | | 5.15 | | | | 9-15-2023 | | | | 3,300,000 | | | | 3,857,139 | |
Verizon Communications Incorporated | | | 6.00 | | | | 4-1-2041 | | | | 500,000 | | | | 634,448 | |
Verizon Communications Incorporated | | | 6.55 | | | | 9-15-2043 | | | | 2,244,000 | | | | 3,037,425 | |
Verizon Global Funding Corporation | | | 5.85 | | | | 9-15-2035 | | | | 175,000 | | | | 218,635 | |
| |
| | | | 51,973,130 | |
| | | | | | | | | | | | | | | | |
| | | | |
| Wireless Telecommunication Services: 0.01% | | | | | | | | | | | | | | | | |
CC Holdings GS V LLC | | | 2.38 | | | | 12-15-2017 | | | | 100,000 | | | | 100,910 | |
CC Holdings GS V LLC | | | 3.85 | | | | 4-15-2023 | | | | 500,000 | | | | 534,930 | |
| |
| | | | 635,840 | |
| | | | | | | | | | | | | | | | |
| | | | |
Utilities: 1.84% | | | | | | | | | | | | | | | | |
| | | | |
| Electric Utilities: 1.37% | | | | | | | | | | | | | | | | |
Alabama Power Company | | | 3.55 | | | | 12-1-2023 | | | | 250,000 | | | | 273,190 | |
Alabama Power Company | | | 3.85 | | | | 12-1-2042 | | | | 200,000 | | | | 214,326 | |
Alabama Power Company | | | 4.15 | | | | 8-15-2044 | | | | 150,000 | | | | 167,621 | |
Alabama Power Company | | | 5.50 | | | | 3-15-2041 | | | | 65,000 | | | | 83,925 | |
Alabama Power Company | | | 6.00 | | | | 3-1-2039 | | | | 500,000 | | | | 667,969 | |
| | | | | | |
| Portfolio of investments—August 31, 2016 (unaudited) | | Wells Fargo Diversified Fixed Income Portfolio | | | 71 | |
| | | | | | | | | | | | | | | | |
| Security name | | Interest rate | | | Maturity date | | | Principal | | | Value | |
| | | | |
| Electric Utilities (continued) | | | | | | | | | | | | | | | | |
Alabama Power Company | | | 6.13 | % | | | 5-15-2038 | | | $ | 105,000 | | | $ | 142,343 | |
American Electric Power Company Incorporated | | | 2.95 | | | | 12-15-2022 | | | | 200,000 | | | | 208,512 | |
Appalachian Power Company | | | 3.40 | | | | 6-1-2025 | | | | 250,000 | | | | 264,750 | |
Appalachian Power Company | | | 4.45 | | | | 6-1-2045 | | | | 250,000 | | | | 276,552 | |
Appalachian Power Company | | | 5.80 | | | | 10-1-2035 | | | | 315,000 | | | | 383,905 | |
Appalachian Power Company | | | 6.38 | | | | 4-1-2036 | | | | 300,000 | | | | 385,016 | |
Appalachian Power Company | | | 7.00 | | | | 4-1-2038 | | | | 100,000 | | | | 138,389 | |
Arizona Public Service Company | | | 3.15 | | | | 5-15-2025 | | | | 150,000 | | | | 159,407 | |
Arizona Public Service Company | | | 4.50 | | | | 4-1-2042 | | | | 100,000 | | | | 118,627 | |
Arizona Public Service Company | | | 4.70 | | | | 1-15-2044 | | | | 250,000 | | | | 302,893 | |
Arizona Public Service Company | | | 8.75 | | | | 3-1-2019 | | | | 500,000 | | | | 585,695 | |
Atlantic City Electric Company | | | 7.75 | | | | 11-15-2018 | | | | 65,000 | | | | 73,748 | |
Baltimore Gas & Electric Company | | | 3.50 | | | | 11-15-2021 | | | | 500,000 | | | | 535,217 | |
Carolina Power & Light Company | | | 2.80 | | | | 5-15-2022 | | | | 250,000 | | | | 261,537 | |
Carolina Power & Light Company | | | 5.30 | | | | 1-15-2019 | | | | 500,000 | | | | 545,213 | |
CenterPoint Energy Houston | | | 2.25 | | | | 8-1-2022 | | | | 300,000 | | | | 299,228 | |
CenterPoint Energy Houston | | | 3.55 | | | | 8-1-2042 | | | | 250,000 | | | | 257,163 | |
CenterPoint Energy Houston | | | 4.50 | | | | 4-1-2044 | | | | 250,000 | | | | 299,093 | |
CenterPoint Energy Houston Series K | | | 6.95 | | | | 3-15-2033 | | | | 250,000 | | | | 361,580 | |
Cleco Power LLC | | | 6.00 | | | | 12-1-2040 | | | | 300,000 | | | | 385,617 | |
Cleveland Electric Illuminating Company | | | 5.95 | | | | 12-15-2036 | | | | 500,000 | | | | 580,028 | |
Columbus Southern Power Company | | | 6.05 | | | | 5-1-2018 | | | | 200,000 | | | | 214,130 | |
Commonwealth Edison Company | | | 3.80 | | | | 10-1-2042 | | | | 100,000 | | | | 107,401 | |
Commonwealth Edison Company | | | 4.70 | | | | 1-15-2044 | | | | 250,000 | | | | 303,386 | |
Commonwealth Edison Company | | | 5.80 | | | | 3-15-2018 | | | | 500,000 | | | | 534,721 | |
Commonwealth Edison Company | | | 5.90 | | | | 3-15-2036 | | | | 250,000 | | | | 335,171 | |
Commonwealth Edison Company Series 100 | | | 5.88 | | | | 2-1-2033 | | | | 65,000 | | | | 84,785 | |
Connecticut Light & Power Company | | | 4.15 | | | | 6-1-2045 | | | | 125,000 | | | | 142,396 | |
Connecticut Light & Power Company | | | 5.65 | | | | 5-1-2018 | | | | 100,000 | | | | 107,237 | |
Connecticut Light & Power Company | | | 6.35 | | | | 6-1-2036 | | | | 200,000 | | | | 278,095 | |
Consolidated Edison Company of New York Incorporated | | | 4.45 | | | | 3-15-2044 | | | | 500,000 | | | | 584,421 | |
Consolidated Edison Company of New York Incorporated | | | 7.13 | | | | 12-1-2018 | | | | 200,000 | | | | 225,544 | |
Consolidated Edison Company of New York Incorporated Series 06-E | | | 5.70 | | | | 12-1-2036 | | | | 250,000 | | | | 323,683 | |
Consolidated Edison Company of New York Incorporated Series 07-A | | | 6.30 | | | | 8-15-2037 | | | | 250,000 | | | | 344,556 | |
Consolidated Edison Company of New York Incorporated Series 08-A | | | 5.85 | | | | 4-1-2018 | | | | 100,000 | | | | 107,056 | |
Consolidated Edison Company of New York Incorporated Series 08-B | | | 6.75 | | | | 4-1-2038 | | | | 300,000 | | | | 440,267 | |
Consolidated Edison Company of New York Incorporated Series 09-C | | | 5.50 | | | | 12-1-2039 | | | | 600,000 | | | | 777,200 | |
Consolidated Edison Company of New York Incorporated Series 12-A | | | 4.20 | | | | 3-15-2042 | | | | 250,000 | | | | 279,563 | |
Delmarva Power & Light Company | | | 4.00 | | | | 6-1-2042 | | | | 300,000 | | | | 329,054 | |
Detroit Edison Company | | | 2.65 | | | | 6-15-2022 | | | | 200,000 | | | | 206,937 | |
Detroit Edison Company | | | 3.45 | | | | 10-1-2020 | | | | 500,000 | | | | 534,194 | |
DTE Electric Company | | | 3.65 | | | | 3-15-2024 | | | | 150,000 | | | | 164,822 | |
DTE Electric Company | | | 6.63 | | | | 6-1-2036 | | | | 250,000 | | | | 359,655 | |
Duke Energy Carolinas LLC | | | 2.50 | | | | 3-15-2023 | | | | 750,000 | | | | 776,431 | |
Duke Energy Carolinas LLC | | | 4.25 | | | | 12-15-2041 | | | | 500,000 | | | | 569,868 | |
Duke Energy Carolinas LLC | | | 6.10 | | | | 6-1-2037 | | | | 250,000 | | | | 335,154 | |
Duke Energy Carolinas LLC Series C | | | 7.00 | | | | 11-15-2018 | | | | 100,000 | | | | 112,220 | |
Duke Energy Corporation | | | 3.05 | | | | 8-15-2022 | | | | 100,000 | | | | 104,624 | |
Duke Energy Corporation | | | 3.95 | | | | 10-15-2023 | | | | 200,000 | | | | 220,202 | |
Duke Energy Corporation | | | 6.45 | | | | 10-15-2032 | | | | 375,000 | | | | 513,720 | |
| | | | |
| 72 | | Wells Fargo Diversified Fixed Income Portfolio | | Portfolio of investments—August 31, 2016 (unaudited) |
| | | | | | | | | | | | | | | | |
| Security name | | Interest rate | | | Maturity date | | | Principal | | | Value | |
| | | | |
| Electric Utilities (continued) | | | | | | | | | | | | | | | | |
Duke Energy Florida Incorporated | | | 3.85 | % | | | 11-15-2042 | | | $ | 100,000 | | | $ | 106,478 | |
Duke Energy Indiana Incorporated | | | 3.75 | | | | 5-15-2046 | | | | 250,000 | | | | 264,203 | |
Duke Energy Indiana Incorporated | | | 4.90 | | | | 7-15-2043 | | | | 150,000 | | | | 181,861 | |
Duke Energy Indiana Incorporated | | | 6.35 | | | | 8-15-2038 | | | | 500,000 | | | | 709,178 | |
Duke Energy Indiana Incorporated | | | 6.45 | | | | 4-1-2039 | | | | 65,000 | | | | 93,134 | |
Duke Energy Ohio Incorporated | | | 5.45 | | | | 4-1-2019 | | | | 250,000 | | | | 274,820 | |
Duke Energy Progress Incorporated | | | 3.00 | | | | 9-15-2021 | | | | 250,000 | | | | 265,020 | |
Duke Energy Progress Incorporated | | | 4.10 | | | | 3-15-2043 | | | | 150,000 | | | | 166,233 | |
Duke Energy Progress Incorporated | | | 4.15 | | | | 12-1-2044 | | | | 250,000 | | | | 282,476 | |
Duke Energy Progress Incorporated | | | 4.38 | | | | 3-30-2044 | | | | 250,000 | | | | 289,667 | |
Entergy Arkansas Incorporated | | | 3.70 | | | | 6-1-2024 | | | | 250,000 | | | | 273,044 | |
Entergy Corporation | | | 5.13 | | | | 9-15-2020 | | | | 250,000 | | | | 277,641 | |
Entergy Gulf States Louisiana LLC | | | 5.59 | | | | 10-1-2024 | | | | 120,000 | | | | 144,222 | |
Entergy Gulf States Louisiana LLC | | | 6.00 | | | | 5-1-2018 | | | | 100,000 | | | | 107,058 | |
Entergy Louisiana LLC | | | 3.25 | | | | 4-1-2028 | | | | 500,000 | | | | 531,966 | |
Entergy Louisiana LLC | | | 4.05 | | | | 9-1-2023 | | | | 400,000 | | | | 442,933 | |
Entergy Louisiana LLC | | | 5.40 | | | | 11-1-2024 | | | | 250,000 | | | | 302,550 | |
Entergy Texas Incorporated | | | 7.13 | | | | 2-1-2019 | | | | 200,000 | | | | 224,852 | |
Exelon Corporation | | | 3.95 | | | | 6-15-2025 | | | | 500,000 | | | | 546,180 | |
Exelon Corporation | | | 4.95 | | | | 6-15-2035 | | | | 200,000 | | | | 231,199 | |
Exelon Corporation | | | 5.10 | | | | 6-15-2045 | | | | 400,000 | | | | 475,478 | |
Exelon Corporation | | | 5.63 | | | | 6-15-2035 | | | | 365,000 | | | | 444,980 | |
Exelon Generation Company LLC | | | 4.25 | | | | 6-15-2022 | | | | 225,000 | | | | 240,971 | |
Exelon Generation Company LLC | | | 5.20 | | | | 10-1-2019 | | | | 500,000 | | | | 548,506 | |
Exelon Generation Company LLC | | | 5.60 | | | | 6-15-2042 | | | | 605,000 | | | | 646,845 | |
Exelon Generation Company LLC | | | 6.25 | | | | 10-1-2039 | | | | 500,000 | | | | 575,368 | |
FirstEnergy Solutions Company | | | 6.80 | | | | 8-15-2039 | | | | 164,000 | | | | 111,042 | |
Florida Power & Light Company | | | 3.25 | | | | 6-1-2024 | | | | 500,000 | | | | 535,664 | |
Florida Power & Light Company | | | 4.05 | | | | 6-1-2042 | | | | 250,000 | | | | 284,405 | |
Florida Power & Light Company | | | 4.13 | | | | 2-1-2042 | | | | 300,000 | | | | 342,671 | |
Florida Power & Light Company | | | 5.25 | | | | 2-1-2041 | | | | 200,000 | | | | 260,825 | |
Florida Power & Light Company | | | 5.65 | | | | 2-1-2037 | | | | 363,000 | | | | 483,511 | |
Florida Power & Light Company | | | 5.95 | | | | 2-1-2038 | | | | 320,000 | | | | 444,453 | |
Florida Power & Light Company | | | 5.96 | | | | 4-1-2039 | | | | 250,000 | | | | 349,360 | |
Florida Power Corporation | | | 5.65 | | | | 6-15-2018 | | | | 300,000 | | | | 323,118 | |
Florida Power Corporation | | | 5.65 | | | | 4-1-2040 | | | | 125,000 | | | | 165,721 | |
Florida Power Corporation | | | 5.80 | | | | 9-15-2017 | | | | 200,000 | | | | 209,384 | |
Florida Power Corporation | | | 6.40 | | | | 6-15-2038 | | | | 500,000 | | | | 714,465 | |
FPL Group Capital Incorporated | | | 6.00 | | | | 3-1-2019 | | | | 750,000 | | | | 825,170 | |
Georgia Power Company | | | 4.25 | | | | 12-1-2019 | | | | 375,000 | | | | 405,890 | |
Georgia Power Company | | | 4.30 | | | | 3-15-2042 | | | | 250,000 | | | | 276,937 | |
Georgia Power Company | | | 4.30 | | | | 3-15-2043 | | | | 350,000 | | | | 386,560 | |
Georgia Power Company | | | 5.40 | | | | 6-1-2018 | | | | 200,000 | | | | 214,010 | |
Georgia Power Company | | | 5.40 | | | | 6-1-2040 | | | | 250,000 | | | | 313,647 | |
Georgia Power Company | | | 5.95 | | | | 2-1-2039 | | | | 250,000 | | | | 331,758 | |
Great Plains Energy Incorporated | | | 4.85 | | | | 6-1-2021 | | | | 50,000 | | | | 54,596 | |
Iberdrola International BV | | | 6.75 | | | | 7-15-2036 | | | | 397,000 | | | | 535,422 | |
Indiana Michigan Power Company | | | 3.20 | | | | 3-15-2023 | | | | 100,000 | | | | 104,243 | |
Indiana Michigan Power Company | | | 7.00 | | | | 3-15-2019 | | | | 500,000 | | | | 562,102 | |
Interstate Power & Light Company | | | 4.70 | | | | 10-15-2043 | | | | 300,000 | | | | 354,986 | |
| | | | | | |
| Portfolio of investments—August 31, 2016 (unaudited) | | Wells Fargo Diversified Fixed Income Portfolio | | | 73 | |
| | | | | | | | | | | | | | | | |
| Security name | | Interest rate | | | Maturity date | | | Principal | | | Value | |
| | | | |
| Electric Utilities (continued) | | | | | | | | | | | | | | | | |
Interstate Power & Light Company | | | 6.25 | % | | | 7-15-2039 | | | $ | 30,000 | | | $ | 41,899 | |
Jersey Central Power & Light Company | | | 7.35 | | | | 2-1-2019 | | | | 250,000 | | | | 279,677 | |
Kansas City Power & Light Company | | | 3.15 | | | | 3-15-2023 | | | | 200,000 | | | | 203,855 | |
Kansas City Power & Light Company | | | 6.38 | | | | 3-1-2018 | | | | 250,000 | | | | 267,132 | |
Kansas City Power & Light Company | | | 7.15 | | | | 4-1-2019 | | | | 200,000 | | | | 227,372 | |
Kentucky Utilities Company | | | 3.25 | | | | 11-1-2020 | | | | 250,000 | | | | 263,748 | |
Kentucky Utilities Company | | | 5.13 | | | | 11-1-2040 | | | | 500,000 | | | | 628,128 | |
LG&E & KU Energy LLC | | | 3.75 | | | | 11-15-2020 | | | | 100,000 | | | | 107,283 | |
MidAmerican Energy Holdings Company | | | 2.40 | | | | 3-15-2019 | | | | 500,000 | | | | 513,140 | |
MidAmerican Energy Holdings Company | | | 4.80 | | | | 9-15-2043 | | | | 300,000 | | | | 372,639 | |
MidAmerican Energy Holdings Company | | | 5.30 | | | | 3-15-2018 | | | | 250,000 | | | | 265,541 | |
MidAmerican Energy Holdings Company | | | 5.80 | | | | 10-15-2036 | | | | 75,000 | | | | 100,658 | |
MidAmerican Energy Holdings Company | | | 5.95 | | | | 5-15-2037 | | | | 300,000 | | | | 395,450 | |
MidAmerican Energy Holdings Company | | | 6.13 | | | | 4-1-2036 | | | | 200,000 | | | | 268,848 | |
MidAmerican Energy Holdings Company | | | 6.50 | | | | 9-15-2037 | | | | 500,000 | | | | 694,754 | |
MidAmerican Energy Holdings Company | | | 6.75 | | | | 12-30-2031 | | | | 150,000 | | | | 211,151 | |
Nevada Power Company | | | 5.45 | | | | 5-15-2041 | | | | 120,000 | | | | 154,962 | |
Nevada Power Company | | | 6.75 | | | | 7-1-2037 | | | | 200,000 | | | | 284,969 | |
Nevada Power Company | | | 7.13 | | | | 3-15-2019 | | | | 300,000 | | | | 342,361 | |
NiSource Finance Corporation | | | 4.80 | | | | 2-15-2044 | | | | 850,000 | | | | 980,211 | |
NiSource Finance Corporation | | | 5.45 | | | | 9-15-2020 | | | | 415,000 | | | | 466,997 | |
NiSource Finance Corporation | | | 5.65 | | | | 2-1-2045 | | | | 200,000 | | | | 261,662 | |
NiSource Finance Corporation | | | 6.13 | | | | 3-1-2022 | | | | 100,000 | | | | 118,919 | |
NiSource Finance Corporation | | | 6.40 | | | | 3-15-2018 | | | | 699,000 | | | | 747,806 | |
NiSource Finance Corporation | | | 6.80 | | | | 1-15-2019 | | | | 90,000 | | | | 100,471 | |
Northeast Utilities | | | 1.45 | | | | 5-1-2018 | | | | 350,000 | | | | 350,299 | |
Northeast Utilities | | | 2.80 | | | | 5-1-2023 | | | | 175,000 | | | | 179,341 | |
Northern States Power Company of Minnesota | | | 2.15 | | | | 8-15-2022 | | | | 250,000 | | | | 253,379 | |
Northern States Power Company of Minnesota | | | 2.60 | | | | 5-15-2023 | | | | 150,000 | | | | 154,872 | |
Northern States Power Company of Minnesota | | | 3.40 | | | | 8-15-2042 | | | | 250,000 | | | | 256,585 | |
Northern States Power Company of Minnesota | | | 5.25 | | | | 3-1-2018 | | | | 500,000 | | | | 530,080 | |
Northern States Power Company of Minnesota | | | 5.35 | | | | 11-1-2039 | | | | 40,000 | | | | 52,595 | |
Northern States Power Company of Minnesota | | | 6.20 | | | | 7-1-2037 | | | | 300,000 | | | | 424,378 | |
NSTAR Electric Company | | | 2.38 | | | | 10-15-2022 | | | | 200,000 | | | | 202,965 | |
NSTAR Electric Company | | | 4.40 | | | | 3-1-2044 | | | | 250,000 | | | | 288,952 | |
NSTAR Electric Company | | | 5.50 | | | | 3-15-2040 | | | | 100,000 | | | | 129,685 | |
Oglethorpe Power Corporation | | | 4.55 | | | | 6-1-2044 | | | | 250,000 | | | | 278,128 | |
Oglethorpe Power Corporation | | | 5.38 | | | | 11-1-2040 | | | | 300,000 | | | | 364,750 | |
Oglethorpe Power Corporation | | | 5.95 | | | | 11-1-2039 | | | | 150,000 | | | | 191,911 | |
Ohio Edison Company | | | 6.88 | | | | 7-15-2036 | | | | 250,000 | | | | 330,078 | |
Ohio Edison Company | | | 8.25 | | | | 10-15-2038 | | | | 200,000 | | | | 303,454 | |
Ohio Power Company | | | 5.38 | | | | 10-1-2021 | | | | 65,000 | | | | 73,953 | |
Ohio Power Company | | | 6.60 | | | | 2-15-2033 | | | | 194,000 | | | | 253,264 | |
Ohio Power Company | | | 6.60 | | | | 3-1-2033 | | | | 150,000 | | | | 194,310 | |
Oklahoma Gas & Electric Company | | | 4.55 | | | | 3-15-2044 | | | | 250,000 | | | | 290,700 | |
Oklahoma Gas & Electric Company | | | 5.25 | | | | 5-15-2041 | | | | 100,000 | | | | 124,286 | |
Oklahoma Gas & Electric Company | | | 5.85 | | | | 6-1-2040 | | | | 100,000 | | | | 134,129 | |
Oncor Electric Delivery Company LLC | | | 4.10 | | | | 6-1-2022 | | | | 500,000 | | | | 552,977 | |
Oncor Electric Delivery Company LLC | | | 4.55 | | | | 12-1-2041 | | | | 200,000 | | | | 237,343 | |
Oncor Electric Delivery Company LLC | | | 5.25 | | | | 9-30-2040 | | | | 250,000 | | | | 323,733 | |
| | | | |
| 74 | | Wells Fargo Diversified Fixed Income Portfolio | | Portfolio of investments—August 31, 2016 (unaudited) |
| | | | | | | | | | | | | | | | |
| Security name | | Interest rate | | | Maturity date | | | Principal | | | Value | |
| | | | |
| Electric Utilities (continued) | | | | | | | | | | | | | | | | |
Oncor Electric Delivery Company LLC | | | 6.80 | % | | | 9-1-2018 | | | $ | 500,000 | | | $ | 550,885 | |
Oncor Electric Delivery Company LLC | | | 7.00 | | | | 5-1-2032 | | | | 175,000 | | | | 247,880 | |
Oncor Electric Delivery Company LLC | | | 7.50 | | | | 9-1-2038 | | | | 200,000 | | | | 312,408 | |
PacifiCorp | | | 3.60 | | | | 4-1-2024 | | | | 250,000 | | | | 273,191 | |
PacifiCorp | | | 4.10 | | | | 2-1-2042 | | | | 100,000 | | | | 112,219 | |
PacifiCorp | | | 5.65 | | | | 7-15-2018 | | | | 600,000 | | | | 648,328 | |
PacifiCorp | | | 5.75 | | | | 4-1-2037 | | | | 250,000 | | | | 331,946 | |
PacifiCorp | | | 6.00 | | | | 1-15-2039 | | | | 500,000 | | | | 688,618 | |
PacifiCorp | | | 6.25 | | | | 10-15-2037 | | | | 720,000 | | | | 1,011,244 | |
PECO Energy Company | | | 2.38 | | | | 9-15-2022 | | | | 750,000 | | | | 764,280 | |
PECO Energy Company | | | 4.15 | | | | 10-1-2044 | | | | 350,000 | | | | 396,342 | |
Portland General Electric Company | | | 6.10 | | | | 4-15-2019 | | | | 250,000 | | | | 277,835 | |
Potomac Electric Power Company | | | 3.60 | | | | 3-15-2024 | | | | 250,000 | | | | 271,094 | |
Potomac Electric Power Company | | | 6.50 | | | | 11-15-2037 | | | | 200,000 | | | | 286,929 | |
PPL Capital Funding Incorporated | | | 1.90 | | | | 6-1-2018 | | | | 100,000 | | | | 100,319 | |
PPL Capital Funding Incorporated | | | 3.40 | | | | 6-1-2023 | | | | 500,000 | | | | 527,454 | |
PPL Capital Funding Incorporated | | | 3.95 | | | | 3-15-2024 | | | | 250,000 | | | | 270,508 | |
PPL Capital Funding Incorporated | | | 4.20 | | | | 6-15-2022 | | | | 200,000 | | | | 218,198 | |
PPL Capital Funding Incorporated | | | 4.70 | | | | 6-1-2043 | | | | 125,000 | | | | 142,286 | |
PPL Capital Funding Incorporated | | | 5.00 | | | | 3-15-2044 | | | | 250,000 | | | | 286,448 | |
PPL Electric Utilities | | | 4.75 | | | | 7-15-2043 | | | | 150,000 | | | | 182,846 | |
PPL Electric Utilities | | | 5.20 | | | | 7-15-2041 | | | | 200,000 | | | | 254,034 | |
PPL Electric Utilities | | | 6.25 | | | | 5-15-2039 | | | | 45,000 | | | | 63,990 | |
Progress Energy Incorporated | | | 3.15 | | | | 4-1-2022 | | | | 500,000 | | | | 525,177 | |
Progress Energy Incorporated | | | 4.10 | | | | 5-15-2042 | | | | 250,000 | | | | 277,501 | |
Progress Energy Incorporated | | | 4.40 | | | | 1-15-2021 | | | | 250,000 | | | | 274,169 | |
Progress Energy Incorporated | | | 4.55 | | | | 4-1-2020 | | | | 75,000 | | | | 82,444 | |
Progress Energy Incorporated | | | 6.00 | | | | 12-1-2039 | | | | 300,000 | | | | 391,252 | |
Progress Energy Incorporated | | | 6.30 | | | | 4-1-2038 | | | | 50,000 | | | | 70,754 | |
Progress Energy Incorporated | | | 7.00 | | | | 10-30-2031 | | | | 500,000 | | | | 678,099 | |
Progress Energy Incorporated | | | 7.75 | | | | 3-1-2031 | | | | 300,000 | | | | 424,050 | |
PSEG Power LLC | | | 2.45 | | | | 11-15-2018 | | | | 300,000 | | | | 303,540 | |
PSEG Power LLC | | | 4.15 | | | | 9-15-2021 | | | | 250,000 | | | | 267,149 | |
PSEG Power LLC « | | | 4.30 | | | | 11-15-2023 | | | | 300,000 | | | | 324,204 | |
PSEG Power LLC | | | 5.13 | | | | 4-15-2020 | | | | 280,000 | | | | 307,658 | |
PSEG Power LLC | | | 8.63 | | | | 4-15-2031 | | | | 75,000 | | | | 98,624 | |
Public Service Company of Colorado | | | 2.25 | | | | 9-15-2022 | | | | 100,000 | | | | 102,047 | |
Public Service Company of Colorado | | | 2.50 | | | | 3-15-2023 | | | | 250,000 | | | | 255,253 | |
Public Service Company of Colorado | | | 3.20 | | | | 11-15-2020 | | | | 300,000 | | | | 318,052 | |
Public Service Company of Colorado | | | 3.60 | | | | 9-15-2042 | | | | 200,000 | | | | 212,047 | |
Public Service Company of Colorado | | | 3.95 | | | | 3-15-2043 | | | | 125,000 | | | | 139,289 | |
Public Service Company of Colorado | | | 4.30 | | | | 3-15-2044 | | | | 250,000 | | | | 291,532 | |
Public Service Company of Colorado | | | 5.13 | | | | 6-1-2019 | | | | 50,000 | | | | 54,982 | |
Public Service Company of New Hampshire | | | 3.50 | | | | 11-1-2023 | | | | 300,000 | | | | 321,272 | |
Public Service Company of Oklahoma | | | 4.40 | | | | 2-1-2021 | | | | 100,000 | | | | 108,798 | |
Public Service Company of Oklahoma | | | 5.15 | | | | 12-1-2019 | | | | 40,000 | | | | 44,066 | |
Public Service Electric & Gas Company | | | 2.00 | | | | 8-15-2019 | | | | 200,000 | | | | 203,631 | |
Public Service Electric & Gas Company | | | 2.38 | | | | 5-15-2023 | | | | 200,000 | | | | 203,664 | |
Public Service Electric & Gas Company | | | 3.65 | | | | 9-1-2042 | | | | 250,000 | | | | 268,263 | |
Public Service Electric & Gas Company | | | 3.80 | | | | 1-1-2043 | | | | 200,000 | | | | 219,904 | |
| | | | | | |
| Portfolio of investments—August 31, 2016 (unaudited) | | Wells Fargo Diversified Fixed Income Portfolio | | | 75 | |
| | | | | | | | | | | | | | | | |
| Security name | | Interest rate | | | Maturity date | | | Principal | | | Value | |
| | | | |
| Electric Utilities (continued) | | | | | | | | | | | | | | | | |
Public Service Electric & Gas Company | | | 3.95 | % | | | 5-1-2042 | | | $ | 100,000 | | | $ | 111,699 | |
Public Service Electric & Gas Company | | | 5.80 | | | | 5-1-2037 | | | | 100,000 | | | | 134,345 | |
South Carolina Electric & Gas Company | | | 4.35 | | | | 2-1-2042 | | | | 600,000 | | | | 671,365 | |
South Carolina Electric & Gas Company | | | 6.50 | | | | 11-1-2018 | | | | 525,000 | | | | 582,103 | |
Southern California Edison Company | | | 3.88 | | | | 6-1-2021 | | | | 270,000 | | | | 295,705 | |
Southern California Edison Company | | | 3.90 | | | | 3-15-2043 | | | | 150,000 | | | | 165,631 | |
Southern California Edison Company | | | 4.05 | | | | 3-15-2042 | | | | 500,000 | | | | 559,256 | |
Southern California Edison Company | | | 5.50 | | | | 8-15-2018 | | | | 500,000 | | | | 541,794 | |
Southern California Edison Company | | | 5.50 | | | | 3-15-2040 | | | | 200,000 | | | | 264,197 | |
Southern California Edison Company | | | 6.00 | | | | 1-15-2034 | | | | 100,000 | | | | 134,490 | |
Southern California Edison Company | | | 6.05 | | | | 3-15-2039 | | | | 350,000 | | | | 489,256 | |
Southern California Edison Company Series 05-E | | | 5.35 | | | | 7-15-2035 | | | | 180,000 | | | | 226,227 | |
Southern Company | | | 2.15 | | | | 9-1-2019 | | | | 500,000 | | | | 507,072 | |
Southern Company | | | 2.45 | | | | 9-1-2018 | | | | 180,000 | | | | 183,639 | |
Southern Company | | | 2.75 | | | | 6-15-2020 | | | | 250,000 | | | | 257,863 | |
Southern Company | | | 2.95 | | | | 7-1-2023 | | | | 1,000,000 | | | | 1,032,348 | |
Southern Company | | | 3.25 | | | | 7-1-2026 | | | | 1,250,000 | | | | 1,302,898 | |
Southern Company | | | 4.40 | | | | 7-1-2046 | | | | 600,000 | | | | 660,580 | |
Southwestern Electric Power Company | | | 6.20 | | | | 3-15-2040 | | | | 50,000 | | | | 63,979 | |
Southwestern Public Service Company | | | 6.00 | | | | 10-1-2036 | | | | 100,000 | | | | 128,697 | |
System Energy Resources | | | 4.10 | | | | 4-1-2023 | | | | 150,000 | | | | 158,727 | |
Tampa Electric Company | | | 2.60 | | | | 9-15-2022 | | | | 200,000 | | | | 205,231 | |
Tampa Electric Company | | | 4.20 | | | | 5-15-2045 | | | | 300,000 | | | | 330,160 | |
Tampa Electric Company | | | 6.10 | | | | 5-15-2018 | | | | 100,000 | | | | 106,979 | |
Tampa Electric Company | | | 6.15 | | | | 5-15-2037 | | | | 75,000 | | | | 101,811 | |
Toleda Edison Company | | | 6.15 | | | | 5-15-2037 | | | | 50,000 | | | | 62,597 | |
TXU Electric Delivery Company | | | 7.25 | | | | 1-15-2033 | | | | 75,000 | | | | 108,875 | |
Union Electric Company | | | 3.90 | | | | 9-15-2042 | | | | 250,000 | | | | 273,065 | |
Union Electric Company | | | 8.45 | | | | 3-15-2039 | | | | 80,000 | | | | 136,221 | |
Virginia Electric & Power Company | | | 3.10 | | | | 5-15-2025 | | | | 100,000 | | | | 105,477 | |
Virginia Electric & Power Company | | | 3.45 | | | | 2-15-2024 | | | | 150,000 | | | | 163,208 | |
Virginia Electric & Power Company | | | 4.00 | | | | 1-15-2043 | | | | 325,000 | | | | 357,219 | |
Virginia Electric & Power Company | | | 4.20 | | | | 5-15-2045 | | | | 150,000 | | | | 169,770 | |
Virginia Electric & Power Company | | | 4.45 | | | | 2-15-2044 | | | | 150,000 | | | | 175,519 | |
Virginia Electric & Power Company | | | 5.00 | | | | 6-30-2019 | | | | 200,000 | | | | 217,062 | |
Virginia Electric & Power Company | | | 8.88 | | | | 11-15-2038 | | | | 300,000 | | | | 512,911 | |
Virginia Electric & Power Company Series B | | | 3.45 | | | | 9-1-2022 | | | | 1,000,000 | | | | 1,071,686 | |
Virginia Electric & Power Company Series B | | | 6.00 | | | | 1-15-2036 | | | | 100,000 | | | | 134,206 | |
Westar Energy Incorporated | | | 4.10 | | | | 4-1-2043 | | | | 300,000 | | | | 332,783 | |
Westar Energy Incorporated | | | 4.13 | | | | 3-1-2042 | | | | 500,000 | | | | 556,127 | |
Wisconsin Electric Power Company | | | 1.70 | | | | 6-15-2018 | | | | 150,000 | | | | 151,321 | |
Wisconsin Electric Power Company | | | 4.25 | | | | 12-15-2019 | | | | 350,000 | | | | 377,981 | |
Wisconsin Electric Power Company | | | 5.63 | | | | 5-15-2033 | | | | 100,000 | | | | 128,095 | |
Wisconsin Electric Power Company | | | 5.70 | | | | 12-1-2036 | | | | 150,000 | | | | 198,905 | |
Wisconsin Power & Light Company | | | 4.10 | | | | 10-15-2044 | | | | 250,000 | | | | 280,167 | |
Wisconsin Power & Light Company | | | 5.00 | | | | 7-15-2019 | | | | 50,000 | | | | 54,474 | |
Wisconsin Power & Light Company | | | 6.38 | | | | 8-15-2037 | | | | 250,000 | | | | 355,483 | |
Wisconsin Public Service Corporation | | | 4.75 | | | | 11-1-2044 | | | | 400,000 | | | | 493,884 | |
| |
| | | | 80,020,411 | |
| | | | | | | | | | | | | | | | |
| | | | |
| 76 | | Wells Fargo Diversified Fixed Income Portfolio | | Portfolio of investments—August 31, 2016 (unaudited) |
| | | | | | | | | | | | | | | | |
| Security name | | Interest rate | | | Maturity date | | | Principal | | | Value | |
| | | | |
| Gas Utilities: 0.09% | | | | | | | | | | | | | | | | |
Atmos Energy Corporation | | | 4.13 | % | | | 10-15-2044 | | | $ | 350,000 | | | $ | 388,689 | |
Atmos Energy Corporation | | | 4.15 | | | | 1-15-2043 | | | | 161,000 | | | | 176,779 | |
Atmos Energy Corporation | | | 5.50 | | | | 6-15-2041 | | | | 60,000 | | | | 77,127 | |
Atmos Energy Corporation | | | 8.50 | | | | 3-15-2019 | | | | 250,000 | | | | 291,568 | |
CenterPoint Energy Resources Corporation | | | 4.50 | | | | 1-15-2021 | | | | 65,000 | | | | 70,385 | |
CenterPoint Energy Resources Corporation | | | 5.85 | | | | 1-15-2041 | | | | 110,000 | | | | 134,132 | |
CenterPoint Energy Resources Corporation | | | 6.00 | | | | 5-15-2018 | | | | 100,000 | | | | 106,488 | |
CenterPoint Energy Resources Corporation | | | 6.13 | | | | 11-1-2017 | | | | 150,000 | | | | 157,422 | |
CenterPoint Energy Resources Corporation | | | 6.63 | | | | 11-1-2037 | | | | 50,000 | | | | 61,789 | |
KeySpan Corporation | | | 5.80 | | | | 4-1-2035 | | | | 125,000 | | | | 154,570 | |
Laclede Group Incorporated | | | 4.70 | | | | 8-15-2044 | | | | 250,000 | | | | 273,222 | |
National Fuel Gas Company | | | 3.75 | | | | 3-1-2023 | | | | 312,000 | | | | 315,718 | |
One Gas Incorporated | | | 2.07 | | | | 2-1-2019 | | | | 100,000 | | | | 101,481 | |
One Gas Incorporated | | | 3.61 | | | | 2-1-2024 | | | | 100,000 | | | | 107,432 | |
One Gas Incorporated | | | 4.66 | | | | 2-1-2044 | | | | 50,000 | | | | 58,563 | |
Panhandle Eastern Pipe Line Company LP | | | 6.20 | | | | 11-1-2017 | | | | 400,000 | | | | 413,180 | |
Piedmont Natural Gas Company | | | 4.65 | | | | 8-1-2043 | | | | 50,000 | | | | 57,699 | |
Sempra Energy | | | 2.88 | | | | 10-1-2022 | | | | 200,000 | | | | 206,662 | |
Sempra Energy | | | 3.55 | | | | 6-15-2024 | | | | 1,000,000 | | | | 1,058,813 | |
Sempra Energy | | | 6.00 | | | | 10-15-2039 | | | | 300,000 | | | | 390,103 | |
Southern California Gas Company | | | 3.75 | | | | 9-15-2042 | | | | 200,000 | | | | 215,894 | |
Southern California Gas Company | | | 5.13 | | | | 11-15-2040 | | | | 100,000 | | | | 128,269 | |
Southern California Gas Company | | | 5.75 | | | | 11-15-2035 | | | | 75,000 | | | | 99,934 | |
| |
| | | | 5,045,919 | |
| | | | | | | | | | | | | | | | |
| | | | |
| Independent Power & Renewable Electricity Producers: 0.02% | | | | | | | | | | | | | | | | |
Constellation Energy Group Incorporated | | | 5.15 | | | | 12-1-2020 | | | | 100,000 | | | | 111,329 | |
Southern Power Company | | | 5.15 | | | | 9-15-2041 | | | | 500,000 | | | | 551,621 | |
Southern Power Company | | | 5.25 | | | | 7-15-2043 | | | | 120,000 | | | | 132,909 | |
Tri-State Generation & Transmission Association Incorporated | | | 3.70 | | | | 11-1-2024 | | | | 100,000 | | | | 106,122 | |
Tri-State Generation & Transmission Association Incorporated | | | 4.70 | | | | 11-1-2044 | | | | 100,000 | | | | 112,893 | |
| |
| | | | 1,014,874 | |
| | | | | | | | | | | | | | | | |
| | | | |
| Multi-Utilities: 0.34% | | | | | | | | | | | | | | | | |
Ameren Illinois Company | | | 4.30 | | | | 7-1-2044 | | | | 500,000 | | | | 577,620 | |
Ameren Illinois Company | | | 4.80 | | | | 12-15-2043 | | | | 100,000 | | | | 123,048 | |
Ameren Illinois Company | | | 6.13 | | | | 11-15-2017 | | | | 100,000 | | | | 105,367 | |
Avista Corporation | | | 5.13 | | | | 4-1-2022 | | | | 55,000 | | | | 60,710 | |
Berkshire Hathaway Energy | | | 2.00 | | | | 11-15-2018 | | | | 250,000 | | | | 252,851 | |
Berkshire Hathaway Energy | | | 3.75 | | | | 11-15-2023 | | | | 500,000 | | | | 546,380 | |
Berkshire Hathaway Energy | | | 5.15 | | | | 11-15-2043 | | | | 400,000 | | | | 491,950 | |
Black Hills Corporation | | | 4.25 | | | | 11-30-2023 | | | | 300,000 | | | | 326,226 | |
CMS Energy Corporation | | | 3.88 | | | | 3-1-2024 | | | | 500,000 | | | | 548,159 | |
CMS Energy Corporation | | | 4.70 | | | | 3-31-2043 | | | | 125,000 | | | | 145,710 | |
CMS Energy Corporation | | | 5.05 | | | | 3-15-2022 | | | | 350,000 | | | | 397,418 | |
Consumers Energy Company | | | 3.95 | | | | 5-15-2043 | | | | 200,000 | | | | 223,856 | |
Consumers Energy Company | | | 4.35 | | | | 8-31-2064 | | | | 150,000 | | | | 174,588 | |
Consumers Energy Company | | | 5.65 | | | | 9-15-2018 | | | | 150,000 | | | | 162,647 | |
Consumers Energy Company | | | 6.70 | | | | 9-15-2019 | | | | 500,000 | | | | 577,498 | |
| | | | | | |
| Portfolio of investments—August 31, 2016 (unaudited) | | Wells Fargo Diversified Fixed Income Portfolio | | | 77 | |
| | | | | | | | | | | | | | | | |
| Security name | | Interest rate | | | Maturity date | | | Principal | | | Value | |
| | | | |
| Multi-Utilities (continued) | | | | | | | | | | | | | | | | |
Dominion Resources Incorporated | | | 1.90 | % | | | 6-15-2018 | | | $ | 200,000 | | | $ | 201,249 | |
Dominion Resources Incorporated | | | 2.50 | | | | 12-1-2019 | | | | 188,000 | | | | 191,879 | |
Dominion Resources Incorporated | | | 2.75 | | | | 9-15-2022 | | | | 200,000 | | | | 203,904 | |
Dominion Resources Incorporated | | | 3.63 | | | | 12-1-2024 | | | | 300,000 | | | | 318,544 | |
Dominion Resources Incorporated | | | 4.05 | | | | 9-15-2042 | | | | 250,000 | | | | 254,789 | |
Dominion Resources Incorporated | | | 4.45 | | | | 3-15-2021 | | | | 100,000 | | | | 110,277 | |
Dominion Resources Incorporated | | | 4.70 | | | | 12-1-2044 | | | | 250,000 | | | | 283,350 | |
Dominion Resources Incorporated | | | 4.90 | | | | 8-1-2041 | | | | 60,000 | | | | 68,863 | |
Dominion Resources Incorporated | | | 5.95 | | | | 6-15-2035 | | | | 225,000 | | | | 278,956 | |
Dominion Resources Incorporated | | | 6.40 | | | | 6-15-2018 | | | | 750,000 | | | | 812,699 | |
Dominion Resources Incorporated | | | 7.00 | | | | 6-15-2038 | | | | 500,000 | | | | 698,114 | |
DTE Energy Company | | | 3.30 | | | | 6-15-2022 | | | | 100,000 | | | | 106,320 | |
DTE Energy Company | | | 3.85 | | | | 12-1-2023 | | | | 243,000 | | | | 266,530 | |
Eversource Energy | | | 4.50 | | | | 11-15-2019 | | | | 100,000 | | | | 108,809 | |
Integrys Energy Group | | | 4.17 | | | | 11-1-2020 | | | | 200,000 | | | | 216,711 | |
Louisville Gas & Electric Company | | | 5.13 | | | | 11-15-2040 | | | | 125,000 | | | | 159,147 | |
NorthWestern Corporation | | | 4.18 | | | | 11-15-2044 | | | | 300,000 | | | | 331,185 | |
Pacific Gas & Electric Company | | | 2.45 | | | | 8-15-2022 | | | | 250,000 | | | | 256,073 | |
Pacific Gas & Electric Company | | | 2.95 | | | | 3-1-2026 | | | | 500,000 | | | | 521,459 | |
Pacific Gas & Electric Company | | | 3.40 | | | | 8-15-2024 | | | | 650,000 | | | | 701,411 | |
Pacific Gas & Electric Company | | | 3.50 | | | | 6-15-2025 | | | | 150,000 | | | | 163,223 | |
Pacific Gas & Electric Company | | | 3.75 | | | | 8-15-2042 | | | | 200,000 | | | | 209,033 | |
Pacific Gas & Electric Company | | | 4.25 | | | | 5-15-2021 | | | | 500,000 | | | | 550,719 | |
Pacific Gas & Electric Company | | | 4.30 | | | | 3-15-2045 | | | | 200,000 | | | | 229,243 | |
Pacific Gas & Electric Company | | | 5.40 | | | | 1-15-2040 | | | | 700,000 | | | | 902,639 | |
Pacific Gas & Electric Company | | | 5.80 | | | | 3-1-2037 | | | | 500,000 | | | | 664,463 | |
Pacific Gas & Electric Company | | | 6.05 | | | | 3-1-2034 | | | | 500,000 | | | | 677,027 | |
Pacific Gas & Electric Company | | | 6.35 | | | | 2-15-2038 | | | | 100,000 | | | | 139,801 | |
Pacific Gas & Electric Company | | | 8.25 | | | | 10-15-2018 | | | | 250,000 | | | | 284,196 | |
Pacific Gas & Electric Corporation | | | 5.13 | | | | 11-15-2043 | | | | 250,000 | | | | 314,812 | |
Puget Energy Incorporated | | | 3.65 | | | | 5-15-2025 | | | | 200,000 | | | | 208,220 | |
Puget Energy Incorporated | | | 6.00 | | | | 9-1-2021 | | | | 250,000 | | | | 288,540 | |
Puget Sound Energy Incorporated | | | 4.43 | | | | 11-15-2041 | | | | 500,000 | | | | 582,906 | |
Puget Sound Energy Incorporated | | | 5.76 | | | | 10-1-2039 | | | | 400,000 | | | | 535,118 | |
Puget Sound Energy Incorporated | | | 5.80 | | | | 3-15-2040 | | | | 50,000 | | | | 67,696 | |
Puget Sound Energy Incorporated | | | 6.27 | | | | 3-15-2037 | | | | 330,000 | | | | 456,803 | |
San Diego Gas & Electric Company | | | 3.00 | | | | 8-15-2021 | | | | 750,000 | | | | 796,121 | |
San Diego Gas & Electric Company | | | 5.35 | | | | 5-15-2035 | | | | 100,000 | | | | 126,830 | |
San Diego Gas & Electric Company | | | 6.00 | | | | 6-1-2039 | | | | 530,000 | | | | 741,625 | |
Scana Corporation | | | 4.75 | | | | 5-15-2021 | | | | 250,000 | | | | 268,649 | |
WEC Energy Group Incorporated | | | 1.65 | | | | 6-15-2018 | | | | 150,000 | | | | 150,933 | |
WEC Energy Group Incorporated | | | 2.45 | | | | 6-15-2020 | | | | 150,000 | | | | 153,181 | |
WEC Energy Group Incorporated | | | 3.55 | | | | 6-15-2025 | | | | 200,000 | | | | 215,556 | |
Xcel Energy Incorporated | | | 4.70 | | | | 5-15-2020 | | | | 250,000 | | | | 273,316 | |
Xcel Energy Incorporated | | | 4.80 | | | | 9-15-2041 | | | | 250,000 | | | | 300,705 | |
| |
| | | | 20,105,652 | |
| | | | | | | | | | | | | | | | |
| | | | |
| Water Utilities: 0.02% | | | | | | | | | | | | | | | | |
American Water Capital Corporation | | | 3.40 | | | | 3-1-2025 | | | | 300,000 | | | | 323,935 | |
American Water Capital Corporation | | | 6.09 | | | | 10-15-2017 | | | | 750,000 | | | | 788,059 | |
| |
| | | | 1,111,994 | |
| | | | | | | | | | | | | | | | |
| | | | |
Total Corporate Bonds and Notes (Cost $1,119,059,698) | | | | | | | | | | | | | | | 1,213,231,257 | |
| | | | | | | | | | | | | | | | |
| | | | |
| 78 | | Wells Fargo Diversified Fixed Income Portfolio | | Portfolio of investments—August 31, 2016 (unaudited) |
| | | | | | | | | | | | | | | | |
| Security name | | Interest rate | | | Maturity date | | | Principal | | | Value | |
| | | | |
Foreign Government Bonds @: 24.63% | | | | | | | | | | | | | | | | |
Australian Government Bond Series 122 (AUD) | | | 5.25 | % | | | 3-15-2019 | | | | 1,850,000 | | | $ | 1,522,916 | |
Australian Government Bond Series 124 (AUD) | | | 5.75 | | | | 5-15-2021 | | | | 1,950,000 | | | | 1,746,027 | |
Australian Government Bond Series 126 (AUD) | | | 4.50 | | | | 4-15-2020 | | | | 2,100,000 | | | | 1,749,379 | |
Australian Government Bond Series 128 (AUD) | | | 5.75 | | | | 7-15-2022 | | | | 300,000 | | | | 277,435 | |
Australian Government Bond Series 128 (AUD) | | | 5.75 | | | | 7-15-2022 | | | | 1,600,000 | | | | 1,479,656 | |
Australian Government Bond Series 132 (AUD) | | | 5.50 | | | | 1-21-2018 | | | | 1,775,000 | | | | 1,407,980 | |
Australian Government Bond Series 133 (AUD) | | | 5.50 | | | | 4-21-2023 | | | | 1,900,000 | | | | 1,769,786 | |
Australian Government Bond Series 136 (AUD) | | | 4.75 | | | | 4-21-2027 | | | | 2,000,000 | | | | 1,918,101 | |
Australian Government Bond Series 137 (AUD) | | | 2.75 | | | | 4-21-2024 | | | | 2,150,000 | | | | 1,732,199 | |
Australian Government Bond Series 138 (AUD) | | | 3.25 | | | | 4-21-2029 | | | | 1,050,000 | | | | 895,437 | |
Australian Government Bond Series 139 (AUD) | | | 3.25 | | | | 4-21-2025 | | | | 2,300,000 | | | | 1,929,660 | |
Australian Government Bond Series 140 (AUD) | | | 4.50 | | | | 4-21-2033 | | | | 1,000,000 | | | | 988,129 | |
Australian Government Bond Series 141 (AUD) | | | 3.25 | | | | 10-21-2018 | | | | 1,565,000 | | | | 1,220,767 | |
Australian Government Bond Series 142 (AUD) | | | 4.25 | | | | 4-21-2026 | | | | 2,650,000 | | | | 2,416,201 | |
Australian Government Bond Series 143 (AUD) | | | 2.75 | | | | 10-21-2019 | | | | 1,800,000 | | | | 1,408,264 | |
Australian Government Bond Series 144 (AUD) | | | 3.75 | | | | 4-21-2037 | | | | 700,000 | | | | 637,806 | |
Australian Government Bond Series 145 (AUD) | | | 2.75 | | | | 6-21-2035 | | | | 750,000 | | | | 595,036 | |
Australian Government Bond Series 146 (AUD) | | | 1.75 | | | | 11-21-2020 | | | | 1,525,000 | | | | 1,159,158 | |
Australian Government Bond Series 147 (AUD) | | | 3.25 | | | | 6-21-2039 | | | | 300,000 | | | | 253,601 | |
Australian Government Bond Series 148 (AUD) | | | 2.75 | | | | 11-21-2027 | | | | 1,000,000 | | | | 813,674 | |
Australian Government Bond Series 149 (AUD) | | | 2.25 | | | | 5-21-2028 | | | | 750,000 | | | | 579,405 | |
Belgium Government Bond Series 31 (EUR) | | | 5.50 | | | | 3-28-2028 | | | | 2,025,000 | | | | 3,620,541 | |
Belgium Government Bond Series 40 (EUR) 144A | | | 5.50 | | | | 9-28-2017 | | | | 400,000 | | | | 475,476 | |
Belgium Government Bond Series 44 (EUR) 144A | | | 5.00 | | | | 3-28-2035 | | | | 1,700,000 | | | | 3,361,055 | |
Belgium Government Bond Series 48 (EUR) | | | 4.00 | | | | 3-28-2022 | | | | 1,200,000 | | | | 1,672,396 | |
Belgium Government Bond Series 52 (EUR) 144A | | | 4.00 | | | | 3-28-2018 | | | | 1,000,000 | | | | 1,196,209 | |
Belgium Government Bond Series 55 (EUR) | | | 4.00 | | | | 3-28-2019 | | | | 1,000,000 | | | | 1,248,369 | |
Belgium Government Bond Series 58 (EUR) 144A | | | 3.75 | | | | 9-28-2020 | | | | 1,650,000 | | | | 2,164,236 | |
Belgium Government Bond Series 60 (EUR) 144A | | | 4.25 | | | | 3-28-2041 | | | | 1,375,000 | | | | 2,704,745 | |
Belgium Government Bond Series 61 (EUR) 144A | | | 4.25 | | | | 9-28-2021 | | | | 1,450,000 | | | | 2,006,835 | |
Belgium Government Bond Series 62 (EUR) | | | 3.00 | | | | 9-28-2019 | | | | 1,150,000 | | | | 1,424,278 | |
Belgium Government Bond Series 64 (EUR) 144A | | | 4.50 | | | | 3-28-2026 | | | | 900,000 | | | | 1,431,910 | |
Belgium Government Bond Series 65 (EUR) | | | 4.25 | | | | 9-28-2022 | | | | 1,300,000 | | | | 1,862,693 | |
Belgium Government Bond Series 66 (EUR) | | | 4.00 | | | | 3-28-2032 | | | | 300,000 | | | | 511,249 | |
Belgium Government Bond Series 68 (EUR) | | | 2.25 | | | | 6-22-2023 | | | | 1,150,000 | | | | 1,507,011 | |
Belgium Government Bond Series 69 (EUR) | | | 1.25 | | | | 6-22-2018 | | | | 1,050,000 | | | | 1,210,330 | |
Belgium Government Bond Series 71 (EUR) | | | 3.75 | | | | 6-22-2045 | | | | 750,000 | | | | 1,432,412 | |
Belgium Government Bond Series 72 (EUR) 144A | | | 2.60 | | | | 6-22-2024 | | | | 1,600,000 | | | | 2,167,968 | |
Belgium Government Bond Series 73 (EUR) 144A | | | 3.00 | | | | 6-22-2034 | | | | 750,000 | | | | 1,175,521 | |
Belgium Government Bond Series 74 (EUR) 144A | | | 0.80 | | | | 6-22-2025 | | | | 1,310,000 | | | | 1,562,059 | |
Belgium Government Bond Series 75 (EUR) 144A | | | 1.00 | | | | 6-22-2031 | | | | 100,000 | | | | 119,164 | |
Belgium Government Bond Series 76 (EUR) 144A | | | 1.90 | | | | 6-22-2038 | | | | 325,000 | | | | 441,737 | |
Belgium Government Bond Series 77 (EUR) 144A | | | 1.00 | | | | 6-22-2026 | | | | 1,000,000 | | | | 1,205,765 | |
Belgium Government Bond Series 78 (EUR) 144A | | | 1.60 | | | | 6-22-2047 | | | | 400,000 | | | | 511,104 | |
Belgium Government Bond Series 79 (EUR) 144A | | | 0.20 | | | | 10-22-2023 | | | | 500,000 | | | | 574,290 | |
Belgium Government Bond Series 80 (EUR) 144A | | | 2.15 | | | | 6-22-2066 | | | | 300,000 | | | | 421,826 | |
Bonos y Obligaciones del Estado (EUR) | | | 0.25 | | | | 4-30-2018 | | | | 1,100,000 | | | | 1,235,707 | |
Bonos y Obligaciones del Estado (EUR) | | | 0.25 | | | | 1-31-2019 | | | | 250,000 | | | | 281,150 | |
Bonos y Obligaciones del Estado (EUR) | | | 0.50 | | | | 10-31-2017 | | | | 1,500,000 | | | | 1,686,875 | |
Bonos y Obligaciones del Estado (EUR) | | | 0.75 | | | | 7-30-2021 | | | | 1,150,000 | | | | 1,321,391 | |
| | | | | | |
| Portfolio of investments—August 31, 2016 (unaudited) | | Wells Fargo Diversified Fixed Income Portfolio | | | 79 | |
| | | | | | | | | | | | | | | | |
| Security name | | Interest rate | | | Maturity date | | | Principal | | | Value | |
| | | | |
Foreign Government Bonds @ (continued) | | | | | | | | | | | | | | | | |
Bonos y Obligaciones del Estado (EUR) | | | 1.15 | % | | | 7-30-2020 | | | | 1,500,000 | | | $ | 1,748,348 | |
Bonos y Obligaciones del Estado (EUR) 144A | | | 1.30 | | | | 10-31-2026 | | | | 500,000 | | | | 569,998 | |
Bonos y Obligaciones del Estado (EUR) | | | 1.40 | | | | 1-31-2020 | | | | 2,050,000 | | | | 2,396,561 | |
Bonos y Obligaciones del Estado (EUR) 144A | | | 1.60 | | | | 4-30-2025 | | | | 1,750,000 | | | | 2,073,205 | |
Bonos y Obligaciones del Estado (EUR) 144A | | | 1.95 | | | | 4-30-2026 | | | | 2,000,000 | | | | 2,426,506 | |
Bonos y Obligaciones del Estado (EUR) 144A | | | 1.95 | | | | 7-30-2030 | | | | 1,500,000 | | | | 1,798,864 | |
Bonos y Obligaciones del Estado (EUR) 144A | | | 2.15 | | | | 10-31-2025 | | | | 2,000,000 | | | | 2,466,939 | |
Bonos y Obligaciones del Estado (EUR) | | | 2.75 | | | | 4-30-2019 | | | | 2,100,000 | | | | 2,518,780 | |
Bonos y Obligaciones del Estado (EUR) 144A | | | 2.75 | | | | 10-31-2024 | | | | 1,800,000 | | | | 2,316,997 | |
Bonos y Obligaciones del Estado (EUR) 144A | | | 2.90 | | | | 10-31-2046 | | | | 500,000 | | | | 657,408 | |
Bonos y Obligaciones del Estado (EUR) 144A | | | 3.45 | | | | 7-30-2066 | | | | 500,000 | | | | 686,119 | |
Bonos y Obligaciones del Estado (EUR) | | | 3.75 | | | | 10-31-2018 | | | | 1,300,000 | | | | 1,573,343 | |
Bonos y Obligaciones del Estado (EUR) 144A | | | 3.80 | | | | 4-30-2024 | | | | 1,800,000 | | | | 2,467,587 | |
Bonos y Obligaciones del Estado (EUR) 144A | | | 4.10 | | | | 7-30-2018 | | | | 2,100,000 | | | | 2,533,643 | |
Bonos y Obligaciones del Estado (EUR) 144A | | | 4.40 | | | | 10-31-2023 | | | | 1,650,000 | | | | 2,335,955 | |
Bonos y Obligaciones del Estado (EUR) | | | 4.50 | | | | 1-31-2018 | | | | 1,850,000 | | | | 2,199,986 | |
Bonos y Obligaciones del Estado (EUR) 144A | | | 5.15 | | | | 10-31-2028 | | | | 1,250,000 | | | | 2,005,803 | |
Bonos y Obligaciones del Estado (EUR) 144A | | | 5.15 | | | | 10-31-2044 | | | | 1,000,000 | | | | 1,860,464 | |
Bonos y Obligaciones del Estado (EUR) 144A | | | 5.40 | | | | 1-31-2023 | | | | 1,950,000 | | | | 2,860,724 | |
Bundesobligation Series 164 (EUR) | | | 0.50 | | | | 10-13-2017 | | | | 1,225,000 | | | | 1,383,484 | |
Bundesobligation Series 165 (EUR) | | | 0.50 | | | | 2-23-2018 | | | | 1,900,000 | | | | 2,154,427 | |
Bundesobligation Series 166 (EUR) | | | 0.25 | | | | 4-13-2018 | | | | 1,300,000 | | | | 1,470,700 | |
Bundesobligation Series 167 (EUR) | | | 1.00 | | | | 10-12-2018 | | | | 1,800,000 | | | | 2,077,532 | |
Bundesobligation Series 168 (EUR) | | | 1.00 | | | | 2-22-2019 | | | | 1,650,000 | | | | 1,916,060 | |
Bundesobligation Series 169 (EUR) | | | 0.50 | | | | 4-12-2019 | | | | 1,500,000 | | | | 1,723,422 | |
Bundesobligation Series 170 (EUR) | | | 0.25 | | | | 10-11-2019 | | | | 1,000,000 | | | | 1,146,476 | |
Bundesobligation Series 171 (EUR) ¤ | | | 0.00 | | | | 4-17-2020 | | | | 1,100,000 | | | | 1,255,168 | |
Bundesobligation Series 172 (EUR) | | | 0.25 | | | | 10-16-2020 | | | | 1,300,000 | | | | 1,501,814 | |
Bundesobligation Series 173 (EUR) ¤ | | | 0.00 | | | | 4-9-2021 | | | | 1,700,000 | | | | 1,945,528 | |
Bundesobligation Series 174 (EUR) ¤ | | | 0.00 | | | | 10-8-2021 | | | | 200,000 | | | | 228,991 | |
Bundesrepublik Deutschland (EUR) ¤ | | | 0.00 | | | | 8-15-2026 | | | | 300,000 | | | | 337,218 | |
Bundesrepublik Deutschland (EUR) | | | 0.50 | | | | 2-15-2025 | | | | 1,600,000 | | | | 1,903,820 | |
Bundesrepublik Deutschland (EUR) | | | 0.50 | | | | 2-15-2026 | | | | 2,000,000 | | | | 2,368,913 | |
Bundesrepublik Deutschland (EUR) | | | 1.00 | | | | 8-15-2024 | | | | 1,750,000 | | | | 2,163,961 | |
Bundesrepublik Deutschland (EUR) | | | 1.00 | | | | 8-15-2025 | | | | 2,000,000 | | | | 2,477,210 | |
Bundesrepublik Deutschland (EUR) | | | 1.50 | | | | 9-4-2022 | | | | 1,750,000 | | | | 2,188,170 | |
Bundesrepublik Deutschland (EUR) | | | 1.50 | | | | 2-15-2023 | | | | 1,750,000 | | | | 2,200,823 | |
Bundesrepublik Deutschland (EUR) | | | 1.50 | | | | 5-15-2023 | | | | 1,500,000 | | | | 1,892,186 | |
Bundesrepublik Deutschland (EUR) | | | 1.50 | | | | 5-15-2024 | | | | 1,500,000 | | | | 1,918,841 | |
Bundesrepublik Deutschland (EUR) | | | 1.75 | | | | 7-4-2022 | | | | 2,000,000 | | | | 2,528,364 | |
Bundesrepublik Deutschland (EUR) | | | 1.75 | | | | 2-15-2024 | | | | 1,700,000 | | | | 2,204,795 | |
Bundesrepublik Deutschland (EUR) | | | 2.00 | | | | 1-4-2022 | | | | 2,000,000 | | | | 2,535,168 | |
Bundesrepublik Deutschland (EUR) | | | 2.00 | | | | 8-15-2023 | | | | 1,575,000 | | | | 2,058,177 | |
Bundesrepublik Deutschland (EUR) | | | 2.25 | | | | 9-4-2020 | | | | 1,125,000 | | | | 1,401,511 | |
Bundesrepublik Deutschland (EUR) | | | 2.50 | | | | 1-4-2021 | | | | 1,950,000 | | | | 2,472,196 | |
Bundesrepublik Deutschland (EUR) | | | 2.50 | | | | 7-4-2044 | | | | 1,500,000 | | | | 2,588,670 | |
Bundesrepublik Deutschland (EUR) | | | 2.50 | | | | 8-15-2046 | | | | 1,500,000 | | | | 2,635,191 | |
Bundesrepublik Deutschland (EUR) | | | 3.00 | | | | 7-4-2020 | | | | 2,100,000 | | | | 2,670,585 | |
Bundesrepublik Deutschland (EUR) | | | 3.25 | | | | 7-4-2021 | | | | 1,500,000 | | | | 1,986,370 | |
Bundesrepublik Deutschland (EUR) | | | 3.25 | | | | 7-4-2042 | | | | 1,300,000 | | | | 2,463,179 | |
| | | | |
| 80 | | Wells Fargo Diversified Fixed Income Portfolio | | Portfolio of investments—August 31, 2016 (unaudited) |
| | | | | | | | | | | | | | | | |
| Security name | | Interest rate | | | Maturity date | | | Principal | | | Value | |
| | | | |
Foreign Government Bonds @ (continued) | | | | | | | | | | | | | | | | |
Bundesrepublik Deutschland (EUR) | | | 4.75 | % | | | 7-4-2040 | | | | 175,000 | | | $ | 392,421 | |
Bundesrepublik Deutschland Series 00 (EUR) | | | 5.50 | | | | 1-4-2031 | | | | 1,175,000 | | | | 2,327,393 | |
Bundesrepublik Deutschland Series 00 (EUR) | | | 6.25 | | | | 1-4-2030 | | | | 850,000 | | | | 1,747,024 | |
Bundesrepublik Deutschland Series 03 (EUR) | | | 4.75 | | | | 7-4-2034 | | | | 1,600,000 | | | | 3,223,608 | |
Bundesrepublik Deutschland Series 05 (EUR) | | | 4.00 | | | | 1-4-2037 | | | | 2,000,000 | | | | 3,874,427 | |
Bundesrepublik Deutschland Series 07 (EUR) | | | 4.00 | | | | 1-4-2018 | | | | 1,700,000 | | | | 2,014,680 | |
Bundesrepublik Deutschland Series 08 (EUR) | | | 4.25 | | | | 7-4-2018 | | | | 2,250,000 | | | | 2,736,176 | |
Bundesrepublik Deutschland Series 08 (EUR) | | | 4.75 | | | | 7-4-2040 | | | | 1,250,000 | | | | 2,803,006 | |
Bundesrepublik Deutschland Series 09 (EUR) | | | 3.25 | | | | 1-4-2020 | | | | 2,000,000 | | | | 2,524,306 | |
Bundesrepublik Deutschland Series 09 (EUR) | | | 3.50 | | | | 7-4-2019 | | | | 2,000,000 | | | | 2,495,666 | |
Bundesrepublik Deutschland Series 09 (EUR) | | | 3.75 | | | | 1-4-2019 | | | | 1,750,000 | | | | 2,154,048 | |
Bundesrepublik Deutschland Series 161 (EUR) | | | 2.25 | | | | 9-4-2021 | | | | 1,500,000 | | | | 1,910,912 | |
Bundesrepublik Deutschland Series 2007 (EUR) | | | 4.25 | | | | 7-4-2039 | | | | 1,250,000 | | | | 2,603,662 | |
Bundesrepublik Deutschland Series 94 (EUR) | | | 6.25 | | | | 1-4-2024 | | | | 855,000 | | | | 1,431,872 | |
Bundesrepublik Deutschland Series 97 (EUR) | | | 6.50 | | | | 7-4-2027 | | | | 1,000,000 | | | | 1,924,780 | |
Bundesrepublik Deutschland Series 98 (EUR) | | | 4.75 | | | | 7-4-2028 | | | | 1,300,000 | | | | 2,283,043 | |
Bundesrepublik Deutschland Series 98 (EUR) | | | 5.63 | | | | 1-4-2028 | | | | 1,400,000 | | | | 2,582,848 | |
Bundesschatzanweisungen (EUR) ¤ | | | 0.00 | | | | 9-15-2017 | | | | 1,400,000 | | | | 1,571,430 | |
Bundesschatzanweisungen (EUR) ¤ | | | 0.00 | | | | 12-15-2017 | | | | 1,000,000 | | | | 1,124,307 | |
Bundesschatzanweisungen (EUR) ¤ | | | 0.00 | | | | 3-16-2018 | | | | 700,000 | | | | 788,197 | |
Bundesschatzanweisungen (EUR) ¤ | | | 0.00 | | | | 6-15-2018 | | | | 500,000 | | | | 564,020 | |
Canadian Government Bond (CAD) | | | 0.25 | | | | 11-1-2017 | | | | 1,500,000 | | | | 1,139,584 | |
Canadian Government Bond (CAD) | | | 0.25 | | | | 5-1-2018 | | | | 650,000 | | | | 493,007 | |
Canadian Government Bond (CAD) | | | 0.50 | | | | 8-1-2018 | | | | 1,000,000 | | | | 761,476 | |
Canadian Government Bond (CAD) | | | 0.75 | | | | 9-1-2020 | | | | 1,000,000 | | | | 767,249 | |
Canadian Government Bond (CAD) | | | 0.75 | | | | 3-1-2021 | | | | 550,000 | | | | 421,697 | |
Canadian Government Bond (CAD) | | | 0.75 | | | | 9-1-2021 | | | | 1,275,000 | | | | 976,813 | |
Canadian Government Bond (CAD) | | | 1.25 | | | | 2-1-2018 | | | | 1,200,000 | | | | 923,782 | |
Canadian Government Bond (CAD) | | | 1.25 | | | | 3-1-2018 | | | | 1,075,000 | | | | 828,022 | |
Canadian Government Bond (CAD) | | | 1.25 | | | | 9-1-2018 | | | | 800,000 | | | | 618,429 | |
Canadian Government Bond (CAD) | | | 1.50 | | | | 9-1-2017 | | | | 1,275,000 | | | | 981,256 | |
Canadian Government Bond (CAD) | | | 1.50 | | | | 3-1-2020 | | | | 1,000,000 | | | | 786,823 | |
Canadian Government Bond (CAD) | | | 1.50 | | | | 6-1-2023 | | | | 1,550,000 | | | | 1,238,676 | |
Canadian Government Bond (CAD) | | | 1.50 | | | | 6-1-2026 | | | | 750,000 | | | | 597,644 | |
Canadian Government Bond (CAD) | | | 1.75 | | | | 3-1-2019 | | | | 1,000,000 | | | | 785,153 | |
Canadian Government Bond (CAD) | | | 1.75 | | | | 9-1-2019 | | | | 1,100,000 | | | | 867,712 | |
Canadian Government Bond (CAD) | | | 2.25 | | | | 6-1-2025 | | | | 1,200,000 | | | | 1,017,264 | |
Canadian Government Bond (CAD) | | | 2.50 | | | | 6-1-2024 | | | | 1,300,000 | | | | 1,114,655 | |
Canadian Government Bond (CAD) | | | 2.75 | | | | 6-1-2022 | | | | 1,450,000 | | | | 1,232,942 | |
Canadian Government Bond (CAD) | | | 2.75 | | | | 12-1-2048 | | | | 550,000 | | | | 536,797 | |
Canadian Government Bond (CAD) | | | 2.75 | | | | 12-1-2064 | | | | 500,000 | | | | 529,358 | |
Canadian Government Bond (CAD) | | | 3.25 | | | | 6-1-2021 | | | | 1,000,000 | | | | 856,314 | |
Canadian Government Bond (CAD) | | | 3.50 | | | | 6-1-2020 | | | | 1,350,000 | | | | 1,140,376 | |
Canadian Government Bond (CAD) | | | 3.50 | | | | 12-1-2045 | | | | 1,450,000 | | | | 1,586,884 | |
Canadian Government Bond (CAD) | | | 3.75 | | | | 6-1-2019 | | | | 1,600,000 | | | | 1,326,106 | |
Canadian Government Bond (CAD) | | | 4.00 | | | | 6-1-2041 | | | | 1,250,000 | | | | 1,409,267 | |
Canadian Government Bond (CAD) | | | 4.25 | | | | 6-1-2018 | | | | 1,000,000 | | | | 811,270 | |
Canadian Government Bond (CAD) | | | 5.00 | | | | 6-1-2037 | | | | 1,100,000 | | | | 1,337,564 | |
Canadian Government Bond (CAD) | | | 5.75 | | | | 6-1-2029 | | | | 1,200,000 | | | | 1,394,092 | |
Canadian Government Bond (CAD) | | | 5.75 | | | | 6-1-2033 | | | | 1,300,000 | | | | 1,612,153 | |
| | | | | | |
| Portfolio of investments—August 31, 2016 (unaudited) | | Wells Fargo Diversified Fixed Income Portfolio | | | 81 | |
| | | | | | | | | | | | | | | | |
| Security name | | Interest rate | | | Maturity date | | | Principal | | | Value | |
| | | | |
Foreign Government Bonds @ (continued) | | | | | | | | | | | | | | | | |
Canadian Government Bond (CAD) | | | 8.00 | % | | | 6-1-2023 | | | | 195,000 | | | $ | 219,154 | |
Canadian Government Bond (CAD) | | | 8.00 | | | | 6-1-2027 | | | | 593,000 | | | | 766,568 | |
Canadian Government Bond (CAD) | | | 9.00 | | | | 6-1-2025 | | | | 200,000 | | | | 255,855 | |
Denmark Government Bond (DKK) | | | 0.25 | | | | 11-15-2018 | | | | 2,000,000 | | | | 304,865 | |
Denmark Government Bond (DKK) | | | 1.50 | | | | 11-15-2023 | | | | 5,700,000 | | | | 957,472 | |
Denmark Government Bond (DKK) | | | 1.75 | | | | 11-15-2025 | | | | 4,500,000 | | | | 780,617 | |
Denmark Government Bond (DKK) | | | 3.00 | | | | 11-15-2021 | | | | 8,000,000 | | | | 1,409,021 | |
Denmark Government Bond (DKK) | | | 4.00 | | | | 11-15-2017 | | | | 5,700,000 | | | | 902,411 | |
Denmark Government Bond (DKK) | | | 4.00 | | | | 11-15-2019 | | | | 9,400,000 | | | | 1,612,986 | |
Denmark Government Bond (DKK) | | | 4.50 | | | | 11-15-2039 | | | | 10,750,000 | | | | 3,013,751 | |
Denmark Government Bond (DKK) | | | 7.00 | | | | 11-10-2024 | | | | 2,500,000 | | | | 597,255 | |
France Government Bond (EUR) ¤ | | | 0.00 | | | | 2-25-2018 | | | | 1,925,000 | | | | 2,165,725 | |
France Government Bond (EUR) ¤ | | | 0.00 | | | | 2-25-2019 | | | | 1,300,000 | | | | 1,470,096 | |
France Government Bond (EUR) ¤ | | | 0.00 | | | | 5-25-2020 | | | | 2,200,000 | | | | 2,499,978 | |
France Government Bond (EUR) ¤ | | | 0.00 | | | | 5-25-2021 | | | | 1,250,000 | | | | 1,420,403 | |
France Government Bond (EUR) | | | 0.25 | | | | 11-25-2020 | | | | 1,500,000 | | | | 1,723,038 | |
France Government Bond (EUR) | | | 0.50 | | | | 11-25-2019 | | | | 2,250,000 | | | | 2,593,835 | |
France Government Bond (EUR) | | | 0.50 | | | | 5-25-2025 | | | | 2,900,000 | | | | 3,368,888 | |
France Government Bond (EUR) | | | 0.50 | | | | 5-25-2026 | | | | 2,750,000 | | | | 3,166,396 | |
France Government Bond (EUR) | | | 1.00 | | | | 5-25-2018 | | | | 1,925,000 | | | | 2,206,025 | |
France Government Bond (EUR) | | | 1.00 | | | | 11-25-2018 | | | | 1,500,000 | | | | 1,731,820 | |
France Government Bond (EUR) | | | 1.00 | | | | 5-25-2019 | | | | 2,000,000 | | | | 2,325,758 | |
France Government Bond (EUR) | | | 1.00 | | | | 11-25-2025 | | | | 1,600,000 | | | | 1,934,369 | |
France Government Bond (EUR) 144A | | | 1.25 | | | | 5-25-2036 | | | | 1,000,000 | | | | 1,210,134 | |
France Government Bond (EUR) | | | 1.50 | | | | 5-25-2031 | | | | 1,000,000 | | | | 1,270,855 | |
France Government Bond (EUR) | | | 1.75 | | | | 5-25-2023 | | | | 2,700,000 | | | | 3,419,183 | |
France Government Bond (EUR) | | | 1.75 | | | | 11-25-2024 | | | | 2,650,000 | | | | 3,393,364 | |
France Government Bond (EUR) 144A | | | 1.75 | | | | 5-25-2066 | | | | 500,000 | | | | 646,672 | |
France Government Bond (EUR) | | | 2.25 | | | | 10-25-2022 | | | | 2,700,000 | | | | 3,490,265 | |
France Government Bond (EUR) | | | 2.25 | | | | 5-25-2024 | | | | 2,950,000 | | | | 3,901,994 | |
France Government Bond (EUR) | | | 2.50 | | | | 10-25-2020 | | | | 3,100,000 | | | | 3,888,763 | |
France Government Bond (EUR) | | | 2.50 | | | | 5-25-2030 | | | | 2,375,000 | | | | 3,381,495 | |
France Government Bond (EUR) | | | 2.75 | | | | 10-25-2027 | | | | 3,300,000 | | | | 4,689,429 | |
France Government Bond (EUR) | | | 3.00 | | | | 4-25-2022 | | | | 2,675,000 | | | | 3,555,077 | |
France Government Bond (EUR) | | | 3.25 | | | | 10-25-2021 | | | | 3,500,000 | | | | 4,641,993 | |
France Government Bond (EUR) | | | 3.25 | | | | 5-25-2045 | | | | 1,150,000 | | | | 2,015,318 | |
France Government Bond (EUR) | | | 3.50 | | | | 4-25-2020 | | | | 2,900,000 | | | | 3,712,463 | |
France Government Bond (EUR) | | | 3.50 | | | | 4-25-2026 | | | | 3,200,000 | | | | 4,734,292 | |
France Government Bond (EUR) | | | 3.75 | | | | 10-25-2019 | | | | 3,150,000 | | | | 3,992,005 | |
France Government Bond (EUR) | | | 3.75 | | | | 4-25-2021 | | | | 3,750,000 | | | | 5,004,258 | |
France Government Bond (EUR) | | | 4.00 | | | | 4-25-2018 | | | | 2,700,000 | | | | 3,239,721 | |
France Government Bond (EUR) | | | 4.00 | | | | 10-25-2038 | | | | 2,350,000 | | | | 4,327,234 | |
France Government Bond (EUR) | | | 4.00 | | | | 4-25-2055 | | | | 1,475,000 | | | | 3,112,508 | |
France Government Bond (EUR) | | | 4.00 | | | | 4-25-2060 | | | | 1,000,000 | | | | 2,174,463 | |
France Government Bond (EUR) | | | 4.25 | | | | 10-25-2017 | | | | 3,100,000 | | | | 3,650,480 | |
France Government Bond (EUR) | | | 4.25 | | | | 10-25-2018 | | | | 2,750,000 | | | | 3,386,200 | |
France Government Bond (EUR) | | | 4.25 | | | | 4-25-2019 | | | | 2,950,000 | | | | 3,711,555 | |
France Government Bond (EUR) | | | 4.25 | | | | 10-25-2023 | | | | 3,825,000 | | | | 5,645,135 | |
France Government Bond (EUR) | | | 4.50 | | | | 4-25-2041 | | | | 2,200,000 | | | | 4,441,266 | |
France Government Bond (EUR) | | | 4.75 | | | | 4-25-2035 | | | | 2,550,000 | | | | 4,885,737 | |
| | | | |
| 82 | | Wells Fargo Diversified Fixed Income Portfolio | | Portfolio of investments—August 31, 2016 (unaudited) |
| | | | | | | | | | | | | | | | |
| Security name | | Interest rate | | | Maturity date | | | Principal | | | Value | |
| | | | |
Foreign Government Bonds @ (continued) | | | | | | | | | | | | | | | | |
France Government Bond (EUR) | | | 5.50 | % | | | 4-25-2029 | | | | 2,575,000 | | | $ | 4,718,974 | |
France Government Bond (EUR) | | | 5.75 | | | | 10-25-2032 | | | | 2,600,000 | | | | 5,247,482 | |
France Government Bond (EUR) | | | 6.00 | | | | 10-25-2025 | | | | 1,750,000 | | | | 3,018,389 | |
France Government Bond (EUR) | | | 8.25 | | | | 4-25-2022 | | | | 650,000 | | | | 1,081,433 | |
France Government Bond (EUR) | | | 8.50 | | | | 10-25-2019 | | | | 650,000 | | | | 932,737 | |
France Government Bond (EUR) | | | 8.50 | | | | 4-25-2023 | | | | 1,050,000 | | | | 1,860,476 | |
Italy Buoni Poliennali del Tesoro (EUR) | | | 0.10 | | | | 4-15-2019 | | | | 900,000 | | | | 1,007,017 | |
Italy Buoni Poliennali del Tesoro (EUR) | | | 0.25 | | | | 5-15-2018 | | | | 1,500,000 | | | | 1,682,826 | |
Italy Buoni Poliennali del Tesoro (EUR) | | | 0.30 | | | | 10-15-2018 | | | | 500,000 | | | | 561,908 | |
Italy Buoni Poliennali del Tesoro (EUR) | | | 0.45 | | | | 6-1-2021 | | | | 1,250,000 | | | | 1,408,103 | |
Italy Buoni Poliennali del Tesoro (EUR) | | | 0.65 | | | | 11-1-2020 | | | | 500,000 | | | | 570,218 | |
Italy Buoni Poliennali del Tesoro (EUR) | | | 0.70 | | | | 5-1-2020 | | | | 1,500,000 | | | | 1,712,997 | |
Italy Buoni Poliennali del Tesoro (EUR) | | | 0.75 | | | | 1-15-2018 | | | | 1,500,000 | | | | 1,693,401 | |
Italy Buoni Poliennali del Tesoro (EUR) | | | 0.95 | | | | 3-15-2023 | | | | 1,750,000 | | | | 1,997,171 | |
Italy Buoni Poliennali del Tesoro (EUR) | | | 1.05 | | | | 12-1-2019 | | | | 1,000,000 | | | | 1,153,380 | |
Italy Buoni Poliennali del Tesoro (EUR) | | | 1.25 | | | | 12-1-2026 | | | | 750,000 | | | | 841,375 | |
Italy Buoni Poliennali del Tesoro (EUR) | | | 1.35 | | | | 4-15-2022 | | | | 1,600,000 | | | | 1,877,169 | |
Italy Buoni Poliennali del Tesoro (EUR) | | | 1.45 | | | | 9-15-2022 | | | | 1,400,000 | | | | 1,651,580 | |
Italy Buoni Poliennali del Tesoro (EUR) | | | 1.50 | | | | 8-1-2019 | | | | 1,500,000 | | | | 1,746,815 | |
Italy Buoni Poliennali del Tesoro (EUR) | | | 1.50 | | | | 6-1-2025 | | | | 1,500,000 | | | | 1,747,146 | |
Italy Buoni Poliennali del Tesoro (EUR) | | | 1.60 | | | | 6-1-2026 | | | | 1,500,000 | | | | 1,743,263 | |
Italy Buoni Poliennali del Tesoro (EUR) 144A | | | 1.65 | | | | 3-1-2032 | | | | 1,000,000 | | | | 1,139,999 | |
Italy Buoni Poliennali del Tesoro (EUR) | | | 2.00 | | | | 12-1-2025 | | | | 2,000,000 | | | | 2,414,794 | |
Italy Buoni Poliennali del Tesoro (EUR) | | | 2.15 | | | | 12-15-2021 | | | | 1,500,000 | | | | 1,831,399 | |
Italy Buoni Poliennali del Tesoro (EUR) 144A | | | 2.25 | | | | 9-1-2036 | | | | 1,000,000 | | | | 1,203,294 | |
Italy Buoni Poliennali del Tesoro (EUR) | | | 2.50 | | | | 5-1-2019 | | | | 1,800,000 | | �� | | 2,141,944 | |
Italy Buoni Poliennali del Tesoro (EUR) | | | 2.50 | | | | 12-1-2024 | | | | 1,450,000 | | | | 1,820,849 | |
Italy Buoni Poliennali del Tesoro (EUR) 144A | | | 2.70 | | | | 3-1-2047 | | | | 1,000,000 | | | | 1,238,915 | |
Italy Buoni Poliennali del Tesoro (EUR) 144A | | | 3.25 | | | | 9-1-2046 | | | | 1,150,000 | | | | 1,596,379 | |
Italy Buoni Poliennali del Tesoro (EUR) | | | 3.50 | | | | 11-1-2017 | | | | 1,500,000 | | | | 1,744,637 | |
Italy Buoni Poliennali del Tesoro (EUR) | | | 3.50 | | | | 6-1-2018 | | | | 1,525,000 | | | | 1,807,369 | |
Italy Buoni Poliennali del Tesoro (EUR) | | | 3.50 | | | | 12-1-2018 | | | | 1,700,000 | | | | 2,048,080 | |
Italy Buoni Poliennali del Tesoro (EUR) 144A | | | 3.50 | | | | 3-1-2030 | | | | 1,300,000 | | | | 1,823,230 | |
Italy Buoni Poliennali del Tesoro (EUR) | | | 3.75 | | | | 3-1-2021 | | | | 2,200,000 | | | | 2,846,874 | |
Italy Buoni Poliennali del Tesoro (EUR) | | | 3.75 | | | | 5-1-2021 | | | | 1,800,000 | | | | 2,335,330 | |
Italy Buoni Poliennali del Tesoro (EUR) | | | 3.75 | | | | 8-1-2021 | | | | 2,750,000 | | | | 3,591,722 | |
Italy Buoni Poliennali del Tesoro (EUR) | | | 3.75 | | | | 9-1-2024 | | | | 1,800,000 | | | | 2,451,818 | |
Italy Buoni Poliennali del Tesoro (EUR) | | | 4.00 | | | | 9-1-2020 | | | | 2,000,000 | | | | 2,579,349 | |
Italy Buoni Poliennali del Tesoro (EUR) | | | 4.00 | | | | 2-1-2037 | | | | 2,000,000 | | | | 3,058,564 | |
Italy Buoni Poliennali del Tesoro (EUR) | | | 4.25 | | | | 2-1-2019 | | | | 2,550,000 | | | | 3,139,334 | |
Italy Buoni Poliennali del Tesoro (EUR) | | | 4.25 | | | | 9-1-2019 | | | | 2,250,000 | | | | 2,829,908 | |
Italy Buoni Poliennali del Tesoro (EUR) | | | 4.25 | | | | 3-1-2020 | | | | 2,450,000 | | | | 3,134,703 | |
Italy Buoni Poliennali del Tesoro (EUR) | | | 4.50 | | | | 2-1-2018 | | | | 2,150,000 | | | | 2,554,822 | |
Italy Buoni Poliennali del Tesoro (EUR) | | | 4.50 | | | | 8-1-2018 | | | | 2,500,000 | | | | 3,032,351 | |
Italy Buoni Poliennali del Tesoro (EUR) | | | 4.50 | | | | 3-1-2019 | | | | 2,250,000 | | | | 2,794,380 | |
Italy Buoni Poliennali del Tesoro (EUR) | | | 4.50 | | | | 2-1-2020 | | | | 2,300,000 | | | | 2,955,466 | |
Italy Buoni Poliennali del Tesoro (EUR) | | | 4.50 | | | | 5-1-2023 | | | | 1,500,000 | | | | 2,099,536 | |
Italy Buoni Poliennali del Tesoro (EUR) | | | 4.50 | | | | 3-1-2024 | | | | 1,800,000 | | | | 2,549,919 | |
Italy Buoni Poliennali del Tesoro (EUR) | | | 4.50 | | | | 3-1-2026 | | | | 1,775,000 | | | | 2,590,814 | |
Italy Buoni Poliennali del Tesoro (EUR) | | | 4.75 | | | | 9-1-2021 | | | | 2,450,000 | | | | 3,339,945 | |
| | | | | | |
| Portfolio of investments—August 31, 2016 (unaudited) | | Wells Fargo Diversified Fixed Income Portfolio | | | 83 | |
| | | | | | | | | | | | | | | | |
| Security name | | Interest rate | | | Maturity date | | | Principal | | | Value | |
| | | | |
Foreign Government Bonds @ (continued) | | | | | | | | | | | | | | | | |
Italy Buoni Poliennali del Tesoro (EUR) 144A | | | 4.75 | % | | | 8-1-2023 | | | | 2,000,000 | | | $ | 2,857,096 | |
Italy Buoni Poliennali del Tesoro (EUR) 144A | | | 4.75 | | | | 9-1-2028 | | | | 1,300,000 | | | | 2,002,420 | |
Italy Buoni Poliennali del Tesoro (EUR) 144A | | | 4.75 | | | | 9-1-2044 | | | | 1,300,000 | | | | 2,259,163 | |
Italy Buoni Poliennali del Tesoro (EUR) | | | 5.00 | | | | 3-1-2022 | | | | 1,900,000 | | | | 2,649,699 | |
Italy Buoni Poliennali del Tesoro (EUR) 144A | | | 5.00 | | | | 3-1-2025 | | | | 2,200,000 | | | | 3,266,016 | |
Italy Buoni Poliennali del Tesoro (EUR) | | | 5.00 | | | | 8-1-2034 | | | | 2,150,000 | | | | 3,625,530 | |
Italy Buoni Poliennali del Tesoro (EUR) | | | 5.00 | | | | 8-1-2039 | | | | 1,700,000 | | | | 2,964,052 | |
Italy Buoni Poliennali del Tesoro (EUR) | | | 5.00 | | | | 9-1-2040 | | | | 2,000,000 | | | | 3,496,624 | |
Italy Buoni Poliennali del Tesoro (EUR) | | | 5.25 | | | | 11-1-2029 | | | | 2,700,000 | | | | 4,406,531 | |
Italy Buoni Poliennali del Tesoro (EUR) | | | 5.50 | | | | 9-1-2022 | | | | 1,350,000 | | | | 1,953,625 | |
Italy Buoni Poliennali del Tesoro (EUR) | | | 5.50 | | | | 11-1-2022 | | | | 2,000,000 | | | | 2,904,307 | |
Italy Buoni Poliennali del Tesoro (EUR) | | | 5.75 | | | | 2-1-2033 | | | | 1,600,000 | | | | 2,859,126 | |
Italy Buoni Poliennali del Tesoro (EUR) | | | 6.00 | | | | 5-1-2031 | | | | 2,425,000 | | | | 4,310,094 | |
Italy Buoni Poliennali del Tesoro (EUR) | | | 6.50 | | | | 11-1-2027 | | | | 2,550,000 | | | | 4,395,061 | |
Italy Buoni Poliennali del Tesoro (EUR) | | | 7.25 | | | | 11-1-2026 | | | | 950,000 | | | | 1,678,002 | |
Italy Buoni Poliennali del Tesoro (EUR) | | | 9.00 | | | | 11-1-2023 | | | | 1,230,000 | | | | 2,166,902 | |
Japan Government Five Year Bond Series 106 (JPY) | | | 0.20 | | | | 9-20-2017 | | | | 1,050,000,000 | | | | 10,192,302 | |
Japan Government Five Year Bond Series 107 (JPY) | | | 0.20 | | | | 12-20-2017 | | | | 650,000,000 | | | | 6,316,494 | |
Japan Government Five Year Bond Series 110 (JPY) | | | 0.30 | | | | 3-20-2018 | | | | 300,000,000 | | | | 2,922,612 | |
Japan Government Five Year Bond Series 111 (JPY) | | | 0.40 | | | | 3-20-2018 | | | | 350,000,000 | | | | 3,414,855 | |
Japan Government Five Year Bond Series 112 (JPY) | | | 0.40 | | | | 6-20-2018 | | | | 400,000,000 | | | | 3,908,529 | |
Japan Government Five Year Bond Series 113 (JPY) | | | 0.30 | | | | 6-20-2018 | | | | 800,000,000 | | | | 7,802,755 | |
Japan Government Five Year Bond Series 117 (JPY) | | | 0.20 | | | | 3-20-2019 | | | | 625,000,000 | | | | 6,100,674 | |
Japan Government Five Year Bond Series 125 (JPY) | | | 0.10 | | | | 9-20-2020 | | | | 300,000,000 | | | | 2,932,934 | |
Japan Government Five Year Bond Series 126 (JPY) | | | 0.10 | | | | 12-20-2020 | | | | 400,000,000 | | | | 3,913,169 | |
Japan Government Five Year Bond Series 127 (JPY) | | | 0.10 | | | | 3-20-2021 | | | | 500,000,000 | | | | 4,894,892 | |
Japan Government Forty Year Bond Series 1 (JPY) | | | 2.40 | | | | 3-20-2048 | | | | 261,500,000 | | | | 3,979,936 | |
Japan Government Forty Year Bond Series 2 (JPY) | | | 2.20 | | | | 3-20-2049 | | | | 241,000,000 | | | | 3,569,358 | |
Japan Government Forty Year Bond Series 3 (JPY) | | | 2.20 | | | | 3-20-2050 | | | | 448,000,000 | | | | 6,680,273 | |
Japan Government Forty Year Bond Series 5 (JPY) | | | 2.00 | | | | 3-20-2052 | | | | 225,000,000 | | | | 3,267,475 | |
Japan Government Forty Year Bond Series 6 (JPY) | | | 1.90 | | | | 3-20-2053 | | | | 175,000,000 | | | | 2,502,585 | |
Japan Government Forty Year Bond Series 7 (JPY) | | | 1.70 | | | | 3-20-2054 | | | | 450,000,000 | | | | 6,178,481 | |
Japan Government Forty Year Bond Series 8 (JPY) | | | 1.40 | | | | 3-20-2055 | | | | 300,000,000 | | | | 3,838,168 | |
Japan Government Forty Year Bond Series 9 (JPY) | | | 0.40 | | | | 3-20-2056 | | | | 250,000,000 | | | | 2,348,765 | |
Japan Government Ten Year Bond Series 288 (JPY) | | | 1.70 | | | | 9-20-2017 | | | | 700,000,000 | | | | 6,902,305 | |
Japan Government Ten Year Bond Series 289 (JPY) | | | 1.50 | | | | 12-20-2017 | | | | 1,000,000,000 | | | | 9,881,119 | |
Japan Government Ten Year Bond Series 290 (JPY) | | | 1.40 | | | | 3-20-2018 | | | | 475,000,000 | | | | 4,705,560 | |
Japan Government Ten Year Bond Series 291 (JPY) | | | 1.30 | | | | 3-20-2018 | | | | 925,000,000 | | | | 9,149,601 | |
Japan Government Ten Year Bond Series 292 (JPY) | | | 1.70 | | | | 3-20-2018 | | | | 400,000,000 | | | | 3,980,554 | |
Japan Government Ten Year Bond Series 293 (JPY) | | | 1.80 | | | | 6-20-2018 | | | | 550,000,000 | | | | 5,507,495 | |
Japan Government Ten Year Bond Series 294 (JPY) | | | 1.70 | | | | 6-20-2018 | | | | 300,000,000 | | | | 2,998,869 | |
Japan Government Ten Year Bond Series 296 (JPY) | | | 1.50 | | | | 9-20-2018 | | | | 630,000,000 | | | | 6,301,948 | |
Japan Government Ten Year Bond Series 297 (JPY) | | | 1.40 | | | | 12-20-2018 | | | | 525,000,000 | | | | 5,259,996 | |
Japan Government Ten Year Bond Series 298 (JPY) | | | 1.30 | | | | 12-20-2018 | | | | 550,000,000 | | | | 5,498,086 | |
Japan Government Ten Year Bond Series 299 (JPY) | | | 1.30 | | | | 3-20-2019 | | | | 500,000,000 | | | | 5,016,237 | |
Japan Government Ten Year Bond Series 300 (JPY) | | | 1.50 | | | | 3-20-2019 | | | | 375,000,000 | | | | 3,780,735 | |
Japan Government Ten Year Bond Series 301 (JPY) | | | 1.50 | | | | 6-20-2019 | | | | 620,000,000 | | | | 6,276,523 | |
Japan Government Ten Year Bond Series 302 (JPY) | | | 1.40 | | | | 6-20-2019 | | | | 600,000,000 | | | | 6,057,933 | |
Japan Government Ten Year Bond Series 303 (JPY) | | | 1.40 | | | | 9-20-2019 | | | | 970,000,000 | | | | 9,831,252 | |
Japan Government Ten Year Bond Series 304 (JPY) | | | 1.30 | | | | 9-20-2019 | | | | 500,000,000 | | | | 5,052,820 | |
| | | | |
| 84 | | Wells Fargo Diversified Fixed Income Portfolio | | Portfolio of investments—August 31, 2016 (unaudited) |
| | | | | | | | | | | | | | | | |
| Security name | | Interest rate | | | Maturity date | | | Principal | | | Value | |
| | | | |
Foreign Government Bonds @ (continued) | | | | | | | | | | | | | | | | |
Japan Government Ten Year Bond Series 305 (JPY) | | | 1.30 | % | | | 12-20-2019 | | | | 1,000,000,000 | | | $ | 10,140,241 | |
Japan Government Ten Year Bond Series 306 (JPY) | | | 1.40 | | | | 3-20-2020 | | | | 460,000,000 | | | | 4,697,677 | |
Japan Government Ten Year Bond Series 309 (JPY) | | | 1.10 | | | | 6-20-2020 | | | | 600,000,000 | | | | 6,082,521 | |
Japan Government Ten Year Bond Series 311 (JPY) | | | 0.80 | | | | 9-20-2020 | | | | 702,000,000 | | | | 7,056,842 | |
Japan Government Ten Year Bond Series 312 (JPY) | | | 1.20 | | | | 12-20-2020 | | | | 650,000,000 | | | | 6,656,304 | |
Japan Government Ten Year Bond Series 313 (JPY) | | | 1.30 | | | | 3-20-2021 | | | | 517,000,000 | | | | 5,331,698 | |
Japan Government Ten Year Bond Series 315 (JPY) | | | 1.20 | | | | 6-20-2021 | | | | 865,000,000 | | | | 8,912,347 | |
Japan Government Ten Year Bond Series 317 (JPY) | | | 1.10 | | | | 9-20-2021 | | | | 200,000,000 | | | | 2,058,203 | |
Japan Government Ten Year Bond Series 318 (JPY) | | | 1.00 | | | | 9-20-2021 | | | | 725,000,000 | | | | 7,425,320 | |
Japan Government Ten Year Bond Series 320 (JPY) | | | 1.00 | | | | 12-20-2021 | | | | 725,000,000 | | | | 7,446,552 | |
Japan Government Ten Year Bond Series 321 (JPY) | | | 1.00 | | | | 3-20-2022 | | | | 600,000,000 | | | | 6,179,713 | |
Japan Government Ten Year Bond Series 322 (JPY) | | | 0.90 | | | | 3-20-2022 | | | | 400,000,000 | | | | 4,098,159 | |
Japan Government Ten Year Bond Series 324 (JPY) | | | 0.80 | | | | 6-20-2022 | | | | 500,000,000 | | | | 5,110,134 | |
Japan Government Ten Year Bond Series 325 (JPY) | | | 0.80 | | | | 9-20-2022 | | | | 450,000,000 | | | | 4,610,907 | |
Japan Government Ten Year Bond Series 326 (JPY) | | | 0.70 | | | | 12-20-2022 | | | | 600,000,000 | | | | 6,126,652 | |
Japan Government Ten Year Bond Series 327 (JPY) | | | 0.80 | | | | 12-20-2022 | | | | 750,000,000 | | | | 7,703,982 | |
Japan Government Ten Year Bond Series 328 (JPY) | | | 0.60 | | | | 3-20-2023 | | | | 1,150,000,000 | | | | 11,691,620 | |
Japan Government Ten Year Bond Series 329 (JPY) | | | 0.80 | | | | 6-20-2023 | | | | 900,000,000 | | | | 9,287,315 | |
Japan Government Ten Year Bond Series 332 (JPY) | | | 0.60 | | | | 12-20-2023 | | | | 500,000,000 | | | | 5,107,863 | |
Japan Government Ten Year Bond Series 333 (JPY) | | | 0.60 | | | | 3-20-2024 | | | | 500,000,000 | | | | 5,113,372 | |
Japan Government Ten Year Bond Series 335 (JPY) | | | 0.50 | | | | 9-20-2024 | | | | 500,000,000 | | | | 5,084,666 | |
Japan Government Ten Year Bond Series 337 (JPY) | | | 0.30 | | | | 12-20-2024 | | | | 800,000,000 | | | | 8,012,217 | |
Japan Government Ten Year Bond Series 338 (JPY) | | | 0.40 | | | | 3-20-2025 | | | | 175,000,000 | | | | 1,767,760 | |
Japan Government Ten Year Bond Series 339 (JPY) | | | 0.40 | | | | 6-20-2025 | | | | 500,000,000 | | | | 5,052,771 | |
Japan Government Ten Year Bond Series 340 (JPY) | | | 0.40 | | | | 9-20-2025 | | | | 450,000,000 | | | | 4,551,017 | |
Japan Government Ten Year Bond Series 341 (JPY) | | | 0.30 | | | | 12-20-2025 | | | | 500,000,000 | | | | 5,012,371 | |
Japan Government Ten Year Bond Series 342 (JPY) | | | 0.10 | | | | 3-20-2026 | | | | 300,000,000 | | | | 2,949,316 | |
Japan Government Ten Year Bond Series 343 (JPY) | | | 0.10 | | | | 6-20-2026 | | | | 500,000,000 | | | | 4,913,401 | |
Japan Government Thirty Year Bond Series 03 (JPY) | | | 2.30 | | | | 5-20-2030 | | | | 100,000,000 | | | | 1,261,441 | |
Japan Government Thirty Year Bond Series 04 (JPY) | | | 2.90 | | | | 11-20-2030 | | | | 40,000,000 | | | | 540,828 | |
Japan Government Thirty Year Bond Series 11 (JPY) | | | 1.70 | | | | 6-20-2033 | | | | 247,000,000 | | | | 2,982,716 | |
Japan Government Thirty Year Bond Series 14 (JPY) | | | 2.40 | | | | 3-20-2034 | | | | 125,000,000 | | | | 1,657,771 | |
Japan Government Thirty Year Bond Series 15 (JPY) | | | 2.50 | | | | 6-20-2034 | | | | 245,000,000 | | | | 3,298,153 | |
Japan Government Thirty Year Bond Series 16 (JPY) | | | 2.50 | | | | 9-20-2034 | | | | 150,000,000 | | | | 2,024,235 | |
Japan Government Thirty Year Bond Series 18 (JPY) | | | 2.30 | | | | 3-20-2035 | | | | 715,500,000 | | | | 9,439,358 | |
Japan Government Thirty Year Bond Series 23 (JPY) | | | 2.50 | | | | 6-20-2036 | | | | 375,000,000 | | | | 5,128,727 | |
Japan Government Thirty Year Bond Series 25 (JPY) | | | 2.30 | | | | 12-20-2036 | | | | 240,000,000 | | | | 3,203,495 | |
Japan Government Thirty Year Bond Series 26 (JPY) | | | 2.40 | | | | 3-20-2037 | | | | 300,000,000 | | | | 4,071,464 | |
Japan Government Thirty Year Bond Series 27 (JPY) | | | 2.50 | | | | 9-20-2037 | | | | 140,000,000 | | | | 1,940,136 | |
Japan Government Thirty Year Bond Series 28 (JPY) | | | 2.50 | | | | 3-20-2038 | | | | 225,000,000 | | | | 3,136,387 | |
Japan Government Thirty Year Bond Series 29 (JPY) | | | 2.40 | | | | 9-20-2038 | | | | 130,000,000 | | | | 1,796,152 | |
Japan Government Thirty Year Bond Series 30 (JPY) | | | 2.30 | | | | 3-20-2039 | | | | 210,000,000 | | | | 2,875,842 | |
Japan Government Thirty Year Bond Series 31 (JPY) | | | 2.20 | | | | 9-20-2039 | | | | 255,000,000 | | | | 3,455,396 | |
Japan Government Thirty Year Bond Series 32 (JPY) | | | 2.30 | | | | 3-20-2040 | | | | 300,000,000 | | | | 4,150,969 | |
Japan Government Thirty Year Bond Series 34 (JPY) | | | 2.20 | | | | 3-20-2041 | | | | 400,000,000 | | | | 5,501,107 | |
Japan Government Thirty Year Bond Series 36 (JPY) | | | 2.00 | | | | 3-20-2042 | | | | 490,000,000 | | | | 6,575,704 | |
Japan Government Thirty Year Bond Series 37 (JPY) | | | 1.90 | | | | 9-20-2042 | | | | 500,000,000 | | | | 6,618,905 | |
Japan Government Thirty Year Bond Series 38 (JPY) | | | 1.80 | | | | 3-20-2043 | | | | 325,000,000 | | | | 4,244,177 | |
Japan Government Thirty Year Bond Series 42 (JPY) | | | 1.70 | | | | 3-20-2044 | | | | 725,000,000 | | | | 9,359,868 | |
Japan Government Twenty Year Bond Series 037 (JPY) | | | 3.10 | | | | 9-20-2017 | | | | 250,000,000 | | | | 2,500,677 | |
| | | | | | |
| Portfolio of investments—August 31, 2016 (unaudited) | | Wells Fargo Diversified Fixed Income Portfolio | | | 85 | |
| | | | | | | | | | | | | | | | |
| Security name | | Interest rate | | | Maturity date | | | Principal | | | Value | |
| | | | |
Foreign Government Bonds @ (continued) | | | | | | | | | | | | | | | | |
Japan Government Twenty Year Bond Series 041 (JPY) | | | 1.50 | % | | | 3-20-2019 | | | | 295,000,000 | | | $ | 2,974,920 | |
Japan Government Twenty Year Bond Series 045 (JPY) | | | 2.40 | | | | 3-20-2020 | | | | 430,000,000 | | | | 4,537,848 | |
Japan Government Twenty Year Bond Series 048 (JPY) | | | 2.50 | | | | 12-21-2020 | | | | 100,000,000 | | | | 1,078,017 | |
Japan Government Twenty Year Bond Series 050 (JPY) | | | 1.90 | | | | 3-22-2021 | | | | 429,000,000 | | | | 4,540,024 | |
Japan Government Twenty Year Bond Series 052 (JPY) | | | 2.10 | | | | 9-21-2021 | | | | 408,000,000 | | | | 4,397,796 | |
Japan Government Twenty Year Bond Series 055 (JPY) | | | 2.00 | | | | 3-21-2022 | | | | 300,000,000 | | | | 3,251,650 | |
Japan Government Twenty Year Bond Series 058 (JPY) | | | 1.90 | | | | 9-20-2022 | | | | 560,000,000 | | | | 6,098,866 | |
Japan Government Twenty Year Bond Series 059 (JPY) | | | 1.70 | | | | 12-20-2022 | | | | 100,000,000 | | | | 1,081,873 | |
Japan Government Twenty Year Bond Series 060 (JPY) | | | 1.40 | | | | 12-20-2022 | | | | 100,000,000 | | | | 1,063,886 | |
Japan Government Twenty Year Bond Series 062 (JPY) | | | 0.80 | | | | 6-20-2023 | | | | 257,000,000 | | | | 2,651,498 | |
Japan Government Twenty Year Bond Series 064 (JPY) | | | 1.90 | | | | 9-20-2023 | | | | 428,500,000 | | | | 4,754,604 | |
Japan Government Twenty Year Bond Series 067 (JPY) | | | 1.90 | | | | 3-20-2024 | | | | 678,000,000 | | | | 7,579,590 | |
Japan Government Twenty Year Bond Series 070 (JPY) | | | 2.40 | | | | 6-20-2024 | | | | 293,000,000 | | | | 3,399,610 | |
Japan Government Twenty Year Bond Series 073 (JPY) | | | 2.00 | | | | 12-20-2024 | | | | 898,500,000 | | | | 10,230,299 | |
Japan Government Twenty Year Bond Series 076 (JPY) | | | 1.90 | | | | 3-20-2025 | | | | 300,000,000 | | | | 3,406,253 | |
Japan Government Twenty Year Bond Series 082 (JPY) | | | 2.10 | | | | 9-20-2025 | | | | 455,000,000 | | | | 5,279,434 | |
Japan Government Twenty Year Bond Series 086 (JPY) | | | 2.30 | | | | 3-20-2026 | | | | 555,000,000 | | | | 6,585,492 | |
Japan Government Twenty Year Bond Series 088 (JPY) | | | 2.30 | | | | 6-20-2026 | | | | 375,000,000 | | | | 4,467,743 | |
Japan Government Twenty Year Bond Series 090 (JPY) | | | 2.20 | | | | 9-20-2026 | | | | 250,000,000 | | | | 2,968,033 | |
Japan Government Twenty Year Bond Series 092 (JPY) | | | 2.10 | | | | 12-20-2026 | | | | 230,000,000 | | | | 2,716,007 | |
Japan Government Twenty Year Bond Series 095 (JPY) | | | 2.30 | | | | 6-20-2027 | | | | 165,000,000 | | | | 1,996,346 | |
Japan Government Twenty Year Bond Series 097 (JPY) | | | 2.20 | | | | 9-20-2027 | | | | 200,000,000 | | | | 2,408,989 | |
Japan Government Twenty Year Bond Series 099 (JPY) | | | 2.10 | | | | 12-20-2027 | | | | 100,000,000 | | | | 1,198,251 | |
Japan Government Twenty Year Bond Series 100 (JPY) | | | 2.20 | | | | 3-20-2028 | | | | 250,000,000 | | | | 3,033,079 | |
Japan Government Twenty Year Bond Series 102 (JPY) | | | 2.40 | | | | 6-20-2028 | | | | 210,000,000 | | | | 2,606,748 | |
Japan Government Twenty Year Bond Series 105 (JPY) | | | 2.10 | | | | 9-20-2028 | | | | 200,000,000 | | | | 2,421,515 | |
Japan Government Twenty Year Bond Series 108 (JPY) | | | 1.90 | | | | 12-20-2028 | | | | 322,000,000 | | | | 3,834,123 | |
Japan Government Twenty Year Bond Series 110 (JPY) | | | 2.10 | | | | 3-20-2029 | | | | 530,000,000 | | | | 6,450,873 | |
Japan Government Twenty Year Bond Series 112 (JPY) | | | 2.10 | | | | 6-20-2029 | | | | 173,000,000 | | | | 2,111,916 | |
Japan Government Twenty Year Bond Series 113 (JPY) | | | 2.10 | | | | 9-20-2029 | | | | 350,000,000 | | | | 4,289,001 | |
Japan Government Twenty Year Bond Series 115 (JPY) | | | 2.20 | | | | 12-20-2029 | | | | 160,000,000 | | | | 1,986,913 | |
Japan Government Twenty Year Bond Series 116 (JPY) | | | 2.20 | | | | 3-20-2030 | | | | 100,000,000 | | | | 1,245,890 | |
Japan Government Twenty Year Bond Series 117 (JPY) | | | 2.10 | | | | 3-20-2030 | | | | 200,000,000 | | | | 2,465,781 | |
Japan Government Twenty Year Bond Series 118 (JPY) | | | 2.00 | | | | 6-20-2030 | | | | 70,000,000 | | | | 856,731 | |
Japan Government Twenty Year Bond Series 120 (JPY) | | | 1.60 | | | | 6-20-2030 | | | | 326,500,000 | | | | 3,823,709 | |
Japan Government Twenty Year Bond Series 121 (JPY) | | | 1.90 | | | | 9-20-2030 | | | | 235,000,000 | | | | 2,852,684 | |
Japan Government Twenty Year Bond Series 123 (JPY) | | | 2.10 | | | | 12-20-2030 | | | | 240,000,000 | | | | 2,982,806 | |
Japan Government Twenty Year Bond Series 125 (JPY) | | | 2.20 | | | | 3-20-2031 | | | | 100,000,000 | | | | 1,260,001 | |
Japan Government Twenty Year Bond Series 126 (JPY) | | | 2.00 | | | | 3-20-2031 | | | | 160,000,000 | | | | 1,971,573 | |
Japan Government Twenty Year Bond Series 127 (JPY) | | | 1.90 | | | | 3-20-2031 | | | | 155,000,000 | | | | 1,888,164 | |
Japan Government Twenty Year Bond Series 128 (JPY) | | | 1.90 | | | | 6-20-2031 | | | | 515,000,000 | | | | 6,292,990 | |
Japan Government Twenty Year Bond Series 130 (JPY) | | | 1.80 | | | | 9-20-2031 | | | | 125,000,000 | | | | 1,511,260 | |
Japan Government Twenty Year Bond Series 133 (JPY) | | | 1.80 | | | | 12-20-2031 | | | | 390,000,000 | | | | 4,726,288 | |
Japan Government Twenty Year Bond Series 134 (JPY) | | | 1.80 | | | | 3-20-2032 | | | | 100,000,000 | | | | 1,213,715 | |
Japan Government Twenty Year Bond Series 139 (JPY) | | | 1.60 | | | | 6-20-2032 | | | | 250,000,000 | | | | 2,964,191 | |
Japan Government Twenty Year Bond Series 140 (JPY) | | | 1.70 | | | | 9-20-2032 | | | | 600,000,000 | | | | 7,216,585 | |
Japan Government Twenty Year Bond Series 141 (JPY) | | | 1.70 | | | | 12-20-2032 | | | | 300,000,000 | | | | 3,611,598 | |
Japan Government Twenty Year Bond Series 142 (JPY) | | | 1.80 | | | | 12-20-2032 | | | | 300,000,000 | | | | 3,657,092 | |
Japan Government Twenty Year Bond Series 143 (JPY) | | | 1.60 | | | | 3-20-2033 | | | | 300,000,000 | | | | 3,567,844 | |
Japan Government Twenty Year Bond Series 146 (JPY) | | | 1.70 | | | | 9-20-2033 | | | | 550,000,000 | | | | 6,647,789 | |
| | | | |
| 86 | | Wells Fargo Diversified Fixed Income Portfolio | | Portfolio of investments—August 31, 2016 (unaudited) |
| | | | | | | | | | | | | | | | |
| Security name | | Interest rate | | | Maturity date | | | Principal | | | Value | |
| | | | |
Foreign Government Bonds @ (continued) | | | | | | | | | | | | | | | | |
Japan Government Twenty Year Bond Series 147 (JPY) | | | 1.60 | % | | | 12-20-2033 | | | | 500,000,000 | | | $ | 5,969,603 | |
Japan Government Twenty Year Bond Series 148 (JPY) | | | 1.50 | | | | 3-20-2034 | | | | 1,150,000,000 | | | | 13,549,915 | |
Japan Government Twenty Year Bond Series 149 (JPY) | | | 1.50 | | | | 6-20-2034 | | | | 680,000,000 | | | | 8,018,302 | |
Japan Government Twenty Year Bond Series 152 (JPY) | | | 1.20 | | | | 3-20-2035 | | | | 300,000,000 | | | | 3,384,043 | |
Japan Government Twenty Year Bond Series 155 (JPY) | | | 1.00 | | | | 12-20-2035 | | | | 150,000,000 | | | | 1,637,235 | |
Japan Government Twenty Year Bond Series 156 (JPY) | | | 0.40 | | | | 3-20-2036 | | | | 325,000,000 | | | | 3,189,627 | |
Japan Government Twenty Year Bond Series 157 (JPY) | | | 0.20 | | | | 6-20-2036 | | | | 200,000,000 | | | | 1,884,521 | |
Japan Government Twenty Year Bond Series 40 (JPY) | | | 2.30 | | | | 9-20-2018 | | | | 200,000,000 | | | | 2,032,011 | |
Japan Government Twenty Year Bond Series 72 (JPY) | | | 2.10 | | | | 9-20-2024 | | | | 175,000,000 | | | | 1,998,787 | |
Japan Government Twenty Year Bond Series 79 (JPY) | | | 2.00 | | | | 6-20-2025 | | | | 825,000,000 | | | | 9,471,254 | |
Japan Government Two Year Bond Series 360 (JPY) | | | 0.10 | | | | 1-15-2018 | | | | 500,000,000 | | | | 4,853,622 | |
Japan Government Two Year Bond Series 362 (JPY) | | | 0.10 | | | | 3-15-2018 | | | | 250,000,000 | | | | 2,427,753 | |
Japan Government Two Year Bond Series 364 (JPY) | | | 0.10 | | | | 5-15-2018 | | | | 500,000,000 | | | | 4,857,875 | |
Japan Government Two Year Bond Series 367 (JPY) | | | 0.10 | | | | 8-15-2018 | | | | 450,000,000 | | | | 4,374,175 | |
Netherlands Government Bond (EUR) 144A¤ | | | 0.00 | | | | 4-15-2018 | | | | 1,450,000 | | | | 1,633,017 | |
Netherlands Government Bond (EUR) | | | 0.25 | | | | 1-15-2020 | | | | 1,450,000 | | | | 1,664,063 | |
Netherlands Government Bond (EUR) 144A | | | 0.25 | | | | 7-15-2025 | | | | 1,350,000 | | | | 1,549,571 | |
Netherlands Government Bond (EUR) 144A | | | 0.50 | | | | 7-15-2026 | | | | 1,000,000 | | | | 1,166,639 | |
Netherlands Government Bond (EUR) 144A | | | 1.25 | | | | 1-15-2018 | | | | 1,000,000 | | | | 1,144,242 | |
Netherlands Government Bond (EUR) 144A | | | 1.25 | | | | 1-15-2019 | | | | 1,000,000 | | | | 1,165,003 | |
Netherlands Government Bond (EUR) 144A | | | 1.75 | | | | 7-15-2023 | | | | 1,450,000 | | | | 1,851,478 | |
Netherlands Government Bond (EUR) 144A | | | 2.00 | | | | 7-15-2024 | | | | 1,425,000 | | | | 1,867,432 | |
Netherlands Government Bond (EUR) 144A | | | 2.25 | | | | 7-15-2022 | | | | 850,000 | | | | 1,098,177 | |
Netherlands Government Bond (EUR) 144A | | | 2.50 | | | | 1-15-2033 | | | | 1,050,000 | | | | 1,591,262 | |
Netherlands Government Bond (EUR) 144A | | | 2.75 | | | | 1-15-2047 | | | | 1,000,000 | | | | 1,812,247 | |
Netherlands Government Bond (EUR) 144A | | | 3.25 | | | | 7-15-2021 | | | | 1,200,000 | | | | 1,584,577 | |
Netherlands Government Bond (EUR) 144A | | | 3.50 | | | | 7-15-2020 | | | | 1,450,000 | | | | 1,875,806 | |
Netherlands Government Bond (EUR) | | | 3.75 | | | | 1-15-2023 | | | | 970,000 | | | | 1,370,633 | |
Netherlands Government Bond (EUR) 144A | | | 3.75 | | | | 1-15-2042 | | | | 1,350,000 | | | | 2,707,636 | |
Netherlands Government Bond (EUR) 144A | | | 4.00 | | | | 7-15-2018 | | | | 1,450,000 | | | | 1,757,530 | |
Netherlands Government Bond (EUR) 144A | | | 4.00 | | | | 7-15-2019 | | | | 1,450,000 | | | | 1,833,811 | |
Netherlands Government Bond (EUR) 144A | | | 4.00 | | | | 1-15-2037 | | | | 1,228,000 | | | | 2,353,407 | |
Netherlands Government Bond (EUR) | | | 5.50 | | | | 1-15-2028 | | | | 1,050,000 | | | | 1,899,173 | |
Netherlands Government Bond (EUR) | | | 7.50 | | | | 1-15-2023 | | | | 335,000 | | | | 563,771 | |
Spain Government Bond (EUR) 144A | | | 4.00 | | | | 4-30-2020 | | | | 2,025,000 | | | | 2,588,570 | |
Spain Government Bond (EUR) 144A | | | 4.20 | | | | 1-31-2037 | | | | 1,400,000 | | | | 2,222,384 | |
Spain Government Bond (EUR) 144A | | | 4.30 | | | | 10-31-2019 | | | | 1,750,000 | | | | 2,220,033 | |
Spain Government Bond (EUR) 144A | | | 4.60 | | | | 7-30-2019 | | | | 2,000,000 | | | | 2,533,411 | |
Spain Government Bond (EUR) 144A | | | 4.65 | | | | 7-30-2025 | | | | 1,600,000 | | | | 2,357,216 | |
Spain Government Bond (EUR) 144A | | | 4.70 | | | | 7-30-2041 | | | | 1,200,000 | | | | 2,074,420 | |
Spain Government Bond (EUR) 144A | | | 4.80 | | | | 1-31-2024 | | | | 1,650,000 | | | | 2,396,447 | |
Spain Government Bond (EUR) 144A | | | 4.85 | | | | 10-31-2020 | | | | 1,600,000 | | | | 2,143,617 | |
Spain Government Bond (EUR) 144A | | | 4.90 | | | | 7-30-2040 | | | | 1,150,000 | | | | 2,025,747 | |
Spain Government Bond (EUR) 144A | | | 5.50 | | | | 4-30-2021 | | | | 2,150,000 | | | | 3,002,137 | |
Spain Government Bond (EUR) | | | 5.75 | | | | 7-30-2032 | | | | 1,850,000 | | | | 3,324,319 | |
Spain Government Bond (EUR) 144A | | | 5.85 | | | | 1-31-2022 | | | | 2,000,000 | | | | 2,907,220 | |
Spain Government Bond (EUR) 144A | | | 5.90 | | | | 7-30-2026 | | | | 1,500,000 | | | | 2,437,080 | |
Spain Government Bond (EUR) | | | 6.00 | | | | 1-31-2029 | | | | 1,100,000 | | | | 1,894,743 | |
Sweden Government Bond Series 1047 (SEK) | | | 5.00 | | | | 12-1-2020 | | | | 7,590,000 | | | | 1,098,126 | |
Sweden Government Bond Series 1052 (SEK) | | | 4.25 | | | | 3-12-2019 | | | | 8,650,000 | | | | 1,136,638 | |
| | | | | | |
| Portfolio of investments—August 31, 2016 (unaudited) | | Wells Fargo Diversified Fixed Income Portfolio | | | 87 | |
| | | | | | | | | | | | | | | | |
| Security name | | Interest rate | | | Maturity date | | | Principal | | | Value | |
| | | | |
Foreign Government Bonds @ (continued) | | | | | | | | | | | | | | | | |
Sweden Government Bond Series 1053 (SEK) | | | 3.50 | % | | | 3-30-2039 | | | | 3,750,000 | | | $ | 669,460 | |
Sweden Government Bond Series 1054 (SEK) | | | 3.50 | | | | 6-1-2022 | | | | 8,650,000 | | | | 1,237,765 | |
Sweden Government Bond Series 1056 (SEK) | | | 2.25 | | | | 6-1-2032 | | | | 1,000,000 | | | | 145,990 | |
Sweden Government Bond Series 1057 (SEK) | | | 1.50 | | | | 11-13-2023 | | | | 7,300,000 | | | | 960,975 | |
Sweden Government Bond Series 1058 (SEK) | | | 2.50 | | | | 5-12-2025 | | | | 4,900,000 | | | | 703,170 | |
Sweden Government Bond Series 1059 (SEK) | | | 1.00 | | | | 11-12-2026 | | | | 5,000,000 | | | | 636,651 | |
United Kingdom Gilt (GBP) | | | 1.00 | | | | 9-7-2017 | | | | 2,820,000 | | | | 3,735,454 | |
United Kingdom Gilt (GBP) | | | 1.25 | | | | 7-22-2018 | | | | 3,100,000 | | | | 4,156,192 | |
United Kingdom Gilt (GBP) | | | 1.50 | | | | 1-22-2021 | | | | 2,900,000 | | | | 4,022,143 | |
United Kingdom Gilt (GBP) | | | 1.50 | | | | 7-22-2026 | | | | 1,000,000 | | | | 1,423,399 | |
United Kingdom Gilt (GBP) | | | 1.75 | | | | 7-22-2019 | | | | 2,500,000 | | | | 3,436,899 | |
United Kingdom Gilt (GBP) | | | 1.75 | | | | 9-7-2022 | | | | 2,850,000 | | | | 4,066,634 | |
United Kingdom Gilt (GBP) | | | 2.00 | | | | 7-22-2020 | | | | 2,950,000 | | | | 4,146,436 | |
United Kingdom Gilt (GBP) | | | 2.00 | | | | 9-7-2025 | | | | 2,000,000 | | | | 2,964,913 | |
United Kingdom Gilt (GBP) | | | 2.25 | | | | 9-7-2023 | | | | 1,750,000 | | | | 2,598,143 | |
United Kingdom Gilt (GBP) | | | 2.50 | | | | 7-22-2065 | | | | 1,200,000 | | | | 2,410,781 | |
United Kingdom Gilt (GBP) | | | 2.75 | | | | 9-7-2024 | | | | 2,450,000 | | | | 3,804,351 | |
United Kingdom Gilt (GBP) | | | 3.25 | | | | 1-22-2044 | | | | 2,250,000 | | | | 4,318,518 | |
United Kingdom Gilt (GBP) | | | 3.50 | | | | 1-22-2045 | | | | 1,600,000 | | | | 3,230,860 | |
United Kingdom Gilt (GBP) | | | 3.50 | | | | 7-22-2068 | | | | 1,600,000 | | | | 4,097,139 | |
United Kingdom Gilt (GBP) | | | 3.75 | | | | 9-7-2019 | | | | 2,450,000 | | | | 3,571,528 | |
United Kingdom Gilt (GBP) | | | 3.75 | | | | 9-7-2020 | | | | 2,000,000 | | | | 3,008,425 | |
United Kingdom Gilt (GBP) | | | 3.75 | | | | 9-7-2021 | | | | 2,000,000 | | | | 3,090,838 | |
United Kingdom Gilt (GBP) | | | 3.75 | | | | 7-22-2052 | | | | 2,100,000 | | | | 4,848,006 | |
United Kingdom Gilt (GBP) | | | 4.00 | | | | 3-7-2022 | | | | 3,600,000 | | | | 5,702,176 | |
United Kingdom Gilt (GBP) | | | 4.00 | | | | 1-22-2060 | | | | 1,900,000 | | | | 5,003,595 | |
United Kingdom Gilt (GBP) | | | 4.25 | | | | 12-7-2027 | | | | 2,600,000 | | | | 4,715,219 | |
United Kingdom Gilt (GBP) | | | 4.25 | | | | 6-7-2032 | | | | 3,000,000 | | | | 5,813,530 | |
United Kingdom Gilt (GBP) | | | 4.25 | | | | 3-7-2036 | | | | 2,450,000 | | | | 4,983,281 | |
United Kingdom Gilt (GBP) | | | 4.25 | | | | 9-7-2039 | | | | 1,850,000 | | | | 3,908,028 | |
United Kingdom Gilt (GBP) | | | 4.25 | | | | 12-7-2040 | | | | 2,300,000 | | | | 4,938,563 | |
United Kingdom Gilt (GBP) | | | 4.25 | | | | 12-7-2046 | | | | 2,000,000 | | | | 4,619,197 | |
United Kingdom Gilt (GBP) | | | 4.25 | | | | 12-7-2049 | | | | 1,950,000 | | | | 4,702,648 | |
United Kingdom Gilt (GBP) | | | 4.25 | | | | 12-7-2055 | | | | 2,000,000 | | | | 5,245,443 | |
United Kingdom Gilt (GBP) | | | 4.50 | | | | 3-7-2019 | | | | 2,725,000 | | | | 3,975,477 | |
United Kingdom Gilt (GBP) | | | 4.50 | | | | 9-7-2034 | | | | 2,850,000 | | | | 5,849,040 | |
United Kingdom Gilt (GBP) | | | 4.50 | | | | 12-7-2042 | | | | 2,200,000 | | | | 5,013,360 | |
United Kingdom Gilt (GBP) | | | 4.75 | | | | 3-7-2020 | | | | 3,100,000 | | | | 4,736,886 | |
United Kingdom Gilt (GBP) | | | 4.75 | | | | 12-7-2030 | | | | 3,100,000 | | | | 6,175,225 | |
United Kingdom Gilt (GBP) | | | 4.75 | | | | 12-7-2038 | | | | 2,300,000 | | | | 5,124,798 | |
United Kingdom Gilt (GBP) | | | 5.00 | | | | 3-7-2018 | | | | 3,200,000 | | | | 4,513,074 | |
United Kingdom Gilt (GBP) | | | 5.00 | | | | 3-7-2025 | | | | 2,500,000 | | | | 4,510,336 | |
United Kingdom Gilt (GBP) | | | 6.00 | | | | 12-7-2028 | | | | 1,825,000 | | | | 3,852,983 | |
United Kingdom Gilt (GBP) | | | 8.00 | | | | 6-7-2021 | | | | 2,300,000 | | | | 4,136,393 | |
| | | | |
Total Foreign Government Bonds (Cost $1,379,786,537) | | | | | | | | | | | | | | | 1,435,565,122 | |
| | | | | | | | | | | | | | | | |
| | | | |
U.S. Treasury Securities: 22.98% | | | | | | | | | | | | | | | | |
U.S. Treasury Bond | | | 2.25 | | | | 8-15-2046 | | | $ | 2,750,000 | | | | 2,764,609 | |
U.S. Treasury Bond | | | 2.50 | | | | 2-15-2045 | | | | 17,750,000 | | | | 18,746,361 | |
U.S. Treasury Bond | | | 2.50 | | | | 2-15-2046 | | | | 8,000,000 | | | | 8,450,624 | |
| | | | |
| 88 | | Wells Fargo Diversified Fixed Income Portfolio | | Portfolio of investments—August 31, 2016 (unaudited) |
| | | | | | | | | | | | | | | | |
| Security name | | Interest rate | | | Maturity date | | | Principal | | | Value | |
| | | | |
U.S. Treasury Securities (continued) | | | | | | | | | | | | | | | | |
U.S. Treasury Bond | | | 2.50 | % | | | 5-15-2046 | | | $ | 10,000,000 | | | $ | 10,582,030 | |
U.S. Treasury Bond | | | 2.75 | | | | 8-15-2042 | | | | 4,500,000 | | | | 5,004,140 | |
U.S. Treasury Bond | | | 2.75 | | | | 11-15-2042 | | | | 8,250,000 | | | | 9,163,943 | |
U.S. Treasury Bond | | | 2.88 | | | | 5-15-2043 | | | | 9,350,000 | | | | 10,623,938 | |
U.S. Treasury Bond | | | 2.88 | | | | 8-15-2045 | | | | 3,000,000 | | | | 3,411,327 | |
U.S. Treasury Bond | | | 3.00 | | | | 5-15-2042 | | | | 2,000,000 | | | | 2,325,468 | |
U.S. Treasury Bond | | | 3.00 | | | | 11-15-2044 | | | | 16,600,000 | | | | 19,320,840 | |
U.S. Treasury Bond | | | 3.13 | | | | 11-15-2041 | | | | 6,000,000 | | | | 7,123,596 | |
U.S. Treasury Bond | | | 3.13 | | | | 2-15-2042 | | | | 2,250,000 | | | | 2,674,512 | |
U.S. Treasury Bond | | | 3.13 | | | | 2-15-2043 | | | | 6,250,000 | | | | 7,430,419 | |
U.S. Treasury Bond | | | 3.13 | | | | 8-15-2044 | | | | 8,000,000 | | | | 9,528,440 | |
U.S. Treasury Bond | | | 3.38 | | | | 5-15-2044 | | | | 9,000,000 | | | | 11,207,808 | |
U.S. Treasury Bond | | | 3.50 | | | | 2-15-2039 | | | | 3,000,000 | | | | 3,781,875 | |
U.S. Treasury Bond | | | 3.63 | | | | 8-15-2043 | | | | 6,500,000 | | | | 8,442,889 | |
U.S. Treasury Bond | | | 3.63 | | | | 2-15-2044 | | | | 9,750,000 | | | | 12,667,005 | |
U.S. Treasury Bond | | | 3.75 | | | | 8-15-2041 | | | | 2,350,000 | | | | 3,078,683 | |
U.S. Treasury Bond | | | 3.75 | | | | 11-15-2043 | | | | 10,000,000 | | | | 13,279,300 | |
U.S. Treasury Bond | | | 4.25 | | | | 11-15-2040 | | | | 4,500,000 | | | | 6,311,075 | |
U.S. Treasury Bond | | | 4.38 | | | | 2-15-2038 | | | | 1,750,000 | | | | 2,483,086 | |
U.S. Treasury Bond | | | 4.38 | | | | 11-15-2039 | | | | 800,000 | | | | 1,136,062 | |
U.S. Treasury Bond | | | 4.50 | | | | 2-15-2036 | | | | 5,000,000 | | | | 7,144,530 | |
U.S. Treasury Bond | | | 4.50 | | | | 5-15-2038 | | | | 600,000 | | | | 866,437 | |
U.S. Treasury Bond | | | 4.50 | | | | 8-15-2039 | | | | 2,100,000 | | | | 3,030,071 | |
U.S. Treasury Bond | | | 4.75 | | | | 2-15-2037 | | | | 800,000 | | | | 1,180,500 | |
U.S. Treasury Bond | | | 4.75 | | | | 2-15-2041 | | | | 5,200,000 | | | | 7,812,392 | |
U.S. Treasury Bond | | | 5.00 | | | | 5-15-2037 | | | | 800,000 | | | | 1,219,344 | |
U.S. Treasury Bond | | | 5.50 | | | | 8-15-2028 | | | | 1,000,000 | | | | 1,414,766 | |
U.S. Treasury Bond | | | 6.00 | | | | 2-15-2026 | | | | 1,150,000 | | | | 1,602,678 | |
U.S. Treasury Bond | | | 6.13 | | | | 11-15-2027 | | | | 2,400,000 | | | | 3,502,313 | |
U.S. Treasury Bond | | | 6.25 | | | | 5-15-2030 | | | | 3,000,000 | | | | 4,663,710 | |
U.S. Treasury Bond | | | 6.38 | | | | 8-15-2027 | | | | 5,400,000 | | | | 7,978,289 | |
U.S. Treasury Bond | | | 6.50 | | | | 11-15-2026 | | | | 1,500,000 | | | | 2,198,379 | |
U.S. Treasury Bond | | | 6.63 | | | | 2-15-2027 | | | | 950,000 | | | | 1,411,938 | |
U.S. Treasury Note | | | 0.63 | | | | 9-30-2017 | | | | 14,000,000 | | | | 13,985,776 | |
U.S. Treasury Note | | | 0.63 | | | | 11-30-2017 | | | | 7,600,000 | | | | 7,589,018 | |
U.S. Treasury Note | | | 0.63 | | | | 4-30-2018 | | | | 4,000,000 | | | | 3,988,908 | |
U.S. Treasury Note | | | 0.63 | | | | 6-30-2018 | | | | 4,000,000 | | | | 3,987,032 | |
U.S. Treasury Note | | | 0.75 | | | | 10-31-2017 | | | | 10,000,000 | | | | 10,002,730 | |
U.S. Treasury Note | | | 0.75 | | | | 12-31-2017 | | | | 4,000,000 | | | | 3,999,688 | |
U.S. Treasury Note | | | 0.75 | | | | 2-28-2018 | | | | 5,000,000 | | | | 4,997,460 | |
U.S. Treasury Note | | | 0.75 | | | | 3-31-2018 | | | | 3,500,000 | | | | 3,498,359 | |
U.S. Treasury Note | | | 0.75 | | | | 4-30-2018 | | | | 5,000,000 | | | | 4,996,095 | |
U.S. Treasury Note | | | 0.75 | | | | 7-31-2018 | | | | 2,000,000 | | | | 1,997,578 | |
U.S. Treasury Note | | | 0.75 | | | | 8-31-2018 | | | | 5,000,000 | | | | 4,996,289 | |
U.S. Treasury Note | | | 0.75 | | | | 2-15-2019 | | | | 2,500,000 | | | | 2,492,188 | |
U.S. Treasury Note | | | 0.75 | | | | 8-15-2019 | | | | 5,000,000 | | | | 4,978,711 | |
U.S. Treasury Note | | | 0.88 | | | | 11-15-2017 | | | | 5,000,000 | | | | 5,008,400 | |
U.S. Treasury Note | | | 0.88 | | | | 1-31-2018 | | | | 5,000,000 | | | | 5,008,010 | |
U.S. Treasury Note | | | 0.88 | | | | 3-31-2018 | | | | 10,000,000 | | | | 10,012,890 | |
U.S. Treasury Note | | | 0.88 | | | | 5-31-2018 | | | | 6,500,000 | | | | 6,507,365 | |
| | | | | | |
| Portfolio of investments—August 31, 2016 (unaudited) | | Wells Fargo Diversified Fixed Income Portfolio | | | 89 | |
| | | | | | | | | | | | | | | | |
| Security name | | Interest rate | | | Maturity date | | | Principal | | | Value | |
| | | | |
U.S. Treasury Securities (continued) | | | | | | | | | | | | | | | | |
U.S. Treasury Note | | | 0.88 | % | | | 4-15-2019 | | | $ | 5,000,000 | | | $ | 4,997,460 | |
U.S. Treasury Note | | | 0.88 | | | | 5-15-2019 | | | | 5,000,000 | | | | 4,996,875 | |
U.S. Treasury Note | | | 0.88 | | | | 7-31-2019 | | | | 2,500,000 | | | | 2,496,485 | |
U.S. Treasury Note | | | 1.00 | | | | 5-15-2018 | | | | 2,500,000 | | | | 2,508,203 | |
U.S. Treasury Note | | | 1.00 | | | | 5-31-2018 | | | | 7,000,000 | | | | 7,022,694 | |
U.S. Treasury Note | | | 1.00 | | | | 3-15-2019 | | | | 10,000,000 | | | | 10,029,690 | |
U.S. Treasury Note | | | 1.00 | | | | 6-30-2019 | | | | 25,000,000 | | | | 25,060,550 | |
U.S. Treasury Note | | | 1.00 | | | | 9-30-2019 | | | | 23,500,000 | | | | 23,531,208 | |
U.S. Treasury Note | | | 1.00 | | | | 11-30-2019 | | | | 10,000,000 | | | | 10,003,910 | |
U.S. Treasury Note | | | 1.13 | | | | 12-31-2019 | | | | 5,000,000 | | | | 5,020,115 | |
U.S. Treasury Note | | | 1.13 | | | | 4-30-2020 | | | | 15,000,000 | | | | 15,037,500 | |
U.S. Treasury Note | | | 1.13 | | | | 2-28-2021 | | | | 12,500,000 | | | | 12,475,100 | |
U.S. Treasury Note | | | 1.13 | | | | 6-30-2021 | | | | 10,000,000 | | | | 9,964,060 | |
U.S. Treasury Note | | | 1.13 | | | | 7-31-2021 | | | | 10,000,000 | | | | 9,959,770 | |
U.S. Treasury Note | | | 1.13 | | | | 8-31-2021 | | | | 6,500,000 | | | | 6,485,527 | |
U.S. Treasury Note | | | 1.25 | | | | 10-31-2018 | | | | 10,000,000 | | | | 10,083,980 | |
U.S. Treasury Note | | | 1.25 | | | | 11-30-2018 | | | | 10,000,000 | | | | 10,087,110 | |
U.S. Treasury Note | | | 1.25 | | | | 1-31-2019 | | | | 2,500,000 | | | | 2,522,070 | |
U.S. Treasury Note | | | 1.25 | | | | 4-30-2019 | | | | 12,000,000 | | | | 12,113,904 | |
U.S. Treasury Note | | | 1.25 | | | | 1-31-2020 | | | | 7,000,000 | | | | 7,051,954 | |
U.S. Treasury Note | | | 1.25 | | | | 2-29-2020 | | | | 10,000,000 | | | | 10,072,660 | |
U.S. Treasury Note | | | 1.25 | | | | 3-31-2021 | | | | 6,750,000 | | | | 6,768,455 | |
U.S. Treasury Note | | | 1.25 | | | | 7-31-2023 | | | | 4,500,000 | | | | 4,442,346 | |
U.S. Treasury Note | | | 1.38 | | | | 6-30-2018 | | | | 5,000,000 | | | | 5,050,195 | |
U.S. Treasury Note | | | 1.38 | | | | 7-31-2018 | | | | 5,000,000 | | | | 5,052,345 | |
U.S. Treasury Note | | | 1.38 | | | | 9-30-2018 | | | | 11,000,000 | | | | 11,120,747 | |
U.S. Treasury Note | | | 1.38 | | | | 12-31-2018 | | | | 10,000,000 | | | | 10,116,020 | |
U.S. Treasury Note | | | 1.38 | | | | 2-28-2019 | | | | 5,000,000 | | | | 5,060,940 | |
U.S. Treasury Note | | | 1.38 | | | | 1-31-2020 | | | | 3,000,000 | | | | 3,035,040 | |
U.S. Treasury Note | | | 1.38 | | | | 4-30-2020 | | | | 15,500,000 | | | | 15,674,980 | |
U.S. Treasury Note | | | 1.38 | | | | 5-31-2020 | | | | 10,000,000 | | | | 10,107,030 | |
U.S. Treasury Note | | | 1.38 | | | | 1-31-2021 | | | | 7,750,000 | | | | 7,815,085 | |
U.S. Treasury Note | | | 1.38 | | | | 4-30-2021 | | | | 10,000,000 | | | | 10,079,690 | |
U.S. Treasury Note | | | 1.38 | | | | 5-31-2021 | | | | 10,000,000 | | | | 10,083,200 | |
U.S. Treasury Note | | | 1.50 | | | | 8-31-2018 | | | | 12,000,000 | | | | 12,156,564 | |
U.S. Treasury Note | | | 1.50 | | | | 1-31-2019 | | | | 7,000,000 | | | | 7,103,908 | |
U.S. Treasury Note | | | 1.50 | | | | 5-31-2019 | | | | 22,500,000 | | | | 22,858,605 | |
U.S. Treasury Note | | | 1.50 | | | | 2-28-2023 | | | | 5,000,000 | | | | 5,026,955 | |
U.S. Treasury Note | | | 1.50 | | | | 3-31-2023 | | | | 5,000,000 | | | | 5,024,220 | |
U.S. Treasury Note | | | 1.50 | | | | 8-15-2026 | | | | 10,000,000 | | | | 9,944,922 | |
U.S. Treasury Note | | | 1.63 | | | | 3-31-2019 | | | | 10,000,000 | | | | 10,185,940 | |
U.S. Treasury Note | | | 1.63 | | | | 8-31-2019 | | | | 5,000,000 | | | | 5,100,000 | |
U.S. Treasury Note | | | 1.63 | | | | 8-15-2022 | | | | 6,100,000 | | | | 6,197,936 | |
U.S. Treasury Note | | | 1.63 | | | | 11-15-2022 | | | | 12,500,000 | | | | 12,680,663 | |
U.S. Treasury Note | | | 1.63 | | | | 4-30-2023 | | | | 6,000,000 | | | | 6,074,298 | |
U.S. Treasury Note | | | 1.63 | | | | 2-15-2026 | | | | 14,000,000 | | | | 14,043,750 | |
U.S. Treasury Note | | | 1.63 | | | | 5-15-2026 | | | | 11,000,000 | | | | 11,031,801 | |
U.S. Treasury Note | | | 1.75 | | | | 9-30-2019 | | | | 30,000,000 | | | | 30,715,742 | |
U.S. Treasury Note | | | 1.75 | | | | 2-28-2022 | | | | 15,000,000 | | | | 15,355,080 | |
U.S. Treasury Note | | | 1.75 | | | | 5-15-2022 | | | | 7,500,000 | | | | 7,677,540 | |
| | | | |
| 90 | | Wells Fargo Diversified Fixed Income Portfolio | | Portfolio of investments—August 31, 2016 (unaudited) |
| | | | | | | | | | | | | | | | |
| Security name | | Interest rate | | | Maturity date | | | Principal | | | Value | |
| | | | |
U.S. Treasury Securities (continued) | | | | | | | | | | | | | | | | |
U.S. Treasury Note | | | 1.75 | % | | | 1-31-2023 | | | $ | 5,000,000 | | | $ | 5,104,295 | |
U.S. Treasury Note | | | 1.75 | | | | 5-15-2023 | | | | 12,500,000 | | | | 12,759,275 | |
U.S. Treasury Note | | | 1.88 | | | | 9-30-2017 | | | | 6,000,000 | | | | 6,075,234 | |
U.S. Treasury Note | | | 2.00 | | | | 7-31-2020 | | | | 6,000,000 | | | | 6,203,436 | |
U.S. Treasury Note | | | 2.00 | | | | 11-30-2020 | | | | 10,000,000 | | | | 10,344,920 | |
U.S. Treasury Note | | | 2.00 | | | | 5-31-2021 | | | | 5,000,000 | | | | 5,182,420 | |
U.S. Treasury Note | | | 2.00 | | | | 11-15-2021 | | | | 16,000,000 | | | | 16,595,008 | |
U.S. Treasury Note | | | 2.00 | | | | 11-30-2022 | | | | 5,000,000 | | | | 5,182,420 | |
U.S. Treasury Note | | | 2.00 | | | | 2-15-2023 | | | | 11,000,000 | | | | 11,405,196 | |
U.S. Treasury Note | | | 2.00 | | | | 2-15-2025 | | | | 16,500,000 | | | | 17,097,482 | |
U.S. Treasury Note | | | 2.00 | | | | 8-15-2025 | | | | 13,500,000 | | | | 13,982,517 | |
U.S. Treasury Note | | | 2.13 | | | | 8-31-2020 | | | | 13,000,000 | | | | 13,505,271 | |
U.S. Treasury Note | | | 2.13 | | | | 1-31-2021 | | | | 10,000,000 | | | | 10,404,690 | |
U.S. Treasury Note | | | 2.13 | | | | 6-30-2021 | | | | 5,000,000 | | | | 5,213,280 | |
U.S. Treasury Note | | | 2.13 | | | | 8-15-2021 | | | | 10,000,000 | | | | 10,425,390 | |
U.S. Treasury Note | | | 2.13 | | | | 9-30-2021 | | | | 2,500,000 | | | | 2,607,715 | |
U.S. Treasury Note | | | 2.13 | | | | 12-31-2022 | | | | 5,000,000 | | | | 5,218,165 | |
U.S. Treasury Note | | | 2.13 | | | | 5-15-2025 | | | | 10,000,000 | | | | 10,463,670 | |
U.S. Treasury Note | | | 2.25 | | | | 11-30-2017 | | | | 7,500,000 | | | | 7,638,578 | |
U.S. Treasury Note | | | 2.25 | | | | 7-31-2021 | | | | 7,000,000 | | | | 7,340,977 | |
U.S. Treasury Note | | | 2.25 | | | | 11-15-2024 | | | | 18,500,000 | | | | 19,526,898 | |
U.S. Treasury Note | | | 2.25 | | | | 11-15-2025 | | | | 11,500,000 | | | | 12,158,559 | |
U.S. Treasury Note | | | 2.38 | | | | 6-30-2018 | | | | 3,000,000 | | | | 3,084,726 | |
U.S. Treasury Note | | | 2.38 | | | | 8-15-2024 | | | | 15,000,000 | | | | 15,965,040 | |
U.S. Treasury Note | | | 2.50 | | | | 8-15-2023 | | | | 14,250,000 | | | | 15,249,167 | |
U.S. Treasury Note | | | 2.50 | | | | 5-15-2024 | | | | 15,500,000 | | | | 16,637,065 | |
U.S. Treasury Note | | | 2.63 | | | | 1-31-2018 | | | | 4,000,000 | | | | 4,103,752 | |
U.S. Treasury Note | | | 2.63 | | | | 4-30-2018 | | | | 5,500,000 | | | | 5,666,073 | |
U.S. Treasury Note | | | 2.63 | | | | 8-15-2020 | | | | 12,000,000 | | | | 12,693,744 | |
U.S. Treasury Note | | | 2.63 | | | | 11-15-2020 | | | | 15,000,000 | | | | 15,898,830 | |
U.S. Treasury Note | | | 2.75 | | | | 12-31-2017 | | | | 6,000,000 | | | | 6,156,330 | |
U.S. Treasury Note | | | 2.75 | | | | 2-28-2018 | | | | 4,000,000 | | | | 4,117,032 | |
U.S. Treasury Note | | | 2.75 | | | | 11-15-2023 | | | | 15,500,000 | | | | 16,878,043 | |
U.S. Treasury Note | | | 2.75 | | | | 2-15-2024 | | | | 18,250,000 | | | | 19,901,059 | |
U.S. Treasury Note | | | 2.88 | | | | 3-31-2018 | | | | 5,000,000 | | | | 5,161,525 | |
U.S. Treasury Note | | | 3.13 | | | | 5-15-2019 | | | | 8,000,000 | | | | 8,473,440 | |
U.S. Treasury Note | | | 3.13 | | | | 5-15-2021 | | | | 4,000,000 | | | | 4,348,908 | |
U.S. Treasury Note | | | 3.38 | | | | 11-15-2019 | | | | 8,000,000 | | | | 8,601,248 | |
U.S. Treasury Note | | | 3.50 | | | | 2-15-2018 | | | | 5,000,000 | | | | 5,196,095 | |
U.S. Treasury Note | | | 3.50 | | | | 5-15-2020 | | | | 25,000,000 | | | | 27,189,450 | |
U.S. Treasury Note | | | 3.63 | | | | 8-15-2019 | | | | 9,500,000 | | | | 10,240,706 | |
U.S. Treasury Note | | | 3.63 | | | | 2-15-2020 | | | | 20,500,000 | | | | 22,297,748 | |
U.S. Treasury Note | | | 3.63 | | | | 2-15-2021 | | | | 20,000,000 | | | | 22,110,160 | |
U.S. Treasury Note | | | 3.75 | | | | 11-15-2018 | | | | 7,000,000 | | | | 7,443,513 | |
U.S. Treasury Note | | | 3.88 | | | | 5-15-2018 | | | | 3,000,000 | | | | 3,158,673 | |
U.S. Treasury Note | | | 4.00 | | | | 8-15-2018 | | | | 2,525,000 | | | | 2,683,502 | |
U.S. Treasury Note | | | 4.25 | | | | 11-15-2017 | | | | 4,000,000 | | | | 4,167,344 | |
U.S. Treasury Note | | | 6.25 | | | | 8-15-2023 | | | | 3,500,000 | | | | 4,627,931 | |
U.S. Treasury Note | | | 6.75 | | | | 8-15-2026 | | | | 1,500,000 | | | | 2,223,282 | |
U.S. Treasury Note | | | 6.88 | | | | 8-15-2025 | | | | 1,500,000 | | | | 2,178,516 | |
| | | | | | |
| Portfolio of investments—August 31, 2016 (unaudited) | | Wells Fargo Diversified Fixed Income Portfolio | | | 91 | |
| | | | | | | | | | | | | | | | |
| Security name | | Interest rate | | | Maturity date | | | Principal | | | Value | |
| | | | |
U.S. Treasury Securities (continued) | | | | | | | | | | | | | | | | |
U.S. Treasury Note | | | 7.13 | % | | | 2-15-2023 | | | $ | 3,000,000 | | | $ | 4,070,157 | |
U.S. Treasury Note | | | 7.25 | | | | 8-15-2022 | | | | 13,000,000 | | | | 17,438,278 | |
U.S. Treasury Note | | | 7.50 | | | | 11-15-2024 | | | | 2,000,000 | | | | 2,938,906 | |
U.S. Treasury Note | | | 7.88 | | | | 2-15-2021 | | | | 500,000 | | | | 645,821 | |
U.S. Treasury Note | | | 8.00 | | | | 11-15-2021 | | | | 4,100,000 | | | | 5,497,362 | |
U.S. Treasury Note | | | 8.13 | | | | 8-15-2019 | | | | 1,350,000 | | | | 1,633,025 | |
U.S. Treasury Note | | | 8.50 | | | | 2-15-2020 | | | | 1,700,000 | | | | 2,133,036 | |
U.S. Treasury Note | | | 8.75 | | | | 8-15-2020 | | | | 400,000 | | | | 518,906 | |
U.S. Treasury Note | | | 8.88 | | | | 2-15-2019 | | | | 1,200,000 | | | | 1,435,640 | |
U.S. Treasury Note | | | 9.13 | | | | 5-15-2018 | | | | 2,900,000 | | | | 3,310,759 | |
| |
Total U.S. Treasury Securities (Cost $1,271,729,003) | | | | 1,339,224,884 | |
| | | | | | | | | | | | | | | | |
| | | | |
Yankee Corporate Bonds and Notes: 3.97% | | | | | | | | | | | | | | | | |
| | | | |
Consumer Discretionary: 0.06% | | | | | | | | | | | | | | | | |
| | | | |
| Auto Components: 0.01% | | | | | | | | | | | | | | | | |
Magna International Incorporated | | | 4.15 | | | | 10-1-2025 | | | | 250,000 | | | | 274,549 | |
| | | | | | | | | | | | | | | | |
| | | | |
| Media: 0.05% | | | | | | | | | | | | | | | | |
Grupo Televisa SAB | | | 5.00 | | | | 5-13-2045 | | | | 500,000 | | | | 520,988 | |
Grupo Televisa SAB | | | 6.00 | | | | 5-15-2018 | | | | 250,000 | | | | 268,245 | |
Grupo Televisa SAB | | | 6.63 | | | | 1-15-2040 | | | | 500,000 | | | | 612,925 | |
WPP Finance 2010 | | | 3.63 | | | | 9-7-2022 | | | | 350,000 | | | | 371,383 | |
WPP Finance 2010 | | | 3.75 | | | | 9-19-2024 | | | | 1,000,000 | | | | 1,068,117 | |
WPP Finance 2010 | | | 5.63 | | | | 11-15-2043 | | | | 200,000 | | | | 240,170 | |
| |
| | | | 3,081,828 | |
| | | | | | | | | | | | | | | | |
| | | | |
Consumer Staples: 0.07% | | | | | | | | | | | | | | | | |
| | | | |
| Beverages: 0.07% | | | | | | | | | | | | | | | | |
Coca-Cola Femsa SAB de CV | | | 2.38 | | | | 11-26-2018 | | | | 500,000 | | | | 509,423 | |
Coca-Cola Femsa SAB de CV | | | 3.88 | | | | 11-26-2023 | | | | 300,000 | | | | 323,260 | |
Coca-Cola Femsa SAB de CV | | | 4.63 | | | | 2-15-2020 | | | | 200,000 | | | | 216,698 | |
Coca-Cola Femsa SAB de CV | | | 5.25 | | | | 11-26-2043 | | | | 300,000 | | | | 369,806 | |
Diageo Capital plc | | | 1.13 | | | | 4-29-2018 | | | | 500,000 | | | | 499,641 | |
Diageo Capital plc | | | 2.63 | | | | 4-29-2023 | | | | 300,000 | | | | 311,195 | |
Diageo Capital plc | | | 3.88 | | | | 4-29-2043 | | | | 230,000 | | | | 248,399 | |
Diageo Capital plc | | | 5.75 | | | | 10-23-2017 | | | | 1,050,000 | | | | 1,103,293 | |
Diageo Capital plc | | | 5.88 | | | | 9-30-2036 | | | | 175,000 | | | | 236,775 | |
Fomento Economico Mexicano SAB de CV | | | 2.88 | | | | 5-10-2023 | | | | 200,000 | | | | 201,389 | |
Fomento Economico Mexicano SAB de CV | | | 4.38 | | | | 5-10-2043 | | | | 150,000 | | | | 162,766 | |
| |
| | | | 4,182,645 | |
| | | | | | | | | | | | | | | | |
| | | | |
Energy: 0.39% | | | | | | | | | | | | | | | | |
| | | | |
| Oil, Gas & Consumable Fuels: 0.39% | | | | | | | | | | | | | | | | |
BP Capital Markets plc | | | 1.38 | | | | 11-6-2017 | | | | 400,000 | | | | 400,569 | |
BP Capital Markets plc | | | 1.38 | | | | 5-10-2018 | | | | 350,000 | | | | 350,704 | |
BP Capital Markets plc | | | 2.24 | | | | 5-10-2019 | | | | 400,000 | | | | 409,091 | |
BP Capital Markets plc | | | 2.50 | | | | 11-6-2022 | | | | 500,000 | | | | 506,417 | |
BP Capital Markets plc | | | 2.52 | | | | 1-15-2020 | | | | 1,000,000 | | | | 1,028,812 | |
| | | | |
| 92 | | Wells Fargo Diversified Fixed Income Portfolio | | Portfolio of investments—August 31, 2016 (unaudited) |
| | | | | | | | | | | | | | | | |
| Security name | | Interest rate | | | Maturity date | | | Principal | | | Value | |
| | | | |
| Oil, Gas & Consumable Fuels (continued) | | | | | | | | | | | | | | | | |
BP Capital Markets plc | | | 2.75 | % | | | 5-10-2023 | | | $ | 600,000 | | | $ | 611,294 | |
BP Capital Markets plc | | | 3.25 | | | | 5-6-2022 | | | | 750,000 | | | | 792,263 | |
BP Capital Markets plc | | | 3.51 | | | | 3-17-2025 | | | | 1,000,000 | | | | 1,064,993 | |
BP Capital Markets plc | | | 3.81 | | | | 2-10-2024 | | | | 500,000 | | | | 544,231 | |
BP Capital Markets plc | | | 4.50 | | | | 10-1-2020 | | | | 500,000 | | | | 552,062 | |
BP Capital Markets plc | | | 4.75 | | | | 3-10-2019 | | | | 450,000 | | | | 486,380 | |
Canadian Natural Resources Limited | | | 3.90 | | | | 2-1-2025 | | | | 300,000 | | | | 302,222 | |
Canadian Natural Resources Limited | | | 5.85 | | | | 2-1-2035 | | | | 565,000 | | | | 588,948 | |
Canadian Natural Resources Limited | | | 6.25 | | | | 3-15-2038 | | | | 500,000 | | | | 549,536 | |
Enbridge Incorporated | | | 3.50 | | | | 6-10-2024 | | | | 1,000,000 | | | | 970,446 | |
Husky Energy Incorporated | | | 4.00 | | | | 4-15-2024 | | | | 500,000 | | | | 510,263 | |
Husky Energy Incorporated | | | 6.80 | | | | 9-15-2037 | | | | 100,000 | | | | 120,783 | |
Husky Energy Incorporated | | | 7.25 | | | | 12-15-2019 | | | | 565,000 | | | | 645,713 | |
Petro-Canada | | | 5.95 | | | | 5-15-2035 | | | | 200,000 | | | | 243,132 | |
Petro-Canada | | | 6.80 | | | | 5-15-2038 | | | | 400,000 | | | | 535,390 | |
Suncor Energy Incorporated | | | 3.60 | | | | 12-1-2024 | | | | 600,000 | | | | 633,670 | |
Suncor Energy Incorporated | | | 5.95 | | | | 12-1-2034 | | | | 75,000 | | | | 90,166 | |
Suncor Energy Incorporated | | | 6.10 | | | | 6-1-2018 | | | | 900,000 | | | | 966,587 | |
Suncor Energy Incorporated | | | 6.50 | | | | 6-15-2038 | | | | 400,000 | | | | 524,876 | |
Suncor Energy Incorporated | | | 6.85 | | | | 6-1-2039 | | | | 250,000 | | | | 344,706 | |
Total Capital Canada Limited | | | 2.75 | | | | 7-15-2023 | | | | 350,000 | | | | 361,059 | |
Total Capital International SA | | | 2.13 | | | | 1-10-2019 | | | | 500,000 | | | | 510,235 | |
Total Capital International SA | | | 2.70 | | | | 1-25-2023 | | | | 350,000 | | | | 363,073 | |
Total Capital International SA | | | 2.88 | | | | 2-17-2022 | | | | 250,000 | | | | 259,930 | |
Total Capital International SA | | | 3.70 | | | | 1-15-2024 | | | | 500,000 | | | | 547,223 | |
Total Capital International SA | | | 3.75 | | | | 4-10-2024 | | | | 500,000 | | | | 549,571 | |
Total Capital SA | | | 4.13 | | | | 1-28-2021 | | | | 100,000 | | | | 109,555 | |
Total Capital SA | | | 4.25 | | | | 12-15-2021 | | | | 250,000 | | | | 278,254 | |
Total Capital SA | | | 4.45 | | | | 6-24-2020 | | | | 500,000 | | | | 550,176 | |
TransCanada PipeLines Limited | | | 2.50 | | | | 8-1-2022 | | | | 500,000 | | | | 501,101 | |
TransCanada PipeLines Limited | | | 3.75 | | | | 10-16-2023 | | | | 250,000 | | | | 267,369 | |
TransCanada PipeLines Limited | | | 3.80 | | | | 10-1-2020 | | | | 300,000 | | | | 320,983 | |
TransCanada PipeLines Limited | | | 5.00 | | | | 10-16-2043 | | | | 500,000 | | | | 579,378 | |
TransCanada PipeLines Limited | | | 5.60 | | | | 3-31-2034 | | | | 100,000 | | | | 119,218 | |
TransCanada PipeLines Limited | | | 6.10 | | | | 6-1-2040 | | | | 300,000 | | | | 384,106 | |
TransCanada PipeLines Limited | | | 6.20 | | | | 10-15-2037 | | | | 585,000 | | | | 744,239 | |
TransCanada PipeLines Limited | | | 7.13 | | | | 1-15-2019 | | | | 1,500,000 | | | | 1,671,804 | |
TransCanada PipeLines Limited | | | 7.63 | | | | 1-15-2039 | | | | 500,000 | | | | 743,772 | |
| |
| | | | 22,634,300 | |
| | | | | | | | | | | | | | | | |
| | | | |
Financials: 2.24% | | | | | | | | | | | | | | | | |
| | | | |
| Banks: 1.48% | | | | | | | | | | | | | | | | |
Australia & New Zealand Banking Group Limited | | | 1.45 | | | | 5-15-2018 | | | | 250,000 | | | | 249,944 | |
Australia & New Zealand Banking Group Limited | | | 1.88 | | | | 10-6-2017 | | | | 250,000 | | | | 251,713 | |
Australia & New Zealand Banking Group Limited | | | 2.25 | | | | 6-13-2019 | | | | 1,000,000 | | | | 1,016,386 | |
Australia & New Zealand Banking Group Limited | | | 2.30 | | | | 6-1-2021 | | | | 750,000 | | | | 763,313 | |
Bancolombia SA | | | 5.95 | | | | 6-3-2021 | | | | 1,000,000 | | | | 1,105,000 | |
Bank of Montreal | | | 1.35 | | | | 8-28-2018 | | | | 1,000,000 | | | | 1,000,040 | |
Bank of Montreal | | | 1.40 | | | | 9-11-2017 | | | | 1,000,000 | | | | 1,001,959 | |
| | | | | | |
| Portfolio of investments—August 31, 2016 (unaudited) | | Wells Fargo Diversified Fixed Income Portfolio | | | 93 | |
| | | | | | | | | | | | | | | | |
| Security name | | Interest rate | | | Maturity date | | | Principal | | | Value | |
| | | | |
| Banks (continued) | | | | | | | | | | | | | | | | |
Bank of Montreal | | | 2.55 | % | | | 11-6-2022 | | | $ | 1,000,000 | | | $ | 1,027,492 | |
Bank of Nova Scotia | | | 1.38 | | | | 12-18-2017 | | | | 500,000 | | | | 500,510 | |
Bank of Nova Scotia | | | 1.45 | | | | 4-25-2018 | | | | 500,000 | | | | 501,161 | |
Bank of Nova Scotia | | | 1.70 | | | | 6-11-2018 | | | | 300,000 | | | | 301,691 | |
Bank of Nova Scotia | | | 1.95 | | | | 1-15-2019 | | | | 750,000 | | | | 758,204 | |
Bank of Nova Scotia | | | 2.05 | | | | 10-30-2018 | | | | 100,000 | | | | 101,197 | |
Bank of Nova Scotia | | | 2.80 | | | | 7-21-2021 | | | | 750,000 | | | | 780,959 | |
Bank of Nova Scotia | | | 4.38 | | | | 1-13-2021 | | | | 500,000 | | | | 550,190 | |
Barclays Bank plc | | | 5.14 | | | | 10-14-2020 | | | | 800,000 | | | | 864,658 | |
Barclays plc | | | 2.75 | | | | 11-8-2019 | | | | 675,000 | | | | 680,434 | |
Barclays plc | | | 2.88 | | | | 6-8-2020 | | | | 300,000 | | | | 302,387 | |
Barclays plc | | | 3.25 | | | | 1-12-2021 | | | | 500,000 | | | | 509,547 | |
Barclays plc | | | 3.65 | | | | 3-16-2025 | | | | 1,500,000 | | | | 1,491,129 | |
Barclays plc | | | 4.38 | | | | 1-12-2026 | | | | 500,000 | | | | 522,000 | |
Barclays plc | | | 5.20 | | | | 5-12-2026 | | | | 500,000 | | | | 519,962 | |
Barclays plc | | | 5.25 | | | | 8-17-2045 | | | | 500,000 | | | | 575,038 | |
BNP Paribas | | | 2.40 | | | | 12-12-2018 | | | | 600,000 | | | | 609,169 | |
BNP Paribas | | | 2.45 | | | | 3-17-2019 | | | | 500,000 | | | | 509,057 | |
BNP Paribas | | | 2.70 | | | | 8-20-2018 | | | | 1,000,000 | | | | 1,022,412 | |
BNP Paribas | | | 3.25 | | | | 3-3-2023 | | | | 500,000 | | | | 523,566 | |
BNP Paribas | | | 4.25 | | | | 10-15-2024 | | | | 400,000 | | | | 419,014 | |
BNP Paribas | | | 5.00 | | | | 1-15-2021 | | | | 1,150,000 | | | | 1,290,039 | |
BPCE SA | | | 2.50 | | | | 7-15-2019 | | | | 1,000,000 | | | | 1,020,718 | |
BPCE SA | | | 4.00 | | | | 4-15-2024 | | | | 500,000 | | | | 548,318 | |
Canadian Imperial Bank | | | 1.55 | | | | 1-23-2018 | | | | 300,000 | | | | 300,632 | |
Cooperatieve Centrale Raiffeisen-Boerenleenbank BA | | | 4.50 | | | | 1-11-2021 | | | | 500,000 | | | | 554,492 | |
CorpBanca SA 144A | | | 3.88 | | | | 9-22-2019 | | | | 600,000 | | | | 628,270 | |
Credit Suisse (New York) | | | 1.75 | | | | 1-29-2018 | | | | 1,000,000 | | | | 1,001,501 | |
Credit Suisse (New York) | | | 3.00 | | | | 10-29-2021 | | | | 1,000,000 | | | | 1,031,571 | |
Credit Suisse (New York) | | | 3.63 | | | | 9-9-2024 | | | | 1,500,000 | | | | 1,573,737 | |
Credit Suisse (New York) | | | 4.38 | | | | 8-5-2020 | | | | 1,000,000 | | | | 1,079,415 | |
Credit Suisse (New York) | | | 5.30 | | | | 8-13-2019 | | | | 1,500,000 | | | | 1,648,241 | |
Credit Suisse (New York) | | | 5.40 | | | | 1-14-2020 | | | | 1,500,000 | | | | 1,644,471 | |
Credit Suisse Group Funding Limited | | | 3.75 | | | | 3-26-2025 | | | | 1,000,000 | | | | 1,001,608 | |
Credit Suisse Group Funding Limited 144A | | | 4.55 | | | | 4-17-2026 | | | | 750,000 | | | | 792,105 | |
Credit Suisse Group Funding Limited | | | 4.88 | | | | 5-15-2045 | | | | 500,000 | | | | 542,031 | |
HSBC Holdings plc | | | 2.95 | | | | 5-25-2021 | | | | 1,000,000 | | | | 1,025,396 | |
HSBC Holdings plc | | | 3.60 | | | | 5-25-2023 | | | | 1,000,000 | | | | 1,034,409 | |
HSBC Holdings plc | | | 3.90 | | | | 5-25-2026 | | | | 1,000,000 | | | | 1,043,261 | |
HSBC Holdings plc | | | 4.00 | | | | 3-30-2022 | | | | 1,000,000 | | | | 1,069,565 | |
HSBC Holdings plc | | | 4.25 | | | | 3-14-2024 | | | | 1,000,000 | | | | 1,041,035 | |
HSBC Holdings plc | | | 4.30 | | | | 3-8-2026 | | | | 1,000,000 | | | | 1,075,409 | |
HSBC Holdings plc | | | 4.88 | | | | 1-14-2022 | | | | 250,000 | | | | 277,931 | |
HSBC Holdings plc | | | 5.10 | | | | 4-5-2021 | | | | 1,000,000 | | | | 1,115,999 | |
HSBC Holdings plc | | | 5.25 | | | | 3-14-2044 | | | | 500,000 | | | | 571,651 | |
HSBC Holdings plc | | | 6.10 | | | | 1-14-2042 | | | | 500,000 | | | | 679,194 | |
HSBC Holdings plc | | | 6.50 | | | | 5-2-2036 | | | | 1,000,000 | | | | 1,285,753 | |
HSBC Holdings plc | | | 6.50 | | | | 9-15-2037 | | | | 850,000 | | | | 1,101,993 | |
HSBC Holdings plc | | | 6.80 | | | | 6-1-2038 | | | | 350,000 | | | | 466,989 | |
Intesa Sanpaolo SpA | | | 3.88 | | | | 1-16-2018 | | | | 700,000 | | | | 715,576 | |
| | | | |
| 94 | | Wells Fargo Diversified Fixed Income Portfolio | | Portfolio of investments—August 31, 2016 (unaudited) |
| | | | | | | | | | | | | | | | |
| Security name | | Interest rate | | | Maturity date | | | Principal | | | Value | |
| | | | |
| Banks (continued) | | | | | | | | | | | | | | | | |
Intesa Sanpaolo SpA | | | 3.88 | % | | | 1-15-2019 | | | $ | 500,000 | | | $ | 513,083 | |
Intesa Sanpaolo SpA | | | 5.25 | | | | 1-12-2024 | | | | 500,000 | | | | 549,142 | |
Lloyds Banking Group plc Subordinated | | | 4.65 | | | | 3-24-2026 | | | | 2,000,000 | | | | 2,075,786 | |
Lloyds TSB Bank plc | | | 1.75 | | | | 5-14-2018 | | | | 1,750,000 | | | | 1,748,765 | |
Lloyds TSB Bank plc | | | 2.30 | | | | 11-27-2018 | | | | 200,000 | | | | 202,212 | |
Lloyds TSB Bank plc | | | 2.40 | | | | 3-17-2020 | | | | 500,000 | | | | 506,009 | |
Mitsubishi UFJ Financial Group Incorporated | | | 2.95 | | | | 3-1-2021 | | | | 425,000 | | | | 438,053 | |
Mitsubishi UFJ Financial Group Incorporated | | | 3.85 | | | | 3-1-2026 | | | | 750,000 | | | | 819,320 | |
National Australia Bank Limited | | | 1.88 | | | | 7-12-2021 | | | | 500,000 | | | | 498,385 | |
National Australia Bank Limited | | | 2.30 | | | | 7-25-2018 | | | | 500,000 | | | | 507,457 | |
National Australia Bank Limited | | | 2.50 | | | | 7-12-2026 | | | | 750,000 | | | | 747,257 | |
National Australia Bank Limited | | | 3.00 | | | | 1-20-2023 | | | | 350,000 | | | | 365,775 | |
NIBC Bank NV | | | 4.88 | | | | 11-19-2019 | | | | 800,000 | | | | 876,122 | |
Perrigo Finance Unlimited Company | | | 4.38 | | | | 3-15-2026 | | | | 500,000 | | | | 521,996 | |
Rabobank Nederland NV | | | 1.70 | | | | 3-19-2018 | | | | 500,000 | | | | 502,509 | |
Rabobank Nederland NV | | | 2.25 | | | | 1-14-2019 | | | | 500,000 | | | | 507,750 | |
Rabobank Nederland NV | | | 3.38 | | | | 5-21-2025 | | | | 500,000 | | | | 533,943 | |
Rabobank Nederland NV | | | 3.88 | | | | 2-8-2022 | | | | 500,000 | | | | 546,062 | |
Rabobank Nederland NV | | | 3.95 | | | | 11-9-2022 | | | | 750,000 | | | | 786,710 | |
Rabobank Nederland NV | | | 4.63 | | | | 12-1-2023 | | | | 750,000 | | | | 812,602 | |
Rabobank Nederland NV | | | 5.25 | | | | 5-24-2041 | | | | 725,000 | | | | 938,186 | |
Rabobank Nederland NV | | | 5.75 | | | | 12-1-2043 | | | | 1,000,000 | | | | 1,244,229 | |
Royal Bank of Canada | | | 1.50 | | | | 1-16-2018 | | | | 450,000 | | | | 450,914 | |
Royal Bank of Canada | | | 2.00 | | | | 12-10-2018 | | | | 1,500,000 | | | | 1,516,643 | |
Royal Bank of Canada | | | 2.15 | | | | 3-15-2019 | | | | 500,000 | | | | 508,187 | |
Royal Bank of Canada | | | 2.20 | | | | 7-27-2018 | | | | 1,000,000 | | | | 1,015,093 | |
Royal Bank of Canada | | | 2.50 | | | | 1-19-2021 | | | | 500,000 | | | | 515,123 | |
Royal Bank of Canada | | | 4.65 | | | | 1-27-2026 | | | | 500,000 | | | | 549,908 | |
Royal Bank of Scotland Group plc | | | 4.80 | | | | 4-5-2026 | | | | 500,000 | | | | 523,199 | |
Santander UK plc | | | 2.50 | | | | 3-14-2019 | | | | 1,500,000 | | | | 1,521,731 | |
Santander UK plc | | | 3.05 | | | | 8-23-2018 | | | | 500,000 | | | | 512,253 | |
Santander UK plc | | | 4.00 | | | | 3-13-2024 | | | | 750,000 | | | | 818,224 | |
Skandinaviska Enskilda | | | 2.63 | | | | 3-15-2021 | | | | 500,000 | | | | 515,726 | |
Societe Generale | | | 2.75 | | | | 10-12-2017 | | | | 700,000 | | | | 709,149 | |
Sumitomo Mitsui Banking Corporation | | | 1.50 | | | | 1-18-2018 | | | | 500,000 | | | | 499,274 | |
Sumitomo Mitsui Banking Corporation | | | 2.25 | | | | 7-11-2019 | | | | 500,000 | | | | 507,022 | |
Sumitomo Mitsui Banking Corporation | | | 2.45 | | | | 1-10-2019 | | | | 500,000 | | | | 508,885 | |
Sumitomo Mitsui Banking Corporation | | | 3.20 | | | | 7-18-2022 | | | | 1,000,000 | | | | 1,045,305 | |
Sumitomo Mitsui Banking Corporation | | | 3.40 | | | | 7-11-2024 | | | | 250,000 | | | | 266,304 | |
Sumitomo Mitsui Banking Corporation | | | 3.95 | | | | 7-19-2023 | | | | 250,000 | | | | 273,451 | |
Sumitomo Mitsui Financial Group | | | 2.93 | | | | 3-9-2021 | | | | 1,500,000 | | | | 1,548,153 | |
Sumitomo Mitsui Financial Group | | | 3.78 | | | | 3-9-2026 | | | | 1,000,000 | | | | 1,088,261 | |
Svenska Handelsbanken AB | | | 1.63 | | | | 3-21-2018 | | | | 400,000 | | | | 401,555 | |
Svenska Handelsbanken AB | | | 2.25 | | | | 6-17-2019 | | | | 500,000 | | | | 509,166 | |
Svenska Handelsbanken AB | | | 2.45 | | | | 3-30-2021 | | | | 750,000 | | | | 768,735 | |
Toronto Dominion Bank | | | 1.40 | | | | 4-30-2018 | | | | 1,250,000 | | | | 1,251,960 | |
Toronto Dominion Bank | | | 2.13 | | | | 7-2-2019 | | | | 500,000 | | | | 508,819 | |
Toronto Dominion Bank | | | 2.50 | | | | 12-14-2020 | | | | 1,500,000 | | | | 1,541,553 | |
Toronto Dominion Bank | | | 2.63 | | | | 9-10-2018 | | | | 600,000 | | | | 613,837 | |
Westpac Banking Corporation | | | 1.55 | | | | 5-25-2018 | | | | 1,000,000 | | | | 1,004,938 | |
| | | | | | |
| Portfolio of investments—August 31, 2016 (unaudited) | | Wells Fargo Diversified Fixed Income Portfolio | | | 95 | |
| | | | | | | | | | | | | | | | |
| Security name | | Interest rate | | | Maturity date | | | Principal | | | Value | |
| | | | |
| Banks (continued) | | | | | | | | | | | | | | | | |
Westpac Banking Corporation | | | 2.10 | % | | | 5-13-2021 | | | $ | 500,000 | | | $ | 503,547 | |
Westpac Banking Corporation | | | 2.25 | | | | 1-17-2019 | | | | 250,000 | | | | 254,038 | |
Westpac Banking Corporation | | | 2.30 | | | | 5-26-2020 | | | | 1,000,000 | | | | 1,016,953 | |
Westpac Banking Corporation | | | 2.85 | | | | 5-13-2026 | | | | 1,000,000 | | | | 1,020,729 | |
| |
| | | | 86,149,430 | |
| | | | | | | | | | | | | | | | |
| | | | |
| Capital Markets: 0.11% | | | | | | | | | | | | | | | | |
Deutsche Bank AG (London) | | | 1.88 | | | | 2-13-2018 | | | | 1,500,000 | | | | 1,492,325 | |
Deutsche Bank AG (London) | | | 2.50 | | | | 2-13-2019 | | | | 500,000 | | | | 500,639 | |
Deutsche Bank AG (London) | | | 2.85 | | | | 5-10-2019 | | | | 600,000 | | | | 601,939 | |
Deutsche Bank AG (London) | | | 3.38 | | | | 5-12-2021 | | | | 600,000 | | | | 599,384 | |
Deutsche Bank AG (London) | | | 3.70 | | | | 5-30-2024 | | | | 1,000,000 | | | | 992,564 | |
Invesco Finance plc | | | 4.00 | | | | 1-30-2024 | | | | 250,000 | | | | 273,771 | |
Invesco Finance plc | | | 5.38 | | | | 11-30-2043 | | | | 250,000 | | | | 302,410 | |
Nomura Holdings Incorporated | | | 2.75 | | | | 3-19-2019 | | | | 500,000 | | | | 511,101 | |
Nomura Holdings Incorporated | | | 6.70 | | | | 3-4-2020 | | | | 356,000 | | | | 409,651 | |
Sasol Financing International Company | | | 4.50 | | | | 11-14-2022 | | | | 500,000 | | | | 502,500 | |
| |
| | | | 6,186,284 | |
| | | | | | | | | | | | | | | | |
| | | | |
| Diversified Financial Services: 0.59% | | | | | | | | | | | | | | | | |
Barrick Australian Finance Proprietary Limited | | | 5.95 | | | | 10-15-2039 | | | | 550,000 | | | | 630,852 | |
BHP Billiton Finance USA Limited | | | 2.88 | | | | 2-24-2022 | | | | 350,000 | | | | 366,752 | |
BHP Billiton Finance USA Limited | | | 3.25 | | | | 11-21-2021 | | | | 500,000 | | | | 532,271 | |
BHP Billiton Finance USA Limited « | | | 3.85 | | | | 9-30-2023 | | | | 1,500,000 | | | | 1,637,537 | |
BHP Billiton Finance USA Limited | | | 4.13 | | | | 2-24-2042 | | | | 650,000 | | | | 683,131 | |
BHP Billiton Finance USA Limited | | | 5.00 | | | | 9-30-2043 | | | | 500,000 | | | | 596,995 | |
Burlington Resources Finance Company | | | 7.20 | | | | 8-15-2031 | | | | 500,000 | | | | 654,183 | |
ConocoPhillips Canada Funding Company | | | 5.95 | | | | 10-15-2036 | | | | 300,000 | | | | 362,637 | |
GE Capital International Funding Company | | | 2.34 | | | | 11-15-2020 | | | | 6,500,000 | | | | 6,688,689 | |
GE Capital International Funding Company | | | 3.37 | | | | 11-15-2025 | | | | 1,500,000 | | | | 1,637,948 | |
GE Capital International Funding Company | | | 4.42 | | | | 11-15-2035 | | | | 4,013,000 | | | | 4,593,693 | |
Schlumberger Investment SA | | | 3.65 | | | | 12-1-2023 | | | | 604,000 | | | | 657,475 | |
Shell International Finance BV | | | 1.38 | | | | 5-10-2019 | | | | 750,000 | | | | 749,438 | |
Shell International Finance BV | | | 1.90 | | | | 8-10-2018 | | | | 1,000,000 | | | | 1,012,959 | |
Shell International Finance BV | | | 2.00 | | | | 11-15-2018 | | | | 500,000 | | | | 507,753 | |
Shell International Finance BV | | | 2.13 | | | | 5-11-2020 | | | | 750,000 | | | | 765,323 | |
Shell International Finance BV | | | 2.25 | | | | 1-6-2023 | | | | 250,000 | | | | 251,345 | |
Shell International Finance BV | | | 2.38 | | | | 8-21-2022 | | | | 250,000 | | | | 254,842 | |
Shell International Finance BV | | | 2.88 | | | | 5-10-2026 | | | | 1,000,000 | | | | 1,028,359 | |
Shell International Finance BV | | | 3.25 | | | | 5-11-2025 | | | | 1,000,000 | | | | 1,061,775 | |
Shell International Finance BV | | | 3.40 | | | | 8-12-2023 | | | | 250,000 | | | | 268,548 | |
Shell International Finance BV | | | 3.63 | | | | 8-21-2042 | | | | 250,000 | | | | 247,044 | |
Shell International Finance BV | | | 4.00 | | | | 5-10-2046 | | | | 650,000 | | | | 681,041 | |
Shell International Finance BV | | | 4.13 | | | | 5-11-2035 | | | | 500,000 | | | | 548,017 | |
Shell International Finance BV | | | 4.30 | | | | 9-22-2019 | | | | 1,000,000 | | | | 1,084,896 | |
Shell International Finance BV | | | 4.38 | | | | 3-25-2020 | | | | 500,000 | | | | 547,819 | |
Shell International Finance BV | | | 4.38 | | | | 5-11-2045 | | | | 500,000 | | | | 550,435 | |
Shell International Finance BV | | | 4.55 | | | | 8-12-2043 | | | | 500,000 | | | | 562,788 | |
Shell International Finance BV | | | 5.50 | | | | 3-25-2040 | | | | 300,000 | | | | 374,561 | |
| | | | |
| 96 | | Wells Fargo Diversified Fixed Income Portfolio | | Portfolio of investments—August 31, 2016 (unaudited) |
| | | | | | | | | | | | | | | | |
| Security name | | Interest rate | | | Maturity date | | | Principal | | | Value | |
| | | | |
| Diversified Financial Services (continued) | | | | | | | | | | | | | | | | |
Shell International Finance BV | | | 6.38 | % | | | 12-15-2038 | | | $ | 850,000 | | | $ | 1,169,298 | |
Syngenta Finance NV | | | 3.13 | | | | 3-28-2022 | | | | 500,000 | | | | 512,956 | |
Tyco International Finance SV | | | 3.90 | | | | 2-14-2026 | | | | 500,000 | | | | 546,840 | |
UBS AG (Stamford) | | | 1.80 | | | | 3-26-2018 | | | | 500,000 | | | | 502,793 | |
UBS AG (Stamford) | | | 2.35 | | | | 3-26-2020 | | | | 500,000 | | | | 511,283 | |
UBS AG (Stamford) | | | 2.38 | | | | 8-14-2019 | | | | 1,750,000 | | | | 1,785,658 | |
| | | | |
| | | | | | | | | | | | | | | 34,567,934 | |
| | | | | | | | | | | | | | | | |
| | | | |
| Insurance: 0.06% | | | | | | | | | | | | | | | | |
AON plc | | | 4.00 | | | | 11-27-2023 | | | | 150,000 | | | | 162,830 | |
AON plc | | | 4.45 | | | | 5-24-2043 | | | | 100,000 | | | | 104,476 | |
AON plc | | | 4.60 | | | | 6-14-2044 | | | | 600,000 | | | | 638,825 | |
Aspen Insurance Holdings Limited | | | 4.65 | | | | 11-15-2023 | | | | 200,000 | | | | 213,225 | |
AXA SA | | | 8.60 | | | | 12-15-2030 | | | | 650,000 | | | | 912,568 | |
Montpelier Re Holdings Limited | | | 4.70 | | | | 10-15-2022 | | | | 100,000 | | | | 103,135 | |
Trinity Acquisition plc | | | 4.63 | | | | 8-15-2023 | | | | 350,000 | | | | 374,596 | |
Trinity Acquisition plc | | | 6.13 | | | | 8-15-2043 | | | | 350,000 | | | | 396,372 | |
XLIT Limited | | | 2.30 | | | | 12-15-2018 | | | | 350,000 | | | | 354,505 | |
XLIT Limited | | | 5.25 | | | | 12-15-2043 | | | | 200,000 | | | | 222,720 | |
| | | | |
| | | | | | | | | | | | | | | 3,483,252 | |
| | | | | | | | | | | | | | | | |
| | | | |
Health Care: 0.27% | | | | | | | | | | | | | | | | |
| | | | |
| Health Care Equipment & Supplies: 0.03% | | | | | | | | | | | | | | | | |
Covidien International Finance SA | | | 3.20 | | | | 6-15-2022 | | | | 500,000 | | | | 528,947 | |
Covidien International Finance SA | | | 6.00 | | | | 10-15-2017 | | | | 600,000 | | | | 632,111 | |
Covidien International Finance SA | | | 6.55 | | | | 10-15-2037 | | | | 400,000 | | | | 564,733 | |
| | | | |
| | | | | | | | | | | | | | | 1,725,791 | |
| | | | | | | | | | | | | | | | |
| | | | |
| Pharmaceuticals: 0.24% | | | | | | | | | | | | | | | | |
Actavis Funding SCS | | | 3.00 | | | | 3-12-2020 | | | | 2,150,000 | | | | 2,222,281 | |
Actavis Funding SCS | | | 3.80 | | | | 3-15-2025 | | | | 2,500,000 | | | | 2,638,238 | |
Actavis Funding SCS | | | 3.85 | | | | 6-15-2024 | | | | 500,000 | | | | 530,941 | |
Actavis Funding SCS | | | 4.75 | | | | 3-15-2045 | | | | 1,000,000 | | | | 1,096,859 | |
Actavis Funding SCS | | | 4.85 | | | | 6-15-2044 | | | | 500,000 | | | | 557,263 | |
AstraZeneca plc | | | 2.38 | | | | 11-16-2020 | | | | 500,000 | | | | 514,510 | |
AstraZeneca plc | | | 4.00 | | | | 9-18-2042 | | | | 550,000 | | | | 588,878 | |
AstraZeneca plc | | | 5.90 | | | | 9-15-2017 | | | | 800,000 | | | | 838,686 | |
AstraZeneca plc | | | 6.45 | | | | 9-15-2037 | | | | 1,150,000 | | | | 1,622,057 | |
Novartis Securities Investment Limited | | | 5.13 | | | | 2-10-2019 | | | | 1,000,000 | | | | 1,093,458 | |
Perrigo Company plc | | | 2.30 | | | | 11-8-2018 | | | | 295,000 | | | | 296,484 | |
Perrigo Company plc | | | 4.00 | | | | 11-15-2023 | | | | 250,000 | | | | 257,330 | |
Sanofi Aventis | | | 1.25 | | | | 4-10-2018 | | | | 591,000 | | | | 592,220 | |
Sanofi Aventis | | | 4.00 | | | | 3-29-2021 | | | | 700,000 | | | | 776,719 | |
Teva Pharmaceutical Finance BV | | | 2.95 | | | | 12-18-2022 | | | | 500,000 | | | | 512,565 | |
| | | | |
| | | | | | | | | | | | | | | 14,138,489 | |
| | | | | | | | | | | | | | | | |
| | | | |
Industrials: 0.19% | | | | | | | | | | | | | | | | |
| | | | |
| Industrial Conglomerates: 0.06% | | | | | | | | | | | | | | | | |
Koninklijke Philips Electronics NV | | | 3.75 | | | | 3-15-2022 | | | | 500,000 | | | | 538,029 | |
Koninklijke Philips Electronics NV | | | 5.00 | | | | 3-15-2042 | | | | 500,000 | | | | 568,217 | |
| | | | | | |
| Portfolio of investments—August 31, 2016 (unaudited) | | Wells Fargo Diversified Fixed Income Portfolio | | | 97 | |
| | | | | | | | | | | | | | | | |
| Security name | | Interest rate | | | Maturity date | | | Principal | | | Value | |
| | | | |
| Industrial Conglomerates (continued) | | | | | | | | | | | | | | | | |
Koninklijke Philips Electronics NV | | | 5.75 | % | | | 3-11-2018 | | | $ | 650,000 | | | $ | 692,812 | |
Koninklijke Philips Electronics NV | | | 6.88 | | | | 3-11-2038 | | | | 250,000 | | | | 335,283 | |
Tyco Electronics Group SA | | | 3.45 | | | | 8-1-2024 | | | | 200,000 | | | | 209,041 | |
Tyco Electronics Group SA | | | 4.88 | | | | 1-15-2021 | | | | 500,000 | | | | 556,002 | |
Tyco Electronics Group SA | | | 7.13 | | | | 10-1-2037 | | | | 350,000 | | | | 500,374 | |
| | | | |
| | | | | | | | | | | | | | | 3,399,758 | |
| | | | | | | | | | | | | | | | |
| | | | |
| Machinery: 0.01% | | | | | | | | | | | | | | | | |
Pentair Finance SA | | | 3.15 | | | | 9-15-2022 | | | | 250,000 | | | | 247,160 | |
Pentair Finance SA | | | 5.00 | | | | 5-15-2021 | | | | 300,000 | | | | 322,866 | |
| | | | |
| | | | | | | | | | | | | | | 570,026 | |
| | | | | | | | | | | | | | | | |
| | | | |
| Road & Rail: 0.06% | | | | | | | | | | | | | | | | |
Canadian National Railway Company | | | 2.25 | | | | 11-15-2022 | | | | 350,000 | | | | 355,318 | |
Canadian National Railway Company | | | 5.55 | | | | 3-1-2019 | | | | 435,000 | | | | 479,884 | |
Canadian National Railway Company | | | 6.20 | | | | 6-1-2036 | | | | 200,000 | | | | 277,713 | |
Canadian National Railway Company | | | 6.38 | | | | 11-15-2037 | | | | 550,000 | | | | 785,732 | |
Canadian Pacific Railway Company | | | 4.45 | | | | 3-15-2023 | | | | 200,000 | | | | 222,770 | |
Canadian Pacific Railway Company | | | 5.75 | | | | 3-15-2033 | | | | 360,000 | | | | 438,762 | |
Canadian Pacific Railway Company | | | 5.95 | | | | 5-15-2037 | | | | 65,000 | | | | 82,710 | |
Canadian Pacific Railway Company | | | 6.13 | | | | 9-15-2115 | | | | 500,000 | | | | 623,368 | |
Canadian Pacific Railway Company | | | 7.25 | | | | 5-15-2019 | | | | 65,000 | | | | 74,309 | |
| | | | |
| | | | | | | | | | | | | | | 3,340,566 | |
| | | | | | | | | | | | | | | | |
| | | | |
| Trading Companies & Distributors: 0.06% | | | | | | | | | | | | | | | | |
AerCap Ireland Capital Limited | | | 3.75 | | | | 5-15-2019 | | | | 825,000 | | | | 849,239 | |
AerCap Ireland Capital Limited | | | 3.95 | | | | 2-1-2022 | | | | 1,100,000 | | | | 1,141,250 | |
AerCap Ireland Capital Limited | | | 4.50 | | | | 5-15-2021 | | | | 850,000 | | | | 896,750 | |
AerCap Ireland Capital Limited | | | 4.63 | | | | 10-30-2020 | | | | 950,000 | | | | 1,006,881 | |
| | | | |
| | | | | | | | | | | | | | | 3,894,120 | |
| | | | | | | | | | | | | | | | |
| | | | |
Information Technology: 0.11% | | | | | | | | | | | | | | | | |
| | | | |
| Communications Equipment: 0.01% | | | | | | | | | | | | | | | | |
Ericsson LM | | | 4.13 | | | | 5-15-2022 | | | | 400,000 | | | | 430,056 | |
| | | | | | | | | | | | | | | | |
| | | | |
| Internet Software & Services: 0.07% | | | | | | | | | | | | | | | | |
Alibaba Group Holding Limited | | | 2.50 | | | | 11-28-2019 | | | | 1,000,000 | | | | 1,018,340 | |
Alibaba Group Holding Limited | | | 3.60 | | | | 11-28-2024 | | | | 1,000,000 | | | | 1,050,135 | |
Alibaba Group Holding Limited | | | 4.50 | | | | 11-28-2034 | | | | 300,000 | | | | 330,766 | |
Baidu Incorporated | | | 2.75 | | | | 6-9-2019 | | | | 750,000 | | | | 764,757 | |
Baidu Incorporated | | | 3.25 | | | | 8-6-2018 | | | | 576,000 | | | | 590,265 | |
| | | | |
| | | | | | | | | | | | | | | 3,754,263 | |
| | | | | | | | | | | | | | | | |
| | | | |
| Technology Hardware, Storage & Peripherals: 0.03% | | | | | | | | | | | | | | | | |
Seagate HDD Cayman | | | 4.75 | | | | 6-1-2023 | | | | 1,000,000 | | | | 974,000 | |
Seagate HDD Cayman | | | 4.75 | | | | 1-1-2025 | | | | 1,000,000 | | | | 925,340 | |
| | | | |
| | | | | | | | | | | | | | | 1,899,340 | |
| | | | | | | | | | | | | | | | |
| | | | |
| 98 | | Wells Fargo Diversified Fixed Income Portfolio | | Portfolio of investments—August 31, 2016 (unaudited) |
| | | | | | | | | | | | | | | | |
| Security name | | Interest rate | | | Maturity date | | | Principal | | | Value | |
| | | | |
Materials: 0.25% | | | | | | | | | | | | | | | | |
| | | | |
| Chemicals: 0.09% | | | | | | | | | | | | | | | | |
Agrium Incorporated | | | 3.50 | % | | | 6-1-2023 | | | $ | 300,000 | | | $ | 311,833 | |
Agrium Incorporated | | | 4.90 | | | | 6-1-2043 | | | | 200,000 | | | | 211,568 | |
Agrium Incorporated | | | 5.25 | | | | 1-15-2045 | | | | 400,000 | | | | 445,239 | |
Agrium Incorporated | | | 6.13 | | | | 1-15-2041 | | | | 165,000 | | | | 201,730 | |
Agrium Incorporated | | | 6.75 | | | | 1-15-2019 | | | | 300,000 | | | | 332,099 | |
LYB International Finance BV | | | 4.88 | | | | 3-15-2044 | | | | 500,000 | | | | 544,639 | |
LyondellBasell Industries NV | | | 4.63 | | | | 2-26-2055 | | | | 500,000 | | | | 501,580 | |
LyondellBasell Industries NV | | | 5.00 | | | | 4-15-2019 | | | | 400,000 | | | | 430,429 | |
LyondellBasell Industries NV | | | 5.75 | | | | 4-15-2024 | | | | 500,000 | | | | 599,238 | |
LyondellBasell Industries NV | | | 6.00 | | | | 11-15-2021 | | | | 500,000 | | | | 583,149 | |
Methanex Corporation | | | 3.25 | | | | 12-15-2019 | | | | 100,000 | | | | 98,893 | |
Potash Corporation of Saskatchewan Incorporated | | | 4.88 | | | | 3-30-2020 | | | | 255,000 | | | | 278,385 | |
Potash Corporation of Saskatchewan Incorporated | | | 5.63 | | | | 12-1-2040 | | | | 200,000 | | | | 243,726 | |
Potash Corporation of Saskatchewan Incorporated | | | 5.88 | | | | 12-1-2036 | | | | 225,000 | | | | 274,943 | |
Potash Corporation of Saskatchewan Incorporated | | | 6.50 | | | | 5-15-2019 | | | | 65,000 | | | | 72,942 | |
| |
| | | | 5,130,393 | |
| | | | | | | | | | | | | | | | |
| | | | |
| Metals & Mining: 0.15% | | | | | | | | | | | | | | | | |
Barrick Gold Corporation | | | 4.10 | | | | 5-1-2023 | | | | 220,000 | | | | 236,927 | |
Barrick Gold Corporation | | | 5.25 | | | | 4-1-2042 | | | | 500,000 | | | | 547,750 | |
Goldcorp Incorporated | | | 2.13 | | | | 3-15-2018 | | | | 100,000 | | | | 100,257 | |
Goldcorp Incorporated | | | 3.70 | | | | 3-15-2023 | | | | 300,000 | | | | 313,160 | |
Rio Tinto Alcan Incorporated | | | 6.13 | | | | 12-15-2033 | | | | 600,000 | | | | 705,751 | |
Rio Tinto Finance (USA) Limited | | | 2.25 | | | | 12-14-2018 | | | | 750,000 | | | | 761,141 | |
Rio Tinto Finance (USA) Limited « | | | 2.88 | | | | 8-21-2022 | | | | 500,000 | | | | 514,014 | |
Rio Tinto Finance (USA) Limited | | | 3.75 | | | | 9-20-2021 | | | | 500,000 | | | | 539,306 | |
Rio Tinto Finance (USA) Limited | | | 4.13 | | | | 8-21-2042 | | | | 250,000 | | | | 257,126 | |
Rio Tinto Finance (USA) Limited | | | 4.75 | | | | 3-22-2042 | | | | 250,000 | | | | 277,338 | |
Rio Tinto Finance (USA) Limited | | | 5.20 | | | | 11-2-2040 | | | | 300,000 | | | | 349,458 | |
Rio Tinto Finance (USA) Limited | | | 7.13 | | | | 7-15-2028 | | | | 500,000 | | | | 654,690 | |
Rio Tinto Finance (USA) Limited | | | 9.00 | | | | 5-1-2019 | | | | 480,000 | | | | 570,897 | |
Vale Overseas Limited | | | 4.38 | | | | 1-11-2022 | | | | 200,000 | | | | 194,700 | |
Vale Overseas Limited | | | 4.63 | | | | 9-15-2020 | | | | 300,000 | | | | 304,851 | |
Vale Overseas Limited | | | 6.88 | | | | 11-21-2036 | | | | 1,260,000 | | | | 1,238,580 | |
Vale Overseas Limited | | | 6.88 | | | | 11-10-2039 | | | | 130,000 | | | | 127,725 | |
Vale Overseas Limited | | | 8.25 | | | | 1-17-2034 | | | | 300,000 | | | | 336,660 | |
Vale SA | | | 5.63 | | | | 9-11-2042 | | | | 750,000 | | | | 645,525 | |
| |
| | | | 8,675,856 | |
| | | | | | | | | | | | | | | | |
| | | | |
| Paper & Forest Products: 0.01% | | | | | | | | | | | | | | | | |
Celulosa Arauco y Constitucion SA | | | 4.75 | | | | 1-11-2022 | | | | 500,000 | | | | 538,049 | |
Celulosa Arauco y Constitucion SA | | | 7.25 | | | | 7-29-2019 | | | | 350,000 | | | | 399,186 | |
| |
| | | | 937,235 | |
| | | | | | | | | | | | | | | | |
| | | | |
Telecommunication Services: 0.38% | | | | | | | | | | | | | | | | |
| | | | |
| Diversified Telecommunication Services: 0.21% | | | | | | | | | | | | | | | | |
British Telecommunications plc | | | 5.95 | | | | 1-15-2018 | | | | 250,000 | | | | 265,614 | |
British Telecommunications plc | | | 9.38 | | | | 12-15-2030 | | | | 650,000 | | | | 1,060,740 | |
| | | | | | |
| Portfolio of investments—August 31, 2016 (unaudited) | | Wells Fargo Diversified Fixed Income Portfolio | | | 99 | |
| | | | | | | | | | | | | | | | |
| Security name | | Interest rate | | | Maturity date | | | Principal | | | Value | |
| | | | |
| Diversified Telecommunication Service (continued) | | | | | | | | | | | | | | | | |
Deutsche Telekom International Finance BV | | | 6.00 | % | | | 7-8-2019 | | | $ | 500,000 | | | $ | 561,195 | |
Deutsche Telekom International Finance BV | | | 8.75 | | | | 6-15-2030 | | | | 830,000 | | | | 1,297,340 | |
Deutsche Telekom International Finance BV | | | 9.25 | | | | 6-1-2032 | | | | 500,000 | | | | 824,809 | |
France Telecom SA | | | 5.38 | | | | 7-8-2019 | | | | 600,000 | | | | 663,279 | |
France Telecom SA | | | 5.38 | | | | 1-13-2042 | | | | 500,000 | | | | 617,495 | |
France Telecom SA | | | 9.00 | | | | 3-1-2031 | | | | 925,000 | | | | 1,482,647 | |
Orange SA | | | 2.75 | | | | 2-6-2019 | | | | 1,000,000 | | | | 1,028,761 | |
Royal KPN NV | | | 8.38 | | | | 10-1-2030 | | | | 375,000 | | | | 521,697 | |
Telefonica Emisiones SAU | | | 3.19 | | | | 4-27-2018 | | | | 500,000 | | | | 512,823 | |
Telefonica Emisiones SAU | | | 4.57 | | | | 4-27-2023 | | | | 300,000 | | | | 336,806 | |
Telefonica Emisiones SAU | | | 5.13 | | | | 4-27-2020 | | | | 445,000 | | | | 493,522 | |
Telefonica Emisiones SAU | | | 7.05 | | | | 6-20-2036 | | | | 1,050,000 | | | | 1,408,148 | |
Telefonica Europe BV | | | 8.25 | | | | 9-15-2030 | | | | 420,000 | | | | 616,034 | |
Telefonica SA | | | 5.88 | | | | 7-15-2019 | | | | 645,000 | | | | 717,086 | |
| |
| | | | 12,407,996 | |
| | | | | | | | | | | | | | | | |
| | | | |
| Wireless Telecommunication Services: 0.17% | | | | | | | | | | | | | | | | |
America Movil SAB de CV | | | 3.13 | | | | 7-16-2022 | | | | 500,000 | | | | 516,973 | |
America Movil SAB de CV | | | 4.38 | | | | 7-16-2042 | | | | 500,000 | | | | 525,519 | |
America Movil SAB de CV | | | 5.00 | | | | 3-30-2020 | | | | 1,000,000 | | | | 1,104,301 | |
America Movil SAB de CV | | | 5.63 | | | | 11-15-2017 | | | | 450,000 | | | | 472,279 | |
America Movil SAB de CV | | | 6.13 | | | | 11-15-2037 | | | | 100,000 | | | | 124,550 | |
America Movil SAB de CV | | | 6.38 | | | | 3-1-2035 | | | | 565,000 | | | | 723,518 | |
Rogers Communications Incorporated | | | 3.00 | | | | 3-15-2023 | | | | 200,000 | | | | 208,560 | |
Rogers Communications Incorporated | | | 4.50 | | | | 3-15-2043 | | | | 200,000 | | | | 221,036 | |
Rogers Communications Incorporated | | | 5.00 | | | | 3-15-2044 | | | | 1,000,000 | | | | 1,195,552 | |
Rogers Communications Incorporated | | | 6.80 | | | | 8-15-2018 | | | | 750,000 | | | | 823,763 | |
Vodafone Group plc | | | 1.25 | | | | 9-26-2017 | | | | 250,000 | | | | 249,951 | |
Vodafone Group plc | | | 1.50 | | | | 2-19-2018 | | | | 500,000 | | | | 499,924 | |
Vodafone Group plc | | | 2.50 | | | | 9-26-2022 | | | | 500,000 | | | | 505,806 | |
Vodafone Group plc | | | 2.95 | | | | 2-19-2023 | | | | 600,000 | | | | 621,412 | |
Vodafone Group plc | | | 4.38 | | | | 2-19-2043 | | | | 500,000 | | | | 512,320 | |
Vodafone Group plc | | | 4.63 | | | | 7-15-2018 | | | | 180,000 | | | | 190,146 | |
Vodafone Group plc | | | 5.45 | | | | 6-10-2019 | | | | 400,000 | | | | 440,213 | |
Vodafone Group plc | | | 6.25 | | | | 11-30-2032 | | | | 300,000 | | | | 369,405 | |
Vodafone Group plc | | | 7.88 | | | | 2-15-2030 | | | | 250,000 | | | | 341,688 | |
| |
| | | | 9,646,916 | |
| | | | | | | | | | | | | | | | |
| | | | |
Utilities: 0.01% | | | | | | | | | | | | | | | | |
| | | | |
| Electric Utilities: 0.00% | | | | | | | | | | | | | | | | |
Scottish Power Limited | | | 5.81 | | | | 3-15-2025 | | | | 150,000 | | | | 174,475 | |
| | | | | | | | | | | | | | | | |
| | | | |
| Independent Power & Renewable Electricity Producers: 0.01% | | | | | | | | | | | | | | | | |
TransAlta Corporation | | | 6.50 | | | | 3-15-2040 | | | | 90,000 | | | | 81,848 | |
TransAlta Corporation | | | 6.90 | | | | 5-15-2018 | | | | 200,000 | | | | 209,352 | |
| |
| | | | 291,200 | |
| | | | | | | | | | | | | | | | |
| | | | |
| Water Utilities: 0.00% | | | | | | | | | | | | | | | | |
United Utilities Group plc | | | 5.38 | | | | 2-1-2019 | | | | 250,000 | | | | 268,558 | |
| | | | | | | | | | | | | | | | |
| |
Total Yankee Corporate Bonds and Notes (Cost $218,120,030) | | | | 231,245,260 | |
| | | | | | | | | | | | | | | | |
| | | | |
| 100 | | Wells Fargo Diversified Fixed Income Portfolio | | Portfolio of investments—August 31, 2016 (unaudited) |
| | | | | | | | | | | | | | | | |
| Security name | | Interest rate | | | Maturity date | | | Principal | | | Value | |
| | | | |
Yankee Government Bonds: 0.03% | | | | | | | | | | | | | | | | |
Ukraine Government Aid | | | 1.84 | % | | | 5-16-2019 | | | $ | 2,000,000 | | | $ | 2,026,706 | |
| | | | | | | | | | | | | | | | |
| | | | |
Total Yankee Government Bonds (Cost $2,000,727) | | | | | | | | | | | | | | | 2,026,706 | |
| | | | | | | | | | | | | | | | |
| | | | |
| | | Yield | | | | | | Shares | | | | |
| Short-Term Investments: 3.32% | | | | | | | | | | | | | | | | |
| | | | |
| Investment Companies: 3.32% | | | | | | | | | | | | | | | | |
Securities Lending Cash Investments LLC (l)(r)(u) | | | 0.51 | | | | | | | | 4,562,280 | | | | 4,562,280 | |
Wells Fargo Government Money Market Fund Select Class (l)(u)## | | | 0.32 | | | | | | | | 188,973,592 | | | | 188,973,592 | |
| | | | |
Total Short-Term Investments (Cost $193,535,872) | | | | | | | | | | | | | | | 193,535,872 | |
| | | | | | | | | | | | | | | | |
| | | | | | | | |
| Total investments in securities (Cost $5,676,096,739) * | | | 102.15 | % | | | 5,953,271,479 | |
Other assets and liabilities, net | | | (2.15 | ) | | | (125,420,626 | ) |
| | | | | | | | |
| Total net assets | | | 100.00 | % | | $ | 5,827,850,853 | |
| | | | | | | | |
| %% | The security is issued on a when-issued basis. |
| ¤ | The security is issued in zero coupon form with no periodic interest payments. |
| 144A | The security may be resold in transactions exempt from registration, normally to qualified institutional buyers, pursuant to Rule 144A under the Securities Act of 1933. |
| « | All or a portion of this security is on loan. |
| (l) | The issuer of the security is an affiliated person of the Portfolio as defined in the Investment Company Act of 1940. |
| ± | Variable rate investment. The rate shown is the rate in effect at period end. |
| @ | Foreign bond principal is denominated in the local currency of the issuer. |
| (r) | The investment is a non-registered investment vehicle purchased with cash collateral received from securities on loan. |
| (u) | The rate represents the 7-day annualized yield at period end. |
| ## | All or a portion of this security is segregated for when-issued securities. |
| * | Cost for federal income tax purposes is $5,679,627,115 and unrealized gains (losses) consists of: |
| | | | |
Gross unrealized gains | | $ | 332,449,793 | |
Gross unrealized losses | | | (58,805,429 | ) |
| | | | |
Net unrealized gains | | $ | 273,644,364 | |
The following table shows the percent of total long-term investments by geographic location as of August 31, 2016:
| | | | |
United States | | | 70.89 | % |
Japan | | | 11.92 | |
United Kingdom | | | 3.64 | |
France | | | 2.69 | |
Italy | | | 2.42 | |
Germany | | | 1.86 | |
Spain | | | 1.38 | |
Canada | | | 1.26 | |
Netherlands | | | 1.05 | |
Other | | | 2.89 | |
| | | | |
| | | 100.00 | % |
| | | | |
| | | | | | |
| Portfolio of investments—August 31, 2016 (unaudited) | | Wells Fargo Diversified Stock Portfolio | | | 1 | |
| | | | | | | | | | | | | | | | |
| Security name | | | | | | | | Shares | | | Value | |
| | | | |
Common Stocks: 97.02% | | | | | | | | | | | | | | | | |
| | | | |
Consumer Discretionary: 13.31% | | | | | | | | | | | | | | | | |
| | | | |
| Auto Components: 0.67% | | | | | | | | | | | | | | | | |
Aisin Seiki Company Limited | | | | | | | | | | | 29,100 | | | $ | 1,373,928 | |
Akebono Brake Industry Company Limited † | | | | | | | | | | | 22,700 | | | | 41,027 | |
Autoliv Incorporated « | | | | | | | | | | | 49,222 | | | | 5,226,392 | |
Bharat Forge Limited | | | | | | | | | | | 28,151 | | | | 357,426 | |
Bosch Limited | | | | | | | | | | | 2,730 | | | | 985,189 | |
Bridgestone Corporation | | | | | | | | | | | 100,100 | | | | 3,439,380 | |
Calsonic Kansei Corporation | | | | | | | | | | | 25,000 | | | | 196,443 | |
Cheng Shin Rubber Industry Company Limited | | | | | | | | | | | 588,369 | | | | 1,249,778 | |
Cie Generale des Establissements Michelin | | | | | | | | | | | 18,498 | | | | 1,966,382 | |
Continental AG | | | | | | | | | | | 10,150 | | | | 2,127,370 | |
Cooper Tire & Rubber Company | | | | | | | | | | | 68,804 | | | | 2,338,648 | |
Daido Metal Company Limited | | | | | | | | | | | 7,000 | | | | 79,157 | |
Dana Holding Corporation | | | | | | | | | | | 172,141 | | | | 2,482,273 | |
Delphi Automotive plc | | | | | | | | | | | 32,768 | | | | 2,315,387 | |
Denso Corporation | | | | | | | | | | | 76,600 | | | | 3,162,762 | |
Exedy Corporation | | | | | | | | | | | 6,200 | | | | 153,524 | |
Exide Industries Limited | | | | | | | | | | | 78,617 | | | | 217,526 | |
Faurecia | | | | | | | | | | | 2,059 | | | | 82,188 | |
FCC Company Limited | | | | | | | | | | | 4,800 | | | | 96,032 | |
Futaba Industrial Company Limited | | | | | | | | | | | 6,100 | | | | 28,653 | |
GKN plc | | | | | | | | | | | 150,914 | | | | 616,317 | |
Halla Holdings Corporation | | | | | | | | | | | 1,219 | | | | 83,089 | |
Hankook Tire Company Limited | | | | | | | | | | | 12,415 | | | | 621,307 | |
Hanon Systems | | | | | | | | | | | 25,350 | | | | 266,004 | |
Hi-Lex Corporation | | | | | | | | | | | 5,800 | | | | 152,309 | |
Hota Industrial Manufacturing Company Limited | | | | | | | | | | | 60,000 | | | | 311,057 | |
Hyundai Mobis | | | | | | | | | | | 11,126 | | | | 2,599,393 | |
Hyundai Wia Corporation | | | | | | | | | | | 3,195 | | | | 260,758 | |
Keihin Corporation | | | | | | | | | | | 6,400 | | | | 98,290 | |
Kenda Rubber Industrial Company Limited | | | | | | | | | | | 190,188 | | | | 300,892 | |
Koito Manufacturing Company Limited | | | | | | | | | | | 18,900 | | | | 899,652 | |
Kumho Tire Company Incorporated † | | | | | | | | | | | 22,990 | | | | 204,951 | |
KYB Corporation | | | | | | | | | | | 38,000 | | | | 154,255 | |
Leoni AG | | | | | | | | | | | 4,204 | | | | 155,382 | |
Linamar Corporation | | | | | | | | | | | 2,422 | | | | 99,953 | |
Magna International Incorporated | | | | | | | | | | | 34,700 | | | | 1,397,367 | |
Mando Corporation | | | | | | | | | | | 1,330 | | | | 311,924 | |
Martinrea International Incorporated | | | | | | | | | | | 3,001 | | | | 19,154 | |
Mitsuba Corporation | | | | | | | | | | | 8,000 | | | | 110,028 | |
Motherson Sumi Systems Limited | | | | | | | | | | | 88,861 | | | | 427,984 | |
Musashi Seimitsu Industry Company Limited | | | | | | | | | | | 4,100 | | | | 82,345 | |
Nan Kang Rubber Tire Company Limited | | | | | | | | | | | 148,145 | | | | 136,797 | |
NGK Spark Plug Company Limited | | | | | | | | | | | 27,600 | | | | 516,175 | |
NHK Spring Company Limited | | | | | | | | | | | 35,900 | | | | 337,956 | |
Nifco Incorporated | | | | | | | | | | | 7,000 | | | | 352,486 | |
Nippon Seiki Company Limited | | | | | | | | | | | 10,000 | | | | 188,566 | |
Nissin Kogyo Company Limited | | | | | | | | | | | 5,400 | | | | 78,600 | |
| | | | |
| 2 | | Wells Fargo Diversified Stock Portfolio | | Portfolio of investments—August 31, 2016 (unaudited) |
| | | | | | | | | | | | | | | | |
| Security name | | | | | | | | Shares | | | Value | |
| | | | |
| Auto Components (continued) | | | | | | | | | | | | | | | | |
NOK Corporation | | | | | | | | | | | 19,200 | | | $ | 389,697 | |
Nokian Renkaat Oyj | | | | | | | | | | | 13,330 | | | | 481,308 | |
Pacific Industrial Company Limited | | | | | | | | | | | 10,300 | | | | 117,271 | |
Plastic Omnium SA | | | | | | | | | | | 6,187 | | | | 197,411 | |
Press Kogyo Company Limited | | | | | | | | | | | 13,000 | | | | 55,787 | |
Riken Corporation | | | | | | | | | | | 14,000 | | | | 45,465 | |
Sanden Corporation | | | | | | | | | | | 27,000 | | | | 76,983 | |
Showa Corporation | | | | | | | | | | | 13,400 | | | | 79,521 | |
Somboon Advance Technology PCL | | | | | | | | | | | 70 | | | | 28 | |
Stanley Electric Company Limited | | | | | | | | | | | 23,000 | | | | 587,532 | |
Sumitomo Riko Company Limited | | | | | | | | | | | 6,500 | | | | 60,499 | |
Sumitomo Rubber Industries Limited | | | | | | | | | | | 30,400 | | | | 450,719 | |
Tachi-S Company Limited | | | | | | | | | | | 5,700 | | | | 94,757 | |
Takata Corporation † | | | | | | | | | | | 7,500 | | | | 29,430 | |
Tenedora Nemak SA de CV 144A | | | | | | | | | | | 158,018 | | | | 178,968 | |
Tenneco Automotive Incorporated † | | | | | | | | | | | 74,500 | | | | 4,159,335 | |
The Goodyear Tire & Rubber Company | | | | | | | | | | | 140,200 | | | | 4,114,870 | |
Tokai Rika Company Limited | | | | | | | | | | | 8,200 | | | | 162,074 | |
Tong Yang Industry Company Limited | | | | | | | | | | | 100,374 | | | | 202,137 | |
Topre Corporation | | | | | | | | | | | 6,800 | | | | 133,549 | |
Toyo Tire & Rubber Company Limited | | | | | | | | | | | 18,000 | | | | 253,129 | |
Toyoda Gosei Company Limited | | | | | | | | | | | 10,900 | | | | 250,943 | |
Toyota Boshoku Corporation | | | | | | | | | | | 12,100 | | | | 276,581 | |
Toyota Industries Corporation | | | | | | | | | | | 30,700 | | | | 1,468,758 | |
TPR Company Limited | | | | | | | | | | | 5,200 | | | | 132,884 | |
TS Tech Company Limited | | | | | | | | | | | 7,600 | | | | 176,365 | |
Unipres Corporation | | | | | | | | | | | 6,700 | | | | 119,540 | |
Valeo SA | | | | | | | | | | | 23,457 | | | | 1,213,800 | |
Visteon Corporation | | | | | | | | | | | 43,514 | | | | 3,076,440 | |
Xinyi Automobile Glass Hong Kong Enterprises Limited † | | | | | | | | | | | 18 | | | | 4 | |
Xinyi Glass Holdings Limited | | | | | | | | | | | 149 | | | | 128 | |
Yarnapund PCL †(a) | | | | | | | | | | | 1,551,500 | | | | 0 | |
Yokohama Rubber Company Limited | | | | | | | | | | | 19,500 | | | | 316,817 | |
Yorozu Corporation | | | | | | | | | | | 3,500 | | | | 44,720 | |
| | | | |
| | | | | | | | | | | | | | | 57,649,906 | |
| | | | | | | | | | | | | | | | |
| | | | |
| Automobiles: 1.21% | | | | | | | | | | | | | | | | |
Bajaj Auto | | | | | | | | | | | 25,817 | | | | 1,148,215 | |
Bayerische Motoren Werke AG | | | | | | | | | | | 30,555 | | | | 2,658,782 | |
Brilliance China Automotive Holdings Limited | | | | | | | | | | | 880,000 | | | | 1,006,194 | |
BYD Company Limited H Shares †« | | | | | | | | | | | 218,000 | | | | 1,517,489 | |
China Motor Company Limited | | | | | | | | | | | 198,150 | | | | 147,065 | |
Daimler AG | | | | | | | | | | | 92,366 | | | | 6,396,082 | |
Dongfeng Motor Group Company Limited H Shares | | | | | | | | | | | 748,000 | | | | 799,340 | |
Ferrari NV | | | | | | | | | | | 8,301 | | | | 400,004 | |
Fiat Chrysler Automobiles NV | | | | | | | | | | | 83,018 | | | | 573,672 | |
Ford Motor Company | | | | | | | | | | | 424,201 | | | | 5,344,933 | |
Ford Otomotiv Sanayi AS | | | | | | | | | | | 14,299 | | | | 155,104 | |
Fuji Heavy Industries Limited | | | | | | | | | | | 96,400 | | | | 3,818,172 | |
Geely Automobile Holdings Limited | | | | | | | | | | | 1,395,000 | | | | 1,118,510 | |
| | | | | | |
| Portfolio of investments—August 31, 2016 (unaudited) | | Wells Fargo Diversified Stock Portfolio | | | 3 | |
| | | | | | | | | | | | | | | | |
| Security name | | | | | | | | Shares | | | Value | |
| | | | |
| Automobiles (continued) | | | | | | | | | | | | | | | | |
General Motors Company | | | | | | | | | | | 151,493 | | | $ | 4,835,657 | |
Ghabbour Auto † | | | | | | | | | | | 25,801 | | | | 6,886 | |
Hero Honda Motors Limited | | | | | | | | | | | 29,463 | | | | 1,557,993 | |
Honda Motor Company Limited | | | | | | | | | | | 261,500 | | | | 8,011,936 | |
Honda Motor Company Limited ADR | | | | | | | | | | | 25 | | | | 770 | |
Hyundai Motor Company | | | | | | | | | | | 24,353 | | | | 2,904,887 | |
Isuzu Motors Limited | | | | | | | | | | | 93,700 | | | | 1,078,141 | |
Kia Motors Corporation | | | | | | | | | | | 43,683 | | | | 1,643,499 | |
Mahindra & Mahindra Limited | | | | | | | | | | | 74,466 | | | | 1,597,400 | |
Mahindra & Mahindra Limited GDR | | | | | | | | | | | 10,726 | | | | 232,218 | |
Maruti Suzuki India Limited | | | | | | | | | | | 36,529 | | | | 2,756,530 | |
Mazda Motor Corporation | | | | | | | | | | | 89,900 | | | | 1,481,897 | |
Mitsubishi Motors Corporation | | | | | | | | | | | 111,400 | | | | 509,276 | |
Nissan Motor Company Limited | | | | | | | | | | | 375,600 | | | | 3,684,666 | |
Nissan Shatai Company Limited | | | | | | | | | | | 11,700 | | | | 106,410 | |
Oriental Holdings Bhd | | | | | | | | | | | 46,320 | | | | 77,666 | |
Peugeot SA † | | | | | | | | | | | 32,543 | | | | 480,069 | |
PT Astra International Tbk | | | | | | | | | | | 6,419,940 | | | | 3,944,403 | |
Renault SA | | | | | | | | | | | 19,824 | | | | 1,621,081 | |
Suzuki Motor Corporation | | | | | | | | | | | 64,500 | | | | 2,137,636 | |
Tata Motors Limited | | | | | | | | | | | 222,094 | | | | 1,783,186 | |
Tata Motors Limited ADR | | | | | | | | | | | 10,643 | | | | 433,915 | |
Tata Motors Limited Class A (Differential Voting Rights) | | | | | | | | | | | 132,940 | | | | 681,970 | |
Tesla Motors Incorporated †« | | | | | | | | | | | 20,300 | | | | 4,303,803 | |
Thor Industries Incorporated | | | | | | | | | | | 59,620 | | | | 4,838,163 | |
Tofas Turk Otomobil Fabrikasi AS | | | | | | | | | | | 25,253 | | | | 185,804 | |
Toyota Motor Corporation | | | | | | | | | | | 428,100 | | | | 25,810,543 | |
UMW Holdings Bhd | | | | | | | | | | | 137,800 | | | | 189,261 | |
Volkswagen AG | | | | | | | | | | | 3,151 | | | | 458,504 | |
Yamaha Motor Company Limited | | | | | | | | | | | 45,300 | | | | 928,198 | |
Yulon Motor Company Limited | | | | | | | | | | | 230,929 | | | | 199,776 | |
| | | | |
| | | | | | | | | | | | | | | 103,565,706 | |
| | | | | | | | | | | | | | | | |
| | | | |
| Distributors: 0.26% | | | | | | | | | | | | | | | | |
Canon Marketing Japan Incorporated | | | | | | | | | | | 7,900 | | | | 138,583 | |
D’ieteren SA NV | | | | | | | | | | | 1,530 | | | | 73,880 | |
DOSHISHA Company Limited | | | | | | | | | | | 4,400 | | | | 83,692 | |
Genuine Parts Company | | | | | | | | | | | 80,400 | | | | 8,266,728 | |
Imperial Holdings Limited | | | | | | | | | | | 47,334 | | | | 507,789 | |
Inchcape plc | | | | | | | | | | | 38,717 | | | | 356,651 | |
Jardine Cycle & Carriage Limited | | | | | | | | | | | 21,598 | | | | 673,724 | |
LKQ Corporation † | | | | | | | | | | | 173,800 | | | | 6,272,442 | |
Paltac Corporation | | | | | | | | | | | 4,300 | | | | 89,354 | |
Pool Corporation | | | | | | | | | | | 55,300 | | | | 5,578,111 | |
Uni-Select Incorporated | | | | | | | | | | | 864 | | | | 20,286 | |
| | | | |
| | | | | | | | | | | | | | | 22,061,240 | |
| | | | | | | | | | | | | | | | |
| | | | |
| Diversified Consumer Services: 0.18% | | | | | | | | | | | | | | | | |
AA plc | | | | | | | | | | | 52,430 | | | | 186,028 | |
Apollo Education Group Incorporated † | | | | | | | | | | | 134,600 | | | | 1,193,902 | |
| | | | |
| 4 | | Wells Fargo Diversified Stock Portfolio | | Portfolio of investments—August 31, 2016 (unaudited) |
| | | | | | | | | | | | | | | | |
| Security name | | | | | | | | Shares | | | Value | |
| | | | |
| Diversified Consumer Services (continued) | | | | | | | | | | | | | | | | |
Benesse Corporation | | | | | | | | | | | 14,400 | | | $ | 332,078 | |
DeVry Incorporated « | | | | | | | | | | | 75,300 | | | | 1,734,912 | |
Dignity plc | | | | | | | | | | | 4,665 | | | | 164,724 | |
Educomp Solutions Limited † | | | | | | | | | | | 5,295 | | | | 1,012 | |
Enercare Incorporated | | | | | | | | | | | 9,800 | | | | 136,530 | |
Grand Canyon Education Incorporated † | | | | | | | | | | | 66,720 | | | | 2,770,882 | |
H&R Block Incorporated | | | | | | | | | | | 116,111 | | | | 2,514,964 | |
Houghton Mifflin Harcourt Company † | | | | | | | | | | | 138,512 | | | | 2,209,266 | |
InvoCare Limited | | | | | | | | | | | 18,207 | | | | 184,043 | |
Navitas Limited | | | | | | | | | | | 46,793 | | | | 182,870 | |
New Oriental Education & Technology Group Incorporated | | | | | | | | | | | 38,053 | | | | 1,502,332 | |
Raffles Education Corporation Limited | | | | | | | | | | | 55,177 | | | | 8,100 | |
Sotheby’s « | | | | | | | | | | | 64,700 | | | | 2,565,355 | |
| | | | |
| | | | | | | | | | | | | | | 15,686,998 | |
| | | | | | | | | | | | | | | | |
| | | | |
| Hotels, Restaurants & Leisure: 2.01% | | | | | | | | | | | | | | | | |
Accor SA | | | | | | | | | | | 17,394 | | | | 656,665 | |
Accordia Golf Company Limited | | | | | | | | | | | 9,600 | | | | 96,311 | |
Ajisen China Holdings Limited | | | | | | | | | | | 200 | | | | 80 | |
Amax International Holdings Limited † | | | | | | | | | | | 6,262 | | | | 371 | |
Amaya Incorporated † | | | | | | | | | | | 9,782 | | | | 146,872 | |
Aramark | | | | | | | | | | | 120,840 | | | | 4,583,461 | |
Ardent Leisure Group | | | | | | | | | | | 63,264 | | | | 120,292 | |
Aristocrat Leisure Limited | | | | | | | | | | | 88,978 | | | | 1,009,759 | |
Autogrill SpA | | | | | | | | | | | 9,260 | | | | 79,431 | |
Banyan Tree Holdings Limited † | | | | | | | | | | | 13,000 | | | | 4,198 | |
Berjaya Land Bhd † | | | | | | | | | | | 408,500 | | | | 65,473 | |
Berjaya Sports Toto Bhd | | | | | | | | | | | 168,499 | | | | 139,187 | |
Brinker International Incorporated | | | | | | | | | | | 72,300 | | | | 3,883,233 | |
Buffalo Wild Wings Incorporated † | | | | | | | | | | | 24,400 | | | | 3,957,680 | |
Cafe de Coral Holdings Limited | | | | | | | | | | | 52,000 | | | | 181,990 | |
Carnival Corporation | | | | | | | | | | | 45,600 | | | | 2,179,680 | |
Carnival plc | | | | | | | | | | | 20,101 | | | | 964,496 | |
Chipotle Mexican Grill Incorporated † | | | | | | | | | | | 5,594 | | | | 2,314,406 | |
Choice Hotels International Incorporated | | | | | | | | | | | 49,840 | | | | 2,416,742 | |
Colowide Company Limited | | | | | | | | | | | 10,000 | | | | 171,362 | |
Compass Group plc | | | | | | | | | | | 155,707 | | | | 2,948,408 | |
Cracker Barrel Old Country Store Incorporated « | | | | | | | | | | | 31,400 | | | | 4,776,254 | |
Crown Limited | | | | | | | | | | | 59,986 | | | | 591,933 | |
Darden Restaurants Incorporated | | | | | | | | | | | 59,900 | | | | 3,692,236 | |
Domino’s Pizza Enterprises Limited | | | | | | | | | | | 9,110 | | | | 518,221 | |
Domino’s Pizza Group plc | | | | | | | | | | | 44,042 | | | | 207,507 | |
Domino’s Pizza Incorporated | | | | | | | | | | | 66,800 | | | | 9,991,276 | |
Doutor Nichires Holdings Company Limited | | | | | | | | | | | 5,200 | | | | 91,973 | |
Egyptian Resorts Company † | | | | | | | | | | | 16,982 | | | | 1,530 | |
Flight Centre Limited | | | | | | | | | | | 11,645 | | | | 322,504 | |
Formosa International Hotels Corporation | | | | | | | | | | | 19,491 | | | | 110,568 | |
Fresh Express Delivery Holding Group Company Limited † | | | | | | | | | | | 1,669 | | | | 155 | |
Fuji Kyuko Company Limited | | | | | | | | | | | 10,000 | | | | 107,573 | |
Fujita Kanko Incorporated | | | | | | | | | | | 12,000 | | | | 43,841 | |
| | | | | | |
| Portfolio of investments—August 31, 2016 (unaudited) | | Wells Fargo Diversified Stock Portfolio | | | 5 | |
| | | | | | | | | | | | | | | | |
| Security name | | | | | | | | Shares | | | Value | |
| | | | |
| Hotels, Restaurants & Leisure (continued) | | | | | | | | | | | | | | | | |
Galaxy Entertainment Group Limited | | | | | | | | | | | 385,000 | | | $ | 1,253,134 | |
Genting Bhd | | | | | | | | | | | 624,500 | | | | 1,201,110 | |
Genting Malaysia Bhd | | | | | | | | | | | 1,046,115 | | | | 1,145,297 | |
Genting Singapore plc | | | | | | | | | | | 1,113,320 | | | | 588,345 | |
Grand Korea Leisure Company Limited | | | | | | | | | | | 4,800 | | | | 112,359 | |
Great Canadian Gaming Corporation † | | | | | | | | | | | 676 | | | | 11,232 | |
Greene King plc | | | | | | | | | | | 29,029 | | | | 309,720 | |
GVC Holdings plc | | | | | | | | | | | 13,541 | | | | 122,602 | |
H.I.S. Company Limited | | | | | | | | | | | 6,500 | | | | 163,592 | |
Hana Tour Service Incorporated | | | | | | | | | | | 1,564 | | | | 100,994 | |
Hilton Worldwide Holdings Incorporated | | | | | | | | | | | 101,213 | | | | 2,415,954 | |
Hong Kong & Shanghai Hotels Limited | | | | | | | | | | | 96,806 | | | | 98,833 | |
Hotel Properties Limited | | | | | | | | | | | 32,000 | | | | 79,621 | |
Hyatt Hotels Corporation Class A † | | | | | | | | | | | 15,414 | | | | 824,341 | |
Imperial Hotel Limited | | | | | | | | | | | 6,400 | | | | 130,394 | |
InterContinental Hotels Group plc | | | | | | | | | | | 21,940 | | | | 939,510 | |
J D Wetherspoon plc | | | | | | | | | | | 8,168 | | | | 95,192 | |
J. Alexander’s Holdings Incorporated † | | | | | | | | | | | 20,074 | | | | 200,138 | |
Jack in the Box Incorporated | | | | | | | | | | | 42,200 | | | | 4,197,212 | |
Jollibee Foods Corporation | | | | | | | | | | | 94,580 | | | | 497,309 | |
Kangwon Land Incorporated | | | | | | | | | | | 17,620 | | | | 623,416 | |
Kisoji Company Limited | | | | | | | | | | | 3,500 | | | | 72,020 | |
Kyoritsu Maintenance Company Limited | | | | | | | | | | | 2,100 | | | | 137,003 | |
Ladbrokers plc | | | | | | | | | | | 95,658 | | | | 193,068 | |
Las Vegas Sands Corporation | | | | | | | | | | | 70,555 | | | | 3,542,567 | |
Macau Legend Development Limited † | | | | | | | | | | | 840,000 | | | | 119,110 | |
Magnum Bhd | | | | | | | | | | | 221,370 | | | | 127,183 | |
Marriott International Incorporated Class A « | | | | | | | | | | | 36,800 | | | | 2,624,944 | |
Marston’s plc | | | | | | | | | | | 50,669 | | | | 96,943 | |
McDonald’s Corporation | | | | | | | | | | | 158,914 | | | | 18,379,993 | |
McDonald’s Holdings Company Japan Limited | | | | | | | | | | | 9,700 | | | | 267,754 | |
Melco Crown Entertainment Limited ADR « | | | | | | | | | | | 32,470 | | | | 421,461 | |
Melco International Development Limited | | | | | | | | | | | 180,000 | | | | 186,090 | |
Merlin Entertainment plc 144A | | | | | | | | | | | 50,120 | | | | 315,978 | |
MGM China Holdings Limited | | | | | | | | | | | 177,200 | | | | 272,737 | |
MGM Resorts International † | | | | | | | | | | | 269,700 | | | | 6,443,133 | |
Millennium & Copthorne Hotels plc | | | | | | | | | | | 18,690 | | | | 106,123 | |
Minor International PCL | | | | | | | | | | | 486,956 | | | | 580,287 | |
Miramar Hotel & Investment Company Limited | | | | | | | | | | | 48,000 | | | | 84,274 | |
Mitchells & Butlers plc | | | | | | | | | | | 19,207 | | | | 64,845 | |
MOS Food Services Incorporated | | | | | | | | | | | 4,700 | | | | 135,960 | |
Norwegian Cruise Line Holdings Limited † | | | | | | | | | | | 87,062 | | | | 3,124,655 | |
Ohsho Food Service Corporation | | | | | | | | | | | 1,600 | | | | 61,470 | |
OPAP SA | | | | | | | | | | | 58,349 | | | | 489,442 | |
Oriental Land Company Limited | | | | | | | | | | | 33,600 | | | | 1,967,645 | |
Paddy Power Betfair plc | | | | | | | | | | | 3,017 | | | | 362,898 | |
Paddy Power plc | | | | | | | | | | | 3,683 | | | | 440,194 | |
Panera Bread Company Class A † | | | | | | | | | | | 30,049 | | | | 6,525,140 | |
Paradise Company Limited | | | | | | | | | | | 11,315 | | | | 169,979 | |
Plenus Company Limited | | | | | | | | | | | 4,100 | | | | 68,079 | |
| | | | |
| 6 | | Wells Fargo Diversified Stock Portfolio | | Portfolio of investments—August 31, 2016 (unaudited) |
| | | | | | | | | | | | | | | | |
| Security name | | | | | | | | Shares | | | Value | |
| | | | |
| Hotels, Restaurants & Leisure (continued) | | | | | | | | | | | | | | | | |
Resorttrust Incorporated | | | | | | | | | | | 14,700 | | | $ | 313,138 | |
Restaurant Brands International Incorporated | | | | | | | | | | | 19,733 | | | | 941,508 | |
Restaurant Group plc | | | | | | | | | | | 15,681 | | | | 76,703 | |
Round One Corporation | | | | | | | | | | | 8,500 | | | | 59,561 | |
Royal Caribbean Cruises Limited | | | | | | | | | | | 95,470 | | | | 6,788,872 | |
Royal Holdings Company Limited | | | | | | | | | | | 5,300 | | | | 86,212 | |
Saint Marc Holdings Company Limited | | | | | | | | | | | 2,400 | | | | 61,400 | |
Saizeriya Company Limited | | | | | | | | | | | 4,700 | | | | 98,166 | |
Sands China Limited | | | | | | | | | | | 395,123 | | | | 1,553,487 | |
Shangri-La Asia Limited | | | | | | | | | | | 274,166 | | | | 296,871 | |
Six Flags Entertainment Corporation | | | | | | | | | | | 105,419 | | | | 5,141,285 | |
SJM Holdings Limited | | | | | | | | | | | 390,000 | | | | 245,335 | |
SKYCITY Entertainment Group Limited | | | | | | | | | | | 125,099 | | | | 454,767 | |
Skylark Company Limited | | | | | | | | | | | 17,100 | | | | 212,541 | |
Sodexho Alliance SA | | | | | | | | | | | 9,330 | | | | 1,080,783 | |
SSP Group plc | | | | | | | | | | | 80,582 | | | | 344,855 | |
Star Entertainment Group Limited | | | | | | | | | | | 140,622 | | | | 623,539 | |
Starbucks Corporation | | | | | | | | | | | 265,200 | | | | 14,912,196 | |
Tabcorp Holdings Limited | | | | | | | | | | | 160,020 | | | | 597,707 | |
Tatts Group Limited | | | | | | | | | | | 233,609 | | | | 668,918 | |
The Cheesecake Factory Incorporated | | | | | | | | | | | 63,600 | | | | 3,269,676 | |
The Wendy’s Company | | | | | | | | | | | 248,114 | | | | 2,528,282 | |
Thomas Cook Group plc † | | | | | | | | | | | 117,612 | | | | 107,492 | |
Tokyo Dome Corporation | | | | | | | | | | | 18,000 | | | | 162,142 | |
Tokyotokeiba Company Limited | | | | | | | | | | | 32,000 | | | | 61,857 | |
TUI AG | | | | | | | | | | | 12,319 | | | | 171,765 | |
TUI AG - BATS Exchange | | | | | | | | | | | 24,427 | | | | 340,971 | |
Unibet Group plc | | | | | | | | | | | 36,544 | | | | 326,993 | |
Vail Resorts Incorporated | | | | | | | | | | | 47,720 | | | | 7,560,280 | |
Whitbread plc | | | | | | | | | | | 16,280 | | | | 891,893 | |
William Hill plc | | | | | | | | | | | 82,355 | | | | 344,116 | |
Wyndham Worldwide Corporation | | | | | | | | | | | 63,100 | | | | 4,466,849 | |
Wynn Macau Limited | | | | | | | | | | | 273,600 | | | | 380,904 | |
Wynn Resorts Limited « | | | | | | | | | | | 45,837 | | | | 4,094,161 | |
Yoshinoya D&C Company Limited | | | | | | | | | | | 11,800 | | | | 160,238 | |
Yum! Brands Incorporated | | | | | | | | | | | 43,700 | | | | 3,964,027 | |
Zensho Company Limited | | | | | | | | | | | 13,100 | | | | 224,864 | |
| | | | |
| | | | | | | | | | | | | | | 172,481,302 | |
| | | | | | | | | | | | | | | | |
| | | | |
| Household Durables: 1.10% | | | | | | | | | | | | | | | | |
Alpine Electronics Incorporated | | | | | | | | | | | 7,900 | | | | 95,061 | |
Altek Corporation | | | | | | | | | | | 436 | | | | 314 | |
Arcelik AS | | | | | | | | | | | 78,008 | | | | 558,133 | |
Barratt Developments plc | | | | | | | | | | | 86,863 | | | | 563,477 | |
Bellway plc | | | | | | | | | | | 9,497 | | | | 290,574 | |
Berkeley Group Holdings plc | | | | | | | | | | | 11,306 | | | | 396,698 | |
Bonava AB B Shares † | | | | | | | | | | | 8,600 | | | | 103,674 | |
Bovis Homes Group plc | | | | | | | | | | | 9,917 | | | | 116,682 | |
Casio Computer Company Limited | | | | | | | | | | | 39,600 | | | | 559,180 | |
Chofu Seisakusho Company Limited | | | | | | | | | | | 3,500 | | | | 83,386 | |
| | | | | | |
| Portfolio of investments—August 31, 2016 (unaudited) | | Wells Fargo Diversified Stock Portfolio | | | 7 | |
| | | | | | | | | | | | | | | | |
| Security name | | | | | | | | Shares | | | Value | |
| | | | |
| Household Durables (continued) | | | | | | | | | | | | | | | | |
Coway Company Limited | | | | | | | | | | | 8,430 | | | $ | 630,549 | |
Crest Nicholson Holdings plc | | | | | | | | | | | 42,434 | | | | 259,164 | |
D.R. Horton Incorporated | | | | | | | | | | | 184,676 | | | | 5,920,713 | |
Dorel Industries Incorporated Class B | | | | | | | | | | | 2,467 | | | | 70,413 | |
Electrolux AB Class B | | | | | | | | | | | 25,871 | | | | 673,925 | |
Forbo Holding AG | | | | | | | | | | | 129 | | | | 177,194 | |
Foster Electric Company Limited | | | | | | | | | | | 4,400 | | | | 77,058 | |
Fujitsu General Limited | | | | | | | | | | | 9,000 | | | | 183,018 | |
Garmin Limited | | | | | | | | | | | 61,100 | | | | 2,998,788 | |
GoPro Incorporated Class A †« | | | | | | | | | | | 111,691 | | | | 1,636,273 | |
GUD Holdings Limited | | | | | | | | | | | 7,917 | | | | 59,738 | |
Haier Electronics Group Company | | | | | | | | | | | 470,000 | | | | 786,408 | |
Hanssem Company Limited | | | | | | | | | | | 1,940 | | | | 255,767 | |
Harman International Industries Incorporated | | | | | | | | | | | 38,970 | | | | 3,300,369 | |
Haseko Corporation | | | | | | | | | | | 44,800 | | | | 423,904 | |
Husqvarna AB Class A | | | | | | | | | | | 1 | | | | 9 | |
Husqvarna AB Class B | | | | | | | | | | | 37,065 | | | | 320,614 | |
Iida Group Holdings Company | | | | | | | | | | | 25,700 | | | | 481,386 | |
JM AB | | | | | | | | | | | 8,886 | | | | 225,766 | |
JVC Kenwood Holdings Incorporated | | | | | | | | | | | 26,300 | | | | 61,769 | |
Leggett & Platt Incorporated | | | | | | | | | | | 70,719 | | | | 3,711,333 | |
Lennar Corporation Class A | | | | | | | | | | | 103,471 | | | | 4,894,178 | |
Lennar Corporation Class B | | | | | | | | | | | 1,900 | | | | 72,181 | |
LG Electronics Incorporated | | | | | | | | | | | 17,628 | | | | 814,208 | |
Mohawk Industries Incorporated † | | | | | | | | | | | 36,200 | | | | 7,702,636 | |
Newell Rubbermaid Incorporated | | | | | | | | | | | 247,742 | | | | 13,150,145 | |
Nikon Corporation « | | | | | | | | | | | 59,000 | | | | 866,196 | |
NVR Incorporated † | | | | | | | | | | | 2,034 | | | | 3,430,951 | |
Panahome Corporation | | | | | | | | | | | 11,000 | | | | 81,332 | |
Panasonic Corporation | | | | | | | | | | | 338,010 | | | | 3,466,183 | |
Peace Mark Holdings Limited †(a) | | | | | | | | | | | 10,000 | | | | 0 | |
Persimmon plc | | | | | | | | | | | 31,295 | | | | 749,573 | |
Pioneer Corporation † | | | | | | | | | | | 54,900 | | | | 120,449 | |
Pulte Homes Incorporated | | | | | | | | | | | 165,500 | | | | 3,536,735 | |
Rinnai Corporation | | | | | | | | | | | 5,700 | | | | 534,384 | |
Sangetsu Company Limited | | | | | | | | | | | 9,300 | | | | 164,221 | |
SEB SA | | | | | | | | | | | 3,036 | | | | 404,010 | |
Sekisui Chemical Company Limited | | | | | | | | | | | 68,900 | | | | 962,929 | |
Sekisui House Limited | | | | | | | | | | | 93,200 | | | | 1,500,712 | |
Sharp Corporation †« | | | | | | | | | | | 269,000 | | | | 371,788 | |
Skyworth Digital Holdings Limited | | | | | | | | | | | 144 | | | | 107 | |
Sony Corporation | | | | | | | | | | | 182,294 | | | | 5,858,286 | |
Starts Corporation Incorporated | | | | | | | | | | | 5,200 | | | | 89,309 | |
Steinhoff International Holdings H Shares | | | | | | | | | | | 949,758 | | | | 5,699,065 | |
Sumitomo Foresting Company Limited | | | | | | | | | | | 24,600 | | | | 332,866 | |
Tamron Company Limited | | | | | | | | | | | 4,000 | | | | 61,663 | |
Taylor Woodrow plc | | | | | | | | | | | 300,372 | | | | 636,221 | |
Techtronic Industries Company Limited | | | | | | | | | | | 217,000 | | | | 879,743 | |
Tempur-Pedic International Incorporated † | | | | | | | | | | | 80,300 | | | | 6,297,126 | |
Token Corporation | | | | | | | | | | | 1,340 | | | | 98,818 | |
| | | | |
| 8 | | Wells Fargo Diversified Stock Portfolio | | Portfolio of investments—August 31, 2016 (unaudited) |
| | | | | | | | | | | | | | | | |
| Security name | | | | | | | | Shares | | | Value | |
| | | | |
| Household Durables (continued) | | | | | | | | | | | | | | | | |
Toll Brothers Incorporated † | | | | | | | | | | | 93,800 | | | $ | 2,916,242 | |
Tupperware Brands Corporation | | | | | | | | | | | 60,300 | | | | 3,951,459 | |
Welling Holding Limited | | | | | | | | | | | 800 | | | | 146 | |
Zojirushi Corporation « | | | | | | | | | | | 6,800 | | | | 106,405 | |
| | | | |
| | | | | | | | | | | | | | | 94,771,604 | |
| | | | | | | | | | | | | | | | |
| | | | |
| Internet & Catalog Retail: 1.35% | | | | | | | | | | | | | | | | |
Amazon.com Incorporated † | | | | | | | | | | | 70,127 | | | | 53,938,883 | |
Askul Corporation | | | | | | | | | | | 4,000 | | | | 144,010 | |
ASOS plc † | | | | | | | | | | | 4,799 | | | | 285,472 | |
CJ O Shopping Company Limited | | | | | | | | | | | 949 | | | | 134,818 | |
Ctrip.com International Limited ADR †« | | | | | | | | | | | 96,068 | | | | 4,548,820 | |
Expedia Incorporated | | | | | | | | | | | 66,712 | | | | 7,279,613 | |
Groupon Incorporated †« | | | | | | | | | | | 588,300 | | | | 3,135,639 | |
GS Home Shopping Incorporated | | | | | | | | | | | 834 | | | | 117,583 | |
Home Retail Group plc | | | | | | | | | | | 62,866 | �� | | | 131,836 | |
HSN Incorporated | | | | | | | | | | | 45,387 | | | | 1,896,269 | |
Hyundai Home Shopping Network Corporation | | | | | | | | | | | 1,833 | | | | 202,205 | |
JD.com Incorporated ADR † | | | | | | | | | | | 240,645 | | | | 6,114,789 | |
Liberty Interactive Corporation Series A † | | | | | | | | | | | 252,900 | | | | 5,343,777 | |
Liberty TripAdvisor Holdings Incorporated Class A † | | | | | | | | | | | 96,300 | | | | 2,004,003 | |
N Brown Group plc | | | | | | | | | | | 13,911 | | | | 37,247 | |
Netflix Incorporated † | | | | | | | | | | | 77,582 | | | | 7,560,366 | |
Ocado Group plc †« | | | | | | | | | | | 44,034 | | | | 176,130 | |
Rakuten Incorporated | | | | | | | | | | | 131,400 | | | | 1,656,073 | |
Senshukai Company Limited | | | | | | | | | | | 7,500 | | | | 50,089 | |
Shutterfly Incorporated † | | | | | | | | | | | 49,300 | | | | 2,475,846 | |
Start Today Company Limited | | | | | | | | | | | 8,700 | | | | 404,035 | |
The Priceline Group Incorporated † | | | | | | | | | | | 8,996 | | | | 12,744,903 | |
TripAdvisor Incorporated † | | | | | | | | | | | 64,201 | | | | 3,916,261 | |
Vipshop Holdings Limited ADR † | | | | | | | | | | | 89,052 | | | | 1,260,976 | |
Zalando SE 144A† | | | | | | | | | | | 12,774 | | | | 488,519 | |
| | | | |
| | | | | | | | | | | | | | | 116,048,162 | |
| | | | | | | | | | | | | | | | |
| | | | |
| Leisure Products: 0.34% | | | | | | | | | | | | | | | | |
Amer Sports Oyj | | | | | | | | | | | 13,925 | | | | 419,381 | |
Bandai Namco Holdings Incorporated | | | | | | | | | | | 32,700 | | | | 893,154 | |
Fields Corporation | | | | | | | | | | | 2,900 | | | | 35,933 | |
Giant Manufacturing Company Limited | | | | | | | | | | | 113,687 | | | | 732,702 | |
Hasbro Incorporated | | | | | | | | | | | 62,721 | | | | 5,126,815 | |
Heiwa Corporation | | | | | | | | | | | 9,000 | | | | 193,022 | |
Mattel Incorporated | | | | | | | | | | | 190,495 | | | | 6,311,099 | |
Merida Industry Company Limited | | | | | | | | | | | 47,250 | | | | 192,839 | |
Mizuno Corporation | | | | | | | | | | | 17,000 | | | | 82,318 | |
Polaris Industries Incorporated « | | | | | | | | | | | 33,156 | | | | 2,872,636 | |
Sankyo Company Limited | | | | | | | | | | | 7,900 | | | | 274,112 | |
Sega Sammy Holdings Incorporated | | | | | | | | | | | 30,200 | | | | 412,435 | |
Shimano Incorporated | | | | | | | | | | | 12,400 | | | | 1,802,503 | |
The Brunswick Corporation | | | | | | | | | | | 119,470 | | | | 5,494,425 | |
| | | | | | |
| Portfolio of investments—August 31, 2016 (unaudited) | | Wells Fargo Diversified Stock Portfolio | | | 9 | |
| | | | | | | | | | | | | | | | |
| Security name | | | | | | | | Shares | | | Value | |
| | | | |
| Leisure Products (continued) | | | | | | | | | | | | | | | | |
Tomy Company Limited | | | | | | | | | | | 14,100 | | | $ | 126,466 | |
Universal Entertainment Corporation † | | | | | | | | | | | 2,500 | | | | 76,475 | |
Vista Outdoor Incorporated † | | | | | | | | | | | 83,224 | | | | 3,313,980 | |
Yamaha Corporation | | | | | | | | | | | 26,700 | | | | 865,786 | |
| | | | |
| | | | | | | | | | | | | | | 29,226,081 | |
| | | | | | | | | | | | | | | | |
| | | | |
| Media: 2.08% | | | | | | | | | | | | | | | | |
Aimia Incorporated | | | | | | | | | | | 16,463 | | | | 101,937 | |
Alibaba Pictures Group Limited † | | | | | | | | | | | 3,700,000 | | | | 763,128 | |
Altice NV Class A | | | | | | | | | | | 24,543 | | | | 408,594 | |
Altice NV Class B † | | | | | | | | | | | 8,181 | | | | 136,016 | |
AMC Networks Incorporated Class A † | | | | | | | | | | | 37,462 | | | | 2,035,685 | |
Asatsu-DK Incorporated | | | | | | | | | | | 5,100 | | | | 125,005 | |
Astro Malaysia Holdings Bhd | | | | | | | | | | | 902,400 | | | | 656,412 | |
Avex Group Holdings Incorporated | | | | | | | | | | | 7,200 | | | | 93,249 | |
Axel Springer AG | | | | | | | | | | | 4,131 | | | | 210,398 | |
BEC World PCL | | | | | | | | | | | 121,700 | | | | 78,753 | |
Cable One Incorporated | | | | | | | | | | | 5,576 | | | | 3,017,285 | |
Charter Communications Incorporated Class A † | | | | | | | | | | | 123,007 | | | | 31,638,630 | |
Cheil Worldwide Incorporated | | | | | | | | | | | 13,120 | | | | 187,092 | |
Cinemark Holdings Incorporated | | | | | | | | | | | 127,500 | | | | 4,927,875 | |
Cineplex Incorporated | | | | | | | | | | | 8,140 | | | | 308,245 | |
Cineworld Group plc | | | | | | | | | | | 18,075 | | | | 135,528 | |
CJ CGV Company Limited | | | | | | | | | | | 2,020 | | | | 149,462 | |
CJ E&M Corporation | | | | | | | | | | | 3,006 | | | | 187,370 | |
Cogeco Communications Incorporated | | | | | | | | | | | 1,258 | | | | 60,866 | |
Corus Entertainment Incorporated Class B « | | | | | | | | | | | 12,391 | | | | 116,124 | |
CTS Eventim AG & Company KGaA | | | | | | | | | | | 4,511 | | | | 156,539 | |
CyberAgent Incorporated | | | | | | | | | | | 7,300 | | | | 395,815 | |
Cyfrowy Polsat SA † | | | | | | | | | | | 97,742 | | | | 615,209 | |
Daiichikosho Company Limited | | | | | | | | | | | 6,700 | | | | 259,349 | |
Daily Mail & General Trust plc Class A | | | | | | | | | | | 23,399 | | | | 221,844 | |
Dentsu Incorporated | | | | | | | | | | | 36,600 | | | | 2,012,797 | |
Discovery Communications Incorporated Class A † | | | | | | | | | | | 92,102 | | | | 2,349,522 | |
Discovery Communications Incorporated Class C † | | | | | | | | | | | 131,948 | | | | 3,274,949 | |
DISH Network Corporation Class A † | | | | | | | | | | | 27,070 | | | | 1,359,726 | |
eSun Holdings Limited † | | | | | | | | | | | 3,000 | | | | 286 | |
Eutelsat Communications SA | | | | | | | | | | | 15,183 | | | | 295,108 | |
Event Hospitality and Entertainment Limited | | | | | | | | | | | 22,965 | | | | 259,926 | |
Fairfax Media Limited | | | | | | | | | | | 382,378 | | | | 283,066 | |
Fuji Television Network Incorporated | | | | | | | | | | | 8,900 | | | | 109,417 | |
Gannett Company Incorporated | | | | | | | | | | | 156,499 | | | | 1,867,033 | |
GFK SE | | | | | | | | | | | 2,287 | | | | 74,363 | |
Grupo Televisa SA | | | | | | | | | | | 590,602 | | | | 3,222,353 | |
Hakuhodo DY Holdings Incorporated | | | | | | | | | | | 42,500 | | | | 461,702 | |
Havas SA | | | | | | | | | | | 34,495 | | | | 288,312 | |
IMAX Corporation † | | | | | | | | | | | 5,455 | | | | 166,323 | |
Informa plc | | | | | | | | | | | 60,450 | | | | 562,406 | |
Ipsos | | | | | | | | | | | 1,688 | | | | 55,432 | |
ITV plc | | | | | | | | | | | 319,668 | | | | 842,482 | |
| | | | |
| 10 | | Wells Fargo Diversified Stock Portfolio | | Portfolio of investments—August 31, 2016 (unaudited) |
| | | | | | | | | | | | | | | | |
| Security name | | | | | | | | Shares | | | Value | |
| | | | |
| Media (continued) | | | | | | | | | | | | | | | | |
JC Decaux SA | | | | | | | | | | | 5,375 | | | $ | 184,663 | |
Kadokawa Dwango Corporation | | | | | | | | | | | 4,900 | | | | 60,288 | |
Lagardere SCA | | | | | | | | | | | 10,820 | | | | 263,892 | |
Liberty Broadband Corporation Class A † | | | | | | | | | | | 35,428 | | | | 2,389,619 | |
Liberty Broadband Corporation Class C † | | | | | | | | | | | 86,366 | | | | 5,918,662 | |
Liberty Global plc Class A | | | | | | | | | | | 54,958 | | | | 1,739,421 | |
Liberty Global plc Class C | | | | | | | | | | | 126,329 | | | | 3,894,723 | |
Liberty Latin America and Caribbean Group Class A † | | | | | | | | | | | 23,705 | | | | 666,822 | |
Liberty Latin America and Caribbean Group Class C † | | | | | | | | | | | 53,670 | | | | 1,532,815 | |
Lions Gate Entertainment Corporation « | | | | | | | | | | | 58,600 | | | | 1,228,256 | |
Live Nation Incorporated † | | | | | | | | | | | 89,455 | | | | 2,390,238 | |
M6 Metropole Television SA | | | | | | | | | | | 5,835 | | | | 103,520 | |
Madison Square Garden Company Class A † | | | | | | | | | | | 26,287 | | | | 4,748,747 | |
Mediaset Espana Comunicacion SA | | | | | | | | | | | 15,943 | | | | 192,152 | |
Mediaset SpA | | | | | | | | | | | 67,736 | | | | 214,277 | |
Meredith Corporation | | | | | | | | | | | 49,800 | | | | 2,641,392 | |
Modern Times Group Class B | | | | | | | | | | | 4,115 | | | | 103,444 | |
MSG Networks Incorporated Class A | | | | | | | | | | | 36,900 | | | | 645,012 | |
Naspers Limited | | | | | | | | | | | 119,631 | | | | 19,577,757 | |
New York Times Company Class A | | | | | | | | | | | 162,087 | | | | 2,097,406 | |
News Corporation Class A | | | | | | | | | | | 221,380 | | | | 3,112,603 | |
News Corporation Class B | | | | | | | | | | | 61,266 | | | | 884,068 | |
Nippon Television Network Corporation | | | | | | | | | | | 10,000 | | | | 161,504 | |
NOS SGPS | | | | | | | | | | | 7,553 | | | | 51,173 | |
Omnicom Group Incorporated | | | | | | | | | | | 128,700 | | | | 11,084,931 | |
Pearson plc | | | | | | | | | | | 78,175 | | | | 888,483 | |
ProSiebenSat.1 Media AG | | | | | | | | | | | 20,366 | | | | 875,978 | |
PT Media Nusantara Citra Tbk | | | | | | | | | | | 1,052,000 | | | | 152,268 | |
Publicis Groupe SA | | | | | | | | | | | 17,005 | | | | 1,262,336 | |
Quebecor Incorporated Class B | | | | | | | | | | | 6,882 | | | | 210,490 | |
REA Group Limited | | | | | | | | | | | 7,600 | | | | 334,768 | |
Regal Entertainment Group Class A « | | | | | | | | | | | 89,393 | | | | 1,911,222 | |
RTL Group | | | | | | | | | | | 1,962 | | | | 165,452 | |
Schibsted ASA Class A | | | | | | | | | | | 8,244 | | | | 261,782 | |
Schibsted ASA Class B | | | | | | | | | | | 8,244 | | | | 238,433 | |
Scripps Networks Interactive Incorporated Class A | | | | | | | | | | | 52,764 | | | | 3,343,655 | |
SES SA | | | | | | | | | | | 43,074 | | | | 989,286 | |
Seven West Media Limited | | | | | | | | | | | 254,688 | | | | 149,300 | |
Shaw Communications Incorporated Class B | | | | | | | | | | | 37,500 | | | | 750,057 | |
Shochiku Company Limited | | | | | | | | | | | 20,000 | | | | 214,372 | |
Sinclair Broadcast Group Incorporated Class A | | | | | | | | | | | 91,674 | | | | 2,610,876 | |
Singapore Press Holdings Limited | | | | | | | | | | | 289,000 | | | | 799,684 | |
Sirius XM Holdings Incorporated † | | | | | | | | | | | 401,788 | | | | 1,663,402 | |
SKY Network Television Limited | | | | | | | | | | | 62,990 | | | | 222,129 | |
Sky Perfect JSAT Holdings Incorporated | | | | | | | | | | | 21,100 | | | | 95,849 | |
Sky plc | | | | | | | | | | | 92,582 | | | | 1,032,163 | |
SM Entertainment Company † | | | | | | | | | | | 3,747 | | | | 91,743 | |
Societe Television Francaise 1 SA | | | | | | | | | | | 10,997 | | | | 107,259 | |
Starz Incorporated Class A † | | | | | | | | | | | 94,146 | | | | 2,936,414 | |
Sun TV Network Limited | | | | | | | | | | | 19,075 | | | | 134,553 | |
| | | | | | |
| Portfolio of investments—August 31, 2016 (unaudited) | | Wells Fargo Diversified Stock Portfolio | | | 11 | |
| | | | | | | | | | | | | | | | |
| Security name | | | | | | | | Shares | | | Value | |
| | | | |
| Media (continued) | | | | | | | | | | | | | | | | |
Technicolor | | | | | | | | | | | 26,745 | | | $ | 173,537 | |
Tegna Incorporated | | | | | | | | | | | 126,571 | | | | 2,564,328 | |
Telenet Group Holding NV † | | | | | | | | | | | 5,930 | | | | 278,112 | |
Television Broadcasts Limited | | | | | | | | | | | 55,000 | | | | 196,389 | |
Time Incorporated | | | | | | | | | | | 135,071 | | | | 1,904,501 | |
Toei Company Limited | | | | | | | | | | | 16,000 | | | | 120,466 | |
Toho Company Limited Tokyo | | | | | | | | | | | 21,500 | | | | 626,516 | |
Tokyo Broadcasting System Incorporated | | | | | | | | | | | 5,700 | | | | 78,284 | |
Tribune Media Company Class A | | | | | | | | | | | 93,147 | | | | 3,547,038 | |
TV Asahi Corporation | | | | | | | | | | | 3,800 | | | | 60,747 | |
Twenty-First Century Fox Incorporated Class A | | | | | | | | | | | 198,623 | | | | 4,874,208 | |
Twenty-First Century Fox Incorporated Class B | | | | | | | | | | | 83,197 | | | | 2,067,445 | |
United Business Media plc | | | | | | | | | | | 31,206 | | | | 281,725 | |
Viacom Incorporated | | | | | | | | | | | 1,244 | | | | 56,216 | |
Viacom Incorporated Class B | | | | | | | | | | | 41,563 | | | | 1,676,651 | |
Vivendi SA | | | | | | | | | | | 113,848 | | | | 2,207,117 | |
Wolters Kluwer NV | | | | | | | | | | | 33,251 | | | | 1,395,505 | |
WPP plc | | | | | | | | | | | 120,952 | | | | 2,789,020 | |
Zee Entertainment Enterprises Limited | | | | | | | | | | | 153,249 | | | | 1,234,550 | |
Zenrin Company Limited | | | | | | | | | | | 5,000 | | | | 80,559 | |
| | | | |
| | | | | | | | | | | | | | | 178,013,866 | |
| | | | | | | | | | | | | | | | |
| | | | |
| Multiline Retail: 0.51% | | | | | | | | | | | | | | | | |
Aeon Company Bhd | | | | | | | | | | | 165,600 | | | | 111,475 | |
B&M European Value Retail SA | | | | | | | | | | | 75,912 | | | | 274,529 | |
Canadian Tire Corporation Limited Class A | | | | | | | | | | | 7,500 | | | | 768,244 | |
Debenhams plc | | | | | | | | | | | 147,783 | | | | 117,601 | |
Dollar General Corporation | | | | | | | | | | | 51,400 | | | | 3,773,274 | |
Dollar Tree Incorporated † | | | | | | | | | | | 135,586 | | | | 11,212,962 | |
Dollarama Incorporated | | | | | | | | | | | 12,916 | | | | 954,370 | |
Don Quijote Company Limited | | | | | | | | | | | 16,800 | | | | 548,823 | |
Far Eastern Department Stores Company Limited | | | | | | | | | | | 185,584 | | | | 97,674 | |
Fuji Company Limited | | | | | | | | | | | 5,100 | | | | 92,965 | |
H2O Retailing Corporation | | | | | | | | | | | 14,100 | | | | 191,879 | |
Harvey Norman Holdings Limited | | | | | | | | | | | 101,944 | | | | 412,194 | |
Hudson’s Bay Company | | | | | | | | | | | 10,727 | | | | 147,973 | |
Hyundai Department Store Company Limited | | | | | | | | | | | 3,673 | | | | 413,418 | |
Isetan Mitsukoshi Holdings Limited | | | | | | | | | | | 58,100 | | | | 528,973 | |
Izumi Company Limited | | | | | | | | | | | 6,700 | | | | 262,910 | |
J.Front Retailing Company Limited | | | | | | | | | | | 39,100 | | | | 441,394 | |
Kintetsu Department Store Company Limited † | | | | | | | | | | | 27,000 | | | | 89,248 | |
Kohl’s Corporation | | | | | | | | | | | 102,033 | | | | 4,528,225 | |
Lifestyle China Group Limited † | | | | | | | | | | | 119,500 | | | | 32,811 | |
Lifestyle International Holdings Limited | | | | | | | | | | | 119,500 | | | | 180,231 | |
Lotte Shopping Company Limited | | | | | | | | | | | 2,095 | | | | 381,422 | |
Macy’s Incorporated | | | | | | | | | | | 36,812 | | | | 1,331,858 | |
Marks & Spencer Group plc | | | | | | | | | | | 149,257 | | | | 675,601 | |
Marui Company Limited | | | | | | | | | | | 38,500 | | | | 469,226 | |
Matsuya Company Limited | | | | | | | | | | | 9,600 | | | | 67,826 | |
Metro Holdings Limited | | | | | | | | | | | 163,200 | | | | 107,806 | |
| | | | |
| 12 | | Wells Fargo Diversified Stock Portfolio | | Portfolio of investments—August 31, 2016 (unaudited) |
| | | | | | | | | | | | | | | | |
| Security name | | | | | | | | Shares | | | Value | |
| | | | |
| Multiline Retail (continued) | | | | | | | | | | | | | | | | |
Myer Holdings Limited « | | | | | | | | | | | 108,425 | | | $ | 111,230 | |
New World Department Store China Limited | | | | | | | | | | | 150,000 | | | | 20,109 | |
Next plc | | | | | | | | | | | 15,421 | | | | 1,118,817 | |
Nordstrom Incorporated « | | | | | | | | | | | 73,000 | | | | 3,683,580 | |
PT Matahari Department Store Tbk | | | | | | | | | | | 650,500 | | | | 980,776 | |
Ryohin Keikaku Company Limited | | | | | | | | | | | 3,900 | | | | 703,368 | |
SACI Falabella | | | | | | | | | | | 339,045 | | | | 2,396,294 | |
Seria Company Limited | | | | | | | | | | | 3,000 | | | | 198,328 | |
Shinsegae Company Limited | | | | | | | | | | | 1,463 | | | | 267,014 | |
Takashimaya Company Limited | | | | | | | | | | | 52,000 | | | | 380,457 | |
Target Corporation | | | | | | | | | | | 63,700 | | | | 4,471,103 | |
Warehouse Group Limited | | | | | | | | | | | 10,254 | | | | 21,502 | |
Woolworths Holdings Limited | | | | | | | | | | | 273,894 | | | | 1,502,300 | |
| | | | |
| | | | | | | | | | | | | | | 44,069,790 | |
| | | | | | | | | | | | | | | | |
| | | | |
| Specialty Retail: 2.41% | | | | | | | | | | | | | | | | |
ABC-Mart Incorporated | | | | | | | | | | | 4,200 | | | | 263,857 | |
Abercrombie & Fitch Company Class A | | | | | | | | | | | 89,100 | | | | 1,580,634 | |
Adastria Company Limited | | | | | | | | | | | 5,000 | | | | 111,342 | |
Advance Auto Parts Incorporated | | | | | | | | | | | 41,796 | | | | 6,577,854 | |
Alpen Company Limited | | | | | | | | | | | 2,900 | | | | 52,162 | |
American Eagle Outfitters Incorporated | | | | | | | | | | | 198,202 | | | | 3,674,665 | |
AOKI Holdings Incorporated | | | | | | | | | | | 6,600 | | | | 68,064 | |
Aoyama Trading Company Limited | | | | | | | | | | | 7,100 | | | | 230,571 | |
Asbury Automotive Group Incorporated † | | | | | | | | | | | 31,680 | | | | 1,701,850 | |
Autobacs Seven Company Limited | | | | | | | | | | | 11,400 | | | | 157,891 | |
AutoNation Incorporated † | | | | | | | | | | | 43,700 | | | | 2,069,195 | |
AutoZone Incorporated † | | | | | | | | | | | 5,400 | | | | 4,005,720 | |
BCA Marketplace plc | | | | | | | | | | | 73,329 | | | | 191,139 | |
Best Buy Company Incorporated | | | | | | | | | | | 157,219 | | | | 6,049,787 | |
BIC Camera Incorporated | | | | | | | | | | | 22,100 | | | | 174,297 | |
Burlington Stores Incorporated † | | | | | | | | | | | 94,228 | | | | 7,653,198 | |
Cabela’s Incorporated † | | | | | | | | | | | 62,400 | | | | 3,056,976 | |
CarMax Incorporated † | | | | | | | | | | | 110,200 | | | | 6,496,290 | |
Chico’s FAS Incorporated | | | | | | | | | | | 175,995 | | | | 2,231,617 | |
Chiyoda Company Limited | | | | | | | | | | | 4,900 | | | | 103,053 | |
Chow Sang Sang Holdings International Limited | | | | | | | | | | | 81,000 | | | | 154,116 | |
Chow Tai Fook Jewellery Company Limited « | | | | | | | | | | | 230,800 | | | | 161,254 | |
CST Brands Incorporated | | | | | | | | | | | 90,669 | | | | 4,334,885 | |
DCM Holdings Company Limited « | | | | | | | | | | | 16,300 | | | | 124,142 | |
Dixons Carphone plc | | | | | | | | | | | 119,075 | | | | 579,639 | |
Dufry Group Register Shares † | | | | | | | | | | | 3,543 | | | | 414,260 | |
Edion Corporation | | | | | | | | | | | 14,400 | | | | 113,012 | |
Esprit Holdings Limited † | | | | | | | | | | | 355,658 | | | | 314,508 | |
Fast Retailing Company Limited « | | | | | | | | | | | 9,300 | | | | 3,266,438 | |
FF Group | | | | | | | | | | | 17,878 | | | | 432,742 | |
Fielmann AG | | | | | | | | | | | 1,552 | | | | 121,390 | |
Foot Locker Incorporated | | | | | | | | | | | 72,035 | | | | 4,728,377 | |
Gamestop Corporation Class A « | | | | | | | | | | | 124,300 | | | | 3,528,877 | |
Geo Holdings Corporation | | | | | | | | | | | 5,700 | | | | 72,555 | |
| | | | | | |
| Portfolio of investments—August 31, 2016 (unaudited) | | Wells Fargo Diversified Stock Portfolio | | | 13 | |
| | | | | | | | | | | | | | | | |
| Security name | | | | | | | | Shares | | | Value | |
| | | | |
| Specialty Retail (continued) | | | | | | | | | | | | | | | | |
Giordano International Limited | | | | | | | | | | | 338,000 | | | $ | 194,324 | |
GNC Holdings Incorporated Class A | | | | | | | | | | | 91,145 | | | | 1,916,779 | |
Group 1 Automotive Incorporated | | | | | | | | | | | 30,700 | | | | 1,821,738 | |
Guess? Incorporated | | | | | | | | | | | 84,100 | | | | 1,398,583 | |
Halfords Group plc | | | | | | | | | | | 10,381 | | | | 47,398 | |
Hennes & Mauritz AB Class B | | | | | | | | | | | 89,703 | | | | 2,734,895 | |
Hikari Tsushin Incorporated | | | | | | | | | | | 3,600 | | | | 323,588 | |
Home Product Center PCL | | | | | | | | | | | 1,192,700 | | | | 375,567 | |
Hotai Motor Company Limited | | | | | | | | | | | 116,000 | | | | 1,283,182 | |
Hotel Shilla Company Limited | | | | | | | | | | | 5,410 | | | | 328,967 | |
IDOM Incorporated | | | | | | | | | | | 11,100 | | | | 66,193 | |
Industria de Diseno Textil SA | | | | | | | | | | | 100,857 | | | | 3,573,593 | |
JB Hi-Fi Limited | | | | | | | | | | | 17,769 | | | | 396,489 | |
JIN Company Limited « | | | | | | | | | | | 2,300 | | | | 105,591 | |
Joshin Denki Company Limited | | | | | | | | | | | 10,000 | | | | 82,153 | |
Joyful Honda Company Limited | | | | | | | | | | | 6,900 | | | | 166,790 | |
Jumbo SA | | | | | | | | | | | 24,601 | | | | 300,481 | |
K’s Holdings Corporation | | | | | | | | | | | 13,400 | | | | 211,494 | |
Kingfisher plc | | | | | | | | | | | 235,574 | | | | 1,147,975 | |
Kohnan Shoji Company Limited | | | | | | | | | | | 4,900 | | | | 89,082 | |
Komeri Company Limited | | | | | | | | | | | 6,500 | | | | 150,776 | |
L Brands Incorporated | | | | | | | | | | | 48,815 | | | | 3,720,191 | |
Lithia Motors Incorporated Class A | | | | | | | | | | | 33,900 | | | | 2,805,903 | |
LOTTE Himart Company Limited | | | | | | | | | | | 2,142 | | | | 84,527 | |
Luk Fook Holdings International Limited | | | | | | | | | | | 65,000 | | | | 148,307 | |
Mr. Price Group Limited | | | | | | | | | | | 65,912 | | | | 827,016 | |
Nafco Company Limited | | | | | | | | | | | 1,400 | | | | 22,083 | |
Nishimatsuya Chain Company Limited | | | | | | | | | | | 8,400 | | | | 115,448 | |
Nitori Company Limited | | | | | | | | | | | 12,100 | | | | 1,226,782 | |
O’Reilly Automotive Incorporated † | | | | | | | | | | | 55,606 | | | | 15,566,900 | |
Praktiker Bau Und Heimwerkermaerkte AG † | | | | | | | | | | | 3,061 | | | | 17 | |
Premier Investments Limited | | | | | | | | | | | 16,893 | | | | 208,721 | |
Restoration Hardware Holdings Incorporated †« | | | | | | | | | | | 53,768 | | | | 1,813,595 | |
Ross Stores Incorporated | | | | | | | | | | | 231,488 | | | | 14,407,813 | |
Sa Sa International Holdings Limited | | | | | | | | | | | 188,740 | | | | 78,342 | |
Sally Beauty Holdings Incorporated † | | | | | | | | | | | 201,900 | | | | 5,495,718 | |
Sanrio Company Limited « | | | | | | | | | | | 8,800 | | | | 163,727 | |
Shimachu Company Limited | | | | | | | | | | | 7,100 | | | | 158,586 | |
Shimamura Company Limited | | | | | | | | | | | 3,500 | | | | 404,920 | |
Signet Jewelers Limited | | | | | | | | | | | 43,600 | | | | 3,574,328 | |
Sports Direct International plc † | | | | | | | | | | | 23,788 | | | | 92,868 | |
Staples Incorporated | | | | | | | | | | | 336,345 | | | | 2,879,113 | |
Super Cheap Auto Group Limited | | | | | | | | | | | 27,099 | | | | 224,029 | |
The Foschini Limited | | | | | | | | | | | 46,328 | | | | 411,885 | |
The Gap Incorporated | | | | | | | | | | | 117,800 | | | | 2,929,686 | |
The Home Depot Incorporated | | | | | | | | | | | 225,520 | | | | 30,246,742 | |
The TJX Companies Incorporated | | | | | | | | | | | 119,700 | | | | 9,269,568 | |
Tiffany & Company | | | | | | | | | | | 61,600 | | | | 4,396,392 | |
Tractor Supply Company | | | | | | | | | | | 75,872 | | | | 6,369,454 | |
Trinity Limited † | | | | | | | | | | | 202,000 | | | | 15,884 | |
| | | | |
| 14 | | Wells Fargo Diversified Stock Portfolio | | Portfolio of investments—August 31, 2016 (unaudited) |
| | | | | | | | | | | | | | | | |
| Security name | | | | | | | | Shares | | | Value | |
| | | | |
| Specialty Retail (continued) | | | | | | | | | | | | | | | | |
Truworths International Limited | | | | | | | | | | | 107,753 | | | $ | 558,114 | |
Ulta Salon Cosmetics & Fragrance Incorporated † | | | | | | | | | | | 35,700 | | | | 8,825,397 | |
United Arrows Limited | | | | | | | | | | | 4,100 | | | | 104,892 | |
Urban Outfitters Incorporated † | | | | | | | | | | | 111,513 | | | | 3,997,741 | |
USS Company Limited | | | | | | | | | | | 32,900 | | | | 525,942 | |
WH Smith plc | | | | | | | | | | | 12,180 | | | | 243,751 | |
Williams-Sonoma Incorporated « | | | | | | | | | | | 50,100 | | | | 2,637,264 | |
Xebio Company Limited | | | | | | | | | | | 4,100 | | | | 62,254 | |
Yamada Denki Company Limited | | | | | | | | | | | 99,900 | | | | 467,323 | |
| | | | |
| | | | | | | | | | | | | | | 206,593,218 | |
| | | | | | | | | | | | | | | | |
| | | | |
| Textiles, Apparel & Luxury Goods: 1.19% | | | | | | | | | | | | | | | | |
Adidas AG | | | | | | | | | | | 19,806 | | | | 3,290,694 | |
ASICS Corporation | | | | | | | | | | | 27,900 | | | | 565,469 | |
Belle International Holdings Limited | | | | | | | | | | | 1,590,000 | | | | 1,033,007 | |
Billabong International Limited † | | | | | | | | | | | 11,336 | | | | 10,777 | |
Burberry Group plc | | | | | | | | | | | 41,524 | | | | 711,035 | |
Carter’s Incorporated | | | | | | | | | | | 27,800 | | | | 2,649,062 | |
CCC SA | | | | | | | | | | | 3,479 | | | | 162,006 | |
China Hongxing Sports Limited †(a) | | | | | | | | | | | 37,000 | | | | 0 | |
Christian Dior SA | | | | | | | | | | | 4,809 | | | | 831,451 | |
Coach Incorporated | | | | | | | | | | | 155,700 | | | | 5,944,626 | |
Compagnie Financiere Richemont SA | | | | | | | | | | | 49,685 | | | | 2,861,731 | |
Daphne International Holdings Limited † | | | | | | | | | | | 130,000 | | | | 17,931 | |
Deckers Outdoor Corporation † | | | | | | | | | | | 45,598 | | | | 2,979,829 | |
Descente Limited | | | | | | | | | | | 9,000 | | | | 100,643 | |
Eclat Textile Company Limited | | | | | | | | | | | 70,965 | | | | 899,070 | |
Feng Tay Enterprise Company Limited | | | | | | | | | | | 101,978 | | | | 485,296 | |
Fibrechem Technologies Limited †(a) | | | | | | | | | | | 20,000 | | | | 0 | |
Fila Korea Limited | | | | | | | | | | | 1,626 | | | | 146,559 | |
Formosa Taffeta Company Limited | | | | | | | | | | | 209,000 | | | | 201,883 | |
Fossil Group Incorporated † | | | | | | | | | | | 58,911 | | | | 1,682,498 | |
Fujibo Holdings Incorporated | | | | | | | | | | | 23,000 | | | | 68,468 | |
G-III Apparel Group Limited † | | | | | | | | | | | 57,100 | | | | 1,802,647 | |
Gildan Activewear Incorporated | | | | | | | | | | | 21,862 | | | | 643,657 | |
Global Brands Group Holding Limited † | | | | | | | | | | | 1,128,530 | | | | 104,742 | |
Gunze Limited | | | | | | | | | | | 36,000 | | | | 106,123 | |
Hansae Company Limited | | | | | | | | | | | 3,320 | | | | 72,057 | |
Hermes International | | | | | | | | | | | 1,835 | | | | 774,938 | |
Hugo Boss AG | | | | | | | | | | | 5,926 | | | | 361,906 | |
Jaybharat Textiles & Real Estate Limited †(a) | | | | | | | | | | | 15,488 | | | | 5,782 | |
Kate Spade & Company † | | | | | | | | | | | 165,138 | | | | 3,081,475 | |
Kering | | | | | | | | | | | 7,111 | | | | 1,348,038 | |
Kurabo Industries Limited | | | | | | | | | | | 43,000 | | | | 76,886 | |
Li & Fung Limited | | | | | | | | | | | 1,128,530 | | | | 580,445 | |
LPP SA « | | | | | | | | | | | 207 | | | | 238,336 | |
lululemon athletica Incorporated † | | | | | | | | | | | 60,995 | | | | 4,666,727 | |
Luxottica Group SpA | | | | | | | | | | | 12,870 | | | | 620,890 | |
LVMH Moet Hennessy Louis Vuitton SA | | | | | | | | | | | 26,096 | | | | 4,415,803 | |
Makalot Industrial Company Limited | | | | | | | | | | | 43,119 | | | | 203,837 | |
| | | | | | |
| Portfolio of investments—August 31, 2016 (unaudited) | | Wells Fargo Diversified Stock Portfolio | | | 15 | |
| | | | | | | | | | | | | | | | |
| Security name | | | | | | | | Shares | | | Value | |
| | | | |
| Textiles, Apparel & Luxury Goods (continued) | | | | | | | | | | | | | | | | |
Michael Kors Holdings Limited † | | | | | | | | | | | 104,486 | | | $ | 5,114,590 | |
Moncler SpA | | | | | | | | | | | 21,572 | | | | 357,809 | |
Nike Incorporated Class B | | | | | | | | | | | 241,000 | | | | 13,891,240 | |
Onward Kashiyama Company Limited | | | | | | | | | | | 21,000 | | | | 147,760 | |
Pacific Textiles Holdings Limited | | | | | | | | | | | 106,000 | | | | 139,374 | |
Page Industries Limited | | | | | | | | | | | 1,637 | | | | 363,099 | |
Pandora AS | | | | | | | | | | | 11,925 | | | | 1,483,498 | |
Pou Chen Corporation | | | | | | | | | | | 853,600 | | | | 1,237,472 | |
Prada SpA | | | | | | | | | | | 47,800 | | | | 143,260 | |
PVH Corporation | | | | | | | | | | | 45,562 | | | | 4,909,761 | |
Rajesh Exports Limited | | | | | | | | | | | 41,060 | | | | 269,431 | |
Ralph Lauren Corporation | | | | | | | | | | | 31,559 | | | | 3,270,144 | |
Ruentex Industries Limited | | | | | | | | | | | 153,911 | | | | 238,891 | |
Sanyo Shokai Limited | | | | | | | | | | | 23,000 | | | | 36,457 | |
Seiko Holdings Corporation Class C | | | | | | | | | | | 23,000 | | | | 71,135 | |
Seiren Company Limited | | | | | | | | | | | 9,500 | | | | 105,959 | |
Shenzhou International Group Holdings Limited | | | | | | | | | | | 201,000 | | | | 1,320,127 | |
Skechers U.S.A. Incorporated Class A † | | | | | | | | | | | 173,100 | | | | 4,208,061 | |
Stella International | | | | | | | | | | | 100,000 | | | | 159,071 | |
Steven Madden Limited † | | | | | | | | | | | 79,250 | | | | 2,780,883 | |
Tainan Spinning Company Limited | | | | | | | | | | | 361,640 | | | | 143,035 | |
Texwinca Holdings Limited | | | | | | | | | | | 100,000 | | | | 71,414 | |
The Japan Wool Textile Company Limited | | | | | | | | | | | 13,000 | | | | 87,952 | |
The Swatch Group AG - Bearer Shares « | | | | | | | | | | | 2,953 | | | | 759,905 | |
The Swatch Group AG - Regular Shares | | | | | | | | | | | 4,901 | | | | 248,899 | |
Titan Industries Limited | | | | | | | | | | | 93,936 | | | | 587,012 | |
Tod’s SpA | | | | | | | | | | | 810 | | | | 48,474 | |
TSI Holdings Company Limited | | | | | | | | | | | 20,900 | | | | 115,342 | |
Under Armour Incorporated Class A « | | | | | | | | | | | 102,692 | | | | 4,069,684 | |
Under Armour Incorporated Class C † | | | | | | | | | | | 103,375 | | | | 3,685,319 | |
Unitika Limited † | | | | | | | | | | | 84,000 | | | | 44,653 | |
VF Corporation | | | | | | | | | | | 60,416 | | | | 3,748,813 | |
Wacoal Corporation | | | | | | | | | | | 21,000 | | | | 224,482 | |
Wolverine World Wide Incorporated | | | | | | | | | | | 127,880 | | | | 3,057,611 | |
Youngone Corporation | | | | | | | | | | | 5,630 | | | | 168,900 | |
Yue Yuen Industrial Holdings Limited | | | | | | | | | | | 151,500 | | | | 644,469 | |
| | | | |
| | | | | | | | | | | | | | | 101,700,310 | |
| | | | | | | | | | | | | | | | |
| | | | |
Consumer Staples: 7.21% | | | | | | | | | | | | | | | | |
| | | | |
| Beverages: 1.67% | | | | | | | | | | | | | | | | |
Ambev SA | | | | | | | | | | | 1,200,673 | | | | 7,135,177 | |
Anadolu Efes Biracilik Ve Malt Sanayii AS | | | | | | | | | | | 41,874 | | | | 259,814 | |
Anheuser-Busch InBev NV | | | | | | | | | | | 75,959 | | | | 9,409,098 | |
Arca Continental SAB de CV | | | | | | | | | | | 95,500 | | | | 596,258 | |
Asahi Breweries Limited | | | | | | | | | | | 69,800 | | | | 2,284,278 | |
Britvic plc | | | | | | | | | | | 18,843 | | | | 158,978 | |
Brown-Forman Corporation Class A | | | | | | | | | | | 34,156 | | | | 1,767,231 | |
Brown-Forman Corporation Class B | | | | | | | | | | | 113,642 | | | | 5,517,319 | |
C&C Group plc | | | | | | | | | | | 40,928 | | | | 173,025 | |
| | | | |
| 16 | | Wells Fargo Diversified Stock Portfolio | | Portfolio of investments—August 31, 2016 (unaudited) |
| | | | | | | | | | | | | | | | |
| Security name | | | | | | | | Shares | | | Value | |
| | | | |
| Beverages (continued) | | | | | | | | | | | | | | | | |
Carlsberg AS Class B | | | | | | | | | | | 10,130 | | | $ | 949,702 | |
Carlsberg Brewery Malaysia Bhd | | | | | | | | | | | 27,300 | | | | 98,955 | |
China Resources Enterprise Limited | | | | | | | | | | | 543,781 | | | | 1,254,736 | |
Coca-Cola Amatil Limited | | | | | | | | | | | 76,261 | | | | 560,531 | |
Coca-Cola East Japan Company Limited | | | | | | | | | | | 12,700 | | | | 223,399 | |
Coca-Cola European Partners plc | | | | | | | | | | | 118,819 | | | | 4,568,591 | |
Coca-Cola HBC AG | | | | | | | | | | | 17,518 | | | | 385,083 | |
Coca-Cola Icecek Uretim AS | | | | | | | | | | | 15,881 | | | | 198,469 | |
Coca-Cola West Japan Company Limited | | | | | | | | | | | 14,900 | | | | 337,704 | |
Compania Cervecerias Unidas SA | | | | | | | | | | | 59,871 | | | | 632,401 | |
Constellation Brands Incorporated Class A | | | | | | | | | | | 101,759 | | | | 16,693,564 | |
Cott Corporation | | | | | | | | | | | 9,100 | | | | 145,098 | |
Davide Campari-Milano SpA | | | | | | | | | | | 22,742 | | | | 247,461 | |
Diageo plc | | | | | | | | | | | 225,296 | | | | 6,237,940 | |
Distell Group Limited | | | | | | | | | | | 26,980 | | | | 313,806 | |
Dr Pepper Snapple Group Incorporated | | | | | | | | | | | 100,385 | | | | 9,406,075 | |
Fomento Economico Mexicano Sab de CV | | | | | | | | | | | 583,400 | | | | 5,345,529 | |
Fraser & Neave Holdings | | | | | | | | | | | 12,000 | | | | 72,198 | |
Heineken Holding NV | | | | | | | | | | | 9,870 | | | | 793,344 | |
Heineken Malaysia Bhd | | | | | | | | | | | 33,500 | | | | 150,009 | |
Heineken NV | | | | | | | | | | | 20,410 | | | | 1,823,584 | |
Hite Jinro Company Limited | | | | | | | | | | | 6,516 | | | | 127,982 | |
ITO EN Limited | | | | | | | | | | | 9,400 | | | | 282,550 | |
Kirin Brewery Company Limited | | | | | | | | | | | 125,400 | | | | 2,044,045 | |
Lotte Chilsung Beverage Company Limited | | | | | | | | | | | 132 | | | | 177,697 | |
Molson Coors Brewing Company Class B | | | | | | | | | | | 99,542 | | | | 10,185,137 | |
Monster Beverage Corporation † | | | | | | | | | | | 25,487 | | | | 3,922,194 | |
PepsiCo Incorporated | | | | | | | | | | | 160,019 | | | | 17,082,028 | |
Pernod Ricard SA | | | | | | | | | | | 18,977 | | | | 2,178,177 | |
Remy Cointreau SA | | | | | | | | | | | 1,992 | | | | 173,825 | |
SABMiller plc | | | | | | | | | | | 88,681 | | | | 5,121,532 | |
Sapporo Holdings Limited | | | | | | | | | | | 11,600 | | | | 284,548 | |
Suntory Beverage & Food Limited | | | | | | | | | | | 18,634 | | | | 739,309 | |
Takara Holdings Incorporated | | | | | | | | | | | 29,500 | | | | 254,898 | |
Thai Beverage PCL | | | | | | | | | | | 2,812,000 | | | | 2,053,609 | |
The Coca-Cola Company | | | | | | | | | | | 431,674 | | | | 18,747,602 | |
Treasury Wine Estates Limited | | | | | | | | | | | 106,565 | | | | 899,399 | |
Tsingtao Brewery Company Limited H Shares | | | | | | | | | | | 70,000 | | | | 234,610 | |
United Breweries Limited | | | | | | | | | | | 33,308 | | | | 404,476 | |
United Spirits Limited † | | | | | | | | | | | 17,882 | | | | 617,619 | |
| | | | |
| | | | | | | | | | | | | | | 143,270,594 | |
| | | | | | | | | | | | | | | | |
| | | | |
| Food & Staples Retailing: 1.16% | | | | | | | | | | | | | | | | |
Aeon Company Limited « | | | | | | | | | | | 125,900 | | | | 1,730,950 | |
Ain Holdings Incorporated | | | | | | | | | | | 3,700 | | | | 209,916 | |
Alimentation Couche-Tard Incorporated Class B | | | | | | | | | | | 39,729 | | | | 2,048,858 | |
ARCS Company Limited | | | | | | | | | | | 7,400 | | | | 169,793 | |
Axfood AB | | | | | | | | | | | 6,336 | | | | 112,574 | |
Axial Retailing Incorporated | | | | | | | | | | | 2,900 | | | | 90,113 | |
BGF Retail Company Limited | | | | | | | | | | | 2,571 | | | | 466,930 | |
| | | | | | |
| Portfolio of investments—August 31, 2016 (unaudited) | | Wells Fargo Diversified Stock Portfolio | | | 17 | |
| | | | | | | | | | | | | | | | |
| Security name | | | | | | | | Shares | | | Value | |
| | | | |
| Food & Staples Retailing (continued) | | | | | | | | | | | | | | | | |
Bim Birlesik Magazalar AS | | | | | | | | | | | 67,584 | | | $ | 1,158,602 | |
Booker Group plc | | | | | | | | | | | 194,495 | | | | 449,761 | |
Carrefour SA | | | | | | | | | | | 53,917 | | | | 1,357,399 | |
Casey’s General Stores Incorporated | | | | | | | | | | | 51,410 | | | | 6,750,647 | |
Casino Guichard Perrachon SA | | | | | | | | | | | 5,420 | | | | 268,098 | |
Cencosud SA | | | | | | | | | | | 443,098 | | | | 1,301,899 | |
Cocokara Fine Incorporated | | | | | | | | | | | 4,000 | | | | 135,118 | |
Colruyt SA | | | | | | | | | | | 6,243 | | | | 342,652 | |
Cosmos Pharmaceutical Corporation | | | | | | | | | | | 1,400 | | | | 254,115 | |
Costco Wholesale Corporation | | | | | | | | | | | 79,327 | | | | 12,858,113 | |
CP ALL PCL | | | | | | | | | | | 1,232,200 | | | | 2,215,899 | |
Dairy Farm International Holdings Limited | | | | | | | | | | | 52,200 | | | | 374,274 | |
Distribuidora Internacional SA | | | | | | | | | | | 55,953 | | | | 341,710 | |
Dongsuh Company Incorporated | | | | | | | | | | | 12,182 | | | | 337,054 | |
E-MART Limited | | | | | | | | | | | 3,311 | | | | 467,697 | |
Empire Company Limited Class A | | | | | | | | | | | 14,916 | | | | 245,339 | |
Eurocash SA | | | | | | | | | | | 15,296 | | | | 168,288 | |
FamilyMart Company Limited « | | | | | | | | | | | 8,800 | | | | 630,242 | |
George Weston Limited | | | | | | | | | | | 5,500 | | | | 473,502 | |
Greggs plc | | | | | | | | | | | 9,507 | | | | 129,460 | |
GS Retail Company Limited | | | | | | | | | | | 7,588 | | | | 320,533 | |
Heiwado Company Limited | | | | | | | | | | | 8,100 | | | | 145,771 | |
Hyundai Greenfood Company Limited | | | | | | | | | | | 13,680 | | | | 204,280 | |
ICA Gruppen AB « | | | | | | | | | | | 11,898 | | | | 407,086 | |
Inageya Company Limited | | | | | | | | | | | 5,500 | | | | 72,933 | |
J Sainsbury plc | | | | | | | | | | | 119,290 | | | | 376,419 | |
Jeronimo Martins SA | | | | | | | | | | | 20,490 | | | | 330,606 | |
Kato Sangyo Company Limited | | | | | | | | | | | 5,600 | | | | 122,809 | |
Kesko Oyj Class A | | | | | | | | | | | 1,500 | | | | 61,539 | |
Kesko Oyj Class B | | | | | | | | | | | 7,559 | | | | 328,752 | |
Koninklijke Ahold Delhaize NV | | | | | | | | | | | 117,595 | | | | 2,815,593 | |
Kusuri No Aoki Company Limited | | | | | | | | | | | 2,300 | | | | 84,140 | |
Lawson Incorporated | | | | | | | | | | | 10,000 | | | | 701,687 | |
Life Corporation | | | | | | | | | | | 4,000 | | | | 108,829 | |
Loblaw Companies Limited | | | | | | | | | | | 20,909 | | | | 1,137,606 | |
Magnit OJSC Sponsored GDR | | | | | | | | | | | 68,877 | | | | 2,716,509 | |
Matsumotokiyoshi Holdings Company Limited | | | | | | | | | | | 7,200 | | | | 316,977 | |
Metcash Limited †« | | | | | | | | | | | 174,566 | | | | 287,317 | |
Metro AG | | | | | | | | | | | 12,722 | | | | 377,474 | |
Metro Incorporated « | | | | | | | | | | | 29,037 | | | | 986,204 | |
Mitsubishi Shokuhin Company Limited | | | | | | | | | | | 4,200 | | | | 119,994 | |
OKUWA Company Limited | | | | | | | | | | | 6,000 | | | | 55,323 | |
President Chain Store Corporation | | | | | | | | | | | 194,032 | | | | 1,544,037 | |
Puregold Price Club Incorporated | | | | | | | | | | | 289,300 | | | | 278,776 | |
Rallye SA | | | | | | | | | | | 2,005 | | | | 32,518 | |
Rite Aid Corporation † | | | | | | | | | | | 552,380 | | | | 4,159,421 | |
San-A Company Limited | | | | | | | | | | | 2,500 | | | | 117,189 | |
Seven & I Holdings Company Limited « | | | | | | | | | | | 115,180 | | | | 4,854,782 | |
Shoprite Holdings Limited | | | | | | | | | | | 105,840 | | | | 1,357,015 | |
Shufersal Limited | | | | | | | | | | | 1 | | | | 3 | |
| | | | |
| 18 | | Wells Fargo Diversified Stock Portfolio | | Portfolio of investments—August 31, 2016 (unaudited) |
| | | | | | | | | | | | | | | | |
| Security name | | | | | | | | Shares | | | Value | |
| | | | |
| Food & Staples Retailing (continued) | | | | | | | | | | | | | | | | |
Sligro Food Group NV | | | | | | | | | | | 1,429 | | | $ | 53,510 | |
Sonae SGPS SA | | | | | | | | | | | 93,661 | | | | 78,147 | |
Sprouts Farmers Market Incorporated † | | | | | | | | | | | 184,947 | | | | 4,166,856 | |
Sugi Pharmacy Company Limited | | | | | | | | | | | 6,100 | | | | 298,913 | |
Sun Art Retail Group Limited | | | | | | | | | | | 518,000 | | | | 333,201 | |
Sundrug Company Limited | | | | | | | | | | | 5,100 | | | | 369,690 | |
Sysco Corporation | | | | | | | | | | | 55,348 | | | | 2,870,347 | |
Tesco plc † | | | | | | | | | | | 770,024 | | | | 1,682,059 | |
The Jean Coutu Group PJC Incorporated Class A | | | | | | | | | | | 9,211 | | | | 136,332 | |
Tsuruha Holdings Incorporated | | | | | | | | | | | 5,800 | | | | 568,424 | |
United Natural Foods Incorporated † | | | | | | | | | | | 64,679 | | | | 2,949,362 | |
United Super Markets Holdings Incorporated | | | | | | | | | | | 11,000 | | | | 99,831 | |
UNY Group Holdings Company Limited (a) | | | | | | | | | | | 34,400 | | | | 339,987 | |
Valor Company Limited | | | | | | | | | | | 7,200 | | | | 194,222 | |
Wal-Mart de Mexico SAB de CV | | | | | | | | | | | 1,414,152 | | | | 3,230,345 | |
Walgreens Boots Alliance Incorporated | | | | | | | | | | | 94,577 | | | | 7,633,310 | |
Welcia Holdings Company | | | | | | | | | | | 3,500 | | | | 205,335 | |
Wesfarmers Limited | | | | | | | | | | | 162,265 | | | | 5,175,571 | |
Whole Foods Market Incorporated | | | | | | | | | | | 182,161 | | | | 5,534,051 | |
William Morrison Supermarkets plc | | | | | | | | | | | 218,799 | | | | 566,012 | |
Woolworths Limited | | | | | | | | | | | 184,615 | | | | 3,289,702 | |
Yaoko Company Limited | | | | | | | | | | | 3,700 | | | | 143,938 | |
Yokohama Reito Company | | | | | | | | | | | 7,100 | | | | 70,544 | |
| | | | |
| | | | | | | | | | | | | | | 99,500,814 | |
| | | | | | | | | | | | | | | | |
| | | | |
| Food Products: 2.32% | | | | | | | | | | | | | | | | |
Ajinomoto Company Incorporated | | | | | | | | | | | 84,300 | | | | 1,786,787 | |
Archer Daniels Midland Company | | | | | | | | | | | 61,900 | | | | 2,708,744 | |
Ariake Japan Company Limited | | | | | | | | | | | 2,900 | | | | 137,201 | |
Aryzta AG | | | | | | | | | | | 9,603 | | | | 382,538 | |
Associated British Foods plc | | | | | | | | | | | 34,117 | | | | 1,362,390 | |
B&G Foods Incorporated | | | | | | | | | | | 74,500 | | | | 3,537,260 | |
Barry Callebaut AG | | | | | | | | | | | 233 | | | | 299,438 | |
BRF SA | | | | | | | | | | | 164,500 | | | | 2,743,195 | |
Britannia Industries Limited | | | | | | | | | | | 8,705 | | | | 449,815 | |
Bunge Limited | | | | | | | | | | | 77,978 | | | | 4,982,794 | |
CALBEE Incorporated | | | | | | | | | | | 16,200 | | | | 587,938 | |
Campbell Soup Company | | | | | | | | | | | 100,500 | | | | 6,102,360 | |
Charoen Pokphand Food PCL | | | | | | | | | | | 866,900 | | | | 813,920 | |
China Agri-Industries Holdings Limited † | | | | | | | | | | | 700 | | | | 247 | |
China Huishan Dairy Holdings Company Limited « | | | | | | | | | | | 1,506,000 | | | | 578,518 | |
China Mengniu Dairy Company | | | | | | | | | | | 730,000 | | | | 1,385,180 | |
CJ Cheiljedang Corporation | | | | | | | | | | | 1,371 | | | | 478,928 | |
ConAgra Foods Incorporated | | | | | | | | | | | 236,377 | | | | 11,017,532 | |
Dairy Crest Group plc | | | | | | | | | | | 6,886 | | | | 59,363 | |
Danone SA | | | | | | | | | | | 57,249 | | | | 4,349,396 | |
Darling Ingredients Incorporated † | | | | | | | | | | | 195,600 | | | | 2,754,048 | |
Dean Foods Company | | | | | | | | | | | 121,104 | | | | 2,084,200 | |
Dydo Drinco Incorporated | | | | | | | | | | | 1,900 | | | | 92,737 | |
Ebro Puleva SA | | | | | | | | | | | 6,042 | | | | 135,195 | |
| | | | | | |
| Portfolio of investments—August 31, 2016 (unaudited) | | Wells Fargo Diversified Stock Portfolio | | | 19 | |
| | | | | | | | | | | | | | | | |
| Security name | | | | | | | | Shares | | | Value | |
| | | | |
| Food Products (continued) | | | | | | | | | | | | | | | | |
Elders Limited † | | | | | | | | | | | 3,653 | | | $ | 10,076 | |
Ezaki Glico Company Limited | | | | | | | | | | | 8,600 | | | | 430,561 | |
Felda Global Ventures Holdings Bhd | | | | | | | | | | | 469,000 | | | | 262,515 | |
Flowers Foods Incorporated « | | | | | | | | | | | 104,950 | | | | 1,564,805 | |
Fuji Oil Company Limited | | | | | | | | | | | 9,500 | | | | 184,647 | |
General Mills Incorporated | | | | | | | | | | | 64,100 | | | | 4,539,562 | |
Genting Plantations Bhd | | | | | | | | | | | 46,000 | | | | 120,232 | |
Glanbia plc | | | | | | | | | | | 16,206 | | | | 308,574 | |
GlaxoSmithKline Consumer Healthcare Limited | | | | | | | | | | | 4,898 | | | | 458,669 | |
Golden Agri-Resources Limited | | | | | | | | | | | 1,248,045 | | | | 329,771 | |
GrainCorp Limited Class A | | | | | | | | | | | 43,413 | | | | 268,194 | |
Greencore Group plc | | | | | | | | | | | 38,147 | | | | 175,825 | |
Gruma SAB de CV Class B | | | | | | | | | | | 60,100 | | | | 798,983 | |
Grupo Bimbo Sab de CV Series A | | | | | | | | | | | 390,400 | | | | 1,111,831 | |
Grupo Lala SAB de CV | | | | | | | | | | | 239,043 | | | | 500,796 | |
Hain Celestial Group Incorporated † | | | | | | | | | | | 136,466 | | | | 5,015,126 | |
Hokuto Corporation | | | | | | | | | | | 5,200 | | | | 88,857 | |
Hormel Foods Corporation | | | | | | | | | | | 151,000 | | | | 5,777,260 | |
House Foods Corporation | | | | | | | | | | | 12,000 | | | | 258,174 | |
Indofood Agri Resources Limited | | | | | | | | | | | 39,000 | | | | 12,881 | |
Ingredion Incorporated | | | | | | | | | | | 40,200 | | | | 5,505,792 | |
IOI Corporation Bhd | | | | | | | | | | | 1,011,046 | | | | 1,101,917 | |
Itoham Yonekyu Holdings Incorporated † | | | | | | | | | | | 23,000 | | | | 217,629 | |
J-Oil Mills Incorporated | | | | | | | | | | | 19,000 | | | | 60,784 | |
JBS SA | | | | | | | | | | | 274,223 | | | | 1,061,497 | |
Kagome Company Limited | | | | | | | | | | | 11,600 | | | | 263,807 | |
KAMEDA SEIKA Company Limited | | | | | | | | | | | 2,900 | | | | 140,424 | |
Kellogg Company | | | | | | | | | | | 26,000 | | | | 2,137,460 | |
Kerry Group plc Class A | | | | | | | | | | | 15,076 | | | | 1,281,083 | |
Kewpie Corporation | | | | | | | | | | | 18,700 | | | | 513,837 | |
Kikkoman Corporation | | | | | | | | | | | 29,000 | | | | 912,338 | |
Kuala Lumpur Kepong Bhd | | | | | | | | | | | 99,100 | | | | 576,200 | |
Lancaster Colony Corporation | | | | | | | | | | | 24,969 | | | | 3,359,080 | |
Lindt & Spruengli AG | | | | | | | | | | | 10 | | | | 688,221 | |
Lindt & Spruengli AG - Participation Certificate | | | | | | | | | | | 96 | | | | 555,864 | |
Lotte Confectionery Company Limited | | | | | | | | | | | 2,280 | | | | 346,601 | |
Lotte Food Company Limited | | | | | | | | | | | 154 | | | | 93,091 | |
Maple Leaf Foods Incorporated | | | | | | | | | | | 14,491 | | | | 321,887 | |
Marine Harvest ASA | | | | | | | | | | | 25,295 | | | | 390,987 | |
Marudai Food Company Limited | | | | | | | | | | | 19,000 | | | | 83,922 | |
Maruha Nichiro Corporation | | | | | | | | | | | 6,900 | | | | 160,188 | |
McCormick & Company Incorporated | | | | | | | | | | | 65,500 | | | | 6,678,380 | |
Mead Johnson Nutrition Company | | | | | | | | | | | 107,020 | | | | 9,104,191 | |
Megmilk Snow Brand Company Limited | | | | | | | | | | | 7,500 | | | | 231,238 | |
Meiji Holdings Company Limited | | | | | | | | | | | 22,000 | | | | 1,979,607 | |
Mitsui Sugar Company Limited | | | | | | | | | | | 17,000 | | | | 77,717 | |
Mondelez International Incorporated Class A | | | | | | | | | | | 169,854 | | | | 7,646,827 | |
Morinaga & Company Limited | | | | | | | | | | | 40,000 | | | | 322,428 | |
Morinaga Milk Industry Company Limited | | | | | | | | | | | 32,000 | | | | 203,199 | |
Nestle India Limited | | | | | | | | | | | 8,749 | | | | 852,502 | |
| | | | |
| 20 | | Wells Fargo Diversified Stock Portfolio | | Portfolio of investments—August 31, 2016 (unaudited) |
| | | | | | | | | | | | | | | | |
| Security name | | | | | | | | Shares | | | Value | |
| | | | |
| Food Products (continued) | | | | | | | | | | | | | | | | |
Nestle Malaysia Bhd | | | | | | | | | | | 10,000 | | | $ | 194,403 | |
Nestle SA | | | | | | | | | | | 299,651 | | | | 23,855,090 | |
NH Foods Limited | | | | | | | | | | | 30,000 | | | | 656,744 | |
Nichirei Corporation | | | | | | | | | | | 44,000 | | | | 435,896 | |
Nippon Flour Mills Company Limited | | | | | | | | | | | 25,000 | | | | 173,489 | |
Nippon Suisan Kaisha Limited | | | | | | | | | | | 41,400 | | | | 173,659 | |
Nisshin Seifun Group Incorporated | | | | | | | | | | | 39,000 | | | | 551,462 | |
Nissin Food Products Company Limited | | | | | | | | | | | 13,700 | | | | 760,044 | |
Nong Shim Company Limited | | | | | | | | | | | 901 | | | | 242,422 | |
Orion Corporation | | | | | | | | | | | 539 | | | | 359,172 | |
Orkla ASA | | | | | | | | | | | 72,715 | | | | 665,825 | |
Ottogi Corporation | | | | | | | | | | | 361 | | | | 226,313 | |
Pioneer Foods Group Limited | | | | | | | | | | | 36,864 | | | | 426,260 | |
Post Holdings Incorporated † | | | | | | | | | | | 84,915 | | | | 7,199,094 | |
PPB Group Bhd | | | | | | | | | | | 119,200 | | | | 472,626 | |
PT Astra Agro Lestari Tbk | | | | | | | | | | | 87,388 | | | | 108,041 | |
PT Charoen Pokphand Indonesia Tbk | | | | | | | | | | | 1,636,000 | | | | 460,029 | |
PT Indofood CBP Sukses Makmur Tbk | | | | | | | | | | | 768,000 | | | | 577,520 | |
PT Indofood Sukses Makmur Tbk | | | | | | | | | | | 993,924 | | | | 593,807 | |
Qinqin Foodstuffs Group † | | | | | | | | | | | 50,000 | | | | 17,982 | |
Riken Vitamin Company Limited | | | | | | | | | | | 2,000 | | | | 81,670 | |
Sakata Seed Corporation | | | | | | | | | | | 5,700 | | | | 126,214 | |
Samyang Holdings Corporation | | | | | | | | | | | 1,019 | | | | 109,668 | |
Saputo Incorporated | | | | | | | | | | | 25,208 | | | | 838,088 | |
Showa Sangyo Company Limited | | | | | | | | | | | 27,000 | | | | 129,174 | |
Standard Foods Corporation | | | | | | | | | | | 87,299 | | | | 215,424 | |
Suedzucker AG | | | | | | | | | | | 5,793 | | | | 151,271 | |
Tate & Lyle plc | | | | | | | | | | | 44,144 | | | | 425,193 | |
Thai Union Group PCL | | | | | | | | | | | 984,976 | | | | 611,778 | |
The J.M. Smucker Company | | | | | | | | | | | 64,700 | | | | 9,173,813 | |
The Kraft Heinz Company | | | | | | | | | | | 64,697 | | | | 5,789,735 | |
The Nisshin Oillio Group Limited | | | | | | | | | | | 21,000 | | | | 89,712 | |
Tiger Brands Limited | | | | | | | | | | | 53,732 | | | | 1,394,357 | |
Tingyi Holding Corporation | | | | | | | | | | | 498,000 | | | | 460,924 | |
Toyo Suisan Kaisha Limited | | | | | | | | | | | 14,900 | | | | 609,883 | |
TreeHouse Foods Incorporated † | | | | | | | | | | | 74,623 | | | | 7,069,037 | |
Ulker Biskuvi Sanayi AS | | | | | | | | | | | 81,281 | | | | 572,206 | |
Uni-President Enterprises Corporation | | | | | | | | | | | 1,489,925 | | | | 2,817,337 | |
United Plantations Bhd | | | | | | | | | | | 17,000 | | | | 116,114 | |
Universal Robina Corporation | | | | | | | | | | | 238,100 | | | | 955,568 | |
Viscofan SA | | | | | | | | | | | 4,011 | | | | 219,185 | |
Vitasoy International Holdings Limited | | | | | | | | | | | 188,000 | | | | 351,884 | |
Want Want China Holdings Limited « | | | | | | | | | | | 2,237,000 | | | | 1,473,541 | |
WH Group Limited 144A | | | | | | | | | | | 1,898,137 | | | | 1,492,563 | |
WhiteWave Foods Company † | | | | | | | | | | | 100,065 | | | | 5,546,603 | |
Wilmar International Limited | | | | | | | | | | | 474,930 | | | | 1,073,643 | |
Yakult Honsha Company Limited | | | | | | | | | | | 24,800 | | | | 1,094,206 | |
Yamazaki Baking Company Limited | | | | | | | | | | | 25,700 | | | | 583,972 | |
| | | | |
| | | | | | | | | | | | | | | 199,638,402 | |
| | | | | | | | | | | | | | | | |
| | | | | | |
| Portfolio of investments—August 31, 2016 (unaudited) | | Wells Fargo Diversified Stock Portfolio | | | 21 | |
| | | | | | | | | | | | | | | | |
| Security name | | | | | | | | Shares | | | Value | |
| | | | |
| Household Products: 0.74% | | | | | | | | | | | | | | | | |
Colgate-Palmolive Company | | | | | | | | | | | 97,616 | | | $ | 7,256,773 | |
Earth Chemical Company Limited | | | | | | | | | | | 2,900 | | | | 123,046 | |
Energizer Holdings Incorporated | | | | | | | | | | | 73,741 | | | | 3,644,280 | |
Henkel AG & Company KGaA | | | | | | | | | | | 11,153 | | | | 1,252,148 | |
Hindustan Unilever Limited | | | | | | | | | | | 192,802 | | | | 2,640,124 | |
Kimberly-Clark Corporation | | | | | | | | | | | 39,016 | | | | 4,996,389 | |
Kimberly-Clark de Mexico SAB de CV Class A | | | | | | | | | | | 424,300 | | | | 1,014,801 | |
Lion Corporation | | | | | | | | | | | 40,000 | | | | 559,803 | |
Pigeon Corporation | | | | | | | | | | | 17,000 | | | | 452,337 | |
PT Unilever Indonesia Tbk | | | | | | | | | | | 402,000 | | | | 1,383,438 | |
PZ Cussons plc | | | | | | | | | | | 28,166 | | | | 123,904 | |
Reckitt Benckiser Group plc | | | | | | | | | | | 58,925 | | | | 5,690,329 | |
Spectrum Brands Holdings Incorporated « | | | | | | | | | | | 35,586 | | | | 4,775,641 | |
Svenska Cellulosa AB Class A | | | | | | | | | | | 7,500 | | | | 230,327 | |
Svenska Cellulosa AB Class B | | | | | | | | | | | 56,712 | | | | 1,742,967 | |
The Procter & Gamble Company | | | | | | | | | | | 295,768 | | | | 25,823,504 | |
Unicharm Corporation | | | | | | | | | | | 65,200 | | | | 1,583,604 | |
| | | | |
| | | | | | | | | | | | | | | 63,293,415 | |
| | | | | | | | | | | | | | | | |
| | | | |
| Personal Products: 0.56% | | | | | | | | | | | | | | | | |
Aderans Company Limited | | | | | | | | | | | 6,500 | | | | 29,150 | |
Amorepacific Corporation | | | | | | | | | | | 5,000 | | | | 1,730,942 | |
Amorepacific Group | | | | | | | | | | | 4,680 | | | | 608,610 | |
Avon Products Incorporated | | | | | | | | | | | 575,200 | | | | 3,278,640 | |
Beiersdorf AG | | | | | | | | | | | 10,132 | | | | 942,678 | |
Blackmores Limited « | | | | | | | | | | | 1,922 | | | | 178,220 | |
Ci:Z Holdings Company Limited | | | | | | | | | | | 4,000 | | | | 101,870 | |
Colgate-Palmolive Company India Limited | | | | | | | | | | | 13,598 | | | | 192,559 | |
Cosmax Incorporated | | | | | | | | | | | 1,043 | | | | 137,040 | |
Dabur India Limited | | | | | | | | | | | 131,061 | | | | 568,707 | |
Edgewell Personal Care Company † | | | | | | | | | | | 34,529 | | | | 2,762,665 | |
Emami Limited | | | | | | | | | | | 9,988 | | | | 171,020 | |
Euglena Company Limited †« | | | | | | | | | | | 10,800 | | | | 152,191 | |
FANCL Corporation | | | | | | | | | | | 7,300 | | | | 115,217 | |
Godrej Consumer Products Limited | | | | | | | | | | | 45,847 | | | | 1,038,318 | |
Hengan International Group Company Limited | | | | | | | | | | | 206,500 | | | | 1,747,552 | |
Kao Corporation | | | | | | | | | | | 72,800 | | | | 3,783,362 | |
Kobayashi Pharmaceutical Company Limited | | | | | | | | | | | 8,400 | | | | 390,103 | |
Korea Kolmar Company Limited | | | | | | | | | | | 4,292 | | | | 346,824 | |
Kose Corporation | | | | | | | | | | | 4,400 | | | | 394,646 | |
L’Oreal SA | | | | | | | | | | | 22,921 | | | | 4,329,811 | |
LG Household & Health Care Limited H Shares | | | | | | | | | | | 1,529 | | | | 1,304,107 | |
Mandom Corporation | | | | | | | | | | | 3,200 | | | | 130,981 | |
Marico Limited | | | | | | | | | | | 140,176 | | | | 610,143 | |
McCarthy & Stone plc | | | | | | | | | | | 46,458 | | | | 124,636 | |
Milbon Company Limited | | | | | | | | | | | 2,000 | | | | 86,599 | |
NU Skin Enterprises Incorporated Class A | | | | | | | | | | | 73,000 | | | | 4,225,240 | |
Oriflame Holding AG † | | | | | | | | | | | 2,947 | | | | 90,675 | |
Pola Orbis Holdings Incorporated | | | | | | | | | | | 3,200 | | | | 255,468 | |
Procter & Gamble Hygiene & Healthcare Limited | | | | | | | | | | | 2,333 | | | | 232,396 | |
| | | | |
| 22 | | Wells Fargo Diversified Stock Portfolio | | Portfolio of investments—August 31, 2016 (unaudited) |
| | | | | | | | | | | | | | | | |
| Security name | | | | | | | | Shares | | | Value | |
| | | | |
| Personal Products (continued) | | | | | | | | | | | | | | | | |
Shiseido Company Limited | | | | | | | | | | | 58,300 | | | $ | 1,465,600 | |
The Estee Lauder Companies Incorporated Class A | | | | | | | | | | | 42,920 | | | | 3,829,752 | |
Unilever NV | | | | | | | | | | | 159,186 | | | | 7,300,546 | |
Unilever plc | | | | | | | | | | | 115,371 | | | | 5,346,412 | |
| | | | |
| | | | | | | | | | | | | | | 48,002,680 | |
| | | | | | | | | | | | | | | | |
| | | | |
| Tobacco: 0.76% | | | | | | | | | | | | | | | | |
Altria Group Incorporated | | | | | | | | | | | 216,369 | | | | 14,299,827 | |
British American Tobacco Malaysia Bhd | | | | | | | | | | | 28,400 | | | | 344,680 | |
British American Tobacco plc | | | | | | | | | | | 167,593 | | | | 10,398,527 | |
Eastern Company | | | | | | | | | | | 2,662 | | | | 64,452 | |
Imperial Tobacco Group plc | | | | | | | | | | | 88,482 | | | | 4,640,051 | |
ITC Limited | | | | | | | | | | | 908,538 | | | | 3,527,928 | |
Japan Tobacco Incorporated | | | | | | | | | | | 167,500 | | | | 6,488,571 | |
KT&G Corporation | | | | | | | | | | | 19,787 | | | | 2,076,304 | |
Philip Morris International Incorporated | | | | | | | | | | | 171,843 | | | | 17,172,271 | |
PT Gudang Garam Tbk | | | | | | | | | | | 106,500 | | | | 517,045 | |
PT Hanjaya Mandala Sampoerna Tbk | | | | | | | | | | | 700,000 | | | | 210,026 | |
Reynolds American Incorporated | | | | | | | | | | | 89,218 | | | | 4,422,536 | |
Swedish Match AB | | | | | | | | | | | 21,840 | | | | 778,629 | |
| | | | |
| | | | | | | | | | | | | | | 64,940,847 | |
| | | | | | | | | | | | | | | | |
| | | | |
Energy: 5.39% | | | | | | | | | | | | | | | | |
| | | | |
| Energy Equipment & Services: 0.78% | | | | | | | | | | | | | | | | |
AMEC Foster Wheeler plc | | | | | | | | | | | 31,672 | | | | 225,002 | |
Amec Foster Wheeler plc ADR | | | | | | | | | | | 4,290 | | | | 30,245 | |
Atwood Oceanics Incorporated « | | | | | | | | | | | 77,700 | | | | 613,830 | |
Baker Hughes Incorporated | | | | | | | | | | | 79,300 | | | | 3,896,009 | |
Bristow Group Incorporated « | | | | | | | | | | | 46,600 | | | | 531,706 | |
Bumi Armada Bhd | | | | | | | | | | | 340,600 | | | | 62,569 | |
Calfrac Well Services Limited | | | | | | | | | | | 3,918 | | | | 8,515 | |
CGG SA † | | | | | | | | | | | 2,054 | | | | 49,878 | |
Core Laboratories NV « | | | | | | | | | | | 26,884 | | | | 3,005,094 | |
Diamond Offshore Drilling Incorporated « | | | | | | | | | | | 85,100 | | | | 1,571,797 | |
Dril-Quip Incorporated † | | | | | | | | | | | 53,910 | | | | 2,995,779 | |
Enerflex Limited | | | | | | | | | | | 4,043 | | | | 41,188 | |
Ensco plc Class A | | | | | | | | | | | 357,660 | | | | 2,714,639 | |
Ensign Energy Services Incorporated | | | | | | | | | | | 11,978 | | | | 70,513 | |
Ezra Holdings Limited † | | | | | | | | | | | 377,000 | | | | 10,792 | |
Fugro NV † | | | | | | | | | | | 7,340 | | | | 116,097 | |
Halliburton Company | | | | | | | | | | | 1 | | | | 43 | |
Helmerich & Payne Incorporated « | | | | | | | | | | | 56,800 | | | | 3,434,128 | |
Hunting plc | | | | | | | | | | | 13,249 | | | | 80,857 | |
John Wood Group plc | | | | | | | | | | | 30,475 | | | | 278,727 | |
KNM Group Bhd † | | | | | | | | | | | 14 | | | | 1 | |
Modec Incorporated « | | | | | | | | | | | 3,100 | | | | 53,002 | |
Mullen Group Limited | | | | | | | | | | | 6,400 | | | | 79,256 | |
Nabors Industries Limited | | | | | | | | | | | 362,400 | | | | 3,602,256 | |
Noble Corporation plc | | | | | | | | | | | 321,235 | | | | 1,850,314 | |
| | | | | | |
| Portfolio of investments—August 31, 2016 (unaudited) | | Wells Fargo Diversified Stock Portfolio | | | 23 | |
| | | | | | | | | | | | | | | | |
| Security name | | | | | | | | Shares | | | Value | |
| | | | |
| Energy Equipment & Services (continued) | | | | | | | | | | | | | | | | |
Oceaneering International Incorporated | | | | | | | | | | | 126,368 | | | $ | 3,351,279 | |
Oil States International Incorporated † | | | | | | | | | | | 68,000 | | | | 2,109,360 | |
Pason Systems Incorporated | | | | | | | | | | | 10,745 | | | | 153,219 | |
Petrofac Limited | | | | | | | | | | | 25,283 | | | | 276,061 | |
Petroleum Geo-Services ASA †« | | | | | | | | | | | 19,980 | | | | 42,512 | |
Precision Drilling Corporation | | | | | | | | | | | 20,412 | | | | 83,896 | |
Prosafe ASA | | | | | | | | | | | 26,130 | | | | 1,756 | |
Rowan Companies plc Class A | | | | | | | | | | | 166,523 | | | | 2,074,877 | |
Saipem SpA † | | | | | | | | | | | 1,047,510 | | | | 480,114 | |
Sapurakencana Petroleum Bhd | | | | | | | | | | | 640,922 | | | | 249,700 | |
SBM Offshore NV | | | | | | | | | | | 17,972 | | | | 263,215 | |
Schlumberger Limited | | | | | | | | | | | 251,555 | | | | 19,872,845 | |
Schoeller-Bleckmann Oilfield Equipment AG | | | | | | | | | | | 1,839 | | | | 106,668 | |
Seadrill Limited †« | | | | | | | | | | | 33,756 | | | | 83,532 | |
Shawcor Limited Class A | | | | | | | | | | | 4,528 | | | | 110,628 | |
Shinko Plantech Company Limited | | | | | | | | | | | 7,600 | | | | 51,639 | |
Subsea 7 SA † | | | | | | | | | | | 26,952 | | | | 293,043 | |
Technip SA | | | | | | | | | | | 11,161 | | | | 659,452 | |
Tecnicas Reunidas SA | | | | | | | | | | | 2,168 | | | | 77,918 | |
Tenaris SA | | | | | | | | | | | 45,222 | | | | 621,456 | |
TGS Nopec Geophysical Company ASA | | | | | | | | | | | 10,707 | | | | 186,572 | |
Transocean Limited « | | | | | | | | | | | 413,208 | | | | 4,008,118 | |
Trican Well Service Limited † | | | | | | | | | | | 16,245 | | | | 26,509 | |
Trinidad Drilling Limited | | | | | | | | | | | 7,400 | | | | 14,220 | |
U.S. Silica Holdings Incorporated « | | | | | | | | | | | 83,671 | | | | 3,284,087 | |
Vallourec SA † | | | | | | | | | | | 30,693 | | | | 135,953 | |
Weatherford International plc † | | | | | | | | | | | 548,362 | | | | 2,999,540 | |
WorleyParsons Limited | | | | | | | | | | | 36,573 | | | | 224,289 | |
| | | | |
| | | | | | | | | | | | | | | 67,164,695 | |
| | | | | | | | | | | | | | | | |
| | | | |
| Oil, Gas & Consumable Fuels: 4.61% | | | | | | | | | | | | | | | | |
Advantage Oil & Gas Limited † | | | | | | | | | | | 8,522 | | | | 58,161 | |
AET&D Holdings No.1 Limited (a) | | | | | | | | | | | 20,314 | | | | 0 | |
Afren plc †«(a) | | | | | | | | | | | 100,824 | | | | 0 | |
Altagas Limited « | | | | | | | | | | | 11,048 | | | | 285,930 | |
Antero Resources Corporation † | | | | | | | | | | | 81,934 | | | | 2,094,233 | |
Apache Corporation | | | | | | | | | | | 45,400 | | | | 2,256,380 | |
ARC Resources Limited « | | | | | | | | | | | 29,540 | | | | 515,384 | |
Athabasca Oil Corporation † | | | | | | | | | | | 28,194 | | | | 26,659 | |
Australian Worldwide Exploration Limited † | | | | | | | | | | | 77,909 | | | | 40,694 | |
Bankers Petroleum Limited † | | | | | | | | | | | 23,555 | | | | 33,948 | |
Banpu PCL | | | | | | | | | | | 213,000 | | | | 96,607 | |
Bayan Resources Group † | | | | | | | | | | | 170,500 | | | | 85,796 | |
Baytex Energy Corporation | | | | | | | | | | | 11,349 | | | | 51,232 | |
Beach Petroleum Limited | | | | | | | | | | | 252,019 | | | | 107,014 | |
Bharat Petroleum Corporation Limited | | | | | | | | | | | 128,848 | | | | 1,159,382 | |
Birchcliff Energy Limited † | | | | | | | | | | | 4,522 | | | | 31,310 | |
Bonavista Energy Corporation | | | | | | | | | | | 16,745 | | | | 44,308 | |
BP plc | | | | | | | | | | | 1,636,500 | | | | 9,195,438 | |
Brightoil Petroleum Holdings Limited « | | | | | | | | | | | 514,000 | | | | 141,130 | |
| | | | |
| 24 | | Wells Fargo Diversified Stock Portfolio | | Portfolio of investments—August 31, 2016 (unaudited) |
| | | | | | | | | | | | | | | | |
| Security name | | | | | | | | Shares | | | Value | |
| | | | |
| Oil, Gas & Consumable Fuels (continued) | | | | | | | | | | | | | | | | |
Cabot Oil & Gas Corporation | | | | | | | | | | | 264,454 | | | $ | 6,513,502 | |
Cairn Energy plc † | | | | | | | | | | | 48,348 | | | | 117,897 | |
Cairn India Limited | | | | | | | | | | | 136,030 | | | | 404,515 | |
California Resources Corporation « | | | | | | | | | | | 51,475 | | | | 511,147 | |
Caltex Australia Limited | | | | | | | | | | | 41,964 | | | | 1,070,717 | |
Cameco Corporation | | | | | | | | | | | 37,200 | | | | 343,236 | |
Canadian Natural Resources Limited | | | | | | | | | | | 103,154 | | | | 3,203,799 | |
Carrizo Oil & Gas Incorporated † | | | | | | | | | | | 77,800 | | | | 2,978,962 | |
Cenovus Energy Incorporated | | | | | | | | | | | 72,271 | | | | 1,044,331 | |
Cheniere Energy Incorporated † | | | | | | | | | | | 133,133 | | | | 5,711,406 | |
Chesapeake Energy Corporation † | | | | | | | | | | | 698,232 | | | | 4,433,773 | |
Chevron Corporation | | | | | | | | | | | 209,116 | | | | 21,032,887 | |
China Petroleum & Chemical Corporation H Shares | | | | | | | | | | | 6,887,600 | | | | 4,998,638 | |
China Shenhua Energy Company Limited H Shares | | | | | | | | | | | 1,109,500 | | | | 1,993,726 | |
Cimarex Energy Company | | | | | | | | | | | 53,900 | | | | 7,124,502 | |
CNOOC Limited | | | | | | | | | | | 4,511,000 | | | | 5,541,676 | |
Coal India Limited | | | | | | | | | | | 421,834 | | | | 2,100,667 | |
Cobalt International Energy Incorporated † | | | | | | | | | | | 456,800 | | | | 548,160 | |
Concho Resources Incorporated † | | | | | | | | | | | 74,528 | | | | 9,629,018 | |
Connacher Oil and Gas Limited †(a) | | | | | | | | | | | 28 | | | | 3 | |
ConocoPhillips | | | | | | | | | | | 134,356 | | | | 5,515,314 | |
CONSOL Energy Incorporated « | | | | | | | | | | | 277,000 | | | | 5,052,480 | |
Continental Resources Incorporated † | | | | | | | | | | | 50,451 | | | | 2,419,630 | |
Corridor Resources Incorporated † | | | | | | | | | | | 1,363 | | | | 411 | |
Cosmo Energy Holdings Company Limited | | | | | | | | | | | 12,900 | | | | 134,654 | |
Crescent Point Energy Corporation | | | | | | | | | | | 49,703 | | | | 750,434 | |
Crew Energy Incorporated † | | | | | | | | | | | 7,839 | | | | 39,691 | |
Delek Group Limited | | | | | | | | | | | 312 | | | | 66,357 | |
Denbury Resources Incorporated « | | | | | | | | | | | 463,400 | | | | 1,427,272 | |
Diamondback Energy Incorporated † | | | | | | | | | | | 99,416 | | | | 9,469,374 | |
Ecopetrol SA Sponsored ADR †« | | | | | | | | | | | 63,212 | | | | 560,058 | |
Empresas Copec SA | | | | | | | | | | | 168,585 | | | | 1,466,183 | |
Enbridge Income Fund Holdings Incorporated | | | | | | | | | | | 5,200 | | | | 124,865 | |
Enbridge Incorporated | | | | | | | | | | | 87,300 | | | | 3,443,004 | |
Encana Corporation | | | | | | | | | | | 70,534 | | | | 673,392 | |
Energy Absolute PCL Class A | | | | | | | | | | | 511,600 | | | | 373,183 | |
Enerplus Corporation | | | | | | | | | | | 20,247 | | | | 140,960 | |
Eni SpA | | | | | | | | | | | 247,150 | | | | 3,732,755 | |
EOG Resources Incorporated | | | | | | | | | | | 99,596 | | | | 8,813,250 | |
EQT Corporation | | | | | | | | | | | 98,100 | | | | 7,014,150 | |
Exxon Mobil Corporation | | | | | | | | | | | 448,552 | | | | 39,086,821 | |
Formosa Petrochemical Corporation | | | | | | | | | | | 462,590 | | | | 1,352,905 | |
Galp Energia SGPS SA | | | | | | | | | | | 56,016 | | | | 814,154 | |
Gazprom ADR | | | | | | | | | | | 1,577,489 | | | | 6,380,943 | |
Gibson Energy Incorporated | | | | | | | | | | | 11,458 | | | | 156,222 | |
Golar LNG Limited (a) | | | | | | | | | | | 2,733 | | | | 56,959 | |
Gran Tierra Energy Incorporated † | | | | | | | | | | | 23,505 | | | | 65,959 | |
Grupa Lotos SA † | | | | | | | | | | | 14,414 | | | | 107,136 | |
GS Holdings Corporation | | | | | | | | | | | 8,189 | | | | 362,813 | |
Gulfport Energy Corporation † | | | | | | | | | | | 163,900 | | | | 4,687,540 | |
| | | | | | |
| Portfolio of investments—August 31, 2016 (unaudited) | | Wells Fargo Diversified Stock Portfolio | | | 25 | |
| | | | | | | | | | | | | | | | |
| Security name | | | | | | | | Shares | | | Value | |
| | | | |
| Oil, Gas & Consumable Fuels (continued) | | | | | | | | | | | | | | | | |
Hindustan Petroleum Corporation Limited | | | | | | | | | | | 24,569 | | | $ | 447,099 | |
HollyFrontier Corporation | | | | | | | | | | | 101,467 | | | | 2,625,966 | |
Husky Energy Incorporated | | | | | | | | | | | 27,170 | | | | 333,979 | |
Idemitsu Kosan Company Limited | | | | | | | | | | | 16,500 | | | | 300,928 | |
Igas Energy plc † | | | | | | | | | | | 2,782 | | | | 648 | |
Imperial Oil Limited | | | | | | | | | | | 23,700 | | | | 723,072 | |
Indian Oil Corporation Limited | | | | | | | | | | | 146,800 | | | | 1,261,292 | |
Inpex Holdings Incorporated | | | | | | | | | | | 162,100 | | | | 1,407,535 | |
Inter Pipeline Limited | | | | | | | | | | | 28,473 | | | | 619,224 | |
InterOil Corporation † | | | | | | | | | | | 3,782 | | | | 185,621 | |
IRPC PCL | | | | | | | | | | | 4,652,021 | | | | 650,454 | |
Itochu Enex Company Limited | | | | | | | | | | | 6,000 | | | | 43,493 | |
Ivanhoe Energy Incorporated †(a) | | | | | | | | | | | 426 | | | | 0 | |
Japan Petroleum Exploration Company | | | | | | | | | | | 5,500 | | | | 121,147 | |
JX Holdings Incorporated | | | | | | | | | | | 373,800 | | | | 1,397,798 | |
Karoon Gas Australia Limited † | | | | | | | | | | | 31,102 | | | | 30,855 | |
Keyera Corporation | | | | | | | | | | | 14,048 | | | | 433,738 | |
Kinder Morgan Incorporated | | | | | | | | | | | 196,503 | | | | 4,293,591 | |
Koninklijke Vopak NV | | | | | | | | | | | 6,083 | | | | 308,459 | |
Kunlun Energy Company Limited | | | | | | | | | | | 1,270,000 | | | | 934,793 | |
Lukoil PJSC ADR | | | | | | | | | | | 138,293 | | | | 6,202,441 | |
Lundin Petroleum AB † | | | | | | | | | | | 23,462 | | | | 413,020 | |
Marathon Oil Corporation | | | | | | | | | | | 456,861 | | | | 6,862,052 | |
Marathon Petroleum Corporation | | | | | | | | | | | 63,483 | | | | 2,698,662 | |
MEG Energy Corporation † | | | | | | | | | | | 12,100 | | | | 50,009 | |
Mitsuuroko Holdings Company Limited | | | | | | | | | | | 10,000 | | | | 48,905 | |
MOL Hungarian Oil & Gas plc | | | | | | | | | | | 18,943 | | | | 1,182,511 | |
Motor Oil (Hellas) Corinth Refineries SA | | | | | | | | | | | 18,029 | | | | 202,914 | |
Murphy Oil Corporation | | | | | | | | | | | 94,200 | | | | 2,517,024 | |
Neste Oil Oyj | | | | | | | | | | | 15,503 | | | | 645,714 | |
New Hope Corporation Limited | | | | | | | | | | | 33,755 | | | | 38,560 | |
Niko Resource Limited † | | | | | | | | | | | 5,137 | | | | 470 | |
Nippon Gas Company Limited | | | | | | | | | | | 6,300 | | | | 175,607 | |
NovaTek OAO | | | | | | | | | | | 6,672 | | | | 699,338 | |
NovaTek OAO Sponsored GDR | | | | | | | | | | | 12,799 | | | | 1,379,732 | |
NuVista Energy Limited † | | | | | | | | | | | 3,905 | | | | 21,499 | |
Oasis Petroleum Incorporated † | | | | | | | | | | | 256,900 | | | | 2,435,412 | |
Occidental Petroleum Corporation | | | | | | | | | | | 83,185 | | | | 6,392,767 | |
Oil & Natural Gas Corporation Limited | | | | | | | | | | | 582,446 | | | | 2,055,129 | |
Oil India Limited | | | | | | | | | | | 23,455 | | | | 134,664 | |
Oil Search Limited | | | | | | | | | | | 194,808 | | | | 983,862 | |
OMV AG | | | | | | | | | | | 14,891 | | | | 417,247 | |
ONEOK Incorporated | | | | | | | | | | | 117,500 | | | | 5,509,575 | |
Ophir Energy plc † | | | | | | | | | | | 50,585 | | | | 48,989 | |
Origin Energy Limited | | | | | | | | | | | 288,382 | | | | 1,140,019 | |
PA Resources AB †(a) | | | | | | | | | | | 1,136 | | | | 0 | |
Paramount Resources Limited Class A † | | | | | | | | | | | 12,300 | | | | 130,841 | |
Parex Resources Incorporated † | | | | | | | | | | | 13,423 | | | | 158,857 | |
Parkland Fuel Corporation | | | | | | | | | | | 7,600 | | | | 168,412 | |
Paz Oil Company Limited | | | | | | | | | | | 173 | | | | 28,169 | |
| | | | |
| 26 | | Wells Fargo Diversified Stock Portfolio | | Portfolio of investments—August 31, 2016 (unaudited) |
| | | | | | | | | | | | | | | | |
| Security name | | | | | | | | Shares | | | Value | |
| | | | |
| Oil, Gas & Consumable Fuels (continued) | | | | | | | | | | | | | | | | |
PBF Energy Incorporated Class A | | | | | | | | | | | 129,437 | | | $ | 2,834,670 | |
Pembina Pipeline Corporation « | | | | | | | | | | | 37,455 | | | | 1,127,020 | |
Pengrowth Energy Corporation | | | | | | | | | | | 42,515 | | | | 61,273 | |
Penn West Petroleum Limited | | | | | | | | | | | 42,170 | | | | 66,885 | |
PetroChina Company Limited H Shares | | | | | | | | | | | 5,696,000 | | | | 3,803,428 | |
Petroleo Brasileiro SA † | | | | | | | | | | | 812,145 | | | | 3,707,115 | |
Petronas Dagangan Bhd | | | | | | | | | | | 125,000 | | | | 721,243 | |
Petronet LNG Limited | | | | | | | | | | | 37,495 | | | | 196,993 | |
Peyto Exploration & Development Corporation « | | | | | | | | | | | 13,213 | | | | 379,745 | |
Phillips 66 Company | | | | | | | | | | | 50,099 | | | | 3,930,267 | |
Pioneer Natural Resources Company | | | | | | | | | | | 29,600 | | | | 5,299,880 | |
Polish Oil & Gas | | | | | | | | | | | 592,108 | | | | 807,485 | |
Polski Koncern Naftowy Orlen SA « | | | | | | | | | | | 100,002 | | | | 1,663,139 | |
PrairieSky Royalty Limited | | | | | | | | | | | 15,807 | | | | 309,776 | |
Premier Oil plc † | | | | | | | | | | | 62,107 | | | | 59,332 | |
PT Adaro Energy Tbk | | | | | | | | | | | 4,031,000 | | | | 349,465 | |
PTT Exploration & Production PCL | | | | | | | | | | | 388,971 | | | | 912,998 | |
PTT PCL | | | | | | | | | | | 239,900 | | | | 2,418,717 | |
Raging River Exploration Incorporated † | | | | | | | | | | | 18,708 | | | | 151,644 | |
Range Resources Corporation | | | | | | | | | | | 94,945 | | | | 3,662,029 | |
Reliance Industries Limited | | | | | | | | | | | 441,513 | | | | 6,988,260 | |
Reliance Industries Limited GDR 144A | | | | | | | | | | | 2,006 | | | | 62,587 | |
Repsol YPF SA | | | | | | | | | | | 95,906 | | | | 1,288,020 | |
Rosneft Oil Company OJSC Sponsored GDR | | | | | | | | | | | 64,216 | | | | 335,529 | |
Rosneft OJSC GDR | | | | | | | | | | | 256,180 | | | | 1,351,426 | |
Royal Dutch Shell plc Class A - Amsterdam Exchange | | | | | | | | | | | 58,261 | | | | 1,430,694 | |
Royal Dutch Shell plc Class A - London Exchange | | | | | | | | | | | 320,148 | | | | 7,821,582 | |
Royal Dutch Shell plc Class B | | | | | | | | | | | 336,685 | | | | 8,585,926 | |
S-Oil Corporation | | | | | | | | | | | 8,742 | | | | 554,313 | |
Santos Limited | | | | | | | | | | | 229,433 | | | | 765,591 | |
Sasol Limited | | | | | | | | | | | 137,035 | | | | 3,450,202 | |
Semirara Mining and Power Corporation | | | | | | | | | | | 100,160 | | | | 238,389 | |
Seven Generations Energy Limited Class A † | | | | | | | | | | | 16,242 | | | | 374,034 | |
Showa Shell Sekiyu KK | | | | | | | | | | | 28,800 | | | | 245,509 | |
SK Innovation Company Limited | | | | | | | | | | | 9,812 | | | | 1,280,400 | |
SM Energy Company | | | | | | | | | | | 96,900 | | | | 3,670,572 | |
Southwestern Energy Company † | | | | | | | | | | | 237,117 | | | | 3,298,297 | |
Spectra Energy Corporation | | | | | | | | | | | 72,349 | | | | 2,577,071 | |
Spyglass Resources Corporation †(a) | | | | | | | | | | | 2,042 | | | | 0 | |
Statoil ASA | | | | | | | | | | | 100,037 | | | | 1,582,296 | |
Storm Resources Limited † | | | | | | | | | | | 281 | | | | 943 | |
Suncor Energy Incorporated | | | | | | | | | | | 149,319 | | | | 4,048,943 | |
Surgutneftegas SP ADR | | | | | | | | | | | 257,109 | | | | 1,212,012 | |
Targa Resources Corporation | | | | | | | | | | | 212,461 | | | | 9,259,050 | |
Tatneft ADR | | | | | | | | | | | 78,690 | | | | 2,321,355 | |
Thai Oil PCL | | | | | | | | | | | 365,200 | | | | 746,426 | |
The Williams Companies Incorporated | | | | | | | | | | | 81,800 | | | | 2,285,492 | |
TonenGeneral Sekiyu KK | | | | | | | | | | | 42,000 | | | | 387,667 | |
Total SA | | | | | | | | | | | 224,363 | | | | 10,698,861 | |
Touchstone Exploration Incorporated † | | | | | | | | | | | 3,067 | | | | 503 | |
| | | | | | |
| Portfolio of investments—August 31, 2016 (unaudited) | | Wells Fargo Diversified Stock Portfolio | | | 27 | |
| | | | | | | | | | | | | | | | |
| Security name | | | | | | | | Shares | | | Value | |
| | | | |
| Oil, Gas & Consumable Fuels (continued) | | | | | | | | | | | | | | | | |
Tourmaline Oil Corporation † | | | | | | | | | | | 13,128 | | | $ | 369,194 | |
TransCanada Corporation | | | | | | | | | | | 66,600 | | | | 3,020,209 | |
Tullow Oil plc † | | | | | | | | | | | 85,595 | | | | 244,917 | |
Tupras Turkiye Petrol Rafinerileri AS | | | | | | | | | | | 43,221 | | | | 846,167 | |
Ultrapar Participacoes SA | | | | | | | | | | | 117,200 | | | | 2,701,349 | |
United Tractors | | | | | | | | | | | 352,380 | | | | 498,087 | |
Valero Energy Corporation | | | | | | | | | | | 49,666 | | | | 2,749,013 | |
Veresen Incorporated | | | | | | | | | | | 41,157 | | | | 405,482 | |
Vermilion Energy Incorporated | | | | | | | | | | | 9,494 | | | | 343,084 | |
Washington H. Soul Pattinson & Company Limited | | | | | | | | | | | 25,619 | | | | 331,361 | |
Western Refining Incorporated | | | | | | | | | | | 106,500 | | | | 2,679,540 | |
Whitecap Resources Incorporated | | | | | | | | | | | 23,314 | | | | 176,891 | |
Whitehaven Coal Limited † | | | | | | | | | | | 113,230 | | | | 165,941 | |
Whiting Petroleum Corporation † | | | | | | | | | | | 298,785 | | | | 2,178,143 | |
Woodside Petroleum Limited | | | | | | | | | | | 104,596 | | | | 2,250,580 | |
World Fuel Services Corporation | | | | | | | | | | | 92,389 | | | | 4,118,702 | |
WPX Energy Incorporated † | | | | | | | | | | | 328,468 | | | | 3,941,616 | |
Yanchang Petroleum International Limited † | | | | | | | | | | | 280,000 | | | | 7,471 | |
| | | | |
| | | | | | | | | | | | | | | 395,029,931 | |
| | | | | | | | | | | | | | | | |
| | | | |
Financials: 21.47% | | | | | | | | | | | | | | | | |
| | | | |
| Banks: 7.85% | | | | | | | | | | | | | | | | |
Abu Dhabi Commercial Bank PJSC | | | | | | | | | | | 680,446 | | | | 1,189,312 | |
Affin Holdings Bhd | | | | | | | | | | | 93,730 | | | | 49,228 | |
Agricultural Bank of China Limited H Shares | | | | | | | | | | | 7,519,000 | | | | 3,091,905 | |
Agricultural Bank of Greece †(a) | | | | | | | | | | | 342 | | | | 0 | |
Akbank TAS | | | | | | | | | | | 548,661 | | | | 1,450,753 | |
Alior Bank SA †« | | | | | | | | | | | 17,880 | | | | 243,792 | |
Alliance Financial Group Bhd | | | | | | | | | | | 96,700 | | | | 94,184 | |
Alpha Bank AE † | | | | | | | | | | | 203,386 | | | | 390,211 | |
AMMB Holdings Bhd | | | | | | | | | | | 186,100 | | | | 201,450 | |
Aozora Bank Limited | | | | | | | | | | | 172,000 | | | | 608,438 | |
Associated Banc-Corp | | | | | | | | | | | 178,305 | | | | 3,537,571 | |
Australia & New Zealand Banking Group Limited | | | | | | | | | | | 422,360 | | | | 8,538,726 | |
Axis Bank Limited | | | | | | | | | | | 367,572 | | | | 3,275,875 | |
Banca Carige SpA † | | | | | | | | | | | 332 | | | | 124 | |
Banca Monte dei Paschi di Sien SpA †« | | | | | | | | | | | 340,385 | | | | 91,731 | |
Banca Popolare dell’Emilia Romagna Scarl | | | | | | | | | | | 38,724 | | | | 149,022 | |
Banca Popolare dell’Etruria e del Lazio †(a) | | | | | | | | | | | 258 | | | | 0 | |
Banca Popolare di Milano Scarl | | | | | | | | | | | 484,767 | | | | 207,642 | |
Banca Popolare di Sondrio Scarl | | | | | | | | | | | 27,109 | | | | 72,936 | |
Banco Bilbao Vizcaya Argentaria SA | | | | | | | | | | | 582,525 | | | | 3,624,460 | |
Banco Bradesco SA | | | | | | | | | | | 194,854 | | | | 1,755,931 | |
Banco Comercial Portugues SA † | | | | | | | | | | | 3,424,278 | | | | 68,753 | |
Banco de Brasil SA | | | | | | | | | | | 301,685 | | | | 2,168,373 | |
Banco de Chile | | | | | | | | | | | 10,275,029 | | | | 1,138,760 | |
Banco de Credito e Inversiones | | | | | | | | | | | 11,329 | | | | 500,963 | |
Banco de Sabade SA | | | | | | | | | | | 435,494 | | | | 590,213 | |
Banco Popolare Societa Cooperativa | | | | | | | | | | | 39,538 | | | | 98,702 | |
| | | | |
| 28 | | Wells Fargo Diversified Stock Portfolio | | Portfolio of investments—August 31, 2016 (unaudited) |
| | | | | | | | | | | | | | | | |
| Security name | | | | | | | | Shares | | | Value | |
| | | | |
| Banks (continued) | | | | | | | | | | | | | | | | |
Banco Popular Espanol SA | | | | | | | | | | | 297,857 | | | $ | 403,013 | |
Banco Santander Brasil SA | | | | | | | | | | | 131,500 | | | | 923,579 | |
Banco Santander Central Hispano SA | | | | | | | | | | | 1,199,869 | | | | 5,380,344 | |
Banco Santander Central Hispano SA ADR | | | | | | | | | | | 87,065 | | | | 390,051 | |
Banco Santander Chile SA | | | | | | | | | | | 22,027,452 | | | | 1,156,879 | |
Bancolombia SA ADR | | | | | | | | | | | 36,000 | | | | 1,413,720 | |
BancorpSouth Incorporated | | | | | | | | | | | 112,836 | | | | 2,809,616 | |
Bangkok Bank PCL | | | | | | | | | | | 31,000 | | | | 151,796 | |
Bangkok Bank PCL - Non-voting | | | | | | | | | | | 152,500 | | | | 746,739 | |
Bank Handlowy w Warszawie SA | | | | | | | | | | | 8,631 | | | | 160,768 | |
Bank Hapoalim Limited | | | | | | | | | | | 105,587 | | | | 566,373 | |
Bank Leumi Le-Israel † | | | | | | | | | | | 148,085 | | | | 554,388 | |
Bank Millennium SA † | | | | | | | | | | | 93,393 | | | | 138,356 | |
Bank of America Corporation | | | | | | | | | | | 1,137,245 | | | | 18,355,134 | |
Bank of Ayudhya PCL | | | | | | | | | | | 470,600 | | | | 523,410 | |
Bank of Baroda | | | | | | | | | | | 81,560 | | | | 198,450 | |
Bank of China Limited H Shares | | | | | | | | | | | 21,357,100 | | | | 9,608,224 | |
Bank of Communications Limited H Shares | | | | | | | | | | | 6,190,350 | | | | 4,779,885 | |
Bank of East Asia Limited | | | | | | | | | | | 197,521 | | | | 798,227 | |
Bank of Hawaii Corporation | | | | | | | | | | | 51,317 | | | | 3,696,877 | |
Bank of Ireland † | | | | | | | | | | | 2,392,830 | | | | 539,155 | |
Bank of Kyoto Limited | | | | | | | | | | | 60,000 | | | | 433,770 | |
Bank of Montreal | | | | | | | | | | | 62,035 | | | | 4,114,537 | |
Bank of Nova Scotia | | | | | | | | | | | 111,405 | | | | 5,930,443 | |
Bank of Queensland Limited | | | | | | | | | | | 61,778 | | | | 489,829 | |
Bank of the Ozarks Incorporated | | | | | | | | | | | 108,200 | | | | 4,239,276 | |
Bank of the Philippine Islands | | | | | | | | | | | 560,676 | | | | 1,269,478 | |
Bank of the Ryukyus Limited | | | | | | | | | | | 7,500 | | | | 85,754 | |
Bank Pekao SA | | | | | | | | | | | 43,062 | | | | 1,446,106 | |
Bank Zachodni WBK SA | | | | | | | | | | | 11,565 | | | | 949,855 | |
Bankia SA | | | | | | | | | | | 318,040 | | | | 268,197 | |
Bankinter SA | | | | | | | | | | | 39,803 | | | | 291,963 | |
BankUnited Incorporated | | | | | | | | | | | 124,419 | | | | 4,000,071 | |
Banque Cantonale Vaudoise Waadtlaender Kantonalbank | | | | | | | | | | | 244 | | | | 160,260 | |
Barclays Africa Group Limited | | | | | | | | | | | 90,379 | | | | 915,347 | |
Barclays plc | | | | | | | | | | | 1,466,378 | | | | 3,316,800 | |
BDO Unibank Incorporated | | | | | | | | | | | 514,398 | | | | 1,261,846 | |
Bendigo Bank Limited | | | | | | | | | | | 75,871 | | | | 626,089 | |
Berner Kantonalbank AG | | | | | | | | | | | 648 | | | | 124,059 | |
BNK Financial Group Incorporated | | | | | | | | | | | 51,437 | | | | 408,267 | |
BNP Paribas SA | | | | | | | | | | | 98,106 | | | | 4,990,663 | |
BOC Hong Kong Holdings Limited | | | | | | | | | | | 518,000 | | | | 1,812,905 | |
BOK Financial Corporation « | | | | | | | | | | | 27,762 | | | | 1,917,521 | |
Branch Banking & Trust Corporation | | | | | | | | | | | 87,227 | | | | 3,358,240 | |
CaixaBank SA | | | | | | | | | | | 214,811 | | | | 578,181 | |
Canadian Imperial Bank of Commerce | | | | | | | | | | | 38,100 | | | | 3,024,409 | |
Canadian Western Bank « | | | | | | | | | | | 8,239 | | | | 165,421 | |
Canara Bank † | | | | | | | | | | | 13,142 | | | | 55,054 | |
Capitec Bank Holdings Limited | | | | | | | | | | | 15,169 | | | | 601,085 | |
Cathay General Bancorp | | | | | | | | | | | 86,409 | | | | 2,714,971 | |
| | | | | | |
| Portfolio of investments—August 31, 2016 (unaudited) | | Wells Fargo Diversified Stock Portfolio | | | 29 | |
| | | | | | | | | | | | | | | | |
| Security name | | | | | | | | Shares | | | Value | |
| | | | |
| Banks (continued) | | | | | | | | | | | | | | | | |
Chang Hwa Commercial Bank | | | | | | | | | | | 2,034,079 | | | $ | 1,022,472 | |
Chiba Bank Limited | | | | | | | | | | | 125,000 | | | | 740,589 | |
China CITIC Bank H Shares | | | | | | | | | | | 3,722,000 | | | | 2,456,528 | |
China Construction Bank H Shares | | | | | | | | | | | 26,890,990 | | | | 20,105,284 | |
China Development Financial Holding Corporation | | | | | | | | | | | 4,863,338 | | | | 1,229,226 | |
China Merchants Bank Company Limited H Shares | | | | | | | | | | | 1,239,522 | | | | 3,016,697 | |
China Minsheng Banking Corporation Limited H Shares | | | | | | | | | | | 2,085,780 | | | | 2,242,384 | |
Chong Hing Bank Limited | | | | | | | | | | | 5,771 | | | | 11,501 | |
CIMB Group Holdings Bhd | | | | | | | | | | | 781,248 | | | | 924,668 | |
CIT Group Incorporated | | | | | | | | | | | 89,142 | | | | 3,287,557 | |
Citigroup Incorporated | | | | | | | | | | | 324,432 | | | | 15,488,384 | |
Citizens Financial Group Incorporated | | | | | | | | | | | 285,109 | | | | 7,062,150 | |
Comerica Incorporated | | | | | | | | | | | 92,609 | | | | 4,379,480 | |
Commerce Bancshares Incorporated | | | | | | | | | | | 100,053 | | | | 5,070,686 | |
Commercial International Bank | | | | | | | | | | | 194,543 | | | | 1,071,088 | |
Commerzbank AG | | | | | | | | | | | 110,488 | | | | 777,176 | |
Commonwealth Bank of Australia | | | | | | | | | | | 247,558 | | | | 13,360,414 | |
Concordia Financial Group Limited | | | | | | | | | | | 189,500 | | | | 977,308 | |
Credicorp Limited | | | | | | | | | | | 20,258 | | | | 3,174,023 | |
Credit Agricole SA | | | | | | | | | | | 111,138 | | | | 1,052,496 | |
Credito Valtellinese Scarl | | | | | | | | | | | 9,849 | | | | 3,767 | |
CTBC Financial Holding Company Limited | | | | | | | | | | | 4,678,759 | | | | 2,705,763 | |
Cullen Frost Bankers Incorporated | | | | | | | | | | | 65,653 | | | | 4,786,104 | |
CYBG plc † | | | | | | | | | | | 102,609 | | | | 359,360 | |
Dah Sing Banking Group Limited | | | | | | | | | | | 36,901 | | | | 67,832 | |
Dah Sing Financial Holdings Limited | | | | | | | | | | | 32,795 | | | | 221,521 | |
Danske Bank AS | | | | | | | | | | | 76,789 | | | | 2,253,524 | |
DBS Group Holdings Limited | | | | | | | | | | | 288,837 | | | | 3,177,854 | |
DGB Financial Group Incorporated | | | | | | | | | | | 34,107 | | | | 279,586 | |
DNB Nor ASA | | | | | | | | | | | 85,061 | | | | 1,034,074 | |
E.SUN Financial Holding Company Limited | | | | | | | | | | | 2,632,313 | | | | 1,480,808 | |
East West Bancorp Incorporated | | | | | | | | | | | 83,820 | | | | 3,113,075 | |
EnTie Commercial Bank | | | | | | | | | | | 238,977 | | | | 101,298 | |
Erste Bank Der Oesterreichischen Sparkassen AG | | | | | | | | | | | 26,833 | | | | 753,809 | |
Eurobank Ergasias SA † | | | | | | | | | | | 25,114 | | | | 14,987 | |
Far Eastern International Bank | | | | | | | | | | | 649,775 | | | | 194,950 | |
Fifth Third Bancorp | | | | | | | | | | | 412,100 | | | | 8,307,936 | |
First Financial Bankshares Incorporated « | | | | | | | | | | | 77,400 | | | | 2,834,388 | |
First Financial Holding Company Limited | | | | | | | | | | | 2,554,749 | | | | 1,312,378 | |
First Gulf Bank PJSC | | | | | | | | | | | 306,590 | | | | 976,587 | |
First Horizon National Corporation | | | | | | | | | | | 278,720 | | | | 4,286,714 | |
First Republic Bank | | | | | | | | | | | 79,443 | | | | 6,113,933 | |
FNB Corporation PA | | | | | | | | | | | 247,616 | | | | 3,092,724 | |
Fukuoka Financial Group Incorporated | | | | | | | | | | | 126,000 | | | | 533,398 | |
Fulton Financial Corporation | | | | | | | | | | | 203,640 | | | | 2,944,634 | |
Glacier Bancorp Incorporated | | | | | | | | | | | 100,518 | | | | 3,009,509 | |
Grupo Elektra SA de CV | | | | | | | | | | | 16,094 | | | | 227,444 | |
Grupo Financiero Banorte SAB de CV | | | | | | | | | | | 748,800 | | | | 4,035,322 | |
Grupo Financiero Inbursa SAB de CV | | | | | | | | | | | 637,564 | | | | 1,111,952 | |
Grupo Financiero Santander SAB de CV Class B | | | | | | | | | | | 551,179 | | | | 1,053,317 | |
| | | | |
| 30 | | Wells Fargo Diversified Stock Portfolio | | Portfolio of investments—August 31, 2016 (unaudited) |
| | | | | | | | | | | | | | | | |
| Security name | | | | | | | | Shares | | | Value | |
| | | | |
| Banks (continued) | | | | | | | | | | | | | | | | |
Gunma Bank Limited | | | | | | | | | | | 75,000 | | | $ | 353,743 | |
Hana Financial Group Incorporated | | | | | | | | | | | 47,314 | | | | 1,243,319 | |
Hancock Holding Company | | | | | | | | | | | 90,832 | | | | 2,963,848 | |
Hang Seng Bank Limited | | | | | | | | | | | 113,100 | | | | 1,984,249 | |
HDFC Bank Limited | | | | | | | | | | | 245,309 | | | | 4,729,625 | |
HDFC Bank Limited ADR | | | | | | | | | | | 4,473 | | | | 320,490 | |
Hokuhoku Financial Group Incorporated | | | | | | | | | | | 219,000 | | | | 302,682 | |
Hong Leong Bank Bhd | | | | | | | | | | | 113,401 | | | | 365,747 | |
Hong Leong Financial Group Bhd | | | | | | | | | | | 75,101 | | | | 297,774 | |
HSBC Holdings plc | | | | | | | | | | | 1,754,059 | | | | 12,997,756 | |
Hua Nan Financial Holdings Company Limited Class C | | | | | | | | | | | 2,791,716 | | | | 1,438,507 | |
Huishang Bank H Shares | | | | | | | | | | | 240,374 | | | | 113,408 | |
Huntington Bancshares Incorporated | | | | | | | | | | | 584,959 | | | | 5,855,441 | |
IBERIABANK Corporation | | | | | | | | | | | 44,600 | | | | 3,067,142 | |
ICICI Bank Limited | | | | | | | | | | | 727,062 | | | | 2,800,985 | |
ICICI Bank Limited ADR | | | | | | | | | | | 21,140 | | | | 162,144 | |
IDFC Bank Limited | | | | | | | | | | | 243,990 | | | | 204,205 | |
Indusind Bank Limited | | | | | | | | | | | 81,278 | | | | 1,439,629 | |
Industrial & Commercial Bank of China Limited H Shares | | | | | | | | | | | 21,073,442 | | | | 13,392,381 | |
Industrial Bank of Korea | | | | | | | | | | | 44,220 | | | | 465,996 | |
ING Bank Slaski SA | | | | | | | | | | | 7,363 | | | | 284,471 | |
ING Groep NV | | | | | | | | | | | 364,202 | | | | 4,558,116 | |
International Bancshares Corporation | | | | | | | | | | | 73,140 | | | | 2,168,601 | |
Intesa Sanpaolo RSP | | | | | | | | | | | 86,693 | | | | 192,050 | |
Intesa Sanpaolo SpA | | | | | | | | | | | 1,335,380 | | | | 3,172,741 | |
Israel Discount Bank Limited Class A † | | | | | | | | | | | 70,341 | | | | 127,012 | |
Itau CorpBanca | | | | | | | | | | | 35,444,248 | | | | 303,624 | |
Itau Unibanco Holding SA | | | | | | | | | | | 64,447 | | | | 612,897 | |
Itausa Investimentos Itau SA | | | | | | | | | | | 64,037 | | | | 165,387 | |
Japan Post Bank Company Limited | | | | | | | | | | | 61,600 | | | | 723,970 | |
Jimoto Holdings Incorporated | | | | | | | | | | | 34,300 | | | | 49,395 | |
Joyo Bank Limited | | | | | | | | | | | 106,000 | | | | 421,070 | |
JPMorgan Chase & Company | | | | | | | | | | | 406,393 | | | | 27,431,528 | |
Jyske Bank AS | | | | | | | | | | | 7,244 | | | | 347,765 | |
Kansai Urban Banking Corporation | | | | | | | | | | | 7,600 | | | | 73,234 | |
Kasikornbank PCL - Non-voting | | | | | | | | | | | 392,700 | | | | 2,240,564 | |
KB Financial Group Incorporated | | | | | | | | | | | 63,082 | | | | 2,200,798 | |
KBC Groep NV † | | | | | | | | | | | 30,404 | | | | 1,799,824 | |
KeyCorp | | | | | | | | | | | 583,639 | | | | 7,330,506 | |
Kiatnakin Finance | | | | | | | | | | | 6,000 | | | | 8,970 | |
King’s Town Bank Company Limited | | | | | | | | | | | 212,000 | | | | 180,394 | |
Komercni Banka AS | | | | | | | | | | | 26,560 | | | | 898,830 | |
Kotak Mahindra Bank Limited | | | | | | | | | | | 198,124 | | | | 2,387,132 | |
Krung Thai Bank PCL ADR | | | | | | | | | | | 937,725 | | | | 514,705 | |
Kwangju Bank | | | | | | | | | | | 5,204 | | | | 43,732 | |
Kyushu Financial Group Incorporated | | | | | | | | | | | 68,236 | | | | 404,278 | |
Laurentian Bank of Canada | | | | | | | | | | | 1,861 | | | | 69,763 | |
Lloyds Banking Group plc | | | | | | | | | | | 5,487,074 | | | | 4,276,374 | |
Luzerner Kantonalbank AG | | | | | | | | | | | 304 | | | | 124,947 | |
M&T Bank Corporation | | | | | | | | | | | 85,940 | | | | 10,169,280 | |
| | | | | | |
| Portfolio of investments—August 31, 2016 (unaudited) | | Wells Fargo Diversified Stock Portfolio | | | 31 | |
| | | | | | | | | | | | | | | | |
| Security name | | | | | | | | Shares | | | Value | |
| | | | |
| Banks (continued) | | | | | | | | | | | | | | | | |
Malayan Banking Bhd | | | | | | | | | | | 985,488 | | | $ | 1,900,263 | |
Masraf Al Rayan | | | | | | | | | | | 100,153 | | | | 1,045,166 | |
mBank SA † | | | | | | | | | | | 3,102 | | | | 309,140 | |
Mediobanca SpA | | | | | | | | | | | 44,444 | | | | 329,674 | |
Mega Financial Holding Company Limited | | | | | | | | | | | 2,967,916 | | | | 2,020,359 | |
Metro Bank plc † | | | | | | | | | | | 6,336 | | | | 199,433 | |
Metropolitan Bank & Trust Company | | | | | | | | | | | 486,081 | | | | 871,076 | |
Mitsubishi UFJ Financial Group Incorporated | | | | | | | | | | | 2,045,570 | | | | 11,152,622 | |
Miyazaki Bank Limited | | | | | | | | | | | 34,000 | | | | 89,383 | |
Mizrahi Tefahot Bank Limited | | | | | | | | | | | 8,324 | | | | 100,386 | |
Mizuho Financial Group Incorporated | | | | | | | | | | | 3,614,300 | | | | 6,277,386 | |
National Australia Bank Limited | | | | | | | | | | | 383,410 | | | | 7,878,073 | |
National Bank of Abu Dhabi PJSC | | | | | | | | | | | 354,945 | | | | 881,299 | |
National Bank of Canada | | | | | | | | | | | 30,600 | | | | 1,075,457 | |
National Bank of Greece SA † | | | | | | | | | | | 608,097 | | | | 143,122 | |
National Bank of Greece SA ADR † | | | | | | | | | | | 32 | | | | 8 | |
Natixis | | | | | | | | | | | 85,430 | | | | 377,932 | |
Nedbank Group Limited | | | | | | | | | | | 70,250 | | | | 986,807 | |
Nishi-Nippon City Bank Limited | | | | | | | | | | | 117,000 | | | | 243,126 | |
Nordea Bank AB | | | | | | | | | | | 282,459 | | | | 2,761,685 | |
North Pacific Bank Limited | | | | | | | | | | | 46,000 | | | | 155,608 | |
OTP Bank | | | | | | | | | | | 66,278 | | | | 1,731,351 | |
Oversea-Chinese Banking Corporation Limited | | | | | | | | | | | 446,202 | | | | 2,813,223 | |
PacWest Bancorp | | | | | | | | | | | 138,700 | | | | 6,007,097 | |
People’s United Financial Incorporated | | | | | | | | | | | 376,941 | | | | 6,125,291 | |
Piraeus Bank SA † | | | | | | | | | | | 4,331 | | | | 705 | |
PKO Bank Polski SA | | | | | | | | | | | 285,823 | | | | 1,943,101 | |
PNC Financial Services Group Incorporated | | | | | | | | | | | 53,802 | | | | 4,847,560 | |
PrivateBancorp Incorporated | | | | | | | | | | | 103,700 | | | | 4,765,015 | |
PT Bank Central Asia Tbk | | | | | | | | | | | 4,214,500 | | | | 4,781,623 | |
PT Bank Danamon Indonesia Tbk | | | | | | | | | | | 786,234 | | | | 241,827 | |
PT Bank Mandiri Persero Tbk | | | | | | | | | | | 3,037,712 | | | | 2,570,548 | |
PT Bank Negara Indonesia Persero Tbk | | | | | | | | | | | 2,701,500 | | | | 1,196,480 | |
PT Bank Pan Indonesia Tbk † | | | | | | | | | | | 506,500 | | | | 34,556 | |
PT Bank Rakyat Indonesia Tbk | | | | | | | | | | | 3,377,500 | | | | 2,966,293 | |
Public Bank Bhd | | | | | | | | | | | 324,251 | | | | 1,583,077 | |
Punjab National Bank † | | | | | | | | | | | 87,525 | | | | 166,699 | |
Qatar National Bank | | | | | | | | | | | 68,128 | | | | 3,049,656 | |
Raiffeisen Bank International AG † | | | | | | | | | | | 3,869 | | | | 54,982 | |
Regions Financial Corporation | | | | | | | | | | | 682,712 | | | | 6,806,639 | |
Resona Holdings Incorporated | | | | | | | | | | | 325,100 | | | | 1,486,854 | |
RHB Capital Bhd | | | | | | | | | | | 258,175 | | | | 318,302 | |
Royal Bank of Canada | | | | | | | | | | | 139,900 | | | | 8,697,611 | |
Royal Bank of Scotland Group plc † | | | | | | | | | | | 296,857 | | | | 785,482 | |
Sberbank of Russia ADR | | | | | | | | | | | 663,511 | | | | 6,084,396 | |
Sberbank Sponsored ADR | | | | | | | | | | | 137,254 | | | | 1,245,580 | |
Senshu Ikeda Holdings Incorporated | | | | | | | | | | | 45,180 | | | | 204,361 | |
Seven Bank Limited | | | | | | | | | | | 107,600 | | | | 380,627 | |
Shiga Bank | | | | | | | | | | | 39,000 | | | | 187,716 | |
Shimizu Bank Limited | | | | | | | | | | | 1,000 | | | | 25,545 | |
| | | | |
| 32 | | Wells Fargo Diversified Stock Portfolio | | Portfolio of investments—August 31, 2016 (unaudited) |
| | | | | | | | | | | | | | | | |
| Security name | | | | | | | | Shares | | | Value | |
| | | | |
| Banks (continued) | | | | | | | | | | | | | | | | |
Shinhan Financial Group Company Limited | | | | | | | | | | | 75,949 | | | $ | 2,792,744 | |
Shinsei Bank Limited | | | | | | | | | | | 305,000 | | | | 486,396 | |
Shizuoka Bank Limited | | | | | | | | | | | 93,000 | | | | 765,824 | |
Siam Commercial Bank PCL | | | | | | | | | | | 437,100 | | | | 2,020,367 | |
Signature Bank † | | | | | | | | | | | 30,100 | | | | 3,672,501 | |
Sinopac Financial Holdings Company Limited | | | | | | | | | | | 3,212,364 | | | | 939,498 | |
Skandinaviska Enskilda Banken AB Class A | | | | | | | | | | | 159,842 | | | | 1,562,822 | |
Sociedad Matriz Banco de Chile Class B | | | | | | | | | | | 1,087,348 | | | | 331,462 | |
Societe Generale SA | | | | | | | | | | | 75,627 | | | | 2,753,872 | |
St. Galler Kantonalbank Class A | | | | | | | | | | | 210 | | | | 82,950 | |
Standard Bank Group Limited | | | | | | | | | | | 323,326 | | | | 2,928,011 | |
Standard Chartered plc | | | | | | | | | | | 248,820 | | | | 2,097,657 | |
State Bank of India | | | | | | | | | | | 472,910 | | | | 1,783,034 | |
State Bank of India Limited GDR 144A | | | | | | | | | | | 3,576 | | | | 133,027 | |
Sumitomo Mitsui Financial Group Incorporated | | | | | | | | | | | 204,184 | | | | 7,145,897 | |
Sumitomo Mitsui Trust Holdings Incorporated | | | | | | | | | | | 569,000 | | | | 2,036,444 | |
SunTrust Banks Incorporated | | | | | | | | | | | 59,600 | | | | 2,626,572 | |
Suruga Bank Limited | | | | | | | | | | | 33,800 | | | | 803,961 | |
SVB Financial Group † | | | | | | | | | | | 31,746 | | | | 3,525,711 | |
Svenska Handelsbanken AB Class A | | | | | | | | | | | 140,664 | | | | 1,815,677 | |
Swedbank AB Class A | | | | | | | | | | | 92,146 | | | | 2,119,412 | |
Sydbank AS | | | | | | | | | | | 8,747 | | | | 277,150 | |
Synovus Financial Corporation | | | | | | | | | | | 160,879 | | | | 5,321,877 | |
Taishin Financial Holdings Company Limited | | | | | | | | | | | 3,572,995 | | | | 1,351,253 | |
Taiwan Business Bank | | | | | | | | | | | 842,576 | | | | 225,179 | |
Taiwan Cooperative Financial Holdings | | | | | | | | | | | 2,579,128 | | | | 1,133,888 | |
TCF Financial Corporation | | | | | | | | | | | 200,598 | | | | 2,938,761 | |
Texas Capital Bancshares Incorporated † | | | | | | | | | | | 60,500 | | | | 3,177,460 | |
Thanachart Capital PCL | | | | | | | | | | | 15,516 | | | | 17,930 | |
The 77 Bank Limited | | | | | | | | | | | 56,000 | | | | 233,277 | |
The Aichi Bank Limited - Tokai | | | | | | | | | | | 1,900 | | | | 86,585 | |
The Akita Bank Limited - Akita | | | | | | | | | | | 37,000 | | | | 109,071 | |
The Aomori Bank Limited | | | | | | | | | | | 40,000 | | | | 118,301 | |
The Awa Bank Limited | | | | | | | | | | | 34,000 | | | | 213,599 | |
The Bank of Iwate Limited | | | | | | | | | | | 3,600 | | | | 140,743 | |
The Bank of Nagoya Limited | | | | | | | | | | | 35,000 | | | | 117,383 | |
The Bank of Okinawa Limited | | | | | | | | | | | 4,800 | | | | 134,585 | |
The Bank of Saga Limited | | | | | | | | | | | 25,000 | | | | 56,299 | |
The Chiba Kogyo Bank Limited | | | | | | | | | | | 4,700 | | | | 18,443 | |
The Chugoku Bank Limited | | | | | | | | | | | 29,200 | | | | 359,550 | |
The Daisan Bank Limited | | | | | | | | | | | 27,000 | | | | 46,190 | |
The Daishi Bank Limited | | | | | | | | | | | 53,000 | | | | 202,851 | |
The Ehime Bank Limited | | | | | | | | | | | 27,000 | | | | 67,066 | |
The Eighteenth Bank Limited | | | | | | | | | | | 34,000 | | | | 104,170 | |
The Fukui Bank Limited | | | | | | | | | | | 32,000 | | | | 77,630 | |
The Hachijuni Bank Limited | | | | | | | | | | | 81,000 | | | | 428,232 | |
The Hiroshima Bank Limited | | | | | | | | | | | 99,000 | | | | 412,400 | |
The Hokkoku Bank Limited | | | | | | | | | | | 44,000 | | | | 133,108 | |
The Hokuetsu Bank Limited | | | | | | | | | | | 48,000 | | | | 106,703 | |
The Hyakugo Bank Limited | | | | | | | | | | | 37,000 | | | | 135,891 | |
| | | | | | |
| Portfolio of investments—August 31, 2016 (unaudited) | | Wells Fargo Diversified Stock Portfolio | | | 33 | |
| | | | | | | | | | | | | | | | |
| Security name | | | | | | | | Shares | | | Value | |
| | | | |
| Banks (continued) | | | | | | | | | | | | | | | | |
The Hyakujushi Bank Limited | | | | | | | | | | | 45,000 | | | $ | 134,828 | |
The Iyo Bank Limited | | | | | | | | | | | 51,300 | | | | 330,712 | |
The Juroku Bank Limited | | | | | | | | | | | 69,000 | | | | 191,398 | |
The Kanto Tsukuba Bank Limited | | | | | | | | | | | 15,600 | | | | 44,780 | |
The Keiyo Bank Limited | | | | | | | | | | | 41,000 | | | | 166,829 | |
The Kiyo Bank Limited | | | | | | | | | | | 10,800 | | | | 168,266 | |
The Michinoku Bank Limited | | | | | | | | | | | 27,000 | | | | 49,582 | |
The Minato Bank Limited | | | | | | | | | | | 79,000 | | | | 125,221 | |
The Musashino Bank Limited | | | | | | | | | | | 4,900 | | | | 126,449 | |
The Nanto Bank Limited | | | | | | | | | | | 40,000 | | | | 141,111 | |
The Ogaki Kyoritsu Bank Limited | | | | | | | | | | | 52,000 | | | | 177,413 | |
The Oita Bank Limited | | | | | | | | | | | 32,000 | | | | 104,538 | |
The San-in Godo Bank Limited | | | | | | | | | | | 23,200 | | | | 158,531 | |
The Shikoku Bank Limited | | | | | | | | | | | 41,000 | | | | 83,613 | |
The Tochigi Bank Limited | | | | | | | | | | | 22,000 | | | | 88,030 | |
The Toho Bank Limited | | | | | | | | | | | 37,000 | | | | 125,163 | |
The Towa Bank Limited | | | | | | | | | | | 58,000 | | | | 48,770 | |
Tisco Financial Group PCL | | | | | | | | | | | 6,820 | | | | 11,132 | |
TMB Bank PCL | | | | | | | | | | | 5,991,165 | | | | 391,155 | |
Tokyo TY Financial Group Incorporated | | | | | | | | | | | 4,800 | | | | 140,801 | |
Tomony Holdings Incorporated | | | | | | | | | | | 27,500 | | | | 121,466 | |
Toronto-Dominion Bank | | | | | | | | | | | 172,162 | | | | 7,682,568 | |
Trustmark Corporation | | | | | | | | | | | 89,267 | | | | 2,531,612 | |
TT Hellenic Postbank SA †(a) | | | | | | | | | | | 8,178 | | | | 0 | |
Turkiye Garanti Bankasi AS | | | | | | | | | | | 646,636 | | | | 1,668,273 | |
Turkiye Halk Bankasi AS | | | | | | | | | | | 227,219 | | | | 682,245 | |
Turkiye Is Bankasi Class C | | | | | | | | | | | 549,429 | | | | 893,592 | |
Turkiye Vakiflar Bankasi Tao | | | | | | | | | | | 219,660 | | | | 323,089 | |
Umpqua Holdings Corporation | | | | | | | | | | | 264,031 | | | | 4,335,389 | |
UniCredit SpA | | | | | | | | | | | 563,189 | | | | 1,448,651 | |
Unione di Banche SpA | | | | | | | | | | | 81,642 | | | | 219,655 | |
United Bankshares Incorporated « | | | | | | | | | | | 76,993 | | | | 3,033,524 | |
United Overseas Bank Limited | | | | | | | | | | | 213,421 | | | | 2,821,177 | |
US Bancorp | | | | | | | | | | | 177,478 | | | | 7,835,654 | |
Valiant Holding AG | | | | | | | | | | | 1,769 | | | | 166,999 | |
Valley National Bancorp | | | | | | | | | | | 297,149 | | | | 2,867,488 | |
VTB Bank OJSC | | | | | | | | | | | 780,769 | | | | 1,596,673 | |
Webster Financial Corporation | | | | | | | | | | | 109,641 | | | | 4,235,432 | |
Wells Fargo & Company (l) | | | | | | | | | | | 513,184 | | | | 26,069,747 | |
Western Alliance Bancorp † | | | | | | | | | | | 119,900 | | | | 4,582,578 | |
Westpac Banking Corporation | | | | | | | | | | | 483,004 | | | | 10,694,033 | |
Woori Bank | | | | | | | | | | | 46,055 | | | | 437,832 | |
Yamagata Bank Limited | | | | | | | | | | | 23,000 | | | | 96,032 | |
Yamaguchi Financial Group | | | | | | | | | | | 36,000 | | | | 379,955 | |
Yamanashi Chou Bank Limited | | | | | | | | | | | 25,000 | | | | 104,866 | |
Yapi Ve Kredi Bankasi AS †« | | | | | | | | | | | 184,289 | | | | 226,821 | |
Yes Bank Limited | | | | | | | | | | | 56,788 | | | | 1,158,401 | |
Zions Bancorporation | | | | | | | | | | | 106,200 | | | | 3,248,658 | |
| | | | |
| | | | | | | | | | | | | | | 673,944,472 | |
| | | | | | | | | | | | | | | | |
| | | | |
| 34 | | Wells Fargo Diversified Stock Portfolio | | Portfolio of investments—August 31, 2016 (unaudited) |
| | | | | | | | | | | | | | | | |
| Security name | | | | | | | | Shares | | | Value | |
| | | | |
| Capital Markets: 1.94% | | | | | | | | | | | | | | | | |
3i Group plc | | | | | | | | | | | 93,011 | | | $ | 750,534 | |
Aberdeen Asset Management plc | | | | | | | | | | | 107,379 | | | | 452,061 | |
Affiliated Managers Group Incorporated † | | | | | | | | | | | 30,186 | | | | 4,287,921 | |
Apollo Investment Corporation | | | | | | | | | | | 1 | | | | 6 | |
Ashmore Group plc | | | | | | | | | | | 39,880 | | | | 184,232 | |
ASX Limited | | | | | | | | | | | 5,334 | | | | 205,049 | |
Azimut Holding SpA | | | | | | | | | | | 9,036 | | | | 138,690 | |
Bank of New York Mellon Corporation | | | | | | | | | | | 116,156 | | | | 4,840,221 | |
BlackRock Incorporated | | | | | | | | | | | 22,774 | | | | 8,490,375 | |
BM&F Bovespa SA | | | | | | | | | | | 465,494 | | | | 2,581,753 | |
Bolsas y Mercados Espanoles « | | | | | | | | | | | 6,793 | | | | 212,883 | |
Brait SE « | | | | | | | | | | | 75,105 | | | | 595,139 | |
Brewin Dolphin Holding plc | | | | | | | | | | | 23,817 | | | | 82,911 | |
Brookfield Asset Management Incorporated Class A « | | | | | | | | | | | 79,275 | | | | 2,674,942 | |
Canaccord Financial Incorporated | | | | | | | | | | | 5,064 | | | | 17,145 | |
Capital Securities Corporation | | | | | | | | | | | 362,713 | | | | 91,906 | |
CBOE Holdings Incorporated | | | | | | | | | | | 44,900 | | | | 3,084,181 | |
Charles Schwab Corporation | | | | | | | | | | | 219,100 | | | | 6,892,886 | |
China Cinda Asset Management Company Limited H Shares | | | | | | | | | | | 3,330,000 | | | | 1,128,952 | |
China Galaxy Securities Company Limited H Shares | | | | | | | | | | | 1,105,000 | | | | 1,035,552 | |
China Huarong Asset Management Company Limited † | | | | | | | | | | | 2,999,000 | | | | 1,186,835 | |
CI Financial Corporation | | | | | | | | | | | 21,303 | | | | 416,996 | |
CITIC Securities Company Limited H Shares | | | | | | | | | | | 685,500 | | | | 1,532,258 | |
Close Brothers Group plc | | | | | | | | | | | 13,950 | | | | 249,314 | |
Credicorp Capital Peru SAA (a) | | | | | | | | | | | 112 | | | | 76 | |
Credit Suisse Group AG | | | | | | | | | | | 153,342 | | | | 1,997,164 | |
Daewoo Securities Company Limited | | | | | | | | | | | 41,552 | | | | 296,268 | |
Daiwa Securities Group Incorporated | | | | | | | | | | | 255,000 | | | | 1,489,605 | |
Deutsche Bank AG † | | | | | | | | | | | 127,306 | | | | 1,875,866 | |
Dundee Corporation Class A † | | | | | | | | | | | 3,983 | | | | 17,889 | |
E*TRADE Financial Corporation † | | | | | | | | | | | 155,800 | | | | 4,110,004 | |
Egyptian Financial Group-Hermes Holding Company † | | | | | | | | | | | 57,952 | | | | 81,642 | |
Euronext NV 144A | | | | | | | | | | | 10,368 | | | | 437,561 | |
FactSet Research Systems Incorporated | | | | | | | | | | | 22,841 | | | | 4,066,383 | |
Federated Investors Incorporated Class B | | | | | | | | | | | 112,714 | | | | 3,640,662 | |
Financial Engines Incorporated « | | | | | | | | | | | 75,323 | | | | 2,408,076 | |
Financiere de Tubize | | | | | | | | | | | 2,881 | | | | 197,509 | |
GAM Holding AG | | | | | | | | | | | 21,185 | | | | 205,701 | |
GIMV NV | | | | | | | | | | | 1,389 | | | | 72,680 | |
Grupo BTG Pactual | | | | | | | | | | | 71,900 | | | | 381,855 | |
Guoco Group Limited | | | | | | | | | | | 14,000 | | | | 157,008 | |
Haitong Securities Company Limited H Shares | | | | | | | | | | | 1,127,600 | | | | 1,962,295 | |
Hargreaves Lansdown plc | | | | | | | | | | | 24,237 | | | | 420,750 | |
Henderson Group plc | | | | | | | | | | | 106,112 | | | | 332,189 | |
Hong Kong Exchanges & Clearing Limited | | | | | | | | | | | 164,000 | | | | 4,010,390 | |
Hyundai Securities Company Limited | | | | | | | | | | | 27,692 | | | | 181,550 | |
ICAP plc | | | | | | | | | | | 54,134 | | | | 340,004 | |
Ichiyoshi Securities Company Limited | | | | | | | | | | | 7,400 | | | | 58,362 | |
IG Group Holdings plc | | | | | | | | | | | 37,974 | | | | 474,221 | |
IGM Financial Incorporated | | | | | | | | | | | 10,400 | | | | 294,220 | |
| | | | | | |
| Portfolio of investments—August 31, 2016 (unaudited) | | Wells Fargo Diversified Stock Portfolio | | | 35 | |
| | | | | | | | | | | | | | | | |
| Security name | | | | | | | | Shares | | | Value | |
| | | | |
| Capital Markets (continued) | | | | | | | | | | | | | | | | |
Intercontinental Exchange Incorporated | | | | | | | | | | | 21,626 | | | $ | 6,098,965 | |
Intermediate Capital Group | | | | | | | | | | | 31,754 | | | | 248,102 | |
Investec plc | | | | | | | | | | | 47,156 | | | | 279,148 | |
IOOF Holdings Limited « | | | | | | | | | | | 40,299 | | | | 269,855 | |
IP Group plc † | | | | | | | | | | | 53,049 | | | | 132,356 | |
JAFCO Company Limited | | | | | | | | | | | 5,300 | | | | 154,444 | |
Janus Capital Group Incorporated | | | | | | | | | | | 170,296 | | | | 2,532,302 | |
Japan Exchange Group Incorporated | | | | | | | | | | | 82,200 | | | | 1,283,866 | |
Julius Baer Group Limited | | | | | | | | | | | 19,658 | | | | 824,055 | |
Jupiter Fund Management plc | | | | | | | | | | | 46,400 | | | | 255,602 | |
Kabu.com Securities Company Limited | | | | | | | | | | | 18,800 | | | | 61,416 | |
Kingston Financial Group Limited « | | | | | | | | | | | 512,000 | | | | 209,221 | |
Kiwoom Securities Company | | | | | | | | | | | 1,800 | | | | 118,332 | |
Korea Investment Holdings Company Limited | | | | | | | | | | | 9,034 | | | | 324,900 | |
Kyokuto Securities Company Limited | | | | | | | | | | | 4,800 | | | | 60,635 | |
Lazard Limited | | | | | | | | | | | 156,912 | | | | 5,810,451 | |
Legg Mason Incorporated | | | | | | | | | | | 126,400 | | | | 4,372,176 | |
London Stock Exchange Group plc | | | | | | | | | | | 29,389 | | | | 1,063,214 | |
LPL Financial Holdings Incorporated « | | | | | | | | | | | 108,675 | | | | 3,230,908 | |
Macquarie Group Limited | | | | | | | | | | | 50,620 | | | | 3,070,108 | |
Man Group plc | | | | | | | | | | | 173,995 | | | | 248,359 | |
MarketAxess Holdings Incorporated | | | | | | | | | | | 49,700 | | | | 8,376,438 | |
Marusan Securities Company Limited | | | | | | | | | | | 8,000 | | | | 65,723 | |
Matsui Securities Company Limited | | | | | | | | | | | 17,400 | | | | 155,055 | |
Mercantile Investment Company Limited † | | | | | | | | | | | 5,857 | | | | 682 | |
Meritz Securities Company Limited | | | | | | | | | | | 46,660 | | | | 141,445 | |
Mirae Asset Securities Company Limited | | | | | | | | | | | 14,204 | | | | 300,004 | |
Monex Beans Holdings Incorporated | | | | | | | | | | | 39,100 | | | | 94,098 | |
Moody’s Corporation | | | | | | | | | | | 96,896 | | | | 10,531,626 | |
NH Investment & Securities Company Class C | | | | | | | | | | | 32,427 | | | | 293,733 | |
Nihon M&A Center Incorporated | | | | | | | | | | | 4,700 | | | | 258,474 | |
Nomura Holdings Incorporated | | | | | | | | | | | 518,800 | | | | 2,443,447 | |
Northern Trust Corporation | | | | | | | | | | | 115,200 | | | | 8,131,968 | |
NorthStar Asset Management Group Incorporated | | | | | | | | | | | 221,138 | | | | 2,748,745 | |
Okasan Holdings Incorporated | | | | | | | | | | | 33,000 | | | | 167,767 | |
Partners Group Holding AG | | | | | | | | | | | 1,488 | | | | 682,312 | |
Perpetual Trustees Australia Limited | | | | | | | | | | | 7,563 | | | | 276,696 | |
Pioneers Holding † | | | | | | | | | | | 13,767 | | | | 14,883 | |
Platinum Asset Management Limited | | | | | | | | | | | 43,875 | | | | 177,402 | |
Rathbone Brothers | | | | | | | | | | | 6,015 | | | | 145,413 | |
Ratos AB Class B | | | | | | | | | | | 21,869 | | | | 103,257 | |
Raymond James Financial Incorporated | | | | | | | | | | | 70,707 | | | | 4,113,026 | |
Reinet Investments SCA | | | | | | | | | | | 1,457 | | | | 30,294 | |
Samsung Securities Company Limited | | | | | | | | | | | 13,029 | | | | 409,566 | |
SBI Holdings Incorporated | | | | | | | | | | | 33,816 | | | | 401,354 | |
Schroders plc | | | | | | | | | | | 11,497 | | | | 420,308 | |
Schroders plc - Non-Voting | | | | | | | | | | | 4,395 | | | | 120,043 | |
Singapore Exchange Limited | | | | | | | | | | | 152,000 | | | | 843,422 | |
State Street Corporation | | | | | | | | | | | 41,600 | | | | 2,921,984 | |
Stifel Financial Corporation † | | | | | | | | | | | 84,970 | | | | 3,343,570 | |
| | | | |
| 36 | | Wells Fargo Diversified Stock Portfolio | | Portfolio of investments—August 31, 2016 (unaudited) |
| | | | | | | | | | | | | | | | |
| Security name | | | | | | | | Shares | | | Value | |
| | | | |
| Capital Markets (continued) | | | | | | | | | | | | | | | | |
T. Rowe Price Group Incorporated | | | | | | | | | | | 47,900 | | | $ | 3,330,966 | |
The NASDAQ OMX Group Incorporated | | | | | | | | | | | 60,900 | | | | 4,336,689 | |
Thomson Corporation | | | | | | | | | | | 34,752 | | | | 1,439,211 | |
TMX Group Limited | | | | | | | | | | | 2,056 | | | | 89,207 | |
Tokai Tokyo Securities Company Limited | | | | | | | | | | | 40,900 | | | | 194,094 | |
Tullett Prebon plc | | | | | | | | | | | 11,401 | | | | 57,115 | |
UBS Group AG | | | | | | | | | | | 326,047 | | | | 4,713,933 | |
UOB-Kay Hian Holdings Limited | | | | | | | | | | | 54,838 | | | | 52,526 | |
Value Partners Group Limited | | | | | | | | | | | 67,000 | | | | 61,753 | |
Vontobel Holdings AG | | | | | | | | | | | 3,142 | | | | 151,901 | |
Waterland Financial Holdings | | | | | | | | | | | 719,704 | | | | 181,001 | |
WisdomTree Investments Incorporated « | | | | | | | | | | | 161,257 | | | | 1,693,199 | |
Yuanta Financial Holding Company Limited | | | | | | | | | | | 3,411,330 | | | | 1,209,482 | |
Yuanta Securities Korea Company Limited † | | | | | | | | | | | 7,124 | | | | 21,276 | |
| | | | |
| | | | | | | | | | | | | | | 166,536,175 | |
| | | | | | | | | | | | | | | | |
| | | | |
| Consumer Finance: 0.33% | | | | | | | | | | | | | | | | |
Acom Company Limited † | | | | | | | | | | | 65,700 | | | | 314,324 | |
Aeon Financial Service Company Limited | | | | | | | | | | | 16,900 | | | | 311,163 | |
Aiful Corporation † | | | | | | | | | | | 54,100 | | | | 173,597 | |
Allied Properties (Hong Kong) Limited | | | | | | | | | | | 297,208 | | | | 61,682 | |
Bajaj Finance Limited | | | | | | | | | | | 4,363 | | | | 717,357 | |
Capital One Financial Corporation | | | | | | | | | | | 59,000 | | | | 4,224,400 | |
Cembra Money Bank AG | | | | | | | | | | | 2,650 | | | | 191,970 | |
Credit Saison Company Limited | | | | | | | | | | | 25,526 | | | | 439,393 | |
Discover Financial Services | | | | | | | | | | | 43,026 | | | | 2,581,560 | |
Hitachi Capital Corporation | | | | | | | | | | | 8,400 | | | | 174,714 | |
Hong Leong Singapore Finance Limited | | | | | | | | | | | 46,000 | | | | 75,628 | |
International Personal Finance plc | | | | | | | | | | | 23,636 | | | | 84,174 | |
J Trust Company Limited | | | | | | | | | | | 11,400 | | | | 86,493 | |
Jaccs Company Limited | | | | | | | | | | | 22,000 | | | | 83,352 | |
LendingClub Corporation †« | | | | | | | | | | | 298,848 | | | | 1,616,768 | |
Mahindra & Mahindra Financial Services Limited | | | | | | | | | | | 51,709 | | | | 275,068 | |
Navient Corporation | | | | | | | | | | | 400,556 | | | | 5,759,995 | |
Orient Corporation † | | | | | | | | | | | 65,100 | | | | 129,615 | |
PRA Group Incorporated † | | | | | | | | | | | 65,964 | | | | 2,109,529 | |
Provident Financial plc | | | | | | | | | | | 12,082 | | | | 476,916 | |
Samsung Card Company Limited | | | | | | | | | | | 9,337 | | | | 370,549 | |
Santander Consumer USA Holdings Incorporated † | | | | | | | | | | | 62,501 | | | | 786,263 | |
Shriram Transport Finance Company Limited | | | | | | | | | | | 46,998 | | | | 868,133 | |
SLM Corporation † | | | | | | | | | | | 510,000 | | | | 3,781,650 | |
Sundaram Finance Limited | | | | | | | | | | | 7,985 | | | | 173,453 | |
Synchrony Financial | | | | | | | | | | | 87,039 | | | | 2,422,295 | |
| | | | |
| | | | | | | | | | | | | | | 28,290,041 | |
| | | | | | | | | | | | | | | | |
| | | | |
| Diversified Financial Services: 0.40% | | | | | | | | | | | | | | | | |
Ackermans & Van Haaren NV | | | | | | | | | | | 2,400 | | | | 286,314 | |
AMP Limited | | | | | | | | | | | 427,009 | | | | 1,688,032 | |
Ayala Corporation | | | | | | | | | | | 69,362 | | | | 1,302,538 | |
Bajaj Auto Limited | | | | | | | | | | | 5,564 | | | | 150,233 | |
| | | | | | |
| Portfolio of investments—August 31, 2016 (unaudited) | | Wells Fargo Diversified Stock Portfolio | | | 37 | |
| | | | | | | | | | | | | | | | |
| Security name | | | | | | | | Shares | | | Value | |
| | | | |
| Diversified Financial Services (continued) | | | | | | | | | | | | | | | | |
Banca Mediolanum SpA | | | | | | | | | | | 18,176 | | | $ | 126,107 | |
Bursa Malaysia Bhd | | | | | | | | | | | 59,100 | | | | 126,783 | |
Century Leasing System Incorporated | | | | | | | | | | | 8,000 | | | | 300,391 | |
Chailease Holding Company Limited | | | | | | | | | | | 274,560 | | | | 474,177 | |
Challenger Financial Services Group Limited | | | | | | | | | | | 81,434 | | | | 562,444 | |
Corporation Financiera Alba | | | | | | | | | | | 1,616 | | | | 66,064 | |
D.Carnegie & Company AB † | | | | | | | | | | | 1 | | | | 13 | |
Deutsche Boerse AG | | | | | | | | | | | 18,044 | | | | 1,541,742 | |
Element Financial Corporation | | | | | | | | | | | 24,304 | | | | 252,974 | |
Eurazeo | | | | | | | | | | | 3,850 | | | | 233,577 | |
Exor SpA | | | | | | | | | | | 5,847 | | | | 240,337 | |
First Pacific Company Limited | | | | | | | | | | | 479,650 | | | | 359,233 | |
FirstRand Limited | | | | | | | | | | | 996,648 | | | | 2,987,504 | |
FNFV Group | | | | | | | | | | | 91,610 | | | | 1,180,853 | |
Fubon Financial Holding Company Limited | | | | | | | | | | | 1,961,579 | | | | 2,775,717 | |
Fuyo General Lease Company Limited | | | | | | | | | | | 4,100 | | | | 192,983 | |
Goldin Financial Holdings Limited †« | | | | | | | | | | | 440,000 | | | | 386,823 | |
Groupe Bruxelles Lambert SA | | | | | | | | | | | 7,755 | | | | 680,520 | |
GT Capital Holdings Incorporated | | | | | | | | | | | 19,520 | | | | 643,056 | |
Haci Omer Sabanci Holding AS | | | | | | | | | | | 362,072 | | | | 1,117,759 | |
Hankook Tire Worldwide Company Limited | | | | | | | | | | | 3,596 | | | | 69,017 | |
IBJ Leasing Company Limited | | | | | | | | | | | 6,500 | | | | 132,243 | |
Industrivarden AB Class A | | | | | | | | | | | 18,200 | | | | 353,342 | |
Industrivarden AB Class C | | | | | | | | | | | 13,675 | | | | 249,198 | |
Investor AB Class A | | | | | | | | | | | 17,400 | | | | 607,328 | |
Investor AB Class B | | | | | | | | | | | 40,618 | | | | 1,432,909 | |
Japan Securities Finance Company Limited | | | | | | | | | | | 17,700 | | | | 80,233 | |
Kinnevik AB Class B | | | | | | | | | | | 21,989 | | | | 541,464 | |
Legend Holdings Corporation H Shares | | | | | | | | | | | 153,800 | | | | 372,726 | |
Lundbergforetagen AB Class B | | | | | | | | | | | 5,095 | | | | 311,569 | |
Metro Pacific Investments Corporation | | | | | | | | | | | 2,050,000 | | | | 304,453 | |
Mitsubishi UFJ Lease & Finance Company Limited | | | | | | | | | | | 85,100 | | | | 398,913 | |
Onex Corporation | | | | | | | | | | | 8,400 | | | | 513,006 | |
ORIX Corporation | | | | | | | | | | | 191,200 | | | | 2,748,852 | |
Pargesa Holding SA | | | | | | | | | | | 2,020 | | | | 139,247 | |
Power Finance Corporation Limited | | | | | | | | | | | 84,672 | | | | 156,397 | |
Power Finance Corporation Limited-Bonus Shares (a) | | | | | | | | | | | 84,672 | | | | 156,397 | |
PSG Group Limited | | | | | | | | | | | 28,452 | | | | 363,710 | |
Remgro Limited | | | | | | | | | | | 120,787 | | | | 2,067,970 | |
Ricoh Leasing Company Limited | | | | | | | | | | | 2,300 | | | | 59,842 | |
RMB Holdings Limited | | | | | | | | | | | 252,615 | | | | 1,008,604 | |
Rural Electrification Corporation Limited | | | | | | | | | | | 147,918 | | | | 526,448 | |
SNS REAAL NV †«(a) | | | | | | | | | | | 4,259 | | | | 0 | |
Sofina SA | | | | | | | | | | | 2,215 | | | | 309,334 | |
Voya Financial Incorporated | | | | | | | | | | | 106,191 | | | | 3,105,025 | |
Wendel | | | | | | | | | | | 3,495 | | | | 397,452 | |
Zenkoku Hosho Company Limited | | | | | | | | | | | 7,700 | | | | 302,523 | |
| | | | |
| | | | | | | | | | | | | | | 34,384,376 | |
| | | | | | | | | | | | | | | | |
| | | | |
| 38 | | Wells Fargo Diversified Stock Portfolio | | Portfolio of investments—August 31, 2016 (unaudited) |
| | | | | | | | | | | | | | | | |
| Security name | | | | | | | | Shares | | | Value | |
| | | | |
| Insurance: 4.02% | | | | | | | | | | | | | | | | |
Admiral Group plc | | | | | | | | | | | 19,943 | | | $ | 536,857 | |
Aegon NV | | | | | | | | | | | 135,914 | | | | 556,998 | |
AFLAC Incorporated | | | | | | | | | | | 44,000 | | | | 3,263,920 | |
Ageas NV | | | | | | | | | | | 24,124 | | | | 833,375 | |
AIA Group Limited | | | | | | | | | | | 1,739,600 | | | | 10,999,269 | |
Alleghany Corporation † | | | | | | | | | | | 9,100 | | | | 4,879,420 | |
Allianz AG | | | | | | | | | | | 42,233 | | | | 6,291,381 | |
Allianz AG ADR | | | | | | | | | | | 5 | | | | 74 | |
Allied World Assurance Company | | | | | | | | | | | 107,834 | | | | 4,373,747 | |
American Financial Group Incorporated | | | | | | | | | | | 36,748 | | | | 2,761,612 | |
American International Group Incorporated | | | | | | | | | | | 122,045 | | | | 7,301,952 | |
AmTrust Financial Services Incorporated | | | | | | | | | | | 92,600 | | | | 2,452,974 | |
Arch Capital Group Limited † | | | | | | | | | | | 68,166 | | | | 5,517,356 | |
Arthur J. Gallagher & Company | | | | | | | | | | | 98,793 | | | | 4,881,362 | |
Aspen Insurance Holdings Limited | | | | | | | | | | | 72,024 | | | | 3,310,223 | |
Assicurazioni Generali SpA | | | | | | | | | | | 129,712 | | | | 1,649,435 | |
Assurant Incorporated | | | | | | | | | | | 31,999 | | | | 2,865,510 | |
Assured Guaranty Limited | | | | | | | | | | | 161,284 | | | | 4,478,857 | |
Aviva plc | | | | | | | | | | | 368,601 | | | | 2,073,577 | |
AXA SA | | | | | | | | | | | 176,076 | | | | 3,696,324 | |
Axis Capital Holdings Limited | | | | | | | | | | | 51,222 | | | | 2,912,995 | |
Bajaj Finserv Limited | | | | | | | | | | | 7,957 | | | | 352,558 | |
Baloise Holding AG | | | | | | | | | | | 4,595 | | | | 546,607 | |
BB Seguridade Participacoes SA | | | | | | | | | | | 221,952 | | | | 2,003,562 | |
Beazley plc | | | | | | | | | | | 46,327 | | | | 237,010 | |
Brown & Brown Incorporated | | | | | | | | | | | 140,455 | | | | 5,262,849 | |
Cathay Financial Holding Company Limited | | | | | | | | | | | 2,272,719 | | | | 2,872,190 | |
China Insurance International Holdings Company Limited † | | | | | | | | | | | 415,000 | | | | 832,402 | |
China Life Insurance Company - Taiwan Exchange | | | | | | | | | | | 1,269,600 | | | | 1,124,337 | |
China Life Insurance Company H Shares | | | | | | | | | | | 2,009,000 | | | | 4,801,369 | |
China Pacific Insurance Group Company Limited H Shares | | | | | | | | | | | 836,200 | | | | 2,942,715 | |
Chubb Limited | | | | | | | | | | | 50,631 | | | | 6,426,593 | |
Cincinnati Financial Corporation | | | | | | | | | | | 82,834 | | | | 6,387,330 | |
CNO Financial Group Incorporated | | | | | | | | | | | 214,300 | | | | 3,482,375 | |
CNP Assurances | | | | | | | | | | | 18,792 | | | | 302,475 | |
Dai-Ichi Mutual Life Insurance Company Limited | | | | | | | | | | | 173,000 | | | | 2,406,935 | |
Delta Lloyd NV | | | | | | | | | | | 29,752 | | | | 120,568 | |
Direct Line Insurance Group plc | | | | | | | | | | | 130,127 | | | | 630,533 | |
Discovery Holdings Limited | | | | | | | | | | | 134,499 | | | | 1,096,338 | |
Dongbu Insurance Company Limited | | | | | | | | | | | 5,940 | | | | 359,596 | |
E-L Financial Corporation Limited | | | | | | | | | | | 200 | | | | 103,248 | |
Endurance Specialty Holdings Limited | | | | | | | | | | | 74,878 | | | | 4,930,716 | |
Erie Indemnity Company Class A | | | | | | | | | | | 30,700 | | | | 3,132,321 | |
Euler Hermes SA | | | | | | | | | | | 1,281 | | | | 105,867 | |
Everest Reinsurance Group Limited | | | | | | | | | | | 22,343 | | | | 4,320,689 | |
Fairfax Financial Holdings Limited | | | | | | | | | | | 1,900 | | | | 1,075,353 | |
First American Financial Corporation | | | | | | | | | | | 132,679 | | | | 5,717,138 | |
FNF Group | | | | | | | | | | | 153,266 | | | | 5,776,596 | |
Genworth Financial Incorporated Class A † | | | | | | | | | | | 657,534 | | | | 3,110,136 | |
Gjensidige Forsikring ASA | | | | | | | | | | | 20,511 | | | | 352,240 | |
| | | | | | |
| Portfolio of investments—August 31, 2016 (unaudited) | | Wells Fargo Diversified Stock Portfolio | | | 39 | |
| | | | | | | | | | | | | | | | |
| Security name | | | | | | | | Shares | | | Value | |
| | | | |
| Insurance (continued) | | | | | | | | | | | | | | | | |
Great Eastern Holdings Limited | | | | | | | | | | | 10,000 | | | $ | 150,464 | |
Great-West Lifeco Incorporated « | | | | | | | | | | | 23,800 | | | | 568,412 | |
Grupo Catalana Occidente SA | | | | | | | | | | | 4,581 | | | | 129,944 | |
Hannover Rueck SE | | | | | | | | | | | 5,268 | | | | 538,259 | |
Hanwha Life Insurance Company Limited | | | | | | | | | | | 51,670 | | | | 262,752 | |
Helvetia Holding AG | | | | | | | | | | | 513 | | | | 256,487 | |
Hiscox Limited | | | | | | | | | | | 26,391 | | | | 361,802 | |
Hyundai Marine & Fire Insurance Company Limited | | | | | | | | | | | 14,670 | | | | 444,705 | |
Industrial Alliance Insurance & Financial Services Incorporated | | | | | | | | | | | 9,339 | | | | 332,854 | |
Insurance Australia Group Limited | | | | | | | | | | | 382,174 | | | | 1,596,960 | |
Intact Financial Corporation | | | | | | | | | | | 12,815 | | | | 930,099 | |
Japan Post Holdings Company Limited | | | | | | | | | | | 72,185 | | | | 945,350 | |
Japan Post Insurance Company Limited | | | | | | | | | | | 10,000 | | | | 211,279 | |
Jardine Lloyd Thompson Group plc | | | | | | | | | | | 11,879 | | | | 153,259 | |
KB Insurance Company Limited | | | | | | | | | | | 12,020 | | | | 290,528 | |
Kemper Corporation | | | | | | | | | | | 63,725 | | | | 2,386,501 | |
Korea Reinsurance Company | | | | | | | | | | | 11,222 | | | | 120,272 | |
Lancashire Holdings Limited | | | | | | | | | | | 19,049 | | | | 157,839 | |
Legal & General Group plc | | | | | | | | | | | 564,612 | | | | 1,559,206 | |
Liberty Holdings Limited | | | | | | | | | | | 27,424 | | | | 210,353 | |
Lincoln National Corporation | | | | | | | | | | | 133,453 | | | | 6,409,748 | |
Loews Corporation | | | | | | | | | | | 149,900 | | | | 6,274,814 | |
Manulife Financial Corporation | | | | | | | | | | | 175,200 | | | | 2,390,063 | |
Mapfre SA | | | | | | | | | | | 59,378 | | | | 160,483 | |
Markel Corporation † | | | | | | | | | | | 7,899 | | | | 7,354,838 | |
Medibank Private Limited | | | | | | | | | | | 441,394 | | | | 892,353 | |
Mercury General Corporation | | | | | | | | | | | 48,122 | | | | 2,613,025 | |
Meritz Fire & Marine Insurance Company Limited | | | | | | | | | | | 13,130 | | | | 183,113 | |
MetLife Incorporated | | | | | | | | | | | 118,945 | | | | 5,162,213 | |
MMI Holdings Limited | | | | | | | | | | | 225,444 | | | | 345,940 | |
MPHB Capital Bhd † | | | | | | | | | | | 85 | | | | 29 | |
MS&AD Insurance Group Holdings Incorporated | | | | | | | | | | | 75,900 | | | | 2,165,899 | |
Muenchener Rueckversicherungs Gesellschaft AG | | | | | | | | | | | 13,431 | | | | 2,427,770 | |
New China Life Insurance Company Limited H Shares | | | | | | | | | | | 243,100 | | | | 988,689 | |
NIB Holdings Limited | | | | | | | | | | | 69,823 | | | | 234,041 | |
NN Group NV | | | | | | | | | | | 15,472 | | | | 460,364 | |
Old Mutual plc | | | | | | | | | | | 447,204 | | | | 1,139,844 | |
Old Republic International Corporation | | | | | | | | | | | 295,685 | | | | 5,686,023 | |
People’s Insurance Company Group of China Limited H Shares | | | | | | | | | | | 2,502,000 | | | | 1,006,276 | |
Phoenix Group Holdings | | | | | | | | | | | 18,917 | | | | 215,867 | |
PICC Property & Casualty Company Limited H Shares | | | | | | | | | | | 1,448,435 | | | | 2,393,660 | |
Ping An Insurance (Group) Company of China Limited H Shares | | | | | | | | | | | 1,381,500 | | | | 7,150,096 | |
Poste Italiane SpA | | | | | | | | | | | 42,438 | | | | 295,859 | |
Power Corporation of Canada | | | | | | | | | | | 32,500 | | | | 686,976 | |
Power Financial Corporation | | | | | | | | | | | 24,500 | | | | 564,393 | |
Powszechny Zaklad Ubezpieczen SA | | | | | | | | | | | 182,060 | | | | 1,288,001 | |
Primerica Incorporated « | | | | | | | | | | | 55,464 | | | | 3,157,566 | |
Principal Financial Group Incorporated | | | | | | | | | | | 145,293 | | | | 7,129,528 | |
ProAssurance Corporation | | | | | | | | | | | 63,098 | | | | 3,471,652 | |
Prudential Financial Incorporated | | | | | | | | | | | 47,162 | | | | 3,743,720 | |
| | | | |
| 40 | | Wells Fargo Diversified Stock Portfolio | | Portfolio of investments—August 31, 2016 (unaudited) |
| | | | | | | | | | | | | | | | |
| Security name | | | | | | | | Shares | | | Value | |
| | | | |
| Insurance (continued) | | | | | | | | | | | | | | | | |
Prudential plc | | | | | | | | | | | 237,335 | | | $ | 4,249,434 | |
QBE Insurance Group Limited | | | | | | | | | | | 216,170 | | | | 1,611,629 | |
Rand Merchant Investment Holdings Limited | | | | | | | | | | | 276,245 | | | | 785,406 | |
Reinsurance Group of America Incorporated | | | | | | | | | | | 33,339 | | | | 3,577,941 | |
RenaissanceRe Holdings Limited | | | | | | | | | | | 52,285 | | | | 6,258,515 | |
RLI Corporation | | | | | | | | | | | 48,870 | | | | 3,468,793 | |
RSA Insurance Group plc | | | | | | | | | | | 97,743 | | | | 636,493 | |
Saga plc | | | | | | | | | | | 57,412 | | | | 166,010 | |
Sampo Oyj Class A | | | | | | | | | | | 45,762 | | | | 1,964,731 | |
Samsung Fire & Marine Insurance Company Limited | | | | | | | | | | | 5,879 | | | | 1,423,614 | |
Samsung Life Insurance Company | | | | | | | | | | | 15,277 | | | | 1,411,239 | |
Sanlam Limited | | | | | | | | | | | 488,659 | | | | 2,076,684 | |
Santam Limited | | | | | | | | | | | 1 | | | | 15 | |
SCOR SE | | | | | | | | | | | 17,098 | | | | 503,023 | |
Shin Kong Financial Holding Company Limited | | | | | | | | | | | 3,485,718 | | | | 764,583 | |
Societa Cattolica di Assicurazione Societa Cooperativa | | | | | | | | | | | 2,135 | | | | 12,348 | |
Sompo Japan Nipponkoa Holdings Incorporated | | | | | | | | | | | 60,000 | | | | 1,922,969 | |
Sony Financial Holdings Incorporated | | | | | | | | | | | 27,600 | | | | 379,062 | |
St. James’s Place plc | | | | | | | | | | | 47,271 | | | | 609,566 | |
Standard Life plc | | | | | | | | | | | 184,742 | | | | 884,255 | |
Storebrand ASA † | | | | | | | | | | | 21,988 | | | | 92,963 | |
Sun Life Financial Incorporated « | | | | | | | | | | | 57,400 | | | | 1,811,203 | |
Suncorp Group Limited | | | | | | | | | | | 185,747 | | | | 1,774,293 | |
Swiss Life Holding AG | | | | | | | | | | | 2,683 | | | | 671,057 | |
Swiss Reinsurance AG | | | | | | | | | | | 32,594 | | | | 2,750,549 | |
T&D Holdings Incorporated | | | | | | | | | | | 102,100 | | | | 1,164,926 | |
The Allstate Corporation | | | | | | | | | | | 39,327 | | | | 2,711,990 | |
The Hanover Insurance Group Incorporated | | | | | | | | | | | 51,559 | | | | 4,031,914 | |
The Hartford Financial Services Group Incorporated | | | | | | | | | | | 212,445 | | | | 8,725,116 | |
The Progressive Corporation | | | | | | | | | | | 315,385 | | | | 10,268,936 | |
The Travelers Companies Incorporated | | | | | | | | | | | 31,290 | | | | 3,714,436 | |
Tokio Marine Holdings Incorporated | | | | | | | | | | | 111,000 | | | | 4,359,967 | |
Tong Yang Life Insurance Company | | | | | | | | | | | 13,010 | | | | 140,601 | |
Topdanmark AS † | | | | | | | | | | | 12,150 | | | | 324,151 | |
Torchmark Corporation | | | | | | | | | | | 58,931 | | | | 3,811,657 | |
Tryg A/S | | | | | | | | | | | 10,915 | | | | 217,747 | |
Unipol Gruppo Finanziario SpA | | | | | | | | | | | 73,717 | | | | 205,076 | |
UnipolSai SpA | | | | | | | | | | | 197,970 | | | | 330,576 | |
Unum Group | | | | | | | | | | | 125,553 | | | | 4,470,942 | |
Validus Holdings Limited | | | | | | | | | | | 98,347 | | | | 4,995,044 | |
Vienna Insurance Group AG | | | | | | | | | | | 4,394 | | | | 86,434 | |
W.R. Berkley Corporation | | | | | | | | | | | 50,912 | | | | 3,022,645 | |
Willis Towers Watson plc | | | | | | | | | | | 74,757 | | | | 9,270,616 | |
Xl Group Limited | | | | | | | | | | | 159,038 | | | | 5,443,871 | |
Zurich Insurance Group AG | | | | | | | | | | | 13,809 | | | | 3,529,645 | |
| | | | |
| | | | | | | | | | | | | | | 344,682,697 | |
| | | | | | | | | | | | | | | | |
| | | | |
| Real Estate Management & Development: 0.88% | | | | | | | | | | | | | | | | |
Aeon Mall Company Limited | | | | | | | | | | | 17,100 | | | | 240,638 | |
Africa Israel Investments Limited † | | | | | | | | | | | 1,061 | | | | 393 | |
| | | | | | |
| Portfolio of investments—August 31, 2016 (unaudited) | | Wells Fargo Diversified Stock Portfolio | | | 41 | |
| | | | | | | | | | | | | | | | |
| Security name | | | | | | | | Shares | | | Value | |
| | | | |
| Real Estate Management & Development (continued) | | | | | | | | | | | | | | | | |
Aldar Properties PJSC | | | | | | | | | | | 857,106 | | | $ | 644,037 | |
Allreal Holding AG | | | | | | | | | | | 1,348 | | | | 198,866 | |
Ascendas India Trust | | | | | | | | | | | 83,000 | | | | 65,793 | |
Atrium European Real Estate Limited | | | | | | | | | | | 10,857 | | | | 47,473 | |
Ayala Land Incorporated | | | | | | | | | | | 1,588,900 | | | | 1,312,859 | |
Bukit Sembawang Estates Limited | | | | | | | | | | | 28,000 | | | | 94,947 | |
Buwog AG | | | | | | | | | | | 5,071 | | | | 131,852 | |
C C Land Holdings Limited | | | | | | | | | | | 511 | | | | 132 | |
CA Immobilien Anlagen AG | | | | | | | | | | | 3,951 | | | | 74,943 | |
Capital & Counties Properties plc | | | | | | | | | | | 89,398 | | | | 348,187 | |
CapitaLand Limited | | | | | | | | | | | 485,500 | | | | 1,093,974 | |
Castellum AB | | | | | | | | | | | 28,107 | | | | 424,856 | |
Cathay Real Estate Development Company Limited † | | | | | | | | | | | 260,000 | | | | 113,487 | |
Central Pattana PCL | | | | | | | | | | | 354,500 | | | | 617,025 | |
Cheung Kong Property Holding Limited | | | | | | | | | | | 399,793 | | | | 2,808,711 | |
China Evergrande Group | | | | | | | | | | | 1,557,000 | | | | 1,075,793 | |
China Overseas Land & Investment Limited | | | | | | | | | | | 1,170,480 | | | | 3,870,141 | |
China Resources Land Limited | | | | | | | | | | | 808,888 | | | | 2,278,323 | |
China Vanke Company Limited H Shares | | | | | | | | | | | 359,280 | | | | 921,640 | |
Chinese Estates Holdings Limited | | | | | | | | | | | 69,696 | | | | 150,037 | |
City Developments Limited | | | | | | | | | | | 83,000 | | | | 517,208 | |
Colliers International Group | | | | | | | | | | | 2,138 | | | | 87,972 | |
Country Garden Holdings Company Limited | | | | | | | | | | | 2,175,580 | | | | 1,104,960 | |
Daibiru Corporation | | | | | | | | | | | 10,800 | | | | 99,373 | |
Daikyo Incorporated | | | | | | | | | | | 44,000 | | | | 69,743 | |
Daito Trust Construction Company Limited | | | | | | | | | | | 11,400 | | | | 1,678,626 | |
Daiwa House Industry Company Limited | | | | | | | | | | | 96,200 | | | | 2,483,915 | |
Deutsche Euroshop AG | | | | | | | | | | | 4,842 | | | | 222,873 | |
Deutsche Wohnen AG | | | | | | | | | | | 27,669 | | | | 1,040,096 | |
DLF Limited | | | | | | | | | | | 85,755 | | | | 198,285 | |
Dream Unlimited Class A † | | | | | | | | | | | 3,983 | | | | 24,237 | |
Elbit Imaging Limited † | | | | | | | | | | | 13 | | | | 51 | |
Emaar Properties PJSC | | | | | | | | | | | 1,168,710 | | | | 2,259,084 | |
Emperor International Holdings Limited | | | | | | | | | | | 200,000 | | | | 44,602 | |
F&C Commercial Property Trust Limited | | | | | | | | | | | 75,126 | | | | 124,301 | |
Fabege AB | | | | | | | | | | | 13,162 | | | | 244,155 | |
Far East Consortium International Limited | | | | | | | | | | | 155,987 | | | | 55,095 | |
Farglory Land Development Company Limited | | | | | | | | | | | 52,252 | | | | 61,012 | |
First Capital Realty Incorporated | | | | | | | | | | | 7,489 | | | | 126,720 | |
FirstService Corporation | | | | | | | | | | | 2,138 | | | | 102,645 | |
Future Mall Management Limited † | | | | | | | | | | | 504 | | | | 238 | |
Gazit Globe Limited | | | | | | | | | | | 4,376 | | | | 45,417 | |
Global Logistic Properties Limited | | | | | | | | | | | 470,000 | | | | 626,115 | |
Goldcrest Company Limited | | | | | | | | | | | 3,340 | | | | 53,523 | |
Goldin Properties Holdings Limited † | | | | | | | | | | | 326,000 | | | | 312,655 | |
Grainger plc | | | | | | | | | | | 37,054 | | | | 112,739 | |
Great Eagle Holdings Limited | | | | | | | | | | | 71,414 | | | | 322,201 | |
Guocoland Limited | | | | | | | | | | | 42,554 | | | | 59,656 | |
Hang Lung Group Limited | | | | | | | | | | | 147,000 | | | | 538,160 | |
Hang Lung Properties Limited | | | | | | | | | | | 305,000 | | | | 695,116 | |
| | | | |
| 42 | | Wells Fargo Diversified Stock Portfolio | | Portfolio of investments—August 31, 2016 (unaudited) |
| | | | | | | | | | | | | | | | |
| Security name | | | | | | | | Shares | | | Value | |
| | | | |
| Real Estate Management & Development (continued) | | | | | | | | | | | | | | | | |
Heiwa Real Estate Company Limited | | | | | | | | | | | 5,200 | | | $ | 67,145 | |
Heliopolis Housing | | | | | | | | | | | 1,417 | | | | 8,831 | |
Henderson Land Development Company Limited | | | | | | | | | | | 170,513 | | | | 996,805 | |
Highwealth Construction Corporation | | | | | | | | | | | 269,880 | | | | 419,315 | |
HKC Holdings Limited † | | | | | | | | | | | 217,196 | | | | 3,528 | |
HKR International Limited | | | | | | | | | | | 125,600 | | | | 56,505 | |
Hong Kong Land Holdings Limited | | | | | | | | | | | 170,000 | | | | 1,103,300 | |
Hufvudstaden AB Class A | | | | | | | | | | | 14,497 | | | | 252,154 | |
Hulic Company Limited | | | | | | | | | | | 62,900 | | | | 595,776 | |
Hysan Development Company Limited | | | | | | | | | | | 117,533 | | | | 567,397 | |
Immoeast AG Interim Shares (a) | | | | | | | | | | | 15,082 | | | | 0 | |
Immofinanz AG | | | | | | | | | | | 101,423 | | | | 231,808 | |
Immofinanz AG Interim Shares †(a) | | | | | | | | | | | 19,870 | | | | 0 | |
IOI Properties Group Bhd | | | | | | | | | | | 502,600 | | | | 312,305 | |
Jones Lang LaSalle Incorporated | | | | | | | | | | | 27,655 | | | | 3,228,721 | |
K Wah International Holdings Limited | | | | | | | | | | | 175,515 | | | | 96,156 | |
Kenedix Incorporated | | | | | | | | | | | 44,000 | | | | 202,001 | |
Kerry Properties Limited | | | | | | | | | | | 145,053 | | | | 421,647 | |
Kowloon Development Company Limited | | | | | | | | | | | 45,000 | | | | 43,216 | |
Kungsleden | | | | | | | | | | | 25,316 | | | | 195,918 | |
Land & Houses PCL | | | | | | | | | | | 456,840 | | | | 126,697 | |
LEG Immobilien AG | | | | | | | | | | | 4,572 | | | | 446,287 | |
Lendlease Corporation Limited | | | | | | | | | | | 85,652 | | | | 889,618 | |
Leopalace21 Corporation | | | | | | | | | | | 39,000 | | | | 258,580 | |
Longfor Properties Company Limited | | | | | | | | | | | 306,000 | | | | 493,068 | |
Medinet Nasr Housing † | | | | | | | | | | | 13,400 | | | | 21,851 | |
Megaworld Corporation | | | | | | | | | | | 2,758,000 | | | | 278,789 | |
Midland Holdings Limited † | | | | | | | | | | | 56,000 | | | | 17,325 | |
Mitsubishi Estate Company Limited | | | | | | | | | | | 204,189 | | | | 3,862,155 | |
Mitsui Fudosan Company Limited | | | | | | | | | | | 143,000 | | | | 3,079,341 | |
Mobimo Holding AG | | | | | | | | | | | 799 | | | | 199,192 | |
New World Development Limited | | | | | | | | | | | 749,118 | | | | 939,590 | |
Nexity SA | | | | | | | | | | | 1,566 | | | | 82,117 | |
Nomura Real Estate Holding Incorporated | | | | | | | | | | | 20,000 | | | | 325,907 | |
NTT Urban Development Corporation | | | | | | | | | | | 15,800 | | | | 144,921 | |
Palm Hills Developments SAE | | | | | | | | | | | 79,185 | | | | 21,937 | |
Prelios SpA † | | | | | | | | | | | 1,105 | | | | 98 | |
PSP Swiss Property AG | | | | | | | | | | | 3,653 | | | | 349,868 | |
PT Bumi Serpong Damai Tbk | | | | | | | | | | | 2,777,000 | | | | 450,098 | |
PT Lippo Karawaci Terbuka Tbk | | | | | | | | | | | 4,995,500 | | | | 414,252 | |
Radium Life Tech Company Limited | | | | | | | | | | | 1,634 | | | | 518 | |
Realogy Holdings Corporation | | | | | | | | | | | 89,395 | | | | 2,399,362 | |
Red Star Macalline Group Corporation H shares | | | | | | | | | | | 459,000 | | | | 415,361 | |
Relo Holdings Incorporated | | | | | | | | | | | 1,600 | | | | 226,859 | |
Robinsons Land Company | | | | | | | | | | | 372,100 | | | | 254,748 | |
Ruentex Development Company Limited † | | | | | | | | | | | 202,996 | | | | 237,667 | |
Savills plc | | | | | | | | | | | 10,369 | | | | 100,759 | |
Shimao Property Holding Limited | | | | | | | | | | | 283,500 | | | | 394,686 | |
Shree Precoated Steels Limited † | | | | | | | | | | | 3,781 | | | | 144 | |
Sinarmas Land Limited | | | | | | | | | | | 85,000 | | | | 30,882 | |
| | | | | | |
| Portfolio of investments—August 31, 2016 (unaudited) | | Wells Fargo Diversified Stock Portfolio | | | 43 | |
| | | | | | | | | | | | | | | | |
| Security name | | | | | | | | Shares | | | Value | |
| | | | |
| Real Estate Management & Development (continued) | | | | | | | | | | | | | | | | |
Sino Land Company | | | | | | | | | | | 677,961 | | | $ | 1,160,588 | |
Sino-Ocean Land Holdings Limited | | | | | | | | | | | 1,039,500 | | | | 482,395 | |
SM Prime Holdings Incorporated | | | | | | | | | | | 3,478,354 | | | | 2,228,326 | |
SP Setia Bhd | | | | | | | | | | | 269,144 | | | | 231,614 | |
Sumitomo Real Estate Sales Company Limited | | | | | | | | | | | 2,500 | | | | 47,190 | |
Sumitomo Realty & Development Company Limited | | | | | | | | | | | 69,000 | | | | 1,820,949 | |
Sun Hung Kai Properties Limited | | | | | | | | | | | 230,284 | | | | 3,241,618 | |
Swire Pacific Limited Class A | | | | | | | | | | | 97,500 | | | | 1,077,112 | |
Swire Pacific Limited Class B | | | | | | | | | | | 195,000 | | | | 385,096 | |
Swire Properties Limited | | | | | | | | | | | 200,183 | | | | 563,838 | |
Swiss Prime Site AG | | | | | | | | | | | 5,716 | | | | 502,703 | |
TAG Immobilien AG | | | | | | | | | | | 11,454 | | | | 164,751 | |
Talaat Moustafa Group | | | | | | | | | | | 108,625 | | | | 70,215 | |
The Howard Hughes Corporation † | | | | | | | | | | | 21,943 | | | | 2,594,101 | |
The RMR Group Incorporated Class A | | | | | | | | | | | 7,013 | | | | 270,351 | |
Tian An China Investment | | | | | | | | | | | 224,097 | | | | 125,950 | |
TOC Company Limited | | | | | | | | | | | 13,900 | | | | 109,894 | |
Tokyo Tatemono Company Limited | | | | | | | | | | | 34,500 | | | | 405,137 | |
Tokyu Fudosan Holdings Corporation | | | | | | | | | | | 74,700 | | | | 415,862 | |
UEM Land Holdings Bhd | | | | | | | | | | | 413,675 | | | | 110,164 | |
Unite Group plc | | | | | | | | | | | 20,850 | | | | 171,530 | |
United Industrial Corporation Limited | | | | | | | | | | | 64,877 | | | | 129,521 | |
United Overseas Land Limited | | | | | | | | | | | 106,331 | | | | 433,924 | |
Vonovia SE | | | | | | | | | | | 40,491 | | | | 1,575,605 | |
Wharf Holdings Limited | | | | | | | | | | | 203,500 | | | | 1,437,541 | |
Wheelock & Company Limited | | | | | | | | | | | 145,000 | | | | 829,901 | |
Wheelock Properties (Singapore) Limited | | | | | | | | | | | 39,000 | | | | 42,079 | |
Wing Tai Holdings Limited | | | | | | | | | | | 88,730 | | | | 111,364 | |
| | | | |
| | | | | | | | | | | | | | | 75,829,404 | |
| | | | | | | | | | | | | | | | |
| | | | |
| REITs: 5.77% | | | | | | | | | | | | | | | | |
Abacus Property Group | | | | | | | | | | | 42,035 | | | | 95,406 | |
Activia Properties Incorporated | | | | | | | | | | | 80 | | | | 408,254 | |
Advance Residence Investment Corporation | | | | | | | | | | | 189 | | | | 504,170 | |
Aeon REIT Investment Corporation | | | | | | | | | | | 168 | | | | 208,975 | |
Alexandria Real Estate Equities Incorporated | | | | | | | | | | | 39,100 | | | | 4,304,519 | |
Allied Properties REIT | | | | | | | | | | | 9,500 | | | | 266,803 | |
American Campus Communities Incorporated | | | | | | | | | | | 159,600 | | | | 7,997,556 | |
American Capital Agency Corporation | | | | | | | | | | | 173,400 | | | | 3,348,354 | |
American Homes 4 Rent Class A | | | | | | | | | | | 212,092 | | | | 4,638,452 | |
American Tower Corporation | | | | | | | | | | | 76,862 | | | | 8,714,614 | |
Annaly Capital Management Incorporated | | | | | | | | | | | 544,533 | | | | 5,831,948 | |
Apartment Investment & Management Company Class A | | | | | | | | | | | 82,337 | | | | 3,719,986 | |
Apple Hospitality REIT Incorporated « | | | | | | | | | | | 185,573 | | | | 3,640,942 | |
Argosy Property Trust | | | | | | | | | | | 146,218 | | | | 123,071 | |
Ascendas REIT | | | | | | | | | | | 362,087 | | | | 651,116 | |
AvalonBay Communities Incorporated | | | | | | | | | | | 24,800 | | | | 4,340,248 | |
Befimmo S.C.A. Sicafi | | | | | | | | | | | 1,044 | | | | 69,872 | |
Big Yellow Group plc | | | | | | | | | | | 13,948 | | | | 138,559 | |
Blackstone Mortgage Trust Incorporated Class A | | | | | | | | | | | 111,287 | | | | 3,318,578 | |
| | | | |
| 44 | | Wells Fargo Diversified Stock Portfolio | | Portfolio of investments—August 31, 2016 (unaudited) |
| | | | | | | | | | | | | | | | |
| Security name | | | | | | | | Shares | | | Value | |
| | | | |
| REITs (continued) | | | | | | | | | | | | | | | | |
Boardwalk REIT | | | | | | | | | | | 1,855 | | | $ | 71,278 | |
Boston Properties Incorporated | | | | | | | | | | | 29,589 | | | | 4,146,307 | |
Brandywine Realty Trust | | | | | | | | | | | 208,094 | | | | 3,356,556 | |
British Land Company plc | | | | | | | | | | | 96,327 | | | | 838,640 | |
Brixmor Property Group Incorporated | | | | | | | | | | | 120,114 | | | | 3,430,456 | |
Bunnings Warehouse Property Trust | | | | | | | | | | | 74,476 | | | | 181,910 | |
Camden Property Trust | | | | | | | | | | | 45,900 | | | | 4,028,643 | |
Canadian Apartment Properties | | | | | | | | | | | 5,440 | | | | 123,949 | |
Canadian REIT | | | | | | | | | | | 4,006 | | | | 148,461 | |
CapitaLand Commercial Trust Limited | | | | | | | | | | | 360,464 | | | | 408,761 | |
CapitaLand Mall Trust | | | | | | | | | | | 468,636 | | | | 742,966 | |
Care Capital Properties Incorporated | | | | | | | | | | | 98,869 | | | | 2,965,081 | |
Cathay No.1 REIT | | | | | | | | | | | 400,000 | | | | 214,305 | |
CBL & Associates Properties Incorporated | | | | | | | | | | | 200,468 | | | | 2,860,678 | |
CDL Hospitality Trusts | | | | | | | | | | | 121,000 | | | | 123,003 | |
Champion REIT | | | | | | | | | | | 571,653 | | | | 364,765 | |
Charter Hall Group | | | | | | | | | | | 46,118 | | | | 202,761 | |
Charter Hall Retail REIT | | | | | | | | | | | 62,961 | | | | 202,523 | |
Chimera Investment Corporation | | | | | | | | | | | 223,979 | | | | 3,693,414 | |
Cofinimmo SA | | | | | | | | | | | 2,555 | | | | 314,637 | |
Colony Financial Incorporated Class A | | | | | | | | | | | 150,927 | | | | 2,787,622 | |
Columbia Property Trust Incorporated | | | | | | | | | | | 146,952 | | | | 3,465,128 | |
Comforia Residential REIT Incorporated | | | | | | | | | | | 72 | | | | 165,760 | |
Cominar REIT | | | | | | | | | | | 20,000 | | | | 250,877 | |
Communications Sales & Leasing Incorporated | | | | | | | | | | | 160,991 | | | | 5,022,919 | |
Corporate Office Properties Trust | | | | | | | | | | | 112,300 | | | | 3,202,796 | |
Corrections Corporation of America | | | | | | | | | | | 141,300 | | | | 2,250,909 | |
Cousins Properties Incorporated | | | | | | | | | | | 232,387 | | | | 2,560,905 | |
Cromwell Group | | | | | | | | | | | 285,800 | | | | 219,089 | |
Crown Castle International Corporation | | | | | | | | | | | 63,053 | | | | 5,975,533 | |
CubeSmart REIT | | | | | | | | | | | 215,900 | | | | 5,943,727 | |
CYS Investments Incorporated | | | | | | | | | | | 202,052 | | | | 1,780,078 | |
Daiwa House REIT Investment Corporation (a) | | | | | | | | | | | 46 | | | | 285,412 | |
Daiwa House Residential Investment Corporation | | | | | | | | | | | 99 | | | | 279,207 | |
Daiwa Office Investment Corporation | | | | | | | | | | | 41 | | | | 245,291 | |
DCT Industrial Trust Incorporated | | | | | | | | | | | 107,037 | | | | 5,213,772 | |
DDR Corporation | | | | | | | | | | | 159,633 | | | | 3,018,660 | |
Derwent Valley Holdings plc | | | | | | | | | | | 8,152 | | | | 292,455 | |
Dexus Property Group | | | | | | | | | | | 143,410 | | | | 1,047,620 | |
DiamondRock Hospitality | | | | | | | | | | | 265,181 | | | | 2,808,267 | |
Douglas Emmett Incorporated | | | | | | | | | | | 170,655 | | | | 6,409,802 | |
Duke Realty Corporation | | | | | | | | | | | 193,178 | | | | 5,432,165 | |
DuPont Fabros Technology Incorporated | | | | | | | | | | | 89,200 | | | | 3,782,080 | |
Emlak Konut Gayrimenkul Yati | | | | | | | | | | | 469,570 | | | | 462,036 | |
EPR Properties | | | | | | | | | | | 77,326 | | | | 6,056,172 | |
Equinix Incorporated | | | | | | | | | | | 39,249 | | | | 14,469,144 | |
Equinix Incorporated | | | | | | | | | | | 770 | | | | 283,861 | |
Equity Commonwealth † | | | | | | | | | | | 150,841 | | | | 4,719,815 | |
Equity Lifestyle Properties Incorporated | | | | | | | | | | | 106,750 | | | | 8,276,328 | |
Equity Residential | | | | | | | | | | | 38,700 | | | | 2,510,469 | |
| | | | | | |
| Portfolio of investments—August 31, 2016 (unaudited) | | Wells Fargo Diversified Stock Portfolio | | | 45 | |
| | | | | | | | | | | | | | | | |
| Security name | | | | | | | | Shares | | | Value | |
| | | | |
| REITs (continued) | | | | | | | | | | | | | | | | |
Essex Property Trust Incorporated | | | | | | | | | | | 37,309 | | | $ | 8,472,874 | |
Eurocommercial Properties NV | | | | | | | | | | | 3,299 | | | | 149,936 | |
Extra Space Storage Incorporated | | | | | | | | | | | 71,200 | | | | 5,735,160 | |
Federal Realty Investment Trust | | | | | | | | | | | 40,301 | | | | 6,407,859 | |
Fibra Uno Administracion SAB de CV | | | | | | | | | | | 718,045 | | | | 1,389,766 | |
Fonciere des Regions | | | | | | | | | | | 3,503 | | | | 327,286 | |
Fortune REIT | | | | | | | | | | | 246,000 | | | | 314,574 | |
Four Corners Property Trust Incorporated | | | | | | | | | | | 71,528 | | | | 1,481,345 | |
Frontier Real Estate Investment Corporation | | | | | | | | | | | 73 | | | | 357,010 | |
Fukuoka REIT Corporation | | | | | | | | | | | 100 | | | | 179,868 | |
Gaming and Leisure Properties Incorporated | | | | | | | | | | | 232,260 | | | | 7,945,615 | |
Gecina SA | | | | | | | | | | | 2,316 | | | | 362,319 | |
General Growth Properties Incorporated | | | | | | | | | | | 69,200 | | | | 2,016,488 | |
Geo Group Incorporated | | | | | | | | | | | 87,942 | | | | 1,762,358 | |
Global One Real Estate Investment Corporation | | | | | | | | | | | 36 | | | | 137,090 | |
GLP J-REIT | | | | | | | | | | | 383 | | | | 475,303 | |
Goodman Group | | | | | | | | | | | 252,674 | | | | 1,441,320 | |
Goodman Property Trust | | | | | | | | | | | 181,257 | | | | 177,552 | |
GPT Group | | | | | | | | | | | 275,271 | | | | 1,102,670 | |
Granite Real Estate Investment Trust | | | | | | | | | | | 4,243 | | | | 134,855 | |
Great Portland Estates plc | | | | | | | | | | | 28,410 | | | | 252,752 | |
Growthpoint Properties Limited | | | | | | | | | | | 721,042 | | | | 1,247,184 | |
H&R REIT | | | | | | | | | | | 11,358 | | | | 201,974 | |
Hammerson plc | | | | | | | | | | | 66,473 | | | | 506,276 | |
Hankyu REIT Incorporated | | | | | | | | | | | 115 | | | | 157,387 | |
HCP Incorporated | | | | | | | | | | | 56,004 | | | | 2,202,637 | |
Healthcare Realty Trust Incorporated | | | | | | | | | | | 139,075 | | | | 4,875,970 | |
Healthcare Trust of America Incorporated Class A | | | | | | | | | | | 165,351 | | | | 5,578,943 | |
Heiwa Real Estate REIT Incorporated | | | | | | | | | | | 149 | | | | 123,273 | |
Hospitality Properties Trust | | | | | | | | | | | 183,721 | | | | 5,601,653 | |
Host Hotels & Resorts Incorporated | | | | | | | | | | | 402,800 | | | | 7,177,896 | |
Hulic REIT Incorporated | | | | | | | | | | | 121 | | | | 213,313 | |
ICADE | | | | | | | | | | | 3,119 | | | | 240,683 | |
Ichigo Real Estate Investment Corporation | | | | | | | | | | | 189 | | | | 140,839 | |
Industrial & Infrastructure Fund Investment Corporation | | | | | | | | | | | 51 | | | | 254,347 | |
Intu Properties plc | | | | | | | | | | | 88,750 | | | | 368,273 | |
Invesco Mortgage Capital Incorporated | | | | | | | | | | | 148,078 | | | | 2,330,748 | |
Investa Office Fund | | | | | | | | | | | 109,870 | | | | 376,532 | |
Invincible Investment Corporation | | | | | | | | | | | 507 | | | | 325,864 | |
Iron Mountain Incorporated | | | | | | | | | | | 133,519 | | | | 5,128,465 | |
Japan Excellent Incorporated | | | | | | | | | | | 184 | | | | 247,906 | |
Japan Hotel REIT Investment Corporation | | | | | | | | | | | 503 | | | | 432,192 | |
Japan Logistics Fund Incorporated | | | | | | | | | | | 129 | | | | 294,120 | |
Japan Prime Realty Investment Corporation | | | | | | | | | | | 128 | | | | 565,989 | |
Japan Real Estate Investment Corporation | | | | | | | | | | | 191 | | | | 1,122,389 | |
Japan Rental Housing Investment Incorporated | | | | | | | | | | | 257 | | | | 203,931 | |
Japan Retail Fund Investment Corporation | | | | | | | | | | | 385 | | | | 864,403 | |
Kenedix Realty Investment | | | | | | | | | | | 52 | | | | 313,613 | |
Kenedix Residential Investment Corporation | | | | | | | | | | | 43 | | | | 118,529 | |
Kenedix Retail REIT Corporation | | | | | | | | | | | 61 | | | | 152,463 | |
| | | | |
| 46 | | Wells Fargo Diversified Stock Portfolio | | Portfolio of investments—August 31, 2016 (unaudited) |
| | | | | | | | | | | | | | | | |
| Security name | | | | | | | | Shares | | | Value | |
| | | | |
| REITs (continued) | | | | | | | | | | | | | | | | |
Keppel REIT | | | | | | | | | | | 206,614 | | | $ | 161,506 | |
Kilroy Realty Corporation | | | | | | | | | | | 51,295 | | | | 3,725,556 | |
Kimco Realty Corporation | | | | | | | | | | | 226,180 | | | | 6,796,709 | |
Kite Realty Group Trust | | | | | | | | | | | 98,139 | | | | 2,834,254 | |
Kiwi Property Group Limited | | | | | | | | | | | 201,240 | | | | 226,331 | |
KLCC Property Holdings Bhd | | | | | | | | | | | 105,300 | | | | 199,150 | |
Klepierre | | | | | | | | | | | 21,292 | | | | 997,744 | |
Lamar Advertising Company Class A | | | | | | | | | | | 42,756 | | | | 2,664,981 | |
Land Securities Group plc | | | | | | | | | | | 74,578 | | | | 1,071,377 | |
LaSalle Hotel Properties | | | | | | | | | | | 134,952 | | | | 3,786,753 | |
LaSalle Logiport REIT | | | | | | | | | | | 172 | | | | 174,219 | |
Lexington Corporate Properties Trust | | | | | | | | | | | 247,458 | | | | 2,670,072 | |
Liberty Property Trust | | | | | | | | | | | 178,732 | | | | 7,369,120 | |
Life Storage Incorporated | | | | | | | | | | | 61,066 | | | | 5,495,940 | |
Link REIT | | | | | | | | | | | 323,655 | | | | 2,353,081 | |
LondonMetric Property plc | | | | | | | | | | | 59,025 | | | | 127,192 | |
Mack-Cali Realty Corporation | | | | | | | | | | | 105,534 | | | | 2,929,624 | |
Mapletree Industrial Trust | | | | | | | | | | | 180,600 | | | | 235,948 | |
Mapletree Logistics Trust | | | | | | | | | | | 301,210 | | | | 236,555 | |
MCUBS MidCity Investment Corporation | | | | | | | | | | | 33 | | | | 111,154 | |
Merlin Properties Socimi SA | | | | | | | | | | | 27,586 | | | | 320,632 | |
MFA Mortgage Investments Incorporated | | | | | | | | | | | 440,466 | | | | 3,400,398 | |
Mirvac Group | | | | | | | | | | | 619,201 | | | | 1,079,637 | |
Mori Hills REIT Corporation | | | | | | | | | | | 189 | | | | 285,879 | |
Mori Trust Sogo REIT Incorporated | | | | | | | | | | | 165 | | | | 291,519 | |
National Retail Properties Incorporated | | | | | | | | | | | 176,454 | | | | 8,840,345 | |
New Residential Investment Corporation | | | | | | | | | | | 275,075 | | | | 3,947,326 | |
Nippon Accommodations Fund Incorporated | | | | | | | | | | | 76 | | | | 325,405 | |
Nippon Building Fund Incorporated | | | | | | | | | | | 208 | | | | 1,272,546 | |
Nippon Prologis REIT Incorporated | | | | | | | | | | | 255 | | | | 611,961 | |
NIPPON REIT Investment Corporation | | | | | | | | | | | 47 | | | | 116,472 | |
Nomura Real Estate Master Fund Incorporated | | | | | | | | | | | 558 | | | | 920,607 | |
NorthStar Realty Europe Corporation | | | | | | | | | | | 80,892 | | | | 828,334 | |
NorthStar Realty Finance Corporation | | | | | | | | | | | 213,311 | | | | 2,845,569 | |
Omega Healthcare Investors Incorporated | | | | | | | | | | | 85,974 | | | | 3,112,259 | |
ORIX JREIT Incorporated « | | | | | | | | | | | 355 | | | | 620,688 | |
Outfront Media Incorporated | | | | | | | | | | | 165,040 | | | | 3,683,693 | |
Paramount Group Incorporated | | | | | | | | | | | 200,225 | | | | 3,604,050 | |
Parkway Life REIT | | | | | | | | | | | 64,000 | | | | 117,436 | |
Pebblebrook Hotel Trust | | | | | | | | | | | 94,940 | | | | 2,851,998 | |
Piedmont Office Realty Trust Incorporated Class A | | | | | | | | | | | 173,200 | | | | 3,742,852 | |
Post Properties Incorporated | | | | | | | | | | | 69,746 | | | | 4,622,765 | |
Potlatch Corporation | | | | | | | | | | | 54,022 | | | | 2,045,813 | |
Precinct Properties New Zealand Limited | | | | | | | | | | | 145,054 | | | | 136,300 | |
Premier Investment Corporation | | | | | | | | | | | 163 | | | | 221,030 | |
Public Storage Incorporated | | | | | | | | | | | 27,597 | | | | 6,180,072 | |
Rayonier Incorporated | | | | | | | | | | | 146,600 | | | | 4,035,898 | |
Realty Income Corporation | | | | | | | | | | | 139,262 | | | | 9,153,691 | |
Redefine Properties Limited | | | | | | | | | | | 1,331,220 | | | | 997,826 | |
Redwood Trust Incorporated | | | | | | | | | | | 101,434 | | | | 1,501,223 | |
| | | | | | |
| Portfolio of investments—August 31, 2016 (unaudited) | | Wells Fargo Diversified Stock Portfolio | | | 47 | |
| | | | | | | | | | | | | | | | |
| Security name | | | | | | | | Shares | | | Value | |
| | | | |
| REITs (continued) | | | | | | | | | | | | | | | | |
Regency Centers Corporation | | | | | | | | | | | 54,383 | | | $ | 4,380,007 | |
Resilient REIT Limited | | | | | | | | | | | 102,685 | | | | 824,162 | |
Retail Properties of America Incorporated Class A | | | | | | | | | | | 286,377 | | | | 4,868,409 | |
RioCan REIT | | | | | | | | | | | 14,088 | | | | 295,854 | |
RLJ Lodging Trust | | | | | | | | | | | 148,627 | | | | 3,468,954 | |
Scentre Group | | | | | | | | | | | 768,669 | | | | 2,871,136 | |
Segro plc | | | | | | | | | | | 80,631 | | | | 479,851 | |
Sekisui House REIT incorporated | | | | | | | | | | | 119 | | | | 167,807 | |
Sekisui House SI Investment Corporation | | | | | | | | | | | 125 | | | | 144,493 | |
Senior Housing Properties Trust | | | | | | | | | | | 288,489 | | | | 6,444,844 | |
Shaftesbury plc | | | | | | | | | | | 24,082 | | | | 305,955 | |
Shopping Centres Australasia Property Group | | | | | | | | | | | 117,209 | | | | 203,484 | |
SIA REIT Incorporated | | | | | | | | | | | 14 | | | | 53,854 | |
Simon Property Group Incorporated | | | | | | | | | | | 55,986 | | | | 12,063,303 | |
Smart REIT | | | | | | | | | | | 5,367 | | | | 145,041 | |
Spirit Realty Capital Incorporated | | | | | | | | | | | 585,754 | | | | 7,761,241 | |
Starhill Global REIT | | | | | | | | | | | 254,000 | | | | 150,075 | |
Starwood Property Trust Incorporated | | | | | | | | | | | 122,500 | | | | 2,805,250 | |
Stockland Australia | | | | | | | | | | | 353,241 | | | | 1,287,570 | |
Sunstone Hotel Investors Incorporated | | | | | | | | | | | 257,450 | | | | 3,575,981 | |
Suntec REIT | | | | | | | | | | | 384,000 | | | | 472,091 | |
Taubman Centers Incorporated | | | | | | | | | | | 79,573 | | | | 6,180,435 | |
Tokyu REIT Incorporated | | | | | | | | | | | 135 | | | | 185,019 | |
Top REIT Incorporated (a) | | | | | | | | | | | 29 | | | | 125,354 | |
Two Harbors Investment Corporation | | | | | | | | | | | 414,286 | | | | 3,687,145 | |
UDR Incorporated | | | | | | | | | | | 149,300 | | | | 5,401,674 | |
Unibail-Rodamco SE | | | | | | | | | | | 8,909 | | | | 2,444,636 | |
United Urban Investment Corporation | | | | | | | | | | | 405 | | | | 721,418 | |
Urban Edge Properties REIT | | | | | | | | | | | 109,548 | | | | 3,139,646 | |
Vastned Retail NV | | | | | | | | | | | 1,059 | | | | 43,854 | |
VEREIT Incorporated | | | | | | | | | | | 505,138 | | | | 5,278,692 | |
Vicinity Centres | | | | | | | | | | | 471,677 | | | | 1,173,359 | |
Washington Prime Group Incorporated | | | | | | | | | | | 217,062 | | | | 2,982,432 | |
Washington Real Estate Investment Trust | | | | | | | | | | | 85,675 | | | | 2,784,438 | |
Weingarten Realty Investors | | | | | | | | | | | 140,000 | | | | 5,775,000 | |
Welltower Incorporated | | | | | | | | | | | 37,753 | | | | 2,897,543 | |
Wereldhave NV | | | | | | | | | | | 4,146 | | | | 198,721 | |
Westfield Corporation | | | | | | | | | | | 275,983 | | | | 2,119,782 | |
Weyerhaeuser Company | | | | | | | | | | | 405,634 | | | | 12,919,443 | |
Workspace Group plc | | | | | | | | | | | 11,049 | | | | 99,604 | |
WP Carey Incorporated | | | | | | | | | | | 51,257 | | | | 3,416,279 | |
Xenia Hotels & Resorts Incorporated | | | | | | | | | | | 143,924 | | | | 2,423,680 | |
Yuexiu Real Estate Investment Trust | | | | | | | | | | | 325,000 | | | | 213,244 | |
| | | | |
| | | | | | | | | | | | | | | 494,812,458 | |
| | | | | | | | | | | | | | | | |
| | | | |
| Thrifts & Mortgage Finance: 0.28% | | | | | | | | | | | | | | | | |
Aareal Bank AG | | | | | | | | | | | 3,994 | | | | 134,544 | |
Capitol Federal Financial Incorporated | | | | | | | | | | | 166,615 | | | | 2,395,924 | |
Genworth Mortgage Insurance Canada Incorporated | | | | | | | | | | | 2,068 | | | | 53,947 | |
Home Capital Group Incorporated « | | | | | | | | | | | 4,758 | | | | 106,306 | |
| | | | |
| 48 | | Wells Fargo Diversified Stock Portfolio | | Portfolio of investments—August 31, 2016 (unaudited) |
| | | | | | | | | | | | | | | | |
| Security name | | | | | | | | Shares | | | Value | |
| | | | |
| Thrifts & Mortgage Finance (continued) | | | | | | | | | | | | | | | | |
Housing Development Finance Corporation Limited | | | | | | | | | | | 443,127 | | | $ | 9,299,580 | |
Indiabulls Housing Finance Limited | | | | | | | | | | | 89,088 | | | | 1,089,755 | |
LIC Housing Finance Limited | | | | | | | | | | | 74,052 | | | | 633,649 | |
MGIC Investment Corporation † | | | | | | | | | | | 403,974 | | | | 3,268,150 | |
New York Community Bancorp Incorporated | | | | | | | | | | | 256,238 | | | | 3,871,756 | |
Paragon Group of Companies plc | | | | | | | | | | | 26,738 | | | | 111,407 | |
Washington Federal Incorporated | | | | | | | | | | | 106,609 | | | | 2,825,139 | |
| | | | |
| | | | | | | | | | | | | | | 23,790,157 | |
| | | | | | | | | | | | | | | | |
| | | | |
Health Care: 10.19% | | | | | | | | | | | | | | | | |
| | | | |
| Biotechnology: 2.28% | | | | | | | | | | | | | | | | |
3-D Matrix Limited † | | | | | | | | | | | 3,100 | | | | 20,853 | |
AbbVie Incorporated | | | | | | | | | | | 178,272 | | | | 11,427,235 | |
Abcam plc | | | | | | | | | | | 16,796 | | | | 160,014 | |
ACADIA Pharmaceuticals Incorporated †« | | | | | | | | | | | 116,502 | | | | 3,743,209 | |
Actelion Limited | | | | | | | | | | | 11,077 | | | | 1,843,633 | |
Agios Pharmaceuticals Incorporated †« | | | | | | | | | | | 37,796 | | | | 1,392,405 | |
Alexion Pharmaceuticals Incorporated † | | | | | | | | | | | 40,608 | | | | 5,110,923 | |
Alkermes plc † | | | | | | | | | | | 84,791 | | | | 3,711,302 | |
Alnylam Pharmaceuticals Incorporated † | | | | | | | | | | | 98,019 | | | | 6,846,627 | |
Amgen Incorporated | | | | | | | | | | | 83,000 | | | | 14,114,980 | |
Biogen Incorporated † | | | | | | | | | | | 39,707 | | | | 12,135,650 | |
BioMarin Pharmaceutical Incorporated † | | | | | | | | | | | 92,649 | | | | 8,698,815 | |
bluebird bio Incorporated †« | | | | | | | | | | | 52,600 | | | | 2,595,284 | |
Celgene Corporation † | | | | | | | | | | | 140,224 | | | | 14,967,510 | |
Cepheid Incorporated † | | | | | | | | | | | 93,354 | | | | 3,203,909 | |
CK Life Sciences International Holdings Incorporated | | | | | | | | | | | 702,000 | | | | 64,250 | |
Clovis Oncology Incorporated †« | | | | | | | | | | | 48,096 | | | | 1,191,338 | |
CSL Limited | | | | | | | | | | | 66,050 | | | | 5,366,073 | |
Dyax Corporation (a) | | | | | | | | | | | 188,200 | | | | 0 | |
Genmab AS † | | | | | | | | | | | 5,982 | | | | 955,772 | |
Genus plc | | | | | | | | | | | 5,667 | | | | 135,512 | |
Gilead Sciences Incorporated | | | | | | | | | | | 241,100 | | | | 18,897,418 | |
Green Cross Corporation | | | | | | | | | | | 1,207 | | | | 189,439 | |
Green Cross Holdings Corporation | | | | | | | | | | | 5,818 | | | | 157,582 | |
Grifols SA | | | | | | | | | | | 26,431 | | | | 559,872 | |
Incyte Corporation † | | | | | | | | | | | 97,380 | | | | 7,897,518 | |
Intercept Pharmaceuticals Incorporated †« | | | | | | | | | | | 22,588 | | | | 3,350,026 | |
Intrexon Corporation †« | | | | | | | | | | | 72,346 | | | | 1,826,013 | |
Ionis Pharmaceuticals Incorporated †« | | | | | | | | | | | 157,612 | | | | 4,673,196 | |
Juno Therapeutics Incorporated †« | | | | | | | | | | | 105,185 | | | | 3,111,372 | |
Karo Bio AB †« | | | | | | | | | | | 107,433 | | | | 530,849 | |
Kite Pharma Incorporated †« | | | | | | | | | | | 55,307 | | | | 3,186,789 | |
Medivation Incorporated † | | | | | | | | | | | 93,286 | | | | 7,515,120 | |
Medy-Tox Incorporated | | | | | | | | | | | 1,142 | | | | 453,215 | |
Mesoblast Limited †« | | | | | | | | | | | 31,890 | | | | 32,116 | |
Myriad Genetics Incorporated † | | | | | | | | | | | 100,100 | | | | 2,038,036 | |
NanoCarrier Company Limited †« | | | | | | | | | | | 6,400 | | | | 57,094 | |
Neurocrine Biosciences Incorporated † | | | | | | | | | | | 104,600 | | | | 5,068,916 | |
| | | | | | |
| Portfolio of investments—August 31, 2016 (unaudited) | | Wells Fargo Diversified Stock Portfolio | | | 49 | |
| | | | | | | | | | | | | | | | |
| Security name | | | | | | | | Shares | | | Value | |
| | | | |
| Biotechnology (continued) | | | | | | | | | | | | | | | | |
Novavax Incorporated †« | | | | | | | | | | | 385,500 | | | $ | 2,636,820 | |
OBI Pharma Incorporated † | | | | | | | | | | | 50,000 | | | | 625,581 | |
OPKO Health Incorporated †« | | | | | | | | | | | 418,615 | | | | 3,809,397 | |
PeptiDream Incorporated †« | | | | | | | | | | | 5,100 | | | | 218,117 | |
Portola Pharmaceuticals Incorporated † | | | | | | | | | | | 80,403 | | | | 1,637,005 | |
Puma Biotechnology Incorporated † | | | | | | | | | | | 31,460 | | | | 1,860,859 | |
Radius Health Incorporated †« | | | | | | | | | | | 48,410 | | | | 2,654,804 | |
Regeneron Pharmaceuticals Incorporated † | | | | | | | | | | | 14,213 | | | | 5,579,313 | |
Savient Pharmaceuticals Incorporated †(a) | | | | | | | | | | | 2,670 | | | | 0 | |
Seattle Genetics Incorporated † | | | | | | | | | | | 66,100 | | | | 2,944,755 | |
Shire Limited plc | | | | | | | | | | | 79,789 | | | | 4,988,332 | |
Shire plc ADR | | | | | | | | | | | 387 | | | | 72,439 | |
Sirtex Medical Limited | | | | | | | | | | | 8,261 | | | | 208,173 | |
Swedish Orphan Biovitrum AB † | | | | | | | | | | | 15,061 | | | | 178,044 | |
Takara Bio Incorporated | | | | | | | | | | | 6,300 | | | | 91,031 | |
Ultragenyx Pharmaceutical Incorporated † | | | | | | | | | | | 50,559 | | | | 3,332,849 | |
United Therapeutics Corporation † | | | | | | | | | | | 27,305 | | | | 3,338,855 | |
Vertex Pharmaceuticals Incorporated † | | | | | | | | | | | 44,738 | | | | 4,228,188 | |
Viromed Company Limited † | | | | | | | | | | | 1,994 | | | | 211,382 | |
| | | | |
| | | | | | | | | | | | | | | 195,845,809 | |
| | | | | | | | | | | | | | | | |
| | | | |
| Health Care Equipment & Supplies: 1.86% | | | | | | | | | | | | | | | | |
Abbott Laboratories | | | | | | | | | | | 160,394 | | | | 6,739,756 | |
Abiomed Incorporated † | | | | | | | | | | | 51,800 | | | | 6,109,292 | |
Align Technology Incorporated † | | | | | | | | | | | 96,605 | | | | 8,974,605 | |
Ansell Limited | | | | | | | | | | | 26,316 | | | | 444,209 | |
Asahi Intecc Company Limited | | | | | | | | | | | 8,000 | | | | 355,676 | |
Baxter International Incorporated | | | | | | | | | | | 58,264 | | | | 2,722,677 | |
bioMerieux SA | | | | | | | | | | | 1,765 | | | | 268,442 | |
Boston Scientific Corporation † | | | | | | | | | | | 739,078 | | | | 17,604,838 | |
C.R. Bard Incorporated | | | | | | | | | | | 41,994 | | | | 9,273,955 | |
Cochlear Limited | | | | | | | | | | | 8,162 | | | | 864,302 | |
Coloplast Class B | | | | | | | | | | | 10,575 | | | | 804,390 | |
Cooper Companies Incorporated | | | | | | | | | | | 27,308 | | | | 5,077,103 | |
CYBERDYNE Incorporated †« | | | | | | | | | | | 8,948 | | | | 140,881 | |
Danaher Corporation | | | | | | | | | | | 108,494 | | | | 8,832,497 | |
DexCom Incorporated † | | | | | | | | | | | 111,060 | | | | 10,116,455 | |
DiaSorin SpA | | | | | | | | | | | 1,623 | | | | 104,911 | |
Edwards Lifesciences Corporation † | | | | | | | | | | | 121,882 | | | | 14,035,931 | |
Elekta AB Class B « | | | | | | | | | | | 35,308 | | | | 301,910 | |
Essilor International SA Cie Generale d’Optique | | | | | | | | | | | 17,811 | | | | 2,261,890 | |
Fisher & Paykel Healthcare Corporation | | | | | | | | | | | 89,568 | | | | 628,458 | |
Fukuda Denshi Company Limited | | | | | | | | | | | 2,200 | | | | 129,706 | |
Getinge AB Class B | | | | | | | | | | | 18,499 | | | | 360,876 | |
GN Store Nord A/S | | | | | | | | | | | 17,550 | | | | 376,941 | |
Halyard Health Incorporated † | | | | | | | | | | | 53,142 | | | | 1,937,026 | |
Hartalega Holdings Bhd | | | | | | | | | | | 183,500 | | | | 198,183 | |
Hogy Medical Company Limited | | | | | | | | | | | 2,000 | | | | 135,891 | |
Hoya Corporation | | | | | | | | | | | 58,400 | | | | 2,262,848 | |
IDEXX Laboratories Incorporated † | | | | | | | | | | | 50,374 | | | | 5,676,142 | |
| | | | |
| 50 | | Wells Fargo Diversified Stock Portfolio | | Portfolio of investments—August 31, 2016 (unaudited) |
| | | | | | | | | | | | | | | | |
| Security name | | | | | | | | Shares | | | Value | |
| | | | |
| Health Care Equipment & Supplies (continued) | | | | | | | | | | | | | | | | |
Intuitive Surgical Incorporated † | | | | | | | | | | | 6,842 | | | $ | 4,696,486 | |
Nagaileben Company Limited | | | | | | | | | | | 3,800 | | | | 77,201 | |
Nakanishi Incorporated | | | | | | | | | | | 4,000 | | | | 144,590 | |
Nihon Kohden Corporation | | | | | | | | | | | 13,200 | | | | 300,577 | |
Nikkiso Company Limited | | | | | | | | | | | 14,000 | | | | 123,133 | |
Nipro Corporation | | | | | | | | | | | 22,400 | | | | 278,850 | |
NuVasive Incorporated † | | | | | | | | | | | 64,800 | | | | 4,242,456 | |
Olympus Corporation | | | | | | | | | | | 45,000 | | | | 1,472,237 | |
Osstem Implant Company Limited † | | | | | | | | | | | 1,678 | | | | 85,631 | |
Paramount Bed Holdings Company Limited | | | | | | | | | | | 3,500 | | | | 126,178 | |
ResMed Incorporated | | | | | | | | | | | 79,251 | | | | 5,285,249 | |
Smith & Nephew plc | | | | | | | | | | | 83,542 | | | | 1,348,251 | |
Sonova Holding AG | | | | | | | | | | | 4,488 | | | | 621,033 | |
St. Jude Medical Incorporated | | | | | | | | | | | 29,645 | | | | 2,309,938 | |
Straumann Holding AG | | | | | | | | | | | 989 | | | | 383,614 | |
Sysmex Corporation | | | | | | | | | | | 24,300 | | | | 1,566,530 | |
Teleflex Incorporated | | | | | | | | | | | 58,090 | | | | 10,635,698 | |
Terumo Corporation | | | | | | | | | | | 52,100 | | | | 2,026,797 | |
Top Glove Corporation Bhd | | | | | | | | | | | 366,800 | | | | 384,392 | |
Varian Medical Systems Incorporated † | | | | | | | | | | | 56,276 | | | | 5,409,812 | |
West Pharmaceutical Services Incorporated | | | | | | | | | | | 96,573 | | | | 7,902,569 | |
William Demant Holding † | | | | | | | | | | | 17,515 | | | | 365,951 | |
Zimmer Holdings Incorporated | | | | | | | | | | | 21,000 | | | | 2,721,810 | |
| | | | |
| | | | | | | | | | | | | | | 159,248,774 | |
| | | | | | | | | | | | | | | | |
| | | | |
| Health Care Providers & Services: 2.06% | | | | | | | | | | | | | | | | |
Acadia Healthcare Company Incorporated † | | | | | | | | | | | 97,541 | | | | 4,993,124 | |
Alfresa Holdings Corporation | | | | | | | | | | | 32,200 | | | | 600,959 | |
AmerisourceBergen Corporation | | | | | | | | | | | 104,700 | | | | 9,105,759 | |
AmSurg Corporation † | | | | | | | | | | | 71,000 | | | | 4,609,320 | |
Anthem Incorporated | | | | | | | | | | | 28,181 | | | | 3,524,879 | |
Apollo Hospitals Enterprise Limited | | | | | | | | | | | 21,420 | | | | 431,774 | |
AS ONE Corporation | | | | | | | | | | | 2,400 | | | | 91,509 | |
Bangkok Chain Hospital PCL | | | | | | | | | | | 87 | | | | 30 | |
Bangkok Dusit Medical Services PCL Class F | | | | | | | | | | | 1,509,100 | | | | 1,024,508 | |
Brookdale Senior Living Incorporated † | | | | | | | | | | | 113,800 | | | | 1,958,498 | |
Bumrungrad Hospital PCL | | | | | | | | | | | 107,400 | | | | 527,452 | |
Cardinal Health Incorporated | | | | | | | | | | | 34,400 | | | | 2,740,648 | |
Celesio AG | | | | | | | | | | | 9,643 | | | | 271,704 | |
Centene Corporation † | | | | | | | | | | | 224,602 | | | | 15,338,071 | |
Chemed Corporation | | | | | | | | | | | 21,451 | | | | 2,894,383 | |
Cigna Corporation | | | | | | | | | | | 46,800 | | | | 6,002,568 | |
DaVita HealthCare Partners Incorporated † | | | | | | | | | | | 92,743 | | | | 5,993,980 | |
Express Scripts Holding Company † | | | | | | | | | | | 114,563 | | | | 8,328,730 | |
Fresenius Medical Care AG & Company KGaA | | | | | | | | | | | 19,133 | | | | 1,693,267 | |
Fresenius SE & Company KGaA | | | | | | | | | | | 36,249 | | | | 2,645,189 | |
Healthscope Limited | | | | | | | | | | | 250,063 | | | | 575,081 | |
HealthSouth Corporation | | | | | | | | | | | 115,500 | | | | 4,702,005 | |
Henry Schein Incorporated † | | | | | | | | | | | 46,782 | | | | 7,662,424 | |
Humana Incorporated | | | | | | | | | | | 27,028 | | | | 4,830,174 | |
| | | | | | |
| Portfolio of investments—August 31, 2016 (unaudited) | | Wells Fargo Diversified Stock Portfolio | | | 51 | |
| | | | | | | | | | | | | | | | |
| Security name | | | | | | | | Shares | | | Value | |
| | | | |
| Health Care Providers & Services (continued) | | | | | | | | | | | | | | | | |
IHH Healthcare Bhd | | | | | | | | | | | 615,700 | | | $ | 992,893 | |
Korian SA | | | | | | | | | | | 11,688 | | | | 418,304 | |
Laboratory Corporation of America Holdings † | | | | | | | | | | | 58,285 | | | | 7,980,965 | |
Life Healthcare Group Holdings Limited | | | | | | | | | | | 246,277 | | | | 644,923 | |
LifePoint Hospitals Incorporated † | | | | | | | | | | | 56,556 | | | | 3,201,070 | |
Magellan Health Services Incorporated † | | | | | | | | | | | 35,157 | | | | 2,008,168 | |
McKesson Corporation | | | | | | | | | | | 40,700 | | | | 7,514,034 | |
Mediclinic International plc | | | | | | | | | | | 78,796 | | | | 1,061,404 | |
Medipal Holdings Corporation | | | | | | | | | | | 30,400 | | | | 480,688 | |
MEDNAX Incorporated † | | | | | | | | | | | 52,256 | | | | 3,436,877 | |
Miraca Holdings Incorporated | | | | | | | | | | | 8,300 | | | | 393,481 | |
Molina Healthcare Incorporated † | | | | | | | | | | | 58,800 | | | | 3,164,028 | |
Netcare Limited | | | | | | | | | | | 414,008 | | | | 925,055 | |
Nichii Gakkan Company | | | | | | | | | | | 7,200 | | | | 57,272 | |
Orpea | | | | | | | | | | | 3,644 | | | | 316,437 | |
Owens & Minor Incorporated | | | | | | | | | | | 73,500 | | | | 2,526,195 | |
Patterson Companies Incorporated | | | | | | | | | | | 100,400 | | | | 4,618,400 | |
Primary Health Care Limited | | | | | | | | | | | 92,654 | | | | 284,804 | |
Quest Diagnostics Incorporated | | | | | | | | | | | 79,200 | | | | 6,559,344 | |
Ramsay Health Care Limited | | | | | | | | | | | 20,419 | | | | 1,273,250 | |
Rhoen Klinikum AG | | | | | | | | | | | 4,591 | | | | 135,784 | |
Ryman Healthcare Limited | | | | | | | | | | | 72,433 | | | | 504,551 | |
Ship Healthcare Holdings Incorporated | | | | | | | | | | | 6,600 | | | | 176,251 | |
Sigma Pharmaceuticals Limited | | | | | | | | | | | 257,710 | | | | 236,292 | |
Sinopharm Group Company Limited H Shares | | | | | | | | | | | 367,600 | | | | 1,883,597 | |
Sonic Healthcare Limited | | | | | | | | | | | 59,652 | | | | 1,031,124 | |
Suzuken Company Limited | | | | | | | | | | | 14,800 | | | | 428,988 | |
Team Health Holdings Incorporated † | | | | | | | | | | | 96,200 | | | | 3,203,460 | |
Tenet Healthcare Corporation † | | | | | | | | | | | 129,164 | | | | 3,087,020 | |
Toho Holdings Company Limited | | | | | | | | | | | 9,400 | | | | 182,703 | |
TOKAI Corporation | | | | | | | | | | | 2,600 | | | | 82,801 | |
UDG Healthcare plc | | | | | | | | | | | 34,039 | | | | 273,777 | |
UnitedHealth Group Incorporated | | | | | | | | | | | 105,163 | | | | 14,307,426 | |
Universal Health Services Incorporated Class B | | | | | | | | | | | 51,000 | | | | 6,147,030 | |
Vital KSK Holdings Incorporated | | | | | | | | | | | 9,000 | | | | 81,854 | |
WellCare Health Plans Incorporated † | | | | | | | | | | | 58,300 | | | | 6,570,410 | |
| | | | |
| | | | | | | | | | | | | | | 176,736,696 | |
| | | | | | | | | | | | | | | | |
| | | | |
| Health Care Technology: 0.17% | | | | | | | | | | | | | | | | |
Allscripts Healthcare Solutions Incorporated † | | | | | | | | | | | 221,500 | | | | 2,859,565 | |
athenahealth Incorporated † | | | | | | | | | | | 24,063 | | | | 2,946,033 | |
Cerner Corporation † | | | | | | | | | | | 58,024 | | | | 3,744,869 | |
M3 Incorporated | | | | | | | | | | | 28,600 | | | | 855,526 | |
Medidata Solutions Incorporated † | | | | | | | | | | | 74,400 | | | | 4,025,040 | |
| | | | |
| | | | | | | | | | | | | | | 14,431,033 | |
| | | | | | | | | | | | | | | | |
| | | | |
| Life Sciences Tools & Services: 0.64% | | | | | | | | | | | | | | | | |
Bio Techne Corporation | | | | | | | | | | | 48,878 | | | | 5,149,297 | |
Bio-Rad Laboratories Incorporated Class A † | | | | | | | | | | | 27,067 | | | | 4,027,840 | |
Charles River Laboratories International Incorporated † | | | | | | | | | | | 62,020 | | | | 5,160,684 | |
| | | | |
| 52 | | Wells Fargo Diversified Stock Portfolio | | Portfolio of investments—August 31, 2016 (unaudited) |
| | | | | | | | | | | | | | | | |
| Security name | | | | | | | | Shares | | | Value | |
| | | | |
| Life Sciences Tools & Services (continued) | | | | | | | | | | | | | | | | |
Divi’s Laboratories Limited | | | | | | | | | | | 25,894 | | | $ | 511,346 | |
Eurofins Scientific SE | | | | | | | | | | | 812 | | | | 329,148 | |
Gerresheimer AG | | | | | | | | | | | 3,694 | | | | 306,769 | |
ICON plc ADR † | | | | | | | | | | | 5,230 | | | | 401,612 | |
Illumina Incorporated † | | | | | | | | | | | 26,657 | | | | 4,487,439 | |
Lonza Group AG | | | | | | | | | | | 5,820 | | | | 1,102,992 | |
Mettler-Toledo International Incorporated † | | | | | | | | | | | 15,260 | | | | 6,150,848 | |
Parexel International Corporation † | | | | | | | | | | | 69,096 | | | | 4,700,601 | |
QIAGEN NV † | | | | | | | | | | | 22,655 | | | | 599,922 | |
Quintiles Transnational Holdings Incorporated † | | | | | | | | | | | 52,465 | | | | 4,055,545 | |
Tecan Group AG | | | | | | | | | | | 803 | | | | 126,547 | |
Thermo Fisher Scientific Incorporated | | | | | | | | | | | 71,200 | | | | 10,835,928 | |
Waters Corporation † | | | | | | | | | | | 46,065 | | | | 7,246,485 | |
| | | | |
| | | | | | | | | | | | | | | 55,193,003 | |
| | | | | | | | | | | | | | | | |
| | | | |
| Pharmaceuticals: 3.18% | | | | | | | | | | | | | | | | |
Akorn Incorporated † | | | | | | | | | | | 108,000 | | | | 2,907,360 | |
Alapis Holding Industrial & Commercial SA of Pharmaceutical Chemical Products †(a) | | | | | | | | | | | 1,231 | | | | 0 | |
Allergan plc † | | | | | | | | | | | 71,612 | | | | 16,795,878 | |
Aspen Pharmacare Holdings Limited | | | | | | | | | | | 82,217 | | | | 1,968,466 | |
Astellas Pharma Incorporated | | | | | | | | | | | 320,800 | | | | 4,900,444 | |
AstraZeneca plc | | | | | | | | | | | 112,231 | | | | 7,234,691 | |
Aurobindo Pharma Limited | | | | | | | | | | | 73,202 | | | | 864,444 | |
Bayer AG | | | | | | | | | | | 76,769 | | | | 8,218,103 | |
Bristol-Myers Squibb Company | | | | | | | | | | | 184,485 | | | | 10,587,594 | |
BTG plc † | | | | | | | | | | | 29,198 | | | | 230,431 | |
Bukwang Pharmaceutical Company | | | | | | | | | | | 3,630 | | | | 90,506 | |
Cadila Healthcare Limited | | | | | | | | | | | 101,725 | | | | 578,573 | |
Celltrion Incorporated †« | | | | | | | | | | | 13,443 | | | | 1,287,634 | |
China Medical System Holding Limited | | | | | | | | | | | 329,000 | | | | 551,334 | |
Chugai Pharmaceutical Company Limited | | | | | | | | | | | 31,300 | | | | 981,670 | |
Cipla Limited India | | | | | | | | | | | 112,548 | | | | 962,885 | |
Daiichi Sankyo Company Limited | | | | | | | | | | | 97,200 | | | | 2,230,720 | |
Dong-A ST Company Limited | | | | | | | | | | | 1,090 | | | | 101,668 | |
Dr. Reddys Laboratories Limited | | | | | | | | | | | 23,358 | | | | 1,077,687 | |
Eisai Company Limited | | | | | | | | | | | 42,800 | | | | 2,494,409 | |
Eli Lilly & Company | | | | | | | | | | | 106,619 | | | | 8,289,627 | |
Endo International plc † | | | | | | | | | | | 124,836 | | | | 2,584,105 | |
Galenica AG | | | | | | | | | | | 419 | | | | 486,075 | |
GlaxoSmithKline Pharmaceuticals Limited | | | | | | | | | | | 4,235 | | | | 191,859 | |
GlaxoSmithKline plc | | | | | | | | | | | 437,688 | | | | 9,420,148 | |
Glenmark Pharmaceuticals Limited | | | | | | | | | | | 35,144 | | | | 441,386 | |
GW Pharmaceuticals plc † | | | | | | | | | | | 22,939 | | | | 155,281 | |
H. Lundbeck AS † | | | | | | | | | | | 7,172 | | | | 286,583 | |
Hanmi Pharm Company Limited | | | | | | | | | | | 750 | | | | 399,552 | |
Hanmi Science Company Limited | | | | | | | | | | | 4,294 | | | | 516,050 | |
Haw Par Corporation Limited | | | | | | | | | | | 27,500 | | | | 184,888 | |
Hikma Pharmaceuticals plc | | | | | | | | | | | 10,618 | | | | 298,381 | |
Hisamitsu Pharmaceutical Company Incorporated | | | | | | | | | | | 12,600 | | | | 563,843 | |
Horizon Pharma plc † | | | | | | | | | | | 188,677 | | | | 3,547,128 | |
| | | | | | |
| Portfolio of investments—August 31, 2016 (unaudited) | | Wells Fargo Diversified Stock Portfolio | | | 53 | |
| | | | | | | | | | | | | | | | |
| Security name | | | | | | | | Shares | | | Value | |
| | | | |
| Pharmaceuticals (continued) | | | | | | | | | | | | | | | | |
Hua Han Bio-Pharmaceutical Holdings Limited H Shares | | | | | | | | | | | 4,987 | | | $ | 347 | |
Ilyang Pharmaceutical Company Limited † | | | | | | | | | | | 2,300 | | | | 96,022 | |
Indivior plc | | | | | | | | | | | 61,638 | | | | 254,637 | |
Innoviva Incorporated « | | | | | | | | | | | 105,049 | | | | 1,164,993 | |
Ipsen SA | | | | | | | | | | | 2,572 | | | | 167,058 | |
Jazz Pharmaceuticals plc † | | | | | | | | | | | 34,000 | | | | 4,210,220 | |
Jeil Pharmaceutical Company | | | | | | | | | | | 1,190 | | | | 101,710 | |
Johnson & Johnson | | | | | | | | | | | 297,596 | | | | 35,515,107 | |
Kaken Pharmaceutical Company Limited | | | | | | | | | | | 6,500 | | | | 366,887 | |
Kissei Pharmaceutical Company Limited | | | | | | | | | | | 7,200 | | | | 173,276 | |
Komipharm International Company †« | | | | | | | | | | | 5,117 | | | | 156,034 | |
Kyorin Company Limited | | | | | | | | | | | 8,900 | | | | 178,318 | |
Kyowa Hakko Kogyo Company Limited | | | | | | | | | | | 37,800 | | | | 536,320 | |
LG Life Sciences Limited † | | | | | | | | | | | 1,820 | | | | 105,283 | |
Lupin Limited | | | | | | | | | | | 66,388 | | | | 1,469,319 | |
Luye Pharma Group Limited † | | | | | | | | | | | 418,000 | | | | 265,643 | |
Merck & Company Incorporated | | | | | | | | | | | 306,685 | | | | 19,256,751 | |
Merck KGaA | | | | | | | | | | | 12,492 | | | | 1,314,553 | |
Mitsubishi Tanabe Pharma Corporation | | | | | | | | | | | 36,000 | | | | 668,052 | |
Mochida Pharmaceutical Company Limited | | | | | | | | | | | 2,200 | | | | 152,032 | |
Mylan NV † | | | | | | | | | | | 82,392 | | | | 3,490,125 | |
Nichi-Iko Pharmaceutical Company Limited | | | | | | | | | | | 8,000 | | | | 141,265 | |
Nippon Shinyaku Company Limited | | | | | | | | | | | 9,000 | | | | 417,098 | |
Novartis AG | | | | | | | | | | | 242,433 | | | | 19,078,150 | |
Novo Nordisk AS Class B | | | | | | | | | | | 176,159 | | | | 8,256,257 | |
Ono Pharmaceutical Company Limited | | | | | | | | | | | 77,700 | | | | 2,025,389 | |
Orion Oyj Class A | | | | | | | | | | | 3,628 | | | | 136,419 | |
Orion Oyj Class B | | | | | | | | | | | 8,702 | | | | 329,444 | |
Otsuka Holdings Company Limited | | | | | | | | | | | 80,500 | | | | 3,487,957 | |
Pacira Pharmaceuticals Incorporated † | | | | | | | | | | | 52,919 | | | | 2,097,180 | |
Perrigo Company plc | | | | | | | | | | | 27,634 | | | | 2,514,418 | |
Pfizer Incorporated | | | | | | | | | | | 673,771 | | | | 23,447,231 | |
Piramal Enterprises Limited | | | | | | | | | | | 18,361 | | | | 504,071 | |
PT Kalbe Farma Tbk | | | | | | | | | | | 7,442,000 | | | | 1,007,040 | |
Recordati SpA | | | | | | | | | | | 6,569 | | | | 198,719 | |
Roche Holding AG | | | | | | | | | | | 2,539 | | | | 620,326 | |
Roche Holding AG Genusschein | | | | | | | | | | | 65,222 | | | | 15,901,821 | |
Rohto Pharmaceutical Company Limited | | | | | | | | | | | 16,300 | | | | 255,374 | |
Sanofi SA | | | | | | | | | | | 110,160 | | | | 8,487,183 | |
Santen Pharmaceutical Company Limited | | | | | | | | | | | 60,900 | | | | 766,364 | |
Sawai Pharmaceutical Company Limited | | | | | | | | | | | 5,200 | | | | 341,758 | |
Seikagaku Corporation | | | | | | | | | | | 7,900 | | | | 111,554 | |
Shionogi & Company Limited | | | | | | | | | | | 44,100 | | | | 1,968,761 | |
Sino Biopharmaceutical Limited | | | | | | | | | | | 1,218,000 | | | | 781,902 | |
Sosei Group Corporation Ǡ | | | | | | | | | | | 2,300 | | | | 371,904 | |
Stada Arzneimittel AG | | | | | | | | | | | 5,207 | | | | 279,604 | |
Sumitomo Dainippon Pharma Company Limited | | | | | | | | | | | 25,200 | | | | 421,847 | |
Sun Pharmaceutical Industries Limited | | | | | | | | | | | 303,946 | | | | 3,520,318 | |
Taisho Pharmaceutical Holding Company Limited | | | | | | | | | | | 8,200 | | | | 751,327 | |
Takeda Pharmaceutical Company Limited | | | | | | | | | | | 107,200 | | | | 4,724,612 | |
| | | | |
| 54 | | Wells Fargo Diversified Stock Portfolio | | Portfolio of investments—August 31, 2016 (unaudited) |
| | | | | | | | | | | | | | | | |
| Security name | | | | | | | | Shares | | | Value | |
| | | | |
| Pharmaceuticals (continued) | | | | | | | | | | | | | | | | |
Teva Pharmaceutical Industries Limited | | | | | | | | | | | 94,247 | | | $ | 4,783,466 | |
The United Laboratories International Holdings Limited † | | | | | | | | | | | 500 | | | | 226 | |
Torrent Pharmaceuticals Limited | | | | | | | | | | | 20,280 | | | | 494,191 | |
Towa Pharmaceutical Company Limited | | | | | | | | | | | 1,900 | | | | 71,802 | |
Tsumura & Company | | | | | | | | | | | 10,400 | | | | 273,809 | |
TTY Biopharm Company Limited | | | | | | | | | | | 65,000 | | | | 236,602 | |
UCB SA | | | | | | | | | | | 13,970 | | | | 1,147,053 | |
Valeant Pharmaceuticals International Incorporated † | | | | | | | | | | | 30,257 | | | | 878,823 | |
Yuhan Corporation | | | | | | | | | | | 1,877 | | | | 485,663 | |
Yungjin Pharmaceutical Company † | | | | | | | | | | | 13,070 | | | | 126,011 | |
Zeria Pharmaceutical Company Limited | | | | | | | | | | | 9,000 | | | | 127,260 | |
| | | | |
| | | | | | | | | | | | | | | 272,642,289 | |
| | | | | | | | | | | | | | | | |
| | | | |
Industrials: 10.76% | | | | | | | | | | | | | | | | |
| | | | |
| Aerospace & Defense: 1.32% | | | | | | | | | | | | | | | | |
Airbus Group NV | | | | | | | | | | | 54,584 | | | | 3,183,715 | |
B/E Aerospace Incorporated | | | | | | | | | | | 62,600 | | | | 3,164,430 | |
BAE Systems plc | | | | | | | | | | | 307,386 | | | | 2,173,621 | |
Bharat Electronics Limited | | | | | | | | | | | 27,081 | | | | 493,520 | |
Bombardier Incorporated Class B † | | | | | | | | | | | 143,159 | | | | 234,705 | |
BWX Technologies Incorporated | | | | | | | | | | | 124,908 | | | | 4,847,679 | |
CAE Incorporated | | | | | | | | | | | 24,800 | | | | 353,637 | |
Chemring Group plc | | | | | | | | | | | 12,198 | | | | 22,946 | |
Cobham plc | | | | | | | | | | | 161,040 | | | | 341,946 | |
Dassault Aviation SA | | | | | | | | | | | 313 | | | | 333,722 | |
Elbit Systems Limited | | | | | | | | | | | 1,785 | | | | 173,538 | |
Embraer SA | | | | | | | | | | | 217,900 | | | | 966,960 | |
General Dynamics Corporation | | | | | | | | | | | 30,926 | | | | 4,707,556 | |
Hanwha Techwin Company Limited | | | | | | | | | | | 9,105 | | | | 503,021 | |
Hexcel Corporation | | | | | | | | | | | 122,400 | | | | 5,489,640 | |
Huntington Ingalls Industries Incorporated | | | | | | | | | | | 62,707 | | | | 10,357,315 | |
KLX Incorporated † | | | | | | | | | | | 75,045 | | | | 2,802,180 | |
Korea Aerospace Industries Limited | | | | | | | | | | | 7,520 | | | | 571,250 | |
L-3 Communications Holdings Incorporated | | | | | | | | | | | 43,085 | | | | 6,411,910 | |
Leonardo-Finmeccanica SpA † | | | | | | | | | | | 34,904 | | | | 398,291 | |
Lockheed Martin Corporation | | | | | | | | | | | 27,449 | | | | 6,669,284 | |
MacDonald Dettwiler & Associates Limited | | | | | | | | | | | 2,966 | | | | 195,818 | |
Meggitt plc | | | | | | | | | | | 77,064 | | | | 473,903 | |
Moog Incorporated Class A † | | | | | | | | | | | 46,740 | | | | 2,757,193 | |
MTU Aero Engines AG | | | | | | | | | | | 4,407 | | | | 448,123 | |
Northrop Grumman Corporation | | | | | | | | | | | 19,451 | | | | 4,124,974 | |
Orbital ATK Incorporated | | | | | | | | | | | 77,157 | | | | 5,819,953 | |
Qinetiq Group plc | | | | | | | | | | | 51,946 | | | | 157,231 | |
Raytheon Company | | | | | | | | | | | 32,000 | | | | 4,484,160 | |
Rockwell Collins Incorporated | | | | | | | | | | | 72,896 | | | | 6,100,666 | |
Rolls-Royce Holdings plc - BATS Exchange | | | | | | | | | | | 181,553 | | | | 1,835,728 | |
Saab AB Class B | | | | | | | | | | | 5,318 | | | | 181,146 | |
Safran SA | | | | | | | | | | | 31,081 | | | | 2,173,072 | |
Senior plc | | | | | | | | | | | 38,774 | | | | 120,213 | |
Singapore Technologies Engineering Limited | | | | | | | | | | | 264,000 | | | | 625,873 | |
| | | | | | |
| Portfolio of investments—August 31, 2016 (unaudited) | | Wells Fargo Diversified Stock Portfolio | | | 55 | |
| | | | | | | | | | | | | | | | |
| Security name | | | | | | | | Shares | | | Value | |
| | | | |
| Aerospace & Defense (continued) | | | | | | | | | | | | | | | | |
Teledyne Technologies Incorporated † | | | | | | | | | | | 45,176 | | | $ | 4,840,157 | |
Thales SA | | | | | | | | | | | 9,751 | | | | 844,362 | |
TransDigm Group Incorporated † | | | | | | | | | | | 30,240 | | | | 8,624,146 | |
Ultra Electronics Holdings plc | | | | | | | | | | | 5,405 | | | | 119,949 | |
United Technologies Corporation | | | | | | | | | | | 140,909 | | | | 14,996,945 | |
Zodiac Aerospace SA | | | | | | | | | | | 17,330 | | | | 394,347 | |
| | | | |
| | | | | | | | | | | | | | | 113,518,825 | |
| | | | | | | | | | | | | | | | |
| | | | |
| Air Freight & Logistics: 0.30% | | | | | | | | | | | | | | | | |
Bollore Investissement | | | | | | | | | | | 97,380 | | | | 351,720 | |
Bpost SA | | | | | | | | | | | 9,098 | | | | 231,383 | |
Deutsche Post AG | | | | | | | | | | | 89,813 | | | | 2,845,167 | |
Expeditors International of Washington Incorporated | | | | | | | | | | | 101,600 | | | | 5,146,040 | |
FedEx Corporation | | | | | | | | | | | 45,200 | | | | 7,454,836 | |
Freightways Limited | | | | | | | | | | | 37,588 | | | | 184,917 | |
Hub Group Incorporated Class A † | | | | | | | | | | | 48,701 | | | | 1,984,566 | |
Hyundai Glovis Company Limited | | | | | | | | | | | 2,877 | | | | 473,479 | |
Kerry Logistics Network Limited | | | | | | | | | | | 72,526 | | | | 101,157 | |
Kintetsu World Express Incorporated | | | | | | | | | | | 5,900 | | | | 71,736 | |
Mainfreight Limited | | | | | | | | | | | 9,747 | | | | 121,646 | |
Mitsui-Soko Company Limited | | | | | | | | | | | 20,000 | | | | 58,764 | |
Oesterreichische Post AG | | | | | | | | | | | 4,954 | | | | 177,935 | |
Panalpina Welttransport Holdings AG | | | | | | | | | | | 1,522 | | | | 209,835 | |
PostNL † | | | | | | | | | | | 25,238 | | | | 110,439 | |
Royal Mail plc | | | | | | | | | | | 72,366 | | | | 488,441 | |
Singapore Post Limited | | | | | | | | | | | 260,000 | | | | 260,487 | |
XPO Logistics Incorporated †« | | | | | | | | | | | 116,105 | | | | 4,156,559 | |
Yamato Holdings Company Limited | | | | | | | | | | | 55,200 | | | | 1,302,574 | |
| | | | |
| | | | | | | | | | | | | | | 25,731,681 | |
| | | | | | | | | | | | | | | | |
| | | | |
| Airlines: 0.40% | | | | | | | | | | | | | | | | |
Air Canada † | | | | | | | | | | | 26,372 | | | | 180,184 | |
Air China H Shares | | | | | | | | | | | 534,000 | | | | 395,120 | |
Air France-KLM † | | | | | | | | | | | 16,025 | | | | 87,999 | |
All Nippon Airways Company Limited | | | | | | | | | | | 169,000 | | | | 459,476 | |
Allegiant Travel Company | | | | | | | | | | | 18,500 | | | | 2,557,440 | |
Asiana Airlines † | | | | | | | | | | | 21,610 | | | | 104,077 | |
Cathay Pacific Airways Limited | | | | | | | | | | | 167,000 | | | | 240,246 | |
China Airlines | | | | | | | | | | | 594,775 | | | | 172,638 | |
Chorus Aviation Incorporated | | | | | | | | | | | 63 | | | | 288 | |
Deutsche Lufthansa AG | | | | | | | | | | | 24,014 | | | | 279,784 | |
easyJet plc | | | | | | | | | | | 22,179 | | | | 321,824 | |
Eva Airways Corporation | | | | | | | | | | | 427,849 | | | | 198,212 | |
International Consolidated Airlines | | | | | | | | | | | 72,922 | | | | 366,751 | |
Japan Airlines Company Limited | | | | | | | | | | | 17,605 | | | | 535,475 | |
JetBlue Airways Corporation † | | | | | | | | | | | 426,213 | | | | 6,798,097 | |
Korean Air Lines Company Limited † | | | | | | | | | | | 7,538 | | | | 213,295 | |
LANTAM Airlines Group SA † | | | | | | | | | | | 79,059 | | | | 622,209 | |
Qantas Airways Limited | | | | | | | | | | | 191,247 | | | | 465,691 | |
| | | | |
| 56 | | Wells Fargo Diversified Stock Portfolio | | Portfolio of investments—August 31, 2016 (unaudited) |
| | | | | | | | | | | | | | | | |
| Security name | | | | | | | | Shares | | | Value | |
| | | | |
| Airlines (continued) | | | | | | | | | | | | | | | | |
Ryanair Holdings plc | | | | | | | | | | | 15,795 | | | $ | 1,146,875 | |
Singapore Airlines Limited | | | | | | | | | | | 90,200 | | | | 695,145 | |
Southwest Airlines Company | | | | | | | | | | | 115,600 | | | | 4,263,328 | |
Spirit Airlines Incorporated † | | | | | | | | | | | 92,614 | | | | 3,703,634 | |
Turk Hava Yollari Anonim Ortakligi †« | | | | | | | | | | | 270,807 | | | | 472,490 | |
United Continental Holdings Incorporated † | | | | | | | | | | | 191,600 | | | | 9,658,556 | |
Virgin Australia International Holdings (a) | | | | | | | | | | | 177,317 | | | | 0 | |
WestJet Airlines Limited | | | | | | | | | | | 32,660 | | | | 602,693 | |
| | | | |
| | | | | | | | | | | | | | | 34,541,527 | |
| | | | | | | | | | | | | | | | |
| | | | |
| Building Products: 0.63% | | | | | | | | | | | | | | | | |
A.O. Smith Corporation | | | | | | | | | | | 99,000 | | | | 9,551,520 | |
Aica Kogyo Company Limited | | | | | | | | | | | 9,900 | | | | 246,005 | |
Armstrong Flooring Incorporated † | | | | | | | | | | | 34,365 | | | | 708,606 | |
Armstrong World Industries Incorporated | | | | | | | | | | | 68,700 | | | | 2,986,389 | |
Asahi Glass Company Limited | | | | | | | | | | | 175,000 | | | | 1,112,937 | |
Assa Abloy AB Class B | | | | | | | | | | | 92,949 | | | | 1,882,726 | |
Belimo Holding AG | | | | | | | | | | | 43 | | | | 144,273 | |
Bunka Shutter Company Limited | | | | | | | | | | | 12,000 | | | | 83,622 | |
Central Glass Company Limited | | | | | | | | | | | 31,000 | | | | 118,948 | |
Compagnie de Saint-Gobain SA | | | | | | | | | | | 45,570 | | | | 1,998,678 | |
Daikin Industries Limited | | | | | | | | | | | 42,700 | | | | 3,957,380 | |
Dorma+Kaba Holding AG Class B | | | | | | | | | | | 280 | | | | 219,775 | |
Geberit AG | | | | | | | | | | | 3,718 | | | | 1,621,699 | |
GWA International Limited | | | | | | | | | | | 44,009 | | | | 97,902 | |
Johnson Controls Incorporated | | | | | | | | | | | 68,800 | | | | 3,018,944 | |
KCC Corporation | | | | | | | | | | | 841 | | | | 311,132 | |
Kingspan Group plc | | | | | | | | | | | 16,453 | | | | 451,105 | |
Lennox International Incorporated | | | | | | | | | | | 51,358 | | | | 8,272,233 | |
LIXIL Group Corporation | | | | | | | | | | | 42,000 | | | | 847,185 | |
Nibe Industrier AB Class B | | | | | | | | | | | 53,652 | | | | 480,387 | |
Nichias Corporation | | | | | | | | | | | 22,000 | | | | 196,260 | |
Nichiha Corporation | | | | | | | | | | | 5,800 | | | | 107,238 | |
Nippon Sheet Glass Company Limited | | | | | | | | | | | 171,000 | | | | 132,219 | |
Nitto Boseki Company Limited | | | | | | | | | | | 38,000 | | | | 128,913 | |
Noritz Corporation | | | | | | | | | | | 8,300 | | | | 162,446 | |
Okabe Company Limited | | | | | | | | | | | 8,500 | | | | 68,680 | |
Owens Corning Incorporated | | | | | | | | | | | 60,200 | | | | 3,306,184 | |
Rockwool International AS Class B | | | | | | | | | | | 400 | | | | 75,900 | |
Sankyo Tateyama Incorporated | | | | | | | | | | | 4,600 | | | | 69,401 | |
Sanwa Holdings Corporation | | | | | | | | | | | 35,900 | | | | 318,525 | |
Sekisui Jushi Corporation | | | | | | | | | | | 6,000 | | | | 93,771 | |
Taiwan Glass Industrial Corporation † | | | | | | | | | | | 343,581 | | | | 140,765 | |
Takara Standard Company Limited | | | | | | | | | | | 20,000 | | | | 166,433 | |
Takasago Thermal Engineering Company | | | | | | | | | | | 9,700 | | | | 143,815 | |
TOTO Limited | | | | | | | | | | | 23,400 | | | | 888,822 | |
Tyco International plc | | | | | | | | | | | 230,254 | | | | 10,057,495 | |
Uponor Oyj | | | | | | | | | | | 2,800 | | | | 50,597 | |
| | | | |
| | | | | | | | | | | | | | | 54,218,910 | |
| | | | | | | | | | | | | | | | |
| | | | | | |
| Portfolio of investments—August 31, 2016 (unaudited) | | Wells Fargo Diversified Stock Portfolio | | | 57 | |
| | | | | | | | | | | | | | | | |
| Security name | | | | | | | | Shares | | | Value | |
| | | | |
| Commercial Services & Supplies: 0.79% | | | | | | | | | | | | | | | | |
Aeon Delight Company Limited | | | | | | | | | | | 3,500 | | | $ | 98,473 | |
Aggreko plc | | | | | | | | | | | 24,032 | | | | 321,572 | |
Babcock International Group plc | | | | | | | | | | | 46,368 | | | | 636,890 | |
Berendsen plc | | | | | | | | | | | 15,297 | | | | 246,069 | |
Bilfinger SE † | | | | | | | | | | | 4,408 | | | | 127,717 | |
Brambles Limited | | | | | | | | | | | 227,942 | | | | 2,110,538 | |
Cabcharge Australia Limited « | | | | | | | | | | | 26,928 | | | | 65,570 | |
China Everbright International Limited | | | | | | | | | | | 717,000 | | | | 916,867 | |
Civeo Corporation † | | | | | | | | | | | 59,549 | | | | 68,481 | |
Clean Harbors Incorporated † | | | | | | | | | | | 67,504 | | | | 3,226,691 | |
Cleanaway Waste Management Limited | | | | | | | | | | | 162,245 | | | | 137,787 | |
Copart Incorporated † | | | | | | | | | | | 131,190 | | | | 6,693,314 | |
Covanta Holding Corporation | | | | | | | | | | | 153,000 | | | | 2,278,170 | |
Dai Nippon Printing Company Limited | | | | | | | | | | | 89,000 | | | | 904,924 | |
Daiseki Company Limited | | | | | | | | | | | 6,700 | | | | 116,496 | |
De La Rue plc | | | | | | | | | | | 11,470 | | | | 91,199 | |
Deluxe Corporation | | | | | | | | | | | 58,634 | | | | 3,997,080 | |
Downer EDI Limited | | | | | | | | | | | 82,141 | | | | 302,492 | |
Duskin Company Limited | | | | | | | | | | | 8,400 | | | | 144,188 | |
Edenred | | | | | | | | | | | 14,866 | | | | 323,686 | |
Essendant Incorporated | | | | | | | | | | | 49,312 | | | | 955,173 | |
G4S plc | | | | | | | | | | | 126,965 | | | | 384,466 | |
HomeServe plc | | | | | | | | | | | 12,155 | | | | 90,341 | |
Intrum Justitia AB | | | | | | | | | | | 10,031 | | | | 316,726 | |
ISS A/S | | | | | | | | | | | 13,842 | | | | 560,576 | |
KEPCO Plant Service & Engineering Company Limited | | | | | | | | | | | 3,274 | | | | 189,099 | |
Kokuyo Company Limited | | | | | | | | | | | 17,300 | | | | 238,938 | |
Loomis AB Class B | | | | | | | | | | | 8,827 | | | | 252,623 | |
Mineral Resources Limited | | | | | | | | | | | 31,646 | | | | 269,706 | |
Mitie Group plc « | | | | | | | | | | | 40,984 | | | | 145,524 | |
Mitsubishi Pencil Company Limited | | | | | | | | | | | 4,400 | | | | 214,759 | |
MSA Safety Incorporated | | | | | | | | | | | 45,321 | | | | 2,639,948 | |
Nissha Printing Company Limited « | | | | | | | | | | | 7,200 | | | | 173,554 | |
Okamura Corporation | | | | | | | | | | | 15,400 | | | | 141,103 | |
Oyo Corporation | | | | | | | | | | | 3,900 | | | | 39,503 | |
Park24 Company Limited | | | | | | | | | | | 16,100 | | | | 470,715 | |
Pilot Corporation | | | | | | | | | | | 5,800 | | | | 227,874 | |
Pitney Bowes Incorporated | | | | | | | | | | | 226,500 | | | | 4,249,140 | |
Prosegur Compania de Seguridad SA | | | | | | | | | | | 26,730 | | | | 179,194 | |
Regus plc | | | | | | | | | | | 55,194 | | | | 217,216 | |
Relia Incorporated | | | | | | | | | | | 8,300 | | | | 78,536 | |
Rentokil Initial plc | | | | | | | | | | | 173,799 | | | | 488,171 | |
Republic Services Incorporated | | | | | | | | | | | 127,900 | | | | 6,461,508 | |
Ritchie Bros. Auctioneers Incorporated | | | | | | | | | | | 6,229 | | | | 216,642 | |
RR Donnelley & Sons Company | | | | | | | | | | | 251,822 | | | | 4,306,156 | |
S1 Corporation Incorporated | | | | | | | | | | | 2,828 | | | | 261,241 | |
Sato Corporation | | | | | | | | | | | 4,000 | | | | 84,202 | |
Secom Company Limited | | | | | | | | | | | 30,000 | | | | 2,276,712 | |
Securitas AB Class B | | | | | | | | | | | 25,461 | | | | 442,857 | |
Serco Group plc † | | | | | | | | | | | 97,398 | | | | 163,710 | |
| | | | |
| 58 | | Wells Fargo Diversified Stock Portfolio | | Portfolio of investments—August 31, 2016 (unaudited) |
| | | | | | | | | | | | | | | | |
| Security name | | | | | | | | Shares | | | Value | |
| | | | |
| Commercial Services & Supplies (continued) | | | | | | | | | | | | | | | | |
Societe BIC SA | | | | | | | | | | | 2,766 | | | $ | 403,716 | |
Sohgo Security Services Company Limited | | | | | | | | | | | 13,000 | | | | 649,592 | |
Spotless Group Holdings Limited | | | | | | | | | | | 290,919 | | | | 230,665 | |
Stericycle Incorporated † | | | | | | | | | | | 47,931 | | | | 4,121,107 | |
Taiwan Secom Company Limited | | | | | | | | | | | 64,960 | | | | 184,661 | |
Tetra Tech Incorporated | | | | | | | | | | | 67,000 | | | | 2,365,100 | |
Tomra Systems ASA | | | | | | | | | | | 7,776 | | | | 86,786 | |
Toppan Forms Company Limited | | | | | | | | | | | 6,500 | | | | 68,477 | |
Toppan Printing Company Limited | | | | | | | | | | | 95,000 | | | | 846,566 | |
Transcontinental Incorporated Class A | | | | | | | | | | | 3,424 | | | | 50,130 | |
Waste Connections Incorporated | | | | | | | | | | | 5,786 | | | | 441,473 | |
Waste Connections Incorporated | | | | | | | | | | | 73,348 | | | | 5,605,988 | |
Waste Management Incorporated | | | | | | | | | | | 43,953 | | | | 2,810,355 | |
| | | | |
| | | | | | | | | | | | | | | 67,408,733 | |
| | | | | | | | | | | | | | | | |
| | | | |
| Construction & Engineering: 0.64% | | | | | | | | | | | | | | | | |
Abengoa SA Class A | | | | | | | | | | | 2,071 | | | | 1,312 | |
Actividades de Construccion y Servicios SA | | | | | | | | | | | 16,688 | | | | 472,905 | |
AECOM Technology Corporation † | | | | | | | | | | | 186,700 | | | | 5,755,961 | |
Aecon Group Incorporated | | | | | | | | | | | 8,690 | | | | 121,596 | |
Arcadis NV | | | | | | | | | | | 7,054 | | | | 94,578 | |
Balfour Beatty plc † | | | | | | | | | | | 61,174 | | | | 226,773 | |
Bouygues SA | | | | | | | | | | | 16,989 | | | | 538,759 | |
Budimex SA | | | | | | | | | | | 6,367 | | | | 320,928 | |
Cardno Limited « | | | | | | | | | | | 53,299 | | | | 30,644 | |
Carillion plc | | | | | | | | | | | 47,881 | | | | 163,601 | |
China Communications Construction Company Limited H Shares | | | | | | | | | | | 1,454,779 | | | | 1,586,510 | |
China Railway Group Limited Class H | | | | | | | | | | | 1,159,000 | | | | 859,066 | |
China State Construction International Holdings Limited | | | | | | | | | | | 438,000 | | | | 522,830 | |
Chiyoda Corporation | | | | | | | | | | | 25,000 | | | | 202,001 | |
Chudenko Corporation | | | | | | | | | | | 6,500 | | | | 123,887 | |
CIMIC Group Limited | | | | | | | | | | | 17,730 | | | | 394,553 | |
Comsys Holdings Corporation | | | | | | | | | | | 16,700 | | | | 315,551 | |
CTCI Corporation | | | | | | | | | | | 123,000 | | | | 174,438 | |
Daelim Industrial Company Limited | | | | | | | | | | | 6,425 | | | | 467,325 | |
Daewoo Engineering & Construction Company Limited † | | | | | | | | | | | 31,654 | | | | 172,607 | |
Dialog Group Bhd | | | | | | | | | | | 784,124 | | | | 297,756 | |
Eiffage SA | | | | | | | | | | | 4,842 | | | | 379,151 | |
EverChina International Holdings Company Limited † | | | | | | | | | | | 960,000 | | | | 32,175 | |
Ferrovial SA | | | | | | | | | | | 37,886 | | | | 746,522 | |
Flsmidth & Company AS | | | | | | | | | | | 5,428 | | | | 200,299 | |
Fluor Corporation | | | | | | | | | | | 73,400 | | | | 3,809,460 | |
Galliford Try plc | | | | | | | | | | | 7,693 | | | | 114,658 | |
Gamuda Bhd | | | | | | | | | | | 828,450 | | | | 996,877 | |
GS Engineering & Construction Corporation † | | | | | | | | | | | 11,855 | | | | 305,678 | |
Hanison Construction Holding Limited | | | | | | | | | | | 30,555 | | | | 5,199 | |
Hazama Ando Corporation | | | | | | | | | | | 30,100 | | | | 167,861 | |
Hibiya Engineering Limited | | | | | | | | | | | 6,000 | | | | 93,597 | |
Hochtief AG | | | | | | | | | | | 4,214 | | | | 566,646 | |
Hyundai Development Company | | | | | | | | | | | 9,673 | | | | 404,704 | |
| | | | | | |
| Portfolio of investments—August 31, 2016 (unaudited) | | Wells Fargo Diversified Stock Portfolio | | | 59 | |
| | | | | | | | | | | | | | | | |
| Security name | | | | | | | | Shares | | | Value | |
| | | | |
| Construction & Engineering (continued) | | | | | | | | | | | | | | | | |
Hyundai Engineering & Construction Company Limited | | | | | | | | | | | 11,463 | | | $ | 396,322 | |
IJM Corporation Bhd | | | | | | | | | | | 1,039,140 | | | | 878,868 | |
Impulsora del Desarrollo y El Empleo en America Latina SAB de CV † | | | | | | | | | | | 407,640 | | | | 613,195 | |
Interserve plc | | | | | | | | | | | 12,112 | | | | 68,431 | |
Jacobs Engineering Group Incorporated † | | | | | | | | | | | 63,900 | | | | 3,366,891 | |
JGC Corporation | | | | | | | | | | | 38,000 | | | | 602,697 | |
Kajima Corporation | | | | | | | | | | | 145,000 | | | | 974,001 | |
Kandenko Company Limited | | | | | | | | | | | 16,000 | | | | 142,425 | |
KBR Incorporated | | | | | | | | | | | 187,800 | | | | 2,756,904 | |
KEPCO Engineering & Construction Company Incorporated | | | | | | | | | | | 1,785 | | | | 51,949 | |
Kier Group plc | | | | | | | | | | | 8,943 | | | | 146,559 | |
Kinden Corporation | | | | | | | | | | | 23,000 | | | | 251,863 | |
Koninklijke Bam Groep NV | | | | | | | | | | | 28,912 | | | | 129,774 | |
Kumagai Gumi Company Limited | | | | | | | | | | | 61,000 | | | | 164,490 | |
Kumho Industrial Company Limited † | | | | | | | | | | | 9 | | | | 90 | |
Kyowa Exeo Corporation | | | | | | | | | | | 14,600 | | | | 209,831 | |
Kyudenko Corporation | | | | | | | | | | | 7,200 | | | | 227,555 | |
Larsen & Toubro Limited | | | | | | | | | | | 54,392 | | | | 1,228,795 | |
Larsen & Toubro Limited GDR | | | | | | | | | | | 8,011 | | | | 180,248 | |
Maeda Corporation | | | | | | | | | | | 23,000 | | | | 191,843 | |
Maeda Road Construction Company Limited | | | | | | | | | | | 10,000 | | | | 170,106 | |
Malaysian Resources Corporation Bhd | | | | | | | | | | | 50 | | | | 15 | |
Mirait Holdings Corporation | | | | | | | | | | | 11,700 | | | | 98,720 | |
Monadelphous Group Limited « | | | | | | | | | | | 19,272 | | | | 125,286 | |
NCC AB Class B | | | | | | | | | | | 8,600 | | | | 214,481 | |
Nippo Corporation | | | | | | | | | | | 8,000 | | | | 144,977 | |
Nippon Densetsu Kogyo Company Limited | | | | | | | | | | | 8,000 | | | | 150,389 | |
Nippon Koei Company Limited | | | | | | | | | | | 15,000 | | | | 57,991 | |
Nishimatsu Construction Company Limited | | | | | | | | | | | 45,000 | | | | 204,852 | |
Obayashi Corporation | | | | | | | | | | | 106,200 | | | | 980,245 | |
Obrascon Huarte Lain SA | | | | | | | | | | | 10,626 | | | | 35,440 | |
Okumura Corporation | | | | | | | | | | | 29,000 | | | | 156,401 | |
Outotec Oyj † | | | | | | | | | | | 15,988 | | | | 68,197 | |
Peab AB | | | | | | | | | | | 21,523 | | | | 179,889 | |
Penta-Ocean Construction Company Limited | | | | | | | | | | | 41,700 | | | | 220,057 | |
Quanta Services Incorporated † | | | | | | | | | | | 198,000 | | | | 5,094,540 | |
Royal Boskalis Westminster NV | | | | | | | | | | | 8,093 | | | | 289,326 | |
Samsung Engineering Company Limited † | | | | | | | | | | | 30,682 | | | | 309,572 | |
Sanki Engineering Company Limited | | | | | | | | | | | 10,000 | | | | 80,704 | |
Shimizu Corporation | | | | | | | | | | | 107,000 | | | | 954,535 | |
Sho-Bond Holdings Company Limited | | | | | | | | | | | 3,600 | | | | 158,836 | |
Sino Thai Engineering & Construction PCL | | | | | | | | | | | 374,529 | | | | 270,492 | |
Skanska AB Class B | | | | | | | | | | | 34,816 | | | | 763,372 | |
SNC-Lavalin Group Incorporated | | | | | | | | | | | 14,400 | | | | 613,817 | |
Socam Development Limited † | | | | | | | | | | | 63 | | | | 27 | |
Sumitomo Mitsui Construction Company Limited | | | | | | | | | | | 150,200 | | | | 140,815 | |
Taikisha Limited | | | | | | | | | | | 5,400 | | | | 121,032 | |
Taisei Corporation | | | | | | | | | | | 169,000 | | | | 1,270,787 | |
Takamatsu Corporation | | | | | | | | | | | 3,600 | | | | 83,054 | |
Toa Corporation | | | | | | | | | | | 31,000 | | | | 56,029 | |
| | | | |
| 60 | | Wells Fargo Diversified Stock Portfolio | | Portfolio of investments—August 31, 2016 (unaudited) |
| | | | | | | | | | | | | | | | |
| Security name | | | | | | | | Shares | | | Value | |
| | | | |
| Construction & Engineering (continued) | | | | | | | | | | | | | | | | |
Toda Corporation | | | | | | | | | | | 37,000 | | | $ | 188,460 | |
Tokyu Construction Company Limited | | | | | | | | | | | 13,280 | | | | 130,021 | |
Toshiba Plant Systems & Services Corporation | | | | | | | | | | | 6,000 | | | | 94,293 | |
Totetsu Kogyo Company Limited | | | | | | | | | | | 5,900 | | | | 162,747 | |
Toyo Engineering Corporation | | | | | | | | | | | 28,000 | | | | 86,329 | |
United Engineers Limited | | | | | | | | | | | 59,000 | | | | 97,435 | |
Valmont Industries Incorporated | | | | | | | | | | | 29,477 | | | | 3,845,864 | |
Vinci SA | | | | | | | | | | | 43,394 | | | | 3,290,978 | |
WSP Global Incorporated | | | | | | | | | | | 5,250 | | | | 172,625 | |
YIT Oyj | | | | | | | | | | | 11,040 | | | | 77,028 | |
Yokogawa Bridge Holdings Corporation | | | | | | | | | | | 8,000 | | | | 88,687 | |
| | | | |
| | | | | | | | | | | | | | | 54,497,590 | |
| | | | | | | | | | | | | | | | |
| | | | |
| Electrical Equipment: 0.73% | | | | | | | | | | | | | | | | |
ABB Limited | | | | | | | | | | | 183,256 | | | | 3,970,500 | |
ABB Limited - Natl India Exchange | | | | | | | | | | | 14,757 | | | | 255,267 | |
Acuity Brands Incorporated | | | | | | | | | | | 24,962 | | | | 6,867,545 | |
AMETEK Incorporated | | | | | | | | | | | 132,768 | | | | 6,472,440 | |
Bharat Heavy Electricals limited | | | | | | | | | | | 223,538 | | | | 464,299 | |
Cosel Company Limited | | | | | | | | | | | 4,900 | | | | 51,148 | |
Daihen Corporation | | | | | | | | | | | 18,000 | | | | 94,467 | |
Denyo Company Limited | | | | | | | | | | | 3,200 | | | | 30,928 | |
Doosan Heavy Industries & Construction Company Limited | | | | | | | | | | | 13,384 | | | | 331,899 | |
Eaton Corporation plc | | | | | | | | | | | 48,605 | | | | 3,234,177 | |
Elswedy Cables Holding Company | | | | | | | | | | | 9,692 | | | | 56,210 | |
Emerson Electric Company | | | | | | | | | | | 68,904 | | | | 3,629,863 | |
FDG Electric Vehicles Limited † | | | | | | | | | | | 1,480,000 | | | | 91,575 | |
Fuji Electric Holdings Company Limited | | | | | | | | | | | 102,000 | | | | 465,317 | |
Fujikura Limited | | | | | | | | | | | 46,000 | | | | 258,310 | |
Furukawa Electric Company Limited | | | | | | | | | | | 104,000 | | | | 268,381 | |
Futaba Corporation | | | | | | | | | | | 6,900 | | | | 103,435 | |
Gamesa Corporación Tecnologica SA | | | | | | | | | | | 20,083 | | | | 460,913 | |
GS Yuasa Corporation | | | | | | | | | | | 61,000 | | | | 237,597 | |
Havells India Limited | | | | | | | | | | | 71,752 | | | | 447,419 | |
Johnson Electric Holdings Limited | | | | | | | | | | | 54,750 | | | | 146,446 | |
Legrand SA | | | | | | | | | | | 23,684 | | | | 1,418,928 | |
LS Corporation | | | | | | | | | | | 7,178 | | | | 404,929 | |
LS Industrial Systems Company Limited | | | | | | | | | | | 3,641 | | | | 139,436 | |
Mabuchi Motor Company Limited | | | | | | | | | | | 8,700 | | | | 461,634 | |
Mitsubishi Electric Corporation | | | | | | | | | | | 313,000 | | | | 4,085,502 | |
Nidec Corporation | | | | | | | | | | | 39,800 | | | | 3,585,904 | |
Nitto Kogyo Corporation | | | | | | | | | | | 4,900 | | | | 60,998 | |
Nordex AG † | | | | | | | | | | | 816 | | | | 22,578 | |
Osram Licht AG | | | | | | | | | | | 7,623 | | | | 399,134 | |
Prysmian SpA | | | | | | | | | | | 18,370 | | | | 453,257 | |
Rockwell Automation Incorporated | | | | | | | | | | | 74,300 | | | | 8,613,599 | |
Sanyo Denki Company Limited | | | | | | | | | | | 6,000 | | | | 31,141 | |
Schneider Electric SE | | | | | | | | | | | 52,663 | | | | 3,588,607 | |
Schneider Electric SE - London Exchange | | | | | | | | | | | 1,614 | | | | 110,307 | |
Sensata Technologies Holding NV † | | | | | | | | | | | 95,700 | | | | 3,644,256 | |
| | | | | | |
| Portfolio of investments—August 31, 2016 (unaudited) | | Wells Fargo Diversified Stock Portfolio | | | 61 | |
| | | | | | | | | | | | | | | | |
| Security name | | | | | | | | Shares | | | Value | |
| | | | |
| Electrical Equipment (continued) | | | | | | | | | | | | | | | | |
SGL Carbon AG « | | | | | | | | | | | 3,056 | | | $ | 39,338 | |
Shihlin Electric | | | | | | | | | | | 118,000 | | | | 144,290 | |
SolarCity Corporation †« | | | | | | | | | | | 85,386 | | | | 1,764,075 | |
Sumitomo Electric Industries Limited | | | | | | | | | | | 115,700 | | | | 1,714,840 | |
Teco Electric & Machinery Company Limited | | | | | | | | | | | 774,000 | | | | 651,291 | |
Ushio Incorporated | | | | | | | | | | | 18,700 | | | | 208,029 | |
Vestas Wind Systems AS | | | | | | | | | | | 23,748 | | | | 1,970,131 | |
Voltronic Power Technology Corporation | | | | | | | | | | | 13,650 | | | | 211,221 | |
Walsin Lihwa Corporation | | | | | | | | | | | 600,000 | | | | 192,874 | |
Ya Hsin Industrial Company Limited †(a) | | | | | | | | | | | 40,000 | | | | 0 | |
Zhuzhou CSR Times Electric Company Limited H Shares | | | | | | | | | | | 151,000 | | | | 802,927 | |
| | | | |
| | | | | | | | | | | | | | | 62,657,362 | |
| | | | | | | | | | | | | | | | |
| | | | |
| Industrial Conglomerates: 1.11% | | | | | | | | | | | | | | | | |
Aboitiz Equity Ventures Incorporated | | | | | | | | | | | 814,780 | | | | 1,311,482 | |
Aditya Birla Nuvo Limited | | | | | | | | | | | 9,359 | | | | 192,183 | |
Alfa SA de CV Class A | | | | | | | | | | | 1,170,200 | | | | 1,904,014 | |
Alliance Global Group Incorporated | | | | | | | | | | | 970,700 | | | | 339,573 | |
Antarchile SA | | | | | | | | | | | 32,607 | | | | 301,786 | |
Beijing Enterprises Holdings Limited | | | | | | | | | | | 135,000 | | | | 774,407 | |
Bidvest Group Limited | | | | | | | | | | | 93,694 | | | | 968,677 | |
Boustead Holdings Bhd | | | | | | | | | | | 158,368 | | | | 84,348 | |
CITIC Pacific Limited | | | | | | | | | | | 1,930,000 | | | | 3,040,212 | |
CJ Corporation | | | | | | | | | | | 1,980 | | | | 339,175 | |
CK Hutchison Holdings Limited | | | | | | | | | | | 384,296 | | | | 4,938,971 | |
DCC plc | | | | | | | | | | | 9,251 | | | | 841,853 | |
DMCI Holdings Incorporated | | | | | | | | | | | 2,121,900 | | | | 523,701 | |
Doosan Corporation | | | | | | | | | | | 2,425 | | | | 257,724 | |
Enka Insaat Ve Sanayi AS | | | | | | | | | | | 342,626 | | | | 506,273 | |
Far Eastern New Century Corporation | | | | | | | | | | | 1,360,496 | | | | 1,003,312 | |
Fosun International | | | | | | | | | | | 445,000 | | | | 616,084 | |
General Electric Company | | | | | | | | | | | 994,738 | | | | 31,075,615 | |
Grupo Carso SAB de CV | | | | | | | | | | | 111,000 | | | | 452,696 | |
Hanwha Corporation (Korea) | | | | | | | | | | | 11,460 | | | | 376,690 | |
HAP Seng Consolidated Bhd | | | | | | | | | | | 197,100 | | | | 378,113 | |
Hopewell Holdings | | | | | | | | | | | 123,000 | | | | 433,649 | |
Industries Qatar | | | | | | | | | | | 18,137 | | | | 557,855 | |
Jardine Matheson Holdings Limited | | | | | | | | | | | 43,585 | | | | 2,608,562 | |
Jardine Strategic Holdings Limited | | | | | | | | | | | 28,894 | | | | 931,543 | |
JG Summit Holdings | | | | | | | | | | | 966,992 | | | | 1,618,744 | |
Katakura Industries Company Limited | | | | | | | | | | | 5,400 | | | | 58,924 | |
Keihan Electric Railway Company Limited | | | | | | | | | | | 82,000 | | | | 531,793 | |
Keppel Corporation Limited | | | | | | | | | | | 270,051 | | | | 1,026,727 | |
Koc Holding AS | | | | | | | | | | | 227,557 | | | | 987,956 | |
Koninklijke Philips NV « | | | | | | | | | | | 95,657 | | | | 2,778,484 | |
LG Corporation | | | | | | | | | | | 21,404 | | | | 1,265,044 | |
LT Group Incorporated | | | | | | | | | | | 735,600 | | | | 268,381 | |
MMC Corporation Bhd | | | | | | | | | | | 109,200 | | | | 60,584 | |
Mytilineos Holdings SA | | | | | | | | | | | 1,209 | | | | 5,259 | |
Nisshinbo Holdings Incorporated | | | | | | | | | | | 21,600 | | | | 219,622 | |
| | | | |
| 62 | | Wells Fargo Diversified Stock Portfolio | | Portfolio of investments—August 31, 2016 (unaudited) |
| | | | | | | | | | | | | | | | |
| Security name | | | | | | | | Shares | | | Value | |
| | | | |
| Industrial Conglomerates (continued) | | | | | | | | | | | | | | | | |
NWS Holdings Limited | | | | | | | | | | | 304,024 | | | $ | 543,183 | |
Quinenco SA | | | | | | | | | | | 62,686 | | | | 128,928 | |
Rheinmetall AG | | | | | | | | | | | 3,555 | | | | 256,722 | |
Roper Industries Incorporated | | | | | | | | | | | 57,993 | | | | 10,296,657 | |
Samsung C&T Corporation | | | | | | | | | | | 14,897 | | | | 2,024,122 | |
San Miguel Corporation | | | | | | | | | | | 214,380 | | | | 388,778 | |
Seibu Holdings Incorporated | | | | | | | | | | | 32,708 | | | | 537,098 | |
SembCorp Industries Limited | | | | | | | | | | | 165,000 | | | | 329,407 | |
Shun Tak Holdings Limited | | | | | | | | | | | 294,250 | | | | 97,103 | |
Siemens AG | | | | | | | | | | | 76,880 | | | | 9,180,160 | |
Siemens India Limited | | | | | | | | | | | 21,727 | | | | 410,743 | |
Sime Darby Bhd | | | | | | | | | | | 699,391 | | | | 1,360,669 | |
SK Company Limited | | | | | | | | | | | 6,119 | | | | 1,163,433 | |
SM Investments Corporation | | | | | | | | | | | 160,932 | | | | 2,348,616 | |
Smiths Group plc | | | | | | | | | | | 35,162 | | | | 619,179 | |
Tokai Holdings Corporation | | | | | | | | | | | 17,500 | | | | 102,668 | |
Top Frontier Investment Holdings Incorporated † | | | | | | | | | | | 8 | | | | 37 | |
Toshiba Corporation † | | | | | | | | | | | 612,000 | | | | 1,935,402 | |
Turk Sise Ve Cam Fabrikalari AS | | | | | | | | | | | 151,693 | | | | 175,418 | |
Yazicilar Holding AS Class A | | | | | | | | | | | 9,222 | | | | 41,223 | |
| | | | |
| | | | | | | | | | | | | | | 95,519,562 | |
| | | | | | | | | | | | | | | | |
| | | | |
| Machinery: 2.35% | | | | | | | | | | | | | | | | |
Aalberts Industries NV | | | | | | | | | | | 11,130 | | | | 373,070 | |
AG Growth International Incorporated | | | | | | | | | | | 1,000 | | | | 32,980 | |
AGCO Corporation | | | | | | | | | | | 85,000 | | | | 4,125,900 | |
Aida Engineering Limited | | | | | | | | | | | 11,300 | | | | 79,181 | |
Airtac International Group | | | | | | | | | | | 16,852 | | | | 125,870 | |
Alfa Laval AB | | | | | | | | | | | 28,699 | | | | 445,874 | |
Allison Transmission Holdings Incorporated | | | | | | | | | | | 98,313 | | | | 2,727,203 | |
Alstom SA † | | | | | | | | | | | 20,310 | | | | 537,258 | |
Amada Company Limited | | | | | | | | | | | 51,500 | | | | 538,569 | |
Andritz AG | | | | | | | | | | | 7,071 | | | | 360,807 | |
Asahi Diamond Industrial Company Limited | | | | | | | | | | | 12,000 | | | | 98,700 | |
Ashok Leyland Limited | | | | | | | | | | | 330,303 | | | | 431,806 | |
Atlas Copco AB Class A | | | | | | | | | | | 61,897 | | | | 1,755,543 | |
Atlas Copco AB Class B | | | | | | | | | | | 37,370 | | | | 960,808 | |
ATS Automation Tooling Systems Incorporated † | | | | | | | | | | | 4,800 | | | | 39,567 | |
Bando Chemical Industries Limited | | | | | | | | | | | 15,000 | | | | 66,689 | |
Bodycote plc | | | | | | | | | | | 18,289 | | | | 141,816 | |
Bucher Industries AG | | | | | | | | | | | 862 | | | | 218,228 | |
Cargotec Oyj Corporation Class B | | | | | | | | | | | 3,652 | | | | 163,963 | |
Caterpillar Incorporated | | | | | | | | | | | 63,293 | | | | 5,186,861 | |
China Conch Venture Holdings Limited | | | | | | | | | | | 543,000 | | | | 1,044,345 | |
CKD Corporation | | | | | | | | | | | 12,000 | | | | 130,479 | |
CLARCOR Incorporated | | | | | | | | | | | 63,038 | | | | 4,127,098 | |
CNH Industrial NV | | | | | | | | | | | 78,164 | | | | 571,082 | |
Colfax Corporation † | | | | | | | | | | | 129,564 | | | | 3,845,460 | |
Cosco Corporation Singapore Limited † | | | | | | | | | | | 190,000 | | | | 36,258 | |
CRRC Corporation Limited H Shares | | | | | | | | | | | 1,315,000 | | | | 1,176,415 | |
| | | | | | |
| Portfolio of investments—August 31, 2016 (unaudited) | | Wells Fargo Diversified Stock Portfolio | | | 63 | |
| | | | | | | | | | | | | | | | |
| Security name | | | | | | | | Shares | | | Value | |
| | | | |
| Machinery (continued) | | | | | | | | | | | | | | | | |
CSBC Corporation Taiwan | | | | | | | | | | | 102 | | | $ | 48 | |
Cummins India Limited | | | | | | | | | | | 13,858 | | | | 190,457 | |
Daewoo Shipbuilding & Marine Engineering Company Limited †«(a) | | | | | | | | | | | 16,970 | | | | 68,184 | |
Daifuku Company Limited | | | | | | | | | | | 16,700 | | | | 289,403 | |
Deere & Company | | | | | | | | | | | 31,400 | | | | 2,654,870 | |
DMG Mori Seiki AG | | | | | | | | | | | 3,643 | | | | 172,845 | |
DMG Mori Seiki Company Limited | | | | | | | | | | | 16,700 | | | | 184,327 | |
Donaldson Company Incorporated | | | | | | | | | | | 149,600 | | | | 5,617,480 | |
Doosan Infracore Company Limited † | | | | | | | | | | | 19,520 | | | | 143,030 | |
Duerr AG | | | | | | | | | | | 2,309 | | | | 195,229 | |
Ebara Corporation | | | | | | | | | | | 69,000 | | | | 354,787 | |
Eicher Motors Limited | | | | | | | | | | | 4,371 | | | | 1,484,910 | |
FANUC Corporation | | | | | | | | | | | 28,200 | | | | 4,805,161 | |
Fortive Corporation | | | | | | | | | | | 56,397 | | | | 2,970,430 | |
Fuji Machine Manufacturing Company Limited | | | | | | | | | | | 13,300 | | | | 152,327 | |
Fujitec Company Limited | | | | | | | | | | | 13,000 | | | | 144,619 | |
Furukawa Company Limited | | | | | | | | | | | 61,000 | | | | 92,563 | |
GEA Group AG | | | | | | | | | | | 16,445 | | | | 882,601 | |
Georg Fischer AG | | | | | | | | | | | 456 | | | | 366,729 | |
Glory Limited | | | | | | | | | | | 10,100 | | | | 323,602 | |
Graco Incorporated | | | | | | | | | | | 73,100 | | | | 5,385,277 | |
Hanjin Heavy Industries & Construction Company Limited † | | | | | | | | | | | 14,343 | | | | 54,928 | |
Hillenbrand Incorporated | | | | | | | | | | | 83,186 | | | | 2,674,430 | |
Hino Motors Limited | | | | | | | | | | | 41,900 | | | | 464,093 | |
Hitachi Construction Machinery Company Limited | | | | | | | | | | | 15,400 | | | | 288,457 | |
Hitachi Koki Company Limited | | | | | | | | | | | 9,300 | | | | 65,347 | |
Hitachi Zosen Corporation | | | | | | | | | | | 30,600 | | | | 159,706 | |
Hiwin Technologies Corporation | | | | | | | | | | | 59,684 | | | | 308,478 | |
Hong Leong Asia Limited | | | | | | | | | | | 11,000 | | | | 5,813 | |
Hoshizaki Electric Company Limited | | | | | | | | | | | 7,700 | | | | 615,464 | |
Hyundai Elevator Company † | | | | | | | | | | | 2,044 | | | | 128,323 | |
Hyundai Heavy Industries Company Limited † | | | | | | | | | | | 7,814 | | | | 963,610 | |
Hyundai Mipo Dockyard Company Limited † | | | | | | | | | | | 2,652 | | | | 181,240 | |
Hyundai Rotem Company Limited † | | | | | | | | | | | 9,250 | | | | 198,688 | |
IDEX Corporation | | | | | | | | | | | 42,263 | | | | 3,949,055 | |
IHI Corporation | | | | | | | | | | | 228,000 | | | | 696,351 | |
Illinois Tool Works Incorporated | | | | | | | | | | | 34,700 | | | | 4,124,095 | |
IMI plc | | | | | | | | | | | 29,234 | | | | 405,768 | |
Ingersoll-Rand plc | | | | | | | | | | | 139,100 | | | | 9,457,409 | |
Iseki & Company Limited | | | | | | | | | | | 44,000 | | | | 110,569 | |
ITT Incorporated | | | | | | | | | | | 107,189 | | | | 3,878,098 | |
Japan Steel Works | | | | | | | | | | | 55,000 | | | | 256,222 | |
Joy Global Incorporated | | | | | | | | | | | 116,100 | | | | 3,167,208 | |
JTEKT Corporation | | | | | | | | | | | 36,000 | | | | 559,494 | |
Kawasaki Heavy Industries Limited | | | | | | | | | | | 246,000 | | | | 720,418 | |
Kennametal Incorporated | | | | | | | | | | | 105,200 | | | | 2,941,392 | |
King Slide Works Company Limited | | | | | | | | | | | 17,000 | | | | 207,608 | |
Kion Group AG | | | | | | | | | | | 5,692 | | | | 324,251 | |
Kitz Corporation | | | | | | | | | | | 21,100 | | | | 118,689 | |
Komatsu Limited | | | | | | | | | | | 140,330 | | | | 3,067,282 | |
| | | | |
| 64 | | Wells Fargo Diversified Stock Portfolio | | Portfolio of investments—August 31, 2016 (unaudited) |
| | | | | | | | | | | | | | | | |
| Security name | | | | | | | | Shares | | | Value | |
| | | | |
| Machinery (continued) | | | | | | | | | | | | | | | | |
Komori Corporation | | | | | | | | | | | 11,000 | | | $ | 135,340 | |
Kone Oyj Class B | | | | | | | | | | | 38,458 | | | | 1,932,554 | |
Konecranes Oyj | | | | | | | | | | | 3,753 | | | | 118,807 | |
Krones AG | | | | | | | | | | | 626 | | | | 59,842 | |
Kubota Corporation | | | | | | | | | | | 170,765 | | | | 2,503,750 | |
Kurita Water Industries Limited | | | | | | | | | | | 16,200 | | | | 369,360 | |
Kyokuto Kaihatsu Kogyo Company | | | | | | | | | | | 6,900 | | | | 73,025 | |
Lincoln Electric Holdings Incorporated | | | | | | | | | | | 82,100 | | | | 5,218,276 | |
Makino Milling Machine Company Limited | | | | | | | | | | | 16,000 | | | | 102,373 | |
Makita Corporation | | | | | | | | | | | 20,400 | | | | 1,464,959 | |
Makita Corporation ADR | | | | | | | | | | | 1 | | | | 71 | |
MAN SE | | | | | | | | | | | 3,130 | | | | 325,604 | |
Manitowoc Company Incorporated | | | | | | | | | | | 185,346 | | | | 908,195 | |
Manitowoc Foodservice Incorporated † | | | | | | | | | | | 162,607 | | | | 2,622,851 | |
Max Company Limited | | | | | | | | | | | 6,000 | | | | 64,834 | |
Meidensha Corporation | | | | | | | | | | | 41,000 | | | | 129,184 | |
Melrose Industries plc | | | | | | | | | | | 170,482 | | | | 331,325 | |
Metso Oyj | | | | | | | | | | | 12,945 | | | | 362,432 | |
Minebea Company Limited | | | | | | | | | | | 55,300 | | | | 561,204 | |
Mitsubishi Heavy Industries Limited | | | | | | | | | | | 492,000 | | | | 2,141,756 | |
Mitsuboshi Belting Company Limited | | | | | | | | | | | 10,000 | | | | 77,128 | |
Mitsui Engineering & Shipbuilding Company Limited | | | | | | | | | | | 121,000 | | | | 167,235 | |
Miura Company Limited | | | | | | | | | | | 16,600 | | | | 313,341 | |
Morgan Advanced Materials plc | | | | | | | | | | | 21,935 | | | | 82,322 | |
Morita Holdings Corporation | | | | | | | | | | | 7,000 | | | | 89,982 | |
Nabtesco Corporation | | | | | | | | | | | 17,300 | | | | 446,274 | |
Nachi-Fujikoshi Corporation | | | | | | | | | | | 45,000 | | | | 153,095 | |
Navistar International Corporation †« | | | | | | | | | | | 94,121 | | | | 1,321,459 | |
NGK Insulators Limited | | | | | | | | | | | 42,000 | | | | 910,917 | |
Nippon Sharyo Limited † | | | | | | | | | | | 14,000 | | | | 35,858 | |
Nippon Thompson Company Limited | | | | | | | | | | | 13,000 | | | | 45,610 | |
Nitta Corporation | | | | | | | | | | | 3,300 | | | | 76,962 | |
NKT Holding AS | | | | | | | | | | | 1,131 | | | | 66,434 | |
Nordson Corporation | | | | | | | | | | | 70,742 | | | | 6,984,358 | |
Noritake Company Limited | | | | | | | | | | | 17,000 | | | | 38,119 | |
Norma Group Se | | | | | | | | | | | 2,994 | | | | 160,304 | |
NSK Limited | | | | | | | | | | | 74,700 | | | | 769,634 | |
NTN Corporation | | | | | | | | | | | 84,000 | | | | 307,698 | |
OILES Corporation | | | | | | | | | | | 5,900 | | | | 96,029 | |
Okuma Corporation | | | | | | | | | | | 21,000 | | | | 160,547 | |
OSG Corporation | | | | | | | | | | | 14,100 | | | | 261,654 | |
Oshkosh Corporation | | | | | | | | | | | 88,100 | | | | 4,751,233 | |
Paccar Incorporated | | | | | | | | | | | 63,456 | | | | 3,797,207 | |
Pentair plc | | | | | | | | | | | 102,659 | | | | 6,575,309 | |
Rotork plc | | | | | | | | | | | 77,250 | | | | 203,795 | |
Ryobi Limited | | | | | | | | | | | 20,000 | | | | 88,339 | |
Samsung Heavy Industries Company Limited †« | | | | | | | | | | | 28,640 | | | | 248,641 | |
Sandvik AB | | | | | | | | | | | 105,184 | | | | 1,142,069 | |
Schindler Holding AG | | | | | | | | | | | 2,474 | | | | 467,357 | |
Schindler Holding AG - Participation Certificate | | | | | | | | | | | 5,042 | | | | 948,883 | |
| | | | | | |
| Portfolio of investments—August 31, 2016 (unaudited) | | Wells Fargo Diversified Stock Portfolio | | | 65 | |
| | | | | | | | | | | | | | | | |
| Security name | | | | | | | | Shares | | | Value | |
| | | | |
| Machinery (continued) | | | | | | | | | | | | | | | | |
SembCorp Marine Limited | | | | | | | | | | | 147,200 | | | $ | 137,752 | |
Shima Seiki Manufacturing Limited | | | | | | | | | | | 4,400 | | | | 96,833 | |
Shinmaywa Industries Limited | | | | | | | | | | | 17,000 | | | | 107,950 | |
Singamas Container Holding | | | | | | | | | | | 180,000 | | | | 18,563 | |
Sintokogio Limited | | | | | | | | | | | 10,700 | | | | 85,422 | |
SKF AB Class A | | | | | | | | | | | 976 | | | | 16,474 | |
SKF AB Class B | | | | | | | | | | | 35,091 | | | | 591,501 | |
SMC Corporation | | | | | | | | | | | 9,700 | | | | 2,731,919 | |
Snap-on Incorporated | | | | | | | | | | | 32,800 | | | | 5,027,912 | |
Spirax-Sarco Engineering plc | | | | | | | | | | | 7,515 | | | | 427,693 | |
Star Micronics Company Limited | | | | | | | | | | | 6,100 | | | | 70,631 | |
Sulzer AG | | | | | | | | | | | 2,037 | | | | 193,645 | |
Sumitomo Heavy Industries Limited | | | | | | | | | | | 97,000 | | | | 476,258 | |
Tadano Limited | | | | | | | | | | | 18,900 | | | | 187,603 | |
Takuma Company Limited | | | | | | | | | | | 14,000 | | | | 120,427 | |
Terex Corporation | | | | | | | | | | | 129,600 | | | | 3,146,688 | |
The Middleby Corporation † | | | | | | | | | | | 76,500 | | | | 9,803,475 | |
The Timken Company | | | | | | | | | | | 81,200 | | | | 2,750,244 | |
The Toro Company | | | | | | | | | | | 72,470 | | | | 7,040,461 | |
THK Company Limited | | | | | | | | | | | 19,500 | | | | 382,028 | |
Toshiba Machine Company Limited | | | | | | | | | | | 18,000 | | | | 59,324 | |
Trelleborg AB Class B | | | | | | | | | | | 21,858 | | | | 416,445 | |
Tsubakimoto Chain Company | | | | | | | | | | | 23,000 | | | | 173,614 | |
Tsugami Corporation | | | | | | | | | | | 18,000 | | | | 83,507 | |
Tsukishima Kikai Company Limited | | | | | | | | | | | 5,000 | | | | 48,326 | |
Valmet Corporation | | | | | | | | | | | 12,945 | | | | 172,841 | |
Vesuvius plc | | | | | | | | | | | 23,880 | | | | 109,753 | |
Volvo AB Class A | | | | | | | | | | | 43,600 | | | | 468,308 | |
Volvo AB Class B | | | | | | | | | | | 132,230 | | | | 1,421,828 | |
WABCO Holdings Incorporated † | | | | | | | | | | | 28,700 | | | | 3,064,012 | |
Wabtec Corporation | | | | | | | | | | | 50,380 | | | | 3,859,612 | |
Wartsila Oyj | | | | | | | | | | | 17,118 | | | | 704,197 | |
WEG SA | | | | | | | | | | | 209,260 | | | | 1,071,184 | |
Weir Group plc | | | | | | | | | | | 19,735 | | | | 390,539 | |
Woodward Governor Company | | | | | | | | | | | 71,600 | | | | 4,490,752 | |
Xylem Incorporated | | | | | | | | | | | 99,633 | | | | 5,067,334 | |
Yangzijiang Shipbuilding Holdings Limited | | | | | | | | | | | 789,000 | | | | 443,014 | |
Zardoya Otis SA (a) | | | | | | | | | | | 629 | | | | 5,933 | |
Zardoya Otis SA - BATS Exchange | | | | | | | | | | | 15,737 | | | | 148,330 | |
| | | | |
| | | | | | | | | | | | | | | 201,739,062 | |
| | | | | | | | | | | | | | | | |
| | | | |
| Marine: 0.10% | | | | | | | | | | | | | | | | |
A.P. Moller Maersk AS Class A | | | | | | | | | | | 200 | | | | 285,076 | |
A.P. Moller Maersk AS Class B | | | | | | | | | | | 645 | | | | 964,324 | |
DS Norden AS † | | | | | | | | | | | 1,300 | | | | 17,341 | |
Evergreen Marine Corporation (Taiwan) Limited † | | | | | | | | | | | 336,630 | | | | 127,308 | |
Hanjin Shipping Company Limited † | | | | | | | | | | | 16,787 | | | | 18,669 | |
Hyundai Merchant Marine Company Limited †« | | | | | | | | | | | 2,539 | | | | 21,246 | |
Iino Kaiun Kaisha Limited | | | | | | | | | | | 15,900 | | | | 57,167 | |
Kawasaki Kisen Kaisha Limited « | | | | | | | | | | | 149,000 | | | | 375,866 | |
| | | | |
| 66 | | Wells Fargo Diversified Stock Portfolio | | Portfolio of investments—August 31, 2016 (unaudited) |
| | | | | | | | | | | | | | | | |
| Security name | | | | | | | | Shares | | | Value | |
| | | | |
| Marine (continued) | | | | | | | | | | | | | | | | |
Kirby Corporation † | | | | | | | | | | | 70,118 | | | $ | 3,653,148 | |
Kuehne & Nagel International AG | | | | | | | | | | | 5,401 | | | | 753,960 | |
MISC Bhd | | | | | | | | | | | 427,800 | | | | 797,477 | |
Mitsui OSK Lines Limited | | | | | | | | | | | 191,000 | | | | 441,202 | |
Nippon Yusen Kabushiki Kaisha | | | | | | | | | | | 250,000 | | | | 454,260 | |
Orient Overseas International Limited | | | | | | | | | | | 30,500 | | | | 103,402 | |
Pacific Basin Shipping Limited † | | | | | | | | | | | 504,000 | | | | 55,224 | |
Pan Ocean Company Limited † | | | | | | | | | | | 159 | | | | 524 | |
U-Ming Marine Transport Corporation | | | | | | | | | | | 113,000 | | | | 76,567 | |
Wan Hai Lines Limited | | | | | | | | | | | 209,212 | | | | 100,879 | |
Yang Ming Marine Transport | | | | | | | | | | | 285,357 | | | | 65,650 | |
| | | | |
| | | | | | | | | | | | | | | 8,369,290 | |
| | | | | | | | | | | | | | | | |
| | | | |
| Professional Services: 0.43% | | | | | | | | | | | | | | | | |
Adecco SA | | | | | | | | | | | 17,602 | | | | 1,012,936 | |
ALS Limited | | | | | | | | | | | 74,573 | | | | 302,645 | |
Bureau Veritas SA | | | | | | | | | | | 23,580 | | | | 505,531 | |
Capita plc | | | | | | | | | | | 61,090 | | | | 830,280 | |
CEB Incorporated | | | | | | | | | | | 40,832 | | | | 2,458,086 | |
Dksh Holding AG | | | | | | | | | | | 2,262 | | | | 156,734 | |
Experian Group Limited | | | | | | | | | | | 87,165 | | | | 1,732,934 | |
Hays plc | | | | | | | | | | | 95,742 | | | | 164,195 | |
Ihs Markit Limited † | | | | | | | | | | | 155,139 | | | | 5,789,787 | |
Intertek Group plc | | | | | | | | | | | 15,050 | | | | 689,923 | |
Meitec Corporation | | | | | | | | | | | 4,600 | | | | 147,605 | |
Michael Page International plc | | | | | | | | | | | 20,623 | | | | 93,971 | |
Nomura Company Limited | | | | | | | | | | | 6,900 | | | | 93,898 | |
Randstad Holdings NV | | | | | | | | | | | 9,424 | | | | 444,395 | |
Recruit Holdings Company Limited | | | | | | | | | | | 66,094 | | | | 2,513,699 | |
RELX NV | | | | | | | | | | | 100,662 | | | | 1,785,307 | |
RELX plc | | | | | | | | | | | 105,383 | | | | 1,999,643 | |
Robert Half International Incorporated | | | | | | | | | | | 80,400 | | | | 3,081,732 | |
SAI Global Limited | | | | | | | | | | | 33,140 | | | | 84,931 | |
SEEK Limited | | | | | | | | | | | 58,955 | | | | 712,024 | |
SGS SA | | | | | | | | | | | 519 | | | | 1,140,317 | |
Stantec Incorporated | | | | | | | | | | | 7,070 | | | | 168,582 | |
TechnoPro Holdings Incorporated | | | | | | | | | | | 4,000 | | | | 130,092 | |
Teleperformance SE | | | | | | | | | | | 6,495 | | | | 673,264 | |
Temp Holdings Company Limited | | | | | | | | | | | 22,700 | | | | 362,226 | |
The Advisory Board Company † | | | | | | | | | | | 58,608 | | | | 2,470,327 | |
Verisk Analytics Incorporated † | | | | | | | | | | | 87,924 | | | | 7,302,088 | |
WS Atkins plc | | | | | | | | | | | 8,888 | | | | 174,486 | |
| | | | |
| | | | | | | | | | | | | | | 37,021,638 | |
| | | | | | | | | | | | | | | | |
| | | | |
| Road & Rail: 0.95% | | | | | | | | | | | | | | | | |
Aurizon Holdings Limited | | | | | | | | | | | 59,294 | | | | 195,629 | |
Avis Budget Group Incorporated † | | | | | | | | | | | 123,700 | | | | 4,469,281 | |
BTS Group Holdings PCL | | | | | | | | | | | 1,605,700 | | | | 419,800 | |
Canadian National Railway Company | | | | | | | | | | | 73,500 | | | | 4,723,078 | |
Canadian Pacific Railway Limited | | | | | | | | | | | 14,300 | | | | 2,190,144 | |
| | | | | | |
| Portfolio of investments—August 31, 2016 (unaudited) | | Wells Fargo Diversified Stock Portfolio | | | 67 | |
| | | | | | | | | | | | | | | | |
| Security name | | | | | | | | Shares | | | Value | |
| | | | |
| Road & Rail (continued) | | | | | | | | | | | | | | | | |
Central Japan Railway Company | | | | | | | | | | | 30,200 | | | $ | 4,959,146 | |
China Auto Rental Incorporated † | | | | | | | | | | | 323,000 | | | | 306,031 | |
CJ Korea Express Corporation † | | | | | | | | | | | 2,016 | | | | 363,422 | |
ComfortDelGro Corporation Limited | | | | | | | | | | | 275,000 | | | | 571,214 | |
Container Corporation of India | | | | | | | | | | | 13,018 | | | | 271,080 | |
CSX Corporation | | | | | | | | | | | 101,000 | | | | 2,856,280 | |
DSV AS | | | | | | | | | | | 17,460 | | | | 865,947 | |
East Japan Railway Company | | | | | | | | | | | 56,700 | | | | 4,855,381 | |
Firstgroup plc † | | | | | | | | | | | 137,119 | | | | 197,883 | |
Fukuyama Transporting Company Limited « | | | | | | | | | | | 28,000 | | | | 161,833 | |
Genesee & Wyoming Incorporated Class A † | | | | | | | | | | | 74,825 | | | | 5,087,352 | |
Go-Ahead Group plc | | | | | | | | | | | 3,179 | | | | 82,613 | |
Hankyu Hanshin Holdings Incorporated | | | | | | | | | | | 38,000 | | | | 1,226,695 | |
Hitachi Transport System Limited | | | | | | | | | | | 8,700 | | | | 170,275 | |
J.B. Hunt Transport Services Incorporated | | | | | | | | | | | 49,914 | | | | 3,962,672 | |
Kansas City Southern | | | | | | | | | | | 61,218 | | | | 5,921,005 | |
Keikyu Corporation | | | | | | | | | | | 80,000 | | | | 740,734 | |
Keio Corporation | | | | | | | | | | | 89,000 | | | | 744,928 | |
Keisei Electric Railway Company Limited | | | | | | | | | | | 51,000 | | | | 613,193 | |
Kintetsu Corporation | | | | | | | | | | | 286,000 | | | | 1,089,103 | |
Landstar System Incorporated | | | | | | | | | | | 54,994 | | | | 3,807,235 | |
Maruzen Showa Unyu Company Limited | | | | | | | | | | | 16,000 | | | | 55,671 | |
MTR Corporation Limited | | | | | | | | | | | 203,684 | | | | 1,113,264 | |
Nagoya Railroad Company Limited | | | | | | | | | | | 134,000 | | | | 656,628 | |
Nankai Electric Railway Company Limited | | | | | | | | | | | 83,000 | | | | 382,651 | |
National Express Group plc | | | | | | | | | | | 29,635 | | | | 137,643 | |
Nikkon Holdings Company Limited | | | | | | | | | | | 9,900 | | | | 213,472 | |
Nippon Express Company Limited | | | | | | | | | | | 139,000 | | | | 658,290 | |
Nishi-Nippon Railroad Company Limited | | | | | | | | | | | 58,000 | | | | 266,834 | |
Norfolk Southern Corporation | | | | | | | | | | | 31,300 | | | | 2,939,070 | |
Odakyu Electric Railway Company Limited | | | | | | | | | | | 94,000 | | | | 964,848 | |
Old Dominion Freight Line Incorporated † | | | | | | | | | | | 41,613 | | | | 2,959,933 | |
PKP Cargo SA † | | | | | | | | | | | 18,354 | | | | 208,976 | |
Sankyu Incorporated | | | | | | | | | | | 44,000 | | | | 250,481 | |
SEINO Holdings Company Limited | | | | | | | | | | | 25,400 | | | | 266,115 | |
Senko Company Limited | | | | | | | | | | | 15,000 | | | | 90,755 | |
SMRT Corporation Limited | | | | | | | | | | | 98,000 | | | | 118,324 | |
Sotetsu Holdings Incorporated | | | | | | | | | | | 68,000 | | | | 340,444 | |
Stagecoach Group plc | | | | | | | | | | | 49,321 | | | | 147,407 | |
Tobu Railway Company Limited | | | | | | | | | | | 158,000 | | | | 766,597 | |
Tokyu Corporation | | | | | | | | | | | 176,000 | | | | 1,313,217 | |
TransForce Incorporated | | | | | | | | | | | 6,211 | | | | 126,787 | |
Transport International Holdings Limited | | | | | | | | | | | 45,600 | | | | 141,957 | |
Union Pacific Corporation | | | | | | | | | | | 152,300 | | | | 14,549,219 | |
West Japan Railway Company | | | | | | | | | | | 28,200 | | | | 1,614,076 | |
| | | | |
| | | | | | | | | | | | | | | 81,134,613 | |
| | | | | | | | | | | | | | | | |
| | | | |
| Trading Companies & Distributors: 0.76% | | | | | | | | | | | | | | | | |
AerCap Holdings NV † | | | | | | | | | | | 20,019 | | | | 800,159 | |
Ashtead Group plc | | | | | | | | | | | 48,201 | | | | 800,683 | |
| | | | |
| 68 | | Wells Fargo Diversified Stock Portfolio | | Portfolio of investments—August 31, 2016 (unaudited) |
| | | | | | | | | | | | | | | | |
| Security name | | | | | | | | Shares | | | Value | |
| | | | |
| Trading Companies & Distributors (continued) | | | | | | | | | | | | | | | | |
Brenntag AG | | | | | | | | | | | 14,433 | | | $ | 785,485 | |
Bunzl plc | | | | | | | | | | | 31,676 | | | | 980,818 | |
Daewoo International Corporation | | | | | | | | | | | 7,912 | | | | 162,498 | |
Fastenal Company | | | | | | | | | | | 164,224 | | | | 7,079,697 | |
Finning International Incorporated | | | | | | | | | | | 16,500 | | | | 292,657 | |
GATX Corporation « | | | | | | | | | | | 54,534 | | | | 2,391,316 | |
Grafton Group plc | | | | | | | | | | | 18,582 | | | | 133,595 | |
Hanwa Company Limited | | | | | | | | | | | 31,000 | | | | 172,880 | |
Howden Joinery Group plc | | | | | | | | | | | 55,350 | | | | 331,724 | |
iMarketKorea Incorporated | | | | | | | | | | | 5,870 | | | | 70,019 | |
Inaba Denki Sangyo Company Limited | | | | | | | | | | | 4,100 | | | | 134,533 | |
Inabata & Company Limited | | | | | | | | | | | 8,900 | | | | 83,095 | |
Itochu Corporation | | | | | | | | | | | 228,100 | | | | 2,691,829 | |
Iwatani International Corporation | | | | | | | | | | | 36,000 | | | | 197,632 | |
Japan Pulp & Paper Company Limited | | | | | | | | | | | 25,000 | | | | 80,462 | |
Kanamoto Company Limited | | | | | | | | | | | 6,000 | | | | 126,710 | |
Kanematsu Corporation | | | | | | | | | | | 81,000 | | | | 118,997 | |
Kloeckner & Company † | | | | | | | | | | | 8,856 | | | | 124,666 | |
Kuroda Electric Company Limited | | | | | | | | | | | 5,800 | | | | 108,920 | |
LG International Corporation | | | | | | | | | | | 5,460 | | | | 162,821 | |
Marubeni Corporation | | | | | | | | | | | 260,300 | | | | 1,297,412 | |
Misumi Group Incorporated | | | | | | | | | | | 40,400 | | | | 705,189 | |
Mitsubishi Corporation | | | | | | | | | | | 233,100 | | | | 4,856,203 | |
Mitsui & Company Limited | | | | | | | | | | | 259,400 | | | | 3,452,315 | |
MonotaRO Company Limited | | | | | | | | | | | 9,800 | | | | 247,309 | |
MRC Global Incorporated † | | | | | | | | | | | 131,519 | | | | 1,929,384 | |
MSC Industrial Direct Company Class A | | | | | | | | | | | 58,225 | | | | 4,252,754 | |
Nagase & Company Limited | | | | | | | | | | | 17,600 | | | | 195,282 | |
Nichiden Corporation | | | | | | | | | | | 2,100 | | | | 58,130 | |
Noble Group Limited † | | | | | | | | | | | 918,576 | | | | 80,231 | |
NOW Incorporated † | | | | | | | | | | | 141,721 | | | | 2,925,121 | |
Reece Australia Limited | | | | | | | | | | | 7,414 | | | | 251,185 | |
Rexel SA | | | | | | | | | | | 26,522 | | | | 426,157 | |
Russel Metals Incorporated | | | | | | | | | | | 4,649 | | | | 77,247 | |
Seven Group Holdings Limited « | | | | | | | | | | | 22,953 | | | | 140,590 | |
SIG plc | | | | | | | | | | | 78,253 | | | | 128,550 | |
SK Networks Company Limited | | | | | | | | | | | 31,860 | | | | 180,873 | |
Sojitz Corporation | | | | | | | | | | | 187,500 | | | | 449,427 | |
Spicers Limited † | | | | | | | | | | | 60,182 | | | | 1,176 | |
STX Corporation Company Limited † | | | | | | | | | | | 116 | | | | 304 | |
Sumitomo Corporation | | | | | | | | | | | 182,300 | | | | 1,976,906 | |
Tat Hong Holdings Limited | | | | | | | | | | | 7,000 | | | | 2,749 | |
Toromont Industries Limited | | | | | | | | | | | 6,843 | | | | 207,054 | |
Toyota Tsusho Corporation | | | | | | | | | | | 34,900 | | | | 798,081 | |
Travis Perkins plc | | | | | | | | | | | 23,342 | | | | 510,348 | |
Trusco Nakayama Corporation | | | | | | | | | | | 3,400 | | | | 156,091 | |
United Rentals Incorporated † | | | | | | | | | | | 49,445 | | | | 4,069,818 | |
W.W. Grainger Incorporated « | | | | | | | | | | | 32,080 | | | | 7,399,573 | |
Wakita & Company Limited | | | | | | | | | | | 7,000 | | | | 49,253 | |
Watsco Incorporated | | | | | | | | | | | 33,780 | | | | 4,994,711 | |
| | | | | | |
| Portfolio of investments—August 31, 2016 (unaudited) | | Wells Fargo Diversified Stock Portfolio | | | 69 | |
| | | | | | | | | | | | | | | | |
| Security name | | | | | | | | Shares | | | Value | |
| | | | |
| Trading Companies & Distributors (continued) | | | | | | | | | | | | | | | | |
WESCO International Incorporated † | | | | | | | | | | | 55,624 | | | $ | 3,457,588 | |
Wolseley plc | | | | | | | | | | | 26,144 | | | | 1,503,697 | |
Yamazen Corporation | | | | | | | | | | | 18,000 | | | | 136,742 | |
Yuasa Trading Company Limited | | | | | | | | | | | 3,800 | | | | 73,565 | |
| | | | |
| | | | | | | | | | | | | | | 64,822,211 | |
| | | | | | | | | | | | | | | | |
| | | | |
| Transportation Infrastructure: 0.25% | | | | | | | | | | | | | | | | |
Abertis Infraestructuras SA | | | | | | | | | | | 43,565 | | | | 674,736 | |
Adani Ports & Special Economic Zone Limited | | | | | | | | | | | 277,615 | | | | 1,090,023 | |
Aena SA 144A | | | | | | | | | | | 6,720 | | | | 950,096 | |
Aeroports de Paris | | | | | | | | | | | 3,323 | | | | 342,864 | |
Airports of Thailand PCL | | | | | | | | | | | 115,000 | | | | 1,335,529 | |
Ansaldo STS SpA | | | | | | | | | | | 6,620 | | | | 77,978 | |
Atlantia SpA | | | | | | | | | | | 40,773 | | | | 1,048,775 | |
Auckland International Airport Limited | | | | | | | | | | | 167,179 | | | | 909,788 | |
BBA Aviation plc | | | | | | | | | | | 82,297 | | | | 260,444 | |
Beijing Capital International Airport Company Limited H Shares | | | | | | | | | | | 426,000 | | | | 480,500 | |
CCR SA | | | | | | | | | | | 296,720 | | | | 1,567,584 | |
China Merchants Holdings International Company Limited | | | | | | | | | | | 503,227 | | | | 1,433,612 | |
China Resources and Transportation Group Limited † | | | | | | | | | | | 130,000 | | | | 2,665 | |
COSCO Pacific Limited | | | | | | | | | | | 416,669 | | | | 451,176 | |
DP World Limited | | | | | | | | | | | 45,239 | | | | 836,922 | |
Flughafen Zuerich AG | | | | | | | | | | | 2,275 | | | | 420,975 | |
Fraport AG | | | | | | | | | | | 3,869 | | | | 215,827 | |
Groupe Eurotunnel SE | | | | | | | | | | | 53,575 | | | | 589,236 | |
Grupo Aeroportuario del Pacifico SAB de CV Class B | | | | | | | | | | | 97,400 | | | | 968,477 | |
Grupo Aeroportuario del Sureste SAB de CV Class B | | | | | | | | | | | 61,000 | | | | 928,916 | |
Hong Kong Aircraft Engineering Company Limited | | | | | | | | | | | 10,000 | | | | 73,864 | |
Hopewell Highway Infrastructure Limited | | | | | | | | | | | 173,650 | | | | 101,179 | |
Hutchison Port Holdings Trust | | | | | | | | | | | 977,000 | | | | 420,110 | |
International Container Term Services Incorporated | | | | | | | | | | | 175,300 | | | | 316,025 | |
Japan Airport Terminal Company Limited « | | | | | | | | | | | 11,500 | | | | 453,487 | |
Kamigumi Company Limited | | | | | | | | | | | 38,000 | | | | 329,077 | |
Macquarie Atlas Roads Limited | | | | | | | | | | | 53,146 | | | | 221,278 | |
Malaysia Airports Holdings Berhad | | | | | | | | | | | 104,804 | | | | 162,807 | |
Mitsubishi Logistics Corporation | | | | | | | | | | | 24,000 | | | | 369,980 | |
Nissin Corporation | | | | | | | | | | | 18,000 | | | | 49,930 | |
Port of Tauranga Limited | | | | | | | | | | | 9,453 | | | | 136,496 | |
PT Jasa Marga Tbk | | | | | | | | | | | 395,500 | | | | 144,902 | |
SIA Engineering Company | | | | | | | | | | | 42,000 | | | | 117,758 | |
Singapore Airport Terminal Services Limited | | | | | | | | | | | 108,666 | | | | 375,659 | |
Sumitomo Warehouse Company Limited | | | | | | | | | | | 29,000 | | | | 143,788 | |
Sydney Airport Holdings Limited | | | | | | | | | | | 173,939 | | | | 951,670 | |
TAV Havalimanlari Holding AS | | | | | | | | | | | 40,981 | | | | 159,908 | |
Transurban Group | | | | | | | | | | | 293,870 | | | | 2,531,034 | |
Westshore Terminals Investment Corporation | | | | | | | | | | | 8,100 | | | | 136,874 | |
| | | | |
| | | | | | | | | | | | | | | 21,781,949 | |
| | | | | | | | | | | | | | | | |
| | | | |
| 70 | | Wells Fargo Diversified Stock Portfolio | | Portfolio of investments—August 31, 2016 (unaudited) |
| | | | | | | | | | | | | | | | |
| Security name | | | | | | | | Shares | | | Value | |
| | | | |
Information Technology: 16.93% | | | | | | | | | | | | | | | | |
| | | | |
| Communications Equipment: 0.88% | | | | | | | | | | | | | | | | |
Arista Networks Incorporated †« | | | | | | | | | | | 45,835 | | | $ | 3,652,133 | |
Brocade Communications Systems Incorporated | | | | | | | | | | | 564,236 | | | | 5,066,839 | |
Ciena Corporation † | | | | | | | | | | | 166,480 | | | | 3,570,996 | |
Cisco Systems Incorporated | | | | | | | | | | | 557,050 | | | | 17,513,652 | |
Comba Telecom Systems Holdings Limited | | | | | | | | | | | 309 | | | | 55 | |
CommScope Holdings Incorporated † | | | | | | | | | | | 85,948 | | | | 2,541,482 | |
D-Link Corporation | | | | | | | | | | | 801 | | | | 289 | |
Denki Kogyo Company Limited | | | | | | | | | | | 13,000 | | | | 58,551 | |
F5 Networks Incorporated † | | | | | | | | | | | 37,638 | | | | 4,619,312 | |
Harris Corporation | | | | | | | | | | | 69,777 | | | | 6,487,865 | |
Hitachi Kokusai Electric Incorporated | | | | | | | | | | | 9,000 | | | | 159,706 | |
Infinera Corporation † | | | | | | | | | | | 201,400 | | | | 1,728,012 | |
Juniper Networks Incorporated | | | | | | | | | | | 187,252 | | | | 4,321,776 | |
Lumentum Holdings Incorporated † | | | | | | | | | | | 67,619 | | | | 2,374,779 | |
NetScout Systems Incorporated † | | | | | | | | | | | 120,100 | | | | 3,552,558 | |
Nokia Oyj | | | | | | | | | | | 354,521 | | | | 1,993,071 | |
Nokia Oyj - BATS Exchange | | | | | | | | | | | 167,970 | | | | 945,055 | |
Palo Alto Networks Incorporated † | | | | | | | | | | | 43,120 | | | | 5,742,290 | |
Plantronics Incorporated | | | | | | | | | | | 47,400 | | | | 2,400,810 | |
Spirent plc | | | | | | | | | | | 75,771 | | | | 84,574 | |
Telefonaktiebolaget LM Ericsson Class B | | | | | | | | | | | 289,375 | | | | 2,063,669 | |
Viasat Incorporated † | | | | | | | | | | | 58,700 | | | | 4,404,848 | |
Viavi Solutions Incorporated † | | | | | | | | | | | 306,088 | | | | 2,381,365 | |
VTech Holdings Limited | | | | | | | | | | | 27,900 | | | | 311,457 | |
Zinwell Corporation | | | | | | | | | | | 446 | | | | 507 | |
| | | | |
| | | | | | | | | | | | | | | 75,975,651 | |
| | | | | | | | | | | | | | | | |
| | | | |
| Electronic Equipment, Instruments & Components: 1.53% | | | | | | | | | | | | | | | | |
AAC Technologies Holdings Incorporated | | | | | | | | | | | 199,000 | | | | 2,268,957 | |
Ai Holdings Corporation | | | | | | | | | | | 5,200 | | | | 123,284 | |
Alps Electric Company Limited | | | | | | | | | | | 28,800 | | | | 649,402 | |
Amano Corporation | | | | | | | | | | | 9,700 | | | | 139,409 | |
Anixter International Incorporated † | | | | | | | | | | | 40,448 | | | | 2,586,245 | |
Anritsu Corporation | | | | | | | | | | | 20,100 | | | | 110,733 | |
Arrow Electronics Incorporated † | | | | | | | | | | | 48,114 | | | | 3,167,345 | |
AU Optronics Corporation | | | | | | | | | | | 3,247,319 | | | | 1,279,258 | |
Avnet Incorporated | | | | | | | | | | | 66,338 | | | | 2,764,968 | |
Azbil Corporation | | | | | | | | | | | 10,300 | | | | 301,638 | |
Canon Electronics Incorporated | | | | | | | | | | | 3,800 | | | | 55,936 | |
CDW Corporation of Delaware | | | | | | | | | | | 77,079 | | | | 3,441,577 | |
Celestica Incorporated † | | | | | | | | | | | 1,675 | | | | 17,856 | |
Cheng Uei Precision Industry Company Limited | | | | | | | | | | | 71,855 | | | | 87,185 | |
Chroma ATE Incorporated | | | | | | | | | | | 84,624 | | | | 218,691 | |
Chunghwa Picture Tubes Limited † | | | | | | | | | | | 75 | | | | 3 | |
Citizen Holdings Company Limited | | | | | | | | | | | 52,300 | | | | 289,137 | |
Corning Incorporated | | | | | | | | | | | 113,100 | | | | 2,566,239 | |
Daiwabo Company Limited | | | | | | | | | | | 29,000 | | | | 61,663 | |
Delta Electronics Incorporated | | | | | | | | | | | 531,015 | | | | 2,761,301 | |
| | | | | | |
| Portfolio of investments—August 31, 2016 (unaudited) | | Wells Fargo Diversified Stock Portfolio | | | 71 | |
| | | | | | | | | | | | | | | | |
| Security name | | | | | | | | Shares | | | Value | |
| | | | |
| Electronic Equipment, Instruments & Components (continued) | | | | | | | | | | | | | | | | |
Delta Electronics Thailand PCL | | | | | | | | | | | 212,000 | | | $ | 453,207 | |
Electrocomponents plc | | | | | | | | | | | 44,350 | | | | 177,510 | |
Enplas Corporation | | | | | | | | | | | 2,000 | | | | 56,000 | |
FEI Company | | | | | | | | | | | 53,800 | | | | 5,728,086 | |
FIH Mobile Limited | | | | | | | | | | | 528,000 | | | | 176,963 | |
Flextronics International Limited † | | | | | | | | | | | 106,400 | | | | 1,408,736 | |
FLIR Systems Incorporated | | | | | | | | | | | 166,600 | | | | 5,136,278 | |
Halma plc | | | | | | | | | | | 39,753 | | | | 553,337 | |
Hamamatsu Photonics | | | | | | | | | | | 21,700 | | | | 682,680 | |
Hexagon AB Class B | | | | | | | | | | | 23,900 | | | | 973,237 | |
Hirose Electric Company Limited | | | | | | | | | | | 4,600 | | | | 590,422 | |
Hitachi High Technologies Corporation | | | | | | | | | | | 9,700 | | | | 359,537 | |
Hitachi Limited | | | | | | | | | | | 709,000 | | | | 3,398,869 | |
Hon Hai Precision Industry Company Limited | | | | | | | | | | | 3,668,660 | | | | 10,174,503 | |
Horiba Limited | | | | | | | | | | | 5,900 | | | | 274,001 | |
Hosiden Corporation | | | | | | | | | | | 12,200 | | | | 91,266 | |
Ibiden Company Limited | | | | | | | | | | | 22,000 | | | | 278,548 | |
Ingenico SA | | | | | | | | | | | 5,513 | | | | 593,671 | |
Ingram Micro Incorporated Class A | | | | | | | | | | | 179,673 | | | | 6,281,368 | |
Innolux Display Corporation | | | | | | | | | | | 3,328,666 | | | | 1,174,928 | |
IPG Photonics Corporation † | | | | | | | | | | | 47,600 | | | | 4,140,248 | |
Jabil Circuit Incorporated | | | | | | | | | | | 230,300 | | | | 4,880,057 | |
Japan Aviation Electronics Industry Limited | | | | | | | | | | | 10,000 | | | | 155,125 | |
Japan Display Incorporated † | | | | | | | | | | | 62,500 | | | | 88,798 | |
Keyence Corporation | | | | | | | | | | | 6,400 | | | | 4,486,464 | |
Keysight Technologies Incorporated † | | | | | | | | | | | 206,255 | | | | 6,276,340 | |
Kingboard Chemicals Holdings Limited | | | | | | | | | | | 140 | | | | 365 | |
Knowles Corporation † | | | | | | | | | | | 120,100 | | | | 1,669,390 | |
KOA Corporation | | | | | | | | | | | 3,700 | | | | 28,931 | |
Kyocera Corporation | | | | | | | | | | | 51,200 | | | | 2,432,699 | |
Laird Group plc | | | | | | | | | | | 37,748 | | | | 148,211 | |
Largan Precision Company Limited | | | | | | | | | | | 27,244 | | | | 3,056,638 | |
LG Display Company Limited | | | | | | | | | | | 36,210 | | | | 975,884 | |
LG Innotek Company Limited | | | | | | | | | | | 2,021 | | | | 149,536 | |
Littelfuse Incorporated | | | | | | | | | | | 28,951 | | | | 3,670,987 | |
Mitsumi Electric Company Limited †« | | | | | | | | | | | 16,600 | | | | 102,843 | |
Murata Manufacturing Company Limited | | | | | | | | | | | 31,000 | | | | 4,166,191 | |
National Instruments Corporation | | | | | | | | | | | 131,400 | | | | 3,671,316 | |
Nichicon Corporation | | | | | | | | | | | 13,600 | | | | 110,414 | |
Nippon Chemi-Con Corporation | | | | | | | | | | | 32,000 | | | | 55,671 | |
Nippon Electric Glass Company Limited | | | | | | | | | | | 62,000 | | | | 311,004 | |
Nippon Signal Company Limited | | | | | | | | | | | 10,900 | | | | 88,494 | |
OC Oerlikon Corporation AG | | | | | | | | | | | 18,201 | | | | 174,876 | |
Oki Electric Industry Company Limited | | | | | | | | | | | 138,000 | | | | 184,062 | |
Omron Corporation | | | | | | | | | | | 32,004 | | | | 1,085,720 | |
Optex Company Limited | | | | | | | | | | | 30 | | | | 631 | |
Pan-International Industrial Coporation | | | | | | | | | | | 770 | | | | 596 | |
Premier Farnell plc | | | | | | | | | | | 32,868 | | | | 78,768 | |
Renishaw plc | | | | | | | | | | | 3,215 | | | | 110,695 | |
Ryosan Company Limited | | | | | | | | | | | 4,600 | | | | 138,047 | |
| | | | |
| 72 | | Wells Fargo Diversified Stock Portfolio | | Portfolio of investments—August 31, 2016 (unaudited) |
| | | | | | | | | | | | | | | | |
| Security name | | | | | | | | Shares | | | Value | |
| | | | |
| Electronic Equipment, Instruments & Components (continued) | | | | | | | | | | | | | | | | |
Samsung Electro-Mechanics Company Limited | | | | | | | | | | | 8,990 | | | $ | 428,940 | |
Samsung SDI Company Limited | | | | | | | | | | | 8,978 | | | | 930,008 | |
Shimadzu Corporation | | | | | | | | | | | 40,000 | | | | 625,912 | |
Silitech Technology Corporation | | | | | | | | | | | 381 | | | | 201 | |
Simplo Technology Company Limited | | | | | | | | | | | 67,000 | | | | 220,655 | |
Spectris plc | | | | | | | | | | | 9,963 | | | | 253,285 | |
Synnex Technology International Corporation | | | | | | | | | | | 274,535 | | | | 289,845 | |
Taiyo Yuden Company Limited | | | | | | | | | | | 17,600 | | | | 182,183 | |
TDK Corporation | | | | | | | | | | | 19,100 | | | | 1,366,066 | |
Tech Data Corporation † | | | | | | | | | | | 41,700 | | | | 3,095,808 | |
Topcon Corporation | | | | | | | | | | | 14,800 | | | | 193,681 | |
Toyo Corporation | | | | | | | | | | | 3,700 | | | | 36,905 | |
TPK Holding Company Limited | | | | | | | | | | | 58,033 | | | | 106,993 | |
Trimble Navigation Limited † | | | | | | | | | | | 332,918 | | | | 9,121,953 | |
Tripod Technology Corporation | | | | | | | | | | | 120,261 | | | | 256,967 | |
Truly International | | | | | | | | | | | 250,000 | | | | 116,983 | |
Unimicron Technology Corporation | | | | | | | | | | | 312,402 | | | | 127,991 | |
Venture Corporation Limited | | | | | | | | | | | 49,000 | | | | 330,875 | |
Vishay Intertechnology Incorporated | | | | | | | | | | | 180,954 | | | | 2,562,309 | |
WPG Holdings Company Limited | | | | | | | | | | | 352,227 | | | | 419,047 | |
Yageo Corporation | | | | | | | | | | | 99,516 | | | | 211,072 | |
Yaskawa Electric Corporation | | | | | | | | | | | 40,000 | | | | 589,185 | |
Yokogawa Electric Corporation | | | | | | | | | | | 33,300 | | | | 426,449 | |
Zebra Technologies Corporation Class A † | | | | | | | | | | | 67,400 | | | | 4,715,304 | |
Zhen Ding Technology Holding | | | | | | | | | | | 195,750 | | | | 392,358 | |
| | | | |
| | | | | | | | | | | | | | | 130,893,950 | |
| | | | | | | | | | | | | | | | |
| | | | |
| Internet Software & Services: 3.20% | | | | | | | | | | | | | | | | |
58.com Incorporated ADR †« | | | | | | | | | | | 8,944 | | | | 406,952 | |
Akamai Technologies Incorporated † | | | | | | | | | | | 98,748 | | | | 5,421,265 | |
Alibaba Group Holding Limited ADR † | | | | | | | | | | | 303,156 | | | | 29,463,732 | |
Alphabet Incorporated Class A † | | | | | | | | | | | 53,249 | | | | 42,058,723 | |
Alphabet Incorporated Class C † | | | | | | | | | | | 53,555 | | | | 41,079,363 | |
Auto Trader Group plc 144A | | | | | | | | | | | 101,594 | | | | 497,746 | |
Baidu.com Incorporated ADR † | | | | | | | | | | | 71,598 | | | | 12,248,270 | |
Carsales.com Limited | | | | | | | | | | | 34,942 | | | | 337,712 | |
Cimpress NV †« | | | | | | | | | | | 2,740 | | | | 272,000 | |
COOKPAD Incorporated | | | | | | | | | | | 6,500 | | | | 64,771 | |
CoStar Group Incorporated ��� | | | | | | | | | | | 18,200 | | | | 3,771,950 | |
Criteo SA ADR † | | | | | | | | | | | 9,221 | | | | 340,070 | |
Dena Company Limited | | | | | | | | | | | 15,200 | | | | 451,012 | |
Dip Corporation | | | | | | | | | | | 4,400 | | | | 126,729 | |
Facebook Incorporated Class A † | | | | | | | | | | | 419,189 | | | | 52,868,117 | |
GMO Internet Incorporated | | | | | | | | | | | 12,000 | | | | 173,740 | |
Gourmet Navigator Incorporated | | | | | | | | | | | 4,400 | | | | 108,868 | |
Gree Incorporated | | | | | | | | | | | 21,300 | | | | 108,080 | |
HC International Incorporated † | | | | | | | | | | | 66,000 | | | | 51,728 | |
IAC/InterActive Corp | | | | | | | | | | | 47,300 | | | | 2,776,983 | |
Internet Initiative Japan Incorporated | | | | | | | | | | | 6,600 | | | | 121,647 | |
J2 Global Incorporated | | | | | | | | | | | 60,087 | | | | 4,096,131 | |
| | | | | | |
| Portfolio of investments—August 31, 2016 (unaudited) | | Wells Fargo Diversified Stock Portfolio | | | 73 | |
| | | | | | | | | | | | | | | | |
| Security name | | | | | | | | Shares | | | Value | |
| | | | |
| Internet Software & Services (continued) | | | | | | | | | | | | | | | | |
Just Eat plc † | | | | | | | | | | | 40,457 | | | $ | 287,412 | |
Kakaku.com Incorporated | | | | | | | | | | | 21,300 | | | | 356,149 | |
Kakao Corporation | | | | | | | | | | | 6,754 | | | | 492,467 | |
LinkedIn Corporation Class A † | | | | | | | | | | | 21,361 | | | | 4,117,333 | |
Mixi Incorporated | | | | | | | | | | | 5,800 | | | | 206,012 | |
Moneysupermarket.com Group plc | | | | | | | | | | | 76,188 | | | | 288,533 | |
Naver Corporation | | | | | | | | | | | 4,228 | | | | 3,204,179 | |
NetEase Incorporated ADR | | | | | | | | | | | 18,883 | | | | 4,002,630 | |
Pandora Media Incorporated †« | | | | | | | | | | | 277,722 | | | | 3,888,108 | |
PChome Online Incorporated | | | | | | | | | | | 25,409 | | | | 277,068 | |
Rackspace Hosting Incorporated † | | | | | | | | | | | 137,104 | | | | 4,311,921 | |
Rightmove plc | | | | | | | | | | | 11,307 | | | | 608,610 | |
Tencent Holdings Limited | | | | | | | | | | | 1,447,566 | | | | 37,656,067 | |
Twitter Incorporated † | | | | | | | | | | | 117,821 | | | | 2,263,341 | |
United Internet AG | | | | | | | | | | | 13,768 | | | | 566,078 | |
VeriSign Incorporated †« | | | | | | | | | | | 56,500 | | | | 4,206,425 | |
Yahoo! Incorporated † | | | | | | | | | | | 159,100 | | | | 6,801,525 | |
Yahoo! Japan Corporation | | | | | | | | | | | 184,500 | | | | 752,515 | |
Yelp Incorporated † | | | | | | | | | | | 81,352 | | | | 3,130,425 | |
| | | | |
| | | | | | | | | | | | | | | 274,262,387 | |
| | | | | | | | | | | | | | | | |
| | | | |
| IT Services: 3.20% | | | | | | | | | | | | | | | | |
Accenture plc Class A | | | | | | | | | | | 68,300 | | | | 7,854,500 | |
Alliance Data Systems Corporation † | | | | | | | | | | | 33,528 | | | | 6,859,158 | |
Amadeus IT Holding SA Class A | | | | | | | | | | | 39,511 | | | | 1,815,569 | |
Amdocs Limited | | | | | | | | | | | 83,862 | | | | 5,041,783 | |
Atos Origin SA | | | | | | | | | | | 9,556 | | | | 940,252 | |
Automatic Data Processing Incorporated | | | | | | | | | | | 49,200 | | | | 4,418,652 | |
Booz Allen Hamilton Holding Corporation | | | | | | | | | | | 154,243 | | | | 4,682,817 | |
Broadridge Financial Solutions Incorporated | | | | | | | | | | | 65,813 | | | | 4,560,841 | |
Capgemini SA | | | | | | | | | | | 14,926 | | | | 1,454,142 | |
CGI Group Incorporated Class A † | | | | | | | | | | | 24,400 | | | | 1,187,625 | |
Cielo SA | | | | | | | | | | | 265,555 | | | | 2,762,292 | |
Cognizant Technology Solutions Corporation Class A † | | | | | | | | | | | 113,374 | | | | 6,512,203 | |
Computer Sciences Corporation | | | | | | | | | | | 72,696 | | | | 3,419,620 | |
Computershare Limited | | | | | | | | | | | 80,644 | | | | 598,807 | |
Convergys Corporation | | | | | | | | | | | 114,777 | | | | 3,423,798 | |
Corelogic Incorporated † | | | | | | | | | | | 106,616 | | | | 4,373,388 | |
CSRA Incorporated | | | | | | | | | | | 164,819 | | | | 4,184,754 | |
DH Corporation | | | | | | | | | | | 7,953 | | | | 180,055 | |
Digital Garage Incorporated | | | | | | | | | | | 7,000 | | | | 117,856 | |
DST Systems Incorporated | | | | | | | | | | | 42,900 | | | | 5,212,779 | |
DTS Corporation | | | | | | | | | | | 4,200 | | | | 86,342 | |
EPAM Systems Incorporated † | | | | | | | | | | | 55,574 | | | | 3,790,703 | |
Euronet Worldwide Incorporated † | | | | | | | | | | | 64,780 | | | | 5,027,576 | |
Fidelity National Information Services Incorporated | | | | | | | | | | | 150,500 | | | | 11,939,165 | |
Fiserv Incorporated † | | | | | | | | | | | 128,028 | | | | 13,193,285 | |
FleetCor Technologies Incorporated † | | | | | | | | | | | 44,240 | | | | 7,264,208 | |
Fujitsu Limited | | | | | | | | | | | 289,000 | | | | 1,466,997 | |
Gartner Incorporated † | | | | | | | | | | | 46,400 | | | | 4,222,400 | |
| | | | |
| 74 | | Wells Fargo Diversified Stock Portfolio | | Portfolio of investments—August 31, 2016 (unaudited) |
| | | | | | | | | | | | | | | | |
| Security name | | | | | | | | Shares | | | Value | |
| | | | |
| IT Services (continued) | | | | | | | | | | | | | | | | |
Genpact Limited † | | | | | | | | | | | 94,100 | | | $ | 2,226,406 | |
Global Payments Incorporated | | | | | | | | | | | 87,550 | | | | 6,649,423 | |
HCL Technologies Limited | | | | | | | | | | | 170,968 | | | | 1,987,564 | |
Indra Sistemas SA † | | | | | | | | | | | 6,012 | | | | 77,724 | |
Infosys Limited ADR | | | | | | | | | | | 11,028 | | | | 174,904 | |
Infosys Technologies Limited | | | | | | | | | | | 587,102 | | | | 9,080,926 | |
International Business Machines Corporation | | | | | | | | | | | 159,846 | | | | 25,396,332 | |
Iress Market Technology Limited | | | | | | | | | | | 16,055 | | | | 147,328 | |
Itochu Techno-Science Corporation | | | | | | | | | | | 7,100 | | | | 173,271 | |
Jack Henry & Associates Incorporated | | | | | | | | | | | 44,300 | | | | 3,866,061 | |
Leidos Holdings Incorporated | | | | | | | | | | | 86,909 | | | | 3,520,678 | |
MasterCard Incorporated Class A | | | | | | | | | | | 175,800 | | | | 16,987,554 | |
Maximus Incorporated | | | | | | | | | | | 85,070 | | | | 5,003,817 | |
NEC Networks & System Integration Corporation | | | | | | | | | | | 5,800 | | | | 94,681 | |
Net One Systems Company Limited | | | | | | | | | | | 17,400 | | | | 118,225 | |
NeuStar Incorporated Class A Ǡ | | | | | | | | | | | 77,400 | | | | 1,966,734 | |
Nihon Unisys Limited | | | | | | | | | | | 9,400 | | | | 119,652 | |
Nomura Research Institute Limited | | | | | | | | | | | 18,200 | | | | 615,667 | |
NS Solutions Corporation | | | | | | | | | | | 5,200 | | | | 89,913 | |
NTT Data Corporation | | | | | | | | | | | 19,000 | | | | 989,803 | |
OBIC Company Limited | | | | | | | | | | | 9,700 | | | | 496,883 | |
Otsuka Corporation | | | | | | | | | | | 8,700 | | | | 368,719 | |
Paychex Incorporated | | | | | | | | | | | 173,500 | | | | 10,526,245 | |
PayPal Holdings Incorporated † | | | | | | | | | | | 199,677 | | | | 7,418,001 | |
Paysafe Group plc † | | | | | | | | | | | 44,072 | | | | 252,732 | |
Sabre Corporation | | | | | | | | | | | 114,372 | | | | 3,219,572 | |
Science Applications International Corporation | | | | | | | | | | | 48,869 | | | | 3,118,331 | |
SCSK Corporation | | | | | | | | | | | 7,600 | | | | 279,495 | |
Tata Consultancy Services Limited | | | | | | | | | | | 127,664 | | | | 4,787,257 | |
Tech Mahindra Limited | | | | | | | | | | | 160,321 | | | | 1,122,271 | |
Tieto Oyj | | | | | | | | | | | 8,394 | | | | 250,463 | |
TIS Incorporated | | | | | | | | | | | 12,806 | | | | 303,859 | |
TKC Corporation | | | | | | | | | | | 2,200 | | | | 64,959 | |
Transcosmos Incorporated | | | | | | | | | | | 4,400 | | | | 102,106 | |
Visa Incorporated Class A | | | | | | | | | | | 344,794 | | | | 27,893,835 | |
Western Union Company | | | | | | | | | | | 274,348 | | | | 5,903,969 | |
WEX Incorporated † | | | | | | | | | | | 50,667 | | | | 5,031,740 | |
Wipro Limited | | | | | | | | | | | 172,934 | | | | 1,269,568 | |
Wipro Limited ADR « | | | | | | | | | | | 13,142 | | | | 135,625 | |
Wirecard AG « | | | | | | | | | | | 9,255 | | | | 458,053 | |
Worldpay Group plc 144A | | | | | | | | | | | 79,838 | | | | 313,260 | |
Xerox Corporation | | | | | | | | | | | 531,484 | | | | 5,235,117 | |
| | | | |
| | | | | | | | | | | | | | | 274,430,290 | |
| | | | | | | | | | | | | | | | |
| | | | |
| Semiconductors & Semiconductor Equipment: 3.06% | | | | | | | | | | | | | | | | |
Advanced Micro Devices Incorporated † | | | | | | | | | | | 777,886 | | | | 5,756,356 | |
Advanced Semiconductor Engineering Incorporated | | | | | | | | | | | 1,727,821 | | | | 2,123,667 | |
Advantest Corporation « | | | | | | | | | | | 25,500 | | | | 381,767 | |
Aixtron AG † | | | | | | | | | | | 8,010 | | | | 49,454 | |
Ams AG | | | | | | | | | | | 10,795 | | | | 365,486 | |
| | | | | | |
| Portfolio of investments—August 31, 2016 (unaudited) | | Wells Fargo Diversified Stock Portfolio | | | 75 | |
| | | | | | | | | | | | | | | | |
| Security name | | | | | | | | Shares | | | Value | |
| | | | |
| Semiconductors & Semiconductor Equipment (continued) | | | | | | | | | | | | | | | | |
Analog Devices Incorporated | | | | | | | | | | | 166,300 | | | $ | 10,403,728 | |
Applied Materials Incorporated | | | | | | | | | | | 115,459 | | | | 3,445,297 | |
ARM Holdings plc | | | | | | | | | | | 132,795 | | | | 2,957,479 | |
ASM International NV | | | | | | | | | | | 4,894 | | | | 186,316 | |
ASM Pacific Technology | | | | | | | | | | | 46,000 | | | | 358,154 | |
ASML Holdings NV | | | | | | | | | | | 38,883 | | | | 4,136,392 | |
Broadcom Limited | | | | | | | | | | | 67,152 | | | | 11,846,956 | |
Cavium Incorporated † | | | | | | | | | | | 73,870 | | | | 4,113,082 | |
Chipbond Technology Corporation | | | | | | | | | | | 155,000 | | | | 200,769 | |
Cree Incorporated † | | | | | | | | | | | 130,163 | | | | 3,125,214 | |
Cypress Semiconductor Corporation | | | | | | | | | | | 398,886 | | | | 4,758,710 | |
Dialog Semiconductor plc † | | | | | | | | | | | 11,319 | | | | 396,828 | |
Disco Corporation | | | | | | | | | | | 4,800 | | | | 541,864 | |
EO Technics Company Limited | | | | | | | | | | | 1,365 | | | | 106,874 | |
Epistar Corporation † | | | | | | | | | | | 213,210 | | | | 154,546 | |
Everlight Electronics Company Limited | | | | | | | | | | | 83,210 | | | | 132,956 | |
Fairchild Semiconductor International Incorporated † | | | | | | | | | | | 149,982 | | | | 2,984,642 | |
Faraday Technology Corporation | | | | | | | | | | | 316 | | | | 315 | |
First Solar Incorporated † | | | | | | | | | | | 44,600 | | | | 1,686,772 | |
Gintech Energy Corporation | | | | | | | | | | | 8 | | | | 6 | |
Global PVQ SE † | | | | | | | | | | | 3,594 | | | | 44 | |
Hanergy Thin Film Power Group Limited †(a) | | | | | | | | | | | 5,441,305 | | | | 1 | |
Hermes Microvision Incorporated | | | | | | | | | | | 21,000 | | | | 900,080 | |
Himax Technologies Incorporated « | | | | | | | | | | | 29,262 | | | | 310,762 | |
Infineon Technologies AG | | | | | | | | | | | 102,520 | | | | 1,726,203 | |
Inotera Memories Incorporated † | | | | | | | | | | | 1,007,888 | | | | 854,452 | |
Intel Corporation | | | | | | | | | | | 523,302 | | | | 18,781,309 | |
King Yuan Electronics Company Limited | | | | | | | | | | | 341,063 | | | | 313,326 | |
Kinsus Interconnect Technology Corporation | | | | | | | | | | | 53,582 | | | | 112,971 | |
KLA-Tencor Corporation | | | | | | | | | | | 88,570 | | | | 6,134,358 | |
Lam Research Corporation | | | | | | | | | | | 91,000 | | | | 8,492,120 | |
Linear Technology Corporation | | | | | | | | | | | 128,900 | | | | 7,507,136 | |
Marvell Technology Group Limited | | | | | | | | | | | 243,900 | | | | 3,024,360 | |
Maxim Integrated Products Incorporated | | | | | | | | | | | 159,000 | | | | 6,474,480 | |
MediaTek Incorporated | | | | | | | | | | | 407,531 | | | | 3,204,456 | |
Microchip Technology Incorporated | | | | | | | | | | | 115,764 | | | | 7,166,949 | |
Micron Technology Incorporated † | | | | | | | | | | | 200,100 | | | | 3,299,649 | |
Microsemi Corporation † | | | | | | | | | | | 148,600 | | | | 5,938,056 | |
Nanya Technology Corporation | | | | | | | | | | | 199,734 | | | | 236,051 | |
Novatek Microelectronics Corporation Limited | | | | | | | | | | | 224,790 | | | | 768,652 | |
NVIDIA Corporation | | | | | | | | | | | 276,000 | | | | 16,929,840 | |
NXP Semiconductors NV † | | | | | | | | | | | 26,126 | | | | 2,299,611 | |
ON Semiconductor Corporation † | | | | | | | | | | | 501,000 | | | | 5,410,800 | |
Phison Electronics Corporation | | | | | | | | | | | 34,000 | | | | 245,915 | |
Powertech Technology Incorporated | | | | | | | | | | | 181,914 | | | | 474,700 | |
PV Crystalox Solar plc † | | | | | | | | | | | 3,180 | | | | 626 | |
Qorvo Incorporated † | | | | | | | | | | | 156,346 | | | | 8,978,951 | |
QUALCOMM Incorporated | | | | | | | | | | | 265,897 | | | | 16,770,124 | |
Radiant Opto-Electronics Corporation | | | | | | | | | | | 114,735 | | | | 188,390 | |
Realtek Semiconductor Corporation | | | | | | | | | | | 99,440 | | | | 398,004 | |
| | | | |
| 76 | | Wells Fargo Diversified Stock Portfolio | | Portfolio of investments—August 31, 2016 (unaudited) |
| | | | | | | | | | | | | | | | |
| Security name | | | | | | | | Shares | | | Value | |
| | | | |
| Semiconductors & Semiconductor Equipment (continued) | | | | | | | | | | | | | | | | |
Renesas Electronics Corporation Ǡ | | | | | | | | | | | 33,400 | | | $ | 199,177 | |
Rohm Company Limited | | | | | | | | | | | 14,300 | | | | 714,551 | |
Sanken Electric Company Limited | | | | | | | | | | | 24,000 | | | | 77,475 | |
SCREEN Holdings Company Limited | | | | | | | | | | | 35,000 | | | | 453,632 | |
Seoul Semiconductor Company Limited | | | | | | | | | | | 9,698 | | | | 129,597 | |
Shindengen Electric Manufacturing Company Limited | | | | | | | | | | | 9,000 | | | | 35,490 | |
Shinko Electric Industries | | | | | | | | | | | 12,800 | | | | 70,888 | |
Silicon Laboratories Incorporated † | | | | | | | | | | | 55,165 | | | | 3,160,955 | |
Silicon Motion Technology Corporation | | | | | | | | | | | 12,675 | | | | 639,834 | |
Siliconware Precision Industries Company | | | | | | | | | | | 885,534 | | | | 1,321,443 | |
Sino-American Silicon Products Incorporated | | | | | | | | | | | 122,000 | | | | 130,726 | |
SK Hynix Incorporated | | | | | | | | | | | 91,427 | | | | 2,988,802 | |
Skyworks Solutions Incorporated | | | | | | | | | | | 108,200 | | | | 8,099,852 | |
Solarworld AG † | | | | | | | | | | | 26 | | | | 145 | |
STMicroelectronics NV | | | | | | | | | | | 66,138 | | | | 495,021 | |
Sumco Corporation | | | | | | | | | | | 21,800 | | | | 190,472 | |
Synaptics Incorporated † | | | | | | | | | | | 52,500 | | | | 2,990,925 | |
Taiwan Semiconductor Manufacturing Company Limited | | | | | | | | | | | 5,093,298 | | | | 28,251,066 | |
Teradyne Incorporated | | | | | | | | | | | 260,835 | | | | 5,493,185 | |
Texas Instruments Incorporated | | | | | | | | | | | 109,967 | | | | 7,647,105 | |
Tokyo Electron Limited | | | | | | | | | | | 23,900 | | | | 2,196,310 | |
Tokyo Seimitsu Company Limited | | | | | | | | | | | 6,000 | | | | 159,416 | |
Tower Semiconductor Limited † | | | | | | | | | | | 470 | | | | 7,358 | |
ULVAC Incorporated | | | | | | | | | | | 6,800 | | | | 191,516 | |
United Microelectronics Corporation | | | | | | | | | | | 4,087,301 | | | | 1,481,350 | |
Vanguard International Semiconductor Corporation | | | | | | | | | | | 191,000 | | | | 358,157 | |
VIA Technologies Incorporated † | | | | | | | | | | | 485 | | | | 170 | |
Windbond Electronics Corporation | | | | | | | | | | | 630,000 | | | | 205,496 | |
Xilinx Incorporated | | | | | | | | | | | 136,800 | | | | 7,415,928 | |
Xinyi Solar Holdings Limited « | | | | | | | | | | | 149 | | | | 61 | |
| | | | |
| | | | | | | | | | | | | | | 262,262,109 | |
| | | | | | | | | | | | | | | | |
| | | | |
| Software: 2.82% | | | | | | | | | | | | | | | | |
ACI Worldwide Incorporated † | | | | | | | | | | | 149,000 | | | | 2,845,900 | |
Ansys Incorporated † | | | | | | | | | | | 49,445 | | | | 4,701,725 | |
Aspen Technology Incorporated † | | | | | | | | | | | 106,870 | | | | 4,858,310 | |
Asseco Poland SA | | | | | | | | | | | 17,110 | | | | 249,579 | |
Autodesk Incorporated † | | | | | | | | | | | 127,698 | | | | 8,606,845 | |
AVEVA Group plc | | | | | | | | | | | 4,997 | | | | 125,068 | |
Blackbaud Incorporated | | | | | | | | | | | 62,000 | | | | 4,176,940 | |
CA Incorporated | | | | | | | | | | | 165,400 | | | | 5,608,714 | |
Capcom Company Limited | | | | | | | | | | | 7,500 | | | | 163,099 | |
CDK Global Incorporated | | | | | | | | | | | 207,510 | | | | 12,031,430 | |
Check Point Software Technologies Limited † | | | | | | | | | | | 13,229 | | | | 1,015,193 | |
Citrix Systems Incorporated † | | | | | | | | | | | 88,300 | | | | 7,699,760 | |
Colopl Incorporated | | | | | | | | | | | 5,900 | | | | 88,159 | |
Com2us Corporation † | | | | | | | | | | | 1,531 | | | | 141,703 | |
CommVault Systems Incorporated † | | | | | | | | | | | 58,100 | | | | 2,994,474 | |
Constellation Software Incorporated | | | | | | | | | | | 1,591 | | | | 694,173 | |
Dassault Systemes SA | | | | | | | | | | | 12,766 | | | | 1,075,393 | |
| | | | | | |
| Portfolio of investments—August 31, 2016 (unaudited) | | Wells Fargo Diversified Stock Portfolio | | | 77 | |
| | | | | | | | | | | | | | | | |
| Security name | | | | | | | | Shares | | | Value | |
| | | | |
| Software (continued) | | | | | | | | | | | | | | | | |
Fair Isaac Corporation | | | | | | | | | | | 40,800 | | | $ | 5,219,952 | |
Fidessa Group plc | | | | | | | | | | | 2,334 | | | | 76,040 | |
FireEye Incorporated † | | | | | | | | | | | 189,824 | | | | 2,725,873 | |
Fortinet Incorporated † | | | | | | | | | | | 89,300 | | | | 3,227,302 | |
Fuji Soft Incorporated | | | | | | | | | | | 4,700 | | | | 127,238 | |
Gemalto NV | | | | | | | | | | | 6,728 | | | | 468,672 | |
Guidewire Software Incorporated † | | | | | | | | | | | 94,870 | | | | 5,837,351 | |
GungHo Online Entertainment Incorporated « | | | | | | | | | | | 66,800 | | | | 158,825 | |
IGG Incorporated | | | | | | | | | | | 195,000 | | | | 111,859 | |
Intuit Incorporated | | | | | | | | | | | 46,342 | | | | 5,164,816 | |
Koei Techmo Holdings Company Limited | | | | | | | | | | | 9,600 | | | | 172,673 | |
Konami Holdings Corporation | | | | | | | | | | | 15,600 | | | | 551,085 | |
Manhattan Associates Incorporated † | | | | | | | | | | | 94,820 | | | | 5,738,506 | |
Micro Focus International plc | | | | | | | | | | | 18,699 | | | | 490,601 | |
Microsoft Corporation | | | | | | | | | | | 850,273 | | | | 48,856,687 | |
NCsoft Corporation | | | | | | | | | | | 2,292 | | | | 555,013 | |
NetSuite Incorporated † | | | | | | | | | | | 23,100 | | | | 2,515,590 | |
Nexon Company Limited | | | | | | | | | | | 22,300 | | | | 305,409 | |
NHN Entertainment Corporation † | | | | | | | | | | | 4,635 | | | | 243,597 | |
Nice Systems Limited | | | | | | | | | | | 6,731 | | | | 459,604 | |
Nintendo Company Limited | | | | | | | | | | | 16,900 | | | | 3,703,740 | |
Nippon System Development Company Limited | | | | | | | | | | | 8,000 | | | | 123,713 | |
Nuance Communications Incorporated † | | | | | | | | | | | 137,300 | | | | 2,001,834 | |
Open Text Corporation | | | | | | | | | | | 11,200 | | | | 704,420 | |
Oracle Corporation (Japan) | | | | | | | | | | | 4,600 | | | | 267,646 | |
Oracle Financials Services | | | | | | | | | | | 4,122 | | | | 212,754 | |
Playtech plc | | | | | | | | | | | 18,069 | | | | 216,156 | |
Proofpoint Incorporated † | | | | | | | | | | | 53,932 | | | | 4,150,067 | |
PTC Incorporated † | | | | | | | | | | | 151,078 | | | | 6,446,498 | |
Red Hat Incorporated † | | | | | | | | | | | 103,211 | | | | 7,532,339 | |
Salesforce.com Incorporated † | | | | | | | | | | | 115,268 | | | | 9,154,585 | |
SAP SE | | | | | | | | | | | 88,957 | | | | 7,815,127 | |
ServiceNow Incorporated † | | | | | | | | | | | 86,968 | | | | 6,319,965 | |
Software AG | | | | | | | | | | | 6,805 | | | | 270,379 | |
Splunk Incorporated † | | | | | | | | | | | 74,415 | | | | 4,333,930 | |
Square Enix Company Limited | | | | | | | | | | | 12,400 | | | | 363,137 | |
SS&C Technologies Holdings Incorporated | | | | | | | | | | | 212,200 | | | | 6,991,990 | |
Symantec Corporation | | | | | | | | | | | 330,000 | | | | 7,962,900 | |
Tableau Software Incorporated Class A † | | | | | | | | | | | 33,716 | | | | 1,956,539 | |
Take-Two Interactive Software Incorporated † | | | | | | | | | | | 101,640 | | | | 4,418,291 | |
Temenos Group AG | | | | | | | | | | | 5,073 | | | | 294,771 | |
The Descartes Systems Group Incorporated † | | | | | | | | | | | 7,120 | | | | 151,804 | |
The Sage Group plc | | | | | | | | | | | 100,222 | | | | 954,147 | |
Trend Micro Incorporated | | | | | | | | | | | 17,600 | | | | 624,288 | |
Tyler Technologies Incorporated † | | | | | | | | | | | 42,924 | | | | 7,037,390 | |
Ubisoft Entertainment SA † | | | | | | | | | | | 8,390 | | | | 327,926 | |
Ultimate Software Group Incorporated † | | | | | | | | | | | 38,285 | | | | 7,999,268 | |
V1 Group Limited | | | | | | | | | | | 1,400 | | | | 67 | |
Verint Systems Incorporated † | | | | | | | | | | | 88,580 | | | | 3,022,350 | |
VMware Incorporated Class A Ǡ | | | | | | | | | | | 15,311 | | | | 1,122,756 | |
| | | | |
| 78 | | Wells Fargo Diversified Stock Portfolio | | Portfolio of investments—August 31, 2016 (unaudited) |
| | | | | | | | | | | | | | | | |
| Security name | | | | | | | | Shares | | | Value | |
| | | | |
| Software (continued) | | | | | | | | | | | | | | | | |
Workday Incorporated Class A † | | | | | | | | | | | 66,699 | | | $ | 5,655,408 | |
Xero Limited Ǡ | | | | | | | | | | | 14,012 | | | | 201,309 | |
| | | | |
| | | | | | | | | | | | | | | 242,420,652 | |
| | | | | | | | | | | | | | | | |
| | | | |
| Technology Hardware, Storage & Peripherals: 2.24% | | | | | | | | | | | | | | | | |
3D Systems Corporation Ǡ | | | | | | | | | | | 151,600 | | | | 2,198,200 | |
Acer Incorporated | | | | | | | | | | | 679,311 | | | | 305,075 | |
Advantech Company Limited | | | | | | | | | | | 130,836 | | | | 1,070,010 | |
Apple Incorporated | | | | | | | | | | | 993,143 | | | | 105,372,472 | |
Asustek Computer Incorporated | | | | | | | | | | | 229,601 | | | | 1,942,858 | |
Blackberry Limited † | | | | | | | | | | | 42,015 | | | | 318,781 | |
Brother Industries Limited | | | | | | | | | | | 38,400 | | | | 644,299 | |
Canon Incorporated | | | | | | | | | | | 157,900 | | | | 4,523,420 | |
Canon Incorporated ADR | | | | | | | | | | | 7 | | | | 200 | |
Catcher Technology Company Limited | | | | | | | | | | | 222,614 | | | | 1,599,596 | |
Chicony Electronics Company Limited | | | | | | | | | | | 117,121 | | | | 289,753 | |
Clevo Company | | | | | | | | | | | 125,978 | | | | 115,931 | |
Compal Electronic Incorporated | | | | | | | | | | | 1,550,754 | | | | 918,806 | |
Diebold Incorporated | | | | | | | | | | | 86,036 | | | | 2,414,170 | |
Diebold Incorporated - Frankfurt Exchange | | | | | | | | | | | 1,147 | | | | 31,865 | |
Eizo Corporation | | | | | | | | | | | 3,500 | | | | 87,783 | |
Electronics For Imaging Incorporated † | | | | | | | | | | | 67,000 | | | | 3,154,360 | |
Foxconn Technology Company Limited | | | | | | | | | | | 274,505 | | | | 769,951 | |
FUJIFILM Holdings Corporation | | | | | | | | | | | 69,800 | | | | 2,622,265 | |
Gigabyte Technology Company Limited | | | | | | | | | | | 100,000 | | | | 137,722 | |
Hewlett Packard Enterprise Company | | | | | | | | | | | 177,583 | | | | 3,814,483 | |
HP Incorporated | | | | | | | | | | | 178,781 | | | | 2,569,083 | |
HTC Corporation | | | | | | | | | | | 165,691 | | | | 443,855 | |
Inventec Company Limited | | | | | | | | | | | 871,583 | | | | 646,879 | |
Jess Link Products Company Limited | | | | | | | | | | | 143 | | | | 129 | |
Konica Minolta Holdings Incorporated | | | | | | | | | | | 74,000 | | | | 666,583 | |
Lenovo Group Limited | | | | | | | | | | | 2,090,000 | | | | 1,409,040 | |
Lexmark International Incorporated Class A | | | | | | | | | | | 73,500 | | | | 2,632,035 | |
Lite-On Technology Corporation | | | | | | | | | | | 535,838 | | | | 810,584 | |
Logitech International SA | | | | | | | | | | | 18,355 | | | | 384,437 | |
Micro-Star International Company Limited | | | | | | | | | | | 186,218 | | | | 448,958 | |
NCR Corporation † | | | | | | | | | | | 149,200 | | | | 5,050,420 | |
NEC Corporation | | | | | | | | | | | 390,149 | | | | 991,728 | |
Neopost SA | | | | | | | | | | | 3,201 | | | | 84,551 | |
NetApp Incorporated | | | | | | | | | | | 162,126 | | | | 5,607,938 | |
Pegatron Corporation | | | | | | | | | | | 620,150 | | | | 1,499,047 | |
Qisda Corporation | | | | | | | | | | | 171,392 | | | | 69,679 | |
Quanta Computer Incorporated | | | | | | | | | | | 913,766 | | | | 1,690,426 | |
Ricoh Company Limited | | | | | | | | | | | 111,565 | | | | 1,006,042 | |
Riso Kagaku Corporation | | | | | | | | | | | 4,100 | | | | 67,207 | |
Ritek Corporation † | | | | | | | | | | | 159 | | | | 20 | |
Samsung Electronics Company Limited | | | | | | | | | | | 16,904 | | | | 24,560,072 | |
Samsung SDS Company Limited | | | | | | | | | | | 6,077 | | | | 872,036 | |
Seagate Technology plc | | | | | | | | | | | 158,907 | | | | 5,361,522 | |
Seiko Epson Corporation | | | | | | | | | | | 46,000 | | | | 881,187 | |
| | | | | | |
| Portfolio of investments—August 31, 2016 (unaudited) | | Wells Fargo Diversified Stock Portfolio | | | 79 | |
| | | | | | | | | | | | | | | | |
| Security name | | | | | | | | Shares | | | Value | |
| | | | |
| Technology Hardware, Storage & Peripherals (continued) | | | | | | | | | | | | | | | | |
Stratasys Limited Ǡ | | | | | | | | | | | 3,967 | | | $ | 84,656 | |
Toshiba TEC Corporation † | | | | | | | | | | | 25,000 | | | | 97,618 | |
Transcend Information Incorporated | | | | | | | | | | | 68,130 | | | | 196,464 | |
Wacom Company Limited | | | | | | | | | | | 32,000 | | | | 100,208 | |
Western Digital Corporation | | | | | | | | | | | 33,700 | | | | 1,572,779 | |
Wistron Corporation | | | | | | | | | | | 565,834 | | | | 415,497 | |
| | | | |
| | | | | | | | | | | | | | | 192,552,680 | |
| | | | | | | | | | | | | | | | |
| | | | |
Materials: 5.23% | | | | | | | | | | | | | | | | |
| | | | |
| Chemicals: 2.40% | | | | | | | | | | | | | | | | |
Adeka Corporation | | | | | | | | | | | 15,200 | | | | 223,449 | |
Agrium Incorporated | | | | | | | | | | | 14,300 | | | | 1,377,877 | |
Air Liquide SA | | | | | | | | | | | 32,542 | | | | 3,569,279 | |
Air Water Incorporated | | | | | | | | | | | 28,000 | | | | 517,431 | |
Akzo Nobel NV | | | | | | | | | | | 25,110 | | | | 1,696,782 | |
Albemarle Corporation | | | | | | | | | | | 62,700 | | | | 5,014,119 | |
Alexandria Mineral Oils Company | | | | | | | | | | | 1,424 | | | | 6,102 | |
Arkema SA | | | | | | | | | | | 6,977 | | | | 622,833 | |
Asahi Kasei Corporation | | | | | | | | | | | 196,000 | | | | 1,652,640 | |
Ashland Incorporated | | | | | | | | | | | 32,700 | | | | 3,828,516 | |
Asian Paints Limited | | | | | | | | | | | 98,719 | | | | 1,706,835 | |
Axalta Coating Systems Limited † | | | | | | | | | | | 103,793 | | | | 2,970,556 | |
BASF SE | | | | | | | | | | | 86,320 | | | | 7,019,225 | |
Batu Kawan Bhd | | | | | | | | | | | 35,500 | | | | 158,439 | |
Cabot Corporation | | | | | | | | | | | 74,407 | | | | 3,709,933 | |
Castrol India Limited | | | | | | | | | | | 27,072 | | | | 180,716 | |
Celanese Corporation Series A | | | | | | | | | | | 82,400 | | | | 5,309,032 | |
China Steel Chemical Corporation | | | | | | | | | | | 35,000 | | | | 112,510 | |
Christian Hansen Holding AS | | | | | | | | | | | 8,826 | | | | 535,230 | |
Chugoku Marine Paints Limited | | | | | | | | | | | 12,000 | | | | 84,550 | |
Ciech SA | | | | | | | | | | | 645 | | | | 11,138 | |
Clariant AG | | | | | | | | | | | 25,999 | | | | 452,812 | |
Corbion NV | | | | | | | | | | | 9,177 | | | | 250,282 | |
Covestro AG | | | | | | | | | | | 5,900 | | | | 307,208 | |
Croda International plc | | | | | | | | | | | 12,234 | | | | 531,754 | |
Daicel Chemical Industries Limited | | | | | | | | | | | 51,000 | | | | 650,162 | |
Dainichiseika Color & Chemicals Manufacturing Company Limited | | | | | | | | | | | 15,000 | | | | 67,994 | |
Denka Company Limited | | | | | | | | | | | 69,000 | | | | 291,432 | |
DIC Incorporated | | | | | | | | | | | 13,500 | | | | 410,356 | |
Dow Chemical Company | | | | | | | | | | | 122,444 | | | | 6,567,896 | |
DuluxGroup Limited | | | | | | | | | | | 61,858 | | | | 297,997 | |
E.I. du Pont de Nemours & Company | | | | | | | | | | | 95,299 | | | | 6,632,810 | |
Ecolab Incorporated | | | | | | | | | | | 47,938 | | | | 5,898,771 | |
Elementis plc | | | | | | | | | | | 43,384 | | | | 124,194 | |
EMS-Chemie Holdings AG | | | | | | | | | | | 754 | | | | 401,321 | |
Essentra plc | | | | | | | | | | | 22,982 | | | | 155,723 | |
Eternal Chemical Company Limited | | | | | | | | | | | 156,644 | | | | 169,823 | |
Evonik Industries AG | | | | | | | | | | | 10,659 | | | | 358,293 | |
Formosa Chemicals & Fibre Corporation | | | | | | | | | | | 1,130,495 | | | | 2,935,749 | |
| | | | |
| 80 | | Wells Fargo Diversified Stock Portfolio | | Portfolio of investments—August 31, 2016 (unaudited) |
| | | | | | | | | | | | | | | | |
| Security name | | | | | | | | Shares | | | Value | |
| | | | |
| Chemicals (continued) | | | | | | | | | | | | | | | | |
Formosa Plastics Corporation | | | | | | | | | | | 1,319,709 | | | $ | 3,256,590 | |
Frutarom Industries Limited | | | | | | | | | | | 1,818 | | | | 95,978 | |
FUCHS PRETROLUB SE | | | | | | | | | | | 3,135 | | | | 131,520 | |
Fufeng Group Limited | | | | | | | | | | | 200 | | | | 87 | |
Fujimori Kogyo Company Limited | | | | | | | | | | | 3,100 | | | | 69,871 | |
GCP Applied Technologies Incorporated † | | | | | | | | | | | 100,657 | | | | 2,945,224 | |
Givaudan SA | | | | | | | | | | | 948 | | | | 1,959,518 | |
Grupa Azoty SA | | | | | | | | | | | 20,022 | | | | 328,940 | |
Hanwha Chem Corporation | | | | | | | | | | | 19,613 | | | | 450,307 | |
Hexpol AB | | | | | | | | | | | 40,678 | | | | 370,873 | |
Hitachi Chemical Company Limited | | | | | | | | | | | 15,000 | | | | 323,298 | |
Huntsman Corporation | | | | | | | | | | | 236,200 | | | | 4,083,898 | |
Hyosung Corporation | | | | | | | | | | | 5,120 | | | | 606,135 | |
Incitec Pivot Limited | | | | | | | | | | | 260,881 | | | | 558,786 | |
Indorama Ventures PCL | | | | | | | | | | | 398,233 | | | | 368,143 | |
Ingevity Corporation † | | | | | | | | | | | 24,044 | | | | 1,067,073 | |
International Flavors & Fragrances Incorporated | | | | | | | | | | | 45,200 | | | | 6,263,816 | |
Ishihara Sangyo Kaisha Limited † | | | | | | | | | | | 110,000 | | | | 71,232 | |
Israel Chemicals Limited | | | | | | | | | | | 39,013 | | | | 165,266 | |
Johnson Matthey plc | | | | | | | | | | | 18,533 | | | | 812,356 | |
JSR Corporation | | | | | | | | | | | 28,700 | | | | 419,689 | |
K&S AG | | | | | | | | | | | 16,172 | | | | 338,593 | |
Kaneka Corporation | | | | | | | | | | | 51,000 | | | | 415,532 | |
Kansai Paint Company Limited | | | | | | | | | | | 39,400 | | | | 867,855 | |
Kemira Oyj | | | | | | | | | | | 9,572 | | | | 122,787 | |
Kolon Industries Incorporated | | | | | | | | | | | 3,691 | | | | 271,446 | |
Koninklijke DSM NV | | | | | | | | | | | 19,849 | | | | 1,383,564 | |
Korea Petrochemical Industrial Company Limited | | | | | | | | | | | 631 | | | | 110,637 | |
Kumho Petrochemical Company Limited | | | | | | | | | | | 2,618 | | | | 161,776 | |
Kuraray Company Limited | | | | | | | | | | | 51,700 | | | | 738,536 | |
Kureha Corporation | | | | | | | | | | | 28,000 | | | | 105,543 | |
LANXESS AG | | | | | | | | | | | 8,492 | | | | 453,160 | |
LG Chem Limited | | | | | | | | | | | 7,139 | | | | 1,731,928 | |
Linde AG | | | | | | | | | | | 17,717 | | | | 3,034,521 | |
Lintec Corporation | | | | | | | | | | | 6,800 | | | | 127,699 | |
Lotte Chemical Corporation | | | | | | | | | | | 3,390 | | | | 814,816 | |
Lotte Fine Chemical Company Limited | | | | | | | | | | | 4,271 | | | | 134,833 | |
LyondellBasell Industries NV Class A | | | | | | | | | | | 36,000 | | | | 2,840,040 | |
Methanex Corporation | | | | | | | | | | | 12,000 | | | | 348,544 | |
Mexichem SAB de CV | | | | | | | | | | | 342,879 | | | | 791,989 | |
Minerals Technologies Incorporated | | | | | | | | | | | 45,884 | | | | 3,238,034 | |
Mitsubishi Chemical Holdings Corporation | | | | | | | | | | | 225,600 | | | | 1,423,396 | |
Mitsubishi Gas Chemical Company Incorporated | | | | | | | | | | | 66,000 | | | | 446,528 | |
Mitsui Chemicals Incorporated | | | | | | | | | | | 149,000 | | | | 712,850 | |
Monsanto Company | | | | | | | | | | | 79,108 | | | | 8,425,002 | |
Nan Ya Plastics Corporation | | | | | | | | | | | 1,428,125 | | | | 2,727,482 | |
NewMarket Corporation | | | | | | | | | | | 13,078 | | | | 5,675,198 | |
Nihon Nohyaku Company Limited | | | | | | | | | | | 10,000 | | | | 49,195 | |
Nihon Parkerizing Company Limited | | | | | | | | | | | 19,000 | | | | 253,603 | |
Nippon Kayaku Company Limited | | | | | | | | | | | 27,000 | | | | 295,404 | |
| | | | | | |
| Portfolio of investments—August 31, 2016 (unaudited) | | Wells Fargo Diversified Stock Portfolio | | | 81 | |
| | | | | | | | | | | | | | | | |
| Security name | | | | | | | | Shares | | | Value | |
| | | | |
| Chemicals (continued) | | | | | | | | | | | | | | | | |
Nippon Paint Company Limited | | | | | | | | | | | 29,200 | | | $ | 1,045,629 | |
Nippon Shokubai Company Limited | | | | | | | | | | | 5,100 | | | | 313,004 | |
Nippon Soda Company Limited | | | | | | | | | | | 28,000 | | | | 141,265 | |
Nippon Synthetic Chemical Industry Company Limited | | | | | | | | | | | 7,000 | | | | 61,431 | |
Nissan Chemical Industries Limited | | | | | | | | | | | 22,900 | | | | 703,832 | |
Nitto Denko Corporation | | | | | | | | | | | 24,100 | | | | 1,645,411 | |
NOF Corporation | | | | | | | | | | | 27,000 | | | | 272,701 | |
Novozymes AS Class B | | | | | | | | | | | 23,343 | | | | 1,012,175 | |
Nufarm Limited | | | | | | | | | | | 41,407 | | | | 262,337 | |
Nuplex Industries Limited | | | | | | | | | | | 34,891 | | | | 135,445 | |
OIC Company Limited Ǡ | | | | | | | | | | | 2,946 | | | | 230,924 | |
Okamoto Industries Incorporated | | | | | | | | | | | 14,000 | | | | 155,202 | |
Olin Corporation | | | | | | | | | | | 198,048 | | | | 4,285,759 | |
Orica Limited | | | | | | | | | | | 58,314 | | | | 646,870 | |
Oriental Union Chemical Corporation | | | | | | | | | | | 186,626 | | | | 116,456 | |
Osaka Soda Company Limited | | | | | | | | | | | 20,000 | | | | 75,195 | |
Petkim Petrokimya Holding SA | | | | | | | | | | | 123,111 | | | | 191,070 | |
Petronas Chemicals Group Bhd | | | | | | | | | | | 692,200 | | | | 1,141,861 | |
Pidilite Industries Limited | | | | | | | | | | | 36,846 | | | | 384,333 | |
PolyOne Corporation | | | | | | | | | | | 109,300 | | | | 3,767,571 | |
Potash Corporation of Saskatchewan | | | | | | | | | | | 82,800 | | | | 1,500,174 | |
PPG Industries Incorporated | | | | | | | | | | | 48,200 | | | | 5,103,416 | |
PTT Global Chemical PCL | | | | | | | | | | | 620,523 | | | | 1,093,496 | |
RPM International Incorporated | | | | | | | | | | | 69,718 | | | | 3,801,723 | |
Sakai Chemical Industry Company Limited | | | | | | | | | | | 13,000 | | | | 38,950 | |
Sanyo Chemical Industries Limited | | | | | | | | | | | 13,000 | | | | 109,564 | |
Scotts Miracle-Gro Company Class A | | | | | | | | | | | 54,292 | | | | 4,495,378 | |
Shikoku Chemicals Corporation | | | | | | | | | | | 9,000 | | | | 82,202 | |
Shin-Etsu Chemical Company Limited | | | | | | | | | | | 59,500 | | | | 4,367,110 | |
Showa Denko KK | | | | | | | | | | | 20,900 | | | | 258,763 | |
Sidi Kerir Petrochemcials Company | | | | | | | | | | | 9,866 | | | | 13,721 | |
Sika AG | | | | | | | | | | | 199 | | | | 948,110 | |
SK Chemicals Company Limited | | | | | | | | | | | 4,328 | | | | 256,187 | |
SK Kaken Company Limited « | | | | | | | | | | | 1,000 | | | | 99,744 | |
SK Materials Company Limited | | | | | | | | | | | 682 | | | | 89,241 | |
SKC Company Limited | | | | | | | | | | | 4,380 | | | | 107,830 | |
Solvay SA | | | | | | | | | | | 7,552 | | | | 828,994 | |
Sumitomo Bakelite Company Limited | | | | | | | | | | | 27,000 | | | | 134,132 | |
Sumitomo Chemical Company Limited | | | | | | | | | | | 248,000 | | | | 1,136,152 | |
Symrise AG | | | | | | | | | | | 9,598 | | | | 706,709 | |
Syngenta AG | | | | | | | | | | | 8,855 | | | | 3,856,028 | |
Synthomer plc | | | | | | | | | | | 25,554 | | | | 122,212 | |
Synthos SA † | | | | | | | | | | | 150,781 | | | | 149,687 | |
T. Hasegawa Company Limited | | | | | | | | | | | 4,600 | | | | 83,362 | |
Taekwang Industrial Company Limited | | | | | | | | | | | 176 | | | | 131,329 | |
Taiwan Fertilizer Company Limited | | | | | | | | | | | 147,000 | | | | 194,113 | |
Taiyo Holdings Company Limited | | | | | | | | | | | 3,100 | | | | 107,413 | |
Taiyo Nippon Sanso Corporation | | | | | | | | | | | 28,000 | | | | 284,154 | |
Takasago International Corporation | | | | | | | | | | | 2,600 | | | | 61,190 | |
Teijin Limited | | | | | | | | | | | 145,000 | | | | 540,956 | |
| | | | |
| 82 | | Wells Fargo Diversified Stock Portfolio | | Portfolio of investments—August 31, 2016 (unaudited) |
| | | | | | | | | | | | | | | | |
| Security name | | | | | | | | Shares | | | Value | |
| | | | |
| Chemicals (continued) | | | | | | | | | | | | | | | | |
The Chemours Company | | | | | | | | | | | 239,572 | | | $ | 3,159,955 | |
The Israel Corporation Limited | | | | | | | | | | | 200 | | | | 36,802 | |
The Mosaic Company | | | | | | | | | | | 195,295 | | | | 5,872,521 | |
The Sherwin-Williams Company | | | | | | | | | | | 14,200 | | | | 4,028,682 | |
The Valspar Corporation | | | | | | | | | | | 40,900 | | | | 4,311,269 | |
Toagosei Company Limited | | | | | | | | | | | 19,200 | | | | 205,240 | |
Tokai Carbon Company Limited | | | | | | | | | | | 40,000 | | | | 105,543 | |
Tokuyama Corporation † | | | | | | | | | | | 51,000 | | | | 208,012 | |
Tokyo Ohka Kogyo Company Limited | | | | | | | | | | | 6,600 | | | | 207,316 | |
Toray Industries Incorporated | | | | | | | | | | | 236,000 | | | | 2,272,753 | |
Tosoh Corporation | | | | | | | | | | | 95,000 | | | | 584,884 | |
Toyo Ink SC Holding Company Limited | | | | | | | | | | | 34,000 | | | | 145,247 | |
Toyobo Company Limited | | | | | | | | | | | 130,000 | | | | 206,060 | |
UBE Industries Limited | | | | | | | | | | | 156,000 | | | | 283,458 | |
Umicore SA | | | | | | | | | | | 12,219 | | | | 721,556 | |
United Phosphorus Limited | | | | | | | | | | | 115,943 | | | | 1,106,194 | |
Victrex plc | | | | | | | | | | | 9,279 | | | | 185,451 | |
W.R. Grace & Company | | | | | | | | | | | 43,035 | | | | 3,362,325 | |
Wacker Chemie AG | | | | | | | | | | | 1,172 | | | | 108,951 | |
Westlake Chemical Corporation | | | | | | | | | | | 23,900 | | | | 1,238,498 | |
Yara International ASA | | | | | | | | | | | 16,864 | | | | 598,646 | |
Zeon Corporation | | | | | | | | | | | 32,000 | | | | 275,262 | |
| | | | |
| | | | | | | | | | | | | | | 205,715,996 | |
| | | | | | | | | | | | | | | | |
| | | | |
| Construction Materials: 0.53% | | | | | | | | | | | | | | | | |
Adelaide Brighton Limited | | | | | | | | | | | 81,546 | | | | 321,751 | |
Ambuja Cements Limited | | | | | | | | | | | 238,447 | | | | 989,642 | |
Anhui Conch Cement Company Limited H Shares | | | | | | | | | | | 341,000 | | | | 958,266 | |
Asia Cement Corporation | | | | | | | | | | | 875,058 | | | | 781,831 | |
Associated Cement Companies Limited | | | | | | | | | | | 9,386 | | | | 239,632 | |
Boral Limited | | | | | | | | | | | 121,372 | | | | 602,945 | |
Brickworks Limited | | | | | | | | | | | 11,048 | | | | 116,327 | |
Buzzi Unicem SpA | | | | | | | | | | | 3,462 | | | | 73,604 | |
Cemex SAB de CV † | | | | | | | | | | | 4,177,579 | | | | 3,460,833 | |
China Resources Cement Holdings Limited | | | | | | | | | | | 336,369 | | | | 131,815 | |
CRH plc | | | | | | | | | | | 74,479 | | | | 2,521,406 | |
CSR Limited | | | | | | | | | | | 85,052 | | | | 220,527 | |
Eagle Materials Incorporated | | | | | | | | | | | 63,400 | | | | 5,095,458 | |
Fletcher Building Limited | | | | | | | | | | | 120,402 | | | | 926,055 | |
Fletcher Building Limited - Australia Exchange | | | | | | | | | | | 8,657 | | | | 66,038 | |
Grasim Industries Limited | | | | | | | | | | | 9,932 | | | | 692,548 | |
Heidelbergcement AG | | | | | | | | | | | 13,467 | | | | 1,250,863 | |
Imerys SA | | | | | | | | | | | 3,080 | | | | 217,026 | |
Italcementi SpA | | | | | | | | | | | 33,149 | | | | 390,837 | |
James Hardie Industries NV | | | | | | | | | | | 64,012 | | | | 1,043,468 | |
Lafarge Malayan Cement Bhd | | | | | | | | | | | 55,470 | | | | 110,106 | |
LafargeHolcim Limited | | | | | | | | | | | 16,849 | | | | 892,068 | |
LafargeHolcim Limited - Switzerland Exchange | | | | | | | | | | | 23,023 | | | | 1,220,730 | |
Martin Marietta Materials Incorporated | | | | | | | | | | | 36,117 | | | | 6,610,495 | |
PT Indocement Tunggal Prakarsa Tbk | | | | | | | | | | | 408,500 | | | | 545,077 | |
| | | | | | |
| Portfolio of investments—August 31, 2016 (unaudited) | | Wells Fargo Diversified Stock Portfolio | | | 83 | |
| | | | | | | | | | | | | | | | |
| Security name | | | | | | | | Shares | | | Value | |
| | | | |
| Construction Materials (continued) | | | | | | | | | | | | | | | | |
PT Semen Gresik Persero Tbk | | | | | | | | | | | 663,500 | | | $ | 495,187 | |
RHI AG | | | | | | | | | | | 2,303 | | | | 58,429 | |
Shree Cement Limited | | | | | | | | | | | 2,671 | | | | 684,992 | |
Siam City Cement PCL | | | | | | | | | | | 10,000 | | | | 87,244 | |
Suez Cement Company | | | | | | | | | | | 4,510 | | | | 5,688 | |
Sumitomo Osaka Cement Company | | | | | | | | | | | 61,000 | | | | 275,919 | |
Taiheiyo Cement Corporation | | | | | | | | | | | 196,000 | | | | 594,829 | |
Taiwan Cement Corporation | | | | | | | | | | | 1,183,746 | | | | 1,352,352 | |
TCC International Holdings Limited | | | | | | | | | | | 121,000 | | | | 23,553 | |
The Siam Cement PCL | | | | | | | | | | | 102,934 | | | | 1,576,029 | |
Titan Cement Company SA | | | | | | | | | | | 8,513 | | | | 197,513 | |
Ultra Tech Cement Limited | | | | | | | | | | | 22,119 | | | | 1,330,608 | |
Ultratech Cement Limited GDR | | | | | | | | | | | 1,352 | | | | 81,332 | |
Vicat SA | | | | | | | | | | | 887 | | | | 56,426 | |
Vulcan Materials Company | | | | | | | | | | | 76,300 | | | | 8,688,281 | |
Wienerberger AG | | | | | | | | | | | 10,742 | | | | 170,746 | |
| | | | |
| | | | | | | | | | | | | | | 45,158,476 | |
| | | | | | | | | | | | | | | | |
| | | | |
| Containers & Packaging: 0.53% | | | | | | | | | | | | | | | | |
Amcor Limited | | | | | | | | | | | 167,201 | | | | 2,010,559 | |
AptarGroup Incorporated | | | | | | | | | | | 83,182 | | | | 6,486,532 | |
Avery Dennison Corporation | | | | | | | | | | | 46,800 | | | | 3,624,192 | |
Ball Corporation | | | | | | | | | | | 3,312 | | | | 262,277 | |
Bemis Company Incorporated | | | | | | | | | | | 114,914 | | | | 6,044,476 | |
BillerudKorsnas AB | | | | | | | | | | | 28,295 | | | | 482,896 | |
CCL Industries Incorporated Class B | | | | | | | | | | | 1,924 | | | | 367,150 | |
DS Smith plc | | | | | | | | | | | 99,241 | | | | 532,350 | |
FP Corporation | | | | | | | | | | | 4,200 | | | | 221,640 | |
Fuji Seal International Incorporated | | | | | | | | | | | 4,300 | | | | 163,331 | |
Huhtamaki Oyj | | | | | | | | | | | 10,786 | | | | 469,219 | |
International Paper Company | | | | | | | | | | | 49,300 | | | | 2,390,557 | |
La Seda De Barcelona SA †(a) | | | | | | | | | | | 482 | | | | 0 | |
Mayr-Melnhof Karton AG | | | | | | | | | | | 610 | | | | 68,689 | |
Orora Limited | | | | | | | | | | | 243,074 | | | | 566,315 | |
Owens-Illinois Incorporated † | | | | | | | | | | | 193,200 | | | | 3,464,076 | |
Packaging Corporation of America | | | | | | | | | | | 52,600 | | | | 4,135,938 | |
Rengo Company Limited | | | | | | | | | | | 36,000 | | | | 213,985 | |
RPC Group plc | | | | | | | | | | | 28,420 | | | | 324,308 | |
Smurfit Kappa Group plc | | | | | | | | | | | 16,584 | | | | 408,820 | |
Sonoco Products Company | | | | | | | | | | | 122,439 | | | | 6,310,506 | |
Toyo Seikan Kaisha Limited | | | | | | | | | | | 26,100 | | | | 483,833 | |
WestRock Company | | | | | | | | | | | 141,183 | | | | 6,762,666 | |
| | | | |
| | | | | | | | | | | | | | | 45,794,315 | |
| | | | | | | | | | | | | | | | |
| | | | |
| Metals & Mining: 1.63% | | | | | | | | | | | | | | | | |
Acerinox SA | | | | | | | | | | | 8,382 | | | | 103,969 | |
Aeris Resources Limited † | | | | | | | | | | | 7,674 | | | | 288 | |
African Minerals Limited Ǡ(a) | | | | | | | | | | | 22,055 | | | | 0 | |
Agnico-Eagle Mines Limited | | | | | | | | | | | 19,266 | | | | 976,522 | |
Aichi Steel Corporation | | | | | | | | | | | 18,000 | | | | 95,511 | |
| | | | |
| 84 | | Wells Fargo Diversified Stock Portfolio | | Portfolio of investments—August 31, 2016 (unaudited) |
| | | | | | | | | | | | | | | | |
| Security name | | | | | | | | Shares | | | Value | |
| | | | |
| Metals & Mining (continued) | | | | | | | | | | | | | | | | |
Alacer Gold Corporation † | | | | | | | | | | | 17,005 | | | $ | 38,253 | |
Alamos Gold Incorporated Class A | | | | | | | | | | | 24,548 | | | | 172,776 | |
Alcoa Incorporated | | | | | | | | | | | 705,800 | | | | 7,114,464 | |
Allegheny Technologies Incorporated « | | | | | | | | | | | 143,900 | | | | 2,454,934 | |
Alumina Limited | | | | | | | | | | | 478,202 | | | | 477,992 | |
Anglo American Platinum Limited | | | | | | | | | | | 11,072 | | | | 297,706 | |
Anglo American plc | | | | | | | | | | | 133,132 | | | | 1,363,264 | |
Anglogold Ashanti Limited † | | | | | | | | | | | 103,958 | | | | 1,695,487 | |
Antofagasta plc | | | | | | | | | | | 33,519 | | | | 217,744 | |
ArcelorMittal | | | | | | | | | | | 157,253 | | | | 928,083 | |
Asahi Holdings Incorporated | | | | | | | | | | | 4,500 | | | | 77,157 | |
Aurubis AG | | | | | | | | | | | 3,804 | | | | 200,341 | |
B2Gold Corporation † | | | | | | | | | | | 55,517 | | | | 139,703 | |
Barrick Gold Corporation | | | | | | | | | | | 107,200 | | | | 1,822,089 | |
Bekaert SA | | | | | | | | | | | 3,186 | | | | 131,598 | |
BHP Billiton Limited | | | | | | | | | | | 463,310 | | | | 7,113,741 | |
BHP Billiton plc | | | | | | | | | | | 191,237 | | | | 2,485,864 | |
BlueScope Steel Limited | | | | | | | | | | | 81,602 | | | | 532,940 | |
Boliden AB | | | | | | | | | | | 25,134 | | | | 532,295 | |
Centerra Gold Incorporated | | | | | | | | | | | 13,776 | | | | 68,912 | |
China Metal Recycling Holdings Limited †(a) | | | | | | | | | | | 68,664 | | | | 0 | |
China Rare Earth Holdings Limited † | | | | | | | | | | | 60 | | | | 4 | |
China Steel Corporation | | | | | | | | | | | 3,740,348 | | | | 2,593,330 | |
Chung Hung Steel Corporation | | | | | | | | | | | 954 | | | | 199 | |
Commercial Metals Company | | | | | | | | | | | 132,505 | | | | 2,056,478 | |
Daido Steel Company Limited | | | | | | | | | | | 59,000 | | | | 268,013 | |
Delong Holdings Limited † | | | | | | | | | | | 1,400 | | | | 313 | |
Detour Gold Corporation † | | | | | | | | | | | 15,148 | | | | 341,910 | |
Dominion Diamond Corporation | | | | | | | | | | | 10,250 | | | | 89,885 | |
Dongkuk Steel Mill Company Limited † | | | | | | | | | | | 6,732 | | | | 51,199 | |
Dowa Mining Company Limited | | | | | | | | | | | 49,000 | | | | 328,198 | |
El Ezz Aldekhela Steel Alexandria | | | | | | | | | | | 164 | | | | 3,878 | |
Eldorado Gold Corporation | | | | | | | | | | | 67,207 | | | | 215,243 | |
Eregli Demir Ve Celik Fabrikalari Tas | | | | | | | | | | | 657,512 | | | | 989,342 | |
Ezz Steel † | | | | | | | | | | | 15,612 | | | | 13,872 | |
Feng Hsin Iron & Steel Company | | | | | | | | | | | 115,690 | | | | 148,028 | |
First Majestic Silver Corporation † | | | | | | | | | | | 10,800 | | | | 130,203 | |
First Quantum Minerals Limited | | | | | | | | | | | 56,722 | | | | 429,935 | |
Fortescue Metals Group Limited | | | | | | | | | | | 245,624 | | | | 904,534 | |
Franco-Nevada Corporation - Toronto Exchange | | | | | | | | | | | 16,707 | | | | 1,167,350 | |
Freeport-McMoRan Incorporated | | | | | | | | | | | 674,000 | | | | 6,935,460 | |
Fresnillo plc | | | | | | | | | | | 15,690 | | | | 330,889 | |
G-Resources Group Limited | | | | | | | | | | | 6,643,718 | | | | 121,612 | |
Glencore International plc | | | | | | | | | | | 1,137,793 | | | | 2,600,467 | |
Goldcorp Incorporated | | | | | | | | | | | 77,180 | | | | 1,174,709 | |
Grupo Mexico SAB de CV Class B | | | | | | | | | | | 1,155,856 | | | | 2,889,847 | |
Hindalco Industries Limited | | | | | | | | | | | 159,435 | | | | 379,125 | |
Hindalco Industries Limited GDR 144A | | | | | | | | | | | 47,917 | | | | 113,942 | |
Hindustan Zinc Limited | | | | | | | | | | | 43,032 | | | | 145,860 | |
Hitachi Metals Limited | | | | | | | | | | | 32,000 | | | | 387,223 | |
| | | | | | |
| Portfolio of investments—August 31, 2016 (unaudited) | | Wells Fargo Diversified Stock Portfolio | | | 85 | |
| | | | | | | | | | | | | | | | |
| Security name | | | | | | | | Shares | | | Value | |
| | | | |
| Metals & Mining (continued) | | | | | | | | | | | | | | | | |
Hudbay Minerals Incorporated | | | | | | | | | | | 14,987 | | | $ | 60,798 | |
Hyundai Steel Company | | | | | | | | | | | 13,240 | | | | 609,159 | |
IAMGOLD Corporation † | | | | | | | | | | | 35,249 | | | | 130,900 | |
Iluka Resources Limited | | | | | | | | | | | 79,595 | | | | 393,613 | |
Independence Group NL | | | | | | | | | | | 42,669 | | | | 117,689 | |
Industrias Penoles SAB de CV | | | | | | | | | | | 28,068 | | | | 649,037 | |
JFE Holdings Incorporated | | | | | | | | | | | 86,492 | | | | 1,342,960 | |
JSW Steel Limited | | | | | | | | | | | 25,023 | | | | 655,037 | |
KGHM Polska Miedz SA « | | | | | | | | | | | 48,720 | | | | 913,107 | |
Kinross Gold Corporation † | | | | | | | | | | | 113,307 | | | | 452,744 | |
Kobe Steel Limited | | | | | | | | | | | 556,000 | | | | 515,885 | |
Korea Zinc Company Limited | | | | | | | | | | | 2,063 | | | | 885,332 | |
Koza Altin Isletmeleri AS | | | | | | | | | | | 13,742 | | | | 64,262 | |
Kurimoto Limited | | | | | | | | | | | 22,000 | | | | 38,274 | |
Kyoei Steel Limited | | | | | | | | | | | 5,200 | | | | 100,919 | |
Labrador Iron Ore Royalty Company | | | | | | | | | | | 2,785 | | | | 27,608 | |
Lundin Mining Corporation † | | | | | | | | | | | 45,155 | | | | 170,786 | |
Maruichi Steel Tube Limited | | | | | | | | | | | 12,300 | | | | 424,404 | |
Melewar Industrial Group Bhd † | | | | | | | | | | | 1 | | | | 0 | |
Mercator Minerals Limited †(a) | | | | | | | | | | | 33,385 | | | | 0 | |
Midas Holdings Limited | | | | | | | | | | | 65,000 | | | | 10,734 | |
Mitsubishi Materials Corporation | | | | | | | | | | | 193,000 | | | | 544,687 | |
Mitsubishi Steel Manufacturing Company Limited | | | | | | | | | | | 27,000 | | | | 43,319 | |
Mitsui Mining & Smelting Company Limited | | | | | | | | | | | 84,000 | | | | 171,304 | |
MMC Norilsk Nickel PJSC | | | | | | | | | | | 187,999 | | | | 2,831,265 | |
Mongolian Mining Corporation † | | | | | | | | | | | 408,750 | | | | 5,691 | |
Neturen Company Limited | | | | | | | | | | | 6,900 | | | | 47,950 | |
Nevsun Resources Limited | | | | | | | | | | | 18,400 | | | | 57,947 | |
New Gold Incorporated † | | | | | | | | | | | 45,386 | | | | 218,036 | |
Newcrest Mining Limited † | | | | | | | | | | | 110,203 | | | | 1,837,844 | |
Newmont Mining Corporation | | | | | | | | | | | 287,564 | | | | 10,996,447 | |
Nippon Denko Company Limited | | | | | | | | | | | 10,000 | | | | 16,237 | |
Nippon Light Metal Holdings Company Limited | | | | | | | | | | | 79,500 | | | | 169,043 | |
Nippon Steel Corporation | | | | | | | | | | | 137,200 | | | | 2,912,011 | |
Nisshin Steel Holdings Company Limited | | | | | | | | | | | 17,264 | | | | 221,755 | |
Nittetsu Mining Company Limited | | | | | | | | | | | 12,000 | | | | 42,565 | |
NMDC Limited | | | | | | | | | | | 207,319 | | | | 334,336 | |
Norsk Hydro ASA | | | | | | | | | | | 97,893 | | | | 416,114 | |
Northern Dynasty Minerals † | | | | | | | | | | | 2,200 | | | | 1,527 | |
Northern Star Resources Limited | | | | | | | | | | | 87,386 | | | | 265,984 | |
NovaCopper Incorporated † | | | | | | | | | | | 2,136 | | | | 1,205 | |
NovaGold Resources Incorporated † | | | | | | | | | | | 12,820 | | | | 66,084 | |
Novolipet Steel GDR Register Shares | | | | | | | | | | | 18,613 | | | | 259,651 | |
Nucor Corporation | | | | | | | | | | | 171,710 | | | | 8,329,652 | |
Oceanagold Corporation | | | | | | | | | | | 56,900 | | | | 179,196 | |
OSAKA Titanium Technologies Company « | | | | | | | | | | | 3,700 | | | | 56,109 | |
Osisko Gold Royalties Limited | | | | | | | | | | | 3,915 | | | | 44,243 | |
Outokumpu Oyj † | | | | | | | | | | | 8,348 | | | | 45,665 | |
OZ Minerals Limited | | | | | | | | | | | 56,980 | | | | 273,641 | |
Pacific Metals Company Limited † | | | | | | | | | | | 27,000 | | | | 75,417 | |
| | | | |
| 86 | | Wells Fargo Diversified Stock Portfolio | | Portfolio of investments—August 31, 2016 (unaudited) |
| | | | | | | | | | | | | | | | |
| Security name | | | | | | | | Shares | | | Value | |
| | | | |
| Metals & Mining (continued) | | | | | | | | | | | | | | | | |
Pan American Silver Corporation | | | | | | | | | | | 16,145 | | | $ | 281,559 | |
Petropavlovsk plc † | | | | | | | | | | | 9,120 | | | | 807 | |
Philex Mining Corporation | | | | | | | | | | | 24 | | | | 4 | |
POSCO | | | | | | | | | | | 12,853 | | | | 2,662,819 | |
Pretium Resources Incorporated † | | | | | | | | | | | 12,526 | | | | 120,828 | |
PT Aneka Tambang Tbk † | | | | | | | | | | | 186 | | | | 10 | |
Randgold Resources Limited | | | | | | | | | | | 8,749 | | | | 821,445 | |
Real Gold Mining Limited †(a) | | | | | | | | | | | 41,000 | | | | 0 | |
Regis Resources Limited | | | | | | | | | | | 88,984 | | | | 247,441 | |
Reliance Steel & Aluminum Company | | | | | | | | | | | 88,100 | | | | 6,350,248 | |
Rio Tinto Limited | | | | | | | | | | | 61,241 | | | | 2,190,823 | |
Rio Tinto plc | | | | | | | | | | | 109,053 | | | | 3,295,098 | |
Royal Gold Incorporated | | | | | | | | | | | 86,085 | | | | 6,311,752 | |
Salzgitter AG | | | | | | | | | | | 2,771 | | | | 84,305 | |
Sandfire Resources NL | | | | | | | | | | | 24,651 | | | | 101,525 | |
Sanyo Special Steel Company Limited | | | | | | | | | | | 26,000 | | | | 141,980 | |
Semafo Incorporated † | | | | | | | | | | | 21,405 | | | | 90,915 | |
Silver Standard Resources Incorporated † | | | | | | | | | | | 5,023 | | | | 58,948 | |
Silver Wheaton Corporation | | | | | | | | | | | 41,341 | | | | 1,047,869 | |
Sims Group Limited | | | | | | | | | | | 28,188 | | | | 211,000 | |
Sociedad Minera Cerro Verde SA † | | | | | | | | | | | 3,244 | | | | 61,020 | |
South32 Limited - Athens Exchange | | | | | | | | | | | 525,142 | | | | 757,768 | |
South32 Limited - London Exchange | | | | | | | | | | | 191,237 | | | | 276,235 | |
Southern Copper Corporation « | | | | | | | | | | | 55,608 | | | | 1,435,799 | |
SSAB Svenskt Stal AB Class A † | | | | | | | | | | | 20,546 | | | | 61,129 | |
SSAB Svenskt Stal AB Class B † | | | | | | | | | | | 25,759 | | | | 61,955 | |
Steel Authority of India Limited | | | | | | | | | | | 105,948 | | | | 76,253 | |
Steel Dynamics Incorporated | | | | | | | | | | | 297,700 | | | | 7,329,374 | |
Sumitomo Metal Mining Company Limited | | | | | | | | | | | 81,000 | | | | 1,027,130 | |
Tahoe Resources Incorporated | | | | | | | | | | | 28,200 | | | | 367,929 | |
Talvivaara Mining Company plc †(a) | | | | | | | | | | | 152,775 | | | | 0 | |
Tata Steel Limited | | | | | | | | | | | 48,920 | | | | 270,349 | |
Teck Resources Limited Class B | | | | | | | | | | | 45,708 | | | | 740,655 | |
Thyssenkrupp AG | | | | | | | | | | | 36,326 | | | | 846,662 | |
Toho Titanium Company Limited | | | | | | | | | | | 7,700 | | | | 55,072 | |
Toho Zinc Company Limited | | | | | | | | | | | 26,000 | | | | 79,911 | |
Tokyo Steel Manufacturing Company Limited | | | | | | | | | | | 16,100 | | | | 113,283 | |
Ton Yi Industrial Corporation | | | | | | | | | | | 243,350 | | | | 108,137 | |
Topy Industries Limited | | | | | | | | | | | 36,000 | | | | 73,068 | |
Torex Gold Resources Incorporated † | | | | | | | | | | | 7,400 | | | | 169,510 | |
Trans Hex Group Limited † | | | | | | | | | | | 3,465 | | | | 896 | |
Turquoise Hill Resources Limited † | | | | | | | | | | | 57,728 | | | | 177,841 | |
UACJ Corporation | | | | | | | | | | | 44,000 | | | | 137,360 | |
United States Steel Corporation « | | | | | | | | | | | 175,400 | | | | 3,409,776 | |
Vale SA | | | | | | | | | | | 412,546 | | | | 2,164,167 | |
Vedanta Limited | | | | | | | | | | | 301,698 | | | | 765,845 | |
Viohalco SA † | | | | | | | | | | | 1,430 | | | | 1,994 | |
Voestalpine AG | | | | | | | | | | | 9,874 | | | | 326,784 | |
Worthington Industries Incorporated | | | | | | | | | | | 52,239 | | | | 2,241,053 | |
Yamana Gold Incorporated | | | | | | | | | | | 78,246 | | | | 316,826 | |
| | | | | | |
| Portfolio of investments—August 31, 2016 (unaudited) | | Wells Fargo Diversified Stock Portfolio | | | 87 | |
| | | | | | | | | | | | | | | | |
| Security name | | | | | | | | Shares | | | Value | |
| | | | |
| Metals & Mining (continued) | | | | | | | | | | | | | | | | |
Yamato Kogyo Company Limited | | | | | | | | | | | 7,200 | | | $ | 220,248 | |
Yieh Phui Enterprise | | | | | | | | | | | 14,220 | | | | 4,446 | |
Yodogawa Steel Works Limited | | | | | | | | | | | 4,500 | | | | 118,170 | |
Young Poong Corporation | | | | | | | | | | | 239 | | | | 233,427 | |
| | | | |
| | | | | | | | | | | | | | | 139,930,302 | |
| | | | | | | | | | | | | | | | |
| | | | |
| Paper & Forest Products: 0.14% | | | | | | | | | | | | | | | | |
Canfor Corporation † | | | | | | | | | | | 8,208 | | | | 95,324 | |
Daio Paper Corporation « | | | | | | | | | | | 16,500 | | | | 175,262 | |
Domtar Corporation | | | | | | | | | | | 73,600 | | | | 2,746,752 | |
Empresas CMPC SA | | | | | | | | | | | 458,328 | | | | 909,054 | |
Fibria Celulose SA | | | | | | | | | | | 78,215 | | | | 533,108 | |
Hokuetsu Paper Mills Limited | | | | | | | | | | | 22,300 | | | | 140,096 | |
Holmen AB Class B | | | | | | | | | | | 6,246 | | | | 218,302 | |
Kapstone Paper & Packaging Corporation | | | | | | | | | | | 122,300 | | | | 2,141,473 | |
Mitsubishi Paper Mills Limited † | | | | | | | | | | | 65,000 | | | | 43,976 | |
Mondi Limited | | | | | | | | | | | 35,625 | | | | 719,672 | |
Mondi plc | | | | | | | | | | | 33,273 | | | | 676,796 | |
Nippon Paper Industries Company Limited | | | | | | | | | | | 17,100 | | | | 316,829 | |
Oji Holdings Corporation | | | | | | | | | | | 146,000 | | | | 587,020 | |
Stella-Jones Incorporated | | | | | | | | | | | 9,800 | | | | 332,246 | |
Stora Enso Oyj | | | | | | | | | | | 69,844 | | | | 616,638 | |
Tokushu Tokai Holdings Company Limited | | | | | | | | | | | 24,000 | | | | 80,955 | |
UPM-Kymmene Oyj | | | | | | | | | | | 55,974 | | | | 1,124,476 | |
West Fraser Timber Company Limited | | | | | | | | | | | 6,150 | | | | 207,048 | |
YFY Incorporated | | | | | | | | | | | 433,565 | | | | 123,386 | |
| | | | |
| | | | | | | | | | | | | | | 11,788,413 | |
| | | | | | | | | | | | | | | | |
| | | | |
Telecommunication Services: 2.60% | | | | | | | | | | | | | | | | |
| | | | |
| Diversified Telecommunication Services: 1.62% | | | | | | | | | | | | | | | | |
AT&T Incorporated | | | | | | | | | | | 684,577 | | | | 27,985,508 | |
BCE Incorporated | | | | | | | | | | | 28,401 | | | | 1,326,925 | |
Bezeq Israeli Telecommunication Corporation Limited | | | | | | | | | | | 178,458 | | | | 358,192 | |
Bharti Infratel Limited | | | | | | | | | | | 184,499 | | | | 966,299 | |
BT Group plc | | | | | | | | | | | 788,518 | | | | 4,000,430 | |
Cellnex Telecom SAU | | | | | | | | | | | 13,745 | | | | 239,944 | |
CenturyLink Incorporated | | | | | | | | | | | 294,060 | | | | 8,174,868 | |
China Telecom Corporation Limited H Shares | | | | | | | | | | | 4,440,000 | | | | 2,295,106 | |
China Unicom Limited | | | | | | | | | | | 1,731,688 | | | | 1,962,158 | |
Chorus Limited | | | | | | | | | | | 62,330 | | | | 192,213 | |
Chunghwa Telecom Company Limited | | | | | | | | | | | 1,036,602 | | | | 3,724,260 | |
Citic 1616 Holdings Limited | | | | | | | | | | | 481 | | | | 182 | |
Deutsche Telekom AG | | | | | | | | | | | 295,083 | | | | 4,927,381 | |
Elisa Oyj | | | | | | | | | | | 17,138 | | | | 602,937 | |
Frontier Communications Corporation « | | | | | | | | | | | 610,441 | | | | 2,808,029 | |
Hellenic Telecommunications Organization SA | | | | | | | | | | | 66,898 | | | | 634,282 | |
Hong Kong Broadband Network Limited | | | | | | | | | | | 153,000 | | | | 170,996 | |
Hong Kong Telecommunications Trust & Hong Kong Trust Limited | | | | | | | | | | | 513,364 | | | | 708,084 | |
Hutchison Telecommunications Hong Kong Holdings Limited | | | | | | | | | | | 196,000 | | | | 67,712 | |
| | | | |
| 88 | | Wells Fargo Diversified Stock Portfolio | | Portfolio of investments—August 31, 2016 (unaudited) |
| | | | | | | | | | | | | | | | |
| Security name | | | | | | | | Shares | | | Value | |
| | | | |
| Diversified Telecommunication Services (continued) | | | | | | | | | | | | | | | | |
Iliad SA | | | | | | | | | | | 1,823 | | | $ | 375,886 | |
Inmarsat plc | | | | | | | | | | | 40,614 | | | | 411,192 | |
Koninklijke KPN NV | | | | | | | | | | | 274,617 | | | | 896,603 | |
KT Corporation | | | | | | | | | | | 20,261 | | | | 574,213 | |
Level 3 Communications Incorporated † | | | | | | | | | | | 165,964 | | | | 8,236,793 | |
LG Uplus Corporation | | | | | | | | | | | 33,879 | | | | 353,982 | |
Manitoba Telecom Services Incorporated | | | | | | | | | | | 5,945 | | | | 172,946 | |
Nippon Telegraph & Telephone Corporation | | | | | | | | | | | 99,900 | | | | 4,389,363 | |
Ooredoo QSC | | | | | | | | | | | 33,164 | | | | 935,352 | |
Orange Polska SA | | | | | | | | | | | 132,850 | | | | 182,873 | |
Orange SA | | | | | | | | | | | 204,770 | | | | 3,126,943 | |
PCCW Limited | | | | | | | | | | | 819,477 | | | | 519,729 | |
Proximus SA | | | | | | | | | | | 15,466 | | | | 473,210 | |
PT Telekomunikasi Indonesia Persero Tbk | | | | | | | | | | | 15,507,084 | | | | 4,921,585 | |
Rostelecom Sponsored ADR | | | | | | | | | | | 3,611 | | | | 27,249 | |
SBA Communications Corporation Class A † | | | | | | | | | | | 71,498 | | | | 8,161,497 | |
SFR Group SA | | | | | | | | | | | 8,018 | | | | 213,307 | |
Singapore Telecommunications Limited | | | | | | | | | | | 1,162,100 | | | | 3,428,854 | |
Spark New Zealand Limited | | | | | | | | | | | 198,250 | | | | 547,350 | |
Sunrise Communications Group AG 144A | | | | | | | | | | | 3,172 | | | | 215,756 | |
Swisscom AG | | | | | | | | | | | 2,129 | | | | 1,017,149 | |
Taicom PCL | | | | | | | | | | | 188,600 | | | | 119,865 | |
TalkTalk Telecom Group plc | | | | | | | | | | | 57,843 | | | | 160,268 | |
TDC AS | | | | | | | | | | | 101,735 | | | | 562,357 | |
Telecom Egypt Company | | | | | | | | | | | 36,313 | | | | 41,302 | |
Telecom Italia SpA † | | | | | | | | | | | 885,010 | | | | 803,075 | |
Telecom Italia SpA RSP | | | | | | | | | | | 592,709 | | | | 434,367 | |
Telecom Malaysia Bhd | | | | | | | | | | | 653,250 | | | | 1,101,770 | |
Telefonica Brasil SA | | | | | | | | | | | 8,717 | | | | 107,950 | |
Telefonica Deutschland Holding AG | | | | | | | | | | | 91,645 | | | | 376,599 | |
Telefonica SA | | | | | | | | | | | 386,950 | | | | 3,897,560 | |
Telenor ASA | | | | | | | | | | | 70,077 | | | | 1,223,630 | |
Telesites SAB de CV † | | | | | | | | | | | 465,117 | | | | 272,789 | |
Telia Company AB | | | | | | | | | | | 284,399 | | | | 1,284,682 | |
Telstra Corporation Limited | | | | | | | | | | | 617,757 | | | | 2,442,089 | |
Telus Corporation | | | | | | | | | | | 19,486 | | | | 639,231 | |
Tiscali SpA † | | | | | | | | | | | 588 | | | | 30 | |
TPG Telecom Limited | | | | | | | | | | | 45,074 | | | | 412,941 | |
True Corporation PCL | | | | | | | | | | | 3,114,716 | | | | 701,847 | |
TT&T PCL †(a) | | | | | | | | | | | 270,800 | | | | 0 | |
Turk Telekomunikasyon AS | | | | | | | | | | | 117,421 | | | | 237,030 | |
Verizon Communications Incorporated | | | | | | | | | | | 452,797 | | | | 23,694,867 | |
Vocus Communications Limited | | | | | | | | | | | 49,969 | | | | 288,792 | |
| | | | |
| | | | | | | | | | | | | | | 139,130,379 | |
| | | | | | | | | | | | | | | | |
| | | | |
| Wireless Telecommunication Services: 0.98% | | | | | | | | | | | | | | | | |
Advanced Info Service PCL - Foreign Register | | | | | | | | | | | 353,800 | | | | 1,691,551 | |
America Movil SAB de CV Class L | | | | | | | | | | | 8,388,136 | | | | 5,008,801 | |
Axiata Group Bhd | | | | | | | | | | | 945,470 | | | | 1,279,899 | |
Bharti Airtel Limited | | | | | | | | | | | 447,901 | | | | 2,218,103 | |
| | | | | | |
| Portfolio of investments—August 31, 2016 (unaudited) | | Wells Fargo Diversified Stock Portfolio | | | 89 | |
| | | | | | | | | | | | | | | | |
| Security name | | | | | | | | Shares | | | Value | |
| | | | |
| Wireless Telecommunication Services (continued) | | | | | | | | | | | | | | | | |
China Mobile Limited | | | | | | | | | | | 1,508,000 | | | $ | 18,622,684 | |
Digi.com Bhd | | | | | | | | | | | 901,400 | | | | 1,115,776 | |
Drillisch AG « | | | | | | | | | | | 7,270 | | | | 335,361 | |
Empresa Nacional de Telecomunicaciones SA | | | | | | | | | | | 28,911 | | | | 272,675 | |
Far Eastone Telecommunications Company Limited | | | | | | | | | | | 553,722 | | | | 1,289,613 | |
Freenet AG | | | | | | | | | | | 9,566 | | | | 274,656 | |
Global Telecom Holding † | | | | | | | | | | | 313,006 | | | | 142,757 | |
Globe Telecom Incorporated | | | | | | | | | | | 8,330 | | | | 352,186 | |
Idea Cellular Limited | | | | | | | | | | | 292,014 | | | | 407,477 | |
Intouch Holdings PCL Class F | | | | | | | | | | | 419,200 | | | | 681,198 | |
KDDI Corporation | | | | | | | | | | | 261,000 | | | | 7,658,590 | |
M1 Limited | | | | | | | | | | | 94,400 | | | | 184,996 | |
Maxis Bhd | | | | | | | | | | | 514,200 | | | | 796,246 | |
MegaFon OAO | | | | | | | | | | | 49,841 | | | | 505,886 | |
Millicom International Cellular SA | | | | | | | | | | | 6,159 | | | | 315,481 | |
Mobile Telesystems ADR | | | | | | | | | | | 144,012 | | | | 1,170,818 | |
MTN Group Limited « | | | | | | | | | | | 414,152 | | | | 3,386,007 | |
NTT DOCOMO Incorporated | | | | | | | | | | | 194,300 | | | | 4,888,251 | |
Okinawa Cellular Telephone Company | | | | | | | | | | | 2,400 | | | | 72,372 | |
Orascom Telecom Media & Technology Holding SAE † | | | | | | | | | | | 313,006 | | | | 20,092 | |
PLDT Incorporated | | | | | | | | | | | 24,955 | | | | 977,955 | |
PT Indonesian Satellite Corporation Tbk † | | | | | | | | | | | 241,500 | | | | 112,876 | |
PT Tower Bersama Infrastructure Tbk | | | | | | | | | | | 565,500 | | | | 237,668 | |
PT Xl Axiata Tbk † | | | | | | | | | | | 651,875 | | | | 139,565 | |
Reliance Communications Limited † | | | | | | | | | | | 442,880 | | | | 356,777 | |
Reliance Communications Limited GDR 144A† | | | | | | | | | | | 32,828 | | | | 26,446 | |
Rogers Communications Incorporated Class B | | | | | | | | | | | 35,000 | | | | 1,498,856 | |
SK Telecom Company Limited | | | | | | | | | | | 6,460 | | | | 1,265,928 | |
SmarTone Telecommunications Holding Limited | | | | | | | | | | | 53,688 | | | | 88,585 | |
SoftBank Group Corporation | | | | | | | | | | | 138,645 | | | | 9,053,164 | |
Sprint Corporation Ǡ | | | | | | | | | | | 93,742 | | | | 579,326 | |
StarHub Limited | | | | | | | | | | | 109,000 | | | | 292,811 | |
Taiwan Mobile Company Limited | | | | | | | | | | | 554,202 | | | | 1,947,449 | |
Tele2 AB Class B | | | | | | | | | | | 29,579 | | | | 246,185 | |
Telephone & Data Systems Incorporated | | | | | | | | | | | 112,802 | | | | 3,143,792 | |
Tim Participacoes SA | | | | | | | | | | | 177,415 | | | | 456,558 | |
Total Access Communication PCL | | | | | | | | | | | 192,200 | | | | 191,559 | |
Turkcell Iletisim Hizmetleri AS † | | | | | | | | | | | 272,349 | | | | 914,445 | |
VimpelCom Limited ADR | | | | | | | | | | | 49,963 | | | | 213,342 | |
Vodacom Group Proprietary Limited | | | | | | | | | | | 136,573 | | | | 1,420,630 | |
Vodafone Group plc | | | | | | | | | | | 2,382,728 | | | | 7,191,725 | |
Vodafone Qatar | | | | | | | | | | | 126,716 | | | | 414,110 | |
| | | | |
| | | | | | | | | | | | | | | 83,461,228 | |
| | | | | | | | | | | | | | | | |
| | | | |
Utilities: 3.93% | | | | | | | | | | | | | | | | |
| | | | |
| Electric Utilities: 1.65% | | | | | | | | | | | | | | | | |
Acciona SA | | | | | | | | | | | 2,541 | | | | 181,059 | |
ALLETE Incorporated | | | | | | | | | | | 55,132 | | | | 3,269,328 | |
Alliant Energy Corporation | | | | | | | | | | | 126,736 | | | | 4,809,631 | |
American Electric Power Company Incorporated | | | | | | | | | | | 52,480 | | | | 3,388,634 | |
| | | | |
| 90 | | Wells Fargo Diversified Stock Portfolio | | Portfolio of investments—August 31, 2016 (unaudited) |
| | | | | | | | | | | | | | | | |
| Security name | | | | | | | | Shares | | | Value | |
| | | | |
| Electric Utilities (continued) | | | | | | | | | | | | | | | | |
AusNet Services | | | | | | | | | | | 244,412 | | | $ | 315,943 | |
CEZ AS | | | | | | | | | | | 55,424 | | | | 967,323 | |
Cheung Kong Infrastructure Holdings Limited | | | | | | | | | | | 104,000 | | | | 873,420 | |
Chubu Electric Power Company Incorporated | | | | | | | | | | | 107,900 | | | | 1,458,968 | |
CLP Holdings Limited | | | | | | | | | | | 284,500 | | | | 2,917,413 | |
Contact Energy Limited | | | | | | | | | | | 167,998 | | | | 633,877 | |
Duke Energy Corporation | | | | | | | | | | | 75,079 | | | | 5,980,793 | |
Edison International | | | | | | | | | | | 34,468 | | | | 2,506,513 | |
El Paso Electric Company | | | | | | | | | | | 46,800 | | | | 2,138,292 | |
Electricite de France SA « | | | | | | | | | | | 26,434 | | | | 338,497 | |
Emera Incorporated | | | | | | | | | | | 12,523 | | | | 455,981 | |
Endesa SA | | | | | | | | | | | 29,051 | | | | 591,714 | |
Enea SA † | | | | | | | | | | | 23,564 | | | | 59,447 | |
Enel SpA | | | | | | | | | | | 694,131 | | | | 3,064,555 | |
Energa SA | | | | | | | | | | | 97,841 | | | | 202,774 | |
Energias de Portugal SA | | | | | | | | | | | 245,535 | | | | 823,016 | |
Enersis Chile SA | | | | | | | | | | | 5,359,575 | | | | 571,236 | |
Enersis SA | | | | | | | | | | | 5,359,575 | | | | 887,994 | |
Entergy Corporation | | | | | | | | | | | 95,946 | | | | 7,502,977 | |
Eversource Energy | | | | | | | | | | | 171,519 | | | | 9,256,880 | |
Exelon Corporation | | | | | | | | | | | 98,571 | | | | 3,351,414 | |
FirstEnergy Corporation | | | | | | | | | | | 228,246 | | | | 7,470,492 | |
Fortis Incorporated | | | | | | | | | | | 25,374 | | | | 798,137 | |
Fortum Oyj | | | | | | | | | | | 40,768 | | | | 629,369 | |
Great Plains Energy Incorporated | | | | | | | | | | | 187,146 | | | | 5,082,885 | |
Hawaiian Electric Industries Incorporated | | | | | | | | | | | 129,177 | | | | 3,876,602 | |
HK Electric Investments Limited 144A | | | | | | | | | | | 344,434 | | | | 323,231 | |
Hokkaido Electric Power Company Incorporated | | | | | | | | | | | 30,100 | | | | 244,082 | |
Hokuriku Electric Power Company | | | | | | | | | | | 29,400 | | | | 351,214 | |
Hydro One Limited 144A | | | | | | | | | | | 15,657 | | | | 313,044 | |
Iberdrola SA | | | | | | | | | | | 539,205 | | | | 3,548,592 | |
IDACORP Incorporated | | | | | | | | | | | 60,844 | | | | 4,628,403 | |
Infratil Limited | | | | | | | | | | | 115,574 | | | | 283,448 | |
Kansai Electric Power Company Incorporated † | | | | | | | | | | | 120,900 | | | | 1,036,119 | |
Korea Electric Power Corporation | | | | | | | | | | | 41,924 | | | | 2,180,800 | |
Kyushu Electric Power Company Incorporated | | | | | | | | | | | 69,700 | | | | 648,732 | |
Manila Electric Company | | | | | | | | | | | 106,140 | | | | 708,435 | |
Nextera Energy Incorporated | | | | | | | | | | | 50,311 | | | | 6,084,612 | |
OGE Energy Corporation | | | | | | | | | | | 105,096 | | | | 3,271,638 | |
PG&E Corporation | | | | | | | | | | | 52,865 | | | | 3,274,458 | |
Pinnacle West Capital Corporation | | | | | | | | | | | 62,004 | | | | 4,652,780 | |
PNM Resources Incorporated | | | | | | | | | | | 95,037 | | | | 3,021,226 | |
Polska Grupa Energetyczna SA | | | | | | | | | | | 252,746 | | | | 746,271 | |
Portland General Electric Company | | | | | | | | | | | 107,135 | | | | 4,511,455 | |
Power Assets Holdings Limited | | | | | | | | | | | 203,605 | | | | 1,947,456 | |
Power Grid Corporation of India Limited | | | | | | | | | | | 426,776 | | | | 1,170,655 | |
PPL Corporation | | | | | | | | | | | 71,566 | | | | 2,489,065 | |
Public Power Corporation SA † | | | | | | | | | | | 10,093 | | | | 29,834 | |
Red Electrica Corporacion SA | | | | | | | | | | | 38,910 | | | | 837,879 | |
Scottish & Southern Energy plc | | | | | | | | | | | 90,573 | | | | 1,788,796 | |
| | | | | | |
| Portfolio of investments—August 31, 2016 (unaudited) | | Wells Fargo Diversified Stock Portfolio | | | 91 | |
| | | | | | | | | | | | | | | | |
| Security name | | | | | | | | Shares | | | Value | |
| | | | |
| Electric Utilities (continued) | | | | | | | | | | | | | | | | |
Shikoku Electric Power Company Incorporated | | | | | | | | | | | 32,900 | | | $ | 313,530 | |
Spark Infrastructure Group | | | | | | | | | | | 255,559 | | | | 487,846 | |
Tata Power Company Limited | | | | | | | | | | | 384,258 | | | | 450,414 | |
Tauron Polska Energia SA | | | | | | | | | | | 210,484 | | | | 149,717 | |
Tenaga Nasional Bhd | | | | | | | | | | | 752,837 | | | | 2,736,239 | |
Terna SpA | | | | | | | | | | | 126,682 | | | | 654,536 | |
The Chugoku Electric Power Company Incorporated | | | | | | | | | | | 50,000 | | | | 600,203 | |
The Okinawa Electric Power Company Incorporated | | | | | | | | | | | 5,800 | | | | 118,282 | |
The Southern Company | | | | | | | | | | | 101,845 | | | | 5,227,704 | |
Tohoku Electric Power Company Incorporated | | | | | | | | | | | 74,100 | | | | 928,891 | |
Tokyo Electric Power Company Incorporated † | | | | | | | | | | | 127,300 | | | | 513,063 | |
Trustpower Limited | | | | | | | | | | | 3,817 | | | | 21,741 | |
Westar Energy Incorporated | | | | | | | | | | | 78,913 | | | | 4,335,480 | |
Xcel Energy Incorporated | | | | | | | | | | | 52,838 | | | | 2,185,380 | |
| | | | |
| | | | | | | | | | | | | | | 141,220,415 | |
| | | | | | | | | | | | | | | | |
| | | | |
| Gas Utilities: 0.68% | | | | | | | | | | | | | | | | |
APA Group | | | | | | | | | | | 176,480 | | | | 1,225,534 | |
Atmos Energy Corporation | | | | | | | | | | | 56,966 | | | | 4,198,394 | |
Aygaz AS | | | | | | | | | | | 12,972 | | | | 48,731 | |
China Gas Holdings Limited | | | | | | | | | | | 654,000 | | | | 1,111,139 | |
China Resources Gas Group Limited | | | | | | | | | | | 210,000 | | | | 703,830 | |
Enagas SA | | | | | | | | | | | 20,387 | | | | 598,649 | |
ENN Energy Holdings Limited | | | | | | | | | | | 136,000 | | | | 761,735 | |
Gail India Limited | | | | | | | | | | | 63,415 | | | | 363,521 | |
Gas Natural SDG SA | | | | | | | | | | | 32,383 | | | | 668,431 | |
Hong Kong & China Gas Company Limited | | | | | | | | | | | 1,065,302 | | | | 2,032,403 | |
Infraestructura Energetica Nova SAB de CV | | | | | | | | | | | 107,712 | | | | 415,747 | |
Korea Gas Corporation | | | | | | | | | | | 5,695 | | | | 216,819 | |
National Fuel Gas Company | | | | | | | | | | | 103,000 | | | | 5,877,180 | |
New Jersey Resources Corporation | | | | | | | | | | | 102,900 | | | | 3,461,556 | |
ONE Gas Incorporated | | | | | | | | | | | 62,484 | | | | 3,825,895 | |
Osaka Gas Company Limited | | | | | | | | | | | 307,000 | | | | 1,208,535 | |
Petronas Gas Bhd | | | | | | | | | | | 166,800 | | | | 913,071 | |
Piedmont Natural Gas Company | | | | | | | | | | | 98,072 | | | | 5,894,127 | |
PT Perusahaan Gas Negara Persero Tbk | | | | | | | | | | | 2,360,000 | | | | 537,294 | |
Questar Corporation | | | | | | | | | | | 212,103 | | | | 5,304,696 | |
Rubis SCA | | | | | | | | | | | 5,494 | | | | 448,590 | |
Saibu Gas Company Limited | | | | | | | | | | | 65,000 | | | | 153,289 | |
Shizuoka Gas Company Limited | | | | | | | | | | | 11,500 | | | | 82,583 | |
Snam SpA | | | | | | | | | | | 230,938 | | | | 1,280,271 | |
South Jersey Industries Incorporated | | | | | | | | | | | 94,400 | | | | 2,801,792 | |
Southwest Gas Corporation | | | | | | | | | | | 57,007 | | | | 3,980,229 | |
Superior Plus Corporation | | | | | | | | | | | 9,992 | | | | 89,527 | |
Toho Gas Company Limited | | | | | | | | | | | 76,000 | | | | 645,668 | |
Tokyo Gas Company Limited | | | | | | | | | | | 337,000 | | | | 1,444,542 | |
Towngas China Company Limited | | | | | | | | | | | 127,000 | | | | 73,179 | |
UGI Corporation | | | | | | | | | | | 91,158 | | | | 4,145,866 | |
WGL Holdings Incorporated | | | | | | | | | | | 60,411 | | | | 3,796,227 | |
| | | | |
| | | | | | | | | | | | | | | 58,309,050 | |
| | | | | | | | | | | | | | | | |
| | | | |
| 92 | | Wells Fargo Diversified Stock Portfolio | | Portfolio of investments—August 31, 2016 (unaudited) |
| | | | | | | | | | | | | | | | |
| Security name | | | | | | | | Shares | | | Value | |
| | | | |
| Independent Power & Renewable Electricity Producers: 0.26% | | | | | | | | | | | | | | | | |
Aboitiz Power Corporation | | | | | | | | | | | 386,100 | | | $ | 377,027 | |
AES Corporation | | | | | | | | | | | 367,200 | | | | 4,432,104 | |
AES Gener SA | | | | | | | | | | | 472,711 | | | | 187,711 | |
Algonquin Power & Utilities Corporation | | | | | | | | | | | 41,900 | | | | 378,295 | |
Calpine Corporation † | | | | | | | | | | | 202,200 | | | | 2,523,456 | |
Capital Power Corporation | | | | | | | | | | | 7,700 | | | | 123,010 | |
China Longyuan Power Group Corporation H Shares | | | | | | | | | | | 1,165,000 | | | | 979,149 | |
China Power International Development Limited | | | | | | | | | | | 969,000 | | | | 365,988 | |
China Renewable Energy Investment Limited | | | | | | | | | | | 15,871 | | | | 405 | |
China Resources Power Holdings Company | | | | | | | | | | | 617,185 | | | | 1,066,094 | |
Colbun SA | | | | | | | | | | | 1,637,920 | | | | 346,500 | |
Drax Group plc | | | | | | | | | | | 35,738 | | | | 142,618 | |
EDP Renovaveis SA | | | | | | | | | | | 9,632 | | | | 76,959 | |
Electric Power Development Company Limited | | | | | | | | | | | 27,700 | | | | 676,269 | |
Electricity Generating PCL | | | | | | | | | | | 111,800 | | | | 637,879 | |
Empresa Nacional de Electricidad SA | | | | | | | | | | | 1,148,063 | | | | 860,168 | |
Endesa Americas SA | | | | | | | | | | | 1,148,063 | | | | 511,884 | |
Energy Development Corporation | | | | | | | | | | | 1,562,250 | | | | 192,117 | |
Engie Brasil Energia SA | | | | | | | | | | | 78,129 | | | | 943,587 | |
Etrion Corporation † | | | | | | | | | | | 2,567 | | | | 684 | |
Glow Energy PCL | | | | | | | | | | | 209,800 | | | | 484,869 | |
Huaneng Power International Incorporated H Shares | | | | | | | | | | | 1,186,000 | | | | 721,609 | |
Malakoff Corporation Bhd | | | | | | | | | | | 1,131,300 | | | | 460,275 | |
Neyveli Lignite Corporation Limited | | | | | | | | | | | 4,901 | | | | 5,690 | |
NHPC Limited | | | | | | | | | | | 186,049 | | | | 78,203 | |
Northland Power Incorporated | | | | | | | | | | | 23,700 | | | | 429,398 | |
NRG Energy Incorporated | | | | | | | | | | | 183,189 | | | | 2,218,419 | |
NTPC Limited | | | | | | | | | | | 682,862 | | | | 1,623,798 | |
Ratchaburi Electricity Generating Holding PCL ADR | | | | | | | | | | | 20,700 | | | | 32,591 | |
Talen Energy Corporation † | | | | | | | | | | | 87,512 | | | | 1,208,541 | |
Transalta Corporation | | | | | | | | | | | 24,700 | | | | 106,982 | |
| | | | |
| | | | | | | | | | | | | | | 22,192,279 | |
| | | | | | | | | | | | | | | | |
| | | | |
| Multi-Utilities: 1.13% | | | | | | | | | | | | | | | | |
A2A SpA | | | | | | | | | | | 134,739 | | | | 178,700 | |
AGL Energy Limited | | | | | | | | | | | 97,194 | | | | 1,355,007 | |
Ameren Corporation | | | | | | | | | | | 130,762 | | | | 6,462,258 | |
ATCO Limited Class I | | | | | | | | | | | 8,258 | | | | 302,953 | |
Avista Corporation | | | | | | | | | | | 75,020 | | | | 3,047,312 | |
Black Hills Corporation | | | | | | | | | | | 61,642 | | | | 3,606,673 | |
Canadian Utilities Limited Class A | | | | | | | | | | | 11,598 | | | | 332,534 | |
CenterPoint Energy Incorporated | | | | | | | | | | | 240,810 | | | | 5,411,001 | |
Centrica plc | | | | | | | | | | | 535,264 | | | | 1,634,903 | |
CMS Energy Corporation | | | | | | | | | | | 150,421 | | | | 6,313,169 | |
Consolidated Edison Incorporated | | | | | | | | | | | 32,115 | | | | 2,416,654 | |
Dominion Resources Incorporated | | | | | | | | | | | 66,745 | | | | 4,949,809 | |
DTE Energy Company | | | | | | | | | | | 96,981 | | | | 9,009,535 | |
Duet Group | | | | | | | | | | | 354,371 | | | | 700,442 | |
E.ON SE | | | | | | | | | | | 187,516 | | | | 1,727,073 | |
Engie SA | | | | | | | | | | | 147,526 | | | | 2,351,533 | |
| | | | | | |
| Portfolio of investments—August 31, 2016 (unaudited) | | Wells Fargo Diversified Stock Portfolio | | | 93 | |
| | | | | | | | | | | | | | | | |
| Security name | | | | | | | | Shares | | | Value | |
| | | | |
| Multi-Utilities (continued) | | | | | | | | | | | | | | | | |
Hera SpA | | | | | | | | | | | 43,571 | | | $ | 120,726 | |
Just Energy Group Incorporated « | | | | | | | | | | | 8,403 | | | | 46,263 | |
Keppel Infrastructure Trust | | | | | | | | | | | 56,761 | | | | 20,830 | |
MDU Resources Group Incorporated | | | | | | | | | | | 236,803 | | | | 5,581,447 | |
National Grid plc | | | | | | | | | | | 352,433 | | | | 4,843,172 | |
NiSource Incorporated | | | | | | | | | | | 179,287 | | | | 4,292,131 | |
Northwestern Corporation | | | | | | | | | | | 57,317 | | | | 3,314,069 | |
Public Service Enterprise Group Incorporated | | | | | | | | | | | 52,702 | | | | 2,253,538 | |
RWE AG † | | | | | | | | | | | 45,697 | | | | 747,515 | |
SCANA Corporation | | | | | | | | | | | 79,957 | | | | 5,648,962 | |
Sempra Energy | | | | | | | | | | | 24,979 | | | | 2,613,553 | |
Suez Environnement Company SA | | | | | | | | | | | 28,095 | | | | 425,108 | |
Vector Limited | | | | | | | | | | | 28,886 | | | | 72,311 | |
Vectren Corporation | | | | | | | | | | | 100,019 | | | | 4,891,929 | |
Veolia Environnement SA | | | | | | | | | | | 45,364 | | | | 964,713 | |
WEC Energy Group Incorporated | | | | | | | | | | | 170,947 | | | | 10,236,306 | |
YTL Corporation Bhd | | | | | | | | | | | 1,978,309 | | | | 819,519 | |
YTL Power International Bhd | | | | | | | | | | | 1,409,368 | | | | 517,805 | |
| | | | |
| | | | | | | | | | | | | | | 97,209,453 | |
| | | | | | | | | | | | | | | | |
| | | | |
| Water Utilities: 0.21% | | | | | | | | | | | | | | | | |
Aguas Andinas SA Class A | | | | | | | | | | | 613,482 | | | | 365,145 | |
American Water Works Company Incorporated | | | | | | | | | | | 95,378 | | | | 7,057,018 | |
Aqua America Incorporated | | | | | | | | | | | 216,312 | | | | 6,578,048 | |
Beijing Enterprises Water Group Limited | | | | | | | | | | | 1,732,000 | | | | 1,207,871 | |
Guangdong Investment Limited | | | | | | | | | | | 804,000 | | | | 1,243,692 | |
Hyflux Limited | | | | | | | | | | | 81,500 | | | | 30,508 | |
Pennon Group plc | | | | | | | | | | | 35,570 | | | | 409,869 | |
Severn Trent plc | | | | | | | | | | | 25,380 | | | | 793,533 | |
United Utilities Group plc | | | | | | | | | | | 65,169 | | | | 831,339 | |
| | | | |
| | | | | | | | | | | | | | | 18,517,023 | |
| | | | | | | | | | | | | | | | |
| | | | |
Total Common Stocks (Cost $6,135,611,402) | | | | | | | | | | | | | | | 8,323,264,946 | |
| | | | | | | | | | | | | | | | |
| | | | |
| | | Dividend yield | | | | | | | | | | |
| Preferred Stocks: 0.48% | | | | | | | | | | | | | | | | |
| | | | |
Consumer Discretionary: 0.06% | | | | | | | | | | | | | | | | |
| | | | |
| Automobiles: 0.05% | | | | | | | | | | | | | | | | |
Bayerische Motoren Werke AG † | | | 0.00 | % | | | | | | | 4,593 | | | | 344,232 | |
Hyundai Motor Company ± | | | 3.90 | | | | | | | | 4,236 | | | | 381,810 | |
Hyundai Motor Company ± | | | 4.04 | | | | | | | | 2,744 | | | | 235,763 | |
Porsche Automobile Holding SE ± | | | 2.21 | | | | | | | | 14,496 | | | | 734,503 | |
Volkswagen AG ± | | | 0.14 | | | | | | | | 16,860 | | | | 2,341,408 | |
| | | | |
| | | | | | | | | | | | | | | 4,037,716 | |
| | | | | | | | | | | | | | | | |
| | | | |
| Multiline Retail: 0.01% | | | | | | | | | | | | | | | | |
Lojas Americanas SA ± | | | 0.27 | | | | | | | | 171,080 | | | | 1,018,787 | |
| | | | | | | | | | | | | | | | |
| | | | |
| 94 | | Wells Fargo Diversified Stock Portfolio | | Portfolio of investments—August 31, 2016 (unaudited) |
| | | | | | | | | | | | | | | | |
| Security name | | Dividend yield | | | | | | Shares | | | Value | |
| | | | |
Consumer Staples: 0.03% | | | | | | | | | | | | | | | | |
| | | | |
| Beverages: 0.00% | | | | | | | | | | | | | | | | |
ITO EN Limited ± | | | 2.60 | % | | | | | | | 4,600 | | | $ | 82,961 | |
| | | | | | | | | | | | | | | | |
| | | | |
| Household Products: 0.03% | | | | | | | | | | | | | | | | |
Henkel AG & Company KGaA ± | | | 1.27 | | | | | | | | 17,027 | | | | 2,234,499 | |
| | | | | | | | | | | | | | | | |
| | | | |
| Personal Products: 0.00% | | | | | | | | | | | | | | | | |
LG Household & Health Care Limited ± | | | 0.93 | | | | | | | | 217 | | | | 110,738 | |
| | | | | | | | | | | | | | | | |
| | | | |
Energy: 0.07% | | | | | | | | | | | | | | | | |
| | | | |
| Oil, Gas & Consumable Fuels: 0.07% | | | | | | | | | | | | | | | | |
Petroleo Brasileiro SA † | | | 0.00 | | | | | | | | 1,115,658 | | | | 4,439,553 | |
Surgutneftegaz SP ADR ± | | | 21.03 | | | | | | | | 269,016 | | | | 1,358,531 | |
| | | | |
| | | | | | | | | | | | | | | 5,798,084 | |
| | | | | | | | | | | | | | | | |
| | | | |
Financials: 0.22% | | | | | | | | | | | | | | | | |
| | | | |
| Banks: 0.22% | | | | | | | | | | | | | | | | |
Banco Bradesco SA ± | | | 3.73 | | | | | | | | 758,614 | | | | 6,826,868 | |
Itau Unibanco Holding SA ± | | | 2.49 | | | | | | | | 801,285 | | | | 8,895,723 | |
Itausa Investimentos Itau SA ± | | | 4.45 | | | | | | | | 1,114,743 | | | | 2,968,782 | |
Shinkin Central Bank Class A ± | | | 2.60 | | | | | | | | 104 | | | | 229,883 | |
| | | | |
| | | | | | | | | | | | | | | 18,921,256 | |
| | | | | | | | | | | | | | | | |
| | | | |
Health Care: 0.01% | | | | | | | | | | | | | | | | |
| | | | |
| Biotechnology: 0.01% | | | | | | | | | | | | | | | | |
Grifols SA Class B ± | | | 1.78 | | | | | | | | 22,412 | | | | 354,992 | |
| | | | | | | | | | | | | | | | |
| | | | |
| Health Care Equipment & Supplies: 0.00% | | | | | | | | | | | | | | | | |
Sartorius AG Vorzug ± | | | 0.55 | | | | | | | | 3,164 | | | | 250,297 | |
| | | | | | | | | | | | | | | | |
| | | | |
| Life Sciences Tools & Services: 0.00% | | | | | | | | | | | | | | | | |
Valneva SE † | | | 0.00 | | | | | | | | 612 | | | | 41 | |
| | | | | | | | | | | | | | | | |
| | | | |
Information Technology: 0.04% | | | | | | | | | | | | | | | | |
| | | | |
| Technology Hardware, Storage & Peripherals: 0.04% | | | | | | | | | | | | | | | | |
Samsung Electronics Company Limited ± | | | 1.51 | | | | | | | | 2,971 | | | | 3,527,896 | |
| | | | | | | | | | | | | | | | |
| | | | |
Materials: 0.03% | | | | | | | | | | | | | | | | |
| | | | |
| Chemicals: 0.01% | | | | | | | | | | | | | | | | |
Fuchs Petrolub AG ± | | | 2.06 | | | | | | | | 6,432 | | | | 292,579 | |
LG Chem Limited ± | | | 2.41 | | | | | | | | 846 | | | | 136,574 | |
Sociedad Quimica y Minera de Chile SA Class B ± | | | 2.01 | | | | | | | | 12,021 | | | | 305,569 | |
| | | | |
| | | | | | | | | | | | | | | 734,722 | |
| | | | | | | | | | | | | | | | |
| | | | |
| Metals & Mining: 0.02% | | | | | | | | | | | | | | | | |
Vale SA † | | | 0.00 | | | | | | | | 553,330 | | | | 2,479,464 | |
| | | | | | | | | | | | | | | | |
| | | | | | |
| Portfolio of investments—August 31, 2016 (unaudited) | | Wells Fargo Diversified Stock Portfolio | | | 95 | |
| | | | | | | | | | | | | | | | |
| Security name | | Dividend yield | | | | | | Shares | | | Value | |
| | | | |
Telecommunication Services: 0.02% | | | | | | | | | | | | | | | | |
| | | | |
| Diversified Telecommunication Services: 0.02% | | | | | | | | | | | | | | | | |
Telefonica Brasil SA ± | | | 2.56 | % | | | | | | | 131,152 | | | $ | 1,977,515 | |
| | | | | | | | | | | | | | | | |
| | | | |
Utilities: 0.00% | | | | | | | | | | | | | | | | |
| | | | |
| Multi-Utilities: 0.00% | | | | | | | | | | | | | | | | |
RWE AG ± | | | 1.24 | | | | | | | | 3,735 | | | | 44,203 | |
| | | | | | | | | | | | | | | | |
| | | | |
Total Preferred Stocks (Cost $52,987,562) | | | | | | | | | | | | | | | 41,573,171 | |
| | | | | | | | | | | | | | | | |
| | | | |
| | | | | | Expiration date | | | | | | | |
| Rights: 0.00% | | | | | | | | | | | | | | | | |
| | | | |
Health Care: 0.00% | | | | | | | | | | | | | | | | |
| | | | |
| Biotechnology: 0.00% | | | | | | | | | | | | | | | | |
Intercell AG †(a) | | | | | | | 5-16-2017 | | | | 1,885 | | | | 0 | |
| | | | | | | | | | | | | | | | |
| | | | |
Industrials: 0.00% | | | | | | | | | | | | | | | | |
| | | | |
| Industrial Conglomerates: 0.00% | | | | | | | | | | | | | | | | |
Hanwha Corporation †(a) | | | | | | | 11-10-2016 | | | | 2,961 | | | | 0 | |
| | | | | | | | | | | | | | | | |
| | | | |
Total Rights (Cost $0) | | | | | | | | | | | | | | | 0 | |
| | | | | | | | | | | | | | | | |
| | | | |
Warrants: 0.00% | | | | | | | | | | | | | | | | |
| | | | |
Consumer Discretionary: 0.00% | | | | | | | | | | | | | | | | |
| | | | |
| Automobiles: 0.00% | | | | | | | | | | | | | | | | |
Peugeot SA † | | | | | | | 4-29-2017 | | | | 32,389 | | | | 85,263 | |
| | | | | | | | | | | | | | | | |
| | | | |
| Media: 0.00% | | | | | | | | | | | | | | | | |
Yellow Pages Limited † | | | | | | | 12-20-2022 | | | | 128 | | | | 358 | |
| | | | | | | | | | | | | | | | |
| | | | |
Energy: 0.00% | | | | | | | | | | | | | | | | |
| | | | |
| Energy Equipment & Services: 0.00% | | | | | | | | | | | | | | | | |
KNM Group Bhd † | | | | | | | 11-15-2017 | | | | 47,262 | | | | 758 | |
KNM Group Bhd † | | | | | | | 4-21-2020 | | | | 1 | | | | 0 | |
| | | | |
| | | | | | | | | | | | | | | 758 | |
| | | | | | | | | | | | | | | | |
| | | | |
| Oil, Gas & Consumable Fuels: 0.00% | | | | | | | | | | | | | | | | |
Banpu PCL † | | | | | | | 6-5-2017 | | | | 71,000 | | | | 20,511 | |
| | | | | | | | | | | | | | | | |
| | | | |
Industrials: 0.00% | | | | | | | | | | | | | | | | |
| | | | |
| Industrial Conglomerates: 0.00% | | | | | | | | | | | | | | | | |
Discount Investment Corporation † | | | | | | | 12-21-2016 | | | | 276 | | | | 337 | |
Discount Investment Corporation † | | | | | | | 12-21-2017 | | | | 276 | | | | 344 | |
Discount Investment Corporation † | | | | | | | 12-21-2018 | | | | 276 | | | | 349 | |
| | | | |
| | | | | | | | | | | | | | | 1,030 | |
| | | | | | | | | | | | | | | | |
| | | | |
Total Warrants (Cost $112,266) | | | | | | | | | | | | | | | 107,920 | |
| | | | | | | | | | | | | | | | |
| | | | |
| 96 | | Wells Fargo Diversified Stock Portfolio | | Portfolio of investments—August 31, 2016 (unaudited) |
| | | | | | | | | | | | | | | | |
| Security name | | Yield | | | | | | Shares | | | Value | |
| | | | |
Short-Term Investments: 3.75% | | | | | | | | | | | | | | | | |
| | | | |
| Investment Companies: 3.75% | | | | | | | | | | | | | | | | |
Securities Lending Cash Investments LLC (l)(r)(u) | | | 0.51 | % | | | | | | | 218,333,728 | | | $ | 218,333,728 | |
Wells Fargo Government Money Market Fund Select Class (l)(u) | | | 0.32 | | | | | | | | 103,413,508 | | | | 103,413,508 | |
| | | | |
Total Short-Term Investments (Cost $321,747,236) | | | | | | | | | | | | | | | 321,747,236 | |
| | | | | | | | | | | | | | | | |
| | | | | | | | |
| Total investments in securities (Cost $6,510,458,466) * | | | 101.25 | % | | | 8,686,693,273 | |
Other assets and liabilities, net | | | (1.25 | ) | | | (107,644,103 | ) |
| | | | | | | | |
| Total net assets | | | 100.00 | % | | $ | 8,579,049,170 | |
| | | | | | | | |
| † | Non-income-earning security |
| « | All or a portion of this security is on loan. |
| 144A | The security may be resold in transactions exempt from registration, normally to qualified institutional buyers, pursuant to Rule 144A under the Securities Act of 1933. |
| (a) | The security is fair valued in accordance with procedures approved by the Board of Trustees. |
| (l) | The issuer of the security is an affiliated person of the Portfolio as defined in the Investment Company Act of 1940. |
| ± | Variable rate investment. The rate shown is the rate in effect at period end. |
| (r) | The investment is a non-registered investment vehicle purchased with cash collateral received from securities on loan. |
| (u) | The rate represents the 7-day annualized yield at period end. |
| * | Cost for federal income tax purposes is $6,583,907,790 and unrealized gains (losses) consists of: |
| | | | |
Gross unrealized gains | | $ | 2,774,571,750 | |
Gross unrealized losses | | | (671,786,267 | ) |
| | | | |
Net unrealized gains | | $ | 2,102,785,483 | |
The following table shows percent of total long-term investments by geographic locations as of August 31, 2016:
| | | | |
United States | | | 63.74 | % |
Japan | | | 6.73 | |
United Kingdom | | | 3.12 | |
China | | | 2.81 | |
Taiwan | | | 1.72 | |
Australia | | | 1.70 | |
Switzerland | | | 1.57 | |
Canada | | | 1.56 | |
India | | | 1.55 | |
Hong Kong | | | 1.47 | |
South Korea | | | 1.37 | |
France | | | 1.34 | |
Germany | | | 1.32 | |
Ireland | | | 1.18 | |
Other | | | 8.82 | |
| | | | |
| | | 100.00 | % |
| | | | |
ITEM 7. DISCLOSURE OF PROXY VOTING POLICIES AND PROCEDURES FOR CLOSED-END MANAGEMENT INVESTMENT COMPANIES
Not applicable.
ITEM 8. PORTFOLIO MANAGERS OF CLOSED-END MANAGEMENT INVESTMENT COMPANIES
Not applicable.
ITEM 9. PURCHASES OF EQUITY SECURITIES BY CLOSED-END MANAGEMEENT INVESTMENT COMPANY AND AFFILIATED PURCHASERS
Not applicable.
ITEM 10. SUBMISSION OF MATTERS TO A VOTE OF SECURITY HOLDERS
There have been no material changes to the procedures by which shareholders may recommend nominees to the registrant’s Board of Trustees that have been implemented since the registrant’s last provided disclosure in response to the requirements of this Item.
ITEM 11. CONTROLS AND PROCEDURES
(a) The President and Treasurer have concluded that the Wells Fargo Master Trust (the “Trust”) disclosure controls and procedures (as defined in Rule 30a-3(c) under the Investment Company Act of 1940) provide reasonable assurances that material information relating to the Trust is made known to them by the appropriate persons, based on their evaluation of these controls and procedures as of a date within 90 days of the filing of this report.
(b) There were no significant changes in the Trust’s internal controls over financial reporting (as defined in Rule 30a-3(d) under the Investment Company Act of 1940) that occurred during the second fiscal quarter of the period covered by this report that materially affected, or is reasonably likely to materially affect, the registrant’s internal control over financial reporting.
ITEM 12. EXHIBITS
(a)(1) Not applicable.
(a)(2) Certification pursuant to Rule 30a-2(a) under the Investment Company Act of 1940 (17 CFR 270.30a-2(a)) is filed and attached hereto as Exhibit 99.CERT.
(a)(3) Not applicable.
(b) Certification pursuant to Rule 30a-2(b) under the Investment Company Act of 1940 (17 CFR 270.30a-2(b)) is filed and attached hereto as Exhibit 99.906CERT.
SIGNATURES
Pursuant to the requirements of the Securities Exchange Act of 1934 and the Investment Company Act of 1940, the registrant has duly caused this report to be signed on its behalf by the undersigned, thereunto duly authorized.
| | |
| Wells Fargo Master Trust |
| |
| By: | | /s/ Karla M. Rabusch |
| | Karla M. Rabusch |
| | President |
|
| Date: October 26, 2016 |
Pursuant to the requirements of the Securities Exchange Act of 1934 and the Investment Company Act of 1940, this report has been signed below by the following persons on behalf of the registrant and in the capacities and on the date indicated.
| | |
| Wells Fargo Master Trust |
| |
| By: | | /s/ Karla M. Rabusch |
| | Karla M. Rabusch |
| | President |
|
| Date: October 26, 2016 |
| |
| By: | | |
| | Jeremy DePalma |
| | Treasurer |
|
| Date: October 26, 2016 |