
UNITED STATES
SECURITIES AND EXCHANGE COMMISSION
Washington, D.C. 20549
FORM N-CSRS
CERTIFIED SHAREHOLDER REPORT OF REGISTERED
MANAGEMENT INVESTMENT COMPANIES
Investment Company Act file number: 811-09689
Wells Fargo Master Trust
(Exact name of registrant as specified in charter)
525 Market St., San Francisco, CA 94105
(Address of principal executive offices) (Zip code)
C. David Messman
Wells Fargo Funds Management, LLC
525 Market St., San Francisco, CA 94105
(Name and address of agent for service)
Registrant’s telephone number, including area code: 800-222-8222
Date of fiscal year end: May 31
Registrant is making a filing for 13 of its series:
Wells Fargo C&B Large Cap Value Portfolio, Wells Fargo Diversified Large Cap Growth Portfolio, Wells Fargo Emerging Growth Portfolio, Wells Fargo Index Portfolio, Wells Fargo International Growth Portfolio, Wells Fargo International Value Portfolio, Wells Fargo Large Company Value Portfolio, Wells Fargo Small Company Growth Portfolio, Wells Fargo Small Company Value Portfolio, Wells Fargo Core Bond Portfolio, Wells Fargo Real Return Portfolio, Wells Fargo Managed Fixed Income Portfolio, and Wells Fargo Stable Income Portfolio.
Date of reporting period: November 30, 2017
ITEM 1. REPORT TO STOCKHOLDERS
Semi-Annual Report
November 30, 2017

Allocation Funds

| ∎ | | Wells Fargo Growth Balanced Fund |
| ∎ | | Wells Fargo Moderate Balanced Fund |

Reduce clutter. Save trees.
Sign up for electronic delivery of prospectuses and shareholder reports at wellsfargo.com/advantagedelivery
Contents
The views expressed and any forward-looking statements are as of November 30, 2017, unless otherwise noted, and are those of the Fund managers and/or Wells Fargo Funds Management, LLC. Discussions of individual securities, or the markets generally, or any Wells Fargo Fund are not intended as individual recommendations. Future events or results may vary significantly from those expressed in any forward-looking statements. The views expressed are subject to change at any time in response to changing circumstances in the market. Wells Fargo Funds Management, LLC and the Fund disclaim any obligation to publicly update or revise any views expressed or forward-looking statements.
NOT FDIC INSURED ◾ NO BANK GUARANTEE ◾ MAY LOSE VALUE
| | | | |
| 2 | | Wells Fargo Allocation Funds | | Letter to shareholders (unaudited) |

Andrew Owen
President
Wells Fargo Funds
In a predominantly improving economic environment, global stocks delivered strong results; bond markets had smaller but positive results as well.
Dear Shareholder:
We are pleased to offer you this semi-annual report for the Wells Fargo Allocation Funds for the six-month period that ended November 30, 2017. In a predominantly improving economic environment, global stocks delivered strong results; bond markets had smaller but positive results as well. U.S. and international stocks returned 10.89% and 9.38%, respectively, for the six-month period, as measured by the S&P 500 Index1 and the MSCI ACWI ex USA Index (Net),2 respectively; within fixed income, the Bloomberg Barclays U.S. Aggregate Bond Index3 returned 0.68% and the Bloomberg Barclays Municipal Bond Index4 returned 0.40%.
Global growth strengthened in June and through the third quarter of 2017, and investment markets generally advanced.
From June through September, most stock markets worldwide moved higher and were at or near all-time highs as September ended. Moderate acceleration in global economic growth was supported by improving corporate earnings, low inflation pressure, and still-low interest rates. Corporate earnings reports were favorable overall as companies continued to benefit from healthy operating leverage. Global commodity prices climbed; oil prices rebounded, partly due to a better balance between supply and demand. While North Korea’s missile launches and nuclear testing raised serious concerns around the world, the heightened geopolitical risk had relatively minimal impact on stock returns.
In the U.S., economic data released in the third quarter reflected a generally healthy economy. Second-quarter economic output grew at a 3.1% annual rate, and consumers displayed more willingness to spend. Meanwhile, after raising the target interest rate by a quarter percentage point in June—to a range of 1.00% to 1.25%—the Federal Reserve (Fed) chose to maintain that target throughout the third quarter, noting that inflation had remained below the Fed’s 2.00% objective. Reflecting continued confidence in the U.S. economy, the Fed also stated the possibility of one more 0.25% increase in the federal funds rate by the end of 2017 and announced plans to begin the process of unwinding its $4.5 trillion portfolio of bonds and other assets in October.
Outside the U.S., stocks in the Asia Pacific region benefited from solid earnings reports and investors’ willingness to take on risk despite the rising tensions between North Korea and the U.S. In Europe, markets were supported by better-than-expected economic growth, which has led to narrowing of the gap between Europe’s growth rate and that of the U.S. In emerging markets, many countries benefited from stronger currencies versus the U.S. dollar. Also, commodity prices were on an upward trajectory, which benefited many companies that rely on natural resources for exports.
| 1 | The S&P 500 Index consists of 500 stocks chosen for market size, liquidity, and industry group representation. It is a market-value-weighted index with each stock’s weight in the index proportionate to its market value. You cannot invest directly in an index. |
| 2 | The Morgan Stanley Capital International (MSCI) All Country World Index (ACWI) ex USA Index (Net) is a free-float-adjusted market-capitalization-weighted index that is designed to measure the equity market performance of developed markets, excluding the United States and Canada. Source: MSCI. MSCI makes no express or implied warranties or representations and shall have no liability whatsoever with respect to any MSCI data contained herein. The MSCI data may not be further redistributed or used as a basis for other indexes or any securities or financial products. This report is not approved, reviewed, or produced by MSCI. You cannot invest directly in an index. |
| 3 | The Bloomberg Barclays U.S. Aggregate Bond Index is a broad-based benchmark that measures the investment-grade, U.S. dollar-denominated, fixed-rate taxable bond market, including Treasuries, government-related and corporate securities, mortgage-backed securities (agency fixed-rate and hybrid adjustable-rate mortgage pass-throughs), asset-backed securities, and commercial mortgage-backed securities. You cannot invest directly in an index. |
| 4 | The Bloomberg Barclays Municipal Bond Index is an unmanaged index composed of long-term tax-exempt bonds with a minimum credit rating of Baa. You cannot invest directly in an index. |
| | | | | | |
| Letter to shareholders (unaudited) | | Wells Fargo Allocation Funds | | | 3 | |
Positive economic and market news generally continued into October and November.
October proved to be a strong month for U.S. stocks. The S&P 500 Index delivered 11 record closes amid rising consumer confidence and signs the economy was continuing to gain momentum, including news in late October that economic output was estimated to have grown at a 3.0% annual rate in the third quarter. At its October meeting, the Fed, in a unanimous vote, left short-term interest rates unchanged but signaled it could make another rate increase before the end of 2017 if the economy remains on track. The Fed also began the process of unwinding its quantitative easing program. Outside the U.S., international stocks generally delivered positive results in October as global economic growth continued to strengthen.
Economic data released in November indicated that the U.S. economy was continuing its steady expansion, even though inflation remained low. The U.S. Bureau of Economic Analysis raised its estimate of third-quarter economic growth to 3.3% during November, consumers increased their spending, and U.S. companies continued to deliver solid earnings gains. As November ended, major U.S. stock indexes climbed to record levels, propelled by investors’ rising confidence that the U.S. Senate would pass its version of a tax-overhaul bill. The optimism led many investors to sell U.S. Treasury bonds in order to purchase stocks, which pushed government bond yields higher. Outside the U.S., stock markets generally delivered favorable monthly results, and economies continued to improve. Within the eurozone, for example, accelerating growth and falling unemployment helped boost the eurozone economic indicator to its highest level in 17 years in November.
Don’t let short-term uncertainty derail long-term investment goals.
Periods of investment uncertainty can present challenges, but experience has taught us that maintaining long-term investment goals can be an effective way to plan for the future. To help you create a sound strategy based on your personal goals and risk tolerance, Wells Fargo Funds offers more than 100 mutual funds spanning a wide range of asset classes and investment styles. Although diversification cannot guarantee an investment profit or prevent losses, we believe it can be an effective way to manage investment risk and potentially smooth out overall portfolio performance. We encourage investors to know their investments and to understand that appropriate levels of risk-taking may unlock opportunities.
Thank you for choosing to invest with Wells Fargo Funds. We appreciate your confidence in us and remain committed to helping you meet your financial needs.
Sincerely,

Andrew Owen
President
Wells Fargo Funds
Although diversification cannot guarantee an investment profit or prevent losses, we believe it can be an effective way to manage investment risk and potentially smooth out overall portfolio performance.
For further information about your Fund, contact your investment professional, visit our website at wellsfargofunds.com, or call us directly at 1-800-222-8222. We are available 24 hours a day, 7 days a week.
| | | | |
| 4 | | Wells Fargo Allocation Funds | | Performance highlights (unaudited) |
Wells Fargo Growth Balanced Fund
Investment objective
The Fund seeks total return, consisting of capital appreciation and current income.
Manager
Wells Fargo Funds Management, LLC
Subadviser
Wells Capital Management Incorporated
Subadvisers for the affiliated master portfolios
Analytic Investors, LLC
Artisan Partners Limited Partnership
Cooke & Bieler, L.P.
Galliard Capital Management, Inc.
LSV Asset Management
Peregrine Capital Management, LLC
Wells Capital Management Incorporated
Portfolio managers
Kandarp R. Acharya, CFA®, FRM
Petros Bocray, CFA®, FRM
Christian L. Chan, CFA®
Average annual total returns (%) as of November 30, 2017
| | | | | | | | | | | | | | | | | | | | | | | | | | | | | | | | | | |
| | | | | Including sales charge | | | Excluding sales charge | | | Expense ratios1 (%) | |
| | | Inception date | | 1 year | | | 5 year | | | 10 year | | | 1 year | | | 5 year | | | 10 year | | | Gross | | | Net2 | |
| Class A (WFGBX) | | 10-14-1998 | | | 9.01 | | | | 9.07 | | | | 4.84 | | | | 15.66 | | | | 10.37 | | | | 5.46 | | | | 1.34 | | | | 1.20 | |
| Class C (WFGWX) | | 10-1-1998 | | | 13.79 | | | | 9.55 | | | | 4.67 | | | | 14.79 | | | | 9.55 | | | | 4.67 | | | | 2.09 | | | | 1.95 | |
| Administrator Class (NVGBX) | | 11-11-1994 | | | – | | | | – | | | | – | | | | 15.96 | | | | 10.65 | | | | 5.72 | | | | 1.26 | | | | 0.95 | |
| Growth Balanced Blended Index3 | | – | | | – | | | | – | | | | – | | | | 15.55 | | | | 10.10 | | | | 6.52 | | | | – | | | | – | |
| Bloomberg Barclays U.S. Aggregate Bond Index4 | | – | | | – | | | | – | | | | – | | | | 3.21 | | | | 1.98 | | | | 3.99 | | | | – | | | | – | |
| MSCI ACWI ex USA Index (Net)5 | | – | | | – | | | | – | | | | – | | | | 27.59 | | | | 7.06 | | | | 1.47 | | | | – | | | | – | |
| Russell 3000® Index6 | | – | | | – | | | | – | | | | – | | | | 22.27 | | | | 15.63 | | | | 8.43 | | | | – | | | | – | |
Figures quoted represent past performance, which is no guarantee of future results, and do not reflect taxes that a shareholder may pay on fund distributions or the redemption of fund shares. Investment return and principal value of an investment will fluctuate so that an investor’s shares, when redeemed, may be worth more or less than their original cost. Performance shown without sales charges would be lower if sales charges were reflected. Current performance may be lower or higher than the performance data quoted, which assumes the reinvestment of dividends and capital gains. Current month-end performance is available on the Fund’s website, wellsfargofunds.com.
Index returns do not include transaction costs associated with buying and selling securities, any mutual fund fees or expenses, or any taxes. It is not possible to invest directly in an index.
For Class A shares, the maximum front-end sales charge is 5.75%. For Class C shares, the maximum contingent deferred sales charge is 1.00%. Performance including a contingent deferred sales charge assumes the sales charge for the corresponding time period. Administrator Class shares are sold without a front-end sales charge or contingent deferred sales charge.
Please see footnotes on page 6.
| | | | | | |
| Performance highlights (unaudited) | | Wells Fargo Allocation Funds | | | 5 | |
Wells Fargo Growth Balanced Fund (continued)
| | | | |
| Ten largest holdings (%) as of November 30, 20177 | |
Wells Fargo Managed Fixed Income Portfolio | | | 24.26 | |
Wells Fargo Disciplined U.S. Core Fund Class R6 | | | 13.05 | |
Wells Fargo Diversified Large Cap Growth Portfolio | | | 13.03 | |
Wells Fargo Large Company Value Portfolio | | | 10.21 | |
Wells Fargo International Value Portfolio | | | 9.81 | |
Wells Fargo International Growth Portfolio | | | 9.64 | |
Wells Fargo Core Bond Portfolio | | | 6.93 | |
Wells Fargo Real Return Portfolio | | | 3.47 | |
Wells Fargo Small Company Value Portfolio | | | 3.31 | |
Wells Fargo C&B Large Cap Value Portfolio | | | 3.06 | |
|
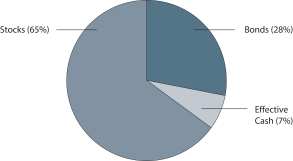
| Current target allocation as of November 30, 20178 |
|
 |
|
| Neutral target allocation |
|
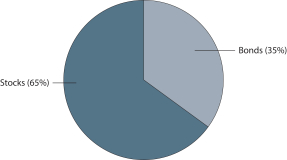 |
Balanced funds may invest in stocks and bonds. Stock values fluctuate in response to the activities of individual companies and general market and economic conditions. Bond values fluctuate in response to the financial condition of individual issuers, general market and economic conditions, and changes in interest rates. Changes in market conditions and government policies may lead to periods of heightened volatility in the bond market and reduced liquidity for certain bonds held by the Fund. In general, when interest rates rise, bond values fall and investors may lose principal value. Interest-rate changes and their impact on the Fund and its share price can be sudden and unpredictable. The use of derivatives may reduce returns and/or increase volatility. The Fund will indirectly be exposed to all of the risks of an investment in the underlying funds and will indirectly bear expenses of the underlying funds. Certain investment strategies tend to increase the total risk of an investment (relative to the broader market). The Fund is exposed to foreign investment risk, mortgage- and asset-backed securities risk, and smaller-company securities risk. Consult the Fund’s prospectus for additional information on these and other risks.
Please see footnotes on page 6.
| | | | |
| 6 | | Wells Fargo Allocation Funds | | Performance highlights (unaudited) |
Wells Fargo Growth Balanced Fund (continued)
| 1 | Reflects the expense ratios as stated in the most recent prospectuses, which include the impact of 0.50% in acquired fund fees and expenses from the affiliated master portfolios. The expense ratios shown are subject to change and may differ from the annualized expense ratios shown in the financial highlights of this report. |
| 2 | The manager has contractually committed through September 30, 2018, to waive fees and/or reimburse expenses to the extent necessary to cap the Fund’s Total Annual Fund Operating Expenses After Fee Waivers at the amounts shown. After this time, the cap may be increased or the commitment to maintain the cap may be terminated only with the approval of the Board of Trustees. Brokerage commissions, stamp duty fees, interest, taxes, acquired fund fees and expenses from funds in which the affiliated master portfolios invest, and extraordinary expenses are excluded from the expense cap. All other acquired fund fees and expenses from the affiliated master portfolios are included in the expense cap. Without this cap, the Fund’s returns would have been lower. The expense ratio paid by an investor is the net expense ratio or the Fund’s Total Annual Fund Operating Expenses After Fee Waivers, as stated in the prospectuses. |
| 3 | Source: Wells Fargo Funds Management, LLC. The Growth Balanced Blended Index is weighted 45% in the Russell 3000® Index, 35% in the Bloomberg Barclays U.S. Aggregate Bond Index, and 20% in the MSCI ACWI ex USA Index (Net). Prior to November 30, 2017, the Growth Balanced Blended Index was weighted 35% in the Bloomberg Barclays U.S. Aggregate Bond Index, 16.25% in the Russell 1000® Growth Index, 16.25% in the Russell 1000® Value Index, 16.25% in the S&P 500 Index, 9.75% in the MSCI EAFE Index (Net), and 6.50% in the Russell 2000® Index. You cannot invest directly in an index. |
| 4 | The Bloomberg Barclays U.S. Aggregate Bond Index is a broad-based benchmark that measures the investment-grade, U.S. dollar–denominated, fixed-rate taxable bond market, including Treasuries, government-related and corporate securities, mortgage-backed securities (agency fixed-rate and hybrid adjustable-rate mortgage pass-throughs), asset-backed securities, and commercial mortgage-backed securities. You cannot invest directly in an index. |
| 5 | The Morgan Stanley Capital International (MSCI) All Country World Index (ACWI) ex USA Index (Net) is a free-float-adjusted market-capitalization-weighted index that is designed to measure the equity market performance of developed markets, excluding the Unites States and Canada. Source: MSCI. MSCI makes no express or implied warranties or representations and shall have no liability whatsoever with respect to any MSCI data contained herein. The MSCI data may not be further redistributed or used as a basis for other indices or any securities or financial products. This report is not approved, reviewed, or produced by MSCI. You cannot invest directly in an index. |
| 6 | The Russell 3000® Index measures the performance of the 3,000 largest U.S. companies based on total market capitalization, which represents approximately 98% of the investable U.S. equity market. You cannot invest directly in an index. |
| 7 | The ten largest holdings, excluding cash and cash equivalents, are calculated based on the value of the investments divided by total net assets of the Fund. Holdings are subject to change and may have changed since the date specified. |
| 8 | Current target allocation includes the effect of any tactical futures overlay that may be in place. Effective cash is comprised of the net impact of long and/or short futures contracts held as part of dynamic risk management strategy. These amounts are subject to change and may have changed since the date specified. |
This page is intentionally left blank.
| | | | |
| 8 | | Wells Fargo Allocation Funds | | Performance highlights (unaudited) |
Wells Fargo Moderate Balanced Fund
Investment objective
The Fund seeks total return, consisting of current income and capital appreciation.
Manager
Wells Fargo Funds Management, LLC
Subadviser
Wells Capital Management Incorporated
Subadvisers for the affiliated master portfolios
Analytic Investors, LLC
Artisan Partners Limited Partnership
Cooke & Bieler, L.P.
Galliard Capital Management, Inc.
LSV Asset Management
Peregrine Capital Management, LLC
Wells Capital Management Incorporated
Portfolio managers
Kandarp R. Acharya, CFA®, FRM
Petros Bocray, CFA®, FRM
Christian L. Chan, CFA®
Average annual total returns (%) as of November 30, 2017
| | | | | | | | | | | | | | | | | | | | | | | | | | | | | | | | | | |
| | | | | Including sales charge | | | Excluding sales charge | | | Expense ratios1 (%) | |
| | | Inception date | | 1 year | | | 5 year | | | 10 year | | | 1 year | | | 5 year | | | 10 year | | | Gross | | | Net2 | |
| Class A (WFMAX) | | 1-30-2004 | | | 4.10 | | | | 5.91 | | | | 4.08 | | | | 10.45 | | | | 7.17 | | | | 4.70 | | | | 1.32 | | | | 1.15 | |
| Class C (WFBCX) | | 1-30-2004 | | | 8.62 | | | | 6.37 | | | | 3.91 | | | | 9.62 | | | | 6.37 | | | | 3.91 | | | | 2.07 | | | | 1.90 | |
| Administrator Class (NVMBX) | | 11-11-1994 | | | – | | | | – | | | | – | | | | 10.75 | | | | 7.44 | | | | 4.95 | | | | 1.24 | | | | 0.90 | |
| Moderate Balanced Blended Index3 | | – | | | – | | | | – | | | | – | | | | 10.36 | | | | 6.74 | | | | 5.21 | | | | – | | | | – | |
| Bloomberg Barclays U.S. Aggregate Bond Index4 | | – | | | – | | | | – | | | | – | | | | 3.21 | | | | 1.98 | | | | 3.99 | | | | – | | | | – | |
| Bloomberg Barclays U.S. Short Treasury 9-12 Months Index5 | | – | | | – | | | | – | | | | – | | | | 0.69 | | | | 0.41 | | | | 0.90 | | | | – | | | | – | |
| MSCI EAFE Index (Net)6 | | – | | | – | | | | – | | | | – | | | | 27.27 | | | | 8.24 | | | | 1.55 | | | | – | | | | – | |
| Russell 1000® Growth Index7 | | – | | | – | | | | – | | | | – | | | | 30.81 | | | | 17.14 | | | | 9.87 | | | | – | | | | – | |
| Russell 1000® Value Index8 | | – | | | – | | | | – | | | | – | | | | 14.83 | | | | 14.17 | | | | 6.84 | | | | – | | | | – | |
| Russell 2000® Index9 | | – | | | – | | | | – | | | | – | | | | 18.34 | | | | 15.02 | | | | 8.75 | | | | – | | | | – | |
| S&P 500 Index10 | | – | | | – | | | | – | | | | – | | | | 22.87 | | | | 15.74 | | | | 8.30 | | | | – | | | | – | |
Figures quoted represent past performance, which is no guarantee of future results, and do not reflect taxes that a shareholder may pay on fund distributions or the redemption of fund shares. Investment return and principal value of an investment will fluctuate so that an investor’s shares, when redeemed, may be worth more or less than their original cost. Performance shown without sales charges would be lower if sales charges were reflected. Current performance may be lower or higher than the performance data quoted, which assumes the reinvestment of dividends and capital gains. Current month-end performance is available on the Fund’s website, wellsfargofunds.com.
Index returns do not include transaction costs associated with buying and selling securities, any mutual fund fees or expenses, or any taxes. It is not possible to invest directly in an index.
For Class A shares, the maximum front-end sales charge is 5.75%. For Class C shares, the maximum contingent deferred sales charge is 1.00%. Performance including a contingent deferred sales charge assumes the sales charge for the corresponding time period. Administrator Class shares are sold without a front-end sales charge or contingent deferred sales charge.
Please see footnotes on page 10.
| | | | | | |
| Performance highlights (unaudited) | | Wells Fargo Allocation Funds | | | 9 | |
Wells Fargo Moderate Balanced Fund (continued)
| | | | |
| Ten largest holdings as of November 30, 201711 | |
Wells Fargo Managed Fixed Income Portfolio | | | 20.20 | |
Wells Fargo Stable Income Portfolio | | | 9.65 | |
Wells Fargo Diversified Large Cap Growth Portfolio | | | 6.53 | |
Wells Fargo Disciplined U.S. Core Fund Class R6 | | | 6.50 | |
Wells Fargo Core Bond Portfolio | | | 5.77 | |
Wells Fargo Large Company Value Portfolio | | | 4.40 | |
Wells Fargo Real Return Portfolio | | | 2.89 | |
Wells Fargo C&B Large Cap Value Portfolio | | | 2.21 | |
Wells Fargo International Value Portfolio | | | 1.96 | |
Wells Fargo International Growth Portfolio | | | 1.94 | |
|
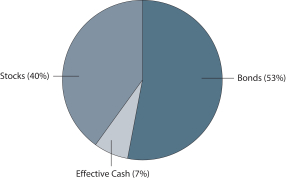
| Current target allocation as of November 30, 201712 |
|
 |
|
| Neutral target allocation |
|
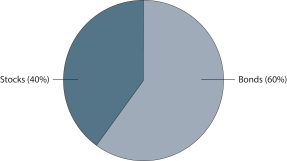 |
Balanced funds may invest in stocks and bonds. Stock values fluctuate in response to the activities of individual companies and general market and economic conditions. Bond values fluctuate in response to the financial condition of individual issuers, general market and economic conditions, and changes in interest rates. Changes in market conditions and government policies may lead to periods of heightened volatility in the bond market and reduced liquidity for certain bonds held by the Fund. In general, when interest rates rise, bond values fall and investors may lose principal value. Interest-rate changes and their impact on the Fund and its share price can be sudden and unpredictable. The use of derivatives may reduce returns and/or increase volatility. The Fund will indirectly be exposed to all of the risks of an investment in the underlying funds and will indirectly bear expenses of the underlying funds. Certain investment strategies tend to increase the total risk of an investment (relative to the broader market). The Fund is exposed to mortgage- and asset-backed securities risk. Consult the Fund’s prospectus for additional information on these and other risks.
Please see footnotes on page 10.
| | | | |
| 10 | | Wells Fargo Allocation Funds | | Performance highlights (unaudited) |
Wells Fargo Moderate Balanced Fund (continued)
| 1 | Reflects the expense ratios as stated in the most recent prospectuses, which include the impact of 0.46% in acquired fund fees and expenses from the affiliated master portfolios. The expense ratios shown are subject to change and may differ from the annualized expense ratios shown in the financial highlights of this report. |
| 2 | The manager has contractually committed through September 30, 2018, to waive fees and/or reimburse expenses to the extent necessary to cap the Fund’s Total Annual Fund Operating Expenses After Fee Waivers at the amounts shown. After this time, the cap may be increased or the commitment to maintain the cap may be terminated only with the approval of the Board of Trustees. Brokerage commissions, stamp duty fees, interest, taxes, acquired fund fees and expenses from funds in which the affiliated master portfolios invest, and extraordinary expenses are excluded from the expense cap. All other acquired fund fees and expenses from the affiliated master portfolios are included in the expense cap. Without this cap, the Fund’s returns would have been lower. The expense ratio paid by an investor is the net expense ratio or the Fund’s Total Annual Fund Operating Expenses After Fee Waivers, as stated in the prospectuses. |
| 3 | Source: Wells Fargo Funds Management, LLC. The Moderate Balanced Blended Index is weighted 45% in the Bloomberg Barclays U.S. Aggregate Bond Index, 15% in the Bloomberg Barclays U.S. Short Treasury 9-12 Months Index, 10% in the Russell 1000® Growth Index, 10% in the Russell 1000® Value Index, 10% in the S&P 500 Index, 6% in the MSCI EAFE Index (Net), and 4% in the Russell 2000® Index. You cannot invest directly in an index. |
| 4 | The Bloomberg Barclays U.S. Aggregate Bond Index is a broad-based benchmark that measures the investment-grade, U.S. dollar–denominated, fixed-rate taxable bond market, including Treasuries, government-related and corporate securities, mortgage-backed securities (agency fixed-rate and hybrid adjustable-rate mortgage pass-throughs), asset-backed securities, and commercial mortgage-backed securities. You cannot invest directly in an index. |
| 5 | The Bloomberg Barclays U.S. Short Treasury 9–12 Months Index is an unmanaged index that includes aged U.S. Treasury bills, notes, and bonds with a remaining maturity from 9 up to (but not including) 12 months. It excludes zero-coupon STRIPS. You cannot invest directly in an index. |
| 6 | The Morgan Stanley Capital International (MSCI) Europe, Australasia, Far East (EAFE) Index (Net) is a free-float-adjusted market-capitalization-weighted index that is designed to measure the equity market performance of developed markets, excluding the United States and Canada. The MSCI EAFE Index (Net) consists of the following 21 developed markets country indexes: Australia, Austria, Belgium, Denmark, Finland, France, Germany, Hong Kong, Ireland, Israel, Italy, Japan, the Netherlands, New Zealand, Norway, Portugal, Singapore, Spain, Sweden, Switzerland, and the United Kingdom. Source: MSCI. MSCI makes no express or implied warranties or representations and shall have no liability whatsoever with respect to any MSCI data contained herein. The MSCI data may not be further redistributed or used as a basis for other indexes or any securities or financial products. This report is not approved, reviewed, or produced by MSCI. You cannot invest directly in an index. |
| 7 | The Russell 1000® Growth Index measures the performance of those Russell 1000 companies with higher price-to-book ratios and higher forecasted growth values. You cannot invest directly in an index. |
| 8 | The Russell 1000® Value Index measures the performance of those Russell 1000 companies with lower price-to-book ratios and lower forecasted growth values. You cannot invest directly in an index. |
| 9 | The Russell 2000® Index measures the performance of the 2,000 smallest companies in the Russell 3000® Index, which represents approximately 8% of the total market capitalization of the Russell 3000® Index. You cannot invest directly in an index. |
| 10 | The S&P 500 Index consists of 500 stocks chosen for market size, liquidity, and industry group representation. It is a market-value-weighted index with each stock’s weight in the index proportionate to its market value. You cannot invest directly in an index. |
| 11 | The ten largest holdings, excluding cash and cash equivalents, are calculated based on the value of the investments divided by total net assets of the Fund. Holdings are subject to change and may have changed since the date specified. |
| 12 | Current target allocation includes the effect of any tactical futures overlay that may be in place. Effective cash is comprised of the net impact of long and/ or short futures contracts held as part of dynamic risk management strategy. These amounts are subject to change and may have changed since the date specified. |
| | | | | | |
| Fund expenses (unaudited) | | Wells Fargo Allocation Funds | | | 11 | |
As a shareholder of the Fund, you incur two types of costs: (1) transaction costs, including sales charges (loads) on purchase payments and contingent deferred sales charges (if any) on redemptions and (2) ongoing costs, including management fees, distribution (12b-1) and/or shareholder servicing fees, and other Fund expenses. This example is intended to help you understand your ongoing costs (in dollars) of investing in the Fund and to compare these costs with the ongoing costs of investing in other mutual funds.
The example is based on an investment of $1,000 invested at the beginning of the six-month period and held for the entire period from June 1, 2017 to November 30, 2017.
Actual expenses
The “Actual” line of the table below provides information about actual account values and actual expenses. You may use the information in this line, together with the amount you invested, to estimate the expenses that you paid over the period. Simply divide your account value by $1,000 (for example, an $8,600 account value divided by $1,000 = 8.6), then multiply the result by the number in the “Actual” line under the heading entitled “Expenses paid during period” for your applicable class of shares to estimate the expenses you paid on your account during this period.
Hypothetical example for comparison purposes
The “Hypothetical” line of the table below provides information about hypothetical account values and hypothetical expenses based on the Fund’s actual expense ratio and an assumed rate of return of 5% per year before expenses, which is not the Fund’s actual return. The hypothetical account values and expenses may not be used to estimate the actual ending account balance or expenses you paid for the period. You may use this information to compare the ongoing costs of investing in the Fund and other funds. To do so, compare this 5% hypothetical example with the 5% hypothetical examples that appear in the shareholder reports of the other funds.
Please note that the expenses shown in the table are meant to highlight your ongoing costs only and do not reflect any transactional costs, such as sales charges (loads) and contingent deferred sales charges. Therefore, the “Hypothetical” line of the table is useful in comparing ongoing costs only and will not help you determine the relative total costs of owning different funds. In addition, if these transactional costs were included, your costs would have been higher.
| | | | | | | | | | | | | | | | |
| Growth Balanced Fund1 | | Beginning
account value
6-1-2017 | | | Ending
account value
11-30-2017 | | | Expenses
paid during
the period2 | | | Annualized net
expense ratio | |
Class A | | | | | | | | | | | | | | | | |
Actual | | $ | 1,000.00 | | | $ | 1,071.51 | | | $ | 6.23 | | | | 1.20 | % |
Hypothetical (5% return before expenses) | | $ | 1,000.00 | | | $ | 1,019.05 | | | $ | 6.07 | | | | 1.20 | % |
Class C | | | | | | | | | | | | | | | | |
Actual | | $ | 1,000.00 | | | $ | 1,067.38 | | | $ | 10.11 | | | | 1.95 | % |
Hypothetical (5% return before expenses) | | $ | 1,000.00 | | | $ | 1,015.29 | | | $ | 9.85 | | | | 1.95 | % |
Administrator Class | | | | | | | | | | | | | | | | |
Actual | | $ | 1,000.00 | | | $ | 1,072.92 | | | $ | 4.94 | | | | 0.95 | % |
Hypothetical (5% return before expenses) | | $ | 1,000.00 | | | $ | 1,020.31 | | | $ | 4.81 | | | | 0.95 | % |
| Moderate Balanced Fund1 | |
Class A | | | | | | | | | | | | | | | | |
Actual | | $ | 1,000.00 | | | $ | 1,046.44 | | | $ | 5.90 | | | | 1.15 | % |
Hypothetical (5% return before expenses) | | $ | 1,000.00 | | | $ | 1,019.30 | | | $ | 5.82 | | | | 1.15 | % |
Class C | | | | | | | | | | | | | | | | |
Actual | | $ | 1,000.00 | | | $ | 1,042.23 | | | $ | 9.73 | | | | 1.90 | % |
Hypothetical (5% return before expenses) | | $ | 1,000.00 | | | $ | 1,015.54 | | | $ | 9.60 | | | | 1.90 | % |
Administrator Class | | | | | | | | | | | | | | | | |
Actual | | $ | 1,000.00 | | | $ | 1,047.72 | | | $ | 4.62 | | | | 0.90 | % |
Hypothetical (5% return before expenses) | | $ | 1,000.00 | | | $ | 1,020.56 | | | $ | 4.56 | | | | 0.90 | % |
| 1 | Amounts include any net expenses allocated from the affiliated Master Portfolios to the Fund. |
| 2 | Expenses paid is equal to the annualized net expense ratio of each class multiplied by the average account value over the period, multiplied by the number of days in the most recent fiscal half-year divided by the number of days in the fiscal year (to reflect the one-half-year period). |
| | | | |
| 12 | | Wells Fargo Allocation Funds | | Portfolio of investments—November 30, 2017 (unaudited) |
GROWTH BALANCED FUND
| | | | | | | | | | | | | | | | |
| Security name | | | | | | | | Shares | | | Value | |
| | | | |
Investment Companies: 100.03% | | | | | | | | | | | | | | | | |
| | | | |
| Affiliated Master Portfolios: 86.98% | | | | | | | | | | | | | | | | |
Wells Fargo C&B Large Cap Value Portfolio | | | | | | | | | | | | | | $ | 7,540,935 | |
Wells Fargo Core Bond Portfolio | | | | | | | | | | | | | | | 17,060,432 | |
Wells Fargo Diversified Large Cap Growth Portfolio | | | | | | | | | | | | | | | 32,066,675 | |
Wells Fargo Emerging Growth Portfolio | | | | | | | | | | | | | | | 3,994,705 | |
Wells Fargo International Growth Portfolio | | | | | | | | | | | | | | | 23,716,828 | |
Wells Fargo International Value Portfolio | | | | | | | | | | | | | | | 24,129,532 | |
Wells Fargo Large Company Value Portfolio | | | | | | | | | | | | | | | 25,129,263 | |
Wells Fargo Managed Fixed Income Portfolio | | | | | | | | | | | | | | | 59,681,658 | |
Wells Fargo Real Return Portfolio | | | | | | | | | | | | | | | 8,529,688 | |
Wells Fargo Small Company Growth Portfolio | | | | | | | | | | | | | | | 4,029,070 | |
Wells Fargo Small Company Value Portfolio | | | | | | | | | | | | | | | 8,140,647 | |
| | | | |
| | | | | | | | | | | | | | | 214,019,433 | |
| | | | | | | | | | | | | | | | |
| | | | |
| Affiliated Stock Funds: 13.05% | | | | | | | | | | | | | | | | |
Wells Fargo Disciplined U.S. Core Fund Class R6 † | | | | | | | | | | | 1,768,323 | | | | 32,112,738 | |
| | | | | | | | | | | | | | | | |
| | | | |
Total Investment Companies (Cost $213,838,103) | | | | | | | | | | | | | | | 246,132,171 | |
| | | | | | | | | | | | | | | | |
| | | | |
| | | Yield | | | Maturity date | | | Principal | | | | |
| Short-Term Investments: 0.07% | | | | | | | | | | | | | | | | |
| | | | |
| U.S. Treasury Securities: 0.07% | | | | | | | | | | | | | | | | |
U.S. Treasury Bill #(z) | | | 1.25 | % | | | 3-1-2018 | | | $ | 170,000 | | | | 169,469 | |
| | | | | | | | | | | | | | | | |
| | | | |
Total Short-Term Investments (Cost $169,465) | | | | | | | | | | | | | | | 169,469 | |
| | | | | | | | | | | | | | | | |
| | | | | | | | |
| Total investments in securities (Cost $214,007,568) | | | 100.10 | % | | | 246,301,640 | |
Other assets and liabilities, net | | | (0.10 | ) | | | (249,181 | ) |
| | | | | | | | |
| Total net assets | | | 100.00 | % | | $ | 246,052,459 | |
| | | | | | | | |
| † | Non-income-earning security |
| # | All or a portion of this security is segregated as collateral for investments in derivative instruments. |
| (z) | Zero coupon security. The rate represents the current yield to maturity. |
Futures Contracts
| | | | | | | | | | | | | | | | | | | | | | | | |
| Description | | Number of
contracts | | | Expiration
date | | | Notional
cost | | | Notional
value | | | Unrealized
gains | | | Unrealized
losses | |
Short | | | | | | | | | | | | | | | | | | | | | | | | |
10-Year U.S. Treasury Notes | | | (144) | | | | 3-20-2018 | | | $ | (17,959,405 | ) | | $ | (17,862,750 | ) | | $ | 96,655 | | | $ | 0 | |
The accompanying notes are an integral part of these financial statements.
| | | | | | |
| Portfolio of investments—November 30, 2017 (unaudited) | | Wells Fargo Allocation Funds | | | 13 | |
GROWTH BALANCED FUND
Investments in Affiliates
An affiliated investment is an investment in which the Fund owns at least 5% of the outstanding voting shares of the issuer or as a result of other relationships, such as the Fund and the issuer having the same investment manager. Transactions with issuers that were either affiliated persons of the Fund at the beginning of the period or the end of the period were as follows:
| | | | | | | | | | | | | | | | | | | | | | | | | | | | |
| | | Shares,
beginning of
period | | | Shares
purchased | | | Shares
sold | | | Shares,
end of
period | | | Net
change in
unrealized
gains
(losses) on
affiliated
Underlying
Funds | | | Value,
end
of period | | | % of
net
assets | |
Investment Companies | | | | | | | | | | | | | | | | | | | | | | | | | | | | |
Affiliated Stock Funds | | | | | | | | | | | | | | | | | | | | | | | | | | | | |
Wells Fargo Disciplined U.S. Core Fund Class R6 | | | 0 | | | | 1,768,323 | | | | 0 | | | | 1,768,323 | | | $ | 265,248 | | | $ | 32,112,738 | | | | 13.05 | % |
Transactions with the affiliated Master Portfolios were as follows:
| | | | | | | | | | | | | | | | | | | | | | | | | | | | | | | | | | | | |
| | | % of
ownership, beginning of
period | | | % of
ownership, end of
period | | | Net
realized
gains
(losses) on
securities
transactions
allocated
from
affiliated
Master
Portfolios | | | Net
change in
unrealized
gains
(losses) on
securities
transactions
allocated
from
affiliated
Master
Portfolios | | | Dividends
allocated
from
affiliated
Master
Portfolios | | | Interest
allocated
from
affiliated
Master
Portfolios | | | Securities
lending
income
from
affiliates
allocated
from
affiliated
Master
Portfolios | | | Value, end
of period | | | % of
net
assets | |
Affiliated Master Portfolios | | | | | | | | | | | | | | | | | | | | | | | | | | | | | | | | | | | | |
Wells Fargo C&B Large Cap Value Portfolio | | | 4 | % | | | 2 | % | | $ | 720,832 | | | $ | 256,858 | | | $ | 103,903 | | | $ | 3,436 | | | $ | 952 | | | $ | 7,540,935 | | | | | |
Wells Fargo Core Bond Portfolio | | | 0 | * | | | 0 | * | | | 52,290 | | | | (103,015 | ) | | | 0 | | | | 207,858 | | | | 882 | | | | 17,060,432 | | | | | |
Wells Fargo Diversified Large Cap Growth Portfolio | | | 38 | | | | 34 | | | | 4,144,925 | | | | 789,168 | | | | 226,960 | | | | 1,775 | | | | 968 | | | | 32,066,675 | | | | | |
Wells Fargo Emerging Growth Portfolio | | | 1 | | | | 0 | * | | | 284,502 | | | | 270,934 | | | | 3,658 | | | | 266 | | | | 1,209 | | | | 3,994,705 | | | | | |
Wells Fargo Index Portfolio | | | 2 | | | | 0 | | | | 2,964,117 | | | | 51,104 | | | | 390,126 | | | | 1,975 | | | | 659 | | | | 0 | | | | | |
Wells Fargo International Growth Portfolio | | | 9 | | | | 57 | | | | 2,719,661 | | | | (1,608,868 | ) | | | 62,740 | | | | 800 | | | | 2,238 | | | | 23,716,828 | | | | | |
Wells Fargo International Value Portfolio | | | 2 | | | | 3 | | | | 46,123 | | | | 894,702 | | | | 192,760 | | | | 341 | | | | 5,181 | | | | 24,129,532 | | | | | |
Wells Fargo Large Company Value Portfolio | | | 37 | | | | 37 | | | | 860,155 | | | | 1,473,901 | | | | 274,501 | | | | 2,222 | | | | 0 | | | | 25,129,263 | | | | | |
Wells Fargo Managed Fixed Income Portfolio | | | 53 | | | | 55 | | | | 174,520 | | | | (415,727 | ) | | | 0 | | | | 1,009,375 | | | | 512 | | | | 59,681,658 | | | | | |
Wells Fargo Real Return Portfolio | | | 9 | | | | 6 | | | | (24,093 | ) | | | 3,928 | | | | 31,949 | | | | 104,123 | | | | 306 | | | | 8,529,688 | | | | | |
Wells Fargo Small Company Growth Portfolio | | | 0 | * | | | 0 | * | | | 26,146 | | | | 460,576 | | | | 9,998 | | | | 711 | | | | 2,634 | | | | 4,029,070 | | | | | |
Wells Fargo Small Company Value Portfolio | | | 4 | | | | 5 | | | | 776,554 | | | | 253,184 | | | | 61,435 | | | | 1,034 | | | | 6,941 | | | | 8,140,647 | | | | | |
| | | | | | | | | | | | | | | | | | | | | | | | | | | | | | | | | | | | |
| | | | | | | | | | $ | 12,745,732 | | | $ | 2,326,745 | | | $ | 1,358,030 | | | $ | 1,333,916 | | | $ | 22,482 | | | $ | 214,019,433 | | | | 86.98 | % |
| | | | | | | | | | | | | | | | | | | | | | | | | | | | | | | | | | | | |
| | * | The amount owned is less than 0.5%. |
The accompanying notes are an integral part of these financial statements.
| | | | |
| 14 | | Wells Fargo Allocation Funds | | Portfolio of investments—November 30, 2017 (unaudited) |
MODERATE BALANCED FUND
| | | | | | | | | | | | | | | | |
| Security name | | | | | | | | Shares | | | Value | |
| | | | |
Investment Companies: 100.66% | | | | | | | | | | | | | | | | |
| | | | |
| Affiliated Master Portfolios: 90.54% | | | | | | | | | | | | | | | | |
Wells Fargo C&B Large Cap Value Portfolio | | | | | | | | | | | | | | $ | 5,428,853 | |
Wells Fargo Core Bond Portfolio | | | | | | | | | | | | | | | 14,200,770 | |
Wells Fargo Diversified Large Cap Growth Portfolio | | | | | | | | | | | | | | | 16,077,626 | |
Wells Fargo Emerging Growth Portfolio | | | | | | | | | | | | | | | 1,608,479 | |
Wells Fargo International Growth Portfolio | | | | | | | | | | | | | | | 4,785,045 | |
Wells Fargo International Value Portfolio | | | | | | | | | | | | | | | 4,821,640 | |
Wells Fargo Large Company Value Portfolio | | | | | | | | | | | | | | | 10,814,612 | |
Wells Fargo Managed Fixed Income Portfolio | | | | | | | | | | | | | | | 49,695,200 | |
Wells Fargo Real Return Portfolio | | | | | | | | | | | | | | | 7,102,425 | |
Wells Fargo Small Company Growth Portfolio | | | | | | | | | | | | | | | 1,624,826 | |
Wells Fargo Small Company Value Portfolio | | | | | | | | | | | | | | | 3,259,864 | |
Wells Fargo Stable Income Portfolio | | | | | | | | | | | | | | | 23,738,532 | |
| | | | |
| | | | | | | | | | | | | | | 143,157,872 | |
| | | | | | | | | | | | | | | | |
| | | | |
| Affiliated Stock Funds: 10.12% | | | | | | | | | | | | | | | | |
Wells Fargo Disciplined U.S. Core Fund Class R6 † | | | | | | | | | | | 880,889 | | | | 15,996,944 | |
| | | | | | | | | | | | | | | | |
| | | | |
Total Investment Companies (Cost $145,227,447) | | | | | | | | | | | | | | | 159,154,816 | |
| | | | | | | | | | | | | | | | |
| | | | |
| | | Yield | | | Maturity date | | | Principal | | | | |
| Short-Term Investments: 0.07% | | | | | | | | | | | | | | | | |
| | | | |
| U.S. Treasury Securities: 0.07% | | | | | | | | | | | | | | | | |
U.S. Treasury Bill #(z) | | | 1.25 | % | | | 3-1-2018 | | | $ | 110,000 | | | | 109,657 | |
| | | | | | | | | | | | | | | | |
| | | | |
Total Short-Term Investments (Cost $109,654) | | | | | | | | | | | | | | | 109,657 | |
| | | | | | | | | | | | | | | | |
| | | | | | | | |
| Total investments in securities (Cost $145,337,101) | | | 100.73 | % | | | 159,264,473 | |
Other assets and liabilities, net | | | (0.73 | ) | | | (1,160,547 | ) |
| | | | | | | | |
| Total net assets | | | 100.00 | % | | $ | 158,103,926 | |
| | | | | | | | |
| † | Non-income-earning security |
| # | All or a portion of this security is segregated as collateral for investments in derivative instruments. |
| (z) | Zero coupon security. The rate represents the current yield to maturity. |
Futures Contracts
| | | | | | | | | | | | | | | | | | | | | | | | |
| Description | | Number of
contracts | | | Expiration
date | | | Notional
cost | | | Notional
value | | | Unrealized
gains | | | Unrealized
losses | |
Short | | | | | | | | | | | | | | | | | | | | | | | | |
10-Year U.S. Treasury Notes | | | (94) | | | | 3-20-2018 | | | $ | (11,723,500 | ) | | $ | (11,660,406 | ) | | $ | 63,094 | | | $ | 0 | |
The accompanying notes are an integral part of these financial statements.
| | | | | | |
| Portfolio of investments—November 30, 2017 (unaudited) | | Wells Fargo Allocation Funds | | | 15 | |
MODERATE BALANCED FUND
Investments in Affiliates
An affiliated investment is an investment in which the Fund owns at least 5% of the outstanding voting shares of the issuer or as a result of other relationships, such as the Fund and the issuer having the same investment manager. Transactions with issuers that were either affiliated persons of the Fund at the beginning of the period or the end of the period were as follows:
| | | | | | | | | | | | | | | | | | | | | | | | | | | | |
| | | Shares,
beginning of
period | | | Shares
purchased | | | Shares
sold | | | Shares,
end of
period | | | Net
change in
unrealized
gains
(losses) on
affiliated
Underlying
Funds | | | Value,
end
of period | | | % of
net
assets | |
Investment Companies | | | | | | | | | | | | | | | | | | | | | | | | | | | | |
Affiliated Stock Funds | | | | | | | | | | | | | | | | | | | | | | | | | | | | |
Wells Fargo Disciplined U.S. Core Fund Class R6 | | | 0 | | | | 880,889 | | | | 0 | | | | 880,889 | | | $ | 132,134 | | | $ | 15,996,944 | | | | 10.12 | % |
Transactions with the affiliated Master Portfolios were as follows:
| | | | | | | | | | | | | | | | | | | | | | | | | | | | | | | | | | | | |
| | | % of
ownership, beginning of
period | | | % of
ownership, end of
period | | | Net
realized
gains
(losses) on
securities
transactions
allocated
from
affiliated
Master
Portfolios | | | Net
change in
unrealized
gains
(losses) on
securities
transactions
allocated
from
affiliated
Master
Portfolios | | | Dividends
allocated
from
affiliated
Master
Portfolios | | | Interest
allocated
from
affiliated
Master
Portfolios | | | Securities
lending
income
from
affiliates
allocated
from
affiliated
Master
Portfolios | | | Value, end
of period | | | % of
net
assets | |
Affiliated Master Portfolios | | | | | | | | | | | | | | | | | | | | | | | | | | | | | | | | | | | | |
Wells Fargo C&B Large Cap Value Portfolio | | | 2 | % | | | 1 | % | | $ | 292,795 | | | $ | 160,871 | | | $ | 42,364 | | | $ | 1,384 | | | $ | 384 | | | $ | 5,428,853 | | | | | |
Wells Fargo Core Bond Portfolio | | | 0 | * | | | 0 | * | | | 44,350 | | | | (85,596 | ) | | | 0 | | | | 175,551 | | | | 743 | | | | 14,200,770 | | | | | |
Wells Fargo Diversified Large Cap Growth Portfolio | | | 16 | | | | 17 | | | | 1,743,557 | | | | 244,652 | | | | 91,653 | | | | 710 | | | | 388 | | | | 16,077,626 | | | | | |
Wells Fargo Emerging Growth Portfolio | | | 0 | * | | | 0 | * | | | 113,454 | | | | 109,225 | | | | 1,468 | | | | 106 | | | | 484 | | | | 1,608,479 | | | | | |
Wells Fargo Index Portfolio | | | 1 | | | | 0 | | | | 1,184,077 | | | | 22,201 | | | | 146,719 | | | | 788 | | | | 263 | | | | 0 | | | | | |
Wells Fargo International Growth Portfolio | | | 4 | | | | 11 | | | | 1,064,529 | | | | (598,318 | ) | | | 24,935 | | | | 225 | | | | 899 | | | | 4,785,045 | | | | | |
Wells Fargo International Value Portfolio | | | 1 | | | | 1 | | | | 18,618 | | | | 315,603 | | | | 76,261 | | | | 130 | | | | 2,053 | | | | 4,821,640 | | | | | |
Wells Fargo Large Company Value Portfolio | | | 15 | | | | 16 | | | | 337,938 | | | | 623,126 | | | | 110,502 | | | | 892 | | | | 0 | | | | 10,814,612 | | | | | |
Wells Fargo Managed Fixed Income Portfolio | | | 47 | | | | 45 | | | | 147,679 | | | | (337,042 | ) | | | 0 | | | | 853,024 | | | | 431 | | | | 49,695,200 | | | | | |
Wells Fargo Real Return Portfolio | | | 8 | | | | 5 | | | | (20,528 | ) | | | 3,220 | | | | 27,044 | | | | 87,037 | | | | 259 | | | | 7,102,425 | | | | | |
Wells Fargo Small Company Growth Portfolio | | | 0 | * | | | 0 | * | | | 10,274 | | | | 186,328 | | | | 4,030 | | | | 285 | | | | 1,056 | | | | 1,624,826 | | | | | |
Wells Fargo Small Company Value Portfolio | | | 2 | | | | 2 | | | | 311,806 | | | | 103,555 | | | | 34,235 | | | | 416 | | | | 2,798 | | | | 3,259,864 | | | | | |
Wells Fargo Stable Income Portfolio | | | 100 | | | | 100 | | | | 2,774 | | | | (122,890 | ) | | | 0 | | | | 239,498 | | | | 0 | | | | 23,738,532 | | | | | |
| | | | | | | | | | | | | | | | | | | | | | | | | | | | | | | | | | | | |
| | | | | | | | | | $ | 5,251,323 | | | $ | 624,935 | | | $ | 559,211 | | | $ | 1,360,046 | | | $ | 9,758 | | | $ | 143,157,872 | | | | 90.54 | % |
| | | | | | | | | | | | | | | | | | | | | | | | | | | | | | | | | | | | |
| | * | The amount owned is less than 0.5%. |
The accompanying notes are an integral part of these financial statements.
| | | | |
| 16 | | Wells Fargo Allocation Funds | | Statements of assets and liabilities—November 30, 2017 (unaudited) |
| | | | | | | | |
| | | Growth
Balanced
Fund | | | Moderate
Balanced
Fund | |
| | |
Assets | | | | | | | | |
Investments in affiliated Master Portfolios, at value (see cost below) | | $ | 214,019,433 | | | $ | 143,157,872 | |
Investments in affiliated Underlying Funds, at value (see cost below) | | | 32,112,738 | | | | 15,996,944 | |
Investments in unaffiliated securities, at value (see cost below) | | | 169,469 | | | | 109,657 | |
Receivable for Fund shares sold | | | 96,081 | | | | 32,632 | |
Receivable for daily variation margin on open futures contracts | | | 60,750 | | | | 39,656 | |
Prepaid expenses and other assets | | | 64,830 | | | | 46,729 | |
| | | | |
Total assets | | | 246,523,301 | | | | 159,383,490 | |
| | | | |
| | |
Liabilities | | | | | | | | |
Payable for Fund shares redeemed | | | 348,264 | | | | 1,195,611 | |
Shareholder servicing fees payable | | | 50,496 | | | | 32,554 | |
Administration fees payable | | | 31,755 | | | | 20,021 | |
Management fee payable | | | 11,945 | | | | 209 | |
Distribution fee payable | | | 10,053 | | | | 7,181 | |
Trustees’ fees and expenses payable | | | 2,069 | | | | 2,500 | |
Accrued expenses and other liabilities | | | 16,260 | | | | 21,488 | |
| | | | |
Total liabilities | | | 470,842 | | | | 1,279,564 | |
| | | | |
Total net assets | | $ | 246,052,459 | | | $ | 158,103,926 | |
| | | | |
| | |
NET ASSETS CONSIST OF | | | | | | | | |
Paid-in capital | | $ | 279,441,354 | | | $ | 129,135,165 | |
Undistributed net investment income | | | 3,990,546 | | | | 2,074,130 | |
Accumulated net realized gains (losses) on investments | | | (69,770,168 | ) | | | 12,904,165 | |
Net unrealized gains on investments | | | 32,390,727 | | | | 13,990,466 | |
| | | | |
Total net assets | | $ | 246,052,459 | | | $ | 158,103,926 | |
| | | | |
| | |
COMPUTATION OF NET ASSET VALUE AND OFFERING PRICE PER SHARE | | | | | | | | |
Net assets – Class A | | $ | 67,818,671 | | | $ | 35,603,723 | |
Shares outstanding – Class A1 | | | 1,441,547 | | | | 1,449,650 | |
Net asset value per share – Class A | | | $47.05 | | | | $24.56 | |
Maximum offering price per share – Class A2 | | | $49.92 | | | | $26.06 | |
Net assets – Class C | | $ | 16,400,806 | | | $ | 11,580,273 | |
Shares outstanding – Class C1 | | | 402,823 | | | | 483,627 | |
Net asset value per share – Class C | | | $40.71 | | | | $23.94 | |
Net assets – Administrator Class | | $ | 161,832,982 | | | $ | 110,919,930 | |
Shares outstanding – Administrator Class1 | | | 3,846,208 | | | | 4,471,285 | |
Net asset value per share – Administrator Class | | | $42.08 | | | | $24.81 | |
| | |
Investments in affiliated Master Portfolios, at cost | | $ | 181,990,613 | | | $ | 129,362,637 | |
| | | | |
Investments in affiliated Underlying Funds, at cost | | $ | 31,847,490 | | | $ | 15,864,810 | |
| | | | |
Investments in unaffiliated securities, at cost | | $ | 169,465 | | | $ | 109,654 | |
| | | | |
| 1 | Each Fund has an unlimited number of authorized shares. |
| 2 | Maximum offering price is computed as 100/94.25 of net asset value. On investments of $50,000 or more, the offering price is reduced. |
The accompanying notes are an integral part of these financial statements.
| | | | | | |
| Statements of operations—six months ended November 30, 2017 (unaudited) | | Wells Fargo Allocation Funds | | | 17 | |
| | | | | | | | |
| | | Growth
Balanced Fund | | | Moderate
Balanced Fund | |
| | |
Investment income | | | | | | | | |
Dividends allocated from affiliated Master Portfolios* | | $ | 1,358,030 | | | $ | 559,211 | |
Interest allocated from affiliated Master Portfolios | | | 1,333,916 | | | | 1,360,046 | |
Securities lending income from affiliates allocated from affiliated Master Portfolios | | | 22,482 | | | | 9,758 | |
Interest | | | 1,776 | | | | 1,172 | |
Expenses allocated from affiliated Master Portfolios | | | (666,826 | ) | | | (439,763 | ) |
Waivers allocated from affiliated Master Portfolios | | | 77,285 | | | | 83,058 | |
| | | | |
Total investment income | | | 2,126,663 | | | | 1,573,482 | |
| | | | |
| | |
Expenses | | | | | | | | |
Management fee | | | 368,522 | | | | 240,254 | |
Administration fees | | | | | | | | |
Class A | | | 69,810 | | | | 37,397 | |
Class C | | | 17,236 | | | | 12,461 | |
Administrator Class | | | 105,807 | | | | 73,246 | |
Shareholder servicing fees | | | | | | | | |
Class A | | | 83,108 | | | | 44,520 | |
Class C | | | 20,520 | | | | 14,834 | |
Administrator Class | | | 203,474 | | | | 140,857 | |
Distribution fee | | | | | | | | |
Class C | | | 61,559 | | | | 44,502 | |
Custody and accounting fees | | | 5,280 | | | | 4,317 | |
Professional fees | | | 13,566 | | | | 15,681 | |
Registration fees | | | 33,597 | | | | 30,753 | |
Shareholder report expenses | | | 32,377 | | | | 30,442 | |
Trustees’ fees and expenses | | | 10,727 | | | | 11,194 | |
Other fees and expenses | | | 5,046 | | | | 4,901 | |
| | | | |
Total expenses | | | 1,030,629 | | | | 705,359 | |
Less: Fee waivers and/or expense reimbursements | | | (287,999 | ) | | | (237,446 | ) |
| | | | |
Net expenses | | | 742,630 | | | | 467,913 | |
| | | | |
Net investment income | | | 1,384,033 | | | | 1,105,569 | |
| | | | |
| | |
REALIZED AND UNREALIZED GAINS (LOSSES) ON INVESTMENTS | | | | | | | | |
| | |
Net realized gains on: | | | | | | | | |
Securities transactions allocated from affiliated Master Portfolios | | | 12,745,732 | | | | 5,251,323 | |
Futures transactions | | | 153,639 | | | | 96,396 | |
| | | | |
Net realized gains on investments | | | 12,899,371 | | | | 5,347,719 | |
| | | | |
| | |
Net change in unrealized gains (losses) on: | | | | | | | | |
Securities transactions allocated from affiliated Master Portfolios | | | 2,326,745 | | | | 624,935 | |
Affiliated Underlying Funds | | | 265,248 | | | | 132,134 | |
Unaffiliated securities | | | 4 | | | | 3 | |
Futures transactions | | | 158,415 | | | | 105,034 | |
| | | | |
Net change in unrealized gains (losses) on investments | | | 2,750,412 | | | | 862,106 | |
| | | | |
Net realized and unrealized gains (losses) on investments | | | 15,649,783 | | | | 6,209,825 | |
| | | | |
Net increase in net assets resulting from operations | | $ | 17,033,816 | | | $ | 7,315,394 | |
| | | | |
| | |
* Net of foreign dividend withholding taxes allocated from affiliated Master Portfolios in the amount of | | | $30,144 | | | | $12,402 | |
The accompanying notes are an integral part of these financial statements.
| | | | |
| 18 | | Wells Fargo Allocation Funds | | Statements of changes in net assets |
| | | | | | | | | | | | | | | | |
| | | Growth Balanced Fund | |
| | | Six months ended
November 30, 2017 (unaudited) | | | Year ended
May 31, 2017 | |
| | | | |
Operations | | | | | | | | | | | | | | | | |
Net investment income | | | | | | $ | 1,384,033 | | | | | | | $ | 2,992,505 | |
Net realized gains on investments | | | | | | | 12,899,371 | | | | | | | | 18,779,025 | |
Net change in unrealized gains (losses) on investments | | | | | | | 2,750,412 | | | | | | | | 3,602,043 | |
| | | | |
Net increase in net assets resulting from operations | | | | | | | 17,033,816 | | | | | | | | 25,373,573 | |
| | | | |
| | | | |
Distributions to shareholders from | | | | | | | | | | | | | | | | |
Net investment income | | | | | | | | | | | | | | | | |
Class A | | | | | | | 0 | | | | | | | | (650,066 | ) |
Class C | | | | | | | 0 | | | | | | | | (82,182 | ) |
Administrator Class | | | | | | | 0 | | | | | | | | (2,218,341 | ) |
| | | | |
Total distributions to shareholders | | | | | | | 0 | | | | | | | | (2,950,589 | ) |
| | | | |
| | | | |
Capital share transactions | | | Shares | | | | | | | | Shares | | | | | |
Proceeds from shares sold | | | | | | | | | | | | | | | | |
Class A | | | 43,793 | | | | 1,986,840 | | | | 154,889 | | | | 6,449,788 | |
Class B | | | N/A | | | | N/A | | | | 239 | 1 | | | 8,516 | 1 |
Class C | | | 22,206 | | | | 869,708 | | | | 48,058 | | | | 1,749,447 | |
Administrator Class | | | 169,593 | | | | 6,844,401 | | | | 485,500 | | | | 17,988,856 | |
| | | | |
| | | | | | | 9,700,949 | | | | | | | | 26,196,607 | |
| | | | |
Reinvestment of distributions | | | | | | | | | | | | | | | | |
Class A | | | 0 | | | | 0 | | | | 15,531 | | | | 638,919 | |
Class C | | | 0 | | | | 0 | | | | 2,062 | | | | 73,918 | |
Administrator Class | | | 0 | | | | 0 | | | | 60,273 | | | | 2,212,614 | |
| | | | |
| | | | | | | 0 | | | | | | | | 2,925,451 | |
| | | | |
Payment for shares redeemed | | | | | | | | | | | | | | | | |
Class A | | | (94,292 | ) | | | (4,273,667 | ) | | | (325,344 | ) | | | (13,483,389 | ) |
Class B | | | N/A | | | | N/A | | | | (4,925 | )1 | | | (180,325 | )1 |
Class C | | | (50,993 | ) | | | (1,995,330 | ) | | | (84,404 | ) | | | (3,075,798 | ) |
Administrator Class | | | (471,479 | ) | | | (19,082,430 | ) | | | (1,309,041 | ) | | | (48,109,721 | ) |
| | | | |
| | | | | | | (25,351,427 | ) | | | | | | | (64,849,233 | ) |
| | | | |
Net decrease in net assets resulting from capital share transactions | | | | | | | (15,650,478 | ) | | | | | | | (35,727,175 | ) |
| | | | |
Total increase (decrease) in net assets | | | | | | | 1,383,338 | | | | | | | | (13,304,191 | ) |
| | | | |
| | | | |
Net assets | | | | | | | | | | | | | | | | |
Beginning of period | | | | | | | 244,669,121 | | | | | | | | 257,973,312 | |
| | | | |
End of period | | | | | | $ | 246,052,459 | | | | | | | $ | 244,669,121 | |
| | | | |
Undistributed net investment income | | | | | | $ | 3,990,546 | | | | | | | $ | 2,606,513 | |
| | | | |
| 1 | For the period from June 1, 2016 to December 5, 2016. Effective at the close of business on December 5, 2016, Class B shares were converted to Class A shares and are no longer offered by the Fund. |
The accompanying notes are an integral part of these financial statements.
| | | | | | |
| Statements of changes in net assets | | Wells Fargo Allocation Funds | | | 19 | |
| | | | | | | | | | | | | | | | |
| | | Moderate Balanced Fund | |
| | | Six months ended
November 30, 2017 (unaudited) | | | Year ended
May 31, 2017 | |
| | | | |
Operations | | | | | | | | | | | | | | | | |
Net investment income | | | | | | $ | 1,105,569 | | | | | | | $ | 2,638,534 | |
Net realized gains on investments | | | | | | | 5,347,719 | | | | | | | | 9,217,094 | |
Net change in unrealized gains (losses) on investments | | | | | | | 862,106 | | | | | | | | 1,926,373 | |
| | | | |
Net increase in net assets resulting from operations | | | | | | | 7,315,394 | | | | | | | | 13,782,001 | |
| | | | |
| | | | |
Distributions to shareholders from | | | | | | | | | | | | | | | | |
Net investment income | | | | | | | | | | | | | | | | |
Class A | | | | | | | 0 | | | | | | | | (472,471 | ) |
Class C | | | | | | | 0 | | | | | | | | (83,270 | ) |
Administrator Class | | | | | | | 0 | | | | | | | | (2,075,168 | ) |
Net realized gains | | | | | | | | | | | | | | | | |
Class A | | | | | | | 0 | | | | | | | | (582,563 | ) |
Class C | | | | | | | 0 | | | | | | | | (220,287 | ) |
Administrator Class | | | | | | | 0 | | | | | | | | (2,170,812 | ) |
| | | | |
Total distributions to shareholders | | | | | | | 0 | | | | | | | | (5,604,571 | ) |
| | | | |
| | | | |
Capital share transactions | | | Shares | | | | | | | | Shares | | | | | |
Proceeds from shares sold | | | | | | | | | | | | | | | | |
Class A | | | 97,868 | | | | 2,347,679 | | | | 444,182 | | | | 10,158,763 | |
Class C | | | 21,365 | | | | 498,164 | | | | 146,228 | | | | 3,273,726 | |
Administrator Class | | | 237,344 | | | | 5,725,896 | | | | 981,319 | | | | 22,650,129 | |
| | | | |
| | | | | | | 8,571,739 | | | | | | | | 36,082,618 | |
| | | | |
Reinvestment of distributions | | | | | | | | | | | | | | | | |
Class A | | | 0 | | | | 0 | | | | 43,981 | | | | 992,139 | |
Class C | | | 0 | | | | 0 | | | | 11,795 | | | | 260,860 | |
Administrator Class | | | 0 | | | | 0 | | | | 184,642 | | | | 4,200,152 | |
| | | | |
| | | | | | | 0 | | | | | | | | 5,453,151 | |
| | | | |
Payment for shares redeemed | | | | | | | | | | | | | | | | |
Class A | | | (210,849 | ) | | | (5,030,631 | ) | | | (524,653 | ) | | | (12,023,431 | ) |
Class B | | | N/A | | | | N/A | | | | (6,694 | )1 | | | (155,293 | )1 |
Class C | | | (67,981 | ) | | | (1,588,369 | ) | | | (194,662 | ) | | | (4,375,549 | ) |
Administrator Class | | | (531,208 | ) | | | (12,858,620 | ) | | | (3,313,693 | ) | | | (77,026,581 | ) |
| | | | |
| | | | | | | (19,477,620 | ) | | | | | | | (93,580,854 | ) |
| | | | |
Net decrease in net assets resulting from capital share transactions | | | | | | | (10,905,881 | ) | | | | | | | (52,045,085 | ) |
| | | | |
Total decrease in net assets | | | | | | | (3,590,487 | ) | | | | | | | (43,867,655 | ) |
| | | | |
| | | | |
Net assets | | | | | | | | | | | | | | | | |
Beginning of period | | | | | | | 161,694,413 | | | | | | | | 205,562,068 | |
| | | | |
End of period | | | | | | $ | 158,103,926 | | | | | | | $ | 161,694,413 | |
| | | | |
Undistributed net investment income | | | | | | $ | 2,074,130 | | | | | | | $ | 968,561 | |
| | | | |
| 1 | For the period from June 1, 2016 to December 5, 2016. Effective at the close of business on December 5, 2016, Class B shares were converted to Class A shares and are no longer offered by the Fund. |
The accompanying notes are an integral part of these financial statements.
| | | | |
| 20 | | Wells Fargo Allocation Funds | | Financial highlights |
| | | | | | | | | | | | | | | | | | | | |
| Growth Balanced Fund | | Beginning
net asset
value per
share | | | Net
investment
income | | | Net realized
and unrealized
gains (losses)
on investments | | | Distributions
from net
investment
income | | | Ending
net asset
value per
share | |
Class A | | | | | | | | | | | | | | | | | | | | |
Six months ended November 30, 2017 (unaudited) | | $ | 43.91 | | | | 0.22 | | | | 2.92 | | | | 0.00 | | | $ | 47.05 | |
Year ended May 31, 2017 | | $ | 39.99 | | | | 0.41 | | | | 3.93 | | | | (0.42 | ) | | $ | 43.91 | |
Year ended May 31, 2016 | | $ | 40.80 | | | | 0.46 | | | | (0.94 | ) | | | (0.33 | ) | | $ | 39.99 | |
Year ended May 31, 2015 | | $ | 37.96 | | | | 0.36 | | | | 2.65 | | | | (0.17 | ) | | $ | 40.80 | |
Year ended May 31, 2014 | | $ | 33.35 | | | | 0.35 | | | | 4.60 | | | | (0.34 | ) | | $ | 37.96 | |
Year ended May 31, 2013 | | $ | 27.77 | | | | 0.32 | | | | 5.70 | | | | (0.44 | ) | | $ | 33.35 | |
Class C | | | | | | | | | | | | | | | | | | | | |
Six months ended November 30, 2017 (unaudited) | | $ | 38.14 | | | | 0.05 | 4 | | | 2.52 | | | | 0.00 | | | $ | 40.71 | |
Year ended May 31, 2017 | | $ | 34.82 | | | | 0.13 | 4 | | | 3.38 | | | | (0.19 | ) | | $ | 38.14 | |
Year ended May 31, 2016 | | $ | 35.63 | | | | 0.12 | 4 | | | (0.79 | ) | | | (0.14 | ) | | $ | 34.82 | |
Year ended May 31, 2015 | | $ | 33.33 | | | | 0.08 | 4 | | | 2.30 | | | | (0.08 | ) | | $ | 35.63 | |
Year ended May 31, 2014 | | $ | 29.38 | | | | 0.10 | 4 | | | 4.00 | | | | (0.15 | ) | | $ | 33.33 | |
Year ended May 31, 2013 | | $ | 24.52 | | | | 0.13 | 4 | | | 4.98 | | | | (0.25 | ) | | $ | 29.38 | |
Administrator Class | | | | | | | | | | | | | | | | | | | | |
Six months ended November 30, 2017 (unaudited) | | $ | 39.22 | | | | 0.26 | 4 | | | 2.60 | | | | 0.00 | | | $ | 42.08 | |
Year ended May 31, 2017 | | $ | 35.78 | | | | 0.50 | 4 | | | 3.47 | | | | (0.53 | ) | | $ | 39.22 | |
Year ended May 31, 2016 | | $ | 36.54 | | | | 0.49 | | | | (0.82 | ) | | | (0.43 | ) | | $ | 35.78 | |
Year ended May 31, 2015 | | $ | 33.98 | | | | 0.45 | | | | 2.32 | | | | (0.21 | ) | | $ | 36.54 | |
Year ended May 31, 2014 | | $ | 29.89 | | | | 0.41 | 4 | | | 4.10 | | | | (0.42 | ) | | $ | 33.98 | |
Year ended May 31, 2013 | | $ | 24.93 | | | | 0.65 | 4 | | | 4.82 | | | | (0.51 | ) | | $ | 29.89 | |
| 1 | Ratios include net expenses allocated from the affiliated Master Portfolios which were as follows: |
| | | | | | | | | | | | | | | | | | | | | | | | |
| | | Six months ended November 30, 2017 (unaudited) | | | Year ended May 31 | |
| | | | 2017 | | | 2016 | | | 2015 | | | 2014 | | | 2013 | |
Class A | | | 0.48 | % | | | 0.50 | % | | | 0.51 | % | | | 0.51 | % | | | 0.51 | % | | | 0.50 | % |
Class C | | | 0.48 | | | | 0.50 | | | | 0.50 | | | | 0.51 | | | | 0.51 | | | | 0.50 | |
Administrator Class | | | 0.48 | | | | 0.50 | | | | 0.50 | | | | 0.51 | | | | 0.51 | | | | 0.50 | |
| 2 | Total return calculations do not include any sales charges. Returns for periods of less than one year are not annualized. |
| 3 | Portfolio turnover rate is calculated by multiplying the Fund’s ownership percentage in the respective affiliated Master Portfolios by the corresponding affiliated Master Portfolio’s purchases and sales. These purchase and sale amounts are aggregated with the direct purchases and sales in Underlying Funds and included in the portfolio turnover calculation. |
| 4 | Calculated based upon average shares outstanding |
The accompanying notes are an integral part of these financial statements.
| | | | | | |
| Financial highlights | | Wells Fargo Allocation Funds | | | 21 | |
| | | | | | | | | | | | | | | | | | | | | | |
| Ratio to average net assets (annualized) | | | Total
return2 | | | Portfolio
turnover
rate3 | | | Net assets at
end of period
(000s omitted) | |
Net investment
income1 | | | Gross
expenses1 | | | Net
expenses1 | | | | |
| | | | | | | | | | | | | | | | | | | | | | |
| | 1.01 | % | | | 1.32 | % | | | 1.20 | % | | | 7.15 | % | | | 50 | % | | $ | 67,819 | |
| | 1.10 | % | | | 1.34 | % | | | 1.20 | % | | | 10.93 | % | | | 114 | % | | $ | 65,514 | |
| | 1.10 | % | | | 1.35 | % | | | 1.20 | % | | | (1.14 | )% | | | 79 | % | | $ | 65,866 | |
| | 0.97 | % | | | 1.40 | % | | | 1.20 | % | | | 7.94 | % | | | 75 | % | | $ | 64,223 | |
| | 1.05 | % | | | 1.39 | % | | | 1.20 | % | | | 14.87 | % | | | 77 | % | | $ | 61,117 | |
| | 1.23 | % | | | 1.39 | % | | | 1.20 | % | | | 21.85 | % | | | 80 | % | | $ | 55,777 | |
| | | | | | | | | | | | | | | | | | | | | | |
| | 0.26 | % | | | 2.07 | % | | | 1.95 | % | | | 6.74 | % | | | 50 | % | | $ | 16,401 | |
| | 0.35 | % | | | 2.09 | % | | | 1.95 | % | | | 10.10 | % | | | 114 | % | | $ | 16,463 | |
| | 0.36 | % | | | 2.10 | % | | | 1.95 | % | | | (1.88 | )% | | | 79 | % | | $ | 16,225 | |
| | 0.22 | % | | | 2.15 | % | | | 1.95 | % | | | 7.13 | % | | | 75 | % | | $ | 14,349 | |
| | 0.31 | % | | | 2.14 | % | | | 1.95 | % | | | 13.99 | % | | | 77 | % | | $ | 12,637 | |
| | 0.48 | % | | | 2.14 | % | | | 1.95 | % | | | 20.97 | % | | | 80 | % | | $ | 9,326 | |
| | | | | | | | | | | | | | | | | | | | | | |
| | 1.26 | % | | | 1.24 | % | | | 0.95 | % | | | 7.29 | % | | | 50 | % | | $ | 161,833 | |
| | 1.34 | % | | | 1.26 | % | | | 0.95 | % | | | 11.19 | % | | | 114 | % | | $ | 162,693 | |
| | 1.35 | % | | | 1.27 | % | | | 0.95 | % | | | (0.86 | )% | | | 79 | % | | $ | 175,715 | |
| | 1.22 | % | | | 1.24 | % | | | 0.95 | % | | | 8.16 | % | | | 75 | % | | $ | 182,373 | |
| | 1.29 | % | | | 1.23 | % | | | 0.95 | % | | | 15.16 | % | | | 77 | % | | $ | 175,094 | |
| | 1.47 | % | | | 1.22 | % | | | 0.95 | % | | | 22.18 | % | | | 80 | % | | $ | 175,142 | |
The accompanying notes are an integral part of these financial statements.
| | | | |
| 22 | | Wells Fargo Allocation Funds | | Financial highlights |
| | | | | | | | | | | | | | | | | | | | | | | | |
| Moderate Balanced Fund | | Beginning
net asset
value per
share | | | Net
investment
income | | | Net realized
and unrealized
gains (losses)
on investments | | | Distributions
from net
investment
income | | | Distributions
from net
realized gains | | | Ending
net asset
value per
share | |
Class A | | | | | | | | | | | | | | | | | | | | | | | | |
Six months ended November 30, 2017 (unaudited) | | $ | 23.47 | | | | 0.13 | | | | 0.96 | | | | 0.00 | | | | 0.00 | | | $ | 24.56 | |
Year ended May 31, 2017 | | $ | 22.51 | | | | 0.28 | | | | 1.34 | | | | (0.29 | ) | | | (0.37 | ) | | $ | 23.47 | |
Year ended May 31, 2016 | | $ | 23.57 | | | | 0.28 | 4 | | | (0.23 | ) | | | (0.26 | ) | | | (0.85 | ) | | $ | 22.51 | |
Year ended May 31, 2015 | | $ | 23.19 | | | | 0.32 | | | | 1.01 | | | | (0.44 | ) | | | (0.51 | ) | | $ | 23.57 | |
Year ended May 31, 2014 | | $ | 21.21 | | | | 0.29 | 4 | | | 1.82 | | | | (0.13 | ) | | | 0.00 | | | $ | 23.19 | |
Year ended May 31, 2013 | | $ | 18.84 | | | | 0.21 | | | | 2.50 | | | | (0.34 | ) | | | 0.00 | | | $ | 21.21 | |
Class C | | | | | | | | | | | | | | | | | | | | | | | | |
Six months ended November 30, 2017 (unaudited) | | $ | 22.97 | | | | 0.06 | 4 | | | 0.91 | | | | 0.00 | | | | 0.00 | | | $ | 23.94 | |
Year ended May 31, 2017 | | $ | 22.05 | | | | 0.11 | 4 | | | 1.32 | | | | (0.14 | ) | | | (0.37 | ) | | $ | 22.97 | |
Year ended May 31, 2016 | | $ | 23.18 | | | | 0.11 | 4 | | | (0.23 | ) | | | (0.16 | ) | | | (0.85 | ) | | $ | 22.05 | |
Year ended May 31, 2015 | | $ | 22.79 | | | | 0.09 | 4 | | | 1.04 | | | | (0.23 | ) | | | (0.51 | ) | | $ | 23.18 | |
Year ended May 31, 2014 | | $ | 20.96 | | | | 0.12 | 4 | | | 1.80 | | | | (0.09 | ) | | | 0.00 | | | $ | 22.79 | |
Year ended May 31, 2013 | | $ | 18.63 | | | | 0.11 | | | | 2.42 | | | | (0.20 | ) | | | 0.00 | | | $ | 20.96 | |
Administrator Class | | | | | | | | | | | | | | | | | | | | | | | | |
Six months ended November 30, 2017 (unaudited) | | $ | 23.68 | | | | 0.18 | 4 | | | 0.95 | | | | 0.00 | | | | 0.00 | | | $ | 24.81 | |
Year ended May 31, 2017 | | $ | 22.70 | | | | 0.35 | 4 | | | 1.35 | | | | (0.35 | ) | | | (0.37 | ) | | $ | 23.68 | |
Year ended May 31, 2016 | | $ | 23.75 | | | | 0.32 | | | | (0.21 | ) | | | (0.31 | ) | | | (0.85 | ) | | $ | 22.70 | |
Year ended May 31, 2015 | | $ | 23.38 | | | | 0.33 | 4 | | | 1.07 | | | | (0.52 | ) | | | (0.51 | ) | | $ | 23.75 | |
Year ended May 31, 2014 | | $ | 21.36 | | | | 0.38 | | | | 1.79 | | | | (0.15 | ) | | | 0.00 | | | $ | 23.38 | |
Year ended May 31, 2013 | | $ | 18.96 | | | | 0.41 | | | | 2.38 | | | | (0.39 | ) | | | 0.00 | | | $ | 21.36 | |
| 1 | Ratios include net expenses allocated from the affiliated Master Portfolios which were as follows: |
| | | | | | | | | | | | | | | | | | | | | | | | |
| | | Six months ended November 30, 2017 (unaudited) | | | Year ended May 31 | |
| | | | 2017 | | | 2016 | | | 2015 | | | 2014 | | | 2013 | |
Class A | | | 0.45 | % | | | 0.46 | % | | | 0.47 | % | | | 0.47 | % | | | 0.46 | % | | | 0.46 | % |
Class C | | | 0.45 | | | | 0.46 | | | | 0.47 | | | | 0.47 | | | | 0.46 | | | | 0.46 | |
Administrator Class | | | 0.45 | | | | 0.46 | | | | 0.47 | | | | 0.47 | | | | 0.46 | | | | 0.46 | |
| 2 | Total return calculations do not include any sales charges. Returns for periods of less than one year are not annualized. |
| 3 | Portfolio turnover rate is calculated by multiplying the Fund’s ownership percentage in the respective affiliated Master Portfolios by the corresponding affiliated Master Portfolio’s purchases and sales. These purchase and sale amounts are aggregated with the direct purchases and sales in Underlying Funds and included in the portfolio turnover calculation. |
| 4 | Calculated based upon average shares outstanding |
The accompanying notes are an integral part of these financial statements.
| | | | | | |
| Financial highlights | | Wells Fargo Allocation Funds | | | 23 | |
| | | | | | | | | | | | | | | | | | | | | | |
| Ratio to average net assets (annualized) | | | Total
return2 | | | Portfolio
turnover
rate3 | | | Net assets at
end of period
(000s omitted) | |
Net investment
income1 | | | Gross
expenses1 | | | Net
expenses1 | | | | |
| | | | | | | | | | | | | | | | | | | | | | |
| | 1.26 | % | | | 1.33 | % | | | 1.15 | % | | | 4.64 | % | | | 49 | % | | $ | 35,604 | |
| | 1.25 | % | | | 1.32 | % | | | 1.15 | % | | | 7.33 | % | | | 114 | % | | $ | 36,679 | |
| | 1.26 | % | | | 1.32 | % | | | 1.15 | % | | | 0.34 | % | | | 87 | % | | $ | 35,993 | |
| | 1.14 | % | | | 1.36 | % | | | 1.15 | % | | | 5.87 | % | | | 84 | % | | $ | 20,782 | |
| | 1.29 | % | | | 1.36 | % | | | 1.15 | % | | | 9.94 | % | | | 89 | % | | $ | 18,169 | |
| | 1.41 | % | | | 1.36 | % | | | 1.15 | % | | | 14.57 | % | | | 86 | % | | $ | 10,344 | |
| | | | | | | | | | | | | | | | | | | | | | |
| | 0.51 | % | | | 2.08 | % | | | 1.90 | % | | | 4.22 | % | | | 49 | % | | $ | 11,580 | |
| | 0.50 | % | | | 2.07 | % | | | 1.90 | % | | | 6.56 | % | | | 114 | % | | $ | 12,180 | |
| | 0.51 | % | | | 2.07 | % | | | 1.90 | % | | | (0.44 | )% | | | 87 | % | | $ | 12,501 | |
| | 0.40 | % | | | 2.11 | % | | | 1.90 | % | | | 5.06 | % | | | 84 | % | | $ | 6,042 | |
| | 0.54 | % | | | 2.11 | % | | | 1.90 | % | | | 9.15 | % | | | 89 | % | | $ | 4,469 | |
| | 0.66 | % | | | 2.11 | % | | | 1.90 | % | | | 13.65 | % | | | 86 | % | | $ | 2,576 | |
| | | | | | | | | | | | | | | | | | | | | | |
| | 1.51 | % | | | 1.25 | % | | | 0.90 | % | | | 4.77 | % | | | 49 | % | | $ | 110,920 | |
| | 1.49 | % | | | 1.24 | % | | | 0.90 | % | | | 7.62 | % | | | 114 | % | | $ | 112,835 | |
| | 1.48 | % | | | 1.23 | % | | | 0.90 | % | | | 0.59 | % | | | 87 | % | | $ | 156,915 | |
| | 1.39 | % | | | 1.20 | % | | | 0.90 | % | | | 6.13 | % | | | 84 | % | | $ | 153,457 | |
| | 1.52 | % | | | 1.20 | % | | | 0.90 | % | | | 10.18 | % | | | 89 | % | | $ | 144,248 | |
| | 1.66 | % | | | 1.20 | % | | | 0.90 | % | | | 14.81 | % | | | 86 | % | | $ | 146,729 | |
The accompanying notes are an integral part of these financial statements.
| | | | |
| 24 | | Wells Fargo Allocation Funds | | Notes to financial statements (unaudited) |
1. ORGANIZATION
Wells Fargo Funds Trust (the “Trust”), a Delaware statutory trust organized on March 10, 1999, is an open-end management investment company registered under the Investment Company Act of 1940, as amended (the “1940 Act”). As an investment company, the Trust follows the accounting and reporting guidance in Financial Accounting Standards Board Accounting Standards Codification Topic 946, Financial Services – Investment Companies. These financial statements report on the following funds: Wells Fargo Growth Balanced Fund (“Growth Balanced Fund”) and Wells Fargo Moderate Balanced Fund (“Moderate Balanced Fund”) (each, a “Fund”, collectively, the “Funds”). Each Fund is a diversified series of the Trust.
Effective at the close of business on December 5, 2016, Class B shares of Growth Balanced Fund and Moderate Balanced Fund were converted to Class A shares and are no longer offered by each Fund. Information for Class B shares reflected in the financial statements represents activity through December 5, 2016.
Each Fund is a fund-of-funds that invests in various affiliated mutual funds (“Underlying Funds”) employing a multi-asset, multi-style investment approach designed to reduce the price and return volatility of the Fund and to provide more consistent returns. The Underlying Funds incur separate expenses in seeking to achieve their investment objectives. Each Fund may invest in other Wells Fargo Funds or directly in securities. Investments in affiliated Underlying Funds may also include investments in one or more separate diversified portfolios (each, an “affiliated Master Portfolio”, collectively, the “affiliated Master Portfolios”) of Wells Fargo Master Trust, a registered open-end management investment company. Each affiliated Master Portfolio directly acquires portfolio securities, and a Fund investing in an affiliated Master Portfolio acquires an indirect interest in those securities. Each Fund accounts for its investments in the affiliated Master Portfolios as partnership investments and records on a daily basis its share of the affiliated Master Portfolio’s income, expense and realized and unrealized gains and losses. The financial statements of the affiliated Master Portfolios for the six months ended November 30, 2017 are included in this report and should be read in conjunction with each Fund’s financial statements. The financial statements and financial highlights for affiliated Underlying Funds are presented in separate financial statements and may be obtained by contacting Investor Services.
2. SIGNIFICANT ACCOUNTING POLICIES
The following significant accounting policies, which are consistently followed in the preparation of the financial statements of each Fund, are in conformity with U.S. generally accepted accounting principles which require management to make estimates and assumptions that affect the reported amounts of assets and liabilities, disclosure of contingent assets and liabilities at the date of the financial statements, and the reported amounts of revenues and expenses during the reporting period. Actual results could differ from those estimates.
Securities valuation
All investments are valued each business day as of the close of regular trading on the New York Stock Exchange (generally 4 p.m. Eastern Time), although the Funds may deviate from this calculation time under unusual or unexpected circumstances.
Investments in the affiliated Master Portfolios are valued daily based on each Fund’s proportionate share of each affiliated Master Portfolio’s net assets, which are also valued daily. Securities held in the affiliated Master Portfolios are valued as discussed in the Notes to Financial Statements of the affiliated Master Portfolios, which are included elsewhere in this report.
Investments in underlying mutual funds are valued at net asset per share as reported by the Underlying Funds as of the close of the regular trading on the New York Stock Exchange on each day the exchange is open for trading.
Debt securities are valued at the evaluated bid price provided by an independent pricing service or, if a reliable price is not available, the quoted bid price from an independent broker-dealer.
Futures that are listed on a foreign or domestic exchange or market are valued at the official closing price or, if none, the last sales price.
Investments which are not valued using the methods discussed above are valued at their fair value, as determined in good faith by the Board of Trustees of the Funds. The Board of Trustees has established a Valuation Committee comprised of the Trustees and has delegated to it the authority to take any actions regarding the valuation of portfolio securities that the Valuation Committee deems necessary or appropriate, including determining the fair value of portfolio securities, unless the determination has been delegated to the Management Valuation Team of Wells Fargo Funds Management, LLC (“Funds Management”). The Board of Trustees retains the authority to make or ratify any valuation
| | | | | | |
| Notes to financial statements (unaudited) | | Wells Fargo Allocation Funds | | | 25 | |
decisions or approve any changes to the Valuation Procedures as it deems appropriate. On a quarterly basis, the Board of Trustees receives reports on any valuation actions taken by the Valuation Committee or the Management Valuation Team which may include items for ratification.
Valuations of fair valued securities are compared to the next actual sales price when available, or other appropriate market values, to assess the continued appropriateness of the fair valuation methodologies used. These securities are fair valued on a day-to-day basis, taking into consideration changes to appropriate market information and any significant changes to the inputs considered in the valuation process until there is a readily available price provided on an exchange or by an independent pricing service. Valuations received from an independent pricing service or independent broker-dealer quotes are periodically validated by comparisons to most recent trades and valuations provided by other independent pricing services in addition to the review of prices by the manager and/or subadviser. Unobservable inputs used in determining fair valuations are identified based on the type of security, taking into consideration factors utilized by market participants in valuing the investment, knowledge about the issuer and the current market environment.
Futures contracts
Each Fund may enter into futures contracts and may be subject to interest rate risk and equity price risk in the normal course of pursuing its investment objectives. The Fund may buy and sell futures contracts in order to gain exposure to, or protect against, changes in interest rates and security values. The primary risks associated with the use of futures contracts are the imperfect correlation between changes in market values of securities held by the Fund and the prices of futures contracts, and the possibility of an illiquid market.
The aggregate principal amounts of the contracts are not recorded in the financial statements. Fluctuations in the value of the contracts are recorded in the Statements of Assets and Liabilities as an asset or liability and in the Statements of Operations as unrealized gains or losses until the contracts are closed, at which point they are recorded as net realized gains or losses on futures contracts. With futures contracts, there is minimal counterparty risk to the Fund since futures are exchange traded and the exchange’s clearinghouse, as counterparty to all exchange traded futures, guarantees the futures against default.
Security transactions and income recognition
Securities transactions are recorded on a trade date basis in each Fund and each affiliated Master Portfolio. Realized gains or losses in each Fund and each affiliated Master Portfolio are recorded on the basis of identified cost.
Interest income is accrued daily and bond discounts are accreted and premiums are amortized daily based on the effective interest method by each Fund and affiliated Master Portfolio. To the extent debt obligations are placed on non-accrual status, any related interest income may be reduced by writing off interest receivables when the collection of all or a portion of interest has been determined to be doubtful based on consistently applied procedures and the fair value has decreased. If the issuer subsequently resumes interest payments or when the collectability of interest is reasonably assured, the debt obligation is removed from non-accrual status.
Dividend income in each affiliated Master Portfolio is recognized on the ex-dividend date, except for certain dividends from foreign securities which are recorded as soon as the custodian verifies the ex-dividend date. Dividend income from foreign securities in each affiliated Master Portfolio is recorded net of foreign taxes withheld where recovery of such taxes is not assured.
Each Fund records daily its proportionate share of each affiliated Master Portfolio’s interest and dividend income and realized and unrealized gains or losses.
Distributions to shareholders
Distributions to shareholders from net investment income and net realized gains, if any, are recorded on the ex-dividend date. Such distributions are determined in accordance with income tax regulations and may differ from U.S. generally accepted accounting principles. Dividend sources are estimated at the time of declaration. The tax character of distributions is determined as of the Funds’ fiscal year end. Therefore, a portion of each Fund’s distributions made prior to the Fund’s fiscal year end may be categorized as a tax return of capital.
Federal and other taxes
Each Fund is treated as a separate entity for federal income tax purposes. Each Fund intends to continue to qualify as a regulated investment company by distributing substantially all of its investment company taxable income and any net realized capital gains (after reduction for capital loss carryforwards) sufficient to relieve it from all, or substantially all, federal income taxes. Accordingly, no provision for federal income taxes was required.
Each Fund’s income and federal excise tax returns and all financial records supporting those returns for the prior three fiscal years are subject to examination by the federal and Delaware revenue authorities. Management has analyzed each Fund’s tax positions taken on federal, state, and foreign tax returns for all open tax years and does not believe that there are any uncertain tax positions that require recognition of a tax liability.
| | | | |
| 26 | | Wells Fargo Allocation Funds | | Notes to financial statements (unaudited) |
As of November 30, 2017, the aggregate cost of all investments for federal income tax purposes and the unrealized gains (losses) were as follows:
| | | | | | | | | | | | | | | | |
| | | Tax cost | | | Gross
unrealized
gains | | | Gross
unrealized
losses | | | Net
unrealized
gains | |
Growth Balanced Fund | | $ | 214,415,460 | | | $ | 31,982,835 | | | $ | 0 | | | $ | 31,982,835 | |
Moderate Balanced Fund | | | 144,260,956 | | | | 15,066,611 | | | | 0 | | | | 15,066,611 | |
As of May 31, 2017, Growth Balanced Fund had capital loss carryforwards that are available to offset future net realized capital gains in the amount of $82,578,227 which expires in 2018.
Class allocations
The separate classes of shares offered by each Fund differ principally in applicable sales charges, distribution, shareholder servicing, and administration fees. Class specific expenses are charged directly to that share class. Investment income, common expenses, and realized and unrealized gains (losses) on investments are allocated daily to each class of shares based on the relative proportion of net assets of each class.
3. FAIR VALUATION MEASUREMENTS
Fair value measurements of investments are determined within a framework that has established a fair value hierarchy based upon the various data inputs utilized in determining the value of each Fund’s investments. The three-level hierarchy gives the highest priority to unadjusted quoted prices in active markets for identical assets or liabilities (Level 1) and the lowest priority to unobservable inputs (Level 3). Each Fund’s investments are classified within the fair value hierarchy based on the lowest level of input that is significant to the fair value measurement. The inputs are summarized into three broad levels as follows:
| ∎ | | Level 1 – quoted prices in active markets for identical securities |
| ∎ | | Level 2 – other significant observable inputs (including quoted prices for similar securities, interest rates, prepayment speeds, credit risk, etc.) |
| ∎ | | Level 3 – significant unobservable inputs (including the Fund’s own assumptions in determining the fair value of investments) |
The inputs or methodologies used for valuing investments in securities are not necessarily an indication of the risk associated with investing in those securities.
The following is a summary of the inputs used in valuing each Fund’s assets and liabilities as of November 30, 2017:
| | | | | | | | | | | | | | | | |
| Growth Balanced Fund | | Quoted prices
(Level 1) | | | Other significant
observable inputs
(Level 2) | | | Significant
unobservable inputs (Level 3) | | | Total | |
Assets | | | | | | | | | | | | | | | | |
Investments in: | | | | | | | | | | | | | | | | |
| | | | |
Investment companies | | $ | 32,112,738 | | | $ | 0 | | | $ | 0 | | | $ | 32,112,738 | |
| | | | |
Short-term investments | | | | | | | | | | | | | | | | |
U.S. Treasury securities | | | 169,469 | | | | 0 | | | | 0 | | | | 169,469 | |
Investments measured at net asset value* | | | | | | | | | | | | | | | 214,019,433 | |
| | | 32,282,207 | | | | 0 | | | | 0 | | | | 246,301,640 | |
Futures contracts | | | 60,750 | | | | 0 | | | | 0 | | | | 60,750 | |
Total assets | | $ | 32,342,957 | | | $ | 0 | | | $ | 0 | | | $ | 246,362,390 | |
| * | Investments that are measured at fair value using the net asset value per share (or its equivalent) as a practical expedient have not been categorized in the fair value hierarchy. The fair value amount presented in the table is intended to permit reconciliation of the fair value hierarchy to the amounts presented in the Statements of Assets and Liabilities. The Fund’s investments in the affiliated Master Portfolios are valued at $214,019,433. Each affiliated Master Portfolio does not have a redemption period notice, can be redeemed daily and does not have any unfunded commitments. |
| | | | | | |
| Notes to financial statements (unaudited) | | Wells Fargo Allocation Funds | | | 27 | |
| | | | | | | | | | | | | | | | |
| Moderate Balanced Fund | | Quoted prices
(Level 1) | | | Other significant
observable inputs
(Level 2) | | | Significant
unobservable inputs (Level 3) | | | Total | |
Assets | | | | | | | | | | | | | | | | |
Investments in: | | | | | | | | | | | | | | | | |
| | | | |
Investment companies | | $ | 15,996,944 | | | $ | 0 | | | $ | 0 | | | $ | 15,996,944 | |
| | | | |
Short-term investments | | | | | | | | | | | | | | | | |
U.S. Treasury securities | | | 109,657 | | | | 0 | | | | 0 | | | | 109,657 | |
Investments measured at net asset value* | | | | | | | | | | | | | | | 143,157,872 | |
| | | 16,106,601 | | | | 0 | | | | 0 | | | | 159,264,473 | |
Futures contracts | | | 39,656 | | | | 0 | | | | 0 | | | | 39,656 | |
Total assets | | $ | 16,146,257 | | | $ | 0 | | | $ | 0 | | | $ | 159,304,129 | |
| * | Investments that are measured at fair value using the net asset value per share (or its equivalent) as a practical expedient have not been categorized in the fair value hierarchy. The fair value amount presented in the table is intended to permit reconciliation of the fair value hierarchy to the amounts presented in the Statements of Assets and Liabilities. The Fund’s investments in the affiliated Master Portfolios are valued at $143,157,872. Each affiliated Master Portfolio does not have a redemption period notice, can be redeemed daily and does not have any unfunded commitments. |
Futures contracts are reported at their variation margin at measurement date, which represents the amount due to the Fund at that date. All other assets and liabilities are reported at their market value at measurement date.
The Funds recognize transfers between levels within the fair value hierarchy at the end of the reporting period. At November 30, 2017, the Funds did not have any transfers into/out of Level 1, Level 2, or Level 3.
The investment objective of each affiliated Master Portfolio is as follows:
| | |
| Affiliated Master Portfolio | | Investment objective |
Wells Fargo C&B Large Cap Value Portfolio | | Seeks maximum long-term total return (current income and capital appreciation),
consistent with minimizing risk to principal |
Wells Fargo Core Bond Portfolio | | Seeks total return, consisting of income and capital appreciation |
Wells Fargo Diversified Large Cap Growth Portfolio | | Seeks long-term capital appreciation |
Wells Fargo Emerging Growth Portfolio | | Seeks long-term capital appreciation |
Wells Fargo International Growth Portfolio | | Seeks long-term capital appreciation |
Wells Fargo International Value Portfolio | | Seeks long-term capital appreciation |
Wells Fargo Large Company Value Portfolio | | Seeks long-term capital appreciation |
Wells Fargo Managed Fixed Income Portfolio | | Seeks consistent fixed-income returns |
Wells Fargo Real Return Portfolio | | Seeks returns that exceed the rate of inflation over the long-term |
Wells Fargo Small Company Growth Portfolio | | Seeks long-term capital appreciation |
Wells Fargo Small Company Value Portfolio | | Seeks long-term capital appreciation |
Wells Fargo Stable Income Portfolio | | Seeks current income consistent with capital preservation |
4. TRANSACTIONS WITH AFFILIATES
Management fee
Funds Management, an indirect wholly owned subsidiary of Wells Fargo & Company (“Wells Fargo”), is the manager of each Fund and provides advisory and fund-level administrative services under an investment management agreement. Under the investment management agreement, Funds Management is responsible for, among other services, implementing the investment objectives and strategies of each Fund, supervising the subadviser, providing fund-level administrative services in connection with each Fund’s operations, and providing any other fund-level administrative services reasonably necessary for the operation of each Fund. As compensation for its services under the investment management agreement, Funds Management is entitled to receive an annual management fee starting at 0.30% and declining to 0.22% as the average daily net assets of each Fund increase. For the six months ended November 30, 2017, the management fee was equivalent to an annual rate of 0.30% of each Fund’s average daily net assets.
| | | | |
| 28 | | Wells Fargo Allocation Funds | | Notes to financial statements (unaudited) |
Funds Management has retained the services of a subadviser to provide daily portfolio management to the Funds. The fee for subadvisory services is borne by Funds Management. Wells Capital Management Incorporated, an affiliate of Funds Management and an indirect wholly owned subsidiary of Wells Fargo, is the subadviser to each Fund and is entitled to receive a fee from Funds Management at an annual rate starting at 0.10% and declining to 0.05% as the average daily net assets of each Fund increase.
Funds Management also serves as the adviser to each affiliated Master Portfolio and is entitled to receive a fee from each affiliated Master Portfolio for those services.
Administration fees
Under a class-level administration agreement, Funds Management provides class-level administrative services to the Fund, which includes paying fees and expenses for services provided by the transfer agent, sub-transfer agents, omnibus account servicers and record-keepers. As compensation for its services under the class-level administration agreement, Funds Management receives an annual fee which is calculated based on the average daily net assets of each class as follows:
| | | | |
| | | Class-level
administration fee | |
Class A, Class C | | | 0.21 | % |
Administrator Class | | | 0.13 | |
Funds Management has contractually waived and/or reimbursed management and administration fees to the extent necessary to maintain certain net operating expense ratios for the Funds. Waiver of fees and/or reimbursement of expenses by Funds Management were made first from fund level expenses on a proportionate basis and then from class specific expenses. Net expenses from the affiliated Master Portfolios are included in the expense caps. Funds Management has committed through September 30, 2018 to waive fees and/or reimburse expenses to the extent necessary to cap each Fund’s expenses as follows:
| | | | | | | | | | | | |
| | | Class A | | | Class C | | | Administrator
Class | |
Growth Balanced Fund | | | 1.20 | % | | | 1.95 | % | | | 0.95 | % |
Moderate Balanced Fund | | | 1.15 | | | | 1.90 | | | | 0.90 | |
After the expiration date, each expense cap may be increased or the commitment to maintain the cap may be terminated only with the approval of the Board of Trustees.
Distribution fee
The Trust has adopted a Distribution Plan for Class C shares of the applicable Funds pursuant to Rule 12b-1 under the 1940 Act. A distribution fee is charged to the Class C shares and paid to Wells Fargo Funds Distributor, LLC (“Funds Distributor”), the principal underwriter of each Fund, at an annual rate of 0.75% of the average daily net assets of Class C shares.
In addition, Funds Distributor is entitled to receive the front-end sales charge from the purchase of Class A shares and a contingent deferred sales charge on the redemption of certain Class A shares. Funds Distributor is also entitled to receive the contingent deferred sales charges from redemptions of Class C shares. For the six months ended November 30, 2017, Funds Distributor received the following amounts in front-end sales charges and contingent deferred sales charges. No contingent deferred sales charges were incurred by Class A shares for the six months ended November 30, 2017.
| | | | | | | | |
| | | Front-end
sales charges | | | Contingent
deferred
sales charges | |
| | | Class A | | | Class C | |
Growth Balanced Fund | | $ | 2,164 | | | $ | 28 | |
Moderate Balanced Fund | | | 2,330 | | | | 17 | |
Shareholder servicing fees
The Trust has entered into contracts with one or more shareholder servicing agents, whereby Class A, Class C, and Administrator Class of each applicable Fund are charged a fee at an annual rate of 0.25% of the average daily net assets of each respective class.
| | | | | | |
| Notes to financial statements (unaudited) | | Wells Fargo Allocation Funds | | | 29 | |
A portion of these total shareholder servicing fees were paid to affiliates of Wells Fargo.
5. INVESTMENT PORTFOLIO TRANSACTIONS
Purchases and sales of investments, excluding short-term securities, for the six months ended November 30, 2017 were as follows:
| | | | | | | | | | | | | | | | |
| | | Purchases at cost* | | | Sales proceeds* | |
| | | U.S.
government | | | Non-U.S.
government | | | U.S.
government | | | Non-U.S.
government | |
Growth Balanced Fund | | $ | 51,053,422 | | | $ | 76,192,037 | | | $ | 46,021,975 | | | $ | 148,847,551 | |
Moderate Balanced Fund | | | 45,415,955 | | | | 36,932,785 | | | | 39,802,965 | | | | 54,080,263 | |
| * | The Funds seek to achieve their investment objectives by investing in multiple affiliated Master Portfolios. Purchases and sales related to these investments have been calculated by aggregating the results of multiplying each Fund’s ownership percentage in the respective affiliated Master Portfolio by the corresponding affiliated Master Portfolio’s purchases and sales. Purchases and sales of affiliated underlying funds and unaffiliated securities in which the Funds invest are actual purchases and sale of those investments. |
6. DERIVATIVE TRANSACTIONS
During the six months ended November 30, 2017, the Funds entered into futures contracts to gain market exposure to certain asset classes consistent with an active allocation strategy.
| | | | | | | | |
| | | Growth
Balanced
Fund | | | Moderate
Balanced
Fund | |
Average notional balance on long futures | | $ | 232,037 | | | $ | 151,598 | |
Average notional balance on short futures | | | (18,501,163 | ) | | | (12,300,764 | ) |
On November 30, 2017, the cumulative unrealized gains on futures contracts are reflected in net unrealized gains on investments on the Statements of Assets and Liabilities. The receivable for daily variation margin on open futures contracts reflected in the Statements of Assets and Liabilities only represents the current day’s variation margin. The realized gains and change in unrealized gains (losses) on futures contracts are reflected in the Statements of Operations.
The effect of derivative instruments on the Statement of Operations for the six months ended November 30, 2017 was as follows for Growth Balanced Fund:
| | | | | | | | |
| | | Amount of realized gains on
derivatives | | | Change in unrealized gains (losses) on
derivatives | |
Equity risk | | $ | 66,307 | | | $ | 0 | |
Interest rate risk | | | 87,332 | | | | 158,415 | |
| | $ | 153,639 | | | $ | 158,415 | |
The effect of derivative instruments on the Statement of Operations for the six months ended November 30, 2017 was as follows for Moderate Balanced Fund:
| | | | | | | | |
| | | Amount of realized
gains on
derivatives | | | Change in unrealized
gains (losses) on
derivatives | |
Equity risk | | $ | 43,321 | | | $ | 0 | |
Interest rate risk | | | 53,075 | | | | 105,034 | |
| | $ | 96,396 | | | $ | 105,034 | |
For certain types of derivative transactions, the Funds have entered into International Swaps and Derivatives Association, Inc. master agreements (“ISDA Master Agreements”) or similar agreements with approved counterparties. The ISDA Master Agreements or similar agreements may have requirements to deliver/deposit securities or cash to/with an exchange or broker-dealer as collateral and allows the Funds to offset, with each counterparty, certain derivative financial instrument’s assets and/or liabilities with collateral held or pledged. Collateral requirements differ by type of derivative. Collateral or margin requirements are set by the broker or exchange clearinghouse for exchange traded derivatives while collateral terms are contract specific for over-the-counter traded derivatives. Cash collateral that has been pledged to
| | | | |
| 30 | | Wells Fargo Allocation Funds | | Notes to financial statements (unaudited) |
cover obligations of the Funds under ISDA Master Agreements or similar agreements, if any, are reported separately in the Statements of Assets and Liabilities. Securities pledged as collateral, if any, are noted in the Portfolio of Investments. With respect to balance sheet offsetting, absent an event of default by the counterparty or a termination of the agreement, the reported amounts of financial assets and financial liabilities in the Statements of Assets and Liabilities are not offset across transactions between the Funds and the applicable counterparty. A reconciliation of the gross amounts on the Statements of Assets and Liabilities to the net amounts by derivative type, including any collateral exposure, is as follows:
| | | | | | | | | | | | | | | | | | |
| | | Counterparty | | Gross amounts
of assets in the Statements of
Assets and
Liabilities | | | Amounts
subject to
netting
agreements | | | Collateral
received | | | Net amount
of assets | |
Growth Balanced Fund | | Goldman Sachs | | $ | 60,750 | | | $ | 0 | | | $ | 0 | | | $ | 60,750 | |
Moderate Balanced Fund | | Goldman Sachs | | | 39,656 | | | | 0 | | | | 0 | | | | 39,656 | |
7. BANK BORROWINGS
The Trust (excluding the money market funds and certain other funds) and Wells Fargo Variable Trust are parties to a $280,000,000 revolving credit agreement whereby each Fund is permitted to use bank borrowings for temporary or emergency purposes, such as to fund shareholder redemption requests. Interest under the credit agreement is charged to each Fund based on a borrowing rate equal to the higher of the Federal Funds rate in effect on that day plus 1.25% or the overnight LIBOR rate in effect on that day plus 1.25%. In addition, an annual commitment fee equal to 0.25% of the unused balance is allocated to each participating fund. Prior to August 29, 2017, the revolving credit agreement amount was $250,000,000.
For the six months ended November 30, 2017, there were no borrowings by the Funds under the agreement.
8. INDEMNIFICATION
Under the Trust’s organizational documents, the officers and Trustees have been granted certain indemnification rights against certain liabilities that may arise out of performance of their duties to the Trust. Additionally, in the normal course of business, the Trust may enter into contracts with service providers that contain a variety of indemnification clauses. The Trust’s maximum exposure under these arrangements is dependent on future claims that may be made against the Funds and, therefore, cannot be estimated.
9. SUBSEQUENT DISTRIBUTIONS
On December 11, 2017, Moderate Balanced Fund declared distributions from capital gains to shareholders of record on December 8, 2017. The per share amounts payable on December 12, 2017 were as follows:
| | | | |
| | | Moderate
Balanced Fund | |
Short-term capital gains | | | | |
Class A | | $ | 0.19921 | |
Class C | | | 0.19921 | |
Administrator Class | | | 0.19921 | |
Long-term capital gains | | | | |
Class A | | $ | 1.47745 | |
Class C | | | 1.47745 | |
Administrator Class | | | 1.47745 | |
On December 19, 2017, Growth Balanced Fund and Moderate Balanced Fund declared distributions from net investment income to shareholders of record on December 18, 2017. The per share amounts payable on December 20, 2017 were as follows:
| | | | | | | | |
| | | Growth
Balanced Fund | | | Moderate
Balanced Fund | |
Net investment income | | | | | | | | |
Class A | | $ | 0.44808 | | | $ | 0.31670 | |
Class C | | | 0.16050 | | | | 0.13852 | |
Administrator Class | | | 0.56175 | | | | 0.37562 | |
These distributions are not reflected in the accompanying financial statements.
| | | | | | |
| Portfolio of investments—November 30, 2017 (unaudited) | | Wells Fargo Allocation Funds | | | 31 | |
C&B LARGE CAP VALUE PORTFOLIO
| | | | | | | | | | | | | | | | |
| Security name | | | | | | | | Shares | | | Value | |
| | | | |
Common Stocks: 94.04% | | | | | | | | | | | | | | | | |
| | | | |
Consumer Discretionary: 15.59% | | | | | | | | | | | | | | | | |
| | | | |
| Hotels, Restaurants & Leisure: 2.63% | | | | | | | | | | | | | | | | |
Brinker International Incorporated « | | | | | | | | | | | 86,400 | | | $ | 3,173,472 | |
Carnival Corporation | | | | | | | | | | | 120,900 | | | | 7,935,876 | |
| | | | |
| | | | | | | | | | | | | | | 11,109,348 | |
| | | | | | | | | | | | | | | | |
| | | | |
| Household Durables: 2.48% | | | | | | | | | | | | | | | | |
Whirlpool Corporation | | | | | | | | | | | 62,000 | | | | 10,451,340 | |
| | | | | | | | | | | | | | | | |
| | | | |
| Media: 5.34% | | | | | | | | | | | | | | | | |
Omnicom Group Incorporated | | | | | | | | | | | 162,500 | | | | 11,609,000 | |
Twenty-First Century Fox Incorporated Class A | | | | | | | | | | | 341,100 | | | | 10,894,734 | |
| | | | |
| | | | | | | | | | | | | | | 22,503,734 | |
| | | | | | | | | | | | | | | | |
| | | | |
| Textiles, Apparel & Luxury Goods: 5.14% | | | | | | | | | | | | | | | | |
Gildan Activewear Incorporated | | | | | | | | | | | 389,700 | | | | 12,369,078 | |
HanesBrands Incorporated « | | | | | | | | | | | 445,900 | | | | 9,314,851 | |
| | | | |
| | | | | | | | | | | | | | | 21,683,929 | |
| | | | | | | | | | | | | | | | |
| | | | |
Consumer Staples: 3.65% | | | | | | | | | | | | | | | | |
| | | | |
| Beverages: 1.37% | | | | | | | | | | | | | | | | |
Diageo plc ADR | | | | | | | | | | | 41,700 | | | | 5,774,199 | |
| | | | | | | | | | | | | | | | |
| | | | |
| Personal Products: 0.92% | | | | | | | | | | | | | | | | |
Unilever NV ADR « | | | | | | | | | | | 67,000 | | | | 3,868,580 | |
| | | | | | | | | | | | | | | | |
| | | | |
| Tobacco: 1.36% | | | | | | | | | | | | | | | | |
Philip Morris International | | | | | | | | | | | 55,800 | | | | 5,733,450 | |
| | | | | | | | | | | | | | | | |
| | | | |
Energy: 5.67% | | | | | | | | | | | | | | | | |
| | | | |
| Energy Equipment & Services: 1.77% | | | | | | | | | | | | | | | | |
Schlumberger Limited | | | | | | | | | | | 118,400 | | | | 7,441,440 | |
| | | | | | | | | | | | | | | | |
| | | | |
| Oil, Gas & Consumable Fuels: 3.90% | | | | | | | | | | | | | | | | |
Exxon Mobil Corporation | | | | | | | | | | | 127,700 | | | | 10,636,133 | |
World Fuel Services Corporation | | | | | | | | | | | 207,300 | | | | 5,818,911 | |
| | | | |
| | | | | | | | | | | | | | | 16,455,044 | |
| | | | | | | | | | | | | | | | |
| | | | |
Financials: 28.59% | | | | | | | | | | | | | | | | |
| | | | |
| Banks: 6.51% | | | | | | | | | | | | | | | | |
Bank of America Corporation | | | | | | | | | | | 223,900 | | | | 6,307,263 | |
JPMorgan Chase & Company | | | | | | | | | | | 126,300 | | | | 13,200,876 | |
PNC Financial Services Group Incorporated | | | | | | | | | | | 56,600 | | | | 7,955,696 | |
| | | | |
| | | | | | | | | | | | | | | 27,463,835 | |
| | | | | | | | | | | | | | | | |
The accompanying notes are an integral part of these financial statements.
| | | | |
| 32 | | Wells Fargo Allocation Funds | | Portfolio of investments—November 30, 2017 (unaudited) |
C&B LARGE CAP VALUE PORTFOLIO
| | | | | | | | | | | | | | | | |
| Security name | | | | | | | | Shares | | | Value | |
| | | | |
| Capital Markets: 7.92% | | | | | | | | | | | | | | | | |
Brookfield Asset Management Incorporated Class A | | | | | | | | | | | 255,900 | | | $ | 10,619,850 | |
Intercontinental Exchange Incorporated | | | | | | | | | | | 165,800 | | | | 11,846,410 | |
State Street Corporation | | | | | | | | | | | 114,700 | | | | 10,936,645 | |
| | | | |
| | | | | | | | | | | | | | | 33,402,905 | |
| | | | | | | | | | | | | | | | |
| | | | |
| Consumer Finance: 1.85% | | | | | | | | | | | | | | | | |
Synchrony Financial | | | | | | | | | | | 217,600 | | | | 7,809,664 | |
| | | | | | | | | | | | | | | | |
| | | | |
| Diversified Financial Services: 2.77% | | | | | | | | | | | | | | | | |
Berkshire Hathaway Incorporated Class B † | | | | | | | | | | | 60,500 | | | | 11,677,105 | |
| | | | | | | | | | | | | | | | |
| | | | |
| Insurance: 9.54% | | | | | | | | | | | | | | | | |
Chubb Limited | | | | | | | | | | | 67,200 | | | | 10,221,792 | |
FNF Group | | | | | | | | | | | 229,200 | | | | 9,273,432 | |
Markel Corporation † | | | | | | | | | | | 3,911 | | | | 4,329,086 | |
RenaissanceRe Holdings Limited | | | | | | | | | | | 68,500 | | | | 9,086,525 | |
The Progressive Corporation | | | | | | | | | | | 137,100 | | | | 7,290,978 | |
| | | | |
| | | | | | | | | | | | | | | 40,201,813 | |
| | | | | | | | | | | | | | | | |
| | | | |
Health Care: 14.10% | | | | | | | | | | | | | | | | |
| | | | |
| Health Care Equipment & Supplies: 3.93% | | | | | | | | | | | | | | | | |
Abbott Laboratories | | | | | | | | | | | 174,900 | | | | 9,859,113 | |
Becton Dickinson & Company | | | | | | | | | | | 29,500 | | | | 6,732,195 | |
| | | | |
| | | | | | | | | | | | | | | 16,591,308 | |
| | | | | | | | | | | | | | | | |
| | | | |
| Health Care Providers & Services: 6.16% | | | | | | | | | | | | | | | | |
Cardinal Health Incorporated | | | | | | | | | | | 106,800 | | | | 6,321,492 | |
Laboratory Corporation of America Holdings † | | | | | | | | | | | 64,300 | | | | 10,176,761 | |
UnitedHealth Group Incorporated | | | | | | | | | | | 41,500 | | | | 9,469,055 | |
| | | | |
| | | | | | | | | | | | | | | 25,967,308 | |
| | | | | | | | | | | | | | | | |
| | | | |
| Pharmaceuticals: 4.01% | | | | | | | | | | | | | | | | |
Allergan plc | | | | | | | | | | | 60,700 | | | | 10,551,481 | |
Johnson & Johnson | | | | | | | | | | | 45,500 | | | | 6,339,515 | |
| | | | |
| | | | | | | | | | | | | | | 16,890,996 | |
| | | | | | | | | | | | | | | | |
| | | | |
Industrials: 13.37% | | | | | | | | | | | | | | | | |
| | | | |
| Air Freight & Logistics: 2.33% | | | | | | | | | | | | | | | | |
United Parcel Service Incorporated Class B | | | | | | | | | | | 81,000 | | | | 9,837,450 | |
| | | | | | | | | | | | | | | | |
| | | | |
| Building Products: 1.98% | | | | | | | | | | | | | | | | |
Johnson Controls International plc | | | | | | | | | | | 221,700 | | | | 8,344,788 | |
| | | | | | | | | | | | | | | | |
| | | | |
| Electrical Equipment: 3.39% | | | | | | | | | | | | | | | | |
AMETEK Incorporated | | | | | | | | | | | 87,800 | | | | 6,382,182 | |
Eaton Corporation plc | | | | | | | | | | | 101,700 | | | | 7,910,226 | |
| | | | |
| | | | | | | | | | | | | | | 14,292,408 | |
| | | | | | | | | | | | | | | | |
| | | | |
| Machinery: 2.65% | | | | | | | | | | | | | | | | |
Snap-on Incorporated | | | | | | | | | | | 65,900 | | | | 11,165,437 | |
| | | | | | | | | | | | | | | | |
The accompanying notes are an integral part of these financial statements.
| | | | | | |
| Portfolio of investments—November 30, 2017 (unaudited) | | Wells Fargo Allocation Funds | | | 33 | |
C&B LARGE CAP VALUE PORTFOLIO
| | | | | | | | | | | | | | | | |
| Security name | | | | | | | | Shares | | | Value | |
| | | | |
| Trading Companies & Distributors: 3.02% | | | | | | | | | | | | | | | | |
AerCap Holdings NV † | | | | | | | | | | | 244,900 | | | $ | 12,727,453 | |
| | | | | | | | | | | | | | | | |
| | | | |
Information Technology: 6.83% | | | | | | | | | | | | | | | | |
| | | | |
| Electronic Equipment, Instruments & Components: 2.92% | | | | | | | | | | | | | | | | |
Arrow Electronics Incorporated † | | | | | | | | | | | 93,000 | | | | 7,507,890 | |
TE Connectivity Limited | | | | | | | | | | | 50,600 | | | | 4,778,664 | |
| | | | |
| | | | | | | | | | | | | | | 12,286,554 | |
| | | | | | | | | | | | | | | | |
| | | | |
| IT Services: 2.83% | | | | | | | | | | | | | | | | |
Accenture plc Class A | | | | | | | | | | | 40,300 | | | | 5,964,803 | |
Alliance Data Systems Corporation | | | | | | | | | | | 25,000 | | | | 5,981,750 | |
| | | | |
| | | | | | | | | | | | | | | 11,946,553 | |
| | | | | | | | | | | | | | | | |
| | | | |
| Semiconductors & Semiconductor Equipment: 1.08% | | | | | | | | | | | | | | | | |
Analog Devices Incorporated | | | | | | | | | | | 53,002 | | | | 4,564,002 | |
| | | | | | | | | | | | | | | | |
| | | | |
Materials: 4.78% | | | | | | | | | | | | | | | | |
| | | | |
| Chemicals: 0.99% | | | | | | | | | | | | | | | | |
Axalta Coating Systems Limited † | | | | | | | | | | | 132,600 | | | | 4,198,116 | |
| | | | | | | | | | | | | | | | |
| | | | |
| Containers & Packaging: 3.79% | | | | | | | | | | | | | | | | |
Ball Corporation | | | | | | | | | | | 193,700 | | | | 7,730,567 | |
Crown Holdings Incorporated † | | | | | | | | | | | 138,200 | | | | 8,254,686 | |
| | | | |
| | | | | | | | | | | | | | | 15,985,253 | |
| | | | | | | | | | | | | | | | |
| | | | |
Real Estate: 1.46% | | | | | | | | | | | | | | | | |
| | | | |
| Real Estate Management & Development: 1.46% | | | | | | | | | | | | | | | | |
CBRE Group Incorporated Class A † | | | | | | | | | | | 142,300 | | | | 6,170,128 | |
| | | | | | | | | | | | | | | | |
| | | | |
Total Common Stocks (Cost $295,034,960) | | | | | | | | | | | | | | | 396,544,140 | |
| | | | | | | | | | | | | | | | |
| | | | |
| | | Yield | | | | | | | | | | |
| Short-Term Investments: 8.70% | | | | | | | | | | | | | | | | |
| | | | |
| Investment Companies: 8.70% | | | | | | | | | | | | | | | | |
Securities Lending Cash Investment LLC (l)(r)(u) | | | 1.29 | % | | | | | | | 13,372,004 | | | | 13,373,341 | |
Wells Fargo Government Money Market Fund Select Class (l)(u) | | | 1.00 | | | | | | | | 23,303,022 | | | | 23,303,022 | |
| | | | |
Total Short-Term Investments (Cost $36,676,314) | | | | | | | | | | | | | | | 36,676,363 | |
| | | | | | | | | | | | | | | | |
| | | | | | | | |
| Total investments in securities (Cost $331,711,274) | | | 102.74 | % | | | 433,220,503 | |
Other assets and liabilities, net | | | (2.74 | ) | | | (11,556,070 | ) |
| | | | | | | | |
| Total net assets | | | 100.00 | % | | $ | 421,664,433 | |
| | | | | | | | |
| « | All or a portion of this security is on loan. |
| † | Non-income-earning security |
| (l) | The issuer of the security is an affiliated person of the Portfolio as defined in the Investment Company Act of 1940. |
| (r) | The investment is a non-registered investment company purchased with cash collateral received from securities on loan. |
| (u) | The rate represents the 7-day annualized yield at period end. |
The accompanying notes are an integral part of these financial statements.
| | | | |
| 34 | | Wells Fargo Allocation Funds | | Portfolio of investments—November 30, 2017 (unaudited) |
C&B LARGE CAP VALUE PORTFOLIO
Investments in Affiliates
An affiliated investment is an investment in which the Portfolio owns at least 5% of the outstanding voting shares of the issuer or as a result of other relationships, such as the Portfolio and the issuer having the same investment manager. Transactions with issuers that were either affiliated persons of the Portfolio at the beginning of the period or the end of the period were as follows:
| | | | | | | | | | | | | | | | | | | | | | | | | | | | | | | | | | | | |
| | | Shares,
beginning of
period | | | Shares
purchased | | | Shares
sold | | | Shares,
end of
period | | | Net
realized
gains
(losses) | | | Net
change in
unrealized
gains
(losses) | | | Income
from
affiliated
securities | | | Value,
end
of period | | | % of
net
assets | |
| | | | | | | | | |
Short-Term Investments | | | | | | | | | | | | | | | | | | | | | | | | | | | | | | | | | | | | |
Investment Companies | | | | | | | | | | | | | | | | | | | | | | | | | | | | | | | | | | | | |
Securities Lending Cash Investment LLC | | | 24,100,596 | | | | 90,970,022 | | | | 101,698,614 | | | | 13,372,004 | | | $ | (35 | ) | | $ | (2 | ) | | $ | 28,015 | | | $ | 13,373,341 | | | | | |
Wells Fargo Government Money Market Fund Select Class | | | 12,499,686 | | | | 77,943,849 | | | | 67,140,513 | | | | 23,303,022 | | | | 0 | | | | 0 | | | | 103,323 | | | | 23,303,022 | | | | | |
| | | | | | | | | | | | | | | | | | | | | | | | | | | | | | | | | | | | |
| | | | | | | | | | | | | | | | | | $ | (35 | ) | | $ | (2 | ) | | $ | 131,338 | | | $ | 36,676,363 | | | | 8.70 | % |
| | | | | | | | | | | | | | | | | | | | | | | | | | | | | | | | | | | | |
The accompanying notes are an integral part of these financial statements.
| | | | | | |
| Portfolio of investments—November 30, 2017 (unaudited) | | Wells Fargo Allocation Funds | | | 35 | |
DIVERSIFIED LARGE CAP GROWTH PORTFOLIO
| | | | | | | | | | | | | | | | |
| Security name | | | | | | | | Shares | | | Value | |
|
Common Stocks: 98.97% | |
| | | | |
Consumer Discretionary: 14.43% | | | | | | | | | | | | | | | | |
| | | | |
| Auto Components: 0.75% | | | | | | | | | | | | | | | | |
Lear Corporation | | | | | | | | | | | 3,877 | | | $ | 701,311 | |
| | | | | | | | | | | | | | | | |
| | | | |
| Automobiles: 0.64% | | | | | | | | | | | | | | | | |
General Motors Company | | | | | | | | | | | 13,710 | | | | 590,764 | |
| | | | | | | | | | | | | | | | |
| | | | |
| Hotels, Restaurants & Leisure: 0.94% | | | | | | | | | | | | | | | | |
Marriott International Incorporated Class A | | | | | | | | | | | 1,910 | | | | 242,570 | |
Norwegian Cruise Line Holdings Limited † | | | | | | | | | | | 6,616 | | | | 358,323 | |
Royal Caribbean Cruises Limited | | | | | | | | | | | 2,220 | | | | 275,014 | |
| |
| | | | 875,907 | |
| | | | | | | | | | | | | | | | |
| | | | |
| Household Durables: 0.68% | | | | | | | | | | | | | | | | |
Mohawk Industries Incorporated † | | | | | | | | | | | 2,240 | | | | 633,046 | |
| | | | | | | | | | | | | | | | |
| | | | |
| Internet & Direct Marketing Retail: 5.50% | | | | | | | | | | | | | | | | |
Amazon.com Incorporated † | | | | | | | | | | | 3,490 | | | | 4,106,858 | |
Netflix Incorporated † | | | | | | | | | | | 2,930 | | | | 549,609 | |
The Priceline Group Incorporated † | | | | | | | | | | | 270 | | | | 469,722 | |
| |
| | | | 5,126,189 | |
| | | | | | | | | | | | | | | | |
| | | | |
| Media: 0.91% | | | | | | | | | | | | | | | | |
Comcast Corporation Class A | | | | | | | | | | | 14,909 | | | | 559,684 | |
Live Nation Incorporated † | | | | | | | | | | | 6,390 | | | | 289,978 | |
| |
| | | | 849,662 | |
| | | | | | | | | | | | | | | | |
| | | | |
| Multiline Retail: 1.81% | | | | | | | | | | | | | | | | |
Dollar Tree Incorporated † | | | | | | | | | | | 11,060 | | | | 1,136,526 | |
Target Corporation | | | | | | | | | | | 9,170 | | | | 549,283 | |
| |
| | | | 1,685,809 | |
| | | | | | | | | | | | | | | | |
| | | | |
| Specialty Retail: 3.20% | | | | | | | | | | | | | | | | |
Burlington Stores Incorporated † | | | | | | | | | | | 2,480 | | | | 263,798 | |
Lowe’s Companies Incorporated | | | | | | | | | | | 6,827 | | | | 569,167 | |
The Home Depot Incorporated | | | | | | | | | | | 9,539 | | | | 1,715,303 | |
The TJX Companies Incorporated | | | | | | | | | | | 5,747 | | | | 434,186 | |
| |
| | | | 2,982,454 | |
| | | | | | | | | | | | | | | | |
| | | | |
Consumer Staples: 3.33% | | | | | | | | | | | | | | | | |
| | | | |
| Beverages: 0.69% | | | | | | | | | | | | | | | | |
Constellation Brands Incorporated Class A | | | | | | | | | | | 2,960 | | | | 644,066 | |
| | | | | | | | | | | | | | | | |
| | | | |
| Food & Staples Retailing: 1.81% | | | | | | | | | | | | | | | | |
Costco Wholesale Corporation | | | | | | | | | | | 3,160 | | | | 582,799 | |
Sysco Corporation | | | | | | | | | | | 8,570 | | | | 494,746 | |
Wal-Mart Stores Incorporated | | | | | | | | | | | 6,243 | | | | 607,007 | |
| |
| | | | 1,684,552 | |
| | | | | | | | | | | | | | | | |
The accompanying notes are an integral part of these financial statements.
| | | | |
| 36 | | Wells Fargo Allocation Funds | | Portfolio of investments—November 30, 2017 (unaudited) |
DIVERSIFIED LARGE CAP GROWTH PORTFOLIO
| | | | | | | | | | | | | | | | |
| Security name | | | | | | | | Shares | | | Value | |
| | | | |
| Personal Products: 0.83% | | | | | | | | | | | | | | | | |
The Estee Lauder Companies Incorporated Class A | | | | | | | | | | | 6,170 | | | $ | 770,201 | |
| | | | | | | | | | | | | | | | |
| | | | |
Energy: 2.44% | | | | | | | | | | | | | | | | |
| | | | |
| Oil, Gas & Consumable Fuels: 2.44% | | | | | | | | | | | | | | | | |
Chevron Corporation | | | | | | | | | | | 4,145 | | | | 493,214 | |
Concho Resources Incorporated † | | | | | | | | | | | 5,550 | | | | 776,223 | |
Exxon Mobil Corporation | | | | | | | | | | | 5,209 | | | | 433,858 | |
Valero Energy Corporation | | | | | | | | | | | 6,634 | | | | 568,003 | |
| | | | |
| | | | | | | | | | | | | | | 2,271,298 | |
| | | | | | | | | | | | | | | | |
| | | | |
Financials: 8.42% | | | | | | | | | | | | | | | | |
| | | | |
| Banks: 2.13% | | | | | | | | | | | | | | | | |
Bank of America Corporation | | | | | | | | | | | 21,062 | | | | 593,317 | |
Citizens Financial Group Incorporated | | | | | | | | | | | 13,310 | | | | 541,717 | |
JPMorgan Chase & Company | | | | | | | | | | | 6,850 | | | | 715,962 | |
Webster Financial Corporation | | | | | | | | | | | 2,250 | | | | 129,083 | |
| | | | |
| | | | | | | | | | | | | | | 1,980,079 | |
| | | | | | | | | | | | | | | | |
| | | | |
| Capital Markets: 4.82% | | | | | | | | | | | | | | | | |
CME Group Incorporated | | | | | | | | | | | 7,200 | | | | 1,076,688 | |
MarketAxess Holdings Incorporated | | | | | | | | | | | 2,190 | | | | 427,641 | |
Morgan Stanley | | | | | | | | | | | 17,110 | | | | 883,047 | |
Raymond James Financial Incorporated | | | | | | | | | | | 11,371 | | | | 1,004,059 | |
TD Ameritrade Holding Corporation | | | | | | | | | | | 3,210 | | | | 164,256 | |
The Charles Schwab Corporation | | | | | | | | | | | 19,250 | | | | 939,208 | |
| | | | |
| | | | | | | | | | | | | | | 4,494,899 | |
| | | | | | | | | | | | | | | | |
| | | | |
| Insurance: 1.47% | | | | | | | | | | | | | | | | |
Lincoln National Corporation | | | | | | | | | | | 7,620 | | | | 583,311 | |
Prudential Financial Incorporated | | | | | | | | | | | 4,949 | | | | 573,292 | |
The Progressive Corporation | | | | | | | | | | | 3,990 | | | | 212,188 | |
| | | | |
| | | | | | | | | | | | | | | 1,368,791 | |
| | | | | | | | | | | | | | | | |
| | | | |
Health Care: 11.98% | | | | | | | | | | | | | | | | |
| | | | |
| Biotechnology: 2.77% | | | | | | | | | | | | | | | | |
Amgen Incorporated | | | | | | | | | | | 2,723 | | | | 478,322 | |
BioMarin Pharmaceutical Incorporated † | | | | | | | | | | | 3,110 | | | | 266,838 | |
Exelixis Incorporated † | | | | | | | | | | | 4,220 | | | | 114,278 | |
Gilead Sciences Incorporated | | | | | | | | | | | 6,031 | | | | 450,998 | |
Incyte Corporation † | | | | | | | | | | | 1,250 | | | | 123,738 | |
Neurocrine Biosciences Incorporated † | | | | | | | | | | | 2,220 | | | | 159,596 | |
Vertex Pharmaceuticals Incorporated † | | | | | | | | | | | 6,860 | | | | 989,829 | |
| | | | |
| | | | | | | | | | | | | | | 2,583,599 | |
| | | | | | | | | | | | | | | | |
| | | | |
| Health Care Equipment & Supplies: 2.71% | | | | | | | | | | | | | | | | |
Abbott Laboratories | | | | | | | | | | | 10,163 | | | | 572,888 | |
Boston Scientific Corporation † | | | | | | | | | | | 25,300 | | | | 664,884 | |
The accompanying notes are an integral part of these financial statements.
| | | | | | |
| Portfolio of investments—November 30, 2017 (unaudited) | | Wells Fargo Allocation Funds | | | 37 | |
DIVERSIFIED LARGE CAP GROWTH PORTFOLIO
| | | | | | | | | | | | | | | | |
| Security name | | | | | | | | Shares | | | Value | |
| | | | |
| Health Care Equipment & Supplies (continued) | | | | | | | | | | | | | | | | |
Edwards Lifesciences Corporation † | | | | | | | | | | | 6,800 | | | $ | 796,960 | |
Intuitive Surgical Incorporated † | | | | | | | | | | | 420 | | | | 167,908 | |
Stryker Corporation | | | | | | | | | | | 850 | | | | 132,600 | |
West Pharmaceutical Services Incorporated | | | | | | | | | | | 1,860 | | | | 185,870 | |
| | | | |
| | | | | | | | | | | | | | | 2,521,110 | |
| | | | | | | | | | | | | | | | |
| | | | |
| Health Care Providers & Services: 2.37% | | | | | | | | | | | | | | | | |
Aetna Incorporated | | | | | | | | | | | 4,329 | | | | 779,999 | |
Centene Corporation † | | | | | | | | | | | 7,108 | | | | 725,656 | |
UnitedHealth Group Incorporated | | | | | | | | | | | 3,099 | | | | 707,099 | |
| | | | |
| | | | | | | | | | | | | | | 2,212,754 | |
| | | | | | | | | | | | | | | | |
| | | | |
| Health Care Technology: 0.21% | | | | | | | | | | | | | | | | |
Veeva Systems Incorporated Class A † | | | | | | | | | | | 3,200 | | | | 192,672 | |
| | | | | | | | | | | | | | | | |
| | | | |
| Life Sciences Tools & Services: 1.17% | | | | | | | | | | | | | | | | |
Agilent Technologies Incorporated | | | | | | | | | | | 11,175 | | | | 773,757 | |
PRA Health Sciences Incorporated † | | | | | | | | | | | 3,850 | | | | 317,125 | |
| | | | |
| | | | | | | | | | | | | | | 1,090,882 | |
| | | | | | | | | | | | | | | | |
| | | | |
| Pharmaceuticals: 2.75% | | | | | | | | | | | | | | | | |
Bristol-Myers Squibb Company | | | | | | | | | | | 7,440 | | | | 470,134 | |
Johnson & Johnson | | | | | | | | | | | 4,009 | | | | 558,574 | |
Merck & Company Incorporated | | | | | | | | | | | 6,969 | | | | 385,177 | |
Zoetis Incorporated | | | | | | | | | | | 15,892 | | | | 1,148,833 | |
| | | | |
| | | | | | | | | | | | | | | 2,562,718 | |
| | | | | | | | | | | | | | | | |
| | | | |
Industrials: 12.01% | | | | | | | | | | | | | | | | |
| | | | |
| Aerospace & Defense: 1.81% | | | | | | | | | | | | | | | | |
Northrop Grumman Corporation | | | | | | | | | | | 2,184 | | | | 671,362 | |
Raytheon Company | | | | | | | | | | | 1,980 | | | | 378,477 | |
The Boeing Company | | | | | | | | | | | 2,310 | | | | 639,408 | |
| | | | |
| | | | | | | | | | | | | | | 1,689,247 | |
| | | | | | | | | | | | | | | | |
| | | | |
| Air Freight & Logistics: 0.91% | | | | | | | | | | | | | | | | |
FedEx Corporation | | | | | | | | | | | 3,530 | | | | 817,054 | |
XPO Logistics Incorporated † | | | | | | | | | | | 430 | | | | 33,983 | |
| | | | |
| | | | | | | | | | | | | | | 851,037 | |
| | | | | | | | | | | | | | | | |
| | | | |
| Airlines: 0.86% | | | | | | | | | | | | | | | | |
Delta Air Lines Incorporated | | | | | | | | | | | 9,410 | | | | 497,977 | |
Southwest Airlines Company | | | | | | | | | | | 5,003 | | | | 303,532 | |
| | | | |
| | | | | | | | | | | | | | | 801,509 | |
| | | | | | | | | | | | | | | | |
| | | | |
| Commercial Services & Supplies: 1.46% | | | | | | | | | | | | | | | | |
KAR Auction Services Incorporated | | | | | | | | | | | 9,521 | | | | 479,573 | |
Waste Connections Incorporated | | | | | | | | | | | 12,810 | | | | 881,712 | |
| | | | |
| | | | | | | | | | | | | | | 1,361,285 | |
| | | | | | | | | | | | | | | | |
The accompanying notes are an integral part of these financial statements.
| | | | |
| 38 | | Wells Fargo Allocation Funds | | Portfolio of investments—November 30, 2017 (unaudited) |
DIVERSIFIED LARGE CAP GROWTH PORTFOLIO
| | | | | | | | | | | | | | | | |
| Security name | | | | | | | | Shares | | | Value | |
| | | | |
| Construction & Engineering: 0.57% | | | | | | | | | | | | | | | | |
EMCOR Group Incorporated | | | | | | | | | | | 6,534 | | | $ | 527,751 | |
| | | | | | | | | | | | | | | | |
| | | | |
| Electrical Equipment: 0.44% | | | | | | | | | | | | | | | | |
Rockwell Automation Incorporated | | | | | | | | | | | 2,130 | | | | 411,260 | |
| | | | | | | | | | | | | | | | |
| | | | |
| Industrial Conglomerates: 0.98% | | | | | | | | | | | | | | | | |
3M Company | | | | | | | | | | | 1,940 | | | | 471,692 | |
Honeywell International Incorporated | | | | | | | | | | | 2,810 | | | | 438,248 | |
| | | | |
| | | | | | | | | | | | | | | 909,940 | |
| | | | | | | | | | | | | | | | |
| | | | |
| Machinery: 2.46% | | | | | | | | | | | | | | | | |
Cummins Incorporated | | | | | | | | | | | 3,340 | | | | 559,116 | |
Fortive Corporation | | | | | | | | | | | 7,785 | | | | 581,150 | |
Nordson Corporation | | | | | | | | | | | 520 | | | | 66,747 | |
Stanley Black & Decker Incorporated | | | | | | | | | | | 3,572 | | | | 605,918 | |
The Toro Company | | | | | | | | | | | 7,257 | | | | 473,519 | |
| | | | |
| | | | | | | | | | | | | | | 2,286,450 | |
| | | | | | | | | | | | | | | | |
| | | | |
| Professional Services: 0.24% | | | | | | | | | | | | | | | | |
IHS Markit Limited † | | | | | | | | | | | 2,120 | | | | 94,594 | |
TransUnion † | | | | | | | | | | | 2,380 | | | | 132,138 | |
| | | | |
| | | | | | | | | | | | | | | 226,732 | |
| | | | | | | | | | | | | | | | |
| | | | |
| Road & Rail: 2.28% | | | | | | | | | | | | | | | | |
CSX Corporation | | | | | | | | | | | 4,369 | | | | 243,572 | |
Norfolk Southern Corporation | | | | | | | | | | | 4,000 | | | | 554,520 | |
Union Pacific Corporation | | | | | | | | | | | 10,470 | | | | 1,324,455 | |
| | | | |
| | | | | | | | | | | | | | | 2,122,547 | |
| | | | | | | | | | | | | | | | |
| | | | |
Information Technology: 40.29% | | | | | | | | | | | | | | | | |
| | | | |
| Electronic Equipment, Instruments & Components: 1.32% | | | | | | | | | | | | | | | | |
CDW Corporation of Delaware | | | | | | | | | | | 9,995 | | | | 699,750 | |
Jabil Circuit Incorporated | | | | | | | | | | | 18,239 | | | | 526,195 | |
| | | | |
| | | | | | | | | | | | | | | 1,225,945 | |
| | | | | | | | | | | | | | | | |
| | | | |
| Internet Software & Services: 10.78% | | | | | | | | | | | | | | | | |
Alibaba Group Holding Limited ADR † | | | | | | | | | | | 1,040 | | | | 184,163 | |
Alphabet Incorporated Class A † | | | | | | | | | | | 2,794 | | | | 2,895,059 | |
Alphabet Incorporated Class C † | | | | | | | | | | | 1,790 | | | | 1,828,324 | |
CoStar Group Incorporated † | | | | | | | | | | | 740 | | | | 225,678 | |
eBay Incorporated † | | | | | | | | | | | 8,560 | | | | 296,775 | |
Facebook Incorporated Class A † | | | | | | | | | | | 21,080 | | | | 3,734,954 | |
LogMeIn Incorporated | | | | | | | | | | | 2,930 | | | | 348,670 | |
MercadoLibre Incorporated | | | | | | | | | | | 830 | | | | 228,366 | |
Shopify Incorporated Class A Ǡ | | | | | | | | | | | 2,880 | | | | 299,002 | |
| | | | |
| | | | | | | | | | | | | | | 10,040,991 | |
| | | | | | | | | | | | | | | | |
The accompanying notes are an integral part of these financial statements.
| | | | | | |
| Portfolio of investments—November 30, 2017 (unaudited) | | Wells Fargo Allocation Funds | | | 39 | |
DIVERSIFIED LARGE CAP GROWTH PORTFOLIO
| | | | | | | | | | | | | | | | |
| Security name | | | | | | | | Shares | | | Value | |
| | | | |
| IT Services: 7.07% | | | | | | | | | | | | | | | | |
Euronet Worldwide Incorporated † | | | | | | | | | | | 3,420 | | | $ | 312,417 | |
Global Payments Incorporated | | | | | | | | | | | 1,760 | | | | 176,986 | |
MasterCard Incorporated Class A | | | | | | | | | | | 12,660 | | | | 1,904,950 | |
PayPal Holdings Incorporated † | | | | | | | | | | | 18,340 | | | | 1,388,888 | |
Square Incorporated Class A Ǡ | | | | | | | | | | | 14,300 | | | | 560,846 | |
Switch Incorporated Ǡ | | | | | | | | | | | 6,198 | | | | 106,234 | |
Visa Incorporated Class A | | | | | | | | | | | 18,980 | | | | 2,136,958 | |
| | | | |
| | | | | | | | | | | | | | | 6,587,279 | |
| | | | | | | | | | | | | | | | |
| | | | |
| Semiconductors & Semiconductor Equipment: 7.22% | | | | | | | | | | | | | | | | |
Broadcom Limited | | | | | | | | | | | 4,931 | | | | 1,370,522 | |
Intel Corporation | | | | | | | | | | | 11,896 | | | | 533,417 | |
Microchip Technology Incorporated | | | | | | | | | | | 21,529 | | | | 1,872,808 | |
NVIDIA Corporation | | | | | | | | | | | 4,980 | | | | 999,536 | |
ON Semiconductor Corporation † | | | | | | | | | | | 26,409 | | | | 530,293 | |
Texas Instruments Incorporated | | | | | | | | | | | 14,550 | | | | 1,415,570 | |
| | | | |
| | | | | | | | | | | | | | | 6,722,146 | |
| | | | | | | | | | | | | | | | |
| | | | |
| Software: 10.47% | | | | | | | | | | | | | | | | |
Activision Blizzard Incorporated | | | | | | | | | | | 8,290 | | | | 517,296 | |
Adobe Systems Incorporated † | | | | | | | | | | | 5,761 | | | | 1,045,449 | |
Electronic Arts Incorporated † | | | | | | | | | | | 5,803 | | | | 617,149 | |
Microsoft Corporation | | | | | | | | | | | 43,562 | | | | 3,666,613 | |
Proofpoint Incorporated † | | | | | | | | | | | 2,520 | | | | 226,926 | |
PTC Incorporated † | | | | | | | | | | | 1,140 | | | | 72,595 | |
Salesforce.com Incorporated † | | | | | | | | | | | 8,824 | | | | 920,520 | |
ServiceNow Incorporated † | | | | | | | | | | | 7,480 | | | | 920,040 | |
Splunk Incorporated † | | | | | | | | | | | 2,488 | | | | 199,264 | |
Take-Two Interactive Software Incorporated † | | | | | | | | | | | 1,770 | | | | 197,444 | |
The Ultimate Software Group Incorporated † | | | | | | | | | | | 2,456 | | | | 518,290 | |
VMware Incorporated Class A Ǡ | | | | | | | | | | | 7,103 | | | | 853,141 | |
| | | | |
| | | | | | | | | | | | | | | 9,754,727 | |
| | | | | | | | | | | | | | | | |
| | | | |
| Technology Hardware, Storage & Peripherals: 3.43% | | | | | | | | | | | | | | | | |
Apple Incorporated | | | | | | | | | | | 10,852 | | | | 1,864,916 | |
HP Incorporated | | | | | | | | | | | 26,561 | | | | 569,733 | |
NetApp Incorporated | | | | | | | | | | | 13,480 | | | | 761,755 | |
| | | | |
| | | | | | | | | | | | | | | 3,196,404 | |
| | | | | | | | | | | | | | | | |
| | | | |
Materials: 4.00% | | | | | | | | | | | | | | | | |
| | | | |
| Chemicals: 3.24% | | | | | | | | | | | | | | | | |
DowDuPont Incorporated | | | | | | | | | | | 8,615 | | | | 619,935 | |
Ecolab Incorporated | | | | | | | | | | | 7,940 | | | | 1,079,205 | |
Praxair Incorporated | | | | | | | | | | | 8,580 | | | | 1,320,634 | |
| | | | |
| | | | | | | | | | | | | | | 3,019,774 | |
| | | | | | | | | | | | | | | | |
| | | | |
| Containers & Packaging: 0.76% | | | | | | | | | | | | | | | | |
Avery Dennison Corporation | | | | | | | | | | | 6,182 | | | | 705,490 | |
| | | | | | | | | | | | | | | | |
The accompanying notes are an integral part of these financial statements.
| | | | |
| 40 | | Wells Fargo Allocation Funds | | Portfolio of investments—November 30, 2017 (unaudited) |
DIVERSIFIED LARGE CAP GROWTH PORTFOLIO
| | | | | | | | | | | | | | | | |
| Security name | | | | | | | | Shares | | | Value | |
| | | | |
Real Estate: 1.50% | | | | | | | | | | | | | | | | |
| | | | |
| Equity REITs: 1.50% | | | | | | | | | | | | | | | | |
American Tower Corporation | | | | | | | | | | | 5,841 | | | $ | 840,696 | |
Prologis Incorporated | | | | | | | | | | | 8,353 | | | | 553,210 | |
| | | | |
| | | | | | | | | | | | | | | 1,393,906 | |
| | | | | | | | | | | | | | | | |
| | | | |
Utilities: 0.57% | | | | | | | | | | | | | | | | |
| | | | |
| Multi-Utilities: 0.57% | | | | | | | | | | | | | | | | |
CenterPoint Energy Incorporated | | | | | | | | | | | 17,706 | | | | 531,357 | |
| | | | | | | | | | | | | | | | |
| | | | |
Total Common Stocks (Cost $55,648,651) | | | | | | | | | | | | | | | 92,188,540 | |
| | | | | | | | | | | | | | | | |
| | | | |
| | | Yield | | | | | | | | | | |
| Short-Term Investments: 2.04% | | | | | | | | | | | | | | | | |
| | | | |
| Investment Companies: 2.04% | | | | | | | | | | | | | | | | |
Securities Lending Cash Investment LLC (l)(r)(u) | | | 1.29 | % | | | | | | | 1,113,802 | | | | 1,113,913 | |
Wells Fargo Government Money Market Fund Select Class (l)(u) | | | 1.00 | | | | | | | | 784,307 | | | | 784,307 | |
| | | | |
Total Short-Term Investments (Cost $1,898,210) | | | | | | | | | | | | | | | 1,898,220 | |
| | | | | | | | | | | | | | | | |
| | | | | | | | |
| Total investments in securities (Cost $57,546,861) | | | 101.01 | % | | | 94,086,760 | |
Other assets and liabilities, net | | | (1.01 | ) | | | (940,136 | ) |
| | | | | | | | |
| Total net assets | | | 100.00 | % | | $ | 93,146,624 | |
| | | | | | | | |
| † | Non-income-earning security |
| « | All or a portion of this security is on loan. |
| (l) | The issuer of the security is an affiliated person of the Portfolio as defined in the Investment Company Act of 1940. |
| (r) | The investment is a non-registered investment company purchased with cash collateral received from securities on loan. |
| (u) | The rate represents the 7-day annualized yield at period end. |
Investments in Affiliates
An affiliated investment is an investment in which the Portfolio owns at least 5% of the outstanding voting shares of the issuer or as a result of other relationships, such as the Portfolio and the issuer having the same investment manager. Transactions with issuers that were either affiliated persons of the Portfolio at the beginning of the period or the end of the period were as follows:
| | | | | | | | | | | | | | | | | | | | | | | | | | | | | | | | | | | | |
| | | Shares,
beginning of
period | | | Shares
purchased | | | Shares
sold | | | Shares,
end of
period | | | Net
realized
gains
(losses) | | | Net
change in
unrealized
gains
(losses) | | | Income
from
affiliates
securities | | | Value,
end
of period | | | % of
net
assets | |
| | | | | | | | | |
Short-Term Investments | | | | | | | | | | | | | | | | | | | | | | | | | | | | | | | | | | | | |
Investment Companies | | | | | | | | | | | | | | | | | | | | | | | | | | | | | | | | | | | | |
Securities Lending Cash Investment LLC | | | 1,105,508 | | | | 15,226,727 | | | | 15,218,433 | | | | 1,113,802 | | | $ | 36 | | | $ | (16 | ) | | $ | 2,447 | | | $ | 1,113,913 | | | | | |
Wells Fargo Government Money Market Fund Select Class | | | 568,057 | | | | 13,002,952 | | | | 12,786,702 | | | | 784,307 | | | | 0 | | | | 0 | | | | 4,485 | | | | 784,307 | | | | | |
| | | | | | | | | | | | | | | | | | | | | | | | | | | | | | | | | | | | |
| | | | | | | | | | | | | | | | | | $ | 36 | | | $ | (16 | ) | | $ | 6,932 | | | $ | 1,898,220 | | | | 2.04 | % |
| | | | | | | | | | | | | | | | | | | | | | | | | | | | | | | | | | | | |
The accompanying notes are an integral part of these financial statements.
| | | | | | |
| Portfolio of investments—November 30, 2017 (unaudited) | | Wells Fargo Allocation Funds | | | 41 | |
EMERGING GROWTH PORTFOLIO
| | | | | | | | | | | | | | | | |
| Security name | | | | | | | | Shares | | | Value | |
| | | | |
Common Stocks: 97.85% | | | | | | | | | | | | | | | | |
| | | | |
Consumer Discretionary: 13.25% | | | | | | | | | | | | | | | | |
| | | | |
| Auto Components: 2.43% | | | | | | | | | | | | | | | | |
Cooper-Standard Holdings Incorporated † | | | | | | | | | | | 93,660 | | | $ | 11,807,716 | |
LCI Industries | | | | | | | | | | | 63,630 | | | | 8,329,167 | |
| | | | |
| | | | | | | | | | | | | | | 20,136,883 | |
| | | | | | | | | | | | | | | | |
| | | | |
| Diversified Consumer Services: 1.93% | | | | | | | | | | | | | | | | |
Chegg Incorporated Ǡ | | | | | | | | | | | 439,414 | | | | 6,683,487 | |
Grand Canyon Education Incorporated † | | | | | | | | | | | 98,160 | | | | 9,321,274 | |
| | | | |
| | | | | | | | | | | | | | | 16,004,761 | |
| | | | | | | | | | | | | | | | |
| | | | |
| Hotels, Restaurants & Leisure: 2.89% | | | | | | | | | | | | | | | | |
Dave & Buster’s Entertainment Incorporated † | | | | | | | | | | | 11,800 | | | | 625,754 | |
Planet Fitness Incorporated Class A | | | | | | | | | | | 371,991 | | | | 12,041,349 | |
Playa Hotels & Resorts NV † | | | | | | | | | | | 427,900 | | | | 4,552,856 | |
Wingstop Incorporated « | | | | | | | | | | | 171,498 | | | | 6,721,007 | |
| | | | |
| | | | | | | | | | | | | | | 23,940,966 | |
| | | | | | | | | | | | | | | | |
| | | | |
| Leisure Products: 0.56% | | | | | | | | | | | | | | | | |
MCBC Holdings Incorporated † | | | | | | | | | | | 198,706 | | | | 4,689,462 | |
| | | | | | | | | | | | | | | | |
| | | | |
| Media: 1.26% | | | | | | | | | | | | | | | | |
Nexstar Broadcasting Group Incorporated « | | | | | | | | | | | 153,800 | | | | 10,443,020 | |
| | | | | | | | | | | | | | | | |
| | | | |
| Multiline Retail: 1.27% | | | | | | | | | | | | | | | | |
Ollie’s Bargain Outlet Holdings Incorporated † | | | | | | | | | | | 221,660 | | | | 10,517,767 | |
| | | | | | | | | | | | | | | | |
| | | | |
| Specialty Retail: 2.91% | | | | | | | | | | | | | | | | |
Camping World Holdings Incorporated Class A | | | | | | | | | | | 101,844 | | | | 4,721,488 | |
Five Below Incorporated † | | | | | | | | | | | 43,897 | | | | 2,712,835 | |
Lithia Motors Incorporated Class A | | | | | | | | | | | 126,630 | | | | 14,852,433 | |
National Vision Holdings Incorporated † | | | | | | | | | | | 57,166 | | | | 1,863,040 | |
| | | | |
| | | | | | | | | | | | | | | 24,149,796 | |
| | | | | | | | | | | | | | | | |
| | | | |
Energy: 1.60% | | | | | | | | | | | | | | | | |
| | | | |
| Oil, Gas & Consumable Fuels: 1.60% | | | | | | | | | | | | | | | | |
Matador Resources Company † | | | | | | | | | | | 148,536 | | | | 4,248,130 | |
PDC Energy Incorporated † | | | | | | | | | | | 59,190 | | | | 2,719,781 | |
RSP Permian Incorporated † | | | | | | | | | | | 172,658 | | | | 6,341,728 | |
| | | | |
| | | | | | | | | | | | | | | 13,309,639 | |
| | | | | | | | | | | | | | | | |
| | | | |
Financials: 3.95% | | | | | | | | | | | | | | | | |
| | | | |
| Capital Markets: 1.45% | | | | | | | | | | | | | | | | |
MarketAxess Holdings Incorporated | | | | | | | | | | | 13,181 | | | | 2,573,854 | |
Stifel Financial Corporation | | | | | | | | | | | 168,000 | | | | 9,448,320 | |
| | | | |
| | | | | | | | | | | | | | | 12,022,174 | |
| | | | | | | | | | | | | | | | |
The accompanying notes are an integral part of these financial statements.
| | | | |
| 42 | | Wells Fargo Allocation Funds | | Portfolio of investments—November 30, 2017 (unaudited) |
EMERGING GROWTH PORTFOLIO
| | | | | | | | | | | | | | | | |
| Security name | | | | | | | | Shares | | | Value | |
| | | | |
| Insurance: 1.29% | | | | | | | | | | | | | | | | |
Kinsale Capital Group Incorporated | | | | | | | | | | | 239,230 | | | $ | 10,667,266 | |
| | | | | | | | | | | | | | | | |
| | | | |
| Thrifts & Mortgage Finance: 1.21% | | | | | | | | | | | | | | | | |
LendingTree Incorporated † | | | | | | | | | | | 33,332 | | | | 10,064,597 | |
| | | | | | | | | | | | | | | | |
| | | | |
Health Care: 22.32% | | | | | | | | | | | | | | | | |
| | | | |
| Biotechnology: 7.01% | | | | | | | | | | | | | | | | |
Clovis Oncology Incorporated † | | | | | | | | | | | 119,000 | | | | 7,481,530 | |
Exact Sciences Corporation † | | | | | | | | | | | 108,800 | | | | 6,471,424 | |
Ligand Pharmaceuticals Incorporated † | | | | | | | | | | | 152,501 | | | | 20,107,257 | |
Portola Pharmaceuticals Incorporated † | | | | | | | | | | | 33,500 | | | | 1,692,671 | |
Repligen Corporation † | | | | | | | | | | | 417,180 | | | | 14,789,031 | |
Sarepta Therapeutics Incorporated Ǡ | | | | | | | | | | | 73,247 | | | | 4,077,660 | |
Spark Therapeutics Incorporated † | | | | | | | | | | | 47,985 | | | | 3,513,942 | |
| | | | |
| | | | | | | | | | | | | | | 58,133,515 | |
| | | | | | | | | | | | | | | | |
| | | | |
| Health Care Equipment & Supplies: 10.19% | | | | | | | | | | | | | | | | |
Axogen Incorporated † | | | | | | | | | | | 199,507 | | | | 5,326,837 | |
Cantel Medical Corporation | | | | | | | | | | | 63,800 | | | | 6,793,424 | |
Glaukos Corporation Ǡ | | | | | | | | | | | 97,759 | | | | 2,617,008 | |
Heska Corporation † | | | | | | | | | | | 43,600 | | | | 3,742,188 | |
Inogen Incorporated † | | | | | | | | | | | 136,750 | | | | 17,605,195 | |
Integra LifeSciences Holdings Corporation † | | | | | | | | | | | 291,040 | | | | 14,150,365 | |
iRhythm Technologies Incorporated † | | | | | | | | | | | 156,112 | | | | 8,664,216 | |
Merit Medical Systems Incorporated † | | | | | | | | | | | 107,400 | | | | 4,666,530 | |
Nevro Corporation † | | | | | | | | | | | 182,355 | | | | 13,643,801 | |
NxStage Medical Incorporated † | | | | | | | | | | | 285,170 | | | | 7,326,017 | |
| | | | |
| | | | | | | | | | | | | | | 84,535,581 | |
| | | | | | | | | | | | | | | | |
| | | | |
| Health Care Providers & Services: 2.60% | | | | | | | | | | | | | | | | |
HealthEquity Incorporated † | | | | | | | | | | | 287,112 | | | | 14,892,499 | |
Teladoc Incorporated Ǡ | | | | | | | | | | | 179,479 | | | | 6,658,671 | |
| | | | |
| | | | | | | | | | | | | | | 21,551,170 | |
| | | | | | | | | | | | | | | | |
| | | | |
| Health Care Technology: 0.60% | | | | | | | | | | | | | | | | |
Vocera Communications Incorporated † | | | | | | | | | | | 171,200 | | | | 5,016,160 | |
| | | | | | | | | | | | | | | | |
| | | | |
| Pharmaceuticals: 1.92% | | | | | | | | | | | | | | | | |
Dova Pharmaceuticals Incorporated Ǡ | | | | | | | | | | | 163,989 | | | | 4,898,351 | |
Kala Pharmaceuticals Incorporated † | | | | | | | | | | | 119,217 | | | | 2,283,006 | |
Optinose Incorporated † | | | | | | | | | | | 150,227 | | | | 2,867,833 | |
Supernus Pharmaceuticals Incorporated † | | | | | | | | | | | 154,700 | | | | 5,847,660 | |
| | | | |
| | | | | | | | | | | | | | | 15,896,850 | |
| | | | | | | | | | | | | | | | |
| | | | |
Industrials: 21.82% | | | | | | | | | | | | | | | | |
| | | | |
| Aerospace & Defense: 1.74% | | | | | | | | | | | | | | | | |
HEICO Corporation « | | | | | | | | | | | 9,025 | | | | 815,499 | |
Mercury Computer Systems Incorporated † | | | | | | | | | | | 260,745 | | | | 13,608,282 | |
| | | | |
| | | | | | | | | | | | | | | 14,423,781 | |
| | | | | | | | | | | | | | | | |
The accompanying notes are an integral part of these financial statements.
| | | | | | |
| Portfolio of investments—November 30, 2017 (unaudited) | | Wells Fargo Allocation Funds | | | 43 | |
EMERGING GROWTH PORTFOLIO
| | | | | | | | | | | | | | | | |
| Security name | | | | | | | | Shares | | | Value | |
| | | | |
| Airlines: 1.01% | | | | | | | | | | | | | | | | |
SkyWest Incorporated | | | | | | | | | | | 160,930 | | | $ | 8,376,407 | |
| | | | | | | | | | | | | | | | |
| | | | |
| Building Products: 1.53% | | | | | | | | | | | | | | | | |
Apogee Enterprises Incorporated | | | | | | | | | | | 185,460 | | | | 9,278,564 | |
JELD-WEN Holding Incorporated † | | | | | | | | | | | 85,966 | | | | 3,362,130 | |
| | | | |
| | | | | | | | | | | | | | | 12,640,694 | |
| | | | | | | | | | | | | | | | |
| | | | |
| Commercial Services & Supplies: 1.26% | | | | | | | | | | | | | | | | |
Advanced Disposal Services Incorporated † | | | | | | | | | | | 265,322 | | | | 6,189,962 | |
Healthcare Services Group Incorporated | | | | | | | | | | | 81,700 | | | | 4,242,681 | |
| | | | |
| | | | | | | | | | | | | | | 10,432,643 | |
| | | | | | | | | | | | | | | | |
| | | | |
| Construction & Engineering: 3.23% | | | | | | | | | | | | | | | | |
Dycom Industries Incorporated † | | | | | | | | | | | 91,430 | | | | 9,816,839 | |
Granite Construction Incorporated | | | | | | | | | | | 104,450 | | | | 6,932,347 | |
MasTec Incorporated † | | | | | | | | | | | 223,700 | | | | 10,032,945 | |
| | | | |
| | | | | | | | | | | | | | | 26,782,131 | |
| | | | | | | | | | | | | | | | |
| | | | |
| Machinery: 5.73% | | | | | | | | | | | | | | | | |
John Bean Technologies Corporation | | | | | | | | | | | 156,890 | | | | 18,787,578 | |
Milacron Holdings Corporation † | | | | | | | | | | | 517,128 | | | | 9,116,967 | |
Mueller Water Products Incorporated Class A | | | | | | | | | | | 410,420 | | | | 5,126,146 | |
REV Group Incorporated | | | | | | | | | | | 155,983 | | | | 4,259,896 | |
Rexnord Corporation † | | | | | | | | | | | 410,110 | | | | 10,219,941 | |
| | | | |
| | | | | | | | | | | | | | | 47,510,528 | |
| | | | | | | | | | | | | | | | |
| | | | |
| Professional Services: 5.54% | | | | | | | | | | | | | | | | |
On Assignment Incorporated † | | | | | | | | | | | 402,943 | | | | 25,772,234 | |
WageWorks Incorporated † | | | | | | | | | | | 314,864 | | | | 20,198,526 | |
| | | | |
| | | | | | | | | | | | | | | 45,970,760 | |
| | | | | | | | | | | | | | | | |
| | | | |
| Road & Rail: 0.15% | | | | | | | | | | | | | | | | |
Daseke Incorporated † | | | | | | | | | | | 98,413 | | | | 1,248,861 | |
| | | | | | | | | | | | | | | | |
| | | | |
| Trading Companies & Distributors: 1.63% | | | | | | | | | | | | | | | | |
Beacon Roofing Supply Incorporated † | | | | | | | | | | | 122,110 | | | | 7,824,809 | |
BMC Stock Holdings Incorporated † | | | | | | | | | | | 247,560 | | | | 5,718,636 | |
| | | | |
| | | | | | | | | | | | | | | 13,543,445 | |
| | | | | | | | | | | | | | | | |
| | | | |
Information Technology: 34.53% | | | | | | | | | | | | | | | | |
| | | | |
| Communications Equipment: 0.26% | | | | | | | | | | | | | | | | |
Quantenna Communications Incorporated Ǡ | | | | | | | | | | | 173,722 | | | | 2,124,620 | |
| | | | | | | | | | | | | | | | |
| | | | |
| Electronic Equipment, Instruments & Components: 1.48% | | | | | | | | | | | | | | | | |
Littelfuse Incorporated | | | | | | | | | | | 60,740 | | | | 12,324,146 | |
| | | | | | | | | | | | | | | | |
| | | | |
| Internet Software & Services: 13.05% | | | | | | | | | | | | | | | | |
2U Incorporated † | | | | | | | | | | | 185,250 | | | | 11,874,525 | |
Alarm.com Holdings Incorporated † | | | | | | | | | | | 91,900 | | | | 3,766,981 | |
The accompanying notes are an integral part of these financial statements.
| | | | |
| 44 | | Wells Fargo Allocation Funds | | Portfolio of investments—November 30, 2017 (unaudited) |
EMERGING GROWTH PORTFOLIO
| | | | | | | | | | | | | | | | |
| Security name | | | | | | | | Shares | | | Value | |
| | | | |
| Internet Software & Services (continued) | | | | | | | | | | | | | | | | |
Coupa Software Incorporated † | | | | | | | | | | | 153,174 | | | $ | 5,426,955 | |
Envestnet Incorporated † | | | | | | | | | | | 318,792 | | | | 15,668,627 | |
Five9 Incorporated † | | | | | | | | | | | 546,500 | | | | 13,394,715 | |
GrubHub Incorporated Ǡ | | | | | | | | | | | 49,200 | | | | 3,323,952 | |
LogMeIn Incorporated | | | | | | | | | | | 105,520 | | | | 12,556,880 | |
MongoDB Incorporated † | | | | | | | | | | | 6,306 | | | | 179,910 | |
Q2 Holdings Incorporated † | | | | | | | | | | | 607,743 | | | | 25,434,045 | |
Sendgrid Incorporated † | | | | | | | | | | | 200,073 | | | | 4,193,530 | |
SPS Commerce Incorporated † | | | | | | | | | | | 133,938 | | | | 6,758,511 | |
Wix.com Limited † | | | | | | | | | | | 102,510 | | | | 5,627,799 | |
| | | | |
| | | | | | | | | | | | | | | 108,206,430 | |
| | | | | | | | | | | | | | | | |
| | | | |
| IT Services: 3.32% | | | | | | | | | | | | | | | | |
InterXion Holding NV † | | | | | | | | | | | 426,820 | | | | 24,640,319 | |
Switch Incorporated † | | | | | | | | | | | 169,750 | | | | 2,909,515 | |
| | | | |
| | | | | | | | | | | | | | | 27,549,834 | |
| | | | | | | | | | | | | | | | |
| | | | |
| Semiconductors & Semiconductor Equipment: 4.42% | | | | | | | | | | | | | | | | |
Aquantia Corporation † | | | | | | | | | | | 71,210 | | | | 850,960 | |
MaxLinear Incorporated Class A † | | | | | | | | | | | 274,278 | | | | 7,243,682 | |
Microsemi Corporation † | | | | | | | | | | | 144,150 | | | | 7,618,328 | |
Monolithic Power Systems Incorporated | | | | | | | | | | | 113,380 | | | | 13,418,523 | |
Semtech Corporation † | | | | | | | | | | | 220,000 | | | | 7,491,000 | |
| | | | |
| | | | | | | | | | | | | | | 36,622,493 | |
| | | | | | | | | | | | | | | | |
| | | | |
| Software: 12.00% | | | | | | | | | | | | | | | | |
Altair Engineering Incorporated † | | | | | | | | | | | 39,636 | | | | 887,450 | |
BlackLine Incorporated † | | | | | | | | | | | 133,703 | | | | 4,902,889 | |
CyberArk Software Limited † | | | | | | | | | | | 53,610 | | | | 2,522,887 | |
Forescout Technologies Incorporated † | | | | | | | | | | | 32,754 | | | | 790,026 | |
HubSpot Incorporated † | | | | | | | | | | | 169,976 | | | | 13,759,557 | |
Paycom Software Incorporated † | | | | | | | | | | | 92,930 | | | | 7,620,260 | |
Paylocity Holding Corporation † | | | | | | | | | | | 104,393 | | | | 4,816,693 | |
Proofpoint Incorporated † | | | | | | | | | | | 250,230 | | | | 22,533,212 | |
Rapid7 Incorporated † | | | | | | | | | | | 107,554 | | | | 2,033,846 | |
RealPage Incorporated † | | | | | | | | | | | 237,500 | | | | 10,770,625 | |
RingCentral Incorporated Class A † | | | | | | | | | | | 218,160 | | | | 10,286,244 | |
Sailpoint Technologies Holding † | | | | | | | | | | | 116,005 | | | | 1,705,274 | |
Talend SA ADR † | | | | | | | | | | | 246,778 | | | | 9,863,717 | |
Zendesk Incorporated † | | | | | | | | | | | 207,800 | | | | 6,984,152 | |
| | | | |
| | | | | | | | | | | | | | | 99,476,832 | |
| | | | | | | | | | | | | | | | |
| | | | |
Materials: 0.38% | | | | | | | | | | | | | | | | |
| | | | |
| Chemicals: 0.38% | | | | | | | | | | | | | | | | |
PQ Group Holdings Incorporated † | | | | | | | | | | | 190,400 | | | | 3,141,600 | |
| | | | | | | | | | | | | | | | |
| | | | |
Total Common Stocks (Cost $524,202,862) | | | | | | | | | | | | | | | 811,454,812 | |
| | | | | | | | | | | | | | | | |
The accompanying notes are an integral part of these financial statements.
| | | | | | |
| Portfolio of investments—November 30, 2017 (unaudited) | | Wells Fargo Allocation Funds | | | 45 | |
EMERGING GROWTH PORTFOLIO
| | | | | | | | | | | | | | | | |
| Security name | | | | | | | | Shares | | | Value | |
| | | | |
Exchange-Traded Funds: 1.03% | | | | | | | | | | | | | | | | |
iShares Russell 2000 Growth Index ETF « | | | | | | | | | | | 45,600 | | | $ | 8,516,712 | |
| | | | | | | | | | | | | | | | |
| | | | |
Total Exchange-Traded Funds (Cost $8,199,582) | | | | | | | | | | | | | | | 8,516,712 | |
| | | | | | | | | | | | | | | | |
| | | | |
| | | Yield | | | | | | | | | | |
| Short-Term Investments: 5.97% | | | | | | | | | | | | | | | | |
| | | | |
| Investment Companies: 5.97% | | | | | | | | | | | | | | | | |
Securities Lending Cash Investment LLC (l)(r)(u) | | | 1.29 | % | | | | | | | 37,024,970 | | | | 37,028,672 | |
Wells Fargo Government Money Market Fund Select Class (l)(u) | | | 1.00 | | | | | | | | 12,485,937 | | | | 12,485,937 | |
| | | | |
Total Short-Term Investments (Cost $49,511,794) | | | | | | | | | | | | | | | 49,514,609 | |
| | | | | | | | | | | | | | | | |
| | | | | | | | |
| Total investments in securities (Cost $581,914,238) * | | | 104.85 | % | | | 869,486,133 | |
Other assets and liabilities, net | | | (4.85 | ) | | | (40,254,514 | ) |
| | | | | | | | |
| Total net assets | | | 100.00 | % | | $ | 829,231,619 | |
| | | | | | | | |
| † | Non-income-earning security |
| « | All or a portion of this security is on loan. |
| (l) | The issuer of the security is an affiliated person of the Portfolio as defined in the Investment Company Act of 1940. |
| (r) | The investment is a non-registered investment company purchased with cash collateral received from securities on loan. |
| (u) | The rate represents the 7-day annualized yield at period end. |
Investments in Affiliates
An affiliated investment is an investment in which the Portfolio owns at least 5% of the outstanding voting shares of the issuer or as a result of other relationships, such as the Portfolio and the issuer having the same investment manager. Transactions with issuers that were either affiliated persons of the Portfolio at the beginning of the period or the end of the period were as follows:
| | | | | | | | | | | | | | | | | | | | | | | | | | | | | | | | | | | | |
| | | Shares,
beginning of
period | | | Shares
purchased | | | Shares
sold | | | Shares,
end of
period | | | Net
realized
gains
(losses) | | | Net
change in
unrealized
gains
(losses) | | | Income
from
affiliates
securities | | | Value,
end
of period | | | % of
net
assets | |
Short-Term Investments | | | | | | | | | | | | | | | | | | | | | | | | | | | | | | | | | | | | |
Investment Companies | | | | | | | | | | | | | | | | | | | | | | | | | | | | | | | | | | | | |
Securities Lending Cash Investment LLC | | | 57,161,425 | | | | 204,685,027 | | | | 224,821,482 | | | | 37,024,970 | | | $ | 3,355 | | | $ | (2,900 | ) | | $ | 244,346 | | | $ | 37,028,672 | | | | | |
Wells Fargo Government Money Market Fund Select Class | | | 13,424,042 | | | | 140,959,230 | | | | 141,897,335 | | | | 12,485,937 | | | | 0 | | | | 0 | | | | 53,739 | | | | 12,485,937 | | | | | |
| | | | | | | | | | | | | | | | | | | | | | | | | | | | | | | | | | | | |
| | | | | | | | | | | | | | | | | | $ | 3,355 | | | $ | (2,900 | ) | | $ | 298,085 | | | $ | 49,514,609 | | | | 5.97 | % |
| | | | | | | | | | | | | | | | | | | | | | | | | | | | | | | | | | | | |
The accompanying notes are an integral part of these financial statements.
| | | | |
| 46 | | Wells Fargo Allocation Funds | | Portfolio of investments—November 30, 2017 (unaudited) |
INTERNATIONAL GROWTH PORTFOLIO
| | | | | | | | | | | | | | | | |
| Security name | | | | | | | | Shares | | | Value | |
|
Common Stocks: 94.57% | |
| | | | |
| Brazil: 0.28% | | | | | | | | | | | | | | | | |
Ambev SA ADR (Consumer Staples, Beverages) | | | | | | | | | | | 18,812 | | | $ | 116,446 | |
| | | | | | | | | | | | | | | | |
| | | | |
| Canada: 2.48% | | | | | | | | | | | | | | | | |
Canadian Pacific Railway Limited (Industrials, Road & Rail) | | | | | | | | | | | 5,927 | | | | 1,038,292 | |
| | | | | | | | | | | | | | | | |
| | | | |
| Cayman Islands: 1.35% | | | | | | | | | | | | | | | | |
NetEase Incorporated ADR (Information Technology, Internet Software & Services) | | | | | | | | | | | 1,722 | | | | 566,039 | |
| | | | | | | | | | | | | | | | |
| | | | |
| Chile: 0.12% | | | | | | | | | | | | | | | | |
Sociedad Quimica Minera de Chile (Materials, Chemicals) | | | | | | | | | | | 901 | | | | 48,942 | |
| | | | | | | | | | | | | | | | |
| | | | |
| China: 6.34% | | | | | | | | | | | | | | | | |
Alibaba Group Holding Limited ADR (Information Technology, Internet Software & Services) † | | | | | | | | | | | 10,116 | | | | 1,791,341 | |
China Literature Limited (Consumer Discretionary, Internet & Direct Marketing Retail) † | | | | | | | | | | | 200 | | | | 2,305 | |
Ping An Insurance (Group) Company of China Limited H Shares (Financials, Insurance) | | | | | | | | | | | 46,000 | | | | 456,468 | |
Tencent Holdings Limited (Information Technology, Internet Software & Services) | | | | | | | | | | | 7,900 | | | | 404,489 | |
| |
| | | | 2,654,603 | |
| | | | | | | | | | | | | | | | |
| | | | |
| Denmark: 0.13% | | | | | | | | | | | | | | | | |
Genmab AS (Health Care, Biotechnology) † | | | | | | | | | | | 268 | | | | 52,716 | |
| | | | | | | | | | | | | | | | |
| | | | |
| France: 2.83% | | | | | | | | | | | | | | | | |
BNP Paribas SA (Financials, Banks) | | | | | | | | | | | 1,709 | | | | 129,393 | |
Eiffage SA (Industrials, Construction & Engineering) | | | | | | | | | | | 4,777 | | | | 523,652 | |
Schneider Electric SE (Industrials, Electrical Equipment) | | | | | | | | | | | 5,319 | | | | 457,117 | |
Zodiac Aerospace SA (Industrials, Aerospace & Defense) | | | | | | | | | | | 2,571 | | | | 75,572 | |
| |
| | | | 1,185,734 | |
| | | | | | | | | | | | | | | | |
| | | | |
| Germany: 23.81% | | | | | | | | | | | | | | | | |
Allianz AG (Financials, Insurance) | | | | | | | | | | | 6,767 | | | | 1,598,192 | |
Beiersdorf AG (Consumer Staples, Personal Products) | | | | | | | | | | | 6,787 | | | | 808,266 | |
Deutsche Boerse AG (Financials, Capital Markets) | | | | | | | | | | | 17,879 | | | | 2,029,140 | |
Deutsche Post AG (Industrials, Air Freight & Logistics) | | | | | | | | | | | 21,925 | | | | 1,043,643 | |
Deutsche Telekom AG (Telecommunication Services, Diversified Telecommunication Services) | | | | | | | | | | | 27,683 | | | | 494,376 | |
Linde AG (Materials, Chemicals) | | | | | | | | | | | 8,872 | | | | 2,058,990 | |
SAP SE (Information Technology, Software) | | | | | | | | | | | 4,358 | | | | 492,681 | |
Wirecard AG (Information Technology, IT Services) | | | | | | | | | | | 13,544 | | | | 1,446,567 | |
| |
| | | | 9,971,855 | |
| | | | | | | | | | | | | | | | |
| | | | |
| Hong Kong: 2.70% | | | | | | | | | | | | | | | | |
AIA Group Limited (Financials, Insurance) | | | | | | | | | | | 139,000 | | | | 1,132,540 | |
| | | | | | | | | | | | | | | | |
| | | | |
| Indonesia: 0.61% | | | | | | | | | | | | | | | | |
PT Bank Rakyat Indonesia Tbk (Financials, Banks) | | | | | | | | | | | 1,068,800 | | | | 253,648 | |
| | | | | | | | | | | | | | | | |
| | | | |
| Ireland: 2.58% | | | | | | | | | | | | | | | | |
Medtronic plc (Health Care, Health Care Equipment & Supplies) | | | | | | | | | | | 13,174 | | | | 1,081,981 | |
| | | | | | | | | | | | | | | | |
The accompanying notes are an integral part of these financial statements.
| | | | | | |
| Portfolio of investments—November 30, 2017 (unaudited) | | Wells Fargo Allocation Funds | | | 47 | |
INTERNATIONAL GROWTH PORTFOLIO
| | | | | | | | | | | | | | | | |
| Security name | | | | | | | | Shares | | | Value | |
| | | | |
| Italy: 4.76% | | | | | | | | | | | | | | | | |
Assicurazioni Generali SpA (Financials, Insurance) | | | | | | | | | | | 41,011 | | | $ | 750,778 | |
Intesa Sanpaolo SpA (Financials, Banks) | | | | | | | | | | | 229,350 | | | | 772,749 | |
UniCredit SpA (Financials, Banks) | | | | | | | | | | | 23,332 | | | | 470,373 | |
| |
| | | | 1,993,900 | |
| | | | | | | | | | | | | | | | |
|
| Japan: 11.06% | |
CALBEE Incorporated (Consumer Staples, Food Products) | | | | | | | | | | | 12,200 | | | | 427,320 | |
FANUC Corporation (Industrials, Machinery) | | | | | | | | | | | 1,800 | | | | 450,187 | |
Japan Tobacco Incorporated (Consumer Staples, Tobacco) | | | | | | | | | | | 30,054 | | | | 995,336 | |
Mitsubishi UFJ Financial Group Incorporated (Financials, Banks) | | | | | | | | | | | 40,100 | | | | 285,838 | |
Nintendo Company Limited (Information Technology, Software) | | | | | | | | | | | 3,100 | | | | 1,264,128 | |
NTT DOCOMO Incorporated (Telecommunication Services, Wireless Telecommunication Services) | | | | | | | | | | | 18,793 | | | | 485,273 | |
Rohm Company Limited (Information Technology, Semiconductors & Semiconductor Equipment) | | | | | | | | | | | 2,800 | | | | 288,570 | |
Sumitomo Metal Mining Company Limited (Materials, Metals & Mining) | | | | | | | | | | | 11,178 | | | | 436,978 | |
| |
| | | | 4,633,630 | |
| | | | | | | | | | | | | | | | |
| | | | |
| Netherlands: 7.69% | | | | | | | | | | | | | | | | |
Airbus SE (Industrials, Aerospace & Defense) | | | | | | | | | | | 6,410 | | | | 667,032 | |
Akzo Nobel NV (Materials, Chemicals) | | | | | | | | | | | 5,258 | | | | 473,756 | |
ASML Holding NV (Information Technology, Semiconductors & Semiconductor Equipment) | | | | | | | | | | | 3,599 | | | | 631,558 | |
ING Groep NV (Financials, Banks) | | | | | | | | | | | 80,032 | | | | 1,446,194 | |
| |
| | | | 3,218,540 | |
| | | | | | | | | | | | | | | | |
| | | | |
| Russia: 1.07% | | | | | | | | | | | | | | | | |
MMC Norilsk Nickel PJSC ADR (Materials, Metals & Mining) | | | | | | | | | | | 25,696 | | | | 446,311 | |
| | | | | | | | | | | | | | | | |
| | | | |
| South Africa: 0.64% | | | | | | | | | | | | | | | | |
Naspers Limited (Consumer Discretionary, Media) | | | | | | | | | | | 1,005 | | | | 269,725 | |
| | | | | | | | | | | | | | | | |
| | | | |
| South Korea: 2.94% | | | | | | | | | | | | | | | | |
LG Household & Health Care Limited (Consumer Staples, Personal Products) | | | | | | | | | | | 178 | | | | 191,862 | |
Samsung Electronics Company Limited (Information Technology, Technology Hardware, Storage & Peripherals) | | | | | | | | | | | 441 | | | | 1,037,877 | |
| |
| | | | 1,229,739 | |
| | | | | | | | | | | | | | | | |
| | | | |
| Spain: 1.46% | | | | | | | | | | | | | | | | |
Amadeus IT Holding SA Class A (Information Technology, IT Services) | | | | | | | | | | | 1,175 | | | | 84,733 | |
Grifols SA (Health Care, Biotechnology) | | | | | | | | | | | 6,722 | | | | 196,025 | |
Grifols SA ADR (Health Care, Biotechnology) | | | | | | | | | | | 14,622 | | | | 332,651 | |
| |
| | | | 613,409 | |
| | | | | | | | | | | | | | | | |
| | | | |
| Switzerland: 3.34% | | | | | | | | | | | | | | | | |
Idorsia Limited (Health Care, Biotechnology) † | | | | | | | | | | | 804 | | | | 17,285 | |
Nestle SA (Consumer Staples, Food Products) | | | | | | | | | | | 16,167 | | | | 1,383,079 | |
| |
| | | | 1,400,364 | |
| | | | | | | | | | | | | | | | |
| | | | |
| Taiwan: 0.41% | | | | | | | | | | | | | | | | |
Taiwan Semiconductor Manufacturing Company Limited (Information Technology, Semiconductors & Semiconductor Equipment) | | | | | | | | | | | 23,000 | | | | 173,732 | |
| | | | | | | | | | | | | | | | |
The accompanying notes are an integral part of these financial statements.
| | | | |
| 48 | | Wells Fargo Allocation Funds | | Portfolio of investments—November 30, 2017 (unaudited) |
INTERNATIONAL GROWTH PORTFOLIO
| | | | | | | | | | | | | | | | |
| Security name | | | | | | | | Shares | | | Value | |
| | | | |
| United Kingdom: 15.17% | | | | | | | | | | | | | | | | |
Aon plc (Financials, Insurance) | | | | | | | | | | | 6,305 | | | $ | 884,087 | |
BAE Systems plc (Industrials, Aerospace & Defense) | | | | | | | | | | | 73,683 | | | | 548,706 | |
Coca-Cola European Partners plc (Consumer Staples, Beverages) | | | | | | | | | | | 26,084 | | | | 1,017,015 | |
ConvaTec Limited (Health Care, Health Care Equipment & Supplies) 144A | | | | | | | | | | | 167,783 | | | | 441,595 | |
Experian Group Limited plc (Industrials, Professional Services) | | | | | | | | | | | 20,030 | | | | 416,769 | |
Glencore International plc (Materials, Metals & Mining) | | | | | | | | | | | 120,022 | | | | 552,142 | |
Liberty Global plc Class A (Consumer Discretionary, Media) † | | | | | | | | | | | 9,443 | | | | 299,910 | |
Liberty Global plc Class C (Consumer Discretionary, Media) † | | | | | | | | | | | 18,239 | | | | 562,308 | |
London Stock Exchange Group plc (Financials, Capital Markets) | | | | | | | | | | | 6,066 | | | | 310,131 | |
Prudential plc (Financials, Insurance) | | | | | | | | | | | 25,078 | | | | 630,406 | |
Wolseley plc (Industrials, Trading Companies & Distributors) | | | | | | | | | | | 9,540 | | | | 687,922 | |
| |
| | | | 6,350,991 | |
| | | | | | | | | | | | | | | | |
| | | | |
| United States: 2.80% | | | | | | | | | | | | | | | | |
Amazon.com Incorporated (Consumer Discretionary, Internet & Direct Marketing Retail) † | | | | | | | | | | | 621 | | | | 730,762 | |
WABCO Holdings Incorporated (Industrials, Machinery) † | | | | | | | | | | | 2,963 | | | | 442,820 | |
| | | | |
| | | | | | | | | | | | | | | 1,173,582 | |
| | | | | | | | | | | | | | | | |
| | | | |
Total Common Stocks (Cost $31,533,841) | | | | | | | | | | | | | | | 39,606,719 | |
| | | | | | | | | | | | | | | | |
| | | | |
| | | | | | Expiration date | | | | | | | |
| Participation Notes: 3.01% | | | | | | | | | | | | | | | | |
| | | | |
| Ireland: 3.01% | | | | | | | | | | | | | | | | |
HSBC Bank plc (Ryanair Holdings plc) (Industrials, Airlines) (a) | | | | | | | 10-29-2018 | | | | 60,115 | | | | 1,260,294 | |
| | | | | | | | | | | | | | | | |
| | | | |
Total Participation Notes (Cost $698,674) | | | | | | | | | | | | | | | 1,260,294 | |
| | | | | | | | | | | | | | | | |
| | | | |
| | | Dividend yield | | | | | | | | | | |
| Preferred Stocks: 1.39% | | | | | | | | | | | | | | | | |
| | | | |
| Germany: 1.39% | | | | | | | | | | | | | | | | |
Henkel AG & Company KGaA (Consumer Staples, Household Products) | | | 1.53 | % | | | | | | | 4,286 | | | | 582,312 | |
| | | | | | | | | | | | | | | | |
| | | | |
Total Preferred Stocks (Cost $381,718) | | | | | | | | | | | | | | | 582,312 | |
| | | | | | | | | | | | | | | | |
| | | | |
| | | Yield | | | | | | | | | | |
| Short-Term Investments: 22.23% | | | | | | | | | | | | | | | | |
| | | | |
| Investment Companies: 22.23% | | | | | | | | | | | | | | | | |
Wells Fargo Government Money Market Fund Select Class (l)(u) | | | 1.00 | | | | | | | | 9,307,998 | | | | 9,307,998 | |
| | | | | | | | | | | | | | | | |
| | | | |
Total Short-Term Investments (Cost $9,307,998) | | | | | | | | | | | | | | | 9,307,998 | |
| | | | | | | | | | | | | | | | |
| | | | | | | | |
| Total investments in securities (Cost $41,922,231) | | | 121.20 | % | | | 50,757,323 | |
Other assets and liabilities, net | | | (21.20 | ) | | | (8,878,545 | ) |
| | | | | | | | |
| Total net assets | | | 100.00 | % | | $ | 41,878,778 | |
| | | | | | | | |
| † | Non-income-earning security |
| 144A | The security may be resold in transactions exempt from registration, normally to qualified institutional buyers, pursuant to Rule 144A under the Securities Act of 1933. |
| (a) | The security is fair valued in accordance with procedures approved by the Board of Trustees. |
| (l) | The issuer of the security is an affiliated person of the Portfolio as defined in the Investment Company Act of 1940. |
| (u) | The rate represents the 7-day annualized yield at period end. |
The accompanying notes are an integral part of these financial statements.
| | | | | | |
| Portfolio of investments—November 30, 2017 (unaudited) | | Wells Fargo Allocation Funds | | | 49 | |
INTERNATIONAL GROWTH PORTFOLIO
The following table shows the percent of total long-term investments by sector as of November 30, 2017:
| | | | |
Financials | | | 26.90 | % |
Information Technology | | | 19.74 | |
Industrials | | | 18.36 | |
Consumer Staples | | | 13.33 | |
Materials | | | 9.69 | |
Health Care | | | 5.12 | |
Consumer Discretionary | | | 4.50 | |
Telecommunication Services | | | 2.36 | |
| | | | |
| | | 100.00 | % |
| | | | |
Investments in Affiliates
An affiliated investment is an investment in which the Portfolio owns at least 5% of the outstanding voting shares of the issuer or as a result of other relationships, such as the Portfolio and the issuer having the same investment manager. Transactions with issuers that were either affiliated persons of the Portfolio at the beginning of the period or the end of the period were as follows:
| | | | | | | | | | | | | | | | | | | | | | | | | | | | | | | | | | | | |
| | | Shares,
beginning of
period | | | Shares
purchased | | | Shares
sold | | | Shares,
end of
period | | | Net
realized
gains
(losses) | | | Net
change in
unrealized
gains
(losses) | | | Income
from
affiliated
securities | | | Value,
end
of period | | | % of
net
assets | |
Short-Term Investments | | | | | | | | | | | | | | | | | | | | | | | | | | | | | | | | | | | | |
Investment Companies | | | | | | | | | | | | | | | | | | | | | | | | | | | | | | | | | | | | |
Securities Lending Cash Investment LLC | | | 5,192,235 | | | | 10,632,712 | | | | 15,824,947 | | | | 0 | | | $ | 6 | | | $ | 0 | | | $ | 24,760 | | | $ | 0 | | | | | |
Wells Fargo Government Money Market Fund Select Class | | | 1,660,070 | | | | 121,595,842 | | | | 113,947,914 | | | | 9,307,998 | | | | 0 | | | | 0 | | | | 10,112 | | | | 9,307,998 | | | | | |
| | | | | | | | | | | | | | | | | | | | | | | | | | | | | | | | | | | | |
| | | | | | | | | | | | | | | | | | $ | 6 | | | $ | 0 | | | $ | 34,872 | | | $ | 9,307,998 | | | | 22.23 | % |
| | | | | | | | | | | | | | | | | | | | | | | | | | | | | | | | | | | | |
The accompanying notes are an integral part of these financial statements.
| | | | |
| 50 | | Wells Fargo Allocation Funds | | Portfolio of investments—November 30, 2017 (unaudited) |
INTERNATIONAL VALUE PORTFOLIO
| | | | | | | | | | | | | | | | |
| Security name | | | | | | | | Shares | | | Value | |
| | | | |
Common Stocks: 96.50% | | | | | | | | | | | | | | | | |
| | | | |
| Australia: 5.43% | | | | | | | | | | | | | | | | |
Arrium Limited (Materials, Metals & Mining) †(a) | | | | | | | | | | | 3,063,400 | | | $ | 2 | |
Asaleo Care Limited (Consumer Staples, Personal Products) | | | | | | | | | | | 1,262,800 | | | | 1,474,030 | |
Automotive Holdings Group Limited (Consumer Discretionary, Specialty Retail) « | | | | | | | | | | | 410,016 | | | | 1,150,861 | |
Bendigo Bank Limited (Financials, Banks) | | | | | | | | | | | 272,500 | | | | 2,413,095 | |
BlueScope Steel Limited (Materials, Metals & Mining) | | | | | | | | | | | 246,000 | | | | 2,554,459 | |
Cabcharge Australia Limited (Industrials, Commercial Services & Supplies) | | | | | | | | | | | 207,386 | | | | 263,536 | |
CSR Limited (Materials, Construction Materials) | | | | | | | | | | | 754,900 | | | | 2,641,220 | |
Downer EDI Limited (Industrials, Commercial Services & Supplies) | | | | | | | | | | | 518,900 | | | | 2,778,478 | |
Fortescue Metals Group Limited (Materials, Metals & Mining) | | | | | | | | | | | 602,200 | | | | 2,104,731 | |
Harvey Norman Holdings Limited (Consumer Discretionary, Multiline Retail) « | | | | | | | | | | | 693,400 | | | | 2,116,576 | |
Lendlease Corporation Limited (Real Estate, Real Estate Management & Development) | | | | | | | | | | | 407,700 | | | | 4,935,789 | |
Macquarie Group Limited (Financials, Capital Markets) | | | | | | | | | | | 69,800 | | | | 5,237,357 | |
McMillan Shakespeare Limited (Industrials, Professional Services) | | | | | | | | | | | 158,800 | | | | 2,147,621 | |
Metcash Limited (Consumer Staples, Food & Staples Retailing) | | | | | | | | | | | 1,164,200 | | | | 2,443,709 | |
Mineral Resources Limited (Materials, Metals & Mining) | | | | | | | | | | | 300,500 | | | | 4,471,346 | |
Mirvac Group (Real Estate, Equity REITs) | | | | | | | | | | | 1,327,400 | | | | 2,467,210 | |
Myer Holdings Limited (Consumer Discretionary, Multiline Retail) « | | | | | | | | | | | 1,702,400 | | | | 1,015,212 | |
Qantas Airways Limited (Industrials, Airlines) | | | | | | | | | | | 1,021,400 | | | | 4,406,474 | |
Retail Food Group Limited (Consumer Discretionary, Food Products) « | | | | | | | | | | | 269,500 | | | | 922,460 | |
| | | | |
| | | | | | | | | | | | | | | 45,544,166 | |
| | | | | | | | | | | | | | | | |
| | | | |
| Austria: 1.25% | | | | | | | | | | | | | | | | |
OMV AG (Energy, Oil, Gas & Consumable Fuels) | | | | | | | | | | | 69,400 | | | | 4,321,213 | |
Raiffeisen Bank International AG (Financials, Banks) † | | | | | | | | | | | 81,200 | | | | 2,870,119 | |
Voestalpine AG (Materials, Metals & Mining) | | | | | | | | | | | 56,800 | | | | 3,299,857 | |
| | | | |
| | | | | | | | | | | | | | | 10,491,189 | |
| | | | | | | | | | | | | | | | |
| | | | |
| Belgium: 0.38% | | | | | | | | | | | | | | | | |
Bpost SA (Industrials, Air Freight & Logistics) « | | | | | | | | | | | 101,900 | | | | 3,147,375 | |
| | | | | | | | | | | | | | | | |
| | | | |
| Brazil: 0.84% | | | | | | | | | | | | | | | | |
Banco de Brasil SA (Financials, Banks) | | | | | | | | | | | 245,800 | | | | 2,244,637 | |
Companhia de Saneamento de Minas Gerais SA (Utilities, Water Utilities) | | | | | | | | | | | 226,100 | | | | 2,822,263 | |
JBS SA (Consumer Staples, Food Products) | | | | | | | | | | | 805,600 | | | | 1,946,661 | |
| | | | |
| | | | | | | | | | | | | | | 7,013,561 | |
| | | | | | | | | | | | | | | | |
| | | | |
| Canada: 1.31% | | | | | | | | | | | | | | | | |
Magna International Incorporated (Consumer Discretionary, Auto Components) | | | | | | | | | | | 131,600 | | | | 7,382,004 | |
Metro Incorporated (Consumer Staples, Food & Staples Retailing) | | | | | | | | | | | 28,100 | | | | 880,146 | |
Open Text Corporation (Information Technology, Software) | | | | | | | | | | | 8,400 | | | | 273,977 | |
WestJet Airlines Limited (Industrials, Airlines) | | | | | | | | | | | 120,000 | | | | 2,488,083 | |
| | | | |
| | | | | | | | | | | | | | | 11,024,210 | |
| | | | | | | | | | | | | | | | |
| | | | |
| China: 2.75% | | | | | | | | | | | | | | | | |
China Communications Services Corporation Limited H Shares (Telecommunication Services, Diversified Telecommunication Services) | | | | | | | | | | | 2,836,000 | | | | 1,806,203 | |
China Petroleum & Chemical Corporation H Shares (Energy, Oil, Gas & Consumable Fuels) | | | | | | | | | | | 2,970,000 | | | | 2,131,793 | |
China Railway Construction Corporation Limited H Shares (Industrials, Construction & Engineering) | | | | | | | | | | | 2,089,500 | | | | 2,480,746 | |
The accompanying notes are an integral part of these financial statements.
| | | | | | |
| Portfolio of investments—November 30, 2017 (unaudited) | | Wells Fargo Allocation Funds | | | 51 | |
INTERNATIONAL VALUE PORTFOLIO
| | | | | | | | | | | | | | | | |
| Security name | | | | | | | | Shares | | | Value | |
| | | | |
| China (continued) | | | | | | | | | | | | | | | | |
China Telecom Corporation Limited H Shares (Telecommunication Services, Diversified Telecommunication Services) | | | | | | | | | | | 10,590,000 | | | $ | 5,130,358 | |
Dongfeng Motor Group Company Limited H Shares (Consumer Discretionary, Automobiles) | | | | | | | | | | | 1,730,000 | | | | 2,184,540 | |
PICC Property & Casualty Company Limited H Shares (Financials, Insurance) | | | | | | | | | | | 1,302,000 | | | | 2,480,263 | |
Shanghai Pharmaceuticals Holding Company Limited H Shares (Health Care, Health Care Providers & Services) | | | | | | | | | | | 676,200 | | | | 1,703,936 | |
Shenzhen International Holdings Limited H Shares (Industrials, Transportation Infrastructure) | | | | | | | | | | | 1,167,000 | | | | 2,101,001 | |
Xinyi Glass Holdings Limited (Consumer Discretionary, Auto Components) | | | | | | | | | | | 2,502,000 | | | | 3,057,265 | |
| | | | |
| | | | | | | | | | | | | | | 23,076,105 | |
| | | | | | | | | | | | | | | | |
| | | | |
| Denmark: 1.17% | | | | | | | | | | | | | | | | |
Danske Bank AS (Financials, Banks) | | | | | | | | | | | 150,300 | | | | 5,610,836 | |
DFDS AS (Industrials, Marine) | | | | | | | | | | | 37,600 | | | | 2,029,777 | |
Sydbank AS (Financials, Banks) | | | | | | | | | | | 56,100 | | | | 2,196,167 | |
| | | | |
| | | | | | | | | | | | | | | 9,836,780 | |
| | | | | | | | | | | | | | | | |
| | | | |
| France: 7.95% | | | | | | | | | | | | | | | | |
Atos Origin SA (Information Technology, IT Services) | | | | | | | | | | | 25,900 | | | | 3,825,758 | |
AXA SA (Financials, Insurance) | | | | | | | | | | | 132,200 | | | | 3,988,780 | |
BNP Paribas SA (Financials, Banks) | | | | | | | | | | | 72,900 | | | | 5,519,472 | |
Carrefour SA (Consumer Staples, Food & Staples Retailing) | | | | | | | | | | | 152,700 | | | | 3,203,004 | |
Cie Generale des Establissements Michelin (Consumer Discretionary, Auto Components) | | | | | | | | | | | 32,700 | | | | 4,741,680 | |
Credit Agricole SA (Financials, Banks) | | | | | | | | | | | 219,328 | | | | 3,695,467 | |
Electricite de France SA (Utilities, Electric Utilities) | | | | | | | | | | | 148,600 | | | | 1,947,351 | |
Engie SA (Utilities, Multi-Utilities) | | | | | | | | | | | 171,900 | | | | 3,008,700 | |
Neopost SA (Information Technology, Technology Hardware, Storage & Peripherals) | | | | | | | | | | | 66,600 | | | | 2,217,992 | |
Orange SA (Telecommunication Services, Diversified Telecommunication Services) « | | | | | | | | | | | 333,800 | | | | 5,744,454 | |
Renault SA (Consumer Discretionary, Automobiles) | | | | | | | | | | | 40,500 | | | | 4,112,257 | |
Sanofi SA (Health Care, Pharmaceuticals) | | | | | | | | | | | 141,800 | | | | 12,934,927 | |
SCOR SE (Financials, Insurance) | | | | | | | | | | | 109,700 | | | | 4,467,928 | |
Societe Generale SA (Financials, Banks) | | | | | | | | | | | 39,000 | | | | 1,962,534 | |
Total SA (Energy, Oil, Gas & Consumable Fuels) | | | | | | | | | | | 93,700 | | | | 5,296,382 | |
| | | | |
| | | | | | | | | | | | | | | 66,666,686 | |
| | | | | | | | | | | | | | | | |
| | | | |
| Germany: 8.43% | | | | | | | | | | | | | | | | |
Allianz AG (Financials, Insurance) | | | | | | | | | | | 35,700 | | | | 8,431,424 | |
Aurubis AG (Materials, Metals & Mining) | | | | | | | | | | | 25,900 | | | | 2,152,000 | |
BASF SE (Materials, Chemicals) | | | | | | | | | | | 46,500 | | | | 5,214,187 | |
Bayer AG (Health Care, Pharmaceuticals) | | | | | | | | | | | 38,000 | | | | 4,850,439 | |
Bayerische Motoren Werke AG (Consumer Discretionary, Automobiles) | | | | | | | | | | | 31,200 | | | | 3,149,806 | |
Ceconomy AG (Consumer Discretionary, Specialty Retail) | | | | | | | | | | | 108,100 | | | | 1,419,059 | |
Covestro AG (Materials, Chemicals) 144A | | | | | | | | | | | 30,200 | | | | 3,145,197 | |
Daimler AG (Consumer Discretionary, Automobiles) | | | | | | | | | | | 75,700 | | | | 6,271,368 | |
Deutsche Bank AG (Financials, Capital Markets) | | | | | | | | | | | 141,800 | | | | 2,674,274 | |
Deutsche Post AG (Industrials, Air Freight & Logistics) | | | | | | | | | | | 186,300 | | | | 8,867,991 | |
Hannover Rueck SE (Financials, Insurance) | | | | | | | | | | | 16,300 | | | | 2,145,380 | |
Metro AG (Consumer Staples, Food & Staples Retailing) † | | | | | | | | | | | 108,100 | | | | 2,111,544 | |
Muenchener Rueckversicherungs Gesellschaft AG (Financials, Insurance) | | | | | | | | | | | 23,200 | | | | 5,170,183 | |
Siemens AG (Industrials, Industrial Conglomerates) | | | | | | | | | | | 34,200 | | | | 4,649,039 | |
Uniper SE (Utilities, Independent Power & Renewable Electricity Producers) « | | | | | | | | | | | 194,200 | | | | 5,777,505 | |
Volkswagen AG (Consumer Discretionary, Automobiles) | | | | | | | | | | | 22,600 | | | | 4,689,921 | |
| | | | |
| | | | | | | | | | | | | | | 70,719,317 | |
| | | | | | | | | | | | | | | | |
The accompanying notes are an integral part of these financial statements.
| | | | |
| 52 | | Wells Fargo Allocation Funds | | Portfolio of investments—November 30, 2017 (unaudited) |
INTERNATIONAL VALUE PORTFOLIO
| | | | | | | | | | | | | | | | |
| Security name | | | | | | | | Shares | | | Value | |
| | | | |
| Hong Kong: 2.28% | | | | | | | | | | | | | | | | |
China Resources Cement Holdings Limited (Materials, Construction Materials) | | | | | | | | | | | 3,222,000 | | | $ | 2,135,989 | |
I Cable Communications Limited (Consumer Discretionary, Media) † | | | | | | | | | | | 96,300 | | | | 2,759 | |
Kingboard Laminates Holdings Limited (Information Technology, Electronic Equipment, Instruments & Components) | | | | | | | | | | | 1,633,000 | | | | 2,713,376 | |
Lee & Man Paper Manufacturing Limited (Materials, Paper & Forest Products) | | | | | | | | | | | 2,338,000 | | | | 2,755,527 | |
Skyworth Digital Holdings Limited (Consumer Discretionary, Household Durables) | | | | | | | | | | | 3,680,000 | | | | 1,575,816 | |
WH Group Limited (Consumer Staples, Food Products) 144A | | | | | | | | | | | 4,840,500 | | | | 5,155,694 | |
Wheelock & Company Limited (Real Estate, Real Estate Management & Development) | | | | | | | | | | | 379,000 | | | | 2,608,272 | |
Yue Yuen Industrial Holdings Limited (Consumer Discretionary, Textiles, Apparel & Luxury Goods) | | | | | | | | | | | 611,500 | | | | 2,188,007 | |
| | | | |
| | | | | | | | | | | | | | | 19,135,440 | |
| | | | | | | | | | | | | | | | |
| | | | |
| India: 0.36% | | | | | | | | | | | | | | | | |
Tech Mahindra Limited (Information Technology, IT Services) | | | | | | | | | | | 399,100 | | | | 3,028,221 | |
| | | | | | | | | | | | | | | | |
| | | | |
| Ireland: 0.84% | | | | | | | | | | | | | | | | |
C&C Group plc (Consumer Staples, Beverages) | | | | | | | | | | | 240,000 | | | | 816,469 | |
Grafton Group plc (Industrials, Trading Companies & Distributors) | | | | | | | | | | | 195,665 | | | | 2,042,769 | |
Smurfit Kappa Group plc (Materials, Containers & Packaging) | | | | | | | | | | | 130,200 | | | | 4,154,759 | |
| |
| | | | 7,013,997 | |
| | | | | | | | | | | | | | | | |
| | | | |
| Israel: 0.45% | | | | | | | | | | | | | | | | |
Bank Hapoalim Limited (Financials, Banks) | | | | | | | | | | | 440,000 | | | | 3,005,286 | |
Teva Pharmaceutical Industries Limited (Health Care, Pharmaceuticals) | | | | | | | | | | | 51,404 | | | | 760,825 | |
| |
| | | | 3,766,111 | |
| | | | | | | | | | | | | | | | |
| | | | |
| Italy: 2.40% | | | | | | | | | | | | | | | | |
A2A SpA (Utilities, Multi-Utilities) | | | | | | | | | | | 1,078,900 | | | | 2,029,867 | |
Enel SpA (Utilities, Electric Utilities) | | | | | | | | | | | 1,706,600 | | | | 11,087,787 | |
Leonardo-Finmeccanica SpA (Industrials, Aerospace & Defense) | | | | | | | | | | | 271,900 | | | | 3,250,562 | |
Mediobanca SpA (Financials, Banks) « | | | | | | | | | | | 324,800 | | | | 3,748,784 | |
| |
| | | | 20,117,000 | |
| | | | | | | | | | | | | | | | |
| | | | |
| Japan: 22.85% | | | | | | | | | | | | | | | | |
Adeka Corporation (Materials, Chemicals) | | | | | | | | | | | 155,300 | | | | 2,628,879 | |
Aisin Seiki Company Limited (Consumer Discretionary, Auto Components) | | | | | | | | | | | 61,200 | | | | 3,293,441 | |
Aoyama Trading Company Limited (Consumer Discretionary, Specialty Retail) | | | | | | | | | | | 24,800 | | | | 945,949 | |
Aozora Bank Limited (Financials, Banks) | | | | | | | | | | | 66,100 | | | | 2,573,668 | |
Astellas Pharma Incorporated (Health Care, Pharmaceuticals) | | | | | | | | | | | 314,200 | | | | 3,994,229 | |
Central Glass Company Limited (Industrials, Building Products) | | | | | | | | | | | 88,800 | | | | 1,986,289 | |
Cocokara Fine Incorporated (Consumer Staples, Food & Staples Retailing) | | | | | | | | | | | 44,700 | | | | 2,794,528 | |
Daikyo Incorporated (Real Estate, Real Estate Management & Development) | | | | | | | | | | | 124,380 | | | | 2,425,711 | |
DCM Holdings Company Limited (Consumer Discretionary, Specialty Retail) | | | | | | | | | | | 183,000 | | | | 1,769,332 | |
Denka Company Limited (Materials, Chemicals) | | | | | | | | | | | 136,400 | | | | 5,044,781 | |
DIC Incorporated (Materials, Chemicals) | | | | | | | | | | | 100,700 | | | | 3,779,043 | |
Eizo Corporation (Information Technology, Technology Hardware, Storage & Peripherals) | | | | | | | | | | | 63,300 | | | | 2,712,806 | |
Fujikura Limited (Industrials, Electrical Equipment) | | | | | | | | | | | 348,000 | | | | 3,257,704 | |
Geo Holdings Corporation (Consumer Discretionary, Specialty Retail) | | | | | | | | | | | 91,700 | | | | 1,864,039 | |
Hitachi Limited (Information Technology, Electronic Equipment, Instruments & Components) | | | | | | | | | | | 481,800 | | | | 3,609,973 | |
Isuzu Motors Limited (Consumer Discretionary, Automobiles) | | | | | | | | | | | 221,400 | | | | 3,522,756 | |
Itochu Corporation (Industrials, Trading Companies & Distributors) | | | | | | | | | | | 200,700 | | | | 3,488,894 | |
Japan Airlines Company Limited (Industrials, Airlines) | | | | | | | | | | | 80,700 | | | | 2,960,651 | |
The accompanying notes are an integral part of these financial statements.
| | | | | | |
| Portfolio of investments—November 30, 2017 (unaudited) | | Wells Fargo Allocation Funds | | | 53 | |
INTERNATIONAL VALUE PORTFOLIO
| | | | | | | | | | | | | | | | |
| Security name | | | | | | | | Shares | | | Value | |
| | | | |
| Japan (continued) | | | | | | | | | | | | | | | | |
JTEKT Corporation (Industrials, Machinery) | | | | | | | | | | | 143,600 | | | $ | 2,486,399 | |
JX Holdings Incorporated (Energy, Oil, Gas & Consumable Fuels) | | | | | | | | | | | 754,900 | | | | 4,265,210 | |
Kaken Pharmaceutical Company Limited (Health Care, Pharmaceuticals) | | | | | | | | | | | 44,700 | | | | 2,238,712 | |
KDDI Corporation (Telecommunication Services, Wireless Telecommunication Services) | | | | | | | | | | | 357,100 | | | | 10,190,190 | |
Keihin Corporation (Consumer Discretionary, Auto Components) | | | | | | | | | | | 103,500 | | | | 2,046,074 | |
Kureha Corporation (Materials, Chemicals) | | | | | | | | | | | 27,100 | | | | 1,789,117 | |
Kyorin Company Limited (Health Care, Pharmaceuticals) | | | | | | | | | | | 88,200 | | | | 1,686,939 | |
Maeda Road Construction Company Limited (Industrials, Construction & Engineering) | | | | | | | | | | | 148,000 | | | | 3,346,895 | |
Makino Milling Machine Company Limited (Industrials, Machinery) | | | | | | | | | | | 286,000 | | | | 2,870,128 | |
Marubeni Corporation (Industrials, Trading Companies & Distributors) | | | | | | | | | | | 516,000 | | | | 3,444,449 | |
Matsumotokiyoshi Holdings Company Limited (Consumer Staples, Food & Staples Retailing) | | | | | | | | | | | 48,900 | | | | 4,049,738 | |
Mazda Motor Corporation (Consumer Discretionary, Automobiles) | | | | | | | | | | | 224,300 | | | | 3,030,194 | |
Mitsubishi Gas Chemical Company Incorporated (Materials, Chemicals) | | | | | | | | | | | 195,500 | | | | 5,488,754 | |
Mitsubishi UFJ Financial Group Incorporated (Financials, Banks) | | | | | | | | | | | 921,500 | | | | 6,568,561 | |
Mitsui Chemicals Incorporated (Materials, Chemicals) | | | | | | | | | | | 163,400 | | | | 5,304,626 | |
Mixi Incorporated (Information Technology, Internet Software & Services) | | | | | | | | | | | 45,500 | | | | 2,119,388 | |
Mizuho Financial Group Incorporated (Financials, Banks) | | | | | | | | | | | 2,244,400 | | | | 4,082,639 | |
Nippon Telegraph & Telephone Corporation (Telecommunication Services, Diversified Telecommunication Services) | | | | | | | | | | | 247,900 | | | | 12,941,365 | |
Nissan Motor Company Limited (Consumer Discretionary, Automobiles) | | | | | | | | | | | 505,000 | | | | 4,910,801 | |
Nisshinbo Holdings Incorporated (Industrials, Industrial Conglomerates) | | | | | | | | | | | 226,100 | | | | 3,176,011 | |
NTN Corporation (Industrials, Machinery) | | | | | | | | | | | 501,000 | | | | 2,495,077 | |
NTT DOCOMO Incorporated (Telecommunication Services, Wireless Telecommunication Services) | | | | | | | | | | | 98,600 | | | | 2,546,051 | |
ORIX Corporation (Financials, Diversified Financial Services) | | | | | | | | | | | 325,300 | | | | 5,635,535 | |
Resona Holdings Incorporated (Financials, Banks) | | | | | | | | | | | 1,013,300 | | | | 5,395,424 | |
Ryobi Limited (Industrials, Machinery) | | | | | | | | | | | 32,300 | | | | 838,359 | |
Sankyu Incorporated (Industrials, Road & Rail) | | | | | | | | | | | 74,000 | | | | 3,177,980 | |
Sawai Pharmaceutical Company Limited (Health Care, Pharmaceuticals) | | | | | | | | | | | 42,000 | | | | 2,053,745 | |
Sojitz Corporation (Industrials, Trading Companies & Distributors) | | | | | | | | | | | 1,638,500 | | | | 4,753,635 | |
Sumitomo Heavy Industries Limited (Industrials, Machinery) | | | | | | | | | | | 51,200 | | | | 2,106,669 | |
Sumitomo Mitsui Financial Group Incorporated (Financials, Banks) | | | | | | | | | | | 100,400 | | | | 4,093,442 | |
Sumitomo Osaka Cement Company (Materials, Construction Materials) | | | | | | | | | | | 444,000 | | | | 2,078,509 | |
T-Gaia Corporation (Consumer Discretionary, Specialty Retail) | | | | | | | | | | | 105,900 | | | | 2,313,638 | |
Teijin Limited (Materials, Chemicals) | | | | | | | | | | | 121,300 | | | | 2,625,725 | |
The Keiyo Bank Limited (Financials, Banks) | | | | | | | | | | | 201,000 | | | | 919,636 | |
The Yokohama Rubber Company Limited (Consumer Discretionary, Auto Components) | | | | | | | | | | | 148,500 | | | | 3,346,560 | |
Toho Holdings Company Limited (Health Care, Health Care Providers & Services) | | | | | | | | | | | 63,000 | | | | 1,312,762 | |
Toyo Ink SC Holding Company Limited (Materials, Chemicals) | | | | | | | | | | | 375,000 | | | | 2,177,643 | |
Toyo Tire & Rubber Company Limited (Consumer Discretionary, Auto Components) | | | | | | | | | | | 95,400 | | | | 1,963,422 | |
UBE Industries Limited (Materials, Chemicals) | | | | | | | | | | | 107,200 | | | | 3,132,149 | |
| |
| | | | 191,654,824 | |
| | | | | | | | | | | | | | | | |
| | | | |
| Liechtenstein: 0.10% | | | | | | | | | | | | | | | | |
VP Bank AG (Financials, Capital Markets) | | | | | | | | | | | 6,558 | | | | 869,956 | |
| | | | | | | | | | | | | | | | |
| | | | |
| Malaysia: 0.32% | | | | | | | | | | | | | | | | |
Tenaga Nasional Bhd (Utilities, Electric Utilities) | | | | | | | | | | | 717,600 | | | | 2,712,825 | |
| | | | | | | | | | | | | | | | |
| | | | |
| Netherlands: 3.26% | | | | | | | | | | | | | | | | |
ABN AMRO Group NV (Financials, Banks) 144A | | | | | | | | | | | 142,600 | | | | 4,226,579 | |
Aegon NV (Financials, Insurance) | | | | | | | | | | | 483,700 | | | | 3,004,645 | |
ASR Nederland NV (Financials, Insurance) | | | | | | | | | | | 60,500 | | | | 2,464,017 | |
The accompanying notes are an integral part of these financial statements.
| | | | |
| 54 | | Wells Fargo Allocation Funds | | Portfolio of investments—November 30, 2017 (unaudited) |
INTERNATIONAL VALUE PORTFOLIO
| | | | | | | | | | | | | | | | |
| Security name | | | | | | | | Shares | | | Value | |
| | | | |
| Netherlands (continued) | | | | | | | | | | | | | | | | |
ING Groep NV (Financials, Banks) | | | | | | | | | | | 282,500 | | | $ | 5,104,830 | |
Koninklijke Ahold NV (Consumer Staples, Food & Staples Retailing) | | | | | | | | | | | 214,800 | | | | 4,595,798 | |
Philips Lighting NV (Industrials, Electrical Equipment) | | | | | | | | | | | 59,400 | | | | 2,247,587 | |
RHI Magnesita NV (Materials, Construction Materials) | | | | | | | | | | | 64,721 | | | | 3,505,053 | |
X5 Retail Group NV GDR (Consumer Staples, Food & Staples Retailing) † | | | | | | | | | | | 58,400 | | | | 2,166,640 | |
| |
| | | | 27,315,149 | |
| | | | | | | | | | | | | | | | |
| | | | |
| Norway: 1.31% | | | | | | | | | | | | | | | | |
Atea ASA (Information Technology, IT Services) | | | | | | | | | | | 84,900 | | | | 1,132,755 | |
Den Norske Bank ASA (Financials, Banks) | | | | | | | | | | | 148,800 | | | | 2,710,443 | |
Grieg Seafood ASA (Consumer Staples, Food Products) | | | | | | | | | | | 245,946 | | | | 2,243,482 | |
Marine Harvest ASA (Consumer Staples, Food Products) | | | | | | | | | | | 143,900 | | | | 2,538,068 | |
Yara International ASA (Materials, Chemicals) | | | | | | | | | | | 53,600 | | | | 2,382,366 | |
| |
| | | | 11,007,114 | |
| | | | | | | | | | | | | | | | |
| | | | |
| Poland: 0.15% | | | | | | | | | | | | | | | | |
Asseco Poland SA (Information Technology, Software) | | | | | | | | | | | 101,800 | | | | 1,280,051 | |
| | | | | | | | | | | | | | | | |
| | | | |
| Portugal: 0.42% | | | | | | | | | | | | | | | | |
Energias de Portugal SA (Utilities, Electric Utilities) | | | | | | | | | | | 1,007,800 | | | | 3,532,626 | |
| | | | | | | | | | | | | | | | |
| | | | |
| Russia: 1.23% | | | | | | | | | | | | | | | | |
Gazprom ADR (Energy, Oil, Gas & Consumable Fuels) | | | | | | | | | | | 832,900 | | | | 3,725,531 | |
Gazprom Neft Sponsored ADR (Energy, Oil, Gas & Consumable Fuels) | | | | | | | | | | | 886 | | | | 18,819 | |
Gazprom Neft Sponsored ADR - London Exchange (Energy, Oil, Gas & Consumable Fuels) | | | | | | | | | | | 150,014 | | | | 3,195,298 | |
LUKOIL OAO ADR (Energy, Oil, Gas & Consumable Fuels) | | | | | | | | | | | 60,400 | | | | 3,379,380 | |
| |
| | | | 10,319,028 | |
| | | | | | | | | | | | | | | | |
| | | | |
| Singapore: 0.93% | | | | | | | | | | | | | | | | |
DBS Group Holdings Limited (Financials, Banks) | | | | | | | | | | | 262,300 | | | | 4,777,226 | |
United Overseas Bank Limited (Financials, Banks) | | | | | | | | | | | 154,100 | | | | 3,001,366 | |
| |
| | | | 7,778,592 | |
| | | | | | | | | | | | | | | | |
| | | | |
| South Africa: 0.41% | | | | | | | | | | | | | | | | |
Barclays Africa Group Limited (Financials, Banks) | | | | | | | | | | | 236,000 | | | | 2,699,766 | |
Petra Diamonds Limited (Materials, Metals & Mining) † | | | | | | | | | | | 850,600 | | | | 773,612 | |
| |
| | | | 3,473,378 | |
| | | | | | | | | | | | | | | | |
| | | | |
| South Korea: 2.61% | | | | | | | | | | | | | | | | |
BNK Financial Group Incorporated (Financials, Banks) | | | | | | | | | | | 127,000 | | | | 1,111,229 | |
E-MART Limited (Consumer Staples, Food & Staples Retailing) | | | | | | | | | | | 8,500 | | | | 2,146,915 | |
Industrial Bank of Korea (Financials, Banks) | | | | | | | | | | | 192,500 | | | | 2,812,982 | |
KT&G Corporation (Consumer Staples, Tobacco) | | | | | | | | | | | 45,200 | | | | 5,067,218 | |
Kwangju Bank (Financials, Banks) | | | | | | | | | | | 13,510 | | | | 147,111 | |
LG Uplus Corporation (Telecommunication Services, Diversified Telecommunication Services) | | | | | | | | | | | 346,100 | | | | 4,419,974 | |
SK Telecom Company Limited (Telecommunication Services, Wireless Telecommunication Services) | | | | | | | | | | | 14,700 | | | | 3,579,465 | |
Woori Bank (Financials, Banks) | | | | | | | | | | | 178,044 | | | | 2,649,104 | |
| |
| | | | 21,933,998 | |
| | | | | | | | | | | | | | | | |
The accompanying notes are an integral part of these financial statements.
| | | | | | |
| Portfolio of investments—November 30, 2017 (unaudited) | | Wells Fargo Allocation Funds | | | 55 | |
INTERNATIONAL VALUE PORTFOLIO
| | | | | | | | | | | | | | | | |
| Security name | | | | | | | | Shares | | | Value | |
| | | | |
| Spain: 2.55% | | | | | | | | | | | | | | | | |
Banco Santander Central Hispano SA (Financials, Banks) | | | | | | | | | | | 429,681 | | | $ | 2,894,104 | |
Distribuidora Internacional SA (Consumer Staples, Food & Staples Retailing) | | | | | | | | | | | 483,500 | | | | 2,275,174 | |
Gas Natural SDG SA (Utilities, Gas Utilities) | | | | | | | | | | | 209,300 | | | | 4,681,757 | |
Iberdrola SA (Utilities, Electric Utilities) | | | | | | | | | | | 433,600 | | | | 3,444,272 | |
International Consolidated Airlines Group SA (Industrials, Airlines) | | | | | | | | | | | 325,200 | | | | 2,699,647 | |
Repsol YPF SA (Energy, Oil, Gas & Consumable Fuels) | | | | | | | | | | | 294,900 | | | | 5,408,490 | |
| |
| | | | 21,403,444 | |
| | | | | | | | | | | | | | | | |
| | | | |
| Sweden: 1.25% | | | | | | | | | | | | | | | | |
Boliden AB (Materials, Metals & Mining) | | | | | | | | | | | 102,400 | | | | 3,241,505 | |
Electrolux AB Class B (Consumer Discretionary, Household Durables) | | | | | | | | | | | 104,100 | | | | 3,457,457 | |
Nordea Bank AB (Financials, Banks) | | | | | | | | | | | 177,300 | | | | 2,079,091 | |
Skandinaviska Enskilda Banken AB Class A (Financials, Banks) | | | | | | | | | | | 144,900 | | | | 1,722,125 | |
| |
| | | | 10,500,178 | |
| | | | | | | | | | | | | | | | |
| | | | |
| Switzerland: 6.22% | | | | | | | | | | | | | | | | |
Baloise Holding AG (Financials, Insurance) | | | | | | | | | | | 28,800 | | | | 4,441,944 | |
Credit Suisse Group AG (Financials, Capital Markets) | | | | | | | | | | | 221,500 | | | | 3,758,783 | |
Georg Fischer AG (Industrials, Machinery) | | | | | | | | | | | 1,900 | | | | 2,503,968 | |
Helvetia Holding AG (Financials, Insurance) | | | | | | | | | | | 4,600 | | | | 2,540,162 | |
Novartis AG (Health Care, Pharmaceuticals) | | | | | | | | | | | 46,600 | | | | 3,998,122 | |
Roche Holding AG (Health Care, Pharmaceuticals) | | | | | | | | | | | 39,500 | | | | 9,982,239 | |
Swiss Life Holding AG (Financials, Insurance) | | | | | | | | | | | 22,100 | | | | 7,432,753 | |
Swiss Reinsurance AG (Financials, Insurance) | | | | | | | | | | | 75,700 | | | | 7,107,517 | |
UBS Group AG (Financials, Capital Markets) | | | | | | | | | | | 290,700 | | | | 5,028,630 | |
Valiant Holding AG (Financials, Banks) | | | | | | | | | | | 22,700 | | | | 2,469,022 | |
Zurich Insurance Group AG (Financials, Insurance) | | | | | | | | | | | 9,500 | | | | 2,875,282 | |
| |
| | | | 52,138,422 | |
| | | | | | | | | | | | | | | | |
| | | | |
| Taiwan: 0.73% | | | | | | | | | | | | | | | | |
Hon Hai Precision Industry Company Limited (Information Technology, Electronic Equipment, Instruments & Components) | | | | | | | | | | | 1,112,000 | | | | 3,732,867 | |
Pegatron Corporation (Information Technology, Technology Hardware, Storage & Peripherals) | | | | | | | | | | | 1,035,000 | | | | 2,373,140 | |
| |
| | | | 6,106,007 | |
| | | | | | | | | | | | | | | | |
| | | | |
| Thailand: 1.31% | | | | | | | | | | | | | | | | |
Bangchak Corporation PCL (Energy, Oil, Gas & Consumable Fuels) | | | | | | | | | | | 2,188,900 | | | | 2,513,281 | |
Krung Thai Bank PCL (Financials, Banks) | | | | | | | | | | | 711,300 | | | | 420,927 | |
Krung Thai Bank PCL ADR (Financials, Banks) | | | | | | | | | | | 4,470,600 | | | | 2,641,843 | |
Thai Oil PCL (Energy, Oil, Gas & Consumable Fuels) | | | | | | | | | | | 1,003,900 | | | | 2,858,625 | |
Thanachart Capital PCL (Financials, Banks) | | | | | | | | | | | 1,481,500 | | | | 2,551,573 | |
| |
| | | | 10,986,249 | |
| | | | | | | | | | | | | | | | |
| | | | |
| Turkey: 0.31% | | | | | | | | | | | | | | | | |
TAV Havalimanlari Holding AS (Industrials, Transportation Infrastructure) | | | | | | | | | | | 522,900 | | | | 2,599,817 | |
| | | | | | | | | | | | | | | | |
| | | | |
| United Kingdom: 14.70% | | | | | | | | | | | | | | | | |
3i Group plc (Financials, Capital Markets) | | | | | | | | | | | 409,100 | | | | 4,989,850 | |
Anglo American plc (Materials, Metals & Mining) | | | | | | | | | | | 183,043 | | | | 3,365,579 | |
Aviva plc (Financials, Insurance) | | | | | | | | | | | 398,600 | | | | 2,749,736 | |
The accompanying notes are an integral part of these financial statements.
| | | | |
| 56 | | Wells Fargo Allocation Funds | | Portfolio of investments—November 30, 2017 (unaudited) |
INTERNATIONAL VALUE PORTFOLIO
| | | | | | | | | | | | | | | | |
| Security name | | | | | | | | Shares | | | Value | |
| | | | |
| United Kingdom (continued) | | | | | | | | | | | | | | | | |
BAE Systems plc (Industrials, Aerospace & Defense) | | | | | | | | | | | 1,220,400 | | | $ | 9,088,123 | |
Barclays plc (Financials, Banks) | | | | | | | | | | | 715,000 | | | | 1,865,643 | |
Barratt Developments plc (Consumer Discretionary, Household Durables) | | | | | | | | | | | 410,800 | | | | 3,369,390 | |
Bellway plc (Consumer Discretionary, Household Durables) | | | | | | | | | | | 80,100 | | | | 3,755,330 | |
Bovis Homes Group plc (Consumer Discretionary, Household Durables) | | | | | | | | | | | 182,700 | | | | 2,767,336 | |
BP plc (Energy, Oil, Gas & Consumable Fuels) | | | | | | | | | | | 1,023,400 | | | | 6,816,079 | |
BT Group plc (Telecommunication Services, Diversified Telecommunication Services) | | | | | | | | | | | 864,700 | | | | 3,037,631 | |
Carillion plc (Industrials, Construction & Engineering) « | | | | | | | | | | | 764,400 | | | | 173,157 | |
Centrica plc (Utilities, Multi-Utilities) | | | | | | | | | | | 898,500 | | | | 1,756,644 | |
Chemring Group plc (Industrials, Aerospace & Defense) | | | | | | | | | | | 294,466 | | | | 701,891 | |
Crest Nicholson Holdings plc (Consumer Discretionary, Household Durables) | | | | | | | | | | | 345,400 | | | | 2,366,969 | |
Debenhams plc (Consumer Discretionary, Multiline Retail) | | | | | | | | | | | 1,238,200 | | | | 657,258 | |
easyJet plc (Industrials, Airlines) | | | | | | | | | | | 130,900 | | | | 2,489,031 | |
Firstgroup plc (Industrials, Road & Rail) † | | | | | | | | | | | 952,400 | | | | 1,410,624 | |
GKN plc (Consumer Discretionary, Auto Components) | | | | | | | | | | | 974,500 | | | | 4,084,133 | |
GlaxoSmithKline plc (Health Care, Pharmaceuticals) | | | | | | | | | | | 555,600 | | | | 9,613,236 | |
Highland Gold Mining Limited (Materials, Metals & Mining) | | | | | | | | | | | 1,164,800 | | | | 2,379,541 | |
Inchcape plc (Consumer Discretionary, Distributors) | | | | | | | | | | | 232,100 | | | | 2,340,787 | |
J Sainsbury plc (Consumer Staples, Food & Staples Retailing) | | | | | | | | | | | 1,270,500 | | | | 3,989,292 | |
John Wood Group plc (Energy, Energy Equipment & Services) | | | | | | | | | | | 62,475 | | | | 612,756 | |
Johnson Matthey plc (Materials, Chemicals) | | | | | | | | | | | 104,400 | | | | 4,279,316 | |
Kingfisher plc (Consumer Discretionary, Specialty Retail) | | | | | | | | | | | 651,600 | | | | 2,939,564 | |
Legal & General Group plc (Financials, Insurance) | | | | | | | | | | | 1,927,000 | | | | 6,968,529 | |
Lloyds Banking Group plc (Financials, Banks) | | | | | | | | | | | 5,260,500 | | | | 4,694,664 | |
Marks & Spencer Group plc (Consumer Discretionary, Multiline Retail) | | | | | | | | | | | 705,000 | | | | 2,986,151 | |
Marston’s plc (Consumer Discretionary, Hotels, Restaurants & Leisure) | | | | | | | | | | | 558,800 | | | | 869,080 | |
Meggitt plc (Industrials, Aerospace & Defense) | | | | | | | | | | | 297,600 | | | | 1,950,687 | |
Mitchells & Butlers plc (Consumer Discretionary, Hotels, Restaurants & Leisure) | | | | | | | | | | | 367,200 | | | | 1,326,422 | |
Old Mutual plc (Financials, Insurance) | | | | | | | | | | | 698,000 | | | | 1,864,644 | |
Paragon Group of Companies plc (Financials, Thrifts & Mortgage Finance) | | | | | | | | | | | 501,100 | | | | 3,278,876 | |
Premier Foods plc (Consumer Staples, Food Products) † | | | | | | | | | | | 73,926 | | | | 42,990 | |
Redrow plc (Consumer Discretionary, Household Durables) | | | | | | | | | | | 388,600 | | | | 3,169,023 | |
Royal Mail plc (Industrials, Air Freight & Logistics) | | | | | | | | | | | 382,800 | | | | 2,290,003 | |
SSE plc (Utilities, Electric Utilities) | | | | | | | | | | | 170,900 | | | | 3,157,789 | |
Tate & Lyle plc (Consumer Staples, Food Products) | | | | | | | | | | | 309,500 | | | | 2,816,010 | |
The Berkeley Group Holdings plc (Consumer Discretionary, Household Durables) | | | | | | | | | | | 75,800 | | | | 3,913,409 | |
The Restaurant Group plc (Consumer Discretionary, Hotels, Restaurants & Leisure) | | | | | | | | | | | 138,516 | | | | 537,073 | |
TP Icap plc (Financials, Capital Markets) | | | | | | | | | | | 113,200 | | | | 774,644 | |
Vesuvius plc (Industrials, Machinery) | | | | | | | | | | | 145,400 | | | | 1,102,468 | |
| |
| | | | 123,341,358 | |
| | | | | | | | | | | | | | | | |
| |
Total Common Stocks (Cost $712,089,639) | | | | 809,533,174 | |
| | | | | | | | | | | | | | | | |
| | | | |
| | | Dividend yield | | | | | | | | | | |
| Preferred Stocks: 0.78% | | | | | | | | | | | | | | | | |
| | | | |
| Brazil: 0.78% | | | | | | | | | | | | | | | | |
Banco do Estado do Rio Grande do Sul SA (Financials, Banks) | | | 5.69 | % | | | | | | | 471,000 | | | | 1,870,504 | |
Companhia Energetica de Minas Gerais SA (Utilities, Electric Utilities) | | | 10.72 | | | | | | | | 826,900 | | | | 1,664,653 | |
Itausa Investimentos Itau SA (Financials, Banks) | | | 1.39 | | | | | | | | 945,000 | | | | 2,995,005 | |
| | | | |
Total Preferred Stocks (Cost $8,528,786) | | | | | | | | | | | | | | | 6,530,162 | |
| | | | | | | | | | | | | | | | |
The accompanying notes are an integral part of these financial statements.
| | | | | | |
| Portfolio of investments—November 30, 2017 (unaudited) | | Wells Fargo Allocation Funds | | | 57 | |
INTERNATIONAL VALUE PORTFOLIO
| | | | | | | | | | | | | | | | |
| Security name | | Yield | | | | | | Shares | | | Value | |
| | | | |
Short-Term Investments: 3.93% | | | | | | | | | | | | | | | | |
| | | | |
| Investment Companies: 3.93% | | | | | | | | | | | | | | | | |
Securities Lending Cash Investment LLC (l)(r)(u) | | | 1.29 | % | | | | | | | 18,389,273 | | | $ | 18,391,111 | |
Wells Fargo Government Money Market Fund Select Class (l)(u) | | | 1.00 | | | | | | | | 14,627,964 | | | | 14,627,964 | |
| | | | |
Total Short-Term Investments (Cost $33,018,781) | | | | | | | | | | | | | | | 33,019,075 | |
| | | | | | | | | | | | | | | | |
| | | | | | | | |
| Total investments in securities (Cost $753,637,206) | | | 101.21 | % | | | 849,082,411 | |
Other assets and liabilities, net | | | (1.21 | ) | | | (10,186,858 | ) |
| | | | | | | | |
| Total net assets | | | 100.00 | % | | $ | 838,895,553 | |
| | | | | �� | | | |
| † | Non-income-earning security |
| (a) | The security is fair valued in accordance with procedures approved by the Board of Trustees. |
| « | All or a portion of this security is on loan. |
| 144A | The security may be resold in transactions exempt from registration, normally to qualified institutional buyers, pursuant to Rule 144A under the Securities Act of 1933. |
| (l) | The issuer of the security is an affiliated person of the Portfolio as defined in the Investment Company Act of 1940. |
| (r) | The investment is a non-registered investment company purchased with cash collateral received from securities on loan. |
| (u) | The rate represents the 7-day annualized yield at period end. |
The following table shows the percent of total long-term investments by sector as of November 30, 2017:
| | | | |
Financials | | | 26.07 | % |
Consumer Discretionary | | | 13.91 | |
Industrials | | | 13.52 | |
Materials | | | 10.86 | |
Health Care | | | 6.76 | |
Consumer Staples | | | 6.46 | |
Telecommunication Services | | | 6.05 | |
Utilities | | | 5.84 | |
Energy | | | 5.46 | |
Information Technology | | | 3.55 | |
Real Estate | | | 1.52 | |
| | | | |
| | | 100.00 | % |
| | | | |
Investments in Affiliates
An affiliated investment is an investment in which the Portfolio owns at least 5% of the outstanding voting shares of the issuer or as a result of other relationships, such as the Portfolio and the issuer having the same investment manager. Transactions with issuers that were either affiliated persons of the Portfolio at the beginning of the period or the end of the period were as follows:
| | | | | | | | | | | | | | | | | | | | | | | | | | | | | | | | | | | | |
| | | Shares,
beginning of
period | | | Shares
purchased | | | Shares
sold | | | Shares,
end of
period | | | Net
realized
gains
(losses) | | | Net
change in
unrealized
gains
(losses) | | | Income
from
affiliated
securities | | | Value,
end
of period | | | % of
net
assets | |
Short-Term Investments | | | | | | | | | | | | | | | | | | | | | | | | | | | | | | | | | | | | |
Investment Companies | | | | | | | | | | | | | | | | | | | | | | | | | | | | | | | | | | | | |
Securities Lending Cash Investment LLC | | | 29,130,426 | | | | 110,798,769 | | | | 121,539,922 | | | | 18,389,273 | | | $ | (164 | ) | | $ | 0 | | | $ | 329,795 | | | $ | 18,391,111 | | | | | |
Wells Fargo Government Money Market Fund Select Class | | | 7,366,036 | | | | 62,151,787 | | | | 54,889,859 | | | | 14,627,964 | | | | 0 | | | | 0 | | | | 21,341 | | | | 14,627,964 | | | | | |
| | | | | | | | | | | | | | | | | | | | | | | | | | | | | | | | | | | | |
| | | | | | | | | | | | | | | | | | $ | (164 | ) | | $ | 0 | | | $ | 351,136 | | | $ | 33,019,075 | | | | 3.93 | % |
| | | | | | | | | | | | | | | | | | | | | | | | | | | | | | | | | | | | |
The accompanying notes are an integral part of these financial statements.
| | | | |
| 58 | | Wells Fargo Allocation Funds | | Portfolio of investments—November 30, 2017 (unaudited) |
LARGE COMPANY VALUE PORTFOLIO
| | | | | | | | | | | | | | | | |
| Security name | | | | | | | | Shares | | | Value | |
| | | | |
Common Stocks: 97.55% | | | | | | | | | | | | | | | | |
| | | | |
Consumer Discretionary: 6.40% | | | | | | | | | | | | | | | | |
| | | | |
| Automobiles: 0.96% | | | | | | | | | | | | | | | | |
General Motors Company | | | | | | | | | | | 15,306 | | | $ | 659,536 | |
| | | | | | | | | | | | | | | | |
| | | | |
| Hotels, Restaurants & Leisure: 1.23% | | | | | | | | | | | | | | | | |
Scientific Games Corporation Class A † | | | | | | | | | | | 1,551 | | | | 81,660 | |
Yum China Holdings Incorporated | | | | | | | | | | | 18,728 | | | | 764,664 | |
| | | | |
| | | | | | | | | | | | | | | 846,324 | |
| | | | | | | | | | | | | | | | |
| | | | |
| Household Durables: 0.53% | | | | | | | | | | | | | | | | |
NVR Incorporated † | | | | | | | | | | | 105 | | | | 364,875 | |
| | | | | | | | | | | | | | | | |
| | | | |
| Media: 3.68% | | | | | | | | | | | | | | | | |
Charter Communications Incorporated Class A † | | | | | | | | | | | 2,248 | | | | 733,320 | |
Live Nation Incorporated † | | | | | | | | | | | 24,929 | | | | 1,131,278 | |
Viacom Incorporated Class B | | | | | | | | | | | 23,219 | | | | 657,562 | |
| | | | |
| | | | | | | | | | | | | | | 2,522,160 | |
| | | | | | | | | | | | | | | | |
| | | | |
Consumer Staples: 8.08% | | | | | | | | | | | | | | | | |
| | | | |
| Beverages: 2.12% | | | | | | | | | | | | | | | | |
PepsiCo Incorporated | | | | | | | | | | | 12,493 | | | | 1,455,684 | |
| | | | | | | | | | | | | | | | |
| | | | |
| Food & Staples Retailing: 3.84% | | | | | | | | | | | | | | | | |
US Foods Holding Corporation † | | | | | | | | | | | 39,265 | | | | 1,143,397 | |
Walgreens Boots Alliance Incorporated | | | | | | | | | | | 20,437 | | | | 1,486,996 | |
| | | | |
| | | | | | | | | | | | | | | 2,630,393 | |
| | | | | | | | | | | | | | | | |
| | | | |
| Household Products: 1.61% | | | | | | | | | | | | | | | | |
The Procter & Gamble Company | | | | | | | | | | | 12,307 | | | | 1,107,507 | |
| | | | | | | | | | | | | | | | |
| | | | |
| Tobacco: 0.51% | | | | | | | | | | | | | | | | |
Philip Morris International | | | | | | | | | | | 3,382 | | | | 347,501 | |
| | | | | | | | | | | | | | | | |
| | | | |
Energy: 10.53% | | | | | | | | | | | | | | | | |
| | | | |
| Oil, Gas & Consumable Fuels: 10.53% | | | | | | | | | | | | | | | | |
Chevron Corporation | | | | | | | | | | | 18,575 | | | | 2,210,239 | |
Devon Energy Corporation | | | | | | | | | | | 33,567 | | | | 1,293,337 | |
Exxon Mobil Corporation | | | | | | | | | | | 39,037 | | | | 3,251,392 | |
SRC Energy Incorporated † | | | | | | | | | | | 8,570 | | | | 75,073 | |
Valero Energy Corporation | | | | | | | | | | | 2,218 | | | | 189,905 | |
World Fuel Services Corporation | | | | | | | | | | | 7,245 | | | | 203,367 | |
| | | | |
| | | | | | | | | | | | | | | 7,223,313 | |
| | | | | | | | | | | | | | | | |
| | | | |
Financials: 26.00% | | | | | | | | | | | | | | | | |
| | | | |
| Banks: 12.34% | | | | | | | | | | | | | | | | |
Bank of America Corporation | | | | | | | | | | | 102,918 | | | | 2,899,200 | |
Bank of N.T. Butterfield & Son | | | | | | | | | | | 3,618 | | | | 143,924 | |
Citigroup Incorporated | | | | | | | | | | | 2,004 | | | | 151,302 | |
The accompanying notes are an integral part of these financial statements.
| | | | | | |
| Portfolio of investments—November 30, 2017 (unaudited) | | Wells Fargo Allocation Funds | | | 59 | |
LARGE COMPANY VALUE PORTFOLIO
| | | | | | | | | | | | | | | | |
| Security name | | | | | | | | Shares | | | Value | |
| | | | |
| Banks (continued) | | | | | | | | | | | | | | | | |
Comerica Incorporated | | | | | | | | | | | 12,286 | | | $ | 1,023,547 | |
Fifth Third Bancorp | | | | | | | | | | | 20,815 | | | | 635,066 | |
JPMorgan Chase & Company | | | | | | | | | | | 30,823 | | | | 3,221,620 | |
US Bancorp | | | | | | | | | | | 7,044 | | | | 388,477 | |
| |
| | | | 8,463,136 | |
| | | | | | | | | | | | | | | | |
| | | | |
| Capital Markets: 2.11% | | | | | | | | | | | | | | | | |
Bank of New York Mellon Corporation | | | | | | | | | | | 26,192 | | | | 1,433,750 | |
Morgan Stanley | | | | | | | | | | | 256 | | | | 13,212 | |
| |
| | | | 1,446,962 | |
| | | | | | | | | | | | | | | | |
| | | | |
| Consumer Finance: 1.18% | | | | | | | | | | | | | | | | |
Capital One Financial Corporation | | | | | | | | | | | 8,849 | | | | 814,108 | |
| | | | | | | | | | | | | | | | |
| | | | |
| Diversified Financial Services: 4.96% | | | | | | | | | | | | | | | | |
Berkshire Hathaway Incorporated Class B † | | | | | | | | | | | 17,628 | | | | 3,402,380 | |
| | | | | | | | | | | | | | | | |
| | | | |
| Insurance: 5.41% | | | | | | | | | | | | | | | | |
American International Group Incorporated | | | | | | | | | | | 1,270 | | | | 76,149 | |
Assured Guaranty Limited | | | | | | | | | | | 20,667 | | | | 750,419 | |
Chubb Limited | | | | | | | | | | | 1,917 | | | | 291,595 | |
CNO Financial Group Incorporated | | | | | | | | | | | 33,711 | | | | 849,854 | |
The Progressive Corporation | | | | | | | | | | | 13,980 | | | | 743,456 | |
The Travelers Companies Incorporated | | | | | | | | | | | 2,658 | | | | 360,345 | |
Unum Group | | | | | | | | | | | 11,268 | | | | 637,994 | |
| |
| | | | 3,709,812 | |
| | | | | | | | | | | | | | | | |
| | | | |
Health Care: 12.45% | | | | | | | | | | | | | | | | |
| | | | |
| Biotechnology: 4.07% | | | | | | | | | | | | | | | | |
Amgen Incorporated | | | | | | | | | | | 7,492 | | | | 1,316,045 | |
Biogen Incorporated | | | | | | | | | | | 4,384 | | | | 1,412,393 | |
Bioverativ Incorporated † | | | | | | | | | | | 1,260 | | | | 63,025 | |
| |
| | | | 2,791,463 | |
| | | | | | | | | | | | | | | | |
| | | | |
| Health Care Equipment & Supplies: 2.18% | | | | | | | | | | | | | | | | |
Baxter International Incorporated | | | | | | | | | | | 22,725 | | | | 1,489,169 | |
Medtronic plc | | | | | | | | | | | 101 | | | | 8,295 | |
| |
| | | | 1,497,464 | |
| | | | | | | | | | | | | | | | |
| | | | |
| Health Care Providers & Services: 0.60% | | | | | | | | | | | | | | | | |
Humana Incorporated | | | | | | | | | | | 1,569 | | | | 409,289 | |
| | | | | | | | | | | | | | | | |
| | | | |
| Pharmaceuticals: 5.60% | | | | | | | | | | | | | | | | |
Johnson & Johnson | | | | | | | | | | | 10,219 | | | | 1,423,813 | |
Mallinckrodt plc † | | | | | | | | | | | 20,479 | | | | 446,852 | |
Merck & Company Incorporated | | | | | | | | | | | 35,647 | | | | 1,970,210 | |
| |
| | | | 3,840,875 | |
| | | | | | | | | | | | | | | | |
The accompanying notes are an integral part of these financial statements.
| | | | |
| 60 | | Wells Fargo Allocation Funds | | Portfolio of investments—November 30, 2017 (unaudited) |
LARGE COMPANY VALUE PORTFOLIO
| | | | | | | | | | | | | | | | |
| Security name | | | | | | | | Shares | | | Value | |
| | | | |
Industrials: 6.44% | | | | | | | | | | | | | | | | |
| | | | |
| Aerospace & Defense: 1.35% | | | | | | | | | | | | | | | | |
Raytheon Company | | | | | | | | | | | 2,071 | | | $ | 395,872 | |
The Boeing Company | | | | | | | | | | | 1,904 | | | | 527,027 | |
| |
| | | | 922,899 | |
| | | | | | | | | | | | | | | | |
| | | | |
| Air Freight & Logistics: 0.12% | | | | | | | | | | | | | | | | |
FedEx Corporation | | | | | | | | | | | 364 | | | | 84,251 | |
| | | | | | | | | | | | | | | | |
| | | | |
| Airlines: 1.64% | | | | | | | | | | | | | | | | |
Southwest Airlines Company | | | | | | | | | | | 18,562 | | | | 1,126,157 | |
| | | | | | | | | | | | | | | | |
| | | | |
| Commercial Services & Supplies: 0.08% | | | | | | | | | | | | | | | | |
Waste Management Incorporated | | | | | | | | | | | 632 | | | | 51,982 | |
| | | | | | | | | | | | | | | | |
| | | | |
| Industrial Conglomerates: 2.42% | | | | | | | | | | | | | | | | |
Honeywell International Incorporated | | | | | | | | | | | 10,634 | | | | 1,658,479 | |
| | | | | | | | | | | | | | | | |
| | | | |
| Machinery: 0.83% | | | | | | | | | | | | | | | | |
EnPro Industries Incorporated | | | | | | | | | | | 3,975 | | | | 343,321 | |
Mueller Industries Incorporated | | | | | | | | | | | 6,272 | | | | 228,301 | |
| |
| | | | 571,622 | |
| | | | | | | | | | | | | | | | |
| | | | |
Information Technology: 8.23% | | | | | | | | | | | | | | | | |
| | | | |
| Communications Equipment: 2.05% | | | | | | | | | | | | | | | | |
Harris Corporation | | | | | | | | | | | 9,750 | | | | 1,408,875 | |
| | | | | | | | | | | | | | | | |
| | | | |
| Electronic Equipment, Instruments & Components: 0.18% | | | | | | | | | | | | | | | | |
Arrow Electronics Incorporated † | | | | | | | | | | | 1,487 | | | | 120,046 | |
| | | | | | | | | | | | | | | | |
| | | | |
| Internet Software & Services: 1.54% | | | | | | | | | | | | | | | | |
Alphabet Incorporated Class C † | | | | | | | | | | | 965 | | | | 985,661 | |
eBay Incorporated † | | | | | | | | | | | 2,120 | | | | 73,500 | |
| |
| | | | 1,059,161 | |
| | | | | | | | | | | | | | | | |
| | | | |
| IT Services: 0.11% | | | | | | | | | | | | | | | | |
Black Knight Incorporated † | | | | | | | | | | | 293 | | | | 13,156 | |
PayPal Holdings Incorporated † | | | | | | | | | | | 842 | | | | 63,765 | |
| |
| | | | 76,921 | |
| | | | | | | | | | | | | | | | |
| | | | |
| Semiconductors & Semiconductor Equipment: 2.85% | | | | | | | | | | | | | | | | |
Intel Corporation | | | | | | | | | | | 19,421 | | | | 870,838 | |
Micron Technology Incorporated † | | | | | | | | | | | 25,377 | | | | 1,075,731 | |
Texas Instruments Incorporated | | | | | | | | | | | 100 | | | | 9,729 | |
| |
| | | | 1,956,298 | |
| | | | | | | | | | | | | | | | |
| | | | |
| Software: 1.50% | | | | | | | | | | | | | | | | |
Dell Technologies Incorporated Class V † | | | | | | | | | | | 9,255 | | | | 724,111 | |
Oracle Corporation | | | | | | | | | | | 6,174 | | | | 302,896 | |
| |
| | | | 1,027,007 | |
| | | | | | | | | | | | | | | | |
The accompanying notes are an integral part of these financial statements.
| | | | | | |
| Portfolio of investments—November 30, 2017 (unaudited) | | Wells Fargo Allocation Funds | | | 61 | |
LARGE COMPANY VALUE PORTFOLIO
| | | | | | | | | | | | | | | | |
| Security name | | | | | | | | Shares | | | Value | |
| | | | |
Materials: 2.38% | | | | | | | | | | | | | | | | |
| | | | |
| Chemicals: 0.63% | | | | | | | | | | | | | | | | |
LyondellBasell Industries NV Class A | | | | | | | | | | | 4,116 | | | $ | 430,945 | |
| | | | | | | | | | | | | | | | |
| | | | |
| Metals & Mining: 0.45% | | | | | | | | | | | | | | | | |
Freeport-McMoRan Incorporated † | | | | | | | | | | | 22,548 | | | | 313,868 | |
| | | | | | | | | | | | | | | | |
| | | | |
| Paper & Forest Products: 1.30% | | | | | | | | | | | | | | | | |
Louisiana-Pacific Corporation † | | | | | | | | | | | 32,246 | | | | 890,312 | |
| | | | | | | | | | | | | | | | |
| | | | |
Real Estate: 8.00% | | | | | | | | | | | | | | | | |
| | | | |
| Equity REITs: 8.00% | | | | | | | | | | | | | | | | |
CoreCivic Incorporated | | | | | | | | | | | 39,532 | | | | 929,397 | |
Park Hotels & Resorts Incorporated | | | | | | | | | | | 19,793 | | | | 577,956 | |
Prologis Incorporated | | | | | | | | | | | 22,622 | | | | 1,498,255 | |
Weyerhaeuser Company | | | | | | | | | | | 32,417 | | | | 1,146,913 | |
Xenia Hotels & Resorts Incorporated | | | | | | | | | | | 60,661 | | | | 1,333,935 | |
| | | | |
| | | | | | | | | | | | | | | 5,486,456 | |
| | | | | | | | | | | | | | | | |
| | | | |
Telecommunication Services: 1.68% | | | | | | | | | | | | | | | | |
| | | | |
| Diversified Telecommunication Services: 1.61% | | | | | | | | | | | | | | | | |
Verizon Communications Incorporated | | | | | | | | | | | 21,705 | | | | 1,104,567 | |
| | | | | | | | | | | | | | | | |
| | | | |
| Wireless Telecommunication Services: 0.07% | | | | | | | | | | | | | | | | |
T-Mobile USA Incorporated † | | | | | | | | | | | 762 | | | | 46,535 | |
| | | | | | | | | | | | | | | | |
| | | | |
Utilities: 7.36% | | | | | | | | | | | | | | | | |
| | | | |
| Electric Utilities: 4.71% | | | | | | | | | | | | | | | | |
American Electric Power Company Incorporated | | | | | | | | | | | 20,024 | | | | 1,554,463 | |
Avangrid Incorporated | | | | | | | | | | | 2,739 | | | | 145,359 | |
NextEra Energy Incorporated | | | | | | | | | | | 6,468 | | | | 1,022,203 | |
PG&E Corporation | | | | | | | | | | | 7,264 | | | | 393,999 | |
PPL Corporation | | | | | | | | | | | 3,093 | | | | 113,420 | |
| | | | |
| | | | | | | | | | | | | | | 3,229,444 | |
| | | | | | | | | | | | | | | | |
| | | | |
| Gas Utilities: 0.63% | | | | | | | | | | | | | | | | |
UGI Corporation | | | | | | | | | | | 8,752 | | | | 428,936 | |
| | | | | | | | | | | | | | | | |
| | | | |
| Multi-Utilities: 2.02% | | | | | | | | | | | | | | | | |
MDU Resources Group Incorporated | | | | | | | | | | | 10,101 | | | | 282,323 | |
Vectren Corporation | | | | | | | | | | | 15,914 | | | | 1,106,023 | |
| | | | |
| | | | | | | | | | | | | | | 1,388,346 | |
| | | | | | | | | | | | | | | | |
| | | | |
Total Common Stocks (Cost $59,052,408) | | | | | | | | | | | | | | | 66,915,889 | |
| | | | | | | | | | | | | | | | |
The accompanying notes are an integral part of these financial statements.
| | | | |
| 62 | | Wells Fargo Allocation Funds | | Portfolio of investments—November 30, 2017 (unaudited) |
LARGE COMPANY VALUE PORTFOLIO
| | | | | | | | | | | | | | | | |
| Security name | | Yield | | | | | | Shares | | | Value | |
| | | | |
Short-Term Investments: 2.01% | | | | | | | | | | | | | | | | |
| | | | |
| Investment Companies: 2.01% | | | | | | | | | | | | | | | | |
Wells Fargo Government Money Market Fund Select Class (l)(u) | | | 1.00 | % | | | | | | | 1,379,139 | | �� | $ | 1,379,139 | |
| | | | | | | | | | | | | | | | |
| | | | |
Total Short-Term Investments (Cost $1,379,139) | | | | | | | | | | | | | | | 1,379,139 | |
| | | | | | | | | | | | | | | | |
| | | | | | | | |
| Total investments in securities (Cost $60,431,547) | | | 99.56 | % | | | 68,295,028 | |
Other assets and liabilities, net | | | 0.44 | | | | 303,537 | |
| | | | | | | | |
| Total net assets | | | 100.00 | % | | $ | 68,598,565 | |
| | | | | | | | |
| † | Non-income-earning security |
| (l) | The issuer of the security is an affiliated person of the Portfolio as defined in the Investment Company Act of 1940. |
| (u) | The rate represents the 7-day annualized yield at period end. |
Futures Contracts
| | | | | | | | | | | | | | | | | | | | | | | | |
| Description | | Number of
contracts | | | Expiration
date | | | Notional
cost | | | Notional
value | | | Unrealized
gains | | | Unrealized
losses | |
Long | | | | | | | | | | | | | | | | | | | | | | | | |
S&P 500 E-Mini Index | | | 11 | | | | 12-15-2017 | | | $ | 1,414,978 | | | $ | 1,456,345 | | | $ | 41,367 | | | $ | 0 | |
Investments in Affiliates
An affiliated investment is an investment in which the Portfolio owns at least 5% of the outstanding voting shares of the issuer or as a result of other relationships, such as the Portfolio and the issuer having the same investment manager. Transactions with issuers that were either affiliated persons of the Portfolio at the beginning of the period or the end of the period were as follows:
| | | | | | | | | | | | | | | | | | | | | | | | | | | | | | | | | | | | |
| | | Shares,
beginning of
period | | | Shares
purchased | | | Shares
sold | | | Shares,
end of
period | | | Net
realized
gains
(losses) | | | Net
change in
unrealized
gains
(losses) | | | Income
from
affiliated
securities | | | Value,
end
of period | | | % of
net
assets | |
Short-Term Investments | | | | | | | | | | | | | | | | | | | | | | | | | | | | | | | | | | | | |
Investment Companies | | | | | | | | | | | | | | | | | | | | | | | | | | | | | | | | | | | | |
Wells Fargo Government Money Market Fund Select Class | | | 1,468,513 | | | | 14,387,409 | | | | 14,476,783 | | | | 1,379,139 | | | $ | 0 | | | $ | 0 | | | $ | 5,604 | | | $ | 1,379,139 | | | | 2.01 | % |
The accompanying notes are an integral part of these financial statements.
| | | | | | |
| Portfolio of investments—November 30, 2017 (unaudited) | | Wells Fargo Allocation Funds | | | 63 | |
SMALL COMPANY GROWTH PORTFOLIO
| | | | | | | | | | | | | | | | |
| Security name | | | | | | | | Shares | | | Value | |
| | | | |
Common Stocks: 96.05% | | | | | | | | | | | | | | | | |
| | | | |
Consumer Discretionary: 10.73% | | | | | | | | | | | | | | | | |
| | | | |
| Auto Components: 0.62% | | | | | | | | | | | | | | | | |
Fox Factory Holding Corporation † | | | | | | | | | | | 290,450 | | | $ | 11,327,547 | |
| | | | | | | | | | | | | | | | |
| | | | |
| Diversified Consumer Services: 0.41% | | | | | | | | | | | | | | | | |
Houghton Mifflin Harcourt Company † | | | | | | | | | | | 770,692 | | | | 7,514,247 | |
| | | | | | | | | | | | | | | | |
| | | | |
| Hotels, Restaurants & Leisure: 3.86% | | | | | | | | | | | | | | | | |
Del Taco Restaurants Incorporated † | | | | | | | | | | | 467,155 | | | | 5,736,663 | |
Eldorado Resorts Incorporated †« | | | | | | | | | | | 537,203 | | | | 16,438,412 | |
Extended Stay America Incorporated | | | | | | | | | | | 916,351 | | | | 16,008,652 | |
International Game Technology | | | | | | | | | | | 872,370 | | | | 23,981,451 | |
Zoe’s Kitchen Incorporated †« | | | | | | | | | | | 527,231 | | | | 8,425,151 | |
| |
| | | | 70,590,329 | |
| | | | | | | | | | | | | | | | |
| | | | |
| Media: 1.49% | | | | | | | | | | | | | | | | |
IMAX Corporation †« | | | | | | | | | | | 421,145 | | | | 10,697,083 | |
Lions Gate Entertainment Class A | | | | | | | | | | | 200,397 | | | | 6,554,986 | |
Lions Gate Entertainment Class B † | | | | | | | | | | | 321,065 | | | | 9,965,858 | |
Media General Incorporated (a) | | | | | | | | | | | 347,897 | | | | 0 | |
| |
| | | | 27,217,927 | |
| | | | | | | | | | | | | | | | |
| | | | |
| Specialty Retail: 3.49% | | | | | | | | | | | | | | | | |
At Home Group Incorporated †« | | | | | | | | | | | 420,017 | | | | 11,605,070 | |
Burlington Stores Incorporated † | | | | | | | | | | | 188,276 | | | | 20,026,918 | |
Dick’s Sporting Goods Incorporated | | | | | | | | | | | 321,197 | | | | 9,462,464 | |
Monro Muffler Brake Incorporated « | | | | | | | | | | | 206,348 | | | | 10,410,257 | |
Party City Holdco Incorporated †« | | | | | | | | | | | 893,227 | | | | 12,415,855 | |
| |
| | | | 63,920,564 | |
| | | | | | | | | | | | | | | | |
| | | | |
| Textiles, Apparel & Luxury Goods: 0.86% | | | | | | | | | | | | | | | | |
G-III Apparel Group Limited † | | | | | | | | | | | 513,408 | | | | 15,812,966 | |
| | | | | | | | | | | | | | | | |
| | | | |
Consumer Staples: 2.31% | | | | | | | | | | | | | | | | |
| | | | |
| Food & Staples Retailing: 1.19% | | | | | | | | | | | | | | | | |
Performance Food Group Company † | | | | | | | | | | | 731,770 | | | | 21,696,981 | |
| | | | | | | | | | | | | | | | |
| | | | |
| Household Products: 1.12% | | | | | | | | | | | | | | | | |
Central Garden & Pet Company Class A † | | | | | | | | | | | 533,041 | | | | 20,559,391 | |
| | | | | | | | | | | | | | | | |
| | | | |
Energy: 1.22% | | | | | | | | | | | | | | | | |
| | | | |
| Oil, Gas & Consumable Fuels: 1.22% | | | | | | | | | | | | | | | | |
Diamondback Energy Incorporated † | | | | | | | | | | | 98,755 | | | | 10,794,909 | |
GasLog Limited « | | | | | | | | | | | 641,463 | | | | 11,546,334 | |
| |
| | | | 22,341,243 | |
| | | | | | | | | | | | | | | | |
The accompanying notes are an integral part of these financial statements.
| | | | |
| 64 | | Wells Fargo Allocation Funds | | Portfolio of investments—November 30, 2017 (unaudited) |
SMALL COMPANY GROWTH PORTFOLIO
| | | | | | | | | | | | | | | | |
| Security name | | | | | | | | Shares | | | Value | |
| | | | |
Financials: 9.13% | | | | | | | | | | | | | | | | |
| | | | |
| Banks: 2.51% | | | | | | | | | | | | | | | | |
ServisFirst Bancshares Incorporated | | | | | | | | | | | 317,091 | | | $ | 13,314,651 | |
Signature Bank † | | | | | | | | | | | 50,488 | | | | 6,930,993 | |
SVB Financial Group † | | | | | | | | | | | 112,882 | | | | 25,696,458 | |
| |
| | | | 45,942,102 | |
| | | | | | | | | | | | | | | | |
| | | | |
| Capital Markets: 3.94% | | | | | | | | | | | | | | | | |
Evercore Partners Incorporated Class A | | | | | | | | | | | 295,882 | | | | 25,697,352 | |
Stifel Financial Corporation | | | | | | | | | | | 354,531 | | | | 19,938,823 | |
Virtu Financial Incorporated Class A « | | | | | | | | | | | 784,293 | | | | 12,783,976 | |
Virtus Investment Partners Incorporated | | | | | | | | | | | 114,782 | | | | 13,779,579 | |
| |
| | | | 72,199,730 | |
| | | | | | | | | | | | | | | | |
| | | | |
| Insurance: 1.10% | | | | | | | | | | | | | | | | |
Argo Group International Holdings Limited | | | | | | | | | | | 327,508 | | | | 20,059,865 | |
| | | | | | | | | | | | | | | | |
| | | | |
| Thrifts & Mortgage Finance: 1.58% | | | | | | | | | | | | | | | | |
Essent Group Limited † | | | | | | | | | | | 521,401 | | | | 23,071,994 | |
Sterling Bancorp Incorporated †« | | | | | | | | | | | 470,289 | | | | 5,831,584 | |
| |
| | | | 28,903,578 | |
| | | | | | | | | | | | | | | | |
| | | | |
Health Care: 19.62% | | | | | | | | | | | | | | | | |
| | | | |
| Biotechnology: 4.99% | | | | | | | | | | | | | | | | |
Alnylam Pharmaceuticals Incorporated † | | | | | | | | | | | 95,124 | | | | 12,797,983 | |
Bioverativ Incorporated † | | | | | | | | | | | 194,487 | | | | 9,728,240 | |
Emergent BioSolutions Incorporated † | | | | | | | | | | | 286,551 | | | | 12,588,185 | |
Esperion Therapeutics Incorporated †« | | | | | | | | | | | 162,458 | | | | 9,992,792 | |
Flexion Therapeutics Incorporated †« | | | | | | | | | | | 415,702 | | | | 10,770,839 | |
Foundation Medicine Incorporated †« | | | | | | | | | | | 208,663 | | | | 11,100,872 | |
Galapagos NV †« | | | | | | | | | | | 74,432 | | | | 6,563,414 | |
Intercept Pharmaceuticals Incorporated †« | | | | | | | | | | | 75,810 | | | | 4,655,492 | |
Intrexon Corporation « | | | | | | | | | | | 411,870 | | | | 5,617,907 | |
Tesaro Incorporated †« | | | | | | | | | | | 89,776 | | | | 7,595,050 | |
| |
| | | | 91,410,774 | |
| | | | | | | | | | | | | | | | |
| | | | |
| Health Care Equipment & Supplies: 6.89% | | | | | | | | | | | | | | | | |
AngioDynamics Incorporated † | | | | | | | | | | | 347,100 | | | | 5,963,178 | |
Atricure Incorporated † | | | | | | | | | | | 623,547 | | | | 11,535,620 | |
Cerus Corporation †« | | | | | | | | | | | 1,765,555 | | | | 6,973,942 | |
DexCom Incorporated †« | | | | | | | | | | | 179,816 | | | | 10,506,649 | |
Glaukos Corporation †« | | | | | | | | | | | 341,928 | | | | 9,153,413 | |
Inogen Incorporated † | | | | | | | | | | | 136,134 | | | | 17,525,891 | |
K2M Group Holdings Incorporated † | | | | | | | | | | | 551,458 | | | | 10,841,664 | |
Nevro Corporation † | | | | | | | | | | | 224,340 | | | | 16,785,119 | |
Novocure Limited †« | | | | | | | | | | | 545,437 | | | | 10,499,662 | |
Tactile Systems Technology Class I †« | | | | | | | | | | | 376,991 | | | | 11,245,642 | |
Wright Medical Group NV †« | | | | | | | | | | | 619,784 | | | | 15,066,949 | |
| |
| | | | 126,097,729 | |
| | | | | | | | | | | | | | | | |
The accompanying notes are an integral part of these financial statements.
| | | | | | |
| Portfolio of investments—November 30, 2017 (unaudited) | | Wells Fargo Allocation Funds | | | 65 | |
SMALL COMPANY GROWTH PORTFOLIO
| | | | | | | | | | | | | | | | |
| Security name | | | | | | | | Shares | | | Value | |
| | | | |
| Health Care Providers & Services: 2.94% | | | | | | | | | | | | | | | | |
AMN Healthcare Services Incorporated †« | | | | | | | | | | | 327,306 | | | $ | 16,430,761 | |
HealthEquity Incorporated † | | | | | | | | | | | 427,073 | | | | 22,152,277 | |
Teladoc Incorporated †« | | | | | | | | | | | 413,525 | | | | 15,341,778 | |
| |
| | | | 53,924,816 | |
| | | | | | | | | | | | | | | | |
| | | | |
| Health Care Technology: 2.69% | | | | | | | | | | | | | | | | |
athenahealth Incorporated † | | | | | | | | | | | 90,570 | | | | 12,035,847 | |
Evolent Health Incorporated Class A †« | | | | | | | | | | | 1,107,692 | | | | 14,233,842 | |
Medidata Solutions Incorporated † | | | | | | | | | | | 212,326 | | | | 14,149,405 | |
Vocera Communications Incorporated † | | | | | | | | | | | 300,199 | | | | 8,795,831 | |
| |
| | | | 49,214,925 | |
| | | | | | | | | | | | | | | | |
| | | | |
| Life Sciences Tools & Services: 1.31% | | | | | | | | | | | | | | | | |
ICON plc ADR † | | | | | | | | | | | 204,842 | | | | 23,927,594 | |
| | | | | | | | | | | | | | | | |
| | | | |
| Pharmaceuticals: 0.80% | | | | | | | | | | | | | | | | |
Optinose Incorporated †« | | | | | | | | | | | 209,550 | | | | 4,000,310 | |
Pacira Pharmaceuticals Incorporated † | | | | | | | | | | | 230,137 | | | | 10,632,329 | |
| |
| | | | 14,632,639 | |
| | | | | | | | | | | | | | | | |
| | | | |
Industrials: 19.55% | | | | | | | | | | | | | | | | |
| | | | |
| Aerospace & Defense: 0.60% | | | | | | | | | | | | | | | | |
Kratos Defense & Security Solutions Incorporated † | | | | | | | | | | | 1,049,602 | | | | 10,947,349 | |
| | | | | | | | | | | | | | | | |
| | | | |
| Air Freight & Logistics: 0.67% | | | | | | | | | | | | | | | | |
Hub Group Incorporated Class A † | | | | | | | | | | | 256,022 | | | | 12,237,852 | |
| | | | | | | | | | | | | | | | |
| | | | |
| Building Products: 4.83% | | | | | | | | | | | | | | | | |
A.O. Smith Corporation | | | | | | | | | | | 353,932 | | | | 22,446,367 | |
Apogee Enterprises Incorporated | | | | | | | | | | | 316,976 | | | | 15,858,309 | |
JELD-WEN Holding Incorporated † | | | | | | | | | | | 280,740 | | | | 10,979,741 | |
Masonite International Corporation † | | | | | | | | | | | 179,023 | | | | 13,185,044 | |
NCI Building Systems Incorporated † | | | | | | | | | | | 853,392 | | | | 14,251,646 | |
PGT Incorporated † | | | | | | | | | | | 719,275 | | | | 11,760,146 | |
| |
| | | | 88,481,253 | |
| | | | | | | | | | | | | | | | |
| | | | |
| Commercial Services & Supplies: 2.53% | | | | | | | | | | | | | | | | |
Copart Incorporated † | | | | | | | | | | | 657,633 | | | | 28,383,440 | |
KAR Auction Services Incorporated | | | | | | | | | | | 355,991 | | | | 17,931,267 | |
| |
| | | | 46,314,707 | |
| | | | | | | | | | | | | | | | |
| | | | |
| Construction & Engineering: 1.67% | | | | | | | | | | | | | | | | |
Dycom Industries Incorporated † | | | | | | | | | | | 59,272 | | | | 6,364,035 | |
Granite Construction Incorporated | | | | | | | | | | | 365,204 | | | | 24,238,589 | |
| |
| | | | 30,602,624 | |
| | | | | | | | | | | | | | | | |
| | | | |
| Machinery: 4.45% | | | | | | | | | | | | | | | | |
EnPro Industries Incorporated | | | | | | | | | | | 222,732 | | | | 19,237,363 | |
Gardner Denver Holdings Incorporated † | | | | | | | | | | | 629,916 | | | | 20,415,578 | |
The accompanying notes are an integral part of these financial statements.
| | | | |
| 66 | | Wells Fargo Allocation Funds | | Portfolio of investments—November 30, 2017 (unaudited) |
SMALL COMPANY GROWTH PORTFOLIO
| | | | | | | | | | | | | | | | |
| Security name | | | | | | | | Shares | | | Value | |
| | | | |
| Machinery (continued) | | | | | | | | | | | | | | | | |
REV Group Incorporated | | | | | | | | | | | 499,651 | | | $ | 13,645,469 | |
SPX Corporation † | | | | | | | | | | | 531,944 | | | | 16,963,694 | |
Wabash National Corporation « | | | | | | | | | | | 556,575 | | | | 11,214,986 | |
| |
| | | | 81,477,090 | |
| | | | | | | | | | | | | | | | |
| | | | |
| Professional Services: 1.90% | | | | | | | | | | | | | | | | |
On Assignment Incorporated † | | | | | | | | | | | 420,611 | | | | 26,902,280 | |
RPX Corporation | | | | | | | | | | | 599,937 | | | | 7,913,169 | |
| |
| | | | 34,815,449 | |
| | | | | | | | | | | | | | | | |
| | | | |
| Road & Rail: 2.90% | | | | | | | | | | | | | | | | |
Genesee & Wyoming Incorporated Class A † | | | | | | | | | | | 246,237 | | | | 19,408,400 | |
Knight-Swift Transportation Holdings Incorporated | | | | | | | | | | | 354,207 | | | | 15,117,555 | |
Schneider National Incorporated Class B « | | | | | | | | | | | 704,545 | | | | 18,480,215 | |
| |
| | | | 53,006,170 | |
| | | | | | | | | | | | | | | | |
| | | | |
Information Technology: 28.69% | | | | | | | | | | | | | | | | |
| | | | |
| Communications Equipment: 0.98% | | | | | | | | | | | | | | | | |
Ciena Corporation † | | | | | | | | | | | 821,847 | | | | 17,875,172 | |
| | | | | | | | | | | | | | | | |
| | | | |
| Electronic Equipment, Instruments & Components: 1.72% | | | | | | | | | | | | | | | | |
OSI Systems Incorporated † | | | | | | | | | | | 173,626 | | | | 15,046,429 | |
Tech Data Corporation † | | | | | | | | | | | 170,060 | | | | 16,444,802 | |
| |
| | | | 31,491,231 | |
| | | | | | | | | | | | | | | | |
| | | | |
| Internet Software & Services: 6.86% | | | | | | | | | | | | | | | | |
2U Incorporated †« | | | | | | | | | | | 374,322 | | | | 23,994,040 | |
Benefitfocus Incorporated †« | | | | | | | | | | | 403,321 | | | | 10,929,999 | |
Cloudera Incorporated † | | | | | | | | | | | 747,114 | | | | 11,826,815 | |
Cornerstone OnDemand Incorporated † | | | | | | | | | | | 388,396 | | | | 14,359,000 | |
Hortonworks Incorporated † | | | | | | | | | | | 544,929 | | | | 10,359,100 | |
Mimecast Limited † | | | | | | | | | | | 368,128 | | | | 11,191,091 | |
New Relic Incorporated † | | | | | | | | | | | 334,176 | | | | 18,807,425 | |
Okta Incorporated † | | | | | | | | | | | 197,857 | | | | 5,779,403 | |
Shopify Incorporated Class A †« | | | | | | | | | | | 177,188 | | | | 18,395,658 | |
| |
| | | | 125,642,531 | |
| | | | | | | | | | | | | | | | |
| | | | |
| IT Services: 1.13% | | | | | | | | | | | | | | | | |
Acxiom Corporation † | | | | | | | | | | | 756,182 | | | | 20,605,960 | |
| | | | | | | | | | | | | | | | |
| | | | |
| Semiconductors & Semiconductor Equipment: 7.06% | | | | | | | | | | | | | | | | |
Axcelis Technologies Incorporated † | | | | | | | | | | | 469,657 | | | | 15,029,024 | |
Cypress Semiconductor Corporation | | | | | | | | | | | 1,566,963 | | | | 25,087,078 | |
FormFactor Incorporated † | | | | | | | | | | | 1,161,867 | | | | 19,054,619 | |
Microsemi Corporation † | | | | | | | | | | | 437,436 | | | | 23,118,493 | |
Nanometrics Incorporated † | | | | | | | | | | | 347,895 | | | | 8,753,038 | |
Silicon Motion Technology Corporation ADR « | | | | | | | | | | | 254,752 | | | | 13,185,964 | |
Teradyne Incorporated | | | | | | | | | | | 616,929 | | | | 24,967,117 | |
| |
| | | | 129,195,333 | |
| | | | | | | | | | | | | | | | |
The accompanying notes are an integral part of these financial statements.
| | | | | | |
| Portfolio of investments—November 30, 2017 (unaudited) | | Wells Fargo Allocation Funds | | | 67 | |
SMALL COMPANY GROWTH PORTFOLIO
| | | | | | | | | | | | | | | | |
| Security name | | | | | | | | Shares | | | Value | |
| | | | |
| Software: 10.94% | | | | | | | | | | | | | | | | |
Atlassian Corporation plc Class A † | | | | | | | | | | | 343,591 | | | $ | 16,042,264 | |
Cadence Design Systems Incorporated † | | | | | | | | | | | 612,201 | | | | 26,881,746 | |
CyberArk Software Limited †« | | | | | | | | | | | 262,991 | | | | 12,376,356 | |
Nuance Communications Incorporated † | | | | | | | | | | | 1,014,522 | | | | 15,765,672 | |
PTC Incorporated † | | | | | | | | | | | 458,731 | | | | 29,211,990 | |
RealPage Incorporated † | | | | | | | | | | | 540,615 | | | | 24,516,890 | |
Sailpoint Technologies Holding † | | | | | | | | | | | 26,340 | | | | 387,198 | |
SS&C Technologies Holdings Incorporated | | | | | | | | | | | 861,135 | | | | 35,556,264 | |
Talend SA ADR † | | | | | | | | | | | 263,371 | | | | 10,526,939 | |
The Ultimate Software Group Incorporated † | | | | | | | | | | | 62,838 | | | | 13,260,703 | |
Zendesk Incorporated † | | | | | | | | | | | 471,259 | | | | 15,839,015 | |
| |
| | | | 200,365,037 | |
| | | | | | | | | | | | | | | | |
| | | | |
Materials: 3.55% | | | | | | | | | | | | | | | | |
| | | | |
| Chemicals: 0.56% | | | | | | | | | | | | | | | | |
KMG Chemicals Incorporated | | | | | | | | | | | 188,641 | | | | 10,260,184 | |
| | | | | | | | | | | | | | | | |
| | | | |
| Metals & Mining: 1.83% | | | | | | | | | | | | | | | | |
Carpenter Technology Corporation | | | | | | | | | | | 338,651 | | | | 16,739,519 | |
Steel Dynamics Incorporated | | | | | | | | | | | 434,392 | | | | 16,724,092 | |
| |
| | | | 33,463,611 | |
| | | | | | | | | | | | | | | | |
| | | | |
| Paper & Forest Products: 1.16% | | | | | | | | | | | | | | | | |
Boise Cascade Company | | | | | | | | | | | 554,198 | | | | 21,336,623 | |
| | | | | | | | | | | | | | | | |
| | | | |
Real Estate: 1.25% | | | | | | | | | | | | | | | | |
| | | | |
| Equity REITs: 1.25% | | | | | | | | | | | | | | | | |
QTS Realty Trust Incorporated Class A | | | | | | | | | | | 411,310 | | | | 22,893,515 | |
| | | | | | | | | | | | | | | | |
| | | | |
Total Common Stocks (Cost $1,220,678,018) | | | | | | | | | | | | | | | 1,758,306,638 | |
| | | | | | | | | | | | | | | | |
| | | | |
| | | Yield | | | | | | | | | | |
| Short-Term Investments: 16.58% | | | | | | | | | | | | | | | | |
| | | | |
| Investment Companies: 16.58% | | | | | | | | | | | | | | | | |
Securities Lending Cash Investment LLC (l)(r)(u) | | | 1.29 | % | | | | | | | 235,213,579 | | | | 235,237,100 | |
Wells Fargo Government Money Market Fund Select Class (l)(u) | | | 1.00 | | | | | | | | 68,328,716 | | | | 68,328,716 | |
| | | | |
Total Short-Term Investments (Cost $303,552,950) | | | | | | | | | | | | | | | 303,565,816 | |
| | | | | | | | | | | | | | | | |
| | | | | | | | |
| Total investments in securities (Cost $1,524,230,968) | | | 112.63 | % | | | 2,061,872,454 | |
Other assets and liabilities, net | | | (12.63 | ) | | | (231,152,167 | ) |
| | | | | | | | |
| Total net assets | | | 100.00 | % | | $ | 1,830,720,287 | |
| | | | | | | | |
| † | Non-income-earning security |
| « | All or a portion of this security is on loan. |
| (a) | The security is fair valued in accordance with procedures approved by the Board of Trustees. |
| (l) | The issuer of the security is an affiliated person of the Portfolio as defined in the Investment Company Act of 1940. |
| (r) | The investment is a non-registered investment company purchased with cash collateral received from securities on loan. |
| (u) | The rate represents the 7-day annualized yield at period end. |
The accompanying notes are an integral part of these financial statements.
| | | | |
| 68 | | Wells Fargo Allocation Funds | | Portfolio of investments—November 30, 2017 (unaudited) |
SMALL COMPANY GROWTH PORTFOLIO
Investments in Affiliates
An affiliated investment is an investment in which the Portfolio owns at least 5% of the outstanding voting shares of the issuer or as a result of other relationships, such as the Portfolio and the issuer having the same investment manager. Transactions with issuers that were either affiliated persons of the Portfolio at the beginning of the period or the end of the period were as follows:
| | | | | | | | | | | | | | | | | | | | | | | | | | | | | | | | | | | | |
| | | Shares,
beginning of
period | | | Shares
purchased | | | Shares
sold | | | Shares,
end of
period | | | Net
realized
gains
(losses) | | | Net
change in
unrealized
gains
(losses) | | | Income
from
affiliated
securities | | | Value,
end
of period | | | % of
net
assets | |
Short-Term Investments | | | | | | | | | | | | | | | | | | | | | | | | | | | | | | | | | | | | |
Investment Companies | | | | | | | | | | | | | | | | | | | | | | | | | | | | | | | | | | | | |
Securities Lending Cash Investment LLC | | | 205,550,129 | | | | 473,115,600 | | | | 443,452,150 | | | | 235,213,579 | | | $ | 715 | | | $ | 0 | | | $ | 1,152,106 | | | $ | 235,237,100 | | | | | |
Wells Fargo Government Money Market Fund Select Class | | | 62,006,657 | | | | 203,531,569 | | | | 197,209,510 | | | | 68,328,716 | | | | 0 | | | | 0 | | | | 311,315 | | | | 68,328,716 | | | | | |
| | | | | | | | | | | | | | | | | | | | | | | | | | | | | | | | | | | | |
| | | | | | | | | | | | | | | | | | $ | 715 | | | $ | 0 | | | $ | 1,463,421 | | | $ | 303,565,816 | | | | 16.58 | % |
| | | | | | | | | | | | | | | | | | | | | | | | | | | | | | | | | | | | |
The accompanying notes are an integral part of these financial statements.
| | | | | | |
| Portfolio of investments—November 30, 2017 (unaudited) | | Wells Fargo Allocation Funds | | | 69 | |
SMALL COMPANY VALUE PORTFOLIO
| | | | | | | | | | | | | | | | |
| Security name | | | | | | | | Shares | | | Value | |
| | | | |
Common Stocks: 97.37% | | | | | | | | | | | | | | | | |
| | | | |
Consumer Discretionary: 18.48% | | | | | | | | | | | | | | | | |
| | | | |
| Auto Components: 2.33% | | | | | | | | | | | | | | | | |
American Axle & Manufacturing Holdings Incorporated † | | | | | | | | | | | 76,335 | | | $ | 1,370,211 | |
Visteon Corporation † | | | | | | | | | | | 18,480 | | | | 2,433,631 | |
| | | | |
| | | | | | | | | | | | | | | 3,803,842 | |
| | | | | | | | | | | | | | | | |
| | | | |
| Diversified Consumer Services: 1.50% | | | | | | | | | | | | | | | | |
Adtalem Global Education Incorporated | | | | | | | | | | | 59,226 | | | | 2,454,918 | |
| | | | | | | | | | | | | | | | |
| | | | |
| Hotels, Restaurants & Leisure: 4.42% | | | | | | | | | | | | | | | | |
Eldorado Resorts Incorporated †« | | | | | | | | | | | 88,176 | | | | 2,698,186 | |
Extended Stay America Incorporated | | | | | | | | | | | 79,072 | | | | 1,381,388 | |
Red Robin Gourmet Burgers Incorporated † | | | | | | | | | | | 33,872 | | | | 1,774,893 | |
SeaWorld Entertainment Incorporated †« | | | | | | | | | | | 117,152 | | | | 1,376,536 | |
| | | | |
| | | | | | | | | | | | | | | 7,231,003 | |
| | | | | | | | | | | | | | | | |
| | | | |
| Household Durables: 3.50% | | | | | | | | | | | | | | | | |
Century Communities Incorporated † | | | | | | | | | | | 75,397 | | | | 2,363,696 | |
Taylor Morrison Home Corporation Class A † | | | | | | | | | | | 57,172 | | | | 1,381,276 | |
TRI Pointe Homes Incorporated † | | | | | | | | | | | 109,509 | | | | 1,984,303 | |
| | | | |
| | | | | | | | | | | | | | | 5,729,275 | |
| | | | | | | | | | | | | | | | |
| | | | |
| Internet & Direct Marketing Retail: 1.03% | | | | | | | | | | | | | | | | |
1-800-Flowers.com Incorporated Class A † | | | | | | | | | | | 164,102 | | | | 1,682,046 | |
| | | | | | | | | | | | | | | | |
| | | | |
| Media: 3.14% | | | | | | | | | | | | | | | | |
AMC Entertainment Holdings Class A « | | | | | | | | | | | 81,261 | | | | 1,157,969 | |
IMAX Corporation †« | | | | | | | | | | | 64,653 | | | | 1,642,186 | |
Regal Entertainment Group Class A « | | | | | | | | | | | 115,133 | | | | 2,326,838 | |
| | | | |
| | | | | | | | | | | | | | | 5,126,993 | |
| | | | | | | | | | | | | | | | |
| | | | |
| Specialty Retail: 1.66% | | | | | | | | | | | | | | | | |
Asbury Automotive Group Incorporated † | | | | | | | | | | | 19,691 | | | | 1,295,668 | |
Urban Outfitters Incorporated †« | | | | | | | | | | | 45,519 | | | | 1,416,551 | |
| | | | |
| | | | | | | | | | | | | | | 2,712,219 | |
| | | | | | | | | | | | | | | | |
| | | | |
| Textiles, Apparel & Luxury Goods: 0.90% | | | | | | | | | | | | | | | | |
Oxford Industries Incorporated | | | | | | | | | | | 21,281 | | | | 1,468,389 | |
| | | | | | | | | | | | | | | | |
| | | | |
Consumer Staples: 1.73% | | | | | | | | | | | | | | | | |
| | | | |
| Food & Staples Retailing: 0.69% | | | | | | | | | | | | | | | | |
United Natural Foods Incorporated † | | | | | | | | | | | 23,356 | | | | 1,121,555 | |
| | | | | | | | | | | | | | | | |
| | | | |
| Food Products: 1.04% | | | | | | | | | | | | | | | | |
Darling Ingredients Incorporated † | | | | | | | | | | | 94,718 | | | | 1,700,188 | |
| | | | | | | | | | | | | | | | |
The accompanying notes are an integral part of these financial statements.
| | | | |
| 70 | | Wells Fargo Allocation Funds | | Portfolio of investments—November 30, 2017 (unaudited) |
SMALL COMPANY VALUE PORTFOLIO
| | | | | | | | | | | | | | | | |
| Security name | | | | | | | | Shares | | | Value | |
| | | | |
Energy: 5.22% | | | | | | | | | | | | | | | | |
| | | | |
| Energy Equipment & Services: 2.21% | | | | | | | | | | | | | | | | |
Basic Energy Services Incorporated † | | | | | | | | | | | 40,880 | | | $ | 914,486 | |
C&J Energy Services Incorporated † | | | | | | | | | | | 43,195 | | | | 1,350,276 | |
Unit Corporation † | | | | | | | | | | | 63,413 | | | | 1,356,404 | |
| | | | |
| | | | | | | | | | | | | | | 3,621,166 | |
| | | | | | | | | | | | | | | | |
| | | | |
| Oil, Gas & Consumable Fuels: 3.01% | | | | | | | | | | | | | | | | |
Callon Petroleum Company † | | | | | | | | | | | 99,424 | | | | 1,097,641 | |
Delek US Holdings Incorporated | | | | | | | | | | | 58,048 | | | | 1,928,355 | |
Scorpio Tankers Incorporated | | | | | | | | | | | 310,064 | | | | 961,198 | |
SM Energy Company | | | | | | | | | | | 45,045 | | | | 929,729 | |
| | | | |
| | | | | | | | | | | | | | | 4,916,923 | |
| | | | | | | | | | | | | | | | |
| | | | |
Financials: 28.11% | | | | | | | | | | | | | | | | |
| | | | |
| Banks: 18.59% | | | | | | | | | | | | | | | | |
Berkshire Hills Bancorp Incorporated | | | | | | | | | | | 42,006 | | | | 1,619,331 | |
Cathay General Bancorp | | | | | | | | | | | 44,756 | | | | 1,941,963 | |
Chemical Financial Corporation | | | | | | | | | | | 33,845 | | | | 1,908,520 | |
ConnectOne Bancorp Incorporated | | | | | | | | | | | 49,823 | | | | 1,352,694 | |
Customers Bancorp Incorporated † | | | | | | | | | | | 45,909 | | | | 1,244,134 | |
FCB Financial Holdings Class A † | | | | | | | | | | | 33,189 | | | | 1,754,039 | |
First Bancorp Corporation | | | | | | | | | | | 36,107 | | | | 1,368,455 | |
FNB Corporation | | | | | | | | | | | 111,754 | | | | 1,585,789 | |
Great Western Bancorp Incorporated | | | | | | | | | | | 41,989 | | | | 1,734,985 | |
Green Bancorp Incorporated † | | | | | | | | | | | 58,235 | | | | 1,304,464 | |
Independent Bank Group Incorporated | | | | | | | | | | | 32,387 | | | | 2,231,464 | |
MB Financial Incorporated | | | | | | | | | | | 37,507 | | | | 1,745,951 | |
Opus Bank † | | | | | | | | | | | 41,498 | | | | 1,157,794 | |
Renasant Corporation | | | | | | | | | | | 35,782 | | | | 1,540,057 | |
Simmons First National Corporation Class A | | | | | | | | | | | 28,151 | | | | 1,629,943 | |
Sterling BanCorp | | | | | | | | | | | 66,949 | | | | 1,697,157 | |
Valley National Bancorp | | | | | | | | | | | 118,465 | | | | 1,409,734 | |
WesBanco Incorporated | | | | | | | | | | | 35,263 | | | | 1,483,514 | |
Wintrust Financial Corporation | | | | | | | | | | | 20,024 | | | | 1,679,012 | |
| | | | |
| | | | | | | | | | | | | | | 30,389,000 | |
| | | | | | | | | | | | | | | | |
| | | | |
| Capital Markets: 0.94% | | | | | | | | | | | | | | | | |
Stifel Financial Corporation | | | | | | | | | | | 27,460 | | | | 1,544,350 | |
| | | | | | | | | | | | | | | | |
| | | | |
| Consumer Finance: 1.90% | | | | | | | | | | | | | | | | |
Encore Capital Group Incorporated †« | | | | | | | | | | | 36,347 | | | | 1,664,693 | |
PRA Group Incorporated † | | | | | | | | | | | 41,545 | | | | 1,445,766 | |
| | | | |
| | | | | | | | | | | | | | | 3,110,459 | |
| | | | | | | | | | | | | | | | |
| | | | |
| Insurance: 4.98% | | | | | | | | | | | | | | | | |
Horace Mann Educators Corporation | | | | | | | | | | | 44,031 | | | | 2,056,248 | |
James River Group Holdings Limited | | | | | | | | | | | 35,044 | | | | 1,418,581 | |
The accompanying notes are an integral part of these financial statements.
| | | | | | |
| Portfolio of investments—November 30, 2017 (unaudited) | | Wells Fargo Allocation Funds | | | 71 | |
SMALL COMPANY VALUE PORTFOLIO
| | | | | | | | | | | | | | | | |
| Security name | | | | | | | | Shares | | | Value | |
| | | | |
| Insurance (continued) | | | | | | | | | | | | | | | | |
Kemper Corporation | | | | | | | | | | | 36,118 | | | $ | 2,492,142 | |
Primerica Incorporated | | | | | | | | | | | 20,857 | | | | 2,169,128 | |
| | | | |
| | | | | | | | | | | | | | | 8,136,099 | |
| | | | | | | | | | | | | | | | |
| | | | |
| Thrifts & Mortgage Finance: 1.70% | | | | | | | | | | | | | | | | |
Bofi Holding Incorporated †« | | | | | | | | | | | 61,382 | | | | 1,696,598 | |
Dime Community Bancshares | | | | | | | | | | | 49,282 | | | | 1,086,668 | |
| | | | |
| | | | | | | | | | | | | | | 2,783,266 | |
| | | | | | | | | | | | | | | | |
| | | | |
Health Care: 7.48% | | | | | | | | | | | | | | | | |
| | | | |
| Health Care Equipment & Supplies: 2.32% | | | | | | | | | | | | | | | | |
Lantheus Holdings Incorporated † | | | | | | | | | | | 70,510 | | | | 1,579,424 | |
Merit Medical Systems Incorporated † | | | | | | | | | | | 50,814 | | | | 2,207,868 | |
| | | | |
| | | | | | | | | | | | | | | 3,787,292 | |
| | | | | | | | | | | | | | | | |
| | | | |
| Health Care Providers & Services: 4.14% | | | | | | | | | | | | | | | | |
AMN Healthcare Services Incorporated † | | | | | | | | | | | 36,978 | | | | 1,856,296 | |
Magellan Health Services Incorporated † | | | | | | | | | | | 18,777 | | | | 1,586,657 | |
MEDNAX Incorporated † | | | | | | | | | | | 34,905 | | | | 1,737,920 | |
Premier Incorporated Class A † | | | | | | | | | | | 54,835 | | | | 1,591,312 | |
| | | | |
| | | | | | | | | | | | | | | 6,772,185 | |
| | | | | | | | | | | | | | | | |
| | | | |
| Life Sciences Tools & Services: 1.02% | | | | | | | | | | | | | | | | |
Cambrex Corporation † | | | | | | | | | | | 34,093 | | | | 1,665,443 | |
| | | | | | | | | | | | | | | | |
| | | | |
Industrials: 8.12% | | | | | | | | | | | | | | | | |
| | | | |
| Aerospace & Defense: 0.71% | | | | | | | | | | | | | | | | |
Triumph Group Incorporated | | | | | | | | | | | 37,505 | | | | 1,158,905 | |
| | | | | | | | | | | | | | | | |
| | | | |
| Building Products: 0.91% | | | | | | | | | | | | | | | | |
Builders FirstSource Incorporated † | | | | | | | | | | | 73,411 | | | | 1,497,584 | |
| | | | | | | | | | | | | | | | |
| | | | |
| Commercial Services & Supplies: 2.10% | | | | | | | | | | | | | | | | |
Interface Incorporated | | | | | | | | | | | 87,264 | | | | 2,177,237 | |
LSC Communications Incorporated | | | | | | | | | | | 77,012 | | | | 1,259,916 | |
| | | | |
| | | | | | | | | | | | | | | 3,437,153 | |
| | | | | | | | | | | | | | | | |
| | | | |
| Construction & Engineering: 0.82% | | | | | | | | | | | | | | | | |
KBR Incorporated | | | | | | | | | | | 71,350 | | | | 1,337,813 | |
| | | | | | | | | | | | | | | | |
| | | | |
| Road & Rail: 1.02% | | | | | | | | | | | | | | | | |
Hertz Global Holdings Incorporated †« | | | | | | | | | | | 87,721 | | | | 1,662,313 | |
| | | | | | | | | | | | | | | | |
| | | | |
| Trading Companies & Distributors: 2.56% | | | | | | | | | | | | | | | | |
Air Lease Corporation | | | | | | | | | | | 50,209 | | | | 2,174,050 | |
Triton International Limited | | | | | | | | | | | 50,682 | | | | 2,005,487 | |
| | | | |
| | | | | | | | | | | | | | | 4,179,537 | |
| | | | | | | | | | | | | | | | |
The accompanying notes are an integral part of these financial statements.
| | | | |
| 72 | | Wells Fargo Allocation Funds | | Portfolio of investments—November 30, 2017 (unaudited) |
SMALL COMPANY VALUE PORTFOLIO
| | | | | | | | | | | | | | | | |
| Security name | | | | | | | | Shares | | | Value | |
| | | | |
Information Technology: 12.78% | | | | | | | | | | | | | | | | |
| | | | |
| Communications Equipment: 1.53% | | | | | | | | | | | | | | | | |
Comtech Telecommunications Corporation | | | | | | | | | | | 37,035 | | | $ | 802,548 | |
Finisar Corporation †« | | | | | | | | | | | 84,545 | | | | 1,691,745 | |
| | | | |
| | | | | | | | | | | | | | | 2,494,293 | |
| | | | | | | | | | | | | | | | |
| | | | |
| Electronic Equipment, Instruments & Components: 3.75% | | | | | | | | | | | | | | | | |
Anixter International Incorporated † | | | | | | | | | | | 21,110 | | | | 1,509,365 | |
TTM Technologies Incorporated † | | | | | | | | | | | 118,506 | | | | 1,935,203 | |
VeriFone Systems Incorporated † | | | | | | | | | | | 65,172 | | | | 1,130,082 | |
Vishay Intertechnology Incorporated « | | | | | | | | | | | 71,022 | | | | 1,555,382 | |
| | | | |
| | | | | | | | | | | | | | | 6,130,032 | |
| | | | | | | | | | | | | | | | |
| | | | |
| IT Services: 1.06% | | | | | | | | | | | | | | | | |
Virtusa Corporation † | | | | | | | | | | | 37,546 | | | | 1,740,257 | |
| | | | | | | | | | | | | | | | |
| | | | |
| Semiconductors & Semiconductor Equipment: 4.84% | | | | | | | | | | | | | | | | |
Cirrus Logic Incorporated † | | | | | | | | | | | 30,705 | | | | 1,696,144 | |
Cypress Semiconductor Corporation | | | | | | | | | | | 166,766 | | | | 2,669,924 | |
FormFactor Incorporated † | | | | | | | | | | | 101,781 | | | | 1,669,208 | |
Synaptics Incorporated † | | | | | | | | | | | 17,951 | | | | 677,471 | |
Veeco Instruments Incorporated † | | | | | | | | | | | 74,180 | | | | 1,198,007 | |
| | | | |
| | | | | | | | | | | | | | | 7,910,754 | |
| | | | | | | | | | | | | | | | |
| | | | |
| Software: 1.18% | | | | | | | | | | | | | | | | |
Tivo Corporation | | | | | | | | | | | 108,643 | | | | 1,933,845 | |
| | | | | | | | | | | | | | | | |
| | | | |
| Technology Hardware, Storage & Peripherals: 0.42% | | | | | | | | | | | | | | | | |
Super Micro Computer Incorporated † | | | | | | | | | | | 31,241 | | | | 688,864 | |
| | | | | | | | | | | | | | | | |
| | | | |
Materials: 2.90% | | | | | | | | | | | | | | | | |
| | | | |
| Chemicals: 2.17% | | | | | | | | | | | | | | | | |
A. Schulman Incorporated | | | | | | | | | | | 51,598 | | | | 1,958,144 | |
Cabot Corporation | | | | | | | | | | | 26,069 | | | | 1,596,466 | |
| | | | |
| | | | | | | | | | | | | | | 3,554,610 | |
| | | | | | | | | | | | | | | | |
| | | | |
| Construction Materials: 0.46% | | | | | | | | | | | | | | | | |
Forterra Incorporated †« | | | | | | | | | | | 76,194 | | | | 749,749 | |
| | | | | | | | | | | | | | | | |
| | | | |
| Metals & Mining: 0.27% | | | | | | | | | | | | | | | | |
AK Steel Holding Corporation †« | | | | | | | | | | | 90,244 | | | | 439,488 | |
| | | | | | | | | | | | | | | | |
| | | | |
Real Estate: 8.97% | | | | | | | | | | | | | | | | |
| | | | |
| Equity REITs: 8.28% | | | | | | | | | | | | | | | | |
Brandywine Realty Trust | | | | | | | | | | | 92,770 | | | | 1,598,427 | |
Corporate Office Properties Trust | | | | | | | | | | | 50,274 | | | | 1,525,313 | |
Cousins Properties Incorporated | | | | | | | | | | | 187,202 | | | | 1,679,202 | |
Equity Commonwealth † | | | | | | | | | | | 50,674 | | | | 1,523,260 | |
Four Corners Property Trust Incorporated | | | | | | | | | | | 51,387 | | | | 1,341,201 | |
Kite Realty Group Trust | | | | | | | | | | | 63,176 | | | | 1,214,874 | |
The accompanying notes are an integral part of these financial statements.
| | | | | | |
| Portfolio of investments—November 30, 2017 (unaudited) | | Wells Fargo Allocation Funds | | | 73 | |
SMALL COMPANY VALUE PORTFOLIO
| | | | | | | | | | | | | | | | |
| Security name | | | | | | | | Shares | | | Value | |
| | | | |
| Equity REITs (continued) | | | | | | | | | | | | | | | | |
Pebblebrook Hotel Trust « | | | | | | | | | | | 39,755 | | | $ | 1,529,375 | |
Ramco-Gershenson Properties Trust | | | | | | | | | | | 96,504 | | | | 1,390,623 | |
Sunstone Hotel Investors Incorporated | | | | | | | | | | | 104,194 | | | | 1,741,082 | |
| | | | |
| | | | | | | | | | | | | | | 13,543,357 | |
| | | | | | | | | | | | | | | | |
| | | | |
| Real Estate Management & Development: 0.69% | | | | | | | | | | | | | | | | |
Alexander & Baldwin Incorporated | | | | | | | | | | | 38,728 | | | | 1,125,436 | |
| | | | | | | | | | | | | | | | |
| | | | |
Utilities: 3.58% | | | | | | | | | | | | | | | | |
| | | | |
| Electric Utilities: 3.58% | | | | | | | | | | | | | | | | |
ALLETE Incorporated | | | | | | | | | | | 20,539 | | | | 1,653,390 | |
El Paso Electric Company | | | | | | | | | | | 35,634 | | | | 2,170,111 | |
Portland General Electric Company | | | | | | | | | | | 24,014 | | | | 1,192,055 | |
Spark Energy Incorporated Class A « | | | | | | | | | | | 67,073 | | | | 838,413 | |
| | | | |
| | | | | | | | | | | | | | | 5,853,969 | |
| | | | | | | | | | | | | | | | |
| | | | |
Total Common Stocks (Cost $124,496,217) | | | | | | | | | | | | | | | 159,194,570 | |
| | | | | | | | | | | | | | | | |
| | | | |
| | | Yield | | | | | | | | | | |
| Short-Term Investments: 13.80% | | | | | | | | | | | | | | | | |
| | | | |
| Investment Companies: 13.80% | | | | | | | | | | | | | | | | |
Securities Lending Cash Investment LLC (l)(r)(u) | | | 1.29 | % | | | | | | | 19,498,529 | | | | 19,500,479 | |
Wells Fargo Government Money Market Fund Select Class (l)(u) | | | 1.00 | | | | | | | | 3,068,712 | | | | 3,068,712 | |
| | | | |
Total Short-Term Investments (Cost $22,568,547) | | | | | | | | | | | | | | | 22,569,191 | |
| | | | | | | | | | | | | | | | |
| | | | | | | | |
| Total investments in securities (Cost $147,064,764) | | | 111.17 | % | | | 181,763,761 | |
Other assets and liabilities, net | | | (11.17 | ) | | | (18,269,435 | ) |
| | | | | | | | |
| Total net assets | | | 100.00 | % | | $ | 163,494,326 | |
| | | | | | | | |
| † | Non-income-earning security |
| « | All or a portion of this security is on loan. |
| (l) | The issuer of the security is an affiliated person of the Portfolio as defined in the Investment Company Act of 1940. |
| (r) | The investment is a non-registered investment company purchased with cash collateral received from securities on loan. |
| (u) | The rate represents the 7-day annualized yield at period end. |
Investments in Affiliates
An affiliated investment is an investment in which the Portfolio owns at least 5% of the outstanding voting shares of the issuer or as a result of other relationships, such as the Portfolio and the issuer having the same investment manager. Transactions with issuers that were either affiliated persons of the Portfolio at the beginning of the period or the end of the period were as follows:
| | | | | | | | | | | | | | | | | | | | | | | | | | | | | | | | | | | | |
| | | Shares,
beginning of
period | | | Shares
purchased | | | Shares
sold | | | Shares,
end of
period | | | Net
realized
gains
(losses) | | | Net
change in
unrealized
gains
(losses) | | | Income
from
affiliated
securities | | | Value,
end
of period | | | % of
net
assets | |
Short-Term Investments | | | | | | | | | | | | | | | | | | | | | | | | | | | | | | | | | | | | |
Investment Companies | | | | | | | | | | | | | | | | | | | | | | | | | | | | | | | | | | | | |
Securities Lending Cash Investment LLC | | | 13,908,596 | | | | 82,168,302 | | | | 76,578,369 | | | | 19,498,529 | | | $ | 30 | | | $ | 0 | | | $ | 185,687 | | | $ | 19,500,479 | | | | | |
Wells Fargo Government Money Market Fund Select Class | | | 4,735,638 | | | | 39,645,032 | | | | 41,311,958 | | | | 3,068,712 | | | | 0 | | | | 0 | | | | 27,897 | | | | 3,068,712 | | | | | |
| | | | | | | | | | | | | | | | | | | | | | | | | | | | | | | | | | | | |
| | | | | | | | | | | | | | | | | | $ | 30 | | | $ | 0 | | | $ | 213,584 | | | $ | 22,569,191 | | | | 13.80 | % |
| | | | | | | | | | | | | | | | | | | | | | | | | | | | | | | | | | | | |
The accompanying notes are an integral part of these financial statements.
| | | | |
| 74 | | Wells Fargo Allocation Funds | | Portfolio of investments—November 30, 2017 (unaudited) |
CORE BOND PORTFOLIO
| | | | | | | | | | | | | | | | |
| Security name | | Interest rate | | | Maturity date | | | Principal | | | Value | |
| | | | |
Agency Securities: 28.64% | | | | | | | | | | | | | | | | |
FHLB | | | 3.50 | % | | | 6-1-2032 | | | $ | 2,658,242 | | | $ | 2,765,770 | |
FHLB | | | 3.50 | | | | 7-1-2032 | | | | 6,950,225 | | | | 7,270,075 | |
FHLB | | | 4.00 | | | | 6-1-2032 | | | | 335,828 | | | | 348,539 | |
FHLB | | | 4.50 | | | | 3-1-2041 | | | | 715,526 | | | | 774,731 | |
FHLB | | | 4.50 | | | | 5-1-2045 | | | | 297,796 | | | | 322,036 | |
FHLMC (12 Month LIBOR +1.63%) ± | | | 2.62 | | | | 7-1-2046 | | | | 10,137,610 | | | | 10,227,162 | |
FHLMC (a) | | | 3.00 | | | | 10-15-2047 | | | | 36,778,000 | | | | 36,736,338 | |
FHLMC (12 Month LIBOR +1.62%) ± | | | 3.09 | | | | 2-1-2045 | | | | 2,349,520 | | | | 2,394,279 | |
FHLMC | | | 3.50 | | | | 9-1-2026 | | | | 1,039,625 | | | | 1,083,167 | |
FHLMC | | | 3.50 | | | | 12-1-2029 | | | | 29,684,720 | | | | 30,885,214 | |
FHLMC | | | 3.50 | | | | 4-1-2030 | | | | 6,254,805 | | | | 6,505,425 | |
FHLMC | | | 3.50 | | | | 6-1-2030 | | | | 1,784,825 | | | | 1,856,375 | |
FHLMC | | | 3.50 | | | | 7-1-2030 | | | | 2,200,656 | | | | 2,288,885 | |
FHLMC | | | 3.50 | | | | 7-1-2030 | | | | 2,587,631 | | | | 2,691,458 | |
FHLMC | | | 3.50 | | | | 8-1-2030 | | | | 423,622 | | | | 440,659 | |
FHLMC | | | 3.50 | | | | 8-1-2030 | | | | 2,574,368 | | | | 2,677,631 | |
FHLMC | | | 3.50 | | | | 10-1-2030 | | | | 1,006,313 | | | | 1,047,094 | |
FHLMC | | | 3.50 | | | | 10-1-2030 | | | | 478,321 | | | | 497,514 | |
FHLMC | | | 3.50 | | | | 10-1-2030 | | | | 400,550 | | | | 416,771 | |
FHLMC | | | 3.50 | | | | 10-1-2030 | | | | 748,771 | | | | 778,754 | |
FHLMC | | | 3.50 | | | | 10-1-2030 | | | | 1,172,335 | | | | 1,220,370 | |
FHLMC | | | 3.50 | | | | 11-1-2030 | | | | 1,686,352 | | | | 1,756,891 | |
FHLMC | | | 3.50 | | | | 11-1-2030 | | | | 3,338,965 | | | | 3,475,776 | |
FHLMC | | | 3.50 | | | | 11-1-2030 | | | | 1,915,766 | | | | 1,993,345 | |
FHLMC | | | 3.50 | | | | 1-1-2031 | | | | 2,326,946 | | | | 2,425,251 | |
FHLMC | | | 3.50 | | | | 1-1-2031 | | | | 395,289 | | | | 411,460 | |
FHLMC | | | 3.50 | | | | 1-1-2031 | | | | 5,705,934 | | | | 5,937,400 | |
FHLMC | | | 3.50 | | | | 2-1-2031 | | | | 822,387 | | | | 857,137 | |
FHLMC | | | 3.50 | | | | 11-1-2031 | | | | 524,899 | | | | 548,021 | |
FHLMC | | | 3.50 | | | | 5-1-2032 | | | | 1,568,204 | | | | 1,626,541 | |
FHLMC | | | 3.50 | | | | 5-1-2032 | | | | 4,291,092 | | | | 4,461,204 | |
FHLMC | | | 3.50 | | | | 6-1-2032 | | | | 19,445,349 | | | | 20,138,566 | |
FHLMC | | | 3.50 | | | | 10-1-2032 | | | | 8,558,690 | | | | 8,864,791 | |
FHLMC | | | 3.50 | | | | 12-1-2032 | | | | 798,515 | | | | 827,079 | |
FHLMC | | | 3.50 | | | | 11-1-2035 | | | | 205,971 | | | | 215,016 | |
FHLMC | | | 3.50 | | | | 12-1-2035 | | | | 1,022,638 | | | | 1,064,140 | |
FHLMC | | | 3.50 | | | | 12-1-2045 | | | | 652,863 | | | | 673,504 | |
FHLMC | | | 4.00 | | | | 10-1-2029 | | | | 1,521,628 | | | | 1,613,132 | |
FHLMC | | | 4.00 | | | | 1-1-2034 | | | | 6,384,837 | | | | 6,744,904 | |
FHLMC | | | 4.00 | | | | 6-1-2034 | | | | 221,827 | | | | 234,240 | |
FHLMC | | | 4.00 | | | | 1-1-2035 | | | | 265,241 | | | | 282,980 | |
FHLMC | | | 4.00 | | | | 1-1-2036 | | | | 392,055 | | | | 415,990 | |
FHLMC | | | 4.00 | | | | 10-1-2036 | | | | 2,736,470 | | | | 2,896,032 | |
FHLMC | | | 4.00 | | | | 3-1-2037 | | | | 315,142 | | | | 335,434 | |
FHLMC | | | 4.00 | | | | 3-1-2037 | | | | 417,372 | | | | 445,274 | |
FHLMC | | | 4.00 | | | | 3-1-2037 | | | | 707,066 | | | | 750,203 | |
FHLMC | | | 4.00 | | | | 4-1-2037 | | | | 3,465,269 | | | | 3,688,291 | |
FHLMC | | | 4.00 | | | | 4-1-2037 | | | | 2,911,935 | | | | 3,089,580 | |
FHLMC | | | 4.00 | | | | 8-1-2043 | | | | 3,208,270 | | | | 3,392,312 | |
FHLMC | | | 4.00 | | | | 8-1-2044 | | | | 1,146,677 | | | | 1,212,095 | |
The accompanying notes are an integral part of these financial statements.
| | | | | | |
| Portfolio of investments—November 30, 2017 (unaudited) | | Wells Fargo Allocation Funds | | | 75 | |
CORE BOND PORTFOLIO
| | | | | | | | | | | | | | | | |
| Security name | | Interest rate | | | Maturity date | | | Principal | | | Value | |
|
Agency Securities (continued) | |
FHLMC | | | 4.00 | % | | | 10-1-2045 | | | $ | 2,036,303 | | | $ | 2,159,306 | |
FHLMC | | | 4.00 | | | | 12-1-2045 | | | | 1,811,932 | | | | 1,921,384 | |
FHLMC | | | 4.00 | | | | 12-1-2045 | | | | 1,193,547 | | | | 1,256,594 | |
FHLMC | | | 4.00 | | | | 2-1-2046 | | | | 1,446,635 | | | | 1,523,124 | |
FHLMC | | | 4.00 | | | | 6-1-2046 | | | | 2,381,872 | | | | 2,510,206 | |
FHLMC | | | 4.00 | | | | 4-1-2047 | | | | 1,933,012 | | | | 2,050,988 | |
FHLMC %% | | | 4.00 | | | | 1-18-2048 | | | | 14,500,000 | | | | 15,127,861 | |
FHLMC | | | 4.50 | | | | 8-1-2020 | | | | 2,357,902 | | | | 2,393,360 | |
FHLMC | | | 4.50 | | | | 6-1-2039 | | | | 266,593 | | | | 282,799 | |
FHLMC | | | 4.50 | | | | 7-1-2039 | | | | 290,085 | | | | 307,787 | |
FHLMC | | | 4.50 | | | | 1-1-2045 | | | | 1,793,884 | | | | 1,945,124 | |
FHLMC | | | 4.50 | | | | 4-1-2047 | | | | 2,372,865 | | | | 2,582,368 | |
FHLMC | | | 4.50 | | | | 4-1-2047 | | | | 2,786,219 | | | | 3,011,166 | |
FHLMC | | | 4.50 | | | | 4-1-2047 | | | | 3,104,005 | | | | 3,341,099 | |
FHLMC | | | 5.00 | | | | 5-1-2044 | | | | 1,266,842 | | | | 1,388,665 | |
FHLMC | | | 5.00 | | | | 6-1-2044 | | | | 3,784,329 | | | | 4,204,092 | |
FHLMC | | | 6.00 | | | | 2-1-2023 | | | | 20,267 | | | | 22,721 | |
FHLMC | | | 6.50 | | | | 4-1-2021 | | | | 785 | | | | 810 | |
FHLMC Series 1590 Class IA (1 Month LIBOR +1.05%) ± | | | 2.30 | | | | 10-15-2023 | | | | 21,593 | | | | 22,060 | |
FHLMC Series 1897 Class K | | | 7.00 | | | | 9-15-2026 | | | | 744 | | | | 825 | |
FHLMC Series 1935 Class FL (1 Month LIBOR +0.70%) ± | | | 1.95 | | | | 2-15-2027 | | �� | | 2,111 | | | | 2,148 | |
FHLMC Series 2423 Class MC | | | 7.00 | | | | 3-15-2032 | | | | 13,287 | | | | 15,141 | |
FHLMC Series 3829 Class ED | | | 3.50 | | | | 10-15-2028 | | | | 703,296 | | | | 705,227 | |
FHLMC Series 3838 Class QE | | | 3.50 | | | | 1-15-2029 | | | | 1,542,653 | | | | 1,550,352 | |
FHLMC Series 4425 Class A | | | 4.00 | | | | 9-15-2040 | | | | 3,422,823 | | | | 3,584,493 | |
FHLMC Series 4529 Class HC | | | 3.00 | | | | 10-15-2039 | | | | 2,084,087 | | | | 2,098,000 | |
FHLMC Series 4604 Class AB | | | 3.00 | | | | 8-15-2046 | | | | 4,868,628 | | | | 4,923,874 | |
FHLMC Series 4640 Class LD | | | 4.00 | | | | 9-15-2043 | | | | 18,932,937 | | | | 19,817,367 | |
FHLMC Series 4700 Class QJ | | | 4.00 | | | | 7-15-2044 | | | | 12,645,168 | | | | 13,250,981 | |
FHLMC Series 4705 Class A | | | 4.50 | | | | 9-15-2042 | | | | 8,323,940 | | | | 8,821,205 | |
FNMA | | | 4.00 | | | | 7-1-2024 | | | | 1,996,584 | | | | 2,075,399 | |
FNMA ¤ | | | 0.00 | | | | 10-9-2019 | | | | 12,760,000 | | | | 12,287,939 | |
FNMA | | | 1.50 | | | | 4-25-2043 | | | | 2,501,577 | | | | 2,288,577 | |
FNMA ±± | | | 2.68 | | | | 12-25-2026 | | | | 4,247,000 | | | | 4,145,511 | |
FNMA (12 Month LIBOR +1.61%) ± | | | 2.69 | | | | 5-1-2046 | | | | 4,478,006 | | | | 4,539,786 | |
FNMA ±± | | | 2.94 | | | | 9-25-2027 | | | | 4,255,000 | | | | 4,252,146 | |
FNMA (12 Month LIBOR +1.61%) ± | | | 2.95 | | | | 10-1-2047 | | | | 6,466,128 | | | | 6,592,046 | |
FNMA (12 Month LIBOR +1.62%) ± | | | 2.99 | | | | 8-1-2047 | | | | 8,259,253 | | | | 8,432,778 | |
FNMA | | | 3.00 | | | | 12-1-2032 | | | | 13,600,000 | | | | 13,865,009 | |
FNMA (12 Month LIBOR +1.62%) ± | | | 3.13 | | | | 3-1-2047 | | | | 7,352,688 | | | | 7,530,115 | |
FNMA (12 Month LIBOR +1.56%) ± | | | 3.16 | | | | 10-1-2043 | | | | 1,457,879 | | | | 1,491,006 | |
FNMA (12 Month LIBOR +1.62%) ± | | | 3.17 | | | | 10-1-2047 | | | | 5,529,248 | | | | 5,649,729 | |
FNMA (12 Month LIBOR +1.62%) ± | | | 3.23 | | | | 6-1-2047 | | | | 6,935,325 | | | | 7,102,371 | |
FNMA | | | 3.50 | | | | 8-1-2028 | | | | 97,853 | | | | 101,453 | |
FNMA | | | 3.50 | | | | 10-1-2028 | | | | 3,789,677 | | | | 3,926,362 | |
FNMA | | | 3.50 | | | | 9-1-2029 | | | | 218,710 | | | | 226,450 | |
FNMA | | | 3.50 | | | | 10-1-2029 | | | | 1,067,262 | | | | 1,110,036 | |
FNMA | | | 3.50 | | | | 1-1-2030 | | | | 2,194,008 | | | | 2,281,894 | |
FNMA | | | 3.50 | | | | 2-1-2030 | | | | 660,583 | | | | 687,077 | |
FNMA | | | 3.50 | | | | 7-1-2030 | | | | 2,493,615 | | | | 2,593,694 | |
The accompanying notes are an integral part of these financial statements.
| | | | |
| 76 | | Wells Fargo Allocation Funds | | Portfolio of investments—November 30, 2017 (unaudited) |
CORE BOND PORTFOLIO
| | | | | | | | | | | | | | | | |
| Security name | | Interest rate | | | Maturity date | | | Principal | | | Value | |
|
Agency Securities (continued) | |
FNMA | | | 3.50 | % | | | 7-1-2030 | | | $ | 771,486 | | | $ | 800,299 | |
FNMA | | | 3.50 | | | | 8-1-2030 | | | | 380,136 | | | | 394,789 | |
FNMA | | | 3.50 | | | | 8-1-2030 | | | | 1,634,397 | | | | 1,700,063 | |
FNMA | | | 3.50 | | | | 1-1-2031 | | | | 2,417,259 | | | | 2,514,034 | |
FNMA | | | 3.50 | | | | 2-1-2031 | | | | 1,874,071 | | | | 1,949,100 | |
FNMA | | | 3.50 | | | | 4-1-2031 | | | | 1,707,558 | | | | 1,778,649 | |
FNMA | | | 3.50 | | | | 4-1-2031 | | | | 6,887,841 | | | | 7,164,061 | |
FNMA | | | 3.50 | | | | 5-1-2031 | | | | 1,643,442 | | | | 1,709,381 | |
FNMA | | | 3.50 | | | | 12-1-2031 | | | | 719,912 | | | | 749,235 | |
FNMA | | | 3.50 | | | | 1-1-2032 | | | | 4,504,631 | | | | 4,692,105 | |
FNMA | | | 3.50 | | | | 2-1-2032 | | | | 868,925 | | | | 902,441 | |
FNMA | | | 3.50 | | | | 3-1-2032 | | | | 5,127,209 | | | | 5,306,631 | |
FNMA | | | 3.50 | | | | 4-1-2032 | | | | 1,449,892 | | | | 1,501,448 | |
FNMA | | | 3.50 | | | | 4-1-2032 | | | | 2,880,333 | | | | 2,992,482 | |
FNMA | | | 3.50 | | | | 4-1-2032 | | | | 4,521,686 | | | | 4,695,080 | |
FNMA | | | 3.50 | | | | 4-1-2032 | | | | 7,084,683 | | | | 7,390,647 | |
FNMA | | | 3.50 | | | | 5-1-2032 | | | | 2,744,079 | | | | 2,851,034 | |
FNMA | | | 3.50 | | | | 5-1-2032 | | | | 3,891,828 | | | | 4,041,217 | |
FNMA | | | 3.50 | | | | 5-1-2032 | | | | 5,683,681 | | | | 5,920,600 | |
FNMA | | | 3.50 | | | | 6-1-2032 | | | | 3,700,470 | | | | 3,844,864 | |
FNMA | | | 3.50 | | | | 6-1-2032 | | | | 3,536,000 | | | | 3,671,758 | |
FNMA | | | 3.50 | | | | 6-1-2032 | | | | 3,232,429 | | | | 3,345,923 | |
FNMA | | | 3.50 | | | | 8-1-2032 | | | | 2,645,301 | | | | 2,759,804 | |
FNMA | | | 3.50 | | | | 8-1-2032 | | | | 2,847,214 | | | | 2,947,515 | |
FNMA | | | 3.50 | | | | 9-1-2032 | | | | 3,450,009 | | | | 3,597,202 | |
FNMA | | | 3.50 | | | | 9-1-2033 | | | | 856,727 | | | | 893,291 | |
FNMA | | | 3.50 | | | | 9-1-2036 | | | | 7,859,823 | | | | 8,195,230 | |
FNMA | | | 3.50 | | | | 12-1-2036 | | | | 4,677,464 | | | | 4,866,908 | |
FNMA | | | 3.50 | | | | 6-1-2043 | | | | 878,708 | | | | 907,322 | |
FNMA %% | | | 3.50 | | | | 12-13-2047 | | | | 67,000,000 | | | | 68,671,127 | |
FNMA %% | | | 3.50 | | | | 1-18-2048 | | | | 80,300,000 | | | | 82,183,663 | |
FNMA %% | | | 3.50 | | | | 2-13-2048 | | | | 82,900,000 | | | | 84,711,884 | |
FNMA | | | 4.00 | | | | 4-1-2024 | | | | 2,891,836 | | | | 3,006,013 | |
FNMA | | | 4.00 | | | | 1-1-2025 | | | | 4,265,058 | | | | 4,433,971 | |
FNMA | | | 4.00 | | | | 4-1-2025 | | | | 2,505,718 | | | | 2,603,769 | |
FNMA | | | 4.00 | | | | 7-1-2029 | | | | 8,360,650 | | | | 8,883,698 | |
FNMA | | | 4.00 | | | | 11-1-2029 | | | | 2,346,775 | | | | 2,487,409 | |
FNMA | | | 4.00 | | | | 2-1-2032 | | | | 109,957 | | | | 116,126 | |
FNMA | | | 4.00 | | | | 3-1-2032 | | | | 448,314 | | | | 476,074 | |
FNMA | | | 4.00 | | | | 5-1-2032 | | | | 781,253 | | | | 821,542 | |
FNMA | | | 4.00 | | | | 6-1-2032 | | | | 6,961,799 | | | | 7,394,618 | |
FNMA | | | 4.00 | | | | 6-1-2032 | | | | 831,933 | | | | 883,793 | |
FNMA | | | 4.00 | | | | 12-1-2033 | | | | 626,035 | | | | 666,369 | |
FNMA | | | 4.00 | | | | 4-1-2034 | | | | 5,792,713 | | | | 6,146,228 | |
FNMA | | | 4.00 | | | | 7-1-2035 | | | | 9,979,321 | | | | 10,622,197 | |
FNMA | | | 4.00 | | | | 11-1-2035 | | | | 4,385,334 | | | | 4,668,163 | |
FNMA | | | 4.00 | | | | 11-1-2035 | | | | 1,005,669 | | | | 1,072,085 | |
FNMA | | | 4.00 | | | | 1-1-2036 | | | | 8,877,197 | | | | 9,449,657 | |
FNMA | | | 4.00 | | | | 1-1-2036 | | | | 551,335 | | | | 587,747 | |
FNMA | | | 4.00 | | | | 7-1-2036 | | | | 7,104,386 | | | | 7,538,824 | |
The accompanying notes are an integral part of these financial statements.
| | | | | | |
| Portfolio of investments—November 30, 2017 (unaudited) | | Wells Fargo Allocation Funds | | | 77 | |
CORE BOND PORTFOLIO
| | | | | | | | | | | | | | | | |
| Security name | | Interest rate | | | Maturity date | | | Principal | | | Value | |
|
Agency Securities (continued) | |
FNMA | | | 4.00 | % | | | 9-1-2036 | | | $ | 3,005,229 | | | $ | 3,186,044 | |
FNMA | | | 4.00 | | | | 11-1-2036 | | | | 2,229,907 | | | | 2,366,206 | |
FNMA | | | 4.00 | | | | 12-1-2036 | | | | 462,266 | | | | 490,554 | |
FNMA | | | 4.00 | | | | 12-1-2036 | | | | 7,133,825 | | | | 7,570,041 | |
FNMA | | | 4.00 | | | | 12-1-2036 | | | | 238,242 | | | | 252,793 | |
FNMA | | | 4.00 | | | | 1-1-2037 | | | | 370,463 | | | | 393,134 | |
FNMA | | | 4.00 | | | | 2-1-2037 | | | | 625,645 | | | | 663,861 | |
FNMA | | | 4.00 | | | | 2-1-2037 | | | | 568,454 | | | | 603,173 | |
FNMA | | | 4.00 | | | | 3-1-2037 | | | | 1,124,509 | | | | 1,193,197 | |
FNMA | | | 4.00 | | | | 3-1-2037 | | | | 992,754 | | | | 1,050,645 | |
FNMA | | | 4.00 | | | | 3-1-2037 | | | | 390,768 | | | | 416,559 | |
FNMA | | | 4.00 | | | | 3-1-2037 | | | | 251,761 | | | | 267,139 | |
FNMA | | | 4.00 | | | | 3-1-2037 | | | | 572,406 | | | | 607,370 | |
FNMA | | | 4.00 | | | | 3-1-2037 | | | | 206,941 | | | | 220,026 | |
FNMA | | | 4.00 | | | | 3-1-2037 | | | | 1,696,735 | | | | 1,806,107 | |
FNMA | | | 4.00 | | | | 3-1-2037 | | | | 1,025,250 | | | | 1,090,081 | |
FNMA | | | 4.00 | | | | 3-1-2037 | | | | 2,041,749 | | | | 2,166,455 | |
FNMA | | | 4.00 | | | | 3-1-2037 | | | | 1,559,819 | | | | 1,650,776 | |
FNMA | | | 4.00 | | | | 3-1-2037 | | | | 754,298 | | | | 801,997 | |
FNMA | | | 4.00 | | | | 4-1-2037 | | | | 4,748,400 | | | | 5,054,473 | |
FNMA | | | 4.00 | | | | 4-1-2037 | | | | 918,158 | | | | 974,243 | |
FNMA | | | 4.00 | | | | 4-1-2037 | | | | 1,507,889 | | | | 1,607,412 | |
FNMA | | | 4.00 | | | | 4-1-2037 | | | | 1,608,904 | | | | 1,712,623 | |
FNMA | | | 4.00 | | | | 4-1-2037 | | | | 1,635,862 | | | | 1,743,837 | |
FNMA | | | 4.00 | | | | 4-1-2037 | | | | 2,152,340 | | | | 2,283,810 | |
FNMA | | | 4.00 | | | | 5-1-2037 | | | | 1,031,834 | | | | 1,094,863 | |
FNMA | | | 4.00 | | | | 5-1-2037 | | | | 1,411,267 | | | | 1,497,466 | |
FNMA | | | 4.00 | | | | 5-1-2037 | | | | 1,007,481 | | | | 1,072,425 | |
FNMA | | | 4.00 | | | | 5-1-2037 | | | | 1,006,936 | | | | 1,071,846 | |
FNMA | | | 4.00 | | | | 5-1-2037 | | | | 645,372 | | | | 686,182 | |
FNMA | | | 4.00 | | | | 5-1-2037 | | | | 1,066,189 | | | | 1,131,313 | |
FNMA | | | 4.00 | | | | 5-1-2037 | | | | 611,168 | | | | 651,506 | |
FNMA | | | 4.00 | | | | 6-1-2037 | | | | 1,221,416 | | | | 1,302,030 | |
FNMA | | | 4.00 | | | | 6-1-2037 | | | | 1,751,433 | | | | 1,864,340 | |
FNMA | | | 4.00 | | | | 6-1-2037 | | | | 2,646,143 | | | | 2,813,473 | |
FNMA | | | 4.00 | | | | 6-1-2037 | | | | 1,564,166 | | | | 1,667,407 | |
FNMA | | | 4.00 | | | | 7-1-2037 | | | | 1,364,003 | | | | 1,443,544 | |
FNMA | | | 4.00 | | | | 7-1-2037 | | | | 662,938 | | | | 701,595 | |
FNMA | | | 4.00 | | | | 9-1-2037 | | | | 800,655 | | | | 853,502 | |
FNMA | | | 4.00 | | | | 9-1-2037 | | | | 2,167,594 | | | | 2,294,000 | |
FNMA | | | 4.00 | | | | 9-1-2037 | | | | 2,543,388 | | | | 2,698,751 | |
FNMA | | | 4.00 | | | | 9-1-2037 | | | | 1,252,348 | | | | 1,331,543 | |
FNMA | | | 4.00 | | | | 9-1-2037 | | | | 1,368,892 | | | | 1,457,143 | |
FNMA | | | 4.00 | | | | 10-1-2037 | | | | 1,352,284 | | | | 1,437,803 | |
FNMA | | | 4.00 | | | | 11-1-2037 | | | | 2,006,947 | | | | 2,123,986 | |
FNMA | | | 4.00 | | | | 11-1-2037 | | | | 7,280,427 | | | | 7,702,538 | |
FNMA | | | 4.00 | | | | 11-1-2040 | | �� | | 6,102,018 | | | | 6,437,880 | |
FNMA | | | 4.00 | | | | 10-1-2043 | | | | 4,622,406 | | | | 4,890,638 | |
FNMA | | | 4.00 | | | | 4-1-2044 | | | | 5,084,391 | | | | 5,394,010 | |
FNMA | | | 4.00 | | | | 5-1-2045 | | | | 9,074,771 | | | | 9,525,602 | |
The accompanying notes are an integral part of these financial statements.
| | | | |
| 78 | | Wells Fargo Allocation Funds | | Portfolio of investments—November 30, 2017 (unaudited) |
CORE BOND PORTFOLIO
| | | | | | | | | | | | | | | | |
| Security name | | Interest rate | | | Maturity date | | | Principal | | | Value | |
|
Agency Securities (continued) | |
FNMA | | | 4.00 | % | | | 5-1-2045 | | | $ | 1,566,406 | | | $ | 1,654,012 | |
FNMA | | | 4.00 | | | | 8-1-2045 | | | | 1,987,013 | | | | 2,099,294 | |
FNMA | | | 4.00 | | | | 8-1-2045 | | | | 1,126,757 | | | | 1,195,276 | |
FNMA | | | 4.00 | | | | 9-1-2045 | | | | 5,217,123 | | | | 5,534,172 | |
FNMA | | | 4.00 | | | | 9-1-2045 | | | | 1,766,060 | | | | 1,878,474 | |
FNMA | | | 4.00 | | | | 9-1-2045 | | | | 1,072,936 | | | | 1,133,611 | |
FNMA | | | 4.00 | | | | 10-1-2045 | | | | 1,100,898 | | | | 1,161,190 | |
FNMA | | | 4.00 | | | | 12-1-2045 | | | | 720,870 | | | | 755,794 | |
FNMA | | | 4.00 | | | | 12-1-2045 | | | | 190,837 | | | | 201,696 | |
FNMA | | | 4.00 | | | | 12-1-2045 | | | | 467,191 | | | | 493,761 | |
FNMA | | | 4.00 | | | | 1-1-2046 | | | | 4,027,321 | | | | 4,255,454 | |
FNMA | | | 4.00 | | | | 2-1-2046 | | | | 640,552 | | | | 679,327 | |
FNMA | | | 4.00 | | | | 7-1-2046 | | | | 374,887 | | | | 396,219 | |
FNMA | | | 4.00 | | | | 7-1-2046 | | | | 1,290,742 | | | | 1,355,766 | |
FNMA | | | 4.00 | | | | 11-1-2046 | | | | 4,489,861 | | | | 4,753,918 | |
FNMA | | | 4.00 | | | | 11-1-2046 | | | | 848,603 | | | | 891,352 | |
FNMA | | | 4.00 | | | | 11-1-2046 | | | | 3,699,177 | | | | 3,924,347 | |
FNMA | | | 4.00 | | | | 1-1-2047 | | | | 601,751 | | | | 636,146 | |
FNMA | | | 4.00 | | | | 1-1-2047 | | | | 918,826 | | | | 968,879 | |
FNMA | | | 4.00 | | | | 2-1-2047 | | | | 2,095,100 | | | | 2,213,683 | |
FNMA | | | 4.00 | | | | 2-1-2047 | | | | 1,072,173 | | | | 1,131,480 | |
FNMA | | | 4.00 | | | | 2-1-2047 | | | | 1,910,115 | | | | 1,999,758 | |
FNMA | | | 4.00 | | | | 2-1-2047 | | | | 3,606,913 | | | | 3,811,068 | |
FNMA | | | 4.00 | | | | 3-1-2047 | | | | 1,188,582 | | | | 1,253,331 | |
FNMA | | | 4.00 | | | | 3-1-2047 | | | | 3,072,059 | | | | 3,245,944 | |
FNMA | | | 4.00 | | | | 4-1-2047 | | | | 1,058,822 | | | | 1,116,735 | |
FNMA | | | 4.00 | | | | 4-1-2047 | | | | 1,024,300 | | | | 1,089,097 | |
FNMA | | | 4.00 | | | | 4-1-2047 | | | | 1,603,096 | | | | 1,693,835 | |
FNMA | | | 4.00 | | | | 4-1-2047 | | | | 1,013,785 | | | | 1,069,862 | |
FNMA | | | 4.00 | | | | 4-1-2047 | | | | 1,584,278 | | | | 1,671,708 | |
FNMA | | | 4.00 | | | | 4-1-2047 | | | | 2,531,720 | | | | 2,669,641 | |
FNMA | | | 4.00 | | | | 4-1-2047 | | | | 3,323,392 | | | | 3,507,505 | |
FNMA | | | 4.00 | | | | 4-1-2047 | | | | 1,158,178 | | | | 1,222,244 | |
FNMA | | | 4.00 | | | | 4-1-2047 | | | | 10,718,319 | | | | 11,365,951 | |
FNMA | | | 4.00 | | | | 5-1-2047 | | | | 4,476,480 | | | | 4,722,914 | |
FNMA | | | 4.00 | | | | 5-1-2047 | | | | 1,032,792 | | | | 1,091,247 | |
FNMA | | | 4.00 | | | | 5-1-2047 | | | | 1,141,228 | | | | 1,206,190 | |
FNMA | | | 4.00 | | | | 5-1-2047 | | | | 1,816,546 | | | | 1,917,029 | |
FNMA | | | 4.00 | | | | 5-1-2047 | | | | 2,415,872 | | | | 2,549,508 | |
FNMA | | | 4.00 | | | | 5-1-2047 | | | | 1,914,483 | | | | 2,020,386 | |
FNMA | | | 4.00 | | | | 6-1-2047 | | | | 1,153,238 | | | | 1,217,032 | |
FNMA | | | 4.00 | | | | 7-1-2047 | | | | 1,814,817 | | | | 1,926,015 | |
FNMA | | | 4.00 | | | | 7-1-2047 | | | | 3,376,863 | | | | 3,550,482 | |
FNMA | | | 4.00 | | | | 10-1-2047 | | | | 921,150 | | | | 972,105 | |
FNMA | | | 4.00 | | | | 10-1-2047 | | | | 2,149,292 | | | | 2,272,876 | |
FNMA | | | 4.00 | | | | 10-1-2047 | | | | 819,857 | | | | 870,235 | |
FNMA | | | 4.00 | | | | 10-1-2047 | | | | 841,218 | | | | 895,279 | |
FNMA | | | 4.00 | | | | 11-1-2047 | | | | 35,646,358 | | | | 37,414,653 | |
FNMA %% | | | 4.00 | | | | 1-18-2048 | | | | 22,200,000 | | | | 23,163,011 | |
FNMA (12 Month LIBOR +1.78%) ± | | | 4.38 | | | | 4-1-2040 | | | | 1,413,161 | | | | 1,484,124 | |
The accompanying notes are an integral part of these financial statements.
| | | | | | |
| Portfolio of investments—November 30, 2017 (unaudited) | | Wells Fargo Allocation Funds | | | 79 | |
CORE BOND PORTFOLIO
| | | | | | | | | | | | | | | | |
| Security name | | Interest rate | | | Maturity date | | | Principal | | | Value | |
|
Agency Securities (continued) | |
FNMA | | | 4.50 | % | | | 1-1-2020 | | | $ | 1,043,018 | | | $ | 1,060,644 | |
FNMA | | | 4.50 | | | | 5-1-2034 | | | | 2,168,371 | | | | 2,340,592 | |
FNMA | | | 4.50 | | | | 1-1-2039 | | | | 6,050,196 | | | | 6,444,655 | |
FNMA | | | 4.50 | | | | 3-1-2043 | | | | 4,807,894 | | | | 5,153,289 | |
FNMA | | | 4.50 | | | | 2-1-2044 | | | | 11,307,901 | | | | 12,216,992 | |
FNMA | | | 4.50 | | | | 3-1-2044 | | | | 1,423,637 | | | | 1,526,109 | |
FNMA | | | 4.50 | | | | 4-1-2044 | | | | 6,283,283 | | | | 6,789,198 | |
FNMA | | | 4.50 | | | | 6-1-2044 | | | | 4,539,343 | | | | 4,903,843 | |
FNMA | | | 4.50 | | | | 6-1-2044 | | | | 508,964 | | | | 545,818 | |
FNMA | | | 4.50 | | | | 10-1-2044 | | | | 318,747 | | | | 344,370 | |
FNMA | | | 4.50 | | | | 10-1-2045 | | | | 8,133,395 | | | | 8,718,887 | |
FNMA | | | 4.50 | | | | 12-1-2045 | | | | 208,670 | | | | 226,615 | |
FNMA | | | 4.50 | | | | 12-1-2045 | | | | 288,215 | | | | 311,424 | |
FNMA | | | 4.50 | | | | 2-1-2046 | | | | 204,871 | | | | 220,371 | |
FNMA | | | 4.50 | | | | 2-1-2046 | | | | 604,741 | | | | 656,745 | |
FNMA | | | 4.50 | | | | 3-1-2046 | | | | 455,514 | | | | 494,690 | |
FNMA | | | 4.50 | | | | 4-1-2046 | | | | 629,083 | | | | 685,835 | |
FNMA | | | 4.50 | | | | 6-1-2046 | | | | 9,392,120 | | | | 10,200,407 | |
FNMA | | | 4.50 | | | | 6-1-2046 | | | | 332,098 | | | | 360,692 | |
FNMA | | | 4.50 | | | | 2-1-2047 | | | | 1,952,762 | | | | 2,100,553 | |
FNMA | | | 4.50 | | | | 3-1-2047 | | | | 265,333 | | | | 286,465 | |
FNMA | | | 4.50 | | | | 4-1-2047 | | | | 2,011,797 | | | | 2,174,459 | |
FNMA | | | 4.50 | | | | 4-1-2047 | | | | 2,621,182 | | | | 2,822,085 | |
FNMA | | | 4.50 | | | | 4-1-2047 | | | | 507,830 | | | | 549,136 | |
FNMA | | | 4.50 | | | | 4-1-2047 | | | | 444,998 | | | | 481,817 | |
FNMA | | | 4.50 | | | | 4-1-2047 | | | | 365,949 | | | | 396,228 | |
FNMA | | | 4.50 | | | | 4-1-2047 | | | | 303,741 | | | | 328,872 | |
FNMA | | | 4.50 | | | | 4-1-2047 | | | | 525,535 | | | | 571,332 | |
FNMA | | | 4.50 | | | | 5-1-2047 | | | | 3,330,382 | | | | 3,600,089 | |
FNMA | | | 4.50 | | | | 5-1-2047 | | | | 4,569,877 | | | | 4,918,243 | |
FNMA | | | 4.50 | | | | 5-1-2047 | | | | 2,698,946 | | | | 2,898,974 | |
FNMA | | | 4.50 | | | | 5-1-2047 | | | | 330,036 | | | | 357,396 | |
FNMA | | | 4.50 | | | | 5-1-2047 | | | | 1,798,829 | | | | 1,942,697 | |
FNMA | | | 4.50 | | | | 5-1-2047 | | | | 623,714 | | | | 678,874 | |
FNMA | | | 4.50 | | | | 5-1-2047 | | | | 613,076 | | | | 663,981 | |
FNMA | | | 4.50 | | | | 5-1-2047 | | | | 533,089 | | | | 579,268 | |
FNMA | | | 4.50 | | | | 5-1-2047 | | | | 404,043 | | | | 437,252 | |
FNMA | | | 4.50 | | | | 5-1-2047 | | | | 407,718 | | | | 441,572 | |
FNMA | | | 4.50 | | | | 6-1-2047 | | | | 1,270,727 | | | | 1,382,119 | |
FNMA | | | 4.50 | | | | 6-1-2047 | | | | 25,925,842 | | | | 27,991,306 | |
FNMA | | | 4.50 | | | | 6-1-2047 | | | | 293,181 | | | | 321,878 | |
FNMA | | | 4.50 | | | | 9-1-2047 | | | | 7,290,293 | | | | 7,871,116 | |
FNMA | | | 5.00 | | | | 7-1-2044 | | | | 820,245 | | | | 897,392 | |
FNMA | | | 5.00 | | | | 8-1-2056 | | | | 25,268,675 | | | | 27,692,088 | |
FNMA | | | 6.00 | | | | 4-1-2022 | | | | 8,305 | | | | 9,308 | |
FNMA | | | 6.00 | | | | 2-1-2029 | | | | 7,889 | | | | 8,854 | |
FNMA | | | 6.00 | | | | 3-1-2033 | | | | 49,032 | | | | 55,707 | |
FNMA | | | 6.00 | | | | 11-1-2033 | | | | 17,481 | | | | 19,873 | |
FNMA Series 1998-38 Class Pl | | | 6.00 | | | | 11-25-2028 | | | | 333,085 | | | | 368,044 | |
FNMA Series 1999-54 Class LH | | | 6.50 | | | | 11-25-2029 | | | | 11,878 | | | | 13,174 | |
The accompanying notes are an integral part of these financial statements.
| | | | |
| 80 | | Wells Fargo Allocation Funds | | Portfolio of investments—November 30, 2017 (unaudited) |
CORE BOND PORTFOLIO
| | | | | | | | | | | | | | | | |
| Security name | | Interest rate | | | Maturity date | | | Principal | | | Value | |
|
Agency Securities (continued) | |
FNMA Series 2005-31 Class PB | | | 5.50 | % | | | 4-25-2035 | | | $ | 70,000 | | | $ | 77,700 | |
FNMA Series 2007-108 Class AN ±± | | | 8.05 | | | | 11-25-2037 | | | | 623,761 | | | | 717,460 | |
FNMA Series 2011-43 Class AN | | | 3.50 | | | | 12-25-2028 | | | | 1,359,860 | | | | 1,362,413 | |
FNMA Series 2014-40 Class EP | | | 3.50 | | | | 10-25-2042 | | | | 3,923,448 | | | | 4,045,477 | |
FNMA Series 2015-18 Class HE | | | 4.00 | | | | 9-25-2041 | | | | 11,943,272 | | | | 12,564,585 | |
FNMA Series 2015-M3 Class FA (1 Month LIBOR +0.22%) ± | | | 1.46 | | | | 6-25-2018 | | | | 363,740 | | | | 363,645 | |
FNMA Series 2016-59 Class CA | | | 3.50 | | | | 9-25-2043 | | | | 7,160,187 | | | | 7,423,743 | |
FNMA Series 2017-13 Class PA | | | 3.00 | | | | 8-25-2046 | | | | 6,884,994 | | | | 6,942,088 | |
FNMA Series 2017-33 Class LB | | | 3.00 | | | | 5-25-2039 | | | | 7,880,415 | | | | 7,960,173 | |
FNMA Series 2017-M7 Class A2 ±± | | | 2.96 | | | | 2-25-2027 | | | | 3,771,000 | | | | 3,777,836 | |
GNMA %% | | | 3.50 | | | | 12-20-2047 | | | | 84,500,000 | | | | 87,351,875 | |
GNMA | | | 4.00 | | | | 6-15-2047 | | | | 5,433,814 | | | | 5,744,576 | |
GNMA %% | | | 3.00 | | | | 12-20-2047 | | | | 113,800,000 | | | | 114,671,276 | |
GNMA | | | 4.00 | | | | 7-15-2045 | | | | 652,837 | | | | 690,255 | |
GNMA | | | 4.00 | | | | 9-15-2045 | | | | 1,677,338 | | | | 1,780,630 | |
GNMA | | | 4.00 | | | | 9-15-2045 | | | | 812,703 | | | | 860,473 | |
GNMA | | | 4.00 | | | | 9-20-2045 | | | | 3,055,871 | | | | 3,240,043 | |
GNMA | | | 4.00 | | | | 10-15-2045 | | | | 2,761,723 | | | | 2,931,701 | |
GNMA | | | 4.00 | | | | 7-15-2047 | | | | 6,015,274 | | | | 6,360,519 | |
GNMA (a) | | | 4.00 | | | | 11-1-2047 | | | | 3,838,000 | | | | 4,029,300 | |
GNMA | | | 4.00 | | | | 11-20-2047 | | | | 32,220,008 | | | | 33,808,916 | |
GNMA | | | 4.50 | | | | 5-20-2045 | | | | 906,455 | | | | 974,629 | |
GNMA | | | 4.50 | | | | 6-20-2045 | | | | 1,245,087 | | | | 1,345,282 | |
GNMA | | | 4.50 | | | | 7-20-2045 | | | | 1,543,761 | | | | 1,659,127 | |
GNMA | | | 4.50 | | | | 8-20-2045 | | | | 597,030 | | | | 639,668 | |
GNMA | | | 4.50 | | | | 12-15-2045 | | | | 1,633,227 | | | | 1,766,947 | |
GNMA | | | 4.50 | | | | 12-15-2045 | | | | 2,500,016 | | | | 2,690,475 | |
GNMA | | | 4.50 | | | | 5-15-2046 | | | | 117,639 | | | | 127,405 | |
GNMA | | | 4.50 | | | | 5-15-2046 | | | | 422,971 | | | | 457,582 | |
GNMA | | | 4.50 | | | | 4-15-2047 | | | | 1,266,468 | | | | 1,362,412 | |
GNMA | | | 4.50 | | | | 4-15-2047 | | | | 1,901,030 | | | | 2,046,818 | |
GNMA | | | 4.50 | | | | 8-15-2047 | | | | 1,160,381 | | | | 1,251,459 | |
GNMA | | | 4.50 | | | | 9-15-2047 | | | | 1,566,760 | | | | 1,687,421 | |
GNMA | | | 4.50 | | | | 10-20-2047 | | | | 8,454,025 | | | | 9,126,358 | |
GNMA | | | 4.50 | | | | 11-20-2047 | | | | 38,416,508 | | | | 40,779,449 | |
GNMA | | | 5.00 | | | | 12-20-2039 | | | | 333,114 | | | | 373,565 | |
GNMA | | | 5.00 | | | | 11-20-2045 | | | | 476,213 | | | | 531,097 | |
| |
Total Agency Securities (Cost $1,587,754,032) | | | | 1,580,320,675 | |
| | | | | | | | | | | | | | | | |
| | | | |
Asset-Backed Securities: 12.52% | | | | | | | | | | | | | | | | |
Ally Master Owner Trust Series 2017-1 Class A (1 Month LIBOR +0.40%) ± | | | 1.64 | | | | 2-15-2021 | | | | 3,386,000 | | | | 3,391,072 | |
American Express Credit Account Master Trust Series 2017-1 Class A | | | 1.93 | | | | 9-15-2022 | | | | 2,221,000 | | | | 2,215,382 | |
American Express Credit Account Master Trust Series 2017-7 Class A | | | 2.35 | | | | 5-15-2025 | | | | 8,278,000 | | | | 8,259,350 | |
Avis Budget Rental Car Funding LLC Series 2014-2A Class A 144A | | | 2.50 | | | | 2-20-2021 | | | | 10,681,000 | | | | 10,699,491 | |
Bank of the West Auto Trust Series 2017-1 Class A4 144A | | | 2.33 | | | | 9-15-2023 | | | | 3,286,000 | | | | 3,262,027 | |
California Republic Auto Receivables Trust Series 2016-1 Class A4 | | | 2.24 | | | | 10-15-2021 | | | | 6,135,000 | | | | 6,145,654 | |
California Republic Auto Receivables Trust Series 2017-1 Class A3 | | | 1.90 | | | | 3-15-2021 | | | | 4,397,000 | | | | 4,383,910 | |
California Republic Auto Receivables Trust Series 2017-1 Class A4 | | | 2.28 | | | | 6-15-2022 | | | | 2,211,000 | | | | 2,207,566 | |
Capital Auto Receivables Asset Trust Series 2015-4 Class A2 | | | 1.62 | | | | 3-20-2019 | | | | 631,696 | | | | 631,750 | |
Capital Auto Receivables Asset Trust Series 2015-4 Class A4 | | | 2.01 | | | | 7-20-2020 | | | | 2,387,000 | | | | 2,388,642 | |
The accompanying notes are an integral part of these financial statements.
| | | | | | |
| Portfolio of investments—November 30, 2017 (unaudited) | | Wells Fargo Allocation Funds | | | 81 | |
CORE BOND PORTFOLIO
| | | | | | | | | | | | | | | | |
| Security name | | Interest rate | | | Maturity date | | | Principal | | | Value | |
| | | | |
Asset-Backed Securities (continued) | | | | | | | | | | | | | | | | |
Capital Auto Receivables Asset Trust Series 2016-1 Class A4 | | | 1.98 | % | | | 10-20-2020 | | | $ | 2,455,000 | | | $ | 2,453,912 | |
Capital Auto Receivables Asset Trust Series 2016-2 Class A2A | | | 1.32 | | | | 1-22-2019 | | | | 6,564 | | | | 6,562 | |
Capital Auto Receivables Asset Trust Series 2016-3 Class A2A | | | 1.36 | | | | 4-22-2019 | | | | 577,051 | | | | 576,935 | |
Capital Auto Receivables Asset Trust Series 2016-3 Class A4 | | | 1.69 | | | | 3-20-2021 | | | | 2,417,000 | | | | 2,401,652 | |
Capital Auto Receivables Asset Trust Series 2017-1 Class A3 144A | | | 2.02 | | | | 8-20-2021 | | | | 2,287,000 | | | | 2,280,519 | |
Capital One Multi Asset Execution Trust Series 2015-A1 Class A | | | 1.39 | | | | 1-15-2021 | | | | 86,000 | | | | 85,974 | |
Capital One Multi Asset Execution Trust Series 2017-A6 Class A6 | | | 2.29 | | | | 7-15-2025 | | | | 1,435,000 | | | | 1,427,053 | |
College Avenue Student Loan Trust Series 2017-A Class A1 (1 Month LIBOR +1.65%) 144A± | | | 2.98 | | | | 11-26-2046 | | | | 4,682,097 | | | | 4,799,210 | |
Discover Card Execution Note Trust Series 2017-A7 Class A7 (1 Month LIBOR +0.36%) ± | | | 1.59 | | | | 4-15-2025 | | | | 4,173,000 | | | | 4,190,922 | |
Enterprise Fleet Financing LLC Series 2017-2 Class A3 144A | | | 2.22 | | | | 1-20-2023 | | | | 5,793,000 | | | | 5,759,888 | |
Flagship Credit Auto Owner Trust Series 2016-3 Class A2 144A | | | 2.05 | | | | 11-15-2020 | | | | 2,940,000 | | | | 2,940,132 | |
Hertz Vehicle Financing LLC Series 2015-1A Class A 144A | | | 2.73 | | | | 3-25-2021 | | | | 10,225,000 | | | | 10,247,516 | |
Hertz Vehicle Financing LLC Series 2015-3A Class A 144A | | | 2.67 | | | | 9-25-2021 | | | | 9,811,000 | | | | 9,728,546 | |
Hertz Vehicle Financing LLC Series 2016-2A Class A2 144A | | | 2.95 | | | | 3-25-2022 | | | | 5,067,000 | | | | 5,050,724 | |
Hertz Vehicle Financing LLC Series 2016-3A Class A 144A | | | 2.27 | | | | 7-25-2020 | | | | 5,551,000 | | | | 5,523,198 | |
Hertz Vehicle Financing LLC Series 2016-3A Class B 144A | | | 3.11 | | | | 7-25-2020 | | | | 2,186,000 | | | | 2,176,529 | |
Hertz Vehicle Financing LLC Series 2016-4A Class A 144A | | | 2.65 | | | | 7-25-2022 | | | | 6,865,000 | | | | 6,752,736 | |
Hertz Vehicle Financing LLC Series 2017-2A Class A 144A | | | 3.29 | | | | 10-25-2023 | | | | 9,581,000 | | | | 9,577,401 | |
Navient Student Loan Trust Series 2014-1 Class A3 (1 Month LIBOR +0.51%) ± | | | 1.75 | | | | 6-25-2031 | | | | 5,319,000 | | | | 5,301,481 | |
Navient Student Loan Trust Series 2014-AA Class A3 (1 Month LIBOR +1.60%) 144A± | | | 2.84 | | | | 10-15-2031 | | | | 6,169,000 | | | | 6,294,269 | |
Navient Student Loan Trust Series 2014-CTA Class A (1 Month LIBOR +0.70%) 144A± | | | 1.94 | | | | 9-16-2024 | | | | 2,766,688 | | | | 2,774,102 | |
Navient Student Loan Trust Series 2015-AA Class A2B (1 Month LIBOR +1.20%) 144A± | | | 2.44 | | | | 12-15-2028 | | | | 4,447,752 | | | | 4,511,775 | |
Navient Student Loan Trust Series 2015-CA Class B 144A | | | 3.25 | | | | 5-15-2040 | | | | 2,766,000 | | | | 2,791,290 | |
Navient Student Loan Trust Series 2016-1A Class A (1 Month LIBOR +0.70%) 144A± | | | 1.94 | | | | 2-25-2070 | | | | 18,995,855 | | | | 19,055,175 | |
Navient Student Loan Trust Series 2016-5A Class A (1 Month LIBOR +1.25%) 144A± | | | 2.49 | | | | 6-25-2065 | | | | 2,941,139 | | | | 3,003,135 | |
Navient Student Loan Trust Series 2016-7A Class A (1 Month LIBOR +1.15%) 144A± | | | 2.39 | | | | 3-25-2066 | | | | 6,096,656 | | | | 6,240,324 | |
Navient Student Loan Trust Series 2016-AA Class A2A 144A | | | 3.91 | | | | 12-15-2045 | | | | 9,901,022 | | | | 10,198,601 | |
Navient Student Loan Trust Series 2016-AA Class A2B (1 Month LIBOR +2.15%) 144A± | | | 3.40 | | | | 12-15-2045 | | | | 3,741,177 | | | | 3,902,636 | |
Navient Student Loan Trust Series 2017-1A Class A3 (1 Month LIBOR +1.15%) 144A± | | | 2.39 | | | | 7-26-2066 | | | | 22,408,000 | | | | 22,953,270 | |
Navient Student Loan Trust Series 2017-2A Class A (1 Month LIBOR +0.77%) 144A± | | | 2.01 | | | | 9-25-2065 | | | | 10,225,939 | | | | 10,264,523 | |
Navient Student Loan Trust Series 2017-2A Class A (1 Month LIBOR +1.05%) 144A± | | | 2.29 | | | | 12-27-2066 | | | | 15,028,745 | | | | 15,196,168 | |
Navient Student Loan Trust Series 2017-3A Class A3 (1 Month LIBOR +1.05%) 144A± | | | 2.29 | | | | 7-26-2066 | | | | 10,921,000 | | | | 11,083,488 | |
Navient Student Loan Trust Series 2017-4A Class A3 (1 Month LIBOR +1.00%) 144A± | | | 2.24 | | | | 9-27-2066 | | | | 15,903,000 | | | | 16,058,519 | |
Navient Student Loan Trust Series 2017-5A Class A (1 Month LIBOR +0.80%) 144A± | | | 2.04 | | | | 7-26-2066 | | | | 20,852,834 | | | | 20,965,458 | |
Navient Student Loan Trust Series 2017-A Class A1 (1 Month LIBOR +0.40%) 144A± | | | 1.64 | | | | 12-16-2058 | | | | 11,503,000 | | | | 11,502,350 | |
Navient Student Loan Trust Series 2017-A Class A2A 144A | | | 2.88 | | | | 12-16-2058 | | | | 6,334,000 | | | | 6,290,257 | |
Navient Student Loan Trust Series 2017-A Class A2B (1 Month LIBOR +0.90%) 144A± | | | 2.14 | | | | 12-16-2058 | | | | 6,435,000 | | | | 6,434,631 | |
Nelnet Student Loan Trust Series 2004-4 Class A5 (3 Month LIBOR +0.16%) ± | | | 1.53 | | | | 1-25-2037 | | | | 3,265,244 | | | | 3,230,192 | |
Nelnet Student Loan Trust Series 2004-5 Class A5 (3 Month LIBOR +0.18%) ± | | | 1.55 | | | | 10-27-2036 | | | | 3,553,763 | | | | 3,508,271 | |
Nelnet Student Loan Trust Series 2005-1 Class A5 (3 Month LIBOR +0.11%) ± | | | 1.48 | | | | 10-25-2033 | | | | 18,057,758 | | | | 17,711,246 | |
Nelnet Student Loan Trust Series 2005-2 Class A5 (3 Month LIBOR +0.10%) ± | | | 1.42 | | | | 3-23-2037 | | | | 4,495,137 | | | | 4,447,857 | |
The accompanying notes are an integral part of these financial statements.
| | | | |
| 82 | | Wells Fargo Allocation Funds | | Portfolio of investments—November 30, 2017 (unaudited) |
CORE BOND PORTFOLIO
| | | | | | | | | | | | | | | | |
| Security name | | Interest rate | | | Maturity date | | | Principal | | | Value | |
| | | | |
Asset-Backed Securities (continued) | | | | | | | | | | | | | | | | |
Nelnet Student Loan Trust Series 2005-3 Class A5 (3 Month LIBOR +0.12%) ± | | | 1.44 | % | | | 12-24-2035 | | | $ | 19,314,197 | | | $ | 19,093,096 | |
Nelnet Student Loan Trust Series 2005-4 Class A4 (3 Month LIBOR +0.18%) ± | | | 1.50 | | | | 3-22-2032 | | | | 4,580,000 | | | | 4,426,850 | |
Nelnet Student Loan Trust Series 2006-2 Class A6 (3 Month LIBOR +0.12%) ± | | | 1.49 | | | | 4-25-2031 | | | | 13,841,000 | | | | 13,859,317 | |
Nelnet Student Loan Trust Series 2010-4A Class A (1 Month LIBOR +0.80%) 144A± | | | 2.04 | | | | 4-25-2046 | | | | 2,190,428 | | | | 2,212,562 | |
Nelnet Student Loan Trust Series 2016-1A Class A (1 Month LIBOR +0.80%) 144A± | | | 2.04 | | | | 9-25-2065 | | | | 6,782,868 | | | | 6,876,219 | |
Nissan Master Owner Trust Receivables Series 2017-C Class A (1 Month LIBOR +0.32%) ± | | | 1.50 | | | | 10-17-2022 | | | | 11,413,000 | | | | 11,422,736 | |
Santander Drive Auto Receivables Trust Series 2017-3 Class A3 | | | 1.87 | | | | 6-15-2021 | | | | 4,665,000 | | | | 4,649,349 | |
SLM Student Loan Trust Series 2003-1 Class A5C (3 Month LIBOR +0.75%) 144A± | | | 2.07 | | | | 12-15-2032 | | | | 4,374,701 | | | | 4,338,578 | |
SLM Student Loan Trust Series 2004-10 Class A7A (3 Month LIBOR +0.75%) 144A± | | | 2.12 | | | | 10-25-2029 | | | | 10,671,000 | | | | 10,671,843 | |
SLM Student Loan Trust Series 2005-6 Class A5B (3 Month LIBOR +1.20%) ± | | | 2.57 | | | | 7-27-2026 | | | | 357,529 | | | | 358,915 | |
SLM Student Loan Trust Series 2005-8 Class A5 (3 Month LIBOR +0.17%) ± | | | 1.54 | | | | 1-25-2040 | | | | 5,112,000 | | | | 4,929,961 | |
SLM Student Loan Trust Series 2006-3 Class A5 (3 Month LIBOR +0.10%) ± | | | 1.47 | | | | 1-25-2021 | | | | 9,339,881 | | | | 9,277,641 | |
SLM Student Loan Trust Series 2007-2 Class A4 (3 Month LIBOR +0.06%) ± | | | 1.43 | | | | 7-25-2022 | | | | 11,939,000 | | | | 11,593,140 | |
SLM Student Loan Trust Series 2010-1 Class A (1 Month LIBOR +0.40%) ± | | | 1.64 | | | | 3-25-2025 | | | | 2,298,140 | | | | 2,272,932 | |
SLM Student Loan Trust Series 2012-1 Class A3 (1 Month LIBOR +0.95%) ± | | | 2.19 | | | | 9-25-2028 | | | | 16,155,045 | | | | 16,306,820 | |
SLM Student Loan Trust Series 2012-2 Class A (1 Month LIBOR +0.70%) ± | | | 1.94 | | | | 1-25-2029 | | | | 6,290,890 | | | | 6,320,950 | |
SLM Student Loan Trust Series 2012-6 Class A3 (1 Month LIBOR +0.75%) ± | | | 1.99 | | | | 5-26-2026 | | | | 3,749,876 | | | | 3,727,112 | |
SLM Student Loan Trust Series 2012-6 Class B (1 Month LIBOR +1.00%) ± | | | 2.24 | | | | 4-27-2043 | | | | 3,262,000 | | | | 2,982,900 | |
SLM Student Loan Trust Series 2012-D Class A2 144A | | | 2.95 | | | | 2-15-2046 | | | | 914,236 | | | | 914,714 | |
SLM Student Loan Trust Series 2012-E Class A2 (1 Month LIBOR +1.75%) 144A± | | | 2.99 | | | | 6-15-2045 | | | | 2,052,083 | | | | 2,068,081 | |
SLM Student Loan Trust Series 2013-1 Class B (1 Month LIBOR +1.80%) ± | | | 3.04 | | | | 11-25-2070 | | | | 1,264,000 | | | | 1,267,612 | |
SLM Student Loan Trust Series 2013-B Class A2B (1 Month LIBOR +1.10%) 144A± | | | 2.34 | | | | 6-17-2030 | | | | 917,619 | | | | 921,176 | |
SMB Private Education Loan Trust Series 2015-A Class A2A 144A | | | 2.49 | | | | 6-15-2027 | | | | 2,787,000 | | | | 2,787,258 | |
SMB Private Education Loan Trust Series 2015-A Class A2B (1 Month LIBOR +1.00%) 144A± | | | 2.24 | | | | 6-15-2027 | | | | 6,176,000 | | | | 6,266,840 | |
SMB Private Education Loan Trust Series 2015-B Class A2A 144A | | | 2.98 | | | | 7-15-2027 | | | | 3,722,295 | | | | 3,752,747 | |
SMB Private Education Loan Trust Series 2015-B Class A2B (1 Month LIBOR +1.20%) 144A± | | | 2.44 | | | | 7-15-2027 | | | | 10,301,212 | | | | 10,459,207 | |
SMB Private Education Loan Trust Series 2015-C Class A2A 144A | | | 2.75 | | | | 7-15-2027 | | | | 4,766,639 | | | | 4,785,722 | |
SMB Private Education Loan Trust Series 2015-C Class A2B (1 Month LIBOR +1.40%) 144A± | | | 2.64 | | | | 7-15-2027 | | | | 3,605,546 | | | | 3,686,434 | |
SMB Private Education Loan Trust Series 2016-A Class A2A 144A | | | 2.70 | | | | 5-15-2031 | | | | 10,488,000 | | | | 10,455,623 | |
SMB Private Education Loan Trust Series 2016-A Class A2B (1 Month LIBOR +1.50%) 144A± | | | 2.74 | | | | 5-15-2031 | | | | 16,601,000 | | | | 17,067,403 | |
SMB Private Education Loan Trust Series 2016-B Class A2A 144A | | | 2.43 | | | | 2-17-2032 | | | | 9,867,000 | | | | 9,714,950 | |
SMB Private Education Loan Trust Series 2016-B Class A2B (1 Month LIBOR +1.45%) 144A± | | | 2.69 | | | | 2-17-2032 | | | | 14,994,000 | | | | 15,489,999 | |
SMB Private Education Loan Trust Series 2016-C Class A2A 144A | | | 2.34 | | | | 9-15-2034 | | | | 10,975,000 | | | | 10,672,319 | |
SMB Private Education Loan Trust Series 2016-C Class A2B (1 Month LIBOR +1.10%) 144A± | | | 2.34 | | | | 9-15-2034 | | | | 10,351,000 | | | | 10,526,506 | |
SMB Private Education Loan Trust Series 2017-A Class A2A 144A | | | 2.88 | | | | 9-15-2034 | | | | 5,777,000 | | | | 5,799,775 | |
SMB Private Education Loan Trust Series 2017-A Class A2B (1 Month LIBOR +0.90%) 144A± | | | 2.14 | | | | 9-15-2034 | | | | 1,631,000 | | | | 1,651,665 | |
SMB Private Education Loan Trust Series 2017-B Class A2A 144A | | | 2.82 | | | | 10-15-2035 | | | | 7,931,000 | | | | 7,914,393 | |
SMB Private Education Loan Trust Series 2017-B Class A2B (1 Month LIBOR +0.75%) 144A± | | | 2.10 | | | | 10-15-2035 | | | | 7,998,000 | | | | 8,027,755 | |
Synchrony Credit Card Master Note Trust Series 2015-1 Class A | | | 2.37 | | | | 3-15-2023 | | | | 2,920,000 | | | | 2,931,508 | |
Synchrony Credit Card Master Note Trust Series 2016-2 Class A | | | 2.21 | | | | 5-15-2024 | | | | 1,924,000 | | | | 1,915,721 | |
Synchrony Credit Card Master Note Trust Series 2016-3 Class A | | | 1.58 | | | | 9-15-2022 | | | | 12,297,000 | | | | 12,177,970 | |
Synchrony Credit Card Master Note Trust Series 2017-2 Class A | | | 2.62 | | | | 10-15-2025 | | | | 8,660,000 | | | | 8,673,665 | |
The accompanying notes are an integral part of these financial statements.
| | | | | | |
| Portfolio of investments—November 30, 2017 (unaudited) | | Wells Fargo Allocation Funds | | | 83 | |
CORE BOND PORTFOLIO
| | | | | | | | | | | | | | | | |
| Security name | | Interest rate | | | Maturity date | | | Principal | | | Value | |
| | | | |
Asset-Backed Securities (continued) | | | | | | | | | | | | | | | | |
TCF Auto Receivables Owner Trust Series 2016-1A Class A 144A | | | 1.93 | % | | | 6-15-2022 | | | $ | 1,067,680 | | | $ | 1,064,796 | |
TCF Auto Receivables Owner Trust Series 2016-1A Class A3 144A | | | 1.71 | | | | 4-15-2021 | | | | 2,235,000 | | | | 2,229,687 | |
TCF Auto Receivables Owner Trust Series 2016-1A Class A4 144A | | | 2.03 | | | | 2-15-2022 | | | | 1,667,000 | | | | 1,658,678 | |
Toyota Auto Receivables Owner Trust Series 2017-D Class A4 | | | 2.12 | | | | 2-15-2023 | | | | 7,252,000 | | | | 7,230,237 | |
Verizon Owner Trust Series 2017-3a Class A1B (1 Month LIBOR +0.27%) 144A± | | | 1.51 | | | | 4-20-2022 | | | | 7,693,000 | | | | 7,702,174 | |
Volvo Financial Equipment LLC Series 2017-A Class A (1 Month LIBOR +0.50%) 144A± | | | 1.74 | | | | 11-15-2022 | | | | 4,737,000 | | | | 4,748,826 | |
World Financial Network Credit Card Master Trust Series 2014-B Class A4 | | | 1.68 | | | | 12-15-2020 | | | | 2,101,000 | | | | 2,098,298 | |
World Financial Network Credit Card Master Trust Series 2015-B Class A | | | 2.55 | | | | 6-17-2024 | | | | 444,000 | | | | 446,370 | |
World Financial Network Credit Card Master Trust Series 2016-A Class A | | | 2.03 | | | | 4-15-2025 | | | | 12,722,000 | | | | 12,505,232 | |
World Financial Network Credit Card Master Trust Series 2016-C Class A | | | 1.72 | | | | 8-15-2023 | | | | 4,867,000 | | | | 4,827,894 | |
World Financial Network Credit Card Master Trust Series 2017-A Class A | | | 2.12 | | | | 3-15-2024 | | | | 7,015,000 | | | | 6,984,870 | |
World Financial Network Credit Card Master Trust Series 2017-C Class A | | | 2.31 | | | | 8-15-2024 | | | | 11,042,000 | | | | 11,029,059 | |
| |
Total Asset-Backed Securities (Cost $687,023,464) | | | | 691,059,356 | |
| | | | | | | | | | | | | | | | |
| | | | |
Corporate Bonds and Notes: 21.54% | | | | | | | | | | | | | | | | |
| | | | |
Consumer Discretionary: 1.56% | | | | | | | | | | | | | | | | |
| | | | |
| Hotels, Restaurants & Leisure: 0.02% | | | | | | | | | | | | | | | | |
McDonald’s Corporation | | | 4.88 | | | | 12-9-2045 | | | | 1,077,000 | | | | 1,219,181 | |
| | | | | | | | | | | | | | | | |
| | | | |
| Household Durables: 0.10% | | | | | | | | | | | | | | | | |
Lennar Corporation 144A | | | 4.75 | | | | 11-29-2027 | | | | 5,280,000 | | | | 5,398,800 | |
| | | | | | | | | | | | | | | | |
| | | | |
| Internet & Direct Marketing Retail: 0.52% | | | | | | | | | | | | | | | | |
Amazon.com Incorporated 144A | | | 1.90 | | | | 8-21-2020 | | | | 7,022,000 | | | | 6,976,084 | |
Amazon.com Incorporated 144A | | | 2.40 | | | | 2-22-2023 | | | | 7,456,000 | | | | 7,364,958 | |
Amazon.com Incorporated 144A | | | 2.80 | | | | 8-22-2024 | | | | 1,169,000 | | | | 1,163,776 | |
Amazon.com Incorporated 144A | | | 3.15 | | | | 8-22-2027 | | | | 7,759,000 | | | | 7,761,534 | |
Amazon.com Incorporated 144A | | | 3.88 | | | | 8-22-2037 | | | | 1,100,000 | | | | 1,146,392 | |
Amazon.com Incorporated 144A | | | 4.05 | | | | 8-22-2047 | | | | 2,875,000 | | | | 2,991,857 | |
Amazon.com Incorporated 144A | | | 4.25 | | | | 8-22-2057 | | | | 1,168,000 | | | | 1,226,701 | |
| |
| | | | 28,631,302 | |
| | | | | | | | | | | | | | | | |
| | | | |
| Media: 0.92% | | | | | | | | | | | | | | | | |
CBS Corporation | | | 2.50 | | | | 2-15-2023 | | | | 6,655,000 | | | | 6,499,696 | |
CBS Corporation | | | 3.38 | | | | 2-15-2028 | | | | 3,340,000 | | | | 3,196,927 | |
Charter Communications Operating LLC | | | 4.46 | | | | 7-23-2022 | | | | 1,990,000 | | | | 2,074,265 | |
Charter Communications Operating LLC | | | 4.91 | | | | 7-23-2025 | | | | 5,220,000 | | | | 5,513,782 | |
Charter Communications Operating LLC | | | 5.38 | | | | 5-1-2047 | | | | 2,003,000 | | | | 2,021,788 | |
Comcast Corporation | | | 2.35 | | | | 1-15-2027 | | | | 2,835,000 | | | | 2,652,124 | |
Comcast Corporation | | | 3.15 | | | | 2-15-2028 | | | | 7,991,000 | | | | 7,893,251 | |
Comcast Corporation | | | 4.00 | | | | 8-15-2047 | | | | 1,185,000 | | | | 1,185,854 | |
Discovery Communications LLC | | | 3.95 | | | | 11-15-2027 | | | | 3,676,000 | | | | 3,636,933 | |
Discovery Communications LLC | | | 3.95 | | | | 3-20-2028 | | | | 2,200,000 | | | | 2,152,744 | |
Discovery Communications LLC | | | 4.88 | | | | 4-1-2043 | | | | 2,325,000 | | | | 2,226,726 | |
Discovery Communications LLC | | | 4.95 | | | | 5-15-2042 | | | | 1,145,000 | | | | 1,100,154 | |
Discovery Communications LLC | | | 5.20 | | | | 9-20-2047 | | | | 1,331,000 | | | | 1,323,948 | |
NBCUniversal Media LLC | | | 4.45 | | | | 1-15-2043 | | | | 745,000 | | | | 786,629 | |
Time Warner Cable Incorporated | | | 3.80 | | | | 2-15-2027 | | | | 2,920,000 | | | | 2,911,008 | |
The accompanying notes are an integral part of these financial statements.
| | | | |
| 84 | | Wells Fargo Allocation Funds | | Portfolio of investments—November 30, 2017 (unaudited) |
CORE BOND PORTFOLIO
| | | | | | | | | | | | | | | | |
| Security name | | Interest rate | | | Maturity date | | | Principal | | | Value | |
| | | | |
| Media (continued) | | | | | | | | | | | | | | | | |
Time Warner Cable Incorporated | | | 4.85 | % | | | 7-15-2045 | | | $ | 2,785,000 | | | $ | 2,861,873 | |
Time Warner Cable Incorporated | | | 6.55 | | | | 5-1-2037 | | | | 1,437,000 | | | | 1,645,235 | |
Viacom Incorporated | | | 4.85 | | | | 12-15-2034 | | | | 1,039,000 | | | | 982,200 | |
| |
| | | | 50,665,137 | |
| | | | | | | | | | | | | | | | |
| | | | |
Consumer Staples: 1.67% | | | | | | | | | | | | | | | | |
| | | | |
| Beverages: 0.41% | | | | | | | | | | | | | | | | |
Anheuser-Busch InBev Finance Company | | | 2.65 | | | | 2-1-2021 | | | | 10,960,000 | | | | 11,041,597 | |
Anheuser-Busch InBev Finance Company | | | 3.30 | | | | 2-1-2023 | | | | 3,872,000 | | | | 3,969,955 | |
Anheuser-Busch InBev Finance Company | | | 4.90 | | | | 2-1-2046 | | | | 3,998,000 | | | | 4,505,465 | |
PepsiCo Incorporated | | | 3.00 | | | | 10-15-2027 | | | | 2,886,000 | | | | 2,856,886 | |
| |
| | | | 22,373,903 | |
| | | | | | | | | | | | | | | | |
| | | | |
| Food & Staples Retailing: 0.33% | | | | | | | | | | | | | | | | |
Costco Wholesale Corporation | | | 2.30 | | | | 5-18-2022 | | | | 6,464,000 | | | | 6,433,167 | |
Costco Wholesale Corporation | | | 2.75 | | | | 5-18-2024 | | | | 4,474,000 | | | | 4,470,327 | |
Costco Wholesale Corporation | | | 3.00 | | | | 5-18-2027 | | | | 7,475,000 | | | | 7,441,430 | |
| |
| | | | 18,344,924 | |
| | | | | | | | | | | | | | | | |
| | | | |
| Food Products: 0.33% | | | | | | | | | | | | | | | | |
Kraft Heinz Foods Company | | | 2.80 | | | | 7-2-2020 | | | | 8,044,000 | | | | 8,104,171 | |
Kraft Heinz Foods Company | | | 3.00 | | | | 6-1-2026 | | | | 4,960,000 | | | | 4,740,380 | |
Kraft Heinz Foods Company | | | 4.38 | | | | 6-1-2046 | | | | 5,777,000 | | | | 5,569,132 | |
| |
| | | | 18,413,683 | |
| | | | | | | | | | | | | | | | |
| | | | |
| Household Products: 0.10% | | | | | | | | | | | | | | | | |
Church & Dwight Company Incorporated | | | 2.45 | | | | 8-1-2022 | | | | 1,565,000 | | | | 1,547,190 | |
Church & Dwight Company Incorporated | | | 3.15 | | | | 8-1-2027 | | | | 2,517,000 | | | | 2,469,767 | |
Church & Dwight Company Incorporated | | | 3.95 | | | | 8-1-2047 | | | | 1,565,000 | | | | 1,540,334 | |
| |
| | | | 5,557,291 | |
| | | | | | | | | | | | | | | | |
| | | | |
| Tobacco: 0.50% | | | | | | | | | | | | | | | | |
B.A.T. Capital Corporation 144A | | | 2.76 | | | | 8-15-2022 | | | | 8,205,000 | | | | 8,136,595 | |
B.A.T. Capital Corporation 144A | | | 3.22 | | | | 8-15-2024 | | | | 4,085,000 | | | | 4,071,392 | |
B.A.T. Capital Corporation 144A | | | 3.56 | | | | 8-15-2027 | | | | 3,078,000 | | | | 3,072,608 | |
B.A.T. Capital Corporation 144A | | | 4.54 | | | | 8-15-2047 | | | | 2,028,000 | | | | 2,094,269 | |
British American Tobacco Capital Corporation 144A | | | 2.30 | | | | 8-14-2020 | | | | 3,081,000 | | | | 3,064,815 | |
Reynolds American Incorporated | | | 5.85 | | | | 8-15-2045 | | | | 5,600,000 | | | | 6,819,655 | |
| |
| | | | 27,259,334 | |
| | | | | | | | | | | | | | | | |
| | | | |
Energy: 1.97% | | | | | | | | | | | | | | | | |
| | | | |
| Energy Equipment & Services: 0.15% | | | | | | | | | | | | | | | | |
Schlumberger Holdings Corporation 144A | | | 4.00 | | | | 12-21-2025 | | | | 8,053,000 | | | | 8,401,633 | |
| | | | | | | | | | | | | | | | |
| | | | |
| Oil, Gas & Consumable Fuels: 1.82% | | | | | | | | | | | | | | | | |
Anadarko Petroleum Corporation | | | 4.50 | | | | 7-15-2044 | | | | 4,267,000 | | | | 4,135,663 | |
Anadarko Petroleum Corporation | | | 4.85 | | | | 3-15-2021 | | | | 2,291,000 | | | | 2,425,445 | |
Anadarko Petroleum Corporation « | | | 5.55 | | | | 3-15-2026 | | | | 5,550,000 | | | | 6,169,436 | |
The accompanying notes are an integral part of these financial statements.
| | | | | | |
| Portfolio of investments—November 30, 2017 (unaudited) | | Wells Fargo Allocation Funds | | | 85 | |
CORE BOND PORTFOLIO
| | | | | | | | | | | | | | | | |
| Security name | | Interest rate | | | Maturity date | | | Principal | | | Value | |
| | | | |
| Oil, Gas & Consumable Fuels (continued) | | | | | | | | | | | | | | | | |
Andeavor Logistics LP | | | 3.50 | % | | | 12-1-2022 | | | $ | 2,363,000 | | | $ | 2,361,431 | |
Andeavor Logistics LP | | | 4.25 | | | | 12-1-2027 | | | | 5,032,000 | | | | 5,023,127 | |
Andeavor Logistics LP | | | 5.20 | | | | 12-1-2047 | | | | 2,105,000 | | | | 2,111,114 | |
Apache Corporation | | | 4.25 | | | | 1-15-2044 | | | | 1,860,000 | | | | 1,750,340 | |
Buckeye Partners LP | | | 4.13 | | | | 12-1-2027 | | | | 3,867,000 | | | | 3,815,633 | |
Chevron Corporation | | | 2.95 | | | | 5-16-2026 | | | | 1,935,000 | | | | 1,926,529 | |
Cimarex Energy Company | | | 4.38 | | | | 6-1-2024 | | | | 6,456,000 | | | | 6,837,847 | |
Concho Resources Incorporated | | | 3.75 | | | | 10-1-2027 | | | | 3,479,000 | | | | 3,502,549 | |
Concho Resources Incorporated | | | 4.88 | | | | 10-1-2047 | | | | 1,620,000 | | | | 1,716,957 | |
Enbridge Energy Partners LP | | | 5.50 | | | | 9-15-2040 | | | | 1,424,000 | | | | 1,520,717 | |
Enbridge Energy Partners LP | | | 7.38 | | | | 10-15-2045 | | | | 1,375,000 | | | | 1,793,815 | |
Energy Transfer Partners LP | | | 2.50 | | | | 6-15-2018 | | | | 4,060,000 | | | | 4,068,393 | |
Energy Transfer Partners LP | | | 6.13 | | | | 12-15-2045 | | | | 3,497,000 | | | | 3,753,652 | |
Enterprise Products Operating LLC | | | 3.35 | | | | 3-15-2023 | | | | 1,933,000 | | | | 1,970,522 | |
Enterprise Products Operating LLC | | | 3.70 | | | | 2-15-2026 | | | | 1,940,000 | | | | 1,978,931 | |
Enterprise Products Operating LLC | | | 4.85 | | | | 3-15-2044 | | | | 1,018,000 | | | | 1,080,884 | |
Kinder Morgan Energy Partners LP | | | 5.40 | | | | 9-1-2044 | | | | 2,157,000 | | | | 2,229,569 | |
Kinder Morgan Incorporated | | | 3.15 | | | | 1-15-2023 | | | | 7,765,000 | | | | 7,711,255 | |
Kinder Morgan Incorporated 144A | | | 5.00 | | | | 2-15-2021 | | | | 8,252,000 | | | | 8,789,314 | |
Kinder Morgan Incorporated | | | 5.55 | | | | 6-1-2045 | | | | 2,705,000 | | | | 2,883,754 | |
Marathon Oil Corporation | | | 6.60 | | | | 10-1-2037 | | | | 1,698,000 | | | | 2,046,340 | |
Marathon Petroleum Corporation | | | 4.75 | | | | 9-15-2044 | | | | 1,060,000 | | | | 1,078,697 | |
Marathon Petroleum Corporation | | | 5.00 | | | | 9-15-2054 | | | | 2,368,000 | | | | 2,365,949 | |
Plains All American Pipeline LP | | | 4.50 | | | | 12-15-2026 | | | | 960,000 | | | | 963,572 | |
Sabine Pass Liquefaction LLC | | | 5.00 | | | | 3-15-2027 | | | | 4,054,000 | | | | 4,317,891 | |
Sabine Pass Liquefaction LLC | | | 5.88 | | | | 6-30-2026 | | | | 2,115,000 | | | | 2,372,118 | |
TC Pipelines LP | | | 3.90 | | | | 5-25-2027 | | | | 3,175,000 | | | | 3,177,019 | |
Williams Partners LP | | | 3.75 | | | | 6-15-2027 | | | | 4,485,000 | | | | 4,449,915 | |
| |
| | | | 100,328,378 | |
| | | | | | | | | | | | | | | | |
| | | | |
Financials: 5.29% | | | | | | | | | | | | | | | | |
| | | | |
| Banks: 2.08% | | | | | | | | | | | | | | | | |
Bank of America Corporation | | | 2.50 | | | | 10-21-2022 | | | | 10,410,000 | | | | 10,267,684 | |
Bank of America Corporation | | | 4.00 | | | | 4-1-2024 | | | | 2,920,000 | | | | 3,082,314 | |
Bank of America Corporation (3 Month LIBOR +1.81%) ± | | | 4.24 | | | | 4-24-2038 | | | | 4,424,000 | | | | 4,728,506 | |
Bank of America Corporation | | | 4.45 | | | | 3-3-2026 | | | | 3,149,000 | | | | 3,342,556 | |
BB&T Corporation | | | 2.85 | | | | 10-26-2024 | | | | 2,893,000 | | | | 2,875,227 | |
Capital One NA | | | 2.65 | | | | 8-8-2022 | | | | 8,764,000 | | | | 8,660,379 | |
Citigroup Incorporated | | | 2.70 | | | | 10-27-2022 | | | | 9,702,000 | | | | 9,616,825 | |
Citigroup Incorporated | | | 4.13 | | | | 7-25-2028 | | | | 5,227,000 | | | | 5,357,391 | |
Citigroup Incorporated | | | 4.45 | | | | 9-29-2027 | | | | 7,592,000 | | | | 7,975,530 | |
Export Import Bank of Korea | | | 2.50 | | | | 11-1-2020 | | | | 3,631,000 | | | | 3,601,709 | |
Export Import Bank of Korea | | | 3.00 | | | | 11-1-2022 | | | | 7,686,000 | | | | 7,674,632 | |
JPMorgan Chase & Company | | | 2.30 | | | | 8-15-2021 | | | | 9,179,000 | | | | 9,107,793 | |
JPMorgan Chase & Company | | | 2.95 | | | | 10-1-2026 | | | | 11,177,000 | | | | 10,916,192 | |
JPMorgan Chase & Company | | | 2.97 | | | | 1-15-2023 | | | | 8,211,000 | | | | 8,256,858 | |
JPMorgan Chase & Company (3 Month LIBOR +1.36%) ± | | | 3.88 | | | | 7-24-2038 | | | | 6,965,000 | | | | 7,069,674 | |
JPMorgan Chase & Company (3 Month LIBOR +1.58%) ± | | | 4.26 | | | | 2-22-2048 | | | | 5,635,000 | | | | 5,944,719 | |
PNC Bank | | | 2.45 | | | | 11-5-2020 | | | | 6,073,000 | | | | 6,091,068 | |
| |
| | | | 114,569,057 | |
| | | | | | | | | | | | | | | | |
The accompanying notes are an integral part of these financial statements.
| | | | |
| 86 | | Wells Fargo Allocation Funds | | Portfolio of investments—November 30, 2017 (unaudited) |
CORE BOND PORTFOLIO
| | | | | | | | | | | | | | | | |
| Security name | | Interest rate | | | Maturity date | | | Principal | | | Value | |
| | | | |
| Capital Markets: 1.18% | | | | | | | | | | | | | | | | |
Bank of New York Mellon Corporation | | | 3.25 | % | | | 5-16-2027 | | | $ | 6,445,000 | | | $ | 6,470,845 | |
Goldman Sachs Group Incorporated | | | 2.75 | | | | 9-15-2020 | | | | 4,845,000 | | | | 4,870,883 | |
Goldman Sachs Group Incorporated | | | 3.50 | | | | 11-16-2026 | | | | 1,530,000 | | | | 1,531,494 | |
Goldman Sachs Group Incorporated (3 Month LIBOR +1.51%) ± | | | 3.69 | | | | 6-5-2028 | | | | 1,932,000 | | | | 1,949,274 | |
Goldman Sachs Group Incorporated (3 Month LIBOR +1.37%) ± | | | 4.02 | | | | 10-31-2038 | | | | 1,944,000 | | | | 1,979,890 | |
Goldman Sachs Group Incorporated | | | 6.75 | | | | 10-1-2037 | | | | 7,334,000 | | | | 9,671,204 | |
Lazard Group LLC | | | 3.75 | | | | 2-13-2025 | | | | 5,510,000 | | | | 5,616,006 | |
Morgan Stanley | | | 2.63 | | | | 11-17-2021 | | | | 10,632,000 | | | | 10,608,381 | |
Morgan Stanley | | | 2.75 | | | | 5-19-2022 | | | | 13,495,000 | | | | 13,467,614 | |
Morgan Stanley | | | 3.63 | | | | 1-20-2027 | | | | 6,693,000 | | | | 6,798,918 | |
Morgan Stanley (3 Month LIBOR +1.46%) ± | | | 3.97 | | | | 7-22-2038 | | | | 1,947,000 | | | | 1,976,051 | |
| |
| | | | 64,940,560 | |
| | | | | | | | | | | | | | | | |
| | | | |
| Consumer Finance: 1.42% | | | | | | | | | | | | | | | | |
Capital One Financial Corporation | | | 2.40 | | | | 10-30-2020 | | | | 3,870,000 | | | | 3,851,130 | |
Capital One Financial Corporation | | | 3.30 | | | | 10-30-2024 | | | | 3,870,000 | | | | 3,846,786 | |
Capital One Financial Corporation | | | 4.20 | | | | 10-29-2025 | | | | 1,374,000 | | | | 1,406,011 | |
ERAC USA Finance LLC 144A | | | 2.70 | | | | 11-1-2023 | | | | 1,330,000 | | | | 1,292,488 | |
ERAC USA Finance LLC 144A | | | 3.30 | | | | 12-1-2026 | | | | 4,926,000 | | | | 4,818,253 | |
ERAC USA Finance LLC 144A | | | 4.50 | | | | 2-15-2045 | | | | 975,000 | | | | 969,241 | |
Ford Motor Credit Company LLC | | | 2.34 | | | | 11-2-2020 | | | | 6,214,000 | | | | 6,153,054 | |
Ford Motor Credit Company LLC | | | 2.98 | | | | 8-3-2022 | | | | 3,756,000 | | | | 3,732,159 | |
Ford Motor Credit Company LLC | | | 3.34 | | | | 3-28-2022 | | | | 5,020,000 | | | | 5,084,265 | |
Ford Motor Credit Company LLC | | | 3.82 | | | | 11-2-2027 | | | | 4,308,000 | | | | 4,292,435 | |
Ford Motor Credit Company LLC | | | 5.29 | | | | 12-8-2046 | | | | 4,630,000 | | | | 4,923,067 | |
General Motors Financial Company | | | 3.50 | | | | 11-7-2024 | | | | 5,507,000 | | | | 5,496,538 | |
General Motors Financial Company | | | 4.35 | | | | 1-17-2027 | | | | 5,663,000 | | | | 5,818,700 | |
General Motors Financial Company | | | 5.15 | | | | 4-1-2038 | | | | 4,085,000 | | | | 4,255,651 | |
General Motors Financial Company | | | 5.40 | | | | 4-1-2048 | | | | 1,165,000 | | | | 1,240,879 | |
John Deere Capital Corporation | | | 2.15 | | | | 9-8-2022 | | | | 3,800,000 | | | | 3,733,054 | |
John Deere Capital Corporation | | | 2.65 | | | | 6-24-2024 | | | | 4,835,000 | | | | 4,792,921 | |
John Deere Capital Corporation | | | 2.80 | | | | 9-8-2027 | | | | 4,811,000 | | | | 4,710,637 | |
Synchrony Financial %% | | | 3.95 | | | | 12-1-2027 | | | | 8,183,000 | | | | 8,077,663 | |
| |
| | | | 78,494,932 | |
| | | | | | | | | | | | | | | | |
| | | | |
| Diversified Financial Services: 0.04% | | | | | | | | | | | | | | | | |
General Electric Capital Corporation | | | 5.88 | | | | 1-14-2038 | | | | 1,813,000 | | | | 2,291,813 | |
| | | | | | | | | | | | | | | | |
| | | | |
| Insurance: 0.57% | | | | | | | | | | | | | | | | |
American International Group Incorporated | | | 4.38 | | | | 1-15-2055 | | | | 1,540,000 | | | | 1,520,350 | |
American International Group Incorporated | | | 4.80 | | | | 7-10-2045 | | | | 855,000 | | | | 932,392 | |
American International Group Incorporated | | | 6.25 | | | | 5-1-2036 | | | | 3,148,000 | | | | 3,981,040 | |
Brighthouse Financial Incorporated 144A | | | 3.70 | | | | 6-22-2027 | | | | 5,515,000 | | | | 5,360,434 | |
Brighthouse Financial Incorporated 144A | | | 4.70 | | | | 6-22-2047 | | | | 1,990,000 | | | | 1,948,837 | |
Chubb INA Holdings Incorporated | | | 4.35 | | | | 11-3-2045 | | | | 3,160,000 | | | | 3,478,892 | |
Guardian Life Insurance Company 144A | | | 4.85 | | | | 1-24-2077 | | | | 634,000 | | | | 687,921 | |
Markel Corporation | | | 3.50 | | | | 11-1-2027 | | | | 3,320,000 | | | | 3,286,536 | |
The accompanying notes are an integral part of these financial statements.
| | | | | | |
| Portfolio of investments—November 30, 2017 (unaudited) | | Wells Fargo Allocation Funds | | | 87 | |
CORE BOND PORTFOLIO
| | | | | | | | | | | | | | | | |
| Security name | | Interest rate | | | Maturity date | | | Principal | | | Value | |
| | | | |
| Insurance (continued) | | | | | | | | | | | | | | | | |
Markel Corporation | | | 4.30 | % | | | 11-1-2047 | | | $ | 1,975,000 | | | $ | 1,967,559 | |
Northwestern Mutual Life Subordinated 144A | | | 3.85 | | | | 9-30-2047 | | | | 3,195,000 | | | | 3,116,369 | |
Teachers Insurance and Annuity Association 144A | | | 4.27 | | | | 5-15-2047 | | | | 1,275,000 | | | | 1,318,620 | |
Teachers Insurance and Annuity Association 144A | | | 4.90 | | | | 9-15-2044 | | | | 1,696,000 | | | | 1,911,313 | |
XL Capital Limited | | | 6.25 | | | | 5-15-2027 | | | | 1,838,000 | | | | 2,171,845 | |
| |
| | | | 31,682,108 | |
| | | | | | | | | | | | | | | | |
| | | | |
Health Care: 2.29% | | | | | | | | | | | | | | | | |
| | | | |
| Biotechnology: 0.71% | | | | | | | | | | | | | | | | |
AbbVie Incorporated | | | 2.50 | | | | 5-14-2020 | | | | 7,789,000 | | | | 7,828,968 | |
AbbVie Incorporated | | | 4.45 | | | | 5-14-2046 | | | | 4,300,000 | | | | 4,520,782 | |
AbbVie Incorporated | | | 4.50 | | | | 5-14-2035 | | | | 1,905,000 | | | | 2,036,906 | |
Celgene Corporation | | | 2.75 | | | | 2-15-2023 | | | | 7,375,000 | | | | 7,313,369 | |
Celgene Corporation | | | 3.45 | | | | 11-15-2027 | | | | 7,720,000 | | | | 7,683,137 | |
Celgene Corporation | | | 4.35 | | | | 11-15-2047 | | | | 5,227,000 | | | | 5,279,406 | |
Celgene Corporation | | | 5.00 | | | | 8-15-2045 | | | | 4,438,000 | | | | 4,879,579 | |
| |
| | | | 39,542,147 | |
| | | | | | | | | | | | | | | | |
| | | | |
| Health Care Equipment & Supplies: 0.55% | | | | | | | | | | | | | | | | |
Abbott Laboratories | | | 3.75 | | | | 11-30-2026 | | | | 8,460,000 | | | | 8,624,352 | |
Abbott Laboratories | | | 4.90 | | | | 11-30-2046 | | | | 935,000 | | | | 1,044,411 | |
Becton Dickinson & Company | | | 2.40 | | | | 6-5-2020 | | | | 6,740,000 | | | | 6,696,871 | |
Becton Dickinson & Company | | | 2.89 | | | | 6-6-2022 | | | | 5,635,000 | | | | 5,594,467 | |
Becton Dickinson & Company | | | 3.70 | | | | 6-6-2027 | | | | 4,520,000 | | | | 4,504,057 | |
Becton Dickinson & Company | | | 4.69 | | | | 12-15-2044 | | | | 3,810,000 | | | | 4,034,047 | |
| |
| | | | 30,498,205 | |
| | | | | | | | | | | | | | | | |
| | | | |
| Health Care Providers & Services: 0.45% | | | | | | | | | | | | | | | | |
AmerisourceBergen Corporation %% | | | 4.30 | | | | 12-15-2047 | | | | 3,837,000 | | | | 3,817,720 | |
Anthem Incorporated | | | 2.50 | | | | 11-21-2020 | | | | 4,412,000 | | | | 4,414,157 | |
Anthem Incorporated | | | 2.95 | | | | 12-1-2022 | | | | 4,410,000 | | | | 4,407,065 | |
Anthem Incorporated | | | 3.35 | | | | 12-1-2024 | | | | 2,225,000 | | | | 2,238,499 | |
Anthem Incorporated | | | 3.65 | | | | 12-1-2027 | | | | 3,312,000 | | | | 3,326,752 | |
Laboratory Corporation of America | | | 3.25 | | | | 9-1-2024 | | | | 3,240,000 | | | | 3,233,429 | |
Laboratory Corporation of America | | | 3.60 | | | | 9-1-2027 | | | | 3,319,000 | | | | 3,318,106 | |
| |
| | | | 24,755,728 | |
| | | | | | | | | | | | | | | | |
| | | | |
| Life Sciences Tools & Services: 0.15% | | | | | | | | | | | | | | | | |
Thermo Fisher Scientific Incorporated | | | 2.95 | | | | 9-19-2026 | | | | 2,895,000 | | | | 2,811,206 | |
Thermo Fisher Scientific Incorporated | | | 3.20 | | | | 8-15-2027 | | | | 5,515,000 | | | | 5,429,814 | |
| |
| | | | 8,241,020 | |
| | | | | | | | | | | | | | | | |
| | | | |
| Pharmaceuticals: 0.43% | | | | | | | | | | | | | | | | |
Eli Lilly and Company | | | 2.35 | | | | 5-15-2022 | | | | 1,860,000 | | | | 1,857,725 | |
Eli Lilly and Company | | | 3.10 | | | | 5-15-2027 | | | | 3,341,000 | | | | 3,365,090 | |
Eli Lilly and Company | | | 3.95 | | | | 5-15-2047 | | | | 1,690,000 | | | | 1,777,011 | |
Johnson & Johnson | | | 2.63 | | | | 1-15-2025 | | | | 2,135,000 | | | | 2,122,902 | |
Johnson & Johnson | | | 2.90 | | | | 1-15-2028 | | | | 8,590,000 | | | | 8,574,645 | |
The accompanying notes are an integral part of these financial statements.
| | | | |
| 88 | | Wells Fargo Allocation Funds | | Portfolio of investments—November 30, 2017 (unaudited) |
CORE BOND PORTFOLIO
| | | | | | | | | | | | | | | | |
| Security name | | Interest rate | | | Maturity date | | | Principal | | | Value | |
|
| Pharmaceuticals (continued) | |
Johnson & Johnson | | | 3.40 | % | | | 1-15-2038 | | | $ | 2,610,000 | | | $ | 2,608,895 | |
Johnson & Johnson | | | 3.50 | | | | 1-15-2048 | | | | 3,300,000 | | | | 3,281,122 | |
| |
| | | | 23,587,390 | |
| | | | | | | | | | | | | | | | |
| | | | |
Industrials: 1.32% | | | | | | | | | | | | | | | | |
| | | | |
| Aerospace & Defense: 0.74% | | | | | | | | | | | | | | | | |
Northrop Grumman Corporation | | | 2.08 | | | | 10-15-2020 | | | | 6,625,000 | | | | 6,569,726 | |
Northrop Grumman Corporation | | | 2.55 | | | | 10-15-2022 | | | | 6,619,000 | | | | 6,571,772 | |
Northrop Grumman Corporation | | | 2.93 | | | | 1-15-2025 | | | | 4,420,000 | | | | 4,396,893 | |
Northrop Grumman Corporation | | | 3.20 | | | | 2-1-2027 | | | | 6,780,000 | | | | 6,806,735 | |
Northrop Grumman Corporation | | | 3.25 | | | | 8-1-2023 | | | | 6,107,000 | | | | 6,238,891 | |
Northrop Grumman Corporation | | | 3.25 | | | | 1-15-2028 | | | | 5,535,000 | | | | 5,535,581 | |
Northrop Grumman Corporation | | | 4.03 | | | | 10-15-2047 | | | | 4,465,000 | | | | 4,551,262 | |
| |
| | | | 40,670,860 | |
| | | | | | | | | | | | | | | | |
| | | | |
| Air Freight & Logistics: 0.09% | | | | | | | | | | | | | | | | |
FedEx Corporation | | | 4.40 | | | | 1-15-2047 | | | | 1,220,000 | | | | 1,263,711 | |
FedEx Corporation | | | 4.55 | | | | 4-1-2046 | | | | 3,305,000 | | | | 3,510,581 | |
| |
| | | | 4,774,292 | |
| | | | | | | | | | | | | | | | |
| | | | |
| Construction & Engineering: 0.05% | | | | | | | | | | | | | | | | |
Valmont Industries Incorporated | | | 5.25 | | | | 10-1-2054 | | | | 2,796,000 | | | | 2,847,011 | |
| | | | | | | | | | | | | | | | |
| | | | |
| Machinery: 0.08% | | | | | | | | | | | | | | | | |
Wabtec Corporation | | | 3.45 | | | | 11-15-2026 | | | | 4,455,000 | | | | 4,337,752 | |
| | | | | | | | | | | | | | | | |
| | | | |
| Road & Rail: 0.19% | | | | | | | | | | | | | | | | |
Penske Truck Leasing Company LP 144A | | | 2.70 | | | | 3-14-2023 | | | | 4,452,000 | | | | 4,375,502 | |
Penske Truck Leasing Company LP 144A | | | 3.38 | | | | 2-1-2022 | | | | 3,562,000 | | | | 3,632,647 | |
Penske Truck Leasing Company LP 144A | | | 3.40 | | | | 11-15-2026 | | | | 2,874,000 | | | | 2,828,582 | |
| |
| | | | 10,836,731 | |
| | | | | | | | | | | | | | | | |
| | | | |
| Trading Companies & Distributors: 0.17% | | | | | | | | | | | | | | | | |
Air Lease Corporation | | | 3.63 | | | | 4-1-2027 | | | | 4,990,000 | | | | 4,962,046 | |
Air Lease Corporation | | | 3.63 | | | | 12-1-2027 | | | | 4,655,000 | | | | 4,627,516 | |
| |
| | | | 9,589,562 | |
| | | | | | | | | | | | | | | | |
| | | | |
Information Technology: 2.81% | | | | | | | | | | | | | | | | |
| | | | |
| Communications Equipment: 0.21% | | | | | | | | | | | | | | | | |
Cisco Systems Incorporated | | | 1.40 | | | | 9-20-2019 | | | | 11,560,000 | | | | 11,442,428 | |
| | | | | | | | | | | | | | | | |
| | | | |
| IT Services: 0.11% | | | | | | | | | | | | | | | | |
Fidelity National Information Services Incorporated | | | 2.25 | | | | 8-15-2021 | | | | 3,340,000 | | | | 3,285,437 | |
Fidelity National Information Services Incorporated | | | 3.63 | | | | 10-15-2020 | | | | 2,578,000 | | | | 2,653,144 | |
| |
| | | | 5,938,581 | |
| | | | | | | | | | | | | | | | |
| | | | |
| Semiconductors & Semiconductor Equipment: 0.22% | | | | | | | | | | | | | | | | |
Analog Devices Incorporated | | | 2.50 | | | | 12-5-2021 | | | | 4,255,000 | | | | 4,228,356 | |
Analog Devices Incorporated | | | 3.13 | | | | 12-5-2023 | | | | 4,550,000 | | | | 4,575,363 | |
Analog Devices Incorporated | | | 3.50 | | | | 12-5-2026 | | | | 3,470,000 | | | | 3,491,071 | |
| |
| | | | 12,294,790 | |
| | | | | | | | | | | | | | | | |
The accompanying notes are an integral part of these financial statements.
| | | | | | |
| Portfolio of investments—November 30, 2017 (unaudited) | | Wells Fargo Allocation Funds | | | 89 | |
CORE BOND PORTFOLIO
| | | | | | | | | | | | | | | | |
| Security name | | Interest rate | | | Maturity date | | | Principal | | | Value | |
| | | | |
| Software: 1.27% | | | | | | | | | | | | | | | | |
Microsoft Corporation | | | 2.00 | % | | | 8-8-2023 | | | $ | 5,095,000 | | | $ | 4,940,654 | |
Microsoft Corporation | | | 2.40 | | | | 2-6-2022 | | | | 7,580,000 | | | | 7,598,053 | |
Microsoft Corporation | | | 2.88 | | | | 2-6-2024 | | | | 6,600,000 | | | | 6,672,320 | |
Microsoft Corporation | | | 4.10 | | | | 2-6-2037 | | | | 3,810,000 | | | | 4,178,071 | |
Oracle Corporation | | | 2.63 | | | | 2-15-2023 | | | | 8,820,000 | | | | 8,830,747 | |
Oracle Corporation | | | 2.95 | | | | 11-15-2024 | | | | 5,513,000 | | | | 5,535,940 | |
Oracle Corporation | | | 3.25 | | | | 11-15-2027 | | | | 8,078,000 | | | | 8,179,337 | |
Oracle Corporation | | | 3.80 | | | | 11-15-2037 | | | | 4,631,000 | | | | 4,730,151 | |
Oracle Corporation | | | 4.00 | | | | 11-15-2047 | | | | 4,037,000 | | | | 4,163,115 | |
VMware Incorporated | | | 2.30 | | | | 8-21-2020 | | | | 6,655,000 | | | | 6,608,082 | |
VMware Incorporated | | | 2.95 | | | | 8-21-2022 | | | | 5,535,000 | | | | 5,502,652 | |
VMware Incorporated | | | 3.90 | | | | 8-21-2027 | | | | 3,300,000 | | | | 3,299,797 | |
| |
| | | | 70,238,919 | |
| | | | | | | | | | | | | | | | |
| | | | |
| Technology Hardware, Storage & Peripherals: 1.00% | | | | | | | | | | | | | | | | |
Apple Incorporated | | | 2.30 | | | | 5-11-2022 | | | | 9,934,000 | | | | 9,874,361 | |
Apple Incorporated | | | 2.75 | | | | 1-13-2025 | | | | 4,834,000 | | | | 4,793,717 | |
Apple Incorporated | | | 2.85 | | | | 5-11-2024 | | | | 8,505,000 | | | | 8,530,473 | |
Apple Incorporated | | | 3.00 | | | | 2-9-2024 | | | | 7,520,000 | | | | 7,629,369 | |
Apple Incorporated | | | 3.00 | | | | 11-13-2027 | | | | 3,870,000 | | | | 3,835,103 | |
Apple Incorporated | | | 3.20 | | | | 5-11-2027 | | | | 5,635,000 | | | | 5,695,832 | |
Apple Incorporated | | | 3.35 | | | | 2-9-2027 | | | | 5,595,000 | | | | 5,715,874 | |
Apple Incorporated | | | 3.75 | | | | 11-13-2047 | | | | 3,093,000 | | | | 3,087,255 | |
Apple Incorporated | | | 4.38 | | | | 5-13-2045 | | | | 1,905,000 | | | | 2,091,245 | |
Hewlett Packard Enterprise Company | | | 6.35 | | | | 10-15-2045 | | | | 3,754,000 | | | | 3,836,796 | |
| |
| | | | 55,090,025 | |
| | | | | | | | | | | | | | | | |
| | | | |
Materials: 0.49% | | | | | | | | | | | | | | | | |
| | | | |
| Chemicals: 0.30% | | | | | | | | | | | | | | | | |
CF Industries Incorporated 144A | | | 3.40 | | | | 12-1-2021 | | | | 4,105,000 | | | | 4,155,661 | |
CF Industries Incorporated 144A | | | 4.50 | | | | 12-1-2026 | | | | 3,176,000 | | | | 3,317,494 | |
The Sherwin-Williams Company | | | 2.75 | | | | 6-1-2022 | | | | 5,010,000 | | | | 4,979,448 | |
The Sherwin-Williams Company | | | 3.45 | | | | 6-1-2027 | | | | 1,921,000 | | | | 1,939,445 | |
The Sherwin-Williams Company | | | 4.50 | | | | 6-1-2047 | | | | 1,835,000 | | | | 1,930,672 | |
| |
| | | | 16,322,720 | |
| | | | | | | | | | | | | | | | |
| | | | |
| Construction Materials: 0.04% | | | | | | | | | | | | | | | | |
Vulcan Materials Company | | | 4.50 | | | | 6-15-2047 | | | | 2,205,000 | | | | 2,221,413 | |
| | | | | | | | | | | | | | | | |
| | | | |
| Containers & Packaging: 0.09% | | | | | | | | | | | | | | | | |
International Paper Company | | | 5.15 | | | | 5-15-2046 | | | | 4,457,000 | | | | 5,086,260 | |
| | | | | | | | | | | | | | | | |
| | | | |
| Metals & Mining: 0.06% | | | | | | | | | | | | | | | | |
Barrick Gold Finance Company LLC | | | 5.70 | | | | 5-30-2041 | | | | 2,835,000 | | | | 3,390,670 | |
| | | | | | | | | | | | | | | | |
| | | | |
Real Estate: 1.06% | | | | | | | | | | | | | | | | |
| | | | |
| Equity REITs: 1.06% | | | | | | | | | | | | | | | | |
Boston Properties LP %% | | | 3.20 | | | | 1-15-2025 | | | | 5,332,000 | | | | 5,305,456 | |
Brandywine Operating Partnership LP | | | 3.95 | | | | 2-15-2023 | | | | 1,102,000 | | | | 1,126,724 | |
The accompanying notes are an integral part of these financial statements.
| | | | |
| 90 | | Wells Fargo Allocation Funds | | Portfolio of investments—November 30, 2017 (unaudited) |
CORE BOND PORTFOLIO
| | | | | | | | | | | | | | | | |
| Security name | | Interest rate | | | Maturity date | | | Principal | | | Value | |
|
| Equity REITs (continued) | |
DDR Corporation | | | 3.38 | % | | | 5-15-2023 | | | $ | 5,041,000 | | | $ | 4,947,438 | |
DDR Corporation | | | 4.63 | | | | 7-15-2022 | | | | 5,566,000 | | | | 5,838,791 | |
Kilroy Realty LP %% | | | 3.45 | | | | 12-15-2024 | | | | 3,313,000 | | | | 3,290,763 | |
Mid-America Apartments LP | | | 3.60 | | | | 6-1-2027 | | | | 2,032,000 | | | | 2,029,616 | |
Mid-America Apartments LP | | | 3.75 | | | | 6-15-2024 | | | | 4,930,000 | | | | 5,053,191 | |
Mid-America Apartments LP | | | 4.00 | | | | 11-15-2025 | | | | 2,500,000 | | | | 2,581,783 | |
Mid-America Apartments LP | | | 4.30 | | | | 10-15-2023 | | | | 2,072,000 | | | | 2,179,799 | |
Public Storage | | | 2.37 | | | | 9-15-2022 | | | | 5,594,000 | | | | 5,526,171 | |
Public Storage | | | 3.09 | | | | 9-15-2027 | | | | 4,401,000 | | | | 4,362,834 | |
Realty Income Corporation | | | 4.65 | | | | 3-15-2047 | | | | 1,850,000 | | | | 1,940,003 | |
Regency Centers LP | | | 3.60 | | | | 2-1-2027 | | | | 2,050,000 | | | | 2,040,509 | |
Tanger Properties LP | | | 3.75 | | | | 12-1-2024 | | | | 2,528,000 | | | | 2,531,143 | |
Tanger Properties LP | | | 3.88 | | | | 12-1-2023 | | | | 2,699,000 | | | | 2,725,011 | |
Washington Prime Group LP | | | 5.95 | | | | 8-15-2024 | | | | 1,945,000 | | | | 1,943,359 | |
WEA Finance LLC 144A | | | 3.15 | | | | 4-5-2022 | | | | 5,175,000 | | | | 5,197,929 | |
| |
| | | | 58,620,520 | |
| | | | | | | | | | | | | | | | |
| | | | |
Telecommunication Services: 1.17% | | | | | | | | | | | | | | | | |
| | | | |
| Diversified Telecommunication Services: 1.17% | | | | | | | | | | | | | | | | |
AT&T Incorporated | | | 3.40 | | | | 5-15-2025 | | | | 15,374,000 | | | | 15,056,814 | |
AT&T Incorporated | | | 3.90 | | | | 8-14-2027 | | | | 6,183,000 | | | | 6,139,891 | |
AT&T Incorporated | | | 4.45 | | | | 4-1-2024 | | | | 2,656,000 | | | | 2,802,002 | |
AT&T Incorporated | | | 4.90 | | | | 8-14-2037 | | | | 4,125,000 | | | | 4,108,357 | |
AT&T Incorporated | | | 5.15 | | | | 2-14-2050 | | | | 2,590,000 | | | | 2,563,746 | |
AT&T Incorporated | | | 5.25 | | | | 3-1-2037 | | | | 6,225,000 | | | | 6,480,675 | |
AT&T Incorporated | | | 5.45 | | | | 3-1-2047 | | | | 4,450,000 | | | | 4,687,787 | |
Verizon Communications Incorporated | | | 2.95 | | | | 3-15-2022 | | | | 2,935,000 | | | | 2,951,770 | |
Verizon Communications Incorporated | | | 4.13 | | | | 3-16-2027 | | | | 2,990,000 | | | | 3,108,230 | |
Verizon Communications Incorporated | | | 4.13 | | | | 8-15-2046 | | | | 7,946,000 | | | | 7,211,311 | |
Verizon Communications Incorporated | | | 4.40 | | | | 11-1-2034 | | | | 7,307,000 | | | | 7,341,124 | |
Verizon Communications Incorporated | | | 5.01 | | | | 8-21-2054 | | | | 1,956,000 | | | | 1,972,570 | |
| |
| | | | 64,424,277 | |
| | | | | | | | | | | | | | | | |
| | | | |
Utilities: 1.91% | | | | | | | | | | | | | | | | |
| | | | |
| Electric Utilities: 1.79% | | | | | | | | | | | | | | | | |
Alabama Power Company | | | 3.70 | | | | 12-1-2047 | | | | 3,152,000 | | | | 3,132,085 | |
American Electric Power Company | | | 1.65 | | | | 12-15-2017 | | | | 4,828,000 | | | | 4,828,002 | |
Appalachian Power Company | | | 3.30 | | | | 6-1-2027 | | | | 3,070,000 | | | | 3,081,462 | |
Avangrid Incorporated | | | 3.15 | | | | 12-1-2024 | | | | 3,822,000 | | | | 3,814,745 | |
Baltimore Gas and Electric Company | | | 3.75 | | | | 8-15-2047 | | | | 1,970,000 | | | | 1,976,694 | |
Charter Communications Operating LLC | | | 3.60 | | | | 9-15-2047 | | | | 4,768,000 | | | | 4,769,394 | |
Commonwealth Edison Company | | | 2.95 | | | | 8-15-2027 | | | | 4,440,000 | | | | 4,378,001 | |
Commonwealth Edison Company | | | 3.75 | | | | 8-15-2047 | | | | 1,292,000 | | | | 1,309,533 | |
Duke Energy Carolinas LLC | | | 2.50 | | | | 3-15-2023 | | | | 3,215,000 | | | | 3,200,778 | |
Duke Energy Carolinas LLC | | | 3.88 | | | | 3-15-2046 | | | | 1,131,000 | | | | 1,169,001 | |
Duke Energy Corporation | | | 1.80 | | | | 9-1-2021 | | | | 4,420,000 | | | | 4,305,895 | |
Duke Energy Corporation | | | 3.15 | | | | 8-15-2027 | | | | 974,000 | | | | 961,967 | |
Duke Energy Florida LLC | | | 3.40 | | | | 10-1-2046 | | | | 1,905,000 | | | | 1,810,127 | |
Duquesne Light Holdings Incorporated 144A | | | 3.62 | | | | 8-1-2027 | | | | 5,600,000 | | | | 5,563,480 | |
Georgia Power Company | | | 4.30 | | | | 3-15-2042 | | | | 950,000 | | | | 983,776 | |
The accompanying notes are an integral part of these financial statements.
| | | | | | |
| Portfolio of investments—November 30, 2017 (unaudited) | | Wells Fargo Allocation Funds | | | 91 | |
CORE BOND PORTFOLIO
| | | | | | | | | | | | | | | | |
| Security name | | Interest rate | | | Maturity date | | | Principal | | | Value | |
|
| Electric Utilities (continued) | |
Indiana Michigan Power Company | | | 4.55 | % | | | 3-15-2046 | | | $ | 2,075,000 | | | $ | 2,301,847 | |
IPALCO Enterprises Incorporated 144A | | | 3.70 | | | | 9-1-2024 | | | | 4,925,000 | | | | 4,903,475 | |
ITC Holdings Corporation 144A | | | 3.35 | | | | 11-15-2027 | | | | 8,210,000 | | | | 8,195,431 | |
New England Power Company 144A%% | | | 3.80 | | | | 12-5-2047 | | | | 2,907,000 | | | | 2,887,407 | |
NiSource Finance Corporation | | | 3.95 | | | | 3-30-2048 | | | | 1,148,000 | | | | 1,147,934 | |
Oklahoma Gas & Electric Company | | | 4.15 | | | | 4-1-2047 | | | | 2,194,000 | | | | 2,347,351 | |
Pacific Gas & Electric Company 144A | | | 3.30 | | | | 12-1-2027 | | | | 5,336,000 | | | | 5,306,347 | |
Pacific Gas & Electric Company | | | 4.00 | | | | 12-1-2046 | | | | 1,347,000 | | | | 1,348,908 | |
PECO Energy Company | | | 3.15 | | | | 10-15-2025 | | | | 5,095,000 | | | | 5,126,941 | |
PPL Electric Utilities Corporation | | | 4.15 | | | | 10-1-2045 | | | | 3,413,000 | | | | 3,720,983 | |
Sierra Pacific Power Company | | | 2.60 | | | | 5-1-2026 | | | | 4,485,000 | | | | 4,326,910 | |
Southern Company | | | 2.45 | | | | 10-1-2023 | | | | 2,962,000 | | | | 2,868,334 | |
Southern Company | | | 4.40 | | | | 7-1-2046 | | | | 2,709,000 | | | | 2,836,275 | |
Southwestern Electric Power Company | | | 3.90 | | | | 4-1-2045 | | | | 1,362,000 | | | | 1,363,833 | |
Southwestern Public Service Company | | | 3.70 | | | | 8-15-2047 | | | | 2,921,000 | | | | 2,930,345 | |
Virginia Electric & Power Company | | | 2.95 | | | | 11-15-2026 | | | | 1,898,000 | | | | 1,873,661 | |
| |
| | | | 98,770,922 | |
| | | | | | | | | | | | | | | | |
| | | | |
| Multi-Utilities: 0.12% | | | | | | | | | | | | | | | | |
Dominion Resources Incorporated | | | 1.60 | | | | 8-15-2019 | | | | 3,765,000 | | | | 3,725,690 | |
Dominion Resources Incorporated | | | 2.00 | | | | 8-15-2021 | | | | 2,905,000 | | | | 2,846,973 | |
| |
| | | | 6,572,663 | |
| | | | | | | | | | | | | | | | |
| |
Total Corporate Bonds and Notes (Cost $1,177,678,230) | | | | 1,188,666,922 | |
| | | | | | | | | | | | | | | | |
| | | | |
Municipal Obligations: 0.64% | | | | | | | | | | | | | | | | |
| | | | |
| California: 0.23% | | | | | | | | | | | | | | | | |
California Build America Bonds (GO Revenue) | | | 7.60 | | | | 11-1-2040 | | | | 3,425,000 | | | | 5,412,254 | |
Los Angeles CA Community College District Build America Bonds (GO Revenue) | | | 6.75 | | | | 8-1-2049 | | | | 4,670,000 | | | | 7,120,489 | |
| |
| | | | 12,532,743 | |
| | | | | | | | | | | | | | | | |
| | | | |
| Nevada: 0.12% | | | | | | | | | | | | | | | | |
Clark County NV Airport Authority Build America Bonds Series C (Airport Revenue) | | | 6.82 | | | | 7-1-2045 | | | | 4,380,000 | | | | 6,731,885 | |
| | | | | | | | | | | | | | | | |
| | | | |
| New York: 0.13% | | | | | | | | | | | | | | | | |
Port Authority of New York & New Jersey Consolidated Bonds Series 174 (Airport Revenue) | | | 4.46 | | | | 10-1-2062 | | | | 6,610,000 | | | | 7,486,089 | |
| | | | | | | | | | | | | | | | |
| | | | |
| Ohio: 0.04% | | | | | | | | | | | | | | | | |
Ohio State University General Receipts Taxable Bonds Series A (Education Revenue) | | | 4.80 | | | | 6-1-2111 | | | | 1,957,000 | | | | 2,150,215 | |
| | | | | | | | | | | | | | | | |
| | | | |
| Texas: 0.12% | | | | | | | | | | | | | | | | |
North Texas Tollway Authority (Transportation Revenue) | | | 6.72 | | | | 1-1-2049 | | | | 4,460,000 | | | | 6,670,108 | |
| | | | | | | | | | | | | | | | |
| |
Total Municipal Obligations (Cost $29,277,919) | | | | 35,571,040 | |
| | | | | | | | | | | | | | | | |
| | | | |
Non-Agency Mortgage-Backed Securities: 5.75% | | | | | | | | | | | | | | | | |
CD Commercial Mortgage Trust Series 2016-CD1 Class A1 | | | 1.44 | | | | 8-10-2049 | | | | 1,473,591 | | | | 1,450,916 | |
CD Commercial Mortgage Trust Series 2016-CD1 Class ASB | | | 2.62 | | | | 8-10-2049 | | | | 4,881,000 | | | | 4,824,903 | |
CD Commercial Mortgage Trust Series 2017-CD4 Class ASB | | | 3.32 | | | | 5-10-2050 | | | | 2,105,000 | | | | 2,161,951 | |
The accompanying notes are an integral part of these financial statements.
| | | | |
| 92 | | Wells Fargo Allocation Funds | | Portfolio of investments—November 30, 2017 (unaudited) |
CORE BOND PORTFOLIO
| | | | | | | | | | | | | | | | |
| Security name | | Interest rate | | | Maturity date | | | Principal | | | Value | |
|
Non-Agency Mortgage-Backed Securities (continued) | |
CD Commercial Mortgage Trust Series 2017-CD6 Class ASB | | | 3.33 | % | | | 11-13-2050 | | | $ | 5,323,000 | | | $ | 5,461,075 | |
CFCRE Commercial Mortgage Trust Series 2011-C1 Class A4 144A±± | | | 4.96 | | | | 4-15-2044 | | | | 3,997,965 | | | | 4,204,490 | |
CFCRE Commercial Mortgage Trust Series 2016-C3 Class A1 | | | 1.79 | | | | 1-10-2048 | | | | 2,113,788 | | | | 2,101,810 | |
CFCRE Commercial Mortgage Trust Series 2016-C4 Class A4 | | | 3.28 | | | | 5-10-2058 | | | | 2,857,000 | | | | 2,864,740 | |
CFCRE Commercial Mortgage Trust Series 2016-C7 Class A2 | | | 3.59 | | | | 12-10-2054 | | | | 2,861,000 | | | | 2,952,728 | |
CFCRE Commercial Mortgage Trust Series 2016-C7 Class A3 | | | 3.84 | | | | 12-10-2054 | | | | 2,195,000 | | | | 2,306,858 | |
CFCRE Commercial Mortgage Trust Series 2017-C8 Class A1 | | | 2.03 | | | | 6-15-2050 | | | | 1,632,825 | | | | 1,621,972 | |
CFCRE Commercial Mortgage Trust Series 2017-C8 Class A4 | | | 3.57 | | | | 6-15-2050 | | | | 1,700,000 | | | | 1,747,651 | |
CFCRE Commercial Mortgage Trust Series 2017-C8 Class ASB | | | 3.37 | | | | 6-15-2050 | | | | 2,014,000 | | | | 2,064,775 | |
Citigroup Commercial Mortgage Trust Series 2013-GC11 Class A2 | | | 1.99 | | | | 4-10-2046 | | | | 3,470,449 | | | | 3,471,299 | |
Citigroup Commercial Mortgage Trust Series 2013-GC11 Class AAB | | | 2.69 | | | | 4-10-2046 | | | | 1,885,000 | | | | 1,894,708 | |
Citigroup Commercial Mortgage Trust Series 2014-GC25 Class A4 | | | 3.64 | | | | 10-10-2047 | | | | 4,840,000 | | | | 5,032,504 | |
Citigroup Commercial Mortgage Trust Series 2015-GC129 Class A4 | | | 3.19 | | | | 4-10-2048 | | | | 2,493,000 | | | | 2,516,931 | |
Commercial Mortgage Pass-Through Certificate Series 2012-CR3 Class A3 | | | 2.82 | | | | 10-15-2045 | | | | 2,286,000 | | | | 2,291,782 | |
Commercial Mortgage Pass-Through Certificate Series 2012-UBS5 Class A3 | | | 3.55 | | | | 9-10-2047 | | | | 1,038,000 | | | | 1,075,299 | |
Commercial Mortgage Pass-Through Certificate Series 2013-CR10 Class A2 | | | 2.97 | | | | 8-10-2046 | | | | 1,392,000 | | | | 1,402,197 | |
Commercial Mortgage Pass-Through Certificate Series 2013-CR12 Class A4 | | | 4.05 | | | | 10-10-2046 | | | | 2,289,000 | | | | 2,438,983 | |
Commercial Mortgage Pass-Through Certificate Series 2013-CR6 Class A2 | | | 2.12 | | | | 3-10-2046 | | | | 1,055,912 | | | | 1,055,528 | |
Commercial Mortgage Pass-Through Certificate Series 2013-CR9 Class ASB | | | 3.83 | | | | 7-10-2045 | | | | 6,032,000 | | | | 6,284,416 | |
Commercial Mortgage Pass-Through Certificate Series 2014-C4 Class A5 | | | 3.69 | | | | 8-10-2047 | | | | 1,663,000 | | | | 1,729,093 | |
Commercial Mortgage Pass-Through Certificate Series 2014-UBS2 Class A5 | | | 3.96 | | | | 3-10-2047 | | | | 1,747,000 | | | | 1,842,234 | |
Commercial Mortgage Pass-Through Certificate Series 2014-UBS6 Class AM | | | 4.05 | | | | 12-10-2047 | | | | 4,230,000 | | | | 4,415,145 | |
Commercial Mortgage Pass-Through Certificate Series 2016-C1 Class ASB | | | 2.97 | | | | 10-10-2049 | | | | 2,071,000 | | | | 2,080,624 | |
Commercial Mortgage Trust Series 2012-CR4 Class A2 | | | 1.80 | | | | 10-15-2045 | | | | 506,570 | | | | 506,225 | |
Commercial Mortgage Trust Series 2013-CR11 Class A1 | | | 1.47 | | | | 8-10-2050 | | | | 457,521 | | | | 456,499 | |
Commercial Mortgage Trust Series 2013-CR12 Class A1 | | | 1.30 | | | | 10-10-2046 | | | | 75,868 | | | | 75,752 | |
Commercial Mortgage Trust Series 2013-CR12 Class A3 | | | 3.77 | | | | 10-10-2046 | | | | 1,384,000 | | | | 1,455,278 | |
Commercial Mortgage Trust Series 2014-UBS6 Class A5 | | | 3.64 | | | | 12-10-2047 | | | | 4,020,000 | | | | 4,170,812 | |
Commercial Mortgage Trust Series 2017-CR2 Class A3 | | | 3.51 | | | | 9-10-2050 | | | | 1,390,000 | | | | 1,422,465 | |
CSAIL Commercial Mortgage Trust Series 2015-C3 Class A4 | | | 3.72 | | | | 8-15-2048 | | | | 2,954,000 | | | | 3,074,142 | |
CSAIL Commercial Mortgage Trust Series 2015-C4 Class A4 | | | 3.81 | | | | 11-15-2048 | | | | 7,385,200 | | | | 7,729,398 | |
CSAIL Commercial Mortgage Trust Series 2016-C5 Class ASB | | | 3.53 | | | | 11-15-2048 | | | | 865,000 | | | | 893,924 | |
Deutsche Bank Commercial Mortgage Trust Series 2017-C6 Class ASB | | | 3.12 | | | | 6-10-2050 | | | | 1,249,000 | | | | 1,261,419 | |
GS Mortgage Securities Trust Series 2012-GCJ7 Class AAB | | | 2.94 | | | | 5-10-2045 | | | | 495,454 | | | | 501,688 | |
GS Mortgage Securities Trust Series 2013-GC14 Class AAB | | | 3.82 | | | | 8-10-2046 | | | | 6,754,000 | | | | 7,028,535 | |
GS Mortgage Securities Trust Series 2013-GC16 Class A2 | | | 3.03 | | | | 11-10-2046 | | | | 1,716,514 | | | | 1,728,459 | |
GS Mortgage Securities Trust Series 2014-GCJ18 Class A3 | | | 3.80 | | | | 1-10-2047 | | | | 1,904,000 | | | | 2,001,373 | |
GS Mortgage Securities Trust Series 2016-GS3 Class A4 | | | 2.85 | | | | 10-10-2049 | | | | 2,075,000 | | | | 2,028,361 | |
GS Mortgage Securities Trust Series 2016-GS3 Class AAB | | | 2.78 | | | | 10-10-2049 | | | | 3,117,000 | | | | 3,101,851 | |
Impact Funding LLC Series 2010-1 Class A1 144A | | | 5.31 | | | | 1-25-2051 | | | | 8,314,473 | | | | 9,071,514 | |
JPMBB Commercial Mortgage Securities Series 2014-C23 Class A4 | | | 3.67 | | | | 9-15-2047 | | | | 2,419,000 | | | | 2,513,877 | |
JPMDB Commercial Mortgage Securities Seris 2017-C5 Class ASB | | | 3.49 | | | | 3-15-2050 | | | | 861,000 | | | | 888,709 | |
JPMorgan Chase Commercial Mortgage Securities Corporation Series 201-C30 Class A5 | | | 3.82 | | | | 7-15-2048 | | | | 5,662,000 | | | | 5,967,120 | |
JPMorgan Chase Commercial Mortgage Securities Corporation Series 2010-A2 Class A2 144A | | | 4.31 | | | | 8-5-2032 | | | | 5,814,738 | | | | 5,972,447 | |
JPMorgan Chase Commercial Mortgage Securities Corporation Series 2012-CBX Class A4 | | | 3.48 | | | | 6-15-2045 | | | | 3,623,000 | | | | 3,732,148 | |
JPMorgan Chase Commercial Mortgage Securities Corporation Series 2012-LC9 Class A5 | | | 2.84 | | | | 12-15-2047 | | | | 5,490,738 | | | | 5,518,410 | |
The accompanying notes are an integral part of these financial statements.
| | | | | | |
| Portfolio of investments—November 30, 2017 (unaudited) | | Wells Fargo Allocation Funds | | | 93 | |
CORE BOND PORTFOLIO
| | | | | | | | | | | | | | | | |
| Security name | | Interest rate | | | Maturity date | | | Principal | | | Value | |
|
Non-Agency Mortgage-Backed Securities (continued) | |
JPMorgan Chase Commercial Mortgage Securities Corporation Series 2013-C13 Class A2 | | | 2.67 | % | | | 1-15-2046 | | | $ | 6,514,273 | | | $ | 6,543,912 | |
JPMorgan Chase Commercial Mortgage Securities Corporation Series 2013-C15 Class A2 | | | 2.98 | | | | 11-15-2045 | | | | 2,834,752 | | | | 2,852,901 | |
JPMorgan Chase Commercial Mortgage Securities Corporation Series 2014-C20 Class A2 | | | 2.87 | | | | 7-15-2047 | | | | 1,932,000 | | | | 1,949,232 | |
JPMorgan Chase Commercial Mortgage Securities Corporation Series 2014-C20 Class A5 | | | 3.80 | | | | 7-15-2047 | | | | 4,897,000 | | | | 5,124,378 | |
JPMorgan Chase Commercial Mortgage Securities Corporation Series 2014-C21 Class A5 | | | 3.77 | | | | 8-15-2047 | | | | 4,908,000 | | | | 5,129,420 | |
JPMorgan Chase Commercial Mortgage Securities Corporation Series 2015-C28 Class A4 | | | 3.23 | | | | 10-15-2048 | | | | 3,312,000 | | | | 3,343,715 | |
JPMorgan Chase Commercial Mortgage Securities Corporation Series 2016-JP2 Class A1 | | | 1.32 | | | | 8-15-2049 | | | | 3,156,604 | | | | 3,111,685 | |
JPMorgan Chase Commercial Mortgage Securities Corporation Series 2017-JP5 Class ASB | | | 3.55 | | | | 3-15-2050 | | | | 6,129,000 | | | | 6,346,659 | |
JPMorgan Chase Commercial Mortgage Securities Corporation Series 2017JP6 Class ASB | | | 3.28 | | | | 7-15-2050 | | | | 2,343,000 | | | | 2,388,847 | |
JPMorgan Chase Commercial Mortgage Securities Trust Series 2010-C2 Class A2 144A | | | 3.62 | | | | 11-15-2043 | | | | 327,787 | | | | 332,169 | |
JPMorgan Chase Commercial Mortgage Securities Trust Series 2011-C4 Class A3 144A | | | 4.11 | | | | 7-15-2046 | | | | 7,442,036 | | | | 7,482,166 | |
JPMorgan Chase Commercial Mortgage Securities Trust Series 2015-C28 Class A2 | | | 2.77 | | | | 10-15-2048 | | | | 2,053,000 | | | | 2,071,214 | |
JPMorgan Chase Commercial Mortgage Securities Trust Series 2015-C28 Class A3 | | | 2.91 | | | | 10-15-2048 | | | | 10,965,000 | | | | 10,865,677 | |
JPMorgan Chase Commercial Mortgage Securities Trust Series 2015-C30 Class AS ±± | | | 4.23 | | | | 7-15-2048 | | | | 2,875,000 | | | | 3,031,343 | |
JPMorgan Chase Commercial Mortgage Securities Trust Series 2015-C30 Class ASB | | | 3.56 | | | | 7-15-2048 | | | | 2,853,000 | | | | 2,961,031 | |
JPMorgan Chase Commercial Mortgage Securities Trust Series 2015-JP1 Class ASB | | | 3.73 | | | | 1-15-2049 | | | | 2,582,000 | | | | 2,700,637 | |
JPMorgan Chase Commercial Mortgage Securities Trust Series 2015-JP2 Class ASB | | | 2.71 | | | | 8-15-2049 | | | | 2,765,000 | | | | 2,738,332 | |
JPMorgan Chase Commercial Mortgage Securities Trust Series 2016-C1 Class ASB | | | 3.32 | | | | 3-15-2049 | | | | 5,263,000 | | | | 5,389,881 | |
JPMorgan Mortgage Trust Series 2017-5 Class A1 144A±± | | | 3.19 | | | | 12-15-2047 | | | | 28,583,000 | | | | 28,913,111 | |
Morgan Stanley Bank of America Merrill Lynch Trust Series 2013-C10 Class A2 | | | 2.96 | | | | 7-15-2046 | | | | 679,248 | | | | 680,931 | |
Morgan Stanley Bank of America Merrill Lynch Trust Series 2013-C9 Class A2 | | | 1.97 | | | | 5-15-2046 | | | | 229,263 | | | | 229,221 | |
Morgan Stanley Bank of America Merrill Lynch Trust Series 2015-C27 Class A4 | | | 3.75 | | | | 12-15-2047 | | | | 3,712,000 | | | | 3,894,933 | |
Morgan Stanley Bank of America Merrill Lynch Trust Series 2016-C28 Class A4 | | | 3.54 | | | | 1-15-2049 | | | | 1,448,000 | | | | 1,492,582 | |
Morgan Stanley Bank of America Merrill Lynch Trust Series 2016-C30 Class ASB | | | 2.73 | | | | 9-15-2049 | | | | 9,888,000 | | | | 9,678,738 | |
Morgan Stanley Capital I Trust Series 2015-UBS8 Class A3 | | | 3.54 | | | | 12-15-2048 | | | | 2,084,000 | | | | 2,153,248 | |
Morgan Stanley Capital I Trust Series 2016-UB11 Class A1 | | | 1.45 | | | | 8-15-2049 | | | | 3,676,728 | | | | 3,619,757 | |
Morgan Stanley Capital I Trust Series 2016-UB11 Class ASB | | | 2.61 | | | | 8-15-2049 | | | | 2,119,000 | | | | 2,081,101 | |
Morgan Stanley Capital I Trust Series 2016-UBS9 Class A1 | | | 1.71 | | | | 3-15-2049 | | | | 1,837,697 | | | | 1,823,058 | |
Perpetual Savings Bank Series 1990-1 Class 1 ±± | | | 4.93 | | | | 3-1-2020 | | | | 12,102 | | | | 12,166 | |
SoFi Professional Loan Program LLC Series 2016-A Class A2 144A | | | 2.76 | | | | 12-26-2036 | | | | 6,476,565 | | | | 6,476,160 | |
SoFi Professional Loan Program LLC Series 2016-D Class A1 (1 Month LIBOR +0.95%) 144A± | | | 2.19 | | | | 1-25-2039 | | | | 1,426,168 | | | | 1,440,152 | |
SoFi Professional Loan Program LLC Series 2016-E Class A1 (1 Month LIBOR +0.85%) 144A± | | | 2.09 | | | | 7-25-2039 | | | | 3,609,347 | | | | 3,643,069 | |
SoFi Professional Loan Program LLC Series 2017-A Class A1 (1 Month LIBOR +0.70%) 144A± | | | 1.94 | | | | 3-26-2040 | | | | 3,404,622 | | | | 3,422,990 | |
SoFi Professional Loan Program LLC Series 2017-A Class A2B 144A | | | 2.40 | | | | 3-26-2040 | | | | 3,470,000 | | | | 3,421,774 | |
SoFi Professional Loan Program LLC Series 2017-B Class A2 144A | | | 2.74 | | | | 5-25-2040 | | | | 3,938,000 | | | | 3,934,161 | |
SoFi Professional Loan Program LLC Series 2017-C Class A2B 144A | | | 2.63 | | | | 7-25-2040 | | | | 5,627,000 | | | | 5,602,170 | |
The accompanying notes are an integral part of these financial statements.
| | | | |
| 94 | | Wells Fargo Allocation Funds | | Portfolio of investments—November 30, 2017 (unaudited) |
CORE BOND PORTFOLIO
| | | | | | | | | | | | | | | | |
| Security name | | Interest rate | | | Maturity date | | | Principal | | | Value | |
|
Non-Agency Mortgage-Backed Securities (continued) | |
SoFi Professional Loan Program LLC Series 2017-D Class A2 144A | | | 2.65 | % | | | 9-25-2040 | | | $ | 1,313,000 | | | $ | 1,307,656 | |
SoFi Professional Loan Program LLC Series 2017-E Class A1 (1 Month LIBOR +0.50%) 144A± | | | 1.74 | | | | 11-26-2040 | | | | 3,229,619 | | | | 3,231,207 | |
SoFi Professional Loan Program LLC Series 2017-E Class A2B 144A | | | 2.72 | | | | 11-26-2040 | | | | 9,869,000 | | | | 9,818,176 | |
Structured Asset Securities Corporation Series 1998-2 Class A (1 Month LIBOR +0.52%) ± | | | 1.76 | | | | 2-25-2028 | | | | 26,141 | | | | 25,863 | |
UBS Barclays Commercial Mortgage Trust Series 2012-C2 Class A4 | | | 3.53 | | | | 5-10-2063 | | | | 3,453,000 | | | | 3,575,818 | |
UBS Barclays Commercial Mortgage Trust Series 2012-C4 Class A2 | | | 1.71 | | | | 12-10-2045 | | | | 146,577 | | | | 146,518 | |
| |
Total Non-Agency Mortgage-Backed Securities (Cost $319,079,810) | | | | 317,382,777 | |
| | | | | | | | | | | | | | | | |
| | | | |
U.S. Treasury Securities: 32.23% | | | | | | | | | | | | | | | | |
U.S. Treasury Bond | | | 2.50 | | | | 2-15-2046 | | | | 34,137,000 | | | | 31,866,089 | |
U.S. Treasury Bond | | | 2.50 | | | | 5-15-2046 | | | | 38,269,000 | | | | 35,700,791 | |
U.S. Treasury Bond | | | 2.75 | | | | 8-15-2047 | | | | 55,089,000 | | | | 54,079,752 | |
U.S. Treasury Bond | | | 2.75 | | | | 11-15-2047 | | | | 15,745,000 | | | | 15,467,617 | |
U.S. Treasury Bond | | | 2.88 | | | | 11-15-2046 | | | | 40,006,000 | | | | 40,268,539 | |
U.S. Treasury Bond ## | | | 3.00 | | | | 11-15-2045 | | | | 27,871,000 | | | | 28,753,945 | |
U.S. Treasury Bond | | | 3.00 | | | | 2-15-2047 | | | | 40,200,000 | | | | 41,471,953 | |
U.S. Treasury Bond | | | 3.00 | | | | 5-15-2047 | | | | 8,159,000 | | | | 8,417,156 | |
U.S. Treasury Note ## | | | 1.13 | | | | 2-28-2021 | | | | 32,572,000 | | | | 31,714,440 | |
U.S. Treasury Note ## | | | 1.13 | | | | 7-31-2021 | | | | 61,475,000 | | | | 59,537,097 | |
U.S. Treasury Note ## | | | 1.25 | | | | 4-30-2019 | | | | 86,576,000 | | | | 85,977,408 | |
U.S. Treasury Note | | | 1.25 | | | | 5-31-2019 | | | | 49,977,000 | | | | 49,611,934 | |
U.S. Treasury Note | | | 1.25 | | | | 8-31-2019 | | | | 13,556,000 | | | | 13,433,149 | |
U.S. Treasury Note | | | 1.38 | | | | 7-31-2019 | | | | 47,445,000 | | | | 47,150,322 | |
U.S. Treasury Note | | | 1.38 | | | | 9-30-2019 | | | | 80,001,000 | | | | 79,419,743 | |
U.S. Treasury Note | | | 1.38 | | | | 8-31-2020 | | | | 11,893,000 | | | | 11,731,794 | |
U.S. Treasury Note | | | 1.38 | | | | 9-30-2020 | | | | 21,834,000 | | | | 21,521,842 | |
U.S. Treasury Note | | | 1.50 | | | | 10-31-2019 | | | | 58,778,000 | | | | 58,451,965 | |
U.S. Treasury Note ## | | | 1.50 | | | | 5-31-2020 | | | | 39,306,000 | | | | 38,957,466 | |
U.S. Treasury Note | | | 1.50 | | | | 7-15-2020 | | | | 15,393,000 | | | | 15,246,285 | |
U.S. Treasury Note | | | 1.50 | | | | 8-15-2020 | | | | 46,333,000 | | | | 45,876,910 | |
U.S. Treasury Note | | | 1.50 | | | | 8-15-2026 | | | | 87,042,000 | | | | 80,894,659 | |
U.S. Treasury Note | | | 1.63 | | | | 7-31-2020 | | | | 48,736,000 | | | | 48,414,266 | |
U.S. Treasury Note | | | 1.63 | | | | 10-15-2020 | | | | 65,381,000 | | | | 64,877,873 | |
U.S. Treasury Note | | | 1.75 | | | | 11-30-2019 | | | | 6,887,000 | | | | 6,881,620 | |
U.S. Treasury Note | | | 1.75 | | | | 11-15-2020 | | | | 48,600,000 | | | | 48,389,273 | |
U.S. Treasury Note | | | 1.75 | | | | 12-31-2020 | | | | 10,145,000 | | | | 10,087,538 | |
U.S. Treasury Note ## | | | 1.88 | | | | 1-31-2022 | | | | 57,835,000 | | | | 57,340,240 | |
U.S. Treasury Note | | | 1.88 | | | | 3-31-2022 | | | | 48,674,000 | | | | 48,210,076 | |
U.S. Treasury Note | | | 1.88 | | | | 4-30-2022 | | | | 82,228,000 | | | | 81,399,296 | |
U.S. Treasury Note | | | 1.88 | | | | 7-31-2022 | | | | 53,553,000 | | | | 52,940,069 | |
U.S. Treasury Note | | | 1.88 | | | | 9-30-2022 | | | | 5,354,000 | | | | 5,288,748 | |
U.S. Treasury Note | | | 2.00 | | | | 10-31-2021 | | | | 35,231,000 | | | | 35,166,318 | |
U.S. Treasury Note | | | 2.00 | | | | 12-31-2021 | | | | 47,116,000 | | | | 46,976,124 | |
U.S. Treasury Note | | | 2.00 | | | | 10-31-2022 | | | | 70,538,000 | | | | 70,086,116 | |
U.S. Treasury Note | | | 2.00 | | | | 11-30-2022 | | | | 38,302,000 | | | | 38,037,178 | |
U.S. Treasury Note ## | | | 2.00 | | | | 11-15-2026 | | | | 80,882,000 | | | | 78,202,784 | |
U.S. Treasury Note | | | 2.25 | | | | 10-31-2024 | | | | 5,669,000 | | | | 5,646,191 | |
U.S. Treasury Note | | | 2.25 | | | | 2-15-2027 | | | | 31,648,000 | | | | 31,195,532 | |
The accompanying notes are an integral part of these financial statements.
| | | | | | |
| Portfolio of investments—November 30, 2017 (unaudited) | | Wells Fargo Allocation Funds | | | 95 | |
CORE BOND PORTFOLIO
| | | | | | | | | | | | | | | | |
| Security name | | Interest rate | | | Maturity date | | | Principal | | | Value | |
|
U.S. Treasury Securities (continued) | |
U.S. Treasury Note | | | 2.25 | % | | | 8-15-2027 | | | $ | 59,379,000 | | | $ | 58,441,925 | |
U.S. Treasury Note « | | | 2.25 | | | | 11-15-2027 | | | | 96,599,000 | | | | 95,157,561 | |
| |
Total U.S. Treasury Securities (Cost $1,791,534,931) | | | | 1,778,289,584 | |
| | | | | | | | | | | | | | | | |
| | | | |
Yankee Corporate Bonds and Notes: 4.56% | | | | | | | | | | | | | | | | |
| | | | |
Consumer Staples: 0.20% | | | | | | | | | | | | | | | | |
| | | | |
| Food & Staples Retailing: 0.20% | | | | | | | | | | | | | | | | |
Alimentation Couche-Tard Incorporated 144A | | | 2.70 | | | | 7-26-2022 | | | | 6,865,000 | | | | 6,785,627 | |
Alimentation Couche-Tard Incorporated 144A | | | 3.55 | | | | 7-26-2027 | | | | 4,105,000 | | | | 4,081,615 | |
| |
| | | | 10,867,242 | |
| | | | | | | | | | | | | | | | |
| | | | |
Energy: 0.91% | | | | | | | | | | | | | | | | |
| | | | |
| Energy Equipment & Services: 0.24% | | | | | | | | | | | | | | | | |
Schlumberger Limited 144A | | | 2.20 | | | | 11-20-2020 | | | | 5,093,000 | | | | 5,072,679 | |
Schlumberger Limited 144A | | | 2.65 | | | | 11-20-2022 | | | | 8,183,000 | | | | 8,155,577 | |
| |
| | | | 13,228,256 | |
| | | | | | | | | | | | | | | | |
| | | | |
| Oil, Gas & Consumable Fuels: 0.67% | | | | | | | | | | | | | | | | |
BP Capital Markets plc | | | 3.59 | | | | 4-14-2027 | | | | 3,652,000 | | | | 3,761,242 | |
BP Capital Markets plc | | | 3.72 | | | | 11-28-2028 | | | | 845,000 | | | | 879,626 | |
Cenovus Energy Incorporated 144A | | | 5.40 | | | | 6-15-2047 | | | | 2,038,000 | | | | 2,076,361 | |
Enbridge Incorporated | | | 2.90 | | | | 7-15-2022 | | | | 4,859,000 | | | | 4,831,324 | |
Enbridge Incorporated | | | 3.70 | | | | 7-15-2027 | | | | 1,443,000 | | | | 1,438,384 | |
Encana Corporation | | | 6.50 | | | | 2-1-2038 | | | | 3,156,000 | | | | 3,908,765 | |
Petroleos Mexicanos Company | | | 2.38 | | | | 4-15-2025 | | | | 2,721,750 | | | | 2,718,190 | |
Petroleos Mexicanos Company | | | 2.46 | | | | 12-15-2025 | | | | 6,855,250 | | | | 6,864,533 | |
Petroleos Mexicanos Company | | | 5.63 | | | | 1-23-2046 | | | | 3,706,000 | | | | 3,471,410 | |
Petroleos Mexicanos Company 144A | | | 6.50 | | | | 3-13-2027 | | | | 3,305,000 | | | | 3,644,589 | |
Petroleos Mexicanos Company | | | 6.75 | | | | 9-21-2047 | | | | 2,155,000 | | | | 2,279,128 | |
Petroleos Mexicanos Company 144A | | | 6.75 | | | | 9-21-2047 | | | | 780,000 | | | | 824,928 | |
| |
| | | | 36,698,480 | |
| | | | | | | | | | | | | | | | |
| | | | |
Financials: 2.44% | | | | | | | | | | | | | | | | |
| | | | |
| Banks: 2.09% | | | | | | | | | | | | | | | | |
Banco Santander SA | | | 3.13 | | | | 2-23-2023 | | | | 5,000,000 | | | | 4,976,395 | |
Banco Santander SA | | | 3.50 | | | | 4-11-2022 | | | | 3,785,000 | | | | 3,856,375 | |
Banco Santander SA | | | 3.80 | | | | 2-23-2028 | | | | 3,000,000 | | | | 2,982,567 | |
Banco Santander SA | | | 4.25 | | | | 4-11-2027 | | | | 2,800,000 | | | | 2,881,679 | |
Credit Suisse Group Funding Limited (3 Month LIBOR +1.20%) 144A± | | | 3.00 | | | | 12-14-2023 | | | | 8,760,000 | | | | 8,658,524 | |
Credit Suisse Group Funding Limited | | | 3.80 | | | | 9-15-2022 | | | | 4,255,000 | | | | 4,393,725 | |
Credit Suisse Group Funding Limited | | | 3.80 | | | | 6-9-2023 | | | | 2,440,000 | | | | 2,521,358 | |
Credit Suisse Group Funding Limited | | | 4.55 | | | | 4-17-2026 | | | | 5,375,000 | | | | 5,747,050 | |
DNB Bank ASA 144A | | | 2.13 | | | | 10-2-2020 | | | | 10,800,000 | | | | 10,714,598 | |
HSBC Holdings plc | | | 2.65 | | | | 1-5-2022 | | | | 11,745,000 | | | | 11,694,253 | |
HSBC Holdings plc (3 Month LIBOR +0.92%) ± | | | 3.03 | | | | 11-22-2023 | | | | 5,075,000 | | | | 5,095,705 | |
HSBC Holdings plc | | | 4.38 | | | | 11-23-2026 | | | | 3,388,000 | | | | 3,524,479 | |
ING Groep NV | | | 3.15 | | | | 3-29-2022 | | | | 2,675,000 | | | | 2,704,038 | |
The accompanying notes are an integral part of these financial statements.
| | | | |
| 96 | | Wells Fargo Allocation Funds | | Portfolio of investments—November 30, 2017 (unaudited) |
CORE BOND PORTFOLIO
| | | | | | | | | | | | | | | | |
| Security name | | Interest rate | | | Maturity date | | | Principal | | | Value | |
| | | | |
| Banks (continued) | | | | | | | | | | | | | | | | |
ING Groep NV | | | 3.95 | % | | | 3-29-2027 | | | $ | 2,325,000 | | | $ | 2,430,624 | |
Intesa Sanpaolo SpA 144A | | | 3.13 | | | | 7-14-2022 | | | | 7,275,000 | | | | 7,236,607 | |
Intesa Sanpaolo SpA 144A | | | 3.88 | | | | 7-14-2027 | | | | 6,020,000 | | | | 6,022,445 | |
Japan Bank for International Cooperation | | | 1.75 | | | | 5-28-2020 | | | | 6,052,000 | | | | 5,970,035 | |
Japan Bank for International Cooperation | | | 1.88 | | | | 4-20-2021 | | | | 2,565,000 | | | | 2,514,768 | |
Japan Bank for International Cooperation | | | 2.25 | | | | 2-24-2020 | | | | 8,380,000 | | | | 8,372,884 | |
Perrigo Finance Unlimited Company | | | 4.38 | | | | 3-15-2026 | | | | 3,615,000 | | | | 3,737,302 | |
UBS Group Funding Company 144A | | | 2.65 | | | | 2-1-2022 | | | | 9,465,000 | | | | 9,377,184 | |
| |
| | | | 115,412,595 | |
| | | | | | | | | | | | | | | | |
| | | | |
| Consumer Finance: 0.12% | | | | | | | | | | | | | | | | |
UBS Group Funding Switzerland 144A | | | 3.49 | | | | 5-23-2023 | | | | 6,645,000 | | | | 6,758,692 | |
| | | | | | | | | | | | | | | | |
| | | | |
| Diversified Financial Services: 0.22% | | | | | | | | | | | | | | | | |
AerCap Ireland Capital Limited | | | 3.50 | | | | 1-15-2025 | | | | 6,365,000 | | | | 6,309,997 | |
BHP Billiton Finance USA Limited | | | 5.00 | | | | 9-30-2043 | | | | 1,945,000 | | | | 2,310,497 | |
Shell International Finance BV | | | 4.00 | | | | 5-10-2046 | | | | 3,530,000 | | | | 3,609,926 | |
| |
| | | | 12,230,420 | |
| | | | | | | | | | | | | | | | |
| | | | |
| Insurance: 0.01% | | | | | | | | | | | | | | | | |
XLIT Limited | | | 5.25 | | | | 12-15-2043 | | | | 320,000 | | | | 357,032 | |
| | | | | | | | | | | | | | | | |
| | | | |
Health Care: 0.06% | | | | | | | | | | | | | | | | |
| | | | |
| Pharmaceuticals: 0.06% | | | | | | | | | | | | | | | | |
Perrigo Finance plc | | | 3.90 | | | | 12-15-2024 | | | | 3,417,000 | | | | 3,479,019 | |
| | | | | | | | | | | | | | | | |
| | | | |
Industrials: 0.15% | | | | | | | | | | | | | | | | |
| | | | |
| Metals & Mining: 0.09% | | | | | | | | | | | | | | | | |
Corporacion Nacional del Cobre de Chile 144A | | | 3.63 | | | | 8-1-2027 | | | | 3,260,000 | | | | 3,248,427 | |
Corporacion Nacional del Cobre de Chile 144A | | | 4.50 | | | | 8-1-2047 | | | | 1,580,000 | | | | 1,645,744 | |
| |
| | | | 4,894,171 | |
| | | | | | | | | | | | | | | | |
| | | | |
| Transportation Infrastructure: 0.06% | | | | | | | | | | | | | | | | |
Mexico City Airport Trust 144A | | | 5.50 | | | | 7-31-2047 | | | | 3,520,000 | | | | 3,530,560 | |
| | | | | | | | | | | | | | | | |
| | | | |
Information Technology: 0.43% | | | | | | | | | | | | | | | | |
| | | | |
| Communications Equipment: 0.17% | | | | | | | | | | | | | | | | |
Nokia Corporation ADR | | | 3.38 | | | | 6-12-2022 | | | | 8,545,000 | | | | 8,523,638 | |
Nokia Corporation ADR | | | 4.38 | | | | 6-12-2027 | | | | 1,135,000 | | | | 1,125,920 | |
| |
| | | | 9,649,558 | |
| | | | | | | | | | | | | | | | |
| | | | |
| Internet Software & Services: 0.26% | | | | | | | | | | | | | | | | |
Alibaba Group Holding Limited %% | | | 2.80 | | | | 6-6-2023 | | | | 4,114,000 | | | | 4,122,254 | |
Alibaba Group Holding Limited %% | | | 3.40 | | | | 12-6-2027 | | | | 5,087,000 | | | | 5,058,498 | |
Alibaba Group Holding Limited %% | | | 4.00 | | | | 12-6-2037 | | | | 1,191,000 | | | | 1,209,972 | |
Alibaba Group Holding Limited %% | | | 4.20 | | | | 12-6-2047 | | | | 967,000 | | | | 975,410 | |
Alibaba Group Holding Limited %% | | | 4.40 | | | | 12-6-2057 | | | | 2,791,000 | | | | 2,838,794 | |
| |
| | | | 14,204,928 | |
| | | | | | | | | | | | | | | | |
The accompanying notes are an integral part of these financial statements.
| | | | | | |
| Portfolio of investments—November 30, 2017 (unaudited) | | Wells Fargo Allocation Funds | | | 97 | |
CORE BOND PORTFOLIO
| | | | | | | | | | | | | | | | |
| Security name | | Interest rate | | | Maturity date | | | Principal | | | Value | |
| | | | |
Materials: 0.07% | | | | | | | | | | | | | | | | |
| | | | |
| Metals & Mining: 0.07% | | | | | | | | | | | | | | | | |
Vale Overseas Limited | | | 6.25 | % | | | 8-10-2026 | | | $ | 3,190,000 | | | $ | 3,700,049 | |
| | | | | | | | | | | | | | | | |
| | | | |
Telecommunication Services: 0.06% | | | | | | | | | | | | | | | | |
| | | | |
| Diversified Telecommunication Services: 0.06% | | | | | | | | | | | | | | | | |
Telefonica Emisiones SAU | | | 5.21 | | | | 3-8-2047 | | | | 2,885,000 | | | | 3,167,745 | |
| | | | | | | | | | | | | | | | |
| | | | |
Utilities: 0.24% | | | | | | | | | | | | | | | | |
| | | | |
| Electric Utilities: 0.24% | | | | | | | | | | | | | | | | |
Electricite de France SA 144A | | | 6.00 | | | | 1-22-2114 | | | | 4,735,000 | | | | 5,262,384 | |
Enel Finance International SA 144A | | | 2.75 | | | | 4-6-2023 | | | | 8,048,000 | | | | 7,916,745 | |
| |
| | | | 13,179,129 | |
| | | | | | | | | | | | | | | | |
| |
Total Yankee Corporate Bonds and Notes (Cost $249,195,875) | | | | 251,357,876 | |
| | | | | | | | | | | | | | | | |
| | | | |
Yankee Government Bonds: 0.97% | | | | | | | | | | | | | | | | |
Abu Dhabi Government International 144A | | | 2.50 | | | | 10-11-2022 | | | | 9,340,000 | | | | 9,223,362 | |
Abu Dhabi Government International 144A | | | 3.13 | | | | 10-11-2027 | | | | 2,960,000 | | | | 2,908,200 | |
Abu Dhabi Government International 144A | | | 4.13 | | | | 10-11-2047 | | | | 4,060,000 | | | | 4,036,046 | |
Province of Ontario | | | 1.63 | | | | 1-18-2019 | | | | 6,045,000 | | | | 6,025,028 | |
Republic of Chile | | | 3.86 | | | | 6-21-2047 | | | | 4,745,000 | | | | 4,839,900 | |
Republic of Paraguay 144A | | | 6.10 | | | | 8-11-2044 | | | | 3,085,000 | | | | 3,547,750 | |
Saudi International 144A | | | 2.88 | | | | 3-4-2023 | | | | 7,390,000 | | | | 7,287,279 | |
Saudi International 144A | | | 3.63 | | | | 3-4-2028 | | | | 3,679,000 | | | | 3,651,408 | |
Saudi International 144A | | | 4.50 | | | | 10-26-2046 | | | | 1,300,000 | | | | 1,298,653 | |
Saudi International 144A | | | 4.63 | | | | 10-4-2047 | | | | 2,225,000 | | | | 2,271,792 | |
State of Israel | | | 4.50 | | | | 1-30-2043 | | | | 1,477,000 | | | | 1,603,727 | |
United Mexican States | | | 4.60 | | | | 2-10-2048 | | | | 3,605,000 | | | | 3,617,618 | |
United Mexican States | | | 5.75 | | | | 10-12-2049 | | | | 3,054,000 | | | | 3,267,785 | |
| |
Total Yankee Government Bonds (Cost $52,976,484) | | | | 53,578,548 | |
| | | | | | | | | | | | | | | | |
| | | | |
| | | Yield | | | | | | Shares | | | | |
| Short-Term Investments: 2.89% | | | | | | | | | | | | | | | | |
| | | | |
| Investment Companies: 2.89% | | | | | | | | | | | | | | | | |
Securities Lending Cash Investment LLC (l)(r)(u) | | | 1.30 | | | | | | | | 50,260,326 | | | | 50,265,352 | |
Wells Fargo Government Money Market Fund Select Class (l)(u)## | | | 1.00 | | | | | | | | 108,987,187 | | | | 108,987,187 | |
| |
Total Short-Term Investments (Cost $159,252,342) | | | | 159,252,539 | |
| | | | | | | | | | | | | | | | |
| | | | | | | | |
| Total investments in securities (Cost $6,053,773,087) | | | 109.74 | % | | | 6,055,479,317 | |
Other assets and liabilities, net | | | (9.74 | ) | | | (537,468,617 | ) |
| | | | | | | | |
| Total net assets | | | 100.00 | % | | $ | 5,518,010,700 | |
| | | | | | | | |
The accompanying notes are an integral part of these financial statements.
| | | | |
| 98 | | Wells Fargo Allocation Funds | | Portfolio of investments—November 30, 2017 (unaudited) |
CORE BOND PORTFOLIO
| ± | Variable rate investment. The rate shown is the rate in effect at period end. |
| (a) | The security is fair valued in accordance with procedures approved by the Board of Trustees. |
| %% | The security is issued on a when-issued basis. |
| ¤ | The security is issued in zero coupon form with no periodic interest payments. |
| ±± | The coupon of the security is adjusted based on the principal and interest payments received from the underlying pool of mortgages as well as the credit quality and the actual prepayment speed of the underlying mortgages. |
| 144A | The security may be resold in transactions exempt from registration, normally to qualified institutional buyers, pursuant to Rule 144A under the Securities Act of 1933. |
| « | All or a portion of this security is on loan. |
| (l) | The issuer of the security is an affiliated person of the Portfolio as defined in the Investment Company Act of 1940. |
| (r) | The investment is a non-registered investment company purchased with cash collateral received from securities on loan. |
| (u) | The rate represents the 7-day annualized yield at period end. |
| ## | All or a portion of this security is segregated for when-issued securities. |
Investments in Affiliates
An affiliated investment is an investment in which the Portfolio owns at least 5% of the outstanding voting shares of the issuer or as a result of other relationships, such as the Portfolio and the issuer having the same investment manager. Transactions with issuers that were either affiliated persons of the Portfolio at the beginning of the period or the end of the period were as follows:
| | | | | | | | | | | | | | | | | | | | | | | | | | | | | | | | | | | | |
| | | Shares,
beginning of
period | | | Shares
purchased | | | Shares sold | | | Shares, end of
period | | | Net
realized
gains
(losses) | | | Net
change in
unrealized
gains
(losses) | | | Income
from
affiliated
securities | | | Value, end of period | | | % of
net
assets | |
Short-Term Investments | | | | | | | | | | | | | | | | | | | | | | | | | | | | | | | | | | | | |
Investment Companies | | | | | | | | | | | | | | | | | | | | | | | | | | | | | | | | | | | | |
Securities Lending Cash Investment LLC | | | 109,666,213 | | | | 1,343,156,994 | | | | 1,402,562,881 | | | | 50,260,326 | | | $ | 0 | | | $ | 0 | | | $ | 53,739 | | | $ | 50,265,352 | | | | | |
Wells Fargo Government Money Market Fund Select Class | | | 85,527,614 | | | | 2,025,539,402 | | | | 2,002,079,829 | | | | 108,987,187 | | | | 0 | | | | 0 | | | | 244,346 | | | | 108,987,187 | | | | | |
| | | | | | | | | | | | | | | | | | | | | | | | | | | | | | | | | | | | |
| | | | | | | | | | | | | | | | | | $ | 0 | | | $ | 0 | | | $ | 298,085 | | | $ | 159,252,539 | | | | 2.89 | % |
| | | | | | | | | | | | | | | | | | | | | | | | | | | | | | | | | | | | |
The accompanying notes are an integral part of these financial statements.
| | | | | | |
| Portfolio of investments—November 30, 2017 (unaudited) | | Wells Fargo Allocation Funds | | | 99 | |
MANAGED FIXED INCOME PORTFOLIO
| | | | | | | | | | | | | | | | |
| Security name | | Interest rate | | | Maturity date | | | Principal | | | Value | |
| | | | |
Agency Securities: 30.07% | | | | | | | | | | | | | | | | |
FHLMC | | | 3.00 | % | | | 7-1-2046 | | | $ | 681,180 | | | $ | 682,621 | |
FHLMC | | | 3.00 | | | | 7-1-2046 | | | | 966,631 | | | | 967,945 | |
FHLMC | | | 3.50 | | | | 9-1-2032 | | | | 738,214 | | | | 767,615 | |
FHLMC | | | 3.50 | | | | 4-1-2043 | | | | 1,278,355 | | | | 1,316,957 | |
FHLMC | | | 3.50 | | | | 5-1-2044 | | | | 593,974 | | | | 612,756 | |
FHLMC | | | 3.50 | | | | 6-1-2046 | | | | 524,876 | | | | 539,964 | |
FHLMC | | | 3.50 | | | | 4-1-2047 | | | | 511,777 | | | | 527,830 | |
FHLMC | | | 4.00 | | | | 4-1-2044 | | | | 749,201 | | | | 794,386 | |
FHLMC | | | 4.00 | | | | 8-1-2044 | | | | 517,845 | | | | 547,095 | |
FHLMC Structured Pass-Through Securities Series T-20 Class A6 | | | 7.09 | | | | 9-25-2029 | | | | 35,659 | | | | 36,910 | |
FHLMC Structured Pass-Through Securities Series T-58 Class 4A | | | 7.50 | | | | 9-25-2043 | | | | 886,954 | | | | 1,052,574 | |
FNMA | | | 2.50 | | | | 8-1-2031 | | | | 464,796 | | | | 464,143 | |
FNMA | | | 2.51 | | | | 9-1-2024 | | | | 951,876 | | | | 947,499 | |
FNMA | | | 2.69 | | | | 5-1-2023 | | | | 568,546 | | | | 571,416 | |
FNMA | | | 2.73 | | | | 1-1-2023 | | | | 560,890 | | | | 568,671 | |
FNMA | | | 2.73 | | | | 9-1-2023 | | | | 577,904 | | | | 586,091 | |
FNMA | | | 2.85 | | | | 12-1-2023 | | | | 590,000 | | | | 598,434 | |
FNMA | | | 3.00 | | | | 12-1-2032 | | | | 53,100 | | | | 54,157 | |
FNMA | | | 3.00 | | | | 7-1-2046 | | | | 552,315 | | | | 552,347 | |
FNMA | | | 3.05 | | | | 11-1-2022 | | | | 341,523 | | | | 349,012 | |
FNMA | | | 3.07 | | | | 2-1-2026 | | | | 360,000 | | | | 367,020 | |
FNMA | | | 3.08 | | | | 1-1-2026 | | | | 480,000 | | | | 489,699 | |
FNMA | | | 3.35 | | | | 1-1-2028 | | | | 280,000 | | | | 289,793 | |
FNMA | | | 3.50 | | | | 9-1-2032 | | | | 1,365,834 | | | | 1,418,075 | |
FNMA | | | 3.50 | | | | 10-1-2032 | | | | 809,150 | | | | 840,105 | |
FNMA | | | 3.50 | | | | 11-1-2042 | | | | 293,458 | | | | 302,890 | |
FNMA | | | 3.50 | | | | 11-1-2042 | | | | 390,473 | | | | 402,015 | |
FNMA | | | 3.50 | | | | 2-1-2043 | | | | 212,681 | | | | 218,997 | |
FNMA | | | 3.50 | | | | 4-1-2046 | | | | 256,538 | | | | 264,101 | |
FNMA | | | 4.00 | | | | 8-1-2046 | | | | 581,528 | | | | 614,280 | |
FNMA | | | 4.00 | | | | 7-1-2056 | | | | 662,365 | | | | 697,691 | |
FNMA | | | 4.50 | | | | 6-1-2056 | | | | 611,252 | | | | 658,033 | |
FNMA | | | 4.50 | | | | 6-1-2056 | | | | 588,223 | | | | 629,197 | |
FNMA | | | 4.50 | | | | 6-1-2056 | | | | 883,705 | | | | 943,854 | |
FNMA | | | 5.00 | | | | 9-1-2033 | | | | 174,482 | | | | 190,638 | |
FNMA | | | 5.50 | | | | 2-1-2036 | | | | 130,257 | | | | 136,865 | |
FNMA Series 2002-90 Class A2 | | | 6.50 | | | | 11-25-2042 | | | | 362,198 | | | | 410,862 | |
FNMA Series 2002-T4 Class A2 | | | 7.00 | | | | 12-25-2041 | | | | 161,570 | | | | 184,256 | |
FNMA Series 2002-W4 Class A4 | | | 6.25 | | | | 5-25-2042 | | | | 1,544,302 | | | | 1,738,050 | |
FNMA Series 2003-86 Class PT | | | 4.50 | | | | 9-25-2018 | | | | 40,176 | | | | 40,342 | |
FNMA Series 2003-W4 Class 3A ±± | | | 6.07 | | | | 10-25-2042 | | | | 245,644 | | | | 279,421 | |
FNMA Series 2004-T2 Class 1A1 | | | 6.00 | | | | 11-25-2043 | | | | 605,081 | | | | 677,802 | |
FNMA Series 2004-T3 Class A1 | | | 6.00 | | | | 2-25-2044 | | | | 836,567 | | | | 945,135 | |
FNMA Series 2004-W01 Class 2A2 | | | 7.00 | | | | 12-25-2033 | | | | 148,224 | | | | 171,477 | |
FNMA Series 2004-W11 Class 1A3 | | | 7.00 | | | | 5-25-2044 | | | | 889,575 | | | | 1,034,942 | |
FNMA Series 2004-W8 Class 3A | | | 7.50 | | | | 6-25-2044 | | | | 280,298 | | | | 325,515 | |
FNMA Series 2006-M2 Class A2F ±± | | | 5.26 | | | | 5-25-2020 | | | | 43,531 | | | | 43,493 | |
GNMA | | | 6.50 | | | | 10-15-2023 | | | | 15,791 | | | | 17,556 | |
GNMA | | | 6.50 | | | | 11-15-2023 | | | | 12,076 | | | | 13,426 | |
The accompanying notes are an integral part of these financial statements.
| | | | |
| 100 | | Wells Fargo Allocation Funds | | Portfolio of investments—November 30, 2017 (unaudited) |
MANAGED FIXED INCOME PORTFOLIO
| | | | | | | | | | | | | | | | |
| Security name | | Interest rate | | | Maturity date | | | Principal | | | Value | |
| | | | |
Agency Securities (continued) | | | | | | | | | | | | | | | | |
GNMA | | | 6.50 | % | | | 12-15-2023 | | | $ | 12,825 | | | $ | 14,259 | |
GNMA | | | 6.50 | | | | 1-15-2024 | | | | 27,625 | | | | 30,714 | |
GNMA | | | 7.00 | | | | 8-15-2027 | | | | 67,333 | | | | 76,545 | |
SBA Series 2006-20B Class 1 | | | 5.35 | | | | 2-1-2026 | | | | 308,946 | | | | 327,568 | |
SBA Series 2006-20H Class 1 | | | 5.70 | | | | 8-1-2026 | | | | 151,589 | | | | 161,746 | |
SBA Series 2007-20J Class 1 | | | 5.57 | | | | 10-1-2027 | | | | 409,534 | | | | 437,597 | |
SBA Series 2013-20A Class 1 | | | 2.13 | | | | 1-1-2033 | | | | 379,279 | | | | 371,279 | |
SBA Series 2013-20J Class 1 | | | 3.37 | | | | 10-1-2033 | | | | 421,303 | | | | 432,513 | |
SBA Series 2014-10A Class 1 | | | 3.19 | | | | 3-10-2024 | | | | 527,104 | | | | 540,150 | |
SBA Series 2014-10B Class 1 | | | 3.02 | | | | 9-10-2024 | | | | 917,643 | | | | 936,231 | |
SBA Series 2014-20A Class 1 | | | 3.46 | | | | 1-1-2034 | | | | 359,964 | | | | 371,080 | |
SBA Series 2015-10B Class 1 | | | 2.83 | | | | 9-10-2025 | | | | 541,434 | | | | 547,911 | |
SBA Series 2015-20C Class 1 | | | 2.72 | | | | 3-1-2035 | | | | 475,726 | | | | 478,194 | |
SBA Series 2015-20E Class 1 | | | 2.77 | | | | 5-1-2035 | | | | 742,237 | | | | 747,585 | |
SBA Series 2015-20F Class 1 | | | 2.98 | | | | 6-1-2035 | | | | 526,324 | | | | 532,949 | |
| | | | |
Total Agency Securities (Cost $32,391,778) | | | | | | | | | | | | | | | 32,890,274 | |
| | | | | | | | | | | | | | | | |
| | | | |
Asset-Backed Securities: 2.73% | | | | | | | | | | | | | | | | |
Barclays Dryrock Issuance Trust Series 2014-3 Class A | | | 2.41 | | | | 7-15-2022 | | | | 570,000 | | | | 573,489 | |
Ford Credit Auto Owner Trust Series 2015-2 Class A 144A | | | 2.44 | | | | 1-15-2027 | | | | 600,000 | | | | 603,686 | |
Ford Credit Auto Owner Trust Series 2016-1 Class A 144A | | | 2.31 | | | | 8-15-2027 | | | | 600,000 | | | | 599,956 | |
Mississippi Higher Education Assistance Corporation Series 2014-1 Class A1 (1 Month LIBOR +0.68%) ± | | | 1.92 | | | | 10-25-2035 | | | | 479,921 | | | | 480,606 | |
MMAF Equipment Finance LLC Series 2015-AA Class A4 144A | | | 1.93 | | | | 7-16-2021 | | | | 240,000 | | | | 239,405 | |
South Carolina Student Loan Corporation Series 2014-1 Class B (1 Month LIBOR +1.50%) ± | | | 2.74 | | | | 8-1-2035 | | | | 500,000 | | | | 488,754 | |
| | | | |
Total Asset-Backed Securities (Cost $2,969,721) | | | | | | | | | | | | | | | 2,985,896 | |
| | | | | | | | | | | | | | | | |
| | | | |
Corporate Bonds and Notes: 33.28% | | | | | | | | | | | | | | | | |
| | | | |
Consumer Discretionary: 4.71% | | | | | | | | | | | | | | | | |
| | | | |
| Auto Components: 0.38% | | | | | | | | | | | | | | | | |
Allison Transmission Incorporated 144A | | | 5.00 | | | | 10-1-2024 | | | | 400,000 | | | | 416,620 | |
| | | | | | | | | | | | | | | | |
| | | | |
| Automobiles: 0.40% | | | | | | | | | | | | | | | | |
General Motors Company | | | 4.88 | | | | 10-2-2023 | | | | 400,000 | | | | 432,366 | |
| | | | | | | | | | | | | | | | |
| | | | |
| Diversified Consumer Services: 2.34% | | | | | | | | | | | | | | | | |
Duke University | | | 3.20 | | | | 10-1-2038 | | | | 175,000 | | | | 169,443 | |
Massachusetts Institute of Technology | | | 3.96 | | | | 7-1-2038 | | | | 200,000 | | | | 217,290 | |
Massachusetts Institute of Technology | | | 7.25 | | | | 11-2-2096 | | | | 500,000 | | | | 838,938 | |
Northwestern University | | | 3.69 | | | | 12-1-2038 | | | | 500,000 | | | | 521,798 | |
President and Fellows of Harvard College | | | 3.62 | | | | 10-1-2037 | | | | 275,000 | | | | 290,533 | |
Service Corporation International | | | 5.38 | | | | 1-15-2022 | | | | 260,000 | | | | 266,825 | |
University of Southern California | | | 3.03 | | | | 10-1-2039 | | | | 275,000 | | | | 256,140 | |
| | | | |
| | | | | | | | | | | | | | | 2,560,967 | |
| | | | | | | | | | | | | | | | |
| | | | |
| Internet & Direct Marketing Retail: 0.04% | | | | | | | | | | | | | | | | |
Amazon.com Incorporated 144A | | | 2.80 | | | | 8-22-2024 | | | | 47,000 | | | | 46,790 | |
| | | | | | | | | | | | | | | | |
The accompanying notes are an integral part of these financial statements.
| | | | | | |
| Portfolio of investments—November 30, 2017 (unaudited) | | Wells Fargo Allocation Funds | | | 101 | |
MANAGED FIXED INCOME PORTFOLIO
| | | | | | | | | | | | | | | | |
| Security name | | Interest rate | | | Maturity date | | | Principal | | | Value | |
| | | | |
| Media: 1.13% | | | | | | | | | | | | | | | | |
Charter Communications Operating LLC | | | 4.91 | % | | | 7-23-2025 | | | $ | 325,000 | | | $ | 343,291 | |
Comcast Corporation | | | 3.00 | | | | 2-1-2024 | | | | 170,000 | | | | 171,305 | |
Lamar Media Corporation | | | 5.88 | | | | 2-1-2022 | | | | 315,000 | | | | 322,481 | |
Time Warner Incorporated | | | 3.40 | | | | 6-15-2022 | | | | 140,000 | | | | 142,844 | |
Time Warner Incorporated | | | 3.60 | | | | 7-15-2025 | | | | 260,000 | | | | 260,893 | |
| | | | |
| | | | | | | | | | | | | | | 1,240,814 | |
| | | | | | | | | | | | | | | | |
| | | | |
| Textiles, Apparel & Luxury Goods: 0.42% | | | | | | | | | | | | | | | | |
HanesBrands Incorporated 144A | | | 4.63 | | | | 5-15-2024 | | | | 200,000 | | | | 203,250 | |
The William Carter Company | | | 5.25 | | | | 8-15-2021 | | | | 250,000 | | | | 257,188 | |
| | | | |
| | | | | | | | | | | | | | | 460,438 | |
| | | | | | | | | | | | | | | | |
| | | | |
Consumer Staples: 1.49% | | | | | | | | | | | | | | | | |
| | | | |
| Beverages: 0.37% | | | | | | | | | | | | | | | | |
Anheuser-Busch InBev Finance Incorporated | | | 3.65 | | | | 2-1-2026 | | | | 140,000 | | | | 143,610 | |
Anheuser-Busch InBev Finance Incorporated | | | 3.75 | | | | 1-15-2022 | | | | 250,000 | | | | 260,884 | |
| | | | |
| | | | | | | | | | | | | | | 404,494 | |
| | | | | | | | | | | | | | | | |
| | | | |
| Food & Staples Retailing: 0.11% | | | | | | | | | | | | | | | | |
CVS Health Corporation | | | 3.50 | | | | 7-20-2022 | | | | 120,000 | | | | 122,220 | |
| | | | | | | | | | | | | | | | |
| | | | |
| Food Products: 1.01% | | | | | | | | | | | | | | | | |
General Mills Incorporated | | | 2.60 | | | | 10-12-2022 | | | | 120,000 | | | | 119,300 | |
Ingredion Incorporated | | | 3.20 | | | | 10-1-2026 | | | | 150,000 | | | | 147,268 | |
Kraft Foods Group Incorporated | | | 3.50 | | | | 6-6-2022 | | | | 300,000 | | | | 306,832 | |
McCormick & Company Incorporated | | | 3.40 | | | | 8-15-2027 | | | | 220,000 | | | | 221,445 | |
Unilever Capital Corporation | | | 2.60 | | | | 5-5-2024 | | | | 310,000 | | | | 306,201 | |
| | | | |
| | | | | | | | | | | | | | | 1,101,046 | |
| | | | | | | | | | | | | | | | |
| | | | |
Energy: 3.90% | | | | | | | | | | | | | | | | |
| | | | |
| Energy Equipment & Services: 0.15% | | | | | | | | | | | | | | | | |
Halliburton Company | | | 3.80 | | | | 11-15-2025 | | | | 160,000 | | | | 164,822 | |
| | | | | | | | | | | | | | | | |
| | | | |
| Oil, Gas & Consumable Fuels: 3.75% | | | | | | | | | | | | | | | | |
Anadarko Petroleum Corporation « | | | 5.55 | | | | 3-15-2026 | | | | 150,000 | | | | 166,742 | |
Cimarex Energy Company | | | 3.90 | | | | 5-15-2027 | | | | 90,000 | | | | 91,413 | |
Columbia Pipeline Group Company | | | 2.45 | | | | 6-1-2018 | | | | 210,000 | | | | 210,352 | |
Concho Resources Incorporated | | | 3.75 | | | | 10-1-2027 | | | | 325,000 | | | | 327,200 | |
ConocoPhillips Company | | | 3.35 | | | | 11-15-2024 | | | | 370,000 | | | | 378,611 | |
EQT Corporation | | | 8.13 | | | | 6-1-2019 | | | | 400,000 | | | | 433,238 | |
Florida Gas Transmission Company 144A | | | 4.35 | | | | 7-15-2025 | | | | 230,000 | | | | 245,721 | |
Magellan Midstream Partners LP | | | 5.00 | | | | 3-1-2026 | | | | 170,000 | | | | 188,397 | |
Marathon Oil Corporation | | | 3.85 | | | | 6-1-2025 | | | | 410,000 | | | | 413,915 | |
MPLX LP | | | 4.13 | | | | 3-1-2027 | | | | 250,000 | | | | 254,013 | |
Newfield Exploration Company | | | 5.38 | | | | 1-1-2026 | | | | 75,000 | | | | 79,875 | |
Newfield Exploration Company | | | 5.63 | | | | 7-1-2024 | | | | 249,000 | | | | 268,920 | |
Pioneer Natural Resource Company | | | 4.45 | | | | 1-15-2026 | | | | 190,000 | | | | 203,421 | |
Plains All American Pipeline LP | | | 4.65 | | | | 10-15-2025 | | | | 400,000 | | | | 407,979 | |
The accompanying notes are an integral part of these financial statements.
| | | | |
| 102 | | Wells Fargo Allocation Funds | | Portfolio of investments—November 30, 2017 (unaudited) |
MANAGED FIXED INCOME PORTFOLIO
| | | | | | | | | | | | | | | | |
| Security name | | Interest rate | | | Maturity date | | | Principal | | | Value | |
| | | | |
| Oil, Gas & Consumable Fuels (continued) | | | | | | | | | | | | | | | | |
Range Resources Corporation | | | 5.00 | % | | | 3-15-2023 | | | $ | 250,000 | | | $ | 247,500 | |
Southwestern Energy Company | | | 6.70 | | | | 1-23-2025 | | | | 175,000 | | | | 182,000 | |
| | | | |
| | | | | | | | | | | | | | | 4,099,297 | |
| | | | | | | | | | | | | | | | |
| | | | |
Financials: 7.47% | | | | | | | | | | | | | | | | |
| | | | |
| Banks: 3.71% | | | | | | | | | | | | | | | | |
Bank of America Corporation | | | 3.95 | | | | 4-21-2025 | | | | 120,000 | | | | 123,365 | |
Bank of America Corporation | | | 4.00 | | | | 4-1-2024 | | | | 700,000 | | | | 738,911 | |
BB&T Corporation | | | 2.85 | | | | 10-26-2024 | | | | 180,000 | | | | 178,894 | |
Citigroup Incorporated | | | 2.75 | | | | 4-25-2022 | | | | 210,000 | | | | 209,493 | |
Citigroup Incorporated | | | 3.30 | | | | 4-27-2025 | | | | 130,000 | | | | 130,740 | |
Citigroup Incorporated | | | 3.40 | | | | 5-1-2026 | | | | 250,000 | | | | 250,446 | |
Citigroup Incorporated | | | 4.40 | | | | 6-10-2025 | | | | 100,000 | | | | 105,029 | |
Corestates Capital Trust II (3 Month LIBOR +0.65%) 144A± | | | 2.01 | | | | 1-15-2027 | | | | 750,000 | | | | 701,250 | |
JPMorgan Chase & Company (3 Month LIBOR +0.94%) ± | | | 2.78 | | | | 4-25-2023 | | | | 240,000 | | | | 239,824 | |
JPMorgan Chase & Company | | | 2.97 | | | | 1-15-2023 | | | | 150,000 | | | | 150,838 | |
JPMorgan Chase & Company (3 Month LIBOR +1.34%) ± | | | 3.78 | | | | 2-1-2028 | | | | 175,000 | | | | 180,066 | |
Manufacturers & Traders Trust Company | | | 3.40 | | | | 8-17-2027 | | | | 250,000 | | | | 251,614 | |
National Capital Commerce Incorporated (3 Month LIBOR +0.98%) ± | | | 2.32 | | | | 4-1-2027 | | | | 400,000 | | | | 374,000 | |
NTC Capital Trust Series A (3 Month LIBOR +0.52%) ± | | | 1.88 | | | | 1-15-2027 | | | | 450,000 | | | | 418,500 | |
| | | | |
| | | | | | | | | | | | | | | 4,052,970 | |
| | | | | | | | | | | | | | | | |
| | | | |
| Capital Markets: 1.58% | | | | | | | | | | | | | | | | |
Bank of New York Mellon Corporation | | | 3.25 | | | | 9-11-2024 | | | | 250,000 | | | | 254,212 | |
Goldman Sachs Capital II (3 Month LIBOR +0.77%) ± | | | 4.00 | | | | 12-29-2049 | | | | 6,000 | | | | 5,284 | |
Goldman Sachs Group Incorporated | | | 3.50 | | | | 1-23-2025 | | | | 265,000 | | | | 268,168 | |
Goldman Sachs Group Incorporated | | | 3.85 | | | | 1-26-2027 | | | | 190,000 | | | | 193,908 | |
Goldman Sachs Group Incorporated | | | 4.25 | | | | 10-21-2025 | | | | 120,000 | | | | 125,322 | |
Goldman Sachs Group Incorporated | | | 5.75 | | | | 1-24-2022 | | | | 200,000 | | | | 222,333 | |
Morgan Stanley | | | 3.70 | | | | 10-23-2024 | | | | 100,000 | | | | 103,227 | |
Morgan Stanley | | | 3.95 | | | | 4-23-2027 | | | | 180,000 | | | | 182,416 | |
Morgan Stanley | | | 5.50 | | | | 7-24-2020 | | | | 350,000 | | | | 376,245 | |
| | | | |
| | | | | | | | | | | | | | | 1,731,115 | |
| | | | | | | | | | | | | | | | |
| | | | |
| Consumer Finance: 0.22% | | | | | | | | | | | | | | | | |
American Express Credit Corporation | | | 2.70 | | | | 3-3-2022 | | | | 240,000 | | | | 241,209 | |
| | | | | | | | | | | | | | | | |
| | | | |
| Diversified Financial Services: 0.40% | | | | | | | | | | | | | | | | |
Abay Leasing 2014 LLC | | | 2.65 | | | | 11-9-2026 | | | | 431,250 | | | | 434,996 | |
| | | | | | | | | | | | | | | | |
| | | | |
| Insurance: 1.56% | | | | | | | | | | | | | | | | |
Berkshire Hathaway Incorporated | | | 2.75 | | | | 3-15-2023 | | | | 210,000 | | | | 211,352 | |
Minnesota Life Insurance Company 144A | | | 8.25 | | | | 9-15-2025 | | | | 650,000 | | | | 804,223 | |
NLV Financial Corporation 144A | | | 7.50 | | | | 8-15-2033 | | | | 565,000 | | | | 693,432 | |
| | | | |
| | | | | | | | | | | | | | | 1,709,007 | |
| | | | | | | | | | | | | | | | |
The accompanying notes are an integral part of these financial statements.
| | | | | | |
| Portfolio of investments—November 30, 2017 (unaudited) | | Wells Fargo Allocation Funds | | | 103 | |
MANAGED FIXED INCOME PORTFOLIO
| | | | | | | | | | | | | | | | |
| Security name | | Interest rate | | | Maturity date | | | Principal | | | Value | |
| | | | |
Health Care: 3.80% | | | | | | | | | | | | | | | | |
| | | | |
| Health Care Equipment & Supplies: 0.32% | | | | | | | | | | | | | | | | |
Becton Dickinson & Company | | | 3.73 | % | | | 12-15-2024 | | | $ | 134,000 | | | $ | 136,362 | |
Teleflex Incorporated | | | 4.88 | | | | 6-1-2026 | | | | 200,000 | | | | 207,178 | |
| | | | |
| | | | | | | | | | | | | | | 343,540 | |
| | | | | | | | | | | | | | | | |
| | | | |
| Health Care Providers & Services: 2.89% | | | | | | | | | | | | | | | | |
Allina Health System Incorporated | | | 4.81 | | | | 11-15-2045 | | | | 235,000 | | | | 264,169 | |
Ascension Health | | | 3.95 | | | | 11-15-2046 | | | | 225,000 | | | | 231,712 | |
Baptist Health South Florida Incorporated | | | 4.34 | | | | 11-15-2041 | | | | 170,000 | | | | 180,470 | |
Cleveland Clinic Foundation | | | 4.86 | | | | 1-1-2114 | | | | 120,000 | | | | 131,902 | |
Duke University Health System Incorporated | | | 3.92 | | | | 6-1-2047 | | | | 165,000 | | | | 169,379 | |
Howard Hughes Medical Institute | | | 3.50 | | | | 9-1-2023 | | | | 107,000 | | | | 112,297 | |
Mayo Clinic | | | 3.77 | | | | 11-15-2043 | | | | 120,000 | | | | 119,746 | |
Mayo Clinic | | | 4.13 | | | | 11-15-2052 | | | | 165,000 | | | | 172,603 | |
Mednax Incorporated 144A | | | 5.25 | | | | 12-1-2023 | | | | 475,000 | | | | 486,875 | |
Memorial Sloan Kettering Cancer Center | | | 4.20 | | | | 7-1-2055 | | | | 195,000 | | | | 206,808 | |
Southern Baptist Hospital | | | 4.86 | | | | 7-15-2045 | | | | 205,000 | | | | 232,492 | |
Texas Health Resources | | | 4.33 | | | | 11-15-2055 | | | | 375,000 | | | | 398,080 | |
The New York and Presbyterian Hospital | | | 3.56 | | | | 8-1-2036 | | | | 275,000 | | | | 273,186 | |
The New York and Presbyterian Hospital | | | 4.06 | | | | 8-1-2056 | | | | 180,000 | | | | 183,684 | |
| | | | |
| | | | | | | | | | | | | | | 3,163,403 | |
| | | | | | | | | | | | | | | | |
| | | | |
| Life Sciences Tools & Services: 0.14% | | | | | | | | | | | | | | | | |
Thermo Fisher Scientific Incorporated | | | 3.30 | | | | 2-15-2022 | | | | 150,000 | | | | 152,931 | |
| | | | | | | | | | | | | | | | |
| | | | |
| Pharmaceuticals: 0.45% | | | | | | | | | | | | | | | | |
Bayer US Finance LLC 144A | | | 3.38 | | | | 10-8-2024 | | | | 240,000 | | | | 241,498 | |
EMD Finance LLC 144A | | | 2.95 | | | | 3-19-2022 | | | | 250,000 | | | | 251,882 | |
| | | | |
| | | | | | | | | | | | | | | 493,380 | |
| | | | | | | | | | | | | | | | |
| | | | |
Industrials: 2.59% | | | | | | | | | | | | | | | | |
| | | | |
| Aerospace & Defense: 0.30% | | | | | | | | | | | | | | | | |
BAE Systems Holdings Incorporated 144A | | | 3.80 | | | | 10-7-2024 | | | | 100,000 | | | | 104,159 | |
Hexcel Corporation | | | 3.95 | | | | 2-15-2027 | | | | 190,000 | | | | 193,016 | |
Northrop Grumman Corporation | | | 3.25 | | | | 1-15-2028 | | | | 30,000 | | | | 30,003 | |
| | | | |
| | | | | | | | | | | | | | | 327,178 | |
| | | | | | | | | | | | | | | | |
| | | | |
| Commercial Services & Supplies: 0.26% | | | | | | | | | | | | | | | | |
Clean Harbors Incorporated | | | 5.25 | | | | 8-1-2020 | | | | 278,000 | | | | 282,170 | |
| | | | | | | | | | | | | | | | |
| | | | |
| Construction & Engineering: 0.24% | | | | | | | | | | | | | | | | |
Valmont Industries Incorporated | | | 5.00 | | | | 10-1-2044 | | | | 260,000 | | | | 267,791 | |
| | | | | | | | | | | | | | | | |
| | | | |
| Electrical Equipment: 0.22% | | | | | | | | | | | | | | | | |
Eaton Corporation | | | 3.10 | | | | 9-15-2027 | | | | 250,000 | | | | 245,095 | |
| | | | | | | | | | | | | | | | |
| | | | |
| Machinery: 1.40% | | | | | | | | | | | | | | | | |
Actuant Corporation | | | 5.63 | | | | 6-15-2022 | | | | 425,000 | | | | 433,500 | |
Briggs & Stratton Corporation | | | 6.88 | | | | 12-15-2020 | | | | 350,000 | | | | 385,070 | |
The accompanying notes are an integral part of these financial statements.
| | | | |
| 104 | | Wells Fargo Allocation Funds | | Portfolio of investments—November 30, 2017 (unaudited) |
MANAGED FIXED INCOME PORTFOLIO
| | | | | | | | | | | | | | | | |
| Security name | | Interest rate | | | Maturity date | | | Principal | | | Value | |
| | | | |
| Machinery (continued) | | | | | | | | | | | | | | | | |
Oshkosh Corporation | | | 5.38 | % | | | 3-1-2022 | | | $ | 375,000 | | | $ | 388,594 | |
Vessel Management Services Incorporated | | | 3.43 | | | | 8-15-2036 | | | | 323,000 | | | | 319,945 | |
| | | | |
| | | | | | | | | | | | | | | 1,527,109 | |
| | | | | | | | | | | | | | | | |
| | | | |
| Road & Rail: 0.17% | | | | | | | | | | | | | | | | |
Union Pacific Corporation | | | 7.88 | | | | 1-15-2019 | | | | 171,000 | | | | 181,548 | |
| | | | | | | | | | | | | | | | |
| | | | |
Information Technology: 1.01% | | | | | | | | | | | | | | | | |
| | | | |
| Internet Software & Services: 0.19% | | | | | | | | | | | | | | | | |
Verisign Incorporated | | | 4.75 | | | | 7-15-2027 | | | | 200,000 | | | | 206,250 | |
| | | | | | | | | | | | | | | | |
| | | | |
| IT Services: 0.10% | | | | | | | | | | | | | | | | |
Fiserv Incorporated | | | 4.75 | | | | 6-15-2021 | | | | 100,000 | | | | 106,762 | |
| | | | | | | | | | | | | | | | |
| | | | |
| Semiconductors & Semiconductor Equipment: 0.04% | | | | | | | | | | | | | | | | |
Maxim Integrated Product | | | 3.45 | | | | 6-15-2027 | | | | 50,000 | | | | 50,153 | |
| | | | | | | | | | | | | | | | |
| | | | |
| Software: 0.32% | | | | | | | | | | | | | | | | |
Activision Blizzard Incorporated | | | 2.60 | | | | 6-15-2022 | | | | 50,000 | | | | 49,557 | |
Oracle Corporation | | | 2.95 | | | | 11-15-2024 | | | | 80,000 | | | | 80,333 | |
Oracle Corporation | | | 3.40 | | | | 7-8-2024 | | | | 220,000 | | | | 227,082 | |
| | | | |
| | | | | | | | | | | | | | | 356,972 | |
| | | | | | | | | | | | | | | | |
| | | | |
| Technology Hardware, Storage & Peripherals: 0.36% | | | | | | | | | | | | | | | | |
Hewlett Packard Enterprise Company | | | 4.90 | | | | 10-15-2025 | | | | 375,000 | | | | 390,468 | |
| | | | | | | | | | | | | | | | |
| | | | |
Materials: 2.20% | | | | | | | | | | | | | | | | |
| | | | |
| Chemicals: 1.25% | | | | | | | | | | | | | | | | |
Ecolab Incorporated 144A | | | 3.25 | | | | 12-1-2027 | | | | 110,000 | | | | 109,114 | |
Mosaic Company | | | 4.05 | | | | 11-15-2027 | | | | 250,000 | | | | 248,002 | |
Scotts Miracle-Gro Company | | | 6.00 | | | | 10-15-2023 | | | | 390,000 | | | | 414,863 | |
The Sherwin-Williams Company | | | 3.30 | | | | 2-1-2025 | | | | 100,000 | | | | 99,307 | |
The Sherwin-Williams Company | | | 3.45 | | | | 6-1-2027 | | | | 160,000 | | | | 161,536 | |
Valvoline Incorporated 144A | | | 5.50 | | | | 7-15-2024 | | | | 185,000 | | | | 196,563 | |
W.R. Grace & Company 144A | | | 5.63 | | | | 10-1-2024 | | | | 130,000 | | | | 140,400 | |
| | | | |
| | | | | | | | | | | | | | | 1,369,785 | |
| | | | | | | | | | | | | | | | |
| | | | |
| Construction Materials: 0.18% | | | | | | | | | | | | | | | | |
CRH America Finance Incorporated 144A | | | 3.40 | | | | 5-9-2027 | | | | 200,000 | | | | 199,092 | |
| | | | | | | | | | | | | | | | |
| | | | |
| Containers & Packaging: 0.45% | | | | | | | | | | | | | | | | |
Ball Corporation | | | 5.00 | | | | 3-15-2022 | | | | 100,000 | | | | 107,375 | |
International Paper Company | | | 3.00 | | | | 2-15-2027 | | | | 210,000 | | | | 202,955 | |
Westrock Company 144A | | | 3.00 | | | | 9-15-2024 | | | | 180,000 | | | | 177,996 | |
| | | | |
| | | | | | | | | | | | | | | 488,326 | |
| | | | | | | | | | | | | | | | |
| | | | |
| Paper & Forest Products: 0.32% | | | | | | | | | | | | | | | | |
Georgia Pacific LLC 144A | | | 3.73 | | | | 7-15-2023 | | | | 340,000 | | | | 354,547 | |
| | | | | | | | | | | | | | | | |
The accompanying notes are an integral part of these financial statements.
| | | | | | |
| Portfolio of investments—November 30, 2017 (unaudited) | | Wells Fargo Allocation Funds | | | 105 | |
MANAGED FIXED INCOME PORTFOLIO
| | | | | | | | | | | | | | | | |
| Security name | | Interest rate | | | Maturity date | | | Principal | | | Value | |
| | | | |
Real Estate: 3.39% | | | | | | | | | | | | | | | | |
| | | | |
| Equity REITs: 3.39% | | | | | | | | | | | | | | | | |
Alexandria Real Estate Equities Incorporated | | | 3.95 | % | | | 1-15-2027 | | | $ | 240,000 | | | $ | 244,327 | |
AvalonBay Communities Incorporated | | | 2.95 | | | | 9-15-2022 | | | | 190,000 | | | | 192,284 | |
AvalonBay Communities Incorporated | | | 3.63 | | | | 10-1-2020 | | | | 40,000 | | | | 41,296 | |
Boston Properties LP %% | | | 3.20 | | | | 1-15-2025 | | | | 250,000 | | | | 248,755 | |
DDR Corporation | | | 3.90 | | | | 8-15-2024 | | | | 200,000 | | | | 199,168 | |
Duke Realty LP | | | 3.25 | | | | 6-30-2026 | | | | 130,000 | | | | 128,277 | |
Duke Realty LP | | | 3.88 | | | | 10-15-2022 | | | | 150,000 | | | | 156,222 | |
ERP Operating LP | | | 4.63 | | | | 12-15-2021 | | | | 281,000 | | | | 302,168 | |
Host Hotels & Resorts Incorporated | | | 3.88 | | | | 4-1-2024 | | | | 265,000 | | | | 269,388 | |
Kimco Realty Corporation | | | 3.30 | | | | 2-1-2025 | | | | 100,000 | | | | 98,906 | |
Liberty Property LP | | | 3.75 | | | | 4-1-2025 | | | | 100,000 | | | | 102,061 | |
Potlatch Corporation | | | 7.50 | | | | 11-1-2019 | | | | 310,000 | | | | 335,656 | |
ProLogis LP | | | 3.75 | | | | 11-1-2025 | | | | 35,000 | | | | 36,791 | |
Realty Income Corporation | | | 4.65 | | | | 8-1-2023 | | | | 370,000 | | | | 399,589 | |
Simon Property Group LP | | | 3.38 | | | | 10-1-2024 | | | | 300,000 | | | | 306,314 | |
UDR Incorporated | | | 4.63 | | | | 1-10-2022 | | | | 260,000 | | | | 276,580 | |
Ventas Realty LP | | | 3.50 | | | | 2-1-2025 | | | | 150,000 | | | | 151,026 | |
Ventas Realty LP | | | 3.85 | | | | 4-1-2027 | | | | 220,000 | | | | 223,582 | |
| | | | |
| | | | | | | | | | | | | | | 3,712,390 | |
| | | | | | | | | | | | | | | | |
| | | | |
Telecommunication Services: 0.83% | | | | | | | | | | | | | | | | |
| | | | |
| Diversified Telecommunication Services: 0.83% | | | | | | | | | | | | | | | | |
AT&T Incorporated | | | 4.75 | | | | 5-15-2046 | | | | 280,000 | | | | 267,678 | |
AT&T Incorporated | | | 4.90 | | | | 8-14-2037 | | | | 10,000 | | | | 9,960 | |
AT&T Incorporated | | | 5.25 | | | | 3-1-2037 | | | | 60,000 | | | | 62,464 | |
Verizon Communications Incorporated | | | 4.50 | | | | 8-10-2033 | | | | 40,000 | | | | 41,411 | |
Verizon Communications Incorporated | | | 4.81 | | | | 3-15-2039 | | | | 391,000 | | | | 402,073 | |
Verizon Communications Incorporated | | | 5.25 | | | | 3-16-2037 | | | | 110,000 | | | | 120,252 | |
| | | | |
| | | | | | | | | | | | | | | 903,838 | |
| | | | | | | | | | | | | | | | |
| | | | |
Utilities: 1.89% | | | | | | | | | | | | | | | | |
| | | | |
| Electric Utilities: 1.56% | | | | | | | | | | | | | | | | |
AEP Texas Incorporated 144A | | | 2.40 | | | | 10-1-2022 | | | | 90,000 | | | | 88,376 | |
ITC Holdings Corporation | | | 3.65 | | | | 6-15-2024 | | | | 120,000 | | | | 123,185 | |
Monongahela Power Company 144A | | | 4.10 | | | | 4-15-2024 | | | | 380,000 | | | | 402,777 | |
Northern States Power Company of Wisconsin | | | 3.30 | | | | 6-15-2024 | | | | 370,000 | | | | 379,416 | |
PacifiCorp | | | 3.35 | | | | 7-1-2025 | | | | 130,000 | | | | 133,206 | |
Southern California Edison Company | | | 6.00 | | | | 1-15-2034 | | | | 188,000 | | | | 241,588 | |
Tenaska Alabama II Partners LP 144A | | | 7.00 | | | | 6-30-2021 | | | | 123,255 | | | | 126,491 | |
Trans-Allegheny Interstate Line Company 144A | | | 3.85 | | | | 6-1-2025 | | | | 200,000 | | | | 207,438 | |
| | | | |
| | | | | | | | | | | | | | | 1,702,477 | |
| | | | | | | | | | | | | | | | |
| | | | |
| Gas Utilities: 0.33% | | | | | | | | | | | | | | | | |
Boardwalk Pipelines Company | | | 5.95 | | | | 6-1-2026 | | | | 325,000 | | | | 361,544 | |
| | | | | | | | | | | | | | | | |
| | | | |
Total Corporate Bonds and Notes (Cost $35,090,515) | | | | | | | | | | | | | | | 36,405,920 | |
| | | | | | | | | | | | | | | | |
The accompanying notes are an integral part of these financial statements.
| | | | |
| 106 | | Wells Fargo Allocation Funds | | Portfolio of investments—November 30, 2017 (unaudited) |
MANAGED FIXED INCOME PORTFOLIO
| | | | | | | | | | | | | | | | |
| Security name | | Interest rate | | | Maturity date | | | Principal | | | Value | |
| | | | |
Municipal Obligations: 8.79% | | | | | | | | | | | | | | | | |
| | | | |
| Alaska: 0.28% | | | | | | | | | | | | | | | | |
Alaska Taxable Build America Bonds Series 2010-A (GO Revenue) | | | 5.74 | % | | | 8-1-2033 | | | $ | 250,000 | | | $ | 309,880 | |
| | | | | | | | | | | | | | | | |
| | | | |
| Georgia: 0.53% | | | | | | | | | | | | | | | | |
Cherokee County GA School System Build America Bonds (GO Revenue) | | | 5.87 | | | | 8-1-2028 | | | | 500,000 | | | | 582,160 | |
| | | | | | | | | | | | | | | | |
| | | | |
| Illinois: 0.14% | | | | | | | | | | | | | | | | |
Lake County IL Community Consolidated School District Series A (GO Revenue) %% | | | 3.40 | | | | 11-1-2027 | | | | 150,000 | | | | 148,646 | |
| | | | | | | | | | | | | | | | |
| | | | |
| Indiana: 0.20% | | | | | | | | | | | | | | | | |
Indiana Finance Authority Taxable Facilities Series A (Miscellaneous Revenue) | | | 2.37 | | | | 7-1-2024 | | | | 225,000 | | | | 219,816 | |
| | | | | | | | | | | | | | | | |
| | | | |
| Massachusetts: 0.68% | | | | | | | | | | | | | | | | |
Boston MA Series C Qualified School Construction Bonds (GO Revenue) | | | 4.40 | | | | 4-1-2026 | | | | 400,000 | | | | 424,648 | |
Massachusetts State Build America Bonds Consolidated Loan Series E (Tax Revenue) | | | 5.46 | | | | 12-1-2039 | | | | 250,000 | | | | 316,355 | |
| | | | |
| | | | | | | | | | | | | | | 741,003 | |
| | | | | | | | | | | | | | | | |
| | | | |
| Missouri: 0.36% | | | | | | | | | | | | | | | | |
Missouri HEFA Washington University Series A (Education Revenue) | | | 3.65 | | | | 8-15-2057 | | | | 130,000 | | | | 129,464 | |
Missouri Higher Education Loan Authority Notes Class A-1 (3 Month LIBOR +0.85%) (Education Revenue) ± | | | 2.17 | | | | 8-27-2029 | | | | 259,488 | | | | 260,116 | |
| | | | |
| | | | | | | | | | | | | | | 389,580 | |
| | | | | | | | | | | | | | | | |
| | | | |
| New Jersey: 0.98% | | | | | | | | | | | | | | | | |
Hudson County NJ Improvement Authority Hudson County Lease Project (Miscellaneous Revenue, AGM Insured) | | | 7.40 | | | | 12-1-2025 | | | | 945,000 | | | | 1,077,376 | |
| | | | | | | | | | | | | | | | |
| | | | |
| New York: 0.47% | | | | | | | | | | | | | | | | |
New York City Transitional Finance Authority Series 2017-A2 (Tax Revenue) | | | 2.00 | | | | 5-1-2024 | | | | 250,000 | | | | 238,348 | |
New York City Transitional Finance Authority Series 2017-F2 (Tax Revenue) | | | 2.75 | | | | 5-1-2024 | | | | 170,000 | | | | 169,509 | |
New York Urban Development Corporation Series 2017-B (Tax Revenue) | | | 2.86 | | | | 3-15-2024 | | | | 105,000 | | | | 104,460 | |
| | | | |
| | | | | | | | | | | | | | | 512,317 | |
| | | | | | | | | | | | | | | | |
| | | | |
| North Carolina: 1.47% | | | | | | | | | | | | | | | | |
Duke University Series A (Education Revenue) | | | 5.85 | | | | 4-1-2037 | | | | 300,000 | | | | 395,022 | |
North Carolina Education Assistance Authority Student Loan Series A-3 (Education Revenue) | | | 2.27 | | | | 10-25-2041 | | | | 650,000 | | | | 654,199 | |
University of North Carolina Chapel Hill (Education Revenue) | | | 3.85 | | | | 12-1-2034 | | | | 375,000 | | | | 403,718 | |
University of North Carolina Chapel Hill Refunding Bonds Series C (Education Revenue) | | | 3.33 | | | | 12-1-2036 | | | | 150,000 | | | | 152,084 | |
| | | | |
| | | | | | | | | | | | | | | 1,605,023 | |
| | | | | | | | | | | | | | | | |
| | | | |
| Ohio: 0.60% | | | | | | | | | | | | | | | | |
Cuyahoga County OH Build America Bonds Series B (GO Revenue) | | | 6.03 | | | | 12-1-2034 | | | | 325,000 | | | | 400,605 | |
Ohio Veterans Compensation (GO Revenue) | | | 3.38 | | | | 10-1-2021 | | | | 250,000 | | | | 260,180 | |
| | | | |
| | | | | | | | | | | | | | | 660,785 | |
| | | | | | | | | | | | | | | | |
| | | | |
| Texas: 1.18% | | | | | | | | | | | | | | | | |
Texas A&M University Taxable Financing System Series B (Education Revenue) | | | 3.11 | | | | 5-15-2028 | | | | 220,000 | | | | 222,211 | |
Texas State (Miscellaneous Revenue) | | | 3.45 | | | | 10-1-2028 | | | | 285,000 | | | | 294,171 | |
The accompanying notes are an integral part of these financial statements.
| | | | | | |
| Portfolio of investments—November 30, 2017 (unaudited) | | Wells Fargo Allocation Funds | | | 107 | |
MANAGED FIXED INCOME PORTFOLIO
| | | | | | | | | | | | | | | | |
| Security name | | Interest rate | | | Maturity date | | | Principal | | | Value | |
| | | | |
| Texas (continued) | | | | | | | | | | | | | | | | |
Texas Tech University Taxable Refunding Financing System Series B (Education Revenue) | | | 3.61 | % | | | 2-15-2029 | | | $ | 180,000 | | | $ | 185,587 | |
Texas Transportation Commission Highway Improvement Taxable Series A (Miscellaneous Revenue) | | | 4.63 | | | | 4-1-2033 | | | | 250,000 | | | | 284,653 | |
Texas Transportation Commission Series B (Tax Revenue) | | | 5.18 | | | | 4-1-2030 | | | | 250,000 | | | | 303,075 | |
| | | | |
| | | | | | | | | | | | | | | 1,289,697 | |
| | | | | | | | | | | | | | | | |
| | | | |
| Virginia: 0.25% | | | | | | | | | | | | | | | | |
University of Virginia Revenue Bond Series C (Education Revenue) | | | 4.18 | | | | 9-1-2117 | | | | 70,000 | | | | 71,294 | |
Virginia State HDA (Housing Revenue) | | | 3.10 | | | | 6-25-2041 | | | | 197,117 | | | | 196,948 | |
| | | | |
| | | | | | | | | | | | | | | 268,242 | |
| | | | | | | | | | | | | | | | |
| | | | |
| Washington: 1.16% | | | | | | | | | | | | | | | | |
King County WA Economic Development Taxable Bond Series C (GO Revenue) | | | 5.03 | | | | 12-1-2023 | | | | 230,000 | | | | 259,514 | |
King County WA School District #210 (GO Revenue, AGM Insured) | | | 4.90 | | | | 12-1-2022 | | | | 400,000 | | | | 418,400 | |
Washington Build America Bonds (Tax Revenue) | | | 5.09 | | | | 8-1-2033 | | | | 500,000 | | | | 594,295 | |
| | | | |
| | | | | | | | | | | | | | | 1,272,209 | |
| | | | | | | | | | | | | | | | |
| | | | |
| West Virginia: 0.49% | | | | | | | | | | | | | | | | |
Ohio County WV Special District Excise Tax Series A (Tax Revenue) | | | 8.25 | | | | 3-1-2035 | | | | 475,000 | | | | 531,948 | |
| | | | | | | | | | | | | | | | |
| | | | |
Total Municipal Obligations (Cost $9,144,606) | | | | | | | | | | | | | | | 9,608,682 | |
| | | | | | | | | | | | | | | | |
| | | | |
Non-Agency Mortgage-Backed Securities: 11.04% | | | | | | | | | | | | | | | | |
Commercial Mortgage Pass-Through Certificate Series 2012-CR2 Class A4 | | | 3.15 | | | | 8-15-2045 | | | | 550,000 | | | | 562,508 | |
Commercial Mortgage Pass-Through Certificate Series 2012-CR3 Class A3 | | | 2.82 | | | | 10-15-2045 | | | | 620,000 | | | | 621,568 | |
Commercial Mortgage Pass-Through Certificate Series 2012-UBS5 Class A3 | | | 3.55 | | | | 9-10-2047 | | | | 630,000 | | | | 652,638 | |
Commercial Mortgage Pass-Through Certificate Series 2013-CR12 Class ASB | | | 3.62 | | | | 10-10-2046 | | | | 550,000 | | | | 570,739 | |
Commercial Mortgage Pass-Through Certificate Series 2013-CR13 Class A4 ±± | | | 4.19 | | | | 11-12-2046 | | | | 600,000 | | | | 642,983 | |
Commercial Mortgage Pass-Through Certificate Series 2013-CR7 Class A4 | | | 3.21 | | | | 3-10-2046 | | | | 630,000 | | | | 642,185 | |
Commercial Mortgage Trust Series 2010-C1 Class A3 144A | | | 4.21 | | | | 7-10-2046 | | | | 659,419 | | | | 682,383 | |
GS Mortgage Securities Trust Series 2011-GC3 Class A4 144A | | | 4.75 | | | | 3-10-2044 | | | | 455,782 | | | | 481,536 | |
GS Mortgage Securities Trust Series 2011-GC5 Class A4 | | | 3.71 | | | | 8-10-2044 | | | | 545,000 | | | | 565,440 | |
GS Mortgage Securities Trust Series 2012-GCJ7 Class A4 | | | 3.38 | | | | 5-10-2045 | | | | 545,330 | | | | 559,437 | |
GS Mortgage Securities Trust Series 2013-GC14 Class A5 | | | 4.24 | | | | 8-10-2046 | | | | 615,000 | | | | 659,661 | |
GS Mortgage Securities Trust Series 2013-GC16 Class A4 | | | 4.27 | | | | 11-10-2046 | | | | 350,000 | | | | 376,325 | |
JPMorgan Chase Commercial Mortgage Securities Trust Series 2010-C2 Class A3 144A | | | 4.07 | | | | 11-15-2043 | | | | 395,000 | | | | 409,980 | |
MMAF Equipment Finance LLC Series 2017-AA Class A5 144A | | | 2.68 | | | | 7-16-2027 | | | | 695,000 | | | | 689,731 | |
Morgan Stanley Bank of America Merrill Lynch Trust Series 2014-C15 Class ASB | | | 3.65 | | | | 4-15-2047 | | | | 550,000 | | | | 571,279 | |
Morgan Stanley Capital I Trust Series 2011-C2 Class A4 144A | | | 4.66 | | | | 6-15-2044 | | | | 500,000 | | | | 530,068 | |
Morgan Stanley Capital I Trust Series 2011-C3 Class A4 | | | 4.12 | | | | 7-15-2049 | | | | 530,000 | | | | 556,544 | |
Small Business Administration Series 2017-10A Class 1 | | | 2.51 | | | | 3-10-2027 | | | | 568,940 | | | | 575,360 | |
Small Business Administration Series 2017-20F Class1 | | | 2.81 | | | | 6-1-2037 | | | | 300,000 | | | | 299,337 | |
Towd Point Mortgage Trust Series 2016-2 Class A1A 144A±± | | | 2.75 | | | | 8-25-2055 | | | | 311,682 | | | | 311,525 | |
Towd Point Mortgage Trust Series 2016-3 Class A1 144A±± | | | 2.25 | | | | 4-25-2056 | | | | 444,338 | | | | 440,887 | |
WFRBS Commercial Mortgage Trust Series 2013-C17 Class A4 | | | 4.02 | | | | 12-15-2046 | | | | 630,000 | | | | 667,924 | |
| | | | |
Total Non-Agency Mortgage-Backed Securities (Cost $12,152,619) | | | | | | | | | | | | | | | 12,070,038 | |
| | | | | | | | | | | | | | | | |
| | | | |
U.S. Treasury Securities: 6.28% | | | | | | | | | | | | | | | | |
U.S. Treasury Bond | | | 2.75 | | | | 8-15-2047 | | | | 1,015,000 | | | | 996,405 | |
U.S. Treasury Bond | | | 2.88 | | | | 11-15-2046 | | | | 1,422,000 | | | | 1,431,332 | |
The accompanying notes are an integral part of these financial statements.
| | | | |
| 108 | | Wells Fargo Allocation Funds | | Portfolio of investments—November 30, 2017 (unaudited) |
MANAGED FIXED INCOME PORTFOLIO
| | | | | | | | | | | | | | | | |
| Security name | | Interest rate | | | Maturity date | | | Principal | | | Value | |
| | | | |
U.S. Treasury Securities (continued) | | | | | | | | | | | | | | | | |
U.S. Treasury Bond | | | 3.00 | % | | | 2-15-2047 | | | $ | 150,000 | | | $ | 154,746 | |
U.S. Treasury Bond | | | 3.00 | | | | 5-15-2047 | | | | 725,000 | | | | 747,939 | |
U.S. Treasury Bond | | | 5.00 | | | | 5-15-2037 | | | | 1,000,000 | | | | 1,361,094 | |
U.S. Treasury Note | | | 1.50 | | | | 5-15-2020 | | | | 2,200,000 | | | | 2,181,180 | |
| | | | |
Total U.S. Treasury Securities (Cost $6,778,955) | | | | | | | | | | | | | | | 6,872,696 | |
| | | | | | | | | | | | | | | | |
| | | | |
Yankee Corporate Bonds and Notes: 5.63% | | | | | | | | | | | | | | | | |
| | | | |
Energy: 1.59% | | | | | | | | | | | | | | | | |
| | | | |
| Energy Equipment & Services: 0.36% | | | | | | | | | | | | | | | | |
Schlumberger Norge AS 144A | | | 4.20 | | | | 1-15-2021 | | | | 380,000 | | | | 398,369 | |
| | | | | | | | | | | | | | | | |
| | | | |
| Oil, Gas & Consumable Fuels: 1.23% | | | | | | | | | | | | | | | | |
BP Capital Markets plc | | | 3.28 | | | | 9-19-2027 | | | | 155,000 | | | | 155,448 | |
BP Capital Markets plc | | | 3.81 | | | | 2-10-2024 | | | | 110,000 | | | | 115,786 | |
Canadian National Resources Limited | | | 2.95 | | | | 1-15-2023 | | | | 50,000 | | | | 49,713 | |
Petroleos Mexicanos | | | 2.29 | | | | 2-15-2024 | | | | 178,750 | | | | 178,352 | |
Petroleos Mexicanos | | | 2.83 | | | | 2-15-2024 | | | | 373,750 | | | | 379,092 | |
Petroleos Mexicanos | | | 6.38 | | | | 1-23-2045 | | | | 250,000 | | | | 255,000 | |
Total Capital International SA | | | 3.70 | | | | 1-15-2024 | | | | 200,000 | | | | 211,123 | |
| | | | |
| | | | | | | | | | | | | | | 1,344,514 | |
| | | | | | | | | | | | | | | | |
| | | | |
Financials: 1.49% | | | | | | | | | | | | | | | | |
| | | | |
| Banks: 0.94% | | | | | | | | | | | | | | | | |
Bank of Nova Scotia | | | 4.50 | | | | 12-16-2025 | | | | 80,000 | | | | 83,924 | |
Credit Suisse New York | | | 3.63 | | | | 9-9-2024 | | | | 250,000 | | | | 258,276 | |
HSBC Holdings plc (3 Month LIBOR +1.06%) ± | | | 3.26 | | | | 3-13-2023 | | | | 220,000 | | | | 223,221 | |
HSBC Holdings plc | | | 3.60 | | | | 5-25-2023 | | | | 250,000 | | | | 258,215 | |
Mitsubishi UFJ Financial Group Incorporated | | | 2.67 | | | | 7-25-2022 | | | | 80,000 | | | | 79,339 | |
Royal Bank of Canada | | | 4.65 | | | | 1-27-2026 | | | | 120,000 | | | | 128,569 | |
| | | | |
| | | | | | | | | | | | | | | 1,031,544 | |
| | | | | | | | | | | | | | | | |
| | | | |
| Consumer Finance: 0.36% | | | | | | | | | | | | | | | | |
UBS Group Funding Switzerland 144A | | | 4.25 | | | | 3-23-2028 | | | | 380,000 | | | | 397,716 | |
| | | | | | | | | | | | | | | | |
| | | | |
| Diversified Financial Services: 0.19% | | | | | | | | | | | | | | | | |
Shell International Finance BV | | | 3.25 | | | | 5-11-2025 | | | | 200,000 | | | | 203,782 | |
| | | | | | | | | | | | | | | | |
| | | | |
Health Care: 0.61% | | | | | | | | | | | | | | | | |
| | | | |
| Pharmaceuticals: 0.61% | | | | | | | | | | | | | | | | |
Actavis Funding SCS | | | 4.55 | | | | 3-15-2035 | | | | 230,000 | | | | 238,632 | |
Teva Pharmaceutical Finance BV | | | 2.20 | | | | 7-21-2021 | | | | 150,000 | | | | 137,837 | |
Teva Pharmaceutical Finance BV | | | 3.15 | | | | 10-1-2026 | | | | 350,000 | | | | 291,931 | |
| | | | |
| | | | | | | | | | | | | | | 668,400 | |
| | | | | | | | | | | | | | | | |
| | | | |
Industrials: 0.60% | | | | | | | | | | | | | | | | |
| | | | |
| Aerospace & Defense: 0.46% | | | | | | | | | | | | | | | | |
BAE Systems plc 144A | | | 4.75 | | | | 10-11-2021 | | | | 470,000 | | | | 502,259 | |
| | | | | | | | | | | | | | | | |
The accompanying notes are an integral part of these financial statements.
| | | | | | |
| Portfolio of investments—November 30, 2017 (unaudited) | | Wells Fargo Allocation Funds | | | 109 | |
MANAGED FIXED INCOME PORTFOLIO
| | | | | | | | | | | | | | | | |
| Security name | | Interest rate | | | Maturity date | | | Principal | | | Value | |
| | | | |
| Road & Rail: 0.14% | | | | | | | | | | | | | | | | |
Canadian Pacific Railway Company | | | 2.90 | % | | | 2-1-2025 | | | $ | 150,000 | | | $ | 148,476 | |
| | | | | | | | | | | | | | | | |
| | | | |
Information Technology: 0.74% | | | | | | | | | | | | | | | | |
| | | | |
| Semiconductors & Semiconductor Equipment: 0.35% | | | | | | | | | | | | | | | | |
TSMC Global Limited 144A | | | 1.63 | | | | 4-3-2018 | | | | 380,000 | | | | 379,264 | |
| | | | | | | | | | | | | | | | |
| | | | |
| Technology Hardware, Storage & Peripherals: 0.39% | | | | | | | | | | | | | | | | |
Seagate HDD | | | 4.75 | | | | 6-1-2023 | | | | 425,000 | | | | 430,844 | |
| | | | | | | | | | | | | | | | |
| | | | |
Materials: 0.24% | | | | | | | | | | | | | | | | |
| | | | |
| Metals & Mining: 0.24% | | | | | | | | | | | | | | | | |
Anglo American Capital plc 144A | | | 4.75 | | | | 4-10-2027 | | | | 250,000 | | | | 259,692 | |
| | | | | | | | | | | | | | | | |
| | | | |
Telecommunication Services: 0.36% | | | | | | | | | | | | | | | | |
| | | | |
| Wireless Telecommunication Services: 0.36% | | | | | | | | | | | | | | | | |
Rogers Communications Incorporated | | | 4.10 | | | | 10-1-2023 | | | | 370,000 | | | | 390,372 | |
| | | | | | | | | | | | | | | | |
| | | | |
Total Yankee Corporate Bonds and Notes (Cost $5,986,828) | | | | | | | | | | | | | | | 6,155,232 | |
| | | | | | | | | | | | | | | | |
| | | | |
| | | Yield | | | | | | Shares | | | | |
| Short-Term Investments: 2.19% | | | | | | | | | | | | | | | | |
| | | | |
| Investment Companies: 2.19% | | | | | | | | | | | | | | | | |
Securities Lending Cash Investment LLC (l)(r)(u) | | | 1.29 | | | | | | | | 163,708 | | | | 163,724 | |
Wells Fargo Government Money Market Fund Select Class (l)(u)## | | | 1.00 | | | | | | | | 2,232,824 | | | | 2,232,824 | |
| | | | |
Total Short-Term Investments (Cost $2,396,532) | | | | | | | | | | | | | | | 2,396,548 | |
| | | | | | | | | | | | | | | | |
| | | | | | | | |
| Total investments in securities (Cost $106,911,554) | | | 100.01 | % | | | 109,385,286 | |
Other assets and liabilities, net | | | (0.01 | ) | | | (8,429 | ) |
| | | | | | | | |
| Total net assets | | | 100.00 | % | | $ | 109,376,857 | |
| | | | | | | | |
| ±± | The coupon of the security is adjusted based on the principal and interest payments received from the underlying pool of mortgages as well as the credit quality and the actual prepayment speed of the underlying mortgages. |
| 144A | The security may be resold in transactions exempt from registration, normally to qualified institutional buyers, pursuant to Rule 144A under the Securities Act of 1933. |
| ± | Variable rate investment. The rate shown is the rate in effect at period end. |
| « | All or a portion of this security is on loan. |
| %% | The security is issued on a when-issued basis. |
| (l) | The issuer of the security is an affiliated person of the Portfolio as defined in the Investment Company Act of 1940. |
| (r) | The investment is a non-registered investment company purchased with cash collateral received from securities on loan. |
| (u) | The rate represents the 7-day annualized yield at period end. |
| ## | All or a portion of this security is segregated for when-issued securities. |
The accompanying notes are an integral part of these financial statements.
| | | | |
| 110 | | Wells Fargo Allocation Funds | | Portfolio of investments—November 30, 2017 (unaudited) |
MANAGED FIXED INCOME PORTFOLIO
Investments in Affiliates
An affiliated investment is an investment in which the Portfolio owns at least 5% of the outstanding voting shares of the issuer or as a result of other relationships, such as the Portfolio and the issuer having the same investment manager. Transactions with issuers that were either affiliated persons of the Portfolio at the beginning of the period or the end of the period were as follows:
| | | | | | | | | | | | | | | | | | | | | | | | | | | | | | | | | | | | |
| | | Shares,
beginning of
period | | | Shares
purchased | | | Shares
sold | | | Shares,
end of
period | | | Net
realized
gains
(losses) | | | Net
change in
unrealized
gains
(losses) | | | Income
from
affiliated
securities | | | Value, end of period | | | % of
net
assets | |
Short-Term Investments | | | | | | | | | | | | | | | | | | | | | | | | | | | | | | | | | | | | |
Investment Companies | | | | | | | | | | | | | | | | | | | | | | | | | | | | | | | | | | | | |
Securities Lending Cash Investment LLC | | | 164,418 | | | | 23,783 | | | | 24,493 | | | | 163,708 | | | $ | 0 | | | $ | 0 | | | $ | 943 | | | $ | 163,724 | | | | | |
Wells Fargo Government Money Market Fund Select Class | | | 1,870,651 | | | | 15,062,030 | | | | 14,699,857 | | | | 2,232,824 | | | | 0 | | | | 0 | | | | 6,271 | | | | 2,232,824 | | | | | |
| | | | | | | | | | | | | | | | | | | | | | | | | | | | | | | | | | | | |
| | | | | | | | | | | | | | | | | | $ | 0 | | | $ | 0 | | | $ | 7,214 | | | $ | 2,396,548 | | | | 2.19 | % |
| | | | | | | | | | | | | | | | | | | | | | | | | | | | | | | | | | | | |
The accompanying notes are an integral part of these financial statements.
| | | | | | |
| Portfolio of investments—November 30, 2017 (unaudited) | | Wells Fargo Allocation Funds | | | 111 | |
REAL RETURN PORTFOLIO
| | | | | | | | | | | | | | | | |
| Security name | | | | | | | | Shares | | | Value | |
| | | | |
Common Stocks: 17.60% | | | | | | | | | | | | | | | | |
| | | | |
Consumer Discretionary: 0.28% | | | | | | | | | | | | | | | | |
| | | | |
| Specialty Retail: 0.28% | | | | | | | | | | | | | | | | |
Ceconomy AG | | | | | | | | | | | 30,658 | | | $ | 402,456 | |
| | | | | | | | | | | | | | | | |
| | | | |
Consumer Staples: 3.97% | | | | | | | | | | | | | | | | |
| | | | |
| Beverages: 0.46% | | | | | | | | | | | | | | | | |
The Coca-Cola Company | | | | | | | | | | | 14,277 | | | | 653,458 | |
| | | | | | | | | | | | | | | | |
| | | | |
| Food & Staples Retailing: 0.85% | | | | | | | | | | | | | | | | |
Metro AG † | | | | | | | | | | | 20,794 | | | | 406,174 | |
Wal-Mart Stores Incorporated | | | | | | | | | | | 4,141 | | | | 402,629 | |
Walgreens Boots Alliance Incorporated | | | | | | | | | | | 5,671 | | | | 412,622 | |
| | | | |
| | | | | | | | | | | | | | | 1,221,425 | |
| | | | | | | | | | | | | | | | |
| | | | |
| Food Products: 1.25% | | | | | | | | | | | | | | | | |
Health & Happiness International Holdings Limited † | | | | | | | | | | | 98,000 | | | | 537,672 | |
Marine Harvest ASA | | | | | | | | | | | 21,439 | | | | 378,135 | |
Mondelez International Incorporated Class A | | | | | | | | | | | 7,465 | | | | 320,547 | |
The Hershey Company | | | | | | | | | | | 1,916 | | | | 212,542 | |
The Kraft Heinz Company | | | | | | | | | | | 4,112 | | | | 334,593 | |
| | | | |
| | | | | | | | | | | | | | | 1,783,489 | |
| | | | | | | | | | | | | | | | |
| | | | |
| Household Products: 0.91% | | | | | | | | | | | | | | | | |
Church & Dwight Company Incorporated | | | | | | | | | | | 6,868 | | | | 323,414 | |
The Clorox Company | | | | | | | | | | | 1,673 | | | | 233,032 | |
The Procter & Gamble Company | | | | | | | | | | | 8,335 | | | | 750,067 | |
| | | | |
| | | | | | | | | | | | | | | 1,306,513 | |
| | | | | | | | | | | | | | | | |
| | | | |
| Personal Products: 0.14% | | | | | | | | | | | | | | | | |
The Estee Lauder Companies Incorporated Class A | | | | | | | | | | | 1,613 | | | | 201,351 | |
| | | | | | | | | | | | | | | | |
| | | | |
| Tobacco: 0.36% | | | | | | | | | | | | | | | | |
Philip Morris International | | | | | | | | | | | 4,992 | | | | 512,925 | |
| | | | | | | | | | | | | | | | |
| | | | |
Energy: 4.43% | | | | | | | | | | | | | | | | |
| | | | |
| Energy Equipment & Services: 0.38% | | | | | | | | | | | | | | | | |
Halliburton Company | | | | | | | | | | | 8,300 | | | | 346,774 | |
Schlumberger Limited | | | | | | | | | | | 3,112 | | | | 195,589 | |
| | | | |
| | | | | | | | | | | | | | | 542,363 | |
| | | | | | | | | | | | | | | | |
| | | | |
| Oil, Gas & Consumable Fuels: 4.05% | | | | | | | | | | | | | | | | |
Anadarko Petroleum Corporation | | | | | | | | | | | 3,903 | | | | 187,695 | |
BP plc | | | | | | | | | | | 120,226 | | | | 800,733 | |
Chevron Corporation | | | | | | | | | | | 8,254 | | | | 982,143 | |
Concho Resources Incorporated † | | | | | | | | | | | 2,385 | | | | 333,566 | |
Cosan Limited Class A | | | | | | | | | | | 114,111 | | | | 1,056,668 | |
Eni SpA | | | | | | | | | | | 33,641 | | | | 553,420 | |
EOG Resources Incorporated | | | | | | | | | | | 6,124 | | | | 626,608 | |
The accompanying notes are an integral part of these financial statements.
| | | | |
| 112 | | Wells Fargo Allocation Funds | | Portfolio of investments—November 30, 2017 (unaudited) |
REAL RETURN PORTFOLIO
| | | | | | | | | | | | | | | | |
| Security name | | | | | | | | Shares | | | Value | |
| | | | |
| Oil, Gas & Consumable Fuels (continued) | | | | | | | | | | | | | | | | |
Occidental Petroleum Corporation | | | | | | | | | | | 6,327 | | | $ | 446,054 | |
Phillips 66 Company | | | | | | | | | | | 3,269 | | | | 318,924 | |
Pioneer Natural Resources Company | | | | | | | | | | | 2,122 | | | | 331,117 | |
RSP Permian Incorporated † | | | | | | | | | | | 4,299 | | | | 157,902 | |
| | | | |
| | | | | | | | | | | | | | | 5,794,830 | |
| | | | | | | | | | | | | | | | |
| | | | |
Health Care: 0.66% | | | | | | | | | | | | | | | | |
| | | | |
| Pharmaceuticals: 0.66% | | | | | | | | | | | | | | | | |
Bayer AG | | | | | | | | | | | 7,395 | | | | 943,921 | |
| | | | | | | | | | | | | | | | |
| | | | |
Materials: 5.16% | | | | | | | | | | | | | | | | |
| | | | |
| Chemicals: 2.24% | | | | | | | | | | | | | | | | |
Axalta Coating Systems Limited † | | | | | | | | | | | 8,613 | | | | 272,688 | |
DowDuPont Incorporated | | | | | | | | | | | 5,150 | | | | 370,594 | |
Ecolab Incorporated | | | | | | | | | | | 2,110 | | | | 286,791 | |
International Flavors & Fragrances Incorporated | | | | | | | | | | | 857 | | | | 133,212 | |
LyondellBasell Industries NV Class A | | | | | | | | | | | 3,650 | | | | 382,155 | |
OCI NV Ǡ | | | | | | | | | | | 34,605 | | | | 774,898 | |
Sasol Limited | | | | | | | | | | | 18,069 | | | | 567,487 | |
The Sherwin-Williams Company | | | | | | | | | | | 1,038 | | | | 414,598 | |
| | | | |
| | | | | | | | | | | | | | | 3,202,423 | |
| | | | | | | | | | | | | | | | |
| | | | |
| Construction Materials: 0.11% | | | | | | | | | | | | | | | | |
Martin Marietta Materials Incorporated | | | | | | | | | | | 777 | | | | 161,919 | |
| | | | | | | | | | | | | | | | |
| | | | |
| Containers & Packaging: 0.12% | | | | | | | | | | | | | | | | |
Crown Holdings Incorporated † | | | | | | | | | | | 2,991 | | | | 178,652 | |
| | | | | | | | | | | | | | | | |
| | | | |
| Metals & Mining: 2.69% | | | | | | | | | | | | | | | | |
Agnico Eagle Mines Limited | | | | | | | | | | | 5,300 | | | | 231,663 | |
Alamos Gold Incorporated Class A | | | | | | | | | | | 8,800 | | | | 55,931 | |
B2Gold Corporation † | | | | | | | | | | | 71,000 | | | | 181,056 | |
Barrick Gold Corporation | | | | | | | | | | | 6,850 | | | | 94,393 | |
Detour Gold Corporation † | | | | | | | | | | | 15,500 | | | | 168,198 | |
Endeavour Mining Corporation † | | | | | | | | | | | 3,400 | | | | 61,535 | |
Franco-Nevada Corporation | | | | | | | | | | | 2,100 | | | | 171,089 | |
Fresnillo plc | | | | | | | | | | | 9,500 | | | | 165,990 | |
Goldcorp Incorporated-U.S. Exchange Traded Shares | | | | | | | | | | | 29,977 | | | | 378,909 | |
IAMGOLD Corporation † | | | | | | | | | | | 17,000 | | | | 92,633 | |
Kinross Gold Corporation † | | | | | | | | | | | 44,000 | | | | 183,824 | |
Kirkland Lake Gold Limited | | | | | | | | | | | 5,000 | | | | 72,046 | |
Lundin Mining Corporation | | | | | | | | | | | 107,049 | | | | 623,965 | |
Newcrest Mining Limited | | | | | | | | | | | 7,400 | | | | 129,895 | |
Newmont Mining Corporation | | | | | | | | | | | 6,600 | | | | 244,134 | |
Pretium Resources Incorporated † | | | | | | | | | | | 6,500 | | | | 69,678 | |
Randgold Resources Limited ADR | | | | | | | | | | | 2,600 | | | | 238,576 | |
Royal Gold Incorporated | | | | | | | | | | | 5,001 | | | | 413,683 | |
Semafo Incorporated † | | | | | | | | | | | 13,000 | | | | 32,144 | |
Steel Dynamics Incorporated | | | | | | | | | | | 6,100 | | | | 234,850 | |
| | | | |
| | | | | | | | | | | | | | | 3,844,192 | |
| | | | | | | | | | | | | | | | |
The accompanying notes are an integral part of these financial statements.
| | | | | | |
| Portfolio of investments—November 30, 2017 (unaudited) | | Wells Fargo Allocation Funds | | | 113 | |
REAL RETURN PORTFOLIO
| | | | | | | | | | | | | | | | |
| Security name | | | | | | | | Shares | | | Value | |
| | | | |
Real Estate: 3.10% | | | | | | | | | | | | | | | | |
| | | | |
| Equity REITs: 3.10% | | | | | | | | | | | | | | | | |
Alexandria Real Estate Equities Incorporated | | | | | | | | | | | 1,463 | | | $ | 185,889 | |
American Homes 4 Rent Class A | | | | | | | | | | | 8,494 | | | | 182,451 | |
American Tower Corporation | | | | | | | | | | | 3,153 | | | | 453,811 | |
AvalonBay Communities Incorporated | | | | | | | | | | | 1,165 | | | | 211,249 | |
Boston Properties Incorporated | | | | | | | | | | | 1,243 | | | | 155,847 | |
Camden Property Trust | | | | | | | | | | | 1,988 | | | | 181,465 | |
Equinix Incorporated | | | | | | | | | | | 848 | | | | 393,888 | |
Essex Property Trust Incorporated | | | | | | | | | | | 928 | | | | 229,207 | |
Host Hotels & Resorts Incorporated | | | | | | | | | | | 12,334 | | | | 244,090 | |
Hudson Pacific Properties Incorporated | | | | | | | | | | | 6,702 | | | | 238,792 | |
Mid-America Apartment Communities Incorporated | | | | | | | | | | | 2,119 | | | | 217,070 | |
Physicians Realty Trust | | | | | | | | | | | 22,116 | | | | 395,213 | |
Prologis Incorporated | | | | | | | | | | | 4,868 | | | | 322,408 | |
Public Storage Incorporated | | | | | | | | | | | 935 | | | | 199,267 | |
Retail Opportunity Investment Corporation | | | | | | | | | | | 11,427 | | | | 223,626 | |
Simon Property Group Incorporated | | | | | | | | | | | 2,169 | | | | 350,836 | |
Ventas Incorporated | | | | | | | | | | | 3,839 | | | | 245,734 | |
| | | | |
| | | | | | | | | | | | | | | 4,430,843 | |
| | | | | | | | | | | | | | | | |
| | | | |
Total Common Stocks (Cost $23,207,641) | | | | | | | | | | | | | | | 25,180,760 | |
| | | | | | | | | | | | | | | | |
| | | | |
| | | Interest rate | | | Maturity date | | | Principal | | | | |
| Corporate Bonds and Notes: 8.92% | | | | | | | | | | | | | | | | |
| | | | |
Consumer Discretionary: 2.86% | | | | | | | | | | | | | | | | |
| | | | |
| Auto Components: 0.10% | | | | | | | | | | | | | | | | |
American Axle & Manufacturing Incorporated « | | | 6.25 | % | | | 3-15-2021 | | | $ | 100,000 | | | | 102,500 | |
American Axle & Manufacturing Incorporated | | | 7.75 | | | | 11-15-2019 | | | | 25,000 | | | | 27,281 | |
Cooper Tire & Rubber Company | | | 8.00 | | | | 12-15-2019 | | | | 20,000 | | | | 22,050 | |
| | | | |
| | | | | | | | | | | | | | | 151,831 | |
| | | | | | | | | | | | | | | | |
| | | | |
| Diversified Consumer Services: 0.14% | | | | | | | | | | | | | | | | |
Service Corporation International | | | 5.38 | | | | 1-15-2022 | | | | 100,000 | | | | 102,625 | |
TRI Pointe Group Incorporated | | | 4.38 | | | | 6-15-2019 | | | | 92,000 | | | | 93,840 | |
| | | | |
| | | | | | | | | | | | | | | 196,465 | |
| | | | | | | | | | | | | | | | |
| | | | |
| Hotels, Restaurants & Leisure: 0.67% | | | | | | | | | | | | | | | | |
GLP Capital LP/GLP Financing II Incorporated | | | 4.88 | | | | 11-1-2020 | | | | 205,000 | | | | 215,539 | |
International Game Technology plc 144A | | | 5.63 | | | | 2-15-2020 | | | | 200,000 | | | | 210,250 | |
MGM Resorts International | | | 5.25 | | | | 3-31-2020 | | | | 165,000 | | | | 173,663 | |
MGM Resorts International | | | 6.75 | | | | 10-1-2020 | | | | 120,000 | | | | 131,213 | |
NCL Corporation Limited 144A | | | 4.75 | | | | 12-15-2021 | | | | 220,000 | | | | 227,700 | |
| | | | |
| | | | | | | | | | | | | | | 958,365 | |
| | | | | | | | | | | | | | | | |
| | | | |
| Household Durables: 0.37% | | | | | | | | | | | | | | | | |
CalAtlantic Group Incorporated | | | 6.63 | | | | 5-1-2020 | | | | 165,000 | | | | 179,438 | |
KB Home | | | 4.75 | | | | 5-15-2019 | | | | 60,000 | | | | 61,275 | |
The accompanying notes are an integral part of these financial statements.
| | | | |
| 114 | | Wells Fargo Allocation Funds | | Portfolio of investments—November 30, 2017 (unaudited) |
REAL RETURN PORTFOLIO
| | | | | | | | | | | | | | | | |
| Security name | | Interest rate | | | Maturity date | | | Principal | | | Value | |
| | | | |
| Household Durables (continued) | | | | | | | | | | | | | | | | |
Lennar Corporation | | | 4.50 | % | | | 6-15-2019 | | | $ | 150,000 | | | $ | 153,750 | |
Lennar Corporation | | | 4.50 | | | | 11-15-2019 | | | | 50,000 | | | | 51,438 | |
Pulte Group Incorporated | | | 4.25 | | | | 3-1-2021 | | | | 80,000 | | | | 82,968 | |
| | | | |
| | | | | | | | | | | | | | | 528,869 | |
| | | | | | | | | | | | | | | | |
| | | | |
| Internet & Direct Marketing Retail: 0.18% | | | | | | | | | | | | | | | | |
Netflix Incorporated | | | 5.38 | | | | 2-1-2021 | | | | 250,000 | | | | 265,000 | |
| | | | | | | | | | | | | | | | |
| | | | |
| Media: 0.86% | | | | | | | | | | | | | | | | |
Cable One Incorporated 144A | | | 5.75 | | | | 6-15-2022 | | | | 260,000 | | | | 269,100 | |
CSC Holdings LLC | | | 7.63 | | | | 7-15-2018 | | | | 75,000 | | | | 76,500 | |
DISH DBS Corporation | | | 4.25 | | | | 4-1-2018 | | | | 90,000 | | | | 90,666 | |
DISH DBS Corporation | | | 7.88 | | | | 9-1-2019 | | | | 125,000 | | | | 133,776 | |
Lin Television Corporation | | | 5.88 | | | | 11-15-2022 | | | | 45,000 | | | | 46,856 | |
National CineMedia LLC | | | 6.00 | | | | 4-15-2022 | | | | 100,000 | | | | 101,250 | |
Nexstar Broadcasting Group Incorporated 144A | | | 6.13 | | | | 2-15-2022 | | | | 105,000 | | | | 108,675 | |
Outfront Media Capital Corporation | | | 5.25 | | | | 2-15-2022 | | | | 95,000 | | | | 97,671 | |
Scientific Games International Incorporated 144A | | | 7.00 | | | | 1-1-2022 | | | | 80,000 | | | | 84,400 | |
Sinclair Television Group Incorporated | | | 6.13 | | | | 10-1-2022 | | | | 100,000 | | | | 103,750 | |
Sirius XM Radio Incorporated 144A | | | 3.88 | | | | 8-1-2022 | | | | 55,000 | | | | 55,424 | |
TEGNA Incorporated | | | 5.13 | | | | 10-15-2019 | | | | 27,000 | | | | 27,371 | |
TEGNA Incorporated | | | 5.13 | | | | 7-15-2020 | | | | 30,000 | | | | 30,788 | |
| | | | |
| | | | | | | | | | | | | | | 1,226,227 | |
| | | | | | | | | | | | | | | | |
| | | | |
| Multiline Retail: 0.07% | | | | | | | | | | | | | | | | |
Dollar Tree Incorporated | | | 5.25 | | | | 3-1-2020 | | | | 100,000 | | | | 102,000 | |
| | | | | | | | | | | | | | | | |
| | | | |
| Specialty Retail: 0.38% | | | | | | | | | | | | | | | | |
Gap Incorporated | | | 5.95 | | | | 4-12-2021 | | | | 100,000 | | | | 107,977 | |
Group 1 Automotive Incorporated | | | 5.00 | | | | 6-1-2022 | | | | 85,000 | | | | 87,656 | |
L Brands Incorporated | | | 6.63 | | | | 4-1-2021 | | | | 195,000 | | | | 214,521 | |
Penske Auto Group Incorporated | | | 3.75 | | | | 8-15-2020 | | | | 20,000 | | | | 20,325 | |
Penske Auto Group Incorporated | | | 5.75 | | | | 10-1-2022 | | | | 110,000 | | | | 113,300 | |
| | | | |
| | | | | | | | | | | | | | | 543,779 | |
| | | | | | | | | | | | | | | | |
| | | | |
| Textiles, Apparel & Luxury Goods: 0.09% | | | | | | | | | | | | | | | | |
The William Carter Company | | | 5.25 | | | | 8-15-2021 | | | | 120,000 | | | | 123,450 | |
| | | | | | | | | | | | | | | | |
| | | | |
Consumer Staples: 0.18% | | | | | | | | | | | | | | | | |
| | | | |
| Food Products: 0.18% | | | | | | | | | | | | | | | | |
B&G Foods Incorporated | | | 4.63 | | | | 6-1-2021 | | | | 155,000 | | | | 157,372 | |
Pinnacle Foods Incorporated | | | 4.88 | | | | 5-1-2021 | | | | 100,000 | | | | 101,750 | |
| | | | |
| | | | | | | | | | | | | | | 259,122 | |
| | | | | | | | | | | | | | | | |
| | | | |
Energy: 0.79% | | | | | | | | | | | | | | | | |
| | | | |
| Oil, Gas & Consumable Fuels: 0.79% | | | | | | | | | | | | | | | | |
DCP Midstream Operating LP | | | 2.70 | | | | 4-1-2019 | | | | 100,000 | | | | 99,375 | |
DCP Midstream Operating LP 144A | | | 5.35 | | | | 3-15-2020 | | | | 100,000 | | | | 103,500 | |
The accompanying notes are an integral part of these financial statements.
| | | | | | |
| Portfolio of investments—November 30, 2017 (unaudited) | | Wells Fargo Allocation Funds | | | 115 | |
REAL RETURN PORTFOLIO
| | | | | | | | | | | | | | | | |
| Security name | | Interest rate | | | Maturity date | | | Principal | | | Value | |
| | | | |
| Oil, Gas & Consumable Fuels (continued) | | | | | | | | | | | | | | | | |
Rockies Express Pipeline LLC 144A | | | 5.63 | % | | | 4-15-2020 | | | $ | 105,000 | | | $ | 109,988 | |
Rockies Express Pipeline LLC 144A | | | 6.00 | | | | 1-15-2019 | | | | 125,000 | | | | 129,025 | |
Sabine Pass Liquefaction LLC | | | 5.63 | | | | 2-1-2021 | | | | 355,000 | | | | 381,420 | |
Targa Resources Partners LP | | | 4.13 | | | | 11-15-2019 | | | | 160,000 | | | | 161,200 | |
Tesoro Logistics LP | | | 5.50 | | | | 10-15-2019 | | | | 75,000 | | | | 78,540 | |
Tesoro Logistics LP | | | 5.88 | | | | 10-1-2020 | | | | 65,000 | | | | 66,040 | |
| | | | |
| | | | | | | | | | | | | | | 1,129,088 | |
| | | | | | | | | | | | | | | | |
| | | | |
Financials: 0.85% | | | | | | | | | | | | | | | | |
| | | | |
| Banks: 0.21% | | | | | | | | | | | | | | | | |
CIT Group Incorporated | | | 3.88 | | | | 2-19-2019 | | | | 300,000 | | | | 304,680 | |
| | | | | | | | | | | | | | | | |
| | | | |
| Consumer Finance: 0.53% | | | | | | | | | | | | | | | | |
Ally Financial Incorporated | | | 3.75 | | | | 11-18-2019 | | | | 155,000 | | | | 157,713 | |
Ally Financial Incorporated | | | 6.25 | | | | 12-1-2017 | | | | 60,000 | | | | 60,000 | |
Navient Corporation | | | 5.50 | | | | 1-15-2019 | | | | 225,000 | | | | 230,513 | |
OneMain Financial Group LLC 144A | | | 7.25 | | | | 12-15-2021 | | | | 160,000 | | | | 166,112 | |
Toll Brothers Finance Corporation | | | 4.00 | | | | 12-31-2018 | | | | 135,000 | | | | 137,194 | |
| | | | |
| | | | | | | | | | | | | | | 751,532 | |
| | | | | | | | | | | | | | | | |
| | | | |
| Real Estate Management & Development: 0.11% | | | | | | | | | | | | | | | | |
Realogy Group LLC 144A | | | 4.50 | | | | 4-15-2019 | | | | 100,000 | | | | 102,000 | |
Realogy Group LLC 144A | | | 5.25 | | | | 12-1-2021 | | | | 50,000 | | | | 52,000 | |
| | | | |
| | | | | | | | | | | | | | | 154,000 | |
| | | | | | | | | | | | | | | | |
| | | | |
Health Care: 0.74% | | | | | | | | | | | | | | | | |
| | | | |
| Health Care Equipment & Supplies: 0.18% | | | | | | | | | | | | | | | | |
Hologic Incorporated 144A | | | 5.25 | | | | 7-15-2022 | | | | 95,000 | | | | 99,156 | |
Kinetics Concepts Incorporated 144A | | | 7.88 | | | | 2-15-2021 | | | | 155,000 | | | | 162,347 | |
| | | | |
| | | | | | | | | | | | | | | 261,503 | |
| | | | | | | | | | | | | | | | |
| | | | |
| Health Care Providers & Services: 0.56% | | | | | | | | | | | | | | | | |
Acadia Healthcare Company Incorporated | | | 5.13 | | | | 7-1-2022 | | | | 162,000 | | | | 161,820 | |
DaVita HealthCare Partners Incorporated | | | 5.75 | | | | 8-15-2022 | | | | 70,000 | | | | 72,188 | |
Fresenius Medical Care Holdings Incorporated 144A | | | 5.63 | | | | 7-31-2019 | | | | 55,000 | | | | 57,739 | |
HCA Incorporated | | | 6.50 | | | | 2-15-2020 | | | | 155,000 | | | | 166,431 | |
Lifepoint Hospitals Incorporated | | | 5.50 | | | | 12-1-2021 | | | | 110,000 | | | | 111,238 | |
Select Medical Corporation | | | 6.38 | | | | 6-1-2021 | | | | 155,000 | | | | 159,069 | |
Tenet Healthcare Corporation | | | 6.00 | | | | 10-1-2020 | | | | 65,000 | | | | 68,494 | |
| | | | |
| | | | | | | | | | | | | | | 796,979 | |
| | | | | | | | | | | | | | | | |
| | | | |
Industrials: 0.95% | | | | | | | | | | | | | | | | |
| | | | |
| Aerospace & Defense: 0.34% | | | | | | | | | | | | | | | | |
Alcoa Incorporated | | | 6.15 | | | | 8-15-2020 | | | | 100,000 | | | | 107,640 | |
Huntington Ingalls Industries Incorporated 144A | | | 5.00 | | | | 12-15-2021 | | | | 170,000 | | | | 174,420 | |
Moog Incorporated 144A | | | 5.25 | | | | 12-1-2022 | | | | 200,000 | | | | 207,750 | |
| | | | |
| | | | | | | | | | | | | | | 489,810 | |
| | | | | | | | | | | | | | | | |
The accompanying notes are an integral part of these financial statements.
| | | | |
| 116 | | Wells Fargo Allocation Funds | | Portfolio of investments—November 30, 2017 (unaudited) |
REAL RETURN PORTFOLIO
| | | | | | | | | | | | | | | | |
| Security name | | Interest rate | | | Maturity date | | | Principal | | | Value | |
| | | | |
| Airlines: 0.14% | | | | | | | | | | | | | | | | |
American Airlines Group Incorporated | | | 6.13 | % | | | 6-1-2018 | | | $ | 100,000 | | | $ | 101,750 | |
United Continental Holdings Incorporated | | | 6.38 | | | | 6-1-2018 | | | | 100,000 | | | | 101,750 | |
| | | | |
| | | | | | | | | | | | | | | 203,500 | |
| | | | | | | | | | | | | | | | |
| | | | |
| Commercial Services & Supplies: 0.07% | | | | | | | | | | | | | | | | |
Clean Harbors Incorporated | | | 5.13 | | | | 6-1-2021 | | | | 100,000 | | | | 101,250 | |
| | | | | | | | | | | | | | | | |
| | | | |
| Machinery: 0.18% | | | | | | | | | | | | | | | | |
CNH Industrial Capital LLC | | | 3.88 | | | | 7-16-2018 | | | | 245,000 | | | | 247,450 | |
| | | | | | | | | | | | | | | | |
| | | | |
| Trading Companies & Distributors: 0.22% | | | | | | | | | | | | | | | | |
Aircastle Limited | | | 4.63 | | | | 12-15-2018 | | | | 100,000 | | | | 101,750 | |
Aircastle Limited | | | 6.25 | | | | 12-1-2019 | | | | 200,000 | | | | 213,000 | |
| | | | |
| | | | | | | | | | | | | | | 314,750 | |
| | | | | | | | | | | | | | | | |
| | | | |
Information Technology: 0.72% | | | | | | | | | | | | | | | | |
| | | | |
| Electronic Equipment, Instruments & Components: 0.17% | | | | | | | | | | | | | | | | |
Dell International LLC/EMC Corporation 144A | | | 3.48 | | | | 6-1-2019 | | | | 40,000 | | | | 40,514 | |
Jabil Circuit Incorporated | | | 8.25 | | | | 3-15-2018 | | | | 75,000 | | | | 76,054 | |
Sanmina Corporation 144A | | | 4.38 | | | | 6-1-2019 | | | | 105,000 | | | | 107,756 | |
Zebra Technologies Corporation | | | 7.25 | | | | 10-15-2022 | | | | 20,000 | | | | 21,090 | |
| | | | |
| | | | | | | | | | | | | | �� | 245,414 | |
| | | | | | | | | | | | | | | | |
| | | | |
| Internet Software & Services: 0.09% | | | | | | | | | | | | | | | | |
Match Group Incorporated | | | 6.75 | | | | 12-15-2022 | | | | 120,000 | | | | 123,000 | |
| | | | | | | | | | | | | | | | |
| | | | |
| Software: 0.11% | | | | | | | | | | | | | | | | |
CDK Global Incorporated | | | 3.80 | | | | 10-15-2019 | | | | 110,000 | | | | 112,063 | |
Symantec Corporation | | | 4.20 | | | | 9-15-2020 | | | | 50,000 | | | | 51,361 | |
| | | | |
| | | | | | | | | | | | | | | 163,424 | |
| | | | | | | | | | | | | | | | |
| | | | |
| Technology Hardware, Storage & Peripherals: 0.35% | | | | | | | | | | | | | | | | |
EMC Corporation | | | 2.65 | | | | 6-1-2020 | | | | 275,000 | | | | 271,790 | |
NCR Corporation | | | 4.63 | | | | 2-15-2021 | | | | 80,000 | | | | 80,400 | |
Western Digital Corporation 144A | | | 7.38 | | | | 4-1-2023 | | | | 130,000 | | | | 141,375 | |
| | | | |
| | | | | | | | | | | | | | | 493,565 | |
| | | | | | | | | | | | | | | | |
| | | | |
Materials: 0.65% | | | | | | | | | | | | | | | | |
| | | | |
| Chemicals: 0.15% | | | | | | | | | | | | | | | | |
CF Industries Incorporated | | | 6.88 | | | | 5-1-2018 | | | | 145,000 | | | | 147,900 | |
Huntsman International LLC | | | 4.88 | | | | 11-15-2020 | | | | 65,000 | | | | 67,925 | |
| | | | |
| | | | | | | | | | | | | | | 215,825 | |
| | | | | | | | | | | | | | | | |
| | | | |
| Containers & Packaging: 0.18% | | | | | | | | | | | | | | | | |
Ball Corporation | | | 4.38 | | | | 12-15-2020 | | | | 160,000 | | | | 166,400 | |
Reynolds Group Issuer Incorporated | | | 5.75 | | | | 10-15-2020 | | | | 85,000 | | | | 86,434 | |
| | | | |
| | | | | | | | | | | | | | | 252,834 | |
| | | | | | | | | | | | | | | | |
The accompanying notes are an integral part of these financial statements.
| | | | | | |
| Portfolio of investments—November 30, 2017 (unaudited) | | Wells Fargo Allocation Funds | | | 117 | |
REAL RETURN PORTFOLIO
| | | | | | | | | | | | | | | | |
| Security name | | Interest rate | | | Maturity date | | | Principal | | | Value | |
| | | | |
| Metals & Mining: 0.32% | | | | | | | | | | | | | | | | |
Freeport-McMoRan Incorporated | | | 3.10 | % | | | 3-15-2020 | | | $ | 160,000 | | | $ | 160,200 | |
United States Steel Corporation 144A | | | 8.38 | | | | 7-1-2021 | | | | 270,000 | | | | 294,975 | |
| | | | |
| | | | | | | | | | | | | | | 455,175 | |
| | | | | | | | | | | | | | | | |
| | | | |
Real Estate: 0.59% | | | | | | | | | | | | | | | | |
| | | | |
| Equity REITs: 0.45% | | | | | | | | | | | | | | | | |
CoreCivic Incorporated | | | 4.13 | | | | 4-1-2020 | | | | 230,000 | | | | 234,853 | |
Equinix Incorporated | | | 5.38 | | | | 1-1-2022 | | | | 120,000 | | | | 124,950 | |
Sabra Health Care REIT Incorporated | | | 5.50 | | | | 2-1-2021 | | | | 150,000 | | | | 154,688 | |
VEREIT Operating Partnership LP | | | 3.00 | | | | 2-6-2019 | | | | 120,000 | | | | 120,748 | |
VEREIT Operating Partnership LP | | | 4.13 | | | | 6-1-2021 | | | | 10,000 | | | | 10,396 | |
| | | | |
| | | | | | | | | | | | | | | 645,635 | |
| | | | | | | | | | | | | | | | |
| | | | |
| Real Estate Management & Development: 0.14% | | | | | | | | | | | | | | | | |
Taylor Morrison Communities Incorporated 144A | | | 5.25 | | | | 4-15-2021 | | | | 195,000 | | | | 198,623 | |
| | | | | | | | | | | | | | | | |
| | | | |
Telecommunication Services: 0.59% | | | | | | | | | | | | | | | | |
| | | | |
| Diversified Telecommunication Services: 0.15% | | | | | | | | | | | | | | | | |
CenturyLink Incorporated | | | 5.63 | | | | 4-1-2020 | | | | 90,000 | | | | 90,225 | |
Hughes Satellite Systems Corporation | | | 6.50 | | | | 6-15-2019 | | | | 115,000 | | | | 120,894 | |
| | | | |
| | | | | | | | | | | | | | | 211,119 | |
| | | | | | | | | | | | | | | | |
| | | | |
| Wireless Telecommunication Services: 0.44% | | | | | | | | | | | | | | | | |
SBA Communications Corporation 144A | | | 4.00 | | | | 10-1-2022 | | | | 80,000 | | | | 80,400 | |
Sprint Communications Incorporated 144A | | | 9.00 | | | | 11-15-2018 | | | | 295,000 | | | | 311,594 | |
Sprint Spectrum LP 144A | | | 3.36 | | | | 3-20-2023 | | | | 65,000 | | | | 65,507 | |
T-Mobile USA Incorporated | | | 6.13 | | | | 1-15-2022 | | | | 50,000 | | | | 51,750 | |
T-Mobile USA Incorporated | | | 6.63 | | | | 4-1-2023 | | | | 125,000 | | | | 130,738 | |
| | | | |
| | | | | | | | | | | | | | | 639,989 | |
| | | | | | | | | �� | | | | | | | |
| | | | |
Total Corporate Bonds and Notes (Cost $12,799,141) | | | | | | | | | | | | | | | 12,754,253 | |
| | | | | | | | | | | | | | | | |
| | | | |
Loans: 3.49% | | | | | | | | | | | | | | | | |
| | | | |
Consumer Discretionary: 0.50% | | | | | | | | | | | | | | | | |
| | | | |
| Auto Components: 0.04% | | | | | | | | | | | | | | | | |
Allison Transmission Incorporated (1 Month LIBOR +2.00%) ± | | | 3.35 | | | | 9-23-2022 | | | | 56,145 | | | | 56,523 | |
| | | | | | | | | | | | | | | | |
| | | | |
| Household Products: 0.25% | | | | | | | | | | | | | | | | |
Michaels Stores Incorporated (1 Month LIBOR +2.75%) ±< | | | 4.07 | | | | 1-30-2023 | | | | 230,783 | | | | 228,563 | |
The ServiceMaster Company LLC (1 Month LIBOR +2.50%) ± | | | 3.85 | | | | 11-8-2023 | | | | 133,988 | | | | 134,197 | |
| | | | |
| | | | | | | | | | | | | | | 362,760 | |
| | | | | | | | | | | | | | | | |
| | | | |
| Media: 0.19% | | | | | | | | | | | | | | | | |
Altice US Finance I Corporation (1 Month LIBOR +2.25%) ± | | | 3.60 | | | | 7-28-2025 | | | | 129,675 | | | | 128,648 | |
Live Nation Entertainment Incorporated (1 Month LIBOR +2.25%) ± | | | 3.63 | | | | 10-31-2023 | | | | 139,649 | | | | 140,522 | |
| | | | |
| | | | | | | | | | | | | | | 269,170 | |
| | | | | | | | | | | | | | | | |
The accompanying notes are an integral part of these financial statements.
| | | | |
| 118 | | Wells Fargo Allocation Funds | | Portfolio of investments—November 30, 2017 (unaudited) |
REAL RETURN PORTFOLIO
| | | | | | | | | | | | | | | | |
| Security name | | Interest rate | | | Maturity date | | | Principal | | | Value | |
| | | | |
| Specialty Retail: 0.02% | | | | | | | | | | | | | | | | |
Sally Beauty Holdings Incorporated (1 Month LIBOR +2.50%) ±‡ | | | 3.88 | % | | | 7-5-2024 | | | $ | 25,000 | | | $ | 24,906 | |
| | | | | | | | | | | | | | | | |
| | | | |
Consumer Staples: 0.18% | | | | | | | | | | | | | | | | |
| | | | |
| Food Products: 0.18% | | | | | | | | | | | | | | | | |
Pinnacle Foods Incorporated (1 Month LIBOR +2.00%) ± | | | 3.24 | | | | 2-2-2024 | | | | 59,550 | | | | 59,866 | |
Post Holdings Incorporated (1 Month LIBOR +2.25%) ± | | | 3.60 | | | | 5-24-2024 | | | | 124,688 | | | | 125,096 | |
Prestige Brands Incorporated (1 Month LIBOR +2.75%) ± | | | 4.10 | | | | 1-26-2024 | | | | 74,874 | | | | 75,236 | |
| | | | |
| | | | | | | | | | | | | | | 260,198 | |
| | | | | | | | | | | | | | | | |
| | | | |
Financials: 0.28% | | | | | | | | | | | | | | | | |
| | | | |
| Diversified Financial Services: 0.28% | | | | | | | | | | | | | | | | |
Delos Finance SARL (3 Month LIBOR +2.00%) ± | | | 3.33 | | | | 10-6-2023 | | | | 200,000 | | | | 201,438 | |
LPL Holdings Incorporated (3 Month LIBOR +2.25%) ± | | | 3.65 | | | | 9-23-2024 | | | | 196,686 | | | | 197,095 | |
| | | | |
| | | | | | | | | | | | | | | 398,533 | |
| | | | | | | | | | | | | | | | |
| | | | |
Health Care: 0.31% | | | | | | | | | | | | | | | | |
| | | | |
| Health Care Providers & Services: 0.22% | | | | | | | | | | | | | | | | |
HCA Incorporated (1 Month LIBOR +2.00%) ± | | | 3.35 | | | | 3-17-2023 | | | | 89,550 | | | | 89,819 | |
Select Medical Corporation (3 Month LIBOR +3.50%) ± | | | 4.85 | | | | 3-1-2021 | | | | 54,725 | | | | 55,249 | |
Surgery Center Holdings Incorporated (1 Month LIBOR +3.25%) ± | | | 4.60 | | | | 9-2-2024 | | | | 90,000 | | | | 88,594 | |
TeamHealth Incorporated (1 Month LIBOR +2.75%) ± | | | 4.10 | | | | 2-6-2024 | | | | 79,600 | | | | 77,760 | |
| | | | |
| | | | | | | | | | | | | | | 311,422 | |
| | | | | | | | | | | | | | | | |
| | | | |
| Health Care Technology: 0.03% | | | | | | | | | | | | | | | | |
Change Healthcare Holdings Incorporated (1 Month LIBOR +2.75%) ± | | | 4.10 | | | | 3-1-2024 | | | | 44,775 | | | | 44,876 | |
| | | | | | | | | | | | | | | | |
| | | | |
| Pharmaceuticals: 0.06% | | | | | | | | | | | | | | | | |
Endo Finance LLC (1 Month LIBOR +4.25%) ± | | | 5.63 | | | | 4-29-2024 | | | | 89,775 | | | | 90,304 | |
| | | | | | | | | | | | | | | | |
| | | | |
Industrials: 0.98% | | | | | | | | | | | | | | | | |
| | | | |
| Airlines: 0.14% | | | | | | | | | | | | | | | | |
Delta Air Lines Incorporated (1 Month LIBOR +2.50%) ± | | | 3.85 | | | | 8-24-2022 | | | | 132,300 | | | | 133,193 | |
United Airlines Incorporated (3 Month LIBOR +2.00%) ± | | | 3.38 | | | | 4-1-2024 | | | | 69,650 | | | | 69,781 | |
| | | | |
| | | | | | | | | | | | | | | 202,974 | |
| | | | | | | | | | | | | | | | |
| | | | |
| Commercial Services & Supplies: 0.50% | | | | | | | | | | | | | | | | |
Advanced Disposal Services Incorporated (1 Month LIBOR +2.25%) ± | | | 3.45 | | | | 11-10-2023 | | | | 98,902 | | | | 98,953 | |
Aramark Services Incorporated (1 Month LIBOR +2.00%) ± | | | 3.35 | | | | 3-28-2024 | | | | 56,425 | | | | 56,654 | |
Columbus McKinnon Corporation (3 Month LIBOR +3.00%) ±‡ | | | 4.33 | | | | 1-31-2024 | | | | 59,197 | | | | 59,567 | |
KAR Auction Services Incorporated (3 Month LIBOR +2.25%) ± | | | 3.63 | | | | 3-11-2021 | | | | 151,178 | | | | 151,744 | |
Multi-Color Corporation (1 Month LIBOR +2.25%) ±< | | | 0.00 | | | | 10-31-2024 | | | | 180,000 | | | | 181,575 | |
Sensata Technologies BV (1 Month LIBOR +1.75%) ± | | | 2.99 | | | | 10-14-2021 | | | | 160,000 | | | | 160,485 | |
| | | | |
| | | | | | | | | | | | | | | 708,978 | |
| | | | | | | | | | | | | | | | |
| | | | |
| Communications Equipment: 0.34% | | | | | | | | | | | | | | | | |
Charter Communications Operating LLC (1 Month LIBOR +2.00%) ±< | | | 3.35 | | | | 1-3-2021 | | | | 353,316 | | | | 354,333 | |
Virgin Media Bristol LLC (1 Month LIBOR +2.50%) ± | | | 3.75 | | | | 1-31-2026 | | | | 135,000 | | | | 134,916 | |
| | | | |
| | | | | | | | | | | | | | | 489,249 | |
| | | | | | | | | | | | | | | | |
The accompanying notes are an integral part of these financial statements.
| | | | | | |
| Portfolio of investments—November 30, 2017 (unaudited) | | Wells Fargo Allocation Funds | | | 119 | |
REAL RETURN PORTFOLIO
| | | | | | | | | | | | | | | | |
| Security name | | Interest rate | | | Maturity date | | | Principal | | | Value | |
| | | | |
Information Technology: 0.61% | | | | | | | | | | | | | | | | |
| | | | |
| Communications Equipment: 0.06% | | | | | | | | | | | | | | | | |
CommScope Incorporated (3 Month LIBOR +2.00%) ± | | | 3.38 | % | | | 12-29-2022 | | | $ | 88,238 | | | $ | 88,680 | |
| | | | | | | | | | | | | | | | |
| | | | |
| Electronic Equipment, Instruments & Components: 0.12% | | | | | | | | | | | | | | | | |
Dell Incorporated (1 Month LIBOR +2.00%) ± | | | 3.35 | | | | 9-7-2023 | | | | 41,002 | | | | 41,012 | |
Zebra Technologies Corporation (3 Month LIBOR +2.00%) ± | | | 3.37 | | | | 10-27-2021 | | | | 130,553 | | | | 130,952 | |
| | | | |
| | | | | | | | | | | | | | | 171,964 | |
| | | | | | | | | | | | | | | | |
| | | | |
| Internet Software & Services: 0.18% | | | | | | | | | | | | | | | | |
Ancestry.com Incorporated (1 Month LIBOR +3.25%) ± | | | 4.50 | | | | 10-19-2023 | | | | 54,450 | | | | 54,705 | |
Zayo Group LLC (1 Month LIBOR +2.25%) ± | | | 3.56 | | | | 1-19-2024 | | | | 195,805 | | | | 196,293 | |
| | | | |
| | | | | | | | | | | | | | | 250,998 | |
| | | | | | | | | | | | | | | | |
| | | | |
| IT Services: 0.10% | | | | | | | | | | | | | | | | |
First Data Corporation (1 Month LIBOR +2.25%) ± | | | 3.56 | | | | 7-8-2022 | | | | 141,619 | | | | 141,611 | |
| | | | | | | | | | | | | | | | |
| | | | |
| Semiconductors & Semiconductor Equipment: 0.15% | | | | | | | | | | | | | | | | |
Micron Technology Incorporated (3 Month LIBOR +2.00%) ± | | | 3.39 | | | | 4-26-2022 | | | | 219,799 | | | | 221,503 | |
| | | | | | | | | | | | | | | | |
| | | | |
Materials: 0.38% | | | | | | | | | | | | | | | | |
| | | | |
| Chemicals: 0.17% | | | | | | | | | | | | | | | | |
Ashland LLC (3 Month LIBOR +2.00%) ± | | | 3.30 | | | | 5-24-2024 | | | | 54,863 | | | | 55,045 | |
Huntsman International LLC (1 Month LIBOR +3.00%) ±‡ | | | 4.35 | | | | 4-1-2023 | | | | 37,155 | | | | 37,387 | |
Ineos US Finance LLC (1 Month LIBOR +2.00%) ±< | | | 0.00 | | | | 3-31-2024 | | | | 145,434 | | | | 145,550 | |
| | | | |
| | | | | | | | | | | | | | | 237,982 | |
| | | | | | | | | | | | | | | | |
| | | | |
| Containers & Packaging: 0.21% | | | | | | | | | | | | | | | | |
Berry Plastics Corporation (1 Month LIBOR +2.00%) ±< | | | 3.41 | | | | 2-8-2020 | | | | 271,176 | | | | 271,448 | |
Reynolds Group Holdings Incorporated (1 Month LIBOR +2.75%) ± | | | 4.10 | | | | 2-5-2023 | | | | 29,701 | | | | 29,833 | |
| | | | |
| | | | | | | | | | | | | | | 301,281 | |
| | | | | | | | | | | | | | | | |
| | | | |
Real Estate: 0.08% | | | | | | | | | | | | | | | | |
| | | | |
| Equity REITs: 0.08% | | | | | | | | | | | | | | | | |
MGM Growth Properties LLC (1 Month LIBOR +2.25%) ± | | | 3.60 | | | | 4-25-2023 | | | | 113,559 | | | | 114,005 | |
| | | | | | | | | | | | | | | | |
| | | | |
Telecommunication Services: 0.17% | | | | | | | | | | | | | | | | |
| | | | |
| Diversified Telecommunication Services: 0.09% | | | | | | | | | | | | | | | | |
Level 3 Financing Incorporated (3 Month LIBOR +2.25%) ± | | | 3.70 | | | | 2-22-2024 | | | | 129,470 | | | | 129,308 | |
| | | | | | | | | | | | | | | | |
| | | | |
| Wireless Telecommunication Services: 0.08% | | | | | | | | | | | | | | | | |
SBA Communications Corporation (1 Month LIBOR +2.25%) ± | | | 3.60 | | | | 3-24-2021 | | | | 119,077 | | | | 119,358 | |
| | | | | | | | | | | | | | | | |
| | | | |
Total Loans (Cost $5,005,638) | | | | | | | | | | | | | | | 4,996,583 | |
| | | | | | | | | | | | | | | | |
The accompanying notes are an integral part of these financial statements.
| | | | |
| 120 | | Wells Fargo Allocation Funds | | Portfolio of investments—November 30, 2017 (unaudited) |
REAL RETURN PORTFOLIO
| | | | | | | | | | | | | | | | |
| Security name | | | | | Expiration date | | | Shares | | | Value | |
| | | | |
Participation Notes: 0.39% | | | | | | | | | | | | | | | | |
| | | | |
Financials: 0.39% | | | | | | | | | | | | | | | | |
| | | | |
| Capital Markets: 0.39% | | | | | | | | | | | | | | | | |
UBS AG (Kweichow Moutai Company Limited) †(a) | | | | | | | 8-15-2018 | | | | 5,800 | | | $ | 554,465 | |
| | | | | | | | | | | | | | | | |
| | | | |
Total Participation Notes (Cost $430,489) | | | | | | | | | | | | | | | 554,465 | |
| | | | | | | | | | | | | | | | |
| | | | |
| | | Interest rate | | | Maturity date | | | Principal | | | | |
| | | | |
U.S. Treasury Securities: 65.88% | | | | | | | | | | | | | | | | |
TIPS | | | 0.13 | % | | | 4-15-2019 | | | $ | 1,848,296 | | | | 1,840,234 | |
TIPS | | | 0.13 | | | | 4-15-2020 | | | | 4,478,565 | | | | 4,457,653 | |
TIPS | | | 0.13 | | | | 4-15-2021 | | | | 3,894,163 | | | | 3,866,706 | |
TIPS | | | 0.13 | | | | 1-15-2022 | | | | 3,592,571 | | | | 3,570,415 | |
TIPS | | | 0.13 | | | | 4-15-2022 | | | | 2,587,536 | | | | 2,563,285 | |
TIPS | | | 0.13 | | | | 7-15-2022 | | | | 4,775,340 | | | | 4,752,499 | |
TIPS | | | 0.13 | | | | 1-15-2023 | | | | 3,720,538 | | | | 3,677,422 | |
TIPS | | | 0.13 | | | | 7-15-2024 | | | | 3,621,926 | | | | 3,559,067 | |
TIPS | | | 0.13 | | | | 7-15-2026 | | | | 3,067,940 | | | | 2,966,234 | |
TIPS | | | 0.25 | | | | 1-15-2025 | | | | 3,630,987 | | | | 3,572,976 | |
TIPS | | | 0.38 | | | | 7-15-2023 | | | | 3,695,529 | | | | 3,707,041 | |
TIPS | | | 0.38 | | | | 7-15-2025 | | | | 3,626,561 | | | | 3,602,918 | |
TIPS | | | 0.38 | | | | 1-15-2027 | | | | 3,039,260 | | | | 2,983,451 | |
TIPS | | | 0.38 | | | | 7-15-2027 | | | | 2,057,993 | | | | 2,023,803 | |
TIPS | | | 0.63 | | | | 7-15-2021 | | | | 3,257,357 | | | | 3,313,197 | |
TIPS | | | 0.63 | | | | 1-15-2024 | | | | 3,685,806 | | | | 3,733,760 | |
TIPS | | | 0.63 | | | | 1-15-2026 | | | | 3,266,303 | | | | 3,288,550 | |
TIPS | | | 0.63 | | | | 2-15-2043 | | | | 1,218,252 | | | | 1,150,232 | |
TIPS | | | 0.75 | | | | 2-15-2042 | | | | 1,654,562 | | | | 1,614,775 | |
TIPS | | | 0.75 | | | | 2-15-2045 | | | | 2,048,762 | | | | 1,979,507 | |
TIPS | | | 0.88 | | | | 2-15-2047 | | | | 2,039,489 | | | | 2,036,472 | |
TIPS | | | 1.00 | | | | 2-15-2046 | | | | 1,504,953 | | | | 1,546,465 | |
TIPS | | | 1.13 | | | | 1-15-2021 | | | | 3,068,432 | | | | 3,155,887 | |
TIPS | | | 1.25 | | | | 7-15-2020 | | | | 2,681,797 | | | | 2,765,569 | |
TIPS | | | 1.38 | | | | 1-15-2020 | | | | 1,746,005 | | | | 1,789,797 | |
TIPS | | | 1.38 | | | | 2-15-2044 | | | | 1,847,693 | | | | 2,060,089 | |
TIPS | | | 1.75 | | | | 1-15-2028 | | | | 1,389,981 | | | | 1,545,127 | |
TIPS | | | 1.88 | | | | 7-15-2019 | | | | 1,438,921 | | | | 1,482,694 | |
TIPS | | | 2.00 | | | | 1-15-2026 | | | | 2,548,847 | | | | 2,843,638 | |
TIPS | | | 2.13 | | | | 1-15-2019 | | | | 477,001 | | | | 486,640 | |
TIPS | | | 2.13 | | | | 2-15-2040 | | | | 753,548 | | | | 953,951 | |
TIPS | | | 2.13 | | | | 2-15-2041 | | | | 940,945 | | | | 1,198,115 | |
TIPS | | | 2.38 | | | | 1-15-2025 | | | | 2,382,708 | | | | 2,698,521 | |
TIPS | | | 2.38 | | | | 1-15-2027 | | | | 1,401,125 | | | | 1,623,605 | |
TIPS | | | 2.50 | | | | 1-15-2029 | | | | 1,350,545 | | | | 1,617,706 | |
TIPS | | | 3.38 | | | | 4-15-2032 | | | | 542,213 | | | | 738,951 | |
TIPS | | | 3.63 | | | | 4-15-2028 | | | | 1,182,464 | | | | 1,535,960 | |
TIPS | | | 3.88 | | | | 4-15-2029 | | | | 1,433,579 | | | | 1,931,318 | |
| | | | |
Total U.S. Treasury Securities (Cost $93,751,544) | | | | | | | | | | | | | | | 94,234,230 | |
| | | | | | | | | | | | | | | | |
The accompanying notes are an integral part of these financial statements.
| | | | | | |
| Portfolio of investments—November 30, 2017 (unaudited) | | Wells Fargo Allocation Funds | | | 121 | |
REAL RETURN PORTFOLIO
| | | | | | | | | | | | | | | | |
| Security name | | Interest rate | | | Maturity date | | | Principal | | | Value | |
| | | | |
Yankee Corporate Bonds and Notes: 0.91% | | | | | | | | | | | | | | | | |
| | | | |
Consumer Discretionary: 0.07% | | | | | | | | | | | | | | | | |
| | | | |
| Automobiles: 0.07% | | | | | | | | | | | | | | | | |
Jaguar Land Rover Automotive plc 144A | | | 4.13 | % | | | 12-15-2018 | | | $ | 100,000 | | | $ | 101,483 | |
| | | | | | | | | | | | | | | | |
| | | | |
Financials: 0.20% | | | | | | | | | | | | | | | | |
| | | | |
| Banks: 0.15% | | | | | | | | | | | | | | | | |
Nielsen Holding and Finance BV 144A | | | 5.50 | | | | 10-1-2021 | | | | 125,000 | | | | 128,594 | |
Royal Bank of Scotland Group plc | | | 4.70 | | | | 7-3-2018 | | | | 80,000 | | | | 81,016 | |
| | | | |
| | | | | | | | | | | | | | | 209,610 | |
| | | | | | | | | | | | | | | | |
| | | | |
| Diversified Financial Services: 0.05% | | | | | | | | | | | | | | | | |
Virgin Media Finance plc | | | 5.25 | | | | 1-15-2021 | | | | 75,000 | | | | 79,500 | |
| | | | | | | | | | | | | | | | |
| | | | |
Health Care: 0.37% | | | | | | | | | | | | | | | | |
| | | | |
| Pharmaceuticals: 0.37% | | | | | | | | | | | | | | | | |
Mallinckrodt International Finance SA | | | 3.50 | | | | 4-15-2018 | | | | 105,000 | | | | 104,475 | |
Teva Pharmaceuticals Industries Incorporated | | | 1.70 | | | | 7-19-2019 | | | | 250,000 | | | | 242,062 | |
Valeant Pharmaceuticals International Incorporated 144A | | | 6.50 | | | | 3-15-2022 | | | | 180,000 | | | | 189,000 | |
| | | | |
| | | | | | | | | | | | | | | 535,537 | |
| | | | | | | | | | | | | | | | |
| | | | |
Information Technology: 0.11% | | | | | | | | | | | | | | | | |
| | | | |
| Communications Equipment: 0.02% | | | | | | | | | | | | | | | | |
Nokia Corporation | | | 5.38 | | | | 5-15-2019 | | | | 31,000 | | | | 32,008 | |
| | | | | | | | | | | | | | | | |
| | | | |
| Semiconductors & Semiconductor Equipment: 0.09% | | | | | | | | | | | | | | | | |
NXP BV / NXP Funding LLC 144A | | | 3.75 | | | | 6-1-2018 | | | | 120,000 | | | | 120,570 | |
| | | | | | | | | | | | | | | | |
| | | | |
Materials: 0.16% | | | | | | | | | | | | | | | | |
| | | | |
| Metals & Mining: 0.16% | | | | | | | | | | | | | | | | |
ArcelorMittal | | | 6.00 | | | | 3-1-2021 | | | | 205,000 | | | | 221,170 | |
| | | | | | | | | | | | | | | | |
| | | | |
Total Yankee Corporate Bonds and Notes (Cost $1,304,599) | | | | | | | | | | | | | | | 1,299,878 | |
| | | | | | | | | | | | | | | | |
| | | | |
| | | Yield | | | | | | Shares | | | | |
| Short-Term Investments: 3.58% | | | | | | | | | | | | | | | | |
| | | | |
| Investment Companies: 3.55% | | | | | | | | | | | | | | | | |
Securities Lending Cash Investment LLC (l)(r)(u) | | | 1.29 | | | | | | | | 561,994 | | | | 562,051 | |
Wells Fargo Government Money Market Fund Select
Class (l)(u)## | | | 1.00 | | | | | | | | 4,513,660 | | | | 4,513,660 | |
| | | | |
| | | | | | | | | | | | | | | 5,075,711 | |
| | | | | | | | | | | | | | | | |
| | | | |
| | | | | | | | | Principal | | | | |
| U.S. Treasury Securities: 0.03% | | | | | | | | | | | | | | | | |
U.S. Treasury Bill (z)# | | | 0.76 | | | | 12-14-2017 | | | $ | 50,000 | | | | 49,984 | |
| | | | | | | | | | | | | | | | |
| | | | |
Total Short-Term Investments (Cost $5,125,693) | | | | | | | | | | | | | | | 5,125,695 | |
| | | | | | | | | | | | | | | | |
| | | | | | | | |
| Total investments in securities (Cost $141,624,745) | | | 100.77 | % | | | 144,145,864 | |
Other assets and liabilities, net | | | (0.77 | ) | | | (1,101,637 | ) |
| | | | | | | | |
| Total net assets | | | 100.00 | % | | $ | 143,044,227 | |
| | | | | | | | |
The accompanying notes are an integral part of these financial statements.
| | | | |
| 122 | | Wells Fargo Allocation Funds | | Portfolio of investments—November 30, 2017 (unaudited) |
REAL RETURN PORTFOLIO
| † | Non-income-earning security |
| « | All or a portion of this security is on loan. |
| 144A | The security may be resold in transactions exempt from registration, normally to qualified institutional buyers, pursuant to Rule 144A under the Securities Act of 1933. |
| ± | Variable rate investment. The rate shown is the rate in effect at period end. |
| < | All or a portion of the position represents an unfunded loan commitment. The rate represents current interest rate if the loan is partially funded. |
| ‡ | Security is valued using significant unobservable inputs. |
| (a) | The security is fair valued in accordance with procedures approved by the Board of Trustees. |
| (l) | The issuer of the security is an affiliated person of the Portfolio as defined in the Investment Company Act of 1940. |
| (r) | The investment is a non-registered investment company purchased with cash collateral received from securities on loan. |
| (u) | The rate represents the 7-day annualized yield at period end. |
| ## | All or a portion of this security is segregated for unfunded loans. |
| (z) | Zero coupon security. The rate represents the current yield to maturity. |
| # | All or a portion of this security is segregated as collateral for investments in derivative instruments. |
Futures Contracts
| | | | | | | | | | | | | | | | | | | | | | | | |
| Description | | Number of
contracts | | | Expiration
date | | | Notional
cost | | | Notional
value | | | Unrealized
gains | | | Unrealized
losses | |
Long | | | | | | | | | | | | | | | | | | | | | | | | |
10-Year U.S. Treasury Notes | | | 3 | | | | 11-29-2017 | | | $ | 374,063 | | | $ | 372,141 | | | $ | 0 | | | $ | (1,922 | ) |
Short | | | | | | | | | | | | | | | | | | | | | | | | |
U.S. Ultra Bond | | | (2) | | | | 11-20-2017 | | | | (332,413 | ) | | | (329,750 | ) | | | 2,663 | | | | 0 | |
2-Year U.S. Treasury Notes | | | (19) | | | | 11-20-2017 | | | | (4,076,064 | ) | | | (4,073,719 | ) | | | 2,345 | | | | 0 | |
5-Year U.S. Treasury Notes | | | (4) | | | | 11-20-2017 | | | | (466,445 | ) | | | (465,375 | ) | | | 1,070 | | | | 0 | |
Investments in Affiliates
An affiliated investment is an investment in which the Portfolio owns at least 5% of the outstanding voting shares of the issuer or as a result of other relationships, such as the Portfolio and the issuer having the same investment manager. Transactions with issuers that were either affiliated persons of the Portfolio at the beginning of the period or the end of the period were as follows:
| | | | | | | | | | | | | | | | | | | | | | | | | | | | | | | | | | | | |
| | | Shares,
beginning of
period | | | Shares
purchased | | | Shares sold | | | Shares, end of
period | | | Net
realized
gains
(losses) | | | Net
change in
unrealized
gains
(losses) | | | Income
from
affiliated
securities | | | Value, end of period | | | % of
net
assets | |
Short-Term Investments | | | | | | | | | | | | | | | | | | | | | | | | | | | | | | | | | | | | |
Investment Companies | | | | | | | | | | | | | | | | | | | | | | | | | | | | | | | | | | | | |
Securities Lending Cash Investment LLC | | | 213,729 | | | | 3,122,413 | | | | 2,774,148 | | | | 561,994 | | | $ | (24 | ) | | $ | 0 | | | $ | 3,701 | | | $ | 562,051 | | | | | |
Wells Fargo Government Money Market Fund Select Class | | | 3,404,176 | | | | 73,628,070 | | | | 72,518,586 | | | | 4,513,660 | | | | 0 | | | | 0 | | | | 16,952 | | | | 4,513,660 | | | | | |
| | | | | | | | | | | | | | | | | | | | | | | | | | | | | | | | | | | | |
| | | | | | | | | | | | | | | | | | $ | (24 | ) | | $ | 0 | | | $ | 20,653 | | | $ | 5,075,711 | | | | 3.55 | % |
| | | | | | | | | | | | | | | | | | | | | | | | | | | | | | | | | | | | |
The accompanying notes are an integral part of these financial statements.
| | | | | | |
| Portfolio of investments—November 30, 2017 (unaudited) | | Wells Fargo Allocation Funds | | | 123 | |
STABLE INCOME PORTFOLIO
| | | | | | | | | | | | | | | | |
| Security name | | Interest rate | | | Maturity date | | | Principal | | | Value | |
| | | | |
Agency Securities: 23.19% | | | | | | | | | | | | | | | | |
FHLMC Series T-54 Class 4A ±± | | | 3.52 | % | | | 2-25-2043 | | | $ | 334,117 | | | $ | 339,688 | |
FHLMC Series T-57 Class 1A2 | | | 7.00 | | | | 7-25-2043 | | | | 453,880 | | | | 535,040 | |
FHLMC Series T-63 Class 1A1 (12 Month Treasury Average +1.20%) ± | | | 2.09 | | | | 2-25-2045 | | | | 280,774 | | | | 282,238 | |
FHLMC Structured Pass-Through Securities Series T-54 Class 3A | | | 7.00 | | | | 2-25-2043 | | | | 319,184 | | | | 369,141 | |
FHLMC Structured Pass-Through Securities Series T-55 Class 1A2 | | | 7.00 | | | | 3-25-2043 | | | | 466,403 | | | | 530,495 | |
FHLMC Structured Pass-Through Securities Series T-58 Class 4A | | | 7.50 | | | | 9-25-2043 | | | | 521,086 | | | | 618,387 | |
FNMA (11th District Cost of Funds +1.25%) ± | | | 1.96 | | | | 4-1-2034 | | | | 207,337 | | | | 209,668 | |
FNMA (12 Month Treasury Average +1.20%) ± | | | 2.14 | | | | 10-1-2034 | | | | 161,143 | | | | 163,919 | |
FNMA (12 Month Treasury Average +1.20%) ± | | | 2.14 | | | | 4-1-2044 | | | | 131,455 | | | | 133,740 | |
FNMA (12 Month Treasury Average +1.20%) ± | | | 2.14 | | | | 10-1-2044 | | | | 150,418 | | | | 153,045 | |
FNMA (6 Month LIBOR +0.97%) ± | | | 2.46 | | | | 4-1-2037 | | | | 143,865 | | | | 145,829 | |
FNMA (1 Year Treasury Constant Maturity +1.62%) ± | | | 2.78 | | | | 9-1-2033 | | | | 38,570 | | | | 39,993 | |
FNMA (1 Year Treasury Constant Maturity +1.66%) ± | | | 2.84 | | | | 10-1-2033 | | | | 259,777 | | | | 268,896 | |
FNMA (6 Month LIBOR +1.56%) ± | | | 2.93 | | | | 6-1-2033 | | | | 211,665 | | | | 219,427 | |
FNMA (6 Month LIBOR +1.63%) ± | | | 3.03 | | | | 12-1-2033 | | | | 234,214 | | | | 243,444 | |
FNMA (12 Month LIBOR +1.45%) ± | | | 3.06 | | | | 1-1-2036 | | | | 120,933 | | | | 125,960 | |
FNMA (12 Month LIBOR +1.38%) ± | | | 3.13 | | | | 8-1-2035 | | | | 212,807 | | | | 221,226 | |
FNMA (6 Month LIBOR +1.66%) ± | | | 3.14 | | | | 6-1-2033 | | | | 186,760 | | | | 191,739 | |
FNMA (12 Month LIBOR +1.56%) ± | | | 3.31 | | | | 7-1-2035 | | | | 116,872 | | | | 122,134 | |
FNMA Series 2003-W4 Class 3A ±± | | | 6.07 | | | | 10-25-2042 | | | | 205,249 | | | | 233,471 | |
FNMA Series 2004-W2 Class 2A2 | | | 7.00 | | | | 2-25-2044 | | | | 126,578 | | | | 144,582 | |
FNMA Series 2007-88 Class HC ±± | | | 3.29 | | | | 9-25-2037 | | | | 117,866 | | | | 124,314 | |
HUD | | | 5.45 | | | | 8-1-2019 | | | | 95,000 | | | | 95,633 | |
| | | | |
Total Agency Securities (Cost $5,159,857) | | | | | | | | | | | | | | | 5,512,009 | |
| | | | | | | | | | | | | | | | |
| | | | |
Asset-Backed Securities: 24.23% | | | | | | | | | | | | | | | | |
Ally Auto Receivables Trust Series 2016-3 Class A2 | | | 1.19 | | | | 12-17-2018 | | | | 1,329 | | | | 1,329 | |
Ally Auto Receivables Trust Series 2017-1 Class A2 | | | 1.38 | | | | 10-15-2019 | | | | 102,659 | | | | 102,568 | |
Ally Auto Receivables Trust Series 2017-2 Class A2 | | | 1.49 | | | | 11-15-2019 | | | | 123,720 | | | | 123,653 | |
AmeriCredit Automobile Receivables Trust Series 2015-2 Class A3 | | | 1.27 | | | | 1-8-2020 | | | | 24,479 | | | | 24,471 | |
AmeriCredit Automobile Receivables Trust Series 2016-2 Class A2A | | | 1.42 | | | | 10-8-2019 | | | | 20,528 | | | | 20,524 | |
AmeriCredit Automobile Receivables Trust Series 2016-3 Class A2A | | | 1.37 | | | | 11-8-2019 | | | | 42,336 | | | | 42,323 | |
AmeriCredit Automobile Receivables Trust Series 2017-1 Class A2A | | | 1.51 | | | | 5-18-2020 | | | | 101,695 | | | | 101,565 | |
AmeriCredit Automobile Receivables Trust Series 2017-4 Class A2A | | | 1.91 | | | | 5-18-2021 | | | | 100,000 | | | | 99,936 | |
BMW Vehicle Owner Trust Series 2016-1 Class A2A | | | 0.99 | | | | 5-28-2019 | | | | 51,300 | | | | 51,240 | |
BMW Vehicle Owner Trust Series 2017-1 Class A2 | | | 1.64 | | | | 7-22-2019 | | | | 125,403 | | | | 125,382 | |
BMW Vehicle Owner Trust Series 2017-2 Class A2A | | | 1.80 | | | | 2-20-2020 | | | | 120,000 | | | | 119,831 | |
Capital Auto Receivables Asset Trust Series 2016-2 Class A2A | | | 1.32 | | | | 1-22-2019 | | | | 737 | | | | 737 | |
Capital Auto Receivables Asset Trust Series 2016-3 Class A2A | | | 1.36 | | | | 4-22-2019 | | | | 25,846 | | | | 25,841 | |
Capital Auto Receivables Asset Trust Series 2017-1 Class A2 144A | | | 1.76 | | | | 6-22-2020 | | | | 115,000 | | | | 114,882 | |
CarMax Auto Owner Trust Series 2015-1 Class A3 | | | 1.38 | | | | 11-15-2019 | | | | 46,078 | | | | 46,036 | |
CarMax Auto Owner Trust Series 2016-1 Class A2 | | | 1.30 | | | | 4-15-2019 | | | | 4,073 | | | | 4,073 | |
CarMax Auto Owner Trust Series 2016-2 Class A2A | | | 1.24 | | | | 6-17-2019 | | | | 21,071 | | | | 21,065 | |
CarMax Auto Owner Trust Series 2017-1 Class A2 | | | 1.54 | | | | 2-18-2020 | | | | 104,089 | | | | 104,024 | |
CarMax Auto Owner Trust Series 2017-2 Class A2 | | | 1.63 | | | | 6-15-2020 | | | | 130,048 | | | | 129,962 | |
CarMax Auto Owner Trust Series 2017-4 Class A2A | | | 1.80 | | | | 4-15-2021 | | | | 100,000 | | | | 99,877 | |
CIT Education Loan Trust Series 2005-1 Class A3 (3 Month LIBOR +0.12%) ± | | | 1.44 | | | | 3-15-2026 | | | | 22,289 | | | | 22,266 | |
CNH Equipment Trust Series 2016-B Class A2A | | | 1.31 | | | | 10-15-2019 | | | | 55,740 | | | | 55,705 | |
CNH Equipment Trust Series 2017-A Class A2 | | | 1.80 | | | | 7-15-2020 | | | | 135,000 | | | | 134,934 | |
Dell Equipment Finance Trust Series 2016-1 Class A2 144A | | | 1.43 | | | | 9-24-2018 | | | | 42,938 | | | | 42,925 | |
The accompanying notes are an integral part of these financial statements.
| | | | |
| 124 | | Wells Fargo Allocation Funds | | Portfolio of investments—November 30, 2017 (unaudited) |
STABLE INCOME PORTFOLIO
| | | | | | | | | | | | | | | | |
| Security name | | Interest rate | | | Maturity date | | | Principal | | | Value | |
| | | | |
Asset-Backed Securities (continued) | | | | | | | | | | | | | | | | |
Dell Equipment Finance Trust Series 2017-1 Class A2 144A | | | 1.86 | % | | | 6-24-2019 | | | $ | 160,000 | | | $ | 159,983 | |
Dell Equipment Finance Trust Series 2017-2 Class A2A 144A | | | 1.97 | | | | 2-24-2020 | | | | 100,000 | | | | 99,886 | |
Fifth Third Auto Trust Series 2017-1 Class A2A | | | 1.59 | | | | 4-15-2020 | | | | 100,000 | | | | 99,819 | |
Ford Credit Auto Owner Trust Series 2014-C Class A3 | | | 1.06 | | | | 5-15-2019 | | | | 29,582 | | | | 29,565 | |
Ford Credit Auto Owner Trust Series 2016-B Class A2A | | | 1.08 | | | | 3-15-2019 | | | | 22,090 | | | | 22,080 | |
Ford Credit Auto Owner Trust Series 2017-A Class A2A | | | 1.33 | | | | 12-15-2019 | | | | 63,436 | | | | 63,322 | |
Ford Credit Auto Owner Trust Series 2017-A Class A2A | | | 1.56 | | | | 11-15-2019 | | | | 126,249 | | | | 126,125 | |
Ford Credit Auto Owner Trust Series 2017-B Class A2A | | | 1.49 | | | | 5-15-2020 | | | | 130,000 | | | | 129,869 | |
Ford Credit Auto Owner Trust Series 2017B Class A2A | | | 1.80 | | | | 6-15-2020 | | | | 115,000 | | | | 114,810 | |
GM Financial Automobile Lease Series 2016-2 Class A2A | | | 1.28 | | | | 10-22-2018 | | | | 44,317 | | | | 44,299 | |
GM Financial Automobile Lease Series 2017-1A Class A2A 144A | | | 1.51 | | | | 3-16-2020 | | | | 130,412 | | | | 130,292 | |
GM Financial Automobile Lease Series 2017-3 Class A2A 144A | | | 1.71 | | | | 9-16-2020 | | | | 110,000 | | | | 109,821 | |
GM Financial Automobile Lease Series 2017-3 Class A2A | | | 1.72 | | | | 1-21-2020 | | | | 110,000 | | | | 109,715 | |
Honda Auto Receivables Owner Trust Series 2014-4 Class A3 | | | 0.99 | | | | 9-17-2018 | | | | 3,905 | | | | 3,904 | |
Honda Auto Receivables Owner Trust Series 2016-2 Class A2 | | | 1.13 | | | | 9-17-2018 | | | | 8,686 | | | | 8,684 | |
Honda Auto Receivables Owner Trust Series 2016-3 Class A2 | | | 1.01 | | | | 10-18-2018 | | | | 22,018 | | | | 22,009 | |
Honda Auto Receivables Owner Trust Series 2017-1 Class A2 | | | 1.42 | | | | 7-22-2019 | | | | 102,102 | | | | 102,002 | |
Honda Auto Receivables Owner Trust Series 2017-3 Class A2 | | | 1.57 | | | | 1-21-2020 | | | | 120,000 | | | | 119,728 | |
Huntington Auto Trust Series 2016-1 Class A2 | | | 1.29 | | | | 5-15-2019 | | | | 60,647 | | | | 60,622 | |
Hyundai Auto Lease Securitization Trust Series 2015-B Class A3 144A | | | 1.40 | | | | 11-15-2018 | | | | 18,236 | | | | 18,236 | |
Hyundai Auto Lease Securitization Trust Series 2016-B Class A2A 144A | | | 1.24 | | | | 11-15-2018 | | | | 35,318 | | | | 35,308 | |
Hyundai Auto Receivables Trust Series 2015-A Class A3 | | | 1.05 | | | | 4-15-2019 | | | | 15,166 | | | | 15,158 | |
Hyundai Auto Receivables Trust Series 2016-A Class A2 | | | 1.21 | | | | 6-17-2019 | | | | 30,310 | | | | 30,291 | |
Hyundai Auto Receivables Trust Series 2017-A Class A2A | | | 1.48 | | | | 2-18-2020 | | | | 127,920 | | | | 127,794 | |
John Deere Owner Trust Series 2015-A Class A3 | | | 1.32 | | | | 6-17-2019 | | | | 45,835 | | | | 45,808 | |
John Deere Owner Trust Series 2016-B Class A2 | | | 1.09 | | | | 2-15-2019 | | | | 51,042 | | | | 51,011 | |
John Deere Owner Trust Series 2017-A Class A2 | | | 1.50 | | | | 10-15-2019 | | | | 140,000 | | | | 139,885 | |
Kubota Credit Owner Trust Series 2016-1A Class A2 144A | | | 1.25 | | | | 4-15-2019 | | | | 69,068 | | | | 68,982 | |
Kubota Credit Owner Trust Series 2017-1A Class A2 144A | | | 1.66 | | | | 5-15-2020 | | | | 140,000 | | | | 139,641 | |
Mercedes Benz Auto Lease Trust Series 2016-1 Class A2A | | | 1.11 | | | | 3-15-2019 | | | | 39,635 | | | | 39,611 | |
Mercedes Benz Auto Lease Trust Series 2017-A Class A2A | | | 1.53 | | | | 8-15-2019 | | | | 135,000 | | | | 134,918 | |
MMAF Equipment Finance LLC Series 2016-AA Class A2 144A | | | 1.39 | | | | 12-17-2018 | | | | 57,358 | | | | 57,333 | |
Montana Higher Education Student Assistance Corporation Series 2012-1 Class A2 (1 Month LIBOR +1.00%) ± | | | 2.24 | | | | 5-20-2030 | | | | 180,433 | | | | 182,289 | |
Nissan Auto Receivables Owner Trust Series 2014-B Class A3 | | | 1.11 | | | | 5-15-2019 | | | | 23,259 | | | | 23,248 | |
Nissan Auto Receivables Owner Trust Series 2015-A Class A3 | | | 1.05 | | | | 10-15-2019 | | | | 41,863 | | | | 41,788 | |
Nissan Auto Receivables Owner Trust Series 2016-A Class A2A | | | 1.22 | | | | 8-15-2018 | | | | 17,040 | | | | 17,037 | |
Nissan Auto Receivables Owner Trust Series 2016-C Class A2A | | | 1.07 | | | | 5-15-2019 | | | | 66,441 | | | | 66,385 | |
Nissan Auto Receivables Owner Trust Series 2017-A Class A2A | | | 1.47 | | | | 1-15-2020 | | | | 134,321 | | | | 134,129 | |
Nissan Auto Receivables Owner Trust Series 2017-A Class A2A | | | 1.64 | | | | 9-16-2019 | | | | 90,000 | | | | 89,867 | |
Nissan Auto Receivables Owner Trust Series 2017-B Class A2A | | | 1.83 | | | | 12-16-2019 | | | | 80,000 | | | | 79,863 | |
Santander Drive Auto Receivables Trust Series 2017-1 Class A2 | | | 1.49 | | | | 2-18-2020 | | | | 92,113 | | | | 92,056 | |
SLM Student Loan Trust Series 2005-8 Class A4 (3 Month LIBOR +0.55%) ± | | | 1.92 | | | | 1-25-2028 | | | | 98,888 | | | | 99,429 | |
SLM Student Loan Trust Series 2006-1 Class A5 (3 Month LIBOR +0.11%) ± | | | 1.48 | | | | 7-26-2021 | | | | 134,282 | | | | 132,576 | |
Toyota Auto Receivables Owner Trust Series 2016-B Class A2A | | | 1.02 | | | | 10-15-2018 | | | | 8,521 | | | | 8,518 | |
Toyota Auto Receivables Owner Trust Series 2016-C Class A2A | | | 1.00 | | | | 1-15-2019 | | | | 41,322 | | | | 41,294 | |
Toyota Auto Receivables Owner Trust Series 2017-A Class A2A | | | 1.42 | | | | 9-16-2019 | | | | 127,804 | | | | 127,689 | |
Toyota Auto Receivables Owner Trust Series 2017-D Class A2A | | | 2.03 | | | | 8-17-2020 | | | | 100,000 | | | | 99,921 | |
Volvo Financial Equipment LLC Series 2015-1A Class A3 144A | | | 1.51 | | | | 6-17-2019 | | | | 56,447 | | | | 56,415 | |
Volvo Financial Equipment LLC Series 2017-1A Class A2 144A | | | 1.55 | | | | 10-15-2019 | | | | 140,000 | | | | 139,825 | |
World Omni Auto Receivables Trust Series 2016-A Class A2A | | | 1.20 | | | | 2-15-2019 | | | | 71,496 | | | | 71,377 | |
The accompanying notes are an integral part of these financial statements.
| | | | | | |
| Portfolio of investments—November 30, 2017 (unaudited) | | Wells Fargo Allocation Funds | | | 125 | |
STABLE INCOME PORTFOLIO
| | | | | | | | | | | | | | | | |
| Security name | | Interest rate | | | Maturity date | | | Principal | | | Value | |
| | | | |
Asset-Backed Securities (continued) | | | | | | | | | | | | | | | | |
World Omni Auto Receivables Trust Series 2016-B Class A2 | | | 1.10 | % | | | 1-15-2020 | | | $ | 79,846 | | | $ | 79,724 | |
World Omni Auto Receivables Trust Series 2017-A Class A2A | | | 1.50 | | | | 8-17-2020 | | | | 100,207 | | | | 100,071 | |
| | | | |
Total Asset-Backed Securities (Cost $5,761,126) | | | | | | | | | | | | | | | 5,759,161 | |
| | | | | | | | | | | | | | | | |
| | | | |
Corporate Bonds and Notes: 28.03% | | | | | | | | | | | | | | | | |
| | | | |
Consumer Discretionary: 0.80% | | | | | | | | | | | | | | | | |
| | | | |
| Automobiles: 0.59% | | | | | | | | | | | | | | | | |
Toyota Motor Credit Corporation | | | 1.70 | | | | 1-9-2019 | | | | 140,000 | | | | 139,687 | |
| | | | | | | | | | | | | | | | |
| | | | |
| Consumer Finance: 0.21% | | | | | | | | | | | | | | | | |
American Honda Finance Corporation | | | 1.20 | | | | 7-12-2019 | | | | 50,000 | | | | 49,307 | |
| | | | | | | | | | | | | | | | |
| | | | |
Consumer Staples: 0.64% | | | | | | | | | | | | | | | | |
| | | | |
| Beverages: 0.42% | | | | | | | | | | | | | | | | |
Brown Forman Corporation | | | 1.00 | | | | 1-15-2018 | | | | 100,000 | | | | 99,931 | |
| | | | | | | | | | | | | | | | |
| | | | |
| Food Products: 0.22% | | | | | | | | | | | | | | | | |
Kraft Foods Group Incorporated | | | 6.13 | | | | 8-23-2018 | | | | 50,000 | | | | 51,464 | |
| | | | | | | | | | | | | | | | |
| | | | |
Energy: 1.05% | | | | | | | | | | | | | | | | |
| | | | |
| Oil, Gas & Consumable Fuels: 1.05% | | | | | | | | | | | | | | | | |
Chevron Corporation | | | 1.69 | | | | 2-28-2019 | | | | 40,000 | | | | 39,908 | |
Enterprise Products Operating LLC | | | 1.65 | | | | 5-7-2018 | | | | 70,000 | | | | 69,926 | |
Exxon Mobil Corporation (3 Month LIBOR +0.60%) ± | | | 2.07 | | | | 2-28-2018 | | | | 90,000 | | | | 90,129 | |
Marathon Petroleum Corporation | | | 2.70 | | | | 12-14-2018 | | | | 50,000 | | | | 50,295 | |
| | | | |
| | | | | | | | | | | | | | | 250,258 | |
| | | | | | | | | | | | | | | | |
| | | | |
Financials: 10.26% | | | | | | | | | | | | | | | | |
| | | | |
| Banks: 3.68% | | | | | | | | | | | | | | | | |
Bank of America Corporation | | | 2.00 | | | | 1-11-2018 | | | | 50,000 | | | | 50,013 | |
Bank of America Corporation | | | 2.60 | | | | 1-15-2019 | | | | 50,000 | | | | 50,274 | |
Bank of America Corporation | | | 2.65 | | | | 4-1-2019 | | | | 50,000 | | | | 50,330 | |
Bank of America Corporation | | | 5.65 | | | | 5-1-2018 | | | | 50,000 | | | | 50,773 | |
Citigroup Incorporated | | | 1.80 | | | | 2-5-2018 | | | | 150,000 | | | | 150,017 | |
HSBC USA Incorporated (3 Month LIBOR +0.77%) ± | | | 2.16 | | | | 8-7-2018 | | | | 110,000 | | | | 110,448 | |
JPMorgan Chase & Company | | | 1.80 | | | | 1-25-2018 | | | | 60,000 | | | | 60,008 | |
JPMorgan Chase & Company (3 Month LIBOR +0.55%) ± | | | 1.87 | | | | 3-9-2021 | | | | 30,000 | | | | 30,074 | |
JPMorgan Chase & Company | | | 6.00 | | | | 1-15-2018 | | | | 60,000 | | | | 60,282 | |
JPMorgan Chase & Company | | | 6.30 | | | | 4-23-2019 | | | | 40,000 | | | | 42,242 | |
KeyCorp | | | 2.30 | | | | 12-13-2018 | | | | 90,000 | | | | 90,082 | |
Suntrust Bank (3 Month LIBOR +0.53%) ± | | | 1.91 | | | | 1-31-2020 | | | | 75,000 | | | | 75,423 | |
US Bancorp (3 Month LIBOR +0.49%) ± | | | 1.91 | | | | 11-15-2018 | | | | 55,000 | | | | 55,179 | |
| | | | |
| | | | | | | | | | | | | | | 875,145 | |
| | | | | | | | | | | | | | | | |
| | | | |
| Capital Markets: 2.76% | | | | | | | | | | | | | | | | |
Bank of New York Mellon Corporation (3 Month LIBOR +0.87%) ± | | | 2.29 | | | | 8-17-2020 | | | | 90,000 | | | | 91,629 | |
Charles Schwab Corporation | | | 2.20 | | | | 7-25-2018 | | | | 90,000 | | | | 90,166 | |
The accompanying notes are an integral part of these financial statements.
| | | | |
| 126 | | Wells Fargo Allocation Funds | | Portfolio of investments—November 30, 2017 (unaudited) |
STABLE INCOME PORTFOLIO
| | | | | | | | | | | | | | | | |
| Security name | | Interest rate | | | Maturity date | | | Principal | | | Value | |
| | | | |
| Capital Markets (continued) | | | | | | | | | | | | | | | | |
Goldman Sachs Group Incorporated | | | 2.38 | % | | | 1-22-2018 | | | $ | 40,000 | | | $ | 40,032 | |
Goldman Sachs Group Incorporated (3 Month LIBOR +1.04%) ± | | | 2.41 | | | | 4-25-2019 | | | | 70,000 | | | | 70,688 | |
Goldman Sachs Group Incorporated | | | 2.60 | | | | 12-27-2020 | | | | 50,000 | | | | 50,119 | |
Goldman Sachs Group Incorporated | | | 5.95 | | | | 1-18-2018 | | | | 50,000 | | | | 50,255 | |
Morgan Stanley | | | 2.38 | | | | 7-23-2019 | | | | 50,000 | | | | 50,075 | |
Morgan Stanley | | | 2.45 | | | | 2-1-2019 | | | | 50,000 | | | | 50,160 | |
Morgan Stanley | | | 2.50 | | | | 1-24-2019 | | | | 40,000 | | | | 40,158 | |
Morgan Stanley | | | 2.65 | | | | 1-27-2020 | | | | 50,000 | | | | 50,315 | |
State Street Bank & Trust Company | | | 5.25 | | | | 10-15-2018 | | | | 70,000 | | | | 72,032 | |
| | | | |
| | | | | | | | | | | | | | | 655,629 | |
| | | | | | | | | | | | | | | | |
| | | | |
| Consumer Finance: 1.82% | | | | | | | | | | | | | | | | |
American Express Credit Corporation (3 Month LIBOR +0.43%) ± | | | 1.75 | | | | 3-3-2020 | | | | 50,000 | | | | 50,157 | |
American Honda Finance Corporation | | | 1.55 | | | | 12-11-2017 | | | | 30,000 | | | | 30,002 | |
American Honda Finance Corporation (3 Month LIBOR +0.27%) ± | | | 1.63 | | | | 7-20-2020 | | | | 40,000 | | | | 40,114 | |
American Honda Finance Corporation (3 Month LIBOR +0.83%) ± | | | 2.27 | | | | 2-22-2019 | | | | 50,000 | | | | 50,430 | |
Caterpillar Financial Services Corporation | | | 1.80 | | | | 11-13-2018 | | | | 90,000 | | | | 89,957 | |
Caterpillar Financial Services Corporation (3 Month LIBOR +0.51%) ± | | | 1.86 | | | | 1-10-2020 | | | | 50,000 | | | | 50,366 | |
Hyundai Capital America 144A | | | 2.00 | | | | 3-19-2018 | | | | 45,000 | | | | 44,980 | |
John Deere Capital Corporation (3 Month LIBOR +0.57%) ± | | | 1.92 | | | | 1-8-2019 | | | | 75,000 | | | | 75,395 | |
| | | | |
| | | | | | | | | | | | | | | 431,401 | |
| | | | | | | | | | | | | | | | |
| | | | |
| Diversified Financial Services: 0.97% | | | | | | | | | | | | | | | | |
AIG Global Funding 144A | | | 1.65 | | | | 12-15-2017 | | | | 100,000 | | | | 100,004 | |
AIG Global Funding (3 Month LIBOR +0.48%) 144A± | | | 1.82 | | | | 7-2-2020 | | | | 30,000 | | | | 30,068 | |
General Electric Capital Corporation | | | 5.50 | | | | 1-8-2020 | | | | 35,000 | | | | 37,312 | |
PNC Funding Corporation | | | 5.13 | | | | 2-8-2020 | | | | 60,000 | | | | 63,571 | |
| | | | |
| | | | | | | | | | | | | | | 230,955 | |
| | | | | | | | | | | | | | | | |
| | | | |
| Insurance: 1.03% | | | | | | | | | | | | | | | | |
Marsh & McLennan Company Incorporated | | | 2.55 | | | | 10-15-2018 | | | | 75,000 | | | | 75,283 | |
New York Life Global Funding 144A | | | 1.55 | | | | 11-2-2018 | | | | 70,000 | | | | 69,824 | |
Travelers Company Incorporated | | | 5.80 | | | | 5-15-2018 | | | | 97,000 | | | | 98,736 | |
| | | | |
| | | | | | | | | | | | | | | 243,843 | |
| | | | | | | | | | | | | �� | | | |
| | | | |
Health Care: 1.96% | | | | | | | | | | | | | | | | |
| | | | |
| Biotechnology: 0.36% | | | | | | | | | | | | | | | | |
AbbVie Incorporated | | | 1.80 | | | | 5-14-2018 | | | | 65,000 | | | | 64,994 | |
Gilead Sciences Incorporated | | | 1.85 | | | | 9-20-2019 | | | | 20,000 | | | | 19,904 | |
| | | | |
| | | | | | | | | | | | | | | 84,898 | |
| | | | | | | | | | | | | | | | |
| | | | |
| Health Care Equipment & Supplies: 0.38% | | | | | | | | | | | | | | | | |
Medtronic plc (3 Month LIBOR +0.80%) ± | | | 2.12 | | | | 3-15-2020 | | | | 90,000 | | | | 91,308 | |
| | | | | | | | | | | | | | | | |
| | | | |
| Health Care Providers & Services: 0.42% | | | | | | | | | | | | | | | | |
Cardinal Health Incorporated | | | 1.95 | | | | 6-15-2018 | | | | 40,000 | | | | 40,004 | |
Cardinal Health Incorporated | | | 1.95 | | | | 6-14-2019 | | | | 30,000 | | | | 29,839 | |
UnitedHealth Group Incorporated | | | 1.70 | | | | 2-15-2019 | | | | 30,000 | | | | 29,921 | |
| | | | |
| | | | | | | | | | | | | | | 99,764 | |
| | | | | | | | | | | | | | | | |
The accompanying notes are an integral part of these financial statements.
| | | | | | |
| Portfolio of investments—November 30, 2017 (unaudited) | | Wells Fargo Allocation Funds | | | 127 | |
STABLE INCOME PORTFOLIO
| | | | | | | | | | | | | | | | |
| Security name | | Interest rate | | | Maturity date | | | Principal | | | Value | |
| | | | |
| Life Sciences Tools & Services: 0.25% | | | | | | | | | | | | | | | | |
Thermo Fisher Scientific | | | 2.15 | % | | | 12-14-2018 | | | $ | 60,000 | | | $ | 60,109 | |
| | | | | | | | | | | | | | | | |
| | | | |
| Pharmaceuticals: 0.55% | | | | | | | | | | | | | | | | |
EMD Finance LLC Company 144A | | | 1.70 | | | | 3-19-2018 | | | | 40,000 | | | | 39,991 | |
Johnson & Johnson (3 Month LIBOR +0.27%) ± | | | 1.59 | | | | 3-1-2019 | | | | 90,000 | | | | 90,260 | |
| | | | |
| | | | | | | | | | | | | | | 130,251 | |
| | | | | | | | | | | | | | | | |
| | | | |
Industrials: 2.71% | | | | | | | | | | | | | | | | |
| | | | |
| Aerospace & Defense: 0.94% | | | | | | | | | | | | | | | | |
Lockheed Martin Corporation | | | 1.85 | | | | 11-23-2018 | | | | 30,000 | | | | 29,956 | |
Lockheed Martin Corporation | | | 4.25 | | | | 11-15-2019 | | | | 40,000 | | | | 41,621 | |
Northrop Grumman Corporation | | | 1.75 | | | | 6-1-2018 | | | | 90,000 | | | | 89,920 | |
Rockwell Collins Incorporated | | | 1.95 | | | | 7-15-2019 | | | | 10,000 | | | | 9,963 | |
Rockwell Collins Incorporated | | | 5.25 | | | | 7-15-2019 | | | | 50,000 | | | | 52,352 | |
| | | | |
| | | | | | | | | | | | | | | 223,812 | |
| | | | | | | | | | | | | | | | |
| | | | |
| Electrical Equipment: 0.79% | | | | | | | | | | | | | | | | |
Eaton Corporation | | | 5.60 | | | | 5-15-2018 | | | | 70,000 | | | | 71,168 | |
Eaton Corporation | | | 6.95 | | | | 3-20-2019 | | | | 40,000 | | | | 42,267 | |
Rockwell Automation Incorporated | | | 5.65 | | | | 12-1-2017 | | | | 75,000 | | | | 75,000 | |
| | | | |
| | | | | | | | | | | | | | | 188,435 | |
| | | | | | | | | | | | | | | | |
| | | | |
| Industrial Conglomerates: 0.25% | | | | | | | | | | | | | | | | |
General Electric Capital Corporation | | | 2.20 | | | | 1-9-2020 | | | | 60,000 | | | | 59,894 | |
| | | | | | | | | | | | | | | | |
| | | | |
| Machinery: 0.39% | | | | | | | | | | | | | | | | |
Parker Hannifin Corporation | | | 5.50 | | | | 5-15-2018 | | | | 90,000 | | | | 91,462 | |
| | | | | | | | | | | | | | | | |
| | | | |
| Road & Rail: 0.34% | | | | | | | | | | | | | | | | |
Norfolk Southern Corporation | | | 5.75 | | | | 4-1-2018 | | | | 80,000 | | | | 80,977 | |
| | | | | | | | | | | | | | | | |
| | | | |
Information Technology: 0.94% | | | | | | | | | | | | | | | | |
| | | | |
| Electronic Equipment, Instruments & Components: 0.25% | | | | | | | | | | | | | | | | |
Corning Incorporated | | | 1.50 | | | | 5-8-2018 | | | | 60,000 | | | | 59,919 | |
| | | | | | | | | | | | | | | | |
| | | | |
| Semiconductors & Semiconductor Equipment: 0.23% | | | | | | | | | | | | | | | | |
Maxim Integrated Product Incorporated | | | 2.50 | | | | 11-15-2018 | | | | 55,000 | | | | 55,247 | |
| | | | | | | | | | | | | | | | |
| | | | |
| Software: 0.21% | | | | | | | | | | | | | | | | |
Microsoft Corporation | | | 1.10 | | | | 8-8-2019 | | | | 50,000 | | | | 49,343 | |
| | | | | | | | | | | | | | | | |
| | | | |
| Technology Hardware, Storage & Peripherals: 0.25% | | | | | | | | | | | | | | | | |
Apple Incorporated | | | 1.55 | | | | 2-8-2019 | | | | 50,000 | | | | 49,786 | |
HP Enterprise Company 144A | | | 2.10 | | | | 10-4-2019 | | | | 10,000 | | | | 9,931 | |
| | | | |
| | | | | | | | | | | | | | | 59,717 | |
| | | | | | | | | | | | | | | | |
| | | | |
Materials: 1.59% | | | | | | | | | | | | | | | | |
| | | | |
| Chemicals: 1.16% | | | | | | | | | | | | | | | | |
Chevron Phillips Chemical Company 144A | | | 1.70 | | | | 5-1-2018 | | | | 75,000 | | | | 74,995 | |
E. I. du Pont de Nemours and Company (3 Month LIBOR +0.53%) ± | | | 1.91 | | | | 5-1-2020 | | | | 50,000 | | | | 50,417 | |
The accompanying notes are an integral part of these financial statements.
i
| | | | |
| 128 | | Wells Fargo Allocation Funds | | Portfolio of investments—November 30, 2017 (unaudited) |
STABLE INCOME PORTFOLIO
| | | | | | | | | | | | | | | | |
| Security name | | Interest rate | | | Maturity date | | | Principal | | | Value | |
| | | | |
| Chemicals (continued) | | | | | | | | | | | | | | | | |
Ecolab Incorporated | | | 1.45 | % | | | 12-8-2017 | | | $ | 60,000 | | | $ | 59,998 | |
The Sherwin-Williams Company | | | 1.35 | | | | 12-15-2017 | | | | 90,000 | | | | 89,991 | |
| | | | |
| | | | | | | | | | | | | | | 275,401 | |
| | | | | | | | | | | | | | | | |
| | | | |
| Containers & Packaging: 0.22% | | | | | | | | | | | | | | | | |
Westrock Company | | | 4.45 | | | | 3-1-2019 | | | | 50,000 | | | | 51,250 | |
| | | | | | | | | | | | | | | | |
| | | | |
| Paper & Forest Products: 0.21% | | | | | | | | | | | | | | | | |
Georgia Pacific LLC 144A | | | 2.54 | | | | 11-15-2019 | | | | 50,000 | | | | 50,255 | |
| | | | | | | | | | | | | | | | |
| | | | |
Real Estate: 1.92% | | | | | | | | | | | | | | | | |
| | | | |
| Equity REITs: 1.92% | | | | | | | | | | | | | | | | |
Alexandria Real Estate Equities Incorporated | | | 2.75 | | | | 1-15-2020 | | | | 50,000 | | | | 50,258 | |
Boston Properties LP | | | 3.70 | | | | 11-15-2018 | | | | 90,000 | | | | 91,136 | |
Realty Income Corporation | | | 2.00 | | | | 1-31-2018 | | | | 73,000 | | | | 73,008 | |
UDR Incorporated | | | 4.25 | | | | 6-1-2018 | | | | 90,000 | | | | 90,999 | |
Ventas Realty LP | | | 2.00 | | | | 2-15-2018 | | | | 50,000 | | | | 50,025 | |
Ventas Realty LP | | | 4.00 | | | | 4-30-2019 | | | | 50,000 | | | | 51,032 | |
Vornado Realty LP | | | 2.50 | | | | 6-30-2019 | | | | 50,000 | | | | 50,059 | |
| | | | |
| | | | | | | | | | | | | | | 456,517 | |
| | | | | | | | | | | | | | | | |
| | | | |
Telecommunication Services: 0.21% | | | | | | | | | | | | | | | | |
| | | | |
| Diversified Telecommunication Services: 0.21% | | | | | | | | | | | | | | | | |
AT&T Incorporated | | | 2.30 | | | | 3-11-2019 | | | | 50,000 | | | | 50,062 | |
| | | | | | | | | | | | | | | | |
| | | | |
Utilities: 5.95% | | | | | | | | | | | | | | | | |
| | | | |
| Electric Utilities: 4.49% | | | | | | | | | | | | | | | | |
Commonwealth Edison Company | | | 2.15 | | | | 1-15-2019 | | | | 50,000 | | | | 50,009 | |
Connecticut Light & Power Company | | | 5.65 | | | | 5-1-2018 | | | | 60,000 | | | | 60,957 | |
Duke Energy Carolinas LLC | | | 5.25 | | | | 1-15-2018 | | | | 55,000 | | | | 55,229 | |
Duke Energy Progress LLC (3 Month LIBOR +0.18%) ± | | | 1.50 | | | | 9-8-2020 | | | | 35,000 | | | | 35,000 | |
Entergy Gulf States Louisiana LLC | | | 6.00 | | | | 5-1-2018 | | | | 90,000 | | | | 91,590 | |
Kansas City Power & Light Company | | | 6.38 | | | | 3-1-2018 | | | | 75,000 | | | | 75,828 | |
Kansas City Power & Light Company | | | 7.15 | | | | 4-1-2019 | | | | 70,000 | | | | 74,439 | |
MidAmerican Energy Holdings Company | | | 5.30 | | | | 3-15-2018 | | | | 55,000 | | | | 55,573 | |
PacifiCorp | | | 5.50 | | | | 1-15-2019 | | | | 100,000 | | | | 103,644 | |
Public Service Company of Colorado | | | 5.80 | | | | 8-1-2018 | | | | 109,000 | | | | 111,726 | |
Public Service Electric & Gas Company | | | 2.00 | | | | 8-15-2019 | | | | 50,000 | | | | 49,912 | |
Public Service Electric & Gas Company | | | 5.30 | | | | 5-1-2018 | | | | 84,000 | | | | 85,236 | |
Southern California Edison Company | | | 5.50 | | | | 8-15-2018 | | | | 80,000 | | | | 82,036 | |
The Connecticut Light & Power Company | | | 5.50 | | | | 2-1-2019 | | | | 60,000 | | | | 62,183 | |
Union Electric Company | | | 6.70 | | | | 2-1-2019 | | | | 70,000 | | | | 73,514 | |
| | | | |
| | | | | | | | | | | | | | | 1,066,876 | |
| | | | | | | | | | | | | | | | |
| | | | |
| Gas Utilities: 0.36% | | | | | | | | | | | | | | | | |
Southern California Gas Company | | | 5.45 | | | | 4-15-2018 | | | | 85,000 | | | | 86,173 | |
| | | | | | | | | | | | | | | | |
The accompanying notes are an integral part of these financial statements.
| | | | | | |
| Portfolio of investments—November 30, 2017 (unaudited) | | Wells Fargo Allocation Funds | | | 129 | |
STABLE INCOME PORTFOLIO
| | | | | | | | | | | | | | | | |
| Security name | | Interest rate | | | Maturity date | | | Principal | | | Value | |
| | | | |
| Multi-Utilities: 1.10% | | | | | | | | | | | | | | | | |
Avista Corporation | | | 5.95 | % | | | 6-1-2018 | | | $ | 80,000 | | | $ | 81,556 | |
Consumers Energy Company | | | 5.65 | | | | 9-15-2018 | | | | 80,000 | | | | 82,312 | |
Peco Energy Company | | | 5.35 | | | | 3-1-2018 | | | | 96,000 | | | | 96,908 | |
| | | | |
| | | | | | | | | | | | | | | 260,776 | |
| | | | | | | | | | | | | | | | |
| | | | |
Total Corporate Bonds and Notes (Cost $6,664,671) | | | | | | | | | | | | | | | 6,660,066 | |
| | | | | | | | | | | | | | | | |
| | | | |
Municipal Obligations: 3.92% | | | | | | | | | | | | | | | | |
| | | | |
| Alaska: 0.21% | | | | | | | | | | | | | | | | |
Anchorage AK Water Revenue Series C (Water & Sewer Revenue) | | | 1.43 | | | | 5-1-2018 | | | | 50,000 | | | | 49,966 | |
| | | | | | | | | | | | | | | | |
| | | | |
| California: 0.42% | | | | | | | | | | | | | | | | |
Santa Clara County CA Series A (GO Revenue) | | | 1.65 | | | | 8-1-2018 | | | | 100,000 | | | | 99,897 | |
| | | | | | | | | | | | | | | | |
| | | | |
| Kentucky: 0.48% | | | | | | | | | | | | | | | | |
Kentucky Higher Education Student Loan Corporation Series 2013-1 Class A1 (1 Month LIBOR +0.50%) (Education Revenue) ± | | | 1.74 | | | | 6-1-2026 | | | | 113,550 | | | | 113,270 | |
| | | | | | | | | | | | | | | | |
| | | | |
| Michigan: 0.17% | | | | | | | | | | | | | | | | |
L’Anse Creuse MI Public Schools Series B (GO Revenue, Qualified School Board Loan Fund Insured) | | | 2.16 | | | | 5-1-2020 | | | | 40,000 | | | | 40,066 | |
| | | | | | | | | | | | | | | | |
| | | | |
| New Jersey: 0.42% | | | | | | | | | | | | | | | | |
Bergen County NJ Improvement Authority Guaranteed Project Notes (Health Revenue) | | | 2.25 | | | | 3-1-2019 | | | | 100,000 | | | | 100,401 | |
| | | | | | | | | | | | | | | | |
| | | | |
| New York: 0.44% | | | | | | | | | | | | | | | | |
New York City Transitional Finance Authority Future Tax Secured Bonds Fiscal 2010 Series A-2 (Tax Revenue) | | | 4.85 | | | | 5-1-2019 | | | | 100,000 | | | | 103,910 | |
| | | | | | | | | | | | | | | | |
| | | | |
| North Carolina: 0.07% | | | | | | | | | | | | | | | | |
North Carolina Education Assistance Authority Student Loan Notes Series 2011-1 Tranche A-2 (Education Revenue) | | | 2.27 | | | | 1-26-2026 | | | | 17,387 | | | | 17,426 | |
| | | | | | | | | | | | | | | | |
| | | | |
| Ohio: 0.32% | | | | | | | | | | | | | | | | |
Ohio Taxable Hospital Refunding Bonds Series B (Health Revenue) | | | 1.56 | | | | 1-1-2019 | | | | 75,000 | | | | 74,689 | |
| | | | | | | | | | | | | | | | |
| | | | |
| South Carolina: 0.28% | | | | | | | | | | | | | | | | |
South Carolina Student Loan Corporation Series 2010-1 Class A2 (3 Month LIBOR +1.00%) (Education Revenue) ± | | | 2.37 | | | | 7-25-2025 | | | | 65,882 | | | | 66,296 | |
| | | | | | | | | | | | | | | | |
| | | | |
| Texas: 0.48% | | | | | | | | | | | | | | | | |
Texas A&M University Revenue Series D (Education Revenue) %% | | | 1.80 | | | | 5-15-2018 | | | | 55,000 | | | | 55,000 | |
Texas Tech Univeristy Revenues Financing System Refunding and Improvement Bonds Taxable Series 2017-B (Education Revenue) | | | 1.56 | | | | 2-15-2019 | | | | 60,000 | | | | 59,698 | |
| | | | |
| | | | | | | | | | | | | | | 114,698 | |
| | | | | | | | | | | | | | | | |
| | | | |
| Virginia: 0.40% | | | | | | | | | | | | | | | | |
Virginia College Building Authority Educational Facilities Series D (Education Revenue) | | | 2.00 | | | | 2-1-2019 | | | | 95,000 | | | | 95,064 | |
| | | | | | | | | | | | | | | | |
The accompanying notes are an integral part of these financial statements.
| | | | |
| 130 | | Wells Fargo Allocation Funds | | Portfolio of investments—November 30, 2017 (unaudited) |
STABLE INCOME PORTFOLIO
| | | | | | | | | | | | | | | | |
| Security name | | Interest rate | | | Maturity date | | | Principal | | | Value | |
| | | | |
| Wisconsin: 0.23% | | | | | | | | | | | | | | | | |
WIsconsin Public Finance Authority Taxable Refunding Bond Series A (Education Revenue) | | | 1.48 | % | | | 7-1-2018 | | | $ | 55,000 | | | $ | 54,929 | |
| | | | | | | | | | | | | | | | |
| | | | |
Total Municipal Obligations (Cost $932,643) | | | | | | | | | | | | | | | 930,612 | |
| | | | | | | | | | | | | | | | |
| | | | |
Non-Agency Mortgage-Backed Securities: 1.18% | | | | | | | | | | | | | | | | |
GAHR Commercial Mortgage Trust Series 2015 Class AFL1 (1 Month LIBOR +1.30%) 144A± | | | 2.54 | | | | 12-15-2034 | | | | 20,070 | | | | 20,082 | |
Towd Point Mortgage Trust Series 2015-6 Class A1 144A±± | | | 3.50 | | | | 4-25-2055 | | | | 65,498 | | | | 66,694 | |
Towd Point Mortgage Trust Series 2016-3 Class A1 144A±± | | | 2.25 | | | | 4-25-2056 | | | | 76,371 | | | | 75,777 | |
Towd Point Mortgage Trust Series 2017-1 Class A1 144A±± | | | 2.75 | | | | 10-25-2056 | | | | 117,373 | | | | 117,619 | |
| | | | |
Total Non-Agency Mortgage-Backed Securities (Cost $280,118) | | | | | | | | | | | | | | | 280,172 | |
| | | | | | | | | | | | | | | | |
| | | | |
U.S. Treasury Securities: 13.69% | | | | | | | | | | | | | | | | |
U.S. Treasury Note | | | 0.75 | | | | 9-30-2018 | | | | 350,000 | | | | 347,498 | |
U.S. Treasury Note | | | 1.25 | | | | 5-31-2019 | | | | 750,000 | | | | 744,521 | |
U.S. Treasury Note | | | 1.25 | | | | 6-30-2019 | | | | 475,000 | | | | 471,215 | |
U.S. Treasury Note | | | 1.25 | | | | 8-31-2019 | | | | 500,000 | | | | 495,469 | |
U.S. Treasury Note | | | 1.38 | | | | 7-31-2019 | | | | 475,000 | | | | 472,050 | |
U.S. Treasury Note | | | 1.50 | | | | 10-31-2019 | | | | 250,000 | | | | 248,613 | |
U.S. Treasury Note | | | 1.75 | | | | 11-30-2019 | | | | 475,000 | | | | 474,797 | |
| | | | |
Total U.S. Treasury Securities (Cost $3,271,532) | | | | | | | | | | | | | | | 3,254,163 | |
| | | | | | | | | | | | | | | | |
| | | | |
Yankee Corporate Bonds and Notes: 3.46% | | | | | | | | | | | | | | | | |
| | | | |
Energy: 0.25% | | | | | | | | | | | | | | | | |
| | | | |
| Oil, Gas & Consumable Fuels: 0.25% | | | | | | | | | | | | | | | | |
Statoil ASA | | | 2.25 | | | | 11-8-2019 | | | | 60,000 | | | | 60,233 | |
| | | | | | | | | | | | | | | | |
| | | | |
Financials: 2.26% | | | | | | | | | | | | | | | | |
| | | | |
| Banks: 2.26% | | | | | | | | | | | | | | | | |
Bank of Montreal | | | 1.35 | | | | 8-28-2018 | | | | 30,000 | | | | 29,890 | |
Bank of Nova Scotia (3 Month LIBOR +0.47%) ± | | | 1.79 | | | | 6-11-2018 | | | | 90,000 | | | | 90,178 | |
Bank of Nova Scotia | | | 2.13 | | | | 9-11-2019 | | | | 100,000 | | | | 99,975 | |
Royal Bank of Canada Incorporated | | | 2.00 | | | | 10-1-2018 | | | | 150,000 | | | | 150,188 | |
Royal Bank of Canada Incorporated (3 Month LIBOR +0.73%) ± | | | 2.11 | | | | 2-1-2022 | | | | 75,000 | | | | 75,787 | |
Toronto Dominion Bank (3 Month LIBOR +0.54%) ± | | | 1.90 | | | | 7-23-2018 | | | | 90,000 | | | | 90,261 | |
| | | | |
| | | | | | | | | | | | | | | 536,279 | |
| | | | | | | | | | | | | | | | |
| | | | |
Health Care: 0.25% | | | | | | | | | | | | | | | | |
| | | | |
| Health Care Equipment & Supplies: 0.13% | | | | | | | | | | | | | | | | |
Medtronic Incorporated | | | 1.70 | | | | 3-28-2019 | | | | 30,000 | | | | 29,883 | |
| | | | | | | | | | | | | | | | |
| | | | |
| Pharmaceuticals: 0.12% | | | | | | | | | | | | | | | | |
Teva Pharmaceutical Finance Netherlands III BV | | | 1.40 | | | | 7-20-2018 | | | | 30,000 | | | | 29,727 | |
| | | | | | | | | | | | | | | | |
The accompanying notes are an integral part of these financial statements.
| | | | | | |
| Portfolio of investments—November 30, 2017 (unaudited) | | Wells Fargo Allocation Funds | | | 131 | |
STABLE INCOME PORTFOLIO
| | | | | | | | | | | | | | | | |
| Security name | | Interest rate | | | Maturity date | | | Principal | | | Value | |
| | | | |
Industrials: 0.50% | | | | | | | | | | | | | | | | |
| | | | |
| Electrical Equipment: 0.50% | | | | | | | | | | | | | | | | |
Tyco Electronics Group SA | | | 2.35 | % | | | 8-1-2019 | | | $ | 50,000 | | | $ | 49,973 | |
Tyco Electronics Group SA | | | 2.38 | | | | 12-17-2018 | | | | 69,000 | | | | 69,221 | |
| | | | |
| | | | | | | | | | | | | | | 119,194 | |
| | | | | | | | | | | | | | | | |
| | | | |
Telecommunication Services: 0.20% | | | | | | | | | | | | | | | | |
| | | | |
| Wireless Telecommunication Services: 0.20% | | | | | | | | | | | | | | | | |
Rogers Communications Incorporated | | | 6.80 | | | | 8-15-2018 | | | | 45,000 | | | | 46,498 | |
| | | | | | | | | | | | | | | | |
| | | | |
Total Yankee Corporate Bonds and Notes (Cost $822,835) | | | | | | | | | | | | | | | 821,814 | |
| | | | | | | | | | | | | | | | |
| | | | |
| | | Yield | | | | | | Shares | | | | |
| Short-Term Investments: 4.25% | | | | | | | | | | | | | | | | |
| | | | |
| Investment Companies: 4.25% | | | | | | | | | | | | | | | | |
Wells Fargo Government Money Market Fund Select Class (l)(u)## | | | 1.00 | | | | | | | | 1,009,851 | | | | 1,009,851 | |
| | | | | | | | | | | | | | | | |
| | | | |
Total Short-Term Investments (Cost $1,009,851) | | | | | | | | | | | | | | | 1,009,851 | |
| | | | | | | | | | | | | | | | |
| | | | | | | | |
| Total investments in securities (Cost $23,902,633) | | | 101.95 | % | | | 24,227,848 | |
Other assets and liabilities, net | | | (1.95 | ) | | | (463,057 | ) |
| | | | | | | | |
| Total net assets | | | 100.00 | % | | $ | 23,764,791 | |
| | | | | | | | |
| ±± | The coupon of the security is adjusted based on the principal and interest payments received from the underlying pool of mortgages as well as the credit quality and the actual prepayment speed of the underlying mortgages. |
| ± | Variable rate investment. The rate shown is the rate in effect at period end. |
| 144A | The security may be resold in transactions exempt from registration, normally to qualified institutional buyers, pursuant to Rule 144A under the Securities Act of 1933. |
| %% | The security is issued on a when-issued basis. |
| (l) | The issuer of the security is an affiliated person of the Portfolio as defined in the Investment Company Act of 1940. |
| (u) | The rate represents the 7-day annualized yield at period end. |
| ## | All or a portion of this security is segregated for when-issued securities. |
Futures Contracts
| | | | | | | | | | | | | | | | | | | | | | | | |
| Description | | Number of
contracts | | | Expiration
date | | | Notional
cost | | | Notional
value | | | Unrealized
gains | | | Unrealized
losses | |
Short | | | | | | | | | | | | | | | | | | | | | | | | |
5-Year U.S. Treasury Notes | | | (10) | | | | 3-29-2018 | | | $ | (1,159,787 | ) | | $ | (1,163,438 | ) | | $ | 3,651 | | | $ | 0 | |
The accompanying notes are an integral part of these financial statements.
| | | | |
| 132 | | Wells Fargo Allocation Funds | | Portfolio of investments—November 30, 2017 (unaudited) |
STABLE INCOME PORTFOLIO
Investments in Affiliates
An affiliated investment is an investment in which the Portfolio owns at least 5% of the outstanding voting shares of the issuer or as a result of other relationships, such as the Portfolio and the issuer having the same investment manager. Transactions with issuers that were either affiliated persons of the Portfolio at the beginning of the period or the end of the period were as follows:
| | | | | | | | | | | | | | | | | | | | | | | | | | | | | | | | | | | | |
| | | Shares,
beginning of
period | | | Shares
purchased | | | Shares
sold | | | Shares,
end of
period | | | Net
realized
gains
(losses) | | | Net
change in
unrealized
gains
(losses) | | | Income
from
affiliated
securities | | | Value,
end of period | | | % of
net
assets | |
Short-Term Investments | | | | | | | | | | | | | | | | | | | | | | | | | | | | | | | | | | | | |
Investment Companies | | | | | | | | | | | | | | | | | | | | | | | | | | | | | | | | | | | | |
Wells Fargo Government Money Market Fund Select Class | | | 352,626 | | | | 5,942,744 | | | | 5,285,519 | | | | 1,009,851 | | | $ | 0 | | | $ | 0 | | | $ | 2,251 | | | $ | 1,009,851 | | | | 4.25 | % |
The accompanying notes are an integral part of these financial statements.
This page is intentionally left blank.
| | | | |
| 134 | | Wells Fargo Allocation Funds | | Statements of assets and liabilities—November 30, 2017 (unaudited) |
| | | | | | | | |
| | | C&B Large Cap Value
Portfolio | | | Diversified Large
Cap Growth
Portfolio | |
| | |
Assets | | | | | | | | |
Investments in unaffiliated securities (including securities on loan), at value (see cost below) | | $ | 396,544,140 | | | $ | 92,188,540 | |
Investments in affiliated securities, at value (see cost below) | | | 36,676,363 | | | | 1,898,220 | |
Segregated cash for futures transactions | | | 0 | | | | 0 | |
Foreign currency, at value (see cost below) | | | 0 | | | | 0 | |
Receivable for investments sold | | | 1,204,040 | | | | 426,540 | |
Receivable for dividends | | | 841,480 | | | | 150,130 | |
Receivable for daily variation margin on open futures contracts | | | 0 | | | | 0 | |
Receivable for securities lending income | | | 3,347 | | | | 400 | |
Prepaid expenses and other assets | | | 14,493 | | | | 1,225 | |
| | | | |
Total assets | | | 435,283,863 | | | | 94,665,055 | |
| | | | |
| | |
Liabilities | | | | | | | | |
Payable upon receipt of securities loaned | | | 13,373,325 | | | | 1,113,825 | |
Payable for investments purchased | | | 0 | | | | 283,485 | |
Management fee payable | | | 213,640 | | | | 43,327 | |
Trustees’ fees and expenses payable | | | 2,338 | | | | 2,340 | |
Due to custodian bank | | | 0 | | | | 11 | |
Professional fees payable | | | 16,983 | | | | 20,042 | |
Accrued expenses and other liabilities | | | 13,144 | | | | 55,401 | |
| | | | |
Total liabilities | | | 13,619,430 | | | | 1,518,431 | |
| | | | |
Total net assets | | $ | 421,664,433 | | | $ | 93,146,624 | |
| | | | |
| | |
Investments in unaffiliated securities, at cost | | $ | 295,034,960 | | | $ | 55,648,651 | |
| | | | |
Investments in affiliated securities, at cost | | $ | 36,676,314 | | | $ | 1,898,210 | |
| | | | |
Securities on loan, at value | | $ | 13,088,401 | | | $ | 1,090,300 | |
| | | | |
Foreign currency, at cost | | $ | 0 | | | $ | 0 | |
| | | | |
The accompanying notes are an integral part of these financial statements.
| | | | | | |
| Statements of assets and liabilities—November 30, 2017 (unaudited) | | Wells Fargo Allocation Funds | | | 135 | |
| | | | | | | | | | | | | | | | | | | | | | |
Emerging Growth Portfolio | | | International
Growth
Portfolio | | | International
Value Portfolio | | | Large Company
Value Portfolio | | | Small Company
Growth Portfolio | | | Small Company
Value Portfolio | |
| | | | | |
| | | | | | | | | | | | | | | | | | | | | | |
| $ | 819,971,524 | | | $ | 41,449,325 | | | $ | 816,063,336 | | | $ | 66,915,889 | | | $ | 1,758,306,638 | | | $ | 159,194,570 | |
| | 49,514,609 | | | | 9,307,998 | | | | 33,019,075 | | | | 1,379,139 | | | | 303,565,816 | | | | 22,569,191 | |
| | 0 | | | | 0 | | | | 0 | | | | 150,000 | | | | 0 | | | | 0 | |
| | 0 | | | | 6,216 | | | | 7,883,760 | | | | 0 | | | | 0 | | | | 0 | |
| | 6,487,270 | | | | 10,086 | | | | 71,715 | | | | 0 | | | | 7,248,262 | | | | 1,308,660 | |
| | 156,350 | | | | 357,501 | | | | 3,293,279 | | | | 185,326 | | | | 1,093,075 | | | | 770,694 | |
| | 0 | | | | 0 | | | | 0 | | | | 10,769 | | | | 0 | | | | 0 | |
| | 46,394 | | | | 12 | | | | 31,142 | | | | 0 | | | | 149,243 | | | | 21,633 | |
| | 0 | | | | 6,761 | | | | 5,312 | | | | 2,495 | | | | 12,736 | | | | 14,347 | |
| | |
| | 876,176,147 | | | | 51,137,899 | | | | 860,367,619 | | | | 68,643,618 | | | | 2,070,375,770 | | | | 183,879,095 | |
| | |
| | | | | |
| | | | | | | | | | | | | | | | | | | | | | |
| | 37,018,173 | | | | 0 | | | | 18,388,755 | | | | 0 | | | | 235,219,267 | | | | 19,499,762 | |
| | 9,313,152 | | | | 9,161,906 | | | | 2,459,943 | | | | 0 | | | | 1,591,063 | | | | 731,449 | |
| | 532,450 | | | | 13,267 | | | | 521,628 | | | | 14,895 | | | | 1,131,086 | | | | 123,576 | |
| | 2,217 | | | | 2,322 | | | | 2,384 | | | | 2,358 | | | | 2,351 | | | | 2,306 | |
| | 0 | | | | 0 | | | | 0 | | | | 855 | | | | 1,670,769 | | | | 0 | |
| | 18,994 | | | | 30,360 | | | | 31,593 | | | | 22,667 | | | | 18,069 | | | | 19,913 | |
| | 59,542 | | | | 51,266 | | | | 67,763 | | | | 4,278 | | | | 22,878 | | | | 7,763 | |
| | |
| | 46,944,528 | | | | 9,259,121 | | | | 21,472,066 | | | | 45,053 | | | | 239,655,483 | | | | 20,384,769 | |
| | |
| $ | 829,231,619 | | | $ | 41,878,778 | | | $ | 838,895,553 | | | $ | 68,598,565 | | | $ | 1,830,720,287 | | | $ | 163,494,326 | |
| | |
| | | | | |
| $ | 532,402,444 | | | $ | 32,614,233 | | | $ | 720,618,425 | | | $ | 59,052,408 | | | $ | 1,220,678,018 | | | $ | 124,496,217 | |
| | |
| $ | 49,511,794 | | | $ | 9,307,998 | | | $ | 33,018,781 | | | $ | 1,379,139 | | | $ | 303,552,950 | | | $ | 22,568,547 | |
| | |
| $ | 36,170,154 | | | $ | 0 | | | $ | 17,490,685 | | | $ | 0 | | | $ | 228,494,698 | | | $ | 19,012,448 | |
| | |
| $ | 0 | | | $ | 6,207 | | | $ | 7,835,016 | | | $ | 0 | | | $ | 0 | | | $ | 0 | |
| | |
The accompanying notes are an integral part of these financial statements.
| | | | |
| 136 | | Wells Fargo Allocation Funds | | Statements of assets and liabilities—November 30, 2017 (unaudited) |
| | | | | | | | |
| | | Core Bond
Portfolio | | | Managed Fixed Income
Portfolio | |
| | |
Assets | | | | | | | | |
Investments in unaffiliated securities (including securities on loan), at value (see cost below) | | $ | 5,894,696,145 | | | $ | 106,988,738 | |
Investments in affiliated securities, at value (see cost below) | | | 159,252,539 | | | | 2,396,548 | |
Cash | | | 14,893,583 | | | | 875 | |
Segregated cash for future transactions | | | 0 | | | | 0 | |
Receivable for investments sold | | | 715,603,764 | | | | 85,000 | |
Principal paydown receivable | | | 82,923 | | | | 0 | |
Receivable for dividends and interest | | | 25,183,965 | | | | 795,082 | |
Receivable for daily variation margin on open futures contracts | | | 0 | | | | 0 | |
Receivable for securities lending income | | | 46,724 | | | | 178 | |
Receivable from manager | | | 0 | | | | 0 | |
Prepaid expenses and other assets | | | 110,185 | | | | 3,028 | |
| | | | |
Total assets | | | 6,809,869,828 | | | | 110,269,449 | |
| | | | |
| | |
Liabilities | | | | | | | | |
Payable for investments purchased | | | 1,239,957,501 | | | | 672,359 | |
Payable upon receipt of securities loaned | | | 50,259,982 | | | | 163,655 | |
Management fee payable | | | 1,553,187 | | | | 26,694 | |
Trustees’ fees and expenses payable | | | 2,308 | | | | 2,201 | |
Payable for daily variation margin on open futures contracts | | | 0 | | | | 0 | |
Due to custodian bank | | | 0 | | | | 0 | |
Professional fees payable | | | 29,497 | | | | 21,042 | |
Accrued expenses and other liabilities | | | 56,653 | | | | 6,641 | |
| | | | |
Total liabilities | | | 1,291,859,128 | | | | 892,592 | |
| | | | |
Total net assets | | $ | 5,518,010,700 | | | $ | 109,376,857 | |
| | | | |
| | |
Investments in unaffiliated securities, at cost | | $ | 5,894,493,620 | | | $ | 104,515,022 | |
| | | | |
Investments in affiliated securities, at cost | | $ | 159,252,342 | | | $ | 2,396,532 | |
| | | | |
Securities on loan, at value | | $ | 49,109,601 | | | $ | 160,179 | |
| | | | |
The accompanying notes are an integral part of these financial statements.
| | | | | | |
| Statements of assets and liabilities—November 30, 2017 (unaudited) | | Wells Fargo Allocation Funds | | | 137 | |
| | | | | | |
Real Return Portfolio | | | Stable Income
Portfolio | |
| |
| | | | | | |
| $ | 139,070,153 | | | $ | 23,217,997 | |
| | 5,075,711 | | | | 1,009,851 | |
| | 135,102 | | | | 0 | |
| | 0 | | | | 7,000 | |
| | 0 | | | | 0 | |
| | 0 | | | | 0 | |
| | 494,487 | | | | 92,613 | |
| | 4,375 | | | | 2,813 | |
| | 55 | | | | 0 | |
| | 0 | | | | 306 | |
| | 2,498 | | | | 2,019 | |
| | |
| | 144,782,381 | | | | 24,332,599 | |
| | |
| |
| | | | | | |
| | 1,122,657 | | | | 529,822 | |
| | 562,074 | | | | 0 | |
| | 33,324 | | | | 0 | |
| | 2,295 | | | | 2,316 | |
| | 1,266 | | | | 0 | |
| | 0 | | | | 13 | |
| | 16,065 | | | | 30,491 | |
| | 473 | | | | 5,166 | |
| | |
| | 1,738,154 | | | | 567,808 | |
| | |
| $ | 143,044,227 | | | $ | 23,764,791 | |
| | |
| |
| $ | 136,549,034 | | | $ | 22,892,781 | |
| | |
| $ | 5,075,711 | | | $ | 1,009,852 | |
| | |
| $ | 538,093 | | | $ | 0 | |
| | |
The accompanying notes are an integral part of these financial statements.
| | | | |
| 138 | | Wells Fargo Allocation Funds | | Statements of operations—six months ended November 30, 2017 (unaudited) |
| | | | | | | | |
| | | C&B Large Cap Value
Portfolio | | | Diversified Large
Cap Growth
Portfolio | |
| | |
Investment income | | | | | | | | |
Dividends* | | $ | 3,145,480 | | | $ | 575,641 | |
Income from affiliated securities | | | 103,323 | | | | 4,485 | |
Securities lending income from affiliates, net | | | 28,015 | | | | 2,447 | |
| | | | |
Total investment income | | | 3,276,818 | | | | 582,573 | |
| | | | |
| | |
Expenses | | | | | | | | |
Management fee | | | 1,283,381 | | | | 329,517 | |
Custody and accounting fees | | | 7,841 | | | | 27,492 | |
Professional fees | | | 22,130 | | | | 24,088 | |
Shareholder report expenses | | | 1,031 | | | | 1,025 | |
Trustees’ fees and expenses | | | 10,801 | | | | 10,722 | |
Other fees and expenses | | | 4,550 | | | | 6,702 | |
| | | | |
Total expenses | | | 1,329,734 | | | | 399,546 | |
Less: Fee waivers and/or expense reimbursements | | | (15,198 | ) | | | (84,173 | ) |
| | | | |
Net expenses | | | 1,314,536 | | | | 315,373 | |
| | | | |
Net investment income (loss) | | | 1,962,282 | | | | 267,200 | |
| | | | |
| | |
REALIZED AND UNREALIZED GAINS (LOSSES) ON INVESTMENTS | | | | | | | | |
| | |
Net realized gains (losses) on: | | | | | | | | |
Unaffiliated securities | | | 21,721,193 | | | | 10,794,225 | |
Affiliated securities | | | (35 | ) | | | 36 | |
Futures transactions | | | 0 | | | | 0 | |
| | | | |
Net realized gains on investments | | | 21,721,158 | | | | 10,794,261 | |
| | | | |
| | |
Net change in unrealized gains (losses) on: | | | | | | | | |
Unaffiliated securities | | | 11,480,149 | | | | 1,716,644 | |
Affiliated securities | | | (2 | ) | | | (16 | ) |
Futures transactions | | | 0 | | | | 0 | |
| | | | |
Net change in unrealized gains (losses) on investments | | | 11,480,147 | | | | 1,716,628 | |
| | | | |
Net realized and unrealized gains (losses) on investments | | | 33,201,305 | | | | 12,510,889 | |
| | | | |
Net increase in net assets resulting from operations | | $ | 35,163,587 | | | $ | 12,778,089 | |
| | | | |
| | |
* Net of foreign dividend withholding taxes in the amount of | | | $27,583 | | | | $526 | |
The accompanying notes are an integral part of these financial statements.
| | | | | | |
| Statements of operations—six months ended November 30, 2017 (unaudited) | | Wells Fargo Allocation Funds | | | 139 | |
| | | | | | | | | | | | | | | | | | | | | | |
Emerging
Growth
Portfolio | | | International
Growth
Portfolio | | | International
Value Portfolio | | | Large Company
Value Portfolio | | | Small Company
Growth Portfolio | | | Small Company
Value Portfolio | |
| | | | | |
| | | | | | | | | | | | | | | | | | | | | | |
| $ | 740,201 | | | $ | 578,653 | | | $ | 12,477,247 | | | $ | 717,719 | | | $ | 4,379,936 | | | $ | 2,049,417 | |
| | 53,739 | | | | 10,112 | | | | 21,341 | | | | 5,604 | | | | 311,315 | | | | 27,897 | |
| | 244,346 | | | | 24,760 | | | | 329,795 | | | | 0 | | | | 1,152,106 | | | | 185,687 | |
| | |
| | 1,038,286 | | | | 613,525 | | | | 12,828,383 | | | | 723,323 | | | | 5,843,357 | | | | 2,263,001 | |
| | |
| | | | | |
| | | | | | | | | | | | | | | | | | | | | | |
| | 3,200,215 | | | | 439,258 | | | | 3,100,391 | | | | 121,817 | | | | 6,730,260 | | | | 849,435 | |
| | 25,935 | | | | 38,031 | | | | 97,942 | | | | 5,086 | | | | 42,573 | | | | 10,610 | |
| | 23,493 | | | | 34,775 | | | | 30,416 | | | | 24,502 | | | | 24,297 | | | | 21,829 | |
| | 2,262 | | | | 1,798 | | | | 1,323 | | | | 1,317 | | | | 1,492 | | | | 1,394 | |
| | 10,625 | | | | 10,845 | | | | 10,982 | | | | 10,742 | | | | 10,471 | | | | 10,523 | |
| | 12,517 | | | | 27,186 | | | | 21,969 | | | | 5,734 | | | | 12,515 | | | | 2,721 | |
| | |
| | 3,275,047 | | | | 551,893 | | | | 3,263,023 | | | | 169,198 | | | | 6,821,608 | | | | 896,512 | |
| | 0 | | | | (10,756 | ) | | | 0 | | | | (14,972 | ) | | | 0 | | | | 0 | |
| | |
| | 3,275,047 | | | | 541,137 | | | | 3,263,023 | | | | 154,226 | | | | 6,821,608 | | | | 896,512 | |
| | |
| | (2,236,761 | ) | | | 72,388 | | | | 9,565,360 | | | | 569,097 | | | | (978,251 | ) | | | 1,366,489 | |
| | |
| | | | | |
| | | | | | | | | | | | | | | | | | | | | | |
| | | | | |
| | | | | | | | | | | | | | | | | | | | | | |
| | 57,757,303 | | | | 27,940,439 | | | | 3,014,353 | | | | 2,160,501 | | | | 11,498,961 | | | | 20,706,828 | |
| | 3,355 | | | | 6 | | | | (164 | ) | | | 0 | | | | 715 | | | | 30 | |
| | 0 | | | | 0 | | | | 0 | | | | 39,449 | | | | 0 | | | | 0 | |
| | |
| | 57,760,658 | | | | 27,940,445 | | | | 3,014,189 | | | | 2,199,950 | | | | 11,499,676 | | | | 20,706,858 | |
| | |
| | | | | |
| | | | | | | | | | | | | | | | | | | | | | |
| | 53,419,156 | | | | (16,732,880 | ) | | | 52,088,189 | | | | 4,029,153 | | | | 200,812,889 | | | | 3,266,049 | |
| | (2,900 | ) | | | 0 | | | | 0 | | | | 0 | | | | 0 | | | | 0 | |
| | 0 | | | | 0 | | | | 0 | | | | 41,367 | | | | 0 | | | | 0 | |
| | |
| | 53,416,256 | | | | (16,732,880 | ) | | | 52,088,189 | | | | 4,070,520 | | | | 200,812,889 | | | | 3,266,049 | |
| | |
| | 111,176,914 | | | | 11,207,565 | | | | 55,102,378 | | | | 6,270,470 | | | | 212,312,565 | | | | 23,972,907 | |
| | |
| $ | 108,940,153 | | | $ | 11,279,953 | | | $ | 64,667,738 | | | $ | 6,839,567 | | | $ | 211,334,314 | | | $ | 25,339,396 | |
| | |
| | | | | |
| | $0 | | | | $95,995 | | | | $1,163,786 | | | | $63 | | | | $23 | | | | $0 | |
The accompanying notes are an integral part of these financial statements.
| | | | |
| 140 | | Wells Fargo Allocation Funds | | Statements of operations—six months ended November 30, 2017 (unaudited) |
| | | | | | | | |
| | | Core Bond
Portfolio | | | Managed
Fixed Income
Portfolio | |
| | |
Investment income | | | | | | | | |
Interest* | | $ | 65,934,185 | | | $ | 1,856,922 | |
Dividends** | | | 0 | | | | 0 | |
Income from affiliated securities | | | 244,346 | | | | 6,271 | |
Securities lending income from affiliates, net | | | 53,739 | | | | 943 | |
| | | | |
Total investment income | | | 66,232,270 | | | | 1,864,136 | |
| | | | |
| | |
Expenses | | | | | | | | |
Management fee | | | 9,288,854 | | | | 219,888 | |
Custody and accounting fees | | | 125,944 | | | | 8,597 | |
Professional fees | | | 39,202 | | | | 25,526 | |
Shareholder report expenses | | | 2,033 | | | | 1,297 | |
Trustees’ fees and expenses | | | 10,722 | | | | 10,843 | |
Other fees and expenses | | | 11,526 | | | | 3,684 | |
| | | | |
Total expenses | | | 9,478,281 | | | | 269,835 | |
Less: Fee waivers and/or expense reimbursements | | | (52,092 | ) | | | (56,105 | ) |
| | | | |
Net expenses | | | 9,426,189 | | | | 213,730 | |
| | | | |
Net investment income | | | 56,806,081 | | | | 1,650,406 | |
| | | | |
| | |
REALIZED AND UNREALIZED GAINS (LOSSES) ON INVESTMENTS | | | | | | | | |
| | |
Net realized gains (losses) on: | | | | | | | | |
Unaffiliated securities | | | 16,377,373 | | | | 322,198 | |
Affiliated securities | | | 0 | | | | 0 | |
Futures transactions | | | 0 | | | | 0 | |
| | | | |
Net realized gain (losses) on investments | | | 16,377,373 | | | | 322,198 | |
| | | | |
| | |
Net change in unrealized gains (losses) on: | | | | | | | | |
Unaffiliated securities | | | (34,147,561 | ) | | | (751,970 | ) |
Futures transactions | | | 0 | | | | 0 | |
| | | | |
Net change in unrealized gains (losses) on investments | | | (34,147,561 | ) | | | (751,970 | ) |
| | | | |
Net realized and unrealized gains (losses) on investments | | | (17,770,188 | ) | | | (429,772 | ) |
| | | | |
Net increase in net assets resulting from operations | | $ | 39,035,893 | | | $ | 1,220,634 | |
| | | | |
| | |
* Net of foreign interest withholding taxes in the amount of | | | $0 | | | | $75 | |
** Net of foreign dividend withholding taxes in the amount of | | | $0 | | | | $0 | |
The accompanying notes are an integral part of these financial statements.
| | | | | | |
| Statements of operations—six months ended November 30, 2017 (unaudited) | | Wells Fargo Allocation Funds | | | 141 | |
| | | | | | |
Real Return
Portfolio | | |
Stable Income
Portfolio | |
| |
| | | | | | |
| $ | 1,293,318 | | | $ | 237,510 | |
| | 202,388 | | | | 0 | |
| | 16,952 | | | | 2,251 | |
| | 3,701 | | | | 0 | |
| | |
| | 1,516,359 | | | | 239,761 | |
| | |
| |
| | | | | | |
| | 211,091 | | | | 35,982 | |
| | 7,183 | | | | 5,287 | |
| | 23,413 | | | | 29,875 | |
| | 1,717 | | | | 1,663 | |
| | 10,627 | | | | 10,790 | |
| | 4,788 | | | | 2,452 | |
| | |
| | 258,819 | | | | 86,049 | |
| | (34,628 | ) | | | (37,413 | ) |
| | |
| | 224,191 | | | | 48,636 | |
| | |
| | 1,292,168 | | | | 191,125 | |
| | |
| |
| | | | | | |
| |
| | | | | | |
| | (282,494 | ) | | | (6,826 | ) |
| | (24 | ) | | | 0 | |
| | 23,408 | | | | 9,604 | |
| | |
| | (259,110 | ) | | | 2,778 | |
| | |
| |
| | | | | | |
| | 251,004 | | | | (122,276 | ) |
| | 5,444 | | | | 5,312 | |
| | |
| | 256,448 | | | | (116,964 | ) |
| | |
| | (2,662 | ) | | | (114,186 | ) |
| | |
| $ | 1,289,506 | | | $ | 76,939 | |
| | |
| |
| | $0 | | | | $0 | |
| | $9,288 | | | | $0 | |
The accompanying notes are an integral part of these financial statements.
| | | | |
| 142 | | Wells Fargo Allocation Funds | | Statements of changes in net assets |
| | | | | | | | |
| | | C&B Large Cap Value Portfolio | |
| | | Six months ended
November 30, 2017
(unaudited) | | | Year ended
May 31, 2017 | |
| | |
Operations | | | | | | | | |
Net investment income | | $ | 1,962,282 | | | $ | 3,655,932 | |
Net realized gains on investments | | | 21,721,158 | | | | 33,005,051 | |
Net change in unrealized gains (losses) on investments | | | 11,480,147 | | | | 22,347,142 | |
| | | | |
Net increase in net assets resulting from operations | | | 35,163,587 | | | | 59,008,125 | |
| | | | |
| |
Capital share transactions | | | | |
Transactions in investors’ beneficial interests | | | | | | | | |
Contributions | | | 41,986,399 | | | | 92,843,484 | |
Withdrawals | | | (19,338,933 | ) | | | (80,962,518 | ) |
| | | | |
Net increase in net assets resulting from capital share transactions | | | 22,647,466 | | | | 11,880,966 | |
| | | | |
Total increase in net assets | | | 57,811,053 | | | | 70,889,091 | |
| | | | |
| |
Net assets | | | | |
Beginning of period | | | 363,853,380 | | | | 292,964,289 | |
| | | | |
End of period | | $ | 421,664,433 | | | $ | 363,853,380 | |
| | | | |
The accompanying notes are an integral part of these financial statements.
| | | | | | |
| Statements of changes in net assets | | Wells Fargo Allocation Funds | | | 143 | |
| | | | | | | | |
| | | Diversified Large Cap Growth Portfolio | |
| | | Six months ended
November 30, 2017
(unaudited) | | | Year ended
May 31, 2017 | |
| | |
Operations | | | | | | | | |
Net investment income | | $ | 267,200 | | | $ | 559,502 | |
Net realized gains on investments | | | 10,794,261 | | | | 16,539,222 | |
Net change in unrealized gains (losses) on investments | | | 1,716,628 | | | | (1,622,597 | ) |
| | | | |
Net increase in net assets resulting from operations | | | 12,778,089 | | �� | | 15,476,127 | |
| | | | |
| |
Capital share transactions | | | | |
Transactions in investors’ beneficial interests | | | | | | | | |
Contributions | | | 473,194 | | | | 1,745,319 | |
Withdrawals | | | (26,357,072 | ) | | | (26,727,509 | ) |
| | | | |
Net decrease in net assets resulting from capital share transactions | | | (25,883,878 | ) | | | (24,982,190 | ) |
| | | | |
Total decrease in net assets | | | (13,105,789 | ) | | | (9,506,063 | ) |
| | | | |
| |
Net assets | | | | |
Beginning of period | | | 106,252,413 | | | | 115,758,476 | |
| | | | |
End of period | | $ | 93,146,624 | | | $ | 106,252,413 | |
| | | | |
The accompanying notes are an integral part of these financial statements.
| | | | |
| 144 | | Wells Fargo Allocation Funds | | Statements of changes in net assets |
| | | | | | | | |
| | | Emerging Growth Portfolio | |
| | | Six months ended
November 30, 2017
(unaudited) | | | Year ended
May 31, 2017 | |
| | |
Operations | | | | | | | | |
Net investment loss | | $ | (2,236,761 | ) | | $ | (1,240,591 | ) |
Net realized gains on investments | | | 57,760,658 | | | | 135,595,165 | |
Net change in unrealized gains (losses) on investments | | | 53,416,256 | | | | 47,322,234 | |
| | | | |
Net increase in net assets resulting from operations | | | 108,940,153 | | | | 181,676,808 | |
| | | | |
| |
Capital share transactions | | | | |
Transactions in investors’ beneficial interests | | | | | | | | |
Contributions | | | 5,445,214 | | | | 56,931,248 | |
Withdrawals | | | (79,793,760 | ) | | | (342,455,709 | ) |
| | | | |
Net decrease in net assets resulting from capital share transactions | | | (74,348,546 | ) | | | (285,524,461 | ) |
| | | | |
Total increase (decrease) in net assets | | | 34,591,607 | | | | (103,847,653 | ) |
| | | | |
| |
Net assets | | | | |
Beginning of period | | | 794,640,012 | | | | 898,487,665 | |
| | | | |
End of period | | $ | 829,231,619 | | | $ | 794,640,012 | |
| | | | |
The accompanying notes are an integral part of these financial statements.
| | | | | | |
| Statements of changes in net assets | | Wells Fargo Allocation Funds | | | 145 | |
| | | | | | | | |
| | | International Growth Portfolio | |
| | | Six months ended
November 30, 2017
(unaudited) | | | Year ended
May 31, 2017 | |
| | |
Operations | | | | | | | | |
Net investment income | | $ | 72,388 | | | $ | 1,772,360 | |
Net realized gains on investments | | | 27,940,445 | | | | 1,901,476 | |
Net change in unrealized gains (losses) on investments | | | (16,732,880 | ) | | | 9,943,224 | |
| | | | |
Net increase in net assets resulting from operations | | | 11,279,953 | | | | 13,617,060 | |
| | | | |
| |
Capital share transactions | | | | |
Transactions in investors’ beneficial interests | | | | | | | | |
Contributions | | | 12,249,110 | | | | 4,029,844 | |
Withdrawals | | | (119,141,315 | ) | | | (28,532,489 | ) |
| | | | |
Net decrease in net assets resulting from capital share transactions | | | (106,892,205 | ) | | | (24,502,645 | ) |
| | | | |
Total decrease in net assets | | | (95,612,252 | ) | | | (10,885,585 | ) |
| | | | |
| |
Net assets | | | | |
Beginning of period | | | 137,491,030 | | | | 148,376,615 | |
| | | | |
End of period | | $ | 41,878,778 | | | $ | 137,491,030 | |
| | | | |
The accompanying notes are an integral part of these financial statements.
| | | | |
| 146 | | Wells Fargo Allocation Funds | | Statements of changes in net assets |
| | | | | | | | |
| | | International Value Portfolio | |
| | | Six months ended
November 30, 2017
(unaudited) | | | Year ended
May 31, 2017 | |
| | |
Operations | | | | | | | | |
Net investment income | | $ | 9,565,360 | | | $ | 17,160,119 | |
Net realized gains (losses) on investments | | | 3,014,189 | | | | (10,175,083 | ) |
Net change in unrealized gains (losses) on investments | | | 52,088,189 | | | | 100,789,122 | |
| | | | |
Net increase in net assets resulting from operations | | | 64,667,738 | | | | 107,774,158 | |
| | | | |
| |
Capital share transactions | | | | |
Transactions in investors’ beneficial interests | | | | | | | | |
Contributions | | | 69,240,560 | | | | 236,560,483 | |
Withdrawals | | | (47,650,472 | ) | | | (100,015,884 | ) |
| | | | |
Net increase in net assets resulting from capital share transactions | | | 21,590,088 | | | | 136,544,599 | |
| | | | |
Total increase in net assets | | | 86,257,826 | | | | 244,318,757 | |
| | | | |
| |
Net assets | | | | |
Beginning of period | | | 752,637,727 | | | | 508,318,970 | |
| | | | |
End of period | | $ | 838,895,553 | | | $ | 752,637,727 | |
| | | | |
The accompanying notes are an integral part of these financial statements.
| | | | | | |
| Statements of changes in net assets | | Wells Fargo Allocation Funds | | | 147 | |
| | | | | | | | |
| | | Large Company Value Portfolio | |
| | | Six months ended
November 30, 2017
(unaudited) | | | Year ended
May 31, 2017 | |
| | |
Operations | | | | | | | | |
Net investment income | | $ | 569,097 | | | $ | 1,094,138 | |
Net realized gains on investments | | | 2,199,950 | | | | 16,081,914 | |
Net change in unrealized gains (losses) on investments | | | 4,070,520 | | | | (7,786,892 | ) |
| | | | |
Net increase in net assets resulting from operations | | | 6,839,567 | | | | 9,389,160 | |
| | | | |
| |
Capital share transactions | | | | |
Transactions in investors’ beneficial interests | | | | | | | | |
Contributions | | | 480,432 | | | | 911,057 | |
Withdrawals | | | (9,940,243 | ) | | | (18,196,238 | ) |
| | | | |
Net decrease in net assets resulting from capital share transactions | | | (9,459,811 | ) | | | (17,285,181 | ) |
| | | | |
Total decrease in net assets | | | (2,620,244 | ) | | | (7,896,021 | ) |
| | | | |
| |
Net assets | | | | |
Beginning of period | | | 71,218,809 | | | | 79,114,830 | |
| | | | |
End of period | | $ | 68,598,565 | | | $ | 71,218,809 | |
| | | | |
The accompanying notes are an integral part of these financial statements.
| | | | |
| 148 | | Wells Fargo Allocation Funds | | Statements of changes in net assets |
| | | | | | | | |
| | | Small Company Growth Portfolio | |
| | | Six months ended
November 30, 2017
(unaudited) | | | Year ended
May 31, 2017 | |
| | |
Operations | | | | | | | | |
Net investment loss | | $ | (978,251 | ) | | $ | (2,125,287 | ) |
Net realized gains (losses) on investments | | | 11,499,676 | | | | (16,225,835 | ) |
Net change in unrealized gains (losses) on investments | | | 200,812,889 | | | | 257,670,175 | |
| | | | |
Net increase in net assets resulting from operations | | | 211,334,314 | | | | 239,319,053 | |
| | | | |
| |
Capital share transactions | | | | |
Transactions in investors’ beneficial interests | | | | | | | | |
Contributions | | | 38,513,574 | | | | 485,927,559 | |
Withdrawals | | | (92,652,047 | ) | | | (248,318,606 | ) |
| | | | |
Net increase (decrease) in net assets resulting from capital share transactions | | | (54,138,473 | ) | | | 237,608,953 | |
| | | | |
Total increase in net assets | | | 157,195,841 | | | | 476,928,006 | |
| | | | |
| |
Net assets | | | | |
Beginning of period | | | 1,673,524,446 | | | | 1,196,596,440 | |
| | | | |
End of period | | $ | 1,830,720,287 | | | $ | 1,673,524,446 | |
| | | | |
The accompanying notes are an integral part of these financial statements.
| | | | | | |
| Statements of changes in net assets | | Wells Fargo Allocation Funds | | | 149 | |
| | | | | | | | |
| | | Small Company Value Portfolio | |
| | | Six months ended
November 30, 2017
(unaudited) | | | Year ended
May 31, 2017 | |
| | |
Operations | | | | | | | | |
Net investment income | | $ | 1,366,489 | | | $ | 1,579,627 | |
Net realized gains on investments | | | 20,706,858 | | | | 28,865,439 | |
Net change in unrealized gains (losses) on investments | | | 3,266,049 | | | | 9,357,164 | |
| | | | |
Net increase in net assets resulting from operations | | | 25,339,396 | | | | 39,802,230 | |
| | | | |
| |
Capital share transactions | | | | |
Transactions in investors’ beneficial interests | | | | | | | | |
Contributions | | | 6,081,013 | | | | 22,385,660 | |
Withdrawals | | | (82,150,882 | ) | | | (65,532,861 | ) |
| | | | |
Net decrease in net assets resulting from capital share transactions | | | (76,069,869 | ) | | | (43,147,201 | ) |
| | | | |
Total decrease in net assets | | | (50,730,473 | ) | | | (3,344,971 | ) |
| | | | |
| |
Net assets | | | | |
Beginning of period | | | 214,224,799 | | | | 217,569,770 | |
| | | | |
End of period | | $ | 163,494,326 | | | $ | 214,224,799 | |
| | | | |
The accompanying notes are an integral part of these financial statements.
| | | | |
| 150 | | Wells Fargo Allocation Funds | | Statements of changes in net assets |
| | | | | | | | |
| | | Core Bond Portfolio | |
| | | Six months ended
November 30, 2017
(unaudited) | | | Year ended
May 31, 2017 | |
| | |
Operations | | | | | | | | |
Net investment income | | $ | 56,806,081 | | | $ | 95,331,543 | |
Net realized gains (losses) on investments | | | 16,377,373 | | | | (15,997,975 | ) |
Net change in unrealized gains (losses) on investments | | | (34,147,561 | ) | | | (1,098,782 | ) |
| | | | |
Net increase in net assets resulting from operations | | | 39,035,893 | | | | 78,234,786 | |
| | | | |
| |
Capital share transactions | | | | |
Transactions in investors’ beneficial interests | | | | | | | | |
Contributions | | | 427,993,948 | | | | 1,503,144,065 | |
Withdrawals | | | (139,564,963 | ) | | | (731,668,087 | ) |
| | | | |
Net increase in net assets resulting from capital share transactions | | | 288,428,985 | | | | 771,475,978 | |
| | | | |
Total increase in net assets | | | 327,464,878 | | | | 849,710,764 | |
| | | | |
| |
Net assets | | | | |
Beginning of period | | | 5,190,545,822 | | | | 4,340,835,058 | |
| | | | |
End of period | | $ | 5,518,010,700 | | | $ | 5,190,545,822 | |
| | | | |
The accompanying notes are an integral part of these financial statements.
| | | | | | |
| Statements of changes in net assets | | Wells Fargo Allocation Funds | | | 151 | |
| | | | | | | | |
| | | Managed Fixed Income Portfolio | |
| | | Six months ended
November 30, 2017
(unaudited) | | | Year ended
May 31, 2017 | |
| | |
Operations | | | | | | | | |
Net investment income | | $ | 1,650,406 | | | $ | 3,585,348 | |
Net realized gains on investments | | | 322,198 | | | | 563,446 | |
Net change in unrealized gains (losses) on investments | | | (751,970 | ) | | | (308,772 | ) |
| | | | |
Net increase in net assets resulting from operations | | | 1,220,634 | | | | 3,840,022 | |
| | | | |
| |
Capital share transactions | | | | |
Transactions in investors’ beneficial interests | | | | | | | | |
Contributions | | | 2,435,361 | | | | 9,672,229 | |
Withdrawals | | | (6,237,111 | ) | | | (28,308,008 | ) |
| | | | |
Net decrease in net assets resulting from capital share transactions | | | (3,801,750 | ) | | | (18,635,779 | ) |
| | | | |
Total decrease in net assets | | | (2,581,116 | ) | | | (14,795,757 | ) |
| | | | |
| |
Net assets | | | | |
Beginning of period | | | 111,957,973 | | | | 126,753,730 | |
| | | | |
End of period | | $ | 109,376,857 | | | $ | 111,957,973 | |
| | | | |
The accompanying notes are an integral part of these financial statements.
| | | | |
| 152 | | Wells Fargo Allocation Funds | | Statements of changes in net assets |
| | | | | | | | |
| | | Real Return Portfolio | |
| | | Six months ended
November 30, 2017
(unaudited) | | | Year ended
May 31, 2017 | |
| | |
Operations | | | | | | | | |
Net investment income | | $ | 1,292,168 | | | $ | 1,793,711 | |
Net realized gains (losses) on investments | | | (259,110 | ) | | | 76,421 | |
Net change in unrealized gains (losses) on investments | | | 256,448 | | | | (10,813 | ) |
| | | | |
Net increase in net assets resulting from operations | | | 1,289,506 | | | | 1,859,319 | |
| | | | |
| |
Capital share transactions | | | | |
Transactions in investors’ beneficial interests | | | | | | | | |
Contributions | | | 75,660,934 | | | | 36,734,228 | |
Withdrawals | | | (23,500,068 | ) | | | (13,097,573 | ) |
| | | | |
Net increase in net assets resulting from capital share transactions | | | 52,160,866 | | | | 23,636,655 | |
| | | | |
Total increase in net assets | | | 53,450,372 | | | | 25,495,974 | |
| | | | |
| |
Net assets | | | | |
Beginning of period | | | 89,593,855 | | | | 64,097,881 | |
| | | | |
End of period | | $ | 143,044,227 | | | $ | 89,593,855 | |
| | | | |
The accompanying notes are an integral part of these financial statements.
| | | | | | |
| Statements of changes in net assets | | Wells Fargo Allocation Funds | | | 153 | |
| | | | | | | | |
| | | Stable Income Portfolio | |
| | | Six months ended
November 30, 2017
(unaudited) | | | Year ended
May 31, 2017 | |
| | |
Operations | | | | | | | | |
Net investment income | | $ | 191,125 | | | $ | 389,666 | |
Net realized gains on investments | | | 2,778 | | | | 68,947 | |
Net change in unrealized gains (losses) on investments | | | (116,964 | ) | | | (27,594 | ) |
| | | | |
Net increase in net assets resulting from operations | | | 76,939 | | | | 431,019 | |
| | | | |
| |
Capital share transactions | | | | |
Transactions in investors’ beneficial interests | | | | | | | | |
Contributions | | | 523,118 | | | | 2,825,563 | |
Withdrawals | | | (1,733,445 | ) | | | (8,776,604 | ) |
| | | | |
Net decrease in net assets resulting from capital share transactions | | | (1,210,327 | ) | | | (5,951,041 | ) |
| | | | |
Total decrease in net assets | | | (1,133,388 | ) | | | (5,520,022 | ) |
| | | | |
| |
Net assets | | | | |
Beginning of period | | | 24,898,179 | | | | 30,418,201 | |
| | | | |
End of period | | $ | 23,764,791 | | | $ | 24,898,179 | |
| | | | |
The accompanying notes are an integral part of these financial statements.
| | | | |
| 154 | | Wells Fargo Allocation Funds | | Financial highlights |
| | | | | | | | | | | | | | | | | | | | |
| | | Ratio to average net assets (annualized) | | | | | | Portfolio turnover
rate | |
| | | Net investment
income (loss) | | | Gross
expenses | | | Net
expenses | | | Total
return1 | | |
| | | | | |
C&B Large Cap Value Portfolio | | | | | | | | | | | | | | | | | | | | |
Six months ended November 30, 2017 (unaudited) | | | 0.99 | % | | | 0.67 | % | | | 0.67 | % | | | 9.33 | % | | | 18 | % |
Year ended May 31, 2017 | | | 1.09 | % | | | 0.68 | % | | | 0.68 | % | | | 19.17 | % | | | 89 | % |
Year ended May 31, 2016 | | | 1.33 | % | | | 0.68 | % | | | 0.68 | % | | | 0.35 | % | | | 29 | % |
Year ended May 31, 2015 | | | 1.20 | % | | | 0.68 | % | | | 0.68 | % | | | 10.29 | % | | | 35 | % |
Year ended May 31, 2014 | | | 1.35 | % | | | 0.68 | % | | | 0.68 | % | | | 17.80 | % | | | 22 | % |
Year ended May 31, 2013 | | | 1.73 | % | | | 0.68 | % | | | 0.68 | % | | | 29.30 | % | | | 18 | % |
| | | | | |
Diversified Large Cap Growth Portfolio | | | | | | | | | | | | | | | | | | | | |
Six months ended November 30, 2017 (unaudited) | | | 0.53 | % | | | 0.79 | % | | | 0.62 | % | | | 13.51 | % | | | 19 | % |
Year ended May 31, 2017 | | | 0.51 | % | | | 0.78 | % | | | 0.62 | % | | | 15.36 | % | | | 98 | % |
Year ended May 31, 2016 | | | 0.29 | % | | | 0.74 | % | | | 0.62 | % | | | (2.28 | )% | | | 59 | % |
Year ended May 31, 2015 | | | 0.28 | % | | | 0.72 | % | | | 0.62 | % | | | 13.11 | % | | | 46 | % |
Year ended May 31, 2014 | | | 0.15 | % | | | 0.72 | % | | | 0.62 | % | | | 21.70 | % | | | 54 | % |
Year ended May 31, 2013 | | | 0.51 | % | | | 0.71 | % | | | 0.62 | % | | | 20.30 | % | | | 56 | % |
| | | | | |
Emerging Growth Portfolio | | | | | | | | | | | | | | | | | | | | |
Six months ended November 30, 2017 (unaudited) | | | (0.55 | )% | | | 0.81 | % | | | 0.81 | % | | | 14.43 | % | | | 26 | % |
Year ended May 31, 2017 | | | (0.15 | )% | | | 0.81 | % | | | 0.81 | % | | | 23.97 | % | | | 115 | % |
Year ended May 31, 2016 | | | (0.40 | )% | | | 0.80 | % | | | 0.80 | % | | | (14.47 | )% | | | 66 | % |
Year ended May 31, 2015 | | | (0.63 | )% | | | 0.80 | % | | | 0.80 | % | | | 24.02 | % | | | 56 | % |
Year ended May 31, 2014 | | | (0.62 | )% | | | 0.80 | % | | | 0.80 | % | | | 11.92 | % | | | 63 | % |
Year ended May 31, 2013 | | | (0.47 | )% | | | 0.80 | % | | | 0.80 | % | | | 20.53 | % | | | 65 | % |
| | | | | |
International Growth Portfolio | | | | | | | | | | | | | | | | | | | | |
Six months ended November 30, 2017 (unaudited) | | | 0.13 | % | | | 1.01 | % | | | 0.99 | % | | | 10.19 | % | | | 37 | % |
Year ended May 31, 2017 | | | 1.25 | % | | | 0.98 | % | | | 0.98 | % | | | 10.31 | % | | | 121 | % |
Year ended May 31, 2016 | | | 1.16 | % | | | 0.99 | % | | | 0.99 | % | | | (12.40 | )% | | | 62 | % |
Year ended May 31, 2015 | | | 0.76 | % | | | 1.00 | % | | | 1.00 | % | | | 5.13 | % | | | 51 | % |
Year ended May 31, 2014 | | | 1.13 | % | | | 1.00 | % | | | 1.00 | % | | | 16.45 | % | | | 46 | % |
Year ended May 31, 2013 | | | 1.63 | % | | | 1.04 | % | | | 1.04 | % | | | 30.34 | % | | | 46 | % |
| | | | | |
International Value Portfolio | | | | | | | | | | | | | | | | | | | | |
Six months ended November 30, 2017 (unaudited) | | | 2.41 | % | | | 0.82 | % | | | 0.82 | % | | | 8.48 | % | | | 6 | % |
Year ended May 31, 2017 | | | 3.03 | % | | | 0.87 | % | | | 0.87 | % | | | 19.16 | % | | | 41 | % |
Year ended May 31, 2016 | | | 2.50 | % | | | 0.91 | % | | | 0.91 | % | | | (11.85 | )% | | | 14 | % |
Year ended May 31, 2015 | | | 2.45 | % | | | 0.91 | % | | | 0.91 | % | | | (1.04 | )% | | | 18 | % |
Year ended May 31, 2014 | | | 3.09 | % | | | 0.91 | % | | | 0.91 | % | | | 18.22 | % | | | 11 | % |
Year ended May 31, 2013 | | | 3.04 | % | | | 0.91 | % | | | 0.91 | % | | | 29.45 | % | | | 16 | % |
| | | | | |
Large Company Value Portfolio | | | | | | | | | | | | | | | | | | | | |
Six months ended November 30, 2017 (unaudited) | | | 1.64 | % | | | 0.49 | % | | | 0.44 | % | | | 10.36 | % | | | 117 | % |
Year ended May 31, 2017 | | | 1.45 | % | | | 0.68 | % | | | 0.66 | % | | | 13.22 | % | | | 203 | % |
Year ended May 31, 2016 | | | 1.54 | % | | | 0.76 | % | | | 0.74 | % | | | (3.92 | )% | | | 50 | % |
Year ended May 31, 2015 | | | 1.09 | % | | | 0.74 | % | | | 0.74 | % | | | 7.90 | % | | | 72 | % |
Year ended May 31, 2014 | | | 0.99 | % | | | 0.73 | % | | | 0.73 | % | | | 20.26 | % | | | 62 | % |
Year ended May 31, 2013 | | | 1.49 | % | | | 0.78 | % | | | 0.74 | % | | | 28.91 | % | | | 95 | % |
| | | | | |
Small Company Growth Portfolio | | | | | | | | | | | | | | | | | | | | |
Six months ended November 30, 2017 (unaudited) | | | (0.11 | )% | | | 0.78 | % | | | 0.78 | % | | | 12.83 | % | | | 17 | % |
Year ended May 31, 2017 | | | (0.14 | )% | | | 0.79 | % | | | 0.79 | % | | | 18.15 | % | | | 82 | % |
Year ended May 31, 2016 | | | (0.03 | )% | | | 0.80 | % | | | 0.80 | % | | | (13.86 | )% | | | 49 | % |
Year ended May 31, 2015 | | | (0.32 | )% | | | 0.82 | % | | | 0.82 | % | | | 18.07 | % | | | 58 | % |
Year ended May 31, 2014 | | | (0.37 | )% | | | 0.83 | % | | | 0.83 | % | | | 23.47 | % | | | 77 | % |
Year ended May 31, 2013 | | | (0.02 | )% | | | 0.86 | % | | | 0.86 | % | | | 31.39 | % | | | 109 | % |
Please see footnote on page 155.
The accompanying notes are an integral part of these financial statements.
| | | | | | |
| Financial highlights | | Wells Fargo Allocation Funds | | | 155 | |
| | | | | | | | | | | | | | | | | | | | |
| | | Ratio to average net assets (annualized) | | | | | | Portfolio turnover
rate | |
| | | Net investment
income | | | Gross
expenses | | | Net
expenses | | | Total
return1 | | |
| | | | | |
Small Company Value Portfolio | | | | | | | | | | | | | | | | | | | | |
Six months ended November 30, 2017 (unaudited) | | | 1.28 | % | | | 0.84 | % | | | 0.84 | % | | | 13.83 | % | | | 27 | % |
Year ended May 31, 2017 | | | 0.72 | % | | | 0.84 | % | | | 0.84 | % | | | 19.44 | % | | | 110 | % |
Year ended May 31, 2016 | | | 0.62 | % | | | 0.85 | % | | | 0.85 | % | | | (4.96 | )% | | | 72 | % |
Year ended May 31, 2015 | | | 0.89 | % | | | 0.84 | % | | | 0.84 | % | | | 7.29 | % | | | 54 | % |
Year ended May 31, 2014 | | | 0.89 | % | | | 0.85 | % | | | 0.85 | % | | | 18.09 | % | | | 47 | % |
Year ended May 31, 2013 | | | 0.58 | % | | | 0.85 | % | | | 0.85 | % | | | 30.76 | % | | | 57 | % |
| | | | | |
Core Bond Portfolio | | | | | | | | | | | | | | | | | | | | |
Six months ended November 30, 2017 (unaudited) | | | 2.10 | % | | | 0.35 | % | | | 0.35 | % | | | 0.75 | % | | | 270 | % |
Year ended May 31, 2017 | | | 1.87 | % | | | 0.35 | % | | | 0.35 | % | | | 1.89 | % | | | 614 | % |
Year ended May 31, 2016 | | | 1.86 | % | | | 0.36 | % | | | 0.35 | % | | | 2.78 | % | | | 667 | % |
Year ended May 31, 2015 | | | 1.82 | % | | | 0.37 | % | | | 0.35 | % | | | 3.22 | % | | | 586 | % |
Year ended May 31, 2014 | | | 1.94 | % | | | 0.37 | % | | | 0.35 | % | | | 2.90 | % | | | 646 | % |
Year ended May 31, 2013 | | | 1.75 | % | | | 0.37 | % | | | 0.35 | % | | | 2.61 | % | | | 547 | % |
| | | | | |
Managed Fixed Income Portfolio | | | | | | | | | | | | | | | | | | | | |
Six months ended November 30, 2017 (unaudited) | | | 3.00 | % | | | 0.49 | % | | | 0.39 | % | | | 1.10 | % | | | 12 | % |
Year ended May 31, 2017 | | | 2.99 | % | | | 0.48 | % | | | 0.39 | % | | | 3.13 | % | | | 47 | % |
Year ended May 31, 2016 | | | 3.12 | % | | | 0.48 | % | | | 0.39 | % | | | 3.95 | % | | | 25 | % |
Year ended May 31, 2015 | | | 3.20 | % | | | 0.48 | % | | | 0.39 | % | | | 4.23 | % | | | 31 | % |
Year ended May 31, 2014 | | | 3.33 | % | | | 0.48 | % | | | 0.39 | % | | | 3.07 | % | | | 35 | % |
Year ended May 31, 2013 | | | 3.42 | % | | | 0.47 | % | | | 0.39 | % | | | 4.81 | % | | | 49 | % |
| | | | | |
Real Return Portfolio | | | | | | | | | | | | | | | | | | | | |
Six months ended November 30, 2017 (unaudited) | | | 2.45 | % | | | 0.49 | % | | | 0.43 | % | | | 1.16 | % | | | 19 | % |
Year ended May 31, 2017 | | | 2.36 | % | | | 0.52 | % | | | 0.44 | % | | | 2.65 | % | | | 25 | % |
Year ended May 31, 2016 | | | 1.45 | % | | | 0.56 | % | | | 0.44 | % | | | 1.29 | % | | | 29 | % |
Year ended May 31, 2015 | | | 0.89 | % | | | 0.57 | % | | | 0.44 | % | | | 1.50 | % | | | 57 | % |
Year ended May 31, 2014 | | | 1.45 | % | | | 0.53 | % | | | 0.44 | % | | | (0.26 | )% | | | 9 | % |
Year ended May 31, 2013 | | | 1.52 | % | | | 0.50 | % | | | 0.44 | % | | | (1.86 | )% | | | 15 | % |
| | | | | |
Stable Income Portfolio | | | | | | | | | | | | | | | | | | | | |
Six months ended November 30, 2017 (unaudited) | | | 1.59 | % | | | 0.72 | % | | | 0.41 | % | | | 0.32 | % | | | 19 | % |
Year ended May 31, 2017 | | | 1.36 | % | | | 0.65 | % | | | 0.41 | % | | | 1.50 | % | | | 46 | % |
Year ended May 31, 2016 | | | 1.22 | % | | | 0.62 | % | | | 0.41 | % | | | 0.83 | % | | | 20 | % |
Year ended May 31, 2015 | | | 1.20 | % | | | 0.64 | % | | | 0.41 | % | | | 0.89 | % | | | 26 | % |
Year ended May 31, 2014 | | | 1.41 | % | | | 0.66 | % | | | 0.41 | % | | | 1.52 | % | | | 33 | % |
Year ended May 31, 2013 | | | 1.50 | % | | | 0.58 | % | | | 0.41 | % | | | 2.78 | % | | | 20 | % |
| 1 | Returns for periods of less than one year are not annualized. |
The accompanying notes are an integral part of these financial statements.
| | | | |
| 156 | | Wells Fargo Allocation Funds | | Notes to financial statements (unaudited) |
1. ORGANIZATION
Wells Fargo Master Trust (the “Trust”), a Delaware statutory trust organized on March 10, 1999, is an open-end management investment company registered under the Investment Company Act of 1940, as amended (the “1940 Act”). As an investment company, the Trust follows the accounting and reporting guidance in Financial Accounting Standards Board Accounting Standards Codification Topic 946, Financial Services – Investment Companies. These financial statements report on the following portfolios: Wells Fargo C&B Large Cap Value Portfolio (“C&B Large Cap Value Portfolio”), Wells Fargo Diversified Large Cap Growth Portfolio (“Diversified Large Cap Growth Portfolio”), Wells Fargo Emerging Growth Portfolio (“Emerging Growth Portfolio”), Wells Fargo International Growth Portfolio (“International Growth Portfolio”), Wells Fargo International Value Portfolio (“International Value Portfolio”), Wells Fargo Large Company Value Portfolio (“Large Company Value Portfolio”), Wells Fargo Small Company Growth Portfolio (“Small Company Growth Portfolio”), Wells Fargo Small Company Value Portfolio (“Small Company Value Portfolio”), Wells Fargo Core Bond Portfolio (“Core Bond Portfolio”), Wells Fargo Managed Fixed Income Portfolio (“Managed Fixed Income Portfolio”), Wells Fargo Real Return Portfolio (“Real Return Portfolio”), and Wells Fargo Stable Income Portfolio (“Stable Income Portfolio”) (each, a “Portfolio”, collectively, the “Portfolios”). Each Portfolio is a diversified series of the Trust.
2. SIGNIFICANT ACCOUNTING POLICIES
The following significant accounting policies, which are consistently followed in the preparation of the financial statements of each Portfolio, are in conformity with U.S. generally accepted accounting principles which require management to make estimates and assumptions that affect the reported amounts of assets and liabilities, disclosure of contingent assets and liabilities at the date of the financial statements, and the reported amounts of revenues and expenses during the reporting period. Actual results could differ from those estimates.
Securities valuation
All investments are valued each business day as of the close of regular trading on the New York Stock Exchange (generally 4 p.m. Eastern Time), although the Portfolios may deviate from this calculation time under unusual or unexpected circumstances.
Equity securities and futures that are listed on a foreign or domestic exchange or market are valued at the official closing price or, if none, the last sales price. If no sale occurs on the principal exchange or market that day, a fair value price will be determined in accordance with the Portfolios’ Valuation Procedures.
The values of securities denominated in foreign currencies are translated into U.S. dollars at rates provided by an independent foreign currency pricing source at a time each business day specified by the Management Valuation Team of Wells Fargo Funds Management, LLC (“Funds Management”).
Many securities markets and exchanges outside the U.S. close prior to the close of the New York Stock Exchange and therefore may not fully reflect trading or events that occur after the close of the principal exchange in which the foreign securities are traded, but before the close of the New York Stock Exchange. If such trading or events are expected to materially affect the value of such securities, then fair value pricing procedures approved by the Board of Trustees of the Portfolios are applied. These procedures take into account multiple factors including movements in U.S. securities markets after foreign exchanges close. Foreign securities that are fair valued under these procedures are categorized as Level 2 and the application of these procedures may result in transfers between Level 1 and Level 2. Depending on market activity, such fair valuations may be frequent. Such fair value pricing may result in net asset values that are higher or lower than net asset values based on the last reported sales price or latest quoted bid price. On November 30, 2017, such fair value pricing was used in pricing foreign securities.
Debt securities are valued at the evaluated bid price provided by an independent pricing service or, if a reliable price is not available, the quoted bid price from an independent broker-dealer.
Investments in registered open-end investment companies are valued at net asset value. Interests in non-registered investment companies that are redeemable at net asset value are fair valued normally at net asset value.
Investments which are not valued using any of the methods discussed above are valued at their fair value, as determined in good faith by the Board of Trustees. The Board of Trustees has established a Valuation Committee comprised of the Trustees and has delegated to it the authority to take any actions regarding the valuation of portfolio securities that the Valuation Committee deems necessary or appropriate, including determining the fair value of portfolio securities, unless the determination has been delegated to the Management Valuation Team. The Board of Trustees retains the authority to make or ratify any valuation decisions or approve any changes to the Valuation Procedures as it deems appropriate. On a quarterly basis, the Board of Trustees receives reports on any valuation actions taken by the Valuation Committee or the Management Valuation Team which may include items for ratification.
| | | | | | |
| Notes to financial statements (unaudited) | | Wells Fargo Allocation Funds | | | 157 | |
Valuations of fair valued securities are compared to the next actual sales price when available, or other appropriate market values, to assess the continued appropriateness of the fair valuation methodologies used. These securities are fair valued on a day-to-day basis, taking into consideration changes to appropriate market information and any significant changes to the inputs considered in the valuation process until there is a readily available price provided on an exchange or by an independent pricing service. Valuations received from an independent pricing service or independent broker-dealer quotes are periodically validated by comparisons to most recent trades and valuations provided by other independent pricing services in addition to the review of prices by the adviser and/or subadviser. Unobservable inputs used in determining fair valuations are identified based on the type of security, taking into consideration factors utilized by market participants in valuing the investment, knowledge about the issuer and the current market environment.
Foreign currency translation
The accounting records of the Portfolios are maintained in U.S. dollars. The value of other assets and liabilities denominated in foreign currencies are translated into U.S. dollars at rates provided by an independent foreign currency pricing source at a time each business day specified by the Management Valuation Team. Purchases and sales of securities, and income and expenses are converted at the rate of exchange on the respective dates of such transactions. Net realized foreign exchange gains or losses arise from sales of foreign currencies, currency gains or losses realized between the trade and settlement dates on securities transactions, and the difference between the amounts of dividends, interest and foreign withholding taxes recorded and the U.S. dollar equivalent of the amounts actually paid or received. Net unrealized foreign exchange gains and losses arise from changes in the fair value of assets and liabilities other than investments in securities resulting from changes in exchange rates. The changes in net assets arising from changes in exchange rates and the changes in net assets resulting from changes in market prices of securities are not separately presented. Such changes are included in net realized and unrealized gains or losses from investments.
Participation notes
Each Portfolio may invest in participation notes to gain exposure to securities in certain foreign markets. Participation notes are issued by banks or broker-dealers and are designed to offer a return linked to a particular underlying foreign security. Participation notes involve transaction costs, which may be higher than those applicable to the underlying foreign security. The holder of the participation note is entitled to receive from the bank or broker-dealer, an amount equal to the dividend paid by the issuer of the underlying foreign security; however, the holder is not entitled to the same rights (i.e. dividends, voting rights) as an owner of the underlying foreign security. Investments in participation notes involve risks beyond those normally associated with a direct investment in an underlying security. The Portfolio has no rights against the issuer of the underlying foreign security and participation notes expose the Portfolio to counterparty risk in the event the counterparty does not perform. There is also no assurance there will be a secondary trading market for the participation note or that the trading price of the participation note will equal the underlying value of the foreign security that it seeks to replicate.
Security loans
Each Portfolio may lend its securities from time to time in order to earn additional income in the form of fees or interest on securities received as collateral or the investment of any cash received as collateral. The Portfolio continues to receive interest or dividends on the securities loaned. The Portfolio receives collateral in the form of cash or securities with a value at least equal to the value of the securities on loan. The value of the loaned securities is determined at the close of each business day and any additional required collateral is delivered to the Portfolio on the next business day. In a securities lending transaction, the net asset value of the Portfolio will be affected by an increase or decrease in the value of the securities loaned and by an increase or decrease in the value of the instrument in which collateral is invested. The amount of securities lending activity undertaken by the Portfolio fluctuates from time to time. In the event of default or bankruptcy by the borrower, the Portfolio may be prevented from recovering the loaned securities or gaining access to the collateral or may experience delays or costs in doing so. In addition, the investment of any cash collateral received may lose all or part of its value. Each Portfolio has the right under the lending agreement to recover the securities from the borrower on demand.
Each Portfolio lends its securities through an unaffiliated securities lending agent. Cash collateral received in connection with its securities lending transactions is invested in Securities Lending Cash Investments, LLC (the “Securities Lending Fund”). The Securities Lending Fund is exempt from registration under Section 3(c)(7) of the 1940 Act and is managed by Funds Management and is subadvised by Wells Capital Management Incorporated (“WellsCap”), an affiliate of Funds Management and an indirect wholly owned subsidiary of Wells Fargo & Company (“Wells Fargo”). Funds Management receives an advisory fee starting at 0.05% and declining to 0.01% as the average daily net assets of the Securities Lending Fund increase. All of the fees received by Funds Management are paid to WellsCap for its services as subadviser. The Securities Lending Fund seeks to provide a positive return compared to the daily Fed Funds Open Rate by investing in high-quality, U.S. dollar-denominated short-term money market instruments. Securities Lending Fund investments are valued at the evaluated bid price provided by an independent pricing service. Income earned from investment in the Securities Lending Fund is included in securities lending income from affiliates (net of fees and rebates) on the Statements of Operations.
| | | | |
| 158 | | Wells Fargo Allocation Funds | | Notes to financial statements (unaudited) |
When-issued transactions
Each Portfolio may purchase securities on a forward commitment or when-issued basis. A Portfolio records a when-issued transaction on the trade date and will segregate assets in an amount at least equal in value to the Portfolio’s commitment to purchase when-issued securities. Securities purchased on a when-issued basis are marked-to-market daily and the Portfolio begins earning interest on the settlement date. Losses may arise due to changes in the market value of the underlying securities or if the counterparty does not perform under the contract.
Loans
Each Portfolio may invest in direct debt instruments which are interests in amounts owed to lenders by corporate or other borrowers. The loans pay interest at rates which are periodically reset by reference to a base lending rate plus a spread. Investments in loans may be in the form of participations in loans or assignments of all or a portion of loans from third parties. When the Portfolio purchases participations, it generally has no rights to enforce compliance with terms of the loan agreement with the borrower. As a result, the Portfolio assumes the credit risk of both the borrower and the lender that is selling the participation. When the Portfolio purchases assignments from lenders, it acquires direct rights against the borrower on the loan and may enforce compliance by the borrower with the terms of the loan agreement. Loans may include fully funded term loans or unfunded loan commitments, which are contractual obligations for future funding.
Futures contracts
Each Portfolio may enter into futures contracts and may be subject to interest rate risk or equity price risk in the normal course of pursuing its investment objectives. A Portfolio may buy and sell futures contracts in order to gain exposure to, or protect against, changes in interest rates and security values. The primary risks associated with the use of futures contracts are the imperfect correlation between changes in market values of securities held by the Portfolio and the prices of futures contracts, and the possibility of an illiquid market.
The aggregate principal amounts of the contracts are not recorded in the financial statements. Fluctuations in the value of the contracts are recorded in the Statements of Assets and Liabilities as an asset or liability and in the Statements of Operations as unrealized gains or losses until the contracts are closed, at which point they are recorded as net realized gains or losses on futures contracts. With futures contracts, there is minimal counterparty risk to the Portfolio since futures are exchange traded and the exchange’s clearinghouse, as counterparty to all exchange traded futures, guarantees the futures against default.
TBA sale commitments
Each Portfolio may enter into To Be Announced (“TBA”) sale commitments to hedge its portfolio positions or to sell mortgage-backed securities it owns under delayed delivery arrangements. Proceeds of TBA sale commitments are not received until the contractual settlement date. During the time a TBA sale commitment is outstanding, equivalent deliverable securities or offsetting TBA purchase commitments, which are deliverable on or before the sale commitment date, are held as “cover” for the transaction. Unsettled TBA sale commitments are valued at the current market value of the underlying securities, generally according to the procedures described under “Securities valuation”. The contract is marked-to-market daily and the change in market value is recorded by the Portfolio as an unrealized gain or loss. If the TBA sale commitment is closed through the acquisition of an offsetting purchase commitment, the Portfolio realizes a gain or loss. If the Portfolio delivers securities under the commitment, the Portfolio realizes a gain or a loss
Inflation-indexed bonds and TIPS
Each Portfolio may invest in inflation-indexed bonds, including Treasury inflation-protected securities (TIPS). Inflation-indexed bonds are fixed income securities whose principal value is periodically adjusted according to the rate of inflation. If the index measuring inflation falls, the principal value of inflation-indexed bonds (other than municipal inflation-indexed bonds and certain corporate inflation-indexed bonds) will be adjusted downward, and consequently the interest payable on these securities (calculated with respect to a smaller principal amount) will be reduced. Repayment of the original bond principal upon maturity (as adjusted for inflation) is guaranteed in the case of U.S. Treasury inflation-indexed bonds. For bonds that do not provide a similar guarantee, the adjusted principal value of the bond repaid at maturity may be less than the original principal. The value of inflation-indexed bonds is expected to change in response to changes in real interest rates. Real interest rates are tied to the relationship between nominal interest rates and the rate of inflation. If nominal interest rates increase at a faster rate than inflation, real interest rates may rise, leading to a decrease in value of inflation-indexed bonds. Inflation-indexed bonds, including TIPS, decline in value when real interest rates rise. In certain interest rate environments, such as when real interest rates are rising faster than nominal interest rates, inflation-indexed bonds may experience greater losses than other fixed income securities with similar durations.
Security transactions and income recognition
Securities transactions are recorded on a trade date basis. Realized gains or losses are recorded on the basis of identified cost.
| | | | | | |
| Notes to financial statements (unaudited) | | Wells Fargo Allocation Funds | | | 159 | |
Dividend income is recognized on the ex-dividend date, except for certain dividends from foreign securities which are recorded as soon as the custodian verifies the ex-dividend date.
Interest income is accrued daily and bond discounts are accreted and premiums are amortized daily based on the effective interest method. To the extent debt obligations are placed on non-accrual status, any related interest income may be reduced by writing off interest receivables when the collection of all or a portion of interest has been determined to be doubtful based on consistently applied procedures and the fair value has decreased. If the issuer subsequently resumes interest payments or when the collectability of interest is reasonably assured, the debt obligation is removed from non-accrual status.
Income from foreign securities is recorded net of foreign taxes withheld where recovery of such taxes is not assured.
Federal and other taxes
Each Portfolio is treated as a separate entity for federal income tax purposes. Each Portfolio is not required to pay federal income taxes on their its net investment income and net capital gain as they are treated as partnerships for federal income tax purposes. All interest, dividends, gains and losses of a Portfolio are deemed to have been “passed through” to the interest holders in proportion to their holdings of the Portfolio regardless of whether such interest, dividends and gains have been distributed by the Portfolio.
Each Portfolio’s income tax returns and all financial records supporting those returns for the prior three fiscal years are subject to examination by the federal revenue authority. Management has analyzed each Portfolio’s tax positions taken on federal, state, and foreign tax returns for all open tax years and does not believe that there are any uncertain tax positions that require recognition of a tax liability.
As of November 30, 2017, the aggregate cost of all investments for federal income tax purposes and the unrealized gains (losses) were as follows:
| | | | | | | | | | | | | | | | |
| | | Tax cost | | | Gross unrealized gains | | | Gross unrealized losses | | | Net unrealized
gains (losses) | |
C&B Large Cap Value Portfolio | | $ | 337,269,887 | | | $ | 107,820,240 | | | $ | (11,869,624 | ) | | $ | 95,950,616 | |
Diversified Large Cap Growth Portfolio | | | 57,478,387 | | | | 36,771,433 | | | | (163,060 | ) | | | 36,608,373 | |
Emerging Growth Portfolio | | | 581,001,147 | | | | 292,824,064 | | | | (4,339,078 | ) | | | 288,484,986 | |
International Growth Portfolio | | | 42,096,472 | | | | 8,884,273 | | | | (223,422 | ) | | | 8,660,851 | |
International Value Portfolio | | | 756,728,329 | | | | 152,755,154 | | | | (60,401,072 | ) | | | 92,354,082 | |
Large Company Value Portfolio | | | 60,850,246 | | | | 8,287,561 | | | | (792,412 | ) | | | 7,486,149 | |
Small Company Growth Portfolio | | | 1,543,991,402 | | | | 574,992,701 | | | | (57,111,649 | ) | | | 517,881,052 | |
Small Company Value Portfolio | | | 147,806,459 | | | | 39,399,149 | | | | (5,441,847 | ) | | | 33,957,302 | |
Core Bond Portfolio | | | 6,067,126,333 | | | | 36,355,318 | | | | (48,002,334 | ) | | | (11,647,016 | ) |
Managed Fixed Income Portfolio | | | 106,939,751 | | | | 3,260,870 | | | | (815,335 | ) | | | 2,445,535 | |
Real Return Portfolio | | | 141,628,350 | | | | 3,431,356 | | | | (909,686 | ) | | | 2,521,670 | |
Stable Income Portfolio | | | 23,902,633 | | | | 379,215 | | | | (50,349 | ) | | | 328,866 | |
3. FAIR VALUATION MEASUREMENTS
Fair value measurements of investments are determined within a framework that has established a fair value hierarchy based upon the various data inputs utilized in determining the value of each Portfolio’s investments. The three-level hierarchy gives the highest priority to unadjusted quoted prices in active markets for identical assets or liabilities (Level 1) and the lowest priority to unobservable inputs (Level 3). Each Portfolio’s investments are classified within the fair value hierarchy based on the lowest level of input that is significant to the fair value measurement. The inputs are summarized into three broad levels as follows:
| ∎ | | Level 1 – quoted prices in active markets for identical securities |
| ∎ | | Level 2 – other significant observable inputs (including quoted prices for similar securities, interest rates, prepayment speeds, credit risk, etc.) |
| ∎ | | Level 3 – significant unobservable inputs (including the Portfolio’s own assumptions in determining the fair value of investments) |
| | | | |
| 160 | | Wells Fargo Allocation Funds | | Notes to financial statements (unaudited) |
The inputs or methodologies used for valuing investments in securities are not necessarily an indication of the risk associated with investing in those securities.
The following is a summary of the inputs used in valuing each Portfolio’s assets and liabilities as of November 30, 2017:
| | | | | | | | | | | | | | | | |
| C&B Large Cap Value Portfolio | | Quoted prices
(Level 1) | | | Other significant
observable inputs
(Level 2) | | | Significant
unobservable inputs
(Level 3) | | | Total | |
Assets | | | | | | | | | | | | | | | | |
Investments in: | | | | | | | | | | | | | | | | |
| | | | |
Common stocks | | | | | | | | | | | | | | | | |
Consumer discretionary | | $ | 65,748,351 | | | $ | 0 | | | $ | 0 | | | $ | 65,748,351 | |
Consumer staples | | | 15,376,229 | | | | 0 | | | | 0 | | | | 15,376,229 | |
Energy | | | 23,896,484 | | | | 0 | | | | 0 | | | | 23,896,484 | |
Financials | | | 120,555,322 | | | | 0 | | | | 0 | | | | 120,555,322 | |
Health care | | | 59,449,612 | | | | 0 | | | | 0 | | | | 59,449,612 | |
Industrials | | | 56,367,536 | | | | 0 | | | | 0 | | | | 56,367,536 | |
Information technology | | | 28,797,109 | | | | 0 | | | | 0 | | | | 28,797,109 | |
Materials | | | 20,183,369 | | | | 0 | | | | 0 | | | | 20,183,369 | |
Real estate | | | 6,170,128 | | | | 0 | | | | 0 | | | | 6,170,128 | |
| | | | |
Short-term investments | | | | | | | | | | | | | | | | |
Investment companies | | | 23,303,022 | | | | 0 | | | | 0 | | | | 23,303,022 | |
Investments measured at net asset value* | | | | | | | | | | | | | | | 13,373,341 | |
Total assets | | $ | 419,847,162 | | | $ | 0 | | | $ | 0 | | | $ | 433,220,503 | |
| * | Investments that are measured at fair value using the net asset value per share (or its equivalent) as a practical expedient have not been categorized in the fair value hierarchy. The fair value amount presented in the table is intended to permit reconciliation of the fair value hierarchy to the amounts presented in the Statements of Assets and Liabilities. The Portfolio’s investment in Securities Lending Cash Investment, LLC valued at $13,373,341 does not have a redemption period notice, can be redeemed daily and does not have any unfunded commitments. |
| | | | | | | | | | | | | | | | |
| Diversified Large Cap Growth Portfolio | | Quoted prices
(Level 1) | | | Other significant
observable inputs
(Level 2) | | | Significant
unobservable inputs
(Level 3) | | | Total | |
Assets | | | | | | | | | | | | | | | | |
Investments in: | | | | | | | | | | | | | | | | |
| | | | |
Common stocks | | | | | | | | | | | | | | | | |
Consumer discretionary | | $ | 13,445,142 | | | $ | 0 | | | $ | 0 | | | $ | 13,445,142 | |
Consumer staples | | | 3,098,819 | | | | 0 | | | | 0 | | | | 3,098,819 | |
Energy | | | 2,271,298 | | | | 0 | | | | 0 | | | | 2,271,298 | |
Financials | | | 7,843,769 | | | | 0 | | | | 0 | | | | 7,843,769 | |
Health care | | | 11,163,735 | | | | 0 | | | | 0 | | | | 11,163,735 | |
Industrials | | | 11,187,758 | | | | 0 | | | | 0 | | | | 11,187,758 | |
Information technology | | | 37,527,492 | | | | 0 | | | | 0 | | | | 37,527,492 | |
Materials | | | 3,725,264 | | | | 0 | | | | 0 | | | | 3,725,264 | |
Real estate | | | 1,393,906 | | | | 0 | | | | 0 | | | | 1,393,906 | |
Utilities | | | 531,357 | | | | 0 | | | | 0 | | | | 531,357 | |
| | | | |
Short-term investments | | | | | | | | | | | | | | | | |
Investment companies | | | 784,307 | | | | 0 | | | | 0 | | | | 784,307 | |
Investments measured at net asset value* | | | | | | | | | | | | | | | 1,113,913 | |
Total assets | | $ | 92,972,847 | | | $ | 0 | | | $ | 0 | | | $ | 94,086,760 | |
| * | Investments that are measured at fair value using the net asset value per share (or its equivalent) as a practical expedient have not been categorized in the fair value hierarchy. The fair value amount presented in the table is intended to permit reconciliation of the fair value hierarchy to the amounts presented in the Statements of Assets and Liabilities. The Portfolio’s investment in Securities Lending Cash Investment, LLC valued at $1,113,913 does not have a redemption period notice, can be redeemed daily and does not have any unfunded commitments. |
| | | | | | |
| Notes to financial statements (unaudited) | | Wells Fargo Allocation Funds | | | 161 | |
| | | | | | | | | | | | | | | | |
| Emerging Growth Portfolio | | Quoted prices
(Level 1) | | | Other significant
observable inputs
(Level 2) | | | Significant
unobservable inputs
(Level 3) | | | Total | |
Assets | | | | | | | | | | | | | | | | |
Investments in: | | | | | | | | | | | | | | | | |
| | | | |
Common stocks | | | | | | | | | | | | | | | | |
Consumer discretionary | | $ | 109,882,655 | | | $ | 0 | | | $ | 0 | | | $ | 109,882,655 | |
Energy | | | 13,309,639 | | | | 0 | | | | 0 | | | | 13,309,639 | |
Financials | | | 32,754,037 | | | | 0 | | | | 0 | | | | 32,754,037 | |
Health care | | | 185,133,276 | | | | 0 | | | | 0 | | | | 185,133,276 | |
Industrials | | | 180,929,250 | | | | 0 | | �� | | 0 | | | | 180,929,250 | |
Information technology | | | 286,304,355 | | | | 0 | | | | 0 | | | | 286,304,355 | |
Materials | | | 3,141,600 | | | | 0 | | | | 0 | | | | 3,141,600 | |
| | | | |
Exchage-traded funds | | | 8,516,712 | | | | 0 | | | | 0 | | | | 8,516,712 | |
| | | | |
Short-term investments | | | | | | | | | | | | | | | | |
Investment companies | | | 12,485,937 | | | | 0 | | | | 0 | | | | 12,485,937 | |
Investments measured at net asset value* | | | | | | | | | | | | | | | 37,028,672 | |
Total assets | | $ | 832,457,461 | | | $ | 0 | | | $ | 0 | | | $ | 869,486,133 | |
| * | Investments that are measured at fair value using the net asset value per share (or its equivalent) as a practical expedient have not been categorized in the fair value hierarchy. The fair value amount presented in the table is intended to permit reconciliation of the fair value hierarchy to the amounts presented in the Statements of Assets and Liabilities. The Portfolio’s investment in Securities Lending Cash Investment, LLC valued at $37,028,672 does not have a redemption period notice, can be redeemed daily and does not have any unfunded commitments. |
| | | | |
| 162 | | Wells Fargo Allocation Funds | | Notes to financial statements (unaudited) |
| | | | | | | | | | | | | | | | |
| International Growth Portfolio | | Quoted prices
(Level 1) | | | Other significant
observable inputs
(Level 2) | | | Significant
unobservable inputs
(Level 3) | | | Total | |
Assets | | | | | | | | | | | | | | | | |
Investments in: | | | | | | | | | | | | | | | | |
| | | | |
Common stocks | | | | | | | | | | | | | | | | |
Brazil | | $ | 116,446 | | | $ | 0 | | | $ | 0 | | | $ | 116,446 | |
Canada | | | 1,038,292 | | | | 0 | | | | 0 | | | | 1,038,292 | |
Cayman Islands | | | 566,039 | | | | 0 | | | | 0 | | | | 566,039 | |
Chile | | | 48,942 | | | | 0 | | | | 0 | | | | 48,942 | |
China | | | 2,654,603 | | | | 0 | | | | 0 | | | | 2,654,603 | |
Denmark | | | 52,716 | | | | 0 | | | | 0 | | | | 52,716 | |
France | | | 1,185,734 | | | | 0 | | | | 0 | | | | 1,185,734 | |
Germany | | | 9,971,855 | | | | 0 | | | | 0 | | | | 9,971,855 | |
Hong Kong | | | 1,132,540 | | | | 0 | | | | 0 | | | | 1,132,540 | |
Indonesia | | | 253,648 | | | | 0 | | | | 0 | | | | 253,648 | |
Ireland | | | 1,081,981 | | | | 0 | | | | 0 | | | | 1,081,981 | |
Italy | | | 1,993,900 | | | | 0 | | | | 0 | | | | 1,993,900 | |
Japan | | | 4,633,630 | | | | 0 | | | | 0 | | | | 4,633,630 | |
Netherlands | | | 3,218,540 | | | | 0 | | | | 0 | | | | 3,218,540 | |
Russia | | | 446,311 | | | | 0 | | | | 0 | | | | 446,311 | |
South Africa | | | 269,725 | | | | 0 | | | | 0 | | | | 269,725 | |
South Korea | | | 1,229,739 | | | | 0 | | | | 0 | | | | 1,229,739 | |
Spain | | | 613,409 | | | | 0 | | | | 0 | | | | 613,409 | |
Switzerland | | | 1,400,364 | | | | 0 | | | | 0 | | | | 1,400,364 | |
Taiwan | | | 173,732 | | | | 0 | | | | 0 | | | | 173,732 | |
United Kingdom | | | 6,350,991 | | | | 0 | | | | 0 | | | | 6,350,991 | |
United States | | | 1,173,582 | | | | 0 | | | | 0 | | | | 1,173,582 | |
| | | | |
Participation notes | | | | | | | | | | | | | | | | |
Ireland | | | 0 | | | | 1,260,294 | | | | 0 | | | | 1,260,294 | |
| | | | |
Preferred stocks | | | | | | | | | | | | | | | | |
Germany | | | 582,312 | | | | 0 | | | | 0 | | | | 582,312 | |
| | | | |
Short-term investments | | | | | | | | | | | | | | | | |
Investment companies | | | 9,307,998 | | | | 0 | | | | 0 | | | | 9,307,998 | |
Total assets | | $ | 49,497,029 | | | $ | 1,260,294 | | | $ | 0 | | | $ | 50,757,323 | |
| | | | | | |
| Notes to financial statements (unaudited) | | Wells Fargo Allocation Funds | | | 163 | |
| | | | | | | | | | | | | | | | |
| International Value Portfolio | | Quoted prices
(Level 1) | | | Other significant
observable inputs
(Level 2) | | | Significant
unobservable inputs
(Level 3) | | | Total | |
Assets | | | | | | | | | | | | | | | | |
Investments in: | | | | | | | | | | | | | | | | |
| | | | |
Common stocks | | | | | | | | | | | | | | | | |
Australia | | $ | 45,544,164 | | | $ | 2 | | | $ | 0 | | | $ | 45,544,166 | |
Austria | | | 10,491,189 | | | | 0 | | | | 0 | | | | 10,491,189 | |
Belgium | | | 3,147,375 | | | | 0 | | | | 0 | | | | 3,147,375 | |
Brazil | | | 7,013,561 | | | | 0 | | | | 0 | | | | 7,013,561 | |
Canada | | | 11,024,210 | | | | 0 | | | | 0 | | | | 11,024,210 | |
China | | | 23,076,105 | | | | 0 | | | | 0 | | | | 23,076,105 | |
Denmark | | | 9,836,780 | | | | 0 | | | | 0 | | | | 9,836,780 | |
France | | | 66,666,686 | | | | 0 | | | | 0 | | | | 66,666,686 | |
Germany | | | 70,719,317 | | | | 0 | | | | 0 | | | | 70,719,317 | |
Hong Kong | | | 19,135,440 | | | | 0 | | | | 0 | | | | 19,135,440 | |
India | | | 3,028,221 | | | | 0 | | | | 0 | | | | 3,028,221 | |
Ireland | | | 7,013,997 | | | | 0 | | | | 0 | | | | 7,013,997 | |
Israel | | | 3,766,111 | | | | 0 | | | | 0 | | | | 3,766,111 | |
Italy | | | 20,117,000 | | | | 0 | | | | 0 | | | | 20,117,000 | |
Japan | | | 191,654,824 | | | | 0 | | | | 0 | | | | 191,654,824 | |
Liechtenstein | | | 869,956 | | | | 0 | | | | 0 | | | | 869,956 | |
Malaysia | | | 2,712,825 | | | | 0 | | | | 0 | | | | 2,712,825 | |
Netherlands | | | 27,315,149 | | | | 0 | | | | 0 | | | | 27,315,149 | |
Norway | | | 11,007,114 | | | | 0 | | | | 0 | | | | 11,007,114 | |
Poland | | | 1,280,051 | | | | 0 | | | | 0 | | | | 1,280,051 | |
Portugal | | | 3,532,626 | | | | 0 | | | | 0 | | | | 3,532,626 | |
Russia | | | 10,319,028 | | | | 0 | | | | 0 | | | | 10,319,028 | |
Singapore | | | 7,778,592 | | | | 0 | | | | 0 | | | | 7,778,592 | |
South Africa | | | 3,473,378 | | | | 0 | | | | 0 | | | | 3,473,378 | |
South Korea | | | 21,933,998 | | | | 0 | | | | 0 | | | | 21,933,998 | |
Spain | | | 21,403,444 | | | | 0 | | | | 0 | | | | 21,403,444 | |
Sweden | | | 10,500,178 | | | | 0 | | | | 0 | | | | 10,500,178 | |
Switzerland | | | 52,138,422 | | | | 0 | | | | 0 | | | | 52,138,422 | |
Taiwan | | | 6,106,007 | | | | 0 | | | | 0 | | | | 6,106,007 | |
Thailand | | | 10,986,249 | | | | 0 | | | | 0 | | | | 10,986,249 | |
Turkey | | | 2,599,817 | | | | 0 | | | | 0 | | | | 2,599,817 | |
United Kingdom | | | 123,341,358 | | | | 0 | | | | 0 | | | | 123,341,358 | |
| | | | |
Preferred stocks | | | | | | | | | | | | | | | | |
Brazil | | | 6,530,162 | | | | 0 | | | | 0 | | | | 6,530,162 | |
| | | | |
Short-term investments | | | | | | | | | | | | | | | | |
Investment companies | | | 14,627,964 | | | | 0 | | | | 0 | | | | 14,627,964 | |
Investments measured at net asset value* | | | | | | | | | | | | | | | 18,391,111 | |
Total assets | | $ | 830,691,298 | | | $ | 2 | | | $ | 0 | | | $ | 849,082,411 | |
| * | Investments that are measured at fair value using the net asset value per share (or its equivalent) as a practical expedient have not been categorized in the fair value hierarchy. The fair value amount presented in the table is intended to permit reconciliation of the fair value hierarchy to the amounts presented in the Statements of Assets and Liabilities. The Portfolio’s investment in Securities Lending Cash Investment, LLC valued at $18,391,111 does not have a redemption period notice, can be redeemed daily and does not have any unfunded commitments. |
| | | | |
| 164 | | Wells Fargo Allocation Funds | | Notes to financial statements (unaudited) |
| | | | | | | | | | | | | | | | |
| Large Company Value Portfolio | | Quoted prices
(Level 1) | | | Other significant
observable inputs
(Level 2) | | | Significant
unobservable inputs
(Level 3) | | | Total | |
Assets | | | | | | | | | | | | | | | | |
Investments in: | | | | | | | | | | | | | | | | |
| | | | |
Common stocks | | | | | | | | | | | | | | | | |
Consumer discretionary | | $ | 4,392,895 | | | $ | 0 | | | $ | 0 | | | $ | 4,392,895 | |
Consumer staples | | | 5,541,085 | | | | 0 | | | | 0 | | | | 5,541,085 | |
Energy | | | 7,223,313 | | | | 0 | | | | 0 | | | | 7,223,313 | |
Financials | | | 17,836,398 | | | | 0 | | | | 0 | | | | 17,836,398 | |
Health care | | | 8,539,091 | | | | 0 | | | | 0 | | | | 8,539,091 | |
Industrials | | | 4,415,390 | | | | 0 | | | | 0 | | | | 4,415,390 | |
Information technology | | | 5,648,308 | | | | 0 | | | | 0 | | | | 5,648,308 | |
Materials | | | 1,635,125 | | | | 0 | | | | 0 | | | | 1,635,125 | |
Real estate | | | 5,486,456 | | | | 0 | | | | 0 | | | | 5,486,456 | |
Telecommunication services | | | 1,151,102 | | | | 0 | | | | 0 | | | | 1,151,102 | |
Utilities | | | 5,046,726 | | | | 0 | | | | 0 | | | | 5,046,726 | |
| | | | |
Short-term investments | | | | | | | | | | | | | | | | |
Investment companies | | | 1,379,139 | | | | 0 | | | | 0 | | | | 1,379,139 | |
| | | 68,295,028 | | | | 0 | | | | 0 | | | | 68,295,028 | |
Futures contracts | | | 10,769 | | | | 0 | | | | 0 | | | | 10,769 | |
Total assets | | $ | 68,305,797 | | | $ | 0 | | | $ | 0 | | | $ | 68,305,797 | |
| | | | | | | | | | | | | | | | |
| Small Company Growth Portfolio | | Quoted prices (Level 1) | | | Other significant
observable inputs
(Level 2) | | | Significant
unobservable inputs
(Level 3) | | | Total | |
Assets | | | | | | | | | | | | | | | | |
Investments in: | | | | | | | | | | | | | | | | |
| | | | |
Common stocks | | | | | | | | | | | | | | | | |
Consumer discretionary | | $ | 196,383,580 | | | $ | 0 | | | $ | 0 | | | $ | 196,383,580 | |
Consumer staples | | | 42,256,372 | | | | 0 | | | | 0 | | | | 42,256,372 | |
Energy | | | 22,341,243 | | | | 0 | | | | 0 | | | | 22,341,243 | |
Financials | | | 167,105,275 | | | | 0 | | | | 0 | | | | 167,105,275 | |
Health care | | | 359,208,477 | | | | 0 | | | | 0 | | | | 359,208,477 | |
Industrials | | | 357,882,494 | | | | 0 | | | | 0 | | | | 357,882,494 | |
Information technology | | | 525,175,264 | | | | 0 | | | | 0 | | | | 525,175,264 | |
Materials | | | 65,060,418 | | | | 0 | | | | 0 | | | | 65,060,418 | |
Real estate | | | 22,893,515 | | | | 0 | | | | 0 | | | | 22,893,515 | |
| | | | |
Short-term investments | | | | | | | | | | | | | | | | |
Investment companies | | | 68,328,716 | | | | 0 | | | | 0 | | | | 68,328,716 | |
Investments measured at net asset value* | | | | | | | | | | | | | | | 235,237,100 | |
Total assets | | $ | 1,826,635,354 | | | $ | 0 | | | $ | 0 | | | $ | 2,061,872,454 | |
| * | Investments that are measured at fair value using the net asset value per share (or its equivalent) as a practical expedient have not been categorized in the fair value hierarchy. The fair value amount presented in the table is intended to permit reconciliation of the fair value hierarchy to the amounts presented in the Statements of Assets and Liabilities. The Portfolio’s investment in Securities Lending Cash Investment, LLC valued at $235,237,100 does not have a redemption period notice, can be redeemed daily and does not have any unfunded commitments. |
| | | | | | |
| Notes to financial statements (unaudited) | | Wells Fargo Allocation Funds | | | 165 | |
| | | | | | | | | | | | | | | | |
| Small Company Value Portfolio | | Quoted prices
(Level 1) | | | Other significant
observable inputs
(Level 2) | | | Significant
unobservable inputs
(Level 3) | | | Total | |
Assets | | | | | | | | | | | | | | | | |
Investments in: | | | | | | | | | | | | | | | | |
| | | | |
Common stocks | | | | | | | | | | | | | | | | |
Consumer discretionary | | $ | 30,208,685 | | | $ | 0 | | | $ | 0 | | | $ | 30,208,685 | |
Consumer staples | | | 2,821,743 | | | | 0 | | | | 0 | | | | 2,821,743 | |
Energy | | | 8,538,089 | | | | 0 | | | | 0 | | | | 8,538,089 | |
Financials | | | 45,963,174 | | | | 0 | | | | 0 | | | | 45,963,174 | |
Health care | | | 12,224,920 | | | | 0 | | | | 0 | | | | 12,224,920 | |
Industrials | | | 13,273,305 | | | | 0 | | | | 0 | | | | 13,273,305 | |
Information technology | | | 20,898,045 | | | | 0 | | | | 0 | | | | 20,898,045 | |
Materials | | | 4,743,847 | | | | 0 | | | | 0 | | | | 4,743,847 | |
Real estate | | | 14,668,793 | | | | 0 | | | | 0 | | | | 14,668,793 | |
Utilities | | | 5,853,969 | | | | 0 | | | | 0 | | | | 5,853,969 | |
| | | | |
Short-term investments | | | | | | | | | | | | | | | | |
Investment companies | | | 3,068,712 | | | | 0 | | | | 0 | | | | 3,068,712 | |
Investments measured at net asset value* | | | | | | | | | | | | | | | 19,500,479 | |
Total assets | | $ | 162,263,282 | | | $ | 0 | | | $ | 0 | | | $ | 181,763,761 | |
| * | Investments that are measured at fair value using the net asset value per share (or its equivalent) as a practical expedient have not been categorized in the fair value hierarchy. The fair value amount presented in the table is intended to permit reconciliation of the fair value hierarchy to the amounts presented in the Statements of Assets and Liabilities. The Portfolio’s investment in Securities Lending Cash Investment, LLC valued at $19,500,479 does not have a redemption period notice, can be redeemed daily and does not have any unfunded commitments. |
| | | | | | | | | | | | | | | | |
| Core Bond Portfolio | | Quoted prices (Level 1) | | | Other significant
observable inputs
(Level 2) | | | Significant
unobservable inputs
(Level 3) | | | Total | |
Assets | | | | | | | | | | | | | | | | |
Investments in: | | | | | | | | | | | | | | | | |
| | | | |
Agency securities | | $ | 0 | | | $ | 1,580,320,675 | | | $ | 0 | | | $ | 1,580,320,675 | |
| | | | |
Asset-backed securities | | | 0 | | | | 691,059,356 | | | | 0 | | | | 691,059,356 | |
| | | | |
Corporate bonds and notes | | | 0 | | | | 1,188,666,922 | | | | 0 | | | | 1,188,666,922 | |
| | | | |
Municipal obligations | | | 0 | | | | 35,571,040 | | | | 0 | | | | 35,571,040 | |
| | | | |
Non-agency mortgage-back securities | | | 0 | | | | 317,382,777 | | | | 0 | | | | 317,382,777 | |
| | | | |
U.S. Treasury securities | | | 1,778,289,584 | | | | 0 | | | | 0 | | | | 1,778,289,584 | |
| | | | |
Yankee corporate bonds and notes | | | 0 | | | | 251,357,876 | | | | 0 | | | | 251,357,876 | |
| | | | |
Yankee government bonds | | | 0 | | | | 53,578,548 | | | | 0 | | | | 53,578,548 | |
| | | | |
Short-term investments | | | | | | | | | | | | | | | | |
Investment companies | | | 108,987,187 | | | | 0 | | | | 0 | | | | 108,987,187 | |
Investments measured at net asset value* | | | | | | | | | | | | | | | 50,265,352 | |
Total assets | | $ | 1,887,276,771 | | | $ | 4,117,937,194 | | | $ | 0 | | | $ | 6,055,479,317 | |
| * | Investments that are measured at fair value using the net asset value per share (or its equivalent) as a practical expedient have not been categorized in the fair value hierarchy. The fair value amount presented in the table is intended to permit reconciliation of the fair value hierarchy to the amounts presented in the Statements of Assets and Liabilities. The Portfolio’s investment in Securities Lending Cash Investment, LLC valued at $50,265,352 does not have a redemption period notice, can be redeemed daily and does not have any unfunded commitments. |
| | | | |
| 166 | | Wells Fargo Allocation Funds | | Notes to financial statements (unaudited) |
| | | | | | | | | | | | | | | | |
| Managed Fixed Income Portfolio | | Quoted prices
(Level 1) | | | Other significant
observable inputs
(Level 2) | | | Significant
unobservable inputs
(Level 3) | | | Total | |
Assets | | | | | | | | | | | | | | | | |
Investments in: | | | | | | | | | | | | | | | | |
| | | | |
Agency securities | | $ | 0 | | | $ | 32,890,274 | | | $ | 0 | | | $ | 32,890,274 | |
| | | | |
Asset-backed securities | | | 0 | | | | 2,985,896 | | | | 0 | | | | 2,985,896 | |
| | | | |
Corporate bonds and notes | | | 0 | | | | 36,405,920 | | | | 0 | | | | 36,405,920 | |
| | | | |
Municipal obligations | | | 0 | | | | 9,608,682 | | | | 0 | | | | 9,608,682 | |
| | | | |
Non-agency mortgage-back securities | | | 0 | | | | 12,070,038 | | | | 0 | | | | 12,070,038 | |
| | | | |
U.S. Treasury securities | | | 6,872,696 | | | | 0 | | | | 0 | | | | 6,872,696 | |
| | | | |
Yankee corporate bonds and notes | | | 0 | | | | 6,155,232 | | | | 0 | | | | 6,155,232 | |
| | | | |
Short-term investments | | | | | | | | | | | | | | | | |
Investment companies | | | 2,232,824 | | | | 0 | | | | 0 | | | | 2,232,824 | |
Investments measured at net asset value* | | | | | | | | | | | | | | | 163,724 | |
Total assets | | $ | 9,105,520 | | | $ | 100,116,042 | | | $ | 0 | | | $ | 109,385,286 | |
| * | Investments that are measured at fair value using the net asset value per share (or its equivalent) as a practical expedient have not been categorized in the fair value hierarchy. The fair value amount presented in the table is intended to permit reconciliation of the fair value hierarchy to the amounts presented in the Statements of Assets and Liabilities. The Portfolio’s investment in Securities Lending Cash Investment, LLC valued at $163,724 does not have a redemption period notice, can be redeemed daily and does not have any unfunded commitments. |
| | | | | | | | | | | | | | | | |
| Real Return Portfolio | | Quoted prices
(Level 1) | | | Other significant
observable inputs
(Level 2) | | �� | Significant
unobservable inputs
(Level 3) | | | Total | |
Assets | | | | | | | | | | | | | | | | |
Investments in: | | | | | | | | | | | | | | | | |
| | | | |
Common stocks | | | | | | | | | | | | | | | | |
Consumer discretionary | | $ | 402,456 | | | $ | 0 | | | $ | 0 | | | $ | 402,456 | |
Consumer staples | | | 5,679,161 | | | | 0 | | | | 0 | | | | 5,679,161 | |
Energy | | | 6,337,193 | | | | 0 | | | | 0 | | | | 6,337,193 | |
Health care | | | 943,921 | | | | 0 | | | | 0 | | | | 943,921 | |
Materials | | | 7,387,186 | | | | 0 | | | | 0 | | | | 7,387,186 | |
Real estate | | | 4,430,843 | | | | 0 | | | | 0 | | | | 4,430,843 | |
| | | | |
Corporate bonds and notes | | | 0 | | | | 12,754,253 | | | | 0 | | | | 12,754,253 | |
| | | | |
Loans | | | 0 | | | | 4,874,723 | | | | 121,860 | | | | 4,996,583 | |
| | | | |
Participation notes | | | | | | | | | | | | | | | | |
Financials | | | 0 | | | | 554,465 | | | | 0 | | | | 554,465 | |
| | | | |
U.S. Treasury securities | | | 94,234,230 | | | | 0 | | | | 0 | | | | 94,234,230 | |
| | | | |
Yankee corporate bonds and notes | | | 0 | | | | 1,299,878 | | | | 0 | | | | 1,299,878 | |
| | | | |
Short-term investments | | | | | | | | | | | | | | | | |
Investment companies | | | 4,513,660 | | | | 0 | | | | 0 | | | | 4,513,660 | |
U.S. Treasury securities | | | 49,984 | | | | 0 | | | | 0 | | | | 49,984 | |
Investments measured at net asset value* | | | | | | | | | | | | | | | 562,051 | |
| | | 123,978,634 | | | | 19,483,319 | | | | 121,860 | | | | 144,145,864 | |
Futures contracts | | | 4,375 | | | | 0 | | | | 0 | | | | 4,375 | |
Total assets | | $ | 123,983,009 | | | $ | 19,483,319 | | | $ | 121,860 | | | $ | 144,150,239 | |
Liabilities | | | | | | | | | | | | | | | | |
Futures contracts | | $ | 1,266 | | | $ | 0 | | | $ | 0 | | | $ | 1,266 | |
Total liabilities | | $ | 1,266 | | | $ | 0 | | | $ | 0 | | | $ | 1,266 | |
| * | Investments that are measured at fair value using the net asset value per share (or its equivalent) as a practical expedient have not been categorized in the fair value hierarchy. The fair value amount presented in the table is intended to permit reconciliation of the fair value hierarchy to the amounts presented in the Statements of Assets and Liabilities. The Portfolio’s investment in Securities Lending Cash Investment, LLC valued at $562,051 does not have a redemption period notice, can be redeemed daily and does not have any unfunded commitments. |
| | | | | | |
| Notes to financial statements (unaudited) | | Wells Fargo Allocation Funds | | | 167 | |
| | | | | | | | | | | | | | | | |
| Stable Income Portfolio | | Quoted prices
(Level 1) | | | Other significant
observable inputs
(Level 2) | | | Significant
unobservable inputs
(Level 3) | | | Total | |
Assets | | | | | | | | | | | | | | | | |
Investments in: | | | | | | | | | | | | | | | | |
| | | | |
Agency securities | | $ | 0 | | | $ | 5,512,009 | | | $ | 0 | | | $ | 5,512,009 | |
| | | | |
Asset-backed securities | | | 0 | | | | 5,759,161 | | | | 0 | | | | 5,759,161 | |
| | | | |
Corporate bonds and notes | | | 0 | | | | 6,660,066 | | | | 0 | | | | 6,660,066 | |
| | | | |
Municipal obligations | | | 0 | | | | 930,612 | | | | 0 | | | | 930,612 | |
| | | | |
Non-agency mortgage-backed securities | | | 0 | | | | 280,172 | | | | 0 | | | | 280,172 | |
| | | | |
U.S. Treasury securities | | | 3,254,163 | | | | 0 | | | | 0 | | | | 3,254,163 | |
| | | | |
Yankee corporate bonds and notes | | | 0 | | | | 821,814 | | | | 0 | | | | 821,814 | |
| | | | |
Short-term investments | | | | | | | | | | | | | | | | |
Investment companies | | | 1,009,851 | | | | 0 | | | | 0 | | | | 1,009,851 | |
| | | 4,264,014 | | | | 19,963,834 | | | | 0 | | | | 24,227,848 | |
Futures contracts | | | 2,813 | | | | 0 | | | | 0 | | | | 2,813 | |
Total assets | | $ | 4,266,827 | | | $ | 19,963,834 | | | $ | 0 | | | $ | 24,230,661 | |
Futures contracts are reported at their variation margin at measurement date, which represents the amount due to/from the Portfolios at that date. All other assets and liabilities are reported at their market value at measurement date.
The Portfolios recognize transfers between levels within the fair value hierarchy at the end of the reporting period. At November 30, 2017, the Portfolios, except Real Return Portfolio, did not have any transfers into/out of Level 1, Level 2, or Level 3. Real Return Portfolio did not have any transfers into/out of Level 1 and had no material transfers between Level 2 and Level 3.
4. TRANSACTIONS WITH AFFILIATES AND OTHER EXPENSES
Advisory fee
The Trust has entered into an advisory contract with Funds Management, an indirect wholly owned subsidiary of Wells Fargo. The adviser is responsible for implementing investment policies and guidelines and for supervising the applicable subadvisers, who are responsible for day-to-day portfolio management of the Portfolios. Pursuant to the contract, Funds Management is entitled to receive an annual advisory fee which is calculated based on the average daily net assets of each Portfolio.
Funds Management has retained the services of certain subadvisers to provide daily portfolio management for the Portfolios. Funds Management has engaged Analytic Investors, LLC, Artisan Partners Limited Partnership, Cooke & Bieler, L.P., Galliard Capital Management, Inc., Golden Capital Management, LLC, LSV Asset Management, Peregrine Capital Management, LLC (“Peregrine”), and WellsCap as subadvisers. Analytic Investors, LLC, Galliard Capital Management, Inc., Golden Capital Management, LLC and WellsCap are each affiliates of Funds Management and an indirect wholly owned subsidiary of Wells Fargo. Effective January 1, 2018, Golden Capital Management, LLC merged into WellsCap. Artisan Partners Limited Partnership, Cooke & Bieler, L.P., LSV Asset Management and Peregrine are not affiliates of Funds Management.
The fees for subadvisory services are borne by Funds Management. The subadvisers are each entitled to receive from Funds Management an annual subadvisory fee which is calculated based on the average daily net assets of each Portfolio.
| | | | |
| 168 | | Wells Fargo Allocation Funds | | Notes to financial statements (unaudited) |
The annual advisory and subadvisory fee rates for each Portfolio are as follows:
| | | | | | | | | | | | | | | | | | | | |
| | | Advisory fee | | | Effective rate for the
six month ended November 30, 2017 | | | Subadviser | | Subadvisory fee | |
| | | starting at | | | declining to | | | | | starting at | | declining to | |
C&B Large Cap Value Portfolio | | | 0.65 | % | | | 0.475 | % | | | 0.65 | % | | Cooke & Bieler, L.P. | | 0.38% | | | 0.30 | % |
Diversified Large Cap Growth Portfolio | | | 0.65 | | | | 0.475 | | | | 0.65 | | | WellsCap+ | | 0.30 | | | 0.20 | |
| | | | | | | | | | | | | | Golden Capital Management, LLC+ | | 0.35 | | | 0.30 | |
Emerging Growth Portfolio | | | 0.80 | | | | 0.68 | | | | 0.79 | | | WellsCap | | 0.55 | | | 0.40 | |
International Growth Portfolio | | | 0.80 | | | | 0.65 | | | | 0.80 | | | Artisan Partners Limited Partnership | | 0.80 | | | 0.50 | |
International Value Portfolio | | | 0.80 | | | | 0.65 | | | | 0.78 | | | LSV Asset Management | | 0.35 | | | 0.30 | |
Large Company Value Portfolio | | | 0.35 | | | | 0.30 | | | | 0.35 | | | Analytic Investor, LLC | | 0.25 | | | 0.15 | |
Small Company Growth Portfolio | | | 0.80 | | | | 0.68 | | | | 0.77 | | | Peregrine | | 0.50 | | | 0.45 | |
Small Company Value Portfolio | | | 0.80 | | | | 0.68 | | | | 0.80 | | | Peregrine | | 0.45 | | | 0.40 | |
Core Bond Portfolio | | | 0.40 | * | | | 0.29 | * | | | 0.34 | | | WellsCap | | 0.20 | | | 0.10 | |
Managed Fixed Income Portfolio | | | 0.40 | * | | | 0.29 | * | | | 0.40 | | | Galliard Capital Management, Inc. | | 0.20 | | | 0.10 | |
Real Return Portfolio | | | 0.40 | * | | | 0.29 | * | | | 0.40 | | | WellsCap | | 0.28 | | | 0.18 | |
Stable Income Portfolio | | | 0.30 | | | | 0.225 | | | | 0.30 | | | Galliard Capital Management, Inc. | | 0.15 | | | 0.05 | |
| + | The subadvisory fee is calculated based on the average daily net assets managed by the subadviser. |
| * | Prior to October 1, 2017, the advisory fee started at 0.40% and declined to 0.30% as the average daily net assets increased. |
Funds Management has voluntarily waived and/or reimbursed advisory fees to the extent necessary to maintain certain net operating expense ratios for the Portfolios.
Interfund transactions
The Portfolios may purchase or sell portfolio investment securities to certain other Wells Fargo affiliates pursuant to Rule 17a-7 of the 1940 Act and under procedures adopted by the Board of Trustees. The procedures have been designed to ensure that these interfund transactions, which do not incur broker commissions, are effected at current market prices.
5. INVESTMENT PORTFOLIO TRANSACTIONS
Purchases and sales of investments, excluding short-term securities, for the six months ended November 30, 2017 were as follows:
| | | | | | | | | | | | | | | | |
| | | Purchases at cost | | | Sales proceeds | |
| | U.S. government | | | Non-U.S. government | | | U.S. government | | | Non-U.S. government | |
C&B Large Cap Value Portfolio | | $ | 0 | | | $ | 85,170,599 | | | $ | 0 | | | $ | 68,671,701 | |
Diversified Large Cap Growth Portfolio | | | 0 | | | | 19,290,473 | | | | 0 | | | | 44,890,800 | |
Emerging Growth Portfolio | | | 0 | | | | 205,421,103 | | | | 0 | | | | 272,724,054 | |
International Growth Portfolio | | | 0 | | | | 38,133,834 | | | | 0 | | | | 140,265,171 | |
International Value Portfolio | | | 0 | | | | 66,524,606 | | | | 0 | | | | 43,419,826 | |
Large Company Value Portfolio | | | 0 | | | | 79,623,196 | | | | 0 | | | | 88,551,795 | |
Small Company Growth Portfolio | | | 0 | | | | 281,008,653 | | | | 0 | | | | 342,076,939 | |
Small Company Value Portfolio | | | 0 | | | | 55,445,457 | | | | 0 | | | | 128,763,747 | |
Core Bond Portfolio | | | 14,029,495,466 | | | | 2,082,601,879 | | | | 13,659,733,800 | | | | 1,978,544,495 | |
Managed Fixed Income Portfolio | | | 8,839,241 | | | | 5,462,356 | | | | 5,528,381 | | | | 7,364,383 | |
Real Return Portfolio | | | 47,866,597 | | | | 26,201,535 | | | | 12,956,955 | | | | 7,196,373 | |
Stable Income Portfolio | | | 2,921,081 | | | | 4,323,419 | | | | 1,495,725 | | | | 3,019,482 | |
As of November 30, 2017, Real Return Portfolio had unfunded term loan commitments of $687,109.
| | | | | | |
| Notes to financial statements (unaudited) | | Wells Fargo Allocation Funds | | | 169 | |
6. DERIVATIVE TRANSACTIONS
During the six months ended November 30, 2017, Large Company Value Portfolio used uninvested cash to enter into futures contracts to gain market exposure. During the six months ended November 30, 2017, Real Return Portfolio and Stable Income Portfolio entered into futures contract to speculate on interest rates and to help manage the duration of each portfolio.
The table below discloses the volume of each Portfolio’s derivative transactions during the six months ended November 30, 2017 and any segregated cash on November 30, 2017.
| | | | | | | | | | | | |
| | | Large Company Value Portfolio | | | Real Return
Portfolio | | | Stable Income
Portfolio | |
Average notional balance on long futures | | $ | 1,414,978 | | | $ | 379,974 | | | $ | 0 | |
Average notional balance on short futures | | | 0 | | | | (4,884,432 | ) | | | (1,189,962 | ) |
Segregated cash at November 30, 2017 | | | 150,000 | | | | 0 | | | | 7,000 | |
The receivable and payable for daily variation margin on open futures contracts reflected in the Statements of Assets and Liabilities only represents the current day’s variation margin. The realized gains or losses and change in unrealized gains or losses on derivative instruments are reflected in the Statements of Operations.
For certain types of derivative transactions, the Portfolios have entered into International Swaps and Derivatives Association, Inc. master agreements (“ISDA Master Agreements”) or similar agreements with approved counterparties. The ISDA Master Agreements or similar agreements may have requirements to deliver/deposit securities or cash to/with an exchange or broker-dealer as collateral and allows the Portfolio to offset, with each counterparty, certain derivative financial instrument’s assets and/or liabilities with collateral held or pledged. Collateral requirements differ by type of derivative. Collateral or margin requirements are set by the broker or exchange clearinghouse for exchange traded derivatives while collateral terms are contract specific for over-the-counter traded derivatives. Cash collateral that has been pledged to cover obligations of the Portfolios under ISDA Master Agreements or similar agreements, if any, will be reported separately in the Statements of Assets and Liabilities. Securities pledged as collateral, if any, for the same purpose are noted in the Portfolio of Investments. With respect to balance sheet offsetting, absent an event of default by the counterparty or a termination of the agreement, the reported amounts of financial assets and financial liabilities in the Statements of Assets and Liabilities are not offset across transactions between the Portfolio and the applicable counterparty. A reconciliation of the gross amounts on the Statements of Assets and Liabilities to the net amounts by derivative type, including any collateral exposure, is as follows:
| | | | | | | | | | | | | | | | | | |
| | | Counterparty | | Gross amounts
of assets in the
Statements of
Assets and
Liabilities | | | Amounts
subject to
netting
agreements | | | Collateral
received | | | Net amount
of assets | |
Large Company Value Portfolio | | Morgan Stanley | | $ | 10,769 | | | $ | 0 | | | $ | 0 | | | $ | 10,769 | |
Real Return Portfolio | | JPMorgan | | | 4,375 | | | | (1,266 | ) | | | 0 | | | | 3,109 | |
Stable Income Portfolio | | JPMorgan | | | 2,813 | | | | 0 | | | | 0 | | | | 2,813 | |
| | | | | | | | | | | | | | | | |
| | | Counterparty | | Gross amounts
of liabilities in the
Statements of
Assets and
Liabilities | | Amounts
subject to
netting
agreements | | | Collateral
pledged | | | Net amount
of liabilities | |
Real Return Portfolio | | JPMorgan | | $1,266 | | $ | (1,266 | ) | | $ | 0 | | | $ | 0 | |
7. CONCENTRATION RISK
Concentration risks result from exposure to a limited number of sectors. Portfolios that invest a substantial portion of their assets in a sector may be more affected by changes in that sector than would be a portfolio whose investments are not heavily weighted in any sector. The Portfolio of Investments includes information on each Portfolio’s holdings, including sector composition, country and/or geographical composition as relevant.
| | | | |
| 170 | | Wells Fargo Allocation Funds | | Notes to financial statements (unaudited) |
8. INDEMNIFICATION
Under the Trust’s organizational documents, the officers and Trustees have been granted certain indemnification rights against certain liabilities that may arise out of performance of their duties to the Trust. Additionally, in the normal course of business, the Trust may enter into contracts with service providers that contain a variety of indemnification clauses. The Trust’s maximum exposure under these arrangements is dependent on future claims that may be made against the Portfolios and, therefore, cannot be estimated.
9. REDEMPTION IN-KIND
After the close of business on July 15, 2016, Wells Fargo Emerging Growth Fund, which invests all of its assets in Emerging Growth Portfolio, redeemed assets through an in-kind redemption. In the redemption transaction, Wells Fargo Emerging Growth Fund issued securities which it received from Emerging Growth Portfolio with a value of $80,953,334 along with cash in the amount of $2,716,932. Emerging Growth Portfolio recognized gains in the amount of $30,973,586. The redemption in-kind represented 9.01% of Emerging Growth Portfolio and is reflected on the Statements of Changes in Net Assets.
| | | | | | |
| Other information (unaudited) | | Wells Fargo Allocation Funds | | | 171 | |
BOARD OF TRUSTEES AND OFFICERS
Each of the Trustees and Officers1 listed in the table below acts in identical capacities for each fund in the Wells Fargo family of funds, which consists of 153 mutual funds comprising the Wells Fargo Funds Trust, Wells Fargo Variable Trust, Wells Fargo Master Trust and four closed-end funds (collectively the “Fund Complex”). This table should be read in conjunction with the Prospectus and the Statement of Additional Information2. The mailing address of each Trustee and Officer is 525 Market Street, 12th Floor, San Francisco, CA 94105. Each Trustee and Officer serves an indefinite term, however, each Trustee serves such term until reaching the mandatory retirement age established by the Trustees.
Independent Trustees
| | | | | | |
Name and year of birth | | Position held and length of service* | | Principal occupations during past five years or longer | | Current other public company or
investment company
directorships |
William R. Ebsworth (Born 1957) | | Trustee, since 2015 | | Retired. From 1984 to 2013, equities analyst, portfolio manager, research director and chief investment officer at Fidelity Management and Research Company in Boston, Tokyo, and Hong Kong, and retired in 2013 as Chief Investment Officer of Fidelity Strategic Advisers, Inc. where he led a team of investment professionals managing client assets. Prior thereto, Board member of Hong Kong Securities Clearing Co., Hong Kong Options Clearing Corp., the Thailand International Fund, Ltd., Fidelity Investments Life Insurance Company, and Empire Fidelity Investments Life Insurance Company. Board member of the Forté Foundation (non-profit organization) and the Vincent Memorial Hospital Endowment (non-profit organization), where he serves on the Investment Committee and as a Chair of the Audit Committee. Mr. Ebsworth is a CFA® charterholder. | | Asset Allocation Trust |
Jane A. Freeman** (Born 1953) | | Trustee, since 2015; Chair Liaison, since 2018 | | Retired. From 2012 to 2014 and 1999 to 2008, Chief Financial Officer of Scientific Learning Corporation. From 2008 to 2012, Ms. Freeman provided consulting services related to strategic business projects. Prior to 1999, Portfolio Manager at Rockefeller & Co. and Scudder, Stevens & Clark. Board member of the Harding Loevner Funds from 1996 to 2014, serving as both Lead Independent Director and chair of the Audit Committee. Board member of the Russell Exchange Traded Funds Trust from 2011 to 2012 and the chair of the Audit Committee. Ms. Freeman is a Board Member of Ruth Bancroft Garden (non-profit organization) and the Glimmerglass Festival. She is also an inactive Chartered Financial Analyst. | | Asset Allocation Trust |
Peter G. Gordon*** (Born 1942) | | Trustee, since 1998; Chairman, from 2005 to 2017 | | Co-Founder, Retired Chairman, President and CEO of Crystal Geyser Water Company. Trustee Emeritus, Colby College. | | Asset Allocation Trust |
Isaiah Harris, Jr. (Born 1952) | | Trustee, since 2009 | | Retired. Chairman of the Board of CIGNA Corporation since 2009, and Director since 2005. From 2003 to 2011, Director of Deluxe Corporation. Prior thereto, President and CEO of BellSouth Advertising and Publishing Corp. from 2005 to 2007, President and CEO of BellSouth Enterprises from 2004 to 2005 and President of BellSouth Consumer Services from 2000 to 2003. Emeritus member of the Iowa State University Foundation Board of Governors. Emeritus Member of the Advisory Board of Iowa State University School of Business. Advisory Board Member, Palm Harbor Academy (charter school). Advisory Board Member, Child Evangelism Fellowship (non-profit). Mr. Harris is a certified public accountant (inactive status). | | CIGNA Corporation; Asset Allocation Trust |
Judith M. Johnson (Born 1949) | | Trustee, since 2008; Audit Committee Chairman, since 2008 | | Retired. Prior thereto, Chief Executive Officer and Chief Investment Officer of Minneapolis Employees Retirement Fund from 1996 to 2008. Ms. Johnson is an attorney, certified public accountant and a certified managerial accountant. | | Asset Allocation Trust |
David F. Larcker (Born 1950) | | Trustee, since 2009 | | James Irvin Miller Professor of Accounting at the Graduate School of Business, Stanford University, Director of the Corporate Governance Research Initiative and Senior Faculty of The Rock Center for Corporate Governance since 2006. From 2005 to 2008, Professor of Accounting at the Graduate School of Business, Stanford University. Prior thereto, Ernst & Young Professor of Accounting at The Wharton School, University of Pennsylvania from 1985 to 2005. | | Asset Allocation Trust |
| | | | |
| 172 | | Wells Fargo Allocation Funds | | Other information (unaudited) |
| | | | | | |
Name and year of birth | | Position held and length of service* | | Principal occupations during past five years or longer | | Current other public company or
investment company
directorships |
Olivia S. Mitchell**** (Born 1953) | | Trustee, since 2006; Governance Committee Chairman, since 2018 | | International Foundation of Employee Benefit Plans Professor, Wharton School of the University of Pennsylvania since 1993. Director of Wharton’s Pension Research Council and Boettner Center on Pensions & Retirement Research, and Research Associate at the National Bureau of Economic Research. Previously, Cornell University Professor from 1978 to 1993. | | Asset Allocation Trust |
Timothy J. Penny***** (Born 1951) | | Trustee, since 1996; Chairman, since 2018; Vice Chairman, from 2017 to 2018 | | President and Chief Executive Officer of Southern Minnesota Initiative Foundation, a non-profit organization, since 2007. Member of the Board of Trustees of NorthStar Education Finance, Inc., a non-profit organization, since 2007. | | Asset Allocation Trust |
James G. Polisson****** (Born 1959) | | Trustee, since 2018; Advisory Board Member, from 2017 to 2018 | | Retired. Chief Marketing Officer, Source (ETF) UK Services, Ltd, from 2015 to 2017. From 2012 to 2015, Principal of The Polisson Group, LLC, a management consulting, corporate advisory and principal investing company. Chief Executive Officer and Managing Director at Russell Investments, Global Exchange Traded Funds from 2010 to 2012. Managing Director of Barclays Global Investors from 1998 to 2010 and Global Chief Marketing Officer for iShares and Barclays Global Investors from 2000 to 2010. Trustee of the San Francisco Mechanics’ Institute, a non-profit organization, from 2013 to 2015. Board member of the Russell Exchange Traded Fund Trust from 2011 to 2012. Director of Barclays Global Investors Holdings Deutschland GmbH from 2006 to 2009. Mr. Polisson is an attorney and has a retired status with the Massachusetts and District of Columbia Bar Associations. | | Asset Allocation Trust |
Michael S. Scofield (Born 1943) | | Trustee, since 2010 | | Served on the Investment Company Institute’s Board of Governors and Executive Committee from 2008-2011 as well the Governing Council of the Independent Directors Council from 2006-2011 and the Independent Directors Council Executive Committee from 2008-2011. Trustee of the Evergreen Funds complex (and its predecessors) from 1984 to 2010. Chairman of the Evergreen Funds from 2000-2010. Former Trustee of the Mentor Funds. Retired Attorney, Law Offices of Michael S. Scofield. | | Asset Allocation Trust |
Pamela Wheelock****** (Born 1959) | | Trustee, since 2018; Advisory Board Member, from 2017 to 2018 | | Chief Operating Officer, Twin Cities Habitat for Humanity, since January, 2017. Vice President of University Services, University of Minnesota from 2012 to 2017. Prior thereto, Interim President and Chief Executive Officer of Blue Cross Blue Shield of Minnesota from 2010 to 2011, Chairman of the Board from 2009 to 2011 and Board Director from 2003 to 2015. Vice President, Leadership and Community Engagement, Bush Foundation, Saint Paul, Minnesota (a private foundation) from 2009 to 2011. Executive Vice President and Chief Financial Officer, Minnesota Sports and Entertainment from 2004 to 2009 and Senior Vice President from 2002 to 2004. Commissioner of Finance, State of Minnesota, from 1999 to 2002. Currently on the Board of Directors, Governance Committee and Finance Committee, for the Minnesota Philanthropy Partners (Saint Paul Foundation) since 2012 and Board Chair of the Minnesota Wild Foundation since 2010. | | Asset Allocation Trust |
| * | Length of service dates reflect the Trustee’s commencement of service with the Trust’s predecessor entities, where applicable. |
| ** | Jane Freeman became Chair Liaison effective January 1, 2018. |
| *** | Peter Gordon retired on December 31, 2017. |
| **** | Olivia Mitchell became Chairman of the Governance Committee effective January 1, 2018. |
| ***** | Timothy Penny became Chairman effective January 1, 2018. |
| ****** | James Polisson and Pamela Wheelock each became a Trustee effective January 1, 2018. |
| | | | | | |
| Other information (unaudited) | | Wells Fargo Allocation Funds | | | 173 | |
Officers
| | | | | | |
Name and year of birth | | Position held and length of service | | Principal occupations during past five years or longer | | |
Andrew Owen (Born 1960) | | President, since 2017 | | Executive Vice President of Wells Fargo & Company and Head of Affiliated Managers, Wells Fargo Asset Management, since 2014. In addition, Mr. Owen is currently President, Chief Executive Officer and Director of Wells Fargo Funds Management, LLC since 2017. Prior thereto, Executive Vice President responsible for marketing, investments and product development for Wells Fargo Funds Management, LLC, from 2009 to 2014. | | |
Nancy Wiser1 (Born 1967) | | Treasurer, since 2012 | | Executive Vice President of Wells Fargo Funds Management, LLC since 2011. Chief Operating Officer and Chief Compliance Officer at LightBox Capital Management LLC, from 2008 to 2011. | | |
Jeremy DePalma1 (Born 1974) | | Treasurer, since 2012 | | Senior Vice President of Wells Fargo Funds Management, LLC since 2009. Senior Vice President of Evergreen Investment Management Company, LLC from 2008 to 2010 and head of the Fund Reporting and Control Team within Fund Administration from 2005 to 2010. | | |
C. David Messman (Born 1960) | | Secretary, since 2000; Chief Legal Officer, since 2003 | | Senior Vice President and Secretary of Wells Fargo Funds Management, LLC since 2001. Assistant General Counsel of Wells Fargo Bank, N.A. since 2013 and Vice President and Managing Counsel of Wells Fargo Bank, N.A. from 1996 to 2013. | | |
Michael H. Whitaker (Born 1967) | | Chief Compliance Officer, since 2016 | | Senior Vice President and Chief Compliance Officer since 2016. Senior Vice President and Chief Compliance Officer for Fidelity Investments from 2007 to 2016. | | |
David Berardi (Born 1975) | | Assistant Treasurer, since 2009 | | Vice President of Wells Fargo Funds Management, LLC since 2009. Vice President of Evergreen Investment Management Company, LLC from 2008 to 2010. Manager of Fund Reporting and Control for Evergreen Investment Management Company, LLC from 2004 to 2010. | | |
| 1 | Jeremy DePalma acts as Treasurer of the Growth Balanced Fund, Moderate Balanced Fund, International Growth Portfolio, and International Value Portfolio and Assistant Treasurer of the remaining funds in this shareholder report. In addition, Jeremy DePalma acts as Treasurer of 72 other funds and Assistant Treasurer of 67 other funds in the Fund Complex. Nancy Wiser serves as Treasurer of the remaining funds in this shareholder report as well as 67 other funds in the Fund Complex. |
| 2 | The Statement of Additional Information includes additional information about the Trustees and is available, without charge, upon request, by calling 1-800-222-8222 or by visiting the website at wellsfargofunds.com. |
| | | | |
| 174 | | Wells Fargo Allocation Funds | | List of abbreviations |
The following is a list of common abbreviations for terms and entities that may have appeared in this report.
| ACA | — ACA Financial Guaranty Corporation |
| ADR | — American depositary receipt |
| ADS | — American depositary shares |
| AGC | — Assured Guaranty Corporation |
| AGM | — Assured Guaranty Municipal |
| Ambac | — Ambac Financial Group Incorporated |
| AMT | — Alternative minimum tax |
| BAN | — Bond anticipation notes |
| BHAC | — Berkshire Hathaway Assurance Corporation |
| CAB | — Capital appreciation bond |
| CCAB | — Convertible capital appreciation bond |
| CDA | — Community Development Authority |
| CDO | — Collateralized debt obligation |
| CLO | — Collateralized loan obligation |
| DRIVER | — Derivative inverse tax-exempt receipts |
| DW&P | — Department of Water & Power |
| DWR | — Department of Water Resources |
| ECFA | — Educational & Cultural Facilities Authority |
| EDA | — Economic Development Authority |
| EDFA | — Economic Development Finance Authority |
| ETF | — Exchange-traded fund |
| FDIC | — Federal Deposit Insurance Corporation |
| FFCB | — Federal Farm Credit Banks |
| FGIC | — Financial Guaranty Insurance Corporation |
| FHA | — Federal Housing Administration |
| FHLB | — Federal Home Loan Bank |
| FHLMC | — Federal Home Loan Mortgage Corporation |
| FICO | — The Financing Corporation |
| FNMA | — Federal National Mortgage Association |
| GDR | — Global depositary receipt |
| GNMA | — Government National Mortgage Association |
| HCFR | — Healthcare facilities revenue |
| HEFA | — Health & Educational Facilities Authority |
| HEFAR | — Higher education facilities authority revenue |
| HFA | — Housing Finance Authority |
| HFFA | — Health Facilities Financing Authority |
| HUD | — Department of Housing and Urban Development |
| IDA | — Industrial Development Authority |
| IDAG | — Industrial Development Agency |
| KRW | — Republic of Korea won |
| LIBOR | — London Interbank Offered Rate |
| LIFER | — Long Inverse Floating Exempt Receipts |
| LLC | — Limited liability company |
| LLLP | — Limited liability limited partnership |
| LLP | — Limited liability partnership |
| MBIA | — Municipal Bond Insurance Association |
| MFHR | — Multifamily housing revenue |
| MSTR | — Municipal securities trust receipts |
| MUD | — Municipal Utility District |
| National | — National Public Finance Guarantee Corporation |
| PCFA | — Pollution Control Financing Authority |
| PCL | — Public Company Limited |
| PCR | — Pollution control revenue |
| PFA | — Public Finance Authority |
| PFFA | — Public Facilities Financing Authority |
| PFOTER | — Puttable floating option tax-exempt receipts |
| PJSC | — Public Joint Stock Company |
| plc | — Public limited company |
| PUTTER | — Puttable tax-exempt receipts |
| R&D | — Research & development |
| Radian | — Radian Asset Assurance |
| RAN | — Revenue anticipation notes |
| RDA | — Redevelopment Authority |
| RDFA | — Redevelopment Finance Authority |
| REIT | — Real estate investment trust |
| ROC | — Reset option certificates |
| SAVRS | — Select auction variable rate securities |
| SBA | — Small Business Authority |
| SDR | — Swedish depositary receipt |
| SFHR | — Single-family housing revenue |
| SFMR | — Single-family mortgage revenue |
| SPA | — Standby purchase agreement |
| SPDR | — Standard & Poor’s Depositary Receipts |
| SPEAR | — Short Puttable Exempt Adjustable Receipts |
| STRIPS | — Separate trading of registered interest and |
| TAN | — Tax anticipation notes |
| TIPS | — Treasury inflation-protected securities |
| TRAN | — Tax revenue anticipation notes |
| TTFA | — Transportation Trust Fund Authority |
| TVA | — Tennessee Valley Authority |
This page is intentionally left blank.
This page is intentionally left blank.

For more information
More information about Wells Fargo Funds is available free upon request. To obtain literature, please write, email, visit the Funds’ website, or call:
Wells Fargo Funds
P.O. Box 8266
Boston, MA 02266-8266
Email: fundservice@wellsfargo.com
Website: wellsfargofunds.com
Individual investors: 1-800-222-8222
Retail investment professionals: 1-888-877-9275
Institutional investment professionals: 1-866-765-0778
This report and the financial statements contained herein are submitted for the general information of the shareholders of Wells Fargo Funds. If this report is used for promotional purposes, distribution of the report must be accompanied or preceded by a current prospectus. Before investing, please consider the investment objectives, risks, charges, and expenses of the investment. For a current prospectus and, if available, a summary prospectus, containing this information, call 1-800-222-8222 or visit the Funds’ website at wellsfargofunds.com. Read the prospectus carefully before you invest or send money.
Wells Fargo Asset Management (WFAM) is a trade name used by the asset management businesses of Wells Fargo & Company. Wells Fargo Funds Management, LLC, a wholly owned subsidiary of Wells Fargo & Company, provides investment advisory and administrative services for Wells Fargo Funds. Other affiliates of Wells Fargo & Company provide subadvisory and other services for the funds. The funds are distributed by Wells Fargo Funds Distributor, LLC, Member FINRA, an affiliate of Wells Fargo & Company. Neither Wells Fargo Funds Distributor nor Wells Fargo Funds Management holds fund shareholder accounts or assets. This material is for general informational and educational purposes only and is NOT intended to provide investment advice or a recommendation of any kind—including a recommendation for any specific investment, strategy, or plan.
NOT FDIC INSURED ◾ NO BANK GUARANTEE ◾ MAY LOSE VALUE
© 2017 Wells Fargo Funds Management, LLC. All rights reserved.
| | |
 | | 307648 01-18 SAAFNLD/SAR109 11-17 |
Semi-Annual Report
November 30, 2017

Equity Gateway Funds

| ∎ | | Wells Fargo C&B Large Cap Value Fund |
| ∎ | | Wells Fargo Diversified Equity Fund |
| ∎ | | Wells Fargo Emerging Growth Fund |
| ∎ | | Wells Fargo International Value Fund |
| ∎ | | Wells Fargo Small Company Growth Fund |
| ∎ | | Wells Fargo Small Company Value Fund |

Reduce clutter. Save trees.
Sign up for electronic delivery of prospectuses and shareholder reports at wellsfargo.com/advantagedelivery
Contents
The views expressed and any forward-looking statements are as of November 30, 2017, unless otherwise noted, and are those of the Fund managers and/or Wells Fargo Funds Management, LLC. Discussions of individual securities, or the markets generally, or any Wells Fargo Fund are not intended as individual recommendations. Future events or results may vary significantly from those expressed in any forward-looking statements. The views expressed are subject to change at any time in response to changing circumstances in the market. Wells Fargo Funds Management, LLC and the Fund disclaim any obligation to publicly update or revise any views expressed or forward-looking statements.
NOT FDIC INSURED ◾ NO BANK GUARANTEE ◾ MAY LOSE VALUE
| | | | |
| 2 | | Wells Fargo Equity Gateway Funds | | Letter to shareholders (unaudited) |

Andrew Owen
President
Wells Fargo Funds
In a predominantly improving economic environment, global stocks delivered strong results; bond markets had smaller but positive results as well.
Dear Shareholder:
We are pleased to offer you this semi-annual report for the Wells Fargo Equity Gateway Funds for the six-month period that ended November 30, 2017. In a predominantly improving economic environment, global stocks delivered strong results; bond markets had smaller but positive results as well. U.S. and international stocks returned 10.89% and 9.38%, respectively, for the six-month period, as measured by the S&P 500 Index1 and the MSCI ACWI ex USA Index (Net),2 respectively; within fixed income, the Bloomberg Barclays U.S. Aggregate Bond Index3 returned 0.68% and the Bloomberg Barclays Municipal Bond Index4 returned 0.40%.
Global growth strengthened in June and through the third quarter of 2017, and investment markets generally advanced.
From June through September, most stock markets worldwide moved higher and were at or near all-time highs as September ended. Moderate acceleration in global economic growth was supported by improving corporate earnings, low inflation pressure, and still-low interest rates. Corporate earnings reports were favorable overall as companies continued to benefit from healthy operating leverage. Global commodity prices climbed; oil prices rebounded, partly due to a better balance between supply and demand. While North Korea’s missile launches and nuclear testing raised serious concerns around the world, the heightened geopolitical risk had relatively minimal impact on stock returns.
In the U.S., economic data released in the third quarter reflected a generally healthy economy. Second-quarter economic output grew at a 3.1% annual rate, and consumers displayed more willingness to spend. Meanwhile, after raising the target interest rate by a quarter percentage point in June—to a range of 1.00% to 1.25%—the Federal Reserve (Fed) chose to maintain that target throughout the third quarter, noting that inflation had remained below the Fed’s 2.00% objective. Reflecting continued confidence in the U.S. economy, the Fed also stated the possibility of one more 0.25% increase in the federal funds rate by the end of 2017 and announced plans to begin the process of unwinding its $4.5 trillion portfolio of bonds and other assets in October.
Outside the U.S., stocks in the Asia Pacific region benefited from solid earnings reports and investors’ willingness to take on risk despite the rising tensions between North Korea and the U.S. In Europe, markets were supported by better-than-expected economic growth, which has led to narrowing of the gap between Europe’s growth rate and that of the U.S. In emerging markets, many countries benefited from stronger currencies versus the U.S. dollar. Also, commodity prices were on an upward trajectory, which benefited many companies that rely on natural resources for exports.
| 1 | The S&P 500 Index consists of 500 stocks chosen for market size, liquidity, and industry group representation. It is a market-value-weighted index with each stock’s weight in the index proportionate to its market value. You cannot invest directly in an index. |
| 2 | The Morgan Stanley Capital International (MSCI) All Country World Index (ACWI) ex USA Index (Net) is a free-float-adjusted market-capitalization-weighted index that is designed to measure the equity market performance of developed markets, excluding the United States and Canada. Source: MSCI. MSCI makes no express or implied warranties or representations and shall have no liability whatsoever with respect to any MSCI data contained herein. The MSCI data may not be further redistributed or used as a basis for other indexes or any securities or financial products. This report is not approved, reviewed, or produced by MSCI. You cannot invest directly in an index. |
| 3 | The Bloomberg Barclays U.S. Aggregate Bond Index is a broad-based benchmark that measures the investment-grade, U.S. dollar-denominated, fixed-rate taxable bond market, including Treasuries, government-related and corporate securities, mortgage-backed securities (agency fixed-rate and hybrid adjustable-rate mortgage pass-throughs), asset-backed securities, and commercial mortgage-backed securities. You cannot invest directly in an index. |
| 4 | The Bloomberg Barclays Municipal Bond Index is an unmanaged index composed of long-term tax-exempt bonds with a minimum credit rating of Baa. You cannot invest directly in an index. |
| | | | | | |
| Letter to shareholders (unaudited) | | Wells Fargo Equity Gateway Funds | | | 3 | |
Positive economic and market news generally continued into October and November.
October proved to be a strong month for U.S. stocks. The S&P 500 Index delivered 11 record closes amid rising consumer confidence and signs the economy was continuing to gain momentum, including news in late October that economic output was estimated to have grown at a 3.0% annual rate in the third quarter. At its October meeting, the Fed, in a unanimous vote, left short-term interest rates unchanged but signaled it could make another rate increase before the end of 2017 if the economy remains on track. The Fed also began the process of unwinding its quantitative easing program. Outside the U.S., international stocks generally delivered positive results in October as global economic growth continued to strengthen.
Economic data released in November indicated that the U.S. economy was continuing its steady expansion, even though inflation remained low. The U.S. Bureau of Economic Analysis raised its estimate of third-quarter economic growth to 3.3% during November, consumers increased their spending, and U.S. companies continued to deliver solid earnings gains. As November ended, major U.S. stock indexes climbed to record levels, propelled by investors’ rising confidence that the U.S. Senate would pass its version of a tax-overhaul bill. The optimism led many investors to sell U.S. Treasury bonds in order to purchase stocks, which pushed government bond yields higher. Outside the U.S., stock markets generally delivered favorable monthly results, and economies continued to improve. Within the eurozone, for example, accelerating growth and falling unemployment helped boost the eurozone economic indicator to its highest level in 17 years in November.
Don’t let short-term uncertainty derail long-term investment goals.
Periods of investment uncertainty can present challenges, but experience has taught us that maintaining long-term investment goals can be an effective way to plan for the future. To help you create a sound strategy based on your personal goals and risk tolerance, Wells Fargo Funds offers more than 100 mutual funds spanning a wide range of asset classes and investment styles. Although diversification cannot guarantee an investment profit or prevent losses, we believe it can be an effective way to manage investment risk and potentially smooth out overall portfolio performance. We encourage investors to know their investments and to understand that appropriate levels of risk-taking may unlock opportunities.
Thank you for choosing to invest with Wells Fargo Funds. We appreciate your confidence in us and remain committed to helping you meet your financial needs.
Sincerely,

Andrew Owen
President
Wells Fargo Funds
Although diversification cannot guarantee an investment profit or prevent losses, we believe it can be an effective way to manage investment risk and potentially smooth out overall portfolio performance.
For further information about your Fund, contact your investment professional, visit our website at wellsfargofunds.com, or call us directly at 1-800-222-8222. We are available 24 hours a day, 7 days a week.
| | | | |
| 4 | | Wells Fargo Equity Gateway Funds | | Performance highlights (unaudited) |
Wells Fargo C&B Large Cap Value Fund1
Investment objective
The Fund seeks maximum long-term total return (current income and capital appreciation), consistent with minimizing risk to principal.
Manager
Wells Fargo Funds Management, LLC
Subadviser for the affiliated master portfolio
Cooke & Bieler, L.P.
Portfolio managers
Andrew Armstrong, CFA®
Steve Lyons, CFA®
Michael M. Meyer, CFA®
Edward W. O’Connor, CFA®
R. James O’Neil, CFA®
Mehul Trivedi, CFA®
William Weber, CFA®
Average annual total returns (%) as of November 30, 2017
| | | | | | | | | | | | | | | | | | | | | | | | | | | | | | | | | | |
| | | | | Including sales charge | | | Excluding sales charge | | | Expense ratios2 (%) | |
| | | Inception date | | 1 year | | | 5 year | | | 10 year | | | 1 year | | | 5 year | | | 10 year | | | Gross | | | Net3 | |
| Class A (CBEAX) | | 7-26-2004 | | | 13.45 | | | | 13.64 | | | | 6.35 | | | | 20.35 | | | | 15.00 | | | | 6.99 | | | | 1.24 | | | | 1.08 | |
| Class C (CBECX) | | 7-26-2004 | | | 18.39 | | | | 14.13 | | | | 6.19 | | | | 19.39 | | | | 14.13 | | | | 6.19 | | | | 1.99 | | | | 1.83 | |
| Class R6 (CBEJX)4 | | 10-31-2016 | | | – | | | | – | | | | – | | | | 20.84 | | | | 15.37 | | | | 7.34 | | | | 0.81 | | | | 0.65 | |
| Administrator Class (CBLLX) | | 7-26-2004 | | | – | | | | – | | | | – | | | | 20.45 | | | | 15.18 | | | | 7.18 | | | | 1.16 | | | | 1.00 | |
| Institutional Class (CBLSX) | | 7-26-2004 | | | – | | | | – | | | | – | | | | 20.74 | | | | 15.46 | | | | 7.45 | | | | 0.91 | | | | 0.75 | |
| Russell 1000® Value Index5 | | – | | | – | | | | – | | | | – | | | | 14.83 | | | | 14.17 | | | | 6.84 | | | | – | | | | – | |
Figures quoted represent past performance, which is no guarantee of future results, and do not reflect taxes that a shareholder may pay on fund distributions or the redemption of fund shares. Investment return and principal value of an investment will fluctuate so that an investor’s shares, when redeemed, may be worth more or less than their original cost. Performance shown without sales charges would be lower if sales charges were reflected. Current performance may be lower or higher than the performance data quoted, which assumes the reinvestment of dividends and capital gains. Current month-end performance is available on the Fund’s website, wellsfargofunds.com.
Index returns do not include transaction costs associated with buying and selling securities, any mutual fund fees or expenses, or any taxes. It is not possible to invest directly in an index.
For Class A shares, the maximum front-end sales charge is 5.75%. For Class C shares, the maximum contingent deferred sales charge is 1.00%. Performance including a contingent deferred sales charge assumes the sales charge for the corresponding time period. Class R6, Administrator Class, and Institutional Class shares are sold without a front-end sales charge or contingent deferred sales charge.
Stock values fluctuate in response to the activities of individual companies and general market and economic conditions. Consult the Fund’s prospectus for additional information on these and other risks.
Please see footnotes on page 5.
| | | | | | |
| Performance highlights (unaudited) | | Wells Fargo Equity Gateway Funds | | | 5 | |
Wells Fargo C&B Large Cap Value Fund1 (continued)
| | | | |
| Ten largest holdings (%) as of November 30, 20176 | |
JPMorgan Chase & Company | | | 3.13 | |
AerCap Holdings NV | | | 3.01 | |
Gildan Activewear Incorporated | | | 2.93 | |
Intercontinental Exchange Incorporated | | | 2.81 | |
Berkshire Hathaway Incorporated Class B | | | 2.77 | |
Omnicom Group Incorporated | | | 2.75 | |
Snap-on Incorporated | | | 2.64 | |
State Street Corporation | | | 2.59 | |
Twenty-First Century Fox Incorporated Class A | | | 2.58 | |
Exxon Mobil Corporation | | | 2.52 | |
|
| Sector distribution as of November 30, 20177 |
|
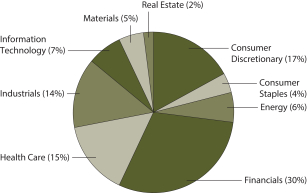 |
| 1 | The Fund is a gateway feeder fund that invests substantially all of its assets in a single affiliated master portfolio of the Wells Fargo Master Trust with a substantially identical investment objective and substantially similar investment strategies. References to the investment activities of the Fund are intended to refer to the investment activities of the affiliated master portfolio in which it invests. |
| 2 | Reflects the expense ratios as stated in the most recent prospectuses. The expense ratios shown are subject to change and may differ from the annualized expense ratios shown in the financial highlights of this report. |
| 3 | The manager has contractually committed through September 30, 2018 to waive fees and/or reimburse expenses to the extent necessary to cap the Fund’s Total Annual Fund Operating Expenses After Fee Waivers at the amounts shown. After this time, the cap may be increased or the commitment to maintain the cap may be terminated only with the approval of the Board of Trustees. Brokerage commissions, stamp duty fees, interest, taxes, and extraordinary expenses are excluded from the expense cap. Net expenses from the affiliated master portfolio are included in the expense cap. Without this cap, the Fund’s returns would have been lower. The expense ratio paid by an investor is the net expense ratio or the Fund’s Total Annual Fund Operating Expenses After Fee Waivers, as stated in the prospectuses. |
| 4 | Historical performance shown for the Class R6 shares prior to their inception reflects the performance of the Institutional Class shares, and includes the higher expenses applicable to Institutional Class shares. If these expenses had not been included, returns for Class R6 shares would be higher. |
| 5 | The Russell 1000® Value Index measures the performance of those Russell 1000 companies with lower price-to-book ratios and lower forecasted growth values. You cannot invest directly in an index. |
| 6 | The ten largest holdings, excluding cash and cash equivalents, are calculated based on the value of the securities of the affiliated master portfolio allocable to the Fund divided by the total net assets of the Fund. Holdings are subject to change and may have changed since the date specified. |
| 7 | Amounts represent the sector distribution of the affiliated master portfolio which are calculated based on the total long-term investments of the affiliated master portfolio. These amounts are subject to change and may have changed since the date specified. |
| | | | |
| 6 | | Wells Fargo Equity Gateway Funds | | Performance highlights (unaudited) |
Wells Fargo Diversified Equity Fund
Investment objective
The Fund seeks long-term total capital appreciation.
Manager
Wells Fargo Funds Management, LLC
Subadvisers for the affiliated master portfolios
Analytic Investors, LLC
Artisan Partners Limited Partnership
Cooke & Bieler, L.P.
Golden Capital Management, LLC
LSV Asset Management
Peregrine Capital Management, LLC
Wells Capital Management Incorporated
Portfolio managers
Thomas C. Biwer, CFA®
Aldo Ceccarelli, CFA®
Erik Sens, CFA®
Average annual total returns (%) as of November 30, 2017
| | | | | | | | | | | | | | | | | | | | | | | | | | | | | | | | | | |
| | | | | Including sales charge | | | Excluding sales charge | | | Expense ratios1 (%) | |
| | | Inception date | | 1 year | | | 5 year | | | 10 year | | | 1 year | | | 5 year | | | 10 year | | | Gross | | | Net2 | |
| Class A (NVDAX) | | 5-2-1996 | | | 16.12 | | | | 11.64 | | | | 5.39 | | | | 23.20 | | | | 12.97 | | | | 6.01 | | | | 1.41 | | | | 1.25 | |
| Class C (WFDEX) | | 10-1-1998 | | | 21.31 | | | | 12.13 | | | | 5.22 | | | | 22.31 | | | | 12.13 | | | | 5.22 | | | | 2.16 | | | | 2.00 | |
| Administrator Class (NVDEX) | | 11-11-1994 | | | – | | | | – | | | | – | | | | 23.48 | | | | 13.25 | | | | 6.28 | | | | 1.33 | | | | 1.00 | |
| Diversified Equity Blended Index3 | | – | | | – | | | | – | | | | – | | | | 22.99 | | | | 14.56 | | | | 7.44 | | | | – | | | | – | |
| MSCI EAFE Index (Net)4 | | – | | | – | | | | – | | | | – | | | | 27.27 | | | | 8.24 | | | | 1.55 | | | | – | | | | – | |
| Russell 1000® Growth Index5 | | – | | | – | | | | – | | | | – | | | | 30.81 | | | | 17.14 | | | | 9.87 | | | | – | | | | – | |
| Russell 1000® Value Index6 | | – | | | – | | | | – | | | | – | | | | 14.83 | | | | 14.17 | | | | 6.84 | | | | – | | | | – | |
| Russell 2000® Index7 | | – | | | – | | | | – | | | | – | | | | 18.34 | | | | 15.02 | | | | 8.75 | | | | – | | | | – | |
| S&P 500 Index8 | | – | | | – | | | | – | | | | – | | | | 22.87 | | | | 15.74 | | | | 8.30 | | | | – | | | | – | |
Figures quoted represent past performance, which is no guarantee of future results, and do not reflect taxes that a shareholder may pay on fund distributions or the redemption of fund shares. Investment return and principal value of an investment will fluctuate so that an investor’s shares, when redeemed, may be worth more or less than their original cost. Performance shown without sales charges would be lower if sales charges were reflected. Current performance may be lower or higher than the performance data quoted, which assumes the reinvestment of dividends and capital gains. Current month-end performance is available on the Fund’s website, wellsfargofunds.com.
Index returns do not include transaction costs associated with buying and selling securities, any mutual fund fees or expenses, or any taxes. It is not possible to invest directly in an index.
For Class A shares, the maximum front-end sales charge is 5.75%. For Class C shares, the maximum contingent deferred sales charge is 1.00%. Performance including a contingent deferred sales charge assumes the sales charge for the corresponding time period. Administrator Class shares are sold without a front-end sales charge or contingent deferred sales charge.
Stock values fluctuate in response to the activities of individual companies and general market and economic conditions. The use of derivatives may reduce returns and/or increase volatility. Certain investment strategies tend to increase the total risk of an investment (relative to the broader market). The Fund is exposed to foreign investment risk and smaller-company securities risk. Consult the Fund’s prospectus for additional information on these and other risks.
Please see footnotes on page 7.
| | | | | | |
| Performance highlights (unaudited) | | Wells Fargo Equity Gateway Funds | | | 7 | |
Wells Fargo Diversified Equity Fund (continued)
| | | | |
| Fund holdings (%) as of November 30, 20179 | |
Wells Fargo Index Portfolio | | | 25.13 | |
Wells Fargo Diversified Large Cap Growth Portfolio | | | 24.95 | |
Wells Fargo Large Company Value Portfolio | | | 16.75 | |
Wells Fargo C&B Large Cap Value Portfolio | | | 8.34 | |
Wells Fargo International Growth Portfolio | | | 7.42 | |
Wells Fargo International Value Portfolio | | | 7.41 | |
Wells Fargo Small Company Value Portfolio | | | 5.07 | |
Wells Fargo Small Company Growth Portfolio | | | 2.52 | |
Wells Fargo Emerging Growth Portfolio | | | 2.50 | |
|
| Neutral target allocation |
|

|
|
| Current target allocation as of November 30, 201710 |
|
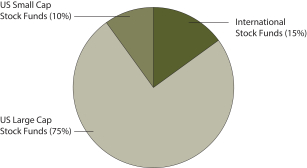 |
| 1 | Reflects the expense ratios as stated in the most recent prospectuses, which include the impact of 0.57% in acquired fund fees and expenses from the affiliated master portfolios. The expense ratios shown are subject to change and may differ from the annualized expense ratios shown in the financial highlights of this report. |
| 2 | The manager has contractually committed through September 30, 2018, to waive fees and/or reimburse expenses to the extent necessary to cap the Fund’s Total Annual Fund Operating Expenses After Fee Waivers at the amounts shown. After this time, the cap may be increased or the commitment to maintain the cap may be terminated only with the approval of the Board of Trustees. Brokerage commissions, stamp duty fees, interest, taxes, and extraordinary expenses are excluded from the expense cap. Acquired fund fees and expenses from the affiliated master portfolios are included in the expense cap. Without this cap, the Fund’s returns would have been lower. The expense ratio paid by an investor is the net expense ratio or the Fund’s Total Annual Fund Operating Expenses After Fee Waivers, as stated in the prospectuses. |
| 3 | Source: Wells Fargo Funds Management, LLC. The Diversified Equity Blended Index is weighted 25% in the S&P 500 Index, 25% in the Russell 1000® Growth Index, 25% in the Russell 1000® Value Index, 15% in the MSCI EAFE Index (Net), and 10% in the Russell 2000® Index. You cannot invest directly in an index. |
| 4 | The Morgan Stanley Capital International (MSCI) Europe, Australasia, Far East (EAFE) Index (Net) is a free-float-adjusted market-capitalization-weighted index that is designed to measure the equity market performance of developed markets, excluding the United States and Canada. The MSCI EAFE Index (Net) consists of the following 21 developed markets country indexes: Australia, Austria, Belgium, Denmark, Finland, France, Germany, Hong Kong, Ireland, Israel, Italy, Japan, the Netherlands, New Zealand, Norway, Portugal, Singapore, Spain, Sweden, Switzerland, and the United Kingdom. Source: MSCI. MSCI makes no express or implied warranties or representations and shall have no liability whatsoever with respect to any MSCI data contained herein. The MSCI data may not be further redistributed or used as a basis for other indexes or any securities or financial products. This report is not approved, reviewed, or produced by MSCI. You cannot invest directly in an index. |
| 5 | The Russell 1000® Growth Index measures the performance of those Russell 1000 companies with higher price-to-book ratios and higher forecasted growth values. You cannot invest directly in an index. |
| 6 | The Russell 1000® Value Index measures the performance of those Russell 1000 companies with lower price-to-book ratios and lower forecasted growth values. You cannot invest directly in an index. |
| 7 | The Russell 2000® Index measures the performance of the 2,000 smallest companies in the Russell 3000® Index, which represents approximately 8% of the total market capitalization of the Russell 3000® Index. You cannot invest directly in an index. |
| 8 | The S&P 500 Index consists of 500 stocks chosen for market size, liquidity, and industry group representation. It is a market-value-weighted index with each stock’s weight in the index proportionate to its market value. You cannot invest directly in an index. |
| 9 | The Fund holdings, excluding cash and cash equivalents, are calculated based on the value of the investments divided by total net assets of the Fund. Holdings are subject to change and may have changed since the date specified. |
| 10 | Current target allocation is subject to change and may have changed since the date specified. |
| | | | |
| 8 | | Wells Fargo Equity Gateway Funds | | Performance highlights (unaudited) |
Wells Fargo Emerging Growth Fund1
Investment objective
The Fund seeks long-term capital appreciation.
Manager
Wells Fargo Funds Management, LLC
Subadviser for the affiliated master portfolio
Wells Capital Management incorporated
Portfolio managers
Joseph M. Eberhardy, CFA®, CPA
Thomas C. Ognar, CFA®
Bruce C. Olson, CFA®
Average annual total returns (%) as of November 30, 20172
| | | | | | | | | | | | | | | | | | | | | | | | | | | | | | | | | | |
| | | | | Including sales charge | | | Excluding sales charge | | | Expense ratios3 (%) | |
| | | Inception date | | 1 year | | | 5 year | | | 10 year | | | 1 year | | | 5 year | | | 10 year | | | Gross | | | Net4 | |
| Class A (WEMAX) | | 3-31-2008 | | | 16.57 | | | | 12.97 | | | | 6.53 | | | | 23.69 | | | | 14.32 | | | | 7.16 | | | | 1.36 | | | | 1.35 | |
| Class C (WEMCX) | | 3-31-2008 | | | 21.72 | | | | 13.47 | | | | 6.36 | | | | 22.72 | | | | 13.47 | | | | 6.36 | | | | 2.11 | | | | 2.10 | |
| Administrator Class (WFGDX) | | 1-31-2007 | | | – | | | | – | | | | – | | | | 23.86 | | | | 14.48 | | | | 7.37 | | | | 1.28 | | | | 1.20 | |
| Institutional Class (WEMIX) | | 3-31-2008 | | | – | | | | – | | | | – | | | | 24.20 | | | | 14.83 | | | | 7.67 | | | | 1.03 | | | | 0.90 | |
| Russell 2000® Growth Index5 | | – | | | – | | | | – | | | | – | | | | 23.69 | | | | 15.84 | | | | 9.25 | | | | – | | | | – | |
Figures quoted represent past performance, which is no guarantee of future results, and do not reflect taxes that a shareholder may pay on fund distributions or the redemption of fund shares. Investment return and principal value of an investment will fluctuate so that an investor’s shares, when redeemed, may be worth more or less than their original cost. Performance shown without sales charges would be lower if sales charges were reflected. Current performance may be lower or higher than the performance data quoted, which assumes the reinvestment of dividends and capital gains. Current month-end performance is available on the Fund’s website, wellsfargofunds.com.
Index returns do not include transaction costs associated with buying and selling securities, any mutual fund fees or expenses, or any taxes. It is not possible to invest directly in an index.
For Class A shares, the maximum front-end sales charge is 5.75%. For Class C shares, the maximum contingent deferred sales charge is 1.00%. Performance including a contingent deferred sales charge assumes the sales charge for the corresponding time period. Administrator Class and Institutional Class shares are sold without a front-end sales charge or contingent deferred sales charge.
Stock values fluctuate in response to the activities of individual companies and general market and economic conditions. Smaller-company stocks tend to be more volatile and less liquid than those of larger companies. Certain investment strategies tend to increase the total risk of an investment (relative to the broader market). The Fund is exposed to foreign investment risk. Consult the Fund’s prospectus for additional information on these and other risks.
Please see footnotes on page 9.
| | | | | | |
| Performance highlights (unaudited) | | Wells Fargo Equity Gateway Funds | | | 9 | |
Wells Fargo Emerging Growth Fund1 (continued)
| | | | |
| Ten largest holdings (%) as of November 30, 20176 | |
On Assignment Incorporated | | | 3.11 | |
Q2 Holdings Incorporated | | | 3.07 | |
InterXion Holding NV | | | 2.97 | |
Proofpoint Incorporated | | | 2.72 | |
WageWorks Incorporated | | | 2.44 | |
Ligand Pharmaceuticals Incorporated | | | 2.42 | |
John Bean Technologies Corporation | | | 2.27 | |
Inogen Incorporated | | | 2.12 | |
Envestnet Incorporated | | | 1.89 | |
HealthEquity Incorporated | | | 1.80 | |
|
| Sector distribution as of November 30, 20177 |
|
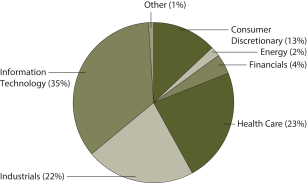
|
| 1 | The Fund is a gateway feeder fund that invests substantially all of its assets in a single affiliated master portfolio of the Wells Fargo Master Trust with a substantially identical investment objective and substantially similar investment strategies. References to the investment activities of the Fund are intended to refer to the investment activities of the affiliated master portfolio in which it invests. |
| 2 | Historical performance shown for Class A shares prior to their inception reflects the performance of the former Investor Class shares, and includes the higher expenses applicable to the former Investor Class shares. If these expenses had not been included, returns for Class A shares would be higher. Historical performance shown for Class C shares prior to their inception reflects the performance of the former Investor Class shares, adjusted to reflect the higher expenses applicable to Class C shares. Historical performance shown for Institutional Class shares prior to their inception reflects the performance of Administrator Class shares, and includes the higher expenses applicable to Administrator Class shares. If these expenses had not been included, returns for Institutional Class shares would be higher. |
| 3 | Reflects the expense ratios as stated in the most recent prospectuses. The expense ratios shown are subject to change and may differ from the annualized expense ratios shown in the financial highlights of this report. |
| 4 | The manager has contractually committed through September 30, 2018, to waive fees and/or reimburse expenses to the extent necessary to cap the Fund’s Total Annual Fund Operating Expenses After Fee Waivers at the amounts shown. After this time, the cap may be increased or the commitment to maintain the cap may be terminated only with the approval of the Board of Trustees. Brokerage commissions, stamp duty fees, interest, taxes, and extraordinary expenses are excluded from the expense cap. Net expenses from the affiliated master portfolio are included in the expense cap. Without this cap, the Fund’s returns would have been lower. The expense ratio paid by an investor is the net expense ratio or the Fund’s Total Annual Fund Operating Expenses After Fee Waivers, as stated in the prospectuses. |
| 5 | The Russell 2000® Growth Index measures the performance of those Russell 2000 companies with higher price-to-book ratios and higher forecasted growth values. You cannot invest directly in an index. |
| 6 | The ten largest holdings, excluding cash and cash equivalents, are calculated based on the value of the securities of the affiliated master portfolio allocable to the Fund divided by the total net assets of the Fund. Holdings are subject to change and may have changed since the date specified. |
| 7 | Amounts represent the sector distribution of the affiliated master portfolio which are calculated based on the total long-term investments of the affiliated master portfolio. These amounts are subject to change and may have changed since the date specified. |
| | | | |
| 10 | | Wells Fargo Equity Gateway Funds | | Performance highlights (unaudited) |
Wells Fargo Index Fund1
Investment objective
The Fund seeks to replicate the total return of S&P 500 Index, before fees and expenses.
Manager
Wells Fargo Funds Management, LLC
Subadviser for the affiliated master portfolio
Wells Capital Management Incorporated
Portfolio managers
John R. Campbell, CFA®
David Neal, CFA®
Robert M. Wicentowski, CFA®
Average annual total returns (%) as of November 30, 20172
| | | | | | | | | | | | | | | | | | | | | | | | | | | | | | | | | | |
| | | | | Including sales charge | | | Excluding sales charge | | | Expense ratios3 (%) | |
| | | Inception date | | 1 year | | | 5 year | | | 10 year | | | 1 year | | | 5 year | | | 10 year | | | Gross | | | Net4 | |
| Class A (WFILX) | | 11-4-1998 | | | 15.31 | | | | 13.82 | | | | 7.12 | | | | 22.35 | | | | 15.17 | | | | 7.76 | | | | 0.62 | | | | 0.45 | |
| Class C (WFINX) | | 4-30-1999 | | | 20.43 | | | | 14.31 | | | | 6.95 | | | | 21.43 | | | | 14.31 | | | | 6.95 | | | | 1.37 | | | | 1.20 | |
| Administrator Class (WFIOX) | | 2-14-1985 | | | – | | | | – | | | | – | | | | 22.59 | | | | 15.47 | | | | 8.05 | | | | 0.39 | | | | 0.25 | |
| S&P 500 Index5 | | – | | | – | | | | – | | | | – | | | | 22.87 | | | | 15.74 | | | | 8.30 | | | | – | | | | – | |
Figures quoted represent past performance, which is no guarantee of future results, and do not reflect taxes that a shareholder may pay on fund distributions or the redemption of fund shares. Investment return and principal value of an investment will fluctuate so that an investor’s shares, when redeemed, may be worth more or less than their original cost. Performance shown without sales charges would be lower if sales charges were reflected. Current performance may be lower or higher than the performance data quoted, which assumes the reinvestment of dividends and capital gains. Current month-end performance is available on the Fund’s website, wellsfargofunds.com.
Index returns do not include transaction costs associated with buying and selling securities, any mutual fund fees or expenses, or any taxes. It is not possible to invest directly in an index.
For Class A shares, the maximum front-end sales charge is 5.75%. For Class C shares, the maximum contingent deferred sales charge is 1.00%. Performance including a contingent deferred sales charge assumes the sales charge for the corresponding time period. Administrator Class shares are sold without a front-end sales charge or contingent deferred sales charge.
Stock values fluctuate in response to the activities of individual companies and general market and economic conditions. The use of derivatives may reduce returns and/or increase volatility. Consult the Fund’s prospectus for additional information on these and other risks.
Please see footnotes on page 11.
| | | | | | |
| Performance highlights (unaudited) | | Wells Fargo Equity Gateway Funds | | | 11 | |
Wells Fargo Index Fund1 (continued)
| | | | |
| Ten largest holdings (%) as of November 30, 20176 | |
Apple Incorporated | | | 3.85 | |
Microsoft Corporation | | | 2.81 | |
Amazon.com Incorporated | | | 2.03 | |
Facebook Incorporated Class A | | | 1.82 | |
Johnson & Johnson | | | 1.62 | |
Berkshire Hathaway Incorporated Class B | | | 1.61 | |
JPMorgan Chase & Company | | | 1.59 | |
Exxon Mobil Corporation | | | 1.53 | |
Alphabet Incorporated Class A | | | 1.34 | |
Alphabet Incorporated Class C | | | 1.34 | |
|
| Sector distribution as of November 30, 20177 |
|
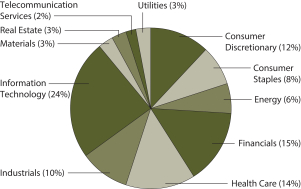
|
| 1 | The Fund is a gateway feeder fund that invests substantially all of its assets in a single affiliated master portfolio of the Wells Fargo Master Trust with a substantially identical investment objective and substantially similar investment strategies. References to the investment activities of the Fund are intended to refer to the investment activities of the affiliated master portfolio in which it invests. |
| 2 | Historical performance shown for all classes of the Fund prior to July 19, 2010, is based on the performance of the Fund’s predecessor, Evergreen Equity Index Fund. |
| 3 | Reflects the expense ratios as stated in the most recent prospectuses. The expense ratios shown are subject to change and may differ from the annualized expense ratios shown in the financial highlights of this report. |
| 4 | The manager has contractually committed through September 30, 2018, to waive fees and/or reimburse expenses to the extent necessary to cap the Fund’s Total Annual Fund Operating Expenses After Fee Waivers at the amounts shown. After this time, the caps may be increased or the commitment to maintain the caps may be terminated only with the approval of the Board of Trustees. Brokerage commissions, stamp duty fees, interest, taxes, and extraordinary expenses are excluded from the expense cap. Net expenses from the affiliated master portfolio are included in the expense cap. Without this cap, the Fund’s returns would have been lower. The expense ratio paid by an investor is the net expense ratio or the Fund’s Total Annual Fund Operating Expenses After Fee Waivers, as stated in the prospectuses. |
| 5 | The S&P 500 Index consists of 500 stocks chosen for market size, liquidity, and industry group representation. It is a market-value-weighted index with each stock’s weight in the index proportionate to its market value. You cannot invest directly in an index. |
| 6 | The ten largest holdings, excluding cash and cash equivalents, are calculated based on the value of the securities of the affiliated master portfolio allocable to the Fund divided by the total net assets of the Fund. Holdings are subject to change and may have changed since the date specified. |
| 7 | Amounts represent the sector distribution of the affiliated master portfolio which are calculated based on the total long-term investments of the affiliated master portfolio. These amounts are subject to change and may have changed since the date specified. |
| | | | |
| 12 | | Wells Fargo Equity Gateway Funds | | Performance highlights (unaudited) |
Wells Fargo International Value Fund1
Investment objective
The Fund seeks long-term capital appreciation.
Manager
Wells Fargo Funds Management, LLC
Subadviser for the affiliated master portfolio
LSV Asset Management
Portfolio managers
Josef Lakonishok, Ph.D
Puneet Mansharamani, CFA®
Menno Vermeulen, CFA®
Average annual total returns (%) as of November 30, 2017
| | | | | | | | | | | | | | | | | | | | | | | | | | | | | | | | | | |
| | | | | Including sales charge | | | Excluding sales charge | | | Expense ratios2 (%) | |
| | | Inception date | | 1 year | | | 5 year | | | 10 year | | | 1 year | | | 5 year | | | 10 year | | | Gross | | | Net3 | |
| Class A (WFFAX) | | 10-31-2003 | | | 19.43 | | | | 6.20 | | | | 0.06 | | | | 26.72 | | | | 7.47 | | | | 0.65 | | | | 1.40 | | | | 1.35 | |
| Class C (WFVCX) | | 4-8-2005 | | | 24.70 | | | | 6.65 | | | | (0.12 | ) | | | 25.70 | | | | 6.65 | | | | (0.12 | ) | | | 2.15 | | | | 2.10 | |
| Administrator Class (WFVDX) | | 4-8-2005 | | | – | | | | – | | | | – | | | | 26.87 | | | | 7.62 | | | | 0.83 | | | | 1.32 | | | | 1.25 | |
| Institutional Class (WFVIX) | | 8-31-2006 | | | – | | | | – | | | | – | | | | 27.12 | | | | 7.90 | | | | 1.06 | | | | 1.07 | | | | 1.00 | |
| MSCI EAFE Value Index (Net)4 | | – | | | – | | | | – | | | | – | | | | 25.08 | | | | 7.47 | | | | 0.75 | | | | – | | | | – | |
Figures quoted represent past performance, which is no guarantee of future results, and do not reflect taxes that a shareholder may pay on fund distributions or the redemption of fund shares. Investment return and principal value of an investment will fluctuate so that an investor’s shares, when redeemed, may be worth more or less than their original cost. Performance shown without sales charges would be lower if sales charges were reflected. Current performance may be lower or higher than the performance data quoted, which assumes the reinvestment of dividends and capital gains. Current month-end performance is available on the Fund’s website, wellsfargofunds.com.
Index returns do not include transaction costs associated with buying and selling securities, any mutual fund fees or expenses, or any taxes. It is not possible to invest directly in an index.
For Class A shares, the maximum front-end sales charge is 5.75%. For Class C shares, the maximum contingent deferred sales charge is 1.00%. Performance including a contingent deferred sales charge assumes the sales charge for the corresponding time period. Administrator Class and Institutional Class shares are sold without a front-end sales charge or contingent deferred sales charge.
Stock values fluctuate in response to the activities of individual companies and general market and economic conditions. Foreign investments are especially volatile and can rise or fall dramatically due to differences in the political and economic conditions of the host country. These risks are generally intensified in emerging markets. The use of derivatives may reduce returns and/or increase volatility. Certain investment strategies tend to increase the total risk of an investment (relative to the broader market). The Fund is exposed to smaller company securities risk. Consult the Fund’s prospectus for additional information on these and other risks.
Please see footnotes on page 13.
| | | | | | |
| Performance highlights (unaudited) | | Wells Fargo Equity Gateway Funds | | | 13 | |
Wells Fargo International Value Fund1 (continued)
| | | | |
| Ten largest holdings (%) as of November 30, 20175 | |
Nippon Telegraph & Telephone Corporation | | | 1.54 | |
Sanofi SA | | | 1.54 | |
Enel SpA | | | 1.32 | |
KDDI Corporation | | | 1.21 | |
Roche Holding AG | | | 1.19 | |
GlaxoSmithKline plc | | | 1.14 | |
BAE Systems plc | | | 1.08 | |
Deutsche Post AG | | | 1.06 | |
Allianz AG | | | 1.00 | |
Swiss Life Holding AG | | | 0.88 | |
|
| Sector distribution as of November 30, 20176 |
|
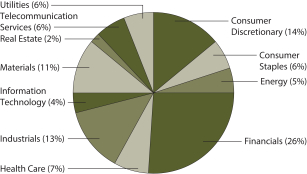
|
|
| Country allocation as of November 30, 20176 |
|
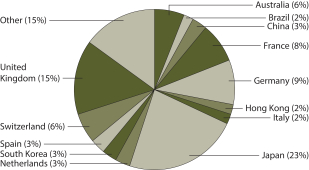 |
| 1 | The Fund is a gateway feeder fund that invests substantially all of its assets in a single affiliated master portfolio of the Wells Fargo Master Trust with a substantially identical investment objective and substantially similar investment strategies. References to the investment activities of the Fund are intended to refer to the investment activities of the affiliated master portfolio in which it invests. |
| 2 | Reflects the expense ratios as stated in the most recent prospectuses. The expense ratios shown are subject to change and may differ from the annualized expense ratios shown in the financial highlights of this report. |
| 3 | The manager has contractually committed through September 30, 2018, to waive fees and/or reimburse expenses to the extent necessary to cap the Fund’s Total Annual Fund Operating Expenses After Fee Waivers at the amounts shown. After this time, the cap may be increased or the commitment to maintain the cap may be terminated only with the approval of the Board of Trustees. Brokerage commissions, stamp duty fees, interest, taxes, and extraordinary expenses are excluded from the expense cap. Net expenses from the affiliated master portfolio are included in the expense cap. Without this cap, the Fund’s returns would have been lower. The expense ratio paid by an investor is the net expense ratio or the Fund’s Total Annual Fund Operating Expenses After Fee Waivers, as stated in the prospectuses. |
| 4 | The Morgan Stanley Capital International (MSCI) Europe, Australasia, and Far East (EAFE) Value Index (Net) is a free-float-adjusted market capitalization-weighted index that is designed to measure the equity market performance of value securities within developed equity markets, excluding the United States and Canada. The MSCI EAFE Value Index (Net) consists of the following 21 developed markets country indexes: Australia, Austria, Belgium, Denmark, Finland, France, Germany, Hong Kong, Ireland, Israel, Italy, Japan, the Netherlands, New Zealand, Norway, Portugal, Singapore, Spain, Sweden, Switzerland, and the United Kingdom. Source: MSCI. MSCI makes no express or implied warranties or representations and shall have no liability whatsoever with respect to any MSCI data contained herein. The MSCI data may not be further redistributed or used as a basis for other indexes or any securities or financial products. This report is not approved, reviewed, or produced by MSCI. You cannot invest directly in an index. |
| 5 | The ten largest holdings, excluding cash and cash equivalents, are calculated based on the value of the securities of the affiliated master portfolio allocable to the Fund divided by the total net assets of the Fund. Holdings are subject to change and may have changed since the date specified. |
| 6 | Amounts represent the composition of the affiliated master portfolio which are calculated based on the total long-term investments of the affiliated master portfolio. These amounts are subject to change and may have changed since the date specified. |
| | | | |
| 14 | | Wells Fargo Equity Gateway Funds | | Performance highlights (unaudited) |
Wells Fargo Small Company Growth Fund1
The Fund is currently closed to most new investors.2
Investment objective
The Fund seeks long-term capital appreciation.
Manager
Wells Fargo Funds Management, LLC
Subadviser for the affiliated master portfolio
Peregrine Capital Management, LLC
Portfolio managers
William A. Grierson, CFA®
Daniel J. Hagen, CFA®
James P. Ross, CFA®
Paul E. von Kuster, CFA®
Average annual total returns (%) as of November 30, 20173
| | | | | | | | | | | | | | | | | | | | | | | | | | | | | | | | | | |
| | | | | Including sales charge | | | Excluding sales charge | | | Expense ratios4 (%) | |
| | | Inception date | | 1 year | | | 5 year | | | 10 year | | | 1 year | | | 5 year | | | 10 year | | | Gross | | | Net5 | |
| Class A (WFSAX) | | 1-30-2004 | | | 12.40 | | | | 13.36 | | | | 8.03 | | | | 19.25 | | | | 14.71 | | | | 8.67 | | | | 1.33 | | | | 1.33 | |
| Class C (WSMCX) | | 1-30-2004 | | | 17.38 | | | | 13.86 | | | | 7.87 | | | | 18.38 | | | | 13.86 | | | | 7.87 | | | | 2.08 | | | | 2.08 | |
| Class R6 (WSCRX) | | 10-31-2014 | | | – | | | | – | | | | – | | | | 19.79 | | | | 15.24 | | | | 9.18 | | | | 0.90 | | | | 0.90 | |
| Administrator Class (NVSCX) | | 11-11-1994 | | | – | | | | – | | | | – | | | | 19.40 | | | | 14.92 | | | | 8.92 | | | | 1.25 | | | | 1.20 | |
| Institutional Class (WSCGX) | | 3-31-2008 | | | – | | | | – | | | | – | | | | 19.72 | | | | 15.20 | | | | 9.16 | | | | 1.00 | | | | 0.95 | |
| Russell 2000® Growth Index6 | | – | | | – | | | | – | | | | – | | | | 23.69 | | | | 15.84 | | | | 9.25 | | | | – | | | | – | |
Figures quoted represent past performance, which is no guarantee of future results, and do not reflect taxes that a shareholder may pay on fund distributions or the redemption of fund shares. Investment return and principal value of an investment will fluctuate so that an investor’s shares, when redeemed, may be worth more or less than their original cost. Performance shown without sales charges would be lower if sales charges were reflected. Current performance may be lower or higher than the performance data quoted, which assumes the reinvestment of dividends and capital gains. Current month-end performance is available on the Fund’s website, wellsfargofunds.com.
Index returns do not include transaction costs associated with buying and selling securities, any mutual fund fees or expenses, or any taxes. It is not possible to invest directly in an index.
For Class A shares, the maximum front-end sales charge is 5.75%. For Class C shares, the maximum contingent deferred sales charge is 1.00%. Performance including a contingent deferred sales charge assumes the sales charge for the corresponding time period. Class R6, Administrator Class, and Institutional Class shares are sold without a front-end sales charge or contingent deferred sales charge.
Stock values fluctuate in response to the activities of individual companies and general market and economic conditions. Smaller-company stocks tend to be more volatile and less liquid than those of larger companies. Certain investment strategies tend to increase the total risk of an investment (relative to the broader market). The Fund is exposed to foreign investment risk. Consult the Fund’s prospectus for additional information on these and other risks.
Please see footnotes on page 15.
| | | | | | |
| Performance highlights (unaudited) | | Wells Fargo Equity Gateway Funds | | | 15 | |
Wells Fargo Small Company Growth Fund1 (continued)
| | | | |
| Ten largest holdings (%) as of November 30, 20177 | |
SS&C Technologies Holdings Incorporated | | | 1.94 | |
PTC Incorporated | | | 1.60 | |
Copart Incorporated | | | 1.55 | |
On Assignment Incorporated | | | 1.47 | |
Cadence Design Systems Incorporated | | | 1.47 | |
Evercore Partners Incorporated Class A | | | 1.40 | |
SVB Financial Group | | | 1.40 | |
Cypress Semiconductor Corporation | | | 1.37 | |
Teradyne Incorporated | | | 1.36 | |
RealPage Incorporated | | | 1.34 | |
|
| Sector distribution as of November 30, 20178 |
|
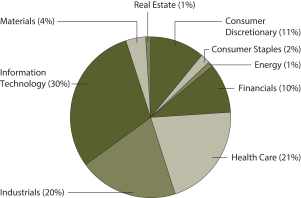 |
| 1 | The Fund is a gateway feeder fund that invests substantially all of its assets in a single affiliated master portfolio of the Wells Fargo Master Trust with a substantially identical investment objective and substantially similar investment strategies. References to the investment activities of the Fund are intended to refer to the investment activities of the affiliated master portfolio in which it invests. |
| 2 | Please see the Fund’s current Statement of Additional Information for further details. |
| 3 | Historical performance shown for Class R6 shares prior to their inception reflects the performance of Institutional Class shares, and includes the higher expenses applicable to Institutional Class shares. If these expenses had not been included, returns for Class R6 shares would be higher. Historical performance shown for Institutional Class shares prior to their inception reflects the performance of Administrator Class shares, and includes the higher expenses applicable to Administrator Class shares. If these expenses had not been included, returns for Institutional Class shares would be higher. |
| 4 | Reflects the expense ratios as stated in the most recent prospectuses. The expense ratios shown are subject to change and may differ from the annualized expense ratios shown in the financial highlights of this report. |
| 5 | The manager has contractually committed through September 30, 2018, to waive fees and/or reimburse expenses to the extent necessary to cap the Fund’s Total Annual Fund Operating Expenses After Fee Waivers at 1.35% for Class A, 2.10% for Class C, 0.90% for Class R6, 1.20% for Administrator Class, and 0.95% for Institutional Class. After this time, the cap may be increased or the commitment to maintain the cap may be terminated only with the approval of the Board of Trustees. Brokerage commissions, stamp duty fees, interest, taxes, and extraordinary expenses are excluded from the expense cap. Net expenses from the affiliated master portfolio are included in the expense cap. Without this cap, the Fund’s returns would have been lower. The expense ratio paid by an investor is the net expense ratio or the Fund’s Total Annual Fund Operating Expenses After Fee Waivers, as stated in the prospectuses. |
| 6 | The Russell 2000® Growth Index measures the performance of those Russell 2000 companies with higher price-to-book ratios and higher forecasted growth values. You cannot invest directly in an index. |
| 7 | The ten largest holdings, excluding cash and cash equivalents, are calculated based on the value of the securities of the affiliated master portfolio allocable to the Fund divided by the total net assets of the Fund. Holdings are subject to change and may have changed since the date specified. |
| 8 | Amounts represent the sector distribution of the affiliated master portfolio which are calculated based on the total long-term investments of the affiliated master portfolio. These amounts are subject to change and may have changed since the date specified. |
| | | | |
| 16 | | Wells Fargo Equity Gateway Funds | | Performance highlights (unaudited) |
Wells Fargo Small Company Value Fund1
Investment objective
The Fund seeks long-term capital appreciation.
Manager
Wells Fargo Funds Management, LLC
Subadviser for the affiliated master portfolio
Peregrine Capital Management, LLC
Portfolio managers
Jason R. Ballsrud, CFA®
Tasso H. Coin, Jr., CFA®
Douglas G. Pugh, CFA®
Average annual total returns (%) as of November 30, 20172
| | | | | | | | | | | | | | | | | | | | | | | | | | | | | | | | | | |
| | | | | Including sales charge | | | Excluding sales charge | | | Expense ratios3 (%) | |
| | | Inception date | | 1 year | | | 5 year | | | 10 year | | | 1 year | | | 5 year | | | 10 year | | | Gross | | | Net4 | |
| Class A (SCVAX) | | 1-31-2002 | | | 10.27 | | | | 12.90 | | | | 8.00 | | | | 17.00 | | | | 14.25 | | | | 8.64 | | | | 1.47 | | | | 1.35 | |
| Class C (SCVFX) | | 8-30-2002 | | | 15.07 | | | | 13.37 | | | | 7.85 | | | | 16.07 | | | | 13.37 | | | | 7.85 | | | | 2.22 | | | | 2.10 | |
| Class R6 (SCVJX) | | 10-31-2016 | | | – | | | | – | | | | – | | | | 17.51 | | | | 14.51 | | | | 8.96 | | | | 1.04 | | | | 0.90 | |
| Administrator Class (SCVIX) | | 1-31-2002 | | | – | | | | – | | | | – | | | | 17.16 | | | | 14.45 | | | | 8.90 | | | | 1.39 | | | | 1.20 | |
| Institutional Class (SCVNX) | | 7-30-2010 | | | – | | | | – | | | | – | | | | 17.35 | | | | 14.67 | | | | 9.06 | | | | 1.14 | | | | 1.00 | |
| Russell 2000® Value Index5 | | – | | | – | | | | – | | | | – | | | | 13.37 | | | | 14.16 | | | | 8.18 | | | | – | | | | – | |
Figures quoted represent past performance, which is no guarantee of future results, and do not reflect taxes that a shareholder may pay on fund distributions or the redemption of fund shares. Investment return and principal value of an investment will fluctuate so that an investor’s shares, when redeemed, may be worth more or less than their original cost. Performance shown without sales charges would be lower if sales charges were reflected. Current performance may be lower or higher than the performance data quoted, which assumes the reinvestment of dividends and capital gains. Current month-end performance is available on the Fund’s website, wellsfargofunds.com.
Index returns do not include transaction costs associated with buying and selling securities, any mutual fund fees or expenses, or any taxes. It is not possible to invest directly in an index.
For Class A shares, the maximum front-end sales charge is 5.75%. For Class C shares, the maximum contingent deferred sales charge is 1.00%. Performance including a contingent deferred sales charge assumes the sales charge for the corresponding time period. Class R6, Administrator Class, and Institutional Class shares are sold without a front-end sales charge or contingent deferred sales charge.
Stock values fluctuate in response to the activities of individual companies and general market and economic conditions. Smaller-company stocks tend to be more volatile and less liquid than those of larger companies. Certain investment strategies tend to increase the total risk of an investment (relative to the broader market). Consult the Fund’s prospectus for additional information on these and other risks.
Please see footnotes on page 17.
| | | | | | |
| Performance highlights (unaudited) | | Wells Fargo Equity Gateway Funds | | | 17 | |
Wells Fargo Small Company Value Fund1 (continued)
| | | | |
| Ten largest holdings (%) as of November 30, 20176 | |
Eldorado Resorts Incorporated | | | 1.65 | |
Cypress Semiconductor Corporation | | | 1.64 | |
Kemper Corporation | | | 1.53 | |
Adtalem Global Education Incorporated | | | 1.50 | |
Visteon Corporation | | | 1.49 | |
Century Communities Incorporated | | | 1.45 | |
Regal Entertainment Group Class A | | | 1.43 | |
Independent Bank Group Incorporated | | | 1.37 | |
Merit Medical Systems Incorporated | | | 1.35 | |
Interface Incorporated | | | 1.33 | |
|
| Sector distribution as of November 30, 20177 |
|
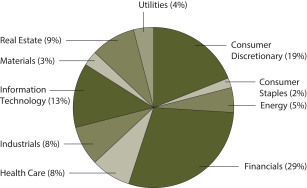
|
| 1 | The Fund is a gateway feeder fund that invests substantially all of its assets in a single affiliated master portfolio of the Wells Fargo Master Trust with a substantially identical investment objective and substantially similar investment strategies. References to the investment activities of the Fund are intended to refer to the investment activities of the affiliated master portfolio in which it invests. |
| 2 | Historical performance shown for the Class R6 shares prior to their inception reflects the performance of the Institutional Class shares, and is not adjusted to reflect Class R6 shares expenses. If these expenses had been included, returns for Class R6 shares would be higher. Historical performance shown for Institutional Class shares prior to their inception reflects the performance of Administrator Class shares and includes the higher expenses applicable to Administrator Class shares. If these expenses had not been included, returns for Institutional Class shares would be higher. |
| 3 | Reflects the expense ratios as stated in the most recent prospectuses. The expense ratios shown are subject to change and may differ from the annualized expense ratios shown in the financial highlights of this report. |
| 4 | The manager has contractually committed through September 30, 2018 to waive fees and/or reimburse expenses to the extent necessary to cap the Fund’s Total Annual Fund Operating Expenses After Fee Waivers at the amounts shown. After this time, the cap may be increased or the commitment to maintain the cap may be terminated only with the approval of the Board of Trustees. Brokerage commissions, stamp duty fees, interest, taxes, and extraordinary expenses are excluded from the expense cap. Net expenses from the affiliated master portfolio are included in the expense cap. Without this cap, the Fund’s returns would have been lower. The expense ratio paid by an investor is the net expense ratio or the Fund’s Total Annual Fund Operating Expenses After Fee Waivers, as stated in the prospectuses. |
| 5 | The Russell 2000® Value Index measures the performance of those Russell 2000 companies with lower price-to-book ratios and lower forecasted growth values. You cannot invest directly in an index. |
| 6 | The ten largest holdings, excluding cash and cash equivalents, are calculated based on the value of the securities of the affiliated master portfolio allocable to the Fund divided by the total net assets of the Fund. Holdings are subject to change and may have changed since the date specified. |
| 7 | Amounts represent the sector distribution of the affiliated master portfolio which are calculated based on the total long-term investments of the affiliated master portfolio. These amounts are subject to change and may have changed since the date specified. |
| | | | |
| 18 | | Wells Fargo Equity Gateway Funds | | Fund expenses (unaudited) |
As a shareholder of the Fund, you incur two types of costs: (1) transaction costs, including sales charges (loads) on purchase payments and contingent deferred sales charges (if any) on redemptions and (2) ongoing costs, including management fees, distribution (12b-1) and/or shareholder servicing fees, and other Fund expenses. This example is intended to help you understand your ongoing costs (in dollars) of investing in the Fund and to compare these costs with the ongoing costs of investing in other mutual funds.
The example is based on an investment of $1,000 invested at the beginning of the six-month period and held for the entire period from June 1, 2017 to November 30, 2017.
Actual expenses
The “Actual” line of the table below provides information about actual account values and actual expenses. You may use the information in this line, together with the amount you invested, to estimate the expenses that you paid over the period. Simply divide your account value by $1,000 (for example, an $8,600 account value divided by $1,000 = 8.6), then multiply the result by the number in the “Actual” line under the heading entitled “Expenses paid during period” for your applicable class of shares to estimate the expenses you paid on your account during this period.
Hypothetical example for comparison purposes
The “Hypothetical” line of the table below provides information about hypothetical account values and hypothetical expenses based on the Fund’s actual expense ratio and an assumed rate of return of 5% per year before expenses, which is not the Fund’s actual return. The hypothetical account values and expenses may not be used to estimate the actual ending account balance or expenses you paid for the period. You may use this information to compare the ongoing costs of investing in the Fund and other funds. To do so, compare this 5% hypothetical example with the 5% hypothetical examples that appear in the shareholder reports of the other funds.
Please note that the expenses shown in the table are meant to highlight your ongoing costs only and do not reflect any transactional costs, such as sales charges (loads) and contingent deferred sales charges. Therefore, the “Hypothetical” line of the table is useful in comparing ongoing costs only and will not help you determine the relative total costs of owning different funds. In addition, if these transactional costs were included, your costs would have been higher.
| | | | | | | | | | | | | | | | |
| C&B Large Cap Value Fund1 | | Beginning
account value
6-1-2017 | | | Ending
account value
11-30-2017 | | | Expenses
paid during
the period2 | | | Annualized net
expense ratio | |
Class A | | | | | | | | | | | | | | | | |
Actual | | $ | 1,000.00 | | | $ | 1,091.47 | | | $ | 5.92 | | | | 1.13 | % |
Hypothetical (5% return before expenses) | | $ | 1,000.00 | | | $ | 1,019.40 | | | $ | 5.72 | | | | 1.13 | % |
Class C | | | | | | | | | | | | | | | | |
Actual | | $ | 1,000.00 | | | $ | 1,087.26 | | | $ | 9.78 | | | | 1.87 | % |
Hypothetical (5% return before expenses) | | $ | 1,000.00 | | | $ | 1,015.69 | | | $ | 9.45 | | | | 1.87 | % |
Class R6 | | | | | | | | | | | | | | | | |
Actual | | $ | 1,000.00 | | | $ | 1,093.21 | | | $ | 3.57 | | | | 0.68 | % |
Hypothetical (5% return before expenses) | | $ | 1,000.00 | | | $ | 1,021.66 | | | $ | 3.45 | | | | 0.68 | % |
Administrator Class | | | | | | | | | | | | | | | | |
Actual | | $ | 1,000.00 | | | $ | 1,091.35 | | | $ | 5.24 | | | | 1.00 | % |
Hypothetical (5% return before expenses) | | $ | 1,000.00 | | | $ | 1,020.05 | | | $ | 5.06 | | | | 1.00 | % |
Institutional Class | | | | | | | | | | | | | | | | |
Actual | | $ | 1,000.00 | | | $ | 1,093.28 | | | $ | 4.09 | | | | 0.78 | % |
Hypothetical (5% return before expenses) | | $ | 1,000.00 | | | $ | 1,021.16 | | | $ | 3.95 | | | | 0.78 | % |
Please see footnotes on page 20.
| | | | | | |
| Fund expenses (unaudited) | | Wells Fargo Equity Gateway Funds | | | 19 | |
| | | | | | | | | | | | | | | | |
| Diversified Equity Fund1 | | Beginning
account value
6-1-2017 | | | Ending
account value
11-30-2017 | | | Expenses
paid during
the period2 | | | Annualized net
expense ratio | |
Class A | | | | | | | | | | | | | | | | |
Actual | | $ | 1,000.00 | | | $ | 1,109.97 | | | $ | 6.61 | | | | 1.25 | % |
Hypothetical (5% return before expenses) | | $ | 1,000.00 | | | $ | 1,018.80 | | | $ | 6.33 | | | | 1.25 | % |
Class C | | | | | | | | | | | | | | | | |
Actual | | $ | 1,000.00 | | | $ | 1,106.11 | | | $ | 10.56 | | | | 2.00 | % |
Hypothetical (5% return before expenses) | | $ | 1,000.00 | | | $ | 1,015.04 | | | $ | 10.10 | | | | 2.00 | % |
Administrator Class | | | | | | | | | | | | | | | | |
Actual | | $ | 1,000.00 | | | $ | 1,111.34 | | | $ | 5.29 | | | | 1.00 | % |
Hypothetical (5% return before expenses) | | $ | 1,000.00 | | | $ | 1,020.05 | | | $ | 5.06 | | | | 1.00 | % |
| Emerging Growth Fund1 | | | | | | | | | | | | |
Class A | | | | | | | | | | | | | | | | |
Actual | | $ | 1,000.00 | | | $ | 1,141.39 | | | $ | 7.25 | | | | 1.35 | % |
Hypothetical (5% return before expenses) | | $ | 1,000.00 | | | $ | 1,018.30 | | | $ | 6.83 | | | | 1.35 | % |
Class C | | | | | | | | | | | | | | | | |
Actual | | $ | 1,000.00 | | | $ | 1,137.05 | | | $ | 11.25 | | | | 2.10 | % |
Hypothetical (5% return before expenses) | | $ | 1,000.00 | | | $ | 1,014.54 | | | $ | 10.61 | | | | 2.10 | % |
Administrator Class | | | | | | | | | | | | | | | | |
Actual | | $ | 1,000.00 | | | $ | 1,142.00 | | | $ | 6.44 | | | | 1.20 | % |
Hypothetical (5% return before expenses) | | $ | 1,000.00 | | | $ | 1,019.05 | | | $ | 6.07 | | | | 1.20 | % |
Institutional Class | | | | | | | | | | | | | | | | |
Actual | | $ | 1,000.00 | | | $ | 1,143.60 | | | $ | 4.84 | | | | 0.90 | % |
Hypothetical (5% return before expenses) | | $ | 1,000.00 | | | $ | 1,020.56 | | | $ | 4.56 | | | | 0.90 | % |
| Index Fund1 | | | | | | | | | | | | |
Class A | | | | | | | | | | | | | | | | |
Actual | | $ | 1,000.00 | | | $ | 1,106.51 | | | $ | 2.38 | | | | 0.45 | % |
Hypothetical (5% return before expenses) | | $ | 1,000.00 | | | $ | 1,022.81 | | | $ | 2.28 | | | | 0.45 | % |
Class C | | | | | | | | | | | | | | | | |
Actual | | $ | 1,000.00 | | | $ | 1,102.37 | | | $ | 6.32 | | | | 1.20 | % |
Hypothetical (5% return before expenses) | | $ | 1,000.00 | | | $ | 1,019.05 | | | $ | 6.07 | | | | 1.20 | % |
Administrator Class | | | | | | | | | | | | | | | | |
Actual | | $ | 1,000.00 | | | $ | 1,107.67 | | | $ | 1.32 | | | | 0.25 | % |
Hypothetical (5% return before expenses) | | $ | 1,000.00 | | | $ | 1,023.82 | | | $ | 1.27 | | | | 0.25 | % |
| International Value Fund1 | | | | | | | | | | | | |
Class A | | | | | | | | | | | | | | | | |
Actual | | $ | 1,000.00 | | | $ | 1,081.32 | | | $ | 7.04 | | | | 1.35 | % |
Hypothetical (5% return before expenses) | | $ | 1,000.00 | | | $ | 1,018.30 | | | $ | 6.83 | | | | 1.35 | % |
Class C | | | | | | | | | | | | | | | | |
Actual | | $ | 1,000.00 | | | $ | 1,077.40 | | | $ | 10.94 | | | | 2.10 | % |
Hypothetical (5% return before expenses) | | $ | 1,000.00 | | | $ | 1,014.54 | | | $ | 10.61 | | | | 2.10 | % |
Administrator Class | | | | | | | | | | | | | | | | |
Actual | | $ | 1,000.00 | | | $ | 1,082.45 | | | $ | 6.53 | | | | 1.25 | % |
Hypothetical (5% return before expenses) | | $ | 1,000.00 | | | $ | 1,018.80 | | | $ | 6.33 | | | | 1.25 | % |
Institutional Class | | | | | | | | | | | | | | | | |
Actual | | $ | 1,000.00 | | | $ | 1,083.78 | | | $ | 5.22 | | | | 1.00 | % |
Hypothetical (5% return before expenses) | | $ | 1,000.00 | | | $ | 1,020.05 | | | $ | 5.06 | | | | 1.00 | % |
Please see footnotes on page 20.
| | | | |
| 20 | | Wells Fargo Equity Gateway Funds | | Fund expenses (unaudited) |
| | | | | | | | | | | | | | | | |
| Small Company Growth Fund1 | | Beginning
account value
6-1-2017 | | | Ending
account value
11-30-2017 | | | Expenses
paid during
the period2 | | | Annualized net
expense ratio | |
Class A | | | | | | | | | | | | | | | | |
Actual | | $ | 1,000.00 | | | $ | 1,125.17 | | | $ | 7.03 | | | | 1.32 | % |
Hypothetical (5% return before expenses) | | $ | 1,000.00 | | | $ | 1,018.45 | | | $ | 6.68 | | | | 1.32 | % |
Class C | | | | | | | | | | | | | | | | |
Actual | | $ | 1,000.00 | | | $ | 1,121.06 | | | $ | 11.01 | | | | 2.07 | % |
Hypothetical (5% return before expenses) | | $ | 1,000.00 | | | $ | 1,014.69 | | | $ | 10.45 | | | | 2.07 | % |
Class R6 | | | | | | | | | | | | | | | | |
Actual | | $ | 1,000.00 | | | $ | 1,127.69 | | | $ | 4.75 | | | | 0.89 | % |
Hypothetical (5% return before expenses) | | $ | 1,000.00 | | | $ | 1,020.61 | | | $ | 4.51 | | | | 0.89 | % |
Administrator Class | | | | | | | | | | | | | | | | |
Actual | | $ | 1,000.00 | | | $ | 1,125.90 | | | $ | 6.40 | | | | 1.20 | % |
Hypothetical (5% return before expenses) | | $ | 1,000.00 | | | $ | 1,019.05 | | | $ | 6.07 | | | | 1.20 | % |
Institutional Class | | | | | | | | | | | | | | | | |
Actual | | $ | 1,000.00 | | | $ | 1,127.43 | | | $ | 5.07 | | | | 0.95 | % |
Hypothetical (5% return before expenses) | | $ | 1,000.00 | | | $ | 1,020.31 | | | $ | 4.81 | | | | 0.95 | % |
| Small Company Value Fund1 | | | | | | | | | | | | |
Class A | | | | | | | | | | | | | | | | |
Actual | | $ | 1,000.00 | | | $ | 1,135.36 | | | $ | 7.23 | | | | 1.35 | % |
Hypothetical (5% return before expenses) | | $ | 1,000.00 | | | $ | 1,018.30 | | | $ | 6.83 | | | | 1.35 | % |
Class C | | | | | | | | | | | | | | | | |
Actual | | $ | 1,000.00 | | | $ | 1,130.84 | | | $ | 11.22 | | | | 2.10 | % |
Hypothetical (5% return before expenses) | | $ | 1,000.00 | | | $ | 1,014.54 | | | $ | 10.61 | | | | 2.10 | % |
Class R6 | | | | | | | | | | | | | | | | |
Actual | | $ | 1,000.00 | | | $ | 1,137.71 | | | $ | 4.82 | | | | 0.90 | % |
Hypothetical (5% return before expenses) | | $ | 1,000.00 | | | $ | 1,020.56 | | | $ | 4.56 | | | | 0.90 | % |
Administrator Class | | | | | | | | | | | | | | | | |
Actual | | $ | 1,000.00 | | | $ | 1,136.57 | | | $ | 6.43 | | | | 1.20 | % |
Hypothetical (5% return before expenses) | | $ | 1,000.00 | | | $ | 1,019.05 | | | $ | 6.07 | | | | 1.20 | % |
Institutional Class | | | | | | | | | | | | | | | | |
Actual | | $ | 1,000.00 | | | $ | 1,136.95 | | | $ | 5.36 | | | | 1.00 | % |
Hypothetical (5% return before expenses) | | $ | 1,000.00 | | | $ | 1,020.05 | | | $ | 5.06 | | | | 1.00 | % |
| 1 | Amounts for the Fund reflect net expenses allocated from the affiliated Master Portfolio(s) in which the Fund invests. |
| 2 | Expenses paid is equal to the annualized net expense ratio of each class multiplied by the average account value over the period, multiplied by the number of days in the most recent fiscal half-year divided by the number of days in the fiscal year (to reflect the one-half-year period). |
| | | | | | |
| Portfolio of investments—November 30, 2017 (unaudited) | | Wells Fargo Equity Gateway Funds | | | 21 | |
C&B LARGE CAP VALUE FUND
| | | | | | | | | | | | | | | | |
| Security name | | | | | | | | | | | Value | |
| | | | |
Investment Companies: 99.87% | | | | | | | | | | | | | | | | |
| | | | |
| Affiliated Master Portfolio: 99.87% | | | | | | | | | | | | | | | | |
Wells Fargo C&B Large Cap Value Portfolio | | | | | | | | | | | | | | $ | 391,212,469 | |
| | | | | | | | | | | | | | | | |
| | | | |
Total Investment Companies (Cost $301,866,089) | | | | | | | | | | | | | | | 391,212,469 | |
| | | | | | | | | | | | | | | | |
| | | | | | | | |
| Total investments in securities (Cost $301,866,089) | | | 99.87 | % | | | 391,212,469 | |
Other assets and liabilities, net | | | 0.13 | | | | 526,715 | |
| | | | | | | | |
| Total net assets | | | 100.00 | % | | $ | 391,739,184 | |
| | | | | | | | |
Transactions with the affiliated Master Portfolio were as follows:
| | | | | | | | | | | | | | | | | | | | | | | | | | | | | | | | | | | | |
| | | % of
ownership, beginning of
period | | | % of
ownership, end of period | | | Net
realized
gains
(losses) on
securities
transactions
allocated
from
affiliated
Master
Portfolio(s) | | | Net
change in
unrealized
gains
(losses) on
securities
transactions
allocated
from
affiliated
Master
Portfolio(s) | | | Dividends
allocated
from
affiliated
Master
Portfolio(s) | | | Affiliated
income
allocated
from
affiliated
Master
Portfolio(s) | | | Securities
lending
income
from
affiliates
allocated
from
affiliated
Master
Portfolio(s) | | | Value,
end
of period | | | % of
net
assets | |
Affiliated Master Portfolio | | | | | | | | | | | | | | | | | | | | | | | | | | | | | | | | | | | | |
Wells Fargo C&B Large Cap Value Portfolio | | | 90 | % | | | 93 | % | | $ | 19,754,588 | | | $ | 10,510,711 | | | $ | 2,862,318 | | | $ | 94,024 | | | $ | 25,422 | | | $ | 391,212,469 | | | | 99.87 | % |
The accompanying notes are an integral part of these financial statements.
| | | | |
| 22 | | Wells Fargo Equity Gateway Funds | | Portfolio of investments—November 30, 2017 (unaudited) |
DIVERSIFIED EQUITY FUND
| | | | | | | | | | | | | | | | |
| Security name | | | | | | | | | | | Value | |
| | | | |
Investment Companies: 100.10% | | | | | | | | | | | | | | | | |
| | | | |
| Affiliated Master Portfolios: 100.10% | | | | | | | | | | | | | | | | |
Wells Fargo C&B Large Cap Value Portfolio | | | | | | | | | | | | | | $ | 15,046,093 | |
Wells Fargo Diversified Large Cap Growth Portfolio | | | | | | | | | | | | | | | 45,002,323 | |
Wells Fargo Emerging Growth Portfolio | | | | | | | | | | | | | | | 4,507,437 | |
Wells Fargo Index Portfolio | | | | | | | | | | | | | | | 45,327,330 | |
Wells Fargo International Growth Portfolio | | | | | | | | | | | | | | | 13,376,905 | |
Wells Fargo International Value Portfolio | | | | | | | | | | | | | | | 13,373,924 | |
Wells Fargo Large Company Value Portfolio | | | | | | | | | | | | | | | 30,217,803 | |
Wells Fargo Small Company Growth Portfolio | | | | | | | | | | | | | | | 4,550,383 | |
Wells Fargo Small Company Value Portfolio | | | | | | | | | | | | | | | 9,147,495 | |
| | | | |
Total Investment Companies (Cost $136,044,858) | | | | | | | | | | | | | | | 180,549,693 | |
| | | | | | | | | | | | | | | | |
| | | | | | | | |
| Total investments in securities (Cost $136,044,858) | | | 100.10 | % | | | 180,549,693 | |
Other assets and liabilities, net | | | (0.10 | ) | | | (183,269 | ) |
| | | | | | | | |
| Total net assets | | | 100.00 | % | | $ | 180,366,424 | |
| | | | | | | | |
Transactions with the affiliated Master Portfolios were as follows:
| | | | | | | | | | | | | | | | | | | | | | | | | | | | | | | | | | | | | | | | |
| | | % of
ownership, beginning of
period | | | % of
ownership, end of
period | | | Net
realized
gains
(losses) on
securities
transactions
allocated
from
affiliated
Master
Portfolio(s) | | | Net
change in
unrealized
gains
(losses) on
securities
transactions
allocated
from
affiliated
Master
Portfolio(s) | | | Dividends
allocated
from
affiliated
Master
Portfolio(s) | | | Affiliated
income
allocated
from
affiliated
Master
Portfolio(s) | | | Securities
lending
income
from
affiliates
allocated
from
affiliated
Master
Portfolio(s) | | | Interest
allocated
from
affiliated
Master
Portfolio(s) | | | Value, end
of period | | | % of
net
assets | |
Affiliated Master Portfolios | | | | | | | | | | | | | | | | | | | | | | | | | | | | | | | | | | | | | | | | |
Wells Fargo C&B Large Cap Value Portfolio | | | 5 | % | | | 4 | % | | $ | 825,354 | | | $ | 483,139 | | | $ | 118,440 | | | $ | 3,874 | | | $ | 1,091 | | | $ | 0 | | | $ | 15,046,093 | | | | | |
Wells Fargo Diversified Large Cap Growth Portfolio | | | 46 | | | | 48 | | | | 4,905,780.00 | | | | 682,807 | | | | 257,029 | | | | 2,000.00 | | | | 1,091 | | | | 0 | | | | 45,002,323 | | | | | |
Wells Fargo Emerging Growth Portfolio | | | 1 | | | | 1 | | | | 324,705 | | | | 312,689 | | | | 4,088 | | | | 294 | | | | 1,353 | | | | 0 | | | | 4,507,437 | | | | | |
Wells Fargo Index Portfolio | | | 2 | | | | 2 | | | | 3,458,611 | | | | 748,421 | | | | 463,629 | | | | 2,140 | | | | 748 | | | | 142 | | | | 45,327,330 | | | | | |
Wells Fargo International Growth Portfolio | | | 11 | | | | 32 | | | | 2,984,791 | | | | (1,668,795 | ) | | | 70,989 | | | | 638 | | | | 2,602 | | | | 0 | | | | 13,376,905 | | | | | |
Wells Fargo International Value Portfolio | | | 2 | | | | 2 | | | | 51169 | | | | 884,029 | | | | 216,290 | | | | 365 | | | | 5,922 | | | | 0 | | | | 13,373,924 | | | | | |
Wells Fargo Large Company Value Portfolio | | | 45 | | | | 44 | | | | 924,932 | | | | 1,818,244 | | | | 308,445 | | | | 2,418.00 | | | | 0 | | | | 90 | | | | 30,217,803 | | | | | |
Wells Fargo Small Company Growth Portfolio | | | 0 | * | | | 0 | * | | | 29,992 | | | | 531,227 | | | | 11,217 | | | | 800 | | | | 2,949 | | | | 0 | | | | 4,550,383 | | | | | |
Wells Fargo Small Company Value Portfolio | | | 4 | | | | 6 | | | | 876,643 | | | | 280,242 | | | | 67,609 | | | | 1,161 | | | | 7,893 | | | | 0 | | | | 9,147,495 | | | | | |
| | | | | | | | | | | | | | | | | | | | | | | | | | | | | | | | | | | | | | | | |
| | | | | | | | | | $ | 14,381,977 | | | $ | 4,072,003 | | | $ | 1,517,736 | | | $ | 13,690 | | | $ | 23,649 | | | $ | 232 | | | $ | 180,549,693 | | | | 100.10 | % |
| | | | | | | | | | | | | | | | | | | | | | | | | | | | | | | | | | | | | | | | |
| * | The amount owned is less than 0.5%. |
The accompanying notes are an integral part of these financial statements.
| | | | | | |
| Portfolios of investments—November 30, 2017 (unaudited) | | Wells Fargo Equity Gateway Funds | | | 23 | |
EMERGING GROWTH FUND
| | | | | | | | | | | | | | | | |
| Security name | | | | | | | | | | | Value | |
| | | | |
Investment Companies: 100.01% | | | | | | | | | | | | | | | | |
| | | | |
| Affiliated Master Portfolio: 100.01% | | | | | | | | | | | | | | | | |
Wells Fargo Emerging Growth Portfolio | | | | | | | | | | | | | | $ | 759,951,603 | |
| | | | | | | | | | | | | | | | |
| | | | |
Total Investment Companies (Cost $507,345,275) | | | | | | | | | | | | | | | 759,951,603 | |
| | | | | | | | | | | | | | | | |
| | | | | | | | |
| Total investments in securities (Cost $507,345,275) | | | 100.01 | % | | | 759,951,603 | |
Other assets and liabilities, net | | | (0.01 | ) | | | (71,191 | ) |
| | | | | | | | |
| Total net assets | | | 100.00 | % | | $ | 759,880,412 | |
| | | | | | | | |
Transactions with the affiliated Master Portfolio were as follows:
| | | | | | | | | | | | | | | | | | | | | | | | | | | | | | | | | | | | |
| | | % of ownership, beginning of period | | | % of ownership, end of period | | | Net realized gains (losses) on securities transactions allocated from affiliated Master Portfolio(s) | | | Net change in unrealized gains (losses) on securities transactions allocated from affiliated Master Portfolio(s) | | | Dividends allocated from affiliated Master Portfolio(s) | | | Affiliated
income allocated from affiliated Master Portfolio(s) | | | Securities
lending
income
from
affiliates
allocated
from
affiliated
Master
Portfolio(s) | | | Value, end of period | | | % of net assets | |
Affiliated Master Portfolio | | | | | | | | | | | | | | | | | | | | | | | | | | | | | | | | | | | | |
Wells Fargo Emerging Growth Portfolio | | | 90 | % | | | 92 | % | | $ | 52,558,829 | | | $ | 48,451,794 | | | $ | 673,130 | | | $ | 48,874 | | | $ | 222,064 | | | $ | 759,951,603 | | | | 100.01 | % |
INDEX FUND
| | | | | | | | | | | | | | | | |
| Security name | | | | | | | | | | | Value | |
| | | | |
Investment Companies: 100.34% | | | | | | | | | | | | | | | | |
| | | | |
| Affiliated Master Portfolio: 100.34% | | | | | | | | | | | | | | | | |
Wells Fargo Index Portfolio | | | | | | | | | | | | | | $ | 1,903,246,091 | |
| | | | | | | | | | | | | | | | |
| | | | |
Total Investment Companies (Cost $515,322,936) | | | | | | | | | | | | | | | 1,903,246,091 | |
| | | | | | | | | | | | | | | | |
| | | | | | | | |
| Total investments in securities (Cost $515,322,936) | | | 100.34 | % | | | 1,903,246,091 | |
Other assets and liabilities, net | | | (0.34 | ) | | | (6,509,931 | ) |
| | | | | | | | |
| Total net assets | | | 100.00 | % | | $ | 1,896,736,160 | |
| | | | | | | | |
Transactions with the affiliated Master Portfolio were as follows:
| | | | | | | | | | | | | | | | | | | | | | | | | | | | | | | | | | | | | | | | |
| | | % of ownership, beginning of period | | | % of ownership, end of period | | | Net realized gains (losses) on securities transactions allocated from affiliated Master Portfolio(s) | | | Net change in unrealized gains (losses) on securities transactions allocated from affiliated Master Portfolio(s) | | | Dividends allocated from affiliated Master Portfolio(s) | | | Affiliated
income
allocated
from
affiliated
Master
Portfolio(s) | | | Securities
lending
income
from
affiliates
allocated
from
affiliated
Master
Portfolio(s) | | | Interest allocated from affiliated Master Portfolio(s) | | | Value, end of period | | | % of net assets | |
Affiliated Master Portfolio | | | | | | | | | | | | | | | | | | | | | | | | | | | | | | | | | | | | | | | | |
Wells Fargo Index Portfolio | | | 95 | % | | | 98 | % | | $ | 144,556,106 | | | $ | 30,340,353 | | | $ | 19,349,982 | | | $ | 89,339 | | | $ | 31,194 | | | $ | 5,917 | | | $ | 1,903,246,091 | | | | 100.34 | % |
The accompanying notes are an integral part of these financial statements.
| | | | |
| 24 | | Wells Fargo Equity Gateway Funds | | Portfolios of investments—November 30, 2017 (unaudited) |
INTERNATIONAL VALUE FUND
| | | | | | | | | | | | | | | | |
| Security name | | | | | | | | | | | Value | |
| | | | |
Investment Companies: 99.84% | | | | | | | | | | | | | | | | |
| | | | |
| Affiliated Master Portfolio: 99.84% | | | | | | | | | | | | | | | | |
Wells Fargo International Value Portfolio | | | | | | | | | | | | | | $ | 796,570,457 | |
| | | | | | | | | | | | | | | | |
| | | | |
Total Investment Companies (Cost $704,918,282) | | | | | | | | | | | | | | | 796,570,457 | |
| | | | | | | | | | | | | | | | |
| | | | | | | | |
| Total investments in securities (Cost $704,918,282) | | | 99.84 | % | | | 796,570,457 | |
Other assets and liabilities, net | | | 0.16 | | | | 1,240,967 | |
| | | | | | | | |
| Total net assets | | | 100.00 | % | | $ | 797,811,424 | |
| | | | | | | | |
Transactions with the affiliated Master Portfolio were as follows:
| | | | | | | | | | | | | | | | | | | | | | | | | | | | | | | | | | | | |
| | | % of
ownership, beginning of
period | | | % of
ownership, end of
period | | | Net
realized
gains
(losses) on
securities
transactions
allocated
from
affiliated
Master
Portfolio(s) | | | Net
change in
unrealized
gains
(losses) on
securities
transactions
allocated
from
affiliated
Master
Portfolio(s) | | | Dividends
allocated
from
affiliated
Master
Portfolio(s) | | | Affiliated
income
allocated
from
affiliated
Master
Portfolio(s) | | | Securities
lending
income
from
affiliates
allocated
from
affiliated
Master
Portfolio(s) | | | Value, end
of period | | | % of
net
assets | |
Affiliated Master Portfolio | | | | | | | | | | | | | | | | | | | | | | | | | | | | | | | | | | | | |
Wells Fargo International Value Portfolio | | | 96 | % | | | 95 | % | | $ | 2,898,280 | | | $ | 49,993,854 | | | $ | 11,991,939 | | | $ | 20,506 | | | $ | 316,638 | | | $ | 796,570,457 | | | | 99.84 | % |
SMALL COMPANY GROWTH FUND
| | | | | | | | | | | | | | | | |
| Security name | | | | | | | | | | | Value | |
| | | | |
Investment Companies: 99.99% | | | | | | | | | | | | | | | | |
| | | | |
| Affiliated Master Portfolio: 99.99% | | | | | | | | | | | | | | | | |
Wells Fargo Small Company Growth Portfolio | | | | | | | | | | | | | | $ | 1,818,949,157 | |
| | | | | | | | | | | | | | | | |
| | | | |
Total Investment Companies (Cost $1,328,835,953) | | | | | | | | | | | | | | | 1,818,949,157 | |
| | | | | | | | | | | | | | | | |
| | | | | | | | |
| Total investments in securities (Cost $1,328,835,953) | | | 99.99 | % | | | 1,818,949,157 | |
Other assets and liabilities, net | | | 0.01 | | | | 138,066 | |
| | | | | | | | |
| Total net assets | | | 100.00 | % | | $ | 1,819,087,223 | |
| | | | | | | | |
Transactions with the affiliated Master Portfolio were as follows:
| | | | | | | | | | | | | | | | | | | | | | | | | | | | | | | | | | | | |
| | | % of
ownership, beginning of
period | | | % of
ownership, end of
period | | | Net
realized
gains
(losses) on
securities
transactions
allocated
from
affiliated
Master
Portfolio(s) | | | Net
change in
unrealized
gains
(losses) on
securities
transactions
allocated
from
affiliated
Master
Portfolio(s) | | | Dividends
allocated
from
affiliated
Master
Portfolio(s) | | | Affiliated
income
allocated
from
affiliated
Master
Portfolio(s) | | | Securities
lending
income
from
affiliates
allocated
from
affiliated
Master
Portfolio(s) | | | Value, end
of period | | | % of
net
assets | |
Affiliated Master Portfolio | | | | | | | | | | | | | | | | | | | | | | | | | | | | | | | | | | | | |
Wells Fargo Small Company Growth Portfolio | | | 99 | % | | | 99 | % | | $ | 11,425,700 | | | $ | 199,462,112 | | | $ | 4,350,939 | | | $ | 309,253 | | | $ | 1,144,479 | | | $ | 1,818,949,157 | | | | 99.99 | % |
The accompanying notes are an integral part of these financial statements.
| | | | | | |
| Portfolio of investments—November 30, 2017 (unaudited) | | Wells Fargo Equity Gateway Funds | | | 25 | |
SMALL COMPANY VALUE FUND
| | | | | | | | | | | | | | | | |
| Security name | | | | | | | | | | | Value | |
| | | | |
Investment Companies: 100.20% | | | | | | | | | | | | | | | | |
| | | | |
| Affiliated Master Portfolio: 100.20% | | | | | | | | | | | | | | | | |
Wells Fargo Small Company Value Portfolio | | | | | | | | | | | | | | $ | 141,370,082 | |
| | | | | | | | | | | | | | | | |
| | | | |
Total Investment Companies (Cost $121,892,712) | | | | | | | | | | | | | | | 141,370,082 | |
| | | | | | | | | | | | | | | | |
| | | | | | | | |
| Total investments in securities (Cost $121, 892,712) | | | 100.20 | % | | | 141,370,082 | |
Other assets and liabilities, net | | | (0.20 | ) | | | (285,775 | ) |
| | | | | | | | |
| Total net assets | | | 100.00 | % | | $ | 141,084,307 | |
| | | | | | | | |
Transactions with the affiliated Master Portfolio were as follows:
| | | | | | | | | | | | | | | | | | | | | | | | | | | | | | | | | | | | |
| | | % of
ownership, beginning of
period | | | % of
ownership, end of
period | | | Net
realized
gains
(losses) on
securities
transactions
allocated
from
affiliated
Master
Portfolio(s) | | | Net
change in
unrealized
gains
(losses) on
securities
transactions
allocated
from
affiliated
Master
Portfolio(s) | | | Dividends
allocated
from
affiliated
Master
Portfolio(s) | | | Affiliated
income
allocated
from
affiliated
Master
Portfolio(s) | | | Securities
lending
income
from
affiliates
allocated
from
affiliated
Master
Portfolio(s) | | | Value, end
of period | | | % of
net
assets | |
Affiliated Master Portfolio | | | | | | | | | | | | | | | | | | | | | | | | | | | | | | | | | | | | |
Wells Fargo Small Company Value Portfolio | | | 60 | % | | | 86 | % | | $ | 12,588,239 | | | $ | 3,712,730 | | | $ | 1,430,447 | | | $ | 17,169 | | | $ | 115,426 | | | $ | 141,370,082 | | | | 100.20 | % |
The accompanying notes are an integral part of these financial statements.
| | | | |
| 26 | | Wells Fargo Equity Gateway Funds | | Statements of assets and liabilities—November 30, 2017 (unaudited) |
| | | | | | | | |
| | | C&B Large Cap
Value Fund | | | Diversified Equity Fund | |
| | |
Assets | | | | | | | | |
Investments in affiliated Master Portfolio(s), at value (see cost below) | | $ | 391,212,469 | | | $ | 180,549,693 | |
Receivable for Fund shares sold | | | 1,460,335 | | | | 35,661 | |
Receivable from manager | | | 22,676 | | | | 0 | |
Prepaid expenses and other assets | | | 129,529 | | | | 61,434 | |
| | | | |
Total assets | | | 392,825,009 | | | | 180,646,788 | |
| | | | |
| | |
Liabilities | | | | | | | | |
Payable for Fund shares redeemed | | | 994,869 | | | | 174,839 | |
Administration fees payable | | | 46,821 | | | | 23,754 | |
Distribution fee payable | | | 6,561 | | | | 1,471 | |
Management fee payable | | | 0 | | | | 9,356 | |
Trustees’ fees and expenses payable | | | 2,237 | | | | 2,263 | |
Shareholder servicing fees payable | | | 23,521 | | | | 36,462 | |
Accrued expenses and other liabilities | | | 11,816 | | | | 32,219 | |
| | | | |
Total liabilities | | | 1,085,825 | | | | 280,364 | |
| | | | |
Total net assets | | $ | 391,739,184 | | | $ | 180,366,424 | |
| | | | |
| | |
NET ASSETS CONSIST OF | | | | | | | | |
Paid-in capital | | $ | 263,186,274 | | | $ | 102,625,644 | |
Undistributed (accumulated) net investment income (loss) | | | 2,196,067 | | | | 459,494 | |
Accumulated net realized gains (losses) on investments | | | 37,010,463 | | | | 32,776,451 | |
Net unrealized gains on investments | | | 89,346,380 | | | | 44,504,835 | |
| | | | |
Total net assets | | $ | 391,739,184 | | | $ | 180,366,424 | |
| | | | |
| | |
COMPUTATION OF NET ASSET VALUE AND OFFERING PRICE PER SHARE | | | | | | | | |
Net assets – Class A | | $ | 91,805,640 | | | $ | 71,670,182 | |
Shares outstanding – Class A1 | | | 5,786,430 | | | | 2,198,807 | |
Net asset value per share – Class A | | | $15.87 | | | | $32.60 | |
Maximum offering price per share – Class A2 | | | $16.84 | | | | $34.59 | |
Net assets – Class C | | $ | 10,888,332 | | | $ | 2,428,786 | |
Shares outstanding – Class C1 | | | 693,699 | | | | 81,755 | |
Net asset value per share – Class C | | | $15.70 | | | | $29.71 | |
Net assets – Class R6 | | $ | 4,335,957 | | | | N/A | |
Shares outstanding – Class R61 | | | 271,854 | | | | N/A | |
Net asset value per share – Class R6 | | | $15.95 | | | | N/A | |
Net assets – Administrator Class | | $ | 14,991,210 | | | $ | 106,267,456 | |
Shares outstanding – Administrator Class1 | | | 943,326 | | | | 3,246,131 | |
Net asset value per share – Administrator Class | | | $15.89 | | | | $32.74 | |
Net assets – Institutional Class | | $ | 269,718,045 | | | | N/A | |
Shares outstanding – Institutional Class1 | | | 16,925,508 | | | | N/A | |
Net asset value per share – Institutional Class | | | $15.94 | | | | N/A | |
| | |
Investments in affiliated Master Portfolio(s), at cost | | $ | 301,866,089 | | | $ | 136,044,858 | |
| | | | |
| 1 | Each Fund has an unlimited number of authorized shares. |
| 2 | Maximum offering price is computed as 100/94.25 of net asset value. On investments of $50,000 or more, the offering price is reduced. |
The accompanying notes are an integral part of these financial statements.
| | | | | | |
| Statements of assets and liabilities—November 30, 2017 (unaudited) | | Wells Fargo Equity Gateway Funds | | | 27 | |
| | | | | | | | | | | | | | | | | | |
Emerging
Growth Fund | | | Index Fund | | | International Value
Fund | | | Small Company
Growth Fund | | | Small Company
Value Fund | |
| | | | |
| | | | | | | | | | | | | | | | | | |
| $ | 759,951,603 | | | $ | 1,903,246,091 | | | $ | 796,570,457 | | | $ | 1,818,949,157 | | | $ | 141,370,082 | |
| | 785,149 | | | | 2,522,712 | | | | 1,781,446 | | | | 2,229,037 | | | | 125,108 | |
| | 30,814 | | | | 169,622 | | | | 0 | | | | 0 | | | | 12,535 | |
| | 46,213 | | | | 75,897 | | | | 308,339 | | | | 155,856 | | | | 104,427 | |
| | |
| | 760,813,779 | | | | 1,906,014,322 | | | | 798,660,242 | | | | 1,821,334,050 | | | | 141,612,152 | |
| | |
| | | | |
| | | | | | | | | | | | | | | | | | |
| | 716,567 | | | | 8,641,423 | | | | 716,384 | | | | 1,953,156 | | | | 479,893 | |
| | 89,164 | | | | 250,999 | | | | 84,053 | | | | 156,576 | | | | 15,816 | |
| | 2,118 | | | | 42,234 | | | | 643 | | | | 12,572 | | | | 1,269 | |
| | 0 | | | | 0 | | | | 19,442 | | | | 31,741 | | | | 0 | |
| | 2,159 | | | | 2,299 | | | | 2,310 | | | | 2,297 | | | | 2,243 | |
| | 39,126 | | | | 249,272 | | | | 1,964 | | | | 40,950 | | | | 16,220 | |
| | 84,233 | | | | 91,935 | | | | 24,022 | | | | 49,535 | | | | 12,404 | |
| | |
| | 933,367 | | | | 9,278,162 | | | | 848,818 | | | | 2,246,827 | | | | 527,845 | |
| | |
| $ | 759,880,412 | | | $ | 1,896,736,160 | | | $ | 797,811,424 | | | $ | 1,819,087,223 | | | $ | 141,084,307 | |
| | |
| | | | |
| | | | | | | | | | | | | | | | | | |
| $ | 417,417,600 | | | $ | 161,370,441 | | | $ | 730,981,104 | | | $ | 1,447,545,831 | | | $ | 173,483,273 | |
| | (4,932,739 | ) | | | 28,738,783 | | | | 19,040,877 | | | | (5,376,371 | ) | | | 1,011,050 | |
| | 94,789,223 | | | | 318,703,781 | | | | (43,862,732 | ) | | | (113,195,441 | ) | | | (52,887,386 | ) |
| | 252,606,328 | | | | 1,387,923,155 | | | | 91,652,175 | | | | 490,113,204 | | | | 19,477,370 | |
| | |
| $ | 759,880,412 | | | $ | 1,896,736,160 | | | $ | 797,811,424 | | | $ | 1,819,087,223 | | | $ | 141,084,307 | |
| | |
| | | | |
| | | | | | | | | | | | | | | | | | |
| $ | 138,449,494 | | | $ | 720,653,834 | | | $ | 3,310,115 | | | $ | 76,985,314 | | | $ | 17,338,751 | |
| | 8,325,602 | | | | 9,742,393 | | | | 205,686 | | | | 1,545,887 | | | | 636,195 | |
| | $16.63 | | | | $73.97 | | | | $16.09 | | | | $49.80 | | | | $27.25 | |
| | $17.64 | | | | $78.48 | | | | $17.07 | | | | $52.84 | | | | $28.91 | |
| $ | 3,451,717 | | | $ | 69,708,912 | | | $ | 1,037,669 | | | $ | 20,717,936 | | | $ | 2,117,438 | |
| | 228,660 | | | | 942,254 | | | | 65,960 | | | | 466,134 | | | | 87,501 | |
| | $15.10 | | | | $73.98 | | | | $15.73 | | | | $44.45 | | | | $24.20 | |
| | N/A | | | | N/A | | | | N/A | | | $ | 493,376,490 | | | $ | 381,892 | |
| | N/A | | | | N/A | | | | N/A | | | | 9,327,419 | | | | 13,598 | |
| | N/A | | | | N/A | | | | N/A | | | | $52.90 | | | | $28.08 | |
| $ | 51,272,321 | | | $ | 1,106,373,414 | | | $ | 4,768,719 | | | $ | 104,141,032 | | | $ | 61,934,538 | |
| | 3,006,960 | | | | 14,812,442 | | | | 292,969 | | | | 2,014,676 | | | | 2,222,017 | |
| | $17.05 | | | | $74.69 | | | | $16.28 | | | | $51.69 | | | | $27.87 | |
| $ | 566,706,880 | | | | N/A | | | $ | 788,694,921 | | | $ | 1,123,866,451 | | | $ | 59,311,688 | |
| | 32,056,856 | | | | N/A | | | | 49,185,666 | | | | 21,279,062 | | | | 2,113,578 | |
| | $17.68 | | | | N/A | | | | $16.04 | | | | $52.82 | | | | $28.06 | |
| | | | |
| $ | 507,345,275 | | | $ | 515,322,936 | | | $ | 704,918,282 | | | $ | 1,328,835,953 | | | $ | 121,892,712 | |
| | |
The accompanying notes are an integral part of these financial statements.
| | | | |
| 28 | | Wells Fargo Equity Gateway Funds | | Statements of operations—six months ended November 30, 2017 (unaudited) |
| | | | | | | | |
| | | C&B Large Cap Value Fund | | | Diversified Equity Fund | |
| | |
Investment income | | | | | | | | |
Dividends allocated from affiliated Master Portfolio(s)* | | $ | 2,862,318 | | | $ | 1,517,736 | |
Affiliated income allocated from affiliated Master Portfolio(s) | | | 94,024 | | | | 13,690 | |
Securities lending income from affiliates allocated from affiliated Master Portfolio(s) | | | 25,422 | | | | 23,649 | |
Interest allocated from affiliated Master Portfolio(s) | | | 0 | | | | 232 | |
Expenses allocated from affiliated Master Portfolio(s) | | | (1,208,914 | ) | | | (528,174 | ) |
Waivers allocated from affiliated Master Portfolio(s) | | | 13,901 | | | | 49,196 | |
| | | | | | | | |
Total investment income | | | 1,786,751 | | | | 1,076,329 | |
| | | | | | | | |
| | |
Expenses | | | | | | | | |
Management fee | | | 89,933 | | | | 270,776 | |
Administration fees | | | | | | | | |
Class A | | | 91,855 | | | | 72,956 | |
Class C | | | 10,143 | | | | 2,490 | |
Class R6 | | | 563 | | | | N/A | |
Administrator Class | | | 8,369 | | | | 70,631 | |
Institutional Class | | | 159,878 | | | | N/A | |
Shareholder servicing fees | | | | | | | | |
Class A | | | 109,351 | | | | 86,853 | |
Class C | | | 12,075 | | | | 2,964 | |
Administrator Class | | | 16,095 | | | | 135,590 | |
Distribution fee | | | | | | | | |
Class C | | | 36,225 | | | | 8,893 | |
Custody and accounting fees | | | 6,850 | | | | 4,425 | |
Professional fees | | | 16,463 | | | | 15,789 | |
Registration fees | | | 28,099 | | | | 25,984 | |
Shareholder report expenses | | | 13,641 | | | | 15,507 | |
Trustees’ fees and expenses | | | 11,129 | | | | 11,509 | |
Other fees and expenses | | | 6,216 | | | | 4,690 | |
| | | | | | | | |
Total expenses | | | 616,885 | | | | 729,057 | |
Less: Fee waivers and/or expense reimbursements | | | (189,118 | ) | | | (206,739 | ) |
| | | | | | | | |
Net expenses | | | 427,767 | | | | 522,318 | |
| | | | | | | | |
Net investment income (loss) | | | 1,358,984 | | | | 554,011 | |
| | | | | | | | |
| | |
REALIZED AND UNREALIZED GAINS (LOSSES) ON INVESTMENTS | | | | | | | | |
Net realized gains on securities transaction allocated from affiliated Master Portfolio(s) | | | 19,754,588 | | | | 14,381,977 | |
Net change in unrealized gains (losses) on securities transactions allocated from affiliated Master
Portfolio(s) | | | 10,510,711 | | | | 4,072,003 | |
| | | | | | | | |
Net realized and unrealized gains (losses) on investments | | | 30,265,299 | | | | 18,453,980 | |
| | | | | | | | |
Net increase in net assets resulting from operations | | $ | 31,624,283 | | | $ | 19,007,991 | |
| | | | | | | | |
| | |
* Net of foreign dividend withholding taxes allocated from affiliated Master Portfolio(s) in the amount of | | | $25,234 | | | | $33,687 | |
The accompanying notes are an integral part of these financial statements.
| | | | | | |
| Statements of operations—six months ended November 30, 2017 (unaudited) | | Wells Fargo Equity Gateway Funds | | | 29 | |
| | | | | | | | | | | | | | | | | | |
Emerging Growth Fund | | | Index Fund | | | International Value Fund | | | Small Company Growth Fund | | | Small Company Value Fund | |
| | | | |
| | | | | | | | | | | | | | | | | | |
| $ | 673,130 | | | $ | 19,349,982 | | | $ | 11,991,939 | | | $ | 4,350,939 | | | $ | 1,430,447 | |
| | 48,874 | | | | 89,339 | | | | 20,506 | | | | 309,253 | | | | 17,169 | |
| | 222,064 | | | | 31,194 | | | | 316,638 | | | | 1,144,479 | | | | 115,426 | |
| | 0 | | | | 5,917 | | | | 0 | | | | 0 | | | | 0 | |
| | (2,975,505 | ) | | | (940,472 | ) | | | (3,137,654 | ) | | | (6,776,363 | ) | | | (558,660 | ) |
| | 0 | | | | 0 | | | | 0 | | | | 0 | | | | 0 | |
| | | | | | | | | | | | | | | | | | |
| | (2,031,437 | ) | | | 18,535,960 | | | | 9,191,429 | | | | (971,692 | ) | | | 1,004,382 | |
| | | | | | | | | | | | | | | | | | |
| | | | |
| | | | | | | | | | | | | | | | | | |
| | 183,913 | | | | 471,214 | | | | 190,981 | | | | 433,431 | | | | 33,081 | |
| | | | | | | | | | | | | | | | | | |
| | 140,021 | | | | 726,165 | | | | 2,956 | | | | 82,430 | | | | 17,235 | |
| | 3,560 | | | | 70,771 | | | | 1,013 | | | | 22,431 | | | | 2,102 | |
| | N/A | | | | N/A | | | | N/A | | | | 68,484 | | | | 11 | |
| | 33,488 | | | | 731,815 | | | | 3,509 | | | | 75,837 | | | | 38,092 | |
| | 355,802 | | | | N/A | | | | 490,585 | | | | 689,406 | | | | 35,899 | |
| | | | | | | | | | | | | | | | | | |
| | 166,691 | | | | 864,482 | | | | 3,520 | | | | 98,130 | | | | 20,518 | |
| | 4,238 | | | | 84,252 | | | | 1,206 | | | | 26,703 | | | | 2,502 | |
| | 64,400 | | | | 551,281 | | | | 6,748 | | | | 145,162 | | | | 73,046 | |
| | | | | | | | | | | | | | | | | | |
| | 12,714 | | | | 252,755 | | | | 3,617 | | | | 80,109 | | | | 7,506 | |
| | 14,053 | | | | 37,413 | | | | 8,000 | | | | 33,191 | | | | 3,071 | |
| | 16,465 | | | | 15,963 | | | | 16,928 | | | | 15,011 | | | | 13,597 | |
| | 35,582 | | | | 38,844 | | | | 26,680 | | | | 86,746 | | | | 35,707 | |
| | 50,358 | | | | 47,725 | | | | 16,702 | | | | 121,181 | | | | 8,052 | |
| | 11,973 | | | | 11,267 | | | | 11,024 | | | | 11,118 | | | | 11,547 | |
| | 11,616 | | | | 16,007 | | | | 5,131 | | | | 11,774 | | | | 4,493 | |
| | | | | | | | | | | | | | | | | | |
| | 1,104,874 | | | | 3,919,954 | | | | 788,600 | | | | 2,001,144 | | | | 306,459 | |
| | (372,299 | ) | | | (1,492,612 | ) | | | (89,665 | ) | | | (257,941 | ) | | | (105,200 | ) |
| | | | | | | | | | | | | | | | | | |
| | 732,575 | | | | 2,427,342 | | | | 698,935 | | | | 1,743,203 | | | | 201,259 | |
| | | | | | | | | | | | | | | | | | |
| | (2,764,012 | ) | | | 16,108,618 | | | | 8,492,494 | | | | (2,714,895 | ) | | | 803,123 | |
| | | | | | | | | | | | | | | | | | |
| | | | |
| | | | | | | | | | | | | | | | | | |
| | 52,558,829 | | | | 144,556,106 | | | | 2,898,280 | | | | 11,425,700 | | | | 12,588,239 | |
| | 48,451,794 | | | | 30,340,353 | | | | 49,993,854 | | | | 199,462,112 | | | | 3,712,730 | |
| | | | | | | | | | | | | | | | | | |
| | 101,010,623 | | | | 174,896,459 | | | | 52,892,134 | | | | 210,887,812 | | | | 16,300,969 | |
| | | | | | | | | | | | | | | | | | |
| $ | 98,246,611 | | | $ | 191,005,077 | | | $ | 61,384,628 | | | $ | 208,172,917 | | | $ | 17,104,092 | |
| | | | | | | | | | | | | | | | | | |
| | | | |
| | $0 | | | | $38,535 | | | | $1,118,365 | | | | $23 | | | | $0 | |
The accompanying notes are an integral part of these financial statements.
| | | | |
| 30 | | Wells Fargo Equity Gateway Funds | | Statements of changes in net assets |
| | | | | | | | | | | | | | | | |
| | | C&B Large Cap Value Fund | |
| | | Six months ended
November 30, 2017
(unaudited) | | | Year ended
May 31, 2017 | |
| | | |
Operations | | | | | | | | | | | | |
Net investment income | | | | | | $ | 1,358,984 | | | | | | | $ | 2,441,983 | |
Net realized gains on investments | | | | | | | 19,754,588 | | | | | | | | 28,429,697 | |
Net change in unrealized gains (losses) on investments | | | | | | | 10,510,711 | | | | | | | | 20,576,353 | |
| | | | |
Net increase in net assets resulting from operations | | | | | | | 31,624,283 | | | | | | | | 51,448,033 | |
| | | | |
| | | | |
Distributions to shareholders from | | | | | | | | | | | | | | | | |
Net investment income | | | | | | | | | | | | | | | | |
Class A | | | | | | | 0 | | | | | | | | (508,998 | ) |
Class R6 | | | | | | | 0 | | | | | | | | (247 | )1 |
Administrator Class | | | | | | | 0 | | | | | | | | (89,812 | ) |
Institutional Class | | | | | | | 0 | | | | | | | | (1,662,224 | ) |
Net realized gains | | | | | | | | | | | | | | | | |
Class A | | | | | | | 0 | | | | | | | | (1,560,447 | ) |
Class C | | | | | | | 0 | | | | | | | | (132,219 | ) |
Class R6 | | | | | | | 0 | | | | | | | | (462 | )1 |
Administrator Class | | | | | | | 0 | | | | | | | | (260,235 | ) |
Institutional Class | | | | | | | 0 | | | | | | | | (3,224,709 | ) |
| | | | |
Total distributions to shareholders | | | | | | | 0 | | | | | | | | (7,439,353 | ) |
| | | | |
| | | | |
Capital share transactions | | | Shares | | | | | | | | Shares | | | | | |
Proceeds from shares sold | | | | | | | | | | | | | | | | |
Class A | | | 618,096 | | | | 9,425,149 | | | | 343,881 | | | | 4,625,261 | |
Class C | | | 194,245 | | | | 2,927,623 | | | | 90,681 | | | | 1,227,446 | |
Class R6 | | | 29,736 | | | | 458,776 | | | | 244,820 | 1 | | | 3,471,021 | 1 |
Administrator Class | | | 192,616 | | | | 2,962,528 | | | | 88,498 | | | | 1,179,784 | |
Institutional Class | | | 3,270,535 | | | | 49,967,125 | | | | 8,708,468 | | | | 116,569,551 | |
| | | | |
| | | | | | | 65,741,201 | | | | | | | | 127,073,063 | |
| | | | |
Reinvestment of distributions | | | | | | | | | | | | | | | | |
Class A | | | 0 | | | | 0 | | | | 149,087 | | | | 2,020,559 | |
Class C | | | 0 | | | | 0 | | | | 9,313 | | | | 125,264 | |
Class R6 | | | 0 | | | | 0 | | | | 52 | 1 | | | 709 | 1 |
Administrator Class | | | 0 | | | | 0 | | | | 21,954 | | | | 297,736 | |
Institutional Class | | | 0 | | | | 0 | | | | 96,800 | | | | 1,316,884 | |
| | | | |
| | | | | | | 0 | | | | | | | | 3,761,152 | |
| | | | |
Payment for shares redeemed | | | | | | | | | | | | | | | | |
Class A | | | (539,618 | ) | | | (8,201,254 | ) | | | (1,830,336 | ) | | | (25,105,145 | ) |
Class B | | | N/A | | | | N/A | | | | (8,260 | )2 | | | (110,160 | )2 |
Class C | | | (57,450 | ) | | | (867,290 | ) | | | (126,360 | ) | | | (1,716,056 | ) |
Class R6 | | | (14 | ) | | | (211 | ) | | | (2,740 | )1 | | | (39,885 | )1 |
Administrator Class | | | (36,915 | ) | | | (559,749 | ) | | | (1,173,095 | ) | | | (15,742,381 | ) |
Institutional Class | | | (1,448,976 | ) | | | (22,313,160 | ) | | | (4,327,353 | ) | | | (58,430,077 | ) |
| | | | |
| | | | | | | (31,941,664 | ) | | | | | | | (101,143,704 | ) |
| | | | |
Net increase in net assets resulting from capital share transactions | | | | | | | 33,799,537 | | | | | | | | 29,690,511 | |
| | | | |
Total increase in net assets | | | | | | | 65,423,820 | | | | | | | | 73,699,191 | |
| | | | |
| | | | |
Net assets | | | | | | | | | | | | | | | | |
Beginning of period | | | | | | | 326,315,364 | | | | | | | | 252,616,173 | |
| | | | |
End of period | | | | | | $ | 391,739,184 | | | | | | | $ | 326,315,364 | |
| | | | |
Undistributed net investment income | | | | | | $ | 2,196,067 | | | | | | | $ | 837,083 | |
| | | | |
| 1 | For the period from October 31, 2016 (commencement of class operations) to May 31, 2017 |
| 2 | For the period from June 1, 2016 to December 5, 2016. Effective at the close of business on December 5, 2016, Class B shares were converted to Class A shares and are no longer offered by the Fund. |
The accompanying notes are an integral part of these financial statements.
| | | | | | |
| Statements of changes in net assets | | Wells Fargo Equity Gateway Funds | | | 31 | |
| | | | | | | | | | | | | | | | |
| | | Diversified Equity Fund | |
| | | Six months ended
November 30, 2017
(unaudited) | | | Year ended
May 31, 2017 | |
| | | |
Operations | | | | | | | | | | | | |
Net investment income | | | | | | $ | 554,011 | | | | | | | $ | 1,565,401 | |
Net realized gains on investments | | | | | | | 14,381,977 | | | | | | | | 32,629,072 | |
Net change in unrealized gains (losses) on investments | | | | | | | 4,072,003 | | | | | | | | (5,119,193 | ) |
| | | | |
Net increase in net assets resulting from operations | | | | | | | 19,007,991 | | | | | | | | 29,075,280 | |
| | | | |
| | | | |
Distributions to shareholders from | | | | | | | | | | | | | | | | |
Net investment income | | | | | | | | | | | | | | | | |
Class A | | | | | | | 0 | | | | | | | | (548,238 | ) |
Class C | | | | | | | 0 | | | | | | | | (1,824 | ) |
Administrator Class | | | | | | | 0 | | | | | | | | (1,387,107 | ) |
Net realized gains | | | | | | | | | | | | | | | | |
Class A | | | | | | | 0 | | | | | | | | (4,106,482 | ) |
Class C | | | | | | | 0 | | | | | | | | (169,044 | ) |
Administrator Class | | | | | | | 0 | | | | | | | | (8,001,631 | ) |
| | | | |
Total distributions to shareholders | | | | | | | 0 | | | | | | | | (14,214,326 | ) |
| | | | |
| | | | |
Capital share transactions | | | Shares | | | | | | | | Shares | | | | | |
Proceeds from shares sold | | | | | | | | | | | | | | | | |
Class A | | | 17,494 | | | | 538,089 | | | | 42,128 | | | | 1,184,822 | |
Class C | | | 1,920 | | | | 52,661 | | | | 4,298 | | | | 110,293 | |
Administrator Class | | | 104,021 | | | | 3,194,725 | | | | 341,788 | | | | 9,569,423 | |
| | | | |
| | | | | | | 3,785,475 | | | | | | | | 10,864,538 | |
| | | | |
Reinvestment of distributions | | | | | | | | | | | | | | | | |
Class A | | | 0 | | | | 0 | | | | 170,486 | | | | 4,632,094 | |
Class C | | | 0 | | | | 0 | | | | 6,571 | | | | 162,767 | |
Administrator Class | | | 0 | | | | 0 | | | | 342,333 | | | | 9,334,511 | |
| | | | |
| | | | | | | 0 | | | | | | | | 14,129,372 | |
| | | | |
Payment for shares redeemed | | | | | | | | | | | | | | | | |
Class A | | | (157,306 | ) | | | (4,802,809 | ) | | | (349,791 | ) | | | (9,766,859 | ) |
Class B | | | N/A | | | | N/A | | | | (29 | )1 | | | (717 | )1 |
Class C | | | (7,851 | ) | | | (217,847 | ) | | | (36,485 | ) | | | (935,925 | ) |
Administrator Class | | | (927,892 | ) | | | (28,332,320 | ) | | | (1,762,777 | ) | | | (49,632,984 | ) |
| | | | |
| | | | | | | (33,352,976 | ) | | | | | | | (60,336,485 | ) |
| | | | |
Net decrease in net assets resulting from capital share transactions | | | | | | | (29,567,501 | ) | | | | | | | (35,342,575 | ) |
| | | | |
Total decrease in net assets | | | | | | | (10,559,510 | ) | | | | | | | (20,481,621 | ) |
| | | | |
| | | | |
Net assets | | | | | | | | | | | | | | | | |
Beginning of period | | | | | | | 190,925,934 | | | | | | | | 211,407,555 | |
| | | | |
End of period | | | | | | $ | 180,366,424 | | | | | | | $ | 190,925,934 | |
| | | | |
Undistributed (overdistributed) net investment income | | | | | | $ | 459,494 | | | | | | | $ | (94,517 | ) |
| | | | |
| 1 | For the period from June 1, 2016 to June 6, 2016, Class B shares of the Fund were no longer offered to shareholders effective June 7, 2016. |
The accompanying notes are an integral part of these financial statements.
| | | | |
| 32 | | Wells Fargo Equity Gateway Funds | | Statements of changes in net assets |
| | | | | | | | | | | | | | | | |
| | | Emerging Growth Fund | |
| | | Six months ended
November 30, 2017
(unaudited) | | | Year ended
May 31, 2017 | |
| | | |
Operations | | | | | | | | | | | | |
Net investment loss | | | | | | $ | (2,764,012 | ) | | | | | | $ | (2,619,840 | ) |
Net realized gains on investments | | | | | | | 52,558,829 | | | | | | | | 123,332,487 | |
Net change in unrealized gains (losses) on investments | | | | | | | 48,451,794 | | | | | | | | 42,152,657 | |
| | | | |
Net increase in net assets resulting from operations | | | | | | | 98,246,611 | | | | | | | | 162,865,304 | |
| | | | |
| | | | |
Distributions to shareholders from | | | | | | | | | | | | | | | | |
Net realized gains | | | | | | | | | | | | | | | | |
Class A | | | | | | | 0 | | | | | | | | (7,691,724 | ) |
Class C | | | | | | | 0 | | | | | | | | (232,220 | ) |
Administrator Class | | | | | | | 0 | | | | | | | | (3,593,519 | ) |
Institutional Class | | | | | | | 0 | | | | | | | | (29,583,940 | ) |
| | | | |
Total distributions to shareholders | | | | | | | 0 | | | | | | | | (41,101,403 | ) |
| | | | |
| | | | |
Capital share transactions | | | Shares | | | | | | | | Shares | | | | | |
Proceeds from shares sold | | | | | | | | | | | | | | | | |
Class A | | | 97,058 | | | | 1,526,451 | | | | 354,305 | | | | 4,952,578 | |
Class C | | | 299 | | | | 4,167 | | | | 6,263 | | | | 79,203 | |
Administrator Class | | | 189,987 | | | | 3,030,008 | | | | 600,645 | | | | 8,457,464 | |
Institutional Class | | | 2,143,113 | | | | 35,470,492 | | | | 9,771,457 | | | | 141,529,618 | |
| | | | |
| | | | | | | 40,031,118 | | | | | | | | 155,018,863 | |
| | | | |
Reinvestment of distributions | | | | | | | | | | | | | | | | |
Class A | | | 0 | | | | 0 | | | | 557,154 | | | | 7,488,146 | |
Class C | | | 0 | | | | 0 | | | | 17,121 | | | | 210,416 | |
Administrator Class | | | 0 | | | | 0 | | | | 260,373 | | | | 3,582,735 | |
Institutional Class | | | 0 | | | | 0 | | | | 1,883,866 | | | | 26,788,571 | |
| | | | |
| | | | | | | 0 | | | | | | | | 38,069,868 | |
| | | | |
Payment for shares redeemed | | | | | | | | | | | | | | | | |
Class A | | | (674,094 | ) | | | (10,402,734 | ) | | | (2,144,553 | ) | | | (29,759,112 | ) |
Class C | | | (22,297 | ) | | | (316,959 | ) | | | (102,153 | ) | | | (1,314,199 | ) |
Administrator Class | | | (589,979 | ) | | | (9,413,113 | ) | | | (5,239,427 | ) | | | (72,373,307 | ) |
Institutional Class | | | (4,691,688 | ) | | | (77,027,382 | ) | | | (21,269,486 | ) | | | (307,246,770 | ) |
| | | | |
| | | | | | | (97,160,188 | ) | | | | | | | (410,693,388 | ) |
| | | | |
Net decrease in net assets resulting from capital share transactions | | | | | | | (57,129,070 | ) | | | | | | | (217,604,657 | ) |
| | | | |
Total increase (decrease) in net assets | | | | | | | 41,117,541 | | | | | | | | (95,840,756 | ) |
| | | | |
| | | | |
Net assets | | | | | | | | | | | | | | | | |
Beginning of period | | | | | | | 718,762,871 | | | | | | | | 814,603,627 | |
| | | | |
End of period | | | | | | $ | 759,880,412 | | | | | | | $ | 718,762,871 | |
| | | | |
Accumulated net investment loss | | | | | | $ | (4,932,739 | ) | | | | | | $ | (2,168,727 | ) |
| | | | |
The accompanying notes are an integral part of these financial statements.
| | | | | | |
| Statements of changes in net assets | | Wells Fargo Equity Gateway Funds | | | 33 | |
| | | | | | | | | | | | | | | | |
| | | Index Fund | |
| | | Six months ended
November 30, 2017
(unaudited) | | | Year ended
May 31, 2017 | |
| | | |
Operations | | | | | | | | | | | | |
Net investment income | | | | | | $ | 16,108,618 | | | | | | | $ | 37,135,511 | |
Net realized gains on investments | | | | | | | 144,556,106 | | | | | | | | 288,140,341 | |
Net change in unrealized gains (losses) on investments | | | | | | | 30,340,353 | | | | | | | | 4,215,968 | |
| | | | |
Net increase in net assets resulting from operations | | | | | | | 191,005,077 | | | | | | | | 329,491,820 | |
| | | | |
| | | | |
Distributions to shareholders from | | | | | | | | | | | | | | | | |
Net investment income | | | | | | | | | | | | | | | | |
Class A | | | | | | | 0 | | | | | | | | (12,057,501 | ) |
Class B | | | | | | | N/A | | | | | | | | (1,670 | )1 |
Class C | | | | | | | 0 | | | | | | | | (961,619 | ) |
Administrator Class | | | | | | | 0 | | | | | | | | (26,746,411 | ) |
Net realized gains | | | | | | | | | | | | | | | | |
Class A | | | | | | | 0 | | | | | | | | (48,387,882 | ) |
Class B | | | | | | | N/A | | | | | | | | (40,358 | )1 |
Class C | | | | | | | 0 | | | | | | | | (6,310,548 | ) |
Administrator Class | | | | | | | 0 | | | | | | | | (100,426,479 | ) |
| | | | |
Total distributions to shareholders | | | | | | | 0 | | | | | | | | (194,932,468 | ) |
| | | | |
| | | | |
Capital share transactions | | | Shares | | | | | | | | Shares | | | | | |
Proceeds from shares sold | | | | | | | | | | | | | | | | |
Class A | | | 175,230 | | | | 12,292,399 | | | | 809,943 | | | | 52,845,528 | |
Class B | | | N/A | | | | N/A | | | | 306 | 1 | | | 20,189 | 1 |
Class C | | | 33,483 | | | | 2,317,837 | | | | 285,395 | | | | 18,338,691 | |
Administrator Class | | | 789,902 | | | | 55,429,342 | | | | 3,211,238 | | | | 208,171,913 | |
| | | | |
| | | | | | | 70,039,578 | | | | | | | | 279,376,321 | |
| | | | |
Reinvestment of distributions | | | | | | | | | | | | | | | | |
Class A | | | 0 | | | | 0 | | | | 940,207 | | | | 58,910,725 | |
Class B | | | N/A | | | | N/A | | | | 647 | 1 | | | 41,477 | 1 |
Class C | | | 0 | | | | 0 | | | | 69,637 | | | | 4,372,382 | |
Administrator Class | | | 0 | | | | 0 | | | | 1,336,944 | | | | 84,513,107 | |
| | | | |
| | | | | | | 0 | | | | | | | | 147,837,691 | |
| | | | |
Payment for shares redeemed | | | | | | | | | | | | | | | | |
Class A | | | (665,112 | ) | | | (45,960,854 | ) | | | (1,693,335 | ) | | | (109,256,032 | ) |
Class B | | | N/A | | | | N/A | | | | (17,611 | )1 | | | (1,171,622 | )1 |
Class C | | | (99,907 | ) | | | (6,901,985 | ) | | | (611,575 | ) | | | (40,211,291 | ) |
Administrator Class | | | (3,054,276 | ) | | | (214,661,903 | ) | | | (11,192,888 | ) | | | (730,619,271 | ) |
| | | | |
| | | | | | | (267,524,742 | ) | | | | | | | (881,258,216 | ) |
| | | | |
Net decrease in net assets resulting from capital share transactions | | | | | | | (197,485,164 | ) | | | | | | | (454,044,204 | ) |
| | | | |
Total decrease in net assets | | | | | | | (6,480,087 | ) | | | | | | | (319,484,852 | ) |
| | | | |
| | | | |
Net assets | | | | | | | | | | | | | | | | |
Beginning of period | | | | | | | 1,903,216,247 | | | | | | | | 2,222,701,099 | |
| | | | |
End of period | | | | | | $ | 1,896,736,160 | | | | | | | $ | 1,903,216,247 | |
| | | | |
Undistributed net investment income | | | | | | $ | 28,738,783 | | | | | | | $ | 12,630,165 | |
| | | | |
| 1 | For the period from June 1, 2016 to May 5, 2017. Effective at the close of business on May 5, 2017, Class B shares were converted to Class A shares and are no longer offered by the Fund. |
The accompanying notes are an integral part of these financial statements.
| | | | |
| 34 | | Wells Fargo Equity Gateway Funds | | Statements of changes in net assets |
| | | | | | | | | | | | | | | | |
| | | International Value Fund | |
| | | Six months ended
November 30, 2017
(unaudited) | | | Year ended
May 31, 2017 | |
| | | |
Operations | | | | | | | | | | | | |
Net investment income | | | | | | $ | 8,492,494 | | | | | | | $ | 15,432,785 | |
Net realized gains (losses) on investments | | | | | | | 2,898,280 | | | | | | | | (9,069,569 | ) |
Net change in unrealized gains (losses) on investments | | | | | | | 49,993,854 | | | | | | | | 94,840,293 | |
| | | | |
Net increase in net assets resulting from operations | | | | | | | 61,384,628 | | | | | | | | 101,203,509 | |
| | | | |
| | | | |
Distributions to shareholders from | | | | | | | | | | | | | | | | |
Net investment income | | | | | | | | | | | | | | | | |
Class A | | | | | | | 0 | | | | | | | | (1,089,141 | ) |
Class C | | | | | | | 0 | | | | | | | | (9,142 | ) |
Administrator Class | | | | | | | 0 | | | | | | | | (89,969 | ) |
Institutional Class | | | | | | | 0 | | | | | | | | (10,969,077 | ) |
| | | | |
Total distributions to shareholders | | | | | | | 0 | | | | | | | | (12,157,329 | ) |
| | | | |
| | | | |
Capital share transactions | | | Shares | | | | | | | | Shares | | | | | |
Proceeds from shares sold | | | | | | | | | | | | | | | | |
Class A | | | 59,695 | | | | 936,766 | | | | 3,968,788 | | | | 51,693,187 | |
Class C | | | 14,663 | | | | 221,211 | | | | 4,105 | | | | 56,334 | |
Administrator Class | | | 32,068 | | | | 511,524 | | | | 424,972 | | | | 5,925,715 | |
Institutional Class | | | 8,047,039 | | | | 124,072,217 | | | | 23,856,910 | | | | 327,309,805 | |
| | | | |
| | | | | | | 125,741,718 | | | | | | | | 384,985,041 | |
| | | | |
Reinvestment of distributions | | | | | | | | | | | | | | | | |
Class A | | | 0 | | | | 0 | | | | 82,922 | | | | 1,086,269 | |
Class C | | | 0 | | | | 0 | | | | 706 | | | | 9,116 | |
Administrator Class | | | 0 | | | | 0 | | | | 6,623 | | | | 87,749 | |
Institutional Class | | | 0 | | | | 0 | | | | 841,957 | | | | 10,962,276 | |
| | | | |
| | | | | | | 0 | | | | | | | | 12,145,410 | |
| | | | |
Payment for shares redeemed | | | | | | | | | | | | | | | | |
Class A | | | (26,858 | ) | | | (415,117 | ) | | | (4,267,186 | ) | | | (58,463,760 | ) |
Class C | | | (5,678 | ) | | | (86,818 | ) | | | (10,177 | ) | | | (132,714 | ) |
Administrator Class | | | (98,634 | ) | | | (1,553,947 | ) | | | (992,010 | ) | | | (13,484,274 | ) |
Institutional Class | | | (7,059,263 | ) | | | (109,249,029 | ) | | | (12,328,866 | ) | | | (165,982,459 | ) |
| | | | |
| | | | | | | (111,304,911 | ) | | | | | | | (238,063,207 | ) |
| | | | |
Net increase in net assets resulting from capital share transactions | | | | | | | 14,436,807 | | | | | | | | 159,067,244 | |
| | | | |
Total increase in net assets | | | | | | | 75,821,435 | | | | | | | | 248,113,424 | |
| | | | |
| | | | |
Net assets | | | | | | | | | | | | | | | | |
Beginning of period | | | | | | | 721,989,989 | | | | | | | | 473,876,565 | |
| | | | |
End of period | | | | | | $ | 797,811,424 | | | | | | | $ | 721,989,989 | |
| | | | |
Undistributed net investment income | | | | | | $ | 19,040,877 | | | | | | | $ | 10,548,383 | |
| | | | |
The accompanying notes are an integral part of these financial statements.
| | | | | | |
| Statements of changes in net assets | | Wells Fargo Equity Gateway Funds | | | 35 | |
| | | | | | | | | | | | | | | | |
| | | Small Company Growth Fund | |
| | | Six months ended
November 30, 2017
(unaudited) | | | Year ended
May 31, 2017 | |
| | | |
Operations | | | | | | | | | | | | |
Net investment loss | | | | | | $ | (2,714,895 | ) | | | | | | $ | (5,413,378 | ) |
Net realized gains (losses) on investments | | | | | | | 11,425,700 | | | | | | | | (16,807,576 | ) |
Net change in unrealized gains (losses) on investments | | | | | | | 199,462,112 | | | | | | | | 256,174,246 | |
| | | | |
Net increase in net assets resulting from operations | | | | | | | 208,172,917 | | | | | | | | 233,953,292 | |
| | | | |
| | | | |
Capital share transactions | | | Shares | | | | | | | | Shares | | | | | |
Proceeds from shares sold | | | | | | | | | | | | | | | | |
Class A | | | 263,412 | | | | 12,305,189 | | | | 518,956 | | | | 21,673,433 | |
Class C | | | 13,135 | | | | 541,125 | | | | 122,580 | | | | 4,701,028 | |
Class R6 | | | 1,226,450 | | | | 60,185,165 | | | | 4,713,702 | | | | 208,089,796 | |
Administrator Class | | | 154,906 | | | | 7,434,118 | | | | 619,478 | | | | 27,040,038 | |
Institutional Class | | | 2,312,763 | | | | 113,625,325 | | | | 13,237,225 | | | | 581,310,282 | |
| | | | |
| | | | | | | 194,090,922 | | | | | | | | 842,814,577 | |
| | | | |
Payment for shares redeemed | | | | | | | | | | | | | | | | |
Class A | | | (436,770 | ) | | | (20,370,603 | ) | | | (2,213,853 | ) | | | (92,531,770 | ) |
Class B | | | N/A | | | | N/A | | | | (508 | )1 | | | (18,660 | )1 |
Class C | | | (112,226 | ) | | | (4,620,497 | ) | | | (349,435 | ) | | | (13,079,140 | ) |
Class R6 | | | (812,869 | ) | | | (40,176,679 | ) | | | (1,567,477 | ) | | | (69,312,644 | ) |
Administrator Class | | | (978,747 | ) | | | (47,210,962 | ) | | | (1,113,084 | ) | | | (48,269,172 | ) |
Institutional Class | | | (2,696,196 | ) | | | (132,562,717 | ) | | | (8,650,898 | ) | | | (385,622,480 | ) |
| | | | |
| | | | | | | (244,941,458 | ) | | | | | | | (608,833,866 | ) |
| | | | |
Net increase (decrease) in net assets resulting from capital share transactions | | | | | | | (50,850,536 | ) | | | | | | | 233,980,711 | |
| | | | |
Total increase in net assets | | | | | | | 157,322,381 | | | | | | | | 467,934,003 | |
| | | | |
| | | | |
Net assets | | | | | | | | | | | | | | | | |
Beginning of period | | | | | | | 1,661,764,842 | | | | | | | | 1,193,830,839 | |
| | | | |
End of period | | | | | | $ | 1,819,087,223 | | | | | | | $ | 1,661,764,842 | |
| | | | |
Accumulated net investment loss | | | | | | $ | (5,376,371 | ) | | | | | | $ | (2,661,476 | ) |
| | | | |
| 1 | For the period from June 1, 2016 to December 5, 2016. Effective at the close of business on December 5, 2016, Class B shares were converted to Class A shares and are no longer offered by the Fund. |
The accompanying notes are an integral part of these financial statements.
| | | | |
| 36 | | Wells Fargo Equity Gateway Funds | | Statements of changes in net assets |
| | | | | | | | | | | | | | | | |
| | | Small Company Value Fund | |
| | | Six months ended
November 30, 2017
(unaudited) | | | Year ended
May 31, 2017 | |
| | | |
Operations | | | | | | | | | | | | |
Net investment income | | | | | | $ | 803,123 | | | | | | | $ | 487,396 | |
Net realized gains on investments | | | | | | | 12,588,239 | | | | | | | | 15,215,549 | |
Net change in unrealized gains (losses) on investments | | | | | | | 3,712,730 | | | | | | | | 6,325,340 | |
| | | | |
Net increase in net assets resulting from operations | | | | | | | 17,104,092 | | | | | | | | 22,028,285 | |
| | | | |
| | | | |
Distributions to shareholders from | | | | | | | | | | | | | | | | |
Net investment income | | | | | | | | | | | | | | | | |
Class A | | | | | | | 0 | | | | | | | | (11,489 | ) |
Class R6 | | | | | | | 0 | | | | | | | | (105 | )1 |
Administrator Class | | | | | | | 0 | | | | | | | | (118,026 | ) |
Institutional Class | | | | | | | 0 | | | | | | | | (162,397 | ) |
| | | | |
Total distributions to shareholders | | | | | | | 0 | | | | | | | | (292,017 | ) |
| | | | |
| | | | |
Capital share transactions | | | Shares | | | | | | | | Shares | | | | | |
Proceeds from shares sold | | | | | | | | | | | | | | | | |
Class A | | | 29,404 | | | | 747,544 | | | | 185,512 | | | | 4,192,321 | |
Class C | | | 8,883 | | | | 188,323 | | | | 16,069 | | | | 347,199 | |
Class R6 | | | 12,435 | | | | 335,029 | | | | 1,170 | 1 | | | 25,000 | 1 |
Administrator Class | | | 52,655 | | | | 1,362,298 | | | | 312,867 | | | | 7,239,116 | |
Institutional Class | | | 175,871 | | | | 4,545,638 | | | | 1,237,044 | | | | 29,029,010 | |
| | | | |
| | | | | | | 7,178,832 | | | | | | | | 40,832,646 | |
| | | | |
Reinvestment of distributions | | | | | | | | | | | | | | | | |
Class A | | | 0 | | | | 0 | | | | 448 | | | | 10,909 | |
Class R6 | | | 0 | | | | 0 | | | | 4 | 1 | | | 105 | 1 |
Administrator Class | | | 0 | | | | 0 | | | | 4,742 | | | | 117,980 | |
Institutional Class | | | 0 | | | | 0 | | | | 6,429 | | | | 160,737 | |
| | | | |
| | | | | | | 0 | | | | | | | | 289,731 | |
| | | | |
Payment for shares redeemed | | | | | | | | | | | | | | | | |
Class A | | | (71,355 | ) | | | (1,773,774 | ) | | | (653,039 | ) | | | (15,208,819 | ) |
Class C | | | (13,075 | ) | | | (290,065 | ) | | | (34,801 | ) | | | (715,917 | ) |
Class R6 | | | (11 | ) | | | (291 | ) | | | 0 | 1 | | | 0 | 1 |
Administrator Class | | | (178,059 | ) | | | (4,575,200 | ) | | | (1,069,748 | ) | | | (24,687,202 | ) |
Institutional Class | | | (172,576 | ) | | | (4,492,754 | ) | | | (662,555 | ) | | | (15,259,116 | ) |
| | | | |
| | | | | | | (11,132,084 | ) | | | | | | | (55,871,054 | ) |
| | | | |
Net decrease in net assets resulting from capital share transactions | | | | | | | (3,953,252 | ) | | | | | | | (14,748,677 | ) |
| | | | |
Total increase in net assets | | | | | | | 13,150,840 | | | | | | | | 6,987,591 | |
| | | | |
| | | | |
Net assets | | | | | | | | | | | | | | | | |
Beginning of period | | | | | | | 127,933,467 | | | | | | | | 120,945,876 | |
| | | | |
End of period | | | | | | $ | 141,084,307 | | | | | | | $ | 127,933,467 | |
| | | | |
Undistributed net investment income | | | | | | $ | 1,011,050 | | | | | | | $ | 207,927 | |
| | | | |
| 1 | For the period from October 31, 2016 (commencement of class operations) to May 31, 2017 |
The accompanying notes are an integral part of these financial statements.
This page is intentionally left blank.
| | | | |
| 38 | | Wells Fargo Equity Gateway Funds | | Financial highlights |
| | | | | | | | | | | | | | | | | | | | | | | | |
| C&B Large Cap Value Fund | | Beginning
net asset
value per
share | | | Net
investment
income (loss) | | | Net realized
and unrealized
gains (losses)
on investments | | | Distributions
from net
investment
income | | | Distributions
from net
realized gains | | | Ending
net asset
value per
share | |
Class A | | | | | | | | | | | | | | | | | | | | | | | | |
Six months ended November 30, 2017 (unaudited) | | $ | 14.54 | | | | 0.04 | | | | 1.29 | | | | 0.00 | | | | 0.00 | | | $ | 15.87 | |
Year ended May 31, 2017 | | $ | 12.55 | | | | 0.08 | | | | 2.23 | | | | (0.08 | ) | | | (0.24 | ) | | $ | 14.54 | |
Year ended May 31, 2016 | | $ | 13.07 | | | | 0.11 | 4 | | | (0.14 | ) | | | (0.10 | ) | | | (0.39 | ) | | $ | 12.55 | |
Year ended May 31, 2015 | | $ | 11.99 | | | | 0.10 | | | | 1.07 | | | | (0.09 | ) | | | 0.00 | | | $ | 13.07 | |
Year ended May 31, 2014 | | $ | 10.32 | | | | 0.09 | | | | 1.68 | | | | (0.10 | ) | | | 0.00 | | | $ | 11.99 | |
Year ended May 31, 2013 | | $ | 8.13 | | | | 0.12 | | | | 2.20 | | | | (0.13 | ) | | | 0.00 | | | $ | 10.32 | |
Class C | | | | | | | | | | | | | | | | | | | | | | | | |
Six months ended November 30, 2017 (unaudited) | | $ | 14.44 | | | | (0.02 | ) | | | 1.28 | | | | 0.00 | | | | 0.00 | | | $ | 15.70 | |
Year ended May 31, 2017 | | $ | 12.48 | | | | (0.02 | ) | | | 2.22 | | | | 0.00 | | | | (0.24 | ) | | $ | 14.44 | |
Year ended May 31, 2016 | | $ | 13.01 | | | | 0.01 | | | | (0.14 | ) | | | (0.01 | ) | | | (0.39 | ) | | $ | 12.48 | |
Year ended May 31, 2015 | | $ | 11.95 | | | | (0.00 | )5 | | | 1.07 | | | | (0.01 | ) | | | 0.00 | | | $ | 13.01 | |
Year ended May 31, 2014 | | $ | 10.29 | | | | 0.01 | | | | 1.67 | | | | (0.02 | ) | | | 0.00 | | | $ | 11.95 | |
Year ended May 31, 2013 | | $ | 8.11 | | | | 0.04 | | | | 2.20 | | | | (0.06 | ) | | | 0.00 | | | $ | 10.29 | |
Class R6 | | | | | | | | | | | | | | | | | | | | | | | | |
Six months ended November 30, 2017 (unaudited) | | $ | 14.59 | | | | 0.07 | | | | 1.29 | | | | 0.00 | | | | 0.00 | | | $ | 15.95 | |
Year ended May 31, 20176 | | $ | 12.73 | | | | 0.16 | | | | 2.06 | | | | (0.12 | ) | | | (0.24 | ) | | $ | 14.59 | |
Administrator Class | | | | | | | | | | | | | | | | | | | | | | | | |
Six months ended November 30, 2017 (unaudited) | | $ | 14.56 | | | | 0.05 | 4 | | | 1.28 | | | | 0.00 | | | | 0.00 | | | $ | 15.89 | |
Year ended May 31, 2017 | | $ | 12.54 | | | | 0.10 | 4 | | | 2.24 | | | | (0.08 | ) | | | (0.24 | ) | | $ | 14.56 | |
Year ended May 31, 2016 | | $ | 13.07 | | | | 0.13 | 4 | | | (0.15 | ) | | | (0.12 | ) | | | (0.39 | ) | | $ | 12.54 | |
Year ended May 31, 2015 | | $ | 12.00 | | | | 0.13 | | | | 1.06 | | | | (0.12 | ) | | | 0.00 | | | $ | 13.07 | |
Year ended May 31, 2014 | | $ | 10.32 | | | | 0.12 | 4 | | | 1.68 | | | | (0.12 | ) | | | 0.00 | | | $ | 12.00 | |
Year ended May 31, 2013 | | $ | 8.13 | | | | 0.13 | 4 | | | 2.21 | | | | (0.15 | ) | | | 0.00 | | | $ | 10.32 | |
Institutional Class | | | | | | | | | | | | | | | | | | | | | | | | |
Six months ended November 30, 2017 (unaudited) | | $ | 14.58 | | | | 0.07 | | | | 1.29 | | | | 0.00 | | | | 0.00 | | | $ | 15.94 | |
Year ended May 31, 2017 | | $ | 12.58 | | | | 0.14 | | | | 2.22 | | | | (0.12 | ) | | | (0.24 | ) | | $ | 14.58 | |
Year ended May 31, 2016 | | $ | 13.11 | | | | 0.16 | | | | (0.14 | ) | | | (0.16 | ) | | | (0.39 | ) | | $ | 12.58 | |
Year ended May 31, 2015 | | $ | 12.03 | | | | 0.15 | | | | 1.08 | | | | (0.15 | ) | | | 0.00 | | | $ | 13.11 | |
Year ended May 31, 2014 | | $ | 10.35 | | | | 0.14 | | | | 1.69 | | | | (0.15 | ) | | | 0.00 | | | $ | 12.03 | |
Year ended May 31, 2013 | | $ | 8.16 | | | | 0.17 | | | | 2.19 | | | | (0.17 | ) | | | 0.00 | | | $ | 10.35 | |
| 1 | Ratios include net expenses allocated from the affiliated Master Portfolio which were as follows: |
| | | | | | | | | | | | | | | | | | | | | | | | |
| | | Six months ended
November 30, 2017
(unaudited) | | | Year ended May 31 | |
| | | | 2017 | | | 2016 | | | 2015 | | | 2014 | | | 2013 | |
Class A | | | 0.66 | % | | | 0.68 | % | | | 0.68 | % | | | 0.68 | % | | | 0.68 | % | | | 0.68 | % |
Class C | | | 0.66 | | | | 0.68 | | | | 0.68 | | | | 0.68 | | | | 0.68 | | | | 0.68 | |
Class R6 | | | 0.66 | | | | 0.68 | 6 | | | N/A | | | | N/A | | | | N/A | | | | N/A | |
Administrator Class | | | 0.66 | | | | 0.68 | | | | 0.68 | | | | 0.68 | | | | 0.68 | | | | 0.68 | |
Institutional Class | | | 0.66 | | | | 0.68 | | | | 0.68 | | | | 0.68 | | | | 0.68 | | | | 0.68 | |
| 2 | Total return calculations do not include any sales charges. Returns for periods of less than one year are not annualized. |
| 3 | Portfolio turnover rate is calculated by multiplying the Fund’s ownership percentage in the affiliated Master Portfolio by the affiliated Master Portfolio’s portfolio turnover rate. |
| 4 | Calculated based upon average shares outstanding |
| 5 | Amount is less than $0.005. |
| 6 | For the period from October 31, 2016 (commencement of class operations) to May 31, 2017 |
The accompanying notes are an integral part of these financial statements.
| | | | | | |
| Financial highlights | | Wells Fargo Equity Gateway Funds | | | 39 | |
| | | | | | | | | | | | | | | | | | | | | | |
| Ratio to average net assets (annualized) | | | Total
return2 | | | Portfolio
turnover
rate3 | | | Net assets at
end of period
(000s omitted) | |
Net investment
income (loss)1 | | | Gross
expenses1 | | | Net
expenses1 | | | | |
| | | | | | | | | | | | | | | | | | | | | | |
| | 0.53 | % | | | 1.22 | % | | | 1.13 | % | | | 9.15 | % | | | 18 | % | | $ | 91,806 | |
| | 0.62 | % | | | 1.24 | % | | | 1.15 | % | | | 18.62 | % | | | 89 | % | | $ | 83,016 | |
| | 0.89 | % | | | 1.25 | % | | | 1.15 | % | | | (0.08 | )% | | | 29 | % | | $ | 88,387 | |
| | 0.73 | % | | | 1.29 | % | | | 1.15 | % | | | 9.78 | % | | | 35 | % | | $ | 27,085 | |
| | 0.86 | % | | | 1.31 | % | | | 1.15 | % | | | 17.25 | % | | | 22 | % | | $ | 29,537 | |
| | 1.25 | % | | | 1.30 | % | | | 1.15 | % | | | 28.82 | % | | | 18 | % | | $ | 23,571 | |
| | | | | | | | | | | | | | | | | | | | | | |
| | (0.21 | )% | | | 1.97 | % | | | 1.87 | % | | | 8.73 | % | | | 18 | % | | $ | 10,888 | |
| | (0.13 | )% | | | 1.99 | % | | | 1.90 | % | | | 17.73 | % | | | 89 | % | | $ | 8,043 | |
| | 0.11 | % | | | 2.00 | % | | | 1.90 | % | | | (0.82 | )% | | | 29 | % | | $ | 7,282 | |
| | (0.02 | )% | | | 2.04 | % | | | 1.90 | % | | | 8.93 | % | | | 35 | % | | $ | 7,654 | |
| | 0.11 | % | | | 2.06 | % | | | 1.90 | % | | | 16.39 | % | | | 22 | % | | $ | 7,262 | |
| | 0.51 | % | | | 2.05 | % | | | 1.90 | % | | | 27.76 | % | | | 18 | % | | $ | 5,818 | |
| | | | | | | | | | | | | | | | | | | | | | |
| | 0.98 | % | | | 0.79 | % | | | 0.68 | % | | | 9.32 | % | | | 18 | % | | $ | 4,336 | |
| | 1.04 | % | | | 0.81 | % | | | 0.70 | % | | | 17.65 | % | | | 89 | % | | $ | 3,532 | |
| | | | | | | | | | | | | | | | | | | | | | |
| | 0.67 | % | | | 1.14 | % | | | 1.00 | % | | | 9.13 | % | | | 18 | % | | $ | 14,991 | |
| | 0.77 | % | | | 1.16 | % | | | 1.00 | % | | | 18.82 | % | | | 89 | % | | $ | 11,467 | |
| | 1.03 | % | | | 1.16 | % | | | 0.98 | % | | | 0.11 | % | | | 29 | % | | $ | 23,210 | |
| | 0.92 | % | | | 1.13 | % | | | 0.95 | % | | | 9.93 | % | | | 35 | % | | $ | 55,705 | |
| | 1.08 | % | | | 1.14 | % | | | 0.95 | % | | | 17.49 | % | | | 22 | % | | $ | 53,884 | |
| | 1.48 | % | | | 1.13 | % | | | 0.95 | % | | | 29.09 | % | | | 18 | % | | $ | 70,727 | |
| | | | | | | | | | | | | | | | | | | | | | |
| | 0.88 | % | | | 0.89 | % | | | 0.78 | % | | | 9.33 | % | | | 18 | % | | $ | 269,718 | |
| | 0.96 | % | | | 0.91 | % | | | 0.80 | % | | | 19.05 | % | | | 89 | % | | $ | 220,257 | |
| | 1.25 | % | | | 0.92 | % | | | 0.77 | % | | | 0.33 | % | | | 29 | % | | $ | 133,632 | |
| | 1.18 | % | | | 0.86 | % | | | 0.70 | % | | | 10.15 | % | | | 35 | % | | $ | 132,768 | |
| | 1.34 | % | | | 0.88 | % | | | 0.70 | % | | | 17.86 | % | | | 22 | % | | $ | 104,758 | |
| | 1.68 | % | | | 0.87 | % | | | 0.70 | % | | | 29.32 | % | | | 18 | % | | $ | 130,015 | |
The accompanying notes are an integral part of these financial statements.
| | | | |
| 40 | | Wells Fargo Equity Gateway Funds | | Financial highlights |
| | | | | | | | | | | | | | | | | | | | | | | | |
| Diversified Equity Fund | | Beginning
net asset
value per
share | | | Net
investment
income (loss) | | | Net realized
and unrealized
gains (losses)
on investments | | | Distributions
from net
investment
income | | | Distributions
from net realized gains | | | Ending
net asset
value per
share | |
Class A | | | | | | | | | | | | | | | | | | | | | | | | |
Six months ended November 30, 2017 (unaudited) | | $ | 29.37 | | | | 0.03 | | | | 3.20 | | | | 0.00 | | | | 0.00 | | | $ | 32.60 | |
Year ended May 31, 2017 | | $ | 27.30 | | | | 0.13 | | | | 3.94 | | | | (0.22 | ) | | | (1.78 | ) | | $ | 29.37 | |
Year ended May 31, 2016 | | $ | 32.37 | | | | 0.16 | | | | (1.55 | ) | | | (0.08 | ) | | | (3.60 | ) | | $ | 27.30 | |
Year ended May 31, 2015 | | $ | 32.78 | | | | 0.14 | | | | 2.79 | | | | (0.15 | ) | | | (3.19 | ) | | $ | 32.37 | |
Year ended May 31, 2014 | | $ | 30.65 | | | | 0.16 | | | | 5.48 | | | | (0.17 | ) | | | (3.34 | ) | | $ | 32.78 | |
Year ended May 31, 2013 | | $ | 26.08 | | | | 0.23 | 4 | | | 6.14 | | | | (0.24 | ) | | | (1.56 | ) | | $ | 30.65 | |
Class C | | | | | | | | | | | | | | | | | | | | | | | | |
Six months ended November 30, 2017 (unaudited) | | $ | 26.86 | | | | (0.04 | )4 | | | 2.89 | | | | 0.00 | | | | 0.00 | | | $ | 29.71 | |
Year ended May 31, 2017 | | $ | 25.12 | | | | (0.03 | )4 | | | 3.57 | | | | (0.02 | ) | | | (1.78 | ) | | $ | 26.86 | |
Year ended May 31, 2016 | | $ | 30.22 | | | | (0.05 | )4 | | | (1.45 | ) | | | 0.00 | | | | (3.60 | ) | | $ | 25.12 | |
Year ended May 31, 2015 | | $ | 30.88 | | | | (0.12 | ) | | | 2.65 | | | | 0.00 | | | | (3.19 | ) | | $ | 30.22 | |
Year ended May 31, 2014 | | $ | 29.13 | | | | (0.08 | )4 | | | 5.18 | | | | (0.01 | ) | | | (3.34 | ) | | $ | 30.88 | |
Year ended May 31, 2013 | | $ | 24.88 | | | | 0.02 | 4 | | | 5.84 | | | | (0.05 | ) | | | (1.56 | ) | | $ | 29.13 | |
Administrator Class | | | | | | | | | | | | | | | | | | | | | | | | |
Six months ended November 30, 2017 (unaudited) | | $ | 29.46 | | | | 0.11 | 4 | | | 3.17 | | | | 0.00 | | | | 0.00 | | | $ | 32.74 | |
Year ended May 31, 2017 | | $ | 27.38 | | | | 0.24 | 4 | | | 3.91 | | | | (0.29 | ) | | | (1.78 | ) | | $ | 29.46 | |
Year ended May 31, 2016 | | $ | 32.45 | | | | 0.24 | | | | (1.55 | ) | | | (0.16 | ) | | | (3.60 | ) | | $ | 27.38 | |
Year ended May 31, 2015 | | $ | 32.84 | | | | 0.22 | 4 | | | 2.81 | | | | (0.23 | ) | | | (3.19 | ) | | $ | 32.45 | |
Year ended May 31, 2014 | | $ | 30.70 | | | | 0.23 | 4 | | | 5.49 | | | | (0.24 | ) | | | (3.34 | ) | | $ | 32.84 | |
Year ended May 31, 2013 | | $ | 26.12 | | | | 0.30 | 4 | | | 6.15 | | | | (0.31 | ) | | | (1.56 | ) | | $ | 30.70 | |
| 1 | Ratios include net expenses allocated from the affiliated Master Portfolio which were as follows: |
| | | | | | | | | | | | | | | | | | | | | | | | |
| | | Six months ended
November 30, 2017
(unaudited) | | | Year ended May 31 | |
| | | | 2017 | | | 2016 | | | 2015 | | | 2014 | | | 2013 | |
Class A | | | 0.53 | % | | | 0.57 | % | | | 0.59 | % | | | 0.59 | % | | | 0.58 | % | | | 0.57 | % |
Class C | | | 0.53 | | | | 0.57 | | | | 0.59 | | | | 0.59 | | | | 0.58 | | | | 0.57 | |
Administrator Class | | | 0.53 | | | | 0.57 | | | | 0.59 | | | | 0.59 | | | | 0.58 | | | | 0.57 | |
| 2 | Total return calculations do not include any sales charges. Returns for periods of less than one year are not annualized. |
| 3 | Portfolio turnover rate is calculated by aggregating the results of multiplying the Fund’s ownership percentage in the respective affiliated Master Portfolio by the corresponding affiliated Master Portfolio’s portfolio turnover rate. |
| 4 | Calculated based upon average shares outstanding |
The accompanying notes are an integral part of these financial statements.
| | | | | | |
| Financial highlights | | Wells Fargo Equity Gateway Funds | | | 41 | |
| | | | | | | | | | | | | | | | | | | | | | |
| Ratio to average net assets (annualized) | | | Total
return2 | | | Portfolio
turnover
rate3 | | | Net assets at
end of period
(000s omitted) | |
Net investment
income (loss)1 | | | Gross
expenses1 | | | Net
expenses1 | | | | |
| | | | | | | | | | | | | | | | | | | | | | |
| | 0.51 | % | | | 1.38 | % | | | 1.25 | % | | | 11.00 | % | | | 32 | % | | $ | 71,670 | |
| | 0.63 | % | | | 1.40 | % | | | 1.25 | % | | | 15.59 | % | | | 90 | % | | $ | 68,678 | |
| | 0.60 | % | | | 1.41 | % | | | 1.25 | % | | | (4.24 | )% | | | 39 | % | | $ | 67,597 | |
| | 0.44 | % | | | 1.44 | % | | | 1.25 | % | | | 9.39 | % | | | 38 | % | | $ | 81,502 | |
| | 0.48 | % | | | 1.43 | % | | | 1.25 | % | | | 19.10 | % | | | 37 | % | | $ | 82,186 | |
| | 0.81 | % | | | 1.43 | % | | | 1.25 | % | | | 25.42 | % | | | 44 | % | | $ | 75,640 | |
| | | | | | | | | | | | | | | | | | | | | | |
| | (0.24 | )% | | | 2.13 | % | | | 2.00 | % | | | 10.61 | % | | | 32 | % | | $ | 2,429 | |
| | (0.13 | )% | | | 2.15 | % | | | 2.00 | % | | | 14.71 | % | | | 90 | % | | $ | 2,355 | |
| | (0.17 | )% | | | 2.16 | % | | | 2.00 | % | | | (4.96 | )% | | | 39 | % | | $ | 2,846 | |
| | (0.31 | )% | | | 2.19 | % | | | 2.00 | % | | | 8.58 | % | | | 38 | % | | $ | 4,165 | |
| | (0.25 | )% | | | 2.19 | % | | | 2.00 | % | | | 18.23 | % | | | 37 | % | | $ | 4,292 | |
| | 0.07 | % | | | 2.18 | % | | | 2.00 | % | | | 24.50 | % | | | 44 | % | | $ | 2,667 | |
| | | | | | | | | | | | | | | | | | | | | | |
| | 0.75 | % | | | 1.30 | % | | | 1.00 | % | | | 11.13 | % | | | 32 | % | | $ | 106,267 | |
| | 0.87 | % | | | 1.32 | % | | | 1.00 | % | | | 15.86 | % | | | 90 | % | | $ | 119,893 | |
| | 0.85 | % | | | 1.33 | % | | | 1.00 | % | | | (3.98 | )% | | | 39 | % | | $ | 140,963 | |
| | 0.67 | % | | | 1.28 | % | | | 1.00 | % | | | 9.65 | % | | | 38 | % | | $ | 167,371 | |
| | 0.71 | % | | | 1.27 | % | | | 1.00 | % | | | 19.40 | % | | | 37 | % | | $ | 225,584 | |
| | 1.06 | % | | | 1.27 | % | | | 1.00 | % | | | 25.75 | % | | | 44 | % | | $ | 290,011 | |
The accompanying notes are an integral part of these financial statements.
| | | | |
| 42 | | Wells Fargo Equity Gateway Funds | | Financial highlights |
| | | | | | | | | | | | | | | | | | | | |
| Emerging Growth Fund | | Beginning
net asset
value per
share | | | Net
investment
loss | | | Net realized
and unrealized
gains (losses)
on investments | | | Distributions
from net
realized gains | | | Ending
net asset
value per
share | |
Class A | | | | | | | | | | | | | | | | | | | | |
Six months ended November 30, 2017 (unaudited) | | $ | 14.57 | | | | (0.11 | ) | | | 2.17 | | | | 0.00 | | | $ | 16.63 | |
Year ended May 31, 2017 | | $ | 12.55 | | | | (0.10 | )4 | | | 2.96 | | | | (0.84 | ) | | $ | 14.57 | |
Year ended May 31, 2016 | | $ | 16.70 | | | | (0.13 | )4 | | | (2.28 | ) | | | (1.74 | ) | | $ | 12.55 | |
Year ended May 31, 2015 | | $ | 14.61 | | | | (0.22 | ) | | | 3.51 | | | | (1.20 | ) | | $ | 16.70 | |
Year ended May 31, 2014 | | $ | 14.10 | | | | (0.19 | ) | | | 1.88 | | | | (1.18 | ) | | $ | 14.61 | |
Year ended May 31, 2013 | | $ | 12.44 | | | | (0.15 | ) | | | 2.49 | | | | (0.68 | ) | | $ | 14.10 | |
Class C | | | | | | | | | | | | | | | | | | | | |
Six months ended November 30, 2017 (unaudited) | | $ | 13.28 | | | | (0.13 | )4 | | | 1.95 | | | | 0.00 | | | $ | 15.10 | |
Year ended May 31, 2017 | | $ | 11.58 | | | | (0.19 | )4 | | | 2.73 | | | | (0.84 | ) | | $ | 13.28 | |
Year ended May 31, 2016 | | $ | 15.67 | | | | (0.21 | ) | | | (2.14 | ) | | | (1.74 | ) | | $ | 11.58 | |
Year ended May 31, 2015 | | $ | 13.88 | | | | (0.33 | ) | | | 3.32 | | | | (1.20 | ) | | $ | 15.67 | |
Year ended May 31, 2014 | | $ | 13.55 | | | | (0.32 | ) | | | 1.83 | | | | (1.18 | ) | | $ | 13.88 | |
Year ended May 31, 2013 | | $ | 12.06 | | | | (0.27 | ) | | | 2.44 | | | | (0.68 | ) | | $ | 13.55 | |
Administrator Class | | | | | | | | | | | | | | | | | | | | |
Six months ended November 30, 2017 (unaudited) | | $ | 14.93 | | | | (0.08 | )4 | | | 2.20 | | | | 0.00 | | | $ | 17.05 | |
Year ended May 31, 2017 | | $ | 12.82 | | | | (0.07 | )4 | | | 3.02 | | | | (0.84 | ) | | $ | 14.93 | |
Year ended May 31, 2016 | | $ | 17.00 | | | | (0.12 | )4 | | | (2.32 | ) | | | (1.74 | ) | | $ | 12.82 | |
Year ended May 31, 2015 | | $ | 14.83 | | | | (0.16 | )4 | | | 3.53 | | | | (1.20 | ) | | $ | 17.00 | |
Year ended May 31, 2014 | | $ | 14.28 | | | | (0.17 | )4 | | | 1.90 | | | | (1.18 | ) | | $ | 14.83 | |
Year ended May 31, 2013 | | $ | 12.56 | | | | (0.12 | ) | | | 2.52 | | | | (0.68 | ) | | $ | 14.28 | |
Institutional Class | | | | | | | | | | | | | | | | | | | | |
Six months ended November 30, 2017 (unaudited) | | $ | 15.46 | | | | (0.05 | ) | | | 2.27 | | | | 0.00 | | | $ | 17.68 | |
Year ended May 31, 2017 | | $ | 13.20 | | | | (0.04 | )4 | | | 3.14 | | | | (0.84 | ) | | $ | 15.46 | |
Year ended May 31, 2016 | | $ | 17.40 | | | | (0.07 | ) | | | (2.39 | ) | | | (1.74 | ) | | $ | 13.20 | |
Year ended May 31, 2015 | | $ | 15.11 | | | | (0.12 | ) | | | 3.61 | | | | (1.20 | ) | | $ | 17.40 | |
Year ended May 31, 2014 | | $ | 14.49 | | | | (0.11 | ) | | | 1.91 | | | | (1.18 | ) | | $ | 15.11 | |
Year ended May 31, 2013 | | $ | 12.70 | | | | (0.08 | ) | | | 2.55 | | | | (0.68 | ) | | $ | 14.49 | |
| 1 | Ratios include net expenses allocated from the affiliated Master Portfolio which were as follows: |
| | | | | | | | | | | | | | | | | | | | | | | | |
| | | Six months ended
November 30, 2017
(unaudited) | | | Year ended May 31 | |
| | | | 2017 | | | 2016 | | | 2015 | | | 2014 | | | 2013 | |
Class A | | | 0.81 | % | | | 0.81 | % | | | 0.80 | % | | | 0.80 | % | | | 0.80 | % | | | 0.80 | % |
Class C | | | 0.81 | | | | 0.81 | | | | 0.80 | | | | 0.80 | | | | 0.80 | | | | 0.80 | |
Administrator Class | | | 0.81 | | | | 0.81 | | | | 0.80 | | | | 0.80 | | | | 0.80 | | | | 0.80 | |
Institutional Class | | | 0.81 | | | | 0.81 | | | | 0.80 | | | | 0.80 | | | | 0.80 | | | | 0.80 | |
| 2 | Total return calculations do not include any sales charges. Returns for periods of less than one year are not annualized. |
| 3 | Portfolio turnover rate is calculated by multiplying the Fund’s ownership percentage in the affiliated Master Portfolio by the affiliated Master Portfolio’s portfolio turnover rate. |
| 4 | Calculated based upon average shares outstanding |
The accompanying notes are an integral part of these financial statements.
| | | | | | |
| Financial highlights | | Wells Fargo Equity Gateway Funds | | | 43 | |
| | | | | | | | | | | | | | | | | | | | | | |
| Ratio to average net assets (annualized) | | | Total
return2 | | | Portfolio
turnover
rate3 | | | Net assets at
end of period
(000s omitted) | |
Net investment
loss1 | | | Gross
expenses1 | | | Net
expenses1 | | | | |
| | | | | | | | | | | | | | | | | | | | | | |
| | (1.09 | )% | | | 1.36 | % | | | 1.35 | % | | | 14.14 | % | | | 26 | % | | $ | 138,449 | |
| | (0.72 | )% | | | 1.36 | % | | | 1.35 | % | | | 23.39 | % | | | 115 | % | | $ | 129,724 | |
| | (0.92 | )% | | | 1.35 | % | | | 1.35 | % | | | (14.94 | )% | | | 68 | % | | $ | 127,154 | |
| | (1.20 | )% | | | 1.39 | % | | | 1.37 | % | | | 23.32 | % | | | 56 | % | | $ | 131,638 | |
| | (1.20 | )% | | | 1.39 | % | | | 1.37 | % | | | 11.30 | % | | | 63 | % | | $ | 130,403 | |
| | (1.04 | )% | | | 1.40 | % | | | 1.37 | % | | | 19.89 | % | | | 65 | % | | $ | 125,070 | |
| | | | | | | | | | | | | | | | | | | | | | |
| | (1.84 | )% | | | 2.11 | % | | | 2.10 | % | | | 13.70 | % | | | 26 | % | | $ | 3,452 | |
| | (1.46 | )% | | | 2.10 | % | | | 2.10 | % | | | 22.56 | % | | | 115 | % | | $ | 3,328 | |
| | (1.70 | )% | | | 2.14 | % | | | 2.10 | % | | | (15.59 | )% | | | 68 | % | | $ | 3,815 | |
| | (1.95 | )% | | | 2.14 | % | | | 2.12 | % | | | 22.35 | % | | | 56 | % | | $ | 5,101 | |
| | (1.95 | )% | | | 2.14 | % | | | 2.12 | % | | | 10.40 | % | | | 63 | % | | $ | 4,816 | |
| | (1.79 | )% | | | 2.15 | % | | | 2.12 | % | | | 19.09 | % | | | 65 | % | | $ | 4,878 | |
| | | | | | | | | | | | | | | | | | | | | | |
| | (0.94 | )% | | | 1.28 | % | | | 1.20 | % | | | 14.20 | % | | | 26 | % | | $ | 51,272 | |
| | (0.48 | )% | | | 1.26 | % | | | 1.20 | % | | | 23.60 | % | | | 115 | % | | $ | 50,865 | |
| | (0.80 | )% | | | 1.23 | % | | | 1.20 | % | | | (14.80 | )% | | | 68 | % | | $ | 99,792 | |
| | (1.03 | )% | | | 1.21 | % | | | 1.20 | % | | | 23.45 | % | | | 56 | % | | $ | 159,813 | |
| | (1.03 | )% | | | 1.22 | % | | | 1.20 | % | | | 11.45 | % | | | 63 | % | | $ | 190,126 | |
| | (0.87 | )% | | | 1.23 | % | | | 1.20 | % | | | 20.19 | % | | | 65 | % | | $ | 200,140 | |
| | | | | | | | | | | | | | | | | | | | | | |
| | (0.64 | )% | | | 1.03 | % | | | 0.90 | % | | | 14.36 | % | | | 26 | % | | $ | 566,707 | |
| | (0.24 | )% | | | 1.03 | % | | | 0.90 | % | | | 24.08 | % | | | 115 | % | | $ | 534,846 | |
| | (0.50 | )% | | | 1.01 | % | | | 0.90 | % | | | (14.62 | )% | | | 68 | % | | $ | 583,843 | |
| | (0.73 | )% | | | 0.96 | % | | | 0.90 | % | | | 23.89 | % | | | 56 | % | | $ | 723,946 | |
| | (0.73 | )% | | | 0.96 | % | | | 0.90 | % | | | 11.77 | % | | | 63 | % | | $ | 650,650 | |
| | (0.57 | )% | | | 0.97 | % | | | 0.90 | % | | | 20.52 | % | | | 65 | % | | $ | 578,841 | |
The accompanying notes are an integral part of these financial statements.
| | | | |
| 44 | | Wells Fargo Equity Gateway Funds | | Financial highlights |
| | | | | | | | | | | | | | | | | | | | | | | | |
| Index Fund | | Beginning
net asset
value per
share | | | Net
investment
income | | | Net realized
and unrealized
gains (losses)
on investments | | | Distributions
from net
investment
income | | | Distributions
from net
realized gains | | | Ending
net asset
value per
share | |
Class A | | | | | | | | | | | | | | | | | | | | | | | | |
Six months ended November 30, 2017 (unaudited) | | $ | 66.85 | | | | 0.57 | | | | 6.55 | | | | 0.00 | | | | 0.00 | | | $ | 73.97 | |
Year ended May 31, 2017 | | $ | 62.85 | | | | 1.05 | | | | 9.09 | | | | (1.16 | ) | | | (4.98 | ) | | $ | 66.85 | |
Year ended May 31, 2016 | | $ | 67.32 | | | | 0.81 | | | | (0.17 | ) | | | (1.08 | ) | | | (4.03 | ) | | $ | 62.85 | |
Year ended May 31, 2015 | | $ | 62.14 | | | | 1.00 | | | | 5.91 | | | | (0.96 | ) | | | (0.77 | ) | | $ | 67.32 | |
Year ended May 31, 2014 | | $ | 54.00 | | | | 0.90 | | | | 9.59 | | | | (0.85 | ) | | | (1.50 | ) | | $ | 62.14 | |
Year ended May 31, 2013 | | $ | 44.25 | | | | 0.86 | | | | 10.66 | | | | (0.83 | ) | | | (0.94 | ) | | $ | 54.00 | |
Class C | | | | | | | | | | | | | | | | | | | | | | | | |
Six months ended November 30, 2017 (unaudited) | | $ | 67.11 | | | | 0.34 | | | | 6.53 | | | | 0.00 | | | | 0.00 | | | $ | 73.98 | |
Year ended May 31, 2017 | | $ | 63.12 | | | | 0.66 | | | | 9.02 | | | | (0.71 | ) | | | (4.98 | ) | | $ | 67.11 | |
Year ended May 31, 2016 | | $ | 67.55 | | | | 0.62 | 4 | | | (0.45 | ) | | | (0.57 | ) | | | (4.03 | ) | | $ | 63.12 | |
Year ended May 31, 2015 | | $ | 62.37 | | | | 0.50 | | | | 5.94 | | | | (0.49 | ) | | | (0.77 | ) | | $ | 67.55 | |
Year ended May 31, 2014 | | $ | 54.22 | | | | 0.47 | | | | 9.62 | | | | (0.44 | ) | | | (1.50 | ) | | $ | 62.37 | |
Year ended May 31, 2013 | | $ | 44.41 | | | | 0.48 | 4 | | | 10.71 | | | | (0.44 | ) | | | (0.94 | ) | | $ | 54.22 | |
Administrator Class | | | | | | | | | | | | | | | | | | | | | | | | |
Six months ended November 30, 2017 (unaudited) | | $ | 67.43 | | | | 0.79 | | | | 6.47 | | | | 0.00 | | | | 0.00 | | | $ | 74.69 | |
Year ended May 31, 2017 | | $ | 63.33 | | | | 1.41 | | | | 8.94 | | | | (1.27 | ) | | | (4.98 | ) | | $ | 67.43 | |
Year ended May 31, 2016 | | $ | 67.80 | | | | 1.31 | | | | (0.51 | ) | | | (1.24 | ) | | | (4.03 | ) | | $ | 63.33 | |
Year ended May 31, 2015 | | $ | 62.56 | | | | 1.27 | | | | 5.90 | | | | (1.16 | ) | | | (0.77 | ) | | $ | 67.80 | |
Year ended May 31, 2014 | | $ | 54.34 | | | | 1.08 | | | | 9.66 | | | | (1.02 | ) | | | (1.50 | ) | | $ | 62.56 | |
Year ended May 31, 2013 | | $ | 44.52 | | | | 1.02 | | | | 10.71 | | | | (0.97 | ) | | | (0.94 | ) | | $ | 54.34 | |
| 1 | Ratios include net expenses allocated from the affiliated Master Portfolio which were as follows: |
| | | | | | | | | | | | | | | | | | | | | | | | |
| | | Six months ended
November 30, 2017
(unaudited) | | | Year ended May 31 | |
| | | | 2017 | | | 2016 | | | 2015 | | | 2014 | | | 2013 | |
Class A | | | 0.10 | % | | | 0.10 | % | | | 0.10 | % | | | 0.11 | % | | | 0.10 | % | | | 0.09 | % |
Class C | | | 0.10 | | | | 0.10 | | | | 0.10 | | | | 0.11 | | | | 0.10 | | | | 0.09 | |
Administrator Class | | | 0.10 | | | | 0.10 | | | | 0.10 | | | | 0.11 | | | | 0.10 | | | | 0.09 | |
| 2 | Total return calculations do not include any sales charges. Returns for periods of less than one year are not annualized. |
| 3 | Portfolio turnover rate is calculated by multiplying the Fund’s ownership percentage in the affiliated Master Portfolio by the affiliated Master Portfolio’s portfolio turnover rate. |
| 4 | Calculated based upon average shares outstanding |
The accompanying notes are an integral part of these financial statements.
| | | | | | |
| Financial highlights | | Wells Fargo Equity Gateway Funds | | | 45 | |
| | | | | | | | | | | | | | | | | | | | | | |
| Ratio to average net assets (annualized) | | | Total
return2 | | | Portfolio
turnover
rate3 | | | Net assets at
end of period
(000s omitted) | |
Net investment
income1 | | | Gross
expenses1 | | | Net
expenses1 | | | | |
| | | | | | | | | | | | | | | | | | | | | | |
| | 1.62 | % | | | 0.63 | % | | | 0.45 | % | | | 10.65 | % | | | 2 | % | | $ | 720,654 | |
| | 1.68 | % | | | 0.62 | % | | | 0.45 | % | | | 16.94 | % | | | 9 | % | | $ | 684,004 | |
| | 1.78 | % | | | 0.63 | % | | | 0.48 | % | | | 1.24 | % | | | 4 | % | | $ | 639,496 | |
| | 1.50 | % | | | 0.68 | % | | | 0.56 | % | | | 11.21 | % | | | 4 | % | | $ | 445,088 | |
| | 1.53 | % | | | 0.67 | % | | | 0.56 | % | | | 19.77 | % | | | 5 | % | | $ | 432,448 | |
| | 1.72 | % | | | 0.67 | % | | | 0.56 | % | | | 26.63 | % | | | 4 | % | | $ | 407,533 | |
| | | | | | | | | | | | | | | | | | | | | | |
| | 0.87 | % | | | 1.38 | % | | | 1.20 | % | | | 10.24 | % | | | 2 | % | | $ | 69,709 | |
| | 0.93 | % | | | 1.37 | % | | | 1.20 | % | | | 16.07 | % | | | 9 | % | | $ | 67,691 | |
| | 0.99 | % | | | 1.38 | % | | | 1.24 | % | | | 0.48 | % | | | 4 | % | | $ | 79,858 | |
| | 0.75 | % | | | 1.43 | % | | | 1.31 | % | | | 10.38 | % | | | 4 | % | | $ | 83,718 | |
| | 0.78 | % | | | 1.42 | % | | | 1.31 | % | | | 18.89 | % | | | 5 | % | | $ | 78,118 | |
| | 0.97 | % | | | 1.42 | % | | | 1.31 | % | | | 25.67 | % | | | 4 | % | | $ | 70,322 | |
| | | | | | | | | | | | | | | | | | | | | | |
| | 1.81 | % | | | 0.40 | % | | | 0.25 | % | | | 10.77 | % | | | 2 | % | | $ | 1,106,373 | |
| | 1.88 | % | | | 0.39 | % | | | 0.25 | % | | | 17.18 | % | | | 9 | % | | $ | 1,151,522 | |
| | 1.97 | % | | | 0.40 | % | | | 0.25 | % | | | 1.49 | % | | | 4 | % | | $ | 1,502,276 | |
| | 1.81 | % | | | 0.37 | % | | | 0.25 | % | | | 11.56 | % | | | 4 | % | | $ | 1,832,814 | |
| | 1.84 | % | | | 0.36 | % | | | 0.25 | % | | | 20.13 | % | | | 5 | % | | $ | 1,984,845 | |
| | 2.03 | % | | | 0.36 | % | | | 0.25 | % | | | 27.02 | % | | | 4 | % | | $ | 1,832,524 | |
The accompanying notes are an integral part of these financial statements.
| | | | |
| 46 | | Wells Fargo Equity Gateway Funds | | Financial highlights |
| | | | | | | | | | | | | | | | | | | | |
| International Value Fund | | Beginning
net asset
value per
share | | | Net
investment
income | | | Net realized
and unrealized
gains (losses)
on investments | | | Distributions
from net
investment
income | | | Ending
net asset
value per
share | |
Class A | | | | | | | | | | | | | | | | | | | | |
Six months ended November 30, 2017 (unaudited) | | $ | 14.88 | | | | 0.14 | 4 | | | 1.07 | | | | 0.00 | | | $ | 16.09 | |
Year ended May 31, 2017 | | $ | 12.83 | | | | 0.09 | 4 | | | 2.26 | | | | (0.30 | ) | | $ | 14.88 | |
Year ended May 31, 2016 | | $ | 14.85 | | | | 0.26 | | | | (2.08 | ) | | | (0.20 | ) | | $ | 12.83 | |
Year ended May 31, 2015 | | $ | 15.45 | | | | 0.26 | 4 | | | (0.53 | ) | | | (0.33 | ) | | $ | 14.85 | |
Year ended May 31, 2014 | | $ | 13.40 | | | | 0.36 | | | | 1.97 | | | | (0.28 | ) | | $ | 15.45 | |
Year ended May 31, 2013 | | $ | 10.64 | | | | 0.31 | | | | 2.71 | | | | (0.26 | ) | | $ | 13.40 | |
Class C | | | | | | | | | | | | | | | | | | | | |
Six months ended November 30, 2017 (unaudited) | | $ | 14.60 | | | | 0.05 | | | | 1.08 | | | | 0.00 | | | $ | 15.73 | |
Year ended May 31, 2017 | | $ | 12.56 | | | | 0.23 | | | | 1.97 | | | | (0.16 | ) | | $ | 14.60 | |
Year ended May 31, 2016 | | $ | 14.54 | | | | 0.17 | | | | (2.05 | ) | | | (0.10 | ) | | $ | 12.56 | |
Year ended May 31, 2015 | | $ | 15.16 | | | | 0.13 | | | | (0.51 | ) | | | (0.24 | ) | | $ | 14.54 | |
Year ended May 31, 2014 | | $ | 13.18 | | | | 0.19 | | | | 2.00 | | | | (0.21 | ) | | $ | 15.16 | |
Year ended May 31, 2013 | | $ | 10.47 | | | | 0.19 | | | | 2.70 | | | | (0.18 | ) | | $ | 13.18 | |
Administrator Class | | | | | | | | | | | | | | | | | | | | |
Six months ended November 30, 2017 (unaudited) | | $ | 15.04 | | | | 0.16 | 4 | | | 1.08 | | | | 0.00 | | | $ | 16.28 | |
Year ended May 31, 2017 | | $ | 12.91 | | | | 0.33 | 4 | | | 2.05 | | | | (0.25 | ) | | $ | 15.04 | |
Year ended May 31, 2016 | | $ | 14.73 | | | | 0.14 | 4 | | | (1.96 | ) | | | 0.00 | | | $ | 12.91 | |
Year ended May 31, 2015 | | $ | 15.35 | | | | 0.28 | | | | (0.52 | ) | | | (0.38 | ) | | $ | 14.73 | |
Year ended May 31, 2014 | | $ | 13.31 | | | | 0.38 | | | | 1.98 | | | | (0.32 | ) | | $ | 15.35 | |
Year ended May 31, 2013 | | $ | 10.57 | | | | 0.33 | 4 | | | 2.70 | | | | (0.29 | ) | | $ | 13.31 | |
Institutional Class | | | | | | | | | | | | | | | | | | | | |
Six months ended November 30, 2017 (unaudited) | | $ | 14.80 | | | | 0.17 | | | | 1.07 | | | | 0.00 | | | $ | 16.04 | |
Year ended May 31, 2017 | | $ | 12.73 | | | | 0.39 | | | | 1.99 | | | | (0.31 | ) | | $ | 14.80 | |
Year ended May 31, 2016 | | $ | 14.75 | | | | 0.36 | | | | (2.12 | ) | | | (0.26 | ) | | $ | 12.73 | |
Year ended May 31, 2015 | | $ | 15.38 | | | | 0.29 | | | | (0.51 | ) | | | (0.41 | ) | | $ | 14.75 | |
Year ended May 31, 2014 | | $ | 13.34 | | | | 0.41 | | | | 1.98 | | | | (0.35 | ) | | $ | 15.38 | |
Year ended May 31, 2013 | | $ | 10.58 | | | | 0.35 | | | | 2.73 | | | | (0.32 | ) | | $ | 13.34 | |
| 1 | Ratios include net expenses allocated from the affiliated Master Portfolio which were as follows: |
| | | | | | | | | | | | | | | | | | | | | | | | |
| | | Six months ended
November 30, 2017
(unaudited) | | | Year ended May 31 | |
| | | | 2017 | | | 2016 | | | 2015 | | | 2014 | | | 2013 | |
Class A | | | 0.82 | % | | | 0.85 | % | | | 0.91 | % | | | 0.91 | % | | | 0.91 | % | | | 0.91 | % |
Class C | | | 0.82 | | | | 0.87 | | | | 0.91 | | | | 0.91 | | | | 0.91 | | | | 0.91 | |
Administrator Class | | | 0.82 | | | | 0.87 | | | | 0.91 | | | | 0.91 | | | | 0.91 | | | | 0.91 | |
Institutional Class | | | 0.82 | | | | 0.86 | | | | 0.91 | | | | 0.91 | | | | 0.91 | | | | 0.91 | |
| 2 | Total return calculations do not include any sales charges. Returns for periods of less than one year are not annualized. |
| 3 | Portfolio turnover rate is calculated by multiplying the Fund’s ownership percentage in the affiliated Master Portfolio by the affiliated Master Portfolio’s portfolio turnover rate. |
| 4 | Calculated based upon average shares outstanding |
The accompanying notes are an integral part of these financial statements.
| | | | | | |
| Financial highlights | | Wells Fargo Equity Gateway Funds | | | 47 | |
| | | | | | | | | | | | | | | | | | | | | | |
| Ratio to average net assets (annualized) | | | Total
return2 | | | Portfolio
turnover
rate3 | | |
Net assets at
end of period
(000s omitted) | |
Net investment
income1 | | | Gross
expenses1 | | | Net
expenses1 | | | | |
| | | | | | | | | | | | | | | | | | | | | | |
| | 1.83 | % | | | 1.35 | % | | | 1.35 | % | | | 8.13 | % | | | 6 | % | | $ | 3,310 | |
| | 0.69 | % | | | 1.39 | % | | | 1.35 | % | | | 18.65 | % | | | 41 | % | | $ | 2,571 | |
| | 1.98 | % | | | 1.46 | % | | | 1.39 | % | | | (12.31 | )% | | | 14 | % | | $ | 4,981 | |
| | 1.80 | % | | | 1.50 | % | | | 1.49 | % | | | (1.55 | )% | | | 18 | % | | $ | 5,768 | |
| | 2.45 | % | | | 1.51 | % | | | 1.50 | % | | | 17.48 | % | | | 11 | % | | $ | 6,725 | |
| | 2.35 | % | | | 1.51 | % | | | 1.50 | % | | | 28.58 | % | | | 16 | % | | $ | 5,922 | |
| | | | | | | | | | | | | | | | | | | | | | |
| | 1.10 | % | | | 2.10 | % | | | 2.10 | % | | | 7.74 | % | | | 6 | % | | $ | 1,038 | |
| | 1.57 | % | | | 2.16 | % | | | 2.10 | % | | | 17.69 | % | | | 41 | % | | $ | 832 | |
| | 1.25 | % | | | 2.21 | % | | | 2.14 | % | | | (12.95 | )% | | | 14 | % | | $ | 783 | |
| | 1.07 | % | | | 2.25 | % | | | 2.24 | % | | | (2.37 | )% | | | 18 | % | | $ | 920 | |
| | 1.88 | % | | | 2.26 | % | | | 2.25 | % | | | 16.64 | % | | | 11 | % | | $ | 920 | |
| | 1.67 | % | | | 2.26 | % | | | 2.25 | % | | | 27.67 | % | | | 16 | % | | $ | 595 | |
| | | | | | | | | | | | | | | | | | | | | | |
| | 2.00 | % | | | 1.27 | % | | | 1.25 | % | | | 8.24 | % | | | 6 | % | | $ | 4,769 | |
| | 2.46 | % | | | 1.33 | % | | | 1.25 | % | | | 18.66 | % | | | 41 | % | | $ | 5,407 | |
| | 0.99 | % | | | 1.36 | % | | | 1.25 | % | | | (12.36 | )% | | | 14 | % | | $ | 11,873 | |
| | 2.12 | % | | | 1.34 | % | | | 1.25 | % | | | (1.35 | )% | | | 18 | % | | $ | 487,582 | |
| | 2.76 | % | | | 1.34 | % | | | 1.25 | % | | | 17.81 | % | | | 11 | % | | $ | 459,415 | |
| | 2.67 | % | | | 1.34 | % | | | 1.25 | % | | | 28.90 | % | | | 16 | % | | $ | 372,187 | |
| | | | | | | | | | | | | | | | | | | | | | |
| | 2.23 | % | | | 1.02 | % | | | 1.00 | % | | | 8.38 | % | | | 6 | % | | $ | 788,695 | |
| | 2.95 | % | | | 1.07 | % | | | 1.00 | % | | | 19.04 | % | | | 41 | % | | $ | 713,180 | |
| | 2.81 | % | | | 1.13 | % | | | 1.01 | % | | | (11.98 | )% | | | 14 | % | | $ | 456,239 | |
| | 2.42 | % | | | 1.07 | % | | | 1.05 | % | | | (1.19 | )% | | | 18 | % | | $ | 3,793 | |
| | 2.91 | % | | | 1.08 | % | | | 1.05 | % | | | 18.07 | % | | | 11 | % | | $ | 2,359 | |
| | 2.81 | % | | | 1.08 | % | | | 1.05 | % | | | 29.20 | % | | | 16 | % | | $ | 1,941 | |
The accompanying notes are an integral part of these financial statements.
| | | | |
| 48 | | Wells Fargo Equity Gateway Funds | | Financial highlights |
| | | | | | | | | | | | | | | | | | | | | | | | |
| Small Company Growth Fund | | Beginning
net asset
value per
share | | | Net
investment
loss | | | Net realized
and unrealized
gains (losses)
on investments | | | Distributions
from net
investment
income | | | Distributions
from net
realized gains | | | Ending
net asset
value per
share | |
Class A | | | | | | | | | | | | | | | | | | | | | | | | |
Six months ended November 30, 2017 (unaudited) | | $ | 44.26 | | | | (0.15 | )4 | | | 5.69 | | | | 0.00 | | | | 0.00 | | | $ | 49.80 | |
Year ended May 31, 2017 | | $ | 37.69 | | | | (0.28 | )4 | | | 6.85 | | | | 0.00 | | | | 0.00 | | | $ | 44.26 | |
Year ended May 31, 2016 | | $ | 44.23 | | | | (0.22 | )4 | | | (6.05 | ) | | | 0.00 | | | | (0.27 | ) | | $ | 37.69 | |
Year ended May 31, 2015 | | $ | 39.44 | | | | (0.37 | )4 | | | 7.08 | | | | 0.00 | | | | (1.92 | ) | | $ | 44.23 | |
Year ended May 31, 2014 | | $ | 34.23 | | | | (0.37 | )4 | | | 7.98 | | | | 0.00 | | | | (2.40 | ) | | $ | 39.44 | |
Year ended May 31, 2013 | | $ | 26.21 | | | | (0.15 | ) | | | 8.17 | | | | 0.00 | | | | 0.00 | | | $ | 34.23 | |
Class C | | | | | | | | | | | | | | | | | | | | | | | | |
Six months ended November 30, 2017 (unaudited) | | $ | 39.65 | | | | (0.29 | )4 | | | 5.09 | | | | 0.00 | | | | 0.00 | | | $ | 44.45 | |
Year ended May 31, 2017 | | $ | 34.02 | | | | (0.54 | )4 | | | 6.17 | | | | 0.00 | | | | 0.00 | | | $ | 39.65 | |
Year ended May 31, 2016 | | $ | 40.25 | | | | (0.46 | )4 | | | (5.50 | ) | | | 0.00 | | | | (0.27 | ) | | $ | 34.02 | |
Year ended May 31, 2015 | | $ | 36.32 | | | | (0.63 | )4 | | | 6.48 | | | | 0.00 | | | | (1.92 | ) | | $ | 40.25 | |
Year ended May 31, 2014 | | $ | 31.91 | | | | (0.62 | )4 | | | 7.43 | | | | 0.00 | | | | (2.40 | ) | | $ | 36.32 | |
Year ended May 31, 2013 | | $ | 24.62 | | | | (0.37 | )4 | | | 7.66 | | | | 0.00 | | | | 0.00 | | | $ | 31.91 | |
Class R6 | | | | | | | | | | | | | | | | | | | | | | | | |
Six months ended November 30, 2017 (unaudited) | | $ | 46.91 | | | | (0.06 | ) | | | 6.05 | | | | 0.00 | | | | 0.00 | | | $ | 52.90 | |
Year ended May 31, 2017 | | $ | 39.77 | | | | (0.11 | ) | | | 7.25 | | | | 0.00 | | | | 0.00 | | | $ | 46.91 | |
Year ended May 31, 2016 | | $ | 46.45 | | | | (0.03 | ) | | | (6.38 | ) | | | 0.00 | | | | (0.27 | ) | | $ | 39.77 | |
Year ended May 31, 20155 | | $ | 42.98 | | | | (0.09 | )4 | | | 5.48 | | | | 0.00 | | | | (1.92 | ) | | $ | 46.45 | |
Administrator Class | | | | | | | | | | | | | | | | | | | | | | | | |
Six months ended November 30, 2017 (unaudited) | | $ | 45.91 | | | | (0.13 | )4 | | | 5.91 | | | | 0.00 | | | | 0.00 | | | $ | 51.69 | |
Year ended May 31, 2017 | | $ | 39.05 | | | | (0.24 | )4 | | | 7.10 | | | | 0.00 | | | | 0.00 | | | $ | 45.91 | |
Year ended May 31, 2016 | | $ | 45.73 | | | | (0.19 | )4 | | | (6.22 | ) | | | 0.00 | | | | (0.27 | ) | | $ | 39.05 | |
Year ended May 31, 2015 | | $ | 40.64 | | | | (0.30 | )4 | | | 7.31 | | | | 0.00 | | | | (1.92 | ) | | $ | 45.73 | |
Year ended May 31, 2014 | | $ | 35.13 | | | | (0.26 | )4 | | | 8.17 | | | | 0.00 | | | | (2.40 | ) | | $ | 40.64 | |
Year ended May 31, 2013 | | $ | 26.90 | | | | (0.09 | )4 | | | 8.38 | | | | (0.06 | ) | | | 0.00 | | | $ | 35.13 | |
Institutional Class | | | | | | | | | | | | | | | | | | | | | | | | |
Six months ended November 30, 2017 (unaudited) | | $ | 46.85 | | | | (0.07 | ) | | | 6.04 | | | | 0.00 | | | | 0.00 | | | $ | 52.82 | |
Year ended May 31, 2017 | | $ | 39.75 | | | | (0.15 | ) | | | 7.25 | | | | 0.00 | | | | 0.00 | | | $ | 46.85 | |
Year ended May 31, 2016 | | $ | 46.44 | | | | (0.09 | ) | | | (6.33 | ) | | | 0.00 | | | | (0.27 | ) | | $ | 39.75 | |
Year ended May 31, 2015 | | $ | 41.14 | | | | (0.20 | )4 | | | 7.42 | | | | 0.00 | | | | (1.92 | ) | | $ | 46.44 | |
Year ended May 31, 2014 | | $ | 35.46 | | | | (0.20 | )4 | | | 8.28 | | | | 0.00 | | | | (2.40 | ) | | $ | 41.14 | |
Year ended May 31, 2013 | | $ | 27.15 | | | | (0.06 | )4 | | | 8.51 | | | | (0.14 | ) | | | 0.00 | | | $ | 35.46 | |
| 1 | Ratios include net expenses allocated from the affiliated Master Portfolio which were as follows: |
| | | | | | | | | | | | | | | | | | | | | | | | |
| | | Six months ended
November 30, 2017
(unaudited) | | | Year ended May 31 | |
| | | | 2017 | | | 2016 | | | 2015 | | | 2014 | | | 2013 | |
Class A | | | 0.78 | % | | | 0.78 | % | | | 0.80 | % | | | 0.81 | % | | | 0.83 | % | | | 0.86 | % |
Class C | | | 0.78 | | | | 0.78 | | | | 0.80 | | | | 0.81 | | | | 0.83 | | | | 0.86 | |
Class R6 | | | 0.78 | | | | 0.78 | | | | 0.80 | | | | 0.81 | 5 | | | N/A | | | | N/A | |
Administrator Class | | | 0.78 | | | | 0.78 | | | | 0.80 | | | | 0.81 | | | | 0.83 | | | | 0.86 | |
Institutional Class | | | 0.78 | | | | 0.78 | | | | 0.80 | | | | 0.81 | | | | 0.83 | | | | 0.86 | |
| 2 | Total return calculations do not include any sales charges. Returns for periods of less than one year are not annualized. |
| 3 | Portfolio turnover rate is calculated by multiplying the Fund’s ownership percentage in the affiliated Master Portfolio by the affiliated Master Portfolio’s portfolio turnover rate. |
| 4 | Calculated based upon average shares outstanding |
| 5 | For the period from October 31, 2014 (commencement of class operations) to May 31, 2015 |
The accompanying notes are an integral part of these financial statements.
| | | | | | |
| Financial highlights | | Wells Fargo Equity Gateway Funds | | | 49 | |
| | | | | | | | | | | | | | | | | | | | | | |
| Ratio to average net assets (annualized) | | | Total
return2 | | | Portfolio
turnover
rate3 | | | Net assets at
end of period
(000s omitted) | |
Net investment
loss1 | | | Gross
expenses1 | | | Net
expenses1 | | | | |
| | | | | | | | | | | | | | | | | | | | | | |
| | (0.65 | )% | | | 1.32 | % | | | 1.32 | % | | | 12.52 | % | | | 17 | % | | $ | 76,985 | |
| | (0.68 | )% | | | 1.33 | % | | | 1.33 | % | | | 17.43 | % | | | 82 | % | | $ | 76,087 | |
| | (0.57 | )% | | | 1.34 | % | | | 1.34 | % | | | (14.20 | )% | | | 49 | % | | $ | 128,675 | |
| | (0.90 | )% | | | 1.41 | % | | | 1.40 | % | | | 17.51 | % | | | 58 | % | | $ | 85,588 | |
| | (0.96 | )% | | | 1.45 | % | | | 1.41 | % | | | 22.63 | % | | | 77 | % | | $ | 30,364 | |
| | (0.58 | )% | | | 1.53 | % | | | 1.45 | % | | | 30.55 | % | | | 109 | % | | $ | 9,357 | |
| | | | | | | | | | | | | | | | | | | | | | |
| | (1.41 | )% | | | 2.07 | % | | | 2.07 | % | | | 12.11 | % | | | 17 | % | | $ | 20,718 | |
| | (1.43 | )% | | | 2.08 | % | | | 2.08 | % | | | 16.55 | % | | | 82 | % | | $ | 22,410 | |
| | (1.32 | )% | | | 2.09 | % | | | 2.09 | % | | | (14.84 | )% | | | 49 | % | | $ | 26,946 | |
| | (1.64 | )% | | | 2.16 | % | | | 2.15 | % | | | 16.62 | % | | | 58 | % | | $ | 17,334 | |
| | (1.71 | )% | | | 2.20 | % | | | 2.16 | % | | | 21.75 | % | | | 77 | % | | $ | 6,546 | |
| | (1.31 | )% | | | 2.28 | % | | | 2.20 | % | | | 29.56 | % | | | 109 | % | | $ | 2,406 | |
| | | | | | | | | | | | | | | | | | | | | | |
| | (0.22 | )% | | | 0.89 | % | | | 0.89 | % | | | 12.77 | % | | | 17 | % | | $ | 493,376 | |
| | (0.25 | )% | | | 0.90 | % | | | 0.90 | % | | | 17.95 | % | | | 82 | % | | $ | 418,111 | |
| | (0.09 | )% | | | 0.91 | % | | | 0.90 | % | | | (13.83 | )% | | | 49 | % | | $ | 229,391 | |
| | (0.34 | )% | | | 0.91 | % | | | 0.90 | % | | | 13.00 | % | | | 58 | % | | $ | 644 | |
| | | | | | | | | | | | | | | | | | | | | | |
| | (0.54 | )% | | | 1.24 | % | | | 1.20 | % | | | 12.59 | % | | | 17 | % | | $ | 104,141 | |
| | (0.55 | )% | | | 1.25 | % | | | 1.20 | % | | | 17.57 | % | | | 82 | % | | $ | 130,311 | |
| | (0.46 | )% | | | 1.25 | % | | | 1.20 | % | | | (14.04 | )% | | | 49 | % | | $ | 130,104 | |
| | (0.70 | )% | | | 1.24 | % | | | 1.20 | % | | | 17.73 | % | | | 58 | % | | $ | 185,267 | |
| | (0.74 | )% | | | 1.29 | % | | | 1.20 | % | | | 22.92 | % | | | 77 | % | | $ | 118,456 | |
| | (0.30 | )% | | | 1.37 | % | | | 1.20 | % | | | 30.89 | % | | | 109 | % | | $ | 98,445 | |
| | | | | | | | | | | | | | | | | | | | | | |
| | (0.28 | )% | | | 0.99 | % | | | 0.95 | % | | | 12.74 | % | | | 17 | % | | $ | 1,123,866 | |
| | (0.31 | )% | | | 1.00 | % | | | 0.95 | % | | | 17.86 | % | | | 82 | % | | $ | 1,014,847 | |
| | (0.18 | )% | | | 1.01 | % | | | 0.95 | % | | | (13.85 | )% | | | 49 | % | | $ | 678,699 | |
| | (0.45 | )% | | | 0.98 | % | | | 0.95 | % | | | 18.03 | % | | | 58 | % | | $ | 457,542 | |
| | (0.49 | )% | | | 1.02 | % | | | 0.95 | % | | | 23.19 | % | | | 77 | % | | $ | 186,581 | |
| | (0.19 | )% | | | 1.10 | % | | | 0.95 | % | | | 31.25 | % | | | 109 | % | | $ | 71,336 | |
The accompanying notes are an integral part of these financial statements.
| | | | |
| 50 | | Wells Fargo Equity Gateway Funds | | Financial highlights |
| | | | | | | | | | | | | | | | | | | | |
| Small Company Value Fund | | Beginning
net asset
value per
share | | | Net
investment
income (loss) | | | Net realized
and unrealized
gains (losses)
on investments | | | Distributions
from net
investment
income | | | Ending
net asset
value per
share | |
Class A | | | | | | | | | | | | | | | | | | | | |
Six months ended November 30, 2017 (unaudited) | | $ | 24.01 | | | | 0.12 | | | | 3.12 | | | | 0.00 | | | $ | 27.25 | |
Year ended May 31, 2017 | | $ | 20.22 | | | | 0.05 | | | | 3.75 | | | | (0.01 | ) | | $ | 24.01 | |
Year ended May 31, 2016 | | $ | 21.42 | | | | 0.08 | | | | (1.25 | ) | | | (0.03 | ) | | $ | 20.22 | |
Year ended May 31, 2015 | | $ | 20.08 | | | | 0.07 | | | | 1.27 | | | | 0.00 | | | $ | 21.42 | |
Year ended May 31, 2014 | | $ | 17.10 | | | | 0.06 | | | | 2.92 | | | | 0.00 | | | $ | 20.08 | |
Year ended May 31, 2013 | | $ | 13.17 | | | | (0.00 | )4 | | | 3.93 | | | | 0.00 | | | $ | 17.10 | |
Class C | | | | | | | | | | | | | | | | | | | | |
Six months ended November 30, 2017 (unaudited) | | $ | 21.40 | | | | 0.03 | 5 | | | 2.77 | | | | 0.00 | | | $ | 24.20 | |
Year ended May 31, 2017 | | $ | 18.15 | | | | (0.11 | )5 | | | 3.36 | | | | 0.00 | | | $ | 21.40 | |
Year ended May 31, 2016 | | $ | 19.34 | | | | (0.11 | )5 | | | (1.08 | ) | | | 0.00 | | | $ | 18.15 | |
Year ended May 31, 2015 | | $ | 18.27 | | | | (0.08 | )5 | | | 1.15 | | | | 0.00 | | | $ | 19.34 | |
Year ended May 31, 2014 | | $ | 15.68 | | | | (0.07 | )5 | | | 2.66 | | | | 0.00 | | | $ | 18.27 | |
Year ended May 31, 2013 | | $ | 12.16 | | | | (0.10 | )5 | | | 3.62 | | | | 0.00 | | | $ | 15.68 | |
Class R6 | | | | | | | | | | | | | | | | | | | | |
Six months ended November 30, 2017 (unaudited) | | $ | 24.69 | | | | 0.25 | | | | 3.14 | | | | 0.00 | | | $ | 28.08 | |
Year ended May 31, 20176 | | $ | 21.37 | | | | 0.08 | | | | 3.33 | | | | (0.09 | ) | | $ | 24.69 | |
Administrator Class | | | | | | | | | | | | | | | | | | | | |
Six months ended November 30, 2017 (unaudited) | | $ | 24.53 | | | | 0.17 | | | | 3.17 | | | | 0.00 | | | $ | 27.87 | |
Year ended May 31, 2017 | | $ | 20.66 | | | | 0.08 | 5 | | | 3.83 | | | | (0.04 | ) | | $ | 24.53 | |
Year ended May 31, 2016 | | $ | 21.90 | | | | 0.13 | | | | (1.30 | ) | | | (0.07 | ) | | $ | 20.66 | |
Year ended May 31, 2015 | | $ | 20.49 | | | | 0.11 | | | | 1.30 | | | | 0.00 | | | $ | 21.90 | |
Year ended May 31, 2014 | | $ | 17.42 | | | | 0.12 | | | | 2.95 | | | | 0.00 | | | $ | 20.49 | |
Year ended May 31, 2013 | | $ | 13.39 | | | | 0.03 | 5 | | | 4.01 | | | | (0.01 | ) | | $ | 17.42 | |
Institutional Class | | | | | | | | | | | | | | | | | | | | |
Six months ended November 30, 2017 (unaudited) | | $ | 24.68 | | | | 0.18 | | | | 3.20 | | | | 0.00 | | | $ | 28.06 | |
Year ended May 31, 2017 | | $ | 20.77 | | | | 0.11 | | | | 3.89 | | | | (0.09 | ) | | $ | 24.68 | |
Year ended May 31, 2016 | | $ | 22.02 | | | | 0.08 | 5 | | | (1.22 | ) | | | (0.11 | ) | | $ | 20.77 | |
Year ended May 31, 2015 | | $ | 20.57 | | | | 0.14 | | | | 1.31 | | | | 0.00 | | | $ | 22.02 | |
Year ended May 31, 2014 | | $ | 17.45 | | | | 0.13 | | | | 2.99 | | | | 0.00 | | | $ | 20.57 | |
Year ended May 31, 2013 | | $ | 13.41 | | | | 0.06 | 5 | | | 4.03 | | | | (0.05 | ) | | $ | 17.45 | |
| 1 | Ratios include net expenses allocated from the affiliated Master Portfolio which were as follows: |
| | | | | | | | | | | | | | | | | | | | | | | | |
| | | Six months ended
November 30, 2017
(unaudited) | | | Year ended May 31 | |
| | | | 2017 | | | 2016 | | | 2015 | | | 2014 | | | 2013 | |
Class A | | | 0.84 | % | | | 0.84 | % | | | 0.84 | % | | | 0.84 | % | | | 0.85 | % | | | 0.85 | % |
Class C | | | 0.84 | | | | 0.84 | | | | 0.84 | | | | 0.84 | | | | 0.85 | | | | 0.85 | |
Class R6 | | | 0.85 | | | | 0.83 | 6 | | | N/A | | | | N/A | | | | N/A | | | | N/A | |
Administrator Class | | | 0.84 | | | | 0.84 | | | | 0.84 | | | | 0.84 | | | | 0.85 | | | | 0.85 | |
Institutional Class | | | 0.84 | | | | 0.84 | | | | 0.84 | | | | 0.84 | | | | 0.85 | | | | 0.85 | |
| 2 | Total return calculations do not include any sales charges. Returns for periods of less than one year are not annualized. |
| 3 | Portfolio turnover rate is calculated by multiplying the Fund’s ownership percentage in the affiliated Master Portfolio by the affiliated Master Portfolio’s portfolio turnover rate. |
| 4 | Amount is less than $0.005. |
| 5 | Calculated based upon average shares outstanding |
| 6 | For the period from October 31, 2016 (commencement of class operations) to May 31, 2017 |
The accompanying notes are an integral part of these financial statements.
| | | | | | |
| Financial highlights | | Wells Fargo Equity Gateway Funds | | | 51 | |
| | | | | | | | | | | | | | | | | | | | | | |
| Ratio to average net assets (annualized) | | | Total
return2 | | | Portfolio
turnover
rate3 | | | Net assets at
end of period
(000s omitted) | |
Net investment
income (loss)1 | | | Gross
expenses1 | | | Net
expenses1 | | | | |
| | | | | | | | | | | | | | | | | | | | | | |
| | 1.00 | % | | | 1.47 | % | | | 1.35 | % | | | 13.54 | % | | | 27 | % | | $ | 17,339 | |
| | 0.20 | % | | | 1.47 | % | | | 1.35 | % | | | 18.86 | % | | | 110 | % | | $ | 16,280 | |
| | 0.11 | % | | | 1.48 | % | | | 1.37 | % | | | (5.48 | )% | | | 72 | % | | $ | 23,151 | |
| | 0.33 | % | | | 1.50 | % | | | 1.40 | % | | | 6.62 | % | | | 54 | % | | $ | 26,339 | |
| | 0.33 | % | | | 1.56 | % | | | 1.42 | % | | | 17.43 | % | | | 47 | % | | $ | 26,517 | |
| | (0.02 | )% | | | 1.57 | % | | | 1.45 | % | | | 29.84 | % | | | 57 | % | | $ | 21,652 | |
| | | | | | | | | | | | | | | | | | | | | | |
| | 0.26 | % | | | 2.22 | % | | | 2.10 | % | | | 13.08 | % | | | 27 | % | | $ | 2,117 | |
| | (0.54 | )% | | | 2.22 | % | | | 2.10 | % | | | 17.97 | % | | | 110 | % | | $ | 1,962 | |
| | (0.62 | )% | | | 2.23 | % | | | 2.12 | % | | | (6.20 | )% | | | 72 | % | | $ | 2,004 | |
| | (0.42 | )% | | | 2.26 | % | | | 2.15 | % | | | 5.86 | % | | | 54 | % | | $ | 2,602 | |
| | (0.42 | )% | | | 2.31 | % | | | 2.17 | % | | | 16.52 | % | | | 47 | % | | $ | 2,192 | |
| | (0.76 | )% | | | 2.32 | % | | | 2.20 | % | | | 28.95 | % | | | 57 | % | | $ | 1,814 | |
| | | | | | | | | | | | | | | | | | | | | | |
| | 4.57 | % | | | 1.04 | % | | | 0.90 | % | | | 13.77 | % | | | 27 | % | | $ | 382 | |
| | 0.58 | % | | | 1.02 | % | | | 0.90 | % | | | 15.95 | % | | | 110 | % | | $ | 29 | |
| | | | | | | | | | | | | | | | | | | | | | |
| | 1.16 | % | | | 1.39 | % | | | 1.20 | % | | | 13.66 | % | | | 27 | % | | $ | 61,935 | |
| | 0.36 | % | | | 1.39 | % | | | 1.20 | % | | | 19.00 | % | | | 110 | % | | $ | 57,591 | |
| | 0.28 | % | | | 1.39 | % | | | 1.20 | % | | | (5.36 | )% | | | 72 | % | | $ | 64,023 | |
| | 0.52 | % | | | 1.34 | % | | | 1.20 | % | | | 6.88 | % | | | 54 | % | | $ | 71,034 | |
| | 0.55 | % | | | 1.39 | % | | | 1.20 | % | | | 17.62 | % | | | 47 | % | | $ | 68,358 | |
| | 0.23 | % | | | 1.40 | % | | | 1.20 | % | | | 30.21 | % | | | 57 | % | | $ | 60,550 | |
| | | | | | | | | | | | | | | | | | | | | | |
| | 1.37 | % | | | 1.14 | % | | | 1.00 | % | | | 13.70 | % | | | 27 | % | | $ | 59,312 | |
| | 0.55 | % | | | 1.14 | % | | | 1.00 | % | | | 13.70 | % | | | 110 | % | | $ | 52,072 | |
| | 0.40 | % | | | 1.14 | % | | | 1.00 | % | | | (5.13 | )% | | | 72 | % | | $ | 31,768 | |
| | 0.75 | % | | | 1.07 | % | | | 1.00 | % | | | 7.05 | % | | | 54 | % | | $ | 16,850 | |
| | 0.75 | % | | | 1.13 | % | | | 1.00 | % | | | 17.88 | % | | | 47 | % | | $ | 11,967 | |
| | 0.40 | % | | | 1.14 | % | | | 1.00 | % | | | 30.54 | % | | | 57 | % | | $ | 8,185 | |
The accompanying notes are an integral part of these financial statements.
| | | | |
| 52 | | Wells Fargo Equity Gateway Funds | | Notes to financial statements (unaudited) |
1. ORGANIZATION
Wells Fargo Funds Trust (the “Trust”), a Delaware statutory trust organized on March 10, 1999, is an open-end management investment company registered under the Investment Company Act of 1940, as amended (the “1940 Act”). As an investment company, the Trust follows the accounting and reporting guidance in Financial Accounting Standards Board Accounting Standards Codification Topic 946, Financial Services – Investment Companies. These financial statements report on the following funds: Wells Fargo C&B Large Cap Value Fund (“C&B Large Cap Value Fund”), Wells Fargo Diversified Equity Fund (“Diversified Equity Fund”), Wells Fargo Emerging Growth Fund (“Emerging Growth Fund”), Wells Fargo Index Fund (“Index Fund”), Wells Fargo International Value Fund (“International Value Fund”), Wells Fargo Small Company Growth Fund (“Small Company Growth Fund”), and Wells Fargo Small Company Value Fund (“Small Company Value Fund”) (each, a “Fund”, collectively, the “Funds”). Each Fund is a diversified series of the Trust.
Class B shares of the respective Funds were converted to Class A shares on the close of business on the following dates and are no longer offered by the respective Funds. Information for Class B shares reflected in the financial statements represents activity through the date of conversion
| | |
| | | Date of conversion |
C&B Large Cap Value Fund | | December 5, 2016 |
Index Fund | | May 5, 2017 |
Small Company Growth Fund | | December 5, 2016 |
Effective June 6, 2016, Class B shares of Diversified Equity Fund are no longer offered. Information for Class B shares reflected in the financial statements represents activity through June 6, 2016.
Each Fund, except Diversified Equity Fund, is a feeder fund in a master-feeder structure that invests substantially all of its assets in a single master portfolio with a substantially identical investment objective and substantially similar investment strategies. Each Fund seeks to achieve its investment objective by investing all investable assets in separate diversified portfolios (each, an “affiliated Master Portfolio”, collectively, the “affiliated Master Portfolios”) of Wells Fargo Master Trust, a registered open-end management investment company. Each affiliated Master Portfolio directly acquires portfolio securities, and a Fund investing in an affiliated Master Portfolio acquires an indirect interest in those securities. Each Fund accounts for its investment in the affiliated Master Portfolios as partnership investments and records on a daily basis its share of the affiliated Master Portfolio’s income, expense and realized and unrealized gains and losses. The financial statements of the affiliated Master Portfolios for the six months ended November 30, 2017 are included in this report and should be read in conjunction with each Fund’s financial statements. As of November 30, 2017, the Funds own the following percentages of the affiliated Master Portfolios:
| | | | | | | | | | | | | | | | | | | | | | | | |
| | | C&B Large
Cap Value
Fund | | | Emerging
Growth
Fund | | | Index
Fund | | | International
Value Fund | | | Small
Company
Growth
Fund | | | Small
Company
Value
Fund | |
Wells Fargo C&B Large Cap Value Portfolio | | | 93 | % | | | N/A | | | | N/A | | | | N/A | | | | N/A | | | | N/A | |
Wells Fargo Emerging Growth Portfolio | | | N/A | | | | 92 | % | | | N/A | | | | N/A | | | | N/A | | | | N/A | |
Wells Fargo Index Portfolio | | | N/A | | | | N/A | | | | 98 | % | | | N/A | | | | N/A | | | | N/A | |
Wells Fargo International Value Portfolio | | | N/A | | | | N/A | | | | N/A | | | | 95 | % | | | N/A | | | | N/A | |
Wells Fargo Small Company Growth Portfolio | | | N/A | | | | N/A | | | | N/A | | | | N/A | | | | 99 | % | | | N/A | |
Wells Fargo Small Company Value Portfolio | | | N/A | | | | N/A | | | | N/A | | | | N/A | | | | N/A | | | | 86 | % |
Diversified Equity Fund is a fund-of-funds that invests in various affiliated mutual funds employing a multi-style equity investment approach.
2. SIGNIFICANT ACCOUNTING POLICIES
The following significant accounting policies, which are consistently followed in the preparation of the financial statements of each Fund, are in conformity with U.S. generally accepted accounting principles which require management to make estimates and assumptions that affect the reported amounts of assets and liabilities, disclosure of contingent assets and liabilities at the date of the financial statements, and the reported amounts of revenues and expenses during the reporting period. Actual results could differ from those estimates.
| | | | | | |
| Notes to financial statements (unaudited) | | Wells Fargo Equity Gateway Funds | | | 53 | |
Securities valuation
All investments are valued each business day as of the close of regular trading on the New York Stock Exchange (generally 4 p.m. Eastern Time), although the Funds may deviate from this calculation time under unusual or unexpected circumstances.
Investments in the affiliated Master Portfolios are valued daily based on each Fund’s proportionate share of each affiliated Master Portfolio’s net assets, which are also valued daily. Securities held in the affiliated Master Portfolios are valued as discussed in the Notes to Financial Statements of the affiliated Master Portfolios, which are included elsewhere in this report.
Security transactions and income recognition
Securities transactions are recorded on a trade date basis in each affiliated Master Portfolio. Realized gains or losses in each affiliated Master Portfolio are recorded on the basis of identified cost.
Dividend income in each affiliated Master Portfolio is recognized on the ex-dividend date, except for certain dividends from foreign securities which are recorded as soon as the custodian verifies the ex-dividend date. Dividend income from foreign securities in each affiliated Master Portfolio is recorded net of foreign taxes withheld where recovery of such taxes is not assured.
Interest income is accrued daily and bond discounts are accreted and premiums are amortized daily based on the effective interest method by each affiliated Master Portfolio. To the extent debt obligations are placed on non-accrual status, any related interest income may be reduced by writing off interest receivables when when the collection of all or a portion of interest has been determined to be doubtful based on consistently applied procedures and the fair value has decreased. If the issuer subsequently resumes interest payments or when the collectability of interest is reasonably assured, the debt obligation is removed from non-accrual status.
Each Fund records daily its proportionate share of each affiliated Master Portfolio’s interest and dividend income and realized and unrealized gains or losses.
Distributions to shareholders
Distributions to shareholders from net investment income and net realized gains, if any, are recorded on the ex-dividend date. Such distributions are determined in accordance with income tax regulations and may differ from U.S. generally accepted accounting principles. Dividend sources are estimated at the time of declaration. The tax character of distributions is determined as of the Funds’ fiscal year end. Therefore, a portion of each Fund’s distributions made prior to the Fund’s fiscal year end may be categorized as a tax return of capital.
Federal and other taxes
Each Fund is treated as a separate entity for federal income tax purposes. Each Fund intends to continue to qualify as a regulated investment company by distributing substantially all of its investment company taxable income and any net realized capital gains (after reduction for capital loss carryforwards) sufficient to relieve it from all, or substantially all, federal income taxes. Accordingly, no provision for federal income taxes was required.
Each Fund’s income and federal excise tax returns and all financial records supporting those returns for the prior three fiscal years are subject to examination by the federal and Delaware revenue authorities. Management has analyzed each Fund’s tax positions taken on federal, state, and foreign tax returns for all open tax years and does not believe that there are any uncertain tax positions that require recognition of a tax liability.
As of November 30, 2017, the aggregate cost of all investments for federal income tax purposes and the unrealized gains (losses) were as follows:
| | | | | | | | | | | | | | | | |
| | | Tax cost | | | Gross
unrealized
gains | | | Gross
unrealized
losses | | | Net unrealized
gains | |
C&B Large Cap Value Fund | | $ | 306,060,271 | | | $ | 85,152,198 | | | $ | 0 | | | $ | 85,152,198 | |
Diversified Equity Fund | | | 142,917,340 | | | | 37,632,353 | | | | 0 | | | | 37,632,353 | |
Emerging Growth Fund | | | 506,941,584 | | | | 253,010,019 | | | | 0 | | | | 253,010,019 | |
Index Fund | | | 544,735,251 | | | | 1,358,510,840 | | | | 0 | | | | 1,358,510,840 | |
International Value Fund | | | 707,498,661 | | | | 89,071,796 | | | | 0 | | | | 89,071,796 | |
Small Company Growth Fund | | | 1,345,629,128 | | | | 473,320,029 | | | | 0 | | | | 473,320,029 | |
Small Company Value Fund | | | 126,977,700 | | | | 14,392,382 | | | | 0 | | | | 14,392,382 | |
| | | | |
| 54 | | Wells Fargo Equity Gateway Funds | | Notes to financial statements (unaudited) |
Capital loss carryforwards that do not expire are required to be utilized prior to capital loss carryforwards that expire. At May 31, 2017, capital loss carryforwards available to offset future net realized capital gains were as follows through the indicated expiration dates:
| | | | | | | | | | | | | | | | |
| | | | | | | | | No expiration | |
| | | 2018 | | | 2019 | | | Short-term | | | Long-term | |
International Value Fund | | $ | (31,783,032 | ) | | $ | (4,561,591 | ) | | $ | 0 | | | $ | (9,762,032 | ) |
Small Company Growth Fund | | | 0 | | | | 0 | | | | (65,147,877 | ) | | | (42,576,110 | ) |
Small Company Value Fund | | | (60,390,637 | ) | | | 0 | | | | 0 | | | | 0 | |
At May 31, 2017, late-year ordinary losses which were recognized on the first day of the current fiscal year were as follows:
| | | | |
| | | Late-year ordinary loss | |
Emerging Growth Fund | | $ | (2,168,727 | ) |
Small Company Growth Fund | | | (2,765,455 | ) |
Class allocations
The separate classes of shares offered by each Fund differ principally in applicable sales charges, distribution, shareholder servicing, and administration fees. Class specific expenses are charged directly to that share class. Investment income, common expenses, and realized and unrealized gains (losses) on investments are allocated daily to each class of shares based on the relative proportion of net assets of each class.
3. FAIR VALUATION MEASUREMENTS
At November 30, 2017, each Fund’s investment in an affiliated Master Portfolio was measured at fair value using the net asset value per share (or its equivalent) as a practical expedient. The aggregate value of affiliated Master Portfolio(s) of each Fund was as follows:
| | | | |
| | | Aggregate value of affiliated
Master Portfolio(s) | |
C&B Large Cap Value Fund | | $ | 391,212,469 | |
Diversified Equity Fund | | | 180,549,693 | |
Emerging Growth Fund | | | 759,951,603 | |
Index Fund | | | 1,903,246,091 | |
International Value Fund | | | 796,570,457 | |
Small Company Growth Fund | | | 1,818,949,157 | |
Small Company Value Fund | | | 141,370,082 | |
The investment objective of each affiliated Master Portfolio is as follows:
| | |
| Affiliated Master Portfolio | | Investment objective |
| Wells Fargo C&B Large Cap Value Portfolio | | Seeks maximum long-term total return (current income and capital appreciation), consistent with minimizing risk to principal |
| Wells Fargo Diversified Large Cap Growth Portfolio | | Seeks long-term capital appreciation |
| Wells Fargo Emerging Growth Portfolio | | Seeks long-term capital appreciation |
| Wells Fargo Index Portfolio | | Seeks to replicate the total return of the S&P 500 Index, before fees and expenses |
| Wells Fargo International Growth Portfolio | | Seeks long-term capital appreciation |
| Wells Fargo International Value Portfolio | | Seeks long-term capital appreciation |
| Wells Fargo Large Company Value Portfolio | | Seeks long-term capital appreciation |
| Wells Fargo Small Company Growth Portfolio | | Seeks long-term capital appreciation |
| Wells Fargo Small Company Value Portfolio | | Seeks long-term capital appreciation |
| | | | | | |
| Notes to financial statements (unaudited) | | Wells Fargo Equity Gateway Funds | | | 55 | |
Each affiliated Master Portfolio does not have a redemption period notice, can be redeemed daily and does not have any unfunded commitments.
4. TRANSACTIONS WITH AFFILIATES
Management fee
Wells Fargo Funds Management, LLC (“Funds Management”), an indirect wholly owned subsidiary of Wells Fargo & Company (“Wells Fargo”), is the manager of each Fund. Under the investment management agreement, Funds Management is responsible for, among other services, implementing the investment objectives and strategies of each Fund, supervising the applicable subadvisers, providing fund-level administrative services in connection with each Fund’s operations, and providing any other fund-level administrative services reasonably necessary for the operation of each Fund. For each Fund that continues to invest substantially all of its assets in a single affiliated Master Portfolio, each Fund pays Funds Management an investment management fee only for fund-level administrative services at an annual rate starting at 0.05% and declining to 0.03% as the average daily net assets of each Fund increase. For Diversified Equity Fund which invests in multiple affiliated Master Portfolios, Funds Management receives a management fee for providing advisory and fund-level administrative services, including the determination of the asset allocations of its investments in the various affiliated Master Portfolios, at an annual rate starting at 0.30% and declining to 0.22% as the average daily net assets of Diversified Equity Fund increase. For the six months ended November 30, 2017, the management fee was equivalent to an annual rate for each Fund as follows:
| | | | |
| | | Management fee | |
C&B Large Cap Value Fund | | | 0.05 | % |
Diversified Equity Fund | | | 0.30 | |
Emerging Growth Fund | | | 0.05 | |
Index Fund | | | 0.05 | |
International Value Fund | | | 0.05 | |
Small Company Growth Fund | | | 0.05 | |
Small Company Value Fund | | | 0.05 | |
Funds Management also serves as the adviser to each affiliated Master Portfolio and is entitled to receive a fee from each affiliated Master Portfolio for those services.
Administration fees
Under a class-level administration agreement, Funds Management provides class-level administrative services to the Funds, which includes paying fees and expenses for services provided by the transfer agent, sub-transfer agents, omnibus account servicers and record-keepers. As compensation for its services under the class-level administration agreement, Funds Management receives an annual fee which is calculated based on the average daily net assets of each class as follows:
| | | | |
| | | Class-level
administration fee | |
Class A, Class B, Class C | | | 0.21 | % |
Class R6 | | | 0.03 | |
Administrator Class, Institutional Class | | | 0.13 | |
Funds Management has contractually waived and/or reimbursed management and administration fees to the extent necessary to maintain certain net operating expense ratios for the Funds. Waiver of fees and/or reimbursement of expenses by Funds Management were made first from fund level expenses on a proportionate basis and then from class
| | | | |
| 56 | | Wells Fargo Equity Gateway Funds | | Notes to financial statements (unaudited) |
specific expenses. Net expenses from affiliated Master Portfolios are included in the expense caps. Funds Management has committed through September 30, 2018 to waive fees and/or reimburse expenses to the extent necessary to cap each Fund’s expenses as follows:
| | | | | | | | | | | | | | | | | | | | |
| | | Class A | | | Class C | | | Class R6 | | | Administrator
Class | | | Institutional
Class | |
C&B Large Cap Value Fund | | | 1.08 | %1 | | | 1.83 | %1 | | | 0.65 | % | | | 1.00 | % | | | 0.75 | %1 |
Diversified Equity Fund | | | 1.25 | | | | 2.00 | | | | N/A | | | | 1.00 | | | | N/A | |
Emerging Growth Fund | | | 1.35 | | | | 2.10 | | | | N/A | | | | 1.20 | | | | 0.90 | |
Index Fund | | | 0.45 | | | | 1.20 | | | | N/A | | | | 0.25 | | | | N/A | |
International Value Fund | | | 1.35 | | | | 2.10 | | | | N/A | | | | 1.25 | | | | 1.00 | |
Small Company Growth Fund | | | 1.35 | | | | 2.10 | | | | 0.90 | | | | 1.20 | | | | 0.95 | |
Small Company Value Fund | | | 1.35 | | | | 2.10 | | | | 0.90 | 2 | | | 1.20 | | | | 1.00 | |
| | 1 | Prior to October 1, 2017, the Fund’s expenses were capped as 1.15% for Class A shares, 1.90% for Class C shares, 0.70% for Class R6 shares, and 0.80% for Institutional Class shares. | |
After the expiration date, each expense cap may be increased or the commitment to maintain the cap may be terminated only with the approval of the Board of Trustees.
Distribution fee
The Trust has adopted a Distribution Plan for Class C shares of the Funds pursuant to Rule 12b-1 under the 1940 Act. A distribution fee is charged to Class C shares and paid to Wells Fargo Funds Distributor, LLC (“Funds Distributor”), the principal underwriter of each Fund, at an annual rate of 0.75% of the average daily net assets of Class C shares.
In addition, Funds Distributor is entitled to receive the front-end sales charge from the purchase of Class A shares and a contingent deferred sales charge on the redemption of certain Class A shares. Funds Distributor is also entitled to receive the contingent deferred sales charges from redemptions of Class C shares. For the six months ended November 30, 2017, Funds Distributor received the following amounts in front-end sales charges and contingent deferred sales charges. No contingent deferred sales charges were incurred by Class A shares for the six months ended November 30, 2017.
| | | | | | | | |
| | | Front-end sales charges | | | Contingent deferred sales charges | |
| | | Class A | | | Class C | |
C&B Large Cap Value Fund | | $ | 6,142 | | | $ | 145 | |
Diversified Equity Fund | | | 1,726 | | | | 0 | |
Emerging Growth Fund | | | 702 | | | | 0 | |
Index Fund | | | 3,200 | | | | 0 | |
International Value Fund | | | 911 | | | | 0 | |
Small Company Growth Fund | | | 2,463 | | | | 13 | |
Small Company Value Fund | | | 179 | | | | 0 | |
Shareholder servicing fees
The Trust has entered into contracts with one or more shareholder servicing agents, whereby Class A, Class C, and Administrator Class of each Fund are charged a fee at an annual rate of 0.25% of the average daily net assets of each respective class. Administrator Class of the Index Fund is charged a fee at an annual rate of 0.10% of its average daily net assets.
A portion of these total shareholder servicing fees were paid to affiliates of Wells Fargo.
| | | | | | |
| Notes to financial statements (unaudited) | | Wells Fargo Equity Gateway Funds | | | 57 | |
5. INVESTMENT PORTFOLIO TRANSACTIONS
Purchases and sales of investments, excluding U.S. Government obligations (if any) and short-term securities, for the six months ended November 30, 2017 were as follows:
| | | | | | | | |
| | | Purchases at cost | | | Sales proceeds | |
C&B Large Cap Value Fund | | $ | 79,019,708 | * | | $ | 63,712,335 | * |
Diversified Equity Fund | | | 66,361,918 | ** | | | 124,821,385 | ** |
Emerging Growth Fund | | | 188,258,736 | * | | | 249,938,711 | * |
Index Fund | | | 32,342,206 | * | | | 278,923,763 | * |
International Value Fund | | | 63,168,217 | * | | | 41,229,150 | * |
Small Company Growth Fund | | | 279,201,829 | * | | | 339,877,459 | * |
Small Company Value Fund | | | 47,942,512 | * | | | 111,339,286 | * |
| * | The Fund seeks to achieve its investment objective by investing substantially all of its investable assets in a single affiliated Master Portfolio. Purchases and sales have been calculated by multiplying each Fund’s ownership percentage of the respective affiliated Master Portfolio by the affiliated Master Portfolio’s purchases and sales. |
| ** | The Fund seeks to achieve its investment objective by investing its investable assets in affiliated Master Portfolios in varying proportions. Purchases and sales related have been calculated by aggregating the results of multiplying the Fund’s ownership percentage of the respective affiliated Master Portfolio by the corresponding affiliated Master Portfolio’s purchases and sales. |
6. BANK BORROWINGS
The Trust (excluding the money market funds and certain other funds) and Wells Fargo Variable Trust are parties to a $280,000,000 revolving credit agreement whereby each Fund is permitted to use bank borrowings for temporary or emergency purposes, such as to fund shareholder redemption requests. Interest under the credit agreement is charged to each Fund based on a borrowing rate equal to the higher of the Federal Funds rate in effect on that day plus 1.25% or the overnight LIBOR rate in effect on that day plus 1.25%. In addition, an annual commitment fee equal to 0.25% of the unused balance is allocated to each participating fund. Prior to August 29, 2017, the revolving credit agreement amount was $250,000,000.
For the six months ended November 30, 2017, there were no borrowings by the Funds under the agreement.
7. CONCENTRATION RISK
Concentration risks result from exposure to a limited number of sectors. Through their investments in affiliated Master Portfolio(s), Funds that invest a substantial portion of their assets in a sector may be more affected by changes in that sector than would be a fund whose investments are not heavily weighted in any sector.
8. INDEMNIFICATION
Under the Trust’s organizational documents, the officers and Trustees have been granted certain indemnification rights against certain liabilities that may arise out of performance of their duties to the Trust. Additionally, in the normal course of business, the Trust may enter into contracts with service providers that contain a variety of indemnification clauses. The Trust’s maximum exposure under these arrangements is dependent on future claims that may be made against the Funds and, therefore, cannot be estimated.
9. REDEMPTION IN-KIND
After the close of business on July 15, 2016, Emerging Growth Fund redeemed assets through an in-kind redemption. In the redemption transaction, Emerging Growth Fund made a corresponding in-kind redemption from Wells Fargo Emerging Growth Portfolio which distributed securities to Emerging Growth Fund. These securities with a value of $80,953,334 along with cash in the amount of $2,716,932, were then in turn distributed to the shareholder. The redemption in-kind by a shareholder of Institutional Class represented 9.89% of Emerging Growth Fund and is reflected on the Statements of Changes in Net Assets.
| | | | |
| 58 | | Wells Fargo Equity Gateway Funds | | Notes to financial statements (unaudited) |
10. SUBSEQUENT DISTRIBUTIONS
On December 11, 2017, the following Funds declared distributions from capital gains to shareholders of record on December 8, 2017. The per share amounts payable on December 12, 2017 were as follows:
| | | | | | | | | | | | | | | | |
| | | C&B Large
Cap Value Fund | | | Diversified
Equity
Fund | | | Emerging Growth
Fund | | | Index
Fund | |
Short-term capital gains | | | | | | | | | | | | | | | | |
Class A | | $ | 0.26241 | | | $ | 0.77127 | | | $ | 0.00262 | | | $ | 0.13113 | |
Class C | | | 0.26241 | | | | 0.77127 | | | | 0.00262 | | | | 0.13113 | |
Class R6 | | | 0.26241 | | | | N/A | | | | N/A | | | | N/A | |
Administrator Class | | | 0.26241 | | | | 0.77127 | | | | 0.00262 | | | | 0.13113 | |
Institutional Class | | | 0.26241 | | | | N/A | | | | 0.00262 | | | | N/A | |
Long-term capital gains | | | | | | | | | | | | | | | | |
Class A | | $ | 1.26875 | | | $ | 6.03948 | | | $ | 1.94850 | | | $ | 11.32787 | |
Class C | | | 1.26875 | | | | 6.03948 | | | | 1.94850 | | | | 11.32787 | |
Class R6 | | | 1.26875 | | | | N/A | | | | N/A | | | | N/A | |
Administrator Class | | | 1.26875 | | | | 6.03948 | | | | 1.94850 | | | | 11.32787 | |
Institutional Class | | | 1.26875 | | | | N/A | | | | 1.94850 | | | | N/A | |
On December 19, 2017, the following Funds declared distributions from net investment income to shareholders of record on December 18, 2017. The per share amounts payable on December 20, 2017 were as follows:
| | | | | | | | | | | | | | | | |
| | | C&B Large
Cap Value Fund | | | Diversified
Equity Fund | | | Index
Fund | | | Small Company Value Fund | |
Net investment income | | | | | | | | | | | | | | | | |
Class A | | $ | 0.06367 | | | $ | 0.16817 | | | $ | 1.02361 | | | $ | 0.08279 | |
Class C | | | N/A | | | | 0.00387 | | | | 0.47842 | | | | N/A | |
Class R6 | | | 0.12225 | | | | N/A | | | | N/A | | | | 0.18575 | |
Administrator Class | | | 0.08433 | | | | 0.22927 | | | | 1.13445 | | | | 0.12834 | |
Institutional Class | | | 0.11139 | | | | N/A | | | | N/A | | | | 0.18165 | |
These distributions are not reflected in the accompanying financial statements.
| | | | | | |
| Portfolio of investments—November 30, 2017 (unaudited) | | Wells Fargo Equity Gateway Funds | | | 59 | |
C&B LARGE CAP VALUE PORTFOLIO
| | | | | | | | | | | | | | | | |
| Security name | | | | | | | | Shares | | | Value | |
| | | | |
Common Stocks: 94.04% | | | | | | | | | | | | | | | | |
| | | | |
Consumer Discretionary: 15.59% | | | | | | | | | | | | | | | | |
| | | | |
| Hotels, Restaurants & Leisure: 2.63% | | | | | | | | | | | | | | | | |
Brinker International Incorporated « | | | | | | | | | | | 86,400 | | | $ | 3,173,472 | |
Carnival Corporation | | | | | | | | | | | 120,900 | | | | 7,935,876 | |
| | | | |
| | | | | | | | | | | | | | | 11,109,348 | |
| | | | | | | | | | | | | | | | |
| | | | |
| Household Durables: 2.48% | | | | | | | | | | | | | | | | |
Whirlpool Corporation | | | | | | | | | | | 62,000 | | | | 10,451,340 | |
| | | | | | | | | | | | | | | | |
| | | | |
| Media: 5.34% | | | | | | | | | | | | | | | | |
Omnicom Group Incorporated | | | | | | | | | | | 162,500 | | | | 11,609,000 | |
Twenty-First Century Fox Incorporated Class A | | | | | | | | | | | 341,100 | | | | 10,894,734 | |
| | | | |
| | | | | | | | | | | | | | | 22,503,734 | |
| | | | | | | | | | | | | | | | |
| | | | |
| Textiles, Apparel & Luxury Goods: 5.14% | | | | | | | | | | | | | | | | |
Gildan Activewear Incorporated | | | | | | | | | | | 389,700 | | | | 12,369,078 | |
HanesBrands Incorporated « | | | | | | | | | | | 445,900 | | | | 9,314,851 | |
| | | | |
| | | | | | | | | | | | | | | 21,683,929 | |
| | | | | | | | | | | | | | | | |
| | | | |
Consumer Staples: 3.65% | | | | | | | | | | | | | | | | |
| | | | |
| Beverages: 1.37% | | | | | | | | | | | | | | | | |
Diageo plc ADR | | | | | | | | | | | 41,700 | | | | 5,774,199 | |
| | | | | | | | | | | | | | | | |
| | | | |
| Personal Products: 0.92% | | | | | | | | | | | | | | | | |
Unilever NV ADR « | | | | | | | | | | | 67,000 | | | | 3,868,580 | |
| | | | | | | | | | | | | | | | |
| | | | |
| Tobacco: 1.36% | | | | | | | | | | | | | | | | |
Philip Morris International | | | | | | | | | | | 55,800 | | | | 5,733,450 | |
| | | | | | | | | | | | | | | | |
| | | | |
Energy: 5.67% | | | | | | | | | | | | | | | | |
| | | | |
| Energy Equipment & Services: 1.77% | | | | | | | | | | | | | | | | |
Schlumberger Limited | | | | | | | | | | | 118,400 | | | | 7,441,440 | |
| | | | | | | | | | | | | | | | |
| | | | |
| Oil, Gas & Consumable Fuels: 3.90% | | | | | | | | | | | | | | | | |
Exxon Mobil Corporation | | | | | | | | | | | 127,700 | | | | 10,636,133 | |
World Fuel Services Corporation | | | | | | | | | | | 207,300 | | | | 5,818,911 | |
| | | | |
| | | | | | | | | | | | | | | 16,455,044 | |
| | | | | | | | | | | | | | | | |
| | | | |
Financials: 28.59% | | | | | | | | | | | | | | | | |
| | | | |
| Banks: 6.51% | | | | | | | | | | | | | | | | |
Bank of America Corporation | | | | | | | | | | | 223,900 | | | | 6,307,263 | |
JPMorgan Chase & Company | | | | | | | | | | | 126,300 | | | | 13,200,876 | |
PNC Financial Services Group Incorporated | | | | | | | | | | | 56,600 | | | | 7,955,696 | |
| | | | |
| | | | | | | | | | | | | | | 27,463,835 | |
| | | | | | | | | | | | | | | | |
The accompanying notes are an integral part of these financial statements.
| | | | |
| 60 | | Wells Fargo Equity Gateway Funds | | Portfolio of investments—November 30, 2017 (unaudited) |
C&B LARGE CAP VALUE PORTFOLIO
| | | | | | | | | | | | | | | | |
| Security name | | | | | | | | Shares | | | Value | |
| | | | |
| Capital Markets: 7.92% | | | | | | | | | | | | | | | | |
Brookfield Asset Management Incorporated Class A | | | | | | | | | | | 255,900 | | | $ | 10,619,850 | |
Intercontinental Exchange Incorporated | | | | | | | | | | | 165,800 | | | | 11,846,410 | |
State Street Corporation | | | | | | | | | | | 114,700 | | | | 10,936,645 | |
| | | | |
| | | | | | | | | | | | | | | 33,402,905 | |
| | | | | | | | | | | | | | | | |
| | | | |
| Consumer Finance: 1.85% | | | | | | | | | | | | | | | | |
Synchrony Financial | | | | | | | | | | | 217,600 | | | | 7,809,664 | |
| | | | | | | | | | | | | | | | |
| | | | |
| Diversified Financial Services: 2.77% | | | | | | | | | | | | | | | | |
Berkshire Hathaway Incorporated Class B † | | | | | | | | | | | 60,500 | | | | 11,677,105 | |
| | | | | | | | | | | | | | | | |
| | | | |
| Insurance: 9.54% | | | | | | | | | | | | | | | | |
Chubb Limited | | | | | | | | | | | 67,200 | | | | 10,221,792 | |
FNF Group | | | | | | | | | | | 229,200 | | | | 9,273,432 | |
Markel Corporation † | | | | | | | | | | | 3,911 | | | | 4,329,086 | |
RenaissanceRe Holdings Limited | | | | | | | | | | | 68,500 | | | | 9,086,525 | |
The Progressive Corporation | | | | | | | | | | | 137,100 | | | | 7,290,978 | |
| | | | |
| | | | | | | | | | | | | | | 40,201,813 | |
| | | | | | | | | | | | | | | | |
| | | | |
Health Care: 14.10% | | | | | | | | | | | | | | | | |
| | | | |
| Health Care Equipment & Supplies: 3.93% | | | | | | | | | | | | | | | | |
Abbott Laboratories | | | | | | | | | | | 174,900 | | | | 9,859,113 | |
Becton Dickinson & Company | | | | | | | | | | | 29,500 | | | | 6,732,195 | |
| | | | |
| | | | | | | | | | | | | | | 16,591,308 | |
| | | | | | | | | | | | | | | | |
| | | | |
| Health Care Providers & Services: 6.16% | | | | | | | | | | | | | | | | |
Cardinal Health Incorporated | | | | | | | | | | | 106,800 | | | | 6,321,492 | |
Laboratory Corporation of America Holdings † | | | | | | | | | | | 64,300 | | | | 10,176,761 | |
UnitedHealth Group Incorporated | | | | | | | | | | | 41,500 | | | | 9,469,055 | |
| | | | |
| | | | | | | | | | | | | | | 25,967,308 | |
| | | | | | | | | | | | | | | | |
| | | | |
| Pharmaceuticals: 4.01% | | | | | | | | | | | | | | | | |
Allergan plc | | | | | | | | | | | 60,700 | | | | 10,551,481 | |
Johnson & Johnson | | | | | | | | | | | 45,500 | | | | 6,339,515 | |
| | | | |
| | | | | | | | | | | | | | | 16,890,996 | |
| | | | | | | | | | | | | | | | |
| | | | |
Industrials: 13.37% | | | | | | | | | | | | | | | | |
| | | | |
| Air Freight & Logistics: 2.33% | | | | | | | | | | | | | | | | |
United Parcel Service Incorporated Class B | | | | | | | | | | | 81,000 | | | | 9,837,450 | |
| | | | | | | | | | | | | | | | |
| | | | |
| Building Products: 1.98% | | | | | | | | | | | | | | | | |
Johnson Controls International plc | | | | | | | | | | | 221,700 | | | | 8,344,788 | |
| | | | | | | | | | | | | | | | |
| | | | |
| Electrical Equipment: 3.39% | | | | | | | | | | | | | | | | |
AMETEK Incorporated | | | | | | | | | | | 87,800 | | | | 6,382,182 | |
Eaton Corporation plc | | | | | | | | | | | 101,700 | | | | 7,910,226 | |
| | | | |
| | | | | | | | | | | | | | | 14,292,408 | |
| | | | | | | | | | | | | | | | |
| | | | |
| Machinery: 2.65% | | | | | | | | | | | | | | | | |
Snap-on Incorporated | | | | | | | | | | | 65,900 | | | | 11,165,437 | |
| | | | | | | | | | | | | | | | |
The accompanying notes are an integral part of these financial statements.
| | | | | | |
| Portfolio of investments—November 30, 2017 (unaudited) | | Wells Fargo Equity Gateway Funds | | | 61 | |
C&B LARGE CAP VALUE PORTFOLIO
| | | | | | | | | | | | | | | | |
| Security name | | | | | | | | Shares | | | Value | |
| | | | |
| Trading Companies & Distributors: 3.02% | | | | | | | | | | | | | | | | |
AerCap Holdings NV † | | | | | | | | | | | 244,900 | | | $ | 12,727,453 | |
| | | | | | | | | | | | | | | | |
| | | | |
Information Technology: 6.83% | | | | | | | | | | | | | | | | |
| | | | |
| Electronic Equipment, Instruments & Components: 2.92% | | | | | | | | | | | | | | | | |
Arrow Electronics Incorporated † | | | | | | | | | | | 93,000 | | | | 7,507,890 | |
TE Connectivity Limited | | | | | | | | | | | 50,600 | | | | 4,778,664 | |
| | | | |
| | | | | | | | | | | | | | | 12,286,554 | |
| | | | | | | | | | | | | | | | |
| | | | |
| IT Services: 2.83% | | | | | | | | | | | | | | | | |
Accenture plc Class A | | | | | | | | | | | 40,300 | | | | 5,964,803 | |
Alliance Data Systems Corporation | | | | | | | | | | | 25,000 | | | | 5,981,750 | |
| | | | |
| | | | | | | | | | | | | | | 11,946,553 | |
| | | | | | | | | | | | | | | | |
| | | | |
| Semiconductors & Semiconductor Equipment: 1.08% | | | | | | | | | | | | | | | | |
Analog Devices Incorporated | | | | | | | | | | | 53,002 | | | | 4,564,002 | |
| | | | | | | | | | | | | | | | |
| | | | |
Materials: 4.78% | | | | | | | | | | | | | | | | |
| | | | |
| Chemicals: 0.99% | | | | | | | | | | | | | | | | |
Axalta Coating Systems Limited † | | | | | | | | | | | 132,600 | | | | 4,198,116 | |
| | | | | | | | | | | | | | | | |
| | | | |
| Containers & Packaging: 3.79% | | | | | | | | | | | | | | | | |
Ball Corporation | | | | | | | | | | | 193,700 | | | | 7,730,567 | |
Crown Holdings Incorporated † | | | | | | | | | | | 138,200 | | | | 8,254,686 | |
| | | | |
| | | | | | | | | | | | | | | 15,985,253 | |
| | | | | | | | | | | | | | | | |
| | | | |
Real Estate: 1.46% | | | | | | | | | | | | | | | | |
| | | | |
| Real Estate Management & Development: 1.46% | | | | | | | | | | | | | | | | |
CBRE Group Incorporated Class A † | | | | | | | | | | | 142,300 | | | | 6,170,128 | |
| | | | | | | | | | | | | | | | |
| | | | |
Total Common Stocks (Cost $295,034,960) | | | | | | | | | | | | | | | 396,544,140 | |
| | | | | | | | | | | | | | | | |
| | | | |
| | | Yield | | | | | | | | | | |
| Short-Term Investments: 8.70% | | | | | | | | | | | | | | | | |
| | | | |
| Investment Companies: 8.70% | | | | | | | | | | | | | | | | |
Securities Lending Cash Investment LLC (l)(r)(u) | | | 1.29 | % | | | | | | | 13,372,004 | | | | 13,373,341 | |
Wells Fargo Government Money Market Fund Select Class (l)(u) | | | 1.00 | | | | | | | | 23,303,022 | | | | 23,303,022 | |
| | | | |
Total Short-Term Investments (Cost $36,676,314) | | | | | | | | | | | | | | | 36,676,363 | |
| | | | | | | | | | | | | | | | |
| | | | | | | | |
| Total investments in securities (Cost $331,711,274) | | | 102.74 | % | | | 433,220,503 | |
Other assets and liabilities, net | | | (2.74 | ) | | | (11,556,070 | ) |
| | | | | | | | |
| Total net assets | | | 100.00 | % | | $ | 421,664,433 | |
| | | | | | | | |
| « | All or a portion of this security is on loan. |
| † | Non-income-earning security |
| (l) | The issuer of the security is an affiliated person of the Portfolio as defined in the Investment Company Act of 1940. |
| (r) | The investment is a non-registered investment company purchased with cash collateral received from securities on loan. |
| (u) | The rate represents the 7-day annualized yield at period end. |
The accompanying notes are an integral part of these financial statements.
| | | | |
| 62 | | Wells Fargo Equity Gateway Funds | | Portfolio of investments—November 30, 2017 (unaudited) |
C&B LARGE CAP VALUE PORTFOLIO
Investments in Affiliates
An affiliated investment is an investment in which the Portfolio owns at least 5% of the outstanding voting shares of the issuer or as a result of other relationships, such as the Portfolio and the issuer having the same investment manager. Transactions with issuers that were either affiliated persons of the Portfolio at the beginning of the period or the end of the period were as follows:
| | | | | | | | | | | | | | | | | | | | | | | | | | | | | | | | | | | | |
| | | Shares,
beginning of
period | | | Shares
purchased | | | Shares
sold | | | Shares,
end of
period | | | Net
realized
gains
(losses) | | | Net
change in
unrealized
gains
(losses) | | | Income
from
affiliated
securities | | | Value,
end
of period | | | % of
net
assets | |
| | | | | | | | | |
Short-Term Investments | | | | | | | | | | | | | | | | | | | | | | | | | | | | | | | | | | | | |
Investment Companies | | | | | | | | | | | | | | | | | | | | | | | | | | | | | | | | | | | | |
Securities Lending Cash Investment LLC | | | 24,100,596 | | | | 90,970,022 | | | | 101,698,614 | | | | 13,372,004 | | | $ | (35 | ) | | $ | (2 | ) | | $ | 28,015 | | | $ | 13,373,341 | | | | | |
Wells Fargo Government Money Market Fund Select Class | | | 12,499,686 | | | | 77,943,849 | | | | 67,140,513 | | | | 23,303,022 | | | | 0 | | | | 0 | | | | 103,323 | | | | 23,303,022 | | | | | |
| | | | | | | | | | | | | | | | | | | | | | | | | | | | | | | | | | | | |
| | | | | | | | | | | | | | | | | | $ | (35 | ) | | $ | (2 | ) | | $ | 131,338 | | | $ | 36,676,363 | | | | 8.70 | % |
| | | | | | | | | | | | | | | | | | | | | | | | | | | | | | | | | | | | |
The accompanying notes are an integral part of these financial statements.
| | | | | | |
| Portfolio of investments—November 30, 2017 (unaudited) | | Wells Fargo Equity Gateway Funds | | | 63 | |
DIVERSIFIED LARGE CAP GROWTH PORTFOLIO
| | | | | | | | | | | | | | | | |
| Security name | | | | | | | | Shares | | | Value | |
|
Common Stocks: 98.97% | |
| | | | |
Consumer Discretionary: 14.43% | | | | | | | | | | | | | | | | |
| | | | |
| Auto Components: 0.75% | | | | | | | | | | | | | | | | |
Lear Corporation | | | | | | | | | | | 3,877 | | | $ | 701,311 | |
| | | | | | | | | | | | | | | | |
| | | | |
| Automobiles: 0.64% | | | | | | | | | | | | | | | | |
General Motors Company | | | | | | | | | | | 13,710 | | | | 590,764 | |
| | | | | | | | | | | | | | | | |
| | | | |
| Hotels, Restaurants & Leisure: 0.94% | | | | | | | | | | | | | | | | |
Marriott International Incorporated Class A | | | | | | | | | | | 1,910 | | | | 242,570 | |
Norwegian Cruise Line Holdings Limited † | | | | | | | | | | | 6,616 | | | | 358,323 | |
Royal Caribbean Cruises Limited | | | | | | | | | | | 2,220 | | | | 275,014 | |
| |
| | | | 875,907 | |
| | | | | | | | | | | | | | | | |
| | | | |
| Household Durables: 0.68% | | | | | | | | | | | | | | | | |
Mohawk Industries Incorporated † | | | | | | | | | | | 2,240 | | | | 633,046 | |
| | | | | | | | | | | | | | | | |
| | | | |
| Internet & Direct Marketing Retail: 5.50% | | | | | | | | | | | | | | | | |
Amazon.com Incorporated † | | | | | | | | | | | 3,490 | | | | 4,106,858 | |
Netflix Incorporated † | | | | | | | | | | | 2,930 | | | | 549,609 | |
The Priceline Group Incorporated † | | | | | | | | | | | 270 | | | | 469,722 | |
| |
| | | | 5,126,189 | |
| | | | | | | | | | | | | | | | |
| | | | |
| Media: 0.91% | | | | | | | | | | | | | | | | |
Comcast Corporation Class A | | | | | | | | | | | 14,909 | | | | 559,684 | |
Live Nation Incorporated † | | | | | | | | | | | 6,390 | | | | 289,978 | |
| |
| | | | 849,662 | |
| | | | | | | | | | | | | | | | |
| | | | |
| Multiline Retail: 1.81% | | | | | | | | | | | | | | | | |
Dollar Tree Incorporated † | | | | | | | | | | | 11,060 | | | | 1,136,526 | |
Target Corporation | | | | | | | | | | | 9,170 | | | | 549,283 | |
| |
| | | | 1,685,809 | |
| | | | | | | | | | | | | | | | |
| | | | |
| Specialty Retail: 3.20% | | | | | | | | | | | | | | | | |
Burlington Stores Incorporated † | | | | | | | | | | | 2,480 | | | | 263,798 | |
Lowe’s Companies Incorporated | | | | | | | | | | | 6,827 | | | | 569,167 | |
The Home Depot Incorporated | | | | | | | | | | | 9,539 | | | | 1,715,303 | |
The TJX Companies Incorporated | | | | | | | | | | | 5,747 | | | | 434,186 | |
| |
| | | | 2,982,454 | |
| | | | | | | | | | | | | | | | |
| | | | |
Consumer Staples: 3.33% | | | | | | | | | | | | | | | | |
| | | | |
| Beverages: 0.69% | | | | | | | | | | | | | | | | |
Constellation Brands Incorporated Class A | | | | | | | | | | | 2,960 | | | | 644,066 | |
| | | | | | | | | | | | | | | | |
| | | | |
| Food & Staples Retailing: 1.81% | | | | | | | | | | | | | | | | |
Costco Wholesale Corporation | | | | | | | | | | | 3,160 | | | | 582,799 | |
Sysco Corporation | | | | | | | | | | | 8,570 | | | | 494,746 | |
Wal-Mart Stores Incorporated | | | | | | | | | | | 6,243 | | | | 607,007 | |
| |
| | | | 1,684,552 | |
| | | | | | | | | | | | | | | | |
The accompanying notes are an integral part of these financial statements.
| | | | |
| 64 | | Wells Fargo Equity Gateway Funds | | Portfolio of investments—November 30, 2017 (unaudited) |
DIVERSIFIED LARGE CAP GROWTH PORTFOLIO
| | | | | | | | | | | | | | | | |
| Security name | | | | | | | | Shares | | | Value | |
| | | | |
| Personal Products: 0.83% | | | | | | | | | | | | | | | | |
The Estee Lauder Companies Incorporated Class A | | | | | | | | | | | 6,170 | | | $ | 770,201 | |
| | | | | | | | | | | | | | | | |
| | | | |
Energy: 2.44% | | | | | | | | | | | | | | | | |
| | | | |
| Oil, Gas & Consumable Fuels: 2.44% | | | | | | | | | | | | | | | | |
Chevron Corporation | | | | | | | | | | | 4,145 | | | | 493,214 | |
Concho Resources Incorporated † | | | | | | | | | | | 5,550 | | | | 776,223 | |
Exxon Mobil Corporation | | | | | | | | | | | 5,209 | | | | 433,858 | |
Valero Energy Corporation | | | | | | | | | | | 6,634 | | | | 568,003 | |
| | | | |
| | | | | | | | | | | | | | | 2,271,298 | |
| | | | | | | | | | | | | | | | |
| | | | |
Financials: 8.42% | | | | | | | | | | | | | | | | |
| | | | |
| Banks: 2.13% | | | | | | | | | | | | | | | | |
Bank of America Corporation | | | | | | | | | | | 21,062 | | | | 593,317 | |
Citizens Financial Group Incorporated | | | | | | | | | | | 13,310 | | | | 541,717 | |
JPMorgan Chase & Company | | | | | | | | | | | 6,850 | | | | 715,962 | |
Webster Financial Corporation | | | | | | | | | | | 2,250 | | | | 129,083 | |
| | | | |
| | | | | | | | | | | | | | | 1,980,079 | |
| | | | | | | | | | | | | | | | |
| | | | |
| Capital Markets: 4.82% | | | | | | | | | | | | | | | | |
CME Group Incorporated | | | | | | | | | | | 7,200 | | | | 1,076,688 | |
MarketAxess Holdings Incorporated | | | | | | | | | | | 2,190 | | | | 427,641 | |
Morgan Stanley | | | | | | | | | | | 17,110 | | | | 883,047 | |
Raymond James Financial Incorporated | | | | | | | | | | | 11,371 | | | | 1,004,059 | |
TD Ameritrade Holding Corporation | | | | | | | | | | | 3,210 | | | | 164,256 | |
The Charles Schwab Corporation | | | | | | | | | | | 19,250 | | | | 939,208 | |
| | | | |
| | | | | | | | | | | | | | | 4,494,899 | |
| | | | | | | | | | | | | | | | |
| | | | |
| Insurance: 1.47% | | | | | | | | | | | | | | | | |
Lincoln National Corporation | | | | | | | | | | | 7,620 | | | | 583,311 | |
Prudential Financial Incorporated | | | | | | | | | | | 4,949 | | | | 573,292 | |
The Progressive Corporation | | | | | | | | | | | 3,990 | | | | 212,188 | |
| | | | |
| | | | | | | | | | | | | | | 1,368,791 | |
| | | | | | | | | | | | | | | | |
| | | | |
Health Care: 11.98% | | | | | | | | | | | | | | | | |
| | | | |
| Biotechnology: 2.77% | | | | | | | | | | | | | | | | |
Amgen Incorporated | | | | | | | | | | | 2,723 | | | | 478,322 | |
BioMarin Pharmaceutical Incorporated † | | | | | | | | | | | 3,110 | | | | 266,838 | |
Exelixis Incorporated † | | | | | | | | | | | 4,220 | | | | 114,278 | |
Gilead Sciences Incorporated | | | | | | | | | | | 6,031 | | | | 450,998 | |
Incyte Corporation † | | | | | | | | | | | 1,250 | | | | 123,738 | |
Neurocrine Biosciences Incorporated † | | | | | | | | | | | 2,220 | | | | 159,596 | |
Vertex Pharmaceuticals Incorporated † | | | | | | | | | | | 6,860 | | | | 989,829 | |
| | | | |
| | | | | | | | | | | | | | | 2,583,599 | |
| | | | | | | | | | | | | | | | |
| | | | |
| Health Care Equipment & Supplies: 2.71% | | | | | | | | | | | | | | | | |
Abbott Laboratories | | | | | | | | | | | 10,163 | | | | 572,888 | |
Boston Scientific Corporation † | | | | | | | | | | | 25,300 | | | | 664,884 | |
The accompanying notes are an integral part of these financial statements.
| | | | | | |
| Portfolio of investments—November 30, 2017 (unaudited) | | Wells Fargo Equity Gateway Funds | | | 65 | |
DIVERSIFIED LARGE CAP GROWTH PORTFOLIO
| | | | | | | | | | | | | | | | |
| Security name | | | | | | | | Shares | | | Value | |
| | | | |
| Health Care Equipment & Supplies (continued) | | | | | | | | | | | | | | | | |
Edwards Lifesciences Corporation † | | | | | | | | | | | 6,800 | | | $ | 796,960 | |
Intuitive Surgical Incorporated † | | | | | | | | | | | 420 | | | | 167,908 | |
Stryker Corporation | | | | | | | | | | | 850 | | | | 132,600 | |
West Pharmaceutical Services Incorporated | | | | | | | | | | | 1,860 | | | | 185,870 | |
| | | | |
| | | | | | | | | | | | | | | 2,521,110 | |
| | | | | | | | | | | | | | | | |
| | | | |
| Health Care Providers & Services: 2.37% | | | | | | | | | | | | | | | | |
Aetna Incorporated | | | | | | | | | | | 4,329 | | | | 779,999 | |
Centene Corporation † | | | | | | | | | | | 7,108 | | | | 725,656 | |
UnitedHealth Group Incorporated | | | | | | | | | | | 3,099 | | | | 707,099 | |
| | | | |
| | | | | | | | | | | | | | | 2,212,754 | |
| | | | | | | | | | | | | | | | |
| | | | |
| Health Care Technology: 0.21% | | | | | | | | | | | | | | | | |
Veeva Systems Incorporated Class A † | | | | | | | | | | | 3,200 | | | | 192,672 | |
| | | | | | | | | | | | | | | | |
| | | | |
| Life Sciences Tools & Services: 1.17% | | | | | | | | | | | | | | | | |
Agilent Technologies Incorporated | | | | | | | | | | | 11,175 | | | | 773,757 | |
PRA Health Sciences Incorporated † | | | | | | | | | | | 3,850 | | | | 317,125 | |
| | | | |
| | | | | | | | | | | | | | | 1,090,882 | |
| | | | | | | | | | | | | | | | |
| | | | |
| Pharmaceuticals: 2.75% | | | | | | | | | | | | | | | | |
Bristol-Myers Squibb Company | | | | | | | | | | | 7,440 | | | | 470,134 | |
Johnson & Johnson | | | | | | | | | | | 4,009 | | | | 558,574 | |
Merck & Company Incorporated | | | | | | | | | | | 6,969 | | | | 385,177 | |
Zoetis Incorporated | | | | | | | | | | | 15,892 | | | | 1,148,833 | |
| | | | |
| | | | | | | | | | | | | | | 2,562,718 | |
| | | | | | | | | | | | | | | | |
| | | | |
Industrials: 12.01% | | | | | | | | | | | | | | | | |
| | | | |
| Aerospace & Defense: 1.81% | | | | | | | | | | | | | | | | |
Northrop Grumman Corporation | | | | | | | | | | | 2,184 | | | | 671,362 | |
Raytheon Company | | | | | | | | | | | 1,980 | | | | 378,477 | |
The Boeing Company | | | | | | | | | | | 2,310 | | | | 639,408 | |
| | | | |
| | | | | | | | | | | | | | | 1,689,247 | |
| | | | | | | | | | | | | | | | |
| | | | |
| Air Freight & Logistics: 0.91% | | | | | | | | | | | | | | | | |
FedEx Corporation | | | | | | | | | | | 3,530 | | | | 817,054 | |
XPO Logistics Incorporated † | | | | | | | | | | | 430 | | | | 33,983 | |
| | | | |
| | | | | | | | | | | | | | | 851,037 | |
| | | | | | | | | | | | | | | | |
| | | | |
| Airlines: 0.86% | | | | | | | | | | | | | | | | |
Delta Air Lines Incorporated | | | | | | | | | | | 9,410 | | | | 497,977 | |
Southwest Airlines Company | | | | | | | | | | | 5,003 | | | | 303,532 | |
| | | | |
| | | | | | | | | | | | | | | 801,509 | |
| | | | | | | | | | | | | | | | |
| | | | |
| Commercial Services & Supplies: 1.46% | | | | | | | | | | | | | | | | |
KAR Auction Services Incorporated | | | | | | | | | | | 9,521 | | | | 479,573 | |
Waste Connections Incorporated | | | | | | | | | | | 12,810 | | | | 881,712 | |
| | | | |
| | | | | | | | | | | | | | | 1,361,285 | |
| | | | | | | | | | | | | | | | |
The accompanying notes are an integral part of these financial statements.
| | | | |
| 66 | | Wells Fargo Equity Gateway Funds | | Portfolio of investments—November 30, 2017 (unaudited) |
DIVERSIFIED LARGE CAP GROWTH PORTFOLIO
| | | | | | | | | | | | | | | | |
| Security name | | | | | | | | Shares | | | Value | |
| | | | |
| Construction & Engineering: 0.57% | | | | | | | | | | | | | | | | |
EMCOR Group Incorporated | | | | | | | | | | | 6,534 | | | $ | 527,751 | |
| | | | | | | | | | | | | | | | |
| | | | |
| Electrical Equipment: 0.44% | | | | | | | | | | | | | | | | |
Rockwell Automation Incorporated | | | | | | | | | | | 2,130 | | | | 411,260 | |
| | | | | | | | | | | | | | | | |
| | | | |
| Industrial Conglomerates: 0.98% | | | | | | | | | | | | | | | | |
3M Company | | | | | | | | | | | 1,940 | | | | 471,692 | |
Honeywell International Incorporated | | | | | | | | | | | 2,810 | | | | 438,248 | |
| | | | |
| | | | | | | | | | | | | | | 909,940 | |
| | | | | | | | | | | | | | | | |
| | | | |
| Machinery: 2.46% | | | | | | | | | | | | | | | | |
Cummins Incorporated | | | | | | | | | | | 3,340 | | | | 559,116 | |
Fortive Corporation | | | | | | | | | | | 7,785 | | | | 581,150 | |
Nordson Corporation | | | | | | | | | | | 520 | | | | 66,747 | |
Stanley Black & Decker Incorporated | | | | | | | | | | | 3,572 | | | | 605,918 | |
The Toro Company | | | | | | | | | | | 7,257 | | | | 473,519 | |
| | | | |
| | | | | | | | | | | | | | | 2,286,450 | |
| | | | | | | | | | | | | | | | |
| | | | |
| Professional Services: 0.24% | | | | | | | | | | | | | | | | |
IHS Markit Limited † | | | | | | | | | | | 2,120 | | | | 94,594 | |
TransUnion † | | | | | | | | | | | 2,380 | | | | 132,138 | |
| | | | |
| | | | | | | | | | | | | | | 226,732 | |
| | | | | | | | | | | | | | | | |
| | | | |
| Road & Rail: 2.28% | | | | | | | | | | | | | | | | |
CSX Corporation | | | | | | | | | | | 4,369 | | | | 243,572 | |
Norfolk Southern Corporation | | | | | | | | | | | 4,000 | | | | 554,520 | |
Union Pacific Corporation | | | | | | | | | | | 10,470 | | | | 1,324,455 | |
| | | | |
| | | | | | | | | | | | | | | 2,122,547 | |
| | | | | | | | | | | | | | | | |
| | | | |
Information Technology: 40.29% | | | | | | | | | | | | | | | | |
| | | | |
| Electronic Equipment, Instruments & Components: 1.32% | | | | | | | | | | | | | | | | |
CDW Corporation of Delaware | | | | | | | | | | | 9,995 | | | | 699,750 | |
Jabil Circuit Incorporated | | | | | | | | | | | 18,239 | | | | 526,195 | |
| | | | |
| | | | | | | | | | | | | | | 1,225,945 | |
| | | | | | | | | | | | | | | | |
| | | | |
| Internet Software & Services: 10.78% | | | | | | | | | | | | | | | | |
Alibaba Group Holding Limited ADR † | | | | | | | | | | | 1,040 | | | | 184,163 | |
Alphabet Incorporated Class A † | | | | | | | | | | | 2,794 | | | | 2,895,059 | |
Alphabet Incorporated Class C † | | | | | | | | | | | 1,790 | | | | 1,828,324 | |
CoStar Group Incorporated † | | | | | | | | | | | 740 | | | | 225,678 | |
eBay Incorporated † | | | | | | | | | | | 8,560 | | | | 296,775 | |
Facebook Incorporated Class A † | | | | | | | | | | | 21,080 | | | | 3,734,954 | |
LogMeIn Incorporated | | | | | | | | | | | 2,930 | | | | 348,670 | |
MercadoLibre Incorporated | | | | | | | | | | | 830 | | | | 228,366 | |
Shopify Incorporated Class A Ǡ | | | | | | | | | | | 2,880 | | | | 299,002 | |
| | | | |
| | | | | | | | | | | | | | | 10,040,991 | |
| | | | | | | | | | | | | | | | |
The accompanying notes are an integral part of these financial statements.
| | | | | | |
| Portfolio of investments—November 30, 2017 (unaudited) | | Wells Fargo Equity Gateway Funds | | | 67 | |
DIVERSIFIED LARGE CAP GROWTH PORTFOLIO
| | | | | | | | | | | | | | | | |
| Security name | | | | | | | | Shares | | | Value | |
| | | | |
| IT Services: 7.07% | | | | | | | | | | | | | | | | |
Euronet Worldwide Incorporated † | | | | | | | | | | | 3,420 | | | $ | 312,417 | |
Global Payments Incorporated | | | | | | | | | | | 1,760 | | | | 176,986 | |
MasterCard Incorporated Class A | | | | | | | | | | | 12,660 | | | | 1,904,950 | |
PayPal Holdings Incorporated † | | | | | | | | | | | 18,340 | | | | 1,388,888 | |
Square Incorporated Class A Ǡ | | | | | | | | | | | 14,300 | | | | 560,846 | |
Switch Incorporated Ǡ | | | | | | | | | | | 6,198 | | | | 106,234 | |
Visa Incorporated Class A | | | | | | | | | | | 18,980 | | | | 2,136,958 | |
| | | | |
| | | | | | | | | | | | | | | 6,587,279 | |
| | | | | | | | | | | | | | | | |
| | | | |
| Semiconductors & Semiconductor Equipment: 7.22% | | | | | | | | | | | | | | | | |
Broadcom Limited | | | | | | | | | | | 4,931 | | | | 1,370,522 | |
Intel Corporation | | | | | | | | | | | 11,896 | | | | 533,417 | |
Microchip Technology Incorporated | | | | | | | | | | | 21,529 | | | | 1,872,808 | |
NVIDIA Corporation | | | | | | | | | | | 4,980 | | | | 999,536 | |
ON Semiconductor Corporation † | | | | | | | | | | | 26,409 | | | | 530,293 | |
Texas Instruments Incorporated | | | | | | | | | | | 14,550 | | | | 1,415,570 | |
| | | | |
| | | | | | | | | | | | | | | 6,722,146 | |
| | | | | | | | | | | | | | | | |
| | | | |
| Software: 10.47% | | | | | | | | | | | | | | | | |
Activision Blizzard Incorporated | | | | | | | | | | | 8,290 | | | | 517,296 | |
Adobe Systems Incorporated † | | | | | | | | | | | 5,761 | | | | 1,045,449 | |
Electronic Arts Incorporated † | | | | | | | | | | | 5,803 | | | | 617,149 | |
Microsoft Corporation | | | | | | | | | | | 43,562 | | | | 3,666,613 | |
Proofpoint Incorporated † | | | | | | | | | | | 2,520 | | | | 226,926 | |
PTC Incorporated † | | | | | | | | | | | 1,140 | | | | 72,595 | |
Salesforce.com Incorporated † | | | | | | | | | | | 8,824 | | | | 920,520 | |
ServiceNow Incorporated † | | | | | | | | | | | 7,480 | | | | 920,040 | |
Splunk Incorporated † | | | | | | | | | | | 2,488 | | | | 199,264 | |
Take-Two Interactive Software Incorporated † | | | | | | | | | | | 1,770 | | | | 197,444 | |
The Ultimate Software Group Incorporated † | | | | | | | | | | | 2,456 | | | | 518,290 | |
VMware Incorporated Class A Ǡ | | | | | | | | | | | 7,103 | | | | 853,141 | |
| | | | |
| | | | | | | | | | | | | | | 9,754,727 | |
| | | | | | | | | | | | | | | | |
| | | | |
| Technology Hardware, Storage & Peripherals: 3.43% | | | | | | | | | | | | | | | | |
Apple Incorporated | | | | | | | | | | | 10,852 | | | | 1,864,916 | |
HP Incorporated | | | | | | | | | | | 26,561 | | | | 569,733 | |
NetApp Incorporated | | | | | | | | | | | 13,480 | | | | 761,755 | |
| | | | |
| | | | | | | | | | | | | | | 3,196,404 | |
| | | | | | | | | | | | | | | | |
| | | | |
Materials: 4.00% | | | | | | | | | | | | | | | | |
| | | | |
| Chemicals: 3.24% | | | | | | | | | | | | | | | | |
DowDuPont Incorporated | | | | | | | | | | | 8,615 | | | | 619,935 | |
Ecolab Incorporated | | | | | | | | | | | 7,940 | | | | 1,079,205 | |
Praxair Incorporated | | | | | | | | | | | 8,580 | | | | 1,320,634 | |
| | | | |
| | | | | | | | | | | | | | | 3,019,774 | |
| | | | | | | | | | | | | | | | |
| | | | |
| Containers & Packaging: 0.76% | | | | | | | | | | | | | | | | |
Avery Dennison Corporation | | | | | | | | | | | 6,182 | | | | 705,490 | |
| | | | | | | | | | | | | | | | |
The accompanying notes are an integral part of these financial statements.
| | | | |
| 68 | | Wells Fargo Equity Gateway Funds | | Portfolio of investments—November 30, 2017 (unaudited) |
DIVERSIFIED LARGE CAP GROWTH PORTFOLIO
| | | | | | | | | | | | | | | | |
| Security name | | | | | | | | Shares | | | Value | |
| | | | |
Real Estate: 1.50% | | | | | | | | | | | | | | | | |
| | | | |
| Equity REITs: 1.50% | | | | | | | | | | | | | | | | |
American Tower Corporation | | | | | | | | | | | 5,841 | | | $ | 840,696 | |
Prologis Incorporated | | | | | | | | | | | 8,353 | | | | 553,210 | |
| | | | |
| | | | | | | | | | | | | | | 1,393,906 | |
| | | | | | | | | | | | | | | | |
| | | | |
Utilities: 0.57% | | | | | | | | | | | | | | | | |
| | | | |
| Multi-Utilities: 0.57% | | | | | | | | | | | | | | | | |
CenterPoint Energy Incorporated | | | | | | | | | | | 17,706 | | | | 531,357 | |
| | | | | | | | | | | | | | | | |
| | | | |
Total Common Stocks (Cost $55,648,651) | | | | | | | | | | | | | | | 92,188,540 | |
| | | | | | | | | | | | | | | | |
| | | | |
| | | Yield | | | | | | | | | | |
| Short-Term Investments: 2.04% | | | | | | | | | | | | | | | | |
| | | | |
| Investment Companies: 2.04% | | | | | | | | | | | | | | | | |
Securities Lending Cash Investment LLC (l)(r)(u) | | | 1.29 | % | | | | | | | 1,113,802 | | | | 1,113,913 | |
Wells Fargo Government Money Market Fund Select Class (l)(u) | | | 1.00 | | | | | | | | 784,307 | | | | 784,307 | |
| | | | |
Total Short-Term Investments (Cost $1,898,210) | | | | | | | | | | | | | | | 1,898,220 | |
| | | | | | | | | | | | | | | | |
| | | | | | | | |
| Total investments in securities (Cost $57,546,861) | | | 101.01 | % | | | 94,086,760 | |
Other assets and liabilities, net | | | (1.01 | ) | | | (940,136 | ) |
| | | | | | | | |
| Total net assets | | | 100.00 | % | | $ | 93,146,624 | |
| | | | | | | | |
| † | Non-income-earning security |
| « | All or a portion of this security is on loan. |
| (l) | The issuer of the security is an affiliated person of the Portfolio as defined in the Investment Company Act of 1940. |
| (r) | The investment is a non-registered investment company purchased with cash collateral received from securities on loan. |
| (u) | The rate represents the 7-day annualized yield at period end. |
Investments in Affiliates
An affiliated investment is an investment in which the Portfolio owns at least 5% of the outstanding voting shares of the issuer or as a result of other relationships, such as the Portfolio and the issuer having the same investment manager. Transactions with issuers that were either affiliated persons of the Portfolio at the beginning of the period or the end of the period were as follows:
| | | | | | | | | | | | | | | | | | | | | | | | | | | | | | | | | | | | |
| | | Shares,
beginning of
period | | | Shares
purchased | | | Shares
sold | | | Shares,
end of
period | | | Net
realized
gains
(losses) | | | Net
change in
unrealized
gains
(losses) | | | Income
from
affiliates
securities | | | Value,
end
of period | | | % of
net
assets | |
| | | | | | | | | |
Short-Term Investments | | | | | | | | | | | | | | | | | | | | | | | | | | | | | | | | | | | | |
Investment Companies | | | | | | | | | | | | | | | | | | | | | | | | | | | | | | | | | | | | |
Securities Lending Cash Investment LLC | | | 1,105,508 | | | | 15,226,727 | | | | 15,218,433 | | | | 1,113,802 | | | $ | 36 | | | $ | (16 | ) | | $ | 2,447 | | | $ | 1,113,913 | | | | | |
Wells Fargo Government Money Market Fund Select Class | | | 568,057 | | | | 13,002,952 | | | | 12,786,702 | | | | 784,307 | | | | 0 | | | | 0 | | | | 4,485 | | | | 784,307 | | | | | |
| | | | | | | | | | | | | | | | | | | | | | | | | | | | | | | | | | | | |
| | | | | | | | | | | | | | | | | | $ | 36 | | | $ | (16 | ) | | $ | 6,932 | | | $ | 1,898,220 | | | | 2.04 | % |
| | | | | | | | | | | | | | | | | | | | | | | | | | | | | | | | | | | | |
The accompanying notes are an integral part of these financial statements.
| | | | | | |
| Portfolio of investments—November 30, 2017 (unaudited) | | Wells Fargo Equity Gateway Funds | | | 69 | |
EMERGING GROWTH PORTFOLIO
| | | | | | | | | | | | | | | | |
| Security name | | | | | | | | Shares | | | Value | |
| | | | |
Common Stocks: 97.85% | | | | | | | | | | | | | | | | |
| | | | |
Consumer Discretionary: 13.25% | | | | | | | | | | | | | | | | |
| | | | |
| Auto Components: 2.43% | | | | | | | | | | | | | | | | |
Cooper-Standard Holdings Incorporated † | | | | | | | | | | | 93,660 | | | $ | 11,807,716 | |
LCI Industries | | | | | | | | | | | 63,630 | | | | 8,329,167 | |
| | | | |
| | | | | | | | | | | | | | | 20,136,883 | |
| | | | | | | | | | | | | | | | |
| | | | |
| Diversified Consumer Services: 1.93% | | | | | | | | | | | | | | | | |
Chegg Incorporated Ǡ | | | | | | | | | | | 439,414 | | | | 6,683,487 | |
Grand Canyon Education Incorporated † | | | | | | | | | | | 98,160 | | | | 9,321,274 | |
| | | | |
| | | | | | | | | | | | | | | 16,004,761 | |
| | | | | | | | | | | | | | | | |
| | | | |
| Hotels, Restaurants & Leisure: 2.89% | | | | | | | | | | | | | | | | |
Dave & Buster’s Entertainment Incorporated † | | | | | | | | | | | 11,800 | | | | 625,754 | |
Planet Fitness Incorporated Class A | | | | | | | | | | | 371,991 | | | | 12,041,349 | |
Playa Hotels & Resorts NV † | | | | | | | | | | | 427,900 | | | | 4,552,856 | |
Wingstop Incorporated « | | | | | | | | | | | 171,498 | | | | 6,721,007 | |
| | | | |
| | | | | | | | | | | | | | | 23,940,966 | |
| | | | | | | | | | | | | | | | |
| | | | |
| Leisure Products: 0.56% | | | | | | | | | | | | | | | | |
MCBC Holdings Incorporated † | | | | | | | | | | | 198,706 | | | | 4,689,462 | |
| | | | | | | | | | | | | | | | |
| | | | |
| Media: 1.26% | | | | | | | | | | | | | | | | |
Nexstar Broadcasting Group Incorporated « | | | | | | | | | | | 153,800 | | | | 10,443,020 | |
| | | | | | | | | | | | | | | | |
| | | | |
| Multiline Retail: 1.27% | | | | | | | | | | | | | | | | |
Ollie’s Bargain Outlet Holdings Incorporated † | | | | | | | | | | | 221,660 | | | | 10,517,767 | |
| | | | | | | | | | | | | | | | |
| | | | |
| Specialty Retail: 2.91% | | | | | | | | | | | | | | | | |
Camping World Holdings Incorporated Class A | | | | | | | | | | | 101,844 | | | | 4,721,488 | |
Five Below Incorporated † | | | | | | | | | | | 43,897 | | | | 2,712,835 | |
Lithia Motors Incorporated Class A | | | | | | | | | | | 126,630 | | | | 14,852,433 | |
National Vision Holdings Incorporated † | | | | | | | | | | | 57,166 | | | | 1,863,040 | |
| | | | |
| | | | | | | | | | | | | | | 24,149,796 | |
| | | | | | | | | | | | | | | | |
| | | | |
Energy: 1.60% | | | | | | | | | | | | | | | | |
| | | | |
| Oil, Gas & Consumable Fuels: 1.60% | | | | | | | | | | | | | | | | |
Matador Resources Company † | | | | | | | | | | | 148,536 | | | | 4,248,130 | |
PDC Energy Incorporated † | | | | | | | | | | | 59,190 | | | | 2,719,781 | |
RSP Permian Incorporated † | | | | | | | | | | | 172,658 | | | | 6,341,728 | |
| | | | |
| | | | | | | | | | | | | | | 13,309,639 | |
| | | | | | | | | | | | | | | | |
| | | | |
Financials: 3.95% | | | | | | | | | | | | | | | | |
| | | | |
| Capital Markets: 1.45% | | | | | | | | | | | | | | | | |
MarketAxess Holdings Incorporated | | | | | | | | | | | 13,181 | | | | 2,573,854 | |
Stifel Financial Corporation | | | | | | | | | | | 168,000 | | | | 9,448,320 | |
| | | | |
| | | | | | | | | | | | | | | 12,022,174 | |
| | | | | | | | | | | | | | | | |
The accompanying notes are an integral part of these financial statements.
| | | | |
| 70 | | Wells Fargo Equity Gateway Funds | | Portfolio of investments—November 30, 2017 (unaudited) |
EMERGING GROWTH PORTFOLIO
| | | | | | | | | | | | | | | | |
| Security name | | | | | | | | Shares | | | Value | |
| | | | |
| Insurance: 1.29% | | | | | | | | | | | | | | | | |
Kinsale Capital Group Incorporated | | | | | | | | | | | 239,230 | | | $ | 10,667,266 | |
| | | | | | | | | | | | | | | | |
| | | | |
| Thrifts & Mortgage Finance: 1.21% | | | | | | | | | | | | | | | | |
LendingTree Incorporated † | | | | | | | | | | | 33,332 | | | | 10,064,597 | |
| | | | | | | | | | | | | | | | |
| | | | |
Health Care: 22.32% | | | | | | | | | | | | | | | | |
| | | | |
| Biotechnology: 7.01% | | | | | | | | | | | | | | | | |
Clovis Oncology Incorporated † | | | | | | | | | | | 119,000 | | | | 7,481,530 | |
Exact Sciences Corporation † | | | | | | | | | | | 108,800 | | | | 6,471,424 | |
Ligand Pharmaceuticals Incorporated † | | | | | | | | | | | 152,501 | | | | 20,107,257 | |
Portola Pharmaceuticals Incorporated † | | | | | | | | | | | 33,500 | | | | 1,692,671 | |
Repligen Corporation † | | | | | | | | | | | 417,180 | | | | 14,789,031 | |
Sarepta Therapeutics Incorporated Ǡ | | | | | | | | | | | 73,247 | | | | 4,077,660 | |
Spark Therapeutics Incorporated † | | | | | | | | | | | 47,985 | | | | 3,513,942 | |
| | | | |
| | | | | | | | | | | | | | | 58,133,515 | |
| | | | | | | | | | | | | | | | |
| | | | |
| Health Care Equipment & Supplies: 10.19% | | | | | | | | | | | | | | | | |
Axogen Incorporated † | | | | | | | | | | | 199,507 | | | | 5,326,837 | |
Cantel Medical Corporation | | | | | | | | | | | 63,800 | | | | 6,793,424 | |
Glaukos Corporation Ǡ | | | | | | | | | | | 97,759 | | | | 2,617,008 | |
Heska Corporation † | | | | | | | | | | | 43,600 | | | | 3,742,188 | |
Inogen Incorporated † | | | | | | | | | | | 136,750 | | | | 17,605,195 | |
Integra LifeSciences Holdings Corporation † | | | | | | | | | | | 291,040 | | | | 14,150,365 | |
iRhythm Technologies Incorporated † | | | | | | | | | | | 156,112 | | | | 8,664,216 | |
Merit Medical Systems Incorporated † | | | | | | | | | | | 107,400 | | | | 4,666,530 | |
Nevro Corporation † | | | | | | | | | | | 182,355 | | | | 13,643,801 | |
NxStage Medical Incorporated † | | | | | | | | | | | 285,170 | | | | 7,326,017 | |
| | | | |
| | | | | | | | | | | | | | | 84,535,581 | |
| | | | | | | | | | | | | | | | |
| | | | |
| Health Care Providers & Services: 2.60% | | | | | | | | | | | | | | | | |
HealthEquity Incorporated † | | | | | | | | | | | 287,112 | | | | 14,892,499 | |
Teladoc Incorporated Ǡ | | | | | | | | | | | 179,479 | | | | 6,658,671 | |
| | | | |
| | | | | | | | | | | | | | | 21,551,170 | |
| | | | | | | | | | | | | | | | |
| | | | |
| Health Care Technology: 0.60% | | | | | | | | | | | | | | | | |
Vocera Communications Incorporated † | | | | | | | | | | | 171,200 | | | | 5,016,160 | |
| | | | | | | | | | | | | | | | |
| | | | |
| Pharmaceuticals: 1.92% | | | | | | | | | | | | | | | | |
Dova Pharmaceuticals Incorporated Ǡ | | | | | | | | | | | 163,989 | | | | 4,898,351 | |
Kala Pharmaceuticals Incorporated † | | | | | | | | | | | 119,217 | | | | 2,283,006 | |
Optinose Incorporated † | | | | | | | | | | | 150,227 | | | | 2,867,833 | |
Supernus Pharmaceuticals Incorporated † | | | | | | | | | | | 154,700 | | | | 5,847,660 | |
| | | | |
| | | | | | | | | | | | | | | 15,896,850 | |
| | | | | | | | | | | | | | | | |
| | | | |
Industrials: 21.82% | | | | | | | | | | | | | | | | |
| | | | |
| Aerospace & Defense: 1.74% | | | | | | | | | | | | | | | | |
HEICO Corporation « | | | | | | | | | | | 9,025 | | | | 815,499 | |
Mercury Computer Systems Incorporated † | | | | | | | | | | | 260,745 | | | | 13,608,282 | |
| | | | |
| | | | | | | | | | | | | | | 14,423,781 | |
| | | | | | | | | | | | | | | | |
The accompanying notes are an integral part of these financial statements.
| | | | | | |
| Portfolio of investments—November 30, 2017 (unaudited) | | Wells Fargo Equity Gateway Funds | | | 71 | |
EMERGING GROWTH PORTFOLIO
| | | | | | | | | | | | | | | | |
| Security name | | | | | | | | Shares | | | Value | |
| | | | |
| Airlines: 1.01% | | | | | | | | | | | | | | | | |
SkyWest Incorporated | | | | | | | | | | | 160,930 | | | $ | 8,376,407 | |
| | | | | | | | | | | | | | | | |
| | | | |
| Building Products: 1.53% | | | | | | | | | | | | | | | | |
Apogee Enterprises Incorporated | | | | | | | | | | | 185,460 | | | | 9,278,564 | |
JELD-WEN Holding Incorporated † | | | | | | | | | | | 85,966 | | | | 3,362,130 | |
| | | | |
| | | | | | | | | | | | | | | 12,640,694 | |
| | | | | | | | | | | | | | | | |
| | | | |
| Commercial Services & Supplies: 1.26% | | | | | | | | | | | | | | | | |
Advanced Disposal Services Incorporated † | | | | | | | | | | | 265,322 | | | | 6,189,962 | |
Healthcare Services Group Incorporated | | | | | | | | | | | 81,700 | | | | 4,242,681 | |
| | | | |
| | | | | | | | | | | | | | | 10,432,643 | |
| | | | | | | | | | | | | | | | |
| | | | |
| Construction & Engineering: 3.23% | | | | | | | | | | | | | | | | |
Dycom Industries Incorporated † | | | | | | | | | | | 91,430 | | | | 9,816,839 | |
Granite Construction Incorporated | | | | | | | | | | | 104,450 | | | | 6,932,347 | |
MasTec Incorporated † | | | | | | | | | | | 223,700 | | | | 10,032,945 | |
| | | | |
| | | | | | | | | | | | | | | 26,782,131 | |
| | | | | | | | | | | | | | | | |
| | | | |
| Machinery: 5.73% | | | | | | | | | | | | | | | | |
John Bean Technologies Corporation | | | | | | | | | | | 156,890 | | | | 18,787,578 | |
Milacron Holdings Corporation † | | | | | | | | | | | 517,128 | | | | 9,116,967 | |
Mueller Water Products Incorporated Class A | | | | | | | | | | | 410,420 | | | | 5,126,146 | |
REV Group Incorporated | | | | | | | | | | | 155,983 | | | | 4,259,896 | |
Rexnord Corporation † | | | | | | | | | | | 410,110 | | | | 10,219,941 | |
| | | | |
| | | | | | | | | | | | | | | 47,510,528 | |
| | | | | | | | | | | | | | | | |
| | | | |
| Professional Services: 5.54% | | | | | | | | | | | | | | | | |
On Assignment Incorporated † | | | | | | | | | | | 402,943 | | | | 25,772,234 | |
WageWorks Incorporated † | | | | | | | | | | | 314,864 | | | | 20,198,526 | |
| | | | |
| | | | | | | | | | | | | | | 45,970,760 | |
| | | | | | | | | | | | | | | | |
| | | | |
| Road & Rail: 0.15% | | | | | | | | | | | | | | | | |
Daseke Incorporated † | | | | | | | | | | | 98,413 | | | | 1,248,861 | |
| | | | | | | | | | | | | | | | |
| | | | |
| Trading Companies & Distributors: 1.63% | | | | | | | | | | | | | | | | |
Beacon Roofing Supply Incorporated † | | | | | | | | | | | 122,110 | | | | 7,824,809 | |
BMC Stock Holdings Incorporated † | | | | | | | | | | | 247,560 | | | | 5,718,636 | |
| | | | |
| | | | | | | | | | | | | | | 13,543,445 | |
| | | | | | | | | | | | | | | | |
| | | | |
Information Technology: 34.53% | | | | | | | | | | | | | | | | |
| | | | |
| Communications Equipment: 0.26% | | | | | | | | | | | | | | | | |
Quantenna Communications Incorporated Ǡ | | | | | | | | | | | 173,722 | | | | 2,124,620 | |
| | | | | | | | | | | | | | | | |
| | | | |
| Electronic Equipment, Instruments & Components: 1.48% | | | | | | | | | | | | | | | | |
Littelfuse Incorporated | | | | | | | | | | | 60,740 | | | | 12,324,146 | |
| | | | | | | | | | | | | | | | |
| | | | |
| Internet Software & Services: 13.05% | | | | | | | | | | | | | | | | |
2U Incorporated † | | | | | | | | | | | 185,250 | | | | 11,874,525 | |
Alarm.com Holdings Incorporated † | | | | | | | | | | | 91,900 | | | | 3,766,981 | |
The accompanying notes are an integral part of these financial statements.
| | | | |
| 72 | | Wells Fargo Equity Gateway Funds | | Portfolio of investments—November 30, 2017 (unaudited) |
EMERGING GROWTH PORTFOLIO
| | | | | | | | | | | | | | | | |
| Security name | | | | | | | | Shares | | | Value | |
| | | | |
| Internet Software & Services (continued) | | | | | | | | | | | | | | | | |
Coupa Software Incorporated † | | | | | | | | | | | 153,174 | | | $ | 5,426,955 | |
Envestnet Incorporated † | | | | | | | | | | | 318,792 | | | | 15,668,627 | |
Five9 Incorporated † | | | | | | | | | | | 546,500 | | | | 13,394,715 | |
GrubHub Incorporated Ǡ | | | | | | | | | | | 49,200 | | | | 3,323,952 | |
LogMeIn Incorporated | | | | | | | | | | | 105,520 | | | | 12,556,880 | |
MongoDB Incorporated † | | | | | | | | | | | 6,306 | | | | 179,910 | |
Q2 Holdings Incorporated † | | | | | | | | | | | 607,743 | | | | 25,434,045 | |
Sendgrid Incorporated † | | | | | | | | | | | 200,073 | | | | 4,193,530 | |
SPS Commerce Incorporated † | | | | | | | | | | | 133,938 | | | | 6,758,511 | |
Wix.com Limited † | | | | | | | | | | | 102,510 | | | | 5,627,799 | |
| | | | |
| | | | | | | | | | | | | | | 108,206,430 | |
| | | | | | | | | | | | | | | | |
| | | | |
| IT Services: 3.32% | | | | | | | | | | | | | | | | |
InterXion Holding NV † | | | | | | | | | | | 426,820 | | | | 24,640,319 | |
Switch Incorporated † | | | | | | | | | | | 169,750 | | | | 2,909,515 | |
| | | | |
| | | | | | | | | | | | | | | 27,549,834 | |
| | | | | | | | | | | | | | | | |
| | | | |
| Semiconductors & Semiconductor Equipment: 4.42% | | | | | | | | | | | | | | | | |
Aquantia Corporation † | | | | | | | | | | | 71,210 | | | | 850,960 | |
MaxLinear Incorporated Class A † | | | | | | | | | | | 274,278 | | | | 7,243,682 | |
Microsemi Corporation † | | | | | | | | | | | 144,150 | | | | 7,618,328 | |
Monolithic Power Systems Incorporated | | | | | | | | | | | 113,380 | | | | 13,418,523 | |
Semtech Corporation † | | | | | | | | | | | 220,000 | | | | 7,491,000 | |
| | | | |
| | | | | | | | | | | | | | | 36,622,493 | |
| | | | | | | | | | | | | | | | |
| | | | |
| Software: 12.00% | | | | | | | | | | | | | | | | |
Altair Engineering Incorporated † | | | | | | | | | | | 39,636 | | | | 887,450 | |
BlackLine Incorporated † | | | | | | | | | | | 133,703 | | | | 4,902,889 | |
CyberArk Software Limited † | | | | | | | | | | | 53,610 | | | | 2,522,887 | |
Forescout Technologies Incorporated † | | | | | | | | | | | 32,754 | | | | 790,026 | |
HubSpot Incorporated † | | | | | | | | | | | 169,976 | | | | 13,759,557 | |
Paycom Software Incorporated † | | | | | | | | | | | 92,930 | | | | 7,620,260 | |
Paylocity Holding Corporation † | | | | | | | | | | | 104,393 | | | | 4,816,693 | |
Proofpoint Incorporated † | | | | | | | | | | | 250,230 | | | | 22,533,212 | |
Rapid7 Incorporated † | | | | | | | | | | | 107,554 | | | | 2,033,846 | |
RealPage Incorporated † | | | | | | | | | | | 237,500 | | | | 10,770,625 | |
RingCentral Incorporated Class A † | | | | | | | | | | | 218,160 | | | | 10,286,244 | |
Sailpoint Technologies Holding † | | | | | | | | | | | 116,005 | | | | 1,705,274 | |
Talend SA ADR † | | | | | | | | | | | 246,778 | | | | 9,863,717 | |
Zendesk Incorporated † | | | | | | | | | | | 207,800 | | | | 6,984,152 | |
| | | | |
| | | | | | | | | | | | | | | 99,476,832 | |
| | | | | | | | | | | | | | | | |
| | | | |
Materials: 0.38% | | | | | | | | | | | | | | | | |
| | | | |
| Chemicals: 0.38% | | | | | | | | | | | | | | | | |
PQ Group Holdings Incorporated † | | | | | | | | | | | 190,400 | | | | 3,141,600 | |
| | | | | | | | | | | | | | | | |
| | | | |
Total Common Stocks (Cost $524,202,862) | | | | | | | | | | | | | | | 811,454,812 | |
| | | | | | | | | | | | | | | | |
The accompanying notes are an integral part of these financial statements.
| | | | | | |
| Portfolio of investments—November 30, 2017 (unaudited) | | Wells Fargo Equity Gateway Funds | | | 73 | |
EMERGING GROWTH PORTFOLIO
| | | | | | | | | | | | | | | | |
| Security name | | | | | | | | Shares | | | Value | |
| | | | |
Exchange-Traded Funds: 1.03% | �� | | | | | | | | | | | | | | | |
iShares Russell 2000 Growth Index ETF « | | | | | | | | | | | 45,600 | | | $ | 8,516,712 | |
| | | | | | | | | | | | | | | | |
| | | | |
Total Exchange-Traded Funds (Cost $8,199,582) | | | | | | | | | | | | | | | 8,516,712 | |
| | | | | | | | | | | | | | | | |
| | | | |
| | | Yield | | | | | | | | | | |
| Short-Term Investments: 5.97% | | | | | | | | | | | | | | | | |
| | | | |
| Investment Companies: 5.97% | | | | | | | | | | | | | | | | |
Securities Lending Cash Investment LLC (l)(r)(u) | | | 1.29 | % | | | | | | | 37,024,970 | | | | 37,028,672 | |
Wells Fargo Government Money Market Fund Select Class (l)(u) | | | 1.00 | | | | | | | | 12,485,937 | | | | 12,485,937 | |
| | | | |
Total Short-Term Investments (Cost $49,511,794) | | | | | | | | | | | | | | | 49,514,609 | |
| | | | | | | | | | | | | | | | |
| | | | | | | | |
| Total investments in securities (Cost $581,914,238) * | | | 104.85 | % | | | 869,486,133 | |
Other assets and liabilities, net | | | (4.85 | ) | | | (40,254,514 | ) |
| | | | | | | | |
| Total net assets | | | 100.00 | % | | $ | 829,231,619 | |
| | | | | | | | |
| † | Non-income-earning security |
| « | All or a portion of this security is on loan. |
| (l) | The issuer of the security is an affiliated person of the Portfolio as defined in the Investment Company Act of 1940. |
| (r) | The investment is a non-registered investment company purchased with cash collateral received from securities on loan. |
| (u) | The rate represents the 7-day annualized yield at period end. |
Investments in Affiliates
An affiliated investment is an investment in which the Portfolio owns at least 5% of the outstanding voting shares of the issuer or as a result of other relationships, such as the Portfolio and the issuer having the same investment manager. Transactions with issuers that were either affiliated persons of the Portfolio at the beginning of the period or the end of the period were as follows:
| | | | | | | | | | | | | | | | | | | | | | | | | | | | | | | | | | | | |
| | | Shares,
beginning of
period | | | Shares
purchased | | | Shares
sold | | | Shares,
end of
period | | | Net
realized
gains
(losses) | | | Net
change in
unrealized
gains
(losses) | | | Income
from
affiliates
securities | | | Value,
end
of period | | | % of
net
assets | |
Short-Term Investments | | | | | | | | | | | | | | | | | | | | | | | | | | | | | | | | | | | | |
Investment Companies | | | | | | | | | | | | | | | | | | | | | | | | | | | | | | | | | | | | |
Securities Lending Cash Investment LLC | | | 57,161,425 | | | | 204,685,027 | | | | 224,821,482 | | | | 37,024,970 | | | $ | 3,355 | | | $ | (2,900 | ) | | $ | 244,346 | | | $ | 37,028,672 | | | | | |
Wells Fargo Government Money Market Fund Select Class | | | 13,424,042 | | | | 140,959,230 | | | | 141,897,335 | | | | 12,485,937 | | | | 0 | | | | 0 | | | | 53,739 | | | | 12,485,937 | | | | | |
| | | | | | | | | | | | | | | | | | | | | | | | | | | | | | | | | | | | |
| | | | | | | | | | | | | | | | | | $ | 3,355 | | | $ | (2,900 | ) | | $ | 298,085 | | | $ | 49,514,609 | | | | 5.97 | % |
| | | | | | | | | | | | | | | | | | | | | | | | | | | | | | | | | | | | |
The accompanying notes are an integral part of these financial statements.
| | | | |
| 74 | | Wells Fargo Equity Gateway Funds | | Portfolio of investments—November 30, 2017 (unaudited) |
INDEX PORTFOLIO
| | | | | | | | | | | | | | | | |
| Security name | | | | | | | | Shares | | | Value | |
| | | | |
Common Stocks: 97.98% | | | | | | | | | | | | | | | | |
| | | | |
Consumer Discretionary: 11.87% | | | | | | | | | | | | | | | | |
| | | | |
| Auto Components: 0.20% | | | | | | | | | | | | | | | | |
BorgWarner Incorporated | | | | | | | | | | | 16,701 | | | $ | 929,912 | |
Delphi Automotive plc | | | | | | | | | | | 22,462 | | | | 2,351,098 | |
The Goodyear Tire & Rubber Company | | | | | | | | | | | 21,193 | | | | 686,017 | |
| | | | |
| | | | | | | | | | | | | | | 3,967,027 | |
| | | | | | | | | | | | | | | | |
| | | | |
| Automobiles: 0.49% | | | | | | | | | | | | | | | | |
Ford Motor Company | | | | | | | | | | | 329,227 | | | | 4,121,922 | |
General Motors Company | | | | | | | | | | | 110,397 | | | | 4,757,007 | |
Harley-Davidson Incorporated « | | | | | | | | | | | 14,360 | | | | 720,872 | |
| | | | |
| | | | | | | | | | | | | | | 9,599,801 | |
| | | | | | | | | | | | | | | | |
| | | | |
| Distributors: 0.11% | | | | | | | | | | | | | | | | |
Genuine Parts Company | | | | | | | | | | | 12,360 | | | | 1,149,109 | |
LKQ Corporation † | | | | | | | | | | | 25,999 | | | | 1,024,881 | |
| | | | |
| | | | | | | | | | | | | | | 2,173,990 | |
| | | | | | | | | | | | | | | | |
| | | | |
| Diversified Consumer Services: 0.02% | | | | | | | | | | | | | | | | |
H&R Block Incorporated | | | | | | | | | | | 17,598 | | | | 460,716 | |
| | | | | | | | | | | | | | | | |
| | | | |
| Hotels, Restaurants & Leisure: 1.84% | | | | | | | | | | | | | | | | |
Carnival Corporation | | | | | | | | | | | 34,330 | | | | 2,253,421 | |
Chipotle Mexican Grill Incorporated † | | | | | | | | | | | 2,112 | | | | 642,872 | |
Darden Restaurants Incorporated | | | | | | | | | | | 10,552 | | | | 889,745 | |
Hilton Worldwide Holdings Incorporated | | | | | | | | | | | 17,193 | | | | 1,333,489 | |
Marriott International Incorporated Class A | | | | | | | | | | | 26,333 | | | | 3,344,291 | |
McDonald’s Corporation | | | | | | | | | | | 68,183 | | | | 11,725,431 | |
MGM Resorts International | | | | | | | | | | | 43,576 | | | | 1,486,813 | |
Norwegian Cruise Line Holdings Limited † | | | | | | | | | | | 14,981 | | | | 811,371 | |
Royal Caribbean Cruises Limited | | | | | | | | | | | 14,483 | | | | 1,794,154 | |
Starbucks Corporation | | | | | | | | | | | 121,543 | | | | 7,027,616 | |
Wyndham Worldwide Corporation | | | | | | | | | | | 8,652 | | | | 972,398 | |
Wynn Resorts Limited | | | | | | | | | | | 6,734 | | | | 1,064,511 | |
Yum! Brands Incorporated | | | | | | | | | | | 29,022 | | | | 2,422,466 | |
| | | | |
| | | | | | | | | | | | | | | 35,768,578 | |
| | | | | | | | | | | | | | | | |
| | | | |
| Household Durables: 0.42% | | | | | | | | | | | | | | | | |
D.R. Horton Incorporated | | | | | | | | | | | 28,670 | | | | 1,462,170 | |
Garmin Limited | | | | | | | | | | | 9,341 | | | | 579,889 | |
Leggett & Platt Incorporated | | | | | | | | | | | 11,135 | | | | 537,152 | |
Lennar Corporation Class A | | | | | | | | | | | 17,104 | | | | 1,073,789 | |
Lennar Corporation Class B | | | | | | | | | | | 1 | | | | 26 | |
Mohawk Industries Incorporated † | | | | | | | | | | | 5,319 | | | | 1,503,203 | |
Newell Rubbermaid Incorporated | | | | | | | | | | | 41,255 | | | | 1,277,667 | |
Pulte Group Incorporated | | | | | | | | | | | 23,365 | | | | 797,447 | |
Whirlpool Corporation | | | | | | | | | | | 6,143 | | | | 1,035,526 | |
| | | | |
| | | | | | | | | | | | | | | 8,266,869 | |
| | | | | | | | | | | | | | | | |
The accompanying notes are an integral part of these financial statements.
| | | | | | |
| Portfolio of investments—November 30, 2017 (unaudited) | | Wells Fargo Equity Gateway Funds | | | 75 | |
INDEX PORTFOLIO
| | | | | | | | | | | | | | | | |
| Security name | | | | | | | | Shares | | | Value | |
| | | | |
| Internet & Direct Marketing Retail: 2.83% | | | | | | | | | | | | | | | | |
Amazon.com Incorporated † | | | | | | | | | | | 33,563 | | | $ | 39,495,260 | |
Expedia Incorporated | | | | | | | | | | | 10,284 | | | | 1,259,790 | |
Netflix Incorporated † | | | | | | | | | | | 36,343 | | | | 6,817,220 | |
The Priceline Group Incorporated † | | | | | | | | | | | 4,130 | | | | 7,185,002 | |
TripAdvisor Incorporated † | | | | | | | | | | | 9,118 | | | | 315,665 | |
| | | | |
| | | | | | | | | | | | | | | 55,072,937 | |
| | | | | | | | | | | | | | | | |
| | | | |
| Leisure Products: 0.07% | | | | | | | | | | | | | | | | |
Hasbro Incorporated | | | | | | | | | | | 9,581 | | | | 891,225 | |
Mattel Incorporated « | | | | | | | | | | | 28,850 | | | | 526,513 | |
| | | | |
| | | | | | | | | | | | | | | 1,417,738 | |
| | | | | | | | | | | | | | | | |
| | | | |
| Media: 2.64% | | | | | | | | | | | | | | | | |
CBS Corporation Class B | | | | | | | | | | | 30,645 | | | | 1,717,959 | |
Charter Communications Incorporated Class A † | | | | | | | | | | | 16,932 | | | | 5,523,388 | |
Comcast Corporation Class A | | | | | | | | | | | 395,962 | | | | 14,864,413 | |
Discovery Communications Incorporated Class A † | | | | | | | | | | | 12,958 | | | | 246,461 | |
Discovery Communications Incorporated Class C † | | | | | | | | | | | 17,107 | | | | 309,295 | |
DISH Network Corporation Class A † | | | | | | | | | | | 19,165 | | | | 970,707 | |
Interpublic Group of Companies Incorporated | | | | | | | | | | | 33,104 | | | | 654,797 | |
News Corporation Class A | | | | | | | | | | | 32,171 | | | | 519,883 | |
News Corporation Class B | | | | | | | | | | | 10,251 | | | | 168,116 | |
Omnicom Group Incorporated | | | | | | | | | | | 19,424 | | | | 1,387,651 | |
Scripps Networks Interactive Incorporated Class A | | | | | | | | | | | 8,078 | | | | 661,104 | |
The Walt Disney Company | | | | | | | | | | | 129,925 | | | | 13,618,739 | |
Time Warner Incorporated | | | | | | | | | | | 65,473 | | | | 5,991,434 | |
Twenty-First Century Fox Incorporated Class A | | | | | | | | | | | 88,599 | | | | 2,829,852 | |
Twenty-First Century Fox Incorporated Class B | | | | | | | | | | | 36,969 | | | | 1,151,584 | |
Viacom Incorporated Class B | | | | | | | | | | | 29,691 | | | | 840,849 | |
| | | | |
| | | | | | | | | | | | | | | 51,456,232 | |
| | | | | | | | | | | | | | | | |
| | | | |
| Multiline Retail: 0.44% | | | | | | | | | | | | | | | | |
Dollar General Corporation | | | | | | | | | | | 21,929 | | | | 1,931,506 | |
Dollar Tree Incorporated † | | | | | | | | | | | 19,937 | | | | 2,048,726 | |
Kohl’s Corporation | | | | | | | | | | | 14,191 | | | | 680,742 | |
Macy’s Incorporated | | | | | | | | | | | 25,637 | | | | 610,161 | |
Nordstrom Incorporated « | | | | | | | | | | | 9,795 | | | | 445,183 | |
Target Corporation | | | | | | | | | | | 45,976 | | | | 2,753,962 | |
| | | | |
| | | | | | | | | | | | | | | 8,470,280 | |
| | | | | | | | | | | | | | | | |
| | | | |
| Specialty Retail: 2.15% | | | | | | | | | | | | | | | | |
Advance Auto Parts Incorporated | | | | | | | | | | | 6,218 | | | | 628,018 | |
AutoZone Incorporated † | | | | | | | | | | | 2,360 | | | | 1,620,754 | |
Best Buy Company Incorporated | | | | | | | | | | | 22,334 | | | | 1,331,330 | |
CarMax Incorporated † | | | | | | | | | | | 15,425 | | | | 1,062,937 | |
Foot Locker Incorporated | | | | | | | | | | | 10,438 | | | | 447,164 | |
L Brands Incorporated | | | | | | | | | | | 21,007 | | | | 1,177,862 | |
Lowe’s Companies Incorporated | | | | | | | | | | | 71,064 | | | | 5,924,606 | |
O’Reilly Automotive Incorporated † | | | | | | | | | | | 7,409 | | | | 1,750,080 | |
The accompanying notes are an integral part of these financial statements.
| | | | |
| 76 | | Wells Fargo Equity Gateway Funds | | Portfolio of investments—November 30, 2017 (unaudited) |
INDEX PORTFOLIO
| | | | | | | | | | | | | | | | |
| Security name | | | | | | | | Shares | | | Value | |
| | | | |
| Specialty Retail (continued) | | | | | | | | | | | | | | | | |
Ross Stores Incorporated | | | | | | | | | | | 32,760 | | | $ | 2,490,743 | |
Signet Jewelers Limited « | | | | | | | | | | | 5,089 | | | | 266,104 | |
The Gap Incorporated | | | | | | | | | | | 18,486 | | | | 597,283 | |
The Home Depot Incorporated | | | | | | | | | | | 99,229 | | | | 17,843,359 | |
The TJX Companies Incorporated | | | | | | | | | | | 53,560 | | | | 4,046,458 | |
Tiffany & Company | | | | | | | | | | | 8,594 | | | | 812,133 | |
Tractor Supply Company | | | | | | | | | | | 10,665 | | | | 727,780 | |
ULTA Beauty Incorporated † | | | | | | | | | | | 4,913 | | | | 1,089,261 | |
| | | | |
| | | | | | | | | | | | | | | 41,815,872 | |
| | | | | | | | | | | | | | | | |
| | | | |
| Textiles, Apparel & Luxury Goods: 0.66% | | | | | | | | | | | | | | | | |
HanesBrands Incorporated | | | | | | | | | | | 30,681 | | | | 640,926 | |
Michael Kors Holdings Limited † | | | | | | | | | | | 12,762 | | | | 745,811 | |
Nike Incorporated Class B | | | | | | | | | | | 110,604 | | | | 6,682,694 | |
PVH Corporation | | | | | | | | | | | 6,517 | | | | 876,862 | |
Ralph Lauren Corporation | | | | | | | | | | | 4,662 | | | | 443,589 | |
Tapestry Incorporated | | | | | | | | | | | 23,787 | | | | 991,680 | |
Under Armour Incorporated Class A Ǡ | | | | | | | | | | | 15,569 | | | | 206,912 | |
Under Armour Incorporated Class C Ǡ | | | | | | | | | | | 15,668 | | | | 186,919 | |
VF Corporation | | | | | | | | | | | 27,501 | | | | 2,006,473 | |
| |
| | | | 12,781,866 | |
| | | | | | | | | | | | | | | | |
| | | | |
Consumer Staples: 7.95% | | | | | | | | | | | | | | | | |
| | | | |
| Beverages: 1.94% | | | | | | | | | | | | | | | | |
Brown-Forman Corporation Class B | | | | | | | | | | | 16,484 | | | | 985,743 | |
Constellation Brands Incorporated Class A | | | | | | | | | | | 14,470 | | | | 3,148,527 | |
Dr Pepper Snapple Group Incorporated | | | | | | | | | | | 15,297 | | | | 1,379,636 | |
Molson Coors Brewing Company Class B | | | | | | | | | | | 15,547 | | | | 1,214,221 | |
Monster Beverage Corporation † | | | | | | | | | | | 34,913 | | | | 2,187,998 | |
PepsiCo Incorporated | | | | | | | | | | | 120,247 | | | | 14,011,180 | |
The Coca-Cola Company | | | | | | | | | | | 323,136 | | | | 14,789,935 | |
| |
| | | | 37,717,240 | |
| | | | | | | | | | | | | | | | |
| | | | |
| Food & Staples Retailing: 1.79% | | | | | | | | | | | | | | | | |
Costco Wholesale Corporation | | | | | | | | | | | 36,919 | | | | 6,808,971 | |
CVS Health Corporation | | | | | | | | | | | 85,571 | | | | 6,554,739 | |
Sysco Corporation | | | | | | | | | | | 40,881 | | | | 2,360,060 | |
The Kroger Company | | | | | | | | | | | 75,536 | | | | 1,953,361 | |
Wal-Mart Stores Incorporated | | | | | | | | | | | 123,212 | | | | 11,979,903 | |
Walgreens Boots Alliance Incorporated | | | | | | | | | | | 73,083 | | | | 5,317,519 | |
| |
| | | | 34,974,553 | |
| | | | | | | | | | | | | | | | |
| | | | |
| Food Products: 1.23% | | | | | | | | | | | | | | | | |
Archer Daniels Midland Company | | | | | | | | | | | 47,353 | | | | 1,888,438 | |
Campbell Soup Company | | | | | | | | | | | 16,327 | | | | 804,921 | |
ConAgra Foods Incorporated | | | | | | | | | | | 34,989 | | | | 1,306,139 | |
General Mills Incorporated | | | | | | | | | | | 48,578 | | | | 2,747,572 | |
Hormel Foods Corporation | | | | | | | | | | | 22,691 | | | | 827,087 | |
The accompanying notes are an integral part of these financial statements.
| | | | | | |
| Portfolio of investments—November 30, 2017 (unaudited) | | Wells Fargo Equity Gateway Funds | | | 77 | |
INDEX PORTFOLIO
| | | | | | | | | | | | | | | | |
| Security name | | | | | | | | Shares | | | Value | |
| | | | |
| Food Products (continued) | | | | | | | | | | | | | | | | |
Kellogg Company | | | | | | | | | | | 20,918 | | | $ | 1,383,935 | |
McCormick & Company Incorporated | | | | | | | | | | | 10,010 | | | | 1,022,822 | |
Mondelez International Incorporated Class A | | | | | | | | | | | 126,908 | | | | 5,449,430 | |
The Hershey Company | | | | | | | | | | | 11,895 | | | | 1,319,512 | |
The J.M. Smucker Company | | | | | | | | | | | 9,561 | | | | 1,115,482 | |
The Kraft Heinz Company | | | | | | | | | | | 50,249 | | | | 4,088,761 | |
Tyson Foods Incorporated Class A | | | | | | | | | | | 24,350 | | | | 2,002,788 | |
| |
| | | | 23,956,887 | |
| | | | | | | | | | | | | | | | |
| | | | |
| Household Products: 1.58% | | | | | | | | | | | | | | | | |
Church & Dwight Company Incorporated | | | | | | | | | | | 21,003 | | | | 989,031 | |
Colgate-Palmolive Company | | | | | | | | | | | 74,147 | | | | 5,371,950 | |
Kimberly-Clark Corporation | | | | | | | | | | | 29,740 | | | | 3,561,662 | |
The Clorox Company | | | | | | | | | | | 10,865 | | | | 1,513,386 | |
The Procter & Gamble Company | | | | | | | | | | | 214,652 | | | | 19,316,533 | |
| |
| | | | 30,752,562 | |
| | | | | | | | | | | | | | | | |
| | | | |
| Personal Products: 0.16% | | | | | | | | | | | | | | | | |
Coty Incorporated Class A « | | | | | | | | | | | 39,704 | | | | 684,100 | |
The Estee Lauder Companies Incorporated Class A | | | | | | | | | | | 18,845 | | | | 2,352,421 | |
| |
| | | | 3,036,521 | |
| | | | | | | | | | | | | | | | |
| | | | |
| Tobacco: 1.25% | | | | | | | | | | | | | | | | |
Altria Group Incorporated | | | | | | | | | | | 161,499 | | | | 10,954,477 | |
Philip Morris International | | | | | | | | | | | 130,739 | | | | 13,433,432 | |
| |
| | | | 24,387,909 | |
| | | | | | | | | | | | | | | | |
| | | | |
Energy: 5.73% | | | | | | | | | | | | | | | | |
| | | | |
| Energy Equipment & Services: 0.73% | | | | | | | | | | | | | | | | |
Baker Hughes Incorporated | | | | | | | | | | | 36,030 | | | | 1,071,172 | |
Halliburton Company | | | | | | | | | | | 73,054 | | | | 3,052,196 | |
Helmerich & Payne Incorporated « | | | | | | | | | | | 9,140 | | | | 535,421 | |
National Oilwell Varco Incorporated | | | | | | | | | | | 31,991 | | | | 1,073,298 | |
Schlumberger Limited | | | | | | | | | | | 116,962 | | | | 7,351,062 | |
TechnipFMC plc | | | | | | | | | | | 36,970 | | | | 1,058,821 | |
| |
| | | | 14,141,970 | |
| | | | | | | | | | | | | | | | |
| | | | |
| Oil, Gas & Consumable Fuels: 5.00% | | | | | | | | | | | | | | | | |
Anadarko Petroleum Corporation | | | | | | | | | | | 47,168 | | | | 2,268,309 | |
Andeavor Corporation | | | | | | | | | | | 12,151 | | | | 1,281,566 | |
Apache Corporation | | | | | | | | | | | 32,066 | | | | 1,341,321 | |
Cabot Oil & Gas Corporation | | | | | | | | | | | 38,931 | | | | 1,127,052 | |
Chesapeake Energy Corporation Ǡ | | | | | | | | | | | 76,438 | | | | 311,103 | |
Chevron Corporation | | | | | | | | | | | 159,515 | | | | 18,980,690 | |
Cimarex Energy Company | | | | | | | | | | | 8,020 | | | | 931,202 | |
Concho Resources Incorporated † | | | | | | | | | | | 12,518 | | | | 1,750,767 | |
ConocoPhillips | | | | | | | | | | | 102,439 | | | | 5,212,096 | |
Devon Energy Corporation | | | | | | | | | | | 44,252 | | | | 1,705,030 | |
The accompanying notes are an integral part of these financial statements.
| | | | |
| 78 | | Wells Fargo Equity Gateway Funds | | Portfolio of investments—November 30, 2017 (unaudited) |
INDEX PORTFOLIO
| | | | | | | | | | | | | | | | |
| Security name | | | | | | | | Shares | | | Value | |
| | | | |
| Oil, Gas & Consumable Fuels (continued) | | | | | | | | | | | | | | | | |
EOG Resources Incorporated | | | | | | | | | | | 48,608 | | | $ | 4,973,571 | |
EQT Corporation | | | | | | | | | | | 20,186 | | | | 1,203,086 | |
Exxon Mobil Corporation | | | | | | | | | | | 356,680 | | | | 29,707,877 | |
Hess Corporation | | | | | | | | | | | 22,747 | | | | 1,043,632 | |
Kinder Morgan Incorporated | | | | | | | | | | | 161,611 | | | | 2,784,558 | |
Marathon Oil Corporation | | | | | | | | | | | 71,550 | | | | 1,061,802 | |
Marathon Petroleum Corporation | | | | | | | | | | | 42,615 | | | | 2,668,977 | |
Newfield Exploration Company † | | | | | | | | | | | 16,768 | | | | 518,634 | |
Noble Energy Incorporated | | | | | | | | | | | 40,956 | | | | 1,077,143 | |
Occidental Petroleum Corporation | | | | | | | | | | | 64,360 | | | | 4,537,380 | |
ONEOK Incorporated | | | | | | | | | | | 31,979 | | | | 1,659,710 | |
Phillips 66 Company | | | | | | | | | | | 36,168 | | | | 3,528,550 | |
Pioneer Natural Resources Company | | | | | | | | | | | 14,318 | | | | 2,234,181 | |
Range Resources Corporation | | | | | | | | | | | 19,007 | | | | 342,506 | |
The Williams Companies Incorporated | | | | | | | | | | | 69,585 | | | | 2,021,444 | |
Valero Energy Corporation | | | | | | | | | | | 37,178 | | | | 3,183,180 | |
| |
| | | | 97,455,367 | |
| | | | | | | | | | | | | | | | |
| | | | |
Financials: 14.46% | | | | | | | | | | | | | | | | |
| | | | |
| Banks: 6.41% | | | | | | | | | | | | | | | | |
Bank of America Corporation | | | | | | | | | | | 825,947 | | | | 23,266,927 | |
BB&T Corporation | | | | | | | | | | | 68,023 | | | | 3,361,697 | |
Citigroup Incorporated | | | | | | | | | | | 229,345 | | | | 17,315,548 | |
Citizens Financial Group Incorporated | | | | | | | | | | | 42,145 | | | | 1,715,302 | |
Comerica Incorporated | | | | | | | | | | | 14,808 | | | | 1,233,654 | |
Fifth Third Bancorp | | | | | | | | | | | 62,015 | | | | 1,892,078 | |
Huntington Bancshares Incorporated | | | | | | | | | | | 91,754 | | | | 1,321,258 | |
JPMorgan Chase & Company | | | | | | | | | | | 296,215 | | | | 30,960,392 | |
KeyCorp | | | | | | | | | | | 91,546 | | | | 1,737,543 | |
M&T Bank Corporation | | | | | | | | | | | 12,789 | | | | 2,160,702 | |
People’s United Financial Incorporated | | | | | | | | | | | 28,986 | | | | 551,314 | |
PNC Financial Services Group Incorporated | | | | | | | | | | | 40,338 | | | | 5,669,909 | |
Regions Financial Corporation | | | | | | | | | | | 100,598 | | | | 1,668,921 | |
SunTrust Banks Incorporated | | | | | | | | | | | 40,400 | | | | 2,489,852 | |
US Bancorp | | | | | | | | | | | 133,768 | | | | 7,377,305 | |
Wells Fargo & Company (l) | | | | | | | | | | | 376,065 | | | | 21,236,391 | |
Zions Bancorporation | | | | | | | | | | | 17,018 | | | | 843,242 | |
| |
| | | | 124,802,035 | |
| | | | | | | | | | | | | | | | |
| | | | |
| Capital Markets: 2.99% | | | | | | | | | | | | | | | | |
Affiliated Managers Group Incorporated | | | | | | | | | | | 4,711 | | | | 935,934 | |
Ameriprise Financial Incorporated | | | | | | | | | | | 12,622 | | | | 2,060,289 | |
Bank of New York Mellon Corporation | | | | | | | | | | | 86,968 | | | | 4,760,628 | |
BlackRock Incorporated | | | | | | | | | | | 10,434 | | | | 5,229,416 | |
CBOE Holdings Incorporated | | | | | | | | | | | 9,493 | | | | 1,171,721 | |
CME Group Incorporated | | | | | | | | | | | 28,612 | | | | 4,278,638 | |
E*TRADE Financial Corporation † | | | | | | | | | | | 23,153 | | | | 1,114,585 | |
Franklin Resources Incorporated | | | | | | | | | | | 27,698 | | | | 1,200,708 | |
Intercontinental Exchange Incorporated | | | | | | | | | | | 49,538 | | | | 3,539,490 | |
Invesco Limited | | | | | | | | | | | 34,248 | | | | 1,238,750 | |
The accompanying notes are an integral part of these financial statements.
| | | | | | |
| Portfolio of investments—November 30, 2017 (unaudited) | | Wells Fargo Equity Gateway Funds | | | 79 | |
INDEX PORTFOLIO
| | | | | | | | | | | | | | | | |
| Security name | | | | | | | | Shares | | | Value | |
| | | | |
| Capital Markets (continued) | | | | | | | | | | | | | | | | |
Moody’s Corporation | | | | | | | | | | | 13,988 | | | $ | 2,123,658 | |
Morgan Stanley | | | | | | | | | | | 119,040 | | | | 6,143,654 | |
Northern Trust Corporation | | | | | | | | | | | 18,079 | | | | 1,767,765 | |
Raymond James Financial Incorporated | | | | | | | | | | | 10,802 | | | | 953,817 | |
S&P Global Incorporated | | | | | | | | | | | 21,633 | | | | 3,579,829 | |
State Street Corporation | | | | | | | | | | | 31,478 | | | | 3,001,427 | |
T. Rowe Price Group Incorporated | | | | | | | | | | | 20,233 | | | | 2,082,380 | |
The Charles Schwab Corporation | | | | | | | | | | | 100,323 | | | | 4,894,759 | |
The Goldman Sachs Group Incorporated | | | | | | | | | | | 30,286 | | | | 7,500,025 | |
The NASDAQ OMX Group Incorporated | | | | | | | | | | | 9,828 | | | | 777,984 | |
| |
| | | | 58,355,457 | |
| | | | | | | | | | | | | | | | |
| | | | |
| Consumer Finance: 0.75% | | | | | | | | | | | | | | | | |
American Express Company | | | | | | | | | | | 61,761 | | | | 6,034,667 | |
Capital One Financial Corporation | | | | | | | | | | | 40,716 | | | | 3,745,872 | |
Discover Financial Services | | | | | | | | | | | 31,343 | | | | 2,212,816 | |
Navient Corporation | | | | | | | | | | | 23,073 | | | | 290,951 | |
Synchrony Financial | | | | | | | | | | | 62,932 | | | | 2,258,629 | |
| |
| | | | 14,542,935 | |
| | | | | | | | | | | | | | | | |
| | | | |
| Diversified Financial Services: 1.64% | | | | | | | | | | | | | | | | |
Berkshire Hathaway Incorporated Class B † | | | | | | | | | | | 161,970 | | | | 31,261,830 | |
Leucadia National Corporation | | | | | | | | | | | 26,654 | | | | 701,267 | |
| |
| | | | 31,963,097 | |
| | | | | | | | | | | | | | | | |
| | | | |
| Insurance: 2.67% | | | | | | | | | | | | | | | | |
AFLAC Incorporated | | | | | | | | | | | 33,269 | | | | 2,915,695 | |
American International Group Incorporated | | | | | | | | | | | 76,046 | | | | 4,559,718 | |
Aon plc | | | | | | | | | | | 21,409 | | | | 3,001,970 | |
Arthur J. Gallagher & Company | | | | | | | | | | | 15,166 | | | | 998,378 | |
Assurant Incorporated | | | | | | | | | | | 4,536 | | | | 457,546 | |
Brighthouse Financial Incorporated † | | | | | | | | | | | 8,066 | | | | 474,200 | |
Chubb Limited | | | | | | | | | | | 39,177 | | | | 5,959,213 | |
Cincinnati Financial Corporation | | | | | | | | | | | 12,561 | | | | 938,684 | |
Everest Reinsurance Group Limited | | | | | | | | | | | 3,457 | | | | 759,157 | |
Lincoln National Corporation | | | | | | | | | | | 18,648 | | | | 1,427,504 | |
Loews Corporation | | | | | | | | | | | 23,234 | | | | 1,168,206 | |
Marsh & McLennan Companies Incorporated | | | | | | | | | | | 43,143 | | | | 3,620,992 | |
MetLife Incorporated | | | | | | | | | | | 89,469 | | | | 4,802,696 | |
Principal Financial Group Incorporated | | | | | | | | | | | 22,621 | | | | 1,601,341 | |
Prudential Financial Incorporated | | | | | | | | | | | 35,944 | | | | 4,163,753 | |
The Allstate Corporation | | | | | | | | | | | 30,418 | | | | 3,122,712 | |
The Hartford Financial Services Group Incorporated | | | | | | | | | | | 30,666 | | | | 1,761,455 | |
The Progressive Corporation | | | | | | | | | | | 48,983 | | | | 2,604,916 | |
The Travelers Companies Incorporated | | | | | | | | | | | 23,228 | | | | 3,149,020 | |
Torchmark Corporation | | | | | | | | | | | 9,106 | | | | 809,068 | |
Unum Group | | | | | | | | | | | 18,997 | | | | 1,075,610 | |
Willis Towers Watson plc | | | | | | | | | | | 11,304 | | | | 1,817,683 | |
XL Group Limited | | | | | | | | | | | 21,713 | | | | 842,899 | |
| |
| | | | 52,032,416 | |
| | | | | | | | | | | | | | | | |
The accompanying notes are an integral part of these financial statements.
| | | | |
| 80 | | Wells Fargo Equity Gateway Funds | | Portfolio of investments—November 30, 2017 (unaudited) |
INDEX PORTFOLIO
| | | | | | | | | | | | | | | | |
| Security name | | | | | | | | Shares | | | Value | |
| | | | |
Health Care: 13.77% | | | | | | | | | | | | | | | | |
| | | | |
| Biotechnology: 2.73% | | | | | | | | | | | | | | | | |
AbbVie Incorporated | | | | | | | | | | | 134,186 | | | $ | 13,005,307 | |
Alexion Pharmaceuticals Incorporated † | | | | | | | | | | | 18,787 | | | | 2,063,000 | |
Amgen Incorporated | | | | | | | | | | | 61,422 | | | | 10,789,389 | |
Biogen Idec Incorporated | | | | | | | | | | | 17,798 | | | | 5,733,982 | |
Celgene Corporation † | | | | | | | | | | | 65,856 | | | | 6,640,260 | |
Gilead Sciences Incorporated | | | | | | | | | | | 109,929 | | | | 8,220,491 | |
Incyte Corporation † | | | | | | | | | | | 14,372 | | | | 1,422,684 | |
Regeneron Pharmaceuticals Incorporated † | | | | | | | | | | | 6,467 | | | | 2,340,149 | |
Vertex Pharmaceuticals Incorporated † | | | | | | | | | | | 21,223 | | | | 3,062,267 | |
| |
| | | | 53,277,529 | |
| | | | | | | | | | | | | | | | |
| | | | |
| Health Care Equipment & Supplies: 2.81% | | | | | | | | | | | | | | | | |
Abbott Laboratories | | | | | | | | | | | 146,253 | | | | 8,244,282 | |
Align Technology Incorporated † | | | | | | | | | | | 6,072 | | | | 1,584,063 | |
Baxter International Incorporated | | | | | | | | | | | 42,196 | | | | 2,765,104 | |
Becton Dickinson & Company | | | | | | | | | | | 19,156 | | | | 4,371,591 | |
Boston Scientific Corporation † | | | | | | | | | | | 115,501 | | | | 3,035,366 | |
C.R. Bard Incorporated | | | | | | | | | | | 6,117 | | | | 2,054,945 | |
Danaher Corporation | | | | | | | | | | | 51,460 | | | | 4,855,766 | |
Dentsply Sirona Incorporated | | | | | | | | | | | 19,319 | | | | 1,294,566 | |
Edwards Lifesciences Corporation † | | | | | | | | | | | 17,775 | | | | 2,083,230 | |
Hologic Incorporated † | | | | | | | | | | | 23,609 | | | | 984,967 | |
IDEXX Laboratories Incorporated † | | | | | | | | | | | 7,347 | | | | 1,149,144 | |
Intuitive Surgical Incorporated † | | | | | | | | | | | 9,415 | | | | 3,763,929 | |
Medtronic plc | | | | | | | | | | | 114,025 | | | | 9,364,873 | |
ResMed Incorporated | | | | | | | | | | | 11,971 | | | | 1,022,323 | |
Stryker Corporation | | | | | | | | | | | 27,079 | | | | 4,224,324 | |
The Cooper Companies Incorporated | | | | | | | | | | | 4,113 | | | | 991,973 | |
Varian Medical Systems Incorporated | | | | | | | | | | | 7,728 | | | | 863,604 | |
Zimmer Biomet Holdings Incorporated | | | | | | | | | | | 17,020 | | | | 1,993,042 | |
| |
| | | | 54,647,092 | |
| | | | | | | | | | | | | | | | |
| | | | |
| Health Care Providers & Services: 2.78% | | | | | | | | | | | | | | | | |
Aetna Incorporated | | | | | | | | | | | 27,921 | | | | 5,030,806 | |
AmerisourceBergen Corporation | | | | | | | | | | | 13,649 | | | | 1,157,708 | |
Anthem Incorporated | | | | | | | | | | | 22,104 | | | | 5,193,556 | |
Cardinal Health Incorporated | | | | | | | | | | | 26,638 | | | | 1,576,703 | |
Centene Corporation † | | | | | | | | | | | 14,518 | | | | 1,482,143 | |
CIGNA Corporation | | | | | | | | | | | 21,194 | | | | 4,487,406 | |
DaVita HealthCare Partners Incorporated † | | | | | | | | | | | 12,876 | | | | 786,209 | |
Envision Healthcare Corporation † | | | | | | | | | | | 10,171 | | | | 324,760 | |
Express Scripts Holding Company † | | | | | | | | | | | 48,616 | | | | 3,168,791 | |
HCA Holdings Incorporated † | | | | | | | | | | | 24,327 | | | | 2,067,795 | |
Henry Schein Incorporated † | | | | | | | | | | | 13,355 | | | | 954,215 | |
Humana Incorporated | | | | | | | | | | | 12,165 | | | | 3,173,362 | |
Laboratory Corporation of America Holdings † | | | | | | | | | | | 8,569 | | | | 1,356,216 | |
McKesson Corporation | | | | | | | | | | | 17,699 | | | | 2,614,850 | |
Patterson Companies Incorporated | | | | | | | | | | | 6,933 | | | | 253,401 | |
Quest Diagnostics Incorporated | | | | | | | | | | | 11,482 | | | | 1,130,518 | |
The accompanying notes are an integral part of these financial statements.
| | | | | | |
| Portfolio of investments—November 30, 2017 (unaudited) | | Wells Fargo Equity Gateway Funds | | | 81 | |
INDEX PORTFOLIO
| | | | | | | | | | | | | | | | |
| Security name | | | | | | | | Shares | | | Value | |
| | | | |
| Health Care Providers & Services (continued) | | | | | | | | | | | | | | | | |
UnitedHealth Group Incorporated | | | | | | | | | | | 81,387 | | | $ | 18,570,072 | |
Universal Health Services Incorporated Class B | | | | | | | | | | | 7,439 | | | | 806,016 | |
| |
| | | | 54,134,527 | |
| | | | | | | | | | | | | | | | |
| | | | |
| Health Care Technology: 0.10% | | | | | | | | | | | | | | | | |
Cerner Corporation † | | | | | | | | | | | 26,516 | | | | 1,874,416 | |
| | | | | | | | | | | | | | | | |
| | | | |
| Life Sciences Tools & Services: 0.81% | | | | | | | | | | | | | | | | |
Agilent Technologies Incorporated | | | | | | | | | | | 27,049 | | | | 1,872,873 | |
Illumina Incorporated † | | | | | | | | | | | 12,290 | | | | 2,827,069 | |
IQVIA Holdings Incorporated † | | | | | | | | | | | 12,759 | | | | 1,301,546 | |
Mettler-Toledo International Incorporated † | | | | | | | | | | | 2,161 | | | | 1,359,723 | |
PerkinElmer Incorporated | | | | | | | | | | | 9,278 | | | | 683,603 | |
Thermo Fisher Scientific Incorporated | | | | | | | | | | | 33,688 | | | | 6,493,699 | |
Waters Corporation † | | | | | | | | | | | 6,719 | | | | 1,324,785 | |
| |
| | | | 15,863,298 | |
| | | | | | | | | | | | | | | | |
| | | | |
| Pharmaceuticals: 4.54% | | | | | | | | | | | | | | | | |
Allergan plc | | | | | | | | | | | 28,141 | | | | 4,891,750 | |
Bristol-Myers Squibb Company | | | | | | | | | | | 138,044 | | | | 8,723,000 | |
Eli Lilly & Company | | | | | | | | | | | 81,557 | | | | 6,902,984 | |
Johnson & Johnson | | | | | | | | | | | 225,931 | | | | 31,478,966 | |
Merck & Company Incorporated | | | | | | | | | | | 230,238 | | | | 12,725,254 | |
Mylan NV † | | | | | | | | | | | 45,142 | | | | 1,649,037 | |
Perrigo Company plc | | | | | | | | | | | 11,164 | | | | 973,612 | |
Pfizer Incorporated | | | | | | | | | | | 502,355 | | | | 18,215,392 | |
Zoetis Incorporated | | | | | | | | | | | 41,314 | | | | 2,986,589 | |
| |
| | | | 88,546,584 | |
| | | | | | | | | | | | | | | | |
| | | | |
Industrials: 9.89% | | | | | | | | | | | | | | | | |
| | | | |
| Aerospace & Defense: 2.45% | | | | | | | | | | | | | | | | |
Arconic Incorporated | | | | | | | | | | | 35,573 | | | | 875,452 | |
General Dynamics Corporation | | | | | | | | | | | 23,443 | | | | 4,856,452 | |
L-3 Technologies Incorporated | | | | | | | | | | | 6,584 | | | | 1,307,517 | |
Lockheed Martin Corporation | | | | | | | | | | | 21,091 | | | | 6,730,560 | |
Northrop Grumman Corporation | | | | | | | | | | | 14,659 | | | | 4,506,177 | |
Raytheon Company | | | | | | | | | | | 24,432 | | | | 4,670,177 | |
Rockwell Collins Incorporated | | | | | | | | | | | 13,677 | | | | 1,809,604 | |
Textron Incorporated | | | | | | | | | | | 22,283 | | | | 1,241,386 | |
The Boeing Company | | | | | | | | | | | 46,770 | | | | 12,945,936 | |
TransDigm Group Incorporated | | | | | | | | | | | 4,064 | | | | 1,153,323 | |
United Technologies Corporation | | | | | | | | | | | 62,532 | | | | 7,594,511 | |
| |
| | | | 47,691,095 | |
| | | | | | | | | | | | | | | | |
| | | | |
| Air Freight & Logistics: 0.71% | | | | | | | | | | | | | | | | |
C.H. Robinson Worldwide Incorporated « | | | | | | | | | | | 11,812 | | | | 1,023,510 | |
Expeditors International of Washington Incorporated | | | | | | | | | | | 15,214 | | | | 985,563 | |
FedEx Corporation | | | | | | | | | | | 20,775 | | | | 4,808,582 | |
United Parcel Service Incorporated Class B | | | | | | | | | | | 57,979 | | | | 7,041,550 | |
| |
| | | | 13,859,205 | |
| | | | | | | | | | | | | | | | |
The accompanying notes are an integral part of these financial statements.
| | | | |
| 82 | | Wells Fargo Equity Gateway Funds | | Portfolio of investments—November 30, 2017 (unaudited) |
INDEX PORTFOLIO
| | | | | | | | | | | | | | | | |
| Security name | | | | | | | | Shares | | | Value | |
|
| Airlines: 0.50% | |
Alaska Air Group Incorporated | | | | | | | | | | | 10,398 | | | $ | 719,230 | |
American Airlines Group Incorporated | | | | | | | | | | | 36,485 | | | | 1,842,128 | |
Delta Air Lines Incorporated | | | | | | | | | | | 56,071 | | | | 2,967,277 | |
Southwest Airlines Company | | | | | | | | | | | 46,355 | | | | 2,812,358 | |
United Continental Holdings Incorporated † | | | | | | | | | | | 21,767 | | | | 1,378,286 | |
| |
| | | | 9,719,279 | |
| | | | | | | | | | | | | | | | |
| | | | |
| Building Products: 0.33% | | | | | | | | | | | | | | | | |
A.O. Smith Corporation | | | | | | | | | | | 12,325 | | | | 781,652 | |
Allegion plc | | | | | | | | | | | 7,996 | | | | 672,783 | |
Fortune Brands Home & Security Incorporated | | | | | | | | | | | 12,964 | | | | 886,997 | |
Johnson Controls International plc | | | | | | | | | | | 78,486 | | | | 2,954,213 | |
Masco Corporation | | | | | | | | | | | 26,818 | | | | 1,150,760 | |
| |
| | | | 6,446,405 | |
| | | | | | | | | | | | | | | | |
| | | | |
| Commercial Services & Supplies: 0.29% | | | | | | | | | | | | | | | | |
Cintas Corporation | | | | | | | | | | | 7,189 | | | | 1,131,836 | |
Republic Services Incorporated | | | | | | | | | | | 19,276 | | | | 1,251,783 | |
Stericycle Incorporated † | | | | | | | | | | | 7,184 | | | | 476,371 | |
Waste Management Incorporated | | | | | | | | | | | 34,078 | | | | 2,802,916 | |
| |
| | | | 5,662,906 | |
| | | | | | | | | | | | | | | | |
| | | | |
| Construction & Engineering: 0.09% | | | | | | | | | | | | | | | | |
Fluor Corporation | | | | | | | | | | | 11,776 | | | | 570,076 | |
Jacobs Engineering Group Incorporated | | | | | | | | | | | 10,128 | | | | 664,701 | |
Quanta Services Incorporated † | | | | | | | | | | | 12,726 | | | | 482,315 | |
| |
| | | | 1,717,092 | |
| | | | | | | | | | | | | | | | |
| | | | |
| Electrical Equipment: 0.54% | | | | | | | | | | | | | | | | |
Acuity Brands Incorporated | | | | | | | | | | | 3,543 | | | | 607,341 | |
AMETEK Incorporated | | | | | | | | | | | 19,428 | | | | 1,412,221 | |
Eaton Corporation plc | | | | | | | | | | | 37,442 | | | | 2,912,239 | |
Emerson Electric Company | | | | | | | | | | | 53,875 | | | | 3,492,178 | |
Rockwell Automation Incorporated | | | | | | | | | | | 10,805 | | | | 2,086,229 | |
| |
| | | | 10,510,208 | |
| | | | | | | | | | | | | | | | |
| | | | |
| Industrial Conglomerates: 1.94% | | | | | | | | | | | | | | | | |
3M Company | | | | | | | | | | | 50,234 | | | | 12,213,895 | |
General Electric Company | | | | | | | | | | | 728,799 | | | | 13,329,734 | |
Honeywell International Incorporated | | | | | | | | | | | 64,171 | | | | 10,008,109 | |
Roper Industries Incorporated | | | | | | | | | | | 8,605 | | | | 2,299,342 | |
| |
| | | | 37,851,080 | |
| | | | | | | | | | | | | | | | |
| | | | |
| Machinery: 1.67% | | | | | | | | | | | | | | | | |
Caterpillar Incorporated | | | | | | | | | | | 49,746 | | | | 7,021,648 | |
Cummins Incorporated | | | | | | | | | | | 13,263 | | | | 2,220,226 | |
Deere & Company | | | | | | | | | | | 26,925 | | | | 4,034,981 | |
Dover Corporation | | | | | | | | | | | 13,104 | | | | 1,280,392 | |
The accompanying notes are an integral part of these financial statements.
| | | | | | |
| Portfolio of investments—November 30, 2017 (unaudited) | | Wells Fargo Equity Gateway Funds | | | 83 | |
INDEX PORTFOLIO
| | | | | | | | | | | | | | | | |
| Security name | | | | | | | | Shares | | | Value | |
| | | | |
| Machinery (continued) | | | | | | | | | | | | | | | | |
Flowserve Corporation | | | | | | | | | | | 10,997 | | | $ | 468,252 | |
Fortive Corporation | | | | | | | | | | | 25,673 | | | | 1,916,489 | |
Illinois Tool Works Incorporated | | | | | | | | | | | 26,072 | | | | 4,412,686 | |
Ingersoll-Rand plc | | | | | | | | | | | 21,353 | | | | 1,870,950 | |
Paccar Incorporated | | | | | | | | | | | 29,578 | | | | 2,080,221 | |
Parker-Hannifin Corporation | | | | | | | | | | | 11,206 | | | | 2,101,013 | |
Pentair plc | | | | | | | | | | | 13,901 | | | | 989,195 | |
Snap-on Incorporated | | | | | | | | | | | 4,847 | | | | 821,227 | |
Stanley Black & Decker Incorporated | | | | | | | | | | | 12,892 | | | | 2,186,870 | |
Xylem Incorporated | | | | | | | | | | | 15,115 | | | | 1,048,074 | |
| |
| | | | 32,452,224 | |
| | | | | | | | | | | | | | | | |
| | | | |
| Professional Services: 0.28% | | | | | | | | | | | | | | | | |
Equifax Incorporated | | | | | | | | | | | 10,133 | | | | 1,156,378 | |
IHS Markit Limited † | | | | | | | | | | | 30,579 | | | | 1,364,435 | |
Nielsen Holdings plc | | | | | | | | | | | 28,272 | | | | 1,038,148 | |
Robert Half International Incorporated | | | | | | | | | | | 10,622 | | | | 605,879 | |
Verisk Analytics Incorporated † | | | | | | | | | | | 13,083 | | | | 1,261,463 | |
| |
| | | | 5,426,303 | |
| | | | | | | | | | | | | | | | |
| | | | |
| Road & Rail: 0.92% | | | | | | | | | | | | | | | | |
CSX Corporation | | | | | | | | | | | 76,880 | | | | 4,286,060 | |
J.B. Hunt Transport Services Incorporated | | | | | | | | | | | 7,185 | | | | 798,541 | |
Kansas City Southern | | | | | | | | | | | 8,874 | | | | 995,130 | |
Norfolk Southern Corporation | | | | | | | | | | | 24,258 | | | | 3,362,887 | |
Union Pacific Corporation | | | | | | | | | | | 67,374 | | | | 8,522,811 | |
| |
| | | | 17,965,429 | |
| | | | | | | | | | | | | | | | |
| | | | |
| Trading Companies & Distributors: 0.17% | | | | | | | | | | | | | | | | |
Fastenal Company | | | | | | | | | | | 24,241 | | | | 1,269,986 | |
United Rentals Incorporated † | | | | | | | | | | | 7,114 | | | | 1,134,541 | |
W.W. Grainger Incorporated | | | | | | | | | | | 4,419 | | | | 977,969 | |
| |
| | | | 3,382,496 | |
| | | | | | | | | | | | | | | | |
| | | | |
Information Technology: 23.54% | | | | | | | | | | | | | | | | |
| | | | |
| Communications Equipment: 1.03% | | | | | | | | | | | | | | | | |
Cisco Systems Incorporated | | | | | | | | | | | 420,889 | | | | 15,699,160 | |
F5 Networks Incorporated † | | | | | | | | | | | 5,349 | | | | 717,836 | |
Harris Corporation | | | | | | | | | | | 10,081 | | | | 1,456,705 | |
Juniper Networks Incorporated | | | | | | | | | | | 32,013 | | | | 888,681 | |
Motorola Solutions Incorporated | | | | | | | | | | | 13,692 | | | | 1,288,554 | |
| |
| | | | 20,050,936 | |
| | | | | | | | | | | | | | | | |
| | | | |
| Electronic Equipment, Instruments & Components: 0.42% | | | | | | | | | | | | | | | | |
Amphenol Corporation Class A | | | | | | | | | | | 25,711 | | | | 2,329,159 | |
Corning Incorporated | | | | | | | | | | | 76,027 | | | | 2,462,515 | |
FLIR Systems Incorporated | | | | | | | | | | | 11,549 | | | | 537,952 | |
TE Connectivity Limited | | | | | | | | | | | 29,747 | | | | 2,809,307 | |
| |
| | | | 8,138,933 | |
| | | | | | | | | | | | | | | | |
The accompanying notes are an integral part of these financial statements.
| | | | |
| 84 | | Wells Fargo Equity Gateway Funds | | Portfolio of investments—November 30, 2017 (unaudited) |
INDEX PORTFOLIO
| | | | | | | | | | | | | | | | |
| Security name | | | | | | | | Shares | | | Value | |
| | | | |
| Internet Software & Services: 4.71% | | | | | | | | | | | | | | | | |
Akamai Technologies Incorporated † | | | | | | | | | | | 14,430 | | | $ | 804,905 | |
Alphabet Incorporated Class A † | | | | | | | | | | | 25,089 | | | | 25,996,469 | |
Alphabet Incorporated Class C † | | | | | | | | | | | 25,410 | | | | 25,954,028 | |
eBay Incorporated † | | | | | | | | | | | 83,789 | | | | 2,904,965 | |
Facebook Incorporated Class A † | | | | | | | | | | | 199,527 | | | | 35,352,194 | |
VeriSign Incorporated Ǡ | | | | | | | | | | | 7,233 | | | | 832,518 | |
| |
| | | | 91,845,079 | |
| | | | | | | | | | | | | | | | |
| | | | |
| IT Services: 3.99% | | | | | | | | | | | | | | | | |
Accenture plc Class A | | | | | | | | | | | 52,020 | | | | 7,699,480 | |
Alliance Data Systems Corporation | | | | | | | | | | | 4,063 | | | | 972,154 | |
Automatic Data Processing Incorporated | | | | | | | | | | | 37,406 | | | | 4,281,491 | |
Cognizant Technology Solutions Corporation Class A | | | | | | | | | | | 49,717 | | | | 3,593,545 | |
CSRA Incorporated | | | | | | | | | | | 13,761 | | | | 398,106 | |
DXC Technology Company | | | | | | | | | | | 23,961 | | | | 2,303,611 | |
Fidelity National Information Services Incorporated | | | | | | | | | | | 27,981 | | | | 2,639,448 | |
Fiserv Incorporated † | | | | | | | | | | | 17,716 | | | | 2,328,768 | |
Gartner Incorporated † | | | | | | | | | | | 7,626 | | | | 921,907 | |
Global Payments Incorporated | | | | | | | | | | | 12,836 | | | | 1,290,788 | |
International Business Machines Corporation | | | | | | | | | | | 72,956 | | | | 11,233,035 | |
MasterCard Incorporated Class A | | | | | | | | | | | 78,602 | | | | 11,827,243 | |
Paychex Incorporated | | | | | | | | | | | 26,925 | | | | 1,812,322 | |
PayPal Holdings Incorporated † | | | | | | | | | | | 95,141 | | | | 7,205,028 | |
Total System Services Incorporated | | | | | | | | | | | 14,113 | | | | 1,049,443 | |
Visa Incorporated Class A | | | | | | | | | | | 153,991 | | | | 17,337,847 | |
Western Union Company | | | | | | | | | | | 39,058 | | | | 769,052 | |
| |
| | | | 77,663,268 | |
| | | | | | | | | | | | | | | | |
| | | | |
| Semiconductors & Semiconductor Equipment: 3.87% | | | | | | | | | | | | | | | | |
Advanced Micro Devices Incorporated Ǡ | | | | | | | | | | | 67,742 | | | | 737,710 | |
Analog Devices Incorporated | | | | | | | | | | | 30,949 | | | | 2,665,018 | |
Applied Materials Incorporated | | | | | | | | | | | 89,774 | | | | 4,737,374 | |
Broadcom Limited | | | | | | | | | | | 34,226 | | | | 9,512,774 | |
Intel Corporation | | | | | | | | | | | 395,547 | | | | 17,736,327 | |
KLA-Tencor Corporation | | | | | | | | | | | 13,202 | | | | 1,349,772 | |
Lam Research Corporation | | | | | | | | | | | 13,675 | | | | 2,630,113 | |
Microchip Technology Incorporated | | | | | | | | | | | 19,590 | | | | 1,704,134 | |
Micron Technology Incorporated † | | | | | | | | | | | 93,779 | | | | 3,975,292 | |
NVIDIA Corporation | | | | | | | | | | | 50,506 | | | | 10,137,059 | |
Qorvo Incorporated † | | | | | | | | | | | 10,713 | | | | 820,402 | |
QUALCOMM Incorporated | | | | | | | | | | | 124,366 | | | | 8,250,440 | |
Skyworks Solutions Incorporated | | | | | | | | | | | 15,467 | | | | 1,620,014 | |
Texas Instruments Incorporated | | | | | | | | | | | 83,338 | | | | 8,107,954 | |
Xilinx Incorporated | | | | | | | | | | | 20,927 | | | | 1,454,636 | |
| |
| | | | 75,439,019 | |
| | | | | | | | | | | | | | | | |
| | | | |
| Software: 5.19% | | | | | | | | | | | | | | | | |
Activision Blizzard Incorporated | | | | | | | | | | | 63,547 | | | | 3,965,333 | |
Adobe Systems Incorporated † | | | | | | | | | | | 41,533 | | | | 7,536,994 | |
The accompanying notes are an integral part of these financial statements.
| | | | | | |
| Portfolio of investments—November 30, 2017 (unaudited) | | Wells Fargo Equity Gateway Funds | | | 85 | |
INDEX PORTFOLIO
| | | | | | | | | | | | | | | | |
| Security name | | | | | | | | Shares | | | Value | |
| | | | |
| Software (continued) | | | | | | | | | | | | | | | | |
Ansys Incorporated † | | | | | | | | | | | 7,135 | | | $ | 1,057,336 | |
Autodesk Incorporated † | | | | | | | | | | | 18,451 | | | | 2,024,075 | |
CA Incorporated | | | | | | | | | | | 26,596 | | | | 879,530 | |
Cadence Design Systems Incorporated † | | | | | | | | | | | 23,586 | | | | 1,035,661 | |
Citrix Systems Incorporated | | | | | | | | | | | 12,116 | | | | 1,061,725 | |
Electronic Arts Incorporated † | | | | | | | | | | | 25,988 | | | | 2,763,824 | |
Intuit Incorporated | | | | | | | | | | | 20,489 | | | | 3,221,281 | |
Microsoft Corporation | | | | | | | | | | | 648,351 | | | | 54,571,704 | |
Oracle Corporation | | | | | | | | | | | 254,196 | | | | 12,470,856 | |
Red Hat Incorporated † | | | | | | | | | | | 14,938 | | | | 1,893,541 | |
Salesforce.com Incorporated † | | | | | | | | | | | 57,473 | | | | 5,995,583 | |
Symantec Corporation | | | | | | | | | | | 51,730 | | | | 1,498,618 | |
Synopsys Incorporated † | | | | | | | | | | | 12,647 | | | | 1,143,036 | |
| |
| | | | 101,119,097 | |
| | | | | | | | | | | | | | | | |
| | | | |
| Technology Hardware, Storage & Peripherals: 4.33% | | | | | | | | | | | | | | | | |
Apple Incorporated | | | | | | | | | | | 434,793 | | | | 74,719,177 | |
Hewlett Packard Enterprise Company | | | | | | | | | | | 138,272 | | | | 1,928,894 | |
HP Incorporated | | | | | | | | | | | 140,597 | | | | 3,015,806 | |
NetApp Incorporated | | | | | | | | | | | 22,707 | | | | 1,283,173 | |
Seagate Technology plc | | | | | | | | | | | 24,229 | | | | 934,270 | |
Western Digital Corporation | | | | | | | | | | | 24,822 | | | | 1,957,463 | |
Xerox Corporation | | | | | | | | | | | 17,970 | | | | 532,990 | |
| |
| | | | 84,371,773 | |
| | | | | | | | | | | | | | | | |
| | | | |
Materials: 2.90% | | | | | | | | | | | | | | | | |
| | | | |
| Chemicals: 2.17% | | | | | | | | | | | | | | | | |
Air Products & Chemicals Incorporated | | | | | | | | | | | 18,347 | | | | 2,991,295 | |
Albemarle Corporation | | | | | | | | | | | 9,299 | | | | 1,249,042 | |
CF Industries Holdings Incorporated | | | | | | | | | | | 19,634 | | | | 735,686 | |
DowDuPont Incorporated | | | | | | | | | | | 196,405 | | | | 14,133,304 | |
Eastman Chemical Company | | | | | | | | | | | 12,195 | | | | 1,126,452 | |
Ecolab Incorporated | | | | | | | | | | | 21,923 | | | | 2,979,774 | |
FMC Corporation | | | | | | | | | | | 11,290 | | | | 1,065,776 | |
International Flavors & Fragrances Incorporated | | | | | | | | | | | 6,648 | | | | 1,033,365 | |
LyondellBasell Industries NV Class A | | | | | | | | | | | 27,320 | | | | 2,860,404 | |
Monsanto Company | | | | | | | | | | | 36,981 | | | | 4,376,332 | |
PPG Industries Incorporated | | | | | | | | | | | 21,590 | | | | 2,522,792 | |
Praxair Incorporated | | | | | | | | | | | 24,080 | | | | 3,706,394 | |
The Mosaic Company | | | | | | | | | | | 29,548 | | | | 717,721 | |
The Sherwin-Williams Company | | | | | | | | | | | 6,919 | | | | 2,763,587 | |
| |
| | | | 42,261,924 | |
| | | | | | | | | | | | | | | | |
| | | | |
| Construction Materials: 0.13% | | | | | | | | | | | | | | | | |
Martin Marietta Materials Incorporated | | | | | | | | | | | 5,290 | | | | 1,102,383 | |
Vulcan Materials Company | | | | | | | | | | | 11,134 | | | | 1,398,987 | |
| |
| | | | 2,501,370 | |
| | | | | | | | | | | | | | | | |
The accompanying notes are an integral part of these financial statements.
| | | | |
| 86 | | Wells Fargo Equity Gateway Funds | | Portfolio of investments—November 30, 2017 (unaudited) |
INDEX PORTFOLIO
| | | | | | | | | | | | | | | | |
| Security name | | | | | | | | Shares | | | Value | |
| | | | |
| Containers & Packaging: 0.36% | | | | | | | | | | | | | | | | |
Avery Dennison Corporation | | | | | | | | | | | 7,440 | | | $ | 849,053 | |
Ball Corporation | | | | | | | | | | | 29,612 | | | | 1,181,815 | |
International Paper Company | | | | | | | | | | | 34,756 | | | | 1,967,537 | |
Packaging Corporation of America | | | | | | | | | | | 7,942 | | | | 941,921 | |
Sealed Air Corporation | | | | | | | | | | | 15,185 | | | | 729,639 | |
WestRock Company | | | | | | | | | | | 21,381 | | | | 1,334,388 | |
| |
| | | | 7,004,353 | |
| | | | | | | | | | | | | | | | |
| | | | |
| Metals & Mining: 0.24% | | | | | | | | | | | | | | | | |
Freeport-McMoRan Incorporated † | | | | | | | | | | | 113,263 | | | | 1,576,621 | |
Newmont Mining Corporation | | | | | | | | | | | 44,886 | | | | 1,660,333 | |
Nucor Corporation | | | | | | | | | | | 26,888 | | | | 1,546,060 | |
| |
| | | | 4,783,014 | |
| | | | | | | | | | | | | | | | |
| | | | |
Real Estate: 2.87% | | | | | | | | | | | | | | | | |
| | | | |
| Equity REITs: 2.82% | | | | | | | | | | | | | | | | |
Alexandria Real Estate Equities Incorporated | | | | | | | | | | | 7,881 | | | | 1,001,360 | |
American Tower Corporation | | | | | | | | | | | 36,127 | | | | 5,199,759 | |
Apartment Investment & Management Company Class A | | | | | | | | | | | 13,218 | | | | 582,782 | |
AvalonBay Communities Incorporated | | | | | | | | | | | 11,623 | | | | 2,107,599 | |
Boston Properties Incorporated | | | | | | | | | | | 12,990 | | | | 1,628,686 | |
Crown Castle International Corporation | | | | | | | | | | | 34,198 | | | | 3,864,374 | |
Digital Realty Trust Incorporated | | | | | | | | | | | 17,224 | | | | 2,010,041 | |
Duke Realty Corporation | | | | | | | | | | | 29,944 | | | | 842,325 | |
Equinix Incorporated | | | | | | | | | | | 6,558 | | | | 3,046,125 | |
Equity Residential Company Limited | | | | | | | | | | | 30,919 | | | | 2,066,008 | |
Essex Property Trust Incorporated | | | | | | | | | | | 5,555 | | | | 1,372,029 | |
Extra Space Storage Incorporated | | | | | | | | | | | 10,599 | | | | 904,731 | |
Federal Realty Investment Trust | | | | | | | | | | | 6,082 | | | | 804,101 | |
GGP Incorporated | | | | | | | | | | | 52,555 | | | | 1,235,043 | |
HCP Incorporated | | | | | | | | | | | 39,476 | | | | 1,043,745 | |
Host Hotels & Resorts Incorporated | | | | | | | | | | | 62,295 | | | | 1,232,818 | |
Iron Mountain Incorporated | | | | | | | | | | | 22,256 | | | | 909,603 | |
Kimco Realty Corporation | | | | | | | | | | | 35,830 | | | | 663,572 | |
Mid-America Apartment Communities Incorporated | | | | | | | | | | | 9,563 | | | | 979,634 | |
Prologis Incorporated | | | | | | | | | | | 44,771 | | | | 2,965,183 | |
Public Storage Incorporated | | | | | | | | | | | 12,596 | | | | 2,684,460 | |
Realty Income Corporation | | | | | | | | | | | 23,071 | | | | 1,275,826 | |
Regency Centers Corporation | | | | | | | | | | | 12,455 | | | | 844,574 | |
SBA Communications Corporation † | | | | | | | | | | | 10,131 | | | | 1,719,737 | |
Simon Property Group Incorporated | | | | | | | | | | | 26,165 | | | | 4,232,189 | |
SL Green Realty Corporation | | | | | | | | | | | 8,331 | | | | 851,678 | |
The Macerich Company | | | | | | | | | | | 9,166 | | | | 593,499 | |
UDR Incorporated | | | | | | | | | | | 22,523 | | | | 885,830 | |
Ventas Incorporated | | | | | | | | | | | 29,980 | | | | 1,919,020 | |
Vornado Realty Trust | | | | | | | | | | | 14,513 | | | | 1,126,499 | |
Welltower Incorporated | | | | | | | | | | | 31,051 | | | | 2,094,700 | |
Weyerhaeuser Company | | | | | | | | | | | 63,380 | | | | 2,242,384 | |
| |
| | | | 54,929,914 | |
| | | | | | | | | | | | | | | | |
The accompanying notes are an integral part of these financial statements.
| | | | | | |
| Portfolio of investments—November 30, 2017 (unaudited) | | Wells Fargo Equity Gateway Funds | | | 87 | |
INDEX PORTFOLIO
| | | | | | | | | | | | | | | | |
| Security name | | | | | | | | Shares | | | Value | |
| | | | |
| Real Estate Management & Development: 0.05% | | | | | | | | | | | | | | | | |
CBRE Group Incorporated Class A † | | | | | | | | | | | 25,317 | | | $ | 1,097,745 | |
| | | | | | | | | | | | | | | | |
| | | | |
Telecommunication Services: 1.92% | | | | | | | | | | | | | | | | |
| | | | |
| Diversified Telecommunication Services: 1.92% | | | | | | | | | | | | | | | | |
AT&T Incorporated | | | | | | | | | | | 516,846 | | | | 18,802,857 | |
CenturyLink Incorporated | | | | | | | | | | | 81,791 | | | | 1,193,331 | |
Verizon Communications Incorporated | | | | | | | | | | | 343,389 | | | | 17,475,066 | |
| |
| | | | 37,471,254 | |
| | | | | | | | | | | | | | | | |
| | | | |
Utilities: 3.08% | | | | | | | | | | | | | | | | |
| | | | |
| Electric Utilities: 1.91% | | | | | | | | | | | | | | | | |
Alliant Energy Corporation | | | | | | | | | | | 19,450 | | | | 877,390 | |
American Electric Power Company Incorporated | | | | | | | | | | | 41,402 | | | | 3,214,037 | |
Duke Energy Corporation | | | | | | | | | | | 58,914 | | | | 5,253,951 | |
Edison International | | | | | | | | | | | 27,426 | | | | 2,228,911 | |
Entergy Corporation | | | | | | | | | | | 15,111 | | | | 1,306,799 | |
Eversource Energy | | | | | | | | | | | 26,674 | | | | 1,729,809 | |
Exelon Corporation | | | | | | | | | | | 80,817 | | | | 3,370,877 | |
FirstEnergy Corporation | | | | | | | | | | | 37,400 | | | | 1,276,836 | |
NextEra Energy Incorporated | | | | | | | | | | | 39,409 | | | | 6,228,198 | |
PG&E Corporation | | | | | | | | | | | 43,168 | | | | 2,341,432 | |
Pinnacle West Capital Corporation | | | | | | | | | | | 9,396 | | | | 862,647 | |
PPL Corporation | | | | | | | | | | | 57,508 | | | | 2,108,818 | |
The Southern Company | | | | | | | | | | | 84,133 | | | | 4,307,610 | |
Xcel Energy Incorporated | | | | | | | | | | | 42,742 | | | | 2,205,915 | |
| |
| | | | 37,313,230 | |
| | | | | | | | | | | | | | | | |
| | | | |
| Independent Power & Renewable Electricity Producers: 0.07% | | | | | | | | | | | | | | | | |
AES Corporation | | | | | | | | | | | 55,578 | | | | 588,015 | |
NRG Energy Incorporated | | | | | | | | | | | 25,307 | | | | 699,739 | |
| |
| | | | 1,287,754 | |
| | | | | | | | | | | | | | | | |
| | | | |
| Multi-Utilities: 1.03% | | | | | | | | | | | | | | | | |
Ameren Corporation | | | | | | | | | | | 20,424 | | | | 1,306,311 | |
CenterPoint Energy Incorporated | | | | | | | | | | | 36,282 | | | | 1,088,823 | |
CMS Energy Corporation | | | | | | | | | | | 23,739 | | | | 1,184,576 | |
Consolidated Edison Incorporated | | | | | | | | | | | 26,080 | | | | 2,322,163 | |
Dominion Resources Incorporated | | | | | | | | | | | 54,091 | | | | 4,550,676 | |
DTE Energy Company | | | | | | | | | | | 15,100 | | | | 1,745,107 | |
NiSource Incorporated | | | | | | | | | | | 27,431 | | | | 755,175 | |
Public Service Enterprise Group Incorporated | | | | | | | | | | | 42,583 | | | | 2,259,454 | |
SCANA Corporation | | | | | | | | | | | 12,030 | | | | 519,335 | |
Sempra Energy | | | | | | | | | | | 21,135 | | | | 2,557,124 | |
WEC Energy Group Incorporated | | | | | | | | | | | 26,564 | | | | 1,845,932 | |
| | | | |
| | | | | | | | | | | | | | | 20,134,676 | |
| | | | | | | | | | | | | | | | |
| | | | |
| Water Utilities: 0.07% | | | | | | | | | | | | | | | | |
American Water Works Company Incorporated | | | | | | | | | | | 15,007 | | | | 1,374,041 | |
| | | | | | | | | | | | | | | | |
| | | | |
Total Common Stocks (Cost $673,496,600) | | | | | | | | | | | | | | | 1,909,185,403 | |
| | | | | | | | | | | | | | | | |
The accompanying notes are an integral part of these financial statements.
| | | | |
| 88 | | Wells Fargo Equity Gateway Funds | | Portfolio of investments—November 30, 2017 (unaudited) |
INDEX PORTFOLIO
| | | | | | | | | | | | | | | | |
| Security name | | Yield | | | | | | Shares | | | Value | |
| | | | |
Short-Term Investments: 1.66% | | | | | | | | | | | | | | | | |
| | | | |
| Investment Companies: 1.57% | | | | | | | | | | | | | | | | |
Securities Lending Cash Investment LLC (l)(r)(u) | | | 1.29 | % | | | | | | | 6,196,896 | | | $ | 6,197,515 | |
Wells Fargo Government Money Market Fund Select Class (l)(u) | | | 1.00 | | | | | | | | 24,370,786 | | | | 24,370,786 | |
| | | | |
| | | | | | | | | | | | | | | 30,568,301 | |
| | | | | | | | | | | | | | | | |
| | | | |
| U.S. Treasury Securities: 0.09% | | | | | | | | | | | | | | | | |
U.S. Treasury Bill (z)# | | | 0.88 | | | | 12-7-2017 | | | | 282,000 | | | | 281,954 | |
U.S. Treasury Bill (z)# | | | 1.02 | | | | 1-4-2018 | | | | 329,000 | | | | 328,657 | |
U.S. Treasury Bill (z)# | | | 1.22 | | | | 2-15-2018 | | | | 749,000 | | | | 747,118 | |
U.S. Treasury Bill (z)# | | | 1.25 | | | | 2-22-2018 | | | | 374,000 | | | | 372,987 | |
| | | | |
| | | | | | | | | | | | | | | 1,730,716 | |
| | | | | | | | | | | | | | | | |
| | | | |
Total Short-Term Investments (Cost $32,298,451) | | | | | | | | | | | | | | | 32,299,017 | |
| | | | | | | | | | | | | | | | |
| | | | | | | | |
| Total investments in securities (Cost $705,795,051) * | | | 99.64 | % | | | 1,941,484,420 | |
Other assets and liabilities, net | | | 0.36 | | | | 7,089,000 | |
| | | | | | | | |
| Total net assets | | | 100.00 | % | | $ | 1,948,573,420 | |
| | | | | | | | |
| « | All or a portion of this security is on loan. |
| † | Non-income-earning security |
| (l) | The issuer of the security is an affiliated person of the Portfolio as defined in the Investment Company Act of 1940. |
| (r) | The investment is a non-registered investment company purchased with cash collateral received from securities on loan. |
| (u) | The rate represents the 7-day annualized yield at period end. |
| (z) | Zero coupon security. The rate represents the current yield to maturity. |
| # | All or a portion of this security is segregated as collateral for investments in derivative instruments. |
Futures Contracts
| | | | | | | | | | | | | | | | | | | | | | | | |
| Description | | Number of
contracts | | | Expiration
date | | | Notional
cost | | | Notional
value | | | Unrealized
gains | | | Unrealized
losses | |
Long | | | | | | | | | | | | | | | | | | | | | | | | |
S&P 500 Index | | | 56 | | | | 12-14-2017 | | | $ | 36,353,830 | | | $ | 37,070,600 | | | $ | 716,770 | | | $ | 0 | |
The accompanying notes are an integral part of these financial statements.
| | | | | | |
| Portfolio of investments—November 30, 2017 (unaudited) | | Wells Fargo Equity Gateway Funds | | | 89 | |
INDEX PORTFOLIO
Investments in Affiliates
An affiliated investment is an investment in which the Portfolio owns at least 5% of the outstanding voting shares of the issuer or as a result of other relationships, such as the Portfolio and the issuer having the same investment manager. Transactions with issuers that were either affiliated persons of the Portfolio at the beginning of the period or the end of the period were as follows:
| | | | | | | | | | | | | | | | | | | | | | | | | | | | | | | | | | | | |
| | | Shares,
beginning of
period | | | Shares
purchased | | | Shares
sold | | | Shares,
end of
period | | | Net
realized
gains
(losses) | | | Net change in
unrealized
gains
(losses) | | | Income
from
affiliated
securities | | | Value,
end
of period | | | % of
net
assets | |
Common Stock | | | | | | | | | | | | | | | | | | | | | | | | | | | | | | | | | | | | |
Financials | | | | | | | | | | | | | | | | | | | | | | | | | | | | | | | | | | | | |
Banks | | | | | | | | | | | | | | | | | | | | | | | | | | | | | | | | | | | | |
Wells Fargo & Company | | | 432,148 | | | | 321 | | | | 56,404 | | | | 376,065 | | | $ | 1,436,813 | | | $ | 717,322 | | | $ | 316,071 | | | $ | 21,236,391 | | | | 1.09 | % |
| | | | | | | | | |
Short-Term Investments | | | | | | | | | | | | | | | | | | | | | | | | | | | | | | | | | | | | |
Investment companies | | | | | | | | | | | | | | | | | | | | | | | | | | | | | | | | | | | | |
Securities Lending Cash Investment LLC | | | 10,256,007 | | | | 56,282,664 | | | | 60,341,775 | | | | 6,196,896 | | | | 209 | | | | (217 | ) | | | 32,864 | | | | 6,197,515 | | | | | |
Wells Fargo Government Money Market Fund Select Class | | | 17,511,265 | | | | 216,475,099 | | | | 209,615,578 | | | | 24,370,786 | | | | 0 | | | | 0 | | | | 94,071 | | | | 24,370,786 | | | | 1.57 | |
| | | | | | | | | | | | | | | | | | | | | | | | | | | | | | | | | | | | |
| | | | | | | | | | | | | | | | | | $ | 1,437,022 | | | $ | 717,105 | | | $ | 443,006 | | | $ | 51,804,692 | | | | 2.66 | % |
| | | | | | | | | | | | | | | | | | | | | | | | | | | | | | | | | | | | |
The accompanying notes are an integral part of these financial statements.
| | | | |
| 90 | | Wells Fargo Equity Gateway Funds | | Portfolio of investments—November 30, 2017 (unaudited) |
INTERNATIONAL GROWTH PORTFOLIO
| | | | | | | | | | | | | | | | |
| Security name | | | | | | | | Shares | | | Value | |
|
Common Stocks: 94.57% | |
| | | | |
| Brazil: 0.28% | | | | | | | | | | | | | | | | |
Ambev SA ADR (Consumer Staples, Beverages) | | | | | | | | | | | 18,812 | | | $ | 116,446 | |
| | | | | | | | | | | | | | | | |
| | | | |
| Canada: 2.48% | | | | | | | | | | | | | | | | |
Canadian Pacific Railway Limited (Industrials, Road & Rail) | | | | | | | | | | | 5,927 | | | | 1,038,292 | |
| | | | | | | | | | | | | | | | |
| | | | |
| Cayman Islands: 1.35% | | | | | | | | | | | | | | | | |
NetEase Incorporated ADR (Information Technology, Internet Software & Services) | | | | | | | | | | | 1,722 | | | | 566,039 | |
| | | | | | | | | | | | | | | | |
| | | | |
| Chile: 0.12% | | | | | | | | | | | | | | | | |
Sociedad Quimica Minera de Chile (Materials, Chemicals) | | | | | | | | | | | 901 | | | | 48,942 | |
| | | | | | | | | | | | | | | | |
| | | | |
| China: 6.34% | | | | | | | | | | | | | | | | |
Alibaba Group Holding Limited ADR (Information Technology, Internet Software & Services) † | | | | | | | | | | | 10,116 | | | | 1,791,341 | |
China Literature Limited (Consumer Discretionary, Internet & Direct Marketing Retail) † | | | | | | | | | | | 200 | | | | 2,305 | |
Ping An Insurance (Group) Company of China Limited H Shares (Financials, Insurance) | | | | | | | | | | | 46,000 | | | | 456,468 | |
Tencent Holdings Limited (Information Technology, Internet Software & Services) | | | | | | | | | | | 7,900 | | | | 404,489 | |
| |
| | | | 2,654,603 | |
| | | | | | | | | | | | | | | | |
| | | | |
| Denmark: 0.13% | | | | | | | | | | | | | | | | |
Genmab AS (Health Care, Biotechnology) † | | | | | | | | | | | 268 | | | | 52,716 | |
| | | | | | | | | | | | | | | | |
| | | | |
| France: 2.83% | | | | | | | | | | | | | | | | |
BNP Paribas SA (Financials, Banks) | | | | | | | | | | | 1,709 | | | | 129,393 | |
Eiffage SA (Industrials, Construction & Engineering) | | | | | | | | | | | 4,777 | | | | 523,652 | |
Schneider Electric SE (Industrials, Electrical Equipment) | | | | | | | | | | | 5,319 | | | | 457,117 | |
Zodiac Aerospace SA (Industrials, Aerospace & Defense) | | | | | | | | | | | 2,571 | | | | 75,572 | |
| |
| | | | 1,185,734 | |
| | | | | | | | | | | | | | | | |
| | | | |
| Germany: 23.81% | | | | | | | | | | | | | | | | |
Allianz AG (Financials, Insurance) | | | | | | | | | | | 6,767 | | | | 1,598,192 | |
Beiersdorf AG (Consumer Staples, Personal Products) | | | | | | | | | | | 6,787 | | | | 808,266 | |
Deutsche Boerse AG (Financials, Capital Markets) | | | | | | | | | | | 17,879 | | | | 2,029,140 | |
Deutsche Post AG (Industrials, Air Freight & Logistics) | | | | | | | | | | | 21,925 | | | | 1,043,643 | |
Deutsche Telekom AG (Telecommunication Services, Diversified Telecommunication Services) | | | | | | | | | | | 27,683 | | | | 494,376 | |
Linde AG (Materials, Chemicals) | | | | | | | | | | | 8,872 | | | | 2,058,990 | |
SAP SE (Information Technology, Software) | | | | | | | | | | | 4,358 | | | | 492,681 | |
Wirecard AG (Information Technology, IT Services) | | | | | | | | | | | 13,544 | | | | 1,446,567 | |
| |
| | | | 9,971,855 | |
| | | | | | | | | | | | | | | | |
| | | | |
| Hong Kong: 2.70% | | | | | | | | | | | | | | | | |
AIA Group Limited (Financials, Insurance) | | | | | | | | | | | 139,000 | | | | 1,132,540 | |
| | | | | | | | | | | | | | | | |
| | | | |
| Indonesia: 0.61% | | | | | | | | | | | | | | | | |
PT Bank Rakyat Indonesia Tbk (Financials, Banks) | | | | | | | | | | | 1,068,800 | | | | 253,648 | |
| | | | | | | | | | | | | | | | |
| | | | |
| Ireland: 2.58% | | | | | | | | | | | | | | | | |
Medtronic plc (Health Care, Health Care Equipment & Supplies) | | | | | �� | | | | | | 13,174 | | | | 1,081,981 | |
| | | | | | | | | | | | | | | | |
The accompanying notes are an integral part of these financial statements.
| | | | | | |
| Portfolio of investments—November 30, 2017 (unaudited) | | Wells Fargo Equity Gateway Funds | | | 91 | |
INTERNATIONAL GROWTH PORTFOLIO
| | | | | | | | | | | | | | | | |
| Security name | | | | | | | | Shares | | | Value | |
| | | | |
| Italy: 4.76% | | | | | | | | | | | | | | | | |
Assicurazioni Generali SpA (Financials, Insurance) | | | | | | | | | | | 41,011 | | | $ | 750,778 | |
Intesa Sanpaolo SpA (Financials, Banks) | | | | | | | | | | | 229,350 | | | | 772,749 | |
UniCredit SpA (Financials, Banks) | | | | | | | | | | | 23,332 | | | | 470,373 | |
| |
| | | | 1,993,900 | |
| | | | | | | | | | | | | | | | |
|
| Japan: 11.06% | |
CALBEE Incorporated (Consumer Staples, Food Products) | | | | | | | | | | | 12,200 | | | | 427,320 | |
FANUC Corporation (Industrials, Machinery) | | | | | | | | | | | 1,800 | | | | 450,187 | |
Japan Tobacco Incorporated (Consumer Staples, Tobacco) | | | | | | | | | | | 30,054 | | | | 995,336 | |
Mitsubishi UFJ Financial Group Incorporated (Financials, Banks) | | | | | | | | | | | 40,100 | | | | 285,838 | |
Nintendo Company Limited (Information Technology, Software) | | | | | | | | | | | 3,100 | | | | 1,264,128 | |
NTT DOCOMO Incorporated (Telecommunication Services, Wireless Telecommunication Services) | | | | | | | | | | | 18,793 | | | | 485,273 | |
Rohm Company Limited (Information Technology, Semiconductors & Semiconductor Equipment) | | | | | | | | | | | 2,800 | | | | 288,570 | |
Sumitomo Metal Mining Company Limited (Materials, Metals & Mining) | | | | | | | | | | | 11,178 | | | | 436,978 | |
| |
| | | | 4,633,630 | |
| | | | | | | | | | | | | | | | |
| | | | |
| Netherlands: 7.69% | | | | | | | | | | | | | | | | |
Airbus SE (Industrials, Aerospace & Defense) | | | | | | | | | | | 6,410 | | | | 667,032 | |
Akzo Nobel NV (Materials, Chemicals) | | | | | | | | | | | 5,258 | | | | 473,756 | |
ASML Holding NV (Information Technology, Semiconductors & Semiconductor Equipment) | | | | | | | | | | | 3,599 | | | | 631,558 | |
ING Groep NV (Financials, Banks) | | | | | | | | | | | 80,032 | | | | 1,446,194 | |
| |
| | | | 3,218,540 | |
| | | | | | | | | | | | | | | | |
| | | | |
| Russia: 1.07% | | | | | | | | | | | | | | | | |
MMC Norilsk Nickel PJSC ADR (Materials, Metals & Mining) | | | | | | | | | | | 25,696 | | | | 446,311 | |
| | | | | | | | | | | | | | | | |
| | | | |
| South Africa: 0.64% | | | | | | | | | | | | | | | | |
Naspers Limited (Consumer Discretionary, Media) | | | | | | | | | | | 1,005 | | | | 269,725 | |
| | | | | | | | | | | | | | | | |
| | | | |
| South Korea: 2.94% | | | | | | | | | | | | | | | | |
LG Household & Health Care Limited (Consumer Staples, Personal Products) | | | | | | | | | | | 178 | | | | 191,862 | |
Samsung Electronics Company Limited (Information Technology, Technology Hardware, Storage & Peripherals) | | | | | | | | | | | 441 | | | | 1,037,877 | |
| |
| | | | 1,229,739 | |
| | | | | | | | | | | | | | | | |
| | | | |
| Spain: 1.46% | | | | | | | | | | | | | | | | |
Amadeus IT Holding SA Class A (Information Technology, IT Services) | | | | | | | | | | | 1,175 | | | | 84,733 | |
Grifols SA (Health Care, Biotechnology) | | | | | | | | | | | 6,722 | | | | 196,025 | |
Grifols SA ADR (Health Care, Biotechnology) | | | | | | | | | | | 14,622 | | | | 332,651 | |
| |
| | | | 613,409 | |
| | | | | | | | | | | | | | | | |
| | | | |
| Switzerland: 3.34% | | | | | | | | | | | | | | | | |
Idorsia Limited (Health Care, Biotechnology) † | | | | | | | | | | | 804 | | | | 17,285 | |
Nestle SA (Consumer Staples, Food Products) | | | | | | | | | | | 16,167 | | | | 1,383,079 | |
| |
| | | | 1,400,364 | |
| | | | | | | | | | | | | | | | |
| | | | |
| Taiwan: 0.41% | | | | | | | | | | | | | | | | |
Taiwan Semiconductor Manufacturing Company Limited (Information Technology, Semiconductors & Semiconductor Equipment) | | | | | | | | | | | 23,000 | | | | 173,732 | |
| | | | | | | | | | | | | | | | |
The accompanying notes are an integral part of these financial statements.
| | | | |
| 92 | | Wells Fargo Equity Gateway Funds | | Portfolio of investments—November 30, 2017 (unaudited) |
INTERNATIONAL GROWTH PORTFOLIO
| | | | | | | | | | | | | | | | |
| Security name | | | | | | | | Shares | | | Value | |
| | | | |
| United Kingdom: 15.17% | | | | | | | | | | | | | | | | |
Aon plc (Financials, Insurance) | | | | | | | | | | | 6,305 | | | $ | 884,087 | |
BAE Systems plc (Industrials, Aerospace & Defense) | | | | | | | | | | | 73,683 | | | | 548,706 | |
Coca-Cola European Partners plc (Consumer Staples, Beverages) | | | | | | | | | | | 26,084 | | | | 1,017,015 | |
ConvaTec Limited (Health Care, Health Care Equipment & Supplies) 144A | | | | | | | | | | | 167,783 | | | | 441,595 | |
Experian Group Limited plc (Industrials, Professional Services) | | | | | | | | | | | 20,030 | | | | 416,769 | |
Glencore International plc (Materials, Metals & Mining) | | | | | | | | | | | 120,022 | | | | 552,142 | |
Liberty Global plc Class A (Consumer Discretionary, Media) † | | | | | | | | | | | 9,443 | | | | 299,910 | |
Liberty Global plc Class C (Consumer Discretionary, Media) † | | | | | | | | | | | 18,239 | | | | 562,308 | |
London Stock Exchange Group plc (Financials, Capital Markets) | | | | | | | | | | | 6,066 | | | | 310,131 | |
Prudential plc (Financials, Insurance) | | | | | | | | | | | 25,078 | | | | 630,406 | |
Wolseley plc (Industrials, Trading Companies & Distributors) | | | | | | | | | | | 9,540 | | | | 687,922 | |
| |
| | | | 6,350,991 | |
| | | | | | | | | | | | | | | | |
| | | | |
| United States: 2.80% | | | | | | | | | | | | | | | | |
Amazon.com Incorporated (Consumer Discretionary, Internet & Direct Marketing Retail) † | | | | | | | | | | | 621 | | | | 730,762 | |
WABCO Holdings Incorporated (Industrials, Machinery) † | | | | | | | | | | | 2,963 | | | | 442,820 | |
| | | | |
| | | | | | | | | | | | | | | 1,173,582 | |
| | | | | | | | | | | | | | | | |
| | | | |
Total Common Stocks (Cost $31,533,841) | | | | | | | | | | | | | | | 39,606,719 | |
| | | | | | | | | | | | | | | | |
| | | | |
| | | | | | Expiration date | | | | | | | |
| Participation Notes: 3.01% | | | | | | | | | | | | | | | | |
| | | | |
| Ireland: 3.01% | | | | | | | | | | | | | | | | |
HSBC Bank plc (Ryanair Holdings plc) (Industrials, Airlines) (a) | | | | | | | 10-29-2018 | | | | 60,115 | | | | 1,260,294 | |
| | | | | | | | | | | | | | | | |
| | | | |
Total Participation Notes (Cost $698,674) | | | | | | | | | | | | | | | 1,260,294 | |
| | | | | | | | | | | | | | | | |
| | | | |
| | | Dividend yield | | | | | | | | | | |
| Preferred Stocks: 1.39% | | | | | | | | | | | | | | | | |
| | | | |
| Germany: 1.39% | | | | | | | | | | | | | | | | |
Henkel AG & Company KGaA (Consumer Staples, Household Products) | | | 1.53 | % | | | | | | | 4,286 | | | | 582,312 | |
| | | | | | | | | | | | | | | | |
| | | | |
Total Preferred Stocks (Cost $381,718) | | | | | | | | | | | | | | | 582,312 | |
| | | | | | | | | | | | | | | | |
| | | | |
| | | Yield | | | | | | | | | | |
| Short-Term Investments: 22.23% | | | | | | | | | | | | | | | | |
| | | | |
| Investment Companies: 22.23% | | | | | | | | | | | | | | | | |
Wells Fargo Government Money Market Fund Select Class (l)(u) | | | 1.00 | | | | | | | | 9,307,998 | | | | 9,307,998 | |
| | | | | | | | | | | | | | | | |
| | | | |
Total Short-Term Investments (Cost $9,307,998) | | | | | | | | | | | | | | | 9,307,998 | |
| | | | | | | | | | | | | | | | |
| | | | | | | | |
| Total investments in securities (Cost $41,922,231) | | | 121.20 | % | | | 50,757,323 | |
Other assets and liabilities, net | | | (21.20 | ) | | | (8,878,545 | ) |
| | | | | | | | |
| Total net assets | | | 100.00 | % | | $ | 41,878,778 | |
| | | | | | | | |
| † | Non-income-earning security |
| 144A | The security may be resold in transactions exempt from registration, normally to qualified institutional buyers, pursuant to Rule 144A under the Securities Act of 1933. |
| (a) | The security is fair valued in accordance with procedures approved by the Board of Trustees. |
| (l) | The issuer of the security is an affiliated person of the Portfolio as defined in the Investment Company Act of 1940. |
| (u) | The rate represents the 7-day annualized yield at period end. |
The accompanying notes are an integral part of these financial statements.
| | | | | | |
| Portfolio of investments—November 30, 2017 (unaudited) | | Wells Fargo Equity Gateway Funds | | | 93 | |
INTERNATIONAL GROWTH PORTFOLIO
The following table shows the percent of total long-term investments by sector as of November 30, 2017:
| | | | |
Financials | | | 26.90 | % |
Information Technology | | | 19.74 | |
Industrials | | | 18.36 | |
Consumer Staples | | | 13.33 | |
Materials | | | 9.69 | |
Health Care | | | 5.12 | |
Consumer Discretionary | | | 4.50 | |
Telecommunication Services | | | 2.36 | |
| | | | |
| | | 100.00 | % |
| | | | |
Investments in Affiliates
An affiliated investment is an investment in which the Portfolio owns at least 5% of the outstanding voting shares of the issuer or as a result of other relationships, such as the Portfolio and the issuer having the same investment manager. Transactions with issuers that were either affiliated persons of the Portfolio at the beginning of the period or the end of the period were as follows:
| | | | | | | | | | | | | | | | | | | | | | | | | | | | | | | | | | | | |
| | | Shares,
beginning of
period | | | Shares
purchased | | | Shares
sold | | | Shares,
end of
period | | | Net
realized
gains
(losses) | | | Net
change in
unrealized
gains
(losses) | | | Income
from
affiliated
securities | | | Value,
end
of period | | | % of
net
assets | |
| | | | | | | | | |
Short-Term Investments | | | | | | | | | | | | | | | | | | | | | | | | | | | | | | | | | | | | |
Investment Companies | | | | | | | | | | | | | | | | | | | | | | | | | | | | | | | | | | | | |
Securities Lending Cash Investment LLC | | | 5,192,235 | | | | 10,632,712 | | | | 15,824,947 | | | | 0 | | | $ | 6 | | | $ | 0 | | | $ | 24,760 | | | $ | 0 | | | | | |
Wells Fargo Government Money Market Fund Select Class | | | 1,660,070 | | | | 121,595,842 | | | | 113,947,914 | | | | 9,307,998 | | | | 0 | | | | 0 | | | | 10,112 | | | | 9,307,998 | | | | | |
| | | | | | | | | | | | | | | | | | | | | | | | | | | | | | | | | | | | |
| | | | | | | | | | | | | | | | | | $ | 6 | | | $ | 0 | | | $ | 34,872 | | | $ | 9,307,998 | | | | 22.23 | % |
| | | | | | | | | | | | | | | | | | | | | | | | | | | | | | | | | | | | |
The accompanying notes are an integral part of these financial statements.
| | | | |
| 94 | | Wells Fargo Equity Gateway Funds | | Portfolio of investments—November 30, 2017 (unaudited) |
INTERNATIONAL VALUE PORTFOLIO
| | | | | | | | | | | | | | | | |
| Security name | | | | | | | | Shares | | | Value | |
| | | | |
Common Stocks: 96.50% | | | | | | | | | | | | | | | | |
| | | | |
| Australia: 5.43% | | | | | | | | | | | | | | | | |
Arrium Limited (Materials, Metals & Mining) †(a) | | | | | | | | | | | 3,063,400 | | | $ | 2 | |
Asaleo Care Limited (Consumer Staples, Personal Products) | | | | | | | | | | | 1,262,800 | | | | 1,474,030 | |
Automotive Holdings Group Limited (Consumer Discretionary, Specialty Retail) « | | | | | | | | | | | 410,016 | | | | 1,150,861 | |
Bendigo Bank Limited (Financials, Banks) | | | | | | | | | | | 272,500 | | | | 2,413,095 | |
BlueScope Steel Limited (Materials, Metals & Mining) | | | | | | | | | | | 246,000 | | | | 2,554,459 | |
Cabcharge Australia Limited (Industrials, Commercial Services & Supplies) | | | | | | | | | | | 207,386 | | | | 263,536 | |
CSR Limited (Materials, Construction Materials) | | | | | | | | | | | 754,900 | | | | 2,641,220 | |
Downer EDI Limited (Industrials, Commercial Services & Supplies) | | | | | | | | | | | 518,900 | | | | 2,778,478 | |
Fortescue Metals Group Limited (Materials, Metals & Mining) | | | | | | | | | | | 602,200 | | | | 2,104,731 | |
Harvey Norman Holdings Limited (Consumer Discretionary, Multiline Retail) « | | | | | | | | | | | 693,400 | | | | 2,116,576 | |
Lendlease Corporation Limited (Real Estate, Real Estate Management & Development) | | | | | | | | | | | 407,700 | | | | 4,935,789 | |
Macquarie Group Limited (Financials, Capital Markets) | | | | | | | | | | | 69,800 | | | | 5,237,357 | |
McMillan Shakespeare Limited (Industrials, Professional Services) | | | | | | | | | | | 158,800 | | | | 2,147,621 | |
Metcash Limited (Consumer Staples, Food & Staples Retailing) | | | | | | | | | | | 1,164,200 | | | | 2,443,709 | |
Mineral Resources Limited (Materials, Metals & Mining) | | | | | | | | | | | 300,500 | | | | 4,471,346 | |
Mirvac Group (Real Estate, Equity REITs) | | | | | | | | | | | 1,327,400 | | | | 2,467,210 | |
Myer Holdings Limited (Consumer Discretionary, Multiline Retail) « | | | | | | | | | | | 1,702,400 | | | | 1,015,212 | |
Qantas Airways Limited (Industrials, Airlines) | | | | | | | | | | | 1,021,400 | | | | 4,406,474 | |
Retail Food Group Limited (Consumer Discretionary, Food Products) « | | | | | | | | | | | 269,500 | | | | 922,460 | |
| | | | |
| | | | | | | | | | | | | | | 45,544,166 | |
| | | | | | | | | | | | | | | | |
| | | | |
| Austria: 1.25% | | | | | | | | | | | | | | | | |
OMV AG (Energy, Oil, Gas & Consumable Fuels) | | | | | | | | | | | 69,400 | | | | 4,321,213 | |
Raiffeisen Bank International AG (Financials, Banks) † | | | | | | | | | | | 81,200 | | | | 2,870,119 | |
Voestalpine AG (Materials, Metals & Mining) | | | | | | | | | | | 56,800 | | | | 3,299,857 | |
| | | | |
| | | | | | | | | | | | | | | 10,491,189 | |
| | | | | | | | | | | | | | | | |
| | | | |
| Belgium: 0.38% | | | | | | | | | | | | | | | | |
Bpost SA (Industrials, Air Freight & Logistics) « | | | | | | | | | | | 101,900 | | | | 3,147,375 | |
| | | | | | | | | | | | | | | | |
| | | | |
| Brazil: 0.84% | | | | | | | | | | | | | | | | |
Banco de Brasil SA (Financials, Banks) | | | | | | | | | | | 245,800 | | | | 2,244,637 | |
Companhia de Saneamento de Minas Gerais SA (Utilities, Water Utilities) | | | | | | | | | | | 226,100 | | | | 2,822,263 | |
JBS SA (Consumer Staples, Food Products) | | | | | | | | | | | 805,600 | | | | 1,946,661 | |
| | | | |
| | | | | | | | | | | | | | | 7,013,561 | |
| | | | | | | | | | | | | | | | |
| | | | |
| Canada: 1.31% | | | | | | | | | | | | | | | | |
Magna International Incorporated (Consumer Discretionary, Auto Components) | | | | | | | | | | | 131,600 | | | | 7,382,004 | |
Metro Incorporated (Consumer Staples, Food & Staples Retailing) | | | | | | | | | | | 28,100 | | | | 880,146 | |
Open Text Corporation (Information Technology, Software) | | | | | | | | | | | 8,400 | | | | 273,977 | |
WestJet Airlines Limited (Industrials, Airlines) | | | | | | | | | | | 120,000 | | | | 2,488,083 | |
| | | | |
| | | | | | | | | | | | | | | 11,024,210 | |
| | | | | | | | | | | | | | | | |
| | | | |
| China: 2.75% | | | | | | | | | | | | | | | | |
China Communications Services Corporation Limited H Shares (Telecommunication Services, Diversified Telecommunication Services) | | | | | | | | | | | 2,836,000 | | | | 1,806,203 | |
China Petroleum & Chemical Corporation H Shares (Energy, Oil, Gas & Consumable Fuels) | | | | | | | | | | | 2,970,000 | | | | 2,131,793 | |
China Railway Construction Corporation Limited H Shares (Industrials, Construction & Engineering) | | | | | | | | | | | 2,089,500 | | | | 2,480,746 | |
The accompanying notes are an integral part of these financial statements.
| | | | | | |
| Portfolio of investments—November 30, 2017 (unaudited) | | Wells Fargo Equity Gateway Funds | | | 95 | |
INTERNATIONAL VALUE PORTFOLIO
| | | | | | | | | | | | | | | | |
| Security name | | | | | | | | Shares | | | Value | |
| | | | |
| China (continued) | | | | | | | | | | | | | | | | |
China Telecom Corporation Limited H Shares (Telecommunication Services, Diversified Telecommunication Services) | | | | | | | | | | | 10,590,000 | | | $ | 5,130,358 | |
Dongfeng Motor Group Company Limited H Shares (Consumer Discretionary, Automobiles) | | | | | | | | | | | 1,730,000 | | | | 2,184,540 | |
PICC Property & Casualty Company Limited H Shares (Financials, Insurance) | | | | | | | | | | | 1,302,000 | | | | 2,480,263 | |
Shanghai Pharmaceuticals Holding Company Limited H Shares (Health Care, Health Care Providers & Services) | | | | | | | | | | | 676,200 | | | | 1,703,936 | |
Shenzhen International Holdings Limited H Shares (Industrials, Transportation Infrastructure) | | | | | | | | | | | 1,167,000 | | | | 2,101,001 | |
Xinyi Glass Holdings Limited (Consumer Discretionary, Auto Components) | | | | | | | | | | | 2,502,000 | | | | 3,057,265 | |
| | | | |
| | | | | | | | | | | | | | | 23,076,105 | |
| | | | | | | | | | | | | | | | |
| | | | |
| Denmark: 1.17% | | | | | | | | | | | | | | | | |
Danske Bank AS (Financials, Banks) | | | | | | | | | | | 150,300 | | | | 5,610,836 | |
DFDS AS (Industrials, Marine) | | | | | | | | | | | 37,600 | | | | 2,029,777 | |
Sydbank AS (Financials, Banks) | | | | | | | | | | | 56,100 | | | | 2,196,167 | |
| | | | |
| | | | | | | | | | | | | | | 9,836,780 | |
| | | | | | | | | | | | | | | | |
| | | | |
| France: 7.95% | | | | | | | | | | | | | | | | |
Atos Origin SA (Information Technology, IT Services) | | | | | | | | | | | 25,900 | | | | 3,825,758 | |
AXA SA (Financials, Insurance) | | | | | | | | | | | 132,200 | | | | 3,988,780 | |
BNP Paribas SA (Financials, Banks) | | | | | | | | | | | 72,900 | | | | 5,519,472 | |
Carrefour SA (Consumer Staples, Food & Staples Retailing) | | | | | | | | | | | 152,700 | | | | 3,203,004 | |
Cie Generale des Establissements Michelin (Consumer Discretionary, Auto Components) | | | | | | | | | | | 32,700 | | | | 4,741,680 | |
Credit Agricole SA (Financials, Banks) | | | | | | | | | | | 219,328 | | | | 3,695,467 | |
Electricite de France SA (Utilities, Electric Utilities) | | | | | | | | | | | 148,600 | | | | 1,947,351 | |
Engie SA (Utilities, Multi-Utilities) | | | | | | | | | | | 171,900 | | | | 3,008,700 | |
Neopost SA (Information Technology, Technology Hardware, Storage & Peripherals) | | | | | | | | | | | 66,600 | | | | 2,217,992 | |
Orange SA (Telecommunication Services, Diversified Telecommunication Services) « | | | | | | | | | | | 333,800 | | | | 5,744,454 | |
Renault SA (Consumer Discretionary, Automobiles) | | | | | | | | | | | 40,500 | | | | 4,112,257 | |
Sanofi SA (Health Care, Pharmaceuticals) | | | | | | | | | | | 141,800 | | | | 12,934,927 | |
SCOR SE (Financials, Insurance) | | | | | | | | | | | 109,700 | | | | 4,467,928 | |
Societe Generale SA (Financials, Banks) | | | | | | | | | | | 39,000 | | | | 1,962,534 | |
Total SA (Energy, Oil, Gas & Consumable Fuels) | | | | | | | | | | | 93,700 | | | | 5,296,382 | |
| | | | |
| | | | | | | | | | | | | | | 66,666,686 | |
| | | | | | | | | | | | | | | | |
| | | | |
| Germany: 8.43% | | | | | | | | | | | | | | | | |
Allianz AG (Financials, Insurance) | | | | | | | | | | | 35,700 | | | | 8,431,424 | |
Aurubis AG (Materials, Metals & Mining) | | | | | | | | | | | 25,900 | | | | 2,152,000 | |
BASF SE (Materials, Chemicals) | | | | | | | | | | | 46,500 | | | | 5,214,187 | |
Bayer AG (Health Care, Pharmaceuticals) | | | | | | | | | | | 38,000 | | | | 4,850,439 | |
Bayerische Motoren Werke AG (Consumer Discretionary, Automobiles) | | | | | | | | | | | 31,200 | | | | 3,149,806 | |
Ceconomy AG (Consumer Discretionary, Specialty Retail) | | | | | | | | | | | 108,100 | | | | 1,419,059 | |
Covestro AG (Materials, Chemicals) 144A | | | | | | | | | | | 30,200 | | | | 3,145,197 | |
Daimler AG (Consumer Discretionary, Automobiles) | | | | | | | | | | | 75,700 | | | | 6,271,368 | |
Deutsche Bank AG (Financials, Capital Markets) | | | | | | | | | | | 141,800 | | | | 2,674,274 | |
Deutsche Post AG (Industrials, Air Freight & Logistics) | | | | | | | | | | | 186,300 | | | | 8,867,991 | |
Hannover Rueck SE (Financials, Insurance) | | | | | | | | | | | 16,300 | | | | 2,145,380 | |
Metro AG (Consumer Staples, Food & Staples Retailing) † | | | | | | | | | | | 108,100 | | | | 2,111,544 | |
Muenchener Rueckversicherungs Gesellschaft AG (Financials, Insurance) | | | | | | | | | | | 23,200 | | | | 5,170,183 | |
Siemens AG (Industrials, Industrial Conglomerates) | | | | | | | | | | | 34,200 | | | | 4,649,039 | |
Uniper SE (Utilities, Independent Power & Renewable Electricity Producers) « | | | | | | | | | | | 194,200 | | | | 5,777,505 | |
Volkswagen AG (Consumer Discretionary, Automobiles) | | | | | | | | | | | 22,600 | | | | 4,689,921 | |
| | | | |
| | | | | | | | | | | | | | | 70,719,317 | |
| | | | | | | | | | | | | | | | |
The accompanying notes are an integral part of these financial statements.
| | | | |
| 96 | | Wells Fargo Equity Gateway Funds | | Portfolio of investments—November 30, 2017 (unaudited) |
INTERNATIONAL VALUE PORTFOLIO
| | | | | | | | | | | | | | | | |
| Security name | | | | | | | | Shares | | | Value | |
| | | | |
| Hong Kong: 2.28% | | | | | | | | | | | | | | | | |
China Resources Cement Holdings Limited (Materials, Construction Materials) | | | | | | | | | | | 3,222,000 | | | $ | 2,135,989 | |
I Cable Communications Limited (Consumer Discretionary, Media) † | | | | | | | | | | | 96,300 | | | | 2,759 | |
Kingboard Laminates Holdings Limited (Information Technology, Electronic Equipment, Instruments & Components) | | | | | | | | | | | 1,633,000 | | | | 2,713,376 | |
Lee & Man Paper Manufacturing Limited (Materials, Paper & Forest Products) | | | | | | | | | | | 2,338,000 | | | | 2,755,527 | |
Skyworth Digital Holdings Limited (Consumer Discretionary, Household Durables) | | | | | | | | | | | 3,680,000 | | | | 1,575,816 | |
WH Group Limited (Consumer Staples, Food Products) 144A | | | | | | | | | | | 4,840,500 | | | | 5,155,694 | |
Wheelock & Company Limited (Real Estate, Real Estate Management & Development) | | | | | | | | | | | 379,000 | | | | 2,608,272 | |
Yue Yuen Industrial Holdings Limited (Consumer Discretionary, Textiles, Apparel & Luxury Goods) | | | | | | | | | | | 611,500 | | | | 2,188,007 | |
| | | | |
| | | | | | | | | | | | | | | 19,135,440 | |
| | | | | | | | | | | | | | | | |
| | | | |
| India: 0.36% | | | | | | | | | | | | | | | | |
Tech Mahindra Limited (Information Technology, IT Services) | | | | | | | | | | | 399,100 | | | | 3,028,221 | |
| | | | | | | | | | | | | | | | |
| | | | |
| Ireland: 0.84% | | | | | | | | | | | | | | | | |
C&C Group plc (Consumer Staples, Beverages) | | | | | | | | | | | 240,000 | | | | 816,469 | |
Grafton Group plc (Industrials, Trading Companies & Distributors) | | | | | | | | | | | 195,665 | | | | 2,042,769 | |
Smurfit Kappa Group plc (Materials, Containers & Packaging) | | | | | | | | | | | 130,200 | | | | 4,154,759 | |
| |
| | | | 7,013,997 | |
| | | | | | | | | | | | | | | | |
| | | | |
| Israel: 0.45% | | | | | | | | | | | | | | | | |
Bank Hapoalim Limited (Financials, Banks) | | | | | | | | | | | 440,000 | | | | 3,005,286 | |
Teva Pharmaceutical Industries Limited (Health Care, Pharmaceuticals) | | | | | | | | | | | 51,404 | | | | 760,825 | |
| |
| | | | 3,766,111 | |
| | | | | | | | | | | | | | | | |
| | | | |
| Italy: 2.40% | | | | | | | | | | | | | | | | |
A2A SpA (Utilities, Multi-Utilities) | | | | | | | | | | | 1,078,900 | | | | 2,029,867 | |
Enel SpA (Utilities, Electric Utilities) | | | | | | | | | | | 1,706,600 | | | | 11,087,787 | |
Leonardo-Finmeccanica SpA (Industrials, Aerospace & Defense) | | | | | | | | | | | 271,900 | | | | 3,250,562 | |
Mediobanca SpA (Financials, Banks) « | | | | | | | | | | | 324,800 | | | | 3,748,784 | |
| |
| | | | 20,117,000 | |
| | | | | | | | | | | | | | | | |
| | | | |
| Japan: 22.85% | | | | | | | | | | | | | | | | |
Adeka Corporation (Materials, Chemicals) | | | | | | | | | | | 155,300 | | | | 2,628,879 | |
Aisin Seiki Company Limited (Consumer Discretionary, Auto Components) | | | | | | | | | | | 61,200 | | | | 3,293,441 | |
Aoyama Trading Company Limited (Consumer Discretionary, Specialty Retail) | | | | | | | | | | | 24,800 | | | | 945,949 | |
Aozora Bank Limited (Financials, Banks) | | | | | | | | | | | 66,100 | | | | 2,573,668 | |
Astellas Pharma Incorporated (Health Care, Pharmaceuticals) | | | | | | | | | | | 314,200 | | | | 3,994,229 | |
Central Glass Company Limited (Industrials, Building Products) | | | | | | | | | | | 88,800 | | | | 1,986,289 | |
Cocokara Fine Incorporated (Consumer Staples, Food & Staples Retailing) | | | | | | | | | | | 44,700 | | | | 2,794,528 | |
Daikyo Incorporated (Real Estate, Real Estate Management & Development) | | | | | | | | | | | 124,380 | | | | 2,425,711 | |
DCM Holdings Company Limited (Consumer Discretionary, Specialty Retail) | | | | | | | | | | | 183,000 | | | | 1,769,332 | |
Denka Company Limited (Materials, Chemicals) | | | | | | | | | | | 136,400 | | | | 5,044,781 | |
DIC Incorporated (Materials, Chemicals) | | | | | | | | | | | 100,700 | | | | 3,779,043 | |
Eizo Corporation (Information Technology, Technology Hardware, Storage & Peripherals) | | | | | | | | | | | 63,300 | | | | 2,712,806 | |
Fujikura Limited (Industrials, Electrical Equipment) | | | | | | | | | | | 348,000 | | | | 3,257,704 | |
Geo Holdings Corporation (Consumer Discretionary, Specialty Retail) | | | | | | | | | | | 91,700 | | | | 1,864,039 | |
Hitachi Limited (Information Technology, Electronic Equipment, Instruments & Components) | | | | | | | | | | | 481,800 | | | | 3,609,973 | |
Isuzu Motors Limited (Consumer Discretionary, Automobiles) | | | | | | | | | | | 221,400 | | | | 3,522,756 | |
Itochu Corporation (Industrials, Trading Companies & Distributors) | | | | | | | | | | | 200,700 | | | | 3,488,894 | |
Japan Airlines Company Limited (Industrials, Airlines) | | | | | | | | | | | 80,700 | | | | 2,960,651 | |
The accompanying notes are an integral part of these financial statements.
| | | | | | |
| Portfolio of investments—November 30, 2017 (unaudited) | | Wells Fargo Equity Gateway Funds | | | 97 | |
INTERNATIONAL VALUE PORTFOLIO
| | | | | | | | | | | | | | | | |
| Security name | | | | | | | | Shares | | | Value | |
| | | | |
| Japan (continued) | | | | | | | | | | | | | | | | |
JTEKT Corporation (Industrials, Machinery) | | | | | | | | | | | 143,600 | | | $ | 2,486,399 | |
JX Holdings Incorporated (Energy, Oil, Gas & Consumable Fuels) | | | | | | | | | | | 754,900 | | | | 4,265,210 | |
Kaken Pharmaceutical Company Limited (Health Care, Pharmaceuticals) | | | | | | | | | | | 44,700 | | | | 2,238,712 | |
KDDI Corporation (Telecommunication Services, Wireless Telecommunication Services) | | | | | | | | | | | 357,100 | | | | 10,190,190 | |
Keihin Corporation (Consumer Discretionary, Auto Components) | | | | | | | | | | | 103,500 | | | | 2,046,074 | |
Kureha Corporation (Materials, Chemicals) | | | | | | | | | | | 27,100 | | | | 1,789,117 | |
Kyorin Company Limited (Health Care, Pharmaceuticals) | | | | | | | | | | | 88,200 | | | | 1,686,939 | |
Maeda Road Construction Company Limited (Industrials, Construction & Engineering) | | | | | | | | | | | 148,000 | | | | 3,346,895 | |
Makino Milling Machine Company Limited (Industrials, Machinery) | | | | | | | | | | | 286,000 | | | | 2,870,128 | |
Marubeni Corporation (Industrials, Trading Companies & Distributors) | | | | | | | | | | | 516,000 | | | | 3,444,449 | |
Matsumotokiyoshi Holdings Company Limited (Consumer Staples, Food & Staples Retailing) | | | | | | | | | | | 48,900 | | | | 4,049,738 | |
Mazda Motor Corporation (Consumer Discretionary, Automobiles) | | | | | | | | | | | 224,300 | | | | 3,030,194 | |
Mitsubishi Gas Chemical Company Incorporated (Materials, Chemicals) | | | | | | | | | | | 195,500 | | | | 5,488,754 | |
Mitsubishi UFJ Financial Group Incorporated (Financials, Banks) | | | | | | | | | | | 921,500 | | | | 6,568,561 | |
Mitsui Chemicals Incorporated (Materials, Chemicals) | | | | | | | | | | | 163,400 | | | | 5,304,626 | |
Mixi Incorporated (Information Technology, Internet Software & Services) | | | | | | | | | | | 45,500 | | | | 2,119,388 | |
Mizuho Financial Group Incorporated (Financials, Banks) | | | | | | | | | | | 2,244,400 | | | | 4,082,639 | |
Nippon Telegraph & Telephone Corporation (Telecommunication Services, Diversified Telecommunication Services) | | | | | | | | | | | 247,900 | | | | 12,941,365 | |
Nissan Motor Company Limited (Consumer Discretionary, Automobiles) | | | | | | | | | | | 505,000 | | | | 4,910,801 | |
Nisshinbo Holdings Incorporated (Industrials, Industrial Conglomerates) | | | | | | | | | | | 226,100 | | | | 3,176,011 | |
NTN Corporation (Industrials, Machinery) | | | | | | | | | | | 501,000 | | | | 2,495,077 | |
NTT DOCOMO Incorporated (Telecommunication Services, Wireless Telecommunication Services) | | | | | | | | | | | 98,600 | | | | 2,546,051 | |
ORIX Corporation (Financials, Diversified Financial Services) | | | | | | | | | | | 325,300 | | | | 5,635,535 | |
Resona Holdings Incorporated (Financials, Banks) | | | | | | | | | | | 1,013,300 | | | | 5,395,424 | |
Ryobi Limited (Industrials, Machinery) | | | | | | | | | | | 32,300 | | | | 838,359 | |
Sankyu Incorporated (Industrials, Road & Rail) | | | | | | | | | | | 74,000 | | | | 3,177,980 | |
Sawai Pharmaceutical Company Limited (Health Care, Pharmaceuticals) | | | | | | | | | | | 42,000 | | | | 2,053,745 | |
Sojitz Corporation (Industrials, Trading Companies & Distributors) | | | | | | | | | | | 1,638,500 | | | | 4,753,635 | |
Sumitomo Heavy Industries Limited (Industrials, Machinery) | | | | | | | | | | | 51,200 | | | | 2,106,669 | |
Sumitomo Mitsui Financial Group Incorporated (Financials, Banks) | | | | | | | | | | | 100,400 | | | | 4,093,442 | |
Sumitomo Osaka Cement Company (Materials, Construction Materials) | | | | | | | | | | | 444,000 | | | | 2,078,509 | |
T-Gaia Corporation (Consumer Discretionary, Specialty Retail) | | | | | | | | | | | 105,900 | | | | 2,313,638 | |
Teijin Limited (Materials, Chemicals) | | | | | | | | | | | 121,300 | | | | 2,625,725 | |
The Keiyo Bank Limited (Financials, Banks) | | | | | | | | | | | 201,000 | | | | 919,636 | |
The Yokohama Rubber Company Limited (Consumer Discretionary, Auto Components) | | | | | | | | | | | 148,500 | | | | 3,346,560 | |
Toho Holdings Company Limited (Health Care, Health Care Providers & Services) | | | | | | | | | | | 63,000 | | | | 1,312,762 | |
Toyo Ink SC Holding Company Limited (Materials, Chemicals) | | | | | | | | | | | 375,000 | | | | 2,177,643 | |
Toyo Tire & Rubber Company Limited (Consumer Discretionary, Auto Components) | | | | | | | | | | | 95,400 | | | | 1,963,422 | |
UBE Industries Limited (Materials, Chemicals) | | | | | | | | | | | 107,200 | | | | 3,132,149 | |
| |
| | | | 191,654,824 | |
| | | | | | | | | | | | | | | | |
| | | | |
| Liechtenstein: 0.10% | | | | | | | | | | | | | | | | |
VP Bank AG (Financials, Capital Markets) | | | | | | | | | | | 6,558 | | | | 869,956 | |
| | | | | | | | | | | | | | | | |
| | | | |
| Malaysia: 0.32% | | | | | | | | | | | | | | | | |
Tenaga Nasional Bhd (Utilities, Electric Utilities) | | | | | | | | | | | 717,600 | | | | 2,712,825 | |
| | | | | | | | | | | | | | | | |
| | | | |
| Netherlands: 3.26% | | | | | | | | | | | | | | | | |
ABN AMRO Group NV (Financials, Banks) 144A | | | | | | | | | | | 142,600 | | | | 4,226,579 | |
Aegon NV (Financials, Insurance) | | | | | | | | | | | 483,700 | | | | 3,004,645 | |
ASR Nederland NV (Financials, Insurance) | | | | | | | | | | | 60,500 | | | | 2,464,017 | |
The accompanying notes are an integral part of these financial statements.
| | | | |
| 98 | | Wells Fargo Equity Gateway Funds | | Portfolio of investments—November 30, 2017 (unaudited) |
INTERNATIONAL VALUE PORTFOLIO
| | | | | | | | | | | | | | | | |
| Security name | | | | | | | | Shares | | | Value | |
| | | | |
| Netherlands (continued) | | | | | | | | | | | | | | | | |
ING Groep NV (Financials, Banks) | | | | | | | | | | | 282,500 | | | $ | 5,104,830 | |
Koninklijke Ahold NV (Consumer Staples, Food & Staples Retailing) | | | | | | | | | | | 214,800 | | | | 4,595,798 | |
Philips Lighting NV (Industrials, Electrical Equipment) | | | | | | | | | | | 59,400 | | | | 2,247,587 | |
RHI Magnesita NV (Materials, Construction Materials) | | | | | | | | | | | 64,721 | | | | 3,505,053 | |
X5 Retail Group NV GDR (Consumer Staples, Food & Staples Retailing) † | | | | | | | | | | | 58,400 | | | | 2,166,640 | |
| |
| | | | 27,315,149 | |
| | | | | | | | | | | | | | | | |
| | | | |
| Norway: 1.31% | | | | | | | | | | | | | | | | |
Atea ASA (Information Technology, IT Services) | | | | | | | | | | | 84,900 | | | | 1,132,755 | |
Den Norske Bank ASA (Financials, Banks) | | | | | | | | | | | 148,800 | | | | 2,710,443 | |
Grieg Seafood ASA (Consumer Staples, Food Products) | | | | | | | | | | | 245,946 | | | | 2,243,482 | |
Marine Harvest ASA (Consumer Staples, Food Products) | | | | | | | | | | | 143,900 | | | | 2,538,068 | |
Yara International ASA (Materials, Chemicals) | | | | | | | | | | | 53,600 | | | | 2,382,366 | |
| |
| | | | 11,007,114 | |
| | | | | | | | | | | | | | | | |
| | | | |
| Poland: 0.15% | | | | | | | | | | | | | | | | |
Asseco Poland SA (Information Technology, Software) | | | | | | | | | | | 101,800 | | | | 1,280,051 | |
| | | | | | | | | | | | | | | | |
| | | | |
| Portugal: 0.42% | | | | | | | | | | | | | | | | |
Energias de Portugal SA (Utilities, Electric Utilities) | | | | | | | | | | | 1,007,800 | | | | 3,532,626 | |
| | | | | | | | | | | | | | | | |
| | | | |
| Russia: 1.23% | | | | | | | | | | | | | | | | |
Gazprom ADR (Energy, Oil, Gas & Consumable Fuels) | | | | | | | | | | | 832,900 | | | | 3,725,531 | |
Gazprom Neft Sponsored ADR (Energy, Oil, Gas & Consumable Fuels) | | | | | | | | | | | 886 | | | | 18,819 | |
Gazprom Neft Sponsored ADR - London Exchange (Energy, Oil, Gas & Consumable Fuels) | | | | | | | | | | | 150,014 | | | | 3,195,298 | |
LUKOIL OAO ADR (Energy, Oil, Gas & Consumable Fuels) | | | | | | | | | | | 60,400 | | | | 3,379,380 | |
| |
| | | | 10,319,028 | |
| | | | | | | | | | | | | | | | |
| | | | |
| Singapore: 0.93% | | | | | | | | | | | | | | | | |
DBS Group Holdings Limited (Financials, Banks) | | | | | | | | | | | 262,300 | | | | 4,777,226 | |
United Overseas Bank Limited (Financials, Banks) | | | | | | | | | | | 154,100 | | | | 3,001,366 | |
| |
| | | | 7,778,592 | |
| | | | | | | | | | | | | | | | |
| | | | |
| South Africa: 0.41% | | | | | | | | | | | | | | | | |
Barclays Africa Group Limited (Financials, Banks) | | | | | | | | | | | 236,000 | | | | 2,699,766 | |
Petra Diamonds Limited (Materials, Metals & Mining) † | | | | | | | | | | | 850,600 | | | | 773,612 | |
| |
| | | | 3,473,378 | |
| | | | | | | | | | | | | | | | |
| | | | |
| South Korea: 2.61% | | | | | | | | | | | | | | | | |
BNK Financial Group Incorporated (Financials, Banks) | | | | | | | | | | | 127,000 | | | | 1,111,229 | |
E-MART Limited (Consumer Staples, Food & Staples Retailing) | | | | | | | | | | | 8,500 | | | | 2,146,915 | |
Industrial Bank of Korea (Financials, Banks) | | | | | | | | | | | 192,500 | | | | 2,812,982 | |
KT&G Corporation (Consumer Staples, Tobacco) | | | | | | | | | | | 45,200 | | | | 5,067,218 | |
Kwangju Bank (Financials, Banks) | | | | | | | | | | | 13,510 | | | | 147,111 | |
LG Uplus Corporation (Telecommunication Services, Diversified Telecommunication Services) | | | | | | | | | | | 346,100 | | | | 4,419,974 | |
SK Telecom Company Limited (Telecommunication Services, Wireless Telecommunication Services) | | | | | | | | | | | 14,700 | | | | 3,579,465 | |
Woori Bank (Financials, Banks) | | | | | | | | | | | 178,044 | | | | 2,649,104 | |
| |
| | | | 21,933,998 | |
| | | | | | | | | | | | | | | | |
The accompanying notes are an integral part of these financial statements.
| | | | | | |
| Portfolio of investments—November 30, 2017 (unaudited) | | Wells Fargo Equity Gateway Funds | | | 99 | |
INTERNATIONAL VALUE PORTFOLIO
| | | | | | | | | | | | | | | | |
| Security name | | | | | | | | Shares | | | Value | |
| | | | |
| Spain: 2.55% | | | | | | | | | | | | | | | | |
Banco Santander Central Hispano SA (Financials, Banks) | | | | | | | | | | | 429,681 | | | $ | 2,894,104 | |
Distribuidora Internacional SA (Consumer Staples, Food & Staples Retailing) | | | | | | | | | | | 483,500 | | | | 2,275,174 | |
Gas Natural SDG SA (Utilities, Gas Utilities) | | | | | | | | | | | 209,300 | | | | 4,681,757 | |
Iberdrola SA (Utilities, Electric Utilities) | | | | | | | | | | | 433,600 | | | | 3,444,272 | |
International Consolidated Airlines Group SA (Industrials, Airlines) | | | | | | | | | | | 325,200 | | | | 2,699,647 | |
Repsol YPF SA (Energy, Oil, Gas & Consumable Fuels) | | | | | | | | | | | 294,900 | | | | 5,408,490 | |
| |
| | | | 21,403,444 | |
| | | | | | | | | | | | | | | | |
| | | | |
| Sweden: 1.25% | | | | | | | | | | | | | | | | |
Boliden AB (Materials, Metals & Mining) | | | | | | | | | | | 102,400 | | | | 3,241,505 | |
Electrolux AB Class B (Consumer Discretionary, Household Durables) | | | | | | | | | | | 104,100 | | | | 3,457,457 | |
Nordea Bank AB (Financials, Banks) | | | | | | | | | | | 177,300 | | | | 2,079,091 | |
Skandinaviska Enskilda Banken AB Class A (Financials, Banks) | | | | | | | | | | | 144,900 | | | | 1,722,125 | |
| |
| | | | 10,500,178 | |
| | | | | | | | | | | | | | | | |
| | | | |
| Switzerland: 6.22% | | | | | | | | | | | | | | | | |
Baloise Holding AG (Financials, Insurance) | | | | | | | | | | | 28,800 | | | | 4,441,944 | |
Credit Suisse Group AG (Financials, Capital Markets) | | | | | | | | | | | 221,500 | | | | 3,758,783 | |
Georg Fischer AG (Industrials, Machinery) | | | | | | | | | | | 1,900 | | | | 2,503,968 | |
Helvetia Holding AG (Financials, Insurance) | | | | | | | | | | | 4,600 | | | | 2,540,162 | |
Novartis AG (Health Care, Pharmaceuticals) | | | | | | | | | | | 46,600 | | | | 3,998,122 | |
Roche Holding AG (Health Care, Pharmaceuticals) | | | | | | | | | | | 39,500 | | | | 9,982,239 | |
Swiss Life Holding AG (Financials, Insurance) | | | | | | | | | | | 22,100 | | | | 7,432,753 | |
Swiss Reinsurance AG (Financials, Insurance) | | | | | | | | | | | 75,700 | | | | 7,107,517 | |
UBS Group AG (Financials, Capital Markets) | | | | | | | | | | | 290,700 | | | | 5,028,630 | |
Valiant Holding AG (Financials, Banks) | | | | | | | | | | | 22,700 | | | | 2,469,022 | |
Zurich Insurance Group AG (Financials, Insurance) | | | | | | | | | | | 9,500 | | | | 2,875,282 | |
| |
| | | | 52,138,422 | |
| | | | | | | | | | | | | | | | |
| | | | |
| Taiwan: 0.73% | | | | | | | | | | | | | | | | |
Hon Hai Precision Industry Company Limited (Information Technology, Electronic Equipment, Instruments & Components) | | | | | | | | | | | 1,112,000 | | | | 3,732,867 | |
Pegatron Corporation (Information Technology, Technology Hardware, Storage & Peripherals) | | | | | | | | | | | 1,035,000 | | | | 2,373,140 | |
| |
| | | | 6,106,007 | |
| | | | | | | | | | | | | | | | |
| | | | |
| Thailand: 1.31% | | | | | | | | | | | | | | | | |
Bangchak Corporation PCL (Energy, Oil, Gas & Consumable Fuels) | | | | | | | | | | | 2,188,900 | | | | 2,513,281 | |
Krung Thai Bank PCL (Financials, Banks) | | | | | | | | | | | 711,300 | | | | 420,927 | |
Krung Thai Bank PCL ADR (Financials, Banks) | | | | | | | | | | | 4,470,600 | | | | 2,641,843 | |
Thai Oil PCL (Energy, Oil, Gas & Consumable Fuels) | | | | | | | | | | | 1,003,900 | | | | 2,858,625 | |
Thanachart Capital PCL (Financials, Banks) | | | | | | | | | | | 1,481,500 | | | | 2,551,573 | |
| |
| | | | 10,986,249 | |
| | | | | | | | | | | | | | | | |
| | | | |
| Turkey: 0.31% | | | | | | | | | | | | | | | | |
TAV Havalimanlari Holding AS (Industrials, Transportation Infrastructure) | | | | | | | | | | | 522,900 | | | | 2,599,817 | |
| | | | | | | | | | | | | | | | |
| | | | |
| United Kingdom: 14.70% | | | | | | | | | | | | | | | | |
3i Group plc (Financials, Capital Markets) | | | | | | | | | | | 409,100 | | | | 4,989,850 | |
Anglo American plc (Materials, Metals & Mining) | | | | | | | | | | | 183,043 | | | | 3,365,579 | |
Aviva plc (Financials, Insurance) | | | | | | | | | | | 398,600 | | | | 2,749,736 | |
The accompanying notes are an integral part of these financial statements.
| | | | |
| 100 | | Wells Fargo Equity Gateway Funds | | Portfolio of investments—November 30, 2017 (unaudited) |
INTERNATIONAL VALUE PORTFOLIO
| | | | | | | | | | | | | | | | |
| Security name | | | | | | | | Shares | | | Value | |
| | | | |
| United Kingdom (continued) | | | | | | | | | | | | | | | | |
BAE Systems plc (Industrials, Aerospace & Defense) | | | | | | | | | | | 1,220,400 | | | $ | 9,088,123 | |
Barclays plc (Financials, Banks) | | | | | | | | | | | 715,000 | | | | 1,865,643 | |
Barratt Developments plc (Consumer Discretionary, Household Durables) | | | | | | | | | | | 410,800 | | | | 3,369,390 | |
Bellway plc (Consumer Discretionary, Household Durables) | | | | | | | | | | | 80,100 | | | | 3,755,330 | |
Bovis Homes Group plc (Consumer Discretionary, Household Durables) | | | | | | | | | | | 182,700 | | | | 2,767,336 | |
BP plc (Energy, Oil, Gas & Consumable Fuels) | | | | | | | | | | | 1,023,400 | | | | 6,816,079 | |
BT Group plc (Telecommunication Services, Diversified Telecommunication Services) | | | | | | | | | | | 864,700 | | | | 3,037,631 | |
Carillion plc (Industrials, Construction & Engineering) « | | | | | | | | | | | 764,400 | | | | 173,157 | |
Centrica plc (Utilities, Multi-Utilities) | | | | | | | | | | | 898,500 | | | | 1,756,644 | |
Chemring Group plc (Industrials, Aerospace & Defense) | | | | | | | | | | | 294,466 | | | | 701,891 | |
Crest Nicholson Holdings plc (Consumer Discretionary, Household Durables) | | | | | | | | | | | 345,400 | | | | 2,366,969 | |
Debenhams plc (Consumer Discretionary, Multiline Retail) | | | | | | | | | | | 1,238,200 | | | | 657,258 | |
easyJet plc (Industrials, Airlines) | | | | | | | | | | | 130,900 | | | | 2,489,031 | |
Firstgroup plc (Industrials, Road & Rail) † | | | | | | | | | | | 952,400 | | | | 1,410,624 | |
GKN plc (Consumer Discretionary, Auto Components) | | | | | | | | | | | 974,500 | | | | 4,084,133 | |
GlaxoSmithKline plc (Health Care, Pharmaceuticals) | | | | | | | | | | | 555,600 | | | | 9,613,236 | |
Highland Gold Mining Limited (Materials, Metals & Mining) | | | | | | | | | | | 1,164,800 | | | | 2,379,541 | |
Inchcape plc (Consumer Discretionary, Distributors) | | | | | | | | | | | 232,100 | | | | 2,340,787 | |
J Sainsbury plc (Consumer Staples, Food & Staples Retailing) | | | | | | | | | | | 1,270,500 | | | | 3,989,292 | |
John Wood Group plc (Energy, Energy Equipment & Services) | | | | | | | | | | | 62,475 | | | | 612,756 | |
Johnson Matthey plc (Materials, Chemicals) | | | | | | | | | | | 104,400 | | | | 4,279,316 | |
Kingfisher plc (Consumer Discretionary, Specialty Retail) | | | | | | | | | | | 651,600 | | | | 2,939,564 | |
Legal & General Group plc (Financials, Insurance) | | | | | | | | | | | 1,927,000 | | | | 6,968,529 | |
Lloyds Banking Group plc (Financials, Banks) | | | | | | | | | | | 5,260,500 | | | | 4,694,664 | |
Marks & Spencer Group plc (Consumer Discretionary, Multiline Retail) | | | | | | | | | | | 705,000 | | | | 2,986,151 | |
Marston’s plc (Consumer Discretionary, Hotels, Restaurants & Leisure) | | | | | | | | | | | 558,800 | | | | 869,080 | |
Meggitt plc (Industrials, Aerospace & Defense) | | | | | | | | | | | 297,600 | | | | 1,950,687 | |
Mitchells & Butlers plc (Consumer Discretionary, Hotels, Restaurants & Leisure) | | | | | | | | | | | 367,200 | | | | 1,326,422 | |
Old Mutual plc (Financials, Insurance) | | | | | | | | | | | 698,000 | | | | 1,864,644 | |
Paragon Group of Companies plc (Financials, Thrifts & Mortgage Finance) | | | | | | | | | | | 501,100 | | | | 3,278,876 | |
Premier Foods plc (Consumer Staples, Food Products) † | | | | | | | | | | | 73,926 | | | | 42,990 | |
Redrow plc (Consumer Discretionary, Household Durables) | | | | | | | | | | | 388,600 | | | | 3,169,023 | |
Royal Mail plc (Industrials, Air Freight & Logistics) | | | | | | | | | | | 382,800 | | | | 2,290,003 | |
SSE plc (Utilities, Electric Utilities) | | | | | | | | | | | 170,900 | | | | 3,157,789 | |
Tate & Lyle plc (Consumer Staples, Food Products) | | | | | | | | | | | 309,500 | | | | 2,816,010 | |
The Berkeley Group Holdings plc (Consumer Discretionary, Household Durables) | | | | | | | | | | | 75,800 | | | | 3,913,409 | |
The Restaurant Group plc (Consumer Discretionary, Hotels, Restaurants & Leisure) | | | | | | | | | | | 138,516 | | | | 537,073 | |
TP Icap plc (Financials, Capital Markets) | | | | | | | | | | | 113,200 | | | | 774,644 | |
Vesuvius plc (Industrials, Machinery) | | | | | | | | | | | 145,400 | | | | 1,102,468 | |
| |
| | | | 123,341,358 | |
| | | | | | | | | | | | | | | | |
| |
Total Common Stocks (Cost $712,089,639) | | | | 809,533,174 | |
| | | | | | | | | | | | | | | | |
| | | | |
| | | Dividend yield | | | | | | | | | | |
| Preferred Stocks: 0.78% | | | | | | | | | | | | | | | | |
| | | | |
| Brazil: 0.78% | | | | | | | | | | | | | | | | |
Banco do Estado do Rio Grande do Sul SA (Financials, Banks) | | | 5.69 | % | | | | | | | 471,000 | | | | 1,870,504 | |
Companhia Energetica de Minas Gerais SA (Utilities, Electric Utilities) | | | 10.72 | | | | | | | | 826,900 | | | | 1,664,653 | |
Itausa Investimentos Itau SA (Financials, Banks) | | | 1.39 | | | | | | | | 945,000 | | | | 2,995,005 | |
| | | | |
Total Preferred Stocks (Cost $8,528,786) | | | | | | | | | | | | | | | 6,530,162 | |
| | | | | | | | | | | | | | | | |
The accompanying notes are an integral part of these financial statements.
| | | | | | |
| Portfolio of investments—November 30, 2017 (unaudited) | | Wells Fargo Equity Gateway Funds | | | 101 | |
INTERNATIONAL VALUE PORTFOLIO
| | | | | | | | | | | | | | | | |
| Security name | | Yield | | | | | | Shares | | | Value | |
| | | | |
Short-Term Investments: 3.93% | | | | | | | | | | | | | | | | |
| | | | |
| Investment Companies: 3.93% | | | | | | | | | | | | | | | | |
Securities Lending Cash Investment LLC (l)(r)(u) | | | 1.29 | % | | | | | | | 18,389,273 | | | $ | 18,391,111 | |
Wells Fargo Government Money Market Fund Select Class (l)(u) | | | 1.00 | | | | | | | | 14,627,964 | | | | 14,627,964 | |
| | | | |
Total Short-Term Investments (Cost $33,018,781) | | | | | | | | | | | | | | | 33,019,075 | |
| | | | | | | | | | | | | | | | |
| | | | | | | | |
| Total investments in securities (Cost $753,637,206) | | | 101.21 | % | | | 849,082,411 | |
Other assets and liabilities, net | | | (1.21 | ) | | | (10,186,858 | ) |
| | | | | | | | |
| Total net assets | | | 100.00 | % | | $ | 838,895,553 | |
| | | | | | | | |
| † | Non-income-earning security |
| (a) | The security is fair valued in accordance with procedures approved by the Board of Trustees. |
| « | All or a portion of this security is on loan. |
| 144A | The security may be resold in transactions exempt from registration, normally to qualified institutional buyers, pursuant to Rule 144A under the Securities Act of 1933. |
| (l) | The issuer of the security is an affiliated person of the Portfolio as defined in the Investment Company Act of 1940. |
| (r) | The investment is a non-registered investment company purchased with cash collateral received from securities on loan. |
| (u) | The rate represents the 7-day annualized yield at period end. |
The following table shows the percent of total long-term investments by sector as of November 30, 2017:
| | | | |
Financials | | | 26.07 | % |
Consumer Discretionary | | | 13.91 | |
Industrials | | | 13.52 | |
Materials | | | 10.86 | |
Health Care | | | 6.76 | |
Consumer Staples | | | 6.46 | |
Telecommunication Services | | | 6.05 | |
Utilities | | | 5.84 | |
Energy | | | 5.46 | |
Information Technology | | | 3.55 | |
Real Estate | | | 1.52 | |
| | | | |
| | | 100.00 | % |
| | | | |
Investments in Affiliates
An affiliated investment is an investment in which the Portfolio owns at least 5% of the outstanding voting shares of the issuer or as a result of other relationships, such as the Portfolio and the issuer having the same investment manager. Transactions with issuers that were either affiliated persons of the Portfolio at the beginning of the period or the end of the period were as follows:
| | | | | | | | | | | | | | | | | | | | | | | | | | | | | | | | | | | | |
| | | Shares,
beginning of
period | | | Shares
purchased | | | Shares
sold | | | Shares,
end of
period | | | Net
realized
gains
(losses) | | | Net
change in
unrealized
gains
(losses) | | | Income
from
affiliated
securities | | | Value,
end
of period | | | % of
net
assets | |
Short-Term Investments | | | | | | | | | | | | | | | | | | | | | | | | | | | | | | | | | | | | |
Investment Companies | | | | | | | | | | | | | | | | | | | | | | | | | | | | | | | | | | | | |
Securities Lending Cash Investment LLC | | | 29,130,426 | | | | 110,798,769 | | | | 121,539,922 | | | | 18,389,273 | | | $ | (164 | ) | | $ | 0 | | | $ | 329,795 | | | $ | 18,391,111 | | | | | |
Wells Fargo Government Money Market Fund Select Class | | | 7,366,036 | | | | 62,151,787 | | | | 54,889,859 | | | | 14,627,964 | | | | 0 | | | | 0 | | | | 21,341 | | | | 14,627,964 | | | | | |
| | | | | | | | | | | | | | | | | | | | | | | | | | | | | | | | | | | | |
| | | | | | | | | | | | | | | | | | $ | (164 | ) | | $ | 0 | | | $ | 351,136 | | | $ | 33,019,075 | | | | 3.93 | % |
| | | | | | | | | | | | | | | | | | | | | | | | | | | | | | | | | | | | |
The accompanying notes are an integral part of these financial statements.
| | | | |
| 102 | | Wells Fargo Equity Gateway Funds | | Portfolio of investments—November 30, 2017 (unaudited) |
LARGE COMPANY VALUE PORTFOLIO
| | | | | | | | | | | | | | | | |
| Security name | | | | | | | | Shares | | | Value | |
| | | | |
Common Stocks: 97.55% | | | | | | | | | | | | | | | | |
| | | | |
Consumer Discretionary: 6.40% | | | | | | | | | | | | | | | | |
| | | | |
| Automobiles: 0.96% | | | | | | | | | | | | | | | | |
General Motors Company | | | | | | | | | | | 15,306 | | | $ | 659,536 | |
| | | | | | | | | | | | | | | | |
| | | | |
| Hotels, Restaurants & Leisure: 1.23% | | | | | | | | | | | | | | | | |
Scientific Games Corporation Class A † | | | | | | | | | | | 1,551 | | | | 81,660 | |
Yum China Holdings Incorporated | | | | | | | | | | | 18,728 | | | | 764,664 | |
| | | | |
| | | | | | | | | | | | | | | 846,324 | |
| | | | | | | | | | | | | | | | |
| | | | |
| Household Durables: 0.53% | | | | | | | | | | | | | | | | |
NVR Incorporated † | | | | | | | | | | | 105 | | | | 364,875 | |
| | | | | | | | | | | | | | | | |
| | | | |
| Media: 3.68% | | | | | | | | | | | | | | | | |
Charter Communications Incorporated Class A † | | | | | | | | | | | 2,248 | | | | 733,320 | |
Live Nation Incorporated † | | | | | | | | | | | 24,929 | | | | 1,131,278 | |
Viacom Incorporated Class B | | | | | | | | | | | 23,219 | | | | 657,562 | |
| | | | |
| | | | | | | | | | | | | | | 2,522,160 | |
| | | | | | | | | | | | | | | | |
| | | | |
Consumer Staples: 8.08% | | | | | | | | | | | | | | | | |
| | | | |
| Beverages: 2.12% | | | | | | | | | | | | | | | | |
PepsiCo Incorporated | | | | | | | | | | | 12,493 | | | | 1,455,684 | |
| | | | | | | | | | | | | | | | |
| | | | |
| Food & Staples Retailing: 3.84% | | | | | | | | | | | | | | | | |
US Foods Holding Corporation † | | | | | | | | | | | 39,265 | | | | 1,143,397 | |
Walgreens Boots Alliance Incorporated | | | | | | | | | | | 20,437 | | | | 1,486,996 | |
| | | | |
| | | | | | | | | | | | | | | 2,630,393 | |
| | | | | | | | | | | | | | | | |
| | | | |
| Household Products: 1.61% | | | | | | | | | | | | | | | | |
The Procter & Gamble Company | | | | | | | | | | | 12,307 | | | | 1,107,507 | |
| | | | | | | | | | | | | | | | |
| | | | |
| Tobacco: 0.51% | | | | | | | | | | | | | | | | |
Philip Morris International | | | | | | | | | | | 3,382 | | | | 347,501 | |
| | | | | | | | | | | | | | | | |
| | | | |
Energy: 10.53% | | | | | | | | | | | | | | | | |
| | | | |
| Oil, Gas & Consumable Fuels: 10.53% | | | | | | | | | | | | | | | | |
Chevron Corporation | | | | | | | | | | | 18,575 | | | | 2,210,239 | |
Devon Energy Corporation | | | | | | | | | | | 33,567 | | | | 1,293,337 | |
Exxon Mobil Corporation | | | | | | | | | | | 39,037 | | | | 3,251,392 | |
SRC Energy Incorporated † | | | | | | | | | | | 8,570 | | | | 75,073 | |
Valero Energy Corporation | | | | | | | | | | | 2,218 | | | | 189,905 | |
World Fuel Services Corporation | | | | | | | | | | | 7,245 | | | | 203,367 | |
| | | | |
| | | | | | | | | | | | | | | 7,223,313 | |
| | | | | | | | | | | | | | | | |
| | | | |
Financials: 26.00% | | | | | | | | | | | | | | | | |
| | | | |
| Banks: 12.34% | | | | | | | | | | | | | | | | |
Bank of America Corporation | | | | | | | | | | | 102,918 | | | | 2,899,200 | |
Bank of N.T. Butterfield & Son | | | | | | | | | | | 3,618 | | | | 143,924 | |
Citigroup Incorporated | | | | | | | | | | | 2,004 | | | | 151,302 | |
The accompanying notes are an integral part of these financial statements.
| | | | | | |
| Portfolio of investments—November 30, 2017 (unaudited) | | Wells Fargo Equity Gateway Funds | | | 103 | |
LARGE COMPANY VALUE PORTFOLIO
| | | | | | | | | | | | | | | | |
| Security name | | | | | | | | Shares | | | Value | |
| | | | |
| Banks (continued) | | | | | | | | | | | | | | | | |
Comerica Incorporated | | | | | | | | | | | 12,286 | | | $ | 1,023,547 | |
Fifth Third Bancorp | | | | | | | | | | | 20,815 | | | | 635,066 | |
JPMorgan Chase & Company | | | | | | | | | | | 30,823 | | | | 3,221,620 | |
US Bancorp | | | | | | | | | | | 7,044 | | | | 388,477 | |
| |
| | | | 8,463,136 | |
| | | | | | | | | | | | | | | | |
| | | | |
| Capital Markets: 2.11% | | | | | | | | | | | | | | | | |
Bank of New York Mellon Corporation | | | | | | | | | | | 26,192 | | | | 1,433,750 | |
Morgan Stanley | | | | | | | | | | | 256 | | | | 13,212 | |
| |
| | | | 1,446,962 | |
| | | | | | | | | | | | | | | | |
| | | | |
| Consumer Finance: 1.18% | | | | | | | | | | | | | | | | |
Capital One Financial Corporation | | | | | | | | | | | 8,849 | | | | 814,108 | |
| | | | | | | | | | | | | | | | |
| | | | |
| Diversified Financial Services: 4.96% | | | | | | | | | | | | | | | | |
Berkshire Hathaway Incorporated Class B † | | | | | | | | | | | 17,628 | | | | 3,402,380 | |
| | | | | | | | | | | | | | | | |
| | | | |
| Insurance: 5.41% | | | | | | | | | | | | | | | | |
American International Group Incorporated | | | | | | | | | | | 1,270 | | | | 76,149 | |
Assured Guaranty Limited | | | | | | | | | | | 20,667 | | | | 750,419 | |
Chubb Limited | | | | | | | | | | | 1,917 | | | | 291,595 | |
CNO Financial Group Incorporated | | | | | | | | | | | 33,711 | | | | 849,854 | |
The Progressive Corporation | | | | | | | | | | | 13,980 | | | | 743,456 | |
The Travelers Companies Incorporated | | | | | | | | | | | 2,658 | | | | 360,345 | |
Unum Group | | | | | | | | | | | 11,268 | | | | 637,994 | |
| |
| | | | 3,709,812 | |
| | | | | | | | | | | | | | | | |
| | | | |
Health Care: 12.45% | | | | | | | | | | | | | | | | |
| | | | |
| Biotechnology: 4.07% | | | | | | | | | | | | | | | | |
Amgen Incorporated | | | | | | | | | | | 7,492 | | | | 1,316,045 | |
Biogen Incorporated | | | | | | | | | | | 4,384 | | | | 1,412,393 | |
Bioverativ Incorporated † | | | | | | | | | | | 1,260 | | | | 63,025 | |
| |
| | | | 2,791,463 | |
| | | | | | | | | | | | | | | | |
| | | | |
| Health Care Equipment & Supplies: 2.18% | | | | | | | | | | | | | | | | |
Baxter International Incorporated | | | | | | | | | | | 22,725 | | | | 1,489,169 | |
Medtronic plc | | | | | | | | | | | 101 | | | | 8,295 | |
| |
| | | | 1,497,464 | |
| | | | | | | | | | | | | | | | |
| | | | |
| Health Care Providers & Services: 0.60% | | | | | | | | | | | | | | | | |
Humana Incorporated | | | | | | | | | | | 1,569 | | | | 409,289 | |
| | | | | | | | | | | | | | | | |
| | | | |
| Pharmaceuticals: 5.60% | | | | | | | | | | | | | | | | |
Johnson & Johnson | | | | | | | | | | | 10,219 | | | | 1,423,813 | |
Mallinckrodt plc † | | | | | | | | | | | 20,479 | | | | 446,852 | |
Merck & Company Incorporated | | | | | | | | | | | 35,647 | | | | 1,970,210 | |
| |
| | | | 3,840,875 | |
| | | | | | | | | | | | | | | | |
The accompanying notes are an integral part of these financial statements.
| | | | |
| 104 | | Wells Fargo Equity Gateway Funds | | Portfolio of investments—November 30, 2017 (unaudited) |
LARGE COMPANY VALUE PORTFOLIO
| | | | | | | | | | | | | | | | |
| Security name | | | | | | | | Shares | | | Value | |
| | | | |
Industrials: 6.44% | | | | | | | | | | | | | | | | |
| | | | |
| Aerospace & Defense: 1.35% | | | | | | | | | | | | | | | | |
Raytheon Company | | | | | | | | | | | 2,071 | | | $ | 395,872 | |
The Boeing Company | | | | | | | | | | | 1,904 | | | | 527,027 | |
| |
| | | | 922,899 | |
| | | | | | | | | | | | | | | | |
| | | | |
| Air Freight & Logistics: 0.12% | | | | | | | | | | | | | | | | |
FedEx Corporation | | | | | | | | | | | 364 | | | | 84,251 | |
| | | | | | | | | | | | | | | | |
| | | | |
| Airlines: 1.64% | | | | | | | | | | | | | | | | |
Southwest Airlines Company | | | | | | | | | | | 18,562 | | | | 1,126,157 | |
| | | | | | | | | | | | | | | | |
| | | | |
| Commercial Services & Supplies: 0.08% | | | | | | | | | | | | | | | | |
Waste Management Incorporated | | | | | | | | | | | 632 | | | | 51,982 | |
| | | | | | | | | | | | | | | | |
| | | | |
| Industrial Conglomerates: 2.42% | | | | | | | | | | | | | | | | |
Honeywell International Incorporated | | | | | | | | | | | 10,634 | | | | 1,658,479 | |
| | | | | | | | | | | | | | | | |
| | | | |
| Machinery: 0.83% | | | | | | | | | | | | | | | | |
EnPro Industries Incorporated | | | | | | | | | | | 3,975 | | | | 343,321 | |
Mueller Industries Incorporated | | | | | | | | | | | 6,272 | | | | 228,301 | |
| |
| | | | 571,622 | |
| | | | | | | | | | | | | | | | |
| | | | |
Information Technology: 8.23% | | | | | | | | | | | | | | | | |
| | | | |
| Communications Equipment: 2.05% | | | | | | | | | | | | | | | | |
Harris Corporation | | | | | | | | | | | 9,750 | | | | 1,408,875 | |
| | | | | | | | | | | | | | | | |
| | | | |
| Electronic Equipment, Instruments & Components: 0.18% | | | | | | | | | | | | | | | | |
Arrow Electronics Incorporated † | | | | | | | | | | | 1,487 | | | | 120,046 | |
| | | | | | | | | | | | | | | | |
| | | | |
| Internet Software & Services: 1.54% | | | | | | | | | | | | | | | | |
Alphabet Incorporated Class C † | | | | | | | | | | | 965 | | | | 985,661 | |
eBay Incorporated † | | | | | | | | | | | 2,120 | | | | 73,500 | |
| |
| | | | 1,059,161 | |
| | | | | | | | | | | | | | | | |
| | | | |
| IT Services: 0.11% | | | | | | | | | | | | | | | | |
Black Knight Incorporated † | | | | | | | | | | | 293 | | | | 13,156 | |
PayPal Holdings Incorporated † | | | | | | | | | | | 842 | | | | 63,765 | |
| |
| | | | 76,921 | |
| | | | | | | | | | | | | | | | |
| | | | |
| Semiconductors & Semiconductor Equipment: 2.85% | | | | | | | | | | | | | | | | |
Intel Corporation | | | | | | | | | | | 19,421 | | | | 870,838 | |
Micron Technology Incorporated † | | | | | | | | | | | 25,377 | | | | 1,075,731 | |
Texas Instruments Incorporated | | | | | | | | | | | 100 | | | | 9,729 | |
| |
| | | | 1,956,298 | |
| | | | | | | | | | | | | | | | |
| | | | |
| Software: 1.50% | | | | | | | | | | | | | | | | |
Dell Technologies Incorporated Class V † | | | | | | | | | | | 9,255 | | | | 724,111 | |
Oracle Corporation | | | | | | | | | | | 6,174 | | | | 302,896 | |
| |
| | | | 1,027,007 | |
| | | | | | | | | | | | | | | | |
The accompanying notes are an integral part of these financial statements.
| | | | | | |
| Portfolio of investments—November 30, 2017 (unaudited) | | Wells Fargo Equity Gateway Funds | | | 105 | |
LARGE COMPANY VALUE PORTFOLIO
| | | | | | | | | | | | | | | | |
| Security name | | | | | | | | Shares | | | Value | |
| | | | |
Materials: 2.38% | | | | | | | | | | | | | | | | |
| | | | |
| Chemicals: 0.63% | | | | | | | | | | | | | | | | |
LyondellBasell Industries NV Class A | | | | | | | | | | | 4,116 | | | $ | 430,945 | |
| | | | | | | | | | | | | | | | |
| | | | |
| Metals & Mining: 0.45% | | | | | | | | | | | | | | | | |
Freeport-McMoRan Incorporated † | | | | | | | | | | | 22,548 | | | | 313,868 | |
| | | | | | | | | | | | | | | | |
| | | | |
| Paper & Forest Products: 1.30% | | | | | | | | | | | | | | | | |
Louisiana-Pacific Corporation † | | | | | | | | | | | 32,246 | | | | 890,312 | |
| | | | | | | | | | | | | | | | |
| | | | |
Real Estate: 8.00% | | | | | | | | | | | | | | | | |
| | | | |
| Equity REITs: 8.00% | | | | | | | | | | | | | | | | |
CoreCivic Incorporated | | | | | | | | | | | 39,532 | | | | 929,397 | |
Park Hotels & Resorts Incorporated | | | | | | | | | | | 19,793 | | | | 577,956 | |
Prologis Incorporated | | | | | | | | | | | 22,622 | | | | 1,498,255 | |
Weyerhaeuser Company | | | | | | | | | | | 32,417 | | | | 1,146,913 | |
Xenia Hotels & Resorts Incorporated | | | | | | | | | | | 60,661 | | | | 1,333,935 | |
| | | | |
| | | | | | | | | | | | | | | 5,486,456 | |
| | | | | | | | | | | | | | | | |
| | | | |
Telecommunication Services: 1.68% | | | | | | | | | | | | | | | | |
| | | | |
| Diversified Telecommunication Services: 1.61% | | | | | | | | | | | | | | | | |
Verizon Communications Incorporated | | | | | | | | | | | 21,705 | | | | 1,104,567 | |
| | | | | | | | | | | | | | | | |
| | | | |
| Wireless Telecommunication Services: 0.07% | | | | | | | | | | | | | | | | |
T-Mobile USA Incorporated † | | | | | | | | | | | 762 | | | | 46,535 | |
| | | | | | | | | | | | | | | | |
| | | | |
Utilities: 7.36% | | | | | | | | | | | | | | | | |
| | | | |
| Electric Utilities: 4.71% | | | | | | | | | | | | | | | | |
American Electric Power Company Incorporated | | | | | | | | | | | 20,024 | | | | 1,554,463 | |
Avangrid Incorporated | | | | | | | | | | | 2,739 | | | | 145,359 | |
NextEra Energy Incorporated | | | | | | | | | | | 6,468 | | | | 1,022,203 | |
PG&E Corporation | | | | | | | | | | | 7,264 | | | | 393,999 | |
PPL Corporation | | | | | | | | | | | 3,093 | | | | 113,420 | |
| | | | |
| | | | | | | | | | | | | | | 3,229,444 | |
| | | | | | | | | | | | | | | | |
| | | | |
| Gas Utilities: 0.63% | | | | | | | | | | | | | | | | |
UGI Corporation | | | | | | | | | | | 8,752 | | | | 428,936 | |
| | | | | | | | | | | | | | | | |
| | | | |
| Multi-Utilities: 2.02% | | | | | | | | | | | | | | | | |
MDU Resources Group Incorporated | | | | | | | | | | | 10,101 | | | | 282,323 | |
Vectren Corporation | | | | | | | | | | | 15,914 | | | | 1,106,023 | |
| | | | |
| | | | | | | | | | | | | | | 1,388,346 | |
| | | | | | | | | | | | | | | | |
| | | | |
Total Common Stocks (Cost $59,052,408) | | | | | | | | | | | | | | | 66,915,889 | |
| | | | | | | | | | | | | | | | |
The accompanying notes are an integral part of these financial statements.
| | | | |
| 106 | | Wells Fargo Equity Gateway Funds | | Portfolio of investments—November 30, 2017 (unaudited) |
LARGE COMPANY VALUE PORTFOLIO
| | | | | | | | | | | | | | | | |
| Security name | | Yield | | | | | | Shares | | | Value | |
| | | | |
Short-Term Investments: 2.01% | | | | | | | | | | | | | | | | |
| | | | |
| Investment Companies: 2.01% | | | | | | | | | | | | | | | | |
Wells Fargo Government Money Market Fund Select Class (l)(u) | | | 1.00 | % | | | | | | | 1,379,139 | | | $ | 1,379,139 | |
| | | | | | | | | | | | | | | | |
| | | | |
Total Short-Term Investments (Cost $1,379,139) | | | | | | | | | | | | | | | 1,379,139 | |
| | | | | | | | | | | | | | | | |
| | | | | | | | |
| Total investments in securities (Cost $60,431,547) | | | 99.56 | % | | | 68,295,028 | |
Other assets and liabilities, net | | | 0.44 | | | | 303,537 | |
| | | | | | | | |
| Total net assets | | | 100.00 | % | | $ | 68,598,565 | |
| | | | | | | | |
| † | Non-income-earning security |
| (l) | The issuer of the security is an affiliated person of the Portfolio as defined in the Investment Company Act of 1940. |
| (u) | The rate represents the 7-day annualized yield at period end. |
Futures Contracts
| | | | | | | | | | | | | | | | | | | | | | | | |
| Description | | Number of
contracts | | | Expiration
date | | | Notional
cost | | | Notional
value | | | Unrealized
gains | | | Unrealized
losses | |
Long | | | | | | | | | | | | | | | | | | | | | | | | |
S&P 500 E-Mini Index | | | 11 | | | | 12-15-2017 | | | $ | 1,414,978 | | | $ | 1,456,345 | | | $ | 41,367 | | | $ | 0 | |
Investments in Affiliates
An affiliated investment is an investment in which the Portfolio owns at least 5% of the outstanding voting shares of the issuer or as a result of other relationships, such as the Portfolio and the issuer having the same investment manager. Transactions with issuers that were either affiliated persons of the Portfolio at the beginning of the period or the end of the period were as follows:
| | | | | | | | | | | | | | | | | | | | | | | | | | | | | | | | | | | | |
| | | Shares,
beginning of
period | | | Shares
purchased | | | Shares
sold | | | Shares,
end of
period | | | Net
realized
gains
(losses) | | | Net
change in
unrealized
gains
(losses) | | | Income
from
affiliated
securities | | | Value,
end
of period | | | % of
net
assets | |
Short-Term Investments | | | | | | | | | | | | | | | | | | | | | | | | | | | | | | | | | | | | |
Investment Companies | | | | | | | | | | | | | | | | | | | | | | | | | | | | | | | | | | | | |
Wells Fargo Government Money Market Fund Select Class | | | 1,468,513 | | | | 14,387,409 | | | | 14,476,783 | | | | 1,379,139 | | | $ | 0 | | | $ | 0 | | | $ | 5,604 | | | $ | 1,379,139 | | | | 2.01 | % |
The accompanying notes are an integral part of these financial statements.
| | | | | | |
| Portfolio of investments—November 30, 2017 (unaudited) | | Wells Fargo Equity Gateway Funds | | | 107 | |
SMALL COMPANY GROWTH PORTFOLIO
| | | | | | | | | | | | | | | | |
| Security name | | | | | | | | Shares | | | Value | |
| | | | |
Common Stocks: 96.05% | | | | | | | | | | | | | | | | |
| | | | |
Consumer Discretionary: 10.73% | | | | | | | | | | | | | | | | |
| | | | |
| Auto Components: 0.62% | | | | | | | | | | | | | | | | |
Fox Factory Holding Corporation † | | | | | | | | | | | 290,450 | | | $ | 11,327,547 | |
| | | | | | | | | | | | | | | | |
| | | | |
| Diversified Consumer Services: 0.41% | | | | | | | | | | | | | | | | |
Houghton Mifflin Harcourt Company † | | | | | | | | | | | 770,692 | | | | 7,514,247 | |
| | | | | | | | | | | | | | | | |
| | | | |
| Hotels, Restaurants & Leisure: 3.86% | | | | | | | | | | | | | | | | |
Del Taco Restaurants Incorporated † | | | | | | | | | | | 467,155 | | | | 5,736,663 | |
Eldorado Resorts Incorporated †« | | | | | | | | | | | 537,203 | | | | 16,438,412 | |
Extended Stay America Incorporated | | | | | | | | | | | 916,351 | | | | 16,008,652 | |
International Game Technology | | | | | | | | | | | 872,370 | | | | 23,981,451 | |
Zoe’s Kitchen Incorporated †« | | | | | | | | | | | 527,231 | | | | 8,425,151 | |
| |
| | | | 70,590,329 | |
| | | | | | | | | | | | | | | | |
| | | | |
| Media: 1.49% | | | | | | | | | | | | | | | | |
IMAX Corporation †« | | | | | | | | | | | 421,145 | | | | 10,697,083 | |
Lions Gate Entertainment Class A | | | | | | | | | | | 200,397 | | | | 6,554,986 | |
Lions Gate Entertainment Class B † | | | | | | | | | | | 321,065 | | | | 9,965,858 | |
Media General Incorporated (a) | | | | | | | | | | | 347,897 | | | | 0 | |
| |
| | | | 27,217,927 | |
| | | | | | | | | | | | | | | | |
| | | | |
| Specialty Retail: 3.49% | | | | | | | | | | | | | | | | |
At Home Group Incorporated †« | | | | | | | | | | | 420,017 | | | | 11,605,070 | |
Burlington Stores Incorporated † | | | | | | | | | | | 188,276 | | | | 20,026,918 | |
Dick’s Sporting Goods Incorporated | | | | | | | | | | | 321,197 | | | | 9,462,464 | |
Monro Muffler Brake Incorporated « | | | | | | | | | | | 206,348 | | | | 10,410,257 | |
Party City Holdco Incorporated †« | | | | | | | | | | | 893,227 | | | | 12,415,855 | |
| |
| | | | 63,920,564 | |
| | | | | | | | | | | | | | | | |
| | | | |
| Textiles, Apparel & Luxury Goods: 0.86% | | | | | | | | | | | | | | | | |
G-III Apparel Group Limited † | | | | | | | | | | | 513,408 | | | | 15,812,966 | |
| | | | | | | | | | | | | | | | |
| | | | |
Consumer Staples: 2.31% | | | | | | | | | | | | | | | | |
| | | | |
| Food & Staples Retailing: 1.19% | | | | | | | | | | | | | | | | |
Performance Food Group Company † | | | | | | | | | | | 731,770 | | | | 21,696,981 | |
| | | | | | | | | | | | | | | | |
| | | | |
| Household Products: 1.12% | | | | | | | | | | | | | | | | |
Central Garden & Pet Company Class A † | | | | | | | | | | | 533,041 | | | | 20,559,391 | |
| | | | | | | | | | | | | | | | |
| | | | |
Energy: 1.22% | | | | | | | | | | | | | | | | |
| | | | |
| Oil, Gas & Consumable Fuels: 1.22% | | | | | | | | | | | | | | | | |
Diamondback Energy Incorporated † | | | | | | | | | | | 98,755 | | | | 10,794,909 | |
GasLog Limited « | | | | | | | | | | | 641,463 | | | | 11,546,334 | |
| |
| | | | 22,341,243 | |
| | | | | | | | | | | | | | | | |
The accompanying notes are an integral part of these financial statements.
| | | | |
| 108 | | Wells Fargo Equity Gateway Funds | | Portfolio of investments—November 30, 2017 (unaudited) |
SMALL COMPANY GROWTH PORTFOLIO
| | | | | | | | | | | | | | | | |
| Security name | | | | | | | | Shares | | | Value | |
| | | | |
Financials: 9.13% | | | | | | | | | | | | | | | | |
| | | | |
| Banks: 2.51% | | | | | | | | | | | | | | | | |
ServisFirst Bancshares Incorporated | | | | | | | | | | | 317,091 | | | $ | 13,314,651 | |
Signature Bank † | | | | | | | | | | | 50,488 | | | | 6,930,993 | |
SVB Financial Group † | | | | | | | | | | | 112,882 | | | | 25,696,458 | |
| |
| | | | 45,942,102 | |
| | | | | | | | | | | | | | | | |
| | | | |
| Capital Markets: 3.94% | | | | | | | | | | | | | | | | |
Evercore Partners Incorporated Class A | | | | | | | | | | | 295,882 | | | | 25,697,352 | |
Stifel Financial Corporation | | | | | | | | | | | 354,531 | | | | 19,938,823 | |
Virtu Financial Incorporated Class A « | | | | | | | | | | | 784,293 | | | | 12,783,976 | |
Virtus Investment Partners Incorporated | | | | | | | | | | | 114,782 | | | | 13,779,579 | |
| |
| | | | 72,199,730 | |
| | | | | | | | | | | | | | | | |
| | | | |
| Insurance: 1.10% | | | | | | | | | | | | | | | | |
Argo Group International Holdings Limited | | | | | | | | | | | 327,508 | | | | 20,059,865 | |
| | | | | | | | | | | | | | | | |
| | | | |
| Thrifts & Mortgage Finance: 1.58% | | | | | | | | | | | | | | | | |
Essent Group Limited † | | | | | | | | | | | 521,401 | | | | 23,071,994 | |
Sterling Bancorp Incorporated †« | | | | | | | | | | | 470,289 | | | | 5,831,584 | |
| |
| | | | 28,903,578 | |
| | | | | | | | | | | | | | | | |
| | | | |
Health Care: 19.62% | | | | | | | | | | | | | | | | |
| | | | |
| Biotechnology: 4.99% | | | | | | | | | | | | | | | | |
Alnylam Pharmaceuticals Incorporated † | | | | | | | | | | | 95,124 | | | | 12,797,983 | |
Bioverativ Incorporated † | | | | | | | | | | | 194,487 | | | | 9,728,240 | |
Emergent BioSolutions Incorporated † | | | | | | | | | | | 286,551 | | | | 12,588,185 | |
Esperion Therapeutics Incorporated †« | | | | | | | | | | | 162,458 | | | | 9,992,792 | |
Flexion Therapeutics Incorporated †« | | | | | | | | | | | 415,702 | | | | 10,770,839 | |
Foundation Medicine Incorporated †« | | | | | | | | | | | 208,663 | | | | 11,100,872 | |
Galapagos NV †« | | | | | | | | | | | 74,432 | | | | 6,563,414 | |
Intercept Pharmaceuticals Incorporated †« | | | | | | | | | | | 75,810 | | | | 4,655,492 | |
Intrexon Corporation « | | | | | | | | | | | 411,870 | | | | 5,617,907 | |
Tesaro Incorporated †« | | | | | | | | | | | 89,776 | | | | 7,595,050 | |
| |
| | | | 91,410,774 | |
| | | | | | | | | | | | | | | | |
| | | | |
| Health Care Equipment & Supplies: 6.89% | | | | | | | | | | | | | | | | |
AngioDynamics Incorporated † | | | | | | | | | | | 347,100 | | | | 5,963,178 | |
Atricure Incorporated † | | | | | | | | | | | 623,547 | | | | 11,535,620 | |
Cerus Corporation †« | | | | | | | | | | | 1,765,555 | | | | 6,973,942 | |
DexCom Incorporated †« | | | | | | | | | | | 179,816 | | | | 10,506,649 | |
Glaukos Corporation †« | | | | | | | | | | | 341,928 | | | | 9,153,413 | |
Inogen Incorporated † | | | | | | | | | | | 136,134 | | | | 17,525,891 | |
K2M Group Holdings Incorporated † | | | | | | | | | | | 551,458 | | | | 10,841,664 | |
Nevro Corporation † | | | | | | | | | | | 224,340 | | | | 16,785,119 | |
Novocure Limited †« | | | | | | | | | | | 545,437 | | | | 10,499,662 | |
Tactile Systems Technology Class I †« | | | | | | | | | | | 376,991 | | | | 11,245,642 | |
Wright Medical Group NV †« | | | | | | | | | | | 619,784 | | | | 15,066,949 | |
| |
| | | | 126,097,729 | |
| | | | | | | | | | | | | | | | |
The accompanying notes are an integral part of these financial statements.
| | | | | | |
| Portfolio of investments—November 30, 2017 (unaudited) | | Wells Fargo Equity Gateway Funds | | | 109 | |
SMALL COMPANY GROWTH PORTFOLIO
| | | | | | | | | | | | | | | | |
| Security name | | | | | | | | Shares | | | Value | |
| | | | |
| Health Care Providers & Services: 2.94% | | | | | | | | | | | | | | | | |
AMN Healthcare Services Incorporated †« | | | | | | | | | | | 327,306 | | | $ | 16,430,761 | |
HealthEquity Incorporated † | | | | | | | | | | | 427,073 | | | | 22,152,277 | |
Teladoc Incorporated †« | | | | | | | | | | | 413,525 | | | | 15,341,778 | |
| |
| | | | 53,924,816 | |
| | | | | | | | | | | | | | | | |
| | | | |
| Health Care Technology: 2.69% | | | | | | | | | | | | | | | | |
athenahealth Incorporated † | | | | | | | | | | | 90,570 | | | | 12,035,847 | |
Evolent Health Incorporated Class A †« | | | | | | | | | | | 1,107,692 | | | | 14,233,842 | |
Medidata Solutions Incorporated † | | | | | | | | | | | 212,326 | | | | 14,149,405 | |
Vocera Communications Incorporated † | | | | | | | | | | | 300,199 | | | | 8,795,831 | |
| |
| | | | 49,214,925 | |
| | | | | | | | | | | | | | | | |
| | | | |
| Life Sciences Tools & Services: 1.31% | | | | | | | | | | | | | | | | |
ICON plc ADR † | | | | | | | | | | | 204,842 | | | | 23,927,594 | |
| | | | | | | | | | | | | | | | |
| | | | |
| Pharmaceuticals: 0.80% | | | | | | | | | | | | | | | | |
Optinose Incorporated †« | | | | | | | | | | | 209,550 | | | | 4,000,310 | |
Pacira Pharmaceuticals Incorporated † | | | | | | | | | | | 230,137 | | | | 10,632,329 | |
| |
| | | | 14,632,639 | |
| | | | | | | | | | | | | | | | |
| | | | |
Industrials: 19.55% | | | | | | | | | | | | | | | | |
| | | | |
| Aerospace & Defense: 0.60% | | | | | | | | | | | | | | | | |
Kratos Defense & Security Solutions Incorporated † | | | | | | | | | | | 1,049,602 | | | | 10,947,349 | |
| | | | | | | | | | | | | | | | |
| | | | |
| Air Freight & Logistics: 0.67% | | | | | | | | | | | | | | | | |
Hub Group Incorporated Class A † | | | | | | | | | | | 256,022 | | | | 12,237,852 | |
| | | | | | | | | | | | | | | | |
| | | | |
| Building Products: 4.83% | | | | | | | | | | | | | | | | |
A.O. Smith Corporation | | | | | | | | | | | 353,932 | | | | 22,446,367 | |
Apogee Enterprises Incorporated | | | | | | | | | | | 316,976 | | | | 15,858,309 | |
JELD-WEN Holding Incorporated † | | | | | | | | | | | 280,740 | | | | 10,979,741 | |
Masonite International Corporation † | | | | | | | | | | | 179,023 | | | | 13,185,044 | |
NCI Building Systems Incorporated † | | | | | | | | | | | 853,392 | | | | 14,251,646 | |
PGT Incorporated † | | | | | | | | | | | 719,275 | | | | 11,760,146 | |
| |
| | | | 88,481,253 | |
| | | | | | | | | | | | | | | | |
| | | | |
| Commercial Services & Supplies: 2.53% | | | | | | | | | | | | | | | | |
Copart Incorporated † | | | | | | | | | | | 657,633 | | | | 28,383,440 | |
KAR Auction Services Incorporated | | | | | | | | | | | 355,991 | | | | 17,931,267 | |
| |
| | | | 46,314,707 | |
| | | | | | | | | | | | | | | | |
| | | | |
| Construction & Engineering: 1.67% | | | | | | | | | | | | | | | | |
Dycom Industries Incorporated † | | | | | | | | | | | 59,272 | | | | 6,364,035 | |
Granite Construction Incorporated | | | | | | | | | | | 365,204 | | | | 24,238,589 | |
| |
| | | | 30,602,624 | |
| | | | | | | | | | | | | | | | |
| | | | |
| Machinery: 4.45% | | | | | | | | | | | | | | | | |
EnPro Industries Incorporated | | | | | | | | | | | 222,732 | | | | 19,237,363 | |
Gardner Denver Holdings Incorporated † | | | | | | | | | | | 629,916 | | | | 20,415,578 | |
The accompanying notes are an integral part of these financial statements.
| | | | |
| 110 | | Wells Fargo Equity Gateway Funds | | Portfolio of investments—November 30, 2017 (unaudited) |
SMALL COMPANY GROWTH PORTFOLIO
| | | | | | | | | | | | | | | | |
| Security name | | | | | | | | Shares | | | Value | |
| | | | |
| Machinery (continued) | | | | | | | | | | | | | | | | |
REV Group Incorporated | | | | | | | | | | | 499,651 | | | $ | 13,645,469 | |
SPX Corporation † | | | | | | | | | | | 531,944 | | | | 16,963,694 | |
Wabash National Corporation « | | | | | | | | | | | 556,575 | | | | 11,214,986 | |
| |
| | | | 81,477,090 | |
| | | | | | | | | | | | | | | | |
| | | | |
| Professional Services: 1.90% | | | | | | | | | | | | | | | | |
On Assignment Incorporated † | | | | | | | | | | | 420,611 | | | | 26,902,280 | |
RPX Corporation | | | | | | | | | | | 599,937 | | | | 7,913,169 | |
| |
| | | | 34,815,449 | |
| | | | | | | | | | | | | | | | |
| | | | |
| Road & Rail: 2.90% | | | | | | | | | | | | | | | | |
Genesee & Wyoming Incorporated Class A † | | | | | | | | | | | 246,237 | | | | 19,408,400 | |
Knight-Swift Transportation Holdings Incorporated | | | | | | | | | | | 354,207 | | | | 15,117,555 | |
Schneider National Incorporated Class B « | | | | | | | | | | | 704,545 | | | | 18,480,215 | |
| |
| | | | 53,006,170 | |
| | | | | | | | | | | | | | | | |
| | | | |
Information Technology: 28.69% | | | | | | | | | | | | | | | | |
| | | | |
| Communications Equipment: 0.98% | | | | | | | | | | | | | | | | |
Ciena Corporation † | | | | | | | | | | | 821,847 | | | | 17,875,172 | |
| | | | | | | | | | | | | | | | |
| | | | |
| Electronic Equipment, Instruments & Components: 1.72% | | | | | | | | | | | | | | | | |
OSI Systems Incorporated † | | | | | | | | | | | 173,626 | | | | 15,046,429 | |
Tech Data Corporation † | | | | | | | | | | | 170,060 | | | | 16,444,802 | |
| |
| | | | 31,491,231 | |
| | | | | | | | | | | | | | | | |
| | | | |
| Internet Software & Services: 6.86% | | | | | | | | | | | | | | | | |
2U Incorporated †« | | | | | | | | | | | 374,322 | | | | 23,994,040 | |
Benefitfocus Incorporated †« | | | | | | | | | | | 403,321 | | | | 10,929,999 | |
Cloudera Incorporated † | | | | | | | | | | | 747,114 | | | | 11,826,815 | |
Cornerstone OnDemand Incorporated † | | | | | | | | | | | 388,396 | | | | 14,359,000 | |
Hortonworks Incorporated † | | | | | | | | | | | 544,929 | | | | 10,359,100 | |
Mimecast Limited † | | | | | | | | | | | 368,128 | | | | 11,191,091 | |
New Relic Incorporated † | | | | | | | | | | | 334,176 | | | | 18,807,425 | |
Okta Incorporated † | | | | | | | | | | | 197,857 | | | | 5,779,403 | |
Shopify Incorporated Class A †« | | | | | | | | | | | 177,188 | | | | 18,395,658 | |
| |
| | | | 125,642,531 | |
| | | | | | | | | | | | | | | | |
| | | | |
| IT Services: 1.13% | | | | | | | | | | | | | | | | |
Acxiom Corporation † | | | | | | | | | | | 756,182 | | | | 20,605,960 | |
| | | | | | | | | | | | | | | | |
| | | | |
| Semiconductors & Semiconductor Equipment: 7.06% | | | | | | | | | | | | | | | | |
Axcelis Technologies Incorporated † | | | | | | | | | | | 469,657 | | | | 15,029,024 | |
Cypress Semiconductor Corporation | | | | | | | | | | | 1,566,963 | | | | 25,087,078 | |
FormFactor Incorporated † | | | | | | | | | | | 1,161,867 | | | | 19,054,619 | |
Microsemi Corporation † | | | | | | | | | | | 437,436 | | | | 23,118,493 | |
Nanometrics Incorporated † | | | | | | | | | | | 347,895 | | | | 8,753,038 | |
Silicon Motion Technology Corporation ADR « | | | | | | | | | | | 254,752 | | | | 13,185,964 | |
Teradyne Incorporated | | | | | | | | | | | 616,929 | | | | 24,967,117 | |
| |
| | | | 129,195,333 | |
| | | | | | | | | | | | | | | | |
The accompanying notes are an integral part of these financial statements.
| | | | | | |
| Portfolio of investments—November 30, 2017 (unaudited) | | Wells Fargo Equity Gateway Funds | | | 111 | |
SMALL COMPANY GROWTH PORTFOLIO
| | | | | | | | | | | | | | | | |
| Security name | | | | | | | | Shares | | | Value | |
| | | | |
| Software: 10.94% | | | | | | | | | | | | | | | | |
Atlassian Corporation plc Class A † | | | | | | | | | | | 343,591 | | | $ | 16,042,264 | |
Cadence Design Systems Incorporated † | | | | | | | | | | | 612,201 | | | | 26,881,746 | |
CyberArk Software Limited †« | | | | | | | | | | | 262,991 | | | | 12,376,356 | |
Nuance Communications Incorporated † | | | | | | | | | | | 1,014,522 | | | | 15,765,672 | |
PTC Incorporated † | | | | | | | | | | | 458,731 | | | | 29,211,990 | |
RealPage Incorporated † | | | | | | | | | | | 540,615 | | | | 24,516,890 | |
Sailpoint Technologies Holding † | | | | | | | | | | | 26,340 | | | | 387,198 | |
SS&C Technologies Holdings Incorporated | | | | | | | | | | | 861,135 | | | | 35,556,264 | |
Talend SA ADR † | | | | | | | | | | | 263,371 | | | | 10,526,939 | |
The Ultimate Software Group Incorporated † | | | | | | | | | | | 62,838 | | | | 13,260,703 | |
Zendesk Incorporated † | | | | | | | | | | | 471,259 | | | | 15,839,015 | |
| |
| | | | 200,365,037 | |
| | | | | | | | | | | | | | | | |
| | | | |
Materials: 3.55% | | | | | | | | | | | | | | | | |
| | | | |
| Chemicals: 0.56% | | | | | | | | | | | | | | | | |
KMG Chemicals Incorporated | | | | | | | | | | | 188,641 | | | | 10,260,184 | |
| | | | | | | | | | | | | | | | |
| | | | |
| Metals & Mining: 1.83% | | | | | | | | | | | | | | | | |
Carpenter Technology Corporation | | | | | | | | | | | 338,651 | | | | 16,739,519 | |
Steel Dynamics Incorporated | | | | | | | | | | | 434,392 | | | | 16,724,092 | |
| |
| | | | 33,463,611 | |
| | | | | | | | | | | | | | | | |
| | | | |
| Paper & Forest Products: 1.16% | | | | | | | | | | | | | | | | |
Boise Cascade Company | | | | | | | | | | | 554,198 | | | | 21,336,623 | |
| | | | | | | | | | | | | | | | |
| | | | |
Real Estate: 1.25% | | | | | | | | | | | | | | | | |
| | | | |
| Equity REITs: 1.25% | | | | | | | | | | | | | | | | |
QTS Realty Trust Incorporated Class A | | | | | | | | | | | 411,310 | | | | 22,893,515 | |
| | | | | | | | | | | | | | | | |
| | | | |
Total Common Stocks (Cost $1,220,678,018) | | | | | | | | | | | | | | | 1,758,306,638 | |
| | | | | | | | | | | | | | | | |
| | | | |
| | | Yield | | | | | | | | | | |
| Short-Term Investments: 16.58% | | | | | | | | | | | | | | | | |
| | | | |
| Investment Companies: 16.58% | | | | | | | | | | | | | | | | |
Securities Lending Cash Investment LLC (l)(r)(u) | | | 1.29 | % | | | | | | | 235,213,579 | | | | 235,237,100 | |
Wells Fargo Government Money Market Fund Select Class (l)(u) | | | 1.00 | | | | | | | | 68,328,716 | | | | 68,328,716 | |
| | | | |
Total Short-Term Investments (Cost $303,552,950) | | | | | | | | | | | | | | | 303,565,816 | |
| | | | | | | | | | | | | | | | |
| | | | | | | | |
| Total investments in securities (Cost $1,524,230,968) | | | 112.63 | % | | | 2,061,872,454 | |
Other assets and liabilities, net | | | (12.63 | ) | | | (231,152,167 | ) |
| | | | | | | | |
| Total net assets | | | 100.00 | % | | $ | 1,830,720,287 | |
| | | | | | | | |
| † | Non-income-earning security |
| « | All or a portion of this security is on loan. |
| (a) | The security is fair valued in accordance with procedures approved by the Board of Trustees. |
| (l) | The issuer of the security is an affiliated person of the Portfolio as defined in the Investment Company Act of 1940. |
| (r) | The investment is a non-registered investment company purchased with cash collateral received from securities on loan. |
| (u) | The rate represents the 7-day annualized yield at period end. |
The accompanying notes are an integral part of these financial statements.
| | | | |
| 112 | | Wells Fargo Equity Gateway Funds | | Portfolio of investments—November 30, 2017 (unaudited) |
SMALL COMPANY GROWTH PORTFOLIO
Investments in Affiliates
An affiliated investment is an investment in which the Portfolio owns at least 5% of the outstanding voting shares of the issuer or as a result of other relationships, such as the Portfolio and the issuer having the same investment manager. Transactions with issuers that were either affiliated persons of the Portfolio at the beginning of the period or the end of the period were as follows:
| | | | | | | | | | | | | | | | | | | | | | | | | | | | | | | | | | | | |
| | | Shares,
beginning of
period | | | Shares
purchased | | | Shares
sold | | | Shares,
end of
period | | | Net
realized
gains
(losses) | | | Net
change in
unrealized
gains
(losses) | | | Income
from
affiliated
securities | | | Value,
end
of period | | | % of
net
assets | |
Short-Term Investments | | | | | | | | | | | | | | | | | | | | | | | | | | | | | | | | | | | | |
Investment Companies | | | | | | | | | | | | | | | | | | | | | | | | | | | | | | | | | | | | |
Securities Lending Cash Investment LLC | | | 205,550,129 | | | | 473,115,600 | | | | 443,452,150 | | | | 235,213,579 | | | $ | 715 | | | $ | 0 | | | $ | 1,152,106 | | | $ | 235,237,100 | | | | | |
Wells Fargo Government Money Market Fund Select Class | | | 62,006,657 | | | | 203,531,569 | | | | 197,209,510 | | | | 68,328,716 | | | | 0 | | | | 0 | | | | 311,315 | | | | 68,328,716 | | | | | |
| | | | | | | | | | | | | | | | | | | | | | | | | | | | | | | | | | | | |
| | | | | | | | | | | | | | | | | | $ | 715 | | | $ | 0 | | | $ | 1,463,421 | | | $ | 303,565,816 | | | | 16.58 | % |
| | | | | | | | | | | | | | | | | | | | | | | | | | | | | | | | | | | | |
The accompanying notes are an integral part of these financial statements.
| | | | | | |
| Portfolio of investments—November 30, 2017 (unaudited) | | Wells Fargo Equity Gateway Funds | | | 113 | |
SMALL COMPANY VALUE PORTFOLIO
| | | | | | | | | | | | | | | | |
| Security name | | | | | | | | Shares | | | Value | |
| | | | |
Common Stocks: 97.37% | | | | | | | | | | | | | | | | |
| | | | |
Consumer Discretionary: 18.48% | | | | | | | | | | | | | | | | |
| | | | |
| Auto Components: 2.33% | | | | | | | | | | | | | | | | |
American Axle & Manufacturing Holdings Incorporated † | | | | | | | | | | | 76,335 | | | $ | 1,370,211 | |
Visteon Corporation † | | | | | | | | | | | 18,480 | | | | 2,433,631 | |
| | | | |
| | | | | | | | | | | | | | | 3,803,842 | |
| | | | | | | | | | | | | | | | |
| | | | |
| Diversified Consumer Services: 1.50% | | | | | | | | | | | | | | | | |
Adtalem Global Education Incorporated | | | | | | | | | | | 59,226 | | | | 2,454,918 | |
| | | | | | | | | | | | | | | | |
| | | | |
| Hotels, Restaurants & Leisure: 4.42% | | | | | | | | | | | | | | | | |
Eldorado Resorts Incorporated †« | | | | | | | | | | | 88,176 | | | | 2,698,186 | |
Extended Stay America Incorporated | | | | | | | | | | | 79,072 | | | | 1,381,388 | |
Red Robin Gourmet Burgers Incorporated † | | | | | | | | | | | 33,872 | | | | 1,774,893 | |
SeaWorld Entertainment Incorporated †« | | | | | | | | | | | 117,152 | | | | 1,376,536 | |
| | | | |
| | | | | | | | | | | | | | | 7,231,003 | |
| | | | | | | | | | | | | | | | |
| | | | |
| Household Durables: 3.50% | | | | | | | | | | | | | | | | |
Century Communities Incorporated † | | | | | | | | | | | 75,397 | | | | 2,363,696 | |
Taylor Morrison Home Corporation Class A † | | | | | | | | | | | 57,172 | | | | 1,381,276 | |
TRI Pointe Homes Incorporated † | | | | | | | | | | | 109,509 | | | | 1,984,303 | |
| | | | |
| | | | | | | | | | | | | | | 5,729,275 | |
| | | | | | | | | | | | | | | | |
| | | | |
| Internet & Direct Marketing Retail: 1.03% | | | | | | | | | | | | | | | | |
1-800-Flowers.com Incorporated Class A † | | | | | | | | | | | 164,102 | | | | 1,682,046 | |
| | | | | | | | | | | | | | | | |
| | | | |
| Media: 3.14% | | | | | | | | | | | | | | | | |
AMC Entertainment Holdings Class A « | | | | | | | | | | | 81,261 | | | | 1,157,969 | |
IMAX Corporation †« | | | | | | | | | | | 64,653 | | | | 1,642,186 | |
Regal Entertainment Group Class A « | | | | | | | | | | | 115,133 | | | | 2,326,838 | |
| | | | |
| | | | | | | | | | | | | | | 5,126,993 | |
| | | | | | | | | | | | | | | | |
| | | | |
| Specialty Retail: 1.66% | | | | | | | | | | | | | | | | |
Asbury Automotive Group Incorporated † | | | | | | | | | | | 19,691 | | | | 1,295,668 | |
Urban Outfitters Incorporated †« | | | | | | | | | | | 45,519 | | | | 1,416,551 | |
| | | | |
| | | | | | | | | | | | | | | 2,712,219 | |
| | | | | | | | | | | | | | | | |
| | | | |
| Textiles, Apparel & Luxury Goods: 0.90% | | | | | | | | | | | | | | | | |
Oxford Industries Incorporated | | | | | | | | | | | 21,281 | | | | 1,468,389 | |
| | | | | | | | | | | | | | | | |
| | | | |
Consumer Staples: 1.73% | | | | | | | | | | | | | | | | |
| | | | |
| Food & Staples Retailing: 0.69% | | | | | | | | | | | | | | | | |
United Natural Foods Incorporated † | | | | | | | | | | | 23,356 | | | | 1,121,555 | |
| | | | | | | | | | | | | | | | |
| | | | |
| Food Products: 1.04% | | | | | | | | | | | | | | | | |
Darling Ingredients Incorporated † | | | | | | | | | | | 94,718 | | | | 1,700,188 | |
| | | | | | | | | | | | | | | | |
The accompanying notes are an integral part of these financial statements.
| | | | |
| 114 | | Wells Fargo Equity Gateway Funds | | Portfolio of investments—November 30, 2017 (unaudited) |
SMALL COMPANY VALUE PORTFOLIO
| | | | | | | | | | | | | | | | |
| Security name | | | | | | | | Shares | | | Value | |
| | | | |
Energy: 5.22% | | | | | | | | | | | | | | | | |
| | | | |
| Energy Equipment & Services: 2.21% | | | | | | | | | | | | | | | | |
Basic Energy Services Incorporated † | | | | | | | | | | | 40,880 | | | $ | 914,486 | |
C&J Energy Services Incorporated † | | | | | | | | | | | 43,195 | | | | 1,350,276 | |
Unit Corporation † | | | | | | | | | | | 63,413 | | | | 1,356,404 | |
| | | | |
| | | | | | | | | | | | | | | 3,621,166 | |
| | | | | | | | | | | | | | | | |
| | | | |
| Oil, Gas & Consumable Fuels: 3.01% | | | | | | | | | | | | | | | | |
Callon Petroleum Company † | | | | | | | | | | | 99,424 | | | | 1,097,641 | |
Delek US Holdings Incorporated | | | | | | | | | | | 58,048 | | | | 1,928,355 | |
Scorpio Tankers Incorporated | | | | | | | | | | | 310,064 | | | | 961,198 | |
SM Energy Company | | | | | | | | | | | 45,045 | | | | 929,729 | |
| | | | |
| | | | | | | | | | | | | | | 4,916,923 | |
| | | | | | | | | | | | | | | | |
| | | | |
Financials: 28.11% | | | | | | | | | | | | | | | | |
| | | | |
| Banks: 18.59% | | | | | | | | | | | | | | | | |
Berkshire Hills Bancorp Incorporated | | | | | | | | | | | 42,006 | | | | 1,619,331 | |
Cathay General Bancorp | | | | | | | | | | | 44,756 | | | | 1,941,963 | |
Chemical Financial Corporation | | | | | | | | | | | 33,845 | | | | 1,908,520 | |
ConnectOne Bancorp Incorporated | | | | | | | | | | | 49,823 | | | | 1,352,694 | |
Customers Bancorp Incorporated † | | | | | | | | | | | 45,909 | | | | 1,244,134 | |
FCB Financial Holdings Class A † | | | | | | | | | | | 33,189 | | | | 1,754,039 | |
First Bancorp Corporation | | | | | | | | | | | 36,107 | | | | 1,368,455 | |
FNB Corporation | | | | | | | | | | | 111,754 | | | | 1,585,789 | |
Great Western Bancorp Incorporated | | | | | | | | | | | 41,989 | | | | 1,734,985 | |
Green Bancorp Incorporated † | | | | | | | | | | | 58,235 | | | | 1,304,464 | |
Independent Bank Group Incorporated | | | | | | | | | | | 32,387 | | | | 2,231,464 | |
MB Financial Incorporated | | | | | | | | | | | 37,507 | | | | 1,745,951 | |
Opus Bank † | | | | | | | | | | | 41,498 | | | | 1,157,794 | |
Renasant Corporation | | | | | | | | | | | 35,782 | | | | 1,540,057 | |
Simmons First National Corporation Class A | | | | | | | | | | | 28,151 | | | | 1,629,943 | |
Sterling BanCorp | | | | | | | | | | | 66,949 | | | | 1,697,157 | |
Valley National Bancorp | | | | | | | | | | | 118,465 | | | | 1,409,734 | |
WesBanco Incorporated | | | | | | | | | | | 35,263 | | | | 1,483,514 | |
Wintrust Financial Corporation | | | | | | | | | | | 20,024 | | | | 1,679,012 | |
| | | | |
| | | | | | | | | | | | | | | 30,389,000 | |
| | | | | | | | | | | | | | | | |
| | | | |
| Capital Markets: 0.94% | | | | | | | | | | | | | | | | |
Stifel Financial Corporation | | | | | | | | | | | 27,460 | | | | 1,544,350 | |
| | | | | | | | | | | | | | | | |
| | | | |
| Consumer Finance: 1.90% | | | | | | | | | | | | | | | | |
Encore Capital Group Incorporated †« | | | | | | | | | | | 36,347 | | | | 1,664,693 | |
PRA Group Incorporated † | | | | | | | | | | | 41,545 | | | | 1,445,766 | |
| | | | |
| | | | | | | | | | | | | | | 3,110,459 | |
| | | | | | | | | | | | | | | | |
| | | | |
| Insurance: 4.98% | | | | | | | | | | | | | | | | |
Horace Mann Educators Corporation | | | | | | | | | | | 44,031 | | | | 2,056,248 | |
James River Group Holdings Limited | | | | | | | | | | | 35,044 | | | | 1,418,581 | |
The accompanying notes are an integral part of these financial statements.
| | | | | | |
| Portfolio of investments—November 30, 2017 (unaudited) | | Wells Fargo Equity Gateway Funds | | | 115 | |
SMALL COMPANY VALUE PORTFOLIO
| | | | | | | | | | | | | | | | |
| Security name | | | | | | | | Shares | | | Value | |
| | | | |
| Insurance (continued) | | | | | | | | | | | | | | | | |
Kemper Corporation | | | | | | | | | | | 36,118 | | | $ | 2,492,142 | |
Primerica Incorporated | | | | | | | | | | | 20,857 | | | | 2,169,128 | |
| | | | |
| | | | | | | | | | | | | | | 8,136,099 | |
| | | | | | | | | | | | | | | | |
| | | | |
| Thrifts & Mortgage Finance: 1.70% | | | | | | | | | | | | | | | | |
Bofi Holding Incorporated †« | | | | | | | | | | | 61,382 | | | | 1,696,598 | |
Dime Community Bancshares | | | | | | | | | | | 49,282 | | | | 1,086,668 | |
| | | | |
| | | | | | | | | | | | | | | 2,783,266 | |
| | | | | | | | | | | | | | | | |
| | | | |
Health Care: 7.48% | | | | | | | | | | | | | | | | |
| | | | |
| Health Care Equipment & Supplies: 2.32% | | | | | | | | | | | | | | | | |
Lantheus Holdings Incorporated † | | | | | | | | | | | 70,510 | | | | 1,579,424 | |
Merit Medical Systems Incorporated † | | | | | | | | | | | 50,814 | | | | 2,207,868 | |
| | | | |
| | | | | | | | | | | | | | | 3,787,292 | |
| | | | | | | | | | | | | | | | |
| | | | |
| Health Care Providers & Services: 4.14% | | | | | | | | | | | | | | | | |
AMN Healthcare Services Incorporated † | | | | | | | | | | | 36,978 | | | | 1,856,296 | |
Magellan Health Services Incorporated † | | | | | | | | | | | 18,777 | | | | 1,586,657 | |
MEDNAX Incorporated † | | | | | | | | | | | 34,905 | | | | 1,737,920 | |
Premier Incorporated Class A † | | | | | | | | | | | 54,835 | | | | 1,591,312 | |
| | | | |
| | | | | | | | | | | | | | | 6,772,185 | |
| | | | | | | | | | | | | | | | |
| | | | |
| Life Sciences Tools & Services: 1.02% | | | | | | | | | | | | | | | | |
Cambrex Corporation † | | | | | | | | | | | 34,093 | | | | 1,665,443 | |
| | | | | | | | | | | | | | | | |
| | | | |
Industrials: 8.12% | | | | | | | | | | | | | | | | |
| | | | |
| Aerospace & Defense: 0.71% | | | | | | | | | | | | | | | | |
Triumph Group Incorporated | | | | | | | | | | | 37,505 | | | | 1,158,905 | |
| | | | | | | | | | | | | | | | |
| | | | |
| Building Products: 0.91% | | | | | | | | | | | | | | | | |
Builders FirstSource Incorporated † | | | | | | | | | | | 73,411 | | | | 1,497,584 | |
| | | | | | | | | | | | | | | | |
| | | | |
| Commercial Services & Supplies: 2.10% | | | | | | | | | | | | | | | | |
Interface Incorporated | | | | | | | | | | | 87,264 | | | | 2,177,237 | |
LSC Communications Incorporated | | | | | | | | | | | 77,012 | | | | 1,259,916 | |
| | | | |
| | | | | | | | | | | | | | | 3,437,153 | |
| | | | | | | | | | | | | | | | |
| | | | |
| Construction & Engineering: 0.82% | | | | | | | | | | | | | | | | |
KBR Incorporated | | | | | | | | | | | 71,350 | | | | 1,337,813 | |
| | | | | | | | | | | | | | | | |
| | | | |
| Road & Rail: 1.02% | | | | | | | | | | | | | | | | |
Hertz Global Holdings Incorporated †« | | | | | | | | | | | 87,721 | | | | 1,662,313 | |
| | | | | | | | | | | | | | | | |
| | | | |
| Trading Companies & Distributors: 2.56% | | | | | | | | | | | | | | | | |
Air Lease Corporation | | | | | | | | | | | 50,209 | | | | 2,174,050 | |
Triton International Limited | | | | | | | | | | | 50,682 | | | | 2,005,487 | |
| | | | |
| | | | | | | | | | | | | | | 4,179,537 | |
| | | | | | | | | | | | | | | | |
The accompanying notes are an integral part of these financial statements.
| | | | |
| 116 | | Wells Fargo Equity Gateway Funds | | Portfolio of investments—November 30, 2017 (unaudited) |
SMALL COMPANY VALUE PORTFOLIO
| | | | | | | | | | | | | | | | |
| Security name | | | | | | | | Shares | | | Value | |
| | | | |
Information Technology: 12.78% | | | | | | | | | | | | | | | | |
| | | | |
| Communications Equipment: 1.53% | | | | | | | | | | | | | | | | |
Comtech Telecommunications Corporation | | | | | | | | | | | 37,035 | | | $ | 802,548 | |
Finisar Corporation †« | | | | | | | | | | | 84,545 | | | | 1,691,745 | |
| | | | |
| | | | | | | | | | | | | | | 2,494,293 | |
| | | | | | | | | | | | | | | | |
| | | | |
| Electronic Equipment, Instruments & Components: 3.75% | | | | | | | | | | | | | | | | |
Anixter International Incorporated † | | | | | | | | | | | 21,110 | | | | 1,509,365 | |
TTM Technologies Incorporated † | | | | | | | | | | | 118,506 | | | | 1,935,203 | |
VeriFone Systems Incorporated † | | | | | | | | | | | 65,172 | | | | 1,130,082 | |
Vishay Intertechnology Incorporated « | | | | | | | | | | | 71,022 | | | | 1,555,382 | |
| | | | |
| | | | | | | | | | | | | | | 6,130,032 | |
| | | | | | | | | | | | | | | | |
| | | | |
| IT Services: 1.06% | | | | | | | | | | | | | | | | |
Virtusa Corporation † | | | | | | | | | | | 37,546 | | | | 1,740,257 | |
| | | | | | | | | | | | | | | | |
| | | | |
| Semiconductors & Semiconductor Equipment: 4.84% | | | | | | | | | | | | | | | | |
Cirrus Logic Incorporated † | | | | | | | | | | | 30,705 | | | | 1,696,144 | |
Cypress Semiconductor Corporation | | | | | | | | | | | 166,766 | | | | 2,669,924 | |
FormFactor Incorporated † | | | | | | | | | | | 101,781 | | | | 1,669,208 | |
Synaptics Incorporated † | | | | | | | | | | | 17,951 | | | | 677,471 | |
Veeco Instruments Incorporated † | | | | | | | | | | | 74,180 | | | | 1,198,007 | |
| | | | |
| | | | | | | | | | | | | | | 7,910,754 | |
| | | | | | | | | | | | | | | | |
| | | | |
| Software: 1.18% | | | | | | | | | | | | | | | | |
Tivo Corporation | | | | | | | | | | | 108,643 | | | | 1,933,845 | |
| | | | | | | | | | | | | | | | |
| | | | |
| Technology Hardware, Storage & Peripherals: 0.42% | | | | | | | | | | | | | | | | |
Super Micro Computer Incorporated † | | | | | | | | | | | 31,241 | | | | 688,864 | |
| | | | | | | | | | | | | | | | |
| | | | |
Materials: 2.90% | | | | | | | | | | | | | | | | |
| | | | |
| Chemicals: 2.17% | | | | | | | | | | | | | | | | |
A. Schulman Incorporated | | | | | | | | | | | 51,598 | | | | 1,958,144 | |
Cabot Corporation | | | | | | | | | | | 26,069 | | | | 1,596,466 | |
| | | | |
| | | | | | | | | | | | | | | 3,554,610 | |
| | | | | | | | | | | | | | | | |
| | | | |
| Construction Materials: 0.46% | | | | | | | | | | | | | | | | |
Forterra Incorporated †« | | | | | | | | | | | 76,194 | | | | 749,749 | |
| | | | | | | | | | | | | | | | |
| | | | |
| Metals & Mining: 0.27% | | | | | | | | | | | | | | | | |
AK Steel Holding Corporation †« | | | | | | | | | | | 90,244 | | | | 439,488 | |
| | | | | | | | | | | | | | | | |
| | | | |
Real Estate: 8.97% | | | | | | | | | | | | | | | | |
| | | | |
| Equity REITs: 8.28% | | | | | | | | | | | | | | | | |
Brandywine Realty Trust | | | | | | | | | | | 92,770 | | | | 1,598,427 | |
Corporate Office Properties Trust | | | | | | | | | | | 50,274 | | | | 1,525,313 | |
Cousins Properties Incorporated | | | | | | | | | | | 187,202 | | | | 1,679,202 | |
Equity Commonwealth † | | | | | | | | | | | 50,674 | | | | 1,523,260 | |
Four Corners Property Trust Incorporated | | | | | | | | | | | 51,387 | | | | 1,341,201 | |
Kite Realty Group Trust | | | | | | | | | | | 63,176 | | | | 1,214,874 | |
The accompanying notes are an integral part of these financial statements.
| | | | | | |
| Portfolio of investments—November 30, 2017 (unaudited) | | Wells Fargo Equity Gateway Funds | | | 117 | |
SMALL COMPANY VALUE PORTFOLIO
| | | | | | | | | | | | | | | | |
| Security name | | | | | | | | Shares | | | Value | |
| | | | |
| Equity REITs (continued) | | | | | | | | | | | | | | | | |
Pebblebrook Hotel Trust « | | | | | | | | | | | 39,755 | | | $ | 1,529,375 | |
Ramco-Gershenson Properties Trust | | | | | | | | | | | 96,504 | | | | 1,390,623 | |
Sunstone Hotel Investors Incorporated | | | | | | | | | | | 104,194 | | | | 1,741,082 | |
| | | | |
| | | | | | | | | | | | | | | 13,543,357 | |
| | | | | | | | | | | | | | | | |
| | | | |
| Real Estate Management & Development: 0.69% | | | | | | | | | | | | | | | | |
Alexander & Baldwin Incorporated | | | | | | | | | | | 38,728 | | | | 1,125,436 | |
| | | | | | | | | | | | | | | | |
| | | | |
Utilities: 3.58% | | | | | | | | | | | | | | | | |
| | | | |
| Electric Utilities: 3.58% | | | | | | | | | | | | | | | | |
ALLETE Incorporated | | | | | | | | | | | 20,539 | | | | 1,653,390 | |
El Paso Electric Company | | | | | | | | | | | 35,634 | | | | 2,170,111 | |
Portland General Electric Company | | | | | | | | | | | 24,014 | | | | 1,192,055 | |
Spark Energy Incorporated Class A « | | | | | | | | | | | 67,073 | | | | 838,413 | |
| | | | |
| | | | | | | | | | | | | | | 5,853,969 | |
| | | | | | | | | | | | | | | | |
| | | | |
Total Common Stocks (Cost $124,496,217) | | | | | | | | | | | | | | | 159,194,570 | |
| | | | | | | | | | | | | | | | |
| | | | |
| | | Yield | | | | | | | | | | |
| Short-Term Investments: 13.80% | | | | | | | | | | | | | | | | |
| | | | |
| Investment Companies: 13.80% | | | | | | | | | | | | | | | | |
Securities Lending Cash Investment LLC (l)(r)(u) | | | 1.29 | % | | | | | | | 19,498,529 | | | | 19,500,479 | |
Wells Fargo Government Money Market Fund Select Class (l)(u) | | | 1.00 | | | | | | | | 3,068,712 | | | | 3,068,712 | |
| | | | |
Total Short-Term Investments (Cost $22,568,547) | | | | | | | | | | | | | | | 22,569,191 | |
| | | | | | | | | | | | | | | | |
| | | | | | | | |
| Total investments in securities (Cost $147,064,764) | | | 111.17 | % | | | 181,763,761 | |
Other assets and liabilities, net | | | (11.17 | ) | | | (18,269,435 | ) |
| | | | | | | | |
| Total net assets | | | 100.00 | % | | $ | 163,494,326 | |
| | | | | | | | |
| † | Non-income-earning security |
| « | All or a portion of this security is on loan. |
| (l) | The issuer of the security is an affiliated person of the Portfolio as defined in the Investment Company Act of 1940. |
| (r) | The investment is a non-registered investment company purchased with cash collateral received from securities on loan. |
| (u) | The rate represents the 7-day annualized yield at period end. |
Investments in Affiliates
An affiliated investment is an investment in which the Portfolio owns at least 5% of the outstanding voting shares of the issuer or as a result of other relationships, such as the Portfolio and the issuer having the same investment manager. Transactions with issuers that were either affiliated persons of the Portfolio at the beginning of the period or the end of the period were as follows:
| | | | | | | | | | | | | | | | | | | | | | | | | | | | | | | | | | | | |
| | | Shares,
beginning of
period | | | Shares
purchased | | | Shares
sold | | | Shares,
end of
period | | | Net
realized
gains
(losses) | | | Net
change in
unrealized
gains
(losses) | | | Income
from
affiliated
securities | | | Value,
end
of period | | | % of
net
assets | |
Short-Term Investments | | | | | | | | | | | | | | | | | | | | | | | | | | | | | | | | | | | | |
Investment Companies | | | | | | | | | | | | | | | | | | | | | | | | | | | | | | | | | | | | |
Securities Lending Cash Investment LLC | | | 13,908,596 | | | | 82,168,302 | | | | 76,578,369 | | | | 19,498,529 | | | $ | 30 | | | $ | 0 | | | $ | 185,687 | | | $ | 19,500,479 | | | | | |
Wells Fargo Government Money Market Fund Select Class | | | 4,735,638 | | | | 39,645,032 | | | | 41,311,958 | | | | 3,068,712 | | | | 0 | | | | 0 | | | | 27,897 | | | | 3,068,712 | | | | | |
| | | | | | | | | | | | | | | | | | | | | | | | | | | | | | | | | | | | |
| | | | | | | | | | | | | | | | | | $ | 30 | | | $ | 0 | | | $ | 213,584 | | | $ | 22,569,191 | | | | 13.80 | % |
| | | | | | | | | | | | | | | | | | | | | | | | | | | | | | | | | | | | |
The accompanying notes are an integral part of these financial statements.
| | | | |
| 118 | | Wells Fargo Equity Gateway Funds | | Statements of assets and liabilities—November 30, 2017 (unaudited) |
| | | | | | | | |
| | | C&B Large Cap Value
Portfolio | | | Diversified Large
Cap Growth
Portfolio | |
| | |
Assets | | | | | | | | |
Investments in unaffiliated securities (including securities on loan), at value (see cost below) | | $ | 396,544,140 | | | $ | 92,188,540 | |
Investments in affiliated securities, at value (see cost below) | | | 36,676,363 | | | | 1,898,220 | |
Segregated cash for futures transactions | | | 0 | | | | 0 | |
Foreign currency, at value (see cost below) | | | 0 | | | | 0 | |
Receivable for investments sold | | | 1,204,040 | | | | 426,540 | |
Receivable for dividends | | | 841,480 | | | | 150,130 | |
Receivable for daily variation margin on open futures contracts | | | 0 | | | | 0 | |
Receivable for securities lending income | | | 3,347 | | | | 400 | |
Prepaid expenses and other assets | | | 14,493 | | | | 1,225 | |
| | | | |
Total assets | | | 435,283,863 | | | | 94,665,055 | |
| | | | |
| | |
Liabilities | | | | | | | | |
Payable upon receipt of securities loaned | | | 13,373,325 | | | | 1,113,825 | |
Payable for investments purchased | | | 0 | | | | 283,485 | |
Management fee payable | | | 213,640 | | | | 43,327 | |
Trustees’ fees and expenses payable | | | 2,338 | | | | 2,340 | |
Due to custodian bank | | | 0 | | | | 11 | |
Professional fees payable | | | 16,983 | | | | 20,042 | |
Accrued expenses and other liabilities | | | 13,144 | | | | 55,401 | |
| | | | |
Total liabilities | | | 13,619,430 | | | | 1,518,431 | |
| | | | |
Total net assets | | $ | 421,664,433 | | | $ | 93,146,624 | |
| | | | |
| | |
Investments in unaffiliated securities, at cost | | $ | 295,034,960 | | | $ | 55,648,651 | |
| | | | |
Investments in affiliated securities, at cost | | $ | 36,676,314 | | | $ | 1,898,210 | |
| | | | |
Securities on loan, at value | | $ | 13,088,401 | | | $ | 1,090,300 | |
| | | | |
Foreign currency, at cost | | $ | 0 | | | $ | 0 | |
| | | | |
The accompanying notes are an integral part of these financial statements.
| | | | | | |
| Statements of assets and liabilities—November 30, 2017 (unaudited) | | Wells Fargo Equity Gateway Funds | | | 119 | |
| | | | | | | | | | | | | | | | | | | | | | | | | | |
Emerging Growth Portfolio | | | Index Portfolio | | | International
Growth
Portfolio | | | International
Value Portfolio | | | Large Company
Value Portfolio | | | Small Company
Growth Portfolio | | | Small Company
Value Portfolio | |
| | | | | | |
| | | | | | | | | | | | | | | | | | | | | | | | | | |
| $ | 819,971,524 | | | $ | 1,889,679,728 | | | $ | 41,449,325 | | | $ | 816,063,336 | | | $ | 66,915,889 | | | $ | 1,758,306,638 | | | $ | 159,194,570 | |
| | 49,514,609 | | | | 51,804,692 | | | | 9,307,998 | | | | 33,019,075 | | | | 1,379,139 | | | | 303,565,816 | | | | 22,569,191 | |
| | 0 | | | | 0 | | | | 0 | | | | 0 | | | | 150,000 | | | | 0 | | | | 0 | |
| | 0 | | | | 0 | | | | 6,216 | | | | 7,883,760 | | | | 0 | | | | 0 | | | | 0 | |
| | 6,487,270 | | | | 8,203,184 | | | | 10,086 | | | | 71,715 | | | | 0 | | | | 7,248,262 | | | | 1,308,660 | |
| | 156,350 | | | | 4,725,735 | | | | 357,501 | | | | 3,293,279 | | | | 185,326 | | | | 1,093,075 | | | | 770,694 | |
| | 0 | | | | 328,990 | | | | 0 | | | | 0 | | | | 10,769 | | | | 0 | | | | 0 | |
| | 46,394 | | | | 3,756 | | | | 12 | | | | 31,142 | | | | 0 | | | | 149,243 | | | | 21,633 | |
| | 0 | | | | 194,957 | | | | 6,761 | | | | 5,312 | | | | 2,495 | | | | 12,736 | | | | 14,347 | |
| | |
| | 876,176,147 | | | | 1,954,941,042 | | | | 51,137,899 | | | | 860,367,619 | | | | 68,643,618 | | | | 2,070,375,770 | | | | 183,879,095 | |
| | |
| | | | | | |
| | | | | | | | | | | | | | | | | | | | | | | | | | |
| | 37,018,173 | | | | 6,195,416 | | | | 0 | | | | 18,388,755 | | | | 0 | | | | 235,219,267 | | | | 19,499,762 | |
| | 9,313,152 | | | | 0 | | | | 9,161,906 | | | | 2,459,943 | | | | 0 | | | | 1,591,063 | | | | 731,449 | |
| | 532,450 | | | | 141,973 | | | | 13,267 | | | | 521,628 | | | | 14,895 | | | | 1,131,086 | | | | 123,576 | |
| | 2,217 | | | | 2,362 | | | | 2,322 | | | | 2,384 | | | | 2,358 | | | | 2,351 | | | | 2,306 | |
| | 0 | | | | 0 | | | | 0 | | | | 0 | | | | 855 | | | | 1,670,769 | | | | 0 | |
| | 18,994 | | | | 21,873 | | | | 30,360 | | | | 31,593 | | | | 22,667 | | | | 18,069 | | | | 19,913 | |
| | 59,542 | | | | 5,998 | | | | 51,266 | | | | 67,763 | | | | 4,278 | | | | 22,878 | | | | 7,763 | |
| | |
| | 46,944,528 | | | | 6,367,622 | | | | 9,259,121 | | | | 21,472,066 | | | | 45,053 | | | | 239,655,483 | | | | 20,384,769 | |
| | |
| $ | 829,231,619 | | | $ | 1,948,573,420 | | | $ | 41,878,778 | | | $ | 838,895,553 | | | $ | 68,598,565 | | | $ | 1,830,720,287 | | | $ | 163,494,326 | |
| | |
| | | | | | |
| $ | 532,402,444 | | | $ | 665,745,634 | | | $ | 32,614,233 | | | $ | 720,618,425 | | | $ | 59,052,408 | | | $ | 1,220,678,018 | | | $ | 124,496,217 | |
| | |
| $ | 49,511,794 | | | $ | 40,049,417 | | | $ | 9,307,998 | | | $ | 33,018,781 | | | $ | 1,379,139 | | | $ | 303,552,950 | | | $ | 22,568,547 | |
| | |
| $ | 36,170,154 | | | $ | 6,039,585 | | | $ | 0 | | | $ | 17,490,685 | | | $ | 0 | | | $ | 228,494,698 | | | $ | 19,012,448 | |
| | |
| $ | 0 | | | $ | 0 | | | $ | 6,207 | | | $ | 7,835,016 | | | $ | 0 | | | $ | 0 | | | $ | 0 | |
| | |
The accompanying notes are an integral part of these financial statements.
| | | | |
| 120 | | Wells Fargo Equity Gateway Funds | | Statements of operations—six months ended November 30, 2017 (unaudited) |
| | | | | | | | |
| | | C&B Large Cap Value
Portfolio | | | Diversified Large
Cap Growth
Portfolio | |
| | |
Investment income | | | | | | | | |
Dividends* | | $ | 3,145,480 | | | $ | 575,641 | |
Income from affiliated securities | | | 103,323 | | | | 4,485 | |
Securities lending income from affiliates, net | | | 28,015 | | | | 2,447 | |
Interest | | | 0 | | | | 0 | |
| | | | |
Total investment income | | | 3,276,818 | | | | 582,573 | |
| | | | |
| | |
Expenses | | | | | | | | |
Management fee | | | 1,283,381 | | | | 329,517 | |
Custody and accounting fees | | | 7,841 | | | | 27,492 | |
Professional fees | | | 22,130 | | | | 24,088 | |
Shareholder report expenses | | | 1,031 | | | | 1,025 | |
Trustees’ fees and expenses | | | 10,801 | | | | 10,722 | |
Other fees and expenses | | | 4,550 | | | | 6,702 | |
| | | | |
Total expenses | | | 1,329,734 | | | | 399,546 | |
Less: Fee waivers and/or expense reimbursements | | | (15,198 | ) | | | (84,173 | ) |
| | | | |
Net expenses | | | 1,314,536 | | | | 315,373 | |
| | | | |
Net investment income (loss) | | | 1,962,282 | | | | 267,200 | |
| | | | |
| | |
REALIZED AND UNREALIZED GAINS (LOSSES) ON INVESTMENTS | | | | | | | | |
| | |
Net realized gains (losses) on: | | | | | | | | |
Unaffiliated securities | | | 21,721,193 | | | | 10,794,225 | |
Affiliated securities | | | (35 | ) | | | 36 | |
Futures transactions | | | 0 | | | | 0 | |
| | | | |
Net realized gains on investments | | | 21,721,158 | | | | 10,794,261 | |
| | | | |
| | |
Net change in unrealized gains (losses) on: | | | | | | | | |
Unaffiliated securities | | | 11,480,149 | | | | 1,716,644 | |
Affiliated securities | | | (2 | ) | | | (16 | ) |
Futures transactions | | | 0 | | | | 0 | |
| | | | |
Net change in unrealized gains (losses) on investments | | | 11,480,147 | | | | 1,716,628 | |
| | | | |
Net realized and unrealized gains (losses) on investments | | | 33,201,305 | | | | 12,510,889 | |
| | | | |
Net increase in net assets resulting from operations | | $ | 35,163,587 | | | $ | 12,778,089 | |
| | | | |
| | |
* Net of foreign dividend withholding taxes in the amount of | | | $27,583 | | | | $526 | |
The accompanying notes are an integral part of these financial statements.
| | | | | | |
| Statements of operations—six months ended November 30, 2017 (unaudited) | | Wells Fargo Equity Gateway Funds | | | 121 | |
| | | | | | | | | | | | | | | | | | | | | | | | | | |
Emerging
Growth
Portfolio | | | Index Portfolio | | | International
Growth
Portfolio | | | International
Value Portfolio | | | Large Company
Value Portfolio | | | Small Company
Growth Portfolio | | | Small Company
Value Portfolio | |
| | | | | | |
| | | | | | | | | | | | | | | | | | | | | | | | | | |
| $ | 740,201 | | | $ | 20,043,815 | | | $ | 578,653 | | | $ | 12,477,247 | | | $ | 717,719 | | | $ | 4,379,936 | | | $ | 2,049,417 | |
| | 53,739 | | | | 410,142 | | | | 10,112 | | | | 21,341 | | | | 5,604 | | | | 311,315 | | | | 27,897 | |
| | 244,346 | | | | 32,864 | | | | 24,760 | | | | 329,795 | | | | 0 | | | | 1,152,106 | | | | 185,687 | |
| | 0 | | | | 6,230 | | | | 0 | | | | 0 | | | | 0 | | | | 0 | | | | 0 | |
| | |
| | 1,038,286 | | | | 20,493,051 | | | | 613,525 | | | | 12,828,383 | | | | 723,323 | | | | 5,843,357 | | | | 2,263,001 | |
| | |
| | | | | | |
| | | | | | | | | | | | | | | | | | | | | | | | | | |
| | 3,200,215 | | | | 870,026 | | | | 439,258 | | | | 3,100,391 | | | | 121,817 | | | | 6,730,260 | | | | 849,435 | |
| | 25,935 | | | | 66,319 | | | | 38,031 | | | | 97,942 | | | | 5,086 | | | | 42,573 | | | | 10,610 | |
| | 23,493 | | | | 30,361 | | | | 34,775 | | | | 30,416 | | | | 24,502 | | | | 24,297 | | | | 21,829 | |
| | 2,262 | | | | 3,561 | | | | 1,798 | | | | 1,323 | | | | 1,317 | | | | 1,492 | | | | 1,394 | |
| | 10,625 | | | | 10,773 | | | | 10,845 | | | | 10,982 | | | | 10,742 | | | | 10,471 | | | | 10,523 | |
| | 12,517 | | | | 9,565 | | �� | | 27,186 | | | | 21,969 | | | | 5,734 | | | | 12,515 | | | | 2,721 | |
| | |
| | 3,275,047 | | | | 990,605 | | | | 551,893 | | | | 3,263,023 | | | | 169,198 | | | | 6,821,608 | | | | 896,512 | |
| | 0 | | | | 0 | | | | (10,756 | ) | | | 0 | | | | (14,972 | ) | | | 0 | | | | 0 | |
| | |
| | 3,275,047 | | | | 990,605 | | | | 541,137 | | | | 3,263,023 | | | | 154,226 | | | | 6,821,608 | | | | 896,512 | |
| | |
| | (2,236,761 | ) | | | 19,502,446 | | | | 72,388 | | | | 9,565,360 | | | | 569,097 | | | | (978,251 | ) | | | 1,366,489 | |
| | |
| | | | | | |
| | | | | | | | | | | | | | | | | | | | | | | | | | |
| | | | | | |
| | | | | | | | | | | | | | | | | | | | | | | | | | |
| | 57,757,303 | | | | 147,894,545 | | | | 27,940,439 | | | | 3,014,353 | | | | 2,160,501 | | | | 11,498,961 | | | | 20,706,828 | |
| | 3,355 | | | | 1,437,022 | | | | 6 | | | | (164 | ) | | | 0 | | | | 715 | | | | 30 | |
| | 0 | | | | 2,829,411 | | | | 0 | | | | 0 | | | | 39,449 | | | | 0 | | | | 0 | |
| | |
| | 57,760,658 | | | | 152,160,978 | | | | 27,940,445 | | | | 3,014,189 | | | | 2,199,950 | | | | 11,499,676 | | | | 20,706,858 | |
| | |
| | | | | | |
| | | | | | | | | | | | | | | | | | | | | | | | | | |
| | 53,419,156 | | | | 30,215,707 | | | | (16,732,880 | ) | | | 52,088,189 | | | | 4,029,153 | | | | 200,812,889 | | | | 3,266,049 | |
| | (2,900 | ) | | | 717,105 | | | | 0 | | | | 0 | | | | 0 | | | | 0 | | | | 0 | |
| | 0 | | | | 233,310 | | | | 0 | | | | 0 | | | | 41,367 | | | | 0 | | | | 0 | |
| | |
| | 53,416,256 | | | | 31,166,122 | | | | (16,732,880 | ) | | | 52,088,189 | | | | 4,070,520 | | | | 200,812,889 | | | | 3,266,049 | |
| | |
| | 111,176,914 | | | | 183,327,100 | | | | 11,207,565 | | | | 55,102,378 | | | | 6,270,470 | | | | 212,312,565 | | | | 23,972,907 | |
| | |
| $ | 108,940,153 | | | $ | 202,829,546 | | | $ | 11,279,953 | | | $ | 64,667,738 | | | $ | 6,839,567 | | | $ | 211,334,314 | | | $ | 25,339,396 | |
| | |
| | | | | | |
| | $0 | | | | $40,647 | | | | $95,995 | | | | $1,163,786 | | | | $63 | | | | $23 | | | | $0 | |
The accompanying notes are an integral part of these financial statements.
| | | | |
| 122 | | Wells Fargo Equity Gateway Funds | | Statements of changes in net assets |
| | | | | | | | |
| | | C&B Large Cap Value Portfolio | |
| | | Six months ended
November 30, 2017
(unaudited) | | | Year ended
May 31, 2017 | |
| | |
Operations | | | | | | | | |
Net investment income | | $ | 1,962,282 | | | $ | 3,655,932 | |
Net realized gains on investments | | | 21,721,158 | | | | 33,005,051 | |
Net change in unrealized gains (losses) on investments | | | 11,480,147 | | | | 22,347,142 | |
| | | | |
Net increase in net assets resulting from operations | | | 35,163,587 | | | | 59,008,125 | |
| | | | |
| |
Capital share transactions | | | | |
Transactions in investors’ beneficial interests | | | | | | | | |
Contributions | | | 41,986,399 | | | | 92,843,484 | |
Withdrawals | | | (19,338,933 | ) | | | (80,962,518 | ) |
| | | | |
Net increase in net assets resulting from capital share transactions | | | 22,647,466 | | | | 11,880,966 | |
| | | | |
Total increase in net assets | | | 57,811,053 | | | | 70,889,091 | |
| | | | |
| |
Net assets | | | | |
Beginning of period | | | 363,853,380 | | | | 292,964,289 | |
| | | | |
End of period | | $ | 421,664,433 | | | $ | 363,853,380 | |
| | | | |
The accompanying notes are an integral part of these financial statements.
| | | | | | |
| Statements of changes in net assets | | Wells Fargo Equity Gateway Funds | | | 123 | |
| | | | | | | | |
| | | Diversified Large Cap Growth Portfolio | |
| | | Six months ended
November 30, 2017
(unaudited) | | | Year ended
May 31, 2017 | |
| | |
Operations | | | | | | | | |
Net investment income | | $ | 267,200 | | | $ | 559,502 | |
Net realized gains on investments | | | 10,794,261 | | | | 16,539,222 | |
Net change in unrealized gains (losses) on investments | | | 1,716,628 | | | | (1,622,597 | ) |
| | | | |
Net increase in net assets resulting from operations | | | 12,778,089 | | | | 15,476,127 | |
| | | | |
| |
Capital share transactions | | | | |
Transactions in investors’ beneficial interests | | | | | | | | |
Contributions | | | 473,194 | | | | 1,745,319 | |
Withdrawals | | | (26,357,072 | ) | | | (26,727,509 | ) |
| | | | |
Net decrease in net assets resulting from capital share transactions | | | (25,883,878 | ) | | | (24,982,190 | ) |
| | | | |
Total decrease in net assets | | | (13,105,789 | ) | | | (9,506,063 | ) |
| | | | |
| |
Net assets | | | | |
Beginning of period | | | 106,252,413 | | | | 115,758,476 | |
| | | | |
End of period | | $ | 93,146,624 | | | $ | 106,252,413 | |
| | | | |
The accompanying notes are an integral part of these financial statements.
| | | | |
| 124 | | Wells Fargo Equity Gateway Funds | | Statements of changes in net assets |
| | | | | | | | |
| | | Emerging Growth Portfolio | |
| | | Six months ended
November 30, 2017
(unaudited) | | | Year ended
May 31, 2017 | |
| | |
Operations | | | | | | | | |
Net investment loss | | $ | (2,236,761 | ) | | $ | (1,240,591 | ) |
Net realized gains on investments | | | 57,760,658 | | | | 135,595,165 | |
Net change in unrealized gains (losses) on investments | | | 53,416,256 | | | | 47,322,234 | |
| | | | |
Net increase in net assets resulting from operations | | | 108,940,153 | | | | 181,676,808 | |
| | | | |
| |
Capital share transactions | | | | |
Transactions in investors’ beneficial interests | | | | | | | | |
Contributions | | | 5,445,214 | | | | 56,931,248 | |
Withdrawals | | | (79,793,760 | ) | | | (342,455,709 | ) |
| | | | |
Net decrease in net assets resulting from capital share transactions | | | (74,348,546 | ) | | | (285,524,461 | ) |
| | | | |
Total increase (decrease) in net assets | | | 34,591,607 | | | | (103,847,653 | ) |
| | | | |
| |
Net assets | | | | |
Beginning of period | | | 794,640,012 | | | | 898,487,665 | |
| | | | |
End of period | | $ | 829,231,619 | | | $ | 794,640,012 | |
| | | | |
The accompanying notes are an integral part of these financial statements.
| | | | | | |
| Statements of changes in net assets | | Wells Fargo Equity Gateway Funds | | | 125 | |
| | | | | | | | |
| | | Index Portfolio | |
| | | Six months ended
November 30, 2017
(unaudited) | | | Year ended
May 31, 2017 | |
| | |
Operations | | | | | | | | |
Net investment income | | $ | 19,502,446 | | | $ | 44,665,747 | |
Net realized gains on investments | | | 152,160,978 | | | | 304,897,871 | |
Net change in unrealized gains (losses) on investments | | | 31,166,122 | | | | 2,704,619 | |
| | | | |
Net increase in net assets resulting from operations | | | 202,829,546 | | | | 352,268,237 | |
| | | | |
| |
Capital share transactions | | | | |
Transactions in investors’ beneficial interests | | | | | | | | |
Contributions | | | 6,569,713 | | | | 39,021,343 | |
Withdrawals | | | (276,360,437 | ) | | | (716,167,440 | ) |
| | | | |
Net decrease in net assets resulting from capital share transactions | | | (269,790,724 | ) | | | (677,146,097 | ) |
| | | | |
Total decrease in net assets | | | (66,961,178 | ) | | | (324,877,860 | ) |
| | | | |
| |
Net assets | | | | |
Beginning of period | | | 2,015,534,598 | | | | 2,340,412,458 | |
| | | | |
End of period | | $ | 1,948,573,420 | | | $ | 2,015,534,598 | |
| | | | |
The accompanying notes are an integral part of these financial statements.
| | | | |
| 126 | | Wells Fargo Equity Gateway Funds | | Statements of changes in net assets |
| | | | | | | | |
| | | International Growth Portfolio | |
| | | Six months ended
November 30, 2017
(unaudited) | | | Year ended
May 31, 2017 | |
| | |
Operations | | | | | | | | |
Net investment income | | $ | 72,388 | | | $ | 1,772,360 | |
Net realized gains on investments | | | 27,940,445 | | | | 1,901,476 | |
Net change in unrealized gains (losses) on investments | | | (16,732,880 | ) | | | 9,943,224 | |
| | | | |
Net increase in net assets resulting from operations | | | 11,279,953 | | | | 13,617,060 | |
| | | | |
| |
Capital share transactions | | | | |
Transactions in investors’ beneficial interests | | | | | | | | |
Contributions | | | 12,249,110 | | | | 4,029,844 | |
Withdrawals | | | (119,141,315 | ) | | | (28,532,489 | ) |
| | | | |
Net decrease in net assets resulting from capital share transactions | | | (106,892,205 | ) | | | (24,502,645 | ) |
| | | | |
Total decrease in net assets | | | (95,612,252 | ) | | | (10,885,585 | ) |
| | | | |
| |
Net assets | | | | |
Beginning of period | | | 137,491,030 | | | | 148,376,615 | |
| | | | |
End of period | | $ | 41,878,778 | | | $ | 137,491,030 | |
| | | | |
The accompanying notes are an integral part of these financial statements.
| | | | | | |
| Statements of changes in net assets | | Wells Fargo Equity Gateway Funds | | | 127 | |
| | | | | | | | |
| | | International Value Portfolio | |
| | | Six months ended
November 30, 2017
(unaudited) | | | Year ended
May 31, 2017 | |
| | |
Operations | | | | | | | | |
Net investment income | | $ | 9,565,360 | | | $ | 17,160,119 | |
Net realized gains (losses) on investments | | | 3,014,189 | | | | (10,175,083 | ) |
Net change in unrealized gains (losses) on investments | | | 52,088,189 | | | | 100,789,122 | |
| | | | |
Net increase in net assets resulting from operations | | | 64,667,738 | | | | 107,774,158 | |
| | | | |
| |
Capital share transactions | | | | |
Transactions in investors’ beneficial interests | | | | | | | | |
Contributions | | | 69,240,560 | | | | 236,560,483 | |
Withdrawals | | | (47,650,472 | ) | | | (100,015,884 | ) |
| | | | |
Net increase in net assets resulting from capital share transactions | | | 21,590,088 | | | | 136,544,599 | |
| | | | |
Total increase in net assets | | | 86,257,826 | | | | 244,318,757 | |
| | | | |
| |
Net assets | | | | |
Beginning of period | | | 752,637,727 | | | | 508,318,970 | |
| | | | |
End of period | | $ | 838,895,553 | | | $ | 752,637,727 | |
| | | | |
The accompanying notes are an integral part of these financial statements.
| | | | |
| 128 | | Wells Fargo Equity Gateway Funds | | Statements of changes in net assets |
| | | | | | | | |
| | | Large Company Value Portfolio | |
| | | Six months ended
November 30, 2017
(unaudited) | | | Year ended
May 31, 2017 | |
| | |
Operations | | | | | | | | |
Net investment income | | $ | 569,097 | | | $ | 1,094,138 | |
Net realized gains on investments | | | 2,199,950 | | | | 16,081,914 | |
Net change in unrealized gains (losses) on investments | | | 4,070,520 | | | | (7,786,892 | ) |
| | | | |
Net increase in net assets resulting from operations | | | 6,839,567 | | | | 9,389,160 | |
| | | | |
| |
Capital share transactions | | | | |
Transactions in investors’ beneficial interests | | | | | | | | |
Contributions | | | 480,432 | | | | 911,057 | |
Withdrawals | | | (9,940,243 | ) | | | (18,196,238 | ) |
| | | | |
Net decrease in net assets resulting from capital share transactions | | | (9,459,811 | ) | | | (17,285,181 | ) |
| | | | |
Total decrease in net assets | | | (2,620,244 | ) | | | (7,896,021 | ) |
| | | | |
| |
Net assets | | | | |
Beginning of period | | | 71,218,809 | | | | 79,114,830 | |
| | | | |
End of period | | $ | 68,598,565 | | | $ | 71,218,809 | |
| | | | |
The accompanying notes are an integral part of these financial statements.
| | | | | | |
| Statements of changes in net assets | | Wells Fargo Equity Gateway Funds | | | 129 | |
| | | | | | | | |
| | | Small Company Growth Portfolio | |
| | | Six months ended
November 30, 2017
(unaudited) | | | Year ended
May 31, 2017 | |
| | |
Operations | | | | | | | | |
Net investment loss | | $ | (978,251 | ) | | $ | (2,125,287 | ) |
Net realized gains (losses) on investments | | | 11,499,676 | | | | (16,225,835 | ) |
Net change in unrealized gains (losses) on investments | | | 200,812,889 | | | | 257,670,175 | |
| | | | |
Net increase in net assets resulting from operations | | | 211,334,314 | | | | 239,319,053 | |
| | | | |
| |
Capital share transactions | | | | |
Transactions in investors’ beneficial interests | | | | | | | | |
Contributions | | | 38,513,574 | | | | 485,927,559 | |
Withdrawals | | | (92,652,047 | ) | | | (248,318,606 | ) |
| | | | |
Net increase (decrease) in net assets resulting from capital share transactions | | | (54,138,473 | ) | | | 237,608,953 | |
| | | | |
Total increase in net assets | | | 157,195,841 | | | | 476,928,006 | |
| | | | |
| |
Net assets | | | | |
Beginning of period | | | 1,673,524,446 | | | | 1,196,596,440 | |
| | | | |
End of period | | $ | 1,830,720,287 | | | $ | 1,673,524,446 | |
| | | | |
The accompanying notes are an integral part of these financial statements.
| | | | |
| 130 | | Wells Fargo Equity Gateway Funds | | Statements of changes in net assets |
| | | | | | | | |
| | | Small Company Value Portfolio | |
| | | Six months ended
November 30, 2017
(unaudited) | | | Year ended
May 31, 2017 | |
| | |
Operations | | | | | | | | |
Net investment income | | $ | 1,366,489 | | | $ | 1,579,627 | |
Net realized gains on investments | | | 20,706,858 | | | | 28,865,439 | |
Net change in unrealized gains (losses) on investments | | | 3,266,049 | | | | 9,357,164 | |
| | | | |
Net increase in net assets resulting from operations | | | 25,339,396 | | | | 39,802,230 | |
| | | | |
| |
Capital share transactions | | | | |
Transactions in investors’ beneficial interests | | | | | | | | |
Contributions | | | 6,081,013 | | | | 22,385,660 | |
Withdrawals | | | (82,150,882 | ) | �� | | (65,532,861 | ) |
| | | | |
Net decrease in net assets resulting from capital share transactions | | | (76,069,869 | ) | | | (43,147,201 | ) |
| | | | |
Total decrease in net assets | | | (50,730,473 | ) | | | (3,344,971 | ) |
| | | | |
| |
Net assets | | | | |
Beginning of period | | | 214,224,799 | | | | 217,569,770 | |
| | | | |
End of period | | $ | 163,494,326 | | | $ | 214,224,799 | |
| | | | |
The accompanying notes are an integral part of these financial statements.
| | | | | | |
| Financial highlights | | Wells Fargo Equity Gateway Funds | | | 131 | |
| | | | | | | | | | | | | | | | | | | | |
| | | Ratio to average net assets (annualized) | | | | | | Portfolio turnover
rate | |
| | | Net investment
income (loss) | | | Gross
expenses | | | Net
expenses | | | Total
return1 | | |
| | | | | |
C&B Large Cap Value Portfolio | | | | | | | | | | | | | | | | | | | | |
Six months ended November 30, 2017 (unaudited) | | | 0.99 | % | | | 0.67 | % | | | 0.67 | % | | | 9.33 | % | | | 18 | % |
Year ended May 31, 2017 | | | 1.09 | % | | | 0.68 | % | | | 0.68 | % | | | 19.17 | % | | | 89 | % |
Year ended May 31, 2016 | | | 1.33 | % | | | 0.68 | % | | | 0.68 | % | | | 0.35 | % | | | 29 | % |
Year ended May 31, 2015 | | | 1.20 | % | | | 0.68 | % | | | 0.68 | % | | | 10.29 | % | | | 35 | % |
Year ended May 31, 2014 | | | 1.35 | % | | | 0.68 | % | | | 0.68 | % | | | 17.80 | % | | | 22 | % |
Year ended May 31, 2013 | | | 1.73 | % | | | 0.68 | % | | | 0.68 | % | | | 29.30 | % | | | 18 | % |
| | | | | |
Diversified Large Cap Growth Portfolio | | | | | | | | | | | | | | | | | | | | |
Six months ended November 30, 2017 (unaudited) | | | 0.53 | % | | | 0.79 | % | | | 0.62 | % | | | 13.51 | % | | | 19 | % |
Year ended May 31, 2017 | | | 0.51 | % | | | 0.78 | % | | | 0.62 | % | | | 15.36 | % | | | 98 | % |
Year ended May 31, 2016 | | | 0.29 | % | | | 0.74 | % | | | 0.62 | % | | | (2.28 | )% | | | 59 | % |
Year ended May 31, 2015 | | | 0.28 | % | | | 0.72 | % | | | 0.62 | % | | | 13.11 | % | | | 46 | % |
Year ended May 31, 2014 | | | 0.15 | % | | | 0.72 | % | | | 0.62 | % | | | 21.70 | % | | | 54 | % |
Year ended May 31, 2013 | | | 0.51 | % | | | 0.71 | % | | | 0.62 | % | | | 20.30 | % | | | 56 | % |
| | | | | |
Emerging Growth Portfolio | | | | | | | | | | | | | | | | | | | | |
Six months ended November 30, 2017 (unaudited) | | | (0.55 | )% | | | 0.81 | % | | | 0.81 | % | | | 14.43 | % | | | 26 | % |
Year ended May 31, 2017 | | | (0.15 | )% | | | 0.81 | % | | | 0.81 | % | | | 23.97 | % | | | 115 | % |
Year ended May 31, 2016 | | | (0.40 | )% | | | 0.80 | % | | | 0.80 | % | | | (14.47 | )% | | | 66 | % |
Year ended May 31, 2015 | | | (0.63 | )% | | | 0.80 | % | | | 0.80 | % | | | 24.02 | % | | | 56 | % |
Year ended May 31, 2014 | | | (0.62 | )% | | | 0.80 | % | | | 0.80 | % | | | 11.92 | % | | | 63 | % |
Year ended May 31, 2013 | | | (0.47 | )% | | | 0.80 | % | | | 0.80 | % | | | 20.53 | % | | | 65 | % |
| | | | | |
Index Portfolio | | | | | | | | | | | | | | | | | | | | |
Six months ended November 30, 2017 (unaudited) | | | 1.96 | % | | | 0.10 | % | | | 0.10 | % | | | 10.85 | % | | | 2 | % |
Year ended May 31, 2017 | | | 2.03 | % | | | 0.10 | % | | | 0.10 | % | | | 17.36 | % | | | 9 | % |
Year ended May 31, 2016 | | | 2.12 | % | | | 0.11 | % | | | 0.10 | % | | | 1.62 | % | | | 4 | % |
Year ended May 31, 2015 | | | 1.96 | % | | | 0.11 | % | | | 0.11 | % | | | 11.69 | % | | | 4 | % |
Year ended May 31, 2014 | | | 1.99 | % | | | 0.10 | % | | | 0.10 | % | | | 20.33 | % | | | 5 | % |
Year ended May 31, 2013 | | | 2.20 | % | | | 0.09 | % | | | 0.09 | % | | | 27.22 | % | | | 4 | % |
| | | | | |
International Growth Portfolio | | | | | | | | | | | | | | | | | | | | |
Six months ended November 30, 2017 (unaudited) | | | 0.13 | % | | | 1.01 | % | | | 0.99 | % | | | 10.19 | % | | | 37 | % |
Year ended May 31, 2017 | | | 1.25 | % | | | 0.98 | % | | | 0.98 | % | | | 10.31 | % | | | 121 | % |
Year ended May 31, 2016 | | | 1.16 | % | | | 0.99 | % | | | 0.99 | % | | | (12.40 | )% | | | 62 | % |
Year ended May 31, 2015 | | | 0.76 | % | | | 1.00 | % | | | 1.00 | % | | | 5.13 | % | | | 51 | % |
Year ended May 31, 2014 | | | 1.13 | % | | | 1.00 | % | | | 1.00 | % | | | 16.45 | % | | | 46 | % |
Year ended May 31, 2013 | | | 1.63 | % | | | 1.04 | % | | | 1.04 | % | | | 30.34 | % | | | 46 | % |
| | | | | |
International Value Portfolio | | | | | | | | | | | | | | | | | | | | |
Six months ended November 30, 2017 (unaudited) | | | 2.41 | % | | | 0.82 | % | | | 0.82 | % | | | 8.48 | % | | | 6 | % |
Year ended May 31, 2017 | | | 3.03 | % | | | 0.87 | % | | | 0.87 | % | | | 19.16 | % | | | 41 | % |
Year ended May 31, 2016 | | | 2.50 | % | | | 0.91 | % | | | 0.91 | % | | | (11.85 | )% | | | 14 | % |
Year ended May 31, 2015 | | | 2.45 | % | | | 0.91 | % | | | 0.91 | % | | | (1.04 | )% | | | 18 | % |
Year ended May 31, 2014 | | | 3.09 | % | | | 0.91 | % | | | 0.91 | % | | | 18.22 | % | | | 11 | % |
Year ended May 31, 2013 | | | 3.04 | % | | | 0.91 | % | | | 0.91 | % | | | 29.45 | % | | | 16 | % |
| | | | | |
Large Company Value Portfolio | | | | | | | | | | | | | | | | | | | | |
Six months ended November 30, 2017 (unaudited) | | | 1.64 | % | | | 0.49 | % | | | 0.44 | % | | | 10.36 | % | | | 117 | % |
Year ended May 31, 2017 | | | 1.45 | % | | | 0.68 | % | | | 0.66 | % | | | 13.22 | % | | | 203 | % |
Year ended May 31, 2016 | | | 1.54 | % | | | 0.76 | % | | | 0.74 | % | | | (3.92 | )% | | | 50 | % |
Year ended May 31, 2015 | | | 1.09 | % | | | 0.74 | % | | | 0.74 | % | | | 7.90 | % | | | 72 | % |
Year ended May 31, 2014 | | | 0.99 | % | | | 0.73 | % | | | 0.73 | % | | | 20.26 | % | | | 62 | % |
Year ended May 31, 2013 | | | 1.49 | % | | | 0.78 | % | | | 0.74 | % | | | 28.91 | % | | | 95 | % |
Please see footnote on page 132.
The accompanying notes are an integral part of these financial statements.
| | | | |
| 132 | | Wells Fargo Equity Gateway Funds | | Financial highlights |
| | | | | | | | | | | | | | | | | | | | |
| | | Ratio to average net assets (annualized) | | | | | | Portfolio turnover
rate | |
| | | Net investment
income (loss) | | | Gross
expenses | | | Net
expenses | | | Total
return1 | | |
| | | | | |
Small Company Growth Portfolio | | | | | | | | | | | | | | | | | | | | |
Six months ended November 30, 2017 (unaudited) | | | (0.11 | )% | | | 0.78 | % | | | 0.78 | % | | | 12.83 | % | | | 17 | % |
Year ended May 31, 2017 | | | (0.14 | )% | | | 0.79 | % | | | 0.79 | % | | | 18.15 | % | | | 82 | % |
Year ended May 31, 2016 | | | (0.03 | )% | | | 0.80 | % | | | 0.80 | % | | | (13.86 | )% | | | 49 | % |
Year ended May 31, 2015 | | | (0.32 | )% | | | 0.82 | % | | | 0.82 | % | | | 18.07 | % | | | 58 | % |
Year ended May 31, 2014 | | | (0.37 | )% | | | 0.83 | % | | | 0.83 | % | | | 23.47 | % | | | 77 | % |
Year ended May 31, 2013 | | | (0.02 | )% | | | 0.86 | % | | | 0.86 | % | | | 31.39 | % | | | 109 | % |
| | | | | |
Small Company Value Portfolio | | | | | | | | | | | | | | | | | | | | |
Six months ended November 30, 2017 (unaudited) | | | 1.28 | % | | | 0.84 | % | | | 0.84 | % | | | 13.83 | % | | | 27 | % |
Year ended May 31, 2017 | | | 0.72 | % | | | 0.84 | % | | | 0.84 | % | | | 19.44 | % | | | 110 | % |
Year ended May 31, 2016 | | | 0.62 | % | | | 0.85 | % | | | 0.85 | % | | | (4.96 | )% | | | 72 | % |
Year ended May 31, 2015 | | | 0.89 | % | | | 0.84 | % | | | 0.84 | % | | | 7.29 | % | | | 54 | % |
Year ended May 31, 2014 | | | 0.89 | % | | | 0.85 | % | | | 0.85 | % | | | 18.09 | % | | | 47 | % |
Year ended May 31, 2013 | | | 0.58 | % | | | 0.85 | % | | | 0.85 | % | | | 30.76 | % | | | 57 | % |
| 1 | Returns for periods of less than one year are not annualized. |
The accompanying notes are an integral part of these financial statements.
| | | | | | |
| Notes to financial statements (unaudited) | | Wells Fargo Equity Gateway Funds | | | 133 | |
1. ORGANIZATION
Wells Fargo Master Trust (the “Trust”), a Delaware statutory trust organized on March 10, 1999, is an open-end management investment company registered under the Investment Company Act of 1940, as amended (the “1940 Act”). As an investment company, the Trust follows the accounting and reporting guidance in Financial Accounting Standards Board Accounting Standards Codification Topic 946, Financial Services – Investment Companies. These financial statements report on the following portfolios: Wells Fargo C&B Large Cap Value Portfolio (“C&B Large Cap Value Portfolio”), Wells Fargo Diversified Large Cap Growth Portfolio (“Diversified Large Cap Growth Portfolio”), Wells Fargo Emerging Growth Portfolio (“Emerging Growth Portfolio”), Wells Fargo Index Portfolio (“Index Portfolio”), Wells Fargo International Growth Portfolio (“International Growth Portfolio”), Wells Fargo International Value Portfolio (“International Value Portfolio”), Wells Fargo Large Company Value Portfolio (“Large Company Value Portfolio”), Wells Fargo Small Company Growth Portfolio (“Small Company Growth Portfolio”), and Wells Fargo Small Company Value Portfolio (“Small Company Value Portfolio”) (each, a “Portfolio”, collectively, the “Portfolios”). Each Portfolio is a diversified series of the Trust.
2. SIGNIFICANT ACCOUNTING POLICIES
The following significant accounting policies, which are consistently followed in the preparation of the financial statements of each Portfolio, are in conformity with U.S. generally accepted accounting principles which require management to make estimates and assumptions that affect the reported amounts of assets and liabilities, disclosure of contingent assets and liabilities at the date of the financial statements, and the reported amounts of revenues and expenses during the reporting period. Actual results could differ from those estimates.
Securities valuation
All investments are valued each business day as of the close of regular trading on the New York Stock Exchange (generally 4 p.m. Eastern Time), although the Portfolios may deviate from this calculation time under unusual or unexpected circumstances.
Equity securities and futures that are listed on a foreign or domestic exchange or market are valued at the official closing price or, if none, the last sales price. If no sale occurs on the principal exchange or market that day, a fair value price will be determined in accordance with the Portfolios’ Valuation Procedures.
The values of securities denominated in foreign currencies are translated into U.S. dollars at rates provided by an independent foreign currency pricing source at a time each business day specified by the Management Valuation Team of Wells Fargo Funds Management, LLC (“Funds Management”).
Many securities markets and exchanges outside the U.S. close prior to the close of the New York Stock Exchange and therefore may not fully reflect trading or events that occur after the close of the principal exchange in which the foreign securities are traded, but before the close of the New York Stock Exchange. If such trading or events are expected to materially affect the value of such securities, then fair value pricing procedures approved by the Board of Trustees of the Portfolios are applied. These procedures take into account multiple factors including movements in U.S. securities markets after foreign exchanges close. Foreign securities that are fair valued under these procedures are categorized as Level 2 and the application of these procedures may result in transfers between Level 1 and Level 2. Depending on market activity, such fair valuations may be frequent. Such fair value pricing may result in net asset values that are higher or lower than net asset values based on the last reported sales price or latest quoted bid price. On November 30, 2017, such fair value pricing was used in pricing foreign securities.
Debt securities are valued at the evaluated bid price provided by an independent pricing service or, if a reliable price is not available, the quoted bid price from an independent broker-dealer.
Investments in registered open-end investment companies are valued at net asset value. Interests in non-registered investment companies that are redeemable at net asset value are fair valued normally at net asset value.
Investments which are not valued using any of the methods discussed above are valued at their fair value, as determined in good faith by the Board of Trustees. The Board of Trustees has established a Valuation Committee comprised of the Trustees and has delegated to it the authority to take any actions regarding the valuation of portfolio securities that the Valuation Committee deems necessary or appropriate, including determining the fair value of portfolio securities, unless the determination has been delegated to the Management Valuation Team. The Board of Trustees retains the authority to make or ratify any valuation decisions or approve any changes to the Valuation Procedures as it deems appropriate. On a quarterly basis, the Board of Trustees receives reports on any valuation actions taken by the Valuation Committee or the Management Valuation Team which may include items for ratification.
Valuations of fair valued securities are compared to the next actual sales price when available, or other appropriate market values, to assess the continued appropriateness of the fair valuation methodologies used. These securities are fair valued on a day-to-day basis, taking into consideration changes to appropriate market information and any significant
| | | | |
| 134 | | Wells Fargo Equity Gateway Funds | | Notes to financial statements (unaudited) |
changes to the inputs considered in the valuation process until there is a readily available price provided on an exchange or by an independent pricing service. Valuations received from an independent pricing service or independent broker-dealer quotes are periodically validated by comparisons to most recent trades and valuations provided by other independent pricing services in addition to the review of prices by the adviser and/or subadviser. Unobservable inputs used in determining fair valuations are identified based on the type of security, taking into consideration factors utilized by market participants in valuing the investment, knowledge about the issuer and the current market environment.
Foreign currency translation
The accounting records of the Portfolios are maintained in U.S. dollars. The value of other assets and liabilities denominated in foreign currencies are translated into U.S. dollars at rates provided by an independent foreign currency pricing source at a time each business day specified by the Management Valuation Team. Purchases and sales of securities, and income and expenses are converted at the rate of exchange on the respective dates of such transactions. Net realized foreign exchange gains or losses arise from sales of foreign currencies, currency gains or losses realized between the trade and settlement dates on securities transactions, and the difference between the amounts of dividends, interest and foreign withholding taxes recorded and the U.S. dollar equivalent of the amounts actually paid or received. Net unrealized foreign exchange gains and losses arise from changes in the fair value of assets and liabilities other than investments in securities resulting from changes in exchange rates. The changes in net assets arising from changes in exchange rates and the changes in net assets resulting from changes in market prices of securities are not separately presented. Such changes are included in net realized and unrealized gains or losses from investments.
Participation notes
Each Portfolio may invest in participation notes to gain exposure to securities in certain foreign markets. Participation notes are issued by banks or broker-dealers and are designed to offer a return linked to a particular underlying foreign security. Participation notes involve transaction costs, which may be higher than those applicable to the underlying foreign security. The holder of the participation note is entitled to receive from the bank or broker-dealer, an amount equal to the dividend paid by the issuer of the underlying foreign security; however, the holder is not entitled to the same rights (i.e. dividends, voting rights) as an owner of the underlying foreign security. Investments in participation notes involve risks beyond those normally associated with a direct investment in an underlying security. The Portfolio has no rights against the issuer of the underlying foreign security and participation notes expose the Portfolio to counterparty risk in the event the counterparty does not perform. There is also no assurance there will be a secondary trading market for the participation note or that the trading price of the participation note will equal the underlying value of the foreign security that it seeks to replicate.
Security loans
Each Portfolio may lend its securities from time to time in order to earn additional income in the form of fees or interest on securities received as collateral or the investment of any cash received as collateral. The Portfolio continues to receive interest or dividends on the securities loaned. The Portfolio receives collateral in the form of cash or securities with a value at least equal to the value of the securities on loan. The value of the loaned securities is determined at the close of each business day and any additional required collateral is delivered to the Portfolio on the next business day. In a securities lending transaction, the net asset value of the Portfolio will be affected by an increase or decrease in the value of the securities loaned and by an increase or decrease in the value of the instrument in which collateral is invested. The amount of securities lending activity undertaken by the Portfolio fluctuates from time to time. In the event of default or bankruptcy by the borrower, the Portfolio may be prevented from recovering the loaned securities or gaining access to the collateral or may experience delays or costs in doing so. In addition, the investment of any cash collateral received may lose all or part of its value. The Portfolio has the right under the lending agreement to recover the securities from the borrower on demand.
Each Portfolio lends its securities through an unaffiliated securities lending agent. Cash collateral received in connection with its securities lending transactions is invested in Securities Lending Cash Investments, LLC (the “Securities Lending Fund”). The Securities Lending Fund is exempt from registration under Section 3(c)(7) of the 1940 Act and is managed by Funds Management and is subadvised by Wells Capital Management Incorporated (“WellsCap”), an affiliate of Funds Management and an indirect wholly owned subsidiary of Wells Fargo & Company (“Wells Fargo”). Funds Management receives an advisory fee starting at 0.05% and declining to 0.01% as the average daily net assets of the Securities Lending Fund increase. All of the fees received by Funds Management are paid to WellsCap for its services as subadviser. The Securities Lending Fund seeks to provide a positive return compared to the daily Fed Funds Open Rate by investing in high-quality, U.S. dollar-denominated short-term money market instruments. Securities Lending Fund investments are valued at the evaluated bid price provided by an independent pricing service. Income earned from investment in the Securities Lending Fund is included in securities lending income from affiliates (net of fees and rebates) on the Statements of Operations.
Futures contracts
Each Portfolio may enter into futures contracts and may be subject to interest rate risk or equity price risk in the normal course of pursuing its investment objectives. The Portfolio may buy and sell futures contracts in order to gain exposure to, or protect against, changes in interest rates and security values. The primary risks associated with the use of futures contracts are the imperfect correlation between changes in market values of securities held by the Portfolio and the prices of futures contracts, and the possibility of an illiquid market.
| | | | | | |
| Notes to financial statements (unaudited) | | Wells Fargo Equity Gateway Funds | | | 135 | |
The aggregate principal amounts of the contracts are not recorded in the financial statements. Fluctuations in the value of the contracts are recorded in the Statements of Assets and Liabilities as an asset or liability and in the Statements of Operations as unrealized gains or losses until the contracts are closed, at which point they are recorded as net realized gains or losses on futures contracts. With futures contracts, there is minimal counterparty risk to the Portfolio since futures are exchange traded and the exchange’s clearinghouse, as counterparty to all exchange traded futures, guarantees the futures against default.
Security transactions and income recognition
Securities transactions are recorded on a trade date basis. Realized gains or losses are recorded on the basis of identified cost.
Dividend income is recognized on the ex-dividend date, except for certain dividends from foreign securities which are recorded as soon as the custodian verifies the ex-dividend date. Dividend income from foreign securities is recorded net of foreign taxes withheld where recovery of such taxes is not assured.
Interest income is accrued daily and bond discounts are accreted and premiums are amortized daily based on the effective interest method. To the extent debt obligations are placed on non-accrual status, any related interest income may be reduced by writing off interest receivables when the collection of all or a portion of interest has been determined to be doubtful based on consistently applied procedures and the fair value has decreased. If the issuer subsequently resumes interest payments or when the collectability of interest is reasonably assured, the debt obligation is removed from non-accrual status.
Federal and other taxes
Each Portfolio is treated as a separate entity for federal income tax purposes. Each Portfolio is not required to pay federal income taxes on its net investment income and net capital gain as it is treated as a partnerships for federal income tax purposes. All interest, dividends, gains and losses of a Portfolio are deemed to have been “passed through” to the interest holders in proportion to their holdings of the Portfolio regardless of whether such interest, dividends and gains have been distributed by the Portfolio.
Each Portfolio’s income tax returns and all financial records supporting those returns for the prior three fiscal years are subject to examination by the federal revenue authority. Management has analyzed each Portfolio’s tax positions taken on federal, state, and foreign tax returns for all open tax years and does not believe that there are any uncertain tax positions that require recognition of a tax liability.
As of November 30, 2017, the aggregate cost of all investments for federal income tax purposes and the unrealized gains (losses) were as follows:
| | | | | | | | | | | | | | | | |
| | | Tax cost | | | Gross
unrealized
gains | | | Gross
unrealized
losses | | | Net
unrealized
gains | |
C&B Large Cap Value Portfolio | | $ | 337,269,887 | | | $ | 107,820,240 | | | $ | (11,869,624 | ) | | $ | 95,950,616 | |
Diversified Large Cap Growth Portfolio | | | 57,478,387 | | | | 36,771,433 | | | | (163,060 | ) | | | 36,608,373 | |
Emerging Growth Portfolio | | | 581,001,147 | | | | 292.824,064 | | | | (4,339,078 | ) | | | 288,484,986 | |
Index Portfolio | | | 703,431,534 | | | | 1,251,543,834 | | | | (12,774,178 | ) | | | 1,238,769,656 | |
International Growth Portfolio | | | 42,096,472 | | | | 8,884,273 | | | | (223,422 | ) | | | 8,660,851 | |
International Value Portfolio | | | 756,728,329 | | | | 152,755,154 | | | | (60,401,072 | ) | | | 92,354,082 | |
Large Company Value Portfolio | | | 60,850,246 | | | | 8,278,561 | | | | (792,412 | ) | | | 7,486,149 | |
Small Company Growth Portfolio | | | 1,543,991,402 | | | | 574,992,701 | | | | (57,111,649 | ) | | | 517,881,052 | |
Small Company Value Portfolio | | | 147,806,459 | | | | 39,399,149 | | | | (5,441,847 | ) | | | 33,957,302 | |
3. FAIR VALUATION MEASUREMENTS
Fair value measurements of investments are determined within a framework that has established a fair value hierarchy based upon the various data inputs utilized in determining the value of each Portfolio’s investments. The three-level hierarchy gives the highest priority to unadjusted quoted prices in active markets for identical assets or liabilities (Level 1) and the lowest priority to unobservable inputs (Level 3). Each Portfolio’s investments are classified within the fair value hierarchy based on the lowest level of input that is significant to the fair value measurement. The inputs are summarized into three broad levels as follows:
| | | | |
| 136 | | Wells Fargo Equity Gateway Funds | | Notes to financial statements (unaudited) |
| ∎ | | Level 1 – quoted prices in active markets for identical securities |
| ∎ | | Level 2 – other significant observable inputs (including quoted prices for similar securities, interest rates, prepayment speeds, credit risk, etc.) |
| ∎ | | Level 3 – significant unobservable inputs (including the Portfolio’s own assumptions in determining the fair value of investments) |
The inputs or methodologies used for valuing investments in securities are not necessarily an indication of the risk associated with investing in those securities.
The following is a summary of the inputs used in valuing each Portfolio’s assets and liabilities as of November 30, 2017:
| | | | | | | | | | | | | | | | |
| C&B Large Cap Value Portfolio | | Quoted prices
(Level 1) | | | Other significant
observable inputs
(Level 2) | | | Significant
unobservable inputs
(Level 3) | | | Total | |
Assets | | | | | | | | | | | | | | | | |
Investments in: | | | | | | | | | | | | | | | | |
| | | | |
Common stocks | | | | | | | | | | | | | | | | |
Consumer discretionary | | $ | 65,748,351 | | | $ | 0 | | | $ | 0 | | | $ | 65,748,351 | |
Consumer staples | | | 15,376,229 | | | | 0 | | | | 0 | | | | 15,376,229 | |
Energy | | | 23,896,484 | | | | 0 | | | | 0 | | | | 23,896,484 | |
Financials | | | 120,555,322 | | | | 0 | | | | 0 | | | | 120,555,322 | |
Health care | | | 59,449,612 | | | | 0 | | | | 0 | | | | 59,449,612 | |
Industrials | | | 56,367,536 | | | | 0 | | | | 0 | | | | 56,367,536 | |
Information technology | | | 28,797,109 | | | | 0 | | | | 0 | | | | 28,797,109 | |
Materials | | | 20,183,369 | | | | 0 | | | | 0 | | | | 20,183,369 | |
Real estate | | | 6,170,128 | | | | 0 | | | | 0 | | | | 6,170,128 | |
| | | | |
Short-term investments | | | | | | | | | | | | | | | | |
Investment companies | | | 23,303,022 | | | | 0 | | | | 0 | | | | 23,303,022 | |
Investments measured at net asset value* | | | | | | | | | | | | | | | 13,373,341 | |
Total assets | | $ | 419,847,162 | | | $ | 0 | | | $ | 0 | | | $ | 433,220,503 | |
| * | Investments that are measured at fair value using the net asset value per share (or its equivalent) as a practical expedient have not been categorized in the fair value hierarchy. The fair value amount presented in the table is intended to permit reconciliation of the fair value hierarchy to the amounts presented in the Statements of Assets and Liabilities. The Portfolio’s investment in Securities Lending Cash Investment, LLC valued at $13,373,341 does not have a redemption period notice, can be redeemed daily and does not have any unfunded commitments. |
| | | | | | | | | | | | | | | | |
| Diversified Large Cap Growth Portfolio | | Quoted prices
(Level 1) | | | Other significant
observable inputs
(Level 2) | | | Significant
unobservable inputs
(Level 3) | | | Total | |
Assets | | | | | | | | | | | | | | | | |
Investments in: | | | | | | | | | | | | | | | | |
| | | | |
Common stocks | | | | | | | | | | | | | | | | |
Consumer discretionary | | $ | 13,445,142 | | | $ | 0 | | | $ | 0 | | | $ | 13,445,142 | |
Consumer staples | | | 3,098,819 | | | | 0 | | | | 0 | | | | 3,098,819 | |
Energy | | | 2,271,298 | | | | 0 | | | | 0 | | | | 2,271,298 | |
Financials | | | 7,843,769 | | | | 0 | | | | 0 | | | | 7,843,769 | |
Health care | | | 11,163,735 | | | | 0 | | | | 0 | | | | 11,163,735 | |
Industrials | | | 11,187,758 | | | | 0 | | | | 0 | | | | 11,187,758 | |
Information technology | | | 37,527,492 | | | | 0 | | | | 0 | | | | 37,527,492 | |
Materials | | | 3,725,264 | | | | 0 | | | | 0 | | | | 3,725,264 | |
Real estate | | | 1,393,906 | | | | 0 | | | | 0 | | | | 1,393,906 | |
Utilities | | | 531,357 | | | | 0 | | | | 0 | | | | 531,357 | |
| | | | |
Short-term investments | | | | | | | | | | | | | | | | |
Investment companies | | | 784,307 | | | | 0 | | | | 0 | | | | 784,307 | |
Investments measured at net asset value* | | | | | | | | | | | | | | | 1,113,913 | |
Total assets | | $ | 92,972,847 | | | $ | 0 | | | $ | 0 | | | $ | 94,086,760 | |
| * | Investments that are measured at fair value using the net asset value per share (or its equivalent) as a practical expedient have not been categorized in the fair value hierarchy. The fair value amount presented in the table is intended to permit reconciliation of the fair value hierarchy to the amounts presented in the Statements of Assets and Liabilities. The Portfolio’s investment in Securities Lending Cash Investment, LLC valued at $1,113,913 does not have a redemption period notice, can be redeemed daily and does not have any unfunded commitments. |
| | | | | | |
| Notes to financial statements (unaudited) | | Wells Fargo Equity Gateway Funds | | | 137 | |
| | | | | | | | | | | | | | | | |
| Emerging Growth Portfolio | | Quoted prices
(Level 1) | | | Other significant
observable inputs
(Level 2) | | | Significant
unobservable inputs
(Level 3) | | | Total | |
Assets | | | | | | | | | | | | | | | | |
Investments in: | | | | | | | | | | | | | | | | |
| | | | |
Common stocks | | | | | | | | | | | | | | | | |
Consumer discretionary | | $ | 109,882,655 | | | $ | 0 | | | $ | 0 | | | $ | 109,882,655 | |
Energy | | | 13,309,639 | | | | 0 | | | | 0 | | | | 13,309,639 | |
Financials | | | 32,754,037 | | | | 0 | | | | 0 | | | | 32,754,037 | |
Health care | | | 185,133,276 | | | | 0 | | | | 0 | | | | 185,133,276 | |
Industrials | | | 180,929,250 | | | | 0 | | | | 0 | | | | 180,929,250 | |
Information technology | | | 286,304,355 | | | | 0 | | | | 0 | | | | 286,304,355 | |
Materials | | | 3,141,600 | | | | 0 | | | | 0 | | | | 3,141,600 | |
| | | | |
Exchage-traded funds | | | 8,516,712 | | | | 0 | | | | 0 | | | | 8,516,712 | |
| | | | |
Short-term investments | | | | | | | | | | | | | | | | |
Investment companies | | | 12,485,937 | | | | 0 | | | | 0 | | | | 12,485,937 | |
Investments measured at net asset value* | | | | | | | | | | | | | | | 37,028,672 | |
Total assets | | $ | 832,457,461 | | | $ | 0 | | | $ | 0 | | | $ | 869,486,133 | |
| * | Investments that are measured at fair value using the net asset value per share (or its equivalent) as a practical expedient have not been categorized in the fair value hierarchy. The fair value amount presented in the table is intended to permit reconciliation of the fair value hierarchy to the amounts presented in the Statements of Assets and Liabilities. The Portfolio’s investment in Securities Lending Cash Investment, LLC valued at $37,028,672 does not have a redemption period notice, can be redeemed daily and does not have any unfunded commitments. |
| | | | | | | | | | | | | | | | |
| Index Portfolio | | Quoted prices
(Level 1) | | | Other significant
observable inputs
(Level 2) | | | Significant
unobservable inputs
(Level 3) | | | Total | |
Assets | | | | | | | | | | | | | | | | |
Investments in: | | | | | | | | | | | | | | | | |
| | | | |
Common stocks | | | | | | | | | | | | | | | | |
Consumer discretionary | | $ | 231,251,906 | | | $ | 0 | | | $ | 0 | | | $ | 231,251,906 | |
Consumer staples | | | 154,825,672 | | | | 0 | | | | 0 | | | | 154,825,672 | |
Energy | | | 111,597,337 | | | | 0 | | | | 0 | | | | 111,597,337 | |
Financials | | | 281,695,940 | | | | 0 | | | | 0 | | | | 281,695,940 | |
Health care | | | 268,343,446 | | | | 0 | | | | 0 | | | | 268,343,446 | |
Industrials | | | 192,683,722 | | | | 0 | | | | 0 | | | | 192,683,722 | |
Information technology | | | 458,628,105 | | | | 0 | | | | 0 | | | | 458,628,105 | |
Materials | | | 56,550,661 | | | | 0 | | | | 0 | | | | 56,550,661 | |
Real estate | | | 56,027,659 | | | | 0 | | | | 0 | | | | 56,027,659 | |
Telecommunication services | | | 37,471,254 | | | | 0 | | | | 0 | | | | 37,471,254 | |
Utilities | | | 60,109,701 | | | | 0 | | | | 0 | | | | 60,109,701 | |
| | | | |
Short-term investments | | | | | | | | | | | | | | | | |
Investment companies | | | 24,370,786 | | | | 0 | | | | 0 | | | | 24,370,786 | |
U.S. Treasury securities | | | 1,730,716 | | | | 0 | | | | 0 | | | | 1,730,716 | |
Investments measured at net asset value* | | | | | | | | | | | | | | | 6,197,515 | |
| | | 1,935,286,905 | | | | 0 | | | | 0 | | | | 1,941,484,420 | |
Futures contracts | | | 328,990 | | | | 0 | | | | 0 | | | | 328,990 | |
Total assets | | $ | 1,935,615,895 | | | $ | 0 | | | $ | 0 | | | $ | 1,941,813,410 | |
| * | Investments that are measured at fair value using the net asset value per share (or its equivalent) as a practical expedient have not been categorized in the fair value hierarchy. The fair value amount presented in the table is intended to permit reconciliation of the fair value hierarchy to the amounts presented in the Statements of Assets and Liabilities. The Portfolio’s investment in Securities Lending Cash Investment, LLC valued at $6,197,515 does not have a redemption period notice, can be redeemed daily and does not have any unfunded commitments. |
| | | | |
| 138 | | Wells Fargo Equity Gateway Funds | | Notes to financial statements (unaudited) |
| | | | | | | | | | | | | | | | |
| International Growth Portfolio | | Quoted prices
(Level 1) | | | Other significant
observable inputs
(Level 2) | | | Significant
unobservable inputs
(Level 3) | | | Total | |
Assets | | | | | | | | | | | | | | | | |
Investments in: | | | | | | | | | | | | | | | | |
| | | | |
Common stocks | | | | | | | | | | | | | | | | |
Brazil | | $ | 116,446 | | | $ | 0 | | | $ | 0 | | | $ | 116,446 | |
Canada | | | 1,038,292 | | | | 0 | | | | 0 | | | | 1,038,292 | |
Cayman Islands | | | 566,039 | | | | 0 | | | | 0 | | | | 566,039 | |
Chile | | | 48,942 | | | | 0 | | | | 0 | | | | 48,942 | |
China | | | 2,654,603 | | | | 0 | | | | 0 | | | | 2,654,603 | |
Denmark | | | 52,716 | | | | 0 | | | | 0 | | | | 52,716 | |
France | | | 1,185,734 | | | | 0 | | | | 0 | | | | 1,185,734 | |
Germany | | | 9,971,855 | | | | 0 | | | | 0 | | | | 9,971,855 | |
Hong Kong | | | 1,132,540 | | | | 0 | | | | 0 | | | | 1,132,540 | |
Indonesia | | | 253,648 | | | | 0 | | | | 0 | | | | 253,648 | |
Ireland | | | 1,081,981 | | | | 0 | | | | 0 | | | | 1,081,981 | |
Italy | | | 1,993,900 | | | | 0 | | | | 0 | | | | 1,993,900 | |
Japan | | | 4,633,630 | | | | 0 | | | | 0 | | | | 4,633,630 | |
Netherlands | | | 3,218,540 | | | | 0 | | | | 0 | | | | 3,218,540 | |
Russia | | | 446,311 | | | | 0 | | | | 0 | | | | 446,311 | |
South Africa | | | 269,725 | | | | 0 | | | | 0 | | | | 269,725 | |
South Korea | | | 1,229,739 | | | | 0 | | | | 0 | | | | 1,229,739 | |
Spain | | | 613,409 | | | | 0 | | | | 0 | | | | 613,409 | |
Switzerland | | | 1,400,364 | | | | 0 | | | | 0 | | | | 1,400,364 | |
Taiwan | | | 173,732 | | | | 0 | | | | 0 | | | | 173,732 | |
United Kingdom | | | 6,350,991 | | | | 0 | | | | 0 | | | | 6,350,991 | |
United States | | | 1,173,582 | | | | 0 | | | | 0 | | | | 1,173,582 | |
| | | | |
Participation notes | | | | | | | | | | | | | | | | |
Ireland | | | 0 | | | | 1,260,294 | | | | 0 | | | | 1,260,294 | |
| | | | |
Preferred stocks | | | | | | | | | | | | | | | | |
Germany | | | 582,312 | | | | 0 | | | | 0 | | | | 582,312 | |
| | | | |
Short-term investments | | | | | | | | | | | | | | | | |
Investment companies | | | 9,307,998 | | | | 0 | | | | 0 | | | | 9,307,998 | |
Total assets | | $ | 49,497,029 | | | $ | 1,260,294 | | | $ | 0 | | | $ | 50,757,323 | |
| | | | | | |
| Notes to financial statements (unaudited) | | Wells Fargo Equity Gateway Funds | | | 139 | |
| | | | | | | | | | | | | | | | |
| International Value Portfolio | | Quoted prices
(Level 1) | | | Other significant
observable inputs
(Level 2) | | | Significant
unobservable inputs
(Level 3) | | | Total | |
Assets | | | | | | | | | | | | | | | | |
Investments in: | | | | | | | | | | | | | | | | |
| | | | |
Common stocks | | | | | | | | | | | | | | | | |
Australia | | $ | 45,544,164 | | | $ | 2 | | | $ | 0 | | | $ | 45,544,166 | |
Austria | | | 10,491,189 | | | | 0 | | | | 0 | | | | 10,491,189 | |
Belgium | | | 3,147,375 | | | | 0 | | | | 0 | | | | 3,147,375 | |
Brazil | | | 7,013,561 | | | | 0 | | | | 0 | | | | 7,013,561 | |
Canada | | | 11,024,210 | | | | 0 | | | | 0 | | | | 11,024,210 | |
China | | | 23,076,105 | | | | 0 | | | | 0 | | | | 23,076,105 | |
Denmark | | | 9,836,780 | | | | 0 | | | | 0 | | | | 9,836,780 | |
France | | | 66,666,686 | | | | 0 | | | | 0 | | | | 66,666,686 | |
Germany | | | 70,719,317 | | | | 0 | | | | 0 | | | | 70,719,317 | |
Hong Kong | | | 19,135,440 | | | | 0 | | | | 0 | | | | 19,135,440 | |
India | | | 3,028,221 | | | | 0 | | | | 0 | | | | 3,028,221 | |
Ireland | | | 7,013,997 | | | | 0 | | | | 0 | | | | 7,013,997 | |
Israel | | | 3,766,111 | | | | 0 | | | | 0 | | | | 3,766,111 | |
Italy | | | 20,117,000 | | | | 0 | | | | 0 | | | | 20,117,000 | |
Japan | | | 191,654,824 | | | | 0 | | | | 0 | | | | 191,654,824 | |
Liechtenstein | | | 869,956 | | | | 0 | | | | 0 | | | | 869,956 | |
Malaysia | | | 2,712,825 | | | | 0 | | | | 0 | | | | 2,712,825 | |
Netherlands | | | 27,315,149 | | | | 0 | | | | 0 | | | | 27,315,149 | |
Norway | | | 11,007,114 | | | | 0 | | | | 0 | | | | 11,007,114 | |
Poland | | | 1,280,051 | | | | 0 | | | | 0 | | | | 1,280,051 | |
Portugal | | | 3,532,626 | | | | 0 | | | | 0 | | | | 3,532,626 | |
Russia | | | 10,319,028 | | | | 0 | | | | 0 | | | | 10,319,028 | |
Singapore | | | 7,778,592 | | | | 0 | | | | 0 | | | | 7,778,592 | |
South Africa | | | 3,473,378 | | | | 0 | | | | 0 | | | | 3,473,378 | |
South Korea | | | 21,933,998 | | | | 0 | | | | 0 | | | | 21,933,998 | |
Spain | | | 21,403,444 | | | | 0 | | | | 0 | | | | 21,403,444 | |
Sweden | | | 10,500,178 | | | | 0 | | | | 0 | | | | 10,500,178 | |
Switzerland | | | 52,138,422 | | | | 0 | | | | 0 | | | | 52,138,422 | |
Taiwan | | | 6,106,007 | | | | 0 | | | | 0 | | | | 6,106,007 | |
Thailand | | | 10,986,249 | | | | 0 | | | | 0 | | | | 10,986,249 | |
Turkey | | | 2,599,817 | | | | 0 | | | | 0 | | | | 2,599,817 | |
United Kingdom | | | 123,341,358 | | | | 0 | | | | 0 | | | | 123,341,358 | |
| | | | |
Preferred stocks | | | | | | | | | | | | | | | | |
Brazil | | | 6,530,162 | | | | 0 | | | | 0 | | | | 6,530,162 | |
| | | | |
Short-term investments | | | | | | | | | | | | | | | | |
Investment companies | | | 14,627,964 | | | | 0 | | | | 0 | | | | 14,627,964 | |
Investments measured at net asset value* | | | | | | | | | | | | | | | 18,391,111 | |
Total assets | | $ | 830,691,298 | | | $ | 2 | | | $ | 0 | | | $ | 849,082,411 | |
| * | Investments that are measured at fair value using the net asset value per share (or its equivalent) as a practical expedient have not been categorized in the fair value hierarchy. The fair value amount presented in the table is intended to permit reconciliation of the fair value hierarchy to the amounts presented in the Statements of Assets and Liabilities. The Portfolio’s investment in Securities Lending Cash Investment, LLC valued at $18,391,111 does not have a redemption period notice, can be redeemed daily and does not have any unfunded commitments. |
| | | | |
| 140 | | Wells Fargo Equity Gateway Funds | | Notes to financial statements (unaudited) |
| | | | | | | | | | | | | | | | |
| Large Company Value Portfolio | | Quoted prices
(Level 1) | | | Other significant
observable inputs
(Level 2) | | | Significant
unobservable inputs
(Level 3) | | | Total | |
Assets | | | | | | | | | | | | | | | | |
Investments in: | | | | | | | | | | | | | | | | |
| | | | |
Common stocks | | | | | | | | | | | | | | | | |
Consumer discretionary | | $ | 4,392,895 | | | $ | 0 | | | $ | 0 | | | $ | 4,392,895 | |
Consumer staples | | | 5,541,085 | | | | 0 | | | | 0 | | | | 5,541,085 | |
Energy | | | 7,223,313 | | | | 0 | | | | 0 | | | | 7,223,313 | |
Financials | | | 17,836,398 | | | | 0 | | | | 0 | | | | 17,836,398 | |
Health care | | | 8,539,091 | | | | 0 | | | | 0 | | | | 8,539,091 | |
Industrials | | | 4,415,390 | | | | 0 | | | | 0 | | | | 4,415,390 | |
Information technology | | | 5,648,308 | | | | 0 | | | | 0 | | | | 5,648,308 | |
Materials | | | 1,635,125 | | | | 0 | | | | 0 | | | | 1,635,125 | |
Real estate | | | 5,486,456 | | | | 0 | | | | 0 | | | | 5,486,456 | |
Telecommunication services | | | 1,151,102 | | | | 0 | | | | 0 | | | | 1,151,102 | |
Utilities | | | 5,046,726 | | | | 0 | | | | 0 | | | | 5,046,726 | |
| | | | |
Short-term investments | | | | | | | | | | | | | | | | |
Investment companies | | | 1,379,139 | | | | 0 | | | | 0 | | | | 1,379,139 | |
| | | 68,295,028 | | | | | | | | | | | | 68,295,028 | |
Futures contracts | | | 10,769 | | | | | | | | | | | | 10,769 | |
Total assets | | $ | 68,305,797 | | | $ | 0 | | | $ | 0 | | | $ | 68,305,797 | |
| | | | | | | | | | | | | | | | |
| Small Company Growth Portfolio | | Quoted prices
(Level 1) | | | Other significant
observable inputs
(Level 2) | | | Significant
unobservable inputs
(Level 3) | | | Total | |
Assets | | | | | | | | | | | | | | | | |
Investments in: | | | | | | | | | | | | | | | | |
| | | | |
Common stocks | | | | | | | | | | | | | | | | |
Consumer discretionary | | $ | 196,383,580 | | | $ | 0 | | | $ | 0 | | | $ | 196,383,580 | |
Consumer staples | | | 42,256,372 | | | | 0 | | | | 0 | | | | 42,256,372 | |
Energy | | | 22,341,243 | | | | 0 | | | | 0 | | | | 22,341,243 | |
Financials | | | 167,105,275 | | | | 0 | | | | 0 | | | | 167,105,275 | |
Health care | | | 359,208,477 | | | | 0 | | | | 0 | | | | 359,208,477 | |
Industrials | | | 357,882,494 | | | | 0 | | | | 0 | | | | 357,882,494 | |
Information technology | | | 525,175,264 | | | | 0 | | | | 0 | | | | 525,175,264 | |
Materials | | | 65,060,418 | | | | 0 | | | | 0 | | | | 65,060,418 | |
Real estate | | | 22,893,515 | | | | 0 | | | | 0 | | | | 22,893,515 | |
| | | | |
Short-term investments | | | | | | | | | | | | | | | | |
Investment companies | | | 68,328,716 | | | | 0 | | | | 0 | | | | 68,328,716 | |
Investments measured at net asset value* | | | | | | | | | | | | | | | 235,237,100 | |
Total assets | | $ | 1,826,635,354 | | | $ | 0 | | | $ | 0 | | | $ | 2,061,872,454 | |
| * | Investments that are measured at fair value using the net asset value per share (or its equivalent) as a practical expedient have not been categorized in the fair value hierarchy. The fair value amount presented in the table is intended to permit reconciliation of the fair value hierarchy to the amounts presented in the Statements of Assets and Liabilities. The Portfolio’s investment in Securities Lending Cash Investment, LLC valued at $235,237,100 does not have a redemption period notice, can be redeemed daily and does not have any unfunded commitments. |
| | | | | | |
| Notes to financial statements (unaudited) | | Wells Fargo Equity Gateway Funds | | | 141 | |
| | | | | | | | | | | | | | | | |
| Small Company Value Portfolio | | Quoted prices
(Level 1) | | | Other significant
observable inputs
(Level 2) | | | Significant
unobservable inputs
(Level 3) | | | Total | |
Assets | | | | | | | | | | | | | | | | |
Investments in: | | | | | | | | | | | | | | | | |
| | | | |
Common stocks | | | | | | | | | | | | | | | | |
Consumer discretionary | | $ | 30,208,685 | | | $ | 0 | | | $ | 0 | | | $ | 30,208,685 | |
Consumer staples | | | 2,821,743 | | | | 0 | | | | 0 | | | | 2,821,743 | |
Energy | | | 8,538,089 | | | | 0 | | | | 0 | | | | 8,538,089 | |
Financials | | | 45,963,174 | | | | 0 | | | | 0 | | | | 45,963,174 | |
Health care | | | 12,224,920 | | | | 0 | | | | 0 | | | | 12,224,920 | |
Industrials | | | 13,273,305 | | | | 0 | | | | 0 | | | | 13,273,305 | |
Information technology | | | 20,898,045 | | | | 0 | | | | 0 | | | | 20,898,045 | |
Materials | | | 4,743,847 | | | | 0 | | | | 0 | | | | 4,743,847 | |
Real estate | | | 14,668,793 | | | | 0 | | | | 0 | | | | 14,668,793 | |
Utilities | | | 5,853,969 | | | | 0 | | | | 0 | | | | 5,853,969 | |
| | | | |
Short-term investments | | | | | | | | | | | | | | | | |
Investment companies | | | 3,068,712 | | | | 0 | | | | 0 | | | | 3,068,712 | |
Investments measured at net asset value* | | | | | | | | | | | | | | | 19,500,479 | |
Total assets | | $ | 162,263,282 | | | $ | 0 | | | $ | 0 | | | $ | 181,763,761 | |
| * | Investments that are measured at fair value using the net asset value per share (or its equivalent) as a practical expedient have not been categorized in the fair value hierarchy. The fair value amount presented in the table is intended to permit reconciliation of the fair value hierarchy to the amounts presented in the Statements of Assets and Liabilities. The Portfolio’s investment in Securities Lending Cash Investment, LLC valued at $19,500,479 does not have a redemption period notice, can be redeemed daily and does not have any unfunded commitments. |
Futures contracts are reported at their variation margin at measurement date, which represents the amount due to the Portfolios at that date. All other assets and liabilities are reported at their market value at measurement date.
The Portfolios recognize transfers between levels within the fair value hierarchy at the end of the reporting period. At November 30, 2017, the Portfolios did not have any transfers into/out of Level 1, Level 2, or Level 3.
4. TRANSACTIONS WITH AFFILIATES AND OTHER EXPENSES
Advisory fee
The Trust has entered into an advisory contract with Funds Management, an indirect wholly owned subsidiary of Wells Fargo. The adviser is responsible for implementing investment policies and guidelines and for supervising the applicable subadvisers, who are responsible for day-to-day portfolio management of the Portfolios. Pursuant to the contract, Funds Management is entitled to receive an annual advisory fee which is calculated based on the average daily net assets of each Portfolio.
Funds Management has retained the services of certain subadvisers to provide daily portfolio management for the Portfolios. Funds Management has engaged Analytic Investors, LLC, Artisan Partners Limited Partnership, Cooke & Bieler, L.P., Golden Capital Management, LLC, LSV Asset Management, Peregrine Capital Management, LLC (“Peregrine”), and WellsCap as subadvisers. Analytic Investors, LLC, Galliard Capital Management, Inc., Golden Capital Management, LLC and WellsCap are each affiliates of Funds Management and an indirect wholly owned subsidiary of Wells Fargo. Effective January 1, 2018, Golden Capital Management, LLC merged into WellsCap. Artisan Partners Limited Partnership, Cooke & Bieler, L.P., LSV Asset Management and Peregrine are not affiliates of Funds Management.
The fees for subadvisory services are borne by Funds Management. The subadvisers are each entitled to receive from Funds Management an annual subadvisory fee which is calculated based on the average daily net assets of each Portfolio.
| | | | |
| 142 | | Wells Fargo Equity Gateway Funds | | Notes to financial statements (unaudited) |
The annual advisory and subadvisory fee rates for each Portfolio are as follows:
| | | | | | | | | | | | | | | | | | | | |
| | | Advisory fee | | | Effective rate for the
six month ended November 30, 2017 | | | Subadviser | | Subadvisory fee | |
| | | starting at | | | declining to | | | | | starting at | | declining to | |
C&B Large Cap Value Portfolio | | | 0.65 | % | | | 0.475 | % | | | 0.65 | % | | Cooke & Bieler, L.P. | | 0.38% | | | 0.30 | % |
Diversified Large Cap Growth Portfolio | | | 0.65 | | | | 0.475 | | | | 0.65 | | | WellsCap+ | | 0.30 | | | 0.20 | |
| | | | | | | | | | | | | | Golden Capital Management, LLC+ | | 0.35 | | | 0.30 | |
Emerging Growth Portfolio | | | 0.80 | | | | 0.68 | | | | 0.79 | | | WellsCap | | 0.55 | | | 0.40 | |
Index Portfolio | | | 0.10 | | | | 0.05 | | | | 0.09 | | | Golden Capital Management, LLC | | 0.05 | | | 0.02 | |
International Growth Portfolio | | | 0.80 | | | | 0.65 | | | | 0.80 | | | Artisan Partners, LLC | | 0.80 | | | 0.50 | |
International Value Portfolio | | | 0.80 | | | | 0.65 | | | | 0.78 | | | LSV Asset Management | | 0.35 | | | 0.30 | |
Large Company Value Portfolio | | | 0.35 | | | | 0.30 | | | | 0.35 | | | Analytic Investors, LLC | | 0.25 | | | 0.15 | |
Small Company Growth Portfolio | | | 0.80 | | | | 0.68 | | | | 0.77 | | | Peregrine | | 0.50 | | | 0.45 | |
Small Company Value Portfolio | | | 0.80 | | | | 0.68 | | | | 0.80 | | | Peregrine | | 0.45 | | | 0.40 | |
| + | The subadvisory fee is calculated based on the average daily net assets managed by the subadviser. |
Funds Management has voluntarily waived and/or reimbursed advisory fees to the extent necessary to maintain certain net operating expense ratios for the Portfolios.
Interfund transactions
The Portfolios may purchase or sell portfolio investment securities to certain other Wells Fargo affiliates pursuant to Rule 17a-7 of the 1940 Act and under procedures adopted by the Board of Trustees. The procedures have been designed to ensure that these interfund transactions, which do not incur broker commissions, are effected at current market prices.
5. INVESTMENT PORTFOLIO TRANSACTIONS
Purchases and sales of investments, excluding short-term securities, for the six month ended November 30, 2017 were as follows:
| | | | | | | | |
| | | Purchases at cost | | | Sales proceeds | |
C&B Large Cap Value Portfolio | | $ | 85,170,599 | | | $ | 68,671,701 | |
Diversified Large Cap Growth Portfolio | | | 19,290,473 | | | | 44,890,800 | |
Emerging Growth Portfolio | | | 205,421,103 | | | | 272,724,054 | |
Index Portfolio | | | 33,112,462 | | | | 285,566,556 | |
International Growth Portfolio | | | 38,133,834 | | | | 140,265,171 | |
International Value Portfolio | | | 66,524,606 | | | | 43,419,826 | |
Large Company Value Portfolio | | | 79,623,196 | | | | 88,551,795 | |
Small Company Growth Portfolio | | | 281,008,653 | | | | 342,076,939 | |
Small Company Value Portfolio | | | 55,445,457 | | | | 128,763,747 | |
6. DERIVATIVE TRANSACTIONS
During the six months ended November 30, 2017, Index Portfolio and Large Company Value Portfolio used uninvested cash to enter into futures contracts to gain market exposure.
The table below discloses the volume of each Portfolio’s derivative transactions during the six months ended November 30, 2017 and any segregated cash on November 30, 2017.
| | | | | | | | |
| | | Index
Portfolio | | | Large
Company
Value
Portfolio | |
Average notional balance on long futures | | $ | 37,070,600 | | | $ | 1,414,978 | |
Segregated cash at November 30, 2017 | | | 0 | | | | 150,000 | |
| | | | | | |
| Notes to financial statements (unaudited) | | Wells Fargo Equity Gateway Funds | | | 143 | |
The receivable for daily variation margin on open futures contracts reflected in the Statements of Assets and Liabilities only represents the current day’s variation margin. The realized gains or losses and change in unrealized gains or losses on derivative instruments are reflected in the Statements of Operations.
For certain types of derivative transactions, the Portfolios have entered into International Swaps and Derivatives Association, Inc. master agreements (“ISDA Master Agreements”) or similar agreements with approved counterparties. The ISDA Master Agreements or similar agreements may have requirements to deliver/deposit securities or cash to/with an exchange or broker-dealer as collateral and allows the Portfolios to offset, with each counterparty, certain derivative financial instrument’s assets and/or liabilities with collateral held or pledged. Collateral requirements differ by type of derivative. Collateral or margin requirements are set by the broker or exchange clearinghouse for exchange traded derivatives while collateral terms are contract specific for over-the-counter traded derivatives. Cash collateral that has been pledged to cover obligations of the Portfolios under ISDA Master Agreements or similar agreements, if any, will be reported separately in the Statements of Assets and Liabilities. Securities pledged as collateral, if any, for the same purpose are noted in the Portfolio of Investments. With respect to balance sheet offsetting, absent an event of default by the counterparty or a termination of the agreement, the reported amounts of financial assets and financial liabilities in the Statements of Assets and Liabilities are not offset across transactions between each Portfolio and the applicable counterparty. A reconciliation of the gross amounts on the Statements of Assets and Liabilities to the net amounts by derivative type, including any collateral exposure, is as follows:
| | | | | | | | | | | | | | | | | | |
| | | Counterparty | | Gross amounts
of assets in the
Statements of
Assets and
Liabilities | | | Amounts
subject to
netting
agreements | | | Collateral
received | | | Net amount
of assets | |
Index Portfolio | | Societe Generale | | $ | 328,990 | | | $ | 0 | | | $ | 0 | | | $ | 328,990 | |
Large Company Value Portfolio | | Morgan Stanley | | | 10,769 | | | | 0 | | | | 0 | | | | 10,769 | |
7. CONCENTRATION RISK
Concentration risks result from exposure to a limited number of sectors. Portfolios that invest a substantial portion of their assets in a sector may be more affected by changes in that sector than would be a portfolio whose investments are not heavily weighted in any sector. The Portfolio of Investments includes information on each Portfolio’s holdings, including sector composition, country and/or geographical composition as relevant.
8. INDEMNIFICATION
Under the Trust’s organizational documents, the officers and Trustees have been granted certain indemnification rights against certain liabilities that may arise out of performance of their duties to the Trust. Additionally, in the normal course of business, the Trust may enter into contracts with service providers that contain a variety of indemnification clauses. The Trust’s maximum exposure under these arrangements is dependent on future claims that may be made against the Portfolios and, therefore, cannot be estimated.
9. REDEMPTION IN-KIND
After the close of business on July 15, 2016, Wells Fargo Emerging Growth Fund, which invests all of its assets in Emerging Growth Portfolio, redeemed assets through an in-kind redemption. In the redemption transaction, Wells Fargo Emerging Growth Fund issued securities which it received from Emerging Growth Portfolio with a value of $80,953,334 along with cash in the amount of $2,716,932 Emerging Growth Portfolio recognized gains in the amount of $30,973,586. The redemption in-kind represented 9.01% of Emerging Growth Portfolio and is reflected on the Statements of Changes in Net Assets.
| | | | |
| 144 | | Wells Fargo Equity Gateway Funds | | Other information (unaudited) |
TAX INFORMATION
Pursuant to Section 853 of the Internal Revenue Code, the following amounts have been designated as foreign taxes paid for the fiscal year ended May 31, 2017. These amounts may be less than the actual foreign taxes paid for financial statement purposes. Foreign taxes paid or withheld should be included in taxable income with an offsetting deduction from gross income or as a credit for taxes paid to foreign governments.
| | | | | | |
| | | Creditable foreign taxes paid | | Per share amount | | Foreign income as % of ordinary income distributions |
International Value Fund | | $1,512,695 | | $0.03101 | | 100% |
PROXY VOTING INFORMATION
A description of the policies and procedures used to determine how to vote proxies relating to portfolio securities is available without charge, upon request, by calling 1-800-222-8222, visiting our website at wellsfargofunds.com, or visiting the SEC website at sec.gov. Information regarding how the proxies related to portfolio securities were voted during the most recent 12-month period ended June 30 is available on the website at wellsfargofunds.com or by visiting the SEC website at sec.gov.
PORTFOLIO HOLDINGS INFORMATION
The complete portfolio holdings are publicly available on the website (wellsfargofunds.com) on a one-month delayed basis. In addition, top ten holdings information (excluding derivative positions) is publicly available on the website on a monthly, seven-day or more delayed basis. Each Fund and Portfolio files its complete schedule of portfolio holdings with the SEC for the first and third quarters of each fiscal year on Form N-Q, which is available by visiting the SEC website at sec.gov. In addition, each Form N-Q may be reviewed and copied at the SEC’s Public Reference Room in Washington, DC, and at regional offices in New York City, at 233 Broadway, and in Chicago, at 175 West Jackson Boulevard, Suite 900. Information about the Public Reference Room may be obtained by calling 1-800-SEC-0330.
| | | | | | |
| Other information (unaudited) | | Wells Fargo Equity Gateway Funds | | | 145 | |
BOARD OF TRUSTEES AND OFFICERS
Each of the Trustees and Officers1 listed in the table below acts in identical capacities for each fund in the Wells Fargo family of funds, which consists of 153 mutual funds comprising the Wells Fargo Funds Trust, Wells Fargo Variable Trust, Wells Fargo Master Trust and four closed-end funds (collectively the “Fund Complex”). This table should be read in conjunction with the Prospectus and the Statement of Additional Information2. The mailing address of each Trustee and Officer is 525 Market Street, 12th Floor, San Francisco, CA 94105. Each Trustee and Officer serves an indefinite term, however, each Trustee serves such term until reaching the mandatory retirement age established by the Trustees.
Independent Trustees
| | | | | | |
Name and year of birth | | Position held and length of service* | | Principal occupations during past five years or longer | | Current other
public company or
investment company
directorships |
| William R. Ebsworth (Born 1957) | | Trustee, since 2015 | | Retired. From 1984 to 2013, equities analyst, portfolio manager, research director and chief investment officer at Fidelity Management and Research Company in Boston, Tokyo, and Hong Kong, and retired in 2013 as Chief Investment Officer of Fidelity Strategic Advisers, Inc. where he led a team of investment professionals managing client assets. Prior thereto, Board member of Hong Kong Securities Clearing Co., Hong Kong Options Clearing Corp., the Thailand International Fund, Ltd., Fidelity Investments Life Insurance Company, and Empire Fidelity Investments Life Insurance Company. Board member of the Forté Foundation (non-profit organization) and the Vincent Memorial Hospital Endowment (non-profit organization), where he serves on the Investment Committee and as a Chair of the Audit Committee. Mr. Ebsworth is a CFA® charterholder. | | Asset Allocation Trust |
Jane A. Freeman** (Born 1953) | | Trustee, since 2015; Chair Liaison, since 2018 | | Retired. From 2012 to 2014 and 1999 to 2008, Chief Financial Officer of Scientific Learning Corporation. From 2008 to 2012, Ms. Freeman provided consulting services related to strategic business projects. Prior to 1999, Portfolio Manager at Rockefeller & Co. and Scudder, Stevens & Clark. Board member of the Harding Loevner Funds from 1996 to 2014, serving as both Lead Independent Director and chair of the Audit Committee. Board member of the Russell Exchange Traded Funds Trust from 2011 to 2012 and the chair of the Audit Committee. Ms. Freeman is a Board Member of Ruth Bancroft Garden (non-profit organization) and the Glimmerglass Festival. She is also an inactive Chartered Financial Analyst. | | Asset Allocation Trust |
Peter G. Gordon*** (Born 1942) | | Trustee, since 1998; Chairman, from 2005 to 2017 | | Co-Founder, Retired Chairman, President and CEO of Crystal Geyser Water Company. Trustee Emeritus, Colby College. | | Asset Allocation Trust |
Isaiah Harris, Jr. (Born 1952) | | Trustee, since 2009 | | Retired. Chairman of the Board of CIGNA Corporation since 2009, and Director since 2005. From 2003 to 2011, Director of Deluxe Corporation. Prior thereto, President and CEO of BellSouth Advertising and Publishing Corp. from 2005 to 2007, President and CEO of BellSouth Enterprises from 2004 to 2005 and President of BellSouth Consumer Services from 2000 to 2003. Emeritus member of the Iowa State University Foundation Board of Governors. Emeritus Member of the Advisory Board of Iowa State University School of Business. Advisory Board Member, Palm Harbor Academy (charter school). Advisory Board Member, Child Evangelism Fellowship (non-profit). Mr. Harris is a certified public accountant (inactive status). | | CIGNA Corporation; Asset Allocation Trust |
Judith M. Johnson (Born 1949) | | Trustee, since 2008; Audit Committee Chairman, since 2008 | | Retired. Prior thereto, Chief Executive Officer and Chief Investment Officer of Minneapolis Employees Retirement Fund from 1996 to 2008. Ms. Johnson is an attorney, certified public accountant and a certified managerial accountant. | | Asset Allocation Trust |
David F. Larcker (Born 1950) | | Trustee, since 2009 | | James Irvin Miller Professor of Accounting at the Graduate School of Business, Stanford University, Director of the Corporate Governance Research Initiative and Senior Faculty of The Rock Center for Corporate Governance since 2006. From 2005 to 2008, Professor of Accounting at the Graduate School of Business, Stanford University. Prior thereto, Ernst & Young Professor of Accounting at The Wharton School, University of Pennsylvania from 1985 to 2005. | | Asset Allocation Trust |
| | | | |
| 146 | | Wells Fargo Equity Gateway Funds | | Other information (unaudited) |
| | | | | | |
Name and year of birth | | Position held and length of service* | | Principal occupations during past five years or longer | | Current other
public company or
investment company
directorships |
Olivia S. Mitchell**** (Born 1953) | | Trustee, since 2006; Governance Committee Chairman, since 2018 | | International Foundation of Employee Benefit Plans Professor, Wharton School of the University of Pennsylvania since 1993. Director of Wharton’s Pension Research Council and Boettner Center on Pensions & Retirement Research, and Research Associate at the National Bureau of Economic Research. Previously, Cornell University Professor from 1978 to 1993. | | Asset Allocation Trust |
Timothy J. Penny***** (Born 1951) | | Trustee, since 1996; Chairman, since 2018; Vice Chairman, from 2017 to 2018 | | President and Chief Executive Officer of Southern Minnesota Initiative Foundation, a non-profit organization, since 2007. Member of the Board of Trustees of NorthStar Education Finance, Inc., a non-profit organization, since 2007. | | Asset Allocation Trust |
James G. Polisson****** (Born 1959) | | Trustee, since 2018; Advisory Board Member, from 2017 to 2018 | | Retired. Chief Marketing Officer, Source (ETF) UK Services, Ltd, from 2015 to 2017. From 2012 to 2015, Principal of The Polisson Group, LLC, a management consulting, corporate advisory and principal investing company. Chief Executive Officer and Managing Director at Russell Investments, Global Exchange Traded Funds from 2010 to 2012. Managing Director of Barclays Global Investors from 1998 to 2010 and Global Chief Marketing Officer for iShares and Barclays Global Investors from 2000 to 2010. Trustee of the San Francisco Mechanics’ Institute, a non-profit organization, from 2013 to 2015. Board member of the Russell Exchange Traded Fund Trust from 2011 to 2012. Director of Barclays Global Investors Holdings Deutschland GmbH from 2006 to 2009. Mr. Polisson is an attorney and has a retired status with the Massachusetts and District of Columbia Bar Associations. | | Asset Allocation Trust |
Michael S. Scofield (Born 1943) | | Trustee, since 2010 | | Served on the Investment Company Institute’s Board of Governors and Executive Committee from 2008-2011 as well the Governing Council of the Independent Directors Council from 2006-2011 and the Independent Directors Council Executive Committee from 2008-2011. Trustee of the Evergreen Funds complex (and its predecessors) from 1984 to 2010. Chairman of the Evergreen Funds from 2000-2010. Former Trustee of the Mentor Funds. Retired Attorney, Law Offices of Michael S. Scofield. | | Asset Allocation Trust |
Pamela Wheelock****** (Born 1959) | | Trustee, since 2018; Advisory Board Member, from 2017 to 2018 | | Chief Operating Officer, Twin Cities Habitat for Humanity, since January, 2017. Vice President of University Services, University of Minnesota from 2012 to 2017. Prior thereto, Interim President and Chief Executive Officer of Blue Cross Blue Shield of Minnesota from 2010 to 2011, Chairman of the Board from 2009 to 2011 and Board Director from 2003 to 2015. Vice President, Leadership and Community Engagement, Bush Foundation, Saint Paul, Minnesota (a private foundation) from 2009 to 2011. Executive Vice President and Chief Financial Officer, Minnesota Sports and Entertainment from 2004 to 2009 and Senior Vice President from 2002 to 2004. Commissioner of Finance, State of Minnesota, from 1999 to 2002. Currently on the Board of Directors, Governance Committee and Finance Committee, for the Minnesota Philanthropy Partners (Saint Paul Foundation) since 2012 and Board Chair of the Minnesota Wild Foundation since 2010. | | Asset Allocation Trust |
| * | Length of service dates reflect the Trustee’s commencement of service with the Trust’s predecessor entities, where applicable. |
| ** | Jane Freeman became Chair Liaison effective January 1, 2018. |
| *** | Peter Gordon retired on December 31, 2017. |
| **** | Olivia Mitchell became Chairman of the Governance Committee effective January 1, 2018. |
| ***** | Timothy Penny became Chairman effective January 1, 2018. |
| ****** | James Polisson and Pamela Wheelock each became a Trustee effective January 1, 2018. |
| | | | | | |
| Other information (unaudited) | | Wells Fargo Equity Gateway Funds | | | 147 | |
Officers
| | | | | | |
Name and year of birth | | Position held and
length of service | | Principal occupations during past five years or longer | | |
Andrew Owen (Born 1960) | | President, since 2017 | | Executive Vice President of Wells Fargo & Company and Head of Affiliated Managers, Wells Fargo Asset Management, since 2014. In addition, Mr. Owen is currently President, Chief Executive Officer and Director of Wells Fargo Funds Management, LLC since 2017. Prior thereto, Executive Vice President responsible for marketing, investments and product development for Wells Fargo Funds Management, LLC, from 2009 to 2014. | | |
Nancy Wiser1 (Born 1967) | | Treasurer, since 2012 | | Executive Vice President of Wells Fargo Funds Management, LLC since 2011. Chief Operating Officer and Chief Compliance Officer at LightBox Capital Management LLC, from 2008 to 2011. | | |
Jeremy DePalma1 (Born 1974) | | Treasurer, since 2012 | | Senior Vice President of Wells Fargo Funds Management, LLC since 2009. Senior Vice President of Evergreen Investment Management Company, LLC from 2008 to 2010 and head of the Fund Reporting and Control Team within Fund Administration from 2005 to 2010. | | |
C. David Messman (Born 1960) | | Secretary, since 2000; Chief Legal Officer, since 2003 | | Senior Vice President and Secretary of Wells Fargo Funds Management, LLC since 2001. Assistant General Counsel of Wells Fargo Bank, N.A. since 2013 and Vice President and Managing Counsel of Wells Fargo Bank, N.A. from 1996 to 2013. | | |
Michael H. Whitaker (Born 1967) | | Chief Compliance Officer, since 2016 | | Senior Vice President and Chief Compliance Officer since 2016. Senior Vice President and Chief Compliance Officer for Fidelity Investments from 2007 to 2016. | | |
David Berardi (Born 1975) | | Assistant Treasurer, since 2009 | | Vice President of Wells Fargo Funds Management, LLC since 2009. Vice President of Evergreen Investment Management Company, LLC from 2008 to 2010. Manager of Fund Reporting and Control for Evergreen Investment Management Company, LLC from 2004 to 2010. | | |
| 1 | Jeremy DePalma acts as Treasurer of the International Value Fund, International Growth Portfolio, and International Value Portfolio and Assistant Treasurer of the remaining funds in this shareholder report. In addition, Jeremy DePalma acts as Treasurer of 73 other funds and Assistant Treasurer of 64 other funds in the Fund Complex. Nancy Wiser serves as Treasurer of the remaining funds in this shareholder report as well as 64 other funds in the Fund Complex. |
| 2 | The Statement of Additional Information includes additional information about the Trustees and is available, without charge, upon request, by calling 1-800-222-8222 or by visiting the website at wellsfargofunds.com. |
| | | | |
| 148 | | Wells Fargo Equity Gateway Funds | | List of abbreviations |
The following is a list of common abbreviations for terms and entities that may have appeared in this report.
| ACA | — ACA Financial Guaranty Corporation |
| ADR | — American depositary receipt |
| ADS | — American depositary shares |
| AGC | — Assured Guaranty Corporation |
| AGM | — Assured Guaranty Municipal |
| Ambac | — Ambac Financial Group Incorporated |
| AMT | — Alternative minimum tax |
| BAN | — Bond anticipation notes |
| BHAC | — Berkshire Hathaway Assurance Corporation |
| CAB | — Capital appreciation bond |
| CCAB | — Convertible capital appreciation bond |
| CDA | — Community Development Authority |
| CDO | — Collateralized debt obligation |
| CLO | — Collateralized loan obligation |
| DRIVER | — Derivative inverse tax-exempt receipts |
| DW&P | — Department of Water & Power |
| DWR | — Department of Water Resources |
| ECFA | — Educational & Cultural Facilities Authority |
| EDA | — Economic Development Authority |
| EDFA | — Economic Development Finance Authority |
| ETF | — Exchange-traded fund |
| FDIC | — Federal Deposit Insurance Corporation |
| FFCB | — Federal Farm Credit Banks |
| FGIC | — Financial Guaranty Insurance Corporation |
| FHA | — Federal Housing Administration |
| FHLB | — Federal Home Loan Bank |
| FHLMC | — Federal Home Loan Mortgage Corporation |
| FICO | — The Financing Corporation |
| FNMA | — Federal National Mortgage Association |
| GDR | — Global depositary receipt |
| GNMA | — Government National Mortgage Association |
| HCFR | — Healthcare facilities revenue |
| HEFA | — Health & Educational Facilities Authority |
| HEFAR | — Higher education facilities authority revenue |
| HFA | — Housing Finance Authority |
| HFFA | — Health Facilities Financing Authority |
| HUD | — Department of Housing and Urban Development |
| IDA | — Industrial Development Authority |
| IDAG | — Industrial Development Agency |
| KRW | — Republic of Korea won |
| LIBOR | — London Interbank Offered Rate |
| LIFER | — Long Inverse Floating Exempt Receipts |
| LLC | — Limited liability company |
| LLLP | — Limited liability limited partnership |
| LLP | — Limited liability partnership |
| MBIA | — Municipal Bond Insurance Association |
| MFHR | — Multifamily housing revenue |
| MSTR | — Municipal securities trust receipts |
| MUD | — Municipal Utility District |
| National | — National Public Finance Guarantee Corporation |
| PCFA | — Pollution Control Financing Authority |
| PCL | — Public Company Limited |
| PCR | — Pollution control revenue |
| PFA | — Public Finance Authority |
| PFFA | — Public Facilities Financing Authority |
| PFOTER | — Puttable floating option tax-exempt receipts |
| PJSC | — Public Joint Stock Company |
| plc | — Public limited company |
| PUTTER | — Puttable tax-exempt receipts |
| R&D | — Research & development |
| Radian | — Radian Asset Assurance |
| RAN | — Revenue anticipation notes |
| RDA | — Redevelopment Authority |
| RDFA | — Redevelopment Finance Authority |
| REIT | — Real estate investment trust |
| ROC | — Reset option certificates |
| SAVRS | — Select auction variable rate securities |
| SBA | — Small Business Authority |
| SDR | — Swedish depositary receipt |
| SFHR | — Single-family housing revenue |
| SFMR | — Single-family mortgage revenue |
| SPA | — Standby purchase agreement |
| SPDR | — Standard & Poor’s Depositary Receipts |
| SPEAR | — Short Puttable Exempt Adjustable Receipts |
| STRIPS | — Separate trading of registered interest and |
| TAN | — Tax anticipation notes |
| TIPS | — Treasury inflation-protected securities |
| TRAN | — Tax revenue anticipation notes |
| TTFA | — Transportation Trust Fund Authority |
| TVA | — Tennessee Valley Authority |

For more information
More information about Wells Fargo Funds is available free upon request. To obtain literature, please write, email, visit the Funds’ website, or call:
Wells Fargo Funds
P.O. Box 8266
Boston, MA 02266-8266
Email: fundservice@wellsfargo.com
Website: wellsfargofunds.com
Individual investors: 1-800-222-8222
Retail investment professionals: 1-888-877-9275
Institutional investment professionals: 1-866-765-0778
This report and the financial statements contained herein are submitted for the general information of the shareholders of Wells Fargo Funds. If this report is used for promotional purposes, distribution of the report must be accompanied or preceded by a current prospectus. Before investing, please consider the investment objectives, risks, charges, and expenses of the investment. For a current prospectus and, if available, a summary prospectus, containing this information, call 1-800-222-8222 or visit the Funds’ website at wellsfargofunds.com. Read the prospectus carefully before you invest or send money.
Wells Fargo Asset Management (WFAM) is a trade name used by the asset management businesses of Wells Fargo & Company. Wells Fargo Funds Management, LLC, a wholly owned subsidiary of Wells Fargo & Company, provides investment advisory and administrative services for Wells Fargo Funds. Other affiliates of Wells Fargo & Company provide subadvisory and other services for the funds. The funds are distributed by Wells Fargo Funds Distributor, LLC, Member FINRA, an affiliate of Wells Fargo & Company. Neither Wells Fargo Funds Distributor nor Wells Fargo Funds Management holds fund shareholder accounts or assets. This material is for general informational and educational purposes only and is NOT intended to provide investment advice or a recommendation of any kind—including a recommendation for any specific investment, strategy, or plan.
NOT FDIC INSURED ◾ NO BANK GUARANTEE ◾ MAY LOSE VALUE
© 2017 Wells Fargo Funds Management, LLC. All rights reserved.
| | |
 | | 307649 01-18 SEGF/SAR111 11-17 |
ITEM 2. CODE OF ETHICS
Not applicable.
ITEM 3. AUDIT COMMITTEE FINANCIAL EXPERT
Not applicable.
ITEM 4. PRINCIPAL ACCOUNTANT FEES AND SERVICES
Not applicable.
ITEM 5. AUDIT COMMITTEE OF LISTED REGISTRANTS
Not applicable.
ITEM 6. INVESTMENTS
A Portfolio of Investments for each Portfolio is included as part of the report to shareholders filed under Item 1 of this Form.
ITEM 7. DISCLOSURE OF PROXY VOTING POLICIES AND PROCEDURES FOR CLOSED-END MANAGEMENT INVESTMENT COMPANIES
Not applicable.
ITEM 8. PORTFOLIO MANAGERS OF CLOSED-END MANAGEMENT INVESTMENT COMPANIES
Not applicable.
ITEM 9. PURCHASES OF EQUITY SECURITIES BY CLOSED-END MANAGEMEENT INVESTMENT COMPANY AND AFFILIATED PURCHASERS
Not applicable.
ITEM 10. SUBMISSION OF MATTERS TO A VOTE OF SECURITY HOLDERS
There have been no material changes to the procedures by which shareholders may recommend nominees to the registrant’s Board of Trustees that have been implemented since the registrant’s last provided disclosure in response to the requirements of this Item.
ITEM 11. CONTROLS AND PROCEDURES
(a) The President and Treasurer have concluded that the Wells Fargo Master Trust (the “Trust”) disclosure controls and procedures (as defined in Rule 30a-3(c) under the Investment Company Act of 1940) provide reasonable assurances that material information relating to the Trust is made known to them by the appropriate persons, based on their evaluation of these controls and procedures as of a date within 90 days of the filing of this report.
(b) There were no significant changes in the Trust’s internal controls over financial reporting (as defined in Rule 30a-3(d) under the Investment Company Act of 1940) that occurred during the second fiscal quarter of the period covered by this report that materially affected, or is reasonably likely to materially affect, the registrant’s internal control over financial reporting.
ITEM 12. EXHIBITS
(a)(1) Not applicable.
(a)(2) Certification pursuant to Rule 30a-2(a) under the Investment Company Act of 1940 (17 CFR 270.30a-2(a)) is filed and attached hereto as Exhibit 99.CERT.
(a)(3) Not applicable.
(b) Certification pursuant to Rule 30a-2(b) under the Investment Company Act of 1940 (17 CFR 270.30a-2(b)) is filed and attached hereto as Exhibit 99.906CERT.
SIGNATURES
Pursuant to the requirements of the Securities Exchange Act of 1934 and the Investment Company Act of 1940, the registrant has duly caused this report to be signed on its behalf by the undersigned, thereunto duly authorized.
| | |
| |
By: | | /s/ Andrew Owen |
| |
| | Andrew Owen |
| | President |
| |
Date: | | January 25, 2018 |
Pursuant to the requirements of the Securities Exchange Act of 1934 and the Investment Company Act of 1940, this report has been signed below by the following persons on behalf of the registrant and in the capacities and on the date indicated.
| | |
| |
By: | | /s/ Andrew Owen |
| |
| | Andrew Owen |
| | President |
| |
Date: | | January 25, 2018 |
| |
By: | | /s/ Nancy Wiser |
| |
| | Nancy Wiser |
| | Treasurer |
| |
Date: | | January 25, 2018 |
| |
By: | | /s/ Jeremy DePalma |
| |
| | Jeremy DePalma |
| | Treasurer |
| |
Date: | | January 25, 2018 |