
UNITED STATES
SECURITIES AND EXCHANGE COMMISSION
Washington, D.C. 20549
FORM N-CSRS
CERTIFIED SHAREHOLDER REPORT OF REGISTERED
MANAGEMENT INVESTMENT COMPANIES
Investment Company Act file number: 811-09689
Wells Fargo Master Trust
(Exact name of registrant as specified in charter)
525 Market St., San Francisco, CA 94105
(Address of principal executive offices) (Zip code)
Alexander Kymn
Wells Fargo Funds Management, LLC
525 Market St., San Francisco, CA 94105
(Name and address of agent for service)
Registrant’s telephone number, including area code: 800-222-8222
Date of fiscal year end: February 28
Registrant is making a filing for 11 of its series:
Wells Fargo Bloomberg Barclays Aggregate-ex Corporate Portfolio, Wells Fargo Emerging Markets Bond Portfolio, Wells Fargo Factor Enhanced Emerging Markets Portfolio, Wells Fargo Factor Enhanced International Portfolio, Wells Fargo Factor Enhanced Large Cap Portfolio, Wells Fargo Factor Enhanced Small Cap Portfolio, Wells Fargo High Yield Corporate Bond Portfolio, Wells Fargo International Government Bond Portfolio, Wells Fargo Investment Grade Corporate Bond Portfolio, Wells Fargo Strategic Retirement Bond Portfolio, and Wells Fargo U.S. REIT Portfolio.
Date of reporting period: August 31, 2018
ITEM 1. REPORT TO STOCKHOLDERS
Semi-Annual Report
August 31, 2018

| ◾ | | Wells Fargo Emerging Markets Bond Fund |
| ◾ | | Wells Fargo Factor Enhanced Emerging Markets Fund |
| ◾ | | Wells Fargo Factor Enhanced International Fund |
| ◾ | | Wells Fargo Factor Enhanced Large Cap Fund |
| ◾ | | Wells Fargo Factor Enhanced Small Cap Fund |
| ◾ | | Wells Fargo High Yield Corporate Bond Fund |
| ◾ | | Wells Fargo International Government Bond Fund |
| ◾ | | Wells Fargo U.S. Core Bond Fund |

Reduce clutter. Save trees.
Sign up for electronic delivery of prospectuses and shareholder reports at wellsfargo.com/advantagedelivery
Contents
The views expressed and any forward-looking statements are as of August 31, 2018, unless otherwise noted, and are those of the Fund managers and/or Wells Fargo Funds Management, LLC. Discussions of individual securities, or the markets generally, or any Wells Fargo Fund are not intended as individual recommendations. Future events or results may vary significantly from those expressed in any forward-looking statements. The views expressed are subject to change at any time in response to changing circumstances in the market. Wells Fargo Funds Management, LLC and the Fund disclaim any obligation to publicly update or revise any views expressed or forward-looking statements.
NOT FDIC INSURED ◾ NO BANK GUARANTEE ◾ MAY LOSE VALUE
| | | | |
| 2 | | Wells Fargo Funds | | Performance highlights (unaudited) |
Wells Fargo Emerging Markets Bond Fund1
Investment objective
The Fund seeks to replicate the total return of the JP Morgan EMBI Global Diversified Index, before fees and expenses.
Manager
Wells Fargo Funds Management, LLC
Subadviser for the affiliated master portfolio
Wells Fargo Asset Management (International), LLC
Portfolio managers
Michael Lee
Tony Norris
Alex Perrin
Average annual total returns (%) as of August 31, 2018
| | | | | | | | | | | | | | | | | | |
| | | | | | | | | | | Expense ratios2 (%) | |
| | | Inception date | | 1 year | | | Since inception | | | Gross | | | Net3 | |
| Wells Fargo Emerging Markets Bond Fund (WBEMX) | | 8-3-2017 | | | (3.22 | ) | | | (2.01 | ) | | | 752.83 | | | | 0.00 | |
| JP Morgan EMBI Global Diversified Index4 | | – | | | (3.37 | ) | | | (2.04 | )* | | | – | | | | – | |
| * | | Return is based on the inception date of the Fund. |
Figures quoted represent past performance, which is no guarantee of future results, and do not reflect taxes that a shareholder may pay on fund distributions or the redemption of fund shares. Investment return and principal value of an investment will fluctuate so that an investor’s shares, when redeemed, may be worth more or less than their original cost. Current performance may be lower or higher than the performance data quoted, which assumes the reinvestment of dividends and capital gains.
Index returns do not include transaction costs associated with buying and selling securities, any mutual fund fees or expenses, or any taxes. It is not possible to invest directly in an index.
Shares are sold without a front-end sales charge or contingent deferred sales charge.
Bond values fluctuate in response to the financial condition of individual issuers, general market and economic conditions, and changes in interest rates. Changes in market conditions and government policies may lead to periods of heightened volatility in the bond market and reduced liquidity for certain bonds held by the Fund. In general, when interest rates rise, bond values fall and investors may lose principal value. Interest-rate changes and their impact on the Fund and its share price can be sudden and unpredictable. The use of derivatives may reduce returns and/or increase volatility. Certain investment strategies tend to increase the total risk of an investment (relative to the broader market). High-yield securities have a greater risk of default and tend to be more volatile than higher-rated debt securities. The Fund is exposed to foreign investment risk and focused portfolio risk. Consult the Fund’s prospectus for additional information on these and other risks.
Please see footnotes on page 3.
| | | | | | |
| Performance highlights (unaudited) | | Wells Fargo Funds | | | 3 | |
Wells Fargo Emerging Markets Bond Fund (continued)
| | | | |
| Ten largest holdings (%) as of August 31, 20185 | |
Dominican Republic, 5.95%, 1-25-2017 | | | 2.79 | |
Republic of Colombia, 3.88%, 4-25-2027 | | | 2.28 | |
Russian Federation, 12.75%, 6-24-2028 | | | 1.89 | |
Petronas Capital Limited, 3.50%, 3-18-2025 | | | 1.64 | |
United Mexican States, 6.75%, 9-27-2034 | | | 1.59 | |
Republic of Argentina, 5.63%, 1-26-2022 | | | 1.46 | |
Romania, 6.75%, 2-7-2022 | | | 1.37 | |
Republic of Indonesia, 5.88%, 1-15-2024 | | | 1.35 | |
Petroleos Mexicanos Company, 4.88%, 1-24-2022 | | | 1.34 | |
Republic of Panama, 4.00%, 9-22-2024 | | | 1.30 | |
|
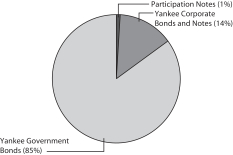
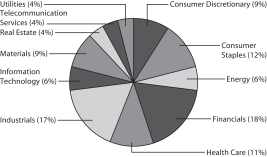
| Portfolio allocation (%) as of August 31, 20186 |
|
|
| 1 | The Fund is a feeder fund that invests substantially all of its assets in a single affiliated master portfolio of the Wells Fargo Master Trust with an identical investment objective. References to the investment activities of the Fund are intended to refer to the investment activities of the affiliated master portfolio in which it invests. |
| 2 | Reflects the expense ratios as stated in the most recent prospectus. The expense ratios shown are subject to change and may differ from the annualized expense ratios shown in the financial highlights of this report. |
| 3 | The manager has contractually committed through June 30, 2019, to waive fees and/or reimburse expenses to the extent necessary to cap the Fund’s Total Annual Fund Operating Expenses After Fee Waivers at the amount shown. Brokerage commissions, stamp duty fees, interest, taxes, acquired fund fees and expenses from unaffiliated funds in which the affiliated master portfolio invests, and extraordinary expenses are excluded from the expense cap. All other acquired fund fees and expenses from the affiliated master portfolio are included in the expense cap. After this time, the cap may be increased or the commitment to maintain the cap may be terminated only with the approval of the Board of Trustees. Without this cap, the Fund’s returns would have been lower. The expense ratio paid by an investor is the net expense ratio (the total annual fund operating expenses after fee waivers) as stated in the prospectus. |
| 4 | The JP Morgan Emerging Markets Bond Index (EMBI) Global Diversified Index is a composite index representing an unleveraged investment in emerging market bonds that is broadly based across the spectrum of emerging market bonds and includes reinvestment of income (to represent real assets). You cannot invest directly in an index. |
| 5 | The ten largest holdings, excluding cash, cash equivalents and any money market funds, are calculated based on the value of the securities of the affiliated master portfolio allocable to the Fund divided by the total net assets of the Fund. Holdings are subject to change and may have changed since the date specified. |
| 6 | Amounts represent the portfolio allocation of the affiliated master portfolio and are calculated based on the total long-term investments of the affiliated master portfolio. These amounts are subject to change and may have changed since the date specified. |
| | | | |
| 4 | | Wells Fargo Funds | | Performance highlights (unaudited) |
Wells Fargo Factor Enhanced Emerging Markets Fund1
Investment objective
The Fund seeks to replicate the total return of the Wells Fargo Factor Enhanced Emerging Markets Index (Net), before fees and expenses.
Manager
Wells Fargo Funds Management, LLC
Subadviser for the affiliated master portfolio
Wells Capital Management Incorporated‡
Portfolio managers
Dennis Bein, CFA®
Harindra de Silva, Ph.D., CFA®
Monisha Jayakumar
David Krider, CFA®
Average annual total returns (%) as of August 31, 2018
| | | | | | | | | | | | | | | | | | |
| | | | | | | | | | | Expense ratios2 (%) | |
| | | Inception date | | 1 year | | | Since inception | | | Gross | | | Net3 | |
| Wells Fargo Factor Enhanced Emerging Markets Fund (WEEMX) | | 8-3-2017 | | | (3.28 | ) | | | (1.79 | ) | | | 728.50 | | | | 0.00 | |
| Wells Fargo Factor Enhanced Emerging Markets Index (Net)4 | | – | | | (2.98 | ) | | | (1.33 | )* | | | – | | | | – | |
| * | | Return is based on the inception date of the Fund. |
Figures quoted represent past performance, which is no guarantee of future results, and do not reflect taxes that a shareholder may pay on fund distributions or the redemption of fund shares. Investment return and principal value of an investment will fluctuate so that an investor’s shares, when redeemed, may be worth more or less than their original cost. Current performance may be lower or higher than the performance data quoted, which assumes the reinvestment of dividends and capital gains.
Index returns do not include transaction costs associated with buying and selling securities, any mutual fund fees or expenses, or any taxes. It is not possible to invest directly in an index.
Shares are sold without a front-end sales charge or contingent deferred sales charge.
Stock values fluctuate in response to the activities of individual companies and general market and economic conditions. Foreign investments are especially volatile and can rise or fall dramatically due to differences in the political and economic conditions of the host country. These risks are generally intensified in emerging markets. The use of derivatives may reduce returns and/or increase volatility. Certain investment strategies tend to increase the total risk of an investment (relative to the broader market). The Fund is exposed to focused portfolio risk, index tracking risk, and smaller-company securities risk. Consult the Fund’s prospectus for additional information on these and other risks.
Please see footnotes on page 5.
| | | | | | |
| Performance highlights (unaudited) | | Wells Fargo Funds | | | 5 | |
Wells Fargo Factor Enhanced Emerging Markets Fund (continued)
| | | | |
| Ten largest holdings (%) as of August 31, 20185 | |
SK Hynix Incorporated | | | 1.39 | |
Hon Hai Precision Industry Company Limited | | | 1.34 | |
Infosys Limited ADR | | | 1.32 | |
Itau Unibanco Holding SA | | | 1.00 | |
Tata Consultancy Services Limited | | | 0.96 | |
POSCO | | | 0.89 | |
China Petroleum & Chemical Corporation H Shares | | | 0.85 | |
Hindustan Unilever Limited | | | 0.77 | |
Naver Corporation | | | 0.74 | |
Banco Bradesco SA | | | 0.71 | |
|
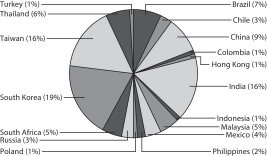
| Country allocation (%) as of August 31, 20186 |
|
|
|
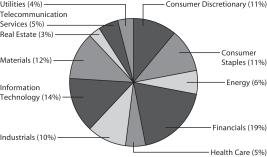
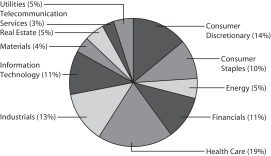
| Sector distribution (%) as of August 31, 20186 |
|
 |
| ‡ | Wells Capital Management Incorporated became the subadviser of the affiliated master portfolio on November 1, 2018. |
| 1 | The Fund is a feeder fund that invests substantially all of its assets in a single affiliated master portfolio of the Wells Fargo Master Trust with an identical investment objective. References to the investment activities of the Fund are intended to refer to the investment activities of the affiliated master portfolio in which it invests. |
| 2 | Reflects the expense ratios as stated in the most recent prospectus. The expense ratios shown are subject to change and may differ from the annualized expense ratios shown in the financial highlights of this report. |
| 3 | The manager has contractually committed through June 30, 2019, to waive fees and/or reimburse expenses to the extent necessary to cap the Fund’s Total Annual Fund Operating Expenses After Fee Waivers at the amount shown. Brokerage commissions, stamp duty fees, interest, taxes, acquired fund fees and expenses from unaffiliated funds in which the affiliated master portfolio invests, and extraordinary expenses are excluded from the expense cap. All other acquired fund fees and expenses from the affiliated master portfolio are included in the expense cap. After this time, the cap may be increased or the commitment to maintain the cap may be terminated only with the approval of the Board of Trustees. Without this cap, the Fund’s returns would have been lower. The expense ratio paid by an investor is the net expense ratio (the total annual fund operating expenses after fee waivers) as stated in the prospectus. |
| 4 | The Wells Fargo Factor Enhanced Emerging Markets Index (Net) is an index of equity securities that is derived from a universe of companies domiciled in various emerging markets countries and that possess, in aggregate, diversified exposure to investment factors (or characteristics) that are commonly tied to a stock’s potential for enhanced risk-adjusted returns relative to the market. You cannot invest directly in an index. |
| 5 | The ten largest holdings, excluding cash, cash equivalents and any money market funds, are calculated based on the value of the securities of the affiliated master portfolio allocable to the Fund divided by the total net assets of the Fund. Holdings are subject to change and may have changed since the date specified. |
| 6 | Amounts represent the composition of the affiliated master portfolio and are calculated based on the total long-term investments of the affiliated master portfolio. These amounts are subject to change and may have changed since the date specified. |
| | | | |
| 6 | | Wells Fargo Funds | | Performance highlights (unaudited) |
Wells Fargo Factor Enhanced International Fund1
Investment objective
The Fund seeks to replicate the total return of the Wells Fargo Factor Enhanced International Index (Net), before fees and expenses.
Manager
Wells Fargo Funds Management, LLC
Subadviser for the affiliated master portfolio
Wells Capital Management Incorporated‡
Portfolio managers
Dennis Bein, CFA®
Harindra de Silva, Ph.D., CFA®
Monisha Jayakumar
David Krider, CFA®
Average annual total returns (%) as of August 31, 2018
| | | | | | | | | | | | | | | | | | |
| | | | | | | | | | | Expense ratios2 (%) | |
| | | Inception date | | 1 year | | | Since inception | | | Gross | | | Net3 | |
| Wells Fargo Factor Enhanced International Fund (WINTX) | | 8-3-2017 | | | 6.01 | | | | 5.37 | | | | 730.62 | | | | 0.00 | |
| Wells Fargo Factor Enhanced International Index (Net)4 | | – | | | 6.07 | | | | 5.31 | * | | | – | | | | – | |
| * | | Return is based on the inception date of the Fund. |
Figures quoted represent past performance, which is no guarantee of future results, and do not reflect taxes that a shareholder may pay on fund distributions or the redemption of fund shares. Investment return and principal value of an investment will fluctuate so that an investor’s shares, when redeemed, may be worth more or less than their original cost. Current performance may be lower or higher than the performance data quoted, which assumes the reinvestment of dividends and capital gains.
Index returns do not include transaction costs associated with buying and selling securities, any mutual fund fees or expenses, or any taxes. It is not possible to invest directly in an index.
Shares are sold without a front-end sales charge or contingent deferred sales charge.
Stock values fluctuate in response to the activities of individual companies and general market and economic conditions. Foreign investments are especially volatile and can rise or fall dramatically due to differences in the political and economic conditions of the host country. These risks are generally intensified in emerging markets. The use of derivatives may reduce returns and/or increase volatility. Certain investment strategies tend to increase the total risk of an investment (relative to the broader market). The Fund is exposed to focused portfolio risk, index tracking risk, and smaller company securities risk. Consult the Fund’s prospectus for additional information on these and other risks.
Please see footnotes on page 7.
| | | | | | |
| Performance highlights (unaudited) | | Wells Fargo Funds | | | 7 | |
Wells Fargo Factor Enhanced International Fund (continued)
| | | | |
| Ten largest holdings (%) as of August 31, 20185 | |
Roche Holding AG | | | 1.42 | |
Royal Dutch Shell plc Class A | | | 1.29 | |
BP plc | | | 1.27 | |
Royal Bank of Canada | | | 0.95 | |
The Toronto-Dominion Bank | | | 0.95 | |
British American Tobacco plc | | | 0.94 | |
AIA Group Limited | | | 0.87 | |
GlaxoSmithKline plc | | | 0.84 | |
AstraZeneca plc | | | 0.78 | |
Unilever NV | | | 0.74 | |
|
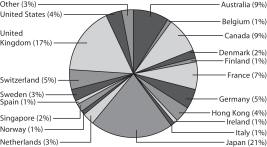
| Country allocation (%) as of August 31, 20186 |
|
|
|
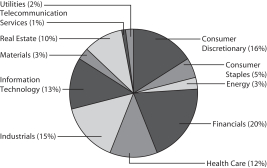
| Sector distribution (%) as of August 31, 20186 |
|
 |
| ‡ | Wells Capital Management Incorporated became the subadviser of the affiliated master portfolio on November 1, 2018. |
| 1 | The Fund is a feeder fund that invests substantially all of its assets in a single affiliated master portfolio of the Wells Fargo Master Trust with an identical investment objective. References to the investment activities of the Fund are intended to refer to the investment activities of the affiliated master portfolio in which it invests. |
| 2 | Reflects the expense ratios as stated in the most recent prospectus. The expense ratios shown are subject to change and may differ from the annualized expense ratios shown in the financial highlights of this report. |
| 3 | The manager has contractually committed through June 30, 2019, to waive fees and/or reimburse expenses to the extent necessary to cap the Fund’s Total Annual Fund Operating Expenses After Fee Waivers at the amount shown. Brokerage commissions, stamp duty fees, interest, taxes, acquired fund fees and expenses from unaffiliated funds in which the affiliated master portfolio invests, and extraordinary expenses are excluded from the expense cap. All other acquired fund fees and expenses from the affiliated master portfolio are included in the expense cap. After this time, the cap may be increased or the commitment to maintain the cap may be terminated only with the approval of the Board of Trustees. Without this cap, the Fund’s returns would have been lower. The expense ratio paid by an investor is the net expense ratio (the total annual fund operating expenses after fee waivers) as stated in the prospectus. |
| 4 | The Wells Fargo Factor Enhanced International Index (Net) is an index of equity securities that is derived from a universe of companies domiciled in various developed markets outside the U.S. and that possess, in aggregate, diversified exposure to investment factors (or characteristics) that are commonly tied to a stock’s potential for enhanced risk-adjusted returns relative to the market. You cannot invest directly in an index. |
| 5 | The ten largest holdings, excluding cash, cash equivalents and any money market funds, are calculated based on the value of the securities of the affiliated master portfolio allocable to the Fund divided by the total net assets of the Fund. Holdings are subject to change and may have changed since the date specified. |
| 6 | Amounts represent the composition of the affiliated master portfolio and are calculated based on the total long-term investments of the affiliated master portfolio. These amounts are subject to change and may have changed since the date specified. |
| | | | |
| 8 | | Wells Fargo Funds | | Performance highlights (unaudited) |
Wells Fargo Factor Enhanced Large Cap Fund1
Investment objective
The Fund seeks to replicate the total return of the Wells Fargo Factor Enhanced Large Cap Index, before fees and expenses.
Manager
Wells Fargo Funds Management, LLC
Subadviser for the affiliated master portfolio
Wells Capital Management Incorporated‡
Portfolio managers
Dennis Bein, CFA®
Ryan Brown, CFA®
Harindra de Silva, Ph.D., CFA®
Monisha Jayakumar
Average annual total returns (%) as of August 31, 2018
| | | | | | | | | | | | | | | | | | |
| | | | | | | | Expense ratios2 (%) | |
| | | Inception date | | 1 year | | | Since
inception | | | Gross | | | Net3 | |
| Wells Fargo Factor Enhanced Large Cap Fund (WLECX) | | 8-3-2017 | | | 16.38 | | | | 15.24 | | | | 718.70 | | | | 0.00 | |
| Wells Fargo Factor Enhanced Large Cap Index4 | | – | | | 16.19 | | | | 15.21 | * | | | – | | | | – | |
| * | | Return is based on the inception date of the Fund. |
Figures quoted represent past performance, which is no guarantee of future results, and do not reflect taxes that a shareholder may pay on fund distributions or the redemption of fund shares. Investment return and principal value of an investment will fluctuate so that an investor’s shares, when redeemed, may be worth more or less than their original cost. Current performance may be lower or higher than the performance data quoted, which assumes the reinvestment of dividends and capital gains.
Index returns do not include transaction costs associated with buying and selling securities, any mutual fund fees or expenses, or any taxes. It is not possible to invest directly in an index.
Shares are sold without a front-end sales charge or contingent deferred sales charge.
Stock values fluctuate in response to the activities of individual companies and general market and economic conditions. The use of derivatives may reduce returns and/or increase volatility. Certain investment strategies tend to increase the total risk of an investment (relative to the broader market). The Fund is exposed to focused portfolio risk and index tracking risk. Consult the Fund’s prospectus for additional information on these and other risks.
Please see footnotes on page 9.
| | | | | | |
| Performance highlights (unaudited) | | Wells Fargo Funds | | | 9 | |
Wells Fargo Factor Enhanced Large Cap Fund (continued)
| | | | |
| Ten largest holdings (%) as of August 31, 20185 | |
Johnson & Johnson | | | 2.04 | |
Exxon Mobil Corporation | | | 1.93 | |
Berkshire Hathaway Incorporated Class B | | | 1.52 | |
UnitedHealth Group Incorporated | | | 1.45 | |
Pfizer Incorporated | | | 1.40 | |
The Home Depot Incorporated | | | 1.32 | |
AT&T Incorporated | | | 1.30 | |
Chevron Corporation | | | 1.29 | |
Verizon Communications Incorporated | | | 1.27 | |
The Procter & Gamble Company | | | 1.18 | |
|
| Sector distribution (%) as of August 31, 20186 |
|
|
| ‡ | Wells Capital Management Incorporated became the subadviser of the affiliated master portfolio on November 1, 2018. |
| 1 | The Fund is a feeder fund that invests substantially all of its assets in a single affiliated master portfolio of the Wells Fargo Master Trust with an identical investment objective. References to the investment activities of the Fund are intended to refer to the investment activities of the affiliated master portfolio in which it invests. |
| 2 | Reflects the expense ratios as stated in the most recent prospectus. The expense ratios shown are subject to change and may differ from the annualized expense ratios shown in the financial highlights of this report. |
| 3 | The manager has contractually committed through June 30, 2019, to waive fees and/or reimburse expenses to the extent necessary to cap the Fund’s Total Annual Fund Operating Expenses After Fee Waivers at the amount shown. Brokerage commissions, stamp duty fees, interest, taxes, acquired fund fees and expenses from unaffiliated funds in which the affiliated master portfolio invests, and extraordinary expenses are excluded from the expense cap. All other acquired fund fees and expenses from the affiliated master portfolio are included in the expense cap. After this time, the cap may be increased or the commitment to maintain the cap may be terminated only with the approval of the Board of Trustees. Without this cap, the Fund’s returns would have been lower. The expense ratio paid by an investor is the net expense ratio (the total annual fund operating expenses after fee waivers) as stated in the prospectus. |
| 4 | The Wells Fargo Factor Enhanced Large Cap Index is an index of equity securities that is derived from a universe of the largest 1,000 companies in the U.S. market and that possess, in aggregate, diversified exposure to investment factors (or characteristics) that are commonly tied to a stock’s potential for enhanced risk-adjusted returns relative to the market. You cannot invest directly in an index. |
| 5 | The ten largest holdings, excluding cash, cash equivalents and any money market funds, are calculated based on the value of the securities of the affiliated master portfolio allocable to the Fund divided by the total net assets of the Fund. Holdings are subject to change and may have changed since the date specified. |
| 6 | Amounts represent the sector distribution of the affiliated master portfolio and are calculated based on the total long-term investments of the affiliated master portfolio. These amounts are subject to change and may have changed since the date specified. |
| | | | |
| 10 | | Wells Fargo Funds | | Performance highlights (unaudited) |
Wells Fargo Factor Enhanced Small Cap Fund1
Investment objective
The Fund seeks to replicate the total return of the Wells Fargo Factor Enhanced Small Cap Index, before fees and expenses.
Manager
Wells Fargo Funds Management, LLC
Subadviser for the affiliated master portfolio
Wells Capital Management Incorporated‡
Portfolio managers
Dennis Bein, CFA®
Ryan Brown, CFA®
Monisha Jayakumar
Harindra de Silva, Ph.D., CFA®
Average annual total returns (%) as of August 31, 2018
| | | | | | | | | | | | | | | | | | |
| | | | | | | | Expense ratios2 (%) | |
| | | Inception date | | 1 year | | | Since
inception | | | Gross | | | Net3 | |
| Wells Fargo Factor Enhanced Small Cap Fund (WFESX) | | 8-3-2017 | | | 26.62 | | | | 23.47 | | | | 717.31 | | | | 0.00 | |
| Wells Fargo Factor Enhanced Small Cap Index4 | | – | | | 25.76 | | | | 23.01 | * | | | – | | | | – | |
| * | | Return is based on the inception date of the Fund. |
Figures quoted represent past performance, which is no guarantee of future results, and do not reflect taxes that a shareholder may pay on fund distributions or the redemption of fund shares. Investment return and principal value of an investment will fluctuate so that an investor’s shares, when redeemed, may be worth more or less than their original cost. Current performance may be lower or higher than the performance data quoted, which assumes the reinvestment of dividends and capital gains.
Index returns do not include transaction costs associated with buying and selling securities, any mutual fund fees or expenses, or any taxes. It is not possible to invest directly in an index.
Shares are sold without a front-end sales charge or contingent deferred sales charge.
Stock values fluctuate in response to the activities of individual companies and general market and economic conditions. Smaller-company stocks tend to be more volatile and less liquid than those of larger companies. The use of derivatives may reduce returns and/or increase volatility. Certain investment strategies tend to increase the total risk of an investment (relative to the broader market). The Fund is exposed to focused portfolio risk, and index tracking risk. Consult the Fund’s prospectus for additional information on these and other risks. Consult the Fund’s prospectus for additional information on these and other risks.
Please see footnotes on page 11.
| | | | | | |
| Performance highlights (unaudited) | | Wells Fargo Funds | | | 11 | |
Wells Fargo Factor Enhanced Small Cap Fund (continued)
| | | | |
| Ten largest holdings (%) as of August 31, 20185 | |
Etsy Incorporated | | | 0.32 | |
Inogen Incorporated | | | 0.29 | |
Insperity Incorporated | | | 0.28 | |
Green Dot Corporation Class A | | | 0.25 | |
Tetra Tech Incorporated | | | 0.24 | |
Two Harbors Investment Corporation | | | 0.24 | |
Deckers Outdoor Corporation | | | 0.23 | |
Kemper Corporation | | | 0.23 | |
SiteOne Landscape Supply Incorporated | | | 0.22 | |
NuVasive Incorporated | | | 0.22 | |
|
| Sector distribution (%) as of August 31, 20186 |
|
|
| ‡ | Wells Capital Management Incorporated became the subadviser of the affiliated master portfolio on November 1, 2018. |
| 1 | The Fund is a feeder fund that invests substantially all of its assets in a single affiliated master portfolio of the Wells Fargo Master Trust with an identical investment objective. References to the investment activities of the Fund are intended to refer to the investment activities of the affiliated master portfolio in which it invests. |
| 2 | Reflects the expense ratios as stated in the most recent prospectus. The expense ratios shown are subject to change and may differ from the annualized expense ratios shown in the financial highlights of this report. |
| 3 | The manager has contractually committed through June 30, 2019, to waive fees and/or reimburse expenses to the extent necessary to cap the Fund’s Total Annual Fund Operating Expenses After Fee Waivers at the amount shown. Brokerage commissions, stamp duty fees, interest, taxes, acquired fund fees and expenses from unaffiliated funds in which the affiliated master portfolio invests, and extraordinary expenses are excluded from the expense cap. All other acquired fund fees and expenses from the affiliated master portfolio are included in the expense cap. After this time, the cap may be increased or the commitment to maintain the cap may be terminated only with the approval of the Board of Trustees. Without this cap, the Fund’s returns would have been lower. The expense ratio paid by an investor is the net expense ratio (the total annual fund operating expenses after fee waivers) as stated in the prospectus. |
| 4 | The Wells Fargo Factor Enhanced Small Cap Index is an index of equity securities that is derived from a universe of the smallest 2,000 companies in the U.S. market and that possess, in aggregate, diversified exposure to investment factors (or characteristics) that are commonly tied to a stock’s potential for enhanced risk-adjusted returns relative to the market. You cannot invest directly in an index. |
| 5 | The ten largest holdings, excluding cash, cash equivalents and any money market funds, are calculated based on the value of the securities of the affiliated master portfolio allocable to the Fund divided by the total net assets of the Fund. Holdings are subject to change and may have changed since the date specified. |
| 6 | Amounts represent the sector distribution of the affiliated master portfolio and are calculated based on the total long-term investments of the affiliated master portfolio. These amounts are subject to change and may have changed since the date specified. |
| | | | |
| 12 | | Wells Fargo Funds | | Performance highlights (unaudited) |
Wells Fargo High Yield Corporate Bond Fund1
Investment objective
The Fund seeks to replicate the total return of the Wells Fargo U.S. High Yield Bond Index, before fees and expenses.
Manager
Wells Fargo Funds Management, LLC
Subadviser for the affiliated master portfolio
Wells Capital Management Incorporated
Portfolio managers
Thomas M. Price, CFA®
Janet S. Rilling, CFA®, CPA
Michael J. Schueller, CFA®
Average annual total returns (%) as of August 31, 2018
| | | | | | | | | | | | | | | | | | |
| | | | | | | | Expense ratios2 (%) | |
| | | Inception date | | 1 year | | | Since
inception | | | Gross | | | Net3 | |
| Wells Fargo High Yield Corporate Bond Fund (WYCBX) | | 8-3-2017 | | | 2.57 | | | | 2.19 | | | | 761.12 | | | | 0.00 | |
| Wells Fargo U.S. High Yield Bond Index4 | | – | | | 3.29 | | | | 2.95 | * | | | – | | | | – | |
| * | | Return is based on the inception date of the Fund. |
Figures quoted represent past performance, which is no guarantee of future results, and do not reflect taxes that a shareholder may pay on fund distributions or the redemption of fund shares. Investment return and principal value of an investment will fluctuate so that an investor’s shares, when redeemed, may be worth more or less than their original cost. Current performance may be lower or higher than the performance data quoted, which assumes the reinvestment of dividends and capital gains.
Index returns do not include transaction costs associated with buying and selling securities, any mutual fund fees or expenses, or any taxes. It is not possible to invest directly in an index.
Shares are sold without a front-end sales charge or contingent deferred sales charge.
Bond values fluctuate in response to the financial condition of individual issuers, general market and economic conditions, and changes in interest rates. Changes in market conditions and government policies may lead to periods of heightened volatility in the bond market and reduced liquidity for certain bonds held by the Fund. In general, when interest rates rise, bond values fall and investors may lose principal value. Interest-rate changes and their impact on the Fund and its share price can be sudden and unpredictable. The use of derivatives may reduce returns and/or increase volatility. High-yield securities have a greater risk of default and tend to be more volatile than higher-rated debt securities. The Fund is exposed to focus portfolio risk, index tracking risk, and foreign investment risk. Consult the Fund’s prospectus for additional information on these and other risks.
Please see footnotes on page 13.
| | | | | | |
| Performance highlights (unaudited) | | Wells Fargo Funds | | | 13 | |
Wells Fargo High Yield Corporate Bond Fund (continued)
| | | | |
| Ten largest holdings (%) as of August 31, 20185 | |
Ardagh Packaging Finance plc 7.25%, 5-15-2024 | | | 0.65 | |
Tenet Healthcare Corporation 4.63%, 7-15-2024 | | | 0.60 | |
Iron Mountain Incorporated 5.75%, 8-15-2024 | | | 0.52 | |
Hexion Incorporated 6.63%, 4-15-2020 | | | 0.50 | |
DISH DBS Corporation 5.88%, 11-15-2024 | | | 0.46 | |
Alcoa Incorporated 6.75%, 1-15-2028 | | | 0.45 | |
BMC Software Finance Incorporated 8.13%, 7-15-2021 | | | 0.45 | |
United Rentals North America Incorporated 5.50%, 7-15-2025 | | | 0.45 | |
Bombardier Incorporated 6.00%, 10-15-2022 | | | 0.44 | |
Crown Americas Capital Corporation IV 4.50%, 1-15-2023 | | | 0.44 | |
|
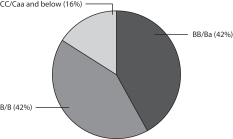
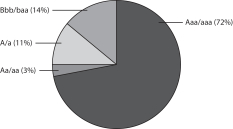
| Credit quality (%) as of August 31, 20186 |
|
|
| 1 | The Fund is a feeder fund that invests substantially all of its assets in a single affiliated master portfolio of the Wells Fargo Master Trust with an identical investment objective. References to the investment activities of the Fund are intended to refer to the investment activities of the affiliated master portfolio in which it invests. |
| 2 | Reflects the expense ratios as stated in the most recent prospectus. The expense ratios shown are subject to change and may differ from the annualized expense ratios shown in the financial highlights of this report. |
| 3 | The manager has contractually committed through June 30, 2019, to waive fees and/or reimburse expenses to the extent necessary to cap the Fund’s Total Annual Fund Operating Expenses After Fee Waivers at the amount shown. Brokerage commissions, stamp duty fees, interest, taxes, acquired fund fees and expenses from unaffiliated funds in which the affiliated master portfolio invests, and extraordinary expenses are excluded from the expense cap. All other acquired fund fees and expenses from the affiliated master portfolio are included in the expense cap. After this time, the cap may be increased or the commitment to maintain the cap may be terminated only with the approval of the Board of Trustees. Without this cap, the Fund’s returns would have been lower. The expense ratio paid by an investor is the net expense ratio (the total annual fund operating expenses after fee waivers) as stated in the prospectus. |
| 4 | The Wells Fargo U.S. High Yield Bond Index is a rules-based index designed to measure the performance of U.S. dollar denominated below investment-grade corporate debt issued by U.S. or foreign issuers that have a remaining maturity of at least one year, regardless of optionality; it is constructed to provide increased diversification and liquidity versus traditional passive high yield bond indices. You cannot invest directly in an index. |
| 5 | The ten largest holdings, excluding cash, cash equivalents and any money market funds, are calculated based on the value of the securities of the affiliated master portfolio allocable to the Fund divided by the total net assets of the Fund. Holdings are subject to change and may have changed since the date specified. |
| 6 | The credit quality distribution of portfolio holdings reflected in the chart is based on ratings from Standard & Poor’s, Moody’s Investors Service, and/or Fitch Ratings Ltd. Credit quality ratings apply to the underlying holdings of the affiliated master portfolio and not to the Fund itself. The percentages of the Fund’s portfolio with the ratings depicted in the chart are calculated based on the total market value of fixed income securities held by the affiliated master portfolio. If a security was rated by all three rating agencies, the middle rating was utilized. If rated by two of three rating agencies, the lower rating was utilized, and if rated by one of the rating agencies, that rating was utilized. Standard & Poor’s rates the creditworthiness of bonds, ranging from AAA (highest) to D (lowest). Ratings from A to CCC may be modified by the addition of a plus (+) or minus (-) sign to show relative standing within the rating categories. Standard & Poor’s rates the creditworthiness of short-term notes from SP-1 (highest) to SP-3 (lowest). Moody’s rates the creditworthiness of bonds, ranging from Aaa (highest) to C (lowest). Ratings Aa to B may be modified by the addition of a number 1 (highest) to 3 (lowest) to show relative standing within the ratings categories. Moody’s rates the creditworthiness of short-term U.S. tax-exempt municipal securities from MIG 1/VMIG 1 (highest) to SG (lowest). Fitch rates the creditworthiness of bonds, ranging from AAA (highest) to D (lowest). Credit quality distribution is subject to change and may have changed since the date specified. |
| | | | |
| 14 | | Wells Fargo Funds | | Performance highlights (unaudited) |
Wells Fargo International Government Bond Fund1
Investment objective
The Fund seeks to replicate the total return of the Wells Fargo International Government Bond Index, before fees and expenses.
Manager
Wells Fargo Funds Management, LLC
Subadviser for the affiliated master portfolio
Wells Fargo Asset Management (International), LLC
Portfolio managers
Michael Lee
Tony Norris
Alex Perrin
Average annual total returns (%) as of August 31, 2018
| | | | | | | | | | | | | | |
| | | | | | | | Expense ratios2 (%) | |
| | | Inception date | | Since
inception | | | Gross | | | Net3 | |
| Wells Fargo International Government Bond Fund (WIGBX) | | 10-31-2017 | | | (0.04 | ) | | | 1,007.15 | | | | 0.00 | |
| Wells Fargo International Government Bond Index4 | | – | | | 0.02 | * | | | – | | | | – | |
| * | | Return is based on the inception date of the Fund. |
Figures quoted represent past performance, which is no guarantee of future results, and do not reflect taxes that a shareholder may pay on fund distributions or the redemption of fund shares. Investment return and principal value of an investment will fluctuate so that an investor’s shares, when redeemed, may be worth more or less than their original cost. Current performance may be lower or higher than the performance data quoted, which assumes the reinvestment of dividends and capital gains.
Index returns do not include transaction costs associated with buying and selling securities, any mutual fund fees or expenses, or any taxes. It is not possible to invest directly in an index.
Shares are sold without a front-end sales charge or contingent deferred sales charge.
Bond values fluctuate in response to the financial condition of individual issuers, general market and economic conditions, and changes in interest rates. Changes in market conditions and government policies may lead to periods of heightened volatility in the bond market and reduced liquidity for certain bonds held by the Fund. In general, when interest rates rise, bond values fall and investors may lose principal value. Interest-rate changes and their impact on the Fund and its share price can be sudden and unpredictable. The use of derivatives may reduce returns and/or increase volatility. Certain investment strategies tend to increase the total risk of an investment (relative to the broader market). High-yield securities have a greater risk of default and tend to be more volatile than higher-rated debt securities. The Fund is exposed to foreign investment risk and focused portfolio risk. Consult the Fund’s prospectus for additional information on these and other risks.
Please see footnotes on page 15.
| | | | | | |
| Performance highlights (unaudited) | | Wells Fargo Funds | | | 15 | |
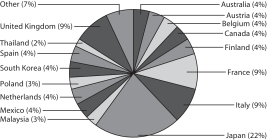
Wells Fargo International Government Bond Fund (continued)
| | | | |
| Ten largest holdings (%) as of August 31, 20185 | |
Japan 0.10%, 12-15-2019 | | | 17.94 | |
United Kingdom Gilt 4.25%, 12-7-2027 | | | 8.08 | |
France Government Bond 1.00%, 5-25-2027 | | | 8.06 | |
Italy Buoni Poliennali del Tesoro 2.15%, 12-15-2021 | | | 6.43 | |
Finland 0.50%, 9-15-2027 | | | 4.03 | |
Netherlands 2.50%, 1-15-2033 | | | 3.92 | |
Belgium Government Bond Series 61 4.00%, 3-28-2032 | | | 3.91 | |
Mexico 6.50%, 6-9-2022 | | | 3.83 | |
Korea 2.00%, 3-10-2021 | | | 3.73 | |
Republic of Austria 0.75%, 10-20-2026 | | | 3.70 | |
|
| Country allocation (%) as of August 31, 20186 |
|
|
| 1 | The Fund is a feeder fund that invests substantially all of its assets in a single affiliated master portfolio of the Wells Fargo Master Trust with an identical investment objective. References to the investment activities of the Fund are intended to refer to the investment activities of the affiliated master portfolio in which it invests. |
| 2 | Reflects the expense ratios as stated in the most recent prospectus. The expense ratios shown are subject to change and may differ from the annualized expense ratios shown in the financial highlights of this report. |
| 3 | The manager has contractually committed through June 30, 2019, to waive fees and/or reimburse expenses to the extent necessary to cap the Fund’s Total Annual Fund Operating Expenses After Fee Waivers at the amount shown. Brokerage commissions, stamp duty fees, interest, taxes, acquired fund fees and expenses from unaffiliated funds in which the affiliated master portfolio invests, and extraordinary expenses are excluded from the expense cap. All other acquired fund fees and expenses from the affiliated master portfolio are included in the expense cap. After this time, the cap may be increased or the commitment to maintain the cap may be terminated only with the approval of the Board of Trustees. Without this cap, the Fund’s returns would have been lower. The expense ratio paid by an investor is the net expense ratio (the total annual fund operating expenses after fee waivers) as stated in the prospectus. |
| 4 | The Wells Fargo International Government Bond Index is a rules-based index designed to track the performance of local currency government debt of both developed and emerging market countries excluding the United States. The Index is composed of fixed rate government bonds, issued by countries other than the U.S., having an investment grade rating or classified as investment grade by Bloomberg Index Services Limited. You cannot invest directly in an index. |
| 5 | The ten largest holdings, excluding cash, cash equivalents and any money market funds, are calculated based on the value of the securities of the affiliated master portfolio allocable to the Fund divided by the total net assets of the Fund. Holdings are subject to change and may have changed since the date specified. |
| 6 | Amounts represent the composition of the affiliated master portfolio and are calculated based on the total long-term investments of the affiliated master portfolio. These amounts are subject to change and may have changed since the date specified. |
| | | | |
| 16 | | Wells Fargo Funds | | Performance highlights (unaudited) |
Wells Fargo U.S. Core Bond Fund
Investment objective
The Fund seeks to replicate the total return of the Wells Fargo U.S. Core Bond Index, before fees and expenses.
Manager
Wells Fargo Funds Management, LLC
Subadviser
Wells Capital Management Incorporated
Portfolio managers
Mark Clegg, CFA®
Christopher Y. Kauffman, CFA®
Janet S. Rilling, CFA®, CPA
Michael J. Schueller, CFA®
Michael Stanczyk
Noah M. Wise, CFA®
Average annual total returns (%) as of August 31, 2018
| | | | | | | | | | | | | | | | | | |
| | | | | | | | | | | Expense ratios2 (%) | |
| | | Inception date | | 1 year | | | Since inception | | | Gross | | | Net3 | |
| Wells Fargo U.S. Core Bond Fund (WUSBX) | | 8-3-2017 | | | (1.09 | ) | | | (0.64 | ) | | | 762.71 | | | | 0.00 | |
| Wells Fargo U.S. Core Bond Index4 | | – | | | (1.07 | ) | | | (0.52 | )* | | | – | | | | – | |
| * | | Return is based on the inception date of the Fund. |
Figures quoted represent past performance, which is no guarantee of future results, and do not reflect taxes that a shareholder may pay on fund distributions or the redemption of fund shares. Investment return and principal value of an investment will fluctuate so that an investor’s shares, when redeemed, may be worth more or less than their original cost. Current performance may be lower or higher than the performance data quoted, which assumes the reinvestment of dividends and capital gains.
Index returns do not include transaction costs associated with buying and selling securities, any mutual fund fees or expenses, or any taxes. It is not possible to invest directly in an index.
Shares are sold without a front-end sales charge or contingent deferred sales charge.
Bond values fluctuate in response to the financial condition of individual issuers, general market and economic conditions, and changes in interest rates. Changes in market conditions and government policies may lead to periods of heightened volatility in the bond market and reduced liquidity for certain bonds held by the Fund. In general, when interest rates rise, bond values fall and investors may lose principal value. Interest-rate changes and their impact on the Fund and its share price can be sudden and unpredictable. The use of derivatives may reduce returns and/or increase volatility. The Fund is exposed to focused portfolio risk, index tracking risk, and mortage- and asset-backed secities risk. Consult the Fund’s prospectus for additional information on these and other risks.
Please see footnotes on page 17.
| | | | | | |
| Performance highlights (unaudited) | | Wells Fargo Funds | | | 17 | |
Wells Fargo U.S. Core Bond Fund (continued)
| | | | |
| Ten largest holdings (%) as of August 31, 20185 | |
U.S. Treasury Bond, 3.00%, 5-15-2047 | | | 2.27 | |
U.S. Treasury Note, 1.50%, 6-15-2020 | | | 2.01 | |
FNMA, 3.00%, 7-1-2047 | | | 1.96 | |
FNMA, 3.50%, 9-1-2043 | | | 1.73 | |
U.S. Treasury Note, 1.75%, 6-30-2022 | | | 1.70 | |
GNMA, 3.50%, 2-20-2045 | | | 1.62 | |
FHLMC, 3.00%, 2-1-2047 | | | 1.60 | |
FNMA, 4.00%, 9-13-2048 | | | 1.52 | |
FHLMC, 3.50%, 2-1-2044 | | | 1.38 | |
GNMA, 3.00%, 3-20-2046 | | | 1.17 | |
|
| Credit quality (%) as of August 31, 20186 |
|
|
| 1 | The Fund is a fund-of-funds that invests substantially all of its assets in two affiliated master portfolios of the Wells Fargo Master Trust in varying proportions. References to the investment activities of the Fund are intended to refer to the investment activities of the affiliated master portfolios in which it invests. |
| 2 | Reflects the expense ratios as stated in the most recent prospectus, which include the impact of 0.06% of acquired fund fees and expenses from affiliated master portfolio(s). The expense ratios shown are subject to change and may differ from the annualized expense ratios shown in the financial highlights of this report, which do not include acquired fund fees and expenses from the affiliated master portfolio(s). |
| 3 | The manager has contractually committed through June 30, 2019, to waive fees and/or reimburse expenses to the extent necessary to cap the Fund’s Total Annual Fund Operating Expenses After Fee Waivers at the amount shown. Brokerage commissions, stamp duty fees, interest, taxes, acquired fund fees and expenses from unaffiliated funds in which the affiliated master portfolio invests, and extraordinary expenses are excluded from the expense cap. All other acquired fund fees and expenses from the affiliated master portfolio are included in the expense cap. After this time, the cap may be increased or the commitment to maintain the cap may be terminated only with the approval of the Board of Trustees. Without this cap, the Fund’s returns would have been lower. The expense ratio paid by an investor is the net expense ratio (the total annual fund operating expenses after fee waivers) as stated in the prospectus. |
| 4 | The Wells Fargo U.S. Core Bond Index is a rules-based index designed to track the performance of fixed-rate, taxable, U.S. dollar denominated bonds, with an investment grade rating or classified as investment grade. The corporate bond component of the index is constructed to provide increased diversification and liquidity versus traditional passive corporate credit indexes. You cannot invest directly in an index. |
| 5 | The ten largest holdings, excluding cash, cash equivalents and any money market funds, are calculated based on the value of the securities of the affiliated master portfolios allocable to the Fund divided by the total net assets of the Fund. Holdings are subject to change and may have changed since the date specified. |
| 6 | The credit quality distribution of portfolio holdings reflected in the chart is based on ratings from Standard & Poor’s, Moody’s Investors Service, and/or Fitch Ratings Ltd. Credit quality ratings apply to the underlying holdings of the affiliated master portfolio(s) and not to the Fund itself. The percentages of the Fund’s portfolio with the ratings depicted in the chart are calculated based on the total market value of fixed income securities held by the affiliated master portfolio(s). If a security was rated by all three rating agencies, the middle rating was utilized. If rated by two of three rating agencies, the lower rating was utilized, and if rated by one of the rating agencies, that rating was utilized. Standard & Poor’s rates the creditworthiness of bonds, ranging from AAA (highest) to D (lowest). Ratings from A to CCC may be modified by the addition of a plus (+) or minus (-) sign to show relative standing within the rating categories. Standard & Poor’s rates the creditworthiness of short-term notes from SP-1 (highest) to SP-3 (lowest). Moody’s rates the creditworthiness of bonds, ranging from Aaa (highest) to C (lowest). Ratings Aa to B may be modified by the addition of a number 1 (highest) to 3 (lowest) to show relative standing within the ratings categories. Moody’s rates the creditworthiness of short-term U.S. tax-exempt municipal securities from MIG 1/VMIG 1 (highest) to SG (lowest). Fitch rates the creditworthiness of bonds, ranging from AAA (highest) to D (lowest). Credit quality distribution is subject to change and may have changed since the date specified. |
| | | | |
| 18 | | Wells Fargo Funds | | Fund expenses (unaudited) |
As a shareholder of the Fund, you incur ongoing costs, including management fees and other Fund expenses. This example is intended to help you understand your ongoing costs (in dollars) of investing in the Fund and to compare these costs with the ongoing costs of investing in other mutual funds.
The example is based on an investment of $1,000 invested at the beginning of the six-month period and held for the entire period from March 1, 2018 to August 31, 2018.
Actual expenses
The “Actual” line of the table below provides information about actual account values and actual expenses. You may use the information in this line, together with the amount you invested, to estimate the expenses that you paid over the period. Simply divide your account value by $1,000 (for example, an $8,600 account value divided by $1,000 = 8.6), then multiply the result by the number in the “Actual” line under the heading entitled “Expenses paid during period” for your applicable class of shares to estimate the expenses you paid on your account during this period.
Hypothetical example for comparison purposes
The “Hypothetical” line of the table below provides information about hypothetical account values and hypothetical expenses based on the Fund’s actual expense ratio and an assumed rate of return of 5% per year before expenses, which is not the Fund’s actual return. The hypothetical account values and expenses may not be used to estimate the actual ending account balance or expenses you paid for the period. You may use this information to compare the ongoing costs of investing in the Fund and other funds. To do so, compare this 5% hypothetical example with the 5% hypothetical examples that appear in the shareholder reports of the other funds.
Please note that the expenses shown in the table are meant to highlight your ongoing costs only. Therefore, the “Hypothetical” line of the table is useful in comparing ongoing costs only and will not help you determine the relative total costs of owning different funds.
| | | | | | | | | | | | | | | | |
| Emerging Markets Bond Fund | | Beginning
account value
3-1-2018 | | | Ending
account value
8-31-2018 | | | Expenses
paid during
the period¹ | | | Annualized net
expense ratio2 | |
Actual | | $ | 1,000.00 | | | $ | 975.61 | | | $ | 0.00 | | | | 0.00 | % |
Hypothetical (5% return before expenses) | | $ | 1,000.00 | | | $ | 1,025.21 | | | $ | 0.00 | | | | 0.00 | % |
| Factor Enhanced Emerging Markets Fund | | | | | | | | | | | | |
Actual | | $ | 1,000.00 | | | $ | 906.05 | | | $ | 0.00 | | | | 0.00 | % |
Hypothetical (5% return before expenses) | | $ | 1,000.00 | | | $ | 1,025.21 | | | $ | 0.00 | | | | 0.00 | % |
| Factor Enhanced International Fund | | | | | | | | | | | | |
Actual | | $ | 1,000.00 | | | $ | 1,006.69 | | | $ | 0.00 | | | | 0.00 | % |
Hypothetical (5% return before expenses) | | $ | 1,000.00 | | | $ | 1,025.21 | | | $ | 0.00 | | | | 0.00 | % |
| Factor Enhanced Large Cap Fund | | | | | | | | | | | | |
Actual | | $ | 1,000.00 | | | $ | 1,069.19 | | | $ | 0.00 | | | | 0.00 | % |
Hypothetical (5% return before expenses) | | $ | 1,000.00 | | | $ | 1,025.21 | | | $ | 0.00 | | | | 0.00 | % |
| Factor Enhanced Small Cap Fund | | | | | | | | | | | | |
Actual | | $ | 1,000.00 | | | $ | 1,172.61 | | | $ | 0.00 | | | | 0.00 | % |
Hypothetical (5% return before expenses) | | $ | 1,000.00 | | | $ | 1,025.21 | | | $ | 0.00 | | | | 0.00 | % |
| High Yield Corporate Bond Fund | | | | | | | | | | | | |
Actual | | $ | 1,000.00 | | | $ | 1,018.34 | | | $ | 0.00 | | | | 0.00 | % |
Hypothetical (5% return before expenses) | | $ | 1,000.00 | | | $ | 1,025.21 | | | $ | 0.00 | | | | 0.00 | % |
| International Government Bond Fund | | | | | | | | | | | | |
Actual | | $ | 1,000.00 | | | $ | 957.87 | | | $ | 0.00 | | | | 0.00 | % |
Hypothetical (5% return before expenses) | | $ | 1,000.00 | | | $ | 1,025.21 | | | $ | 0.00 | | | | 0.00 | % |
| U.S. Core Bond Fund | | | | | | | | | | | | |
Actual | | $ | 1,000.00 | | | $ | 1,010.67 | | | $ | 0.00 | | | | 0.00 | % |
Hypothetical (5% return before expenses) | | $ | 1,000.00 | | | $ | 1,025.21 | | | $ | 0.00 | | | | 0.00 | % |
| 1 | Expenses paid is equal to the annualized net expense ratio multiplied by the average account value over the period, multiplied by the number of days in the most recent fiscal half-year divided by the number of days in the fiscal year (to reflect the one-half-year period). |
| 2 | Amounts reflect net expenses allocated from the affiliated Master Portfolio(s) in which the Fund invests. |
| | | | | | |
| Portfolio of investments—August 31, 2018 (unaudited) | | Wells Fargo Funds | | | 19 | |
EMERGING MARKETS BOND FUND
| | | | | | | | | | | | | | | | |
| Security name | | | | | | | | | | | Value | |
| | | | |
Investment Companies: 99.99% | | | | | | | | | | | | | | | | |
| | | | |
| Affiliated Master Portfolio: 99.99% | | | | | | | | | | | | | | | | |
Wells Fargo Emerging Markets Bond Portfolio | | | | | | | | | | | | | | $ | 1,007,768 | |
| | | | | | | | | | | | | | | | |
| | | | |
Total Investment Companies (Cost $1,010,093) | | | | | | | | | | | | | | | 1,007,768 | |
| | | | | | | | | | | | | | | | |
| | | | | | | | |
| Total investments in securities (Cost $1,010,093) | | | 99.99 | % | | | 1,007,768 | |
Other assets and liabilities, net | | | 0.01 | | | | 114 | |
| | | | | | | | |
| Total net assets | | | 100.00 | % | | $ | 1,007,882 | |
| | | | | | | | |
Transactions with the affiliated Master Portfolio were as follows:
| | | | | | | | | | | | | | | | | | | | | | | | | | | | | | | | |
| | | % of
ownership,
beginning of
period | | | % of
ownership,
end of
period | | | Net
realized
gains
(losses) on
securities
transactions
allocated
from
affiliated
Master
Portfolio | | | Net
change in
unrealized
gains
(losses) on
securities
transactions
allocated
from
affiliated
Master
Portfolio | | | Interest
allocated
from
affiliated
Master
Portfolio | | | Affiliated
income
allocated
from
affiliated
Master
Portfolio | | | Value,
end
of period | | | % of
net
assets | |
Affiliated Master Portfolio | | | | | | | | | | | | | | | | | | | | | | | | | | | | | | | | |
Wells Fargo Emerging Markets Bond Portfolio | | | 0.01 | % | | | 1.58 | % | | $ | (369 | ) | | $ | (2,120 | ) | | $ | 754 | | | $ | 10 | | | $ | 1,007,768 | | | | 99.99 | % |
The accompanying notes are an integral part of these financial statements.
| | | | |
| 20 | | Wells Fargo Funds | | Portfolio of investments—August 31, 2018 (unaudited) |
FACTOR ENHANCED EMERGING MARKETS FUND
| | | | | | | | | | | | | | | | |
| Security name | | | | | | | | | | | Value | |
| | | | |
Investment Companies: 99.99% | | | | | | | | | | | | | | | | |
| | | | |
| Affiliated Master Portfolio: 99.99% | | | | | | | | | | | | | | | | |
Wells Fargo Factor Enhanced Emerging Markets Portfolio | | | | | | | | | | | | | | $ | 1,012,566 | |
| | | | | | | | | | | | | | | | |
| | | | |
Total Investment Companies (Cost $1,009,101) | | | | | | | | | | | | | | | 1,012,566 | |
| | | | | | | | | | | | | | | | |
| | | | | | | | |
| Total investments in securities (Cost $1,009,101) | | | 99.99 | % | | | 1,012,566 | |
Other assets and liabilities, net | | | 0.01 | | | | 112 | |
| | | | | | | | |
| Total net assets | | | 100.00 | % | | $ | 1,012,678 | |
| | | | | | | | |
Transactions with the affiliated Master Portfolio were as follows:
| | | | | | | | | | | | | | | | | | | | | | | | | | | | | | | | |
| | | % of
ownership,
beginning of
period | | | % of
ownership,
end of
period | | | Net
realized
gains
(losses) on
securities
transactions
allocated
from
affiliated
Master
Portfolio | | | Net
change in
unrealized
gains
(losses) on
securities
transactions
allocated
from
affiliated
Master
Portfolio | | | Dividends
allocated
from
affiliated
Master
Portfolio | | | Affiliated income allocated from affiliated Master Portfolio | | | Value,
end
of period | | | % of
net
assets | |
Affiliated Master Portfolio | | | | | | | | | | | | | | | | | | | | | | | | | | | | | | | | |
Wells Fargo Factor Enhanced Emerging Markets Portfolio | | | 0.00 | %* | | | 0.33 | % | | $ | (1,440 | ) | | $ | 3,034 | | | $ | 303 | | | $ | 11 | | | $ | 1,012,566 | | | | 99.99 | % |
| | * | The amount owned is less than 0.005%. |
The accompanying notes are an integral part of these financial statements.
| | | | | | |
| Portfolio of investments—August 31, 2018 (unaudited) | | Wells Fargo Funds | | | 21 | |
FACTOR ENHANCED INTERNATIONAL FUND
| | | | | | | | | | | | | | | | |
| Security name | | | | | | | | | | | Value | |
| | | | |
Investment Companies: 100.00% | | | | | | | | | | | | | | | | |
| | | | |
| Affiliated Master Portfolio: 100.00% | | | | | | | | | | | | | | | | |
Wells Fargo Factor Enhanced International Portfolio | | | | | | | | | | | | | | $ | 1,000,841 | |
| | | | | | | | | | | | | | | | |
| | | | |
Total Investment Companies (Cost $1,010,403) | | | | | | | | | | | | | | | 1,000,841 | |
| | | | | | | | | | | | | | | | |
| | | | | | | | |
| Total investments in securities (Cost $1,010,403) | | | 100.00 | % | | | 1,000,841 | |
Other assets and liabilities, net | | | 0.00 | | | | 45 | |
| | | | | | | | |
| Total net assets | | | 100.00 | % | | $ | 1,000,886 | |
| | | | | | | | |
Transactions with the affiliated Master Portfolio were as follows:
| | | | | | | | | | | | | | | | | | | | | | | | | | | | | | | | |
| | | % of
ownership,
beginning of
period | | | % of
ownership,
end of
period | | | Net
realized
gains
(losses) on
securities
transactions
allocated
from
affiliated
Master
Portfolio | | | Net
change in
unrealized
gains
(losses) on
securities
transactions
allocated
from
affiliated
Master
Portfolio | | | Dividends
allocated
from
affiliated
Master
Portfolio | | | Affiliated
income
allocated
from
affiliated
Master
Portfolio | | | Value,
end
of period | | | % of
net
assets | |
Affiliated Master Portfolio | | | | | | | | | | | | | | | | | | | | | | | | | | | | | | | | |
Wells Fargo Factor Enhanced International Portfolio | | | 0.00 | %* | | | 0.10 | % | | $ | (59 | ) | | $ | (9,820 | ) | | $ | 288 | | | $ | 11 | | | $ | 1,000,841 | | | | 100.00 | % |
| | * | The amount owned is less than 0.005%. |
The accompanying notes are an integral part of these financial statements.
| | | | |
| 22 | | Wells Fargo Funds | | Portfolio of investments—August 31, 2018 (unaudited) |
FACTOR ENHANCED LARGE CAP FUND
| | | | | | | | | | | | | | | | |
| Security name | | | | | | | | | | | Value | |
| | | | |
Investment Companies: 100.00% | | | | | | | | | | | | | | | | |
| | | | |
| Affiliated Master Portfolio: 100.00% | | | | | | | | | | | | | | | | |
Wells Fargo Factor Enhanced Large Cap Portfolio | | | | | | | | | | | | | | $ | 1,012,147 | |
| | | | | | | | | | | | | | | | |
| | | | |
Total Investment Companies (Cost $1,020,915) | | | | | | | | | | | | | | | 1,012,147 | |
| | | | | | | | | | | | | | | | |
| | | | | | | | |
| Total investments in securities (Cost $1,020,915) | | | 100.00 | % | | | 1,012,147 | |
Other assets and liabilities, net | | | 0.00 | | | | 25 | |
| | | | | | | | |
| Total net assets | | | 100.00 | % | | $ | 1,012,172 | |
| | | | | | | | |
Transactions with the affiliated Master Portfolio were as follows:
| | | | | | | | | | | | | | | | | | | | | | | | | | | | | | | | |
| | | % of
ownership,
beginning of
period | | | % of
ownership,
end of
period | | | Net
realized
gains
(losses) on
securities
transactions
allocated
from
affiliated
Master
Portfolio | | | Net
change in
unrealized
gains
(losses) on
securities
transactions
allocated
from
affiliated
Master
Portfolio | | | Dividends
allocated
from
affiliated
Master
Portfolio | | | Affiliated
income
allocated
from
affiliated
Master
Portfolio | | | Value,
end
of period | | | % of
net
assets | |
Affiliated Master Portfolio | | | | | | | | | | | | | | | | | | | | | | | | | | | | | | | | |
Wells Fargo Factor Enhanced Large Cap Portfolio | | | 0.00 | %* | | | 0.06 | % | | $ | 10,123 | | | $ | (9,079 | ) | | $ | 287 | | | $ | 4 | | | $ | 1,012,147 | | | | 100.00 | % |
| | * | The amount owned is less than 0.005%. |
The accompanying notes are an integral part of these financial statements.
| | | | | | |
| Portfolio of investments—August 31, 2018 (unaudited) | | Wells Fargo Funds | | | 23 | |
FACTOR ENHANCED SMALL CAP FUND
| | | | | | | | | | | | | | | | |
| Security name | | | | | | | | | | | Value | |
| | | | |
Investment Companies: 100.00% | | | | | | | | | | | | | | | | |
| | | | |
| Affiliated Master Portfolio: 100.00% | | | | | | | | | | | | | | | | |
Wells Fargo Factor Enhanced Small Cap Portfolio | | | | | | | | | | | | | | $ | 1,017,105 | |
| | | | | | | | | | | | | | | | |
| | | | |
Total Investment Companies (Cost $1,018,631) | | | | | | | | | | | | | | | 1,017,105 | |
| | | | | | | | | | | | | | | | |
| | | | | | | | |
| Total investments in securities (Cost $1,018,631) | | | 100.00 | % | | | 1,017,105 | |
Other assets and liabilities, net | | | 0.00 | | | | 41 | |
| | | | | | | | |
| Total net assets | | | 100.00 | % | | $ | 1,017,146 | |
| | | | | | | | |
Transactions with the affiliated Master Portfolio were as follows:
| | | | | | | | | | | | | | | | | | | | | | | | | | | | | | | | |
| | | % of
ownership, beginning of
period | | | % of
ownership, end of
period | | | Net realized gains (losses) on securities transactions allocated from affiliated Master Portfolio | | | Net change in unrealized gains (losses) on securities transactions allocated from affiliated Master Portfolio | | | Dividends allocated from affiliated Master Portfolio | | | Affiliated income allocated from affiliated Master Portfolio | | | Value, end
of period | | | % of
net
assets | |
Affiliated Master Portfolio | | | | | | | | | | | | | | | | | | | | | | | | | | | | | | | | |
Wells Fargo Factor Enhanced Small Cap Portfolio | | | 0.00 | %* | | | 0.25 | % | | $ | 8,259 | | | $ | (2,011 | ) | | $ | 226 | | | $ | 9 | | | $ | 1,017,105 | | | | 100.00 | % |
| | * | The amount owned is less than 0.005%. |
The accompanying notes are an integral part of these financial statements.
| | | | |
| 24 | | Wells Fargo Funds | | Portfolio of investments—August 31, 2018 (unaudited) |
HIGH YIELD CORPORATE BOND FUND
| | | | | | | | | | | | | | | | |
| Security name | | | | | | | | | | | Value | |
| | | | |
Investment Companies: 100.04% | | | | | | | | | | | | | | | | |
| | | | |
| Affiliated Master Portfolio: 100.04% | | | | | | | | | | | | | | | | |
Wells Fargo High Yield Corporate Bond Portfolio | | | | | | | | | | | | | | $ | 1,010,034 | |
| | | | | | | | | | | | | | | | |
| | | | |
Total Investment Companies (Cost $1,010,164) | | | | | | | | | | | | | | | 1,010,034 | |
| | | | | | | | | | | | | | | | |
| | | | | | | | |
| Total investments in securities (Cost $1,010,164) | | | 100.04 | % | | | 1,010,034 | |
Other assets and liabilities, net | | | (0.04 | ) | | | (441 | ) |
| | | | | | | | |
| Total net assets | | | 100.00 | % | | $ | 1,009,593 | |
| | | | | | | | |
Transactions with the Affiliated Master Portfolio were as follows:
| | | | | | | | | | | | | | | | | | | | | | | | | | | | | | | | |
| | | % of
ownership,
beginning of
period | | | % of
ownership,
end of
period | | | Net
realized
gains
(losses) on
securities
transactions
allocated
from
affiliated
Master
Portfolio | | | Net
change in
unrealized
gains
(losses) on
securities
transactions
allocated
from
affiliated
Master
Portfolio | | | Interest
allocated
from
affiliated
Master
Portfolio | | | Income
from
affiliated
securities
allocated
from
affiliated
Master
Portfolio | | | Value,
end
of period | | | % of
net
assets | |
Affiliated Master Portfolio | | | | | | | | | | | | | | | | | | | | | | | | | | | | | | | | |
Wells Fargo High Yield Corporate Bond Portfolio | | | 0.01 | % | | | 0.89 | % | | $ | (268 | ) | | $ | 73 | | | $ | 899 | | | $ | 6 | | | $ | 1,010,034 | | | | 100.04 | % |
The accompanying notes are an integral part of these financial statements.
| | | | | | |
| Portfolio of investments—August 31, 2018 (unaudited) | | Wells Fargo Funds | | | 25 | |
INTERNATIONAL GOVERNMENT BOND FUND
| | | | | | | | | | | | | | | | |
| Security name | | | | | | | | | | | Value | |
| | | | |
Investment Companies: 99.98% | | | | | | | | | | | | | | | | |
| | | | |
| Affiliated Master Portfolio: 99.98% | | | | | | | | | | | | | | | | |
Wells Fargo International Government Bond Portfolio | | | | | | | | | | | | | | $ | 1,006,514 | |
| | | | | | | | | | | | | | | | |
| | | | |
Total Investment Companies (Cost $995,212) | | | | | | | | | | | | | | | 1,006,514 | |
| | | | | | | | | | | | | | | | |
| | | | | | | | |
| Total investments in securities (Cost $995,212) | | | 99.98 | % | | | 1,006,514 | |
Other assets and liabilities, net | | | 0.02 | | | | 213 | |
| | | | | | | | |
| Total net assets | | | 100.00 | % | | $ | 1,006,727 | |
| | | | | | | | |
Transactions with the Affiliated Master Portfolio were as follows:
| | | | | | | | | | | | | | | | | | | | | | | | | | | | | | | | |
| | | % of
ownership,
beginning of
period | | | % of
ownership,
end of
period | | | Net
realized
gains
(losses) on
securities
transactions
allocated
from
affiliated
Master
Portfolio | | | Net
change in
unrealized
gains
(losses) on
securities
transactions
allocated
from
affiliated
Master
Portfolio | | | Interest
allocated
from
affiliated
Master
Portfolio | | | Income
from
affiliated
securities
allocated
from
affiliated
Master
Portfolio | | | Value,
end
of period | | | % of
net
assets | |
Affiliated Master Portfolio | | | | | | | | | | | | | | | | | | | | | | | | | | | | | | | | |
Wells Fargo International Government Bond Portfolio | | | 0.10 | % | | | 9.43 | % | | $ | 14,705 | | | $ | 10,888 | | | $ | 226 | | | $ | 15 | | | $ | 1,006,514 | | | | 99.98 | % |
The accompanying notes are an integral part of these financial statements.
| | | | |
| 26 | | Wells Fargo Funds | | Portfolio of investments—August 31, 2018 (unaudited) |
U.S. CORE BOND FUND
| | | | | | | | | | | | | | | | |
| Security name | | | | | | | | | | | Value | |
| | | | |
Investment Companies: 100.03% | | | | | | | | | | | | | | | | |
| | | | |
| Affiliated Master Portfolios: 100.03% | | | | | | | | | | | | | | | | |
Wells Fargo Bloomberg Barclays US Aggregate ex-Corporate Portfolio | | | | | | | | | | | | | | $ | 756,236 | |
Wells Fargo Investment Grade Corporate Bond Portfolio | | | | | | | | | | | | | | | 253,525 | |
| | | | |
Total Investment Companies (Cost $1,009,497) | | | | | | | | | | | | | | | 1,009,761 | |
| | | | | | | | | | | | | | | | |
| | | | | | | | |
| Total investments in securities (Cost $1,009,497) | | | 100.03 | % | | | 1,009,761 | |
Other assets and liabilities, net | | | (0.03 | ) | | | (301 | ) |
| | | | | | | | |
| Total net assets | | | 100.00 | % | | $ | 1,009,460 | |
| | | | | | | | |
Transactions with the affiliated Master Portfolios were as follows:
| | | | | | | | | | | | | | | | | | | | | | | | | | | | | | | | |
| | | % of
ownership,
beginning of
period | | | % of
ownership,
end of
period | | | Net
realized
gains
(losses) on
securities
transactions
allocated
from
affiliated
Master
Portfolios | | | Net
change in
unrealized
gains
(losses) on
securities
transactions
allocated
from
affiliated
Master
Portfolios | | | Interest
allocated
from
affiliated
Master
Portfolios | | | Affiliated
income
allocated
from
affiliated
Master
Portfolios | | | Value,
end
of period | | | % of
net
assets | |
Affiliated Master Portfolios | | | | | | | | | | | | | | | | | | | | | | | | | | | | | | | | |
Wells Fargo Bloomberg Barclays US Aggregate ex-Corporate Portfolio | | | 0.00 | %* | | | 0.09 | % | | $ | (599 | ) | | $ | 802 | | | $ | 173 | | | $ | 8 | | | $ | 756,236 | | | | | |
Wells Fargo Investment Grade Corporate Bond Portfolio | | | 0.00 | %* | | | 0.07 | % | | | (4 | ) | | | (251 | ) | | | 148 | | | | 0 | | | | 253,525 | | | | | |
| | | | | | | | | | | | | | | | | | | | | | | | | | | | | | | | |
| | | | | | | | | | $ | (603 | ) | | $ | 551 | | | $ | 321 | | | $ | 8 | | | $ | 1,009,761 | | | | 100.03 | % |
| | | | | | | | | | | | | | | | | | | | | | | | | | | | | | | | |
| | * | The amount owned is less than 0.005%. |
The accompanying notes are an integral part of these financial statements.
This page is intentionally left blank.
| | | | |
| 28 | | Wells Fargo Funds | | Statements of assets and liabilities—August 31, 2018 (unaudited) |
| | | | | | | | |
| | | Emerging Markets Bond Fund | | | Factor Enhanced Emerging Markets Fund | |
| | |
Assets | | | | | | | | |
Investments in affiliated Master Portfolio(s), at value (see cost below) | | $ | 1,007,768 | | | $ | 1,012,566 | |
Cash | | | 6,729 | | | | 3,217 | |
Receivable from manager | | | 4,669 | | | | 4,672 | |
Prepaid expenses and other assets | | | 0 | | | | 2,498 | |
| | | | |
Total assets | | | 1,019,166 | | | | 1,022,953 | |
| | | | |
| | |
Liabilities | | | | | | | | |
Professional fees payable | | | 4,677 | | | | 4,678 | |
Shareholder report expenses payable | | | 3,378 | | | | 3,378 | |
Trustees’ fees and expenses payable | | | 1,134 | | | | 1,134 | |
Custodian and accounting fees payable | | | 1,084 | | | | 1,085 | |
Dividends payable | | | 0 | | | | 0 | |
Accrued expenses and other liabilities | | | 1,011 | | | | 0 | |
| | | | |
Total liabilities | | | 11,284 | | | | 10,275 | |
| | | | |
Total net assets | | $ | 1,007,882 | | | $ | 1,012,678 | |
| | | | |
| | |
NET ASSETS CONSIST OF | | | | | | | | |
Paid-in capital | | $ | 1,009,999 | | | $ | 1,009,961 | |
Undistributed (overdistributed) net investment income | | | 632 | | | | 379 | |
Accumulated net realized gains (losses) on investments | | | (424 | ) | | | (1,127 | ) |
Net unrealized gains (losses) on investments | | | (2,325 | ) | | | 3,465 | |
| | | | |
Total net assets | | $ | 1,007,882 | | | $ | 1,012,678 | |
| | | | |
| | |
COMPUTATION OF NET ASSET VALUE | | | | | | | | |
Net assets | | $ | 1,007,882 | | | $ | 1,012,678 | |
Shares outstanding1 | | | 107,610 | | | | 103,987 | |
Net asset value per share | | | $9.37 | | | | $9.74 | |
| | |
Investments in affiliated Master Portfolio(s), at cost | | $ | 1,010,093 | | | $ | 1,009,101 | |
| | | | |
| 1 | Each Fund has an unlimited number of authorized shares. |
The accompanying notes are an integral part of these financial statements.
| | | | | | |
| Statements of assets and liabilities—August 31, 2018 (unaudited) | | Wells Fargo Funds | | | 29 | |
| | | | | | | | | | | | | | | | | | | | | | |
Factor Enhanced
International Fund | | | Factor Enhanced Large Cap Fund | | | Factor Enhanced Small Cap Fund | | | High Yield Corporate Bond Fund | | | International Government Bond Fund | | | U.S. Core Bond Fund | |
| | | | | |
| | | | | | | | | | | | | | | | | | | | | | |
| $ | 1,000,841 | | | $ | 1,012,147 | | | $ | 1,017,105 | | | $ | 1,010,034 | | | $ | 1,006,514 | | | $ | 1,009,761 | |
| | 6,714 | | | | 6,705 | | | | 6,713 | | | | 6,519 | | | | 11,638 | | | | 6,700 | |
| | 4,643 | | | | 4,632 | | | | 4,641 | | | | 4,658 | | | | 4,700 | | | | 4,627 | |
| | 0 | | | | 0 | | | | 0 | | | | 0 | | | | 0 | | | | 0 | |
| | |
| | 1,012,198 | | | | 1,023,484 | | | | 1,028,459 | | | | 1,021,211 | | | | 1,022,852 | | | | 1,021,088 | |
| | |
| | | | | |
| | | | | | | | | | | | | | | | | | | | | | |
| | 4,678 | | | | 4,678 | | | | 4,678 | | | | 4,678 | | | | 9,645 | | | | 4,677 | |
| | 3,378 | | | | 3,378 | | | | 3,378 | | | | 3,378 | | | | 3,682 | | | | 3,378 | |
| | 1,134 | | | | 1,134 | | | | 1,134 | | | | 1,134 | | | | 1,407 | | | | 1,134 | |
| | 1,085 | | | | 1,085 | | | | 1,085 | | | | 1,085 | | | | 841 | | | | 1,085 | |
| | 0 | | | | 0 | | | | 0 | | | | 510 | | | | 0 | | | | 0 | |
| | 1,037 | | | | 1,037 | | | | 1,038 | | | | 833 | | | | 550 | | | | 1,354 | |
| | |
| | 11,312 | | | | 11,312 | | | | 11,313 | | | | 11,618 | | | | 16,125 | | | | 11,628 | |
| | |
| $ | 1,000,886 | | | $ | 1,012,172 | | | $ | 1,017,146 | | | $ | 1,009,593 | | | $ | 1,006,727 | | | $ | 1,009,460 | |
| | |
| | | | | |
| | | | | | | | | | | | | | | | | | | | | | |
| $ | 1,010,092 | | | $ | 1,010,083 | | | $ | 1,009,888 | | | $ | 1,009,986 | | | $ | 1,010,000 | | | $ | 1,010,015 | |
| | 375 | | | | 360 | | | | 279 | | | | 71 | | | | 131 | | | | (124 | ) |
| | (19 | ) | | | 10,497 | | | | 8,505 | | | | (334 | ) | | | (14,706 | ) | | | (695 | ) |
| | (9,562 | ) | | | (8,768 | ) | | | (1,526 | ) | | | (130 | ) | | | 11,302 | | | | 264 | |
| | |
| $ | 1,000,886 | | | $ | 1,012,172 | | | $ | 1,017,146 | | | $ | 1,009,593 | | | $ | 1,006,727 | | | $ | 1,009,460 | |
| | |
| | | | | |
| | | | | | | | | | | | | | | | | | | | | | |
| $ | 1,000,886 | | | $ | 1,012,172 | | | $ | 1,017,146 | | | $ | 1,009,593 | | | $ | 1,006,727 | | | $ | 1,009,460 | |
| | 95,073 | | | | 87,356 | | | | 81,386 | | | | 106,042 | | | | 102,112 | | | | 105,058 | |
| | $10.53 | | | | $11.59 | | | | $12.50 | | | | $9.52 | | | | $9.86 | | | | $9.61 | |
| | | | | |
| $ | 1,010,403 | | | $ | 1,020,915 | | | $ | 1,018,631 | | | $ | 1,010,164 | | | $ | 995,212 | | | $ | 1,009,497 | |
| | |
The accompanying notes are an integral part of these financial statements.
| | | | |
| 30 | | Wells Fargo Funds | | Statements of operations—six months ended August 31, 2018 (unaudited) |
| | | | | | | | |
| | | Emerging Markets Bond Fund | | | Factor Enhanced Emerging Markets Fund | |
| | |
Investment income | | | | | | | | |
Interest allocated from affiliated Master Portfolio(s) | | $ | 754 | | | $ | 0 | |
Dividends allocated from affiliated Master Portfolio(s)* | | | 0 | | | | 303 | |
Affiliated income allocated from affiliated Master Portfolio(s) | | | 10 | | | | 11 | |
Expenses allocated from affiliated Master Portfolio(s) | | | (68 | ) | | | (90 | ) |
Waivers allocated from affiliated Master Portfolio(s) | | | 1 | | | | 17 | |
| | | | |
Total investment income | | | 697 | | | | 241 | |
| | | | |
| | |
Expenses | | | | | | | | |
Custody and accounting fees | | | 512 | | | | 512 | |
Professional fees | | | 14,864 | | | | 14,864 | |
Registration fees | | | 512 | | | | 512 | |
Shareholder report expenses | | | 4,516 | | | | 4,516 | |
Trustees’ fees and expenses | | | 10,246 | | | | 10,246 | |
Other fees and expenses | | | 1,538 | | | | 1,538 | |
| | | | |
Total expenses | | | 32,188 | | | | 32,188 | |
Less: Fee waivers and/or expense reimbursements | | | (32,256 | ) | | | (32,278 | ) |
| | | | |
Net expenses | | | (68 | ) | | | (90 | ) |
| | | | |
Net investment income | | | 765 | | | | 331 | |
| | | | |
| | |
REALIZED AND UNREALIZED GAINS (LOSSES) ON INVESTMENTS | | | | | | | | |
Net realized gains (losses) on securities transactions allocated from affiliated Master Portfolio(s) | | | (369 | ) | | | (1,440 | ) |
Net change in unrealized gains (losses) on securities transactions allocated from affiliated Master Portfolio(s) | | | (2,120 | ) | | | 3,034 | |
| | | | |
Net realized and unrealized gains (losses) on investments | | | (2,489 | ) | | | 1,594 | |
| | | | |
Net increase (decrease) in net assets resulting from operations | | $ | (1,724 | ) | | $ | 1,925 | |
| | | | |
| | |
* Net of foreign dividend withholding taxes in the amount of | | | $0 | | | | $33 | |
The accompanying notes are an integral part of these financial statements.
| | | | | | |
| Statements of operations—six months ended August 31, 2018 (unaudited) | | Wells Fargo Funds | | | 31 | |
| | | | | | | | | | | | | | | | | | | | | | |
Factor Enhanced International Fund | | | Factor Enhanced Large Cap Fund | | | Factor Enhanced Small Cap Fund | | | High Yield Corporate Bond Fund | | | International Government Bond Fund | | | U.S. Core Bond Fund | |
| | | | | |
| | | | | | | | | | | | | | | | | | | | | | |
| $ | 0 | | | $ | 0 | | | $ | 0 | | | $ | 899 | | | $ | 226 | | | $ | 321 | |
| | 288 | | | | 287 | | | | 226 | | | | 0 | | | | 0 | | | | 0 | |
| | 11 | | | | 4 | | | | 9 | | | | 6 | | | | 15 | | | | 8 | |
| | (37 | ) | | | (20 | ) | | | (33 | ) | | | (52 | ) | | | (154 | ) | | | (11 | ) |
| | 3 | | | | 1 | | | | 2 | | | | 1 | | | | 0 | | | | 1 | |
| | |
| | 265 | | | | 272 | | | | 204 | | | | 854 | | | | 87 | | | | 319 | |
| | |
| | | | | |
| | | | | | | | | | | | | | | | | | | | | | |
| | 512 | | | | 512 | | | | 512 | | | | 512 | | | | 512 | | | | 512 | |
| | 14,864 | | | | 14,864 | | | | 14,864 | | | | 14,865 | | | | 15,325 | | | | 14,864 | |
| | 512 | | | | 512 | | | | 512 | | | | 512 | | | | 512 | | | | 512 | |
| | 4,516 | | | | 4,516 | | | | 4,516 | | | | 4,516 | | | | 4,516 | | | | 4,516 | |
| | 10,246 | | | | 10,246 | | | | 10,246 | | | | 10,246 | | | | 10,246 | | | | 10,246 | |
| | 1,538 | | | | 1,537 | | | | 1,538 | | | | 1,537 | | | | 1,537 | | | | 1,538 | |
| | |
| | 32,188 | | | | 32,187 | | | | 32,188 | | | | 32,188 | | | | 32,648 | | | | 32,188 | |
| | (32,225 | ) | | | (32,207 | ) | | | (32,221 | ) | | | (32,240 | ) | | | (32,802 | ) | | | (32,199 | ) |
| | |
| | (37 | ) | | | (20 | ) | | | (33 | ) | | | (52 | ) | | | (154 | ) | | | (11 | ) |
| | |
| | 302 | | | | 292 | | | | 237 | | | | 906 | | | | 241 | | | | 330 | |
| | |
| | | | | |
| | | | | | | | | | | | | | | | | | | | | | |
| | (59 | ) | | | 10,123 | | | | 8,259 | | | | (268 | ) | | | (14,705 | ) | | | (603 | ) |
| | (9,820 | ) | | | (9,079 | ) | | | (2,011 | ) | | | 73 | | | | 10,888 | | | | 551 | |
| | |
| | (9,879 | ) | | | 1,044 | | | | 6,248 | | | | (195 | ) | | | (3,817 | ) | | | (52 | ) |
| | |
| $ | (9,577 | ) | | $ | 1,336 | | | $ | 6,485 | | | $ | 711 | | | $ | (3,576 | ) | | $ | 278 | |
| | |
| | | | | |
| | $9 | | | | $0 | | | | $0 | | | | $0 | | | | $0 | | | | $0 | |
The accompanying notes are an integral part of these financial statements.
| | | | |
| 32 | | Wells Fargo Funds | | Statements of changes in net assets |
| | | | | | | | | | | | | | | | |
| | | Emerging Markets Bond Fund | |
| | | Six months ended
August 31, 2018
(unaudited) | | | Year ended
February 28, 20181 | |
| | | | |
Operations | | | | | | | | | | | | | | | | |
Net investment income | | | | | | $ | 765 | | | | | | | $ | 261 | |
Net realized losses on investments | | | | | | | (369 | ) | | | | | | | (26 | ) |
Net change in unrealized gains (losses) on investments | | | | | | | (2,120 | ) | | | | | | | (206 | ) |
| | | | |
Net increase (decrease) in net assets resulting from operations | | | | | | | (1,724 | ) | | | | | | | 29 | |
| | | | |
| | | | |
Distributions to shareholders from | | | | | | | | | | | | | | | | |
Net investment income | | | | | | | (190 | ) | | | | | | | (233 | ) |
| | | | |
| | | | |
Capital share transactions | | | Shares | | | | | | | | Shares | | | | | |
Proceeds from shares sold | | | 106,610 | | | | 1,000,000 | | | | 1,000 | | | | 10,000 | |
| | | | |
Net increase in net assets resulting from capital share transactions | | | | | | | 1,000,000 | | | | | | | | 10,000 | |
| | | | |
Total increase in net assets | | | | | | | 998,086 | | | | | | | | 9,796 | |
| | | | |
| | | | |
Net assets | | | | | | | | | | | | | | | | |
Beginning of period | | | | | | | 9,796 | | | | | | | | 0 | |
| | | | |
End of period | | | | | | $ | 1,007,882 | | | | | | | $ | 9,796 | |
| | | | |
Undistributed net investment income | | | | | | $ | 632 | | | | | | | $ | 57 | |
| | | | |
| 1 | For the period from August 3, 2017 (commencement of operations) to February 28, 2018 |
The accompanying notes are an integral part of these financial statements.
| | | | | | |
| Statements of changes in net assets | | Wells Fargo Funds | | | 33 | |
| | | | | | | | | | | | | | | | |
| | | Factor Enhanced Emerging Markets Fund | |
| | | Six months ended
August 31, 2018
(unaudited) | | | Year ended
February 28, 20181 | |
| | | | |
Operations | | | | | | | | | | | | | | | | |
Net investment income | | | | | | $ | 331 | | | | | | | $ | 107 | |
Net realized gains (losses) on investments | | | | | | | (1,440 | ) | | | | | | | 326 | |
Net change in unrealized gains (losses) on investments | | | | | | | 3,034 | | | | | | | | 392 | |
| | | | |
Net increase in net assets resulting from operations | | | | | | | 1,925 | | | | | | | | 825 | |
| | | | |
| | | | |
Distributions to shareholders from | | | | | | | | | | | | | | | | |
Net investment income | | | | | | | 0 | | | | | | | | (72 | ) |
| | | | |
| | | | |
Capital share transactions | | | Shares | | | | | | | | Shares | | | | | |
Proceeds from shares sold | | | 102,987 | | | | 1,000,000 | | | | 1,000 | | | | 10,000 | |
| | | | |
Net increase in net assets resulting from capital share transactions | | | | | | | 1,000,000 | | | | | | | | 10,000 | |
| | | | |
Total increase in net assets | | | | | | | 1,001,925 | | | | | | | | 10,753 | |
| | | | |
| | | | |
Net assets | | | | | | | | | | | | | | | | |
Beginning of period | | | | | | | 10,753 | | | | | | | | 0 | |
| | | | |
End of period | | | | | | $ | 1,012,678 | | | | | | | $ | 10,753 | |
| | | | |
Undistributed net investment income | | | | | | $ | 379 | | | | | | | $ | 48 | |
| | | | |
| 1 | For the period from August 3, 2017 (commencement of operations) to February 28, 2018 |
The accompanying notes are an integral part of these financial statements.
| | | | |
| 34 | | Wells Fargo Funds | | Statements of changes in net assets |
| | | | | | | | | | | | | | | | |
| | | Factor Enhanced International Fund | |
| | | Six months ended
August 31, 2018
(unaudited) | | | Year ended
February 28, 20181 | |
| | | | |
Operations | | | | | | | | | | | | | | | | |
Net investment income | | | | | | $ | 302 | | | | | | | $ | 115 | |
Net realized gains (losses) on investments | | | | | | | (59 | ) | | | | | | | 47 | |
Net change in unrealized gains (losses) on investments | | | | | | | (9,820 | ) | | | | | | | 350 | |
| | | | |
Net increase (decrease) in net assets resulting from operations | | | | | | | (9,577 | ) | | | | | | | 512 | |
| | | | |
| | | | |
Distributions to shareholders from | | | | | | | | | | | | | | | | |
Net investment income | | | | | | | 0 | | | | | | | | (49 | ) |
| | | | |
| | | | |
Capital share transactions | | | Shares | | | | | | | | Shares | | | | | |
Proceeds from shares sold | | | 94,073 | | | | 1,000,000 | | | | 1,000 | | | | 10,000 | |
| | | | |
Net increase in net assets resulting from capital share transactions | | | | | | | 1,000,000 | | | | | | | | 10,000 | |
| | | | |
Total increase in net assets | | | | | | | 990,423 | | | | | | | | 10,463 | |
| | | | |
| | | | |
Net assets | | | | | | | | | | | | | | | | |
Beginning of period | | | | | | | 10,463 | | | | | | | | 0 | |
| | | | |
End of period | | | | | | $ | 1,000,886 | | | | | | | $ | 10,463 | |
| | | | |
Undistributed net investment income | | | | | | $ | 375 | | | | | | | $ | 73 | |
| | | | |
| 1 | For the period from August 3, 2017 (commencement of operations) to February 28, 2018 |
The accompanying notes are an integral part of these financial statements.
| | | | | | |
| Statements of changes in net assets | | Wells Fargo Funds | | | 35 | |
| | | | | | | | | | | | | | | | |
| | | Factor Enhanced Large Cap Fund | |
| | | Six months ended
August 31, 2018
(unaudited) | | | Year ended
February 28, 20181 | |
| | | | |
Operations | | | | | | | | | | | | | | | | |
Net investment income | | | | | | $ | 292 | | | | | | | $ | 124 | |
Net realized gains on investments | | | | | | | 10,123 | | | | | | | | 374 | |
Net change in unrealized gains (losses) on investments | | | | | | | (9,079 | ) | | | | | | | 394 | |
| | | | |
Net increase in net assets resulting from operations | | | | | | | 1,336 | | | | | | | | 892 | |
| | | | |
| | | | |
Distributions to shareholders from | | | | | | | | | | | | | | | | |
Net investment income | | | | | | | 0 | | | | | | | | (56 | ) |
| | | | |
| | | | |
Capital share transactions | | | Shares | | | | | | | | Shares | | | | | |
Proceeds from shares sold | | | 86,356 | | | | 1,000,000 | | | | 1,000 | | | | 10,000 | |
| | | | |
Net increase in net assets resulting from capital share transactions | | | | | | | 1,000,000 | | | | | | | | 10,000 | |
| | | | |
Total increase in net assets | | | | | | | 1,001,336 | | | | | | | | 10,836 | |
| | | | |
| | | | |
Net assets | | | | | | | | | | | | | | | | |
Beginning of period | | | | | | | 10,836 | | | | | | | | 0 | |
| | | | |
End of period | | | | | | $ | 1,012,172 | | | | | | | $ | 10,836 | |
| | | | |
Undistributed net investment income | | | | | | $ | 360 | | | | | | | $ | 68 | |
| | | | |
| 1 | For the period from August 3, 2017 (commencement of operations) to February 28, 2018 |
The accompanying notes are an integral part of these financial statements.
| | | | |
| 36 | | Wells Fargo Funds | | Statements of changes in net assets |
| | | | | | | | | | | | | | | | |
| | | Factor Enhanced Small Cap Fund | |
| | | Six months ended
August 31, 2018
(unaudited) | | | Year ended
February 28, 20181 | |
| | | | |
Operations | | | | | | | | | | | | | | | | |
Net investment income | | | | | | $ | 237 | | | | | | | $ | 84 | |
Net realized gains on investments | | | | | | | 8,259 | | | | | | | | 246 | |
Net change in unrealized gains (losses) on investments | | | | | | | (2,011 | ) | | | | | | | 373 | |
| | | | |
Net increase in net assets resulting from operations | | | | | | | 6,485 | | | | | | | | 703 | |
| | | | |
| | | | |
Distributions to shareholders from | | | | | | | | | | | | | | | | |
Net investment income | | | | | | | 0 | | | | | | | | (42 | ) |
| | | | |
| | | | |
Capital share transactions | | | Shares | | | | | | | | Shares | | | | | |
Proceeds from shares sold | | | 80,386 | | | | 1,000,000 | | | | 1,000 | | | | 10,000 | |
| | | | |
Net increase in net assets resulting from capital share transactions | | | | | | | 1,000,000 | | | | | | | | 10,000 | |
| | | | |
Total increase in net assets | | | | | | | 1,006,485 | | | | | | | | 10,661 | |
| | | | |
| | | | |
Net assets | | | | | | | | | | | | | | | | |
Beginning of period | | | | | | | 10,661 | | | | | | | | 0 | |
| | | | |
End of period | | | | | | $ | 1,017,146 | | | | | | | $ | 10,661 | |
| | | | |
Undistributed net investment income | | | | | | $ | 279 | | | | | | | $ | 42 | |
| | | | |
| 1 | For the period from August 3, 2017 (commencement of operations) to February 28, 2018 |
The accompanying notes are an integral part of these financial statements.
| | | | | | |
| Statements of changes in net assets | | Wells Fargo Funds | | | 37 | |
| | | | | | | | | | | | | | | | |
| | | High Yield Corporate Bond Fund | |
| | | Six months ended
August 31, 2018
(unaudited) | | | Year ended
February 28, 20181 | |
| | | | |
Operations | | | | | | | | | | | | | | | | |
Net investment income | | | | | | $ | 906 | | | | | | | $ | 326 | |
Net realized losses on investments | | | | | | | (268 | ) | | | | | | | (66 | ) |
Net change in unrealized gains (losses) on investments | | | | | | | 73 | | | | | | | | (209 | ) |
| | | | |
Net increase in net assets resulting from operations | | | | | | | 711 | | | | | | | | 51 | |
| | | | |
| | | | |
Distributions to shareholders from | | | | | | | | | | | | | | | | |
Net investment income | | | | | | | (776 | ) | | | | | | | (385 | ) |
Tax basis return of capital | | | | | | | 0 | | | | | | | | (8 | ) |
| | | | |
Total distributions to shareholders | | | | | | | (776 | ) | | | | | | | (393 | ) |
| | | | |
| | | | |
Capital share transactions | | | Shares | | | | | | | | Shares | | | | | |
Proceeds from shares sold | | | 105,042 | | | | 1,000,000 | | | | 1,000 | | | | 10,000 | |
| | | | |
Net increase in net assets resulting from capital share transactions | | | | | | | 1,000,000 | | | | | | | | 10,000 | |
| | | | |
Total increase in net assets | | | | | | | 999,935 | | | | | | | | 9,658 | |
| | | | |
| | | | |
Net assets | | | | | | | | | | | | | | | | |
Beginning of period | | | | | | | 9,658 | | | | | | | | 0 | |
| | | | |
End of period | | | | | | $ | 1,009,593 | | | | | | | $ | 9,658 | |
| | | | |
Undistributed (overdistributed) net investment income | | | | | | $ | 71 | | | | | | | $ | (59 | ) |
| | | | |
| 1 | For the period from August 3, 2017 (commencement of operations) to February 28, 2018. |
The accompanying notes are an integral part of these financial statements.
| | | | |
| 38 | | Wells Fargo Funds | | Statements of changes in net assets |
| | | | | | | | | | | | | | | | |
| | | International Government Bond Fund | |
| | | Six months ended
August 31, 2018
(unaudited) | | | Year ended
February 28, 20181 | |
| | | | |
Operations | | | | | | | | | | | | | | | | |
Net investment income | | | | | | $ | 241 | | | | | | | $ | 54 | |
Net realized losses on investments | | | | | | | (14,705 | ) | | | | | | | (27 | ) |
Net change in unrealized gains (losses) on investments | | | | | | | 10,888 | | | | | | | | 414 | |
| | | | |
Net increase (decrease) in net assets resulting from operations | | | | | | | (3,576 | ) | | | | | | | 441 | |
| | | | |
| | | | |
Distributions to shareholders from | | | | | | | | | | | | | | | | |
Net investment income | | | | | | | (103 | ) | | | | | | | (35 | ) |
| | | | |
| | | | |
Capital share transactions | | | Shares | | | | | | | | Shares | | | | | |
Proceeds from shares sold | | | 101,112 | | | | 1,000,000 | | | | 1,000 | | | | 10,000 | |
| | | | |
Net increase in net assets resulting from capital share transactions | | | | | | | 1,000,000 | | | | | | | | 10,000 | |
| | | | |
Total increase in net assets | | | | | | | 996,321 | | | | | | | | 10,406 | |
| | | | |
| | | | |
Net assets | | | | | | | | | | | | | | | | |
Beginning of period | | | | | | | 10,406 | | | | | | | | 0 | |
| | | | |
End of period | | | | | | $ | 1,006,727 | | | | | | | $ | 10,406 | |
| | | | |
Undistributed (overdistributed) net investment income | | | | | | $ | 131 | | | | | | | $ | (7 | ) |
| | | | |
| 1 | For the period from October 31, 2017 (commencement of operations) to February 28, 2018. |
The accompanying notes are an integral part of these financial statements.
| | | | | | |
| Statements of changes in net assets | | Wells Fargo Funds | | | 39 | |
| | | | | | | | | | | | | | | | |
| | | U.S. Core Bond Fund | |
| | | Six months ended
August 31, 2018
(unaudited) | | | Year ended
February 28, 20181 | |
| | | | |
Operations | | | | | | | | | | | | | | | | |
Net investment income | | | | | | $ | 330 | | | | | | | $ | 137 | |
Net realized losses on investments | | | | | | | (603 | ) | | | | | | | (63 | ) |
Net change in unrealized gains (losses) on investments | | | | | | | 551 | | | | | | | | (250 | ) |
| | | | |
Net increase (decrease) in net assets resulting from operations | | | | | | | 278 | | | | | | | | (176 | ) |
| | | | |
| | | | |
Distributions to shareholders from | | | | | | | | | | | | | | | | |
Net investment income | | | | | | | (454 | ) | | | | | | | (166 | ) |
Tax basis return of capital | | | | | | | 0 | | | | | | | | (22 | ) |
| | | | |
Total distributions to shareholders | | | | | | | (454 | ) | | | | | | | (188 | ) |
| | | | |
| | | | |
Capital share transactions | | | Shares | | | | | | | | Shares | | | | | |
Proceeds from shares sold | | | 104,058 | | | | 1,000,000 | | | | 1,000 | | | | 10,000 | |
| | | | |
Net increase in net assets resulting from capital share transactions | | | | | | | 1,000,000 | | | | | | | | 10,000 | |
| | | | |
Total increase in net assets | | | | | | | 999,824 | | | | | | | | 9,636 | |
| | | | |
| | | | |
Net assets | | | | | | | | | | | | | | | | |
Beginning of period | | | | | | | 9,636 | | | | | | | | 0 | |
| | | | |
End of period | | | | | | $ | 1,009,460 | | | | | | | $ | 9,636 | |
| | | | |
Undistributed (overdistributed) net investment income | | | | | | $ | (124 | ) | | | | | | $ | 0 | |
| | | | |
| 1 | For the period from August 3, 2017 (commencement of operations) to February 28, 2018 |
The accompanying notes are an integral part of these financial statements.
| | | | |
| 40 | | Wells Fargo Funds | | Financial highlights |
| | | | | | | | | | | | | | | | | | | | | | | | |
| | | Beginning net asset value per share | | | Net investment income | | | Net realized and unrealized gains (losses) on investments | | | Distributions from net investment income | | | Tax basis return of capital | | | Ending net asset value per share | |
| | | | | | |
Emerging Markets Bond Fund | | | | | | | | | | | | | | | | | | | | | | | | |
Six months ended August 31, 2018 (unaudited) | | $ | 9.80 | | | | 0.20 | | | | (0.44 | ) | | | (0.19 | ) | | | 0.00 | | | $ | 9.37 | |
Year ended February 28, 20185 | | $ | 10.00 | | | | 0.26 | | | | (0.23 | ) | | | (0.23 | ) | | | 0.00 | | | $ | 9.80 | |
| | | | | | |
Factor Enhanced Emerging Markets Fund | | | | | | | | | | | | | | | | | | | | | | | | |
Six months ended August 31, 2018 (unaudited) | | $ | 10.75 | | | | 0.20 | | | | (1.21 | ) | | | 0.00 | | | | 0.00 | | | $ | 9.74 | |
Year ended February 28, 20185 | | $ | 10.00 | | | | 0.11 | | | | 0.70 | | | | (0.06 | ) | | | 0.00 | | | $ | 10.75 | |
| | | | | | |
Factor Enhanced International Fund | | | | | | | | | | | | | | | | | | | | | | | | |
Six months ended August 31, 2018 (unaudited) | | $ | 10.46 | | | | 0.20 | 7 | | | (0.13 | ) | | | 0.00 | | | | 0.00 | | | $ | 10.53 | |
Year ended February 28, 20185 | | $ | 10.00 | | | | 0.12 | | | | 0.39 | | | | (0.05 | ) | | | 0.00 | | | $ | 10.46 | |
| | | | | | |
Factor Enhanced Large Cap Fund | | | | | | | | | | | | | | | | | | | | | | | | |
Six months ended August 31, 2018 (unaudited) | | $ | 10.84 | | | | 0.20 | 7 | | | 0.55 | | | | 0.00 | | | | 0.00 | | | $ | 11.59 | |
Year ended February 28, 20185 | | $ | 10.00 | | | | 0.12 | | | | 0.78 | | | | (0.06 | ) | | | 0.00 | | | $ | 10.84 | |
| | | | | | |
Factor Enhanced Small Cap Fund | | | | | | | | | | | | | | | | | | | | | | | | |
Six months ended August 31, 2018 (unaudited) | | $ | 10.66 | | | | 0.16 | | | | 1.68 | | | | 0.00 | | | | 0.00 | | | $ | 12.50 | |
Year ended February 28, 20185 | | $ | 10.00 | | | | 0.08 | | | | 0.62 | | | | (0.04 | ) | | | 0.00 | | | $ | 10.66 | |
| | | | | | |
High Yield Corporate Bond Fund | | | | | | | | | | | | | | | | | | | | | | | | |
Six months ended August 31, 2018 (unaudited) | | $ | 9.66 | | | | 0.37 | | | | (0.19 | ) | | | (0.32 | ) | | | 0.00 | | | $ | 9.52 | |
Year ended February 28, 20185 | | $ | 10.00 | | | | 0.33 | | | | (0.28 | ) | | | (0.38 | ) | | | (0.01 | ) | | $ | 9.66 | |
| | | | | | |
International Government Bond Fund | | | | | | | | | | | | | | | | | | | | | | | | |
Six months ended August 31, 2018 (unaudited) | | $ | 10.41 | | | | 0.11 | | | | (0.56 | ) | | | (0.10 | ) | | | 0.00 | | | $ | 9.86 | |
Year ended February 28, 20186 | | $ | 10.00 | | | | 0.05 | | | | 0.40 | | | | (0.04 | ) | | | 0.00 | | | $ | 10.41 | |
| | | | | | |
U.S. Core Bond Fund | | | | | | | | | | | | | | | | | | | | | | | | |
Six months ended August 31, 2018 (unaudited) | | $ | 9.64 | | | | 0.13 | | | | (0.03 | ) | | | (0.13 | ) | | | 0.00 | | | $ | 9.61 | |
Year ended February 28, 20185 | | $ | 10.00 | | | | 0.14 | | | | (0.31 | ) | | | (0.17 | ) | | | (0.02 | ) | | $ | 9.64 | |
| 1 | The Funds incurred expenses typical of funds with similar structures and strategies. Since the Funds were not open to public investment during the period since each Fund’s commencement of operations and the only investments have been the initial seed capital investments, the gross expenses are higher than the typical operation of a fund. These expenses were waived by the manager. |
| 2 | Ratios include net expenses allocated from the affiliated Master Portfolio(s), which are waived by the manager. These amounts were as follows: |
| | | | | | | | |
| | | Six months ended August 31, 2018 (unaudited) | | | Year ended February 28, 2018 | |
Emerging Markets Bond Fund | | | 0.43 | % | | | 0.39 | %5 |
Factor Enhanced Emerging Markets Fund | | | 0.55 | | | | 0.46 | 5 |
Factor Enhanced International Fund | | | 0.22 | | | | 0.20 | 5 |
Factor Enhanced Large Cap Fund | | | 0.35 | | | | 0.11 | 5 |
Factor Enhanced Small Cap Fund | | | 0.20 | | | | 0.18 | 5 |
High Yield Corporate Bond Fund | | | 0.33 | | | | 0.33 | 5 |
International Government Bond Fund | | | 0.95 | | | | 1.76 | 6 |
U.S. Core Bond Fund | | | 0.21 | | | | 0.06 | 5 |
| 3 | Returns for periods of less than one year are not annualized. |
| 4 | Portfolio turnover rate is calculated by aggregating the results of multiplying the Fund’s investment percentage in the respective affiliated Master Portfolio(s) by the corresponding affiliated Master Portfolio’s portfolio turnover rate. | |
| 5 | For the period from August 3, 2017 (commencement of operations) to February 28, 2018 |
| 6 | For the period from October 31, 2017 (commencement of operations) to February 28, 2018 |
| 7 | Calculated based upon average shares outstanding |
The accompanying notes are an integral part of these financial statements.
| | | | | | |
| Financial highlights | | Wells Fargo Funds | | | 41 | |
| | | | | | | | | | | | | | | | | | | | | | |
| Ratio to average net assets (annualized) | | | Total Return3 | | | Portfolio turnover rate4 | | | Net assets at end of period (000s omitted) | |
Net investment income | | | Gross expenses1,2 | | | Net expenses2 | |
| | | | | |
| | | | | | | | | | | | | | | | | | | | | | | |
| | 4.82 | % | | | 203.24 | % | | | 0.00 | % | | | (2.44 | )% | | | 17 | % | | $ | 1,008 | |
| | 4.55 | % | | | 752.83 | % | | | 0.00 | % | | | 0.29 | % | | | 18 | % | | $ | 10 | |
| | | | | |
| | | | | | | | | | | | | | | | | | | | | | | |
| | 1.95 | % | | | 199.60 | % | | | 0.00 | % | | | (9.40 | )% | | | 33 | % | | $ | 1,013 | |
| | 1.80 | % | | | 728.50 | % | | | 0.00 | % | | | 8.25 | % | | | 79 | % | | $ | 11 | |
| | | | | |
| | | | | | | | | | | | | | | | | | | | | | | |
| | 1.85 | % | | | 196.94 | % | | | 0.00 | % | | | 0.67 | % | | | 21 | % | | $ | 1,001 | |
| | 1.94 | % | | | 730.62 | % | | | 0.00 | % | | | 5.09 | % | | | 44 | % | | $ | 10 | |
| | | | | |
| | | | | | | | | | | | | | | | | | | | | | | |
| | 5.19 | % | | | 572.51 | % | | | 0.00 | % | | | 6.92 | % | | | 14 | % | | $ | 1,012 | |
| | 2.06 | % | | | 718.70 | % | | | 0.00 | % | | | 8.96 | % | | | 36 | % | | $ | 11 | |
| | | | | |
| | | | | | | | | | | | | | | | | | | | | | | |
| | 1.39 | % | | | 190.78 | % | | | 0.00 | % | | | 17.26 | % | | | 53 | % | | $ | 1,017 | |
| | 1.39 | % | | | 717.33 | % | | | 0.00 | % | | | 7.01 | % | | | 44 | % | | $ | 11 | |
| | | | | |
| | | | | | | | | | | | | | | | | | | | | | | |
| | 5.72 | % | | | 203.46 | % | | | 0.00 | % | | | 1.83 | % | | | 16 | % | | $ | 1,010 | |
| | 5.73 | % | | | 761.12 | % | | | 0.00 | % | | | 0.52 | % | | | 51 | % | | $ | 10 | |
| | | | | |
| | | | | | | | | | | | | | | | | | | | | | | |
| | 1.49 | % | | | 203.14 | % | | | 0.00 | % | | | (4.21 | )% | | | 141 | % | | $ | 1,007 | |
| | 1.62 | % | | | 1,007.15 | % | | | 0.00 | % | | | 4.46 | % | | | 127 | % | | $ | 10 | |
| | | | | |
| | | | | | | | | | | | | | | | | | | | | | | |
| | 2.08 | % | | | 203.03 | % | | | 0.00 | % | | | 1.07 | % | | | 34 | % | | $ | 1,009 | |
| | 2.43 | % | | | 762.71 | % | | | 0.00 | % | | | (1.74 | )% | | | 62 | % | | $ | 10 | |
The accompanying notes are an integral part of these financial statements.
| | | | |
| 42 | | Wells Fargo Funds | | Notes to financial statements (unaudited) |
1. ORGANIZATION
Wells Fargo Funds Trust (the “Trust”), a Delaware statutory trust organized on March 10, 1999, is an open-end management investment company registered under the Investment Company Act of 1940, as amended (the “1940 Act”). As an investment company, the Trust follows the accounting and reporting guidance in Financial Accounting Standards Board Accounting Standards Codification Topic 946, Financial Services – Investment Companies. These financial statements report on the following funds: Wells Fargo Emerging Markets Bond Fund (“Emerging Markets Bond Fund”), Wells Fargo Factor Enhanced Emerging Markets Fund (“Factor Enhanced Emerging Markets Fund”), Wells Fargo Factor Enhanced International Fund (“Factor Enhanced International Fund”), Wells Fargo Factor Enhanced Large Cap Fund (“Factor Enhanced Large Cap Fund”), Wells Fargo Factor Enhanced Small Cap Fund (“Factor Enhanced Small Cap Fund”), Wells Fargo High Yield Corporate Bond Fund (“High Yield Corporate Bond Fund”), Wells Fargo International Government Bond Fund (“International Government Bond Fund”), and Wells Fargo U.S. Core Bond Fund (“U.S. Core Bond Fund”) (each, a “Fund”, collectively, the “Funds”). Each Fund, except International Government Bond Fund, is a diversified series of the Trust. International Government Bond Fund is a non-diversified series of the Trust.
Each Fund seeks to achieve its investment objective by investing all investable assets in separate diversified portfolios (each, an “affiliated Master Portfolio”, collectively, the “affiliated Master Portfolios”) of Wells Fargo Master Trust, a registered open-end management investment company. Each Fund, except U. S. Core Bond Fund, is a feeder fund in a master-feeder structure that invests substantially all of its assets in a single affiliated master portfolio with a substantially identical investment objective and substantially similar investment strategies. U. S. Core Bond Fund is a fund-of-funds that invests in substantially all of its assets in two affiliated Master Portfolios. Each affiliated Master Portfolio directly acquires portfolio securities, and a Fund investing in an affiliated Master Portfolio acquires an indirect interest in those securities. Each Fund accounts for its investment in the affiliated Master Portfolios as a partnership investment and records on a daily basis its share of the affiliated Master Portfolio’s income, expense and realized and unrealized gains and losses. The financial statements of the affiliated Master Portfolios for the six months ended August 31, 2018 are included in this report and should be read in conjunction with each Fund’s financial statements. As of August 31, 2018, each Fund in a master-feeder structure own the following percentages of the respective affiliated Master Portfolio:
| | | | | | | | | | | | | | | | | | | | | | | | | | | | |
| | | Emerging
Markets
Bond
Fund | | | Factor
Enhanced
Emerging
Markets
Fund | | | Factor
Enhanced
International
Fund | | | Factor
Enhanced
Large
Cap
Fund | | | Factor
Enhanced
Small
Cap
Fund | | | High
Yield
Corporate
Bond
Fund | | | International
Government
Bond
Fund | |
Wells Fargo Emerging Markets Bond Portfolio | | | 1.58 | % | | | N/A | | | | N/A | | | | N/A | | | | N/A | | | | N/A | | | | N/A | |
Wells Fargo Factor Enhanced Emerging Markets Portfolio | | | N/A | | | | 0.33 | % | | | N/A | | | | N/A | | | | N/A | | | | N/A | | | | N/A | |
Wells Fargo Factor Enhanced International Portfolio | | | N/A | | | | N/A | | | | 0.10 | % | | | N/A | | | | N/A | | | | N/A | | | | N/A | |
Wells Fargo Factor Enhanced Large Cap Portfolio | | | N/A | | | | N/A | | | | N/A | | | | 0.06 | % | | | N/A | | | | N/A | | | | N/A | |
Wells Fargo Factor Enhanced Small Cap Portfolio | | | N/A | | | | N/A | | | | N/A | | | | N/A | | | | 0.25 | % | | | N/A | | | | N/A | |
Wells Fargo High Yield Corporate Bond Portfolio | | | N/A | | | | N/A | | | | N/A | | | | N/A | | | | N/A | | | | 0.89 | % | | | N/A | |
Wells Fargo International Government Bond Portfolio | | | N/A | | | | N/A | | | | N/A | | | | N/A | | | | N/A | | | | N/A | | | | 9.43 | % |
2. SIGNIFICANT ACCOUNTING POLICIES
The following significant accounting policies, which are consistently followed in the preparation of the financial statements of each Fund, are in conformity with U.S. generally accepted accounting principles which require management to make estimates and assumptions that affect the reported amounts of assets and liabilities, disclosure of contingent assets and liabilities at the date of the financial statements, and the reported amounts of revenues and expenses during the reporting period. Actual results could differ from those estimates.
Securities valuation
All investments are valued each business day as of the close of regular trading on the New York Stock Exchange (generally 4 p.m. Eastern Time), although the Funds may deviate from this calculation time under unusual or unexpected circumstances.
Investments in the affiliated Master Portfolios are valued daily based on each Fund’s proportionate share of each affiliated Master Portfolio’s net assets, which are also valued daily.
| | | | | | |
| Notes to financial statements (unaudited) | | Wells Fargo Funds | | | 43 | |
Investment transactions, income and expenses
Investments in affiliated Master Portfolios are recorded on a trade basis.
Each Fund records daily its proportionate share of each affiliated Master Portfolio’s interest and dividend income, expenses and realized and unrealized gains or losses. Each Fund also accrues its own expenses.
Distributions to shareholders
Distributions to shareholders from net investment income and any net realized gains are recorded on the ex-dividend date for each Fund as follows:
| | | | |
| | | Net
investment
income | | Net realized
gains |
Emerging Markets Bond Fund | | Semi-annually | | Annually |
Factor Enhanced Emerging Markets Fund | | Annually | | Annually |
Factor Enhanced International Fund | | Annually | | Annually |
Factor Enhanced Large Cap Fund | | Annually | | Annually |
Factor Enhanced Small Cap Fund | | Annually | | Annually |
High Yield Corporate Bond Fund | | Monthly | | Annually |
International Government Bond Fund | | Semi-annually | | Annually |
U.S. Core Bond Fund | | Monthly | | Annually |
Such distributions are determined in accordance with income tax regulations and may differ from U.S. generally accepted accounting principles. Dividend sources are estimated at the time of declaration. The tax character of distributions is determined as of the Funds’ fiscal year end. Therefore, a portion of each Fund’s distributions made prior to the Fund’s fiscal year end may be categorized as a tax return of capital at year end.
Federal and other taxes
Each Fund is treated as a separate entity for federal income tax purposes. Each Fund intends to continue to qualify as a regulated investment company by distributing substantially all of its investment company taxable income and any net realized capital gains (after reduction for capital loss carryforwards) sufficient to relieve it from all, or substantially all, federal income taxes. Accordingly, no provision for federal income taxes was required.
Each Fund’s income and federal excise tax returns and all financial records supporting those returns for the fiscal periods since commencement of operations are subject to examination by the federal and Delaware revenue authorities. Management has analyzed each Fund’s tax positions taken on federal, state, and foreign tax returns for all open tax years and does not believe that there are any uncertain tax positions that require recognition of a tax liability.
As of August 31, 2018, the aggregate cost of all investments for federal income tax purposes and the unrealized gains (losses) were as follows:
| | | | | | | | | | | | | | | | |
| | | Tax cost | | | Gross
unrealized
gains | | | Gross
unrealized
losses | | | Net unrealized
gains (losses) | |
Emerging Markets Bond Fund | | $ | 1,009,168 | | | $ | 0 | | | $ | (1,400 | ) | | $ | (1,400 | ) |
Factor Enhanced Emerging Markets Fund | | | 1,009,097 | | | | 3,469 | | | | 0 | | | | 3,469 | |
Factor Enhanced International Fund | | | 1,005,327 | | | | 0 | | | | (4,486 | ) | | | (4,486 | ) |
Factor Enhanced Large Cap Fund | | | 1,019,176 | | | | 0 | | | | (7,029 | ) | | | (7,029 | ) |
Factor Enhanced Small Cap Fund | | | 1,009,362 | | | | 0 | | | | 7,743 | | | | 7,743 | |
High Yield Corporate Bond Fund | | | 1,009,519 | | | | 515 | | | | 0 | | | | 515 | |
International Government Bond Fund | | | 994,349 | | | | 12,165 | | | | 0 | | | | 12,165 | |
U.S. Core Bond Fund | | | 1,009,445 | | | | 599 | | | | (283 | ) | | | 316 | |
| | | | |
| 44 | | Wells Fargo Funds | | Notes to financial statements (unaudited) |
As of February 28, 2018, capital loss carryforwards available to offset future net realized capital gains were as follows:
| | | | | | | | |
| | | No expiration | |
| | | Short-term | | | Long-term | |
Emerging Markets Bond Fund | | $ | 55 | | | $ | 0 | |
High Yield Corporate Bond Fund | | | 32 | | | | 0 | |
U.S. Core Bond Fund | | | 33 | | | | 20 | |
At February 28, 2018, current year deferred post-October capital losses and late-year ordinary losses, which were recognized on the first day of the current fiscal year were as follows:
| | | | | | | | |
| | | Deferred post-October
capital losses | |
| | | Short-term | | | Long-term | |
High Yield Corporate Bond Fund | | $ | 60 | | | $ | 0 | |
International Government Bond Fund | | | 14 | | | | 0 | |
U.S. Core Bond Fund | | | 27 | | | | 11 | |
3. FAIR VALUATION MEASUREMENTS
At August 31, 2018, each Fund’s investment in the affiliated Master Portfolio(s) was measured at fair value using the net asset value per share (or its equivalent) as a practical expedient. The aggregate value of the affiliated Master Portfolio(s) of each Fund was as follows:
| | | | |
| | | Aggregate
value of affiliated
Master Portfolio(s) | |
Emerging Markets Bond Fund | | $ | 1,007,768 | |
Factor Enhanced Emerging Markets Fund | | | 1,012,566 | |
Factor Enhanced International Fund | | | 1,000,841 | |
Factor Enhanced Large Cap Fund | | | 1,012,147 | |
Factor Enhanced Small Cap Fund | | | 1,017,105 | |
High Yield Corporate Bond Fund | | | 1,010,034 | |
International Government Bond Fund | | | 1,006,514 | |
U.S. Core Bond Fund | | | 1,009,761 | |
| | | | | | |
| Notes to financial statements (unaudited) | | Wells Fargo Funds | | | 45 | |
The investment objective of each affiliated Master Portfolio is as follows:
| | |
| Affiliated Master Portfolio | | Investment objective |
Wells Fargo Bloomberg Barclays US Aggregate ex-Corporate Portfolio | | Seeks to replicate the total return of the Bloomberg Barclays US ex-Corporate Index, before fees and expenses |
Wells Fargo Emerging Markets Bond Portfolio | | Seeks to replicate the total return of the JP Morgan EMBI Global Dividend Index, before fees and expenses |
Wells Fargo Factor Enhanced Emerging Markets Portfolio | | Seeks to replicate the total return of the Wells Fargo Factor Enhanced Emerging Markets Index, before fees and expenses |
Wells Fargo Factor Enhanced International Portfolio | | Seeks to replicate the total return of the Wells Fargo Factor Enhanced International Index, before fees and expenses |
Wells Fargo Factor Enhanced Large Cap Portfolio | | Seeks to replicate the total return of the Wells Fargo Factor Enhanced Large Cap Index, before fees and expenses |
Wells Fargo Factor Enhanced Small Cap Portfolio | | Seeks to replicate the total return of the Wells Fargo Factor Enhanced Small Cap Index, before fees and expenses |
Wells Fargo High Yield Corporate Bond Portfolio | | Seeks to replicate the total return of the Wells Fargo U.S. High Yield Bond Index, before fees and expenses |
Wells Fargo International Government Bond Portfolio | | Seeks to replicate the total return of the Wells Fargo International Government Bond Index, before fees and expenses |
Wells Fargo Investment Grade Corporate Bond Portfolio | | Seeks to replicate the total return of the Wells Fargo U.S. Investment Grade Corporate Bond Index, before fees and expenses |
Each affiliated Master Portfolio does not have a redemption period notice, can be redeemed daily and does not have any unfunded commitments.
4. TRANSACTIONS WITH AFFILIATES
Management fee
Wells Fargo Funds Management, LLC (“Funds Management”), an indirect wholly owned subsidiary of Wells Fargo & Company (“Wells Fargo”), is the manager of each Fund and provides advisory and administrative services under an investment management agreement. Under the investment management agreement, Funds Management is responsible for, among other services, implementing the investment objectives and strategies of each Fund, supervising the applicable subadvisers and providing administrative services in connection with each Fund’s operations. Funds Management does not receive an investment management or administration fee from each Fund. However, Funds Management also serves as the adviser to each affiliated Master Portfolio and is entitled to receive a fee from each affiliated Master Portfolio for those services.
Funds Management has retained the services of a subadviser to provide daily portfolio management to U.S. Core Bond Fund. Funds Management has engaged Wells Capital Management Incorporated (“WellsCap”), an affiliate of Funds Management and an indirect, wholly owned subsidiary of Wells Fargo, as subadviser. WellsCap does not receive an annual fee for its services.
Funds Management has committed through June 30, 2019 to waive fees and/or reimburse expenses to the extent necessary to cap each Fund’s expenses at 0.00%. Net expenses from affiliated Master Portfolios are included in the expense caps. After the expiration date, each expense cap may be increased or the commitment to maintain the cap may be terminated only with the approval of the Board of Trustees.
| | | | |
| 46 | | Wells Fargo Funds | | Notes to financial statements (unaudited) |
5. INVESTMENT PORTFOLIO TRANSACTIONS
Purchases and sales of investments, excluding short-term securities, for the six months ended August 31, 2018 were as follows:
| | | | | | | | | | | | | | | | |
| | | Purchases at cost* | | | Sales proceeds* | |
| | | U.S.
government | | | Non-U.S.
government | | | U.S.
government | | | Non-U.S.
government | |
Emerging Markets Bond Fund | | $ | 0 | | | $ | 180,649 | | | $ | 0 | | | $ | 351,016 | |
Factor Enhanced Emerging Markets Fund | | | 0 | | | | 349,219 | | | | 0 | | | | 452,788 | |
Factor Enhanced International Fund | | | 0 | | | | 221,636 | | | | 0 | | | | 424,614 | |
Factor Enhanced Large Cap Fund | | | 0 | | | | 148,982 | | | | 0 | | | | 400,399 | |
Factor Enhanced Small Cap Fund | | | 0 | | | | 544,932 | | | | 0 | | | | 826,734 | |
High Yield Corporate Bond Fund | | | 0 | | | | 170,575 | | | | 0 | | | | 316,939 | |
International Government Bond Fund | | | 0 | | | | 1,428,636 | | | | 0 | | | | 1,319,474 | |
U.S. Core Bond Fund | | | 349,574 | | | | 28,748 | | | | 480,728 | | | | 97,071 | |
| * | The Funds seek to achieve their investment objectives by investing substantially all of their investable assets in affiliated Master Portfolio(s). Purchases and sales related to these investments have been calculated by aggregating the results of multiplying each Fund’s ownership percentage in the respective affiliated Master Portfolio by the corresponding affiliated Master Portfolio’s purchases and sales. |
6. BANK BORROWINGS
The Trust (excluding the money market funds), Wells Fargo Master Trust and Wells Fargo Variable Trust are parties to a $280,000,000 revolving credit agreement whereby each Fund is permitted to use bank borrowings for temporary or emergency purposes, such as to fund shareholder redemption requests. Interest under the credit agreement is charged to each Fund based on a borrowing rate equal to the higher of the Federal Funds rate in effect on that day plus 1.25% or the overnight LIBOR rate in effect on that day plus 1.25%. In addition, an annual commitment fee equal to 0.25% of the unused balance is allocated to each participating fund.
For the six months ended August 31, 2018, there were no borrowings by the Funds under the agreement.
7. CONCENTRATION OF OWNERSHIP
At August 31, 2018, Wells Fargo owned 100% of each Fund. Investment and/or voting activities of Wells Fargo with respect to their holdings in each Fund could have a material impact on each Fund.
8. INDEMNIFICATION
Under the Trust’s organizational documents, the officers and Trustees have been granted certain indemnification rights against certain liabilities that may arise out of performance of their duties to the Trust. Additionally, in the normal course of business, the Trust may enter into contracts with service providers that contain a variety of indemnification clauses. The Trust’s maximum exposure under these arrangements is dependent on future claims that may be made against the Funds and, therefore, cannot be estimated.
9. NEW ACCOUNTING PRONOUNCEMENTS AND REGULATORY CHANGES
On August 17, 2018, the Securities and Exchange Commission (“SEC”) adopted Disclosure Update and Simplification, which amends certain disclosure requirements. The amendments are effective for filings subsequent to November 5, 2018. Management expects these amendments will impact the classification of disclosures in the financial statements.
In August 2018, FASB issued Accounting Standards Update (“ASU”) No. 2018-13, Fair Value Measurement (Topic 820) Disclosure Framework—Changes to the Disclosure Requirements for Fair Value Measurement. ASU 2018-13 updates the disclosure requirements for fair value measurements by modifying or removing certain disclosures and adding certain new disclosures. The amendments are effective for fiscal years, and interim periods within those fiscal years, beginning after December 15, 2019. Early adoption is permitted. Management is currently evaluating the potential impact of this new guidance to the financial statements.
In March 2017, FASB issued ASU No. 2017-08, Premium Amortization on Purchased Callable Debt Securities. ASU 2017-08 shortens the amortization period for certain callable debt securities held at a premium. The amendments require the premium to be amortized to the earliest call date. The amendments do not require an accounting change for securities held at a discount; the discount continues to be amortized to maturity. ASU 2017-08 is effective for fiscal years beginning after December 15, 2018 and for interim periods within those fiscal years. Management is currently evaluating the potential impact of this new guidance to the financial statements.
| | | | | | |
| Portfolio of investments—August 31, 2018 (unaudited) | | Wells Fargo Funds | | | 47 | |
BLOOMBERG BARCLAYS US AGGREGATE EX-CORPORATE PORTFOLIO
| | | | | | | | | | | | | | | | |
| Security name | | Interest rate | | | Maturity date | | | Principal | | | Value | |
| | | | |
Agency Securities: 38.50% | | | | | | | | | | | | | | | | |
FFCB | | | 1.95 | % | | | 1-10-2020 | | | $ | 670,000 | | | $ | 664,215 | |
FHLB | | | 1.00 | | | | 9-26-2019 | | | | 120,000 | | | | 118,139 | |
FHLB | | | 2.00 | | | | 9-13-2019 | | | | 330,000 | | | | 328,116 | |
FHLB | | | 2.13 | | | | 2-11-2020 | | | | 1,740,000 | | | | 1,728,152 | |
FHLB | | | 3.00 | | | | 3-1-2048 | | | | 199,384 | | | | 192,840 | |
FHLB | | | 5.63 | | | | 3-14-2036 | | | | 60,000 | | | | 78,247 | |
FHLMC | | | 1.13 | | | | 7-14-2021 | | | | 120,000 | | | | 114,788 | |
FHLMC | | | 1.25 | | | | 10-2-2019 | | | | 1,680,000 | | | | 1,657,263 | |
FHLMC | | | 2.13 | | | | 6-9-2023 | | | | 520,000 | | | | 505,091 | |
FHLMC | | | 2.38 | | | | 12-13-2019 | | | | 280,000 | | | | 279,394 | |
FHLMC | | | 2.38 | | | | 1-13-2022 | | | | 2,040,000 | | | | 2,014,323 | |
FHLMC | | | 2.50 | | | | 3-1-2032 | | | | 6,760,625 | | | | 6,570,381 | |
FHLMC | | | 2.75 | | | | 12-13-2024 | | | | 1,560,000 | | | | 1,539,789 | |
FHLMC | | | 3.00 | | | | 2-1-2047 | | | | 18,595,736 | | | | 17,995,283 | |
FHLMC ±± | | | 3.31 | | | | 5-25-2023 | | | | 50,000 | | | | 50,537 | |
FHLMC | | | 3.50 | | | | 2-1-2044 | | | | 15,466,754 | | | | 15,491,619 | |
FHLMC | | | 3.50 | | | | 4-1-2045 | | | | 657,885 | | | | 656,556 | |
FHLMC | | | 3.50 | | | | 8-1-2047 | | | | 10,214,993 | | | | 10,161,496 | |
FHLMC | | | 4.50 | | | | 9-13-2019 | | | | 360,000 | | | | 367,233 | |
FHLMC | | | 6.00 | | | | 7-1-2040 | | | | 2,967,944 | | | | 3,277,925 | |
FHLMC Multifamily Structured Pass-Through Certificate Series K070 Class A2 ±± | | | 3.30 | | | | 11-25-2027 | | | | 540,000 | | | | 535,715 | |
FHLMC Series K005 Class A2 | | | 4.32 | | | | 11-25-2019 | | | | 875,000 | | | | 885,525 | |
FHLMC Series K015 Class A2 | | | 3.23 | | | | 7-25-2021 | | | | 60,000 | | | | 60,326 | |
FHLMC Series K028 Class A1 | | | 2.18 | | | | 11-25-2022 | | | | 525,998 | | | | 518,011 | |
FHLMC Series K029 Class A2 ±± | | | 3.32 | | | | 2-25-2023 | | | | 545,000 | | | | 550,908 | |
FHLMC Series K030 Class A2 ±± | | | 3.25 | | | | 4-25-2023 | | | | 760,000 | | | | 767,444 | |
FHLMC Series K034 Class A2 ±± | | | 3.53 | | | | 7-25-2023 | | | | 60,000 | | | | 61,192 | |
FHLMC Series K035 Class A2 ±± | | | 3.46 | | | | 8-25-2023 | | | | 55,000 | | | | 55,972 | |
FHLMC Series K048 Class A2 ±± | | | 3.28 | | | | 6-25-2025 | | | | 215,000 | | | | 216,252 | |
FHLMC Series K062 Class A2 | | | 3.41 | | | | 12-25-2026 | | | | 750,000 | | | | 754,093 | |
FHLMC Series K063 Class A2 ±± | | | 3.43 | | | | 1-25-2027 | | | | 45,000 | | | | 45,300 | |
FHLMC Series K152 Class A2 | | | 3.08 | | | | 1-25-2031 | | | | 125,000 | | | | 118,745 | |
FHLMC Series K717 Class A2 | | | 2.99 | | | | 9-25-2021 | | | | 900,000 | | | | 900,525 | |
FNMA ¤ | | | 0.00 | | | | 10-9-2019 | | | | 790,000 | | | | 767,656 | |
FNMA | | | 1.00 | | | | 10-24-2019 | | | | 650,000 | | | | 638,906 | |
FNMA | | | 1.38 | | | | 2-26-2021 | | | | 120,000 | | | | 116,153 | |
FNMA | | | 1.50 | | | | 11-30-2020 | | | | 120,000 | | | | 116,921 | |
FNMA | | | 1.90 | | | | 10-27-2020 | | | | 1,050,000 | | | | 1,030,213 | |
FNMA | | | 2.13 | | | | 4-24-2026 | | | | 910,000 | | | | 857,590 | |
FNMA | | | 2.50 | | | | 12-1-2027 | | | | 923,524 | | | | 905,251 | |
FNMA | | | 2.50 | | | | 9-1-2031 | | | | 7,431,084 | | | | 7,237,116 | |
FNMA ±± | | | 2.99 | | | | 9-25-2027 | | | | 167,319 | | | | 159,865 | |
FNMA | | | 3.00 | | | | 12-1-2026 | | | | 4,337,073 | | | | 4,335,501 | |
FNMA | | | 3.00 | | | | 12-1-2030 | | | | 614,750 | | | | 611,254 | |
FNMA | | | 3.00 | | | | 7-1-2032 | | | | 6,737,836 | | | | 6,699,513 | |
FNMA | | | 3.00 | | | | 9-18-2033 | | | | 3,085,000 | | | | 3,065,546 | |
FNMA | | | 3.00 | | | | 8-1-2036 | | | | 296,189 | | | | 291,788 | |
FNMA | | | 3.00 | | | | 2-1-2037 | | | | 5,798,185 | | | | 5,711,823 | |
FNMA | | | 3.00 | | | | 11-1-2046 | | | | 864,241 | | | | 836,350 | |
FNMA | | | 3.00 | | | | 7-1-2047 | | | | 22,667,238 | | | | 21,935,454 | |
The accompanying notes are an integral part of these financial statements.
| | | | |
| 48 | | Wells Fargo Funds | | Portfolio of investments—August 31, 2018 (unaudited) |
BLOOMBERG BARCLAYS US AGGREGATE EX-CORPORATE PORTFOLIO
| | | | | | | | | | | | | | | | |
| Security name | | Interest rate | | | Maturity date | | | Principal | | | Value | |
| | | | |
Agency Securities (continued) | | | | | | | | | | | | | | | | |
FNMA | | | 3.00 | % | | | 3-1-2048 | | | $ | 3,192,676 | | | $ | 3,089,434 | |
FNMA | | | 3.50 | | | | 6-1-2031 | | | | 3,309,440 | | | | 3,351,374 | |
FNMA | | | 3.50 | | | | 9-18-2033 | | | | 3,900,000 | | | | 3,941,156 | |
FNMA | | | 3.50 | | | | 1-1-2035 | | | | 226,540 | | | | 229,576 | |
FNMA | | | 3.50 | | | | 3-1-2036 | | | | 3,353,159 | | | | 3,383,723 | |
FNMA | | | 3.50 | | | | 4-1-2037 | | | | 2,352,376 | | | | 2,375,694 | |
FNMA | | | 3.50 | | | | 6-1-2042 | | | | 3,097,153 | | | | 3,102,491 | |
FNMA | | | 3.50 | | | | 7-1-2042 | | | | 1,275,939 | | | | 1,279,489 | |
FNMA | | | 3.50 | | | | 10-1-2042 | | | | 6,545,743 | | | | 6,557,023 | |
FNMA | | | 3.50 | | | | 9-1-2043 | | | | 19,303,678 | | | | 19,378,764 | |
FNMA | | | 3.50 | | | | 3-1-2048 | | | | 3,410,831 | | | | 3,391,399 | |
FNMA | | | 4.00 | | | | 6-1-2042 | | | | 1,146,651 | | | | 1,175,838 | |
FNMA | | | 4.00 | | | | 6-1-2042 | | | | 11,587,407 | | | | 11,882,350 | |
FNMA | | | 4.00 | | | | 8-1-2043 | | | | 8,484,614 | | | | 8,677,507 | |
FNMA | | | 4.00 | | | | 9-13-2048 | | | | 16,780,000 | | | | 17,081,761 | |
FNMA | | | 4.50 | | | | 5-1-2040 | | | | 489,753 | | | | 512,846 | |
FNMA | | | 4.50 | | | | 9-1-2040 | | | | 12,100,959 | | | | 12,628,866 | |
FNMA | | | 4.50 | | | | 2-1-2047 | | | | 3,762,115 | | | | 3,906,735 | |
FNMA | | | 4.50 | | | | 9-13-2048 | | | | 4,770,000 | | | | 4,952,159 | |
FNMA | | | 5.00 | | | | 1-1-2042 | | | | 439,073 | | | | 470,230 | |
FNMA | | | 5.00 | | | | 6-1-2045 | | | | 1,631,645 | | | | 1,748,706 | |
FNMA | | | 5.00 | | | | 7-1-2045 | | | | 5,561,217 | | | | 5,933,090 | |
FNMA | | | 5.50 | | | | 9-1-2040 | | | | 4,427,282 | | | | 4,778,300 | |
FNMA | | | 6.00 | | | | 5-1-2041 | | | | 167,762 | | | | 185,442 | |
FNMA | | | 7.13 | | | | 1-15-2030 | | | | 1,340,000 | | | | 1,836,521 | |
FNMA | | | 7.25 | | | | 5-15-2030 | | | | 80,000 | | | | 111,397 | |
FNMA Series 2016-M6 Class A2 | | | 2.49 | | | | 5-25-2026 | | | | 430,000 | | | | 405,052 | |
FNMA Series 2016-M7 Class A2 | | | 2.50 | | | | 9-25-2026 | | | | 495,000 | | | | 466,401 | |
FNMA Series 2017-M1 Class A2 ±± | | | 2.50 | | | | 10-25-2026 | | | | 275,000 | | | | 256,947 | |
FNMA Series 2017-M11 Class A2 | | | 2.98 | | | | 8-25-2029 | | | | 320,000 | | | | 302,611 | |
FNMA Series 2017-M3 Class A2 ±± | | | 2.57 | | | | 12-25-2026 | | | | 995,000 | | | | 933,558 | |
FNMA Series 2017-M5 Class A2 ±± | | | 3.30 | | | | 4-25-2029 | | | | 70,000 | | | | 67,606 | |
GNMA | | | 3.00 | | | | 4-20-2045 | | | | 9,273,008 | | | | 9,102,370 | |
GNMA | | | 3.00 | | | | 11-20-2045 | | | | 679,474 | | | | 666,480 | |
GNMA | | | 3.00 | | | | 3-20-2046 | | | | 13,429,576 | | | | 13,165,121 | |
GNMA | | | 3.00 | | | | 5-20-2046 | | | | 670,682 | | | | 658,097 | |
GNMA | | | 3.00 | | | | 8-20-2046 | | | | 1,360,585 | | | | 1,332,740 | |
GNMA | | | 3.50 | | | | 2-20-2045 | | | | 18,023,449 | | | | 18,124,655 | |
GNMA | | | 3.50 | | | | 6-20-2045 | | | | 2,933,599 | | | | 2,950,073 | |
GNMA | | | 3.50 | | | | 11-20-2045 | | | | 3,346,350 | | | | 3,369,269 | |
GNMA | | | 3.50 | | | | 7-20-2047 | | | | 10,313,224 | | | | 10,353,452 | |
GNMA | | | 3.50 | | | | 12-20-2047 | | | | 2,271,217 | | | | 2,280,076 | |
GNMA | | | 3.50 | | | | 5-20-2048 | | | | 282,874 | | | | 283,977 | |
GNMA | | | 4.00 | | | | 7-20-2044 | | | | 3,206,150 | | | | 3,307,286 | |
GNMA | | | 4.00 | | | | 8-20-2044 | | | | 1,572,060 | | | | 1,621,730 | |
GNMA | | | 4.00 | | | | 9-20-2044 | | | | 3,163,822 | | | | 3,263,657 | |
GNMA | | | 4.00 | | | | 12-20-2047 | | | | 8,870,744 | | | | 9,089,384 | |
TVA | | | 2.88 | | | | 2-1-2027 | | | | 35,000 | | | | 34,182 | |
TVA | | | 3.50 | | | | 12-15-2042 | | | | 120,000 | | | | 118,561 | |
TVA | | | 3.88 | | | | 2-15-2021 | | | | 800,000 | | | | 820,531 | |
The accompanying notes are an integral part of these financial statements.
| | | | | | |
| Portfolio of investments—August 31, 2018 (unaudited) | | Wells Fargo Funds | | | 49 | |
BLOOMBERG BARCLAYS US AGGREGATE EX-CORPORATE PORTFOLIO
| | | | | | | | | | | | | | | | |
| Security name | | Interest rate | | | Maturity date | | | Principal | | | Value | |
| | | | |
Agency Securities (continued) | | | | | | | | | | | | | | | | |
TVA | | | 4.63 | % | | | 9-15-2060 | | | $ | 35,000 | | | $ | 42,017 | |
TVA | | | 5.38 | | | | 4-1-2056 | | | | 100,000 | | | | 133,834 | |
TVA | | | 6.75 | | | | 11-1-2025 | | | | 190,000 | | | | 234,100 | |
| | | | |
Total Agency Securities (Cost $343,085,492) | | | | | | | | | | | | | | | 333,923,933 | |
| | | | | | | | | | | | | | | | |
| | | | |
Asset-Backed Securities: 0.73% | | | | | | | | | | | | | | | | |
Bank of America Credit Card Trust Series 2017-A1 Class A1 | | | 1.95 | | | | 8-15-2022 | | | | 15,000 | | | | 14,793 | |
Capital One Multi Asset Execution Trust Series 2017-A1 Class A1 | | | 2.00 | | | | 1-17-2023 | | | | 15,000 | | | | 14,805 | |
Capital One Multi Asset Execution Trust Series 2017-A3 Class A3 | | | 2.43 | | | | 1-15-2025 | | | | 225,000 | | | | 220,285 | |
Capital One Multi Asset Execution Trust Series 2017-A4 Class A4 | | | 1.99 | | | | 7-17-2023 | | | | 230,000 | | | | 225,755 | |
Capital One Multi Asset Execution Trust Series 2017-A6 Class A6 | | | 2.29 | | | | 7-15-2025 | | | | 85,000 | | | | 82,391 | |
CarMax Auto Owner Trust Series 2016-2 Class A4 | | | 1.68 | | | | 9-15-2021 | | | | 335,000 | | | | 328,437 | |
CarMax Auto Owner Trust Series 2016-3 Class A3 | | | 1.97 | | | | 4-15-2022 | | | | 375,000 | | | | 370,019 | |
CarMax Auto Owner Trust Series 2016-3 Class A4 | | | 1.60 | | | | 1-18-2022 | | | | 17,000 | | | | 16,583 | |
CarMax Auto Owner Trust Series 2016-4 Class A4 | | | 1.60 | | | | 6-15-2022 | | | | 10,000 | | | | 9,702 | |
CarMax Auto Owner Trust Series 2017-2 Class A4 | | | 2.25 | | | | 9-15-2022 | | | | 195,000 | | | | 191,306 | |
CarMax Auto Owner Trust Series 2017-3 Class A4 | | | 2.22 | | | | 11-15-2022 | | | | 89,000 | | | | 87,190 | |
Chase Issuance Trust Series 2012-A7 Class A7 | | | 2.16 | | | | 9-15-2024 | | | | 205,000 | | | | 198,075 | |
Chase Issuance Trust Series 2016-A4 Class A4 | | | 1.49 | | | | 7-15-2022 | | | | 330,000 | | | | 321,526 | |
Citibank Credit Card Issuance Trust Series 2014-A5 Class A5 | | | 2.68 | | | | 6-7-2023 | | | | 110,000 | | | | 108,981 | |
Citibank Credit Card Issuance Trust Series 2017-A3 Class A3 | | | 1.92 | | | | 4-7-2022 | | | | 590,000 | | | | 581,081 | |
Discover Card Execution Note Trust Series 2017-A2 Class A2 | | | 2.39 | | | | 7-15-2024 | | | | 335,000 | | | | 327,777 | |
Ford Credit Floorplan Master Owner Trust Series 2016-5 Class A1 | | | 1.95 | | | | 11-15-2021 | | | | 40,000 | | | | 39,557 | |
Ford Credit Floorplan Master Owner Trust Series 2017-3 Class A | | | 2.48 | | | | 9-15-2024 | | | | 50,000 | | | | 48,586 | |
Hyundai Auto Receivables Trust Series 2016-B Class D | | | 2.68 | | | | 9-15-2023 | | | | 130,000 | | | | 127,606 | |
Mercedes-Benz Auto Lease Trust Series 2017-A Class A4 | | | 2.01 | | | | 1-17-2023 | | | | 60,000 | | | | 59,558 | |
Nissan Auto Lease Trust Series 2017-A Class A4 | | | 2.04 | | | | 9-15-2022 | | | | 160,000 | | | | 158,462 | |
Nissan Auto Receivables Owner Trust Series 2017-A Class A4 | | | 2.11 | | | | 5-15-2023 | | | | 15,000 | | | | 14,716 | |
Nissan Auto Receivables Owner Trust Series 2017-C Class A3 | | | 2.12 | | | | 4-18-2022 | | | | 290,000 | | | | 285,881 | |
Nissan Auto Receivables Owner Trust Series 2017-C Class A4 | | | 2.28 | | | | 2-15-2024 | | | | 95,000 | | | | 93,089 | |
Synchrony Credit Card Master Note Trust Series 2012-7 Class A | | | 1.76 | | | | 9-15-2022 | | | | 130,000 | | | | 128,517 | |
Synchrony Credit Card Master Note Trust Series 2015-1 Class A | | | 2.37 | | | | 3-15-2023 | | | | 425,000 | | | | 421,013 | |
Synchrony Credit Card Master Note Trust Series 2016-2 Class A | | | 2.21 | | | | 5-15-2024 | | | | 175,000 | | | | 170,662 | |
Synchrony Credit Card Master Note Trust Series 2018-2 Class A | | | 3.47 | | | | 5-15-2026 | | | | 105,000 | | | | 105,771 | |
Toyota Auto Receivables Owner Trust Series 2017-B Class A3 | | | 1.76 | | | | 7-15-2021 | | | | 425,000 | | | | 420,083 | |
World Financial Network Credit Card Master Trust Series 2016-A Class A | | | 2.03 | | | | 4-15-2025 | | | | 487,000 | | | | 471,750 | |
World Omni Auto Receivables Trust Series 2016-B Class A4 | | | 1.48 | | | | 11-15-2022 | | | | 192,000 | | | | 186,388 | |
World Omni Auto Receivables Trust Series 2017-A Class A3 | | | 1.93 | | | | 9-15-2022 | | | | 95,000 | | | | 93,964 | |
World Omni Auto Receivables Trust Series 2017-A Class A4 | | | 2.24 | | | | 6-15-2023 | | | | 210,000 | | | | 206,315 | |
World Omni Auto Receivables Trust Series 2017-B Class A4 | | | 2.25 | | | | 10-16-2023 | | | | 205,000 | | | | 199,988 | |
| | | | |
Total Asset-Backed Securities (Cost $6,420,684) | | | | | | | | | | | | | | | 6,330,612 | |
| | | | | | | | | | | | | | | | |
| | | | |
Municipal Obligations: 0.82% | | | | | | | | | | | | | | | | |
| | | | |
California: 0.27% | | | | | | | | | | | | | | | | |
| | | | |
| Education Revenue: 0.01% | | | | | | | | | | | | | | | | |
California Series B | | | 3.90 | | | | 11-1-2047 | | | | 15,000 | | | | 14,772 | |
University of California Series AD | | | 4.86 | | | | 5-15-2112 | | | | 70,000 | | | | 73,361 | |
| | | | |
| | | | | | | | | | | | | | | 88,133 | |
| | | | | | | | | | | | | | | | |
The accompanying notes are an integral part of these financial statements.
| | | | |
| 50 | | Wells Fargo Funds | | Portfolio of investments—August 31, 2018 (unaudited) |
BLOOMBERG BARCLAYS US AGGREGATE EX-CORPORATE PORTFOLIO
| | | | | | | | | | | | | | | | |
| Security name | | Interest rate | | | Maturity date | | | Principal | | | Value | |
| | | | |
| GO Revenue: 0.18% | | | | | | | | | | | | | | | | |
California Build America Bonds | | | 5.70 | % | | | 11-1-2021 | | | $ | 90,000 | | | $ | 97,404 | |
California Build America Bonds | | | 6.20 | | | | 10-1-2019 | | | | 80,000 | | | | 82,965 | |
California Build America Bonds | | | 7.55 | | | | 4-1-2039 | | | | 110,000 | | | | 163,133 | |
California Build America Bonds | | | 7.60 | | | | 11-1-2040 | | | | 15,000 | | | | 22,665 | |
California Build America Bonds | | | 7.63 | | | | 3-1-2040 | | | | 450,000 | | | | 666,369 | |
California Build America Bonds Taxable Various Purpose | | | 7.50 | | | | 4-1-2034 | | | | 160,000 | | | | 224,830 | |
Los Angeles CA Community College District Build America Bonds | | | 6.75 | | | | 8-1-2049 | | | | 5,000 | | | | 7,312 | |
Los Angeles CA Unified School District Build America Bonds | | | 5.75 | | | | 7-1-2034 | | | | 15,000 | | | | 18,262 | |
Los Angeles CA Unified School District Build America Bonds | | | 5.76 | | | | 7-1-2029 | | | | 60,000 | | | | 69,712 | |
Los Angeles CA Unified School District Build America Bonds | | | 6.76 | | | | 7-1-2034 | | | | 160,000 | | | | 211,469 | |
| | | | |
| | | | | | | | | | | | | | | 1,564,121 | |
| | | | | | | | | | | | | | | | |
| | | | |
| Transportation Revenue: 0.06% | | | | | | | | | | | | | | | | |
Bay Area CA Toll Authority Series 1 | | | 6.26 | | | | 4-1-2049 | | | | 100,000 | | | | 138,697 | |
Bay Area CA Toll Authority Series 1 | | | 6.92 | | | | 4-1-2040 | | | | 15,000 | | | | 20,398 | |
Bay Area CA Toll Authority Series 1 | | | 7.04 | | | | 4-1-2050 | | | | 260,000 | | | | 383,050 | |
| | | | |
| | | | | | | | | | | | | | | 542,145 | |
| | | | | | | | | | | | | | | | |
| | | | |
| Utilities Revenue: 0.02% | | | | | | | | | | | | | | | | |
California Department of Water Resources Series P | | | 2.00 | | | | 5-1-2022 | | | | 55,000 | | | | 53,458 | |
Los Angeles CA DW&P Build America Bonds | | | 6.57 | | | | 7-1-2045 | | | | 55,000 | | | | 78,017 | |
| | | | |
| | | | | | | | | | | | | | | 131,475 | |
| | | | | | | | | | | | | | | | |
| | | | |
| | | | | | | | | | | | | | | 2,325,874 | |
| | | | | | | | | | | | | | | | |
| | | | |
Florida: 0.03% | | | | | | | | | | | | | | | | |
| | | | |
| Miscellaneous Revenue: 0.03% | | | | | | | | | | | | | | | | |
Florida Board of Administrative Finance Series A | | | 2.64 | | | | 7-1-2021 | | | | 240,000 | | | | 237,223 | |
| | | | | | | | | | | | | | | | |
| | | | |
Georgia: 0.03% | | | | | | | | | | | | | | | | |
| | | | |
| Utilities Revenue: 0.03% | | | | | | | | | | | | | | | | |
Municipal Electric Authority of Georgia Build America Bonds | | | 6.66 | | | | 4-1-2057 | | | | 209,000 | | | | 250,574 | |
Municipal Electric Authority of Georgia Build America Bonds | | | 7.06 | | | | 4-1-2057 | | | | 10,000 | | | | 11,951 | |
| | | | |
| | | | | | | | | | | | | | | 262,525 | |
| | | | | | | | | | | | | | | | |
| | | | |
Illinois: 0.11% | | | | | | | | | | | | | | | | |
| | | | |
| GO Revenue: 0.07% | | | | | | | | | | | | | | | | |
Chicago IL Series B | | | 6.31 | | | | 1-1-2044 | | | | 50,000 | | | | 51,242 | |
Illinois Taxable Pension | | | 5.10 | | | | 6-1-2033 | | | | 640,000 | | | | 617,664 | |
| | | | |
| | | | | | | | | | | | | | | 668,906 | |
| | | | | | | | | | | | | | | | |
| | | | |
| Miscellaneous Revenue: 0.01% | | | | | | | | | | | | | | | | |
Illinois Build America Bonds Series 3 | | | 6.73 | | | | 4-1-2035 | | | | 45,000 | | | | 48,286 | |
| | | | | | | | | | | | | | | | |
| | | | |
| Tax Revenue: 0.03% | | | | | | | | | | | | | | | | |
Chicago IL Transit Authority Series B | | | 6.90 | | | | 12-1-2040 | | | | 210,000 | | | | 270,509 | |
| | | | | | | | | | | | | | | | |
| | | | |
| | | | | | | | | | | | | | | 987,701 | |
| | | | | | | | | | | | | | | | |
The accompanying notes are an integral part of these financial statements.
| | | | | | |
| Portfolio of investments—August 31, 2018 (unaudited) | | Wells Fargo Funds | | | 51 | |
BLOOMBERG BARCLAYS US AGGREGATE EX-CORPORATE PORTFOLIO
| | | | | | | | | | | | | | | | |
| Security name | | Interest rate | | | Maturity date | | | Principal | | | Value | |
| | | | |
Kansas: 0.00% | | | | | | | | | | | | | | | | |
| | | | |
| Miscellaneous Revenue: 0.00% | | | | | | | | | | | | | | | | |
Kansas Development Finance Authority Series H | | | 4.93 | % | | | 4-15-2045 | | | $ | 5,000 | | | $ | 5,452 | |
| | | | | | | | | | | | | | | | |
| | | | |
Massachusetts: 0.03% | | | | | | | | | | | | | | | | |
| | | | |
| GO Revenue: 0.03% | | | | | | | | | | | | | | | | |
Massachusetts Build America Bonds Series A | | | 4.91 | | | | 5-1-2029 | | | | 130,000 | | | | 144,112 | |
Massachusetts Build America Bonds Series D | | | 4.50 | | | | 8-1-2031 | | | | 85,000 | | | | 91,488 | |
Massachusetts Build America Bonds Series E | | | 4.20 | | | | 12-1-2021 | | | | 10,000 | | | | 10,281 | |
| | | | |
| | | | | | | | | | | | | | | 245,881 | |
| | | | | | | | | | | | | | | | |
| | | | |
New Jersey: 0.07% | | | | | | | | | | | | | | | | |
| | | | |
| Miscellaneous Revenue: 0.05% | | | | | | | | | | | | | | | | |
New Jersey EDA Series A (National Insured) | | | 7.43 | | | | 2-15-2029 | | | | 395,000 | | | | 480,186 | |
| | | | | | | | | | | | | | | | |
| | | | |
| Transportation Revenue: 0.02% | | | | | | | | | | | | | | | | |
New Jersey Turnpike Authority Build America Bonds Series A | | | 7.10 | | | | 1-1-2041 | | | | 120,000 | | | | 168,600 | |
| | | | | | | | | | | | | | | | |
| | | | |
| | | | | | | | | | | | | | | 648,786 | |
| | | | | | | | | | | | | | | | |
| | | | |
New York: 0.13% | | | | | | | | | | | | | | | | |
| | | | |
| Airport Revenue: 0.03% | | | | | | | | | | | | | | | | |
Port Authority of New York & New Jersey Consolidated Bonds Series 174 | | | 4.46 | | | | 10-1-2062 | | | | 270,000 | | | | 287,064 | |
| | | | | | | | | | | | | | | | |
| | | | |
| Tax Revenue: 0.05% | | | | | | | | | | | | | | | | |
New York Metropolitan Transportation Authority Dedicated Tax Fund Build America Bonds | | | 7.34 | | | | 11-15-2039 | | | | 210,000 | | | | 307,245 | |
New York NY Transitional Finance Authority Build America Bonds Subseries C-2 | | | 5.77 | | | | 8-1-2036 | | | | 100,000 | | | | 118,772 | |
| | | | |
| | | | | | | | | | | | | | | 426,017 | |
| | | | | | | | | | | | | | | | |
| | | | |
| Water & Sewer Revenue: 0.05% | | | | | | | | | | | | | | | | |
New York NY Municipal Water Finance Authority | | | 5.44 | | | | 6-15-2043 | | | | 10,000 | | | | 12,241 | |
New York NY Municipal Water Finance Authority Series CC | | | 5.88 | | | | 6-15-2044 | | | | 280,000 | | | | 364,487 | |
| | | | |
| | | | | | | | | | | | | | | 376,728 | |
| | | | | | | | | | | | | | | | |
| | | | |
| | | | | | | | | | | | | | | 1,089,809 | |
| | | | | | | | | | | | | | | | |
| | | | |
Ohio: 0.02% | | | | | | | | | | | | | | | | |
| | | | |
| Education Revenue: 0.00% | | | | | | | | | | | | | | | | |
Ohio State University Build America Bonds | | | 4.91 | | | | 6-1-2040 | | | | 5,000 | | | | 5,726 | |
| | | | | | | | | | | | | | | | |
| | | | |
| Utilities Revenue: 0.02% | | | | | | | | | | | | | | | | |
American Municipal Power Ohio Incorporated Build America Bonds | | | 5.94 | | | | 2-15-2047 | | | | 150,000 | | | | 188,403 | |
American Municipal Power Ohio Incorporated Build America Bonds Series E | | | 6.27 | | | | 2-15-2050 | | | | 10,000 | | | | 12,592 | |
| | | | |
| | | | | | | | | | | | | | | 200,995 | |
| | | | | | | | | | | | | | | | |
| | | | |
| | | | | | | | | | | | | | | 206,721 | |
| | | | | | | | | | | | | | | | |
The accompanying notes are an integral part of these financial statements.
| | | | |
| 52 | | Wells Fargo Funds | | Portfolio of investments—August 31, 2018 (unaudited) |
BLOOMBERG BARCLAYS US AGGREGATE EX-CORPORATE PORTFOLIO
| | | | | | | | | | | | | | | | |
| Security name | | Interest rate | | | Maturity date | | | Principal | | | Value | |
| | | | |
Oregon: 0.03% | | | | | | | | | | | | | | | | |
| | | | |
| Tax Revenue: 0.03% | | | | | | | | | | | | | | | | |
Oregon | | | 5.76 | % | | | 6-1-2023 | | | $ | 159,867 | | | $ | 171,251 | |
Oregon Department of Transportation Build America Bonds Series A | | | 5.83 | | | | 11-15-2034 | | | | 50,000 | | | | 61,618 | |
| | | | |
| | | | | | | | | | | | | | | 232,869 | |
| | | | | | | | | | | | | | | | |
| | | | |
Pennsylvania: 0.00% | | | | | | | | | | | | | | | | |
| | | | |
| Transportation Revenue: 0.00% | | | | | | | | | | | | | | | | |
Pennsylvania Turnpike Commission Series B | | | 5.51 | | | | 12-1-2045 | | | | 5,000 | | | | 6,116 | |
| | | | | | | | | | | | | | | | |
| | | | |
Texas: 0.09% | | | | | | | | | | | | | | | | |
| | | | |
| Miscellaneous Revenue: 0.06% | | | | | | | | | | | | | | | | |
Texas Build America Bonds | | | 5.52 | | | | 4-1-2039 | | | | 400,000 | | | | 498,220 | |
| | | | | | | | | | | | | | | | |
| | | | |
| Utilities Revenue: 0.03% | | | | | | | | | | | | | | | | |
San Antonio TX | | | 4.43 | | | | 2-1-2042 | | | | 250,000 | | | | 270,113 | |
| | | | | | | | | | | | | | | | |
| | | | |
| | | | | | | | | | | | | | | 768,333 | |
| | | | | | | | | | | | | | | | |
| | | | |
Wisconsin: 0.01% | | | | | | | | | | | | | | | | |
| | | | |
| Tax Revenue: 0.01% | | | | | | | | | | | | | | | | |
Wisconsin General Fund Annual Appropriations Series C | | | 3.15 | | | | 5-1-2027 | | | | 80,000 | | | | 77,822 | |
| | | | | | | | | | | | | | | | |
| | | | |
Total Municipal Obligations (Cost $7,269,144) | | | | | | | | | | | | | | | 7,095,112 | |
| | | | | | | | | | | | | | | | |
| | | | |
Non-Agency Mortgage-Backed Securities: 1.54% | | | | | | | | | | | | | | | | |
Benchmark Mortgage Trust Series 2018-B1 Class A2 | | | 3.57 | | | | 1-15-2051 | | | | 480,000 | | | | 485,423 | |
Benchmark Mortgage Trust Series 2018-B1 Class A4 | | | 3.40 | | | | 1-15-2051 | | | | 695,000 | | | | 684,330 | |
CFCRE Commercial Mortgage Trust Series 2016-C7 Class A3 | | | 3.84 | | | | 12-10-2054 | | | | 20,000 | | | | 20,177 | |
Citigroup Commercial Mortgage Trust Series 2015-GC27 Class A5 | | | 3.14 | | | | 2-10-2048 | | | | 55,000 | | | | 53,798 | |
Citigroup Commercial Mortgage Trust Series 2016 GC37 Class B | | | 4.23 | | | | 4-10-2049 | | | | 535,000 | | | | 540,551 | |
Citigroup Commercial Mortgage Trust Series 2016-GC36 Class A5 | | | 3.62 | | | | 2-10-2049 | | | | 1,465,000 | | | | 1,466,079 | |
Citigroup Commercial Mortgage Trust Series 2016-GC36 Class B ±± | | | 4.92 | | | | 2-10-2049 | | | | 40,000 | | | | 41,688 | |
Citigroup Commercial Mortgage Trust Series 2016-GC36 Class C ±± | | | 4.92 | | | | 2-10-2049 | | | | 95,000 | | | | 95,392 | |
Citigroup Commercial Mortgage Trust Series 2016-P4 Class A4 | | | 2.90 | | | | 7-10-2049 | | | | 135,000 | | | | 128,543 | |
Citigroup Commercial Mortgage Trust Series 2016-P5 Class A2 | | | 2.40 | | | | 10-10-2049 | | | | 141,000 | | | | 137,721 | |
Commercial Mortgage Pass-Through Certificate Series 2012-CR3 Class A3 | | | 2.82 | | | | 10-15-2045 | | | | 54,483 | | | | 53,551 | |
Commercial Mortgage Pass-Through Certificate Series 2013-CR9 Class A4 ±± | | | 4.37 | | | | 7-10-2045 | | | | 505,000 | | | | 526,613 | |
Commercial Mortgage Trust Series 2012-LC4 Class A4 | | | 3.29 | | | | 12-10-2044 | | | | 1,025,000 | | | | 1,024,187 | |
Commercial Mortgage Trust Series 2013-CR6 Class A4 | | | 3.10 | | | | 3-10-2046 | | | | 60,000 | | | | 59,569 | |
Commercial Mortgage Trust Series 2014 UBS5 Class C ±± | | | 4.76 | | | | 9-10-2047 | | | | 390,000 | | | | 389,913 | |
Commercial Mortgage Trust Series 2014-UBS6 Class C ±± | | | 4.61 | | | | 12-10-2047 | | | | 60,000 | | | | 58,471 | |
Commercial Mortgage Trust Series 2015-CR23 Class A3 | | | 3.23 | | | | 5-10-2048 | | | | 60,000 | | | | 59,130 | |
Commercial Mortgage Trust Series 2016-COR1 Class C ±± | | | 4.54 | | | | 10-10-2049 | | | | 65,000 | | | | 64,352 | |
Commercial Mortgage Trust Series 2016-CR28 Class A4 | | | 3.76 | | | | 2-10-2049 | | | | 1,055,000 | | | | 1,065,579 | |
Goldman Sachs Mortgage Securities Trust Series 2012-GC6 Class A3 | | | 3.48 | | | | 1-10-2045 | | | | 722,272 | | | | 727,918 | |
Goldman Sachs Mortgage Securities Trust Series 2012-GCJ9 Class AS | | | 3.12 | | | | 11-10-2045 | | | | 40,000 | | | | 39,057 | |
Goldman Sachs Mortgage Securities Trust Series 2014-GC18 Class B ±± | | | 4.89 | | | | 1-10-2047 | | | | 80,000 | | | | 82,802 | |
Goldman Sachs Mortgage Securities Trust Series 2017-GS5 Class A3 | | | 3.41 | | | | 3-10-2050 | | | | 600,000 | | | | 590,049 | |
GS Mortgage Securities Trust Series 2013-GC14 Class A5 | | | 4.24 | | | | 8-10-2046 | | | | 1,150,000 | | | | 1,195,609 | |
The accompanying notes are an integral part of these financial statements.
| | | | | | |
| Portfolio of investments—August 31, 2018 (unaudited) | | Wells Fargo Funds | | | 53 | |
BLOOMBERG BARCLAYS US AGGREGATE EX-CORPORATE PORTFOLIO
| | | | | | | | | | | | | | | | |
| Security name | | Interest rate | | | Maturity date | | | Principal | | | Value | |
| | | | |
Non-Agency Mortgage-Backed Securities (continued) | | | | | | | | | | | | | | | | |
JPMorgan Chase Commercial Mortgage Securities Corporation Series 2013-C15 Class A4 | | | 4.10 | % | | | 11-15-2045 | | | $ | 20,000 | | | $ | 20,664 | |
JPMorgan Chase Commercial Mortgage Securities Corporation Series 2015-C28 Class A4 | | | 3.23 | | | | 10-15-2048 | | | | 100,000 | | | | 98,274 | |
JPMorgan Chase Commercial Mortgage Securities Corporation Series 2015-C30 Class A5 | | | 3.82 | | | | 7-15-2048 | | | | 1,450,000 | | | | 1,473,836 | |
JPMorgan Chase Commercial Mortgage Securities Corporation Series 2015-C31 Class A3 | | | 3.80 | | | | 8-15-2048 | | | | 195,000 | | | | 197,867 | |
JPMorgan Chase Commercial Mortgage Securities Trust Series 2015-C28 Class A2 | | | 2.77 | | | | 10-15-2048 | | | | 20,000 | | | | 19,926 | |
Morgan Stanley Bank of America Merrill Lynch Trust Series 2012-C5 Class A4 | | | 3.18 | | | | 8-15-2045 | | | | 60,000 | | | | 59,802 | |
Morgan Stanley Bank of America Merrill Lynch Trust Series 2013-C11 Class AS ±± | | | 4.50 | | | | 8-15-2046 | | | | 360,000 | | | | 371,264 | |
Morgan Stanley Bank of America Merrill Lynch Trust Series 2013-C8 Class A4 | | | 3.13 | | | | 12-15-2048 | | | | 50,000 | | | | 49,690 | |
Morgan Stanley Bank of America Merrill Lynch Trust Series 2015-C22 Class A4 | | | 3.31 | | | | 4-15-2048 | | | | 60,000 | | | | 59,158 | |
Morgan Stanley Bank of America Merrill Lynch Trust Series 2015-C22 Class B ±± | | | 3.88 | | | | 4-15-2048 | | | | 1,030,000 | | | | 1,015,140 | |
Morgan Stanley Bank of America Merrill Lynch Trust Series 2015-C24 Class A4 | | | 3.73 | | | | 5-15-2048 | | | | 400,000 | | | | 403,679 | |
| | | | |
Total Non-Agency Mortgage-Backed Securities (Cost $13,767,980) | | | | | | | | | | | | | | | 13,359,802 | |
| | | | | | | | | | | | | | | | |
| | | | |
U.S. Treasury Securities: 48.07% | | | | | | | | | | | | | | | | |
U.S. Treasury Bond | | | 2.13 | | | | 11-30-2024 | | | | 4,755,000 | | | | 4,572,415 | |
U.S. Treasury Bond | | | 2.50 | | | | 2-15-2046 | | | | 915,000 | | | | 825,001 | |
U.S. Treasury Bond | | | 2.75 | | | | 8-15-2042 | | | | 6,035,000 | | | | 5,760,596 | |
U.S. Treasury Bond | | | 2.75 | | | | 11-15-2042 | | | | 6,085,000 | | | | 5,804,995 | |
U.S. Treasury Bond | | | 2.75 | | | | 11-15-2047 | | | | 1,255,000 | | | | 1,187,740 | |
U.S. Treasury Bond | | | 2.88 | | | | 5-15-2028 | | | | 2,295,000 | | | | 2,295,359 | |
U.S. Treasury Bond | | | 2.88 | | | | 5-15-2043 | | | | 5,955,000 | | | | 5,803,799 | |
U.S. Treasury Bond | | | 2.88 | | | | 8-15-2045 | | | | 735,000 | | | | 714,673 | |
U.S. Treasury Bond | | | 3.00 | | | | 5-15-2042 | | | | 5,800,000 | | | | 5,789,578 | |
U.S. Treasury Bond | | | 3.00 | | | | 11-15-2044 | | | | 585,000 | | | | 582,509 | |
U.S. Treasury Bond | | | 3.00 | | | | 5-15-2045 | | | | 105,000 | | | | 104,569 | |
U.S. Treasury Bond | | | 3.00 | | | | 11-15-2045 | | | | 55,000 | | | | 54,766 | |
U.S. Treasury Bond | | | 3.00 | | | | 2-15-2047 | | | | 70,000 | | | | 69,702 | |
U.S. Treasury Bond | | | 3.00 | | | | 5-15-2047 | | | | 25,556,000 | | | | 25,431,215 | |
U.S. Treasury Bond | | | 3.00 | | | | 2-15-2048 | | | | 435,000 | | | | 432,808 | |
U.S. Treasury Bond | | | 3.13 | | | | 11-15-2041 | | | | 2,125,000 | | | | 2,167,251 | |
U.S. Treasury Bond | | | 3.13 | | | | 2-15-2042 | | | | 1,555,000 | | | | 1,585,614 | |
U.S. Treasury Bond | | | 3.38 | | | | 5-15-2044 | | | | 1,565,000 | | | | 1,663,302 | |
U.S. Treasury Bond | | | 3.63 | | | | 8-15-2043 | | | | 1,100,000 | | | | 1,216,059 | |
U.S. Treasury Bond | | | 3.63 | | | | 2-15-2044 | | | | 35,000 | | | | 38,735 | |
U.S. Treasury Bond | | | 3.75 | | | | 8-15-2041 | | | | 1,740,000 | | | | 1,954,917 | |
U.S. Treasury Bond | | | 4.25 | | | | 11-15-2040 | | | | 1,410,000 | | | | 1,696,627 | |
U.S. Treasury Bond | | | 4.75 | | | | 2-15-2041 | | | | 390,000 | | | | 501,622 | |
U.S. Treasury Bond | | | 5.00 | | | | 5-15-2037 | | | | 3,264,000 | | | | 4,237,207 | |
U.S. Treasury Bond | | | 5.25 | | | | 2-15-2029 | | | | 760,000 | | | | 922,034 | |
U.S. Treasury Bond | | | 5.38 | | | | 2-15-2031 | | | | 2,017,000 | | | | 2,537,481 | |
U.S. Treasury Bond | | | 5.50 | | | | 8-15-2028 | | | | 1,805,000 | | | | 2,212,958 | |
U.S. Treasury Bond | | | 6.13 | | | | 11-15-2027 | | | | 2,285,000 | | | | 2,884,991 | |
U.S. Treasury Bond | | | 6.38 | | | | 8-15-2027 | | | | 730,000 | | | | 932,461 | |
U.S. Treasury Bond | | | 6.88 | | | | 8-15-2025 | | | | 2,430,000 | | | | 3,051,738 | |
U.S. Treasury Note | | | 1.00 | | | | 11-15-2019 | | | | 2,360,000 | | | | 2,317,686 | |
U.S. Treasury Note | | | 1.00 | | | | 11-30-2019 | | | | 6,015,000 | | | | 5,902,924 | |
The accompanying notes are an integral part of these financial statements.
| | | | |
| 54 | | Wells Fargo Funds | | Portfolio of investments—August 31, 2018 (unaudited) |
BLOOMBERG BARCLAYS US AGGREGATE EX-CORPORATE PORTFOLIO
| | | | | | | | | | | | | | | | |
| Security name | | Interest rate | | | Maturity date | | | Principal | | | Value | |
| | | | |
U.S. Treasury Securities (continued) | | | | | | | | | | | | | | | | |
U.S. Treasury Note | | | 1.13 | % | | | 12-31-2019 | | | $ | 6,010,000 | | | $ | 5,899,660 | |
U.S. Treasury Note | | | 1.13 | | | | 4-30-2020 | | | | 4,905,000 | | | | 4,787,931 | |
U.S. Treasury Note | | | 1.13 | | | | 2-28-2021 | | | | 1,855,000 | | | | 1,785,945 | |
U.S. Treasury Note | | | 1.13 | | | | 6-30-2021 | | | | 2,555,000 | | | | 2,446,612 | |
U.S. Treasury Note | | | 1.13 | | | | 9-30-2021 | | | | 3,655,000 | | | | 3,485,242 | |
U.S. Treasury Note | | | 1.25 | | | | 1-31-2020 | | | | 4,605,000 | | | | 4,521,894 | |
U.S. Treasury Note | | | 1.25 | | | | 3-31-2021 | | | | 6,035,000 | | | | 5,821,889 | |
U.S. Treasury Note | | | 1.25 | | | | 10-31-2021 | | | | 6,010,000 | | | | 5,745,419 | |
U.S. Treasury Note | | | 1.38 | | | | 12-15-2019 | | | | 5,970,000 | | | | 5,882,082 | |
U.S. Treasury Note | | | 1.38 | | | | 2-15-2020 | | | | 2,925,000 | | | | 2,875,184 | |
U.S. Treasury Note | | | 1.38 | | | | 2-29-2020 | | | | 435,000 | | | | 427,354 | |
U.S. Treasury Note | | | 1.38 | | | | 5-31-2020 | | | | 3,325,000 | | | | 3,254,863 | |
U.S. Treasury Note | | | 1.38 | | | | 8-31-2020 | | | | 5,190,000 | | | | 5,063,291 | |
U.S. Treasury Note | | | 1.38 | | | | 9-30-2020 | | | | 5,030,000 | | | | 4,901,696 | |
U.S. Treasury Note | | | 1.38 | | | | 10-31-2020 | | | | 3,365,000 | | | | 3,274,960 | |
U.S. Treasury Note | | | 1.38 | | | | 1-31-2021 | | | | 1,750,000 | | | | 1,697,227 | |
U.S. Treasury Note | | | 1.38 | | | | 4-30-2021 | | | | 6,025,000 | | | | 5,823,304 | |
U.S. Treasury Note | | | 1.38 | | | | 6-30-2023 | | | | 6,170,000 | | | | 5,789,195 | |
U.S. Treasury Note | | | 1.38 | | | | 8-31-2023 | | | | 435,000 | | | | 407,116 | |
U.S. Treasury Note | | | 1.38 | | | | 9-30-2023 | | | | 6,135,000 | | | | 5,734,308 | |
U.S. Treasury Note | | | 1.50 | | | | 11-30-2019 | | | | 1,125,000 | | | | 1,110,850 | |
U.S. Treasury Note | | | 1.50 | | | | 6-15-2020 | | | | 23,000,000 | | | | 22,553,477 | |
U.S. Treasury Note | | | 1.50 | | | | 8-15-2020 | | | | 5,170,000 | | | | 5,059,330 | |
U.S. Treasury Note | | | 1.50 | | | | 3-31-2023 | | | | 6,085,000 | | | | 5,760,308 | |
U.S. Treasury Note | | | 1.50 | | | | 8-15-2026 | | | | 1,680,000 | | | | 1,520,663 | |
U.S. Treasury Note | | | 1.63 | | | | 12-31-2019 | | | | 5,935,000 | | | | 5,862,899 | |
U.S. Treasury Note | | | 1.63 | | | | 3-15-2020 | | | | 10,000 | | | | 9,856 | |
U.S. Treasury Note | | | 1.63 | | | | 8-15-2022 | | | | 5,765,000 | | | | 5,526,293 | |
U.S. Treasury Note | | | 1.63 | | | | 11-15-2022 | | | | 2,035,000 | | | | 1,945,015 | |
U.S. Treasury Note | | | 1.63 | | | | 4-30-2023 | | | | 3,940,000 | | | | 3,747,617 | |
U.S. Treasury Note | | | 1.63 | | | | 5-31-2023 | | | | 6,085,000 | | | | 5,782,652 | |
U.S. Treasury Note | | | 1.63 | | | | 10-31-2023 | | | | 6,080,000 | | | | 5,748,925 | |
U.S. Treasury Note | | | 1.63 | | | | 2-15-2026 | | | | 6,240,000 | | | | 5,736,656 | |
U.S. Treasury Note | | | 1.63 | | | | 5-15-2026 | | | | 6,285,000 | | | | 5,762,068 | |
U.S. Treasury Note | | | 1.75 | | | | 10-31-2020 | | | | 3,080,000 | | | | 3,021,889 | |
U.S. Treasury Note | | | 1.75 | | | | 12-31-2020 | | | | 10,000 | | | | 9,795 | |
U.S. Treasury Note | | | 1.75 | | | | 11-30-2021 | | | | 1,975,000 | | | | 1,915,981 | |
U.S. Treasury Note | | | 1.75 | | | | 2-28-2022 | | | | 1,030,000 | | | | 996,766 | |
U.S. Treasury Note | | | 1.75 | | | | 6-30-2022 | | | | 19,763,000 | | | | 19,057,399 | |
U.S. Treasury Note | | | 1.75 | | | | 9-30-2022 | | | | 10,000 | | | | 9,619 | |
U.S. Treasury Note | | | 1.75 | | | | 5-15-2023 | | | | 775,000 | | | | 741,063 | |
U.S. Treasury Note | | | 1.88 | | | | 11-30-2021 | | | | 5,925,000 | | | | 5,770,857 | |
U.S. Treasury Note | | | 1.88 | | | | 7-31-2022 | | | | 1,670,000 | | | | 1,616,704 | |
U.S. Treasury Note | | | 1.88 | | | | 9-30-2022 | | | | 3,245,000 | | | | 3,137,002 | |
U.S. Treasury Note | | | 2.00 | | | | 5-31-2021 | | | | 5,890,000 | | | | 5,783,014 | |
U.S. Treasury Note | | | 2.00 | | | | 10-31-2021 | | | | 1,160,000 | | | | 1,135,033 | |
U.S. Treasury Note | | | 2.00 | | | | 12-31-2021 | | | | 3,630,000 | | | | 3,547,049 | |
U.S. Treasury Note | | | 2.00 | | | | 10-31-2022 | | | | 1,990,000 | | | | 1,932,010 | |
U.S. Treasury Note | | | 2.00 | | | | 2-15-2023 | | | | 30,000 | | | | 29,068 | |
U.S. Treasury Note | | | 2.00 | | | | 6-30-2024 | | | | 9,501,000 | | | | 9,101,290 | |
The accompanying notes are an integral part of these financial statements.
| | | | | | |
| Portfolio of investments—August 31, 2018 (unaudited) | | Wells Fargo Funds | | | 55 | |
BLOOMBERG BARCLAYS US AGGREGATE EX-CORPORATE PORTFOLIO
| | | | | | | | | | | | | | | | |
| Security name | | Interest rate | | | Maturity date | | | Principal | | | Value | |
| | | | |
U.S. Treasury Securities (continued) | | | | | | | | | | | | | | | | |
U.S. Treasury Note | | | 2.00 | % | | | 2-15-2025 | | | $ | 340,000 | | | $ | 323,744 | |
U.S. Treasury Note | | | 2.00 | | | | 8-15-2025 | | | | 3,385,000 | | | | 3,209,403 | |
U.S. Treasury Note | | | 2.13 | | | | 12-31-2021 | | | | 3,880,000 | | | | 3,806,795 | |
U.S. Treasury Note | | | 2.13 | | | | 12-31-2022 | | | | 3,190,000 | | | | 3,109,129 | |
U.S. Treasury Note | | | 2.13 | | | | 11-30-2023 | | | | 4,850,000 | | | | 4,699,385 | |
U.S. Treasury Note | | | 2.13 | | | | 7-31-2024 | | | | 2,455,000 | | | | 2,366,198 | |
U.S. Treasury Note | | | 2.13 | | | | 5-15-2025 | | | | 160,000 | | | | 153,269 | |
U.S. Treasury Note | | | 2.25 | | | | 3-31-2021 | | | | 5,810,000 | | | | 5,747,588 | |
U.S. Treasury Note | | | 2.25 | | | | 4-30-2021 | | | | 5,825,000 | | | | 5,759,924 | |
U.S. Treasury Note | | | 2.25 | | | | 7-31-2021 | | | | 5,580,000 | | | | 5,510,250 | |
U.S. Treasury Note | | | 2.25 | | | | 10-31-2024 | | | | 4,675,000 | | | | 4,530,915 | |
U.S. Treasury Note | | | 2.25 | | | | 11-15-2024 | | | | 4,275,000 | | | | 4,141,072 | |
U.S. Treasury Note | | | 2.25 | | | | 12-31-2024 | | | | 3,550,000 | | | | 3,437,121 | |
U.S. Treasury Note | | | 2.25 | | | | 11-15-2025 | | | | 4,360,000 | | | | 4,197,011 | |
U.S. Treasury Note | | | 2.25 | | | | 2-15-2027 | | | | 400,000 | | | | 382,047 | |
U.S. Treasury Note | | | 2.25 | | | | 8-15-2027 | | | | 2,870,000 | | | | 2,731,881 | |
U.S. Treasury Note | | | 2.38 | | | | 4-15-2021 | | | | 2,895,000 | | | | 2,872,270 | |
U.S. Treasury Note | | | 2.38 | | | | 8-15-2024 | | | | 3,705,000 | | | | 3,619,611 | |
U.S. Treasury Note | | | 2.38 | | | | 5-15-2027 | | | | 8,628,000 | | | | 8,314,224 | |
U.S. Treasury Note | | | 2.50 | | | | 8-15-2023 | | | | 5,540,000 | | | | 5,475,727 | |
U.S. Treasury Note | | | 2.75 | | | | 5-31-2023 | | | | 1,895,000 | | | | 1,895,370 | |
U.S. Treasury Note | | | 2.75 | | | | 11-15-2023 | | | | 2,040,000 | | | | 2,039,123 | |
U.S. Treasury Note | | | 2.75 | | | | 2-28-2025 | | | | 3,500,000 | | | | 3,489,746 | |
U.S. Treasury Note | | | 2.75 | | | | 6-30-2025 | | | | 1,270,000 | | | | 1,264,841 | |
U.S. Treasury Note | | | 2.75 | | | | 2-15-2028 | | | | 3,935,000 | | | | 3,896,111 | |
U.S. Treasury Note | | | 2.88 | | | | 8-15-2028 | | | | 1,675,000 | | | | 1,680,627 | |
U.S. Treasury Note | | | 3.13 | | | | 5-15-2021 | | | | 2,430,000 | | | | 2,457,053 | |
U.S. Treasury Note | | | 3.38 | | | | 11-15-2019 | | | | 3,910,000 | | | | 3,948,489 | |
U.S. Treasury Note | | | 6.00 | | | | 2-15-2026 | | | | 2,955,000 | | | | 3,587,439 | |
U.S. Treasury Note | | | 7.25 | | | | 8-15-2022 | | | | 3,150,000 | | | | 3,679,102 | |
U.S. Treasury Note | | | 8.00 | | | | 11-15-2021 | | | | 760,000 | | | | 882,342 | |
U.S. Treasury Note | | | 8.13 | | | | 5-15-2021 | | | | 2,490,000 | | | | 2,839,281 | |
U.S. Treasury Note | | | 8.75 | | | | 5-15-2020 | | | | 1,865,000 | | | | 2,055,580 | |
| | | | |
Total U.S. Treasury Securities (Cost $426,898,391) | | | | | | | | | | | | | | | 416,912,320 | |
| | | | | | | | | | | | | | | | |
| | | | |
Yankee Corporate Bonds and Notes: 0.87% | | | | | | | | | | | | | | | | |
| | | | |
Energy: 0.46% | | | | | | | | | | | | | | | | |
| | | | |
| Oil, Gas & Consumable Fuels: 0.46% | | | | | | | | | | | | | | | | |
Ecopetrol SA | | | 5.88 | | | | 9-18-2023 | | | | 520,000 | | | | 552,760 | |
Ecopetrol SA | | | 7.38 | | | | 9-18-2043 | | | | 40,000 | | | | 45,000 | |
Nexen Incorporated | | | 7.50 | | | | 7-30-2039 | | | | 150,000 | | | | 208,759 | |
Nexen Incorporated | | | 7.88 | | | | 3-15-2032 | | | | 200,000 | | | | 271,000 | |
Petroleos Mexicanos Company | | | 4.50 | | | | 1-23-2026 | | | | 140,000 | | | | 129,500 | |
Petroleos Mexicanos Company | | | 5.50 | | | | 6-27-2044 | | | | 1,490,000 | | | | 1,231,783 | |
Petroleos Mexicanos Company | | | 6.38 | | | | 2-4-2021 | | | | 430,000 | | | | 449,350 | |
Petroleos Mexicanos Company | | | 6.50 | | | | 3-13-2027 | | | | 530,000 | | | | 536,572 | |
Petroleos Mexicanos Company | | | 6.50 | | | | 6-2-2041 | | | | 110,000 | | | | 100,722 | |
Petroleos Mexicanos Company | | | 6.63 | | | | 6-15-2038 | | | | 10,000 | | | | 9,519 | |
The accompanying notes are an integral part of these financial statements.
| | | | |
| 56 | | Wells Fargo Funds | | Portfolio of investments—August 31, 2018 (unaudited) |
BLOOMBERG BARCLAYS US AGGREGATE EX-CORPORATE PORTFOLIO
| | | | | | | | | | | | | | | | |
| Security name | | Interest rate | | | Maturity date | | | Principal | | | Value | |
| | | | |
| Oil, Gas & Consumable Fuels (continued) | | | | | | | | | | | | | | | | |
Statoil ASA | | | 2.90 | % | | | 11-8-2020 | | | $ | 110,000 | | | $ | 109,687 | |
Statoil ASA | | | 4.80 | | | | 11-8-2043 | | | | 310,000 | | | | 339,110 | |
| | | | |
| | | | | | | | | | | | | | | 3,983,762 | |
| | | | | | | | | | | | | | | | |
| | | | |
Financials: 0.41% | | | | | | | | | | | | | | | | |
| | | | |
| Banks: 0.41% | | | | | | | | | | | | | | | | |
Corporacion Andina de Fomento | | | 2.13 | | | | 9-27-2021 | | | | 10,000 | | | | 9,623 | |
Corporación Andina de Fomento | | | 4.38 | | | | 6-15-2022 | | | | 270,000 | | | | 278,348 | |
Export-Import Bank of Korea | | | 2.88 | | | | 1-21-2025 | | | | 400,000 | | | | 377,578 | |
Export-Import Bank of Korea | | | 5.13 | | | | 6-29-2020 | | | | 510,000 | | | | 526,523 | |
Japan Bank for International Cooperation | | | 1.88 | | | | 4-20-2021 | | | | 1,480,000 | | | | 1,437,109 | |
Japan Bank for International Cooperation | | | 2.75 | | | | 11-16-2027 | | | | 360,000 | | | | 344,287 | |
Nordic Investment Bank | | | 1.25 | | | | 8-2-2021 | | | | 400,000 | | | | 381,992 | |
Oesterreichische Kontrollbank AG | | | 2.88 | | | | 3-13-2023 | | | | 260,000 | | | | 259,169 | |
| | | | |
| | | | | | | | | | | | | | | 3,614,629 | |
| | | | | | | | | | | | | | | | |
| | | | |
Total Yankee Corporate Bonds and Notes (Cost $7,865,831) | | | | | | | | | | | | | | | 7,598,391 | |
| | | | | | | | | | | | | | | | |
| | | | |
Yankee Government Bonds: 4.48% | | | | | | | | | | | | | | | | |
African Development Bank | | | 1.13 | | | | 9-20-2019 | | | | 570,000 | | | | 561,376 | |
Asian Development Bank | | | 1.63 | | | | 5-5-2020 | | | | 140,000 | | | | 137,485 | |
Asian Development Bank | | | 2.00 | | | | 2-16-2022 | | | | 1,290,000 | | | | 1,252,189 | |
Asian Development Bank | | | 2.00 | | | | 4-24-2026 | | | | 160,000 | | | | 149,164 | |
Asian Development Bank | | | 2.63 | | | | 1-12-2027 | | | | 900,000 | | | | 873,791 | |
Asian Development Bank | | | 5.82 | | | | 6-16-2028 | | | | 10,000 | | | | 11,994 | |
Asian Development Bank | | | 6.22 | | | | 8-15-2027 | | | | 160,000 | | | | 195,021 | |
Canada | | | 2.00 | | | | 11-15-2022 | | | | 70,000 | | | | 67,612 | |
Council of Europe | | | 1.88 | | | | 1-27-2020 | | | | 370,000 | | | | 365,711 | |
European Bank for Reconstruction and Development | | | 2.13 | | | | 3-7-2022 | | | | 780,000 | | | | 759,473 | |
European Investment Bank | | | 1.25 | | | | 12-16-2019 | | | | 370,000 | | | | 363,361 | |
European Investment Bank | | | 1.38 | | | | 6-15-2020 | | | | 970,000 | | | | 946,937 | |
European Investment Bank | | | 1.63 | | | | 8-14-2020 | | | | 570,000 | | | | 557,809 | |
European Investment Bank | | | 1.63 | | | | 12-15-2020 | | | | 280,000 | | | | 272,798 | |
European Investment Bank | | | 1.88 | | | | 2-10-2025 | | | | 110,000 | | | | 102,737 | |
European Investment Bank | | | 2.13 | | | | 10-15-2021 | | | | 750,000 | | | | 733,415 | |
European Investment Bank | | | 2.38 | | | | 6-15-2022 | | | | 1,540,000 | | | | 1,505,858 | |
European Investment Bank | | | 2.88 | | | | 8-15-2023 | | | | 120,000 | | | | 119,606 | |
European Investment Bank | | | 3.25 | | | | 1-29-2024 | | | | 100,000 | | | | 101,408 | |
Export Development Canada | | | 1.63 | | | | 1-17-2020 | | | | 530,000 | | | | 522,293 | |
Export Development Canada | | | 2.00 | | | | 11-30-2020 | | | | 170,000 | | | | 166,984 | |
FMS Wertmanagement | | | 1.75 | | | | 3-17-2020 | | | | 550,000 | | | | 541,903 | |
Hydro-Quebec | | | 9.40 | | | | 2-1-2021 | | | | 865,000 | | | | 988,244 | |
Inter-American Development Bank | | | 1.75 | | | | 4-14-2022 | | | | 580,000 | | | | 557,685 | |
Inter-American Development Bank | | | 2.13 | | | | 1-18-2022 | | | | 60,000 | | | | 58,566 | |
Inter-American Development Bank | | | 2.13 | | | | 1-15-2025 | | | | 690,000 | | | | 656,681 | |
Inter-American Development Bank | | | 3.20 | | | | 8-7-2042 | | | | 50,000 | | | | 49,633 | |
Inter-American Development Bank | | | 3.88 | | | | 2-14-2020 | | | | 140,000 | | | | 142,345 | |
Inter-American Development Bank | | | 4.38 | | | | 1-24-2044 | | | | 30,000 | | | | 35,835 | |
International Bank for Reconstruction & Development | | | 1.13 | | | | 8-10-2020 | | | | 190,000 | | | | 184,377 | |
The accompanying notes are an integral part of these financial statements.
| | | | | | |
| Portfolio of investments—August 31, 2018 (unaudited) | | Wells Fargo Funds | | | 57 | |
BLOOMBERG BARCLAYS US AGGREGATE EX-CORPORATE PORTFOLIO
| | | | | | | | | | | | | | | | |
| Security name | | Interest rate | | | Maturity date | | | Principal | | | Value | |
| | | | |
Yankee Government Bonds (continued) | | | | | | | | | | | | | | | | |
International Bank for Reconstruction & Development | | | 1.38 | % | | | 3-30-2020 | | | $ | 1,070,000 | | | $ | 1,048,356 | |
International Bank for Reconstruction & Development | | | 1.38 | | | | 5-24-2021 | | | | 890,000 | | | | 856,214 | |
International Bank for Reconstruction & Development | | | 1.75 | | | | 9-14-2022 | | | | 1,180,000 | | | | 1,129,018 | |
International Bank for Reconstruction & Development | | | 1.88 | | | | 4-21-2020 | | | | 1,040,000 | | | | 1,026,320 | |
International Bank for Reconstruction & Development | | | 2.00 | | | | 1-26-2022 | | | | 240,000 | | | | 233,208 | |
International Bank for Reconstruction & Development | | | 2.50 | | | | 7-29-2025 | | | | 250,000 | | | | 243,270 | |
International Bank for Reconstruction & Development | | | 4.75 | | | | 2-15-2035 | | | | 110,000 | | | | 133,543 | |
International Finance Corporation | | | 1.75 | | | | 9-16-2019 | | | | 590,000 | | | | 584,854 | |
Italy | | | 5.38 | | | | 6-15-2033 | | | | 200,000 | | | | 211,703 | |
Italy | | | 6.88 | | | | 9-27-2023 | | | | 100,000 | | | | 109,387 | |
KfW ¤ | | | 0.00 | | | | 4-18-2036 | | | | 340,000 | | | | 197,492 | |
KfW | | | 1.25 | | | | 9-30-2019 | | | | 10,000 | | | | 9,860 | |
KfW | | | 1.50 | | | | 6-15-2021 | | | | 890,000 | | | | 858,387 | |
KfW | | | 2.00 | | | | 5-2-2025 | | | | 40,000 | | | | 37,708 | |
KfW | | | 2.13 | | | | 3-7-2022 | | | | 1,820,000 | | | | 1,773,599 | |
KfW | | | 2.13 | | | | 6-15-2022 | | | | 130,000 | | | | 126,367 | |
KfW | | | 2.13 | | | | 1-17-2023 | | | | 1,500,000 | | | | 1,451,236 | |
KfW | | | 2.75 | | | | 9-8-2020 | | | | 1,080,000 | | | | 1,079,164 | |
Korea Development Bank | | | 2.25 | | | | 5-18-2020 | | | | 650,000 | | | | 638,928 | |
Landwirtschaftliche Rentenbank | | | 1.75 | | | | 7-27-2026 | | | | 10,000 | | | | 9,122 | |
Landwirtschaftliche Rentenbank | | | 2.25 | | | | 10-1-2021 | | | | 700,000 | | | | 687,497 | |
Oriental Republic of Uruguay | | | 5.10 | | | | 6-18-2050 | | | | 650,000 | | | | 661,050 | |
Province of Alberta | | | 1.90 | | | | 12-6-2019 | | | | 230,000 | | | | 227,549 | |
Province of Alberta | | | 2.20 | | | | 7-26-2022 | | | | 90,000 | | | | 86,895 | |
Province of British Columbia | | | 2.00 | | | | 10-23-2022 | | | | 15,000 | | | | 14,416 | |
Province of British Columbia | | | 2.25 | | | | 6-2-2026 | | | | 230,000 | | | | 215,392 | |
Province of Manitoba | | | 2.10 | | | | 9-6-2022 | | | | 240,000 | | | | 230,345 | |
Province of Manitoba | | | 2.13 | | | | 6-22-2026 | | | | 20,000 | | | | 18,375 | |
Province of Ontario | | | 1.88 | | | | 5-21-2020 | | | | 60,000 | | | | 59,001 | |
Province of Ontario | | | 2.50 | | | | 4-27-2026 | | | | 660,000 | | | | 627,155 | |
Province of Ontario | | | 3.20 | | | | 5-16-2024 | | | | 5,000 | | | | 5,000 | |
Province of Ontario | | | 4.40 | | | | 4-14-2020 | | | | 440,000 | | | | 450,943 | |
Province of Quebec | | | 2.50 | | | | 4-20-2026 | | | | 75,000 | | | | 71,750 | |
Province of Quebec | | | 2.63 | | | | 2-13-2023 | | | | 60,000 | | | | 58,840 | |
Republic of Chile | | | 2.25 | | | | 10-30-2022 | | | | 200,000 | | | | 191,120 | |
Republic of Chile | | | 3.63 | | | | 10-30-2042 | | | | 285,000 | | | | 266,048 | |
Republic of Colombia | | | 4.38 | | | | 7-12-2021 | | | | 330,000 | | | | 337,920 | |
Republic of Colombia | | | 6.13 | | | | 1-18-2041 | | | | 335,000 | | | | 382,738 | |
Republic of Colombia | | | 7.38 | | | | 9-18-2037 | | | | 510,000 | | | | 652,163 | |
Republic of Hungary | | | 5.38 | | | | 3-25-2024 | | | | 315,000 | | | | 337,390 | |
Republic of Hungary | | | 6.38 | | | | 3-29-2021 | | | | 30,000 | | | | 32,123 | |
Republic of Hungary | | | 7.63 | | | | 3-29-2041 | | | | 245,000 | | | | 343,613 | |
Republic of Indonesia | | | 2.95 | | | | 1-11-2023 | | | | 200,000 | | | | 192,124 | |
Republic of Korea | | | 3.88 | | | | 9-11-2023 | | | | 210,000 | | | | 214,578 | |
Republic of Panama | | | 6.70 | | | | 1-26-2036 | | | | 60,000 | | | | 74,850 | |
Republic of Panama | | | 9.38 | | | | 4-1-2029 | | | | 475,000 | | | | 674,500 | |
Republic of Peru | | | 5.63 | | | | 11-18-2050 | | | | 390,000 | | | | 466,440 | |
Republic of Peru | | | 6.55 | | | | 3-14-2037 | | | | 45,000 | | | | 57,263 | |
Republic of Peru | | | 7.35 | | | | 7-21-2025 | | | | 130,000 | | | | 160,225 | |
Republic of Poland | | | 3.00 | | | | 3-17-2023 | | | | 660,000 | | | | 648,490 | |
The accompanying notes are an integral part of these financial statements.
| | | | |
| 58 | | Wells Fargo Funds | | Portfolio of investments—August 31, 2018 (unaudited) |
BLOOMBERG BARCLAYS US AGGREGATE EX-CORPORATE PORTFOLIO
| | | | | | | | | | | | | | | | |
| Security name | | Interest rate | | | Maturity date | | | Principal | | | Value | |
| | | | |
Yankee Government Bonds (continued) | | | | | | | | | | | | | | | | |
Republic of Poland | | | 3.25 | % | | | 4-6-2026 | | | $ | 10,000 | | | $ | 9,725 | |
Republic of Poland | | | 5.13 | | | | 4-21-2021 | | | | 10,000 | | | | 10,479 | |
Republic of the Philippines | | | 4.00 | | | | 1-15-2021 | | | | 105,000 | | | | 106,544 | |
Republic of the Philippines | | | 5.50 | | | | 3-30-2026 | | | | 705,000 | | | | 786,711 | |
Republic of the Philippines | | | 6.38 | | | | 10-23-2034 | | | | 415,000 | | | | 519,679 | |
State of Israel | | | 4.00 | | | | 6-30-2022 | | | | 365,000 | | | | 373,450 | |
State of Israel | | | 5.50 | | | | 12-4-2023 | | | | 240,000 | | | | 269,822 | |
State of Israel | | | 5.50 | | | | 4-26-2024 | | | | 60,000 | | | | 67,897 | |
State of Israel | | | 5.50 | | | | 9-18-2033 | | | | 176,000 | | | | 219,430 | |
Swedish Export Credit ¤ | | | 0.00 | | | | 5-11-2037 | | | | 175,000 | | | | 90,850 | |
Swedish Export Credit | | | 1.88 | | | | 6-23-2020 | | | | 590,000 | | | | 580,094 | |
United Mexican States | | | 4.00 | | | | 10-2-2023 | | | | 445,000 | | | | 446,113 | |
United Mexican States | | | 4.15 | | | | 3-28-2027 | | | | 420,000 | | | | 414,330 | |
United Mexican States | | | 4.35 | | | | 1-15-2047 | | | | 225,000 | | | | 204,188 | |
United Mexican States | | | 5.75 | | | | 10-12-2099 | | | | 275,000 | | | | 275,688 | |
United Mexican States | | | 6.05 | | | | 1-11-2040 | | | | 60,000 | | | | 67,050 | |
United Mexican States | | | 7.50 | | | | 4-8-2033 | | | | 715,000 | | | | 900,900 | |
United Mexican States | | | 8.13 | | | | 12-30-2019 | | | | 205,000 | | | | 220,888 | |
United Mexican States | | | 8.30 | | | | 8-15-2031 | | | | 60,000 | | | | 83,250 | |
| | | | |
Total Yankee Government Bonds (Cost $39,847,145) | | | | | | | | | | | | | | | 38,832,908 | |
| | | | | | | | | | | | | | | | |
| | | | |
| | | Yield | | | | | | Shares | | | | |
| Short-Term Investments: 3.93% | | | | | | | | | | | | | | | | |
| | | | |
| Investment Companies: 3.93% | | | | | | | | | | | | | | | | |
Wells Fargo Government Money Market Fund Select
Class (l)(u) | | | 1.87 | | | | | | | | 34,114,908 | | | | 34,114,908 | |
| | | | | | | | | | | | | | | | |
| | | | |
Total Short-Term Investments (Cost $34,114,908) | | | | | | | | | | | | | | | 34,114,908 | |
| | | | | | | | | | | | | | | | |
| | | | | | | | |
| Total investments in securities (Cost $879,269,575) | | | 98.94 | % | | | 858,167,986 | |
Other assets and liabilities, net | | | 1.06 | | | | 9,191,467 | |
| | | | | | | | |
| Total net assets | | | 100.00 | % | | $ | 867,359,453 | |
| | | | | | | | |
| ±± | The coupon of the security is adjusted based on the principal and interest payments received from the underlying pool of mortgages as well as the credit quality and the actual prepayment speed of the underlying mortgages. |
| ¤ | The security is issued in zero coupon form with no periodic interest payments. |
| (l) | The issuer of the security is an affiliated person of the Portfolio as defined in the Investment Company Act of 1940. |
| (u) | The rate represents the 7-day annualized yield at period end. |
Abbreviations:
| DW&P | Department of Water & Power |
| EDA | Economic Development Authority |
| FFCB | Federal Farm Credit Banks |
| FHLB | Federal Home Loan Bank |
| FHLMC | Federal Home Loan Mortgage Corporation |
| FNMA | Federal National Mortgage Association |
| GNMA | Government National Mortgage Association |
| National | National Public Finance Guarantee Corporation |
| TVA | Tennessee Valley Authority |
The accompanying notes are an integral part of these financial statements.
| | | | | | |
| Portfolio of investments—August 31, 2018 (unaudited) | | Wells Fargo Funds | | | 59 | |
BLOOMBERG BARCLAYS US AGGREGATE EX-CORPORATE PORTFOLIO
Investments in Affiliates
An affiliated investment is an investment in which the Portfolio owns at least 5% of the outstanding voting shares of the issuer or as a result of other relationships, such as the Portfolio and the issuer having the same adviser or investment manager. Transactions with issuers that were either affiliated persons of the Portfolio at the beginning of the period or the end of the period were as follows:
| | | | | | | | | | | | | | | | | | | | | | | | | | | | | | | | | | | | |
| | | Shares,
beginning of
period | | | Shares purchased | | | Shares sold | | | Shares,
end of
period | | | Net
realized
gains
(losses) | | | Net
change in
unrealized
gains
(losses) | | | Income
from
affiliated
securities | | | Value, end of period | | | % of
net
assets | |
Short-Term Investments | | | | | | | | | | | | | | | | | | | | | | | | | | | | | | | | | | | | |
Investment Companies | | | | | | | | | | | | | | | | | | | | | | | | | | | | | | | | | | | | |
Wells Fargo Government Money Market Fund Select Class | | | 72,834,127 | | | | 144,728,208 | | | | 183,447,427 | | | | 34,114,908 | | | $ | 0 | | | $ | 0 | | | $ | 273,020 | | | $ | 34,114,908 | | | | 3.93 | % |
The accompanying notes are an integral part of these financial statements.
| | | | |
| 60 | | Wells Fargo Funds | | Portfolio of investments—August 31, 2018 (unaudited) |
EMERGING MARKETS BOND PORTFOLIO
| | | | | | | | | | | | | | | | |
| Security name | | Interest rate | | | Expiration date | | | Principal | | | Value | |
| | | | |
Participation Notes: 0.48% | | | | | | | | | | | | | | | | |
| | | | |
| United Kingdom: 0.48% | | | | | | | | | | | | | | | | |
Biz Finance plc (State Export-Import Ukreximbank) (Financials, Banks) | | | 9.63 | % | | | 4-27-2022 | | | $ | 300,000 | | | $ | 303,767 | |
| | | | | | | | | | | | | | | | |
| | | | |
Total Participation Notes (Cost $313,748) | | | | | | | | | | | | | | | 303,767 | |
| | | | | | | | | | | | | | | | |
| | | | |
| | | | | | Maturity date | | | | | | | |
| Yankee Corporate Bonds and Notes: 13.27% | | | | | | | | | | | | | | | | |
| | | | |
| Azerbaijan: 0.62% | | | | | | | | | | | | | | | | |
State Oil Company of the Azerbaijan Republic (Energy, Oil, Gas & Consumable Fuels) | | | 4.75 | | | | 3-13-2023 | | | | 400,000 | | | | 393,240 | |
| | | | | | | | | | | | | | | | |
| | | | |
| Cayman Islands: 0.28% | | | | | | | | | | | | | | | | |
Lamar Funding Limited (Utilities, Electric Utilities) | | | 3.96 | | | | 5-7-2025 | | | | 200,000 | | | | 179,125 | |
| | | | | | | | | | | | | | | | |
| | | | |
| Chile: 1.20% | | | | | | | | | | | | | | | | |
Banco del Estado de Chile (Financials, Banks) | | | 4.13 | | | | 10-7-2020 | | | | 300,000 | | | | 303,426 | |
Codelco Incorporated (Materials, Metals & Mining) | | | 4.50 | | | | 8-13-2023 | | | | 200,000 | | | | 204,471 | |
Codelco Incorporated (Materials, Metals & Mining) | | | 4.88 | | | | 11-4-2044 | | | | 250,000 | | | | 253,078 | |
| | | | |
| | | | | | | | | | | | | | | 760,975 | |
| | | | | | | | | | | | | | | | |
| | | | |
| China: 0.68% | | | | | | | | | | | | | | | | |
Export-Import Bank of China (Financials, Banks) | | | 2.00 | | | | 4-26-2021 | | | | 450,000 | | | | 433,079 | |
| | | | | | | | | | | | | | | | |
| | | | |
| Hong Kong: 0.32% | | | | | | | | | | | | | | | | |
CNAC Hong Kong Finbridge Company Limited (Materials, Chemicals) | | | 4.63 | | | | 3-14-2023 | | | | 200,000 | | | | 202,028 | |
| | | | | | | | | | | | | | | | |
| | | | |
| Indonesia: 0.63% | | | | | | | | | | | | | | | | |
PT Pertamina Persero (Energy, Oil, Gas & Consumable Fuels) | | | 5.63 | | | | 5-20-2043 | | | | 400,000 | | | | 398,010 | |
| | | | | | | | | | | | | | | | |
| | | | |
| Kazakhstan: 0.99% | | | | | | | | | | | | | | | | |
KazMunayGas National Company JSC (Energy, Oil, Gas & Consumable Fuels) | | | 5.75 | | | | 4-19-2047 | | | | 450,000 | | | | 439,875 | |
KaztransGas Company JSC (Energy, Oil, Gas & Consumable Fuels) | | | 4.38 | | | | 9-26-2027 | | | | 200,000 | | | | 190,000 | |
| | | | |
| | | | | | | | | | | | | | | 629,875 | |
| | | | | | | | | | | | | | | | |
| | | | |
| Malaysia: 1.64% | | | | | | | | | | | | | | | | |
Petronas Capital Limited (Energy, Oil, Gas & Consumable Fuels) | | | 3.50 | | | | 3-18-2025 | | | | 1,066,000 | | | | 1,046,486 | |
| | | | | | | | | | | | | | | | |
| | | | |
| Mexico: 3.42% | | | | | | | | | | | | | | | | |
Comision Federal de Electricidad (Utilities, Electric Utilities) | | | 5.75 | | | | 2-14-2042 | | | | 200,000 | | | | 197,250 | |
Mexico City Airport Trust (Industrials, Airlines) | | | 5.50 | | | | 7-31-2047 | | | | 200,000 | | | | 177,486 | |
Petroleos Mexicanos Company (Energy, Oil, Gas & Consumable Fuels) | | | 3.50 | | | | 1-30-2023 | | | | 225,000 | | | | 212,029 | |
Petroleos Mexicanos Company (Energy, Oil, Gas & Consumable Fuels) | | | 4.88 | | | | 1-24-2022 | | | | 850,000 | | | | 854,888 | |
Petroleos Mexicanos Company (Energy, Oil, Gas & Consumable Fuels) | | | 5.38 | | | | 3-13-2022 | | | | 225,000 | | | | 229,950 | |
Petroleos Mexicanos Company (Energy, Oil, Gas & Consumable Fuels) | | | 5.63 | | | | 1-23-2046 | | | | 400,000 | | | | 329,560 | |
Petroleos Mexicanos Company (Energy, Oil, Gas & Consumable Fuels) | | | 6.35 | | | | 2-12-2048 | | | | 200,000 | | | | 177,500 | |
| | | | |
| | | | | | | | | | | | | | | 2,178,663 | |
| | | | | | | | | | | | | | | | |
| | | | |
| Peru: 0.46% | | | | | | | | | | | | | | | | |
Petroleos del Peru SA (Energy, Oil, Gas & Consumable Fuels) | | | 4.75 | | | | 6-19-2032 | | | | 300,000 | | | | 292,725 | |
| | | | | | | | | | | | | | | | |
The accompanying notes are an integral part of these financial statements.
| | | | | | |
| Portfolio of investments—August 31, 2018 (unaudited) | | Wells Fargo Funds | | | 61 | |
EMERGING MARKETS BOND PORTFOLIO
| | | | | | | | | | | | | | | | |
| Security name | | Interest rate | | | Maturity date | | | Principal | | | Value | |
| | | | |
| Russia: 0.42% | | | | | | | | | | | | | | | | |
Vnesheconombank (Financials, Banks) | | | 5.94 | % | | | 11-21-2023 | | | $ | 275,000 | | | $ | 264,184 | |
| | | | | | | | | | | | | | | | |
| | | | |
| South Africa: 0.71% | | | | | | | | | | | | | | | | |
Eskom Holdings SOC Limited (Utilities, Electric Utilities) | | | 5.75 | | | | 1-26-2021 | | | | 275,000 | | | | 262,973 | |
Eskom Holdings SOC Limited (Utilities, Electric Utilities) | | | 6.75 | | | | 8-6-2023 | | | | 200,000 | | | | 190,516 | |
| | | | |
| | | | | | | | | | | | | | | 453,489 | |
| | | | | | | | | | | | | | | | |
| | | | |
| Venezuela: 0.37% | | | | | | | | | | | | | | | | |
Petroleos de Venezuela SA (Energy, Oil, Gas & Consumable Fuels) †† | | | 5.38 | | | | 4-12-2027 | | | | 550,000 | | | | 112,750 | |
Petroleos de Venezuela SA (Energy, Oil, Gas & Consumable Fuels) †† | | | 5.50 | | | | 4-12-2037 | | | | 200,000 | | | | 41,000 | |
Petroleos de Venezuela SA (Energy, Oil, Gas & Consumable Fuels) †† | | | 9.00 | | | | 11-17-2021 | | | | 400,000 | | | | 81,200 | |
| | | | |
| | | | | | | | | | | | | | | 234,950 | |
| | | | | | | | | | | | | | | | |
| | | | |
| Virgin Islands (British): 1.53% | | | | | | | | | | | | | | | | |
CCTI 2017 Limited (Financials, Capital Markets) | | | 3.63 | | | | 8-8-2022 | | | | 200,000 | | | | 189,981 | |
Charming Light Investments Limited (Financials, Diversified Financial Services) | | | 2.38 | | | | 8-30-2021 | | | | 200,000 | | | | 189,749 | |
Chinalco Capital Holdings Limited (Materials, Metals & Mining) | | | 4.25 | | | | 4-21-2022 | | | | 200,000 | | | | 190,052 | |
Sinochem Capital Company Limited (5 Year Treasury Constant Maturity +4.30%) (Materials, Chemicals) ± | | | 5.00 | | | | 12-29-2049 | | | | 25,000 | | | | 25,038 | |
Sinopec Group Overseas Development (2015) Limited (Energy, Oil, Gas & Consumable Fuels) | | | 3.00 | | | | 4-12-2022 | | | | 200,000 | | | | 195,113 | |
State Grid Overseas Investment (2016) Limited (Utilities, Electric Utilities) | | | 2.88 | | | | 5-18-2026 | | | | 200,000 | | | | 185,235 | |
| | | | |
| | | | | | | | | | | | | | | 975,168 | |
| | | | | | | | | | | | | | | | |
| | | | |
Total Yankee Corporate Bonds and Notes (Cost $8,832,628) | | | | | | | | | | | | | | | 8,441,997 | |
| | | | | | | | | | | | | | | | |
| | | | |
Yankee Government Bonds: 79.01% | | | | | | | | | | | | | | | | |
Arab Republic of Egypt | | | 5.75 | | | | 4-29-2020 | | | | 200,000 | | | | 202,489 | |
Arab Republic of Egypt | | | 5.88 | | | | 6-11-2025 | | | | 387,000 | | | | 363,893 | |
Arab Republic of Egypt | | | 6.13 | | | | 1-31-2022 | | | | 200,000 | | | | 198,850 | |
Arab Republic of Egypt | | | 8.50 | | | | 1-31-2047 | | | | 750,000 | | | | 732,867 | |
China Development Bank | | | 4.00 | | | | 1-24-2037 | | | | 600,000 | | | | 583,261 | |
Dominican Republic | | | 5.95 | | | | 1-25-2027 | | | | 1,750,000 | | | | 1,782,813 | |
Export Credit Bank of Turkey | | | 5.00 | | | | 9-23-2021 | | | | 200,000 | | | | 162,064 | |
Export-Import Bank of India | | | 4.00 | | | | 1-14-2023 | | | | 475,000 | | | | 472,639 | |
Federal Republic of Brazil | | | 2.63 | | | | 1-5-2023 | | | | 200,000 | | | | 180,700 | |
Federal Republic of Brazil | | | 5.63 | | | | 1-7-2041 | | | | 450,000 | | | | 388,580 | |
Federation of Malaysia | | | 3.18 | | | | 4-27-2026 | | | | 650,000 | | | | 624,813 | |
Federative Republic of Brazil | | | 5.63 | | | | 2-21-2047 | | | | 200,000 | | | | 167,000 | |
Federative Republic of Brazil | | | 6.00 | | | | 4-7-2026 | | | | 423,000 | | | | 424,058 | |
Federative Republic of Brazil | | | 10.13 | | | | 5-15-2027 | | | | 425,000 | | | | 548,250 | |
Government of Jamaica | | | 6.75 | | | | 4-28-2028 | | | | 325,000 | | | | 353,438 | |
Government of Jamaica | | | 7.88 | | | | 7-28-2045 | | | | 300,000 | | | | 345,000 | |
Islamic Republic of Pakistan | | | 8.25 | | | | 4-15-2024 | | | | 550,000 | | | | 552,836 | |
Kingdom of Jordan | | | 5.75 | | | | 1-31-2027 | | | | 300,000 | | | | 279,390 | |
Kingdom of Morocco | | | 5.50 | | | | 12-11-2042 | | | | 200,000 | | | | 212,000 | |
Lebanese Republic | | | 6.00 | | | | 1-27-2023 | | | | 500,000 | | | | 428,660 | |
Lebanese Republic | | | 6.38 | | | | 3-9-2020 | | | | 200,000 | | | | 192,479 | |
Lebanese Republic | | | 6.60 | | | | 11-27-2026 | | | | 500,000 | | | | 395,569 | |
Lebanese Republic | | | 7.05 | | | | 11-2-2035 | | | | 200,000 | | | | 151,330 | |
The accompanying notes are an integral part of these financial statements.
| | | | |
| 62 | | Wells Fargo Funds | | Portfolio of investments—August 31, 2018 (unaudited) |
EMERGING MARKETS BOND PORTFOLIO
| | | | | | | | | | | | | | | | |
| Security name | | Interest rate | | | Maturity date | | | Principal | | | Value | |
| | | | |
Yankee Government Bonds (continued) | | | | | | | | | | | | | | | | |
Lebanese Republic | | | 8.25 | % | | | 4-12-2021 | | | $ | 350,000 | | | $ | 338,513 | |
Mongolia Government | | | 5.63 | | | | 5-1-2023 | | | | 450,000 | | | | 435,532 | |
Oman Government International Bond | | | 4.75 | | | | 6-15-2026 | | | | 375,000 | | | | 347,594 | |
Oriental Republic of Uruguay | | | 4.13 | | | | 11-20-2045 | | | | 850,000 | | | | 790,075 | |
Oriental Republic of Uruguay | | | 4.50 | | | | 8-14-2024 | | | | 500,000 | | | | 509,975 | |
Oriental Republic of Uruguay | | | 7.88 | | | | 1-15-2033 | | | | 250,000 | | | | 338,500 | |
Republic of Angola | | | 8.25 | | | | 5-9-2028 | | | | 400,000 | | | | 397,599 | |
Republic of Angola | | | 9.50 | | | | 11-12-2025 | | | | 250,000 | | | | 275,368 | |
Republic of Argentina | | | 5.63 | | | | 1-26-2022 | | | | 1,100,000 | | | | 929,500 | |
Republic of Argentina | | | 7.63 | | | | 4-22-2046 | | | | 1,000,000 | | | | 736,010 | |
Republic of Armenia | | | 6.00 | | | | 9-30-2020 | | | | 200,000 | | | | 203,604 | |
Republic of Azerbaijan | | | 3.50 | | | | 9-1-2032 | | | | 200,000 | | | | 165,000 | |
Republic of Belarus | | | 7.63 | | | | 6-29-2027 | | | | 200,000 | | | | 208,320 | |
Republic of Chile | | | 3.86 | | | | 6-21-2047 | | | | 550,000 | | | | 524,425 | |
Republic of Colombia | | | 3.88 | | | | 4-25-2027 | | | | 1,493,000 | | | | 1,453,436 | |
Republic of Colombia | | | 5.00 | | | | 6-15-2045 | | | | 586,000 | | | | 589,663 | |
Republic of Costa Rica | | | 7.00 | | | | 4-4-2044 | | | | 350,000 | | | | 333,375 | |
Republic of Croatia | | | 6.00 | | | | 1-26-2024 | | | | 425,000 | | | | 460,156 | |
Republic of Croatia | | | 6.63 | | | | 7-14-2020 | | | | 628,000 | | | | 661,568 | |
Republic of Ecuador | | | 7.95 | | | | 6-20-2024 | | | | 550,000 | | | | 499,813 | |
Republic of Ecuador | | | 9.63 | | | | 6-2-2027 | | | | 500,000 | | | | 476,250 | |
Republic of Ecuador | | | 9.65 | | | | 12-13-2026 | | | | 200,000 | | | | 191,500 | |
Republic of Ecuador | | | 10.50 | | | | 3-24-2020 | | | | 725,000 | | | | 743,125 | |
Republic of El Salvador | | | 7.65 | | | | 6-15-2035 | | | | 547,000 | | | | 534,654 | |
Republic of Gabon | | | 6.38 | | | | 12-12-2024 | | | | 350,000 | | | | 318,011 | |
Republic of Ghana | | | 7.63 | | | | 5-16-2029 | | | | 300,000 | | | | 293,271 | |
Republic of Ghana | | | 8.13 | | | | 1-18-2026 | | | | 225,000 | | | | 230,241 | |
Republic of Guatemala | | | 4.38 | | | | 6-5-2027 | | | | 400,000 | | | | 376,400 | |
Republic of Hungary | | | 5.38 | | | | 2-21-2023 | | | | 450,000 | | | | 479,250 | |
Republic of Hungary | | | 5.38 | | | | 3-25-2024 | | | | 200,000 | | | | 214,216 | |
Republic of Hungary | | | 6.25 | | | | 1-29-2020 | | | | 450,000 | | | | 469,211 | |
Republic of Hungary | | | 7.63 | | | | 3-29-2041 | | | | 200,000 | | | | 280,500 | |
Republic of Indonesia | | | 4.55 | | | | 3-29-2026 | | | | 500,000 | | | | 500,375 | |
Republic of Indonesia | | | 4.63 | | | | 4-15-2043 | | | | 200,000 | | | | 193,827 | |
Republic of Indonesia | | | 5.88 | | | | 1-15-2024 | | | | 800,000 | | | | 862,985 | |
Republic of Indonesia | | | 7.75 | | | | 1-17-2038 | | | | 475,000 | | | | 630,653 | |
Republic of Iraq | | | 5.80 | | | | 1-15-2028 | | | | 500,000 | | | | 458,377 | |
Republic of Ivory Coast | | | 5.38 | | | | 7-23-2024 | | | | 375,000 | | | | 350,970 | |
Republic of Ivory Coast | | | 6.13 | | | | 6-15-2033 | | | | 250,000 | | | | 216,165 | |
Republic of Kazakhstan | | | 3.88 | | | | 10-14-2024 | | | | 594,000 | | | | 601,098 | |
Republic of Kazakhstan | | | 4.88 | | | | 10-14-2044 | | | | 300,000 | | | | 306,799 | |
Republic of Kenya | | | 6.88 | | | | 6-24-2024 | | | | 400,000 | | | | 392,256 | |
Republic of Kenya | | | 8.25 | | | | 2-28-2048 | | | | 200,000 | | | | 186,627 | |
Republic of Lithuania | | | 6.63 | | | | 2-1-2022 | | | | 450,000 | | | | 497,588 | |
Republic of Nigeria | | | 6.38 | | | | 7-12-2023 | | | | 300,000 | | | | 298,836 | |
Republic of Nigeria | | | 6.50 | | | | 11-28-2027 | | | | 550,000 | | | | 510,681 | |
Republic of Nigeria | | | 7.88 | | | | 2-16-2032 | | | | 300,000 | | | | 292,344 | |
Republic of Panama | | | 4.00 | | | | 9-22-2024 | | | | 813,000 | | | | 829,260 | |
Republic of Panama | | | 4.50 | | | | 5-15-2047 | | | | 600,000 | | | | 604,500 | |
Republic of Panama | | | 5.20 | | | | 1-30-2020 | | | | 200,000 | | | | 206,200 | |
The accompanying notes are an integral part of these financial statements.
| | | | | | |
| Portfolio of investments—August 31, 2018 (unaudited) | | Wells Fargo Funds | | | 63 | |
EMERGING MARKETS BOND PORTFOLIO
| | | | | | | | | | | | | | | | |
| Security name | | Interest rate | | | Maturity date | | | Principal | | | Value | |
| | | | |
Yankee Government Bonds (continued) | | | | | | | | | | | | | | | | |
Republic of Paraguay | | | 4.63 | % | | | 1-25-2023 | | | $ | 225,000 | | | $ | 230,175 | |
Republic of Paraguay | | | 5.00 | | | | 4-15-2026 | | | | 250,000 | | | | 258,125 | |
Republic of Peru | | | 6.55 | | | | 3-14-2037 | | | | 565,000 | | | | 718,963 | |
Republic of Peru | | | 7.35 | | | | 7-21-2025 | | | | 200,000 | | | | 246,500 | |
Republic of Peru | | | 8.75 | | | | 11-21-2033 | | | | 325,000 | | | | 482,300 | |
Republic of Poland | | | 3.25 | | | | 4-6-2026 | | | | 750,000 | | | | 729,375 | |
Republic of Poland | | | 5.13 | | | | 4-21-2021 | | | | 625,000 | | | | 654,938 | |
Republic of Senegal | | | 6.75 | | | | 3-13-2048 | | | | 250,000 | | | | 213,575 | |
Republic of Serbia | | | 4.88 | | | | 2-25-2020 | | | | 425,000 | | | | 430,896 | |
Republic of South Africa | | | 4.85 | | | | 9-27-2027 | | | | 200,000 | | | | 186,513 | |
Republic of South Africa | | | 4.88 | | | | 4-14-2026 | | | | 400,000 | | | | 379,574 | |
Republic of South Africa | | | 5.00 | | | | 10-12-2046 | | | | 200,000 | | | | 167,820 | |
Republic of South Africa | | | 6.25 | | | | 3-8-2041 | | | | 200,000 | | | | 195,600 | |
Republic of Sri Lanka | | | 6.25 | | | | 7-27-2021 | | | | 600,000 | | | | 609,802 | |
Republic of Sri Lanka | | | 6.75 | | | | 4-18-2028 | | | | 300,000 | | | | 290,286 | |
Republic of Sri Lanka | | | 6.85 | | | | 11-3-2025 | | | | 400,000 | | | | 398,202 | |
Republic of the Philippines | | | 3.70 | | | | 2-2-2042 | | | | 700,000 | | | | 661,514 | |
Republic of the Philippines | | | 4.00 | | | | 1-15-2021 | | | | 450,000 | | | | 456,618 | |
Republic of the Philippines | | | 5.50 | | | | 3-30-2026 | | | | 379,000 | | | | 422,927 | |
Republic of the Philippines | | | 6.38 | | | | 1-15-2032 | | | | 300,000 | | | | 367,177 | |
Republic of Turkey | | | 3.25 | | | | 3-23-2023 | | | | 250,000 | | | | 200,625 | |
Republic of Turkey | | | 5.63 | | | | 3-30-2021 | | | | 561,000 | | | | 513,539 | |
Republic of Turkey | | | 6.63 | | | | 2-17-2045 | | | | 1,050,000 | | | | 804,279 | |
Republic of Turkey | | | 8.00 | | | | 2-14-2034 | | | | 200,000 | | | | 181,411 | |
Republic of Venezuela † | | | 6.00 | | | | 12-9-2020 | | | | 225,000 | | | | 54,563 | |
Republic of Venezuela † | | | 7.00 | | | | 3-31-2038 | | | | 200,000 | | | | 49,000 | |
Republic of Venezuela † | | | 9.00 | | | | 5-7-2023 | | | | 1,010,000 | | | | 242,400 | |
Republic of Zambia | | | 8.50 | | | | 4-14-2024 | | | | 200,000 | | | | 144,420 | |
Republic of Zambia | | | 8.97 | | | | 7-30-2027 | | | | 200,000 | | | | 145,564 | |
Romania | | | 4.88 | | | | 1-22-2024 | | | | 250,000 | | | | 258,764 | |
Romania | | | 6.75 | | | | 2-7-2022 | | | | 802,000 | | | | 877,027 | |
Russian Federation | | | 4.50 | | | | 4-4-2022 | | | | 400,000 | | | | 403,654 | |
Russian Federation | | | 5.25 | | | | 6-23-2047 | | | | 200,000 | | | | 189,804 | |
Russian Federation | | | 7.50 | | | | 3-31-2030 | | | | 222,500 | | | | 243,533 | |
Russian Federation | | | 12.75 | | | | 6-24-2028 | | | | 750,000 | | | | 1,207,500 | |
Socialist Republic of Vietnam | | | 4.80 | | | | 11-19-2024 | | | | 250,000 | | | | 255,616 | |
Sultanate of Oman | | | 5.38 | | | | 3-8-2027 | | | | 697,000 | | | | 664,077 | |
Sultanate of Oman | | | 6.50 | | | | 3-8-2047 | | | | 400,000 | | | | 366,420 | |
Trinidad & Tobago Government | | | 4.38 | | | | 1-16-2024 | | | | 300,000 | | | | 295,284 | |
Ukraine Government | | | 7.75 | | | | 9-1-2020 | | | | 225,000 | | | | 223,657 | |
Ukraine Government | | | 7.75 | | | | 9-1-2023 | | | | 550,000 | | | | 533,280 | |
Ukraine Government | | | 7.75 | | | | 9-1-2025 | | | | 400,000 | | | | 375,542 | |
Ukraine Government | | | 7.75 | | | | 9-1-2026 | | | | 250,000 | | | | 229,855 | |
United Mexican States | | | 6.75 | | | | 9-27-2034 | | | | 850,000 | | | | 1,011,500 | |
ZAR Sovereign Capital Fund Proprietary Limited | | | 3.90 | | | | 6-24-2020 | | | | 200,000 | | | | 198,596 | |
| | | | |
Total Yankee Government Bonds (Cost $53,891,397) | | | | | | | | | | | | | | | 50,257,965 | |
| | | | | | | | | | | | | | | | |
The accompanying notes are an integral part of these financial statements.
| | | | |
| 64 | | Wells Fargo Funds | | Portfolio of investments—August 31, 2018 (unaudited) |
EMERGING MARKETS BOND PORTFOLIO
| | | | | | | | | | | | | | | | |
| Security name | | Yield | | | | | | Shares | | | Value | |
| | | | |
Short-Term Investments: 4.41% | | | | | | | | | | | | | | | | |
| | | | |
| Investment Companies: 4.41% | | | | | | | | | | | | | | | | |
Wells Fargo Government Money Market Fund Select Class (l)(u) | | | 1.87 | % | | | | | | | 2,807,900 | | | $ | 2,807,900 | |
| | | | | | | | | | | | | | | | |
| | | | |
Total Short-Term Investments (Cost $2,807,900) | | | | | | | | | | | | | | | 2,807,900 | |
| | | | | | | | | | | | | | | | |
| | | | | | | | |
| Total investments in securities (Cost $65,845,673) | | | 97.17 | % | | | 61,811,629 | |
Other assets and liabilities, net | | | 2.83 | | | | 1,797,331 | |
| | | | | | | | |
| Total net assets | | | 100.00 | % | | $ | 63,608,960 | |
| | | | | | | | |
| †† | On the last interest date, partial interest was paid. |
| ± | Variable rate investment. The rate shown is the rate in effect at period end. |
| † | Non-income-earning security |
| (l) | The issuer of the security is an affiliated person of the Portfolio as defined in the Investment Company Act of 1940. |
| (u) | The rate represents the 7-day annualized yield at period end. |
Investments in Affiliates
An affiliated investment is an investment in which the Portfolio owns at least 5% of the outstanding voting shares of the issuer or as a result of other relationships, such as the Portfolio and the issuer having the same adviser or investment manager. Transactions with issuers that were either affiliated persons of the Portfolio at the beginning of the period or the end of the period were as follows:
| | | | | | | | | | | | | | | | | | | | | | | | | | | | | | | | | | | | |
| | | Shares,
beginning of
period | | | Shares
purchased | | | Shares sold | | | Shares,
end of
period | | | Net
realized
gains
(losses) | | | Net
change in
unrealized
gains
(losses) | | | Income
from
affiliated
securities | | | Value, end
of period | | | % of
net
assets | |
Short-Term Investments | | | | | | | | | | | | | | | | | | | | | | | | | | | | | | | | | | | | |
Investment Companies | | | | | | | | | | | | | | | | | | | | | | | | | | | | | | | | | | | | |
Wells Fargo Government Money Market Fund Select Class | | | 0 | | | | 12,881,740 | | | | 10,073,840 | | | | 2,807,900 | | | $ | 0 | | | $ | 0 | | | $ | 9,735 | | | $ | 2,807,900 | | | | 4.41 | % |
The accompanying notes are an integral part of these financial statements.
| | | | | | |
| Portfolio of investments—August 31, 2018 (unaudited) | | Wells Fargo Funds | | | 65 | |
FACTOR ENHANCED EMERGING MARKETS PORTFOLIO
| | | | | | | | | | | | | | | | |
| Security name | | | | | | | | Shares | | | Value | |
| | | | |
Common Stocks: 88.68% | | | | | | | | | | | | | | | | |
| | | | |
| Brazil: 3.23% | | | | | | | | | | | | | | | | |
Arezzo Industria E Comercio SA (Consumer Discretionary, Textiles, Apparel & Luxury Goods) | | | | | | | | | | | 5,500 | | | $ | 53,432 | |
Atacadao Distribuicao Comercio e Industria Limitada (Consumer Staples, Food & Staples Retailing) | | | | | | | | | | | 61,700 | | | | 220,254 | |
B2W Companhia Digital (Consumer Discretionary, Internet & Direct Marketing Retail) † | | | | | | | | | | | 18,235 | | | | 118,281 | |
Banco de Brasil SA (Financials, Banks) | | | | | | | | | | | 108,200 | | | | 799,592 | |
Banco Santander (Brasil) SA (Financials, Banks) | | | | | | | | | | | 13,000 | | | | 60,993 | |
BK Brasil Operacao e Assessoria a Restaurantes SA (Consumer Discretionary, Hotels, Restaurants & Leisure) † | | | | | | | | | | | 26,400 | | | | 93,982 | |
BRF SA (Consumer Staples, Food Products) † | | | | | | | | | | | 51,400 | | | | 254,028 | |
CCR SA (Industrials, Transportation Infrastructure) | | | | | | | | | | | 126,882 | | | | 291,575 | |
Centrais Electricas Brasileiras SA (Utilities, Electric Utilities) † | | | | | | | | | | | 25,200 | | | | 97,877 | |
Companhia de Saneamento Basico do Estado de Sao Paulo SA (Utilities, Water Utilities) | | | | | | | | | | | 32,741 | | | | 196,136 | |
Companhia de Saneamento de Minas Gerais SA (Utilities, Water Utilities) | | | | | | | | | | | 5,959 | | | | 61,271 | |
Companhia Hering SA (Consumer Discretionary, Specialty Retail) | | | | | | | | | | | 17,310 | | | | 69,740 | |
CPFL Energias Renovaveis SA (Utilities, Independent Power & Renewable Electricity Producers) | | | | | | | | | | | 9,100 | | | | 36,976 | |
CVC Brasil Operadora e Agencia de Viagens SA (Consumer Discretionary, Hotels, Restaurants & Leisure) | | | | | | | | | | | 15,064 | | | | 157,367 | |
Duratex SA (Materials, Paper & Forest Products) | | | | | | | | | | | 35,700 | | | | 84,668 | |
Ecorodovias Infraestrutura Logistica SA (Industrials, Transportation Infrastructure) | | | | | | | | | | | 21,800 | | | | 38,001 | |
EDP Energias do Brasil SA (Utilities, Electric Utilities) | | | | | | | | | | | 27,247 | | | | 89,706 | |
Embraer SA (Industrials, Aerospace & Defense) | | | | | | | | | | | 77,630 | | | | 373,560 | |
Eneva SA (Utilities, Independent Power & Renewable Electricity Producers) † | | | | | | | | | | | 34,200 | | | | 108,567 | |
Engie Brasil Energia SA (Utilities, Independent Power & Renewable Electricity Producers) | | | | | | | | | | | 11,300 | | | | 102,372 | |
Equatorial Energia SA (Utilities, Electric Utilities) | | | | | | | | | | | 18,614 | | | | 260,489 | |
Estacio Participacoes SA (Consumer Discretionary, Diversified Consumer Services) | | | | | | | | | | | 30,233 | | | | 167,305 | |
Ez Tec Empreendimentos e Participacoes SA (Consumer Discretionary, Household Durables) | | | | | | | | | | | 16,200 | | | | 63,836 | |
Fibria Celulose SA (Materials, Paper & Forest Products) | | | | | | | | | | | 23,966 | | | | 465,893 | |
Fleury SA (Health Care, Health Care Providers & Services) | | | | | | | | | | | 22,505 | | | | 142,000 | |
Grendene SA (Consumer Discretionary, Textiles, Apparel & Luxury Goods) | | | | | | | | | | | 36,720 | | | | 64,549 | |
Hypermarcas SA (Health Care, Pharmaceuticals) | | | | | | | | | | | 44,236 | | | | 297,578 | |
Iguatemi Empresa de Shopping Centers SA (Real Estate, Real Estate Management & Development) | | | | | | | | | | | 10,980 | | | | 82,597 | |
Iochpe Maxion SA (Industrials, Machinery) | | | | | | | | | | | 13,800 | | | | 76,232 | |
IRB-Brasil Resseguros SA (Financials, Insurance) | | | | | | | | | | | 14,400 | | | | 210,144 | |
JBS SA (Consumer Staples, Food Products) | | | | | | | | | | | 105,529 | | | | 243,542 | |
Kroton Educacional SA (Consumer Discretionary, Diversified Consumer Services) | | | | | | | | | | | 139,569 | | | | 350,199 | |
Linx SA (Information Technology, Software) | | | | | | | | | | | 14,400 | | | | 60,809 | |
Localiza Rent A Car SA (Industrials, Road & Rail) | | | | | | | | | | | 53,721 | | | | 283,964 | |
Lojas Renner SA (Consumer Discretionary, Multiline Retail) | | | | | | | | | | | 75,733 | | | | 525,823 | |
M Dias Branco SA (Consumer Staples, Food Products) | | | | | | | | | | | 14,455 | | | | 150,154 | |
Magazine Luiza SA (Consumer Discretionary, Multiline Retail) | | | | | | | | | | | 8,300 | | | | 265,418 | |
MRV Engenharia e Participacoes SA (Consumer Discretionary, Household Durables) | | | | | | | | | | | 33,200 | | | | 105,964 | |
Natura Cosmeticos SA (Consumer Staples, Personal Products) | | | | | | | | | | | 26,276 | | | | 187,082 | |
Odontoprev SA (Health Care, Health Care Providers & Services) | | | | | | | | | | | 29,162 | | | | 93,792 | |
Petrobras Distribuidora SA (Consumer Discretionary, Specialty Retail) | | | | | | | | | | | 33,800 | | | | 164,141 | |
Porto Seguro SA (Financials, Insurance) | | | | | | | | | | | 9,668 | | | | 130,264 | |
Qualicorp SA (Health Care, Health Care Providers & Services) | | | | | | | | | | | 23,301 | | | | 90,158 | |
Raia Drogasil SA (Consumer Staples, Food & Staples Retailing) | | | | | | | | | | | 20,533 | | | | 388,167 | |
Sao Martinho SA (Consumer Staples, Food Products) | | | | | | | | | | | 18,611 | | | | 86,587 | |
Smiles Fidelidade SA (Consumer Discretionary, Media) | | | | | | | | | | | 6,400 | | | | 81,565 | |
Suzano Papel E Celulose SA (Materials, Paper & Forest Products) | | | | | | | | | | | 44,000 | | | | 511,070 | |
Tim Participacoes SA (Telecommunication Services, Wireless Telecommunication Services) | | | | | | | | | | | 91,514 | | | | 276,130 | |
The accompanying notes are an integral part of these financial statements.
| | | | |
| 66 | | Wells Fargo Funds | | Portfolio of investments—August 31, 2018 (unaudited) |
FACTOR ENHANCED EMERGING MARKETS PORTFOLIO
| | | | | | | | | | | | | | | | |
| Security name | | | | | | | | Shares | | | Value | |
| | | | |
| Brazil (continued) | | | | | | | | | | | | | | | | |
Totvs SA (Information Technology, Software) | | | | | | | | | | | 10,700 | | | $ | 69,983 | |
Ultrapar Participacoes SA (Energy, Oil, Gas & Consumable Fuels) | | | | | | | | | | | 43,998 | | | | 444,722 | |
WEG SA (Industrials, Machinery) | | | | | | | | | | | 72,733 | | | | 341,781 | |
| | | | |
| | | | | | | | | | | | | | | 9,990,316 | |
| | | | | | | | | | | | | | | | |
| | | | |
| Chile: 2.32% | | | | | | | | | | | | | | | | |
AES Gener SA (Utilities, Independent Power & Renewable Electricity Producers) | | | | | | | | | | | 196,985 | | | | 49,418 | |
Aguas Andinas SA Class A (Utilities, Water Utilities) | | | | | | | | | | | 166,200 | | | | 89,483 | |
Almendral SA (Telecommunication Services, Wireless Telecommunication Services) | | | | | | | | | | | 760,717 | | | | 50,378 | |
Antarchile SA (Industrials, Industrial Conglomerates) | | | | | | | | | | | 15,471 | | | | 242,860 | |
Banco de Chile (Financials, Banks) | | | | | | | | | | | 3,507,069 | | | | 502,168 | |
Banco de Credito e Inversiones (Financials, Banks) | | | | | | | | | | | 5,937 | | | | 379,759 | |
Banco Santander Chile (Financials, Banks) | | | | | | | | | | | 3,197,725 | | | | 242,870 | |
CAP SA (Materials, Metals & Mining) | | | | | | | | | | | 7,286 | | | | 65,471 | |
Cencosud SA (Consumer Staples, Food & Staples Retailing) | | | | | | | | | | | 140,053 | | | | 329,984 | |
Colbun SA (Utilities, Independent Power & Renewable Electricity Producers) | | | | | | | | | | | 591,494 | | | | 124,351 | |
Compania Cervecerias Unidas SA (Consumer Staples, Beverages) | | | | | | | | | | | 16,174 | | | | 213,076 | |
Empresa Nacional de Telecomunicaciones SA (Telecommunication Services, Wireless Telecommunication Services) | | | | | | | | | | | 16,944 | | | | 139,204 | |
Empresas CMPC SA (Materials, Paper & Forest Products) | | | | | | | | | | | 131,275 | | | | 512,485 | |
Empresas Copec SA (Energy, Oil, Gas & Consumable Fuels) | | | | | | | | | | | 54,555 | | | | 824,378 | |
Enel Americas SA (Utilities, Electric Utilities) | | | | | | | | | | | 2,159,386 | | | | 320,918 | |
Enel Chile SA (Utilities, Electric Utilities) | | | | | | | | | | | 1,504,637 | | | | 147,015 | |
Engie Energia Chile SA (Utilities, Electric Utilities) | | | | | | | | | | | 39,708 | | | | 72,533 | |
Grupo Security SA (Financials, Diversified Financial Services) | | | | | | | | | | | 265,105 | | | | 113,793 | |
Inversiones Aguas Metropolitanas SA (Utilities, Water Utilities) | | | | | | | | | | | 24,491 | | | | 35,679 | |
Itau CorpBanca SA (Financials, Banks) | | | | | | | | | | | 21,575,733 | | | | 204,164 | |
LANTAM Airlines Group SA (Industrials, Airlines) | | | | | | | | | | | 44,045 | | | | 410,652 | |
Molibdenos Y Metales SA (Materials, Metals & Mining) | | | | | | | | | | | 2,467 | | | | 29,899 | |
Parque Arauco SA (Real Estate, Real Estate Management & Development) | | | | | | | | | | | 65,742 | | | | 165,217 | |
Quinenco SA (Industrials, Industrial Conglomerates) | | | | | | | | | | | 43,322 | | | | 122,964 | |
Ripley Corporation SA (Consumer Discretionary, Multiline Retail) | | | | | | | | | | | 118,775 | | | | 101,067 | |
SACI Falabella (Consumer Discretionary, Multiline Retail) | | | | | | | | | | | 129,367 | | | | 1,029,622 | |
Salfacorp SA (Industrials, Construction & Engineering) | | | | | | | | | | | 47,798 | | | | 72,578 | |
Sigdo Koppers SA (Industrials, Industrial Conglomerates) | | | | | | | | | | | 59,450 | | | | 94,195 | |
SMU SA (Consumer Staples, Food & Staples Retailing) † | | | | | | | | | | | 273,610 | | | | 76,669 | |
Sociedad Matriz del Banco de Chile SA Class B (Financials, Banks) | | | | | | | | | | | 399,807 | | | | 183,297 | |
Sociedad Matriz SAAM SA (Industrials, Transportation Infrastructure) | | | | | | | | | | | 603,811 | | | | 54,736 | |
Sonda SA (Information Technology, IT Services) | | | | | | | | | | | 27,589 | | | | 36,630 | |
Vina Concha y Toro SA (Consumer Staples, Beverages) | | | | | | | | | | | 66,930 | | | | 132,559 | |
| | | | |
| | | | | | | | | | | | | | | 7,170,072 | |
| | | | | | | | | | | | | | | | |
| | | | |
| China: 8.34% | | | | | | | | | | | | | | | | |
Agricultural Bank of China H Shares (Financials, Banks) | | | | | | | | | | | 2,877,000 | | | | 1,392,910 | |
Air China H Shares (Industrials, Airlines) | | | | | | | | | | | 224,000 | | | | 210,051 | |
Aluminum Corporation of China Limited H Shares (Materials, Metals & Mining) † | | | | | | | | | | | 430,000 | | | | 181,889 | |
Anhui Conch Cement Company Limited H Shares (Materials, Construction Materials) | | | | | | | | | | | 122,000 | | | | 742,997 | |
Anhui Gujing Distillery Company Class B (Consumer Staples, Beverages) | | | | | | | | | | | 11,000 | | | | 68,617 | |
BAIC Motor Corporation Limited H Shares (Consumer Discretionary, Auto Components) 144A | | | | | | | | | | | 173,500 | | | | 145,896 | |
Bank of Communications Limited H Shares (Financials, Banks) | | | | | | | | | | | 846,000 | | | | 611,157 | |
The accompanying notes are an integral part of these financial statements.
| | | | | | |
| Portfolio of investments—August 31, 2018 (unaudited) | | Wells Fargo Funds | | | 67 | |
FACTOR ENHANCED EMERGING MARKETS PORTFOLIO
| | | | | | | | | | | | | | | | |
| Security name | | | | | | | | Shares | | | Value | |
| | | | |
| China (continued) | | | | | | | | | | | | | | | | |
Bank of Jinzhou Company Limited H Shares (Financials, Banks) | | | | | | | | | | | 59,000 | | | $ | 50,290 | |
BBMG Corporation (Materials, Construction Materials) | | | | | | | | | | | 248,000 | | | | 92,264 | |
Beijing Capital International Airport Company Limited H Shares (Industrials, Transportation Infrastructure) | | | | | | | | | | | 158,000 | | | | 168,292 | |
Boe Technology Group Company Limited (Information Technology, Technology Hardware, Storage & Peripherals) | | | | | | | | | | | 97,300 | | | | 37,934 | |
CGN Power Company Limited H Shares (Utilities, Independent Power & Renewable Electricity Producers) | | | | | | | | | | | 949,000 | | | | 224,894 | |
China Cinda Asset Management Company Limited H Shares (Financials, Capital Markets) | | | | | | | | | | | 944,000 | | | | 244,156 | |
China CITIC Bank H Shares (Financials, Banks) | | | | | | | | | | | 999,351 | | | | 623,898 | |
China Communications Construction Company Limited H Shares (Industrials, Construction & Engineering) | | | | | | | | | | | 491,000 | | | | 487,325 | |
China Communications Services Corporation Limited H Shares (Telecommunication Services, Diversified Telecommunication Services) | | | | | | | | | | | 260,000 | | | | 215,321 | |
China Cosco Holdings Company Limited (Industrials, Marine) | | | | | | | | | | | 276,000 | | | | 114,989 | |
China Eastern Airlines Company H Shares (Industrials, Airlines) | | | | | | | | | | | 184,000 | | | | 117,685 | |
China Energy Engineering Corporation Limited H Shares (Industrials, Construction & Engineering) | | | | | | | | | | | 802,000 | | | | 98,095 | |
China Everbright Bank Company Limited H Shares (Financials, Banks) | | | | | | | | | | | 530,000 | | | | 221,488 | |
China International Capital Corporation Limited H Shares (Financials, Diversified Financial Services) | | | | | | | | | | | 112,800 | | | | 206,378 | |
China Longyuan Power Group Corporation H Shares (Utilities, Independent Power & Renewable Electricity Producers) | | | | | | | | | | | 296,000 | | | | 249,283 | |
China Mengniu Dairy Company Limited (Consumer Staples, Food Products) | | | | | | | | | | | 274,000 | | | | 790,712 | |
China Merchants Bank Company Limited H Shares (Financials, Banks) | | | | | | | | | | | 397,500 | | | | 1,524,415 | |
China Merchants Securities H Shares (Financials, Capital Markets) | | | | | | | | | | | 55,200 | | | | 63,930 | |
China Minsheng Banking Corporation Limited H Shares (Financials, Banks) | | | | | | | | | | | 670,700 | | | | 480,246 | |
China National Building Material Company Limited H Shares (Materials, Construction Materials) | | | | | | | | | | | 404,000 | | | | 377,813 | |
China Oilfield Services Limited H Shares (Energy, Energy Equipment & Services) | | | | | | | | | | | 212,000 | | | | 187,994 | |
China Petroleum & Chemical Corporation H Shares (Energy, Oil, Gas & Consumable Fuels) | | | | | | | | | | | 2,616,000 | | | | 2,629,749 | |
China Railway Construction Corporation Limited H Shares (Industrials, Construction & Engineering) | | | | | | | | | | | 210,000 | | | | 253,913 | |
China Railway Group Limited H Shares (Industrials, Construction & Engineering) | | | | | | | | | | | 410,000 | | | | 354,171 | |
China Railway Signal & Communication Corporation Limited H Shares (Information Technology, Electronic Equipment, Instruments & Components) 144A | | | | | | | | | | | 155,000 | | | | 109,603 | |
China Reinsurance Group Corporation H Shares (Financials, Insurance) | | | | | | | | | | | 749,000 | | | | 147,915 | |
China Resources Cement Holdings Limited (Materials, Construction Materials) | | | | | | | | | | | 178,000 | | | | 207,738 | |
China Resources Gas Group Limited (Utilities, Gas Utilities) | | | | | | | | | | | 76,000 | | | | 346,170 | |
China Southern Airlines Company H Shares (Industrials, Airlines) | | | | | | | | | | | 202,000 | | | | 133,573 | |
China Telecom Corporation Limited H Shares (Telecommunication Services, Diversified Telecommunication Services) | | | | | | | | | | | 1,426,000 | | | | 670,418 | |
China Vanke Company Limited H Shares (Real Estate, Real Estate Management & Development) | | | | | | | | | | | 142,300 | | | | 493,143 | |
Chongqing Changchun Automobile Class B (Consumer Discretionary, Automobiles) | | | | | | | | | | | 78,600 | | | | 68,899 | |
Chongqing Rural Commercial Bank (Financials, Banks) | | | | | | | | | | | 277,000 | | | | 149,286 | |
CITIC Securities Company Limited H Shares (Financials, Capital Markets) | | | | | | | | | | | 221,500 | | | | 396,788 | |
COSCO Shipping Development Company Limited H Shares (Industrials, Marine) † | | | | | | | | | | | 363,000 | | | | 52,724 | |
COSCO Shipping Ports Limited (Industrials, Transportation Infrastructure) | | | | | | | | | | | 178,000 | | | | 188,461 | |
CRRC Corporation Limited H Shares (Industrials, Machinery) | | | | | | | | | | | 469,000 | | | | 388,406 | |
CSC Financial Company Limited H Shares (Financials, Capital Markets) | | | | | | | | | | | 147,500 | | | | 89,454 | |
CSG Holding Company Limited Class B (Materials, Construction Materials) | | | | | | | | | | | 156,200 | | | | 60,102 | |
Datang International Power Generation Company Limited (Utilities, Independent Power & Renewable Electricity Producers) | | | | | | | | | | | 288,000 | | | | 73,754 | |
Dongfeng Motor Group Company Limited H Shares (Consumer Discretionary, Automobiles) | | | | | | | | | | | 284,000 | | | | 317,335 | |
Fuyao Glass Industry Group Company Limited H Shares (Consumer Discretionary, Auto Components) | | | | | | | | | | | 50,400 | | | | 185,900 | |
Great Wall Motor Company Limited H Shares (Consumer Discretionary, Automobiles) | | | | | | | | | | | 314,500 | | | | 193,538 | |
Guangzhou Automobile Group Company Limited H Shares (Consumer Discretionary, Automobiles) | | | | | | | | | | | 296,400 | | | | 321,749 | |
Guangzhou R&F Properties Company Limited H Shares (Real Estate, Real Estate Management & Development) | | | | | | | | | | | 108,800 | | | | 219,575 | |
Guotai Junan Securities Company Limited H Shares (Financials, Capital Markets) | | | | | | | | | | | 62,800 | | | | 129,621 | |
Huaneng Power International Incorporated H Shares (Utilities, Independent Power & Renewable Electricity Producers) | | | | | | | | | | | 404,000 | | | | 259,425 | |
The accompanying notes are an integral part of these financial statements.
| | | | |
| 68 | | Wells Fargo Funds | | Portfolio of investments—August 31, 2018 (unaudited) |
FACTOR ENHANCED EMERGING MARKETS PORTFOLIO
| | | | | | | | | | | | | | | | |
| Security name | | | | | | | | Shares | | | Value | |
| | | | |
| China (continued) | | | | | | | | | | | | | | | | |
Huaneng Renewables Corporation Limited H Shares (Utilities, Independent Power & Renewable Electricity Producers) | | | | | | | | | | | 468,000 | | | $ | 149,665 | |
Inner Mongolia Yitai Coal Company Limited Class B (Energy, Oil, Gas & Consumable Fuels) | | | | | | | | | | | 141,400 | | | | 170,104 | |
Jiangsu Express Company Limited H Shares (Industrials, Transportation Infrastructure) | | | | | | | | | | | 130,000 | | | | 164,306 | |
Jiangxi Copper Company Limited H Shares (Materials, Metals & Mining) | | | | | | | | | | | 135,000 | | | | 159,962 | |
Lao Feng Xiang Company Limited Class B (Consumer Discretionary, Textiles, Apparel & Luxury Goods) | | | | | | | | | | | 30,412 | | | | 93,791 | |
Legend Holdings Corporation H Shares (Financials, Diversified Financial Services) | | | | | | | | | | | 34,700 | | | | 107,432 | |
Metallurgical Corporation of China Limited H Shares (Industrials, Construction & Engineering) | | | | | | | | | | | 335,000 | | | | 91,766 | |
Orient Securities Company Limited of China H Shares (Financials, Diversified Financial Services) | | | | | | | | | | | 86,800 | | | | 58,503 | |
PetroChina Company Limited H Shares (Energy, Oil, Gas & Consumable Fuels) | | | | | | | | | | | 2,272,692 | | | | 1,691,036 | |
PICC Property & Casualty Company Limited H Shares (Financials, Insurance) | | | | | | | | | | | 686,000 | | | | 772,638 | |
Postal Savings Bank of China Company Limited H Shares (Financials, Banks) | | | | | | | | | | | 658,000 | | | | 387,318 | |
Shandong Weigao Group Medical Polymer Company Limited H Shares (Health Care, Health Care Equipment & Supplies) | | | | | | | | | | | 172,000 | | | | 162,823 | |
Shanghai Electric Group Company Limited H Shares (Industrials, Electrical Equipment) | | | | | | | | | | | 328,000 | | | | 102,804 | |
Shanghai Fosun Pharmaceutical Company Limited H Shares (Health Care, Pharmaceuticals) | | | | | | | | | | | 48,500 | | | | 195,885 | |
Shanghai Lujiazui Finance & Trade Zone Development Company Limited (Real Estate, Real Estate Management & Development) | | | | | | | | | | | 113,800 | | | | 153,516 | |
Shanghai Pharmaceuticals Holding Company Limited H Shares (Health Care, Health Care Providers & Services) | | | | | | | | | | | 81,600 | | | | 214,169 | |
Shanghai Zhenhua Heavy Industry Company Limited Class B (Industrials, Machinery) | | | | | | | | | | | 9,360 | | | | 3,688 | |
Shenzhen International Holdings Limited H Shares (Industrials, Transportation Infrastructure) | | | | | | | | | | | 109,500 | | | | 205,363 | |
Sinopec Engineering Group H Shares (Industrials, Construction & Engineering) | | | | | | | | | | | 158,000 | | | | 164,668 | |
Sinopec Shanghai Petrochemical Company Limited (Materials, Chemicals) | | | | | | | | | | | 338,000 | | | | 198,526 | |
Sinopharm Group Company Limited H Shares (Health Care, Health Care Providers & Services) | | | | | | | | | | | 114,400 | | | | 569,176 | |
Sinotrans Limited H Shares (Industrials, Air Freight & Logistics) | | | | | | | | | | | 234,000 | | | | 98,087 | |
Tong Ren Tang Technologies Company Limited H Shares (Health Care, Pharmaceuticals) | | | | | | | | | | | 76,000 | | | | 110,193 | |
Tsingtao Brewery Company Limited H Shares (Consumer Staples, Beverages) | | | | | | | | | | | 68,000 | | | | 323,160 | |
Weichai Power Company Limited (Industrials, Machinery) | | | | | | | | | | | 214,000 | | | | 226,849 | |
Yantai Changyu Pioneer Wine Company Limited Class B (Consumer Staples, Beverages) | | | | | | | | | | | 37,500 | | | | 96,082 | |
Yanzhou Coal Mining Company Limited (Energy, Oil, Gas & Consumable Fuels) | | | | | | | | | | | 194,000 | | | | 224,186 | |
Zhaojin Mining Industry Company Limited (Materials, Metals & Mining) | | | | | | | | | | | 136,500 | | | | 106,435 | |
Zhejiang Expressway Company Limited H Shares (Industrials, Transportation Infrastructure) | | | | | | | | | | | 148,000 | | | | 117,476 | |
Zijin Mining Group Company Limited H Shares (Materials, Metals & Mining) | | | | | | | | | | | 612,000 | | | | 228,464 | |
ZTE Corporation H Shares (Information Technology, Communications Equipment) † | | | | | | | | | | | 55,800 | | | | 108,347 | |
| | | | |
| | | | | | | | | | | | | | | 25,828,747 | |
| | | | | | | | | | | | | | | | |
| | | | |
| Colombia: 0.75% | | | | | | | | | | | | | | | | |
Almacenes Exito SA (Consumer Staples, Food & Staples Retailing) | | | | | | | | | | | 26,484 | | | | 137,891 | |
Banco De Bogota SA (Financials, Banks) | | | | | | | | | | | 7,331 | | | | 166,058 | |
Cementos Argos SA (Materials, Construction Materials) | | | | | | | | | | | 61,317 | | | | 181,567 | |
Corporacion Financiera Colombiana SA (Financials, Diversified Financial Services) | | | | | | | | | | | 13,167 | | | | 104,518 | |
Empresa de Energia de Bogota SA (Utilities, Gas Utilities) | | | | | | | | | | | 225,222 | | | | 151,200 | |
Grupo Argos SA (Materials, Construction Materials) | | | | | | | | | | | 42,901 | | | | 268,998 | |
Grupo de Inversiones Suramericana SA (Financials, Diversified Financial Services) | | | | | | | | | | | 36,998 | | | | 437,250 | |
Grupo Nutresa SA (Consumer Staples, Food Products) | | | | | | | | | | | 34,073 | | | | 298,432 | |
Interconexion Electrica SA (Utilities, Electric Utilities) | | | | | | | | | | | 55,544 | | | | 246,526 | |
Nexteer Automotive Group Limited (Consumer Discretionary, Auto Components) | | | | | | | | | | | 85,000 | | | | 143,169 | |
Silergy Corporation (Information Technology, Semiconductors & Semiconductor Equipment) | | | | | | | | | | | 9,000 | | | | 177,275 | |
| | | | |
| | | | | | | | | | | | | | | 2,312,884 | |
| | | | | | | | | | | | | | | | |
The accompanying notes are an integral part of these financial statements.
| | | | | | |
| Portfolio of investments—August 31, 2018 (unaudited) | | Wells Fargo Funds | | | 69 | |
FACTOR ENHANCED EMERGING MARKETS PORTFOLIO
| | | | | | | | | | | | | | | | |
| Security name | | | | | | | | Shares | | | Value | |
| | | | |
| Egypt: 0.26% | | | | | | | | | | | | | | | | |
Commercial International Bank ADR (Financials, Banks) | | | | | | | | | | | 173,158 | | | $ | 810,726 | |
| | | | | | | | | | | | | | | | |
| | | | |
| Greece: 0.20% | | | | | | | | | | | | | | | | |
FF Group (Consumer Discretionary, Specialty Retail) †‡ | | | | | | | | | | | 3,820 | | | | 21,284 | |
Hellenic Petroleum SA (Energy, Oil, Gas & Consumable Fuels) | | | | | | | | | | | 13,385 | | | | 113,417 | |
Motor Oil (Hellas) Corinth Refineries SA (Energy, Oil, Gas & Consumable Fuels) | | | | | | | | | | | 8,607 | | | | 202,809 | |
Mytilineos Holdings SA (Industrials, Industrial Conglomerates) | | | | | | | | | | | 13,838 | | | | 138,619 | |
Titan Cement Company SA (Materials, Construction Materials) | | | | | | | | | | | 5,874 | | | | 135,001 | |
| | | | |
| | | | | | | | | | | | | | | 611,130 | |
| | | | | | | | | | | | | | | | |
| | | | |
| Hong Kong: 1.05% | | | | | | | | | | | | | | | | |
Beijing Enterprises Holdings Limited (Utilities, Gas Utilities) | | | | | | | | | | | 45,000 | | | | 215,862 | |
China Agri-Industries Holdings Limited (Consumer Staples, Food Products) | | | | | | | | | | | 299,000 | | | | 118,857 | |
China Resources Beer Holdings Company Limited (Consumer Staples, Beverages) | | | | | | | | | | | 166,000 | | | | 706,405 | |
China Resources Pharmaceutical Group Limited (Health Care, Pharmaceuticals) | | | | | | | | | | | 192,000 | | | | 307,249 | |
China Resources Power Holdings Company (Utilities, Independent Power & Renewable Electricity Producers) | | | | | | | | | | | 170,000 | | | | 306,265 | |
China Travel International Investment Hong Kong Limited (Holding & Other Investment Offices, Hotels, Restaurants & Leisure) | | | | | | | | | | | 238,000 | | | | 77,324 | |
Far East Horizon Limited (Financials, Diversified Financial Services) | | | | | | | | | | | 274,000 | | | | 259,381 | |
Guangdong Investment Limited (Utilities, Water Utilities) | | | | | | | | | | | 258,000 | | | | 457,571 | |
Lenovo Group Limited (Information Technology, Technology Hardware, Storage & Peripherals) | | | | | | | | | | | 746,000 | | | | 486,641 | |
Poly Property Group Company Limited (Real Estate, Real Estate Management & Development) | | | | | | | | | | | 227,000 | | | | 86,476 | |
Sinotruk Hong Kong Limited (Industrials, Machinery) | | | | | | | | | | | 73,500 | | | | 109,753 | |
Yuexiu Property Company Limited (Real Estate, Real Estate Management & Development) | | | | | | | | | | | 730,000 | | | | 132,072 | |
| | | | |
| | | | | | | | | | | | | | | 3,263,856 | |
| | | | | | | | | | | | | | | | |
| | | | |
| India: 14.68% | | | | | | | | | | | | | | | | |
3M India Limited (Industrials, Industrial Conglomerates) † | | | | | | | | | | | 335 | | | | 122,544 | |
Aarti Industries Limited (Materials, Chemicals) | | | | | | | | | | | 8,064 | | | | 156,331 | |
Aia Engineering Limited (Industrials, Machinery) | | | | | | | | | | | 4,640 | | | | 115,058 | |
Ajanta Pharma Limited (Health Care, Pharmaceuticals) † | | | | | | | | | | | 5,398 | | | | 96,713 | |
Alkem Laboratories Limited (Health Care, Pharmaceuticals) | | | | | | | | | | | 6,657 | | | | 198,482 | |
Amara Raja Batteries Limited (Information Technology, Electrical Equipment) | | | | | | | | | | | 9,622 | | | | 114,757 | |
Apollo Hospitals Enterprise Limited (Health Care, Health Care Providers & Services) | | | | | | | | | | | 11,813 | | | | 196,983 | |
Apollo Tyres Limited (Consumer Discretionary, Auto Components) | | | | | | | | | | | 47,110 | | | | 166,983 | |
Arvind Limited (Consumer Discretionary, Textiles, Apparel & Luxury Goods) | | | | | | | | | | | 18,142 | | | | 102,123 | |
Asahi India Glass Limited (Consumer Discretionary, Auto Components) | | | | | | | | | | | 14,905 | | | | 71,671 | |
Ashok Leyland Limited (Industrials, Machinery) | | | | | | | | | | | 198,089 | | | | 360,422 | |
Associated Cement Companies Limited (Materials, Construction Materials) | | | | | | | | | | | 8,531 | | | | 197,109 | |
Astral Poly Technik Limited (Industrials, Building Products) | | | | | | | | | | | 6,398 | | | | 99,804 | |
Atul Limited (Materials, Chemicals) | | | | | | | | | | | 2,152 | | | | 98,072 | |
Aurobindo Pharma Limited (Health Care, Pharmaceuticals) | | | | | | | | | | | 43,488 | | | | 437,018 | |
Bajaj Auto Limited (Financials, Diversified Financial Services) | | | | | | | | | | | 6,319 | | | | 277,724 | |
Bajaj Finserv Limited (Financials, Insurance) | | | | | | | | | | | 7,149 | | | | 680,143 | |
Balkrishna Industries Limited (Consumer Discretionary, Auto Components) | | | | | | | | | | | 8,692 | | | | 166,680 | |
Bata India Limited (Consumer Discretionary, Textiles, Apparel & Luxury Goods) | | | | | | | | | | | 7,165 | | | | 109,345 | |
Bayer Cropscience Limited (Materials, Chemicals) | | | | | | | | | | | 1,798 | | | | 111,629 | |
Berger Paints India Limited (Materials, Chemicals) | | | | | | | | | | | 34,191 | | | | 161,347 | |
Bharat Financial Inclusion Limited (Financials, Consumer Finance) † | | | | | | | | | | | 15,151 | | | | 248,350 | |
The accompanying notes are an integral part of these financial statements.
| | | | |
| 70 | | Wells Fargo Funds | | Portfolio of investments—August 31, 2018 (unaudited) |
FACTOR ENHANCED EMERGING MARKETS PORTFOLIO
| | | | | | | | | | | | | | | | |
| Security name | | | | | | | | Shares | | | Value | |
| | | | |
| India (continued) | | | | | | | | | | | | | | | | |
Bharat Petroleum Corporation Limited (Energy, Oil, Gas & Consumable Fuels) | | | | | | | | | | | 80,627 | | | $ | 411,625 | |
Biocon Limited (Health Care, Biotechnology) | | | | | | | | | | | 27,452 | | | | 241,519 | |
Blue Star Limited (Industrials, Building Products) | | | | | | | | | | | 9,307 | | | | 88,666 | |
Britannia Industries Limited (Consumer Staples, Food Products) | | | | | | | | | | | 6,745 | | | | 640,657 | |
Cadila Healthcare Limited (Health Care, Pharmaceuticals) | | | | | | | | | | | 29,806 | | | | 169,251 | |
Capital First Limited (Financials, Consumer Finance) | | | | | | | | | | | 9,653 | | | | 87,689 | |
Carborundum Universal Limited (Industrials, Machinery) | | | | | | | | | | | 18,231 | | | | 95,388 | |
Care Ratings Limited (Financials, Capital Markets) | | | | | | | | | | | 3,396 | | | | 62,063 | |
Castrol India Limited (Materials, Chemicals) | | | | | | | | | | | 75,206 | | | | 168,382 | |
Ceat Limited (Consumer Discretionary, Auto Components) | | | | | | | | | | | 4,020 | | | | 78,579 | |
Century Plyboards India Limited (Materials, Paper & Forest Products) † | | | | | | | | | | | 14,822 | | | | 46,675 | |
CESC Limited (Utilities, Electric Utilities) | | | | | | | | | | | 13,475 | | | | 189,207 | |
Chambal Fertilisers and Chemicals Limited (Materials, Chemicals) | | | | | | | | | | | 42,170 | | | | 98,192 | |
Cholamandalam Investment (Financials, Consumer Finance) | | | | | | | | | | | 8,545 | | | | 177,842 | |
Cipla Limited India (Health Care, Pharmaceuticals) | | | | | | | | | | | 63,592 | | | | 593,679 | |
City Union Bank Limited (Financials, Banks) | | | | | | | | | | | 76,146 | | | | 217,456 | |
Colgate-Palmolive Company India Limited (Consumer Staples, Personal Products) | | | | | | | | | | | 15,475 | | | | 255,058 | |
Container Corporation of India Limited (Industrials, Transportation Infrastructure) | | | | | | | | | | | 22,805 | | | | 209,590 | |
Coromandel International Limited (Materials, Chemicals) | | | | | | | | | | | 12,967 | | | | 76,841 | |
Crisil Limited (Financials, Capital Markets) | | | | | | | | | | | 2,623 | | | | 65,283 | |
Crompton Greaves Consumer Electricals Limited (Consumer Discretionary, Household Durables) | | | | | | | | | | | 44,835 | | | | 158,318 | |
Cyient Limited (Information Technology, Software) | | | | | | | | | | | 10,575 | | | | 108,678 | |
Dabur India Limited (Consumer Staples, Personal Products) | | | | | | | | | | | 77,354 | | | | 522,137 | |
DCB Bank Limited (Financials, Banks) | | | | | | | | | | | 34,806 | | | | 87,694 | |
Dewan Housing Finance Corporation (Financials, Thrifts & Mortgage Finance) | | | | | | | | | | | 21,358 | | | | 201,049 | |
Dish TV India Limited (Consumer Discretionary, Media) † | | | | | | | | | | | 139,903 | | | | 141,133 | |
Divi’s Laboratories Limited (Health Care, Life Sciences Tools & Services) | | | | | | | | | | | 13,797 | | | | 254,032 | |
Doctor Reddy’s Laboratories Limited ADR (Health Care, Pharmaceuticals) | | | | | | | | | | | 11,840 | | | | 416,058 | |
Doctor Reddys Laboratories Limited (Health Care, Pharmaceuticals) | | | | | | | | | | | 1,909 | | | | 67,073 | |
Edelweiss Financial Services Limited (Financials, Capital Markets) | | | | | | | | | | | 78,146 | | | | 308,777 | |
Endurance Technologies Limited (Consumer Discretionary, Auto Components) 144A | | | | | | | | | | | 3,074 | | | | 65,774 | |
Equitas Holdings Limited (Financials, Consumer Finance) † | | | | | | | | | | | 35,488 | | | | 79,306 | |
Eris Lifesciences Limited (Health Care, Pharmaceuticals) 144A† | | | | | | | | | | | 7,204 | | | | 73,725 | |
Escorts Limited (Industrials, Machinery) | | | | | | | | | | | 8,150 | | | | 99,941 | |
Exide Industries Limited (Consumer Discretionary, Auto Components) | | | | | | | | | | | 45,838 | | | | 184,254 | |
Fertilisers & Chemicals Travancore Limited (Materials, Chemicals) † | | | | | | | | | | | 74,029 | | | | 45,977 | |
Finolex Cables Limited (Industrials, Electrical Equipment) | | | | | | | | | | | 10,438 | | | | 80,574 | |
Finolex Industries Limited (Materials, Chemicals) | | | | | | | | | | | 7,393 | | | | 65,840 | |
Fortis Healthcare Limited (Health Care, Health Care Providers & Services) † | | | | | | | | | | | 36,662 | | | | 75,778 | |
Future Consumer Limited (Consumer Staples, Food Products) † | | | | | | | | | | | 116,752 | | | | 86,997 | |
Future Retail Limited (Consumer Discretionary, Multiline Retail) | | | | | | | | | | | 25,247 | | | | 198,199 | |
Gail India Limited (Utilities, Gas Utilities) | | | | | | | | | | | 100,872 | | | | 529,346 | |
Gillette India Limited (Consumer Staples, Personal Products) | | | | | | | | | | | 1,137 | | | | 106,165 | |
GlaxoSmithKline Consumer Healthcare Limited (Consumer Staples, Food Products) | | | | | | | | | | | 1,332 | | | | 144,709 | |
GlaxoSmithKline Pharmaceuticals Limited (Health Care, Pharmaceuticals) | | | | | | | | | | | 2,441 | | | | 117,990 | |
Glenmark Pharmaceuticals Limited (Health Care, Pharmaceuticals) | | | | | | | | | | | 18,091 | | | | 169,786 | |
Godrej Properties Limited (Real Estate, Real Estate Management & Development) | | | | | | | | | | | 9,264 | | | | 89,824 | |
Graphite India Limited (Industrials, Electrical Equipment) | | | | | | | | | | | 8,230 | | | | 117,544 | |
Gruh Finance Limited (Financials, Thrifts & Mortgage Finance) | | | | | | | | | | | 34,461 | | | | 162,961 | |
Gujarat Fluorochemicals Limited (Materials, Chemicals) | | | | | | | | | | | 4,501 | | | | 49,096 | |
The accompanying notes are an integral part of these financial statements.
| | | | | | |
| Portfolio of investments—August 31, 2018 (unaudited) | | Wells Fargo Funds | | | 71 | |
FACTOR ENHANCED EMERGING MARKETS PORTFOLIO
| | | | | | | | | | | | | | | | |
| Security name | | | | | | | | Shares | | | Value | |
| | | | |
| India (continued) | | | | | | | | | | | | | | | | |
Gujarat Gas Limited (Utilities, Gas Utilities) | | | | | | | | | | | 12,300 | | | $ | 134,305 | |
Gujarat Narmada Valley Fertilizers Company Limited (Materials, Chemicals) | | | | | | | | | | | 10,105 | | | | 55,813 | |
Gujarat Piavav Port Limited (Industrials, Transportation Infrastructure) | | | | | | | | | | | 29,453 | | | | 46,136 | |
Gujarat State Fertilizers & Chemicals Limited (Materials, Chemicals) | | | | | | | | | | | 29,506 | | | | 49,984 | |
Hatsun Agro Products Limited (Consumer Staples, Food Products) | | | | | | | | | | | 6,602 | | | | 72,958 | |
HCL Technologies Limited (Information Technology, IT Services) | | | | | | | | | | | 55,862 | | | | 824,191 | |
HEG Limited (Industrials, Electrical Equipment) | | | | | | | | | | | 2,569 | | | | 153,592 | |
Hero Honda Motors Limited (Consumer Discretionary, Automobiles) | | | | | | | | | | | 13,500 | | | | 619,324 | |
Hexaware Technologies Limited (Information Technology, IT Services) | | | | | | | | | | | 27,256 | | | | 168,625 | |
Hindustan Petroleum Corporation Limited (Energy, Oil, Gas & Consumable Fuels) | | | | | | | | | | | 81,349 | | | | 291,096 | |
Hindustan Unilever Limited (Consumer Staples, Household Products) | | | | | | | | | | | 94,756 | | | | 2,378,177 | |
Honeywell Automation India Limited (Information Technology, Electronic Equipment, Instruments & Components) | | | | | | | | | | | 256 | | | | 81,071 | |
India Cements Limited (Materials, Construction Materials) | | | | | | | | | | | 27,590 | | | | 49,169 | |
India Infoline Limited (Financials, Capital Markets) | | | | | | | | | | | 20,021 | | | | 204,525 | |
Indiabulls Housing Finance Limited (Financials, Thrifts & Mortgage Finance) | | | | | | | | | | | 39,851 | | | | 707,529 | |
Indiabulls Real Estate Limited (Financials, Real Estate Management & Development) † | | | | | | | | | | | 34,687 | | | | 75,486 | |
Indian Energy Exchange Limited (Financials, Capital Markets) | | | | | | | | | | | 3,374 | | | | 82,877 | |
Indian Hotels Company Limited (Consumer Discretionary, Hotels, Restaurants & Leisure) | | | | | | | | | | | 81,357 | | | | 157,435 | |
Indian Oil Corporation Limited (Energy, Oil, Gas & Consumable Fuels) | | | | | | | | | | | 294,534 | | | | 645,949 | |
Indraprastha Gas Limited (Utilities, Gas Utilities) | | | | | | | | | | | 33,978 | | | | 139,119 | |
Info Edge India Limited (Information Technology, Internet Software & Services) | | | | | | | | | | | 6,404 | | | | 147,897 | |
Infosys Limited (Information Technology, IT Services) | | | | | | | | | | | 23,076 | | | | 468,865 | |
Infosys Limited ADR (Information Technology, IT Services) | | | | | | | | | | | 196,542 | | | | 4,082,177 | |
Infrastructure Development Finance Company Limited (Financials, Diversified Financial Services) | | | | | | | | | | | 137,555 | | | | 102,110 | |
Interglobe Aviation Limited (Industrials, Airlines) | | | | | | | | | | | 11,550 | | | | 151,259 | |
Ipca Laboratories Limited (Health Care, Pharmaceuticals) | | | | | | | | | | | 10,248 | | | | 111,487 | |
Jain Irrigation Systems Limited (Industrials, Machinery) | | | | | | | | | | | 45,127 | | | | 54,241 | |
JM Financial Limited (Financials, Capital Markets) | | | | | | | | | | | 78,077 | | | | 132,539 | |
JSW Energy Limited (Utilities, Independent Power & Renewable Electricity Producers) † | | | | | | | | | | | 49,138 | | | | 50,505 | |
JSW Steel Limited (Materials, Metals & Mining) | | | | | | | | | | | 146,737 | | | | 819,996 | |
Jubilant Foodworks Limited (Consumer Discretionary, Hotels, Restaurants & Leisure) | | | | | | | | | | | 8,007 | | | | 174,909 | |
Jubilant Organosys Limited (Health Care, Pharmaceuticals) | | | | | | | | | | | 11,197 | | | | 114,012 | |
Jyothy Laboratories Limited (Consumer Staples, Household Products) | | | | | | | | | | | 24,502 | | | | 75,241 | |
Kajaria Ceramics Limited (Industrials, Building Products) | | | | | | | | | | | 7,066 | | | | 46,709 | |
Karnataka Bank Limited (Financials, Banks) | | | | | | | | | | | 38,155 | | | | 64,312 | |
Karur Vysya Bank Limited (Financials, Banks) | | | | | | | | | | | 97,298 | | | | 128,403 | |
KEC International Limited (Industrials, Construction & Engineering) | | | | | | | | | | | 29,297 | | | | 124,745 | |
KPIT Technologies Limited (Information Technology, Software) | | | | | | | | | | | 13,837 | | | | 59,112 | |
KRBL Limited (Consumer Staples, Food Products) | | | | | | | | | | | 10,342 | | | | 56,022 | |
L&T Finance Holdings Limited (Financials, Diversified Financial Services) | | | | | | | | | | | 73,906 | | | | 189,021 | |
Lakshmi Machine Works Limited (Industrials, Machinery) | | | | | | | | | | | 969 | | | | 98,293 | |
Larsen & Toubro Infotech Limited (Information Technology, IT Services) 144A | | | | | | | | | | | 3,604 | | | | 91,350 | |
Laurus Labs Limited (Health Care, Pharmaceuticals) 144A | | | | | | | | | | | 11,765 | | | | 72,729 | |
Lupin Limited (Health Care, Pharmaceuticals) | | | | | | | | | | | 27,889 | | | | 366,257 | |
Madras Cements Limited (Materials, Construction Materials) | | | | | | | | | | | 16,867 | | | | 163,935 | |
Mahindra & Mahindra Financial Services Limited (Financials, Consumer Finance) | | | | | | | | | | | 29,683 | | | | 204,712 | |
Mahindra & Mahindra Limited (Consumer Discretionary, Automobiles) | | | | | | | | | | | 101,326 | | | | 1,379,038 | |
Manappuram Finance Limited (Financials, Consumer Finance) | | | | | | | | | | | 51,938 | | | | 73,301 | |
Marico Limited (Consumer Staples, Personal Products) | | | | | | | | | | | 72,571 | | | | 378,017 | |
Minda Industries Limited (Consumer Discretionary, Auto Components) | | | | | | | | | | | 12,230 | | | | 74,155 | |
The accompanying notes are an integral part of these financial statements.
| | | | |
| 72 | | Wells Fargo Funds | | Portfolio of investments—August 31, 2018 (unaudited) |
FACTOR ENHANCED EMERGING MARKETS PORTFOLIO
| | | | | | | | | | | | | | | | |
| Security name | | | | | | | | Shares | | | Value | |
| | | | |
| India (continued) | | | | | | | | | | | | | | | | |
Mindtree Limited (Information Technology, IT Services) | | | | | | | | | | | 12,037 | | | $ | 189,177 | |
Motherson Sumi Systems Limited (Consumer Discretionary, Auto Components) | | | | | | | | | | | 88,275 | | | | 378,484 | |
Motilal Oswal Financial Services Limited (Financials, Capital Markets) | | | | | | | | | | | 12,747 | | | | 149,663 | |
Mphasis Limited (Information Technology, IT Services) | | | | | | | | | | | 6,393 | | | | 113,571 | |
MRF Limited (Consumer Discretionary, Auto Components) | | | | | | | | | | | 344 | | | | 359,038 | |
Multi Commodity Exchange of India Limited (Financials, Capital Markets) | | | | | | | | | | | 4,800 | | | | 56,042 | |
Muthoot Finance Limited (Financials, Consumer Finance) | | | | | | | | | | | 39,442 | | | | 227,667 | |
Nagarjuna Construction Company (Industrials, Construction & Engineering) | | | | | | | | | | | 60,636 | | | | 84,337 | |
Natco Pharma Limited (Health Care, Pharmaceuticals) | | | | | | | | | | | 13,398 | | | | 147,286 | |
National Aluminum Company Limited (Materials, Metals & Mining) | | | | | | | | | | | 85,217 | | | | 89,931 | |
Nestle India Limited (Consumer Staples, Food Products) | | | | | | | | | | | 3,624 | | | | 591,799 | |
NIIT Technologies Limited (Information Technology, Software) | | | | | | | | | | | 4,043 | | | | 80,186 | |
NTPC Limited (Utilities, Independent Power & Renewable Electricity Producers) | | | | | | | | | | | 326,358 | | | | 789,135 | |
Oberoi Realty Limited (Real Estate, Real Estate Management & Development) | | | | | | | | | | | 9,705 | | | | 60,323 | |
Oracle Financials Services (Information Technology, Software) | | | | | | | | | | | 1,801 | | | | 105,638 | |
Page Industries Limited (Consumer Discretionary, Textiles, Apparel & Luxury Goods) | | | | | | | | | | | 493 | | | | 239,227 | |
PC Jeweller Limited (Consumer Discretionary, Specialty Retail) | | | | | | | | | | | 20,118 | | | | 23,897 | |
Persistent Systems Limited (Information Technology, IT Services) | | | | | | | | | | | 6,509 | | | | 75,950 | |
Petronet LNG Limited (Energy, Oil, Gas & Consumable Fuels) | | | | | | | | | | | 149,642 | | | | 523,342 | |
Pfizer Limited (Health Care, Pharmaceuticals) | | | | | | | | | | | 2,380 | | | | 121,516 | |
Phoenix Mills Limited (Real Estate, Real Estate Management & Development) | | | | | | | | | | | 7,720 | | | | 68,268 | |
Pidilite Industries Limited (Materials, Chemicals) | | | | | | | | | | | 29,869 | | | | 492,151 | |
PNB Housing Finance Limited (Financials, Thrifts & Mortgage Finance) 144A | | | | | | | | | | | 12,189 | | | | 233,284 | |
Prestige Estates Projects Limited (Real Estate, Real Estate Management & Development) | | | | | | | | | | | 15,746 | | | | 52,626 | |
Procter & Gamble Hygiene & Healthcare Limited (Consumer Staples, Personal Products) | | | | | | | | | | | 1,272 | | | | 184,215 | |
PVR Limited (Consumer Discretionary, Media) | | | | | | | | | | | 3,790 | | | | 73,354 | |
Quess Corporation Limited (Industrials, Professional Services) 144A† | | | | | | | | | | | 4,618 | | | | 63,616 | |
Rain Industries Limited (Materials, Chemicals) | | | | | | | | | | | 24,750 | | | | 66,074 | |
Rajesh Exports Limited (Consumer Discretionary, Textiles, Apparel & Luxury Goods) | | | | | | | | | | | 16,020 | | | | 149,841 | |
Redington India Limited (Information Technology, Electronic Equipment, Instruments & Components) | | | | | | | | | | | 29,010 | | | | 42,967 | |
Reliance Capital Limited (Financials, Diversified Financial Services) | | | | | | | | | | | 13,776 | | | | 91,715 | |
Reliance Energy Limited (Utilities, Electric Utilities) | | | | | | | | | | | 12,944 | | | | 87,226 | |
Reliance Nippon Life Asset Management Limited (Financials, Diversified Financial Services) | | | | | | | | | | | 66,154 | | | | 219,888 | |
Sadbhav Engineering Limited (Industrials, Construction & Engineering) | | | | | | | | | | | 14,751 | | | | 59,367 | |
Sanofi India Limited (Health Care, Pharmaceuticals) | | | | | | | | | | | 1,031 | | | | 93,034 | |
Schaeffler India Limited (Industrials, Machinery) | | | | | | | | | | | 1,066 | | | | 81,873 | |
Shriram City Union Finance Limited (Financials, Consumer Finance) | | | | | | | | | | | 2,569 | | | | 72,597 | |
Shriram Transport Finance Company Limited (Financials, Consumer Finance) | | | | | | | | | | | 16,029 | | | | 301,885 | |
SKF India Limited (Industrials, Machinery) | | | | | | | | | | | 3,207 | | | | 81,086 | |
Solar Industries India Limited (Materials, Chemicals) | | | | | | | | | | | 4,688 | | | | 77,228 | |
South Indian Bank Limited (Financials, Banks) | | | | | | | | | | | 234,384 | | | | 57,996 | |
SRF Limited (Consumer Discretionary, Textiles, Apparel & Luxury Goods) | | | | | | | | | | | 3,169 | | | | 90,361 | |
Star Cement Limited (Materials, Construction Materials) | | | | | | | | | | | 32,250 | | | | 47,971 | |
Strides Shasun Limited (Health Care, Pharmaceuticals) | | | | | | | | | | | 9,862 | | | | 69,050 | |
Sun TV Network Limited (Consumer Discretionary, Media) | | | | | | | | | | | 10,131 | | | | 109,443 | |
Sundaram Finance Limited (Financials, Consumer Finance) | | | | | | | | | | | 12,722 | | | | 285,538 | |
Sundram Fasteners Limited (Consumer Discretionary, Auto Components) | | | | | | | | | | | 12,200 | | | | 113,604 | |
Supreme Industries Limited (Materials, Chemicals) | | | | | | | | | | | 7,333 | | | | 124,232 | |
Suzlon Energy Limited (Industrials, Electrical Equipment) † | | | | | | | | | | | 605,001 | | | | 60,990 | |
Tata Chemicals Limited (Materials, Chemicals) | | | | | | | | | | | 18,823 | | | | 201,602 | |
The accompanying notes are an integral part of these financial statements.
| | | | | | |
| Portfolio of investments—August 31, 2018 (unaudited) | | Wells Fargo Funds | | | 73 | |
FACTOR ENHANCED EMERGING MARKETS PORTFOLIO
| | | | | | | | | | | | | | | | |
| Security name | | | | | | | | Shares | | | Value | |
| | | | |
| India (continued) | | | | | | | | | | | | | | | | |
Tata Consultancy Services Limited (Information Technology, IT Services) | | | | | | | | | | | 101,436 | | | $ | 2,972,448 | |
Tata Elxsi Limited (Information Technology, Software) | | | | | | | | | | | 2,299 | | | | 46,542 | |
Tata Power Company Limited (Utilities, Electric Utilities) | | | | | | | | | | | 178,435 | | | | 192,961 | |
Tata Tea Limited (Consumer Staples, Food Products) | | | | | | | | | | | 48,037 | | | | 158,687 | |
Tech Mahindra Limited (Information Technology, IT Services) | | | | | | | | | | | 63,431 | | | | 684,873 | |
Thermax India Limited (Industrials, Machinery) | | | | | | | | | | | 5,549 | | | | 80,618 | |
TI Financial Holdings Limited (Financials, Diversified Financial Services) | | | | | | | | | | | 13,801 | | | | 114,142 | |
Titan Industries Limited (Consumer Discretionary, Textiles, Apparel & Luxury Goods) | | | | | | | | | | | 42,527 | | | | 534,778 | |
Torrent Pharmaceuticals Limited (Health Care, Pharmaceuticals) | | | | | | | | | | | 6,057 | | | | 154,811 | |
Torrent Power Limited (Utilities, Electric Utilities) | | | | | | | | | | | 17,134 | | | | 63,679 | |
TVS Motor Company Limited (Consumer Discretionary, Automobiles) | | | | | | | | | | | 21,888 | | | | 175,703 | |
Ujjivan Financial Services Limited (Financials, Consumer Finance) | | | | | | | | | | | 12,147 | | | | 59,822 | |
United Breweries Limited (Consumer Staples, Beverages) | | | | | | | | | | | 9,889 | | | | 195,769 | |
United Spirits Limited (Consumer Staples, Beverages) † | | | | | | | | | | | 37,778 | | | | 335,695 | |
Vardhman Textiles Limited (Consumer Discretionary, Textiles, Apparel & Luxury Goods) | | | | | | | | | | | 3,162 | | | | 49,044 | |
Varun Beverages Limited (Consumer Staples, Beverages) | | | | | | | | | | | 6,313 | | | | 72,924 | |
VIP Industries Limited (Consumer Discretionary, Textiles, Apparel & Luxury Goods) | | | | | | | | | | | 12,785 | | | | 112,490 | |
Wabco India Limited (Consumer Discretionary, Auto Components) | | | | | | | | | | | 590 | | | | 59,566 | |
Whirlpool of India Limited (Consumer Discretionary, Household Durables) | | | | | | | | | | | 3,931 | | | | 98,300 | |
Wipro Limited (Information Technology, IT Services) | | | | | | | | | | | 105,452 | | | | 447,894 | |
Wockhardt Limited (Health Care, Pharmaceuticals) | | | | | | | | | | | 6,167 | | | | 57,726 | |
Zee Entertainment Enterprises Limited (Consumer Discretionary, Media) | | | | | | | | | | | 59,917 | | | | 422,347 | |
Zensar Technologies Limited (Information Technology, IT Services) | | | | | | | | | | | 5,396 | | | | 127,276 | |
| | | | |
| | | | | | | | | | | | | | | 45,441,761 | |
| | | | | | | | | | | | | | | | |
| | | | |
| Indonesia: 0.92% | | | | | | | | | | | | | | | | |
PT Ace Hardware Incorporated Indonesia Tbk (Consumer Discretionary, Specialty Retail) | | | | | | | | | | | 838,800 | | | | 77,445 | |
PT AKR Corporindo Tbk (Industrials, Trading Companies & Distributors) | | | | | | | | | | | 162,800 | | | | 39,899 | |
PT Bank Danamon Indonesia Tbk (Financials, Banks) | | | | | | | | | | | 249,900 | | | | 115,365 | |
PT Bank Negara Indonesia Persero Tbk (Financials, Banks) | | | | | | | | | | | 707,600 | | | | 374,697 | |
PT Bank Pembangunan Daerah Jawa Barat dan Banten Tbk (Financials, Banks) | | | | | | | | | | | 491,300 | | | | 64,373 | |
PT Bank Tabungan Negara Persero Tbk (Financials, Banks) | | | | | | | | | | | 441,500 | | | | 82,425 | |
PT Bumi Serpong Damai Tbk (Real Estate, Real Estate Management & Development) | | | | | | | | | | | 899,900 | | | | 73,312 | |
PT Charoen Pokphand Indonesia Tbk (Consumer Staples, Food Products) | | | | | | | | | | | 349,900 | | | | 118,296 | |
PT Gudang Garam Tbk (Consumer Staples, Tobacco) | | | | | | | | | | | 49,200 | | | | 243,829 | |
PT Hanjaya Mandala Sampoerna Tbk (Consumer Staples, Tobacco) | | | | | | | | | | | 849,700 | | | | 220,934 | |
PT Hanson International Tbk (Real Estate, Real Estate Management & Development) † | | | | | | | | | | | 7,252,100 | | | | 69,912 | |
PT Indo Tambangraya Megah Tbk (Energy, Oil, Gas & Consumable Fuels) | | | | | | | | | | | 38,100 | | | | 73,200 | |
PT Indofood CBP Sukses Makmur Tbk (Consumer Staples, Food Products) | | | | | | | | | | | 243,900 | | | | 143,641 | |
PT Jasa Marga (Persero) Tbk (Industrials, Transportation Infrastructure) | | | | | | | | | | | 179,700 | | | | 55,264 | |
PT Kalbe Farma Tbk (Health Care, Pharmaceuticals) | | | | | | | | | | | 1,942,000 | | | | 177,325 | |
PT Lippo Karawaci Terbuka Tbk (Real Estate, Real Estate Management & Development) | | | | | | | | | | | 1,884,300 | | | | 45,540 | |
PT Mayora Indah Tbk (Consumer Staples, Food Products) | | | | | | | | | | | 370,287 | | | | 72,398 | |
PT Medco Energi Internasional Tbk (Energy, Oil, Gas & Consumable Fuels) † | | | | | | | | | | | 1,436,700 | | | | 84,856 | |
PT Media Nusantara Citra Tbk (Consumer Discretionary, Media) | | | | | | | | | | | 549,800 | | | | 33,779 | |
PT Mitra Keluarga Karyasehat Tbk (Health Care, Health Care Providers & Services) † | | | | | | | | | | | 579,000 | | | | 71,736 | |
PT Perusahaan Gas Negara Persero Tbk (Utilities, Gas Utilities) | | | | | | | | | | | 1,034,500 | | | | 150,294 | |
PT Sumber Alfaria Trijaya Tbk (Consumer Staples, Food & Staples Retailing) | | | | | | | | | | | 1,764,700 | | | | 101,833 | |
PT Summarecon Agung Tbk (Real Estate, Real Estate Management & Development) | | | | | | | | | | | 904,600 | | | | 40,532 | |
The accompanying notes are an integral part of these financial statements.
| | | | |
| 74 | | Wells Fargo Funds | | Portfolio of investments—August 31, 2018 (unaudited) |
FACTOR ENHANCED EMERGING MARKETS PORTFOLIO
| | | | | | | | | | | | | | | | |
| Security name | | | | | | | | Shares | | | Value | |
| | | | |
| Indonesia (continued) | | | | | | | | | | | | | | | | |
PT Surya Citra Media Tbk (Consumer Discretionary, Media) | | | | | | | | | | | 598,400 | | | $ | 85,312 | |
PT Tambang Batubara Bukit Asam Tbk (Energy, Oil, Gas & Consumable Fuels) | | | | | | | | | | | 296,800 | | | | 81,605 | |
PT Trada Alam Minera Tbk (Industrials, Marine) † | | | | | | | | | | | 2,912,200 | | | | 44,286 | |
PT Ultrajaya Milk Industry & Trading Company Tbk (Consumer Staples, Food Products) | | | | | | | | | | | 844,000 | | | | 74,201 | |
PT Waskita Karya Persero Tbk (Industrials, Construction & Engineering) | | | | | | | | | | | 384,800 | | | | 49,504 | |
| | | | |
| | | | | | | | | | | | | | | 2,865,793 | |
| | | | | | | | | | | | | | | | |
| | | | |
| Luxembourg: 0.10% | | | | | | | | | | | | | | | | |
Kernel Holding SA (Consumer Staples, Food Products) | | | | | | | | | | | 17,565 | | | | 234,330 | |
PLAY Communications SA (Telecommunication Services, Wireless Telecommunication Services) | | | | | | | | | | | 15,312 | | | | 89,640 | |
| | | | |
| | | | | | | | | | | | | | | 323,970 | |
| | | | | | | | | | | | | | | | |
| | | | |
| Malaysia: 4.75% | | | | | | | | | | | | | | | | |
Affin Holdings Bhd (Financials, Banks) | | | | | | | | | | | 179,400 | | | | 107,330 | |
AirAsia Bhd (Industrials, Airlines) | | | | | | | | | | | 242,700 | | | | 202,815 | |
Alliance Financial Group Bhd (Financials, Banks) | | | | | | | | | | | 139,400 | | | | 139,946 | |
AMMB Holdings Bhd (Financials, Banks) | | | | | | | | | | | 182,100 | | | | 181,360 | |
Astro Malaysia Holdings Bhd (Consumer Discretionary, Media) | | | | | | | | | | | 246,800 | | | | 104,497 | |
Axiata Group Bhd (Telecommunication Services, Wireless Telecommunication Services) | | | | | | | | | | | 397,600 | | | | 463,071 | |
Batu Kawan Bhd (Materials, Chemicals) | | | | | | | | | | | 27,500 | | | | 114,017 | |
Bimb Holdings Bhd (Financials, Banks) | | | | | | | | | | | 83,900 | | | | 80,595 | |
Boustead Holdings Bhd (Industrials, Industrial Conglomerates) | | | | | | | | | | | 286,400 | | | | 137,294 | |
British American Tobacco Malaysia Bhd (Consumer Staples, Tobacco) | | | | | | | | | | | 15,600 | | | | 128,535 | |
Bumi Armada Bhd (Energy, Energy Equipment & Services) † | | | | | | | | | | | 419,900 | | | | 56,586 | |
Bursa Malaysia Bhd (Financials, Diversified Financial Services) | | | | | | | | | | | 58,700 | | | | 109,609 | |
Carlsberg Brewery Malaysia Bhd (Consumer Staples, Beverages) | | | | | | | | | | | 19,800 | | | | 98,289 | |
Dialog Group Bhd (Energy, Energy Equipment & Services) | | | | | | | | | | | 482,200 | | | | 407,510 | |
Digi.com Bhd (Telecommunication Services, Wireless Telecommunication Services) | | | | | | | | | | | 346,900 | | | | 396,695 | |
Felda Global Ventures Holdings Bhd (Consumer Staples, Food Products) | | | | | | | | | | | 200,500 | | | | 73,504 | |
Fraser & Neave Holdings Bhd (Consumer Staples, Beverages) | | | | | | | | | | | 15,000 | | | | 138,703 | |
Genting Bhd (Consumer Discretionary, Hotels, Restaurants & Leisure) | | | | | | | | | | | 244,300 | | | | 512,033 | |
HAP Seng Consolidated Bhd (Industrials, Industrial Conglomerates) | | | | | | | | | | | 78,700 | | | | 188,004 | |
Hartalega Holdings Bhd (Health Care, Health Care Equipment & Supplies) | | | | | | | | | | | 169,000 | | | | 291,143 | |
Heineken Malaysia Bhd (Consumer Staples, Beverages) | | | | | | | | | | | 20,300 | | | | 108,082 | |
Hong Leong Bank Bhd (Financials, Banks) | | | | | | | | | | | 88,300 | | | | 441,179 | |
Hong Leong Financial Group Bhd (Financials, Banks) | | | | | | | | | | | 35,000 | | | | 166,799 | |
IGB REIT Bhd (Real Estate, Equity REITs) | | | | | | | | | | | 235,700 | | | | 99,302 | |
IHH Healthcare Bhd (Health Care, Health Care Providers & Services) | | | | | | | | | | | 363,100 | | | | 492,167 | |
IJM Corporation Bhd (Industrials, Construction & Engineering) | | | | | | | | | | | 304,300 | | | | 138,219 | |
Inari Amertron Bhd (Information Technology, Electronic Equipment, Instruments & Components) | | | | | | | | | | | 239,500 | | | | 130,356 | |
IOI Corporation Bhd (Consumer Staples, Food Products) | | | | | | | | | | | 333,600 | | | | 366,292 | |
IOI Properties Group Bhd (Real Estate, Real Estate Management & Development) | | | | | | | | | | | 229,600 | | | | 97,763 | |
KLCC Property Holdings Bhd (Real Estate, Equity REITs) | | | | | | | | | | | 36,900 | | | | 69,319 | |
Kossan Rubber Industries Bhd (Health Care, Health Care Equipment & Supplies) | | | | | | | | | �� | | 68,800 | | | | 74,501 | |
Kuala Lumpur Kepong Bhd (Consumer Staples, Food Products) | | | | | | | | | | | 58,800 | | | | 352,843 | |
Lotte Chemical Titan Holding Bhd (Industrials, Chemicals) 144A | | | | | | | | | | | 63,400 | | | | 79,350 | |
LPI Capital Bhd (Financials, Insurance) | | | | | | | | | | | 28,300 | | | | 117,773 | |
Malakoff Corporation Bhd (Utilities, Independent Power & Renewable Electricity Producers) | | | | | | | | | | | 170,700 | | | | 39,831 | |
Malaysia Airports Holdings Bhd (Industrials, Transportation Infrastructure) | | | | | | | | | | | 93,300 | | | | 212,278 | |
The accompanying notes are an integral part of these financial statements.
| | | | | | |
| Portfolio of investments—August 31, 2018 (unaudited) | | Wells Fargo Funds | | | 75 | |
FACTOR ENHANCED EMERGING MARKETS PORTFOLIO
| | | | | | | | | | | | | | | | |
| Security name | | | | | | | | Shares | | | Value | |
| | | | |
| Malaysia (continued) | | | | | | | | | | | | | | | | |
Malaysian Resources Corporation Bhd (Industrials, Construction & Engineering) | | | | | | | | | | | 331,400 | | | $ | 56,268 | |
Maxis Bhd (Telecommunication Services, Wireless Telecommunication Services) | | | | | | | | | | | 246,600 | | | | 346,299 | |
Nestle Malaysia Bhd (Consumer Staples, Food Products) | | | | | | | | | | | 6,900 | | | | 246,818 | |
Oriental Holdings Bhd (Consumer Discretionary, Automobiles) | | | | | | | | | | | 64,400 | | | | 98,100 | |
Petronas Chemicals Group Bhd (Materials, Chemicals) | | | | | | | | | | | 279,900 | | | | 643,401 | |
Petronas Dagangan Bhd (Energy, Oil, Gas & Consumable Fuels) | | | | | | | | | | | 29,100 | | | | 192,117 | |
PPB Group Bhd (Consumer Staples, Food Products) | | | | | | | | | | | 84,440 | | | | 345,198 | |
Press Metal Bhd (Materials, Metals & Mining) | | | | | | | | | | | 239,500 | | | | 289,590 | |
Public Bank Bhd (Financials, Banks) | | | | | | | | | | | 321,100 | | | | 1,961,026 | |
Ql Resources Bhd (Consumer Staples, Food Products) | | | | | | | | | | | 75,460 | | | | 107,052 | |
RHB Capital Bhd (Financials, Banks) | | | | | | | | | | | 277,600 | | | | 364,488 | |
Scientex Bhd (Materials, Chemicals) | | | | | | | | | | | 32,800 | | | | 66,612 | |
Sime Darby Bhd (Industrials, Industrial Conglomerates) | | | | | | | | | | | 365,500 | | | | 226,471 | |
Sime Darby Property Bhd (Real Estate, Real Estate Management & Development) | | | | | | | | | | | 370,200 | | | | 113,318 | |
SP Setia Bhd (Real Estate, Real Estate Management & Development) | | | | | | | | | | | 223,700 | | | | 142,982 | |
Sunway REIT Bhd (Real Estate, Real Estate Management & Development) | | | | | | | | | | | 191,300 | | | | 72,545 | |
Sunway REIT Bhd (Real Estate, Real Estate Management & Development) | | | | | | | | | | | 211,400 | | | | 88,541 | |
Telecom Malaysia Bhd (Telecommunication Services, Diversified Telecommunication Services) | | | | | | | | | | | 189,100 | | | | 152,190 | |
Tenaga Nasional Bhd (Utilities, Electric Utilities) | | | | | | | | | | | 332,900 | | | | 1,269,056 | |
Time Dotcom Bhd (Telecommunication Services, Diversified Telecommunication Services) | | | | | | | | | | | 53,000 | | | | 105,755 | |
Top Glove Corporation Bhd (Health Care, Health Care Equipment & Supplies) | | | | | | | | | | | 89,600 | | | | 242,767 | |
TSH Resources Bhd (Consumer Staples, Food Products) | | | | | | | | | �� | | 119,200 | | | | 34,807 | |
UMW Holdings Bhd (Consumer Discretionary, Automobiles) | | | | | | | | | | | 56,400 | | | | 81,739 | |
United Plantations Bhd (Consumer Staples, Food Products) | | | | | | | | | | | 7,300 | | | | 48,459 | |
VS Industry Bhd (Information Technology, Electronic Equipment, Instruments & Components) | | | | | | | | | | | 143,375 | | | | 55,076 | |
Westports Holdings Bhd (Industrials, Transportation Infrastructure) | | | | | | | | | | | 102,200 | | | | 92,288 | |
Yinson Holdings Bhd (Energy, Energy Equipment & Services) | | | | | | | | | | | 99,200 | | | | 111,040 | |
YTL Corporation Bhd (Utilities, Multi-Utilities) | | | | | | | | | | | 506,162 | | | | 163,525 | |
YTL Power International Bhd (Utilities, Multi-Utilities) | | | | | | | | | | | 260,600 | | | | 72,242 | |
| | | | |
| | | | | | | | | | | | | | | 14,707,360 | |
| | | | | | | | | | | | | | | | |
| | | | |
| Mexico: 3.73% | | | | | | | | | | | | | | | | |
Alsea SAB de CV (Consumer Discretionary, Hotels, Restaurants & Leisure) | | | | | | | | | | | 47,874 | | | | 170,896 | |
America Movil SAB de CV Series L (Telecommunication Services, Wireless Telecommunication Services) | | | | | | | | | | | 2,478,323 | | | | 2,084,592 | |
Arca Continental SAB de CV (Consumer Staples, Beverages) | | | | | | | | | | | 40,467 | | | | 250,255 | |
Banco del Bajio SA (Financials, Banks) | | | | | | | | | | | 83,800 | | | | 196,064 | |
Banco Santander Mexico SA (Financials, Banks) | | | | | | | | | | | 148,378 | | | | 235,087 | |
Coca-Cola Femsa SAB de CV Series L (Consumer Staples, Beverages) | | | | | | | | | | | 48,828 | | | | 293,859 | |
Corporacion Inmobiliaria Vesta SAB de CV (Real Estate, Real Estate Management & Development) | | | | | | | | | | | 52,000 | | | | 73,624 | |
El Puerto de Liverpool SAB de CV (Consumer Discretionary, Multiline Retail) | | | | | | | | | | | 20,533 | | | | 144,917 | |
Fibra Uno Administracion SAB de CV (Real Estate, Equity REITs) | | | | | | | | | | | 358,953 | | | | 469,705 | |
Fomento Economico Mexicano SAB de CV (Consumer Staples, Beverages) | | | | | | | | | | | 205,228 | | | | 1,965,780 | |
Genomma Lab Internacional SAB de CV Class B (Health Care, Pharmaceuticals) † | | | | | | | | | | | 97,293 | | | | 84,280 | |
Gentera SAB de CV (Financials, Consumer Finance) | | | | | | | | | | | 99,348 | | | | 100,829 | |
GMexico Transportes SAB de CV (Industrials, Road & Rail) 144A | | | | | | | | | | | 54,100 | | | | 87,357 | |
Gruma SAB de CV Class B (Consumer Staples, Food Products) | | | | | | | | | | | 19,330 | | | | 244,553 | |
Grupo Aeromexico SAB de CV (Industrials, Airlines) † | | | | | | | | | | | 61,170 | | | | 85,230 | |
Grupo Aeroportuario del Centro Norte SAB de CV (Industrials, Transportation Infrastructure) | | | | | | | | | | | 28,210 | | | | 185,441 | |
Grupo Aeroportuario del Pacifico SAB de CV Class B (Industrials, Transportation Infrastructure) | | | | | | | | | | | 37,415 | | | | 386,600 | |
The accompanying notes are an integral part of these financial statements.
| | | | |
| 76 | | Wells Fargo Funds | | Portfolio of investments—August 31, 2018 (unaudited) |
FACTOR ENHANCED EMERGING MARKETS PORTFOLIO
| | | | | | | | | | | | | | | | |
| Security name | | | | | | | | Shares | | | Value | |
| | | | |
| Mexico (continued) | | | | | | | | | | | | | | | | |
Grupo Aeroportuario del Sureste SAB de CV Class B (Industrials, Transportation Infrastructure) | | | | | | | | | | | 18,425 | | | $ | 345,514 | |
Grupo Carso SAB de CV (Industrials, Industrial Conglomerates) | | | | | | | | | | | 50,001 | | | | 185,686 | |
Grupo Cementos de Chihuahua SAB de CV (Materials, Construction Materials) | | | | | | | | | | | 16,700 | | | | 109,193 | |
Grupo Comercial Chedraui SAB de CV (Consumer Staples, Food & Staples Retailing) | | | | | | | | | | | 29,944 | | | | 70,514 | |
Grupo Elektra SAB de CV (Financials, Banks) | | | | | | | | | | | 6,104 | | | | 285,947 | |
Grupo Financiero Inbursa SAB de CV (Financials, Banks) | | | | | | | | | | | 213,600 | | | | 339,877 | |
Grupo Lala SAB de CV (Consumer Staples, Food Products) | | | | | | | | | | | 61,367 | | | | 65,301 | |
Grupo Sanborns SAB de CV (Consumer Discretionary, Multiline Retail) | | | | | | | | | | | 94,200 | | | | 95,160 | |
Industrias Bachoco SAB de CV Series B (Consumer Staples, Food Products) | | | | | | | | | | | 18,655 | | | | 90,623 | |
Industrias CH SAB de CV Series B (Materials, Metals & Mining) † | | | | | | | | | | | 17,100 | | | | 67,307 | |
Industrias Penoles SAB de CV (Materials, Metals & Mining) | | | | | | | | | | | 12,928 | | | | 219,019 | |
Macquarie Mexico Real Estate Management SA de CV (Real Estate, Equity REITs) 144A | | | | | | | | | | | 88,205 | | | | 96,999 | |
Mexichem SAB de CV (Materials, Chemicals) | | | | | | | | | | | 109,424 | | | | 369,247 | |
OHL Mexico SAB de CV (Industrials, Transportation Infrastructure) | | | | | | | | | | | 75,291 | | | | 113,457 | |
PLA Administradora Industria S de RL de CV (Real Estate, Equity REITs) | | | | | | | | | | | 81,504 | | | | 122,222 | |
Prologis Property Mexico SA de CV (Real Estate, Equity REITs) | | | | | | | | | | | 40,994 | | | | 80,678 | |
Promotora Y Operadora de Infraestructura SAB de CV (Industrials, Transportation Infrastructure) | | | | | | | | | | | 18,659 | | | | 198,307 | |
Regional SAB de CV (Financials, Banks) | | | | | | | | | | | 21,900 | | | | 134,207 | |
Telesites SAB de CV (Telecommunication Services, Diversified Telecommunication Services) † | | | | | | | | | | | 133,829 | | | | 105,002 | |
Wal-Mart de Mexico SAB de CV (Consumer Staples, Food & Staples Retailing) | | | | | | | | | | | 506,439 | | | | 1,402,265 | |
| | | | |
| | | | | | | | | | | | | | | 11,555,594 | |
| | | | | | | | | | | | | | | | |
| | | | |
| Philippines: 1.47% | | | | | | | | | | | | | | | | |
Aboitiz Power Corporation (Utilities, Independent Power & Renewable Electricity Producers) | | | | | | | | | | | 166,500 | | | | 115,218 | |
Alliance Global Group Incorporated (Industrials, Industrial Conglomerates) | | | | | | | | | | | 585,900 | | | | 151,220 | |
Ayala Corporation (Financials, Diversified Financial Services) | | | | | | | | | | | 25,110 | | | | 469,627 | |
Bloomberry Resorts Corporation (Consumer Discretionary, Hotels, Restaurants & Leisure) | | | | | | | | | | | 334,600 | | | | 59,763 | |
China Banking Corporation (Financials, Banks) | | | | | | | | | | | 249,208 | | | | 148,682 | |
D&L Industries Incorporated (Materials, Chemicals) | | | | | | | | | | | 390,800 | | | | 77,037 | |
DMCI Holdings Incorporated (Industrials, Industrial Conglomerates) | | | | | | | | | | | 531,800 | | | | 127,311 | |
Energy Development Corporation (Utilities, Independent Power & Renewable Electricity Producers) | | | | | | | | | | | 955,600 | | | | 125,821 | |
Globe Telecom Incorporated (Telecommunication Services, Wireless Telecommunication Services) | | | | | | | | | | | 3,400 | | | | 134,555 | |
Golden Bria Holdings Incorporated (Consumer Discretionary, Diversified Consumer Services) † | | | | | | | | | | | 6,800 | | | | 40,316 | |
GT Capital Holdings Incorporated (Financials, Diversified Financial Services) | | | | | | | | | | | 11,493 | | | | 188,297 | |
International Container Term Services Incorporated (Industrials, Transportation Infrastructure) | | | | | | | | | | | 188,430 | | | | 330,038 | |
Jollibee Foods Corporation (Consumer Discretionary, Hotels, Restaurants & Leisure) | | | | | | | | | | | 79,810 | | | | 429,889 | |
LT Group Incorporated (Industrials, Industrial Conglomerates) | | | | | | | | | | | 362,500 | | | | 116,612 | |
Manila Electric Company (Utilities, Electric Utilities) | | | | | | | | | | | 22,920 | | | | 160,064 | |
Manila Water Company (Utilities, Water Utilities) | | | | | | | | | | | 128,800 | | | | 58,778 | |
Megaworld Corporation (Real Estate, Real Estate Management & Development) | | | | | | | | | | | 1,318,000 | | | | 113,145 | |
Metro Pacific Investments Corporation (Financials, Diversified Financial Services) | | | | | | | | | | | 1,322,300 | | | | 134,782 | |
Metropolitan Bank & Trust Company (Financials, Banks) | | | | | | | | | | | 283,660 | | | | 388,608 | |
Philippine National Bank (Financials, Banks) † | | | | | | | | | | | 142,630 | | | | 128,044 | |
Philippine Seven Corporation (Consumer Staples, Food & Staples Retailing) | | | | | | | | | | | 14,223 | | | | 29,208 | |
Pilipinas Shell Petroleum Corporation (Energy, Oil, Gas & Consumable Fuels) | | | | | | | | | | | 83,330 | | | | 89,614 | |
PLDT Incorporated (Telecommunication Services, Wireless Telecommunication Services) | | | | | | | | | | | 12,645 | | | | 329,440 | |
Puregold Price Club Incorporated (Consumer Staples, Food & Staples Retailing) | | | | | | | | | | | 129,210 | | | | 111,163 | |
Rizal Commercial Banking (Financials, Banks) | | | | | | | | | | | 27,280 | | | | 14,541 | |
Robinsons Land Company (Real Estate, Real Estate Management & Development) | | | | | | | | | | | 273,300 | | | | 108,874 | |
The accompanying notes are an integral part of these financial statements.
| | | | | | |
| Portfolio of investments—August 31, 2018 (unaudited) | | Wells Fargo Funds | | | 77 | |
FACTOR ENHANCED EMERGING MARKETS PORTFOLIO
| | | | | | | | | | | | | | | | |
| Security name | | | | | | | | Shares | | | Value | |
| | | | |
| Philippines (continued) | | | | | | | | | | | | | | | | |
Robinsons Retail Holdings Incorporated (Consumer Staples, Food & Staples Retailing) | | | | | | | | | | | 81,700 | | | $ | 124,686 | |
San Miguel Corporation (Industrials, Industrial Conglomerates) | | | | | | | | | | | 53,630 | | | | 169,512 | |
Union Bank of Philippines (Financials, Banks) | | | | | | | | | | | 7,650 | | | | 10,888 | |
Vista Land & Lifescapes Incorporated (Real Estate, Real Estate Management & Development) | | | | | | | | | | | 637,200 | | | | 76,271 | |
| | | | |
| | | | | | | | | | | | | | | 4,562,004 | |
| | | | | | | | | | | | | | | | |
| | | | |
| Poland: 1.21% | | | | | | | | | | | | | | | | |
Alior Bank SA (Financials, Banks) † | | | | | | | | | | | 9,919 | | | | 182,099 | |
Asseco Poland SA (Information Technology, Software) | | | | | | | | | | | 7,253 | | | | 89,814 | |
Budimex SA (Industrials, Construction & Engineering) | | | | | | | | | | | 1,468 | | | | 45,149 | |
CCC SA (Consumer Discretionary, Textiles, Apparel & Luxury Goods) | | | | | | | | | | | 2,993 | | | | 174,088 | |
CD Projekt SA (Information Technology, Software) † | | | | | | | | | | | 5,479 | | | | 304,496 | |
Ciech SA (Materials, Chemicals) | | | | | | | | | | | 3,416 | | | | 48,475 | |
Cyfrowy Polsat SA (Consumer Discretionary, Media) † | | | | | | | | | | | 32,822 | | | | 199,055 | |
Dino Polska SA (Consumer Staples, Food & Staples Retailing) † | | | | | | | | | | | 5,641 | | | | 138,944 | |
Enea SA (Utilities, Electric Utilities) † | | | | | | | | | | | 21,895 | | | | 50,445 | |
Energa SA (Utilities, Electric Utilities) | | | | | | | | | | | 20,069 | | | | 45,480 | |
Eurocash SA (Consumer Staples, Food & Staples Retailing) | | | | | | | | | | | 9,264 | | | | 50,885 | |
Grupa Kety SA (Materials, Metals & Mining) | | | | | | | | | | | 1,227 | | | | 128,271 | |
Grupa Lotos SA (Energy, Oil, Gas & Consumable Fuels) | | | | | | | | | | | 9,880 | | | | 186,315 | |
ING Bank Slaski SA (Financials, Banks) | | | | | | | | | | | 3,191 | | | | 154,957 | |
Inter Cars SA (Consumer Discretionary, Distributors) | | | | | | | | | | | 1,474 | | | | 114,128 | |
Jastrzebska Spolka Weglowa SA (Materials, Metals & Mining) † | | | | | | | | | | | 5,922 | | | | 123,019 | |
Kruk SA (Financials, Consumer Finance) | | | | | | | | | | | 1,648 | | | | 92,032 | |
LPP SA (Consumer Discretionary, Textiles, Apparel & Luxury Goods) | | | | | | | | | | | 147 | | | | 365,051 | |
Orange Polska SA (Telecommunication Services, Diversified Telecommunication Services) † | | | | | | | | | | | 92,510 | | | | 121,293 | |
Orbis SA (Consumer Discretionary, Hotels, Restaurants & Leisure) | | | | | | | | | | | 1,253 | | | | 28,936 | |
Polska Grupa Energetyczna SA (Utilities, Electric Utilities) † | | | | | | | | | | | 74,931 | | | | 181,935 | |
Polski Koncern Naftowy Orlen SA (Energy, Oil, Gas & Consumable Fuels) | | | | | | | | | | | 33,143 | | | | 878,401 | |
Tauron Polska Energia SA (Utilities, Electric Utilities) † | | | | | | | | | | | 100,084 | | | | 54,002 | |
| | | | |
| | | | | | | | | | | | | | | 3,757,270 | |
| | | | | | | | | | | | | | | | |
| | | | |
| Russia: 2.35% | | | | | | | | | | | | | | | | |
Aeroflot PJSC (Industrials, Airlines) | | | | | | | | | | | 60,458 | | | | 103,370 | |
Alrosa PJSC (Materials, Metals & Mining) | | | | | | | | | | | 321,200 | | | | 482,225 | |
Bank Otkritie Financial Corporation PJSC (Financials, Banks) (a)† | | | | | | | | | | | 3,758 | | | | 0 | |
Credit Bank of Moscow PJSC (Financials, Banks) † | | | | | | | | | | | 1,306,800 | | | | 96,848 | |
Gazprom Neft PJSC (Energy, Oil, Gas & Consumable Fuels) | | | | | | | | | | | 22,315 | | | | 111,222 | |
Inter Rao Ues PJSC (Utilities, Electric Utilities) | | | | | | | | | | | 4,055,002 | | | | 240,379 | |
LSR Group PJSC (Real Estate, Real Estate Management & Development) | | | | | | | | | | | 4,827 | | | | 51,636 | |
Lukoil PJSC (Energy, Oil, Gas & Consumable Fuels) | | | | | | | | | | | 6,374 | | | | 441,783 | |
M.video PSJC (Consumer Discretionary, Specialty Retail) † | | | | | | | | | | | 8,350 | | | | 52,208 | |
Magnit PJSC (Consumer Staples, Food & Staples Retailing) | | | | | | | | | | | 7,642 | | | | 459,129 | |
Magnitogorsk Iron & Steel Works PJSC (Materials, Metals & Mining) | | | | | | | | | | | 193,300 | | | | 137,714 | |
Megafon PJSC (Telecommunication Services, Wireless Telecommunication Services) † | | | | | | | | | | | 24,520 | | | | 184,262 | |
MMC Norilsk Nickel PJSC (Materials, Metals & Mining) | | | | | | | | | | | 8,590 | | | | 1,427,981 | |
Mobile TeleSystems PJSC (Telecommunication Services, Wireless Telecommunication Services) | | | | | | | | | | | 116,754 | | | | 451,923 | |
Nizhnekamskneftekhim PJSC (Materials, Chemicals) † | | | | | | | | | | | 9,600 | | | | 8,107 | |
Novolipetsk Steel PJSC (Materials, Metals & Mining) | | | | | | | | | | | 103,510 | | | | 252,342 | |
The accompanying notes are an integral part of these financial statements.
| | | | |
| 78 | | Wells Fargo Funds | | Portfolio of investments—August 31, 2018 (unaudited) |
FACTOR ENHANCED EMERGING MARKETS PORTFOLIO
| | | | | | | | | | | | | | | | |
| Security name | | | | | | | | Shares | | | Value | |
| | | | |
| Russia (continued) | | | | | | | | | | | | | | | | |
PhosAgro PJSC (Materials, Chemicals) | | | | | | | | | | | 4,345 | | | $ | 167,378 | |
PIK Group PJSC (Real Estate, Real Estate Management & Development) | | | | | | | | | | | 18,799 | | | | 101,190 | |
Polyus PJSC (Materials, Metals & Mining) | | | | | | | | | | | 2,568 | | | | 164,101 | |
Rosgosstrakh PJSC (Financials, Insurance) † | | | | | | | | | | | 563,000 | | | | 3,078 | |
Rostelecom PJSC (Telecommunication Services, Diversified Telecommunication Services) | | | | | | | | | | | 118,730 | | | | 119,146 | |
RussNeft PJSC (Energy, Oil, Gas & Consumable Fuels) † | | | | | | | | | | | 6,482 | | | | 59,333 | |
Safmar Financial Investment PJSC (Financials, Consumer Finance) | | | | | | | | | | | 6,600 | | | | 76,274 | |
Severstal PJSC (Materials, Metals & Mining) | | | | | | | | | | | 18,660 | | | | 298,698 | |
Sistema PJSC (Telecommunication Services, Wireless Telecommunication Services) | | | | | | | | | | | 386,200 | | | | 47,378 | |
Tatneft PJSC (Energy, Oil, Gas & Consumable Fuels) | | | | | | | | | | | 105,840 | | | | 1,224,565 | |
Unipro PJSC (Utilities, Independent Power & Renewable Electricity Producers) | | | | | | | | | | | 1,140,000 | | | | 44,641 | |
United Wagon PJSC (Industrials, Road & Rail) † | | | | | | | | | | | 13,180 | | | | 105,723 | |
Uralkali PJSC (Materials, Chemicals) † | | | | | | | | | | | 37,200 | | | | 44,176 | |
VTB Bank PJSC (Financials, Banks) | | | | | | | | | | | 512,000,000 | | | | 314,056 | |
| | | | |
| | | | | | | | | | | | | | | 7,270,866 | |
| | | | | | | | | | | | | | | | |
| | | | |
| South Africa: 4.53% | | | | | | | | | | | | | | | | |
Absa Group Limited (Financials, Banks) | | | | | | | | | | | 69,157 | | | | 764,986 | |
ADvTECH Limited (Consumer Discretionary, Diversified Consumer Services) | | | | | | | | | | | 57,748 | | | | 59,929 | |
AECI Limited (Materials, Chemicals) | | | | | | | | | | | 10,163 | | | | 71,974 | |
Anglo American Platinum Limited (Materials, Metals & Mining) | | | | | | | | | | | 5,908 | | | | 172,878 | |
Anglogold Ashanti Limited (Materials, Metals & Mining) | | | | | | | | | | | 38,559 | | | | 309,364 | |
Aspen Pharmacare Holdings Limited (Health Care, Pharmaceuticals) | | | | | | | | | | | 36,820 | | | | 730,186 | |
Astral Foods Limited (Consumer Staples, Food Products) | | | | | | | | | | | 3,262 | | | | 57,464 | |
Attacq Limited (Real Estate, Real Estate Management & Development) | | | | | | | | | | | 78,449 | | | | 86,163 | |
Avi Limited (Consumer Staples, Food Products) | | | | | | | | | | | 29,591 | | | | 233,607 | |
Barloworld Limited (Industrials, Trading Companies & Distributors) | | | | | | | | | | | 18,063 | | | | 153,649 | |
Blue Label Telecoms Limited (Industrials, Commercial Services & Supplies) | | | | | | | | | | | 77,766 | | | | 37,891 | |
Capitec Bank Holdings Limited (Financials, Banks) | | | | | | | | | | | 5,560 | | | | 379,400 | |
Cashbuild Limited (Consumer Discretionary, Specialty Retail) | | | | | | | | | | | 2,711 | | | | 57,190 | |
Clicks Group Limited (Consumer Staples, Food & Staples Retailing) | | | | | | | | | | | 21,763 | | | | 300,639 | |
Coronation Fund Managers Limited (Financials, Capital Markets) | | | | | | | | | | | 15,754 | | | | 61,697 | |
Dis-Chem Pharmacies Limited (Consumer Staples, Food & Staples Retailing) | | | | | | | | | | | 85,372 | | | | 196,539 | |
Equites Property Fund Limited (Real Estate, Equity REITs) | | | | | | | | | | | 49,906 | | | | 67,922 | |
Fortress REIT Limited Class B (Real Estate, Equity REITs) | | | | | | | | | | | 101,851 | | | | 109,510 | |
Foschini Limited (Consumer Discretionary, Specialty Retail) | | | | | | | | | | | 22,815 | | | | 271,063 | |
Gold Fields Limited (Materials, Metals & Mining) | | | | | | | | | | | 80,814 | | | | 197,979 | |
Growthpoint Properties Limited (Real Estate, Equity REITs) | | | | | | | | | | | 255,488 | | | | 442,301 | |
Harmony Gold Mining Company Limited (Materials, Metals & Mining) | | | | | | | | | | | 40,768 | | | | 66,361 | |
Hyprop Investments Limited (Real Estate, Real Estate Management & Development) | | | | | | | | | | | 21,244 | | | | 147,457 | |
Imperial Holdings Limited (Consumer Discretionary, Distributors) | | | | | | | | | | | 17,798 | | | | 249,717 | |
Investec Limited (Financials, Capital Markets) | | | | | | | | | | | 22,687 | | | | 148,473 | |
Italtile Limited (Consumer Discretionary, Specialty Retail) | | | | | | | | | | | 105,075 | | | | 98,675 | |
JSE Limited (Financials, Capital Markets) | | | | | | | | | | | 7,675 | | | | 84,590 | |
KAP Industrial Holdings Limited (Industrials, Industrial Conglomerates) | | | | | | | | | | | 201,195 | | | | 102,001 | |
Kumba Iron Ore Limited (Materials, Metals & Mining) | | | | | | | | | | | 5,566 | | | | 100,408 | |
Liberty Holdings Limited (Financials, Insurance) | | | | | | | | | | | 11,498 | | | | 91,084 | |
Life Healthcare Group Holdings Limited (Health Care, Health Care Providers & Services) | | | | | | | | | | | 121,932 | | | | 221,212 | |
Massmart Holdings Limited (Consumer Staples, Food & Staples Retailing) | | | | | | | | | | | 9,078 | | | | 68,423 | |
The accompanying notes are an integral part of these financial statements.
| | | | | | |
| Portfolio of investments—August 31, 2018 (unaudited) | | Wells Fargo Funds | | | 79 | |
FACTOR ENHANCED EMERGING MARKETS PORTFOLIO
| | | | | | | | | | | | | | | | |
| Security name | | | | | | | | Shares | | | Value | |
| | | | |
| South Africa (continued) | | | | | | | | | | | | | | | | |
MMI Holdings Limited (Financials, Insurance) | | | | | | | | | | | 96,694 | | | $ | 112,848 | |
Mondi Limited (Materials, Paper & Forest Products) | | | | | | | | | | | 10,319 | | | | 288,047 | |
Montauk Holdings Limited (Utilities, Independent Power & Renewable Electricity Producers) | | | | | | | | | | | 8,845 | | | | 56,573 | |
Mr. Price Group Limited (Consumer Discretionary, Specialty Retail) | | | | | | | | | | | 24,667 | | | | 378,255 | |
Nampak Limited (Materials, Containers & Packaging) † | | | | | | | | | | | 62,410 | | | | 66,933 | |
Nedbank Group Limited (Financials, Banks) | | | | | | | | | | | 18,964 | | | | 358,735 | |
Netcare Limited (Health Care, Health Care Providers & Services) | | | | | | | | | | | 119,502 | | | | 238,679 | |
Omnia Holdings Limited (Materials, Chemicals) | | | | | | | | | | | 7,084 | | | | 62,669 | |
Pepkor Holdings Limited (Consumer Discretionary, Household Durables) † | | | | | | | | | | | 106,555 | | | | 130,520 | |
Pick’n Pay Stores Limited (Consumer Staples, Food & Staples Retailing) | | | | | | | | | | | 30,936 | | | | 152,627 | |
Pioneer Foods Group Limited (Consumer Staples, Food Products) | | | | | | | | | | | 16,832 | | | | 120,842 | |
PPC Limited (Materials, Construction Materials) | | | | | | | | | | | 134,035 | | | | 56,004 | |
PSG Group Limited (Financials, Diversified Financial Services) | | | | | | | | | | | 16,592 | | | | 254,091 | |
Redefine Properties Limited (Real Estate, Equity REITs) | | | | | | | | | | | 480,178 | | | | 338,200 | |
Resilient REIT Limited (Real Estate, Equity REITs) | | | | | | | | | | | 37,321 | | | | 144,738 | |
Reunert Limited (Industrials, Industrial Conglomerates) | | | | | | | | | | | 14,654 | | | | 75,828 | |
SA Corporate Real Estate Limited REIT (Real Estate, Equity REITs) | | | | | | | | | | | 192,027 | | | | 57,236 | |
Santam Limited (Financials, Insurance) | | | | | | | | | | | 4,384 | | | | 90,446 | |
Sappi Limited (Materials, Paper & Forest Products) | | | | | | | | | | | 47,376 | | | | 323,653 | |
Shoprite Holdings Limited (Consumer Staples, Food & Staples Retailing) | | | | | | | | | | | 43,109 | | | | 598,451 | |
Sibanye Gold Limited (Materials, Metals & Mining) † | | | | | | | | | | | 227,342 | | | | 132,275 | |
SPAR Group Limited (Consumer Staples, Food & Staples Retailing) | | | | | | | | | | | 16,429 | | | | 229,190 | |
Standard Bank Group Limited (Financials, Banks) | | | | | | | | | | | 112,410 | | | | 1,425,415 | |
Super Group Limited (Consumer Staples, Food & Staples Retailing) † | | | | | | | | | | | 39,969 | | | | 107,164 | |
Telkom South Africa Limited (Telecommunication Services, Diversified Telecommunication Services) | | | | | | | | | | | 26,522 | | | | 90,765 | |
The Bidvest Group Limited (Industrials, Industrial Conglomerates) | | | | | | | | | | | 30,215 | | | | 444,127 | |
Tiger Brands Limited (Consumer Staples, Food Products) | | | | | | | | | | | 16,762 | | | | 326,537 | |
Tongaat-Hulett Limited (Consumer Staples, Food Products) | | | | | | | | | �� | | 9,684 | | | | 52,114 | |
Truworths International Limited (Consumer Discretionary, Specialty Retail) | | | | | | | | | | | 41,328 | | | | 241,978 | |
Tsogo Sun Holdings Limited (Consumer Discretionary, Hotels, Restaurants & Leisure) | | | | | | | | | | | 55,437 | | | | 79,298 | |
Vodacom Group Proprietary Limited (Telecommunication Services, Wireless Telecommunication Services) | | | | | | | | | | | 38,268 | | | | 329,139 | |
Vukile Property Fund Limited REIT (Real Estate, Equity REITs) | | | | | | | | | | | 69,269 | | | | 94,747 | |
Wilson Bayly Holmes Ovcon Limited (Industrials, Construction & Engineering) | | | | | | | | | | | 7,160 | | | | 72,989 | |
Woolworths Holdings Limited (Consumer Discretionary, Multiline Retail) | | | | | | | | | | | 96,310 | | | | 355,354 | |
| | | | |
| | | | | | | | | | | | | | | 14,027,199 | |
| | | | | | | | | | | | | | | | |
| | | | |
| South Korea: 17.87% | | | | | | | | | | | | | | | | |
Amorepacific Group (Consumer Staples, Personal Products) | | | | | | | | | | | 4,310 | | | | 373,251 | |
Asiana Airlines (Industrials, Airlines) † | | | | | | | | | | | 17,377 | | | | 65,877 | |
BH Company Limited (Information Technology, Electronic Equipment, Instruments & Components) † | | | | | | | | | | | 2,373 | | | | 54,041 | |
BNK Financial Group Incorporated (Financials, Banks) | | | | | | | | | | | 34,360 | | | | 257,434 | |
Bukwang Pharmaceutical Company (Health Care, Pharmaceuticals) | | | | | | | | | | | 3,808 | | | | 88,260 | |
Cafe24 Corporation (Information Technology, Internet Software & Services) † | | | | | | | | | | | 546 | | | | 79,363 | |
Celltrion Incorporated (Health Care, Pharmaceuticals) † | | | | | | | | | | | 7,362 | | | | 1,785,689 | |
Celltrion Pharm Incorporated (Health Care, Pharmaceuticals) † | | | | | | | | | | | 1,713 | | | | 123,264 | |
Chabiotech Company Limited (Health Care, Health Care Providers & Services) † | | | | | | | | | | | 5,530 | | | | 95,632 | |
Cheil Worldwide Incorporated (Consumer Discretionary, Media) | | | | | | | | | | | 9,686 | | | | 167,938 | |
Chong Kun Dang Pharmaceutical Corporation (Health Care, Pharmaceuticals) | | | | | | | | | | | 858 | | | | 83,630 | |
CJ CGV Company Limited (Consumer Discretionary, Media) | | | | | | | | | | | 1,408 | | | | 67,039 | |
The accompanying notes are an integral part of these financial statements.
| | | | |
| 80 | | Wells Fargo Funds | | Portfolio of investments—August 31, 2018 (unaudited) |
FACTOR ENHANCED EMERGING MARKETS PORTFOLIO
| | | | | | | | | | | | | | | | |
| Security name | | | | | | | | Shares | | | Value | |
| | | | |
| South Korea (continued) | | | | | | | | | | | | | | | | |
CJ Cheiljedang Corporation (Consumer Staples, Food Products) | | | | | | | | | | | 938 | | | $ | 288,609 | |
CJ Corporation (Industrials, Industrial Conglomerates) | | | | | | | | | | | 1,797 | | | | 213,093 | |
CJ Korea Express Corporation (Industrials, Road & Rail) † | | | | | | | | | | | 1,478 | | | | 204,476 | |
CJ O Shopping Company Limited (Consumer Discretionary, Internet & Direct Marketing Retail) | | | | | | | | | | | 456 | | | | 103,231 | |
Com2us Corporation (Information Technology, Software) | | | | | | | | | | | 949 | | | | 132,910 | |
Cosmax Incorporated (Consumer Staples, Personal Products) | | | | | | | | | | | 888 | | | | 121,256 | |
Coway Company Limited (Consumer Discretionary, Household Durables) | | | | | | | | | | | 4,879 | | | | 400,611 | |
DAEA TI Company Limited (Information Technology, Electronic Equipment, Instruments & Components) | | | | | | | | | | | 7,239 | | | | 54,497 | |
Daelim Industrial Company Limited (Industrials, Construction & Engineering) | | | | | | | | | | | 3,118 | | | | 229,407 | |
Daesang Corporation (Consumer Staples, Food Products) | | | | | | | | | | | 2,776 | | | | 66,336 | |
Daewoo Engineering & Construction Company Limited (Industrials, Construction & Engineering) † | | | | | | | | | | | 22,865 | | | | 107,634 | |
Daewoo International Corporation (Industrials, Trading Companies & Distributors) | | | | | | | | | | | 5,057 | | | | 82,909 | |
Daewoo Securities Company Limited (Financials, Capital Markets) | | | | | | | | | | | 65,053 | | | | 480,381 | |
Daewoo Shipbuilding & Marine Engineering Company Limited (Industrials, Machinery) † | | | | | | | | | | | 4,431 | | | | 113,248 | |
Daewoong Company Limited (Health Care, Pharmaceuticals) | | | | | | | | | | | 4,745 | | | | 79,073 | |
Daewoong Pharmaceutical Company (Health Care, Pharmaceuticals) | | | | | | | | | | | 629 | | | | 115,838 | |
Daishin Securities Company Limited (Financials, Capital Markets) | | | | | | | | | | | 5,573 | | | | 61,079 | |
Daou Technology Incorporated (Technology, Capital Markets) | | | | | | | | | | | 3,134 | | | | 63,910 | |
DB HiTek Company Limited (Information Technology, Semiconductors & Semiconductor Equipment) | | | | | | | | | | | 4,669 | | | | 76,967 | |
Dentium Company Limited (Health Care, Health Care Equipment & Supplies) | | | | | | | | | | | 966 | | | | 81,227 | |
DGB Financial Group Incorporated (Financials, Banks) | | | | | | | | | | | 18,946 | | | | 174,457 | |
Dongbu Insurance Company Limited (Financials, Insurance) | | | | | | | | | | | 6,103 | | | | 350,889 | |
Dongkuk Steel Mill Company Limited (Materials, Metals & Mining) | | | | | | | | | | | 7,567 | | | | 63,628 | |
Doosan Bobcat Incorporated (Industrials, Machinery) | | | | | | | | | | | 4,249 | | | | 135,889 | |
Doosan Corporation (Industrials, Industrial Conglomerates) | | | | | | | | | | | 2,024 | | | | 212,737 | |
Doosan Heavy Industries & Construction Company Limited (Industrials, Electrical Equipment) † | | | | | | | | | | | 8,156 | | | | 103,676 | |
Doosan Infracore Company Limited (Industrials, Machinery) † | | | | | | | | | | | 14,875 | | | | 127,216 | |
DoubleUGames Company Limited (Consumer Discretionary, Hotels, Restaurants & Leisure) | | | | | | | | | | | 954 | | | | 59,735 | |
Douzone Bizon Company Limited (Information Technology, Software) | | | | | | | | | | | 2,076 | | | | 106,304 | |
E-MART Incorporated (Consumer Staples, Food & Staples Retailing) | | | | | | | | | | | 2,134 | | | | 411,214 | |
Ecopro Company Limited (Materials, Chemicals) † | | | | | | | | | | | 1,850 | | | | 65,398 | |
EO Technics Company Limited (Information Technology, Semiconductors & Semiconductor Equipment) | | | | | | | | | | | 1,017 | | | | 54,635 | |
Fila Korea Limited (Consumer Discretionary, Textiles, Apparel & Luxury Goods) | | | | | | | | | | | 5,238 | | | | 196,457 | |
Genexine Company Limited (Health Care, Biotechnology) † | | | | | | | | | | | 1,428 | | | | 128,156 | |
Grand Korea Leisure Company Limited (Consumer Discretionary, Hotels, Restaurants & Leisure) | | | | | | | | | | | 3,292 | | | | 71,421 | |
Green Cross Corporation (Health Care, Biotechnology) | | | | | | | | | | | 706 | | | | 124,310 | |
Green Cross Holdings Corporation (Health Care, Biotechnology) | | | | | | | | | | | 4,397 | | | | 121,069 | |
GS Engineering & Construction Corporation (Industrials, Construction & Engineering) | | | | | | | | | | | 6,531 | | | | 281,036 | |
GS Holdings Corporation (Energy, Oil, Gas & Consumable Fuels) | | | | | | | | | | | 10,100 | | | | 481,795 | |
GS Home Shopping Incorporated (Consumer Discretionary, Internet & Direct Marketing Retail) | | | | | | | | | | | 559 | | | | 104,202 | |
GS Retail Company Limited (Consumer Staples, Food & Staples Retailing) | | | | | | | | | | | 2,947 | | | | 98,485 | |
Hana Tour Service Incorporated (Consumer Discretionary, Hotels, Restaurants & Leisure) | | | | | | | | | | | 1,091 | | | | 68,901 | |
Hanall Biopharma Company Limited (Health Care, Pharmaceuticals) † | | | | | | | | | | | 3,355 | | | | 95,543 | |
Handsome Company Limited (Consumer Discretionary, Textiles, Apparel & Luxury Goods) | | | | | | | | | | | 2,136 | | | | 74,644 | |
Hanil Cement Company Limited (Materials, Construction Materials) | | | | | | | | | | | 274 | | | | 19,569 | |
Hanjin Kal Corporation (Industrials, Airlines) | | | | | | | | | | | 5,945 | | | | 96,667 | |
Hankook Tire Company Limited (Consumer Discretionary, Auto Components) | | | | | | | | | | | 8,334 | | | | 349,262 | |
Hanmi Pharm Company Limited (Health Care, Pharmaceuticals) | | | | | | | | | | | 564 | | | | 252,068 | |
Hanmi Science Company Limited (Health Care, Pharmaceuticals) | | | | | | | | | | | 2,975 | | | | 232,249 | |
Hanon Systems (Consumer Discretionary, Auto Components) | | | | | | | | | | | 16,602 | | | | 178,973 | |
The accompanying notes are an integral part of these financial statements.
| | | | | | |
| Portfolio of investments—August 31, 2018 (unaudited) | | Wells Fargo Funds | | | 81 | |
FACTOR ENHANCED EMERGING MARKETS PORTFOLIO
| | | | | | | | | | | | | | | | |
| Security name | | | | | | | | Shares | | | Value | |
| | | | |
| South Korea (continued) | | | | | | | | | | | | | | | | |
Hansol Chemical Company Limited (Materials, Chemicals) | | | | | | | | | | | 1,082 | | | $ | 80,872 | |
Hanssem Company Limited (Consumer Discretionary, Household Durables) | | | | | | | | | | | 2,051 | | | | 152,008 | |
Hanwha Chem Corporation (Materials, Chemicals) | | | | | | | | | | | 10,729 | | | | 195,178 | |
Hanwha Corporation (Korea) (Industrials, Industrial Conglomerates) | | | | | | | | | | | 5,952 | | | | 170,302 | |
Hanwha Life Insurance Company Limited (Financials, Insurance) | | | | | | | | | | | 46,176 | | | | 201,189 | |
Hanwha Techwin Company Limited (Industrials, Aerospace & Defense) † | | | | | | | | | | | 4,010 | | | | 90,060 | |
HDC Hyundai Development Co-Engineering & Construction (Industrials, Construction & Engineering) † | | | | | | | | | | | 4,039 | | | | 202,830 | |
Hite Jinro Company Limited (Consumer Staples, Beverages) | | | | | | | | | | | 4,475 | | | | 67,538 | |
Hotel Shilla Company Limited (Consumer Discretionary, Specialty Retail) | | | | | | | | | | | 3,878 | | | | 376,251 | |
Huchems Fine Chemical Corporation (Materials, Chemicals) | | | | | | | | | | | 2,585 | | | | 58,869 | |
Hugel Incorporated (Health Care, Biotechnology) † | | | | | | | | | | | 258 | | | | 99,339 | |
Hyosung Corporation (Materials, Chemicals) | | | | | | | | | | | 949 | | | | 39,131 | |
Hyundai Construction Equipment Corporation (Industrials, Machinery) † | | | | | | | | | | | 724 | | | | 76,748 | |
Hyundai Department Store Company Limited (Consumer Discretionary, Multiline Retail) | | | | | | | | | | | 2,011 | | | | 179,936 | |
Hyundai Development Company (Industrials, Construction & Engineering) | | | | | | | | | | | 3,351 | | | | 73,754 | |
Hyundai Elevator Company (Industrials, Machinery) | | | | | | | | | | | 2,624 | | | | 215,219 | |
Hyundai Engineering & Construction Company Limited (Industrials, Construction & Engineering) | | | | | | | | | | | 8,191 | | | | 441,504 | |
Hyundai Glovis Company Limited (Industrials, Air Freight & Logistics) | | | | | | | | | | | 2,108 | | | | 229,141 | |
Hyundai Greenfood Company Limited (Consumer Staples, Food & Staples Retailing) | | | | | | | | | | | 7,233 | | | | 84,796 | |
Hyundai Home Shopping Network Corporation (Consumer Discretionary, Internet & Direct Marketing Retail) | | | | | | | | | | | 1,096 | | | | 111,751 | |
Hyundai Marine & Fire Insurance Company Limited (Financials, Insurance) | | | | | | | | | | | 7,708 | | | | 257,591 | |
Hyundai Merchant Marine Company Limited (Industrials, Marine) † | | | | | | | | | | | 26,696 | | | | 109,120 | |
Hyundai Mipo Dockyard Company Limited (Industrials, Machinery) † | | | | | | | | | | | 1,292 | | | | 113,514 | |
Hyundai Mobis Company (Consumer Discretionary, Auto Components) | | | | | | | | | | | 6,936 | | | | 1,395,736 | |
Hyundai Motor Company (Consumer Discretionary, Automobiles) | | | | | | | | | | | 17,044 | | | | 1,913,938 | |
Hyundai Robotics Company Limited (Information Technology, Semiconductors & Semiconductor Equipment) † | | | | | | | | | | | 1,154 | | | | 391,353 | |
Hyundai Rotem Company (Industrials, Machinery) † | | | | | | | | | | | 4,478 | | | | 109,622 | |
Hyundai Steel Company (Materials, Metals & Mining) | | | | | | | | | | | 8,649 | | | | 414,133 | |
Hyundai Wia Corporation (Consumer Discretionary, Auto Components) | | | | | | | | | | | 1,998 | | | | 76,553 | |
Ilyang Pharmaceutical Company Limited (Health Care, Pharmaceuticals) † | | | | | | | | | | | 2,397 | | | | 72,783 | |
Industrial Bank of Korea (Financials, Banks) | | | | | | | | | | | 28,751 | | | | 384,845 | |
ING Life Insurance Korea Limited (Financials, Insurance) | | | | | | | | | | | 3,658 | | | | 114,359 | |
Innocean Worldwide Incorporated (Consumer Discretionary, Media) | | | | | | | | | | | 1,212 | | | | 63,586 | |
Inscobee Incorporated (Telecommunication Services, Diversified Telecommunication Services) † | | | | | | | | | | | 9,737 | | | | 86,335 | |
JB Financial Group Company Limited (Financials, Banks) | | | | | | | | | | | 18,342 | | | | 102,326 | |
JYP Entertainment Corporation (Consumer Discretionary, Media) † | | | | | | | | | | | 3,045 | | | | 88,219 | |
Kakao Corporation (Information Technology, Internet Software & Services) | | | | | | | | | | | 4,786 | | | | 537,439 | |
Kangwon Land Incorporated (Consumer Discretionary, Hotels, Restaurants & Leisure) | | | | | | | | | | | 13,065 | | | | 339,785 | |
KCC Corporation (Industrials, Building Products) | | | | | | | | | | | 766 | | | | 223,301 | |
KEPCO Plant Service & Engineering Company Limited (Industrials, Commercial Services & Supplies) | | | | | | | | | | | 2,458 | | | | 80,377 | |
Kia Motors Corporation (Consumer Discretionary, Automobiles) | | | | | | | | | | | 27,455 | | | | 790,489 | |
Kiwoom Securities Company (Financials, Capital Markets) | | | | | | | | | | | 1,248 | | | | 103,369 | |
Koh Young Technology Incorporated (Information Technology, Semiconductors & Semiconductor Equipment) | | | | | | | | | | | 1,248 | | | | 119,177 | |
Kolon Industries Incorporated (Materials, Chemicals) | | | | | | | | | | | 1,908 | | | | 116,213 | |
Kolon Life Science Incorporated (Health Care, Pharmaceuticals) † | | | | | | | | | | | 965 | | | | 69,439 | |
Korea Electric Power Corporation (Utilities, Electric Utilities) | | | | | | | | | | | 33,667 | | | | 922,466 | |
Korea Gas Corporation (Utilities, Gas Utilities) † | | | | | | | | | | | 5,444 | | | | 257,247 | |
Korea Investment Holdings Company Limited (Financials, Capital Markets) | | | | | | | | | | | 4,544 | | | | 291,054 | |
Korea Kolmar Company Limited (Consumer Staples, Personal Products) | | | | | | | | | | | 1,585 | | | | 105,795 | |
Korea Petrochemical Industrial Company Limited (Materials, Chemicals) | | | | | | | | | | | 435 | | | | 84,214 | |
The accompanying notes are an integral part of these financial statements.
| | | | |
| 82 | | Wells Fargo Funds | | Portfolio of investments—August 31, 2018 (unaudited) |
FACTOR ENHANCED EMERGING MARKETS PORTFOLIO
| | | | | | | | | | | | | | | | |
| Security name | | | | | | | | Shares | | | Value | |
| | | | |
| South Korea (continued) | | | | | | | | | | | | | | | | |
Korea Real Estate Investment & Trust Company Limited (Real Estate, Real Estate Management & Development) | | | | | | | | | | | 20,326 | | | $ | 52,588 | |
Korea Reinsurance Company (Financials, Insurance) | | | | | | | | | | | 14,093 | | | | 131,669 | |
Korea Zinc Company Limited (Materials, Metals & Mining) | | | | | | | | | | | 1,517 | | | | 552,615 | |
Korean Air Lines Company Limited (Industrials, Airlines) | | | | | | | | | | | 7,888 | | | | 198,768 | |
KT&G Corporation (Consumer Staples, Tobacco) | | | | | | | | | | | 14,520 | | | | 1,317,450 | |
Kumho Petrochemical Company Limited (Materials, Chemicals) | | | | | | | | | | | 2,519 | | | | 230,821 | |
Kumho Tire Company Incorporated (Consumer Discretionary, Auto Components) † | | | | | | | | | | | 15,865 | | | | 77,675 | |
L&F Company Limited (Information Technology, Electronic Equipment, Instruments & Components) | | | | | | | | | | | 2,110 | | | | 91,648 | |
LF Corporation (Consumer Discretionary, Textiles, Apparel & Luxury Goods) | | | | | | | | | | | 2,603 | | | | 62,085 | |
LG Chem Limited (Materials, Chemicals) | | | | | | | | | | | 4,824 | | | | 1,586,115 | |
LG Corporation (Industrials, Industrial Conglomerates) | | | | | | | | | | | 13,506 | | | | 867,519 | |
LG Display Company Limited (Information Technology, Electronic Equipment, Instruments & Components) | | | | | | | | | | | 21,112 | | | | 403,027 | |
LG Electronics Incorporated (Consumer Discretionary, Household Durables) | | | | | | | | | | | 11,634 | | | | 802,669 | |
LG Household & Health Care Limited (Consumer Staples, Personal Products) | | | | | | | | | | | 1,078 | | | | 1,225,055 | |
LG Innotek Company Limited (Information Technology, Electronic Equipment, Instruments & Components) | | | | | | | | | | | 1,242 | | | | 160,110 | |
LG International Corporation (Industrials, Trading Companies & Distributors) | | | | | | | | | | | 3,538 | | | | 67,699 | |
LG Uplus Corporation (Telecommunication Services, Diversified Telecommunication Services) | | | | | | | | | | | 28,756 | | | | 405,578 | |
Loen Entertainment Incorporated (Consumer Discretionary, Media) (a) | | | | | | | | | | | 683 | | | | 61,534 | |
Lotte Chemical Corporation (Materials, Chemicals) | | | | | | | | | | | 1,679 | | | | 476,633 | |
Lotte Chilsung Beverage Company Limited (Consumer Staples, Beverages) | | | | | | | | | | | 68 | | | | 82,469 | |
Lotte Confectionery Company Limited (Industrials, Industrial Conglomerates) | | | | | | | | | | | 10,547 | | | | 456,691 | |
Lotte Fine Chemical Company Limited (Materials, Chemicals) | | | | | | | | | | | 1,933 | | | | 105,580 | |
Lotte Food Company Limited (Consumer Staples, Food Products) | | | | | | | | | | | 116 | | | | 85,451 | |
LOTTE Himart Company Limited (Consumer Discretionary, Specialty Retail) | | | | | | | | | | | 1,312 | | | | 84,390 | |
Lotte Shopping Company Limited (Consumer Discretionary, Multiline Retail) | | | | | | | | | | | 501 | | | | 81,013 | |
LS Corporation (Industrials, Electrical Equipment) | | | | | | | | | | | 3,588 | | | | 216,605 | |
LS Industrial Systems Company Limited (Industrials, Electrical Equipment) | | | | | | | | | | | 1,665 | | | | 107,096 | |
Mando Corporation (Consumer Discretionary, Auto Components) | | | | | | | | | | | 3,387 | | | | 108,777 | |
Medy-Tox Incorporated (Health Care, Biotechnology) | | | | | | | | | | | 433 | | | | 260,543 | |
Meritz Financial Group Incorporated (Financials, Diversified Financial Services) | | | | | | | | | | | 5,519 | | | | 60,983 | |
Meritz Fire & Marine Insurance Company Limited (Financials, Insurance) | | | | | | | | | | | 5,552 | | | | 91,025 | |
Meritz Securities Company Limited (Financials, Capital Markets) | | | | | | | | | | | 34,503 | | | | 122,743 | |
Mirae Asset Life Insurance Company Limited (Financials, Insurance) | | | | | | | | | | | 17,170 | | | | 80,054 | |
Naver Corporation (Information Technology, Internet Software & Services) | | | | | | | | | | | 3,399 | | | | 2,296,230 | |
NCsoft Corporation (Information Technology, Software) | | | | | | | | | | | 1,666 | | | | 579,953 | |
NH Investment & Securities Company Class C (Financials, Capital Markets) | | | | | | | | | | | 15,557 | | | | 187,973 | |
NHN Entertainment Corporation (Information Technology, Software) † | | | | | | | | | | | 1,061 | | | | 57,475 | |
Nong Shim Company Limited (Consumer Staples, Food Products) | | | | | | | | | | | 458 | | | | 102,656 | |
OIC Company Limited (Materials, Chemicals) | | | | | | | | | | | 2,202 | | | | 228,479 | |
Orion Holdings Corporation (Consumer Staples, Food Products) | | | | | | | | | | | 1 | | | | 18 | |
Osstem Implant Company Limited (Health Care, Health Care Equipment & Supplies) † | | | | | | | | | | | 1,057 | | | | 47,288 | |
Ottogi Corporation (Consumer Staples, Food Products) | | | | | | | | | | | 251 | | | | 163,478 | |
Pan Ocean Company Limited (Industrials, Marine) † | | | | | | | | | | | 23,678 | | | | 109,759 | |
Paradise Company Limited (Consumer Discretionary, Hotels, Restaurants & Leisure) | | | | | | | | | | | 5,991 | | | | 108,986 | |
Pharmicell Company Limited (Health Care, Biotechnology) † | | | | | | | | | | | 5,264 | | | | 85,593 | |
Poongsan Corporation (Materials, Metals & Mining) | | | | | | | | | | | 2,005 | | | | 60,610 | |
POSCO (Materials, Metals & Mining) | | | | | | | | | | | 9,416 | | | | 2,761,824 | |
POSCO Chemtech Company Limited (Materials, Construction Materials) | | | | | | | | | | | 2,058 | | | | 111,853 | |
S-Oil Corporation (Energy, Oil, Gas & Consumable Fuels) | | | | | | | | | | | 4,244 | | | | 455,606 | |
S1 Corporation Incorporated (Industrials, Commercial Services & Supplies) | | | | | | | | | | | 2,406 | | | | 185,235 | |
The accompanying notes are an integral part of these financial statements.
| | | | | | |
| Portfolio of investments—August 31, 2018 (unaudited) | | Wells Fargo Funds | | | 83 | |
FACTOR ENHANCED EMERGING MARKETS PORTFOLIO
| | | | | | | | | | | | | | | | |
| Security name | | | | | | | | Shares | | | Value | |
| | | | |
| South Korea (continued) | | | | | | | | | | | | | | | | |
Samsung Card Company Limited (Financials, Consumer Finance) | | | | | | | | | | | 3,939 | | | $ | 124,736 | |
Samsung Electro-Mechanics Company Limited (Information Technology, Electronic Equipment, Instruments & Components) | | | | | | | | | | | 5,269 | | | | 762,080 | |
Samsung Engineering Company Limited (Industrials, Construction & Engineering) † | | | | | | | | | | | 17,207 | | | | 260,466 | |
Samsung Fire & Marine Insurance Company Limited (Financials, Insurance) | | | | | | | | | | | 4,311 | | | | 1,026,290 | |
Samsung SDS Company Limited (Information Technology, Technology Hardware, Storage & Peripherals) | | | | | | | | | | | 3,938 | | | | 857,894 | |
Samsung Securities Company Limited (Financials, Capital Markets) | | | | | | | | | | | 6,750 | | | | 196,166 | |
Samyang Holdings Corporation (Consumer Staples, Food Products) | | | | | | | | | | | 893 | | | | 81,827 | |
Seegene Incorporated (Health Care, Biotechnology) † | | | | | | | | | | | 2,835 | | | | 65,326 | |
Seoul Semiconductor Company Limited (Information Technology, Semiconductors & Semiconductor Equipment) | | | | | | | | | | | 4,095 | | | | 64,930 | |
SFA Engineering Corporation (Information Technology, Electronic Equipment, Instruments & Components) | | | | | | | | | | | 2,180 | | | | 74,811 | |
Shinsegae Company Limited (Consumer Discretionary, Multiline Retail) | | | | | | | | | | | 821 | | | | 239,334 | |
SK Chemicals Company Limited (Materials, Chemicals) | | | | | | | | | | | 1,342 | | | | 38,820 | |
SK Company Limited (Industrials, Industrial Conglomerates) | | | | | | | | | | | 4,967 | | | | 1,173,535 | |
SK Hynix Incorporated (Information Technology, Semiconductors & Semiconductor Equipment) | | | | | | | | | | | 57,600 | | | | 4,294,839 | |
SK Innovation Company Limited (Energy, Oil, Gas & Consumable Fuels) | | | | | | | | | | | 6,708 | | | | 1,163,045 | |
SK Networks Company Limited (Industrials, Trading Companies & Distributors) | | | | | | | | | | | 19,105 | | | | 76,890 | |
SK Telecom Company Limited (Telecommunication Services, Wireless Telecommunication Services) | | | | | | | | | | | 6,217 | | | | 1,466,076 | |
SKC Company Limited (Materials, Chemicals) | | | | | | | | | | | 2,387 | | | | 100,892 | |
SM Entertainment Company (Consumer Discretionary, Media) † | | | | | | | | | | | 2,021 | | | | 88,146 | |
Soulbrain Company Limited (Materials, Chemicals) | | | | | | | | | | | 1,228 | | | | 72,920 | |
Ssangyong Cement Industrial Company Limited (Materials, Construction Materials) | | | | | | | | | | | 12,988 | | | | 71,174 | |
Studio Dragon Corporation (Consumer Discretionary, Media) † | | | | | | | | | | | 900 | | | | 89,341 | |
Taekwang Industrial Company Limited (Materials, Chemicals) | | | | | | | | | | | 70 | | | | 101,244 | |
Wonik IPS Company Limited (Information Technology, Semiconductors & Semiconductor Equipment) | | | | | | | | | | | 3,349 | | | | 80,329 | |
Young Poong Corporation (Materials, Metals & Mining) | | | | | | | | | | | 111 | | | | 72,395 | |
Youngone Corporation (Consumer Discretionary, Textiles, Apparel & Luxury Goods) | | | | | | | | | | | 2,650 | | | | 82,489 | |
Yuhan Corporation (Health Care, Pharmaceuticals) | | | | | | | | | | | 1,024 | | | | 219,859 | |
Yungjin Pharmaceutical Company (Health Care, Pharmaceuticals) † | | | | | | | | | | | 10,334 | | | | 74,361 | |
| | | | |
| | | | | | | | | | | | | | | 55,317,398 | |
| | | | | | | | | | | | | | | | |
| | | | |
| Spain: 0.03% | | | | | | | | | | | | | | | | |
AmRest Holdings SE (Consumer Discretionary, Hotels, Restaurants & Leisure) † | | | | | | | | | | | 812 | | | | 88,939 | |
| | | | | | | | | | | | | | | | |
| | | | |
| Taiwan: 14.82% | | | | | | | | | | | | | | | | |
Accton Technology Corporation (Information Technology, Communications Equipment) | | | | | | | | | | | 41,000 | | | | 146,166 | |
Acer Incorporated (Information Technology, Technology Hardware, Storage & Peripherals) | | | | | | | | | | | 307,000 | | | | 256,874 | |
Advantech Company Limited (Information Technology, Technology Hardware, Storage & Peripherals) | | | | | | | | | | | 41,000 | | | | 278,984 | |
Aerospace industrial Development Corporation (Industrials, Aerospace & Defense) | | | | | | | | | | | 74,000 | | | | 73,482 | |
ASE Industrial Holding Company Limited (Information Technology, Semiconductors & Semiconductor Equipment) | | | | | | | | | | | 349,000 | | | | 855,598 | |
Asia Cement Corporation (Materials, Construction Materials) | | | | | | | | | | | 205,000 | | | | 279,318 | |
Asia Optical Company Incorporated (Information Technology, Electronic Equipment, Instruments & Components) | | | | | | | | | | | 27,000 | | | | 71,027 | |
Asustek Computer Incorporated (Information Technology, Technology Hardware, Storage & Peripherals) | | | | | | | | | | | 78,000 | | | | 664,073 | |
AU Optronics Corporation (Information Technology, Electronic Equipment, Instruments & Components) | | | | | | | | | | | 865,000 | | | | 374,556 | |
BizLink Holding Incorporated (Industrials, Electrical Equipment) | | | | | | | | | | | 11,000 | | | | 57,122 | |
Capital Securities Corporation (Financials, Capital Markets) | | | | | | | | | | | 331,700 | | | | 111,773 | |
Career Technology Company Limited (Information Technology, Electronic Equipment, Instruments & Components) | | | | | | | | | | | 47,000 | | | | 77,887 | |
Cathay No.1 REIT (Real Estate, Equity REITs) | | | | | | | | | | | 126,500 | | | | 62,272 | |
Chailease Holding Company Limited (Financials, Diversified Financial Services) | | | | | | | | | | | 137,700 | | | | 468,489 | |
Chang Hwa Commercial Bank (Financials, Banks) | | | | | | | | | | | 657,000 | | | | 408,553 | |
The accompanying notes are an integral part of these financial statements.
| | | | |
| 84 | | Wells Fargo Funds | | Portfolio of investments—August 31, 2018 (unaudited) |
FACTOR ENHANCED EMERGING MARKETS PORTFOLIO
| | | | | | | | | | | | | | | | |
| Security name | | | | | | | | Shares | | | Value | |
| | | | |
| Taiwan (continued) | | | | | | | | | | | | | | | | |
Cheng Loong Corporation (Materials, Containers & Packaging) | | | | | | | | | | | 123,000 | | | $ | 85,898 | |
Cheng Uei Precision Industry Company Limited (Information Technology, Electronic Equipment, Instruments & Components) | | | | | | | | | | | 39,000 | | | | 35,616 | |
Chicony Electronics Company Limited (Information Technology, Technology Hardware, Storage & Peripherals) | | | | | | | | | | | 67,335 | | | | 141,619 | |
Chilisin Electronics Corporation (Information Technology, Electronic Equipment, Instruments & Components) | | | | | | | | | | | 20,000 | | | | 72,277 | |
Chin Poon Industrial Company Limited (Information Technology, Electronic Equipment, Instruments & Components) | | | | | | | | | | | 35,000 | | | | 43,244 | |
China Airlines (Industrials, Airlines) | | | | | | | | | | | 383,000 | | | | 117,338 | |
China Bills Finance Corporation (Financials, Capital Markets) | | | | | | | | | | | 240,000 | | | | 110,174 | |
China Development Financial Holding Corporation (Financials, Banks) | | | | | | | | | | | 1,556,000 | | | | 562,318 | |
China Life Insurance Company - Taiwan Exchange (Financials, Insurance) | | | | | | | | | | | 329,660 | | | | 327,889 | |
China Motor Company Limited (Consumer Discretionary, Automobiles) | | | | | | | | | | | 95,000 | | | | 79,798 | |
China Petrochemical Development Corporation (Materials, Chemicals) † | | | | | | | | | | | 285,000 | | | | 131,760 | |
China Steel Chemical Corporation (Materials, Chemicals) | | | | | | | | | | | 15,000 | | | | 70,080 | |
China Steel Corporation (Materials, Metals & Mining) | | | | | | | | | | | 1,280,000 | | | | 1,048,087 | |
China Synthetic Rubber Corporation (Materials, Chemicals) | | | | | | | | | | | 57,200 | | | | 79,147 | |
ChipMOS Technologies Incorporated (Information Technology, Semiconductors & Semiconductor Equipment) | | | | | | | | | | | 84,000 | | | | 57,568 | |
Chong Hong Construction Company Limited (Real Estate, Real Estate Management & Development) | | | | | | | | | | | 21,000 | | | | 55,654 | |
Chroma ATE Incorporated Chroma ATE Inc(Information Technology, Electronic Equipment, Instruments & Components) | | | | | | | | | | | 39,000 | | | | 215,221 | |
Chunghwa Telecom Company Limited (Telecommunication Services, Diversified Telecommunication Services) | | | | | | | | | | | 476,000 | | | | 1,681,459 | |
Cleanaway Company Limited (Industrials, Commercial Services & Supplies) | | | | | | | | | | | 10,000 | | | | 59,092 | |
Clevo Company (Information Technology, Technology Hardware, Storage & Peripherals) | | | | | | | | | | | 73,000 | | | | 75,103 | |
Compal Electronic Incorporated (Information Technology, Technology Hardware, Storage & Peripherals) | | | | | | | | | | | 405,000 | | | | 253,825 | |
Compeq Manufacturing Company Limited (Information Technology, Electronic Equipment, Instruments & Components) | | | | | | | | | | | 122,000 | | | | 116,777 | |
Concraft Holding Company Limited (Information Technology, Electronic Equipment, Instruments & Components) | | | | | | | | | | | 6,600 | | | | 59,092 | |
CTBC Financial Holding Company Limited (Financials, Banks) | | | | | | | | | | | 2,110,000 | | | | 1,483,835 | |
CTCI Corporation (Industrials, Construction & Engineering) | | | | | | | | | | | 76,000 | | | | 116,419 | |
Cub Elecparts Incorporated (Consumer Discretionary, Auto Components) | | | | | | | | | | | 7,777 | | | | 67,098 | |
E.SUN Financial Holding Company Limited (Financials, Banks) | | | | | | | | | | | 1,213,077 | | | | 892,578 | |
Elan Microelectronics Corporation (Information Technology, Semiconductors & Semiconductor Equipment) | | | | | | | | | | | 53,000 | | | | 93,697 | |
Elite Material Company Limited (Information Technology, Electronic Equipment, Instruments & Components) | | | | | | | | | | | 26,000 | | | | 75,168 | |
Ennoconn Corporation (Information Technology, Technology Hardware, Storage & Peripherals) | | | | | | | | | | | 4,000 | | | | 38,939 | |
Epistar Corporation (Information Technology, Semiconductors & Semiconductor Equipment) | | | | | | | | | | | 116,000 | | | | 133,694 | |
Eternal Chemical Company Limited (Materials, Chemicals) | | | | | | | | | | | 115,453 | | | | 101,113 | |
Eva Airways Corporation (Industrials, Airlines) | | | | | | | | | | | 329,490 | | | | 167,346 | |
Evergreen Marine Corporation (Taiwan) Limited (Industrials, Marine) | | | | | | | | | | | 311,850 | | | | 132,497 | |
Everlight Electronics Company Limited (Information Technology, Semiconductors & Semiconductor Equipment) | | | | | | | | | | | 70,000 | | | | 72,473 | |
Far Eastern Department Stores Company Limited (Consumer Discretionary, Multiline Retail) | | | | | | | | | | | 198,000 | | | | 112,811 | |
Far Eastern International Bank (Financials, Banks) | | | | | | | | | | | 458,108 | | | | 167,791 | |
Far Eastern New Century Corporation (Industrials, Industrial Conglomerates) | | | | | | | | | | | 388,000 | | | | 451,603 | |
Far EasTone Telecommunications Company Limited (Telecommunication Services, Wireless Telecommunication Services) | | | | | | | | | | | 254,000 | | | | 605,333 | |
Feng Hsin Iron & Steel Company (Materials, Metals & Mining) | | | | | | | | | | | 70,000 | | | | 132,183 | |
Feng Tay Enterprise Company Limited (Consumer Discretionary, Textiles, Apparel & Luxury Goods) | | | | | | | | | | | 51,000 | | | | 308,839 | |
First Financial Holding Company Limited (Financials, Banks) | | | | | | | | | | | 1,100,172 | | | | 736,075 | |
Flexium Interconnect Incorporated (Information Technology, Electronic Equipment, Instruments & Components) | | | | | | | | | | | 24,000 | | | | 77,356 | |
Formosa Chemicals & Fibre Corporation (Materials, Chemicals) | | | | | | | | | | | 474,000 | | | | 1,898,161 | |
Formosa Petrochemical Corporation (Energy, Oil, Gas & Consumable Fuels) | | | | | | | | | | | 198,000 | | | | 812,242 | |
Formosa Sumco Technology Corporation (Information Technology, Semiconductors & Semiconductor Equipment) | | | | | | | | | | | 13,000 | | | | 46,557 | |
The accompanying notes are an integral part of these financial statements.
| | | | | | |
| Portfolio of investments—August 31, 2018 (unaudited) | | Wells Fargo Funds | | | 85 | |
FACTOR ENHANCED EMERGING MARKETS PORTFOLIO
| | | | | | | | | | | | | | | | |
| Security name | | | | | | | | Shares | | | Value | |
| | | | |
| Taiwan (continued) | | | | | | | | | | | | | | | | |
Formosa Taffeta Company Limited (Consumer Discretionary, Textiles, Apparel & Luxury Goods) | | | | | | | | | | | 117,000 | | | $ | 136,179 | |
Foxconn Technology Company Limited (Information Technology, Electronic Equipment, Instruments & Components) | | | | | | | | | | | 89,000 | | | | 226,013 | |
Foxsemicon Integrated Technology Incorporated (Information Technology, Semiconductors & Semiconductor Equipment) | | | | | | | | | | | 8,400 | | | | 44,304 | |
Fubon Financial Holding Company Limited (Financials, Diversified Financial Services) | | | | | | | | | | | 720,000 | | | | 1,193,163 | |
General Interface Solution Holding Limited (Information Technology, Electronic Equipment, Instruments & Components) | | | | | | | | | | | 21,000 | | | | 130,246 | |
Getac Technology Corporation (Information Technology, Technology Hardware, Storage & Peripherals) | | | | | | | | | | | 33,000 | | | | 45,071 | |
Giant Manufacturing Company Limited (Consumer Discretionary, Leisure Products) | | | | | | | | | | | 39,000 | | | | 168,240 | |
Gigabyte Technology Company Limited (Information Technology, Technology Hardware, Storage & Peripherals) | | | | | | | | | | | 60,000 | | | | 102,360 | |
Global Unichip Corporation (Information Technology, Semiconductors & Semiconductor Equipment) | | | | | | | | | | | 8,000 | | | | 81,524 | |
Gourmet Master Company Limited (Consumer Discretionary, Hotels, Restaurants & Leisure) | | | | | | | | | | | 11,936 | | | | 85,493 | |
Grand Pacific Petrochemical Corporation (Materials, Chemicals) | | | | | | | | | | | 93,000 | | | | 89,775 | |
Grape King Bio Limited (Consumer Staples, Personal Products) | | | | | | | | | | | 13,000 | | | | 91,844 | |
Great Wall Enterprises Company Limited (Consumer Staples, Food Products) | | | | | | | | | | | 82,000 | | | | 111,594 | |
Greatek Electronic Incorporated (Information Technology, Semiconductors & Semiconductor Equipment) | | | | | | | | | | | 56,000 | | | | 95,354 | |
Hannstar Display Corporation (Information Technology, Electronic Equipment, Instruments & Components) | | | | | | | | | | | 287,000 | | | | 76,714 | |
Highwealth Construction Corporation (Real Estate, Real Estate Management & Development) | | | | | | | | | | | 98,000 | | | | 159,212 | |
Hiwin Technologies Corporation (Industrials, Machinery) | | | | | | | | | | | 29,870 | | | | 269,379 | |
Holy Stone Enterprise Company Limited (Information Technology, Electronic Equipment, Instruments & Components) | | | | | | | | | | | 15,000 | | | | 87,417 | |
Hon Hai Precision Industry Company Limited (Information Technology, Electronic Equipment, Instruments & Components) | | | | | | | | | | | 1,584,000 | | | | 4,151,457 | |
Hota Industrial Manufacturing Company Limited (Consumer Discretionary, Auto Components) | | | | | | | | | | | 28,000 | | | | 113,951 | |
Huaku Development Company Limited (Real Estate, Real Estate Management & Development) | | | | | | | | | | | 34,000 | | | | 72,173 | |
Hung Sheng Construction Company Limited (Real Estate, Real Estate Management & Development) | | | | | | | | | | | 73,200 | | | | 76,262 | |
Innolux Display Corporation (Information Technology, Electronic Equipment, Instruments & Components) | | | | | | | | | | | 933,000 | | | | 347,806 | |
Inventec Company Limited (Information Technology, Technology Hardware, Storage & Peripherals) | | | | | | | | | | | 315,000 | | | | 282,541 | |
Kenda Rubber Industrial Company Limited (Consumer Discretionary, Auto Components) | | | | | | | | | | | 86,000 | | | | 88,058 | |
King Yuan Electronics Company Limited (Information Technology, Semiconductors & Semiconductor Equipment) | | | | | | | | | | | 152,000 | | | | 107,387 | |
King’s Town Bank Company Limited (Financials, Banks) | | | | | | | | | | | 112,000 | | | | 112,675 | |
Kinpo Electronics Incorporated (Consumer Discretionary, Household Durables) | | | | | | | | | | | 258,000 | | | | 86,098 | |
Kinsus Interconnect Technology Corporation (Information Technology, Semiconductors & Semiconductor Equipment) | | | | | | | | | | | 33,000 | | | | 52,968 | |
Lee Chang Yung Chemical Industry Corporation (Materials, Chemicals) | | | | | | | | | | | 52,000 | | | | 87,697 | |
Lien Hwa Industrial Corporation (Consumer Staples, Food Products) | | | | | | | | | | | 106,260 | | | | 126,100 | |
Lite-On Technology Corporation (Information Technology, Technology Hardware, Storage & Peripherals) | | | | | | | | | | | 215,000 | | | | 258,644 | |
Long Chen Paper Company Limited (Materials, Paper & Forest Products) | | | | | | | | | | | 65,000 | | | | 48,250 | |
Macronix International Company Limited (Information Technology, Semiconductors & Semiconductor Equipment) | | | | | | | | | | | 202,536 | | | | 217,603 | |
Makalot Industrial Company Limited (Consumer Discretionary, Textiles, Apparel & Luxury Goods) | | | | | | | | | | | 22,000 | | | | 113,886 | |
Mercuries Life Insurance Company (Financials, Insurance) † | | | | | | | | | | | 167,302 | | | | 86,878 | |
Merida Industry Company Limited (Consumer Discretionary, Leisure Products) | | | | | | | | | | | 28,000 | | | | 134,462 | |
Merry Electronics Company Limited (Information Technology, Electronic Equipment, Instruments & Components) | | | | | | | | | | | 21,000 | | | | 113,495 | |
Micro-Star International Company Limited (Information Technology, Technology Hardware, Storage & Peripherals) | | | | | | | | | | | 72,000 | | | | 249,650 | |
Mitac Holdings Corporation (Information Technology, Technology Hardware, Storage & Peripherals) † | | | | | | | | | | | 61,000 | | | | 70,503 | |
Nan Kang Rubber Tire Company Limited (Consumer Discretionary, Auto Components) | | | | | | | | | | | 82,000 | | | | 67,277 | |
Nan Ya Plastics Corporation (Materials, Chemicals) | | | | | | | | | | | 605,000 | | | | 1,682,142 | |
Nanya Technology Corporation (Information Technology, Semiconductors & Semiconductor Equipment) | | | | | | | | | | | 108,000 | | | | 245,079 | |
Novatek Microelectronics Corporation Limited (Information Technology, Semiconductors & Semiconductor Equipment) | | | | | | | | | | | 66,000 | | | | 323,392 | |
Oriental Union Chemical Corporation (Materials, Chemicals) | | | | | | | | | | | 68,000 | | | | 72,063 | |
Pan Jit International Incorporated (Information Technology, Semiconductors & Semiconductor Equipment) † | | | | | | | | | | | 42,000 | | | | 56,953 | |
Pegatron Corporation (Information Technology, Technology Hardware, Storage & Peripherals) | | | | | | | | | | | 203,000 | | | | 437,526 | |
The accompanying notes are an integral part of these financial statements.
| | | | |
| 86 | | Wells Fargo Funds | | Portfolio of investments—August 31, 2018 (unaudited) |
FACTOR ENHANCED EMERGING MARKETS PORTFOLIO
| | | | | | | | | | | | | | | | |
| Security name | | | | | | | | Shares | | | Value | |
| | | | |
| Taiwan (continued) | | | | | | | | | | | | | | | | |
Pharmally International Holding Company Limited (Health Care, Pharmaceuticals) | | | | | | | | | | | 5,882 | | | $ | 70,664 | |
Pou Chen Corporation (Consumer Discretionary, Textiles, Apparel & Luxury Goods) | | | | | | | | | | | 264,000 | | | | 290,946 | |
Powertech Technology Incorporated (Information Technology, Semiconductors & Semiconductor Equipment) | | | | | | | | | | | 87,000 | | | | 258,040 | |
President Chain Store Corporation (Consumer Staples, Food & Staples Retailing) | | | | | | | | | | | 57,000 | | | | 621,683 | |
Primax Electronics Limited (Information Technology, Technology Hardware, Storage & Peripherals) | | | | | | | | | | | 43,000 | | | | 79,798 | |
Prince Housing & Development Corporation (Real Estate, Real Estate Management & Development) | | | | | | | | | | | 223,000 | | | | 79,863 | |
Qisda Corporation (Information Technology, Technology Hardware, Storage & Peripherals) | | | | | | | | | | | 146,000 | | | | 99,346 | |
Quanta Computer Incorporated (Information Technology, Technology Hardware, Storage & Peripherals) | | | | | | | | | | | 285,000 | | | | 489,923 | |
Radiant Opto-Electronics Corporation (Information Technology, Semiconductors & Semiconductor Equipment) | | | | | | | | | | | 53,000 | | | | 116,474 | |
Realtek Semiconductor Corporation (Information Technology, Semiconductors & Semiconductor Equipment) | | | | | | | | | | | 48,000 | | | | 232,850 | |
Ruentex Development Company Limited (Real Estate, Real Estate Management & Development) | | | | | | | | | | | 104,800 | | | | 118,056 | |
Ruentex Industries Limited (Consumer Discretionary, Textiles, Apparel & Luxury Goods) | | | | | | | | | | | 75,000 | | | | 153,834 | |
Sanyang Industry Company Limited (Consumer Discretionary, Automobiles) | | | | | | | | | | | 115,000 | | | | 78,064 | |
Sercomm Corporation (Information Technology, Communications Equipment) | | | | | | | | | | | 36,000 | | | | 63,292 | |
Shihlin Electric & Engineering Corporation (Industrials, Electrical Equipment) | | | | | | | | | | | 85,000 | | | | 116,230 | |
Shin Kong Financial Holding Company Limited (Financials, Insurance) | | | | | | | | | | | 1,090,000 | | | | 431,174 | |
Shin Kong No.1 REIT (Real Estate, Equity REITs) | | | | | | | | | | | 214,000 | | | | 103,464 | |
Shinkong Synthetic Fibers Corporation (Materials, Chemicals) | | | | | | | | | | | 164,000 | | | | 72,883 | |
Sinbon Electronics Company Limited (Information Technology, Electronic Equipment, Instruments & Components) | | | | | | | | | | | 18,000 | | | | 51,102 | |
Sinopac Financial Holdings Company Limited (Financials, Banks) | | | | | | | | | | | 1,244,400 | | | | 455,787 | |
Synnex Technology International Corporation (Information Technology, Electronic Equipment, Instruments & Components) | | | | | | | | | | | 145,000 | | | | 194,026 | |
Ta Chen Stainless Pipe Company (Materials, Metals & Mining) | | | | | | | | | | | 99,840 | | | | 150,825 | |
Taichung Commercial Bank (Financials, Banks) | | | | | | | | | | | 395,112 | | | | 134,427 | |
Tainan Spinning Company Limited (Consumer Discretionary, Textiles, Apparel & Luxury Goods) | | | | | | | | | | | 200,000 | | | | 87,579 | |
Taishin Financial Holdings Company Limited (Financials, Banks) | | | | | | | | | | | 1,160,876 | | | | 546,139 | |
Taiwan Acceptance Corporation (Financials, Consumer Finance) | | | | | | | | | | | 16,000 | | | | 53,655 | |
Taiwan Business Bank (Financials, Banks) † | | | | | | | | | | | 494,250 | | | | 178,615 | |
Taiwan Cement Corporation (Materials, Construction Materials) | | | | | | | | | | | 509,300 | | | | 702,225 | |
Taiwan Cooperative Financial Holdings Company Limited (Financials, Banks) | | | | | | | | | | | 1,032,801 | | | | 613,662 | |
Taiwan Fertilizer Company Limited (Materials, Chemicals) | | | | | | | | | | | 79,000 | | | | 108,926 | |
Taiwan Glass Industrial Corporation (Industrials, Building Products) | | | | | | | | | | | 138,000 | | | | 73,459 | |
Taiwan High Speed Rail Corporation (Industrials, Transportation Infrastructure) | | | | | | | | | | | 301,000 | | | | 253,814 | |
Taiwan Hon Chuan Enterprise Company Limited (Materials, Containers & Packaging) | | | | | | | | | | | 41,000 | | | | 70,080 | |
Taiwan Mobile Company Limited (Telecommunication Services, Wireless Telecommunication Services) | | | | | | | | | | | 288,000 | | | | 1,003,288 | |
Taiwan Secom Company Limited (Industrials, Commercial Services & Supplies) | | | | | | | | | | | 32,000 | | | | 91,369 | |
Tatung Company Limited (Consumer Discretionary, Household Durables) † | | | | | | | | | | | 164,000 | | | | 200,228 | |
Tong Hsing Electronic Industries Limited (Information Technology, Electronic Equipment, Instruments & Components) | | | | | | | | | | | 15,000 | | | | 41,266 | |
Tong Yang Industry Company Limited (Consumer Discretionary, Auto Components) | | | | | | | | | | | 45,000 | | | | 64,244 | |
TPK Holding Company Limited (Information Technology, Electronic Equipment, Instruments & Components) | | | | | | | | | | | 34,000 | | | | 63,650 | |
Transcend Information Incorporated (Information Technology, Technology Hardware, Storage & Peripherals) | | | | | | | | | | | 19,000 | | | | 45,961 | |
Tripod Technology Corporation (Information Technology, Electronic Equipment, Instruments & Components) | | | | | | | | | | | 49,000 | | | | 150,916 | |
TSRC Corporation (Materials, Chemicals) | | | | | | | | | | | 71,000 | | | | 73,970 | |
Tung Ho Steel Enterprise Corporation (Materials, Metals & Mining) | | | | | | | | | | | 107,000 | | | | 78,730 | |
U-Ming Marine Transport Corporation (Industrials, Marine) | | | | | | | | | | | 55,000 | | | | 61,151 | |
Uni-President Enterprises Corporation (Consumer Staples, Food Products) | | | | | | | | | | | 580,000 | | | | 1,465,343 | |
Unimicron Technology Corporation (Information Technology, Electronic Equipment, Instruments & Components) | | | | | | | | | | | 144,000 | | | | 82,513 | |
Union Bank of Taiwan (Financials, Banks) | | | | | | | | | | | 477,920 | | | | 158,710 | |
United Microelectronics Corporation (Information Technology, Semiconductors & Semiconductor Equipment) | | | | | | | | | | | 1,286,000 | | | | 726,424 | |
Visual Photonics Epitaxy Company Limited (Information Technology, Semiconductors & Semiconductor Equipment) | | | | | | | | | | | 20,000 | | | | 61,468 | |
The accompanying notes are an integral part of these financial statements.
| | | | | | |
| Portfolio of investments—August 31, 2018 (unaudited) | | Wells Fargo Funds | | | 87 | |
FACTOR ENHANCED EMERGING MARKETS PORTFOLIO
| | | | | | | | | | | | | | | | |
| Security name | | | | | | | | Shares | | | Value | |
| | | | |
| Taiwan (continued) | | | | | | | | | | | | | | | | |
Voltronic Power Technology Corporation (Industrials, Electrical Equipment) | | | | | | | | | | | 7,000 | | | $ | 120,560 | |
Walsin Lihwa Corporation (Industrials, Electrical Equipment) | | | | | | | | | | | 281,000 | | | | 198,525 | |
Wan Hai Lines Limited (Industrials, Marine) | | | | | | | | | | | 154,000 | | | | 84,232 | |
Waterland Financial Holdings (Financials, Capital Markets) | | | | | | | | | | | 349,527 | | | | 120,625 | |
Windbond Electronics Corporation (Information Technology, Semiconductors & Semiconductor Equipment) | | | | | | | | | | | 314,000 | | | | 176,347 | |
Wistron Corporation (Information Technology, Technology Hardware, Storage & Peripherals) | | | | | | | | | | | 285,607 | | | | 202,245 | |
Wistron Neweb Corporation (Information Technology, Communications Equipment) | | | | | | | | | | | 38,599 | | | | 86,208 | |
WPG Holdings Company Limited (Information Technology, Electronic Equipment, Instruments & Components) | | | | | | | | | | | 143,000 | | | | 181,107 | |
WT Microelectronics Company Limited (Information Technology, Electronic Equipment, Instruments & Components) | | | | | | | | | | | 44,000 | | | | 62,673 | |
Yageo Corporation (Information Technology, Electronic Equipment, Instruments & Components) | | | | | | | | | | | 26,566 | | | | 603,714 | |
Yang Ming Marine Transport (Industrials, Marine) † | | | | | | | | | | | 142,000 | | | | 40,869 | |
YFY Incorporated (Materials, Paper & Forest Products) | | | | | | | | | | | 173,000 | | | | 69,560 | |
Yieh Phui Enterprise Company Limited (Materials, Metals & Mining) | | | | | | | | | | | 211,150 | | | | 69,432 | |
Yuanta Financial Holding Company Limited (Financials, Capital Markets) | | | | | | | | | | | 1,204,000 | | | | 609,546 | |
Yulon Motor Company Limited (Consumer Discretionary, Automobiles) | | | | | | | | | | | 111,000 | | | | 76,072 | |
Yungtay Engineering Company Limited (Industrials, Machinery) | | | | | | | | | | | 49,000 | | | | 74,740 | |
Zhen Ding Technology Holding (Information Technology, Electronic Equipment, Instruments & Components) | | | | | | | | | | | 43,000 | | | | 110,037 | |
| | | | |
| | | | | | | | | | | | | | | 45,872,504 | |
| | | | | | | | | | | | | | | | |
| | | | |
| Thailand: 5.20% | | | | | | | | | | | | | | | | |
Advanced Info Service PCL (Telecommunication Services, Wireless Telecommunication Services) | | | | | | | | | | | 109,200 | | | | 673,950 | |
Airports of Thailand PCL (Industrials, Transportation Infrastructure) | | | | | | | | | | | 436,200 | | | | 889,592 | |
Amata Corporation PCL (Real Estate, Real Estate Management & Development) | | | | | | | | | | | 94,200 | | | | 61,303 | |
AP Thailand PCL (Real Estate, Real Estate Management & Development) | | | | | | | | | | | 310,600 | | | | 89,204 | |
B.Grimm PPCL (Utilities, Independent Power & Renewable Electricity Producers) | | | | | | | | | | | 77,700 | | | | 63,504 | |
Bangchak Corporation PCL (Energy, Oil, Gas & Consumable Fuels) | | | | | | | | | | | 152,000 | | | | 167,186 | |
Bangkok Bank PCL (Financials, Banks) | | | | | | | | | | | 137,800 | | | | 863,092 | |
Bangkok Chain Hospital PCL (Health Care, Health Care Providers & Services) | | | | | | | | | | | 138,200 | | | | 80,648 | |
Bangkok Dusit Medical Services PCL (Health Care, Health Care Providers & Services) | | | | | | | | | | | 1,067,400 | | | | 856,072 | |
Bangkok Expressway and Metro PCL (Industrials, Transportation Infrastructure) | | | | | | | | | | | 868,000 | | | | 222,768 | |
Bangkok Insurance PCL (Financials, Insurance) | | | | | | | | | | | 12,400 | | | | 132,221 | |
Bangkokland PCL (Real Estate, Real Estate Management & Development) | | | | | | | | | | | 2,081,500 | | | | 117,653 | |
Bank of Ayudhya PCL (Financials, Banks) | | | | | | | | | | | 198,700 | | | | 248,906 | |
Banpu Power PCL (Utilities, Independent Power & Renewable Electricity Producers) | | | | | | | | | | | 49,700 | | | | 37,810 | |
Beauty Community PCL (Consumer Discretionary, Specialty Retail) | | | | | | | | | | | 291,400 | | | | 100,606 | |
BTS Group Holdings PCL (Industrials, Road & Rail) | | | | | | | | | | | 889,100 | | | | 251,273 | |
Bumrungrad Hospital PCL (Health Care, Health Care Providers & Services) | | | | | | | | | | | 46,700 | | | | 258,969 | |
Carabao Group PCL (Consumer Staples, Beverages) | | | | | | | | | | | 54,000 | | | | 76,306 | |
Central Pattana PCL (Real Estate, Real Estate Management & Development) | | | | | | | | | | | 326,500 | | | | 822,983 | |
Central Plaza Hotel PCL (Consumer Discretionary, Hotels, Restaurants & Leisure) | | | | | | | | | | | 139,300 | | | | 169,177 | |
CH Karnchang PCL (Industrials, Construction & Engineering) | | | | | | | | | | | 155,900 | | | | 126,225 | |
Charoen Pokphand Foods PCL (Consumer Staples, Food Products) | | | | | | | | | | | 472,500 | | | | 371,735 | |
Cimb Thai Bank PCL (Financials, Banks) † | | | | | | | | | | | 1,894,100 | | | | 50,347 | |
CP All PCL (Consumer Staples, Food & Staples Retailing) | | | | | | | | | | | 628,000 | | | | 1,295,142 | |
Delta Electronics Thailand PCL (Information Technology, Electronic Equipment, Instruments & Components) | | | | | | | | | | | 113,700 | | | | 242,303 | |
Electricity Genera PCL (Utilities, Independent Power & Renewable Electricity Producers) | | | | | | | | | | | 23,300 | | | | 160,886 | |
GFPT PCL (Consumer Staples, Food Products) | | | | | | | | | | | 170,900 | | | | 77,278 | |
Global Power Synergy PCL (Utilities, Independent Power & Renewable Electricity Producers) | | | | | | | | | | | 35,100 | | | | 78,018 | |
Glow Energy PCL (Utilities, Independent Power & Renewable Electricity Producers) | | | | | | | | | | | 37,700 | | | | 108,274 | |
The accompanying notes are an integral part of these financial statements.
| | | | |
| 88 | | Wells Fargo Funds | | Portfolio of investments—August 31, 2018 (unaudited) |
FACTOR ENHANCED EMERGING MARKETS PORTFOLIO
| | | | | | | | | | | | | | | | |
| Security name | | | | | | | | Shares | | | Value | |
| | | | |
| Thailand (continued) | | | | | | | | | | | | | | | | |
Hana Microelectronics PCL (Information Technology, Electronic Equipment, Instruments & Components) | | | | | | | | | | | 56,800 | | | $ | 66,813 | |
Home Product Center PCL (Consumer Discretionary, Specialty Retail) | | | | | | | | | | | 727,800 | | | | 324,653 | |
Indorama Ventures PCL (Materials, Chemicals) | | | | | | | | | | | 209,400 | | | | 383,868 | |
IRPC PCL (Energy, Oil, Gas & Consumable Fuels) | | | | | | | | | | | 1,251,100 | | | | 265,663 | |
Italian Thai Development PCL (Industrials, Construction & Engineering) † | | | | | | | | | | | 750,400 | | | | 64,654 | |
Jasmine International PCL (Telecommunication Services, Diversified Telecommunication Services) | | | | | | | | | | | 348,400 | | | | 56,949 | |
Kaset Thailand International Sugar PCL (Consumer Staples, Food Products) | | | | | | | | | | | 97,500 | | | | 17,576 | |
KCE Electronics PCL (Information Technology, Electronic Equipment, Instruments & Components) | | | | | | | | | | | 75,200 | | | | 103,966 | |
Kiatnakin Bank PCL (Financials, Banks) | | | | | | | | | | | 91,400 | | | | 215,724 | |
Krungthai Card PCL (Financials, Consumer Finance) | | | | | | | | | | | 109,000 | | | | 105,736 | |
Land & Houses PCL (Real Estate, Real Estate Management & Development) | | | | | | | | | | | 734,600 | | | | 253,620 | |
LPN Development PCL (Real Estate, Real Estate Management & Development) | | | | | | | | | | | 195,500 | | | | 59,134 | |
Major Cineplex Group PCL (Consumer Discretionary, Media) | | | | | | | | | | | 84,000 | | | | 63,905 | |
MBK PCL (Real Estate, Real Estate Management & Development) | | | | | | | | | | | 109,700 | | | | 84,630 | |
MK Restaurants Group PCL (Consumer Discretionary, Hotels, Restaurants & Leisure) | | | | | | | | | | | 38,400 | | | | 85,060 | |
Muangthai Leasing PCL (Financials, Consumer Finance) | | | | | | | | | | | 67,800 | | | | 86,485 | |
Pruksa Holding PCL (Real Estate, Real Estate Management & Development) | | | | | | | | | | | 119,300 | | | | 73,628 | |
PTG Energy PCL (Consumer Discretionary, Specialty Retail) | | | | | | | | | | | 133,800 | | | | 47,830 | |
PTT Global Chemical PCL (Materials, Chemicals) | | | | | | | | | | | 224,300 | | | | 560,236 | |
Quality Houses PCL (Real Estate, Real Estate Management & Development) | | | | | | | | | | | 891,600 | | | | 94,254 | |
Ratchaburi Electricity Generating Holding PCL (Utilities, Independent Power & Renewable Electricity Producers) | | | | | | | | | | | 68,900 | | | | 109,992 | |
Robinson PCL (Consumer Discretionary, Multiline Retail) | | | | | | | | | | | 72,000 | | | | 143,538 | |
Saha Pathana Inter Holding PCL (Real Estate, Real Estate Management & Development) | | | | | | | | | | | 29,800 | | | | 68,514 | |
Sansiri PCL (Real Estate, Real Estate Management & Development) | | | | | | | | | | | 1,732,600 | | | | 85,227 | |
Siam City Cement PCL (Materials, Construction Materials) | | | | | | | | | | | 12,400 | | | | 89,410 | |
Siam Global House PCL (Consumer Discretionary, Specialty Retail) | | | | | | | | | | | 245,800 | | | | 143,440 | |
Sino Thai Engineering & Construction PCL (Industrials, Construction & Engineering) † | | | | | | | | | | | 138,900 | | | | 95,486 | |
Srisawad Power 1979 PCL (Financials, Diversified Financial Services) | | | | | | | | | | | 78,550 | | | | 101,397 | |
Star Petroleum Refining PCL (Energy, Oil, Gas & Consumable Fuels) | | | | | | | | | | | 265,800 | | | | 121,003 | |
Supalai PCL (Real Estate, Real Estate Management & Development) | | | | | | | | | | | 162,700 | | | | 120,298 | |
Thai Airways International PCL (Industrials, Airlines) † | | | | | | | | | | | 181,600 | | | | 72,684 | |
Thai Oil PCL (Energy, Oil, Gas & Consumable Fuels) | | | | | | | | | | | 117,200 | | | | 301,683 | |
Thai President Foods PCL (Consumer Staples, Food Products) | | | | | | | | | | | 3,200 | | | | 15,643 | |
Thai Union Group PCL (Consumer Staples, Food Products) | | | | | | | | | | | 479,600 | | | | 256,431 | |
Thai Vegetable Oil PCL (Consumer Staples, Food Products) | | | | | | | | | | | 84,100 | | | | 75,800 | |
Thanachart Capital PCL (Financials, Banks) | | | | | | | | | | | 124,500 | | | | 204,457 | |
The Siam Cement PCL (Materials, Construction Materials) | | | | | | | | | | | 83,900 | | | | 1,158,656 | |
Tipco Asphalt PCL (Materials, Construction Materials) | | | | | | | | | | | 138,000 | | | | 64,510 | |
Tisco Financial Group PCL (Financials, Banks) | | | | | | | | | | | 82,100 | | | | 205,689 | |
TMB Bank PCL (Financials, Banks) | | | | | | | | | | | 2,252,600 | | | | 151,412 | |
TOA Paint Thailand PCL (Materials, Chemicals) | | | | | | | | | | | 73,500 | | | | 80,282 | |
Total Access Communication PCL (Telecommunication Services, Wireless Telecommunication Services) | | | | | | | | | | | 76,000 | | | | 106,233 | |
True Corporation PCL (Telecommunication Services, Diversified Telecommunication Services) | | | | | | | | | | | 1,995,700 | | | | 408,530 | |
TTW PCL (Utilities, Water Utilities) | | | | | | | | | | | 100,700 | | | | 38,151 | |
Vibhavadi Medical Center PCL (Health Care, Health Care Providers & Services) | | | | | | | | | | | 901,300 | | | | 64,438 | |
WHA Corporation PCL (Real Estate, Real Estate Management & Development) | | | | | | | | | | | 817,300 | | | | 100,383 | |
| | | | |
| | | | | | | | | | | | | | | 16,091,102 | |
| | | | | | | | | | | | | | | | |
The accompanying notes are an integral part of these financial statements.
| | | | | | |
| Portfolio of investments—August 31, 2018 (unaudited) | | Wells Fargo Funds | | | 89 | |
FACTOR ENHANCED EMERGING MARKETS PORTFOLIO
| | | | | | | | | | | | | | | | |
| Security name | | | | | | | | Shares | | | Value | |
| | | | |
| Turkey: 0.87% | | | | | | | | | | | | | | | | |
Anadolu Efes Biracilik ve Malt Sanayii AS (Consumer Staples, Beverages) | | | | | | | | | | | 22,366 | | | $ | 71,190 | |
Arcelik AS (Consumer Discretionary, Household Durables) | | | | | | | | | | | 24,323 | | | | 49,156 | |
Aselsan Elektronik Sanayi ve Ticaret AS (Industrials, Aerospace & Defense) | | | | | | | | | | | 16,756 | | | | 65,889 | |
Bim Birlesik Magazalar AS (Consumer Staples, Food & Staples Retailing) | | | | | | | | | | | 22,903 | | | | 254,625 | |
Coca-Cola Icecek Uretim AS (Consumer Staples, Beverages) | | | | | | | | | | | 8,505 | | | | 36,993 | |
Emlak Konut Gayrimenkul Yati AS (Real Estate, Equity REITs) | | | | | | | | | | | 173,324 | | | | 48,569 | |
Eregli Demir ve Celik Fabrikalari T AS (Materials, Metals & Mining) | | | | | | | | | | | 141,346 | | | | 254,871 | |
Ford Otomotiv Sanayi AS (Consumer Discretionary, Automobiles) | | | | | | | | | | | 8,066 | | | | 82,242 | |
Kardemir Karabuk Demir Celik Sanayi ve Ticaret AS (Materials, Metals & Mining) † | | | | | | | | | | | 83,817 | | | | 53,740 | |
Koç Holding AS (Industrials, Industrial Conglomerates) | | | | | | | | | | | 113,997 | | | | 260,071 | |
Petkim Petrokimya Holding SA (Materials, Chemicals) | | | | | | | | | | | 86,906 | | | | 72,927 | |
TAV Havalimanlari Holding AS (Industrials, Transportation Infrastructure) | | | | | | | | | | | 18,442 | | | | 92,572 | |
Tekfen Holding AS (Industrials, Construction & Engineering) | | | | | | | | | | | 22,805 | | | | 71,059 | |
Tofas Turk Otomobil Fabrikasi AS (Consumer Discretionary, Automobiles) | | | | | | | | | | | 10,886 | | | | 37,966 | |
Tupras Turkiye Petrol Rafinerileri AS (Energy, Oil, Gas & Consumable Fuels) | | | | | | | | | | | 14,175 | | | | 254,736 | |
Turk Hava Yollari Anonim Ortakligi AS (Industrials, Airlines) † | | | | | | | | | | | 78,549 | | | | 194,752 | |
Turk Sise ve Cam Fabrikalari AS (Industrials, Industrial Conglomerates) | | | | | | | | | | | 64,004 | | | | 60,045 | |
Turk Telekomunikasyon AS (Telecommunication Services, Diversified Telecommunication Services) † | | | | 79,773 | | | | 44,465 | |
Turkcell Iletisim Hizmetleri AS (Telecommunication Services, Wireless Telecommunication Services) | | | | 116,367 | | | | 187,854 | |
Turkiye Garanti Bankasi AS (Financials, Banks) | | | | | | | | | | | 214,189 | | | | 194,089 | |
Turkiye Halk Bankasi AS (Financials, Banks) | | | | | | | | | | | 63,436 | | | | 59,318 | |
Turkiye Is Bankasi Class C AS (Financials, Banks) | | | | | | | | | | | 147,763 | | | | 89,789 | |
Turkiye Vakiflar Bankasi TAO AS (Financials, Banks) | | | | | | | | | | | 63,236 | | | | 33,322 | |
Ulker Biskuvi Sanayi AS (Consumer Staples, Food Products) | | | | | | | | | | | 18,106 | | | | 40,893 | |
Yapi Ve Kredi Bankasi AS (Financials, Banks) † | | | | | | | | | | | 170,556 | | | | 43,638 | |
Yazicilar Holding AS Class A (Industrials, Industrial Conglomerates) | | | | | | | | | | | 14,709 | | | | 40,568 | |
| | | | |
| | | | | | | | | | | | | | | 2,695,339 | |
| | | | | | | | | | | | | | | | |
| | | | |
Total Common Stocks (Cost $281,839,137) | | | | | | | | | | | | | | | 274,564,830 | |
| | | | | | | | | | | | | | | | |
| | | | |
| | | Dividend yield | | | | | | | | | | |
| Preferred Stocks: 3.34% | | | | | | | | | | | | | | | | |
| | | | |
| Brazil: 2.98% | | | | | | | | | | | | | | | | |
Alpargatas SA (Consumer Discretionary, Personal Products) | | | 5.04 | % | | | | | | | 20,872 | | | | 62,005 | |
Azul SA Preference (Industrials, Transportation Infrastructure) † | | | 0.00 | | | | | | | | 24,800 | | | | 140,041 | |
Banco Bradesco SA (Financials, Banks) | | | 1.26 | | | | | | | | 314,128 | | | | 2,188,739 | |
Banco do Estado do Rio Grande do Sul SA (Financials, Banks) | | | 5.13 | | | | | | | | 22,800 | | | | 82,006 | |
Bradespar SA (Materials, Metals & Mining) | | | 9.55 | | | | | | | | 22,800 | | | | 173,921 | |
Braskem SA Preference A (Materials, Chemicals) | | | 3.66 | | | | | | | | 18,310 | | | | 266,170 | |
Companhia Brasileira de Distribuicao (Consumer Staples, Food & Staples Retailing) | | | 0.85 | | | | | | | | 16,473 | | | | 330,301 | |
Companhia de Saneamento do Parana (Utilities, Water Utilities) | | | 7.68 | | | | | | | | 35,140 | | | | 73,332 | |
Companhia de Transmissao de Energia Electrica Paulista (Utilities, Electric Utilities) | | | 9.67 | | | | | | | | 4,080 | | | | 57,347 | |
Companhia Energetica de Minas Gerais SA (Utilities, Electric Utilities) | | | 7.71 | | | | | | | | 78,869 | | | | 144,451 | |
Companhia Energetica de Sao Paulo Preference B (Utilities, Independent Power & Renewable Electricity Producers) | | | 2.68 | | | | | | | | 16,700 | | | | 68,471 | |
Companhia Paranaense de Energia-Copel Preference B (Utilities, Electric Utilities) | | | 5.79 | | | | | | | | 9,200 | | | | 46,055 | |
Energisa SA (Utilities, Electric Utilities) | | | 6.68 | | | | | | | | 500 | | | | 614 | |
Gerdau SA (Materials, Metals & Mining) | | | 1.88 | | | | | | | | 91,400 | | | | 359,936 | |
Itau Unibanco Holding SA (Financials, Banks) | | | 2.25 | | | | | | | | 297,580 | | | | 3,088,239 | |
The accompanying notes are an integral part of these financial statements.
| | | | |
| 90 | | Wells Fargo Funds | | Portfolio of investments—August 31, 2018 (unaudited) |
FACTOR ENHANCED EMERGING MARKETS PORTFOLIO
| | | | | | | | | | | | | | | | |
| Security name | | Dividend yield | | | | | | Shares | | | Value | |
| | | | |
| Brazil (continued) | | | | | | | | | | | | | | | | |
Itausa Investimentos Itau SA (Financials, Banks) | | | 3.04 | % | | | | | | | 416,261 | | | $ | 980,075 | |
Klabin SA (Materials, Containers & Packaging) | | | 5.72 | | | | | | | | 177,700 | | | | 140,917 | |
Lojas Americanas SA (Consumer Discretionary, Multiline Retail) | | | 0.48 | | | | | | | | 74,000 | | | | 283,420 | |
Marcopolo SA (Industrials, Machinery) | | | 1.21 | | | | | | | | 67,300 | | | | 62,622 | |
Metalurgica Gerdau SA (Materials, Metals & Mining) | | | 1.46 | | | | | | | | 56,100 | | | | 108,258 | |
Telefonica Brasil SA (Telecommunication Services, Diversified Telecommunication Services) | | | 11.74 | | | | | | | | 50,209 | | | | 493,326 | |
Usinas Siderurgicas de Minas Gerais SA Class A (Materials, Metals & Mining) | | | 0.69 | | | | | | | | 38,800 | | | | 76,874 | |
Via Varejo SA (Consumer Discretionary, Specialty Retail) | | | 0.24 | | | | | | | | 7,200 | | | | 10,164 | |
| | | | |
| | | | | | | | | | | | | | | 9,237,284 | |
| | | | | | | | | | | | | | | | |
| | | | |
| Chile: 0.10% | | | | | | | | | | | | | | | | |
Coca-Cola Embonor SA Class B (Consumer Staples, Food Products) | | | 3.91 | | | | | | | | 32,225 | | | | 80,323 | |
Embotelladora Andina SA Preference B (Consumer Discretionary, Food & Staples Retailing) | | | 3.88 | | | | | | | | 29,720 | | | | 114,018 | |
Sociedad Quimica y Minera de Chile SA Class B (Materials, Chemicals) | | | 3.92 | | | | | | | | 2,235 | | | | 97,283 | |
| | | | |
| | | | | | | | | | | | | | | 291,624 | |
| | | | | | | | | | | | | | | | |
| | | | |
| Colombia: 0.22% | | | | | | | | | | | | | | | | |
Banco Davivienda SA (Financials, Banks) | | | 2.38 | | | | | | | | 13,287 | | | | 154,847 | |
Bancolombia SA (Financials, Banks) | | | 3.18 | | | | | | | | 47,740 | | | | 520,318 | |
| | | | |
| | | | | | | | | | | | | | | 675,165 | |
| | | | | | | | | | | | | | | | |
| | | | |
| Russia: 0.02% | | | | | | | | | | | | | | | | |
Bashneft PAO (Energy, Oil, Gas & Consumable Fuels) | | | 10.04 | | | | | | | | 2,772 | | | | 69,697 | |
| | | | | | | | | | | | | | | | |
| | | | |
| South Korea: 0.02% | | | | | | | | | | | | | | | | |
Mirae Asset Daewoo Company Limited Class P (Financials, Capital Markets) | | | 5.29 | | | | | | | | 12,702 | | | | 54,087 | |
| | | | | | | | | | | | | | | | |
| | | | |
Total Preferred Stocks (Cost $12,073,081) | | | | | | | | | | | | | | | 10,327,857 | |
| | | | | | | | | | | | | | | | |
| | | | |
| | | | | | Expiration date | | | | | | | |
| Rights: 0.00% | | | | | | | | | | | | | | | | |
| | | | |
| Philippines: 0.00% | | | | | | | | | | | | | | | | |
Union Bank of Philippines (Financials, Banks) (a)† | | | | | | | 9-21-2018 | | | | 1,148 | | | | 282 | |
| | | | | | | | | | | | | | | | |
| | | | |
Total Rights (Cost $0) | | | | | | | | | | | | | | | 282 | |
| | | | | | | | | | | | | | | | |
| | | | |
Warrants: 0.02% | | | | | | | | | | | | | | | | |
| | | | |
| Malaysia: 0.00% | | | | | | | | | | | | | | | | |
Sunway Bhd (Real Estate, Real Estate Management & Development) † | | | | | | | | | | | 122,430 | | | | 10,278 | |
| | | | | | | | | | | | | | | | |
| | | | |
| Thailand: 0.02% | | | | | | | | | | | | | | | | |
BTS Group Holdings PCL (Industrials, Transportation Infrastructure) (a)† | | | | | | | | | | | 98,789 | | | | 490 | |
Supalai PCL (Real Estate, Real Estate Management & Development) † | | | | | | | | | | | 81,050 | | | | 49,279 | |
| | | | |
| | | | | | | | | | | | | | | 49,769 | |
| | | | | | | | | | | | | | | | |
| | | | |
Total Warrants (Cost $38,857) | | | | | | | | | | | | | | | 60,047 | |
| | | | | | | | | | | | | | | | |
The accompanying notes are an integral part of these financial statements.
| | | | | | |
| Portfolio of investments—August 31, 2018 (unaudited) | | Wells Fargo Funds | | | 91 | |
FACTOR ENHANCED EMERGING MARKETS PORTFOLIO
| | | | | | | | | | | | | | | | |
| Security name | | Yield | | | | | | Shares | | | Value | |
| | | | |
Short-Term Investments: 4.31% | | | | | | | | | | | | | | | | |
| | | | |
| Investment Companies: 4.31% | | | | | | | | | | | | | | | | |
Wells Fargo Government Money Market Fund Select Class (l)(u) | | | 1.87 | % | | | | | | | 13,354,608 | | | $ | 13,354,608 | |
| | | | | | | | | | | | | | | | |
| | | | |
Total Short-Term Investments (Cost $13,354,608) | | | | | | | | | | | | | | | 13,354,608 | |
| | | | | | | | | | | | | | | | |
| | | | | | | | |
| Total investments in securities (Cost $307,305,683) | | | 96.35 | % | | | 298,307,624 | |
Other assets and liabilities, net | | | 3.65 | | | | 11,301,723 | |
| | | | | | | | |
| Total net assets | | | 100.00 | % | | $ | 309,609,347 | |
| | | | | | | | |
| † | Non-income-earning security |
| 144A | The security may be resold in transactions exempt from registration, normally to qualified institutional buyers, pursuant to Rule 144A under the Securities Act of 1933. |
| ‡ | Security is valued using significant unobservable inputs. |
| (a) | The security is fair valued in accordance with procedures approved by the Board of Trustees. |
| (l) | The issuer of the security is an affiliated person of the Fund as defined in the Investment Company Act of 1940. |
| (u) | The rate represents the 7-day annualized yield at period end. |
Abbreviations:
| ADR | American depositary receipt |
| REIT | Real estate investment trust |
Futures Contracts
| | | | | | | | | | | | | | | | | | | | | | | | |
| Description | | Number of
contracts | | | Expiration
date | | | Notional
cost | | | Notional
value | | | Unrealized
gains | | | Unrealized
losses | |
Long | | | | | | | | | | | | | | | | | | | | | | | | |
MSCI Emerging Markets Index | | | 286 | | | | 9-21-2018 | | | $ | 15,343,527 | | | $ | 15,085,070 | | | $ | 0 | | | $ | (258,457 | ) |
Investments in Affiliates
An affiliated investment is an investment in which the Portfolio owns at least 5% of the outstanding voting shares of the issuer or as a result of other relationships, such as the Portfolio and the issuer having the same adviser or investment manager. Transactions with issuers that were either affiliated persons of the Portfolio at the beginning of the period or the end of the period were as follows:
| | | | | | | | | | | | | | | | | | | | | | | | | | | | | | | | | | | | |
| | | Shares,
beginning of
period | | | Shares
purchased | | | Shares
sold | | | Shares,
end of
period | | | Net
realized
gains
(losses) | | | Net
change in
unrealized
gains
(losses) | | | Income
from
affiliated
securities | | | Value,
end
of period | | | % of
net
assets | |
Short-Term Investments | | | | | | | | | | | | | | | | | | | | | | | | | | | | | | | | | | | | |
Investment Companies | | | | | | | | | | | | | | | | | | | | | | | | | | | | | | | | | | | | |
Wells Fargo Government Money Market Fund Select Class | | | 7,994,492 | | | | 73,898,222 | | | | 68,538,106 | | | | 13,354,608 | | | $ | 0 | | | $ | 0 | | | $ | 72,160 | | | $ | 13,354,608 | | | | 4.31 | % |
The accompanying notes are an integral part of these financial statements.
| | | | |
| 92 | | Wells Fargo Funds | | Portfolio of investments—August 31, 2018 (unaudited) |
FACTOR ENHANCED INTERNATIONAL PORTFOLIO
| | | | | | | | | | | | | | | | |
| Security name | | | | | | | | Shares | | | Value | |
| | | | |
Common Stocks: 90.82% | | | | | | | | | | | | | | | | |
| | | | |
| Australia: 8.75% | | | | | | | | | | | | | | | | |
Adelaide Brighton Limited (Materials, Construction Materials) | | | | | | | | | | | 28,296 | | | $ | 131,002 | |
AGL Energy Limited (Utilities, Multi-Utilities) | | | | | | | | | | | 55,405 | | | | 827,681 | |
ALS Limited (Industrials, Professional Services) | | | | | | | | | | | 38,125 | | | | 243,110 | |
Alumina Limited (Materials, Metals & Mining) | | | | | | | | | | | 212,701 | | | | 440,383 | |
Amcor Limited (Materials, Containers & Packaging) | | | | | | | | | | | 95,919 | | | | 986,073 | |
AMP Limited (Financials, Diversified Financial Services) | | | | | | | | | | | 238,898 | | | | 573,624 | |
Ansell Limited (Health Care, Health Care Equipment & Supplies) | | | | | | | | | | | 10,460 | | | | 188,744 | |
APA Group (Utilities, Gas Utilities) | | | | | | | | | | | 80,532 | | | | 578,945 | |
Aristocrat Leisure Limited (Consumer Discretionary, Hotels, Restaurants & Leisure) | | | | | | | | | | | 51,271 | | | | 1,164,367 | |
ASX Limited (Financials, Capital Markets) | | | | | | | | | | | 15,172 | | | | 737,760 | |
Atlas Arteria Stapled Securities (Industrials, Transportation Infrastructure) | | | | | | | | | | | 53,665 | | | | 265,429 | |
AusNet Services (Utilities, Electric Utilities) | | | | | | | | | | | 135,758 | | | | 160,546 | |
Australia & New Zealand Banking Group Limited (Financials, Banks) | | | | | | | | | | | 237,601 | | | | 5,038,935 | |
Bank of Queensland Limited (Financials, Banks) | | | | | | | | | | | 30,767 | | | | 254,140 | |
Bendigo Bank Limited (Financials, Banks) | | | | | | | | | | | 38,211 | | | | 318,376 | |
BHP Billiton Limited (Materials, Metals & Mining) | | | | | | | | | | | 271,826 | | | | 6,489,756 | |
BlueScope Steel Limited (Materials, Metals & Mining) | | | | | | | | | | | 45,596 | | | | 567,404 | |
Boral Limited (Materials, Construction Materials) | | | | | | | | | | | 96,256 | | | | 484,389 | |
Brambles Limited (Industrials, Commercial Services & Supplies) | | | | | | | | | | | 122,111 | | | | 963,008 | |
Caltex Australia Limited (Energy, Oil, Gas & Consumable Fuels) | | | | | | | | | | | 21,571 | | | | 468,478 | |
Carsales.com Limited (Information Technology, Internet Software & Services) | | | | | | | | | | | 18,977 | | | | 211,460 | |
Challenger Financial Services Group Limited (Financials, Diversified Financial Services) | | | | | | | | | | | 43,243 | | | | 336,676 | |
CIMIC Group Limited (Industrials, Construction & Engineering) | | | | | | | | | | | 6,964 | | | | 246,716 | |
Cleanaway Waste Management Limited (Industrials, Commercial Services & Supplies) | | | | | | | | | | | 145,621 | | | | 201,522 | |
Coca-Cola Amatil Limited (Consumer Staples, Beverages) | | | | | | | | | | | 37,239 | | | | 251,381 | |
Cochlear Limited (Health Care, Health Care Equipment & Supplies) | | | | | | | | | | | 4,552 | | | | 706,224 | |
Commonwealth Bank of Australia (Financials, Banks) | | | | | | | | | | | 140,407 | | | | 7,190,866 | |
Computershare Limited (Information Technology, IT Services) | | | | | | | | | | | 40,612 | | | | 561,146 | |
Crown Limited (Consumer Discretionary, Hotels, Restaurants & Leisure) | | | | | | | | | | | 29,139 | | | | 297,462 | |
CSL Limited (Health Care, Biotechnology) | | | | | | | | | | | 36,736 | | | | 6,003,146 | |
Dexus Property Group (Real Estate, Equity REITs) | | | | | | | | | | | 82,897 | | | | 638,855 | |
Domino’s Pizza Enterprises Limited (Consumer Discretionary, Hotels, Restaurants & Leisure) | | | | | | | | | | | 4,913 | | | | 191,079 | |
Downer EDI Limited (Industrials, Commercial Services & Supplies) | | | | | | | | | | | 43,308 | | | | 240,355 | |
Duluxgroup Limited DuluxGroup Ltd(Materials, Chemicals) | | | | | | | | | | | 29,826 | | | | 168,533 | |
Evolution Mining Limited (Materials, Metals & Mining) | | | | | | | | | | | 117,118 | | | | 223,120 | |
Flight Centre Travel Group Limited (Consumer Discretionary, Hotels, Restaurants & Leisure) | | | | | | | | | | | 4,169 | | | | 175,090 | |
Goodman Group (Real Estate, Equity REITs) | | | | | | | | | | | 130,378 | | | | 1,002,898 | |
Harvey Norman Holdings Limited (Consumer Discretionary, Multiline Retail) | | | | | | | | | | | 56,402 | | | | 145,971 | |
Healthscope Limited (Health Care, Health Care Providers & Services) | | | | | | | | | | | 136,783 | | | | 215,350 | |
Iluka Resources Limited (Materials, Metals & Mining) | | | | | | | | | | | 34,214 | | | | 228,255 | |
Incitec Pivot Limited (Materials, Chemicals) | | | | | | | | | | | 133,354 | | | | 375,803 | |
Insurance Australia Group Limited (Financials, Insurance) | | | | | | | | | | | 202,014 | | | | 1,121,159 | |
IOOF Holdings Limited (Financials, Capital Markets) | | | | | | | | | | | 24,501 | | | | 147,956 | |
JB Hi-Fi Limited (Consumer Discretionary, Specialty Retail) | | | | | | | | | | | 8,545 | | | | 162,175 | |
Lendlease Corporation Limited (Real Estate, Real Estate Management & Development) | | | | | | | | | | | 46,691 | | | | 687,771 | |
Link Administration Holdings Limited (Information Technology, IT Services) | | | | | | | | | | | 38,165 | | | | 213,733 | |
Macquarie Group Limited (Financials, Capital Markets) | | | | | | | | | | | 27,100 | | | | 2,520,995 | |
Magellan Financial Group Limited (Financials, Capital Markets) | | | | | | | | | | | 9,986 | | | | 201,154 | |
The accompanying notes are an integral part of these financial statements.
| | | | | | |
| Portfolio of investments—August 31, 2018 (unaudited) | | Wells Fargo Funds | | | 93 | |
FACTOR ENHANCED INTERNATIONAL PORTFOLIO
| | | | | | | | | | | | | | | | |
| Security name | | | | | | | | Shares | | | Value | |
| | | | |
| Australia (continued) | | | | | | | | | | | | | | | | |
Medibank Private Limited (Financials, Insurance) | | | | | | | | | | | 205,086 | | | $ | 448,206 | |
Metcash Limited (Consumer Staples, Food & Staples Retailing) | | | | | | | | | | | 75,377 | | | | 149,560 | |
Mineral Resources Limited (Materials, Metals & Mining) | | | | | | | | | | | 12,886 | | | | 140,624 | |
Mirvac Group (Real Estate, Equity REITs) | | | | | | | | | | | 298,742 | | | | 521,880 | |
National Australia Bank Limited (Financials, Banks) | | | | | | | | | | | 225,336 | | | | 4,595,771 | |
Newcrest Mining Limited (Materials, Metals & Mining) | | | | | | | | | | | 67,359 | | | | 938,949 | |
Northern Star Resources Limited (Materials, Metals & Mining) (a) | | | | | | | | | | | 54,174 | | | | 289,123 | |
Oil Search Limited (Energy, Oil, Gas & Consumable Fuels) | | | | | | | | | | | 105,995 | | | | 682,750 | |
Orica Limited (Materials, Chemicals) | | | | | | | | | | | 30,399 | | | | 384,409 | |
Orora Limited (Materials, Containers & Packaging) | | | | | | | | | | | 91,453 | | | | 232,082 | |
OZ Minerals Limited (Materials, Metals & Mining) | | | | | | | | | | | 23,330 | | | | 152,121 | |
Qantas Airways Limited (Industrials, Airlines) | | | | | | | | | | | 133,453 | | | | 616,890 | |
Qube Holdings Limited (Industrials, Transportation Infrastructure) | | | | | | | | | | | 116,308 | | | | 230,774 | |
Ramsay Health Care Limited (Health Care, Health Care Providers & Services) | | | | | | | | | | | 11,039 | | | | 442,032 | |
REA Group Limited (Information Technology, Internet Software & Services) | | | | | | | | | | | 3,968 | | | | 259,957 | |
Reece Limited (Industrials, Trading Companies & Distributors) | | | | | | | | | | | 25,799 | | | | 233,135 | |
Reliance Worldwide Corporation Limited (Industrials, Building Products) | | | | | | | | | | | 46,193 | | | | 176,335 | |
Rio Tinto Limited (Materials, Metals & Mining) | | | | | | | | | | | 35,624 | | | | 1,862,878 | |
Santos Limited (Energy, Oil, Gas & Consumable Fuels) | | | | | | | | | | | 158,591 | | | | 772,995 | |
Scentre Group (Real Estate, Equity REITs) | | | | | | | | | | | 446,295 | | | | 1,318,659 | |
SEEK Limited (Industrials, Professional Services) | | | | | | | | | | | 27,434 | | | | 441,780 | |
Sonic Healthcare Limited (Health Care, Health Care Providers & Services) | | | | | | | | | | | 31,711 | | | | 597,054 | |
South32 Limited - Athens Exchange (Materials, Metals & Mining) | | | | | | | | | | | 432,510 | | | | 1,082,041 | |
Spark Infrastructure Group (Utilities, Electric Utilities) | | | | | | | | | | | 124,556 | | | | 214,904 | |
Stockland Corporation Limited (Real Estate, Equity REITs) | | | | | | | | | | | 199,655 | | | | 592,787 | |
Suncorp Group Limited (Financials, Insurance) | | | | | | | | | | | 105,720 | | | | 1,177,273 | |
Sydney Airport Holdings Limited (Industrials, Transportation Infrastructure) | | | | | | | | | | | 190,014 | | | | 984,894 | |
Tabcorp Holdings Limited (Consumer Discretionary, Hotels, Restaurants & Leisure) | | | | | | | | | | | 153,003 | | | | 527,971 | |
Telstra Corporation Limited (Telecommunication Services, Diversified Telecommunication Services) | | | | | | | | | | | 953,574 | | | | 2,125,126 | |
The GPT Group (Real Estate, Equity REITs) | | | | | | | | | | | 126,645 | | | | 470,703 | |
The Star Entertainment Group Limited (Consumer Discretionary, Hotels, Restaurants & Leisure) | | | | | | | | | | | 74,848 | | | | 290,026 | |
Transurban Group (Industrials, Transportation Infrastructure) | | | | | | | | | | | 189,982 | | | | 1,647,131 | |
Treasury Wine Estates Limited (Consumer Staples, Beverages) | | | | | | | | | | | 58,482 | | | | 818,572 | |
Vicinity Centres (Real Estate, Equity REITs) | | | | | | | | | | | 261,503 | | | | 520,745 | |
Wesfarmers Limited (Consumer Staples, Food & Staples Retailing) | | | | | | | | | | | 94,735 | | | | 3,504,002 | |
Westpac Banking Corporation (Financials, Banks) | | | | | | | | | | | 282,613 | | | | 5,798,486 | |
Whitehaven Coal Limited (Energy, Oil, Gas & Consumable Fuels) | | | | | | | | | | | 49,197 | | | | 177,900 | |
Woodside Petroleum Limited (Energy, Oil, Gas & Consumable Fuels) | | | | | | | | | | | 66,999 | | | | 1,775,865 | |
Woolworths Group Limited (Consumer Staples, Food & Staples Retailing) | | | | | | | | | | | 107,892 | | | | 2,195,049 | |
WorleyParsons Limited (Energy, Energy Equipment & Services) | | | | | | | | | | | 14,656 | | | | 216,414 | |
| | | | |
| | | | | | | | | | | | | | | 85,156,854 | |
| | | | | | | | | | | | | | | | |
| | | | |
| Austria: 0.30% | | | | | | | | | | | | | | | | |
Andritz AG (Industrials, Machinery) | | | | | | | | | | | 5,613 | | | | 332,280 | |
Erste Bank Der Oesterreichischen Sparkassen AG (Financials, Banks) | | | | | | | | | | | 25,008 | | | | 994,791 | |
OMV AG (Energy, Oil, Gas & Consumable Fuels) | | | | | | | | | | | 11,891 | | | | 629,807 | |
Raiffeisen Bank International AG (Financials, Banks) | | | | | | | | | | | 10,349 | | | | 294,309 | |
Voestalpine AG (Materials, Metals & Mining) | | | | | | | | | | | 8,668 | | | | 388,772 | |
Wienerberger AG (Materials, Construction Materials) | | | | | | | | | | | 9,283 | | | | 253,865 | |
| | | | |
| | | | | | | | | | | | | | | 2,893,824 | |
| | | | | | | | | | | | | | | | |
The accompanying notes are an integral part of these financial statements.
| | | | |
| 94 | | Wells Fargo Funds | | Portfolio of investments—August 31, 2018 (unaudited) |
FACTOR ENHANCED INTERNATIONAL PORTFOLIO
| | | | | | | | | | | | | | | | |
| Security name | | | | | | | | Shares | | | Value | |
| | | | |
| Belgium: 0.60% | | | | | | | | | | | | | | | | |
Ablynx NV (Health Care, Biotechnology) (a)† | | | | | | | | | | | 6,931 | | | $ | 362,032 | |
Ackermans & Van Haaren NV (Financials, Diversified Financial Services) | | | | | | | | | | | 1,523 | | | | 271,537 | |
Ageas NV (Financials, Insurance) | | | | | | | | | | | 16,068 | | | | 831,458 | |
Cofinimmo SA (Real Estate, Equity REITs) | | | | | | | | | | | 1,297 | | | | 168,766 | |
Colruyt SA (Consumer Staples, Food & Staples Retailing) | | | | | | | | | | | 3,657 | | | | 217,337 | |
Galapagos NV (Health Care, Biotechnology) † | | | | | | | | | | | 3,987 | | | | 403,369 | |
Groupe Bruxelles Lambert SA (Financials, Diversified Financial Services) | | | | | | | | | | | 6,359 | | | | 667,261 | |
Proximus SA (Telecommunication Services, Diversified Telecommunication Services) | | | | | | | | | | | 11,788 | | | | 271,538 | |
Solvay SA (Materials, Chemicals) | | | | | | | | | | | 5,992 | | | | 797,415 | |
UCB SA (Health Care, Pharmaceuticals) | | | | | | | | | | | 9,847 | | | | 900,219 | |
Umicore SA (Materials, Chemicals) | | | | | | | | | | | 16,688 | | | | 930,563 | |
| | | | |
| | | | | | | | | | | | | | | 5,821,495 | |
| | | | | | | | | | | | | | | | |
| | | | |
| Canada: 8.77% | | | | | | | | | | | | | | | | |
Agnico-Eagle Mines Limited (Materials, Metals & Mining) | | | | | | | | | | | 19,895 | | | | 685,730 | |
Alimentation Couche-Tard Incorporated Class B (Consumer Staples, Food & Staples Retailing) | | | | | | | | | | | 32,835 | | | | 1,572,054 | |
Bank of Montreal (Financials, Banks) | | | | | | | | | | | 52,191 | | | | 4,278,062 | |
Barrick Gold Corporation (Materials, Metals & Mining) | | | | | | | | | | | 101,871 | | | | 1,042,129 | |
BCE Incorporated (Telecommunication Services, Diversified Telecommunication Services) | | | | | | | | | | | 70,915 | | | | 2,892,571 | |
Brookfield Asset Management Incorporated Class A (Financials, Capital Markets) | | | | | | | | | | | 74,219 | | | | 3,171,227 | |
Canadian Imperial Bank of Commerce (Financials, Banks) | | | | | | | | | | | 36,174 | | | | 3,390,100 | |
Canadian National Railway Company (Industrials, Road & Rail) | | | | | | | | | | | 51,837 | | | | 4,610,117 | |
Canadian Pacific Railway Limited (Industrials, Road & Rail) | | | | | | | | | | | 11,982 | | | | 2,520,260 | |
Canadian Tire Corporation Limited Class A (Consumer Discretionary, Multiline Retail) | | | | | | | | | | | 4,975 | | | | 622,428 | |
Cenovus Energy Incorporated (Energy, Oil, Gas & Consumable Fuels) | | | | | | | | | | | 84,300 | | | | 781,632 | |
CGI Group Incorporated Class A (Information Technology, IT Services) † | | | | | | | | | | | 19,865 | | | | 1,304,392 | |
Constellation Software Incorporated (Information Technology, Software) | | | | | | | | | | | 1,628 | | | | 1,241,384 | |
Dollarama Incorporated (Consumer Discretionary, Multiline Retail) | | | | | | | | | | | 25,932 | | | | 980,647 | |
EnCana Corporation (Energy, Oil, Gas & Consumable Fuels) | | | | | | | | | | | 81,500 | | | | 1,079,172 | |
Fairfax Financial Holdings Limited (Financials, Insurance) | | | | | | | | | | | 2,300 | | | | 1,262,726 | |
Fortis Incorporated (Utilities, Electric Utilities) | | | | | | | | | | | 34,544 | | | | 1,130,820 | |
Franco-Nevada Corporation (Materials, Metals & Mining) | | | | | | | | | | | 15,708 | | | | 1,004,108 | |
Goldcorp Incorporated (Materials, Metals & Mining) | | | | | | | | | | | 73,900 | | | | 798,460 | |
Great-West Lifeco Incorporated (Financials, Insurance) | | | | | | | | | | | 21,168 | | | | 516,467 | |
Imperial Oil Limited (Energy, Oil, Gas & Consumable Fuels) | | | | | | | | | | | 20,362 | | | | 634,577 | |
Intact Financial Corporation (Financials, Insurance) | | | | | | | | | | | 10,975 | | | | 870,431 | |
Inter Pipeline Limited (Energy, Oil, Gas & Consumable Fuels) | | | | | | | | | | | 31,089 | | | | 571,275 | |
Loblaw Companies Limited (Consumer Staples, Food & Staples Retailing) | | | | | | | | | | | 15,254 | | | | 789,000 | |
Magna International Incorporated (Consumer Discretionary, Auto Components) | | | | | | | | | | | 27,327 | | | | 1,479,637 | |
Metro Incorporated (Consumer Staples, Food & Staples Retailing) | | | | | | | | | | | 18,330 | | | | 573,919 | |
National Bank of Canada (Financials, Banks) | | | | | | | | | | | 27,908 | | | | 1,396,683 | |
Open Text Corporation (Information Technology, Software) | | | | | | | | | | | 18,969 | | | | 744,533 | |
Pembina Pipeline Corporation (Energy, Oil, Gas & Consumable Fuels) | | | | | | | | | | | 41,352 | | | | 1,410,404 | |
Power Corporation of Canada (Financials, Insurance) | | | | | | | | | | | 29,796 | | | | 667,841 | |
Restaurant Brands International Incorporated (Consumer Discretionary, Hotels, Restaurants & Leisure) | | | | | | | | | | | 19,603 | | | | 1,124,356 | |
Rogers Communications Incorporated Class B (Telecommunication Services, Wireless Telecommunication Services) | | | | | | | | | | | 28,122 | | | | 1,457,172 | |
Royal Bank of Canada (Financials, Banks) | | | | | | | | | | | 116,531 | | | | 9,256,401 | |
Saputo Incorporated (Consumer Staples, Food Products) | | | | | | | | | | | 17,033 | | | | 521,562 | |
Shaw Communications Incorporated Class B (Consumer Discretionary, Media) | | | | | | | | | | | 34,726 | | | | 700,374 | |
The accompanying notes are an integral part of these financial statements.
| | | | | | |
| Portfolio of investments—August 31, 2018 (unaudited) | | Wells Fargo Funds | | | 95 | |
FACTOR ENHANCED INTERNATIONAL PORTFOLIO
| | | | | | | | | | | | | | | | |
| Security name | | | | | | | | Shares | | | Value | |
| | | | |
| Canada (continued) | | | | | | | | | | | | | | | | |
Sun Life Financial Incorporated (Financials, Insurance) | | | | | | | | | | | 49,858 | | | $ | 1,981,712 | |
Suncor Energy Incorporated (Energy, Oil, Gas & Consumable Fuels) | | | | | | | | | | | 135,062 | | | | 5,559,794 | |
Teck Resources Limited Class B (Materials, Metals & Mining) | | | | | | | | | | | 42,700 | | | | 962,304 | |
TELUS Corporation (Telecommunication Services, Diversified Telecommunication Services) | | | | | | | | | | | 44,094 | | | | 1,635,026 | |
The Bank of Nova Scotia (Financials, Banks) | | | | | | | | | | | 98,408 | | | | 5,695,599 | |
The Toronto-Dominion Bank (Financials, Banks) | | | | | | | | | | | 153,128 | | | | 9,228,749 | |
Thomson Reuters Corporation (Financials, Capital Markets) | | | | | | | | | | | 19,967 | | | | 888,034 | |
Waste Connections Incorporated - Toronto Exchange (Industrials, Commercial Services & Supplies) | | | | | | | | | | | 21,200 | | | | 1,682,516 | |
Wheaton Precious Metals Corporation (Materials, Metals & Mining) | | | | | | | | | | | 37,976 | | | | 650,685 | |
| | | | |
| | | | | | | | | | | | | | | 85,367,070 | |
| | | | | | | | | | | | | | | | |
| | | | |
| China: 0.38% | | | | | | | | | | | | | | | | |
AAC Technologies Holdings Incorporated (Information Technology, Electronic Equipment, Instruments & Components) | | | | | | | | | | | 60,500 | | | | 670,616 | |
Genscript Biotech Corporation (Health Care, Life Sciences Tools & Services) † | | | | | | | | | | | 62,000 | | | | 133,499 | |
MGM China Holdings Limited (Consumer Discretionary, Hotels, Restaurants & Leisure) | | | | | | | | | | | 62,800 | | | | 118,419 | |
Minth Group Limited (Consumer Discretionary, Auto Components) | | | | | | | | | | | 54,000 | | | | 221,194 | |
Sands China Limited (Consumer Discretionary, Hotels, Restaurants & Leisure) | | | | | | | | | | | 205,200 | | | | 1,001,326 | |
Shenzhou International Group Holdings Limited (Consumer Discretionary, Textiles, Apparel & Luxury Goods) | | | | | | | | | | | 60,000 | | | | 787,387 | |
WuXi Biologics Cayman Incorporated (Health Care, Life Sciences Tools & Services) 144A† | | | | | | | | | | | 41,000 | | | | 404,842 | |
Wynn Macau Limited (Consumer Discretionary, Hotels, Restaurants & Leisure) | | | | | | | | | | | 116,734 | | | | 324,974 | |
| | | | |
| | | | | | | | | | | | | | | 3,662,257 | |
| | | | | | | | | | | | | | | | |
| | | | |
| Czech Republic: 0.05% | | | | | | | | | | | | | | | | |
CEZ AS (Utilities, Electric Utilities) | | | | | | | | | | | 12,077 | | | | 306,107 | |
Komercni Banka AS (Financials, Banks) | | | | | | | | | | | 5,308 | | | | 220,924 | |
| | | | |
| | | | | | | | | | | | | | | 527,031 | |
| | | | | | | | | | | | | | | | |
| | | | |
| Denmark: 1.94% | | | | | | | | | | | | | | | | |
Ambu AS Class B (Health Care, Health Care Equipment & Supplies) | | | | | | | | | | | 11,891 | | | | 445,482 | |
Carlsberg AS Class B (Consumer Staples, Beverages) | | | | | | | | | | | 8,431 | | | | 1,029,227 | |
Christian Hansen Holding AS (Materials, Chemicals) | | | | | | | | | | | 7,201 | | | | 731,066 | |
Coloplast AS Class B (Health Care, Health Care Equipment & Supplies) | | | | | | | | | | | 9,075 | | | | 971,342 | |
Danske Bank AS (Financials, Banks) | | | | | | | | | | | 62,443 | | | | 1,837,159 | |
DONG Energy AS (Utilities, Electric Utilities) 144A | | | | | | | | | | | 13,100 | | | | 828,159 | |
DSV AS (Industrials, Road & Rail) | | | | | | | | | | | 16,092 | | | | 1,507,920 | |
FLSmidth & Company AS (Industrials, Construction & Engineering) | | | | | | | | | | | 3,239 | | | | 201,233 | |
GN Store Nord AS (Health Care, Health Care Equipment & Supplies) | | | | | | | | | | | 10,791 | | | | 559,696 | |
H. Lundbeck AS (Health Care, Pharmaceuticals) | | | | | | | | | | | 4,941 | | | | 289,896 | |
ISS AS (Industrials, Commercial Services & Supplies) | | | | | | | | | | | 12,719 | | | | 444,022 | |
Jyske Bank AS (Financials, Banks) | | | | | | | | | | | 5,813 | | | | 294,895 | |
Novo Nordisk AS Class B (Health Care, Pharmaceuticals) | | | | | | | | | | | 137,762 | | | | 6,751,672 | |
Novozymes AS Class B (Materials, Chemicals) | | | | | | | | | | | 17,695 | | | | 969,861 | |
Pandora AS (Consumer Discretionary, Textiles, Apparel & Luxury Goods) | | | | | | | | | | | 9,212 | | | | 550,379 | |
Rockwool International AS B Shares Rockwool International AS (Industrials, Building Products) | | | | | | | | | | | 685 | | | | 296,732 | |
Royal Unibrew AS (Consumer Staples, Beverages) | | | | | | | | | | | 3,366 | | | | 290,100 | |
SimCorp AS (Information Technology, Software) | | | | | | | | | | | 3,027 | | | | 286,335 | |
Sydbank AS (Financials, Banks) | | | | | | | | | | | 4,554 | | | | 133,311 | |
Tryg AS (Financials, Insurance) | | | | | | | | | | | 8,071 | | | | 198,313 | |
William Demant Holding (Health Care, Health Care Equipment & Supplies) † | | | | | | | | | | | 7,640 | | | | 310,730 | |
| | | | |
| | | | | | | | | | | | | | | 18,927,530 | |
| | | | | | | | | | | | | | | | |
The accompanying notes are an integral part of these financial statements.
| | | | |
| 96 | | Wells Fargo Funds | | Portfolio of investments—August 31, 2018 (unaudited) |
FACTOR ENHANCED INTERNATIONAL PORTFOLIO
| | | | | | | | | | | | | | | | |
| Security name | | | | | | | | Shares | | | Value | |
| | | | |
| Finland: 1.40% | | | | | | | | | | | | | | | | |
Amer Sports Oyj (Consumer Discretionary, Leisure Products) | | | | | | | | | | | 9,050 | | | $ | 304,114 | |
Elisa Oyj (Telecommunication Services, Diversified Telecommunication Services) | | | | | | | | | | | 12,730 | | | | 544,508 | |
Fortum Oyj (Utilities, Electric Utilities) | | | | | | | | | | | 33,276 | | | | 842,028 | |
Huhtamaki Oyj (Materials, Containers & Packaging) | | | | | | | | | | | 7,719 | | | | 276,411 | |
Kesko Oyj Class B (Consumer Staples, Food & Staples Retailing) | | | | | | | | | | | 5,198 | | | | 302,886 | |
Kone Oyj Class B (Industrials, Machinery) | | | | | | | | | | | 33,243 | | | | 1,794,673 | |
Konecranes Oyj (Industrials, Machinery) | | | | | | | | | | | 5,130 | | | | 202,756 | |
Neste Oil Oyj (Energy, Oil, Gas & Consumable Fuels) | | | | | | | | | | | 10,905 | | | | 946,817 | |
Nokia Oyj (Information Technology, Communications Equipment) | | | | | | | | | | | 465,969 | | | | 2,595,111 | |
Orion Oyj Class B (Health Care, Pharmaceuticals) | | | | | | | | | | | 7,599 | | | | 279,346 | |
Sampo Oyj Class A (Financials, Insurance) | | | | | | | | | | | 40,964 | | | | 2,095,483 | |
Stora Enso Oyj (Materials, Paper & Forest Products) | | | | | | | | | | | 48,292 | | | | 898,841 | |
UPM-Kymmene Oyj (Materials, Paper & Forest Products) | | | | | | | | | | | 45,547 | | | | 1,755,240 | |
Wartsila Oyj (Industrials, Machinery) | | | | | | | | | | | 36,546 | | | | 771,634 | |
| | | | |
| | | | | | | | | | | | | | | 13,609,848 | |
| | | | | | | | | | | | | | | | |
| | | | |
| France: 6.27% | | | | | | | | | | | | | | | | |
Aeroports de Paris SA (Industrials, Transportation Infrastructure) | | | | | | | | | | | 2,232 | | | | 490,437 | |
Alstom SA (Industrials, Machinery) | | | | | | | | | | | 13,393 | | | | 590,745 | |
ALTEN SA (Information Technology, IT Services) | | | | | | | | | | | 2,182 | | | | 225,289 | |
Altran Technologies SA (Information Technology, IT Services) | | | | | | | | | | | 17,603 | | | | 193,702 | |
Amundi SA (Financials, Diversified Financial Services) | | | | | | | | | | | 4,897 | | | | 352,988 | |
Arkema SA (Materials, Chemicals) | | | | | | | | | | | 6,001 | | | | 751,595 | |
bioMerieux (Health Care, Health Care Equipment & Supplies) | | | | | | | | | | | 3,308 | | | | 290,670 | |
Bollore SA (Industrials, Air Freight & Logistics) | | | | | | | | | | | 73,260 | | | | 350,691 | |
Bouygues SA (Industrials, Construction & Engineering) | | | | | | | | | | | 23,957 | | | | 1,057,542 | |
Bureau Veritas SA (Industrials, Professional Services) | | | | | | | | | | | 21,009 | | | | 539,910 | |
Capgemini SA (Information Technology, IT Services) | | | | | | | | | | | 13,842 | | | | 1,779,431 | |
Christian Dior SA (Consumer Discretionary, Textiles, Apparel & Luxury Goods) | | | | | | | | | | | 690 | | | | 297,301 | |
CNP Assurances SA (Financials, Insurance) | | | | | | | | | | | 12,807 | | | | 295,382 | |
Compagnie Generale des Etablissements Michelin SCA (Consumer Discretionary, Auto Components) | | | | | | | | | | | 14,883 | | | | 1,761,231 | |
Dassault Aviation SA (Industrials, Aerospace & Defense) | | | | | | | | | | | 179 | | | | 333,062 | |
Dassault Systemes SA (Information Technology, Software) | | | | | | | | | | | 10,705 | | | | 1,734,646 | |
Edenred SA (Industrials, Commercial Services & Supplies) | | | | | | | | | | | 18,508 | | | | 705,292 | |
Eiffage SA (Industrials, Construction & Engineering) | | | | | | | | | | | 7,995 | | | | 899,808 | |
Electricite de France SA (Utilities, Electric Utilities) | | | | | | | | | | | 38,822 | | | | 635,834 | |
Elis SA (Industrials, Commercial Services & Supplies) | | | | | | | | | | | 15,685 | | | | 363,217 | |
Engie SA (Utilities, Multi-Utilities) | | | | | | | | | | | 154,125 | | | | 2,259,514 | |
Essilor International SA Cie Generale d’Optique (Health Care, Health Care Equipment & Supplies) | | | | | | | | | | | 17,961 | | | | 2,591,435 | |
Eurazeo SA (Financials, Diversified Financial Services) | | | | | | | | | | | 3,788 | | | | 287,559 | |
Eutelsat Communications SA (Consumer Discretionary, Media) | | | | | | | | | | | 10,842 | | | | 256,731 | |
Faurecia (Consumer Discretionary, Auto Components) | | | | | | | | | | | 5,892 | | | | 360,970 | |
Fonciere des Regions (Real Estate, Equity REITs) | | | | | | | | | | | 2,805 | | | | 293,194 | |
Gecina SA (Real Estate, Equity REITs) | | | | | | | | | | | 4,452 | | | | 764,297 | |
Groupe Danone SA (Consumer Staples, Food Products) | | | | | | | | | | | 52,067 | | | | 4,098,822 | |
Groupe Eurotunnel SE (Industrials, Transportation Infrastructure) | | | | | | | | | | | 37,614 | | | | 473,716 | |
Hermes International SA (Consumer Discretionary, Textiles, Apparel & Luxury Goods) | | | | | | | | | | | 2,376 | | | | 1,544,999 | |
ICADE (Real Estate, Equity REITs) | | | | | | | | | | | 2,440 | | | | 238,049 | |
Iliad SA (Telecommunication Services, Diversified Telecommunication Services) | | | | | | | | | | | 2,211 | | | | 285,642 | |
Imerys SA (Materials, Construction Materials) | | | | | | | | | | | 2,477 | | | | 177,973 | |
The accompanying notes are an integral part of these financial statements.
| | | | | | |
| Portfolio of investments—August 31, 2018 (unaudited) | | Wells Fargo Funds | | | 97 | |
FACTOR ENHANCED INTERNATIONAL PORTFOLIO
| | | | | | | | | | | | | | | | |
| Security name | | | | | | | | Shares | | | Value | |
| | | | |
| France (continued) | | | | | | | | | | | | | | | | |
Ingenico SA (Information Technology, Electronic Equipment, Instruments & Components) | | | | | | | | | | | 4,637 | | | $ | 325,850 | |
Ipsen SA (Health Care, Pharmaceuticals) | | | | | | | | | | | 2,801 | | | | 497,931 | |
JCDecaux SA (Consumer Discretionary, Media) | | | | | | | | | | | 6,484 | | | | 213,596 | |
Kering SA (Consumer Discretionary, Textiles, Apparel & Luxury Goods) | | | | | | | | | | | 6,192 | | | | 3,363,686 | |
Klepierre SA (Real Estate, Equity REITs) | | | | | | | | | | | 17,631 | | | | 632,374 | |
Lagardere SCA (Consumer Discretionary, Media) | | | | | | | | | | | 8,591 | | | | 253,289 | |
Legrand SA (Industrials, Electrical Equipment) | | | | | | | | | | | 22,129 | | | | 1,667,037 | |
Orange SA (Telecommunication Services, Diversified Telecommunication Services) | | | | | | | | | | | 169,996 | | | | 2,752,654 | |
Orpea SA (Health Care, Health Care Providers & Services) | | | | | | | | | | | 3,485 | | | | 471,267 | |
Pernod-Ricard SA (Consumer Staples, Beverages) | | | | | | | | | | | 17,840 | | | | 2,816,258 | |
Plastic Omnium SA (Consumer Discretionary, Auto Components) | | | | | | | | | | | 4,920 | | | | 194,856 | |
Publicis Groupe SA (Consumer Discretionary, Media) | | | | | | | | | | | 17,720 | | | | 1,137,437 | |
Remy Cointreau SA (Consumer Staples, Beverages) | | | | | | | | | | | 1,743 | | | | 244,199 | |
Rubis SCA (Utilities, Gas Utilities) | | | | | | | | | | | 7,050 | | | | 417,348 | |
Safran SA (Industrials, Aerospace & Defense) | | | | | | | | | | | 29,432 | | | | 3,836,526 | |
SCOR SE (Financials, Insurance) | | | | | | | | | | | 13,969 | | | | 566,049 | |
SEB SA (Consumer Discretionary, Household Durables) | | | | | | | | | | | 1,981 | | | | 369,291 | |
Societe BIC SA (Industrials, Commercial Services & Supplies) | | | | | | | | | | | 1,948 | | | | 180,326 | |
Sodexho Alliance SA (Consumer Discretionary, Hotels, Restaurants & Leisure) | | | | | | | | | | | 7,068 | | | | 736,079 | |
Sopra Steria Group (Information Technology, IT Services) | | | | | | | | | | | 1,250 | | | | 222,574 | |
Spie SA (Industrials, Commercial Services & Supplies) | | | | | | | | | | | 10,545 | | | | 199,759 | |
Teleperformance SE (Industrials, Professional Services) | | | | | | | | | | | 4,278 | | | | 821,821 | |
Thales SA (Industrials, Aerospace & Defense) | | | | | | | | | | | 8,404 | | | | 1,183,762 | |
Ubisoft Entertainment SA (Information Technology, Software) † | | | | | | | | | | | 4,373 | | | | 470,338 | |
Unibail Rodamco Westfield (Real Estate, Equity REITs) † | | | | | | | | | | | 9,625 | | | | 2,022,171 | |
Unibail-Rodamco-Westfield SE (Real Estate, Equity REITs) † | | | | | | | | | | | 65,100 | | | | 679,542 | |
Veolia Environnement SA (Utilities, Multi-Utilities) | | | | | | | | | | | 44,886 | | | | 946,162 | |
Vinci SA (Industrials, Construction & Engineering) | | | | | | | | | | | 45,109 | | | | 4,322,864 | |
Vivendi SA (Consumer Discretionary, Media) | | | | | | | | | | | 86,066 | | | | 2,232,790 | |
| | | | |
| | | | | | | | | | | | | | | 61,059,510 | |
| | | | | | | | | | | | | | | | |
| | | | |
| Germany: 4.55% | | | | | | | | | | | | | | | | |
Aareal Bank AG (Financials, Thrifts & Mortgage Finance) | | | | | | | | | | | 4,474 | | | | 181,918 | |
Adidas AG (Consumer Discretionary, Textiles, Apparel & Luxury Goods) | | | | | | | | | | | 15,141 | | | | 3,776,849 | |
Aurubis AG (Materials, Metals & Mining) | | | | | | | | | | | 2,886 | | | | 212,318 | |
Axel Springer AG (Consumer Discretionary, Media) | | | | | | | | | | | 3,885 | | | | 282,296 | |
Beiersdorf AG (Consumer Staples, Personal Products) | | | | | | | | | | | 7,375 | | | | 858,621 | |
Continental AG (Consumer Discretionary, Auto Components) | | | | | | | | | | | 8,753 | | | | 1,605,795 | |
Covestro AG (Materials, Chemicals) 144A | | | | | | | | | | | 15,645 | | | | 1,332,576 | |
Delivery Hero AG (Information Technology, Internet Software & Services) 144A† | | | | | | | | | | | 8,542 | | | | 470,572 | |
Deutsche Boerse AG (Financials, Capital Markets) | | | | | | | | | | | 15,420 | | | | 2,129,953 | |
Deutsche Lufthansa AG (Industrials, Airlines) | | | | | | | | | | | 18,794 | | | | 490,622 | |
Deutsche Post AG (Industrials, Air Freight & Logistics) | | | | | | | | | | | 82,431 | | | | 3,005,365 | |
Deutsche Wohnen AG (Real Estate, Real Estate Management & Development) | | | | | | | | | | | 27,452 | | | | 1,387,398 | |
Drillisch AG (Telecommunication Services, Wireless Telecommunication Services) | | | | | | | | | | | 3,591 | | | | 181,736 | |
E.ON SE (Utilities, Multi-Utilities) | | | | | | | | | | | 175,264 | | | | 1,867,558 | |
Evonik Industries AG (Materials, Chemicals) | | | | | | | | | | | 12,124 | | | | 451,882 | |
Fraport AG (Industrials, Transportation Infrastructure) | | | | | | | | | | | 2,930 | | | | 263,373 | |
Freenet AG (Telecommunication Services, Wireless Telecommunication Services) | | | | | | | | | | | 9,922 | | | | 263,854 | |
Fresenius Medical Care AG & Company KGaA (Health Care, Health Care Providers & Services) | | | | | | | | | | | 17,975 | | | | 1,820,635 | |
The accompanying notes are an integral part of these financial statements.
| | | | |
| 98 | | Wells Fargo Funds | | Portfolio of investments—August 31, 2018 (unaudited) |
FACTOR ENHANCED INTERNATIONAL PORTFOLIO
| | | | | | | | | | | | | | | | |
| Security name | | | | | | | | Shares | | | Value | |
| | | | |
| Germany (continued) | | | | | | | | | | | | | | | | |
Fresenius SE & Company KGaA (Health Care, Health Care Providers & Services) | | | | | | | | | | | 34,888 | | | $ | 2,663,843 | |
Gerresheimer AG (Health Care, Life Sciences Tools & Services) | | | | | | | | | | | 2,269 | | | | 189,629 | |
Grenke AG (Financials, Diversified Financial Services) | | | | | | | | | | | 1,941 | | | | 234,088 | |
Hannover Rueck SE (Financials, Insurance) | | | | | | | | | | | 4,608 | | | | 632,755 | |
Heidelbergcement AG (Materials, Construction Materials) | | | | | | | | | | | 12,561 | | | | 999,909 | |
HELLA GmbH & Company KGAA (Consumer Discretionary, Auto Components) | | | | | | | | | | | 3,412 | | | | 205,945 | |
Hochtief AG (Industrials, Construction & Engineering) | | | | | | | | | | | 1,365 | | | | 221,502 | |
Hugo Boss AG (Consumer Discretionary, Textiles, Apparel & Luxury Goods) | | | | | | | | | | | 5,136 | | | | 410,278 | |
Innogy SE (Utilities, Multi-Utilities) | | | | | | | | | | | 10,318 | | | | 448,045 | |
Kion Group AG (Industrials, Machinery) | | | | | | | | | | | 5,341 | | | | 364,658 | |
LEG Immobilien AG (Real Estate, Real Estate Management & Development) | | | | | | | | | | | 5,130 | | | | 626,131 | |
Linde AG - Tender Shares (Materials, Chemicals) | | | | | | | | | | | 13,467 | | | | 3,066,963 | |
MAN SE (Industrials, Machinery) | | | | | | | | | | | 2,497 | | | | 271,434 | |
Merck KGaA (Health Care, Pharmaceuticals) | | | | | | | | | | | 10,524 | | | | 1,105,279 | |
Metro AG (Consumer Staples, Food & Staples Retailing) | | | | | | | | | | | 13,288 | | | | 207,531 | |
MTU Aero Engines AG (Industrials, Aerospace & Defense) | | | | | | | | | | | 4,283 | | | | 939,115 | |
Osram Licht AG (Industrials, Electrical Equipment) | | | | | | | | | | | 7,626 | | | | 342,391 | |
ProSiebenSat.1 Media AG (Consumer Discretionary, Media) | | | | | | | | | | | 18,747 | | | | 493,748 | |
Rheinmetall AG (Industrials, Industrial Conglomerates) | | | | | | | | | | | 3,364 | | | | 366,735 | |
RWE AG (Utilities, Multi-Utilities) | | | | | | | | | | | 40,294 | | | | 1,021,952 | |
Scout24 AG (Information Technology, Internet Software & Services) | | | | | | | | | | | 8,290 | | | | 428,784 | |
Siemens Healthineers AG (Health Care, Health Care Equipment & Supplies) 144A† | | | | | | | | | | | 10,117 | | | | 459,809 | |
Siltronic AG (Information Technology, Semiconductors & Semiconductor Equipment) | | | | | | | | | | | 1,509 | | | | 218,596 | |
Software AG (Information Technology, Software) | | | | | | | | | | | 3,532 | | | | 174,240 | |
Symrise AG (Materials, Chemicals) | | | | | | | | | | | 9,660 | | | | 902,185 | |
TAG Immobilien AG (Real Estate, Real Estate Management & Development) | | | | | | | | | | | 11,000 | | | | 270,687 | |
TUI AG (Consumer Discretionary, Hotels, Restaurants & Leisure) | | | | | | | | | | | 37,788 | | | | 696,641 | |
Uniper SE (Utilities, Independent Power & Renewable Electricity Producers) | | | | | | | | | | | 15,255 | | | | 466,055 | |
United Internet AG (Information Technology, Internet Software & Services) | | | | | | | | | | | 10,387 | | | | 546,410 | |
Vonovia SE (Real Estate, Real Estate Management & Development) | | | | | | | | | | | 39,603 | | | | 2,031,378 | |
Wacker Chemie AG (Materials, Chemicals) | | | | | | | | | | | 1,336 | | | | 192,682 | |
Wirecard AG (Information Technology, IT Services) | | | | | | | | | | | 8,611 | | | | 1,912,085 | |
Zalando SE (Consumer Discretionary, Internet & Direct Marketing Retail) 144A† | | | | | | | | | | | 11,830 | | | | 622,319 | |
| | | | |
| | | | | | | | | | | | | | | 44,317,123 | |
| | | | | | | | | | | | | | | | |
| | | | |
| Hong Kong: 3.84% | | | | | | | | | | | | | | | | |
AIA Group Limited (Financials, Insurance) | | | | | | | | | | | 979,800 | | | | 8,451,341 | |
ASM Pacific Technology (Information Technology, Semiconductors & Semiconductor Equipment) | | | | | | | | | | | 21,244 | | | | 224,113 | |
China Pharmaceutical Group Limited (Health Care, Pharmaceuticals) | | | | | | | | | | | 366,000 | | | | 923,306 | |
CK Asset Holdings Limited (Real Estate, Real Estate Management & Development) | | | | | | | | | | | 226,690 | | | | 1,615,965 | |
CK Hutchison Holdings Limited (Industrials, Industrial Conglomerates) | | | | | | | | | | | 232,570 | | | | 2,680,166 | |
CK Infrastructure Holdings Limited (Utilities, Electric Utilities) | | | | | | | | | | | 56,500 | | | | 413,200 | |
CLP Holdings Limited (Utilities, Electric Utilities) | | | | | | | | | | | 142,386 | | | | 1,673,529 | |
Dairy Farm International Holdings Limited (Consumer Staples, Food & Staples Retailing) | | | | | | | | | | | 23,540 | | | | 218,216 | |
Fullshare Holdings Limited (Real Estate, Real Estate Management & Development) | | | | | | | | | | | 622,500 | | | | 249,040 | |
Galaxy Entertainment Group Limited (Consumer Discretionary, Hotels, Restaurants & Leisure) | | | | | | | | | | | 218,625 | | | | 1,618,361 | |
Hang Lung Group Limited (Real Estate, Real Estate Management & Development) | | | | | | | | | | | 68,705 | | | | 192,580 | |
Hang Lung Properties Limited (Real Estate, Real Estate Management & Development) | | | | | | | | | | | 164,332 | | | | 324,529 | |
Hang Seng Bank Limited (Financials, Banks) | | | | | | | | | | | 58,855 | | | | 1,595,712 | |
Henderson Land Development Company Limited (Real Estate, Real Estate Management & Development) | | | | | | | | | | | 100,908 | | | | 533,548 | |
The accompanying notes are an integral part of these financial statements.
| | | | | | |
| Portfolio of investments—August 31, 2018 (unaudited) | | Wells Fargo Funds | | | 99 | |
FACTOR ENHANCED INTERNATIONAL PORTFOLIO
| | | | | | | | | | | | | | | | |
| Security name | | | | | | | | Shares | | | Value | |
| | | | |
| Hong Kong (continued) | | | | | | | | | | | | | | | | |
HK Electric Investments Limited (Utilities, Electric Utilities) 144A | | | | | | | | | | | 162,000 | | | $ | 163,677 | |
Hong Kong & China Gas Company Limited (Utilities, Gas Utilities) | | | | | | | | | | | 723,269 | | | | 1,489,158 | |
Hong Kong Exchanges & Clearing Limited (Financials, Capital Markets) | | | | | | | | | | | 100,300 | | | | 2,854,852 | |
Hong Kong Land Holdings Limited (Real Estate, Real Estate Management & Development) | | | | | | | | | | | 98,225 | | | | 679,717 | |
Hong Kong Telecommunications Trust & Hong Kong Trust Limited (Telecommunication Services, Diversified Telecommunication Services) | | | | | | | | | | | 206,574 | | | | 266,878 | |
Hopewell Holdings (Industrials, Industrial Conglomerates) | | | | | | | | | | | 59,500 | | | | 209,231 | |
Hysan Development Company Limited (Real Estate, Real Estate Management & Development) | | | | | | | | | | | 48,574 | | | | 249,097 | |
Jardine Matheson Holdings Limited (Industrials, Industrial Conglomerates) | | | | | | | | | | | 23,128 | | | | 1,459,839 | |
Jardine Strategic Holdings Limited (Industrials, Industrial Conglomerates) | | | | | | | | | | | 14,317 | | | | 519,707 | |
Kerry Properties Limited (Real Estate, Real Estate Management & Development) | | | | | | | | | | | 47,000 | | | | 178,149 | |
Li & Fung Limited (Consumer Discretionary, Textiles, Apparel & Luxury Goods) | | | | | | | | | | | 454,000 | | | | 128,991 | |
Link REIT (Real Estate, Equity REITs) | | | | | | | | | | | 176,607 | | | | 1,759,601 | |
Melco International Development Limited (Consumer Discretionary, Hotels, Restaurants & Leisure) | | | | | | | | | | | 55,000 | | | | 146,456 | |
MTR Corporation Limited (Industrials, Road & Rail) | | | | | | | | | | | 132,569 | | | | 683,219 | |
New World Development Limited (Real Estate, Real Estate Management & Development) | | | | | | | | | | | 475,961 | | | | 635,524 | |
NWS Holdings Limited (Industrials, Industrial Conglomerates) | | | | | | | | | | | 120,429 | | | | 214,505 | |
PCCW Limited (Telecommunication Services, Diversified Telecommunication Services) | | | | | | | | | | | 297,000 | | | | 157,795 | |
Power Assets Holdings Limited (Utilities, Electric Utilities) | | | | | | | | | | | 101,000 | | | | 708,399 | |
Shangri-La Asia Limited (Consumer Discretionary, Hotels, Restaurants & Leisure) | | | | | | | | | | | 102,000 | | | | 157,248 | |
Sino Land Company (Real Estate, Real Estate Management & Development) | | | | | | | | | | | 261,899 | | | | 443,798 | |
SJM Holdings Limited (Consumer Discretionary, Hotels, Restaurants & Leisure) | | | | | | | | | | | 170,000 | | | | 192,336 | |
Swire Pacific Limited Class A (Real Estate, Real Estate Management & Development) | | | | | | | | | | | 39,978 | | | | 452,053 | |
Swire Properties Limited (Real Estate, Real Estate Management & Development) | | | | | | | | | | | 86,553 | | | | 340,202 | |
Techtronic Industries Company Limited (Consumer Discretionary, Household Durables) | | | | | | | | | | | 126,243 | | | | 772,055 | |
The Bank of East Asia Limited (Financials, Banks) | | | | | | | | | | | 119,600 | | | | 442,667 | |
The Wharf Holdings Limited (Real Estate, Real Estate Management & Development) | | | | | | | | | | | 91,717 | | | | 261,756 | |
Vitasoy International Holdings Limited (Consumer Staples, Food Products) | | | | | | | | | | | 71,005 | | | | 227,976 | |
VTech Holdings Limited (Information Technology, Communications Equipment) | | | | | | | | | | | 12,400 | | | | 137,212 | |
Wheelock & Company Limited (Real Estate, Real Estate Management & Development) | | | | | | | | | | | 65,945 | | | | 413,797 | |
Xinyi Glass Holdings Limited (Consumer Discretionary, Auto Components) | | | | | | | | | | | 178,000 | | | | 222,252 | |
Yue Yuen Industrial Holdings Limited (Consumer Discretionary, Textiles, Apparel & Luxury Goods) | | | | | | | | | | | 52,222 | | | | 144,715 | |
| | | | |
| | | | | | | | | | | | | | | 37,426,468 | |
| | | | | | | | | | | | | | | | |
| | | | |
| Ireland: 0.79% | | | | | | | | | | | | | | | | |
AIB Group plc (Financials, Banks) | | | | | | | | | | | 57,415 | | | | 322,826 | |
Bank of Ireland Group plc (Financials, Banks) | | | | | | | | | | | 76,020 | | | | 621,211 | |
CRH plc (Materials, Construction Materials) | | | | | | | | | | | 69,292 | | | | 2,301,122 | |
DCC plc (Industrials, Industrial Conglomerates) | | | | | | | | | | | 7,516 | | | | 677,704 | |
Glanbia plc (Consumer Staples, Food Products) | | | | | | | | | | | 15,688 | | | | 264,589 | |
Kerry Group plc Class A (Consumer Staples, Food Products) | | | | | | | | | | | 12,054 | | | | 1,374,683 | |
Kingspan Group plc (Industrials, Building Products) | | | | | | | | | | | 12,599 | | | | 612,173 | |
Paddy Power plc (Consumer Discretionary, Hotels, Restaurants & Leisure) | | | | | | | | | | | 6,995 | | | | 637,377 | |
Smurfit Kappa Group plc (Materials, Containers & Packaging) | | | | | | | | | | | 17,581 | | | | 717,923 | |
UDG Healthcare plc (Health Care, Health Care Providers & Services) | | | | | | | | | | | 18,990 | | | | 181,200 | |
| | | | |
| | | | | | | | | | | | | | | 7,710,808 | |
| | | | | | | | | | | | | | | | |
| | | | |
| Italy: 0.56% | | | | | | | | | | | | | | | | |
A2A SpA (Utilities, Multi-Utilities) | | | | | | | | | | | 107,982 | | | | 185,629 | |
Atlantia SpA (Industrials, Transportation Infrastructure) | | | | | | | | | | | 38,787 | | | | 808,145 | |
Davide Campari-Milano SpA (Consumer Staples, Beverages) | | | | | | | | | | | 33,153 | | | | 293,428 | |
The accompanying notes are an integral part of these financial statements.
| | | | |
| 100 | | Wells Fargo Funds | | Portfolio of investments—August 31, 2018 (unaudited) |
FACTOR ENHANCED INTERNATIONAL PORTFOLIO
| | | | | | | | | | | | | | | | |
| Security name | | | | | | | | Shares | | | Value | |
| | | | |
| Italy (continued) | | | | | | | | | | | | | | | | |
FinecoBank SpA (Financials, Banks) | | | | | | | | | | | 28,716 | | | $ | 342,154 | |
Italgas SpA (Utilities, Gas Utilities) | | | | | | | | | | | 36,936 | | | | 199,533 | |
Luxottica Group SpA (Consumer Discretionary, Textiles, Apparel & Luxury Goods) | | | | | | | | | | | 14,620 | | | | 969,336 | |
Moncler SpA (Consumer Discretionary, Textiles, Apparel & Luxury Goods) | | | | | | | | | | | 14,517 | | | | 656,500 | |
Poste Italiane SpA (Financials, Insurance) | | | | | | | | | | | 32,654 | | | | 251,374 | |
Recordati SpA (Health Care, Pharmaceuticals) | | | | | | | | | | | 8,121 | | | | 284,396 | |
Saipem SpA (Energy, Energy Equipment & Services) † | | | | | | | | | | | 45,612 | | | | 243,702 | |
Telecom Italia SpA (Telecommunication Services, Diversified Telecommunication Services) † | | | | | | | | | | | 990,903 | | | | 631,455 | |
Terna SpA (Utilities, Electric Utilities) | | | | | | | | | | | 110,544 | | | | 580,749 | |
| | | | |
| | | | | | | | | | | | | | | 5,446,401 | |
| | | | | | | | | | | | | | | | |
| | | | |
| Japan: 20.47% | | | | | | | | | | | | | | | | |
Activia Properties Incorporated (Real Estate, Equity REITs) | | | | | | | | | | | 52 | | | | 228,854 | |
Advance Residence Investment Corporation (Real Estate, Equity REITs) | | | | | | | | | | | 111 | | | | 283,419 | |
Advantest Corporation (Information Technology, Semiconductors & Semiconductor Equipment) | | | | | | | | | | | 12,600 | | | | 302,101 | |
Aeon Company Limited (Consumer Staples, Food & Staples Retailing) | | | | | | | | | | | 76,300 | | | | 1,652,560 | |
Aeon Financial Service Company Limited (Financials, Consumer Finance) | | | | | | | | | | | 10,100 | | | | 206,800 | |
Aeon Mall Company Limited (Real Estate, Real Estate Management & Development) | | | | | | | | | | | 8,200 | | | | 137,196 | |
Aica Kogyo Company Limited (Industrials, Building Products) | | | | | | | | | | | 5,500 | | | | 211,615 | |
Air Water Incorporated (Materials, Chemicals) | | | | | | | | | | | 15,300 | | | | 274,301 | |
Ajinomoto Company Incorporated (Consumer Staples, Food Products) | | | | | | | | | | | 49,300 | | | | 836,827 | |
Alfresa Holdings Corporation (Health Care, Health Care Providers & Services) | | | | | | | | | | | 17,900 | | | | 448,990 | |
All Nippon Airways Company Limited (Industrials, Airlines) | | | | | | | | | | | 29,500 | | | | 1,021,920 | |
Amada Holdings Company Limited (Industrials, Machinery) | | | | | | | | | | | 31,300 | | | | 334,663 | |
Aozora Bank Limited (Financials, Banks) | | | | | | | | | | | 9,800 | | | | 346,188 | |
Asahi Breweries Limited (Consumer Staples, Beverages) | | | | | | | | | | | 40,100 | | | | 1,811,375 | |
Asahi Glass Company Limited (Industrials, Building Products) | | | | | | | | | | | 20,100 | | | | 805,013 | |
Asahi Intecc Company Limited (Health Care, Health Care Equipment & Supplies) | | | | | | | | | | | 9,900 | | | | 377,342 | |
Asahi Kasei Corporation (Materials, Chemicals) | | | | | | | | | | | 119,500 | | | | 1,753,083 | |
Astellas Pharma Incorporated (Health Care, Pharmaceuticals) | | | | | | | | | | | 171,400 | | | | 2,903,202 | |
Azbil Corporation (Information Technology, Electronic Equipment, Instruments & Components) | | | | | | | | | | | 5,500 | | | | 239,830 | |
Bandai Namco Holdings Incorporated (Consumer Discretionary, Leisure Products) | | | | | | | | | | | 18,600 | | | | 721,501 | |
Benesse Corporation (Consumer Discretionary, Diversified Consumer Services) | | | | | | | | | | | 6,000 | | | | 187,652 | |
Bic Camera Incorporated (Consumer Discretionary, Specialty Retail) | | | | | | | | | | | 12,100 | | | | 162,263 | |
Brother Industries Limited (Information Technology, Technology Hardware, Storage & Peripherals) | | | | | | | | | | | 21,300 | | | | 437,464 | |
CALBEE Incorporated (Consumer Staples, Food Products) | | | | | | | | | | | 6,900 | | | | 219,526 | |
Canon Incorporated (Information Technology, Technology Hardware, Storage & Peripherals) | | | | | | | | | | | 93,900 | | | | 3,011,121 | |
Casio Computer Company Limited (Consumer Discretionary, Household Durables) | | | | | | | | | | | 21,500 | | | | 345,401 | |
Central Japan Railway Company (Industrials, Road & Rail) | | | | | | | | | | | 17,900 | | | | 3,594,982 | |
Chiba Bank Limited (Financials, Banks) | | | | | | | | | | | 65,100 | | | | 427,711 | |
Chubu Electric Power Company Incorporated (Utilities, Electric Utilities) | | | | | | | | | | | 60,700 | | | | 882,556 | |
Chugai Pharmaceutical Company Limited (Health Care, Pharmaceuticals) | | | | | | | | | | | 19,200 | | | | 1,112,843 | |
Citizen Holdings Company Limited (Information Technology, Electronic Equipment, Instruments & Components) | | | | | | | | | | | 25,600 | | | | 175,567 | |
Coca-Cola Bottlers Japan Incorporated (Consumer Staples, Beverages) | | | | | | | | | | | 11,800 | | | | 334,533 | |
Comsys Holdings Corporation (Industrials, Construction & Engineering) | | | | | | | | | | | 9,300 | | | | 252,358 | |
Concordia Financial Group Limited (Financials, Banks) | | | | | | | | | | | 105,200 | | | | 504,649 | |
Cosmo Energy Holdings Company Limited (Energy, Oil, Gas & Consumable Fuels) | | | | | | | | | | | 5,200 | | | | 191,648 | |
Cosmos Pharmaceutical Corporation (Consumer Staples, Food & Staples Retailing) | | | | | | | | | | | 900 | | | | 188,489 | |
Credit Saison Company Limited (Financials, Consumer Finance) | | | | | | | | | | | 13,500 | | | | 223,562 | |
CyberAgent Incorporated (Consumer Discretionary, Media) | | | | | | | | | | | 8,300 | | | | 472,109 | |
The accompanying notes are an integral part of these financial statements.
| | | | | | |
| Portfolio of investments—August 31, 2018 (unaudited) | | Wells Fargo Funds | | | 101 | |
FACTOR ENHANCED INTERNATIONAL PORTFOLIO
| | | | | | | | | | | | | | | | |
| Security name | | | | | | | | Shares | | | Value | |
| | | | |
| Japan (continued) | | | | | | | | | | | | | | | | |
Daicel Corporation (Materials, Chemicals) | | | | | | | | | | | 29,400 | | | $ | 332,606 | |
Daifuku Company Limited (Industrials, Machinery) | | | | | | | | | | | 10,200 | | | | 529,691 | |
Daiichi Sankyo Company Limited (Health Care, Pharmaceuticals) | | | | | | | | | | | 48,900 | | | | 1,909,173 | |
Daiichikosho Company Limited (Consumer Discretionary, Media) | | | | | | | | | | | 3,900 | | | | 180,416 | |
Daito Trust Construction Company Limited (Real Estate, Real Estate Management & Development) | | | | | | | | | | | 6,500 | | | | 974,035 | |
Daiwa House Industry Company Limited (Real Estate, Real Estate Management & Development) | | | | | | | | | | | 56,900 | | | | 1,735,524 | |
Daiwa House Residential Investment Corporation (Real Estate, Equity REITs) | | | | | | | | | | | 123 | | | | 285,166 | |
Daiwa Securities Group Incorporated (Financials, Capital Markets) | | | | | | | | | | | 145,800 | | | | 874,459 | |
DeNA Company Limited (Information Technology, Internet Software & Services) | | | | | | | | | | | 9,100 | | | | 157,413 | |
Denka Company Limited (Materials, Chemicals) | | | | | | | | | | | 7,100 | | | | 243,142 | |
DIC Incorporated (Materials, Chemicals) | | | | | | | | | | | 7,500 | | | | 266,290 | |
Disco Corporation (Information Technology, Semiconductors & Semiconductor Equipment) | | | | | | | | | | | 2,500 | | | | 447,304 | |
DMG Mori Seiko Company Limited (Industrials, Machinery) | | | | | | | | | | | 9,600 | | | | 158,805 | |
Don Quijote Company Limited (Consumer Discretionary, Multiline Retail) | | | | | | | | | | | 11,700 | | | | 568,626 | |
Ebara Corporation (Industrials, Machinery) | | | | | | | | | | | 8,300 | | | | 283,863 | |
Eisai Company Limited (Health Care, Pharmaceuticals) | | | | | | | | | | | 18,400 | | | | 1,665,953 | |
Electric Power Development Company Limited (Utilities, Independent Power & Renewable Electricity Producers) | | | | | | | | | | | 15,100 | | | | 399,686 | |
Ezaki Glico Company Limited (Consumer Staples, Food Products) | | | | | | | | | | | 4,700 | | | | 236,459 | |
FamilyMart Company Limited (Consumer Staples, Food & Staples Retailing) | | | | | | | | | | | 6,500 | | | | 566,871 | |
FANCL Corporation (Consumer Staples, Personal Products) | | | | | | | | | | | 4,100 | | | | 210,701 | |
Fuji Electric Holdings Company Limited (Industrials, Electrical Equipment) | | | | | | | | | | | 62,000 | | | | 499,415 | |
FUJIFILM Holdings Corporation (Information Technology, Technology Hardware, Storage & Peripherals) | | | | | | | | | | | 36,600 | | | | 1,547,866 | |
Fujikura Limited (Industrials, Electrical Equipment) | | | | | | | | | | | 23,000 | | | | 142,003 | |
Furukawa Electric Company Limited (Industrials, Electrical Equipment) | | | | | | | | | | | 5,700 | | | | 196,224 | |
GLP J-REIT (Real Estate, Equity REITs) | | | | | | | | | | | 200 | | | | 200,342 | |
GS Yuasa Corporation (Industrials, Electrical Equipment) | | | | | | | | | | | 33,000 | | | | 162,758 | |
Hakuhodo DY Holdings Incorporated (Consumer Discretionary, Media) | | | | | | | | | | | 27,700 | | | | 467,442 | |
Hamamatsu Photonics (Information Technology, Electronic Equipment, Instruments & Components) | | | | | | | | | | | 12,100 | | | | 486,788 | |
Hankyu Hanshin Holdings Incorporated (Industrials, Road & Rail) | | | | | | | | | | | 21,700 | | | | 774,372 | |
Haseko Corporation (Consumer Discretionary, Household Durables) | | | | | | | | | | | 24,500 | | | | 317,523 | |
Hikari Tsushin Incorporated (Consumer Discretionary, Specialty Retail) | | | | | | | | | | | 2,300 | | | | 434,911 | |
Hino Motors Limited (Industrials, Machinery) | | | | | | | | | | | 23,300 | | | | 245,351 | |
Hisamitsu Pharmaceutical Company Incorporated (Health Care, Pharmaceuticals) | | | | | | | | | | | 7,100 | | | | 518,873 | |
Hitachi Construction Machinery Company Limited (Industrials, Machinery) | | | | | | | | | | | 8,500 | | | | 253,983 | |
Hitachi High Technologies Corporation (Information Technology, Electronic Equipment, Instruments & Components) | | | | | | | | | | | 5,400 | | | | 212,141 | |
Hitachi Limited (Information Technology, Electronic Equipment, Instruments & Components) | | | | | | | | | | | 418,000 | | | | 2,729,358 | |
Horiba Limited (Information Technology, Electronic Equipment, Instruments & Components) | | | | | | | | | | | 3,400 | | | | 210,530 | |
Hoshizaki Electric Company Limited (Industrials, Machinery) | | | | | | | | | | | 5,100 | | | | 483,791 | |
House Foods Corporation (Consumer Staples, Food Products) | | | | | | | | | | | 6,800 | | | | 201,656 | |
Hoya Corporation (Health Care, Health Care Equipment & Supplies) | | | | | | | | | | | 31,800 | | | | 1,859,460 | |
Idemitsu Kosan Company Limited (Energy, Oil, Gas & Consumable Fuels) | | | | | | | | | | | 12,200 | | | | 615,984 | |
IHI Corporation (Industrials, Machinery) | | | | | | | | | | | 13,100 | | | | 457,457 | |
Iida Group Holdings Company (Consumer Discretionary, Household Durables) | | | | | | | | | | | 16,000 | | | | 295,491 | |
ITO EN Limited (Consumer Staples, Beverages) | | | | | | | | | | | 5,400 | | | | 237,170 | |
Itochu Corporation (Industrials, Trading Companies & Distributors) | | | | | | | | | | | 133,600 | | | | 2,336,888 | |
Izumi Company Limited (Consumer Discretionary, Multiline Retail) | | | | | | | | | | | 3,900 | | | | 233,417 | |
J.Front Retailing Company Limited (Consumer Discretionary, Multiline Retail) | | | | | | | | | | | 22,500 | | | | 319,953 | |
Japan Airlines Company Limited (Industrials, Airlines) | | | | | | | | | | | 30,200 | | | | 1,088,570 | |
Japan Airport Terminal Company Limited (Industrials, Transportation Infrastructure) | | | | | | | | | | | 6,000 | | | | 268,653 | |
Japan Hotel REIT Investment Corporation (Real Estate, Equity REITs) | | | | | | | | | | | 323 | | | | 244,772 | |
The accompanying notes are an integral part of these financial statements.
| | | | |
| 102 | | Wells Fargo Funds | | Portfolio of investments—August 31, 2018 (unaudited) |
FACTOR ENHANCED INTERNATIONAL PORTFOLIO
| | | | | | | | | | | | | | | | |
| Security name | | | | | | | | Shares | | | Value | |
| | | | |
| Japan (continued) | | | | | | | | | | | | | | | | |
Japan Prime Realty Investment Corporation (Real Estate, Equity REITs) | | | | | | | | | | | 76 | | | $ | 274,971 | |
Japan Real Estate Investment Corporation (Real Estate, Equity REITs) | | | | | | | | | | | 113 | | | | 601,053 | |
Japan Retail Fund Investment Corporation (Real Estate, Equity REITs) | | | | | | | | | | | 222 | | | | 401,602 | |
JFE Holdings Incorporated (Materials, Metals & Mining) | | | | | | | | | | | 49,500 | | | | 1,083,244 | |
JGC Corporation (Industrials, Construction & Engineering) | | | | | | | | | | | 21,900 | | | | 441,114 | |
JSR Corporation (Materials, Chemicals) | | | | | | | | | | | 16,900 | | | | 328,083 | |
JTEKT Corporation (Industrials, Machinery) | | | | | | | | | | | 20,200 | | | | 283,065 | |
JXTG Holdings Incorporated (Energy, Oil, Gas & Consumable Fuels) | | | | | | | | | | | 293,100 | | | | 2,063,914 | |
K’s Holdings Corporation (Consumer Discretionary, Specialty Retail) | | | | | | | | | | | 15,800 | | | | 191,261 | |
Kagome Company Limited (Consumer Staples, Food Products) | | | | | | | | | | | 7,300 | | | | 206,957 | |
Kajima Corporation (Industrials, Construction & Engineering) | | | | | | | | | | | 90,000 | | | | 648,006 | |
Kakaku.com Incorporated (Information Technology, Internet Software & Services) | | | | | | | | | | | 10,600 | | | | 195,954 | |
Kaken Pharmaceutical Company Limited (Health Care, Pharmaceuticals) | | | | | | | | | | | 3,200 | | | | 164,450 | |
Kamigumi Company Limited (Industrials, Transportation Infrastructure) | | | | | | | | | | | 9,800 | | | | 198,981 | |
Kaneka Corporation (Materials, Chemicals) | | | | | | | | | | | 27,000 | | | | 246,647 | |
Kansai Electric Power Company Incorporated (Utilities, Electric Utilities) | | | | | | | | | | | 72,900 | | | | 1,044,850 | |
Kao Corporation (Consumer Staples, Personal Products) | | | | | | | | | | | 43,100 | | | | 3,345,671 | |
Kawasaki Heavy Industries Limited (Industrials, Machinery) | | | | | | | | | | | 13,900 | | | | 380,308 | |
Kawasaki Kisen Kaisha Limited (Industrials, Marine) † | | | | | | | | | | | 7,500 | | | | 138,781 | |
KDDI Corporation (Telecommunication Services, Wireless Telecommunication Services) | | | | | | | | | | | 149,100 | | | | 3,946,567 | |
Keihan Electric Railway Company Limited (Industrials, Industrial Conglomerates) | | | | | | | | | | | 9,000 | | | | 330,483 | |
Keio Corporation (Industrials, Road & Rail) | | | | | | | | | | | 10,200 | | | | 505,823 | |
Keisei Electric Railway Company Limited (Industrials, Road & Rail) | | | | | | | | | | | 14,700 | | | | 493,484 | |
Kenedix Realty Investment Corporation (Real Estate, Equity REITs) | | | | | | | | | | | 32 | | | | 198,722 | |
Kewpie Corporation (Consumer Staples, Food Products) | | | | | | | | | | | 10,100 | | | | 243,433 | |
Kikkoman Corporation (Consumer Staples, Food Products) | | | | | | | | | | | 16,400 | | | | 822,140 | |
Kinden Corporation (Industrials, Construction & Engineering) | | | | | | | | | | | 12,000 | | | | 189,326 | |
Kintetsu Corporation (Industrials, Road & Rail) | | | | | | | | | | | 16,300 | | | | 639,618 | |
Kirin Brewery Company Limited (Consumer Staples, Beverages) | | | | | | | | | | | 79,100 | | | | 1,955,965 | |
Kobayashi Pharmaceutical Company Limited (Consumer Staples, Personal Products) | | | | | | | | | | | 5,100 | | | | 366,286 | |
Koito Manufacturing Company Limited (Consumer Discretionary, Auto Components) | | | | | | | | | | | 10,700 | | | | 661,588 | |
Komatsu Limited (Industrials, Machinery) | | | | | | | | | | | 83,200 | | | | 2,366,980 | |
Konica Minolta Holdings Incorporated (Information Technology, Technology Hardware, Storage & Peripherals) | | | | | | | | | | | 41,700 | | | | 424,469 | |
KOSE Corporation (Consumer Staples, Personal Products) | | | | | | | | | | | 3,000 | | | | 553,506 | |
Kurita Water Industries Limited (Industrials, Machinery) | | | | | | | | | | | 9,100 | | | | 270,273 | |
Kyowa Exeo Corporation (Industrials, Construction & Engineering) | | | | | | | | | | | 7,700 | | | | 215,525 | |
Kyowa Hakko Kogyo Company Limited (Health Care, Pharmaceuticals) | | | | | | | | | | | 21,700 | | | | 384,745 | |
Kyudenko Corporation (Industrials, Construction & Engineering) | | | | | | | | | | | 4,300 | | | | 163,703 | |
Kyushu Electric Power Company Incorporated (Utilities, Electric Utilities) | | | | | | | | | | | 40,200 | | | | 450,807 | |
Kyushu Railway Company (Industrials, Road & Rail) | | | | | | | | | | | 13,300 | | | | 399,802 | |
Lawson Incorporated (Consumer Staples, Food & Staples Retailing) | | | | | | | | | | | 4,200 | | | | 246,458 | |
Lion Corporation (Consumer Staples, Household Products) | | | | | | | | | | | 25,600 | | | | 539,372 | |
LIXIL Group Corporation (Industrials, Building Products) | | | | | | | | | | | 24,300 | | | | 476,552 | |
M3 Incorporated (Health Care, Health Care Technology) | | | | | | | | | | | 18,200 | | | | 801,809 | |
Makita Corporation (Industrials, Machinery) | | | | | | | | | | | 24,300 | | | | 1,102,259 | |
Marubeni Corporation (Industrials, Trading Companies & Distributors) | | | | | | | | | | | 148,000 | | | | 1,214,263 | |
Marui Group Company Limited (Consumer Discretionary, Multiline Retail) | | | | | | | | | | | 18,300 | | | | 404,343 | |
Maruichi Steel Tube Limited (Materials, Metals & Mining) | | | | | | | | | | | 6,700 | | | | 205,324 | |
Matsumotokiyoshi Holdings Company Limited (Consumer Staples, Food & Staples Retailing) | | | | | | | | | | | 7,400 | | | | 279,723 | |
Mebuki Financial Group Incorporated (Financials, Banks) | | | | | | | | | | | 87,500 | | | | 310,278 | |
The accompanying notes are an integral part of these financial statements.
| | | | | | |
| Portfolio of investments—August 31, 2018 (unaudited) | | Wells Fargo Funds | | | 103 | |
FACTOR ENHANCED INTERNATIONAL PORTFOLIO
| | | | | | | | | | | | | | | | |
| Security name | | | | | | | | Shares | | | Value | |
| | | | |
| Japan (continued) | | | | | | | | | | | | | | | | |
Medipal Holdings Corporation (Health Care, Health Care Providers & Services) | | | | | | | | | | | 16,400 | | | $ | 330,775 | |
Meiji Holdings Company Limited (Consumer Staples, Food Products) | | | | | | | | | | | 12,300 | | | | 816,974 | |
Minebea Company Limited (Industrials, Machinery) | | | | | | | | | | | 35,100 | | | | 658,974 | |
Misumi Group Incorporated (Industrials, Machinery) | | | | | | | | | | | 24,600 | | | | 634,096 | |
Mitsubishi Chemical Holdings Corporation (Materials, Chemicals) | | | | | | | | | | | 129,300 | | | | 1,159,057 | |
Mitsubishi Corporation (Industrials, Trading Companies & Distributors) | | | | | | | | | | | 136,100 | | | | 3,884,197 | |
Mitsubishi Gas Chemical Company Incorporated (Materials, Chemicals) | | | | | | | | | | | 17,800 | | | | 370,386 | |
Mitsubishi Motors Corporation (Consumer Discretionary, Automobiles) | | | | | | | | | | | 59,100 | | | | 421,269 | |
Mitsubishi UFJ Lease & Finance Company Limited (Financials, Diversified Financial Services) | | | | | | | | | | | 43,600 | | | | 245,252 | |
Mitsui & Company Limited (Industrials, Trading Companies & Distributors) | | | | | | | | | | | 154,400 | | | | 2,574,260 | |
Mitsui Chemicals Incorporated (Materials, Chemicals) | | | | | | | | | | | 17,200 | | | | 444,900 | |
Mitsui Mining & Smelting Company Limited (Materials, Metals & Mining) | | | | | | | | | | | 4,600 | | | | 131,860 | |
Mitsui OSK Lines Limited (Industrials, Marine) | | | | | | | | | | | 9,900 | | | | 266,233 | |
Miura Company Limited (Industrials, Machinery) | | | | | | | | | | | 9,100 | | | | 255,121 | |
Morinaga & Company Limited (Consumer Staples, Food Products) | | | | | | | | | | | 4,000 | | | | 155,522 | |
Nabtesco Corporation (Industrials, Machinery) | | | | | | | | | | | 10,100 | | | | 263,340 | |
Nagase & Company Limited (Industrials, Trading Companies & Distributors) | | | | | | | | | | | 10,500 | | | | 175,110 | |
Nagoya Railroad Company Limited (Industrials, Road & Rail) | | | | | | | | | | | 15,900 | | | | 362,762 | |
Nankai Electric Railway Company Limited (Industrials, Road & Rail) | | | | | | | | | | | 9,400 | | | | 244,750 | |
NEC Corporation (Information Technology, Technology Hardware, Storage & Peripherals) | | | | | | | | | | | 22,000 | | | | 607,866 | |
Nexon Company Limited (Information Technology, Software) † | | | | | | | | | | | 35,200 | | | | 441,624 | |
NGK Spark Plug Company Limited (Consumer Discretionary, Auto Components) | | | | | | | | | | | 15,000 | | | | 426,604 | |
NH Foods Limited (Consumer Staples, Food Products) | | | | | | | | | | | 9,000 | | | | 328,458 | |
NHK Spring Company Limited (Consumer Discretionary, Auto Components) | | | | | | | | | | | 16,700 | | | | 176,604 | |
Nichirei Corporation (Consumer Staples, Food Products) | | | | | | | | | | | 11,600 | | | | 291,488 | |
Nidec Corporation (Industrials, Electrical Equipment) | | | | | | | | | | | 23,100 | | | | 3,348,263 | |
Nifco Incorporated (Consumer Discretionary, Auto Components) | | | | | | | | | | | 7,500 | | | | 205,877 | |
Nihon Kohden Corporation (Health Care, Health Care Equipment & Supplies) | | | | | | | | | | | 6,800 | | | | 198,902 | |
Nihon M&A Center Incorporated (Industrials, Professional Services) | | | | | | | | | | | 11,500 | | | | 301,085 | |
Nippon Accommodations Fund Incorporated (Real Estate, Equity REITs) | | | | | | | | | | | 39 | | | | 177,257 | |
Nippon Building Fund Incorporated (Real Estate, Equity REITs) | | | | | | | | | | | 120 | | | | 698,767 | |
Nippon Express Company Limited (Industrials, Road & Rail) | | | | | | | | | | | 8,000 | | | | 501,125 | |
Nippon Paper Industries Company Limited (Materials, Paper & Forest Products) | | | | | | | | | | | 9,200 | | | | 167,506 | |
Nippon Prologis REIT Incorporated (Real Estate, Equity REITs) | | | | | | | | | | | 144 | | | | 280,587 | |
Nippon Shinyaku Company Limited (Health Care, Pharmaceuticals) | | | | | | | | | | | 5,100 | | | | 299,730 | |
Nippon Shokubai Company Limited (Materials, Chemicals) | | | | | | | | | | | 2,900 | | | | 213,761 | |
Nippon Telegraph & Telephone Corporation (Telecommunication Services, Diversified Telecommunication Services) | | | | | | | | | | | 109,700 | | | | 4,887,184 | |
Nippon Television Network Corporation (Consumer Discretionary, Media) | | | | | | | | | | | 300 | | | | 4,968 | |
Nippon Yusen Kabushiki Kaisha (Industrials, Marine) | | | | | | | | | | | 14,000 | | | | 264,099 | |
Nishi-Nippon Railroad Company Limited (Industrials, Road & Rail) | | | | | | | | | | | 6,400 | | | | 171,016 | |
Nissan Chemical Industries Limited (Materials, Chemicals) | | | | | | | | | | | 12,800 | | | | 610,566 | |
Nisshin Seifun Group Incorporated (Consumer Staples, Food Products) | | | | | | | | | | | 22,500 | | | | 450,162 | |
Nissin Food Products Company Limited (Consumer Staples, Food Products) | | | | | | | | | | | 7,500 | | | | 478,580 | |
Nitori Holdings Company Limited (Consumer Discretionary, Specialty Retail) | | | | | | | | | | | 8,100 | | | | 1,229,835 | |
NOF Corporation (Materials, Chemicals) | | | | | | | | | | | 7,100 | | | | 235,793 | |
Nomura Real Estate Holding Incorporated (Real Estate, Real Estate Management & Development) | | | | | | | | | | | 10,400 | | | | 225,485 | |
Nomura Real Estate Master Fund Incorporated (Real Estate, Equity REITs) | | | | | | | | | | | 337 | | | | 469,513 | |
Nomura Research Institute Limited (Information Technology, IT Services) | | | | | | | | | | | 12,900 | | | | 642,039 | |
NTT DOCOMO Incorporated (Telecommunication Services, Wireless Telecommunication Services) | | | | | | | | | | | 103,400 | | | | 2,684,808 | |
Obayashi Corporation (Industrials, Construction & Engineering) | | | | | | | | | | | 60,400 | | | | 565,893 | |
The accompanying notes are an integral part of these financial statements.
| | | | |
| 104 | | Wells Fargo Funds | | Portfolio of investments—August 31, 2018 (unaudited) |
FACTOR ENHANCED INTERNATIONAL PORTFOLIO
| | | | | | | | | | | | | | | | |
| Security name | | | | | | | | Shares | | | Value | |
| | | | |
| Japan (continued) | | | | | | | | | | | | | | | | |
OBIC Company Limited (Information Technology, IT Services) | | | | | | | | | | | 6,100 | | | $ | 573,162 | |
Oji Holdings Corporation (Materials, Paper & Forest Products) | | | | | | | | | | | 86,000 | | | | 589,020 | |
Olympus Corporation (Health Care, Health Care Equipment & Supplies) | | | | | | | | | | | 27,500 | | | | 1,119,949 | |
Omron Corporation (Information Technology, Electronic Equipment, Instruments & Components) | | | | | | | | | | | 18,100 | | | | 810,436 | |
Ono Pharmaceutical Company Limited (Health Care, Pharmaceuticals) | | | | | | | | | | | 43,900 | | | | 1,153,704 | |
Oracle Corporation (Japan) (Information Technology, Software) | | | | | | | | | | | 2,600 | | | | 218,324 | |
Oriental Land Company Limited (Consumer Discretionary, Hotels, Restaurants & Leisure) | | | | | | | | | | | 19,500 | | | | 2,089,348 | |
ORIX Corporation (Financials, Diversified Financial Services) | | | | | | | | | | | 115,200 | | | | 1,852,780 | |
ORIX JREIT Incorporated (Real Estate, Equity REITs) | | | | | | | | | | | 223 | | | | 348,017 | |
Osaka Gas Company Limited (Utilities, Gas Utilities) | | | | | | | | | | | 35,500 | | | | 663,129 | |
OSG Corporation (Industrials, Machinery) | | | | | | | | | | | 7,600 | | | | 174,490 | |
Otsuka Corporation (Information Technology, IT Services) | | | | | | | | | | | 10,900 | | | | 394,856 | |
Otsuka Holdings Company Limited (Health Care, Pharmaceuticals) | | | | | | | | | | | 43,100 | | | | 2,021,367 | |
Park24 Company Limited (Industrials, Commercial Services & Supplies) | | | | | | | | | | | 9,600 | | | | 281,667 | |
Persol Holdings Company Limited (Industrials, Professional Services) | | | | | | | | | | | 16,400 | | | | 366,790 | |
Pigeon Corporation (Consumer Staples, Household Products) | | | | | | | | | | | 10,200 | | | | 492,971 | |
Pola Orbis Holdings Incorporated (Consumer Staples, Personal Products) | | | | | | | | | | | 8,200 | | | | 289,299 | |
Recruit Holdings Company Limited (Industrials, Professional Services) | | | | | | | | | | | 134,800 | | | | 4,109,149 | |
Relo Holdings Incorporated (Real Estate, Real Estate Management & Development) | | | | | | | | | | | 9,600 | | | | 263,091 | |
Resona Holdings Incorporated (Financials, Banks) | | | | | | | | | | | 200,400 | | | | 1,136,099 | |
Ricoh Company Limited (Information Technology, Technology Hardware, Storage & Peripherals) | | | | | | | | | | | 63,700 | | | | 667,901 | |
Rinnai Corporation (Consumer Discretionary, Household Durables) | | | | | | | | | | | 3,400 | | | | 253,065 | |
Rohto Pharmaceutical Company Limited (Health Care, Pharmaceuticals) | | | | | | | | | | | 9,500 | | | | 303,528 | |
Ryohin Keikaku Company Limited (Consumer Discretionary, Multiline Retail) | | | | | | | | | | | 2,200 | | | | 653,407 | |
Sankyu Incorporated (Industrials, Road & Rail) | | | | | | | | | | | 4,800 | | | | 254,883 | |
Santen Pharmaceutical Company Limited (Health Care, Pharmaceuticals) | | | | | | | | | | | 34,700 | | | | 534,663 | |
Sanwa Holdings Corporation (Industrials, Building Products) | | | | | | | | | | | 18,500 | | | | 212,123 | |
Sapporo Holdings Limited (Consumer Staples, Beverages) | | | | | | | | | | | 6,100 | | | | 127,644 | |
SBI Holdings Incorporated (Financials, Capital Markets) | | | | | | | | | | | 18,500 | | | | 510,328 | |
SCREEN Holdings Company Limited (Information Technology, Semiconductors & Semiconductor Equipment) | | | | | | | | | | | 3,800 | | | | 287,625 | |
SCSK Corporation (Information Technology, IT Services) | | | | | | | | | | | 4,300 | | | | 204,338 | |
Sega Sammy Holdings Incorporated (Consumer Discretionary, Leisure Products) | | | | | | | | | | | 16,300 | | | | 262,889 | |
Seibu Holdings Incorporated (Industrials, Industrial Conglomerates) | | | | | | | | | | | 24,400 | | | | 439,863 | |
SEINO Holdings Company Limited (Industrials, Road & Rail) | | | | | | | | | | | 14,400 | | | | 220,452 | |
Sekisui House Limited (Consumer Discretionary, Household Durables) | | | | | | | | | | | 55,400 | | | | 904,220 | |
Seven Bank Limited (Financials, Banks) | | | | | | | | | | | 58,300 | | | | 181,548 | |
SG Holdings Company Limited (Industrials, Air Freight & Logistics) | | | | | | | | | | | 20,500 | | | | 485,055 | |
Shikoku Electric Power Company Incorporated (Utilities, Electric Utilities) | | | | | | | | | | | 16,800 | | | | 223,325 | |
Shimadzu Corporation (Information Technology, Electronic Equipment, Instruments & Components) | | | | | | | | | | | 23,100 | | | | 685,037 | |
Shimamura Company Limited (Consumer Discretionary, Specialty Retail) | | | | | | | | | | | 2,000 | | | | 184,862 | |
Shimizu Corporation (Industrials, Construction & Engineering) | | | | | | | | | | | 60,900 | | | | 532,759 | |
Shionogi & Company Limited (Health Care, Pharmaceuticals) | | | | | | | | | | | 26,300 | | | | 1,528,150 | |
Shiseido Company Limited (Consumer Staples, Personal Products) | | | | | | | | | | | 33,700 | | | | 2,373,043 | |
Shizuoka Bank Limited (Financials, Banks) | | | | | | | | | | | 49,900 | | | | 441,021 | |
Showa Denko KK (Materials, Chemicals) | | | | | | | | | | | 12,100 | | | | 576,087 | |
Showa Shell Sekiyu KK (Energy, Oil, Gas & Consumable Fuels) | | | | | | | | | | | 16,300 | | | | 328,758 | |
Skylark Holdings Company Limited (Consumer Discretionary, Hotels, Restaurants & Leisure) | | | | | | | | | | | 16,200 | | | | 231,387 | |
Sohgo Security Services Company Limited (Industrials, Commercial Services & Supplies) | | | | | | | | | | | 7,400 | | | | 325,677 | |
Sojitz Corporation (Industrials, Trading Companies & Distributors) | | | | | | | | | | | 104,100 | | | | 362,584 | |
Sompo Holdings Incorporated NKSJ Holdings Inc(Financials, Insurance) | | | | | | | | | | | 33,200 | | | | 1,417,521 | |
The accompanying notes are an integral part of these financial statements.
| | | | | | |
| Portfolio of investments—August 31, 2018 (unaudited) | | Wells Fargo Funds | | | 105 | |
FACTOR ENHANCED INTERNATIONAL PORTFOLIO
| | | | | | | | | | | | | | | | |
| Security name | | | | | | | | Shares | | | Value | |
| | | | |
| Japan (continued) | | | | | | | | | | | | | | | | |
Sony Financial Holdings Incorporated (Financials, Insurance) | | | | | | | | | | | 13,200 | | | $ | 263,145 | |
Sotetsu Holdings Incorporated (Industrials, Road & Rail) | | | | | | | | | | | 7,400 | | | | 230,771 | |
Square Enix Company Limited (Information Technology, Software) | | | | | | | | | | | 7,500 | | | | 342,228 | |
Start Today Company Limited (Consumer Discretionary, Internet & Direct Marketing Retail) | | | | | | | | | | | 14,300 | | | | 492,926 | |
Sugi Pharmacy Company Limited (Consumer Staples, Food & Staples Retailing) | | | | | | | | | | | 3,600 | | | | 177,878 | |
Sumitomo Chemical Company Limited (Materials, Chemicals) | | | | | | | | | | | 140,000 | | | | 795,068 | |
Sumitomo Corporation (Industrials, Trading Companies & Distributors) | | | | | | | | | | | 107,700 | | | | 1,748,150 | |
Sumitomo Dainippon Pharma Company Limited (Health Care, Pharmaceuticals) | | | | | | | | | | | 13,400 | | | | 285,222 | |
Sumitomo Foresting Company Limited (Consumer Discretionary, Household Durables) | | | | | | | | | | | 13,800 | | | | 223,065 | |
Sumitomo Heavy Industries Limited (Industrials, Machinery) | | | | | | | | | | | 10,000 | | | | 325,353 | |
Sumitomo Mitsui Financial Group Incorporated (Financials, Banks) | | | | | | | | | | | 122,200 | | | | 4,818,272 | |
Sumitomo Osaka Cement Company (Materials, Construction Materials) | | | | | | | | | | | 32,000 | | | | 137,089 | |
Sumitomo Rubber Industries Limited (Consumer Discretionary, Auto Components) | | | | | | | | | | | 15,200 | | | | 225,449 | |
Sundrug Company Limited (Consumer Staples, Food & Staples Retailing) | | | | | | | | | | | 5,800 | | | | 208,280 | |
Suntory Beverage & Food Limited (Consumer Staples, Beverages) | | | | | | | | | | | 10,700 | | | | 438,651 | |
Suzuken Company Limited (Health Care, Health Care Providers & Services) | | | | | | | | | | | 7,800 | | | | 354,514 | |
Sysmex Corporation (Health Care, Health Care Equipment & Supplies) | | | | | | | | | | | 14,900 | | | | 1,292,737 | |
Taiheiyo Cement Corporation (Materials, Construction Materials) | | | | | | | | | | | 10,600 | | | | 320,547 | |
Taisei Corporation (Industrials, Construction & Engineering) | | | | | | | | | | | 19,200 | | | | 858,825 | |
Taisho Pharmaceutical Holding Company Limited (Health Care, Pharmaceuticals) | | | | | | | | | | | 4,800 | | | | 520,133 | |
Taiyo Nippon Sanso Corporation (Materials, Chemicals) | | | | | | | | | | | 17,200 | | | | 253,255 | |
Takara Holdings Incorporated (Consumer Staples, Beverages) | | | | | | | | | | | 16,300 | | | | 161,665 | |
Takashimaya Company Limited (Consumer Discretionary, Multiline Retail) | | | | | | | | | | | 15,000 | | | | 242,192 | |
TDK Corporation (Information Technology, Electronic Equipment, Instruments & Components) | | | | | | | | | | | 10,900 | | | | 1,225,281 | |
Teijin Limited (Materials, Chemicals) | | | | | | | | | | | 16,600 | | | | 328,833 | |
Terumo Corporation (Health Care, Health Care Equipment & Supplies) | | | | | | | | | | | 28,100 | | | | 1,550,293 | |
The Chugoku Electric Power Company Incorporated (Utilities, Electric Utilities) | | | | | | | | | | | 24,000 | | | | 299,811 | |
The Gunma Bank Limited (Financials, Banks) | | | | | | | | | | | 35,400 | | | | 180,648 | |
The Iyo Bank Limited (Financials, Banks) | | | | | | | | | | | 25,800 | | | | 168,347 | |
The Yokohama Rubber Company Limited (Consumer Discretionary, Auto Components) | | | | | | | | | | | 10,800 | | | | 226,964 | |
THK Company Limited (Industrials, Machinery) | | | | | | | | | | | 10,400 | | | | 278,556 | |
TIS Incorporated (Information Technology, IT Services) | | | | | | | | | | | 7,100 | | | | 342,507 | |
Tobu Railway Company Limited (Industrials, Road & Rail) | | | | | | | | | | | 18,200 | | | | 507,785 | |
Toda Corporation (Industrials, Construction & Engineering) | | | | | | | | | | | 22,200 | | | | 154,247 | |
Toho Company Limited Tokyo (Consumer Discretionary, Media) | | | | | | | | | | | 11,900 | | | | 365,215 | |
Toho Gas Company Limited (Utilities, Gas Utilities) | | | | | | | | | | | 8,200 | | | | 274,908 | |
Tohoku Electric Power Company Incorporated (Utilities, Electric Utilities) | | | | | | | | | | | 42,400 | | | | 531,956 | |
Tokai Carbon Company Limited (Materials, Chemicals) | | | | | | | | | | | 16,900 | | | | 302,074 | |
Tokuyama Corporation (Materials, Chemicals) | | | | | | | | | | | 5,500 | | | | 168,797 | |
Tokyo Broadcasting System Incorporated (Consumer Discretionary, Media) | | | | | | | | | | | 15,200 | | | | 320,526 | |
Tokyo Century Corporation (Financials, Diversified Financial Services) | | | | | | | | | | | 4,400 | | | | 243,146 | |
Tokyo Electric Power Company Holdings Incorporated (Utilities, Electric Utilities) † | | | | | | | | | | | 136,600 | | | | 631,918 | |
Tokyo Electron Limited (Information Technology, Semiconductors & Semiconductor Equipment) | | | | | | | | | | | 14,300 | | | | 2,429,237 | |
Tokyo Gas Company Limited (Utilities, Gas Utilities) | | | | | | | | | | | 36,500 | | | | 864,949 | |
Tokyu Corporation (Industrials, Road & Rail) | | | | | | | | | | | 49,600 | | | | 817,813 | |
Tokyu Fudosan Holdings Corporation (Real Estate, Real Estate Management & Development) | | | | | | | | | | | 42,500 | | | | 289,555 | |
Toray Industries Incorporated (Materials, Chemicals) | | | | | | | | | | | 141,600 | | | | 1,062,478 | |
Tosoh Corporation (Materials, Chemicals) | | | | | | | | | | | 27,000 | | | | 424,282 | |
TOTO Limited (Industrials, Building Products) | | | | | | | | | | | 14,200 | | | | 600,666 | |
Toyo Suisan Kaisha Limited (Consumer Staples, Food Products) | | | | | | | | | | | 8,500 | | | | 313,271 | |
The accompanying notes are an integral part of these financial statements.
| | | | |
| 106 | | Wells Fargo Funds | | Portfolio of investments—August 31, 2018 (unaudited) |
FACTOR ENHANCED INTERNATIONAL PORTFOLIO
| | | | | | | | | | | | | | | | |
| Security name | | | | | | | | Shares | | | Value | |
| | | | |
| Japan (continued) | | | | | | | | | | | | | | | | |
Toyoda Gosei Company Limited (Consumer Discretionary, Auto Components) | | | | | | | | | | | 5,800 | | | $ | 144,700 | |
Trend Micro Incorporated (Information Technology, Software) | | | | | | | | | | | 10,700 | | | | 674,107 | |
Tsumura & Company (Health Care, Pharmaceuticals) | | | | | | | | | | | 6,000 | | | | 204,932 | |
Tsuruha Holdings Incorporated (Consumer Staples, Food & Staples Retailing) | | | | | | | | | | | 3,600 | | | | 411,160 | |
UBE Industries Limited (Materials, Chemicals) | | | | | | | | | | | 8,800 | | | | 223,901 | |
ULVAC Incorporated (Information Technology, Semiconductors & Semiconductor Equipment) | | | | | | | | | | | 3,600 | | | | 149,203 | |
Unicharm Corporation (Consumer Staples, Household Products) | | | | | | | | | | | 36,100 | | | | 1,180,049 | |
United Urban Investment Corporation (Real Estate, Equity REITs) | | | | | | | | | | | 256 | | | | 403,895 | |
Wacoal Corporation (Consumer Discretionary, Textiles, Apparel & Luxury Goods) | | | | | | | | | | | 5,400 | | | | 159,896 | |
Welcia Holdings Company Limiited (Consumer Staples, Food & Staples Retailing) | | | | | | | | | | | 4,200 | | | | 193,916 | |
West Japan Railway Company (Industrials, Road & Rail) | | | | | | | | | | | 16,700 | | | | 1,120,648 | |
Yakult Honsha Company Limited (Consumer Staples, Food Products) | | | | | | | | | | | 11,300 | | | | 803,438 | |
Yamada Denki Company Limited (Consumer Discretionary, Specialty Retail) | | | | | | | | | | | 60,800 | | | | 301,510 | |
Yamaguchi Financial Group (Financials, Banks) | | | | | | | | | | | 20,500 | | | | 225,461 | |
Yamaha Corporation (Consumer Discretionary, Leisure Products) | | | | | | | | | | | 15,700 | | | | 750,311 | |
Yamazaki Baking Company Limited (Consumer Staples, Food Products) | | | | | | | | | | | 15,100 | | | | 293,819 | |
Yaskawa Electric Corporation (Information Technology, Electronic Equipment, Instruments & Components) | | | | | | | | | | | 22,200 | | | | 745,261 | |
Yokogawa Electric Corporation (Information Technology, Electronic Equipment, Instruments & Components) | | | | | | | | | | | 19,900 | | | | 408,173 | |
Zenkoku Hosho Company Limited (Financials, Diversified Financial Services) | | | | | | | | | | | 4,100 | | | | 166,052 | |
Zensho Holdings Company Limited (Consumer Discretionary, Hotels, Restaurants & Leisure) | | | | | | | | | | | 7,700 | | | | 155,026 | |
Zeon Corporation (Materials, Chemicals) | | | | | | | | | | | 15,500 | | | | 166,146 | |
| | | | |
| | | | | | | | | | | | | | | 199,235,833 | |
| | | | | | | | | | | | | | | | |
| | | | |
| Luxembourg: 0.25% | | | | | | | | | | | | | | | | |
Aroundtown SA (Real Estate, Real Estate Management & Development) | | | | | | | | | | | 53,929 | | | | 481,066 | |
B&M European Value Retail SA (Consumer Discretionary, Multiline Retail) | | | | | | | | | | | 56,587 | | | | 302,619 | |
Eurofins Scientific SE (Health Care, Life Sciences Tools & Services) | | | | | | | | | | | 917 | | | | 517,728 | |
RTL Group SA (Consumer Discretionary, Media) | | | | | | | | | | | 2,950 | | | | 221,204 | |
SES SA (Consumer Discretionary, Media) | | | | | | | | | | | 29,539 | | | | 592,486 | |
Subsea 7 SA (Energy, Energy Equipment & Services) | | | | | | | | | | | 20,780 | | | | 282,604 | |
| | | | |
| | | | | | | | | | | | | | | 2,397,707 | |
| | | | | | | | | | | | | | | | |
| | | | |
| Malta: 0.02% | | | | | | | | | | | | | | | | |
Kindred Group plc SDR (Consumer Discretionary, Hotels, Restaurants & Leisure) | | | | | | | | | | | 16,018 | | | | 196,872 | |
| | | | | | | | | | | | | | | | |
| | | | |
| Netherlands: 3.27% | | | | | | | | | | | | | | | | |
Aalberts Industries NV (Industrials, Machinery) | | | | | | | | | | | 7,342 | | | | 314,811 | |
ABN AMRO Group NV (Financials, Banks) 144A | | | | | | | | | | | 39,039 | | | | 1,057,188 | |
Aegon NV (Financials, Insurance) | | | | | | | | | | | 145,156 | | | | 870,418 | |
Akzo Nobel NV (Materials, Chemicals) | | | | | | | | | | | 20,636 | | | | 1,928,715 | |
Argenx SE (Health Care, Biotechnology) † | | | | | | | | | | | 2,400 | | | | 223,421 | |
ASM International NV (Information Technology, Semiconductors & Semiconductor Equipment) | | | | | | | | | | | 3,472 | | | | 187,078 | |
ASR Nederland NV (Financials, Insurance) | | | | | | | | | | | 11,402 | | | | 543,953 | |
BE Semiconductor Industries NV (Information Technology, Semiconductors & Semiconductor Equipment) | | | | | | | | | | | 5,360 | | | | 116,344 | |
Euronext NV (Financials, Capital Markets) 144A | | | | | | | | | | | 4,215 | | | | 276,919 | |
Exor NV (Financials, Diversified Financial Services) | | | | | | | | | | | 9,416 | | | | 611,840 | |
Fiat Chrysler Automobiles NV (Consumer Discretionary, Automobiles) † | | | | | | | | | | | 90,800 | | | | 1,534,567 | |
Gemalto NV (Information Technology, Software) † | | | | | | | | | | | 10,383 | | | | 602,844 | |
Heineken Holding NV (Consumer Staples, Beverages) | | | | | | | | | | | 7,651 | | | | 729,122 | |
The accompanying notes are an integral part of these financial statements.
| | | | | | |
| Portfolio of investments—August 31, 2018 (unaudited) | | Wells Fargo Funds | | | 107 | |
FACTOR ENHANCED INTERNATIONAL PORTFOLIO
| | | | | | | | | | | | | | | | |
| Security name | | | | | | | | Shares | | | Value | |
| | | | |
| Netherlands (continued) | | | | | | | | | | | | | | | | |
Heineken NV (Consumer Staples, Beverages) | | | | | | | | | | | 18,578 | | | $ | 1,835,994 | |
IMCD Group NV (Industrials, Trading Companies & Distributors) | | | | | | | | | | | 3,561 | | | | 266,193 | |
Koninklijke Ahold NV (Consumer Staples, Food & Staples Retailing) | | | | | | | | | | | 100,451 | | | | 2,443,904 | |
Koninklijke DSM NV (Materials, Chemicals) | | | | | | | | | | | 14,591 | | | | 1,530,721 | |
Koninklijke KPN NV (Telecommunication Services, Diversified Telecommunication Services) | | | | | | | | | | | 250,808 | | | | 640,767 | |
Koninklijke Philips NV (Industrials, Industrial Conglomerates) | | | | | | | | | | | 76,712 | | | | 3,427,282 | |
Koninklijke Vopak NV (Energy, Oil, Gas & Consumable Fuels) | | | | | | | | | | | 4,981 | | | | 256,707 | |
NN Group NV (Financials, Insurance) | | | | | | | | | | | 26,760 | | | | 1,147,107 | |
Philips Lighting NV (Industrials, Electrical Equipment) 144A | | | | | | | | | | | 8,802 | | | | 247,658 | |
Randstad Holdings NV (Industrials, Professional Services) | | | | | | | | | | | 9,305 | | | | 582,810 | |
RELX NV (Industrials, Professional Services) | | | | | | | | | | | 84,429 | | | | 1,869,858 | |
Unilever NV (Consumer Staples, Personal Products) | | | | | | | | | | | 125,756 | | | | 7,232,147 | |
Wolters Kluwer NV (Consumer Discretionary, Media) | | | | | | | | | | | 22,110 | | | | 1,401,264 | |
| | | | |
| | | | | | | | | | | | | | | 31,879,632 | |
| | | | | | | | | | | | | | | | |
| | | | |
| New Zealand: 0.33% | | | | | | | | | | | | | | | | |
A2 Milk Company Limited (Consumer Staples, Food Products) † | | | | | | | | | | | 60,192 | | | | 502,567 | |
Auckland International Airport Limited (Industrials, Transportation Infrastructure) | | | | | | | | | | | 75,812 | | | | 358,373 | |
Contact Energy Limited (Utilities, Electric Utilities) | | | | | | | | | | | 56,905 | | | | 208,948 | |
Fisher & Paykel Healthcare Corporation (Health Care, Health Care Equipment & Supplies) | | | | | | | | | | | 46,311 | | | | 502,179 | |
Fletcher Building Limited (Materials, Construction Materials) | | | | | | | | | | | 67,021 | | | | 282,009 | |
Meridian Energy Limited (Utilities, Independent Power & Renewable Electricity Producers) | | | | | | | | | | | 99,575 | | | | 213,447 | |
Ryman Healthcare Limited (Health Care, Health Care Providers & Services) | | | | | | | | | | | 31,585 | | | | 294,434 | |
Spark New Zealand Limited (Telecommunication Services, Diversified Telecommunication Services) | | | | | | | | | | | 142,967 | | | | 377,402 | |
Xero Limited (Information Technology, Software) † | | | | | | | | | | | 8,297 | | | | 304,618 | |
Z Energy Limited (Energy, Oil, Gas & Consumable Fuels) | | | | | | | | | | | 31,294 | | | | 149,277 | |
| | | | |
| | | | | | | | | | | | | | | 3,193,254 | |
| | | | | | | | | | | | | | | | |
| | | | |
| Norway: 0.94% | | | | | | | | | | | | | | | | |
Aker BP ASA (Energy, Oil, Gas & Consumable Fuels) | | | | | | | | | | | 8,766 | | | | 310,453 | |
Den Norske Bank ASA (Financials, Banks) | | | | | | | | | | | 79,995 | | | | 1,629,251 | |
Equinor ASA (Energy, Oil, Gas & Consumable Fuels) | | | | | | | | | | | 94,219 | | | | 2,416,664 | |
Gjensidige Forsikring ASA (Financials, Insurance) | | | | | | | | | | | 14,590 | | | | 244,090 | |
Marine Harvest ASA (Consumer Staples, Food Products) | | | | | | | | | | | 33,611 | | | | 726,034 | |
Norsk Hydro ASA (Materials, Metals & Mining) | | | | | | | | | | | 117,843 | | | | 650,753 | |
Orkla ASA (Consumer Staples, Food Products) | | | | | | | | | | | 68,469 | | | | 563,353 | |
Schibsted ASA Class A (Consumer Discretionary, Media) | | | | | | | | | | | 6,023 | | | | 215,678 | |
Storebrand ASA (Financials, Insurance) | | | | | | | | | | | 37,455 | | | | 331,846 | |
Telenor ASA (Telecommunication Services, Diversified Telecommunication Services) | | | | | | | | | | | 58,574 | | | | 1,104,267 | |
TGS Nopec Geophysical Company ASA (Energy, Energy Equipment & Services) | | | | | | | | | | | 7,997 | | | | 303,720 | |
Yara International ASA (Materials, Chemicals) | | | | | | | | | | | 14,289 | | | | 657,698 | |
| | | | |
| | | | | | | | | | | | | | | 9,153,807 | |
| | | | | | | | | | | | | | | | |
| | | | |
| Portugal: 0.19% | | | | | | | | | | | | | | | | |
Energias de Portugal SA (Utilities, Electric Utilities) | | | | | | | | | | | 198,431 | | | | 775,056 | |
Galp Energia SGPS SA (Energy, Oil, Gas & Consumable Fuels) | | | | | | | | | | | 37,197 | | | | 754,292 | |
Jeronimo Martins SA (Consumer Staples, Food & Staples Retailing) | | | | | | | | | | | 18,849 | | | | 282,348 | |
| | | | |
| | | | | | | | | | | | | | | 1,811,696 | |
| | | | | | | | | | | | | | | | |
The accompanying notes are an integral part of these financial statements.
| | | | |
| 108 | | Wells Fargo Funds | | Portfolio of investments—August 31, 2018 (unaudited) |
FACTOR ENHANCED INTERNATIONAL PORTFOLIO
| | | | | | | | | | | | | | | | |
| Security name | | | | | | | | Shares | | | Value | |
| | | | |
| Singapore: 1.58% | | | | | | | | | | | | | | | | |
Ascendas REIT (Real Estate, Equity REITs) | | | | | | | | | | | 194,600 | | | $ | 388,477 | |
CapitaLand Commercial Trust Limited (Real Estate, Equity REITs) | | | | | | | | | | | 220,500 | | | | 284,350 | |
CapitaLand Limited (Real Estate, Real Estate Management & Development) | | | | | | | | | | | 206,963 | | | | 517,200 | |
CapitaLand Mall Trust (Real Estate, Equity REITs) | | | | | | | | | | | 204,300 | | | | 318,533 | |
City Developments Limited (Real Estate, Real Estate Management & Development) | | | | | | | | | | | 36,775 | | | | 248,641 | |
ComfortDelGro Corporation Limited (Industrials, Road & Rail) | | | | | | | | | | | 177,637 | | | | 296,374 | |
DBS Group Holdings Limited (Financials, Banks) | | | | | | | | | | | 157,013 | | | | 2,854,158 | |
Genting Singapore Limited (Consumer Discretionary, Hotels, Restaurants & Leisure) | | | | | | | | | | | 459,324 | | | | 358,076 | |
Jardine Cycle & Carriage Limited (Consumer Discretionary, Distributors) | | | | | | | | | | | 7,777 | | | | 183,808 | |
Keppel Corporation Limited (Industrials, Industrial Conglomerates) | | | | | | | | | | | 118,343 | | | | 563,025 | |
Mapletree Commercial Trust (Real Estate, Equity REITs) | | | | | | | | | | | 144,400 | | | | 171,485 | |
Oversea-Chinese Banking Corporation Limited (Financials, Banks) | | | | | | | | | | | 320,896 | | | | 2,641,889 | |
SembCorp Industries Limited (Industrials, Industrial Conglomerates) | | | | | | | | | | | 69,200 | | | | 137,639 | |
Singapore Airlines Limited (Industrials, Airlines) | | | | | | | | | | | 42,400 | | | | 302,736 | |
Singapore Airport Terminal Services Limited (Industrials, Transportation Infrastructure) | | | | | | | | | | | 51,200 | | | | 189,125 | |
Singapore Exchange Limited (Financials, Capital Markets) | | | | | | | | | | | 66,274 | | | | 357,794 | |
Singapore Press Holdings Limited (Consumer Discretionary, Media) | | | | | | | | | | | 140,700 | | | | 287,028 | |
Singapore Technologies Engineering Limited (Industrials, Aerospace & Defense) | | | | | | | | | | | 124,369 | | | | 302,643 | |
Singapore Telecommunications Limited (Telecommunication Services, Diversified Telecommunication Services) | | | | | | | | | | | 589,655 | | | | 1,387,626 | |
Suntec REIT (Real Estate, Equity REITs) | | | | | | | | | | | 158,900 | | | | 216,490 | |
United Overseas Bank Limited (Financials, Banks) | | | | | | | | | | | 116,686 | | | | 2,300,480 | |
UOL Group Limited (Real Estate, Real Estate Management & Development) | | | | | | | | | | | 43,773 | | | | 220,372 | |
Venture Corporation Limited (Information Technology, Electronic Equipment, Instruments & Components) | | | | | | | | | | | 22,100 | | | | 291,597 | |
Wilmar International Limited (Consumer Staples, Food Products) | | | | | | | | | | | 225,185 | | | | 525,002 | |
| | | | |
| | | | | | | | | | | | | | | 15,344,548 | |
| | | | | | | | | | | | | | | | |
| | | | |
| South Africa: 0.07% | | | | | | | | | | | | | | | | |
Old Mutual Limited (Financials, Insurance) | | | | | | | | | | | 339,946 | | | | 694,756 | |
| | | | | | | | | | | | | | | | |
| | | | |
| Spain: 1.28% | | | | | | | | | | | | | | | | |
Actividades de Construccion y Servicios SA (Industrials, Construction & Engineering) | | | | | | | | | | | 22,087 | | | | 919,873 | |
Aena SA (Industrials, Transportation Infrastructure) 144A | | | | | | | | | | | 6,188 | | | | 1,095,365 | |
Amadeus IT Holding SA Class A (Information Technology, IT Services) | | | | | | | | | | | 34,390 | | | | 3,190,262 | |
Bankinter SA (Financials, Banks) | | | | | | | | | | | 50,589 | | | | 450,039 | |
Bolsas y Mercados Espanoles (Financials, Capital Markets) | | | | | | | | | | | 5,275 | | | | 172,790 | |
Cellnex Telecom SA (Telecommunication Services, Diversified Telecommunication Services) 144A | | | | | | | | | | | 11,214 | | | | 287,928 | |
Enagás SA (Energy, Oil, Gas & Consumable Fuels) | | | | | | | | | | | 19,373 | | | | 538,569 | |
Endesa SA (Utilities, Electric Utilities) | | | | | | | | | | | 23,957 | | | | 536,418 | |
Gas Natural SDG SA (Utilities, Gas Utilities) | | | | | | | | | | | 27,746 | | | | 744,929 | |
Grifols SA (Health Care, Biotechnology) | | | | | | | | | | | 23,525 | | | | 691,677 | |
Inmobiliaria Colonial Socimi SA (Real Estate, Equity REITs) | | | | | | | | | | | 21,236 | | | | 229,858 | |
Mapfre SA (Financials, Insurance) | | | | | | | | | | | 76,239 | | | | 224,687 | |
Merlin Properties Socimi SA (Real Estate, Equity REITs) | | | | | | | | | | | 29,164 | | | | 407,072 | |
Red Electrica Corporacion SA (Utilities, Electric Utilities) | | | | | | | | | | | 33,529 | | | | 704,430 | |
Repsol YPF SA (Energy, Oil, Gas & Consumable Fuels) | | | | | | | | | | | 108,275 | | | | 2,081,893 | |
Viscofan SA (Consumer Staples, Food Products) | | | | | | | | | | | 2,866 | | | | 208,751 | |
| | | | |
| | | | | | | | | | | | | | | 12,484,541 | |
| | | | | | | | | | | | | | | | |
The accompanying notes are an integral part of these financial statements.
| | | | | | |
| Portfolio of investments—August 31, 2018 (unaudited) | | Wells Fargo Funds | | | 109 | |
FACTOR ENHANCED INTERNATIONAL PORTFOLIO
| | | | | | | | | | | | | | | | |
| Security name | | | | | | | | Shares | | �� | Value | |
| | | | |
| Sweden: 2.71% | | | | | | | | | | | | | | | | |
Alfa Laval AB (Industrials, Machinery) | | | | | | | | | | | 22,282 | | | $ | 597,182 | |
Assa Abloy AB Class B (Industrials, Building Products) | | | | | | | | | | | 87,164 | | | | 1,776,611 | |
Atlas Copco AB Class A (Industrials, Machinery) | | | | | | | | | | | 54,636 | | | | 1,557,504 | |
BillerudKorsnas AB (Materials, Containers & Packaging) | | | | | | | | | | | 14,032 | | | | 165,711 | |
Castellum AB (Real Estate, Real Estate Management & Development) | | | | | | | | | | | 20,903 | | | | 378,054 | |
Dometic Group AB (Consumer Discretionary, Auto Components) 144A | | | | | | | | | | | 22,591 | | | | 214,420 | |
Electrolux AB Class B (Consumer Discretionary, Household Durables) | | | | | | | | | | | 19,088 | | | | 425,794 | |
Elekta AB Class B (Health Care, Health Care Equipment & Supplies) | | | | | | | | | | | 28,039 | | | | 366,540 | |
Epiroc AB Class A (Industrials, Machinery) † | | | | | | | | | | | 51,818 | | | | 538,286 | |
Ericsson LM Class B (Information Technology, Communications Equipment) | | | | | | | | | | | 227,141 | | | | 1,915,951 | |
Essity Aktiebolag AB (Consumer Staples, Household Products) | | | | | | | | | | | 52,336 | | | | 1,356,307 | |
Fabege AB (Real Estate, Real Estate Management & Development) | | | | | | | | | | | 18,719 | | | | 250,087 | |
Fastighets AB Balder B Shares (Real Estate, Real Estate Management & Development) † | | | | | | | | | | | 7,259 | | | | 206,376 | |
Getinge AB Class B (Health Care, Health Care Equipment & Supplies) | | | | | | | | | | | 16,144 | | | | 192,418 | |
Hennes & Mauritz AB Class B (Consumer Discretionary, Specialty Retail) | | | | | | | | | | | 70,676 | | | | 952,275 | |
Hexagon AB Class B (Information Technology, Electronic Equipment, Instruments & Components) | | | | | | | | | | | 22,342 | | | | 1,327,061 | |
Hexpol AB (Materials, Chemicals) | | | | | | | | | | | 19,636 | | | | 209,669 | |
Husqvarna AB Class B (Consumer Discretionary, Household Durables) | | | | | | | | | | | 31,771 | | | | 252,566 | |
ICA Gruppen AB (Consumer Staples, Food & Staples Retailing) | | | | | | | | | | | 5,751 | | | | 175,137 | |
Industrivarden AB Class A (Financials, Diversified Financial Services) | | | | | | | | | | | 14,365 | | | | 315,412 | |
Investor AB Class B (Financials, Diversified Financial Services) | | | | | | | | | | | 38,749 | | | | 1,748,655 | |
Kinnevik AB Class B (Financials, Diversified Financial Services) | | | | | | | | | | | 18,893 | | | | 620,598 | |
Loomis AB Class B (Industrials, Commercial Services & Supplies) | | | | | | | | | | | 5,685 | | | | 182,887 | |
Lundbergforetagen AB Class B (Financials, Diversified Financial Services) | | | | | | | | | | | 6,008 | | | | 201,818 | |
Nibe Industrier AB Class B (Industrials, Building Products) | | | | | | | | | | | 27,653 | | | | 318,254 | |
Sandvik AB (Industrials, Machinery) | | | | | | | | | | | 94,333 | | | | 1,650,929 | |
Securitas AB (Industrials, Commercial Services & Supplies) | | | | | | | | | | | 25,508 | | | | 453,809 | |
SKF AB Class B (Industrials, Machinery) | | | | | | | | | | | 30,781 | | | | 591,544 | |
Svenska Cellulosa AB Class B (Materials, Paper & Forest Products) | | | | | | | | | | | 48,734 | | | | 567,266 | |
Swedbank AB Class A (Financials, Banks) | | | | | | | | | | | 76,843 | | | | 1,788,072 | |
Swedish Match AB (Consumer Staples, Tobacco) | | | | | | | | | | | 14,016 | | | | 749,296 | |
Swedish Orphan Biovitrum AB (Health Care, Biotechnology) † | | | | | | | | | | | 11,023 | | | | 351,236 | |
Tele2 AB Class B (Telecommunication Services, Wireless Telecommunication Services) | | | | | | | | | | | 25,343 | | | | 312,591 | |
Telia Company AB (Telecommunication Services, Diversified Telecommunication Services) | | | | | | | | | | | 221,911 | | | | 984,206 | |
Trelleborg AB Class B (Industrials, Machinery) | | | | | | | | | | | 19,780 | | | | 386,509 | |
Volvo AB Class B (Industrials, Machinery) | | | | | | | | | | | 132,496 | | | | 2,281,878 | |
| | | | |
| | | | | | | | | | | | | | | 26,362,909 | |
| | | | | | | | | | | | | | | | |
| | | | |
| Switzerland: 4.70% | | | | | | | | | | | | | | | | |
Adecco SA (Industrials, Professional Services) | | | | | | | | | | | 14,588 | | | | 893,717 | |
Baloise Holding AG (Financials, Insurance) | | | | | | | | | | | 4,121 | | | | 633,509 | |
Barry Callebaut AG (Consumer Staples, Food Products) | | | | | | | | | | | 187 | | | | 333,388 | |
BB Biotech AG (Health Care, Biotechnology) | | | | | | | | | | | 31,735 | | | | 2,205,161 | |
Bucher Industries AG (Industrials, Machinery) | | | | | | | | | | | 511 | | | | 179,147 | |
Cembra Money Bank AG (Financials, Consumer Finance) | | | | | | | | | | | 2,169 | | | | 202,970 | |
Chocoladefabriken Lindt & Sprungli AG (Consumer Staples, Food Products) | | | | | | | | | | | 9 | | | | 792,984 | |
Clariant AG (Materials, Chemicals) | | | | | | | | | | | 16,543 | | | | 413,383 | |
Coca-Cola HBC AG (Consumer Staples, Beverages) | | | | | | | | | | | 14,845 | | | | 507,704 | |
DKSH Holding AG (Industrials, Professional Services) | | | | | | | | | | | 2,403 | | | | 175,034 | |
dormakaba Holding AG (Industrials, Building Products) | | | | | | | | | | | 233 | | | | 163,587 | |
The accompanying notes are an integral part of these financial statements.
| | | | |
| 110 | | Wells Fargo Funds | | Portfolio of investments—August 31, 2018 (unaudited) |
FACTOR ENHANCED INTERNATIONAL PORTFOLIO
| | | | | | | | | | | | | | | | |
| Security name | | | | | | | | Shares | | | Value | |
| | | | |
| Switzerland (continued) | | | | | | | | | | | | | | | | |
Flughafen Zuerich AG (Industrials, Transportation Infrastructure) | | | | | | | | | | | 1,537 | | | $ | 317,787 | |
GAM Holding AG (Financials, Capital Markets) | | | | | | | | | | | 11,561 | | | | 89,279 | |
Geberit AG (Industrials, Building Products) | | | | | | | | | | | 3,071 | | | | 1,396,644 | |
Georg Fischer AG (Industrials, Machinery) | | | | | | | | | | | 333 | | | | 435,983 | |
Givaudan SA (Materials, Chemicals) | | | | | | | | | | | 639 | | | | 1,554,565 | |
Helvetia Holding AG (Financials, Insurance) | | | | | | | | | | | 541 | | | | 324,851 | |
Julius Baer Group Limited (Financials, Capital Markets) | | | | | | | | | | | 18,976 | | | | 1,008,660 | |
Kuehne & Nagel International AG (Industrials, Marine) | | | | | | | | | | | 4,725 | | | | 762,922 | |
Logitech International SA (Information Technology, Technology Hardware, Storage & Peripherals) | | | | | | | | | | | 12,760 | | | | 629,805 | |
Lonza Group AG (Health Care, Life Sciences Tools & Services) | | | | | | | | | | | 5,785 | | | | 1,861,585 | |
OC Oerlikon Corporation AG (Information Technology, Electronic Equipment, Instruments & Components) | | | | | | | | | | | 15,176 | | | | 221,083 | |
Pargesa Holding SA (Financials, Diversified Financial Services) | | | | | | | | | | | 3,126 | | | | 253,982 | |
Partners Group Holding AG (Financials, Capital Markets) | | | | | | | | | | | 1,788 | | | | 1,403,836 | |
PSP Swiss Property AG (Real Estate, Real Estate Management & Development) | | | | | | | | | | | 3,365 | | | | 334,330 | |
Roche Holding AG (Health Care, Pharmaceuticals) | | | | | | | | | | | 55,766 | | | | 13,854,478 | |
Schindler Holding AG - Participation Certificate (Industrials, Machinery) | | | | | | | | | | | 3,192 | | | | 761,404 | |
SGS SA (Industrials, Professional Services) | | | | | | | | | | | 438 | | | | 1,153,690 | |
Sika AG (Materials, Chemicals) | | | | | | | | | | | 10,896 | | | | 1,615,430 | |
Sonova Holding AG (Health Care, Health Care Equipment & Supplies) | | | | | | | | | | | 4,402 | | | | 835,211 | |
Straumann Holding AG (Health Care, Health Care Equipment & Supplies) | | | | | | | | | | | 919 | | | | 732,450 | |
Sunrise Communications Group AG (Telecommunication Services, Diversified Telecommunication Services) 144A | | | | | | | | | | | 2,324 | | | | 211,959 | |
Swatch Group AG Class B (Consumer Discretionary, Textiles, Apparel & Luxury Goods) | | | | | | | | | | | 2,643 | | | | 1,127,825 | |
Swiss Life Holding AG (Financials, Insurance) | | | | | | | | | | | 2,948 | | | | 1,068,184 | |
Swiss Prime Site AG (Real Estate, Real Estate Management & Development) | | | | | | | | | | | 6,041 | | | | 556,888 | |
Swisscom AG (Telecommunication Services, Diversified Telecommunication Services) | | | | | | | | | | | 2,105 | | | | 940,165 | |
Tecan Group AG (Health Care, Life Sciences Tools & Services) | | | | | | | | | | | 902 | | | | 215,531 | |
Temenos Group AG (Information Technology, Software) | | | | | | | | | | | 4,766 | | | | 860,511 | |
VAT Group AG (Industrials, Machinery) 144A | | | | | | | | | | | 1,638 | | | | 211,753 | |
Vifor Pharma AG (Health Care, Pharmaceuticals) | | | | | | | | | | | 3,396 | | | | 625,943 | |
Zurich Insurance Group AG (Financials, Insurance) | | | | | | | | | | | 12,787 | | | | 3,894,478 | |
| | | | |
| | | | | | | | | | | | | | | 45,761,796 | |
| | | | | | | | | | | | | | | | |
| | | | |
| Thailand: 0.03% | | | | | | | | | | | | | | | | |
Thai Beverage PCL (Consumer Staples, Beverages) | | | | | | | | | | | 614,900 | | | | 277,759 | |
| | | | | | | | | | | | | | | | |
| | | | |
| United Kingdom: 16.78% | | | | | | | | | | | | | | | | |
3i Group plc (Financials, Capital Markets) | | | | | | | | | | | 80,976 | | | | 941,053 | |
Admiral Group plc (Financials, Insurance) | | | | | | | | | | | 17,773 | | | | 479,270 | |
Aggreko plc (Industrials, Commercial Services & Supplies) | | | | | | | | | | | 19,491 | | | | 211,907 | |
Anglo American plc (Materials, Metals & Mining) | | | | | | | | | | | 81,161 | | | | 1,622,090 | |
Antofagasta plc (Materials, Metals & Mining) | | | | | | | | | | | 30,664 | | | | 320,261 | |
Associated British Foods plc (Consumer Staples, Food Products) | | | | | | | | | | | 31,229 | | | | 926,744 | |
AstraZeneca plc (Health Care, Pharmaceuticals) | | | | | | | | | | | 101,156 | | | | 7,599,778 | |
Babcock International Group plc (Industrials, Commercial Services & Supplies) | | | | | | | | | | | 19,836 | | | | 183,461 | |
BAE Systems plc (Industrials, Aerospace & Defense) | | | | | | | | | | | 257,323 | | | | 2,021,655 | |
Balfour Beatty plc (Industrials, Construction & Engineering) | | | | | | | | | | | 54,175 | | | | 203,471 | |
Barratt Developments plc (Consumer Discretionary, Household Durables) | | | | | | | | | | | 83,992 | | | | 590,192 | |
BBA Aviation plc (Industrials, Transportation Infrastructure) | | | | | | | | | | | 71,277 | | | | 285,723 | |
Beazley plc (Financials, Insurance) | | | | | | | | | | | 41,759 | | | | 321,853 | |
Bellway plc (Consumer Discretionary, Household Durables) | | | | | | | | | | | 10,148 | | | | 383,903 | |
The accompanying notes are an integral part of these financial statements.
| | | | | | |
| Portfolio of investments—August 31, 2018 (unaudited) | | Wells Fargo Funds | | | 111 | |
FACTOR ENHANCED INTERNATIONAL PORTFOLIO
| | | | | | | | | | | | | | | | |
| Security name | | | | | | | | Shares | | | Value | |
| | | | |
| United Kingdom (continued) | | | | | | | | | | | | | | | | |
BHP Billiton plc (Materials, Metals & Mining) | | | | | | | | | | | 180,876 | | | $ | 3,854,657 | |
BP plc (Energy, Oil, Gas & Consumable Fuels) | | | | | | | | | | | 1,736,901 | | | | 12,324,132 | |
British American Tobacco plc (Consumer Staples, Tobacco) | | | | | | | | | | | 189,100 | | | | 9,123,582 | |
Britvic plc (Consumer Staples, Beverages) | | | | | | | | | | | 20,922 | | | | 221,063 | |
BT Group plc (Telecommunication Services, Diversified Telecommunication Services) | | | | | | | | | | | 724,057 | | | | 2,040,273 | |
BTG plc (Health Care, Pharmaceuticals) † | | | | | | | | | | | 26,418 | | | | 186,318 | |
Bunzl plc (Industrials, Trading Companies & Distributors) | | | | | | | | | | | 27,674 | | | | 860,354 | |
Burberry Group plc (Consumer Discretionary, Textiles, Apparel & Luxury Goods) | | | | | | | | | | | 35,411 | | | | 1,026,516 | |
Carnival plc (Consumer Discretionary, Hotels, Restaurants & Leisure) | | | | | | | | | | | 15,137 | | | | 908,804 | |
Centrica plc (Utilities, Multi-Utilities) | | | | | | | | | | | 467,241 | | | | 868,046 | |
Cineworld Group plc (Consumer Discretionary, Media) | | | | | | | | | | | 78,037 | | | | 313,833 | |
Close Brothers Group plc (Financials, Capital Markets) | | | | | | | | | | | 12,161 | | | | 251,627 | |
Cobham plc (Industrials, Aerospace & Defense) † | | | | | | | | | | | 199,579 | | | | 321,878 | |
Compass Group plc (Consumer Discretionary, Hotels, Restaurants & Leisure) | | | | | | | | | | | 130,812 | | | | 2,812,671 | |
ConvaTec Limited (Health Care, Health Care Equipment & Supplies) 144A | | | | | | | | | | | 111,951 | | | | 309,581 | |
Croda International plc (Materials, Chemicals) | | | | | | | | | | | 10,900 | | | | 720,697 | |
CYBG plc (Financials, Banks) | | | | | | | | | | | 69,116 | | | | 297,490 | |
Daily Mail & General Trust plc Class A (Consumer Discretionary, Media) | | | | | | | | | | | 22,691 | | | | 221,810 | |
Dechra Pharmaceuticals plc (Health Care, Pharmaceuticals) | | | | | | | | | | | 7,599 | | | | 307,374 | |
Derwent Valley Holdings plc (Real Estate, Equity REITs) | | | | | | | | | | | 8,699 | | | | 343,071 | |
Diageo plc (Consumer Staples, Beverages) | | | | | | | | | | | 203,866 | | | | 7,121,620 | |
Direct Line Insurance Group plc (Financials, Insurance) | | | | | | | | | | | 112,547 | | | | 482,821 | |
Dixons Carphone plc (Consumer Discretionary, Specialty Retail) | | | | | | | | | | | 80,664 | | | | 172,866 | |
DS Smith plc (Materials, Containers & Packaging) | | | | | | | | | | | 89,149 | | | | 570,952 | |
easyJet plc (Industrials, Airlines) | | | | | | | | | | | 15,767 | | | | 311,727 | |
Electrocomponents plc (Information Technology, Electronic Equipment, Instruments & Components) | | | | | | | | | | | 34,826 | | | | 334,924 | |
EVRAZ plc (Materials, Metals & Mining) | | | | | | | | | | | 33,271 | | | | 214,593 | |
Experian Group Limited plc (Industrials, Professional Services) | | | | | | | | | | | 75,339 | | | | 1,875,327 | |
Ferguson plc (Industrials, Trading Companies & Distributors) | | | | | | | | | | | 19,347 | | | | 1,550,344 | |
Fresnillo plc (Materials, Metals & Mining) | | | | | | | | | | | 14,846 | | | | 172,685 | |
G4S plc (Industrials, Commercial Services & Supplies) | | | | | | | | | | | 123,956 | | | | 400,793 | |
GlaxoSmithKline plc (Health Care, Pharmaceuticals) | | | | | | | | | | | 402,096 | | | | 8,134,325 | |
Great Portland Estates plc (Real Estate, Equity REITs) | | | | | | | | | | | 19,929 | | | | 186,414 | |
GVC Holdings plc (Consumer Discretionary, Hotels, Restaurants & Leisure) | | | | | | | | | | | 45,497 | | | | 650,010 | |
Halma plc (Information Technology, Electronic Equipment, Instruments & Components) | | | | | | | | | | | 29,873 | | | | 554,597 | |
Hammerson plc (Real Estate, Equity REITs) | | | | | | | | | | | 65,259 | | | | 398,574 | |
Hargreaves Lansdown plc (Financials, Capital Markets) | | | | | | | | | | | 20,778 | | | | 592,628 | |
Hays plc (Industrials, Professional Services) | | | | | | | | | | | 94,961 | | | | 250,410 | |
Hiscox Limited (Financials, Insurance) | | | | | | | | | | | 23,468 | | | | 512,663 | |
HomeServe plc (Industrials, Commercial Services & Supplies) | | | | | | | | | | | 21,351 | | | | 287,600 | |
Howden Joinery Group plc (Industrials, Trading Companies & Distributors) | | | | | | | | | | | 49,406 | | | | 315,586 | |
IG Group Holdings plc (Financials, Capital Markets) | | | | | | | | | | | 29,214 | | | | 342,385 | |
IMI plc (Industrials, Machinery) | | | | | | | | | | | 23,065 | | | | 361,224 | |
Imperial Tobacco Group plc (Consumer Staples, Tobacco) | | | | | | | | | | | 79,354 | | | | 2,822,986 | |
Inchcape plc (Consumer Discretionary, Distributors) | | | | | | | | | | | 32,952 | | | | 295,627 | |
Indivior plc (Health Care, Pharmaceuticals) † | | | | | | | | | | | 58,029 | | | | 203,502 | |
Informa plc (Consumer Discretionary, Media) | | | | | | | | | | | 103,480 | | | | 1,022,810 | |
Inmarsat plc (Telecommunication Services, Diversified Telecommunication Services) | | | | | | | | | | | 36,847 | | | | 260,062 | |
Intermediate Capital Group (Financials, Capital Markets) | | | | | | | | | | | 23,625 | | | | 321,294 | |
Intertek Group plc (Industrials, Professional Services) | | | | | | | | | | | 13,112 | | | | 872,731 | |
The accompanying notes are an integral part of these financial statements.
| | | | |
| 112 | | Wells Fargo Funds | | Portfolio of investments—August 31, 2018 (unaudited) |
FACTOR ENHANCED INTERNATIONAL PORTFOLIO
| | | | | | | | | | | | | | | | |
| Security name | | | | | | | | Shares | | | Value | |
| | | | |
| United Kingdom (continued) | | | | | | | | | | | | | | | | |
Intu Properties plc (Real Estate, Equity REITs) | | | | | | | | | | | 59,863 | | | $ | 122,623 | |
Investec plc (Financials, Capital Markets) | | | | | | | | | | | 50,679 | | | | 332,719 | |
ITV plc (Consumer Discretionary, Media) | | | | | | | | | | | 338,579 | | | | 705,174 | |
IWG plc (Industrials, Commercial Services & Supplies) | | | | | | | | | | | 53,772 | | | | 167,311 | |
J Sainsbury plc (Consumer Staples, Food & Staples Retailing) | | | | | | | | | | | 139,782 | | | | 587,517 | |
John Wood Group plc (Energy, Energy Equipment & Services) | | | | | | | | | | | 56,861 | | | | 529,734 | |
Johnson Matthey plc (Materials, Chemicals) | | | | | | | | | | | 16,204 | | | | 734,428 | |
Jupiter Fund Management plc (Financials, Capital Markets) | | | | | | | | | | | 35,528 | | | | 193,085 | |
Kazakhmys plc (Materials, Metals & Mining) † | | | | | | | | | | | 17,784 | | | | 107,441 | |
Kingfisher plc (Consumer Discretionary, Specialty Retail) | | | | | | | | | | | 172,827 | | | | 612,808 | |
Legal & General Group plc (Financials, Insurance) | | | | | | | | | | | 497,837 | | | | 1,641,305 | |
London Stock Exchange Group plc (Financials, Capital Markets) | | | | | | | | | | | 25,984 | | | | 1,557,685 | |
Man Group plc (Financials, Capital Markets) | | | | | | | | | | | 126,627 | | | | 282,036 | |
Marks & Spencer Group plc (Consumer Discretionary, Multiline Retail) | | | | | | | | | | | 128,342 | | | | 501,829 | |
Mediclinic International plc (Health Care, Health Care Providers & Services) | | | | | | | | | | | 27,243 | | | | 174,159 | |
Meggitt plc (Industrials, Aerospace & Defense) | | | | | | | | | | | 56,647 | | | | 395,254 | |
Merlin Entertainment plc (Consumer Discretionary, Hotels, Restaurants & Leisure) 144A | | | | | | | | | | | 55,321 | | | | 266,730 | |
Micro Focus International plc (Information Technology, Software) | | | | | | | | | | | 36,647 | | | | 620,019 | |
Mondi plc (Materials, Paper & Forest Products) | | | | | | | | | | | 30,736 | | | | 854,733 | |
Moneysupermarket.com Group plc (Information Technology, Internet Software & Services) | | | | | | | | | | | 41,118 | | | | 151,393 | |
National Grid plc (Utilities, Multi-Utilities) | | | | | | | | | | | 281,865 | | | | 2,959,934 | |
NEX Group plc (Financials, Capital Markets) | | | | | | | | | | | 24,786 | | | | 338,048 | |
Next plc (Consumer Discretionary, Multiline Retail) | | | | | | | | | | | 11,668 | | | | 831,984 | |
NMC Health plc (Health Care, Health Care Providers & Services) | | | | | | | | | | | 7,907 | | | | 402,250 | |
Ocado Group plc (Consumer Discretionary, Internet & Direct Marketing Retail) † | | | | | | | | | | | 50,277 | | | | 699,073 | |
Pearson plc (Consumer Discretionary, Media) | | | | | | | | | | �� | 63,742 | | | | 758,124 | |
Pennon Group plc (Utilities, Water Utilities) | | | | | | | | | | | 34,327 | | | | 342,052 | |
Persimmon plc (Consumer Discretionary, Household Durables) | | | | | | | | | | | 26,470 | | | | 834,934 | |
Phoenix Group Holdings (Financials, Insurance) | | | | | | | | | | | 47,510 | | | | 437,320 | |
Playtech plc (Consumer Discretionary, Hotels, Restaurants & Leisure) | | | | | | | | | | | 23,457 | | | | 161,786 | |
Polymetal International plc (Materials, Metals & Mining) | | | | | | | | | | | 19,285 | | | | 160,763 | |
Quilter plc (Financials, Capital Markets) 144A | | | | | | | | | | | 114,693 | | | | 209,420 | |
Randgold Resources Limited (Materials, Metals & Mining) | | | | | | | | | | | 7,996 | | | | 520,601 | |
Reckitt Benckiser Group plc (Consumer Staples, Household Products) | | | | | | | | | | | 55,601 | | | | 4,727,985 | |
RELX plc (Industrials, Professional Services) | | | | | | | | | | | 83,505 | | | | 1,851,247 | |
Rentokil Initial plc (Industrials, Commercial Services & Supplies) | | | | | | | | | | | 151,615 | | | | 638,824 | |
Rightmove plc (Information Technology, Internet Software & Services) | | | | | | | | | | | 81,040 | | | | 516,969 | |
Rio Tinto plc (Materials, Metals & Mining) | | | | | | | | | | | 99,863 | | | | 4,737,212 | |
Rolls-Royce Holdings plc (Industrials, Aerospace & Defense) | | | | | | | | | | | 156,013 | | | | 2,032,744 | |
Rotork plc (Industrials, Machinery) | | | | | | | | | | | 66,849 | | | | 292,932 | |
Royal Dutch Shell plc Class A (Energy, Oil, Gas & Consumable Fuels) | | | | | | | | | | | 385,903 | | | | 12,537,753 | |
Royal Mail plc (Industrials, Air Freight & Logistics) | | | | | | | | | | | 87,577 | | | | 508,656 | |
RPC Group plc (Materials, Containers & Packaging) | | | | | | | | | | | 32,406 | | | | 300,055 | |
RSA Insurance Group plc (Financials, Insurance) | | | | | | | | | | | 87,786 | | | | 718,825 | |
Schroders plc (Financials, Capital Markets) | | | | | | | | | | | 9,237 | | | | 368,241 | |
Segro plc (Real Estate, Equity REITs) | | | | | | | | | | | 82,317 | | | | 702,430 | |
Severn Trent plc (Utilities, Water Utilities) | | | | | | | | | | | 20,258 | | | | 525,532 | |
Shire plc (Health Care, Biotechnology) | | | | | | | | | | | 75,458 | | | | 4,400,772 | |
Sky plc (Consumer Discretionary, Media) | | | | | | | | | | | 84,166 | | | | 1,680,948 | |
Smith & Nephew plc (Health Care, Health Care Equipment & Supplies) | | | | | | | | | | | 77,114 | | | | 1,357,153 | |
The accompanying notes are an integral part of these financial statements.
| | | | | | |
| Portfolio of investments—August 31, 2018 (unaudited) | | Wells Fargo Funds | | | 113 | |
FACTOR ENHANCED INTERNATIONAL PORTFOLIO
| | | | | | | | | | | | | | | | |
| Security name | | | | | | | | Shares | | | Value | |
| | | | |
| United Kingdom (continued) | | | | | | | | | | | | | | | | |
Smiths Group plc (Industrials, Industrial Conglomerates) | | | | | | | | | | | 32,029 | | | $ | 669,159 | |
Spectris plc (Information Technology, Electronic Equipment, Instruments & Components) | | | | | | | | | | | 9,961 | | | | 303,994 | |
Spirax-Sarco Engineering plc (Industrials, Machinery) | | | | | | | | | | | 5,768 | | | | 533,176 | |
SSE plc (Utilities, Electric Utilities) | | | | | | | | | | | 84,908 | | | | 1,379,290 | |
SSP Group plc (Consumer Discretionary, Hotels, Restaurants & Leisure) | | | | | | | | | | | 35,723 | | | | 321,552 | |
Tate & Lyle plc (Consumer Staples, Food Products) | | | | | | | | | | | 38,962 | | | | 338,634 | |
Taylor Wimpey plc (Consumer Discretionary, Household Durables) | | | | | | | | | | | 272,369 | | | | 590,934 | |
TechnipFMC plc - BATS Exchange (Energy, Energy Equipment & Services) | | | | | | | | | | | 39,345 | | | | 1,204,310 | |
Tesco plc (Consumer Staples, Food & Staples Retailing) | | | | | | | | | | | 831,953 | | | | 2,658,714 | |
The Berkeley Group Holdings plc (Consumer Discretionary, Household Durables) | | | | | | | | | | | 11,763 | | | | 555,563 | |
The British Land Company plc (Real Estate, Equity REITs) | | | | | | | | | | | 80,112 | | | | 660,142 | |
The Sage Group plc (Information Technology, Software) | | | | | | | | | | | 93,104 | | | | 718,676 | |
The Weir Group plc (Industrials, Machinery) | | | | | | | | | | | 19,603 | | | | 476,391 | |
TP Icap plc (Financials, Capital Markets) | | | | | | | | | | | 44,243 | | | | 163,473 | |
Travis Perkins plc (Industrials, Trading Companies & Distributors) | | | | | | | | | | | 20,734 | | | | 309,261 | |
Unilever plc (Consumer Staples, Personal Products) | | | | | | | | | | | 102,368 | | | | 5,828,843 | |
United Utilities Group plc (Utilities, Water Utilities) | | | | | | | | | | | 57,299 | | | | 550,900 | |
Victrex plc (Materials, Chemicals) | | | | | | | | | | | 6,762 | | | | 277,726 | |
WH Smith plc (Consumer Discretionary, Specialty Retail) | | | | | | | | | | | 8,830 | | | | 236,280 | |
Whitbread plc (Consumer Discretionary, Hotels, Restaurants & Leisure) | | | | | | | | | | | 14,941 | | | | 890,257 | |
William Hill plc (Consumer Discretionary, Hotels, Restaurants & Leisure) | | | | | | | | | | | 70,709 | | | | 236,144 | |
William Morrison Supermarkets plc (Consumer Staples, Food & Staples Retailing) | | | | | | | | | | | 191,981 | | | | 655,213 | |
WPP plc (Consumer Discretionary, Media) | | | | | | | | | | | 104,525 | | | | 1,732,514 | |
| | | | |
| | | | | | | | | | | | | | | 163,382,914 | |
| | | | | | | | | | | | | | | | |
| | | | |
Total Common Stocks (Cost $851,300,807) | | | | | | | | | | | | | | | 884,104,243 | |
| | | | | | | | | | | | | | | | |
| | | | |
| | | Dividend yield | | | | | | | | | | | | | |
| Preferred Stocks: 0.55% | | | | | | | | | | | | | | | | |
| | | | |
| Germany: 0.55% | | | | | | | | | | | | | | | | |
Fuchs Petrolub SE (Materials, Chemicals) | | | 1.55 | % | | | | | | | 5,546 | | | | 324,773 | |
Henkel AG & Company KGaA (Consumer Staples, Household Products) | | | 1.73 | | | | | | | | 14,642 | | | | 1,868,677 | |
Sartorius AG Vorzug (Health Care, Health Care Equipment & Supplies) | | | 0.34 | | | | | | | | 2,435 | | | | 442,053 | |
Schaeffler AG Preference (Consumer Discretionary, Auto Components) | | | 4.95 | | | | | | | | 12,342 | | | | 167,614 | |
Volkswagen AG (Consumer Discretionary, Automobiles) † | | | 0.00 | | | | | | | | 15,352 | | | | 2,509,745 | |
| | | | |
| | | | | | | | | | | | | | | 5,312,862 | |
| | | | | | | | | | | | | | | | |
| | | | |
Total Preferred Stocks (Cost $5,362,649) | | | | | | | | | | | | | | | 5,312,862 | |
| | | | | | | | | | | | | | | | |
| | | | |
Rights: 0.00% | | | | | | | | | | | | | | | | |
| | | | |
| United Kingdom: 0.00% | | | | | | | | | | | | | | | | |
GVC CVR †(a) | | | | | | | | | | | 174,403 | | | | 0 | |
| | | | | | | | | | | | | | | | |
| | | | |
Total Rights (Cost $0) | | | | | | | | | | | | | | | 0 | |
| | | | | | | | | | | | | | | | |
The accompanying notes are an integral part of these financial statements.
| | | | |
| 114 | | Wells Fargo Funds | | Portfolio of investments—August 31, 2018 (unaudited) |
FACTOR ENHANCED INTERNATIONAL PORTFOLIO
| | | | | | | | | | | | | | | | |
| Security name | | Yield | | | | | | Shares | | | Value | |
| | | | |
Short-Term Investments: 4.20% | | | | | | | | | | | | | | | | |
| | | | |
| Investment Companies: 4.20% | | | | | | | | | | | | | | | | |
Wells Fargo Government Money Market Fund Select Class (l)(u) | | | 1.87 | % | | | | | | | 40,929,757 | | | $ | 40,929,757 | |
| | | | | | | | | | | | | | | | |
| |
Total Short-Term Investments (Cost $40,929,757) | | | | 40,929,757 | |
| | | | | | | | | | | | | | | | |
| | | | | | | | |
| Total investments in securities (Cost $897,593,213) | | | 95.57 | % | | | 930,346,862 | |
Other assets and liabilities, net | | | 4.43 | | | | 43,087,393 | |
| | | | | | | | |
| Total net assets | | | 100.00 | % | | $ | 973,434,255 | |
| | | | | | | | |
| † | Non-income-earning security |
| 144A | The security may be resold in transactions exempt from registration, normally to qualified institutional buyers, pursuant to Rule 144A under the Securities Act of 1933. |
| (a) | The security is fair valued in accordance with procedures approved by the Board of Trustees. |
| (l) | The issuer of the security is an affiliated person of the Portfolio as defined in the Investment Company Act of 1940. |
| (u) | The rate represents the 7-day annualized yield at period end. |
Abbreviations:
| REIT | Real estate investment trust |
| SDR | Swedish depositary receipt |
Futures Contracts
| | | | | | | | | | | | | | | | | | | | | | | | |
| Description | | Number of
contracts | | | Expiration
date | | | Notional
cost | | | Notional
value | | | Unrealized
gains | | | Unrealized
losses | |
Long | | | | | | | | | | | | | | | | | | | | | | | | |
MSCI EAFE Index | | | 493 | | | | 9/21/2018 | | | $ | 48,769,994 | | | $ | 48,284,420 | | | $ | 0 | | | $ | (485,574 | ) |
Investments in Affiliates
An affiliated investment is an investment in which the Portfolio owns at least 5% of the outstanding voting shares of the issuer or as a result of the Portfolio and the issuer having the same adviser or investment manager. Transactions with issuers that were either affiliates of the Portfolio at the beginning of the period or the end of the period were as follows:
| | | | | | | | | | | | | | | | | | | | | | | | | | | | | | | | | | | | |
| | | Shares,
beginning of
period | | | Shares
purchased | | | Shares
sold | | | Shares,
end of
period | | | Net
realized
gains
(losses) | | | Net
change in
unrealized
gains
(losses) | | | Income
from
affiliated
securities | | | Value,
end
of period | | | % of
net
assets | |
Short-Term Investments | | | | | | | | | | | | | | | | | | | | | | | | | | | | | | | | | | | | |
Investment Companies | | | | | | | | | | | | | | | | | | | | | | | | | | | | | | | | | | | | |
Wells Fargo Government Money Market Fund Select Class | | | 27,179,905 | | | | 230,301,089 | | | | 216,551,237 | | | | 40,929,757 | | | $ | 0 | | | $ | 0 | | | $ | 226,231 | | | $ | 40,929,757 | | | | 4.20 | % |
The accompanying notes are an integral part of these financial statements.
| | | | | | |
| Portfolio of investments—August 31, 2018 (unaudited) | | Wells Fargo Funds | | | 115 | |
FACTOR ENHANCED LARGE CAP PORTFOLIO
| | | | | | | | | | | | | | | | |
| Security name | | | | | | | | Shares | | | Value | |
| | | | |
Common Stocks: 92.02% | | | | | | | | | | | | | | | | |
| | | | |
Consumer Discretionary: 12.65% | | | | | | | | | | | | | | | | |
| | | | |
| Auto Components: 0.15% | | | | | | | | | | | | | | | | |
Adient plc | | | | | | | | | | | 8,967 | | | $ | 388,181 | |
Dana Incorporated | | | | | | | | | | | 13,864 | | | | 271,318 | |
Lear Corporation | | | | | | | | | | | 6,316 | | | | 1,024,455 | |
The Goodyear Tire & Rubber Company | | | | | | | | | | | 22,636 | | | | 513,611 | |
Visteon Corporation † | | | | | | | | | | | 2,950 | | | | 325,651 | |
| | | | |
| | | | | | | | | | | | | | | 2,523,216 | |
| | | | | | | | | | | | | | | | |
| | | | |
| Automobiles: 0.54% | | | | | | | | | | | | | | | | |
Ford Motor Company | | | | | | | | | | | 371,695 | | | | 3,523,669 | |
General Motors Company | | | | | | | | | | | 118,731 | | | | 4,280,253 | |
Harley-Davidson Incorporated | | | | | | | | | | | 15,832 | | | | 674,760 | |
Thor Industries Incorporated | | | | | | | | | | | 4,653 | | | | 444,082 | |
| | | | |
| | | | | | | | | | | | | | | 8,922,764 | |
| | | | | | | | | | | | | | | | |
| | | | |
| Distributors: 0.18% | | | | | | | | | | | | | | | | |
Genuine Parts Company | | | | | | | | | | | 13,560 | | | | 1,353,966 | |
LKQ Corporation † | | | | | | | | | | | 27,607 | | | | 952,994 | |
Pool Corporation | | | | | | | | | | | 3,706 | | | | 608,748 | |
| | | | |
| | | | | | | | | | | | | | | 2,915,708 | |
| | | | | | | | | | | | | | | | |
| | | | |
| Diversified Consumer Services: 0.19% | | | | | | | | | | | | | | | | |
Bright Horizons Family Solutions Incorporated † | | | | | | | | | | | 5,461 | | | | 652,207 | |
Grand Canyon Education Incorporated † | | | | | | | | | | | 4,560 | | | | 543,278 | |
H&R Block Incorporated | | | | | | | | | | | 19,110 | | | | 517,117 | |
Service Corporation International | | | | | | | | | | | 17,484 | | | | 733,629 | |
ServiceMaster Global Holdings Incorporated † | | | | | | | | | | | 12,826 | | | | 773,023 | |
| | | | |
| | | | | | | | | | | | | | | 3,219,254 | |
| | | | | | | | | | | | | | | | |
| | | | |
| Hotels, Restaurants & Leisure: 2.48% | | | | | | | | | | | | | | | | |
Aramark | | | | | | | | | | | 22,950 | | | | 942,786 | |
Carnival Corporation | | | | | | | | | | | 38,691 | | | | 2,379,110 | |
Chipotle Mexican Grill Incorporated † | | | | | | | | | | | 2,303 | | | | 1,094,340 | |
Cracker Barrel Old Country Store Incorporated | | | | | | | | | | | 2,255 | | | | 336,198 | |
Darden Restaurants Incorporated | | | | | | | | | | | 11,603 | | | | 1,346,412 | |
Domino’s Pizza Incorporated | | | | | | | | | | | 4,016 | | | | 1,199,017 | |
Dunkin Brands Group Incorporated | | | | | | | | | | | 7,807 | | | | 569,052 | |
Hilton Grand Vacations Incorporated † | | | | | | | | | | | 9,371 | | | | 306,057 | |
Hilton Worldwide Holdings Incorporated | | | | | | | | | | | 24,739 | | | | 1,920,241 | |
Hyatt Hotels Corporation Class A | | | | | | | | | | | 3,781 | | | | 292,498 | |
Interval Leisure Group Incorporated | | | | | | | | | | | 9,851 | | | | 336,215 | |
Marriott International Incorporated Class A | | | | | | | | | | | 25,638 | | | | 3,242,438 | |
McDonald’s Corporation | | | | | | | | | | | 73,808 | | | | 11,973,872 | |
Norwegian Cruise Line Holdings Limited † | | | | | | | | | | | 19,207 | | | | 1,029,687 | |
Planet Fitness Incorporated Class A † | | | | | | | | | | | 8,290 | | | | 425,857 | |
Six Flags Entertainment Corporation | | | | | | | | | | | 6,609 | | | | 446,438 | |
Starbucks Corporation | | | | | | | | | | | 128,355 | | | | 6,860,575 | |
The accompanying notes are an integral part of these financial statements.
| | | | |
| 116 | | Wells Fargo Funds | | Portfolio of investments—August 31, 2018 (unaudited) |
FACTOR ENHANCED LARGE CAP PORTFOLIO
| | | | | | | | | | | | | | | | |
| Security name | | | | | | | | Shares | | | Value | |
| | | | |
| Hotels, Restaurants & Leisure (continued) | | | | | | | | | | | | | | | | |
Texas Roadhouse Incorporated | | | | | | | | | | | 6,215 | | | $ | 428,524 | |
The Wendy’s Company | | | | | | | | | | | 17,786 | | | | 313,923 | |
Vail Resorts Incorporated | | | | | | | | | | | 3,733 | | | | 1,112,621 | |
Wyndham Worldwide Corporation | | | | | | | | | | | 9,232 | | | | 408,054 | |
Wynn Resorts Limited | | | | | | | | | | | 9,201 | | | | 1,364,876 | |
Yum! Brands Incorporated | | | | | | | | | | | 30,798 | | | | 2,676,038 | |
| | | | |
| | | | | | | | | | | | | | | 41,004,829 | |
| | | | | | | | | | | | | | | | |
| | | | |
| Household Durables: 0.54% | | | | | | | | | | | | | | | | |
D.R. Horton Incorporated | | | | | | | | | | | 32,868 | | | | 1,462,955 | |
Garmin Limited | | | | | | | | | | | 9,360 | | | | 637,790 | |
Leggett & Platt Incorporated | | | | | | | | | | | 12,232 | | | | 555,822 | |
Lennar Corporation Class A | | | | | | | | | | | 26,635 | | | | 1,376,230 | |
Mohawk Industries Incorporated † | | | | | | | | | | | 5,833 | | | | 1,117,544 | |
Newell Rubbermaid Incorporated | | | | | | | | | | | 42,845 | | | | 930,593 | |
NVR Incorporated † | | | | | | | | | | | 321 | | | | 856,572 | |
Pulte Group Incorporated | | | | | | | | | | | 24,494 | | | | 684,607 | |
Toll Brothers Incorporated | | | | | | | | | | | 13,369 | | | | 484,359 | |
Whirlpool Corporation | | | | | | | | | | | 6,707 | | | | 838,241 | |
| | | | |
| | | | | | | | | | | | | | | 8,944,713 | |
| | | | | | | | | | | | | | | | |
| | | | |
| Internet & Direct Marketing Retail: 0.09% | | | | | | | | | | | | | | | | |
Qurate Retail Incorporated † | | | | | | | | | | | 40,832 | | | | 848,897 | |
Wayfair Incorporated Class A † | | | | | | | | | | | 5,015 | | | | 677,878 | |
| | | | |
| | | | | | | | | | | | | | | 1,526,775 | |
| | | | | | | | | | | | | | | | |
| | | | |
| Leisure Products: 0.16% | | | | | | | | | | | | | | | | |
Hasbro Incorporated | | | | | | | | | | | 10,692 | | | | 1,061,823 | |
Mattel Incorporated | | | | | | | | | | | 32,334 | | | | 498,914 | |
Polaris Industries Incorporated | | | | | | | | | | | 5,472 | | | | 593,438 | |
The Brunswick Corporation | | | | | | | | | | | 8,156 | | | | 541,722 | |
| | | | |
| | | | | | | | | | | | | | | 2,695,897 | |
| | | | | | | | | | | | | | | | |
| | | | |
| Media: 3.11% | | | | | | | | | | | | | | | | |
Cable One Incorporated | | | | | | | | | | | 470 | | | | 393,738 | |
CBS Corporation Class B | | | | | | | | | | | 31,230 | | | | 1,655,815 | |
Charter Communications Incorporated Class A † | | | | | | | | | | | 16,157 | | | | 5,015,133 | |
Cinemark Holdings Incorporated | | | | | | | | | | | 10,150 | | | | 378,798 | |
Comcast Corporation Class A | | | | | | | | | | | 434,298 | | | | 16,064,683 | |
Discovery Communications Incorporated Class A † | | | | | | | | | | | 14,367 | | | | 399,834 | |
Discovery Communications Incorporated Class C † | | | | | | | | | | | 32,065 | | | | 822,147 | |
DISH Network Corporation Class A † | | | | | | | | | | | 20,896 | | | | 738,674 | |
Interpublic Group of Companies Incorporated | | | | | | | | | | | 36,046 | | | | 841,674 | |
Live Nation Incorporated † | | | | | | | | | | | 12,932 | | | | 642,462 | |
News Corporation Class A | | | | | | | | | | | 36,071 | | | | 471,448 | |
Nexstar Media Group Incorporated Class A | | | | | | | | | | | 4,234 | | | | 347,188 | |
Omnicom Group Incorporated | | | | | | | | | | | 21,193 | | | | 1,469,099 | |
Sirius XM Holdings Incorporated | | | | | | | | | | | 111,197 | | | | 789,499 | |
The Madison Square Garden Company Class A † | | | | | | | | | | | 1,718 | | | | 518,733 | |
The accompanying notes are an integral part of these financial statements.
| | | | | | |
| Portfolio of investments—August 31, 2018 (unaudited) | | Wells Fargo Funds | | | 117 | |
FACTOR ENHANCED LARGE CAP PORTFOLIO
| | | | | | | | | | | | | | | | |
| Security name | | | | | | | | Shares | | | Value | |
| | | | |
| Media (continued) | | | | | | | | | | | | | | | | |
The Walt Disney Company | | | | | | | | | | | 135,334 | | | $ | 15,160,115 | |
Tribune Media Company Class A | | | | | | | | | | | 7,295 | | | | 269,113 | |
Twenty-First Century Fox Incorporated Class A | | | | | | | | | | | 98,901 | | | | 4,490,105 | |
Viacom Incorporated Class B | | | | | | | | | | | 33,244 | | | | 973,384 | |
| | | | |
| | | | | | | | | | | | | | | 51,441,642 | |
| | | | | | | | | | | | | | | | |
| | | | |
| Multiline Retail: 0.73% | | | | | | | | | | | | | | | | |
Dollar General Corporation | | | | | | | | | | | 25,464 | | | | 2,743,237 | |
Dollar Tree Incorporated † | | | | | | | | | | | 23,548 | | | | 1,895,849 | |
Kohl’s Corporation | | | | | | | | | | | 15,689 | | | | 1,241,157 | |
Macy’s Incorporated | | | | | | | | | | | 28,954 | | | | 1,058,269 | |
Nordstrom Incorporated | | | | | | | | | | | 10,727 | | | | 674,192 | |
Target Corporation | | | | | | | | | | | 50,967 | | | | 4,459,613 | |
| | | | |
| | | | | | | | | | | | | | | 12,072,317 | |
| | | | | | | | | | | | | | | | |
| | | | |
| Specialty Retail: 3.36% | | | | | | | | | | | | | | | | |
Aaron’s Incorporated | | | | | | | | | | | 6,648 | | | | 330,539 | |
Advance Auto Parts Incorporated | | | | | | | | | | | 6,649 | | | | 1,090,635 | |
American Eagle Outfitters Incorporated | | | | | | | | | | | 15,347 | | | | 398,408 | |
AutoNation Incorporated † | | | | | | | | | | | 5,696 | | | | 258,314 | |
AutoZone Incorporated † | | | | | | | | | | | 2,528 | | | | 1,938,673 | |
Best Buy Company Incorporated | | | | | | | | | | | 22,872 | | | | 1,819,696 | |
Burlington Stores Incorporated † | | | | | | | | | | | 6,478 | | | | 1,089,470 | |
CarMax Incorporated † | | | | | | | | | | | 17,484 | | | | 1,364,626 | |
Five Below Incorporated † | | | | | | | | | | | 5,131 | | | | 597,608 | |
Foot Locker Incorporated | | | | | | | | | | | 11,022 | | | | 543,385 | |
L Brands Incorporated | | | | | | | | | | | 22,042 | | | | 582,570 | |
Lowe’s Companies Incorporated | | | | | | | | | | | 74,531 | | | | 8,105,246 | |
O’Reilly Automotive Incorporated † | | | | | | | | | | | 7,694 | | | | 2,580,721 | |
Ross Stores Incorporated | | | | | | | | | | | 34,992 | | | | 3,351,534 | |
The Gap Incorporated | | | | | | | | | | | 26,591 | | | | 807,037 | |
The Home Depot Incorporated | | | | | | | | | | | 109,112 | | | | 21,906,416 | |
The TJX Companies Incorporated | | | | | | | | | | | 54,495 | | | | 5,992,815 | |
Tractor Supply Company | | | | | | | | | | | 11,565 | | | | 1,020,958 | |
ULTA Beauty Incorporated † | | | | | | | | | | | 5,353 | | | | 1,391,780 | |
Williams-Sonoma Incorporated | | | | | | | | | | | 7,199 | | | | 505,586 | |
| | | | |
| | | | | | | | | | | | | | | 55,676,017 | |
| | | | | | | | | | | | | | | | |
| | | | |
| Textiles, Apparel & Luxury Goods: 1.12% | | | | | | | | | | | | | | | | |
Carter’s Incorporated | | | | | | | | | | | 4,367 | | | | 462,596 | |
HanesBrands Incorporated | | | | | | | | | | | 33,578 | | | | 588,958 | |
Michael Kors Holdings Limited † | | | | | | | | | | | 13,791 | | | | 1,001,502 | |
Nike Incorporated Class B | | | | | | | | | | | 119,049 | | | | 9,785,828 | |
PVH Corporation | | | | | | | | | | | 7,684 | | | | 1,100,041 | |
Ralph Lauren Corporation | | | | | | | | | | | 5,223 | | | | 693,667 | |
Skechers U.S.A. Incorporated Class A † | | | | | | | | | | | 12,415 | | | | 365,994 | |
Tapestry Incorporated | | | | | | | | | | | 26,789 | | | | 1,357,934 | |
Under Armour Incorporated Class A † | | | | | | | | | | | 17,313 | | | | 354,051 | |
VF Corporation | | | | | | | | | | | 30,951 | | | | 2,851,516 | |
| | | | |
| | | | | | | | | | | | | | | 18,562,087 | |
| | | | | | | | | | | | | | | | |
The accompanying notes are an integral part of these financial statements.
| | | | |
| 118 | | Wells Fargo Funds | | Portfolio of investments—August 31, 2018 (unaudited) |
FACTOR ENHANCED LARGE CAP PORTFOLIO
| | | | | | | | | | | | | | | | |
| Security name | | | | | | | | Shares | | | Value | |
| | | | |
Consumer Staples: 8.87% | | | | | | | | | | | | | | | | |
| | | | |
| Beverages: 2.37% | | | | | | | | | | | | | | | | |
Brown-Forman Corporation Class B | | | | | | | | | | | 26,432 | | | $ | 1,380,279 | |
Constellation Brands Incorporated Class A | | | | | | | | | | | 15,440 | | | | 3,214,608 | |
Molson Coors Brewing Company Class B | | | | | | | | | | | 18,097 | | | | 1,207,794 | |
Monster Beverage Corporation † | | | | | | | | | | | 39,277 | | | | 2,391,577 | |
PepsiCo Incorporated | | | | | | | | | | | 133,859 | | | | 14,993,547 | |
The Coca-Cola Company | | | | | | | | | | | 362,803 | | | | 16,170,130 | |
| | | | |
| | | | | | | | | | | | | | | 39,357,935 | |
| | | | | | | | | | | | | | | | |
| | | | |
| Food & Staples Retailing: 1.75% | | | | | | | | | | | | | | | | |
Casey’s General Stores Incorporated | | | | | | | | | | | 3,556 | | | | 405,989 | |
Costco Wholesale Corporation | | | | | | | | | | | 40,567 | | | | 9,457,385 | |
Sysco Corporation | | | | | | | | | | | 44,574 | | | | 3,335,027 | |
The Kroger Company | | | | | | | | | | | 79,293 | | | | 2,497,730 | |
US Foods Holding Corporation † | | | | | | | | | | | 20,253 | | | | 660,045 | |
Wal-Mart Stores Incorporated | | | | | | | | | | | 132,448 | | | | 12,696,465 | |
| | | | |
| | | | | | | | | | | | | | | 29,052,641 | |
| | | | | | | | | | | | | | | | |
| | | | |
| Food Products: 1.21% | | | | | | | | | | | | | | | | |
Archer Daniels Midland Company | | | | | | | | | | | 51,083 | | | | 2,574,583 | |
Bunge Limited | | | | | | | | | | | 13,217 | | | | 858,841 | |
Campbell Soup Company | | | | | | | | | | | 19,131 | | | | 754,718 | |
ConAgra Foods Incorporated | | | | | | | | | | | 36,872 | | | | 1,355,046 | |
Flowers Foods Incorporated | | | | | | | | | | | 17,821 | | | | 359,093 | |
General Mills Incorporated | | | | | | | | | | | 55,393 | | | | 2,548,632 | |
Hain Celestial Group Incorporated † | | | | | | | | | | | 8,066 | | | | 230,365 | |
Hormel Foods Corporation | | | | | | | | | | | 25,114 | | | | 983,213 | |
Ingredion Incorporated | | | | | | | | | | | 6,702 | | | | 677,371 | |
Kellogg Company | | | | | | | | | | | 26,097 | | | | 1,873,504 | |
Lamb Weston Holdings Incorporated | | | | | | | | | | | 13,695 | | | | 925,782 | |
McCormick & Company Incorporated | | | | | | | | | | | 11,275 | | | | 1,408,022 | |
Pinnacle Foods Incorporated | | | | | | | | | | | 11,179 | | | | 742,509 | |
Post Holdings Incorporated † | | | | | | | | | | | 5,934 | | | | 577,141 | |
The Hershey Company | | | | | | | | | | | 13,134 | | | | 1,320,230 | |
The J.M. Smucker Company | | | | | | | | | | | 10,288 | | | | 1,063,573 | |
Tyson Foods Incorporated Class A | | | | | | | | | | | 27,582 | | | | 1,732,425 | |
| | | | |
| | | | | | | | | | | | | | | 19,985,048 | |
| | | | | | | | | | | | | | | | |
| | | | |
| Household Products: 1.95% | | | | | | | | | | | | | | | | |
Church & Dwight Company Incorporated | | | | | | | | | | | 23,230 | | | | 1,314,353 | |
Colgate-Palmolive Company | | | | | | | | | | | 81,984 | | | | 5,444,557 | |
Energizer Holdings Incorporated | | | | | | | | | | | 5,507 | | | | 350,190 | |
Kimberly-Clark Corporation | | | | | | | | | | | 32,764 | | | | 3,785,553 | |
The Clorox Company | | | | | | | | | | | 12,153 | | | | 1,761,942 | |
The Procter & Gamble Company | | | | | | | | | | | 236,509 | | | | 19,618,422 | |
| | | | |
| | | | | | | | | | | | | | | 32,275,017 | |
| | | | | | | | | | | | | | | | |
The accompanying notes are an integral part of these financial statements.
| | | | | | |
| Portfolio of investments—August 31, 2018 (unaudited) | | Wells Fargo Funds | | | 119 | |
FACTOR ENHANCED LARGE CAP PORTFOLIO
| | | | | | | | | | | | | | | | |
| Security name | | | | | | | | Shares | | | Value | |
| | | | |
| Personal Products: 0.27% | | | | | | | | | | | | | | | | |
Coty Incorporated Class A | | | | | | | | | | | 40,978 | | | $ | 506,488 | |
Herbalife Limited Herbalife Ltd † | | | | | | | | | | | 10,371 | | | | 586,895 | |
NU Skin Enterprises Incorporated Class A | | | | | | | | | | | 5,132 | | | | 408,507 | |
The Estee Lauder Companies Incorporated Class A | | | | | | | | | | | 20,860 | | | | 2,922,903 | |
| | | | |
| | | | | | | | | | | | | | | 4,424,793 | |
| | | | | | | | | | | | | | | | |
| | | | |
| Tobacco: 1.32% | | | | | | | | | | | | | | | | |
Altria Group Incorporated | | | | | | | | | | | 177,235 | | | | 10,371,792 | |
Philip Morris International Incorporated | | | | | | | | | | | 147,029 | | | | 11,452,089 | |
| | | | |
| | | | | | | | | | | | | | | 21,823,881 | |
| | | | | | | | | | | | | | | | |
| | | | |
Energy: 4.97% | | | | | | | | | | | | | | | | |
| | | | |
| Energy Equipment & Services: 0.45% | | | | | | | | | | | | | | | | |
Apergy Corporation † | | | | | | | | | | | 7,322 | | | | 331,101 | |
Baker Hughes Incorporated | | | | | | | | | | | 39,602 | | | | 1,305,678 | |
Halliburton Company | | | | | | | | | | | 76,729 | | | | 3,060,720 | |
Helmerich & Payne Incorporated | | | | | | | | | | | 9,926 | | | | 650,848 | |
National Oilwell Varco Incorporated | | | | | | | | | | | 35,281 | | | | 1,660,677 | |
Patterson-UTI Energy Incorporated | | | | | | | | | | | 20,739 | | | | 355,259 | |
| | | | |
| | | | | | | | | | | | | | | 7,364,283 | |
| | | | | | | | | | | | | | | | |
| | | | |
| Oil, Gas & Consumable Fuels: 4.52% | | | | | | | | | | | | | | | | |
Andeavor Corporation | | | | | | | | | | | 13,485 | | | | 2,060,373 | |
Antero Resources Corporation † | | | | | | | | | | | 21,783 | | | | 403,203 | |
Centennial Resource Development Class A † | | | | | | | | | | | 17,141 | | | | 330,307 | |
Chevron Corporation | | | | | | | | | | | 179,695 | | | | 21,286,670 | |
Delek US Holdings Incorporated | | | | | | | | | | | 7,278 | | | | 396,651 | |
Exxon Mobil Corporation | | | | | | | | | | | 398,292 | | | | 31,931,070 | |
HollyFrontier Corporation | | | | | | | | | | | 16,545 | | | | 1,232,933 | |
Marathon Petroleum Corporation | | | | | | | | | | | 44,508 | | | | 3,662,563 | |
ONEOK Incorporated | | | | | | | | | | | 38,491 | | | | 2,536,942 | |
PBF Energy Incorporated Class A | | | | | | | | | | | 9,846 | | | | 511,204 | |
Peabody Energy Corporation | | | | | | | | | | | 8,608 | | | | 355,596 | |
Phillips 66 Company | | | | | | | | | | | 39,602 | | | | 4,693,233 | |
Plains GP Holdings LP Class A | | | | | | | | | | | 13,627 | | | | 351,304 | |
Range Resources Corporation | | | | | | | | | | | 22,798 | | | | 374,343 | |
Valero Energy Corporation | | | | | | | | | | | 40,490 | | | | 4,772,961 | |
| | | | |
| | | | | | | | | | | | | | | 74,899,353 | |
| | | | | | | | | | | | | | | | |
| | | | |
Financials: 9.78% | | | | | | | | | | | | | | | | |
| | | | |
| Banks: 2.32% | | | | | | | | | | | | | | | | |
Associated Banc Corporation | | | | | | | | | | | 15,814 | | | | 430,932 | |
Bank of Hawaii Corporation | | | | | | | | | | | 4,038 | | | | 335,679 | |
BankUnited Incorporated | | | | | | | | | | | 10,072 | | | | 390,693 | |
BB&T Corporation | | | | | | | | | | | 72,547 | | | | 3,747,778 | |
Chemical Financial Corporation | | | | | | | | | | | 6,671 | | | | 381,048 | |
CIT Group Incorporated | | | | | | | | | | | 11,441 | | | | 620,560 | |
Citizens Financial Group Incorporated | | | | | | | | | | | 45,769 | | | | 1,883,852 | |
The accompanying notes are an integral part of these financial statements.
| | | | |
| 120 | | Wells Fargo Funds | | Portfolio of investments—August 31, 2018 (unaudited) |
FACTOR ENHANCED LARGE CAP PORTFOLIO
| | | | | | | | | | | | | | | | |
| Security name | | | | | | | | Shares | | | Value | |
| | | | |
| Banks (continued) | | | | | | | | | | | | | | | | |
Commerce Bancshares Incorporated | | | | | | | | | | | 8,922 | | | $ | 633,997 | |
Fifth Third Bancorp | | | | | | | | | | | 64,521 | | | | 1,898,853 | |
First Horizon National Corporation | | | | | | | | | | | 30,538 | | | | 562,510 | |
FNB Corporation | | | | | | | | | | | 30,458 | | | | 409,660 | |
Fulton Financial Corporation | | | | | | | | | | | 16,313 | | | | 296,897 | |
Hancock Holding Company | | | | | | | | | | | 8,151 | | | | 420,184 | |
Home Bancshares Incorporated | | | | | | | | | | | 14,841 | | | | 347,428 | |
Huntington Bancshares Incorporated | | | | | | | | | | | 99,913 | | | | 1,619,590 | |
IBERIABANK Corporation | | | | | | | | | | | 5,027 | | | | 435,590 | |
Investors Bancorp Incorporated | | | | | | | | | | | 23,804 | | | | 304,691 | |
M&T Bank Corporation | | | | | | | | | | | 12,580 | | | | 2,228,547 | |
MB Financial Incorporated | | | | | | | | | | | 7,710 | | | | 373,627 | |
People’s United Financial Incorporated | | | | | | | | | | | 33,253 | | | | 615,513 | |
PNC Financial Services Group Incorporated | | | | | | | | | | | 41,501 | | | | 5,957,054 | |
SunTrust Banks Incorporated | | | | | | | | | | | 44,135 | | | | 3,246,571 | |
Synovus Financial Corporation | | | | | | | | | | | 10,575 | | | | 529,385 | |
TCF Financial Corporation | | | | | | | | | | | 14,926 | | | | 378,374 | |
UMB Financial Corporation | | | | | | | | | | | 4,328 | | | | 325,639 | |
Umpqua Holdings Corporation | | | | | | | | | | | 20,672 | | | | 442,381 | |
United Bankshares Incorporated | | | | | | | | | | | 9,662 | | | | 380,683 | |
US Bancorp | | | | | | | | | | | 144,714 | | | | 7,830,475 | |
Valley National Bancorp | | | | | | | | | | | 29,947 | | | | 360,861 | |
Webster Financial Corporation | | | | | | | | | | | 8,574 | | | | 560,568 | |
Wintrust Financial Corporation | | | | | | | | | | | 5,327 | | | | 471,706 | |
| | | | |
| | | | | | | | | | | | | | | 38,421,326 | |
| | | | | | | | | | | | | | | | |
| | | | |
| Capital Markets: 1.81% | | | | | | | | | | | | | | | | |
BGC Partners Incorporated Class A | | | | | | | | | | | 22,847 | | | | 283,760 | |
CBOE Holdings Incorporated | | | | | | | | | | | 10,538 | | | | 1,062,230 | |
CME Group Incorporated | | | | | | | | | | | 31,783 | | | | 5,553,444 | |
Eaton Vance Corporation | | | | | | | | | | | 10,893 | | | | 574,388 | |
FactSet Research Systems Incorporated | | | | | | | | | | | 3,610 | | | | 828,098 | |
Interactive Brokers Group Incorporated Class A | | | | | | | | | | | 6,552 | | | | 407,272 | |
Intercontinental Exchange Incorporated | | | | | | | | | | | 54,154 | | | | 4,128,159 | |
Lazard Limited Class A | | | | | | | | | | | 11,971 | | | | 576,284 | |
Legg Mason Incorporated | | | | | | | | | | | 8,032 | | | | 250,598 | |
LPL Financial Holdings Incorporated | | | | | | | | | | | 8,308 | | | | 550,322 | |
MarketAxess Holdings Incorporated | | | | | | | | | | | 3,436 | | | | 652,222 | |
Moody’s Corporation | | | | | | | | | | | 15,548 | | | | 2,767,855 | |
MSCI Incorporated | | | | | | | | | | | 8,257 | | | | 1,488,407 | |
Raymond James Financial Incorporated | | | | | | | | | | | 12,413 | | | | 1,154,906 | |
S&P Global Incorporated | | | | | | | | | | | 23,426 | | | | 4,850,353 | |
SEI Investments Company | | | | | | | | | | | 13,556 | | | | 855,112 | |
Stifel Financial Corporation | | | | | | | | | | | 6,581 | | | | 367,680 | |
T. Rowe Price Group Incorporated | | | | | | | | | | | 22,489 | | | | 2,606,250 | |
The NASDAQ OMX Group Incorporated | | | | | | | | | | | 10,941 | | | | 1,044,209 | |
| | | | |
| | | | | | | | | | | | | | | 30,001,549 | |
| | | | | | | | | | | | | | | | |
The accompanying notes are an integral part of these financial statements.
| | | | | | |
| Portfolio of investments—August 31, 2018 (unaudited) | | Wells Fargo Funds | | | 121 | |
FACTOR ENHANCED LARGE CAP PORTFOLIO
| | | | | | | | | | | | | | | | |
| Security name | | | | | | | | Shares | | | Value | |
| | | | |
| Consumer Finance: 0.89% | | | | | | | | | | | | | | | | |
Ally Financial Incorporated | | | | | | | | | | | 40,886 | | | $ | 1,099,016 | |
American Express Company | | | | | | | | | | | 66,321 | | | | 7,028,700 | |
Credit Acceptance Corporation † | | | | | | | | | | | 1,267 | | | | 578,652 | |
Discover Financial Services | | | | | | | | | | | 33,052 | | | | 2,582,022 | |
First Cash Financial Services Incorporated | | | | | | | | | | | 4,291 | | | | 348,858 | |
Navient Corporation | | | | | | | | | | | 24,444 | | | | 333,416 | |
SLM Corporation † | | | | | | | | | | | 40,518 | | | | 474,871 | |
Synchrony Financial | | | | | | | | | | | 69,382 | | | | 2,197,328 | |
| | | | |
| | | | | | | | | | | | | | | 14,642,863 | |
| | | | | | | | | | | | | | | | |
| | | | |
| Diversified Financial Services: 1.52% | | | | | | | | | | | | | | | | |
Berkshire Hathaway Incorporated Class B † | | | | | | | | | | | 120,923 | | | | 25,239,049 | |
| | | | | | | | | | | | | | | | |
| | | | |
| Insurance: 2.93% | | | | | | | | | | | | | | | | |
AFLAC Incorporated | | | | | | | | | | | 72,921 | | | | 3,371,867 | |
Alleghany Corporation | | | | | | | | | | | 1,403 | | | | 886,387 | |
American Financial Group Incorporated | | | | | | | | | | | 6,272 | | | | 698,450 | |
Aon plc | | | | | | | | | | | 22,926 | | | | 3,337,109 | |
Arch Capital Group Limited † | | | | | | | | | | | 37,570 | | | | 1,148,515 | |
Arthur J. Gallagher & Company | | | | | | | | | | | 17,011 | | | | 1,227,174 | |
Assurant Incorporated | | | | | | | | | | | 4,964 | | | | 510,398 | |
Assured Guaranty Limited | | | | | | | | | | | 10,666 | | | | 434,533 | |
Athene Holding Limited Class A † | | | | | | | | | | | 14,752 | | | | 732,584 | |
Axis Capital Holdings Limited | | | | | | | | | | | 7,655 | | | | 440,316 | |
Brown & Brown Incorporated | | | | | | | | | | | 21,810 | | | | 664,769 | |
Chubb Limited | | | | | | | | | | | 40,704 | | | | 5,504,809 | |
Cincinnati Financial Corporation | | | | | | | | | | | 14,605 | | | | 1,119,765 | |
CNO Financial Group Incorporated | | | | | | | | | | | 15,783 | | | | 341,071 | |
Erie Indemnity Company Class A | | | | | | | | | | | 2,336 | | | | 288,566 | |
Everest Reinsurance Group Limited | | | | | | | | | | | 4,788 | | | | 1,067,820 | |
First American Financial Corporation | | | | | | | | | | | 10,131 | | | | 576,049 | |
Loews Corporation | | | | | | | | | | | 26,789 | | | | 1,347,755 | |
Markel Corporation † | | | | | | | | | | | 1,284 | | | | 1,552,099 | |
Marsh & McLennan Companies Incorporated | | | | | | | | | | | 47,701 | | | | 4,036,936 | |
Old Republic International Corporation | | | | | | | | | | | 27,204 | | | | 603,385 | |
Primerica Incorporated | | | | | | | | | | | 4,149 | | | | 507,215 | |
Reinsurance Group of America Incorporated | | | | | | | | | | | 6,077 | | | | 868,099 | |
Selective Insurance Group Incorporated | | | | | | | | | | | 5,459 | | | | 350,468 | |
The Allstate Corporation | | | | | | | | | | | 32,533 | | | | 3,271,844 | |
The Hanover Insurance Group Incorporated | | | | | | | | | | | 4,173 | | | | 511,151 | |
The Hartford Financial Services Group Incorporated | | | | | | | | | | | 33,848 | | | | 1,704,924 | |
The Progressive Corporation | | | | | | | | | | | 54,520 | | | | 3,681,736 | |
The Travelers Companies Incorporated | | | | | | | | | | | 25,388 | | | | 3,341,061 | |
Torchmark Corporation | | | | | | | | | | | 9,962 | | | | 875,859 | |
Unum Group | | | | | | | | | | | 20,456 | | | | 754,417 | |
W.R. Berkley Corporation | | | | | | | | | | | 8,960 | | | | 701,210 | |
White Mountain Insurance Group Limited | | | | | | | | | | | 215 | | | | 199,509 | |
Willis Towers Watson plc | | | | | | | | | | | 12,475 | | | | 1,837,193 | |
| | | | |
| | | | | | | | | | | | | | | 48,495,043 | |
| | | | | | | | | | | | | | | | |
The accompanying notes are an integral part of these financial statements.
| | | | |
| 122 | | Wells Fargo Funds | | Portfolio of investments—August 31, 2018 (unaudited) |
FACTOR ENHANCED LARGE CAP PORTFOLIO
| | | | | | | | | | | | | | | | |
| Security name | | | | | | | | Shares | | | Value | |
| | | | |
| Mortgage REITs: 0.21% | | | | | | | | | | | | | | | | |
AGNC Investment Corporation | | | | | | | | | | | 34,861 | | | $ | 663,056 | |
Annaly Capital Management Incorporated | | | | | | | | | | | 112,483 | | | | 1,194,569 | |
Chimera Investment Corporation | | | | | | | | | | | 18,233 | | | | 339,681 | |
MFA Financial Incorporated | | | | | | | | | | | 33,438 | | | | 256,135 | |
New Residential Investment Corporation | | | | | | | | | | | 31,992 | | | | 594,091 | |
Starwood Property Trust Incorporated | | | | | | | | | | | 18,982 | | | | 418,173 | |
| | | | |
| | | | | | | | | | | | | | | 3,465,705 | |
| | | | | | | | | | | | | | | | |
| | | | |
| Thrifts & Mortgage Finance: 0.10% | | | | | | | | | | | | | | | | |
Essent Group Limited † | | | | | | | | | | | 8,597 | | | | 372,766 | |
MGIC Investment Corporation † | | | | | | | | | | | 34,154 | | | | 434,439 | |
New York Community Bancorp Incorporated | | | | | | | | | | | 44,456 | | | | 478,791 | |
Radian Group Incorporated | | | | | | | | | | | 20,146 | | | | 409,568 | |
| | | | |
| | | | | | | | | | | | | | | 1,695,564 | |
| | | | | | | | | | | | | | | | |
| | | | |
Health Care: 17.93% | | | | | | | | | | | | | | | | |
| | | | |
| Biotechnology: 1.44% | | | | | | | | | | | | | | | | |
AbbVie Incorporated | | | | | | | | | | | 147,073 | | | | 14,116,067 | |
Gilead Sciences Incorporated | | | | | | | | | | | 121,761 | | | | 9,220,961 | |
United Therapeutics Corporation † | | | | | | | | | | | 4,016 | | | | 493,928 | |
| | | | |
| | | | | | | | | | | | | | | 23,830,956 | |
| | | | | | | | | | | | | | | | |
| | | | |
| Health Care Equipment & Supplies: 4.70% | | | | | | | | | | | | | | | | |
Abbott Laboratories | | | | | | | | | | | 162,763 | | | | 10,879,079 | |
ABIOMED Incorporated † | | | | | | | | | | | 3,862 | | | | 1,570,212 | |
Baxter International Incorporated | | | | | | | | | | | 47,373 | | | | 3,523,130 | |
Becton Dickinson & Company | | | | | | | | | | | 24,802 | | | | 6,494,900 | |
Boston Scientific Corporation † | | | | | | | | | | | 129,150 | | | | 4,592,574 | |
Cantel Medical Corporation | | | | | | | | | | | 3,400 | | | | 329,800 | |
Danaher Corporation | | | | | | | | | | | 58,260 | | | | 6,032,240 | |
Dentsply Sirona Incorporated | | | | | | | | | | | 21,180 | | | | 845,506 | |
DexCom Incorporated † | | | | | | | | | | | 7,873 | | | | 1,136,704 | |
Edwards Lifesciences Corporation † | | | | | | | | | | | 19,549 | | | | 2,819,748 | |
Globus Medical Incorporated Class A † | | | | | | | | | | | 6,754 | | | | 359,786 | |
Haemonetics Corporation † | | | | | | | | | | | 5,017 | | | | 560,098 | |
Hill-Rom Holdings Incorporated | | | | | | | | | | | 6,203 | | | | 603,366 | |
Hologic Incorporated † | | | | | | | | | | | 25,662 | | | | 1,020,321 | |
ICU Medical Incorporated † | | | | | | | | | | | 1,475 | | | | 451,350 | |
IDEXX Laboratories Incorporated † | | | | | | | | | | | 8,066 | | | | 2,049,087 | |
Insulet Corporation † | | | | | | | | | | | 5,418 | | | | 564,935 | |
Integra LifeSciences Holdings Corporation † | | | | | | | | | | | 6,020 | | | | 358,009 | |
Intuitive Surgical Incorporated † | | | | | | | | | | | 10,504 | | | | 5,882,240 | |
LivaNova plc † | | | | | | | | | | | 4,576 | | | | 574,517 | |
Masimo Corporation † | | | | | | | | | | | 4,511 | | | | 531,802 | |
Medtronic plc | | | | | | | | | | | 126,491 | | | | 12,194,997 | |
Neogen Corporation † | | | | | | | | | | | 4,693 | | | | 438,514 | |
Penumbra Incorporated † | | | | | | | | | | | 2,896 | | | | 402,110 | |
ResMed Incorporated | | | | | | | | | | | 13,273 | | | | 1,478,745 | |
Steris plc | | | | | | | | | | | 7,990 | | | | 914,216 | |
The accompanying notes are an integral part of these financial statements.
| | | | | | |
| Portfolio of investments—August 31, 2018 (unaudited) | | Wells Fargo Funds | | | 123 | |
FACTOR ENHANCED LARGE CAP PORTFOLIO
| | | | | | | | | | | | | | | | |
| Security name | | | | | | | | Shares | | | Value | |
| | | | |
| Health Care Equipment & Supplies (continued) | | | | | | | | | | | | | | | | |
Stryker Corporation | | | | | | | | | | | 28,898 | | | $ | 4,896,188 | |
Teleflex Incorporated | | | | | | | | | | | 4,267 | | | | 1,055,784 | |
The Cooper Companies Incorporated | | | | | | | | | | | 4,605 | | | | 1,177,867 | |
Varian Medical Systems Incorporated † | | | | | | | | | | | 8,596 | | | | 962,924 | |
West Pharmaceutical Services Incorporated | | | | | | | | | | | 6,930 | | | | 811,157 | |
Zimmer Biomet Holdings Incorporated | | | | | | | | | | | 19,083 | | | | 2,359,231 | |
| | | | |
| | | | | | | | | | | | | | | 77,871,137 | |
| | | | | | | | | | | | | | | | |
| | | | |
| Health Care Providers & Services: 4.37% | | | | | | | | | | | | | | | | |
Aetna Incorporated | | | | | | | | | | | 30,723 | | | | 6,152,895 | |
AmerisourceBergen Corporation | | | | | | | | | | | 15,175 | | | | 1,365,295 | |
Anthem Incorporated | | | | | | | | | | | 24,053 | | | | 6,367,551 | |
Cardinal Health Incorporated | | | | | | | | | | | 29,234 | | | | 1,525,722 | |
Centene Corporation † | | | | | | | | | | | 15,923 | | | | 2,332,401 | |
Chemed Corporation | | | | | | | | | | | 1,480 | | | | 478,839 | |
CVS Health Corporation | | | | | | | | | | | 95,225 | | | | 7,164,729 | |
DaVita HealthCare Partners Incorporated † | | | | | | | | | | | 14,220 | | | | 985,304 | |
Encompass Health Corporation | | | | | | | | | | | 8,809 | | | | 718,726 | |
Express Scripts Holding Company † | | | | | | | | | | | 52,493 | | | | 4,620,434 | |
HCA Holdings Incorporated | | | | | | | | | | | 26,124 | | | | 3,503,490 | |
Henry Schein Incorporated † | | | | | | | | | | | 14,869 | | | | 1,155,024 | |
Humana Incorporated | | | | | | | | | | | 13,008 | | | | 4,335,046 | |
Laboratory Corporation of America Holdings † | | | | | | | | | | | 9,586 | | | | 1,657,132 | |
McKesson Corporation | | | | | | | | | | | 19,300 | | | | 2,484,875 | |
MEDNAX Incorporated † | | | | | | | | | | | 8,762 | | | | 414,881 | |
Molina Healthcare Incorporated † | | | | | | | | | | | 5,312 | | | | 733,056 | |
UnitedHealth Group Incorporated | | | | | | | | | | | 89,288 | | | | 23,970,256 | |
Universal Health Services Incorporated Class B | | | | | | | | | | | 8,061 | | | | 1,049,220 | |
WellCare Health Plans Incorporated † | | | | | | | | | | | 4,175 | | | | 1,263,230 | |
| | | | |
| | | | | | | | | | | | | | | 72,278,106 | |
| | | | | | | | | | | | | | | | |
| | | | |
| Health Care Technology: 0.15% | | | | | | | | | | | | | | | | |
athenahealth Incorporated † | | | | | | | | | | | 3,662 | | | | 563,582 | |
Cerner Corporation † | | | | | | | | | | | 29,824 | | | | 1,941,841 | |
| | | | |
| | | | | | | | | | | | | | | 2,505,423 | |
| | | | | | | | | | | | | | | | |
| | | | |
| Life Sciences Tools & Services: 1.20% | | | | | | | | | | | | | | | | |
Agilent Technologies Incorporated | | | | | | | | | | | 30,282 | | | | 2,045,246 | |
Bio-Rad Laboratories Incorporated Class A † | | | | | | | | | | | 2,002 | | | | 651,251 | |
Bio-Techne Corporation | | | | | | | | | | | 2,903 | | | | 557,870 | |
Charles River Laboratories International Incorporated † | | | | | | | | | | | 3,653 | | | | 451,182 | |
ICON plc ADR † | | | | | | | | | | | 5,085 | | | | 757,767 | |
IQVIA Holdings Incorporated † | | | | | | | | | | | 14,768 | | | | 1,876,865 | |
Mettler-Toledo International Incorporated † | | | | | | | | | | | 2,375 | | | | 1,388,093 | |
PerkinElmer Incorporated | | | | | | | | | | | 9,769 | | | | 902,949 | |
PRA Health Sciences Incorporated † | | | | | | | | | | | 4,433 | | | | 468,125 | |
Syneos Health Incorporated † | | | | | | | | | | | 7,477 | | | | 372,728 | |
Thermo Fisher Scientific Incorporated | | | | | | | | | | | 37,702 | | | | 9,014,548 | |
Waters Corporation † | | | | | | | | | | | 7,109 | | | | 1,347,013 | |
| | | | |
| | | | | | | | | | | | | | | 19,833,637 | |
| | | | | | | | | | | | | | | | |
The accompanying notes are an integral part of these financial statements.
| | | | |
| 124 | | Wells Fargo Funds | | Portfolio of investments—August 31, 2018 (unaudited) |
FACTOR ENHANCED LARGE CAP PORTFOLIO
| | | | | | | | | | | | | | | | |
| Security name | | | | | | | | Shares | | | Value | |
| | | | |
| Pharmaceuticals: 6.07% | | | | | | | | | | | | | | | | |
Bristol-Myers Squibb Company | | | | | | | | | | | 153,885 | | | $ | 9,317,737 | |
Catalent Incorporated † | | | | | | | | | | | 12,701 | | | | 530,902 | |
Eli Lilly & Company | | | | | | | | | | | 90,752 | | | | 9,587,949 | |
Johnson & Johnson | | | | | | | | | | | 251,411 | | | | 33,862,548 | |
Merck & Company Incorporated | | | | | | | | | | | 253,208 | | | | 17,367,537 | |
Mylan NV † | | | | | | | | | | | 45,556 | | | | 1,782,578 | |
Perrigo Company plc | | | | | | | | | | | 11,846 | | | | 906,337 | |
Pfizer Incorporated | | | | | | | | | | | 556,498 | | | | 23,105,797 | |
Zoetis Incorporated | | | | | | | | | | | 45,432 | | | | 4,116,139 | |
| | | | |
| | | | | | | | | | | | | | | 100,577,524 | |
| | | | | | | | | | | | | | | | |
| | | | |
Industrials: 11.86% | | | | | | | | | | | | | | | | |
| | | | |
| Aerospace & Defense: 3.18% | | | | | | | | | | | | | | | | |
BWX Technologies Incorporated | | | | | | | | | | | 9,436 | | | | 578,616 | |
Curtiss-Wright Corporation | | | | | | | | | | | 3,819 | | | | 511,555 | |
General Dynamics Corporation | | | | | | | | | | | 24,283 | | | | 4,696,332 | |
Harris Corporation | | | | | | | | | | | 11,141 | | | | 1,810,524 | |
Hexcel Corporation | | | | | | | | | | | 8,417 | | | | 556,532 | |
Huntington Ingalls Industries Incorporated | | | | | | | | | | | 4,161 | | | | 1,017,240 | |
KLX Incorporated † | | | | | | | | | | | 4,720 | | | | 348,525 | |
L-3 Technologies Incorporated | | | | | | | | | | | 7,239 | | | | 1,547,119 | |
Lockheed Martin Corporation | | | | | | | | | | | 22,391 | | | | 7,174,300 | |
Northrop Grumman Corporation | | | | | | | | | | | 16,134 | | | | 4,815,838 | |
Raytheon Company | | | | | | | | | | | 26,909 | | | | 5,366,731 | |
Rockwell Collins Incorporated | | | | | | | | | | | 15,514 | | | | 2,109,128 | |
Spirit AeroSystems Holdings Incorporated Class A | | | | | | | | | | | 10,716 | | | | 916,218 | |
Teledyne Technologies Incorporated † | | | | | | | | | | | 3,148 | | | | 746,894 | |
Textron Incorporated | | | | | | | | | | | 22,220 | | | | 1,533,847 | |
The Boeing Company | | | | | | | | | | | 55,251 | | | | 18,939,490 | |
| | | | |
| | | | | | | | | | | | | | | 52,668,889 | |
| | | | | | | | | | | | | | | | |
| | | | |
| Air Freight & Logistics: 0.97% | | | | | | | | | | | | | | | | |
C.H. Robinson Worldwide Incorporated | | | | | | | | | | | 13,072 | | | | 1,255,958 | |
Expeditors International of Washington Incorporated | | | | | | | | | | | 16,457 | | | | 1,205,969 | |
FedEx Corporation | | | | | | | | | | | 23,198 | | | | 5,659,152 | |
United Parcel Service Incorporated Class B | | | | | | | | | | | 64,528 | | | | 7,929,201 | |
| | | | |
| | | | | | | | | | | | | | | 16,050,280 | |
| | | | | | | | | | | | | | | | |
| | | | |
| Airlines: 0.27% | | | | | | | | | | | | | | | | |
Alaska Air Group Incorporated | | | | | | | | | | | 11,449 | | | | 772,693 | |
JetBlue Airways Corporation † | | | | | | | | | | | 29,991 | | | | 572,228 | |
Southwest Airlines Company | | | | | | | | | | | 50,025 | | | | 3,066,533 | |
| | | | |
| | | | | | | | | | | | | | | 4,411,454 | |
| | | | | | | | | | | | | | | | |
| | | | |
| Building Products: 0.54% | | | | | | | | | | | | | | | | |
A.O. Smith Corporation | | | | | | | | | | | 13,658 | | | | 793,257 | |
Allegion plc | | | | | | | | | | | 8,908 | | | | 776,956 | |
Fortune Brands Home & Security Incorporated | | | | | | | | | | | 13,893 | | | | 736,051 | |
The accompanying notes are an integral part of these financial statements.
| | | | | | |
| Portfolio of investments—August 31, 2018 (unaudited) | | Wells Fargo Funds | | | 125 | |
FACTOR ENHANCED LARGE CAP PORTFOLIO
| | | | | | | | | | | | | | | | |
| Security name | | | | | | | | Shares | | | Value | |
| | | | |
| Building Products (continued) | | | | | | | | | | | | | | | | |
Johnson Controls International plc | | | | | | | | | | | 87,651 | | | $ | 3,310,578 | |
Lennox International Incorporated | | | | | | | | | | | 3,712 | | | | 827,071 | |
Masco Corporation | | | | | | | | | | | 29,258 | | | | 1,110,926 | |
Owens Corning Incorporated | | | | | | | | | | | 10,380 | | | | 587,716 | |
Trex Company Incorporated † | | | | | | | | | | | 5,465 | | | | 462,886 | |
USG Corporation | | | | | | | | | | | 7,682 | | | | 331,094 | |
| | | | |
| | | | | | | | | | | | | | | 8,936,535 | |
| | | | | | | | | | | | | | | | |
| | | | |
| Commercial Services & Supplies: 0.64% | | | | | | | | | | | | | | | | |
Cintas Corporation | | | | | | | | | | | 8,192 | | | | 1,747,927 | |
Copart Incorporated † | | | | | | | | | | | 18,969 | | | | 1,219,896 | |
Deluxe Corporation | | | | | | | | | | | 4,475 | | | | 265,010 | |
KAR Auction Services Incorporated | | | | | | | | | | | 12,652 | | | | 793,154 | |
Republic Services Incorporated | | | | | | | | | | | 20,730 | | | | 1,520,753 | |
Rollins Incorporated | | | | | | | | | | | 9,020 | | | | 541,922 | |
Stericycle Incorporated † | | | | | | | | | | | 8,030 | | | | 495,371 | |
The Brink’s Company | | | | | | | | | | | 4,578 | | | | 343,808 | |
Waste Management Incorporated | | | | | | | | | | | 40,460 | | | | 3,677,814 | |
| | | | |
| | | | | | | | | | | | | | | 10,605,655 | |
| | | | | | | | | | | | | | | | |
| | | | |
| Construction & Engineering: 0.21% | | | | | | | | | | | | | | | | |
AECOM Technology Corporation † | | | | | | | | | | | 14,893 | | | | 501,001 | |
EMCOR Group Incorporated | | | | | | | | | | | 5,382 | | | | 431,098 | |
Fluor Corporation | | | | | | | | | | | 13,174 | | | | 756,319 | |
Jacobs Engineering Group Incorporated | | | | | | | | | | | 13,257 | | | | 963,651 | |
Quanta Services Incorporated † | | | | | | | | | | | 14,073 | | | | 486,785 | |
Valmont Industries Incorporated | | | | | | | | | | | 2,099 | | | | 294,700 | |
| | | | |
| | | | | | | | | | | | | | | 3,433,554 | |
| | | | | | | | | | | | | | | | |
| | | | |
| Electrical Equipment: 0.75% | | | | | | | | | | | | | | | | |
Acuity Brands Incorporated | | | | | | | | | | | 3,801 | | | | 580,945 | |
AMETEK Incorporated | | | | | | | | | | | 21,536 | | | | 1,657,411 | |
Eaton Corporation plc | | | | | | | | | | | 41,270 | | | | 3,431,188 | |
Emerson Electric Company | | | | | | | | | | | 59,325 | | | | 4,552,007 | |
EnerSys | | | | | | | | | | | 3,933 | | | | 326,400 | |
Hubbell Incorporated | | | | | | | | | | | 5,168 | | | | 653,028 | |
Regal-Beloit Corporation | | | | | | | | | | | 4,222 | | | | 353,381 | |
Sensata Technologies Holding plc † | | | | | | | | | | | 16,042 | | | | 849,424 | |
| | | | |
| | | | | | | | | | | | | | | 12,403,784 | |
| | | | | | | | | | | | | | | | |
| | | | |
| Industrial Conglomerates: 1.60% | | | | | | | | | | | | | | | | |
3M Company | | | | | | | | | | | 55,614 | | | | 11,730,105 | |
Carlisle Companies Incorporated | | | | | | | | | | | 5,684 | | | | 720,788 | |
Honeywell International Incorporated | | | | | | | | | | | 70,111 | | | | 11,151,856 | |
Roper Industries Incorporated | | | | | | | | | | | 9,489 | | | | 2,831,233 | |
| | | | |
| | | | | | | | | | | | | | | 26,433,982 | |
| | | | | | | | | | | | | | | | |
The accompanying notes are an integral part of these financial statements.
| | | | |
| 126 | | Wells Fargo Funds | | Portfolio of investments—August 31, 2018 (unaudited) |
FACTOR ENHANCED LARGE CAP PORTFOLIO
| | | | | | | | | | | | | | | | |
| Security name | | | | | | | | Shares | | | Value | |
| | | | |
| Machinery: 2.23% | | | | | | | | | | | | | | | | |
AGCO Corporation | | | | | | | | | | | 6,339 | | | $ | 378,185 | |
Allison Transmission Holdings Incorporated | | | | | | | | | | | 12,609 | | | | 626,163 | |
Barnes Group Incorporated | | | | | | | | | | | 4,741 | | | | 322,672 | |
Crane Company | | | | | | | | | | | 4,884 | | | | 445,812 | |
Cummins Incorporated | | | | | | | | | | | 15,157 | | | | 2,149,263 | |
Deere & Company | | | | | | | | | | | 30,422 | | | | 4,374,684 | |
Donaldson Company Incorporated | | | | | | | | | | | 12,192 | | | | 616,915 | |
Dover Corporation | | | | | | | | | | | 14,517 | | | | 1,246,575 | |
Flowserve Corporation | | | | | | | | | | | 12,364 | | | | 644,412 | |
Fortive Corporation | | | | | | | | | | | 28,553 | | | | 2,397,881 | |
Graco Incorporated Graco Inc | | | | | | | | | | | 15,687 | | | | 737,446 | |
IDEX Corporation | | | | | | | | | | | 7,225 | | | | 1,106,942 | |
Illinois Tool Works Incorporated | | | | | | | | | | | 27,298 | | | | 3,791,146 | |
Ingersoll-Rand plc | | | | | | | | | | | 23,364 | | | | 2,366,540 | |
ITT Incorporated | | | | | | | | | | | 8,306 | | | | 490,968 | |
John Bean Technologies Corporation | | | | | | | | | | | 2,926 | | | | 346,146 | |
Kennametal Incorporated | | | | | | | | | | | 7,519 | | | | 307,076 | |
Lincoln Electric Holdings Incorporated | | | | | | | | | | | 5,860 | | | | 551,778 | |
Nordson Corporation | | | | | | | | | | | 4,853 | | | | 674,664 | |
Oshkosh Corporation | | | | | | | | | | | 6,987 | | | | 490,907 | |
Paccar Incorporated | | | | | | | | | | | 32,524 | | | | 2,225,292 | |
Parker-Hannifin Corporation | | | | | | | | | | | 12,356 | | | | 2,169,714 | |
Snap-on Incorporated | | | | | | | | | | | 5,292 | | | | 935,520 | |
Stanley Black & Decker Incorporated | | | | | | | | | | | 14,477 | | | | 2,034,453 | |
Terex Corporation | | | | | | | | | | | 6,988 | | | | 270,785 | |
The Middleby Corporation † | | | | | | | | | | | 5,191 | | | | 630,914 | |
The Timken Company | | | | | | | | | | | 6,582 | | | | 320,214 | |
The Toro Company | | | | | | | | | | | 9,692 | | | | 589,177 | |
Trinity Industries Incorporated | | | | | | | | | | | 14,057 | | | | 503,803 | |
WABCO Holdings Incorporated † | | | | | | | | | | | 5,084 | | | | 625,739 | |
Wabtec Corporation | | | | | | | | | | | 8,068 | | | | 873,926 | |
Woodward Governor Company | | | | | | | | | | | 5,265 | | | | 424,148 | |
Xylem Incorporated | | | | | | | | | | | 16,814 | | | | 1,276,351 | |
| | | | |
| | | | | | | | | | | | | | | 36,946,211 | |
| | | | | | | | | | | | | | | | |
| | | | |
| Marine: 0.03% | | | | | | | | | | | | | | | | |
Kirby Corporation † | | | | | | | | | | | 5,116 | | | | 446,627 | |
| | | | | | | | | | | | | | | | |
| | | | |
| Professional Services: 0.58% | | | | | | | | | | | | | | | | |
ASGN Incorporated † | | | | | | | | | | | 4,686 | | | | 433,877 | |
Dun & Bradstreet Corporation | | | | | | | | | | | 3,485 | | | | 498,076 | |
Equifax Incorporated | | | | | | | | | | | 11,227 | | | | 1,504,081 | |
IHS Markit Limited † | | | | | | | | | | | 33,577 | | | | 1,846,735 | |
Manpower Incorporated | | | | | | | | | | | 6,248 | | | | 585,625 | |
Nielsen Holdings plc | | | | | | | | | | | 33,583 | | | | 873,158 | |
Robert Half International Incorporated | | | | | | | | | | | 11,451 | | | | 895,239 | |
TransUnion | | | | | | | | | | | 17,196 | | | | 1,294,859 | |
Verisk Analytics Incorporated † | | | | | | | | | | | 14,502 | | | | 1,727,043 | |
| | | | |
| | | | | | | | | | | | | | | 9,658,693 | |
| | | | | | | | | | | | | | | | |
The accompanying notes are an integral part of these financial statements.
| | | | | | |
| Portfolio of investments—August 31, 2018 (unaudited) | | Wells Fargo Funds | | | 127 | |
FACTOR ENHANCED LARGE CAP PORTFOLIO
| | | | | | | | | | | | | | | | |
| Security name | | | | | | | | Shares | | | Value | |
| | | | |
| Road & Rail: 0.57% | | | | | | | | | | | | | | | | |
Genesee & Wyoming Incorporated Class A † | | | | | | | | | | | 5,726 | | | $ | 503,258 | |
J.B. Hunt Transport Services Incorporated | | | | | | | | | | | 8,218 | | | | 992,324 | |
Kansas City Southern | | | | | | | | | | | 9,757 | | | | 1,131,422 | |
Knight-Swift Transportation Holdings Incorporated | | | | | | | | | | | 12,334 | | | | 420,959 | |
Landstar System Incorporated | | | | | | | | | | | 3,947 | | | | 457,063 | |
Norfolk Southern Corporation | | | | | | | | | | | 26,519 | | | | 4,610,063 | |
Old Dominion Freight Line Incorporated | | | | | | | | | | | 6,534 | | | | 995,782 | |
Ryder System Incorporated | | | | | | | | | | | 5,032 | | | | 386,659 | |
| | | | |
| | | | | | | | | | | | | | | 9,497,530 | |
| | | | | | | | | | | | | | | | |
| | | | |
| Trading Companies & Distributors: 0.27% | | | | | | | | | | | | | | | | |
Beacon Roofing Supply Incorporated † | | | | | | | | | | | 6,313 | | | | 234,086 | |
Fastenal Company | | | | | | | | | | | 26,925 | | | | 1,571,343 | |
MSC Industrial Direct Company Class A | | | | | | | | | | | 4,275 | | | | 365,427 | |
W.W. Grainger Incorporated | | | | | | | | | | | 4,434 | | | | 1,569,946 | |
Watsco Incorporated | | | | | | | | | | | 2,977 | | | | 520,945 | |
WESCO International Incorporated † | | | | | | | | | | | 4,476 | | | | 273,707 | |
| | | | |
| | | | | | | | | | | | | | | 4,535,454 | |
| | | | | | | | | | | | | | | | |
| | | | |
| Transportation Infrastructure: 0.02% | | | | | | | | | | | | | | | | |
Macquarie Infrastructure Company LLC | | | | | | | | | | | 7,441 | | | | 350,025 | |
| | | | | | | | | | | | | | | | |
| | | | |
Information Technology: 10.02% | | | | | | | | | | | | | | | | |
| | | | |
| Communications Equipment: 0.36% | | | | | | | | | | | | | | | | |
ARRIS International plc † | | | | | | | | | | | 16,281 | | | | 421,841 | |
Ciena Corporation † | | | | | | | | | | | 11,686 | | | | 369,044 | |
CommScope Holdings Incorporated † | | | | | | | | | | | 17,861 | | | | 566,015 | |
F5 Networks Incorporated † | | | | | | | | | | | 5,842 | | | | 1,104,839 | |
Juniper Networks Incorporated | | | | | | | | | | | 32,009 | | | | 910,016 | |
Lumentum Holdings Incorporated † | | | | | | | | | | | 5,586 | | | | 379,289 | |
Motorola Solutions Incorporated | | | | | | | | | | | 15,176 | | | | 1,947,991 | |
Viasat Incorporated † | | | | | | | | | | | 5,208 | | | | 327,167 | |
| | | | |
| | | | | | | | | | | | | | | 6,026,202 | |
| | | | | | | | | | | | | | | | |
| | | | |
| Electronic Equipment, Instruments & Components: 0.85% | | | | | | | | | | | | | | | | |
Amphenol Corporation Class A | | | | | | | | | | | 28,264 | | | | 2,673,209 | |
Arrow Electronics Incorporated † | | | | | | | | | | | 8,383 | | | | 649,934 | |
Avnet Incorporated | | | | | | | | | | | 11,231 | | | | 543,580 | |
Belden Incorporated | | | | | | | | | | | 3,710 | | | | 269,791 | |
CDW Corporation of Delaware | | | | | | | | | | | 14,192 | | | | 1,242,652 | |
Coherent Incorporated † | | | | | | | | | | | 2,306 | | | | 439,524 | |
Dolby Laboratories Incorporated Class A | | | | | | | | | | | 5,494 | | | | 385,624 | |
FLIR Systems Incorporated | | | | | | | | | | | 13,014 | | | | 816,498 | |
Jabil Circuit Incorporated | | | | | | | | | | | 14,500 | | | | 428,620 | |
Keysight Technologies Incorporated † | | | | | | | | | | | 17,472 | | | | 1,133,758 | |
Littelfuse Incorporated | | | | | | | | | | | 2,299 | | | | 513,964 | |
National Instruments Corporation | | | | | | | | | | | 11,444 | | | | 546,451 | |
Synnex Corporation | | | | | | | | | | | 2,873 | | | | 278,595 | |
TE Connectivity Limited | | | | | | | | | | | 33,093 | | | | 3,033,966 | |
The accompanying notes are an integral part of these financial statements.
| | | | |
| 128 | | Wells Fargo Funds | | Portfolio of investments—August 31, 2018 (unaudited) |
FACTOR ENHANCED LARGE CAP PORTFOLIO
| | | | | | | | | | | | | | | | |
| Security name | | | | | | | | Shares | | | Value | |
| | | | |
| Electronic Equipment, Instruments & Components (continued) | | | | | | | | | | | | | | | | |
Tech Data Corporation † | | | | | | | | | | | 3,911 | | | $ | 284,525 | |
Zebra Technologies Corporation Class A † | | | | | | | | | | | 4,938 | | | | 848,052 | |
| | | | |
| | | | | | | | | | | | | | | 14,088,743 | |
| | | | | | | | | | | | | | | | |
| | | | |
| Internet Software & Services: 0.71% | | | | | | | | | | | | | | | | |
2U Incorporated † | | | | | | | | | | | 4,725 | | | | 422,226 | |
Akamai Technologies Incorporated † | | | | | | | | | | | 15,600 | | | | 1,172,184 | |
eBay Incorporated † | | | | | | | | | | | 87,537 | | | | 3,029,656 | |
GoDaddy Incorporated Class A † | | | | | | | | | | | 12,679 | | | | 1,032,831 | |
GrubHub Incorporated † | | | | | | | | | | | 8,094 | | | | 1,166,426 | |
IAC Corporation † | | | | | | | | | | | 7,201 | | | | 1,420,037 | |
J2 Global Incorporated | | | | | | | | | | | 4,419 | | | | 364,877 | |
Nutanix Incorporated Class A † | | | | | | | | | | | 10,586 | | | | 596,204 | |
Stamps.com Incorporated † | | | | | | | | | | | 1,549 | | | | 384,849 | |
VeriSign Incorporated † | | | | | | | | | | | 7,798 | | | | 1,236,841 | |
Yelp Incorporated † | | | | | | | | | | | 7,449 | | | | 350,997 | |
Zillow Group Incorporated Class C † | | | | | | | | | | | 10,372 | | | | 504,598 | |
| | | | |
| | | | | | | | | | | | | | | 11,681,726 | |
| | | | | | | | | | | | | | | | |
| | | | |
| IT Services: 4.04% | | | | | | | | | | | | | | | | |
Accenture plc Class A | | | | | | | | | | | 60,342 | | | | 10,202,022 | |
Alliance Data Systems Corporation | | | | | | | | | | | 4,523 | | | | 1,079,097 | |
Amdocs Limited | | | | | | | | | | | 13,502 | | | | 881,411 | |
Automatic Data Processing Incorporated | | | | | | | | | | | 39,028 | | | | 5,727,359 | |
Black Knight Incorporated † | | | | | | | | | | | 12,157 | | | | 649,184 | |
Booz Allen Hamilton Holding Corporation | | | | | | | | | | | 13,349 | | | | 682,935 | |
Broadridge Financial Solutions Incorporated | | | | | | | | | | | 10,909 | | | | 1,474,242 | |
CACI International Incorporated Class A † | | | | | | | | | | | 2,290 | | | | 446,550 | |
Cognizant Technology Solutions Corporation Class A | | | | | | | | | | | 54,905 | | | | 4,306,199 | |
Conduent Incorporated † | | | | | | | | | | | 18,485 | | | | 428,482 | |
CoreLogic Incorporated † | | | | | | | | | | | 7,604 | | | | 386,587 | |
DXC Technology Company | | | | | | | | | | | 26,785 | | | | 2,439,846 | |
EPAM Systems Incorporated † | | | | | | | | | | | 4,753 | | | | 679,346 | |
Euronet Worldwide Incorporated † | | | | | | | | | | | 4,659 | | | | 455,650 | |
Fidelity National Information Services Incorporated | | | | | | | | | | | 30,919 | | | | 3,344,508 | |
First Data Corporation Class A † | | | | | | | | | | | 43,685 | | | | 1,123,578 | |
Fiserv Incorporated † | | | | | | | | | | | 38,374 | | | | 3,072,606 | |
Gartner Incorporated † | | | | | | | | | | | 8,341 | | | | 1,249,148 | |
Global Payments Incorporated | | | | | | | | | | | 15,072 | | | | 1,877,670 | |
International Business Machines Corporation | | | | | | | | | | | 86,686 | | | | 12,697,765 | |
Jack Henry & Associates Incorporated | | | | | | | | | | | 7,221 | | | | 1,144,095 | |
Leidos Holdings Incorporated | | | | | | | | | | | 14,204 | | | | 1,005,217 | |
Maximus Incorporated | | | | | | | | | | | 6,129 | | | | 407,579 | |
Paychex Incorporated | | | | | | | | | | | 30,054 | | | | 2,201,456 | |
Sabre Corporation | | | | | | | | | | | 21,027 | | | | 549,015 | |
Square Incorporated Class A † | | | | | | | | | | | 24,679 | | | | 2,187,547 | |
Teradata Corporation † | | | | | | | | | | | 11,261 | | | | 466,994 | |
The Western Union Company | | | | | | | | | | | 42,982 | | | | 813,219 | |
Total System Services Incorporated | | | | | | | | | | | 15,725 | | | | 1,527,527 | |
The accompanying notes are an integral part of these financial statements.
| | | | | | |
| Portfolio of investments—August 31, 2018 (unaudited) | | Wells Fargo Funds | | | 129 | |
FACTOR ENHANCED LARGE CAP PORTFOLIO
| | | | | | | | | | | | | | | | |
| Security name | | | | | | | | Shares | | | Value | |
| | | | |
| IT Services (continued) | | | | | | | | | | | | | | | | |
WEX Incorporated † | | | | | | | | | | | 4,022 | | | $ | 765,065 | |
Worldpay Incorporated Class A † | | | | | | | | | | | 27,671 | | | | 2,694,879 | |
| | | | |
| | | | | | | | | | | | | | | 66,966,778 | |
| | | | | | | | | | | | | | | | |
| | | | |
| Semiconductors & Semiconductor Equipment: 1.45% | | | | | | | | | | | | | | | | |
Applied Materials Incorporated | | | | | | | | | | | 97,762 | | | | 4,205,721 | |
Entegris Incorporated | | | | | | | | | | | 12,948 | | | | 438,937 | |
KLA-Tencor Corporation | | | | | | | | | | | 14,573 | | | | 1,693,528 | |
Lam Research Corporation | | | | | | | | | | | 15,010 | | | | 2,598,081 | |
Maxim Integrated Products Incorporated | | | | | | | | | | | 26,686 | | | | 1,613,702 | |
MKS Instruments Incorporated | | | | | | | | | | | 5,124 | | | | 476,020 | |
ON Semiconductor Corporation † | | | | | | | | | | | 39,228 | | | | 837,126 | |
Silicon Laboratories Incorporated † | | | | | | | | | | | 3,964 | | | | 388,472 | |
Teradyne Incorporated | | | | | | | | | | | 18,387 | | | | 757,361 | |
Texas Instruments Incorporated | | | | | | | | | | | 93,378 | | | | 10,495,687 | |
Versum Materials Incorporated | | | | | | | | | | | 10,386 | | | | 413,259 | |
| | | | |
| | | | | | | | | | | | | | | 23,917,894 | |
| | | | | | | | | | | | | | | | |
| | | | |
| Software: 1.94% | | | | | | | | | | | | | | | | |
Ansys Incorporated † | | | | | | | | | | | 7,831 | | | | 1,456,409 | |
Aspen Technology Incorporated † | | | | | | | | | | | 6,695 | | | | 772,335 | |
Blackbaud Incorporated | | | | | | | | | | | 4,438 | | | | 464,082 | |
CA Incorporated | | | | | | | | | | | 29,385 | | | | 1,287,063 | |
Cadence Design Systems Incorporated † | | | | | | | | | | | 26,350 | | | | 1,239,504 | |
CDK Global Incorporated | | | | | | | | | | | 12,501 | | | | 779,062 | |
Citrix Systems Incorporated † | | | | | | | | | | | 12,039 | | | | 1,372,687 | |
Electronic Arts Incorporated † | | | | | | | | | | | 30,884 | | | | 3,502,554 | |
Ellie Mae Incorporated † | | | | | | | | | | | 3,142 | | | | 331,073 | |
Fair Isaac Corporation † | | | | | | | | | | | 2,789 | | | | 644,203 | |
Fortinet Incorporated † | | | | | | | | | | | 13,411 | | | | 1,123,305 | |
HubSpot Incorporated † | | | | | | | | | | | 3,238 | | | | 465,301 | |
Intuit Incorporated | | | | | | | | | | | 23,074 | | | | 5,064,051 | |
Manhattan Associates Incorporated † | | | | | | | | | | | 6,204 | | | | 359,770 | |
Micro Focus International plc ADR | | | | | | | | | | | 1 | | | | 17 | |
Nuance Communications Incorporated † | | | | | | | | | | | 27,291 | | | | 445,389 | |
Paycom Software Incorporated † | | | | | | | | | | | 4,571 | | | | 709,054 | |
PTC Incorporated † | | | | | | | | | | | 10,801 | | | | 1,079,452 | |
RealPage Incorporated † | | | | | | | | | | | 5,967 | | | | 372,341 | |
Red Hat Incorporated † | | | | | | | | | | | 16,699 | | | | 2,466,943 | |
RingCentral Incorporated Class A † | | | | | | | | | | | 5,992 | | | | 558,155 | |
SS&C Technologies Holdings Incorporated | | | | | | | | | | | 18,880 | | | | 1,120,339 | |
Symantec Corporation | | | | | | | | | | | 58,296 | | | | 1,175,247 | |
Synopsys Incorporated † | | | | | | | | | | | 13,892 | | | | 1,418,929 | |
Take-Two Interactive Software Incorporated † | | | | | | | | | | | 10,570 | | | | 1,411,729 | |
Tyler Technologies Incorporated † | | | | | | | | | | | 3,396 | | | | 838,642 | |
VMware Incorporated Class A † | | | | | | | | | | | 6,815 | | | | 1,044,467 | |
Zendesk Incorporated † | | | | | | | | | | | 9,376 | | | | 645,913 | |
| | | | |
| | | | | | | | | | | | | | | 32,148,016 | |
| | | | | | | | | | | | | | | | |
The accompanying notes are an integral part of these financial statements.
| | | | |
| 130 | | Wells Fargo Funds | | Portfolio of investments—August 31, 2018 (unaudited) |
FACTOR ENHANCED LARGE CAP PORTFOLIO
| | | | | | | | | | | | | | | | |
| Security name | | | | | | | | Shares | | | Value | |
| | | | |
| Technology Hardware, Storage & Peripherals: 0.67% | | | | | | | | | | | | | | | | |
Hewlett Packard Enterprise Company | | | | | | | | | | | 142,971 | | | $ | 2,363,311 | |
HP Incorporated | | | | | | | | | | | 152,809 | | | | 3,766,742 | |
NCR Corporation † | | | | | | | | | | | 10,919 | | | | 310,209 | |
NetApp Incorporated | | | | | | | | | | | 25,024 | | | | 2,172,333 | |
Pure Storage Incorporated Class A † | | | | | | | | | | | 14,669 | | | | 393,716 | |
Seagate Technology plc | | | | | | | | | | | 25,459 | | | | 1,363,075 | |
Xerox Corporation | | | | | | | | | | | 22,967 | | | | 639,861 | |
| | | | |
| | | | | | | | | | | | | | | 11,009,247 | |
| | | | | | | | | | | | | | | | |
| | | | |
Materials: 3.23% | | | | | | | | | | | | | | | | |
| | | | |
| Chemicals: 2.06% | | | | | | | | | | | | | | | | |
Air Products & Chemicals Incorporated | | | | | | | | | | | 20,952 | | | | 3,484,108 | |
Ashland Global Holdings Incorporated | | | | | | | | | | | 5,983 | | | | 503,769 | |
Axalta Coating Systems Limited † | | | | | | | | | | | 20,886 | | | | 637,023 | |
Cabot Corporation | | | | | | | | | | | 4,292 | | | | 278,637 | |
Celanese Corporation Series A | | | | | | | | | | | 12,903 | | | | 1,507,457 | |
CF Industries Holdings Incorporated | | | | | | | | | | | 21,922 | | | | 1,138,848 | |
Eastman Chemical Company | | | | | | | | | | | 12,588 | | | | 1,221,414 | |
Ecolab Incorporated | | | | | | | | | | | 24,127 | | | | 3,630,631 | |
Huntsman Corporation | | | | | | | | | | | 20,190 | | | | 615,593 | |
Ingevity Corporation † | | | | | | | | | | | 3,954 | | | | 399,394 | |
International Flavors & Fragrances Incorporated | | | | | | | | | | | 7,423 | | | | 967,143 | |
LyondellBasell Industries NV Class A | | | | | | | | | | | 30,968 | | | | 3,492,571 | |
NewMarket Corporation | | | | | | | | | | | 873 | | | | 350,108 | |
Olin Corporation | | | | | | | | | | | 16,170 | | | | 496,904 | |
PolyOne Corporation | | | | | | | | | | | 7,626 | | | | 322,275 | |
PPG Industries Incorporated | | | | | | | | | | | 23,568 | | | | 2,605,207 | |
Praxair Incorporated | | | | | | | | | | | 27,262 | | | | 4,312,576 | |
RPM International Incorporated | | | | | | | | | | | 12,492 | | | | 843,210 | |
Scotts Miracle-Gro Company Class A | | | | | | | | | | | 2,726 | | | | 203,687 | |
Sensient Technologies Corporation | | | | | | | | | | | 3,998 | | | | 283,938 | |
The Chemours Company | | | | | | | | | | | 17,462 | | | | 761,343 | |
The Mosaic Company | | | | | | | | | | | 33,174 | | | | 1,037,351 | |
The Sherwin-Williams Company | | | | | | | | | | | 7,826 | | | | 3,565,369 | |
Trinseo SA | | | | | | | | | | | 3,641 | | | | 280,903 | |
Valvoline Incorporated | | | | | | | | | | | 18,161 | | | | 390,825 | |
W.R. Grace & Company | | | | | | | | | | | 6,003 | | | | 424,172 | |
Westlake Chemical Corporation | | | | | | | | | | | 2,935 | | | | 277,563 | |
| | | | |
| | | | | | | | | | | | | | | 34,032,019 | |
| | | | | | | | | | | | | | | | |
| | | | |
| Construction Materials: 0.11% | | | | | | | | | | | | | | | | |
Eagle Materials Incorporated | | | | | | | | | | | 4,435 | | | | 409,484 | |
Martin Marietta Materials Incorporated | | | | | | | | | | | 5,878 | | | | 1,168,076 | |
Summit Materials Incorporated Class A † | | | | | | | | | | | 10,373 | | | | 220,634 | |
| | | | |
| | | | | | | | | | | | | | | 1,798,194 | |
| | | | | | | | | | | | | | | | |
| | | | |
| Containers & Packaging: 0.63% | | | | | | | | | | | | | | | | |
AptarGroup Incorporated | | | | | | | | | | | 5,772 | | | | 604,386 | |
Avery Dennison Corporation | | | | | | | | | | | 8,286 | | | | 871,521 | |
The accompanying notes are an integral part of these financial statements.
| | | | | | |
| Portfolio of investments—August 31, 2018 (unaudited) | | Wells Fargo Funds | | | 131 | |
FACTOR ENHANCED LARGE CAP PORTFOLIO
| | | | | | | | | | | | | | | | |
| Security name | | | | | | | | Shares | | | Value | |
| | | | |
| Containers & Packaging (continued) | | | | | | | | | | | | | | | | |
Ball Corporation | | | | | | | | | | | 32,434 | | | $ | 1,358,336 | |
Bemis Company Incorporated | | | | | | | | | | | 8,714 | | | | 429,426 | |
Berry Global Group Incorporated † | | | | | | | | | | | 12,454 | | | | 594,429 | |
Crown Holdings Incorporated † | | | | | | | | | | | 12,433 | | | | 532,257 | |
Graphic Packaging Holding Company | | | | | | | | | | | 29,362 | | | | 417,528 | |
International Paper Company | | | | | | | | | | | 39,011 | | | | 1,995,023 | |
Owens-Illinois Incorporated † | | | | | | | | | | | 15,430 | | | | 272,648 | |
Packaging Corporation of America | | | | | | | | | | | 8,885 | | | | 976,639 | |
Sealed Air Corporation | | | | | | | | | | | 15,570 | | | | 624,513 | |
Sonoco Products Company | | | | | | | | | | | 9,389 | | | | 526,160 | |
WestRock Company | | | | | | | | | | | 23,828 | | | | 1,312,446 | |
| | | | |
| | | | | | | | | | | | | | | 10,515,312 | |
| | | | | | | | | | | | | | | | |
| | | | |
| Metals & Mining: 0.41% | | | | | | | | | | | | | | | | |
Alcoa Corporation † | | | | | | | | | | | 17,597 | | | | 786,058 | |
Newmont Mining Corporation | | | | | | | | | | | 50,332 | | | | 1,561,802 | |
Nucor Corporation | | | | | | | | | | | 30,188 | | | | 1,886,750 | |
Reliance Steel & Aluminum Company | | | | | | | | | | | 6,718 | | | | 590,445 | |
Royal Gold Incorporated | | | | | | | | | | | 6,176 | | | | 470,982 | |
Steel Dynamics Incorporated | | | | | | | | | | | 21,514 | | | | 983,835 | |
United States Steel Corporation | | | | | | | | | | | 17,323 | | | | 514,147 | |
| | | | |
| | | | | | | | | | | | | | | 6,794,019 | |
| | | | | | | | | | | | | | | | |
| | | | |
| Paper & Forest Products: 0.02% | | | | | | | | | | | | | | | | |
Louisiana-Pacific Corporation | | | | | | | | | | | 13,657 | | | | 398,238 | |
| | | | | | | | | | | | | | | | |
| | | | |
Real Estate: 5.34% | | | | | | | | | | | | | | | | |
| | | | |
| Equity REITs: 5.20% | | | | | | | | | | | | | | | | |
Alexandria Real Estate Equities Incorporated | | | | | | | | | | | 9,287 | | | | 1,191,986 | |
American Campus Communities Incorporated | | | | | | | | | | | 12,945 | | | | 542,784 | |
American Homes 4 Rent Class A | | | | | | | | | | | 24,840 | | | | 576,288 | |
American Tower Corporation | | | | | | | | | | | 41,598 | | | | 6,203,094 | |
Apartment Investment & Management Company Class A | | | | | | | | | | | 14,621 | | | | 640,400 | |
Apple Hospitality REIT Incorporated | | | | | | | | | | | 21,149 | | | | 373,280 | |
AvalonBay Communities Incorporated | | | | | | | | | | | 12,950 | | | | 2,373,606 | |
Boston Properties Incorporated | | | | | | | | | | | 14,325 | | | | 1,868,696 | |
Brixmor Property Group Incorporated | | | | | | | | | | | 28,075 | | | | 511,527 | |
Camden Property Trust | | | | | | | | | | | 8,883 | | | | 844,418 | |
Colony Capital Incorporated | | | | | | | | | | | 47,493 | | | | 291,132 | |
CoreSite Realty Corporation | | | | | | | | | | | 3,162 | | | | 368,278 | |
Cousins Properties Incorporated | | | | | | | | | | | 39,046 | | | | 365,080 | |
Crown Castle International Corporation | | | | | | | | | | | 39,013 | | | | 4,448,652 | |
CubeSmart REIT | | | | | | | | | | | 17,415 | | | | 532,028 | |
CyrusOne Incorporated | | | | | | | | | | | 8,977 | | | | 601,100 | |
Digital Realty Trust Incorporated | | | | | | | | | | | 19,409 | | | | 2,412,151 | |
Douglas Emmett Incorporated | | | | | | | | | | | 15,448 | | | | 603,399 | |
Duke Realty Corporation | | | | | | | | | | | 33,361 | | | | 950,455 | |
EPR Properties | | | | | | | | | | | 6,970 | | | | 489,155 | |
Equinix Incorporated | | | | | | | | | | | 7,446 | | | | 3,247,424 | |
The accompanying notes are an integral part of these financial statements.
| | | | |
| 132 | | Wells Fargo Funds | | Portfolio of investments—August 31, 2018 (unaudited) |
FACTOR ENHANCED LARGE CAP PORTFOLIO
| | | | | | | | | | | | | | | | |
| Security name | | | | | | | | Shares | | | Value | |
| | | | |
| Equity REITs (continued) | | | | | | | | | | | | | | | | |
Equity Commonwealth † | | | | | | | | | | | 8,274 | | | $ | 265,264 | |
Equity Lifestyle Properties Incorporated | | | | | | | | | | | 6,040 | | | | 585,155 | |
Equity Residential | | | | | | | | | | | 33,975 | | | | 2,301,806 | |
Essex Property Trust Incorporated | | | | | | | | | | | 6,186 | | | | 1,523,488 | |
Extra Space Storage Incorporated | | | | | | | | | | | 11,492 | | | | 1,059,677 | |
Federal Realty Investment Trust | | | | | | | | | | | 6,836 | | | | 892,850 | |
First Industrial Realty Trust Incorporated | | | | | | | | | | | 11,461 | | | | 372,024 | |
Forest City Realty Trust Incorporated | | | | | | | | | | | 23,452 | | | | 589,818 | |
Gaming and Leisure Properties Incorporated | | | | | | | | | | | 19,392 | | | | 694,040 | |
Gramercy Property Trust Incorporated | | | | | | | | | | | 15,372 | | | | 420,424 | |
HCP Incorporated | | | | | | | | | | | 44,854 | | | | 1,212,404 | |
Healthcare Realty Trust Incorporated | | | | | | | | | | | 10,111 | | | | 313,037 | |
Healthcare Trust of America Incorporated Class A | | | | | | | | | | | 19,955 | | | | 570,114 | |
Highwoods Properties Incorporated | | | | | | | | | | | 9,580 | | | | 476,509 | |
Hospitality Properties Trust | | | | | | | | | | | 15,138 | | | | 438,851 | |
Host Hotels & Resorts Incorporated | | | | | | | | | | | 67,567 | | | | 1,454,718 | |
Hudson Pacific Properties Incorporated | | | | | | | | | | | 14,542 | | | | 492,101 | |
Invitation Homes Incorporated | | | | | | | | | | | 27,829 | | | | 650,364 | |
Iron Mountain Incorporated | | | | | | | | | | | 25,764 | | | | 930,080 | |
JBG Smith Properties | | | | | | | | | | | 10,371 | | | | 388,498 | |
Kilroy Realty Corporation | | | | | | | | | | | 9,069 | | | | 663,307 | |
Kimco Realty Corporation | | | | | | | | | | | 38,647 | | | | 661,250 | |
Lamar Advertising Company Class A | | | | | | | | | | | 7,840 | | | | 604,072 | |
LaSalle Hotel Properties | | | | | | | | | | | 10,616 | | | | 372,728 | |
Liberty Property Trust | | | | | | | | | | | 13,895 | | | | 607,906 | |
Life Storage Incorporated | | | | | | | | | | | 4,400 | | | | 429,440 | |
Medical Properties Trust Incorporated | | | | | | | | | | | 34,196 | | | | 514,650 | |
Mid-America Apartment Communities Incorporated | | | | | | | | | | | 10,597 | | | | 1,097,425 | |
National Retail Properties Incorporated | | | | | | | | | | | 14,611 | | | | 673,421 | |
Omega Healthcare Investors Incorporated | | | | | | | | | | | 18,573 | | | | 613,838 | |
Paramount Group Incorporated | | | | | | | | | | | 19,749 | | | | 313,614 | |
Park Hotels & Resorts Incorporated | | | | | | | | | | | 18,924 | | | | 633,008 | |
Prologis Incorporated | | | | | | | | | | | 62,826 | | | | 4,220,639 | |
Public Storage Incorporated | | | | | | | | | | | 14,026 | | | | 2,981,647 | |
Rayonier Incorporated | | | | | | | | | | | 12,359 | | | | 430,464 | |
Realty Income Corporation | | | | | | | | | | | 26,776 | | | | 1,568,270 | |
Regency Centers Corporation | | | | | | | | | | | 14,245 | | | | 940,597 | |
RLJ Lodging Trust | | | | | | | | | | | 16,152 | | | | 353,890 | |
Ryman Hospitality Properties Incorporated | | | | | | | | | | | 4,170 | | | | 370,004 | |
Sabra Health Care REIT Incorporated | | | | | | | | | | | 16,482 | | | | 388,646 | |
SBA Communications Corporation † | | | | | | | | | | | 10,932 | | | | 1,696,974 | |
Senior Housing Properties Trust | | | | | | | | | | | 22,175 | | | | 423,764 | |
Simon Property Group Incorporated | | | | | | | | | | | 28,903 | | | | 5,290,116 | |
SL Green Realty Corporation | | | | | | | | | | | 8,380 | | | | 874,872 | |
Spirit Realty Capital Incorporated | | | | | | | | | | | 43,876 | | | | 367,242 | |
STORE Capital Corporation | | | | | | | | | | | 16,966 | | | | 488,790 | |
Sun Communities Incorporated | | | | | | | | | | | 6,219 | | | | 641,676 | |
Sunstone Hotel Investors Incorporated | | | | | | | | | | | 20,867 | | | | 350,148 | |
Taubman Centers Incorporated | | | | | | | | | | | 5,408 | | | | 349,411 | |
The Macerich Company | | | | | | | | | | | 13,077 | | | | 768,143 | |
The accompanying notes are an integral part of these financial statements.
| | | | | | |
| Portfolio of investments—August 31, 2018 (unaudited) | | Wells Fargo Funds | | | 133 | |
FACTOR ENHANCED LARGE CAP PORTFOLIO
| | | | | | | | | | | | | | | | |
| Security name | | | | | | | | Shares | | | Value | |
| | | | |
| Equity REITs (continued) | | | | | | | | | | | | | | | | |
UDR Incorporated | | | | | | | | | | | 24,846 | | | $ | 993,095 | |
Ventas Incorporated | | | | | | | | | | | 33,592 | | | | 2,011,153 | |
VEREIT Incorporated | | | | | | | | | | | 91,869 | | | | 718,416 | |
VICI Properties Incorporated | | | | | | | | | | | 27,164 | | | | 567,999 | |
Vornado Realty Trust | | | | | | | | | | | 16,235 | | | | 1,250,095 | |
Weingarten Realty Investors | | | | | | | | | | | 11,516 | | | | 356,190 | |
Welltower Incorporated | | | | | | | | | | | 35,041 | | | | 2,337,585 | |
Weyerhaeuser Company | | | | | | | | | | | 71,235 | | | | 2,472,567 | |
WP Carey Incorporated | | | | | | | | | | | 10,116 | | | | 673,523 | |
| | | | |
| | | | | | | | | | | | | | | 86,136,730 | |
| | | | | | | | | | | | | | | | |
| | | | |
| Real Estate Management & Development: 0.14% | | | | | | | | | | | | | | | | |
CBRE Group Incorporated Class A † | | | | | | | | | | | 29,364 | | | | 1,433,257 | |
Jones Lang LaSalle Incorporated | | | | | | | | | | | 4,227 | | | | 644,702 | |
Realogy Holdings Corporation | | | | | | | | | | | 12,062 | | | | 258,006 | |
| | | | |
| | | | | | | | | | | | | | | 2,335,965 | |
| | | | | | | | | | | | | | | | |
| | | | |
Telecommunication Services: 2.91% | | | | | | | | | | | | | | | | |
| | | | |
| Diversified Telecommunication Services: 2.75% | | | | | | | | | | | | | | | | |
AT&T Incorporated | | | | | | | | | | | 676,559 | | | | 21,609,294 | |
CenturyLink Incorporated | | | | | | | | | | | 103,394 | | | | 2,208,496 | |
Verizon Communications Incorporated | | | | | | | | | | | 387,679 | | | | 21,078,107 | |
Zayo Group Holdings Incorporated † | | | | | | | | | | | 20,285 | | | | 703,078 | |
| | | | |
| | | | | | | | | | | | | | | 45,598,975 | |
| | | | | | | | | | | | | | | | |
| | | | |
| Wireless Telecommunication Services: 0.16% | | | | | | | | | | | | | | | | |
Sprint Corporation † | | | | | | | | | | | 53,559 | | | | 327,245 | |
T-Mobile US Incorporated † | | | | | | | | | | | 29,425 | | | | 1,943,227 | |
Telephone & Data Systems Incorporated | | | | | | | | | | | 9,233 | | | | 277,359 | |
| | | | |
| | | | | | | | | | | | | | | 2,547,831 | |
| | | | | | | | | | | | | | | | |
| | | | |
Utilities: 4.46% | | | | | | | | | | | | | | | | |
| | | | |
| Electric Utilities: 2.57% | | | | | | | | | | | | | | | | |
ALLETE Incorporated | | | | | | | | | | | 4,933 | | | | 370,370 | |
Alliant Energy Corporation | | | | | | | | | | | 21,950 | | | | 940,338 | |
American Electric Power Company Incorporated | | | | | | | | | | | 46,105 | | | | 3,307,112 | |
Duke Energy Corporation | | | | | | | | | | | 65,556 | | | | 5,325,769 | |
Edison International | | | | | | | | | | | 30,500 | | | | 2,004,765 | |
Entergy Corporation | | | | | | | | | | | 16,897 | | | | 1,412,420 | |
Evergy Incorporated | | | | | | | | | | | 13,306 | | | | 759,107 | |
Eversource Energy | | | | | | | | | | | 29,398 | | | | 1,835,317 | |
Exelon Corporation | | | | | | | | | | | 89,989 | | | | 3,933,419 | |
FirstEnergy Corporation | | | | | | | | | | | 44,600 | | | | 1,667,148 | |
Hawaiian Electric Industries Incorporated | | | | | | | | | | | 10,642 | | | | 375,343 | |
IDACORP Incorporated | | | | | | | | | | | 4,744 | | | | 464,200 | |
NextEra Energy Incorporated | | | | | | | | | | | 43,985 | | | | 7,481,849 | |
OGE Energy Corporation | | | | | | | | | | | 18,397 | | | | 677,562 | |
PG&E Corporation | | | | | | | | | | | 47,391 | | | | 2,188,516 | |
The accompanying notes are an integral part of these financial statements.
| | | | |
| 134 | | Wells Fargo Funds | | Portfolio of investments—August 31, 2018 (unaudited) |
FACTOR ENHANCED LARGE CAP PORTFOLIO
| | | | | | | | | | | | | | | | |
| Security name | | | | | | | | Shares | | | Value | |
| | | | |
| Electric Utilities (continued) | | | | | | | | | | | | | | | | |
Pinnacle West Capital Corporation | | | | | | | | | | | 10,644 | | | $ | 836,086 | |
PNM Resources Incorporated | | | | | | | | | | | 7,402 | | | | 288,308 | |
Portland General Electric Company | | | | | | | | | | | 8,462 | | | | 392,637 | |
PPL Corporation | | | | | | | | | | | 64,515 | | | | 1,918,676 | |
The Southern Company | | | | | | | | | | | 95,104 | | | | 4,163,653 | |
Xcel Energy Incorporated | | | | | | | | | | | 47,441 | | | | 2,279,540 | |
| | | | |
| | | | | | | | | | | | | | | 42,622,135 | |
| | | | | | | | | | | | | | | | |
| | | | |
| Gas Utilities: 0.22% | | | | | | | | | | | | | | | | |
Atmos Energy Corporation | | | | | | | | | | | 10,271 | | | | 947,294 | |
National Fuel Gas Company | | | | | | | | | | | 7,770 | | | | 431,468 | |
New Jersey Resources Corporation | | | | | | | | | | | 8,053 | | | | 367,217 | |
ONE Gas Incorporated | | | | | | | | | | | 4,787 | | | | 375,923 | |
Southwest Gas Corporation | | | | | | | | | | | 4,034 | | | | 311,909 | |
Spire Incorporated | | | | | | | | | | | 4,425 | | | | 329,884 | |
UGI Corporation | | | | | | | | | | | 16,235 | | | | 877,502 | |
| | | | |
| | | | | | | | | | | | | | | 3,641,197 | |
| | | | | | | | | | | | | | | | |
| | | | |
| Independent Power & Renewable Electricity Producers: 0.16% | | | | | | | | | | | | | | | | |
AES Corporation | | | | | | | | | | | 60,787 | | | | 818,193 | |
NRG Energy Incorporated | | | | | | | | | | | 28,513 | | | | 1,009,075 | |
Vistra Energy Corporation † | | | | | | | | | | | 32,185 | | | | 757,635 | |
| | | | |
| | | | | | | | | | | | | | | 2,584,903 | |
| | | | | | | | | | | | | | | | |
| | | | |
| Multi-Utilities: 1.38% | | | | | | | | | | | | | | | | |
Ameren Corporation | | | | | | | | | | | 22,912 | | | | 1,448,726 | |
Avista Corporation | | | | | | | | | | | 5,765 | | | | 295,802 | |
Black Hills Corporation | | | | | | | | | | | 5,109 | | | | 300,665 | |
CenterPoint Energy Incorporated | | | | | | | | | | | 39,452 | | | | 1,096,371 | |
CMS Energy Corporation | | | | | | | | | | | 26,729 | | | | 1,316,136 | |
Consolidated Edison Incorporated | | | | | | | | | | | 29,250 | | | | 2,308,703 | |
Dominion Energy Incorporated | | | | | | | | | | | 63,049 | | | | 4,461,978 | |
DTE Energy Company | | | | | | | | | | | 17,019 | | | | 1,891,492 | |
MDU Resources Group Incorporated | | | | | | | | | | | 17,935 | | | | 500,207 | |
NiSource Incorporated | | | | | | | | | | | 32,177 | | | | 871,031 | |
Public Service Enterprise Group Incorporated | | | | | | | | | | | 47,318 | | | | 2,477,097 | |
SCANA Corporation | | | | | | | | | | | 12,237 | | | | 469,167 | |
Sempra Energy | | | | | | | | | | | 24,629 | | | | 2,858,934 | |
Vectren Corporation | | | | | | | | | | | 7,948 | | | | 565,898 | |
WEC Energy Group Incorporated | | | | | | | | | | | 29,645 | | | | 2,003,409 | |
| | | | |
| | | | | | | | | | | | | | | 22,865,616 | |
| | | | | | | | | | | | | | | | |
| | | | |
| Water Utilities: 0.13% | | | | | | | | | | | | | | | | |
American Water Works Company Incorporated | | | | | | | | | | | 16,960 | | | | 1,484,509 | |
Aqua America Incorporated | | | | | | | | | | | 15,966 | | | | 593,616 | |
| | | | |
| | | | | | | | | | | | | | | 2,078,125 | |
| | | | | | | | | �� | | | | | | | |
| | | | |
Total Common Stocks (Cost $1,293,088,767) | | | | | | | | | | | | | | | 1,523,712,590 | |
| | | | | | | | | | | | | | | | |
The accompanying notes are an integral part of these financial statements.
| | | | | | |
| Portfolio of investments—August 31, 2018 (unaudited) | | Wells Fargo Funds | | | 135 | |
FACTOR ENHANCED LARGE CAP PORTFOLIO
| | | | | | | | | | | | | | | | |
| Security name | | | | | | | | Shares | | | Value | |
| | | | |
Exchange-Traded Funds: 0.03% | | | | | | | | | | | | | | | | |
Brookfield Property Partners LP | | | | | | | | | | | 23,753 | | | $ | 474,585 | |
| | | | | | | | | | | | | | | | |
| | | | |
Total Exchange-Traded Funds (Cost $479,811) | | | | | | | | | | | | | | | 474,585 | |
| | | | | | | | | | | | | | | | |
| | | Yield | | | | | | | | | | |
| | | | |
Short-Term Investments: 1.01% | | | | | | | | | | | | | | | | |
| | | | |
| Investment Companies: 1.01% | | | | | | | | | | | | | | | | |
Wells Fargo Government Money Market Fund Select Class (l)(u) | | | 1.87 | % | | | | | | | 16,690,970 | | | | 16,690,970 | |
| | | | | | | | | | | | | | | | |
| |
Total Short-Term Investments (Cost $16,690,970) | | | | 16,690,970 | |
| | | | | | | | | | | | | | | | |
| | | | | | | | |
| Total investments in securities (Cost $1,310,259,548) | | | 93.06 | % | | | 1,540,878,145 | |
Other assets and liabilities, net | | | 6.94 | | | | 114,986,219 | |
| | | | | | | | |
| Total net assets | | | 100.00 | % | | $ | 1,655,864,364 | |
| | | | | | | | |
| † | Non-income-earning security |
| (l) | The issuer of the security is an affiliated person of the Portfolio as defined in the Investment Company Act of 1940. |
| (u) | The rate represents the 7-day annualized yield at period end. |
Futures Contracts
| | | | | | | | | | | | | | | | | | | | | | | | |
| Description | | Number of
contracts | | | Expiration
date | | | Notional
cost | | | Notional
value | | | Unrealized
gains | | | Unrealized
losses | |
Long | | | | | | | | | | | | | | | | | | | | | | | | |
S&P 500 E-Mini Index | | | 947 | | | | 9-21-2018 | | | | 136,258,949 | | | $ | 137,414,435 | | | $ | 1,155,486 | | | $ | 0 | |
Investments in Affiliates
An affiliated investment is an investment in which the Portfolio owns at least 5% of the outstanding voting shares of the issuer or as a result of other relationships, such as the Portfolio and the issuer having the same adviser or investment manager. Transactions with issuers that were either affiliated persons of the Portfolio at the beginning of the period or the end of the period were as follows:
| | | | | | | | | | | | | | | | | | | | | | | | | | | | | | | | | | | | |
| | | Shares,
beginning of
period | | | Shares
purchased | | | Shares
sold | | | Shares,
end of
period | | | Net
realized
gains
(losses) | | | Net
change in
unrealized
gains
(losses) | | | Income
from
affiliated
securities | | | Value,
end
of period | | | % of
net
assets | |
| | | | | | | | | |
Short-Term Investments | | | | | | | | | | | | | | | | | | | | | | | | | | | | | | | | | | | | |
Investment Companies | | | | | | | | | | | | | | | | | | | | | | | | | | | | | | | | | | | | |
Wells Fargo Government Money Market Fund Select Class | | | 39,764,513 | | | | 266,950,885 | | | | 290,024,428 | | | | 16,690,970 | | | $ | 0 | | | $ | 0 | | | $ | 311,696 | | | $ | 16,690,970 | | | | 1.01 | % |
The accompanying notes are an integral part of these financial statements.
| | | | |
| 136 | | Wells Fargo Funds | | Portfolio of investments—August 31, 2018 (unaudited) |
FACTOR ENHANCED SMALL CAP PORTFOLIO
| | | | | | | | | | | | | | | | |
| Security name | | | | | | | | Shares | | | Value | |
| | | | |
Common Stocks: 91.73% | | | | | | | | | | | | | | | | |
| | | | |
Consumer Discretionary: 14.73% | | | | | | | | | | | | | | | | |
| | | | |
| Auto Components: 1.23% | | | | | | | | | | | | | | | | |
American Axle & Manufacturing Holdings Incorporated † | | | | | | | | | | | 27,341 | | | $ | 484,167 | |
Cooper Tire & Rubber Company | | | | | | | | | | | 12,393 | | | | 357,538 | |
Cooper-Standard Holdings Incorporated † | | | | | | | | | | | 4,454 | | | | 616,567 | |
Dorman Products Incorporated † | | | | | | | | | | | 6,814 | | | | 551,798 | |
Fox Factory Holding Corporation † | | | | | | | | | | | 8,953 | | | | 591,346 | |
Horizon Global Corporation † | | | | | | | | | | | 5,643 | | | | 43,790 | |
LCI Industries | | | | | | | | | | | 6,077 | | | | 564,857 | |
Modine Manufacturing Company † | | | | | | | | | | | 12,195 | | | | 205,486 | |
Motorcar Parts of America Incorporated † | | | | | | | | | | | 4,798 | | | | 127,339 | |
Shiloh Industries Incorporated † | | | | | | | | | | | 3,657 | | | | 32,840 | |
Standard Motor Products Incorporated | | | | | | | | | | | 5,080 | | | | 257,912 | |
Stoneridge Incorporated † | | | | | | | | | | | 6,779 | | | | 202,895 | |
Strattec Security Corporation | | | | | | | | | | | 911 | | | | 31,247 | |
Superior Industries International Incorporated | | | | | | | | | | | 5,839 | | | | 126,706 | |
Tenneco Incorporated | | | | | | | | | | | 12,619 | | | | 539,967 | |
Tower International Incorporated | | | | | | | | | | | 4,831 | | | | 163,288 | |
Voxx International Corporation † | | | | | | | | | | | 4,960 | | | | 26,784 | |
| | | | |
| | | | | | | | | | | | | | | 4,924,527 | |
| | | | | | | | | | | | | | | | |
| | | | |
| Automobiles: 0.07% | | | | | | | | | | | | | | | | |
Winnebago Industries Incorporated | | | | | | | | | | | 7,241 | | | | 267,555 | |
| | | | | | | | | | | | | | | | |
| | | | |
| Distributors: 0.11% | | | | | | | | | | | | | | | | |
Core Mark Holding Company Incorporated | | | | | | | | | | | 11,189 | | | | 400,231 | |
Weyco Group Incorporated | | | | | | | | | | | 1,474 | | | | 52,283 | |
| | | | |
| | | | | | | | | | | | | | | 452,514 | |
| | | | | | | | | | | | | | | | |
| | | | |
| Diversified Consumer Services: 0.85% | | | | | | | | | | | | | | | | |
Adtalem Global Education Incorporated † | | | | | | | | | | | 14,511 | | | | 694,351 | |
American Public Education Incorporated † | | | | | | | | | | | 3,922 | | | | 136,290 | |
Bridgepoint Education Incorporated † | | | | | | | | | | | 6,644 | | | | 78,133 | |
Cambium Learning Group Incorporated † | | | | | | | | | | | 3,681 | | | | 49,252 | |
Career Education Corporation † | | | | | | | | | | | 16,547 | | | | 263,925 | |
Carriage Services Incorporated | | | | | | | | | | | 3,671 | | | | 83,589 | |
Collectors Universe Incorporated | | | | | | | | | | | 2,068 | | | | 30,875 | |
Graham Holdings Company Class B | | | | | | | | | | | 1,072 | | | | 603,161 | |
Houghton Mifflin Harcourt Company † | | | | | | | | | | | 26,036 | | | | 167,932 | |
K12 Incorporated † | | | | | | | | | | | 9,618 | | | | 159,274 | |
Laureate Education Incorporated Class A † | | | | | | | | | | | 12,889 | | | | 205,837 | |
Liberty Tax Incorporated | | | | | | | | | | | 1,688 | | | | 19,412 | |
Regis Corporation † | | | | | | | | | | | 8,753 | | | | 187,227 | |
Strategic Education Incorporated | | | | | | | | | | | 5,134 | | | | 712,445 | |
| | | | |
| | | | | | | | | | | | | | | 3,391,703 | |
| | | | | | | | | | | | | | | | |
| | | | |
| Hotels, Restaurants & Leisure: 3.16% | | | | | | | | | | | | | | | | |
Bbx Capital Corporation | | | | | | | | | | | 16,122 | | | | 119,786 | |
Biglari Holdings Incorporated Class A † | | | | | | | | | | | 28 | | | | 26,827 | |
The accompanying notes are an integral part of these financial statements.
| | | | | | |
| Portfolio of investments—August 31, 2018 (unaudited) | | Wells Fargo Funds | | | 137 | |
FACTOR ENHANCED SMALL CAP PORTFOLIO
| | | | | | | | | | | | | | | | |
| Security name | | | | | | | | Shares | | | Value | |
| | | | |
| Hotels, Restaurants & Leisure (continued) | | | | | | | | | | | | | | | | |
Biglari Holdings Incorporated Class B † | | | | | | | | | | | 299 | | | $ | 59,067 | |
BJ’s Restaurants Incorporated | | | | | | | | | | | 4,902 | | | | 371,081 | |
Bloomin’ Brands Incorporated | | | | | | | | | | | 21,484 | | | | 414,641 | |
Bluegreen Vacations Corporation | | | | | | | | | | | 1,816 | | | | 33,923 | |
Bojangles Incorporated † | | | | | | | | | | | 4,181 | | | | 61,043 | |
Brinker International Incorporated | | | | | | | | | | | 11,437 | | | | 506,430 | |
Carrols Restaurant Group Incorporated † | | | | | | | | | | | 8,541 | | | | 134,948 | |
Century Casinos Incorporated † | | | | | | | | | | | 6,694 | | | | 53,552 | |
Choice Hotels International Incorporated | | | | | | | | | | | 8,781 | | | | 685,357 | |
Churchill Downs Incorporated | | | | | | | | | | | 2,630 | | | | 743,238 | |
Chuy’s Holding Incorporated † | | | | | | | | | | | 4,074 | | | | 117,942 | |
Dave & Buster’s Entertainment Incorporated † | | | | | | | | | | | 9,821 | | | | 571,288 | |
Del Frisco’s Restaurant Group Incorporated † | | | | | | | | | | | 4,914 | | | | 46,437 | |
Del Taco Restaurants Incorporated † | | | | | | | | | | | 7,217 | | | | 93,316 | |
Denny’s Corporation † | | | | | | | | | | | 15,290 | | | | 230,420 | |
Dine Brands Global Incorporated | | | | | | | | | | | 4,174 | | | | 348,195 | |
Drive Shack Incorporated † | | | | | | | | | | | 14,799 | | | | 91,754 | |
El Pollo Loco Holdings Incorporated † | | | | | | | | | | | 5,295 | | | | 63,011 | |
Eldorado Resorts Incorporated † | | | | | | | | | | | 14,423 | | | | 693,025 | |
Fiesta Restaurant Group Incorporated † | | | | | | | | | | | 5,118 | | | | 147,143 | |
Golden Entertainment Incorporated † | | | | | | | | | | | 4,630 | | | | 134,316 | |
International Speedway Corporation Class A | | | | | | | | | | | 5,923 | | | | 261,500 | |
J. Alexander’s Holdings Incorporated † | | | | | | | | | | | 3,138 | | | | 38,911 | |
Jack in the Box Incorporated | | | | | | | | | | | 7,146 | | | | 647,713 | |
Jamba Incorporated † | | | | | | | | | | | 3,047 | | | | 39,550 | |
Lindblad Expeditions Holding † | | | | | | | | | | | 6,107 | | | | 92,765 | |
Marriott Vacations Worldwide Corporation | | | | | | | | | | | 5,250 | | | | 624,750 | |
Monarch Casino & Resort Incorporated † | | | | | | | | | | | 2,874 | | | | 135,222 | |
Nathan S Famous Incorporated | | | | | | | | | | | 703 | | | | 62,356 | |
Noodles & Company † | | | | | | | | | | | 4,035 | | | | 49,631 | |
Papa John’s International Incorporated | | | | | | | | | | | 5,709 | | | | 263,299 | |
Penn National Gaming Incorporated † | | | | | | | | | | | 21,010 | | | | 724,005 | |
Pinnacle Entertainment Incorporated † | | | | | | | | | | | 13,351 | | | | 457,138 | |
Playa Hotels & Resorts NV † | | | | | | | | | | | 14,270 | | | | 147,409 | |
Potbelly Corporation † | | | | | | | | | | | 5,721 | | | | 77,520 | |
RCI Hospitality Holdings Incorporated | | | | | | | | | | | 2,205 | | | | 71,508 | |
Red Lion Hotels Corporation † | | | | | | | | | | | 4,054 | | | | 55,337 | |
Red Robin Gourmet Burgers Incorporated † | | | | | | | | | | | 3,151 | | | | 130,136 | |
Red Rock Resorts Incorporated Class A | | | | | | | | | | | 17,284 | | | | 564,150 | |
Ruth’s Chris Steak House Incorporated | | | | | | | | | | | 7,156 | | | | 220,405 | |
SeaWorld Entertainment Incorporated † | | | | | | | | | | | 13,368 | | | | 391,950 | |
Shake Shack Incorporated Class A † | | | | | | | | | | | 4,887 | | | | 295,419 | |
Sonic Corporation | | | | | | | | | | | 8,621 | | | | 309,149 | |
Speedway Motorsports Incorporated | | | | | | | | | | | 1,498 | | | | 26,799 | |
The Cheesecake Factory Incorporated | | | | | | | | | | | 10,542 | | | | 560,518 | |
The Habit Restaurants Incorporated Class A † | | | | | | | | | | | 5,071 | | | | 83,925 | |
Town Sports International Holdings Incorporated † | | | | | | | | | | | 3,483 | | | | 31,869 | |
Wingstop Incorporated | | | | | | | | | | | 7,165 | | | | 479,697 | |
Zoe’s Kitchen Incorporated † | | | | | | | | | | | 4,823 | | | | 66,075 | |
| | | | |
| | | | | | | | | | | | | | | 12,655,446 | |
| | | | | | | | | | | | | | | | |
The accompanying notes are an integral part of these financial statements.
| | | | |
| 138 | | Wells Fargo Funds | | Portfolio of investments—August 31, 2018 (unaudited) |
FACTOR ENHANCED SMALL CAP PORTFOLIO
| | | | | | | | | | | | | | | | |
| Security name | | | | | | | | Shares | | | Value | |
| | | | |
| Household Durables: 1.70% | | | | | | | | | | | | | | | | |
AV Homes Incorporated † | | | | | | | | | | | 2,463 | | | $ | 52,831 | |
Bassett Furniture Industries Incorporated | | | | | | | | | | | 2,625 | | | | 61,294 | |
Cavco Industries Incorporated † | | | | | | | | | | | 2,111 | | | | 518,039 | |
Century Communities Incorporated † | | | | | | | | | | | 6,357 | | | | 185,942 | |
CSS Industries Incorporated | | | | | | | | | | | 2,481 | | | | 34,436 | |
Ethan Allen Interiors Incorporated | | | | | | | | | | | 6,426 | | | | 142,979 | |
Flexsteel Industries Incorporated | | | | | | | | | | | 1,875 | | | | 66,900 | |
Green Brick Partners Incorporated † | | | | | | | | | | | 5,791 | | | | 60,516 | |
Hamilton Beach Brand Class A | | | | | | | | | | | 2,028 | | | | 46,948 | |
Helen of Troy Limited † | | | | | | | | | | | 6,517 | | | | 775,197 | |
Hooker Furniture Corporation | | | | | | | | | | | 3,082 | | | | 129,598 | |
Hovnanian Enterprises Incorporated Class A † | | | | | | | | | | | 30,394 | | | | 47,415 | |
Installed Building Products † | | | | | | | | | | | 5,141 | | | | 239,314 | |
KB Home Incorporated | | | | | | | | | | | 21,652 | | | | 538,052 | |
La-Z-Boy Incorporated | | | | | | | | | | | 11,524 | | | | 383,173 | |
LGI Homes Incorporated † | | | | | | | | | | | 4,537 | | | | 261,331 | |
Libbey Incorporated | | | | | | | | | | | 5,248 | | | | 51,588 | |
Lifetime Brands Incorporated | | | | | | | | | | | 3,060 | | | | 35,649 | |
M/I Homes Incorporated † | | | | | | | | | | | 6,970 | | | | 180,593 | |
MDC Holdings Incorporated | | | | | | | | | | | 11,378 | | | | 360,683 | |
Meritage Corporation † | | | | | | | | | | | 9,516 | | | | 410,615 | |
Skyline Corporation | | | | | | | | | | | 1,703 | | | | 49,234 | |
Tempur-Pedic International Incorporated † | | | | | | | | | | | 11,632 | | | | 644,296 | |
The New Home Company Incorporated † | | | | | | | | | | | 3,279 | | | | 28,790 | |
TopBuild Corporation † | | | | | | | | | | | 8,931 | | | | 556,223 | |
TRI Pointe Homes Incorporated † | | | | | | | | | | | 37,129 | | | | 537,999 | |
Universal Electronics Incorporated † | | | | | | | | | | | 3,409 | | | | 147,269 | |
William Lyon Homes Class A † | | | | | | | | | | | 8,241 | | | | 161,276 | |
Zagg Incorporated † | | | | | | | | | | | 6,708 | | | | 108,670 | |
| | | | |
| | | | | | | | | | | | | | | 6,816,850 | |
| | | | | | | | | | | | | | | | |
| | | | |
| Internet & Direct Marketing Retail: 0.69% | | | | | | | | | | | | | | | | |
1-800-Flowers.com Incorporated Class A † | | | | | | | | | | | 6,002 | | | | 72,324 | |
Blue Apron Holdings Incorporated Class A † | | | | | | | | | | | 10,588 | | | | 21,388 | |
Duluth Holdings Incorporated Class B † | | | | | | | | | | | 2,475 | | | | 71,627 | |
FTD Companies Incorporated † | | | | | | | | | | | 4,360 | | | | 15,609 | |
Gaia Incorporated † | | | | | | | | | | | 2,771 | | | | 48,493 | |
Groupon Incorporated † | | | | | | | | | | | 109,195 | | | | 466,263 | |
Lands End Incorporated † | | | | | | | | | | | 2,543 | | | | 65,355 | |
Liberty Expedia Holdings Incorporated Class A † | | | | | | | | | | | 13,140 | | | | 606,411 | |
Nutrisystem Incorporated | | | | | | | | | | | 7,246 | | | | 268,102 | |
Overstock.com Incorporated † | | | | | | | | | | | 5,345 | | | | 156,074 | |
PetMed Express Incorporated | | | | | | | | | | | 4,957 | | | | 181,872 | |
Shutterfly Incorporated † | | | | | | | | | | | 8,185 | | | | 635,811 | |
Stitch Fix Incorporated Class A † | | | | | | | | | | | 4,163 | | | | 168,935 | |
| | | | |
| | | | | | | | | | | | | | | 2,778,264 | |
| | | | | | | | | | | | | | | | |
| | | | |
| Leisure Products: 0.54% | | | | | | | | | | | | | | | | |
Acushnet Holdings Corporation | | | | | | | | | | | 8,338 | | | | 225,543 | |
American Outdoor Brands Corporation † | | | | | | | | | | | 13,520 | | | | 189,686 | |
The accompanying notes are an integral part of these financial statements.
| | | | | | |
| Portfolio of investments—August 31, 2018 (unaudited) | | Wells Fargo Funds | | | 139 | |
FACTOR ENHANCED SMALL CAP PORTFOLIO
| | | | | | | | | | | | | | | | |
| Security name | | | | | | | | Shares | | | Value | |
| | | | |
| Leisure Products (continued) | | | | | | | | | | | | | | | | |
Callaway Golf Company | | | | | | | | | | | 23,561 | | | $ | 537,426 | |
Clarus Corporation | | | | | | | | | | | 5,193 | | | | 53,748 | |
Escalade Incorporated | | | | | | | | | | | 2,341 | | | | 31,135 | |
Johnson Outdoors Incorporated Class A | | | | | | | | | | | 927 | | | | 93,887 | |
Malibu Boats Incorporated Class A † | | | | | | | | | | | 4,975 | | | | 239,845 | |
Marine Products Corporation | | | | | | | | | | | 1,812 | | | | 35,588 | |
MCBC Holdings Incorporated † | | | | | | | | | | | 4,430 | | | | 122,135 | |
Nautilus Group Incorporated † | | | | | | | | | | | 7,397 | | | | 108,366 | |
Sturm, Ruger & Company Incorporated | | | | | | | | | | | 4,232 | | | | 276,984 | |
Vista Outdoor Incorporated † | | | | | | | | | | | 14,166 | | | | 261,646 | |
| | | | |
| | | | | | | | | | | | | | | 2,175,989 | |
| | | | | | | | | | | | | | | | |
| | | | |
| Media: 1.59% | | | | | | | | | | | | | | | | |
A.H. Belo Corporation Class A | | | | | | | | | | | 4,445 | | | | 19,558 | |
AMC Entertainment Holdings Class A | | | | | | | | | | | 12,998 | | | | 247,612 | |
AMC Networks Incorporated Class A † | | | | | | | | | | | 11,980 | | | | 752,464 | |
Boston Omaha Corporation Class A † | | | | | | | | | | | 1,571 | | | | 40,783 | |
Clear Channel Outdoor Holdings Incorporated Class A | | | | | | | | | | | 9,306 | | | | 42,342 | |
Daily Journal Corporation † | | | | | | | | | | | 219 | | | | 52,221 | |
Emerald Expositions Events Class I | | | | | | | | | | | 6,351 | | | | 99,203 | |
Entercom Communications Corporation | | | | | | | | | | | 30,570 | | | | 239,975 | |
Entravision Communications Corporation Class A | | | | | | | | | | | 16,081 | | | | 84,425 | |
Gannett Company Incorporated | | | | | | | | | | | 27,781 | | | | 285,589 | |
Gray Television Incorporated † | | | | | | | | | | | 19,929 | | | | 347,761 | |
Hemisphere Media Group Incorporated † | | | | | | | | | | | 4,254 | | | | 58,280 | |
John Wiley & Sons Incorporated Class A | | | | | | | | | | | 11,643 | | | | 751,556 | |
Lee Enterprises Incorporated † | | | | | | | | | | | 11,367 | | | | 32,396 | |
Marcus Corporation | | | | | | | | | | | 4,659 | | | | 189,155 | |
Meredith Corporation | | | | | | | | | | | 9,738 | | | | 502,968 | |
MSG Networks Incorporated Class A † | | | | | | | | | | | 14,805 | | | | 359,762 | |
National CineMedia Incorporated | | | | | | | | | | | 19,047 | | | | 173,328 | |
New Media Investment Group Incorporated | | | | | | | | | | | 14,211 | | | | 225,955 | |
Reading International Incorporated Class A † | | | | | | | | | | | 3,635 | | | | 58,524 | |
Saga Communications Incorporated Cl ass A | | | | | | | | | | | 1,210 | | | | 45,980 | |
Scholastic Corporation | | | | | | | | | | | 5,807 | | | | 244,126 | |
Sinclair Broadcast Group Incorporated Class A | | | | | | | | | | | 18,589 | | | | 538,152 | |
Tronc Incorporated † | | | | | | | | | | | 4,224 | | | | 69,696 | |
WideOpenWest Incorporated † | | | | | | | | | | | 7,454 | | | | 86,839 | |
World Wrestling Entertainment Incorporated Class A | | | | | | | | | | | 9,452 | | | | 826,199 | |
| | | | |
| | | | | | | | | | | | | | | 6,374,849 | |
| | | | | | | | | | | | | | | | |
| | | | |
| Multiline Retail: 0.22% | | | | | | | | | | | | | | | | |
Big Lots Stores Incorporated | | | | | | | | | | | 10,584 | | | | 455,641 | |
Dillard’s Incorporated Class A | | | | | | | | | | | 2,929 | | | | 230,161 | |
JCPenny Company Incorporated † | | | | | | | | | | | 74,435 | | | | 131,750 | |
Sears Holdings Corporation † | | | | | | | | | | | 9,114 | | | | 12,213 | |
Tuesday Morning Corporation † | | | | | | | | | | | 11,289 | | | | 34,431 | |
| | | | |
| | | | | | | | | | | | | | | 864,196 | |
| | | | | | | | | | | | | | | | |
The accompanying notes are an integral part of these financial statements.
| | | | |
| 140 | | Wells Fargo Funds | | Portfolio of investments—August 31, 2018 (unaudited) |
FACTOR ENHANCED SMALL CAP PORTFOLIO
| | | | | | | | | | | | | | | | |
| Security name | | | | | | | | Shares | | | Value | |
| | | | |
| Specialty Retail: 3.51% | | | | | | | | | | | | | | | | |
Abercrombie & Fitch Company Class A | | | | | | | | | | | 18,137 | | | $ | 393,029 | |
America’s Car-Mart Incorporated † | | | | | | | | | | | 1,583 | | | | 132,101 | |
Asbury Automotive Group Incorporated † | | | | | | | | | | | 5,144 | | | | 383,228 | |
Barnes & Noble Education Incorporated † | | | | | | | | | | | 8,045 | | | | 48,109 | |
Barnes & Noble Incorporated | | | | | | | | | | | 13,203 | | | | 69,316 | |
Bed Bath & Beyond Incorporated | | | | | | | | | | | 34,037 | | | | 610,624 | |
Big 5 Sporting Goods Corporation | | | | | | | | | | | 5,451 | | | | 31,071 | |
Boot Barn Holdings Incorporated † | | | | | | | | | | | 4,927 | | | | 147,465 | |
Build A Bear Workshop Incorporated † | | | | | | | | | | | 3,202 | | | | 29,458 | |
Caleres Incorporated | | | | | | | | | | | 9,293 | | | | 376,181 | |
Camping World Holdings Incorporated Class A | | | | | | | | | | | 8,237 | | | | 170,588 | |
Carvana Corporation † | | | | | | | | | | | 4,208 | | | | 272,426 | |
Chico’s FAS Incorporated | | | | | | | | | | | 30,304 | | | | 276,372 | |
Children’s Place Retail Stores Incorporated | | | | | | | | | | | 4,135 | | | | 582,001 | |
Citi Trends Incorporated | | | | | | | | | | | 3,148 | | | | 97,399 | |
Container Store Group Incorporated † | | | | | | | | | | | 4,390 | | | | 49,607 | |
Dick’s Sporting Goods Incorporated | | | | | | | | | | | 19,118 | | | | 715,778 | |
DSW Incorporated Class A | | | | | | | | | | | 17,098 | | | | 568,679 | |
Express Incorporated † | | | | | | | | | | | 17,230 | | | | 193,321 | |
Francescas Holdings Corporation † | | | | | | | | | | | 8,787 | | | | 55,182 | |
GameStop Corporation Class A | | | | | | | | | | | 25,168 | | | | 333,979 | |
Genesco Incorporated † | | | | | | | | | | | 4,313 | | | | 219,316 | |
Group 1 Automotive Incorporated | | | | | | | | | | | 4,829 | | | | 372,268 | |
Guess? Incorporated | | | | | | | | | | | 12,357 | | | | 302,747 | |
Haverty Furniture Companies Incorporated | | | | | | | | | | | 4,464 | | | | 98,654 | |
Hibbett Sports Incorporated † | | | | | | | | | | | 4,667 | | | | 95,907 | |
Kirkland’s Incorporated † | | | | | | | | | | | 3,898 | | | | 35,433 | |
Lithia Motors Incorporated Class A | | | | | | | | | | | 5,916 | | | | 511,142 | |
MarineMax Incorporated † | | | | | | | | | | | 6,473 | | | | 145,643 | |
Monro Muffler Brake Incorporated | | | | | | | | | | | 7,835 | | | | 555,893 | |
Murphy USA Incorporated † | | | | | | | | | | | 7,930 | | | | 658,031 | |
New York & Company Incorporated † | | | | | | | | | | | 7,108 | | | | 32,341 | |
Office Depot Incorporated | | | | | | | | | | | 136,040 | | | | 455,734 | |
Party City Holdco Incorporated † | | | | | | | | | | | 9,397 | | | | 144,244 | |
Penske Auto Group Incorporated | | | | | | | | | | | 9,257 | | | | 487,196 | |
Pier 1 Imports Incorporated | | | | | | | | | | | 20,027 | | | | 36,850 | |
Rent-A-Center Incorporated † | | | | | | | | | | | 10,646 | | | | 156,922 | |
Sally Beauty Holdings Incorporated † | | | | | | | | | | | 31,214 | | | | 480,696 | |
Shoe Carnival Incorporated | | | | | | | | | | | 2,859 | | | | 127,111 | |
Signet Jewelers Limited | | | | | | | | | | | 11,663 | | | | 748,765 | |
Sleep Number Corporation † | | | | | | | | | | | 9,068 | | | | 305,592 | |
Sonic Automotive Incorporated | | | | | | | | | | | 5,288 | | | | 113,692 | |
Sportsman’s Warehouse Holdings Incorporated † | | | | | | | | | | | 8,097 | | | | 46,234 | |
Tailored Brands Incorporated | | | | | | | | | | | 11,896 | | | | 280,032 | |
The Buckle Incorporated | | | | | | | | | | | 7,202 | | | | 185,452 | |
The Cato Corporation Class A | | | | | | | | | | | 5,688 | | | | 122,008 | |
The Michaels Companies Incorporated † | | | | | | | | | | | 28,284 | | | | 480,545 | |
Tilly’s Incorporated Class A | | | | | | | | | | | 3,283 | | | | 77,216 | |
Travelcenters of America LLC † | | | | | | | | | | | 8,273 | | | | 35,988 | |
Urban Outfitters Incorporated † | | | | | | | | | | | 18,766 | | | | 872,244 | |
The accompanying notes are an integral part of these financial statements.
| | | | | | |
| Portfolio of investments—August 31, 2018 (unaudited) | | Wells Fargo Funds | | | 141 | |
FACTOR ENHANCED SMALL CAP PORTFOLIO
| | | | | | | | | | | | | | | | |
| Security name | | | | | | | | Shares | | | Value | |
| | | | |
| Specialty Retail (continued) | | | | | | | | | | | | | | | | |
Vitamin Shoppe Incorporated † | | | | | | | | | | | 5,973 | | | $ | 76,454 | |
Winmark Corporation | | | | | | | | | | | 585 | | | | 87,282 | |
Zumiez Incorporated † | | | | | | | | | | | 4,665 | | | | 145,315 | |
| | | | |
| | | | | | | | | | | | | | | 14,028,861 | |
| | | | | | | | | | | | | | | | |
| | | | |
| Textiles, Apparel & Luxury Goods: 1.06% | | | | | | | | | | | | | | | | |
Columbia Sportswear Company | | | | | | | | | | | 7,536 | | | | 683,515 | |
Crocs Incorporated † | | | | | | | | | | | 16,629 | | | | 343,555 | |
Culp Incorporated | | | | | | | | | | | 2,782 | | | | 70,524 | |
Deckers Outdoor Corporation † | | | | | | | | | | | 7,699 | | | | 938,046 | |
Delta Apparel Incorporated † | | | | | | | | | | | 1,460 | | | | 27,083 | |
G-III Apparel Group Limited † | | | | | | | | | | | 10,187 | | | | 463,305 | |
Lakeland Industries Incorporated † | | | | | | | | | | | 1,788 | | | | 23,602 | |
Movado Group Incorporated | | | | | | | | | | | 3,750 | | | | 159,750 | |
Oxford Industries Incorporated | | | | | | | | | | | 4,052 | | | | 377,201 | |
Perry Ellis International Incorporated † | | | | | | | | | | | 3,091 | | | | 85,095 | |
Rocky Brands Incorporated | | | | | | | | | | | 1,692 | | | | 51,014 | |
Steven Madden Limited | | | | | | | | | | | 13,195 | | | | 767,289 | |
Superior Uniform Group Incorporated | | | | | | | | | | | 2,296 | | | | 43,509 | |
Unifi Incorporated † | | | | | | | | | | | 3,727 | | | | 118,556 | |
Vera Bradley Incorporated † | | | | | | | | | | | 6,944 | | | | 101,799 | |
| | | | |
| | | | | | | | | | | | | | | 4,253,843 | |
| | | | | | | | | | | | | | | | |
| | | | |
Consumer Staples: 4.00% | | | | | | | | | | | | | | | | |
| | | | |
| Beverages: 0.41% | | | | | | | | | | | | | | | | |
Boston Beer Company Incorporated † | | | | | | | | | | | 2,076 | | | | 629,339 | |
Castle Brands Incorporated † | | | | | | | | | | | 25,168 | | | | 28,943 | |
Coca Cola Bottling Corporation | | | | | | | | | | | 1,158 | | | | 196,350 | |
Craft Brew Alliance Incorporated † | | | | | | | | | | | 2,373 | | | | 44,968 | |
MGP Ingredients Incorporated | | | | | | | | | | | 3,193 | | | | 246,212 | |
National Beverage Corporation † | | | | | | | | | | | 2,886 | | | | 340,086 | |
Primo Water Corporation † | | | | | | | | | | | 6,734 | | | | 134,680 | |
| | | | |
| | | | | | | | | | | | | | | 1,620,578 | |
| | | | | | | | | | | | | | | | |
| | | | |
| Food & Staples Retailing: 1.08% | | | | | | | | | | | | | | | | |
Ingles Markets Incorporated Class A | | | | | | | | | | | 3,408 | | | | 122,518 | |
Performance Food Group Company † | | | | | | | | | | | 25,241 | | | | 835,477 | |
Pricesmart Incorporated | | | | | | | | | | | 6,579 | | | | 571,386 | |
Rite Aid Corporation † | | | | | | | | | | | 262,690 | | | | 359,885 | |
Smart & Final Stores Incorporated † | | | | | | | | | | | 6,902 | | | | 48,314 | |
SpartanNash Company | | | | | | | | | | | 8,655 | | | | 184,784 | |
Sprouts Farmers Market Incorporated † | | | | | | | | | | | 30,868 | | | | 817,076 | |
SUPERVALU Incorporated † | | | | | | | | | | | 8,981 | | | | 289,996 | |
The Andersons Incorporated | | | | | | | | | | | 6,580 | | | | 268,793 | |
The Chef’s Warehouse Incorporated † | | | | | | | | | | | 5,667 | | | | 166,610 | |
United Natural Foods Incorporated † | | | | | | | | | | | 12,374 | | | | 439,401 | |
Village Super Market Class A | | | | | | | | | | | 1,892 | | | | 55,209 | |
Weis Markets Incorporated | | | | | | | | | | | 3,692 | | | | 172,010 | |
| | | | |
| | | | | | | | | | | | | | | 4,331,459 | |
| | | | | | | | | | | | | | | | |
The accompanying notes are an integral part of these financial statements.
| | | | |
| 142 | | Wells Fargo Funds | | Portfolio of investments—August 31, 2018 (unaudited) |
FACTOR ENHANCED SMALL CAP PORTFOLIO
| | | | | | | | | | | | | | | | |
| Security name | | | | | | | | Shares | | | Value | |
| | | | |
| Food Products: 1.67% | | | | | | | | | | | | | | | | |
Alico Incorporated | | | | | | | | | | | 565 | | | $ | 18,250 | |
B&G Foods Incorporated | | | | | | | | | | | 16,448 | | | | 525,514 | |
Cal-Maine Foods Incorporated | | | | | | | | | | | 7,135 | | | | 352,826 | |
Calavo Growers Incorporated | | | | | | | | | | | 3,826 | | | | 404,982 | |
Darling Ingredients Incorporated † | | | | | | | | | | | 40,469 | | | | 800,477 | |
Dean Foods Company | | | | | | | | | | | 22,620 | | | | 172,364 | |
Farmer Bros Corporation † | | | | | | | | | | | 2,687 | | | | 77,923 | |
Fresh Del Monte Produce Incorporated | | | | | | | | | | | 7,511 | | | | 281,212 | |
Freshpet Incorporated † | | | | | | | | | | | 6,060 | | | | 225,129 | |
Hostess Brands Incorporated † | | | | | | | | | | | 23,334 | | | | 274,408 | |
J & J Snack Foods Corporation | | | | | | | | | | | 3,708 | | | | 539,514 | |
John B. Sanfilippo & Son Incorporated | | | | | | | | | | | 2,099 | | | | 153,374 | |
Lancaster Colony Corporation | | | | | | | | | | | 4,751 | | | | 742,439 | |
Landec Corporation † | | | | | | | | | | | 6,588 | | | | 88,609 | |
Limoneira Corporation | | | | | | | | | | | 2,949 | | | | 90,977 | |
Pilgrim’s Pride Corporation † | | | | | | | | | | | 13,262 | | | | 245,214 | |
Sanderson Farms Incorporated | | | | | | | | | | | 5,093 | | | | 538,636 | |
Seneca Foods Corporation Class A † | | | | | | | | | | | 1,598 | | | | 51,615 | |
Simply Good Foods Company † | | | | | | | | | | | 14,699 | | | | 264,582 | |
Tootsie Roll Industries Incorporated | | | | | | | | | | | 3,328 | | | | 95,846 | |
TreeHouse Foods Incorporated † | | | | | | | | | | | 14,055 | | | | 732,266 | |
| | | | |
| | | | | | | | | | | | | | | 6,676,157 | |
| | | | | | | | | | | | | | | | |
| | | | |
| Household Products: 0.24% | | | | | | | | | | | | | | | | |
Central Garden & Pet Company Class A † | | | | | | | | | | | 8,713 | | | | 316,543 | |
Oil Dri Corporation of America | | | | | | | | | | | 1,275 | | | | 51,829 | |
WD-40 Company | | | | | | | | | | | 3,306 | | | | 586,650 | |
| | | | |
| | | | | | | | | | | | | | | 955,022 | |
| | | | | | | | | | | | | | | | |
| | | | |
| Personal Products: 0.37% | | | | | | | | | | | | | | | | |
Elf Beauty Incorporated † | | | | | | | | | | | 5,758 | | | | 79,979 | |
Inter Parfums Incorporated | | | | | | | | | | | 4,291 | | | | 280,202 | |
Medifast Incorporated | | | | | | | | | | | 2,774 | | | | 634,553 | |
Natural Health Trends Corporation | | | | | | | | | | | 1,829 | | | | 48,414 | |
Revlon Incorporation Class A † | | | | | | | | | | | 1,842 | | | | 40,064 | |
USANA Health Sciences Incorporated † | | | | | | | | | | | 3,108 | | | | 410,101 | |
| | | | |
| | | | | | | | | | | | | | | 1,493,313 | |
| | | | | | | | | | | | | | | | |
| | | | |
| Tobacco: 0.23% | | | | | | | | | | | | | | | | |
22nd Century Group Incorporated † | | | | | | | | | | | 27,515 | | | | 74,566 | |
Alliance One International † | | | | | | | | | | | 2,057 | | | | 36,409 | |
Turning Point Brands Incorporated | | | | | | | | | | | 1,829 | | | | 61,564 | |
Universal Corporation | | | | | | | | | | | 6,095 | | | | 364,481 | |
Vector Group Limited | | | | | | | | | | | 24,487 | | | | 380,283 | |
| | | | |
| | | | | | | | | | | | | | | 917,303 | |
| | | | | | | | | | | | | | | | |
The accompanying notes are an integral part of these financial statements.
| | | | | | |
| Portfolio of investments—August 31, 2018 (unaudited) | | Wells Fargo Funds | | | 143 | |
FACTOR ENHANCED SMALL CAP PORTFOLIO
| | | | | | | | | | | | | | | | |
| Security name | | | | | | | | Shares | | | Value | |
| | | | |
Energy: 2.87% | | | | | | | | | | | | | | | | |
| | | | |
| Energy Equipment & Services: 1.29% | | | | | | | | | | | | | | | | |
Basic Energy Services Incorporated † | | | | | | | | | | | 5,660 | | | $ | 50,148 | |
Bristow Group Incorporated † | | | | | | | | | | | 5,867 | | | | 64,302 | |
Cactus Incorporated Class A † | | | | | | | | | | | 6,607 | | | | 225,827 | |
Dawson Geophysical Corporation † | | | | | | | | | | | 5,557 | | | | 34,453 | |
Diamond Offshore Drilling Incorporated † | | | | | | | | | | | 16,451 | | | | 286,576 | |
Era Group Incorporated † | | | | | | | | | | | 5,135 | | | | 61,312 | |
Exterran Corporation † | | | | | | | | | | | 8,840 | | | | 242,128 | |
FTS International Incorporated † | | | | | | | | | | | 6,865 | | | | 75,721 | |
Gulf Island Fabrication Incorporated | | | | | | | | | | | 3,510 | | | | 33,170 | |
Gulfmark Offshore Incorporated † | | | | | | | | | | | 732 | | | | 26,718 | |
Hornbeck Offshore Services Incorporated † | | | | | | | | | | | 8,163 | | | | 35,999 | |
Independence Contract Drilli † | | | | | | | | | | | 8,813 | | | | 38,513 | |
Ion Geophysical Corporation † | | | | | | | | | | | 2,732 | | | | 49,039 | |
Keane Group Incorporated † | | | | | | | | | | | 11,589 | | | | 142,313 | |
Liberty Oilfield Services Class A | | | | | | | | | | | 3,791 | | | | 74,455 | |
Mammoth Energy Services Incorporated | | | | | | | | | | | 2,028 | | | | 55,729 | |
Matrix Service Company † | | | | | | | | | | | 6,622 | | | | 138,400 | |
McDermott International Incorporated † | | | | | | | | | | | 44,444 | | | | 859,547 | |
Natural Gas Services Group Incorporated † | | | | | | | | | | | 3,086 | | | | 68,201 | |
Newpark Resources Incorporated † | | | | | | | | | | | 21,370 | | | | 224,385 | |
Nine Energy Service Incorporated † | | | | | | | | | | | 1,930 | | | | 57,861 | |
Oceaneering International Incorporated | | | | | | | | | | | 24,771 | | | | 700,276 | |
Parker Drilling Company † | | | | | | | | | | | 2,262 | | | | 8,912 | |
PHI Incorporated - Non Voting † | | | | | | | | | | | 2,880 | | | | 23,472 | |
ProPetro Holding Corporation † | | | | | | | | | | | 15,392 | | | | 234,266 | |
RigNet Incorporated † | | | | | | | | | | | 3,383 | | | | 55,143 | |
RPC Incorporated | | | | | | | | | | | 14,736 | | | | 201,588 | |
Seacor Holdings Incorporated | | | | | | | | | | | 4,196 | | | | 215,884 | |
Seacor Marine Holdings Incorporated † | | | | | | | | | | | 4,033 | | | | 82,596 | |
Select Energy Services Incorporated Class A † | | | | | | | | | | | 10,831 | | | | 147,843 | |
Smart Sand Incorporated † | | | | | | | | | | | 5,287 | | | | 26,329 | |
Solaris Oilfield Infrastructure Incorporated Class A † | | | | | | | | | | | 6,402 | | | | 110,242 | |
Tetra Technologies Incorporated † | | | | | | | | | | | 31,313 | | | | 143,727 | |
Unit Corporation † | | | | | | | | | | | 13,236 | | | | 347,974 | |
| | | | |
| | | | | | | | | | | | | | | 5,143,049 | |
| | | | | | | | | | | | | | | | |
| | | | |
| Oil, Gas & Consumable Fuels: 1.58% | | | | | | | | | | | | | | | | |
Abraxas Petroleum Corporation † | | | | | | | | | | | 39,213 | | | | 88,229 | |
Adams Resources & Energy Incorporated | | | | | | | | | | | 361 | | | | 16,570 | |
Alta Mesa Resources Incorporated † | | | | | | | | | | | 20,108 | | | | 95,312 | |
Amyris Incorporated † | | | | | | | | | | | 6,476 | | | | 58,090 | |
Arch Coal Incorporated | | | | | | | | | | | 4,894 | | | | 433,951 | |
Cloud Peak Energy Incorporated † | | | | | | | | | | | 19,839 | | | | 46,820 | |
Consol Energy Incorporated † | | | | | | | | | | | 6,261 | | | | 268,597 | |
Contango Oil & Gas Company † | | | | | | | | | | | 6,099 | | | | 41,656 | |
CVR Energy Incorporated | | | | | | | | | | | 3,994 | | | | 151,972 | |
DHT Holdings Incorporated | | | | | | | | | | | 34,357 | | | | 160,791 | |
Dorian LPG Limited † | | | | | | | | | | | 8,051 | | | | 61,349 | |
The accompanying notes are an integral part of these financial statements.
| | | | |
| 144 | | Wells Fargo Funds | | Portfolio of investments—August 31, 2018 (unaudited) |
FACTOR ENHANCED SMALL CAP PORTFOLIO
| | | | | | | | | | | | | | | | |
| Security name | | | | | | | | Shares | | | Value | |
| | | | |
| Oil, Gas & Consumable Fuels (continued) | | | | | | | | | | | | | | | | |
Earthstone Energy Incorporated Class A † | | | | | | | | | | | 4,664 | | | $ | 39,084 | |
Energy XXI Gulf Coast Incorporated † | | | | | | | | | | | 8,339 | | | | 75,468 | |
Enlink Midstream LLC | | | | | | | | | | | 16,296 | | | | 265,625 | |
Euronav NV | | | | | | | | | | | 1 | | | | 9 | |
Evolution Petroleum Corporation | | | | | | | | | | | 6,309 | | | | 63,405 | |
Gastar Exploration Limited † | | | | | | | | | | | 26,018 | | | | 2,058 | |
Green Plains Renewable Energy Incorporated | | | | | | | | | | | 9,815 | | | | 174,216 | |
Gulfport Energy Corporation † | | | | | | | | | | | 40,513 | | | | 476,433 | |
Halcon Resources Corporation † | | | | | | | | | | | 38,892 | | | | 178,125 | |
Hallador Energy Corporation | | | | | | | | | | | 5,329 | | | | 32,560 | |
International Seaways Incorporated † | | | | | | | | | | | 4,602 | | | | 94,433 | |
Laredo Petroleum Incorporated † | | | | | | | | | | | 39,887 | | | | 330,663 | |
Lilis Energy Incorporated † | | | | | | | | | | | 8,889 | | | | 47,289 | |
Midstates Petroleum Company Incorporated † | | | | | | | | | | | 4,558 | | | | 53,010 | |
Nacco Industries Class A | | | | | | | | | | | 891 | | | | 31,319 | |
Overseas Shipholding Group Class A † | | | | | | | | | | | 16,864 | | | | 57,844 | |
Pacific Ethanol Incorporated † | | | | | | | | | | | 11,443 | | | | 21,170 | |
Panhandle Oil And Gas Incorporated Class A | | | | | | | | | | | 3,779 | | | | 70,478 | |
Par Pacific Holdings Incorporated † | | | | | | | | | | | 7,160 | | | | 145,420 | |
Penn Virginia Corporation † | | | | | | | | | | | 2,945 | | | | 261,928 | |
Renewable Energy Group Incorporated † | | | | | | | | | | | 9,489 | | | | 255,729 | |
Resolute Energy Corporation † | | | | | | | | | | | 4,905 | | | | 161,669 | |
Rex American Resources Corporation † | | | | | | | | | | | 1,447 | | | | 116,599 | |
Sanchez Energy Corporation † | | | | | | | | | | | 18,627 | | | | 48,989 | |
Sandridge Energy Incorporated † | | | | | | | | | | | 8,770 | | | | 139,092 | |
SilverBow Resources Incorporated † | | | | | | | | | | | 1,635 | | | | 50,456 | |
Southwestern Energy Company † | | | | | | | | | | | 144,566 | | | | 812,461 | |
Tallgrass Energy GP LP | | | | | | | | | | | 14,679 | | | | 360,957 | |
W&T Offshore Incorporated † | | | | | | | | | | | 22,462 | | | | 152,068 | |
World Fuel Services Corporation | | | | | | | | | | | 13,878 | | | | 389,000 | |
| | | | |
| | | | | | | | | | | | | | | 6,330,894 | |
| | | | | | | | | | | | | | | | |
| | | | |
Financials: 18.35% | | | | | | | | | | | | | | | | |
| | | | |
| Banks: 9.23% | | | | | | | | | | | | | | | | |
1st Constitution Bancorp | | | | | | | | | | | 1,649 | | | | 34,876 | |
1st Source Corporation | | | | | | | | | | | 1,502 | | | | 84,097 | |
Access National Corporation | | | | | | | | | | | 3,727 | | | | 101,151 | |
Acnb Corporation | | | | | | | | | | | 1,636 | | | | 58,569 | |
Allegiance Bancshares Incorporated † | | | | | | | | | | | 2,794 | | | | 124,473 | |
American National Bankshares Incorporated | | | | | | | | | | | 1,941 | | | | 79,872 | |
Ameris Bancorp | | | | | | | | | | | 10,220 | | | | 507,423 | |
AMES National Corporation | | | | | | | | | | | 2,259 | | | | 68,335 | |
Arrow Financial Corporation | | | | | | | | | | | 3,286 | | | | 129,304 | |
Atlantic Capital Bancshares † | | | | | | | | | | | 6,202 | | | | 113,187 | |
Banc of California Incorporated | | | | | | | | | | | 10,789 | | | | 217,398 | |
BancFirst Corporation | | | | | | | | | | | 4,411 | | | | 281,422 | |
Bank of Commerce Holdings | | | | | | | | | | | 3,574 | | | | 46,105 | |
Bank of Marin Bancorp | | | | | | | | | | | 1,541 | | | | 135,839 | |
Bankwell Financial Group Incorporated | | | | | | | | | | | 1,447 | | | | 45,581 | |
The accompanying notes are an integral part of these financial statements.
| | | | | | |
| Portfolio of investments—August 31, 2018 (unaudited) | | Wells Fargo Funds | | | 145 | |
FACTOR ENHANCED SMALL CAP PORTFOLIO
| | | | | | | | | | | | | | | | |
| Security name | | | | | | | | Shares | | | Value | |
| | | | |
| Banks (continued) | | | | | | | | | | | | | | | | |
Banner Corporation | | | | | | | | | | | 8,006 | | | $ | 515,026 | |
Bar Harbor Bankshares | | | | | | | | | | | 3,785 | | | | 111,468 | |
BCB Bancorp Incorporated | | | | | | | | | | | 3,019 | | | | 44,832 | |
Berkshire Hills Bancorp Incorporated | | | | | | | | | | | 9,540 | | | | 403,065 | |
Blue Hills Bancorp Incorporated | | | | | | | | | | | 5,943 | | | | 136,689 | |
Boston Private Financial Holdings Incorporated | | | | | | | | | | | 20,826 | | | | 300,936 | |
Bridge Bancorp Incorporated | | | | | | | | | | | 4,478 | | | | 156,730 | |
Brookline Bancorp Incorporated | | | | | | | | | | | 19,490 | | | | 353,744 | |
Bryn Mawr Bank Corporation | | | | | | | | | | | 4,934 | | | | 240,779 | |
Byline Bancorp Incorporated † | | | | | | | | | | | 3,737 | | | | 85,316 | |
C&F Financial Corporation | | | | | | | | | | | 803 | | | | 50,027 | |
Cadence Bancorp | | | | | | | | | | | 7,382 | | | | 208,542 | |
Cambridge Bancorp | | | | | | | | | | | 990 | | | | 88,635 | |
Camden National Corporation | | | | | | | | | | | 3,768 | | | | 172,348 | |
Capital City Bank Group Incorporated | | | | | | | | | | | 2,489 | | | | 61,030 | |
Capstar Financial Holdings Class I | | | | | | | | | | | 1,479 | | | | 25,838 | |
Carolina Financial Corporation | | | | | | | | | | | 4,840 | | | | 199,166 | |
CenterState Banks Incorporated | | | | | | | | | | | 20,320 | | | | 622,198 | |
Central Pacific Financial Company | | | | | | | | | | | 7,239 | | | | 205,081 | |
Central Valley Community Bancorp | | | | | | | | | | | 2,861 | | | | 61,826 | |
Century Bancorp Incorporated Class A | | | | | | | | | | | 635 | | | | 45,244 | |
Chemung Financial Corporation | | | | | | | | | | | 909 | | | | 38,178 | |
Citizens & Northern Corporation | | | | | | | | | | | 2,969 | | | | 83,162 | |
City Holding Company | | | | | | | | | | | 3,740 | | | | 303,239 | |
Civista Bancshares Incorporated | | | | | | | | | | | 2,169 | | | | 51,796 | |
CNB Financial Corporation | | | | | | | | | | | 3,476 | | | | 107,165 | |
CoBiz Incorporated | | | | | | | | | | | 9,800 | | | | 225,890 | |
Codorus Valley Bancorp Incorporated | | | | | | | | | | | 2,092 | | | | 65,459 | |
Community Bank System Incorporated | | | | | | | | | | | 12,483 | | | | 825,501 | |
Community Bankers Trust Corporation † | | | | | | | | | | | 5,129 | | | | 46,417 | |
Community Financial Corporation | | | | | | | | | | | 1,115 | | | | 37,130 | |
Community Trust Bancorp | | | | | | | | | | | 3,753 | | | | 185,398 | |
ConnectOne Bancorp Incorporated | | | | | | | | | | | 7,504 | | | | 184,974 | |
County Bancorp Incorporated | | | | | | | | | | | 1,236 | | | | 30,875 | |
Customers Bancorp Incorporated † | | | | | | | | | | | 7,194 | | | | 177,692 | |
DNB Financial Corporation | | | | | | | | | | | 839 | | | | 28,736 | |
Eagle Bancorp Incorporated † | | | | | | | | | | | 8,038 | | | | 432,846 | |
Enterprise Bancorp Incorporated | | | | | | | | | | | 2,001 | | | | 71,976 | |
Enterprise Financial Service | | | | | | | | | | | 5,440 | | | | 306,272 | |
Equity Bancshares Incorporated Class A † | | | | | | | | | | | 3,269 | | | | 132,689 | |
Esquire Financial Holdings Class I † | | | | | | | | | | | 1,214 | | | | 31,564 | |
Evans Bancorp Incorporated | | | | | | | | | | | 1,169 | | | | 55,586 | |
Farmers & Merchants Banco | | | | | | | | | | | 2,219 | | | | 100,942 | |
Farmers Natl Banc Corporation | | | | | | | | | | | 5,913 | | | | 93,721 | |
FB Financial Corporation | | | | | | | | | | | 3,159 | | | | 138,933 | |
FCB Financial Holdings Class A † | | | | | | | | | | | 11,201 | | | | 580,212 | |
Fidelity Southern Corporation | | | | | | | | | | | 5,459 | | | | 132,654 | |
Financial Institutions Incorporated | | | | | | | | | | | 3,820 | | | | 123,386 | |
First Bancorp Corporation | | | | | | | | | | | 7,185 | | | | 299,758 | |
First Bancorp Incorporated | | | | | | | | | | | 2,473 | | | | 72,409 | |
The accompanying notes are an integral part of these financial statements.
| | | | |
| 146 | | Wells Fargo Funds | | Portfolio of investments—August 31, 2018 (unaudited) |
FACTOR ENHANCED SMALL CAP PORTFOLIO
| | | | | | | | | | | | | | | | |
| Security name | | | | | | | | Shares | | | Value | |
| | | | |
| Banks (continued) | | | | | | | | | | | | | | | | |
First Bancshares Incorporated | | | | | | | | | | | 3,009 | | | $ | 123,519 | |
First Bank | | | | | | | | | | | 3,631 | | | | 51,923 | |
First Busey Corporation | | | | | | | | | | | 10,884 | | | | 348,832 | |
First Business Financial Service | | | | | | | | | | | 1,931 | | | | 42,791 | |
First Citizens BancShares Corporation Class A | | | | | | | | | | | 1,422 | | | | 675,464 | |
First Commonwealth Financial Corporation | | | | | | | | | | | 24,096 | | | | 403,608 | |
First Community Bancshares | | | | | | | | | | | 3,679 | | | | 123,504 | |
First Community Corporation | | | | | | | | | | | 1,736 | | | | 43,660 | |
First Connecticut Bancorp | | | | | | | | | | | 3,511 | | | | 111,299 | |
First Financial Corporation | | | | | | | | | | | 2,604 | | | | 133,976 | |
First Financial Northwest | | | | | | | | | | | 1,987 | | | | 34,693 | |
First Foundation Incorporated † | | | | | | | | | | | 8,025 | | | | 129,845 | |
First Guaranty Bancshares Incorporated | | | | | | | | | | | 1,195 | | | | 29,863 | |
First Internet Bancorp | | | | | | | | | | | 1,996 | | | | 62,774 | |
First Interstate BancSystem Class A | | | | | | | | | | | 7,763 | | | | 360,591 | |
First Merchants Corporation | | | | | | | | | | | 12,243 | | | | 589,133 | |
First Mid-Illinois Bancshares | | | | | | | | | | | 2,135 | | | | 87,727 | |
First Midwest Bancorp Incorporated | | | | | | | | | | | 25,471 | | | | 692,302 | |
First Northwest Bancorp † | | | | | | | | | | | 2,289 | | | | 38,318 | |
First of Long Island Corporation | | | | | | | | | | | 5,855 | | | | 127,639 | |
First United Corporation | | | | | | | | | | | 1,702 | | | | 34,295 | |
Flushing Financial Corporation | | | | | | | | | | | 6,839 | | | | 177,267 | |
Franklin Financial Network † | | | | | | | | | | | 3,230 | | | | 124,840 | |
German American Bancorp | | | | | | | | | | | 5,350 | | | | 201,107 | |
Great Southern Bancorp Incorporated | | | | | | | | | | | 2,837 | | | | 168,234 | |
Great Western Bancorp Incorporated | | | | | | | | | | | 14,742 | | | | 641,867 | |
Green Bancorp Incorporated | | | | | | | | | | | 6,144 | | | | 147,456 | |
Guaranty Bancorp | | | | | | | | | | | 6,067 | | | | 189,594 | |
Guaranty Bancshares Incorporated | | | | | | | | | | | 1,819 | | | | 57,208 | |
Hanmi Financial Corporation | | | | | | | | | | | 7,944 | | | | 207,338 | |
Harborone Bancorp Incorporated † | | | | | | | | | | | 3,485 | | | | 68,689 | |
Hawthorn Bancshares Incorporated | | | | | | | | | | | 1,361 | | | | 30,146 | |
Heartland Financial USA Incorporated | | | | | | | | | | | 7,119 | | | | 432,835 | |
Heritage Commerce Corporation | | | | | | | | | | | 9,751 | | | | 154,456 | |
Heritage Financial Corporation | | | | | | | | | | | 8,327 | | | | 302,270 | |
Hilltop Holdings Incorporated | | | | | | | | | | | 18,996 | | | | 394,167 | |
Hometrust Bancshares Incorporated † | | | | | | | | | | | 4,096 | | | | 117,965 | |
Hope Bancorp Incorporated | | | | | | | | | | | 32,759 | | | | 573,610 | |
Horizon Bancorp Indiana | | | | | | | | | | | 9,023 | | | | 184,340 | |
Howard Bancorp Incorporated † | | | | | | | | | | | 3,832 | | | | 66,868 | |
Independent Bank Corporation | | | | | | | | | | | 5,849 | | | | 145,933 | |
Independent Bank Corporation (Massachusetts) | | | | | | | | | | | 6,694 | | | | 609,823 | |
Independent Bank Group Incorporated | | | | | | | | | | | 4,539 | | | | 314,326 | |
Investar Holding Corporation | | | | | | | | | | | 2,145 | | | | 58,880 | |
Lakeland Bancorp Incorporated | | | | | | | | | | | 11,042 | | | | 213,111 | |
Lakeland Financial Corporation | | | | | | | | | | | 6,055 | | | | 298,330 | |
LCNB Corporation | | | | | | | | | | | 2,279 | | | | 42,389 | |
LegacyTexas Financial Group | | | | | | | | | | | 11,259 | | | | 520,954 | |
Live Oak Bancshares Incorporated | | | | | | | | | | | 6,272 | | | | 189,728 | |
Macatawa Bank Corporation | | | | | | | | | | | 6,072 | | | | 75,718 | |
The accompanying notes are an integral part of these financial statements.
| | | | | | |
| Portfolio of investments—August 31, 2018 (unaudited) | | Wells Fargo Funds | | | 147 | |
FACTOR ENHANCED SMALL CAP PORTFOLIO
| | | | | | | | | | | | | | | | |
| Security name | | | | | | | | Shares | | | Value | |
| | | | |
| Banks (continued) | | | | | | | | | | | | | | | | |
MBT Financial Corporation | | | | | | | | | | | 3,937 | | | $ | 43,110 | |
Mercantile Bank Corporation | | | | | | | | | | | 3,975 | | | | 140,755 | |
Metropolitan Bank Holding Corporation † | | | | | | | | | | | 655 | | | | 27,012 | |
Middlefield Banc Corporation | | | | | | | | | | | 736 | | | | 36,506 | |
Midland States Bancorp Incorporated | | | | | | | | | | | 4,599 | | | | 158,344 | |
Midsouth Bancorp Incorporated | | | | | | | | | | | 3,497 | | | | 53,679 | |
Midwestone Financial Group Class I | | | | | | | | | | | 2,542 | | | | 85,259 | |
Mutualfirst Financial Incorporated | | | | | | | | | | | 1,695 | | | | 64,410 | |
MVB Financial Corporation | | | | | | | | | | | 2,288 | | | | 41,733 | |
National Bank Holdings Corporation Class A | | | | | | | | | | | 6,608 | | | | 265,311 | |
National Bankshares Incorporated | | | | | | | | | | | 1,668 | | | | 76,728 | |
National Commerce Corporation † | | | | | | | | | | | 3,718 | | | | 163,592 | |
NBT Bancorp Incorporated | | | | | | | | | | | 10,629 | | | | 430,262 | |
Nicolet Bankshares Incorporated † | | | | | | | | | | | 1,995 | | | | 110,443 | |
Northeast Bancorp | | | | | | | | | | | 1,783 | | | | 38,869 | |
Northrim BanCorp Incorporated | | | | | | | | | | | 1,645 | | | | 73,285 | |
Norwood Financial Corporation | | | | | | | | | | | 1,373 | | | | 53,877 | |
Oak Valley Bancorp | | | | | | | | | | | 1,542 | | | | 32,336 | |
Ohio Valley Banc Corporation | | | | | | | | | | | 940 | | | | 39,621 | |
Old Line Bancshares Incorporated | | | | | | | | | | | 3,489 | | | | 119,324 | |
Old National Bancorp | | | | | | | | | | | 37,465 | | | | 760,540 | |
Old Point Financial Corporation | | | | | | | | | | | 927 | | | | 24,658 | |
Old Second Bancorp Incorporated | | | | | | | | | | | 6,770 | | | | 104,597 | |
Opus Bank | | | | | | | | | | | 5,318 | | | | 150,765 | |
Orrstown Financial Services Incorporated | | | | | | | | | | | 1,888 | | | | 49,182 | |
Pacific Mercantile Bancorp † | | | | | | | | | | | 3,522 | | | | 35,572 | |
Pacific Premier Bancorp Incorporated † | | | | | | | | | | | 11,260 | | | | 445,333 | |
Park National Corporation | | | | | | | | | | | 3,331 | | | | 366,910 | |
Parke Bancorp Incorporated | | | | | | | | | | | 1,652 | | | | 38,079 | |
Peapack-Gladstone Financial Corporation | | | | | | | | | | | 4,243 | | | | 141,759 | |
Penns Woods Bancorp Incorporated | | | | | | | | | | | 1,104 | | | | 49,989 | |
People’s Utah Bancorp | | | | | | | | | | | 3,708 | | | | 134,044 | |
Peoples Bancorp Incorporated | | | | | | | | | | | 4,038 | | | | 144,803 | |
Peoples Bancorp of North Carolina Incorporated | | | | | | | | | | | 1,044 | | | | 31,863 | |
Peoples Financial Services | | | | | | | | | | | 1,684 | | | | 77,430 | |
Preferred Bank (Los Angeles) | | | | | | | | | | | 3,488 | | | | 213,500 | |
Premier Financial Bancorp | | | | | | | | | | | 2,613 | | | | 50,954 | |
Qcr Holdings Incorporated | | | | | | | | | | | 3,205 | | | | 139,418 | |
Rbb Bancorp | | | | | | | | | | | 2,770 | | | | 79,361 | |
Reliant Bancorp Incorporated | | | | | | | | | | | 2,450 | | | | 67,498 | |
Renasant Corporation | | | | | | | | | | | 12,183 | | | | 568,824 | |
Republic Bancorp Incorporated Class A | | | | | | | | | | | 2,425 | | | | 117,879 | |
Republic First Bancorp Incorporated † | | | | | | | | | | | 12,715 | | | | 99,177 | |
S&T Bancorp Incorporated | | | | | | | | | | | 8,494 | | | | 396,330 | |
Sandy Spring Bancorp Incorporated | | | | | | | | | | | 8,684 | | | | 338,676 | |
SB Financial Group Incorporated | | | | | | | | | | | 1,332 | | | | 26,773 | |
SB One Bancorp | | | | | | | | | | | 1,678 | | | | 46,648 | |
Seacoast Banking Corporation † | | | | | | | | | | | 10,928 | | | | 345,543 | |
Select Bancorp Incorporated † | | | | | | | | | | | 2,987 | | | | 38,263 | |
ServisFirst Bancshares Incorporated | | | | | | | | | | | 11,309 | | | | 487,418 | |
The accompanying notes are an integral part of these financial statements.
| | | | |
| 148 | | Wells Fargo Funds | | Portfolio of investments—August 31, 2018 (unaudited) |
FACTOR ENHANCED SMALL CAP PORTFOLIO
| | | | | | | | | | | | | | | | |
| Security name | | | | | | | | Shares | | | Value | |
| | | | |
| Banks (continued) | | | | | | | | | | | | | | | | |
Shore Bancshares Incorporated | | | | | | | | | | | 3,083 | | | $ | 57,930 | |
Sierra Bancorp | | | | | | | | | | | 3,004 | | | | 89,129 | |
Simmons First National Corporation Class A | | | | | | | | | | | 21,162 | | | | 668,719 | |
Smartfinancial Incorporated † | | | | | | | | | | | 2,436 | | | | 59,877 | |
Southern First Bancshares † | | | | | | | | | | | 1,606 | | | | 66,810 | |
Southern National Bancorp of Virginia | | | | | | | | | | | 4,752 | | | | 83,398 | |
Southside Bancshares Incorporated | | | | | | | | | | | 8,218 | | | | 292,561 | |
State Bank Financial Corporation | | | | | | | | | | | 9,501 | | | | 309,543 | |
Stock Yards Bancorp Incorporated | | | | | | | | | | | 5,085 | | | | 196,790 | |
Summit Financial Group Incorporated | | | | | | | | | | | 2,357 | | | | 59,396 | |
The Bancorp Incorporated † | | | | | | | | | | | 12,306 | | | | 123,429 | |
The Bank of Princeton † | | | | | | | | | | | 1,371 | | | | 45,106 | |
Tompkins Trust Company Incorporated | | | | | | | | | | | 3,685 | | | | 323,801 | |
Towne Bank | | | | | | | | | | | 16,453 | | | | 536,368 | |
TriCo Bancshares | | | | | | | | | | | 6,403 | | | | 248,949 | |
TriState Capital Holdings Incorporated † | | | | | | | | | | | 5,394 | | | | 160,472 | |
Triumph Bancorp Incorporated † | | | | | | | | | | | 5,777 | | | | 245,234 | |
Trustmark Corporation | | | | | | | | | | | 16,418 | | | | 582,511 | |
Two River Bancorp | | | | | | | | | | | 1,651 | | | | 28,166 | |
Union Bankshares Corporation | | | | | | | | | | | 15,281 | | | | 635,690 | |
Union Bankshares Incorporated | | | | | | | | | | | 839 | | | | 44,048 | |
United Community Bank | | | | | | | | | | | 18,583 | | | | 563,808 | |
United Security Bancshare | | | | | | | | | | | 3,109 | | | | 34,510 | |
Unity Bancorp Incorporated | | | | | | | | | | | 1,818 | | | | 44,359 | |
Univest Corporation of Pennsylvania | | | | | | | | | | | 7,313 | | | | 208,421 | |
Veritex Holdings Incorporated † | | | | | | | | | | | 5,755 | | | | 176,218 | |
Washington Trust Bancorp | | | | | | | | | | | 3,483 | | | | 208,980 | |
WesBanco Incorporated | | | | | | | | | | | 13,771 | | | | 679,620 | |
West Bancorporation | | | | | | | | | | | 3,494 | | | | 84,380 | |
Westamerica Bancorporation | | | | | | | | | | | 6,390 | | | | 409,152 | |
| | | | |
| | | | | | | | | | | | | | | 36,929,534 | |
| | | | | | | | | | | | | | | | |
| | | | |
| Capital Markets: 1.60% | | | | | | | | | | | | | | | | |
Ares Management LP | | | | | | | | | | | 17,552 | | | | 373,858 | |
Arlington Asset Investment Class A | | | | | | | | | | | 6,820 | | | | 69,359 | |
Artisan Partners Asset Management Incorporated Class A | | | | | | | | | | | 12,775 | | | | 423,491 | |
Associated Capital Group Class A | | | | | | | | | | | 1,078 | | | | 40,317 | |
B. Riley Financial Incorporated | | | | | | | | | | | 4,849 | | | | 111,042 | |
Blucora Incorporated † | | | | | | | | | | | 10,923 | | | | 395,413 | |
BrightSphere Investment Group Incorporated | | | | | | | | | | | 20,380 | | | | 258,622 | |
Cohen & Steers Incorporated | | | | | | | | | | | 5,447 | | | | 226,432 | |
Diamond Hill Investment Group | | | | | | | | | | | 820 | | | | 153,004 | |
Donnelley Financial Solutions † | | | | | | | | | | | 8,249 | | | | 172,322 | |
Federated Investors Incorporated Class B | | | | | | | | | | | 23,343 | | | | 540,624 | |
Gain Capital Holdings Incorporated | | | | | | | | | | | 5,970 | | | | 43,999 | |
Gamco Investors Incorporated Class A | | | | | | | | | | | 1,140 | | | | 29,469 | |
Hamilton Lane Incorporated Class A | | | | | | | | | | | 3,423 | | | | 166,974 | |
Houlihan Lokey Incorporated | | | | | | | | | | | 7,550 | | | | 355,077 | |
INTL FCStone Incorporated † | | | | | | | | | | | 3,739 | | | | 208,487 | |
The accompanying notes are an integral part of these financial statements.
| | | | | | |
| Portfolio of investments—August 31, 2018 (unaudited) | | Wells Fargo Funds | | | 149 | |
FACTOR ENHANCED SMALL CAP PORTFOLIO
| | | | | | | | | | | | | | | | |
| Security name | | | | | | | | Shares | | | Value | |
| | | | |
| Capital Markets (continued) | | | | | | | | | | | | | | | | |
Investment Technology Group Incorporated | | | | | | | | | | | 7,745 | | | $ | 169,461 | |
Ladenburg Thalmann Financial Services Incorporated | | | | | | | | | | | 25,683 | | | | 88,606 | |
Moelis Company Class A | | | | | | | | | | | 10,020 | | | | 581,661 | |
Morningstar Incorporated | | | | | | | | | | | 4,410 | | | | 627,631 | |
PJT Partners Incorporated Class A | | | | | | | | | | | 4,622 | | | | 267,706 | |
Pzena Investment Managm Class A | | | | | | | | | | | 4,304 | | | | 39,080 | |
Victory Capital Holding Class A † | | | | | | | | | | | 3,068 | | | | 30,312 | |
Virtu Financial Incorporated Class A | | | | | | | | | | | 12,525 | | | | 273,045 | |
Virtus Investment Partners Incorporated | | | | | | | | | | | 1,689 | | | | 217,881 | |
Waddell & Reed Financial Incorporated Class A | | | | | | | | | | | 20,284 | | | | 406,086 | |
Westwood Holdings Group Incorporated | | | | | | | | | | | 2,040 | | | | 117,361 | |
| | | | |
| | | | | | | | | | | | | | | 6,387,320 | |
| | | | | | | | | | | | | | | | |
| | | | |
| Consumer Finance: 0.78% | | | | | | | | | | | | | | | | |
Curo Group Holdings Corporation † | | | | | | | | | | | 1,813 | | | | 55,949 | |
Elevate Credit Incorporated † | | | | | | | | | | | 5,068 | | | | 47,436 | |
Encore Capital Group Incorporated † | | | | | | | | | | | 6,335 | | | | 245,481 | |
Enova International Incorporated † | | | | | | | | | | | 7,733 | | | | 256,736 | |
Ezcorp Incorporated † | | | | | | | | | | | 11,531 | | | | 127,994 | |
Green Dot Corporation Class A † | | | | | | | | | | | 11,523 | | | | 987,175 | |
Nelnet Incorporated Class A | | | | | | | | | | | 3,239 | | | | 186,728 | |
PRA Group Incorporated † | | | | | | | | | | | 11,001 | | | | 402,087 | |
Regional Management Corporation † | | | | | | | | | | | 2,072 | | | | 69,060 | |
Santander Consumer USA Holdings Incorporated | | | | | | | | | | | 28,409 | | | | 613,066 | |
World Acceptance Corporation † | | | | | | | | | | | 1,173 | | | | 139,130 | |
| | | | |
| | | | | | | | | | | | | | | 3,130,842 | |
| | | | | | | | | | | | | | | | |
| | | | |
| Diversified Financial Services: 0.21% | | | | | | | | | | | | | | | | |
Cannae Holdings Incorporated † | | | | | | | | | | | 16,487 | | | | 320,507 | |
FGL Holdings † | | | | | | | | | | | 34,568 | | | | 301,087 | |
Marlin Business Services Incorporated | | | | | | | | | | | 2,079 | | | | 59,459 | |
PHH Corporation † | | | | | | | | | | | 7,830 | | | | 84,956 | |
Schulman Incorporated Class A (a) | | | | | | | | | | | 6,818 | | | | 13,022 | |
Tiptree Incorporated | | | | | | | | | | | 7,829 | | | | 50,889 | |
| | | | |
| | | | | | | | | | | | | | | 829,920 | |
| | | | | | | | | | | | | | | | |
| | | | |
| Insurance: 2.58% | | | | | | | | | | | | | | | | |
American National Insurance Company | | | | | | | | | | | 1,926 | | | | 247,183 | |
Amerisafe Incorporated | | | | | | | | | | | 5,230 | | | | 333,674 | |
AmTrust Financial Services Incorporated | | | | | | | | | | | 28,989 | | | | 421,500 | |
Argo Group International Holdings Limited | | | | | | | | | | | 7,835 | | | | 499,090 | |
Atlas Financial Holdings Incorporated † | | | | | | | | | | | 3,015 | | | | 30,904 | |
CNA Financial Corporation | | | | | | | | | | | 7,520 | | | | 337,648 | |
Crawford & Company Class A | | | | | | | | | | | 4,961 | | | | 42,317 | |
Crawford & Company Class B | | | | | | | | | | | 3,169 | | | | 27,634 | |
Donegal Group Incorporated Class A | | | | | | | | | | | 3,749 | | | | 54,173 | |
EMC Insurance Group Incorporated | | | | | | | | | | | 2,746 | | | | 70,517 | |
Employers Holdings Incorporated | | | | | | | | | | | 8,742 | | | | 400,821 | |
FBL Financial Group Incorporated | | | | | | | | | | | 2,798 | | | | 227,617 | |
The accompanying notes are an integral part of these financial statements.
| | | | |
| 150 | | Wells Fargo Funds | | Portfolio of investments—August 31, 2018 (unaudited) |
FACTOR ENHANCED SMALL CAP PORTFOLIO
| | | | | | | | | | | | | | | | |
| Security name | | | | | | | | Shares | | | Value | |
| | | | |
| Insurance (continued) | | | | | | | | | | | | | | | | |
Genworth Financial Incorporated Class A † | | | | | | | | | | | 125,110 | | | $ | 581,762 | |
Greenlight Capital Limited † | | | | | | | | | | | 8,592 | | | | 110,407 | |
Hallmark Financial Services Incorporated † | | | | | | | | | | | 3,660 | | | | 41,102 | |
HCI Group Incorporated | | | | | | | | | | | 2,107 | | | | 85,334 | |
Health Insurance Innovations Incorporated Class A † | | | | | | | | | | | 2,714 | | | | 143,571 | |
Heritage Insurance Holdings Incorporated | | | | | | | | | | | 6,397 | | | | 93,716 | |
Horace Mann Educators Corporation | | | | | | | | | | | 10,364 | | | | 479,853 | |
Independence Holding Company | | | | | | | | | | | 1,294 | | | | 45,614 | |
Investors Title Company | | | | | | | | | | | 353 | | | | 68,482 | |
James River Group Holdings Limited | | | | | | | | | | | 6,948 | | | | 284,521 | |
Kemper Corporation | | | | | | | | | | | 11,103 | | | | 903,229 | |
Kingstone Company Incorporated | | | | | | | | | | | 2,548 | | | | 47,265 | |
Kinsale Capital Group Incorporated | | | | | | | | | | | 5,183 | | | | 314,971 | |
Maiden Holdings Limited | | | | | | | | | | | 17,793 | | | | 67,613 | |
Mercury General Corporation | | | | | | | | | | | 7,395 | | | | 398,591 | |
National General Holdings Corporation | | | | | | | | | | | 15,177 | | | | 414,484 | |
National Western Life Group Class A | | | | | | | | | | | 556 | | | | 181,228 | |
Ni Holdings Incorporated † | | | | | | | | | | | 2,959 | | | | 49,948 | |
Protective Insurance Corporation Class B | | | | | | | | | | | 2,755 | | | | 64,743 | |
RLI Corporation | | | | | | | | | | | 11,181 | | | | 860,602 | |
Safety Insurance Group Incorporated | | | | | | | | | | | 4,140 | | | | 400,338 | |
State Auto Financial Corporation | | | | | | | | | | | 4,501 | | | | 141,286 | |
Stewart Information Services Corporation | | | | | | | | | | | 6,326 | | | | 283,278 | |
The Navigators Group Incorporated | | | | | | | | | | | 7,051 | | | | 493,570 | |
Trupanion Incorporated † | | | | | | | | | | | 5,581 | | | | 213,138 | |
United Fire Group Incorporated | | | | | | | | | | | 5,589 | | | | 276,823 | |
United Insurance Holdings Company | | | | | | | | | | | 6,649 | | | | 138,499 | |
Universal Insurance Holdings Company | | | | | | | | | | | 8,323 | | | | 371,206 | |
WMIH Corporation † | | | | | | | | | | | 59,870 | | | | 90,404 | |
| | | | |
| | | | | | | | | | | | | | | 10,338,656 | |
| | | | | | | | | | | | | | | | |
| | | | |
| Mortgage REITs: 1.75% | | | | | | | | | | | | | | | | |
AG Mortgage Investment Trust Incorporated | | | | | | | | | | | 6,774 | | | | 127,351 | |
Anworth Mortgage Asset Corporation | | | | | | | | | | | 23,752 | | | | 115,910 | |
Apollo Commercial Real Estate Finance Incorporated | | | | | | | | | | | 30,540 | | | | 593,392 | |
Arbor Realty Trust Incorporated | | | | | | | | | | | 12,206 | | | | 149,646 | |
Ares Commercial Real Estate | | | | | | | | | | | 6,147 | | | | 89,869 | |
ARMOUR Residential REIT Incorporated | | | | | | | | | | | 10,300 | | | | 242,256 | |
Blackstone Mortgage Trust Incorporated Class A | | | | | | | | | | | 25,477 | | | | 867,747 | |
Capstead Mortgage Corporation | | | | | | | | | | | 23,023 | | | | 193,393 | |
Cherry Hill Mortgage Investment Corporation | | | | | | | | | | | 2,959 | | | | 55,037 | |
Colony Credit Real Estate Incorporated | | | | | | | | | | | 20,921 | | | | 420,094 | |
Dynex Capital Incorporated | | | | | | | | | | | 12,752 | | | | 81,740 | |
Ellington Residential Mortgage REIT | | | | | | | | | | | 2,353 | | | | 27,812 | |
Exantas Capital Corporation | | | | | | | | | | | 7,205 | | | | 85,379 | |
Granite Point Mortgage Trust Incorporated | | | | | | | | | | | 10,503 | | | | 201,027 | |
Great Ajax Corporation | | | | | | | | | | | 3,929 | | | | 53,592 | |
Hannon Armstrong Sustainable | | | | | | | | | | | 12,441 | | | | 268,228 | |
Invesco Mortgage Capital Incorporated | | | | | | | | | | | 27,631 | | | | 448,451 | |
The accompanying notes are an integral part of these financial statements.
| | | | | | |
| Portfolio of investments—August 31, 2018 (unaudited) | | Wells Fargo Funds | | | 151 | |
FACTOR ENHANCED SMALL CAP PORTFOLIO
| | | | | | | | | | | | | | | | |
| Security name | | | | | | | | Shares | | | Value | |
| | | | |
| Mortgage REITs (continued) | | | | | | | | | | | | | | | | |
KKR Real Estate Finance Trust | | | | | | | | | | | 5,861 | | | $ | 124,253 | |
Ladder Capital Corporation | | | | | | | | | | | 21,679 | | | | 376,564 | |
Mortgage Investment Corporation | | | | | | | | | | | 11,371 | | | | 222,872 | |
New York Mortgage Trust Incorporated | | | | | | | | | | | 27,553 | | | | 176,339 | |
Orchid Island Capital Incorporated | | | | | | | | | | | 12,889 | | | | 102,339 | |
Owens Realty Mortgage Incorporated | | | | | | | | | | | 2,210 | | | | 36,465 | |
PennyMac Mortgage Investment Trust | | | | | | | | | | | 14,681 | | | | 293,326 | |
Redwood Trust Incorporated | | | | | | | | | | | 18,773 | | | | 318,766 | |
Sutherland Asset Management | | | | | | | | | | | 4,148 | | | | 71,138 | |
TPG Real Estate Finance Trust Incorporated | | | | | | | | | | | 10,758 | | | | 222,153 | |
Two Harbors Investment Corporation | | | | | | | | | | | 60,870 | | | | 950,789 | |
Western Asset Mortgage Capital Corporation | | | | | | | | | | | 9,761 | | | | 108,640 | |
| | | | |
| | | | | | | | | | | | | | | 7,024,568 | |
| | | | | | | | | | | | | | | | |
| | | | |
| Thrifts & Mortgage Finance: 2.20% | | | | | | | | | | | | | | | | |
BankFinancial Corporation | | | | | | | | | | | 3,582 | | | | 57,133 | |
Beneficial Bancorp Incorporated | | | | | | | | | | | 17,240 | | | | 303,424 | |
BofI Holding Incorporated † | | | | | | | | | | | 13,572 | | | | 505,421 | |
Bridgewater Bancshares Incorporated † | | | | | | | | | | | 1,787 | | | | 22,981 | |
BSB Bancorp Incorporated † | | | | | | | | | | | 2,017 | | | | 67,166 | |
Capitol Federal Financial Incorporated | | | | | | | | | | | 33,667 | | | | 444,741 | |
Charter Financial Corporation | | | | | | | | | | | 3,289 | | | | 81,929 | |
Dime Community Bancshares | | | | | | | | | | | 7,898 | | | | 143,349 | |
Entegra Financial Corporation † | | | | | | | | | | | 1,549 | | | | 42,598 | |
Essa Bancorp Incorporated | | | | | | | | | | | 2,175 | | | | 34,974 | |
Federal Agricultural Mortgage Corporation Class C | | | | | | | | | | | 2,224 | | | | 171,404 | |
First Defiance Financial Corporation | | | | | | | | | | | 4,874 | | | | 155,919 | |
Flagstar Bancorp Incorporated † | | | | | | | | | | | 5,325 | | | | 175,991 | |
FS Bancorp Incorporated | | | | | | | | | | | 757 | | | | 44,156 | |
Greene County Bancorp Incorporated | | | | | | | | | | | 807 | | | | 28,205 | |
Hingham Institution For Savings Corporation | | | | | | | | | | | 333 | | | | 72,264 | |
Home Bancorp Incorporated | | | | | | | | | | | 1,843 | | | | 84,317 | |
Homestreet Incorporated † | | | | | | | | | | | 6,551 | | | | 192,927 | |
Impac Mortgage Holdings Incorporated † | | | | | | | | | | | 2,519 | | | | 18,842 | |
Kearny Financial Corporation | | | | | | | | | | | 24,211 | | | | 331,691 | |
LendingTree Incorporated † | | | | | | | | | | | 1,831 | | | | 463,884 | |
Luther Burbank Corporation | | | | | | | | | | | 3,251 | | | | 37,061 | |
Malvern Bancorp Incorporated † | | | | | | | | | | | 1,533 | | | | 37,712 | |
Merchants Bancorp Incorporated | | | | | | | | | | | 3,568 | | | | 93,160 | |
Meridian Bancorp Incorporated | | | | | | | | | | | 12,187 | | | | 218,147 | |
Meta Financial Group Incorporated | | | | | | | | | | | 2,282 | | | | 197,621 | |
MMA Capital Management LLC † | | | | | | | | | | | 994 | | | | 26,485 | |
NewStar Financial Incorporated (a) | | | | | | | | | | | 9,129 | | | | 0 | |
NMI Holdings Incorporated Class A † | | | | | | | | | | | 15,593 | | | | 336,809 | |
Northfield Bancorp Incorporated | | | | | | | | | | | 10,614 | | | | 172,796 | |
Northwest Bancshares Incorporated | | | | | | | | | | | 23,745 | | | | 432,634 | |
OceanFirst Financial Corporation | | | | | | | | | | | 10,308 | | | | 300,994 | |
Ocwen Financial Corporation † | | | | | | | | | | | 27,580 | | | | 115,284 | |
Oritani Financial Corporation | | | | | | | | | | | 10,267 | | | | 166,325 | |
The accompanying notes are an integral part of these financial statements.
| | | | |
| 152 | | Wells Fargo Funds | | Portfolio of investments—August 31, 2018 (unaudited) |
FACTOR ENHANCED SMALL CAP PORTFOLIO
| | | | | | | | | | | | | | | | |
| Security name | | | | | | | | Shares | | | Value | |
| | | | |
| Thrifts & Mortgage Finance (continued) | | | | | | | | | | | | | | | | |
PCSB Financial Corporation | | | | | | | | | | | 4,053 | | | $ | 83,168 | |
PDL Community Bancorp † | | | | | | | | | | | 1,940 | | | | 28,790 | |
Pennymac Financial Service Incorporated | | | | | | | | | | | 5,267 | | | | 111,397 | |
Provident Bancorp Incorporated † | | | | | | | | | | | 1,083 | | | | 30,649 | |
Provident Financial Holdings | | | | | | | | | | | 1,081 | | | | 19,890 | |
Provident Financial Services Incorporated | | | | | | | | | | | 15,404 | | | | 388,643 | |
Prudential Bancorp Incorporated | | | | | | | | | | | 1,996 | | | | 36,686 | |
Randolph Bancorp Incorporated † | | | | | | | | | | | 1,224 | | | | 20,930 | |
Riverview Bancorp Incorporated | | | | | | | | | | | 5,045 | | | | 49,693 | |
SI Financial Group Incorporated | | | | | | | | | | | 2,589 | | | | 35,858 | |
Southern Missouri Bancorp | | | | | | | | | | | 1,694 | | | | 67,760 | |
Sterling Bancorp Incorporated | | | | | | | | | | | 4,116 | | | | 50,421 | |
Territorial Bancorp Incorporated | | | | | | | | | | | 1,885 | | | | 56,324 | |
Timberland Bancorp Incorporated | | | | | | | | | | | 1,509 | | | | 53,585 | |
Trustco Bank Corporation | | | | | | | | | | | 23,281 | | | | 215,349 | |
United Community Financial Corporation | | | | | | | | | | | 11,840 | | | | 122,544 | |
United Financial Bancorp Incorporated | | | | | | | | | | | 12,567 | | | | 223,316 | |
Walker & Dunlop Incorporated | | | | | | | | | | | 7,027 | | | | 382,972 | |
Washington Federal Incorporated | | | | | | | | | | | 21,023 | | | | 716,884 | |
Waterstone Financial Incorporated | | | | | | | | | | | 6,217 | | | | 105,067 | |
Western New England Bancorp | | | | | | | | | | | 6,404 | | | | 68,203 | |
WSFS Financial Corporation | | | | | | | | | | | 7,743 | | | | 377,858 | |
| | | | |
| | | | | | | | | | | | | | | 8,824,331 | |
| | | | | | | | | | | | | | | | |
| | | | |
Health Care: 10.92% | | | | | | | | | | | | | | | | |
| | | | |
| Biotechnology: 3.06% | | | | | | | | | | | | | | | | |
Abeona Therapeutics Incorporated † | | | | | | | | | | | 7,806 | | | | 120,212 | |
Acorda Therapeutics Incorporated † | | | | | | | | | | | 11,450 | | | | 329,760 | |
Advaxis Incorporated † | | | | | | | | | | | 12,354 | | | | 17,913 | |
Agenus Incorporated † | | | | | | | | | | | 20,721 | | | | 45,793 | |
Akebia Therapeutics Incorporated † | | | | | | | | | | | 11,462 | | | | 94,103 | |
Aldeyra Therapeutics Incorporated † | | | | | | | | | | | 3,911 | | | | 33,048 | |
AMAG Pharmaceuticals Incorporated † | | | | | | | | | | | 8,201 | | | | 200,104 | |
Anaptysbio Incorporated † | | | | | | | | | | | 3,869 | | | | 342,948 | |
Anavex Life Sciences Corporation † | | | | | | | | | | | 10,780 | | | | 28,783 | |
Arcus Biosciences Incorporated † | | | | | | | | | | | 2,254 | | | | 32,458 | |
Ardelyx Incorporated † | | | | | | | | | | | 7,841 | | | | 33,716 | |
Arena Pharmaceuticals Incorporated † | | | | | | | | | | | 12,165 | | | | 472,489 | |
Arqule Incorporated † | | | | | | | | | | | 20,019 | | | | 132,726 | |
Arrowhead Pharmaceuticals Incorporated † | | | | | | | | | | | 19,247 | | | | 284,086 | |
Athenex Incorporated † | | | | | | | | | | | 8,701 | | | | 142,957 | |
Athersys Incorporated † | | | | | | | | | | | 29,704 | | | | 61,190 | |
Aveo Pharmaceuticals Incorporated † | | | | | | | | | | | 28,376 | | | | 84,844 | |
Avid Bioservices Incorporated † | | | | | | | | | | | 12,486 | | | | 91,398 | |
Biospecifics Technologies † | | | | | | | | | | | 1,277 | | | | 68,498 | |
Calyxt Incorporated † | | | | | | | | | | | 1,292 | | | | 21,874 | |
CareDx Incorporated † | | | | | | | | | | | 5,129 | | | | 124,686 | |
Casi Pharmaceuticals Incorporated † | | | | | | | | | | | 9,467 | | | | 65,796 | |
Catalyst Biosciences Incorporated † | | | | | | | | | | | 2,853 | | | | 31,183 | |
The accompanying notes are an integral part of these financial statements.
| | | | | | |
| Portfolio of investments—August 31, 2018 (unaudited) | | Wells Fargo Funds | | | 153 | |
FACTOR ENHANCED SMALL CAP PORTFOLIO
| | | | | | | | | | | | | | | | |
| Security name | | | | | | | | Shares | | | Value | |
| | | | |
| Biotechnology (continued) | | | | | | | | | | | | | | | | |
Celcuity Incorporated † | | | | | | | | | | | 1,427 | | | $ | 35,275 | |
Cellular Biomedicine Group Class I † | | | | | | | | | | | 3,085 | | | | 65,556 | |
Chemocentryx Incorporated † | | | | | | | | | | | 8,108 | | | | 106,863 | |
Cohbar Incorporated † | | | | | | | | | | | 6,356 | | | | 33,305 | |
Conatus Pharmaceuticals Incorporated † | | | | | | | | | | | 6,333 | | | | 35,528 | |
Concert Pharmaceuticals Incorporated † | | | | | | | | | | | 5,116 | | | | 80,679 | |
Corbus Pharmaceuticals Holdings † | | | | | | | | | | | 12,187 | | | | 71,294 | |
CTI Biopharma Corporation † | | | | | | | | | | | 12,468 | | | | 23,440 | |
Cue Biopharma Incorporated † | | | | | | | | | | | 3,422 | | | | 32,920 | |
Curis Incorporated † | | | | | | | | | | | 6,724 | | | | 11,431 | |
Cytomx Therapeutics Incorporated † | | | | | | | | | | | 8,558 | | | | 192,469 | |
Eagle Pharmaceuticals Incorporated † | | | | | | | | | | | 3,189 | | | | 220,456 | |
Emergent BioSolutions Incorporated † | | | | | | | | | | | 10,366 | | | | 642,692 | |
Enanta Pharmaceuticals Incorporated † | | | | | | | | | | | 3,591 | | | | 326,530 | |
Fate Therapeutics Incorporated † | | | | | | | | | | | 10,748 | | | | 138,542 | |
Fortress Biotech Incorporated † | | | | | | | | | | | 6,774 | | | | 13,345 | |
Galectin Therapeutics Incorporated † | | | | | | | | | | | 6,969 | | | | 45,089 | |
Genomic Health Incorporated † | | | | | | | | | | | 4,998 | | | | 305,728 | |
GTX Incorporated † | | | | | | | | | | | 1,986 | | | | 47,505 | |
Halozyme Therapeutics Incorporated † | | | | | | | | | | | 31,321 | | | | 576,620 | |
Immunogen Incorporated † | | | | | | | | | | | 31,874 | | | | 324,796 | |
Insys Therapeutics Incorporated † | | | | | | | | | | | 6,636 | | | | 62,047 | |
Invitae Corporation † | | | | | | | | | | | 13,469 | | | | 199,476 | |
Jounce Therapeutics Incorporated † | | | | | | | | | | | 3,940 | | | | 30,929 | |
Kadmon Holdings Incorporated † | | | | | | | | | | | 16,836 | | | | 72,563 | |
Kindred Biosciences Incorporated † | | | | | | | | | | | 6,341 | | | | 94,481 | |
Macrogenics Incorporated † | | | | | | | | | | | 9,500 | | | | 207,765 | |
Madrigal Pharmaceuticals Incorporated † | | | | | | | | | | | 1,735 | | | | 415,029 | |
Mannkind Corporation † | | | | | | | | | | | 33,659 | | | | 37,025 | |
Medicinova Incorporated † | | | | | | | | | | | 8,214 | | | | 99,964 | |
Mei Pharma Incorporated † | | | | | | | | | | | 9,059 | | | | 37,867 | |
Mersana Therapeutics Incorporated † | | | | | | | | | | | 2,799 | | | | 39,046 | |
MiMedx Group Incorporated † | | | | | | | | | | | 26,756 | | | | 141,807 | |
Miragen Therapeutics Incorporated † | | | | | | | | | | | 4,471 | | | | 27,765 | |
Molecular Templates Incorporated † | | | | | | | | | | | 2,402 | | | | 13,836 | |
Momenta Pharmaceuticals Incorporated † | | | | | | | | | | | 17,858 | | | | 473,237 | |
Mustang Bio Incorporated † | | | | | | | | | | | 3,866 | | | | 26,753 | |
Myriad Genetics Incorporated † | | | | | | | | | | | 17,052 | | | | 849,019 | |
Natera Incorporated † | | | | | | | | | | | 7,996 | | | | 221,009 | |
Oncomed Pharmaceuticals Incorporated † | | | | | | | | | | | 6,822 | | | | 15,691 | |
Ophthotech Corporation † | | | | | | | | | | | 9,444 | | | | 24,177 | |
Palatin Technologies Incorporated † | | | | | | | | | | | 45,441 | | | | 45,895 | |
PDL BioPharma Incorporated † | | | | | | | | | | | 36,441 | | | | 88,187 | |
Pfenex Incorporated † | | | | | | | | | | | 5,204 | | | | 27,477 | |
Pieris Pharmaceuticals Incorporated † | | | | | | | | | | | 13,518 | | | | 74,890 | |
Protagonist Therapeutics Incorporated † | | | | | | | | | | | 3,319 | | | | 31,962 | |
Proteostasis Therapeutics Incorporated † | | | | | | | | | | | 6,062 | | | | 16,307 | |
Recro Pharma Incorporated † | | | | | | | | | | | 3,696 | | | | 23,580 | |
Repligen Corporation † | | | | | | | | | | | 9,473 | | | | 519,878 | |
Retrophin Incorporated † | | | | | | | | | | | 9,765 | | | | 309,453 | |
The accompanying notes are an integral part of these financial statements.
| | | | |
| 154 | | Wells Fargo Funds | | Portfolio of investments—August 31, 2018 (unaudited) |
FACTOR ENHANCED SMALL CAP PORTFOLIO
| | | | | | | | | | | | | | | | |
| Security name | | | | | | | | Shares | | | Value | |
| | | | |
| Biotechnology (continued) | | | | | | | | | | | | | | | | |
Rocket Pharmaceuticals Incorporated † | | | | | | | | | | | 5,052 | | | $ | 120,490 | |
Savara Incorporated † | | | | | | | | | | | 4,999 | | | | 58,788 | |
Selecta Biosciences Incorporated † | | | | | | | | | | | 3,753 | | | | 50,891 | |
Sorrento Therapeutics Incorporated † | | | | | | | | | | | 17,150 | | | | 95,183 | |
Spectrum Pharmaceuticals Incorporated † | | | | | | | | | | | 22,800 | | | | 490,884 | |
Spring Bank Pharmaceuticals † | | | | | | | | | | | 2,205 | | | | 31,289 | |
Synlogic Incorporated † | | | | | | | | | | | 4,335 | | | | 45,864 | |
T2 Biosystems Incorporated † | | | | | | | | | | | 5,896 | | | | 38,501 | |
Tyme Technologies Incorporated † | | | | | | | | | | | 12,159 | | | | 27,115 | |
Unum Therapeutics Incorporated † | | | | | | | | | | | 4,059 | | | | 66,202 | |
Vanda Pharmaceuticals Incorporated † | | | | | | | | | | | 12,362 | | | | 238,896 | |
Veracyte Incorporated † | | | | | | | | | | | 6,143 | | | | 77,648 | |
Verastem Incorporated † | | | | | | | | | | | 11,433 | | | | 113,873 | |
Vericel Corporation † | | | | | | | | | | | 9,107 | | | | 111,105 | |
Viking Therapeutics Incorporated † | | | | | | | | | | | 9,426 | | | | 123,198 | |
Voyager Therapeutics Incorporated † | | | | | | | | | | | 5,582 | | | | 121,353 | |
Xoma Corporation † | | | | | | | | | | | 1,556 | | | | 29,144 | |
| | | | |
| | | | | | | | | | | | | | | 12,258,167 | |
| | | | | | | | | | | | | | | | |
| | | | |
| Health Care Equipment & Supplies: 3.05% | | | | | | | | | | | | | | | | |
Accuray Incorporated † | | | | | | | | | | | 20,929 | | | | 83,716 | |
AngioDynamics Incorporated † | | | | | | | | | | | 8,935 | | | | 200,323 | |
Anika Therapeutics Incorporated † | | | | | | | | | | | 3,454 | | | | 142,961 | |
Atricure Incorporated † | | | | | | | | | | | 8,031 | | | | 277,471 | |
Atrion Corporation | | | | | | | | | | | 358 | | | | 234,508 | |
Avanos Medical Incorporated † | | | | | | | | | | | 11,682 | | | | 842,272 | |
Axogen Incorporated † | | | | | | | | | | | 7,305 | | | | 320,324 | |
Bovie Medical Corporation † | | | | | | | | | | | 7,021 | | | | 37,492 | |
Cardiovascular Systems Incorporated † | | | | | | | | | | | 7,921 | | | | 305,196 | |
ConforMIS Incorporated † | | | | | | | | | | | 14,871 | | | | 18,143 | |
CONMED Corporation | | | | | | | | | | | 6,339 | | | | 509,846 | |
CryoLife Incorporated † | | | | | | | | | | | 8,391 | | | | 291,168 | |
Cryoport Incorporated † | | | | | | | | | | | 6,790 | | | | 96,418 | |
Cutera Incorporated † | | | | | | | | | | | 3,222 | | | | 109,548 | |
Cytosorbents Corporation † | | | | | | | | | | | 5,616 | | | | 82,274 | |
Endologix Incorporated † | | | | | | | | | | | 20,838 | | | | 47,927 | |
Fonar Corporation † | | | | | | | | | | | 1,501 | | | | 39,326 | |
Glaukos Corporation † | | | | | | | | | | | 7,152 | | | | 488,982 | |
Heska Corporation † | | | | | | | | | | | 1,680 | | | | 179,760 | |
Inogen Incorporated † | | | | | | | | | | | 4,312 | | | | 1,142,292 | |
Integer Holdings Corporation † | | | | | | | | | | | 7,741 | | | | 618,506 | |
Intricon Corporation † | | | | | | | | | | | 1,499 | | | | 110,776 | |
Invacare Corporation | | | | | | | | | | | 8,007 | | | | 121,706 | |
Invuity Incorporated † | | | | | | | | | | | 5,475 | | | | 25,459 | |
iRhythm Technologies Incorporated † | | | | | | | | | | | 4,350 | | | | 404,942 | |
Lantheus Holdings Incorporated † | | | | | | | | | | | 8,797 | | | | 141,632 | |
Lemaitre Vascular Incorporated | | | | | | | | | | | 3,805 | | | | 142,726 | |
Meridian Diagnostics Incorporated | | | | | | | | | | | 10,215 | | | | 160,376 | |
Merit Medical Systems Incorporated † | | | | | | | | | | | 12,126 | | | | 713,615 | |
The accompanying notes are an integral part of these financial statements.
| | | | | | |
| Portfolio of investments—August 31, 2018 (unaudited) | | Wells Fargo Funds | | | 155 | |
FACTOR ENHANCED SMALL CAP PORTFOLIO
| | | | | | | | | | | | | | | | |
| Security name | | | | | | | | Shares | | | Value | |
| | | | |
| Health Care Equipment & Supplies (continued) | | | | | | | | | | | | | | | | |
Natus Medical Incorporated † | | | | | | | | | | | 7,994 | | | $ | 298,176 | |
NuVasive Incorporated † | | | | | | | | | | | 12,628 | | | | 886,359 | |
Nuvectra Corporation † | | | | | | | | | | | 3,381 | | | | 78,913 | |
NxStage Medical Incorporated † | | | | | | | | | | | 16,198 | | | | 459,051 | |
OraSure Technologies Incorporated † | | | | | | | | | | | 15,011 | | | | 240,326 | |
Orthopediatrics Corporation † | | | | | | | | | | | 1,721 | | | | 59,925 | |
Oxford Immunotec Global plc † | | | | | | | | | | | 6,202 | | | | 91,293 | |
Quidel Corporation † | | | | | | | | | | | 7,916 | | | | 608,582 | |
RTI Biologics Incorporation † | | | | | | | | | | | 14,599 | | | | 65,331 | |
Seaspine Holdings Corporation † | | | | | | | | | | | 2,876 | | | | 44,290 | |
Senseonics Holdings Incorporated † | | | | | | | | | | | 20,405 | | | | 83,252 | |
Sientra Incorporated † | | | | | | | | | | | 3,355 | | | | 84,278 | |
STAAR Surgical Company † | | | | | | | | | | | 7,490 | | | | 357,273 | |
Surmodics Incorporated † | | | | | | | | | | | 3,164 | | | | 249,165 | |
Tactile Systems Technology Class I † | | | | | | | | | | | 3,518 | | | | 238,063 | |
Utah Medical Products Incorporated | | | | | | | | | | | 836 | | | | 75,951 | |
Varex Imaging Corporation † | | | | | | | | | | | 9,450 | | | | 296,730 | |
Viewray Incorporated † | | | | | | | | | | | 9,347 | | | | 94,218 | |
| | | | |
| | | | | | | | | | | | | | | 12,200,861 | |
| | | | | | | | | | | | | | | | |
| | | | |
| Health Care Providers & Services: 1.90% | | | | | | | | | | | | | | | | |
Aceto Corporation | | | | | | | | | | | 7,907 | | | | 26,251 | |
Addus Homecare Corporation † | | | | | | | | | | | 1,926 | | | | 124,997 | |
American Renal Associates Holdings † | | | | | | | | | | | 3,312 | | | | 72,698 | |
AMN Healthcare Services Incorporated † | | | | | | | | | | | 11,821 | | | | 689,164 | |
Apollo Medical Holdings Incorporated † | | | | | | | | | | | 5,653 | | | | 86,208 | |
BioScrip Incorporated † | | | | | | | | | | | 31,074 | | | | 90,115 | |
Capital Senior Living Corporation † | | | | | | | | | | | 6,309 | | | | 55,961 | |
Civitas Solutions Incorporated † | | | | | | | | | | | 4,006 | | | | 64,096 | |
CorVel Corporation † | | | | | | | | | | | 2,351 | | | | 139,767 | |
Cross Country Healthcare Incorporated † | | | | | | | | | | | 8,658 | | | | 86,667 | |
Diplomat Pharmacy Incorporated † | | | | | | | | | | | 13,940 | | | | 288,000 | |
Ensign Group Incorporated | | | | | | | | | | | 12,224 | | | | 477,592 | |
LHC Group Incorporated † | | | | | | | | | | | 7,193 | | | | 711,603 | |
LifePoint Hospitals Incorporated † | | | | | | | | | | | 9,521 | | | | 613,152 | |
Magellan Health Services Incorporated † | | | | | | | | | | | 6,176 | | | | 453,936 | |
National Healthcare Corporation | | | | | | | | | | | 2,352 | | | | 181,269 | |
National Research Corporation Class A | | | | | | | | | | | 2,378 | | | | 93,099 | |
Owens & Minor Incorporated | | | | | | | | | | | 15,226 | | | | 258,537 | |
Patterson Companies Incorporated | | | | | | | | | | | 21,611 | | | | 487,328 | |
Petiq Incorporated † | | | | | | | | | | | 2,233 | | | | 87,444 | |
Premier Incorporated Class A † | | | | | | | | | | | 13,536 | | | | 598,697 | |
Providence Service Corporation † | | | | | | | | | | | 2,758 | | | | 185,172 | |
Psychemedics Corporation | | | | | | | | | | | 1,333 | | | | 25,767 | |
Quorum Health Corporation † | | | | | | | | | | | 7,300 | | | | 33,215 | |
R1 RCM Incorporated † | | | | | | | | | | | 20,242 | | | | 201,813 | |
RadNet Incorporated † | | | | | | | | | | | 9,618 | | | | 133,209 | |
Select Medical Holdings Corporation † | | | | | | | | | | | 26,468 | | | | 524,066 | |
Surgery Partners Incorporated † | | | | | | | | | | | 4,654 | | | | 80,747 | |
The accompanying notes are an integral part of these financial statements.
| | | | |
| 156 | | Wells Fargo Funds | | Portfolio of investments—August 31, 2018 (unaudited) |
FACTOR ENHANCED SMALL CAP PORTFOLIO
| | | | | | | | | | | | | | | | |
| Security name | | | | | | | | Shares | | | Value | |
| | | | |
| Health Care Providers & Services (continued) | | | | | | | | | | | | | | | | |
Tivity Health Incorporated † | | | | | | | | | | | 9,725 | | | $ | 334,540 | |
U.S. Physical Therapy Incorporated | | | | | | | | | | | 3,091 | | | | 387,148 | |
| | | | |
| | | | | | | | | | | | | | | 7,592,258 | |
| | | | | | | | | | | | | | | | |
| | | | |
| Health Care Technology: 0.83% | | | | | | | | | | | | | | | | |
Allscripts Healthcare Solutions Incorporated † | | | | | | | | | | | 43,388 | | | | 633,899 | |
Castlight Health Incorporated Class B † | | | | | | | | | | | 17,460 | | | | 52,380 | |
Computer Programs & Systems Incorporated | | | | | | | | | | | 3,306 | | | | 90,254 | |
HealthStream Incorporated | | | | | | | | | | | 6,372 | | | | 202,184 | |
HMS Holdings Corporation † | | | | | | | | | | | 20,223 | | | | 648,147 | |
Inovalon Holdings Incorporated Class A † | | | | | | | | | | | 17,205 | | | | 189,255 | |
Omnicell Incorporated † | | | | | | | | | | | 8,440 | | | | 580,250 | |
Quality Systems Incorporated † | | | | | | | | | | | 12,934 | | | | 296,059 | |
Simulations Plus Incorporated | | | | | | | | | | | 2,905 | | | | 60,569 | |
Tabula Rasa Healthcare Incorporated † | | | | | | | | | | | 3,876 | | | | 339,809 | |
Vocera Communications Incorporated † | | | | | | | | | | | 6,992 | | | | 231,855 | |
| | | | |
| | | | | | | | | | | | | | | 3,324,661 | |
| | | | | | | | | | | | | | | | |
| | | | |
| Life Sciences Tools & Services: 0.63% | | | | | | | | | | | | | | | | |
Bruker Corporation | | | | | | | | | | | 24,573 | | | | 874,307 | |
Cambrex Corporation † | | | | | | | | | | | 8,428 | | | | 568,047 | |
Chromadex Corporation † | | | | | | | | | | | 8,400 | | | | 38,052 | |
Codexis Incorporated † | | | | | | | | | | | 12,150 | | | | 208,980 | |
Enzo Biochem Incorporated † | | | | | | | | | | | 11,156 | | | | 51,206 | |
Fluidigm Corporation † | | | | | | | | | | | 5,953 | | | | 47,148 | |
Harvard Bioscience Incorporated † | | | | | | | | | | | 8,021 | | | | 47,725 | |
Luminex Corporation | | | | | | | | | | | 10,081 | | | | 284,385 | |
Medpace Holdings Incorporated † | | | | | | | | | | | 2,200 | | | | 131,538 | |
Neogenomics Incorporated † | | | | | | | | | | | 18,338 | | | | 253,981 | |
| | | | |
| | | | | | | | | | | | | | | 2,505,369 | |
| | | | | | | | | | | | | | | | |
| | | | |
| Pharmaceuticals: 1.45% | | | | | | | | | | | | | | | | |
Acer Therapeutics Incorporated † | | | | | | | | | | | 1,200 | | | | 38,496 | |
Adamis Pharmaceuticals Corporation † | | | | | | | | | | | 8,056 | | | | 22,960 | |
Agile Therapeutics Incorporated † | | | | | | | | | | | 7,949 | | | | 2,329 | |
Akcea Therapeutics Incorporated † | | | | | | | | | | | 3,798 | | | | 100,305 | |
Akorn Incorporated † | | | | | | | | | | | 23,184 | | | | 363,757 | |
Amneal Pharmaceuticals Incorporated † | | | | | | | | | | | 18,059 | | | | 417,163 | |
Amphastar Pharmaceuticals Incorporated † | | | | | | | | | | | 8,472 | | | | 160,799 | |
ANI Pharmaceuticals Incorporated † | | | | | | | | | | | 2,045 | | | | 119,019 | |
Assembly Biosciences Incorporated † | | | | | | | | | | | 4,296 | | | | 171,840 | |
Assertio Therapeutics Incorporated † | | | | | | | | | | | 14,481 | | | | 92,389 | |
BioDelivery Sciences International Incorporated † | | | | | | | | | | | 13,656 | | | | 40,627 | |
Corcept Therapeutics Incorporated † | | | | | | | | | | | 25,449 | | | | 382,244 | |
Corium International Incorporated † | | | | | | | | | | | 6,709 | | | | 65,480 | |
Cymabay Therapeutics Incorporated † | | | | | | | | | | | 14,049 | | | | 191,488 | |
Durect Corporation † | | | | | | | | | | | 36,408 | | | | 47,694 | |
Innovate Biopharmaceuticals † | | | | | | | | | | | 5,783 | | | | 41,175 | |
Innoviva Incorporated † | | | | | | | | | | | 16,591 | | | | 240,901 | |
The accompanying notes are an integral part of these financial statements.
| | | | | | |
| Portfolio of investments—August 31, 2018 (unaudited) | | Wells Fargo Funds | | | 157 | |
FACTOR ENHANCED SMALL CAP PORTFOLIO
| | | | | | | | | | | | | | | | |
| Security name | | | | | | | | Shares | | | Value | |
| | | | |
| Pharmaceuticals (continued) | | | | | | | | | | | | | | | | |
Intersect ENT Incorporated † | | | | | | | | | | | 7,095 | | | $ | 207,884 | |
Lannett Company Incorporated † | | | | | | | | | | | 8,485 | | | | 45,395 | |
Mallinckrodt plc † | | | | | | | | | | | 21,315 | | | | 734,515 | |
Melinta Therapeutics Incorporated † | | | | | | | | | | | 4,770 | | | | 22,300 | |
Neos Therapeutics Incorporated † | | | | | | | | | | | 6,089 | | | | 35,012 | |
Pacira Pharmaceuticals Incorporated † | | | | | | | | | | | 9,845 | | | | 464,192 | |
Phibro Animal Health Corporation Class A | | | | | | | | | | | 4,904 | | | | 231,469 | |
Prestige Brands Holdings Incorporated † | | | | | | | | | | | 13,052 | | | | 502,502 | |
Reata Pharmaceuticals Incorporated Class A † | | | | | | | | | | | 3,660 | | | | 316,078 | |
Siga Technologies Incorporated † | | | | | | | | | | | 12,134 | | | | 99,863 | |
Strongbridge Biopharma plc † | | | | | | | | | | | 10,295 | | | | 56,623 | |
Supernus Pharmaceuticals Incorporated † | | | | | | | | | | | 12,535 | | | | 555,301 | |
Teligent Incorporated † | | | | | | | | | | | 10,794 | | | | 43,608 | |
| | | | |
| | | | | | | | | | | | | | | 5,813,408 | |
| | | | | | | | | | | | | | | | |
| | | | |
Industrials: 13.98% | | | | | | | | | | | | | | | | |
| | | | |
| Aerospace & Defense: 1.10% | | | | | | | | | | | | | | | | |
AAR Corporation | | | | | | | | | | | 8,134 | | | | 379,614 | |
Aerojet Rocketdyne Holdings † | | | | | | | | | | | 17,272 | | | | 606,420 | |
AeroVironment Incorporated † | | | | | | | | | | | 5,285 | | | | 464,869 | |
Astronics Corporation † | | | | | | | | | | | 5,196 | | | | 226,078 | |
Cubic Corporation | | | | | | | | | | | 6,371 | | | | 482,285 | |
Ducommun Incorporated † | | | | | | | | | | | 2,582 | | | | 105,062 | |
Engility Holdings Incorporated † | | | | | | | | | | | 4,633 | | | | 160,811 | |
HEICO Corporation | | | | | | | | | | | 9,647 | | | | 874,790 | |
Moog Incorporated Class A | | | | | | | | | | | 7,994 | | | | 630,807 | |
National Presto Industries Incorporated | | | | | | | | | | | 1,343 | | | | 178,082 | |
Sparton Corporation † | | | | | | | | | | | 2,184 | | | | 27,890 | |
Vectrus Incorporated † | | | | | | | | | | | 2,700 | | | | 88,614 | |
Wesco Aircraft Holdings Incorporated † | | | | | | | | | | | 13,193 | | | | 160,295 | |
| | | | |
| | | | | | | | | | | | | | | 4,385,617 | |
| | | | | | | | | | | | | | | | |
| | | | |
| Air Freight & Logistics: 0.38% | | | | | | | | | | | | | | | | |
Atlas Air Worldwide Holdings Incorporated † | | | | | | | | | | | 6,252 | | | | 380,747 | |
Echo Global Logistics Incorporated † | | | | | | | | | | | 6,711 | | | | 222,805 | |
Forward Air Corporation | | | | | | | | | | | 7,205 | | | | 462,993 | |
Hub Group Incorporated Class A † | | | | | | | | | | | 8,057 | | | | 425,812 | |
Radiant Logistics Incorporated † | | | | | | | | | | | 8,717 | | | | 37,919 | |
| | | | |
| | | | | | | | | | | | | | | 1,530,276 | |
| | | | | | | | | | | | | | | | |
| | | | |
| Airlines: 0.44% | | | | | | | | | | | | | | | | |
Allegiant Travel Company | | | | | | | | | | | 3,169 | | | | 431,776 | |
Hawaiian Holdings Incorporated | | | | | | | | | | | 12,534 | | | | 520,161 | |
SkyWest Incorporated | | | | | | | | | | | 12,527 | | | | 818,013 | |
| | | | |
| | | | | | | | | | | | | | | 1,769,950 | |
| | | | | | | | | | | | | | | | |
| | | | |
| Building Products: 1.46% | | | | | | | | | | | | | | | | |
Advanced Drainage Systems Incorporated | | | | | | | | | | | 8,653 | | | | 271,272 | |
American Woodmark Corporation † | | | | | | | | | | | 3,944 | | | | 335,043 | |
The accompanying notes are an integral part of these financial statements.
| | | | |
| 158 | | Wells Fargo Funds | | Portfolio of investments—August 31, 2018 (unaudited) |
FACTOR ENHANCED SMALL CAP PORTFOLIO
| | | | | | | | | | | | | | | | |
| Security name | | | | | | | | Shares | | | Value | |
| | | | |
| Building Products (continued) | | | | | | | | | | | | | | | | |
Apogee Enterprises Incorporated | | | | | | | | | | | 6,943 | | | $ | 341,734 | |
Armstrong Flooring Incorporated † | | | | | | | | | | | 5,067 | | | | 88,723 | |
Armstrong World Industries Incorporated † | | | | | | | | | | | 11,419 | | | | 797,046 | |
Builders FirstSource Incorporated † | | | | | | | | | | | 28,279 | | | | 441,718 | |
Continental Building Product † | | | | | | | | | | | 9,141 | | | | 340,959 | |
CSW Industrials Incorporated † | | | | | | | | | | | 3,858 | | | | 216,048 | |
Gibraltar Industries Incorporated † | | | | | | | | | | | 7,783 | | | | 353,348 | |
Griffon Corporation | | | | | | | | | | | 9,243 | | | | 168,685 | |
Insteel Industries Incorporated | | | | | | | | | | | 4,524 | | | | 173,495 | |
NCI Building Systems Incorporated † | | | | | | | | | | | 10,107 | | | | 170,808 | |
Patrick Industries Incorporated † | | | | | | | | | | | 5,703 | | | | 364,992 | |
PGT Incorporated † | | | | | | | | | | | 12,303 | | | | 298,963 | |
Quanex Building Products Corporation | | | | | | | | | | | 8,757 | | | | 143,615 | |
Simpson Manufacturing Company Incorporated | | | | | | | | | | | 10,350 | | | | 794,570 | |
Universal Forest Products Incorporated | | | | | | | | | | | 14,801 | | | | 554,445 | |
| | | | |
| | | | | | | | | | | | | | | 5,855,464 | |
| | | | | | | | | | | | | | | | |
| | | | |
| Commercial Services & Supplies: 2.69% | | | | | | | | | | | | | | | | |
ABM Industries Incorporated | | | | | | | | | | | 16,275 | | | | 516,243 | |
ACCO Brands Corporation | | | | | | | | | | | 26,358 | | | | 326,839 | |
Advanced Disposal Services Incorporated † | | | | | | | | | | | 14,671 | | | | 391,422 | |
Arc Document Solutions Incorporated † | | | | | | | | | | | 10,015 | | | | 32,248 | |
Brady Corporation Class A | | | | | | | | | | | 11,454 | | | | 463,314 | |
Casella Waste Systems Incorporated Class A † | | | | | | | | | | | 9,722 | | | | 275,910 | |
Ceco Environmental Corporation | | | | | | | | | | | 7,204 | | | | 60,802 | |
Covanta Holding Corporation | | | | | | | | | | | 28,859 | | | | 509,361 | |
Ennis Incorporated | | | | | | | | | | | 6,082 | | | | 132,588 | |
Essendant Incorporated | | | | | | | | | | | 8,135 | | | | 117,388 | |
Healthcare Services Group Incorporated | | | | | | | | | | | 17,715 | | | | 730,035 | |
Heritage Crystal Clean Incorporated † | | | | | | | | | | | 3,877 | | | | 90,334 | |
Herman Miller Incorporated | | | | | | | | | | | 15,051 | | | | 576,453 | |
HNI Corporation | | | | | | | | | | | 10,654 | | | | 469,841 | |
Hudson Technologies Incorporated † | | | | | | | | | | | 9,759 | | | | 18,249 | |
InnerWorkings Incorporated † | | | | | | | | | | | 11,951 | | | | 93,457 | |
Interface Incorporated | | | | | | | | | | | 14,590 | | | | 343,595 | |
Kimball International Incorporated Class B | | | | | | | | | | | 8,940 | | | | 156,182 | |
Knoll Incorporated | | | | | | | | | | | 11,898 | | | | 280,079 | |
LSC Communications Incorporated | | | | | | | | | | | 8,489 | | | | 103,820 | |
Matthews International Corporation Class A | | | | | | | | | | | 7,877 | | | | 408,816 | |
Mcgrath RentCorp | | | | | | | | | | | 5,853 | | | | 339,474 | |
Mobile Mini Incorporated | | | | | | | | | | | 10,694 | | | | 458,773 | |
Multi-Color Corporation | | | | | | | | | | | 3,486 | | | | 215,261 | |
PICO Holdings Incorporated | | | | | | | | | | | 5,288 | | | | 63,192 | |
Pitney Bowes Incorporated | | | | | | | | | | | 49,277 | | | | 357,751 | |
Quad Graphics Incorporated | | | | | | | | | | | 8,289 | | | | 188,741 | |
RR Donnelley & Sons Company | | | | | | | | | | | 17,771 | | | | 89,921 | |
SP Plus Corporation † | | | | | | | | | | | 5,366 | | | | 208,737 | |
Steelcase Incorporated Class A | | | | | | | | | | | 20,148 | | | | 294,161 | |
Tetra Tech Incorporated | | | | | | | | | | | 13,713 | | | | 957,167 | |
The accompanying notes are an integral part of these financial statements.
| | | | | | |
| Portfolio of investments—August 31, 2018 (unaudited) | | Wells Fargo Funds | | | 159 | |
FACTOR ENHANCED SMALL CAP PORTFOLIO
| | | | | | | | | | | | | | | | |
| Security name | | | | | | | | Shares | | | Value | |
| | | | |
| Commercial Services & Supplies (continued) | | | | | | | | | | | | | | | | |
UniFirst Corporation | | | | | | | | | | | 3,749 | | | $ | 694,315 | |
US Ecology Incorporated | | | | | | | | | | | 5,373 | | | | 390,886 | |
Viad Corporation | | | | | | | | | | | 5,024 | | | | 309,478 | |
VSE Corporation | | | | | | | | | | | 2,111 | | | | 81,442 | |
| | | | |
| | | | | | | | | | | | | | | 10,746,275 | |
| | | | | | | | | | | | | | | | |
| | | | |
| Construction & Engineering: 0.60% | | | | | | | | | | | | | | | | |
Ameresco Incorporated Class A † | | | | | | | | | | | 4,276 | | | | 61,361 | |
Argan Incorporated | | | | | | | | | | | 3,721 | | | | 148,096 | |
Comfort Systems Incorporated | | | | | | | | | | | 8,482 | | | | 486,867 | |
Goldfield Corporation † | | | | | | | | | | | 5,965 | | | | 28,334 | |
Great Lakes Dredge & Dock Company † | | | | | | | | | | | 14,017 | | | | 76,743 | |
Hc2 Holdings Incorporated † | | | | | | | | | | | 10,367 | | | | 65,001 | |
IES Holdings Incorporated † | | | | | | | | | | | 2,083 | | | | 39,889 | |
KBR Incorporated | | | | | | | | | | | 35,042 | | | | 735,181 | |
MYR Group Incorporated † | | | | | | | | | | | 4,002 | | | | 139,150 | |
Northwest Pipe Company † | | | | | | | | | | | 2,331 | | | | 42,098 | |
Nv5 Global Incorporated † | | | | | | | | | | | 2,061 | | | | 182,295 | |
Orion Marine Group Incorporated † | | | | | | | | | | | 6,747 | | | | 58,159 | |
Primoris Services Corporation | | | | | | | | | | | 10,498 | | | | 263,080 | |
Sterling Construction Company Incorporated † | | | | | | | | | | | 6,458 | | | | 93,964 | |
| | | | |
| | | | | | | | | | | | | | | 2,420,218 | |
| | | | | | | | | | | | | | | | |
| | | | |
| Electrical Equipment: 0.69% | | | | | | | | | | | | | | | | |
Allied Motion Technologies | | | | | | | | | | | 1,926 | | | | 94,066 | |
American Superconductor Corporation † | | | | | | | | | | | 4,387 | | | | 26,761 | |
Atkore International Incorporated † | | | | | | | | | | | 9,893 | | | | 270,870 | |
AZZ Incorporated | | | | | | | | | | | 6,424 | | | | 345,290 | |
Babcock & Wilcox Enterprises Incorporated † | | | | | | | | | | | 9,496 | | | | 13,294 | |
Encore Wire Corporation | | | | | | | | | | | 5,075 | | | | 255,019 | |
Enphase Energy Incorporated † | | | | | | | | | | | 20,646 | | | | 100,959 | |
Generac Holdings Incorporated † | | | | | | | | | | | 15,235 | | | | 845,390 | |
LSI Industries Incorporated | | | | | | | | | | | 6,287 | | | | 32,504 | |
Powell Industries Incorporated | | | | | | | | | | | 2,150 | | | | 84,173 | |
Preformed Line Products Company | | | | | | | | | | | 545 | | | | 44,527 | |
Sunrun Incorporated † | | | | | | | | | | | 21,912 | | | | 287,485 | |
Thermon Group Holdings Incorporated † | | | | | | | | | | | 8,035 | | | | 215,338 | |
TPI mposites Incorporated † | | | | | | | | | | | 3,810 | | | | 106,794 | |
Vivint Solar Incorporated † | | | | | | | | | | | 7,163 | | | | 37,606 | |
| | | | |
| | | | | | | | | | | | | | | 2,760,076 | |
| | | | | | | | | | | | | | | | |
| | | | |
| Electronic Equipment, Instruments & Components: 0.06% | | | | | | | | | | | | | | | | |
ScanSource Incorporated † | | | | | | | | | | | 6,170 | | | | 250,811 | |
| | | | | | | | | | | | | | | | |
| | | | |
| Industrial Conglomerates: 0.11% | | | | | | | | | | | | | | | | |
Raven Industries Incorporated | | | | | | | | | | | 8,799 | | | | 425,872 | |
| | | | | | | | | | | | | | | | |
| | | | |
| Machinery: 3.18% | | | | | | | | | | | | | | | | |
Alamo Group Incorporated | | | | | | | | | | | 2,439 | | | | 232,437 | |
Albany International Corporation Class A | | | | | | | | | | | 7,122 | | | | 549,462 | |
The accompanying notes are an integral part of these financial statements.
| | | | |
| 160 | | Wells Fargo Funds | | Portfolio of investments—August 31, 2018 (unaudited) |
FACTOR ENHANCED SMALL CAP PORTFOLIO
| | | | | | | | | | | | | | | | |
| Security name | | | | | | | | Shares | | | Value | |
| | | | |
| Machinery (continued) | | | | | | | | | | | | | | | | |
Altra Holdings Incorporated | | | | | | | | | | | 7,047 | | | $ | 275,185 | |
American Railcar Industries | | | | | | | | | | | 1,797 | | | | 82,339 | |
Astec Industries Incorporated | | | | | | | | | | | 5,233 | | | | 254,585 | |
Blue Bird Corporation † | | | | | | | | | | | 2,878 | | | | 66,050 | |
Briggs & Stratton Corporation | | | | | | | | | | | 10,603 | | | | 213,756 | |
Columbus McKinnon Corporation | | | | | | | | | | | 5,069 | | | | 215,585 | |
Commercial Vehicle Group Incorporated † | | | | | | | | | | | 6,969 | | | | 68,017 | |
DMC Global Incorporated | | | | | | | | | | | 3,543 | | | | 139,063 | |
Douglas Dynamics Incorporated | | | | | | | | | | | 5,526 | | | | 253,091 | |
Eastern Company | | | | | | | | | | | 1,203 | | | | 35,489 | |
EnPro Industries Incorporated | | | | | | | | | | | 5,271 | | | | 395,694 | |
ESCO Technologies Incorporated | | | | | | | | | | | 6,241 | | | | 422,204 | |
Evoqua Water Technologies Company † | | | | | | | | | | | 10,875 | | | | 210,758 | |
Federal Signal Corporation | | | | | | | | | | | 14,627 | | | | 380,741 | |
Foster Company Class A † | | | | | | | | | | | 2,029 | | | | 46,160 | |
Franklin Electric Company Incorporated | | | | | | | | | | | 9,638 | | | | 471,298 | |
Freightcar America Incorporated | | | | | | | | | | | 3,057 | | | | 51,694 | |
Gencor Industries Incorporated † | | | | | | | | | | | 2,181 | | | | 28,135 | |
Global Brass & Copper Holdings Incorporated | | | | | | | | | | | 5,398 | | | | 208,093 | |
Gorman Rupp Company | | | | | | | | | | | 5,353 | | | | 196,241 | |
Graham Corporation | | | | | | | | | | | 2,324 | | | | 64,630 | |
Hillenbrand Incorporated | | | | | | | | | | | 14,277 | | | | 730,269 | |
Hurco Companies Incorporated | | | | | | | | | | | 1,532 | | | | 65,723 | |
Hyster Yale Materials Handeling Incorporated | | | | | | | | | | | 2,147 | | | | 132,470 | |
Kadant Incorporated | | | | | | | | | | | 2,690 | | | | 271,825 | |
Lindsay Manufacturing Company | | | | | | | | | | | 2,608 | | | | 249,768 | |
Lydall Incorporated † | | | | | | | | | | | 4,228 | | | | 180,958 | |
Manitex International Incorporated † | | | | | | | | | | | 3,480 | | | | 36,818 | |
Manitowoc Company Incorporated † | | | | | | | | | | | 8,397 | | | | 194,726 | |
Meritor Incorporated † | | | | | | | | | | | 22,083 | | | | 478,318 | |
Milacron Holdings Corporation † | | | | | | | | | | | 17,358 | | | | 367,990 | |
Miller Industries Incorporated | | | | | | | | | | | 2,686 | | | | 77,357 | |
Mueller Industries Incorporated | | | | | | | | | | | 14,087 | | | | 450,361 | |
Omega Flex Incorporated | | | | | | | | | | | 918 | | | | 81,473 | |
Park Ohio Holdings Corporation | | | | | | | | | | | 2,152 | | | | 89,200 | |
REV Group Incorporated | | | | | | | | | | | 7,620 | | | | 129,616 | |
Rexnord Corporation † | | | | | | | | | | | 25,503 | | | | 740,352 | |
Spartan Motors Incorporated | | | | | | | | | | | 7,823 | | | | 113,042 | |
SPX Corporation † | | | | | | | | | | | 10,338 | | | | 351,389 | |
Standex International Corporation | | | | | | | | | | | 3,117 | | | | 336,324 | |
Tennant Company | | | | | | | | | | | 4,147 | | | | 317,453 | |
The Greenbrier Companies Incorporated | | | | | | | | | | | 7,950 | | | | 461,100 | |
Trimas Corporation † | | | | | | | | | | | 11,302 | | | | 346,971 | |
Twin Disc Incorporated † | | | | | | | | | | | 2,548 | | | | 65,101 | |
Wabash National Corporation | | | | | | | | | | | 14,108 | | | | 257,330 | |
Watts Water Technologies Incorporated | | | | | | | | | | | 6,846 | | | | 564,453 | |
Welbilt Incorporated † | | | | | | | | | | | 34,783 | | | | 769,748 | |
| | | | |
| | | | | | | | | | | | | | | 12,720,842 | |
| | | | | | | | | | | | | | | | |
The accompanying notes are an integral part of these financial statements.
| | | | | | |
| Portfolio of investments—August 31, 2018 (unaudited) | | Wells Fargo Funds | | | 161 | |
FACTOR ENHANCED SMALL CAP PORTFOLIO
| | | | | | | | | | | | | | | | |
| Security name | | | | | | | | Shares | | | Value | |
| | | | |
| Marine: 0.10% | | | | | | | | | | | | | | | | |
Genco Shipping & Trading Limited † | | | | | | | | | | | 2,141 | | | $ | 29,396 | |
Matson Incorporated | | | | | | | | | | | 10,404 | | | | 388,693 | |
| | | | |
| | | | | | | | | | | | | | | 418,089 | |
| | | | | | | | | | | | | | | | |
| | | | |
| Professional Services: 1.47% | | | | | | | | | | | | | | | | |
Acacia Research-Acacia Technologies † | | | | | | | | | | | 12,185 | | | | 47,522 | |
Barrett Business Services Incorporated | | | | | | | | | | | 1,740 | | | | 130,552 | |
BG Staffing Incorporated | | | | | | | | | | | 1,906 | | | | 46,430 | |
CBIZ Incorporated † | | | | | | | | | | | 12,984 | | | | 310,318 | |
CRA International Incorporated | | | | | | | | | | | 1,985 | | | | 113,463 | |
Exponent Incorporated | | | | | | | | | | | 12,816 | | | | 670,918 | |
Forrester Research Incorporated | | | | | | | | | | | 2,541 | | | | 125,017 | |
Franklin Covey Company † | | | | | | | | | | | 2,350 | | | | 60,160 | |
FTI Consulting Incorporated † | | | | | | | | | | | 9,169 | | | | 698,861 | |
GP Strategies Corporation † | | | | | | | | | | | 3,089 | | | | 58,845 | |
Heidrick & Struggles International Incorporated | | | | | | | | | | | 4,577 | | | | 202,303 | |
ICF International Incorporated | | | | | | | | | | | 4,482 | | | | 365,955 | |
Insperity Incorporated | | | | | | | | | | | 9,352 | | | | 1,120,837 | |
Kelly Services Incorporated Class A | | | | | | | | | | | 7,576 | | | | 190,991 | |
Kforce Incorporated | | | | | | | | | | | 5,816 | | | | 244,563 | |
Mistras Group Incorporated † | | | | | | | | | | | 4,239 | | | | 96,692 | |
Navigant Consulting Incorporated | | | | | | | | | | | 10,980 | | | | 262,312 | |
Reis Incorporated | | | | | | | | | | | 1,550 | | | | 35,728 | |
Resources Connection Incorporated | | | | | | | | | | | 7,277 | | | | 120,434 | |
TriNet Group Incorporated † | | | | | | | | | | | 10,624 | | | | 627,560 | |
TrueBlue Incorporated † | | | | | | | | | | | 10,076 | | | | 295,227 | |
Willdan Group Incorporated † | | | | | | | | | | | 2,104 | | | | 66,002 | |
| | | | |
| | | | | | | | | | | | | | | 5,890,690 | |
| | | | | | | | | | | | | | | | |
| | | | |
| Road & Rail: 0.63% | | | | | | | | | | | | | | | | |
Arcbest Corporation | | | | | | | | | | | 6,195 | | | | 297,980 | |
Covenant Transport Incorporated Class A † | | | | | | | | | | | 3,209 | | | | 95,853 | |
Daseke Incorporated † | | | | | | | | | | | 9,748 | | | | 87,635 | |
Hertz Global Holdings Incorporated † | | | | | | | | | | | 13,060 | | | | 229,987 | |
Marten Transport Limited | | | | | | | | | | | 9,549 | | | | 210,555 | |
Roadrunner Transportation Systems Incorporated † | | | | | | | | | | | 10,080 | | | | 13,104 | |
Saia Incorporated † | | | | | | | | | | | 6,320 | | | | 500,860 | |
Schneider National Incorporated Class B | | | | | | | | | | | 17,191 | | | | 465,017 | |
Universal Truckload Services | | | | | | | | | | | 1,929 | | | | 70,601 | |
USA Truck Incorporated † | | | | | | | | | | | 1,677 | | | | 36,743 | |
Werner Enterprises Incorporated | | | | | | | | | | | 11,206 | | | | 415,182 | |
YRC Worldwide Incorporated † | | | | | | | | | | | 8,101 | | | | 77,527 | |
| | | | |
| | | | | | | | | | | | | | | 2,501,044 | |
| | | | | | | | | | | | | | | | |
| | | | |
| Trading Companies & Distributors: 1.07% | | | | | | | | | | | | | | | | |
Applied Industrial Technologies Incorporated | | | | | | | | | | | 9,504 | | | | 732,283 | |
Bluelinx Holdings Incorporated † | | | | | | | | | | | 1,996 | | | | 71,716 | |
BMC Stock Holdings Incorporated † | | | | | | | | | | | 16,194 | | | | 364,365 | |
CAI International Incorporated † | | | | | | | | | | | 4,563 | | | | 123,155 | |
The accompanying notes are an integral part of these financial statements.
| | | | |
| 162 | | Wells Fargo Funds | | Portfolio of investments—August 31, 2018 (unaudited) |
FACTOR ENHANCED SMALL CAP PORTFOLIO
| | | | | | | | | | | | | | | | |
| Security name | | | | | | | | Shares | | | Value | |
| | | | |
| Trading Companies & Distributors (continued) | | | | | | | | | | | | | | | | |
DXP Enterprises Incorporated † | | | | | | | | | | | 3,931 | | | $ | 180,394 | |
Envirostar Incorporated | | | | | | | | | | | 1,150 | | | | 54,338 | |
Foundation Building Material † | | | | | | | | | | | 3,641 | | | | 50,282 | |
GMS Incorporated † | | | | | | | | | | | 8,053 | | | | 200,117 | |
H&E Equipment Services Incorporated | | | | | | | | | | | 7,957 | | | | 276,983 | |
Houston Wire & Cable Company † | | | | | | | | | | | 3,968 | | | | 32,538 | |
Huttig Building Products Incorporated † | | | | | | | | | | | 5,199 | | | | 26,931 | |
Kaman Corporation | | | | | | | | | | | 6,776 | | | | 441,863 | |
Lawson Products Incorporated † | | | | | | | | | | | 1,069 | | | | 36,025 | |
Nexeo Solutions Incorporated † | | | | | | | | | | | 7,779 | | | | 77,868 | |
Rush Enterprises Incorporated | | | | | | | | | | | 7,555 | | | | 324,563 | |
SiteOne Landscape Supply Incorporated † | | | | | | | | | | | 9,897 | | | | 894,392 | |
Systemax Incorporated | | | | | | | | | | | 3,683 | | | | 134,430 | |
Titan Machinery Incorporated † | | | | | | | | | | | 4,373 | | | | 78,976 | |
Transcat Incorporated † | | | | | | | | | | | 1,662 | | | | 40,470 | |
Veritiv Corporation † | | | | | | | | | | | 2,724 | | | | 130,071 | |
Willis Lease Finance Corporation † | | | | | | | | | | | 762 | | | | 26,121 | |
| | | | |
| | | | | | | | | | | | | | | 4,297,881 | |
| | | | | | | | | | | | | | | | |
| | | | |
Information Technology: 11.89% | | | | | | | | | | | | | | | | |
| | | | |
| Communications Equipment: 1.04% | | | | | | | | | | | | | | | | |
ADTRAN Incorporated | | | | | | | | | | | 11,876 | | | | 204,267 | |
Applied Optoelectronics Incorporated † | | | | | | | | | | | 4,563 | | | | 188,726 | |
Calamp Corporation † | | | | | | | | | | | 8,505 | | | | 199,868 | |
Calix Networks Incorporated † | | | | | | | | | | | 11,017 | | | | 85,933 | |
Casa Systems Incorporated † | | | | | | | | | | | 1,805 | | | | 26,515 | |
Clearfield Incorporated † | | | | | | | | | | | 2,818 | | | | 38,466 | |
Comtech Telecommunications Corporation | | | | | | | | | | | 5,687 | | | | 203,879 | |
Digi International Incorporated † | | | | | | | | | | | 6,484 | | | | 87,210 | |
Echostar Corporation † | | | | | | | | | | | 8,998 | | | | 431,904 | |
Emcore Corporation † | | | | | | | | | | | 6,373 | | | | 30,909 | |
Extreme Networks Incorporated † | | | | | | | | | | | 28,451 | | | | 178,388 | |
Harmonic Incorporated † | | | | | | | | | | | 20,388 | | | | 111,115 | |
InterDigital Incorporated | | | | | | | | | | | 8,652 | | | | 714,655 | |
KVH Industries Incorporated † | | | | | | | | | | | 3,762 | | | | 46,837 | |
NETGEAR Incorporated † | | | | | | | | | | | 7,526 | | | | 533,217 | |
Oclaro Incorporated † | | | | | | | | | | | 40,768 | | | | 388,927 | |
PCTEL Incorporated | | | | | | | | | | | 4,148 | | | | 18,002 | |
Plantronics Incorporated | | | | | | | | | | | 8,198 | | | | 551,070 | |
Ribbon Communications Incorporated † | | | | | | | | | | | 11,991 | | | | 82,978 | |
Tessco Technologies Incorporated | | | | | | | | | | | 1,608 | | | | 28,703 | |
| | | | |
| | | | | | | | | | | | | | | 4,151,569 | |
| | | | | | | | | | | | | | | | |
| | | | |
| Electronic Equipment, Instruments & Components: 2.27% | | | | | | | | | | | | | | | | |
Anixter International Incorporated † | | | | | | | | | | | 7,138 | | | | 514,650 | |
Badger Meter Incorporated | | | | | | | | | | | 7,086 | | | | 389,376 | |
Bel Fuse Incorporated Class B | | | | | | | | | | | 2,326 | | | | 66,640 | |
Benchmark Electronics Incorporated | | | | | | | | | | | 11,824 | | | | 305,650 | |
Control4 Corporation † | | | | | | | | | | | 6,464 | | | | 209,498 | |
The accompanying notes are an integral part of these financial statements.
| | | | | | |
| Portfolio of investments—August 31, 2018 (unaudited) | | Wells Fargo Funds | | | 163 | |
FACTOR ENHANCED SMALL CAP PORTFOLIO
| | | | | | | | | | | | | | | | |
| Security name | | | | | | | | Shares | | | Value | |
| | | | |
| Electronic Equipment, Instruments & Components (continued) | | | | | | | | | | | | | | | | |
CTS Corporation | | | | | | | | | | | 8,074 | | | $ | 298,334 | |
Daktronics Incorporated | | | | | | | | | | | 9,033 | | | | 73,258 | |
Electro Scientific Industries Incorporated † | | | | | | | | | | | 8,004 | | | | 175,688 | |
Eplus Incorporated † | | | | | | | | | | | 3,336 | | | | 345,776 | |
ID Systems Incorporated † | | | | | | | | | | | 3,725 | | | | 23,989 | |
II-VI Incorporated † | | | | | | | | | | | 13,776 | | | | 685,356 | |
Insight Enterprises Incorporated † | | | | | | | | | | | 8,878 | | | | 489,533 | |
Iteris Incorporated † | | | | | | | | | | | 6,974 | | | | 35,916 | |
Itron Incorporated † | | | | | | | | | | | 8,324 | | | | 552,714 | |
Kemet Corporation † | | | | | | | | | | | 12,663 | | | | 327,212 | |
Kimball Electronics Incorporated † | | | | | | | | | | | 6,296 | | | | 124,661 | |
Mesa Laboratories Incorporated | | | | | | | | | | | 831 | | | | 166,823 | |
Methode Electronics Incorporated | | | | | | | | | | | 9,191 | | | | 364,423 | |
MTS Systems Corporation | | | | | | | | | | | 4,346 | | | | 235,119 | |
Napco Security Technologies Incorporated † | | | | | | | | | | | 2,913 | | | | 43,986 | |
OSI Systems Incorporated † | | | | | | | | | | | 4,379 | | | | 341,080 | |
Par Technology Corporation † | | | | | | | | | | | 2,511 | | | | 64,482 | |
Park Electrochemical Corporation | | | | | | | | | | | 4,750 | | | | 101,555 | |
PC Connection Incorporated | | | | | | | | | | | 2,809 | | | | 111,517 | |
PC Mall Incorporated † | | | | | | | | | | | 2,294 | | | | 52,303 | |
Plexus Corporation † | | | | | | | | | | | 8,133 | | | | 514,738 | |
Rogers Corporation † | | | | | | | | | | | 4,534 | | | | 626,009 | |
Sanmina Corporation † | | | | | | | | | | | 17,324 | | | | 533,579 | |
TTM Technologies Incorporated † | | | | | | | | | | | 22,843 | | | | 427,164 | |
Vishay Intertechnology Incorporated | | | | | | | | | | | 32,918 | | | | 783,448 | |
Vishay Precision Group † | | | | | | | | | | | 2,503 | | | | 108,380 | |
| | | | |
| | | | | | | | | | | | | | | 9,092,857 | |
| | | | | | | | | | | | | | | | |
| | | | |
| Internet Software & Services: 3.06% | | | | | | | | | | | | | | | | |
Actua Corporation ‡(a) | | | | | | | | | | | 9,483 | | | | 5,405 | |
Aerohive Networks Incorporated † | | | | | | | | | | | 8,422 | | | | 35,541 | |
Alarm.com Holdings Incorporated † | | | | | | | | | | | 7,384 | | | | 415,645 | |
Alteryx Incorporated Class A † | | | | | | | | | | | 6,254 | | | | 363,045 | |
Amber Road Incorporated † | | | | | | | | | | | 6,279 | | | | 54,816 | |
Angi Homeservices Incorporated Class A † | | | | | | | | | | | 15,417 | | | | 333,932 | |
AppFolio Incorporated Class A † | | | | | | | | | | | 3,370 | | | | 287,798 | |
Apptio Incorporated Class A † | | | | | | | | | | | 7,321 | | | | 284,055 | |
Bandwidth Incorporated Class A † | | | | | | | | | | | 1,062 | | | | 48,385 | |
Brightcove Incorporated † | | | | | | | | | | | 7,696 | | | | 63,107 | |
Carbonite Incorporated † | | | | | | | | | | | 5,984 | | | | 248,635 | |
Care.com Incorporated † | | | | | | | | | | | 6,314 | | | | 122,681 | |
CarGurus Incorporated † | | | | | | | | | | | 10,668 | | | | 526,146 | |
Cars.com Incorporated † | | | | | | | | | | | 17,770 | | | | 478,191 | |
ChannelAdvisor Corporation † | | | | | | | | | | | 5,941 | | | | 77,530 | |
Cision Limited † | | | | | | | | | | | 9,675 | | | | 175,214 | |
DHI Group Incorporated † | | | | | | | | | | | 11,629 | | | | 25,002 | |
Dropbox Incorporated Class A † | | | | | | | | | | | 8,939 | | | | 240,012 | |
Egain Corporation † | | | | | | | | | | | 3,552 | | | | 50,794 | |
Endurance International Group Holdings † | | | | | | | | | | | 15,102 | | | | 145,734 | |
The accompanying notes are an integral part of these financial statements.
| | | | |
| 164 | | Wells Fargo Funds | | Portfolio of investments—August 31, 2018 (unaudited) |
FACTOR ENHANCED SMALL CAP PORTFOLIO
| | | | | | | | | | | | | | | | |
| Security name | | | | | | | | Shares | | | Value | |
| | | | |
| Internet Software & Services (continued) | | | | | | | | | | | | | | | | |
Envestnet Incorporated † | | | | | | | | | | | 10,920 | | | $ | 690,144 | |
Etsy Incorporated † | | | | | | | | | | | 26,324 | | | | 1,281,716 | |
Five9 Incorporated † | | | | | | | | | | | 13,639 | | | | 655,354 | |
Fusion Connect Incorporated † | | | | | | | | | | | 5,485 | | | | 20,295 | |
Gogo Incorporated † | | | | | | | | | | | 14,482 | | | | 65,024 | |
GTT Communications Incorporated † | | | | | | | | | | | 8,360 | | | | 359,898 | |
Instructure Incorporated † | | | | | | | | | | | 7,149 | | | | 292,752 | |
Internap Corporation † | | | | | | | | | | | 4,535 | | | | 60,860 | |
Leaf Group Limited † | | | | | | | | | | | 3,589 | | | | 39,658 | |
Limelight Networks Incorporated † | | | | | | | | | | | 25,918 | | | | 131,404 | |
Liquidity Services Incorporated † | | | | | | | | | | | 6,313 | | | | 45,454 | |
LivePerson Incorporated † | | | | | | | | | | | 13,498 | | | | 363,096 | |
Marchex Incorporated Class B | | | | | | | | | | | 7,560 | | | | 21,773 | |
Match Group Incorporated † | | | | | | | | | | | 12,433 | | | | 622,272 | |
MINDBODY Incorporated Class A † | | | | | | | | | | | 8,734 | | | | 324,031 | |
MongoDB Incorporated † | | | | | | | | | | | 3,347 | | | | 240,850 | |
NIC Incorporated | | | | | | | | | | | 15,949 | | | | 267,943 | |
Q2 Holdings Incorporated † | | | | | | | | | | | 8,760 | | | | 545,748 | |
Quinstreet Incorporated † | | | | | | | | | | | 8,979 | | | | 136,211 | |
Quotient Technology Incorporated † | | | | | | | | | | | 19,411 | | | | 290,194 | |
Remark Holdings Incorporated † | | | | | | | | | | | 6,711 | | | | 23,623 | |
SendGrid Incorporated † | | | | | | | | | | | 2,346 | | | | 85,089 | |
Shotspotter Incorporated † | | | | | | | | | | | 1,359 | | | | 77,517 | |
Shutterstock Incorporated | | | | | | | | | | | 4,496 | | | | 247,460 | |
SPS Commerce Incorporated † | | | | | | | | | | | 3,945 | | | | 387,675 | |
Techtarget † | | | | | | | | | | | 5,164 | | | | 123,884 | |
Telaria Incorporated † | | | | | | | | | | | 7,653 | | | | 31,454 | |
Web.com Group Incorporated † | | | | | | | | | | | 11,824 | | | | 330,481 | |
Xo Group Incorporated † | | | | | | | | | | | 6,099 | | | | 183,336 | |
Yext Incorporated † | | | | | | | | | | | 12,329 | | | | 306,499 | |
| | | | |
| | | | | | | | | | | | | | | 12,233,363 | |
| | | | | | | | | | | | | | | | |
| | | | |
| IT Services: 1.48% | | | | | | | | | | | | | | | | |
Cass Information Systems Incorporated | | | | | | | | | | | 2,718 | | | | 194,419 | |
Computer Task Group Incorporated † | | | | | | | | | | | 3,442 | | | | 20,101 | |
Convergeone Holdings Incorporated | | | | | | | | | | | 4,675 | | | | 42,730 | |
Convergys Corporation | | | | | | | | | | | 22,594 | | | | 558,750 | |
CSG Systems International Incorporated | | | | | | | | | | | 8,226 | | | | 307,241 | |
Exela Technologies Incorporated † | | | | | | | | | | | 8,475 | | | | 50,681 | |
Exlservice Holdings Incorporated † | | | | | | | | | | | 8,119 | | | | 520,266 | |
Hackett Group Incorporated | | | | | | | | | | | 5,966 | | | | 122,124 | |
Information Services Group Incorporated † | | | | | | | | | | | 8,012 | | | | 39,659 | |
Luxoft Holding Incorporated † | | | | | | | | | | | 5,349 | | | | 249,263 | |
ManTech International Corporation Class A | | | | | | | | | | | 6,588 | | | | 436,916 | |
Moneygram International Incorporated † | | | | | | | | | | | 7,109 | | | | 46,280 | |
Perficient Incorporated † | | | | | | | | | | | 8,223 | | | | 236,247 | |
Pfsweb Incorporated † | | | | | | | | | | | 3,679 | | | | 31,676 | |
Presidio Incorporated | | | | | | | | | | | 8,097 | | | | 122,427 | |
PRGX Global Incorporated † | | | | | | | | | | | 4,892 | | | | 46,719 | |
The accompanying notes are an integral part of these financial statements.
| | | | | | |
| Portfolio of investments—August 31, 2018 (unaudited) | | Wells Fargo Funds | | | 165 | |
FACTOR ENHANCED SMALL CAP PORTFOLIO
| | | | | | | | | | | | | | | | |
| Security name | | | | | | | | Shares | | | Value | |
| | | | |
| IT Services (continued) | | | | | | | | | | | | | | | | |
Science Applications International Corporation | | | | | | | | | | | 9,366 | | | $ | 845,001 | |
StarTek Incorporated † | | | | | | | | | | | 2,821 | | | | 17,095 | |
Switch Incorporated Class A | | | | | | | | | | | 8,327 | | | | 96,260 | |
Sykes Enterprises Incorporated † | | | | | | | | | | | 9,804 | | | | 296,473 | |
Syntel Incorporated † | | | | | | | | | | | 8,492 | | | | 345,964 | |
Travelport Worldwide Limited | | | | | | | | | | | 30,970 | | | | 575,113 | |
TTEC Holdings Incorporated | | | | | | | | | | | 3,524 | | | | 92,329 | |
Unisys Corporation † | | | | | | | | | | | 12,253 | | | | 227,906 | |
Virtusa Corporation † | | | | | | | | | | | 6,677 | | | | 389,002 | |
| | | | |
| | | | | | | | | | | | | | | 5,910,642 | |
| | | | | | | | | | | | | | | | |
| | | | |
| Semiconductors & Semiconductor Equipment: 1.88% | | | | | | | | | | | | | | | | |
Adesto Technologies Corporation † | | | | | | | | | | | 3,952 | | | | 23,910 | |
Advanced Energy Industries Incorporated † | | | | | | | | | | | 9,775 | | | | 582,395 | |
Alpha & Omega Semiconductor † | | | | | | | | | | | 4,778 | | | | 67,895 | |
Amkor Technology Incorporated † | | | | | | | | | | | 23,136 | | | | 201,977 | |
Amtech Systems Incorporated † | | | | | | | | | | | 3,252 | | | | 17,853 | |
Aquantia Corporation † | | | | | | | | | | | 2,277 | | | | 28,781 | |
Axcelis Technologies Incorporated † | | | | | | | | | | | 7,865 | | | | 158,873 | |
AXT Incorporated † | | | | | | | | | | | 8,820 | | | | 69,678 | |
Brooks Automation Incorporated | | | | | | | | | | | 17,115 | | | | 674,502 | |
Cabot Microelectronics Corporation | | | | | | | | | | | 6,234 | | | | 702,759 | |
Ceva Incorporated † | | | | | | | | | | | 5,444 | | | | 166,586 | |
Cirrus Logic Incorporated † | | | | | | | | | | | 15,618 | | | | 686,411 | |
Cohu Incorporated | | | | | | | | | | | 6,738 | | | | 177,748 | |
Cyberoptics Corporation † | | | | | | | | | | | 1,695 | | | | 37,799 | |
Diodes Incorporated † | | | | | | | | | | | 9,591 | | | | 363,691 | |
DSP Group Incorporated † | | | | | | | | | | | 4,697 | | | | 60,356 | |
FormFactor Incorporated † | | | | | | | | | | | 17,929 | | | | 277,003 | |
GSI Technology Incorporated † | | | | | | | | | | | 3,501 | | | | 24,542 | |
Ichor Holdings Limited † | | | | | | | | | | | 6,333 | | | | 164,215 | |
Lattice Semiconductor Corporation † | | | | | | | | | | | 28,642 | | | | 234,578 | |
Nanometrics Incorporated † | | | | | | | | | | | 5,618 | | | | 246,125 | |
Neophotonics Corporation † | | | | | | | | | | | 9,866 | | | | 86,722 | |
NVE Corporation | | | | | | | | | | | 1,198 | | | | 136,189 | |
Photronics Incorporated † | | | | | | | | | | | 17,129 | | | | 183,280 | |
Pixelworks Incorporated † | | | | | | | | | | | 7,579 | | | | 41,760 | |
Power Integrations Incorporated | | | | | | | | | | | 7,102 | | | | 520,932 | |
Quicklogic Corporation † | | | | | | | | | | | 20,871 | | | | 22,749 | |
Rambus Incorporated † | | | | | | | | | | | 27,135 | | | | 331,590 | |
Rudolph Technologies Incorporated † | | | | | | | | | | | 7,585 | | | | 210,863 | |
Smart Global Holdings Incorporated † | | | | | | | | | | | 2,974 | | | | 98,112 | |
Synaptics Incorporated † | | | | | | | | | | | 8,534 | | | | 411,851 | |
Ultra Clean Holdings Incorporated † | | | | | | | | | | | 9,089 | | | | 138,698 | |
Xcerra Corporation † | | | | | | | | | | | 12,954 | | | | 187,574 | |
Xperi Corporation | | | | | | | | | | | 12,321 | | | | 193,440 | |
| | | | |
| | | | | | | | | | | | | | | 7,531,437 | |
| | | | | | | | | | | | | | | | |
The accompanying notes are an integral part of these financial statements.
| | | | |
| 166 | | Wells Fargo Funds | | Portfolio of investments—August 31, 2018 (unaudited) |
FACTOR ENHANCED SMALL CAP PORTFOLIO
| | | | | | | | | | | | | | | | |
| Security name | | | | | | | | Shares | | | Value | |
| | | | |
| Software: 1.90% | | | | | | | | | | | | | | | | |
A10 Networks Incorporated † | | | | | | | | | | | 12,309 | | | $ | 85,794 | |
Agilysys Incorporated † | | | | | | | | | | | 4,182 | | | | 67,205 | |
Altair Engineering Incorporated Class A † | | | | | | | | | | | 4,309 | | | | 179,987 | |
American Software Incorporated Class A | | | | | | | | | | | 6,953 | | | | 125,015 | |
Appian Corporation † | | | | | | | | | | | 1,873 | | | | 65,424 | |
Asure Software Incorporated † | | | | | | | | | | | 2,296 | | | | 34,509 | |
Avaya Holdings Corporation † | | | | | | | | | | | 27,413 | | | | 640,368 | |
Bottomline Technologies (de) Incorporated † | | | | | | | | | | | 9,851 | | | | 649,870 | |
Datawatch Corporation † | | | | | | | | | | | 2,501 | | | | 31,888 | |
Ebix Incorporated | | | | | | | | | | | 5,679 | | | | 452,332 | |
Everbridge Incorporated † | | | | | | | | | | | 6,117 | | | | 368,305 | |
ForeScout Technologies Incorporated † | | | | | | | | | | | 3,903 | | | | 140,781 | |
Globant SA † | | | | | | | | | | | 6,338 | | | | 411,209 | |
Glu Mobile Incorporated † | | | | | | | | | | | 27,817 | | | | 214,191 | |
MicroStrategy Incorporated Class A † | | | | | | | | | | | 2,273 | | | | 338,677 | |
Mitek Systems Incorporated † | | | | | | | | | | | 8,359 | | | | 60,603 | |
MobileIron Incorporated † | | | | | | | | | | | 16,061 | | | | 78,699 | |
Model N Incorporated † | | | | | | | | | | | 5,526 | | | | 93,942 | |
Monotype Imaging Holdings Incorporated | | | | | | | | | | | 10,319 | | | | 212,571 | |
OneSpan Incorporated † | | | | | | | | | | | 7,742 | | | | 145,163 | |
Park City Group Incorporated † | | | | | | | | | | | 3,106 | | | | 26,246 | |
Progress Software Corporation | | | | | | | | | | | 11,153 | | | | 456,492 | |
Qad Incorporated Class A | | | | | | | | | | | 2,447 | | | | 148,411 | |
Qualys Incorporated † | | | | | | | | | | | 8,096 | | | | 737,141 | |
Realnetworks Incorporated † | | | | | | | | | | | 6,256 | | | | 20,019 | |
Rosetta Stone Incorporated † | | | | | | | | | | | 5,172 | | | | 81,718 | |
Seachange International Incorporated † | | | | | | | | | | | 8,301 | | | | 13,697 | |
Secureworks Corporation Class A † | | | | | | | | | | | 2,144 | | | | 28,537 | |
TeleNav Incorporated † | | | | | | | | | | | 7,602 | | | | 42,571 | |
The Rubicon Project Incorporated † | | | | | | | | | | | 10,651 | | | | 42,391 | |
Tivo Corporation | | | | | | | | | | | 30,183 | | | | 411,998 | |
Upland Software Incorporated † | | | | | | | | | | | 3,785 | | | | 140,878 | |
Verint Systems Incorporated † | | | | | | | | | | | 15,762 | | | | 765,245 | |
Workiva Incorporated † | | | | | | | | | | | 6,107 | | | | 225,043 | |
Zix Corporation † | | | | | | | | | | | 12,932 | | | | 71,773 | |
| | | | |
| | | | | | | | | | | | | | | 7,608,693 | |
| | | | | | | | | | | | | | | | |
| | | | |
| Technology Hardware, Storage & Peripherals: 0.26% | | | | | | | | | | | | | | | | |
Astronova Incorporated | | | | | | | | | | | 1,431 | | | | 31,697 | |
Avid Technology Incorporated † | | | | | | | | | | | 9,108 | | | | 53,919 | |
Cray Incorporated † | | | | | | | | | | | 9,964 | | | | 216,219 | |
Diebold Nixdorf Incorporated | | | | | | | | | | | 17,489 | | | | 83,073 | |
Eastman Kodak Company † | | | | | | | | | | | 6,860 | | | | 22,295 | |
Electronics for Imaging Incorporated † | | | | | | | | | | | 11,026 | | | | 383,595 | |
Intevac Incorporated † | | | | | | | | | | | 5,221 | | | | 30,151 | |
Quantum Corporation † | | | | | | | | | | | 7,935 | | | | 16,029 | |
USA Technologies Incorporated † | | | | | | | | | | | 13,016 | | | | 211,510 | |
| | | | |
| | | | | | | | | | | | | | | 1,048,488 | |
| | | | | | | | | | | | | | | | |
The accompanying notes are an integral part of these financial statements.
| | | | | | |
| Portfolio of investments—August 31, 2018 (unaudited) | | Wells Fargo Funds | | | 167 | |
FACTOR ENHANCED SMALL CAP PORTFOLIO
| | | | | | | | | | | | | | | | |
| Security name | | | | | | | | Shares | | | Value | |
| | | | |
Materials: 3.07% | | | | | | | | | | | | | | | | |
| | | | |
| Chemicals: 1.47% | | | | | | | | | | | | | | | | |
Advanced Emissions Solutions | | | | | | | | | | | 4,761 | | | $ | 54,371 | |
Advansix Incorporated † | | | | | | | | | | | 7,377 | | | | 249,638 | |
Agrofresh Solutions Incorporated † | | | | | | | | | | | 7,040 | | | | 46,816 | |
American Vanguard Corporation | | | | | | | | | | | 6,649 | | | | 145,613 | |
Chase Corporation | | | | | | | | | | | 1,793 | | | | 222,242 | |
Core Molding Technologies Incorporated | | | | | | | | | | | 1,962 | | | | 17,992 | |
Ferro Corporation † | | | | | | | | | | | 21,089 | | | | 462,904 | |
Flotek Industries Incorporated † | | | | | | | | | | | 13,818 | | | | 34,407 | |
Futurefuel Corporation | | | | | | | | | | | 6,217 | | | | 92,198 | |
Hawkins Incorporated | | | | | | | | | | | 2,411 | | | | 99,574 | |
HB Fuller Company | | | | | | | | | | | 12,633 | | | | 719,955 | |
Innophos Holdings Incorporated | | | | | | | | | | | 4,848 | | | | 211,906 | |
Innospec Incorporated | | | | | | | | | | | 6,118 | | | | 474,757 | |
KMG Chemicals Incorporated | | | | | | | | | | | 3,398 | | | | 263,277 | |
Kooper Holdings Incorporated † | | | | | | | | | | | 5,139 | | | | 182,178 | |
Kraton Performance Polymers Incorporated † | | | | | | | | | | | 7,826 | | | | 368,057 | |
Kronos Worldwide Incorporated | | | | | | | | | | | 5,782 | | | | 116,392 | |
Loop Industries Incorporated † | | | | | | | | | | | 3,115 | | | | 30,776 | |
LSB Industries Incorporated † | | | | | | | | | | | 4,889 | | | | 42,632 | |
Marrone Bio Innovations Incorporated † | | | | | | | | | | | 16,974 | | | | 35,391 | |
Northern Technologies International | | | | | | | | | | | 942 | | | | 33,724 | |
Omnova Solutions Incorporated † | | | | | | | | | | | 10,821 | | | | 97,930 | |
PQ Group Holdings Incorporated † | | | | | | | | | | | 9,331 | | | | 166,092 | |
Quaker Chemical Corporation | | | | | | | | | | | 3,242 | | | | 584,014 | |
Rayonier Advanced Materials | | | | | | | | | | | 13,009 | | | | 271,888 | |
Stepan Company | | | | | | | | | | | 5,008 | | | | 446,764 | |
Trecora Resources † | | | | | | | | | | | 5,133 | | | | 71,862 | |
Tredegar Corporation | | | | | | | | | | | 8,151 | | | | 178,914 | |
Valhi Incorporated | | | | | | | | | | | 6,747 | | | | 22,265 | |
Venator Materials plc † | | | | | | | | | | | 12,602 | | | | 152,232 | |
| | | | |
| | | | | | | | | | | | | | | 5,896,761 | |
| | | | | | | | | | | | | | | | |
| | | | |
| Construction Materials: 0.07% | | | | | | | | | | | | | | | | |
Forterra Incorporated † | | | | | | | | | | | 4,631 | | | | 39,178 | |
United States Lime & Mineral | | | | | | | | | | | 456 | | | | 34,606 | |
US Concrete Incorporated † | | | | | | | | | | | 4,029 | | | | 194,198 | |
| | | | |
| | | | | | | | | | | | | | | 267,982 | |
| | | | | | | | | | | | | | | | |
| | | | |
| Containers & Packaging: 0.27% | | | | | | | | | | | | | | | | |
Greif Incorporated Class A | | | | | | | | | | | 6,227 | | | | 343,606 | |
Myers Industries Incorporated | | | | | | | | | | | 7,275 | | | | 161,869 | |
Silgan Holdings Incorporated | | | | | | | | | | | 18,985 | | | | 517,341 | |
UFP Technologies Incorporated † | | | | | | | | | | | 1,538 | | | | 54,215 | |
| | | | |
| | | | | | | | | | | | | | | 1,077,031 | |
| | | | | | | | | | | | | | | | |
| | | | |
| Metals & Mining: 0.84% | | | | | | | | | | | | | | | | |
Ampco Pittsburgh Corporation † | | | | | | | | | | | 2,764 | | | | 20,868 | |
Cleveland Cliffs Incorporated † | | | | | | | | | | | 76,067 | | | | 764,473 | |
The accompanying notes are an integral part of these financial statements.
| | | | |
| 168 | | Wells Fargo Funds | | Portfolio of investments—August 31, 2018 (unaudited) |
FACTOR ENHANCED SMALL CAP PORTFOLIO
| | | | | | | | | | | | | | | | |
| Security name | | | | | | | | Shares | | | Value | |
| | | | |
| Metals & Mining (continued) | | | | | | | | | | | | | | | | |
Compass Minerals International Incorporated | | | | | | | | | | | 8,562 | | | $ | 535,553 | |
Gold Resource Corporation | | | | | | | | | | | 13,653 | | | | 70,449 | |
Kaiser Aluminum Corporation | | | | | | | | | | | 4,098 | | | | 449,100 | |
Materion Corporation | | | | | | | | | | | 4,963 | | | | 316,639 | |
Olympic Steel Incorporated | | | | | | | | | | | 2,278 | | | | 50,207 | |
Ryerson Holding Corporation † | | | | | | | | | | | 4,037 | | | | 41,985 | |
Schnitzer Steel Industries Incorporated Class A | | | | | | | | | | | 6,600 | | | | 173,910 | |
Suncoke Energy Incorporated † | | | | | | | | | | | 16,405 | | | | 183,080 | |
Synalloy Corporation | | | | | | | | | | | 1,967 | | | | 45,143 | |
Universal Stainless & Alloy † | | | | | | | | | | | 1,696 | | | | 51,355 | |
Warrior Met Coal Incorporated | | | | | | | | | | | 7,226 | | | | 173,785 | |
Worthington Industries Incorporated | | | | | | | | | | | 10,573 | | | | 492,490 | |
| | | | |
| | | | | | | | | | | | | | | 3,369,037 | |
| | | | | | | | | | | | | | | | |
| | | | |
| Paper & Forest Products: 0.42% | | | | | | | | | | | | | | | | |
Boise Cascade Company | | | | | | | | | | | 9,674 | | | | 422,754 | |
Clearwater Paper Corporation † | | | | | | | | | | | 3,951 | | | | 114,777 | |
Neenah Paper Incorporated | | | | | | | | | | | 4,116 | | | | 375,585 | |
PH Glatfelter Company | | | | | | | | | | | 10,655 | | | | 204,896 | |
Schweitzer-Mauduit International Incorporated | | | | | | | | | | | 7,561 | | | | 307,657 | |
Verso Corporation Class A † | | | | | | | | | | | 8,326 | | | | 261,353 | |
| | | | |
| | | | | | | | | | | | | | | 1,687,022 | |
| | | | | | | | | | | | | | | | |
| | | | |
Real Estate: 8.86% | | | | | | | | | | | | | | | | |
| | | | |
| Equity REITs: 8.19% | | | | | | | | | | | | | | | | |
Acadia Realty Trust | | | | | | | | | | | 20,061 | | | | 572,140 | |
Agree Realty Corporation | | | | | | | | | | | 8,241 | | | | 470,314 | |
Alexander & Baldwin Incorporated | | | | | | | | | | | 17,030 | | | | 399,694 | |
Alexander’s Incorporated | | | | | | | | | | | 514 | | | | 185,518 | |
American Assets Trust Incorporated | | | | | | | | | | | 9,514 | | | | 375,803 | |
Americold Realty Trust | | | | | | | | | | | 13,240 | | | | 329,676 | |
Armada Hoffler Properties Incorporated | | | | | | | | | | | 11,074 | | | | 172,644 | |
Ashford Hospitality Trust Incorporated | | | | | | | | | | | 23,359 | | | | 151,600 | |
Bluerock Residential Growth REIT Incorporated | | | | | | | | | | | 6,136 | | | | 60,685 | |
Braemar Hotels & Resorts Incorporated | | | | | | | | | | | 7,530 | | | | 86,972 | |
Brandywine Realty Trust | | | | | | | | | | | 44,371 | | | | 743,658 | |
CareTrust REIT Incorporated | | | | | | | | | | | 18,784 | | | | 346,565 | |
Catchmark Timber Trust Incorporated Class A | | | | | | | | | | | 11,899 | | | | 149,213 | |
CBL & Associates Properties Incorporated | | | | | | | | | | | 42,361 | | | | 188,930 | |
Cedar Shopping Centers Incorporated | | | | | | | | | | | 22,344 | | | | 99,878 | |
Chatham Lodging Trust | | | | | | | | | | | 11,229 | | | | 240,862 | |
Chesapeake Lodging Trust | | | | | | | | | | | 14,691 | | | | 483,481 | |
Clipper Realty Incorporated | | | | | | | | | | | 3,756 | | | | 45,823 | |
Columbia Property Trust Incorporated | | | | | | | | | | | 29,514 | | | | 710,697 | |
Community Healthcare Trust Incorporated | | | | | | | | | | | 4,273 | | | | 132,591 | |
CoreCivic Incorporated | | | | | | | | | | | 29,120 | | | | 753,917 | |
CorEnergy Infrastructure Trust Incorporated | | | | | | | | | | | 2,906 | | | | 108,772 | |
Corepoint Lodging Incorporated | | | | | | | | | | | 10,007 | | | | 208,646 | |
Corporate Office Properties Trust | | | | | | | | | | | 25,262 | | | | 777,564 | |
The accompanying notes are an integral part of these financial statements.
| | | | | | |
| Portfolio of investments—August 31, 2018 (unaudited) | | Wells Fargo Funds | | | 169 | |
FACTOR ENHANCED SMALL CAP PORTFOLIO
| | | | | | | | | | | | | | | | |
| Security name | | | | | | | | Shares | | | Value | |
| | | | |
| Equity REITs (continued) | | | | | | | | | | | | | | | | |
DiamondRock Hospitality | | | | | | | | | | | 49,386 | | | $ | 590,657 | |
Easterly Government Properties Incorporated | | | | | | | | | | | 11,551 | | | | 233,908 | |
EastGroup Properties Incorporated | | | | | | | | | | | 8,394 | | | | 816,484 | |
Education Realty Trust Incorporated | | | | | | | | | | | 18,841 | | | | 779,641 | |
Empire State Realty Trust Incorporated | | | | | | | | | | | 40,441 | | | | 711,357 | |
Farmland Partners REIT Incorporated | | | | | | | | | | | 7,974 | | | | 56,296 | |
Four Corners Property Trust Incorporated | | | | | | | | | | | 15,306 | | | | 412,344 | |
Franklin Street Properties Corporation | | | | | | | | | | | 25,755 | | | | 220,720 | |
Getty Realty Corporation | | | | | | | | | | | 7,944 | | | | 231,250 | |
Gladstone Commercial Corporation | | | | | | | | | | | 6,910 | | | | 137,578 | |
Gladstone Land REIT Corporation | | | | | | | | | | | 3,214 | | | | 44,032 | |
Global Medical REIT Incorporated | | | | | | | | | | | 4,712 | | | | 45,094 | |
Global Net Lease Incorporated | | | | | | | | | | | 17,132 | | | | 371,593 | |
Government Properties Income | | | | | | | | | | | 24,567 | | | | 415,428 | |
Hersha Hospitality Trust | | | | | | | | | | | 9,660 | | | | 227,976 | |
Independence Realty Trust Incorporated | | | | | | | | | | | 21,581 | | | | 222,932 | |
Industrial Logistics Properties Trust | | | | | | | | | | | 4,920 | | | | 118,424 | |
InfraReit Incorporated | | | | | | | | | | | 9,713 | | | | 202,905 | |
Innovative Industrial Proper | | | | | | | | | | | 1,555 | | | | 70,597 | |
Investors Real Estate Trust | | | | | | | | | | | 29,460 | | | | 160,557 | |
iStar Financial Incorporated | | | | | | | | | | | 15,695 | | | | 175,627 | |
Jernigan Capital Incorporated | | | | | | | | | | | 3,304 | | | | 66,113 | |
Kite Realty Group Trust | | | | | | | | | | | 21,116 | | | | 369,108 | |
Lexington Corporate Properties Trust | | | | | | | | | | | 54,484 | | | | 508,881 | |
LTC Properties Incorporated | | | | | | | | | | | 9,775 | | | | 454,049 | |
Mack-Cali Realty Corporation | | | | | | | | | | | 20,815 | | | | 454,600 | |
Medequities Realty Trust Incorporated | | | | | | | | | | | 6,723 | | | | 72,003 | |
MGM Growth Properties LLC Class A | | | | | | | | | | | 17,829 | | | | 547,885 | |
Monmouth Real Estate Investment Corporation | | | | | | | | | | | 17,923 | | | | 311,681 | |
National Health Investors Incorporated | | | | | | | | | | | 10,012 | | | | 793,451 | |
National Storage Affiliates Trust | | | | | | | | | | | 12,534 | | | | 355,464 | |
New Senior Investment Group Incorporated | | | | | | | | | | | 20,392 | | | | 129,285 | |
New York Incorporated | | | | | | | | | | | 3,873 | | | | 72,231 | |
Nexpoint Residential | | | | | | | | | | | 4,135 | | | | 133,561 | |
NorthStar Realty Europe Corporation | | | | | | | | | | | 12,119 | | | | 166,273 | |
One Liberty Properties Incorporated | | | | | | | | | | | 3,568 | | | | 102,723 | |
Outfront Media Incorporated | | | | | | | | | | | 34,787 | | | | 691,218 | |
Pebblebrook Hotel Trust | | | | | | | | | | | 16,981 | | | | 655,636 | |
Pennsylvania Real Estate Investment Trust | | | | | | | | | | | 17,308 | | | | 176,542 | |
Physicians Realty Trust | | | | | | | | | | | 45,718 | | | | 799,608 | |
Piedmont Office Realty Trust Incorporated Class A | | | | | | | | | | | 33,265 | | | | 659,978 | |
Potlatch Corporation | | | | | | | | | | | 15,273 | | | | 737,686 | |
Preferred Apartment Communities Incorporated Series A | | | | | | | | | | | 9,861 | | | | 175,723 | |
PS Business Parks Incorporated | | | | | | | | | | | 4,899 | | | | 638,977 | |
QTS Realty Trust Incorporated Class A | | | | | | | | | | | 11,004 | | | | 503,213 | |
Ramco-Gershenson Properties Trust | | | | | | | | | | | 19,190 | | | | 267,892 | |
Retail Opportunity Investment Corporation | | | | | | | | | | | 27,610 | | | | 545,021 | |
Retail Properties of America Incorporated Class A | | | | | | | | | | | 55,162 | | | | 702,212 | |
Rexford Industrial Realty Incorporated | | | | | | | | | | | 20,095 | | | | 653,088 | |
Safety Income & Growth Incorporated | | | | | | | | | | | 1,598 | | | | 26,367 | |
The accompanying notes are an integral part of these financial statements.
| | | | |
| 170 | | Wells Fargo Funds | | Portfolio of investments—August 31, 2018 (unaudited) |
FACTOR ENHANCED SMALL CAP PORTFOLIO
| | | | | | | | | | | | | | | | |
| Security name | | | | | | | | Shares | | | Value | |
| | | | |
| Equity REITs (continued) | | | | | | | | | | | | | | | | |
Saul Centers Incorporated | | | | | | | | | | | 3,106 | | | $ | 186,360 | |
Select Income REIT | | | | | | | | | | | 15,930 | | | | 327,362 | |
Seritage Growth Property Class A | | | | | | | | | | | 7,881 | | | | 405,714 | |
STAG Industrial Incorporated | | | | | | | | | | | 24,504 | | | | 707,430 | |
Summit Hotel Properties Incorporated | | | | | | | | | | | 25,779 | | | | 353,946 | |
Tanger Factory Outlet Centers Incorporated | | | | | | | | | | | 23,166 | | | | 557,374 | |
Terreno Realty Corporation | | | | | | | | | | | 13,363 | | | | 513,273 | |
The Geo Group Incorporated | | | | | | | | | | | 30,154 | | | | 765,007 | |
Tier Incorporated | | | | | | | | | | | 11,724 | | | | 279,500 | |
UMH Properties Incorporated | | | | | | | | | | | 7,944 | | | | 126,786 | |
Universal Health Realty Income Trust | | | | | | | | | | | 3,186 | | | | 242,933 | |
Urban Edge Properties | | | | | | | | | | | 26,110 | | | | 596,875 | |
Urstadt Biddle Properties Incorporated | | | | | | | | | | | 7,184 | | | | 163,436 | |
Washington Prime Group Incorporated | | | | | | | | | | | 46,616 | | | | 360,808 | |
Washington REIT | | | | | | | | | | | 19,407 | | | | 612,485 | |
Whitestone REIT | | | | | | | | | | | 9,234 | | | | 125,952 | |
Xenia Hotels & Resorts Incorporated | | | | | | | | | | | 26,758 | | | | 649,149 | |
| | | | |
| | | | | | | | | | | | | | | 32,785,902 | |
| | | | | | | | | | | | | | | | |
| | | | |
| Real Estate Management & Development: 0.67% | | | | | | | | | | | | | | | | |
Altisource Portfolio Solutions SA † | | | | | | | | | | | 2,567 | | | | 92,797 | |
Consolidated-Tomoka Land Company | | | | | | | | | | | 920 | | | | 57,758 | |
Five Point Holdings LLC Class A † | | | | | | | | | | | 13,348 | | | | 146,027 | |
Forestar Group Incorporated † | | | | | | | | | | | 2,429 | | | | 62,425 | |
FRP Holdings Incorporated † | | | | | | | | | | | 1,661 | | | | 108,463 | |
Griffin Industrial Realty Incorporated | | | | | | | | | | | 515 | | | | 20,652 | |
HFF Incorporated Class A | | | | | | | | | | | 8,376 | | | | 380,354 | |
Kennedy Wilson Holdings Incorporated | | | | | | | | | | | 31,895 | | | | 684,148 | |
Marcus & Millichap Incorporated † | | | | | | | | | | | 4,636 | | | | 168,797 | |
Newmark Group Incorporated Class A | | | | | | | | | | | 5,519 | | | | 70,919 | |
Re/Max Holdings Incorporated Class A | | | | | | | | | | | 4,316 | | | | 212,563 | |
Redfin Corporation † | | | | | | | | | | | 12,640 | | | | 250,398 | |
Stratus Properties Incorporated † | | | | | | | | | | | 1,316 | | | | 40,006 | |
The RMR Group Incorporated Class A | | | | | | | | | | | 1,742 | | | | 164,532 | |
The St. Joe Company † | | | | | | | | | | | 9,951 | | | | 171,157 | |
Trinity Place Holdings Incorporated † | | | | | | | | | | | 5,420 | | | | 33,062 | |
| | | | |
| | | | | | | | | | | | | | | 2,664,058 | |
| | | | | | | | | | | | | | | | |
| | | | |
Telecommunication Services: 1.00% | | | | | | | | | | | | | | | | |
| | | | |
| Diversified Telecommunication Services: 0.72% | | | | | | | | | | | | | | | | |
ATN International Incorporated | | | | | | | | | | | 2,623 | | | | 192,082 | |
Cincinnati Bell Incorporated † | | | | | | | | | | | 11,377 | | | | 147,901 | |
Cogent Communications Group Incorporated | | | | | | | | | | | 10,435 | | | | 570,795 | |
Consolidated Communications Holdings Incorporated | | | | | | | | | | | 17,516 | | | | 206,864 | |
Frontier Communications Corporation | | | | | | | | | | | 20,039 | | | | 104,203 | |
IDT Corporation Class B | | | | | | | | | | | 4,697 | | | | 24,847 | |
Intelsat SA † | | | | | | | | | | | 12,256 | | | | 269,264 | |
Iradium Communications Incorporated † | | | | | | | | | | | 23,031 | | | | 466,378 | |
Ooma Incorporated † | | | | | | | | | | | 4,429 | | | | 70,864 | |
The accompanying notes are an integral part of these financial statements.
| | | | | | |
| Portfolio of investments—August 31, 2018 (unaudited) | | Wells Fargo Funds | | | 171 | |
FACTOR ENHANCED SMALL CAP PORTFOLIO
| | | | | | | | | | | | | | | | |
| Security name | | | | | | | | Shares | | | Value | |
| | | | |
| Diversified Telecommunication Services (continued) | | | | | | | | | | | | | | | | |
Pareteum Corporation † | | | | | | | | | | | 10,835 | | | $ | 29,905 | |
Vonage Holdings Corporation † | | | | | | | | | | | 51,973 | | | | 736,977 | |
Windstream Holdings Incorporated † | | | | | | | | | | | 10,706 | | | | 50,425 | |
| | | | |
| | | | | | | | | | | | | | | 2,870,505 | |
| | | | | | | | | | | | | | | | |
| | | | |
| Wireless Telecommunication Services: 0.28% | | | | | | | | | | | | | | | | |
Boingo Wireless Incorporated † | | | | | | | | | | | 10,061 | | | | 332,818 | |
Nii Holdings Incorporated † | | | | | | | | | | | 20,873 | | | | 119,811 | |
Shenandoah Telecommunications Company | | | | | | | | | | | 11,569 | | | | 441,357 | |
Spok Holdings Incorporated | | | | | | | | | | | 4,845 | | | | 74,371 | |
United States Cellular Corporation † | | | | | | | | | | | 3,586 | | | | 153,337 | |
| | | | |
| | | | | | | | | | | | | | | 1,121,694 | |
| | | | | | | | | | | | | | | | |
| | | | |
Utilities: 2.06% | | | | | | | | | | | | | | | | |
| | | | |
| Electric Utilities: 0.59% | | | | | | | | | | | | | | | | |
Avangrid Incorporated | | | | | | | | | | | 13,861 | | | | 683,902 | |
El Paso Electric Company | | | | | | | | | | | 9,947 | | | | 609,751 | |
MGE Energy Incorporated | | | | | | | | | | | 8,569 | | | | 560,841 | |
Otter Tail Corporation | | | | | | | | | | | 9,678 | | | | 463,576 | |
Spark Energy Incorporated Class A | | | | | | | | | | | 3,013 | | | | 26,514 | |
| | | | |
| | | | | | | | | | | | | | | 2,344,584 | |
| | | | | | | | | | | | | | | | |
| | | | |
| Gas Utilities: 0.40% | | | | | | | | | | | | | | | | |
Chesapeake Utilities Corporation | | | | | | | | | | | 3,859 | | | | 331,874 | |
Northwest Natural Gas Company | | | | | | | | | | | 7,085 | | | | 459,817 | |
RGC Resources Incorporated | | | | | | | | | | | 1,727 | | | | 46,508 | |
South Jersey Industries Incorporated | | | | | | | | | | | 19,817 | | | | 657,528 | |
Star Group LP | | | | | | | | | | | 12,704 | | | | 121,450 | |
| | | | |
| | | | | | | | | | | | | | | 1,617,177 | |
| | | | | | | | | | | | | | | | |
| | | | |
| Independent Power & Renewable Electricity Producers: 0.36% | | | | | | | | | | | | | | | | |
Nextera Energy Partners LP | | | | | | | | | | | 13,171 | | | | 638,794 | |
NRG Yield Incorporated Class C | | | | | | | | | | | 16,389 | | | | 325,322 | |
Ormat Technologies Incorporated | | | | | | | | | | | 9,220 | | | | 485,433 | |
| | | | |
| | | | | | | | | | | | | | | 1,449,549 | |
| | | | | | | | | | | | | | | | |
| | | | |
| Multi-Utilities: 0.23% | | | | | | | | | | | | | | | | |
Northwestern Corporation | | | | | | | | | | | 12,144 | | | | 728,154 | |
Unitil Corporation | | | | | | | | | | | 3,616 | | | | 182,789 | |
| | | | |
| | | | | | | | | | | | | | | 910,943 | |
| | | | | | | | | | | | | | | | |
| | | | |
| Water Utilities: 0.48% | | | | | | | | | | | | | | | | |
American States Water Company | | | | | | | | | | | 8,982 | | | | 542,782 | |
Aquaventure Holdings Limited † | | | | | | | | | | | 3,351 | | | | 60,921 | |
Artesian Resources Corporation Class A | | | | | | | | | | | 2,021 | | | | 72,615 | |
California Water Service Group | | | | | | | | | | | 11,870 | | | | 488,451 | |
Connecticut Water Service Incorporated | | | | | | | | | | | 2,890 | | | | 197,994 | |
Middlesex Water Company | | | | | | | | | | | 3,908 | | | | 178,986 | |
The accompanying notes are an integral part of these financial statements.
| | | | |
| 172 | | Wells Fargo Funds | | Portfolio of investments—August 31, 2018 (unaudited) |
FACTOR ENHANCED SMALL CAP PORTFOLIO
| | | | | | | | | | | | | | | | |
| Security name | | | | | | | | Shares | | | Value | |
| | | | |
| Water Utilities (continued) | | | | | | | | | | | | | | | | |
Pure Cycle Corporation † | | | | | | | | | | | 4,082 | | | $ | 45,923 | |
SJW Corporation | | | | | | | | | | | 4,482 | | | | 259,553 | |
York Water Company | | | | | | | | | | | 3,147 | | | | 94,725 | |
| | | | |
| | | | | | | | | | | | | | | 1,941,950 | |
| | | | | | | | | | | | | | | | |
| | | | |
Total Common Stocks (Cost $310,199,161) | | | | | | | | | | | | | | | 367,166,616 | |
| | | | | | | | | | | | | | | | |
| | | | |
| | | Yield | | | | | | | | | | |
| Short-Term Investments: 2.90% | | | | | | | | | | | | | | | | |
| | | | |
| Investment Companies: 2.90% | | | | | | | | | | | | | | | | |
Wells Fargo Government Money Market Fund Select Class (l)(u) | | | 1.87 | % | | | | | | | 11,630,466 | | | | 11,630,466 | |
| | | | | | | | | | | | | | | | |
| | | | |
Total Short-Term Investments (Cost $11,630,466) | | | | | | | | | | | | | | | 11,630,466 | |
| | | | | | | | | | | | | | | | |
| | | | | | | | |
| Total investments in securities (Cost $321,829,627) | | | 94.63 | % | | | 378,797,082 | |
Other assets and liabilities, net | | | 5.37 | | | | 21,490,967 | |
| | | | | | | | |
| Total net assets | | | 100.00 | % | | $ | 400,288,049 | |
| | | | | | | | |
| † | Non-income-earning security |
| ‡ | Security is valued using significant unobservable inputs. |
| (a) | The security is fair valued in accordance with procedures approved by the Board of Trustees. |
| (l) | The issuer of the security is an affiliated person of the Portfolio as defined in the Investment Company Act of 1940. |
| (u) | The rate represents the 7-day annualized yield at period end. |
Abbreviations:
| REIT | Real estate investment trust |
Futures Contracts
| | | | | | | | | | | | | | | | | | | | | | | | |
| Description | | Number of
contracts | | | Expiration
date | | | Notional
cost | | | Notional
value | | | Unrealized
gains | | | Unrealized
losses | |
Long | | | | | | | | | | | | | | | | | | | | | | | | |
Russell 2000 Index | | | 399 | | | | 9-21-2018 | | | $ | 33,914,693 | | | $ | 34,724,970 | | | $ | 810,277 | | | $ | 0 | |
Investments in Affiliates
An affiliated investment is an investment in which the Portfolio owns at least 5% of the outstanding voting shares of the issuer or as a result of other relationships, such as the Portfolio and the issuer having the same adviser or investment manager. Transactions with issuers that were either affiliated persons of the Portfolio at the beginning of the period or the end of the period were as follows:
| | | | | | | | | | | | | | | | | | | | | | | | | | | | | | | | | | | | |
| | | Shares,
beginning of
period | | | Shares
purchased | | | Shares
sold | | | Shares,
end of
period | | | Net
realized
gains
(losses) | | | Net
change in
unrealized
gains
(losses) | | | Income
from
affiliated
securities | | | Value,
end
of period | | | % of
net
assets | |
Short-Term Investments | | | | | | | | | | | | | | | | | | | | | | | | | | | | | | | | | | | | |
Investment Companies | | | | | | | | | | | | | | | | | | | | | | | | | | | | | | | | | | | | |
Wells Fargo Government Money Market Fund Select Class | | | 14,195,316 | | | | 87,617,102 | | | | 90,181,952 | | | | 11,630,466 | | | $ | 0 | | | $ | 0 | | | $ | 98,967 | | | $ | 11,630,466 | | | | 2.90 | % |
The accompanying notes are an integral part of these financial statements.
| | | | | | |
| Portfolio of investments—August 31, 2018 (unaudited) | | Wells Fargo Funds | | | 173 | |
HIGH YIELD CORPORATE BOND PORTFOLIO
| | | | | | | | | | | | | | | | |
| Security name | | Interest rate | | | Maturity date | | | Principal | | | Value | |
| | | | |
Corporate Bonds and Notes: 79.76% | | | | | | | | | | | | | | | | |
| | | | |
Consumer Discretionary: 18.32% | | | | | | | | | | | | | | | | |
| | | | |
| Auto Components: 0.44% | | | | | | | | | | | | | | | | |
American Axle & Manufacturing Incorporated | | | 6.50 | % | | | 4-1-2027 | | | $ | 300,000 | | | $ | 297,000 | |
Goodyear Tire & Rubber Company | | | 5.13 | | | | 11-15-2023 | | | | 200,000 | | | | 199,500 | |
| | | | |
| | | | | | | | | | | | | | | 496,500 | |
| | | | | | | | | | | | | | | | |
| | | | |
| Automobiles: 0.15% | | | | | | | | | | | | | | | | |
Tesla Incorporated 144A | | | 5.30 | | | | 8-15-2025 | | | | 200,000 | | | | 173,000 | |
| | | | | | | | | | | | | | | | |
| | | | |
| Distributors: 0.17% | | | | | | | | | | | | | | | | |
Ahern Rentals Incorporated 144A | | | 7.38 | | | | 5-15-2023 | | | | 200,000 | | | | 196,760 | |
| | | | | | | | | | | | | | | | |
| | | | |
| Diversified Consumer Services: 0.95% | | | | | | | | | | | | | | | | |
APX Group Incorporated | | | 7.63 | | | | 9-1-2023 | | | | 200,000 | | | | 180,250 | |
APX Group Incorporated | | | 7.88 | | | | 12-1-2022 | | | | 200,000 | | | | 204,250 | |
Cengage Learning Incorporated 144A | | | 9.50 | | | | 6-15-2024 | | | | 200,000 | | | | 172,120 | |
Laureate Education Incorporated 144A | | | 8.25 | | | | 5-1-2025 | | | | 200,000 | | | | 215,750 | |
Service Corporation International | | | 5.38 | | | | 5-15-2024 | | | | 300,000 | | | | 306,000 | |
| | | | |
| | | | | | | | | | | | | | | 1,078,370 | |
| | | | | | | | | | | | | | | | |
| | | | |
| Hotels, Restaurants & Leisure: 4.50% | | | | | | | | | | | | | | | | |
24 Hour Fitness Worldwide Incorporated 144A | | | 8.00 | | | | 6-1-2022 | | | | 200,000 | | | | 200,064 | |
Boyd Gaming Corporation | | | 6.88 | | | | 5-15-2023 | | | | 200,000 | | | | 210,250 | |
Caesars Resort Collection LLC 144A | | | 5.25 | | | | 10-15-2025 | | | | 400,000 | | | | 382,500 | |
Carlson Travel Incorporated 144A | | | 6.75 | | | | 12-15-2023 | | | | 300,000 | | | | 301,500 | |
ClubCorp Holdings Incorporated 144A | | | 8.50 | | | | 9-15-2025 | | | | 200,000 | | | | 189,000 | |
Diamond Resorts International Incorporated 144A | | | 7.75 | | | | 9-1-2023 | | | | 300,000 | | | | 313,407 | |
Eldorado Resorts Incorporated | | | 6.00 | | | | 4-1-2025 | | | | 200,000 | | | | 203,250 | |
Golden Nugget Incorporated 144A | | | 6.75 | | | | 10-15-2024 | | | | 300,000 | | | | 304,875 | |
Golden Nugget Incorporated 144A | | | 8.75 | | | | 10-1-2025 | | | | 200,000 | | | | 211,000 | |
Hilton Worldwide Finance LLC | | | 4.88 | | | | 4-1-2027 | | | | 300,000 | | | | 295,125 | |
Jack Ohio Finance LLC 144A | | | 6.75 | | | | 11-15-2021 | | | | 200,000 | | | | 207,000 | |
KFC Holding Company 144A | | | 5.00 | | | | 6-1-2024 | | | | 300,000 | | | | 299,250 | |
KFC Holding Company 144A | | | 5.25 | | | | 6-1-2026 | | | | 200,000 | | | | 200,000 | |
MGM Resorts International | | | 4.63 | | | | 9-1-2026 | | | | 400,000 | | | | 377,000 | |
MGM Resorts International | | | 5.25 | | | | 3-31-2020 | | | | 200,000 | | | | 204,000 | |
Scientific Games International Incorporated | | | 10.00 | | | | 12-1-2022 | | | | 400,000 | | | | 423,040 | |
Six Flags Entertainment Company 144A | | | 4.88 | | | | 7-31-2024 | | | | 200,000 | | | | 196,500 | |
Wyndham Destinations Incorporated | | | 3.90 | | | | 3-1-2023 | | | | 200,000 | | | | 186,500 | |
Wynn Las Vegas LLC 144A | | | 5.50 | | | | 3-1-2025 | | | | 400,000 | | | | 395,760 | |
| | | | |
| | | | | | | | | | | | | | | 5,100,021 | |
| | | | | | | | | | | | | | | | |
| | | | |
| Household Durables: 1.50% | | | | | | | | | | | | | | | | |
Lennar Corporation | | | 4.88 | | | | 12-15-2023 | | | | 200,000 | | | | 200,250 | |
Lennar Corporation | | | 5.00 | | | | 6-15-2027 | | | | 200,000 | | | | 193,250 | |
Lennar Corporation | | | 8.38 | | | | 1-15-2021 | | | | 200,000 | | | | 219,500 | |
Pulte Group Incorporated | | | 4.25 | | | | 3-1-2021 | | | | 200,000 | | | | 201,060 | |
Pulte Group Incorporated | | | 5.00 | | | | 1-15-2027 | | | | 200,000 | | | | 190,500 | |
The accompanying notes are an integral part of these financial statements.
| | | | |
| 174 | | Wells Fargo Funds | | Portfolio of investments—August 31, 2018 (unaudited) |
HIGH YIELD CORPORATE BOND PORTFOLIO
| | | | | | | | | | | | | | | | |
| Security name | | Interest rate | | | Maturity date | | | Principal | | | Value | |
| | | | |
| Household Durables (continued) | | | | | | | | | | | | | | | | |
Pulte Group Incorporated | | | 6.38 | % | | | 5-15-2033 | | | $ | 200,000 | | | $ | 195,000 | |
Toll Brothers Finance Corporation | | | 5.88 | | | | 2-15-2022 | | | | 300,000 | | | | 312,750 | |
William Lyon Homes Incorporated | | | 5.88 | | | | 1-31-2025 | | | | 200,000 | | | | 189,750 | |
| | | | |
| | | | | | | | | | | | | | | 1,702,060 | |
| | | | | | | | | | | | | | | | |
| | | | |
| Household Products: 0.18% | | | | | | | | | | | | | | | | |
Avon International Operations Incorporated 144A | | | 7.88 | | | | 8-15-2022 | | | | 200,000 | | | | 203,250 | |
| | | | | | | | | | | | | | | | |
| | | | |
| Internet & Direct Marketing Retail: 0.42% | | | | | | | | | | | | | | | | |
Netflix Incorporated 144A | | | 4.88 | | | | 4-15-2028 | | | | 500,000 | | | | 473,750 | |
| | | | | | | | | | | | | | | | |
| | | | |
| Leisure Products: 0.14% | | | | | | | | | | | | | | | | |
Mattel Incorporated | | | 5.45 | | | | 11-1-2041 | | | | 200,000 | | | | 161,000 | |
| | | | | | | | | | | | | | | | |
| | | | |
| Media: 7.74% | | | | | | | | | | | | | | | | |
Altice US Finance I Corporation 144A | | | 5.38 | | | | 7-15-2023 | | | | 400,000 | | | | 402,500 | |
AMC Entertainment Holdings Incorporated | | | 5.75 | | | | 6-15-2025 | | | | 200,000 | | | | 194,126 | |
AMC Entertainment Holdings Incorporated | | | 5.88 | | | | 11-15-2026 | | | | 300,000 | | | | 292,500 | |
AMC Networks Incorporated | | | 4.75 | | | | 8-1-2025 | | | | 300,000 | | | | 289,500 | |
CCO Holdings LLC 144A | | | 5.50 | | | | 5-1-2026 | | | | 200,000 | | | | 197,500 | |
CCO Holdings LLC 144A | | | 5.88 | | | | 5-1-2027 | | | | 500,000 | | | | 496,875 | |
Cequel Communications Holdings I LLC 144A | | | 7.50 | | | | 4-1-2028 | | | | 300,000 | | | | 312,750 | |
Cequel Communications Holdings I LLC 144A | | | 5.13 | | | | 12-15-2021 | | | | 200,000 | | | | 200,000 | |
Cinemark USA Incorporated | | | 4.88 | | | | 6-1-2023 | | | | 300,000 | | | | 296,250 | |
Clear Channel Worldwide Holdings Incorporated | | | 6.50 | | | | 11-15-2022 | | | | 400,000 | | | | 409,000 | |
CSC Holdings LLC 144A | | | 5.50 | | | | 4-15-2027 | | | | 200,000 | | | | 194,750 | |
CSC Holdings LLC | | | 6.75 | | | | 11-15-2021 | | | | 300,000 | | | | 318,000 | |
DISH DBS Corporation | | | 5.88 | | | | 11-15-2024 | | | | 600,000 | | | | 522,000 | |
DISH DBS Corporation | | | 7.88 | | | | 9-1-2019 | | | | 200,000 | | | | 206,750 | |
Gray Television Incorporated 144A | | | 5.88 | | | | 7-15-2026 | | | | 300,000 | | | | 300,000 | |
Lamar Media Corporation | | | 5.00 | | | | 5-1-2023 | | | | 200,000 | | | | 203,500 | |
McGraw-Hill Global Education Holdings LLC 144A | | | 7.88 | | | | 5-15-2024 | | | | 200,000 | | | | 176,000 | |
Meredith Corporation 144A | | | 6.88 | | | | 2-1-2026 | | | | 300,000 | | | | 303,750 | |
Neptune Finco Corporation 144A | | | 10.88 | | | | 10-15-2025 | | | | 400,000 | | | | 465,500 | |
Nielsen Finance LLC 144A | | | 5.00 | | | | 4-15-2022 | | | | 400,000 | | | | 388,420 | |
Outfront Media Capital Corporation | | | 5.63 | | | | 2-15-2024 | | | | 300,000 | | | | 303,375 | |
Sinclair Television Group Incorporated | | | 6.13 | | | | 10-1-2022 | | | | 200,000 | | | | 205,040 | |
Sinclair Television Group Incorporated 144A | | | 5.63 | | | | 8-1-2024 | | | | 200,000 | | | | 197,000 | |
Sirius XM Radio Incorporated 144A | | | 5.38 | | | | 4-15-2025 | | | | 300,000 | | | | 304,500 | |
Sirius XM Radio Incorporated 144A | | | 5.38 | | | | 7-15-2026 | | | | 200,000 | | | | 199,500 | |
Sirius XM Radio Incorporated 144A | | | 6.00 | | | | 7-15-2024 | | | | 200,000 | | | | 207,820 | |
TEGNA Incorporated | | | 6.38 | | | | 10-15-2023 | | | | 300,000 | | | | 310,875 | |
Tribune Media Company | | | 5.88 | | | | 7-15-2022 | | | | 300,000 | | | | 304,500 | |
Univision Communications Incorporated 144A | | | 5.13 | | | | 5-15-2023 | | | | 400,000 | | | | 380,000 | |
Viacom Incorporated (3 Month LIBOR +3.90%) ± | | | 6.25 | | | | 2-28-2057 | | | | 200,000 | | | | 197,943 | |
| | | | |
| | | | | | | | | | | | | | | 8,780,224 | |
| | | | | | | | | | | | | | | | |
| | | | |
| Multiline Retail: 0.13% | | | | | | | | | | | | | | | | |
Neiman Marcus Group Limited (PIK at 9.50%) 144A¥ | | | 8.75 | | | | 10-15-2021 | | | | 209,500 | | | | 142,984 | |
| | | | | | | | | | | | | | | | |
The accompanying notes are an integral part of these financial statements.
| | | | | | |
| Portfolio of investments—August 31, 2018 (unaudited) | | Wells Fargo Funds | | | 175 | |
HIGH YIELD CORPORATE BOND PORTFOLIO
| | | | | | | | | | | | | | | | |
| Security name | | Interest rate | | | Maturity date | | | Principal | | | Value | |
| | | | |
| Specialty Retail: 1.83% | | | | | | | | | | | | | | | | |
Gap Incorporated | | | 5.95 | % | | | 4-12-2021 | | | $ | 200,000 | | | $ | 209,168 | |
Group 1 Automotive Incorporated | | | 5.00 | | | | 6-1-2022 | | | | 100,000 | | | | 99,000 | |
JCPenney Corporation Incorporated | | | 6.38 | | | | 10-15-2036 | | | | 200,000 | | | | 95,000 | |
L Brands Incorporated | | | 6.75 | | | | 7-1-2036 | | | | 200,000 | | | | 163,000 | |
L Brands Incorporated | | | 6.88 | | | | 11-1-2035 | | | | 200,000 | | | | 166,560 | |
Limited Brands Incorporated | | | 5.63 | | | | 2-15-2022 | | | | 200,000 | | | | 202,250 | |
New Albertsons Incorporated | | | 7.45 | | | | 8-1-2029 | | | | 200,000 | | | | 168,000 | |
Penske Auto Group Incorporated | | | 5.75 | | | | 10-1-2022 | | | | 300,000 | | | | 306,000 | |
PetSmart Incorporated 144A | | | 5.88 | | | | 6-1-2025 | | | | 200,000 | | | | 162,250 | |
PetSmart Incorporated 144A | | | 7.13 | | | | 3-15-2023 | | | | 200,000 | | | | 134,500 | |
Sally Holdings LLC | | | 5.63 | | | | 12-1-2025 | | | | 200,000 | | | | 183,500 | |
Staples Incorporated 144A | | | 8.50 | | | | 9-15-2025 | | | | 200,000 | | | | 188,980 | |
| | | | |
| | | | | | | | | | | | | | | 2,078,208 | |
| | | | | | | | | | | | | | | | |
| | | | |
| Textiles, Apparel & Luxury Goods: 0.17% | | | | | | | | | | | | | | | | |
HanesBrands Incorporated 144A | | | 4.63 | | | | 5-15-2024 | | | | 200,000 | | | | 195,000 | |
| | | | | | | | | | | | | | | | |
| | | | |
Consumer Staples: 3.43% | | | | | | | | | | | | | | | | |
| | | | |
| Beverages: 0.17% | | | | | | | | | | | | | | | | |
Cott Beverages Incorporated 144A | | | 5.50 | | | | 4-1-2025 | | | | 200,000 | | | | 195,870 | |
| | | | | | | | | | | | | | | | |
| | | | |
| Food & Staples Retailing: 1.00% | | | | | | | | | | | | | | | | |
Albertsons Companies LLC | | | 5.75 | | | | 3-15-2025 | | | | 300,000 | | | | 271,500 | |
Aramark Services Incorporated | | | 4.75 | | | | 6-1-2026 | | | | 300,000 | | | | 295,500 | |
Aramark Services Incorporated 144A | | | 5.00 | | | | 4-1-2025 | | | | 200,000 | | | | 201,250 | |
Rite Aid Corporation 144A | | | 6.13 | | | | 4-1-2023 | | | | 200,000 | | | | 179,440 | |
Safeway Incorporated | | | 7.25 | | | | 2-1-2031 | | | | 200,000 | | | | 190,500 | |
| | | | |
| | | | | | | | | | | | | | | 1,138,190 | |
| | | | | | | | | | | | | | | | |
| | | | |
| Food Products: 1.20% | | | | | | | | | | | | | | | | |
B&G Foods Incorporated | | | 4.63 | | | | 6-1-2021 | | | | 200,000 | | | | 199,000 | |
Lamb Weston Holdings Incorporated 144A | | | 4.63 | | | | 11-1-2024 | | | | 200,000 | | | | 196,500 | |
Lamb Weston Holdings Incorporated 144A | | | 4.88 | | | | 11-1-2026 | | | | 200,000 | | | | 197,000 | |
Pilgrim’s Pride Corporation 144A | | | 5.75 | | | | 3-15-2025 | | | | 200,000 | | | | 193,500 | |
Pilgrim’s Pride Corporation 144A | | | 5.88 | | | | 9-30-2027 | | | | 200,000 | | | | 190,000 | |
Post Holdings Incorporated 144A | | | 5.00 | | | | 8-15-2026 | | | | 400,000 | | | | 384,000 | |
| | | | |
| | | | | | | | | | | | | | | 1,360,000 | |
| | | | | | | | | | | | | | | | |
| | | | |
| Household Products: 0.62% | | | | | | | | | | | | | | | | |
Energizer Holdings Incorporated 144A | | | 5.50 | | | | 6-15-2025 | | | | 300,000 | | | | 299,250 | |
HRG Group Incorporated | | | 7.75 | | | | 1-15-2022 | | | | 200,000 | | | | 205,500 | |
Spectrum Brands Incorporated | | | 5.75 | | | | 7-15-2025 | | | | 200,000 | | | | 202,000 | |
| | | | |
| | | | | | | | | | | | | | | 706,750 | |
| | | | | | | | | | | | | | | | |
| | | | |
| Personal Products: 0.44% | | | | | | | | | | | | | | | | |
Edgewell Personal Care Company | | | 4.70 | | | | 5-24-2022 | | | | 300,000 | | | | 297,840 | |
First Quality Finance Company 144A | | | 4.63 | | | | 5-15-2021 | | | | 200,000 | | | | 197,500 | |
| | | | |
| | | | | | | | | | | | | | | 495,340 | |
| | | | | | | | | | | | | | | | |
The accompanying notes are an integral part of these financial statements.
| | | | |
| 176 | | Wells Fargo Funds | | Portfolio of investments—August 31, 2018 (unaudited) |
HIGH YIELD CORPORATE BOND PORTFOLIO
| | | | | | | | | | | | | | | | |
| Security name | | Interest rate | | | Maturity date | | | Principal | | | Value | |
| | | | |
Energy: 13.40% | | | | | | | | | | | | | | | | |
| | | | |
| Energy Equipment & Services: 1.04% | | | | | | | | | | | | | | | | |
Bristow Group Incorporated | | | 6.25 | % | | | 10-15-2022 | | | $ | 200,000 | | | $ | 141,000 | |
Diamond Offshore Drilling Incorporated | | | 5.70 | | | | 10-15-2039 | | | | 300,000 | | | | 238,500 | |
Hilcorp Energy Company 144A | | | 5.75 | | | | 10-1-2025 | | | | 200,000 | | | | 198,500 | |
NGPL PipeCo LLC 144A | | | 4.88 | | | | 8-15-2027 | | | | 200,000 | | | | 201,548 | |
SESI LLC | | | 7.13 | | | | 12-15-2021 | | | | 200,000 | | | | 203,000 | |
Unit Corporation | | | 6.63 | | | | 5-15-2021 | | | | 200,000 | | | | 199,750 | |
| | | | |
| | | | | | | | | | | | | | | 1,182,298 | |
| | | | | | | | | | | | | | | | |
| | | | |
| Oil, Gas & Consumable Fuels: 12.36% | | | | | | | | | | | | | | | | |
Antero Resources Corporation | | | 5.13 | | | | 12-1-2022 | | | | 200,000 | | | | 202,000 | |
Antero Resources Corporation | | | 5.63 | | | | 6-1-2023 | | | | 200,000 | | | | 205,810 | |
Ascent Resources Utica Holdings LLC 144A | | | 10.00 | | | | 4-1-2022 | | | | 300,000 | | | | 331,500 | |
California Resources Corporation 144A | | | 8.00 | | | | 12-15-2022 | | | | 400,000 | | | | 358,500 | |
Carrizo Oil & Gas Incorporated | | | 6.25 | | | | 4-15-2023 | | | | 200,000 | | | | 204,500 | |
Cheniere Corpus Christi Holdings LLC | | | 5.88 | | | | 3-31-2025 | | | | 300,000 | | | | 318,750 | |
Cheniere Energy Partners LP | | | 5.25 | | | | 10-1-2025 | | | | 200,000 | | | | 200,000 | |
Chesapeake Energy Corporation | | | 4.88 | | | | 4-15-2022 | | | | 200,000 | | | | 193,000 | |
Chesapeake Energy Corporation | | | 8.00 | | | | 6-15-2027 | | | | 300,000 | | | | 303,750 | |
CONSOL Energy Incorporated | | | 5.88 | | | | 4-15-2022 | | | | 300,000 | | | | 299,985 | |
Crestwood Midstream Partners LP | | | 6.25 | | | | 4-1-2023 | | | | 200,000 | | | | 206,250 | |
CrownRock LP 144A | | | 5.63 | | | | 10-15-2025 | | | | 200,000 | | | | 194,500 | |
DCP Midstream Operating LP | | | 3.88 | | | | 3-15-2023 | | | | 200,000 | | | | 195,000 | |
DCP Midstream Operating LP (3 Month LIBOR +3.85%) 144A± | | | 5.85 | | | | 5-21-2043 | | | | 200,000 | | | | 184,000 | |
Denbury Resources Incorporated 144A | | | 9.00 | | | | 5-15-2021 | | | | 200,000 | | | | 215,000 | |
Diamondback Energy Incorporated | | | 4.75 | | | | 11-1-2024 | | | | 200,000 | | | | 201,250 | |
Energy Transfer Equity LP | | | 4.25 | | | | 3-15-2023 | | | | 200,000 | | | | 200,560 | |
Energy Transfer Equity LP | | | 5.88 | | | | 1-15-2024 | | | | 200,000 | | | | 212,500 | |
Enlink Midstream | | | 5.45 | | | | 6-1-2047 | | | | 300,000 | | | | 266,259 | |
EP Energy Corporation 144A | | | 9.38 | | | | 5-1-2024 | | | | 200,000 | | | | 157,500 | |
Extraction Oil & Gas Incorporated 144A | | | 5.63 | | | | 2-1-2026 | | | | 200,000 | | | | 187,250 | |
Genesis Energy LP | | | 6.75 | | | | 8-1-2022 | | | | 400,000 | | | | 408,000 | |
Gulfport Energy Corporation | | | 6.00 | | | | 10-15-2024 | | | | 300,000 | | | | 296,250 | |
Jonah Energy LLC 144A | | | 7.25 | | | | 10-15-2025 | | | | 200,000 | | | | 156,000 | |
McDermott Technology Americas Incorporated 144A | | | 10.63 | | | | 5-1-2024 | | | | 200,000 | | | | 212,810 | |
Murphy Oil Corporation | | | 5.75 | | | | 8-15-2025 | | | | 200,000 | | | | 200,350 | |
Murphy Oil Corporation | | | 6.88 | | | | 8-15-2024 | | | | 200,000 | | | | 211,238 | |
Nabors Industries Incorporated | | | 5.00 | | | | 9-15-2020 | | | | 200,000 | | | | 200,712 | |
Nabors Industries Incorporated | | | 5.10 | | | | 9-15-2023 | | | | 200,000 | | | | 193,163 | |
Newfield Exploration Company | | | 5.63 | | | | 7-1-2024 | | | | 200,000 | | | | 213,250 | |
Newfield Exploration Company | | | 5.75 | | | | 1-30-2022 | | | | 200,000 | | | | 211,000 | |
NGL Energy Partners LP | | | 6.13 | | | | 3-1-2025 | | | | 200,000 | | | | 188,500 | |
Oasis Petroleum Incorporated | | | 6.88 | | | | 3-15-2022 | | | | 190,000 | | | | 193,563 | |
Parsley Energy LLC 144A | | | 5.38 | | | | 1-15-2025 | | | | 300,000 | | | | 302,220 | |
PBF Holding Company LLC | | | 7.00 | | | | 11-15-2023 | | | | 200,000 | | | | 209,000 | |
PDC Energy Incorporated | | | 5.75 | | | | 5-15-2026 | | | | 200,000 | | | | 194,000 | |
Pride International LLC Company | | | 7.88 | | | | 8-15-2040 | | | | 200,000 | | | | 186,500 | |
QEP Resources Incorporated | | | 5.25 | | | | 5-1-2023 | | | | 400,000 | | | | 390,000 | |
Range Resources Corporation | | | 4.88 | | | | 5-15-2025 | | | | 400,000 | | | | 383,000 | |
Range Resources Corporation | | | 5.00 | | | | 3-15-2023 | | | | 200,000 | | | | 195,660 | |
Rockies Express Pipeline LLC 144A | | | 5.63 | | | | 4-15-2020 | | | | 200,000 | | | | 206,250 | |
The accompanying notes are an integral part of these financial statements.
| | | | | | |
| Portfolio of investments—August 31, 2018 (unaudited) | | Wells Fargo Funds | | | 177 | |
HIGH YIELD CORPORATE BOND PORTFOLIO
| | | | | | | | | | | | | | | | |
| Security name | | Interest rate | | | Maturity date | | | Principal | | | Value | |
| | | | |
| Oil, Gas & Consumable Fuels (continued) | | | | | | | | | | | | | | | | |
Rockies Express Pipeline LLC 144A | | | 6.88 | % | | | 4-15-2040 | | | $ | 100,000 | | | $ | 116,000 | |
Rose Rock Midstream LP | | | 5.63 | | | | 11-15-2023 | | | | 200,000 | | | | 193,500 | |
Rowan Companies Incorporated | | | 4.88 | | | | 6-1-2022 | | | | 400,000 | | | | 372,000 | |
Sable Permian Resources Land LLC 144A | | | 13.00 | | | | 11-30-2020 | | | | 200,000 | | | | 221,000 | |
Sanchez Energy Corporation | | | 6.13 | | | | 1-15-2023 | | | | 200,000 | | | | 112,930 | |
SM Energy Company | | | 6.75 | | | | 9-15-2026 | | | | 200,000 | | | | 207,250 | |
Southwestern Energy Company | | | 4.10 | | | | 3-15-2022 | | | | 200,000 | | | | 195,000 | |
Southwestern Energy Company | | | 7.75 | | | | 10-1-2027 | | | | 200,000 | | | | 211,500 | |
Suburban Propane Partners LP | | | 5.50 | | | | 6-1-2024 | | | | 200,000 | | | | 196,000 | |
Sunoco LP 144A | | | 5.50 | | | | 2-15-2026 | | | | 300,000 | | | | 287,250 | |
Tallgrass Energy Partners LP 144A | | | 5.50 | | | | 1-15-2028 | | | | 200,000 | | | | 202,000 | |
Targa Resources Partners LP | | | 4.25 | | | | 11-15-2023 | | | | 200,000 | | | | 194,000 | |
Targa Resources Partners LP | | | 5.13 | | | | 2-1-2025 | | | | 200,000 | | | | 201,000 | |
Targa Resources Partners LP | | | 5.25 | | | | 5-1-2023 | | | | 200,000 | | | | 202,500 | |
Transocean Incorporated | | | 6.80 | | | | 3-15-2038 | | | | 300,000 | | | | 247,125 | |
Ultra Resources Incorporated 144A | | | 6.88 | | | | 4-15-2022 | | | | 400,000 | | | | 195,000 | |
Vine Oil & Gas LP 144A | | | 8.75 | | | | 4-15-2023 | | | | 200,000 | | | | 193,250 | |
Whiting Petroleum Corporation | | | 5.75 | | | | 3-15-2021 | | | | 200,000 | | | | 205,000 | |
Williams Companies Incorporated | | | 8.75 | | | | 3-15-2032 | | | | 200,000 | | | | 268,000 | |
WPX Energy Incorporated | | | 6.00 | | | | 1-15-2022 | | | | 400,000 | | | | 413,000 | |
| | | | |
| | | | | | | | | | | | | | | 14,022,635 | |
| | | | | | | | | | | | | | | | |
| | | | |
Financials: 6.89% | | | | | | | | | | | | | | | | |
| | | | |
| Banks: 0.36% | | | | | | | | | | | | | | | | |
CIT Group Incorporated | | | 5.00 | | | | 8-15-2022 | | | | 200,000 | | | | 204,000 | |
CIT Group Incorporated | | | 5.00 | | | | 8-1-2023 | | | | 200,000 | | | | 203,250 | |
| | | | |
| | | | | | | | | | | | | | | 407,250 | |
| | | | | | | | | | | | | | | | |
| | | | |
| Capital Markets: 0.77% | | | | | | | | | | | | | | | | |
BCD Acquisition Incorporated 144A | | | 9.63 | | | | 9-15-2023 | | | | 300,000 | | | | 317,250 | |
Blue Cube Spinco Incorporated | | | 10.00 | | | | 10-15-2025 | | | | 300,000 | | | | 347,250 | |
MSCI Incorporated 144A | | | 5.25 | | | | 11-15-2024 | | | | 200,000 | | | | 205,500 | |
| | | | |
| | | | | | | | | | | | | | | 870,000 | |
| | | | | | | | | | | | | | | | |
| | | | |
| Consumer Finance: 2.64% | | | | | | | | | | | | | | | | |
Ally Financial Incorporated | | | 4.63 | | | | 3-30-2025 | | | | 200,000 | | | | 199,750 | |
Ally Financial Incorporated | | | 5.13 | | | | 9-30-2024 | | | | 300,000 | | | | 306,750 | |
Ally Financial Incorporated | | | 5.75 | | | | 11-20-2025 | | | | 200,000 | | | | 207,250 | |
Navient Corporation | | | 5.88 | | | | 3-25-2021 | | | | 200,000 | | | | 204,560 | |
Navient Corporation | | | 5.88 | | | | 10-25-2024 | | | | 200,000 | | | | 193,500 | |
Navient Corporation | | | 6.50 | | | | 6-15-2022 | | | | 200,000 | | | | 206,810 | |
Navient Corporation | | | 6.75 | | | | 6-25-2025 | | | | 200,000 | | | | 199,500 | |
Opal Acquisition Incorporated 144A | | | 10.00 | | | | 10-1-2024 | | | | 200,000 | | | | 170,000 | |
Quicken Loans Incorporated 144A | | | 5.25 | | | | 1-15-2028 | | | | 400,000 | | | | 366,500 | |
SLM Corporation | | | 5.50 | | | | 1-25-2023 | | | | 200,000 | | | | 197,748 | |
Springleaf Finance Corporation | | | 6.88 | | | | 3-15-2025 | | | | 200,000 | | | | 200,060 | |
Springleaf Finance Corporation | | | 8.25 | | | | 12-15-2020 | | | | 300,000 | | | | 324,375 | |
Springleaf Finance Corporation | | | 8.25 | | | | 10-1-2023 | | | | 200,000 | | | | 220,500 | |
| | | | |
| | | | | | | | | | | | | | | 2,997,303 | |
| | | | | | | | | | | | | | | | |
The accompanying notes are an integral part of these financial statements.
| | | | |
| 178 | | Wells Fargo Funds | | Portfolio of investments—August 31, 2018 (unaudited) |
HIGH YIELD CORPORATE BOND PORTFOLIO
| | | | | | | | | | | | | | | | |
| Security name | | Interest rate | | | Maturity date | | | Principal | | | Value | |
| | | | |
| Diversified Financial Services: 1.79% | | | | | | | | | | | | | | | | |
Beacon Escrow Corporation 144A | | | 4.88 | % | | | 11-1-2025 | | | $ | 200,000 | | | $ | 184,500 | |
Freedom Mortgage Corporation 144A | | | 8.25 | | | | 4-15-2025 | | | | 300,000 | | | | 290,625 | |
Harland Clarke Holdings 144A | | | 9.25 | | | | 3-1-2021 | | | | 400,000 | | | | 364,000 | |
Hilton Domestic Operating Company | | | 4.25 | | | | 9-1-2024 | | | | 200,000 | | | | 194,500 | |
Jefferies Finance LLC 144A | | | 7.50 | | | | 4-15-2021 | | | | 300,000 | | | | 309,000 | |
Prime Services Company 144A | | | 9.25 | | | | 5-15-2023 | | | | 243,000 | | | | 260,326 | |
Transocean Incorporated 144A | | | 9.00 | | | | 7-15-2023 | | | | 400,000 | | | | 431,500 | |
| | | | |
| | | | | | | | | | | | | | | 2,034,451 | |
| | | | | | | | | | | | | | | | |
| | | | |
| Insurance: 0.90% | | | | | | | | | | | | | | | | |
Alliant Holdings International LLC 144A | | | 8.25 | | | | 8-1-2023 | | | | 200,000 | | | | 207,500 | |
Genworth Holdings Incorporated | | | 7.63 | | | | 9-24-2021 | | | | 400,000 | | | | 414,000 | |
HUB International Limited 144A | | | 7.00 | | | | 5-1-2026 | | | | 200,000 | | | | 198,710 | |
USIS Merger Subordinate Incorporated 144A | | | 6.88 | | | | 5-1-2025 | | | | 200,000 | | | | 199,000 | |
| | | | |
| | | | | | | | | | | | | | | 1,019,210 | |
| | | | | | | | | | | | | | | | |
| | | | |
| Mortgage REITs: 0.25% | | | | | | | | | | | | | | | | |
Starwood Property Trust | | | 4.75 | | | | 3-15-2025 | | | | 300,000 | | | | 285,000 | |
| | | | | | | | | | | | | | | | |
| | | | |
| Thrifts & Mortgage Finance: 0.18% | | | | | | | | | | | | | | | | |
Ladder Capital Finance LLC 144A | | | 5.25 | | | | 3-15-2022 | | | | 200,000 | | | | 200,750 | |
| | | | | | | | | | | | | | | | |
| | | | |
Health Care: 7.32% | | | | | | | | | | | | | | | | |
| | | | |
| Health Care Equipment & Supplies: 1.15% | | | | | | | | | | | | | | | | |
Crimson Incorporated 144A | | | 6.63 | | | | 5-15-2022 | | | | 500,000 | | | | 490,625 | |
DJO Finco Incorporated 144A | | | 8.13 | | | | 6-15-2021 | | | | 200,000 | | | | 206,560 | |
Hologic Incorporated 144A | | | 4.38 | | | | 10-15-2025 | | | | 200,000 | | | | 192,500 | |
Kinetic Concepts Incorporated 144A | | | 12.50 | | | | 11-1-2021 | | | | 200,000 | | | | 219,000 | |
Surgery Center Holdings Incorporated 144A | | | 6.75 | | | | 7-1-2025 | | | | 200,000 | | | | 193,000 | |
| | | | |
| | | | | | | | | | | | | | | 1,301,685 | |
| | | | | | | | | | | | | | | | |
| | | | |
| Health Care Providers & Services: 5.62% | | | | | | | | | | | | | | | | |
Acadia Healthcare Company Incorporated | | | 5.13 | | | | 7-1-2022 | | | | 200,000 | | | | 201,000 | |
Centene Corporation | | | 4.75 | | | | 5-15-2022 | | | | 200,000 | | | | 203,500 | |
Centene Corporation | | | 6.13 | | | | 2-15-2024 | | | | 200,000 | | | | 210,250 | |
Community Health Systems Incorporated | | | 6.88 | | | | 2-1-2022 | | | | 200,000 | | | | 102,000 | |
Davita Incorporated | | | 5.00 | | | | 5-1-2025 | | | | 200,000 | | | | 189,500 | |
Davita Incorporated | | | 5.13 | | | | 7-15-2024 | | | | 300,000 | | | | 289,236 | |
Encompass Health Corporation | | | 5.75 | | | | 11-1-2024 | | | | 400,000 | | | | 405,000 | |
Envision Healthcare Corporation | | | 5.63 | | | | 7-15-2022 | | | | 300,000 | | | | 307,500 | |
HCA Incorporated | | | 5.50 | | | | 6-15-2047 | | | | 200,000 | | | | 200,500 | |
HCA Incorporated | | | 6.50 | | | | 2-15-2020 | | | | 200,000 | | | | 207,600 | |
HCA Incorporated | | | 7.50 | | | | 2-15-2022 | | | | 300,000 | | | | 329,250 | |
Jaguar Holding Company II 144A | | | 6.38 | | | | 8-1-2023 | | | | 200,000 | | | | 201,000 | |
Lifepoint Health Incorporated | | | 5.38 | | | | 5-1-2024 | | | | 200,000 | | | | 207,750 | |
Lifepoint Health Incorporated | | | 5.50 | | | | 12-1-2021 | | | | 200,000 | | | | 203,250 | |
MPH Acquisition Holdings LLC 144A | | | 7.13 | | | | 6-1-2024 | | | | 300,000 | | | | 310,500 | |
MPT Operating Partnership LP | | | 5.00 | | | | 10-15-2027 | | | | 200,000 | | | | 196,000 | |
MPT Operating Partnership LP | | | 6.38 | | | | 3-1-2024 | | | | 300,000 | | | | 316,290 | |
The accompanying notes are an integral part of these financial statements.
| | | | | | |
| Portfolio of investments—August 31, 2018 (unaudited) | | Wells Fargo Funds | | | 179 | |
HIGH YIELD CORPORATE BOND PORTFOLIO
| | | | | | | | | | | | | | | | |
| Security name | | Interest rate | | | Maturity date | | | Principal | | | Value | |
| | | | |
| Health Care Providers & Services (continued) | | | | | | | | | | | | | | | | |
Polaris Intermediate Corporation 144A | | | 8.50 | % | | | 12-1-2022 | | | $ | 300,000 | | | $ | 309,750 | |
RegionalCare Hospital Partners 144A | | | 8.25 | | | | 5-1-2023 | | | | 200,000 | | | | 212,500 | |
Team Health Holdings Incorporated 144A | | | 6.38 | | | | 2-1-2025 | | | | 300,000 | | | | 260,250 | |
Tenet Healthcare Corporation | | | 4.63 | | | | 7-15-2024 | | | | 700,000 | | | | 685,671 | |
Tenet Healthcare Corporation | | | 7.00 | | | | 8-1-2025 | | | | 200,000 | | | | 199,625 | |
Tenet Healthcare Corporation 144A | | | 7.50 | | | | 1-1-2022 | | | | 200,000 | | | | 209,438 | |
Vizient Incorporated 144A | | | 10.38 | | | | 3-1-2024 | | | | 200,000 | | | | 218,500 | |
Wellcare Health Plans | | | 5.25 | | | | 4-1-2025 | | | | 200,000 | | | | 204,500 | |
| | | | |
| | | | | | | | | | | | | | | 6,380,360 | |
| | | | | | | | | | | | | | | | |
| | | | |
| Health Care Technology: 0.17% | | | | | | | | | | | | | | | | |
Quintiles IMS Holdings Incorporated 144A | | | 4.88 | | | | 5-15-2023 | | | | 200,000 | | | | 200,500 | |
| | | | | | | | | | | | | | | | |
| | | | |
| Pharmaceuticals: 0.38% | | | | | | | | | | | | | | | | |
Endo Finance LLC 144A | | | 5.38 | | | | 1-15-2023 | | | | 500,000 | | | | 427,500 | |
| | | | | | | | | | | | | | | | |
| | | | |
Industrials: 6.86% | | | | | | | | | | | | | | | | |
| | | | |
| Aerospace & Defense: 1.33% | | | | | | | | | | | | | | | | |
Alcoa Incorporated | | | 6.15 | | | | 8-15-2020 | | | | 200,000 | | | | 208,000 | |
Alcoa Incorporated | | | 6.75 | | | | 1-15-2028 | | | | 500,000 | | | | 511,250 | |
TransDigm Group Incorporated | | | 6.38 | | | | 6-15-2026 | | | | 200,000 | | | | 202,125 | |
TransDigm Group Incorporated | | | 6.50 | | | | 7-15-2024 | | | | 200,000 | | | | 203,250 | |
Triumph Group Incorporated | | | 5.25 | | | | 6-1-2022 | | | | 200,000 | | | | 187,500 | |
Triumph Group Incorporated | | | 7.75 | | | | 8-15-2025 | | | | 200,000 | | | | 194,250 | |
| | | | |
| | | | | | | | | | | | | | | 1,506,375 | |
| | | | | | | | | | | | | | | | |
| | | | |
| Air Freight & Logistics: 0.36% | | | | | | | | | | | | | | | | |
XPO Logistics Incorporated 144A | | | 6.13 | | | | 9-1-2023 | | | | 400,000 | | | | 412,000 | |
| | | | | | | | | | | | | | | | |
| | | | |
| Airlines: 0.27% | | | | | | | | | | | | | | | | |
American Airlines Group Incorporated 144A | | | 4.63 | | | | 3-1-2020 | | | | 300,000 | | | | 301,800 | |
| | | | | | | | | | | | | | | | |
| | | | |
| Building Products: 0.17% | | | | | | | | | | | | | | | | |
Griffon Corporation | | | 5.25 | | | | 3-1-2022 | | | | 200,000 | | | | 197,310 | |
| | | | | | | | | | | | | | | | |
| | | | |
| Commercial Services & Supplies: 1.14% | | | | | | | | | | | | | | | | |
ADT Corporation | | | 3.50 | | | | 7-15-2022 | | | | 200,000 | | | | 189,250 | |
ADT Corporation 144A | | | 4.88 | | | | 7-15-2032 | | | | 200,000 | | | | 163,000 | |
ADT Corporation | | | 6.25 | | | | 10-15-2021 | | | | 200,000 | | | | 211,000 | |
APTIM Corporation 144A | | | 7.75 | | | | 6-15-2025 | | | | 200,000 | | | | 170,500 | |
Covanta Holding Corporation | | | 5.88 | | | | 3-1-2024 | | | | 200,000 | | | | 201,500 | |
Pitney Bowes Incorporated | | | 4.70 | | | | 4-1-2023 | | | | 200,000 | | | | 178,500 | |
West Corp Company 144A | | | 8.50 | | | | 10-15-2025 | | | | 200,000 | | | | 182,000 | |
| | | | |
| | | | | | | | | | | | | | | 1,295,750 | |
| | | | | | | | | | | | | | | | |
| | | | |
| Construction & Engineering: 0.91% | | | | | | | | | | | | | | | | |
AECOM | | | 5.88 | | | | 10-15-2024 | | | | 300,000 | | | | 320,217 | |
United Rentals North America Incorporated | | | 5.50 | | | | 7-15-2025 | | | | 500,000 | | | | 510,000 | |
United Rentals North America Incorporated | | | 5.50 | | | | 5-15-2027 | | | | 200,000 | | | | 199,500 | |
| | | | |
| | | | | | | | | | | | | | | 1,029,717 | |
| | | | | | | | | | | | | | | | |
The accompanying notes are an integral part of these financial statements.
| | | | |
| 180 | | Wells Fargo Funds | | Portfolio of investments—August 31, 2018 (unaudited) |
HIGH YIELD CORPORATE BOND PORTFOLIO
| | | | | | | | | | | | | | | | |
| Security name | | Interest rate | | | Maturity date | | | Principal | | | Value | |
| | | | |
| Electrical Equipment: 0.18% | | | | | | | | | | | | | | | | |
Vertiv Group Corporation 144A | | | 9.25 | % | | | 10-15-2024 | | | $ | 200,000 | | | $ | 205,500 | |
| | | | | | | | | | | | | | | | |
| | | | |
| Machinery: 0.73% | | | | | | | | | | | | | | | | |
BlueLine Rental Finance Corporation 144A | | | 9.25 | | | | 3-15-2024 | | | | 300,000 | | | | 315,000 | |
Gates Global LLC 144A | | | 6.00 | | | | 7-15-2022 | | | | 95,000 | | | | 95,950 | |
Navistar International Corporation 144A | | | 6.63 | | | | 11-1-2025 | | | | 200,000 | | | | 208,000 | |
Xerium Technologies Incorporated | | | 9.50 | | | | 8-15-2021 | | | | 200,000 | | | | 210,250 | |
| | | | |
| | | | | | | | | | | | | | | 829,200 | |
| | | | | | | | | | | | | | | | |
| | | | |
| Metals & Mining: 0.18% | | | | | | | | | | | | | | | | |
AK Steel Corporation | | | 7.63 | | | | 10-1-2021 | | | | 200,000 | | | | 204,000 | |
| | | | | | | | | | | | | | | | |
| | | | |
| Professional Services: 0.63% | | | | | | | | | | | | | | | | |
Brand Industrial Services Incorporated 144A | | | 8.50 | | | | 7-15-2025 | | | | 200,000 | | | | 205,500 | |
CyrusOne LP | | | 5.38 | | | | 3-15-2027 | | | | 300,000 | | | | 301,500 | |
Exela Technologies Incorporated 144A | | | 10.00 | | | | 7-15-2023 | | | | 200,000 | | | | 209,500 | |
| | | | |
| | | | | | | | | | | | | | | 716,500 | |
| | | | | | | | | | | | | | | | |
| | | | |
| Road & Rail: 0.43% | | | | | | | | | | | | | | | | |
Hertz Corporation | | | 6.25 | | | | 10-15-2022 | | | | 200,000 | | | | 186,500 | |
Hertz Corporation | | | 7.38 | | | | 1-15-2021 | | | | 300,000 | | | | 299,625 | |
| | | | |
| | | | | | | | | | | | | | | 486,125 | |
| | | | | | | | | | | | | | | | |
| | | | |
| Trading Companies & Distributors: 0.53% | | | | | | | | | | | | | | | | |
HD Supply Incorporated 144A | | | 5.75 | | | | 4-15-2024 | | | | 300,000 | | | | 315,375 | |
Herc Rentals Incorporated 144A | | | 7.50 | | | | 6-1-2022 | | | | 78,000 | | | | 81,608 | |
United Rentals North America Incorporated | | | 5.75 | | | | 11-15-2024 | | | | 200,000 | | | | 206,440 | |
| | | | |
| | | | | | | | | | | | | | | 603,423 | |
| | | | | | | | | | | | | | | | |
| | | | |
Information Technology: 5.67% | | | | | | | | | | | | | | | | |
| | | | |
| Communications Equipment: 0.59% | | | | | | | | | | | | | | | | |
CommScope Technologies Finance LLC 144A | | | 5.00 | | | | 3-15-2027 | | | | 500,000 | | | | 486,250 | |
Riverbed Technology Incorporated 144A | | | 8.88 | | | | 3-1-2023 | | | | 200,000 | | | | 185,000 | |
| | | | |
| | | | | | | | | | | | | | | 671,250 | |
| | | | | | | | | | | | | | | | |
| | | | |
| Electronic Equipment, Instruments & Components: 0.18% | | | | | | | | | | | | | | | | |
Anixter International Incorporated | | | 5.13 | | | | 10-1-2021 | | | | 200,000 | | | | 205,500 | |
| | | | | | | | | | | | | | | | |
| | | | |
| Internet Software & Services: 1.61% | | | | | | | | | | | | | | | | |
Infor Software Parent LLC (PIK at 7.88%) 144A¥ | | | 7.13 | | | | 5-1-2021 | | | | 400,000 | | | | 403,628 | |
Rackspace Hosting Company 144A | | | 8.63 | | | | 11-15-2024 | | | | 300,000 | | | | 295,313 | |
Sabre GLBL Incorporated 144A | | | 5.38 | | | | 4-15-2023 | | | | 200,000 | | | | 201,500 | |
Verisign Incorporated | | | 5.25 | | | | 4-1-2025 | | | | 300,000 | | | | 304,140 | |
Zayo Group LLC 144A | | | 5.75 | | | | 1-15-2027 | | | | 200,000 | | | | 200,500 | |
Zayo Group LLC | | | 6.00 | | | | 4-1-2023 | | | | 200,000 | | | | 206,134 | |
Zayo Group LLC | | | 6.38 | | | | 5-15-2025 | | | | 200,000 | | | | 209,000 | |
| | | | |
| | | | | | | | | | | | | | | 1,820,215 | |
| | | | | | | | | | | | | | | | |
The accompanying notes are an integral part of these financial statements.
| | | | | | |
| Portfolio of investments—August 31, 2018 (unaudited) | | Wells Fargo Funds | | | 181 | |
HIGH YIELD CORPORATE BOND PORTFOLIO
| | | | | | | | | | | | | | | | |
| Security name | | Interest rate | | | Maturity date | | | Principal | | | Value | |
| | | | |
| IT Services: 0.72% | | | | | | | | | | | | | | | | |
Alliance Data Systems Company 144A | | | 5.88 | % | | | 11-1-2021 | | | $ | 200,000 | | | $ | 204,500 | |
First Data Corporation 144A | | | 5.00 | | | | 1-15-2024 | | | | 400,000 | | | | 400,820 | |
First Data Corporation 144A | | | 7.00 | | | | 12-1-2023 | | | | 200,000 | | | | 208,100 | |
| | | | |
| | | | | | | | | | | | | | | 813,420 | |
| | | | | | | | | | | | | | | | |
| | | | |
| Semiconductors & Semiconductor Equipment: 0.27% | | | | | | | | | | | | | | | | |
Micron Technology Incorporated | | | 5.50 | | | | 2-1-2025 | | | | 300,000 | | | | 310,470 | |
| | | | | | | | | | | | | | | | |
| | | | |
| Software: 0.97% | | | | | | | | | | | | | | | | |
BMC Software Finance Incorporated 144A | | | 8.13 | | | | 7-15-2021 | | | | 500,000 | | | | 511,105 | |
Solera Finance Incorporated 144A | | | 10.50 | | | | 3-1-2024 | | | | 200,000 | | | | 219,500 | |
Symantec Corporation 144A | | | 5.00 | | | | 4-15-2025 | | | | 200,000 | | | | 198,225 | |
Veritas US Incorporated 144A | | | 10.50 | | | | 2-1-2024 | | | | 200,000 | | | | 172,000 | |
| | | | |
| | | | | | | | | | | | | | | 1,100,830 | |
| | | | | | | | | | | | | | | | |
| | | | |
| Technology Hardware, Storage & Peripherals: 1.33% | | | | | | | | | | | | | | | | |
CDW Finance Corporation | | | 5.00 | | | | 9-1-2023 | | | | 200,000 | | | | 204,000 | |
Dell International LLC 144A | | | 5.88 | | | | 6-15-2021 | | | | 200,000 | | | | 205,770 | |
Dell International LLC 144A | | | 7.13 | | | | 6-15-2024 | | | | 200,000 | | | | 213,810 | |
NCR Corporation | | | 5.00 | | | | 7-15-2022 | | | | 300,000 | | | | 292,500 | |
NCR Corporation | | | 6.38 | | | | 12-15-2023 | | | | 200,000 | | | | 200,750 | |
Western Digital Corporation | | | 4.75 | | | | 2-15-2026 | | | | 400,000 | | | | 392,172 | |
| | | | |
| | | | | | | | | | | | | | | 1,509,002 | |
| | | | | | | | | | | | | | | | |
| | | | |
Materials: 8.80% | | | | | | | | | | | | | | | | |
| | | | |
| Chemicals: 3.07% | | | | | | | | | | | | | | | | |
Avantor Incorporated 144A | | | 6.00 | | | | 10-1-2024 | | | | 300,000 | | | | 304,500 | |
Avantor Incorporated 144A | | | 9.00 | | | | 10-1-2025 | | | | 200,000 | | | | 206,250 | |
Calumet Specialty Products Partners LP | | | 7.63 | | | | 1-15-2022 | | | | 400,000 | | | | 396,000 | |
CF Industries Incorporated | | | 3.45 | | | | 6-1-2023 | | | | 500,000 | | | | 480,000 | |
CF Industries Incorporated | | | 4.95 | | | | 6-1-2043 | | | | 200,000 | | | | 175,600 | |
Chemours Company | | | 6.63 | | | | 5-15-2023 | | | | 200,000 | | | | 209,500 | |
Chemours Company | | | 7.00 | | | | 5-15-2025 | | | | 200,000 | | | | 213,500 | |
CVR Partners LP 144A | | | 9.25 | | | | 6-15-2023 | | | | 200,000 | | | | 213,250 | |
Hexion Incorporated | | | 6.63 | | | | 4-15-2020 | | | | 600,000 | | | | 567,750 | |
Huntsman International LLC | | | 4.88 | | | | 11-15-2020 | | | | 200,000 | | | | 204,600 | |
Platform Specialty Products 144A | | | 6.50 | | | | 2-1-2022 | | | | 300,000 | | | | 306,750 | |
TPC Group Incorporated 144A | | | 8.75 | | | | 12-15-2020 | | | | 200,000 | | | | 200,000 | |
| | | | |
| | | | | | | | | | | | | | | 3,477,700 | |
| | | | | | | | | | | | | | | | |
| | | | |
| Construction Materials: 0.60% | | | | | | | | | | | | | | | | |
Standard Industries Incorporated 144A | | | 5.00 | | | | 2-15-2027 | | | | 500,000 | | | | 475,000 | |
Summit Materials LLC | | | 6.13 | | | | 7-15-2023 | | | | 200,000 | | | | 202,750 | |
| | | | |
| | | | | | | | | | | | | | | 677,750 | |
| | | | | | | | | | | | | | | | |
| | | | |
| Containers & Packaging: 3.00% | | | | | | | | | | | | | | | | |
Ball Corporation | | | 4.00 | | | | 11-15-2023 | | | | 200,000 | | | | 195,250 | |
Ball Corporation | | | 5.25 | | | | 7-1-2025 | | | | 200,000 | | | | 206,000 | |
The accompanying notes are an integral part of these financial statements.
| | | | |
| 182 | | Wells Fargo Funds | | Portfolio of investments—August 31, 2018 (unaudited) |
HIGH YIELD CORPORATE BOND PORTFOLIO
| | | | | | | | | | | | | | | | |
| Security name | | Interest rate | | | Maturity date | | | Principal | | | Value | |
| | | | |
| Containers & Packaging (continued) | | | | | | | | | | | | | | | | |
Berry Global Incorporated | | | 6.00 | % | | | 10-15-2022 | | | $ | 300,000 | | | $ | 308,625 | |
BWAY Holding Company 144A | | | 5.50 | | | | 4-15-2024 | | | | 300,000 | | | | 298,125 | |
BWAY Holding Company 144A | | | 7.25 | | | | 4-15-2025 | | | | 300,000 | | | | 292,500 | |
Crown Americas Capital Corporation IV | | | 4.50 | | | | 1-15-2023 | | | | 500,000 | | | | 500,000 | |
Flex Acquisition Company Incorporated 144A | | | 6.88 | | | | 1-15-2025 | | | | 200,000 | | | | 192,500 | |
Owens-Brockway Glass Container Incorporated 144A | | | 5.38 | | | | 1-15-2025 | | | | 200,000 | | | | 197,500 | |
Owens-Brockway Glass Container Incorporated 144A | | | 5.88 | | | | 8-15-2023 | | | | 200,000 | | | | 205,000 | |
Reynolds Group Issuer Incorporated 144A | | | 5.13 | | | | 7-15-2023 | | | | 200,000 | | | | 199,250 | |
Reynolds Group Issuer Incorporated 144A | | | 7.00 | | | | 7-15-2024 | | | | 400,000 | | | | 406,400 | |
Sealed Air Corporation 144A | | | 5.25 | | | | 4-1-2023 | | | | 200,000 | | | | 203,000 | |
Sealed Air Corporation 144A | | | 5.50 | | | | 9-15-2025 | | | | 200,000 | | | | 203,000 | |
| | | | |
| | | | | | | | | | | | | | | 3,407,150 | |
| | | | | | | | | | | | | | | | |
| | | | |
| Metals & Mining: 1.95% | | | | | | | | | | | | | | | | |
Big River Steel LLC 144A | | | 7.25 | | | | 9-1-2025 | | | | 200,000 | | | | 209,506 | |
Cleveland-Cliffs Incorporated | | | 5.75 | | | | 3-1-2025 | | | | 400,000 | | | | 392,824 | |
Freeport-McMoRan Copper & Gold Incorporated | | | 5.40 | | | | 11-14-2034 | | | | 400,000 | | | | 369,376 | |
Freeport-McMoRan Copper & Gold Incorporated | | | 6.88 | | | | 2-15-2023 | | | | 300,000 | | | | 320,250 | |
Joseph T Ryerson & Son Incorporated 144A | | | 11.00 | | | | 5-15-2022 | | | | 200,000 | | | | 220,500 | |
Novelis Corporation 144A | | | 6.25 | | | | 8-15-2024 | | | | 300,000 | | | | 303,750 | |
Steel Dynamics Incorporated | | | 4.13 | | | | 9-15-2025 | | | | 200,000 | | | | 190,500 | |
United States Steel Corporation | | | 6.88 | | | | 8-15-2025 | | | | 200,000 | | | | 203,000 | |
| | | | |
| | | | | | | | | | | | | | | 2,209,706 | |
| | | | | | | | | | | | | | | | |
| | | | |
| Paper & Forest Products: 0.18% | | | | | | | | | | | | | | | | |
Resolute Forest Products Company | | | 5.88 | | | | 5-15-2023 | | | | 200,000 | | | | 205,750 | |
| | | | | | | | | | | | | | | | |
| | | | |
Real Estate: 2.76% | | | | | | | | | | | | | | | | |
| | | | |
| Equity REITs: 2.12% | | | | | | | | | | | | | | | | |
CBL & Associates LP | | | 5.95 | | | | 12-15-2026 | | | | 300,000 | | | | 243,750 | |
Equinix Incorporated | | | 5.38 | | | | 4-1-2023 | | | | 300,000 | | | | 306,375 | |
Equinix Incorporated | | | 5.88 | | | | 1-15-2026 | | | | 200,000 | | | | 207,500 | |
ESH Hospitality Incorporated 144A | | | 5.25 | | | | 5-1-2025 | | | | 200,000 | | | | 193,750 | |
Iron Mountain Incorporated | | | 5.75 | | | | 8-15-2024 | | | | 600,000 | | | | 594,750 | |
Istar Incorporated | | | 5.25 | | | | 9-15-2022 | | | | 200,000 | | | | 198,000 | |
MGM Growth Properties Operating Partnership LP | | | 4.50 | | | | 9-1-2026 | | | | 300,000 | | | | 285,750 | |
Uniti Group Incorporated 144A | | | 6.00 | | | | 4-15-2023 | | | | 200,000 | | | | 192,000 | |
Uniti Group Incorporated | | | 8.25 | | | | 10-15-2023 | | | | 200,000 | | | | 188,438 | |
| | | | |
| | | | | | | | | | | | | | | 2,410,313 | |
| | | | | | | | | | | | | | | | |
| | | | |
| Real Estate Management & Development: 0.64% | | | | | | | | | | | | | | | | |
Icahn Enterprises Company | | | 6.25 | | | | 2-1-2022 | | | | 300,000 | | | | 308,220 | |
Icahn Enterprises Company | | | 6.75 | | | | 2-1-2024 | | | | 400,000 | | | | 413,000 | |
| | | | |
| | | | | | | | | | | | | | | 721,220 | |
| | | | | | | | | | | | | | | | |
| | | | |
Telecommunication Services: 3.54% | | | | | | | | | | | | | | | | |
| | | | |
| Diversified Telecommunication Services: 2.07% | | | | | | | | | | | | | | | | |
CenturyLink Incorporated | | | 5.63 | | | | 4-1-2025 | | | | 300,000 | | | | 293,250 | |
CenturyLink Incorporated | | | 6.45 | | | | 6-15-2021 | | | | 200,000 | | | | 208,000 | |
The accompanying notes are an integral part of these financial statements.
| | | | | | |
| Portfolio of investments—August 31, 2018 (unaudited) | | Wells Fargo Funds | | | 183 | |
HIGH YIELD CORPORATE BOND PORTFOLIO
| | | | | | | | | | | | | | | | |
| Security name | | Interest rate | | | Maturity date | | | Principal | | | Value | |
| | | | |
| Diversified Telecommunication Services (continued) | | | | | | | | | | | | | | | | |
Centurylink Incorporated | | | 7.50 | % | | | 4-1-2024 | | | $ | 200,000 | | | $ | 214,000 | |
Cincinnati Bell Incorporated 144A | | | 7.00 | | | | 7-15-2024 | | | | 200,000 | | | | 176,000 | |
Embarq Corporation | | | 8.00 | | | | 6-1-2036 | | | | 200,000 | | | | 195,000 | |
Frontier Communications Corporation 144A | | | 8.50 | | | | 4-1-2026 | | | | 200,000 | | | | 188,160 | |
Hughes Satellite Systems Company | | | 7.63 | | | | 6-15-2021 | | | | 300,000 | | | | 322,875 | |
Level 3 Financing Incorporated | | | 5.38 | | | | 1-15-2024 | | | | 200,000 | | | | 200,000 | |
Level 3 Financing Incorporated | | | 5.38 | | | | 5-1-2025 | | | | 200,000 | | | | 197,500 | |
Qwest Capital Funding | | | 6.88 | | | | 7-15-2028 | | | | 200,000 | | | | 186,500 | |
Windstream Services Finance Company 144A | | | 9.00 | | | | 6-30-2025 | | | | 236,000 | | | | 170,510 | |
| | | | |
| | | | | | | | | | | | | | | 2,351,795 | |
| | | | | | | | | | | | | | | | |
| | | | |
| Wireless Telecommunication Services: 1.47% | | | | | | | | | | | | | | | | |
SBA Communications Corporation | | | 4.88 | | | | 7-15-2022 | | | | 200,000 | | | | 202,500 | |
Sprint Capital Corporation | | | 8.75 | | | | 3-15-2032 | | | | 200,000 | | | | 221,000 | |
Sprint Communications Incorporated | | | 7.00 | | | | 8-15-2020 | | | | 200,000 | | | | 209,500 | |
Sprint Corporation | | | 7.13 | | | | 6-15-2024 | | | | 200,000 | | | | 207,500 | |
Sprint Corporation | | | 7.25 | | | | 9-15-2021 | | | | 200,000 | | | | 209,688 | |
T-Mobile USA Incorporated | | | 5.13 | | | | 4-15-2025 | | | | 200,000 | | | | 201,592 | |
T-Mobile USA Incorporated | | | 5.38 | | | | 4-15-2027 | | | | 200,000 | | | | 201,040 | |
T-Mobile USA Incorporated | | | 6.50 | | | | 1-15-2024 | | | | 200,000 | | | | 207,000 | |
| | | | |
| | | | | | | | | | | | | | | 1,659,820 | |
| | | | | | | | | | | | | | | | |
| | | | |
Utilities: 2.77% | | | | | | | | | | | | | | | | |
| | | | |
| Electric Utilities: 0.46% | | | | | | | | | | | | | | | | |
NextEra Energy Incorporated 144A | | | 4.25 | | | | 9-15-2024 | | | | 200,000 | | | | 195,000 | |
Talen Energy Supply LLC | | | 4.60 | | | | 12-15-2021 | | | | 200,000 | | | | 173,500 | |
Talen Energy Supply LLC | | | 6.50 | | | | 6-1-2025 | | | | 200,000 | | | | 149,000 | |
| | | | |
| | | | | | | | | | | | | | | 517,500 | |
| | | | | | | | | | | | | | | | |
| | | | |
| Gas Utilities: 0.64% | | | | | | | | | | | | | | | | |
AmeriGas Partners LP | | | 5.50 | | | | 5-20-2025 | | | | 300,000 | | | | 294,000 | |
Ferrellgas LP | | | 6.75 | | | | 6-15-2023 | | | | 500,000 | | | | 430,000 | |
| | | | |
| | | | | | | | | | | | | | | 724,000 | |
| | | | | | | | | | | | | | | | |
| | | | |
| Independent Power & Renewable Electricity Producers: 1.67% | | | | | | | | | | | | | | | | |
Calpine Corporation 144A | | | 5.25 | | | | 6-1-2026 | | | | 200,000 | | | | 188,816 | |
Calpine Corporation | | | 5.38 | | | | 1-15-2023 | | | | 500,000 | | | | 475,000 | |
Calpine Corporation | | | 5.75 | | | | 1-15-2025 | | | | 200,000 | | | | 181,500 | |
Dynergy Incorporated | | | 5.88 | | | | 6-1-2023 | | | | 200,000 | | | | 205,750 | |
NRG Energy Incorporated | | | 6.25 | | | | 5-1-2024 | | | | 200,000 | | | | 207,000 | |
NWG Energy Incorporated | | | 7.25 | | | | 5-15-2026 | | | | 400,000 | | | | 432,000 | |
The AES Corporation | | | 5.50 | | | | 4-15-2025 | | | | 200,000 | | | | 205,500 | |
| | | | |
| | | | | | | | | | | | | | | 1,895,566 | |
| | | | | | | | | | | | | | | | |
| | | | |
Total Corporate Bonds and Notes (Cost $92,815,651) | | | | | | | | | | | | | | | 90,482,876 | |
| | | | | | | | | | | | | | | | |
| | | | |
Yankee Corporate Bonds and Notes: 15.49% | | | | | | | | | | | | | | | | |
| | | | |
Consumer Discretionary: 4.14% | | | | | | | | | | | | | | | | |
| | | | |
| Auto Components: 0.26% | | | | | | | | | | | | | | | | |
IHO Verwaltungs GmbH 144A | | | 4.50 | | | | 9-15-2023 | | | | 300,000 | | | | 291,000 | |
| | | | | | | | | | | | | | | | |
The accompanying notes are an integral part of these financial statements.
| | | | |
| 184 | | Wells Fargo Funds | | Portfolio of investments—August 31, 2018 (unaudited) |
HIGH YIELD CORPORATE BOND PORTFOLIO
| | | | | | | | | | | | | | | | |
| Security name | | Interest rate | | | Maturity date | | | Principal | | | Value | |
| | | | |
| Automobiles: 0.74% | | | | | | | | | | | | | | | | |
Fiat Chrysler Automobiles NV | | | 4.50 | % | | | 4-15-2020 | | | $ | 200,000 | | | $ | 201,000 | |
Fiat Chrysler Automobiles NV | | | 5.25 | | | | 4-15-2023 | | | | 300,000 | | | | 304,875 | |
Jaguar Land Rover Automotive plc 144A | | | 4.50 | | | | 10-1-2027 | | | | 400,000 | | | | 338,500 | |
| | | | |
| | | | | | | | | | | | | | | 844,375 | |
| | | | | | | | | | | | | | | | |
| | | | |
| Hotels, Restaurants & Leisure: 1.04% | | | | | | | | | | | | | | | | |
International Game Technology plc 144A | | | 6.50 | | | | 2-15-2025 | | | | 400,000 | | | | 420,000 | |
New Red Finance Incorporated 144A | | | 4.25 | | | | 5-15-2024 | | | | 500,000 | | | | 477,500 | |
Wynn Macau Limited 144A | | | 5.50 | | | | 10-1-2027 | | | | 300,000 | | | | 283,500 | |
| | | | |
| | | | | | | | | | | | | | | 1,181,000 | |
| | | | | | | | | | | | | | | | |
| | | | |
| Household Durables: 0.27% | | | | | | | | | | | | | | | | |
Brookfield Residential Properties Incorporated 144A | | | 6.13 | | | | 7-1-2022 | | | | 300,000 | | | | 302,250 | |
| | | | | | | | | | | | | | | | |
| | | | |
| Media: 1.83% | | | | | | | | | | | | | | | | |
Altice Financing SA 144A | | | 6.63 | | | | 2-15-2023 | | | | 100,000 | | | | 100,624 | |
Altice Finco SA 144A | | | 8.13 | | | | 1-15-2024 | | | | 400,000 | | | | 403,000 | |
Altice Luxembourg SA 144A | | | 7.75 | | | | 5-15-2022 | | | | 300,000 | | | | 289,125 | |
Altice SA 144A | | | 7.63 | | | | 2-15-2025 | | | | 200,000 | | | | 184,858 | |
Unitymedia GmbH 144A | | | 6.13 | | | | 1-15-2025 | | | | 300,000 | | | | 313,500 | |
UPC Holding BV 144A | | | 5.50 | | | | 1-15-2028 | | | | 200,000 | | | | 186,250 | |
Videotron Limited | | | 5.00 | | | | 7-15-2022 | | | | 400,000 | | | | 407,000 | |
Virgin Media Secured Finance plc 144A | | | 5.25 | | | | 1-15-2026 | | | | 200,000 | | | | 194,540 | |
| | | | |
| | | | | | | | | | | | | | | 2,078,897 | |
| | | | | | | | | | | | | | | | |
| | | | |
Consumer Staples: 0.09% | | | | | | | | | | | | | | | | |
| | | | |
| Food & Staples Retailing: 0.09% | | | | | | | | | | | | | | | | |
Tesco Place 144A | | | 6.15 | | | | 11-15-2037 | | | | 100,000 | | | | 106,605 | |
| | | | | | | | | | | | | | | | |
| | | | |
Energy: 2.48% | | | | | | | | | | | | | | | | |
| | | | |
| Energy Equipment & Services: 0.61% | | | | | | | | | | | | | | | | |
Alcoa Nederland Holding Company BV 144A | | | 6.75 | | | | 9-30-2024 | | | | 200,000 | | | | 212,000 | |
Alcoa Nederland Holding Company BV 144A | | | 7.00 | | | | 9-30-2026 | | | | 100,000 | | | | 107,875 | |
Noble Holding International Limited | | | 8.95 | | | | 4-1-2045 | | | | 200,000 | | | | 181,000 | |
Precision Drilling Corporation | | | 5.25 | | | | 11-15-2024 | | | | 200,000 | | | | 190,500 | |
| | | | |
| | | | | | | | | | | | | | | 691,375 | |
| | | | | | | | | | | | | | | | |
| | | | |
| Oil, Gas & Consumable Fuels: 1.87% | | | | | | | | | | | | | | | | |
Baytex Energy Corporation 144A | | | 5.13 | | | | 6-1-2021 | | | | 200,000 | | | | 194,500 | |
Jupiter Resources Incorporated 144A | | | 8.50 | | | | 10-1-2022 | | | | 400,000 | | | | 201,000 | |
KCA Deutag UK Finance plc 144A | | | 9.63 | | | | 4-1-2023 | | | | 200,000 | | | | 194,000 | |
KCA Deutag UK Finance plc 144A | | | 9.88 | | | | 4-1-2022 | | | | 300,000 | | | | 299,250 | |
MEG Energy Corporation 144A | | | 6.38 | | | | 1-30-2023 | | | | 200,000 | | | | 181,500 | |
MEG Energy Corporation 144A | | | 6.50 | | | | 1-15-2025 | | | | 300,000 | | | | 298,500 | |
Seven Generations Energy Company 144A | | | 6.88 | | | | 6-30-2023 | | | | 400,000 | | | | 416,000 | |
Weatherford International Limited | | | 7.00 | | | | 3-15-2038 | | | | 200,000 | | | | 152,000 | |
Weatherford International Limited | | | 8.25 | | | | 6-15-2023 | | | | 200,000 | | | | 186,500 | |
| | | | |
| | | | | | | | | | | | | | | 2,123,250 | |
| | | | | | | | | | | | | | | | |
The accompanying notes are an integral part of these financial statements.
| | | | | | |
| Portfolio of investments—August 31, 2018 (unaudited) | | Wells Fargo Funds | | | 185 | |
HIGH YIELD CORPORATE BOND PORTFOLIO
| | | | | | | | | | | | | | | | |
| Security name | | Interest rate | | | Maturity date | | | Principal | | | Value | |
| | | | |
Financials: 2.46% | | | | | | | | | | | | | | | | |
| | | | |
| Banks: 0.76% | | | | | | | | | | | | | | | | |
Barclays plc | | | 4.84 | % | | | 5-9-2028 | | | $ | 300,000 | | | $ | 284,892 | |
Credit Agricole SA (3 Month LIBOR +6.98%) 144A± | | | 8.38 | | | | 10-29-2049 | | | | 200,000 | | | | 208,622 | |
Intesa Sanpaolo SpA 144A | | | 5.02 | | | | 6-26-2024 | | | | 400,000 | | | | 361,729 | |
| | | | |
| | | | | | | | | | | | | | | 855,243 | |
| | | | | | | | | | | | | | | | |
| | | | |
| Capital Markets: 0.49% | | | | | | | | | | | | | | | | |
Deutsche Bank AG (5 Year USD Swap +2.25%) ± | | | 4.30 | | | | 5-24-2028 | | | | 200,000 | | | | 182,712 | |
Deutsche Bank AG | | | 4.50 | | | | 4-1-2025 | | | | 400,000 | | | | 374,075 | |
| | | | |
| | | | | | | | | | | | | | | 556,787 | |
| | | | | | | | | | | | | | | | |
| | | | |
| Diversified Financial Services: 1.21% | | | | | | | | | | | | | | | | |
GW Honos Security Corporation 144A | | | 8.75 | | | | 5-15-2025 | | | | 200,000 | | | | 197,000 | |
Hulk Finance Corporation 144A | | | 7.00 | | | | 6-1-2026 | | | | 200,000 | | | | 192,000 | |
Intelsat Jackson Holdings SA | | | 5.50 | | | | 8-1-2023 | | | | 200,000 | | | | 182,440 | |
Intelsat Jackson Holdings SA 144A | | | 8.00 | | | | 2-15-2024 | | | | 200,000 | | | | 210,500 | |
New Red Finance Incorporated 144A | | | 5.00 | | | | 10-15-2025 | | | | 200,000 | | | | 193,000 | |
Park Aerospace Holdings Company 144A | | | 4.50 | | | | 3-15-2023 | | | | 200,000 | | | | 197,750 | |
Park Aerospace Holdings Company 144A | | | 5.25 | | | | 8-15-2022 | | | | 200,000 | | | | 203,750 | |
| | | | |
| | | | | | | | | | | | | | | 1,376,440 | |
| | | | | | | | | | | | | | | | |
| | | | |
Health Care: 1.28% | | | | | | | | | | | | | | | | |
| | | | |
| Pharmaceuticals: 1.28% | | | | | | | | | | | | | | | | |
Bausch Health Companies Incorporated 144A | | | 6.13 | | | | 4-15-2025 | | | | 200,000 | | | | 186,000 | |
Bausch Health Companies Incorporated 144A | | | 7.50 | | | | 7-15-2021 | | | | 200,000 | | | | 203,176 | |
Bausch Health Companies Incorporated 144A | | | 8.50 | | | | 1-31-2027 | | | | 300,000 | | | | 308,250 | |
Mallinckrodt International Finance SA | | | 4.75 | | | | 4-15-2023 | | | | 300,000 | | | | 260,250 | |
Mallinckrodt International Finance SA 144A | | | 4.88 | | | | 4-15-2020 | | | | 300,000 | | | | 298,875 | |
Valeant Pharmaceuticals International Incorporated 144A | | | 5.63 | | | | 12-1-2021 | | | | 200,000 | | | | 198,000 | |
| | | | |
| | | | | | | | | | | | | | | 1,454,551 | |
| | | | | | | | | | | | | | | | |
| | | | |
Industrials: 1.22% | | | | | | | | | | | | | | | | |
| | | | |
| Aerospace & Defense: 0.62% | | | | | | | | | | | | | | | | |
Bombardier Incorporated 144A | | | 5.75 | | | | 3-15-2022 | | | | 200,000 | | | | 200,500 | |
Bombardier Incorporated 144A | | | 6.00 | | | | 10-15-2022 | | | | 500,000 | | | | 502,500 | |
| | | | |
| | | | | | | | | | | | | | | 703,000 | |
| | | | | | | | | | | | | | | | |
| | | | |
| Electrical Equipment: 0.27% | | | | | | | | | | | | | | | | |
Sensata Technologies BV 144A | | | 5.63 | | | | 11-1-2024 | | | | 300,000 | | | | 310,500 | |
| | | | | | | | | | | | | | | | |
| | | | |
| Professional Services: 0.17% | | | | | | | | | | | | | | | | |
GFL Environmental Incorporated 144A | | | 5.38 | | | | 3-1-2023 | | | | 200,000 | | | | 190,000 | |
| | | | | | | | | | | | | | | | |
| | | | |
| Transportation Infrastructure: 0.16% | | | | | | | | | | | | | | | | |
Stena International SA 144A | | | 5.75 | | | | 3-1-2024 | | | | 200,000 | | | | 185,500 | |
| | | | | | | | | | | | | | | | |
| | | | |
Information Technology: 0.73% | | | | | | | | | | | | | | | | |
| | | | |
| Communications Equipment: 0.19% | | | | | | | | | | | | | | | | |
Nokia Corporation | | | 6.63 | | | | 5-15-2039 | | | | 200,000 | | | | 215,000 | |
| | | | | | | | | | | | | | | | |
| | | | |
| Semiconductors & Semiconductor Equipment: 0.36% | | | | | | | | | | | | | | | | |
NXP BV 144A | | | 4.63 | | | | 6-15-2022 | | | | 400,000 | | | | 404,884 | |
| | | | | | | | | | | | | | | | |
The accompanying notes are an integral part of these financial statements.
| | | | |
| 186 | | Wells Fargo Funds | | Portfolio of investments—August 31, 2018 (unaudited) |
HIGH YIELD CORPORATE BOND PORTFOLIO
| | | | | | | | | | | | | | | | |
| Security name | | Interest rate | | | Maturity date | | | Principal | | | Value | |
| | | | |
| Software: 0.18% | | | | | | | | | | | | | | | | |
Open Text Corporation 144A | | | 5.63 | % | | | 1-15-2023 | | | $ | 200,000 | | | $ | 206,500 | |
| | | | | | | | | | | | | | | | |
| | | | |
Materials: 1.55% | | | | | | | | | | | | | | | | |
| | | | |
| Containers & Packaging: 0.65% | | | | | | | | | | | | | | | | |
Ardagh Packaging Finance plc 144A | | | 7.25 | | | | 5-15-2024 | | | | 700,000 | | | | 735,875 | |
| | | | | | | | | | | | | | | | |
| | | | |
| Metals & Mining: 0.90% | | | | | | | | | | | | | | | | |
Constellium NV Company 144A | | | 5.75 | | | | 5-15-2024 | | | | 250,000 | | | | 249,063 | |
FMG Resources Proprietary Limited 144A | | | 4.75 | | | | 5-15-2022 | | | | 200,000 | | | | 196,260 | |
Hudbay Minerals Incorporated 144A | | | 7.63 | | | | 1-15-2025 | | | | 200,000 | | | | 203,250 | |
New Gold Incorporated 144A | | | 6.25 | | | | 11-15-2022 | | | | 200,000 | | | | 177,500 | |
Teck Resources Limited | | | 5.40 | | | | 2-1-2043 | | | | 200,000 | | | | 190,500 | |
| | | | |
| | | | | | | | | | | | | | | 1,016,573 | |
| | | | | | | | | | | | | | | | |
| | | | |
Telecommunication Services: 1.54% | | | | | | | | | | | | | | | | |
| | | | |
| Diversified Telecommunication Services: 1.19% | | | | | | | | | | | | | | | | |
SFR Group SA 144A | | | 7.38 | | | | 5-1-2026 | | | | 500,000 | | | | 491,250 | |
Telecom Italia SpA 144A | | | 5.30 | | | | 5-30-2024 | | | | 200,000 | | | | 199,500 | |
Virgin Media Finance plc 144A | | | 6.00 | | | | 10-15-2024 | | | | 200,000 | | | | 197,500 | |
Wind Tre SpA 144A | | | 5.00 | | | | 1-20-2026 | | | | 200,000 | | | | 178,806 | |
Ziggo Bond Finance BV 144A | | | 5.88 | | | | 1-15-2025 | | | | 300,000 | | | | 280,125 | |
| | | | |
| | | | | | | | | | | | | | | 1,347,181 | |
| | | | | | | | | | | | | | | | |
| | | | |
| Wireless Telecommunication Services: 0.35% | | | | | | | | | | | | | | | | |
C&W Senior Financing Designated Activity Company 144A | | | 6.88 | | | | 9-15-2027 | | | | 200,000 | | | | 198,500 | |
Inmarsat Finance plc 144A | | | 4.88 | | | | 5-15-2022 | | | | 200,000 | | | | 200,500 | |
| | | | |
| | | | | | | | | | | | | | | 399,000 | |
| | | | | | | | | | | | | | | | |
| | | | |
Total Yankee Corporate Bonds and Notes (Cost $18,128,160) | | | | | | | | | | | | | | | 17,575,786 | |
| | | | | | | | | | | | | | | | |
| | | | |
| | | Yield | | | | | | Shares | | | | |
| Short-Term Investments: 2.70% | | | | | | | | | | | | | | | | |
| | | | |
| Investment Companies: 2.70% | | | | | | | | | | | | | | | | |
Wells Fargo Government Money Market Fund Select Class (l)(u) | | | 1.87 | | | | | | | | 3,064,761 | | | | 3,064,761 | |
| | | | | | | | | | | | | | | | |
| | | | |
Total Short-Term Investments (Cost $3,064,761) | | | | | | | | | | | | | | | 3,064,761 | |
| | | | | | | | | | | | | | | | |
| | | | | | | | |
| Total investments in securities (Cost $114,008,572) | | | 97.95 | % | | | 111,123,423 | |
Other assets and liabilities, net | | | 2.05 | | | | 2,328,483 | |
| | | | | | | | |
| Total net assets | | | 100.00 | % | | $ | 113,451,906 | |
| | | | | | | | |
| 144A | The security may be resold in transactions exempt from registration, normally to qualified institutional buyers, pursuant to Rule 144A under the Securities Act of 1933. |
| ± | Variable rate investment. The rate shown is the rate in effect at period end. |
| ¥ | A payment-in-kind (PIK) security is a security in which the issuer may make interest or dividend payments in cash or additional securities. These additional securities generally have the same terms as the original holdings. |
| (l) | The issuer of the security is an affiliated person of the Portfolio as defined in the Investment Company Act of 1940. |
| (u) | The rate represents the 7-day annualized yield at period end. |
The accompanying notes are an integral part of these financial statements.
| | | | | | |
| Portfolio of investments—August 31, 2018 (unaudited) | | Wells Fargo Funds | | | 187 | |
HIGH YIELD CORPORATE BOND PORTFOLIO
Abbreviations:
| LIBOR | London Interbank Offered Rate |
| REIT | Real estate investment trust |
Investments in Affiliates
An affiliated investment is an investment in which the Portfolio owns at least 5% of the outstanding voting shares of the issuer or as a result of other relationships, such as the Portfolio and the issuer having the same adviser or investment manager. Transactions with issuers that were either affiliated persons of the Portfolio at the beginning of the period or the end of the period were as follows:
| | | | | | | | | | | | | | | | | | | | | | | | | | | | | | | | | | | | |
| | | Shares,
beginning of
period | | | Shares
purchased | | | Shares
sold | | | Shares,
end of
period | | | Net
realized
gains
(losses) | | | Net
change in
unrealized gains
(losses) | | | Income
from
affiliated
securities | | | Value,
end
of period | | | % of
net
assets | |
Short-Term Investments | | | | | | | | | | | | | | | | | | | | | | | | | | | | | | | | | | | | |
Investment Companies | | | | | | | | | | | | | | | | | | | | | | | | | | | | | | | | | | | | |
Wells Fargo Government Money Market Fund Select Class | | | 1,484,192 | | | | 17,498,638 | | | | 15,918,069 | | | | 3,064,761 | | | $ | 0 | | | $ | 0 | | | $ | 11,863 | | | $ | 3,064,761 | | | | 2.70 | % |
The accompanying notes are an integral part of these financial statements.
| | | | |
| 188 | | Wells Fargo Funds | | Portfolio of investments—August 31, 2018 (unaudited) |
INTERNATIONAL GOVERNMENT BOND PORTFOLIO
| | | | | | | | | | | | | | | | |
| Security name | | Interest rate | | | Maturity date | | | Principal | | | Value | |
| | | | |
Foreign Government Bonds @: 98.31% | | | | | | | | | | | | | | | | |
Australian Government Bond Series 144 (AUD) | | | 3.75 | % | | | 4-21-2037 | | | | 350,000 | | | $ | 285,090 | |
Australian Government Bond Series 150 (AUD) | | | 3.00 | | | | 3-21-2047 | | | | 200,000 | | | | 143,642 | |
Belgium Government Bond Series 66 (EUR) | | | 4.00 | | | | 3-28-2032 | | | | 260,000 | | | | 417,286 | |
Bundesrepublik Deutschland (EUR) | | | 2.50 | | | | 7-4-2044 | | | | 120,000 | | | | 189,529 | |
Bundesrepublik Deutschland Series 05 (EUR) | | | 4.00 | | | | 1-4-2037 | | | | 110,000 | | | | 199,771 | |
Canada (CAD) | | | 0.75 | | | | 9-1-2021 | | | | 530,000 | | | | 390,279 | |
Czech Republic Bond (CZK) | | | 0.01 | | | | 2-10-2020 | | | | 3,540,000 | | | | 156,706 | |
Finnish Government Bond (EUR) 144A | | | 0.50 | | | | 9-15-2027 | | | | 370,000 | | | | 430,564 | |
France Government Bond (EUR) | | | 1.00 | | | | 5-25-2027 | | | | 710,000 | | | | 860,572 | |
Italy Buoni Poliennali del Tesoro (EUR) | | | 1.35 | | | | 4-15-2022 | | | | 160,000 | | | | 179,085 | |
Italy Buoni Poliennali del Tesoro (EUR) | | | 2.15 | | | | 12-15-2021 | | | | 590,000 | | | | 686,602 | |
Japan (JPY) | | | 0.10 | | | | 12-15-2019 | | | | 212,200,000 | | | | 1,914,957 | |
Japan (JPY) | | | 0.10 | | | | 8-1-2020 | | | | 33,800,000 | | | | 305,450 | |
Korea (KRW) | | | 2.00 | | | | 3-10-2021 | | | | 442,380,000 | | | | 398,148 | |
Malaysia (MYR) | | | 3.88 | | | | 3-10-2022 | | | | 1,140,000 | | | | 279,721 | |
Mexico (MXN) | | | 6.50 | | | | 6-9-2022 | | | | 8,170,000 | | | | 408,705 | |
Netherlands Government Bond (EUR) 144A | | | 2.50 | | | | 1-15-2033 | | | | 290,000 | | | | 418,214 | |
New Zealand Government Bond (NZD) | | | 2.75 | | | | 4-15-2037 | | | | 150,000 | | | | 97,601 | |
Norway (NOK) 144A | | | 1.75 | | | | 2-17-2027 | | | | 770,000 | | | | 92,218 | |
Poland (PLN) | | | 2.50 | | | | 7-25-2027 | | | | 1,230,000 | | | | 315,904 | |
Republic of Austria (EUR) 144A | | | 0.75 | | | | 10-20-2026 | | | | 330,000 | | | | 394,508 | |
Russia Government Bond (RUB) | | | 7.70 | | | | 3-23-2033 | | | | 11,430,000 | | | | 157,413 | |
Singapore (SGD) | | | 2.88 | | | | 9-1-2030 | | | | 280,000 | | | | 211,752 | |
Spain Government Bond (EUR) 144A | | | 5.85 | | | | 1-31-2022 | | | | 270,000 | | | | 375,047 | |
Switzerland Bond (CHF) | | | 0.50 | | | | 6-28-2045 | | | | 100,000 | | | | 105,711 | |
Thailand Government Bond (THB) | | | 1.88 | | | | 6-17-2022 | | | | 7,050,000 | | | | 212,888 | |
United Kingdom Gilt (GBP) | | | 4.25 | | | | 12-7-2027 | | | | 530,000 | | | | 862,856 | |
| | | | |
Total Foreign Government Bonds (Cost $10,566,684) | | | | | | | | | | | | | | | 10,490,219 | |
| | | | | | | | | | | | | | | | |
| | | | |
| | | Yield | | | | | | Shares | | | | |
| Short-Term Investments: 9.55% | | | | | | | | | | | | | | | | |
| | | | |
| Investment Companies: 9.55% | | | | | | | | | | | | | | | | |
Wells Fargo Government Money Market Fund Select Class (l)(u) | | | 1.87 | | | | | | | | 1,018,943 | | | | 1,018,943 | |
| | | | | | | | | | | | | | | | |
| | | | |
Total Short-Term Investments (Cost $1,018,943) | | | | | | | | | | | | | | | 1,018,943 | |
| | | | | | | | | | | | | | | | |
| | | | | | | | |
| Total investments in securities (Cost $11,585,627) | | | 107.86 | % | | | 11,509,162 | |
Other assets and liabilities, net | | | (7.86 | ) | | | (838,650 | ) |
| | | | | | | | |
| Total net assets | | | 100.00 | % | | $ | 10,670,512 | |
| | | | | | | | |
| @ | Foreign bond principal is denominated in the local currency of the issuer. |
| 144A | The security may be resold in transactions exempt from registration, normally to qualified institutional buyers, pursuant to Rule 144A under the Securities Act of 1933. |
| (l) | The issuer of the security is an affiliated person of the Portfolio as defined in the Investment Company Act of 1940. |
| (u) | The rate represents the 7-day annualized yield at period end. |
The accompanying notes are an integral part of these financial statements.
| | | | | | |
| Portfolio of investments—August 31, 2018 (unaudited) | | Wells Fargo Funds | | | 189 | |
INTERNATIONAL GOVERNMENT BOND PORTFOLIO
Abbreviations:
Forward Foreign Currency Contracts
| | | | | | | | | | | | | | |
Currency to be
received | | Currency to be
delivered | | Counterparty | | Settlement date | | Unrealized
gains | | | Unrealized
losses | |
| 98,382 USD | | 140,000 NZD | | State Street Bank | | 9/6/2018 | | $ | 5,758 | | | $ | 0 | |
| 91,613 USD | | 1,860,000 MXN | | State Street Bank | | 9/6/2018 | | | 0 | | | | (5,726 | ) |
| 206,104 USD | | 755,000 PLN | | State Street Bank | | 9/6/2018 | | | 2,416 | | | | 0 | |
| 255,149 USD | | 2,220,000 SEK | | State Street Bank | | 9/6/2018 | | | 12,380 | | | | 0 | |
| 182,417 USD | | 155,000 EUR | | State Street Bank | | 9/6/2018 | | | 2,488 | | | | 0 | |
| 168,168 USD | | 217,000 CAD | | State Street Bank | | 9/6/2018 | | | 1,879 | | | | 0 | |
| 78,709 USD | | 105,000 SGD | | State Street Bank | | 9/6/2018 | | | 2,208 | | | | 0 | |
| 81,900,000 JPY | | 750,738 USD | | State Street Bank | | 9/6/2018 | | | 0 | | | | (13,585 | ) |
| 365,000 AUD | | 279,252 USD | | State Street Bank | | 9/6/2018 | | | 0 | | | | (16,854 | ) |
| 63,00 GBP | | 84,225 USD | | State Street Bank | | 9/6/2018 | | | 0 | | | | (2,546 | ) |
| 1,375,000 DKK | | 217,540 USD | | State Street Bank | | 9/6/2018 | | | 0 | | | | (3,422 | ) |
| 187,214 USD | | 11,750,000 RUB | | State Street Bank | | 9/12/2018 | | | 13,258 | | | | 0 | |
| 190,858 USD | | 762,000 MYR | | State Street Bank | | 9/12/2018 | | | 5,472 | | | | 0 | |
| 88,896 USD | | 2,830,000 THB | | State Street Bank | | 9/12/2018 | | | 2,419 | | | | 0 | |
| 315,400,000 KRW | | 295,850 USD | | State Street Bank | | 9/12/2018 | | | 0 | | | | (12,483 | ) |
| | | | | | | | | | | | | | |
| | | | | | | | $ | 48,278 | | | $ | (54,616 | ) |
| | | | | | | | | | | | | | |
The accompanying notes are an integral part of these financial statements.
| | | | |
| 190 | | Wells Fargo Funds | | Portfolio of investments—August 31, 2018 (unaudited) |
INTERNATIONAL GOVERNMENT BOND PORTFOLIO
Investments in Affiliates
An affiliated investment is an investment in which the Portfolio owns at least 5% of the outstanding voting shares of the issuer or as a result of other relationships, such as the Portfolio and the issuer having the same adviser or investment manager. Transactions with issuers that were either affiliated persons of the Portfolio at the beginning of the period or the end of the period were as follows:
| | | | | | | | | | | | | | | | | | | | | | | | | | | | | | | | | | | | |
| | | Shares,
beginning of
period | | | Shares
purchased | | | Shares
sold | | | Shares,
end of
period | | | Net
realized
gains
(losses) | | | Net
change in
unrealized
gains
(losses) | | | Income
from
affiliated
securities | | | Value,
end
of period | | | % of
net
assets | |
Short-Term Investments | | | | | | | | | | | | | | | | | | | | | | | | | | | | | | | | | | | | |
Investment Companies | | | | | | | | | | | | | | | | | | | | | | | | | | | | | | | | | | | | |
Wells Fargo Government Money Market Fund Select Class | | | 41,773 | | | | 1,153,229 | | | | 176,059 | | | | 1,018,943 | | | $ | 0 | | | $ | 0 | | | $ | 552 | | | $ | 1,018,943 | | | | 9.55 | % |
The following table shows the percent of total long-term investments by country allocation as of August 31, 2018:
| | | | |
Japan | | | 21.17 | % |
Italy | | | 8.25 | |
United Kingdom | | | 8.22 | |
France | | | 8.20 | |
Finland | | | 4.10 | |
Australia | | | 4.09 | |
Netherlands | | | 3.99 | |
Belgium | | | 3.98 | |
Mexico | | | 3.89 | |
South Korea | | | 3.80 | |
Austria | | | 3.76 | |
Canada | | | 3.72 | |
Germany | | | 3.71 | |
Spain | | | 3.58 | |
Poland | | | 3.01 | |
Malaysia | | | 2.67 | |
Thailand | | | 2.03 | |
Singapore | | | 2.02 | |
Russia | | | 1.50 | |
Czech Republic | | | 1.49 | |
Switzerland | | | 1.01 | |
New Zealand | | | 0.93 | |
Norway | | | 0.88 | |
| | | | |
| | | 100.00 | % |
| | | | |
The accompanying notes are an integral part of these financial statements.
| | | | | | |
| Portfolio of investments—August 31, 2018 (unaudited) | | Wells Fargo Funds | | | 191 | |
INVESTMENT GRADE CORPORATE BOND PORTFOLIO
| | | | | | | | | | | | | | | | |
| Security name | | Interest rate | | | Maturity date | | | Principal | | | Value | |
| | | | |
Corporate Bonds and Notes: 81.28% | | | | | | | | | | | | | | | | |
| | | | |
Consumer Discretionary: 8.60% | | | | | | | | | | | | | | | | |
| | | | |
| Auto Components: 0.08% | | | | | | | | | | | | | | | | |
Lear Corporation | | | 5.25 | % | | | 1-15-2025 | | | $ | 297,000 | | | $ | 308,396 | |
| | | | | | | | | | | | | | | | |
| | | | |
| Automobiles: 0.69% | | | | | | | | | | | | | | | | |
American Honda Finance Corporation | | | 2.90 | | | | 2-16-2024 | | | | 200,000 | | | | 194,711 | |
American Honda Finance Corporation | | | 1.65 | | | | 7-12-2021 | | | | 500,000 | | | | 479,971 | |
Ford Motor Company | | | 7.45 | | | | 7-16-2031 | | | | 500,000 | | | | 554,177 | |
General Motors Company | | | 6.25 | | | | 10-2-2043 | | | | 175,000 | | | | 181,115 | |
General Motors Company | | | 6.60 | | | | 4-1-2036 | | | | 350,000 | | | | 375,724 | |
Toyota Motor Credit Corporation | | | 1.95 | | | | 4-17-2020 | | | | 300,000 | | | | 295,371 | |
Toyota Motor Credit Corporation | | | 2.60 | | | | 1-11-2022 | | | | 300,000 | | | | 294,798 | |
Toyota Motor Credit Corporation | | | 2.63 | | | | 1-10-2023 | | | | 310,000 | | | | 302,434 | |
| | | | |
| | | | | | | | | | | | | | | 2,678,301 | |
| | | | | | | | | | | | | | | | |
| | | | |
| Diversified Consumer Services: 0.06% | | | | | | | | | | | | | | | | |
President & Fellows of Harvard College | | | 4.88 | | | | 10-15-2040 | | | | 210,000 | | | | 246,228 | |
| | | | | | | | | | | | | | | | |
| | | | |
| Hotels, Restaurants & Leisure: 0.65% | | | | | | | | | | | | | | | | |
Marriott International Incorporated | | | 3.38 | | | | 10-15-2020 | | | | 117,000 | | | | 117,206 | |
Marriott International Incorporated | | | 3.75 | | | | 3-15-2025 | | | | 500,000 | | | | 492,363 | |
McDonald’s Corporation | | | 2.63 | | | | 1-15-2022 | | | | 250,000 | | | | 244,926 | |
McDonald’s Corporation | | | 3.25 | | | | 6-10-2024 | | | | 350,000 | | | | 348,523 | |
McDonald’s Corporation | | | 3.38 | | | | 5-26-2025 | | | | 245,000 | | | | 240,594 | |
McDonald’s Corporation | | | 3.50 | | | | 7-15-2020 | | | | 140,000 | | | | 141,279 | |
McDonald’s Corporation | | | 3.63 | | | | 5-20-2021 | | | | 70,000 | | | | 70,970 | |
McDonald’s Corporation | | | 3.70 | | | | 2-15-2042 | | | | 350,000 | | | | 315,910 | |
McDonald’s Corporation | | | 4.60 | | | | 5-26-2045 | | | | 175,000 | | | | 176,180 | |
McDonald’s Corporation | | | 6.30 | | | | 10-15-2037 | | | | 210,000 | | | | 257,422 | |
Starbucks Corporation | | | 4.30 | | | | 6-15-2045 | | | | 105,000 | | | | 101,393 | |
| | | | |
| | | | | | | | | | | | | | | 2,506,766 | |
| | | | | | | | | | | | | | | | |
| | | | |
| Household Durables: 0.50% | | | | | | | | | | | | | | | | |
D.R. Horton Incorporated | | | 4.00 | | | | 2-15-2020 | | | | 231,000 | | | | 232,841 | |
Newell Brands Incorporated | | | 4.20 | | | | 4-1-2026 | | | | 525,000 | | | | 504,653 | |
Newell Brands Incorporated | | | 5.38 | | | | 4-1-2036 | | | | 200,000 | | | | 192,584 | |
Newell Brands Incorporated | | | 5.50 | | | | 4-1-2046 | | | | 225,000 | | | | 215,409 | |
Newell Rubbermaid Incorporated | | | 2.88 | | | | 12-1-2019 | | | | 140,000 | | | | 139,396 | |
Newell Rubbermaid Incorporated | | | 4.70 | | | | 8-15-2020 | | | | 350,000 | | | | 357,330 | |
Whirlpool Corporation | | | 4.00 | | | | 3-1-2024 | | | | 87,000 | | | | 87,098 | |
Whirlpool Corporation | | | 4.70 | | | | 6-1-2022 | | | | 140,000 | | | | 145,236 | |
Whirlpool Corporation | | | 4.85 | | | | 6-15-2021 | | | | 70,000 | | | | 72,405 | |
| | | | |
| | | | | | | | | | | | | | | 1,946,952 | |
| | | | | | | | | | | | | | | | |
| | | | |
| Internet & Direct Marketing Retail: 0.62% | | | | | | | | | | | | | | | | |
Amazon.com Incorporated | | | 2.50 | | | | 11-29-2022 | | | | 620,000 | | | | 605,121 | |
Amazon.com Incorporated | | | 2.60 | | | | 12-5-2019 | | | | 280,000 | | | | 279,695 | |
Amazon.com Incorporated | | | 4.05 | | | | 8-22-2047 | | | | 200,000 | | | | 197,290 | |
The accompanying notes are an integral part of these financial statements.
| | | | |
| 192 | | Wells Fargo Funds | | Portfolio of investments—August 31, 2018 (unaudited) |
INVESTMENT GRADE CORPORATE BOND PORTFOLIO
| | | | | | | | | | | | | | | | |
| Security name | | Interest rate | | | Maturity date | | | Principal | | | Value | |
| | | | |
| Internet & Direct Marketing Retail (continued) | | | | | | | | | | | | | | | | |
Amazon.com Incorporated | | | 4.25 | % | | | 8-22-2057 | | | $ | 400,000 | | | $ | 399,451 | |
Amazon.com Incorporated | | | 4.95 | | | | 12-5-2044 | | | | 300,000 | | | | 339,650 | |
Expedia Incorporated | | | 4.50 | | | | 8-15-2024 | | | | 70,000 | | | | 70,947 | |
QVC Incorporated | | | 4.38 | | | | 3-15-2023 | | | | 210,000 | | | | 207,599 | |
QVC Incorporated | | | 5.13 | | | | 7-2-2022 | | | | 140,000 | | | | 142,780 | |
QVC Incorporated | | | 5.45 | | | | 8-15-2034 | | | | 175,000 | | | | 158,805 | |
| | | | |
| | | | | | | | | | | | | | | 2,401,338 | |
| | | | | | | | | | | | | | | | |
| | | | |
| Leisure Products: 0.13% | | | | | | | | | | | | | | | | |
Hasbro Incorporated | | | 6.35 | | | | 3-15-2040 | | | | 108,000 | | | | 118,524 | |
Unilever Capital Corporation | | | 3.10 | | | | 7-30-2025 | | | | 390,000 | | | | 380,847 | |
| | | | |
| | | | | | | | | | | | | | | 499,371 | |
| | | | | | | | | | | | | | | | |
| | | | |
| Media: 3.74% | | | | | | | | | | | | | | | | |
21st Century Fox America Incorporated | | | 3.00 | | | | 9-15-2022 | | | | 262,000 | | | | 258,137 | |
21st Century Fox America Incorporated | | | 4.50 | | | | 2-15-2021 | | | | 350,000 | | | | 360,211 | |
21st Century Fox America Incorporated | | | 4.75 | | | | 9-15-2044 | | | | 350,000 | | | | 369,454 | |
21st Century Fox America Incorporated | | | 6.65 | | | | 11-15-2037 | | | | 325,000 | | | | 418,930 | |
21st Century Fox America Incorporated | | | 8.15 | | | | 10-17-2036 | | | | 175,000 | | | | 250,226 | |
CBS Corporation | | | 3.70 | | | | 8-15-2024 | | | | 350,000 | | | | 340,784 | |
CBS Corporation | | | 4.85 | | | | 7-1-2042 | | | | 140,000 | | | | 135,342 | |
CBS Corporation | | | 4.90 | | | | 8-15-2044 | | | | 350,000 | | | | 338,409 | |
CBS Corporation | | | 7.88 | | | | 7-30-2030 | | | | 420,000 | | | | 525,389 | |
Charter Communications Operating LLC | | | 4.46 | | | | 7-23-2022 | | | | 900,000 | | | | 917,969 | |
Charter Communications Operating LLC | | | 4.91 | | | | 7-23-2025 | | | | 400,000 | | | | 407,869 | |
Comcast Corporation | | | 2.35 | | | | 1-15-2027 | | | | 210,000 | | | | 186,367 | |
Comcast Corporation | | | 3.13 | | | | 7-15-2022 | | | | 350,000 | | | | 347,576 | |
Comcast Corporation | | | 4.40 | | | | 8-15-2035 | | | | 210,000 | | | | 208,990 | |
Comcast Corporation | | | 4.65 | | | | 7-15-2042 | | | | 384,000 | | | | 381,732 | |
Comcast Corporation | | | 4.75 | | | | 3-1-2044 | | | | 262,000 | | | | 265,491 | |
Comcast Corporation | | | 5.15 | | | | 3-1-2020 | | | | 350,000 | | | | 360,894 | |
Discovery Communications LLC | | | 3.30 | | | | 5-15-2022 | | | | 175,000 | | | | 172,287 | |
Discovery Communications LLC | | | 3.95 | | | | 3-20-2028 | | | | 1,000,000 | | | | 951,314 | |
Discovery Communications LLC | | | 4.38 | | | | 6-15-2021 | | | | 210,000 | | | | 213,963 | |
Discovery Communications LLC | | | 5.63 | | | | 8-15-2019 | | | | 108,000 | | | | 110,656 | |
Discovery Communications LLC | | | 6.35 | | | | 6-1-2040 | | | | 175,000 | | | | 191,653 | |
Omnicom Group Incorporated | | | 3.63 | | | | 5-1-2022 | | | | 175,000 | | | | 174,231 | |
Time Warner Cable Incorporated | | | 4.00 | | | | 1-15-2022 | | | | 210,000 | | | | 212,941 | |
Time Warner Cable Incorporated | | | 4.50 | | | | 9-15-2042 | | | | 220,000 | | | | 185,374 | |
Time Warner Cable Incorporated | | | 4.70 | | | | 1-15-2021 | | | | 175,000 | | | | 180,555 | |
Time Warner Cable Incorporated | | | 5.50 | | | | 9-1-2041 | | | | 210,000 | | | | 201,745 | |
Time Warner Cable Incorporated | | | 6.55 | | | | 5-1-2037 | | | | 300,000 | | | | 323,957 | |
Time Warner Cable Incorporated | | | 7.30 | | | | 7-1-2038 | | | | 385,000 | | | | 447,323 | |
Time Warner Cable Incorporated | | | 7.63 | | | | 4-15-2031 | | | | 200,000 | | | | 253,316 | |
Time Warner Cable Incorporated | | | 8.38 | | | | 3-15-2023 | | | | 175,000 | | | | 203,503 | |
Time Warner Entertainment Company LP | | | 3.40 | | | | 6-15-2022 | | | | 70,000 | | | | 69,602 | |
Time Warner Entertainment Company LP | | | 4.05 | | | | 12-15-2023 | | | | 400,000 | | | | 404,636 | |
Time Warner Entertainment Company LP | | | 4.75 | | | | 3-29-2021 | | | | 350,000 | | | | 360,795 | |
Time Warner Entertainment Company LP | | | 4.90 | | | | 6-15-2042 | | | | 36,000 | | | | 33,639 | |
The accompanying notes are an integral part of these financial statements.
| | | | | | |
| Portfolio of investments—August 31, 2018 (unaudited) | | Wells Fargo Funds | | | 193 | |
INVESTMENT GRADE CORPORATE BOND PORTFOLIO
| | | | | | | | | | | | | | | | |
| Security name | | Interest rate | | | Maturity date | | | Principal | | | Value | |
| | | | |
| Media (continued) | | | | | | | | | | | | | | | | |
Time Warner Entertainment Company LP | | | 8.38 | % | | | 7-15-2033 | | | $ | 210,000 | | | $ | 263,722 | |
Viacom Incorporated | | | 4.25 | | | | 9-1-2023 | | | | 180,000 | | | | 181,008 | |
Viacom Incorporated | | | 4.38 | | | | 3-15-2043 | | | | 386,000 | | | | 332,331 | |
Viacom Incorporated | | | 4.50 | | | | 3-1-2021 | | | | 350,000 | | | | 356,983 | |
Viacom Incorporated | | | 5.50 | | | | 5-15-2033 | | | | 140,000 | | | | 147,701 | |
Viacom Incorporated | | | 5.63 | | | | 9-15-2019 | | | | 105,000 | | | | 107,671 | |
Viacom Incorporated | | | 5.85 | | | | 9-1-2043 | | | | 87,000 | | | | 90,332 | |
Viacom Incorporated | | | 6.88 | | | | 4-30-2036 | | | | 238,000 | | | | 268,934 | |
Walt Disney Company | | | 2.55 | | | | 2-15-2022 | | | | 175,000 | | | | 171,090 | |
Walt Disney Company | | | 2.75 | | | | 8-16-2021 | | | | 350,000 | | | | 346,061 | |
Walt Disney Company | | | 2.95 | | | | 6-15-2027 | | | | 700,000 | | | | 669,400 | |
Walt Disney Company | | | 3.00 | | | | 2-13-2026 | | | | 350,000 | | | | 338,478 | |
Walt Disney Company | | | 4.13 | | | | 12-1-2041 | | | | 175,000 | | | | 173,513 | |
Walt Disney Company | | | 4.13 | | | | 6-1-2044 | | | | 245,000 | | | | 242,360 | |
| | | | |
| | | | | | | | | | | | | | | 14,454,844 | |
| | | | | | | | | | | | | | | | |
| | | | |
| Multiline Retail: 0.60% | | | | | | | | | | | | | | | | |
Dollar General Corporation | | | 3.25 | | | | 4-15-2023 | | | | 245,000 | | | | 241,517 | |
Kohl’s Corporation | | | 3.25 | | | | 2-1-2023 | | | | 105,000 | | | | 101,972 | |
Macy’s Retail Holdings Incorporated | | | 3.88 | | | | 1-15-2022 | | | | 140,000 | | | | 139,415 | |
Nordstrom Incorporated | | | 4.00 | | | | 10-15-2021 | | | | 175,000 | | | | 177,110 | |
Nordstrom Incorporated | | | 4.75 | | | | 5-1-2020 | | | | 94,000 | | | | 96,289 | |
Nordstrom Incorporated | | | 5.00 | | | | 1-15-2044 | | | | 70,000 | | | | 64,811 | |
Target Corporation | | | 2.50 | | | | 4-15-2026 | | | | 1,200,000 | | | | 1,118,341 | |
Target Corporation | | | 2.90 | | | | 1-15-2022 | | | | 175,000 | | | | 174,464 | |
Target Corporation | | | 3.63 | | | | 4-15-2046 | | | | 210,000 | | | | 190,369 | |
| | | | |
| | | | | | | | | | | | | | | 2,304,288 | |
| | | | | | | | | | | | | | | | |
| | | | |
| Specialty Retail: 1.41% | | | | | | | | | | | | | | | | |
AutoZone Incorporated | | | 2.88 | | | | 1-15-2023 | | | | 175,000 | | | | 169,986 | |
AutoZone Incorporated | | | 3.13 | | | | 7-15-2023 | | | | 105,000 | | | | 102,578 | |
AutoZone Incorporated | | | 4.00 | | | | 11-15-2020 | | | | 140,000 | | | | 141,918 | |
Bed Bath & Beyond Incorporated | | | 4.92 | | | | 8-1-2034 | | | | 175,000 | | | | 143,951 | |
Bed Bath & Beyond Incorporated | | | 5.17 | | | | 8-1-2044 | | | | 245,000 | | | | 185,411 | |
Home Depot Incorporated | | | 2.70 | | | | 4-1-2023 | | | | 262,000 | | | | 257,006 | |
Home Depot Incorporated | | | 3.50 | | | | 9-15-2056 | | | | 260,000 | | | | 229,110 | |
Home Depot Incorporated | | | 3.75 | | | | 2-15-2024 | | | | 350,000 | | | | 358,185 | |
Home Depot Incorporated | | | 3.95 | | | | 9-15-2020 | | | | 280,000 | | | | 285,827 | |
Home Depot Incorporated | | | 4.20 | | | | 4-1-2043 | | | | 280,000 | | | | 283,360 | |
Home Depot Incorporated | | | 4.40 | | | | 4-1-2021 | | | | 350,000 | | | | 362,542 | |
Home Depot Incorporated | | | 5.40 | | | | 9-15-2040 | | | | 140,000 | | | | 165,463 | |
Lowe’s Companies Incorporated | | | 2.50 | | | | 4-15-2026 | | | | 350,000 | | | | 323,262 | |
Lowe’s Companies Incorporated | | | 3.12 | | | | 4-15-2022 | | | | 140,000 | | | | 139,925 | |
Lowe’s Companies Incorporated | | | 3.75 | | | | 4-15-2021 | | | | 105,000 | | | | 106,871 | |
Lowe’s Companies Incorporated | | | 3.88 | | | | 9-15-2023 | | | | 175,000 | | | | 179,997 | |
Lowe’s Companies Incorporated | | | 4.25 | | | | 9-15-2044 | | | | 175,000 | | | | 174,638 | |
Lowe’s Companies Incorporated | | | 4.38 | | | | 9-15-2045 | | | | 400,000 | | | | 405,032 | |
Lowe’s Companies Incorporated | | | 4.65 | | | | 4-15-2042 | | | | 350,000 | | | | 368,197 | |
O’Reilly Automotive Incorporated | | | 3.80 | | | | 9-1-2022 | | | | 105,000 | | | | 106,042 | |
The accompanying notes are an integral part of these financial statements.
| | | | |
| 194 | | Wells Fargo Funds | | Portfolio of investments—August 31, 2018 (unaudited) |
INVESTMENT GRADE CORPORATE BOND PORTFOLIO
| | | | | | | | | | | | | | | | |
| Security name | | Interest rate | | | Maturity date | | | Principal | | | Value | |
| | | | |
| Specialty Retail (continued) | | | | | | | | | | | | | | | | |
O’Reilly Automotive Incorporated | | | 4.63 | % | | | 9-15-2021 | | | $ | 105,000 | | | $ | 108,692 | |
O’Reilly Automotive Incorporated | | | 4.88 | | | | 1-14-2021 | | | | 31,000 | | | | 32,076 | |
TJX Companies Incorporated | | | 2.75 | | | | 6-15-2021 | | | | 350,000 | | | | 347,555 | |
Unilever Capital Corporation | | | 2.00 | | | | 7-28-2026 | | | | 500,000 | | | | 448,603 | |
| | | | |
| | | | | | | | | | | | | | | 5,426,227 | |
| | | | | | | | | | | | | | | | |
| | | | |
| Textiles, Apparel & Luxury Goods: 0.12% | | | | | | | | | | | | | | | | |
Nike Incorporated | | | 2.25 | | | | 5-1-2023 | | | | 70,000 | | | | 67,265 | |
Nike Incorporated | | | 3.63 | | | | 5-1-2043 | | | | 70,000 | | | | 66,182 | |
Nike Incorporated | | | 3.88 | | | | 11-1-2045 | | | | 350,000 | | | | 339,240 | |
| | | | |
| | | | | | | | | | | | | | | 472,687 | |
| | | | | | | | | | | | | | | | |
| | | | |
Consumer Staples: 7.03% | | | | | | | | | | | | | | | | |
| | | | |
| Beverages: 2.10% | | | | | | | | | | | | | | | | |
Anheuser-Busch InBev Finance Company | | | 3.30 | | | | 2-1-2023 | | | | 525,000 | | | | 520,868 | |
Anheuser-Busch InBev Finance Company | | | 4.00 | | | | 1-17-2043 | | | | 210,000 | | | | 190,490 | |
Anheuser-Busch InBev Finance Company | | | 4.63 | | | | 2-1-2044 | | | | 245,000 | | | | 240,714 | |
Anheuser-Busch InBev Worldwide Incorporated | | | 2.50 | | | | 7-15-2022 | | | | 500,000 | | | | 484,847 | |
Anheuser-Busch InBev Worldwide Incorporated | | | 3.75 | | | | 7-15-2042 | | | | 252,000 | | | | 224,149 | |
Constellation Brands Incorporated | | | 3.50 | | | | 5-9-2027 | | | | 1,000,000 | | | | 945,539 | |
Constellation Brands Incorporated | | | 3.75 | | | | 5-1-2021 | | | | 98,000 | | | | 99,100 | |
Constellation Brands Incorporated | | | 3.88 | | | | 11-15-2019 | | | | 77,000 | | | | 77,765 | |
Constellation Brands Incorporated | | | 4.25 | | | | 5-1-2023 | | | | 360,000 | | | | 366,846 | |
Diageo Investment Corporation | | | 7.45 | | | | 4-15-2035 | | | | 105,000 | | | | 145,887 | |
Keurig Dr Pepper Incorporated 144A | | | 3.55 | | | | 5-25-2021 | | | | 1,100,000 | | | | 1,102,177 | |
Molson Coors Brewing Company | | | 2.10 | | | | 7-15-2021 | | | | 260,000 | | | | 250,519 | |
Molson Coors Brewing Company | | | 5.00 | | | | 5-1-2042 | | | | 350,000 | | | | 355,350 | |
PepsiCo Incorporated | | | 2.75 | | | | 3-5-2022 | | | | 259,000 | | | | 257,025 | |
PepsiCo Incorporated | | | 3.00 | | | | 8-25-2021 | | | | 175,000 | | | | 175,363 | |
PepsiCo Incorporated | | | 3.60 | | | | 8-13-2042 | | | | 285,000 | | | | 266,145 | |
PepsiCo Incorporated | | | 4.00 | | | | 3-5-2042 | | | | 175,000 | | | | 174,722 | |
PepsiCo Incorporated | | | 4.25 | | | | 10-22-2044 | | | | 140,000 | | | | 144,159 | |
PepsiCo Incorporated | | | 4.50 | | | | 1-15-2020 | | | | 140,000 | | | | 143,410 | |
PepsiCo Incorporated | | | 5.50 | | | | 1-15-2040 | | | | 210,000 | | | | 251,267 | |
The Coca-Cola Company | | | 2.50 | | | | 4-1-2023 | | | | 245,000 | | | | 238,598 | |
The Coca-Cola Company | | | 2.55 | | | | 6-1-2026 | | | | 500,000 | | | | 467,236 | |
The Coca-Cola Company | | | 2.88 | | | | 10-27-2025 | | | | 700,000 | | | | 676,222 | |
The Coca-Cola Company | | | 3.20 | | | | 11-1-2023 | | | | 280,000 | | | | 279,821 | |
The Coca-Cola Company | | | 3.30 | | | | 9-1-2021 | | | | 49,000 | | | | 49,570 | |
| | | | |
| | | | | | | | | | | | | | | 8,127,789 | |
| | | | | | | | | | | | | | | | |
| | | | |
| Food & Staples Retailing: 1.39% | | | | | | | | | | | | | | | | |
Costco Wholesale Corporation | | | 1.70 | | | | 12-15-2019 | | | | 350,000 | | | | 345,703 | |
Sysco Corporation | | | 3.30 | | | | 7-15-2026 | | | | 200,000 | | | | 191,966 | |
Sysco Corporation | | | 4.45 | | | | 3-15-2048 | | | | 200,000 | | | | 198,369 | |
Sysco Corporation | | | 5.38 | | | | 9-21-2035 | | | | 200,000 | | | | 223,247 | |
The Kroger Company | | | 3.40 | | | | 4-15-2022 | | | | 175,000 | | | | 174,424 | |
The Kroger Company | | | 3.85 | | | | 8-1-2023 | | | | 175,000 | | | | 176,797 | |
The Kroger Company | | | 5.00 | | | | 4-15-2042 | | | | 175,000 | | | | 172,812 | |
The accompanying notes are an integral part of these financial statements.
| | | | | | |
| Portfolio of investments—August 31, 2018 (unaudited) | | Wells Fargo Funds | | | 195 | |
INVESTMENT GRADE CORPORATE BOND PORTFOLIO
| | | | | | | | | | | | | | | | |
| Security name | | Interest rate | | | Maturity date | | | Principal | | | Value | |
| | | | |
| Food & Staples Retailing (continued) | | | | | | | | | | | | | | | | |
The Kroger Company | | | 5.15 | % | | | 8-1-2043 | | | $ | 105,000 | | | $ | 104,914 | |
The Kroger Company | | | 6.90 | | | | 4-15-2038 | | | | 210,000 | | | | 252,112 | |
The Kroger Company | | | 7.50 | | | | 4-1-2031 | | | | 342,000 | | | | 425,822 | |
Wal-Mart Stores Incorporated | | | 3.63 | | | | 7-8-2020 | | | | 270,000 | | | | 273,895 | |
Wal-Mart Stores Incorporated | | | 4.00 | | | | 4-11-2043 | | | | 280,000 | | | | 279,116 | |
Wal-Mart Stores Incorporated | | | 4.25 | | | | 4-15-2021 | | | | 350,000 | | | | 361,998 | |
Wal-Mart Stores Incorporated | | | 4.30 | | | | 4-22-2044 | | | | 350,000 | | | | 368,252 | |
Wal-Mart Stores Incorporated | | | 4.88 | | | | 7-8-2040 | | | | 175,000 | | | | 197,645 | |
Wal-Mart Stores Incorporated | | | 5.63 | | | | 4-1-2040 | | | | 180,000 | | | | 222,234 | |
Wal-Mart Stores Incorporated | | | 5.88 | | | | 4-5-2027 | | | | 70,000 | | | | 81,754 | |
Walgreen Company | | | 4.40 | | | | 9-15-2042 | | | | 350,000 | | | | 318,012 | |
Walgreens Boots Alliance Incorporated | | | 2.70 | | | | 11-18-2019 | | | | 210,000 | | | | 209,317 | |
Walgreens Boots Alliance Incorporated | | | 3.45 | | | | 6-1-2026 | | | | 525,000 | | | | 500,210 | |
Walgreens Boots Alliance Incorporated | | | 4.80 | | | | 11-18-2044 | | | | 300,000 | | | | 288,814 | |
| | | | |
| | | | | | | | | | | | | | | 5,367,413 | |
| | | | | | | | | | | | | | | | |
| | | | |
| Food Products: 1.54% | | | | | | | | | | | | | | | | |
Archer-Daniels-Midland Company | | | 4.48 | | | | 3-1-2021 | | | | 374,000 | | | | 385,278 | |
Archer-Daniels-Midland Company | | | 4.54 | | | | 3-26-2042 | | | | 175,000 | | | | 183,530 | |
Campbell Soup Company | | | 2.50 | | | | 8-2-2022 | | | | 85,000 | | | | 80,396 | |
ConAgra Foods Incorporated | | | 8.25 | | | | 9-15-2030 | | | | 84,000 | | | | 107,368 | |
General Mills Incorporated | | | 3.65 | | | | 2-15-2024 | | | | 175,000 | | | | 173,749 | |
General Mills Incorporated | | | 4.20 | | | | 4-17-2028 | | | | 1,100,000 | | | | 1,096,989 | |
General Mills Incorporated | | | 5.40 | | | | 6-15-2040 | | | | 241,000 | | | | 262,022 | |
Hershey Company | | | 4.13 | | | | 12-1-2020 | | | | 350,000 | | | | 360,526 | |
J.M. Smucker Company | | | 3.50 | | | | 10-15-2021 | | | | 210,000 | | | | 210,766 | |
Kellogg Company | | | 4.00 | | | | 12-15-2020 | | | | 155,000 | | | | 158,062 | |
Kellogg Company | | | 4.15 | | | | 11-15-2019 | | | | 210,000 | | | | 213,010 | |
Kraft Heinz Foods Company | | | 2.80 | | | | 7-2-2020 | | | | 400,000 | | | | 396,630 | |
Kraft Heinz Foods Company | | | 3.00 | | | | 6-1-2026 | | | | 500,000 | | | | 455,926 | |
Kraft Heinz Foods Company | | | 4.38 | | | | 6-1-2046 | | | | 300,000 | | | | 262,148 | |
Mead Johnson Nutrition Company | | | 4.90 | | | | 11-1-2019 | | | | 175,000 | | | | 178,741 | |
Mead Johnson Nutrition Company | | | 5.90 | | | | 11-1-2039 | | | | 70,000 | | | | 84,134 | |
Tyson Foods Incorporated | | | 4.50 | | | | 6-15-2022 | | | | 350,000 | | | | 360,575 | |
Tyson Foods Incorporated | | | 4.88 | | | | 8-15-2034 | | | | 175,000 | | | | 178,483 | |
Unilever Capital Corporation | | | 4.25 | | | | 2-10-2021 | | | | 300,000 | | | | 308,723 | |
Unilever Capital Corporation | | | 5.90 | | | | 11-15-2032 | | | | 410,000 | | | | 506,221 | |
| | | | |
| | | | | | | | | | | | | | | 5,963,277 | |
| | | | | | | | | | | | | | | | |
| | | | |
| Household Products: 0.77% | | | | | | | | | | | | | | | | |
Clorox Company | | | 3.05 | | | | 9-15-2022 | | | | 113,000 | | | | 112,024 | |
Clorox Company | | | 3.50 | | | | 12-15-2024 | | | | 140,000 | | | | 139,535 | |
Colgate-Palmolive Company | | | 2.30 | | | | 5-3-2022 | | | | 350,000 | | | | 342,298 | |
Kimberly-Clark Corporation | | | 2.40 | | | | 6-1-2023 | | | | 105,000 | | | | 100,913 | |
Kimberly-Clark Corporation | | | 5.30 | | | | 3-1-2041 | | | | 171,000 | | | | 201,175 | |
Kimberly-Clark Corporation | | | 6.63 | | | | 8-1-2037 | | | | 140,000 | | | | 185,546 | |
The Procter & Gamble Company | | | 3.10 | | | | 8-15-2023 | | | | 1,902,000 | | | | 1,903,836 | |
| | | | |
| | | | | | | | | | | | | | | 2,985,327 | |
| | | | | | | | | | | | | | | | |
The accompanying notes are an integral part of these financial statements.
| | | | |
| 196 | | Wells Fargo Funds | | Portfolio of investments—August 31, 2018 (unaudited) |
INVESTMENT GRADE CORPORATE BOND PORTFOLIO
| | | | | | | | | | | | | | | | |
| Security name | | Interest rate | | | Maturity date | | | Principal | | | Value | |
| | | | |
| Personal Products: 0.05% | | | | | | | | | | | | | | | | |
Estee Lauder Companies Incorporated | | | 6.00 | % | | | 5-15-2037 | | | $ | 140,000 | | | $ | 172,359 | |
| | | | | | | | | | | | | | | | |
| | | | |
| Tobacco: 1.18% | | | | | | | | | | | | | | | | |
Altria Group Incorporated | | | 2.63 | | | | 1-14-2020 | | | | 280,000 | | | | 278,828 | |
Altria Group Incorporated | | | 4.00 | | | | 1-31-2024 | | | | 62,000 | | | | 63,322 | |
Altria Group Incorporated | | | 4.25 | | | | 8-9-2042 | | | | 350,000 | | | | 326,142 | |
Altria Group Incorporated | | | 4.50 | | | | 5-2-2043 | | | | 175,000 | | | | 170,529 | |
Altria Group Incorporated | | | 4.75 | | | | 5-5-2021 | | | | 590,000 | | | | 613,364 | |
Altria Group Incorporated | | | 9.25 | | | | 8-6-2019 | | | | 200,000 | | | | 211,585 | |
Philip Morris International Incorporated | | | 2.50 | | | | 8-22-2022 | | | | 175,000 | | | | 169,352 | |
Philip Morris International Incorporated | | | 2.63 | | | | 2-18-2022 | | | | 400,000 | | | | 391,246 | |
Philip Morris International Incorporated | | | 2.63 | | | | 3-6-2023 | | | | 122,000 | | | | 117,914 | |
Philip Morris International Incorporated | | | 3.25 | | | | 11-10-2024 | | | | 210,000 | | | | 206,464 | |
Philip Morris International Incorporated | | | 4.13 | | | | 3-4-2043 | | | | 210,000 | | | | 197,762 | |
Philip Morris International Incorporated | | | 4.25 | | | | 11-10-2044 | | | | 210,000 | | | | 200,042 | |
Philip Morris International Incorporated | | | 4.38 | | | | 11-15-2041 | | | | 350,000 | | | | 342,289 | |
Philip Morris International Incorporated | | | 4.50 | | | | 3-20-2042 | | | | 140,000 | | | | 138,972 | |
Reynolds American Incorporated | | | 4.00 | | | | 6-12-2022 | | | | 280,000 | | | | 283,394 | |
Reynolds American Incorporated | | | 4.45 | | | | 6-12-2025 | | | | 350,000 | | | | 354,764 | |
Reynolds American Incorporated | | | 5.70 | | | | 8-15-2035 | | | | 210,000 | | | | 226,534 | |
Reynolds American Incorporated | | | 6.15 | | | | 9-15-2043 | | | | 87,000 | | | | 97,182 | |
Reynolds American Incorporated | | | 7.25 | | | | 6-15-2037 | | | | 140,000 | | | | 175,676 | |
| | | | |
| | | | | | | | | | | | | | | 4,565,361 | |
| | | | | | | | | | | | | | | | |
| | | | |
Energy: 7.84% | | | | | | | | | | | | | | | | |
| | | | |
| Energy Equipment & Services: 0.38% | | | | | | | | | | | | | | | | |
Halliburton Company | | | 3.25 | | | | 11-15-2021 | | | | 140,000 | | | | 140,582 | |
Halliburton Company | | | 3.50 | | | | 8-1-2023 | | | | 350,000 | | | | 351,063 | |
Halliburton Company | | | 3.80 | | | | 11-15-2025 | | | | 350,000 | | | | 349,290 | |
Halliburton Company | | | 4.50 | | | | 11-15-2041 | | | | 175,000 | | | | 172,949 | |
Halliburton Company | | | 4.75 | | | | 8-1-2043 | | | | 175,000 | | | | 176,709 | |
Sabine Pass Liquefaction LLC | | | 4.20 | | | | 3-15-2028 | | | | 270,000 | | | | 262,472 | |
| | | | |
| | | | | | | | | | | | | | | 1,453,065 | |
| | | | | | | | | | | | | | | | |
| | | | |
| Oil, Gas & Consumable Fuels: 7.46% | | | | | | | | | | | | | | | | |
Anadarko Finance Company | | | 7.50 | | | | 5-1-2031 | | | | 227,000 | | | | 284,179 | |
Anadarko Petroleum Corporation | | | 3.45 | | | | 7-15-2024 | | | | 175,000 | | | | 169,666 | |
Anadarko Petroleum Corporation | | | 5.55 | | | | 3-15-2026 | | | | 350,000 | | | | 376,109 | |
Anadarko Petroleum Corporation | | | 6.20 | | | | 3-15-2040 | | | | 210,000 | | | | 236,651 | |
Anadarko Petroleum Corporation | | | 6.45 | | | | 9-15-2036 | | | | 160,000 | | | | 185,578 | |
Apache Corporation | | | 3.25 | | | | 4-15-2022 | | | | 253,000 | | | | 250,353 | |
Apache Corporation | | | 5.10 | | | | 9-1-2040 | | | | 402,000 | | | | 400,305 | |
Apache Corporation | | | 5.25 | | | | 2-1-2042 | | | | 70,000 | | | | 71,442 | |
Apache Corporation | | | 6.00 | | | | 1-15-2037 | | | | 350,000 | | | | 386,258 | |
Baker Hughes LLC/Baker Hughes Co-Obligor Incorporated | | | 4.08 | | | | 12-15-2047 | | | | 800,000 | | | | 726,765 | |
Boardwalk Pipelines LP | | | 3.38 | | | | 2-1-2023 | | | | 70,000 | | | | 67,751 | |
Boardwalk Pipelines LP | | | 5.75 | | | | 9-15-2019 | | | | 105,000 | | | | 107,591 | |
Buckeye Partners LP | | | 4.15 | | | | 7-1-2023 | | | | 175,000 | | | | 174,069 | |
Buckeye Partners LP | | | 4.88 | | | | 2-1-2021 | | | | 392,000 | | | | 399,374 | |
The accompanying notes are an integral part of these financial statements.
| | | | | | |
| Portfolio of investments—August 31, 2018 (unaudited) | | Wells Fargo Funds | | | 197 | |
INVESTMENT GRADE CORPORATE BOND PORTFOLIO
| | | | | | | | | | | | | | | | |
| Security name | | Interest rate | | | Maturity date | | | Principal | | | Value | |
| | | | |
| Oil, Gas & Consumable Fuels (continued) | | | | | | | | | | | | | | | | |
Buckeye Partners LP | | | 5.85 | % | | | 11-15-2043 | | | $ | 140,000 | | | $ | 132,526 | |
Chevron Corporation | | | 2.10 | | | | 5-16-2021 | | | | 260,000 | | | | 254,319 | |
Chevron Corporation | | | 2.19 | | | | 11-15-2019 | | | | 70,000 | | | | 69,585 | |
Chevron Corporation | | | 2.36 | | | | 12-5-2022 | | | | 525,000 | | | | 508,539 | |
Chevron Corporation | | | 2.42 | | | | 11-17-2020 | | | | 350,000 | | | | 346,676 | |
Chevron Corporation | | | 2.95 | | | | 5-16-2026 | | | | 700,000 | | | | 672,762 | |
Columbia Pipeline Group Incorporated | | | 5.80 | | | | 6-1-2045 | | | | 140,000 | | | | 156,210 | |
ConocoPhillips Company | | | 4.30 | | | | 11-15-2044 | | | | 210,000 | | | | 216,811 | |
ConocoPhillips Company | | | 4.95 | | | | 3-15-2026 | | | | 350,000 | | | | 378,414 | |
ConocoPhillips Company | | | 5.90 | | | | 10-15-2032 | | | | 175,000 | | | | 208,175 | |
ConocoPhillips Company | | | 6.95 | | | | 4-15-2029 | | | | 210,000 | | | | 264,218 | |
Devon Energy Corporation | | | 4.00 | | | | 7-15-2021 | | | | 140,000 | | | | 141,969 | |
Devon Energy Corporation | | | 7.95 | | | | 4-15-2032 | | | | 150,000 | | | | 193,015 | |
El Paso Pipeline Partners Operating LLC | | | 4.70 | | | | 11-1-2042 | | | | 70,000 | | | | 64,967 | |
Enbridge Energy Partners LP | | | 5.20 | | | | 3-15-2020 | | | | 266,000 | | | | 273,119 | |
Enbridge Energy Partners LP | | | 5.50 | | | | 9-15-2040 | | | | 140,000 | | | | 148,851 | |
Enbridge Energy Partners LP | | | 7.50 | | | | 4-15-2038 | | | | 189,000 | | | | 241,427 | |
Energy Transfer Partners LP | | | 3.60 | | | | 2-1-2023 | | | | 210,000 | | | | 207,031 | |
Energy Transfer Partners LP | | | 4.75 | | | | 1-15-2026 | | | | 280,000 | | | | 283,412 | |
Energy Transfer Partners LP | | | 4.90 | | | | 2-1-2024 | | | | 210,000 | | | | 216,562 | |
Energy Transfer Partners LP | | | 5.15 | | | | 2-1-2043 | | | | 140,000 | | | | 131,524 | |
Energy Transfer Partners LP | | | 5.95 | | | | 10-1-2043 | | | | 140,000 | | | | 145,347 | |
Energy Transfer Partners LP | | | 6.05 | | | | 6-1-2041 | | | | 210,000 | | | | 219,098 | |
Energy Transfer Partners LP | | | 7.50 | | | | 7-1-2038 | | | | 70,000 | | | | 83,551 | |
Enterprise Products Operating LLC | | | 3.35 | | | | 3-15-2023 | | | | 245,000 | | | | 243,498 | |
Enterprise Products Operating LLC | | | 3.90 | | | | 2-15-2024 | | | | 210,000 | | | | 212,264 | |
Enterprise Products Operating LLC | | | 4.05 | | | | 2-15-2022 | | | | 175,000 | | | | 178,496 | |
Enterprise Products Operating LLC | | | 4.45 | | | | 2-15-2043 | | | | 355,000 | | | | 344,073 | |
Enterprise Products Operating LLC | | | 4.85 | | | | 3-15-2044 | | | | 280,000 | | | | 286,465 | |
Enterprise Products Operating LLC | | | 5.25 | | | | 1-31-2020 | | | | 140,000 | | | | 144,122 | |
Enterprise Products Operating LLC | | | 5.70 | | | | 2-15-2042 | | | | 140,000 | | | | 157,992 | |
Enterprise Products Operating LLC | | | 5.95 | | | | 2-1-2041 | | | | 70,000 | | | | 80,739 | |
Enterprise Products Operating LLC | | | 7.55 | | | | 4-15-2038 | | | | 70,000 | | | | 92,965 | |
EOG Resources Incorporated | | | 3.90 | | | | 4-1-2035 | | | | 140,000 | | | | 138,156 | |
EOG Resources Incorporated | | | 4.10 | | | | 2-1-2021 | | | | 140,000 | | | | 142,656 | |
EOG Resources Incorporated | | | 4.40 | | | | 6-1-2020 | | | | 210,000 | | | | 214,303 | |
EQT Corporation | | | 4.88 | | | | 11-15-2021 | | | | 210,000 | | | | 216,413 | |
Exxon Mobil Corporation | | | 2.71 | | | | 3-6-2025 | | | | 350,000 | | | | 336,833 | |
Exxon Mobil Corporation | | | 3.57 | | | | 3-6-2045 | | | | 350,000 | | | | 326,909 | |
Exxon Mobil Corporation | | | 4.11 | | | | 3-1-2046 | | | | 800,000 | | | | 819,186 | |
Hess Corporation | | | 7.30 | | | | 8-15-2031 | | | | 269,000 | | | | 313,224 | |
Hess Corporation | | | 7.88 | | | | 10-1-2029 | | | | 196,000 | | | | 238,629 | |
Kerr-McGee Corporation | | | 6.95 | | | | 7-1-2024 | | | | 140,000 | | | | 159,688 | |
Kinder Morgan Energy Partners LP | | | 3.45 | | | | 2-15-2023 | | | | 175,000 | | | | 172,533 | |
Kinder Morgan Energy Partners LP | | | 3.50 | | | | 3-1-2021 | | | | 210,000 | | | | 210,393 | |
Kinder Morgan Energy Partners LP | | | 3.95 | | | | 9-1-2022 | | | | 262,000 | | | | 264,731 | |
Kinder Morgan Energy Partners LP | | | 5.00 | | | | 8-15-2042 | | | | 175,000 | | | | 169,934 | |
Kinder Morgan Energy Partners LP | | | 5.00 | | | | 3-1-2043 | | | | 157,000 | | | | 152,320 | |
Kinder Morgan Energy Partners LP | | | 5.30 | | | | 9-15-2020 | | | | 87,000 | | | | 90,234 | |
Kinder Morgan Energy Partners LP | | | 5.50 | | | | 3-1-2044 | | | | 210,000 | | | | 214,472 | |
The accompanying notes are an integral part of these financial statements.
| | | | |
| 198 | | Wells Fargo Funds | | Portfolio of investments—August 31, 2018 (unaudited) |
INVESTMENT GRADE CORPORATE BOND PORTFOLIO
| | | | | | | | | | | | | | | | |
| Security name | | Interest rate | | | Maturity date | | | Principal | | | Value | |
| | | | |
| Oil, Gas & Consumable Fuels (continued) | | | | | | | | | | | | | | | | |
Kinder Morgan Energy Partners LP | | | 5.80 | % | | | 3-15-2035 | | | $ | 70,000 | | | $ | 73,556 | |
Magellan Midstream Partners LP | | | 5.15 | | | | 10-15-2043 | | | | 140,000 | | | | 149,900 | |
Marathon Oil Corporation | | | 3.85 | | | | 6-1-2025 | | | | 245,000 | | | | 240,760 | |
Marathon Oil Corporation | | | 5.20 | | | | 6-1-2045 | | | | 140,000 | | | | 147,186 | |
Marathon Petroleum Corporation | | | 3.63 | | | | 9-15-2024 | | | | 350,000 | | | | 347,646 | |
Marathon Petroleum Corporation | | | 4.75 | | | | 9-15-2044 | | | | 350,000 | | | | 339,707 | |
Marathon Petroleum Corporation | | | 5.13 | | | | 3-1-2021 | | | | 24,000 | | | | 24,949 | |
MPLX LP | | | 4.70 | | | | 4-15-2048 | | | | 1,200,000 | | | | 1,121,369 | |
MPLX LP | | | 4.88 | | | | 6-1-2025 | | | | 200,000 | | | | 207,633 | |
MPLX LP | | | 5.20 | | | | 3-1-2047 | | | | 220,000 | | | | 219,465 | |
NextEra Energy Capital | | | 4.50 | | | | 6-1-2021 | | | | 140,000 | | | | 143,108 | |
Noble Energy Incorporated | | | 3.90 | | | | 11-15-2024 | | | | 210,000 | | | | 207,934 | |
Noble Energy Incorporated | | | 4.15 | | | | 12-15-2021 | | | | 350,000 | | | | 355,589 | |
Occidental Petroleum Corporation | | | 3.00 | | | | 2-15-2027 | | | | 200,000 | | | | 191,240 | |
Occidental Petroleum Corporation | | | 3.50 | | | | 6-15-2025 | | | | 610,000 | | | | 609,435 | |
Occidental Petroleum Corporation | | | 4.10 | | | | 2-1-2021 | | | | 322,000 | | | | 329,157 | |
Occidental Petroleum Corporation | | | 4.40 | | | | 4-15-2046 | | | | 200,000 | | | | 205,376 | |
ONEOK Incorporated | | | 4.00 | | | | 7-13-2027 | | | | 900,000 | | | | 878,666 | |
ONEOK Partners LP | | | 3.38 | | | | 10-1-2022 | | | | 350,000 | | | | 345,723 | |
Phillips 66 | | | 4.30 | | | | 4-1-2022 | | | | 700,000 | | | | 720,415 | |
Phillips 66 | | | 4.65 | | | | 11-15-2034 | | | | 140,000 | | | | 141,830 | |
Phillips 66 | | | 5.88 | | | | 5-1-2042 | | | | 400,000 | | | | 460,872 | |
Plains All American Pipeline LP | | | 2.60 | | | | 12-15-2019 | | | | 140,000 | | | | 138,889 | |
Plains All American Pipeline LP | | | 3.60 | | | | 11-1-2024 | | | | 210,000 | | | | 201,889 | |
Plains All American Pipeline LP | | | 3.85 | | | | 10-15-2023 | | | | 350,000 | | | | 345,664 | |
Plains All American Pipeline LP | | | 4.90 | | | | 2-15-2045 | | | | 175,000 | | | | 163,166 | |
Plains All American Pipeline LP | | | 5.00 | | | | 2-1-2021 | | | | 140,000 | | | | 143,977 | |
Plains All American Pipeline LP | | | 5.15 | | | | 6-1-2042 | | | | 350,000 | | | | 326,600 | |
Plains All American Pipeline LP | | | 6.65 | | | | 1-15-2037 | | | | 140,000 | | | | 156,722 | |
Sabine Pass Liquefaction LLC | | | 5.63 | | | | 3-1-2025 | | | | 545,000 | | | | 580,894 | |
Sabine Pass Liquefaction LLC | | | 5.75 | | | | 5-15-2024 | | | | 545,000 | | | | 585,712 | |
Spectra Energy Partners LP | | | 4.75 | | | | 3-15-2024 | | | | 245,000 | | | | 253,869 | |
Sunoco Logistics Partner LP | | | 3.45 | | | | 1-15-2023 | | | | 140,000 | | | | 136,962 | |
Sunoco Logistics Partner LP | | | 4.95 | | | | 1-15-2043 | | | | 105,000 | | | | 97,194 | |
Sunoco Logistics Partner LP | | | 5.35 | | | | 5-15-2045 | | | | 140,000 | | | | 135,395 | |
TC Pipelines LP | | | 4.65 | | | | 6-15-2021 | | | | 210,000 | | | | 213,237 | |
Tennessee Gas Pipeline Company | | | 7.00 | | | | 10-15-2028 | | | | 175,000 | | | | 205,397 | |
Texas Eastern Transmission LP | | | 7.00 | | | | 7-15-2032 | | | | 227,000 | | | | 278,846 | |
Valero Energy Corporation | | | 6.13 | | | | 2-1-2020 | | | | 45,000 | | | | 46,880 | |
Valero Energy Corporation | | | 7.50 | | | | 4-15-2032 | | | | 210,000 | | | | 268,223 | |
Western Gas Partners LP | | | 4.00 | | | | 7-1-2022 | | | | 280,000 | | | | 278,659 | |
Williams Partners LP | | | 3.35 | | | | 8-15-2022 | | | | 175,000 | | | | 172,204 | |
Williams Partners LP | | | 4.13 | | | | 11-15-2020 | | | | 210,000 | | | | 212,694 | |
Williams Partners LP | | | 4.30 | | | | 3-4-2024 | | | | 350,000 | | | | 354,166 | |
Williams Partners LP | | | 5.25 | | | | 3-15-2020 | | | | 448,000 | | | | 461,005 | |
Williams Partners LP | | | 6.30 | | | | 4-15-2040 | | | | 273,000 | | | | 310,896 | |
| | | | |
| | | | | | | | | | | | | | | 28,846,083 | |
| | | | | | | | | | | | | | | | |
The accompanying notes are an integral part of these financial statements.
| | | | | | |
| Portfolio of investments—August 31, 2018 (unaudited) | | Wells Fargo Funds | | | 199 | |
INVESTMENT GRADE CORPORATE BOND PORTFOLIO
| | | | | | | | | | | | | | | | |
| Security name | | Interest rate | | | Maturity date | | | Principal | | | Value | |
| | | | |
Financials: 16.16% | | | | | | | | | | | | | | | | |
| | | | |
| Banks: 6.16% | | | | | | | | | | | | | | | | |
ABB Finance (USA) Incorporated | | | 4.38 | % | | | 5-8-2042 | | | $ | 26,000 | | | $ | 26,880 | |
Australia & New Zealand Banking Group Limited | | | 2.55 | | | | 11-23-2021 | | | | 250,000 | | | | 243,726 | |
Australia & New Zealand Banking Group Limited | | | 2.63 | | | | 5-19-2022 | | | | 300,000 | | | | 290,983 | |
Australia & New Zealand Banking Group Limited | | | 2.63 | | | | 11-9-2022 | | | | 250,000 | | | | 241,813 | |
Bank of America Corporation | | | 3.25 | | | | 10-21-2027 | | | | 525,000 | | | | 493,040 | |
Bank of America Corporation (3 Month LIBOR +1.19%) ± | | | 3.95 | | | | 1-23-2049 | | | | 200,000 | | | | 184,189 | |
Bank of America Corporation | | | 4.18 | | | | 11-25-2027 | | | | 560,000 | | | | 547,001 | |
Bank of America Corporation | | | 4.20 | | | | 8-26-2024 | | | | 390,000 | | | | 391,836 | |
Bank of America Corporation | | | 4.25 | | | | 10-22-2026 | | | | 280,000 | | | | 277,984 | |
Bank of America Corporation | | | 5.88 | | | | 1-5-2021 | | | | 350,000 | | | | 371,170 | |
Bank One Corporation | | | 7.63 | | | | 10-15-2026 | | | | 168,000 | | | | 204,684 | |
BB&T Corporation | | | 2.05 | | | | 5-10-2021 | | | | 210,000 | | | | 203,785 | |
BB&T Corporation | | | 2.45 | | | | 1-15-2020 | | | | 200,000 | | | | 198,846 | |
BB&T Corporation | | | 2.85 | | | | 10-26-2024 | | | | 1,300,000 | | | | 1,249,345 | |
BB&T Corporation | | | 3.80 | | | | 10-30-2026 | | | | 400,000 | | | | 399,722 | |
Citigroup Incorporated | | | 2.75 | | | | 4-25-2022 | | | | 200,000 | | | | 194,906 | |
Citigroup Incorporated | | | 3.88 | | | | 3-26-2025 | | | | 300,000 | | | | 293,090 | |
Citigroup Incorporated | | | 4.40 | | | | 6-10-2025 | | | | 500,000 | | | | 501,002 | |
Citigroup Incorporated | | | 4.45 | | | | 9-29-2027 | | | | 525,000 | | | | 520,063 | |
Citigroup Incorporated | | | 4.60 | | | | 3-9-2026 | | | | 200,000 | | | | 201,786 | |
Citigroup Incorporated | | | 4.65 | | | | 7-30-2045 | | | | 300,000 | | | | 303,446 | |
Citigroup Incorporated | | | 4.75 | | | | 5-18-2046 | | | | 300,000 | | | | 295,787 | |
Citizens Financial Group Incorporated | | | 4.30 | | | | 12-3-2025 | | | | 200,000 | | | | 199,195 | |
City National Corporation | | | 5.25 | | | | 9-15-2020 | | | | 140,000 | | | | 145,269 | |
Compass Bank | | | 2.75 | | | | 9-29-2019 | | | | 250,000 | | | | 249,179 | |
Discover Bank | | | 3.10 | | | | 6-4-2020 | | | | 500,000 | | | | 497,905 | |
Discover Bank | | | 4.20 | | | | 8-8-2023 | | | | 310,000 | | | | 312,774 | |
Discover Bank | | | 4.25 | | | | 3-13-2026 | | | | 250,000 | | | | 248,159 | |
Fifth Third Bancorp | | | 4.30 | | | | 1-16-2024 | | | | 350,000 | | | | 356,736 | |
Fifth Third Bank | | | 2.25 | | | | 6-14-2021 | | | | 200,000 | | | | 195,169 | |
Fifth Third Bank | | | 2.88 | | | | 10-1-2021 | | | | 300,000 | | | | 295,579 | |
Fifth Third Bank | | | 3.85 | | | | 3-15-2026 | | | | 1,400,000 | | | | 1,376,227 | |
HSBC Bank USA NA | | | 5.00 | | | | 9-27-2020 | | | | 350,000 | | | | 360,938 | |
HSBC Bank USA NA | | | 5.63 | | | | 8-15-2035 | | | | 225,000 | | | | 251,304 | |
Huntington Bancshares Incorporated | | | 7.00 | | | | 12-15-2020 | | | | 17,000 | | | | 18,318 | |
Huntington National Bank | | | 2.38 | | | | 3-10-2020 | | | | 855,000 | | | | 845,702 | |
JPMorgan Chase & Company | | | 2.95 | | | | 10-1-2026 | | | | 525,000 | | | | 491,295 | |
JPMorgan Chase & Company | | | 3.20 | | | | 1-25-2023 | | | | 700,000 | | | | 692,799 | |
JPMorgan Chase & Company | | | 4.13 | | | | 12-15-2026 | | | | 500,000 | | | | 499,165 | |
JPMorgan Chase & Company (3 Month LIBOR +1.58%) ± | | | 4.26 | | | | 2-22-2048 | | | | 240,000 | | | | 230,651 | |
JPMorgan Chase & Company | | | 5.63 | | | | 8-16-2043 | | | | 140,000 | | | | 159,302 | |
Key Bank NA | | | 2.40 | | | | 6-9-2022 | | | | 1,300,000 | | | | 1,253,528 | |
Key Bank NA | | | 3.18 | | | | 10-15-2027 | | | | 250,000 | | | | 246,507 | |
KeyCorp | | | 5.10 | | | | 3-24-2021 | | | | 300,000 | | | | 313,464 | |
National Australia Bank | | | 2.63 | | | | 1-14-2021 | | | | 850,000 | | | | 836,859 | |
People’s United Financial Incorporated | | | 3.65 | | | | 12-6-2022 | | | | 105,000 | | | | 104,568 | |
PNC Bank NA | | | 2.15 | | | | 4-29-2021 | | | | 250,000 | | | | 243,760 | |
PNC Bank NA | | | 2.95 | | | | 1-30-2023 | | | | 300,000 | | | | 292,318 | |
The accompanying notes are an integral part of these financial statements.
| | | | |
| 200 | | Wells Fargo Funds | | Portfolio of investments—August 31, 2018 (unaudited) |
INVESTMENT GRADE CORPORATE BOND PORTFOLIO
| | | | | | | | | | | | | | | | |
| Security name | | Interest rate | | | Maturity date | | | Principal | | | Value | |
| | | | |
| Banks (continued) | | | | | | | | | | | | | | | | |
PNC Bank NA | | | 3.30 | % | | | 10-30-2024 | | | $ | 500,000 | | | $ | 491,991 | |
PNC Bank NA | | | 3.80 | | | | 7-25-2023 | | | | 300,000 | | | | 302,175 | |
PNC Bank NA | | | 4.20 | | | | 11-1-2025 | | | | 250,000 | | | | 256,545 | |
PNC Funding Corporation | | | 5.13 | | | | 2-8-2020 | | | | 105,000 | | | | 108,115 | |
Santander Holdings USA Incorporated | | | 4.50 | | | | 7-17-2025 | | | | 350,000 | | | | 349,283 | |
SunTrust Banks Incorporated | | | 3.30 | | | | 5-15-2026 | | | | 2,200,000 | | | | 2,094,705 | |
UnionBanCal Corporation | | | 3.50 | | | | 6-18-2022 | | | | 140,000 | | | | 140,169 | |
US Bancorp | | | 2.38 | | | | 7-22-2026 | | | | 190,000 | | | | 173,879 | |
US Bancorp | | | 3.00 | | | | 3-15-2022 | | | | 350,000 | | | | 347,413 | |
US Bancorp | | | 3.10 | | | | 4-27-2026 | | | | 500,000 | | | | 476,536 | |
US Bancorp | | | 3.60 | | | | 9-11-2024 | | | | 350,000 | | | | 349,158 | |
US Bancorp | | | 4.13 | | | | 5-24-2021 | | | | 350,000 | | | | 358,456 | |
| | | | |
| | | | | | | | | | | | | | | 23,800,179 | |
| | | | | | | | | | | | | | | | |
| | | | |
| Capital Markets: 3.33% | | | | | | | | | | | | | | | | |
AGL Capital Corporation | | | 4.40 | | | | 6-1-2043 | | | | 140,000 | | | | 138,200 | |
Ameriprise Financial Incorporated | | | 4.00 | | | | 10-15-2023 | | | | 350,000 | | | | 358,183 | |
Ameriprise Financial Incorporated | | | 5.30 | | | | 3-15-2020 | | | | 210,000 | | | | 217,040 | |
Ares Capital Corporation | | | 3.88 | | | | 1-15-2020 | | | | 280,000 | | | | 280,822 | |
Bank of New York Mellon Corporation | | | 2.30 | | | | 9-11-2019 | | | | 270,000 | | | | 268,984 | |
Bank of New York Mellon Corporation | | | 2.50 | | | | 4-15-2021 | | | | 350,000 | | | | 344,399 | |
Bank of New York Mellon Corporation | | | 2.95 | | | | 1-29-2023 | | | | 300,000 | | | | 294,732 | |
Bank of New York Mellon Corporation | | | 3.40 | | | | 1-29-2028 | | | | 300,000 | | | | 295,235 | |
Bank of New York Mellon Corporation | | | 3.55 | | | | 9-23-2021 | | | | 420,000 | | | | 424,116 | |
Bank of New York Mellon Corporation | | | 3.95 | | | | 11-18-2025 | | | | 350,000 | | | | 357,306 | |
Charles Schwab Corporation | | | 4.45 | | | | 7-22-2020 | | | | 140,000 | | | | 143,769 | |
CME Group Incorporated | | | 5.30 | | | | 9-15-2043 | | | | 210,000 | | | | 248,931 | |
Deutsche Bank AG | | | 3.15 | | | | 1-22-2021 | | | | 200,000 | | | | 195,444 | |
Goldman Sachs Group Incorporated | | | 3.00 | | | | 4-26-2022 | | | | 750,000 | | | | 736,792 | |
Goldman Sachs Group Incorporated | | | 3.63 | | | | 1-22-2023 | | | | 270,000 | | | | 269,773 | |
Goldman Sachs Group Incorporated | | | 3.75 | | | | 5-22-2025 | | | | 350,000 | | | | 344,544 | |
Goldman Sachs Group Incorporated | | | 4.25 | | | | 10-21-2025 | | | | 700,000 | | | | 696,170 | |
Goldman Sachs Group Incorporated | | | 6.13 | | | | 2-15-2033 | | | | 200,000 | | | | 231,482 | |
Intercontinental Exchange Incorporated | | | 2.75 | | | | 12-1-2020 | | | | 350,000 | | | | 347,340 | |
Intercontinental Exchange Incorporated | | | 4.00 | | | | 10-15-2023 | | | | 140,000 | | | | 143,682 | |
Jefferies Group Incorporated | | | 5.13 | | | | 1-20-2023 | | | | 175,000 | | | | 182,215 | |
Jefferies Group Incorporated | | | 6.25 | | | | 1-15-2036 | | | | 105,000 | | | | 107,545 | |
Jefferies Group Incorporated | | | 6.45 | | | | 6-8-2027 | | | | 105,000 | | | | 113,971 | |
Jefferies Group Incorporated | | | 6.88 | | | | 4-15-2021 | | | | 105,000 | | | | 113,157 | |
Legg Mason Incorporated | | | 4.75 | | | | 3-15-2026 | | | | 190,000 | | | | 196,110 | |
Moody’s Corporation | | | 4.50 | | | | 9-1-2022 | | | | 175,000 | | | | 180,963 | |
Moody’s Corporation | | | 4.88 | | | | 2-15-2024 | | | | 245,000 | | | | 257,430 | |
Moody’s Corporation | | | 5.25 | | | | 7-15-2044 | | | | 210,000 | | | | 235,143 | |
Morgan Stanley | | | 4.30 | | | | 1-27-2045 | | | | 350,000 | | | | 337,029 | |
Morgan Stanley | | | 5.00 | | | | 11-24-2025 | | | | 200,000 | | | | 207,906 | |
Morgan Stanley | | | 5.50 | | | | 7-24-2020 | | | | 350,000 | | | | 364,451 | |
Morgan Stanley | | | 5.63 | | | | 9-23-2019 | | | | 250,000 | | | | 256,998 | |
Morgan Stanley | | | 6.25 | | | | 8-9-2026 | | | | 300,000 | | | | 339,657 | |
Morgan Stanley | | | 7.25 | | | | 4-1-2032 | | | | 329,000 | | | | 420,740 | |
The accompanying notes are an integral part of these financial statements.
| | | | | | |
| Portfolio of investments—August 31, 2018 (unaudited) | | Wells Fargo Funds | | | 201 | |
INVESTMENT GRADE CORPORATE BOND PORTFOLIO
| | | | | | | | | | | | | | | | |
| Security name | | Interest rate | | | Maturity date | | | Principal | | | Value | |
| | | | |
| Capital Markets (continued) | | | | | | | | | | | | | | | | |
NASDAQ OMX Group Incorporated | | | 5.55 | % | | | 1-15-2020 | | | $ | 350,000 | | | $ | 361,508 | |
Northern Trust Corporation | | | 3.45 | | | | 11-4-2020 | | | | 350,000 | | | | 353,501 | |
Northern Trust Corporation | | | 3.95 | | | | 10-30-2025 | | | | 175,000 | | | | 178,444 | |
PPL Capital Funding Incorporated | | | 3.10 | | | | 5-15-2026 | | | | 100,000 | | | | 93,658 | |
S&P Global Incorporated | | | 4.00 | | | | 6-15-2025 | | | | 227,000 | | | | 229,276 | |
State Street Corporation | | | 3.70 | | | | 11-20-2023 | | | | 1,300,000 | | | | 1,321,657 | |
State Street Corporation | | | 2.65 | | | | 5-19-2026 | | | | 400,000 | | | | 375,578 | |
TD Ameritrade Holding Corporation | | | 3.63 | | | | 4-1-2025 | | | | 140,000 | | | | 139,390 | |
TD Ameritrade Holding Corporation | | | 5.60 | | | | 12-1-2019 | | | | 140,000 | | | | 144,410 | |
| | | | |
| | | | | | | | | | | | | | | 12,847,681 | |
| | | | | | | | | | | | | | | | |
| | | | |
| Consumer Finance: 2.45% | | | | | | | | | | | | | | | | |
Ahold Finance USA LLC | | | 6.88 | | | | 5-1-2029 | | | | 210,000 | | | | 247,637 | |
American Express Company | | | 2.65 | | | | 12-2-2022 | | | | 402,000 | | | | 388,954 | |
American Express Company | | | 4.05 | | | | 12-3-2042 | | | | 633,000 | | | | 628,161 | |
American Express Credit Corporation | | | 2.25 | | | | 5-5-2021 | | | | 200,000 | | | | 195,239 | |
American Express Credit Corporation | | | 2.38 | | | | 5-26-2020 | | | | 175,000 | | | | 172,963 | |
American Honda Finance Corporation | | | 2.00 | | | | 2-14-2020 | | | | 360,000 | | | | 355,659 | |
Capital One Bank USA NA | | | 2.40 | | | | 9-5-2019 | | | | 200,000 | | | | 198,975 | |
Capital One Bank USA NA | | | 3.38 | | | | 2-15-2023 | | | | 500,000 | | | | 488,978 | |
Capital One Financial Corporation | | | 3.75 | | | | 7-28-2026 | | | | 525,000 | | | | 492,677 | |
Capital One Financial Corporation | | | 3.75 | | | | 3-9-2027 | | | | 330,000 | | | | 314,771 | |
Capital One Financial Corporation | | | 4.75 | | | | 7-15-2021 | | | | 315,000 | | | | 325,988 | |
Caterpillar Financial Services Corporation | | | 2.63 | | | | 3-1-2023 | | | | 260,000 | | | | 252,762 | |
Caterpillar Financial Services Corporation | | | 3.25 | | | | 12-1-2024 | | | | 200,000 | | | | 198,948 | |
Caterpillar Financial Services Corporation | | | 3.75 | | | | 11-24-2023 | | | | 175,000 | | | | 178,699 | |
Daimler Finance North America LLC | | | 8.50 | | | | 1-18-2031 | | | | 297,000 | | | | 419,061 | |
Discover Financial Services | | | 3.95 | | | | 11-6-2024 | | | | 700,000 | | | | 686,051 | |
Discover Financial Services | | | 3.85 | | | | 11-21-2022 | | | | 385,000 | | | | 383,576 | |
Ford Motor Credit Company LLC | | | 5.75 | | | | 2-1-2021 | | | | 200,000 | | | | 207,309 | |
Ford Motor Credit Company LLC | | | 3.10 | | | | 5-4-2023 | | | | 200,000 | | | | 187,504 | |
Ford Motor Credit Company LLC | | | 3.66 | | | | 9-8-2024 | | | | 300,000 | | | | 281,964 | |
General Motors Financial Company Incorporated | | | 3.70 | | | | 5-9-2023 | | | | 180,000 | | | | 176,371 | |
General Motors Financial Company Incorporated | | | 3.15 | | | | 1-15-2020 | | | | 350,000 | | | | 350,168 | |
John Deere Capital Corporation | | | 2.80 | | | | 1-27-2023 | | | | 350,000 | | | | 343,843 | |
John Deere Capital Corporation | | | 3.90 | | | | 7-12-2021 | | | | 210,000 | | | | 214,910 | |
Synchrony Financial | | | 4.25 | | | | 8-15-2024 | | | | 1,200,000 | | | | 1,163,443 | |
Toyota Motor Credit Corporation | | | 3.40 | | | | 9-15-2021 | | | | 245,000 | | | | 247,145 | |
Toyota Motor Credit Corporation | | | 4.50 | | | | 6-17-2020 | | | | 350,000 | | | | 359,419 | |
| | | | |
| | | | | | | | | | | | | | | 9,461,175 | |
| | | | | | | | | | | | | | | | |
| | | | |
| Diversified Financial Services: 0.45% | | | | | | | | | | | | | | | | |
Berkshire Hathaway Incorporated | | | 2.75 | | | | 3-15-2023 | | | | 425,000 | | | | 417,751 | |
Block Financial LLC | | | 5.50 | | | | 11-1-2022 | | | | 140,000 | | | | 146,076 | |
National Rural Utilities Cooperative Finance Corporation | | | 3.40 | | | | 2-7-2028 | | | | 300,000 | | | | 294,328 | |
National Rural Utilities Cooperative Finance Corporation | | | 2.30 | | | | 11-15-2019 | | | | 233,000 | | | | 231,810 | |
National Rural Utilities Cooperative Finance Corporation | | | 3.25 | | | | 11-1-2025 | | | | 300,000 | | | | 293,588 | |
National Rural Utilities Cooperative Finance Corporation | | | 4.02 | | | | 11-1-2032 | | | | 140,000 | | | | 141,852 | |
National Rural Utilities Cooperative Finance Corporation (3 Month LIBOR +2.91%) ± | | | 4.75 | | | | 4-30-2043 | | | | 175,000 | | | | 176,176 | |
TECO Finance Incorporated | | | 5.15 | | | | 3-15-2020 | | | | 45,000 | | | | 46,198 | |
| | | | |
| | | | | | | | | | | | | | | 1,747,779 | |
| | | | | | | | | | | | | | | | |
The accompanying notes are an integral part of these financial statements.
| | | | |
| 202 | | Wells Fargo Funds | | Portfolio of investments—August 31, 2018 (unaudited) |
INVESTMENT GRADE CORPORATE BOND PORTFOLIO
| | | | | | | | | | | | | | | | |
| Security name | | Interest rate | | | Maturity date | | | Principal | | | Value | |
| | | | |
| Insurance: 3.77% | | | | | | | | | | | | | | | | |
ACE INA Holdings Incorporated | | | 2.70 | % | | | 3-13-2023 | | | $ | 280,000 | | | $ | 272,337 | |
ACE INA Holdings Incorporated | | | 3.15 | | | | 3-15-2025 | | | | 200,000 | | | | 195,317 | |
ACE INA Holdings Incorporated | | | 3.35 | | | | 5-15-2024 | | | | 350,000 | | | | 346,657 | |
Alleghany Corporation | | | 5.63 | | | | 9-15-2020 | | | | 70,000 | | | | 73,044 | |
Allstate Corporation (3 Month LIBOR +2.12%) ± | | | 6.50 | | | | 5-15-2067 | | | | 140,000 | | | | 156,100 | |
American International Group Incorporated | | | 4.50 | | | | 7-16-2044 | | | | 300,000 | | | | 285,876 | |
American International Group Incorporated | | | 4.75 | | | | 4-1-2048 | | | | 600,000 | | | | 592,512 | |
American International Group Incorporated | | | 4.88 | | | | 6-1-2022 | | | | 600,000 | | | | 628,671 | |
American International Group Incorporated | | | 6.40 | | | | 12-15-2020 | | | | 200,000 | | | | 213,840 | |
Aon Corporation | | | 6.25 | | | | 9-30-2040 | | | | 70,000 | | | | 85,731 | |
Arch Capital Group Limited | | | 5.14 | | | | 11-1-2043 | | | | 147,000 | | | | 158,101 | |
Berkshire Hathaway Finance Corporation | | | 2.90 | | | | 10-15-2020 | | | | 150,000 | | | | 150,349 | |
Berkshire Hathaway Finance Corporation | | | 4.40 | | | | 5-15-2042 | | | | 180,000 | | | | 187,509 | |
Berkshire Hathaway Finance Corporation | | | 5.75 | | | | 1-15-2040 | | | | 175,000 | | | | 211,699 | |
Berkshire Hathaway Incorporated | | | 2.10 | | | | 8-14-2019 | | | | 200,000 | | | | 199,158 | |
Berkshire Hathaway Incorporated | | | 3.00 | | | | 2-11-2023 | | | | 75,000 | | | | 75,138 | |
Berkshire Hathaway Incorporated | | | 3.13 | | | | 3-15-2026 | | | | 525,000 | | | | 510,483 | |
Berkshire Hathaway Incorporated | | | 3.40 | | | | 1-31-2022 | | | | 175,000 | | | | 177,403 | |
Berkshire Hathaway Incorporated | | | 4.50 | | | | 2-11-2043 | | | | 275,000 | | | | 290,075 | |
Chubb Corporation | | | 6.00 | | | | 5-11-2037 | | | | 196,000 | | | | 241,583 | |
Chubb INA Holdings Incorporated | | | 2.30 | | | | 11-3-2020 | | | | 200,000 | | | | 196,887 | |
Chubb INA Holdings Incorporated | | | 4.35 | | | | 11-3-2045 | | | | 900,000 | | | | 934,592 | |
CNA Financial Corporation | | | 5.88 | | | | 8-15-2020 | | | | 350,000 | | | | 366,893 | |
Hartford Financial Services Group Incorporated | | | 4.30 | | | | 4-15-2043 | | | | 30,000 | | | | 28,908 | |
Hartford Financial Services Group Incorporated | | | 5.13 | | | | 4-15-2022 | | | | 168,000 | | | | 177,217 | |
Hartford Financial Services Group Incorporated | | | 5.50 | | | | 3-30-2020 | | | | 175,000 | | | | 181,176 | |
Hartford Financial Services Group Incorporated | | | 5.95 | | | | 10-15-2036 | | | | 52,000 | | | | 61,111 | |
Hartford Financial Services Group Incorporated | | | 6.10 | | | | 10-1-2041 | | | | 175,000 | | | | 208,470 | |
Lincoln National Corporation | | | 4.00 | | | | 9-1-2023 | | | | 175,000 | | | | 178,546 | |
Lincoln National Corporation | | | 4.85 | | | | 6-24-2021 | | | | 56,000 | | | | 57,980 | |
Lincoln National Corporation | | | 6.25 | | | | 2-15-2020 | | | | 210,000 | | | | 218,552 | |
Loews Corporation | | | 2.63 | | | | 5-15-2023 | | | | 105,000 | | | | 101,478 | |
Loews Corporation | | | 4.13 | | | | 5-15-2043 | | | | 140,000 | | | | 133,577 | |
Marsh & McLennan Companies Incorporated | | | 4.80 | | | | 7-15-2021 | | | | 210,000 | | | | 217,541 | |
MetLife Incorporated | | | 3.05 | | | | 12-15-2022 | | | | 190,000 | | | | 187,767 | |
MetLife Incorporated | | | 4.13 | | | | 8-13-2042 | | | | 210,000 | | | | 201,315 | |
MetLife Incorporated | | | 4.37 | | | | 9-15-2023 | | | | 400,000 | | | | 417,365 | |
MetLife Incorporated | | | 4.72 | | | | 12-15-2044 | | | | 175,000 | | | | 181,923 | |
MetLife Incorporated | | | 4.75 | | | | 2-8-2021 | | | | 525,000 | | | | 543,050 | |
MetLife Incorporated | | | 4.88 | | | | 11-13-2043 | | | | 350,000 | | | | 372,264 | |
MetLife Incorporated | | | 6.38 | | | | 6-15-2034 | | | | 196,000 | | | | 238,261 | |
MetLife Incorporated | | | 6.40 | | | | 12-15-2066 | | | | 200,000 | | | | 213,500 | |
MetLife Incorporated | | | 6.50 | | | | 12-15-2032 | | | | 140,000 | | | | 174,618 | |
Principal Financial Group Incorporated | | | 3.30 | | | | 9-15-2022 | | | | 175,000 | | | | 173,561 | |
Principal Financial Group Incorporated | | | 3.40 | | | | 5-15-2025 | | | | 140,000 | | | | 137,046 | |
Principal Financial Group Incorporated | | | 4.63 | | | | 9-15-2042 | | | | 175,000 | | | | 178,787 | |
Progressive Corporation | | | 6.25 | | | | 12-1-2032 | | | | 52,000 | | | | 63,873 | |
Prudential Financial Incorporated | | | 3.91 | | | | 12-7-2047 | | | | 155,000 | | | | 142,394 | |
Prudential Financial Incorporated | | | 3.94 | | | | 12-7-2049 | | | | 448,000 | | | | 411,925 | |
Prudential Financial Incorporated | | | 4.50 | | | | 11-16-2021 | | | | 175,000 | | | | 181,057 | |
The accompanying notes are an integral part of these financial statements.
| | | | | | |
| Portfolio of investments—August 31, 2018 (unaudited) | | Wells Fargo Funds | | | 203 | |
INVESTMENT GRADE CORPORATE BOND PORTFOLIO
| | | | | | | | | | | | | | | | |
| Security name | | Interest rate | | | Maturity date | | | Principal | | | Value | |
| | | | |
| Insurance (continued) | | | | | | | | | | | | | | | | |
Prudential Financial Incorporated | | | 4.60 | % | | | 5-15-2044 | | | $ | 350,000 | | | $ | 359,638 | |
Prudential Financial Incorporated (3 Month LIBOR +3.04%) ± | | | 5.20 | | | | 3-15-2044 | | | | 175,000 | | | | 175,875 | |
Prudential Financial Incorporated (3 Month LIBOR +3.92%) ± | | | 5.63 | | | | 6-15-2043 | | | | 475,000 | | | | 496,722 | |
Prudential Financial Incorporated | | | 5.75 | | | | 7-15-2033 | | | | 350,000 | | | | 404,735 | |
Prudential Financial Incorporated | | | 6.63 | | | | 12-1-2037 | | | | 45,000 | | | | 57,015 | |
Reinsurance Group of America Incorporated | | | 5.00 | | | | 6-1-2021 | | | | 42,000 | | | | 43,693 | |
Reinsurance Group of America Incorporated | | | 6.45 | | | | 11-15-2019 | | | | 245,000 | | | | 254,558 | |
Transatlantic Holdings Incorporated | | | 8.00 | | | | 11-30-2039 | | | | 70,000 | | | | 97,021 | |
Travelers Companies Incorporated | | | 5.35 | | | | 11-1-2040 | | | | 245,000 | | | | 283,925 | |
Travelers Companies Incorporated | | | 6.25 | | | | 6-15-2037 | | | | 255,000 | | | | 321,394 | |
WR Berkley Corporation | | | 5.38 | | | | 9-15-2020 | | | | 140,000 | | | | 144,991 | |
| | | | |
| | | | | | | | | | | | | | | 14,572,784 | |
| | | | | | | | | | | | | | | | |
| | | | |
Health Care: 10.84% | | | | | | | | | | | | | | | | |
| | | | |
| Biotechnology: 1.87% | | | | | | | | | | | | | | | | |
AbbVie Incorporated | | | 2.30 | | | | 5-14-2021 | | | | 350,000 | | | | 341,169 | |
AbbVie Incorporated | | | 2.50 | | | | 5-14-2020 | | | | 250,000 | | | | 247,678 | |
AbbVie Incorporated | | | 3.20 | | | | 5-14-2026 | | | | 420,000 | | | | 395,510 | |
AbbVie Incorporated | | | 4.30 | | | | 5-14-2036 | | | | 245,000 | | | | 235,627 | |
AbbVie Incorporated | | | 4.45 | | | | 5-14-2046 | | | | 420,000 | | | | 396,629 | |
Amgen Incorporated | | | 3.63 | | | | 5-15-2022 | | | | 200,000 | | | | 201,552 | |
Amgen Incorporated | | | 3.63 | | | | 5-22-2024 | | | | 350,000 | | | | 351,897 | |
Amgen Incorporated | | | 3.88 | | | | 11-15-2021 | | | | 200,000 | | | | 203,431 | |
Amgen Incorporated | | | 4.50 | | | | 3-15-2020 | | | | 45,000 | | | | 46,027 | |
Amgen Incorporated | | | 4.95 | | | | 10-1-2041 | | | | 320,000 | | | | 327,521 | |
Amgen Incorporated | | | 5.75 | | | | 3-15-2040 | | | | 56,000 | | | | 63,770 | |
Amgen Incorporated | | | 6.40 | | | | 2-1-2039 | | | | 175,000 | | | | 213,063 | |
Baxalta Incorporated | | | 3.60 | | | | 6-23-2022 | | | | 140,000 | | | | 140,805 | |
Baxalta Incorporated | | | 4.00 | | | | 6-23-2025 | | | | 455,000 | | | | 459,357 | |
Baxalta Incorporated | | | 5.25 | | | | 6-23-2045 | | | | 280,000 | | | | 305,227 | |
Celgene Corporation | | | 3.25 | | | | 8-15-2022 | | | | 350,000 | | | | 346,494 | |
Celgene Corporation | | | 3.63 | | | | 5-15-2024 | | | | 350,000 | | | | 345,720 | |
Celgene Corporation | | | 3.88 | | | | 8-15-2025 | | | | 175,000 | | | | 172,457 | |
Celgene Corporation | | | 3.95 | | | | 10-15-2020 | | | | 140,000 | | | | 142,582 | |
Celgene Corporation | | | 4.00 | | | | 8-15-2023 | | | | 175,000 | | | | 177,424 | |
Celgene Corporation | | | 4.63 | | | | 5-15-2044 | | | | 240,000 | | | | 226,040 | |
Celgene Corporation | | | 5.25 | | | | 8-15-2043 | | | | 105,000 | | | | 108,156 | |
Genzyme Corporation | | | 5.00 | | | | 6-15-2020 | | | | 140,000 | | | | 144,855 | |
Gilead Sciences Incorporated | | | 3.65 | | | | 3-1-2026 | | | | 350,000 | | | | 346,475 | |
Gilead Sciences Incorporated | | | 3.70 | | | | 4-1-2024 | | | | 350,000 | | | | 351,921 | |
Gilead Sciences Incorporated | | | 4.50 | | | | 2-1-2045 | | | | 200,000 | | | | 200,100 | |
Gilead Sciences Incorporated | | | 4.75 | | | | 3-1-2046 | | | | 350,000 | | | | 363,882 | |
Gilead Sciences Incorporated | | | 4.80 | | | | 4-1-2044 | | | | 350,000 | | | | 364,952 | |
| | | | |
| | | | | | | | | | | | | | | 7,220,321 | |
| | | | | | | | | | | | | | | | |
| | | | |
| Health Care Equipment & Supplies: 1.71% | | | | | | | | | | | | | | | | |
Abbott Laboratories | | | 2.35 | | | | 11-22-2019 | | | | 38,000 | | | | 37,744 | |
Abbott Laboratories | | | 4.13 | | | | 5-27-2020 | | | | 175,000 | | | | 178,174 | |
Abbott Laboratories | | | 4.90 | | | | 11-30-2046 | | | | 700,000 | | | | 760,622 | |
The accompanying notes are an integral part of these financial statements.
| | | | |
| 204 | | Wells Fargo Funds | | Portfolio of investments—August 31, 2018 (unaudited) |
INVESTMENT GRADE CORPORATE BOND PORTFOLIO
| | | | | | | | | | | | | | | | |
| Security name | | Interest rate | | | Maturity date | | | Principal | | | Value | |
| | | | |
| Health Care Equipment & Supplies (continued) | | | | | | | | | | | | | | | | |
Abbott Laboratories | | | 5.30 | % | | | 5-27-2040 | | | $ | 175,000 | | | $ | 195,732 | |
Abbott Laboratories | | | 6.00 | | | | 4-1-2039 | | | | 105,000 | | | | 125,213 | |
Abbott Laboratories | | | 6.15 | | | | 11-30-2037 | | | | 166,000 | | | | 199,760 | |
Becton Dickinson & Company | | | 2.89 | | | | 6-6-2022 | | | | 500,000 | | | | 486,771 | |
Becton Dickinson & Company | | | 3.13 | | | | 11-8-2021 | | | | 210,000 | | | | 207,607 | |
Becton Dickinson & Company | | | 3.25 | | | | 11-12-2020 | | | | 245,000 | | | | 244,649 | |
Becton Dickinson & Company | | | 3.70 | | | | 6-6-2027 | | | | 750,000 | | | | 718,168 | |
Boston Scientific Corporation | | | 3.85 | | | | 5-15-2025 | | | | 200,000 | | | | 200,804 | |
Boston Scientific Corporation | | | 6.00 | | | | 1-15-2020 | | | | 245,000 | | | | 254,495 | |
Boston Scientific Corporation | | | 7.38 | | | | 1-15-2040 | | | | 210,000 | | | | 281,756 | |
Medtronic Incorporated | | | 2.50 | | | | 3-15-2020 | | | | 220,000 | | | | 218,572 | |
Medtronic Incorporated | | | 3.15 | | | | 3-15-2022 | | | | 350,000 | | | | 349,089 | |
Medtronic Incorporated | | | 3.50 | | | | 3-15-2025 | | | | 600,000 | | | | 599,290 | |
Medtronic Incorporated | | | 4.63 | | | | 3-15-2044 | | | | 175,000 | | | | 185,805 | |
Stryker Corporation | | | 4.10 | | | | 4-1-2043 | | | | 175,000 | | | | 166,533 | |
Stryker Corporation | | | 4.38 | | | | 1-15-2020 | | | | 105,000 | | | | 106,866 | |
Stryker Corporation | | | 4.63 | | | | 3-15-2046 | | | | 350,000 | | | | 361,134 | |
Zimmer Holdings Incorporated | | | 3.55 | | | | 4-1-2025 | | | | 500,000 | | | | 482,010 | |
Zimmer Holdings Incorporated | | | 4.63 | | | | 11-30-2019 | | | | 250,000 | | | | 254,130 | |
| | | | |
| | | | | | | | | | | | | | | 6,614,924 | |
| | | | | | | | | | | | | | | | |
| | | | |
| Health Care Providers & Services: 3.97% | | | | | | | | | | | | | | | | |
Aetna Incorporated | | | 2.75 | | | | 11-15-2022 | | | | 650,000 | | | | 628,953 | |
Aetna Incorporated | | | 4.13 | | | | 6-1-2021 | | | | 340,000 | | | | 346,603 | |
Aetna Incorporated | | | 4.13 | | | | 11-15-2042 | | | | 175,000 | | | | 163,200 | |
Aetna Incorporated | | | 4.75 | | | | 3-15-2044 | | | | 400,000 | | | | 398,838 | |
AmerisourceBergen Corporation | | | 3.50 | | | | 11-15-2021 | | | | 210,000 | | | | 210,809 | |
AmerisourceBergen Corporation | | | 4.25 | | | | 3-1-2045 | | | | 175,000 | | | | 156,024 | |
Anthem Incorporated | | | 4.38 | | | | 12-1-2047 | | | | 200,000 | | | | 186,658 | |
Cardinal Health Incorporated | | | 2.62 | | | | 6-15-2022 | | | | 400,000 | | | | 383,867 | |
Cardinal Health Incorporated | | | 3.50 | | | | 11-15-2024 | | | | 350,000 | | | | 338,263 | |
Cardinal Health Incorporated | | | 4.37 | | | | 6-15-2047 | | | | 600,000 | | | | 524,019 | |
Catholic Health Initiatives | | | 4.35 | | | | 11-1-2042 | | | | 175,000 | | | | 164,615 | |
CIGNA Corporation | | | 4.00 | | | | 2-15-2022 | | | | 175,000 | | | | 177,334 | |
CIGNA Corporation | | | 4.50 | | | | 3-15-2021 | | | | 70,000 | | | | 71,757 | |
CIGNA Corporation | | | 5.13 | | | | 6-15-2020 | | | | 150,000 | | | | 154,753 | |
CIGNA Corporation | | | 5.38 | | | | 2-15-2042 | | | | 245,000 | | | | 258,930 | |
Coventry Health Care Incorporated | | | 5.45 | | | | 6-15-2021 | | | | 406,000 | | | | 425,996 | |
CVS Caremark Corporation | | | 2.75 | | | | 12-1-2022 | | | | 350,000 | | | | 337,366 | |
CVS Caremark Corporation | | | 5.30 | | | | 12-5-2043 | | | | 210,000 | | | | 221,265 | |
CVS Health Corporation | | | 2.13 | | | | 6-1-2021 | | | | 260,000 | | | | 251,790 | |
CVS Health Corporation | | | 2.80 | | | | 7-20-2020 | | | | 400,000 | | | | 397,254 | |
CVS Health Corporation | | | 3.88 | | | | 7-20-2025 | | | | 525,000 | | | | 518,345 | |
Dignity Health | | | 2.64 | | | | 11-1-2019 | | | | 350,000 | | | | 348,951 | |
Express Scripts Holding Company | | | 3.40 | | | | 3-1-2027 | | | | 600,000 | | | | 555,383 | |
Express Scripts Holding Company | | | 3.90 | | | | 2-15-2022 | | | | 350,000 | | | | 352,419 | |
Express Scripts Holding Company | | | 4.80 | | | | 7-15-2046 | | | | 210,000 | | | | 202,088 | |
Express Scripts Holding Company | | | 6.13 | | | | 11-15-2041 | | | | 175,000 | | | | 193,575 | |
Howard Hughes Medical Institute | | | 3.50 | | | | 9-1-2023 | | | | 332,000 | | | | 337,673 | |
The accompanying notes are an integral part of these financial statements.
| | | | | | |
| Portfolio of investments—August 31, 2018 (unaudited) | | Wells Fargo Funds | | | 205 | |
INVESTMENT GRADE CORPORATE BOND PORTFOLIO
| | | | | | | | | | | | | | | | |
| Security name | | Interest rate | | | Maturity date | | | Principal | | | Value | |
| | | | |
| Health Care Providers & Services (continued) | | | | | | | | | | | | | | | | |
Humana Incorporated | | | 3.15 | % | | | 12-1-2022 | | | $ | 210,000 | | | $ | 206,555 | |
Humana Incorporated | | | 4.95 | | | | 10-1-2044 | | | | 350,000 | | | | 366,236 | |
Kaiser Foundation Hospitals | | | 4.88 | | | | 4-1-2042 | | | | 175,000 | | | | 197,712 | |
Laboratory Corporation of America Holdings | | | 3.60 | | | | 2-1-2025 | | | | 350,000 | | | | 342,859 | |
Laboratory Corporation of America Holdings | | | 3.75 | | | | 8-23-2022 | | | | 39,000 | | | | 39,265 | |
Laboratory Corporation of America Holdings | | | 4.00 | | | | 11-1-2023 | | | | 105,000 | | | | 106,263 | |
McKesson Corporation | | | 2.85 | | | | 3-15-2023 | | | | 140,000 | | | | 134,430 | |
McKesson Corporation | | | 4.88 | | | | 3-15-2044 | | | | 350,000 | | | | 352,056 | |
Medco Health Solutions Incorporated | | | 4.13 | | | | 9-15-2020 | | | | 350,000 | | | | 354,715 | |
Quest Diagnostics Incorporated | | | 4.70 | | | | 4-1-2021 | | | | 112,000 | | | | 115,171 | |
Quest Diagnostics Incorporated | | | 4.75 | | | | 1-30-2020 | | | | 413,000 | | | | 422,351 | |
UnitedHealth Group Incorporated | | | 2.70 | | | | 7-15-2020 | | | | 320,000 | | | | 319,093 | |
UnitedHealth Group Incorporated | | | 2.88 | | | | 3-15-2023 | | | | 800,000 | | | | 784,578 | |
UnitedHealth Group Incorporated | | | 3.95 | | | | 10-15-2042 | | | | 520,000 | | | | 503,661 | |
UnitedHealth Group Incorporated | | | 4.25 | | | | 3-15-2043 | | | | 175,000 | | | | 175,634 | |
UnitedHealth Group Incorporated | | | 4.75 | | | | 7-15-2045 | | | | 350,000 | | | | 378,510 | |
UnitedHealth Group Incorporated | | | 5.80 | | | | 3-15-2036 | | | | 175,000 | | | | 209,439 | |
UnitedHealth Group Incorporated | | | 6.63 | | | | 11-15-2037 | | | | 105,000 | | | | 137,589 | |
WellPoint Incorporated | | | 2.25 | | | | 8-15-2019 | | | | 280,000 | | | | 278,546 | |
WellPoint Incorporated | | | 3.13 | | | | 5-15-2022 | | | | 350,000 | | | | 345,221 | |
WellPoint Incorporated | | | 3.30 | | | | 1-15-2023 | | | | 700,000 | | | | 693,451 | |
WellPoint Incorporated | | | 4.65 | | | | 1-15-2043 | | | | 315,000 | | | | 308,508 | |
WellPoint Incorporated | | | 4.65 | | | | 8-15-2044 | | | | 50,000 | | | | 48,674 | |
WellPoint Incorporated | | | 5.85 | | | | 1-15-2036 | | | | 200,000 | | | | 224,578 | |
| | | | |
| | | | | | | | | | | | | | | 15,351,823 | |
| | | | | | | | | | | | | | | | |
| | | | |
| Life Sciences Tools & Services: 0.46% | | | | | | | | | | | | | | | | |
Life Technologies Corporation | | | 5.00 | | | | 1-15-2021 | | | | 105,000 | | | | 107,926 | |
Life Technologies Corporation | | | 6.00 | | | | 3-1-2020 | | | | 175,000 | | | | 181,818 | |
Thermo Fisher Scientific Incorporated | | | 3.00 | | | | 4-15-2023 | | | | 200,000 | | | | 194,713 | |
Thermo Fisher Scientific Incorporated | | | 3.15 | | | | 1-15-2023 | | | | 350,000 | | | | 343,838 | |
Thermo Fisher Scientific Incorporated | | | 3.30 | | | | 2-15-2022 | | | | 210,000 | | | | 209,150 | |
Thermo Fisher Scientific Incorporated | | | 3.60 | | | | 8-15-2021 | | | | 280,000 | | | | 281,389 | |
Thermo Fisher Scientific Incorporated | | | 4.15 | | | | 2-1-2024 | | | | 280,000 | | | | 286,477 | |
Thermo Fisher Scientific Incorporated | | | 5.30 | | | | 2-1-2044 | | | | 140,000 | | | | 156,099 | |
| | | | |
| | | | | | | | | | | | | | | 1,761,410 | |
| | | | | | | | | | | | | | | | |
| | | | |
| Pharmaceuticals: 2.83% | | | | | | | | | | | | | | | | |
Allergan Incorporated | | | 2.80 | | | | 3-15-2023 | | | | 157,000 | | �� | | 149,660 | |
Allergan Incorporated | | | 3.38 | | | | 9-15-2020 | | | | 350,000 | | | | 350,716 | |
Bristol-Myers Squibb Company | | | 2.00 | | | | 8-1-2022 | | | | 175,000 | | | | 167,516 | |
Bristol-Myers Squibb Company | | | 3.25 | | | | 11-1-2023 | | | | 109,000 | | | | 109,081 | |
Bristol-Myers Squibb Company | | | 3.25 | | | | 8-1-2042 | | | | 175,000 | | | | 154,962 | |
Bristol-Myers Squibb Company | | | 4.50 | | | | 3-1-2044 | | | | 200,000 | | | | 212,266 | |
Eli Lilly & Company | | | 2.75 | | | | 6-1-2025 | | | | 70,000 | | | | 67,212 | |
Eli Lilly & Company | | | 3.70 | | | | 3-1-2045 | | | | 350,000 | | | | 336,111 | |
Eli Lilly & Company | | | 5.50 | | | | 3-15-2027 | | | | 280,000 | | | | 322,215 | |
GlaxoSmithKline Capital Incorporated | | | 2.80 | | | | 3-18-2023 | | | | 140,000 | | | | 136,742 | |
GlaxoSmithKline Capital Incorporated | | | 5.38 | | | | 4-15-2034 | | | | 210,000 | | | | 241,945 | |
The accompanying notes are an integral part of these financial statements.
| | | | |
| 206 | | Wells Fargo Funds | | Portfolio of investments—August 31, 2018 (unaudited) |
INVESTMENT GRADE CORPORATE BOND PORTFOLIO
| | | | | | | | | | | | | | | | |
| Security name | | Interest rate | | | Maturity date | | | Principal | | | Value | |
| | | | |
| Pharmaceuticals (continued) | | | | | | | | | | | | | | | | |
GlaxoSmithKline Capital Incorporated | | | 6.38 | % | | | 5-15-2038 | | | $ | 900,000 | | | $ | 1,155,789 | |
Johnson & Johnson | | | 2.45 | | | | 3-1-2026 | | | | 525,000 | | | | 496,354 | |
Johnson & Johnson | | | 3.38 | | | | 12-5-2023 | | | | 300,000 | | | | 304,454 | |
Johnson & Johnson | | | 3.70 | | | | 3-1-2046 | | | | 175,000 | | | | 169,077 | |
Johnson & Johnson | | | 4.38 | | | | 12-5-2033 | | | | 200,000 | | | | 216,926 | |
Johnson & Johnson | | | 4.50 | | | | 9-1-2040 | | | | 210,000 | | | | 228,264 | |
Johnson & Johnson | | | 4.85 | | | | 5-15-2041 | | | | 140,000 | | | | 161,056 | |
Johnson & Johnson | | | 4.95 | | | | 5-15-2033 | | | | 126,000 | | | | 144,754 | |
Merck & Company Incorporated | | | 2.35 | | | | 2-10-2022 | | | | 250,000 | | | | 244,688 | |
Merck & Company Incorporated | | | 2.75 | | | | 2-10-2025 | | | | 270,000 | | | | 261,319 | |
Merck & Company Incorporated | | | 3.60 | | | | 9-15-2042 | | | | 175,000 | | | | 167,736 | |
Merck & Company Incorporated | | | 3.70 | | | | 2-10-2045 | | | | 200,000 | | | | 193,170 | |
Merck & Company Incorporated | | | 3.88 | | | | 1-15-2021 | | | | 245,000 | | | | 250,417 | |
Merck & Company Incorporated | | | 4.15 | | | | 5-18-2043 | | | | 350,000 | | | | 360,954 | |
Mylan Incorporated | | | 4.20 | | | | 11-29-2023 | | | | 200,000 | | | | 199,034 | |
Mylan Incorporated | | | 5.40 | | | | 11-29-2043 | | | | 23,000 | | | | 22,036 | |
Mylan NV Company | | | 3.15 | | | | 6-15-2021 | | | | 280,000 | | | | 275,846 | |
Novartis Capital Corporation | | | 1.80 | | | | 2-14-2020 | | | | 180,000 | | | | 177,395 | |
Novartis Capital Corporation | | | 2.40 | | | | 9-21-2022 | | | | 350,000 | | | | 339,439 | |
Novartis Capital Corporation | | | 3.40 | | | | 5-6-2024 | | | | 600,000 | | | | 601,323 | |
Novartis Capital Corporation | | | 3.70 | | | | 9-21-2042 | | | | 175,000 | | | | 169,860 | |
Novartis Capital Corporation | | | 4.40 | | | | 4-24-2020 | | | | 350,000 | | | | 358,493 | |
Pfizer Incorporated | | | 3.40 | | | | 5-15-2024 | | | | 350,000 | | | | 354,265 | |
Pfizer Incorporated | | | 4.13 | | | | 12-15-2046 | | | | 420,000 | | | | 425,143 | |
Pfizer Incorporated | | | 4.30 | | | | 6-15-2043 | | | | 210,000 | | | | 217,790 | |
Pharmacia Corporation | | | 6.60 | | | | 12-1-2028 | | | | 350,000 | | | | 425,720 | |
Schering-Plough Corporation | | | 6.50 | | | | 12-1-2033 | | | | 175,000 | | | | 226,080 | |
Schering-Plough Corporation | | | 6.55 | | | | 9-15-2037 | | | | 140,000 | | | | 189,908 | |
Zoetis Incorporated | | | 4.70 | | | | 2-1-2043 | | | | 350,000 | | | | 359,226 | |
| | | | |
| | | | | | | | | | | | | | | 10,944,942 | |
| | | | | | | | | | | | | | | | |
| | | | |
Industrials: 8.93% | | | | | | | | | | | | | | | | |
| | | | |
| Aerospace & Defense: 2.52% | | | | | | | | | | | | | | | | |
General Dynamics Corporation | | | 2.25 | | | | 11-15-2022 | | | | 350,000 | | | | 336,254 | |
General Dynamics Corporation | | | 3.50 | | | | 5-15-2025 | | | | 200,000 | | | | 201,800 | |
General Dynamics Corporation | | | 3.75 | | | | 5-15-2028 | | | | 600,000 | | | | 608,642 | |
General Dynamics Corporation | | | 3.88 | | | | 7-15-2021 | | | | 140,000 | | | | 142,699 | |
L-3 Communications Corporation | | | 4.95 | | | | 2-15-2021 | | | | 350,000 | | | | 361,291 | |
Lockheed Martin Corporation | | | 2.50 | | | | 11-23-2020 | | | | 260,000 | | | | 256,950 | |
Lockheed Martin Corporation | | | 3.35 | | | | 9-15-2021 | | | | 175,000 | | | | 176,103 | |
Lockheed Martin Corporation | | | 3.80 | | | | 3-1-2045 | | | | 350,000 | | | | 324,309 | |
Lockheed Martin Corporation | | | 4.07 | | | | 12-15-2042 | | | | 229,000 | | | | 222,647 | |
Lockheed Martin Corporation | | | 4.70 | | | | 5-15-2046 | | | | 350,000 | | | | 372,937 | |
Lockheed Martin Corporation | | | 6.15 | | | | 9-1-2036 | | | | 122,000 | | | | 149,694 | |
Northrop Grumman Corporation | | | 2.55 | | | | 10-15-2022 | | | | 1,100,000 | | | | 1,065,714 | |
Northrop Grumman Corporation | | | 3.50 | | | | 3-15-2021 | | | | 210,000 | | | | 211,868 | |
Northrop Grumman Corporation | | | 5.05 | | | | 8-1-2019 | | | | 59,000 | | | | 60,170 | |
Northrop Grumman Corporation | | | 5.05 | | | | 11-15-2040 | | | | 70,000 | | | | 75,101 | |
Northrop Grumman Corporation | | | 7.75 | | | | 2-15-2031 | | | | 210,000 | | | | 280,546 | |
The accompanying notes are an integral part of these financial statements.
| | | | | | |
| Portfolio of investments—August 31, 2018 (unaudited) | | Wells Fargo Funds | | | 207 | |
INVESTMENT GRADE CORPORATE BOND PORTFOLIO
| | | | | | | | | | | | | | | | |
| Security name | | Interest rate | | | Maturity date | | | Principal | | | Value | |
| | | | |
| Aerospace & Defense (continued) | | | | | | | | | | | | | | | | |
Precision Castparts Corporation | | | 2.50 | % | | | 1-15-2023 | | | $ | 175,000 | | | $ | 169,279 | |
Precision Castparts Corporation | | | 3.25 | | | | 6-15-2025 | | | | 210,000 | | | | 205,770 | |
Precision Castparts Corporation | | | 3.90 | | | | 1-15-2043 | | | | 140,000 | | | | 135,451 | |
Raytheon Company | | | 2.50 | | | | 12-15-2022 | | | | 245,000 | | | | 239,012 | |
Raytheon Company | | | 7.20 | | | | 8-15-2027 | | | | 84,000 | | | | 106,128 | |
Rockwell Collins Incorporated | | | 3.70 | | | | 12-15-2023 | | | | 245,000 | | | | 245,180 | |
Rockwell Collins Incorporated | | | 4.80 | | | | 12-15-2043 | | | | 175,000 | | | | 179,445 | |
Textron Incorporated | | | 4.30 | | | | 3-1-2024 | | | | 140,000 | | | | 142,386 | |
The Boeing Company | | | 2.60 | | | | 10-30-2025 | | | | 800,000 | | | | 755,039 | |
The Boeing Company | | | 2.80 | | | | 3-1-2023 | | | | 200,000 | | | | 197,365 | |
The Boeing Company | | | 4.88 | | | | 2-15-2020 | | | | 428,000 | | | | 441,580 | |
The Boeing Company | | | 5.88 | | | | 2-15-2040 | | | | 21,000 | | | | 26,461 | |
The Boeing Company | | | 6.13 | | | | 2-15-2033 | | | | 126,000 | | | | 157,598 | |
United Technologies Corporation | | | 3.10 | | | | 6-1-2022 | | | | 200,000 | | | | 197,591 | |
United Technologies Corporation | | | 3.75 | | | | 11-1-2046 | | | | 270,000 | | | | 238,441 | |
United Technologies Corporation | | | 4.05 | | | | 5-4-2047 | | | | 1,200,000 | | | | 1,112,181 | |
United Technologies Corporation | | | 4.50 | | | | 4-15-2020 | | | | 350,000 | | | | 357,988 | |
| | | | |
| | | | | | | | | | | | | | | 9,753,620 | |
| | | | | | | | | | | | | | | | |
| | | | |
| Air Freight & Logistics: 0.82% | | | | | | | | | | | | | | | | |
FedEx Corporation | | | 2.63 | | | | 8-1-2022 | | | | 337,000 | | | | 328,460 | |
FedEx Corporation | | | 3.88 | | | | 8-1-2042 | | | | 140,000 | | | | 124,387 | |
FedEx Corporation | | | 3.90 | | | | 2-1-2035 | | | | 330,000 | | | | 311,897 | |
FedEx Corporation | | | 4.00 | | | | 1-15-2024 | | | | 203,000 | | | | 207,810 | |
FedEx Corporation | | | 4.55 | | | | 4-1-2046 | | | | 350,000 | | | | 342,904 | |
FedEx Corporation | | | 4.90 | | | | 1-15-2034 | | | | 175,000 | | | | 186,866 | |
FedEx Corporation | | | 5.10 | | | | 1-15-2044 | | | | 210,000 | | | | 220,669 | |
United Parcel Service Incorporated | | | 2.35 | | | | 5-16-2022 | | | | 300,000 | | | | 291,469 | |
United Parcel Service Incorporated | | | 2.45 | | | | 10-1-2022 | | | | 280,000 | | | | 272,072 | |
United Parcel Service Incorporated | | | 3.13 | | | | 1-15-2021 | | | | 630,000 | | | | 633,457 | |
United Parcel Service Incorporated | | | 6.20 | | | | 1-15-2038 | | | | 206,000 | | | | 258,464 | |
| | | | |
| | | | | | | | | | | | | | | 3,178,455 | |
| | | | | | | | | | | | | | | | |
| | | | |
| Airlines: 0.32% | | | | | | | | | | | | | | | | |
American Airlines Incorporated | | | 3.20 | | | | 12-15-2029 | | | | 57,164 | | | | 54,518 | |
American Airlines Incorporated | | | 3.38 | | | | 11-1-2028 | | | | 27,307 | | | | 26,454 | |
American Airlines Incorporated | | | 4.95 | | | | 7-15-2024 | | | | 433,159 | | | | 444,963 | |
Continental Airlines Incorporated Series A | | | 7.25 | | | | 5-10-2021 | | | | 85,306 | | | | 88,888 | |
Delta Air Lines Incorporated | | | 6.82 | | | | 2-10-2024 | | | | 35,512 | | | | 38,619 | |
United Airlines Incorporated | | | 4.00 | | | | 10-11-2027 | | | | 291,517 | | | | 294,561 | |
United Airlines Incorporated | | | 4.30 | | | | 2-15-2027 | | | | 184,572 | | | | 188,660 | |
US Airways Group Incorporated | | | 3.95 | | | | 5-15-2027 | | | | 78,086 | | | | 77,934 | |
| | | | |
| | | | | | | | | | | | | | | 1,214,597 | |
| | | | | | | | | | | | | | | | |
| | | | |
| Building Products: 0.34% | | | | | | | | | | | | | | | | |
Johnson Controls International plc | | | 3.90 | | | | 2-14-2026 | | | | 500,000 | | | | 496,340 | |
Johnson Controls International plc | | | 4.25 | | | | 3-1-2021 | | | | 120,000 | | | | 122,120 | |
Johnson Controls International plc | | | 5.00 | | | | 3-30-2020 | | | | 100,000 | | | | 102,753 | |
Masco Corporation | | | 3.50 | | | | 4-1-2021 | | | | 245,000 | | | | 244,672 | |
The accompanying notes are an integral part of these financial statements.
| | | | |
| 208 | | Wells Fargo Funds | | Portfolio of investments—August 31, 2018 (unaudited) |
INVESTMENT GRADE CORPORATE BOND PORTFOLIO
| | | | | | | | | | | | | | | | |
| Security name | | Interest rate | | | Maturity date | | | Principal | | | Value | |
| | | | |
| Building Products (continued) | | | | | | | | | | | | | | | | |
Masco Corporation | | | 4.38 | % | | | 4-1-2026 | | | $ | 190,000 | | | $ | 190,180 | |
Owens Corning Incorporated | | | 4.20 | | | | 12-15-2022 | | | | 149,000 | | | | 150,551 | |
| | | | |
| | | | | | | | | | | | | | | 1,306,616 | |
| | | | | | | | | | | | | | | | |
| | | | |
| Commercial Services & Supplies: 0.30% | | | | | | | | | | | | | | | | |
Cintas Corporation No. 2 | | | 3.25 | | | | 6-1-2022 | | | | 70,000 | | | | 69,689 | |
Republic Services Incorporated | | | 2.90 | | | | 7-1-2026 | | | | 260,000 | | | | 242,516 | |
Republic Services Incorporated | | | 4.75 | | | | 5-15-2023 | | | | 210,000 | | | | 220,289 | |
Republic Services Incorporated | | | 5.25 | | | | 11-15-2021 | | | | 35,000 | | | | 36,994 | |
Republic Services Incorporated | | | 5.50 | | | | 9-15-2019 | | | | 87,000 | | | | 89,242 | |
Waste Management Incorporated | | | 4.10 | | | | 3-1-2045 | | | | 350,000 | | | | 345,589 | |
Waste Management Incorporated | | | 4.60 | | | | 3-1-2021 | | | | 140,000 | | | | 144,451 | |
| | | | |
| | | | | | | | | | | | | | | 1,148,770 | |
| | | | | | | | | | | | | | | | |
| | | | |
| Electrical Equipment: 0.21% | | | | | | | | | | | | | | | | |
Eaton Corporation | | | 4.15 | | | | 11-2-2042 | | | | 350,000 | | | | 335,559 | |
Emerson Electric Company | | | 3.15 | | | | 6-1-2025 | | | | 210,000 | | | | 203,827 | |
Emerson Electric Company | | | 4.25 | | | | 11-15-2020 | | | | 140,000 | | | | 142,735 | |
Emerson Electric Company | | | 4.88 | | | | 10-15-2019 | | | | 140,000 | | | | 143,087 | |
| | | | |
| | | | | | | | | | | | | | | 825,208 | |
| | | | | | | | | | | | | | | | |
| | | | |
| Industrial Conglomerates: 1.04% | | | | | | | | | | | | | | | | |
3M Company | | | 5.70 | | | | 3-15-2037 | | | | 227,000 | | | | 276,412 | |
General Electric Capital Corporation | | | 4.38 | | | | 9-16-2020 | | | | 200,000 | | | | 204,866 | |
General Electric Capital Corporation | | | 5.88 | | | | 1-14-2038 | | | | 200,000 | | | | 228,281 | |
General Electric Capital Corporation | | | 6.75 | | | | 3-15-2032 | | | | 621,000 | | | | 769,101 | |
General Electric Company | | | 4.13 | | | | 10-9-2042 | | | | 400,000 | | | | 365,431 | |
General Electric Company | | | 4.50 | | | | 3-11-2044 | | | | 200,000 | | | | 193,540 | |
Honeywell International Incorporated | | | 2.50 | | | | 11-1-2026 | | | | 1,800,000 | | | | 1,673,515 | |
Honeywell International Incorporated | | | 3.35 | | | | 12-1-2023 | | | | 140,000 | | | | 141,286 | |
Honeywell International Incorporated | | | 4.25 | | | | 3-1-2021 | | | | 35,000 | | | | 36,016 | |
Roper Industries Incorporated | | | 6.25 | | | | 9-1-2019 | | | | 140,000 | | | | 144,418 | |
| | | | |
| | | | | | | | | | | | | | | 4,032,866 | |
| | | | | | | | | | | | | | | | |
| | | | |
| Machinery: 0.88% | | | | | | | | | | | | | | | | |
Caterpillar Incorporated | | | 3.80 | | | | 8-15-2042 | | | | 105,000 | | | | 101,169 | |
Caterpillar Incorporated | | | 4.30 | | | | 5-15-2044 | | | | 350,000 | | | | 367,640 | |
Caterpillar Incorporated | | | 4.75 | | | | 5-15-2064 | | | | 900,000 | | | | 948,147 | |
Deere & Company | | | 2.60 | | | | 6-8-2022 | | | | 350,000 | | | | 343,554 | |
Deere & Company | | | 3.90 | | | | 6-9-2042 | | | | 350,000 | | | | 350,157 | |
Deere & Company | | | 5.38 | | | | 10-16-2029 | | | | 210,000 | | | | 240,271 | |
Dover Corporation | | | 5.38 | | | | 10-15-2035 | | | | 140,000 | | | | 158,235 | |
Illinois Tool Works Incorporated | | | 3.38 | | | | 9-15-2021 | | | | 84,000 | | | | 84,499 | |
Illinois Tool Works Incorporated | | | 3.90 | | | | 9-1-2042 | | | | 214,000 | | | | 212,060 | |
Illinois Tool Works Incorporated | | | 4.88 | | | | 9-15-2041 | | | | 206,000 | | | | 230,131 | |
Parker Hannifin Corporation | | | 3.50 | | | | 9-15-2022 | | | | 70,000 | | | | 70,426 | |
Parker Hannifin Corporation | | | 6.25 | | | | 5-15-2038 | | | | 42,000 | | | | 52,532 | |
Stanley Black & Decker Incorporated | | | 2.90 | | | | 11-1-2022 | | | | 245,000 | | | | 240,269 | |
| | | | |
| | | | | | | | | | | | | | | 3,399,090 | |
| | | | | | | | | | | | | | | | |
The accompanying notes are an integral part of these financial statements.
| | | | | | |
| Portfolio of investments—August 31, 2018 (unaudited) | | Wells Fargo Funds | | | 209 | |
INVESTMENT GRADE CORPORATE BOND PORTFOLIO
| | | | | | | | | | | | | | | | |
| Security name | | Interest rate | | | Maturity date | | | Principal | | | Value | |
| | | | |
| Professional Services: 0.05% | | | | | | | | | | | | | | | | |
Verisk Analytics Incorporated | | | 4.13 | % | | | 9-12-2022 | | | $ | 175,000 | | | $ | 177,629 | |
| | | | | | | | | | | | | | | | |
| | | | |
| Road & Rail: 1.89% | | | | | | | | | | | | | | | | |
Burlington Northern Santa Fe LLC | | | 3.00 | | | | 3-15-2023 | | | | 210,000 | | | | 207,364 | |
Burlington Northern Santa Fe LLC | | | 3.40 | | | | 9-1-2024 | | | | 210,000 | | | | 209,693 | |
Burlington Northern Santa Fe LLC | | | 3.75 | | | | 4-1-2024 | | | | 350,000 | | | | 355,352 | |
Burlington Northern Santa Fe LLC | | | 4.45 | | | | 3-15-2043 | | | | 210,000 | | | | 216,435 | |
Burlington Northern Santa Fe LLC | | | 4.55 | | | | 9-1-2044 | | | | 210,000 | | | | 219,850 | |
Burlington Northern Santa Fe LLC | | | 4.70 | | | | 10-1-2019 | | | | 87,000 | | | | 88,693 | |
Burlington Northern Santa Fe LLC | | | 4.95 | | | | 9-15-2041 | | | | 140,000 | | | | 153,636 | |
Burlington Northern Santa Fe LLC | | | 5.05 | | | | 3-1-2041 | | | | 175,000 | | | | 193,716 | |
Burlington Northern Santa Fe LLC | | | 5.15 | | | | 9-1-2043 | | | | 210,000 | | | | 236,784 | |
CSX Corporation | | | 3.40 | | | | 8-1-2024 | | | | 278,000 | | | | 275,748 | |
CSX Corporation | | | 3.70 | | | | 10-30-2020 | | | | 175,000 | | | | 176,630 | |
CSX Corporation | | | 4.10 | | | | 3-15-2044 | | | | 280,000 | | | | 264,848 | |
CSX Corporation | | | 4.50 | | | | 8-1-2054 | | | | 350,000 | | | | 341,332 | |
CSX Corporation | | | 4.75 | | | | 5-30-2042 | | | | 161,000 | | | | 166,892 | |
CSX Corporation | | | 6.00 | | | | 10-1-2036 | | | | 210,000 | | | | 249,476 | |
CSX Corporation | | | 6.22 | | | | 4-30-2040 | | | | 140,000 | | | | 171,381 | |
Kansas City Southern | | | 3.00 | | | | 5-15-2023 | | | | 51,000 | | | | 49,266 | |
Kansas City Southern | | | 4.30 | | | | 5-15-2043 | | | | 140,000 | | | | 132,601 | |
Norfolk Southern Corporation | | | 2.90 | | | | 2-15-2023 | | | | 400,000 | | | | 391,850 | |
Norfolk Southern Corporation | | | 2.90 | | | | 6-15-2026 | | | | 50,000 | | | | 47,340 | |
Norfolk Southern Corporation | | | 3.00 | | | | 4-1-2022 | | | | 350,000 | | | | 346,178 | |
Norfolk Southern Corporation | | | 3.15 | | | | 6-1-2027 | | | | 300,000 | | | | 285,939 | |
Norfolk Southern Corporation | | | 3.85 | | | | 1-15-2024 | | | | 140,000 | | | | 142,088 | |
Norfolk Southern Corporation | | | 3.95 | | | | 10-1-2042 | | | | 384,000 | | | | 360,773 | |
Ryder System Incorporated | | | 2.50 | | | | 5-11-2020 | | | | 140,000 | | | | 138,274 | |
Union Pacific Corporation | | | 2.75 | | | | 4-15-2023 | | | | 200,000 | | | | 194,486 | |
Union Pacific Corporation | | | 3.25 | | | | 1-15-2025 | | | | 175,000 | | | | 171,010 | |
Union Pacific Corporation | | | 3.75 | | | | 3-15-2024 | | | | 140,000 | | | | 141,490 | |
Union Pacific Corporation | | | 3.80 | | | | 10-1-2051 | | | | 809,000 | | | | 721,580 | |
Union Pacific Corporation | | | 4.15 | | | | 1-15-2045 | | | | 175,000 | | | | 169,527 | |
Union Pacific Corporation | | | 4.16 | | | | 7-15-2022 | | | | 306,000 | | | | 315,887 | |
Union Pacific Corporation | | | 4.30 | | | | 6-15-2042 | | | | 175,000 | | | | 175,448 | |
| | | | |
| | | | | | | | | | | | | | | 7,311,567 | |
| | | | | | | | | | | | | | | | |
| | | | |
| Trading Companies & Distributors: 0.56% | | | | | | | | | | | | | | | | |
Air Lease Corporation | | | 3.25 | | | | 3-1-2025 | | | | 200,000 | | | | 188,625 | |
Air Lease Corporation | | | 3.63 | | | | 12-1-2027 | | | | 1,500,000 | | | | 1,394,787 | |
GATX Corporation | | | 4.85 | | | | 6-1-2021 | | | | 70,000 | | | | 72,218 | |
International Lease Finance Corporation | | | 8.25 | | | | 12-15-2020 | | | | 200,000 | | | | 219,587 | |
W.W. Grainger Incorporated | | | 4.60 | | | | 6-15-2045 | | | | 280,000 | | | | 295,822 | |
| | | | |
| | | | | | | | | | | | | | | 2,171,039 | |
| | | | | | | | | | | | | | | | |
| | | | |
Information Technology: 6.73% | | | | | | | | | | | | | | | | |
| | | | |
| Communications Equipment: 0.59% | | | | | | | | | | | | | | | | |
Cisco Systems Incorporated | | | 2.20 | | | | 2-28-2021 | | | | 700,000 | | | | 688,370 | |
Cisco Systems Incorporated | | | 2.45 | | | | 6-15-2020 | | | | 420,000 | | | | 417,453 | |
The accompanying notes are an integral part of these financial statements.
| | | | |
| 210 | | Wells Fargo Funds | | Portfolio of investments—August 31, 2018 (unaudited) |
INVESTMENT GRADE CORPORATE BOND PORTFOLIO
| | | | | | | | | | | | | | | | |
| Security name | | Interest rate | | | Maturity date | | | Principal | | | Value | |
| | | | |
| Communications Equipment (continued) | | | | | | | | | | | | | | | | |
Cisco Systems Incorporated | | | 2.90 | % | | | 3-4-2021 | | | $ | 210,000 | | | $ | 209,636 | |
Cisco Systems Incorporated | | | 2.95 | | | | 2-28-2026 | | | | 340,000 | | | | 328,008 | |
Cisco Systems Incorporated | | | 3.00 | | | | 6-15-2022 | | | | 140,000 | | | | 139,547 | |
Motorola Incorporated | | | 3.50 | | | | 3-1-2023 | | | | 385,000 | | | | 376,435 | |
Motorola Incorporated | | | 7.50 | | | | 5-15-2025 | | | | 84,000 | | | | 96,612 | |
| | | | |
| | | | | | | | | | | | | | | 2,256,061 | |
| | | | | | | | | | | | | | | | |
| | | | |
| Electronic Equipment, Instruments & Components: 0.24% | | | | | | | | | | | | | | | | |
Amphenol Corporation | | | 4.00 | | | | 2-1-2022 | | | | 210,000 | | | | 214,073 | |
Avnet Incorporated | | | 5.88 | | | | 6-15-2020 | | | | 70,000 | | | | 72,669 | |
Corning Incorporated | | | 4.25 | | | | 8-15-2020 | | | | 175,000 | | | | 177,816 | |
Corning Incorporated | | | 5.75 | | | | 8-15-2040 | | | | 105,000 | | | | 121,218 | |
Keysight Technologies Incorporated | | | 3.30 | | | | 10-30-2019 | | | | 175,000 | | | | 174,432 | |
Keysight Technologies Incorporated | | | 4.55 | | | | 10-30-2024 | | | | 175,000 | | | | 178,166 | |
| | | | |
| | | | | | | | | | | | | | | 938,374 | |
| | | | | | | | | | | | | | | | |
| | | | |
| Internet Software & Services: 0.44% | | | | | | | | | | | | | | | | |
Alphabet Incorporated | | | 3.38 | | | | 2-25-2024 | | | | 87,000 | | | | 88,426 | |
Alphabet Incorporated | | | 3.63 | | | | 5-19-2021 | | | | 350,000 | | | | 357,471 | |
eBay Incorporated | | | 2.60 | | | | 7-15-2022 | | | | 245,000 | | | | 237,680 | |
eBay Incorporated | | | 2.88 | | | | 8-1-2021 | | | | 350,000 | | | | 345,902 | |
eBay Incorporated | | | 3.25 | | | | 10-15-2020 | | | | 140,000 | | | | 140,560 | |
eBay Incorporated | | | 3.45 | | | | 8-1-2024 | | | | 405,000 | | | | 396,538 | |
eBay Incorporated | | | 4.00 | | | | 7-15-2042 | | | | 175,000 | | | | 146,458 | |
| | | | |
| | | | | | | | | | | | | | | 1,713,035 | |
| | | | | | | | | | | | | | | | |
| | | | |
| IT Services: 1.45% | | | | | | | | | | | | | | | | |
Fidelity National Information Services Incorporated | | | 3.00 | | | | 8-15-2026 | | | | 400,000 | | | | 372,511 | |
Fidelity National Information Services Incorporated | | | 3.50 | | | | 4-15-2023 | | | | 49,000 | | | | 48,714 | |
Fidelity National Information Services Incorporated | | | 4.75 | | | | 5-15-2048 | | | | 500,000 | | | | 503,273 | |
Fidelity National Information Services Incorporated | | | 5.00 | | | | 10-15-2025 | | | | 195,000 | | | | 206,547 | |
Fiserv Incorporated | | | 2.70 | | | | 6-1-2020 | | | | 280,000 | | | | 277,619 | |
Fiserv Incorporated | | | 3.85 | | | | 6-1-2025 | | | | 210,000 | | | | 208,826 | |
IBM Corporation | | | 1.63 | | | | 5-15-2020 | | | | 350,000 | | | | 343,164 | |
IBM Corporation | | | 1.88 | | | | 8-1-2022 | | | | 280,000 | | | | 266,195 | |
IBM Corporation | | | 3.38 | | | | 8-1-2023 | | | | 210,000 | | | | 210,635 | |
IBM Corporation | | | 4.00 | | | | 6-20-2042 | | | | 350,000 | | | | 339,277 | |
IBM Corporation | | | 5.88 | | | | 11-29-2032 | | | | 175,000 | | | | 210,453 | |
IBM Corporation | | | 7.00 | | | | 10-30-2025 | | | | 210,000 | | | | 254,300 | |
Mastercard Incorporated | | | 3.50 | | | | 2-26-2028 | | | | 400,000 | | | | 399,215 | |
Total System Services Incorporated | | | 3.75 | | | | 6-1-2023 | | | | 105,000 | | | | 104,534 | |
Visa Incorporated | | | 2.20 | | | | 12-14-2020 | | | | 700,000 | | | | 690,087 | |
Visa Incorporated | | | 3.15 | | | | 12-14-2025 | | | | 1,020,000 | | | | 998,586 | |
Western Union Company | | | 5.25 | | | | 4-1-2020 | | | | 56,000 | | | | 57,369 | |
Western Union Company | | | 6.20 | | | | 11-17-2036 | | | | 122,000 | | | | 121,788 | |
| | | | |
| | | | | | | | | | | | | | | 5,613,093 | |
| | | | | | | | | | | | | | | | |
| | | | |
| Life Sciences Tools & Services: 0.03% | | | | | | | | | | | | | | | | |
Agilent Technologies Incorporated | | | 3.88 | | | | 7-15-2023 | | | | 105,000 | | | | 105,346 | |
| | | | | | | | | | | | | | | | |
The accompanying notes are an integral part of these financial statements.
| | | | | | |
| Portfolio of investments—August 31, 2018 (unaudited) | | Wells Fargo Funds | | | 211 | |
INVESTMENT GRADE CORPORATE BOND PORTFOLIO
| | | | | | | | | | | | | | | | |
| Security name | | Interest rate | | | Maturity date | | | Principal | | | Value | |
| | | | |
| Semiconductors & Semiconductor Equipment: 1.35% | | | | | | | | | | | | | | | | |
Analog Devices Incorporated | | | 2.88 | % | | | 6-1-2023 | | | $ | 105,000 | | | $ | 101,393 | |
Applied Materials Incorporated | | | 4.30 | | | | 6-15-2021 | | | | 210,000 | | | | 217,353 | |
Applied Materials Incorporated | | | 5.85 | | | | 6-15-2041 | | | | 140,000 | | | | 167,823 | |
Broadcom Corporation | | | 3.88 | | | | 1-15-2027 | | | | 1,200,000 | | | | 1,121,870 | |
Intel Corporation | | | 2.60 | | | | 5-19-2026 | | | | 220,000 | | | | 206,090 | |
Intel Corporation | | | 4.10 | | | | 5-19-2046 | | | | 800,000 | | | | 799,677 | |
Intel Corporation | | | 4.10 | | | | 5-11-2047 | | | | 310,000 | | | | 311,195 | |
Intel Corporation | | | 4.25 | | | | 12-15-2042 | | | | 175,000 | | | | 178,944 | |
Intel Corporation | | | 4.90 | | | | 7-29-2045 | | | | 230,000 | | | | 256,626 | |
Lam Research Corporation | | | 2.80 | | | | 6-15-2021 | | | | 350,000 | | | | 345,031 | |
Qualcomm Incorporated | | | 2.25 | | | | 5-20-2020 | | | | 500,000 | | | | 493,922 | |
Qualcomm Incorporated | | | 3.45 | | | | 5-20-2025 | | | | 700,000 | | | | 681,381 | |
Texas Instruments Incorporated | | | 2.25 | | | | 5-1-2023 | | | | 175,000 | | | | 167,123 | |
Xilinx Incorporated | | | 3.00 | | | | 3-15-2021 | | | | 175,000 | | | | 174,158 | |
| | | | |
| | | | | | | | | | | | | | | 5,222,586 | |
| | | | | | | | | | | | | | | | |
| | | | |
| Software: 1.23% | | | | | | | | | | | | | | | | |
Adobe Systems Incorporated | | | 4.75 | | | | 2-1-2020 | | | | 227,000 | | | | 233,090 | |
Autodesk Incorporated | | | 3.60 | | | | 12-15-2022 | | | | 175,000 | | | | 173,892 | |
CA Incorporated | | | 5.38 | | | | 12-1-2019 | | | | 350,000 | | | | 358,985 | |
Microsoft Corporation | | | 2.00 | | | | 11-3-2020 | | | | 490,000 | | | | 483,019 | |
Microsoft Corporation | | | 3.00 | | | | 10-1-2020 | | | | 280,000 | | | | 281,987 | |
Microsoft Corporation | | | 3.75 | | | | 5-1-2043 | | | | 33,000 | | | | 32,055 | |
Microsoft Corporation | | | 3.75 | | | | 2-12-2045 | | | | 350,000 | | | | 340,695 | |
Microsoft Corporation | | | 4.00 | | | | 2-12-2055 | | | | 350,000 | | | | 347,832 | |
Microsoft Corporation | | | 4.50 | | | | 2-6-2057 | | | | 250,000 | | | | 272,134 | |
Microsoft Corporation | | | 4.88 | | | | 12-15-2043 | | | | 140,000 | | | | 159,087 | |
Microsoft Corporation | | | 5.20 | | | | 6-1-2039 | | | | 77,000 | | | | 90,772 | |
Oracle Corporation | | | 2.80 | | | | 7-8-2021 | | | | 250,000 | | | | 249,060 | |
Oracle Corporation | | | 3.88 | | | | 7-15-2020 | | | | 245,000 | | | | 249,393 | |
Oracle Corporation | | | 4.00 | | | | 7-15-2046 | | | | 350,000 | | | | 336,444 | |
Oracle Corporation | | | 4.30 | | | | 7-8-2034 | | | | 175,000 | | | | 180,114 | |
Oracle Corporation | | | 4.38 | | | | 5-15-2055 | | | | 200,000 | | | | 201,424 | |
Oracle Corporation | | | 4.50 | | | | 7-8-2044 | | | | 350,000 | | | | 362,806 | |
Oracle Corporation | | | 6.13 | | | | 7-8-2039 | | | | 140,000 | | | | 174,236 | |
Oracle Corporation | | | 6.50 | | | | 4-15-2038 | | | | 175,000 | | | | 225,320 | |
| | | | |
| | | | | | | | | | | | | | | 4,752,345 | |
| | | | | | | | | | | | | | | | |
| | | | |
| Technology Hardware, Storage & Peripherals: 1.40% | | | | | | | | | | | | | | | | |
Apple Incorporated | | | 3.25 | | | | 2-23-2026 | | | | 475,000 | | | | 467,084 | |
Apple Incorporated | | | 3.35 | | | | 2-9-2027 | | | | 200,000 | | | | 197,129 | |
Apple Incorporated | | | 4.38 | | | | 5-13-2045 | | | | 350,000 | | | | 365,295 | |
Apple Incorporated | | | 4.65 | | | | 2-23-2046 | | | | 200,000 | | | | 217,830 | |
Diamond 1 Finance Corporation 144A | | | 4.42 | | | | 6-15-2021 | | | | 400,000 | | | | 406,789 | |
Diamond 1 Finance Corporation 144A | | | 8.35 | | | | 7-15-2046 | | | | 700,000 | | | | 857,120 | |
Hewlett Packard Enterprise Company | | | 4.40 | | | | 10-15-2022 | | | | 200,000 | | | | 205,933 | |
Hewlett Packard Enterprise Company | | | 4.90 | | | | 10-15-2025 | | | | 700,000 | | | | 721,426 | |
Hewlett Packard Enterprise Company | | | 6.35 | | | | 10-15-2045 | | | | 525,000 | | | | 541,164 | |
Hewlett-Packard Company | | | 3.75 | | | | 12-1-2020 | | | | 29,000 | | | | 29,298 | |
The accompanying notes are an integral part of these financial statements.
| | | | |
| 212 | | Wells Fargo Funds | | Portfolio of investments—August 31, 2018 (unaudited) |
INVESTMENT GRADE CORPORATE BOND PORTFOLIO
| | | | | | | | | | | | | | | | |
| Security name | | Interest rate | | | Maturity date | | | Principal | | | Value | |
| | | | |
| Technology Hardware, Storage & Peripherals (continued) | | | | | | | | | | | | | | | | |
Hewlett-Packard Company | | | 4.05 | % | | | 9-15-2022 | | | $ | 175,000 | | | $ | 177,879 | |
Hewlett-Packard Company | | | 6.00 | | | | 9-15-2041 | | | | 332,000 | | | | 339,465 | |
Seagate HDD | | | 4.75 | | | | 1-1-2025 | | | | 350,000 | | | | 335,272 | |
Xerox Corporation | | | 4.50 | | | | 5-15-2021 | | | | 400,000 | | | | 403,534 | |
Xerox Corporation | | | 5.63 | | | | 12-15-2019 | | | | 140,000 | | | | 143,820 | |
| | | | |
| | | | | | | | | | | | | | | 5,409,038 | |
| | | | | | | | | | | | | | | | |
| | | | |
Materials: 2.69% | | | | | | | | | | | | | | | | |
| | | | |
| Chemicals: 1.80% | | | | | | | | | | | | | | | | |
Air Products & Chemicals Incorporated | | | 3.00 | | | | 11-3-2021 | | | | 175,000 | | | | 174,631 | |
Air Products & Chemicals Incorporated | | | 4.38 | | | | 8-21-2019 | | | | 105,000 | | | | 106,724 | |
Dow Chemical Company | | | 3.50 | | | | 10-1-2024 | | | | 675,000 | | | | 661,860 | |
Dow Chemical Company | | | 4.13 | | | | 11-15-2021 | | | | 350,000 | | | | 357,028 | |
Dow Chemical Company | | | 4.25 | | | | 10-1-2034 | | | | 175,000 | | | | 170,181 | |
Dow Chemical Company | | | 5.25 | | | | 11-15-2041 | | | | 175,000 | | | | 185,399 | |
E.I. du Pont de Nemours & Company | | | 2.80 | | | | 2-15-2023 | | | | 810,000 | | | | 790,941 | |
E.I. du Pont de Nemours & Company | | | 4.50 | | | | 8-15-2019 | | | | 280,000 | | | | 284,762 | |
E.I. du Pont de Nemours & Company | | | 4.63 | | | | 1-15-2020 | | | | 140,000 | | | | 143,183 | |
E.I. du Pont de Nemours & Company | | | 6.50 | | | | 1-15-2028 | | | | 175,000 | | | | 207,901 | |
Eastman Chemical Company | | | 2.70 | | | | 1-15-2020 | | | | 210,000 | | | | 209,025 | |
Eastman Chemical Company | | | 3.60 | | | | 8-15-2022 | | | | 280,000 | | | | 280,319 | |
Eastman Chemical Company | | | 4.80 | | | | 9-1-2042 | | | | 140,000 | | | | 139,985 | |
Ecolab Incorporated | | | 4.35 | | | | 12-8-2021 | | | | 286,000 | | | | 295,815 | |
Ecolab Incorporated | | | 5.50 | | | | 12-8-2041 | | | | 210,000 | | | | 247,536 | |
Mosaic Company | | | 3.75 | | | | 11-15-2021 | | | | 80,000 | | | | 80,039 | |
Mosaic Company | | | 4.25 | | | | 11-15-2023 | | | | 297,000 | | | | 301,069 | |
Mosaic Company | | | 5.63 | | | | 11-15-2043 | | | | 175,000 | | | | 178,642 | |
Praxair Incorporated | | | 2.45 | | | | 2-15-2022 | | | | 140,000 | | | | 136,821 | |
Praxair Incorporated | | | 2.70 | | | | 2-21-2023 | | | | 105,000 | | | | 102,714 | |
Praxair Incorporated | | | 4.05 | | | | 3-15-2021 | | | | 140,000 | | | | 143,097 | |
RPM International Incorporated | | | 6.13 | | | | 10-15-2019 | | | | 140,000 | | | | 144,217 | |
The Sherwin-Williams Company | | | 3.13 | | | | 6-1-2024 | | | | 1,200,000 | | | | 1,158,618 | |
The Sherwin Williams Company | | | 3.45 | | | | 8-1-2025 | | | | 400,000 | | | | 385,289 | |
The Sherwin-Williams Company | | | 4.00 | | | | 12-15-2042 | | | | 92,000 | | | | 83,072 | |
| | | | |
| | | | | | | | | | | | | | | 6,968,868 | |
| | | | | | | | | | | | | | | | |
| | | | |
| Containers & Packaging: 0.46% | | | | | | | | | | | | | | | | |
Bemis Company Incorporated | | | 6.80 | | | | 8-1-2019 | | | | 7,000 | | | | 7,238 | |
International Paper Company | | | 3.00 | | | | 2-15-2027 | | | | 200,000 | | | | 185,072 | |
International Paper Company | | | 3.65 | | | | 6-15-2024 | | | | 350,000 | | | | 348,316 | |
International Paper Company | | | 4.75 | | | | 2-15-2022 | | | | 52,000 | | | | 54,021 | |
International Paper Company | | | 4.80 | | | | 6-15-2044 | | | | 175,000 | | | | 172,853 | |
International Paper Company | | | 7.30 | | | | 11-15-2039 | | | | 175,000 | | | | 222,598 | |
International Paper Company | | | 7.50 | | | | 8-15-2021 | | | | 214,000 | | | | 237,730 | |
MeadWestvaco Corporation | | | 7.95 | | | | 2-15-2031 | | | | 35,000 | | | | 45,763 | |
Packaging Corporation of America | | | 3.65 | | | | 9-15-2024 | | | | 175,000 | | | | 172,202 | |
Packaging Corporation of America | | | 3.90 | | | | 6-15-2022 | | | | 140,000 | | | | 141,872 | |
Plum Creek Timberlands LP | | | 3.25 | | | | 3-15-2023 | | | | 192,000 | | | | 187,483 | |
| | | | |
| | | | | | | | | | | | | | | 1,775,148 | |
| | | | | | | | | | | | | | | | |
The accompanying notes are an integral part of these financial statements.
| | | | | | |
| Portfolio of investments—August 31, 2018 (unaudited) | | Wells Fargo Funds | | | 213 | |
INVESTMENT GRADE CORPORATE BOND PORTFOLIO
| | | | | | | | | | | | | | | | |
| Security name | | Interest rate | | | Maturity date | | | Principal | | | Value | |
| | | | |
| Metals & Mining: 0.38% | | | | | | | | | | | | | | | | |
Barrick Gold Finance Company LLC | | | 5.70 | % | | | 5-30-2041 | | | $ | 210,000 | | | $ | 228,516 | |
Newmont Mining Corporation | | | 4.88 | | | | 3-15-2042 | | | | 350,000 | | | | 343,910 | |
Nucor Corporation | | | 4.00 | | | | 8-1-2023 | | | | 132,000 | | | | 135,039 | |
Nucor Corporation | | | 5.20 | | | | 8-1-2043 | | | | 140,000 | | | | 154,527 | |
Nucor Corporation | | | 6.40 | | | | 12-1-2037 | | | | 140,000 | | | | 173,530 | |
Southern Copper Corporation | | | 5.38 | | | | 4-16-2020 | | | | 63,000 | | | | 65,180 | |
Southern Copper Corporation | | | 6.75 | | | | 4-16-2040 | | | | 308,000 | | | | 364,014 | |
| | | | |
| | | | | | | | | | | | | | | 1,464,716 | |
| | | | | | | | | | | | | | | | |
| | | | |
| Paper & Forest Products: 0.05% | | | | | | | | | | | | | | | | |
Georgia-Pacific LLC | | | 8.00 | | | | 1-15-2024 | | | | 140,000 | | | | 168,665 | |
| | | | | | | | | | | | | | | | |
| | | | |
Real Estate: 4.50% | | | | | | | | | | | | | | | | |
| | | | |
| Equity REITs: 4.50% | | | | | | | | | | | | | | | | |
Alexandria Real Estate Equities Incorporated | | | 4.50 | | | | 7-30-2029 | | | | 525,000 | | | | 527,454 | |
American Campus Communities Incorporated | | | 3.75 | | | | 4-15-2023 | | | | 70,000 | | | | 69,615 | |
American Tower Corporation | | | 3.45 | | | | 9-15-2021 | | | | 350,000 | | | | 350,022 | |
American Tower Corporation | | | 3.50 | | | | 1-31-2023 | | | | 295,000 | | | | 290,864 | |
American Tower Corporation | | | 4.00 | | | | 6-1-2025 | | | | 350,000 | | | | 347,063 | |
American Tower Corporation | | | 5.00 | | | | 2-15-2024 | | | | 245,000 | | | | 257,187 | |
American Tower Corporation | | | 5.05 | | | | 9-1-2020 | | | | 350,000 | | | | 360,967 | |
AvalonBay Communities Incorporated | | | 2.95 | | | | 9-15-2022 | | | | 245,000 | | | | 240,514 | |
AvalonBay Communities Incorporated | | | 3.45 | | | | 6-1-2025 | | | | 140,000 | | | | 137,700 | |
AvalonBay Communities Incorporated | | | 3.63 | | | | 10-1-2020 | | | | 140,000 | | | | 140,987 | |
AvalonBay Communities Incorporated | | | 4.20 | | | | 12-15-2023 | | | | 175,000 | | | | 180,272 | |
Boston Properties LP | | | 2.75 | | | | 10-1-2026 | | | | 500,000 | | | | 457,493 | |
Boston Properties LP | | | 3.13 | | | | 9-1-2023 | | | | 105,000 | | | | 102,846 | |
Boston Properties LP | | | 3.80 | | | | 2-1-2024 | | | | 300,000 | | | | 300,135 | |
Boston Properties LP | | | 3.85 | | | | 2-1-2023 | | | | 200,000 | | | | 201,922 | |
Boston Properties LP | | | 4.13 | | | | 5-15-2021 | | | | 210,000 | | | | 214,288 | |
Boston Properties LP | | | 5.63 | | | | 11-15-2020 | | | | 380,000 | | | | 397,114 | |
Boston Properties LP | | | 5.88 | | | | 10-15-2019 | | | | 350,000 | | | | 358,898 | |
Corporate Office Properties LP | | | 3.60 | | | | 5-15-2023 | | | | 70,000 | | | | 68,223 | |
Corporate Office Properties LP | | | 3.70 | | | | 6-15-2021 | | | | 350,000 | | | | 347,238 | |
Crown Castle International Corporation | | | 3.70 | | | | 6-15-2026 | | | | 350,000 | | | | 335,142 | |
Crown Castle International Corporation | | | 4.88 | | | | 4-15-2022 | | | | 50,000 | | | | 51,605 | |
Crown Castle International Corporation | | | 5.25 | | | | 1-15-2023 | | | | 350,000 | | | | 368,077 | |
DDR Corporation | | | 4.63 | | | | 7-15-2022 | | | | 175,000 | | | | 179,915 | |
Digital Realty Trust LP | | | 3.63 | | | | 10-1-2022 | | | | 140,000 | | | | 139,863 | |
Digital Realty Trust LP | | | 3.95 | | | | 7-1-2022 | | | | 140,000 | | | | 141,653 | |
Digital Realty Trust LP | | | 5.25 | | | | 3-15-2021 | | | | 70,000 | | | | 72,735 | |
Digital Realty Trust LP | | | 5.88 | | | | 2-1-2020 | | | | 210,000 | | | | 216,074 | |
Duke Realty LP | | | 3.75 | | | | 12-1-2024 | | | | 455,000 | | | | 450,970 | |
Entertainment Properties Trust | | | 5.75 | | | | 8-15-2022 | | | | 105,000 | | | | 110,667 | |
Equity One Incorporated | | | 3.75 | | | | 11-15-2022 | | | | 175,000 | | | | 174,787 | |
ERP Operating LP | | | 4.63 | | | | 12-15-2021 | | | | 419,000 | | | | 434,384 | |
Essex Portfolio LP | | | 3.25 | | | | 5-1-2023 | | | | 70,000 | | | | 68,432 | |
Federal Realty Investment Trust | | | 4.50 | | | | 12-1-2044 | | | | 175,000 | | | | 179,246 | |
HCP Incorporated | | | 3.15 | | | | 8-1-2022 | | | | 70,000 | | | | 68,459 | |
The accompanying notes are an integral part of these financial statements.
| | | | |
| 214 | | Wells Fargo Funds | | Portfolio of investments—August 31, 2018 (unaudited) |
INVESTMENT GRADE CORPORATE BOND PORTFOLIO
| | | | | | | | | | | | | | | | |
| Security name | | Interest rate | | | Maturity date | | | Principal | | | Value | |
| | | | |
| Equity REITs (continued) | | | | | | | | | | | | | | | | |
HCP Incorporated | | | 3.88 | % | | | 8-15-2024 | | | $ | 300,000 | | | $ | 295,153 | |
HCP Incorporated | | | 6.75 | | | | 2-1-2041 | | | | 95,000 | | | | 119,916 | |
Health Care REIT Incorporated | | | 4.00 | | | | 6-1-2025 | | | | 210,000 | | | | 208,238 | |
Health Care REIT Incorporated | | | 4.50 | | | | 1-15-2024 | | | | 140,000 | | | | 143,334 | |
Health Care REIT Incorporated | | | 6.50 | | | | 3-15-2041 | | | | 140,000 | | | | 168,555 | |
Hospitality Properties Trust | | | 4.65 | | | | 3-15-2024 | | | | 350,000 | | | | 350,169 | |
Host Hotels & Resorts Company | | | 3.75 | | | | 10-15-2023 | | | | 70,000 | | | | 68,755 | |
Host Hotels & Resorts Company | | | 4.75 | | | | 3-1-2023 | | | | 175,000 | | | | 179,512 | |
Host Hotels & Resorts Company | | | 6.00 | | | | 10-1-2021 | | | | 350,000 | | | | 370,723 | |
Kilroy Realty Corporation | | | 3.80 | | | | 1-15-2023 | | | | 175,000 | | | | 174,642 | |
Kimco Realty Corporation | | | 2.80 | | | | 10-1-2026 | | | | 350,000 | | | | 314,640 | |
Liberty Property LP | | | 4.40 | | | | 2-15-2024 | | | | 109,000 | | | | 111,232 | |
Liberty Property LP | | | 4.75 | | | | 10-1-2020 | | | | 175,000 | | | | 179,306 | |
Mid-America Apartments LP | | | 4.30 | | | | 10-15-2023 | | | | 35,000 | | | | 35,723 | |
National Retail Properties Incorporated | | | 3.30 | | | | 4-15-2023 | | | | 70,000 | | | | 68,671 | |
National Retail Properties Incorporated | | | 3.80 | | | | 10-15-2022 | | | | 70,000 | | | | 70,212 | |
Realty Income Corporation | | | 3.88 | | | | 7-15-2024 | | | | 350,000 | | | | 352,186 | |
Realty Income Corporation | | | 4.65 | | | | 8-1-2023 | | | | 210,000 | | | | 218,943 | |
Simon Property Group LP | | | 3.30 | | | | 1-15-2026 | | | | 410,000 | | | | 398,940 | |
Simon Property Group LP | | | 3.38 | | | | 3-15-2022 | | | | 350,000 | | | | 350,715 | |
Simon Property Group LP | | | 3.75 | | | | 2-1-2024 | | | | 175,000 | | | | 176,846 | |
Simon Property Group LP | | | 4.13 | | | | 12-1-2021 | | | | 210,000 | | | | 215,369 | |
Simon Property Group LP | | | 4.25 | | | | 11-30-2046 | | | | 400,000 | | | | 398,671 | |
Simon Property Group LP | | | 4.38 | | | | 3-1-2021 | | | | 350,000 | | | | 359,478 | |
Simon Property Group LP | | | 4.75 | | | | 3-15-2042 | | | | 175,000 | | | | 186,625 | |
Simon Property Group LP | | | 6.75 | | | | 2-1-2040 | | | | 245,000 | | | | 322,771 | |
UDR Incorporated | | | 3.70 | | | | 10-1-2020 | | | | 175,000 | | | | 176,086 | |
UDR Incorporated | | | 4.63 | | | | 1-10-2022 | | | | 70,000 | | | | 72,064 | |
Ventas Realty LP | | | 3.85 | | | | 4-1-2027 | | | | 800,000 | | | | 775,133 | |
Ventas Realty LP | | | 4.25 | | | | 3-1-2022 | | | | 700,000 | | | | 714,883 | |
Ventas Realty LP | | | 5.70 | | | | 9-30-2043 | | | | 175,000 | | | | 195,565 | |
VEREIT Operating Partnership LP | | | 4.13 | | | | 6-1-2021 | | | | 80,000 | | | | 81,017 | |
VEREIT Operating Partnership LP | | | 4.60 | | | | 2-6-2024 | | | | 98,000 | | | | 98,852 | |
VEREIT Operating Partnership LP | | | 4.88 | | | | 6-1-2026 | | | | 119,000 | | | | 120,849 | |
Welltower Incorporated | | | 5.25 | | | | 1-15-2022 | | | | 70,000 | | | | 73,286 | |
Weyerhaeuser Company | | | 4.63 | | | | 9-15-2023 | | | | 210,000 | | | | 217,368 | |
Weyerhaeuser Company | | | 7.38 | | | | 10-1-2019 | | | | 70,000 | | | | 73,162 | |
Weyerhaeuser Company | | | 7.38 | | | | 3-15-2032 | | | | 200,000 | | | | 254,871 | |
WP Carey Incorporated | | | 4.60 | | | | 4-1-2024 | | | | 350,000 | | | | 355,126 | |
| | | | |
| | | | | | | | | | | | | | | 17,390,398 | |
| | | | | | | | | | | | | | | | |
| | | | |
Telecommunication Services: 0.80% | | | | | | | | | | | | | | | | |
| | | | |
| Diversified Telecommunication Services: 0.71% | | | | | | | | | | | | | | | | |
AT&T Incorporated | | | 3.00 | | | | 2-15-2022 | | | | 200,000 | | | | 196,648 | |
AT&T Incorporated | | | 3.90 | | | | 3-11-2024 | | | | 350,000 | | | | 349,127 | |
AT&T Incorporated | | | 4.30 | | | | 12-15-2042 | | | | 350,000 | | | | 299,736 | |
AT&T Incorporated | | | 4.50 | | | | 5-15-2035 | | | | 230,000 | | | | 213,452 | |
AT&T Incorporated | | | 5.00 | | | | 3-1-2021 | | | | 200,000 | | | | 207,626 | |
AT&T Incorporated | | | 6.00 | | | | 8-15-2040 | | | | 280,000 | | | | 294,862 | |
The accompanying notes are an integral part of these financial statements.
| | | | | | |
| Portfolio of investments—August 31, 2018 (unaudited) | | Wells Fargo Funds | | | 215 | |
INVESTMENT GRADE CORPORATE BOND PORTFOLIO
| | | | | | | | | | | | | | | | |
| Security name | | Interest rate | | | Maturity date | | | Principal | | | Value | |
| | | | |
| Diversified Telecommunication Services (continued) | | | | | | | | | | | | | | | | |
Verizon Communications Incorporated | | | 3.85 | % | | | 11-1-2042 | | | $ | 260,000 | | | $ | 223,485 | |
Verizon Communications Incorporated | | | 4.67 | | | | 3-15-2055 | | | | 655,000 | | | | 604,834 | |
Verizon Communications Incorporated | | | 4.75 | | | | 11-1-2041 | | | | 350,000 | | | | 340,017 | |
| | | | |
| | | | | | | | | | | | | | | 2,729,787 | |
| | | | | | | | | | | | | | | | |
| | | | |
| Wireless Telecommunication Services: 0.09% | | | | | | | | | | | | | | | | |
CC Holdings GS V LLC | | | 3.85 | | | | 4-15-2023 | | | | 350,000 | | | | 348,531 | |
| | | | | | | | | | | | | | | | |
| | | | |
Utilities: 7.16% | | | | | | | | | | | | | | | | |
| | | | |
| Electric Utilities: 5.72% | | | | | | | | | | | | | | | | |
Alabama Power Company | | | 3.55 | | | | 12-1-2023 | | | | 175,000 | | | | 176,067 | |
Alabama Power Company | | | 3.85 | | | | 12-1-2042 | | | | 140,000 | | | | 133,221 | |
Alabama Power Company | | | 4.15 | | | | 8-15-2044 | | | | 105,000 | | | | 103,483 | |
American Electric Power Company Incorporated | | | 2.95 | | | | 12-15-2022 | | | | 740,000 | | | | 722,011 | |
Appalachian Power Company | | | 3.40 | | | | 6-1-2025 | | | | 175,000 | | | | 172,561 | |
Appalachian Power Company | | | 4.45 | | | | 6-1-2045 | | | | 175,000 | | | | 180,574 | |
Appalachian Power Company | | | 7.00 | | | | 4-1-2038 | | | | 70,000 | | | | 92,839 | |
Arizona Public Service Company | | | 3.15 | | | | 5-15-2025 | | | | 105,000 | | | | 102,269 | |
Arizona Public Service Company | | | 4.50 | | | | 4-1-2042 | | | | 70,000 | | | | 72,882 | |
Baltimore Gas & Electric Company | | | 3.50 | | | | 8-15-2046 | | | | 50,000 | | | | 45,129 | |
Carolina Power & Light Company | | | 2.80 | | | | 5-15-2022 | | | | 175,000 | | | | 172,451 | |
CenterPoint Energy Houston | | | 2.25 | | | | 8-1-2022 | | | | 210,000 | | | | 201,901 | |
CenterPoint Energy Houston | | | 3.55 | | | | 8-1-2042 | | | | 175,000 | | | | 162,071 | |
CenterPoint Energy Houston | | | 4.50 | | | | 4-1-2044 | | | | 175,000 | | | | 187,234 | |
Commonwealth Edison Company | | | 3.80 | | | | 10-1-2042 | | | | 70,000 | | | | 66,886 | |
Commonwealth Edison Company | | | 5.90 | | | | 3-15-2036 | | | | 175,000 | | | | 211,688 | |
Connecticut Light & Power Company | | | 4.15 | | | | 6-1-2045 | | | | 87,000 | | | | 88,596 | |
Consolidated Edison Company of New York Incorporated | | | 4.45 | | | | 3-15-2044 | | | | 350,000 | | | | 362,530 | |
Consolidated Edison Company of New York Incorporated | | | 4.63 | | | | 12-1-2054 | | | | 300,000 | | | | 310,409 | |
Consolidated Edison Company of New York Incorporated Series 07-A | | | 6.30 | | | | 8-15-2037 | | | | 175,000 | | | | 222,958 | |
Consolidated Edison Company of New York Incorporated Series 08-B | | | 6.75 | | | | 4-1-2038 | | | | 210,000 | | | | 279,912 | |
Consolidated Edison Company of New York Incorporated Series 12-A | | | 4.20 | | | | 3-15-2042 | | | | 175,000 | | | | 174,284 | |
Consolidated Edison Company of New York Incorporated Series C | | | 4.30 | | | | 12-1-2056 | | | | 245,000 | | | | 240,024 | |
Constellation Energy Group Incorporated | | | 5.15 | | | | 12-1-2020 | | | | 70,000 | | | | 72,096 | |
DTE Electric Company | | | 3.65 | | | | 3-15-2024 | | | | 105,000 | | | | 105,865 | |
Duke Energy Carolinas LLC | | | 3.70 | | | | 12-1-2047 | | | | 200,000 | | | | 186,045 | |
Duke Energy Carolinas LLC | | | 4.30 | | | | 6-15-2020 | | | | 50,000 | | | | 51,228 | |
Duke Energy Corporation | | | 3.05 | | | | 8-15-2022 | | | | 70,000 | | | | 69,077 | |
Duke Energy Corporation | | | 3.95 | | | | 10-15-2023 | | | | 140,000 | | | | 141,663 | |
Duke Energy Florida Incorporated | | | 3.85 | | | | 11-15-2042 | | | | 70,000 | | | | 66,994 | |
Duke Energy Indiana Incorporated | | | 4.90 | | | | 7-15-2043 | | | | 105,000 | | | | 116,957 | |
Duke Energy Indiana Incorporated | | | 6.45 | | | | 4-1-2039 | | | | 45,000 | | | | 58,365 | |
Duke Energy Progress Incorporated | | | 3.00 | | | | 9-15-2021 | | | | 175,000 | | | | 174,234 | |
Duke Energy Progress Incorporated | | | 4.10 | | | | 3-15-2043 | | | | 105,000 | | | | 104,777 | |
Duke Energy Progress Incorporated | | | 4.15 | | | | 12-1-2044 | | | | 175,000 | | | | 175,483 | |
Duke Energy Progress Incorporated | | | 4.38 | | | | 3-30-2044 | | | | 175,000 | | | | 181,313 | |
Emera US Finance LP | | | 3.55 | | | | 6-15-2026 | | | | 200,000 | | | | 190,059 | |
Entergy Arkansas Incorporated | | | 3.70 | | | | 6-1-2024 | | | | 175,000 | | | | 176,549 | |
Entergy Corporation | | | 5.13 | | | | 9-15-2020 | | | | 175,000 | | | | 179,920 | |
The accompanying notes are an integral part of these financial statements.
| | | | |
| 216 | | Wells Fargo Funds | | Portfolio of investments—August 31, 2018 (unaudited) |
INVESTMENT GRADE CORPORATE BOND PORTFOLIO
| | | | | | | | | | | | | | | | |
| Security name | | Interest rate | | | Maturity date | | | Principal | | | Value | |
| | | | |
| Electric Utilities (continued) | | | | | | | | | | | | | | | | |
Entergy Gulf States Louisiana LLC | | | 5.59 | % | | | 10-1-2024 | | | $ | 84,000 | | | $ | 92,398 | |
Entergy Louisiana LLC | | | 5.40 | | | | 11-1-2024 | | | | 175,000 | | | | 192,204 | |
Eversource Energy | | | 4.50 | | | | 11-15-2019 | | | | 70,000 | | | | 71,227 | |
Exelon Corporation | | | 4.95 | | | | 6-15-2035 | | | | 140,000 | | | | 146,880 | |
Exelon Corporation | | | 5.10 | | | | 6-15-2045 | | | | 280,000 | | | | 297,820 | |
Exelon Generation Company LLC | | | 4.25 | | | | 6-15-2022 | | | | 157,000 | | | | 160,243 | |
FirstEnergy Corporation | | | 4.25 | | | | 3-15-2023 | | | | 168,000 | | | | 171,321 | |
Florida Power & Light Company | | | 3.25 | | | | 6-1-2024 | | | | 350,000 | | | | 346,992 | |
Florida Power & Light Company | | | 4.05 | | | | 6-1-2042 | | | | 175,000 | | | | 177,506 | |
Florida Power & Light Company | | | 5.25 | | | | 2-1-2041 | | | | 140,000 | | | | 163,012 | |
Florida Power & Light Company | | | 5.95 | | | | 2-1-2038 | | | | 224,000 | | | | 278,607 | |
Florida Power & Light Company | | | 5.96 | | | | 4-1-2039 | | | | 175,000 | | | | 221,584 | |
Florida Power Corporation | | | 5.65 | | | | 4-1-2040 | | | | 87,000 | | | | 104,208 | |
Georgia Power Company | | | 4.30 | | | | 3-15-2042 | | | | 175,000 | | | | 168,724 | |
Interstate Power & Light Company | | | 6.25 | | | | 7-15-2039 | | | | 21,000 | | | | 26,839 | |
Kansas City Power & Light Company | | | 3.15 | | | | 3-15-2023 | | | | 140,000 | | | | 137,500 | |
Kentucky Utilities Company | | | 3.25 | | | | 11-1-2020 | | | | 175,000 | | | | 175,448 | |
LG&E & KU Energy LLC | | | 3.75 | | | | 11-15-2020 | | | | 70,000 | | | | 70,537 | |
MidAmerican Energy Holdings Company | | | 5.95 | | | | 5-15-2037 | | | | 210,000 | | | | 252,007 | |
MidAmerican Energy Holdings Company | | | 6.13 | | | | 4-1-2036 | | | | 140,000 | | | | 169,731 | |
MidAmerican Energy Holdings Company | | | 6.75 | | | | 12-30-2031 | | | | 105,000 | | | | 135,413 | |
Nevada Power Company | | | 6.75 | | | | 7-1-2037 | | | | 140,000 | | | | 182,340 | |
Northeast Utilities | | | 2.80 | | | | 5-1-2023 | | | | 122,000 | | | | 118,043 | |
Northern States Power Company of Minnesota | | | 2.15 | | | | 8-15-2022 | | | | 175,000 | | | | 167,609 | |
Northern States Power Company of Minnesota | | | 2.60 | | | | 5-15-2023 | | | | 105,000 | | | | 101,967 | |
Northern States Power Company of Minnesota | | | 3.40 | | | | 8-15-2042 | | | | 175,000 | | | | 160,433 | |
Northern States Power Company of Minnesota | | | 5.35 | | | | 11-1-2039 | | | | 28,000 | | | | 32,631 | |
Northern States Power Company of Minnesota | | | 6.20 | | | | 7-1-2037 | | | | 210,000 | | | | 266,729 | |
NSTAR Electric Company | | | 2.38 | | | | 10-15-2022 | | | | 140,000 | | | | 134,819 | |
NSTAR Electric Company | | | 5.50 | | | | 3-15-2040 | | | | 70,000 | | | | 82,238 | |
Oglethorpe Power Corporation | | | 5.38 | | | | 11-1-2040 | | | | 210,000 | | | | 237,127 | |
Oglethorpe Power Corporation | | | 5.95 | | | | 11-1-2039 | | | | 105,000 | | | | 127,089 | |
Ohio Edison Company | | | 6.88 | | | | 7-15-2036 | | | | 175,000 | | | | 230,202 | |
Ohio Power Company | | | 5.38 | | | | 10-1-2021 | | | | 45,000 | | | | 47,881 | |
Oncor Electric Delivery Company LLC | | | 4.55 | | | | 12-1-2041 | | | | 140,000 | | | | 149,660 | |
Oncor Electric Delivery Company LLC | | | 5.25 | | | | 9-30-2040 | | | | 175,000 | | | | 202,396 | |
Oncor Electric Delivery Company LLC | | | 7.00 | | | | 5-1-2032 | | | | 122,000 | | | | 160,146 | |
Oncor Electric Delivery Company LLC | | | 7.50 | | | | 9-1-2038 | | | | 140,000 | | | | 198,764 | |
Pacific Gas & Electric Company | | | 2.45 | | | | 8-15-2022 | | | | 175,000 | | | | 164,911 | |
Pacific Gas & Electric Company | | | 2.95 | | | | 3-1-2026 | | | | 350,000 | | | | 316,904 | |
Pacific Gas & Electric Company | | | 3.40 | | | | 8-15-2024 | | | | 205,000 | | | | 196,626 | |
Pacific Gas & Electric Company | | | 3.50 | | | | 6-15-2025 | | | | 105,000 | | | | 99,687 | |
Pacific Gas & Electric Company | | | 3.75 | | | | 8-15-2042 | | | | 140,000 | | | | 121,330 | |
Pacific Gas & Electric Company | | | 4.30 | | | | 3-15-2045 | | | | 140,000 | | | | 130,533 | |
Pacific Gas & Electric Company | | | 5.13 | | | | 11-15-2043 | | | | 175,000 | | | | 181,563 | |
Pacific Gas & Electric Company | | | 5.40 | | | | 1-15-2040 | | | | 310,000 | | | | 331,176 | |
Pacific Gas & Electric Company | | | 6.35 | | | | 2-15-2038 | | | | 70,000 | | | | 80,311 | |
PacifiCorp | | | 3.60 | | | | 4-1-2024 | | | | 175,000 | | | | 175,996 | |
PacifiCorp | | | 4.10 | | | | 2-1-2042 | | | | 70,000 | | | | 69,662 | |
PacifiCorp | | | 5.75 | | | | 4-1-2037 | | | | 175,000 | | | | 211,860 | |
The accompanying notes are an integral part of these financial statements.
| | | | | | |
| Portfolio of investments—August 31, 2018 (unaudited) | | Wells Fargo Funds | | | 217 | |
INVESTMENT GRADE CORPORATE BOND PORTFOLIO
| | | | | | | | | | | | | | | | |
| Security name | | Interest rate | | | Maturity date | | | Principal | | | Value | |
| | | | |
| Electric Utilities (continued) | | | | | | | | | | | | | | | | |
PECO Energy Company | | | 4.15 | % | | | 10-1-2044 | | | $ | 245,000 | | | $ | 247,617 | |
Potomac Electric Power Company | | | 3.60 | | | | 3-15-2024 | | | | 175,000 | | | | 176,280 | |
Potomac Electric Power Company | | | 6.50 | | | | 11-15-2037 | | | | 140,000 | | | | 179,923 | |
PPL Capital Funding Incorporated | | | 4.20 | | | | 6-15-2022 | | | | 140,000 | | | | 142,431 | |
PPL Capital Funding Incorporated | | | 4.70 | | | | 6-1-2043 | | | | 87,000 | | | | 88,103 | |
PPL Electric Utilities | | | 4.75 | | | | 7-15-2043 | | | | 105,000 | | | | 114,219 | |
PPL Electric Utilities | | | 6.25 | | | | 5-15-2039 | | | | 31,000 | | | | 39,716 | |
PPL Electric Utilities Corporation | | | 4.15 | | | | 6-15-2048 | | | | 200,000 | | | | 201,976 | |
PSEG Power LLC | | | 5.13 | | | | 4-15-2020 | | | | 196,000 | | | | 201,259 | |
PSEG Power LLC | | | 8.63 | | | | 4-15-2031 | | | | 75,000 | | | | 99,197 | |
Public Service Company of Colorado | | | 2.25 | | | | 9-15-2022 | | | | 70,000 | | | | 67,309 | |
Public Service Company of Colorado | | | 3.20 | | | | 11-15-2020 | | | | 210,000 | | | | 210,441 | |
Public Service Company of Colorado | | | 3.60 | | | | 9-15-2042 | | | | 140,000 | | | | 131,645 | |
Public Service Company of Colorado | | | 4.30 | | | | 3-15-2044 | | | | 175,000 | | | | 181,081 | |
Public Service Company of New Hampshire | | | 3.50 | | | | 11-1-2023 | | | | 210,000 | | | | 211,409 | |
Public Service Electric & Gas Company | | | 2.38 | | | | 5-15-2023 | | | | 140,000 | | | | 134,345 | |
Public Service Electric & Gas Company | | | 3.00 | | | | 5-15-2027 | | | | 500,000 | | | | 478,815 | |
Public Service Electric & Gas Company | | | 3.65 | | | | 9-1-2042 | | | | 175,000 | | | | 165,294 | |
Public Service Electric & Gas Company | | | 3.80 | | | | 1-1-2043 | | | | 140,000 | | | | 135,408 | |
Public Service Electric & Gas Company | | | 3.95 | | | | 5-1-2042 | | | | 70,000 | | | | 69,336 | |
Public Service Electric & Gas Company | | | 5.80 | | | | 5-1-2037 | | | | 70,000 | | | | 85,904 | |
South Carolina Eletric & Gas Company | | | 4.50 | | | | 6-1-2064 | | | | 200,000 | | | | 185,380 | |
Southern California Edison Company | | | 3.88 | | | | 6-1-2021 | | | | 449,000 | | | | 455,535 | |
Southern California Edison Company | | | 3.90 | | | | 3-15-2043 | | | | 105,000 | | | | 97,954 | |
Southern California Edison Company | | | 4.05 | | | | 3-15-2042 | | | | 350,000 | | | | 336,104 | |
Southern California Edison Company | | | 5.35 | | | | 7-15-2035 | | | | 126,000 | | | | 139,746 | |
Southern California Edison Company | | | 5.50 | | | | 3-15-2040 | | | | 140,000 | | | | 159,180 | |
Southern California Edison Company | | | 6.00 | | | | 1-15-2034 | | | | 70,000 | | | | 82,387 | |
Southern Company | | | 2.75 | | | | 6-15-2020 | | | | 175,000 | | | | 173,380 | |
Southern Company | | | 2.95 | | | | 7-1-2023 | | | | 200,000 | | | | 192,781 | |
Southwestern Electric Power Company | | | 6.20 | | | | 3-15-2040 | | | | 35,000 | | | | 42,611 | |
TXU Electric Delivery Company | | | 7.25 | | | | 1-15-2033 | | | | 52,000 | | | | 70,695 | |
Union Electric Company | | | 3.90 | | | | 9-15-2042 | | | | 175,000 | | | | 171,835 | |
Union Electric Company | | | 8.45 | | | | 3-15-2039 | | | | 56,000 | | | | 85,349 | |
Virginia Electric & Power Company | | | 3.10 | | | | 5-15-2025 | | | | 70,000 | | | | 67,671 | |
Virginia Electric & Power Company | | | 3.45 | | | | 2-15-2024 | | | | 105,000 | | | | 104,670 | |
Virginia Electric & Power Company | | | 4.00 | | | | 1-15-2043 | | | | 227,000 | | | | 219,254 | |
Virginia Electric & Power Company | | | 4.00 | | | | 11-15-2046 | | | | 270,000 | | | | 258,311 | |
Virginia Electric & Power Company | | | 4.20 | | | | 5-15-2045 | | | | 105,000 | | | | 103,424 | |
Virginia Electric & Power Company | | | 4.45 | | | | 2-15-2044 | | | | 105,000 | | | | 106,816 | |
Virginia Electric & Power Company | | | 6.00 | | | | 1-15-2036 | | | | 70,000 | | | | 84,417 | |
Westar Energy Incorporated | | | 4.10 | | | | 4-1-2043 | | | | 210,000 | | | | 209,496 | |
Wisconsin Electric Power Company | | | 5.63 | | | | 5-15-2033 | | | | 70,000 | | | | 80,981 | |
Wisconsin Electric Power Company | | | 5.70 | | | | 12-1-2036 | | | | 105,000 | | | | 126,777 | |
Wisconsin Power & Light Company | | | 6.38 | | | | 8-15-2037 | | | | 175,000 | | | | 222,138 | |
Xcel Energy Incorporated | | | 4.70 | | | | 5-15-2020 | | | | 175,000 | | | | 178,518 | |
| | | | |
| | | | | | | | | | | | | | | 22,090,557 | |
| | | | | | | | | | | | | | | | |
The accompanying notes are an integral part of these financial statements.
| | | | |
| 218 | | Wells Fargo Funds | | Portfolio of investments—August 31, 2018 (unaudited) |
INVESTMENT GRADE CORPORATE BOND PORTFOLIO
| | | | | | | | | | | | | | | | |
| Security name | | Interest rate | | | Maturity date | | | Principal | | | Value | |
| | | | |
| Gas Utilities: 0.29% | | | | | | | | | | | | | | | | |
Atmos Energy Corporation | | | 4.13 | % | | | 10-15-2044 | | | $ | 245,000 | | | $ | 243,079 | |
Atmos Energy Corporation | | | 4.15 | | | | 1-15-2043 | | | | 113,000 | | | | 112,102 | |
Atmos Energy Corporation | | | 5.50 | | | | 6-15-2041 | | | | 42,000 | | | | 48,961 | |
CenterPoint Energy Resources Corporation | | | 4.50 | | | | 1-15-2021 | | | | 45,000 | | | | 45,935 | |
CenterPoint Energy Resources Corporation | | | 5.85 | | | | 1-15-2041 | | | | 77,000 | | | | 91,529 | |
National Fuel Gas Company | | | 3.75 | | | | 3-1-2023 | | | | 218,000 | | | | 216,128 | |
One Gas Incorporated | | | 3.61 | | | | 2-1-2024 | | | | 70,000 | | | | 69,868 | |
One Gas Incorporated | | | 4.66 | | | | 2-1-2044 | | | | 35,000 | | | | 37,380 | |
Piedmont Natural Gas Company | | | 4.65 | | | | 8-1-2043 | | | | 35,000 | | | | 37,398 | |
Southern California Gas Company | | | 3.75 | | | | 9-15-2042 | | | | 140,000 | | | | 132,716 | |
Southern California Gas Company | | | 5.13 | | | | 11-15-2040 | | | | 70,000 | | | | 79,370 | |
| | | | |
| | | | | | | | | | | | | | | 1,114,466 | |
| | | | | | | | | | | | | | | | |
| | | | |
| Multi-Utilities: 1.10% | | | | | | | | | | | | | | | | |
Berkshire Hathaway Energy | | | 5.15 | | | | 11-15-2043 | | | | 280,000 | | | | 308,389 | |
Black Hills Corporation | | | 4.25 | | | | 11-30-2023 | | | | 210,000 | | | | 214,446 | |
CMS Energy Corporation | | | 5.05 | | | | 3-15-2022 | | | | 245,000 | | | | 256,679 | |
Consumers Energy Company | | | 3.95 | | | | 5-15-2043 | | | | 140,000 | | | | 138,638 | |
Consumers Energy Company | | | 6.70 | | | | 9-15-2019 | | | | 100,000 | | | | 103,951 | |
Dominion Resources Incorporated | | | 2.50 | | | | 12-1-2019 | | | | 132,000 | | | | 131,073 | |
Dominion Resources Incorporated | | | 2.75 | | | | 9-15-2022 | | | | 210,000 | | | | 203,427 | |
Dominion Resources Incorporated | | | 3.63 | | | | 12-1-2024 | | | | 210,000 | | | | 206,414 | |
Dominion Resources Incorporated | | | 4.05 | | | | 9-15-2042 | | | | 175,000 | | | | 164,290 | |
Dominion Resources Incorporated | | | 4.45 | | | | 3-15-2021 | | | | 70,000 | | | | 71,680 | |
Dominion Resources Incorporated | | | 4.90 | | | | 8-1-2041 | | | | 42,000 | | | | 44,062 | |
Dominion Resources Incorporated | | | 5.95 | | | | 6-15-2035 | | | | 157,000 | | | | 179,828 | |
DTE Energy Company | | | 2.40 | | | | 12-1-2019 | | | | 210,000 | | | | 208,003 | |
DTE Energy Company | | | 3.30 | | | | 6-15-2022 | | | | 70,000 | | | | 69,264 | |
DTE Energy Company | | | 3.85 | | | | 12-1-2023 | | | | 170,000 | | | | 171,222 | |
NiSource Finance Corporation | | | 5.65 | | | | 2-1-2045 | | | | 140,000 | | | | 161,138 | |
Puget Energy Incorporated | | | 3.65 | | | | 5-15-2025 | | | | 140,000 | | | | 136,029 | |
Puget Energy Incorporated | | | 6.00 | | | | 9-1-2021 | | | | 175,000 | | | | 186,485 | |
Puget Sound Energy Incorporated | | | 5.80 | | | | 3-15-2040 | | | | 35,000 | | | | 43,015 | |
Puget Sound Energy Incorporated | | | 6.27 | | | | 3-15-2037 | | | | 231,000 | | | | 291,372 | |
San Diego Gas & Electric Company | | | 3.00 | | | | 8-15-2021 | | | | 300,000 | | | | 298,134 | |
Sempra Energy | | | 2.88 | | | | 10-1-2022 | | | | 140,000 | | | | 136,395 | |
Sempra Energy | | | 3.25 | | | | 6-15-2027 | | | | 300,000 | | | | 280,410 | |
WEC Energy Group Incorporated | | | 2.45 | | | | 6-15-2020 | | | | 105,000 | | | | 104,115 | |
WEC Energy Group Incorporated | | | 3.55 | | | | 6-15-2025 | | | | 140,000 | | | | 138,543 | |
| | | | |
| | | | | | | | | | | | | | | 4,247,002 | |
| | | | | | | | | | | | | | | | |
| | | | |
| Water Utilities: 0.05% | | | | | | | | | | | | | | | | |
American Water Capital Corporation | | | 3.40 | | | | 3-1-2025 | | | | 210,000 | | | | 208,425 | |
| | | | | | | | | | | | | | | | |
| | | | |
Total Corporate Bonds and Notes (Cost $314,926,378) | | | | | | | | | | | | | | | 314,084,988 | |
| | | | | | | | | | | | | | | | |
| | | | |
Yankee Corporate Bonds and Notes: 17.13% | | | | | | | | | | | | | | | | |
| | | | |
Consumer Discretionary: 0.26% | | | | | | | | | | | | | | | | |
| | | | |
| Auto Components: 0.05% | | | | | | | | | | | | | | | | |
Magna International Incorporated | | | 4.15 | | | | 10-1-2025 | | | | 175,000 | | | | 177,930 | |
| | | | | | | | | | | | | | | | |
The accompanying notes are an integral part of these financial statements.
| | | | | | |
| Portfolio of investments—August 31, 2018 (unaudited) | | Wells Fargo Funds | | | 219 | |
INVESTMENT GRADE CORPORATE BOND PORTFOLIO
| | | | | | | | | | | | | | | | |
| Security name | | Interest rate | | | Maturity date | | | Principal | | | Value | |
| | | | |
| Media: 0.21% | | | | | | | | | | | | | | | | |
Thomson Reuters Corporation | | | 4.30 | % | | | 11-23-2023 | | | $ | 210,000 | | | $ | 214,460 | |
Thomson Reuters Corporation | | | 5.65 | | | | 11-23-2043 | | | | 140,000 | | | | 151,183 | |
Thomson Reuters Corporation | | | 5.85 | | | | 4-15-2040 | | | | 94,000 | | | | 102,227 | |
WPP Finance 2010 | | | 3.75 | | | | 9-19-2024 | | | | 200,000 | | | | 193,079 | |
WPP Finance 2010 | | | 5.63 | | | | 11-15-2043 | | | | 140,000 | | | | 146,430 | |
| | | | |
| | | | | | | | | | | | | | | 807,379 | |
| | | | | | | | | | | | | | | | |
| | | | |
Consumer Staples: 0.26% | | | | | | | | | | | | | | | | |
| | | | |
| Beverages: 0.26% | | | | | | | | | | | | | | | | |
Coca-Cola Femsa SAB de CV | | | 3.88 | | | | 11-26-2023 | | | | 300,000 | | | | 302,800 | |
Coca-Cola Femsa SAB de CV | | | 4.63 | | | | 2-15-2020 | | | | 200,000 | | | | 203,902 | |
Diageo Capital plc | | | 2.63 | | | | 4-29-2023 | | | | 210,000 | | | | 204,028 | |
Diageo Capital plc | | | 3.88 | | | | 4-29-2043 | | | | 161,000 | | | | 158,317 | |
Diageo Capital plc | | | 5.88 | | | | 9-30-2036 | | | | 122,000 | | | | 148,213 | |
| | | | |
| | | | | | | | | | | | | | | 1,017,260 | |
| | | | | | | | | | | | | | | | |
| | | | |
Energy: 2.07% | | | | | | | | | | | | | | | | |
| | | | |
| Oil, Gas & Consumable Fuels: 2.07% | | | | | | | | | | | | | | | | |
BP Capital Markets plc | | | 3.25 | | | | 5-6-2022 | | | | 525,000 | | | | 523,983 | |
BP Capital Markets plc | | | 3.81 | | | | 2-10-2024 | | | | 350,000 | | | | 355,417 | |
BP Capital Markets plc | | | 4.50 | | | | 10-1-2020 | | | | 350,000 | | | | 359,917 | |
Canadian National Resources Limited | | | 6.75 | | | | 2-1-2039 | | | | 110,000 | | | | 135,860 | |
Canadian Natural Resources Limited | | | 3.85 | | | | 6-1-2027 | | | | 800,000 | | | | 777,632 | |
Canadian Natural Resources Limited | | | 3.90 | | | | 2-1-2025 | | | | 210,000 | | | | 208,557 | |
Canadian Natural Resources Limited | | | 4.95 | | | | 6-1-2047 | | | | 200,000 | | | | 209,570 | |
Cenovus Energy Incorporated | | | 3.00 | | | | 8-15-2022 | | | | 145,000 | | | | 139,496 | |
Cenovus Energy Incorporated | | | 4.25 | | | | 4-15-2027 | | | | 800,000 | | | | 772,731 | |
Cenovus Energy Incorporated | | | 4.45 | | | | 9-15-2042 | | | | 320,000 | | | | 279,263 | |
Cenovus Energy Incorporated | | | 5.70 | | | | 10-15-2019 | | | | 200,000 | | | | 204,820 | |
Cenovus Energy Incorporated | | | 6.75 | | | | 11-15-2039 | | | | 240,000 | | | | 274,226 | |
Husky Energy Incorporated | | | 4.00 | | | | 4-15-2024 | | | | 350,000 | | | | 350,328 | |
Husky Energy Incorporated | | | 6.80 | | | | 9-15-2037 | | | | 70,000 | | | | 86,803 | |
Petro-Canada | | | 5.95 | | | | 5-15-2035 | | | | 140,000 | | | | 162,343 | |
Suncor Energy Incorporated | | | 5.95 | | | | 12-1-2034 | | | | 52,000 | | | | 60,669 | |
Total Capital Canada Limited | | | 2.75 | | | | 7-15-2023 | | | | 245,000 | | | | 239,024 | |
Total Capital International SA | | | 2.70 | | | | 1-25-2023 | | | | 385,000 | | | | 375,457 | |
Total Capital International SA | | | 2.88 | | | | 2-17-2022 | | | | 175,000 | | | | 173,483 | |
Total Capital International SA | | | 3.75 | | | | 4-10-2024 | | | | 350,000 | | | | 356,159 | |
Total Capital SA | | | 4.13 | | | | 1-28-2021 | | | | 70,000 | | | | 71,723 | |
Total Capital SA | | | 4.45 | | | | 6-24-2020 | | | | 350,000 | | | | 359,777 | |
TransCanada PipeLines Limited | | | 3.75 | | | | 10-16-2023 | | | | 175,000 | | | | 176,236 | |
TransCanada PipeLines Limited | | | 3.80 | | | | 10-1-2020 | | | | 210,000 | | | | 212,747 | |
TransCanada PipeLines Limited | | | 5.00 | | | | 10-16-2043 | | | | 350,000 | | | | 360,518 | |
TransCanada PipeLines Limited | | | 5.60 | | | | 3-31-2034 | | | | 70,000 | | | | 76,962 | |
TransCanada PipeLines Limited | | | 6.10 | | | | 6-1-2040 | | | | 210,000 | | | | 241,238 | |
TransCanada PipeLines Limited | | | 7.63 | | | | 1-15-2039 | | | | 350,000 | | | | 467,464 | |
| | | | |
| | | | | | | | | | | | | | | 8,012,403 | |
| | | | | | | | | | | | | | | | |
The accompanying notes are an integral part of these financial statements.
| | | | |
| 220 | | Wells Fargo Funds | | Portfolio of investments—August 31, 2018 (unaudited) |
INVESTMENT GRADE CORPORATE BOND PORTFOLIO
| | | | | | | | | | | | | | | | |
| Security name | | Interest rate | | | Maturity date | | | Principal | | | Value | |
| | | | |
Financials: 10.46% | | | | | | | | | | | | | | | | |
| | | | |
| Banks: 8.66% | | | | | | | | | | | | | | | | |
Australia & New Zealand Banking Group Limited | | | 2.70 | % | | | 11-16-2020 | | | $ | 850,000 | | | $ | 841,695 | |
Banco Santander SA | | | 4.38 | | | | 4-12-2028 | | | | 2,000,000 | | | | 1,933,579 | |
Bancolombia SA | | | 5.95 | | | | 6-3-2021 | | | | 200,000 | | | | 209,750 | |
Bank of Montreal | | | 1.75 | | | | 9-11-2019 | | | | 300,000 | | | | 297,291 | |
Bank of Montreal | | | 1.90 | | | | 8-27-2021 | | | | 470,000 | | | | 452,808 | |
Bank of Montreal (5 Year USD Swap +1.43%) ± | | | 3.80 | | | | 12-15-2032 | | | | 800,000 | | | | 751,920 | |
Bank of Nova Scotia | | | 2.45 | | | | 9-19-2022 | | | | 300,000 | | | | 289,937 | |
Bank of Nova Scotia | | | 2.80 | | | | 7-21-2021 | | | | 900,000 | | | | 888,821 | |
Bank of Nova Scotia | | | 4.38 | | | | 1-13-2021 | | | | 350,000 | | | | 359,190 | |
Barclays plc | | | 2.75 | | | | 11-8-2019 | | | | 2,000 | | | | 1,989 | |
Barclays plc | | | 2.88 | | | | 6-8-2020 | | | | 300,000 | | | | 296,698 | |
Barclays plc | | | 3.25 | | | | 1-12-2021 | | | | 500,000 | | | | 494,259 | |
Barclays plc | | | 4.38 | | | | 1-12-2026 | | | | 800,000 | | | | 781,392 | |
BNP Paribas | | | 3.25 | | | | 3-3-2023 | | | | 300,000 | | | | 296,116 | |
BNP Paribas | | | 4.25 | | | | 10-15-2024 | | | | 400,000 | | | | 398,347 | |
BNP Paribas | | | 5.00 | | | | 1-15-2021 | | | | 1,105,000 | | | | 1,149,332 | |
BPCE SA | | | 2.75 | | | | 12-2-2021 | | | | 330,000 | | | | 321,968 | |
BPCE SA | | | 4.00 | | | | 4-15-2024 | | | | 250,000 | | | | 253,320 | |
Commonwealth Bank of Australia | | | 2.30 | | | | 9-6-2019 | | | | 250,000 | | | | 248,986 | |
Cooperatieve Rabobank UA | | | 3.75 | | | | 7-21-2026 | | | | 780,000 | | | | 743,880 | |
Credit Suisse | | | 5.40 | | | | 1-14-2020 | | | | 200,000 | | | | 205,633 | |
Credit Suisse Group Funding Limited | | | 3.45 | | | | 4-16-2021 | | | | 250,000 | | | | 249,393 | |
Credit Suisse Group Funding Limited | | | 4.55 | | | | 4-17-2026 | | | | 750,000 | | | | 759,146 | |
HSBC Holdings plc | | | 4.00 | | | | 3-30-2022 | | | | 200,000 | | | | 203,485 | |
HSBC Holdings plc (3 Month LIBOR +1.55%) ± | | | 4.04 | | | | 3-13-2028 | | | | 500,000 | | | | 488,876 | |
HSBC Holdings plc | | | 4.88 | | | | 1-14-2022 | | | | 175,000 | | | | 182,501 | |
HSBC Holdings plc | | | 6.10 | | | | 1-14-2042 | | | | 280,000 | | | | 341,458 | |
HSBC Holdings plc | | | 6.50 | | | | 5-2-2036 | | | | 200,000 | | | | 237,348 | |
Intesa Sanpaolo SpA | | | 5.25 | | | | 1-12-2024 | | | | 200,000 | | | | 198,450 | |
Lloyds Banking Group plc (3 Month LIBOR +1.21%) ± | | | 3.57 | | | | 11-7-2028 | | | | 800,000 | | | | 737,156 | |
Lloyds Banking Group plc | | | 4.50 | | | | 11-4-2024 | | | | 600,000 | | | | 595,907 | |
Lloyds Banking Group plc | | | 4.58 | | | | 12-10-2025 | | | | 250,000 | | | | 246,306 | |
Lloyds Banking Group plc | | | 5.30 | | | | 12-1-2045 | | | | 300,000 | | | | 305,545 | |
Mitsubishi UFJ Financial Group Incorporated | | | 2.19 | | | | 9-13-2021 | | | | 600,000 | | | | 577,839 | |
Mitsubishi UFJ Financial Group Incorporated | | | 2.76 | | | | 9-13-2026 | | | | 900,000 | | | | 829,055 | |
Mitsubishi UFJ Financial Group Incorporated | | | 3.85 | | | | 3-1-2026 | | | | 200,000 | | | | 199,401 | |
Mizuho Financial Group | | | 2.95 | | | | 2-28-2022 | | | | 750,000 | | | | 735,432 | |
Mizuho Financial Group | | | 3.17 | | | | 9-11-2027 | | | | 1,200,000 | | | | 1,131,949 | |
MUFG Americas Holdings Corporation | | | 3.00 | | | | 2-10-2025 | | | | 350,000 | | | | 334,839 | |
National Australia Bank Limited | | | 2.50 | | | | 7-12-2026 | | | | 1,100,000 | | | | 998,665 | |
Rabobank Nederland NV | | | 3.88 | | | | 2-8-2022 | | | | 750,000 | | | | 760,264 | |
Rabobank Nederland NV | | | 4.50 | | | | 1-11-2021 | | | | 350,000 | | | | 359,662 | |
Rabobank Nederland NV | | | 5.75 | | | | 12-1-2043 | | | | 250,000 | | | | 287,309 | |
Royal Bank of Canada | | | 2.15 | | | | 3-6-2020 | | | | 500,000 | | | | 494,216 | |
Royal Bank of Canada | | | 2.50 | | | | 1-19-2021 | | | | 350,000 | | | | 344,672 | |
Royal Bank of Canada | | | 4.65 | | | | 1-27-2026 | | | | 700,000 | | | | 719,575 | |
Royal Bank of Scotland Group plc | | | 3.88 | | | | 9-12-2023 | | | | 300,000 | | | | 292,319 | |
Royal Bank of Scotland Group plc | | | 4.80 | | | | 4-5-2026 | | | | 1,300,000 | | | | 1,317,731 | |
The accompanying notes are an integral part of these financial statements.
| | | | | | |
| Portfolio of investments—August 31, 2018 (unaudited) | | Wells Fargo Funds | | | 221 | |
INVESTMENT GRADE CORPORATE BOND PORTFOLIO
| | | | | | | | | | | | | | | | |
| Security name | | Interest rate | | | Maturity date | | | Principal | | | Value | |
| | | | |
| Banks (continued) | | | | | | | | | | | | | | | | |
Santander UK Group Holdings plc | | | 3.57 | % | | | 1-10-2023 | | | $ | 800,000 | | | $ | 782,315 | |
Santander UK plc | | | 2.35 | | | | 9-10-2019 | | | | 240,000 | | | | 238,765 | |
Santander UK plc | | | 4.00 | | | | 3-13-2024 | | | | 525,000 | | | | 532,186 | |
Skandinaviska Enskilda | | | 2.63 | | | | 3-15-2021 | | | | 500,000 | | | | 491,854 | |
Sumitomo Mitsui Banking Corporation | | | 3.95 | | | | 7-19-2023 | | | | 250,000 | | | | 253,861 | |
Sumitomo Mitsui Financial Group | | | 3.01 | | | | 10-19-2026 | | | | 655,000 | | | | 614,539 | |
Sumitomo Mitsui Financial Group | | | 3.78 | | | | 3-9-2026 | | | | 700,000 | | | | 696,507 | |
Svenska Handelsbanken AB | | | 1.88 | | | | 9-7-2021 | | | | 500,000 | | | | 478,979 | |
Svenska Handelsbanken AB | | | 2.45 | | | | 3-30-2021 | | | | 1,000,000 | | | | 979,278 | |
Toronto Dominion Bank | | | 1.80 | | | | 7-13-2021 | | | | 200,000 | | | | 192,572 | |
Toronto Dominion Bank | | | 2.50 | | | | 12-14-2020 | | | | 560,000 | | | | 552,189 | |
Toronto Dominion Bank | | | 3.50 | | | | 7-19-2023 | | | | 300,000 | | | | 301,335 | |
Toronto Dominion Bank (5 Year USD Swap +2.21%) ± | | | 3.63 | | | | 9-15-2031 | | | | 525,000 | | | | 497,610 | |
Westpac Banking Corporation | | | 2.10 | | | | 5-13-2021 | | | | 350,000 | | | | 338,914 | |
Westpac Banking Corporation | | | 2.30 | | | | 5-26-2020 | | | | 700,000 | | | | 690,448 | |
Westpac Banking Corporation | | | 2.85 | | | | 5-13-2026 | | | | 700,000 | | | | 655,858 | |
| | | | |
| | | | | | | | | | | | | | | 33,442,620 | |
| | | | | | | | | | | | | | | | |
| | | | |
| Capital Markets: 0.42% | | | | | | | | | | | | | | | | |
Deutsche Bank AG | | | 3.13 | | | | 1-13-2021 | | | | 350,000 | | | | 342,381 | |
Deutsche Bank AG | | | 3.70 | | | | 5-30-2024 | | | | 700,000 | | | | 660,538 | |
Invesco Finance plc | | | 4.00 | | | | 1-30-2024 | | | | 175,000 | | | | 177,484 | |
Invesco Finance plc | | | 5.38 | | | | 11-30-2043 | | | | 175,000 | | | | 198,357 | |
Nomura Holdings Incorporated | | | 6.70 | | | | 3-4-2020 | | | | 249,000 | | | | 261,103 | |
| | | | |
| | | | | | | | | | | | | | | 1,639,863 | |
| | | | | | | | | | | | | | | | |
| | | | |
| Diversified Financial Services: 1.27% | | | | | | | | | | | | | | | | |
Barrick Australian Finance Proprietary Limited | | | 5.95 | | | | 10-15-2039 | | | | 135,000 | | | | 148,775 | |
BHP Billiton Finance USA Limited | | | 3.85 | | | | 9-30-2023 | | | | 200,000 | | | | 204,541 | |
Burlington Resources Finance Company | | | 7.20 | | | | 8-15-2031 | | | | 350,000 | | | | 449,728 | |
ConocoPhillips Canada Funding Company | | | 5.95 | | | | 10-15-2036 | | | | 210,000 | | | | 253,810 | |
GE Capital International Funding Company | | | 2.34 | | | | 11-15-2020 | | | | 1,200,000 | | | | 1,175,406 | |
GE Capital International Funding Company | | | 3.37 | | | | 11-15-2025 | | | | 550,000 | | | | 532,147 | |
Shell International Finance BV | | | 2.25 | | | | 1-6-2023 | | | | 175,000 | | | | 168,343 | |
Shell International Finance BV | | | 2.38 | | | | 8-21-2022 | | | | 175,000 | | | | 170,196 | |
Shell International Finance BV | | | 2.88 | | | | 5-10-2026 | | | | 230,000 | | | | 220,114 | |
Shell International Finance BV | | | 3.25 | | | | 5-11-2025 | | | | 350,000 | | | | 345,176 | |
Shell International Finance BV | | | 3.40 | | | | 8-12-2023 | | | | 175,000 | | | | 176,109 | |
Shell International Finance BV | | | 3.63 | | | | 8-21-2042 | | | | 175,000 | | | | 161,832 | |
Shell International Finance BV | | | 4.38 | | | | 3-25-2020 | | | | 350,000 | | | | 358,335 | |
Shell International Finance BV | | | 6.38 | | | | 12-15-2038 | | | | 245,000 | | | | 318,052 | |
UBS AG | | | 2.38 | | | | 8-14-2019 | | | | 225,000 | | | | 224,121 | |
| | | | |
| | | | | | | | | | | | | | | 4,906,685 | |
| | | | | | | | | | | | | | | | |
| | | | |
| Insurance: 0.11% | | | | | | | | | | | | | | | | |
Aon plc | | | 4.00 | | | | 11-27-2023 | | | | 105,000 | | | | 106,976 | |
XL Capital Limited | | | 6.25 | | | | 5-15-2027 | | | | 70,000 | | | | 80,192 | |
XL Capital Limited | | | 6.38 | | | | 11-15-2024 | | | | 70,000 | | | | 78,627 | |
XLIT Limited | | | 5.25 | | | | 12-15-2043 | | | | 140,000 | | | | 153,064 | |
| | | | |
| | | | | | | | | | | | | | | 418,859 | |
| | | | | | | | | | | | | | | | |
The accompanying notes are an integral part of these financial statements.
| | | | |
| 222 | | Wells Fargo Funds | | Portfolio of investments—August 31, 2018 (unaudited) |
INVESTMENT GRADE CORPORATE BOND PORTFOLIO
| | | | | | | | | | | | | | | | |
| Security name | | Interest rate | | | Maturity date | | | Principal | | | Value | |
| | | | |
Health Care: 1.16% | | | | | | | | | | | | | | | | |
| | | | |
| Health Care Equipment & Supplies: 0.15% | | | | | | | | | | | | | | | | |
Covidien International Finance SA | | | 6.55 | % | | | 10-15-2037 | | | $ | 280,000 | | | $ | 359,282 | |
Koninklijke Philips Electronics NV | | | 6.88 | | | | 3-11-2038 | | | | 175,000 | | | | 227,733 | |
| | | | |
| | | | | | | | | | | | | | | 587,015 | |
| | | | | | | | | | | | | | | | |
| | | | |
| Pharmaceuticals: 1.01% | | | | | | | | | | | | | | | | |
Actavis Funding SCS | | | 3.85 | | | | 6-15-2024 | | | | 350,000 | | | | 348,744 | |
Actavis Funding SCS | | | 4.85 | | | | 6-15-2044 | | | | 350,000 | | | | 346,280 | |
AstraZeneca plc | | | 1.95 | | | | 9-18-2019 | | | | 200,000 | | | | 198,366 | |
AstraZeneca plc | | | 2.38 | | | | 11-16-2020 | | | | 350,000 | | | | 344,434 | |
AstraZeneca plc | | | 3.38 | | | | 11-16-2025 | | | | 500,000 | | | | 486,059 | |
AstraZeneca plc | | | 4.00 | | | | 9-18-2042 | | | | 385,000 | | | | 362,670 | |
AstraZeneca plc | | | 4.38 | | | | 11-16-2045 | | | | 200,000 | | | | 199,194 | |
AstraZeneca plc | | | 6.45 | | | | 9-15-2037 | | | | 180,000 | | | | 225,257 | |
Mylan NV | | | 3.95 | | | | 6-15-2026 | | | | 700,000 | | | | 663,848 | |
Shire Acquisitions Investment Ireland Limited | | | 1.90 | | | | 9-23-2019 | | | | 190,000 | | | | 187,788 | |
Shire plc ADR | | | 3.20 | | | | 9-23-2026 | | | | 560,000 | | | | 521,545 | |
| | | | |
| | | | | | | | | | | | | | | 3,884,185 | |
| | | | | | | | | | | | | | | | |
| | | | |
Industrials: 0.73% | | | | | | | | | | | | | | | | |
| | | | |
| Aerospace & Defense: 0.07% | | | | | | | | | | | | | | | | |
Embraer Netherlands Finance BV | | | 5.05 | | | | 6-15-2025 | | | | 290,000 | | | | 290,003 | |
| | | | | | | | | | | | | | | | |
| | | | |
| Industrial Conglomerates: 0.09% | | | | | | | | | | | | | | | | |
Tyco Electronics Group SA | | | 7.13 | | | | 10-1-2037 | | | | 245,000 | | | | 330,206 | |
| | | | | | | | | | | | | | | | |
| | | | |
| Road & Rail: 0.21% | | | | | | | | | | | | | | | | |
Canadian National Railway Company | | | 6.20 | | | | 6-1-2036 | | | | 140,000 | | | | 175,548 | |
Canadian Pacific Railway Company | | | 4.45 | | | | 3-15-2023 | | | | 140,000 | | | | 145,110 | |
Canadian Pacific Railway Company | | | 5.95 | | | | 5-15-2037 | | | | 45,000 | | | | 54,279 | |
Canadian Pacific Railway Company | | | 6.13 | | | | 9-15-2115 | | | | 350,000 | | | | 418,093 | |
| | | | |
| | | | | | | | | | | | | | | 793,030 | |
| | | | | | | | | | | | | | | | |
| | | | |
| Trading Companies & Distributors: 0.36% | | | | | | | | | | | | | | | | |
AerCap Ireland Capital DAC | | | 3.95 | | | | 2-1-2022 | | | | 520,000 | | | | 519,613 | |
AerCap Ireland Capital DAC | | | 4.25 | | | | 7-1-2020 | | | | 200,000 | | | | 202,534 | |
AerCap Ireland Capital DAC | | | 4.63 | | | | 10-30-2020 | | | | 665,000 | | | | 679,948 | |
| | | | |
| | | | | | | | | | | | | | | 1,402,095 | |
| | | | | | | | | | | | | | | | |
| | | | |
Information Technology: 0.38% | | | | | | | | | | | | | | | | |
| | | | |
| Internet Software & Services: 0.38% | | | | | | | | | | | | | | | | |
Alibaba Group Holding Limited | | | 3.13 | | | | 11-28-2021 | | | | 250,000 | | | | 247,864 | |
Alibaba Group Holding Limited | | | 3.40 | | | | 12-6-2027 | | | | 1,100,000 | | | | 1,033,416 | |
Alibaba Group Holding Limited | | | 3.60 | | | | 11-28-2024 | | | | 200,000 | | | | 197,912 | |
| | | | |
| | | | | | | | | | | | | | | 1,479,192 | |
| | | | | | | | | | | | | | | | |
The accompanying notes are an integral part of these financial statements.
| | | | | | |
| Portfolio of investments—August 31, 2018 (unaudited) | | Wells Fargo Funds | | | 223 | |
INVESTMENT GRADE CORPORATE BOND PORTFOLIO
| | | | | | | | | | | | | | | | |
| Security name | | Interest rate | | | Maturity date | | | Principal | | | Value | |
| | | | |
Materials: 0.74% | | | | | | | | | | | | | | | | |
| | | | |
| Chemicals: 0.32% | | | | | | | | | | | | | | | | |
LyondellBasell Industries NV | | | 4.63 | % | | | 2-26-2055 | | | $ | 350,000 | | | $ | 328,516 | |
LyondellBasell Industries NV | | | 5.75 | | | | 4-15-2024 | | | | 250,000 | | | | 271,415 | |
Nutrien Limited | | | 4.88 | | | | 3-30-2020 | | | | 178,000 | | | | 181,748 | |
Nutrien Limited | | | 5.63 | | | | 12-1-2040 | | | | 140,000 | | | | 152,079 | |
Nutrien Limited | | | 5.88 | | | | 12-1-2036 | | | | 157,000 | | | | 174,140 | |
Nutrien Limited | | | 6.13 | | | | 1-15-2041 | | | | 115,000 | | | | 130,838 | |
| | | | |
| | | | | | | | | | | | | | | 1,238,736 | |
| | | | | | | | | | | | | | | | |
| | | | |
| Metals & Mining: 0.42% | | | | | | | | | | | | | | | | |
Goldcorp Incorporated | | | 3.70 | | | | 3-15-2023 | | | | 210,000 | | | | 208,671 | |
Rio Tinto Finance (USA) Limited | | | 4.13 | | | | 8-21-2042 | | | | 175,000 | | | | 172,170 | |
Vale Overseas Limited | | | 4.38 | | | | 1-11-2022 | | | | 140,000 | | | | 140,728 | |
Vale Overseas Limited | | | 6.88 | | | | 11-21-2036 | | | | 382,000 | | | | 439,778 | |
Vale Overseas Limited | | | 6.88 | | | | 11-10-2039 | | | | 91,000 | | | | 105,788 | |
Vale SA | | | 5.63 | | | | 9-11-2042 | | | | 525,000 | | | | 536,813 | |
| | | | |
| | | | | | | | | | | | | | | 1,603,948 | |
| | | | | | | | | | | | | | | | |
| | | | |
Telecommunication Services: 1.07% | | | | | | | | | | | | | | | | |
| | | | |
| Diversified Telecommunication Services: 0.40% | | | | | | | | | | | | | | | | |
British Telecommunications plc | | | 9.63 | | | | 12-15-2030 | | | | 200,000 | | | | 285,408 | |
France Telecom SA | | | 5.38 | | | | 1-13-2042 | | | | 350,000 | | | | 381,747 | |
Telefonica Emisiones SAU | | | 4.57 | | | | 4-27-2023 | | | | 500,000 | | | | 516,655 | |
Telefonica Europe BV | | | 8.25 | | | | 9-15-2030 | | | | 294,000 | | | | 383,767 | |
| | | | |
| | | | | | | | | | | | | | | 1,567,577 | |
| | | | | | | | | | | | | | | | |
| | | | |
| Wireless Telecommunication Services: 0.67% | | | | | | | | | | | | | | | | |
America Movil SAB de CV | | | 3.13 | | | | 7-16-2022 | | | | 220,000 | | | | 215,637 | |
America Movil SAB de CV | | | 4.38 | | | | 7-16-2042 | | | | 250,000 | | | | 245,324 | |
America Movil SAB de CV | | | 6.13 | | | | 11-15-2037 | | | | 70,000 | | | | 81,630 | |
America Movil SAB de CV | | | 6.38 | | | | 3-1-2035 | | | | 395,000 | | | | 467,502 | |
Rogers Communications Incorporated | | | 3.00 | | | | 3-15-2023 | | | | 140,000 | | | | 137,073 | |
Rogers Communications Incorporated | | | 4.50 | | | | 3-15-2043 | | | | 140,000 | | | | 137,102 | |
Vodafone Group plc | | | 2.50 | | | | 9-26-2022 | | | | 350,000 | | | | 336,984 | |
Vodafone Group plc | | | 2.95 | | | | 2-19-2023 | | | | 190,000 | | | | 184,565 | |
Vodafone Group plc | | | 4.38 | | | | 2-19-2043 | | | | 350,000 | | | | 316,018 | |
Vodafone Group plc | | | 6.25 | | | | 11-30-2032 | | | | 210,000 | | | | 239,480 | |
Vodafone Group plc | | | 7.88 | | | | 2-15-2030 | | | | 175,000 | | | | 221,142 | |
| | | | |
| | | | | | | | | | | | | | | 2,582,457 | |
| | | | | | | | | | | | | | | | |
| | | | |
Total Yankee Corporate Bonds and Notes (Cost $66,730,549) | | | | | | | | | | | | | | | 66,181,443 | |
| | | | | | | | | | | | | | | | |
| | | | |
| | | Yield | | | | | | Shares | | | | |
| Short-Term Investments: 0.49% | | | | | | | | | | | | | | | | |
| | | | |
| Investment Companies: 0.48% | | | | | | | | | | | | | | | | |
Wells Fargo Government Money Market Fund Select Class (l)(u) | | | 1.87 | | | | | | | | 1,867,794 | | | | 1,867,794 | |
| | | | | | | | | | | | | | | | |
The accompanying notes are an integral part of these financial statements.
| | | | |
| 224 | | Wells Fargo Funds | | Portfolio of investments—August 31, 2018 (unaudited) |
INVESTMENT GRADE CORPORATE BOND PORTFOLIO
| | | | | | | | | | | | | | | | |
| Security name | | Yield | | | Maturity date | | | Principal | | | Value | |
| | | | |
| U.S. Treasury Securities: 0.01% | | | | | | | | | | | | | | | | |
U.S. Treasury Bill (z) | | | 1.32 | % | | | 9-13-2018 | | | $ | 40,000 | | | $ | 39,981 | |
| | | | | | | | | | | | | | | | |
| | | | |
Total Short-Term Investments (Cost $1,907,775) | | | | | | | | | | | | | | | 1,907,775 | |
| | | | | | | | | | | | | | | | |
| | | | | | | | |
| Total investments in securities (Cost $383,564,702) | | | 98.90 | % | | | 382,174,206 | |
Other assets and liabilities, net | | | 1.10 | | | | 4,244,238 | |
| | | | | | | | |
| Total net assets | | | 100.00 | % | | $ | 386,418,444 | |
| | | | | | | | |
| 144A | The security may be resold in transactions exempt from registration, normally to qualified institutional buyers, pursuant to Rule 144A under the Securities Act of 1933. |
| ± | Variable rate investment. The rate shown is the rate in effect at period end. |
| (l) | The issuer of the security is an affiliated person of the Portfolio as defined in the Investment Company Act of 1940. |
| (u) | The rate represents the 7-day annualized yield at period end. |
| (z) | Zero coupon security. The rate represents the current yield to maturity. |
Abbreviations:
| ADR | American depositary receipt |
| LIBOR | London Interbank Offered Rate |
| REIT | Real estate investment trust |
Investments in Affiliates
An affiliated investment is an investment in which the Portfolio owns at least 5% of the outstanding voting shares of the issuer or as a result of other relationships, such as the Portfolio and the issuer having the same adviser or investment manager. Transactions with issuers that were either affiliated persons of the Portfolio at the beginning of the period or the end of the period were as follows:
| | | | | | | | | | | | | | | | | | | | | | | | | | | | | | | | | | | | |
| | | Shares,
beginning of
period | | | Shares
purchased | | | Shares
sold | | | Shares,
end of
period | | | Net
realized
gains
(losses) | | | Net
change in
unrealized
gains
(losses) | | | Income
from
affiliated
securities | | | Value,
end
of period | | | % of
net
assets | |
Short-Term Investments | | | | | | | | | | | | | | | | | | | | | | | | | | | | | | | | | | | | |
Investment Companies | | | | | | | | | | | | | | | | | | | | | | | | | | | | | | | | | | | | |
Wells Fargo Government Money Market Fund Select Class | | | 0 | | | | 46,024,533 | | | | 44,156,739 | | | | 1,867,794 | | | $ | 0 | | | $ | 0 | | | $ | 21,199 | | | $ | 1,867,794 | | | | 0.48 | % |
The accompanying notes are an integral part of these financial statements.
| | | | | | |
| Portfolio of investments—August 31, 2018 (unaudited) | | Wells Fargo Funds | | | 225 | |
STRATEGIC RETIREMENT BOND PORTFOLIO
| | | | | | | | | | | | | | | | |
| Security name | | Interest rate | | | Maturity date | | | Principal | | | Value | |
| | | | |
Agency Securities: 1.83% | | | | | | | | | | | | | | | | |
FHLB | | | 2.00 | % | | | 9-13-2019 | | | $ | 370,000 | | | $ | 367,888 | |
FHLB | | | 2.26 | | | | 10-4-2022 | | | | 165,000 | | | | 161,890 | |
FHLMC | | | 1.50 | | | | 1-17-2020 | | | | 430,000 | | | | 423,745 | |
FHLMC | | | 2.13 | | | | 6-9-2023 | | | | 35,000 | | | | 33,997 | |
FHLMC | | | 2.75 | | | | 12-13-2024 | | | | 135,000 | | | | 133,251 | |
FHLMC | | | 3.25 | | | | 6-9-2023 | | | | 50,000 | | | | 50,811 | |
FNMA ¤ | | | 0.00 | | | | 10-9-2019 | | | | 310,000 | | | | 301,232 | |
FNMA | | | 1.38 | | | | 10-7-2021 | | | | 45,000 | | | | 43,191 | |
FNMA | | | 1.50 | | | | 6-22-2020 | | | | 33,000 | | | | 32,352 | |
FNMA | | | 1.50 | | | | 11-30-2020 | | | | 110,000 | | | | 107,177 | |
FNMA | | | 1.88 | | | | 9-24-2026 | | | | 95,000 | | | | 87,292 | |
FNMA | | | 2.13 | | | | 4-24-2026 | | | | 93,000 | | | | 87,644 | |
FNMA | | | 2.63 | | | | 9-6-2024 | | | | 100,000 | | | | 98,506 | |
| |
Total Agency Securities (Cost $1,939,295) | | | | 1,928,976 | |
| | | | | | | | | | | | | | | | |
| | | | |
U.S. Treasury Securities: 92.99% | | | | | | | | | | | | | | | | |
TIPS | | | 0.13 | | | | 4-15-2020 | | | | 3,789,848 | | | | 3,740,402 | |
TIPS | | | 0.13 | | | | 4-15-2021 | | | | 696,409 | | | | 683,324 | |
TIPS | | | 0.13 | | | | 1-15-2022 | | | | 3,512,619 | | | | 3,438,621 | |
TIPS | | | 0.13 | | | | 4-15-2022 | | | | 101,544 | | | | 99,082 | |
TIPS | | | 0.13 | | | | 7-15-2022 | | | | 3,920,737 | | | | 3,843,277 | |
TIPS | | | 0.13 | | | | 1-15-2023 | | | | 2,962,901 | | | | 2,885,483 | |
TIPS | | | 0.13 | | | | 7-15-2024 | | | | 2,444,059 | | | | 2,367,495 | |
TIPS | | | 0.13 | | | | 7-15-2026 | | | | 2,078,361 | | | | 1,982,426 | |
TIPS | | | 0.25 | | | | 1-15-2025 | | | | 1,276,680 | | | | 1,236,971 | |
TIPS | | | 0.38 | | | | 7-15-2023 | | | | 2,631,228 | | | | 2,596,634 | |
TIPS | | | 0.38 | | | | 7-15-2025 | | | | 1,758,620 | | | | 1,719,875 | |
TIPS | | | 0.38 | | | | 1-15-2027 | | | | 1,789,054 | | | | 1,729,652 | |
TIPS | | | 0.38 | | | | 7-15-2027 | | | | 30,904 | | | | 29,909 | |
TIPS | | | 0.63 | | | | 7-15-2021 | | | | 893,322 | | | | 893,285 | |
TIPS | | | 0.63 | | | | 4-15-2023 | | | | 461,593 | | | | 458,828 | |
TIPS | | | 0.63 | | | | 1-15-2024 | | | | 3,456,984 | | | | 3,436,737 | |
TIPS | | | 0.63 | | | | 1-15-2026 | | | | 3,764,811 | | | | 3,725,839 | |
TIPS | | | 0.75 | | | | 7-15-2028 | | | | 757,929 | | | | 755,857 | |
TIPS | | | 1.13 | | | | 1-15-2021 | | | | 3,664,321 | | | | 3,694,145 | |
TIPS | | | 1.25 | | | | 7-15-2020 | | | | 2,276,276 | | | | 2,304,417 | |
TIPS | | | 1.38 | | | | 1-15-2020 | | | | 5,826 | | | | 5,870 | |
TIPS | | | 1.75 | | | | 1-15-2028 | | | | 1,401,309 | | | | 1,519,416 | |
TIPS | | | 2.00 | | | | 1-15-2026 | | | | 1,022,044 | | | | 1,111,841 | |
TIPS | | | 2.38 | | | | 1-15-2025 | | | | 1,328,819 | | | | 1,462,667 | |
TIPS | | | 2.38 | | | | 1-15-2027 | | | | 1,297,033 | | | | 1,463,568 | |
TIPS | | | 3.63 | | | | 4-15-2028 | | | | 927,010 | | | | 1,165,486 | |
U.S. Treasury Bond | | | 6.38 | | | | 8-15-2027 | | | | 365,000 | | | | 466,230 | |
U.S. Treasury Bond | | | 6.88 | | | | 8-15-2025 | | | | 20,000 | | | | 25,117 | |
U.S. Treasury Note | | | 0.50 | | | | 1-15-2028 | | | | 1,808,214 | | | | 1,757,829 | |
U.S. Treasury Note | | | 1.13 | | | | 4-30-2020 | | | | 689,000 | | | | 672,556 | |
U.S. Treasury Note | | | 1.13 | | | | 7-31-2021 | | | | 778,000 | | | | 743,902 | |
U.S. Treasury Note | | | 1.13 | | | | 9-30-2021 | | | | 780,000 | | | | 743,773 | |
U.S. Treasury Note | | | 1.25 | | | | 10-31-2019 | | | | 569,000 | | | | 560,843 | |
U.S. Treasury Note | | | 1.25 | | | | 10-31-2021 | | | | 778,000 | | | | 743,750 | |
The accompanying notes are an integral part of these financial statements.
| | | | |
| 226 | | Wells Fargo Funds | | Portfolio of investments—August 31, 2018 (unaudited) |
STRATEGIC RETIREMENT BOND PORTFOLIO
| | | | | | | | | | | | | | | | |
| Security name | | Interest rate | | | Maturity date | | | Principal | | | Value | |
| | | | |
U.S. Treasury Securities (continued) | | | | | | | | | | | | | | | | |
U.S. Treasury Note | | | 1.25 | % | | | 7-31-2023 | | | $ | 743,000 | | | $ | 691,977 | |
U.S. Treasury Note | | | 1.38 | | | | 1-15-2020 | | | | 686,000 | | | | 675,174 | |
U.S. Treasury Note | | | 1.38 | | | | 1-31-2020 | | | | 538,000 | | | | 529,258 | |
U.S. Treasury Note | | | 1.38 | | | | 2-15-2020 | | | | 449,000 | | | | 441,353 | |
U.S. Treasury Note | | | 1.38 | | | | 3-31-2020 | | | | 275,000 | | | | 269,844 | |
U.S. Treasury Note | | | 1.38 | | | | 4-30-2020 | | | | 3,000 | | | | 2,940 | |
U.S. Treasury Note | | | 1.38 | | | | 5-31-2020 | | | | 99,000 | | | | 96,912 | |
U.S. Treasury Note | | | 1.38 | | | | 10-31-2020 | | | | 775,000 | | | | 754,263 | |
U.S. Treasury Note | | | 1.38 | | | | 4-30-2021 | | | | 774,000 | | | | 748,089 | |
U.S. Treasury Note | | | 1.38 | | | | 6-30-2023 | | | | 744,000 | | | | 698,081 | |
U.S. Treasury Note | | | 1.38 | | | | 8-31-2023 | | | | 740,000 | | | | 692,565 | |
U.S. Treasury Note | | | 1.38 | | | | 9-30-2023 | | | | 339,000 | | | | 316,859 | |
U.S. Treasury Note | | | 1.50 | | | | 11-30-2019 | | | | 400,000 | | | | 394,969 | |
U.S. Treasury Note | | | 1.50 | | | | 4-15-2020 | | | | 686,000 | | | | 674,129 | |
U.S. Treasury Note | | | 1.50 | | | | 5-15-2020 | | | | 347,000 | | | | 340,589 | |
U.S. Treasury Note | | | 1.50 | | | | 5-31-2020 | | | | 488,000 | | | | 478,736 | |
U.S. Treasury Note | | | 1.50 | | | | 3-31-2023 | | | | 735,000 | | | | 695,781 | |
U.S. Treasury Note | | | 1.50 | | | | 8-15-2026 | | | | 1,032,000 | | | | 934,121 | |
U.S. Treasury Note | | | 1.63 | | | | 3-15-2020 | | | | 684,000 | | | | 674,141 | |
U.S. Treasury Note | | | 1.63 | | | | 6-30-2020 | | | | 2,000 | | | | 1,964 | |
U.S. Treasury Note | | | 1.63 | | | | 7-31-2020 | | | | 700,000 | | | | 686,902 | |
U.S. Treasury Note | | | 1.63 | | | | 8-15-2022 | | | | 365,000 | | | | 349,887 | |
U.S. Treasury Note | | | 1.63 | | | | 4-30-2023 | | | | 733,000 | | | | 697,209 | |
U.S. Treasury Note | | | 1.63 | | | | 5-31-2023 | | | | 20,000 | | | | 19,006 | |
U.S. Treasury Note | | | 1.63 | | | | 10-31-2023 | | | | 516,000 | | | | 487,902 | |
U.S. Treasury Note | | | 1.63 | | | | 2-15-2026 | | | | 1,018,000 | | | | 935,884 | |
U.S. Treasury Note | | | 1.63 | | | | 5-15-2026 | | | | 1,019,000 | | | | 934,216 | |
U.S. Treasury Note | | | 1.75 | | | | 9-30-2019 | | | | 275,000 | | | | 272,809 | |
U.S. Treasury Note | | | 1.75 | | | | 10-31-2020 | | | | 718,000 | | | | 704,453 | |
U.S. Treasury Note | | | 1.75 | | | | 2-28-2022 | | | | 733,000 | | | | 709,349 | |
U.S. Treasury Note | | | 1.75 | | | | 3-31-2022 | | | | 549,000 | | | | 530,771 | |
U.S. Treasury Note | | | 1.75 | | | | 5-31-2022 | | | | 772,000 | | | | 745,010 | |
U.S. Treasury Note | | | 1.75 | | | | 6-30-2022 | | | | 305,000 | | | | 294,111 | |
U.S. Treasury Note | | | 1.75 | | | | 1-31-2023 | | | | 10,000 | | | | 9,589 | |
U.S. Treasury Note | | | 1.75 | | | | 5-15-2023 | | | | 885,000 | | | | 846,247 | |
U.S. Treasury Note | | | 1.88 | | | | 6-30-2020 | | | | 586,000 | | | | 578,309 | |
U.S. Treasury Note | | | 1.88 | | | | 2-28-2022 | | | | 450,000 | | | | 437,309 | |
U.S. Treasury Note | | | 1.88 | | | | 4-30-2022 | | | | 770,000 | | | | 747,111 | |
U.S. Treasury Note | | | 1.88 | | | | 8-31-2022 | | | | 732,000 | | | | 708,153 | |
U.S. Treasury Note | | | 1.88 | | | | 8-31-2024 | | | | 160,000 | | | | 151,944 | |
U.S. Treasury Note | | | 2.00 | | | | 1-31-2020 | | | | 625,000 | | | | 620,166 | |
U.S. Treasury Note | | | 2.00 | | | | 7-31-2020 | | | | 434,000 | | | | 428,982 | |
U.S. Treasury Note | | | 2.00 | | | | 9-30-2020 | | | | 636,000 | | | | 627,752 | |
U.S. Treasury Note | | | 2.00 | | | | 11-30-2020 | | | | 674,000 | | | | 664,259 | |
U.S. Treasury Note | | | 2.00 | | | | 5-31-2021 | | | | 714,000 | | | | 701,031 | |
U.S. Treasury Note | | | 2.00 | | | | 10-31-2021 | | | | 729,000 | | | | 713,309 | |
U.S. Treasury Note | | | 2.00 | | | | 2-15-2022 | | | | 10,000 | | | | 9,762 | |
U.S. Treasury Note | | | 2.00 | | | | 11-30-2022 | | | | 780,000 | | | | 756,844 | |
U.S. Treasury Note | | | 2.00 | | | | 2-15-2023 | | | | 285,000 | | | | 276,149 | |
U.S. Treasury Note | | | 2.00 | | | | 4-30-2024 | | | | 10,000 | | | | 9,591 | |
The accompanying notes are an integral part of these financial statements.
| | | | | | |
| Portfolio of investments—August 31, 2018 (unaudited) | | Wells Fargo Funds | | | 227 | |
STRATEGIC RETIREMENT BOND PORTFOLIO
| | | | | | | | | | | | | | | | |
| Security name | | Interest rate | | | Maturity date | | | Principal | | | Value | |
| | | | |
U.S. Treasury Securities (continued) | | | | | | | | | | | | | | | | |
U.S. Treasury Note | | | 2.00 | % | | | 5-31-2024 | | | $ | 269,000 | | | $ | 257,830 | |
U.S. Treasury Note | | | 2.00 | | | | 6-30-2024 | | | | 185,000 | | | | 177,217 | |
U.S. Treasury Note | | | 2.00 | | | | 2-15-2025 | | | | 907,000 | | | | 863,634 | |
U.S. Treasury Note | | | 2.00 | | | | 8-15-2025 | | | | 1,025,000 | | | | 971,828 | |
U.S. Treasury Note | | | 2.00 | | | | 11-15-2026 | | | | 990,000 | | | | 929,014 | |
U.S. Treasury Note | | | 2.13 | | | | 1-31-2021 | | | | 157,000 | | | | 154,995 | |
U.S. Treasury Note | | | 2.13 | | | | 12-31-2021 | | | | 729,000 | | | | 715,246 | |
U.S. Treasury Note | | | 2.13 | | | | 12-31-2022 | | | | 985,000 | | | | 960,029 | |
U.S. Treasury Note | | | 2.13 | | | | 2-29-2024 | | | | 723,000 | | | | 699,135 | |
U.S. Treasury Note | | | 2.13 | | | | 5-15-2025 | | | | 990,000 | | | | 948,350 | |
U.S. Treasury Note | | | 2.25 | | | | 3-31-2021 | | | | 693,000 | | | | 685,556 | |
U.S. Treasury Note | | | 2.25 | | | | 7-31-2021 | | | | 723,000 | | | | 713,963 | |
U.S. Treasury Note | | | 2.25 | | | | 12-31-2023 | | | | 482,000 | | | | 469,649 | |
U.S. Treasury Note | | | 2.25 | | | | 1-31-2024 | | | | 719,000 | | | | 700,182 | |
U.S. Treasury Note | | | 2.25 | | | | 11-15-2024 | | | | 705,000 | | | | 682,914 | |
U.S. Treasury Note | | | 2.25 | | | | 2-15-2027 | | | | 580,000 | | | | 553,968 | |
U.S. Treasury Note | | | 2.25 | | | | 8-15-2027 | | | | 480,000 | | | | 456,900 | |
U.S. Treasury Note | | | 2.25 | | | | 11-15-2027 | | | | 420,000 | | | | 399,230 | |
U.S. Treasury Note | | | 2.38 | | | | 12-31-2020 | | | | 668,000 | | | | 663,642 | |
U.S. Treasury Note | | | 2.38 | | | | 5-15-2027 | | | | 453,000 | | | | 436,526 | |
U.S. Treasury Note | | | 2.50 | | | | 8-15-2023 | | | | 559,000 | | | | 552,515 | |
U.S. Treasury Note | | | 2.63 | | | | 8-15-2020 | | | | 758,000 | | | | 757,882 | |
U.S. Treasury Note | | | 2.63 | | | | 11-15-2020 | | | | 275,000 | | | | 274,710 | |
U.S. Treasury Note | | | 2.75 | | | | 11-15-2023 | | | | 16,000 | | | | 15,993 | |
U.S. Treasury Note | | | 3.38 | | | | 11-15-2019 | | | | 700,000 | | | | 706,891 | |
U.S. Treasury Note | | | 3.50 | | | | 5-15-2020 | | | | 729,000 | | | | 739,508 | |
U.S. Treasury Note | | | 3.63 | | | | 2-15-2020 | | | | 801,000 | | | | 812,671 | |
U.S. Treasury Note | | | 6.00 | | | | 2-15-2026 | | | | 146,000 | | | | 177,241 | |
U.S. Treasury Note | | | 6.50 | | | | 11-15-2026 | | | | 30,000 | | | | 38,032 | |
U.S. Treasury Note | | | 6.75 | | | | 8-15-2026 | | | | 355,000 | | | | 453,942 | |
U.S. Treasury Note | | | 8.00 | | | | 11-15-2021 | | | | 421,000 | | | | 488,771 | |
U.S. Treasury Note | | | 8.13 | | | | 5-15-2021 | | | | 339,000 | | | | 386,553 | |
U.S. Treasury Note | | | 8.13 | | | | 8-15-2021 | | | | 340,000 | | | | 392,023 | |
U.S. Treasury Note | | | 8.75 | | | | 8-15-2020 | | | | 76,000 | | | | 84,743 | |
| | | | |
Total U.S. Treasury Securities (Cost $100,086,978) | | | | | | | | | | | | | | | 98,152,151 | |
| | | | | | | | | | | | | | | | |
| | | | |
| | | Yield | | | | | | Shares | | | | |
| Short-Term Investments: 0.16% | | | | | | | | | | | | | | | | |
| | | | |
| Investment Companies: 0.16% | | | | | | | | | | | | | | | | |
Wells Fargo Government Money Market Fund Select Class (l)(u) | | | 1.87 | | | | | | | | 169,918 | | | | 169,918 | |
| | | | | | | | | | | | | | | | |
| | | | |
Total Short-Term Investments (Cost $169,918) | | | | | | | | | | | | | | | 169,918 | |
| | | | | | | | | | | | | | | | |
| | | | | | | | |
| Total investments in securities (Cost $102,196,191) | | | 94.98 | % | | | 100,251,045 | |
Other assets and liabilities, net | | | 5.02 | | | | 5,298,678 | |
| | | | | | | | |
| Total net assets | | | 100.00 | % | | $ | 105,549,723 | |
| | | | | | | | |
| ¤ | The security is issued in zero coupon form with no periodic interest payments. |
| (l) | The issuer of the security is an affiliated person of the Portfolio as defined in the Investment Company Act of 1940. |
| (u) | The rate represents the 7-day annualized yield at period end. |
The accompanying notes are an integral part of these financial statements.
| | | | |
| 228 | | Wells Fargo Funds | | Portfolio of investments—August 31, 2018 (unaudited) |
STRATEGIC RETIREMENT BOND PORTFOLIO
Abbreviations:
| FHLB | Federal Home Loan Bank |
| FHLMC | Federal Home Loan Mortgage Corporation |
| FNMA | Federal National Mortgage Association |
| TIPS | Treasury inflation-protected securities |
Investments in Affiliates
An affiliated investment is an investment in which the Portfolio owns at least 5% of the outstanding voting shares of the issuer or as a result of other relationships, such as the Portfolio and the issuer having the same adviser or investment manager. Transactions with issuers that were either affiliated persons of the Portfolio at the beginning of the period or the end of the period were as follows:
| | | | | | | | | | | | | | | | | | | | | | | | | | | | | | | | | | | | |
| | | Shares,
beginning of
period | | | Shares
purchased | | | Shares
sold | | | Shares, end of period | | | Net
realized
gains
(losses) | | | Net
change in
unrealized
gains
(losses) | | | Income
from
affiliated
securities | | | Value,
end
of period | | | % of
net
assets | |
Short-Term Investments | | | | | | | | | | | | | | | | | | | | | | | | | | | | | | | | | | | | |
Investment Companies | | | | | | | | | | | | | | | | | | | | | | | | | | | | | | | | | | | | |
Wells Fargo Government Money Market Fund Select Class | | | 0 | | | | 5,888,321 | | | | 5,718,403 | | | | 169,918 | | | $ | 0 | | | $ | 0 | | | $ | 2,720 | | | $ | 169,918 | | | | 0.16 | % |
The accompanying notes are an integral part of these financial statements.
| | | | | | |
| Portfolio of investments—August 31, 2018 (unaudited) | | Wells Fargo Funds | | | 229 | |
U.S. REIT PORTFOLIO
| | | | | | | | | | | | | | | | |
| Security name | | | | | | | | Shares | | | Value | |
| | | | |
Common Stocks: 100.05% | | | | | | | | | | | | | | | | |
| | | | |
Real Estate: 100.05% | | | | | | | | | | | | | | | | |
| | | | |
| Equity REITs: 100.05% | | | | | | | | | | | | | | | | |
Acadia Realty Trust | | | | | | | | | | | 6,269 | | | $ | 178,792 | |
Alexandria Real Estate Equities Incorporated | | | | | | | | | | | 8,153 | | | | 1,046,438 | |
American Assets Trust Incorporated | | | | | | | | | | | 3,054 | | | | 120,633 | |
American Campus Communities Incorporated | | | | | | | | | | | 10,960 | | | | 459,553 | |
American Homes 4 Rent Class A | | | | | | | | | | | 21,002 | | | | 487,246 | |
Americold Realty Trust | | | | | | | | | | | 5,101 | | | | 127,015 | |
Apartment Investment & Management Company Class A | | | | | | | | | | | 12,440 | | | | 544,872 | |
Apple Hospitality REIT Incorporated | | | | | | | | | | | 17,533 | | | | 309,457 | |
Armada Hoffler Properties Incorporated | | | | | | | | | | | 3,596 | | | | 56,062 | |
Ashford Hospitality Trust Incorporated | | | | | | | | | | | 7,762 | | | | 50,375 | |
AvalonBay Communities Incorporated | | | | | | | | | | | 10,987 | | | | 2,013,807 | |
Boston Properties Incorporated | | | | | | | | | | | 12,453 | | | | 1,624,494 | |
Brandywine Realty Trust | | | | | | | | | | | 14,268 | | | | 239,132 | |
Brixmor Property Group Incorporated | | | | | | | | | | | 24,387 | | | | 444,331 | |
Camden Property Trust | | | | | | | | | | | 7,292 | | | | 693,178 | |
CBL & Associates Properties Incorporated | | | | | | | | | | | 13,639 | | | | 60,830 | |
Chatham Lodging Trust | | | | | | | | | | | 3,664 | | | | 78,593 | |
Chesapeake Lodging Trust | | | | | | | | | | | 4,788 | | | | 157,573 | |
Colony Capital Incorporated | | | | | | | | | | | 39,193 | | | | 240,253 | |
Columbia Property Trust Incorporated | | | | | | | | | | | 9,506 | | | | 228,904 | |
CoreCivic Incorporated | | | | | | | | | | | 9,424 | | | | 243,987 | |
Corporate Office Properties Trust | | | | | | | | | | | 8,194 | | | | 252,211 | |
Cousins Properties Incorporated | | | | | | | | | | | 33,893 | | | | 316,900 | |
CubeSmart | | | | | | | | | | | 14,644 | | | | 447,374 | |
DDR Corporation | | | | | | | | | | | 11,387 | | | | 159,304 | |
DiamondRock Hospitality | | | | | | | | | | | 16,307 | | | | 195,032 | |
Digital Realty Trust Incorporated | | | | | | | | | | | 16,373 | | | | 2,034,836 | |
Douglas Emmett Incorporated | | | | | | | | | | | 13,113 | | | | 512,194 | |
Duke Realty Corporation | | | | | | | | | | | 28,407 | | | | 809,315 | |
Easterly Government Properties Incorporated | | | | | | | | | | | 4,804 | | | | 97,281 | |
EastGroup Properties Incorporated | | | | | | | | | | | 2,745 | | | | 267,006 | |
Education Realty Trust Incorporated | | | | | | | | | | | 6,457 | | | | 267,191 | |
Empire State Realty Trust Incorporated | | | | | | | | | | | 13,344 | | | | 234,721 | |
Equity Commonwealth † | | | | | | | | | | | 9,441 | | | | 302,678 | |
Equity Lifestyle Properties Incorporated | | | | | | | | | | | 6,394 | | | | 619,451 | |
Equity Residential | | | | | | | | | | | 28,755 | | | | 1,948,151 | |
Essex Property Trust Incorporated | | | | | | | | | | | 5,179 | | | | 1,275,484 | |
Extra Space Storage Incorporated | | | | | | | | | | | 9,791 | | | | 902,828 | |
Federal Realty Investment Trust | | | | | | | | | | | 5,823 | | | | 760,542 | |
First Industrial Realty Trust Incorporated | | | | | | | | | | | 9,886 | | | | 320,900 | |
Forest City Realty Trust Incorporated | | | | | | | | | | | 18,564 | | | | 466,885 | |
Gaming and Leisure Properties Incorporated | | | | | | | | | | | 16,104 | | | | 576,362 | |
Government Properties Income | | | | | | | | | | | 7,837 | | | | 132,524 | |
HCP Incorporated | | | | | | | | | | | 37,423 | | | | 1,011,544 | |
Healthcare Realty Trust Incorporated | | | | | | | | | | | 9,816 | | | | 303,903 | |
Healthcare Trust of America Incorporated Class A | | | | | | | | | | | 16,333 | | | | 466,634 | |
Hersha Hospitality Trust | | | | | | | | | | | 3,182 | | | | 75,095 | |
The accompanying notes are an integral part of these financial statements.
| | | | |
| 230 | | Wells Fargo Funds | | Portfolio of investments—August 31, 2018 (unaudited) |
U.S. REIT PORTFOLIO
| | | | | | | | | | | | | | | | |
| Security name | | | | | | | | Shares | | | Value | |
| | | | |
| Equity REITs (continued) | | | | | | | | | | | | | | | | |
Highwoods Properties Incorporated | | | | | | | | | | | 8,239 | | | $ | 409,808 | |
Hospitality Properties Trust | | | | | | | | | | | 12,905 | | | | 374,116 | |
Host Hotels & Resorts Incorporated | | | | | | | | | | | 59,362 | | | | 1,278,064 | |
Hudson Pacific Properties Incorporated | | | | | | | | | | | 12,477 | | | | 422,222 | |
Independence Realty Trust Incorporated | | | | | | | | | | | 6,944 | | | | 71,732 | |
Invitation Homes Incorporated | | | | | | | | | | | 23,847 | | | | 557,304 | |
Iron Mountain Incorporated | | | | | | | | | | | 22,446 | | | | 810,301 | |
JBG Smith Properties | | | | | | | | | | | 8,786 | | | | 329,124 | |
Jernigan Capital Incorporated | | | | | | | | | | | 1,435 | | | | 28,714 | |
Kilroy Realty Corporation | | | | | | | | | | | 8,004 | | | | 585,413 | |
Kimco Realty Corporation | | | | | | | | | | | 33,391 | | | | 571,320 | |
Kite Realty Group Trust | | | | | | | | | | | 6,729 | | | | 117,623 | |
Lamar Advertising Company Class A | | | | | | | | | | | 6,722 | | | | 517,930 | |
LaSalle Hotel Properties | | | | | | | | | | | 8,982 | | | | 315,358 | |
Liberty Property Trust | | | | | | | | | | | 11,903 | | | | 520,756 | |
Life Storage Incorporated | | | | | | | | | | | 3,680 | | | | 359,168 | |
LTC Properties Incorporated | | | | | | | | | | | 3,116 | | | | 144,738 | |
Mack-Cali Realty Corporation | | | | | | | | | | | 6,824 | | | | 149,036 | |
Mid-America Apartment Communities Incorporated | | | | | | | | | | | 9,066 | | | | 938,875 | |
National Health Investors Incorporated | | | | | | | | | | | 3,211 | | | | 254,472 | |
National Storage Affiliates Trust | | | | | | | | | | | 4,154 | | | | 117,807 | |
Outfront Media Incorporated | | | | | | | | | | | 11,273 | | | | 223,995 | |
Paramount Group Incorporated | | | | | | | | | | | 17,231 | | | | 273,628 | |
Park Hotels & Resorts Incorporated | | | | | | | | | | | 16,330 | | | | 546,239 | |
Pebblebrook Hotel Trust | | | | | | | | | | | 5,486 | | | | 211,814 | |
Pennsylvania Real Estate Investment Trust | | | | | | | | | | | 5,284 | | | | 53,897 | |
Piedmont Office Realty Trust Incorporated Class A | | | | | | | | | | | 10,198 | | | | 202,328 | |
Preferred Apartment Communities Incorporated Series A | | | | | | | | | | | 3,161 | | | | 56,329 | |
Prologis Incorporated | | | | | | | | | | | 49,569 | | | | 3,330,045 | |
PS Business Parks Incorporated | | | | | | | | | | | 1,604 | | | | 209,210 | |
Public Storage Incorporated | | | | | | | | | | | 12,014 | | | | 2,553,936 | |
Ramco-Gershenson Properties Trust | | | | | | | | | | | 6,156 | | | | 85,938 | |
Regency Centers Corporation | | | | | | | | | | | 12,484 | | | | 824,319 | |
Retail Opportunity Investment Corporation | | | | | | | | | | | 8,818 | | | | 174,067 | |
Rexford Industrial Realty Incorporated | | | | | | | | | | | 6,477 | | | | 210,503 | |
RLJ Lodging Trust | | | | | | | | | | | 14,061 | | | | 308,077 | |
Ryman Hospitality Properties Incorporated | | | | | | | | | | | 3,612 | | | | 320,493 | |
SBA Communications Corporation † | | | | | | | | | | | 9,119 | | | | 1,415,542 | |
Senior Housing Properties Trust | | | | | | | | | | | 18,884 | | | | 360,873 | |
Seritage Growth Property Class A | | | | | | | | | | | 2,640 | | | | 135,907 | |
Simon Property Group Incorporated | | | | | | | | | | | 24,638 | | | | 4,509,493 | |
SL Green Realty Corporation | | | | | | | | | | | 6,859 | | | | 716,080 | |
STAG Industrial Incorporated | | | | | | | | | | | 7,760 | | | | 224,031 | |
Summit Hotel Properties Incorporated | | | | | | | | | | | 8,412 | | | | 115,497 | |
Sun Communities Incorporated | | | | | | | | | | | 6,197 | | | | 639,406 | |
Sunstone Hotel Investors Incorporated | | | | | | | | | | | 18,228 | | | | 305,866 | |
Tanger Factory Outlet Centers Incorporated | | | | | | | | | | | 7,391 | | | | 177,827 | |
Taubman Centers Incorporated | | | | | | | | | | | 4,533 | | | | 292,877 | |
Terreno Realty Corporation | | | | | | | | | | | 4,398 | | | | 168,927 | |
The Geo Group Incorporated | | | | | | | | | | | 9,714 | | | | 246,444 | |
The accompanying notes are an integral part of these financial statements.
| | | | | | |
| Portfolio of investments—August 31, 2018 (unaudited) | | Wells Fargo Funds | | | 231 | |
U.S. REIT PORTFOLIO
| | | | | | | | | | | | | | | | |
| Security name | | | | | | | | Shares | | | Value | |
| | | | |
| Equity REITs (continued) | | | | | | | | | | | | | | | | |
The Macerich Company | | | | | | | | | | | 11,221 | | | $ | 659,122 | |
Tier Incorporated | | | | | | | | | | | 3,799 | | | | 90,568 | |
UDR Incorporated | | | | | | | | | | | 21,076 | | | | 842,408 | |
Uniti Group Incorporated | | | | | | | | | | | 13,798 | | | | 287,274 | |
Urban Edge Properties | | | | | | | | | | | 8,758 | | | | 200,208 | |
Ventas Incorporated | | | | | | | | | | | 28,525 | | | | 1,707,792 | |
VICI Properties Incorporated | | | | | | | | | | | 23,164 | | | | 484,359 | |
Vornado Realty Trust | | | | | | | | | | | 14,013 | | | | 1,079,001 | |
Washington Prime Group Incorporated | | | | | | | | | | | 14,864 | | | | 115,047 | |
Washington REIT | | | | | | | | | | | 6,247 | | | | 197,155 | |
Weingarten Realty Investors | | | | | | | | | | | 9,638 | | | | 298,103 | |
Welltower Incorporated | | | | | | | | | | | 29,675 | | | | 1,979,619 | |
Xenia Hotels & Resorts Incorporated | | | | | | | | | | | 8,682 | | | | 210,625 | |
| | | | |
| | | | | | | | | | | | | | | 60,080,621 | |
| | | | | | | | | | | | | | | | |
| | | | |
Total Common Stocks (Cost $54,289,877) | | | | | | | | | | | | | | | 60,080,621 | |
| | | | | | | | | | | | | | | | |
| | | | | | | | |
| Total investments in securities (Cost $54,289,877) | | | 100.05 | % | | | 60,080,621 | |
Other assets and liabilities, net | | | (0.05 | ) | | | (31,204 | ) |
| | | | | | | | |
| Total net assets | | | 100.00 | % | | $ | 60,049,417 | |
| | | | | | | | |
| † | Non-income-earning security |
Abbreviations:
| REIT | Real estate investment trust |
Investments in Affiliates
An affiliated investment is an investment in which the Portfolio owns at least 5% of the outstanding voting shares of the issuer or as a result of other relationships, such as the Portfolio and the issuer having the same adviser or investment manager. Transactions with issuers that were either affiliated persons of the Portfolio at the beginning of the period or the end of the period were as follows:
| | | | | | | | | | | | | | | | | | | | | | | | | | | | | | | | |
| | | Shares,
beginning of
period | | | Shares
purchased | | | Shares
sold | | | Shares,
end of
period | | | Net
realized
gains
(losses) | | | Net
change in
unrealized
gains
(losses) | | | Income
from
affiliated
securities | | | Value,
end
of period | |
| Short-Term Investments | | | | | | | | | | | | | | | | | | | | | | | | | | | | | | | | |
Investment Companies | | | | | | | | | | | | | | | | | | | | | | | | | | | | | | | | |
Wells Fargo Government Money Market Fund Select Class * | | | 336,973 | | | | 4,794,892 | | | | 5,131,865 | | | | 0 | | | $ | 0 | | | $ | 0 | | | $ | 947 | | | $ | 0 | |
| | * | No longer held at the end of the period. |
The accompanying notes are an integral part of these financial statements.
| | | | |
| 232 | | Wells Fargo Funds | | Statements of assets and liabilities—August 31, 2018 (unaudited) |
| | | | | | | | |
| | | Bloomberg
Barclays US
Aggregate ex-
Corporate
Portfolio | | | Emerging
Markets
Bond
Portfolio | |
| | |
Assets | | | | | | | | |
Investments in unaffiliated securities, at value (see cost below) | | $ | 824,053,078 | | | $ | 59,003,729 | |
Investments in affiliated securities, at value (see cost below) | | | 34,114,908 | | | | 2,807,900 | |
Cash | | | 0 | | | | 0 | |
Segregated cash for futures contracts | | | 0 | | | | 0 | |
Foreign currency, at value (see cost below) | | | 0 | | | | 0 | |
Receivable for investments sold | | | 42,641,719 | | | | 950,608 | |
Receivable for dividends and interest | | | 3,869,628 | | | | 913,511 | |
Receivable for daily variation margin on open futures contracts | | | 0 | | | | 0 | |
Unrealized gains on forward foreign currency contracts | | | 0 | | | | 0 | |
Prepaid expenses and other assets | | | 2,515 | | | | 568 | |
| | | | |
Total assets | | | 904,681,848 | | | | 63,676,316 | |
| | | | |
| | |
Liabilities | | | | | | | | |
Payable for investments purchased | | | 37,121,717 | | | | 0 | |
Custodian and accounting fees payable | | | 87,031 | | | | 0 | |
Professional fees payable | | | 50,688 | | | | 22,166 | |
Management fee payable | | | 39,803 | | | | 13,960 | |
Shareholder report expenses payable | | | 13,692 | | | | 16,007 | |
Payable for daily variation margin on open futures contracts | | | 0 | | | | 0 | |
Unrealized losses on forward foreign currency contracts | | | 0 | | | | 0 | |
Contingent tax liability | | | 0 | | | | 0 | |
Trustees’ fees and expenses payable | | | 0 | | | | 0 | |
Accrued expenses and other liabilities | | | 9,464 | | | | 15,223 | |
| | | | |
Total liabilities | | | 37,322,395 | | | | 67,356 | |
| | | | |
Total net assets | | $ | 867,359,453 | | | $ | 63,608,960 | |
| | | | |
| | |
Investments in unaffiliated securities, at cost | | $ | 845,154,667 | | | $ | 63,037,773 | |
| | | | |
Investments in affiliated securities, at cost | | $ | 34,114,908 | | | $ | 2,807,900 | |
| | | | |
Foreign currency, at cost | | $ | 0 | | | $ | 0 | |
| | | | |
The accompanying notes are an integral part of these financial statements.
| | | | | | |
| Statements of assets and liabilities—August 31, 2018 (unaudited) | | Wells Fargo Funds | | | 233 | |
| | | | | | | | | | | | | | | | | | | | | | | | | | |
Factor
Enhanced
Emerging
Markets
Portfolio | | | Factor
Enhanced
International
Portfolio | | | Factor
Enhanced
Large Cap
Portfolio | | | Factor
Enhanced
Small Cap
Portfolio | | | High Yield
Corporate
Bond
Portfolio | | | International
Government
Bond
Portfolio | | | Investment
Grade
Corporate
Bond
Portfolio | |
| | | | | | |
| | | | | | | | | | | | | | | | | | | | | | | | | | |
| $ | 284,953,016 | | | $ | 889,417,105 | | | $ | 1,524,187,175 | | | $ | 367,166,616 | | | $ | 108,058,662 | | | $ | 10,490,219 | | | $ | 380,306,412 | |
| | 13,354,608 | | | | 40,929,757 | | | | 16,690,970 | | | | 11,630,466 | | | | 3,064,761 | | | | 1,018,943 | | | | 1,867,794 | |
| | 0 | | | | 0 | | | | 905,298 | | | | 1,119 | | | | 0 | | | | 0 | | | | 0 | |
| | 1,778,773 | | | | 2,846,472 | | | | 4,508,000 | | | | 1,880,000 | | | | 0 | | | | 0 | | | | 0 | |
| | 1,427,906 | | | | 1,159,900 | | | | 0 | | | | 0 | | | | 0 | | | | 47,864 | | | | 0 | |
| | 8,243,014 | | | | 33,052,794 | | | | 106,420,618 | | | | 19,281,100 | | | | 425,301 | | | | 4,472,779 | | | | 0 | |
| | 652,941 | | | | 4,356,554 | | | | 3,523,041 | | | | 308,219 | | | | 1,957,279 | | | | 84,179 | | | | 4,372,554 | |
| | 88,660 | | | | 0 | | | | 4,735 | | | | 113,715 | | | | 0 | | | | 0 | | | | 0 | |
| | 0 | | | | 0 | | | | 0 | | | | 0 | | | | 0 | | | �� | 48,278 | | | | 0 | |
| | 0 | | | | 2,629,437 | | | | 12,308 | | | | 1,361 | | | | 0 | | | | 0 | | | | 69,820 | |
| | |
| | 310,498,918 | | | | 974,392,019 | | | | 1,656,252,145 | | | | 400,382,596 | | | | 113,506,003 | | | | 16,162,262 | | | | 386,616,580 | |
| | |
| | | | | | |
| | | | | | | | | | | | | | | | | | | | | | | | | | |
| | 0 | | | | 0 | | | | 0 | | | | 0 | | | | 0 | | | | 5,387,151 | | | | 0 | |
| | 832,638 | | | | 486,122 | | | | 0 | | | | 19,347 | | | | 0 | | | | 0 | | | | 100,974 | |
| | 0 | | | | 0 | | | | 0 | | | | 22,617 | | | | 0 | | | | 0 | | | | 70,676 | |
| | 10,851 | | | | 117,714 | | | | 146,224 | | | | 51,042 | | | | 25,888 | | | | 2,278 | | | | 16,518 | |
| | 0 | | | | 0 | | | | 0 | | | | 1,541 | | | | 2,042 | | | | 10 | | | | 7,088 | |
| | 0 | | | | 347,565 | | | | 0 | | | | 0 | | | | 0 | | | | 0 | | | | 0 | |
| | 0 | | | | 0 | | | | 0 | | | | 0 | | | | 0 | | | | 54,616 | | | | 0 | |
| | 42,259 | | | | 0 | | | | 0 | | | | 0 | | | | 0 | | | | 0 | | | | 0 | |
| | 0 | | | | 0 | | | | 0 | | | | 0 | | | | 0 | | | | 0 | | | | 2,880 | |
| | 3,823 | | | | 6,363 | | | | 241,557 | | | | 0 | | | | 26,167 | | | | 47,695 | | | | 0 | |
| | |
| | 889,571 | | | | 957,764 | | | | 387,781 | | | | 94,547 | | | | 54,097 | | | | 5,491,750 | | | | 198,136 | |
| | |
| $ | 309,609,347 | | | $ | 973,434,255 | | | $ | 1,655,864,364 | | | $ | 400,288,049 | | | $ | 113,451,906 | | | $ | 10,670,512 | | | $ | 386,418,444 | |
| | |
| | | | | | |
| $ | 293,951,075 | | | $ | 856,663,456 | | | $ | 1,293,568,578 | | | $ | 310,199,161 | | | $ | 110,943,811 | | | $ | 10,566,684 | | | $ | 381,696,908 | |
| | |
| $ | 13,354,608 | | | $ | 40,929,757 | | | $ | 16,690,970 | | | $ | 11,630,466 | | | $ | 3,064,761 | | | $ | 1,018,943 | | | $ | 1,867,794 | |
| | |
| $ | 1,433,012 | | | $ | 1,160,013 | | | $ | 0 | | | $ | 0 | | | $ | 0 | | | $ | 46,957 | | | $ | 0 | |
| | |
The accompanying notes are an integral part of these financial statements.
| | | | |
| 234 | | Wells Fargo Funds | | Statements of assets and liabilities—August 31, 2018 (unaudited) |
| | | | | | | | |
| | | Strategic
Retirement Bond
Portfolio | | | U.S. REIT
Portfolio | |
| | |
Assets | | | | | | | | |
Investments in unaffiliated securities, at value (see cost below) | | $ | 100,081,127 | | | $ | 60,080,622 | |
Investments in affiliated securities, at value (see cost below) | | | 169,918 | | | | 0 | |
Receivable for investments sold | | | 5,081,062 | | | | 490,211 | |
Receivable for dividends and interest | | | 278,197 | | | | 24,629 | |
Prepaid expenses and other assets | | | 931 | | | | 19,603 | |
| | | | |
Total assets | | | 105,611,235 | | | | 60,615,065 | |
| | | | |
| | |
Liabilities | | | | | | | | |
Custodian and accounting fees payable | | | 1,800 | | | | 0 | |
Professional fees payable | | | 35,200 | | | | 34,889 | |
Management fee payable | | | 4,933 | | | | 5,606 | |
Shareholder report expenses payable | | | 19,579 | | | | 0 | |
Due to custodian bank | | | 0 | | | | 524,241 | |
Accrued expenses and other liabilities | | | 0 | | | | 912 | |
| | | | |
Total liabilities | | | 61,512 | | | | 565,648 | |
| | | | |
Total net assets | | $ | 105,549,723 | | | $ | 60,049,417 | |
| | | | |
| | |
Investments in unaffiliated securities, at cost | | $ | 102,026,273 | | | $ | 54,289,877 | |
| | | | |
Investments in affiliated securities, at cost | | $ | 169,918 | | | $ | 0 | |
| | | | |
The accompanying notes are an integral part of these financial statements.
This page is intentionally left blank.
| | | | |
| 236 | | Wells Fargo Funds | | Statements of operations—six months ended August 31, 2018 (unaudited) |
| | | | | | | | |
| | | Bloomberg
Barclays US
Aggregate ex-
Corporate
Portfolio | | | Emerging
Markets
Bond
Portfolio | |
| | |
Investment income | | | | | | | | |
Interest* | | $ | 11,089,653 | | | $ | 1,671,584 | |
Income from affiliated securities | | | 273,020 | | | | 9,735 | |
Dividends** | | | 0 | | | | 0 | |
| | | | |
Total investment income | | | 11,362,673 | | | | 1,681,319 | |
| | | | |
| | |
Expenses | | | | | | | | |
Management fee | | | 239,014 | | | | 86,945 | |
Custody and accounting fees | | | 56,541 | | | | 5,058 | |
Professional fees | | | 25,352 | | | | 24,225 | |
Shareholder report expenses | | | 8,518 | | | | 8,252 | |
Trustees’ fees and expenses | | | 9,651 | | | | 9,651 | |
Other fees and expenses | | | 9,941 | | | | 10,044 | |
| | | | |
Total expenses | | | 349,017 | | | | 144,175 | |
Less: Fee waivers and/or expense reimbursements | | | (818 | ) | | | (830 | ) |
| | | | |
Net expenses | | | 348,199 | | | | 143,345 | |
| | | | |
Net investment income (loss) | | | 11,014,474 | | | | 1,537,974 | |
| | | | |
| | |
REALIZED AND UNREALIZED GAINS (LOSSES) ON INVESTMENTS | | | | | | | | |
| | |
Net realized gains (losses) on: | | | | | | | | |
Unaffiliated securities | | | (4,877,624 | ) | | | (998,896 | ) |
Futures contracts | | | 17,089 | | | | 0 | |
Forward foreign currency contracts | | | 0 | | | | 0 | |
| | | | |
Net realized gain (losses) on investments | | | (4,860,535 | ) | | | (998,896 | ) |
| | | | |
| | |
Net change in unrealized gains (losses) on: | | | | | | | | |
Unaffiliated securities | | | 5,342,274 | | | | (2,319,243 | ) |
Futures contracts | | | 0 | | | | 0 | |
Forward foreign currency contracts | | | 0 | | | | 0 | |
Foreign currency and foreign currency translations | | | 0 | | | | 0 | |
| | | | |
Net change in unrealized gains (losses) on investments | | | 5,342,274 | | | | (2,319,243 | ) |
| | | | |
Net realized and unrealized gains (losses) on investments | | | 481,739 | | | | (3,318,139 | ) |
| | | | |
Net increase (decrease) in net assets resulting from operations | | $ | 11,496,213 | | | $ | (1,780,165 | ) |
| | | | |
| | |
* Net of foreign interest withholding taxes in the amount of | | | $0 | | | | $0 | |
** Net of foreign dividend withholding taxes in the amount of | | | $0 | | | | $0 | |
The accompanying notes are an integral part of these financial statements.
| | | | | | |
| Statements of operations—six months ended August 31, 2018 (unaudited) | | Wells Fargo Funds | | | 237 | |
| | | | | | | | | | | | | | | | | | | | | | | | | | |
Factor
Enhanced
Emerging
Markets
Portfolio | | | Factor
Enhanced
International
Portfolio | | | Factor
Enhanced
Large Cap
Portfolio | | | Factor
Enhanced
Small Cap
Portfolio | | | High Yield
Corporate
Bond
Portfolio | | | International
Government
Bond
Portfolio | | | Investment
Grade
Corporate
Bond
Portfolio | |
| | | | | | |
| | | | | | | | | | | | | | | | | | | | | | | | | | | |
| $ | 0 | | | $ | 0 | | | $ | 0 | | | $ | 0 | | | $ | 3,619,917 | | | $ | 62,720 | | | $ | 8,035,368 | |
| | 72,160 | | | | 226,231 | | | | 311,696 | | | | 98,967 | | | | 11,863 | | | | 552 | | | | 21,199 | |
| | 5,762,564 | | | | 21,373,614 | | | | 21,375,089 | | | | 3,540,255 | | | | 0 | | | | 0 | | | | 0 | |
| | |
| | 5,834,724 | | | | 21,599,845 | | | | 21,686,785 | | | | 3,639,222 | | | | 3,631,780 | | | | 63,272 | | | | 8,056,567 | |
| | |
| | | | | | |
| | | | | | | | | | | | | | | | | | | | | | | | | | | |
| | 255,148 | | | | 813,231 | | | | 914,683 | | | | 331,452 | | | | 153,567 | | | | 12,726 | | | | 107,086 | |
| | 623,570 | | | | 356,871 | | | | 144,927 | | | | 59,148 | | | | 4,363 | | | | 2,050 | | | | 24,203 | |
| | 25,352 | | | | 25,352 | | | | 25,352 | | | | 25,352 | | | | 23,659 | | | | 44,163 | | | | 25,352 | |
| | 2,796 | | | | 2,796 | | | | 2,796 | | | | 2,994 | | | | 3,194 | | | | 3,835 | | | | 8,518 | |
| | 9,651 | | | | 9,651 | | | | 9,651 | | | | 9,651 | | | | 9,651 | | | | 9,651 | | | | 9,651 | |
| | 6,150 | | | | 6,148 | | | | 4,611 | | | | 4,611 | | | | 7,174 | | | | 4,612 | | | | 3,333 | |
| | |
| | 922,667 | | | | 1,214,049 | | | | 1,102,020 | | | | 433,208 | | | | 201,608 | | | | 77,037 | | | | 178,143 | |
| | (136,810 | ) | | | (70,104 | ) | | | (31,867 | ) | | | (15,586 | ) | | | (563 | ) | | | 0 | | | | (3,895 | ) |
| | |
| | 785,857 | | | | 1,143,945 | | | | 1,070,153 | | | | 417,622 | | | | 201,045 | | | | 77,037 | | | | 174,248 | |
| | |
| | 5,048,867 | | | | 20,455,900 | | | | 20,616,632 | | | | 3,221,600 | | | | 3,430,735 | | | | (13,765 | ) | | | 7,882,319 | |
| | |
| | | | | | |
| | | | | | | | | | | | | | | | | | | | | | | | | | | |
| | | | | | |
| | | | | | | | | | | | | | | | | | | | | | | | | | | |
| | (7,793,408 | ) | | | (111,592,155 | ) | | | (357,072,709 | ) | | | 21,728,139 | | | | (1,520,793 | ) | | | (313,912 | ) | | | (866,784 | ) |
| | (1,316,155 | ) | | | (2,231,048 | ) | | | (1,024,299 | ) | | | 1,087,352 | | | | 0 | | | | 0 | | | | 85,774 | |
| | 0 | | | | 0 | | | | 0 | | | | 0 | | | | 0 | | | | 12,101 | | | | 0 | |
| | |
| | (9,109,563 | ) | | | (113,823,203 | ) | | | (358,097,008 | ) | | | 22,815,491 | | | | (1,520,793 | ) | | | (301,811 | ) | | | (781,010 | ) |
| | |
| | | | | | |
| | | | | | | | | | | | | | | | | | | | | | | | | | |
| | (28,980,884 | ) | | | 98,894,607 | | | | 446,187,050 | | | | 40,997,274 | | | | 75,363 | | | | (193,972 | ) | | | (5,578,240 | ) |
| | 111,419 | | | | 1,208,717 | | | | 3,016,898 | | | | 1,355,992 | | | | 0 | | | | 0 | | | | 0 | |
| | 0 | | | | 0 | | | | 0 | | | | 0 | | | | 0 | | | | (11,579 | ) | | | 0 | |
| | (5,057 | ) | | | 5,745 | | | | 0 | | | | 0 | | | | 0 | | | | (4,258 | ) | | | 0 | |
| | |
| | (28,874,522 | ) | | | 100,109,069 | | | | 449,203,948 | | | | 42,353,266 | | | | 75,363 | | | | (209,809 | ) | | | (5,578,240 | ) |
| | |
| | (37,984,085 | ) | | | (13,714,134 | ) | | | 91,106,940 | | | | 65,168,757 | | | | (1,445,430 | ) | | | (511,620 | ) | | | (6,359,250 | ) |
| | |
| $ | (32,935,218 | ) | | $ | 6,741,766 | | | $ | 111,723,572 | | | $ | 68,390,357 | | | $ | 1,985,305 | | | $ | (525,385 | ) | | $ | 1,523,069 | |
| | |
| | | | | | |
| | $0 | | | | $0 | | | | $0 | | | | $0 | | | | $0 | | | | $1,445 | | | | $230 | |
| | $841,264 | | | | $2,214,929 | | | | $365 | | | | $0 | | | | $0 | | | | $0 | | | | $0 | |
The accompanying notes are an integral part of these financial statements.
| | | | |
| 238 | | Wells Fargo Funds | | Statements of operations—six months ended August 31, 2018 (unaudited) |
| | | | | | | | |
| | | Strategic
Retirement Bond
Portfolio | | | U.S. REIT
Portfolio | |
| | |
Investment income | | | | | | | | |
Interest | | $ | 1,929,696 | | | $ | 0 | |
Income from affiliated securities | | | 2,720 | | | | 947 | |
Dividends | | | 0 | | | | 1,331,256 | |
| | | | |
Total investment income | | | 1,932,416 | | | | 1,332,203 | |
| | | | |
| | |
Expenses | | | | | | | | |
Management fee | | | 29,173 | | | | 32,571 | |
Custody and accounting fees | | | 4,067 | | | | 1,573 | |
Professional fees | | | 25,352 | | | | 25,352 | |
Shareholder report expenses | | | 9,982 | | | | 2,994 | |
Trustees’ fees and expenses | | | 9,651 | | | | 9,651 | |
Other fees and expenses | | | 3,330 | | | | 4,612 | |
| | | | |
Total expenses | | | 81,555 | | | | 76,753 | |
| | | | |
Net investment income | | | 1,850,861 | | | | 1,255,450 | |
| | | | |
| | |
REALIZED AND UNREALIZED GAINS (LOSSES) ON INVESTMENTS | | | | | | | | |
Net realized gains (losses) on investments | | | (431,552 | ) | | | (5,223,068 | ) |
Net change in unrealized gains (losses) on investments | | | 13,027 | | | | 14,198,957 | |
| | | | |
Net realized and unrealized gains (losses) on investments | | | (418,525 | ) | | | 8,975,889 | |
| | | | |
Net increase (decrease) in net assets resulting from operations | | $ | 1,432,336 | | | $ | 10,231,339 | |
| | | | |
The accompanying notes are an integral part of these financial statements.
| | | | | | |
| Statements of changes in net assets | | Wells Fargo Funds | | | 239 | |
| | | | | | | | |
| | | Bloomberg Barclays US Aggregate
ex-Corporate Portfolio | |
| | | Six months ended
August 31, 2018
(unaudited) | | | Year ended
February 28, 20181 | |
| | |
Operations | | | | | | | | |
Net investment income | | $ | 11,014,474 | | | $ | 13,940,324 | |
Net realized gains (losses) on investments | | | (4,860,535 | ) | | | 2,695,847 | |
Net change in unrealized gains (losses) on investments | | | 5,342,274 | | | | (26,443,863 | ) |
| | | | |
Net increase (decrease) in net assets resulting from operations | | | 11,496,213 | | | | (9,807,692 | ) |
| | | | |
| |
Capital share transactions | | | | |
Transactions in investors’ beneficial interests | | | | | | | | |
Contributions | | | 48,054,130 | | | | 1,487,528,060 | |
Withdrawals | | | (218,619,817 | ) | | | (451,291,441 | ) |
| | | | |
Net increase (decrease) in net assets resulting from capital share transactions | | | (170,565,687 | ) | | | 1,036,236,619 | |
| | | | |
Total increase (decrease) in net assets | | | (159,069,474 | ) | | | 1,026,428,927 | |
| | | | |
| | |
Net assets | | | | | | | | |
Beginning of period | | | 1,026,428,927 | | | | 0 | |
| | | | |
End of period | | $ | 867,359,453 | | | $ | 1,026,428,927 | |
| | | | |
| 1 | For the period from May 23, 2017 (commencement of operations) to February 28, 2018 |
The accompanying notes are an integral part of these financial statements.
| | | | |
| 240 | | Wells Fargo Funds | | Statements of changes in net assets |
| | | | | | | | |
| | | Emerging Markets Bond Portfolio | |
| | | Six months ended
August 31, 2018
(unaudited) | | | Year ended
February 28, 20181 | |
| | |
Operations | | | | | | | | |
Net investment income | | $ | 1,537,974 | | | $ | 2,384,919 | |
Net realized gains (losses) on investments | | | (998,896 | ) | | | 717,913 | |
Net change in unrealized gains (losses) on investments | | | (2,319,243 | ) | | | (1,714,801 | ) |
| | | | |
Net increase (decrease) in net assets resulting from operations | | | (1,780,165 | ) | | | 1,388,031 | |
| | | | |
| |
Capital share transactions | | | | |
Transactions in investors’ beneficial interests | | | | | | | | |
Contributions | | | 7,995,687 | | | | 129,766,929 | |
Withdrawals | | | (17,560,242 | ) | | | (56,201,280 | ) |
| | | | |
Net increase (decrease) in net assets resulting from capital share transactions | | | (9,564,555 | ) | | | 74,565,649 | |
| | | | |
Total increase (decrease) in net assets | | | (11,344,720 | ) | | | 74,953,680 | |
| | | | |
| | |
Net assets | | | | | | | | |
Beginning of period | | | 74,953,680 | | | | 0 | |
| | | | |
End of period | | $ | 63,608,960 | | | $ | 74,953,680 | |
| | | | |
| 1 | For the period from May 23, 2017 (commencement of operations) to February 28, 2018 |
The accompanying notes are an integral part of these financial statements.
| | | | | | |
| Statements of changes in net assets | | Wells Fargo Funds | | | 241 | |
| | | | | | | | |
| | | Factor Enhanced Emerging Markets Portfolio | |
| | | Six months ended
August 31, 2018
(unaudited) | | | Year ended
February 28, 20181 | |
| | |
Operations | | | | | | | | |
Net investment income | | $ | 5,048,867 | | | $ | 3,823,944 | |
Net realized gains (losses) on investments | | | (9,109,563 | ) | | | 15,886,798 | |
Net change in unrealized gains (losses) on investments | | | (28,874,522 | ) | | | 19,565,366 | |
| | | | |
Net increase (decrease) in net assets resulting from operations | | | (32,935,218 | ) | | | 39,276,108 | |
| | | | |
| |
Capital share transactions | | | | |
Transactions in investors’ beneficial interests | | | | | | | | |
Contributions | | | 38,647,802 | | | | 515,679,635 | |
Withdrawals | | | (59,681,741 | ) | | | (191,377,239 | ) |
| | | | |
Net increase (decrease) in net assets resulting from capital share transactions | | | (21,033,939 | ) | | | 324,302,396 | |
| | | | |
Total increase (decrease) in net assets | | | (53,969,157 | ) | | | 363,578,504 | |
| | | | |
| | |
Net assets | | | | | | | | |
Beginning of period | | | 363,578,504 | | | | 0 | |
| | | | |
End of period | | $ | 309,609,347 | | | $ | 363,578,504 | |
| | | | |
| 1 | For the period from May 23, 2017 (commencement of operations) to February 28, 2018 |
The accompanying notes are an integral part of these financial statements.
| | | | |
| 242 | | Wells Fargo Funds | | Statements of changes in net assets |
| | | | | | | | |
| | | Factor Enhanced International Portfolio | |
| | | Six months ended
August 31, 2018
(unaudited) | | | Year ended
February 28, 20181 | |
| | |
Operations | | | | | | | | |
Net investment income | | $ | 20,455,900 | | | $ | 13,815,516 | |
Net realized gains (losses) on investments | | | (113,823,203 | ) | | | 129,352,717 | |
Net change in unrealized gains (losses) on investments | | | 100,109,069 | | | | (67,926,428 | ) |
| | | | |
Net increase in net assets resulting from operations | | | 6,741,766 | | | | 75,241,805 | |
| | | | |
| | |
Capital share transactions | | | | | | | | |
Transactions in investors’ beneficial interests | | | | | | | | |
Contributions | | | 40,409,604 | | | | 1,627,315,279 | |
Withdrawals | | | (211,330,918 | ) | | | (564,943,281 | ) |
| | | | |
Net increase (decrease) in net assets resulting from capital share transactions | | | (170,921,314 | ) | | | 1,062,371,998 | |
| | | | |
Total increase (decrease) in net assets | | | (164,179,548 | ) | | | 1,137,613,803 | |
| | | | |
| | |
Net assets | | | | | | | | |
Beginning of period | | | 1,137,613,803 | | | | 0 | |
| | | | |
End of period | | $ | 973,434,255 | | | $ | 1,137,613,803 | |
| | | | |
| 1 | For the period from May 23, 2017 (commencement of operations) to February 28, 2018 |
The accompanying notes are an integral part of these financial statements.
| | | | | | |
| Statements of changes in net assets | | Wells Fargo Funds | | | 243 | |
| | | | | | | | |
| | | Factor Enhanced Large Cap Portfolio | |
| | | Six months ended
August 31, 2018
(unaudited) | | | Year ended
February 28, 20181 | |
| | |
Operations | | | | | | | | |
Net investment income | | $ | 20,616,632 | | | $ | 25,720,430 | |
Net realized gains (losses) on investments | | | (358,097,008 | ) | | | 360,790,673 | |
Net change in unrealized gains (losses) on investments | | | 449,203,948 | | | | (216,930,577 | ) |
| | | | |
Net increase in net assets resulting from operations | | | 111,723,572 | | | | 169,580,526 | |
| | | | |
| | |
Capital share transactions | | | | | | | | |
Transactions in investors’ beneficial interests | | | | | | | | |
Contributions | | | 65,036,246 | | | | 2,690,661,084 | |
Withdrawals | | | (430,733,414 | ) | | | (950,403,650 | ) |
| | | | |
Net increase (decrease) in net assets resulting from capital share transactions | | | (365,697,168 | ) | | | 1,740,257,434 | |
| | | | |
Total increase (decrease) in net assets | | | (253,973,596 | ) | | | 1,909,837,960 | |
| | | | |
| | |
Net assets | | | | | | | | |
Beginning of period | | | 1,909,837,960 | | | | 0 | |
| | | | |
End of period | | $ | 1,655,864,364 | | | $ | 1,909,837,960 | |
| | | | |
| 1 | For the period from May 23, 2017 (commencement of operations) to February 28, 2018 |
The accompanying notes are an integral part of these financial statements.
| | | | |
| 244 | | Wells Fargo Funds | | Statements of changes in net assets |
| | | | | | | | |
| | | Factor Enhanced Small Cap Portfolio | |
| | | Six months ended
August 31, 2018
(unaudited) | | | Year ended
February 28, 20181 | |
| | |
Operations | | | | | | | | |
Net investment income | | $ | 3,221,600 | | | $ | 3,985,942 | |
Net realized gains on investments | | | 22,815,491 | | | | 14,886,344 | |
Net change in unrealized gains (losses) on investments | | | 42,353,266 | | | | 15,424,466 | |
| | | | |
Net increase in net assets resulting from operations | | | 68,390,357 | | | | 34,296,752 | |
| | | | |
| | |
Capital share transactions | | | | | | | | |
Transactions in investors’ beneficial interests | | | | | | | | |
Contributions | | | 15,490,143 | | | | 671,189,441 | |
Withdrawals | | | (140,103,005 | ) | | | (248,975,639 | ) |
| | | | |
Net increase (decrease) in net assets resulting from capital share transactions | | | (124,612,862 | ) | | | 422,213,802 | |
| | | | |
Total increase (decrease) in net assets | | | (56,222,505 | ) | | | 456,510,554 | |
| | | | |
| | |
Net assets | | | | | | | | |
Beginning of period | | | 456,510,554 | | | | 0 | |
| | | | |
End of period | | $ | 400,288,049 | | | $ | 456,510,554 | |
| | | | |
| 1 | For the period from May 23, 2017 (commencement of operations) to February 28, 2018 |
The accompanying notes are an integral part of these financial statements.
| | | | | | |
| Statements of changes in net assets | | Wells Fargo Funds | | | 245 | |
| | | | | | | | |
| | | High Yield Corporate Bond Portfolio | |
| | | Six months ended
August 31, 2018
(unaudited) | | | Year ended
February 28, 20181 | |
| | |
Operations | | | | | | | | |
Net investment income | | $ | 3,430,735 | | | $ | 4,096,582 | |
Net realized losses on investments | | | (1,520,793 | ) | | | (309,369 | ) |
Net change in unrealized gains (losses) on investments | | | 75,363 | | | | (2,960,512 | ) |
| | | | |
Net increase in net assets resulting from operations | | | 1,985,305 | | | | 826,701 | |
| | | | |
| | |
Capital share transactions | | | | | | | | |
Transactions in investors’ beneficial interests | | | | | | | | |
Contributions | | | 6,246,233 | | | | 220,176,332 | |
Withdrawals | | | (25,237,407 | ) | | | (90,545,258 | ) |
| | | | |
Net increase (decrease) in net assets resulting from capital share transactions | | | (18,991,174 | ) | | | 129,631,074 | |
| | | | |
Total increase (decrease) in net assets | | | (17,005,869 | ) | | | 130,457,775 | |
| | | | |
| | |
Net assets | | | | | | | | |
Beginning of period | | | 130,457,775 | | | | 0 | |
| | | | |
End of period | | $ | 113,451,906 | | | $ | 130,457,775 | |
| | | | |
| 1 | For the period from May 23, 2017 (commencement of operations) to February 28, 2018 |
The accompanying notes are an integral part of these financial statements.
| | | | |
| 246 | | Wells Fargo Funds | | Statements of changes in net assets |
| | | | | | | | |
| | | International Government Bond Portfolio | |
| | | Six months ended
August 31, 2018
(unaudited) | | | Year ended
February 28, 20181 | |
| | |
Operations | | | | | | | | |
Net investment loss | | $ | (13,765 | ) | | $ | (9,546 | ) |
Net realized gains (losses) on investments | | | (301,811 | ) | | | 78,824 | |
Net change in unrealized gains (losses) on investments | | | (209,809 | ) | | | 126,757 | |
| | | | |
Net increase (decrease) in net assets resulting from operations | | | (525,385 | ) | | | 196,035 | |
| | | | |
| | |
Capital share transactions | | | | | | | | |
Transactions in investors’ beneficial interests | | | | | | | | |
Contributions | | | 999,897 | | | | 10,000,000 | |
Withdrawals | | | 0 | | | | (35 | ) |
| | | | |
Net increase in net assets resulting from capital share transactions | | | 999,897 | | | | 9,999,965 | |
| | | | |
Total increase in net assets | | | 474,512 | | | | 10,196,000 | |
| | | | |
| | |
Net assets | | | | | | | | |
Beginning of period | | | 10,196,000 | | | | 0 | |
| | | | |
End of period | | $ | 10,670,512 | | | $ | 10,196,000 | |
| | | | |
| 1 | For the period from August 16, 2017 (commencement of operations) to February 28, 2018 |
The accompanying notes are an integral part of these financial statements.
| | | | | | |
| Statements of changes in net assets | | Wells Fargo Funds | | | 247 | |
| | | | | | | | |
| | | Investment Grade Corporate Bond Portfolio | |
| | | Six months ended
August 31, 2018
(unaudited) | | | Year ended
February 28, 20181 | |
| | |
Operations | | | | | | | | |
Net investment income | | $ | 7,882,319 | | | $ | 11,821,570 | |
Net realized gains (losses) on investments | | | (781,010 | ) | | | 7,149,309 | |
Net change in unrealized gains (losses) on investments | | | (5,578,240 | ) | | | 4,187,744 | |
| | | | |
Net increase in net assets resulting from operations | | | 1,523,069 | | | | 23,158,623 | |
| | | | |
| | |
Capital share transactions | | | | | | | | |
Transactions in investors’ beneficial interests | | | | | | | | |
Contributions | | | 26,282,136 | | | | 699,980,637 | |
Withdrawals | | | (103,383,062 | ) | | | (261,142,959 | ) |
| | | | |
Net increase (decrease) in net assets resulting from capital share transactions | | | (77,100,926 | ) | | | 438,837,678 | |
| | | | |
Total increase (decrease) in net assets | | | (75,577,857 | ) | | | 461,996,301 | |
| | | | |
| | |
Net assets | | | | | | | | |
Beginning of period | | | 461,996,301 | | | | 0 | |
| | | | |
End of period | | $ | 386,418,444 | | | $ | 461,996,301 | |
| | | | |
| 1 | For the period from May 23, 2017 (commencement of operations) to February 28, 2018 |
The accompanying notes are an integral part of these financial statements.
| | | | |
| 248 | | Wells Fargo Funds | | Statements of changes in net assets |
| | | | | | | | |
| | | Strategic Retirement Bond Portfolio | |
| | | Six months ended
August 31, 2018
(unaudited) | | | Year ended
February 28, 20181 | |
| | |
Operations | | | | | | | | |
Net investment income | | $ | 1,850,861 | | | $ | 1,236,369 | |
Net realized gains (losses) on investments | | | (431,552 | ) | | | 326,544 | |
Net change in unrealized gains (losses) on investments | | | 13,027 | | | | (2,020,610 | ) |
| | | | |
Net increase (decrease) in net assets resulting from operations | | | 1,432,336 | | | | (457,697 | ) |
| | | | |
| | |
Capital share transactions | | | | | | | | |
Transactions in investors’ beneficial interests | | | | | | | | |
Contributions | | | 2,910,222 | | | | 184,009,394 | |
Withdrawals | | | (25,017,182 | ) | | | (57,327,350 | ) |
| | | | |
Net increase (decrease) in net assets resulting from capital share transactions | | | (22,106,960 | ) | | | 126,682,044 | |
| | | | |
Total increase (decrease) in net assets | | | (20,674,624 | ) | | | 126,224,347 | |
| | | | |
| | |
Net assets | | | | | | | | |
Beginning of period | | | 126,224,347 | | | | 0 | |
| | | | |
End of period | | $ | 105,549,723 | | | $ | 126,224,347 | |
| | | | |
| 1 | For the period from May 23, 2017 (commencement of operations) to February 28, 2018 |
The accompanying notes are an integral part of these financial statements.
| | | | | | |
| Statements of changes in net assets | | Wells Fargo Funds | | | 249 | |
| | | | | | | | |
| | | U.S. REIT Portfolio | |
| | | Six months ended
August 31, 2018
(unaudited) | | | Year ended
February 28, 20181 | |
| | |
Operations | | | | | | | | |
Net investment income | | $ | 1,255,450 | | | $ | 891,262 | |
Net realized gains (losses) on investments | | | (5,223,068 | ) | | | 1,952,565 | |
Net change in unrealized gains (losses) on investments | | | 14,198,957 | | | | (8,390,155 | ) |
| | | | |
Net increase (decrease) in net assets resulting from operations | | | 10,231,339 | | | | (5,546,328 | ) |
| | | | |
| | |
Capital share transactions | | | | | | | | |
Transactions in investors’ beneficial interests | | | | | | | | |
Contributions | | | 3,050,719 | | | | 92,668,856 | |
Withdrawals | | | (19,446,222 | ) | | | (20,908,947 | ) |
| | | | |
Net increase (decrease) in net assets resulting from capital share transactions | | | (16,395,503 | ) | | | 71,759,909 | |
| | | | |
Total increase (decrease) in net assets | | | (6,164,164 | ) | | | 66,213,581 | |
| | | | |
| | |
Net assets | | | | | | | | |
Beginning of period | | | 66,213,581 | | | | 0 | |
| | | | |
End of period | | $ | 60,049,417 | | | $ | 66,213,581 | |
| | | | |
| 1 | For the period from May 23, 2017 (commencement of operations) to February 28, 2018 |
The accompanying notes are an integral part of these financial statements.
| | | | |
| 250 | | Wells Fargo Funds | | Financial highlights |
| | | | | | | | | | | | | | | | | | | | |
| | | Ratio to average net assets (annualized) | | | | | | | |
| | | Net investment
income | | | Gross
expenses | | | Net
expenses | | | Total
return1 | | | Portfolio
turnover
rate | |
| | | | | |
Bloomberg Barclays US Aggregate ex-Corporate Portfolio | | | | | | | | | | | | | | | | | | | | |
Six months ended August 31, 2018 (unaudited) | | | 2.30 | % | | | 0.07 | % | | | 0.07 | % | | | 1.24 | % | | | 44 | % |
Year ended February 28, 20182 | | | 2.03 | % | | | 0.08 | % | | | 0.07 | % | | | (1.39 | )% | | | 221 | % |
| | | | | |
Emerging Markets Bond Portfolio | | | | | | | | | | | | | | | | | | | | |
Six months ended August 31, 2018 (unaudited) | | | 4.42 | % | | | 0.41 | % | | | 0.41 | % | | | (2.63 | )% | | | 17 | % |
Year ended February 28, 20182 | | | 4.19 | % | | | 0.44 | % | | | 0.43 | % | | | 0.62 | % | | | 174 | % |
| | | | | |
Factor Enhanced Emerging Markets Portfolio | | | | | | | | | | | | | | | | | | | | |
Six months ended August 31, 2018 (unaudited) | | | 2.97 | % | | | 0.54 | % | | | 0.46 | % | | | (9.71 | )% | | | 33 | % |
Year ended February 28, 20182 | | | 1.56 | % | | | 0.49 | % | | | 0.49 | % | | | 13.43 | % | | | 136 | % |
| | | | | |
Factor Enhanced International Portfolio | | | | | | | | | | | | | | | | | | | | |
Six months ended August 31, 2018 (unaudited) | | | 3.78 | % | | | 0.22 | % | | | 0.21 | % | | | 0.49 | % | | | 21 | % |
Year ended February 28, 20182 | | | 1.74 | % | | | 0.21 | % | | | 0.21 | % | | | 8.99 | % | | | 106 | % |
| | | | | |
Factor Enhanced Large Cap Portfolio | | | | | | | | | | | | | | | | | | | | |
Six months ended August 31, 2018 (unaudited) | | | 2.25 | % | | | 0.12 | % | | | 0.12 | % | | | 6.83 | % | | | 14 | % |
Year ended February 28, 20182 | | | 1.94 | % | | | 0.12 | % | | | 0.12 | % | | | 11.92 | % | | | 75 | % |
| | | | | |
Factor Enhanced Small Cap Portfolio | | | | | | | | | | | | | | | | | | | | |
Six months ended August 31, 2018 (unaudited) | | | 1.46 | % | | | 0.20 | % | | | 0.19 | % | | | 17.11 | % | | | 53 | % |
Year ended February 28, 20182 | | | 1.23 | % | | | 0.19 | % | | | 0.19 | % | | | 8.75 | % | | | 85 | % |
| | | | | |
High Yield Corporate Bond Portfolio | | | | | | | | | | | | | | | | | | | | |
Six months ended August 31, 2018 (unaudited) | | | 5.59 | % | | | 0.33 | % | | | 0.33 | % | | | 1.77 | % | | | 16 | % |
Year ended February 28, 20182 | | | 5.36 | % | | | 0.37 | % | | | 0.37 | % | | | 0.49 | % | | | 122 | % |
| | | | | |
International Government Bond Portfolio | | | | | | | | | | | | | | | | | | | | |
Six months ended August 31, 2018 (unaudited) | | | (0.27 | )% | | | 1.51 | % | | | 1.51 | % | | | (5.13 | )% | | | 141 | % |
Year ended February 28, 20183 | | | (0.18 | )% | | | 1.69 | % | | | 1.69 | % | | | 1.95 | % | | | 224 | % |
| | | | | |
Investment Grade Corporate Bond Portfolio | | | | | | | | | | | | | | | | | | | | |
Six months ended August 31, 2018 (unaudited) | | | 3.68 | % | | | 0.08 | % | | | 0.08 | % | | | 0.46 | % | | | 8 | % |
Year ended February 28, 20182 | | | 3.48 | % | | | 0.08 | % | | | 0.08 | % | | | (0.12 | )% | | | 61 | % |
| | | | | |
Strategic Retirement Bond Portfolio | | | | | | | | | | | | | | | | | | | | |
Six months ended August 31, 2018 (unaudited) | | | 3.17 | % | | | 0.14 | % | | | 0.14 | % | | | 1.26 | % | | | 7 | % |
Year ended February 28, 20182 | | | 1.45 | % | | | 0.17 | % | | | 0.17 | % | | | 1.40 | % | | | 193 | % |
| | | | | |
U.S. REIT Portfolio | | | | | | | | | | | | | | | | | | | | |
Six months ended August 31, 2018 (unaudited) | | | 3.97 | % | | | 0.24 | % | | | 0.24 | % | | | 17.23 | % | | | 9 | % |
Year ended February 28, 20182 | | | 2.53 | % | | | 0.33 | % | | | 0.32 | % | | | (8.74 | )% | | | 51 | % |
| 1 | Returns for periods of less than one year are not annualized. |
| 2 | For the period from May 23, 2017 (commencement of class operations) to February 28, 2018. |
| 3 | For the period from August 16, 2017 (commencement of class operations) to February 28, 2018 |
The accompanying notes are an integral part of these financial statements.
| | | | | | |
| Notes to financial statements (unaudited) | | Wells Fargo Funds | | | 251 | |
1. ORGANIZATION
Wells Fargo Master Trust (the “Trust”), a Delaware statutory trust organized on March 10, 1999, is an open-end management investment company registered under the Investment Company Act of 1940, as amended (the “1940 Act”). As an investment company, the Trust follows the accounting and reporting guidance in Financial Accounting Standards Board (“FASB”) Accounting Standards Codification Topic 946, Financial Services – Investment Companies. These financial statements report on the following portfolios: Wells Fargo Bloomberg Barclays US Aggregate ex-Corporate Portfolio (“Bloomberg Barclays US Aggregate ex-Corporate Portfolio”), Wells Fargo Emerging Market Bond Portfolio (“Emerging Market Bond Portfolio”), Wells Fargo Factor Enhanced Emerging Markets Portfolio (“Factor Enhanced Emerging Markets Portfolio”), Wells Fargo Factor Enhanced International Portfolio (“Factor Enhanced International Portfolio”), Wells Fargo Factor Enhanced Large Cap Portfolio (“Factor Enhanced Large Cap Portfolio”), Wells Fargo Factor Enhanced Small Cap Portfolio (“Factor Enhanced Small Cap Portfolio”), Wells Fargo High Yield Corporate Bond Portfolio (“High Yield Corporate Bond Portfolio”), Wells Fargo International Government Bond Portfolio (“International Government Bond Portfolio”), Wells Fargo Investment Grade Corporate Bond Portfolio (“Investment Grade Corporate Bond Portfolio”), Wells Fargo Strategic Retirement Bond Portfolio (“Strategic Retirement Bond Portfolio”), and Wells Fargo U.S. REIT Portfolio (“U.S. REIT Portfolio”) (each, a “Portfolio”, collectively, the “Portfolios”). Each Portfolio is a diversified series of the Trust.
The Portfolios offer their shares to multiple feeder funds and other affiliated master portfolios rather than directly to the public.
2. SIGNIFICANT ACCOUNTING POLICIES
The following significant accounting policies, which are consistently followed in the preparation of the financial statements of each Portfolio, are in conformity with U.S. generally accepted accounting principles which require management to make estimates and assumptions that affect the reported amounts of assets and liabilities, disclosure of contingent assets and liabilities at the date of the financial statements, and the reported amounts of revenues and expenses during the reporting period. Actual results could differ from those estimates.
Securities valuation
All investments are valued each business day as of the close of regular trading on the New York Stock Exchange (generally 4 p.m. Eastern Time), although the Portfolios may deviate from this calculation time under unusual or unexpected circumstances.
Debt securities are valued at the evaluated bid price provided by an independent pricing service or, if a reliable price is not available, the quoted bid price from an independent broker-dealer.
Equity securities and futures contracts that are listed on a foreign or domestic exchange or market are valued at the official closing price or, if none, the last sales price. If no sale occurs on the principal exchange or market that day, a fair value price will be determined in accordance with the Portfolios’ Valuation Procedures.
Swap contracts are valued at the evaluated price provided by an independent pricing service or, if a reliable price is not available, the quoted bid price from an independent broker-dealer.
The values of securities denominated in foreign currencies are translated into U.S. dollars at rates provided by an independent foreign currency pricing source at a time each business day specified by the Wells Fargo Asset Management Pricing Committee at Wells Fargo Funds Management, LLC (“Funds Management”).
Many securities markets and exchanges outside the U.S. close prior to the close of the New York Stock Exchange and therefore may not fully reflect trading or events that occur after the close of the principal exchange in which the foreign securities are traded, but before the close of the New York Stock Exchange. If such trading or events are expected to materially affect the value of such securities, then fair value pricing procedures approved by the Board of Trustees of the Portfolios are applied. These procedures take into account multiple factors including movements in U.S. securities markets after foreign exchanges close. Foreign securities that are fair valued under these procedures are categorized as Level 2 and the application of these procedures may result in transfers between Level 1 and Level 2. Depending on market activity, such fair valuations may be frequent. Such fair value pricing may result in net asset values that are higher or lower than net asset values based on the last reported sales price or latest quoted bid price. On August 31, 2018, such fair value pricing was not used in pricing foreign securities.
Investments in registered open-end investment companies are valued at net asset value.
Investments which are not valued using the methods discussed above are valued at their fair value, as determined in good faith by the Board of Trustees of the Portfolios. The Board of Trustees has established a Valuation Committee comprised of the Trustees and has delegated to it the authority to take any actions regarding the valuation of portfolio securities that the Valuation Committee deems necessary or appropriate, including determining the fair value of portfolio securities, unless the determination has been delegated to the the Wells Fargo Asset Management Pricing Committee. The Board of Trustees retains the authority to make or ratify any valuation decisions or approve any changes to the Valuation Procedures as it deems appropriate. On a quarterly basis, the Board of Trustees receives reports on any valuation actions taken by the Valuation Committee or the Wells Fargo Asset Management Pricing Committee which may include items for ratification.
| | | | |
| 252 | | Wells Fargo Funds | | Notes to financial statements (unaudited) |
Valuations of fair valued securities are compared to the next actual sales price when available, or other appropriate market values, to assess the continued appropriateness of the fair valuation methodologies used. These securities are fair valued on a day-to-day basis, taking into consideration changes to appropriate market information and any significant changes to the inputs considered in the valuation process until there is a readily available price provided on an exchange or by an independent pricing service. Valuations received from an independent pricing service or independent broker-dealer quotes are periodically validated by comparisons to most recent trades and valuations provided by other independent pricing services in addition to the review of prices by the adviser and/or subadviser. Unobservable inputs used in determining fair valuations are identified based on the type of security, taking into consideration factors utilized by market participants in valuing the investment, knowledge about the issuer and the current market environment.
Foreign currency translation
The accounting records of each Portfolio are maintained in U.S. dollars. The values of other assets and liabilities denominated in foreign currencies are translated into U.S. dollars at rates provided by an independent foreign currency pricing source at a time each business day specified by the Wells Fargo Asset Management Pricing Committee. Purchases and sales of securities, and income and expenses are converted at the rate of exchange on the respective dates of such transactions. Net realized foreign exchange gains or losses arise from sales of foreign currencies, currency gains or losses realized between the trade and settlement dates on securities transactions, and the difference between the amounts of dividends, interest and foreign withholding taxes recorded and the U.S. dollar equivalent of the amounts actually paid or received. Net unrealized foreign exchange gains and losses arise from changes in the fair value of assets and liabilities other than investments in securities resulting from changes in exchange rates. The changes in net assets arising from changes in exchange rates of securities and the changes in net assets resulting from changes in market prices of securities are not separately presented. Such changes are included in net realized and unrealized gains or losses from investments.
Participation notes
Each Portfolio may invest in participation notes to gain exposure to securities in certain foreign markets. Participation notes are issued by banks or broker-dealers and are designed to offer a return linked to a particular underlying foreign security. Participation notes involve transaction costs, which may be higher than those applicable to the underlying foreign security. The holder of the participation note is entitled to receive from the bank or broker-dealer, an amount equal to the dividend paid by the issuer of the underlying foreign security; however, the holder is not entitled to the same rights (i.e. dividends, voting rights) as an owner of the underlying foreign security. Investments in participation notes involve risks beyond those normally associated with a direct investment in an underlying security. The Portfolio has no rights against the issuer of the underlying foreign security and participation notes expose the Portfolio to counterparty risk in the event the counterparty does not perform. There is also no assurance there will be a secondary trading market for the participation note or that the trading price of the participation note will equal the underlying value of the foreign security that it seeks to replicate.
Forward foreign currency contracts
Each Portfolio may be subject to foreign currency risk in the normal course of pursuing its investment objectives. A forward foreign currency contract is an agreement between two parties to purchase or sell a specific currency for an agreed-upon price at a future date. The Portfolio enters into forward foreign currency contracts to facilitate transactions in foreign-denominated securities and to attempt to minimize the risk to the Portfolio from adverse changes in the relationship between currencies. Forward foreign currency contracts are recorded at the forward rate and marked-to-market daily. When the contracts are closed, realized gains and losses arising from such transactions are recorded as realized gains or losses on forward foreign currency contracts. The Portfolio could be exposed to risks if the counterparties to the contracts are unable to meet the terms of their contracts or if the value of the foreign currency changes unfavorably. The Portfolio’s maximum risk of loss from counterparty credit risk is the unrealized gains on the contracts. This risk may be mitigated if there is a master netting arrangement between the Portfolio and the counterparty.
When-issued transactions
Each Portfolio may purchase securities on a forward commitment or when-issued basis. A Portfolio records a when-issued transaction on the trade date and will segregate assets in an amount at least equal in value to the Portfolio’s commitment to purchase when-issued securities. Securities purchased on a when-issued basis are marked-to-market daily and the Portfolio begins earning interest on the settlement date. Losses may arise due to changes in the market value of the underlying securities or if the counterparty does not perform under the contract.
Futures contracts
Each Portfolio is subject to equity price risk and foreign currency risk in the normal course of pursuing its investment objectives. Futures contracts are agreements between the Portfolio and a counterparty to buy or sell a specific amount of a commodity, financial instrument or currency at specified price and on a specified date. The Portfolio may buy and sell
| | | | | | |
| Notes to financial statements (unaudited) | | Wells Fargo Funds | | | 253 | |
futures contracts in order to gain exposure to, or protect against, changes in security values and foreign exchange rates. The primary risks associated with the use of futures contracts are the imperfect correlation between changes in market values of securities held by the Portfolio and the prices of futures contracts, and the possibility of an illiquid market. Futures contracts are generally entered into on a regulated futures exchange and cleared through a clearinghouse associated with the exchange. With futures contracts, there is minimal counterparty risk to the Portfolio since futures contracts are exchange traded and the exchange’s clearinghouse, as counterparty to all exchange traded futures, guarantees the futures contracts against default.
Upon entering into a futures contracts, the Portfolio is required to deposit either cash or securities (initial margin) with the broker in an amount equal to a certain percentage of the contract value. Subsequent payments (variation margin) are paid to or from the broker each day equal to the daily changes in the contract value. Such payments are recorded as unrealized gains or losses and, if any, shown as variation margin receivable (payable) in the Statements of Assets and Liabilities. Should the Portfolio fail to make requested variation margin payments, the broker can gain access to the initial margin to satisfy the Portfolio’s payment obligations. When the contracts are closed, a realized gain or loss is recorded in the Statements of Operations.
Swap contracts
Swap contracts are agreements between the Portfolio and a counterparty to exchange a series of cash flows over a specified period. Swap agreements are privately negotiated contracts between the Portfolio and a counterparty in the OTC market and may be entered into as a bilateral contract (“OTC swaps”) or centrally cleared (“centrally cleared swaps”) with a central clearinghouse.
For OTC swaps, any upfront premiums paid and any upfront fees received are shown as swap premiums paid and swap premiums received, respectively, in the Statements of Assets and Liabilities and amortized over the term of the contract. The daily fluctuations in market value are recorded as unrealized gains or losses on OTC swaps in the Statements of Assets and Liabilities. Payments received or paid are recorded in the Statements of Operations as realized gains or losses, respectively. When an OTC swap is terminated, a realized gain or loss is recorded in the Statements of Operations equal to the difference between the proceeds from (or cost of) the closing transaction and the Fund’s basis in the contract, if any. Generally, the basis of the contract is the premium received or paid.
In a centrally cleared swap, immediately following execution of the swap contract, the swap contract is novated to a central counterparty (the “CCP”) and the Portfolio’s counterparty on the swap agreement becomes the CCP. Upon entering into a centrally cleared swap, the Portfolio is required to deposit an initial margin with the broker in the form of cash or securities. Securities deposited as initial margin are designated in the Portfolio of Investments and cash deposited is shown as cash segregated for centrally cleared swaps in the Statements of Assets and Liabilities. Pursuant to the contract, the Portfolio agrees to receive from or pay to the broker an amount of cash equal to the daily fluctuation in market value of the contract (“variation margin”). The variation margin is recorded as an unrealized gain (or loss) and shown as variation margin receivable (or payable) on centrally cleared swaps in the Statements of Assets and Liabilities. Payments received from (paid to) the counterparty, including at termination, are recorded as realized gains (losses) in the Statements of Operations.
Credit default swaps
Each Portfolio is subject to credit risk in the normal course of pursuing its investment objectives. Each Portfolio may enter into credit default swaps for hedging or speculative purposes to provide or receive a measure of protection against default on a referenced entity, obligation or index or a basket of single-name issuers or traded indexes. An index credit default swap references all the names in the index, and if a credit event is triggered, the credit event is settled based on that name’s weight in the index. Credit default swaps are agreements in which the protection buyer pays fixed periodic payments to the protection seller in consideration for a promise from the protection seller to make a specific payment should a negative credit event take place with respect to the referenced entity (e.g., bankruptcy, failure to pay, obligation acceleration, repudiation, moratorium or restructuring).
Each Portfolio may enter into credit default swaps as either the seller of protection or the buyer of protection. If the Portfolio is the buyer of protection and a credit event occurs, the Portfolio will either receive from the seller an amount equal to the notional amount of the swap and deliver the referenced security or underlying securities comprising the index, or receive a net settlement of cash equal to the notional amount of the swap less the recovery value of the security or underlying securities comprising the index. If the Portfolio is the seller of protection and a credit event occurs, the Portfolio will either pay the buyer an amount equal to the notional amount of the swap and take delivery of the referenced security or underlying securities comprising the index or pay a net settlement of cash equal to the notional amount of the swap less the recovery value of the security or underlying securities comprising the index.
| | | | |
| 254 | | Wells Fargo Funds | | Notes to financial statements (unaudited) |
As the seller of protection, the Portfolio is subject to investment exposure on the notional amount of the swap and has assumed the risk of default of the underlying security or index. As the buyer of protection, the Portfolio could be exposed to risks if the seller of the protection defaults on its obligation to perform, or if there are unfavorable changes in the fluctuation of interest rates.
Security transactions and income recognition
Securities transactions are recorded on a trade date basis in each affiliated Master Portfolio. Realized gains or losses in each affiliated Master Portfolio are recorded on the basis of identified cost.
Interest income is accrued daily and bond discounts are accreted and premiums are amortized daily based. To the extent debt obligations are placed on non-accrual status, any related interest income may be reduced by writing off interest receivables when the collection of all or a portion of interest has been determined to be doubtful based on consistently applied procedures and the fair value has decreased. If the issuer subsequently resumes interest payments or when the collectability of interest is reasonably assured, the debt obligation is removed from non-accrual status.
Dividend income is recognized in each affiliated Master Portfolio on the ex-dividend date, except for certain dividends from foreign securities which are recorded as soon as the custodian verifies the ex-dividend date.
Income from foreign securities is recorded net of foreign taxes withheld where recovery of such taxes is not assured.
Income dividends and capital gain distributions from investment companies are recorded on the ex-dividend date. Capital gain distributions from investment companies are treated as realized gains.
Federal and other taxes
Each Portfolio is treated as a separate entity for federal income tax purposes. Each Portfolio is not required to pay federal income taxes on its net investment income and net capital gain as it is treated as a partnership for federal income tax purposes. All interest, dividends, gains and losses of the Portfolio are deemed to have been “passed through” to the interestholders in proportion to their holdings of the Portfolio regardless of whether such interest, dividends and gains have been distributed by the Portfolio.
Each Portfolio’s income and federal tax returns and all financial records supporting those returns for the fiscal year since commencement of operations will be subject to examination by the federal revenue authority.
As of August 31, 2018, the aggregate cost of all investments for federal income tax purposes and the unrealized gains (losses) were as follows:
| | | | | | | | | | | | | | | | |
| | | Tax cost | | | Gross unrealized
gains | | | Gross unrealized
losses | | | Net unrealized
gains (losses) | |
Bloomberg Barclays US Aggregate ex-Corporate Portfolio | | $ | 879,825,076 | | | $ | 195,459 | | | $ | (21,852,549 | ) | | $ | (21,657,090 | ) |
Emerging Markets Bond Portfolio | | | 65,845,673 | | | | 73,023 | | | | (4,107,067 | ) | | | (4,034,044 | ) |
Factor Enhanced Emerging Markets Portfolio | | | 302,108,780 | | | | 18,931,439 | | | | (22,991,052 | ) | | | (4,059,613 | ) |
Factor Enhanced International Portfolio | | | 775,755,327 | | | | 191,290,790 | | | | (37,184,829 | ) | | | 154,105,961 | |
Factor Enhanced Large Cap Portfolio | | | 856,538,917 | | | | 710,111,659 | | | | (24,616,945 | ) | | | 685,494,714 | |
Factor Enhanced Small Cap Portfolio | | | 311,523,634 | | | | 81,461,187 | | | | (13,377,462 | ) | | | 68,083,725 | |
High Yield Corporate Bond Portfolio | | | 114,008,572 | | | | 642,015 | | | | (3,527,164 | ) | | | (2,885,149 | ) |
International Government Bond Portfolio | | | 11,590,868 | | | | 52,213 | | | | (140,257 | ) | | | (88,044 | ) |
Investment Grade Corporate Bond Portfolio | | | 384,141,046 | | | | 6,881,897 | | | | (8,848,737 | ) | | | (1,966,840 | ) |
Strategic Retirement Bond Portfolio | | | 102,108,672 | | | | 64,546 | | | | (1,922,173 | ) | | | (1,857,627 | ) |
U.S. REIT Portfolio | | | 47,850,939 | | | | 12,580,133 | | | | (350,451 | ) | | | 12,229,682 | |
3. FAIR VALUATION MEASUREMENTS
Fair value measurements of investments are determined within a framework that has established a fair value hierarchy based upon the various data inputs utilized in determining the value of each Portfolio’s investments. The three-level hierarchy gives the highest priority to unadjusted quoted prices in active markets for identical assets or liabilities (Level 1) and the lowest priority to unobservable inputs (Level 3). Each Portfolio’s investments are classified within the fair value hierarchy based on the lowest level of input that is significant to the fair value measurement. The inputs are summarized into three broad levels as follows:
| | | | | | |
| Notes to financial statements (unaudited) | | Wells Fargo Funds | | | 255 | |
| ∎ | | Level 1 – quoted prices in active markets for identical securities |
| ∎ | | Level 2 – other significant observable inputs (including quoted prices for similar securities, interest rates, prepayment speeds, credit risk, etc.) |
| ∎ | | Level 3 – significant unobservable inputs (including the Portfolio’s own assumptions in determining the fair value of investments) |
The inputs or methodologies used for valuing investments in securities are not necessarily an indication of the risk associated with investing in those securities.
The following is a summary of the inputs used in valuing each Portfolio’s assets and liabilities as of August 31, 2018:
| | | | | | | | | | | | | | | | |
| Bloomberg Barclays US Aggregate ex-Corporate Portfolio | | Quoted prices
(Level 1) | | | Other significant
observable inputs
(Level 2) | | | Significant
unobservable inputs
(Level 3) | | | Total | |
Assets | | | | | | | | | | | | | | | | |
Investments in: | | | | | | | | | | | | | | | | |
| | | | |
Agency securities | | $ | 0 | | | $ | 333,923,933 | | | $ | 0 | | | $ | 333,923,933 | |
| | | | |
Asset-backed securities | | | 0 | | | | 6,330,612 | | | | 0 | | | | 6,330,612 | |
| | | | |
Municipal obligations | | | 0 | | | | 7,095,112 | | | | 0 | | | | 7,095,112 | |
| | | | |
Non-agency mortgage-backed securities | | | 0 | | | | 13,359,802 | | | | 0 | | | | 13,359,802 | |
| | | | |
U.S. Treasury securities | | | 416,912,320 | | | | 0 | | | | 0 | | | | 416,912,320 | |
| | | | |
Yankee corporate bonds and notes | | | 0 | | | | 7,598,391 | | | | 0 | | | | 7,598,391 | |
| | | | |
Yankee government bonds | | | 0 | | | | 38,832,908 | | | | 0 | | | | 38,832,908 | |
| | | | |
Short-term investments | | | | | | | | | | | | | | | | |
Investment companies | | | 34,114,908 | | | | 0 | | | | 0 | | | | 34,114,908 | |
Total assets | | $ | 451,027,228 | | | $ | 407,140,758 | | | $ | 0 | | | $ | 858,167,986 | |
| | | | | | | | | | | | | | | | |
| Emerging Markets Bond Portfolio | | Quoted prices
(Level 1) | | | Other significant
observable inputs
(Level 2) | | | Significant
unobservable inputs
(Level 3) | | | Total | |
Assets | | | | | | | | | | | | | | | | |
Investments in: | | | | | | | | | | | | | | | | |
| | | | |
Participation notes | | $ | 0 | | | $ | 303,767 | | | $ | 0 | | | $ | 303,767 | |
| | | | |
Yankee corporate bonds and notes | | | 0 | | | | 8,441,997 | | | | 0 | | | | 8,441,997 | |
| | | | |
Yankee government bonds | | | 0 | | | | 50,257,965 | | | | 0 | | | | 50,257,965 | |
| | | | |
Short-term investments | | | | | | | | | | | | | | | | |
Investment companies | | | 2,807,900 | | | | 0 | | | | 0 | | | | 2,807,900 | |
Total assets | | $ | 2,807,900 | | | $ | 59,003,729 | | | $ | 0 | | | $ | 61,811,629 | |
| | | | |
| 256 | | Wells Fargo Funds | | Notes to financial statements (unaudited) |
| | | | | | | | | | | | | | | | |
| Factor Enhanced Emerging Markets Portfolio | | Quoted prices
(Level 1) | | | Other significant
observable inputs
(Level 2) | | | Significant
unobservable inputs
(Level 3) | | | Total | |
Assets | | | | | | | | | | | | | | | | |
Investments in: | | | | | | | | | | | | | | | | |
| | | | |
Common stocks | | | | | | | | | | | | | | | | |
Brazil | | $ | 9,990,316 | | | $ | 0 | | | $ | 0 | | | $ | 14,739,245 | |
Chile | | | 7,170,072 | | | | 0 | | | | 0 | | | | 0 | |
China | | | 25,828,747 | | | | 0 | | | | 0 | | | | 0 | |
Columbia | | | 2,312,884 | | | | 0 | | | | 0 | | | | 0 | |
Egypt | | | 810,726 | | | | 0 | | | | 0 | | | | 0 | |
Greece | | | 589,846 | | | | 0 | | | | 21,284 | | | | 0 | |
Hong Kong | | | 3,263,856 | | | | 0 | | | | 0 | | | | 0 | |
India | | | 45,441,761 | | | | 0 | | | | 0 | | | | 0 | |
Indonesia | | | 2,865,793 | | | | 0 | | | | 0 | | | | 0 | |
Luxembourg | | | 323,970 | | | | 0 | | | | 0 | | | | 0 | |
Malaysia | | | 2,521,570 | | | | 12,185,790 | | | | 0 | | | | 14,707,360 | |
Mexico | | | 11,460,434 | | | | 95,160 | | | | 0 | | | | 11,555,594 | |
Philippines | | | 4,562,004 | | | | 0 | | | | 0 | | | | 0 | |
Poland | | | 3,757,270 | | | | 0 | | | | 0 | | | | 0 | |
Russia | | | 7,270,866 | | | | 0 | | | | 0 | | | | 0 | |
South Africa | | | 14,027,199 | | | | 0 | | | | 0 | | | | 0 | |
South Korea | | | 55,255,864 | | | | 61,534 | | | | 0 | | | | 55,317,398 | |
Spain | | | 88,939 | | | | 0 | | | | 0 | | | | 0 | |
Taiwan | | | 45,872,504 | | | | 0 | | | | 0 | | | | 0 | |
Thailand | | | 16,091,102 | | | | 0 | | | | 0 | | | | 0 | |
Turkey | | | 2,695,339 | | | | 0 | | | | 0 | | | | 0 | |
| | | | |
Preferred stocks | | | | | | | | | | | | | | | | |
Brazil | | | 9,237,284 | | | | 0 | | | | 0 | | | | 0 | |
Chile | | | 291,624 | | | | 0 | | | | 0 | | | | 0 | |
Colombia | | | 675,165 | | | | 0 | | | | 0 | | | | 0 | |
Russia | | | 69,697 | | | | 0 | | | | 0 | | | | 0 | |
South Korea | | | 54,087 | | | | 0 | | | | 0 | | | | 0 | |
| | | | |
Rights | | | | | | | | | | | | | | | | |
Phillipines | | | 0 | | | | 282 | | | | 0 | | | | 282 | |
| | | | |
Warrants | | | | | | | | | | | | | | | | |
Malaysia | | | 0 | | | | 10,278 | | | | 0 | | | | 10,278 | |
Thailand | | | 0 | | | | 49,769 | | | | 0 | | | | 49,769 | |
| | | | |
Short-term investments | | | | | | | | | | | | | | | | |
Investment companies | | | 13,354,608 | | | | 0 | | | | 0 | | | | 13,354,608 | |
Total assets | | $ | 285,883,527 | | | $ | 12,402,813 | | | $ | 21,284 | | | $ | 298,307,624 | |
Liabilities | | | | | | | | | | | | | | | | |
| | | | |
Future contracts | | $ | (258,457 | ) | | $ | 0 | | | $ | 0 | | | $ | (258,457 | ) |
Total liabilities | | $ | (258,457 | ) | | $ | 0 | | | $ | 0 | | | $ | (258,457 | ) |
| | | | | | |
| Notes to financial statements (unaudited) | | Wells Fargo Funds | | | 257 | |
| | | | | | | | | | | | | | | | |
| Factor Enhanced International Portfolio | | Quoted prices
(Level 1) | | | Other significant
observable inputs
(Level 2) | | | Significant
unobservable inputs
(Level 3) | | | Total | |
Assets | | | | | | | | | | | | | | | | |
Investments in: | | | | | | | | | | | | | | | | |
| | | | |
Common stocks | | | | | | | | | | | | | | | | |
Australia | | $ | 84,867,731 | | | $ | 289,123 | | | $ | 0 | | | $ | 85,156,854 | |
Austria | | | 2,893,824 | | | | 0 | | | | 0 | | | | 2,893,824 | |
Belgium | | | 5,459,463 | | | | 362,032 | | | | 0 | | | | 5,821,495 | |
Canada | | | 85,367,070 | | | | 0 | | | | 0 | | | | 85,367,070 | |
China | | | 3,662,257 | | | | 0 | | | | 0 | | | | 3,662,257 | |
Czech Republic | | | 527,031 | | | | 0 | | | | 0 | | | | 527,031 | |
Denmark | | | 18,927,530 | | | | 0 | | | | 0 | | | | 18,927,530 | |
Finland | | | 13,609,848 | | | | 0 | | | | 0 | | | | 13,609,848 | |
France | | | 61,059,510 | | | | 0 | | | | 0 | | | | 61,059,510 | |
Germany | | | 44,317,123 | | | | 0 | | | | 0 | | | | 44,317,123 | |
Hong Kong | | | 37,426,468 | | | | 0 | | | | 0 | | | | 37,426,468 | |
Ireland | | | 7,710,808 | | | | 0 | | | | 0 | | | | 7,710,808 | |
Italy | | | 5,446,401 | | | | 0 | | | | 0 | | | | 5,446,401 | |
Japan | | | 199,235,833 | | | | 0 | | | | 0 | | | | 199,235,833 | |
Luxembourg | | | 2,397,707 | | | | 0 | | | | 0 | | | | 2,397,707 | |
Malta | | | 196,872 | | | | 0 | | | | 0 | | | | 196,872 | |
Netherlands | | | 31,879,632 | | | | 0 | | | | 0 | | | | 31,879,632 | |
New Zealand | | | 3,193,254 | | | | 0 | | | | 0 | | | | 3,193,254 | |
Norway | | | 9,153,807 | | | | 0 | | | | 0 | | | | 9,153,807 | |
Portugal | | | 1,811,696 | | | | 0 | | | | 0 | | | | 1,811,696 | |
Singapore | | | 15,344,548 | | | | 0 | | | | 0 | | | | 15,344,548 | |
South Africa | | | 694,756 | | | | 0 | | | | 0 | | | | 694,756 | |
Spain | | | 12,484,541 | | | | 0 | | | | 0 | | | | 12,484,541 | |
Sweden | | | 26,362,909 | | | | 0 | | | | 0 | | | | 26,362,909 | |
Switzerland | | | 45,761,796 | | | | 0 | | | | 0 | | | | 45,761,796 | |
Thailand | | | 277,759 | | | | 0 | | | | 0 | | | | 277,759 | |
United Kingdom | | | 163,382,914 | | | | 0 | | | | 0 | | | | 163,382,914 | |
| | | | |
Preferred stocks | | | 0 | | | | 0 | | | | 0 | | | | 0 | |
Germany | | | 5,312,862 | | | | 0 | | | | 0 | | | | 5,312,862 | |
| | | | |
Short-term investments | | | 0 | | | | 0 | | | | 0 | | | | 0 | |
Investment companies | | | 40,929,757 | | | | 0 | | | | 0 | | | | 40,929,757 | |
Total assets | | $ | 929,695,707 | | | $ | 651,155 | | | $ | 0 | | | $ | 930,346,862 | |
Liabilities | | | | | | | | | | | | | | | | |
| | | | |
Future contracts | | $ | 485,574 | | | $ | 0 | | | $ | 0 | | | $ | 485,574 | |
Total liabilities | | $ | 485,574 | | | $ | 0 | | | $ | 0 | | | $ | 485,574 | |
| | | | |
| 258 | | Wells Fargo Funds | | Notes to financial statements (unaudited) |
| | | | | | | | | | | | | | | | |
| Factor Enhanced Large Cap Portfolio | | Quoted prices (Level 1) | | | Other significant
observable inputs
(Level 2) | | | Significant
unobservable inputs
(Level 3) | | | Total | |
Assets | | | | | | | | | | | | | | | | |
Investments in: | | | | | | | | | | | | | | | | |
| | | | |
Common stocks | | | | | | | | | | | | | | | | |
Consumer discretionary | | $ | 209,505,219 | | | $ | 0 | | | $ | 0 | | | $ | 209,505,219 | |
Consumer staples | | | 146,919,315 | | | | 0 | | | | 0 | | | | 146,919,315 | |
Energy | | | 82,263,636 | | | | 0 | | | | 0 | | | | 82,263,636 | |
Financials | | | 161,961,099 | | | | 0 | | | | 0 | | | | 161,961,099 | |
Health care | | | 296,896,783 | | | | 0 | | | | 0 | | | | 296,896,783 | |
Industrials | | | 196,378,673 | | | | 0 | | | | 0 | | | | 196,378,673 | |
Information technology | | | 165,838,606 | | | | 0 | | | | 0 | | | | 165,838,606 | |
Materials | | | 53,537,782 | | | | 0 | | | | 0 | | | | 53,537,782 | |
Real estate | | | 88,472,695 | | | | 0 | | | | 0 | | | | 88,472,695 | |
Telecommunication | | | 48,146,806 | | | | 0 | | | | 0 | | | | 48,146,806 | |
Utilities | | | 73,791,976 | | | | 0 | | | | 0 | | | | 73,791,976 | |
| | | | |
Exchange-traded funds | | | 474,585 | | | | 0 | | | | 0 | | | | 474,585 | |
| | | | |
Short-term investments | | | | | | | | | | | | | | | | |
Investment companies | | | 16,690,970 | | | | 0 | | | | 0 | | | | 16,690,970 | |
| | | 1,540,878,145 | | | | 0 | | | | 0 | | | | 1,540,878,145 | |
Futures contracts | | | 1,155,486 | | | | 0 | | | | 0 | | | | 1,155,486 | |
Total assets | | $ | 1,542,033,631 | | | $ | 0 | | | $ | 0 | | | $ | 1,542,033,631 | |
| | | | | | | | | | | | | | | | |
| Factor Enhanced Small Cap Portfolio | | Quoted prices
(Level 1) | | | Other significant
observable inputs
(Level 2) | | | Significant
unobservable inputs
(Level 3) | | | Total | |
Assets | | | | | | | | | | | | | | | | |
Investments in: | | | | | | | | | | | | | | | | |
| | | | |
Common stocks | | | | | | | | | | | | | | | | |
Consumer discretionary | | $ | 58,984,597 | | | $ | 0 | | | $ | 0 | | | $ | 58,984,597 | |
Consumer staples | | | 15,993,832 | | | | 0 | | | | 0 | | | | 15,993,832 | |
Energy | | | 11,473,943 | | | | 0 | | | | 0 | | | | 11,473,943 | |
Financials | | | 73,452,149 | | | | 13,022 | | | | 0 | | | | 73,465,171 | |
Health care | | | 43,694,724 | | | | 0 | | | | 0 | | | | 43,694,724 | |
Industrials | | | 55,973,105 | | | | 0 | | | | 0 | | | | 55,973,105 | |
Information technology | | | 47,571,644 | | | | 0 | | | | 5,405 | | | | 47,577,049 | |
Materials | | | 12,297,833 | | | | 0 | | | | 0 | | | | 12,297,833 | |
Real estate | | | 35,449,960 | | | | 0 | | | | 0 | | | | 35,449,960 | |
Telecommunication | | | 3,992,199 | | | | 0 | | | | 0 | | | | 3,992,199 | |
Utilities | | | 8,264,203 | | | | 0 | | | | 0 | | | | 8,264,203 | |
| | | | |
Short-term investments | | | | | | | | | | | | | | | | |
Investment companies | | | 11,630,466 | | | | 0 | | | | 0 | | | | 11,630,466 | |
| | | 378,788,655 | | | | 13,022 | | | | 5,405 | | | | 378,797,082 | |
Future contracts | | | 810,277 | | | | 0 | | | | 0 | | | | 810,277 | |
Total assets | | $ | 379,588,932 | | | $ | 13,022 | | | $ | 5,405 | | | $ | 379,607,359 | |
| | | | | | |
| Notes to financial statements (unaudited) | | Wells Fargo Funds | | | 259 | |
| | | | | | | | | | | | | | | | |
| High Yield Corporate Bond Portfolio | | Quoted prices
(Level 1) | | | Other significant
observable inputs
(Level 2) | | | Significant
unobservable inputs
(Level 3) | | | Total | |
Assets | | | | | | | | | | | | | | | | |
Investments in: | | | | | | | | | | | | | | | | |
| | | | |
Corporate bonds and notes | | $ | 0 | | | $ | 90,482,876 | | | $ | 0 | | | $ | 90,482,876 | |
| | | | |
Yankee corporate bonds and notes | | | 0 | | | | 17,575,786 | | | | 0 | | | | 17,575,786 | |
| | | | |
Short-term investments | | | | | | | | | | | | | | | | |
Investment companies | | | 3,064,761 | | | | 0 | | | | 0 | | | | 3,064,761 | |
Total assets | | $ | 3,064,761 | | | $ | 108,058,662 | | | $ | 0 | | | $ | 111,123,423 | |
| | | | | | | | | | | | | | | | |
| International Government Bond Portfolio | | Quoted prices
(Level 1) | | | Other significant
observable inputs
(Level 2) | | | Significant
unobservable inputs
(Level 3) | | | Total | |
Assets | | | | | | | | | | | | | | | | |
Investments in: | | | | | | | | | | | | | | | | |
| | | | |
Foreign government bonds | | $ | 0 | | | $ | 10,490,219 | | | $ | 0 | | | $ | 10,490,219 | |
| | | | |
Short-term investments | | | | | | | | | | | | | | | | |
Investment companies | | | 1,018,943 | | | | 0 | | | | 0 | | | | 1,018,943 | |
| | | 1,018,943 | | | | 10,490,219 | | | | 0 | | | | 11,509,162 | |
Forward foreign currency contracts | | | 0 | | | | 48,278 | | | | 0 | | | | 48,278 | |
Total assets | | $ | 1,018,943 | | | $ | 10,538,497 | | | $ | 0 | | | $ | 11,557,440 | |
Liabilities | | | | | | | | | | | | | | | | |
| | | | |
Forward foreign currency contracts | | $ | 0 | | | $ | 54,616 | | | $ | 0 | | | $ | 54,616 | |
Total liabilities | | $ | 0 | | | $ | 54,616 | | | $ | 0 | | | $ | 54,616 | |
| | | | | | | | | | | | | | | | |
| Investment Grade Corporate Bond Portfolio | | Quoted prices
(Level 1) | | | Other significant
observable inputs
(Level 2) | | | Significant
unobservable inputs
(Level 3) | | | Total | |
Assets | | | | | | | | | | | | | | | | |
Investments in: | | | | | | | | | | | | | | | | |
| | | | |
Corporate bonds and notes | | $ | 0 | | | $ | 314,084,988 | | | $ | 0 | | | $ | 314,084,988 | |
| | | | |
Yankee corporate bonds and notes | | | 0 | | | | 66,181,443 | | | | 0 | | | | 66,181,443 | |
| | | | |
Short-term investments | | | | | | | | | | | | | | | | |
Investment companies | | | 1,867,794 | | | | 0 | | | | 0 | | | | 1,867,794 | |
U.S. Treasuries securities | | | 39,981 | | | | 0 | | | | 0 | | | | 39,981 | |
Total assets | | $ | 1,907,775 | | | $ | 380,266,431 | | | $ | 0 | | | $ | 382,174,206 | |
| | | | | | | | | | | | | | | | |
| Strategic Retirement Bond Portfolio | | Quoted prices
(Level 1) | | | Other significant
observable inputs
(Level 2) | | | Significant
unobservable inputs
(Level 3) | | | Total | |
Assets | | | | | | | | | | | | | | | | |
Investments in: | | | | | | | | | | | | | | | | |
| | | | |
Agency securities | | $ | 0 | | | $ | 1,928,976 | | | $ | 0 | | | $ | 1,928,976 | |
| | | | |
U.S. Treasury securities | | | 98,152,151 | | | | 0 | | | | 0 | | | | 98,152,151 | |
| | | | |
Short-term investments | | | | | | | | | | | | | | | | |
Investment companies | | | 169,918 | | | | 0 | | | | 0 | | | | 169,918 | |
Total assets | | $ | 98,322,069 | | | $ | 1,928,976 | | | $ | 0 | | | $ | 100,251,045 | |
| | | | |
| 260 | | Wells Fargo Funds | | Notes to financial statements (unaudited) |
| | | | | | | | | | | | | | | | |
| U.S. REIT Portfolio | | Quoted prices
(Level 1) | | | Other significant
observable inputs
(Level 2) | | | Significant
unobservable inputs
(Level 3) | | | Total | |
Assets | | | | | | | | | | | | | | | | |
Investments in: | | | | | | | | | | | | | | | | |
| | | | |
Common stocks | | | | | | | | | | | | | | | | |
Real estate | | $ | 60,080,621 | | | $ | 0 | | | $ | 0 | | | $ | 60,080,621 | |
Total assets | | $ | 60,080,621 | | | $ | 0 | | | $ | 0 | | | $ | 60,080,621 | |
Additional sector, industry or geographic detail for each Portfolio is included in the Portfolio of Investments.
Future contracts and forward foreign currency contracts are reported at their cumulative unrealized gains (losses) at measurement date as reported in the tables following the Portfolio of Investments. For futures contracts, the current day’s variation margin is reported on the Statement of Assets and Liabilities. All other assets and liabilities are reported at their market value at measurement date.
The Portfolios recognize transfers between levels within the fair value hierarchy at the end of the reporting period. At August 31, 2018, the Portfolios, except Factor Enhanced Emerging Markets Portfolio, Factor Enhanced International Portfolio and Factor Enhanced Small Cap Portfolio, did not have any transfers into/out of Level 1, Level 2, or Level 3.
Factor Enhanced Small Cap Portfolio had no material transfers between Level 1 and Level 3 and the Portfolio did not have any transfers into/out of Level 2.
For Factor Enhanced Emerging Markets Portfolio and Factor Enhanced International Portfolio, fair value pricing was not used in pricing certain foreign securities at August 31, 2018, but was used in pricing certain foreign securities at the previous period end and therefore common stocks and preferred stocks were transferred from Level 2 to Level 1 within the fair value hierarchy in the following amounts:
| | | | | | | | |
| | | Common
stocks | | | Preferred
stocks | |
Factor Enhanced Emerging Markets Portfolio | | $ | 160,267,242 | | | $ | 166,980 | |
Factor Enhanced International Portfolio | | $ | 676,104,001 | | | $ | 5,312,862 | |
However, fair value pricing was used in pricing certain other foreign securities at August 31, 2018 for Factor Enhanced Emerging Markets Portfolio and common stocks valued at $3,433,387 were transferred from Level 1 to Level 2 within the fair value hierarchy.
Factor Enhanced Emerging Markets Portfolio and Factor Enhanced International Portfolio did not have any transfers into/out of Level 3.
4. TRANSACTIONS WITH AFFILIATES
Advisory fees
The Trust has entered into an advisory contract with Funds Management, an indirect wholly owned subsidiary of Wells Fargo & Company (“Wells Fargo”). The adviser is responsible for implementing investment policies and guidelines and for supervising the applicable subadvisers, who are responsible for day-to-day portfolio management of the Portfolios. Pursuant to the contract, Funds Management is entitled to receive an annual advisory fee which is calculated based on the average daily net assets of each Portfolio.
Funds Management has retained the services of subadvisers to provide daily portfolio management to the Portfolios. Funds Management has engaged Wells Capital Management Incorporated (“WellsCap”) and Wells Fargo Asset Management (International), LLC as subadvisers. Each subadviser is an affiliate of Funds Management and an indirect, wholly owned subsidiary of Wells Fargo. The fees for subadvisory services are borne by Funds Management. The subadvisers are each entitled to receive from Funds Management an annual subadvisory fee which is calculated based on the average daily net assets of each Portfolio.
| | | | | | |
| Notes to financial statements (unaudited) | | Wells Fargo Funds | | | 261 | |
The annual advisory and subadvisory fee rates for each Portfolio are as follows:
| | | | | | | | | | | | | | | | | | | | |
| | | Advisory fee | | | Effective rate for the period ended
August 31, 2018 | | | Subadviser | | Subadvisory fee | |
| | | starting at | | | declining to | | | starting at | | declining to | |
Bloomberg Barclays US Aggregate ex-Corporate Portfolio | | | 0.05 | % | | | 0.03 | % | | | 0.05 | % | | WellsCap | | 0.04% | | | 0.03 | % |
Emerging Markets Bond Portfolio | | | 0.25 | | | | 0.21 | | | | 0.25 | | | Wells Fargo Asset Management (International), LLC | | 0.09 | | | 0.07 | |
Factor Enhanced Emerging Markets Portfolio | | | 0.15 | | | | 0.11 | | | | 0.15 | | | WellsCap* | | 0.08 | | | 0.05 | |
Factor Enhanced International Portfolio | | | 0.15 | | | | 0.11 | | | | 0.15 | | | WellsCap* | | 0.08 | | | 0.05 | |
Factor Enhanced Large Cap Portfolio | | | 0.10 | | | | 0.06 | | | | 0.10 | | | WellsCap* | | 0.06 | | | 0.04 | |
Factor Enhanced Small Cap Portfolio | | | 0.15 | | | | 0.11 | | | | 0.15 | | | WellsCap* | | 0.08 | | | 0.05 | |
High Yield Corporate Bond Portfolio | | | 0.25 | | | | 0.21 | | | | 0.25 | | | WellsCap | | 0.09 | | | 0.07 | |
International Government Bond Portfolio | | | 0.25 | | | | 0.21 | | | | 0.25 | | | Wells Fargo Asset Management (International), LLC | | 0.09 | | | 0.07 | |
Investment Grade Corporate Bond Portfolio | | | 0.05 | | | | 0.03 | | | | 0.05 | | | WellsCap | | 0.04 | | | 0.03 | |
Strategic Retirement Bond Portfolio | | | 0.05 | | | | 0.03 | | | | 0.05 | | | WellsCap | | 0.04 | | | 0.03 | |
U.S. REIT Portfolio | | | 0.10 | | | | 0.06 | | | | 0.10 | | | WellsCap | | 0.06 | | | 0.04 | |
| * | On November 1, 2018, Analytic Investors, LLC was consolidated into WellsCap and WellsCap became the subadviser to the Portfolio. The consolidation did not result in any changes to the services provided to the Portfolio or to its strategy or fees and expenses. |
Funds Management has voluntarily waived and/or reimbursed the management fee to the extent necessary to maintain certain net operating expense ratios for the Portfolios.
Interfund transactions
The Portfolios may purchase or sell portfolio investment securities to certain other Wells Fargo affiliates pursuant to Rule 17a-7 under the 1940 Act and under procedures adopted by the Board of Trustees. The procedures have been designed to ensure that these interfund transactions, which do not incur broker commissions, are effected at current market prices. Pursuant to these procedures, High Yield Corporate Bond Portfolio had $715,813 in interfund sales during the six months ended August 31, 2018.
5. INVESTMENT PORTFOLIO TRANSACTIONS
Purchases and sales of investments, excluding short-term securities, for the six months ended August 31, 2018 were as follows:
| | | | | | | | | | | | | | | | |
| | | Purchase at cost | | | Sales proceeds | |
| | | U.S.
government | | | Non-U.S.
government | | | U.S.
government | | | Non-U.S.
government | |
Bloomberg Barclays US Aggregate ex-Corporate Portfolio | | $ | 400,941,300 | | | $ | 9,522,837 | | | $ | 551,368,116 | | | $ | 35,164,588 | |
Emerging Markets Bond Portfolio | | | 0 | | | | 11,402,319 | | | | 0 | | | | 22,155,647 | |
Factor Enhanced Emerging Markets Portfolio | | | 0 | | | | 106,882,106 | | | | 0 | | | | 139,012,615 | |
Factor Enhanced International Portfolio | | | 0 | | | | 217,733,027 | | | | 0 | | | | 417,476,477 | |
Factor Enhanced Large Cap Portfolio | | | 0 | | | | 243,733,449 | | | | 0 | | | | 655,048,844 | |
Factor Enhanced Small Cap Portfolio | | | 0 | | | | 214,461,446 | | | | 0 | | | | 325,366,379 | |
High Yield Corporate Bond Portfolio | | | 0 | | | | 19,159,828 | | | | 0 | | | | 35,600,071 | |
International Government Bond Portfolio | | | 0 | | | | 15,145,624 | | | | 0 | | | | 13,988,345 | |
Investment Grade Corporate Bond Portfolio | | | 0 | | | | 31,162,641 | | | | 0 | | | | 101,223,270 | |
Strategic Retirement Bond Portfolio | | | 7,991,255 | | | | 161,783 | | | | 35,089,837 | | | | 0 | |
U.S. REIT Portfolio | | | 0 | | | | 5,962,444 | | | | 0 | | | | 20,923,657 | |
| | | | |
| 262 | | Wells Fargo Funds | | Notes to financial statements (unaudited) |
6. DERIVATIVE TRANSACTIONS
During the six months ended August 31, 2018, Bloomberg Barclays US Aggregate ex-Corporate Portfolio, Factor Enhanced Emerging Markets Portfolio, Factor Enhanced International Portfolio, Factor Enhanced Large Cap Portfolio, Factor Enhanced Small Cap Portfolio and Investment Grade Corporate Bond Portfolio entered into futures contracts to gain market exposure. Factor Enhanced Emerging Markets Portfolio and International Government Bond Portfolio entered into forward foreign currency contracts for economic hedging purposes.
The table below discloses the volume of the each Portfolio’s derivative transactions during the six months ended August 31, 2018.
| | | | | | | | | | | | | | | | | | | | | | | | | | | | |
| | | Bloomberg Barclays US Aggregate ex-Corporate Portfolio | | | Factor Enhanced
Emerging
Markets
Portfolio | | | Factor
Enhanced
International
Portfolio | | | Factor
Enhanced
Large Cap
Portfolio | | | Factor
Enhanced
Small Cap
Portfolio | | | International
Government
Bond
Portfolio | | | Investment Grade
Corporate
Bond Portfolio | |
Futures contracts | | | | | | | | | | | | | | | | | | | | | | | | | | | | |
Average notional balance on long futures | | $ | 202,946 | | | $ | 15,085,070 | | | $ | 48,284,420 | | | $ | 50,561,548 | | | $ | 14,093,898 | | | | N/A | | | $ | 339,959 | |
Average notional balance on short futures | | | 67,946 | | | | 0 | | | | 0 | | | | 0 | | | | 0 | | | | N/A | | | | 19,606 | |
Forward foreign currency contracts | | | | | | | | | | | | | | | | | | | | | | | | | | | | |
Average contract amounts to buy | | | N/A | | | | 0 | | | | N/A | | | | N/A | | | | N/A | | | $ | 2,086,815 | | | | N/A | |
Average contract amounts to sell | | | N/A | | | | 867 | | | | N/A | | | | N/A | | | | N/A | | | | 2,012,934 | | | | N/A | |
The fair value, realized gains or losses and change in unrealized gains or losses, on these derivative transactions are reflected in the corresponding financial statement captions.
For certain types of derivative transactions, the Portfolios have entered into International Swaps and Derivatives Association, Inc. master agreements (“ISDA Master Agreements”) or similar agreements with approved counterparties. The ISDA Master Agreements or similar agreements may have requirements to deliver/deposit securities or cash to/with an exchange or broker-dealer as collateral and allows a Portfolio to offset, with each counterparty, certain derivative financial instrument’s assets and/or liabilities with collateral held or pledged. Collateral requirements differ by type of derivative. Collateral or margin requirements are set by the broker or exchange clearinghouse for exchange traded derivatives while collateral terms are contract specific for over-the-counter traded derivatives. Cash collateral that has been pledged to cover obligations of a Portfolio under ISDA Master Agreements or similar agreements, if any, are reported separately in the Statements of Assets and Liabilities. Securities pledged as collateral, if any, are noted in the Portfolio of Investments. With respect to balance sheet offsetting, absent an event of default by the counterparty or a termination of the agreement, the reported amounts of financial assets and financial liabilities in the Statements of Assets and Liabilities are not offset across transactions between a Portfolio and the applicable counterparty. A reconciliation of the gross amounts on the Statements of Assets and Liabilities to the net amounts by counterparty, including any collateral exposure, is as follows:
| | | | | | | | | | | | | | | | |
| | | Counterparty | | Gross amounts
of assets in the Statements of
Assets and
Liabilities | | Amounts
subject to
netting
agreements | | | Collateral
received | | | Net amount
of assets | |
International Government Bond Portfolio | | State Street Bank | | $48,278 | | $ | (48,278 | ) | | $ | 0 | | | $ | 0 | |
| | | | | | | | | | | | | | | | |
| | | Counterparty | | Gross amounts
of liabilities in the
Statements of
Assets and
Liabilities | | Amounts
subject to
netting
agreements | | | Collateral
pledged | | | Net amount
of liabilities | |
International Government Bond Portfolio | | State Street Bank | | $54,616 | | $ | (48,278 | ) | | $ | 0 | | | $ | 6,338 | |
7. BANK BORROWINGS
The Trust, Wells Fargo Master Trust and Wells Fargo Funds Trust (excluding the money market funds) are parties to a $280,000,000 revolving credit agreement whereby each Portfolio is permitted to use bank borrowings for temporary or emergency purposes, such as to fund shareholder redemption requests. Interest under the credit agreement is charged
| | | | | | |
| Notes to financial statements (unaudited) | | Wells Fargo Funds | | | 263 | |
to each Portfolio based on a borrowing rate equal to the higher of the Federal Funds rate in effect on that day plus 1.25% or the overnight LIBOR rate in effect on that day plus 1.25%. In addition, an annual commitment fee equal to 0.25% of the unused balance is allocated to each participating portfolio.
For the six months ended August 31, 2018, there were no borrowings by the Portfolios under the agreement.
8. INDEMNIFICATION
Under the Trust’s organizational documents, the officers and Trustees have been granted certain indemnification rights against certain liabilities that may arise out of performance of their duties to the Trust. Additionally, in the normal course of business, the Trust may enter into contracts with service providers that contain a variety of indemnification clauses. The Trust’s maximum exposure under these arrangements is dependent on future claims that may be made against the Portfolios and, therefore, cannot be estimated.
9. NEW ACCOUNTING PRONOUNCEMENTS AND REGULATORY CHANGES
On August 17, 2018, the Securities and Exchange Commission (“SEC”) adopted Disclosure Update and Simplification, which amends certain disclosure requirements. The amendments are effective for filings subsequent to November 5, 2018. Management expects these amendments will impact the classification of disclosures in the financial statements.
In August 2018, FASB issued Accounting Standards Update (“ASU”) No. 2018-13, Fair Value Measurement (Topic 820) Disclosure Framework—Changes to the Disclosure Requirements for Fair Value Measurement. ASU 2018-13 updates the disclosure requirements for fair value measurements by modifying or removing certain disclosures and adding certain new disclosures. The amendments are effective for fiscal years, and interim periods within those fiscal years, beginning after December 15, 2019. Early adoption is permitted. Management is currently evaluating the potential impact of this new guidance to the financial statements.
In March 2017, FASB issued ASU No. 2017-08, Premium Amortization on Purchased Callable Debt Securities. ASU 2017-08 shortens the amortization period for certain callable debt securities held at a premium. The amendments require the premium to be amortized to the earliest call date. The amendments do not require an accounting change for securities held at a discount; the discount continues to be amortized to maturity. ASU 2017-08 is effective for fiscal years beginning after December 15, 2018 and for interim periods within those fiscal years. Management is currently evaluating the potential impact of this new guidance to the financial statements.
| | | | |
| 264 | | Wells Fargo Funds | | Other information (unaudited) |
PROXY VOTING INFORMATION
A description of the policies and procedures used to determine how to vote proxies relating to portfolio securities is available without charge, upon request, by calling 1-800-222-8222, visiting our website at wellsfargofunds.com, or visiting the SEC website at sec.gov. Information regarding how the proxies related to portfolio securities were voted during the most recent 12-month period ended June 30 is available on the website at wellsfargofunds.com or by visiting the SEC website at sec.gov.
PORTFOLIO HOLDINGS INFORMATION
The complete portfolio holdings are publicly available on the website (wellsfargofunds.com) on a one-month delayed basis. In addition, top ten holdings information (excluding derivative positions) is publicly available on the website on a monthly, seven-day or more delayed basis. Each Fund and Portfolio files its complete schedule of portfolio holdings with the SEC for the first and third quarters of each fiscal year on Form N-Q, which is available by visiting the SEC website at sec.gov. In addition, each Form N-Q may be reviewed and copied at the SEC’s Public Reference Room in Washington, DC, and at regional offices in New York City, at 233 Broadway, and in Chicago, at 175 West Jackson Boulevard, Suite 900. Information about the Public Reference Room may be obtained by calling 1-800-SEC-0330.
| | | | | | |
| Other information (unaudited) | | Wells Fargo Funds | | | 265 | |
BOARD OF TRUSTEES AND OFFICERS
Each of the Trustees and Officers1 listed in the table below acts in identical capacities for each fund in the Wells Fargo family of funds, which consists of 154 mutual funds comprising the Wells Fargo Funds Trust, Wells Fargo Variable Trust, Wells Fargo Master Trust and four closed-end funds (collectively the “Fund Complex”). This table should be read in conjunction with the Prospectus and the Statement of Additional Information2. The mailing address of each Trustee and Officer is 525 Market Street, 12th Floor, San Francisco, CA 94105. Each Trustee and Officer serves an indefinite term, however, each Trustee serves such term until reaching the mandatory retirement age established by the Trustees.
Independent Trustees
| | | | | | |
Name and year of birth | | Position held and length of service* | | Principal occupations during past five years or longer | | Current other
public company or
investment company
directorships |
William R. Ebsworth (Born 1957) | | Trustee, since 2015 | | Retired. From 1984 to 2013, equities analyst, portfolio manager, research director and chief investment officer at Fidelity Management and Research Company in Boston, Tokyo, and Hong Kong, and retired in 2013 as Chief Investment Officer of Fidelity Strategic Advisers, Inc. where he led a team of investment professionals managing client assets. Prior thereto, Board member of Hong Kong Securities Clearing Co., Hong Kong Options Clearing Corp., the Thailand International Fund, Ltd., Fidelity Investments Life Insurance Company, and Empire Fidelity Investments Life Insurance Company. Board member of the Vincent Memorial Hospital Endowment (non-profit organization), where he serves on the Investment Committee and as a Chair of the Audit Committee. Mr. Ebsworth is a CFA® charterholder. | | N/A |
Jane A. Freeman (Born 1953) | | Trustee, since 2015; Chair Liaison, since 2018 | | Retired. From 2012 to 2014 and 1999 to 2008, Chief Financial Officer of Scientific Learning Corporation. From 2008 to 2012, Ms. Freeman provided consulting services related to strategic business projects. Prior to 1999, Portfolio Manager at Rockefeller & Co. and Scudder, Stevens & Clark. Board member of the Harding Loevner Funds from 1996 to 2014, serving as both Lead Independent Director and chair of the Audit Committee. Board member of the Russell Exchange Traded Funds Trust from 2011 to 2012 and the chair of the Audit Committee. Ms. Freeman is a Board Member of The Ruth Bancroft Garden (non-profit organization). She is also an inactive Chartered Financial Analyst. | | N/A |
Isaiah Harris, Jr. (Born 1952) | | Trustee, since 2009 | | Retired. Chairman of the Board of CIGNA Corporation since 2009, and Director since 2005. From 2003 to 2011, Director of Deluxe Corporation. Prior thereto, President and CEO of BellSouth Advertising and Publishing Corp. from 2005 to 2007, President and CEO of BellSouth Enterprises from 2004 to 2005 and President of BellSouth Consumer Services from 2000 to 2003. Emeritus member of the Iowa State University Foundation Board of Governors. Emeritus Member of the Advisory Board of Iowa State University School of Business. Advisory Board Member, Palm Harbor Academy (private school). Advisory Board Member, Child Evangelism Fellowship (non-profit). Mr. Harris is a certified public accountant (inactive status). | | CIGNA Corporation |
Judith M. Johnson (Born 1949) | | Trustee, since 2008; Audit Committee Chairman, since 2009 | | Retired. Prior thereto, Chief Executive Officer and Chief Investment Officer of Minneapolis Employees Retirement Fund from 1996 to 2008. Ms. Johnson is an attorney, certified public accountant and a certified managerial accountant. | | N/A |
David F. Larcker (Born 1950) | | Trustee, since 2009 | | James Irvin Miller Professor of Accounting at the Graduate School of Business, Stanford University, Director of the Corporate Governance Research Initiative and Senior Faculty of The Rock Center for Corporate Governance since 2006. From 2005 to 2008, Professor of Accounting at the Graduate School of Business, Stanford University. Prior thereto, Ernst & Young Professor of Accounting at The Wharton School, University of Pennsylvania from 1985 to 2005. | | N/A |
| | | | |
| 266 | | Wells Fargo Funds | | Other information (unaudited) |
| | | | | | |
Name and year of birth | | Position held and length of service* | | Principal occupations during past five years or longer | | Current other
public company or
investment company
directorships |
Olivia S. Mitchell (Born 1953) | | Trustee, since 2006; Governance Committee Chairman, since 2018 | | International Foundation of Employee Benefit Plans Professor, Wharton School of the University of Pennsylvania since 1993. Director of Wharton’s Pension Research Council and Boettner Center on Pensions & Retirement Research, and Research Associate at the National Bureau of Economic Research. Previously, Cornell University Professor from 1978 to 1993. | | N/A |
Timothy J. Penny (Born 1951) | | Trustee, since 1996; Chairman, since 2018; Vice Chairman, from 2017 to 2018 | | President and Chief Executive Officer of Southern Minnesota Initiative Foundation, a non-profit organization, since 2007. Member of the Board of Trustees of NorthStar Education Finance, Inc., a non-profit organization, since 2007. | | N/A |
James G. Polisson (Born 1959) | | Trustee, since 2018; Advisory Board Member, from 2017 to 2018 | | Retired. Chief Marketing Officer, Source (ETF) UK Services, Ltd, from 2015 to 2017. From 2012 to 2015, Principal of The Polisson Group, LLC, a management consulting, corporate advisory and principal investing company. Chief Executive Officer and Managing Director at Russell Investments, Global Exchange Traded Funds from 2010 to 2012. Managing Director of Barclays Global Investors from 1998 to 2010 and Global Chief Marketing Officer for iShares and Barclays Global Investors from 2000 to 2010. Trustee of the San Francisco Mechanics’ Institute, a non-profit organization, from 2013 to 2015. Board member of the Russell Exchange Traded Fund Trust from 2011 to 2012. Director of Barclays Global Investors Holdings Deutschland GmbH from 2006 to 2009. Mr. Polisson is an attorney and has a retired status with the Massachusetts and District of Columbia Bar Associations. | | N/A |
Michael S. Scofield (Born 1943) | | Trustee, since 2010 | | Served on the Investment Company Institute’s Board of Governors and Executive Committee from 2008-2011 as well the Governing Council of the Independent Directors Council from 2006-2011 and the Independent Directors Council Executive Committee from 2008-2011. Trustee of the Evergreen Fund complex (and its predecessors) from 1984 to 2010. Chairman of the Evergreen Funds from 2000-2010. Former Trustee of the Mentor Funds. Retired Attorney, Law Offices of Michael S. Scofield. | | N/A |
| Pamela Wheelock (Born 1959) | | Trustee, since 2018; Advisory Board Member, from 2017 to 2018 | | Chief Operating Officer, Twin Cities Habitat for Humanity, since January, 2017. Vice President of University Services, University of Minnesota from 2012 to 2017. Prior thereto, on the Board of Directors, Governance Committee and Finance Committee for the Minnesota Philanthropy Partners (Saint Paul Foundation) from 2012 to 2018, Interim President and Chief Executive Officer of Blue Cross Blue Shield of Minnesota from 2010 to 2011, Chairman of the Board from 2009 to 2011 and Board Director from 2003 to 2015. Vice President, Leadership and Community Engagement, Bush Foundation, Saint Paul, Minnesota (a private foundation) from 2009 to 2011. Executive Vice President and Chief Financial Officer, Minnesota Sports and Entertainment from 2004 to 2009 and Senior Vice President from 2002 to 2004. Commissioner of Finance, State of Minnesota, from 1999 to 2002. Currently the Board Chair of the Minnesota Wild Foundation since 2010. | | N/A |
| * | Length of service dates reflect the Trustee’s commencement of service with the Trust’s predecessor entities, where applicable. |
| | | | | | |
| Other information (unaudited) | | Wells Fargo Funds | | | 267 | |
Officers
| | | | | | |
Name and year of birth | | Position held and
length of service | | Principal occupations during past five years or longer | | |
Andrew Owen (Born 1960) | | President, since 2017 | | Executive Vice President of Wells Fargo & Company and Head of Affiliated Managers, Wells Fargo Asset Management, since 2014. In addition, Mr. Owen is currently President, Chief Executive Officer and Director of Wells Fargo Funds Management, LLC since 2017. Prior thereto, Executive Vice President responsible for marketing, investments and product development for Wells Fargo Funds Management, LLC, from 2009 to 2014. | | |
Nancy Wiser1 (Born 1967) | | Treasurer, since 2012 | | Executive Vice President of Wells Fargo Funds Management, LLC since 2011. Chief Operating Officer and Chief Compliance Officer at LightBox Capital Management LLC, from 2008 to 2011. | | |
| Alexander Kymn3 (Born 1973) | | Secretary, since 2018; Chief Legal Officer, since 2018 | | Senior Company Counsel of Wells Fargo Bank, N.A. since 2018 (previously Senior Counsel from 2007 to 2018). Vice President of Wells Fargo Funds Management, LLC from 2008 to 2014. | | |
| Michael H. Whitaker (Born 1967) | | Chief Compliance Officer, since 2016 | | Senior Vice President and Chief Compliance Officer since 2016. Senior Vice President and Chief Compliance Officer for Fidelity Investments from 2007 to 2016. | | |
David Berardi (Born 1975) | | Assistant Treasurer, since 2009 | | Vice President of Wells Fargo Funds Management, LLC since 2009. Vice President of Evergreen Investment Management Company, LLC from 2008 to 2010. Manager of Fund Reporting and Control for Evergreen Investment Management Company, LLC from 2004 to 2010. | | |
Jeremy DePalma1
(Born 1974) | | Assistant Treasurer, since 2009 | | Senior Vice President of Wells Fargo Funds Management, LLC since 2009. Senior Vice President of Evergreen Investment Management Company, LLC from 2008 to 2010 and head of the Fund Reporting and Control Team within Fund Administration from 2005 to 2010. | | |
| 1 | Jeremy DePalma acts as Treasurer of the Bloomberg Barclays US Aggregate ex-Corporate Portfolio, Emerging Markets Bond Portfolio, Factor Enhanced Emerging Markets Portfolio, Factor Enhanced International Portfolio, Factor Enhanced Large Cap Portfolio, Factor Enhanced Small Cap Portfolio, High Yield Corporate Bond Portfolio, International Government Bond Portfolio, Investment Grade Corporate Bond Portfolio, Strategic Retirement Bond Portfolio and U.S. REIT Portfolio and as Assistant Treasurer of the remaining funds in this shareholder report. In addition, Jeremy DePalma acts as Treasurer of 66 other funds and Assistant Treasurer of 69 other funds in the Fund Complex. Nancy Wiser serves as Treasurer of the remaining funds in this shareholder report and 69 other funds in the Fund Complex. |
| 2 | The Statement of Additional Information includes additional information about the Trustees and is available, without charge, upon request, by calling 1-800-222-8222 or by visiting the website at wellsfargofunds.com. |
| 3 | Alexander Kymn became the Secretary and Chief Legal Officer effective April 17, 2018. |
| | | | |
| 268 | | Wells Fargo Funds | | Other information (unaudited) |
BOARD CONSIDERATION OF INVESTMENT MANAGEMENT, ADVISORY AND SUB-ADVISORY AGREEMENTS:
Wells Fargo Emerging Markets Bond Fund; Wells Fargo Factor Enhanced Emerging Markets Fund; Wells Fargo Factor Enhanced International Fund; Wells Fargo Factor Enhanced Large Cap Fund; Wells Fargo Factor Enhanced Small Cap Fund; Wells Fargo High Yield Corporate Bond Fund; Wells Fargo International Government Bond Fund; Wells Fargo U.S. Core Bond Fund; Wells Fargo Bloomberg Barclays US Aggregate ex-Corporate Portfolio; Wells Fargo International Government Bond Portfolio; Wells Fargo Emerging Markets Bond Portfolio; Wells Fargo Factor Enhanced Emerging Markets Portfolio; Wells Fargo Factor Enhanced International Portfolio; Wells Fargo Factor Enhanced Large Cap Portfolio; Wells Fargo Factor Enhanced Small Cap Portfolio; Wells Fargo High Yield Corporate Bond Portfolio; Wells Fargo Investment Grade Corporate Bond Portfolio
Under the Investment Company Act of 1940 (the “1940 Act”), the Board of Trustees (each, a “Board” and collectively, the “Boards”) of each of Wells Fargo Funds Trust (“Funds Trust”) and Wells Fargo Master Trust (“Master Trust”) (collectively, the “Trusts”) must determine annually whether to approve the continuation of the Trusts’ investment management, advisory and sub-advisory agreements, as applicable. In this regard, at an in-person meeting held on May 22-23, 2018 (the “Meeting”), the Funds Trust Board, all the members of which have no direct or indirect interest in the investment management agreement and are not “interested persons” of the Trusts, as defined in the 1940 Act (the “Independent Trustees”), reviewed and approved an investment management agreement (the “Management Agreement”) with Wells Fargo Funds Management, LLC (“Funds Management”) for each of the funds of Funds Trust identified in the table below (individually, an “Intuitive Fund” and collectively, the “Intuitive Funds”):
|
| Intuitive Fund |
Wells Fargo Emerging Markets Bond Fund |
Wells Fargo Factor Enhanced Emerging Markets Fund |
Wells Fargo Factor Enhanced International Fund |
Wells Fargo Factor Enhanced Large Cap Fund |
Wells Fargo Factor Enhanced Small Cap Fund |
Wells Fargo High Yield Corporate Bond Fund |
Wells Fargo International Government Bond Fund |
Wells Fargo U.S. Core Bond Fund |
In addition, the Funds Trust Board reviewed and approved an investment sub-advisory agreement with Wells Capital Management Incorporated (“WellsCap”) for the U.S. Core Bond Fund (the “Core Bond Fund Sub-Advisory Agreement”).
At the Meeting, the Master Trust Board, all the members of which have no direct or indirect interest in the investment advisory and sub-advisory agreements and are Independent Trustees, reviewed and approved: (i) an investment advisory agreement (the “Master Portfolio Advisory Agreement”) with Funds Management for each of the portfolios of Master Trust identified in the table below (individually, a “Master Portfolio” and collectively, the “Master Portfolios”); and (ii) an investment sub-advisory agreement (each, a “Master Portfolio Sub-Advisory Agreement”, and collectively, the “Master Portfolio Sub-Advisory Agreements”) with the sub-adviser(s) identified in the chart below (each, a “Sub-Adviser”, and collectively, the “Sub-Advisers”) for the corresponding Master Portfolio identified in the chart:
| | |
| Portfolio | | Sub-Adviser |
Wells Fargo Bloomberg Barclays US Aggregate ex-Corporate Portfolio | | Wells Cap |
Wells Fargo Factor Enhanced Emerging Markets Portfolio | | Analytic Investors, LLC (“Analytic”) |
Wells Fargo Emerging Markets Bond Portfolio | | Wells Fargo Asset Management (International), LLC (“WFAM International”) |
Wells Fargo Factor Enhanced International Portfolio | | Analytic |
Wells Fargo Factor Enhanced Large Cap Portfolio | | Analytic |
Wells Fargo Factor Enhanced Small Cap Portfolio | | Analytic |
Wells Fargo International Government Bond Portfolio | | WFAM International |
Wells Fargo Investment Grade Corporate Bond Portfolio | | WellsCap |
Wells Fargo High Yield Corporate Bond Portfolio | | WellsCap |
| | | | | | |
| Other information (unaudited) | | Wells Fargo Funds | | | 269 | |
The Intuitive Funds and the Master Portfolios are collectively referred to as the “Funds.” The Management Agreement, the Core Bond Fund Sub-Advisory Agreement, the Master Portfolio Advisory Agreement and the Master Portfolio Sub-Advisory Agreements are collectively referred to as the “Advisory Agreements.”
The Board noted that each of the Intuitive Funds is a feeder fund that invests all of its assets in its corresponding Master Portfolio, with the exception of the U.S. Core Bond Fund, which invests in multiple Master Portfolios. Information provided to the Boards regarding the Intuitive Funds is also applicable to the Master Portfolios identified above, as relevant.
At the Meeting, the Boards considered the factors and reached the conclusions described below relating to the selection of Funds Management and the Sub-Advisers and the approval of the Advisory Agreements. Prior to the Meeting, including at an in-person meeting in April 2018, the Trustees conferred extensively among themselves and with representatives of Funds Management about these matters. Also, the Boards have adopted a team-based approach, with each team consisting of a sub-set of Trustees, to assist the Boards in the discharge of their duties in reviewing investment performance and other matters throughout the year. The Independent Trustees were assisted in their evaluation of the Advisory Agreements by independent legal counsel, from whom they received separate legal advice and with whom they met separately.
In providing information to the Boards, Funds Management and the Sub-Advisers were guided by a detailed set of requests for information submitted to them by independent legal counsel on behalf of the Independent Trustees at the start of the Boards’ annual contract renewal process earlier in 2018. In considering and approving the Advisory Agreements, the Trustees considered the information they believed relevant, including but not limited to the information discussed below. The Boards considered not only the specific information presented in connection with the Meeting, but also the knowledge gained over time through interaction with Funds Management and the Sub-Advisers about various topics. In this regard, the Boards reviewed reports of Funds Management at each of their quarterly meetings, which included, among other things, portfolio reviews and investment performance reports. In addition, the Boards and the teams mentioned above confer with portfolio managers at various times throughout the year. The Boards did not identify any particular information or consideration that was all-important or controlling, and each individual Trustee may have attributed different weights to various factors.
After its deliberations, the Funds Trust Board unanimously approved the continuation of the Management Agreement and the Core Bond Fund Sub-Advisory Agreement for a one-year period. Additionally, after its deliberations, the Master Trust Board unanimously approved the continuation of the Master Portfolio Advisory Agreement and each Master Portfolio Sub-Advisory Agreement for a one-year term. The Boards also determined that the compensation or the absence of compensation payable to Funds Management and to each of the Sub-Advisers was reasonable. The Boards considered the approval of the Advisory Agreements for the Funds as part of their consideration of agreements for funds across the complex, but their approvals were made on a fund-by-fund basis. The following summarizes a number of important, but not necessarily all, factors considered by the Boards in support of their approvals.
Nature, extent and quality of services
The Boards received and considered various information regarding the nature, extent and quality of services provided to the Funds by Funds Management and the Sub-Advisers under the Advisory Agreements. This information included a description of the investment advisory services and Fund-level administrative services, as well as, among other things, a summary of the background and experience of senior management of Wells Fargo Asset Management (“WFAM”), of which Funds Management and the Sub-Advisers are a part, a summary of investments made in the business of WFAM, a summary of certain organizational and/or personnel changes involving Funds Management and the Subadvisers, and a description of Funds Management’s and the Sub-Advisers’ business continuity planning programs and of their approaches to data privacy and cybersecurity. The Boards also considered the qualifications, background, tenure and responsibilities of each of the portfolio managers primarily responsible for the day-to-day portfolio management of the Funds. The Master Trust Board noted that each of the Master Portfolios replicates the performance of a proprietary index provided by an affiliate of Funds Management, except that the Bloomberg Barclays US Aggregate ex-Corporate Portfolio and the Emerging Markets Bond Portfolio will track the performance of third-party indexes.
The Boards evaluated the ability of Funds Management and the Sub-Advisers to attract and retain qualified investment professionals, including research, advisory and supervisory personnel. The Boards further considered the compliance programs and compliance records of Funds Management and the Sub-Advisers. In addition, the Boards took into account the full range of services provided to the Funds by Funds Management and its affiliates.
| | | | |
| 270 | | Wells Fargo Funds | | Other information (unaudited) |
Investment performance and expenses
The Boards noted that the Funds had recently commenced operations and had no performance history to review. The Boards noted that they would have the opportunity to review the Funds’ performance history in connection with the Boards’ future review and approval of the Funds’ advisory agreements.
The Funds Trust Board also received and considered information regarding the “zero fee and expense” structure of each Intuitive Fund. Specifically, the Funds Trust Board noted that each Intuitive Fund’s gross operating expense ratio and each of its various components, including management fees, administration fees, custody fees, Rule 12b-1 fees, and other fees, are zero. The Funds Trust Board also noted that each Fund serves as a dedicated mutual fund for use exclusively as part of a robo-advisory program offered by Wells Fargo Advisors, LLC (“WFA”), an affiliate of Funds Management, and that Funds Management assumes and pays or reimburses all of the ordinary operating expenses of each Intuitive Fund, including acquired fund fees and expenses, pursuant to an agreement with each of the Intuitive Funds (the “Fee and Expense Agreement”). The Funds Trust Board further noted that Funds Management receives a fee from Wells Fargo Wealth and Investment Management (“WIM”) pursuant to an intercompany agreement equal to the Master Portfolio fees and expenses absorbed by Funds Management through its Fee and Expense Agreement with each of the Intuitive Funds.
With respect to the Master Portfolios, the Master Trust Board reviewed the fee rates that are payable to Funds Management for investment advisory services (as discussed below), which are the only fees charged at the Master Portfolio level, relative to a corresponding expense Group.
The Boards took into account the Funds’ expense information provided to it among the factors considered in deciding to re-approve the Advisory Agreements.
Investment management, advisory and sub-advisory fee rates
The Funds Trust Board reviewed and considered that the contractual investment management fee rate payable by each Intuitive Fund to Funds Management for investment management services zero, and also reviewed and considered that each Fund’s other expenses would normally be zero, because of Funds Management’s commitment to assume and pay or reimburse all of the ordinary operating expenses of each Fund, including acquired fund fees and expenses, under the Fee and Expense Agreement. The Funds Trust Board also reviewed and considered that the contractual investment sub-advisory fee rate payable by Funds Management to WellsCap for investment sub-advisory services for the U.S. Core Bond Fund is also zero.
The Master Trust Board reviewed and considered the contractual investment advisory fee rates that are payable by the Master Portfolios to Funds Management for investment advisory services under the Master Portfolio Advisory Agreement (the “Advisory Agreement Rates”). The Master Trust Board also reviewed and considered the contractual investment sub-advisory fee rates that are payable by Funds Management to the Sub-Advisers for investment sub-advisory services (the “Sub-Advisory Agreement Rates”).
The Master Trust Board reviewed a comparison of the Advisory Agreement Rates of each Master Portfolio with those of other funds in each Master Portfolio’s respective expense Group at a common asset level. The Master Trust Board noted that the Advisory Agreement Rates of each Master Portfolio were lower than or in range of the median rate for the Master Portfolio’s expense Group.
The Boards also received and considered information about the portions of the total management fees that were retained by Funds Management after payment of the fees to the Sub-Advisers for sub-advisory services. In assessing the reasonableness of these amounts, the Boards received and evaluated information about the nature and extent of responsibilities retained and risks assumed by Funds Management and not delegated to or assumed by the Sub-Advisers, and about Funds Management’s on-going oversight services. Given the current affiliation between Funds Management and the Sub-Advisers, the Boards ascribed limited relevance to the allocation of the fees between them.
The Boards also received and considered information about the nature and extent of services offered and fee rates charged by Funds Management and the Sub-Advisers to other types of clients with investment strategies similar to those of certain Funds. In this regard, the Boards received information about the significantly greater scope of services, and compliance, reporting and other legal burdens and risks of managing mutual funds compared with those associated with managing assets of non-mutual fund clients such as collective funds or institutional separate accounts.
Based on its consideration of the factors and information it deemed relevant, including those described here, the Funds Trust Board determined that the compensation received by Funds Management from WIM pursuant to the intercompany agreement, and the absence of compensation payable by the Funds to Funds Management pursuant to the Management Agreement or to WellsCap pursuant to the Core Bond Fund Sub-Advisory Agreement, was reasonable. Based on its consideration of the factors and information it deemed relevant, including those described here, the Master Trust Board determined that the Advisory Agreement Rates and the Sub-Advisory Agreement Rates for each Master Portfolio were reasonable.
| | | | | | |
| Other information (unaudited) | | Wells Fargo Funds | | | 271 | |
Profitability
The Boards received and considered information concerning the profitability of Funds Management, as well as the profitability of both WFAM and Wells Fargo & Co. (“Wells Fargo”) as a whole, from providing services to the Funds and the fund family as a whole. The Boards noted that the Sub-Advisers’ profitability information with respect to providing services to the Funds was subsumed in the WFAM and Wells Fargo profitability analysis.
Funds Management reported on the methodologies and estimates used in calculating profitability, including a description of the methodology used to allocate certain expenses and recent enhancements made to the methodology. Among other things, the Boards noted that the levels of profitability reported on a fund-by-fund basis varied widely, depending on factors such as the size and type of fund. Based on its review, the Boards did not deem the profits reported by Funds Management, WFAM or Wells Fargo from services provided to the Funds to be at a level that would prevent the Boards from approving the continuation of the Advisory Agreements.
Economies of scale
The Boards considered the extent to which Funds Management may experience economies of scale in the provision of management services, and the extent to which scale benefits, if any, would be shared with shareholders. In particular, the Boards noted the existence of breakpoints in each Master Portfolio’s advisory fee structure and each Intuitive Fund’s management fee structure, which operate generally to reduce the Funds’ expense ratios as the Funds grow in size. They considered that, for a small fund or a fund that shrinks in size, breakpoints conversely can result in higher fee levels. The Boards also considered that, in addition to management fee breakpoints, competitive fee rates set at the outset without regard to breakpoints and fee waiver and expense reimbursement arrangements, as well as investments in the business intended to enhance services available to Fund shareholders, are means of sharing potential economies of scale with shareholders of the Funds.
The Boards concluded that the Funds’ fee and expense arrangements, including contractual breakpoints, constituted a reasonable approach to sharing potential economies of scale with the Funds and their shareholders.
Other benefits to Funds Management and the Sub-Advisers
The Boards received and considered information regarding potential “fall-out” or ancillary benefits received by Funds Management and its affiliates, including WellsCap, Analytic, and WFAM International, as a result of their relationships with the Funds. Ancillary benefits could include, among others, benefits directly attributable to other relationships with the Funds and benefits potentially derived from an increase in Funds Management’s and the Sub-Advisers’ business as a result of their relationships with the Funds. The Boards noted that various affiliates of Funds Management may receive distribution-related fees, shareholder servicing payments and sub-transfer agency fees in respect of shares sold or held through them and services provided.
The Boards also reviewed information about soft dollar credits earned and utilized by the Sub-Advisers, fees earned by Funds Management and WellsCap from managing a private investment vehicle for the fund family’s securities lending collateral, and commissions earned by an affiliated broker from portfolio transactions.
Based on their consideration of the factors and information they deemed relevant, including those described here, the Boards did not find that any ancillary benefits received by Funds Management and its affiliates, including WellsCap, Analytic, and WFAM International, were unreasonable.
Conclusion
At the Meeting, after considering the above-described factors and based on its deliberations and its evaluation of the information described above, the Funds Trust Board unanimously approved the continuation of the Management Agreement and the Core Bond Fund Sub-Advisory Agreement for a one-year period. Additionally, after its deliberations, the Master Trust Board unanimously approved the continuation of the Master Portfolio Advisory Agreement and each Master Portfolio Sub-Advisory Agreement for a one-year term. The Boards also determined that the compensation or the absence of compensation payable to Funds Management and to each of the Sub-Advisers was reasonable.
| | | | |
| 272 | | Wells Fargo Funds | | Other information (unaudited) |
BOARD CONSIDERATION OF INVESTMENT ADVISORY AND SUB-ADVISORY AGREEMENTS:
Wells Fargo Strategic Retirement Bond Portfolio
Under the Investment Company Act of 1940 (the “1940 Act”), the Board of Trustees (the “Board”) of Wells Fargo Master Trust (the “Trust”) must determine annually whether to approve the continuation of the Trust’s investment advisory and sub-advisory agreements. In this regard, at an in-person meeting held on May 22-23, 2018 (the “Meeting”), the Board, all the members of which have no direct or indirect interest in the investment advisory or sub-advisory agreements and are not “interested persons” of the Trust, as defined in the 1940 Act (the “Independent Trustees”), reviewed and approved: (i) an investment advisory agreement (the “Advisory Agreement”) with Wells Fargo Funds Management, LLC (“Funds Management”) for the Wells Fargo Strategic Retirement Bond Portfolio (the “Portfolio”); and (ii) an investment sub-advisory agreement (the “Sub-Advisory Agreement”) with Wells Capital Management Incorporated (the “Sub-Adviser”), an affiliate of Funds Management. The Management Agreement and the Sub-Advisory Agreement are collectively referred to as the “Advisory Agreements.”
At the Meeting, the Board considered the factors and reached the conclusions described below relating to the selection of Funds Management and the Sub-Adviser and the approval of the Advisory Agreements. Prior to the Meeting, including at an in-person meeting in April 2018, the Trustees conferred extensively among themselves and with representatives of Funds Management about these matters. Also, the Board has adopted a team-based approach, with each team consisting of a sub-set of Trustees, to assist the full Board in the discharge of its duties in reviewing investment performance and other matters throughout the year. The Independent Trustees were assisted in their evaluation of the Advisory Agreements by independent legal counsel, from whom they received separate legal advice and with whom they met separately.
In providing information to the Board, Funds Management and the Sub-Adviser were guided by a detailed set of requests for information submitted to them by independent legal counsel on behalf of the Independent Trustees at the start of the Board’s annual contract renewal process earlier in 2018. In considering and approving the Advisory Agreements, the Trustees considered the information they believed relevant, including but not limited to the information discussed below. The Board considered not only the specific information presented in connection with the Meeting, but also the knowledge gained over time through interaction with Funds Management and the Sub-Adviser about various topics. In this regard, the Board reviewed reports of Funds Management at each of its quarterly meetings, which included, among other things, portfolio reviews and investment performance reports. In addition, the Board and the teams mentioned above confer with portfolio managers at various times throughout the year. The Board did not identify any particular information or consideration that was all-important or controlling, and each individual Trustee may have attributed different weights to various factors.
After its deliberations, the Board unanimously approved the continuation of the Advisory Agreements for a one-year term and determined that the compensation payable to Funds Management and the Sub-Adviser under each of the Advisory Agreements was reasonable. The Board considered the approval of the Advisory Agreements for the Portfolio as part of its consideration of agreements for funds across the complex, but its approvals were made on a portfolio-by-portfolio basis. The following summarizes a number of important, but not necessarily all, factors considered by the Board in support of its approvals.
Nature, extent and quality of services
The Board received and considered various information regarding the nature, extent and quality of services provided to the Portfolio by Funds Management and the Sub-Adviser under the Advisory Agreements. This information included a description of the investment advisory and administrative services provided to the Portfolio, as well as, among other things, a summary of the background and experience of senior management of Wells Fargo Asset Management (“WFAM”), of which Funds Management and the Sub-Adviser are a part, a summary of investments made in the business of WFAM, a summary of certain organizational and personnel changes involving Funds Management and the Sub-Adviser, and a description of Funds Management’s and the Sub-Adviser’s business continuity planning programs and of their approaches to data privacy and cybersecurity. The Board also considered the qualifications, background, tenure and responsibilities of each of the portfolio managers primarily responsible for the day-to-day portfolio management of the Portfolio.
The Board evaluated the ability of Funds Management and the Sub-Adviser to attract and retain qualified investment professionals, including research, advisory and supervisory personnel. The Board further considered the compliance programs and compliance records of Funds Management and the Sub-Adviser. In addition, the Board took into account the full range of services provided to the Portfolio by Funds Management and its affiliates.
| | | | | | |
| Other information (unaudited) | | Wells Fargo Funds | | | 273 | |
Investment performance and expenses
The Boards noted that the Portfolio had recently commenced operations and had no performance history to review. The Board noted that it would have the opportunity to review the Portfolio’s performance history in connection with the Board’s future review and approval of the Portfolio’s advisory agreements.
The Board reviewed the fee rates that are payable to Funds Management for investment advisory services (as discussed below), which are the only fees charged at the Master Portfolio level, relative to a corresponding class-specific expense groups that was determined by Broadridge to be similar to the Portfolio (the “Group”). The Board received a description of the methodology used by Broadridge to select the mutual funds in the expense Group. The Board also received an explanation of how funds comprising expense Group and its expense ratios may vary from year-to-year.
The Board took into account the Portfolio’s expense information provided to it among the factors considered in deciding to re-approve the Advisory Agreements.
Investment advisory and sub-advisory fee rates
The Board reviewed and considered the contractual investment advisory fee rate that is payable by the Portfolio to Funds Management for investment advisory services under the Advisory Agreement (the “Advisory Agreement Rate”). The Board also reviewed and considered the contractual investment sub-advisory fee rate that are payable by Funds Management to the Sub-Adviser for investment sub-advisory services (the “Sub-Advisory Agreement Rate”).
The Master Trust Board reviewed a comparison of the Advisory Agreement Rate of the Portfolio with those of other funds in the Portfolio’s expense Group at a common asset level. The Board noted that the Portfolio’s Advisory Agreement Rate was lower than the median rate for the Portfolio’s expense Group.
The Board also received and considered information about the portion of the total advisory fee that was retained by Funds Management after payment of the fees to the Sub-Adviser for sub-advisory services. In assessing the reasonableness of this amount, the Board received and evaluated information about the nature and extent of responsibilities retained and risks assumed by Funds Management and not delegated to or assumed by the Sub-Adviser, and about Funds Management’s on-going oversight services. Given the current affiliation between Funds Management and the Sub-Adviser, the Board ascribed limited relevance to the allocation of the fees between them.
Based on its consideration of the factors and information it deemed relevant, including those described here, the Board determined that the compensation payable to Funds Management under the Advisory Agreement and to the Sub-Adviser under the Sub-Advisory Agreement was reasonable.
Profitability
The Board received and considered information concerning the profitability of Funds Management, as well as the profitability of both WFAM and Wells Fargo & Co. (“Wells Fargo”) as a whole, from providing services to the Portfolio and the fund family as a whole. The Board noted that the Sub-Adviser’s profitability information with respect to providing services to the Portfolio was subsumed in the WFAM and Wells Fargo profitability analysis.
Funds Management reported on the methodologies and estimates used in calculating profitability, including a description of the methodology used to allocate certain expenses and recent enhancements made to the methodology. Among other things, the Board noted that the levels of profitability reported on a fund-by-fund basis varied widely, depending on factors such as the size and type of fund. Based on its review, the Board did not deem the profits reported by Funds Management, WFAM or Wells Fargo from services provided to the Portfolio to be at a level that would prevent it from approving the continuation of the Advisory Agreements.
Economies of scale
The Board considered the extent to which Funds Management may experience economies of scale in the provision of management services, and the extent to which scale benefits, if any, would be shared with shareholders. In particular, the Board noted the existence of breakpoints in the Portfolio’s advisory fee structure, which operate generally to reduce the Portfolio’s expense ratios as the Portfolio grows in size. It considered that, for a small fund or a fund that shrinks in size, breakpoints conversely can result in higher fee levels. The Board also considered that in addition to management fee breakpoints, competitive management fee rates set at the outset without regard to breakpoints and fee waiver and expense reimbursement arrangements, as well as investments in the business intended to enhance services available to Portfolio shareholders, are means of sharing potential economies of scale with shareholders of the Portfolio.
The Board concluded that the Portfolio’s fee and expense arrangements, including contractual breakpoints, constituted a reasonable approach to sharing potential economies of scale with the Portfolio and its shareholders.
| | | | |
| 274 | | Wells Fargo Funds | | Other information (unaudited) |
Other benefits to Funds Management and the Sub-Adviser
The Board received and considered information regarding potential “fall-out” or ancillary benefits received by Funds Management and its affiliates, including the Sub-Adviser, as a result of their relationships with the Portfolio. Ancillary benefits could include, among others, benefits directly attributable to other relationships with the Portfolio and benefits potentially derived from an increase in Funds Management’s and the Sub-Adviser’s business as a result of their relationships with the Portfolio. The Board noted that various affiliates of Funds Management may receive distribution-related fees, shareholder servicing payments and sub-transfer agency fees in respect of shares sold or held through them and services provided.
The Board also reviewed information about soft dollar credits earned and utilized by the Sub-Adviser, fees earned by Funds Management and the Sub-Adviser from managing a private investment vehicle for the fund family’s securities lending collateral and commissions earned by an affiliated broker from portfolio transactions.
Based on its consideration of the factors and information it deemed relevant, including those described here, the Board did not find that any ancillary benefits received by Funds Management and its affiliates, including the Sub-Adviser, were unreasonable.
Conclusion
At the Meeting, after considering the above-described factors and based on its deliberations and its evaluation of the information described above, the Board unanimously approved the continuation of the Advisory Agreements for a one-year term and determined that the compensation payable to Funds Management and the Sub-Adviser under each of the Advisory Agreements was reasonable.
| | | | | | |
| Other information (unaudited) | | Wells Fargo Funds | | | 275 | |
BOARD CONSIDERATION OF INVESTMENT ADVISORY AND SUB-ADVISORY AGREEMENTS:
Wells Fargo U.S. REIT Portfolio
Under the Investment Company Act of 1940 (the “1940 Act”), the Board of Trustees (the “Board”) of Wells Fargo Master Trust (the “Trust”) must determine annually whether to approve the continuation of the Trust’s investment advisory and sub-advisory agreements. In this regard, at an in-person meeting held on May 22-23, 2018 (the “Meeting”), the Board, all the members of which have no direct or indirect interest in the investment advisory or sub-advisory agreements and are not “interested persons” of the Trust, as defined in the 1940 Act (the “Independent Trustees”), reviewed and approved: (i) an investment advisory agreement (the “Advisory Agreement”) with Wells Fargo Funds Management, LLC (“Funds Management”) for the Wells Fargo U.S. REIT Portfolio (the “Portfolio”); and (ii) an investment sub-advisory agreement (the “Sub-Advisory Agreement”) with Wells Capital Management Incorporated (the “Sub-Adviser”), an affiliate of Funds Management. The Management Agreement and the Sub-Advisory Agreement are collectively referred to as the “Advisory Agreements.”
At the Meeting, the Board considered the factors and reached the conclusions described below relating to the selection of Funds Management and the Sub-Adviser and the approval of the Advisory Agreements. Prior to the Meeting, including at an in-person meeting in April 2018, the Trustees conferred extensively among themselves and with representatives of Funds Management about these matters. Also, the Board has adopted a team-based approach, with each team consisting of a sub-set of Trustees, to assist the full Board in the discharge of its duties in reviewing investment performance and other matters throughout the year. The Independent Trustees were assisted in their evaluation of the Advisory Agreements by independent legal counsel, from whom they received separate legal advice and with whom they met separately.
In providing information to the Board, Funds Management and the Sub-Adviser were guided by a detailed set of requests for information submitted to them by independent legal counsel on behalf of the Independent Trustees at the start of the Board’s annual contract renewal process earlier in 2018. In considering and approving the Advisory Agreements, the Trustees considered the information they believed relevant, including but not limited to the information discussed below. The Board considered not only the specific information presented in connection with the Meeting, but also the knowledge gained over time through interaction with Funds Management and the Sub-Adviser about various topics. In this regard, the Board reviewed reports of Funds Management at each of its quarterly meetings, which included, among other things, portfolio reviews and investment performance reports. In addition, the Board and the teams mentioned above confer with portfolio managers at various times throughout the year. The Board did not identify any particular information or consideration that was all-important or controlling, and each individual Trustee may have attributed different weights to various factors.
After its deliberations, the Board unanimously approved the continuation of the Advisory Agreements for a one-year term and determined that the compensation payable to Funds Management and the Sub-Adviser under each of the Advisory Agreements was reasonable. The Board considered the approval of the Advisory Agreements for the Portfolio as part of its consideration of agreements for funds across the complex, but its approvals were made on a portfolio-by-portfolio basis. The following summarizes a number of important, but not necessarily all, factors considered by the Board in support of its approvals.
Nature, extent and quality of services
The Board received and considered various information regarding the nature, extent and quality of services provided to the Portfolio by Funds Management and the Sub-Adviser under the Advisory Agreements. This information included a description of the investment advisory and administrative services provided to the Portfolio, as well as, among other things, a summary of the background and experience of senior management of Wells Fargo Asset Management (“WFAM”), of which Funds Management and the Sub-Adviser are a part, a summary of investments made in the business of WFAM, a summary of certain organizational and personnel changes involving Funds Management and the Sub-Adviser, and a description of Funds Management’s and the Sub-Adviser’s business continuity planning programs and of their approaches to data privacy and cybersecurity. The Board also considered the qualifications, background, tenure and responsibilities of each of the portfolio managers primarily responsible for the day-to-day portfolio management of the Portfolio.
The Board evaluated the ability of Funds Management and the Sub-Adviser to attract and retain qualified investment professionals, including research, advisory and supervisory personnel. The Board further considered the compliance programs and compliance records of Funds Management and the Sub-Adviser. In addition, the Board took into account the full range of services provided to the Portfolio by Funds Management and its affiliates.
| | | | |
| 276 | | Wells Fargo Funds | | Other information (unaudited) |
Investment performance and expenses
The Boards noted that the Portfolio had recently commenced operations and had no performance history to review. The Board noted that it would have the opportunity to review the Portfolio’s performance history in connection with the Board’s future review and approval of the Portfolio’s advisory agreements.
The Board reviewed the fee rates that are payable to Funds Management for investment advisory services (as discussed below), which are the only fees charged at the Master Portfolio level, relative to a corresponding class-specific expense groups that was determined by Broadridge to be similar to the Portfolio (the “Group”). The Board received a description of the methodology used by Broadridge to select the mutual funds in the expense Group. The Board also received an explanation of how funds comprising expense Group and its expense ratios may vary from year-to-year.
The Board took into account the Portfolio’s expense information provided to it among the factors considered in deciding to re-approve the Advisory Agreements.
Investment advisory and sub-advisory fee rates
The Board reviewed and considered the contractual investment advisory fee rate that is payable by the Portfolio to Funds Management for investment advisory services under the Advisory Agreement (the “Advisory Agreement Rate”). The Board also reviewed and considered the contractual investment sub-advisory fee rate that are payable by Funds Management to the Sub-Adviser for investment sub-advisory services (the “Sub-Advisory Agreement Rate”).
The Master Trust Board reviewed a comparison of the Advisory Agreement Rate of the Portfolio with those of other funds in the Portfolio’s expense Group at a common asset level. The Board noted that the Portfolio’s Advisory Agreement Rate was lower than the median rate for the Portfolio’s expense Group.
The Board also received and considered information about the portion of the total advisory fee that was retained by Funds Management after payment of the fees to the Sub-Adviser for sub-advisory services. In assessing the reasonableness of this amount, the Board received and evaluated information about the nature and extent of responsibilities retained and risks assumed by Funds Management and not delegated to or assumed by the Sub-Adviser, and about Funds Management’s on-going oversight services. Given the current affiliation between Funds Management and the Sub-Adviser, the Board ascribed limited relevance to the allocation of the fees between them.
Based on its consideration of the factors and information it deemed relevant, including those described here, the Board determined that the compensation payable to Funds Management under the Advisory Agreement and to the Sub-Adviser under the Sub-Advisory Agreement was reasonable.
Profitability
The Board received and considered information concerning the profitability of Funds Management, as well as the profitability of both WFAM and Wells Fargo & Co. (“Wells Fargo”) as a whole, from providing services to the Portfolio and the fund family as a whole. The Board noted that the Sub-Adviser’s profitability information with respect to providing services to the Portfolio was subsumed in the WFAM and Wells Fargo profitability analysis.
Funds Management reported on the methodologies and estimates used in calculating profitability, including a description of the methodology used to allocate certain expenses and recent enhancements made to the methodology. Among other things, the Board noted that the levels of profitability reported on a fund-by-fund basis varied widely, depending on factors such as the size and type of fund. Based on its review, the Board did not deem the profits reported by Funds Management, WFAM or Wells Fargo from services provided to the Portfolio to be at a level that would prevent it from approving the continuation of the Advisory Agreements.
Economies of scale
The Board considered the extent to which Funds Management may experience economies of scale in the provision of management services, and the extent to which scale benefits, if any, would be shared with shareholders. In particular, the Board noted the existence of breakpoints in the Portfolio’s advisory fee structure, which operate generally to reduce the Portfolio’s expense ratios as the Portfolio grows in size. It considered that, for a small fund or a fund that shrinks in size, breakpoints conversely can result in higher fee levels. The Board also considered that in addition to management fee breakpoints, competitive management fee rates set at the outset without regard to breakpoints and fee waiver and expense reimbursement arrangements, as well as investments in the business intended to enhance services available to Portfolio shareholders, are means of sharing potential economies of scale with shareholders of the Portfolio.
The Board concluded that the Portfolio’s fee and expense arrangements, including contractual breakpoints, constituted a reasonable approach to sharing potential economies of scale with the Portfolio and its shareholders.
| | | | | | |
| Other information (unaudited) | | Wells Fargo Funds | | | 277 | |
Other benefits to Funds Management and the Sub-Adviser
The Board received and considered information regarding potential “fall-out” or ancillary benefits received by Funds Management and its affiliates, including the Sub-Adviser, as a result of their relationships with the Portfolio. Ancillary benefits could include, among others, benefits directly attributable to other relationships with the Portfolio and benefits potentially derived from an increase in Funds Management’s and the Sub-Adviser’s business as a result of their relationships with the Portfolio. The Board noted that various affiliates of Funds Management may receive distribution-related fees, shareholder servicing payments and sub-transfer agency fees in respect of shares sold or held through them and services provided.
The Board also reviewed information about soft dollar credits earned and utilized by the Sub-Adviser, fees earned by Funds Management and the Sub-Adviser from managing a private investment vehicle for the fund family’s securities lending collateral and commissions earned by an affiliated broker from portfolio transactions.
Based on its consideration of the factors and information it deemed relevant, including those described here, the Board did not find that any ancillary benefits received by Funds Management and its affiliates, including the Sub-Adviser, were unreasonable.
Conclusion
At the Meeting, after considering the above-described factors and based on its deliberations and its evaluation of the information described above, the Board unanimously approved the continuation of the Advisory Agreements for a one-year term and determined that the compensation payable to Funds Management and the Sub-Adviser under each of the Advisory Agreements was reasonable.
This page is intentionally left blank.
This page is intentionally left blank.
This page is intentionally left blank.

For more information
More information about Wells Fargo Funds is available free upon request. To obtain literature, please write, visit the Funds’ website, or call:
Wells Fargo Funds
P.O. Box 219967
Kansas City, MO 64121-9967
Website: wellsfargofunds.com
Individual investors: 1-800-222-8222
Retail investment professionals: 1-888-877-9275
Institutional investment professionals: 1-866-765-0778
This report and the financial statements contained herein are submitted for the general information of the shareholders of Wells Fargo Funds. If this report is used for promotional purposes, distribution of the report must be accompanied or preceded by a current prospectus. Before investing, please consider the investment objectives, risks, charges, and expenses of the investment. For a current prospectus and, if available, a summary prospectus, containing this information, call 1-800-222-8222 or visit the Funds’ website at wellsfargofunds.com. Read the prospectus carefully before you invest or send money.
Wells Fargo Asset Management (WFAM) is the trade name for certain investment advisory/management firms owned by Wells Fargo & Company. These firms include but are not limited to Wells Capital Management Incorporated and Wells Fargo Funds Management, LLC. Certain products managed by WFAM entities are distributed by Wells Fargo Funds Distributor, LLC (a broker/dealer and Member FINRA).
This material is for general informational and educational purposes only and is NOT intended to provide investment advice or a recommendation of any kind—including a recommendation for any specific investment, strategy, or plan.
NOT FDIC INSURED ◾ NO BANK GUARANTEE ◾ MAY LOSE VALUE
© 2018 Wells Fargo Funds Management, LLC. All rights reserved.
| | |
 | | 315414 10-18 SA271/SAR271 08-18 |
ITEM 2. CODE OF ETHICS
Not applicable.
ITEM 3. AUDIT COMMITTEE FINANCIAL EXPERT
Not applicable.
ITEM 4. PRINCIPAL ACCOUNTANT FEES AND SERVICES
Not applicable.
ITEM 5. AUDIT COMMITTEE OF LISTED REGISTRANTS
Not applicable.
ITEM 6. INVESTMENTS
A Portfolio of Investments for each series of Wells Fargo Master Trust is included as part of the report to shareholders filed under Item 1 of this Form.
ITEM 7. DISCLOSURE OF PROXY VOTING POLICIES AND PROCEDURES FOR CLOSED-END MANAGEMENT INVESTMENT COMPANIES
Not applicable.
ITEM 8. PORTFOLIO MANAGERS OF CLOSED-END MANAGEMENT INVESTMENT COMPANIES
Not applicable.
ITEM 9. PURCHASES OF EQUITY SECURITIES BY CLOSED-END MANAGEMENT INVESTMENT COMPANY AND AFFILIATED PURCHASERS
Not applicable.
ITEM 10. SUBMISSION OF MATTERS TO A VOTE OF SECURITY HOLDERS
There have been no material changes to the procedures by which shareholders may recommend nominees to the registrant’s Board of Trustees that have been implemented since the registrant’s last provided disclosure in response to the requirements of this Item.
ITEM 11. CONTROLS AND PROCEDURES
(a) The President and Treasurer have concluded that the Wells Fargo Master Trust (the “Trust”) disclosure controls and procedures (as defined in Rule 30a-3(c) under the Investment Company Act of 1940) provide reasonable assurances that material information relating to the Trust is made known to them by the appropriate persons, based on their evaluation of these controls and procedures as of a date within 90 days of the filing of this report.
(b) There were no significant changes in the Trust’s internal controls over financial reporting (as defined in Rule 30a-3(d) under the Investment Company Act of 1940) that occurred during the second fiscal quarter of the period covered by this report that materially affected, or is reasonably likely to materially affect, the registrant’s internal control over financial reporting.
ITEM 12. EXHIBITS
(a)(1) Not applicable.
(a)(2) Certification pursuant to Rule 30a-2(a) under the Investment Company Act of 1940 (17 CFR 270.30a-2(a)) is filed and attached hereto as Exhibit 99.CERT.
(a)(3) Not applicable.
(b) Certification pursuant to Rule 30a-2(b) under the Investment Company Act of 1940 (17 CFR 270.30a-2(b)) is filed and attached hereto as Exhibit 99.906CERT.
SIGNATURES
Pursuant to the requirements of the Securities Exchange Act of 1934 and the Investment Company Act of 1940, the registrant has duly caused this report to be signed on its behalf by the undersigned, thereunto duly authorized.
| | |
| Wells Fargo Master Trust |
| |
| By: | | |
| | /s/ Andrew Owen |
| |
| | Andrew Owen |
| | President |
| |
| Date: | | October 26, 2018 |
Pursuant to the requirements of the Securities Exchange Act of 1934 and the Investment Company Act of 1940, this report has been signed below by the following persons on behalf of the registrant and in the capacities and on the date indicated.
| | |
| Wells Fargo Master Trust |
| |
| By: | | |
| | /s/ Andrew Owen |
| |
| | Andrew Owen |
| | President |
| |
| Date: | | October 26, 2018 |
| |
| By: | | |
| | /s/ Jeremy DePalma |
| |
| | Jeremy DePalma |
| | Treasurer |
| |
| Date: | | October 26, 2018 |