
UNITED STATES
SECURITIES AND EXCHANGE COMMISSION
Washington, D.C. 20549
FORMN-CSRS
CERTIFIED SHAREHOLDER REPORT OF REGISTERED
MANAGEMENT INVESTMENT COMPANIES
Investment Company Act file number:811-09689
Wells Fargo Master Trust
(Exact name of registrant as specified in charter)
525 Market St., San Francisco, CA 94105
(Address of principal executive offices) (Zip code)
Alexander Kymn
Wells Fargo Funds Management, LLC
525 Market St., San Francisco, CA 94105
(Name and address of agent for service)
Registrant’s telephone number, including area code:800-222-8222
Date of fiscal year end: May 31
Registrant is making a filing for 13 of its series:
Wells Fargo C&B Large Cap Value Portfolio, Wells Fargo Emerging Growth Portfolio, Wells Fargo Index Portfolio, Wells Fargo International Value Portfolio, Wells Fargo Small Company Growth Portfolio, Wells Fargo Small Company Value Portfolio, Wells Fargo Core Bond Portfolio, Wells Fargo Real Return Portfolio, Wells Fargo Diversified Large Cap Growth Portfolio, Wells Fargo Disciplined Large Cap Portfolio, Wells Fargo International Growth Portfolio, Wells Fargo Large Company Value Portfolio, and Wells Fargo Managed Fixed Income Portfolio.
Date of reporting period: November 30, 2018
ITEM 1. REPORT TO STOCKHOLDERS
Semi-Annual Report
November 30, 2018

Diversified Large Cap Growth Portfolio


Contents
INVESTMENT PRODUCTS: NOT FDIC INSURED ◾ NO BANK GUARANTEE ◾ MAY LOSE VALUE
| | | | |
| 2 | | Wells Fargo Diversified Large Cap Growth Portfolio | | Fund information (unaudited) |
Investment objective
The Portfolio seeks long-term capital appreciation.
Manager
Wells Fargo Funds Management, LLC
Subadviser
Wells Capital Management Incorporated
Portfolio managers
John R. Campbell, CFA®‡
Joseph M. Eberhardy, CFA®‡, CPA
Jeff C. Moser, CFA®‡
Thomas C. Ognar, CFA®‡
| | | | |
| Ten largest holdings (%) as of November 30, 20181 | |
Amazon.com Incorporated | | | 5.09 | |
Microsoft Corporation | | | 4.62 | |
Alphabet Incorporated Class A | | | 3.39 | |
Visa Incorporated Class A | | | 2.66 | |
MasterCard Incorporated Class A | | | 2.38 | |
Microchip Technology Incorporated | | | 2.07 | |
Alphabet Incorporated Class C | | | 1.85 | |
PayPal Holdings Incorporated | | | 1.83 | |
Apple Incorporated | | | 1.83 | |
Texas Instruments Incorporated | | | 1.68 | |
|
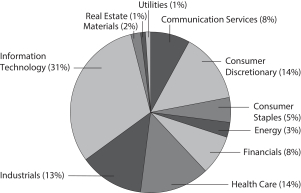
| Sector distribution as of November 30, 20182 |
|
 |
| ‡ | CFA® and Chartered Financial Analyst® are trademarks owned by CFA Institute. |
| 1 | The ten largest holdings, excluding cash, cash equivalents and any money market funds, are calculated based on the value of the investments divided by the total net assets of the Portfolio. Holdings are subject to change and may have changed since the date specified. |
| 2 | Amounts are calculated based on the total long-term investments of the Portfolio. These amounts are subject to change and may have changed since the date specified. |
| | | | | | |
| Portfolio of investments—November 30, 2018 (unaudited) | | Wells Fargo Diversified Large Cap Growth Portfolio | | | 3 | |
| | | | | | | | | | | | | | | | |
| Security name | | | | | | | | Shares | | | Value | |
| | | | |
Common Stocks: 98.27% | | | | | | | | | | | | | | | | |
| | | | |
Communication Services: 8.11% | | | | | | | | | | | | | | | | |
| | | | |
| Entertainment: 1.90% | | | | | | | | | | | | | | | | |
Activision Blizzard Incorporated | | | | | | | | | | | 43,914 | | | $ | 2,190,430 | |
Electronic Arts Incorporated † | | | | | | | | | | | 9,533 | | | | 801,439 | |
Live Nation Incorporated † | | | | | | | | | | | 19,230 | | | | 1,070,726 | |
Netflix Incorporated † | | | | | | | | | | | 7,471 | | | | 2,137,677 | |
Take-Two Interactive Software Incorporated † | | | | | | | | | | | 9,858 | | | | 1,081,127 | |
| | | | |
| | | | | | | | | | | | | | | 7,281,399 | |
| | | | | | | | | | | | | | | | |
| | | | |
| Interactive Media & Services: 6.21% | | | | | | | | | | | | | | | | |
Alphabet Incorporated Class A † | | | | | | | | | | | 11,685 | | | | 12,966,260 | |
Alphabet Incorporated Class C † | | | | | | | | | | | 6,483 | | | | 7,095,190 | |
Facebook Incorporated Class A † | | | | | | | | | | | 20,841 | | | | 2,930,453 | |
Match Group Incorporated « | | | | | | | | | | | 19,535 | | | | 786,674 | |
| | | | |
| | | | | | | | | | | | | | | 23,778,577 | |
| | | | | | | | | | | | | | | | |
| | | | |
Consumer Discretionary: 13.48% | | | | | | | | | | | | | | | | |
| | | | |
| Auto Components: 0.53% | | | | | | | | | | | | | | | | |
Lear Corporation | | | | | | | | | | | 14,832 | | | | 2,020,860 | |
| | | | | | | | | | | | | | | | |
| | | | |
| Hotels, Restaurants & Leisure: 2.38% | | | | | | | | | | | | | | | | |
Carnival Corporation | | | | | | | | | | | 15,470 | | | | 932,686 | |
Domino’s Pizza Incorporated | | | | | | | | | | | 4,585 | | | | 1,271,512 | |
Marriott International Incorporated Class A | | | | | | | | | | | 7,080 | | | | 814,412 | |
Norwegian Cruise Line Holdings Limited † | | | | | | | | | | | 33,881 | | | | 1,738,773 | |
Planet Fitness Incorporated Class A † | | | | | | | | | | | 17,040 | | | | 940,949 | |
Royal Caribbean Cruises Limited | | | | | | | | | | | 22,354 | | | | 2,527,567 | |
Vail Resorts Incorporated | | | | | | | | | | | 3,200 | | | | 893,376 | |
| | | | |
| | | | | | | | | | | | | | | 9,119,275 | |
| | | | | | | | | | | | | | | | |
| | | | |
| Household Durables: 0.18% | | | | | | | | | | | | | | | | |
Roku Incorporated †« | | | | | | | | | | | 17,035 | | | | 694,176 | |
| | | | | | | | | | | | | | | | |
| | | | |
| Internet & Direct Marketing Retail: 5.35% | | | | | | | | | | | | | | | | |
Amazon.com Incorporated † | | | | | | | | | | | 11,526 | | | | 19,480,901 | |
Farfetch Limited Class A † | | | | | | | | | | | 26,703 | | | | 607,493 | |
MercadoLibre Incorporated | | | | | | | | | | | 1,054 | | | | 370,976 | |
| | | | |
| | | | | | | | | | | | | | | 20,459,370 | |
| | | | | | | | | | | | | | | | |
| | | | |
| Multiline Retail: 1.43% | | | | | | | | | | | | | | | | |
Dollar Tree Incorporated † | | | | | | | | | | | 3,232 | | | | 280,441 | |
Macy’s Incorporated | | | | | | | | | | | 75,534 | | | | 2,584,773 | |
Target Corporation | | | | | | | | | | | 36,761 | | | | 2,608,561 | |
| | | | |
| | | | | | | | | | | | | | | 5,473,775 | |
| | | | | | | | | | | | | | | | |
| | | | |
| Specialty Retail: 3.61% | | | | | | | | | | | | | | | | |
Burlington Stores Incorporated † | | | | | | | | | | | 25,125 | | | | 4,164,720 | |
O’Reilly Automotive Incorporated † | | | | | | | | | | | 2,930 | | | | 1,016,065 | |
The accompanying notes are an integral part of these financial statements.
| | | | |
| 4 | | Wells Fargo Diversified Large Cap Growth Portfolio | | Portfolio of investments—November 30, 2018 (unaudited) |
| | | | | | | | | | | | | | | | |
| Security name | | | | | | | | Shares | | | Value | |
| | | | |
| Specialty Retail(continued) | | | | | | | | | | | | | | | | |
The Home Depot Incorporated | | | | | | | | | | | 28,396 | | | $ | 5,120,367 | |
The TJX Companies Incorporated | | | | | | | | | | | 45,766 | | | | 2,235,669 | |
ULTA Beauty Incorporated † | | | | | | | | | | | 4,359 | | | | 1,298,067 | |
| | | | |
| | | | | | | | | | | | | | | 13,834,888 | |
| | | | | | | | | | | | | | | | |
| | | | |
Consumer Staples: 4.78% | | | | | | | | | | | | | | | | |
| | | | |
| Beverages: 1.64% | | | | | | | | | | | | | | | | |
Constellation Brands Incorporated Class A | | | | | | | | | | | 11,221 | | | | 2,196,623 | |
The Coca-Cola Company | | | | | | | | | | | 80,887 | | | | 4,076,705 | |
| | | | |
| | | | | | | | | | | | | | | 6,273,328 | |
| | | | | | | | | | | | | | | | |
| | | | |
| Food & Staples Retailing: 2.49% | | | | | | | | | | | | | | | | |
Costco Wholesale Corporation | | | | | | | | | | | 20,315 | | | | 4,698,453 | |
Sysco Corporation | | | | | | | | | | | 34,960 | | | | 2,356,304 | |
Wal-Mart Stores Incorporated | | | | | | | | | | | 25,426 | | | | 2,482,849 | |
| | | | |
| | | | | | | | | | | | | | | 9,537,606 | |
| | | | | | | | | | | | | | | | |
| | | | |
| Personal Products: 0.65% | | | | | | | | | | | | | | | | |
The Estee Lauder Companies Incorporated Class A | | | | | | | | | | | 17,465 | | | | 2,491,557 | |
| | | | | | | | | | | | | | | | |
| | | | |
Energy: 2.71% | | | | | | | | | | | | | | | | |
| | | | |
| Oil, Gas & Consumable Fuels: 2.71% | | | | | | | | | | | | | | | | |
Chevron Corporation | | | | | | | | | | | 16,739 | | | | 1,990,937 | |
Concho Resources Incorporated † | | | | | | | | | | | 20,517 | | | | 2,674,186 | |
Exxon Mobil Corporation | | | | | | | | | | | 21,188 | | | | 1,684,446 | |
Marathon Petroleum Corporation | | | | | | | | | | | 30,617 | | | | 1,995,004 | |
Valero Energy Corporation | | | | | | | | | | | 25,426 | | | | 2,031,537 | |
| | | | |
| | | | | | | | | | | | | | | 10,376,110 | |
| | | | | | | | | | | | | | | | |
| | | | |
Financials: 7.89% | | | | | | | | | | | | | | | | |
| | | | |
| Banks: 1.94% | | | | | | | | | | | | | | | | |
Bank of America Corporation | | | | | | | | | | | 85,068 | | | | 2,415,931 | |
Citizens Financial Group Incorporated | | | | | | | | | | | 53,711 | | | | 1,952,932 | |
JPMorgan Chase & Company | | | | | | | | | | | 27,544 | | | | 3,062,617 | |
| | | | |
| | | | | | | | | | | | | | | 7,431,480 | |
| | | | | | | | | | | | | | | | |
| | | | |
| Capital Markets: 4.55% | | | | | | | | | | | | | | | | |
BlackRock Incorporated | | | | | | | | | | | 780 | | | | 333,848 | |
CME Group Incorporated | | | | | | | | | | | 14,719 | | | | 2,797,788 | |
E*TRADE Financial Corporation | | | | | | | | | | | 3,925 | | | | 205,238 | |
Evercore Partners Incorporated Class A | | | | | | | | | | | 22,460 | | | | 1,854,298 | |
MarketAxess Holdings Incorporated | | | | | | | | | | | 8,807 | | | | 1,917,548 | |
Morgan Stanley | | | | | | | | | | | 9,260 | | | | 411,051 | |
Northern Trust Corporation | | | | | | | | | | | 23,095 | | | | 2,291,717 | |
Raymond James Financial Incorporated | | | | | | | | | | | 41,121 | | | | 3,278,577 | |
The Charles Schwab Corporation | | | | | | | | | | | 96,398 | | | | 4,318,630 | |
| | | | |
| | | | | | | | | | | | | | | 17,408,695 | |
| | | | | | | | | | | | | | | | |
The accompanying notes are an integral part of these financial statements.
| | | | | | |
| Portfolio of investments—November 30, 2018 (unaudited) | | Wells Fargo Diversified Large Cap Growth Portfolio | | | 5 | |
| | | | | | | | | | | | | | | | |
| Security name | | | | | | | | Shares | | | Value | |
| | | | |
| Insurance: 1.40% | | | | | | | | | | | | | | | | |
Prudential Financial Incorporated | | | | | | | | | | | 19,387 | | | $ | 1,817,725 | |
The Progressive Corporation | | | | | | | | | | | 53,693 | | | | 3,559,309 | |
| | | | |
| | | | | | | | | | | | | | | 5,377,034 | |
| | | | | | | | | | | | | | | | |
| | | | |
Health Care: 14.22% | | | | | | | | | | | | | | | | |
| | | | |
| Biotechnology: 3.43% | | | | | | | | | | | | | | | | |
AbbVie Incorporated | | | | | | | | | | | 21,294 | | | | 2,007,385 | |
Agios Pharmaceuticals Incorporated † | | | | | | | | | | | 951 | | | | 62,576 | |
Alexion Pharmaceuticals Incorporated † | | | | | | | | | | | 5,721 | | | | 704,541 | |
Amgen Incorporated | | | | | | | | | | | 10,701 | | | | 2,228,483 | |
BioMarin Pharmaceutical Incorporated † | | | | | | | | | | | 6,114 | | | | 587,127 | |
Ligand Pharmaceuticals Incorporated † | | | | | | | | | | | 3,150 | | | | 496,976 | |
Neurocrine Biosciences Incorporated † | | | | | | | | | | | 10,134 | | | | 894,528 | |
Sage Therapeutics Incorporated † | | | | | | | | | | | 4,033 | | | | 464,965 | |
Sarepta Therapeutics Incorporated † | | | | | | | | | | | 5,595 | | | | 724,385 | |
Vertex Pharmaceuticals Incorporated † | | | | | | | | | | | 27,383 | | | | 4,950,573 | |
| | | | |
| | | | | | | | | | | | | | | 13,121,539 | |
| | | | | | | | | | | | | | | | |
| | | | |
| Health Care Equipment & Supplies: 4.03% | | | | | | | | | | | | | | | | |
Abbott Laboratories | | | | | | | | | | | 79,887 | | | | 5,915,632 | |
Baxter International Incorporated | | | | | | | | | | | 49,339 | | | | 3,382,189 | |
Boston Scientific Corporation † | | | | | | | | | | | 110,332 | | | | 4,156,206 | |
Intuitive Surgical Incorporated † | | | | | | | | | | | 1,513 | | | | 803,206 | |
Stryker Corporation | | | | | | | | | | | 6,743 | | | | 1,183,127 | |
| | | | |
| | | | | | | | | | | | | | | 15,440,360 | |
| | | | | | | | | | | | | | | | |
| | | | |
| Health Care Providers & Services: 2.69% | | | | | | | | | | | | | | | | |
Centene Corporation † | | | | | | | | | | | 31,658 | | | | 4,503,351 | |
Encompass Health Corporation | | | | | | | | | | | 33,371 | | | | 2,509,833 | |
Humana Incorporated | | | | | | | | | | | 940 | | | | 309,702 | |
UnitedHealth Group Incorporated | | | | | | | | | | | 10,595 | | | | 2,981,009 | |
| | | | |
| | | | | | | | | | | | | | | 10,303,895 | |
| | | | | | | | | | | | | | | | |
| | | | |
| Health Care Technology: 0.26% | | | | | | | | | | | | | | | | |
Veeva Systems Incorporated Class A † | | | | | | | | | | | 10,307 | | | | 991,121 | |
| | | | | | | | | | | | | | | | |
| | | | |
| Life Sciences Tools & Services: 1.83% | | | | | | | | | | | | | | | | |
Agilent Technologies Incorporated | | | | | | | | | | | 76,922 | | | | 5,565,306 | |
PRA Health Sciences Incorporated † | | | | | | | | | | | 12,276 | | | | 1,433,100 | |
| | | | |
| | | | | | | | | | | | | | | 6,998,406 | |
| | | | | | | | | | | | | | | | |
| | | | |
| Pharmaceuticals: 1.98% | | | | | | | | | | | | | | | | |
Elanco Animal Health Incorporated †« | | | | | | | | | | | 14,117 | | | | 471,649 | |
Johnson & Johnson | | | | | | | | | | | 16,209 | | | | 2,381,102 | |
Zoetis Incorporated | | | | | | | | | | | 50,299 | | | | 4,721,567 | |
| | | | |
| | | | | | | | | | | | | | | 7,574,318 | |
| | | | | | | | | | | | | | | | |
The accompanying notes are an integral part of these financial statements.
| | | | |
| 6 | | Wells Fargo Diversified Large Cap Growth Portfolio | | Portfolio of investments—November 30, 2018 (unaudited) |
| | | | | | | | | | | | | | | | |
| Security name | | | | | | | | Shares | | | Value | |
| | | | |
Industrials: 12.41% | | | | | | | | | | | | | | | | |
| | | | |
| Aerospace & Defense: 2.03% | | | | | | | | | | | | | | | | |
HEICO Corporation | | | | | | | | | | | 11,815 | | | $ | 998,604 | |
Northrop Grumman Corporation | | | | | | | | | | | 7,311 | | | | 1,899,983 | |
The Boeing Company | | | | | | | | | | | 13,989 | | | | 4,850,826 | |
| | | | |
| | | | | | | | | | | | | | | 7,749,413 | |
| | | | | | | | | | | | | | | | |
| | | | |
| Air Freight & Logistics: 0.71% | | | | | | | | | | | | | | | | |
FedEx Corporation | | | | | | | | | | | 1,784 | | | | 408,536 | |
XPO Logistics Incorporated † | | | | | | | | | | | 30,496 | | | | 2,313,427 | |
| | | | |
| | | | | | | | | | | | | | | 2,721,963 | |
| | | | | | | | | | | | | | | | |
| | | | |
| Airlines: 0.51% | | | | | | | | | | | | | | | | |
Southwest Airlines Company | | | | | | | | | | | 35,860 | | | | 1,958,315 | |
| | | | | | | | | | | | | | | | |
| | | | |
| Commercial Services & Supplies: 1.96% | | | | | | | | | | | | | | | | |
KAR Auction Services Incorporated | | | | | | | | | | | 30,689 | | | | 1,753,569 | |
Rollins Incorporated | | | | | | | | | | | 22,020 | | | | 1,399,591 | |
Waste Connections Incorporated | | | | | | | | | | | 55,390 | | | | 4,347,007 | |
| | | | |
| | | | | | | | | | | | | | | 7,500,167 | |
| | | | | | | | | | | | | | | | |
| | | | |
| Construction & Engineering: 0.53% | | | | | | | | | | | | | | | | |
EMCOR Group Incorporated | | | | | | | | | | | 27,862 | | | | 2,030,025 | |
| | | | | | | | | | | | | | | | |
| | | | |
| Industrial Conglomerates: 0.79% | | | | | | | | | | | | | | | | |
3M Company | | | | | | | | | | | 1,662 | | | | 345,563 | |
Roper Industries Incorporated | | | | | | | | | | | 9,017 | | | | 2,683,369 | |
| | | | |
| | | | | | | | | | | | | | | 3,028,932 | |
| | | | | | | | | | | | | | | | |
| | | | |
| Machinery: 1.73% | | | | | | | | | | | | | | | | |
Allison Transmission Holdings Incorporated | | | | | | | | | | | 50,957 | | | | 2,400,584 | |
Cummins Incorporated | | | | | | | | | | | 13,349 | | | | 2,016,500 | |
Fortive Corporation | | | | | | | | | | | 28,806 | | | | 2,191,272 | |
| | | | |
| | | | | | | | | | | | | | | 6,608,356 | |
| | | | | | | | | | | | | | | | |
| | | | |
| Professional Services: 0.70% | | | | | | | | | | | | | | | | |
CoStar Group Incorporated † | | | | | | | | | | | 4,913 | | | | 1,814,813 | |
TransUnion | | | | | | | | | | | 13,639 | | | | 880,670 | |
| | | | |
| | | | | | | | | | | | | | | 2,695,483 | |
| | | | | | | | | | | | | | | | |
| | | | |
| Road & Rail: 2.86% | | | | | | | | | | | | | | | | |
CSX Corporation | | | | | | | | | | | 46,103 | | | | 3,348,461 | |
Norfolk Southern Corporation | | | | | | | | | | | 21,081 | | | | 3,599,370 | |
Union Pacific Corporation | | | | | | | | | | | 25,988 | | | | 3,996,435 | |
| | | | |
| | | | | | | | | | | | | | | 10,944,266 | |
| | | | | | | | | | | | | | | | |
| | | | |
| Trading Companies & Distributors: 0.59% | | | | | | | | | | | | | | | | |
Applied Industrial Technologies Incorporated | | | | | | | | | | | 34,642 | | | | 2,259,698 | |
| | | | | | | | | | | | | | | | |
The accompanying notes are an integral part of these financial statements.
| | | | | | |
| Portfolio of investments—November 30, 2018 (unaudited) | | Wells Fargo Diversified Large Cap Growth Portfolio | | | 7 | |
| | | | | | | | | | | | | | | | |
| Security name | | | | | | | | Shares | | | Value | |
| | | | |
Information Technology: 30.64% | | | | | | | | | | | | | | | | |
| | | | |
| Communications Equipment: 0.67% | | | | | | | | | | | | | | | | |
Cisco Systems Incorporated | | | | | | | | | | | 53,817 | | | $ | 2,576,220 | |
| | | | | | | | | | | | | | | | |
| | | | |
| Electronic Equipment, Instruments & Components: 1.34% | | | | | | | | | | | | | | | | |
Jabil Circuit Incorporated | | | | | | | | | | | 72,461 | | | | 1,809,351 | |
Zebra Technologies Corporation Class A † | | | | | | | | | | | 18,328 | | | | 3,295,374 | |
| | | | |
| | | | | | | | | | | | | | | 5,104,725 | |
| | | | | | | | | | | | | | | | |
| | | | |
| IT Services: 8.72% | | | | | | | | | | | | | | | | |
Euronet Worldwide Incorporated † | | | | | | | | | | | 987 | | | | 116,081 | |
Global Payments Incorporated | | | | | | | | | | | 8,892 | | | | 994,215 | |
MasterCard Incorporated Class A | | | | | | | | | | | 45,268 | | | | 9,102,037 | |
PayPal Holdings Incorporated † | | | | | | | | | | | 81,838 | | | | 7,022,519 | |
Shopify Incorporated Class A † | | | | | | | | | | | 11,692 | | | | 1,784,901 | |
Square Incorporated Class A † | | | | | | | | | | | 35,998 | | | | 2,514,100 | |
Visa Incorporated Class A | | | | | | | | | | | 71,812 | | | | 10,176,479 | |
Worldpay Incorporated Class A † | | | | | | | | | | | 19,605 | | | | 1,682,305 | |
| | | | |
| | | | | | | | | | | | | | | 33,392,637 | |
| | | | | | | | | | | | | | | | |
| | | | |
| Semiconductors & Semiconductor Equipment: 6.30% | | | | | | | | | | | | | | | | |
Intel Corporation | | | | | | | | | | | 46,295 | | | | 2,282,806 | |
Microchip Technology Incorporated « | | | | | | | | | | | 105,892 | | | | 7,941,900 | |
Monolithic Power Systems Incorporated | | | | | | | | | | | 5,900 | | | | 779,213 | |
NVIDIA Corporation | | | | | | | | | | | 28,440 | | | | 4,647,949 | |
ON Semiconductor Corporation † | | | | | | | | | | | 104,666 | | | | 2,007,494 | |
Texas Instruments Incorporated | | | | | | | | | | | 64,515 | | | | 6,441,823 | |
| | | | |
| | | | | | | | | | | | | | | 24,101,185 | |
| | | | | | | | | | | | | | | | |
| | | | |
| Software: 10.36% | | | | | | | | | | | | | | | | |
Adobe Systems Incorporated † | | | | | | | | | | | 16,135 | | | | 4,048,110 | |
Dropbox Incorporated Class A †« | | | | | | | | | | | 46,680 | | | | 1,091,845 | |
Microsoft Corporation | | | | | | | | | | | 159,622 | | | | 17,700,484 | |
Pivotal Software Incorporated Class A † | | | | | | | | | | | 28,446 | | | | 509,468 | |
Proofpoint Incorporated † | | | | | | | | | | | 11,822 | | | | 1,146,852 | |
RealPage Incorporated † | | | | | | | | | | | 13,645 | | | | 703,809 | |
Salesforce.com Incorporated † | | | | | | | | | | | 29,735 | | | | 4,244,969 | |
ServiceNow Incorporated † | | | | | | | | | | | 14,760 | | | | 2,734,585 | |
Splunk Incorporated † | | | | | | | | | | | 11,909 | | | | 1,330,593 | |
The Ultimate Software Group Incorporated † | | | | | | | | | | | 8,287 | | | | 2,187,105 | |
VMware Incorporated Class A † | | | | | | | | | | | 23,753 | | | | 3,974,827 | |
| | | | |
| | | | | | | | | | | | | | | 39,672,647 | |
| | | | | | | | | | | | | | | | |
| | | | |
| Technology Hardware, Storage & Peripherals: 3.25% | | | | | | | | | | | | | | | | |
Apple Incorporated | | | | | | | | | | | 39,149 | | | | 6,991,228 | |
HP Incorporated | | | | | | | | | | | 107,421 | | | | 2,470,683 | |
NetApp Incorporated | | | | | | | | | | | 44,494 | | | | 2,975,314 | |
| | | | |
| | | | | | | | | | | | | | | 12,437,225 | |
| | | | | | | | | | | | | | | | |
The accompanying notes are an integral part of these financial statements.
| | | | |
| 8 | | Wells Fargo Diversified Large Cap Growth Portfolio | | Portfolio of investments—November 30, 2018 (unaudited) |
| | | | | | | | | | | | | | | | |
| Security name | | | | | | | | Shares | | | Value | |
| | | | |
Materials: 2.00% | | | | | | | | | | | | | | | | |
| | | | |
| Chemicals: 1.38% | | | | | | | | | | | | | | | | |
Air Products & Chemicals Incorporated | | | | | | | | | | | 3,188 | | | $ | 512,854 | |
Huntsman Corporation | | | | | | | | | | | 77,864 | | | | 1,574,410 | |
Linde plc | | | | | | | | | | | 20,077 | | | | 3,193,247 | |
| | | | |
| | | | | | | | | | | | | | | 5,280,511 | |
| | | | | | | | | | | | | | | | |
| | | | |
| Containers & Packaging: 0.62% | | | | | | | | | | | | | | | | |
Avery Dennison Corporation | | | | | | | | | | | 24,790 | | | | 2,389,756 | |
| | | | | | | | | | | | | | | | |
| | | | |
Real Estate: 1.51% | | | | | | | | | | | | | | | | |
| | | | |
| Equity REITs: 1.24% | | | | | | | | | | | | | | | | |
American Tower Corporation | | | | | | | | | | | 15,574 | | | | 2,561,767 | |
Prologis Incorporated | | | | | | | | | | | 32,524 | | | | 2,190,166 | |
| | | | |
| | | | | | | | | | | | | | | 4,751,933 | |
| | | | | | | | | | | | | | | | |
| | | | |
| Real Estate Management & Development: 0.27% | | | | | | | | | | | | | | | | |
CBRE Group Incorporated Class A † | | | | | | | | | | | 23,655 | | | | 1,033,250 | |
| | | | | | | | | | | | | | | | |
| | | | |
Utilities: 0.52% | | | | | | | | | | | | | | | | |
| | | | |
| Multi-Utilities: 0.52% | | | | | | | | | | | | | | | | |
CenterPoint Energy Incorporated | | | | | | | | | | | 71,296 | | | | 1,997,001 | |
| | | | | | | | | | | | | | | | |
| | | | |
Total Common Stocks (Cost $341,046,397) | | | | | | | | | | | | | | | 376,221,477 | |
| | | | | | | | | | | | | | | | |
| | | | |
| | | Yield | | | | | | | | | | |
| Short-Term Investments: 4.00% | | | | | | | | | | | | | | | | |
| | | | |
| Investment Companies: 4.00% | | | | | | | | | | | | | | | | |
Securities Lending Cash Investments LLC (l)(r)(u) | | | 2.38 | % | | | | | | | 9,710,512 | | | | 9,711,483 | |
Wells Fargo Government Money Market Fund Select Class (l)(u) | | | 2.13 | | | | | | | | 5,601,857 | | | | 5,601,857 | |
| | | | |
Total Short-Term Investments (Cost $15,313,340) | | | | | | | | | | | | | | | 15,313,340 | |
| | | | | | | | | | | | | | | | |
| | | | | | | | |
| Total investments in securities (Cost $356,359,737) | | | 102.27 | % | | | 391,534,817 | |
Other assets and liabilities, net | | | (2.27 | ) | | | (8,696,510 | ) |
| | | | | | | | |
| Total net assets | | | 100.00 | % | | $ | 382,838,307 | |
| | | | | | | | |
| † | Non-income-earning security |
| « | All or a portion of this security is on loan. |
| (l) | The issuer of the security is an affiliated person of the Portfolio as defined in the Investment Company Act of 1940. |
| (r) | The investment is a non-registered investment company purchased with cash collateral received from securities on loan. |
| (u) | The rate represents the 7-day annualized yield at period end. |
Abbreviations:
| REIT | Real estate investment trust |
The accompanying notes are an integral part of these financial statements.
| | | | | | |
| Portfolio of investments—November 30, 2018 (unaudited) | | Wells Fargo Diversified Large Cap Growth Portfolio | | | 9 | |
Investments in Affiliates
An affiliated investment is an investment in which the Portfolio owns at least 5% of the outstanding voting shares of the issuer or as a result of other relationships, such as the Portfolio and the issuer having the same adviser or investment manager. Transactions with issuers that were either affiliated persons of the Portfolio at the beginning of the period or the end of the period were as follows:
| | | | | | | | | | | | | | | | | | | | | | | | | | | | | | | | | | | | |
| | | Shares,
beginning of
period | | | Shares
purchased | | | Shares
sold | | | Shares,
end of
period | | | Net
realized
gains
(losses) | | | Net
change in
unrealized
gains
(losses) | | | Income
from
affiliated
securities | | | Value,
end
of period | | | % of
net
assets | |
Short-Term Investments | | | | | | | | | | | | | | | | | | | | | | | | | | | | | | | | | | | | |
Investment Companies | | | | | | | | | | | | | | | | | | | | | | | | | | | | | | | | | | | | |
Securities Lending Cash Investments LLC | | | 2,198,826 | | | | 45,016,007 | | | | 37,504,321 | | | | 9,710,512 | | | $ | (322 | ) | | $ | (10 | ) | | $ | 12,899 | | | $ | 9,711,483 | | | | | |
Wells Fargo Government Money Market Fund Select Class | | | 417,874 | | | | 84,104,456 | | | | 78,920,473 | | | | 5,601,857 | | | | 0 | | | | 0 | | | | 35,452 | | | | 5,601,857 | | | | | |
| | | | | | | | | | | | | | | | | | | | | | | | | | | | | | | | | | | | |
| | | | | | | | | | | | | | | | | | $ | (322 | ) | | $ | (10 | ) | | $ | 48,351 | | | $ | 15,313,340 | | | | 4.00 | % |
| | | | | | | | | | | | | | | | | | | | | | | | | | | | | | | | | | | | |
The accompanying notes are an integral part of these financial statements.
| | | | |
| 10 | | Wells Fargo Diversified Large Cap Growth Portfolio | | Statement of assets and liabilities—November 30, 2018 (unaudited) |
| | | | |
| | | | |
| |
Assets | | | | |
Investments in unaffiliated securities (including $9,511,777 of securities loaned), at value (cost $341,046,397) | | $ | 376,221,477 | |
Investments in affiliated securities, at value (cost $15,313,340) | | | 15,313,340 | |
Receivable for investments sold | | | 982,817 | |
Receivable for dividends | | | 577,286 | |
Receivable for securities lending income | | | 3,063 | |
| | | | |
Total assets | | | 393,097,983 | |
| | | | |
| |
Liabilities | | | | |
Payable upon receipt of securities loaned | | | 9,711,727 | |
Payable for investments purchased | | | 241,557 | |
Advisory fee payable | | | 193,157 | |
Accrued expenses and other liabilities | | | 113,235 | |
| | | | |
Total liabilities | | | 10,259,676 | |
| | | | |
Total net assets | | $ | 382,838,307 | |
| | | | |
The accompanying notes are an integral part of these financial statements.
| | | | | | |
| Statement of operations—six months ended November 30, 2018 (unaudited) | | Wells Fargo Diversified Large Cap Growth Portfolio | | | 11 | |
| | | | |
| | | | |
| |
Investment income | | | | |
Dividends (net of foreign withholding taxes of $2,695) | | $ | 1,951,739 | |
Income from affiliated securities | | | 48,351 | |
| | | | |
Total investment income | | | 2,000,090 | |
| | | | |
| |
Expenses | | | | |
Advisory fee | | | 1,105,290 | |
Custody and accounting fees | | | 27,618 | |
Professional fees | | | 24,352 | |
Shareholder report expenses | | | 1,036 | |
Trustees’ fees and expenses | | | 11,014 | |
Other fees and expenses | | | 6,774 | |
| | | | |
Total expenses | | | 1,176,084 | |
Less: Fee waivers and/or expense reimbursements | | | (118,237 | ) |
| | | | |
Net expenses | | | 1,057,847 | |
| | | | |
Net investment income | | | 942,243 | |
| | | | |
| |
REALIZED AND UNREALIZED GAINS (LOSSES) ON INVESTMENTS | | | | |
| |
Net realized gains (losses) on: | | | | |
Unaffiliated securities | | | 944,196 | |
Affiliated securities | | | (322 | ) |
| | | | |
Net realized gains on investments | | | 943,874 | |
| | | | |
| |
Net change in unrealized gains (losses) on: | | | | |
Unaffiliated securities | | | (214,619 | ) |
Affiliated securities | | | (10 | ) |
| | | | |
Net change in unrealized gains (losses) on investments | | | (214,629 | ) |
| | | | |
Net realized and unrealized gains (losses) on investments | | | 729,245 | |
| | | | |
Net increase in net assets resulting from operations | | $ | 1,671,488 | |
| | | | |
The accompanying notes are an integral part of these financial statements.
| | | | |
| 12 | | Wells Fargo Diversified Large Cap Growth Portfolio | | Statement of changes in net assets |
| | | | | | | | |
| | | Six months ended November 30, 2018 (unaudited) | | | Year ended
May 31, 2018 | |
| | |
Operations | | | | | | | | |
Net investment income | | $ | 942,243 | | | $ | 504,456 | |
Net realized gains on investments | | | 943,874 | | | | 19,836,626 | |
Net change in unrealized gains (losses) on investments | | | (214,629 | ) | | | 566,404 | |
| | | | |
Net increase in net assets resulting from operations | | | 1,671,488 | | | | 20,907,486 | |
| | | | |
| | |
Capital transactions | | | | | | | | |
Transactions in investors’ beneficial interests | | | | | | | | |
Contributions | | | 363,610,503 | | | | 831,948 | |
Withdrawals | | | (68,562,517 | ) | | | (41,873,014 | ) |
| | | | |
Net increase (decrease) in net assets resulting from capital transactions | | | 295,047,986 | | | | (41,041,066 | ) |
| | | | |
Total increase (decrease) in net assets | | | 296,719,474 | | | | (20,133,580 | ) |
| | | | |
| | |
Net assets | | | | | | | | |
Beginning of period | | | 86,118,833 | | | | 106,252,413 | |
| | | | |
End of period | | $ | 382,838,307 | | | $ | 86,118,833 | |
| | | | |
The accompanying notes are an integral part of these financial statements.
| | | | | | |
| Financial highlights | | Wells Fargo Diversified Large Cap Growth Portfolio | | | 13 | |
| | | | | | | | | | | | | | | | | | | | | | | | |
| | | Six months ended
November 30, 2018
(unaudited) | | | Year ended May 31 | |
| | | 2018 | | | 2017 | | | 2016 | | | 2015 | | | 2014 | |
Total return1 | | | (0.92 | )% | | | 24.12 | % | | | 15.36 | % | | | (2.28 | )% | | | 13.11 | % | | | 21.70 | % |
Ratios to average net assets (annualized) | | | | | | | | | | | | | | | | | | | | | | | | |
Gross expenses | | | 0.69 | % | | | 0.80 | % | | | 0.78 | % | | | 0.74 | % | | | 0.72 | % | | | 0.72 | % |
Net expenses | | | 0.62 | % | | | 0.62 | % | | | 0.62 | % | | | 0.62 | % | | | 0.62 | % | | | 0.62 | % |
Net investment income | | | 0.55 | % | | | 0.53 | % | | | 0.51 | % | | | 0.29 | % | | | 0.28 | % | | | 0.15 | % |
Supplemental data | | | | | | | | | | | | | | | | | | | | | | | | |
Portfolio turnover rate | | | 33 | % | | | 37 | % | | | 98 | % | | | 59 | % | | | 46 | % | | | 54 | % |
| 1 | Returns for periods of less than one year are not annualized. |
The accompanying notes are an integral part of these financial statements.
| | | | |
| 14 | | Wells Fargo Diversified Large Cap Growth Portfolio | | Notes to financial statements (unaudited) |
1. ORGANIZATION
Wells Fargo Master Trust (the “Trust”), a Delaware statutory trust organized on March 10, 1999, is an open-end management investment company registered under the Investment Company Act of 1940, as amended (the “1940 Act”). As an investment company, the Trust follows the accounting and reporting guidance in Financial Accounting Standards Board (“FASB”) Accounting Standards Codification Topic 946, Financial Services – Investment Companies. These financial statements report on the Wells Fargo Diversified Large Cap Growth Portfolio (the “Portfolio”) which is a diversified series of the Trust.
2. SIGNIFICANT ACCOUNTING POLICIES
The following significant accounting policies, which are consistently followed in the preparation of the financial statements of the Portfolio, are in conformity with U.S. generally accepted accounting principles which require management to make estimates and assumptions that affect the reported amounts of assets and liabilities, disclosure of contingent assets and liabilities at the date of the financial statements, and the reported amounts of revenues and expenses during the reporting period. Actual results could differ from those estimates.
Securities valuation
All investments are valued each business day as of the close of regular trading on the New York Stock Exchange (generally 4 p.m. Eastern Time), although the Portfolio may deviate from this calculation time under unusual or unexpected circumstances.
Equity securities that are listed on a foreign or domestic exchange or market are valued at the official closing price or, if none, the last sales price. If no sale occurs on the principal exchange or market that day, a fair value price will be determined in accordance with the Portfolio’s Valuation Procedures.
Investments in registered open-end investment companies are valued at net asset value. Interests in non-registered investment companies that are redeemable at net asset value are fair valued normally at net asset value.
Investments which are not valued using any of the methods discussed above are valued at their fair value, as determined in good faith by the Board of Trustees of the Portfolio. The Board of Trustees has established a Valuation Committee comprised of the Trustees and has delegated to it the authority to take any actions regarding the valuation of portfolio securities that the Valuation Committee deems necessary or appropriate, including determining the fair value of portfolio securities, unless the determination has been delegated to the Wells Fargo Asset Management Pricing Committee at Wells Fargo Funds Management, LLC (“Funds Management”). The Board of Trustees retains the authority to make or ratify any valuation decisions or approve any changes to the Valuation Procedures as it deems appropriate. On a quarterly basis, the Board of Trustees receives reports on any valuation actions taken by the Valuation Committee or the Wells Fargo Asset Management Pricing Committee which may include items for ratification.
Foreign currency translation
The accounting records of the Portfolio are maintained in U.S. dollars. The values of other assets and liabilities denominated in foreign currencies are translated into U.S. dollars at rates provided by an independent foreign currency pricing source at a time each business day specified by the Wells Fargo Asset Management Pricing Committee. Purchases and sales of securities, and income and expenses are converted at the rate of exchange on the respective dates of such transactions. Net realized foreign exchange gains or losses arise from sales of foreign currencies, currency gains or losses realized between the trade and settlement dates on securities transactions, and the difference between the amounts of dividends, interest and foreign withholding taxes recorded and the U.S. dollar equivalent of the amounts actually paid or received. Net unrealized foreign exchange gains and losses arise from changes in the fair value of assets and liabilities other than investments in securities resulting from changes in exchange rates. The changes in net assets arising from changes in exchange rates of securities and the changes in net assets resulting from changes in market prices of securities are not separately presented. Such changes are included in net realized and unrealized gains or losses from investments.
Securities lending
The Portfolio may lend its securities from time to time in order to earn additional income in the form of fees or interest on securities received as collateral or the investment of any cash received as collateral. The Portfolio continues to receive interest or dividends on the securities loaned. The Portfolio receives collateral in the form of cash or securities with a value at least equal to the value of the securities on loan. The value of the loaned securities is determined at the close of each business day and any additional required collateral is delivered to the Portfolio on the next business day. In a securities lending transaction, the net asset value of the Portfolio will be affected by an increase or decrease in the value
| | | | | | |
| Notes to financial statements (unaudited) | | Wells Fargo Diversified Large Cap Growth Portfolio | | | 15 | |
of the securities loaned and by an increase or decrease in the value of the instrument in which collateral is invested. The amount of securities lending activity undertaken by the Portfolio fluctuates from time to time. In the event of default or bankruptcy by the borrower, the Portfolio may be prevented from recovering the loaned securities or gaining access to the collateral or may experience delays or costs in doing so. In addition, the investment of any cash collateral received may lose all or part of its value. The Portfolio has the right under the lending agreement to recover the securities from the borrower on demand.
The Portfolio lends its securities through an unaffiliated securities lending agent. Cash collateral received in connection with its securities lending transactions is invested in Securities Lending Cash Investments, LLC (the “Securities Lending Portfolio”). The Securities Lending Portfolio is exempt from registration under Section 3(c)(7) of the 1940 Act and is managed by Portfolios Management and is subadvised by Wells Capital Management Incorporated (“WellsCap”), an affiliate of Portfolios Management and an indirect wholly owned subsidiary of Wells Fargo & Company (“Wells Fargo”). Portfolios Management receives an advisory fee starting at 0.05% and declining to 0.01% as the average daily net assets of the Securities Lending Portfolio increase. All of the fees received by Portfolios Management are paid to WellsCap for its services as subadviser. The Securities Lending Portfolio seeks to provide a positive return compared to the daily Fed Portfolios Open Rate by investing in high-quality, U.S. dollar-denominated short-term money market instruments. Securities Lending Portfolio investments are valued at the evaluated bid price provided by an independent pricing service. Income earned from investment in the Securities Lending Portfolio, if any, is included in income from affiliated securities on the Statement of Operations.
Security transactions and income recognition
Securities transactions are recorded on a trade date basis. Realized gains or losses are recorded on the basis of identified cost.
Dividend income is recognized on the ex-dividend date. Dividend income is recorded net of foreign taxes withheld where recovery of such taxes is not assured.
Federal and other taxes
The Portfolio is treated as a separate entity for federal income tax purposes. The Portfolio is not required to pay federal income taxes on its net investment income and net capital gains as it is treated as a partnership for federal income tax purposes. All interest, dividends, gains and losses of the Portfolio are deemed to have been “passed through” to the interest holders in proportion to their holdings of the Portfolio regardless of whether such interest, dividends and gains have been distributed by the Portfolio.
The Portfolio’s income tax returns and all financial records supporting those returns for the prior three fiscal years are subject to examination by the federal revenue authority. Management has analyzed the Portfolio’s tax positions taken on federal, state, and foreign tax returns for all open tax years and does not believe that there are any uncertain tax positions that require recognition of a tax liability.
As of November 30, 2018, the aggregate cost of all investments for federal income tax purposes was $356,568,633 and the unrealized gains (losses) consisted of:
| | | | |
Gross unrealized gains | | $ | 45,099,363 | |
Gross unrealized losses | | | (10,133,179 | ) |
Net unrealized gains | | $ | 34,966,184 | |
3. FAIR VALUATION MEASUREMENTS
Fair value measurements of investments are determined within a framework that has established a fair value hierarchy based upon the various data inputs utilized in determining the value of the Portfolio’s investments. The three-level hierarchy gives the highest priority to unadjusted quoted prices in active markets for identical assets or liabilities (Level 1) and the lowest priority to unobservable inputs (Level 3). The Portfolio’s investments are classified within the fair value hierarchy based on the lowest level of input that is significant to the fair value measurement. The inputs are summarized into three broad levels as follows:
| ∎ | | Level 1 – quoted prices in active markets for identical securities |
| ∎ | | Level 2 – other significant observable inputs (including quoted prices for similar securities, interest rates, prepayment speeds, credit risk, etc.) |
| ∎ | | Level 3 – significant unobservable inputs (including the Portfolio’s own assumptions in determining the fair value of investments) |
| | | | |
| 16 | | Wells Fargo Diversified Large Cap Growth Portfolio | | Notes to financial statements (unaudited) |
The inputs or methodologies used for valuing investments in securities are not necessarily an indication of the risk associated with investing in those securities.
The following is a summary of the inputs used in valuing the Portfolio’s assets and liabilities as of November 30, 2018:
| | | | | | | | | | | | | | | | |
| | | Quoted prices
(Level 1) | | | Other significant
observable inputs
(Level 2) | | | Significant
unobservable inputs (Level 3) | | | Total | |
Assets | | | | | | | | | | | | | | | | |
Investments in: | | | | | | | | | | | | | | | | |
| | | | |
Common stocks | | | | | | | | | | | | | | | | |
Communication services | | $ | 31,059,976 | | | $ | 0 | | | $ | 0 | | | $ | 31,059,976 | |
Consumer discretionary | | | 51,602,344 | | | | 0 | | | | 0 | | | | 51,602,344 | |
Consumer staples | | | 18,302,491 | | | | 0 | | | | 0 | | | | 18,302,491 | |
Energy | | | 10,376,110 | | | | 0 | | | | 0 | | | | 10,376,110 | |
Financials | | | 30,217,209 | | | | 0 | | | | 0 | | | | 30,217,209 | |
Health care | | | 54,429,639 | | | | 0 | | | | 0 | | | | 54,429,639 | |
Industrials | | | 47,496,618 | | | | 0 | | | | 0 | | | | 47,496,618 | |
Information technology | | | 117,284,639 | | | | 0 | | | | 0 | | | | 117,284,639 | |
Materials | | | 7,670,267 | | | | 0 | | | | 0 | | | | 7,670,267 | |
Real estate | | | 5,785,183 | | | | 0 | | | | 0 | | | | 5,785,183 | |
Utilities | | | 1,997,001 | | | | 0 | | | | 0 | | | | 1,997,001 | |
| | | | |
Short-term investments | | | | | | | | | | | | | | | | |
Investment companies | | | 5,601,857 | | | | 9,711,483 | | �� | | 0 | | | | 15,313,340 | |
Total assets | | $ | 381,823,334 | | | $ | 9,711,483 | | | $ | 0 | | | $ | 391,534,817 | |
Additional sector, industry or geographic detail is included in the Portfolio of Investments.
At November 30, 2018, the Portfolio did not have any transfers into/out of Level 3.
4. TRANSACTIONS WITH AFFILIATES
Advisory fee
The Trust has entered into an advisory contract with Funds Management, an indirect wholly owned subsidiary of Wells Fargo. The adviser is responsible for implementing investment policies and guidelines and for supervising the subadviser, who is responsible for day-to-day portfolio management of the Portfolio. Pursuant to the contract, Funds Management is entitled to receive an annual advisory fee starting at 0.65% and declining to 0.475% as the average daily net assets of the Portfolio increase. For the six months ended November 30, 2018, the advisory fee was equivalent to an annual rate of 0.65% of the Portfolio’s average daily net assets.
Funds Management has retained the services of a subadviser to provide daily portfolio management to the Portfolio. The fee for subadvisory services is borne by Funds Management. WellsCap is the subadviser to the Portfolio and is entitled to receive a fee from Funds Management at an annual rate starting at 0.30% and declining to 0.20% as the average daily net assets of the Portfolio increase.
Funds Management has voluntarily waived and/or reimbursed advisory fees to the extent necessary to maintain the net operating expense ratio of the Portfolio.
Interfund transactions
The Portfolio may purchase or sell portfolio investment securities to certain other Wells Fargo affiliates pursuant to Rule 17a-7 under the 1940 Act and under procedures adopted by the Board of Trustees. The procedures have been designed to ensure that these interfund transactions, which do not incur broker commissions, are effected at current market prices.
5. INVESTMENT PORTFOLIO TRANSACTIONS
Purchases and sales of investments, excluding U.S. government obligations (if any) and short-term securities, for the six months ended November 30, 2018 were $400,710,700 and $110,695,655, respectively.
| | | | | | |
| Notes to financial statements (unaudited) | | Wells Fargo Diversified Large Cap Growth Portfolio | | | 17 | |
6. BANK BORROWINGS
Effective August 28, 2018, the Trust, along with Wells Fargo Variable Trust and Wells Fargo Funds Trust (excluding the money market funds), are parties to a $280,000,000 revolving credit agreement whereby the Portfolio is permitted to use bank borrowings for temporary or emergency purposes, such as to fund shareholder redemption requests. Interest under the credit agreement is charged to the Portfolio based on a borrowing rate equal to the higher of the Federal Funds rate in effect on that day plus 1.25% or the overnight LIBOR rate in effect on that day plus 1.25%. In addition, an annual commitment fee equal to 0.25% of the unused balance is allocated to each participating fund.
For the six months ended November 30, 2018, there were no borrowings by the Portfolio under the agreement.
7. CONCENTRATION RISK
Concentration risks result from exposure to a limited number of sectors. A portfolio that invests a substantial portion of its assets in any sector may be more affected by changes in that sector than would be a portfolio whose investments are not heavily weighted in any sector.
8. INDEMNIFICATION
Under the Trust’s organizational documents, the officers and Trustees have been granted certain indemnification rights against certain liabilities that may arise out of performance of their duties to the Trust. Additionally, in the normal course of business, the Trust may enter into contracts with service providers that contain a variety of indemnification clauses. The Trust’s maximum exposure under these arrangements is dependent on future claims that may be made against the Portfolio and, therefore, cannot be estimated.
9. NEW ACCOUNTING PRONOUNCEMENT
In August 2018, FASB issued Accounting Standards Update (“ASU”) No. 2018-13, Fair Value Measurement (Topic 820)Disclosure Framework—Changes to the Disclosure Requirements for Fair Value Measurement. ASU 2018-13 updates the disclosure requirements for fair value measurements by modifying or removing certain disclosures and adding certain new disclosures. The amendments are effective for fiscal years, and interim periods within those fiscal years, beginning after December 15, 2019. Early adoption is permitted. Management has adopted the removal and modification of disclosures early, as permitted, and will adopt the additional new disclosures at the effective date.
| | | | |
| 18 | | Wells Fargo Diversified Large Cap Growth Portfolio | | Other information (unaudited) |
PROXY VOTING INFORMATION
A description of the policies and procedures used to determine how to vote proxies relating to portfolio securities is available without charge, upon request, by calling1-800-222-8222, visiting our website atwellsfargofunds.com, or visiting the SEC website at sec.gov. Information regarding how the proxies related to portfolio securities were voted during the most recent 12-month period ended June 30 is available on the website atwellsfargofunds.comor by visiting the SEC website at sec.gov.
PORTFOLIO HOLDINGS INFORMATION
The Portfolio files its complete schedule of portfolio holdings with the SEC for the first and third quarters of each fiscal year on Form N-Q, which is available by visiting the SEC website at sec.gov. In addition, the Portfolio’s Form N-Q may be reviewed and copied at the SEC’s Public Reference Room in Washington, DC, and at regional offices in New York City, at 233 Broadway, and in Chicago, at 175 West Jackson Boulevard, Suite 900. Information about the Public Reference Room may be obtained by calling 1-800-SEC-0330.
| | | | | | |
| Other information (unaudited) | | Wells Fargo Diversified Large Cap Growth Portfolio | | | 19 | |
BOARD OF TRUSTEES AND OFFICERS
Each of the Trustees and Officers1 listed in the table below acts in identical capacities for each fund in the Wells Fargo family of funds, which consists of 152 mutual funds comprising the Wells Fargo Funds Trust, Wells Fargo Variable Trust, Wells Fargo Master Trust and four closed-end funds (collectively the “Fund Complex”). This table should be read in conjunction with the Prospectus and the Statement of Additional Information2. The mailing address of each Trustee and Officer is 525 Market Street, 12th Floor, San Francisco, CA 94105. Each Trustee and Officer serves an indefinite term, however, each Trustee serves such term until reaching the mandatory retirement age established by the Trustees.
Independent Trustees
| | | | | | |
Name and
year of birth | | Position held and
length of service* | | Principal occupations during past five years or longer | | Current other
public company or
investment company
directorships |
William R. Ebsworth
(Born 1957) | | Trustee, since 2015 | | Retired. From 1984 to 2013, equities analyst, portfolio manager, research director and chief investment officer at Fidelity Management and Research Company in Boston, Tokyo, and Hong Kong, and retired in 2013 as Chief Investment Officer of Fidelity Strategic Advisers, Inc. where he led a team of investment professionals managing client assets. Prior thereto, Board member of Hong Kong Securities Clearing Co., Hong Kong Options Clearing Corp., the Thailand International Fund, Ltd., Fidelity Investments Life Insurance Company, and Empire Fidelity Investments Life Insurance Company. Board member of the Vincent Memorial Hospital Endowment (non-profit organization), where he serves on the Investment Committee and as a Chair of the Audit Committee. Mr. Ebsworth is a CFA® charterholder. | | N/A |
Jane A. Freeman
(Born 1953) | | Trustee, since 2015; Chair Liaison, since 2018 | | Retired. From 2012 to 2014 and 1999 to 2008, Chief Financial Officer of Scientific Learning Corporation. From 2008 to 2012, Ms. Freeman provided consulting services related to strategic business projects. Prior to 1999, Portfolio Manager at Rockefeller & Co. and Scudder, Stevens & Clark. Board member of the Harding Loevner Funds from 1996 to 2014, serving as both Lead Independent Director and chair of the Audit Committee. Board member of the Russell Exchange Traded Funds Trust from 2011 to 2012 and the chair of the Audit Committee. Ms. Freeman is a Board Member of The Ruth Bancroft Garden (non-profit organization). She is also an inactive Chartered Financial Analyst. | | N/A |
Isaiah Harris, Jr.3
(Born 1952) | | Trustee, since 2009 | | Retired. Chairman of the Board of CIGNA Corporation since 2009, and Director since 2005. From 2003 to 2011, Director of Deluxe Corporation. Prior thereto, President and CEO of BellSouth Advertising and Publishing Corp. from 2005 to 2007, President and CEO of BellSouth Enterprises from 2004 to 2005 and President of BellSouth Consumer Services from 2000 to 2003. Emeritus member of the Iowa State University Foundation Board of Governors. Emeritus Member of the Advisory Board of Iowa State University School of Business. Advisory Board Member, Palm Harbor Academy (private school). Advisory Board Member, Child Evangelism Fellowship (non-profit). Mr. Harris is a certified public accountant (inactive status). | | CIGNA Corporation |
Judith M. Johnson3
(Born 1949) | | Trustee, since 2008; Audit Committee Chairman, since 2009 | | Retired. Prior thereto, Chief Executive Officer and Chief Investment Officer of Minneapolis Employees Retirement Fund from 1996 to 2008. Ms. Johnson is an attorney, certified public accountant and a certified managerial accountant. | | N/A |
David F. Larcker
(Born 1950) | | Trustee, since 2009 | | James Irvin Miller Professor of Accounting at the Graduate School of Business, Stanford University, Director of the Corporate Governance Research Initiative and Senior Faculty of The Rock Center for Corporate Governance since 2006. From 2005 to 2008, Professor of Accounting at the Graduate School of Business, Stanford University. Prior thereto, Ernst & Young Professor of Accounting at The Wharton School, University of Pennsylvania from 1985 to 2005. | | N/A |
| | | | |
| 20 | | Wells Fargo Diversified Large Cap Growth Portfolio | | Other information (unaudited) |
| | | | | | |
Name and
year of birth | | Position held and
length of service* | | Principal occupations during past five years or longer | | Current other
public company or
investment company
directorships |
Olivia S. Mitchell
(Born 1953) | | Trustee, since 2006; Nominating and Governance Committee Chairman, since 2018 | | International Foundation of Employee Benefit Plans Professor, Wharton School of the University of Pennsylvania since 1993. Director of Wharton’s Pension Research Council and Boettner Center on Pensions & Retirement Research, and Research Associate at the National Bureau of Economic Research. Previously, Cornell University Professor from 1978 to 1993. | | N/A |
Timothy J. Penny
(Born 1951) | | Trustee, since 1996; Chairman, since 2018; Vice Chairman, from 2017 to 2018 | | President and Chief Executive Officer of Southern Minnesota Initiative Foundation, a non-profit organization, since 2007. Member of the Board of Trustees of NorthStar Education Finance, Inc., a non-profit organization, since 2007. | | N/A |
James G. Polisson
(Born 1959) | | Trustee, since 2018; Advisory Board Member, from 2017 to 2018 | | Retired. Chief Marketing Officer, Source (ETF) UK Services, Ltd, from 2015 to 2017. From 2012 to 2015, Principal of The Polisson Group, LLC, a management consulting, corporate advisory and principal investing company. Chief Executive Officer and Managing Director at Russell Investments, Global Exchange Traded Funds from 2010 to 2012. Managing Director of Barclays Global Investors from 1998 to 2010 and Global Chief Marketing Officer for iShares and Barclays Global Investors from 2000 to 2010. Trustee of the San Francisco Mechanics’ Institute, a non-profit organization, from 2013 to 2015. Board member of the Russell Exchange Traded Fund Trust from 2011 to 2012. Director of Barclays Global Investors Holdings Deutschland GmbH from 2006 to 2009. Mr. Polisson is an attorney and has a retired status with the Massachusetts and District of Columbia Bar Associations. | | N/A |
Michael S. Scofield4 (Born 1943) | | Trustee, since 2010 | | Served on the Investment Company Institute’s Board of Governors and Executive Committee from 2008-2011 as well the Governing Council of the Independent Directors Council from 2006-2011 and the Independent Directors Council Executive Committee from 2008-2011. Trustee of the Evergreen Fund complex (and its predecessors) from 1984 to 2010. Chairman of the Evergreen Funds from 2000-2010. Former Trustee of the Mentor Funds. Retired Attorney, Law Offices of Michael S. Scofield. | | N/A |
Pamela Wheelock
(Born 1959) | | Trustee, since 2018; Advisory Board Member, from 2017 to 2018 | | Chief Operating Officer, Twin Cities Habitat for Humanity, since January, 2017. Vice President of University Services, University of Minnesota from 2012 to 2017. Prior thereto, on the Board of Directors, Governance Committee and Finance Committee for the Minnesota Philanthropy Partners (Saint Paul Foundation) from 2012 to 2018, Interim President and Chief Executive Officer of Blue Cross Blue Shield of Minnesota from 2010 to 2011, Chairman of the Board from 2009 to 2011 and Board Director from 2003 to 2015. Vice President, Leadership and Community Engagement, Bush Foundation, Saint Paul, Minnesota (a private foundation) from 2009 to 2011. Executive Vice President and Chief Financial Officer, Minnesota Sports and Entertainment from 2004 to 2009 and Senior Vice President from 2002 to 2004. Commissioner of Finance, State of Minnesota, from 1999 to 2002. Currently the Board Chair of the Minnesota Wild Foundation since 2010. | | N/A |
| * | Length of service dates reflect the Trustee’s commencement of service with the Trust’s predecessor entities, where applicable. |
| | | | | | |
| Other information (unaudited) | | Wells Fargo Diversified Large Cap Growth Portfolio | | | 21 | |
Officers
| | | | | | |
Name and
year of birth | | Position held and
length of service | | Principal occupations during past five years or longer | | |
Andrew Owen
(Born 1960) | | President, since 2017 | | Executive Vice President of Wells Fargo & Company and Head of Affiliated Managers, Wells Fargo Asset Management, since 2014. In addition, Mr. Owen is currently President, Chief Executive Officer and Director of Wells Fargo Funds Management, LLC since 2017. Prior thereto, Executive Vice President responsible for marketing, investments and product development for Wells Fargo Funds Management, LLC, from 2009 to 2014. | | |
Nancy Wiser1
(Born 1967) | | Treasurer, since 2012 | | Executive Vice President of Wells Fargo Funds Management, LLC since 2011. Chief Operating Officer and Chief Compliance Officer at LightBox Capital Management LLC, from 2008 to 2011. | | |
Alexander Kymn
(Born 1973) | | Secretary, since 2018; Chief Legal Officer, since 2018 | | Senior Company Counsel of Wells Fargo Bank, N.A. since 2018 (previously Senior Counsel from 2007 to 2018). Vice President of Wells Fargo Funds Management, LLC from 2008 to 2014. | | |
Michael H. Whitaker
(Born 1967) | | Chief Compliance Officer, since 2016 | | Senior Vice President and Chief Compliance Officer since 2016. Senior Vice President and Chief Compliance Officer for Fidelity Investments from 2007 to 2016. | | |
David Berardi
(Born 1975) | | Assistant Treasurer, since 2009 | | Vice President of Wells Fargo Funds Management, LLC since 2009. Vice President of Evergreen Investment Management Company, LLC from 2008 to 2010. Manager of Fund Reporting and Control for Evergreen Investment Management Company, LLC from 2004 to 2010. | | |
Jeremy DePalma1
(Born 1974) | | Assistant Treasurer, since 2009 | | Senior Vice President of Wells Fargo Funds Management, LLC since 2009. Senior Vice President of Evergreen Investment Management Company, LLC from 2008 to 2010 and head of the Fund Reporting and Control Team within Fund Administration from 2005 to 2010. | | |
| 1 | Nancy Wiser acts as Treasurer of 76 funds in the Fund Complex. Jeremy DePalma acts as Treasurer of 76 funds and Assistant Treasurer of 76 funds in the Fund Complex. |
| 2 | The Statement of Additional Information includes additional information about the Trustees and is available, without charge, upon request, by calling1-800-222-8222 or by visiting the website atwellsfargofunds.com. |
| 3 | Mr. Harris will replace Ms. Johnson as the Chairman of the Audit Committee effective January 1, 2019. |
| 4 | Mr. Scofield is expected to retire on December 31, 2018. |
This page is intentionally left blank.
This page is intentionally left blank.
This page is intentionally left blank.
INVESTMENT PRODUCTS: NOT FDIC INSURED ◾ NO BANK GUARANTEE ◾ MAY LOSE VALUE
© 2019 Wells Fargo Funds Management, LLC. All rights reserved.
Semi-Annual Report
November 30, 2018

Disciplined Large Cap Portfolio


Reduce clutter. Save trees.
Sign up for electronic delivery of prospectuses and shareholder reports atwellsfargo.com/advantagedelivery
Contents
The views expressed and any forward-looking statements are as of November 30, 2018, unless otherwise noted, and are those of the Fund managers and/or Wells Fargo Funds Management, LLC. Discussions of individual securities, or the markets generally, or any Wells Fargo Fund are not intended as individual recommendations. Future events or results may vary significantly from those expressed in any forward-looking statements. The views expressed are subject to change at any time in response to changing circumstances in the market. Wells Fargo Funds Management, LLC and the Fund disclaim any obligation to publicly update or revise any views expressed or forward-looking statements.
INVESTMENT PRODUCTS: NOT FDIC INSURED ◾ NO BANK GUARANTEE ◾ MAY LOSE VALUE
| | | | |
| 2 | | Wells Fargo Disciplined Large Cap Portfolio | | Performance highlights (unaudited) |
Investment objective
The Portfolio seeks long-term capital appreciation.
Manager
Wells Fargo Funds Management, LLC
Subadviser
Wells Capital Management Incorporated
Portfolio managers
Justin P. Carr, CFA®‡
Greg W. Golden, CFA®‡
| | | | |
| Ten largest holdings (%) as of November 30, 20181 | |
Apple Incorporated | | | 3.76 | |
Microsoft Corporation | | | 3.57 | |
Amazon.com Incorporated | | | 2.62 | |
Exxon Mobil Corporation | | | 1.67 | |
Berkshire Hathaway Incorporated Class B | | | 1.65 | |
Johnson & Johnson | | | 1.64 | |
Facebook Incorporated Class A | | | 1.51 | |
JPMorgan Chase & Company | | | 1.48 | |
Alphabet Incorporated Class A | | | 1.46 | |
Bank of America Corporation | | | 1.44 | |
|
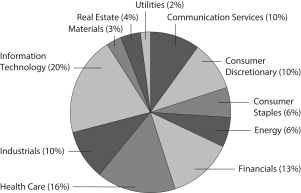
| Sector distribution as of November 30, 20182 |
|
 |
| ‡ | CFA® and Chartered Financial Analyst® are trademarks owned by CFA Institute. |
| 1 | The ten largest holdings, excluding cash, cash equivalents and any money market funds, are calculated based on the value of the investments divided by the total net assets of the portfolio. Holdings are subject to change and may have changed since the date specified. |
| 2 | Amounts are calculated based on the total long-term investments of the Portfolio. These amounts are subject to change and may have changed since the date specified. |
| | | | | | |
| Portfolio of investments—November 30, 2018 (unaudited) | | Wells Fargo Disciplined Large Cap Portfolio | | | 3 | |
| | | | | | | | | | | | | | | | |
| Security name | | | | | | | | Shares | | | Value | |
| | | | |
Common Stocks: 99.25% | | | | | | | | | | | | | | | | |
| | | | |
Communication Services: 10.00% | | | | | | | | | | | | | | | | |
| | | | |
| Diversified Telecommunication Services: 1.88% | | | | | | | | | | | | | | | | |
AT&T Incorporated | | | | | | | | | | | 134,067 | | | $ | 4,188,253 | |
Verizon Communications Incorporated | | | | | | | | | | | 52,940 | | | | 3,192,282 | |
| | | | |
| | | | | | | | | | | | | | | 7,380,535 | |
| | | | | | | | | | | | | | | | |
| | | | |
| Entertainment: 1.91% | | | | | | | | | | | | | | | | |
Netflix Incorporated † | | | | | | | | | | | 3,294 | | | | 942,512 | |
The Walt Disney Company | | | | | | | | | | | 30,209 | | | | 3,488,837 | |
Twenty-First Century Fox Incorporated Class A | | | | | | | | | | | 28,121 | | | | 1,391,146 | |
Twenty-First Century Fox Incorporated Class B | | | | | | | | | | | 9,165 | | | | 449,360 | |
Viacom Incorporated Class B | | | | | | | | | | | 40,292 | | | | 1,243,411 | |
| | | | |
| | | | | | | | | | | | | | | 7,515,266 | |
| | | | | | | | | | | | | | | | |
| | | | |
| Interactive Media & Services: 4.59% | | | | | | | | | | | | | | | | |
Alphabet Incorporated Class A † | | | | | | | | | | | 5,167 | | | | 5,733,562 | |
Alphabet Incorporated Class C † | | | | | | | | | | | 5,182 | | | | 5,671,336 | |
Facebook Incorporated Class A † | | | | | | | | | | | 42,259 | | | | 5,942,038 | |
IAC Corporation † | | | | | | | | | | | 3,871 | | | | 688,883 | |
| | | | |
| | | | | | | | | | | | | | | 18,035,819 | |
| | | | | | | | | | | | | | | | |
| | | | |
| Media: 1.54% | | | | | | | | | | | | | | | | |
Comcast Corporation Class A | | | | | | | | | | | 106,534 | | | | 4,155,891 | |
John Wiley & Sons Incorporated Class A | | | | | | | | | | | 11,908 | | | | 658,393 | |
Sirius XM Holdings Incorporated | | | | | | | | | | | 197,089 | | | | 1,227,864 | |
| | | | |
| | | | | | | | | | | | | | | 6,042,148 | |
| | | | | | | | | | | | | | | | |
| | | | |
| Wireless Telecommunication Services: 0.08% | | | | | | | | | | | | | | | | |
Sprint Corporation † | | | | | | | | | | | 49,959 | | | | 313,743 | |
| | | | | | | | | | | | | | | | |
| | | | |
Consumer Discretionary: 9.63% | | | | | | | | | | | | | | | | |
| | | | |
| Auto Components: 0.33% | | | | | | | | | | | | | | | | |
Gentex Corporation | | | | | | | | | | | 56,849 | | | | 1,280,239 | |
| | | | | | | | | | | | | | | | |
| | | | |
| Automobiles: 0.65% | | | | | | | | | | | | | | | | |
Ford Motor Company | | | | | | | | | | | 172,359 | | | | 1,621,898 | |
General Motors Company | | | | | | | | | | | 24,187 | | | | 917,897 | |
| | | | |
| | | | | | | | | | | | | | | 2,539,795 | |
| | | | | | | | | | | | | | | | |
| | | | |
| Diversified Consumer Services: 0.16% | | | | | | | | | | | | | | | | |
H&R Block Incorporated | | | | | | | | | | | 15,670 | | | | 423,247 | |
Service Corporation International | | | | | | | | | | | 4,397 | | | | 203,141 | |
| | | | |
| | | | | | | | | | | | | | | 626,388 | |
| | | | | | | | | | | | | | | | |
| | | | |
| Hotels, Restaurants & Leisure: 0.54% | | | | | | | | | | | | | | | | |
Carnival Corporation | | | | | | | | | | | 6,881 | | | | 414,855 | |
Chipotle Mexican Grill Incorporated † | | | | | | | | | | | 800 | | | | 378,568 | |
The accompanying notes are an integral part of these financial statements.
| | | | |
| 4 | | Wells Fargo Disciplined Large Cap Portfolio | | Portfolio of investments—November 30, 2018 (unaudited) |
| | | | | | | | | | | | | | | | |
| Security name | | | | | | | | Shares | | | Value | |
| | | | |
| Hotels, Restaurants & Leisure(continued) | | | | | | | | | | | | | | | | |
Domino’s Pizza Incorporated | | | | | | | | | | | 1,324 | | | $ | 367,172 | |
Las Vegas Sands Corporation | | | | | | | | | | | 8,218 | | | | 451,497 | |
McDonald’s Corporation | | | | | | | | | | | 2,821 | | | | 531,787 | |
| | | | |
| | | | | | | | | | | | | | | 2,143,879 | |
| | | | | | | | | | | | | | | | |
| | | | |
| Household Durables: 0.33% | | | | | | | | | | | | | | | | |
NVR Incorporated † | | | | | | | | | | | 182 | | | | 445,900 | |
Pulte Group Incorporated | | | | | | | | | | | 32,848 | | | | 871,129 | |
| | | | |
| | | | | | | | | | | | | | | 1,317,029 | |
| | | | | | | | | | | | | | | | |
| | | | |
| Internet & Direct Marketing Retail: 2.71% | | | | | | | | | | | | | | | | |
Amazon.com Incorporated † | | | | | | | | | | | 6,093 | | | | 10,298,206 | |
GrubHub Incorporated † | | | | | | | | | | | 4,479 | | | | 350,661 | |
| | | | |
| | | | | | | | | | | | | | | 10,648,867 | |
| | | | | | | | | | | | | | | | |
| | | | |
| Multiline Retail: 0.72% | | | | | | | | | | | | | | | | |
Kohl’s Corporation | | | | | | | | | | | 12,776 | | | | 858,164 | |
Macy’s Incorporated | | | | | | | | | | | 38,369 | | | | 1,312,987 | |
Target Corporation | | | | | | | | | | | 9,198 | | | | 652,690 | |
| | | | |
| | | | | | | | | | | | | | | 2,823,841 | |
| | | | | | | | | | | | | | | | |
| | | | |
| Specialty Retail: 3.78% | | | | | | | | | | | | | | | | |
Best Buy Company Incorporated | | | | | | | | | | | 24,621 | | | | 1,590,270 | |
Burlington Stores Incorporated † | | | | | | | | | | | 2,535 | | | | 420,202 | |
Dick’s Sporting Goods Incorporated | | | | | | | | | | | 35,919 | | | | 1,292,366 | |
Foot Locker Incorporated | | | | | | | | | | | 16,537 | | | | 932,687 | |
Lowe’s Companies Incorporated | | | | | | | | | | | 22,655 | | | | 2,137,952 | |
Penske Auto Group Incorporated | | | | | | | | | | | 4,434 | | | | 193,322 | |
Ross Stores Incorporated | | | | | | | | | | | 12,317 | | | | 1,078,969 | |
The Gap Incorporated | | | | | | | | | | | 31,037 | | | | 847,000 | |
The Home Depot Incorporated | | | | | | | | | | | 24,642 | | | | 4,443,445 | |
The TJX Companies Incorporated | | | | | | | | | | | 22,764 | | | | 1,112,021 | |
Urban Outfitters Incorporated † | | | | | | | | | | | 20,704 | | | | 788,615 | |
| | | | |
| | | | | | | | | | | | | | | 14,836,849 | |
| | | | | | | | | | | | | | | | |
| | | | |
| Textiles, Apparel & Luxury Goods: 0.41% | | | | | | | | | | | | | | | | |
Michael Kors Holdings Limited † | | | | | | | | | | | 4,021 | | | | 175,919 | |
Nike Incorporated Class B | | | | | | | | | | | 10,614 | | | | 797,324 | |
Ralph Lauren Corporation | | | | | | | | | | | 5,726 | | | | 637,876 | |
| | | | |
| | | | | | | | | | | | | | | 1,611,119 | |
| | | | | | | | | | | | | | | | |
| | | | |
Consumer Staples: 6.40% | | | | | | | | | | | | | | | | |
| | | | |
| Beverages: 1.22% | | | | | | | | | | | | | | | | |
Molson Coors Brewing Company Class B | | | | | | | | | | | 6,574 | | | | 432,372 | |
PepsiCo Incorporated | | | | | | | | | | | 13,786 | | | | 1,681,065 | |
The Coca-Cola Company | | | | | | | | | | | 53,550 | | | | 2,698,920 | |
| | | | |
| | | | | | | | | | | | | | | 4,812,357 | |
| | | | | | | | | | | | | | | | |
The accompanying notes are an integral part of these financial statements.
| | | | | | |
| Portfolio of investments—November 30, 2018 (unaudited) | | Wells Fargo Disciplined Large Cap Portfolio | | | 5 | |
| | | | | | | | | | | | | | | | |
| Security name | | | | | | | | Shares | | | Value | |
| | | | |
| Food & Staples Retailing: 2.36% | | | | | | | | | | | | | | | | |
Costco Wholesale Corporation | | | | | | | | | | | 8,575 | | | $ | 1,983,226 | |
Sysco Corporation | | | | | | | | | | | 2,900 | | | | 195,460 | |
The Kroger Company | | | | | | | | | | | 54,478 | | | | 1,615,817 | |
US Foods Holding Corporation † | | | | | | | | | | | 12,830 | | | | 425,699 | |
Wal-Mart Stores Incorporated | | | | | | | | | | | 36,920 | | | | 3,605,238 | |
Walgreens Boots Alliance Incorporated | | | | | | | | | | | 17,310 | | | | 1,465,638 | |
| | | | |
| | | | | | | | | | | | | | | 9,291,078 | |
| | | | | | | | | | | | | | | | |
| | | | |
| Food Products: 1.02% | | | | | | | | | | | | | | | | |
Archer Daniels Midland Company | | | | | | | | | | | 12,257 | | | | 564,067 | |
Ingredion Incorporated | | | | | | | | | | | 3,838 | | | | 400,917 | |
Kellogg Company | | | | | | | | | | | 6,115 | | | | 389,220 | |
Lamb Weston Holdings Incorporated | | | | | | | | | | | 5,144 | | | | 394,545 | |
Pilgrim’s Pride Corporation † | | | | | | | | | | | 20,368 | | | | 404,101 | |
Tyson Foods Incorporated Class A | | | | | | | | | | | 31,334 | | | | 1,847,139 | |
| | | | |
| | | | | | | | | | | | | | | 3,999,989 | |
| | | | | | | | | | | | | | | | |
| | | | |
| Household Products: 0.99% | | | | | | | | | | | | | | | | |
Energizer Holdings Incorporated | | | | | | | | | | | 6,772 | | | | 303,589 | |
Kimberly-Clark Corporation | | | | | | | | | | | 3,526 | | | | 406,795 | |
Spectrum Brands Holdings Incorporated | | | | | | | | | | | 12,098 | | | | 597,399 | |
The Procter & Gamble Company | | | | | | | | | | | 27,515 | | | | 2,600,443 | |
| | | | |
| | | | | | | | | | | | | | | 3,908,226 | |
| | | | | | | | | | | | | | | | |
| | | | |
| Personal Products: 0.20% | | | | | | | | | | | | | | | | |
NU Skin Enterprises Incorporated Class A | | | | | | | | | | | 11,734 | | | | 774,092 | |
| | | | | | | | | | | | | | | | |
| | | | |
| Tobacco: 0.61% | | | | | | | | | | | | | | | | |
Altria Group Incorporated | | | | | | | | | | | 13,959 | | | | 765,372 | |
Philip Morris International Incorporated | | | | | | | | | | | 18,619 | | | | 1,611,102 | |
| | | | |
| | | | | | | | | | | | | | | 2,376,474 | |
| | | | | | | | | | | | | | | | |
| | | | |
Energy: 5.59% | | | | | | | | | | | | | | | | |
| | | | |
| Energy Equipment & Services: 0.61% | | | | | | | | | | | | | | | | |
Schlumberger Limited | | | | | | | | | | | 53,247 | | | | 2,401,440 | |
| | | | | | | | | | | | | | | | |
| | | | |
| Oil, Gas & Consumable Fuels: 4.98% | | | | | | | | | | | | | | | | |
Chevron Corporation | | | | | | | | | | | 41,116 | | | | 4,890,337 | |
ConocoPhillips | | | | | | | | | | | 16,150 | | | | 1,068,807 | |
Exxon Mobil Corporation | | | | | | | | | | | 82,637 | | | | 6,569,642 | |
Kinder Morgan Incorporated | | | | | | | | | | | 101,076 | | | | 1,725,367 | |
Marathon Petroleum Corporation | | | | | | | | | | | 10,654 | | | | 694,215 | |
Occidental Petroleum Corporation | | | | | | | | | | | 5,479 | | �� | | 385,009 | |
ONEOK Incorporated | | | | | | | | | | | 30,511 | | | | 1,874,291 | |
PBF Energy Incorporated Class A | | | | | | | | | | | 19,258 | | | | 744,899 | |
Valero Energy Corporation | | | | | | | | | | | 20,377 | | | | 1,628,122 | |
| | | | |
| | | | | | | | | | | | | | | 19,580,689 | |
| | | | | | | | | | | | | | | | |
The accompanying notes are an integral part of these financial statements.
| | | | |
| 6 | | Wells Fargo Disciplined Large Cap Portfolio | | Portfolio of investments—November 30, 2018 (unaudited) |
| | | | | | | | | | | | | | | | |
| Security name | | | | | | | | Shares | | | Value | |
| | | | |
Financials: 13.33% | | | | | | | | | | | | | | | | |
| | | | |
| Banks: 5.04% | | | | | | | | | | | | | | | | |
Bank of America Corporation | | | | | | | | | | | 199,769 | | | $ | 5,673,440 | |
BB&T Corporation | | | | | | | | | | | 15,002 | | | | 766,602 | |
Citigroup Incorporated | | | | | | | | | | | 57,304 | | | | 3,712,726 | |
Citizens Financial Group Incorporated | | | | | | | | | | | 17,999 | | | | 654,444 | |
First Hawaiian Incorporated | | | | | | | | | | | 30,317 | | | | 788,848 | |
JPMorgan Chase & Company | | | | | | | | | | | 52,383 | | | | 5,824,466 | |
KeyCorp | | | | | | | | | | | 21,053 | | | | 386,112 | |
Popular Incorporated | | | | | | | | | | | 18,028 | | | | 1,016,779 | |
SunTrust Banks Incorporated | | | | | | | | | | | 9,158 | | | | 574,115 | |
Umpqua Holdings Corporation | | | | | | | | | | | 22,089 | | | | 424,992 | |
| | | | |
| | | | | | | | | | | | | | | 19,822,524 | |
| | | | | | | | | | | | | | | | |
| | | | |
| Capital Markets: 1.73% | | | | | | | | | | | | | | | | |
Affiliated Managers Group Incorporated | | | | | | | | | | | 6,067 | | | | 674,165 | |
BGC Partners Incorporated Class A | | | | | | | | | | | 18,502 | | | | 195,011 | |
CBOE Holdings Incorporated | | | | | | | | | | | 7,438 | | | | 800,478 | |
Evercore Partners Incorporated Class A | | | | | | | | | | | 19,700 | | | | 1,626,432 | |
Intercontinental Exchange Incorporated | | | | | | | | | | | 4,914 | | | | 401,572 | |
Legg Mason Incorporated | | | | | | | | | | | 23,291 | | | | 674,740 | |
LPL Financial Holdings Incorporated | | | | | | | | | | | 13,318 | | | | 854,616 | |
MSCI Incorporated | | | | | | | | | | | 2,625 | | | | 412,361 | |
S&P Global Incorporated | | | | | | | | | | | 4,311 | | | | 788,309 | |
The Goldman Sachs Group Incorporated | | | | | | | | | | | 1,891 | �� | | | 360,595 | |
| | | | |
| | | | | | | | | | | | | | | 6,788,279 | |
| | | | | | | | | | | | | | | | |
| | | | |
| Consumer Finance: 0.70% | | | | | | | | | | | | | | | | |
Capital One Financial Corporation | | | | | | | | | | | 15,529 | | | | 1,392,641 | |
Synchrony Financial | | | | | | | | | | | 51,887 | | | | 1,348,024 | |
| | | | |
| | | | | | | | | | | | | | | 2,740,665 | |
| | | | | | | | | | | | | | | | |
| | | | |
| Diversified Financial Services: 1.65% | | | | | | | | | | | | | | | | |
Berkshire Hathaway Incorporated Class B † | | | | | | | | | | | 29,665 | | | | 6,474,090 | |
| | | | | | | | | | | | | | | | |
| | | | |
| Insurance: 4.21% | | | | | | | | | | | | | | | | |
AFLAC Incorporated | | | | | | | | | | | 46,211 | | | | 2,113,691 | |
American International Group Incorporated | | | | | | | | | | | 4,599 | | | | 198,907 | |
Assured Guaranty Limited | | | | | | | | | | | 9,601 | | | | 391,913 | |
Brown & Brown Incorporated | | | | | | | | | | | 15,015 | | | | 435,735 | |
Everest Reinsurance Group Limited | | | | | | | | | | | 7,473 | | | | 1,659,604 | |
Fidelity National Financial Incorporated | | | | | | | | | | | 21,518 | | | | 723,005 | |
Mercury General Corporation | | | | | | | | | | | 6,540 | | | | 370,491 | |
MetLife Incorporated | | | | | | | | | | | 45,979 | | | | 2,052,043 | |
Old Republic International Corporation | | | | | | | | | | | 26,710 | | | | 602,311 | |
Prudential Financial Incorporated | | | | | | | | | | | 12,095 | | | | 1,134,027 | |
Reinsurance Group of America Incorporated | | | | | | | | | | | 7,838 | | | | 1,170,840 | |
RenaissanceRe Holdings Limited | | | | | | | | | | | 3,210 | | | | 425,678 | |
The Allstate Corporation | | | | | | | | | | | 11,725 | | | | 1,045,753 | |
The Hartford Financial Services Group Incorporated | | | | | | | | | | | 17,687 | | | | 781,589 | |
The accompanying notes are an integral part of these financial statements.
| | | | | | |
| Portfolio of investments—November 30, 2018 (unaudited) | | Wells Fargo Disciplined Large Cap Portfolio | | | 7 | |
| | | | | | | | | | | | | | | | |
| Security name | | | | | | | | Shares | | | Value | |
| | | | |
| Insurance(continued) | | | | | | | | | | | | | | | | |
The Progressive Corporation | | | | | | | | | | | 5,581 | | | $ | 369,964 | |
The Travelers Companies Incorporated | | | | | | | | | | | 8,101 | | | | 1,056,127 | |
Torchmark Corporation | | | | | | | | | | | 8,815 | | | | 761,704 | |
Unum Group | | | | | | | | | | | 11,361 | | | | 407,974 | |
W.R. Berkley Corporation | | | | | | | | | | | 10,653 | | | | 839,243 | |
| | | | |
| | | | | | | | | | | | | | | 16,540,599 | |
| | | | | | | | | | | | | | | | |
| | | | |
Health Care: 15.45% | | | | | | | | | | | | | | | | |
| | | | |
| Biotechnology: 2.76% | | | | | | | | | | | | | | | | |
AbbVie Incorporated | | | | | | | | | | | 39,120 | | | | 3,687,842 | |
Amgen Incorporated | | | | | | | | | | | 13,435 | | | | 2,797,839 | |
Exelixis Incorporated † | | | | | | | | | | | 43,567 | | | | 884,846 | |
Gilead Sciences Incorporated | | | | | | | | | | | 37,897 | | | | 2,726,310 | |
United Therapeutics Corporation † | | | | | | | | | | | 6,406 | | | | 756,549 | |
| | | | |
| | | | | | | | | | | | | | | 10,853,386 | |
| | | | | | | | | | | | | | | | |
| | | | |
| Health Care Equipment & Supplies: 2.43% | | | | | | | | | | | | | | | | |
Abbott Laboratories | | | | | | | | | | | 37,288 | | | | 2,761,176 | |
ABIOMED Incorporated † | | | | | | | | | | | 4,082 | | | | 1,358,000 | |
Baxter International Incorporated | | | | | | | | | | | 24,379 | | | | 1,671,180 | |
Danaher Corporation | | | | | | | | | | | 3,918 | | | | 429,178 | |
ICU Medical Incorporated † | | | | | | | | | | | 5,087 | | | | 1,223,373 | |
Medtronic plc | | | | | | | | | | | 21,714 | | | | 2,117,766 | |
| | | | |
| | | | | | | | | | | | | | | 9,560,673 | |
| | | | | | | | | | | | | | | | |
| | | | |
| Health Care Providers & Services: 4.42% | | | | | | | | | | | | | | | | |
AmerisourceBergen Corporation | | | | | | | | | | | 9,255 | | | | 822,770 | |
Anthem Incorporated | | | | | | | | | | | 7,693 | | | | 2,231,509 | |
Cardinal Health Incorporated | | | | | | | | | | | 13,075 | | | | 716,902 | |
Cigna Corporation | | | | | | | | | | | 2,548 | | | | 569,172 | |
CVS Health Corporation | | | | | | | | | | | 37,345 | | | | 2,995,092 | |
Express Scripts Holding Company † | | | | | | | | | | | 14,463 | | | | 1,467,561 | |
Humana Incorporated | | | | | | | | | | | 6,607 | | | | 2,176,808 | |
McKesson Corporation | | | | | | | | | | | 6,439 | | | | 801,656 | |
UnitedHealth Group Incorporated | | | | | | | | | | | 19,864 | | | | 5,588,935 | |
| | | | |
| | | | | | | | | | | | | | | 17,370,405 | |
| | | | | | | | | | | | | | | | |
| | | | |
| Health Care Technology: 0.19% | | | | | | | | | | | | | | | | |
Veeva Systems Incorporated Class A † | | | | | | | | | | | 7,657 | | | | 736,297 | |
| | | | | | | | | | | | | | | | |
| | | | |
| Life Sciences Tools & Services: 0.32% | | | | | | | | | | | | | | | | |
Agilent Technologies Incorporated | | | | | | | | | | | 6,445 | | | | 466,296 | |
Bio-Rad Laboratories Incorporated Class A † | | | | | | | | | | | 2,803 | | | | 769,311 | |
| | | | |
| | | | | | | | | | | | | | | 1,235,607 | |
| | | | | | | | | | | | | | | | |
| | | | |
| Pharmaceuticals: 5.33% | | | | | | | | | | | | | | | | |
Allergan plc | | | | | | | | | | | 7,604 | | | | 1,190,786 | |
Bristol-Myers Squibb Company | | | | | | | | | | | 26,021 | | | | 1,391,083 | |
The accompanying notes are an integral part of these financial statements.
| | | | |
| 8 | | Wells Fargo Disciplined Large Cap Portfolio | | Portfolio of investments—November 30, 2018 (unaudited) |
| | | | | | | | | | | | | | | | |
| Security name | | | | | | | | Shares | | | Value | |
| | | | |
| Pharmaceuticals(continued) | | | | | | | | | | | | | | | | |
Eli Lilly & Company | | | | | | | | | | | 20,358 | | | $ | 2,415,273 | |
Johnson & Johnson | | | | | | | | | | | 43,897 | | | | 6,448,469 | |
Merck & Company Incorporated | | | | | | | | | | | 53,017 | | | | 4,206,369 | |
Nektar Therapeutics † | | | | | | | | | | | 13,498 | | | | 545,184 | |
Pfizer Incorporated | | | | | | | | | | | 102,653 | | | | 4,745,648 | |
| | | | |
| | | | | | | | | | | | | | | 20,942,812 | |
| | | | | | | | | | | | | | | | |
| | | | |
Industrials: 9.65% | | | | | | | | | | | | | | | | |
| | | | |
| Aerospace & Defense: 1.47% | | | | | | | | | | | | | | | | |
Arconic Incorporated | | | | | | | | | | | 19,284 | | | | 414,220 | |
Raytheon Company | | | | | | | | | | | 7,923 | | | | 1,389,219 | |
The Boeing Company | | | | | | | | | | | 5,988 | | | | 2,076,399 | |
United Technologies Corporation | | | | | | | | | | | 15,542 | | | | 1,893,637 | |
| | | | |
| | | | | | | | | | | | | | | 5,773,475 | |
| | | | | | | | | | | | | | | | |
| | | | |
| Air Freight & Logistics: 1.63% | | | | | | | | | | | | | | | | |
C.H. Robinson Worldwide Incorporated | | | | | | | | | | | 13,632 | | | | 1,258,643 | |
Expeditors International of Washington Incorporated | | | | | | | | | | | 11,291 | | | | 859,132 | |
FedEx Corporation | | | | | | | | | | | 6,503 | | | | 1,489,187 | |
United Parcel Service Incorporated Class B | | | | | | | | | | | 18,433 | | | | 2,125,141 | |
XPO Logistics Incorporated † | | | | | | | | | | | 8,834 | | | | 670,147 | |
| | | | |
| | | | | | | | | | | | | | | 6,402,250 | |
| | | | | | | | | | | | | | | | |
| | | | |
| Airlines: 0.48% | | | | | | | | | | | | | | | | |
Delta Air Lines Incorporated | | | | | | | | | | | 24,050 | | | | 1,460,076 | |
United Continental Holdings Incorporated † | | | | | | | | | | | 4,504 | | | | 435,537 | |
| | | | |
| | | | | | | | | | | | | | | 1,895,613 | |
| | | | | | | | | | | | | | | | |
| | | | |
| Commercial Services & Supplies: 0.17% | | | | | | | | | | | | | | | | |
Waste Management Incorporated | | | | | | | | | | | 7,296 | | | | 684,000 | |
| | | | | | | | | | | | | | | | |
| | | | |
| Construction & Engineering: 0.42% | | | | | | | | | | | | | | | | |
Fluor Corporation | | | | | | | | | | | 20,044 | | | | 820,401 | |
Quanta Services Incorporated † | | | | | | | | | | | 23,187 | | | | 813,864 | |
| | | | |
| | | | | | | | | | | | | | | 1,634,265 | |
| | | | | | | | | | | | | | | | |
| | | | |
| Electrical Equipment: 0.74% | | | | | | | | | | | | | | | | |
Eaton Corporation plc | | | | | | | | | | | 24,670 | | | | 1,898,110 | |
Emerson Electric Company | | | | | | | | | | | 5,411 | | | | 365,351 | |
Regal-Beloit Corporation | | | | | | | | | | | 8,485 | | | | 663,357 | |
| | | | |
| | | | | | | | | | | | | | | 2,926,818 | |
| | | | | | | | | | | | | | | | |
| | | | |
| Industrial Conglomerates: 0.67% | | | | | | | | | | | | | | | | |
3M Company | | | | | | | | | | | 1,895 | | | | 394,008 | |
General Electric Company | | | | | | | | | | | 13,512 | | | | 101,340 | |
Honeywell International Incorporated | | | | | | | | | | | 14,455 | | | | 2,121,271 | |
| | | | |
| | | | | | | | | | | | | | | 2,616,619 | |
| | | | | | | | | | | | | | | | |
The accompanying notes are an integral part of these financial statements.
| | | | | | |
| Portfolio of investments—November 30, 2018 (unaudited) | | Wells Fargo Disciplined Large Cap Portfolio | | | 9 | |
| | | | | | | | | | | | | | | | |
| Security name | | | | | | | | Shares | | | Value | |
| | | | |
| Machinery: 1.06% | | | | | | | | | | | | | | | | |
Allison Transmission Holdings Incorporated | | | | | | | | | | | 27,607 | | | $ | 1,300,566 | |
Caterpillar Incorporated | | | | | | | | | | | 3,119 | | | | 423,155 | |
Cummins Incorporated | | | | | | | | | | | 4,654 | | | | 703,033 | |
Oshkosh Corporation | | | | | | | | | | | 13,889 | | | | 990,702 | |
The Timken Company | | | | | | | | | | | 18,488 | | | | 742,293 | |
| | | | |
| | | | | | | | | | | | | | | 4,159,749 | |
| | | | | | | | | | | | | | | | |
| | | | |
| Professional Services: 0.79% | | | | | | | | | | | | | | | | |
Dun & Bradstreet Corporation | | | | | | | | | | | 2,766 | | | | 397,032 | |
Manpower Incorporated | | | | | | | | | | | 19,327 | | | | 1,568,966 | |
Robert Half International Incorporated | | | | | | | | | | | 18,449 | | | | 1,140,702 | |
| | | | |
| | | | | | | | | | | | | | | 3,106,700 | |
| | | | | | | | | | | | | | | | |
| | | | |
| Road & Rail: 1.39% | | | | | | | | | | | | | | | | |
Landstar System Incorporated | | | | | | | | | | | 13,079 | | | | 1,426,657 | |
Old Dominion Freight Line Incorporated | | | | | | | | | | | 8,256 | | | | 1,128,843 | |
Ryder System Incorporated | | | | | | | | | | | 10,301 | | | | 582,728 | |
Schneider National Incorporated Class B | | | | | | | | | | | 66,402 | | | | 1,482,757 | |
Union Pacific Corporation | | | | | | | | | | | 5,582 | | | | 858,400 | |
| | | | |
| | | | | | | | | | | | | | | 5,479,385 | |
| | | | | | | | | | | | | | | | |
| | | | |
| Trading Companies & Distributors: 0.83% | | | | | | | | | | | | | | | | |
HD Supply Holdings Incorporated † | | | | | | | | | | | 31,233 | | | | 1,246,197 | |
W.W. Grainger Incorporated | | | | | | | | | | | 2,708 | | | | 850,420 | |
WESCO International Incorporated † | | | | | | | | | | | 21,508 | | | | 1,148,742 | |
| | | | |
| | | | | | | | | | | | | | | 3,245,359 | |
| | | | | | | | | | | | | | | | |
| | | | |
Information Technology: 20.20% | | | | | | | | | | | | | | | | |
| | | | |
| Communications Equipment: 1.52% | | | | | | | | | | | | | | | | |
Arista Networks Incorporated † | | | | | | | | | | | 3,618 | | | | 862,821 | |
Cisco Systems Incorporated | | | | | | | | | | | 107,016 | | | | 5,122,856 | |
| | | | |
| | | | | | | | | | | | | | | 5,985,677 | |
| | | | | | | | | | | | | | | | |
| | | | |
| Electronic Equipment, Instruments & Components: 0.37% | | | | | | | | | | | | | | | | |
CDW Corporation of Delaware | | | | | | | | | | | 15,440 | | | | 1,430,979 | |
| | | | | | | | | | | | | | | | |
| | | | |
| IT Services: 3.99% | | | | | | | | | | | | | | | | |
Accenture plc Class A | | | | | | | | | | | 10,881 | | | | 1,790,142 | |
Alliance Data Systems Corporation | | | | | | | | | | | 3,589 | | | | 719,092 | |
FleetCor Technologies Incorporated † | | | | | | | | | | | 3,788 | | | | 732,599 | |
International Business Machines Corporation | | | | | | | | | | | 14,980 | | | | 1,861,565 | |
MasterCard Incorporated Class A | | | | | | | | | | | 17,410 | | | | 3,500,629 | |
Paychex Incorporated | | | | | | | | | | | 7,159 | | | | 506,571 | |
Total System Services Incorporated | | | | | | | | | | | 8,478 | | | | 740,723 | |
Twilio Incorporated Class A † | | | | | | | | | | | 4,557 | | | | 430,591 | |
Visa Incorporated Class A | | | | | | | | | | | 38,124 | | | | 5,402,552 | |
| | | | |
| | | | | | | | | | | | | | | 15,684,464 | |
| | | | | | | | | | | | | | | | |
The accompanying notes are an integral part of these financial statements.
| | | | |
| 10 | | Wells Fargo Disciplined Large Cap Portfolio | | Portfolio of investments—November 30, 2018 (unaudited) |
| | | | | | | | | | | | | | | | |
| Security name | | | | | | | | Shares | | | Value | |
| | | | |
| Semiconductors & Semiconductor Equipment: 3.81% | | | | | | | | | | | | | | | | |
Analog Devices Incorporated | | | | | | | | | | | 8,729 | | | $ | 802,370 | |
Broadcom Incorporated | | | | | | | | | | | 11,558 | | | | 2,743,985 | |
Intel Corporation | | | | | | | | | | | 98,724 | | | | 4,868,080 | |
Lam Research Corporation | | | | | | | | | | | 8,738 | | | | 1,371,516 | |
Micron Technology Incorporated † | | | | | | | | | | | 53,939 | | | | 2,079,888 | |
NVIDIA Corporation | | | | | | | | | | | 4,366 | | | | 713,535 | |
Texas Instruments Incorporated | | | | | | | | | | | 23,823 | | | | 2,378,727 | |
| | | | |
| | | | | | | | | | | | | | | 14,958,101 | |
| | | | | | | | | | | | | | | | |
| | | | |
| Software: 5.88% | | | | | | | | | | | | | | | | |
Adobe Systems Incorporated † | | | | | | | | | | | 1,782 | | | | 447,086 | |
Cadence Design Systems Incorporated † | | | | | | | | | | | 18,377 | | | | 827,700 | |
Citrix Systems Incorporated | | | | | | | | | | | 7,316 | | | | 797,225 | |
Dell Technologies Incorporated Class V † | | | | | | | | | | | 4,262 | | | | 449,556 | |
Intuit Incorporated | | | | | | | | | | | 8,192 | | | | 1,757,430 | |
Microsoft Corporation | | | | | | | | | | | 126,483 | | | | 14,025,700 | |
Oracle Corporation | | | | | | | | | | | 58,746 | | | | 2,864,455 | |
Proofpoint Incorporated † | | | | | | | | | | | 7,016 | | | | 680,622 | |
Synopsys Incorporated † | | | | | | | | | | | 4,487 | | | | 412,535 | |
The Ultimate Software Group Incorporated † | | | | | | | | | | | 1,549 | | | | 408,812 | |
VMware Incorporated Class A † | | | | | | | | | | | 2,577 | | | | 431,235 | |
| | | | |
| | | | | | | | | | | | | | | 23,102,356 | |
| | | | | | | | | | | | | | | | |
| | | | |
| Technology Hardware, Storage & Peripherals: 4.63% | | | | | | | | | | | | | | | | |
Apple Incorporated | | | | | | | | | | | 82,839 | | | | 14,793,386 | |
HP Incorporated | | | | | | | | | | | 79,585 | | | | 1,830,455 | |
NetApp Incorporated | | | | | | | | | | | 10,985 | | | | 734,567 | |
Western Digital Corporation | | | | | | | | | | | 18,564 | | | | 842,620 | |
| | | | |
| | | | | | | | | | | | | | | 18,201,028 | |
| | | | | | | | | | | | | | | | |
| | | | |
Materials: 2.74% | | | | | | | | | | | | | | | | |
| | | | |
| Chemicals: 1.21% | | | | | | | | | | | | | | | | |
DowDuPont Incorporated | | | | | | | | | | | 20,521 | | | | 1,187,140 | |
Huntsman Corporation | | | | | | | | | | | 51,810 | | | | 1,047,598 | |
LyondellBasell Industries NV Class A | | | | | | | | | | | 19,355 | | | | 1,806,015 | |
The Chemours Company | | | | | | | | | | | 24,939 | | | | 710,263 | |
| | | | |
| | | | | | | | | | | | | | | 4,751,016 | |
| | | | | | | | | | | | | | | | |
| | | | |
| Containers & Packaging: 0.58% | | | | | | | | | | | | | | | | |
Avery Dennison Corporation | | | | | | | | | | | 7,395 | | | | 712,878 | |
Packaging Corporation of America | | | | | | | | | | | 8,510 | | | | 832,448 | |
Sonoco Products Company | | | | | | | | | | | 12,951 | | | | 745,201 | |
| | | | |
| | | | | | | | | | | | | | | 2,290,527 | |
| | | | | | | | | | | | | | | | |
| | | | |
| Metals & Mining: 0.95% | | | | | | | | | | | | | | | | |
Freeport-McMoRan Incorporated | | | | | | | | | | | 146,247 | | | | 1,746,189 | |
Nucor Corporation | | | | | | | | | | | 6,745 | | | | 407,465 | |
Reliance Steel & Aluminum Company | | | | | | | | | | | 6,384 | | | | 513,593 | |
Steel Dynamics Incorporated | | | | | | | | | | | 29,754 | | | | 1,047,341 | |
| | | | |
| | | | | | | | | | | | | | | 3,714,588 | |
| | | | | | | | | | | | | | | | |
The accompanying notes are an integral part of these financial statements.
| | | | | | |
| Portfolio of investments—November 30, 2018 (unaudited) | | Wells Fargo Disciplined Large Cap Portfolio | | | 11 | |
| | | | | | | | | | | | | | | | |
| Security name | | | | | | | | Shares | | | Value | |
| | | | |
Real Estate: 3.81% | | | | | | | | | | | | | | | | |
| | | | |
| Equity REITs: 3.41% | | | | | | | | | | | | | | | | |
American Tower Corporation | | | | | | | | | | | 16,348 | | | $ | 2,689,083 | |
Crown Castle International Corporation | | | | | | | | | | | 17,416 | | | | 2,001,098 | |
Digital Realty Trust Incorporated | | | | | | | | | | | 6,995 | | | | 804,705 | |
Equinix Incorporated | | | | | | | | | | | 4,657 | | | | 1,794,249 | |
Hospitality Properties Trust | | | | | | | | | | | 26,401 | | | | 708,603 | |
Kimco Realty Corporation | | | | | | | | | | | 46,817 | | | | 765,458 | |
Prologis Incorporated | | | | | | | | | | | 20,093 | | | | 1,353,063 | |
SBA Communications Corporation † | | | | | | | | | | | 6,171 | | | | 1,054,069 | |
Simon Property Group Incorporated | | | | | | | | | | | 5,955 | | | | 1,105,784 | |
Weyerhaeuser Company | | | | | | | | | | | 43,346 | | | | 1,144,768 | |
| | | | |
| | | | | | | | | | | | | | | 13,420,880 | |
| | | | | | | | | | | | | | | | |
| | | | |
| Real Estate Management & Development: 0.40% | | | | | | | | | | | | | | | | |
CBRE Group Incorporated Class A † | | | | | | | | | | | 36,019 | | | | 1,573,310 | |
| | | | | | | | | | | | | | | | |
| | | | |
Utilities: 2.45% | | | | | | | | | | | | | | | | |
| | | | |
| Electric Utilities: 1.02% | | | | | | | | | | | | | | | | |
Exelon Corporation | | | | | | | | | | | 48,148 | | | | 2,233,586 | |
The Southern Company | | | | | | | | | | | 37,931 | | | | 1,795,274 | |
| | | | |
| | | | | | | | | | | | | | | 4,028,860 | |
| | | | | | | | | | | | | | | | |
| | | | |
| Gas Utilities: 0.43% | | | | | | | | | | | | | | | | |
UGI Corporation | | | | | | | | | | | 29,450 | | | | 1,691,903 | |
| | | | | | | | | | | | | | | | |
| | | | |
| Multi-Utilities: 1.00% | | | | | | | | | | | | | | | | |
Ameren Corporation | | | | | | | | | | | 6,277 | | | | 430,728 | |
CenterPoint Energy Incorporated | | | | | | | | | | | 53,216 | | | | 1,490,580 | |
Dominion Energy Incorporated | | | | | | | | | | | 5,239 | | | | 390,306 | |
DTE Energy Company | | | | | | | | | | | 7,264 | | | | 869,791 | |
MDU Resources Group Incorporated | | | | | | | | | | | 28,111 | | | | 744,098 | |
| | | | |
| | | | | | | | | | | | | | | 3,925,503 | |
| | | | | | | | | | | | | | | | |
| | | | |
Total Common Stocks (Cost $397,417,254) | | | | | | | | | | | | | | | 390,008,624 | |
| | | | | | | | | | | | | | | | |
| | | | |
| | | Yield | | | | | | | | | | |
| Short-Term Investments: 0.55% | | | | | | | | | | | | | | | | |
| | | | |
| Investment Companies: 0.55% | | | | | | | | | | | | | | | | |
Wells Fargo Government Money Market Fund Select Class (l)(u) | | | 2.13 | % | | | | | | | 2,154,144 | | | | 2,154,144 | |
| | | | | | | | | | | | | | | | |
| | | | |
Total Short-Term Investments (Cost $2,154,144) | | | | | | | | | | | | | | | 2,154,144 | |
| | | | | | | | | | | | | | | | |
| | | | | | | | |
| Total investments in securities (Cost $399,571,398) | | | 99.80 | % | | | 392,162,768 | |
Other assets and liabilities, net | | | 0.20 | | | | 776,815 | |
| | | | | | | | |
| Total net assets | | | 100.00 | % | | $ | 392,939,583 | |
| | | | | | | | |
The accompanying notes are an integral part of these financial statements.
| | | | |
| 12 | | Wells Fargo Disciplined Large Cap Portfolio | | Portfolio of investments—November 30, 2018 (unaudited) |
| † | Non-income-earning security |
| (l) | The issuer of the security is an affiliated person of the Portfolio as defined in the Investment Company Act of 1940. |
| (u) | The rate represents the 7-day annualized yield at period end. |
Investments in Affiliates
An affiliated investment is an investment in which the Portfolio owns at least 5% of the outstanding voting shares of the issuer or as a result of other relationships, such as the Portfolio and the issuer having the same adviser or investment manager. Transactions with issuers that were either affiliated persons of the Portfolio at the beginning of the period or the end of the period were as follows:
| | | | | | | | | | | | | | | | | | | | | | | | | | | | | | | | | | | | |
| | | Shares,
beginning of
period | | | Shares
purchased | | | Shares
sold | | | Shares,
end of
period | | | Net
realized
gains
(losses) | | | Net
change in
unrealized
gains
(losses) | | | Income
from
affiliated
securities | | | Value,
end
of period | | | % of
net
assets | |
Short-Term Investments | | | | | | | | | | | | | | | | | | | | | | | | | | | | | | | | | | | | |
Investment Companies | | | | | | | | | | | | | | | | | | | | | | | | | | | | | | | | | | | | |
Wells Fargo Government Money Market Fund Select Class | | | 0 | | | | 340,374,293 | | | | 338,220,149 | | | | 2,154,144 | | | $ | 0 | | | $ | 0 | | | $ | 46,286 | | | $ | 2,154,144 | | | | 0.55 | % |
The accompanying notes are an integral part of these financial statements.
| | | | | | |
| Statement of assets and liabilities—November 30, 2018 (unaudited) | | Wells Fargo Disciplined Large Cap Portfolio | | | 13 | |
| | | | |
| | | | |
| |
Assets | | | | |
Investments in unaffiliated securities, at value (cost $397,417,254) | | $ | 390,008,624 | |
Investments in affiliated securities, at value (cost $2,154,144) | | | 2,154,144 | |
Receivable for dividends | | | 886,623 | |
Prepaid expenses and other assets | | | 2,965 | |
| | | | |
Total assets | | | 393,052,356 | |
| | | | |
| |
Liabilities | | | | |
Advisory fee payable | | | 85,550 | |
Accrued expenses and other liabilities | | | 27,223 | |
| | | | |
Total liabilities | | | 112,773 | |
| | | | |
Total net assets | | $ | 392,939,583 | |
| | | | |
The accompanying notes are an integral part of these financial statements.
| | | | |
| 14 | | Wells Fargo Disciplined Large Cap Portfolio | | Statement of operations—Period ended November 30, 20181 (unaudited) |
| | | | |
| | | | |
| |
Investment income | | | | |
Dividends (net of foreign dividend withholding taxes of $15,810) | | $ | 4,989,935 | |
Income from affiliated securities | | | 46,286 | |
| | | | |
Total investment income | | | 5,036,221 | |
| | | | |
| |
Expenses | | | | |
Advisory fee | | | 508,577 | |
Custody and accounting fees | | | 8,221 | |
Professional fees | | | 23,225 | |
Shareholder report expenses | | | 2,661 | |
Trustees’ fees and expenses | | | 11,743 | |
Other fees and expenses | | | 4,266 | |
| | | | |
Total expenses | | | 558,693 | |
| | | | |
Net investment income | | | 4,477,528 | |
| | | | |
| |
REALIZED AND UNREALIZED GAINS (LOSSES) ON INVESTMENTS | | | | |
Net realized losses on investments | | | (2,335,836 | ) |
Net change in unrealized gains (losses) on investments | | | (7,408,630 | ) |
| | | | |
Net realized and unrealized gains (losses) on investments | | | (9,744,466 | ) |
| | | | |
Net decrease in net assets resulting from operations | | $ | (5,266,938 | ) |
| | | | |
| 1 | For the period from June 12, 2018 (commencement of operations) to November 30, 2018. |
The accompanying notes are an integral part of these financial statements.
| | | | | | |
| Statement of changes in net assets | | Wells Fargo Disciplined Large Cap Portfolio | | | 15 | |
| | | | |
| | | Period ended
November 30, 2018
(unaudited)1 | |
| |
Operations | | | | |
Net investment income | | $ | 4,477,528 | |
Net realized losses on investments | | | (2,335,836 | ) |
Net change in unrealized gains (losses) on investments | | | (7,408,630 | ) |
| | | | |
Net decrease in net assets resulting from operations | | | (5,266,938 | ) |
| | | | |
| |
Capital transactions | | | | |
Transactions in investors’ beneficial interests | | | | |
Contributions | | | 454,169,423 | |
Withdrawals | | | (55,962,902 | ) |
| | | | |
Net increase in net assets resulting from capital transactions | | | 398,206,521 | |
| | | | |
Total increase in net assets | | | 392,939,583 | |
| | | | |
| |
Net assets | | | | |
Beginning of period | | | 0 | |
| | | | |
End of period | | $ | 392,939,583 | |
| | | | |
| 1 | For the period from June 12, 2018 (commencement of operations) to November 30, 2018. |
The accompanying notes are an integral part of these financial statements.
| | | | |
| 16 | | Wells Fargo Disciplined Large Cap Portfolio | | Financial highlights |
| | | | |
| | | Period ended
November 30, 20181
(unaudited) | |
Total return2 | | | (1.45 | )% |
Ratios to average net assets (annualized) | | | | |
Gross expenses | | | 0.27 | % |
Net expenses | | | 0.27 | % |
Net investment income | | | 2.16 | % |
Supplemental data | | | | |
Portfolio turnover rate | | | 42 | % |
| 1 | For the period from June 12, 2018 (commencement of operations) to November 30, 2018. |
| 2 | Returns for periods of less than one year are not annualized. |
The accompanying notes are an integral part of these financial statements.
| | | | | | |
| Notes to financial statements (unaudited) | | Wells Fargo Disciplined Large Cap Portfolio | | | 17 | |
1. ORGANIZATION
Wells Fargo Master Trust (the “Trust”), a Delaware statutory trust organized on March 10, 1999, is an open-end management investment company registered under the Investment Company Act of 1940, as amended (the “1940 Act”). As an investment company, the Trust follows the accounting and reporting guidance in Financial Accounting Standards Board (“FASB”) Accounting Standards Codification Topic 946, Financial Services – Investment Companies. These financial statements report on the Wells Fargo Disciplined Large Cap Portfolio (the “Portfolio”) which is a diversified series of the Trust.
2. SIGNIFICANT ACCOUNTING POLICIES
The following significant accounting policies, which are consistently followed in the preparation of the financial statements of the Portfolio, are in conformity with U.S. generally accepted accounting principles which require management to make estimates and assumptions that affect the reported amounts of assets and liabilities, disclosure of contingent assets and liabilities at the date of the financial statements, and the reported amounts of revenues and expenses during the reporting period. Actual results could differ from those estimates.
Securities valuation
All investments are valued each business day as of the close of regular trading on the New York Stock Exchange (generally 4 p.m. Eastern Time), although the Portfolio may deviate from this calculation time under unusual or unexpected circumstances.
Equity securities that are listed on a foreign or domestic exchange or market are valued at the official closing price or, if none, the last sales price. If no sale occurs on the principal exchange or market that day, a fair value price will be determined in accordance with the Portfolio’s Valuation Procedures.
Investments in registered open-end investment companies are valued at net asset value.
Investments which are not valued using any of the methods discussed above are valued at their fair value, as determined in good faith by the Board of Trustees of the Portfolio. The Board of Trustees has established a Valuation Committee comprised of the Trustees and has delegated to it the authority to take any actions regarding the valuation of portfolio securities that the Valuation Committee deems necessary or appropriate, including determining the fair value of portfolio securities, unless the determination has been delegated to the Wells Fargo Asset Management Pricing Committee at Wells Fargo Funds Management, LLC (“Funds Management”). The Board of Trustees retains the authority to make or ratify any valuation decisions or approve any changes to the Valuation Procedures as it deems appropriate. On a quarterly basis, the Board of Trustees receives reports on any valuation actions taken by the Valuation Committee or the Wells Fargo Asset Management Pricing Committee which may include items for ratification.
Security transactions and income recognition
Securities transactions are recorded on a trade date basis. Realized gains or losses are recorded on the basis of identified cost.
Dividend income is recognized on the ex-dividend date. Dividend income is recorded net of foreign taxes withheld where recovery of such taxes is not assured.
Federal and other taxes
The Portfolio is treated as a separate entity for federal income tax purposes. The Portfolio is not required to pay federal income taxes on its net investment income and net capital gains as it is treated as a partnership for federal income tax purposes. All interest, dividends, gains and losses of the Portfolio are deemed to have been “passed through” to the interest holders in proportion to their holdings of the Portfolio regardless of whether such interest, dividends and gains have been distributed by the Portfolio.
The Portfolio’s income tax returns and all financial records supporting those returns for the fiscal year are subject to examination by the federal revenue authority. Management has analyzed the Portfolio’s tax positions taken on federal, state, and foreign tax returns for all open tax years and does not believe that there are any uncertain tax positions that require recognition of a tax liability.
| | | | |
| 18 | | Wells Fargo Disciplined Large Cap Portfolio | | Notes to financial statements (unaudited) |
As of November 30, 2018, the aggregate cost of all investments for federal income tax purposes was $399,571,398 and the unrealized gains (losses) consisted of:
| | | | |
Gross unrealized gains | | $ | 17,564,467 | |
Gross unrealized losses | | | (24,973,097 | ) |
Net unrealized loss | | $ | (7,408,630 | ) |
3. FAIR VALUATION MEASUREMENTS
Fair value measurements of investments are determined within a framework that has established a fair value hierarchy based upon the various data inputs utilized in determining the value of the Portfolio’s investments. The three-level hierarchy gives the highest priority to unadjusted quoted prices in active markets for identical assets or liabilities (Level 1) and the lowest priority to unobservable inputs (Level 3). The Portfolio’s investments are classified within the fair value hierarchy based on the lowest level of input that is significant to the fair value measurement. The inputs are summarized into three broad levels as follows:
| ∎ | | Level 1 – quoted prices in active markets for identical securities |
| ∎ | | Level 2 – other significant observable inputs (including quoted prices for similar securities, interest rates, prepayment speeds, credit risk, etc.) |
| ∎ | | Level 3 – significant unobservable inputs (including the Portfolio’s own assumptions in determining the fair value of investments) |
The inputs or methodologies used for valuing investments in securities are not necessarily an indication of the risk associated with investing in those securities.
The following is a summary of the inputs used in valuing the Portfolio’s assets and liabilities as of November 30, 2018:
| | | | | | | | | | | | | | | | |
| | | Quoted prices
(Level 1) | | | Other significant
observable inputs
(Level 2) | | | Significant
unobservable inputs (Level 3) | | | Total | |
Assets | | | | | | | | | | | | | | | | |
Investments in: | | | | | | | | | | | | | | | | |
| | | | |
Common stocks | | | | | | | | | | | | | | | | |
Communication services | | $ | 39,287,511 | | | $ | 0 | | | $ | 0 | | | $ | 39,287,511 | |
Consumer discretionary | | | 37,828,006 | | | | 0 | | | | 0 | | | | 37,828,006 | |
Consumer staples | | | 25,162,216 | | | | 0 | | | | 0 | | | | 25,162,216 | |
Energy | | | 21,982,129 | | | | 0 | | | | 0 | | | | 21,982,129 | |
Financials | | | 52,366,157 | | | | 0 | | | | 0 | | | | 52,366,157 | |
Health care | | | 60,699,180 | | | | 0 | | | | 0 | | | | 60,699,180 | |
Industrials | | | 37,924,233 | | | | 0 | | | | 0 | | | | 37,924,233 | |
Information technology | | | 79,362,605 | | | | 0 | | | | 0 | | | | 79,362,605 | |
Materials | | | 10,756,131 | | | | 0 | | | | 0 | | | | 10,756,131 | |
Real estate | | | 14,994,190 | | | | 0 | | | | 0 | | | | 14,994,190 | |
Utilities | | | 9,646,266 | | | | 0 | | | | 0 | | | | 9,646,266 | |
| | | | |
Short-term investments | | | | | | | | | | | | | | | | |
Investment companies | | | 2,154,144 | | | | 0 | | | | 0 | | | | 2,154,144 | |
Total assets | | $ | 392,162,768 | | | $ | 0 | | | $ | 0 | | | $ | 392,162,768 | |
Additional sector, industry or geographic detail is included in the Portfolio of Investments.
At November 30, 2018, the Portfolio did not have any transfers into/out of Level 3.
| | | | | | |
| Notes to financial statements (unaudited) | | Wells Fargo Disciplined Large Cap Portfolio | | | 19 | |
4. TRANSACTIONS WITH AFFILIATES
Advisory fee
The Trust has entered into an advisory contract with Funds Management, an indirect wholly owned subsidiary of Wells Fargo & Company (“Wells Fargo”). The adviser is responsible for implementing investment policies and guidelines and for supervising the subadviser, who is responsible for day-to-day portfolio management of the Portfolio. Pursuant to the contract, Funds Management is entitled to receive an annual advisory fee starting at 0.25% and declining to 0.20% as the average daily net assets of the Portfolio increase. For the period ended November 30, 2018, the advisory fee was equivalent to an annual rate of 0.25% of the Portfolio’s average daily net assets.
Funds Management has retained the services of a subadviser to provide daily portfolio management to the Portfolio. The fee for subadvisory services is borne by Funds Management. Wells Capital Management Incorporated, an affiliate of Funds Management and an indirect wholly owned subsidiary of Wells Fargo, is the subadviser to the Portfolio and is entitled to receive a fee from Funds Management at an annual rate starting at 0.20% and declining to 0.15% as the average daily net assets of the Portfolio increase.
Interfund transactions
The Portfolio may purchase or sell portfolio investment securities to certain other Wells Fargo affiliates pursuant to Rule 17a-7 under the 1940 Act and under procedures adopted by the Board of Trustees. The procedures have been designed to ensure that these interfund transactions, which do not incur broker commissions, are effected at current market prices.
5. INVESTMENT PORTFOLIO TRANSACTIONS
Purchases and sales of investments, excluding U.S. government obligations (if any) and short-term securities, for the period ended November 30, 2018 were $577,291,691 and $174,451,911, respectively.
6. BANK BORROWINGS
Effective August 28, 2018, the Trust, along with Wells Fargo Variable Trust and Wells Fargo Funds Trust (excluding the money market funds), are parties to a $280,000,000 revolving credit agreement whereby the Portfolio is permitted to use bank borrowings for temporary or emergency purposes, such as to fund shareholder redemption requests. Interest under the credit agreement is charged to the Portfolio based on a borrowing rate equal to the higher of the Federal Funds rate in effect on that day plus 1.25% or the overnight LIBOR rate in effect on that day plus 1.25%. In addition, an annual commitment fee equal to 0.25% of the unused balance is allocated to each participating fund.
For the period ended November 30, 2018, there were no borrowings by the Portfolio under the agreement.
7. INDEMNIFICATION
Under the Trust’s organizational documents, the officers and Trustees have been granted certain indemnification rights against certain liabilities that may arise out of performance of their duties to the Trust. Additionally, in the normal course of business, the Trust may enter into contracts with service providers that contain a variety of indemnification clauses. The Trust’s maximum exposure under these arrangements is dependent on future claims that may be made against the Portfolio and, therefore, cannot be estimated.
8. NEW ACCOUNTING PRONOUNCEMENT
In August 2018, FASB issued Accounting Standards Update (“ASU”) No. 2018-13, Fair Value Measurement (Topic 820)Disclosure Framework—Changes to the Disclosure Requirements for Fair Value Measurement. ASU 2018-13 updates the disclosure requirements for fair value measurements by modifying or removing certain disclosures and adding certain new disclosures. The amendments are effective for fiscal years, and interim periods within those fiscal years, beginning after December 15, 2019. Early adoption is permitted. Management has adopted the removal and modification of disclosures early, as permitted, and will adopt the additional new disclosures at the effective date.
| | | | |
| 20 | | Wells Fargo Disciplined Large Cap Portfolio | | Other information (unaudited) |
PROXY VOTING INFORMATION
A description of the policies and procedures used to determine how to vote proxies relating to portfolio securities is available without charge, upon request, by calling1-800-222-8222, visiting our website atwellsfargofunds.com, or visiting the SEC website at sec.gov. Information regarding how the proxies related to portfolio securities were voted during the most recent 12-month period ended June 30 is available on the website atwellsfargofunds.comor by visiting the SEC website at sec.gov.
PORTFOLIO HOLDINGS INFORMATION
The Portfolio files its complete schedule of portfolio holdings with the SEC for the first and third quarters of each fiscal year on Form N-Q, which is available by visiting the SEC website at sec.gov. In addition, the Portfolio’s Form N-Q may be reviewed and copied at the SEC’s Public Reference Room in Washington, DC, and at regional offices in New York City, at 233 Broadway, and in Chicago, at 175 West Jackson Boulevard, Suite 900. Information about the Public Reference Room may be obtained by calling 1-800-SEC-0330.
| | | | | | |
| Other information (unaudited) | | Wells Fargo Disciplined Large Cap Portfolio | | | 21 | |
BOARD OF TRUSTEES AND OFFICERS
Each of the Trustees and Officers1 listed in the table below acts in identical capacities for each fund in the Wells Fargo family of funds, which consists of 152 mutual funds comprising the Wells Fargo Funds Trust, Wells Fargo Variable Trust, Wells Fargo Master Trust and four closed-end funds (collectively the “Fund Complex”). This table should be read in conjunction with the Prospectus and the Statement of Additional Information2. The mailing address of each Trustee and Officer is 525 Market Street, 12th Floor, San Francisco, CA 94105. Each Trustee and Officer serves an indefinite term, however, each Trustee serves such term until reaching the mandatory retirement age established by the Trustees.
Independent Trustees
| | | | | | |
Name and year of birth | | Position held and length of service* | | Principal occupations during past five years or longer | | Current other public company or
investment company
directorships |
William R. Ebsworth (Born 1957) | | Trustee, since 2015 | | Retired. From 1984 to 2013, equities analyst, portfolio manager, research director and chief investment officer at Fidelity Management and Research Company in Boston, Tokyo, and Hong Kong, and retired in 2013 as Chief Investment Officer of Fidelity Strategic Advisers, Inc. where he led a team of investment professionals managing client assets. Prior thereto, Board member of Hong Kong Securities Clearing Co., Hong Kong Options Clearing Corp., the Thailand International Fund, Ltd., Fidelity Investments Life Insurance Company, and Empire Fidelity Investments Life Insurance Company. Board member of the Vincent Memorial Hospital Endowment (non-profit organization), where he serves on the Investment Committee and as a Chair of the Audit Committee. Mr. Ebsworth is a CFA® charterholder. | | N/A |
Jane A. Freeman (Born 1953) | | Trustee, since 2015; Chair Liaison, since 2018 | | Retired. From 2012 to 2014 and 1999 to 2008, Chief Financial Officer of Scientific Learning Corporation. From 2008 to 2012, Ms. Freeman provided consulting services related to strategic business projects. Prior to 1999, Portfolio Manager at Rockefeller & Co. and Scudder, Stevens & Clark. Board member of the Harding Loevner Funds from 1996 to 2014, serving as both Lead Independent Director and chair of the Audit Committee. Board member of the Russell Exchange Traded Funds Trust from 2011 to 2012 and the chair of the Audit Committee. Ms. Freeman is a Board Member of The Ruth Bancroft Garden (non-profit organization). She is also an inactive Chartered Financial Analyst. | | N/A |
Isaiah Harris, Jr.3 (Born 1952) | | Trustee, since 2009 | | Retired. Chairman of the Board of CIGNA Corporation since 2009, and Director since 2005. From 2003 to 2011, Director of Deluxe Corporation. Prior thereto, President and CEO of BellSouth Advertising and Publishing Corp. from 2005 to 2007, President and CEO of BellSouth Enterprises from 2004 to 2005 and President of BellSouth Consumer Services from 2000 to 2003. Emeritus member of the Iowa State University Foundation Board of Governors. Emeritus Member of the Advisory Board of Iowa State University School of Business. Advisory Board Member, Palm Harbor Academy (private school). Advisory Board Member, Child Evangelism Fellowship (non-profit). Mr. Harris is a certified public accountant (inactive status). | | CIGNA Corporation |
Judith M. Johnson3 (Born 1949) | | Trustee, since 2008; Audit Committee Chairman, since 2009 | | Retired. Prior thereto, Chief Executive Officer and Chief Investment Officer of Minneapolis Employees Retirement Fund from 1996 to 2008. Ms. Johnson is an attorney, certified public accountant and a certified managerial accountant. | | N/A |
David F. Larcker (Born 1950) | | Trustee, since 2009 | | James Irvin Miller Professor of Accounting at the Graduate School of Business, Stanford University, Director of the Corporate Governance Research Initiative and Senior Faculty of The Rock Center for Corporate Governance since 2006. From 2005 to 2008, Professor of Accounting at the Graduate School of Business, Stanford University. Prior thereto, Ernst & Young Professor of Accounting at The Wharton School, University of Pennsylvania from 1985 to 2005. | | N/A |
| | | | |
| 22 | | Wells Fargo Disciplined Large Cap Portfolio | | Other information (unaudited) |
| | | | | | |
Name and year of birth | | Position held and length of service* | | Principal occupations during past five years or longer | | Current other public company or
investment company
directorships |
Olivia S. Mitchell (Born 1953) | | Trustee, since 2006; Nominating and Governance Committee Chairman, since 2018 | | International Foundation of Employee Benefit Plans Professor, Wharton School of the University of Pennsylvania since 1993. Director of Wharton’s Pension Research Council and Boettner Center on Pensions & Retirement Research, and Research Associate at the National Bureau of Economic Research. Previously, Cornell University Professor from 1978 to 1993. | | N/A |
Timothy J. Penny (Born 1951) | | Trustee, since 1996; Chairman, since 2018; Vice Chairman, from 2017 to 2018 | | President and Chief Executive Officer of Southern Minnesota Initiative Foundation, a non-profit organization, since 2007. Member of the Board of Trustees of NorthStar Education Finance, Inc., a non-profit organization, since 2007. | | N/A |
James G. Polisson (Born 1959) | | Trustee, since 2018; Advisory Board Member, from 2017 to 2018 | | Retired. Chief Marketing Officer, Source (ETF) UK Services, Ltd, from 2015 to 2017. From 2012 to 2015, Principal of The Polisson Group, LLC, a management consulting, corporate advisory and principal investing company. Chief Executive Officer and Managing Director at Russell Investments, Global Exchange Traded Funds from 2010 to 2012. Managing Director of Barclays Global Investors from 1998 to 2010 and Global Chief Marketing Officer for iShares and Barclays Global Investors from 2000 to 2010. Trustee of the San Francisco Mechanics’ Institute, a non-profit organization, from 2013 to 2015. Board member of the Russell Exchange Traded Fund Trust from 2011 to 2012. Director of Barclays Global Investors Holdings Deutschland GmbH from 2006 to 2009. Mr. Polisson is an attorney and has a retired status with the Massachusetts and District of Columbia Bar Associations. | | N/A |
Michael S. Scofield4 (Born 1943) | | Trustee, since 2010 | | Served on the Investment Company Institute’s Board of Governors and Executive Committee from 2008-2011 as well the Governing Council of the Independent Directors Council from 2006-2011 and the Independent Directors Council Executive Committee from 2008-2011. Trustee of the Evergreen Fund complex (and its predecessors) from 1984 to 2010. Chairman of the Evergreen Funds from 2000-2010. Former Trustee of the Mentor Funds. Retired Attorney, Law Offices of Michael S. Scofield. | | N/A |
Pamela Wheelock (Born 1959) | | Trustee, since 2018; Advisory Board Member, from 2017 to 2018 | | Chief Operating Officer, Twin Cities Habitat for Humanity, since January, 2017. Vice President of University Services, University of Minnesota from 2012 to 2017. Prior thereto, on the Board of Directors, Governance Committee and Finance Committee for the Minnesota Philanthropy Partners (Saint Paul Foundation) from 2012 to 2018, Interim President and Chief Executive Officer of Blue Cross Blue Shield of Minnesota from 2010 to 2011, Chairman of the Board from 2009 to 2011 and Board Director from 2003 to 2015. Vice President, Leadership and Community Engagement, Bush Foundation, Saint Paul, Minnesota (a private foundation) from 2009 to 2011. Executive Vice President and Chief Financial Officer, Minnesota Sports and Entertainment from 2004 to 2009 and Senior Vice President from 2002 to 2004. Commissioner of Finance, State of Minnesota, from 1999 to 2002. Currently the Board Chair of the Minnesota Wild Foundation since 2010. | | N/A |
| * | Length of service dates reflect the Trustee’s commencement of service with the Trust’s predecessor entities, where applicable. |
| | | | | | |
| Other information (unaudited) | | Wells Fargo Disciplined Large Cap Portfolio | | | 23 | |
Officers
| | | | | | |
Name and year of birth | | Position held and length of service | | Principal occupations during past five years or longer | | |
Andrew Owen (Born 1960) | | President, since 2017 | | Executive Vice President of Wells Fargo & Company and Head of Affiliated Managers, Wells Fargo Asset Management, since 2014. In addition, Mr. Owen is currently President, Chief Executive Officer and Director of Wells Fargo Funds Management, LLC since 2017. Prior thereto, Executive Vice President responsible for marketing, investments and product development for Wells Fargo Funds Management, LLC, from 2009 to 2014. | | |
Jeremy DePalma1 (Born 1974) | | Treasurer, since 2012 | | Senior Vice President of Wells Fargo Funds Management, LLC since 2009. Senior Vice President of Evergreen Investment Management Company, LLC from 2008 to 2010 and head of the Fund Reporting and Control Team within Fund Administration from 2005 to 2010. | | |
Alexander Kymn (Born 1973) | | Secretary, since 2018; Chief Legal Officer, since 2018 | | Senior Company Counsel of Wells Fargo Bank, N.A. since 2018 (previously Senior Counsel from 2007 to 2018). Vice President of Wells Fargo Funds Management, LLC from 2008 to 2014. | | |
Michael H. Whitaker (Born 1967) | | Chief Compliance Officer, since 2016 | | Senior Vice President and Chief Compliance Officer since 2016. Senior Vice President and Chief Compliance Officer for Fidelity Investments from 2007 to 2016. | | |
David Berardi (Born 1975) | | Assistant Treasurer, since 2009 | | Vice President of Wells Fargo Funds Management, LLC since 2009. Vice President of Evergreen Investment Management Company, LLC from 2008 to 2010. Manager of Fund Reporting and Control for Evergreen Investment Management Company, LLC from 2004 to 2010. | | |
| 1 | Jeremy DePalma acts as Treasurer of 76 funds and Assistant Treasurer of 76 funds in the Fund Complex. |
| 2 | The Statement of Additional Information includes additional information about the Trustees and is available, without charge, upon request, by calling 1-800-222-8222 or by visiting the website atwellsfargofunds.com. |
| 3 | Mr. Harris will replace Ms. Johnson as the Chairman of the Audit Committee effective January 1, 2019. |
| 4 | Mr. Scofield is expected to retire on December 31, 2018. |
This page is intentionally left blank.
INVESTMENT PRODUCTS: NOT FDIC INSURED ◾ NO BANK GUARANTEE ◾ MAY LOSE VALUE
© 2019 Wells Fargo Funds Management, LLC. All rights reserved.
Semi-Annual Report
November 30, 2018

Wells Fargo International Growth Portfolio


Contents
INVESTMENT PRODUCTS: NOT FDIC INSURED ◾ NO BANK GUARANTEE ◾ MAY LOSE VALUE
| | | | |
| 2 | | Wells Fargo International Growth Portfolio | | Fund information (unaudited) |
Investment objective
The Portfolio seeks long-term capital appreciation.
Manager
Wells Fargo Funds Management, LLC
Subadviser
Artisan Partners, Limited Partnership
Portfolio manager
Mark L. Yockey, CFA®‡
| | | | |
| Ten largest holdings (%) as of November 30, 20181 | |
Linde plc | | | 6.24 | |
Deutsche Boerse AG | | | 6.01 | |
Wirecard AG | | | 4.53 | |
Medtronic plc | | | 4.22 | |
Nestle SA | | | 3.85 | |
Airbus SE | | | 3.71 | |
Deutsche Post AG | | | 3.46 | |
ING Groep NV | | | 3.15 | |
Aon plc | | | 3.05 | |
AIA Group Limited | | | 2.95 | |
|
| Sector distribution as of November 30, 20182 |
|
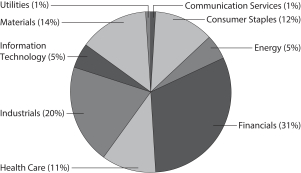
|
|
| Country allocation as of November 30, 20182 |
|
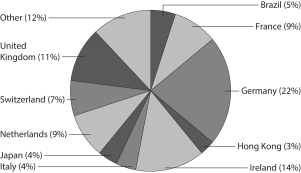 |
| ‡ | CFA® and Chartered Financial Analyst® are trademarks owned by CFA Institute. |
| 1 | The ten largest holdings, excluding cash, cash equivalents and any money market funds, are calculated based on the value of the investments divided by the total net assets of the Portfolio. Holdings are subject to change and may have changed since the date specified. |
| 2 | Amounts are calculated based on the total long-term investments of the Portfolio. These amounts are subject to change and may have changed since the date specified. |
| | | | | | |
| Portfolio of investments—November 30, 2018 (unaudited) | | Wells Fargo International Growth Portfolio | | | 3 | |
| | | | | | | | | | | | | | | | |
| Security name | | | | | | | | Shares | | | Value | |
| | | | |
Common Stocks: 92.24% | | | | | | | | | | | | | | | | |
| | | | |
| Belgium: 2.26% | | | | | | | | | | | | | | | | |
Anheuser-Busch InBev NV (Consumer Staples, Beverages) | | | | | | | | | | | 76,259 | | | $ | 5,839,553 | |
| | | | | | | | | | | | | | | | |
| | | | |
| Brazil: 2.48% | | | | | | | | | | | | | | | | |
B3 SA (Financials, Capital Markets) | | | | | | | | | | | 115,505 | | | | 842,317 | |
Petroleo Brasileiro SA ADR (Energy, Oil, Gas & Consumable Fuels) | | | | | | | | | | | 382,469 | | | | 5,568,749 | |
| | | | |
| | | | | | | | | | | | | | | 6,411,066 | |
| | | | | | | | | | | | | | | | |
| | | | |
| Canada: 2.09% | | | | | | | | | | | | | | | | |
Canadian National Railway Company (Industrials, Road & Rail) | | | | | | | | | | | 26,774 | | | | 2,297,745 | |
Canadian Pacific Railway Limited (Industrials, Road & Rail) | | | | | | | | | | | 14,644 | | | | 3,097,792 | |
| | | | |
| | | | | | | | | | | | | | | 5,395,537 | |
| | | | | | | | | | | | | | | | |
| | | | |
| Denmark: 1.76% | | | | | | | | | | | | | | | | |
Genmab AS (Health Care, Biotechnology) † | | | | | | | | | | | 29,894 | | | | 4,548,185 | |
| | | | | | | | | | | | | | | | |
| | | | |
| Finland: 1.00% | | | | | | | | | | | | | | | | |
Fortum Oyj (Utilities, Electric Utilities) | | | | | | | | | | | 124,379 | | | | 2,592,303 | |
| | | | | | | | | | | | | | | | |
| | | | |
| France: 8.81% | | | | | | | | | | | | | | | | |
Air Liquide SA (Materials, Chemicals) | | | | | | | | | | | 51,714 | | | | 6,249,725 | |
BNP Paribas SA (Financials, Banks) | | | | | | | | | | | 74,504 | | | | 3,742,854 | |
Eiffage SA (Industrials, Construction & Engineering) | | | | | | | | | | | 34,347 | | | | 3,267,054 | |
Groupe Danone SA (Consumer Staples, Food Products) | | | | | | | | | | | 26,717 | | | | 1,998,072 | |
Safran SA (Industrials, Aerospace & Defense) | | | | | | | | | | | 20,904 | | | | 2,611,480 | |
Schneider Electric SE (Industrials, Electrical Equipment) | | | | | | | | | | | 17,837 | | | | 1,298,024 | |
Vinci SA (Industrials, Construction & Engineering) | | | | | | | | | | | 41,020 | | | | 3,580,428 | |
| | | | |
| | | | | | | | | | | | | | | 22,747,637 | |
| | | | | | | | | | | | | | | | |
| | | | |
| Germany: 19.59% | | | | | | | | | | | | | | | | |
Allianz AG (Financials, Insurance) | | | | | | | | | | | 31,056 | | | | 6,557,061 | |
Beiersdorf AG (Consumer Staples, Personal Products) | | | | | | | | | | | 44,763 | | | | 4,790,928 | |
Deutsche Boerse AG (Financials, Capital Markets) | | | | | | | | | | | 121,537 | | | | 15,520,385 | |
Deutsche Post AG (Industrials, Air Freight & Logistics) | | | | | | | | | | | 280,667 | | | | 8,934,938 | |
Symrise AG (Materials, Chemicals) | | | | | | | | | | | 38,390 | | | | 3,098,793 | |
Wirecard AG (Information Technology, IT Services) | | | | | | | | | | | 77,504 | | | | 11,709,210 | |
| | | | |
| | | | | | | | | | | | | | | 50,611,315 | |
| | | | | | | | | | | | | | | | |
| | | | |
| Hong Kong: 2.95% | | | | | | | | | | | | | | | | |
AIA Group Limited (Financials, Insurance) | | | | | | | | | | | 933,400 | | | | 7,617,279 | |
| | | | | | | | | | | | | | | | |
| | | | |
| India: 2.39% | | | | | | | | | | | | | | | | |
Housing Development Finance Corporation Limited (Financials, Thrifts & Mortgage Finance) | | | | | | | | | | | 216,431 | | | | 6,176,645 | |
| | | | | | | | | | | | | | | | |
| | | | |
| Indonesia: 0.78% | | | | | | | | | | | | | | | | |
PT Bank Rakyat Indonesia Tbk (Financials, Banks) | | | | | | | | | | | 7,926,800 | | | | 2,006,294 | |
| | | | | | | | | | | | | | | | |
| | | | |
| Ireland: 12.05% | | | | | | | | | | | | | | | | |
Linde plc (Materials, Chemicals) | | | | | | | | | | | 101,335 | | | | 16,118,354 | |
The accompanying notes are an integral part of these financial statements.
| | | | |
| 4 | | Wells Fargo International Growth Portfolio | | Portfolio of investments—November 30, 2018 (unaudited) |
| | | | | | | | | | | | | | | | |
| Security name | | | | | | | | Shares | | | Value | |
| | | | |
| Ireland(continued) | | | | | | | | | | | | | | | | |
Medtronic plc (Health Care, Health Care Equipment & Supplies) | | | | | | | | | | | 111,730 | | | $ | 10,897,027 | |
Willis Towers Watson plc (Financials, Insurance) | | | | | | | | | | | 25,716 | | | | 4,100,412 | |
| | | | |
| | | | | | | | | | | | | | | 31,115,793 | |
| | | | | | | | | | | | | | | | |
| | | | |
| Italy: 3.46% | | | | | | | | | | | | | | | | |
Assicurazioni Generali SpA (Financials, Insurance) | | | | | | | | | | | 306,947 | | | | 5,174,197 | |
Intesa Sanpaolo SpA (Financials, Banks) | | | | | | | | | | | 1,628,238 | | | | 3,775,137 | |
| | | | |
| | | | | | | | | | | | | | | 8,949,334 | |
| | | | | | | | | | | | | | | | |
| | | | |
| Japan: 3.74% | | | | | | | | | | | | | | | | |
CALBEE Incorporated (Consumer Staples, Food Products) « | | | | | | | | | | | 101,800 | | | | 3,371,960 | |
Japan Exchange Group Incorporated (Financials, Capital Markets) | | | | | | | | | | | 118,400 | | | | 2,133,004 | |
Nippon Shinyaku Company Limited (Health Care, Pharmaceuticals) | | | | | | | | | | | 41,900 | | | | 2,864,326 | |
Taiyo Nippon Sanso Corporation (Materials, Chemicals) | | | | | | | | | | | 77,400 | | | | 1,303,694 | |
| | | | |
| | | | | | | | | | | | | | | 9,672,984 | |
| | | | | | | | | | | | | | | | |
| | | | |
| Luxembourg: 0.35% | | | | | | | | | | | | | | | | |
Spotify Technology SA (Communication Services, Entertainment) † | | | | | | | | | | | 6,720 | | | | 916,474 | |
| | | | | | | | | | | | | | | | |
| | | | |
| Netherlands: 9.27% | | | | | | | | | | | | | | | | |
Airbus SE (Industrials, Aerospace & Defense) | | | | | | | | | | | 89,541 | | | | 9,591,572 | |
Akzo Nobel NV (Materials, Chemicals) | | | | | | | | | | | 19,253 | | | | 1,615,108 | |
ASML Holding NV (Information Technology, Semiconductors & Semiconductor Equipment) | | | | | | | | | | | 7,646 | | | | 1,290,615 | |
ING Groep NV (Financials, Banks) | | | | | | | | | | | 672,035 | | | | 8,128,505 | |
Koninklijke DSM NV (Materials, Chemicals) | | | | | | | | | | | 37,366 | | | | 3,309,713 | |
| | | | |
| | | | | | | | | | | | | | | 23,935,513 | |
| | | | | | | | | | | | | | | | |
| | | | |
| Russia: 1.35% | | | | | | | | | | | | | | | | |
MMC Norilsk Nickel PJSC ADR (Materials, Metals & Mining) | | | | | | | | | | | 184,561 | | | | 3,477,129 | |
| | | | | | | | | | | | | | | | |
| | | | |
| Switzerland: 6.45% | | | | | | | | | | | | | | | | |
Idorsia Limited (Health Care, Biotechnology) † | | | | | | | | | | | 26,529 | | | | 504,265 | |
Lonza Group AG (Health Care, Life Sciences Tools & Services) | | | | | | | | | | | 13,345 | | | | 4,313,198 | |
Nestle SA (Consumer Staples, Food Products) | | | | | | | | | | | 116,685 | | | | 9,944,008 | |
Sonova Holding AG (Health Care, Health Care Equipment & Supplies) | | | | | | | | | | | 11,733 | | | | 1,894,920 | |
| | | | |
| | | | | | | | | | | | | | | 16,656,391 | |
| | | | | | | | | | | | | | | | |
| | | | |
| United Kingdom: 11.13% | | | | | | | | | | | | | | | | |
Aon plc (Financials, Insurance) | | | | | | | | | | | 47,647 | | | | 7,866,996 | |
British American Tobacco plc (Consumer Staples, Tobacco) | | | | | | | | | | | 39,379 | | | | 1,379,915 | |
ConvaTec Limited (Health Care, Health Care Equipment & Supplies) 144A | | | | | | | | | | | 1,285,254 | | | | 2,488,539 | |
Experian Group Limited plc (Industrials, Professional Services) | | | | | | | | | | | 123,076 | | | | 2,989,958 | |
Ferguson plc (Industrials, Trading Companies & Distributors) | | | | | | | | | | | 74,880 | | | | 4,789,877 | |
Glencore International plc (Materials, Metals & Mining) | | | | | | | | | | | 252,196 | | | | 932,429 | |
HSBC Holdings plc (Financials, Banks) | | | | | | | | | | | 333,923 | | | | 2,826,607 | |
London Stock Exchange Group plc (Financials, Capital Markets) | | | | | | | | | | | 54,113 | | | | 2,780,896 | |
Rentokil Initial plc (Industrials, Commercial Services & Supplies) | | | | | | | | | | | 639,883 | | | | 2,690,725 | |
| | | | |
| | | | | | | | | | | | | | | 28,745,942 | |
| | | | | | | | | | | | | | | | |
The accompanying notes are an integral part of these financial statements.
| | | | | | |
| Portfolio of investments—November 30, 2018 (unaudited) | | Wells Fargo International Growth Portfolio | | | 5 | |
| | | | | | | | | | | | | | | | |
| Security name | | | | | | | | Shares | | | Value | |
| | | | |
| United States: 0.33% | | | | | | | | | | | | | | | | |
WABCO Holdings Incorporated (Industrials, Machinery) † | | | | | | | | | | | 7,116 | | | $ | 864,238 | |
| | | | | | | | | | | | | | | | |
| | | | |
Total Common Stocks (Cost $237,836,587) | | | | | | | | | | | | | | | 238,279,612 | |
| | | | | | | | | | | | | | | | |
| | | | |
| | | | | | Expiration date | | | | | | | |
| Participation Notes: 1.57% | | | | | | | | | | | | | | | | |
| | | | |
| Ireland: 1.57% | | | | | | | | | | | | | | | | |
HSBC Bank plc (Ryanair Holdings plc) (Industrials, Airlines) †(a) | | | | | | | 10-29-2019 | | | | 305,715 | | | | 4,051,610 | |
| | | | | | | | | | | | | | | | |
| | | | |
Total Participation Notes (Cost $4,318,284) | | | | | | | | | | | | | | | 4,051,610 | |
| | | | | | | | | | | | | | | | |
| | | | |
| | | Dividend yield | | | | | | | | | | |
| Preferred Stocks: 3.84% | | | | | | | | | | | | | | | | |
| | | | |
| Brazil: 2.23% | | | | | | | | | | | | | | | | |
Petroleo Brasileiro SA (Energy, Oil, Gas & Consumable Fuels) | | | 0.80 | % | | | | | | | 874,091 | | | | 5,754,941 | |
| | | | | | | | | | | | | | | | |
| | | | |
| Germany: 1.61% | | | | | | | | | | | | | | | | |
Henkel AG & Company KGaA (Consumer Staples, Household Products) | | | 1.91 | | | | | | | | 36,112 | | | | 4,165,917 | |
| | | | | | | | | | | | | | | | |
| | | | |
Total Preferred Stocks (Cost $8,262,253) | | | | | | | | | | | | | | | 9,920,858 | |
| | | | | | | | | | | | | | | | |
| | | | |
| | | Yield | | | | | | | | | | |
| Short-Term Investments: 2.23% | | | | | | | | | | | | | | | | |
| | | | |
| Investment Companies: 2.23% | | | | | | | | | | | | | | | | |
Securities Lending Cash Investments LLC (l)(r)(u) | | | 2.38 | | | | | | | | 1,361 | | | | 1,361 | |
Wells Fargo Government Money Market Fund Select Class (l)(u) | | | 2.13 | | | | | | | | 5,754,309 | | | | 5,754,309 | |
| | | | |
Total Short-Term Investments (Cost $5,755,670) | | | | | | | | | | | | | | | 5,755,670 | |
| | | | | | | | | | | | | | | | |
| | | | | | | | |
| Total investments in securities (Cost $256,172,794) | | | 99.88 | % | | | 258,007,750 | |
Other assets and liabilities, net | | | 0.12 | | | | 320,186 | |
| | | | | | | | |
| Total net assets | | | 100.00 | % | | $ | 258,327,936 | |
| | | | | | | | |
| † | Non-income-earning security |
| « | All or a portion of this security is on loan. |
| 144A | The security may be resold in transactions exempt from registration, normally to qualified institutional buyers, pursuant to Rule 144A under the Securities Act of 1933. |
| (a) | The security is fair valued in accordance with procedures approved by the Board of Trustees. |
| (l) | The issuer of the security is an affiliated person of the Portfolio as defined in the Investment Company Act of 1940. |
| (r) | The investment is a non-registered investment company purchased with cash collateral received from securities on loan. |
| (u) | The rate represents the 7-day annualized yield at period end. |
Abbreviations:
| ADR | American depositary receipt |
The accompanying notes are an integral part of these financial statements.
| | | | |
| 6 | | Wells Fargo International Growth Portfolio | | Portfolio of investments—November 30, 2018 (unaudited) |
Investments in Affiliates
An affiliated investment is an investment in which the Portfolio owns at least 5% of the outstanding voting shares of the issuer or as a result of other relationships, such as the Portfolio and the issuer having the same adviser or investment manager. Transactions with issuers that were either affiliated persons of the Portfolio at the beginning of the period or the end of the period were as follows:
| | | | | | | | | | | | | | | | | | | | | | | | | | | | | | | | | | | | |
| | | Shares,
beginning of
period | | | Shares
purchased | | | Shares
sold | | | Shares,
end of
period | | | Net
realized
gains
(losses) | | | Net
change in
unrealized
gains
(losses) | | | Income
from
affiliated
securities | | | Value,
end
of period | | | % of
net
assets | |
Short-Term Investments | | | | | | | | | | | | | | | | | | | | | | | | | | | | | | | | | | | | |
Investment Companies | | | | | | | | | | | | | | | | | | | | | | | | | | | | | | | | | | | | |
Securities Lending Cash Investments LLC | | | 427,749 | | | | 31,370,112 | | | | 31,796,500 | | | | 1,361 | | | $ | (33 | ) | | $ | 0 | | | $ | 12,093 | | | $ | 1,361 | | | | | |
Wells Fargo Government Money Market Fund Select Class | | | 1,633,072 | | | | 108,672,190 | | | | 104,550,953 | | | | 5,754,309 | | | | 0 | | | | 0 | | | | 136,548 | | | | 5,754,309 | | | | | |
| | | | | | | | | | | | | | | | | | | | | | | | | | | | | | | | | | | | |
| | | | | | | | | | | | | | | | | | $ | (33 | ) | | $ | 0 | | | $ | 148,641 | | | $ | 5,755,670 | | | | 2.23 | % |
| | | | | | | | | | | | | | | | | | | | | | | | | | | | | | | | | | | | |
The accompanying notes are an integral part of these financial statements.
| | | | | | |
| Statement of assets and liabilities—November 30, 2018 (unaudited) | | Wells Fargo International Growth Portfolio | | | 7 | |
| | | | |
| | | | |
| |
Assets | | | | |
Investments in unaffiliated securities (including $1,327 of securities loaned), at value (cost $250,417,124) | | $ | 252,252,080 | |
Investments in affiliated securities, at value (cost $5,755,670) | | | 5,755,670 | |
Foreign currency, at value (cost $48,357) | | | 48,346 | |
Receivable for investments sold | | | 411,826 | |
Receivable for dividends | | | 565,104 | |
Receivable for securities lending income | | | 6,087 | |
| | | | |
Total assets | | | 259,039,113 | |
| | | | |
| |
Liabilities | | | | |
Payable for investments purchased | | | 379,550 | |
Advisory fee payable | | | 182,807 | |
Custodian and accounting fees payable | | | 47,008 | |
Professional fees payable | | | 45,787 | |
Payable upon receipt of securities loaned | | | 1,394 | |
Trustees’ fees and expenses payable | | | 236 | |
Accrued expenses and other liabilities | | | 54,395 | |
| | | | |
Total liabilities | | | 711,177 | |
| | | | |
Total net assets | | $ | 258,327,936 | |
| | | | |
The accompanying notes are an integral part of these financial statements.
| | | | |
| 8 | | Wells Fargo International Growth Portfolio | | Statement of operations—six months ended November 30, 2018 (unaudited) |
| | | | |
| | | | |
| |
Investment income | | | | |
Dividends (net of foreign interest withholding tax of $113,804) | | $ | 1,578,693 | |
Income from affiliated securities | | | 148,641 | |
| | | | |
Total investment income | | | 1,727,334 | |
| | | | |
| |
Expenses | | | | |
Advisory fee | | | 1,107,464 | |
Custody and accounting fees | | | 38,447 | |
Professional fees | | | 35,156 | |
Shareholder report expenses | | | 302 | |
Trustees’ fees and expenses | | | 12,480 | |
Other fees and expenses | | | 27,484 | |
| | | | |
Total expenses | | | 1,221,333 | |
Less: Fee waivers and/or expense reimbursements | | | (2,338 | ) |
| | | | |
Net expenses | | | 1,218,995 | |
| | | | |
Net investment income | | | 508,339 | |
| | | | |
| |
REALIZED AND UNREALIZED GAINS (LOSSES) ON INVESTMENTS | | | | |
| |
Net realized losses on: | | | | |
Unaffiliated securities | | | (5,966,768 | ) |
Affiliated securities | | | (33 | ) |
| | | | |
Net realized losses on investments | | | (5,966,801 | ) |
Net change in unrealized gains (losses) on investments | | | (5,122,260 | ) |
| | | | |
Net realized and unrealized gains (losses) on investments | | | (11,089,061 | ) |
| | | | |
Net decrease in net assets resulting from operations | | $ | (10,580,722 | ) |
| | | | |
The accompanying notes are an integral part of these financial statements.
| | | | | | |
| Statement of changes in net assets | | Wells Fargo International Growth Portfolio | | | 9 | |
| | | | | | | | |
| | | Six months ended
November 30, 2018
(unaudited) | | | Year ended
May 31, 2018 | |
| | |
Operations | | | | | | | | |
Net investment income | | $ | 508,339 | | | $ | 534,471 | |
Net realized gains (losses) on investments | | | (5,966,801 | ) | | | 29,192,956 | |
Net change in unrealized gains (losses) on investments | | | (5,122,260 | ) | | | (18,628,392 | ) |
| | | | |
Net increase (decrease) in net assets resulting from operations | | | (10,580,722 | ) | | | 11,099,035 | |
| | | | |
| | |
Capital transactions | | | | | | | | |
Transactions in investors’ beneficial interests | | | | | | | | |
Contributions | | | 290,427,526 | | | | 18,015,755 | |
Withdrawals | | | (66,093,537 | ) | | | (122,031,151 | ) |
| | | | |
Net increase (decrease) in net assets resulting from capital transactions | | | 224,333,989 | | | | (104,015,396 | ) |
| | | | |
Total increase (decrease) in net assets | | | 213,753,267 | | | | (92,916,361 | ) |
| | | | |
| | |
Net assets | | | | | | | | |
Beginning of period | | | 44,574,669 | | | | 137,491,030 | |
| | | | |
End of period | | $ | 258,327,936 | | | $ | 44,574,669 | |
| | | | |
The accompanying notes are an integral part of these financial statements.
| | | | |
| 10 | | Wells Fargo International Growth Portfolio | | Financial highlights |
| | | | | | | | | | | | | | | | | | | | | | | | |
| | | Six months ended
November 30, 2018
(unaudited) | | | Year ended May 31 | |
| | | 2018 | | | 2017 | | | 2016 | | | 2015 | | | 2014 | |
Total return1 | | | (5.83 | )% | | | 9.46 | % | | | 10.31 | % | | | (12.40 | )% | | | 5.13 | % | | | 16.45 | % |
Ratios to average net assets (annualized) | | | | | | | | | | | | | | | | | | | | | | | | |
Gross expenses | | | 0.88 | % | | | 1.10 | % | | | 0.98 | % | | | 0.99 | % | | | 1.00 | % | | | 1.00 | % |
Net expenses | | | 0.88 | % | | | 1.06 | % | | | 0.98 | % | | | 0.99 | % | | | 1.00 | % | | | 1.00 | % |
Net investment income | | | 0.37 | % | | | 0.70 | % | | | 1.25 | % | | | 1.16 | % | | | 0.76 | % | | | 1.13 | % |
Supplemental data | | | | | | | | | | | | | | | | | | | | | | | | |
Portfolio turnover rate | | | 51 | % | | | 71 | % | | | 121 | % | | | 62 | % | | | 51 | % | | | 46 | % |
| 1 | Returns for periods of less than one year are not annualized. |
The accompanying notes are an integral part of these financial statements.
| | | | | | |
| Notes to financial statements (unaudited) | | Wells Fargo International Growth Portfolio | | | 11 | |
1. ORGANIZATION
Wells Fargo Master Trust (the “Trust”), a Delaware statutory trust organized on March 10, 1999, is an open-end management investment company registered under the Investment Company Act of 1940, as amended (the “1940 Act”). As an investment company, the Trust follows the accounting and reporting guidance in Financial Accounting Standards Board (“FASB”) Accounting Standards Codification Topic 946, Financial Services – Investment Companies. These financial statements report on the Wells Fargo International Growth Portfolio (the “Portfolio”) which is a diversified series of the Trust.
2. SIGNIFICANT ACCOUNTING POLICIES
The following significant accounting policies, which are consistently followed in the preparation of the financial statements of the Portfolio, are in conformity with U.S. generally accepted accounting principles which require management to make estimates and assumptions that affect the reported amounts of assets and liabilities, disclosure of contingent assets and liabilities at the date of the financial statements, and the reported amounts of revenues and expenses during the reporting period. Actual results could differ from those estimates.
Securities valuation
All investments are valued each business day as of the close of regular trading on the New York Stock Exchange (generally 4 p.m. Eastern Time), although the Portfolio may deviate from this calculation time under unusual or unexpected circumstances.
Equity securities that are listed on a foreign or domestic exchange or market are valued at the official closing price or, if none, the last sales price. If no sale occurs on the principal exchange or market that day, a fair value price will be determined in accordance with the Portfolio’s Valuation Procedures.
The values of securities denominated in foreign currencies are translated into U.S. dollars at rates provided by an independent foreign currency pricing source at a time each business day specified by the Wells Fargo Asset Management Pricing Committee at Wells Fargo Funds Management, LLC (“Funds Management”).
Many securities markets and exchanges outside the U.S. close prior to the close of the New York Stock Exchange and therefore may not fully reflect trading or events that occur after the close of the principal exchange in which the foreign securities are traded, but before the close of the New York Stock Exchange. If such trading or events are expected to materially affect the value of such securities, then fair value pricing procedures approved by the Board of Trustees of the Portfolio are applied. These procedures take into account multiple factors including movements in U.S. securities markets after foreign exchanges close. Foreign securities that are fair valued under these procedures are categorized as Level 2 and the application of these procedures may result in transfers between Level 1 and Level 2. Depending on market activity, such fair valuations may be frequent. Such fair value pricing may result in net asset values that are higher or lower than net asset values based on the last reported sales price or latest quoted bid price. On November 30, 2018, such fair value pricing was not used in pricing foreign securities.
Investments in registered open-end investment companies are valued at net asset value. Interests in non-registered investment companies that are redeemable at net asset value are fair valued normally at net asset value.
Investments which are not valued using the methods discussed above are valued at their fair value, as determined in good faith by the Board of Trustees. The Board of Trustees has established a Valuation Committee comprised of the Trustees and has delegated to it the authority to take any actions regarding the valuation of portfolio securities that the Valuation Committee deems necessary or appropriate, including determining the fair value of portfolio securities, unless the determination has been delegated to the Wells Fargo Asset Management Pricing Committee. The Board of Trustees retains the authority to make or ratify any valuation decisions or approve any changes to the Valuation Procedures as it deems appropriate. On a quarterly basis, the Board of Trustees receives reports on any valuation actions taken by the Valuation Committee or the Wells Fargo Asset Management Pricing Committee which may include items for ratification.
Foreign currency translation
The accounting records of the Portfolio are maintained in U.S. dollars. The values of other assets and liabilities denominated in foreign currencies are translated into U.S. dollars at rates provided by an independent foreign currency pricing source at a time each business day specified by the Wells Fargo Asset Management Pricing Committee. Purchases and sales of securities, and income and expenses are converted at the rate of exchange on the respective dates of such transactions. Net realized foreign exchange gains or losses arise from sales of foreign currencies, currency gains or losses realized between the trade and settlement dates on securities transactions, and the difference between the amounts of dividends, interest and foreign withholding taxes recorded and the U.S. dollar equivalent of the amounts actually paid or received. Net unrealized foreign exchange gains and losses arise from changes in the fair value of assets and liabilities other than investments in securities
| | | | |
| 12 | | Wells Fargo International Growth Portfolio | | Notes to financial statements (unaudited) |
resulting from changes in exchange rates. The changes in net assets arising from changes in exchange rates of securities and the changes in net assets resulting from changes in market prices of securities are not separately presented. Such changes are included in net realized and unrealized gains or losses from investments.
Participation notes
The Portfolio may invest in participation notes to gain exposure to securities in certain foreign markets. Participation notes are issued by banks or broker-dealers and are designed to offer a return linked to a particular underlying foreign security. Participation notes involve transaction costs, which may be higher than those applicable to the underlying foreign security. The holder of the participation note is entitled to receive from the bank or broker-dealer, an amount equal to the dividend paid by the issuer of the underlying foreign security; however, the holder is not entitled to the same rights (i.e. voting rights) as an owner of the underlying foreign security. Investments in participation notes involve risks beyond those normally associated with a direct investment in an underlying security. The Portfolio has no rights against the issuer of the underlying foreign security and participation notes expose the Portfolio to counterparty risk in the event the counterparty does not perform. There is also no assurance there will be a secondary trading market for the participation note or that the trading price of the participation note will equal the underlying value of the foreign security that it seeks to replicate.
Forward foreign currency contracts
The Portfolio is subject to foreign currency risk in the normal course of pursuing its investment objectives. A forward foreign currency contract is an agreement between two parties to purchase or sell a specific currency for an agreed-upon price at a future date. The Portfolio enters into forward foreign currency contracts to facilitate transactions in foreign-denominated securities and to attempt to minimize the risk to the Portfolio from adverse changes in the relationship between currencies. Forward foreign currency contracts are recorded at the forward rate and marked-to-market daily. When the contracts are closed, realized gains and losses arising from such transactions are recorded as realized gains or losses on forward foreign currency contracts. The Portfolio could be exposed to risks if the counterparties to the contracts are unable to meet the terms of their contracts or if the value of the foreign currency changes unfavorably. The Portfolio’s maximum risk of loss from counterparty credit risk is the unrealized gains on the contracts. This risk may be mitigated if there is a master netting arrangement between the Portfolio and the counterparty.
Securities lending
The Portfolio may lend its securities from time to time in order to earn additional income in the form of fees or interest on securities received as collateral or the investment of any cash received as collateral. The Portfolio continues to receive interest or dividends on the securities loaned. The Portfolio receives collateral in the form of cash or securities with a value at least equal to the value of the securities on loan. The value of the loaned securities is determined at the close of each business day and any additional required collateral is delivered to the Portfolio on the next business day. In a securities lending transaction, the net asset value of the Portfolio will be affected by an increase or decrease in the value of the securities loaned and by an increase or decrease in the value of the instrument in which collateral is invested. The amount of securities lending activity undertaken by the Portfolio fluctuates from time to time. In the event of default or bankruptcy by the borrower, the Portfolio may be prevented from recovering the loaned securities or gaining access to the collateral or may experience delays or costs in doing so. In addition, the investment of any cash collateral received may lose all or part of its value. The Portfolio has the right under the lending agreement to recover the securities from the borrower on demand.
The Portfolio lends its securities through an unaffiliated securities lending agent. Cash collateral received in connection with its securities lending transactions is invested in Securities Lending Cash Investments, LLC (the “Securities Lending Fund”). The Securities Lending Fund is exempt from registration under Section 3(c)(7) of the 1940 Act and is managed by Funds Management and is subadvised by Wells Capital Management Incorporated (“WellsCap”), an affiliate of Funds Management and an indirect wholly owned subsidiary of Wells Fargo & Company (“Wells Fargo”). Funds Management receives an advisory fee starting at 0.05% and declining to 0.01% as the average daily net assets of the Securities Lending Fund increase. All of the fees received by Funds Management are paid to WellsCap for its services as subadviser. The Securities Lending Fund seeks to provide a positive return compared to the daily Fed Funds Open Rate by investing in high-quality, U.S. dollar-denominated short-term money market instruments. Securities Lending Fund investments are valued at the evaluated bid price provided by an independent pricing service. Income earned from investment in the Securities Lending Fund, if any, is included in income from affiliated securities on the Statement of Operations.
| | | | | | |
| Notes to financial statements (unaudited) | | Wells Fargo International Growth Portfolio | | | 13 | |
Security transactions and income recognition
Securities transactions are recorded on a trade date basis. Realized gains or losses are recorded on the basis of identified cost.
Dividend income is recognized on the ex-dividend date, except for certain dividends from foreign securities, which are recorded as soon as the custodian verifies the ex-dividend date. Dividend income from foreign securities is recorded net of foreign taxes withheld where recovery of such taxes is not assured.
Federal and other taxes
The Portfolio is treated as a separate entity for federal income tax purposes. The Portfolio is not required to pay federal income taxes on its net investment income and net capital gains as it is treated as a partnership for federal income tax purposes. All interest, dividends, gains and losses of the Portfolio are deemed to have been “passed through” to the interest holders in proportion to their holdings of the Portfolio regardless of whether such interest, dividends and gains have been distributed by the Portfolio.
The Portfolio’s income tax returns and all financial records supporting those returns for the prior three fiscal years are subject to examination by the federal revenue authority. Management has analyzed the Portfolio’s tax positions taken on federal, state, and foreign tax returns for all open tax years and does not believe that there are any uncertain tax positions that require recognition of a tax liability.
As of November 30, 2018, the aggregate cost of all investments for federal income tax purposes was $256,348,241 and the unrealized gains (losses) consisted of:
| | | | |
Gross unrealized gains | | $ | 14,739,622 | |
Gross unrealized losses | | | (13,080,113 | ) |
Net unrealized gains | | $ | 1,659,509 | |
3. FAIR VALUATION MEASUREMENTS
Fair value measurements of investments are determined within a framework that has established a fair value hierarchy based upon the various data inputs utilized in determining the value of the Portfolio’s investments. The three-level hierarchy gives the highest priority to unadjusted quoted prices in active markets for identical assets or liabilities (Level 1) and the lowest priority to unobservable inputs (Level 3). The Portfolio’s investments are classified within the fair value hierarchy based on the lowest level of input that is significant to the fair value measurement. The inputs are summarized into three broad levels as follows:
| ∎ | | Level 1 – quoted prices in active markets for identical securities |
| ∎ | | Level 2 – other significant observable inputs (including quoted prices for similar securities, interest rates, prepayment speeds, credit risk, etc.) |
| ∎ | | Level 3 – significant unobservable inputs (including the Portfolio’s own assumptions in determining the fair value of investments) |
The inputs or methodologies used for valuing investments in securities are not necessarily an indication of the risk associated with investing in those securities.
| | | | |
| 14 | | Wells Fargo International Growth Portfolio | | Notes to financial statements (unaudited) |
The following is a summary of the inputs used in valuing the Portfolio’s assets and liabilities as of November 30, 2018:
| | | | | | | | | | | | | | | | |
| | | Quoted prices
(Level 1) | | | Other significant
observable inputs
(Level 2) | | | Significant
unobservable inputs (Level 3) | | | Total | |
Assets | | | | | | | | | | | | | | | | |
Investments in: | | | | | | | | | | | | | | | | |
| | | | |
Common stocks | | | | | | | | | | | | | | | | |
Belgium | | $ | 5,839,553 | | | $ | 0 | | | $ | 0 | | | $ | 5,839,553 | |
Brazil | | | 6,411,066 | | | | 0 | | | | 0 | | | | 6,411,066 | |
Canada | | | 5,395,537 | | | | 0 | | | | 0 | | | | 5,395,537 | |
Denmark | | | 4,548,185 | | | | 0 | | | | 0 | | | | 4,548,185 | |
Finland | | | 2,592,303 | | | | 0 | | | | 0 | | | | 2,592,303 | |
France | | | 22,747,637 | | | | 0 | | | | 0 | | | | 22,747,637 | |
Germany | | | 50,611,315 | | | | 0 | | | | 0 | | | | 50,611,315 | |
Hong Kong | | | 7,617,279 | | | | 0 | | | | 0 | | | | 7,617,279 | |
India | | | 6,176,645 | | | | 0 | | | | 0 | | | | 6,176,645 | |
Indonesia | | | 2,006,294 | | | | 0 | | | | 0 | | | | 2,006,294 | |
Ireland | | | 31,115,793 | | | | 0 | | | | 0 | | | | 31,115,793 | |
Italy | | | 8,949,334 | | | | 0 | | | | 0 | | | | 8,949,334 | |
Japan | | | 9,672,984 | | | | 0 | | | | 0 | | | | 9,672,984 | |
Luxembourg | | | 916,474 | | | | 0 | | | | 0 | | | | 916,474 | |
Netherlands | | | 23,935,513 | | | | 0 | | | | 0 | | | | 23,935,513 | |
Russia | | | 3,477,129 | | | | 0 | | | | 0 | | | | 3,477,129 | |
Switzerland | | | 16,656,391 | | | | 0 | | | | 0 | | | | 16,656,391 | |
United Kingdom | | | 28,745,942 | | | | 0 | | | | 0 | | | | 28,745,942 | |
United States | | | 864,238 | | | | 0 | | | | 0 | | | | 864,238 | |
| | | | |
Participation notes | | | | | | | | | | | | | | | | |
Ireland | | | 0 | | | | 4,051,610 | | | | 0 | | | | 4,051,610 | |
| | | | |
Preferred stocks | | | | | | | | | | | | | | | | |
Brazil | | | 5,754,941 | | | | 0 | | | | 0 | | | | 5,754,941 | |
Germany | | | 4,165,917 | | | | 0 | | | | 0 | | | | 4,165,917 | |
| | | | |
Short-term investments | | | | | | | | | | | | | | | | |
Investment companies | | | 5,754,309 | | | | 1,361 | | | | 0 | | | | 5,755,670 | |
Total assets | | $ | 253,954,779 | | | $ | 4,052,971 | | | $ | 0 | | | $ | 258,007,750 | |
Additional sector, industry or geographic detail is included in the Portfolio of Investments.
At November 30, 2018, the Portfolio did not have any transfers into/out of Level 3.
4. TRANSACTIONS WITH AFFILIATES AND OTHER EXPENSES
Advisory fee
The Trust has entered into an advisory contract with Funds Management, an indirect wholly owned subsidiary of Wells Fargo. The adviser is responsible for implementing investment policies and guidelines and for supervising the subadviser, who is responsible for day-to-day portfolio management of the Portfolio. Pursuant to the contract, Funds Management is entitled to receive an annual advisory fee starting at 0.80% and declining to 0.65% as the average daily net assets of the Portfolio increase. For the six months end November 30, 2018, the advisory fee was equivalent to an annual rate of 0.80% of the Portfolio’s average daily net assets.
Funds Management has retained the services of a subadviser to provide daily portfolio management to the Portfolio. The fee for subadvisory services is borne by Funds Management. Artisan Partners, Limited Partnership, which is not an affiliate of Funds Management, is the subadviser to the Portfolio and is entitled to receive a fee from Funds Management at an annual rate starting at 0.80% and declining to 0.50% as the average daily net assets of the Portfolio increase.
Funds Management has voluntarily waived and/or reimbursed advisory fees to the extent necessary to maintain the net operating expense ratio of the Portfolio.
| | | | | | |
| Notes to financial statements (unaudited) | | Wells Fargo International Growth Portfolio | | | 15 | |
Interfund transactions
The Portfolio may purchase or sell portfolio investment securities to certain other Wells Fargo affiliates pursuant to Rule 17a-7 under the 1940 Act and under procedures adopted by the Board of Trustees. The procedures have been designed to ensure that these interfund transactions, which do not incur broker commissions, are effected at current market prices.
5. INVESTMENT PORTFOLIO TRANSACTIONS
Purchases and sales of investments, excluding U.S. government obligations (if any) and short-term securities, for the six months ended November 30, 2018 were $352,222,605 and $131,433,917, respectively.
6. BANK BORROWINGS
Effective August 28, 2018, the Trust, along with Wells Fargo Variable Trust and Wells Fargo Funds Trust (excluding the money market funds), are parties to a $280,000,000 revolving credit agreement whereby the Portfolio is permitted to use bank borrowings for temporary or emergency purposes, such as to fund shareholder redemption requests. Interest under the credit agreement is charged to the Portfolio based on a borrowing rate equal to the higher of the Federal Funds rate in effect on that day plus 1.25% or the overnight LIBOR rate in effect on that day plus 1.25%. In addition, an annual commitment fee equal to 0.25% of the unused balance is allocated to each participating fund.
For the six months ended November 30, 2018, there were no borrowings by the Portfolio under the agreement.
7. CONCENTRATION RISK
Concentration risk result from exposure to a limited number of sectors. A portfolio that invests a substantial portion of its assets in any sector may be more affected by changes in that sector than would be a portfolio whose investments are not heavily weighted in any sector.
8. INDEMNIFICATION
Under the Trust’s organizational documents, the officers and Trustees have been granted certain indemnification rights against certain liabilities that may arise out of performance of their duties to the Trust. Additionally, in the normal course of business, the Trust may enter into contracts with service providers that contain a variety of indemnification clauses. The Trust’s maximum exposure under these arrangements is dependent on future claims that may be made against the Portfolio and, therefore, cannot be estimated.
9. NEW ACCOUNTING PRONOUNCEMENT
In August 2018, FASB issued Accounting Standards Update (“ASU”) No. 2018-13, Fair Value Measurement (Topic 820)Disclosure Framework—Changes to the Disclosure Requirements for Fair Value Measurement. ASU 2018-13 updates the disclosure requirements for fair value measurements by modifying or removing certain disclosures and adding certain new disclosures. The amendments are effective for fiscal years, and interim periods within those fiscal years, beginning after December 15, 2019. Early adoption is permitted. Management has adopted the removal and modification of disclosures early, as permitted, and will adopt the additional new disclosures at the effective date.
| | | | |
| 16 | | Wells Fargo International Growth Portfolio | | Other information (unaudited) |
PROXY VOTING INFORMATION
A description of the policies and procedures used to determine how to vote proxies relating to portfolio securities is available, upon request, by calling1-800-222-8222, visiting our website at wellsfargofunds.com, or visiting the SEC website at sec.gov. Information regarding how the Portfolio voted proxies relating to portfolio securities during the most recent 12-month period ended June 30 is available on the Portfolio’s website atwellsfargofunds.comor by visiting the SEC website at sec.gov.
PORTFOLIO HOLDINGS INFORMATION
The complete portfolio holdings for the Portfolio are publicly available monthly on the Portfolio’s website (wellsfargofunds.com), on a one-month delayed basis. In addition, top ten holdings information (excluding derivative positions) for the Portfolio is publicly available on the Portfolio’s website on a monthly, seven-day or more delayed basis. The Portfolio files its complete schedule of portfolio holdings with the SEC for the first and third quarters of each fiscal year on Form N-Q, which is available by visiting the SEC website at sec.gov. In addition, the Portfolio’s Form N-Q may be reviewed and copied at the SEC’s Public Reference Room in Washington, DC, and at regional offices in New York City, at 233 Broadway, and in Chicago, at 175 West Jackson Boulevard, Suite 900. Information about the Public Reference Room may be obtained by calling 1-800-SEC-0330.
| | | | | | |
| Other information (unaudited) | | Wells Fargo International Growth Portfolio | | | 17 | |
BOARD OF TRUSTEES AND OFFICERS
Each of the Trustees and Officers1 listed in the table below acts in identical capacities for each fund in the Wells Fargo family of funds, which consists of 152 mutual funds comprising the Wells Fargo Funds Trust, Wells Fargo Variable Trust, Wells Fargo Master Trust and four closed-end funds (collectively the “Fund Complex”). This table should be read in conjunction with the Prospectus and the Statement of Additional Information2. The mailing address of each Trustee and Officer is 525 Market Street, 12th Floor, San Francisco, CA 94105. Each Trustee and Officer serves an indefinite term, however, each Trustee serves such term until reaching the mandatory retirement age established by the Trustees.
Independent Trustees
| | | | | | |
Name and
year of birth | | Position held and
length of service* | | Principal occupations during past five years or longer | | Current other
public company or
investment company
directorships |
William R. Ebsworth
(Born 1957) | | Trustee, since 2015 | | Retired. From 1984 to 2013, equities analyst, portfolio manager, research director and chief investment officer at Fidelity Management and Research Company in Boston, Tokyo, and Hong Kong, and retired in 2013 as Chief Investment Officer of Fidelity Strategic Advisers, Inc. where he led a team of investment professionals managing client assets. Prior thereto, Board member of Hong Kong Securities Clearing Co., Hong Kong Options Clearing Corp., the Thailand International Fund, Ltd., Fidelity Investments Life Insurance Company, and Empire Fidelity Investments Life Insurance Company. Board member of the Vincent Memorial Hospital Endowment (non-profit organization), where he serves on the Investment Committee and as a Chair of the Audit Committee. Mr. Ebsworth is a CFA® charterholder. | | N/A |
Jane A. Freeman
(Born 1953) | | Trustee, since 2015; Chair Liaison, since 2018 | | Retired. From 2012 to 2014 and 1999 to 2008, Chief Financial Officer of Scientific Learning Corporation. From 2008 to 2012, Ms. Freeman provided consulting services related to strategic business projects. Prior to 1999, Portfolio Manager at Rockefeller & Co. and Scudder, Stevens & Clark. Board member of the Harding Loevner Funds from 1996 to 2014, serving as both Lead Independent Director and chair of the Audit Committee. Board member of the Russell Exchange Traded Funds Trust from 2011 to 2012 and the chair of the Audit Committee. Ms. Freeman is a Board Member of The Ruth Bancroft Garden (non-profit organization). She is also an inactive Chartered Financial Analyst. | | N/A |
Isaiah Harris, Jr.3
(Born 1952) | | Trustee, since 2009 | | Retired. Chairman of the Board of CIGNA Corporation since 2009, and Director since 2005. From 2003 to 2011, Director of Deluxe Corporation. Prior thereto, President and CEO of BellSouth Advertising and Publishing Corp. from 2005 to 2007, President and CEO of BellSouth Enterprises from 2004 to 2005 and President of BellSouth Consumer Services from 2000 to 2003. Emeritus member of the Iowa State University Foundation Board of Governors. Emeritus Member of the Advisory Board of Iowa State University School of Business. Advisory Board Member, Palm Harbor Academy (private school). Advisory Board Member, Child Evangelism Fellowship (non-profit). Mr. Harris is a certified public accountant (inactive status). | | CIGNA Corporation |
Judith M. Johnson3
(Born 1949) | | Trustee, since 2008; Audit Committee Chairman, since 2009 | | Retired. Prior thereto, Chief Executive Officer and Chief Investment Officer of Minneapolis Employees Retirement Fund from 1996 to 2008. Ms. Johnson is an attorney, certified public accountant and a certified managerial accountant. | | N/A |
David F. Larcker
(Born 1950) | | Trustee, since 2009 | | James Irvin Miller Professor of Accounting at the Graduate School of Business, Stanford University, Director of the Corporate Governance Research Initiative and Senior Faculty of The Rock Center for Corporate Governance since 2006. From 2005 to 2008, Professor of Accounting at the Graduate School of Business, Stanford University. Prior thereto, Ernst & Young Professor of Accounting at The Wharton School, University of Pennsylvania from 1985 to 2005. | | N/A |
| | | | |
| 18 | | Wells Fargo International Growth Portfolio | | Other information (unaudited) |
| | | | | | |
Name and
year of birth | | Position held and
length of service* | | Principal occupations during past five years or longer | | Current other
public company or
investment company
directorships |
Olivia S. Mitchell
(Born 1953) | | Trustee, since 2006; Nominating and Governance Committee Chairman, since 2018 | | International Foundation of Employee Benefit Plans Professor, Wharton School of the University of Pennsylvania since 1993. Director of Wharton’s Pension Research Council and Boettner Center on Pensions & Retirement Research, and Research Associate at the National Bureau of Economic Research. Previously, Cornell University Professor from 1978 to 1993. | | N/A |
Timothy J. Penny
(Born 1951) | | Trustee, since 1996; Chairman, since 2018; Vice Chairman, from 2017 to 2018 | | President and Chief Executive Officer of Southern Minnesota Initiative Foundation, a non-profit organization, since 2007. Member of the Board of Trustees of NorthStar Education Finance, Inc., a non-profit organization, since 2007. | | N/A |
James G. Polisson
(Born 1959) | | Trustee, since 2018; Advisory Board Member, from 2017 to 2018 | | Retired. Chief Marketing Officer, Source (ETF) UK Services, Ltd, from 2015 to 2017. From 2012 to 2015, Principal of The Polisson Group, LLC, a management consulting, corporate advisory and principal investing company. Chief Executive Officer and Managing Director at Russell Investments, Global Exchange Traded Funds from 2010 to 2012. Managing Director of Barclays Global Investors from 1998 to 2010 and Global Chief Marketing Officer for iShares and Barclays Global Investors from 2000 to 2010. Trustee of the San Francisco Mechanics’ Institute, a non-profit organization, from 2013 to 2015. Board member of the Russell Exchange Traded Fund Trust from 2011 to 2012. Director of Barclays Global Investors Holdings Deutschland GmbH from 2006 to 2009. Mr. Polisson is an attorney and has a retired status with the Massachusetts and District of Columbia Bar Associations. | | N/A |
Michael S. Scofield4 (Born 1943) | | Trustee, since 2010 | | Served on the Investment Company Institute’s Board of Governors and Executive Committee from 2008-2011 as well the Governing Council of the Independent Directors Council from 2006-2011 and the Independent Directors Council Executive Committee from 2008-2011. Trustee of the Evergreen Fund complex (and its predecessors) from 1984 to 2010. Chairman of the Evergreen Funds from 2000-2010. Former Trustee of the Mentor Funds. Retired Attorney, Law Offices of Michael S. Scofield. | | N/A |
Pamela Wheelock
(Born 1959) | | Trustee, since 2018; Advisory Board Member, from 2017 to 2018 | | Chief Operating Officer, Twin Cities Habitat for Humanity, since January, 2017. Vice President of University Services, University of Minnesota from 2012 to 2017. Prior thereto, on the Board of Directors, Governance Committee and Finance Committee for the Minnesota Philanthropy Partners (Saint Paul Foundation) from 2012 to 2018, Interim President and Chief Executive Officer of Blue Cross Blue Shield of Minnesota from 2010 to 2011, Chairman of the Board from 2009 to 2011 and Board Director from 2003 to 2015. Vice President, Leadership and Community Engagement, Bush Foundation, Saint Paul, Minnesota (a private foundation) from 2009 to 2011. Executive Vice President and Chief Financial Officer, Minnesota Sports and Entertainment from 2004 to 2009 and Senior Vice President from 2002 to 2004. Commissioner of Finance, State of Minnesota, from 1999 to 2002. Currently the Board Chair of the Minnesota Wild Foundation since 2010. | | N/A |
| * | Length of service dates reflect the Trustee’s commencement of service with the Trust’s predecessor entities, where applicable. |
| | | | | | |
| Other information (unaudited) | | Wells Fargo International Growth Portfolio | | | 19 | |
Officers
| | | | | | |
Name and
year of birth | | Position held and
length of service | | Principal occupations during past five years or longer | | |
Andrew Owen
(Born 1960) | | President, since 2017 | | Executive Vice President of Wells Fargo & Company and Head of Affiliated Managers, Wells Fargo Asset Management, since 2014. In addition, Mr. Owen is currently President, Chief Executive Officer and Director of Wells Fargo Funds Management, LLC since 2017. Prior thereto, Executive Vice President responsible for marketing, investments and product development for Wells Fargo Funds Management, LLC, from 2009 to 2014. | | |
Jeremy DePalma1
(Born 1974) | | Treasurer, since 2012 | | Senior Vice President of Wells Fargo Funds Management, LLC since 2009. Senior Vice President of Evergreen Investment Management Company, LLC from 2008 to 2010 and head of the Fund Reporting and Control Team within Fund Administration from 2005 to 2010. | | |
Alexander Kymn
(Born 1973) | | Secretary, since 2018; Chief Legal Officer, since 2018 | | Senior Company Counsel of Wells Fargo Bank, N.A. since 2018 (previously Senior Counsel from 2007 to 2018). Vice President of Wells Fargo Funds Management, LLC from 2008 to 2014. | | |
Michael H. Whitaker
(Born 1967) | | Chief Compliance Officer, since 2016 | | Senior Vice President and Chief Compliance Officer since 2016. Senior Vice President and Chief Compliance Officer for Fidelity Investments from 2007 to 2016. | | |
David Berardi
(Born 1975) | | Assistant Treasurer, since 2009 | | Vice President of Wells Fargo Funds Management, LLC since 2009. Vice President of Evergreen Investment Management Company, LLC from 2008 to 2010. Manager of Fund Reporting and Control for Evergreen Investment Management Company, LLC from 2004 to 2010. | | |
| 1 | Jeremy DePalma acts as Treasurer of 76 funds and Assistant Treasurer of 76 funds in the Fund Complex. |
| 2 | The Statement of Additional Information includes additional information about the Trustees and is available, without charge, upon request, by calling1-800-222-8222 or by visiting the website atwellsfargofunds.com. |
| 3 | Mr. Harris will replace Ms. Johnson as the Chairman of the Audit Committee effective January 1, 2019. |
| 4 | Mr. Scofield is expected to retire on December 31, 2018. |
This page is intentionally left blank.
INVESTMENT PRODUCTS: NOT FDIC INSURED ◾ NO BANK GUARANTEE ◾ MAY LOSE VALUE
© 2019 Wells Fargo Funds Management, LLC. All rights reserved.
Semi-Annual Report
November 30, 2018

Wells Fargo Large Company Value Portfolio


Contents
INVESTMENT PRODUCTS: NOT FDIC INSURED ◾ NO BANK GUARANTEE ◾ MAY LOSE VALUE
| | | | |
| 2 | | Wells Fargo Large Company Value Portfolio | | Fund information (unaudited) |
Investment objective
The Portfolio seeks long-term capital appreciation.
Manager
Wells Fargo Funds Management, LLC
Subadviser
Wells Capital Management Incorporated
Portfolio managers
Dennis Bein, CFA®‡
Ryan Brown, CFA®‡
Harindra de Silva, Ph.D., CFA®‡
| | | | |
| Ten largest holdings (%) as of November 30, 20181 | |
JPMorgan Chase & Company | | | 4.60 | |
Bank of America Corporation | | | 3.96 | |
Exxon Mobil Corporation | | | 3.94 | |
The Procter & Gamble Company | | | 3.73 | |
AT&T Incorporated | | | 3.68 | |
Merck & Company Incorporated | | | 3.49 | |
Pfizer Incorporated | | | 3.35 | |
Chevron Corporation | | | 3.26 | |
Berkshire Hathaway Incorporated Class B | | | 3.01 | |
Cisco Systems Incorporated | | | 2.87 | |
|
| Sector distribution as of November 30, 20182 |
|
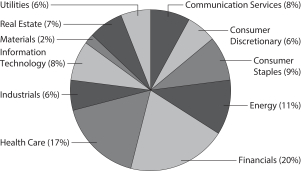
|
| ‡ | CFA® and Chartered Financial Analyst® are trademarks owned by CFA Institute. |
| 1 | The ten largest holdings, excluding cash, cash equivalents and any money market funds, are calculated based on the value of the investments divided by the total net assets of the Portfolio. Holdings are subject to change and may have changed since the date specified. |
| 2 | Amounts are calculated based on the total long-term investments of the Portfolio. These amounts are subject to change and may have changed since the date specified. |
| | | | | | |
| Portfolio of investments—November 30, 2018 (unaudited) | | Wells Fargo Large Company Value Portfolio | | | 3 | |
| | | | | | | | | | | | | | | | |
| Security name | | | | | | | | Shares | | | Value | |
| | | | |
Common Stocks: 98.26% | | | | | | | | | | | | | | | | |
| | | | |
Communication Services: 7.91% | | | | | | | | | | | | | | | | |
| | | | |
| Diversified Telecommunication Services: 4.80% | | | | | | | | | | | | | | | | |
AT&T Incorporated | | | | | | | | | | | 340,721 | | | $ | 10,644,124 | |
Verizon Communications Incorporated | | | | | | | | | | | 53,562 | | | | 3,229,789 | |
| | | | |
| | | | | | | | | | | | | | | 13,873,913 | |
| | | | | | | | | | | | | | | | |
| | | | |
| Entertainment: 1.29% | | | | | | | | | | | | | | | | |
Viacom Incorporated Class B | | | | | | | | | | | 120,956 | | | | 3,732,702 | |
| | | | | | | | | | | | | | | | |
| | | | |
| Interactive Media & Services: 1.82% | | | | | | | | | | | | | | | | |
Alphabet Incorporated Class A † | | | | | | | | | | | 1,863 | | | | 2,067,278 | |
Cars.com Incorporated † | | | | | | | | | | | 123,704 | | | | 3,200,222 | |
| | | | |
| | | | | | | | | | | | | | | 5,267,500 | |
| | | | | | | | | | | | | | | | |
| | | | |
Consumer Discretionary: 5.54% | | | | | | | | | | | | | | | | |
| | | | |
| Hotels, Restaurants & Leisure: 3.12% | | | | | | | | | | | | | | | | |
Darden Restaurants Incorporated | | | | | | | | | | | 6,215 | | | | 687,006 | |
Las Vegas Sands Corporation | | | | | | | | | | | 44,144 | | | | 2,425,271 | |
Royal Caribbean Cruises Limited | | | | | | | | | | | 12,547 | | | | 1,418,686 | |
Texas Roadhouse Incorporated | | | | | | | | | | | 1,788 | | | | 118,062 | |
The Cheesecake Factory Incorporated | | | | | | | | | | | 1,322 | | | | 62,385 | |
Yum China Holdings Incorporated | | | | | | | | | | | 120,472 | | | | 4,316,512 | |
| | | | |
| | | | | | | | | | | | | | | 9,027,922 | |
| | | | | | | | | | | | | | | | |
| | | | |
| Leisure Products: 0.28% | | | | | | | | | | | | | | | | |
Callaway Golf Company | | | | | | | | | | | 47,118 | | | | 807,131 | |
| | | | | | | | | | | | | | | | |
| | | | |
| Multiline Retail: 0.90% | | | | | | | | | | | | | | | | |
Target Corporation | | | | | | | | | | | 36,614 | | | | 2,598,129 | |
| | | | | | | | | | | | | | | | |
| | | | |
| Textiles, Apparel & Luxury Goods: 1.24% | | | | | | | | | | | | | | | | |
Nike Incorporated Class B | | | | | | | | | | | 47,508 | | | | 3,568,801 | |
| | | | | | | | | | | | | | | | |
| | | | |
Consumer Staples: 8.78% | | | | | | | | | | | | | | | | |
| | | | |
| Beverages: 1.82% | | | | | | | | | | | | | | | | |
Keurig Dr Pepper Incorporated | | | | | | | | | | | 72,088 | | | | 1,946,376 | |
PepsiCo Incorporated | | | | | | | | | | | 27,123 | | | | 3,307,379 | |
| | | | |
| | | | | | | | | | | | | | | 5,253,755 | |
| | | | | | | | | | | | | | | | |
| | | | |
| Food & Staples Retailing: 0.33% | | | | | | | | | | | | | | | | |
Wal-Mart Stores Incorporated | | | | | | | | | | | 9,675 | | | | 944,764 | |
| | | | | | | | | | | | | | | | |
| | | | |
| Food Products: 2.91% | | | | | | | | | | | | | | | | |
Archer Daniels Midland Company | | | | | | | | | | | 39,720 | | | | 1,827,914 | |
Cal-Maine Foods Incorporated | | | | | | | | | | | 25,531 | | | | 1,192,808 | |
Ingredion Incorporated | | | | | | | | | | | 35,575 | | | | 3,716,165 | |
Tyson Foods Incorporated Class A | | | | | | | | | | | 28,530 | | | | 1,681,844 | |
| | | | |
| | | | | | | | | | | | | | | 8,418,731 | |
| | | | | | | | | | | | | | | | |
The accompanying notes are an integral part of these financial statements.
| | | | |
| 4 | | Wells Fargo Large Company Value Portfolio | | Portfolio of investments—November 30, 2018 (unaudited) |
| | | | | | | | | | | | | | | | |
| Security name | | | | | | | | Shares | | | Value | |
| | | | |
| Household Products: 3.72% | | | | | | | | | | | | | | | | |
The Procter & Gamble Company | | | | | | | | | | | 113,980 | | | $ | 10,772,250 | |
| | | | | | | | | | | | | | | | |
| | | | |
Energy: 10.34% | | | | | | | | | | | | | | | | |
| | | | |
| Energy Equipment & Services: 0.81% | | | | | | | | | | | | | | | | |
Baker Hughes Incorporated | | | | | | | | | | | 24,367 | | | | 556,055 | |
McDermott International Incorporated † | | | | | | | | | | | 206,133 | | | | 1,795,418 | |
| | | | |
| | | | | | | | | | | | | | | 2,351,473 | |
| | | | | | | | | | | | | | | | |
| | | | |
| Oil, Gas & Consumable Fuels: 9.53% | | | | | | | | | | | | | | | | |
Chevron Corporation | | | | | | | | | | | 79,221 | | | | 9,422,546 | |
ConocoPhillips | | | | | | | | | | | 95,679 | | | | 6,332,036 | |
Exxon Mobil Corporation | | | | | | | | | | | 143,099 | | | | 11,376,371 | |
PBF Energy Incorporated Class A | | | | | | | | | | | 10,325 | | | | 399,371 | |
| | | | |
| | | | | | | | | | | | | | | 27,530,324 | |
| | | | | | | | | | | | | | | | |
| | | | |
Financials: 19.57% | | | | | | | | | | | | | | | | |
| | | | |
| Banks: 11.59% | | | | | | | | | | | | | | | | |
Bank of America Corporation | | | | | | | | | | | 403,534 | | | | 11,460,366 | |
FNB Corporation | | | | | | | | | | | 6,374 | | | | 78,145 | |
Huntington Bancshares Incorporated | | | | | | | | | | | 282,027 | | | | 4,114,774 | |
JPMorgan Chase & Company | | | | | | | | | | | 119,576 | | | | 13,295,655 | |
PNC Financial Services Group Incorporated | | | | | | | | | | | 13,029 | | | | 1,769,078 | |
US Bancorp | | | | | | | | | | | 51,389 | | | | 2,798,645 | |
| | | | |
| | | | | | | | | | | | | | | 33,516,663 | |
| | | | | | | | | | | | | | | | |
| | | | |
| Capital Markets: 2.12% | | | | | | | | | | | | | | | | |
Affiliated Managers Group Incorporated | | | | | | | | | | | 2,242 | | | | 249,131 | |
Ameriprise Financial Incorporated | | | | | | | | | | | 11,969 | | | | 1,552,978 | |
State Street Corporation | | | | | | | | | | | 26,190 | | | | 1,912,394 | |
T. Rowe Price Group Incorporated | | | | | | | | | | | 24,187 | | | | 2,403,220 | |
| | | | |
| | | | | | | | | | | | | | | 6,117,723 | |
| | | | | | | | | | | | | | | | |
| | | | |
| Consumer Finance: 0.35% | | | | | | | | | | | | | | | | |
Discover Financial Services | | | | | | | | | | | 14,015 | | | | 999,270 | |
| | | | | | | | | | | | | | | | |
| | | | |
| Diversified Financial Services: 3.01% | | | | | | | | | | | | | | | | |
Berkshire Hathaway Incorporated Class B † | | | | | | | | | | | 39,809 | | | | 8,687,916 | |
| | | | | | | | | | | | | | | | |
| | | | |
| Insurance: 2.50% | | | | | | | | | | | | | | | | |
CNO Financial Group Incorporated | | | | | | | | | | | 30,136 | | | | 551,489 | |
Kemper Corporation | | | | | | | | | | | 9,736 | | | | 740,910 | |
Old Republic International Corporation | | | | | | | | | | | 41,761 | | | | 941,711 | |
The Progressive Corporation | | | | | | | | | | | 75,388 | | | | 4,997,471 | |
| | | | |
| | | | | | | | | | | | | | | 7,231,581 | |
| | | | | | | | | | | | | | | | |
| | | | |
Health Care: 17.19% | | | | | | | | | | | | | | | | |
| | | | |
| Biotechnology: 1.62% | | | | | | | | | | | | | | | | |
AbbVie Incorporated | | | | | | | | | | | 20,192 | | | | 1,903,500 | |
The accompanying notes are an integral part of these financial statements.
| | | | | | |
| Portfolio of investments—November 30, 2018 (unaudited) | | Wells Fargo Large Company Value Portfolio | | | 5 | |
| | | | | | | | | | | | | | | | |
| Security name | | | | | | | | Shares | | | Value | |
| | | | |
| Biotechnology(continued) | | | | | | | | | | | | | | | | |
Alexion Pharmaceuticals Incorporated † | | | | | | | | | | | 11,336 | | | $ | 1,396,028 | |
Gilead Sciences Incorporated | | | | | | | | | | | 19,101 | | | | 1,374,126 | |
| | | | |
| | | | | | | | | | | | | | | 4,673,654 | |
| | | | | | | | | | | | | | | | |
| | | | |
| Health Care Equipment & Supplies: 2.10% | | | | | | | | | | | | | | | | |
Baxter International Incorporated | | | | | | | | | | | 1,883 | | | | 129,080 | |
Cantel Medical Corporation | | | | | | | | | | | 3,395 | | | | 291,563 | |
CONMED Corporation | | | | | | | | | | | 5,403 | | | | 367,188 | |
Medtronic plc | | | | | | | | | | | 13,547 | | | | 1,321,239 | |
Varian Medical Systems Incorporated † | | | | | | | | | | | 14,302 | | | | 1,764,724 | |
West Pharmaceutical Services Incorporated | | | | | | | | | | | 20,121 | | | | 2,204,457 | |
| | | | |
| | | | | | | | | | | | | | | 6,078,251 | |
| | | | | | | | | | | | | | | | |
| | | | |
| Health Care Providers & Services: 2.13% | | | | | | | | | | | | | | | | |
Humana Incorporated | | | | | | | | | | | 16,244 | | | | 5,351,911 | |
McKesson Corporation | | | | | | | | | | | 6,459 | | | | 804,146 | |
| | | | |
| | | | | | | | | | | | | | | 6,156,057 | |
| | | | | | | | | | | | | | | | |
| | | | |
| Life Sciences Tools & Services: 2.52% | | | | | | | | | | | | | | | | |
Agilent Technologies Incorporated | | | | | | | | | | | 95,367 | | | | 6,899,802 | |
Bruker Corporation | | | | | | | | | | | 11,802 | | | | 391,118 | |
| | | | |
| | | | | | | | | | | | | | | 7,290,920 | |
| | | | | | | | | | | | | | | | |
| | | | |
| Pharmaceuticals: 8.82% | | | | | | | | | | | | | | | | |
Johnson & Johnson | | | | | | | | | | | 7,939 | | | | 1,166,239 | |
Mallinckrodt plc † | | | | | | | | | | | 10,649 | | | | 253,340 | |
Merck & Company Incorporated | | | | | | | | | | | 127,199 | | | | 10,091,969 | |
Mylan NV † | | | | | | | | | | | 126,770 | | | | 4,292,432 | |
Pfizer Incorporated | | | | | | | | | | | 209,747 | | | | 9,696,604 | |
| | | | |
| | | | | | | | | | | | | | | 25,500,584 | |
| | | | | | | | | | | | | | | | |
| | | | |
Industrials: 5.93% | | | | | | | | | | | | | | | | |
| | | | |
| Aerospace & Defense: 1.92% | | | | | | | | | | | | | | | | |
Raytheon Company | | | | | | | | | | | 31,734 | | | | 5,564,240 | |
| | | | | | | | | | | | | | | | |
| | | | |
| Airlines: 1.91% | | | | | | | | | | | | | | | | |
SkyWest Incorporated | | | | | | | | | | | 1,181 | | | | 68,120 | |
Southwest Airlines Company | | | | | | | | | | | 99,721 | | | | 5,445,764 | |
| | | | |
| | | | | | | | | | | | | | | 5,513,884 | |
| | | | | | | | | | | | | | | | |
| | | | |
| Commercial Services & Supplies: 0.05% | | | | | | | | | | | | | | | | |
Republic Services Incorporated | | | | | | | | | | | 1,907 | | | | 147,487 | |
| | | | | | | | | | | | | | | | |
| | | | |
| Machinery: 0.18% | | | | | | | | | | | | | | | | |
Paccar Incorporated | | | | | | | | | | | 8,391 | | | | 522,088 | |
| | | | | | | | | | | | | | | | |
| | | | |
| Professional Services: 0.09% | | | | | | | | | | | | | | | | |
Robert Half International Incorporated | | | | | | | | | | | 4,305 | | | | 266,178 | |
| | | | | | | | | | | | | | | | |
The accompanying notes are an integral part of these financial statements.
| | | | |
| 6 | | Wells Fargo Large Company Value Portfolio | | Portfolio of investments—November 30, 2018 (unaudited) |
| | | | | | | | | | | | | | | | |
| Security name | | | | | | | | Shares | | | Value | |
| | | | |
| Road & Rail: 1.78% | | | | | | | | | | | | | | | | |
Norfolk Southern Corporation | | | | | | | | | | | 30,093 | | | $ | 5,138,079 | |
| | | | | | | | | | | | | | | | |
| | | | |
Information Technology: 8.30% | | | | | | | | | | | | | | | | |
| | | | |
| Communications Equipment: 2.87% | | | | | | | | | | | | | | | | |
Cisco Systems Incorporated | | | | | | | | | | | 173,256 | | | | 8,293,765 | |
| | | | | | | | | | | | | | | | |
| | | | |
| Electronic Equipment, Instruments & Components: 0.12% | | | | | | | | | | | | | | | | |
SYNNEX Corporation | | | | | | | | | | | 4,435 | | | | 358,082 | |
| | | | | | | | | | | | | | | | |
| | | | |
| IT Services: 0.35% | | | | | | | | | | | | | | | | |
Akamai Technologies Incorporated † | | | | | | | | | | | 14,820 | | | | 1,018,875 | |
| | | | | | | | | | | | | | | | |
| | | | |
| Semiconductors & Semiconductor Equipment: 1.17% | | | | | | | | | | | | | | | | |
Intel Corporation | | | | | | | | | | | 68,291 | | | | 3,367,429 | |
| | | | | | | | | | | | | | | | |
| | | | |
| Software: 3.79% | | | | | | | | | | | | | | | | |
Intuit Incorporated | | | | | | | | | | | 20,712 | | | | 4,443,345 | |
Microsoft Corporation | | | | | | | | | | | 58,597 | | | | 6,497,821 | |
| | | | |
| | | | | | | | | | | | | | | 10,941,166 | |
| | | | | | | | | | | | | | | | |
| | | | |
Materials: 2.03% | | | | | | | | | | | | | | | | |
| | | | |
| Chemicals: 0.33% | | | | | | | | | | | | | | | | |
LyondellBasell Industries NV Class A | | | | | | | | | | | 10,096 | | | | 942,058 | |
| | | | | | | | | | | | | | | | |
| | | | |
| Metals & Mining: 1.04% | | | | | | | | | | | | | | | | |
Freeport-McMoRan Incorporated | | | | | | | | | | | 12,997 | | | | 155,184 | |
Newmont Mining Corporation | | | | | | | | | | | 42,558 | | | | 1,376,326 | |
Nucor Corporation | | | | | | | | | | | 15,827 | | | | 956,109 | |
Southern Copper Corporation | | | | | | | | | | | 15,628 | | | | 523,225 | |
| | | | |
| | | | | | | | | | | | | | | 3,010,844 | |
| | | | | | | | | | | | | | | | |
| | | | |
| Paper & Forest Products: 0.66% | | | | | | | | | | | | | | | | |
Louisiana-Pacific Corporation | | | | | | | | | | | 83,865 | | | | 1,917,154 | |
| | | | | | | | | | | | | | | | |
| | | | |
Real Estate: 6.66% | | | | | | | | | | | | | | | | |
| | | | |
| Equity REITs: 6.66% | | | | | | | | | | | | | | | | |
CoreCivic Incorporated | | | | | | | | | | | 100,098 | | | | 2,197,151 | |
Outfront Media Incorporated | | | | | | | | | | | 22,805 | | | | 473,888 | |
Park Hotels & Resorts Incorporated | | | | | | | | | | | 129,460 | | | | 3,989,957 | |
Public Storage Incorporated | | | | | | | | | | | 4,284 | | | | 913,606 | |
Senior Housing Properties Trust | | | | | | | | | | | 23,220 | | | | 319,507 | |
The Geo Group Incorporated | | | | | | | | | | | 86,667 | | | | 2,014,141 | |
VICI Properties Incorporated | | | | | | | | | | | 201,479 | | | | 4,386,198 | |
Weyerhaeuser Company | | | | | | | | | | | 52,252 | | | | 1,379,975 | |
Xenia Hotels & Resorts Incorporated | | | | | | | | | | | 176,266 | | | | 3,581,725 | |
| | | | |
| | | | | | | | | | | | | | | 19,256,148 | |
| | | | | | | | | | | | | | | | |
| | | | |
Utilities: 6.01% | | | | | | | | | | | | | | | | |
| | | | |
| Electric Utilities: 2.19% | | | | | | | | | | | | | | | | |
Avangrid Incorporated | | | | | | | | | | | 63,392 | | | | 3,193,689 | |
The accompanying notes are an integral part of these financial statements.
| | | | | | |
| Portfolio of investments—November 30, 2018 (unaudited) | | Wells Fargo Large Company Value Portfolio | | | 7 | |
| | | | | | | | | | | | | | | | |
| Security name | | | | | | | | Shares | | | Value | |
| | | | |
| Electric Utilities(continued) | | | | | | | | | | | | | | | | |
Duke Energy Corporation | | | | | | | | | | | 35,550 | | | $ | 3,148,664 | |
Evergy Incorporated | | | | | | | | | | | 1 | | | | 59 | |
| | | | |
| | | | | | | | | | | | | | | 6,342,412 | |
| | | | | | | | | | | | | | | | |
| | | | |
| Gas Utilities: 2.04% | | | | | | | | | | | | | | | | |
UGI Corporation | | | | | | | | | | | 102,549 | | | | 5,891,440 | |
| | | | | | | | | | | | | | | | |
| | | | |
| Multi-Utilities: 1.78% | | | | | | | | | | | | | | | | |
MDU Resources Group Incorporated | | | | | | | | | | | 194,427 | | | | 5,146,483 | |
| | | | | | | | | | | | | | | | |
| | | | |
Total Common Stocks (Cost $277,637,755) | | | | | | | | | | | | | | | 284,037,826 | |
| | | | | | | | | | | | | | | | |
| | | | |
| | | Yield | | | | | | | | | | |
| Short-Term Investments: 1.18% | | | | | | | | | | | | | | | | |
| | | | |
| Investment Companies: 1.18% | | | | | | | | | | | | | | | | |
Wells Fargo Government Money Market Fund Select Class (l)(u) | | | 2.13 | % | | | | | | | 3,413,510 | | | | 3,413,510 | |
| | | | | | | | | | | | | | | | |
| | | | |
Total Short-Term Investments (Cost $3,413,510) | | | | | | | | | | | | | | | 3,413,510 | |
| | | | | | | | | | | | | | | | |
| | | | | | | | |
| Total investments in securities (Cost $281,051,265) | | | 99.44 | % | | | 287,451,336 | |
Other assets and liabilities, net | | | 0.56 | | | | 1,625,197 | |
| | | | | | | | |
| Total net assets | | | 100.00 | % | | $ | 289,076,533 | |
| | | | | | | | |
| † | Non-income-earning security |
| (l) | The issuer of the security is an affiliated person of the Portfolio as defined in the Investment Company Act of 1940. |
| (u) | The rate represents the 7-day annualized yield at period end. |
Abbreviations:
| REIT | Real estate investment trust |
Futures Contracts
| | | | | | | | | | | | | | | | | | | | | | | | |
| Description | | Number of
contracts | | | Expiration
date | | | Notional
cost | | | Notional
value | | | Unrealized
gains | | | Unrealized
losses | |
Long | | | | | | | | | | | | | | | | | | | | | | | | |
S&P 500 E-Mini Index | | | 48 | | | | 12-21-2018 | | | $ | 6,690,022 | | | $ | 6,619,920 | | | $ | 0 | | | $ | (70,102 | ) |
Investments in Affiliates
An affiliated investment is an investment in which the Portfolio owns at least 5% of the outstanding voting shares of the issuer or as a result of other relationships, such as the Portfolio and the issuer having the same adviser or investment manager. Transactions with issuers that were either affiliated persons of the Portfolio at the beginning of the period or the end of the period were as follows:
| | | | | | | | | | | | | | | | | | | | | | | | | | | | | | | | | | | | |
| | | Shares,
beginning of
period | | | Shares
purchased | | | Shares
sold | | | Shares,
end of
period | | | Net
realized
gains
(losses) | | | Net
change in
unrealized
gains
(losses) | | | Income
from
affiliated
securities | | | Value,
end
of period | | | % of
net
assets | |
Short-Term Investments | | | | | | | | | | | | | | | | | | | | | | | | | | | | | | | | | | | | |
Investment Companies | | | | | | | | | | | | | | | | | | | | | | | | | | | | | | | | | | | | |
Wells Fargo Government Money Market Fund Select Class | | | 1,158,700 | | | | 71,309,560 | | | | 69,054,750 | | | | 3,413,510 | | | $ | 0 | | | $ | 0 | | | $ | 46,696 | | | $ | 3,413,510 | | | | 1.18 | % |
The accompanying notes are an integral part of these financial statements.
| | | | |
| 8 | | Wells Fargo Large Company Value Portfolio | | Statement of assets and liabilities—November 30, 2018 (unaudited) |
| | | | |
| | | | |
| |
Assets | | | | |
Investments in unaffiliated securities, at value (cost $277,637,755) | | $ | 284,037,826 | |
Investments in affiliated securities, at value (cost $3,413,510) | | | 3,413,510 | |
Segregated cash for futures contracts | | | 1,150,000 | |
Receivable for dividends | | | 558,520 | |
Receivable for daily variation margin on open futures contracts | | | 33,840 | |
| | | | |
Total assets | | | 289,193,696 | |
| | | | |
| |
Liabilities | | | | |
Advisory fee payable | | | 88,502 | |
Professional fees payable | | | 24,106 | |
Accrued expenses and other liabilities | | | 4,555 | |
| | | | |
Total liabilities | | | 117,163 | |
| | | | |
Total net assets | | $ | 289,076,533 | |
| | | | |
The accompanying notes are an integral part of these financial statements.
| | | | | | |
| Statement of operations—six months ended November 30, 2018 (unaudited) | | Wells Fargo Large Company Value Portfolio | | | 9 | |
| | | | |
| | | | |
| |
Investment income | | | | |
Dividends (net of foreign withholding taxes of $377) | | $ | 3,138,092 | |
Income from affiliated securities | | | 46,696 | |
| | | | |
Total investment income | | | 3,184,788 | |
| | | | |
| |
Expenses | | | | |
Advisory fee | | | 452,155 | |
Custody and accounting fees | | | 5,141 | |
Professional fees | | | 24,770 | |
Shareholder report expenses | | | 320 | |
Trustees’ fees and expenses | | | 10,860 | |
Other fees and expenses | | | 6,808 | |
| | | | |
Total expenses | | | 500,054 | |
Less: Fee waivers and/or expense reimbursements | | | (4,675 | ) |
| | | | |
Net expenses | | | 495,379 | |
| | | | |
Net investment income | | | 2,689,409 | |
| | | | |
| |
REALIZED AND UNREALIZED GAINS (LOSSES) ON INVESTMENTS | | | | |
| |
Net realized gains on: | | | | |
Unaffiliated securities | | | 4,325,178 | |
Futures contracts | | | 298,653 | |
| | | | |
Net realized gains on investments | | | 4,623,831 | |
| | | | |
| |
Net change in unrealized gains (losses) on: | | | | |
Unaffiliated securities | | | 1,752,148 | |
Futures contracts | | | (68,229 | ) |
| | | | |
Net change in unrealized gains (losses) on investments | | | 1,683,919 | |
| | | | |
Net realized and unrealized gains (losses) on investments | | | 6,307,750 | |
| | | | |
Net increase in net assets resulting from operations | | $ | 8,997,159 | |
| | | | |
The accompanying notes are an integral part of these financial statements.
| | | | |
| 10 | | Wells Fargo Large Company Value Portfolio | | Statement of changes in net assets |
| | | | | | | | |
| | | Six months ended
November 30, 2018 (unaudited) | | | Year ended
May 31, 2018 | |
| | |
Operations | | | | | | | | |
Net investment income | | $ | 2,689,409 | | | $ | 1,053,337 | |
Net realized gains on investments | | | 4,623,831 | | | | 4,549,013 | |
Net change in unrealized gains (losses) on investments | | | 1,683,919 | | | | 811,722 | |
| | | | |
Net increase in net assets resulting from operations | | | 8,997,159 | | | | 6,414,072 | |
| | | | |
| | |
Capital transactions | | | | | | | | |
Transactions in investors’ beneficial interests | | | | | | | | |
Contributions | | | 251,851,752 | | | | 965,354 | |
Withdrawals | | | (33,608,516 | ) | | | (16,762,097 | ) |
| | | | |
Net increase (decrease) in net assets resulting from capital transactions | | | 218,243,236 | | | | (15,796,743 | ) |
| | | | |
Total increase (decrease) in net assets | | | 227,240,395 | | | | (9,382,671 | ) |
| | | | |
| |
Net assets | | | | |
Beginning of period | | | 61,836,138 | | | | 71,218,809 | |
| | | | |
End of period | | $ | 289,076,533 | | | $ | 61,836,138 | |
| | | | |
The accompanying notes are an integral part of these financial statements.
| | | | | | |
| Financial highlights | | Wells Fargo Large Company Value Portfolio | | | 11 | |
| | | | | | | | | | | | | | | | | | | | | | | | |
| | | Six months ended
November 30, 2018 (unaudited) | | | Year ended May 31 | |
| | | 2018 | | | 2017 | | | 2016 | | | 2015 | | | 2014 | |
Total return1 | | | 2.09 | % | | | 9.80 | % | | | 13.22 | % | | | (3.92 | )% | | | 7.90 | % | | | 20.26 | % |
Ratios to average net assets (annualized) | | | | | | | | | | | | | | | | | | | | | | | | |
Gross expenses | | | 0.39 | % | | | 0.49 | % | | | 0.68 | % | | | 0.76 | % | | | 0.74 | % | | | 0.73 | % |
Net expenses | | | 0.38 | % | | | 0.42 | % | | | 0.66 | % | | | 0.74 | % | | | 0.74 | % | | | 0.73 | % |
Net investment income | | | 2.08 | % | | | 1.56 | % | | | 1.45 | % | | | 1.54 | % | | | 1.09 | % | | | 0.99 | % |
Supplemental data | | | | | | | | | | | | | | | | | | | | | | | | |
Portfolio turnover rate | | | 128 | % | | | 244 | % | | | 203 | % | | | 50 | % | | | 72 | % | | | 62 | % |
| 1 | Returns for periods of less than one year are not annualized. |
The accompanying notes are an integral part of these financial statements.
| | | | |
| 12 | | Wells Fargo Large Company Value Portfolio | | Notes to financial statements (unaudited) |
1. ORGANIZATION
Wells Fargo Master Trust (the “Trust”), a Delaware statutory trust organized on March 10, 1999, is an open-end management investment company registered under the Investment Company Act of 1940, as amended (the “1940 Act”). As an investment company, the Trust follows the accounting and reporting guidance in Financial Accounting Standards Board (“FASB”) Accounting Standards Codification Topic 946, Financial Services – Investment Companies. These financial statements report on the Wells Fargo Large Company Value Portfolio (the “Portfolio”) which is a diversified series of the Trust.
2. SIGNIFICANT ACCOUNTING POLICIES
The following significant accounting policies, which are consistently followed in the preparation of the financial statements of the Portfolio, are in conformity with U.S. generally accepted accounting principles which require management to make estimates and assumptions that affect the reported amounts of assets and liabilities, disclosure of contingent assets and liabilities at the date of the financial statements, and the reported amounts of revenues and expenses during the reporting period. Actual results could differ from those estimates.
Securities valuation
All investments are valued each business day as of the close of regular trading on the New York Stock Exchange (generally 4 p.m. Eastern Time), although the Portfolio may deviate from this calculation time under unusual or unexpected circumstances.
Equity securities and futures contracts that are listed on a foreign or domestic exchange or market are valued at the official closing price or, if none, the last sales price. If no sale occurs on the principal exchange or market that day, a fair value price will be determined in accordance with the Portfolio’s Valuation Procedures.
Investments in registered open-end investment companies are valued at net asset value.
Investments which are not valued using the methods discussed above are valued at their fair value, as determined in good faith by the Board of Trustees of the Portfolio. The Board of Trustees has established a Valuation Committee comprised of the Trustees and has delegated to it the authority to take any actions regarding the valuation of portfolio securities that the Valuation Committee deems necessary or appropriate, including determining the fair value of portfolio securities, unless the determination has been delegated to the Wells Fargo Asset Management Pricing Committee at Wells Fargo Funds Management, LLC (“Funds Management”). The Board of Trustees retains the authority to make or ratify any valuation decisions or approve any changes to the Valuation Procedures as it deems appropriate. On a quarterly basis, the Board of Trustees receives reports on any valuation actions taken by the Valuation Committee or the Wells Fargo Asset Management Pricing Committee which may include items for ratification.
Futures contracts
The Portfolio is subject to equity price risk in the normal course of pursuing its investment objectives. Futures contracts are agreements between the Portfolio and a counterparty to buy or sell a specific amount of a commodity, financial instrument or currency at specified price and on a specified date. The Portfolio may buy and sell futures contracts in order to gain exposure to, or protect against, changes in security values. The primary risks associated with the use of futures contracts are the imperfect correlation between changes in market values of securities held by the Portfolio and the prices of futures contracts, and the possibility of an illiquid market. Futures contracts are generally entered into on a regulated futures exchange and cleared through a clearinghouse associated with the exchange. With futures contracts, there is minimal counterparty risk to the Portfolio since futures contracts are exchange traded and the exchange’s clearinghouse, as counterparty to all exchange traded futures, guarantees the futures contracts against default.
Upon entering into a futures contracts, the Portfolio is required to deposit either cash or securities (initial margin) with the broker in an amount equal to a certain percentage of the contract value. Subsequent payments (variation margin) are paid to or from the broker each day equal to the daily changes in the contract value. Such payments are recorded as unrealized gains or losses and, if any, shown as variation margin receivable (payable) in the Statement of Assets and Liabilities. Should the Portfolio fail to make requested variation margin payments, the broker can gain access to the initial margin to satisfy the Portfolio’s payment obligations. When the contracts are closed, a realized gain or loss is recorded in the Statement of Operations.
Foreign currency translation
The accounting records of the Portfolio are maintained in U.S. dollars. The values of other assets and liabilities denominated in foreign currencies are translated into U.S. dollars at rates provided by an independent foreign currency pricing source at a time each business day specified by the Wells Fargo Asset Management Pricing Committee. Purchases and sales of securities, and income and expenses are converted at the rate of exchange on the respective dates of such transactions. Net realized foreign exchange gains or losses arise from sales of foreign currencies, currency gains or losses realized between the
| | | | | | |
| Notes to financial statements (unaudited) | | Wells Fargo Large Company Value Portfolio | | | 13 | |
trade and settlement dates on securities transactions, and the difference between the amounts of dividends, interest and foreign withholding taxes recorded and the U.S. dollar equivalent of the amounts actually paid or received. Net unrealized foreign exchange gains and losses arise from changes in the fair value of assets and liabilities other than investments in securities resulting from changes in exchange rates. The changes in net assets arising from changes in exchange rates of securities and the changes in net assets resulting from changes in market prices of securities are not separately presented. Such changes are included in net realized and unrealized gains or losses from investments.
Securities lending
The Portfolio may lend its securities from time to time in order to earn additional income in the form of fees or interest on securities received as collateral or the investment of any cash received as collateral. The Portfolio continues to receive interest or dividends on the securities loaned. The Portfolio receives collateral in the form of cash or securities with a value at least equal to the value of the securities on loan. The value of the loaned securities is determined at the close of each business day and any additional required collateral is delivered to the Portfolio on the next business day. In a securities lending transaction, the net asset value of the Portfolio will be affected by an increase or decrease in the value of the securities loaned and by an increase or decrease in the value of the instrument in which collateral is invested. The amount of securities lending activity undertaken by the Portfolio fluctuates from time to time. In the event of default or bankruptcy by the borrower, the Portfolio may be prevented from recovering the loaned securities or gaining access to the collateral or may experience delays or costs in doing so. In addition, the investment of any cash collateral received may lose all or part of its value. The Portfolio has the right under the lending agreement to recover the securities from the borrower on demand.
The Portfolio lends its securities through an unaffiliated securities lending agent. Cash collateral received in connection with its securities lending transactions is invested in Securities Lending Cash Investments, LLC (the “Securities Lending Fund”). The Securities Lending Fund is exempt from registration under Section 3(c)(7) of the 1940 Act and is managed by Funds Management and is subadvised by Wells Capital Management Incorporated (“WellsCap”), an affiliate of Funds Management and an indirect wholly owned subsidiary of Wells Fargo & Company (“Wells Fargo”). Funds Management receives an advisory fee starting at 0.05% and declining to 0.01% as the average daily net assets of the Securities Lending Fund increase. All of the fees received by Funds Management are paid to WellsCap for its services as subadviser. The Securities Lending Fund seeks to provide a positive return compared to the daily Fed Funds Open Rate by investing in high-quality, U.S. dollar-denominated short-term money market instruments. Securities Lending Fund investments are valued at the evaluated bid price provided by an independent pricing service. Income earned from investment in the Securities Lending Fund, if any, is included in income from affiliated securities on the Statement of Operations.
Security transactions and income recognition
Securities transactions are recorded on a trade date basis. Realized gains or losses are recorded on the basis of identified cost.
Dividend income is recognized on the ex-dividend date. Dividend income is recorded net of foreign taxes withheld where recovery of such taxes is not assured.
Federal and other taxes
The Portfolio is treated as a separate entity for federal income tax purposes. The Portfolio is not required to pay federal income taxes on its net investment income and net capital gains as it is treated as a partnership for federal income tax purposes. All interest, dividends, gains and losses of the Portfolio are deemed to have been “passed through” to the interest holders in proportion to their holdings of the Portfolio regardless of whether such interest, dividends and gains have been distributed by the Portfolio.
The Portfolio’s income tax returns and all financial records supporting those returns for the prior three fiscal years are subject to examination by the federal revenue authority. Management has analyzed the Portfolio’s tax positions taken on federal, state, and foreign tax returns for all open tax years and does not believe that there are any uncertain tax positions that require recognition of a tax liability.
As of November 30, 2018, the aggregate cost of all investments for federal income tax purposes was $281,481,575 and the unrealized gains (losses) consisted of:
| | | | |
Gross unrealized gains | | $ | 14,480,745 | |
Gross unrealized losses | | | (8,581,086 | ) |
Net unrealized gains | | $ | 5,899,659 | |
| | | | |
| 14 | | Wells Fargo Large Company Value Portfolio | | Notes to financial statements (unaudited) |
3. FAIR VALUATION MEASUREMENTS
Fair value measurements of investments are determined within a framework that has established a fair value hierarchy based upon the various data inputs utilized in determining the value of the Portfolio’s investments. The three-level hierarchy gives the highest priority to unadjusted quoted prices in active markets for identical assets or liabilities (Level 1) and the lowest priority to unobservable inputs (Level 3). The Portfolio’s investments are classified within the fair value hierarchy based on the lowest level of input that is significant to the fair value measurement. The inputs are summarized into three broad levels as follows:
| ∎ | | Level 1 – quoted prices in active markets for identical securities |
| ∎ | | Level 2 – other significant observable inputs (including quoted prices for similar securities, interest rates, prepayment speeds, credit risk, etc.) |
| ∎ | | Level 3 – significant unobservable inputs (including the Portfolio’s own assumptions in determining the fair value of investments) |
The inputs or methodologies used for valuing investments in securities are not necessarily an indication of the risk associated with investing in those securities.
The following is a summary of the inputs used in valuing the Portfolio’s assets and liabilities as of November 30, 2018:
| | | | | | | | | | | | | | | | |
| | | Quoted prices
(Level 1) | | | Other significant
observable inputs
(Level 2) | | | Significant
unobservable inputs (Level 3) | | | Total | |
Assets | | | | | | | | | | | | | | | | |
Investments in: | | | | | | | | | | | | | | | | |
| | | | |
Common stocks | | | | | | | | | | | | | | | | |
Communication services | | $ | 22,874,115 | | | $ | 0 | | | $ | 0 | | | $ | 22,874,115 | |
Consumer discretionary | | | 16,001,983 | | | | 0 | | | | 0 | | | | 16,001,983 | |
Consumer staples | | | 25,389,500 | | | | 0 | | | | 0 | | | | 25,389,500 | |
Energy | | | 29,881,797 | | | | 0 | | | | 0 | | | | 29,881,797 | |
Financials | | | 56,553,153 | | | | 0 | | | | 0 | | | | 56,553,153 | |
Health care | | | 49,699,466 | | | | 0 | | | | 0 | | | | 49,699,466 | |
Industrials | | | 17,151,956 | | | | 0 | | | | 0 | | | | 17,151,956 | |
Information technology | | | 23,979,317 | | | | 0 | | | | 0 | | | | 23,979,317 | |
Materials | | | 5,870,056 | | | | 0 | | | | 0 | | | | 5,870,056 | |
Real estate | | | 19,256,148 | | | | 0 | | | | 0 | | | | 19,256,148 | |
Utilities | | | 17,380,335 | | | | 0 | | | | 0 | | | | 17,380,335 | |
| | | | |
Short-term investments | | | | | | | | | | | | | | | | |
Investment companies | | | 3,413,510 | | | | 0 | | | | 0 | | | | 3,413,510 | |
Total assets | | $ | 287,451,336 | | | $ | 0 | | | $ | 0 | | | $ | 287,451,336 | |
Liabilities | | | | | | | | | | | | | | | | |
Futures contracts | | $ | 70,102 | | | $ | 0 | | | $ | 0 | | | $ | 70,102 | |
Total liabilities | | $ | 70,102 | | | $ | 0 | | | $ | 0 | | | $ | 70,102 | |
Additional sector, industry or geographic detail is included in the Portfolio of Investments.
Futures contracts are reported at their cumulative unrealized gains (losses) at measurement date as reported in the table following the Portfolio of Investments. For futures contracts, the current day’s variation margin is reported on the Statement of Assets and Liabilities. All other assets and liabilities are reported at their market value at measurement date.
At November 30, 2018, the Portfolio did not have any transfers into/out of Level 3.
4. TRANSACTIONS WITH AFFILIATES
Advisory fee
The Trust has entered into an advisory contract with Funds Management, an indirect wholly owned subsidiary of Wells Fargo. The adviser is responsible for implementing investment policies and guidelines and for supervising the subadviser, who is responsible for day-to-day portfolio management of the Portfolio. Pursuant to the contract, Funds Management is entitled to
| | | | | | |
| Notes to financial statements (unaudited) | | Wells Fargo Large Company Value Portfolio | | | 15 | |
receive an annual advisory fee starting at 0.35% and declining to 0.30% as the average daily net assets of the Portfolio increase. For the six months end November 30, 2018, the advisory fee was equivalent to an annual rate of 0.35% of the Portfolio’s average daily net assets.
Funds Management has retained the services of a subadviser to provide daily portfolio management to the Portfolio. The fee for subadvisory services is borne by Funds Management. WellsCap is the subadviser to the Portfolio and is entitled to receive a fee from Funds Management at an annual rate starting at 0.25% and declining to 0.15% as the average daily net assets of the Portfolio increase. Prior to November 1, 2018, Analytic Investors, LLC, an affiliate of Funds Management and an indirect wholly owned subsidiary of Wells Fargo, was the subadviser for the Portfolio. On November 1, 2018, Analytic Investors, LLC was consolidated into WellsCap and WellsCap became the subadviser to the Portfolio. The consolidation did not result in any changes to the services provided to the Portfolio or to its strategy or fees and expenses.
Funds Management has voluntarily waived and/or reimbursed advisory fees to the extent necessary to maintain the net operating expense ratio of the Portfolio.
Interfund transactions
The Portfolio may purchase or sell portfolio investment securities to certain other Wells Fargo affiliates pursuant toRule 17a-7 under the 1940 Act and under procedures adopted by the Board of Trustees. The procedures have been designed to ensure that these interfund transactions, which do not incur broker commissions, are effected at current market prices.
5. INVESTMENT PORTFOLIO TRANSACTIONS
Purchases and sales of investments, excluding U.S. government obligations (if any) and short-term securities, for the six months ended November 30, 2018 were $ 539,970,759 and $ 322,473,140, respectively.
6. DERIVATIVE TRANSACTIONS
During the six months ended November 30, 2018, the Portfolio entered into futures contracts for to gain market exposure. The Portfolio had an average notional amount of $5,444,024 in long futures contracts during the six months ended November 30, 2018.
The fair value, realized gains or losses and change in unrealized gains or losses, if any, on derivative instruments are reflected in the corresponding financial statement captions.
7. BANK BORROWINGS
Effective August 28, 2018, the Trust, along with Wells Fargo Variable Trust and Wells Fargo Funds Trust (excluding the money market funds), are parties to a $280,000,000 revolving credit agreement whereby the Portfolio is permitted to use bank borrowings for temporary or emergency purposes, such as to fund shareholder redemption requests. Interest under the credit agreement is charged to the Portfolio based on a borrowing rate equal to the higher of the Federal Funds rate in effect on that day plus 1.25% or the overnight LIBOR rate in effect on that day plus 1.25%. In addition, an annual commitment fee equal to 0.25% of the unused balance is allocated to each participating fund.
For the six months ended November 30, 2018, there were no borrowings by the Portfolio under the agreement.
8. INDEMNIFICATION
Under the Trust’s organizational documents, the officers and Trustees have been granted certain indemnification rights against certain liabilities that may arise out of performance of their duties to the Trust. Additionally, in the normal course of business, the Trust may enter into contracts with service providers that contain a variety of indemnification clauses. The Trust’s maximum exposure under these arrangements is dependent on future claims that may be made against the Portfolio and, therefore, cannot be estimated.
9. NEW ACCOUNTING PRONOUNCEMENT
In August 2018, FASB issued Accounting Standards Update (“ASU”) No. 2018-13, Fair Value Measurement (Topic 820)Disclosure Framework—Changes to the Disclosure Requirements for Fair Value Measurement. ASU 2018-13 updates the disclosure requirements for fair value measurements by modifying or removing certain disclosures and adding certain new disclosures. The amendments are effective for fiscal years, and interim periods within those fiscal years, beginning after December 15, 2019. Early adoption is permitted. Management has adopted the removal and modification of disclosures early, as permitted, and will adopt the additional new disclosures at the effective date.
| | | | |
| 16 | | Wells Fargo Large Company Value Portfolio | | Other information (unaudited) |
PROXY VOTING INFORMATION
A description of the policies and procedures used to determine how to vote proxies relating to portfolio securities is available, upon request, by calling1-800-222-8222, visiting our website at wellsfargofunds.com, or visiting the SEC website at sec.gov. Information regarding how the Portfolio voted proxies relating to portfolio securities during the most recent 12-month period ended June 30 is available on the Portfolio’s website atwellsfargofunds.comor by visiting the SEC website at sec.gov.
PORTFOLIO HOLDINGS INFORMATION
The Portfolio files its complete schedule of portfolio holdings with the SEC for the first and third quarters of each fiscal year on Form N-Q, which is available by visiting the SEC website at sec.gov. In addition, the Portfolio’s Form N-Q may be reviewed and copied at the SEC’s Public Reference Room in Washington, DC, and at regional offices in New York City, at 233 Broadway, and in Chicago, at 175 West Jackson Boulevard, Suite 900. Information about the Public Reference Room may be obtained by calling 1-800-SEC-0330.
| | | | | | |
| Other information (unaudited) | | Wells Fargo Large Company Value Portfolio | | | 17 | |
BOARD OF TRUSTEES AND OFFICERS
Each of the Trustees and Officers1 listed in the table below acts in identical capacities for each fund in the Wells Fargo family of funds, which consists of 152 mutual funds comprising the Wells Fargo Funds Trust, Wells Fargo Variable Trust, Wells Fargo Master Trust and four closed-end funds (collectively the “Fund Complex”). This table should be read in conjunction with the Prospectus and the Statement of Additional Information2. The mailing address of each Trustee and Officer is 525 Market Street, 12th Floor, San Francisco, CA 94105. Each Trustee and Officer serves an indefinite term, however, each Trustee serves such term until reaching the mandatory retirement age established by the Trustees.
Independent Trustees
| | | | | | |
Name and
year of birth | | Position held and
length of service* | | Principal occupations during past five years or longer | | Current other
public company or
investment company
directorships |
William R. Ebsworth
(Born 1957) | | Trustee, since 2015 | | Retired. From 1984 to 2013, equities analyst, portfolio manager, research director and chief investment officer at Fidelity Management and Research Company in Boston, Tokyo, and Hong Kong, and retired in 2013 as Chief Investment Officer of Fidelity Strategic Advisers, Inc. where he led a team of investment professionals managing client assets. Prior thereto, Board member of Hong Kong Securities Clearing Co., Hong Kong Options Clearing Corp., the Thailand International Fund, Ltd., Fidelity Investments Life Insurance Company, and Empire Fidelity Investments Life Insurance Company. Board member of the Vincent Memorial Hospital Endowment (non-profit organization), where he serves on the Investment Committee and as a Chair of the Audit Committee. Mr. Ebsworth is a CFA® charterholder. | | N/A |
Jane A. Freeman
(Born 1953) | | Trustee, since 2015; Chair Liaison, since 2018 | | Retired. From 2012 to 2014 and 1999 to 2008, Chief Financial Officer of Scientific Learning Corporation. From 2008 to 2012, Ms. Freeman provided consulting services related to strategic business projects. Prior to 1999, Portfolio Manager at Rockefeller & Co. and Scudder, Stevens & Clark. Board member of the Harding Loevner Funds from 1996 to 2014, serving as both Lead Independent Director and chair of the Audit Committee. Board member of the Russell Exchange Traded Funds Trust from 2011 to 2012 and the chair of the Audit Committee. Ms. Freeman is a Board Member of The Ruth Bancroft Garden (non-profit organization). She is also an inactive Chartered Financial Analyst. | | N/A |
Isaiah Harris, Jr.3
(Born 1952) | | Trustee, since 2009 | | Retired. Chairman of the Board of CIGNA Corporation since 2009, and Director since 2005. From 2003 to 2011, Director of Deluxe Corporation. Prior thereto, President and CEO of BellSouth Advertising and Publishing Corp. from 2005 to 2007, President and CEO of BellSouth Enterprises from 2004 to 2005 and President of BellSouth Consumer Services from 2000 to 2003. Emeritus member of the Iowa State University Foundation Board of Governors. Emeritus Member of the Advisory Board of Iowa State University School of Business. Advisory Board Member, Palm Harbor Academy (private school). Advisory Board Member, Child Evangelism Fellowship (non-profit). Mr. Harris is a certified public accountant (inactive status). | | CIGNA Corporation |
Judith M. Johnson3
(Born 1949) | | Trustee, since 2008; Audit Committee Chairman, since 2009 | | Retired. Prior thereto, Chief Executive Officer and Chief Investment Officer of Minneapolis Employees Retirement Fund from 1996 to 2008. Ms. Johnson is an attorney, certified public accountant and a certified managerial accountant. | | N/A |
David F. Larcker
(Born 1950) | | Trustee, since 2009 | | James Irvin Miller Professor of Accounting at the Graduate School of Business, Stanford University, Director of the Corporate Governance Research Initiative and Senior Faculty of The Rock Center for Corporate Governance since 2006. From 2005 to 2008, Professor of Accounting at the Graduate School of Business, Stanford University. Prior thereto, Ernst & Young Professor of Accounting at The Wharton School, University of Pennsylvania from 1985 to 2005. | | N/A |
| | | | |
| 18 | | Wells Fargo Large Company Value Portfolio | | Other information (unaudited) |
| | | | | | |
Name and
year of birth | | Position held and
length of service* | | Principal occupations during past five years or longer | | Current other
public company or
investment company
directorships |
Olivia S. Mitchell
(Born 1953) | | Trustee, since 2006; Nominating and Governance Committee Chairman, since 2018 | | International Foundation of Employee Benefit Plans Professor, Wharton School of the University of Pennsylvania since 1993. Director of Wharton’s Pension Research Council and Boettner Center on Pensions & Retirement Research, and Research Associate at the National Bureau of Economic Research. Previously, Cornell University Professor from 1978 to 1993. | | N/A |
Timothy J. Penny
(Born 1951) | | Trustee, since 1996; Chairman, since 2018; Vice Chairman, from 2017 to 2018 | | President and Chief Executive Officer of Southern Minnesota Initiative Foundation, a non-profit organization, since 2007. Member of the Board of Trustees of NorthStar Education Finance, Inc., a non-profit organization, since 2007. | | N/A |
James G. Polisson
(Born 1959) | | Trustee, since 2018; Advisory Board Member, from 2017 to 2018 | | Retired. Chief Marketing Officer, Source (ETF) UK Services, Ltd, from 2015 to 2017. From 2012 to 2015, Principal of The Polisson Group, LLC, a management consulting, corporate advisory and principal investing company. Chief Executive Officer and Managing Director at Russell Investments, Global Exchange Traded Funds from 2010 to 2012. Managing Director of Barclays Global Investors from 1998 to 2010 and Global Chief Marketing Officer for iShares and Barclays Global Investors from 2000 to 2010. Trustee of the San Francisco Mechanics’ Institute, a non-profit organization, from 2013 to 2015. Board member of the Russell Exchange Traded Fund Trust from 2011 to 2012. Director of Barclays Global Investors Holdings Deutschland GmbH from 2006 to 2009. Mr. Polisson is an attorney and has a retired status with the Massachusetts and District of Columbia Bar Associations. | | N/A |
Michael S. Scofield4
(Born 1943) | | Trustee, since 2010 | | Served on the Investment Company Institute’s Board of Governors and Executive Committee from 2008-2011 as well the Governing Council of the Independent Directors Council from 2006-2011 and the Independent Directors Council Executive Committee from 2008-2011. Trustee of the Evergreen Fund complex (and its predecessors) from 1984 to 2010. Chairman of the Evergreen Funds from 2000-2010. Former Trustee of the Mentor Funds. Retired Attorney, Law Offices of Michael S. Scofield. | | N/A |
Pamela Wheelock
(Born 1959) | | Trustee, since 2018; Advisory Board Member, from 2017 to 2018 | | Chief Operating Officer, Twin Cities Habitat for Humanity, since January, 2017. Vice President of University Services, University of Minnesota from 2012 to 2017. Prior thereto, on the Board of Directors, Governance Committee and Finance Committee for the Minnesota Philanthropy Partners (Saint Paul Foundation) from 2012 to 2018, Interim President and Chief Executive Officer of Blue Cross Blue Shield of Minnesota from 2010 to 2011, Chairman of the Board from 2009 to 2011 and Board Director from 2003 to 2015. Vice President, Leadership and Community Engagement, Bush Foundation, Saint Paul, Minnesota (a private foundation) from 2009 to 2011. Executive Vice President and Chief Financial Officer, Minnesota Sports and Entertainment from 2004 to 2009 and Senior Vice President from 2002 to 2004. Commissioner of Finance, State of Minnesota, from 1999 to 2002. Currently the Board Chair of the Minnesota Wild Foundation since 2010. | | N/A |
| * | Length of service dates reflect the Trustee’s commencement of service with the Trust’s predecessor entities, where applicable. |
| | | | | | |
| Other information (unaudited) | | Wells Fargo Large Company Value Portfolio | | | 19 | |
Officers
| | | | | | |
Name and
year of birth | | Position held and
length of service | | Principal occupations during past five years or longer | | |
Andrew Owen (Born 1960) | | President, since 2017 | | Executive Vice President of Wells Fargo & Company and Head of Affiliated Managers, Wells Fargo Asset Management, since 2014. In addition, Mr. Owen is currently President, Chief Executive Officer and Director of Wells Fargo Funds Management, LLC since 2017. Prior thereto, Executive Vice President responsible for marketing, investments and product development for Wells Fargo Funds Management, LLC, from 2009 to 2014. | | |
Nancy Wiser1
(Born 1967) | | Treasurer, since 2012 | | Executive Vice President of Wells Fargo Funds Management, LLC since 2011. Chief Operating Officer and Chief Compliance Officer at LightBox Capital Management LLC, from 2008 to 2011. | | |
Alexander Kymn
(Born 1973) | | Secretary, since 2018; Chief Legal Officer, since 2018 | | Senior Company Counsel of Wells Fargo Bank, N.A. since 2018 (previously Senior Counsel from 2007 to 2018). Vice President of Wells Fargo Funds Management, LLC from 2008 to 2014. | | |
Michael H. Whitaker
(Born 1967) | | Chief Compliance Officer, since 2016 | | Senior Vice President and Chief Compliance Officer since 2016. Senior Vice President and Chief Compliance Officer for Fidelity Investments from 2007 to 2016. | | |
David Berardi
(Born 1975) | | Assistant Treasurer, since 2009 | | Vice President of Wells Fargo Funds Management, LLC since 2009. Vice President of Evergreen Investment Management Company, LLC from 2008 to 2010. Manager of Fund Reporting and Control for Evergreen Investment Management Company, LLC from 2004 to 2010. | | |
Jeremy DePalma1
(Born 1974) | | Assistant Treasurer, since 2009 | | Senior Vice President of Wells Fargo Funds Management, LLC since 2009. Senior Vice President of Evergreen Investment Management Company, LLC from 2008 to 2010 and head of the Fund Reporting and Control Team within Fund Administration from 2005 to 2010. | | |
| 1 | Nancy Wiser acts as Treasurer of 76 funds in the Fund Complex. Jeremy DePalma acts as Treasurer of 76 funds and Assistant Treasurer of 76 funds in the Fund Complex. |
| 2 | The Statement of Additional Information includes additional information about the Trustees and is available, without charge, upon request, by calling1-800-222-8222 or by visiting the website atwellsfargofunds.com. |
| 3 | Mr. Harris will replace Ms. Johnson as the Chairman of the Audit Committee effective January 1, 2019. |
| 4 | Mr. Scofield is expected to retire on December 31, 2018. |
This page is intentionally left blank.
INVESTMENT PRODUCTS: NOT FDIC INSURED ◾ NO BANK GUARANTEE ◾ MAY LOSE VALUE
© 2019 Wells Fargo Funds Management, LLC. All rights reserved.
Semi-Annual Report
November 30, 2018

Wells Fargo
Managed Fixed Income Portfolio


Reduce clutter. Save trees.
Sign up for electronic delivery of prospectuses and shareholder reports atwellsfargo.com/advantagedelivery
Contents
The views expressed and any forward-looking statements are as of November 30, 2018, unless otherwise noted, and are those of the Fund managers and/or Wells Fargo Funds Management, LLC. Discussions of individual securities, or the markets generally, or any Wells Fargo Fund are not intended as individual recommendations. Future events or results may vary significantly from those expressed in any forward-looking statements. The views expressed are subject to change at any time in response to changing circumstances in the market. Wells Fargo Funds Management, LLC and the Fund disclaim any obligation to publicly update or revise any views expressed or forward-looking statements.
INVESTMENT PRODUCTS: NOT FDIC INSURED ◾ NO BANK GUARANTEE ◾ MAY LOSE VALUE
| | | | |
| 2 | | Wells Fargo Managed Fixed Income Portfolio | | Fund information (unaudited) |
Investment objective
The Portfolio seeks long-term capital appreciation.
Manager
Wells Fargo Funds Management, LLC
Subadviser
Galliard Capital Management, Inc.
Portfolio managers
Andrea Johnson, CFA®‡
Brandon Kanz, CFA®‡*
| | | | |
| Ten largest holdings(%) as of November 30, 20181 | |
FNMA, 4.50%, 1-1-2051 | | | 3.08 | |
U.S. Treasury Bond, 4.50%, 5-15-2038 | | | 2.92 | |
FNMA, 4.00%, 8-1-2051 | | | 2.57 | |
SBA Series 2018-20G Class 1, 3.54%, 7-1-2038 | | | 1.70 | |
SBA Series 2018-20E Class 1, 3.50%, 5-1-2038 | | | 1.58 | |
U.S. Treasury Note, 1.00%, 6-30-2019 | | | 1.36 | |
U.S. Treasury Bond, 3.13%, 5-1-2048 | | | 1.32 | |
Commercial Mortgage Pass-Through Certificate Series 2014-CR17 Class A5, 3.98%, 5-10-2047 | | | 1.20 | |
FNMA, 4.50%, 11-1-2048 | | | 1.18 | |
FNMA, 3.97%, 6-1-2025 | | | 1.10 | |
| | |
| Portfolio allocation as of November 30, 20182 |
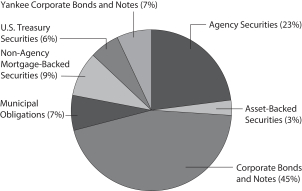
|
| ‡ | CFA® and Chartered Financial Analyst® are trademarks owned by CFA Institute. |
| * | Mr. Kanz became a portfolio manager of the Fund on September 28, 2018. |
| 1 | The ten largest holdings, excluding cash, cash equivalents and any money market funds, are calculated based on the value of the investments divided by the total net assets of the Portfolio. Holdings are subject to change and may have changed since the date specified. |
| 2 | Amounts are calculated based on the total long-term investments of the Portfolio. These amounts are subject to change and may have changed since the date specified. |
| | | | | | |
| Portfolio of investments—November 30, 2018 (unaudited) | | Wells Fargo Managed Fixed Income Portfolio | | | 3 | |
| | | | | | | | | | | | | | | | |
| Security name | | Interest rate | | | Maturity date | | | Principal | | | Value | |
|
Agency Securities: 21.74% | |
FHLMC | | | 3.00 | % | | | 7-1-2046 | | | $ | 629,713 | | | $ | 602,045 | |
FHLMC | | | 3.00 | | | | 7-1-2046 | | | | 860,516 | | | | 821,906 | |
FHLMC | | | 3.50 | | | | 4-1-2043 | | | | 1,116,765 | | | | 1,104,060 | |
FHLMC | | | 3.50 | | | | 5-1-2044 | | | | 518,016 | | | | 512,591 | |
FHLMC | | | 3.50 | | | | 6-1-2046 | | | | 447,381 | | | | 440,430 | |
FHLMC | | | 3.50 | | | | 4-1-2047 | | | | 455,887 | | | | 448,517 | |
FHLMC | | | 4.00 | | | | 4-1-2044 | | | | 669,585 | | | | 679,356 | |
FHLMC | | | 4.00 | | | | 8-1-2044 | | | | 444,039 | | | | 449,607 | |
FHLMC | | | 4.50 | | | | 8-1-2048 | | | | 3,805,177 | | | | 3,915,968 | |
FHLMC | | | 4.50 | | | | 11-1-2048 | | | | 4,066,461 | | | | 4,205,585 | |
FHLMC | | | 4.50 | | | | 11-1-2048 | | | | 6,880,000 | | | | 7,136,622 | |
FHLMC Series2018-3 Class MA | | | 3.50 | | | | 8-25-2057 | | | | 3,337,265 | | | | 3,300,609 | |
FHLMC Structured Pass-Through Securities SeriesT-20 Class A6 | | | 6.92 | | | | 9-25-2029 | | | | 25,859 | | | | 26,286 | |
FHLMC Structured Pass-Through Securities SeriesT-58 Class 4A | | | 7.50 | | | | 9-25-2043 | | | | 797,472 | | | | 905,466 | |
FNMA | | | 2.50 | | | | 8-1-2031 | | | | 404,327 | | | | 390,213 | |
FNMA | | | 2.51 | | | | 9-1-2024 | | | | 937,127 | | | | 896,544 | |
FNMA | | | 2.69 | | | | 5-1-2023 | | | | 348,743 | | | | 339,912 | |
FNMA | | | 2.73 | | | | 1-1-2023 | | | | 549,857 | | | | 539,003 | |
FNMA | | | 2.73 | | | | 9-1-2023 | | | | 567,302 | | | | 554,672 | |
FNMA | | | 2.85 | | | | 12-1-2023 | | | | 590,000 | | | | 576,767 | |
FNMA | | | 3.00 | | | | 12-1-2032 | | | | 47,410 | | | | 46,428 | |
FNMA | | | 3.00 | | | | 7-1-2046 | | | | 501,026 | | | | 479,127 | |
FNMA | | | 3.05 | | | | 11-1-2022 | | | | 294,282 | | | | 292,524 | |
FNMA | | | 3.07 | | | | 2-1-2026 | | | | 360,000 | | | | 351,996 | |
FNMA | | | 3.08 | | | | 1-1-2026 | | | | 480,000 | | | | 470,293 | |
FNMA | | | 3.35 | | | | 1-1-2028 | | | | 280,000 | | | | 276,353 | |
FNMA | | | 3.47 | | | | 12-1-2024 | | | | 2,625,000 | | | | 2,618,337 | |
FNMA | | | 3.50 | | | | 10-1-2032 | | | | 669,102 | | | | 666,969 | |
FNMA | | | 3.50 | | | | 11-1-2042 | | | | 266,599 | | | | 263,846 | |
FNMA | | | 3.50 | | | | 11-1-2042 | | | | 346,641 | | | | 343,061 | |
FNMA | | | 3.50 | | | | 2-1-2043 | | | | 175,217 | | | | 173,408 | |
FNMA | | | 3.50 | | | | 4-1-2046 | | | | 228,041 | | | | 224,554 | |
FNMA | | | 3.51 | | | | 1-1-2025 | | | | 2,770,000 | | | | 2,769,157 | |
FNMA (a) | | | 3.62 | | | | 12-31-2049 | | | | 3,720,000 | | | | 3,721,162 | |
FNMA | | | 3.86 | | | | 10-1-2025 | | | | 1,954,337 | | | | 1,987,597 | |
FNMA | | | 3.97 | | | | 6-1-2025 | | | | 6,994,978 | | | | 7,153,482 | |
FNMA | | | 4.00 | | | | 11-1-2040 | | | | 339,479 | | | | 344,230 | |
FNMA | | | 4.00 | | | | 4-1-2041 | | | | 445,771 | | | | 452,017 | |
FNMA | | | 4.00 | | | | 8-1-2046 | | | | 482,496 | | | | 490,316 | |
FNMA | | | 4.00 | | | | 8-1-2051 | | | | 16,533,472 | | | | 16,683,767 | |
FNMA | | | 4.00 | | | | 7-1-2056 | | | | 578,795 | | | | 584,603 | |
FNMA | | | 4.50 | | | | 8-1-2048 | | | | 2,736,295 | | | | 2,816,228 | |
FNMA | | | 4.50 | | | | 11-1-2048 | | | | 7,400,000 | | | | 7,651,593 | |
FNMA | | | 4.50 | | | | 1-1-2051 | | | | 19,357,495 | | | | 19,975,391 | |
FNMA | | | 4.50 | | | | 6-1-2056 | | | | 490,669 | | | | 506,964 | |
FNMA | | | 4.50 | | | | 6-1-2056 | | | | 740,986 | | | | 764,460 | |
FNMA | | | 4.50 | | | | 6-1-2056 | | | | 518,546 | | | | 534,976 | |
FNMA | | | 5.00 | | | | 9-1-2033 | | | | 142,349 | | | | 150,979 | |
FNMA | | | 5.50 | | | | 2-1-2036 | | | | 107,573 | | | | 111,241 | |
The accompanying notes are an integral part of these financial statements.
| | | | |
| 4 | | Wells Fargo Managed Fixed Income Portfolio | | Portfolio of investments—November 30, 2018 (unaudited) |
| | | | | | | | | | | | | | | | |
| Security name | | Interest rate | | | Maturity date | | | Principal | | | Value | |
| | | | |
Agency Securities(continued) | | | | | | | | | | | | | | | | |
FNMA Series2002-90 Class A2 | | | 6.50 | % | | | 11-25-2042 | | | $ | 324,488 | | | $ | 357,566 | |
FNMA Series2002-T4 Class A2 | | | 7.00 | | | | 12-25-2041 | | | | 144,599 | | | | 160,150 | |
FNMA Series2002-W4 Class A4 | | | 6.25 | | | | 5-25-2042 | | | | 1,371,565 | | | | 1,494,542 | |
FNMA Series2003-W4 Class 3A ±± | | | 7.00 | | | | 10-25-2042 | | | | 220,099 | | | | 236,445 | |
FNMA Series2004-T2 Class 1A1 | | | 6.00 | | | | 11-25-2043 | | | | 518,476 | | | | 561,561 | |
FNMA Series2004-T3 Class A1 | | | 6.00 | | | | 2-25-2044 | | | | 777,321 | | | | 848,383 | |
FNMA Series2004-W01 Class 2A2 | | | 7.00 | | | | 12-25-2033 | | | | 130,918 | | | | 148,005 | |
FNMA Series2004-W11 Class 1A3 | | | 7.00 | | | | 5-25-2044 | | | | 809,337 | | | | 930,588 | |
FNMA Series2004-W8 Class 3A | | | 7.50 | | | | 6-25-2044 | | | | 232,261 | | | | 261,414 | |
GNMA | | | 6.50 | | | | 10-15-2023 | | | | 10,618 | | | | 11,527 | |
GNMA | | | 6.50 | | | | 11-15-2023 | | | | 6,576 | | | | 7,139 | |
GNMA | | | 6.50 | | | | 11-15-2023 | | | | 2,501 | | | | 2,715 | |
GNMA | | | 6.50 | | | | 12-15-2023 | | | | 9,861 | | | | 10,705 | |
GNMA | | | 6.50 | | | | 1-15-2024 | | | | 22,033 | | | | 23,919 | |
GNMA | | | 7.00 | | | | 8-15-2027 | | | | 56,615 | | | | 62,018 | |
SBA Series2006-20B Class 1 | | | 5.35 | | | | 2-1-2026 | | | | 246,522 | | | | 253,660 | |
SBA Series2006-20H Class 1 | | | 5.70 | | | | 8-1-2026 | | | | 113,843 | | | | 117,852 | |
SBA Series2007-20J Class 1 | | | 5.57 | | | | 10-1-2027 | | | | 303,084 | | | | 314,199 | |
SBA Series2013-20A Class 1 | | | 2.13 | | | | 1-1-2033 | | | | 322,083 | | | | 306,048 | |
SBA Series2013-20J Class 1 | | | 3.37 | | | | 10-1-2033 | | | | 360,544 | | | | 361,747 | |
SBA Series2014-10A Class 1 | | | 3.19 | | | | 3-10-2024 | | | | 337,236 | | | | 336,753 | |
SBA Series2014-10B Class 1 | | | 3.02 | | | | 9-10-2024 | | | | 721,270 | | | | 714,376 | |
SBA Series2014-20A Class 1 | | | 3.46 | | | | 1-1-2034 | | | | 311,986 | | | | 314,029 | |
SBA Series2015-10B Class 1 | | | 2.83 | | | | 9-10-2025 | | | | 470,187 | | | | 461,328 | |
SBA Series2015-20C Class 1 | | | 2.72 | | | | 3-1-2035 | | | | 441,535 | | | | 431,842 | |
SBA Series2015-20E Class 1 | | | 2.77 | | | | 5-1-2035 | | | | 638,702 | | | | 624,159 | |
SBA Series2015-20F Class 1 | | | 2.98 | | | | 6-1-2035 | | | | 446,459 | | | | 437,222 | |
SBA Series2017-10A Class 1 | | | 2.85 | | | | 3-10-2027 | | | | 547,849 | | | | 535,802 | |
SBA Series2017-20F Class1 | | | 2.81 | | | | 6-1-2037 | | | | 279,362 | | | | 269,613 | |
SBA Series2018-20E Class 1 | | | 3.50 | | | | 5-1-2038 | | | | 10,246,672 | | | | 10,244,692 | |
SBA Series2018-20F Class 1 | | | 3.60 | | | | 6-1-2038 | | | | 1,770,000 | | | | 1,780,492 | |
SBA Series2018-20G Class 1 | | | 3.54 | | | | 7-1-2038 | | | | 11,000,000 | | | | 11,026,367 | |
SBA Series2018-20H Class 1 | | | 3.58 | | | | 8-1-2038 | | | | 4,000,000 | | | | 4,004,055 | |
SBA Series2018-20K Class 1 | | | 3.87 | | | | 11-1-2038 | | | | 2,725,000 | | | | 2,782,913 | |
| | | | |
Total Agency Securities (Cost $141,671,035) | | | | | | | | | | | | | | | 141,185,044 | |
| | | | | | | | | | | | | | | | |
| | | | |
Asset-Backed Securities: 3.31% | | | | | | | | | | | | | | | | |
Ally Auto Receivables Trust Series2018-3 Class A3 | | | 3.00 | | | | 1-17-2023 | | | | 3,715,000 | | | | 3,708,023 | |
American Express Credit Account Master Trust Series2018-6 Class A | | | 3.06 | | | | 2-15-2024 | | | | 2,650,000 | | | | 2,648,735 | |
Barclays Dryrock Issuance Trust Series2014-3 Class A | | | 2.41 | | | | 7-15-2022 | | | | 570,000 | | | | 566,848 | |
Discover Card Execution Note Trust Series2018-A4 Class A4 | | | 3.11 | | | | 1-16-2024 | | | | 2,500,000 | | | | 2,497,607 | |
ECMC Group Student Loan Trust Series2018-2A Class A (1 Month LIBOR +0.80%) 144A± | | | 3.12 | | | | 9-25-2068 | | | | 3,047,012 | | | | 3,044,386 | |
Ford Credit Auto Owner Trust Series2015-2 Class A 144A | | | 2.44 | | | | 1-15-2027 | | | | 600,000 | | | | 592,516 | |
Ford Credit Auto Owner Trust Series2018-2 Class A 144A | | | 3.47 | | | | 1-15-2030 | | | | 3,200,000 | | | | 3,186,728 | |
GM Financial Automobile Leasing Trust Series2018-2 Class A3 | | | 3.06 | | | | 6-21-2021 | | | | 1,825,000 | | | | 1,822,934 | |
MMAF Equipment Finance LLC Series2015-AA Class A4 144A | | | 1.93 | | | | 7-16-2021 | | | | 135,552 | | | | 134,946 | |
MMAF Equipment Finance LLC Series2017-AA Class A5 144A | | | 2.68 | | | | 7-16-2027 | | | | 695,000 | | | | 672,063 | |
South Carolina Student Loan Corporation Series2014-1 Class B (1 Month LIBOR +1.50%) ± | | | 3.80 | | | | 8-1-2035 | | | | 500,000 | | | | 508,311 | |
The accompanying notes are an integral part of these financial statements.
| | | | | | |
| Portfolio of investments—November 30, 2018 (unaudited) | | Wells Fargo Managed Fixed Income Portfolio | | | 5 | |
| | | | | | | | | | | | | | | | |
| Security name | | Interest rate | | | Maturity date | | | Principal | | | Value | |
| | | | |
Asset-Backed Securities(continued) | | | | | | | | | | | | | | | | |
Verizon Owner Trust Series2018-A Class A1A | | | 3.23 | % | | | 4-20-2023 | | | $ | 2,140,000 | | | $ | 2,140,656 | |
| |
Total Asset-Backed Securities (Cost $21,548,477) | | | | 21,523,753 | |
| | | | | | | | | | | | | | | | |
|
Corporate Bonds and Notes: 44.29% | |
|
Communication Services: 1.55% | |
|
| Diversified Telecommunication Services: 0.29% | |
AT&T Incorporated | | | 4.75 | | | | 5-15-2046 | | | | 280,000 | | | | 241,582 | |
AT&T Incorporated | | | 5.25 | | | | 3-1-2037 | | | | 60,000 | | | | 57,119 | |
Verizon Communications Incorporated | | | 4.50 | | | | 8-10-2033 | | | | 40,000 | | | | 39,002 | |
Verizon Communications Incorporated | | | 4.81 | | | | 3-15-2039 | | | | 1,500,000 | | | | 1,450,091 | |
Verizon Communications Incorporated | | | 5.25 | | | | 3-16-2037 | | | | 110,000 | | | | 113,069 | |
| | | | |
| | | | | | | | | | | | | | | 1,900,863 | |
| | | | | | | | | | | | | | | | |
|
| Entertainment: 0.25% | |
Activision Blizzard Incorporated | | | 2.60 | | | | 6-15-2022 | | | | 1,655,000 | | | | 1,586,228 | |
| | | | | | | | | | | | | | | | |
|
| Media: 1.01% | |
Charter Communications Operating LLC | | | 4.91 | | | | 7-23-2025 | | | | 1,500,000 | | | | 1,493,319 | |
Comcast Corporation | | | 3.00 | | | | 2-1-2024 | | | | 170,000 | | | | 163,754 | |
Comcast Corporation | | | 3.55 | | | | 5-1-2028 | | | | 1,500,000 | | | | 1,418,504 | |
Comcast Corporation | | | 4.15 | | | | 10-15-2028 | | | | 1,190,000 | | | | 1,180,012 | |
Lamar Media Corporation | | | 5.75 | | | | 2-1-2026 | | | | 1,895,000 | | | | 1,928,163 | |
Time Warner Entertainment Company LP | | | 3.40 | | | | 6-15-2022 | | | | 140,000 | | | | 137,826 | |
Time Warner Incorporated | | | 3.60 | | | | 7-15-2025 | | | | 260,000 | | | | 243,831 | |
| | | | |
| | | | | | | | | | | | | | | 6,565,409 | |
| | | | | | | | | | | | | | | | |
|
Consumer Discretionary: 3.14% | |
|
| Auto Components: 0.25% | |
Allison Transmission Incorporated 144A | | | 5.00 | | | | 10-1-2024 | | | | 1,655,000 | | | | 1,590,869 | |
| | | | | | | | | | | | | | | | |
|
| Automobiles: 0.06% | |
General Motors Company | | | 4.88 | | | | 10-2-2023 | | | | 400,000 | | | | 400,370 | |
| | | | | | | | | | | | | | | | |
|
| Diversified Consumer Services: 1.86% | |
Duke University | | | 3.20 | | | | 10-1-2038 | | | | 1,175,000 | | | | 1,034,292 | |
Massachusetts Institute of Technology | | | 3.96 | | | | 7-1-2038 | | | | 2,200,000 | | | | 2,176,366 | |
Massachusetts Institute of Technology | | | 4.68 | | | | 7-1-2114 | | | | 120,000 | | | | 125,357 | |
Massachusetts Institute of Technology | | | 7.25 | | | | 11-2-2096 | | | | 500,000 | | | | 753,373 | |
Northwestern University | | | 3.66 | | | | 12-1-2057 | | | | 105,000 | | | | 93,517 | |
Northwestern University | | | 3.69 | | | | 12-1-2038 | | | | 1,915,000 | | | | 1,803,966 | |
President and Fellows of Harvard College | | | 3.15 | | | | 7-15-2046 | | | | 1,000,000 | | | | 868,495 | |
President and Fellows of Harvard College | | | 3.62 | | | | 10-1-2037 | | | | 275,000 | | | | 262,359 | |
President and Fellows of Harvard College | | | 4.88 | | | | 10-15-2040 | | | | 33,000 | | | | 37,243 | |
President and Fellows of Harvard College | | | 5.63 | | | | 10-1-2038 | | | | 400,000 | | | | 482,410 | |
Princeton University | | | 5.70 | | | | 3-1-2039 | | | | 1,740,000 | | | | 2,128,309 | |
Service Corporation International | | | 5.38 | | | | 1-15-2022 | | | | 750,000 | | | | 753,750 | |
Service Corporation International | | | 5.38 | | | | 5-15-2024 | | | | 750,000 | | | | 753,750 | |
Service Corporation International | | | 7.50 | | | | 4-1-2027 | | | | 535,000 | | | | 581,813 | |
The accompanying notes are an integral part of these financial statements.
| | | | |
| 6 | | Wells Fargo Managed Fixed Income Portfolio | | Portfolio of investments—November 30, 2018 (unaudited) |
| | | | | | | | | | | | | | | | |
| Security name | | Interest rate | | | Maturity date | | | Principal | | | Value | |
| | | | |
| Diversified Consumer Services(continued) | | | | | | | | | | | | | | | | |
University of Southern California | | | 3.03 | % | | | 10-1-2039 | | | $ | 275,000 | | | $ | 241,973 | |
| | | | |
| | | | | | | | | | | | | | | 12,096,973 | |
| | | | | | | | | | | | | | | | |
|
| Hotels, Restaurants & Leisure: 0.40% | |
Cedar Fair Entertainment Company | | | 5.38 | | | | 4-15-2027 | | | | 300,000 | | | | 291,000 | |
Cedar Fair LP | | | 5.38 | | | | 6-1-2024 | | | | 1,480,000 | | | | 1,472,600 | |
McDonalds Corporation | | | 3.35 | | | | 4-1-2023 | | | | 860,000 | | | | 846,548 | |
| | | | |
| | | | | | | | | | | | | | | 2,610,148 | |
| | | | | | | | | | | | | | | | |
|
| Textiles, Apparel & Luxury Goods: 0.57% | |
HanesBrands Incorporated 144A | | | 4.63 | | | | 5-15-2024 | | | | 200,000 | | | | 192,500 | |
HanesBrands Incorporated 144A | | | 4.88 | | | | 5-15-2026 | | | | 1,750,000 | | | | 1,645,000 | |
The William Carter Company | | | 5.25 | | | | 8-15-2021 | | | | 250,000 | | | | 250,313 | |
Wolverine World Wide Incorporated 144A | | | 5.00 | | | | 9-1-2026 | | | | 1,700,000 | | | | 1,589,500 | |
| | | | |
| | | | | | | | | | | | | | | 3,677,313 | |
| | | | | | | | | | | | | | | | |
|
Consumer Staples: 1.85% | |
|
| Beverages: 0.25% | |
Anheuser-Busch InBev SA/NV 144A | | | 3.65 | | | | 2-1-2026 | | | | 1,640,000 | | | | 1,550,488 | |
Brown Forman Corporation | | | 3.50 | | | | 4-15-2025 | | | | 50,000 | | | | 49,283 | |
| | | | |
| | | | | | | | | | | | | | | 1,599,771 | |
| | | | | | | | | | | | | | | | |
|
| Food Products: 1.36% | |
Cargill Incorporated 144A | | | 3.25 | | | | 3-1-2023 | | | | 1,130,000 | | | | 1,111,270 | |
General Mills Incorporated | | | 2.60 | | | | 10-12-2022 | | | | 120,000 | | | | 114,679 | |
General Mills Incorporated | | | 4.20 | | | | 4-17-2028 | | | | 1,600,000 | | | | 1,542,740 | |
Ingredion Incorporated | | | 3.20 | | | | 10-1-2026 | | | | 150,000 | | | | 138,054 | |
Kellogg Company | | | 4.30 | | | | 5-15-2028 | | | | 1,005,000 | | | | 982,635 | |
Kraft Heinz Foods Company | | | 3.00 | | | | 6-1-2026 | | | | 1,500,000 | | | | 1,327,007 | |
Kraft Heinz Foods Company | | | 3.50 | | | | 6-6-2022 | | | | 300,000 | | | | 295,017 | |
Kraft Heinz Foods Company | | | 4.63 | | | | 1-30-2029 | | | | 120,000 | | | | 116,836 | |
McCormick & Company Incorporated | | | 3.40 | | | | 8-15-2027 | | | | 1,500,000 | | | | 1,415,724 | |
Mondelez International Incorporated | | | 3.63 | | | | 5-7-2023 | | | | 1,500,000 | | | | 1,482,205 | |
Unilever Capital Corporation | | | 2.60 | | | | 5-5-2024 | | | | 310,000 | | | | 294,890 | |
| | | | |
| | | | | | | | | | | | | | | 8,821,057 | |
| | | | | | | | | | | | | | | | |
|
| Household Products: 0.24% | |
Unilever Capital Corporation | | | 3.25 | | | | 3-7-2024 | | | | 1,590,000 | | | | 1,562,403 | |
| | | | | | | | | | | | | | | | |
|
Energy: 6.76% | |
|
| Energy Equipment & Services: 0.43% | |
Baker Hughes LLC | | | 3.34 | | | | 12-15-2027 | | | | 1,500,000 | | | | 1,354,122 | |
Halliburton Company | | | 3.80 | | | | 11-15-2025 | | | | 1,500,000 | | | | 1,444,628 | |
| | | | |
| | | | | | | | | | | | | | | 2,798,750 | |
| | | | | | | | | | | | | | | | |
|
| Oil, Gas & Consumable Fuels: 6.33% | |
Anadarko Petroleum Corporation | | | 5.55 | | | | 3-15-2026 | | | | 150,000 | | | | 155,624 | |
Antero Resources Corporation | | | 5.00 | | | | 3-1-2025 | | | | 2,000,000 | | | | 1,900,000 | |
The accompanying notes are an integral part of these financial statements.
| | | | | | |
| Portfolio of investments—November 30, 2018 (unaudited) | | Wells Fargo Managed Fixed Income Portfolio | | | 7 | |
| | | | | | | | | | | | | | | | |
| Security name | | Interest rate | | | Maturity date | | | Principal | | | Value | |
| | | | |
| Oil, Gas & Consumable Fuels(continued) | | | | | | | | | | | | | | | | |
Apache Corporation « | | | 4.38 | % | | | 10-15-2028 | | | $ | 1,740,000 | | | $ | 1,636,283 | |
BP Capital Markets America Incorporated | | | 3.80 | | | | 9-21-2025 | | | | 610,000 | | | | 603,779 | |
Chevron Corporation | | | 2.90 | | | | 3-3-2024 | | | | 1,820,000 | | | | 1,753,258 | |
Cimarex Energy Company | | | 3.90 | | | | 5-15-2027 | | | | 1,500,000 | | | | 1,378,984 | |
Concho Resources Incorporated | | | 3.75 | | | | 10-1-2027 | | | | 1,500,000 | | | | 1,393,595 | |
Continental Resources Incorporated | | | 3.80 | | | | 6-1-2024 | | | | 1,000,000 | | | | 944,280 | |
Continental Resources Incorporated | | | 5.00 | | | | 9-15-2022 | | | | 192,000 | | | | 192,022 | |
Enable Midstream Partners | | | 4.95 | | | | 5-15-2028 | | | | 1,500,000 | | | | 1,412,738 | |
Energen Corporation | | | 4.63 | | | | 9-1-2021 | | | | 550,000 | | | | 550,000 | |
EnLink Midstream Partners LP | | | 4.85 | | | | 7-15-2026 | | | | 1,325,000 | | | | 1,210,958 | |
Enterprise Products Operating LLC | | | 3.75 | | | | 2-15-2025 | | | | 1,500,000 | | | | 1,463,163 | |
Enterprise Products Operating LLC | | | 4.15 | | | | 10-16-2028 | | | | 260,000 | | | | 253,759 | |
EQT Corporation | | | 3.90 | | | | 10-1-2027 | | | | 1,350,000 | | | | 1,183,714 | |
EQT Corporation | | | 8.13 | | | | 6-1-2019 | | | | 400,000 | | | | 409,374 | |
Florida Gas Transmission Company 144A | | | 4.35 | | | | 7-15-2025 | | | | 1,521,000 | | | | 1,531,393 | |
Gulfstream Natural Gas System LLC 144A | | | 6.19 | | | | 11-1-2025 | | | | 210,000 | | | | 230,911 | |
Hess Corporpation | | | 4.30 | | | | 4-1-2027 | | | | 1,500,000 | | | | 1,371,739 | |
Kerr-McGee Corporation | | | 6.95 | | | | 7-1-2024 | | | | 1,485,000 | | | | 1,647,544 | |
Magellan Midstream Partners LP | | | 5.00 | | | | 3-1-2026 | | | | 170,000 | | | | 176,094 | |
Marathon Oil Corporation | | | 3.85 | | | | 6-1-2025 | | | | 1,030,000 | | | | 964,554 | |
Marathon Oil Corporation 144A | | | 5.13 | | | | 12-15-2026 | | | | 1,500,000 | | | | 1,510,665 | |
MPLX LP | | | 4.13 | | | | 3-1-2027 | | | | 1,500,000 | | | | 1,406,358 | |
Newfield Exploration Company | | | 5.38 | | | | 1-1-2026 | | | | 1,650,000 | | | | 1,643,813 | |
Newfield Exploration Company | | | 5.63 | | | | 7-1-2024 | | | | 249,000 | | | | 254,603 | |
NuStar Logistics LP | | | 4.75 | | | | 2-1-2022 | | | | 1,500,000 | | | | 1,432,500 | |
Phillips 66 | | | 4.30 | | | | 4-1-2022 | | | | 1,570,000 | | | | 1,594,896 | |
Pioneer Natural Resource Company | | | 4.45 | | | | 1-15-2026 | | | | 190,000 | | | | 189,767 | |
Plains All American Pipeline LP | | | 4.65 | | | | 10-15-2025 | | | | 1,500,000 | | | | 1,452,405 | |
PSEG | | | 3.65 | | | | 9-1-2028 | | | | 960,000 | | | | 951,241 | |
Range Resources Corporation | | | 5.00 | | | | 3-15-2023 | | | | 2,300,000 | | | | 2,169,188 | |
Southwestern Energy Company | | | 6.20 | | | | 1-23-2025 | | | | 1,600,000 | | | | 1,534,000 | |
Transcontinental Gas Pipe Line Company LLC | | | 7.85 | | | | 2-1-2026 | | | | 1,200,000 | | | | 1,439,615 | |
Western Gas Partners LP | | | 4.65 | | | | 7-1-2026 | | | | 1,625,000 | | | | 1,549,590 | |
Whiting Petroleum Corporation | | | 6.25 | | | | 4-1-2023 | | | | 713,000 | | | | 700,594 | |
Whiting Petroleum Corporation | | | 6.63 | | | | 1-15-2026 | | | | 950,000 | | | | 914,375 | |
| | | | |
| | | | | | | | | | | | | | | 41,107,376 | |
| | | | | | | | | | | | | | | | |
|
Financials: 9.92% | |
|
| Banks: 4.46% | |
Bank of America Corporation | | | 3.50 | | | | 4-19-2026 | | | | 1,500,000 | | | | 1,422,727 | |
Bank of America Corporation (3 Month LIBOR +1.51%) ± | | | 3.71 | | | | 4-24-2028 | | | | 1,500,000 | | | | 1,416,268 | |
Bank of America Corporation | | | 3.88 | | | | 8-1-2025 | | | | 1,470,000 | | | | 1,451,259 | |
Bank of America Corporation | | | 3.95 | | | | 4-21-2025 | | | | 120,000 | | | | 115,975 | |
Bank of America Corporation | | | 4.00 | | | | 4-1-2024 | | | | 1,500,000 | | | | 1,495,038 | |
BB&T Corporation | | | 3.70 | | | | 6-5-2025 | | | | 1,160,000 | | | | 1,147,392 | |
Citigroup Incorporated | | | 2.75 | | | | 4-25-2022 | | | | 210,000 | | | | 201,976 | |
Citigroup Incorporated | | | 3.30 | | | | 4-27-2025 | | | | 1,630,000 | | | | 1,536,319 | |
Citigroup Incorporated | | | 3.40 | | | | 5-1-2026 | | | | 1,750,000 | | | | 1,629,869 | |
Citigroup Incorporated (3 Month LIBOR +1.02%) ± | | | 4.04 | | | | 6-1-2024 | | | | 1,500,000 | | | | 1,490,232 | |
Citigroup Incorporated | | | 4.40 | | | | 6-10-2025 | | | | 65,000 | | | | 63,883 | |
The accompanying notes are an integral part of these financial statements.
| | | | |
| 8 | | Wells Fargo Managed Fixed Income Portfolio | | Portfolio of investments—November 30, 2018 (unaudited) |
| | | | | | | | | | | | | | | | |
| Security name | | Interest rate | | | Maturity date | | | Principal | | | Value | |
| | | | |
| Banks(continued) | | | | | | | | | | | | | | | | |
Citigroup Incorporated | | | 4.65 | % | | | 7-23-2048 | | | $ | 360,000 | | | $ | 344,509 | |
Citizens Bank NA | | | 3.70 | | | | 3-29-2023 | | | | 1,500,000 | | | | 1,489,181 | |
Fifth Third Bank | | | 3.95 | | | | 7-28-2025 | | | | 710,000 | | | | 709,637 | |
Huntington National Bank | | | 3.55 | | | | 10-6-2023 | | | | 900,000 | | | | 888,331 | |
JPMorgan Chase & Company (3 Month LIBOR +1.33%) ±%% | | | 1.00 | | | | 12-5-2029 | | | | 470,000 | | | | 470,277 | |
JPMorgan Chase & Company (3 Month LIBOR +0.94%) ± | | | 2.78 | | | | 4-25-2023 | | | | 1,740,000 | | | | 1,677,598 | |
JPMorgan Chase & Company | | | 2.97 | | | | 1-15-2023 | | | | 150,000 | | | | 145,185 | |
JPMorgan Chase & Company | | | 3.20 | | | | 6-15-2026 | | | | 1,500,000 | | | | 1,396,202 | |
JPMorgan Chase & Company (3 Month LIBOR +1.34%) ± | | | 3.78 | | | | 2-1-2028 | | | | 1,675,000 | | | | 1,608,017 | |
JPMorgan Chase & Company (3 Month LIBOR +1.26%) ± | | | 4.20 | | | | 7-23-2029 | | | | 600,000 | | | | 588,511 | |
M&T Bank Corporation | | | 3.55 | | | | 7-26-2023 | | | | 950,000 | | | | 947,039 | |
National Capital Commerce Incorporated (3 Month LIBOR +0.98%) ± | | | 3.38 | | | | 4-1-2027 | | | | 400,000 | | | | 368,000 | |
NTC Capital Trust Series A (3 Month LIBOR +0.52%) ± | | | 2.96 | | | | 1-15-2027 | | | | 450,000 | | | | 409,500 | |
PNC Bank | | | 4.05 | | | | 7-26-2028 | | | | 1,000,000 | | | | 985,281 | |
PNC Bank | | | 3.25 | | | | 6-1-2025 | | | | 1,500,000 | | | | 1,440,156 | |
Regions Financial Corporation | | | 3.80 | | | | 8-14-2023 | | | | 1,020,000 | | | | 1,010,786 | |
SunTrust Banks Incorporated | | | 4.00 | | | | 5-1-2025 | | | | 80,000 | | | | 79,178 | |
SunTrust Banks Incorporated | | | 4.05 | | | | 11-3-2025 | | | | 270,000 | | | | 271,811 | |
US Bank NA | | | 3.40 | | | | 7-24-2023 | | | | 2,200,000 | | | | 2,171,791 | |
| | | | |
| | | | | | | | | | | | | | | 28,971,928 | |
| | | | | | | | | | | | | | | | |
|
| Capital Markets: 2.47% | |
Bank of New York Mellon Corporation | | | 3.25 | | | | 9-11-2024 | | | | 1,500,000 | | | | 1,454,755 | |
Bank of New York Mellon Corporation | | | 3.45 | | | | 8-11-2023 | | | | 1,370,000 | | | | 1,358,661 | |
Charles Schwab Corporation | | | 3.85 | | | | 5-21-2025 | | | | 230,000 | | | | 230,692 | |
Goldman Sachs Capital II (3 Month LIBOR +0.77%) ± | | | 4.00 | | | | 12-29-2049 | | | | 6,000 | | | | 4,496 | |
Goldman Sachs Group Incorporated | | | 3.50 | | | | 1-23-2025 | | | | 1,765,000 | | | | 1,670,503 | |
Goldman Sachs Group Incorporated | | | 3.75 | | | | 2-25-2026 | | | | 1,500,000 | | | | 1,419,953 | |
Goldman Sachs Group Incorporated | | | 3.85 | | | | 1-26-2027 | | | | 1,690,000 | | | | 1,590,393 | |
Goldman Sachs Group Incorporated | | | 4.25 | | | | 10-21-2025 | | | | 120,000 | | | | 115,781 | |
Goldman Sachs Group Incorporated | | | 5.75 | | | | 1-24-2022 | | | | 200,000 | | | | 209,806 | |
Morgan Stanley | | | 3.70 | | | | 10-23-2024 | | | | 1,600,000 | | | | 1,556,346 | |
Morgan Stanley | | | 3.88 | | | | 1-27-2026 | | | | 1,500,000 | | | | 1,446,136 | |
Morgan Stanley | | | 3.95 | | | | 4-23-2027 | | | | 1,680,000 | | | | 1,577,005 | |
MSCI Incorporated 144A | | | 5.75 | | | | 8-15-2025 | | | | 1,600,000 | | | | 1,620,000 | |
Nuveen LLC 144A | | | 4.00 | | | | 11-1-2028 | | | | 940,000 | | | | 944,238 | |
State Street Corporation (3 Month LIBOR +1.03%) ±%% | | | 4.14 | | | | 12-3-2029 | | | | 820,000 | | | | 824,403 | |
| | | | |
| | | | | | | | | | | | | | | 16,023,168 | |
| | | | | | | | | | | | | | | | |
|
| Consumer Finance: 1.86% | |
American Express Company | | | 3.40 | | | | 2-27-2023 | | | | 1,500,000 | | | | 1,466,547 | |
American Express Company | | | 3.70 | | | | 8-3-2023 | | | | 540,000 | | | | 533,967 | |
American Express Company | | | 4.20 | | | | 11-6-2025 | | | | 320,000 | | | | 321,044 | |
American Honda Finance Corporation | | | 3.45 | | | | 7-14-2023 | | | | 820,000 | | | | 815,847 | |
American Honda Finance Corporation | | | 3.63 | | | | 10-10-2023 | | | | 2,260,000 | | | | 2,256,710 | |
BMW US Capital LLC 144A« | | | 3.95 | | | | 8-14-2028 | | | | 1,180,000 | | | | 1,139,599 | |
Capital One Financial Corporation | | | 3.20 | | | | 1-30-2023 | | | | 160,000 | | | | 154,605 | |
Capital One Financial Corporation | | | 3.30 | | | | 10-30-2024 | | | | 1,500,000 | | | | 1,400,511 | |
Daimler Finance North America LLC 144A | | | 3.35 | | | | 2-22-2023 | | | | 1,490,000 | | | | 1,457,871 | |
Ford Motor Credit Company LLC | | | 3.20 | | | | 1-15-2021 | | | | 1,500,000 | | | | 1,452,381 | |
The accompanying notes are an integral part of these financial statements.
| | | | | | |
| Portfolio of investments—November 30, 2018 (unaudited) | | Wells Fargo Managed Fixed Income Portfolio | | | 9 | |
| | | | | | | | | | | | | | | | |
| Security name | | Interest rate | | | Maturity date | | | Principal | | | Value | |
| | | | |
| Consumer Finance(continued) | | | | | | | | | | | | | | | | |
John Deere Capital Corporation | | | 3.65 | % | | | 10-12-2023 | | | $ | 1,060,000 | | | $ | 1,061,608 | |
| | | | |
| | | | | | | | | | | | | | | 12,060,690 | |
| | | | | | | | | | | | | | | | |
|
| Diversified Financial Services: 0.23% | |
CNH Industrial Capital LLC | | | 4.20 | | | | 1-15-2024 | | | | 1,480,000 | | | | 1,464,231 | |
| | | | | | | | | | | | | | | | |
|
| Insurance: 0.90% | |
Marsh & McLennan Companies Incorporated | | | 3.30 | | | | 3-14-2023 | | | | 1,500,000 | | | | 1,476,630 | |
MassMutual Global Funding 144A | | | 2.75 | | | | 6-22-2024 | | | | 1,600,000 | | | | 1,519,352 | |
Minnesota Life Insurance Company 144A | | | 8.25 | | | | 9-15-2025 | | | | 650,000 | | | | 748,538 | |
New York Life Global Funding 144A | | | 2.90 | | | | 1-17-2024 | | | | 1,500,000 | | | | 1,446,867 | |
NLV Financial Corporation 144A | | | 7.50 | | | | 8-15-2033 | | | | 565,000 | | | | 686,485 | |
| | | | |
| | | | | | | | | | | | | | | 5,877,872 | |
| | | | | | | | | | | | | | | | |
|
Health Care: 3.81% | |
|
| Health Care Equipment & Supplies: 0.64% | |
Becton Dickinson & Company | | | 3.73 | | | | 12-15-2024 | | | | 134,000 | | | | 129,378 | |
Hill-Rom Holdings Incorporated 144A | | | 5.00 | | | | 2-15-2025 | | | | 1,910,000 | | | | 1,862,250 | |
Hologic Incorporated 144A | | | 4.38 | | | | 10-15-2025 | | | | 1,000,000 | | | | 950,000 | |
Hologic Incorporated 144A | | | 4.63 | | | | 2-1-2028 | | | | 170,000 | | | | 159,055 | |
Teleflex Incorporated | | | 4.88 | | | | 6-1-2026 | | | | 1,100,000 | | | | 1,065,306 | |
| | | | |
| | | | | | | | | | | | | | | 4,165,989 | |
| | | | | | | | | | | | | | | | |
|
| Health Care Providers & Services: 2.22% | |
Advocate Health Corporation | | | 4.27 | | | | 8-15-2048 | | | | 920,000 | | | | 898,134 | |
Ascension Health | | | 3.95 | | | | 11-15-2046 | | | | 1,875,000 | | | | 1,739,619 | |
Cleveland Clinic Foundation | | | 4.86 | | | | 1-1-2114 | | | | 894,000 | | | | 875,993 | |
CVS Health Corporation | | | 3.50 | | | | 7-20-2022 | | | | 120,000 | | | | 118,380 | |
CVS Health Corporation | | | 4.30 | | | | 3-25-2028 | | | | 1,300,000 | | | | 1,266,299 | |
CVS Health Corporation | | | 5.05 | | | | 3-25-2048 | | | | 130,000 | | | | 125,928 | |
Duke University Health System Incorporated | | | 3.92 | | | | 6-1-2047 | | | | 165,000 | | | | 155,754 | |
Halfmoon Parent Incorporated 144A | | | 3.75 | | | | 7-15-2023 | | | | 610,000 | | | | 601,806 | |
Mayo Clinic | | | 4.13 | | | | 11-15-2052 | | | | 810,000 | | | | 791,447 | |
Mednax Incorporated 144A | | | 5.25 | | | | 12-1-2023 | | | | 1,630,000 | | | | 1,609,625 | |
Memorial Sloan Kettering Cancer Center | | | 4.20 | | | | 7-1-2055 | | | | 538,000 | | | | 517,988 | |
Peacehealth Obligated Group | | | 4.79 | | | | 11-15-2048 | | | | 975,000 | | | | 982,333 | |
Providence St. Joseph Health Obligated Group | | | 3.93 | | | | 10-1-2048 | | | | 350,000 | | | | 316,325 | |
Southern Baptist Hospital | | | 4.86 | | | | 7-15-2045 | | | | 175,000 | | | | 186,075 | |
Stanford Health Care | | | 3.80 | | | | 11-15-2048 | | | | 275,000 | | | | 253,975 | |
Texas Health Resources | | | 4.33 | | | | 11-15-2055 | | | | 1,115,000 | | | | 1,074,146 | |
The New York-Presbyterian Hospital | | | 3.56 | | | | 8-1-2036 | | | | 275,000 | | | | 250,141 | |
The New York-Presbyterian Hospital | | | 4.06 | | | | 8-1-2056 | | | | 570,000 | | | | 536,257 | |
UnitedHealth Group Incorporated | | | 3.50 | | | | 6-15-2023 | | | | 600,000 | | | | 599,030 | |
UnitedHealth Group Incorporated | | | 3.75 | | | | 7-15-2025 | | | | 1,500,000 | | | | 1,493,151 | |
| | | | |
| | | | | | | | | | | | | | | 14,392,406 | |
| | | | | | | | | | | | | | | | |
|
| Health Care Technology: 0.28% | |
Quintiles IMS Holdings Incorporated 144A | | | 5.00 | | | | 10-15-2026 | | | | 1,865,000 | | | | 1,795,063 | |
| | | | | | | | | | | | | | | | |
The accompanying notes are an integral part of these financial statements.
| | | | |
| 10 | | Wells Fargo Managed Fixed Income Portfolio | | Portfolio of investments—November 30, 2018 (unaudited) |
| | | | | | | | | | | | | | | | |
| Security name | | Interest rate | | | Maturity date | | | Principal | | | Value | |
|
| Life Sciences Tools & Services: 0.24% | |
Thermo Fisher Scientific Incorporated | | | 3.00 | % | | | 4-15-2023 | | | $ | 1,500,000 | | | $ | 1,442,539 | |
Thermo Fisher Scientific Incorporated | | | 3.30 | | | | 2-15-2022 | | | | 150,000 | | | | 148,026 | |
| | | | |
| | | | | | | | | | | | | | | 1,590,565 | |
| | | | | | | | | | | | | | | | |
|
| Pharmaceuticals: 0.43% | |
Bayer US Finance LLC 144A | | | 3.38 | | | | 10-8-2024 | | | | 240,000 | | | | 225,404 | |
Bayer US Finance LLC 144A | | | 4.38 | | | | 12-15-2028 | | | | 1,170,000 | | | | 1,122,421 | |
EMD Finance LLC 144A | | | 2.95 | | | | 3-19-2022 | | | | 1,500,000 | | | | 1,462,895 | |
| | | | |
| | | | | | | | | | | | | | | 2,810,720 | |
| | | | | | | | | | | | | | | | |
|
Industrials: 4.37% | |
|
| Aerospace & Defense: 1.01% | |
BAE Systems Holdings Incorporated 144A | | | 3.80 | | | | 10-7-2024 | | | | 1,345,000 | | | | 1,325,075 | |
Hexcel Corporation | | | 3.95 | | | | 2-15-2027 | | | | 1,302,000 | | | | 1,259,156 | |
Northrop Grumman Corporation | | | 3.25 | | | | 1-15-2028 | | | | 1,500,000 | | | | 1,395,051 | |
United Technologies Corporation | | | 3.95 | | | | 8-16-2025 | | | | 1,700,000 | | | | 1,679,977 | |
United Technologies Corporation | | | 4.13 | | | | 11-16-2028 | | | | 930,000 | | | | 913,422 | |
| | | | |
| | | | | | | | | | | | | | | 6,572,681 | |
| | | | | | | | | | | | | | | | |
|
| Air Freight & Logistics: 0.22% | |
Fedex Corporation | | | 4.20 | | | | 10-17-2028 | | | | 1,430,000 | | | | 1,420,192 | |
| | | | | | | | | | | | | | | | |
|
| Building Products: 0.06% | |
Fortune Brands Home & Security Incorporated | | | 4.00 | | | | 9-21-2023 | | | | 240,000 | | | | 238,492 | |
Masco Corporation | | | 6.50 | | | | 8-15-2032 | | | | 150,000 | | | | 161,138 | |
| | | | |
| | | | | | | | | | | | | | | 399,630 | |
| | | | | | | | | | | | | | | | |
|
| Commercial Services & Supplies: 0.61% | |
Acco Brands Corporation 144A | | | 5.25 | | | | 12-15-2024 | | | | 1,800,000 | | | | 1,660,500 | |
Cintas Corporation No. 2 | | | 2.90 | | | | 4-1-2022 | | | | 1,600,000 | | | | 1,564,617 | |
Clean Harbors Incorporated | | | 5.13 | | | | 6-1-2021 | | | | 750,000 | | | | 751,395 | |
| | | | |
| | | | | | | | | | | | | | | 3,976,512 | |
| | | | | | | | | | | | | | | | |
|
| Construction & Engineering: 0.01% | |
Valmont Industries Incorporated | | | 5.00 | | | | 10-1-2044 | | | | 110,000 | | | | 96,190 | |
| | | | | | | | | | | | | | | | |
|
| Electrical Equipment: 0.03% | |
Eaton Corporation | | | 3.10 | | | | 9-15-2027 | | | | 250,000 | | | | 232,422 | |
| | | | | | | | | | | | | | | | |
|
| Industrial Conglomerates: 0.16% | |
General Electric Capital Corporation | | | 4.65 | | | | 10-17-2021 | | | | 130,000 | | | | 127,709 | |
Roper Technologies Incorporated | | | 3.65 | | | | 9-15-2023 | | | | 910,000 | | | | 896,681 | |
| | | | |
| | | | | | | | | | | | | | | 1,024,390 | |
| | | | | | | | | | | | | | | | |
|
| Machinery: 1.41% | |
Actuant Corporation | | | 5.63 | | | | 6-15-2022 | | | | 1,910,000 | | | | 1,912,377 | |
Briggs & Stratton Corporation | | | 6.88 | | | | 12-15-2020 | | | | 850,000 | | | | 884,000 | |
Fortive Corporation | | | 2.35 | | | | 6-15-2021 | | | | 215,000 | | | | 208,025 | |
Mueller Water Products Incorporated 144A | | | 5.50 | | | | 6-15-2026 | | | | 1,825,000 | | | | 1,806,750 | |
The accompanying notes are an integral part of these financial statements.
| | | | | | |
| Portfolio of investments—November 30, 2018 (unaudited) | | Wells Fargo Managed Fixed Income Portfolio | | | 11 | |
| | | | | | | | | | | | | | | | |
| Security name | | Interest rate | | | Maturity date | | | Principal | | | Value | |
|
| Machinery(continued) | |
Oshkosh Corporation | | | 4.60 | % | | | 5-15-2028 | | | $ | 1,035,000 | | | $ | 1,013,006 | |
Oshkosh Corporation | | | 5.38 | | | | 3-1-2025 | | | | 350,000 | | | | 353,500 | |
Parker Hannifin Corporation | | | 3.30 | | | | 11-21-2024 | | | | 1,400,000 | | | | 1,369,413 | |
Stanley Black & Decker Incorporated | | | 4.25 | | | | 11-15-2028 | | | | 1,290,000 | | | | 1,294,948 | |
Vessel Management Services Incorporated | | | 3.43 | | | | 8-15-2036 | | | | 306,000 | | | | 290,377 | |
| | | | |
| | | | | | | | | | | | | | | 9,132,396 | |
| | | | | | | | | | | | | | | | |
|
| Professional Services: 0.28% | |
Equifax Incorporated | | | 3.95 | | | | 6-15-2023 | | | | 1,700,000 | | | | 1,684,406 | |
Relx Capital Incorporated | | | 3.50 | | | | 3-16-2023 | | | | 110,000 | | | | 107,750 | |
| | | | |
| | | | | | | | | | | | | | | 1,792,156 | |
| | | | | | | | | | | | | | | | |
|
| Road & Rail: 0.34% | |
Norfolk Southern Corporation | | | 5.10 | | | | 12-31-2049 | | | | 760,000 | | | | 724,956 | |
Union Pacific Corporation | | | 3.95 | | | | 9-10-2028 | | | | 1,500,000 | | | | 1,480,304 | |
| | | | |
| | | | | | | | | | | | | | | 2,205,260 | |
| | | | | | | | | | | | | | | | |
|
| Transportation Infrastructure: 0.24% | |
Crowley Conro LLC | | | 4.18 | | | | 8-15-2043 | | | | 1,530,000 | | | | 1,543,512 | |
| | | | | | | | | | | | | | | | |
|
Information Technology: 2.72% | |
|
| Electronic Equipment, Instruments & Components: 0.48% | |
Amphenol Corporation | | | 3.20 | | | | 4-1-2024 | | | | 1,531,000 | | | | 1,463,092 | |
Jabil Incorporated | | | 3.95 | | | | 1-12-2028 | | | | 1,875,000 | | | | 1,691,438 | |
| | | | |
| | | | | | | | | | | | | | | 3,154,530 | |
| | | | | | | | | | | | | | | | |
|
| IT Services: 0.50% | |
Fiserv Incorporated | | | 4.20 | | | | 10-1-2028 | | | | 1,470,000 | | | | 1,453,286 | |
Fiserv Incorporated | | | 4.75 | | | | 6-15-2021 | | | | 100,000 | | | | 102,299 | |
Verisign Incorporated | | | 4.75 | | | | 7-15-2027 | | | | 1,745,000 | | | | 1,664,294 | |
| | | | |
| | | | | | | | | | | | | | | 3,219,879 | |
| | | | | | | | | | | | | | | | |
|
| Semiconductors & Semiconductor Equipment: 0.67% | |
Maxim Integrated Products Incorporated | | | 3.45 | | | | 6-15-2027 | | | | 1,550,000 | | | | 1,430,266 | |
Microchip Technology Incorporated 144A | | | 4.33 | | | | 6-1-2023 | | | | 1,500,000 | | | | 1,460,217 | |
Versum Materials Incorporated 144A | | | 5.50 | | | | 9-30-2024 | | | | 1,500,000 | | | | 1,481,250 | |
| | | | |
| | | | | | | | | | | | | | | 4,371,733 | |
| | | | | | | | | | | | | | | | |
|
| Software: 1.01% | |
CDK Global Incorporated | | | 4.88 | | | | 6-1-2027 | | | | 1,125,000 | | | | 1,049,063 | |
CDK Global Incorporated | | | 5.88 | | | | 6-15-2026 | | | | 400,000 | | | | 398,000 | |
Fair Isaac Corporation 144A | | | 5.25 | | | | 5-15-2026 | | | | 1,750,000 | | | | 1,725,938 | |
Oracle Corporation | | | 2.95 | | | | 11-15-2024 | | | | 3,467,000 | | | | 3,316,156 | |
Oracle Corporation | | | 3.40 | | | | 7-8-2024 | | | | 70,000 | | | | 68,907 | |
| | | | |
| | | | | | | | | | | | | | | 6,558,064 | |
| | | | | | | | | | | | | | | | |
The accompanying notes are an integral part of these financial statements.
| | | | |
| 12 | | Wells Fargo Managed Fixed Income Portfolio | | Portfolio of investments—November 30, 2018 (unaudited) |
| | | | | | | | | | | | | | | | |
| Security name | | Interest rate | | | Maturity date | | | Principal | | | Value | |
|
| Technology Hardware, Storage & Peripherals: 0.06% | |
Hewlett Packard Enterprise Company | | | 4.90 | % | | | 10-15-2025 | | | $ | 375,000 | | | $ | 376,454 | |
| | | | | | | | | | | | | | | | |
|
Materials: 3.96% | |
|
| Chemicals: 2.25% | |
Albemarle Corporation | | | 4.15 | | | | 12-1-2024 | | | | 1,390,000 | | | | 1,383,511 | |
Axalta Coating Systems Limited 144A | | | 4.88 | | | | 8-15-2024 | | | | 1,675,000 | | | | 1,621,735 | |
DowDuPont Incorporated | | | 4.73 | | | | 11-15-2028 | | | | 1,930,000 | | | | 1,957,052 | |
Dowdupont Incorporated | | | 4.49 | | | | 11-15-2025 | | | | 430,000 | | | | 434,637 | |
Ecolab Incorporated | | | 3.25 | | | | 12-1-2027 | | | | 75,000 | | | | 71,043 | |
Ingevity Corporation 144A | | | 4.50 | | | | 2-1-2026 | | | | 2,475,000 | | | | 2,283,188 | |
Mosaic Company | | | 4.05 | | | | 11-15-2027 | | | | 1,500,000 | | | | 1,424,416 | |
ScottsMiracle-Gro Company | | | 5.25 | | | | 12-15-2026 | | | | 1,410,000 | | | | 1,318,350 | |
ScottsMiracle-Gro Company | | | 6.00 | | | | 10-15-2023 | | | | 390,000 | | | | 394,875 | |
The Sherwin-Williams Company | | | 3.30 | | | | 2-1-2025 | | | | 100,000 | | | | 94,153 | |
The Sherwin-Williams Company | | | 3.45 | | | | 6-1-2027 | | | | 1,500,000 | | | | 1,373,631 | |
Valvoline Incorporated | | | 5.50 | | | | 7-15-2024 | | | | 1,750,000 | | | | 1,736,875 | |
W.R. Grace & Company 144A | | | 5.63 | | | | 10-1-2024 | | | | 500,000 | | | | 506,100 | |
| | | | |
| | | | | | | | | | | | | | | 14,599,566 | |
| | | | | | | | | | | | | | | | |
|
| Construction Materials: 0.03% | |
CRH America Finance Incorporated 144A | | | 3.40 | | | | 5-9-2027 | | | | 200,000 | | | | 183,195 | |
| | | | | | | | | | | | | | | | |
|
| Containers & Packaging: 1.55% | |
Ball Corporation | | | 4.88 | | | | 3-15-2026 | | | | 1,075,000 | | | | 1,056,188 | |
Ball Corporation | | | 5.25 | | | | 7-1-2025 | | | | 350,000 | | | | 355,250 | |
Graphic Packaging International Company | | | 4.13 | | | | 8-15-2024 | | | | 1,700,000 | | | | 1,602,250 | |
International Paper Company « | | | 3.00 | | | | 2-15-2027 | | | | 1,600,000 | | | | 1,440,170 | |
Packaging Corporation of America | | | 4.50 | | | | 11-1-2023 | | | | 1,500,000 | | | | 1,531,808 | |
Sealed Air Corporation 144A | | | 5.50 | | | | 9-15-2025 | | | | 200,000 | | | | 197,500 | |
Sealed Air Corporation 144A | | | 6.88 | | | | 7-15-2033 | | | | 515,000 | | | | 524,013 | |
Silgan Holdings Incorporated | | | 4.75 | | | | 3-15-2025 | | | | 1,875,000 | | | | 1,762,500 | |
Westrock Company 144A | | | 3.00 | | | | 9-15-2024 | | | | 1,680,000 | | | | 1,548,874 | |
| | | | |
| | | | | | | | | | | | | | | 10,018,553 | |
| | | | | | | | | | | | | | | | |
|
| Metals & Mining: 0.08% | |
Freeport-McMoRan Copper & Gold Incorporated « | | | 4.55 | | | | 11-14-2024 | | | | 575,000 | | | | 534,031 | |
| | | | | | | | | | | | | | | | |
|
| Paper & Forest Products: 0.05% | |
Georgia Pacific LLC 144A | | | 3.73 | | | | 7-15-2023 | | | | 340,000 | | | | 339,838 | |
| | | | | | | | | | | | | | | | |
|
Real Estate: 3.50% | |
|
| Equity REITs: 3.50% | |
Alexandria Real Estate Equities Incorporated | | | 3.95 | | | | 1-15-2027 | | | | 240,000 | | | | 229,768 | |
Alexandria Real Estate Equities Incorporated | | | 4.30 | | | | 1-15-2026 | | | | 1,500,000 | | | | 1,481,264 | |
AvalonBay Communities Incorporated | | | 2.95 | | | | 9-15-2022 | | | | 190,000 | | | | 185,718 | |
Boston Properties LP | | | 2.75 | | | | 10-1-2026 | | | | 1,500,000 | | | | 1,342,535 | |
Boston Properties LP | | | 3.20 | | | | 1-15-2025 | | | | 250,000 | | | | 235,857 | |
Boston Properties LP | | | 3.85 | | | | 2-1-2023 | | | | 410,000 | | | | 405,558 | |
Boston Properties LP | | | 4.50 | | | | 12-1-2028 | | | | 310,000 | | | | 310,219 | |
The accompanying notes are an integral part of these financial statements.
| | | | | | |
| Portfolio of investments—November 30, 2018 (unaudited) | | Wells Fargo Managed Fixed Income Portfolio | | | 13 | |
| | | | | | | | | | | | | | | | |
| Security name | | Interest rate | | | Maturity date | | | Principal | | | Value | |
| | | | |
| Equity REITs(continued) | | | | | | | | | | | | | | | | |
Digital Realty Trust LP | | | 4.45 | % | | | 7-15-2028 | | | $ | 510,000 | | | $ | 505,780 | |
Duke Realty LP | | | 3.25 | | | | 6-30-2026 | | | | 1,500,000 | | | | 1,410,544 | |
Duke Realty LP | | | 3.88 | | | | 10-15-2022 | | | | 150,000 | | | | 150,499 | |
Duke Realty LP | | | 4.00 | | | | 9-15-2028 | | | | 230,000 | | | | 225,310 | |
Federal Realty Investment Trust | | | 2.75 | | | | 6-1-2023 | | | | 1,895,000 | | | | 1,812,436 | |
Host Hotels & Resorts Incorporated | | | 3.88 | | | | 4-1-2024 | | | | 265,000 | | | | 258,393 | |
Kimco Realty Corporation | | | 3.30 | | | | 2-1-2025 | | | | 1,500,000 | | | | 1,406,228 | |
Liberty Property LP | | | 3.75 | | | | 4-1-2025 | | | | 1,600,000 | | | | 1,543,959 | |
Mid America Apartment Communities | | | 4.20 | | | | 6-15-2028 | | | | 160,000 | | | | 157,449 | |
National Retail Properties Incorporated | | | 4.30 | | | | 10-15-2028 | | | | 370,000 | | | | 363,440 | |
Potlatch Corporation | | | 7.50 | | | | 11-1-2019 | | | | 310,000 | | | | 319,853 | |
ProLogis LP | | | 3.75 | | | | 11-1-2025 | | | | 1,535,000 | | | | 1,521,455 | |
Realty Income Corporation | | | 4.65 | | | | 8-1-2023 | | | | 1,870,000 | | | | 1,938,254 | |
Simon Property Group LP | | | 3.38 | | | | 10-1-2024 | | | | 1,800,000 | | | | 1,749,499 | |
UDR Incorporated | | | 3.75 | | | | 7-1-2024 | | | | 1,500,000 | | | | 1,469,303 | |
UDR Incorporated | | | 4.63 | | | | 1-10-2022 | | | | 260,000 | | | | 265,291 | |
Ventas Realty LP | | | 3.50 | | | | 2-1-2025 | | | | 150,000 | | | | 142,665 | |
Ventas Realty LP | | | 3.85 | | | | 4-1-2027 | | | | 1,500,000 | | | | 1,427,187 | |
Vornado Realty Trust | | | 3.50 | | | �� | 1-15-2025 | | | | 1,500,000 | | | | 1,427,209 | |
Welltower Incorporated | | | 3.95 | | | | 9-1-2023 | | | | 470,000 | | | | 467,028 | |
| | | | |
| | | | | | | | | | | | | | | 22,752,701 | |
| | | | | | | | | | | | | | | | |
|
Utilities: 2.71% | |
|
| Electric Utilities: 2.16% | |
AEP Texas Incorporated | | | 2.40 | | | | 10-1-2022 | | | | 90,000 | | | | 86,346 | |
Alliant Energy Finance LLC 144A | | | 3.75 | | | | 6-15-2023 | | | | 1,510,000 | | | | 1,495,267 | |
DPL Incorporated | | | 7.25 | | | | 10-15-2021 | | | | 870,000 | | | | 924,375 | |
Duke Energy Carolinas LLC | | | 6.05 | | | | 4-15-2038 | | | | 830,000 | | | | 984,593 | |
Duke Energy Progress LLC | | | 3.70 | | | | 9-1-2028 | | | | 940,000 | | | | 925,762 | |
Entergy Arkansas Incorporated | | | 3.05 | | | | 6-1-2023 | | | | 1,196,000 | | | | 1,175,346 | |
Entergy Arkansas Incorporated | | | 4.00 | | | | 6-1-2028 | | | | 80,000 | | | | 79,647 | |
Florida Power & Light Company | | | 4.95 | | | | 6-1-2035 | | | | 1,000,000 | | | | 1,067,066 | |
Interstate Power & Light Company | | | 4.10 | | | | 9-26-2028 | | | | 1,070,000 | | | | 1,065,227 | |
ITC Holdings Corporation | | | 3.65 | | | | 6-15-2024 | | | | 120,000 | | | | 117,039 | |
MidAmerican Energy Holdings Company | | | 5.80 | | | | 10-15-2036 | | | | 900,000 | | | | 1,056,305 | |
Monongahela Power Company 144A | | | 4.10 | | | | 4-15-2024 | | | | 1,660,000 | | | | 1,687,227 | |
Northern States Power Company of Minnesota | | | 5.35 | | | | 11-1-2039 | | | | 1,580,000 | | | | 1,781,979 | |
Pacific Gas & Electric Company | | | 3.95 | | | | 12-1-2047 | | | | 500,000 | | | | 376,006 | |
PacifiCorp | | | 3.35 | | | | 7-1-2025 | | | | 130,000 | | | | 126,132 | |
Public Service Electric & Gas Company | | | 5.70 | | | | 12-1-2036 | | | | 590,000 | | | | 679,935 | |
Southern California Edison Company | | | 6.00 | | | | 1-15-2034 | | | | 188,000 | | | | 199,453 | |
Trans-Allegheny Interstate Line Company 144A | | | 3.85 | | | | 6-1-2025 | | | | 200,000 | | | | 197,308 | |
| | | | |
| | | | | | | | | | | | | | | 14,025,013 | |
| | | | | | | | | | | | | | | | |
|
| Gas Utilities: 0.44% | |
AmeriGas Partners LP | | | 5.50 | | | | 5-20-2025 | | | | 950,000 | | | | 879,938 | |
AmeriGas Partners LP | | | 5.88 | | | | 8-20-2026 | | | | 500,000 | | | | 466,250 | |
Boardwalk Pipelines Company | | | 5.95 | | | | 6-1-2026 | | | | 1,500,000 | | | | 1,528,070 | |
| | | | |
| | | | | | | | | | | | | | | 2,874,258 | |
| | | | | | | | | | | | | | | | |
The accompanying notes are an integral part of these financial statements.
| | | | |
| 14 | | Wells Fargo Managed Fixed Income Portfolio | | Portfolio of investments—November 30, 2018 (unaudited) |
| | | | | | | | | | | | | | | | |
| Security name | | Interest rate | | | Maturity date | | | Principal | | | Value | |
|
| Multi-Utilities: 0.11% | |
Black Hills Corporation | | | 4.35 | % | | | 5-1-2033 | | | $ | 710,000 | | | $ | 696,921 | |
| | | | | | | | | | | | | | | | |
| |
Total Corporate Bonds and Notes (Cost $293,330,919) | | | | 287,570,239 | |
| | | | | | | | | | | | | | | | |
|
Municipal Obligations: 6.57% | |
|
California: 0.07% | |
|
| GO Revenue: 0.04% | |
Alameda County CA Series A | | | 3.70 | | | | 8-1-2031 | | | | 275,000 | | | | 271,428 | |
| | | | | | | | | | | | | | | | |
|
| Tax Revenue: 0.03% | |
San Jose CA RDA Senior Taxable Refunding Bonds SeriesA-T | | | 3.38 | | | | 8-1-2034 | | | | 220,000 | | | | 202,869 | |
| | | | | | | | | | | | | | | | |
| | | | |
| | | | | | | | | | | | | | | 474,297 | |
| | | | | | | | | | | | | | | | |
|
Delaware: 0.20% | |
|
| Miscellaneous Revenue: 0.20% | |
Delaware Build America Bonds | | | 4.45 | | | | 7-1-2028 | | | | 1,250,000 | | | | 1,317,050 | |
| | | | | | | | | | | | | | | | |
|
Georgia: 0.09% | |
|
| GO Revenue: 0.09% | |
Cherokee County GA School System Build America Bonds | | | 5.87 | | | | 8-1-2028 | | | | 500,000 | | | | 567,755 | |
| | | | | | | | | | | | | | | | |
|
Hawaii: 0.17% | |
|
| GO Revenue: 0.17% | |
Honolulu HI Series F | | | 3.75 | | | | 9-1-2030 | | | | 1,110,000 | | | | 1,099,644 | |
| | | | | | | | | | | | | | | | |
|
Idaho: 0.02% | |
|
| Miscellaneous Revenue: 0.02% | |
Idaho Building Authority State Office Campus Project Series B | | | 3.28 | | | | 9-1-2028 | | | | 170,000 | | | | 161,235 | |
| | | | | | | | | | | | | | | | |
|
Illinois: 0.02% | |
|
| GO Revenue: 0.02% | |
Lake County IL Community Consolidated School District Series A | | | 3.40 | | | | 11-1-2027 | | | | 150,000 | | | | 145,851 | |
| | | | | | | | | | | | | | | | |
|
Indiana: 0.08% | |
|
| Miscellaneous Revenue: 0.08% | |
Indiana Finance Authority Taxable Facilities Series A | | | 2.37 | | | | 7-1-2024 | | | | 225,000 | | | | 212,994 | |
Indianapolis IN Local Public Improvement Bonds SeriesA-2 | | | 6.00 | | | | 1-15-2040 | | | | 235,000 | | | | 283,535 | |
| | | | |
| | | | | | | | | | | | | | | 496,529 | |
| | | | | | | | | | | | | | | | |
|
Massachusetts: 0.46% | |
|
| GO Revenue: 0.23% | |
Boston MA Series C Qualified School Construction Bonds | | | 4.40 | | | | 4-1-2026 | | | | 400,000 | | | | 411,396 | |
Massachusetts Build America Bonds Series D | | | 4.50 | | | | 8-1-2031 | | | | 1,000,000 | | | | 1,052,810 | |
| | | | |
| | | | | | | | | | | | | | | 1,464,206 | |
| | | | | | | | | | | | | | | | |
The accompanying notes are an integral part of these financial statements.
| | | | | | |
| Portfolio of investments—November 30, 2018 (unaudited) | | Wells Fargo Managed Fixed Income Portfolio | | | 15 | |
| | | | | | | | | | | | | | | | |
| Security name | | Interest rate | | | Maturity date | | | Principal | | | Value | |
|
| Tax Revenue: 0.23% | |
Massachusetts Build America Bonds Series E | | | 5.46 | % | | | 12-1-2039 | | | $ | 1,275,000 | | | $ | 1,495,409 | |
| | | | | | | | | | | | | | | | |
| | | | |
| | | | | | | | | | | | | | | 2,959,615 | |
| | | | | | | | | | | | | | | | |
|
Mississippi: 0.06% | |
|
| Education Revenue: 0.06% | |
Mississippi Higher Education Assistance Corporation Series2014-1 Class A1 (1 Month LIBOR +0.68%) ± | | | 3.00 | | | | 10-25-2035 | | | | 418,915 | | | | 419,359 | |
| | | | | | | | | | | | | | | | |
|
Missouri: 0.50% | |
|
| Education Revenue: 0.50% | |
Missouri HEFA Washington University Series A | | | 3.65 | | | | 8-15-2057 | | | | 1,000,000 | | | | 904,820 | |
Missouri Higher Education Loan Authority NotesClass A-1 (1 Month LIBOR +0.83%) ± | | | 3.11 | | | | 1-26-2026 | | | | 2,121,796 | | | | 2,121,393 | |
Missouri Higher Education Loan Authority NotesClass A-1 (3 Month LIBOR +0.85%) ± | | | 3.53 | | | | 8-27-2029 | | | | 213,844 | | | | 214,420 | |
| | | | |
| | | | | | | | | | | | | | | 3,240,633 | |
| | | | | | | | | | | | | | | | |
|
New Jersey: 0.15% | |
|
| Miscellaneous Revenue: 0.15% | |
Hudson County NJ Improvement Authority Hudson County Lease Project (AGM Insured) | | | 7.40 | | | | 12-1-2025 | | | | 855,000 | | | | 943,039 | |
| | | | | | | | | | | | | | | | |
|
New York: 0.34% | |
|
| Tax Revenue: 0.34% | |
New York City Transitional Finance Authority | | | 3.43 | | | | 8-1-2026 | | | | 1,750,000 | | | | 1,719,883 | |
New York City Transitional Finance Authority Series A2 | | | 2.00 | | | | 5-1-2024 | | | | 250,000 | | | | 232,490 | |
New York City Transitional Finance Authority Series F2 | | | 2.75 | | | | 5-1-2024 | | | | 170,000 | | | | 164,337 | |
New York Urban Development Corporation Series B | | | 2.86 | | | | 3-15-2024 | | | | 105,000 | | | | 102,447 | |
| | | | |
| | | | | | | | | | | | | | | 2,219,157 | |
| | | | | | | | | | | | | | | | |
|
North Carolina: 0.86% | |
|
| Education Revenue: 0.86% | |
Duke University Series A | | | 5.85 | | | | 4-1-2037 | | | | 880,000 | | | | 1,077,410 | |
North Carolina Education Assistance Authority Student Loan (3 Month LIBOR +0.90%) ± | | | 3.39 | | | | 7-25-2041 | | | | 1,955,114 | | | | 1,987,119 | |
North Carolina Education Assistance Authority Student Loan SeriesA-3 (3 Month LIBOR +0.90%) | | | 3.39 | | | | 10-25-2041 | | | | 587,393 | | | | 595,810 | |
University of North Carolina Chapel Hill | | | 3.85 | | | | 12-1-2034 | | | | 375,000 | | | | 377,820 | |
University of North Carolina Chapel Hill Refunding Bonds Series C | | | 3.33 | | | | 12-1-2036 | | | | 1,710,000 | | | | 1,571,695 | |
| | | | |
| | | | | | | | | | | | | | | 5,609,854 | |
| | | | | | | | | | | | | | | | |
|
Ohio: 0.13% | |
|
| GO Revenue: 0.06% | |
Cuyahoga County OH Build America Bonds Series B | | | 6.03 | | | | 12-1-2034 | | | | 325,000 | | | | 387,722 | |
| | | | | | | | | | | | | | | | |
|
| Tax Revenue: 0.07% | |
Ohio County WV Special District Excise Tax Series A | | | 8.25 | | | | 3-1-2035 | | | | 450,000 | | | | 482,990 | |
| | | | | | | | | | | | | | | | |
| | | | |
| | | | | | | | | | | | | | | 870,712 | |
| | | | | | | | | | | | | | | | |
The accompanying notes are an integral part of these financial statements.
| | | | |
| 16 | | Wells Fargo Managed Fixed Income Portfolio | | Portfolio of investments—November 30, 2018 (unaudited) |
| | | | | | | | | | | | | | | | |
| Security name | | Interest rate | | | Maturity date | | | Principal | | | Value | |
|
Oregon: 0.37% | |
|
| Education Revenue: 0.28% | |
Oregon | | | 5.90 | % | | | 8-1-2038 | | | $ | 1,500,000 | | | $ | 1,787,790 | |
| | | | | | | | | | | | | | | | |
|
| GO Revenue: 0.09% | |
Oregon Board of Higher Education Build America Bonds Series C | | | 5.38 | | | | 8-1-2039 | | | | 500,000 | | | | 586,205 | |
| | | | | | | | | | | | | | | | |
| | | | |
| | | | | | | | | | | | | | | 2,373,995 | |
| | | | | | | | | | | | | | | | |
|
Pennsylvania: 0.21% | |
|
| Education Revenue: 0.21% | |
Pennsylvania Higher Education Authority Class A (1 Month LIBOR +1.15%) 144A± | | | 3.43 | | | | 9-25-2065 | | | | 1,338,843 | | | | 1,351,059 | |
| | | | | | | | | | | | | | | | |
|
Rhode Island: 0.54% | |
|
| Education Revenue: 0.54% | |
Rhode Island Student Loan AuthorityClass A-1 (1 Month LIBOR +0.90%) ± | | | 3.20 | | | | 7-1-2031 | | | | 3,469,157 | | | | 3,475,644 | |
| | | | | | | | | | | | | | | | |
|
Tennessee: 0.02% | |
|
| GO Revenue: 0.02% | |
Metropolitan Government of Nashville | | | 5.71 | | | | 7-1-2034 | | | | 100,000 | | | | 116,439 | |
| | | | | | | | | | | | | | | | |
|
Texas: 0.92% | |
|
| Education Revenue: 0.16% | |
University of Texas Build America Bonds Series A | | | 5.26 | | | | 7-1-2039 | | | | 550,000 | | | | 641,487 | |
University of Texas Build America Bonds Series C | | | 4.79 | | | | 8-15-2046 | | | | 120,000 | | | | 130,352 | |
University of Texas Build America Bonds Series D | | | 5.13 | | | | 8-15-2042 | | | | 215,000 | | | | 242,739 | |
| | | | |
| | | | | | | | | | | | | | | 1,014,578 | |
| | | | | | | | | | | | | | | | |
|
| GO Revenue: 0.21% | |
Hidalgo County TX | | | 4.04 | | | | 8-15-2030 | | | | 1,270,000 | | | | 1,284,491 | |
Houston TX Pension Obligation Bonds Series 2017 | | | 3.73 | | | | 3-1-2030 | | | | 110,000 | | | | 109,049 | |
| | | | |
| | | | | | | | | | | | | | | 1,393,540 | |
| | | | | | | | | | | | | | | | |
|
| Miscellaneous Revenue: 0.41% | |
Texas | | | 3.45 | | | | 10-1-2028 | | | | 285,000 | | | | 286,228 | |
Texas Transportation Commission Highway Improvement Taxable Series A | | | 4.63 | | | | 4-1-2033 | | | | 2,215,000 | | | | 2,370,006 | |
| | | | |
| | | | | | | | | | | | | | | 2,656,234 | |
| | | | | | | | | | | | | | | | |
|
| Tax Revenue: 0.04% | |
Texas Transportation Commission Series B | | | 5.18 | | | | 4-1-2030 | | | | 250,000 | | | | 280,425 | |
| | | | | | | | | | | | | | | | |
|
| Water & Sewer Revenue: 0.10% | |
Houston TX Combined Utility System Series E | | | 3.97 | | | | 11-15-2031 | | | | 655,000 | | | | 655,177 | |
| | | | | | | | | | | | | | | | |
| | | | |
| | | | | | | | | | | | | | | 5,999,954 | |
| | | | | | | | | | | | | | | | |
|
Utah: 0.80% | |
|
| Education Revenue: 0.56% | |
State Board of Regents of Utah Series1-A (1 Month LIBOR +0.75%) ± | | | 3.07 | | | | 9-25-2056 | | | | 3,610,375 | | | | 3,612,289 | |
| | | | | | | | | | | | | | | | |
The accompanying notes are an integral part of these financial statements.
| | | | | | |
| Portfolio of investments—November 30, 2018 (unaudited) | | Wells Fargo Managed Fixed Income Portfolio | | | 17 | |
| | | | | | | | | | | | | | | | |
| Security name | | Interest rate | | | Maturity date | | | Principal | | | Value | |
|
| GO Revenue: 0.24% | |
Utah Build America Bonds Series B | | | 3.54 | % | | | 7-1-2025 | | | $ | 1,545,000 | | | $ | 1,551,118 | |
| | | | | | | | | | | | | | | | |
| | | | |
| | | | | | | | | | | | | | | 5,163,407 | |
| | | | | | | | | | | | | | | | |
|
Vermont: 0.00% | |
|
| Housing Revenue: 0.00% | |
Vermont Housing Finance Agency | | | 3.80 | | | | 11-1-2037 | | | | 30,000 | | | | 29,081 | |
| | | | | | | | | | | | | | | | |
|
Virginia: 0.10% | |
|
| Education Revenue: 0.07% | |
University of Virginia Build America Bonds | | | 6.20 | | | | 9-1-2039 | | | | 315,000 | | | | 409,818 | |
University of Virginia Revenue Bond Series C | | | 4.18 | | | | 9-1-2117 | | | | 70,000 | | | | 64,952 | |
| | | | |
| | | | | | | | | | | | | | | 474,770 | |
| | | | | | | | | | | | | | | | |
|
| Housing Revenue: 0.03% | |
Virginia Housing Development Authority | | | 3.10 | | | | 6-25-2041 | | | | 168,606 | | | | 159,449 | |
| | | | | | | | | | | | | | | | |
| | | | |
| | | | | | | | | | | | | | | 634,219 | |
| | | | | | | | | | | | | | | | |
|
Washington: 0.46% | |
|
| GO Revenue: 0.43% | |
King County WA Economic Development Taxable Bond Series C | | | 5.03 | | | | 12-1-2023 | | | | 230,000 | | | | 249,309 | |
King County WA School District #210 (AGM Insured) | | | 4.90 | | | | 12-1-2022 | | | | 400,000 | | | | 407,896 | |
Washington Series T | | | 3.45 | | | | 8-1-2029 | | | | 1,000,000 | | | | 979,370 | |
Washington Build America Bonds Series D | | | 5.48 | | | | 8-1-2039 | | | | 1,000,000 | | | | 1,163,960 | |
| | | | |
| | | | | | | | | | | | | | | 2,800,535 | |
| | | | | | | | | | | | | | | | |
|
| Tax Revenue: 0.03% | |
Washington Build America Bonds | | | 5.09 | | | | 8-1-2033 | | | | 175,000 | | | | 194,511 | |
| | | | | | | | | | | | | | | | |
| | | | |
| | | | | | | | | | | | | | | 2,995,046 | |
| | | | | | | | | | | | | | | | |
| |
Total Municipal Obligations (Cost $42,713,676) | | | | 42,663,574 | |
| | | | | | | | | | | | | | | | |
|
Non-Agency Mortgage-Backed Securities: 8.93% | |
Commercial Mortgage Pass-Through Certificate Series2010-C1 Class A3 144A | | | 4.21 | | | | 7-10-2046 | | | | 636,837 | | | | 643,539 | |
Commercial Mortgage Pass-Through Certificate Series2012-CR2 Class A4 | | | 3.15 | | | | 8-15-2045 | | | | 550,000 | | | | 543,951 | |
Commercial Mortgage Pass-Through Certificate Series2012-CR3 Class A3 | | | 2.82 | | | | 10-15-2045 | | | | 607,731 | | | | 593,130 | |
Commercial Mortgage Pass-Through Certificate Series 2012-UBS5 Class A3 | | | 3.55 | | | | 9-10-2047 | | | | 630,000 | | | | 631,351 | |
Commercial Mortgage Pass-Through Certificate Series 2013-CR12 Class ASB | | | 3.62 | | | | 10-10-2046 | | | | 549,997 | | | | 552,503 | |
Commercial Mortgage Pass-Through Certificate Series 2013-CR13 Class A4 ±± | | | 4.19 | | | | 11-10-2046 | | | | 600,000 | | | | 616,390 | |
Commercial Mortgage Pass-Through Certificate Series2013-CR7 Class A4 | | | 3.21 | | | | 3-10-2046 | | | | 593,569 | | | | 586,242 | |
Commercial Mortgage Pass-Through Certificate Series 2014-CR17 Class A5 | | | 3.98 | | | | 5-10-2047 | | | | 7,660,000 | | | | 7,785,912 | |
Commercial Mortgage Pass-Through Certificate Series 2014-CR21 Class A3 | | | 3.53 | | | | 12-10-2047 | | | | 2,900,000 | | | | 2,872,477 | |
Commercial Mortgage Pass-Through Certificate Series 2014-UBS5 Class A4 | | | 3.84 | | | | 9-10-2047 | | | | 620,000 | | | | 622,878 | |
GS Mortgage Securities Trust Series2011-GC3 Class A4 144A | | | 4.75 | | | | 3-10-2044 | | | | 421,446 | | | | 431,496 | |
GS Mortgage Securities Trust Series2011-GC5 Class A4 | | | 3.71 | | | | 8-10-2044 | | | | 545,000 | | | | 548,358 | |
GS Mortgage Securities Trust Series 2012-GCJ7 Class A4 | | | 3.38 | | | | 5-10-2045 | | | | 513,310 | | | | 512,218 | |
GS Mortgage Securities Trust Series 2013-GC14 Class A5 | | | 4.24 | | | | 8-10-2046 | | | | 615,000 | | | | 632,681 | |
GS Mortgage Securities Trust Series 2013-GC16 Class A4 | | | 4.27 | | | | 11-10-2046 | | | | 350,000 | | | | 360,974 | |
The accompanying notes are an integral part of these financial statements.
| | | | |
| 18 | | Wells Fargo Managed Fixed Income Portfolio | | Portfolio of investments—November 30, 2018 (unaudited) |
| | | | | | | | | | | | | | | | |
| Security name | | Interest rate | | | Maturity date | | | Principal | | | Value | |
| | | | |
Non-Agency Mortgage-Backed Securities(continued) | | | | | | | | | | | | | | | | |
GS Mortgage Securities Trust Series 2014-GC20 Class A5 | | | 4.00 | % | | | 4-10-2047 | | | $ | 4,693,000 | | | $ | 4,765,894 | |
GS Mortgage Securities Trust Series 2014-GC26 Class A5 | | | 3.63 | | | | 11-10-2047 | | | | 2,565,000 | | | | 2,555,605 | |
JPMorgan Chase Commercial Mortgage Securities Corporation Series2014-C20 Class A5 | | | 3.80 | | | | 7-15-2047 | | | | 4,065,000 | | | | 4,092,116 | |
JPMorgan Chase Commercial Mortgage Securities Trust Series2010-C2 Class A3 144A | | | 4.07 | | | | 11-15-2043 | | | | 347,084 | | | | 350,235 | |
JPMorgan Chase Commercial Mortgage Securities Trust Series2013-C13 Class A4 ±± | | | 3.99 | | | | 1-15-2046 | | | | 5,000,000 | | | | 5,085,148 | |
JPMorgan Chase Commercial Mortgage Securities Trust Series2014-C19 Class A4 | | | 4.00 | | | | 4-15-2047 | | | | 450,000 | | | | 457,177 | |
JPMorgan Chase Commercial Mortgage Securities Trust Series 2014-GC26 Class A4 | | | 3.49 | | | | 1-15-2048 | | | | 1,338,000 | | | | 1,327,698 | |
Morgan Stanley Bank of America Merril Lynch Trust Series2014-C19 ClassA4 | | | 3.53 | | | | 12-15-2047 | | | | 1,790,000 | | | | 1,772,832 | |
Morgan Stanley Bank of America Merrill Lynch Trust Series2014-C15 Class ASB | | | 3.65 | | | | 4-15-2047 | | | | 550,000 | | | | 552,592 | |
Morgan Stanley Capital I Trust Series2011-C2 Class A4 144A | | | 4.66 | | | | 6-15-2044 | | | | 500,000 | | | | 513,331 | |
Morgan Stanley Capital I Trust Series2011-C3 Class A4 | | | 4.12 | | | | 7-15-2049 | | | | 530,000 | | | | 538,325 | |
SBA Series2018-10B Class 1 | | | 3.55 | | | | 9-11-2028 | | | | 5,700,000 | | | | 5,725,939 | |
Towd Point Mortgage Trust Series2016-2 Class A1A 144A±± | | | 2.75 | | | | 8-25-2055 | | | | 243,142 | | | | 237,461 | |
Towd Point Mortgage Trust Series2016-3 Class A1 144A±± | | | 2.25 | | | | 4-25-2056 | | | | 326,509 | | | | 318,219 | |
Towd Point Mortgage Trust Series2018-3 Class A1 144A±± | | | 3.75 | | | | 5-25-2058 | | | | 2,743,304 | | | | 2,735,830 | |
WFRBS Commercial Mortgage Trust Series2013-C17 Class A4 | | | 4.02 | | | | 12-15-2046 | | | | 4,370,000 | | | | 4,448,261 | |
WFRBS Commercial Mortgage Trust Series2014-C20 Class A5 | | | 4.00 | | | | 5-15-2047 | | | | 4,531,047 | | | | 4,607,134 | |
| |
TotalNon-Agency Mortgage-Backed Securities (Cost $58,555,703) | | | | 58,017,897 | |
| | | | | | | | | | | | | | | | |
|
U.S. Treasury Securities: 6.17% | |
U.S. Treasury Bond | | | 3.13 | | | | 5-15-2048 | | | | 8,910,000 | | | | 8,601,282 | |
U.S. Treasury Bond | | | 4.50 | | | | 5-15-2038 | | | | 15,900,000 | | | | 18,979,383 | |
U.S. Treasury Note | | | 1.00 | | | | 6-30-2019 | | | | 8,900,000 | | | | 8,820,039 | |
U.S. Treasury Note | | | 2.50 | | | | 5-31-2020 | | | | 3,675,000 | | | | 3,658,922 | |
| |
Total U.S. Treasury Securities (Cost $40,980,365) | | | | 40,059,626 | |
| | | | | | | | | | | | | | | | |
|
Yankee Corporate Bonds and Notes: 6.98% | |
|
Communication Services: 0.32% | |
|
| Wireless Telecommunication Services: 0.32% | |
Rogers Communications Incorporated | | | 3.63 | | | | 12-15-2025 | | | | 250,000 | | | | 240,482 | |
Rogers Communications Incorporated | | | 4.10 | | | | 10-1-2023 | | | | 370,000 | | | | 374,713 | |
Vodafone Group plc | | | 4.13 | | | | 5-30-2025 | | | | 1,500,000 | | | | 1,462,958 | |
| | | | |
| | | | | | | | | | | | | | | 2,078,153 | |
| | | | | | | | | | | | | | | | |
|
Consumer Discretionary: 0.47% | |
|
| Automobiles: 0.47% | |
Jaguar Land Rover Automotive plc 144A« | | | 4.50 | | | | 10-1-2027 | | | | 620,000 | | | | 457,250 | |
Toyota Motor Corporation | | | 3.42 | | | | 7-20-2023 | | | | 2,610,000 | | | | 2,594,332 | |
| | | | |
| | | | | | | | | | | | | | | 3,051,582 | |
| | | | | | | | | | | | | | | | |
|
Consumer Staples: 0.12% | |
|
| Household Products: 0.12% | |
Reckitt Benckiser Treasury Services plc 144A | | | 2.75 | | | | 6-26-2024 | | | | 855,000 | | | | 804,530 | |
| | | | | | | | | | | | | | | | |
The accompanying notes are an integral part of these financial statements.
| | | | | | |
| Portfolio of investments—November 30, 2018 (unaudited) | | Wells Fargo Managed Fixed Income Portfolio | | | 19 | |
| | | | | | | | | | | | | | | | |
| Security name | | Interest rate | | | Maturity date | | | Principal | | | Value | |
|
Energy: 0.82% | |
|
| Oil, Gas & Consumable Fuels: 0.82% | |
BP Capital Markets plc | | | 3.28 | % | | | 9-19-2027 | | | $ | 155,000 | | | $ | 144,639 | |
BP Capital Markets plc | | | 3.81 | | | | 2-10-2024 | | | | 1,500,000 | | | | 1,494,223 | |
Canadian National Resources Limited | | | 2.95 | | | | 1-15-2023 | | | | 50,000 | | | | 47,763 | |
Cenovus Energy Incorporated | | | 4.25 | | | | 4-15-2027 | | | | 1,500,000 | | | | 1,337,888 | |
Petroleos Mexicanos | | | 2.29 | | | | 2-15-2024 | | | | 151,250 | | | | 148,092 | |
Petroleos Mexicanos | | | 2.83 | | | | 2-15-2024 | | | | 316,250 | | | | 314,040 | |
Petroleos Mexicanos | | | 6.38 | | | | 1-23-2045 | | | | 1,600,000 | | | | 1,280,000 | |
Schlumberger Investment SA 144A | | | 2.40 | | | | 8-1-2022 | | | | 357,000 | | | | 341,351 | |
Total Capital International SA | | | 3.70 | | | | 1-15-2024 | | | | 200,000 | | | | 201,092 | |
| | | | |
| | | | | | | | | | | | | | | 5,309,088 | |
| | | | | | | | | | | | | | | | |
|
Financials: 3.27% | |
|
| Banks: 2.05% | |
Bank of Nova Scotia | | | 4.50 | | | | 12-16-2025 | | | | 80,000 | | | | 79,114 | |
BNP Paribas SA 144A | | | 4.40 | | | | 8-14-2028 | | | | 1,430,000 | | | | 1,374,992 | |
Cooperatieve Rabobank U.A. 144A | | | 3.88 | | | | 9-26-2023 | | | | 300,000 | | | | 298,150 | |
Cooperatieve Rabobank U.A. | | | 2.75 | | | | 1-10-2023 | | | | 1,500,000 | | | | 1,437,177 | |
Credit Suisse New York | | | 3.63 | | | | 9-9-2024 | | | | 250,000 | | | | 243,125 | |
HSBC Holdings plc (3 Month LIBOR +1.06%) ± | | | 3.26 | | | | 3-13-2023 | | | | 220,000 | | | | 213,965 | |
HSBC Holdings plc | | | 3.60 | | | | 5-25-2023 | | | | 250,000 | | | | 244,967 | |
HSBC Holdings plc (3 Month LIBOR +1.35%) ± | | | 4.29 | | | | 9-12-2026 | | | | 950,000 | | | | 927,214 | |
HSBC Holdings plc (3 Month LIBOR +1.53%) ± | | | 4.58 | | | | 6-19-2029 | | | | 1,500,000 | | | | 1,468,711 | |
Mitsubishi UFJ Financial Group Incorporated | | | 2.67 | | | | 7-25-2022 | | | | 80,000 | | | | 77,183 | |
Mitsubishi UFJ Financial Group Incorporated | | | 3.46 | | | | 3-2-2023 | | | | 1,500,000 | | | | 1,483,507 | |
Mitsubishi UFJ Financial Group Incorporated | | | 3.76 | | | | 7-26-2023 | | | | 350,000 | | | | 349,147 | |
Royal Bank of Canada | | | 3.70 | | | | 10-5-2023 | | | | 2,620,000 | | | | 2,609,424 | |
Royal Bank of Canada | | | 4.65 | | | | 1-27-2026 | | | | 120,000 | | | | 121,534 | |
Sumitomo Mitsui Financial Group | | | 3.94 | | | | 10-16-2023 | | | | 780,000 | | | | 786,947 | |
Toronto Dominion Bank | | | 3.50 | | | | 7-19-2023 | | | | 1,610,000 | | | | 1,604,434 | |
| | | | |
| | | | | | | | | | | | | | | 13,319,591 | |
| | | | | | | | | | | | | | | | |
|
| Capital Markets: 0.28% | |
Credit Suisse Group AG (3 Month LIBOR +1.41%) 144A± | | | 3.87 | | | | 1-12-2029 | | | | 1,500,000 | | | | 1,383,247 | |
Credit Suisse Group AG (3 Month LIBOR +1.24%) 144A± | | | 4.21 | | | | 6-12-2024 | | | | 450,000 | | | | 444,533 | |
| | | | |
| | | | | | | | | | | | | | | 1,827,780 | |
| | | | | | | | | | | | | | | | |
|
| Consumer Finance: 0.23% | |
UBS Group Funding Switzerland 144A | | | 4.25 | | | | 3-23-2028 | | | | 1,500,000 | | | | 1,465,639 | |
| | | | | | | | | | | | | | | | |
|
| Diversified Financial Services: 0.71% | |
Air Liquide Finance Company 144A | | | 2.25 | | | | 9-27-2023 | | | | 1,500,000 | | | | 1,409,781 | |
Diageo Capital plc | | | 3.50 | | | | 9-18-2023 | | | | 200,000 | | | | 199,247 | |
Shell International Finance BV | | | 3.25 | | | | 5-11-2025 | | | | 200,000 | | | | 193,912 | |
Shell International Finance BV | | | 3.40 | | | | 8-12-2023 | | | | 1,070,000 | | | | 1,064,228 | |
Siemens Financieringsmaatschappij NV 144A | | | 3.13 | | | | 3-16-2024 | | | | 1,810,000 | | | | 1,755,352 | |
| | | | |
| | | | | | | | | | | | | | | 4,622,520 | |
| | | | | | | | | | | | | | | | |
The accompanying notes are an integral part of these financial statements.
| | | | |
| 20 | | Wells Fargo Managed Fixed Income Portfolio | | Portfolio of investments—November 30, 2018 (unaudited) |
| | | | | | | | | | | | | | | | |
| Security name | | Interest rate | | | Maturity date | | | Principal | | | Value | |
|
Health Care: 0.60% | |
|
| Health Care Equipment & Supplies: 0.23% | |
Covidien International Finance SA | | | 3.20 | % | | | 6-15-2022 | | | $ | 1,500,000 | | | $ | 1,480,339 | |
| | | | | | | | | | | | | | | | |
|
| Pharmaceuticals: 0.37% | |
Actavis Funding SCS | | | 4.55 | | | | 3-15-2035 | | | | 1,200,000 | | | | 1,116,428 | |
Teva Pharmaceutical Finance BV | | | 2.20 | | | | 7-21-2021 | | | | 150,000 | | | | 139,277 | |
Teva Pharmaceutical Finance BV | | | 2.80 | | | | 7-21-2023 | | | | 1,000,000 | | | | 876,648 | |
Teva Pharmaceutical Finance BV | | | 3.15 | | | | 10-1-2026 | | | | 350,000 | | | | 285,293 | |
| | | | |
| | | | | | | | | | | | | | | 2,417,646 | |
| | | | | | | | | | | | | | | | |
|
Industrials: 0.39% | |
|
| Aerospace & Defense: 0.19% | |
Embraer Netherlands Finance BV | | | 5.05 | | | | 6-15-2025 | | | | 1,200,000 | | | | 1,213,500 | |
| | | | | | | | | | | | | | | | |
|
| Electrical Equipment: 0.04% | |
Sensata Technologies BV 144A | | | 5.63 | | | | 11-1-2024 | | | | 265,000 | | | | 265,663 | |
| | | | | | | | | | | | | | | | |
|
| Machinery: 0.09% | |
CNH Industrial NV | | | 4.50 | | | | 8-15-2023 | | | | 600,000 | | | | 600,000 | |
| | | | | | | | | | | | | | | | |
|
| Road & Rail: 0.07% | |
Canadian Pacific Railway Company | | | 2.90 | | | | 2-1-2025 | | | | 450,000 | | | | 427,153 | |
| | | | | | | | | | | | | | | | |
|
Information Technology: 0.28% | |
|
| Technology Hardware, Storage & Peripherals: 0.28% | |
Seagate HDD | | | 4.75 | | | | 6-1-2023 | | | | 1,925,000 | | | | 1,829,746 | |
| | | | | | | | | | | | | | | | |
|
Materials: 0.71% | |
|
| Metals & Mining: 0.71% | |
Anglo American Capital plc 144A | | | 4.75 | | | | 4-10-2027 | | | | 1,500,000 | | | | 1,439,295 | |
ArcelorMittal SA | | | 6.13 | | | | 6-1-2025 | | | | 1,500,000 | | | | 1,576,290 | |
Vale Overseas Limited | | | 6.25 | | | | 8-10-2026 | | | | 1,500,000 | | | | 1,601,250 | |
| | | | |
| | | | | | | | | | | | | | | 4,616,835 | |
| | | | | | | | | | | | | | | | |
| |
Total Yankee Corporate Bonds and Notes (Cost $46,344,566) | | | | 45,329,765 | |
| | | | | | | | | | | | | | | | |
| | | | |
| | | Yield | | | | | | Shares | | | | |
| Short-Term Investments: 4.01% | |
| | | | |
| Investment Companies: 4.01% | | | | | | | | | | | | | | | | |
Securities Lending Cash Investments LLC (l)(r)(u) | | | 2.38 | | | | | | | | 3,437,806 | | | | 3,438,149 | |
Wells Fargo Government Money Market Fund Select Class (l)(u)## | | | 2.13 | | | | | | | | 22,572,741 | | | | 22,572,741 | |
| | | | |
Total Short-Term Investments (Cost $26,010,890) | | | | | | | | | | | | | | | 26,010,890 | |
| | | | | | | | | | | | | | | | |
| | | | | | | | |
| Total investments in securities (Cost $671,155,631) | | | 102.00 | % | | | 662,360,788 | |
Other assets and liabilities, net | | | (2.00 | ) | | | (13,003,883 | ) |
| | | | | | | | |
| Total net assets | | | 100.00 | % | | $ | 649,356,905 | |
| | | | | | | | |
The accompanying notes are an integral part of these financial statements.
| | | | | | |
| Portfolio of investments—November 30, 2018 (unaudited) | | Wells Fargo Managed Fixed Income Portfolio | | | 21 | |
| (a) | The security is fair valued in accordance with procedures approved by the Board of Trustees. |
| ±± | The coupon of the security is adjusted based on the principal and interest payments received from the underlying pool of mortgages as well as the credit quality and the actual prepayment speed of the underlying mortgages. |
| 144A | The security may be resold in transactions exempt from registration, normally to qualified institutional buyers, pursuant to Rule 144A under the Securities Act of 1933. |
| ± | Variable rate investment. The rate shown is the rate in effect at period end. |
| « | All or a portion of this security is on loan. |
| %% | The security is issued on a when-issued basis. |
| (l) | The issuer of the security is an affiliated person of the Portfolio as defined in the Investment Company Act of 1940. |
| (r) | The investment is anon-registered investment company purchased with cash collateral received from securities on loan. |
| (u) | The rate represents the7-day annualized yield at period end. |
| ## | All or a portion of this security is segregated for when-issued securities. |
Abbreviations:
| AGM | Assured Guaranty Municipal |
| FHLMC | Federal Home Loan Mortgage Corporation |
| FNMA | Federal National Mortgage Association |
| GNMA | Government National Mortgage Association |
| HEFA | Health & Educational Facilities Authority |
| LIBOR | London Interbank Offered Rate |
| RDA | Redevelopment Authority |
| REIT | Real estate investment trust |
| SBA | Small Business Administration |
Investments in Affiliates
An affiliated investment is an investment in which the Portfolio owns at least 5% of the outstanding voting shares of the issuer or as a result of other relationships, such as the Portfolio and the issuer having the same adviser or investment manager. Transactions with issuers that were either affiliated persons of the Portfolio at the beginning of the period or the end of the period were as follows:
| | | | | | | | | | | | | | | | | | | | | | | | | | | | | | | | | | | | |
| | | Shares,
beginning of
period | | | Shares
purchased | | | Shares
sold | | | Shares,
end of
period | | | Net
realized
gains
(losses) | | | Net
change in
unrealized
gains
(losses) | | | Income
from
affiliated
securities | | | Value,
end
of period | | | % of
net
assets | |
Short-Term Investments | | | | | | | | | | | | | | | | | | | | | | | | | | | | | | | | | | | | |
Investment Companies | | | | | | | | | | | | | | | | | | | | | | | | | | | | | | | | | | | | |
Securities Lending Cash Investments LLC | | | 418,594 | | | | 48,511,863 | | | | 45,492,651 | | | | 3,437,806 | | | $ | (11 | ) | | $ | 0 | | | $ | 10,117 | | | $ | 3,438,149 | | | | | |
Wells Fargo Government Money Market Fund Fund Select Class | | | 417,223 | | | | 828,546,299 | | | | 806,390,781 | | | | 22,572,741 | | | | 0 | | | | 0 | | | | 917,982 | | | | 22,572,741 | | | | | |
| | | | | | | | | | | | | | | | | | | | | | | | | | | | | | | | | | | | |
| | | | | | | | | | | | | | | | | | $ | (11 | ) | | $ | 0 | | | $ | 928,099 | | | $ | 26,010,890 | | | | 4.01 | % |
| | | | | | | | | | | | | | | | | | | | | | | | | | | | | | | | | | | | |
The accompanying notes are an integral part of these financial statements.
| | | | |
| 22 | | Wells Fargo Managed Fixed Income Portfolio | | Statement of assets and liabilities—November 30, 2018 (unaudited) |
| | | | |
| | | | |
| |
Assets | | | | |
Investments in unaffiliated securities (including $3,368,690 of securities loaned), at value (cost $645,144,741) | | $ | 636,349,898 | |
Investments in affiliated securities, at value (cost $26,010,890) | | | 26,010,890 | |
Receivable for investments sold | | | 32,627,830 | |
Principal paydown receivable | | | 42,845 | |
Receivable for interest | | | 5,496,268 | |
Receivable for securities lending income | | | 1,460 | |
Prepaid expenses and other assets | | | 5,686 | |
| | | | |
Total assets | | | 700,534,877 | |
| | | | |
| |
Liabilities | | | | |
Payable for investments purchased | | | 47,497,649 | |
Payable upon receipt of securities loaned | | | 3,438,091 | |
Advisory fee payable | | | 215,331 | |
Accrued expenses and other liabilities | | | 26,901 | |
| | | | |
Total liabilities | | | 51,177,972 | |
| | | | |
Total net assets | | $ | 649,356,905 | |
| | | | |
The accompanying notes are an integral part of these financial statements.
| | | | | | |
| Statement of operations—six months ended November 30, 2018 (unaudited) | | Wells Fargo Managed Fixed Income Portfolio | | | 23 | |
| | | | |
| | | | |
| |
Investment income | | | | |
Interest (net of foreign interest withholding taxes of $2,448) | | $ | 10,507,013 | |
Income from affiliated securities | | | 928,099 | |
| | | | |
Total investment income | | | 11,435,112 | |
| | | | |
| |
Expenses | | | | |
Advisory fee | | | 1,304,131 | |
Custody and accounting fees | | | 8,691 | |
Professional fees | | | 28,838 | |
Shareholder report expenses | | | 1,312 | |
Trustees’ fees and expenses | | | 7,929 | |
Other fees and expenses | | | 3,724 | |
| | | | |
Total expenses | | | 1,354,625 | |
Less: Fee waivers and/or expense reimbursements | | | (63,442 | ) |
| | | | |
Net expenses | | | 1,291,183 | |
| | | | |
Net investment income | | | 10,143,929 | |
| | | | |
| |
REALIZED AND UNREALIZED GAINS (LOSSES) ON INVESTMENTS | | | | |
| |
Net realized gains (losses) on: | | | | |
Unaffiliated securities | | | (1,715,949 | ) |
Affiliated securities | | | (11 | ) |
Futures contracts | | | 14,951 | |
| | | | |
Net realized losses on investments | | | (1,701,009 | ) |
| | | | |
Net change in unrealized gains (losses) on investments | | | (8,363,508 | ) |
| | | | |
Net realized and unrealized gains (losses) on investments | | | (10,064,517 | ) |
| | | | |
Net increase in net assets resulting from operations | | $ | 79,412 | |
| | | | |
The accompanying notes are an integral part of these financial statements.
| | | | |
| 24 | | Wells Fargo Managed Fixed Income Portfolio | | Statement of changes in net assets |
| | | | | | | | |
| | | Six months ended
November 30, 2018
(unaudited) | | | Year ended
May 31, 2018 | |
| | |
Operations | | | | | | | | |
Net investment income | | $ | 10,143,929 | | | $ | 3,360,611 | |
Net realized gains (losses) on investments | | | (1,701,009 | ) | | | 366,933 | |
Net change in unrealized gains (losses) on investments | | | (8,363,508 | ) | | | (3,657,037 | ) |
| | | | |
Net increase in net assets resulting from operations | | | 79,412 | | | | 70,507 | |
| | | | |
| | |
Capital transactions | | | | | | | | |
Transactions in investors’ beneficial interests | | | | | | | | |
Contributions | | | 649,177,165 | | | | 8,441,165 | |
Withdrawals | | | (106,611,508 | ) | | | (13,757,809 | ) |
| | | | |
Net increase (decrease) in net assets resulting from capital transactions | | | 542,565,657 | | | | (5,316,644 | ) |
| | | | |
Total increase (decrease) in net assets | | | 542,645,069 | | | | (5,246,137 | ) |
| | | | |
| | |
Net assets | | | | | | | | |
Beginning of period | | | 106,711,836 | | | | 111,957,973 | |
| | | | |
End of period | | $ | 649,356,905 | | | $ | 106,711,836 | |
| | | | |
The accompanying notes are an integral part of these financial statements.
| | | | | | |
| Financial highlights | | Wells Fargo Managed Fixed Income Portfolio | | | 25 | |
| | | | | | | | | | | | | | | | | | | | | | | | |
| | | Six months ended
November 30, 2018
(unaudited) | | | Year ended May 31 | |
| | | 2018 | | | 2017 | | | 2016 | | | 2015 | | | 2014 | |
Total return1 | | | (0.21 | )% | | | 0.05 | % | | | 3.13 | % | | | 3.95 | % | | | 4.23 | % | | | 3.07 | % |
Ratios to average net assets (annualized) | | | | | | | | | | | | | | | | | | | | | | | | |
Gross expenses | | | 0.41 | % | | | 0.49 | % | | | 0.48 | % | | | 0.48 | % | | | 0.48 | % | | | 0.48 | % |
Net expenses | | | 0.39 | % | | | 0.39 | % | | | 0.39 | % | | | 0.39 | % | | | 0.39 | % | | | 0.39 | % |
Net investment income | | | 3.05 | % | | | 3.09 | % | | | 2.99 | % | | | 3.12 | % | | | 3.20 | % | | | 3.33 | % |
Supplemental data | | | | | | | | | | | | | | | | | | | | | | | | |
Portfolio turnover rate | | | 188 | % | | | 23 | % | | | 47 | % | | | 25 | % | | | 31 | % | | | 35 | % |
| 1 | Returns for periods of less than one year are not annualized. |
The accompanying notes are an integral part of these financial statements.
| | | | |
| 26 | | Wells Fargo Managed Fixed Income Portfolio | | Notes to financial statements (unaudited) |
1. ORGANIZATION
Wells Fargo Master Trust (the “Trust”), a Delaware statutory trust organized on March 10, 1999, is anopen-end management investment company registered under the Investment Company Act of 1940, as amended (the “1940 Act”). As an investment company, the Trust follows the accounting and reporting guidance in Financial Accounting Standards Board (“FASB”)Accounting Standards Codification Topic 946, Financial Services – Investment Companies. These financial statements report on the Wells Fargo Managed Fixed Income Portfolio (the “Portfolio”) which is a diversified series of the Trust.
2. SIGNIFICANT ACCOUNTING POLICIES
The following significant accounting policies, which are consistently followed in the preparation of the financial statements of the Portfolio, are in conformity with U.S. generally accepted accounting principles which require management to make estimates and assumptions that affect the reported amounts of assets and liabilities, disclosure of contingent assets and liabilities at the date of the financial statements, and the reported amounts of revenues and expenses during the reporting period. Actual results could differ from those estimates.
Securities valuation
All investments are valued each business day as of the close of regular trading on the New York Stock Exchange (generally 4 p.m. Eastern Time), although the Portfolio may deviate from this calculation time under unusual or unexpected circumstances.
Debt securities are valued at the evaluated bid price provided by an independent pricing service service (e.g. taking into account various factors, including yields, maturities, or credit ratings) or, if a reliable price is not available, the quoted bid price from an independent broker-dealer.
Futures contracts that are listed on a foreign or domestic exchange or market are valued at the official closing price or, if none, the last sales price.
Investments in registeredopen-end investment companies are valued at net asset value. Interests innon-registered investment companies that are redeemable at net asset value are fair valued normally at net asset value.
Investments which are not valued using any of the methods discussed above are valued at their fair value, as determined in good faith by the Board of Trustees of the Portfolio. The Board of Trustees has established a Valuation Committee comprised of the Trustees and has delegated to it the authority to take any actions regarding the valuation of portfolio securities that the Valuation Committee deems necessary or appropriate, including determining the fair value of portfolio securities, unless the determination has been delegated to the Wells Fargo Asset Management Pricing Committee at Wells Fargo Funds Management, LLC (“Funds Management”). The Board of Trustees retains the authority to make or ratify any valuation decisions or approve any changes to the Valuation Procedures as it deems appropriate. On a quarterly basis, the Board of Trustees receives reports on any valuation actions taken by the Valuation Committee or the Wells Fargo Asset Management Pricing Committee which may include items for ratification.
Securities lending
The Portfolio may lend its securities from time to time in order to earn additional income in the form of fees or interest on securities received as collateral or the investment of any cash received as collateral. The Portfolio continues to receive interest or dividends on the securities loaned. The Portfolio receives collateral in the form of cash or securities with a value at least equal to the value of the securities on loan. The value of the loaned securities is determined at the close of each business day and any additional required collateral is delivered to the Portfolio on the next business day. In a securities lending transaction, the net asset value of the Portfolio will be affected by an increase or decrease in the value of the securities loaned and by an increase or decrease in the value of the instrument in which collateral is invested. The amount of securities lending activity undertaken by the Portfolio fluctuates from time to time. In the event of default or bankruptcy by the borrower, the Portfolio may be prevented from recovering the loaned securities or gaining access to the collateral or may experience delays or costs in doing so. In addition, the investment of any cash collateral received may lose all or part of its value. The Portfolio has the right under the lending agreement to recover the securities from the borrower on demand.
The Portfolio lends its securities through an unaffiliated securities lending agent. Cash collateral received in connection with its securities lending transactions is invested in Securities Lending Cash Investments, LLC (the “Securities Lending Fund”). The Securities Lending Fund is exempt from registration under Section 3(c)(7) of the 1940 Act and is managed by Funds Management and is subadvised by Wells Capital Management Incorporated (“WellsCap”), an affiliate of Funds Management and an indirect wholly owned subsidiary of Wells Fargo & Company (“Wells Fargo”). Funds Management
| | | | | | |
| Notes to financial statements (unaudited) | | Wells Fargo Managed Fixed Income Portfolio | | | 27 | |
receives an advisory fee starting at 0.05% and declining to 0.01% as the average daily net assets of the Securities Lending Fund increase. All of the fees received by Funds Management are paid to WellsCap for its services as subadviser. The Securities Lending Fund seeks to provide a positive return compared to the daily Fed Funds Open Rate by investing in high-quality, U.S. dollar-denominated short-term money market instruments. Securities Lending Fund investments are valued at the evaluated bid price provided by an independent pricing service. Income earned from investment in the Securities Lending Fund, if any, is included in income from affiliated securities on the Statement of Operations.
When-issued transactions
The Portfolio may purchase securities on a forward commitment or when-issued basis. The Portfolio records awhen-issued transaction on the trade date and will segregate assets in an amount at least equal in value to the Portfolio’s commitment to purchase when-issued securities. Securities purchased on a when-issued basis aremarked-to-market daily and the Portfolio begins earning interest on the settlement date. Losses may arise due to changes in the market value of the underlying securities or if the counterparty does not perform under the contract.
Futures contracts
The Fund is subject to interest rate risk in the normal course of pursuing its investment objectives. Futures contracts are agreements between the Fund and a counterparty to buy or sell a specific amount of a commodity, financial instrument or currency at specified price and on a specified date. The Fund may buy and sell futures contracts in order to gain exposure to, or protect against, changes in interest rates. The primary risks associated with the use of futures contracts are the imperfect correlation between changes in market values of securities held by the Fund and the prices of futures contracts, and the possibility of an illiquid market. Futures contracts are generally entered into on a regulated futures exchange and cleared through a clearinghouse associated with the exchange. With futures contracts, there is minimal counterparty risk to the Fund since futures contracts are exchange traded and the exchange’s clearinghouse, as counterparty to all exchange traded futures, guarantees the futures contracts against default.
Upon entering into a futures contracts, the Fund is required to deposit either cash or securities (initial margin) with the broker in an amount equal to a certain percentage of the contract value. Subsequent payments (variation margin) are paid to or from the broker each day equal to the daily changes in the contract value. Such payments are recorded as unrealized gains or losses and, if any, shown as variation margin receivable (payable) in the Statement of Assets and Liabilities. Should the Fund fail to make requested variation margin payments, the broker can gain access to the initial margin to satisfy the Fund’s payment obligations. When the contracts are closed, a realized gain or loss is recorded in the Statement of Operations.
Security transactions and income recognition
Securities transactions are recorded on a trade date basis. Realized gains or losses are recorded on the basis of identified cost.
Interest income is accrued daily and bond discounts are accreted and premiums are amortized daily. To the extent debt obligations are placed onnon-accrual status, any related interest income may be reduced by writing off interest receivables when the collection of all or a portion of interest has been determined to be doubtful based on consistently applied procedures and the fair value has decreased. If the issuer subsequently resumes interest payments or when the collectability of interest is reasonably assured, the debt obligation is removed fromnon-accrual status.
Income is recorded net of foreign taxes withheld where recovery of such taxes is not assured.
Federal and other taxes
The Portfolio is treated as a separate entity for federal income tax purposes. The Portfolio is not required to pay federal income taxes on its net investment income and net capital gains as it is treated as a partnership for federal income tax purposes. All interest, dividends, gains and losses of the Portfolio are deemed to have been “passed through” to the interest holders in proportion to their holdings of the Portfolio regardless of whether such interest, dividends and gains have been distributed by the Portfolio.
The Portfolio’s income tax returns and all financial records supporting those returns for the prior three fiscal years are subject to examination by the federal revenue authority. Management has analyzed the Fund’s tax positions taken on federal, state, and foreign tax returns for all open tax years and does not believe that there are any uncertain tax positions that require recognition of a tax liability.
| | | | |
| 28 | | Wells Fargo Managed Fixed Income Portfolio | | Notes to financial statements (unaudited) |
As of November 30, 2018, the aggregate cost of all investments for federal income tax purposes was $671,151,800 and the unrealized gains (losses) consisted of:
| | | | |
Gross unrealized gains | | $ | 1,745,827 | |
Gross unrealized losses | | | (10,536,839 | ) |
Net unrealized losses | | $ | (8,791,012 | ) |
3. FAIR VALUATION MEASUREMENTS
Fair value measurements of investments are determined within a framework that has established a fair value hierarchy based upon the various data inputs utilized in determining the value of the Portfolio’s investments. The three-level hierarchy gives the highest priority to unadjusted quoted prices in active markets for identical assets or liabilities (Level 1) and the lowest priority to unobservable inputs (Level 3). The Portfolio’s investments are classified within the fair value hierarchy based on the lowest level of input that is significant to the fair value measurement. The inputs are summarized into three broad levels as follows:
| ∎ | | Level 1 – quoted prices in active markets for identical securities |
| ∎ | | Level 2 – other significant observable inputs (including quoted prices for similar securities, interest rates, prepayment speeds, credit risk, etc.) |
| ∎ | | Level 3 – significant unobservable inputs (including the Portfolio’s own assumptions in determining the fair value of investments) |
The inputs or methodologies used for valuing investments in securities are not necessarily an indication of the risk associated with investing in those securities.
The following is a summary of the inputs used in valuing the Portfolio’s assets and liabilities as of November 30, 2018:
| | | | | | | | | | | | | | | | |
| | | Quoted prices
(Level 1) | | | Other significant
observable inputs
(Level 2) | | | Significant
unobservable inputs (Level 3) | | | Total | |
Assets | | | | | | | | | | | | | | | | |
Investments in: | | | | | | | | | | | | | | | | |
| | | | |
Agency securities | | $ | 0 | | | $ | 141,185,044 | | | $ | 0 | | | $ | 141,185,044 | |
| | | | |
Asset-backed securities | | | 0 | | | | 21,523,753 | | | | 0 | | | | 21,523,753 | |
| | | | |
Corporate bonds and notes | | | 0 | | | | 287,570,239 | | | | 0 | | | | 287,570,239 | |
| | | | |
Municipal obligations | | | 0 | | | | 42,663,574 | | | | 0 | | | | 42,663,574 | |
| | | | |
Non-agency mortgage-backed securities | | | 0 | | | | 58,017,897 | | | | 0 | | | | 58,017,897 | |
| | | | |
U.S. Treasury securities | | | 40,059,626 | | | | 0 | | | | 0 | | | | 40,059,626 | |
| | | | |
Yankee corporate bonds and notes | | | 0 | | | | 45,329,765 | | | | 0 | | | | 45,329,765 | |
| | | | |
Short-term investments | | | | | | | | | | | | | | | | |
Investment companies | | | 22,572,741 | | | | 3,438,149 | | | | 0 | | | | 26,010,890 | |
Total assets | | $ | 62,632,367 | | | $ | 599,728,421 | | | $ | 0 | | | $ | 662,360,788 | |
Additional sector, industry or geographic detail is included in the Portfolio of Investments
At November 30, 2018, the Portfolio did not have any transfers into/out of Level 3.
4. TRANSACTIONS WITH AFFILIATES
Advisory fee
The Trust has entered into an advisory contract with Funds Management, an indirect wholly owned subsidiary of Wells Fargo. The adviser is responsible for implementing investment policies and guidelines and for supervising the subadviser, who is responsible forday-to-day portfolio management of the Portfolio. Pursuant to the contract, Funds Management is entitled to receive an annual advisory fee starting at 0.40% and declining to 0.29% as the average daily net assets of the Portfolio increase. For the six months ended November 30, 2018, the advisory fee was equivalent to an annual rate of 0.40% of the Portfolio’s average daily net assets.
| | | | | | |
| Notes to financial statements (unaudited) | | Wells Fargo Managed Fixed Income Portfolio | | | 29 | |
Funds Management has retained the services of a subadviser to provide daily portfolio management to the Portfolio. The fee for subadvisory services is borne by Funds Management. Galliard Capital Management, Inc., an affiliate of Funds Management and an indirect wholly owned subsidiary of Wells Fargo, is the subadviser to the Portfolio and is entitled to receive a fee from Funds Management at an annual rate starting at 0.20% and declining to 0.10% as the average daily net assets of the Portfolio increase.
Funds Management has voluntarily waived and/or reimbursed advisory fees to the extent necessary to maintain the net operating expense ratio of the Portfolio.
Interfund transactions
The Portfolio may purchase or sell portfolio investment securities to certain other Wells Fargo affiliates pursuant to Rule17a-7 under the 1940 Act and under procedures adopted by the Board of Trustees. The procedures have been designed to ensure that these interfund transactions, which do not incur broker commissions, are effected at current market prices.
5. INVESTMENT PORTFOLIO TRANSACTIONS
Purchases and sales of investments, excluding short-term securities, for the six months ended November 30, 2018 were as follows:
| | | | | | |
Purchases at cost | | Sales proceeds |
U.S.
government | | Non-U.S.
government | | U.S.
government | | Non-U.S.
government |
| $1,241,784,375 | | $449,216,032 | | $1,125,383,663 | | $19,223,731 |
6. DERIVATIVE TRANSACTIONS
During the six months ended November 30, 2018, the Fund entered into futures contracts for speculative purposes. The Fund had an average notional amount of $103,116 in long futures contracts during the six months ended November 30, 2018.
The fair value, realized gains or losses and change in unrealized gains or losses, if any, on derivative instruments are reflected in the corresponding financial statement captions.
7. BANK BORROWINGS
Effective August 28, 2018, the Trust, along with Wells Fargo Variable Trust and Wells Fargo Funds Trust (excluding the money market funds), are parties to a $280,000,000 revolving credit agreement whereby the Portfolio is permitted to use bank borrowings for temporary or emergency purposes, such as to fund shareholder redemption requests. Interest under the credit agreement is charged to the Portfolio based on a borrowing rate equal to the higher of the Federal Funds rate in effect on that day plus 1.25% or the overnight LIBOR rate in effect on that day plus 1.25%. In addition, an annual commitment fee equal to 0.25% of the unused balance is allocated to each participating fund.
For the six months ended November 30, 2018, there were no borrowings by the Portfolio under the agreement.
8. INDEMNIFICATION
Under the Trust’s organizational documents, the officers and Trustees have been granted certain indemnification rights against certain liabilities that may arise out of performance of their duties to the Trust. Additionally, in the normal course of business, the Trust may enter into contracts with service providers that contain a variety of indemnification clauses. The Trust’s maximum exposure under these arrangements is dependent on future claims that may be made against the Portfolio and, therefore, cannot be estimated.
9. NEW ACCOUNTING PRONOUNCEMENT
In August 2018, FASB issued Accounting Standards Update (“ASU”)No. 2018-13, Fair Value Measurement (Topic 820)Disclosure Framework—Changes to the Disclosure Requirements for Fair Value Measurement. ASU2018-13 updates the disclosure requirements for fair value measurements by modifying or removing certain disclosures and adding certain new disclosures. The amendments are effective for fiscal years, and interim periods within those fiscal years, beginning after December 15, 2019. Early adoption is permitted. Management has adopted the removal and modification of disclosures early, as permitted, and will adopt the additional new disclosures at the effective date.
| | | | |
| 30 | | Wells Fargo Managed Fixed Income Portfolio | | Other information (unaudited) |
PROXY VOTING INFORMATION
A description of the policies and procedures used to determine how to vote proxies relating to portfolio securities is available, upon request, by calling1-800-222-8222, visiting our website atwellsfargofunds.com, or visiting the SEC website at sec.gov. Information regarding how the Fund voted proxies relating to portfolio securities during the most recent12-month period ended June 30 is available on the Fund’s website atwellsfargofunds.comor by visiting the SEC website at sec.gov.
PORTFOLIO HOLDINGS INFORMATION
The Portfolio files its complete schedule of portfolio holdings with the SEC for the first and third quarters of each fiscal year on FormN-Q, which is available by visiting the SEC website at sec.gov. In addition, the Portfolio’s FormN-Q may be reviewed and copied at the SEC’s Public Reference Room in Washington, DC, and at regional offices in New York City, at 233 Broadway, and in Chicago, at 175 West Jackson Boulevard, Suite 900. Information about the Public Reference Room may be obtained by calling1-800-SEC-0330.
| | | | | | |
| Other information (unaudited) | | Wells Fargo Managed Fixed Income Portfolio | | | 31 | |
BOARD OF TRUSTEES AND OFFICERS
Each of the Trustees and Officers1 listed in the table below acts in identical capacities for each fund in the Wells Fargo family of funds, which consists of 152 mutual funds comprising the Wells Fargo Funds Trust, Wells Fargo Variable Trust, Wells Fargo Master Trust and fourclosed-end funds (collectively the “Fund Complex”). This table should be read in conjunction with the Prospectus and the Statement of Additional Information2. The mailing address of each Trustee and Officer is 525 Market Street, 12th Floor, San Francisco, CA 94105. Each Trustee and Officer serves an indefinite term, however, each Trustee serves such term until reaching the mandatory retirement age established by the Trustees.
Independent Trustees
| | | | | | |
Name and year of birth | | Position held and
length of service* | | Principal occupations during past five years or longer | | Current other public company or
investment company
directorships |
| William R. Ebsworth (Born 1957) | | Trustee, since 2015 | | Retired. From 1984 to 2013, equities analyst, portfolio manager, research director and chief investment officer at Fidelity Management and Research Company in Boston, Tokyo, and Hong Kong, and retired in 2013 as Chief Investment Officer of Fidelity Strategic Advisers, Inc. where he led a team of investment professionals managing client assets. Prior thereto, Board member of Hong Kong Securities Clearing Co., Hong Kong Options Clearing Corp., the Thailand International Fund, Ltd., Fidelity Investments Life Insurance Company, and Empire Fidelity Investments Life Insurance Company. Board member of the Vincent Memorial Hospital Endowment(non-profit organization), where he serves on the Investment Committee and as a Chair of the Audit Committee. Mr. Ebsworth is a CFA® charterholder. | | N/A |
| Jane A. Freeman (Born 1953) | | Trustee, since 2015; Chair Liaison, since 2018 | | Retired. From 2012 to 2014 and 1999 to 2008, Chief Financial Officer of Scientific Learning Corporation. From 2008 to 2012, Ms. Freeman provided consulting services related to strategic business projects. Prior to 1999, Portfolio Manager at Rockefeller & Co. and Scudder, Stevens & Clark. Board member of the Harding Loevner Funds from 1996 to 2014, serving as both Lead Independent Director and chair of the Audit Committee. Board member of the Russell Exchange Traded Funds Trust from 2011 to 2012 and the chair of the Audit Committee. Ms. Freeman is a Board Member of The Ruth Bancroft Garden(non-profit organization). She is also an inactive Chartered Financial Analyst. | | N/A |
Isaiah Harris, Jr.3
(Born 1952) | | Trustee, since 2009 | | Retired. Chairman of the Board of CIGNA Corporation since 2009, and Director since 2005. From 2003 to 2011, Director of Deluxe Corporation. Prior thereto, President and CEO of BellSouth Advertising and Publishing Corp. from 2005 to 2007, President and CEO of BellSouth Enterprises from 2004 to 2005 and President of BellSouth Consumer Services from 2000 to 2003. Emeritus member of the Iowa State University Foundation Board of Governors. Emeritus Member of the Advisory Board of Iowa State University School of Business. Advisory Board Member, Palm Harbor Academy (private school). Advisory Board Member, Child Evangelism Fellowship(non-profit). Mr. Harris is a certified public accountant (inactive status). | | CIGNA Corporation |
Judith M. Johnson3
(Born 1949) | | Trustee, since 2008; Audit Committee Chairman, since 2009 | | Retired. Prior thereto, Chief Executive Officer and Chief Investment Officer of Minneapolis Employees Retirement Fund from 1996 to 2008. Ms. Johnson is an attorney, certified public accountant and a certified managerial accountant. | | N/A |
| | | | |
| 32 | | Wells Fargo Managed Fixed Income Portfolio | | Other information (unaudited) |
| | | | | | |
Name and year of birth | | Position held and
length of service* | | Principal occupations during past five years or longer | | Current other public company or
investment company
directorships |
David F. Larcker
(Born 1950) | | Trustee, since 2009 | | James Irvin Miller Professor of Accounting at the Graduate School of Business, Stanford University, Director of the Corporate Governance Research Initiative and Senior Faculty of The Rock Center for Corporate Governance since 2006. From 2005 to 2008, Professor of Accounting at the Graduate School of Business, Stanford University. Prior thereto, Ernst & Young Professor of Accounting at The Wharton School, University of Pennsylvania from 1985 to 2005. | | N/A |
Olivia S. Mitchell
(Born 1953) | | Trustee, since 2006; Nominating and Governance Committee Chairman, since 2018 | | International Foundation of Employee Benefit Plans Professor, Wharton School of the University of Pennsylvania since 1993. Director of Wharton’s Pension Research Council and Boettner Center on Pensions & Retirement Research, and Research Associate at the National Bureau of Economic Research. Previously, Cornell University Professor from 1978 to 1993. | | N/A |
| Timothy J. Penny (Born 1951) | | Trustee, since 1996; Chairman, since 2018; Vice Chairman, from 2017 to 2018 | | President and Chief Executive Officer of Southern Minnesota Initiative Foundation, anon-profit organization, since 2007. Member of the Board of Trustees of NorthStar Education Finance, Inc., anon-profit organization, since 2007. | | N/A |
| James G. Polisson (Born 1959) | | Trustee, since 2018; Advisory Board Member, from 2017 to 2018 | | Retired. Chief Marketing Officer, Source (ETF) UK Services, Ltd, from 2015 to 2017. From 2012 to 2015, Principal of The Polisson Group, LLC, a management consulting, corporate advisory and principal investing company. Chief Executive Officer and Managing Director at Russell Investments, Global Exchange Traded Funds from 2010 to 2012. Managing Director of Barclays Global Investors from 1998 to 2010 and Global Chief Marketing Officer for iShares and Barclays Global Investors from 2000 to 2010. Trustee of the San Francisco Mechanics’ Institute, anon-profit organization, from 2013 to 2015. Board member of the Russell Exchange Traded Fund Trust from 2011 to 2012. Director of Barclays Global Investors Holdings Deutschland GmbH from 2006 to 2009. Mr. Polisson is an attorney and has a retired status with the Massachusetts and District of Columbia Bar Associations. | | N/A |
Michael S. Scofield4
(Born 1943) | | Trustee, since 2010 | | Served on the Investment Company Institute’s Board of Governors and Executive Committee from 2008-2011 as well the Governing Council of the Independent Directors Council from 2006-2011 and the Independent Directors Council Executive Committee from 2008-2011. Trustee of the Evergreen Fund complex (and its predecessors) from 1984 to 2010. Chairman of the Evergreen Funds from 2000-2010. Former Trustee of the Mentor Funds. Retired Attorney, Law Offices of Michael S. Scofield. | | N/A |
Pamela Wheelock
(Born 1959) | | Trustee, since 2018; Advisory Board Member, from 2017 to 2018 | | Chief Operating Officer, Twin Cities Habitat for Humanity, since January, 2017. Vice President of University Services, University of Minnesota from 2012 to 2017. Prior thereto, on the Board of Directors, Governance Committee and Finance Committee for the Minnesota Philanthropy Partners (Saint Paul Foundation) from 2012 to 2018, Interim President and Chief Executive Officer of Blue Cross Blue Shield of Minnesota from 2010 to 2011, Chairman of the Board from 2009 to 2011 and Board Director from 2003 to 2015. Vice President, Leadership and Community Engagement, Bush Foundation, Saint Paul, Minnesota (a private foundation) from 2009 to 2011. Executive Vice President and Chief Financial Officer, Minnesota Sports and Entertainment from 2004 to 2009 and Senior Vice President from 2002 to 2004. Commissioner of Finance, State of Minnesota, from 1999 to 2002. Currently the Board Chair of the Minnesota Wild Foundation since 2010. | | N/A |
| * | Length of service dates reflect the Trustee’s commencement of service with the Trust’s predecessor entities, where applicable. |
| | | | | | |
| Other information (unaudited) | | Wells Fargo Managed Fixed Income Portfolio | | | 33 | |
Officers
| | | | | | |
Name and year of birth | | Position held and
length of service | | Principal occupations during past five years or longer | | |
Andrew Owen
(Born 1960) | | President, since 2017 | | Executive Vice President of Wells Fargo & Company and Head of Affiliated Managers, Wells Fargo Asset Management, since 2014. In addition, Mr. Owen is currently President, Chief Executive Officer and Director of Wells Fargo Funds Management, LLC since 2017. Prior thereto, Executive Vice President responsible for marketing, investments and product development for Wells Fargo Funds Management, LLC, from 2009 to 2014. | | |
Nancy Wiser1
(Born 1967) | | Treasurer, since 2012 | | Executive Vice President of Wells Fargo Funds Management, LLC since 2011. Chief Operating Officer and Chief Compliance Officer at LightBox Capital Management LLC, from 2008 to 2011. | | |
Alexander Kymn
(Born 1973) | | Secretary, since 2018; Chief Legal Officer, since 2018 | | Senior Company Counsel of Wells Fargo Bank, N.A. since 2018 (previously Senior Counsel from 2007 to 2018). Vice President of Wells Fargo Funds Management, LLC from 2008 to 2014. | | |
Michael H. Whitaker
(Born 1967) | | Chief Compliance Officer, since 2016 | | Senior Vice President and Chief Compliance Officer since 2016. Senior Vice President and Chief Compliance Officer for Fidelity Investments from 2007 to 2016. | | |
David Berardi
(Born 1975) | | Assistant Treasurer, since 2009 | | Vice President of Wells Fargo Funds Management, LLC since 2009. Vice President of Evergreen Investment Management Company, LLC from 2008 to 2010. Manager of Fund Reporting and Control for Evergreen Investment Management Company, LLC from 2004 to 2010. | | |
| Jeremy DePalma1 (Born 1974) | | Assistant Treasurer, since 2009 | | Senior Vice President of Wells Fargo Funds Management, LLC since 2009. Senior Vice President of Evergreen Investment Management Company, LLC from 2008 to 2010 and head of the Fund Reporting and Control Team within Fund Administration from 2005 to 2010. | | |
| 1 | Nancy Wiser acts as Treasurer of 76 funds in the Fund Complex. Jeremy DePalma acts as Treasurer of 76 funds and Assistant Treasurer of 76 funds in the Fund Complex. |
| 2 | The Statement of Additional Information includes additional information about the Trustees and is available, without charge, upon request, by calling1-800-222-8222 or by visiting the website atwellsfargofunds.com. |
| 3 | Mr. Harris will replace Ms. Johnson as the Chairman of the Audit Committee effective January 1, 2019. |
| 4 | Mr. Scofield is expected to retire on December 31, 2018. |
This page is intentionally left blank.
This page is intentionally left blank.
This page is intentionally left blank.
INVESTMENT PRODUCTS: NOT FDIC INSURED ◾ NO BANK GUARANTEE ◾ MAY LOSE VALUE
© 2019 Wells Fargo Funds Management, LLC. All rights reserved.
Semi-Annual Report
November 30, 2018

Wells Fargo C&B Large Cap Value Fund

Beginning on January 1, 2021, as permitted by new regulations adopted by the Securities and Exchange Commission, paper copies of the Wells Fargo Funds’ annual and semi-annual shareholder reports issued after this date will no longer be sent by mail, unless you specifically request paper copies of the reports. Instead, the reports will be made available on the Funds’ website, and you will be notified by mail each time a report is posted and provided with a website address to access the report.
If you already elected to receive shareholder reports electronically, you will not be affected by this change and you need not take any action. You may elect to receive shareholder reports and other communications from the Fund electronically at any time by contacting your financial intermediary (such as a broker-dealer or bank) or, if you are a direct investor, by calling 1-800-222-8222 or by enrolling at wellsfargo.com/advantagedelivery.
You may elect to receive all future reports in paper free of charge. If you invest through a financial intermediary, you can contact your financial intermediary to request that you continue to receive paper copies of your shareholder reports; if you invest directly with the Fund, you can call 1-800-222-8222. Your election to receive reports in paper will apply to all Wells Fargo Funds held in your account with your financial intermediary or, if you are a direct investor, to all Wells Fargo Funds that you hold.

Reduce clutter. Save trees.
Sign up for electronic delivery of prospectuses and shareholder reports atwellsfargo.com/advantagedelivery
Contents
The views expressed and any forward-looking statements are as of November 30, 2018, unless otherwise noted, and are those of the Fund managers and/or Wells Fargo Funds Management, LLC. Discussions of individual securities, or the markets generally, or any Wells Fargo Fund are not intended as individual recommendations. Future events or results may vary significantly from those expressed in any forward-looking statements. The views expressed are subject to change at any time in response to changing circumstances in the market. Wells Fargo Funds Management, LLC and the Fund disclaim any obligation to publicly update or revise any views expressed or forward-looking statements.
INVESTMENT PRODUCTS: NOT FDIC INSURED ◾ NO BANK GUARANTEE ◾ MAY LOSE VALUE
| | | | |
| 2 | | Wells Fargo C&B Large Cap Value Fund | | Letter to shareholders (unaudited) |

Andrew Owen
President
Wells Fargo Funds
Global trade tensions escalated during the third quarter of 2018.
Dear Shareholder:
We are pleased to offer you this semi-annual report for the Wells Fargo C&B Large Cap Value Fund for thesix-month period that ended November 30, 2018. During the reporting period, the U.S. generated encouraging economic and business data that was offset by less positive and more inconsistent data from international markets. Investment returns were restrained in comparison with recent periods as geopolitical tensions and uncertainty tended to distract investors from more favorable underlying trends.
For the period, U.S. stocks, as measured by the S&P 500 Index,1 gained 3.02% and international stocks, as measured by the MSCI ACWI ex USA Index (Net),2 declined 8.37%. Based on the MSCI EM Index (Net),3 emerging market stocks lost 9.89%. For bond investors, the Bloomberg Barclays U.S. Aggregate Bond Index4 declined 0.30% while the Bloomberg Barclays Global Aggregateex-USD Index5 fell 3.67%. The Bloomberg Barclays Municipal Bond Index6 gained 0.42%. The ICE BofAML U.S. High Yield Index7 was up 0.19%.
Global trade tensions prompted investor concerns.
Global trade tensions escalated during the third quarter of 2018. The U.S. government’s decision during the second quarter to impose tariffs on a wide range of products manufactured overseas drew retaliatory responses from foreign governments, which punished U.S. commodity producers and product manufacturers. Investors were left to wonder about next steps in what appeared to be an escalating divergence in global economic policies and growth prospects.
Inflation trended higher. TheCPI-U8 added 0.1% in September after an increase of 0.2% in both July and August. On a year-over-year basis, theall-items index rose 2.3% for the 12 months that ended September 30, 2018, after a seasonal adjustment. The rate of increase was slower than that recorded during the first half of 2018. The index for all items less food and energy rose 2.2% for the same12-month period.
| 1 | The S&P 500 Index consists of 500 stocks chosen for market size, liquidity, and industry group representation. It is a market-value-weighted index with each stock’s weight in the index proportionate to its market value. You cannot invest directly in an index. |
| 2 | The Morgan Stanley Capital International (MSCI) All Country World Index (ACWI) ex USA Index (Net) is a free-float-adjusted market-capitalization-weighted index that is designed to measure the equity market performance of developed markets, excluding the U.S. and Canada. Source: MSCI. MSCI makes no express or implied warranties or representations and shall have no liability whatsoever with respect to any MSCI data contained herein. The MSCI data may not be further redistributed or used as a basis for other indices or any securities or financial products. This report is not approved, reviewed, or produced by MSCI. You cannot invest directly in an index. |
| 3 | The MSCI Emerging Markets (EM) Index (Net) is a free-float-adjusted market-capitalization-weighted index that is designed to measure large- andmid-cap equity market performance of emerging markets. The MSCI EM Index (Net) consists of the following 24 emerging market country indices: Brazil, Chile, China, Colombia, Czech Republic, Egypt, Greece, Hungary, India, Indonesia, Korea, Malaysia, Mexico, Pakistan, Peru, the Philippines, Poland, Qatar, Russia, South Africa, Taiwan, Thailand, Turkey, and the United Arab Emirates. You cannot invest directly in an index. |
| 4 | The Bloomberg Barclays U.S. Aggregate Bond Index is a broad-based benchmark that measures the investment-grade, U.S.-dollar-denominated, fixed-rate taxable bond market, including Treasuries, government-related and corporate securities, mortgage-backed securities (agency fixed-rate and hybrid adjustable-rate mortgage pass-throughs), asset-backed securities, and commercial mortgage-backed securities. You cannot invest directly in an index. |
| 5 | The Bloomberg Barclays Global Aggregateex-USD Index is an unmanaged index that provides a broad-based measure of the global investment-grade fixed-income markets excluding the U.S.-dollar-denominated debt market. You cannot invest directly in an index. |
| 6 | The Bloomberg Barclays Municipal Bond Index is an unmanaged index composed of long-termtax-exempt bonds with a minimum credit rating of Baa. You cannot invest directly in an index. |
| 7 | The ICE BofAML U.S. High Yield Index is a market-capitalization-weighted index of domestic and Yankee high-yield bonds. The index tracks the performance of high-yield securities traded in the U.S. bond market. You cannot invest directly in an index. Copyright 2018. ICE Data Indices, LLC. All rights reserved. |
| 8 | The Consumer Price Index for All Urban Consumers(CPI-U) measures the changes in the price of a basket of goods and services purchased by urban consumers. The urban consumer population is deemed by many as a better representative measure of the general public because close to 90% of the country’s population lives in highly populated areas. You cannot invest directly in an index. |
| | | | | | |
| Letter to shareholders (unaudited) | | Wells Fargo C&B Large Cap Value Fund | | | 3 | |
U.S. stocks gained following positive economic data while international stocks and bonds declined.
During the summer months, the U.S. economy strengthened. Revised second-quarter gross domestic product (GDP) data released in August showed the U.S. economy growing at a 4.2% rate. The unemployment rate in the U.S. was 3.7% by the end of September, according to the U.S. Department of Labor. Wages showed more consistent growth, and consumer confidence remained strong. Several U.S. equity market indices reached records during August, with the S&P 500 Index gaining 7.20% for the three-month period that ended September 30, 2018. In contrast, the MSCI ACWI ex USA Index (Net) gained 0.71% while the MSCI EM Index (Net) declined 1.09% during the same three-month period.
In June, the Federal Reserve increased the target range for the federal funds rate to range from 1.75% to 2.00%. It raised the range again in September to range from 2.00% to 2.25%. Long-term interest rates in the U.S. remained at higher levels relative to the prior 10 years. Rates on10-year and30-year Treasury bonds—2.46% and 2.81%, respectively, on January 1, 2018—were 3.01% and 3.30%, respectively, on November 30, 2018. Investor concerns about an inverted yield curve reemerged, only to be replaced by concerns about the potentially negative influence of higher interest rates on economic activity.
November saw improvement in many equity markets.
As interest rates and bond yields gained during October, stock markets struggled. For the month, the S&P 500 Index fell 6.84%, the MSCI ACWI ex USA Index (Net) dropped 8.13%, and the MSCI EM Index (Net) lost 8.71%. The Bureau of Economic Analysis released its first estimate of third-quarter GDP, which, at an annualized 3.5% rate, indicated growth may be slowing compared with the second quarter. Readings on consumer sentiment and business spending were mixed. Markets rebounded somewhat in November as the S&P 500 Index gained 2.04%, the MSCI ACWI ex USA Index (Net) added 0.95%, and the MSCI EM Index (Net) was up 4.12% as the uncertainty leading up to midterm elections in the U.S. was resolved and progress seemed to be possible on several international trade issues.
Economic signals overseas were mixed as the third quarter ended and the fourth quarter began. In early August, the Bank of England’s Monetary Policy Committee increased its key interest rate to 0.75%. The European Central Bank and the Bank of Japan maintained low interest rates and accommodative monetary policies. Amid rising trade uncertainty, the People’s Bank of China cut reserve requirement ratios and accelerated infrastructure spending and tax cuts for business enterprises and individuals. Nevertheless, a strengthening U.S. dollar and the trade tensions remained headwinds for investors overseas.
Don’t let short-term uncertainty derail long-term investment goals.
Periods of investment uncertainty can present challenges, but experience has taught us that maintaining long-term investment goals can be an effective way to plan for the future. To help you create a sound strategy based on your personal goals and risk tolerance, Wells Fargo Funds offers more than 100 mutual funds spanning a wide range of asset classes and investment styles. Although diversification cannot guarantee an investment profit or prevent losses, we believe it can be an effective way to manage investment risk and potentially smooth out overall portfolio performance. We encourage investors to know their investments and to understand that appropriate levels of risk-taking may unlock opportunities.
Economic signals overseas were mixed as the third quarter ended and the fourth quarter began.
| | | | |
| 4 | | Wells Fargo C&B Large Cap Value Fund | | Letter to shareholders (unaudited) |
Thank you for choosing to invest with Wells Fargo Funds. We appreciate your confidence in us and remain committed to helping you meet your financial needs.
Sincerely,

Andrew Owen
President
Wells Fargo Funds
Notice to shareholders
At a meeting held on August 14-15, 2018, the Board of Trustees of the Fund approved the following policy which will be effective on or about February 5, 2019:
Class C shares will convert automatically into Class A shares ten years after the initial date of purchase or, if you acquired your Class C shares through an exchange or conversion from another share class, ten years after the date you acquired your Class C shares. When Class C shares that you acquired through a purchase or exchange convert, any other Class C shares that you purchased with reinvested dividends and distributions also will convert into Class A shares on a pro rata basis. A shorter holding period may also apply depending on your intermediary. Please see “Appendix A—Sales Charge Reductions and Waivers for Certain Intermediaries” in the Fund’s prospectus or at the end of this report.
For further information about your Fund, contact your investment professional, visit our website atwellsfargofunds.com, or call us directly at1-800-222-8222.
This page is intentionally left blank.
| | | | |
| 6 | | Wells Fargo C&B Large Cap Value Fund1 | | Performance highlights (unaudited) |
Investment objective
The Fund seeks maximum long-term total return (current income and capital appreciation), consistent with minimizing risk to principal.
Manager
Wells Fargo Funds Management, LLC
Subadviser for the affiliated master portfolio
Cooke & Bieler, L.P.
Portfolio managers
Andrew Armstrong, CFA®‡
Steve Lyons, CFA®‡
Michael M. Meyer, CFA®‡
Edward W. O’Connor, CFA®‡
R. James O’Neil, CFA®‡
Mehul Trivedi, CFA®‡
William Weber, CFA®‡
Average annual total returns (%) as of November 30, 2018
| | | | | | | | | | | | | | | | | | | | | | | | | | | | | | | | | | |
| | | | | Including sales charge | | | Excluding sales charge | | | Expense ratios2 (%) | |
| | | Inception date | | 1 year | | | 5 year | | | 10 year | | | 1 year | | | 5 year | | | 10 year | | | Gross | | | Net3 | |
| Class A (CBEAX) | | 7-26-2004 | | | (6.11 | ) | | | 7.03 | | | | 11.91 | | | | (0.38 | ) | | | 8.30 | | | | 12.57 | | | | 1.21 | | | | 1.08 | |
| Class C (CBECX) | | 7-26-2004 | | | (2.10 | ) | | | 7.50 | | | | 11.74 | | | | (1.10 | ) | | | 7.50 | | | | 11.74 | | | | 1.96 | | | | 1.83 | |
| Class R6 (CBEJX)4 | | 10-31-2016 | | | – | | | | – | | | | – | | | | 0.10 | | | | 8.69 | | | | 12.95 | | | | 0.78 | | | | 0.65 | |
| Administrator Class (CBLLX) | | 7-26-2004 | | | – | | | | – | | | | – | | | | (0.23 | ) | | | 8.46 | | | | 12.76 | | | | 1.13 | | | | 1.00 | |
| Institutional Class (CBLSX) | | 7-26-2004 | | | – | | | | – | | | | – | | | | (0.04 | ) | | | 8.71 | | | | 13.03 | | | | 0.88 | | | | 0.75 | |
| Russell 1000® Value Index5 | | – | | | – | | | | – | | | | – | | | | 2.96 | | | | 8.65 | | | | 12.46 | | | | – | | | | – | |
Figures quoted represent past performance, which is no guarantee of future results, and do not reflect taxes that a shareholder may pay on fund distributions or the redemption of fund shares. Investment return and principal value of an investment will fluctuate so that an investor’s shares, when redeemed, may be worth more or less than their original cost. Performance shown without sales charges would be lower if sales charges were reflected. Current performance may be lower or higher than the performance data quoted, which assumes the reinvestment of dividends and capital gains. Current month-end performance is available on the Fund’s website,wellsfargofunds.com.
Index returns do not include transaction costs associated with buying and selling securities, any mutual fund fees or expenses, or any taxes. It is not possible to invest directly in an index.
For Class A shares, the maximum front-end sales charge is 5.75%. For Class C shares, the maximum contingent deferred sales charge is 1.00%. Performance including a contingent deferred sales charge assumes the sales charge for the corresponding time period. Class R6, Administrator Class, and Institutional Class shares are sold without a front-end sales charge or contingent deferred sales charge.
Stock values fluctuate in response to the activities of individual companies and general market and economic conditions. Consult the Fund’s prospectus for additional information on these and other risks.
Please see footnotes on page 7.
| | | | | | |
| Performance highlights (unaudited) | | Wells Fargo C&B Large Cap Value Fund | | | 7 | |
| | | | |
| Ten largest holdings (%) as of November 30, 20186 | |
Arrow Electronics Incorporated | | | 3.20 | |
State Street Corporation | | | 3.20 | |
Gildan Activewear Incorporated | | | 2.99 | |
AerCap Holdings NV | | | 2.98 | |
Chubb Limited | | | 2.77 | |
JPMorgan Chase & Company | | | 2.77 | |
Intercontinental Exchange Incorporated | | | 2.75 | |
Johnson & Johnson | | | 2.69 | |
Omnicom Group Incorporated | | | 2.68 | |
PNC Financial Services Group Incorporated | | | 2.63 | |
|
| Sector distribution as of November 30, 20187 |
|
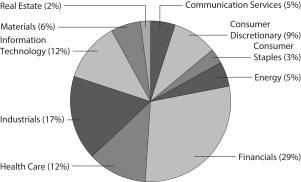 |
| ‡ | CFA® and Chartered Financial Analyst® are trademarks owned by CFA Institute. |
| 1 | The Fund is a gateway feeder fund that invests substantially all of its assets in a single affiliated master portfolio of the Wells Fargo Master Trust with a substantially identical investment objective and substantially similar investment strategies. References to the investment activities of the Fund are intended to refer to the investment activities of the affiliated master portfolio in which it invests. |
| 2 | Reflects the expense ratios as stated in the most recent prospectuses. The expense ratios shown are subject to change and may differ from the annualized expense ratios shown in the financial highlights of this report. |
| 3 | The manager has contractually committed through September 30, 2019 to waive fees and/or reimburse expenses to the extent necessary to cap the Fund’s Total Annual Fund Operating Expenses After Fee Waivers at the amounts shown. Brokerage commissions, stamp duty fees, interest, taxes, acquired money market fund fees and expenses (if any) from funds in which the underlying master portfolio invests, and extraordinary expenses are excluded from the expense cap. After this time, the cap may be increased or the commitment to maintain the cap may be terminated only with the approval of the Board of Trustees. Net expenses from the underlying affiliated master portfolio are included in the expense cap. Without this cap, the Fund’s returns would have been lower. The expense ratio paid by an investor is the net expense ratio (the total annual fund operating expenses after fee waivers) as stated in the prospectuses. |
| 4 | Historical performance shown for Class R6 shares prior to their inception reflects the performance of the Institutional Class shares adjusted to reflect the higher expenses applicable to Class R6 shares. If these expenses had been included, returns for Class R6 shares would be higher. |
| 5 | The Russell 1000® Value Index measures the performance of those Russell 1000 companies with lower price/book ratios and lower forecasted growth values. You cannot invest directly in an index. |
| 6 | The ten largest holdings, excluding cash, cash equivalents and any money market funds, are calculated based on the value of the securities of the affiliated master portfolio allocable to the Fund divided by the total net assets of the Fund. Holdings are subject to change and may have changed since the date specified. |
| 7 | Amounts represent the sector distribution of the affiliated master portfolio which are calculated based on the total long-term investments of the affiliated master portfolio. These amounts are subject to change and may have changed since the date specified. |
| | | | |
| 8 | | Wells Fargo C&B Large Cap Value Fund | | Fund expenses (unaudited) |
As a shareholder of the Fund, you incur two types of costs: (1) transaction costs, including sales charges (loads) on purchase payments and contingent deferred sales charges (if any) on redemptions and (2) ongoing costs, including management fees, distribution (12b-1) and/or shareholder servicing fees, and other Fund expenses. This example is intended to help you understand your ongoing costs (in dollars) of investing in the Fund and to compare these costs with the ongoing costs of investing in other mutual funds.
The example is based on an investment of $1,000 invested at the beginning of the six-month period and held for the entire period from June 1, 2018 to November 30, 2018.
Actual expenses
The “Actual” line of the table below provides information about actual account values and actual expenses. You may use the information in this line, together with the amount you invested, to estimate the expenses that you paid over the period. Simply divide your account value by $1,000 (for example, an $8,600 account value divided by $1,000 = 8.6), then multiply the result by the number in the “Actual” line under the heading entitled “Expenses paid during period” for your applicable class of shares to estimate the expenses you paid on your account during this period.
Hypothetical example for comparison purposes
The “Hypothetical” line of the table below provides information about hypothetical account values and hypothetical expenses based on the Fund’s actual expense ratio and an assumed rate of return of 5% per year before expenses, which is not the Fund’s actual return. The hypothetical account values and expenses may not be used to estimate the actual ending account balance or expenses you paid for the period. You may use this information to compare the ongoing costs of investing in the Fund and other funds. To do so, compare this 5% hypothetical example with the 5% hypothetical examples that appear in the shareholder reports of the other funds.
Please note that the expenses shown in the table are meant to highlight your ongoing costs only and do not reflect any transactional costs, such as sales charges (loads) and contingent deferred sales charges. Therefore, the “Hypothetical” line of the table is useful in comparing ongoing costs only and will not help you determine the relative total costs of owning different funds. In addition, if these transactional costs were included, your costs would have been higher.
| | | | | | | | | | | | | | | | |
| | | Beginning
account value
6-1-2018 | | | Ending
account value
11-30-2018 | | | Expenses
paid during
the period1,2 | | | Annualized net
expense ratio1 | |
Class A | | | | | | | | | | | | | | | | |
Actual | | $ | 1,000.00 | | | $ | 1,023.01 | | | $ | 5.48 | | | | 1.08 | % |
Hypothetical (5% return before expenses) | | $ | 1,000.00 | | | $ | 1,019.65 | | | $ | 5.47 | | | | 1.08 | % |
Class C | | | | | | | | | | | | | | | | |
Actual | | $ | 1,000.00 | | | $ | 1,019.64 | | | $ | 9.27 | | | | 1.83 | % |
Hypothetical (5% return before expenses) | | $ | 1,000.00 | | | $ | 1,015.89 | | | $ | 9.25 | | | | 1.83 | % |
Class R6 | | | | | | | | | | | | | | | | |
Actual | | $ | 1,000.00 | | | $ | 1,025.05 | | | $ | 3.30 | | | | 0.65 | % |
Hypothetical (5% return before expenses) | | $ | 1,000.00 | | | $ | 1,021.81 | | | $ | 3.29 | | | | 0.65 | % |
Administrator Class | | | | | | | | | | | | | | | | |
Actual | | $ | 1,000.00 | | | $ | 1,023.71 | | | $ | 5.07 | | | | 1.00 | % |
Hypothetical (5% return before expenses) | | $ | 1,000.00 | | | $ | 1,020.05 | | | $ | 5.06 | | | | 1.00 | % |
Institutional Class | | | | | | | | | | | | | | | | |
Actual | | $ | 1,000.00 | | | $ | 1,024.36 | | | $ | 3.81 | | | | 0.75 | % |
Hypothetical (5% return before expenses) | | $ | 1,000.00 | | | $ | 1,021.31 | | | $ | 3.80 | | | | 0.75 | % |
| 1 | Amounts reflect net expenses allocated from the affiliated Master Portfolio in which the Fund invests. |
| 2 | Expenses paid is equal to the annualized net expense ratio of each class multiplied by the average account value over the period, multiplied by the number of days in the most recent fiscal half-year divided by the number of days in the fiscal year (to reflect the one-half-year period). |
| | | | | | |
| Portfolio of investments—November 30, 2018 (unaudited) | | Wells Fargo C&B Large Cap Value Fund | | | 9 | |
| | | | | | | | | | | | | | | | |
| Security name | | | | | | | | | | | Value | |
| | | | |
Investment Companies: 100.01% | | | | | | | | | | | | | | | | |
| | | | |
| Affiliated Master Portfolio: 100.01% | | | | | | | | | | | | | | | | |
Wells Fargo C&B Large Cap Value Portfolio | | | | | | | | | | | | | | $ | 332,646,637 | |
| | | | | | | | | | | | | | | | |
| | | | |
Total Investment Companies (Cost $268,890,306) | | | | | | | | | | | | | | | 332,646,637 | |
| | | | | | | | | | | | | | | | |
| | | | | | | | |
| Total investments in securities (Cost $268,890,306) | | | 100.01 | % | | | 332,646,637 | |
Other assets and liabilities, net | | | (0.01 | ) | | | (43,227 | ) |
| | | | | | | | |
| Total net assets | | | 100.00 | % | | $ | 332,603,410 | |
| | | | | | | | |
Transactions with the affiliated Master Portfolio were as follows:
| | | | | | | | | | | | | | | | | | | | | | | | | | | | | | | | |
| | | % of
ownership, beginning of
period | | | % of
ownership, end of period | | | Net realized
gains (losses) on
securities
transactions
allocated from
affiliated
Master
Portfolio | | | Net change in
unrealized gains (losses) on
securities
transactions
allocated from
affiliated Master
Portfolio | | | Dividends
allocated from
affiliated
Master
Portfolio | | | Affiliated
income
allocated from
affiliated
Master
Portfolio | | | Value,
end of period | | | % of net
assets | |
Wells Fargo C&B Large Cap Value Portfolio | | | 93 | % | | | 78 | % | | $ | 10,026,125 | | | $ | (3,233,984 | ) | | $ | 3,345,618 | | | $ | 80,173 | | | $ | 332,646,637 | | | | 100.01 | % |
The accompanying notes are an integral part of these financial statements.
| | | | |
| 10 | | Wells Fargo C&B Large Cap Value Fund | | Statement of assets and liabilities—November 30, 2018 (unaudited) |
| | | | |
| | | | |
| |
Assets | | | | |
Investments in affiliated Master Portfolio, at value (cost $268,890,306) | | $ | 332,646,637 | |
Receivable for Fund shares sold | | | 328,669 | |
Receivable from manager | | | 23,019 | |
Prepaid expenses and other assets | | | 146,181 | |
| | | | |
Total assets | | | 333,144,506 | |
| | | | |
| |
Liabilities | | | | |
Payable for Fund shares redeemed | | | 492,275 | |
Administration fees payable | | | 34,326 | |
Distribution fee payable | | | 6,526 | |
Trustees’ fees and expenses payable | | | 2,684 | |
Accrued expenses and other liabilities | | | 5,285 | |
| | | | |
Total liabilities | | | 541,096 | |
| | | | |
Total net assets | | $ | 332,603,410 | |
| | | | |
| |
NET ASSETS CONSIST OF | | | | |
Paid-in capital | | $ | 246,014,826 | |
Total distributable earnings | | | 86,588,584 | |
| | | | |
Total net assets | | $ | 332,603,410 | |
| | | | |
| |
COMPUTATION OF NET ASSET VALUE AND OFFERING PRICE PER SHARE | | | | |
Net assets – Class A | | $ | 80,521,129 | |
Shares outstanding – Class A1 | | | 5,658,072 | |
Net asset value per share – Class A | | | $14.23 | |
Maximum offering price per share – Class A2 | | | $15.10 | |
Net assets – Class C | | $ | 10,151,507 | |
Shares outstanding – Class C1 | | | 724,185 | |
Net asset value per share – Class C | | | $14.02 | |
Net assets – Class R6 | | $ | 109,826,284 | |
Shares outstanding – Class R61 | | | 7,669,024 | |
Net asset value per share – Class R6 | | | $14.32 | |
Net assets – Administrator Class | | $ | 10,146,993 | |
Shares outstanding – Administrator Class1 | | | 712,183 | |
Net asset value per share – Administrator Class | | | $14.25 | |
Net assets – Institutional Class | | $ | 121,957,497 | |
Shares outstanding – Institutional Class1 | | | 8,526,553 | |
Net asset value per share – Institutional Class | | | $14.30 | |
| 1 | The Fund has an unlimited number of authorized shares. |
| 2 | Maximum offering price is computed as 100/94.25 of net asset value. On investments of $50,000 or more, the offering price is reduced. |
The accompanying notes are an integral part of these financial statements.
| | | | | | |
| Statement of operations—six months ended November 30, 2018 (unaudited) | | Wells Fargo C&B Large Cap Value Fund | | | 11 | |
| | | | |
| | | | |
| |
Investment income | | | | |
Dividends allocated from affiliated Master Portfolio (net of foreign withholding taxes of $24,938) | | $ | 3,345,618 | |
Affiliated income allocated from affiliated Master Portfolio | | | 80,173 | |
Expenses allocated from affiliated Master Portfolio | | | (1,196,633 | ) |
Waivers allocated from affiliated Master Portfolio | | | 37,850 | |
| | | | |
Total investment income | | | 2,267,008 | |
| | | | |
| |
Expenses | | | | |
Management fee | | | 89,180 | |
Administration fees | | | | |
Class A | | | 89,223 | |
Class C | | | 11,380 | |
Class R6 | | | 17,202 | |
Administrator Class | | | 7,809 | |
Institutional Class | | | 87,237 | |
Shareholder servicing fees | | | | |
Class A | | | 106,218 | |
Class C | | | 13,548 | |
Administrator Class | | | 15,017 | |
Distribution fee | | | | |
Class C | | | 40,643 | |
Custody and accounting fees | | | 6,925 | |
Professional fees | | | 11,642 | |
Registration fees | | | 33,461 | |
Shareholder report expenses | | | 13,790 | |
Trustees’ fees and expenses | | | 11,196 | |
Other fees and expenses | | | 6,283 | |
| | | | |
Total expenses | | | 560,754 | |
Less: Fee waivers and/or expense reimbursements | | | (225,540 | ) |
| | | | |
Net expenses | | | 335,214 | |
| | | | |
Net investment income | | | 1,931,794 | |
| | | | |
| |
REALIZED AND UNREALIZED GAINS (LOSSES) ON INVESTMENTS | | | | |
Net realized gains on securities transactions allocated from affiliated Master Portfolio | | | 10,026,125 | |
Net change in unrealized gains (losses) on securities transactions allocated from affiliated Master Portfolio | | | (3,233,984 | ) |
| | | | |
Net realized and unrealized gains (losses) on investments | | | 6,792,141 | |
| | | | |
Net increase in net assets resulting from operations | | $ | 8,723,935 | |
| | | | |
The accompanying notes are an integral part of these financial statements.
| | | | |
| 12 | | Wells Fargo C&B Large Cap Value Fund | | Statement of changes in net assets |
| | | | | | | | | | | | | | | | |
| | | Six months ended
November 30, 2018
(unaudited) | | | Year ended
May 31, 20181 | |
| | | |
Operations | | | | | | | | | | | | |
Net investment income | | | | | | $ | 1,931,794 | | | | | | | $ | 3,023,151 | |
Net realized gains on investments | | | | | | | 10,026,125 | | | | | | | | 30,034,249 | |
Net change in unrealized gains (losses) on investments | | | | | | | (3,233,984 | ) | | | | | | | (11,845,354 | ) |
| | | | |
Net increase in net assets resulting from operations | | | | | | | 8,723,935 | | | | | | | | 21,212,046 | |
| | | | |
| | | |
Distributions to shareholders from net investment income and net realized gains | | | | | | | | | | | | |
Class A | | | | | | | 0 | | | | | | | | (9,243,548 | ) |
Class C | | | | | | | 0 | | | | | | | | (1,063,860 | ) |
Class R6 | | | | | | | 0 | | | | | | | | (453,208 | ) |
Administrator Class | | | | | | | 0 | | | | | | | | (1,533,377 | ) |
Institutional Class | | | | | | | 0 | | | | | | | | (27,982,031 | ) |
| | | | |
Total distributions to shareholders | | | | | | | 0 | | | | | | | | (40,276,024 | ) |
| | | | |
| | | | |
Capital share transactions | | | Shares | | | | | | | | Shares | | | | | |
Proceeds from shares sold | | | | | | | | | | | | | | | | |
Class A | | | 151,159 | | | | 2,180,129 | | | | 919,384 | | | | 13,795,201 | |
Class C | | | 64,539 | | | | 908,136 | | | | 281,614 | | | | 4,187,818 | |
Class R6 | | | 421,840 | | | | 6,115,192 | | | | 7,863,006 | | | | 110,525,989 | |
Administrator Class | | | 45,861 | | | | 664,800 | | | | 297,700 | | | | 4,486,264 | |
Institutional Class | | | 919,138 | | | | 13,245,520 | | | | 6,201,334 | | | | 92,921,657 | |
| | | | |
| | | | | | | 23,113,777 | | | | | | | | 225,916,929 | |
| | | | |
Reinvestment of distributions | | | | | | | | | | | | | | | | |
Class A | | | 0 | | | | 0 | | | | 629,729 | | | | 9,080,968 | |
Class C | | | 0 | | | | 0 | | | | 73,825 | | | | 1,051,272 | |
Class R6 | | | 0 | | | | 0 | | | | 31,033 | | | | 449,875 | |
Administrator Class | | | 0 | | | | 0 | | | | 87,651 | | | | 1,265,630 | |
Institutional Class | | | 0 | | | | 0 | | | | 1,065,954 | | | | 15,442,909 | |
| | | | |
| | | | | | | 0 | | | | | | | | 27,290,654 | |
| | | | |
Payment for shares redeemed | | | | | | | | | | | | | | | | |
Class A | | | (655,183 | ) | | | (9,373,276 | ) | | | (1,094,969 | ) | | | (16,239,579 | ) |
Class C | | | (142,490 | ) | | | (2,039,097 | ) | | | (110,207 | ) | | | (1,620,229 | ) |
Class R6 | | | (676,849 | ) | | | (9,827,587 | ) | | | (212,138 | ) | | | (3,029,866 | ) |
Administrator Class | | | (249,141 | ) | | | (3,576,108 | ) | | | (257,513 | ) | | | (3,725,510 | ) |
Institutional Class | | | (2,071,822 | ) | | | (29,645,834 | ) | | | (12,692,000 | ) | | | (180,616,185 | ) |
| | | | |
| | | | | | | (54,461,902 | ) | | | | | | | (205,231,369 | ) |
| | | | |
Net increase (decrease) in net assets resulting from capital share transactions | | | | | | | (31,348,125 | ) | | | | | | | 47,976,214 | |
| | | | |
Total increase (decrease) in net assets | | | | | | | (22,624,190 | ) | | | | | | | 28,912,236 | |
| | | | |
| | | |
Net assets | | | | | | | | | | | | |
Beginning of period | | | | | | | 355,227,600 | | | | | | | | 326,315,364 | |
| | | | |
End of period | | | | | | $ | 332,603,410 | | | | | | | $ | 355,227,600 | |
| | | | |
| 1 | Effective for all filings after November 4, 2018, the SEC prospectively eliminated the requirement to parenthetically disclose undistributed net investment income at the end of the period and permitted the aggregation of distributions, with the exception of tax basis returns of capital. Undistributed net investment income at May 31, 2018 was $1,304,663. The disaggregated distributions information for the year ended May 31, 2018 is included in Note 7,Distributions to Shareholders, in the notes to the financial statements. |
The accompanying notes are an integral part of these financial statements.
| | | | | | |
| Financial highlights | | Wells Fargo C&B Large Cap Value Fund | | | 13 | |
(For a share outstanding throughout each period)
| | | | | | | | | | | | | | | | | | | | | | | | |
| | | Six months ended
November 30, 2018
(unaudited) | | | Year ended May 31 | |
| CLASS A | | 2018 | | | 2017 | | | 2016 | | | 2015 | | | 2014 | |
Net asset value, beginning of period | | | $13.91 | | | | $14.54 | | | | $12.55 | | | | $13.07 | | | | $11.99 | | | | $10.32 | |
Net investment income | | | 0.06 | | | | 0.09 | 1 | | | 0.08 | | | | 0.11 | 1 | | | 0.10 | | | | 0.09 | |
Net realized and unrealized gains (losses) on investments | | | 0.26 | | | | 0.87 | | | | 2.23 | | | | (0.14 | ) | | | 1.07 | | | | 1.68 | |
| | | | | | | | | | | | | | | | | | | | | | | | |
Total from investment operations | | | 0.32 | | | | 0.96 | | | | 2.31 | | | | 0.03 | | | | 1.17 | | | | 1.77 | |
Distributions to shareholders from | | | | | | | | | | | | | | | | | | | | | | | | |
Net investment income | | | 0.00 | | | | (0.06 | ) | | | (0.08 | ) | | | (0.10 | ) | | | (0.09 | ) | | | (0.10 | ) |
Net realized gains | | | 0.00 | | | | (1.53 | ) | | | (0.24 | ) | | | (0.39 | ) | | | 0.00 | | | | 0.00 | |
| | | | | | | | | | | | | | | | | | | | | | | | |
Total distributions to shareholders | | | 0.00 | | | | (1.59 | ) | | | (0.32 | ) | | | (0.49 | ) | | | (0.09 | ) | | | (0.10 | ) |
Net asset value, end of period | | | $14.23 | | | | $13.91 | | | | $14.54 | | | | $12.55 | | | | $13.07 | | | | $11.99 | |
Total return2 | | | 2.30 | % | | | 6.29 | % | | | 18.62 | % | | | (0.08 | )% | | | 9.78 | % | | | 17.25 | % |
Ratios to average net assets (annualized) | | | | | | | | | | | | | | | | | | | | | | | | |
Gross expenses3 | | | 1.21 | % | | | 1.21 | % | | | 1.24 | % | | | 1.25 | % | | | 1.29 | % | | | 1.31 | % |
Net expenses3 | | | 1.08 | % | | | 1.10 | % | | | 1.15 | % | | | 1.15 | % | | | 1.15 | % | | | 1.15 | % |
Net investment income3 | | | 0.84 | % | | | 0.58 | % | | | 0.62 | % | | | 0.89 | % | | | 0.73 | % | | | 0.86 | % |
Supplemental data | | | | | | | | | | | | | | | | | | | | | | | | |
Portfolio turnover rate4 | | | 23 | % | | | 42 | % | | | 89 | % | | | 29 | % | | | 35 | % | | | 22 | % |
Net assets, end of period (000s omitted) | | | $80,521 | | | | $85,707 | | | | $83,016 | | | | $88,387 | | | | $27,085 | | | | $29,537 | |
| 1 | Calculated based upon average shares outstanding |
| 2 | Total return calculations do not include any sales charges. Returns for periods of less than one year are not annualized. |
| 3 | Ratios include net expenses allocated from the affiliated Master Portfolio which were as follows: |
| | | | |
Six months ended November 30, 2018 (unaudited) | | | 0.65 | % |
Year ended May 31, 2018 | | | 0.66 | % |
Year ended May 31, 2017 | | | 0.68 | % |
Year ended May 31, 2016 | | | 0.68 | % |
Year ended May 31, 2015 | | | 0.68 | % |
Year ended May 31, 2014 | | | 0.68 | % |
| 4 | Portfolio turnover rate is calculated by multiplying the affiliated Master Portfolio’s percentage of the Fund’s total investments in securities at the end of the period by the affiliated Master Portfolio’s portfolio turnover rate. |
The accompanying notes are an integral part of these financial statements.
| | | | |
| 14 | | Wells Fargo C&B Large Cap Value Fund | | Financial highlights |
(For a share outstanding throughout each period)
| | | | | | | | | | | | | | | | | | | | | | | | |
| | | Six months ended
November 30, 2018 (unaudited) | | | Year ended May 31 | |
| CLASS C | | 2018 | | | 2017 | | | 2016 | | | 2015 | | | 2014 | |
Net asset value, beginning of period | | | $13.75 | | | | $14.44 | | | | $12.48 | | | | $13.01 | | | | $11.95 | | | | $10.29 | |
Net investment income (loss) | | | 0.00 | 1 | | | (0.02 | )2 | | | (0.02 | ) | | | 0.01 | | | | (0.00 | )3 | | | 0.01 | |
Net realized and unrealized gains (losses) on investments | | | 0.27 | | | | 0.86 | | | | 2.22 | | | | (0.14 | ) | | | 1.07 | | | | 1.67 | |
| | | | | | | | | | | | | | | | | | | | | | | | |
Total from investment operations | | | 0.27 | | | | 0.84 | | | | 2.20 | | | | (0.13 | ) | | | 1.07 | | | | 1.68 | |
Distributions to shareholders from | | | | | | | | | | | | | | | | | | | | | | | | |
Net investment income | | | 0.00 | | | | 0.00 | | | | 0.00 | | | | (0.01 | ) | | | (0.01 | ) | | | (0.02 | ) |
Net realized gains | | | 0.00 | | | | (1.53 | ) | | | (0.24 | ) | | | (0.39 | ) | | | 0.00 | | | | 0.00 | |
| | | | | | | | | | | | | | | | | | | | | | | | |
Total distributions to shareholders | | | 0.00 | | | | (1.53 | ) | | | (0.24 | ) | | | (0.40 | ) | | | (0.01 | ) | | | (0.02 | ) |
Net asset value, end of period | | | $14.02 | | | | $13.75 | | | | $14.44 | | | | $12.48 | | | | $13.01 | | | | $11.95 | |
Total return4 | | | 1.96 | % | | | 5.46 | % | | | 17.73 | % | | | (0.82 | )% | | | 8.93 | % | | | 16.39 | % |
Ratios to average net assets (annualized) | | | | | | | | | | | | | | | | | | | | | | | | |
Gross expenses5 | | | 1.96 | % | | | 1.96 | % | | | 1.99 | % | | | 2.00 | % | | | 2.04 | % | | | 2.06 | % |
Net expenses5 | | | 1.83 | % | | | 1.85 | % | | | 1.90 | % | | | 1.90 | % | | | 1.90 | % | | | 1.90 | % |
Net investment income (loss)5 | | | 0.09 | % | | | (0.16 | )% | | | (0.13 | )% | | | 0.11 | % | | | (0.02 | )% | | | 0.11 | % |
Supplemental data | | | | | | | | | | | | | | | | | | | | | | | | |
Portfolio turnover rate6 | | | 23 | % | | | 42 | % | | | 89 | % | | | 29 | % | | | 35 | % | | | 22 | % |
Net assets, end of period (000s omitted) | | | $10,152 | | | | $11,031 | | | | $8,043 | | | | $7,282 | | | | $7,654 | | | | $7,262 | |
| 1 | Amount is less than $0.005. |
| 2 | Calculated based upon average shares outstanding |
| 3 | Amount is more than $(0.005). |
| 4 | Total return calculations do not include any sales charges. Returns for periods of less than one year are not annualized. |
| 5 | Ratios include net expenses allocated from the affiliated Master Portfolio which were as follows: |
| | | | |
Six months ended November 30, 2018 (unaudited) | | | 0.65 | % |
Year ended May 31, 2018 | | | 0.66 | % |
Year ended May 31, 2017 | | | 0.68 | % |
Year ended May 31, 2016 | | | 0.68 | % |
Year ended May 31, 2015 | | | 0.68 | % |
Year ended May 31, 2014 | | | 0.68 | % |
| 6 | Portfolio turnover rate is calculated by multiplying the affiliated Master Portfolio’s percentage of the Fund’s total investments in securities at the end of the period by the affiliated Master Portfolio’s portfolio turnover rate. |
The accompanying notes are an integral part of these financial statements.
| | | | | | |
| Financial highlights | | Wells Fargo C&B Large Cap Value Fund | | | 15 | |
(For a share outstanding throughout each period)
| | | | | | | | | | | | |
| | | Six months ended
November 30, 2018 (unaudited) | | | Year ended May 31 | |
| CLASS R6 | | 2018 | | | 20171 | |
Net asset value, beginning of period | | | $13.97 | | | | $14.59 | | | | $12.73 | |
Net investment income | | | 0.10 | | | | 0.18 | 2 | | | 0.16 | |
Net realized and unrealized gains (losses) on investments | | | 0.25 | | | | 0.85 | | | | 2.06 | |
| | | | | | | | | | | | |
Total from investment operations | | | 0.35 | | | | 1.03 | | | | 2.22 | |
Distributions to shareholders from | | | | | | | | | | | | |
Net investment income | | | 0.00 | | | | (0.12 | ) | | | (0.12 | ) |
Net realized gains | | | 0.00 | | | | (1.53 | ) | | | (0.24 | ) |
| | | | | | | | | | | | |
Total distributions to shareholders | | | 0.00 | | | | (1.65 | ) | | | (0.36 | ) |
Net asset value, end of period | | | $14.32 | | | | $13.97 | | | | $14.59 | |
Total return3 | | | 2.51 | % | | | 6.76 | % | | | 17.65 | % |
Ratios to average net assets (annualized) | | | | | | | | | | | | |
Gross expenses4 | | | 0.78 | % | | | 0.77 | % | | | 0.81 | % |
Net expenses4 | | | 0.65 | % | | | 0.65 | % | | | 0.70 | % |
Net investment income4 | | | 1.27 | % | | | 1.28 | % | | | 1.04 | % |
Supplemental data | | | | | | | | | | | | |
Portfolio turnover rate5 | | | 23 | % | | | 42 | % | | | 89 | % |
Net assets, end of period (000s omitted) | | | $109,826 | | | | $110,665 | | | | $3,532 | |
| 1 | For the period from October 31, 2016 (commencement of class operations) to May 31, 2017 |
| 2 | Calculated based upon average shares outstanding |
| 3 | Returns for periods of less than one year are not annualized. |
| 4 | Ratios include net expenses allocated from the affiliated Master Portfolio which were as follows: |
| | | | |
Six months ended November 30, 2018 (unaudited) | | | 0.65 | % |
Year ended May 31, 2018 | | | 0.65 | % |
Year ended May 31, 20171 | | | 0.68 | % |
| 5 | Portfolio turnover rate is calculated by multiplying the affiliated Master Portfolio’s percentage of the Fund’s total investments in securities at the end of the period by the affiliated Master Portfolio’s portfolio turnover rate. |
The accompanying notes are an integral part of these financial statements.
| | | | |
| 16 | | Wells Fargo C&B Large Cap Value Fund | | Financial highlights |
(For a share outstanding throughout each period)
| | | | | | | | | | | | | | | | | | | | | | | | |
| | | Six months ended
November 30, 2018 (unaudited) | | | Year ended May 31 | |
| ADMINISTRATOR CLASS | | 2018 | | | 2017 | | | 2016 | | | 2015 | | | 2014 | |
Net asset value, beginning of period | | | $13.92 | | | | $14.56 | | | | $12.54 | | | | $13.07 | | | | $12.00 | | | | $10.32 | |
Net investment income | | | 0.07 | 1 | | | 0.10 | 1 | | | 0.10 | 1 | | | 0.13 | 1 | | | 0.13 | | | | 0.12 | 1 |
Net realized and unrealized gains (losses) on investments | | | 0.26 | | | | 0.87 | | | | 2.24 | | | | (0.15 | ) | | | 1.06 | | | | 1.68 | |
| | | | | | | | | | | | | | | | | | | | | | | | |
Total from investment operations | | | 0.33 | | | | 0.97 | | | | 2.34 | | | | (0.02 | ) | | | 1.19 | | | | 1.80 | |
Distributions to shareholders from | | | | | | | | | | | | | | | | | | | | | | | | |
Net investment income | | | 0.00 | | | | (0.08 | ) | | | (0.08 | ) | | | (0.12 | ) | | | (0.12 | ) | | | (0.12 | ) |
Net realized gains | | | 0.00 | | | | (1.53 | ) | | | (0.24 | ) | | | (0.39 | ) | | | 0.00 | | | | 0.00 | |
| | | | | | | | | | | | | | | | | | | | | | | | |
Total distributions to shareholders | | | 0.00 | | | | (1.61 | ) | | | (0.32 | ) | | | (0.51 | ) | | | (0.12 | ) | | | (0.12 | ) |
Net asset value, end of period | | | $14.25 | | | | $13.92 | | | | $14.56 | | | | $12.54 | | | | $13.07 | | | | $12.00 | |
Total return2 | | | 2.37 | % | | | 6.36 | % | | | 18.82 | % | | | 0.11 | % | | | 9.93 | % | | | 17.49 | % |
Ratios to average net assets (annualized) | | | | | | | | | | | | | | | | | | | | | | | | |
Gross expenses3 | | | 1.13 | % | | | 1.13 | % | | | 1.16 | % | | | 1.16 | % | | | 1.13 | % | | | 1.14 | % |
Net expenses3 | | | 1.00 | % | | | 1.00 | % | | | 1.00 | % | | | 0.98 | % | | | 0.95 | % | | | 0.95 | % |
Net investment income3 | | | 0.90 | % | | | 0.69 | % | | | 0.77 | % | | | 1.03 | % | | | 0.92 | % | | | 1.08 | % |
Supplemental data | | | | | | | | | | | | | | | | | | | | | | | | |
Portfolio turnover rate4 | | | 23 | % | | | 42 | % | | | 89 | % | | | 29 | % | | | 35 | % | | | 22 | % |
Net assets, end of period (000s omitted) | | | $10,147 | | | | $12,742 | | | | $11,467 | | | | $23,210 | | | | $55,705 | | | | $53,884 | |
| 1 | Calculated based upon average shares outstanding |
| 2 | Returns for periods of less than one year are not annualized. |
| 3 | Ratios include net expenses allocated from the affiliated Master Portfolio which were as follows: |
| | | | |
Six months ended November 30, 2018 (unaudited) | | | 0.65 | % |
Year ended May 31, 2018 | | | 0.66 | % |
Year ended May 31, 2017 | | | 0.68 | % |
Year ended May 31, 2016 | | | 0.68 | % |
Year ended May 31, 2015 | | | 0.68 | % |
Year ended May 31, 2014 | | | 0.68 | % |
| 4 | Portfolio turnover rate is calculated by multiplying the affiliated Master Portfolio’s percentage of the Fund’s total investments in securities at the end of the period by the affiliated Master Portfolio’s portfolio turnover rate. |
The accompanying notes are an integral part of these financial statements.
| | | | | | |
| Financial highlights | | Wells Fargo C&B Large Cap Value Fund | | | 17 | |
(For a share outstanding throughout each period)
| | | | | | | | | | | | | | | | | | | | | | | | |
| | | Six months ended
November 30, 2018 (unaudited) | | | Year ended May 31 | |
| INSTITUTIONAL CLASS | | 2018 | | | 2017 | | | 2016 | | | 2015 | | | 2014 | |
Net asset value, beginning of period | | | $13.96 | | | | $14.58 | | | | $12.58 | | | | $13.11 | | | | $12.03 | | | | $10.35 | |
Net investment income | | | 0.09 | | | | 0.13 | 1 | | | 0.14 | | | | 0.16 | | | | 0.15 | | | | 0.14 | |
Net realized and unrealized gains (losses) on investments | | | 0.25 | | | | 0.89 | | | | 2.22 | | | | (0.14 | ) | | | 1.08 | | | | 1.69 | |
| | | | | | | | | | | | | | | | | | | | | | | | |
Total from investment operations | | | 0.34 | | | | 1.02 | | | | 2.36 | | | | 0.02 | | | | 1.23 | | | | 1.83 | |
Distributions to shareholders from | | | | | | | | | | | | | | | | | | | | | | | | |
Net investment income | | | 0.00 | | | | (0.11 | ) | | | (0.12 | ) | | | (0.16 | ) | | | (0.15 | ) | | | (0.15 | ) |
Net realized gains | | | 0.00 | | | | (1.53 | ) | | | (0.24 | ) | | | (0.39 | ) | | | 0.00 | | | | 0.00 | |
| | | | | | | | | | | | | | | | | | | | | | | | |
Total distributions to shareholders | | | 0.00 | | | | (1.64 | ) | | | (0.36 | ) | | | (0.55 | ) | | | (0.15 | ) | | | (0.15 | ) |
Net asset value, end of period | | | $14.30 | | | | $13.96 | | | | $14.58 | | | | $12.58 | | | | $13.11 | | | | $12.03 | |
Total return2 | | | 2.44 | % | | | 6.68 | % | | | 19.05 | % | | | 0.33 | % | | | 10.15 | % | | | 17.86 | % |
Ratios to average net assets (annualized) | | | | | | | | | | | | | | | | | | | | | | | | |
Gross expenses3 | | | 0.88 | % | | | 0.88 | % | | | 0.91 | % | | | 0.92 | % | | | 0.86 | % | | | 0.88 | % |
Net expenses3 | | | 0.75 | % | | | 0.77 | % | | | 0.80 | % | | | 0.77 | % | | | 0.70 | % | | | 0.70 | % |
Net investment income3 | | | 1.17 | % | | | 0.87 | % | | | 0.96 | % | | | 1.25 | % | | | 1.18 | % | | | 1.34 | % |
Supplemental data | | | | | | | | | | | | | | | | | | | | | | | | |
Portfolio turnover rate4 | | | 23 | % | | | 42 | % | | | 89 | % | | | 29 | % | | | 35 | % | | | 22 | % |
Net assets, end of period (000s omitted) | | | $121,957 | | | | $135,082 | | | | $220,257 | | | | $133,632 | | | | $132,768 | | | | $104,758 | |
| 1 | Calculated based upon average shares outstanding |
| 2 | Returns for periods of less than one year are not annualized. |
| 3 | Ratios include net expenses allocated from the affiliated Master Portfolio which were as follows: |
| | | | |
Six months ended November 30, 2018 (unaudited) | | | 0.65 | % |
Year ended May 31, 2018 | | | 0.66 | % |
Year ended May 31, 2017 | | | 0.68 | % |
Year ended May 31, 2016 | | | 0.68 | % |
Year ended May 31, 2015 | | | 0.68 | % |
Year ended May 31, 2014 | | | 0.68 | % |
| 4 | Portfolio turnover rate is calculated by multiplying the affiliated Master Portfolio’s percentage of the Fund’s total investments in securities at the end of the period by the affiliated Master Portfolio’s portfolio turnover rate. |
The accompanying notes are an integral part of these financial statements.
| | | | |
| 18 | | Wells Fargo C&B Large Cap Value Fund | | Notes to financial statements (unaudited) |
1. ORGANIZATION
Wells Fargo Funds Trust (the “Trust”), a Delaware statutory trust organized on March 10, 1999, is an open-end management investment company registered under the Investment Company Act of 1940, as amended (the “1940 Act”). As an investment company, the Trust follows the accounting and reporting guidance in Financial Accounting Standards Board (“FASB”) Accounting Standards Codification Topic 946, Financial Services – Investment Companies. These financial statements report on the Wells Fargo C&B Large Cap Value Fund (the “Fund”) which is a diversified series of the Trust.
The Fund is a feeder fund in a master-feeder structure that invests substantially all of its assets in a single master portfolio with a substantially identical investment objective and substantially similar investment strategies. The Fund seeks to achieve its investment objective by investing all investable assets in a separate diversified portfolio (the “affiliated Master Portfolio”) of Wells Fargo Master Trust, a registered open-end management investment company. The affiliated Master Portfolio directly acquires portfolio securities and the Fund acquires an indirect interest in those securities. The Fund accounts for its investment in the affiliated Master Portfolio as a partnership investment and records on a daily basis its share of the affiliated Master Portfolio’s income, expense and realized and unrealized gains and losses. The financial statements of the affiliated Master Portfolio for the six months ended November 30, 2018 are included in this report and should be read in conjunction with the Fund’s financial statements. As of November 30, 2018, the Fund owned 78% of Wells Fargo C&B Large Cap Value Portfolio.
2. SIGNIFICANT ACCOUNTING POLICIES
The following significant accounting policies, which are consistently followed in the preparation of the financial statements of the Fund, are in conformity with U.S. generally accepted accounting principles which require management to make estimates and assumptions that affect the reported amounts of assets and liabilities, disclosure of contingent assets and liabilities at the date of the financial statements, and the reported amounts of revenues and expenses during the reporting period. Actual results could differ from those estimates.
Securities valuation
All investments are valued each business day as of the close of regular trading on the New York Stock Exchange (generally 4 p.m. Eastern Time), although the Fund may deviate from this calculation time under unusual or unexpected circumstances.
Investments in the affiliated Master Portfolio are valued daily based on the Fund’s proportionate share of the affiliated Master Portfolio’s net assets, which are also valued daily. Securities held in the affiliated Master Portfolio are valued as discussed in the Notes to Financial Statements of the affiliated Master Portfolio, which are included elsewhere in this report.
Investment transactions, income and expenses
Investments in the affiliated Master Portfolio are recorded on a trade basis.
The Fund records daily its proportionate share of the affiliated Master Portfolio’s interest and dividend income, expenses and realized and unrealized gains or losses. The Fund also accrues its own expenses.
Distributions to shareholders
Distributions to shareholders from net investment income and any net realized gains are recorded on the ex-dividend date and paid at least annually. Such distributions are determined in accordance with income tax regulations and may differ from U.S. generally accepted accounting principles. Dividend sources are estimated at the time of declaration. The tax character of distributions is determined as of the Fund’s fiscal year end. Therefore, a portion of the Fund’s distributions made prior to the Fund’s fiscal year end may be categorized as a tax return of capital at year end.
Federal and other taxes
The Fund intends to continue to qualify as a regulated investment company by distributing substantially all of its investment company taxable income and any net realized capital gains (after reduction for capital loss carryforwards) sufficient to relieve it from all, or substantially all, federal income taxes. Accordingly, no provision for federal income taxes was required.
The Fund’s income and federal excise tax returns and all financial records supporting those returns for the prior three fiscal years are subject to examination by the federal and Delaware revenue authorities. Management has analyzed the Fund’s tax positions taken on federal, state, and foreign tax returns for all open tax years and does not believe that there are any uncertain tax positions that require recognition of a tax liability.
| | | | | | |
| Notes to financial statements (unaudited) | | Wells Fargo C&B Large Cap Value Fund | | | 19 | |
As of November 30, 2018, the aggregate cost of all investments for federal income tax purposes was $271,105,087 and the unrealized gains (losses) consisted of:
| | | | |
Gross unrealized gains | | $ | 61,541,550 | |
Gross unrealized losses | | | 0 | |
Net unrealized gains | | $ | 61,541,550 | |
Class allocations
The separate classes of shares offered by the Fund differ principally in applicable sales charges, distribution, shareholder servicing, and administration fees. Class specific expenses are charged directly to that share class. Investment income, common expenses, and realized and unrealized gains (losses) on investments are allocated daily to each class of shares based on the relative proportion of net assets of each class.
3. FAIR VALUATION MEASUREMENTS
At November 30, 2018, the affiliated Master Portfolio was measured at fair value using the net asset value per share (or its equivalent) as a practical expedient. The investment objective and the value of the affiliate Master Portfolio was as follows:
| | | | | | |
| Affiliated Master Portfolio | | Investment objective | | Value of
affiliated Master
Portfolio | |
Wells Fargo C&B Large Cap Value Portfolio | | Seeks maximum long-term total return (current income and capital appreciation), consistent with minimizing risk to principal | | | $332,646,637 | |
The affiliated Master Portfolio does not have a redemption period notice, can be redeemed daily and does not have any unfunded commitments.
4. TRANSACTIONS WITH AFFILIATES
Management fee
Wells Fargo Funds Management, LLC (“Funds Management”), an indirect wholly owned subsidiary of Wells Fargo & Company (“Wells Fargo”), is the manager of the Fund and provides advisory and fund-level administrative services under an investment management agreement. Under the investment management agreement, Funds Management is responsible for, among other services, implementing the investment objectives and strategies of the Fund, supervising the subadviser and providing fund-level administrative services in connection with the Fund’s operations. As long as the Fund continues to invest substantially all of its assets in a single affiliated Master Portfolio, the Fund pays Funds Management an investment management fee only for fund-level administrative services at an annual rate starting at 0.05% and declining to 0.03% as the average daily net assets of the Fund increase. For the six months ended November 30, 2018, the management fee was equivalent to an annual rate of 0.05% of the Fund’s average daily net assets.
Funds Management also serves as the adviser to the affiliated Master Portfolio and is entitled to receive a fee from the affiliated Master Portfolio for those services.
Administration fees
Under a class-level administration agreement, Funds Management provides class-level administrative services to the Fund, which includes paying fees and expenses for services provided by the transfer agent, sub-transfer agents, omnibus account servicers and record-keepers. As compensation for its services under the class-level administration agreement, Funds Management receives an annual fee which is calculated based on the average daily net assets of each class as follows:
| | | | |
| | | Class-level
administration fee | |
Class A, Class C | | | 0.21 | % |
Class R6 | | | 0.03 | |
Administrator Class, Institutional Class | | | 0.13 | |
| | | | |
| 20 | | Wells Fargo C&B Large Cap Value Fund | | Notes to financial statements (unaudited) |
Funds Management has contractually waived and/or reimbursed management and administration fees to the extent necessary to maintain certain net operating expense ratios for the Fund. When each class of the Fund has exceeded its expense cap, Funds Management has waived fees and/or reimbursed expenses from fund level expenses on a proportionate basis and then from class specific expenses; otherwise, waivers and/or reimbursements are applied against class specific expenses before fund level expenses. Net expenses from the affiliated Master Portfolio are included in the expense cap. Funds Management has committed through September 30, 2019 to waive fees and/or reimburse expenses to the extent necessary to cap each Fund’s expenses at 1.08% for Class A shares, 1.83% for Class C shares, 0.65% for Class R6 shares, 1.00% for Class Administrator Class shares and 0.75% for Institutional Class shares. After this time, the cap may be increased or the commitment to maintain the cap may be terminated only with the approval of the Board of Trustees.
Distribution fee
The Trust has adopted a distribution plan for Class C shares of the Fund pursuant to Rule 12b-1 under the 1940 Act. A distribution fee is charged to Class C shares and paid to Wells Fargo Funds Distributor, LLC (“Funds Distributor”), the principal underwriter, at an annual rate of 0.75% of the average daily net assets of Class C shares.
In addition, Funds Distributor is entitled to receive the front-end sales charge from the purchase of Class A shares and a contingent deferred sales charge on the redemption of certain Class A shares. Funds Distributor is also entitled to receive the contingent deferred sales charges from redemptions of Class C shares. For the six months ended November 30, 2018, Funds Distributor received $854 from the sale of Class A shares and $29 in contingent deferred sales charges from redemptions of Class C shares. No contingent deferred sales charges were incurred by Class A shares for the six months ended November 30, 2018.
Shareholder servicing fees
The Trust has entered into contracts with one or more shareholder servicing agents, whereby Class A, Class C, and Administrator Class of the Fund are charged a fee at an annual rate of 0.25% of the average daily net assets of each respective class.
A portion of these total shareholder servicing fees were paid to affiliates of Wells Fargo.
5. INVESTMENT PORTFOLIO TRANSACTIONS
The Fund seeks to achieve its investment objective by investing substantially all of its investable assets in a single affiliated Master Portfolio. Purchases and sales have been calculated by multiplying the Fund’s ownership percentage of the affiliated Master Portfolio by the affiliated Master Portfolio’s purchases and sales. Purchases and sales of investments, excluding U.S. government obligations (if any) and short-term securities, for the six months ended November 30, 2018 were $103,695,875 and $75,798,561, respectively.
6. BANK BORROWINGS
The Trust (excluding the money market funds), Wells Fargo Master Trust and Wells Fargo Variable Trust are parties to a $280,000,000 revolving credit agreement whereby the Fund is permitted to use bank borrowings for temporary or emergency purposes, such as to fund shareholder redemption requests. Interest under the credit agreement is charged to the Fund based on a borrowing rate equal to the higher of the Federal Funds rate in effect on that day plus 1.25% or the overnight LIBOR rate in effect on that day plus 1.25%. In addition, an annual commitment fee equal to 0.25% of the unused balance is allocated to each participating fund.
For the six months ended November 30, 2018, there were no borrowings by the Fund under the agreement.
7. DISTRIBUTIONS TO SHAREHOLDERS
Effective for all filings after November 4, 2018, the Securities and Exchange Commission eliminated the requirement to separately state the components of distributions to shareholders. The amounts of distributions to shareholders for the year ended May 31, 2018 were as follows:
| | | | | | | | |
| | | Net investment income | | | Net realized
gains | |
Class A | | $ | 403,349 | | | $ | 8,840,199 | |
Class C | | | 0 | | | | 1,063,860 | |
Class R6 | | | 36,739 | | | | 416,469 | |
Administrator Class | | | 86,666 | | | | 1,446,711 | |
Institutional Class | | | 2,028,817 | | | | 25,953,214 | |
| | | | | | |
| Notes to financial statements (unaudited) | | Wells Fargo C&B Large Cap Value Fund | | | 21 | |
8. CONCENTRATION RISK
Concentration risk result from exposure to a limited number of sectors. Through its investment in the affiliated Master Portfolio which may invest a substantial portion of its assets in any sector, the Fund may in turn be more affected by changes in that sector than a fund whose investments are not heavily weighted in any sector.
9. INDEMNIFICATION
Under the Trust’s organizational documents, the officers and Trustees have been granted certain indemnification rights against certain liabilities that may arise out of performance of their duties to the Trust. Additionally, in the normal course of business, the Trust may enter into contracts with service providers that contain a variety of indemnification clauses. The Trust’s maximum exposure under these arrangements is dependent on future claims that may be made against the Fund and, therefore, cannot be estimated.
10. NEW ACCOUNTING PRONOUNCEMENT
In August 2018, FASB issued Accounting Standards Update (“ASU”) No. 2018-13, Fair Value Measurement (Topic 820) Disclosure Framework—Changes to the Disclosure Requirements for Fair Value Measurement. ASU 2018-13 updates the disclosure requirements for fair value measurements by modifying or removing certain disclosures and adding certain new disclosures. The amendments are effective for fiscal years, and interim periods within those fiscal years, beginning after December 15, 2019. Early adoption is permitted. Management has adopted the removal and modification of disclosures early, as permitted, and will adopt the additional new disclosures at the effective date.
11. SUBSEQUENT DISTRIBUTIONS
On December 12, 2018, the Fund declared distributions from short-term capital gains and long-term capital gains to shareholders of record on December 11, 2018. The per share amounts payable on December 13, 2018, were as follows:
| | | | | | | | |
| | | Short-term
capital gains | | | Long-term
capital gains | |
Class A | | | $0.20176 | | | | $0.71046 | |
Class C | | | 0.20176 | | | | 0.71046 | |
Class R6 | | | 0.20176 | | | | 0.71046 | |
Administrator Class | | | 0.20176 | | | | 0.71046 | |
Institutional Class | | | 0.20176 | | | | 0.71046 | |
On December 18, 2018, the Fund declared distributions from net investment income to shareholders of record on December 17, 2018. The per share amounts payable on December 19, 2018 were as follows:
| | | | |
| | | Net investment
income | |
Class A | | $ | 0.11518 | |
Class C | | | 0.00789 | |
Class R6 | | | 0.17502 | |
Administrator Class | | | 0.11958 | |
Institutional Class | | | 0.16218 | |
These distributions are not reflected in the accompanying financial statements.
| | | | |
| 22 | | Wells Fargo C&B Large Cap Value Portfolio | | Portfolio of investments—November 30, 2018 (unaudited) |
| | | | | | | | | | | | | | | | |
| Security name | | | | | | | | Shares | | | Value | |
| | | | |
Common Stocks: 97.50% | | | | | | | | | | | | | | | | |
| | | | |
Communication Services: 5.15% | | | | | | | | | | | | | | | | |
| | | | |
| Diversified Telecommunication Services: 2.47% | | | | | | | | | | | | | | | | |
Verizon Communications Incorporated | | | | | | | | | | | 174,500 | | | $ | 10,522,350 | |
| | | | | | | | | | | | | | | | |
| | | | |
| Media: 2.68% | | | | | | | | | | | | | | | | |
Omnicom Group Incorporated | | | | | | | | | | | 148,600 | | | | 11,437,742 | |
| | | | | | | | | | | | | | | | |
| | | | |
Consumer Discretionary: 8.60% | | | | | | | | | | | | | | | | |
| | | | |
| Hotels, Restaurants & Leisure: 2.11% | | | | | | | | | | | | | | | | |
Carnival Corporation | | | | | | | | | | | 149,500 | | | | 9,013,355 | |
| | | | | | | | | | | | | | | | |
| | | | |
| Household Durables: 1.80% | | | | | | | | | | | | | | | | |
Whirlpool Corporation | | | | | | | | | | | 60,900 | | | | 7,681,317 | |
| | | | | | | | | | | | | | | | |
| | | | |
| Textiles, Apparel & Luxury Goods: 4.69% | | | | | | | | | | | | | | | | |
Gildan Activewear Incorporated | | | | | | | | | | | 387,904 | | | | 12,738,767 | |
HanesBrands Incorporated | | | | | | | | | | | 455,400 | | | | 7,245,414 | |
| |
| | | | 19,984,181 | |
| | | | | | | | | | | | | | | | |
| | | | |
Consumer Staples: 3.20% | | | | | | | | | | | | | | | | |
| | | | |
| Beverages: 1.16% | | | | | | | | | | | | | | | | |
Diageo plc ADR | | | | | | | | | | | 34,200 | | | | 4,936,770 | |
| | | | | | | | | | | | | | | | |
| | | | |
| Tobacco: 2.04% | | | | | | | | | | | | | | | | |
Philip Morris International Incorporated | | | | | | | | | | | 100,600 | | | | 8,704,918 | |
| | | | | | | | | | | | | | | | |
| | | | |
Energy: 5.21% | | | | | | | | | | | | | | | | |
| | | | |
| Energy Equipment & Services: 1.61% | | | | | | | | | | | | | | | | |
Schlumberger Limited | | | | | | | | | | | 153,000 | | | | 6,900,300 | |
| | | | | | | | | | | | | | | | |
| | | | |
| Oil, Gas & Consumable Fuels: 3.60% | | | | | | | | | | | | | | | | |
Exxon Mobil Corporation | | | | | | | | | | | 125,500 | | | | 9,977,250 | |
World Fuel Services Corporation | | | | | | | | | | | 208,300 | | | | 5,372,057 | |
| |
| | | | 15,349,307 | |
| | | | | | | | | | | | | | | | |
| | | | |
Financials: 27.79% | | | | | | | | | | | | | | | | |
| | | | |
| Banks: 5.40% | | | | | | | | | | | | | | | | |
JPMorgan Chase & Company | | | | | | | | | | | 106,200 | | | | 11,808,378 | |
PNC Financial Services Group Incorporated | | | | | | | | | | | 82,750 | | | | 11,235,795 | |
| |
| | | | 23,044,173 | |
| | | | | | | | | | | | | | | | |
| | | | |
| Capital Markets: 8.53% | | | | | | | | | | | | | | | | |
Brookfield Asset Management Incorporated Class A | | | | | | | | | | | 251,500 | | | | 11,035,820 | |
Intercontinental Exchange Incorporated | | | | | | | | | | | 143,700 | | | | 11,743,164 | |
State Street Corporation | | | | | | | | | | | 186,700 | | | | 13,632,834 | |
| |
| | | | 36,411,818 | |
| | | | | | | | | | | | | | | | |
The accompanying notes are an integral part of these financial statements.
| | | | | | |
| Portfolio of investments—November 30, 2018 (unaudited) | | Wells Fargo C&B Large Cap Value Portfolio | | | 23 | |
| | | | | | | | | | | | | | | | |
| Security name | | | | | | | | Shares | | | Value | |
| | | | |
| Consumer Finance: 2.09% | | | | | | | | | | | | | | | | |
Synchrony Financial | | | | | | | | | | | 344,000 | | | $ | 8,937,120 | |
| | | | | | | | | | | | | | | | |
| | | | |
| Diversified Financial Services: 1.54% | | | | | | | | | | | | | | | | |
Berkshire Hathaway Incorporated Class B † | | | | | | | | | | | 30,100 | | | | 6,569,024 | |
| | | | | | | | | | | | | | | | |
| | | | |
| Insurance: 10.23% | | | | | | | | | | | | | | | | |
Arch Capital Group Limited † | | | | | | | | | | | 302,644 | | | | 8,661,671 | |
Chubb Limited | | | | | | | | | | | 88,500 | | | | 11,835,990 | |
Fidelity National Financial Incorporated | | | | | | | | | | | 329,300 | | | | 11,064,480 | |
RenaissanceRe Holdings Limited | | | | | | | | | | | 54,000 | | | | 7,160,940 | |
The Progressive Corporation | | | | | | | | | | | 74,000 | | | | 4,905,460 | |
| |
| | | | 43,628,541 | |
| | | | | | | | | | | | | | | | |
| | | | |
Health Care: 11.58% | | | | | | | | | | | | | | | | |
| | | | |
| Health Care Equipment & Supplies: 2.78% | | | | | | | | | | | | | | | | |
Abbott Laboratories | | | | | | | | | | | 59,600 | | | | 4,413,380 | |
Becton Dickinson & Company | | | | | | | | | | | 29,400 | | | | 7,430,850 | |
| |
| | | | 11,844,230 | |
| | | | | | | | | | | | | | | | |
| | | | |
| Health Care Providers & Services: 3.92% | | | | | | | | | | | | | | | | |
Cardinal Health Incorporated | | | | | | | | | | | 104,900 | | | | 5,751,667 | |
Laboratory Corporation of America Holdings † | | | | | | | | | | | 39,700 | | | | 5,781,908 | |
UnitedHealth Group Incorporated | | | | | | | | | | | 18,400 | | | | 5,177,024 | |
| |
| | | | 16,710,599 | |
| | | | | | | | | | | | | | | | |
| | | | |
| Pharmaceuticals: 4.88% | | | | | | | | | | | | | | | | |
Allergan plc | | | | | | | | | | | 59,900 | | | | 9,380,340 | |
Johnson & Johnson | | | | | | | | | | | 78,000 | | | | 11,458,200 | |
| |
| | | | 20,838,540 | |
| | | | | | | | | | | | | | | | |
| | | | |
Industrials: 16.26% | | | | | | | | | | | | | | | | |
| | | | |
| Air Freight & Logistics: 2.45% | | | | | | | | | | | | | | | | |
United Parcel Service Incorporated Class B | | | | | | | | | | | 90,800 | | | | 10,468,332 | |
| | | | | | | | | | | | | | | | |
| | | | |
| Building Products: 2.39% | | | | | | | | | | | | | | | | |
Johnson Controls International plc | | | | | | | | | | | 292,600 | | | | 10,176,628 | |
| | | | | | | | | | | | | | | | |
| | | | |
| Electrical Equipment: 3.73% | | | | | | | | | | | | | | | | |
AMETEK Incorporated | | | | | | | | | | | 77,500 | | | | 5,690,825 | |
Eaton Corporation plc | | | | | | | | | | | 132,900 | | | | 10,225,326 | |
| |
| | | | 15,916,151 | |
| | | | | | | | | | | | | | | | |
| | | | |
| Machinery: 4.71% | | | | | | | | | | | | | | | | |
Colfax Corporation † | | | | | | | | | | | 377,200 | | | | 9,407,368 | |
Snap-on Incorporated | | | | | | | | | | | 64,300 | | | | 10,689,232 | |
| |
| | | | 20,096,600 | |
| | | | | | | | | | | | | | | | |
| | | | |
| Trading Companies & Distributors: 2.98% | | | | | | | | | | | | | | | | |
AerCap Holdings NV † | | | | | | | | | | | 240,700 | | | | 12,725,809 | |
| | | | | | | | | | | | | | | | |
The accompanying notes are an integral part of these financial statements.
| | | | |
| 24 | | Wells Fargo C&B Large Cap Value Portfolio | | Portfolio of investments—November 30, 2018 (unaudited) |
| | | | | | | | | | | | | | | | |
| Security name | | | | | | | | Shares | | | Value | |
| | | | |
Information Technology: 11.90% | | | | | | | | | | | | | | | | |
| | | | |
| Electronic Equipment, Instruments & Components: 4.82% | | | | | | | | | | | | | | | | |
Arrow Electronics Incorporated † | | | | | | | | | | | 177,300 | | | $ | 13,646,781 | |
TE Connectivity Limited | | | | | | | | | | | 90,100 | | | | 6,931,393 | |
| |
| | | | 20,578,174 | |
| | | | | | | | | | | | | | | | |
| | | | |
| IT Services: 3.70% | | | | | | | | | | | | | | | | |
Alliance Data Systems Corporation | | | | | | | | | | | 30,500 | | | | 6,110,980 | |
Amdocs Limited | | | | | | | | | | | 148,800 | | | | 9,658,608 | |
| | | | |
| | | | | | | | | | | | | | | 15,769,588 | |
| | | | | | | | | | | | | | | | |
| | | | |
| Semiconductors & Semiconductor Equipment: 3.38% | | | | | | | | | | | | | | | | |
Analog Devices Incorporated | | | | | | | | | | | 47,301 | | | | 4,347,908 | |
Applied Materials Incorporated | | | | | | | | | | | 269,800 | | | | 10,058,144 | |
| | | | |
| | | | | | | | | | | | | | | 14,406,052 | |
| | | | | | | | | | | | | | | | |
| | | | |
Materials: 6.31% | | | | | | | | | | | | | | | | |
| | | | |
| Chemicals: 1.73% | | | | | | | | | | | | | | | | |
Axalta Coating Systems Limited † | | | | | | | | | | | 295,700 | | | | 7,401,371 | |
| | | | | | | | | | | | | | | | |
| | | | |
| Containers & Packaging: 3.57% | | | | | | | | | | | | | | | | |
Ball Corporation | | | | | | | | | | | 87,400 | | | | 4,292,214 | |
Crown Holdings Incorporated † | | | | | | | | | | | 213,600 | | | | 10,953,408 | |
| | | | |
| | | | | | | | | | | | | | | 15,245,622 | |
| | | | | | | | | | | | | | | | |
| | | | |
| Metals & Mining: 1.01% | | | | | | | | | | | | | | | | |
Reliance Steel & Aluminum Company | | | | | | | | | | | 53,300 | | | | 4,287,985 | |
| | | | | | | | | | | | | | | | |
| | | | |
Real Estate: 1.50% | | | | | | | | | | | | | | | | |
| | | | |
| Real Estate Management & Development: 1.50% | | | | | | | | | | | | | | | | |
CBRE Group Incorporated Class A † | | | | | | | | | | | 146,700 | | | | 6,407,856 | |
| | | | | | | | | | | | | | | | |
| | | | |
Total Common Stocks (Cost $342,985,403) | | | | | | | | | | | | | | | 415,994,453 | |
| | | | | | | | | | | | | | | | |
| | | | |
| | | Yield | | | | | | | | | | |
| Short-Term Investments: 1.94% | | | | | | | | | | | | | | | | |
| | | | |
| Investment Companies: 1.94% | | | | | | | | | | | | | | | | |
Wells Fargo Government Money Market Fund Select Class (l)(u) | | | 2.13 | % | | | | | | | 8,272,722 | | | | 8,272,722 | |
| | | | | | | | | | | | | | | | |
| | | | |
Total Short-Term Investments (Cost $8,272,722) | | | | | | | | | | | | | | | 8,272,722 | |
| | | | | | | | | | | | | | | | |
| | | | | | | | |
| Total investments in securities (Cost $351,258,125) | | | 99.44 | % | | | 424,267,175 | |
Other assets and liabilities, net | | | 0.56 | | | | 2,397,128 | |
| | | | | | | | |
| Total net assets | | | 100.00 | % | | $ | 426,664,303 | |
| | | | | | | | |
| † | Non-income-earning security |
| (l) | The issuer of the security is an affiliated person of the Portfolio as defined in the Investment Company Act of 1940. |
| (u) | The rate represents the 7-day annualized yield at period end. |
Abbreviations:
| ADR | American depositary receipt |
The accompanying notes are an integral part of these financial statements.
| | | | | | |
| Portfolio of investments—November 30, 2018 (unaudited) | | Wells Fargo C&B Large Cap Value Portfolio | | | 25 | |
Investments in Affiliates
An affiliated investment is an investment in which the Portfolio owns at least 5% of the outstanding voting shares of the issuer or as a result of other relationships, such as the Portfolio and the issuer having the same adviser or investment manager. Transactions with issuers that were either affiliated persons of the Portfolio at the beginning of the period or the end of the period were as follows:
| | | | | | | | | | | | | | | | | | | | | | | | | | | | | | | | | | | | |
| | | Shares,
beginning of
period | | | Shares
purchased | | | Shares
sold | | | Shares,
end of
period | | | Net
realized gains
(losses) | | | Net
change in
unrealized gains
(losses) | | | Income
from
affiliated
securities | | | Value,
end
of period | | | % of
net
assets | |
Short-Term Investments | | | | | | | | | | | | | | | | | | | | | | | | | | | | | | | | | | | | |
Investment Companies | | | | | | | | | | | | | | | | | | | | | | | | | | | | | | | | | | | | |
Securities Lending Cash Investments LLC* | | | 10,765,440 | | | | 41,129,061 | | | | 51,894,501 | | | | 0 | | | $ | 2,788 | | | $ | (49 | ) | | $ | 9,452 | | | $ | 0 | | | | | |
Wells Fargo Government Money Market Fund Select Class | | | 11,494,258 | | | | 70,046,036 | | | | 73,267,572 | | | | 8,272,722 | | | | 0 | | | | 0 | | | | 89,422 | | | | 8,272,722 | | | | | |
| | | | | | | | | | | | | | | | | | | | | | | | | | | | | | | | | | | | |
| | | | | | | | | | | | | | | | | | $ | 2,788 | | | $ | (49 | ) | | $ | 98,874 | | | $ | 8,272,722 | | | | 1.94 | % |
| | | | | | | | | | | | | | | | | | | | | | | | | | | | | | | | | | | | |
| | * | No longer held at the end of the period. |
The accompanying notes are an integral part of these financial statements.
| | | | |
| 26 | | Wells Fargo C&B Large Cap Value Portfolio | | Statement of assets and liabilities—November 30, 2018 (unaudited) |
| | | | |
| | | | |
| |
Assets | | | | |
Investments in unaffiliated securities, at value (cost $342,985,403) | | $ | 415,994,453 | |
Investments in affiliated securities, at value (cost $8,272,722) | | | 8,272,722 | |
Receivable for investments sold | | | 1,425,998 | |
Receivable for dividends | | | 1,219,591 | |
Receivable for securities lending income | | | 2,954 | |
Prepaid expenses and other assets | | | 20,755 | |
| | | | |
Total assets | | | 426,936,473 | |
| | | | |
| |
Liabilities | | | | |
Advisory fee payable | | | 233,233 | |
Custodian and accounting fees payable | | | 25,368 | |
Professional fees payable | | | 13,569 | |
| | | | |
Total liabilities | | | 272,170 | |
| | | | |
Total net assets | | $ | 426,664,303 | |
| | | | |
The accompanying notes are an integral part of these financial statements.
| | | | | | |
| Statement of operations—six months ended November 30, 2018 (unaudited) | | Wells Fargo C&B Large Cap Value Portfolio | | | 27 | |
| | | | |
| | | | |
| |
Investment income | | | | |
Dividends (net of foreign withholding taxes of $31,807) | | $ | 4,150,571 | |
Income from affiliated securities | | | 98,874 | |
| | | | |
Total investment income | | | 4,249,445 | |
| | | | |
| |
Expenses | | | | |
Advisory fee | | | 1,438,482 | |
Custody and accounting fees | | | 10,981 | |
Professional fees | | | 19,372 | |
Shareholder report expenses | | | 537 | |
Trustees’ fees and expenses | | | 11,370 | |
Other fees and expenses | | | 4,601 | |
| | | | |
Total expenses | | | 1,485,343 | |
Less: Fee waivers and/or expense reimbursements | | | (46,861 | ) |
| | | | |
Net expenses | | | 1,438,482 | |
| | | | |
Net investment income | | | 2,810,963 | |
| | | | |
| |
REALIZED AND UNREALIZED GAINS (LOSSES) ON INVESTMENTS | | | | |
| |
Net realized gains on: | | | | |
Unaffiliated securities | | | 12,254,730 | |
Affiliated securities | | | 2,788 | |
| | | | |
Net realized gains on investments | | | 12,257,518 | |
| | | | |
| |
Net change in unrealized gains (losses) on: | | | | |
Unaffiliated securities | | | (3,051,819 | ) |
Affiliated securities | | | (49 | ) |
| | | | |
Net change in unrealized gains (losses) on investments | | | (3,051,868 | ) |
| | | | |
Net realized and unrealized gains (losses) on investments | | | 9,205,650 | |
| | | | |
Net increase in net assets resulting from operations | | $ | 12,016,613 | |
| | | | |
The accompanying notes are an integral part of these financial statements.
| | | | |
| 28 | | Wells Fargo C&B Large Cap Value Portfolio | | Statement of changes in net assets |
| | | | | | | | |
| | | Six months ended
November 30, 2018 (unaudited) | | | Year ended
May 31, 2018 | |
| | |
Operations | | | | | | | | |
Net investment income | | $ | 2,810,963 | | | $ | 4,162,366 | |
Net realized gains on investments | | | 12,257,518 | | | | 34,247,156 | |
Net change in unrealized gains (losses) on investments | | | (3,051,868 | ) | | | (13,968,164 | ) |
| | | | |
Net increase in net assets resulting from operations | | | 12,016,613 | | | | 24,441,358 | |
| | | | |
| |
Capital transactions | | | | |
Transactions in investors’ beneficial interests | | | | | | | | |
Contributions | | | 88,281,269 | | | | 67,670,834 | |
Withdrawals | | | (55,836,696 | ) | | | (73,762,455 | ) |
| | | | |
Net increase (decrease) in net assets resulting from capital transactions | | | 32,444,573 | | | | (6,091,621 | ) |
| | | | |
Total increase in net assets | | | 44,461,186 | | | | 18,349,737 | |
| | | | |
| |
Net assets | | | | |
Beginning of period | | | 382,203,117 | | | | 363,853,380 | |
| | | | |
End of period | | $ | 426,664,303 | | | $ | 382,203,117 | |
| | | | |
The accompanying notes are an integral part of these financial statements.
| | | | | | |
| Financial highlights | | Wells Fargo C&B Large Cap Value Portfolio | | | 29 | |
| | | | | | | | | | | | | | | | | | | | | | | | |
| | | Six months ended November 30, 2018 (unaudited) | | | Year ended May 31 | |
| | | 2018 | | | 2017 | | | 2016 | | | 2015 | | | 2014 | |
Total return1 | | | 2.55 | % | | | 6.65 | % | | | 19.17 | % | | | 0.35 | % | | | 10.29 | % | | | 17.80 | % |
Ratios to average net assets (annualized) | | | | | | | | | | | | | | | | | | | | | | | | |
Gross expenses | | | 0.67 | % | | | 0.67 | % | | | 0.68 | % | | | 0.68 | % | | | 0.68 | % | | | 0.68 | % |
Net expenses | | | 0.65 | % | | | 0.66 | % | | | 0.68 | % | | | 0.68 | % | | | 0.68 | % | | | 0.68 | % |
Net investment income | | | 1.27 | % | | | 1.02 | % | | | 1.09 | % | | | 1.33 | % | | | 1.20 | % | | | 1.35 | % |
Supplemental data | | | | | | | | | | | | | | | | | | | | | | | | |
Portfolio turnover rate | | | 23 | % | | | 42 | % | | | 89 | % | | | 29 | % | | | 35 | % | | | 22 | % |
| 1 | Returns for periods of less than one year are not annualized. |
The accompanying notes are an integral part of these financial statements.
| | | | |
| 30 | | Wells Fargo C&B Large Cap Value Portfolio | | Notes to financial statements (unaudited) |
1. ORGANIZATION
Wells Fargo Master Trust (the “Trust”), a Delaware statutory trust organized on March 10, 1999, is an open-end management investment company registered under the Investment Company Act of 1940, as amended (the “1940 Act”). As an investment company, the Trust follows the accounting and reporting guidance in Financial Accounting Standards Board (“FASB”) Accounting Standards Codification Topic 946, Financial Services – Investment Companies. These financial statements report on the Wells Fargo C&B Large Cap Value Portfolio (“C&B Large Cap Value Portfolio”) which is a diversified series of the Trust.
2. SIGNIFICANT ACCOUNTING POLICIES
The following significant accounting policies, which are consistently followed in the preparation of the financial statements of the Portfolio, are in conformity with U.S. generally accepted accounting principles which require management to make estimates and assumptions that affect the reported amounts of assets and liabilities, disclosure of contingent assets and liabilities at the date of the financial statements, and the reported amounts of revenues and expenses during the reporting period. Actual results could differ from those estimates.
Securities valuation
All investments are valued each business day as of the close of regular trading on the New York Stock Exchange (generally 4 p.m. Eastern Time), although the Portfolio may deviate from this calculation time under unusual or unexpected circumstances.
Equity securities that are listed on a foreign or domestic exchange or market are valued at the official closing price or, if none, the last sales price. If no sale occurs on the principal exchange or market that day, a fair value price will be determined in accordance with the Portfolio’s Valuation Procedures.
Investments in registered open-end investment companies are valued at net asset value. Interests in non-registered investment companies that are redeemable at net asset value are fair valued normally at net asset value.
Investments which are not valued using any of the methods discussed above are valued at their fair value, as determined in good faith by the Board of Trustees of the Portfolio. The Board of Trustees has established a Valuation Committee comprised of the Trustees and has delegated to it the authority to take any actions regarding the valuation of portfolio securities that the Valuation Committee deems necessary or appropriate, including determining the fair value of portfolio securities, unless the determination has been delegated to the Wells Fargo Asset Management Pricing Committee at Wells Fargo Funds Management, LLC (“Funds Management”). The Board of Trustees retains the authority to make or ratify any valuation decisions or approve any changes to the Valuation Procedures as it deems appropriate. On a quarterly basis, the Board of Trustees receives reports on any valuation actions taken by the Valuation Committee or the Wells Fargo Asset Management Pricing Committee which may include items for ratification.
Securities lending
The Portfolio may lend its securities from time to time in order to earn additional income in the form of fees or interest on securities received as collateral or the investment of any cash received as collateral. The Portfolio continues to receive interest or dividends on the securities loaned. The Portfolio receives collateral in the form of cash or securities with a value at least equal to the value of the securities on loan. The value of the loaned securities is determined at the close of each business day and any additional required collateral is delivered to the Portfolio on the next business day. In a securities lending transaction, the net asset value of the Portfolio will be affected by an increase or decrease in the value of the securities loaned and by an increase or decrease in the value of the instrument in which collateral is invested. The amount of securities lending activity undertaken by the Portfolio fluctuates from time to time. In the event of default or bankruptcy by the borrower, the Portfolio may be prevented from recovering the loaned securities or gaining access to the collateral or may experience delays or costs in doing so. In addition, the investment of any cash collateral received may lose all or part of its value. The Portfolio has the right under the lending agreement to recover the securities from the borrower on demand.
The Portfolio lends its securities through an unaffiliated securities lending agent. Cash collateral received in connection with its securities lending transactions is invested in Securities Lending Cash Investments, LLC (the “Securities Lending Fund”). The Securities Lending Fund is exempt from registration under Section 3(c)(7) of the 1940 Act and is managed by Funds Management and is subadvised by Wells Capital Management Incorporated (“WellsCap”), an affiliate of Funds Management and an indirect wholly owned subsidiary of Wells Fargo & Company (“Wells Fargo”). Funds Management receives an advisory fee starting at 0.05% and declining to 0.01% as the average daily net assets of the Securities Lending Fund increase. All of the fees received by Funds Management are paid to WellsCap for its services as subadviser. The
| | | | | | |
| Notes to financial statements (unaudited) | | Wells Fargo C&B Large Cap Value Portfolio | | | 31 | |
Securities Lending Fund seeks to provide a positive return compared to the daily Fed Funds Open Rate by investing in high-quality, U.S. dollar-denominated short-term money market instruments. Securities Lending Fund investments are valued at the evaluated bid price provided by an independent pricing service. Income earned from investment in the Securities Lending Fund, if any, is included in income from affiliated securities on the Statement of Operations.
Security transactions and income recognition
Securities transactions are recorded on a trade date basis. Realized gains or losses are recorded on the basis of identified cost.
Dividend income is recognized on the ex-dividend date. Dividend income is recorded net of foreign taxes withheld where recovery of such taxes is not assured.
Federal and other taxes
The Portfolio is treated as a separate entity for federal income tax purposes. The Portfolio is not required to pay federal income taxes on its net investment income and net capital gains as it is treated as a partnership for federal income tax purposes. All interest, dividends, gains and losses of the Portfolio are deemed to have been “passed through” to the interest holders in proportion to their holdings of the Portfolio regardless of whether such interest, dividends and gains have been distributed by the Portfolio.
The Portfolio’s income tax returns and all financial records supporting those returns for the prior three fiscal years are subject to examination by the federal revenue authority. Management has analyzed the Fund’s tax positions taken on federal, state, and foreign tax returns for all open tax years and does not believe that there are any uncertain tax positions that require recognition of a tax liability.
As of November 30, 2018, the aggregate cost of all investments for federal income tax purposes was $354,702,026 and the unrealized gains (losses) consisted of:
| | | | |
Gross unrealized gains | | $ | 87,654,641 | |
Gross unrealized losses | | | (18,089,492 | ) |
Net unrealized gains | | $ | 69,565,149 | |
3. FAIR VALUATION MEASUREMENTS
Fair value measurements of investments are determined within a framework that has established a fair value hierarchy based upon the various data inputs utilized in determining the value of the Portfolio’s investments. The three-level hierarchy gives the highest priority to unadjusted quoted prices in active markets for identical assets or liabilities (Level 1) and the lowest priority to unobservable inputs (Level 3). The Portfolio’s investments are classified within the fair value hierarchy based on the lowest level of input that is significant to the fair value measurement. The inputs are summarized into three broad levels as follows:
| ∎ | | Level 1 – quoted prices in active markets for identical securities |
| ∎ | | Level 2 – other significant observable inputs (including quoted prices for similar securities, interest rates, prepayment speeds, credit risk, etc.) |
| ∎ | | Level 3 – significant unobservable inputs (including the Portfolio’s own assumptions in determining the fair value of investments) |
The inputs or methodologies used for valuing investments in securities are not necessarily an indication of the risk associated with investing in those securities.
| | | | |
| 32 | | Wells Fargo C&B Large Cap Value Portfolio | | Notes to financial statements (unaudited) |
The following is a summary of the inputs used in valuing the Portfolio’s assets and liabilities as of November 30, 2018:
| | | | | | | | | | | | | | | | |
| | | Quoted prices
(Level 1) | | | Other significant
observable inputs
(Level 2) | | | Significant
unobservable inputs (Level 3) | | | Total | |
Assets | | | | | | | | | | | | | | | | |
Investments in: | | | | | | | | | | | | | | | | |
| | | | |
Common stocks | | | | | | | | | | | | | | | | |
Communication services | | $ | 21,960,092 | | | $ | 0 | | | $ | 0 | | | $ | 21,960,092 | |
Consumer discretionary | | | 36,678,853 | | | | 0 | | | | 0 | | | | 36,678,853 | |
Consumer staples | | | 13,641,688 | | | | 0 | | | | 0 | | | | 13,641,688 | |
Energy | | | 22,249,607 | | | | 0 | | | | 0 | | | | 22,249,607 | |
Financials | | | 118,590,676 | | | | 0 | | | | 0 | | | | 118,590,676 | |
Health care | | | 49,393,369 | | | | 0 | | | | 0 | | | | 49,393,369 | |
Industrials | | | 69,383,520 | | | | 0 | | | | 0 | | | | 69,383,520 | |
Information technology | | | 50,753,814 | | | | 0 | | | | 0 | | | | 50,753,814 | |
Materials | | | 26,934,978 | | | | 0 | | | | 0 | | | | 26,934,978 | |
Real estate | | | 6,407,856 | | | | 0 | | | | 0 | | | | 6,407,856 | |
| | | | |
Short-term investments | | | | | | | | | | | | | | | | |
Investment companies | | | 8,272,722 | | | | 0 | | | | 0 | | | | 8,272,722 | |
Total assets | | $ | 424,267,175 | | | $ | 0 | | | $ | 0 | | | $ | 424,267,175 | |
Additional sector, industry or geographic detail is included in the Portfolio of Investments.
At November 30, 2018, the Portfolio did not have any transfers into/out of Level 3.
4. TRANSACTIONS WITH AFFILIATES AND OTHER EXPENSES
Advisory fee
The Trust has entered into an advisory contract with Funds Management, an indirect wholly owned subsidiary of Wells Fargo. The adviser is responsible for implementing investment policies and guidelines and for supervising the subadviser, who is responsible for day-to-day portfolio management of the Portfolios. Pursuant to the contract, Funds Management is entitled to receive an annual advisory fee starting at 0.65% and declining to 0.475% as the average daily net assets of the Portfolio increase. For the six months ended November 30, 2018, the advisory fee was equivalent to an annual rate of 0.65% of the Portfolio’s average daily net assets.
Funds Management has retained the services of a subadviser to provide daily portfolio management to the Portfolio. The fee for subadvisory services is borne by Funds Management. Cooke & Bieler, L.P., which is not an affiliate of Funds Management, is the subadviser to the Portfolio and is entitled to receive a fee from Funds Management at an annual rate starting at 0.38% and declining to 0.30% as the average daily net assets of the Portfolio increase.
Funds Management has voluntarily waived and/or reimbursed advisory fees to the extent necessary to maintain the net operating expense ratio of the Portfolio.
Interfund transactions
The Portfolio may purchase or sell portfolio investment securities to certain other Wells Fargo affiliates pursuant to Rule 17a-7 under the 1940 Act and under procedures adopted by the Board of Trustees. The procedures have been designed to ensure that these interfund transactions, which do not incur broker commissions, are effected at current market prices.
5. INVESTMENT PORTFOLIO TRANSACTIONS
Purchases and sales of investments, excluding U.S. government obligations (if any) and short-term securities, for the six months ended November 30, 2018 were $133,003,984 and $97,221,906, respectively.
6. BANK BORROWINGS
Effective August 28, 2018, the Trust, along with Wells Fargo Variable Trust and Wells Fargo Funds Trust (excluding the money market funds), are parties to a $280,000,000 revolving credit agreement whereby the Portfolio is permitted to use
| | | | | | |
| Notes to financial statements (unaudited) | | Wells Fargo C&B Large Cap Value Portfolio | | | 33 | |
bank borrowings for temporary or emergency purposes, such as to fund shareholder redemption requests. Interest under the credit agreement is charged to the Portfolio based on a borrowing rate equal to the higher of the Federal Funds rate in effect on that day plus 1.25% or the overnight LIBOR rate in effect on that day plus 1.25%. In addition, an annual commitment fee equal to 0.25% of the unused balance is allocated to each participating fund.
For the six months ended November 30, 2018, there were no borrowings by the Portfolio under the agreement.
7. CONCENTRATION RISK
Concentration risks result from exposure to a limited number of sectors. A portfolio that invests a substantial portion of its assets in a sector may be more affected by changes in that sector than would be a portfolio whose investments are not heavily weighted in any sector.
8. INDEMNIFICATION
Under the Trust’s organizational documents, the officers and Trustees have been granted certain indemnification rights against certain liabilities that may arise out of performance of their duties to the Trust. Additionally, in the normal course of business, the Trust may enter into contracts with service providers that contain a variety of indemnification clauses. The Trust’s maximum exposure under these arrangements is dependent on future claims that may be made against the Portfolio and, therefore, cannot be estimated.
9. NEW ACCOUNTING PRONOUNCEMENT
In August 2018, FASB issued Accounting Standards Update (“ASU”) No. 2018-13, Fair Value Measurement (Topic 820)Disclosure Framework—Changes to the Disclosure Requirements for Fair Value Measurement. ASU 2018-13 updates the disclosure requirements for fair value measurements by modifying or removing certain disclosures and adding certain new disclosures. The amendments are effective for fiscal years, and interim periods within those fiscal years, beginning after December 15, 2019. Early adoption is permitted. Management has adopted the removal and modification of disclosures early, as permitted, and will adopt the additional new disclosures at the effective date.
| | | | |
| 34 | | Wells Fargo C&B Large Cap Value Fund | | Other information (unaudited) |
PROXY VOTING INFORMATION
A description of the policies and procedures used to determine how to vote proxies relating to portfolio securities is available without charge, upon request, by calling1-800-222-8222, visiting our website atwellsfargofunds.com, or visiting the SEC website at sec.gov. Information regarding how the proxies related to portfolio securities were voted during the most recent 12-month period ended June 30 is available on the website atwellsfargofunds.comor by visiting the SEC website at sec.gov.
PORTFOLIO HOLDINGS INFORMATION
The complete portfolio holdings are publicly available on the website (wellsfargofunds.com) on a one-month delayed basis. In addition, top ten holdings information (excluding derivative positions) is publicly available on the website on a monthly, seven-day or more delayed basis. The Fund and the Portfolio each file their complete schedule of portfolio holdings with the SEC for the first and third quarters of each fiscal year on Form N-Q, which is available by visiting the SEC website at sec.gov. In addition, each Form N-Q may be reviewed and copied at the SEC’s Public Reference Room in Washington, DC, and at regional offices in New York City, at 233 Broadway, and in Chicago, at 175 West Jackson Boulevard, Suite 900. Information about the Public Reference Room may be obtained by calling 1-800-SEC-0330.
| | | | | | |
| Other information (unaudited) | | Wells Fargo C&B Large Cap Value Fund | | | 35 | |
BOARD OF TRUSTEES AND OFFICERS
Each of the Trustees and Officers1 listed in the table below acts in identical capacities for each fund in the Wells Fargo family of funds, which consists of 152 mutual funds comprising the Wells Fargo Funds Trust, Wells Fargo Variable Trust, Wells Fargo Master Trust and four closed-end funds (collectively the “Fund Complex”). This table should be read in conjunction with the Prospectus and the Statement of Additional Information2. The mailing address of each Trustee and Officer is 525 Market Street, 12th Floor, San Francisco, CA 94105. Each Trustee and Officer serves an indefinite term, however, each Trustee serves such term until reaching the mandatory retirement age established by the Trustees.
Independent Trustees
| | | | | | |
Name and year of birth | | Position held and length of service* | | Principal occupations during past five years or longer | | Current other public company or
investment company
directorships |
William R. Ebsworth (Born 1957) | | Trustee, since 2015 | | Retired. From 1984 to 2013, equities analyst, portfolio manager, research director and chief investment officer at Fidelity Management and Research Company in Boston, Tokyo, and Hong Kong, and retired in 2013 as Chief Investment Officer of Fidelity Strategic Advisers, Inc. where he led a team of investment professionals managing client assets. Prior thereto, Board member of Hong Kong Securities Clearing Co., Hong Kong Options Clearing Corp., the Thailand International Fund, Ltd., Fidelity Investments Life Insurance Company, and Empire Fidelity Investments Life Insurance Company. Board member of the Vincent Memorial Hospital Endowment (non-profit organization), where he serves on the Investment Committee and as a Chair of the Audit Committee. Mr. Ebsworth is a CFA® charterholder. | | N/A |
Jane A. Freeman (Born 1953) | | Trustee, since 2015; Chair Liaison, since 2018 | | Retired. From 2012 to 2014 and 1999 to 2008, Chief Financial Officer of Scientific Learning Corporation. From 2008 to 2012, Ms. Freeman provided consulting services related to strategic business projects. Prior to 1999, Portfolio Manager at Rockefeller & Co. and Scudder, Stevens & Clark. Board member of the Harding Loevner Funds from 1996 to 2014, serving as both Lead Independent Director and chair of the Audit Committee. Board member of the Russell Exchange Traded Funds Trust from 2011 to 2012 and the chair of the Audit Committee. Ms. Freeman is a Board Member of The Ruth Bancroft Garden (non-profit organization). She is also an inactive Chartered Financial Analyst. | | N/A |
Isaiah Harris, Jr.3 (Born 1952) | | Trustee, since 2009 | | Retired. Chairman of the Board of CIGNA Corporation since 2009, and Director since 2005. From 2003 to 2011, Director of Deluxe Corporation. Prior thereto, President and CEO of BellSouth Advertising and Publishing Corp. from 2005 to 2007, President and CEO of BellSouth Enterprises from 2004 to 2005 and President of BellSouth Consumer Services from 2000 to 2003. Emeritus member of the Iowa State University Foundation Board of Governors. Emeritus Member of the Advisory Board of Iowa State University School of Business. Advisory Board Member, Palm Harbor Academy (private school). Advisory Board Member, Child Evangelism Fellowship (non-profit). Mr. Harris is a certified public accountant (inactive status). | | CIGNA Corporation |
Judith M. Johnson3 (Born 1949) | | Trustee, since 2008; Audit Committee Chairman, since 2009 | | Retired. Prior thereto, Chief Executive Officer and Chief Investment Officer of Minneapolis Employees Retirement Fund from 1996 to 2008. Ms. Johnson is an attorney, certified public accountant and a certified managerial accountant. | | N/A |
David F. Larcker (Born 1950) | | Trustee, since 2009 | | James Irvin Miller Professor of Accounting at the Graduate School of Business, Stanford University, Director of the Corporate Governance Research Initiative and Senior Faculty of The Rock Center for Corporate Governance since 2006. From 2005 to 2008, Professor of Accounting at the Graduate School of Business, Stanford University. Prior thereto, Ernst & Young Professor of Accounting at The Wharton School, University of Pennsylvania from 1985 to 2005. | | N/A |
| | | | |
| 36 | | Wells Fargo C&B Large Cap Value Fund | | Other information (unaudited) |
| | | | | | |
Name and year of birth | | Position held and length of service* | | Principal occupations during past five years or longer | | Current other public company or
investment company
directorships |
Olivia S. Mitchell (Born 1953) | | Trustee, since 2006; Nominating and Governance Committee Chairman, since 2018 | | International Foundation of Employee Benefit Plans Professor, Wharton School of the University of Pennsylvania since 1993. Director of Wharton’s Pension Research Council and Boettner Center on Pensions & Retirement Research, and Research Associate at the National Bureau of Economic Research. Previously, Cornell University Professor from 1978 to 1993. | | N/A |
Timothy J. Penny (Born 1951) | | Trustee, since 1996; Chairman, since 2018; Vice Chairman, from 2017 to 2018 | | President and Chief Executive Officer of Southern Minnesota Initiative Foundation, a non-profit organization, since 2007. Member of the Board of Trustees of NorthStar Education Finance, Inc., a non-profit organization, since 2007. | | N/A |
James G. Polisson (Born 1959) | | Trustee, since 2018; Advisory Board Member, from 2017 to 2018 | | Retired. Chief Marketing Officer, Source (ETF) UK Services, Ltd, from 2015 to 2017. From 2012 to 2015, Principal of The Polisson Group, LLC, a management consulting, corporate advisory and principal investing company. Chief Executive Officer and Managing Director at Russell Investments, Global Exchange Traded Funds from 2010 to 2012. Managing Director of Barclays Global Investors from 1998 to 2010 and Global Chief Marketing Officer for iShares and Barclays Global Investors from 2000 to 2010. Trustee of the San Francisco Mechanics’ Institute, a non-profit organization, from 2013 to 2015. Board member of the Russell Exchange Traded Fund Trust from 2011 to 2012. Director of Barclays Global Investors Holdings Deutschland GmbH from 2006 to 2009. Mr. Polisson is an attorney and has a retired status with the Massachusetts and District of Columbia Bar Associations. | | N/A |
Michael S. Scofield4 (Born 1943) | | Trustee, since 2010 | | Served on the Investment Company Institute’s Board of Governors and Executive Committee from 2008-2011 as well the Governing Council of the Independent Directors Council from 2006-2011 and the Independent Directors Council Executive Committee from 2008-2011. Trustee of the Evergreen Fund complex (and its predecessors) from 1984 to 2010. Chairman of the Evergreen Funds from 2000-2010. Former Trustee of the Mentor Funds. Retired Attorney, Law Offices of Michael S. Scofield. | | N/A |
Pamela Wheelock (Born 1959) | | Trustee, since 2018; Advisory Board Member, from 2017 to 2018 | | Chief Operating Officer, Twin Cities Habitat for Humanity, since January, 2017. Vice President of University Services, University of Minnesota from 2012 to 2017. Prior thereto, on the Board of Directors, Governance Committee and Finance Committee for the Minnesota Philanthropy Partners (Saint Paul Foundation) from 2012 to 2018, Interim President and Chief Executive Officer of Blue Cross Blue Shield of Minnesota from 2010 to 2011, Chairman of the Board from 2009 to 2011 and Board Director from 2003 to 2015. Vice President, Leadership and Community Engagement, Bush Foundation, Saint Paul, Minnesota (a private foundation) from 2009 to 2011. Executive Vice President and Chief Financial Officer, Minnesota Sports and Entertainment from 2004 to 2009 and Senior Vice President from 2002 to 2004. Commissioner of Finance, State of Minnesota, from 1999 to 2002. Currently the Board Chair of the Minnesota Wild Foundation since 2010. | | N/A |
| * | Length of service dates reflect the Trustee’s commencement of service with the Trust’s predecessor entities, where applicable. |
| | | | | | |
| Other information (unaudited) | | Wells Fargo C&B Large Cap Value Fund | | | 37 | |
Officers
| | | | | | |
Name and year of birth | | Position held and
length of service | | Principal occupations during past five years or longer | | |
Andrew Owen (Born 1960) | | President, since 2017 | | Executive Vice President of Wells Fargo & Company and Head of Affiliated Managers, Wells Fargo Asset Management, since 2014. In addition, Mr. Owen is currently President, Chief Executive Officer and Director of Wells Fargo Funds Management, LLC since 2017. Prior thereto, Executive Vice President responsible for marketing, investments and product development for Wells Fargo Funds Management, LLC, from 2009 to 2014. | | |
Nancy Wiser1 (Born 1967) | | Treasurer, since 2012 | | Executive Vice President of Wells Fargo Funds Management, LLC since 2011. Chief Operating Officer and Chief Compliance Officer at LightBox Capital Management LLC, from 2008 to 2011. | | |
Alexander Kymn (Born 1973) | | Secretary, since 2018; Chief Legal Officer, since 2018 | | Senior Company Counsel of Wells Fargo Bank, N.A. since 2018 (previously Senior Counsel from 2007 to 2018). Vice President of Wells Fargo Funds Management, LLC from 2008 to 2014. | | |
Michael H. Whitaker (Born 1967) | | Chief Compliance Officer, since 2016 | | Senior Vice President and Chief Compliance Officer since 2016. Senior Vice President and Chief Compliance Officer for Fidelity Investments from 2007 to 2016. | | |
David Berardi (Born 1975) | | Assistant Treasurer, since 2009 | | Vice President of Wells Fargo Funds Management, LLC since 2009. Vice President of Evergreen Investment Management Company, LLC from 2008 to 2010. Manager of Fund Reporting and Control for Evergreen Investment Management Company, LLC from 2004 to 2010. | | |
Jeremy DePalma1 (Born 1974) | | Assistant Treasurer, since 2009 | | Senior Vice President of Wells Fargo Funds Management, LLC since 2009. Senior Vice President of Evergreen Investment Management Company, LLC from 2008 to 2010 and head of the Fund Reporting and Control Team within Fund Administration from 2005 to 2010. | | |
| 1 | Nancy Wiser acts as Treasurer of 76 funds in the Fund Complex. Jeremy DePalma acts as Treasurer of 76 funds and Assistant Treasurer of 76 funds in the Fund Complex. |
| 2 | The Statement of Additional Information includes additional information about the Trustees and is available, without charge, upon request, by calling 1-800-222-8222 or by visiting the website atwellsfargofunds.com. |
| 3 | Mr. Harris will replace Ms. Johnson as the Chairman of the Audit Committee effective January 1, 2019. |
| 4 | Mr. Scofield is expected to retire on December 31, 2018. |
| | | | |
| 38 | | Wells Fargo C&B Large Cap Value Fund | | Appendix A (unaudited) |
SALES CHARGE REDUCTIONS AND WAIVERS FOR CERTAIN INTERMEDIARIES
Raymond James & Associates, Inc., Raymond James Financial Services & Raymond James affiliates (“Raymond James”)
Effective on or about March 1, 2019, shareholders purchasing Fund shares through a Raymond James platform or account will be eligible only for the following load waivers (front-end sales charge waivers and contingent deferred, or back-end, sales charge waivers) and discounts, which may differ from those disclosed elsewhere in the Fund’s Prospectus or SAI.
Front-end Sales Load Waivers on Class A shares Available at Raymond James
| | • | | Shares purchased in an investment advisory program. |
| | • | | Shares purchased through reinvestment of capital gains distributions and dividend reinvestment when purchasing shares of the same fund (but not any other fund within the fund family). |
| | • | | Employees and registered representatives of Raymond James or its affiliates and their family members as designated by Raymond James. |
| | • | | Shares purchased from the proceeds of redemptions within the same fund family, provided (1) the repurchase occurs within 90 days following the redemption, (2) the redemption and purchase occur in the same account, and (3) redeemed shares were subject to a front-end or deferred sales load (known as Rights of Reinstatement). |
| | • | | A shareholder in the fund’s Class C shares will have their shares automatically exchanged at net asset value to Class A shares (or the appropriate share class) of the fund if the shares are no longer subject to a CDSC and the exchange is in line with the policies and procedures of Raymond James. |
CDSC Waivers on Class A and C Shares Available at Raymond James
| | • | | Death or disability of the shareholder. |
| | • | | Shares sold as part of a systematic withdrawal plan as described in the Fund’s Prospectus. |
| | • | | Return of excess contributions from an IRA Account. |
| | • | | Shares sold as part of a required minimum distribution for IRA and retirement accounts due to the shareholder reaching age 70½ as described in the Fund’s prospectus. |
| | • | | Shares sold to pay Raymond James fees but only if the transaction is initiated by Raymond James. |
| | • | | Shares acquired through a right of reinstatement. |
Front-end Load Discounts Available at Raymond James: Breakpoints, and/or Rights of Accumulation
| | • | | Breakpoints as described in the Fund’s Prospectus. |
| | • | | Rights of accumulation which entitle shareholders to breakpoint discounts will be automatically calculated based on the aggregated holding of fund family assets held by accounts within the purchaser’s household at Raymond James. Eligible fund family assets not held at Raymond James may be included in the rights of accumulation calculation only if the shareholder notifies his or her financial advisor about such assets. |
This page is intentionally left blank.
This page is intentionally left blank.

For more information
More information about Wells Fargo Funds is available free upon request. To obtain literature, please write, visit the Fund’s website, or call:
Wells Fargo Funds
P.O. Box 219967
Kansas City, MO 64121-9967
Website: wellsfargofunds.com
Individual investors: 1-800-222-8222
Retail investment professionals: 1-888-877-9275
Institutional investment professionals:1-866-765-0778
This report and the financial statements contained herein are submitted for the general information of the shareholders of the Fund. If this report is used for promotional purposes, distribution of the report must be accompanied or preceded by a current prospectus. Before investing, please consider the investment objectives, risks, charges, and expenses of the investment. For a current prospectus and, if available, a summary prospectus, containing this information, call1-800-222-8222 or visit the Fund’s website atwellsfargofunds.com. Read the prospectus carefully before you invest or send money.
Wells Fargo Asset Management (WFAM) is the trade name for certain investment advisory/management firms owned by Wells Fargo & Company. These firms include but are not limited to Wells Capital Management Incorporated and Wells Fargo Funds Management, LLC. Certain products managed by WFAM entities are distributed by Wells Fargo Funds Distributor, LLC (a broker/dealer and Member FINRA).
This material is for general informational and educational purposes only and is NOT intended to provide investment advice or a recommendation of any kind—including a recommendation for any specific investment, strategy, or plan.
INVESTMENT PRODUCTS: NOT FDIC INSURED ◾ NO BANK GUARANTEE ◾ MAY LOSE VALUE
© 2019 Wells Fargo Funds Management, LLC. All rights reserved.
| | |
 | | 318974 01-19 SA280/SAR280 11-18 |
Semi-Annual Report
November 30, 2018

Wells Fargo Emerging Growth Fund

Beginning on January 1, 2021, as permitted by new regulations adopted by the Securities and Exchange Commission, paper copies of the Wells Fargo Funds’ annual and semi-annual shareholder reports issued after this date will no longer be sent by mail, unless you specifically request paper copies of the reports. Instead, the reports will be made available on the Funds’ website, and you will be notified by mail each time a report is posted and provided with a website address to access the report.
If you already elected to receive shareholder reports electronically, you will not be affected by this change and you need not take any action. You may elect to receive shareholder reports and other communications from the Fund electronically at any time by contacting your financial intermediary (such as a broker-dealer or bank) or, if you are a direct investor, by calling 1-800-222-8222 or by enrolling at wellsfargo.com/advantagedelivery.
You may elect to receive all future reports in paper free of charge. If you invest through a financial intermediary, you can contact your financial intermediary to request that you continue to receive paper copies of your shareholder reports; if you invest directly with the Fund, you can call 1-800-222-8222. Your election to receive reports in paper will apply to all Wells Fargo Funds held in your account with your financial intermediary or, if you are a direct investor, to all Wells Fargo Funds that you hold.

Reduce clutter. Save trees.
Sign up for electronic delivery of prospectuses and shareholder reports atwellsfargo.com/advantagedelivery
Contents
The views expressed and any forward-looking statements are as of November 30, 2018, unless otherwise noted, and are those of the Fund managers and/or Wells Fargo Funds Management, LLC. Discussions of individual securities, or the markets generally, or any Wells Fargo Fund are not intended as individual recommendations. Future events or results may vary significantly from those expressed in any forward-looking statements. The views expressed are subject to change at any time in response to changing circumstances in the market. Wells Fargo Funds Management, LLC and the Fund disclaim any obligation to publicly update or revise any views expressed or forward-looking statements.
INVESTMENT PRODUCTS: NOT FDIC INSURED ◾ NO BANK GUARANTEE ◾ MAY LOSE VALUE
| | | | |
| 2 | | Wells Fargo Emerging Growth Fund | | Letter to shareholders (unaudited) |

Andrew Owen
President
Wells Fargo Funds
Global trade tensions escalated during the third quarter of 2018.
Dear Shareholder:
We are pleased to offer you this semi-annual report for the Wells Fargo Emerging Growth Fund for thesix-month period that ended November 30, 2018. During the reporting period, the U.S. generated encouraging economic and business data that was offset by less positive and more inconsistent data from international markets. Investment returns were restrained in comparison with recent periods as geopolitical tensions and uncertainty tended to distract investors from more favorable underlying trends.
For the period, U.S. stocks, as measured by the S&P 500 Index,1 gained 3.02% and international stocks, as measured by the MSCI ACWI ex USA Index (Net),2 declined 8.37%. Based on the MSCI EM Index (Net),3 emerging market stocks lost 9.89%. For bond investors, the Bloomberg Barclays U.S. Aggregate Bond Index4 declined 0.30% while the Bloomberg Barclays Global Aggregateex-USD Index5 fell 3.67%. The Bloomberg Barclays Municipal Bond Index6 gained 0.42%. The ICE BofAML U.S. High Yield Index7 was up 0.19%.
Global trade tensions prompted investor concerns.
Global trade tensions escalated during the third quarter of 2018. The U.S. government’s decision during the second quarter to impose tariffs on a wide range of products manufactured overseas drew retaliatory responses from foreign governments, which punished U.S. commodity producers and product manufacturers. Investors were left to wonder about next steps in what appeared to be an escalating divergence in global economic policies and growth prospects.
Inflation trended higher. TheCPI-U8 added 0.1% in September after an increase of 0.2% in both July and August. On a year-over-year basis, theall-items index rose 2.3% for the 12 months that ended September 30, 2018, after a seasonal adjustment. The rate of increase was slower than that recorded during the first half of 2018. The index for all items less food and energy rose 2.2% for the same12-month period.
| 1 | The S&P 500 Index consists of 500 stocks chosen for market size, liquidity, and industry group representation. It is a market-value-weighted index with each stock’s weight in the index proportionate to its market value. You cannot invest directly in an index. |
| 2 | The Morgan Stanley Capital International (MSCI) All Country World Index (ACWI) ex USA Index (Net) is a free-float-adjusted market-capitalization-weighted index that is designed to measure the equity market performance of developed markets, excluding the U.S. and Canada. Source: MSCI. MSCI makes no express or implied warranties or representations and shall have no liability whatsoever with respect to any MSCI data contained herein. The MSCI data may not be further redistributed or used as a basis for other indices or any securities or financial products. This report is not approved, reviewed, or produced by MSCI. You cannot invest directly in an index. |
| 3 | The MSCI Emerging Markets (EM) Index (Net) is a free-float-adjusted market-capitalization-weighted index that is designed to measure large- andmid-cap equity market performance of emerging markets. The MSCI EM Index (Net) consists of the following 24 emerging market country indices: Brazil, Chile, China, Colombia, Czech Republic, Egypt, Greece, Hungary, India, Indonesia, Korea, Malaysia, Mexico, Pakistan, Peru, the Philippines, Poland, Qatar, Russia, South Africa, Taiwan, Thailand, Turkey, and the United Arab Emirates. You cannot invest directly in an index. |
| 4 | The Bloomberg Barclays U.S. Aggregate Bond Index is a broad-based benchmark that measures the investment-grade, U.S.-dollar-denominated, fixed-rate taxable bond market, including Treasuries, government-related and corporate securities, mortgage-backed securities (agency fixed-rate and hybrid adjustable-rate mortgage pass-throughs), asset-backed securities, and commercial mortgage-backed securities. You cannot invest directly in an index. |
| 5 | The Bloomberg Barclays Global Aggregateex-USD Index is an unmanaged index that provides a broad-based measure of the global investment-grade fixed-income markets excluding the U.S.-dollar-denominated debt market. You cannot invest directly in an index. |
| 6 | The Bloomberg Barclays Municipal Bond Index is an unmanaged index composed of long-termtax-exempt bonds with a minimum credit rating of Baa. You cannot invest directly in an index. |
| 7 | The ICE BofAML U.S. High Yield Index is a market-capitalization-weighted index of domestic and Yankee high-yield bonds. The index tracks the performance of high-yield securities traded in the U.S. bond market. You cannot invest directly in an index. Copyright 2018. ICE Data Indices, LLC. All rights reserved. |
| 8 | The Consumer Price Index for All Urban Consumers(CPI-U) measures the changes in the price of a basket of goods and services purchased by urban consumers. The urban consumer population is deemed by many as a better representative measure of the general public because close to 90% of the country’s population lives in highly populated areas. You cannot invest directly in an index. |
| | | | | | |
| Letter to shareholders (unaudited) | | Wells Fargo Emerging Growth Fund | | | 3 | |
U.S. stocks gained following positive economic data while international stocks and bonds declined.
During the summer months, the U.S. economy strengthened. Revised second-quarter gross domestic product (GDP) data released in August showed the U.S. economy growing at a 4.2% rate. The unemployment rate in the U.S. was 3.7% by the end of September, according to the U.S. Department of Labor. Wages showed more consistent growth, and consumer confidence remained strong. Several U.S. equity market indices reached records during August, with the S&P 500 Index gaining 7.20% for the three-month period that ended September 30, 2018. In contrast, the MSCI ACWI ex USA Index (Net) gained 0.71% while the MSCI EM Index (Net) declined 1.09% during the same three-month period.
In June, the Federal Reserve increased the target range for the federal funds rate to range from 1.75% to 2.00%. It raised the range again in September to range from 2.00% to 2.25%. Long-term interest rates in the U.S. remained at higher levels relative to the prior 10 years. Rates on10-year and30-year Treasury bonds—2.46% and 2.81%, respectively, on January 1, 2018—were 3.01% and 3.30%, respectively, on November 30, 2018. Investor concerns about an inverted yield curve reemerged, only to be replaced by concerns about the potentially negative influence of higher interest rates on economic activity.
November saw improvement in many equity markets.
As interest rates and bond yields gained during October, stock markets struggled. For the month, the S&P 500 Index fell 6.84%, the MSCI ACWI ex USA Index (Net) dropped 8.13%, and the MSCI EM Index (Net) lost 8.71%. The Bureau of Economic Analysis released its first estimate of third-quarter GDP, which, at an annualized 3.5% rate, indicated growth may be slowing compared with the second quarter. Readings on consumer sentiment and business spending were mixed. Markets rebounded somewhat in November as the S&P 500 Index gained 2.04%, the MSCI ACWI ex USA Index (Net) added 0.95%, and the MSCI EM Index (Net) was up 4.12% as the uncertainty leading up to midterm elections in the U.S. was resolved and progress seemed to be possible on several international trade issues.
Economic signals overseas were mixed as the third quarter ended and the fourth quarter began. In early August, the Bank of England’s Monetary Policy Committee increased its key interest rate to 0.75%. The European Central Bank and the Bank of Japan maintained low interest rates and accommodative monetary policies. Amid rising trade uncertainty, the People’s Bank of China cut reserve requirement ratios and accelerated infrastructure spending and tax cuts for business enterprises and individuals. Nevertheless, a strengthening U.S. dollar and the trade tensions remained headwinds for investors overseas.
Don’t let short-term uncertainty derail long-term investment goals.
Periods of investment uncertainty can present challenges, but experience has taught us that maintaining long-term investment goals can be an effective way to plan for the future. To help you create a sound strategy based on your personal goals and risk tolerance, Wells Fargo Funds offers more than 100 mutual funds spanning a wide range of asset classes and investment styles. Although diversification cannot guarantee an investment profit or prevent losses, we believe it can be an effective way to manage investment risk and potentially smooth out overall portfolio performance. We encourage investors to know their investments and to understand that appropriate levels of risk-taking may unlock opportunities.
Economic signals overseas were mixed as the third quarter ended and the fourth quarter began.
| | | | |
| 4 | | Wells Fargo Emerging Growth Fund | | Letter to shareholders (unaudited) |
Thank you for choosing to invest with Wells Fargo Funds. We appreciate your confidence in us and remain committed to helping you meet your financial needs.
Sincerely,

Andrew Owen
President
Wells Fargo Funds
Notice to shareholders
At a meeting held on August 14-15, 2018, the Board of Trustees of the Fund approved the following policy which will be effective on or about February 5, 2019:
Class C shares will convert automatically into Class A shares ten years after the initial date of purchase or, if you acquired your Class C shares through an exchange or conversion from another share class, ten years after the date you acquired your Class C shares. When Class C shares that you acquired through a purchase or exchange convert, any other Class C shares that you purchased with reinvested dividends and distributions also will convert into Class A shares on a pro rata basis. A shorter holding period may also apply depending on your intermediary. Please see “Appendix A—Sales Charge Reductions and Waivers for Certain Intermediaries” in the Fund’s prospectus or at the end of this report.
For further information about your Fund, contact your investment professional, visit our website atwellsfargofunds.com, or call us directly at1-800-222-8222.
This page is intentionally left blank.
| | | | |
| 6 | | Wells Fargo Emerging Growth Fund1 | | Performance highlights (unaudited) |
Investment objective
The Fund seeks long-term capital appreciation.
Manager
Wells Fargo Funds Management, LLC
Subadviser for the affiliated master portfolio
Wells Capital Management Incorporated
Portfolio managers
Joseph M. Eberhardy, CFA®‡, CPA
Thomas C. Ognar, CFA®‡
Average annual total returns (%) as of November 30, 20182
| | | | | | | | | | | | | | | | | | | | | | | | | | | | | | | | | | |
| | | | | Including sales charge | | | Excluding sales charge | | | Expense ratios3 (%) | |
| | | Inception date | | 1 year | | | 5 year | | | 10 year | | | 1 year | | | 5 year | | | 10 year | | | Gross | | | Net4 | |
| Class A (WEMAX) | | 3-31-2008 | | | 8.40 | | | | 7.05 | | | | 15.73 | | | | 15.01 | | | | 8.32 | | | | 16.41 | | | | 1.36 | | | | 1.28 | |
| Class C (WEMCX) | | 3-31-2008 | | | 13.10 | | | | 7.50 | | | | 15.54 | | | | 14.10 | | | | 7.50 | | | | 15.54 | | | | 2.11 | | | | 2.03 | |
| Class R6 (WEGRX) | | 7-31-2018 | | | – | | | | – | | | | – | | | | 15.53 | | | | 8.80 | | | | 16.97 | | | | 0.93 | | | | 0.85 | |
| Administrator Class (WFGDX) | | 1-31-2007 | | | – | | | | – | | | | – | | | | 15.19 | | | | 8.48 | | | | 16.63 | | | | 1.28 | | | | 1.20 | |
| Institutional Class (WEMIX) | | 3-31-2008 | | | – | | | | – | | | | – | | | | 15.53 | | | | 8.80 | | | | 16.97 | | | | 1.03 | | | | 0.90 | |
| Russell 2000® Growth Index5 | | – | | | – | | | | – | | | | – | | | | 2.81 | | | | 8.22 | | | | 15.55 | | | | – | | | | – | |
Figures quoted represent past performance, which is no guarantee of future results, and do not reflect taxes that a shareholder may pay on fund distributions or the redemption of fund shares. Investment return and principal value of an investment will fluctuate so that an investor’s shares, when redeemed, may be worth more or less than their original cost. Performance shown without sales charges would be lower if sales charges were reflected. Current performance may be lower or higher than the performance data quoted, which assumes the reinvestment of dividends and capital gains. Current month-end performance is available on the Fund’s website, wellsfargofunds.com.
Index returns do not include transaction costs associated with buying and selling securities, any mutual fund fees or expenses, or any taxes. It is not possible to invest directly in an index.
For Class A shares, the maximum front-end sales charge is 5.75%. For Class C shares, the maximum contingent deferred sales charge is 1.00%. Performance including a contingent deferred sales charge assumes the sales charge for the corresponding time period. Class R6, Administrator Class, and Institutional Class shares are sold without a front-end sales charge or contingent deferred sales charge.
Stock values fluctuate in response to the activities of individual companies and general market and economic conditions. Smaller-company stocks tend to be more volatile and less liquid than those of larger companies. Certain investment strategies tend to increase the total risk of an investment (relative to the broader market). The Fund is exposed to foreign investment risk. Consult the Fund’s prospectus for additional information on these and other risks.
Please see footnotes on page 7.
| | | | | | |
| Performance highlights (unaudited) | | Wells Fargo Emerging Growth Fund | | | 7 | |
| | | | |
| Ten largest holdings (%) as of November 30, 20186 | |
InterXion Holding NV | | | 3.00 | |
ASGN Incorporated | | | 2.91 | |
Ligand Pharmaceuticals Incorporated | | | 2.71 | |
Q2 Holdings Incorporated | | | 2.66 | |
Proofpoint Incorporated | | | 2.23 | |
HealthEquity Incorporated | | | 2.10 | |
Axogen Incorporated | | | 2.07 | |
Inogen Incorporated | | | 2.00 | |
Integra LifeSciences Holdings Corporation | | | 1.98 | |
RealPage Incorporated | | | 1.92 | |
|
| Sector distribution as of November 30, 20187 |
|
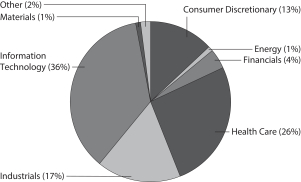
|
| ‡ | CFA® and Chartered Financial Analyst® are trademarks owned by CFA Institute. |
| 1 | The Fund is a gateway feeder fund that invests substantially all of its assets in a single affiliated master portfolio of the Wells Fargo Master Trust with a substantially identical investment objective and substantially similar investment strategies. References to the investment activities of the Fund are intended to refer to the investment activities of the affiliated master portfolio in which it invests. |
| 2 | Historical performance shown for Class R6 shares prior to their inception reflects the performance of Institutional Class shares, and includes the higher expenses applicable to Institutional Class shares. If these expenses had not been included, returns for Class R6 shares would be higher. |
| 3 | Reflects the expense ratios as stated in the most recent prospectuses. The expense ratios shown are subject to change and may differ from the annualized expense ratios shown in the financial highlights of this report. |
| 4 | The manager has contractually committed through September 30, 2019, to waive fees and/or reimburse expenses to the extent necessary to cap the Fund’s Total Annual Fund Operating Expenses After Fee Waivers at the amounts shown. After this time, the cap may be increased or the commitment to maintain the cap may be terminated only with the approval of the Board of Trustees. Brokerage commissions, stamp duty fees, interest, taxes, acquired fund fees and expenses (if any) from funds in which the affiliated master portfolio invests, and extraordinary expenses are excluded from the expense cap. Net expenses from the affiliated master portfolio are included in the expense cap. Without this cap, the Fund’s returns would have been lower. The expense ratio paid by an investor is the net expense ratio (the total annual fund operating expenses after fee waivers) as stated in the prospectuses. |
| 5 | The Russell 2000® Growth Index measures the performance of those Russell 2000 companies with higher price/book ratios and higher forecasted growth values. You cannot invest directly in an index. |
| 6 | The ten largest holdings, excluding cash, cash equivalents and any money market funds, are calculated based on the value of the securities of the affiliated master portfolio allocable to the Fund divided by the total net assets of the Fund. Holdings are subject to change and may have changed since the date specified. |
| 7 | Amounts represent the sector distribution of the affiliated master portfolio which are calculated based on the total long-term investments of the affiliated master portfolio. These amounts are subject to change and may have changed since the date specified. |
| | | | |
| 8 | | Wells Fargo Emerging Growth Fund | | Fund expenses (unaudited) |
As a shareholder of the Fund, you incur two types of costs: (1) transaction costs, including sales charges (loads) on purchase payments and contingent deferred sales charges (if any) on redemptions and (2) ongoing costs, including management fees, distribution (12b-1) and/or shareholder servicing fees, and other Fund expenses. This example is intended to help you understand your ongoing costs (in dollars) of investing in the Fund and to compare these costs with the ongoing costs of investing in other mutual funds.
The example is based on an investment of $1,000 invested at the beginning of the six-month period and held for the entire period from June 1, 2018 to November 30, 2018.
Actual expenses
The “Actual” line of the table below provides information about actual account values and actual expenses. You may use the information in this line, together with the amount you invested, to estimate the expenses that you paid over the period. Simply divide your account value by $1,000 (for example, an $8,600 account value divided by $1,000 = 8.6), then multiply the result by the number in the “Actual” line under the heading entitled “Expenses paid during period” for your applicable class of shares to estimate the expenses you paid on your account during this period.
Hypothetical example for comparison purposes
The “Hypothetical” line of the table below provides information about hypothetical account values and hypothetical expenses based on the Fund’s actual expense ratio and an assumed rate of return of 5% per year before expenses, which is not the Fund’s actual return. The hypothetical account values and expenses may not be used to estimate the actual ending account balance or expenses you paid for the period. You may use this information to compare the ongoing costs of investing in the Fund and other funds. To do so, compare this 5% hypothetical example with the 5% hypothetical examples that appear in the shareholder reports of the other funds.
Please note that the expenses shown in the table are meant to highlight your ongoing costs only and do not reflect any transactional costs, such as sales charges (loads) and contingent deferred sales charges. Therefore, the “Hypothetical” line of the table is useful in comparing ongoing costs only and will not help you determine the relative total costs of owning different funds. In addition, if these transactional costs were included, your costs would have been higher.
| | | | | | | | | | | | | | | | |
| | | Beginning
account value
6-1-2018 | | | Ending
account value
11-30-2018 | | | Expenses
paid during
the period1,2 | | | Annualized net
expense ratio1 | |
Class A | | | | | | | | | | | | | | | | |
Actual | | $ | 1,000.00 | | | $ | 987.68 | | | $ | 6.48 | | | | 1.30 | % |
Hypothetical (5% return before expenses) | | $ | 1,000.00 | | | $ | 1,018.55 | | | $ | 6.58 | | | | 1.30 | % |
Class C | | | | | | | | | | | | | | | | |
Actual | | $ | 1,000.00 | | | $ | 984.20 | | | $ | 10.20 | | | | 2.05 | % |
Hypothetical (5% return before expenses) | | $ | 1,000.00 | | | $ | 1,014.79 | | | $ | 10.35 | | | | 2.05 | % |
Class R6 | | | | | | | | | | | | | | | | |
Actual | | $ | 1,000.00 | | | $ | 991.15 | | | $ | 4.24 | | | | 0.85 | % |
Hypothetical (5% return before expenses) | | $ | 1,000.00 | | | $ | 1,021.83 | | | $ | 4.31 | | | | 0.85 | % |
Administrator Class | | | | | | | | | | | | | | | | |
Actual | | $ | 1,000.00 | | | $ | 988.60 | | | $ | 5.98 | | | | 1.20 | % |
Hypothetical (5% return before expenses) | | $ | 1,000.00 | | | $ | 1,019.05 | | | $ | 6.07 | | | | 1.20 | % |
Institutional Class | | | | | | | | | | | | | | | | |
Actual | | $ | 1,000.00 | | | $ | 990.16 | | | $ | 4.49 | | | | 0.90 | % |
Hypothetical (5% return before expenses) | | $ | 1,000.00 | | | $ | 1,020.56 | | | $ | 4.56 | | | | 0.90 | % |
| 1 | Amounts reflect net expenses allocated from the affiliated Master Portfolio in which the Fund invests. |
| 2 | Expenses paid is equal to the annualized net expense ratio of each class multiplied by the average account value over the period, multiplied by the number of days in the most recent fiscal half-year divided by the number of days in the fiscal year (to reflect the one-half-year period). |
| | | | | | |
| Portfolio of investments—November 30, 2018 (unaudited) | | Wells Fargo Emerging Growth Fund | | | 9 | |
| | | | | | | | | | | | | | | | |
| Security name | | | | | | | | | | | Value | |
| | | | |
Investment Companies: 99.87% | | | | | | | | | | | | | | | | |
| | | | |
| Affiliated Master Portfolio: 99.87% | | | | | | | | | | | | | | | | |
Wells Fargo Emerging Growth Portfolio | | | | | | | | | | | | | | $ | 788,361,884 | |
| | | | | | | | | | | | | | | | |
| | | | |
Total Investment Companies (Cost $551,734,102) | | | | | | | | | | | | | | | 788,361,884 | |
| | | | | | | | | | | | | | | | |
| | | | | | | | |
| Total investments in securities (Cost $551,734,102) | | | 99.87 | % | | | 788,361,884 | |
Other assets and liabilities, net | | | 0.13 | | | | 998,967 | |
| | | | | | | | |
| Total net assets | | | 100.00 | % | | $ | 789,360,851 | |
| | | | | | | | |
Transactions with the affiliated Master Portfolio were as follows:
| | | | | | | | | | | | | | | | | | | | | | | | | | | | | | | | | | | | |
| | | % of
ownership,
beginning of
period | | | % of
ownership,
end of
period | | | Net
realized
gains
(losses) on
securities
transactions
allocated
from
affiliated
Master
Portfolio | | | Net change in
unrealized
gains
(losses) on
securities
transactions
allocated
from
affiliated
Master
Portfolio | | | Dividends
allocated
from
affiliated
Master
Portfolio | | | Securities
lending
income
allocated
from
affiliated
Master
Portfolio | | | Affiliated
income
allocated
from
affiliated
Master
Portfolio | | | Value,
end
of period | | | % of
net
assets | |
Wells Fargo Emerging Growth Portfolio | | | 93 | % | | | 89 | % | | $ | 73,407,063 | | | $ | (78,617,604 | ) | | $ | 866,015 | | | $ | 361,869 | | | $ | 191,622 | | | $ | 788,361,884 | | | | 99.87 | % |
The accompanying notes are an integral part of these financial statements.
| | | | |
| 10 | | Wells Fargo Emerging Growth Fund | | Statement of assets and liabilities—November 30, 2018 (unaudited) |
| | | | |
| | | | |
| |
Assets | | | | |
Investments in affiliated Master Portfolio, at value (cost $551,734,102) | | $ | 788,361,884 | |
Receivable for Fund shares sold | | | 1,699,091 | |
Receivable from manager | | | 40,333 | |
Prepaid expenses and other assets | | | 49,436 | |
| | | | |
Total assets | | | 790,150,744 | |
| | | | |
| |
Liabilities | | | | |
Payable for Fund shares redeemed | | | 528,895 | |
Administration fees payable | | | 101,012 | |
Shareholder report expenses payable | | | 50,742 | |
Shareholder servicing fees payable | | | 43,728 | |
Custodian and accounting fees payable | | | 42,106 | |
Distribution fee payable | | | 2,735 | |
Trustees’ fees and expenses payable | | | 2,294 | |
Accrued expenses and other liabilities | | | 18,381 | |
| | | | |
Total liabilities | | | 789,893 | |
| | | | |
Total net assets | | $ | 789,360,851 | |
| | | | |
| |
NET ASSETS CONSIST OF | | | | |
Paid-in capital | | $ | 420,797,901 | |
Total distributable earnings | | | 368,562,950 | |
| | | | |
Total net assets | | $ | 789,360,851 | |
| | | | |
| |
COMPUTATION OF NET ASSET VALUE AND OFFERING PRICE PER SHARE | | | | |
Net assets – Class A | | $ | 149,435,129 | |
Shares outstanding – Class A1 | | | 8,878,355 | |
Net asset value per share – Class A | | | $16.83 | |
Maximum offering price per share – Class A2 | | | $17.86 | |
Net assets – Class C | | $ | 4,260,549 | |
Shares outstanding – Class C1 | | | 284,913 | |
Net asset value per share – Class C | | | $14.95 | |
Net assets – Class R6 | | $ | 252,046 | |
Shares outstanding – Class R61 | | | 13,910 | |
Net asset value per share – R6 | | | $18.12 | |
Net assets – Administrator Class | | $ | 48,341,046 | |
Shares outstanding – Administrator Class1 | | | 2,788,150 | |
Net asset value per share – Administrator Class | | | $17.34 | |
Net assets – Institutional Class | | $ | 587,072,081 | |
Shares outstanding – Institutional Class1 | | | 32,406,964 | |
Net asset value per share – Institutional Class | | | $18.12 | |
| 1 | The Fund has an unlimited number of authorized shares. |
| 2 | Maximum offering price is computed as 100/94.25 of net asset value. On investments of $50,000 or more, the offering price is reduced. |
The accompanying notes are an integral part of these financial statements.
| | | | | | |
| Statement of operations—six months ended November 30, 2018 (unaudited) | | Wells Fargo Emerging Growth Fund | | | 11 | |
| | | | |
| | | | |
| |
Investment income | | | | |
Dividends allocated from affiliated Master Portfolio | | $ | 866,015 | |
Securities lending income allocated from affiliated Master Portfolio | | | 361,869 | |
Affiliated income allocated from affiliated Master Portfolio | | | 191,622 | |
Expenses allocated from affiliated Master Portfolio | | | (3,458,913 | ) |
| | | | |
Total investment income | | | (2,039,407 | ) |
| | | | |
| |
Expenses | | | | |
Management fee | | | 215,253 | |
Administration fees | | | | |
Class A | | | 168,535 | |
Class C | | | 4,757 | |
Class R6 | | | 18 | 1 |
Administrator Class | | | 35,174 | |
Institutional Class | | | 417,130 | |
Shareholder servicing fees | | | | |
Class A | | | 200,636 | |
Class C | | | 5,664 | |
Administrator Class | | | 67,639 | |
Distribution fee | | | | |
Class C | | | 16,990 | |
Custody and accounting fees | | | 9,206 | |
Professional fees | | | 16,646 | |
Registration fees | | | 35,972 | |
Shareholder report expenses | | | 56,975 | |
Trustees’ fees and expenses | | | 11,038 | |
Other fees and expenses | | | 11,740 | |
| | | | |
Total expenses | | | 1,273,373 | |
Less: Fee waivers and/or expense reimbursements | | | (427,980 | ) |
| | | | |
Net expenses | | | 845,393 | |
| | | | |
Net investment loss | | | (2,884,800 | ) |
| | | | |
| |
REALIZED AND UNREALIZED GAINS (LOSSES) ON INVESTMENTS | | | | |
Net realized gains on securities transactions allocated from affiliated Master Portfolio | | | 73,407,063 | |
Net change in unrealized gains (losses) on securities transactions allocated from affiliated Master Portfolio | | | (78,617,604 | ) |
| | | | |
Net realized and unrealized gains (losses) on investments | | | (5,210,541 | ) |
| | | | |
Net decrease in net assets resulting from operations | | $ | (8,095,341 | ) |
| | | | |
| 1 | For the period from July 31, 2018 (commencement of operations) to November 30, 2018 |
The accompanying notes are an integral part of these financial statements.
| | | | |
| 12 | | Wells Fargo Emerging Growth Fund | | Statement of changes in net assets |
| | | | | | | | | | | | | | | | |
| | | Six months ended
November 30, 2018
(unaudited) | | | Year ended
May 31, 20181 | |
| | | | |
Operations | | | | | | | | | | | | | | | | |
Net investment loss | | | | | | $ | (2,884,800 | ) | | | | | | $ | (5,006,023 | ) |
Net realized gains on investments | | | | | | | 73,407,063 | | | | | | | | 111,281,986 | |
Net change in unrealized gains (losses) on investments | | | | | | | (78,617,604 | ) | | | | | | | 111,090,852 | |
| | | | |
Net increase (decrease) in net assets resulting from operations | | | | | | | (8,095,341 | ) | | | | | | | 217,366,815 | |
| | | | |
| | | | |
Distributions to shareholders from net investment income and net realized gains | | | | | | | | | | | | | | | | |
Class A | | | | | | | 0 | | | | | | | | (16,172,743 | ) |
Class C | | | | | | | 0 | | | | | | | | (446,164 | ) |
Administrator Class | | | | | | | 0 | | | | | | | | (5,883,416 | ) |
Institutional Class | | | | | | | 0 | | | | | | | | (62,422,402 | ) |
| | | | |
Total distributions to shareholders | | | | | | | 0 | | | | | | | | (84,924,725 | ) |
| | | | |
| | | | |
Capital share transactions | | | Shares | | | | | | | | Shares | | | | | |
Proceeds from shares sold | | | | | | | | | | | | | | | | |
Class A | | | 386,521 | | | | 6,888,941 | | | | 304,935 | | | | 4,820,337 | |
Class C | | | 34,593 | | | | 552,953 | | | | 26,206 | | | | 364,560 | |
Class R6 | | | 14,133 | 2 | | | 288,882 | 2 | | | N/A | | | | N/A | |
Administrator Class | | | 252,731 | | | | 4,631,682 | | | | 418,055 | | | | 6,747,014 | |
Institutional Class | | | 4,492,488 | | | | 85,035,911 | | | | 5,505,435 | | | | 91,822,139 | |
| | | | |
| | | | | | | 97,398,369 | | | | | | | | 103,754,050 | |
| | | | |
Reinvestment of distributions | | | | | | | | | | | | | | | | |
Class A | | | 0 | | | | 0 | | | | 1,097,179 | | | | 15,689,654 | |
Class C | | | 0 | | | | 0 | | | | 34,857 | | | | 446,164 | |
Administrator Class | | | 0 | | | | 0 | | | | 398,600 | | | | 5,863,399 | |
Institutional Class | | | 0 | | | | 0 | | | | 3,940,125 | | | | 60,402,110 | |
| | | | |
| | | | | | | 0 | | | | | | | | 82,401,327 | |
| | | | |
Payment for shares redeemed | | | | | | | | | | | | | | | | |
Class A | | | (519,476 | ) | | | (9,242,158 | ) | | | (1,293,442 | ) | | | (20,049,449 | ) |
Class C | | | (25,428 | ) | | | (395,695 | ) | | | (35,973 | ) | | | (509,745 | ) |
Class R6 | | | (223 | )2 | | | (4,051 | )2 | | | N/A | | | | N/A | |
Administrator Class | | | (448,183 | ) | | | (8,009,266 | ) | | | (1,240,005 | ) | | | (19,665,862 | ) |
Institutional Class | | | (5,240,880 | ) | | | (99,070,126 | ) | | | (10,895,635 | ) | | | (180,356,163 | ) |
| | | | |
| | | | | | | (116,721,296 | ) | | | | | | | (220,581,219 | ) |
| | | | |
Net decrease in net assets resulting from capital share transactions | | | | | | | (19,322,927 | ) | | | | | | | (34,425,842 | ) |
| | | | |
Total increase (decrease) in net assets | | | | | | | (27,418,268 | ) | | | | | | | 98,016,248 | |
| | | | |
| | | | |
Net assets | | | | | | | | | | | | | | | | |
Beginning of period | | | | | | | 816,779,119 | | | | | | | | 718,762,871 | |
| | | | |
End of period | | | | | | $ | 789,360,851 | | | | | | | $ | 816,779,119 | |
| | | | |
| 1 | Effective for all filings after November 4, 2018, the SEC prospectively eliminated the requirement to parenthetically disclose undistributed net investment income at the end of the period and permitted the aggregation of distributions, with the exception of tax basis returns of capital. Accumulated net investment loss at May 31, 2018 was $1,472,576. The disaggregated distributions information for the year ended May 31, 2018 is included in Note 7,Distributions to Shareholders, in the notes to the financial statements. |
| 2 | For the period from July 31, 2018 (commencement of operations) to November 30, 2018 |
The accompanying notes are an integral part of these financial statements.
| | | | | | |
| Financial highlights | | Wells Fargo Emerging Growth Fund | | | 13 | |
(For a share outstanding throughout each period)
| | | | | | | | | | | | | | | | | | | | | | | | |
| | | Six months ended
November 30, 2018
(unaudited) | | | Year ended May 31 | |
| CLASS A | | 2018 | | | 2017 | | | 2016 | | | 2015 | | | 2014 | |
Net asset value, beginning of period | | | $17.04 | | | | $14.57 | | | | $12.55 | | | | $16.70 | | | | $14.61 | | | | $14.10 | |
Net investment loss | | | (0.09 | ) | | | (0.15 | ) | | | (0.10 | )1 | | | (0.13 | )1 | | | (0.22 | ) | | | (0.19 | ) |
Net realized and unrealized gains (losses) on investments | | | (0.12 | ) | | | 4.57 | | | | 2.96 | | | | (2.28 | ) | | | 3.51 | | | | 1.88 | |
| | | | | | | | | | | | | | | | | | | | | | | | |
Total from investment operations | | | (0.21 | ) | | | 4.42 | | | | 2.86 | | | | (2.41 | ) | | | 3.29 | | | | 1.69 | |
Distributions to shareholders from | | | | | | | | | | | | | | | | | | | | | | | | |
Net realized gains | | | 0.00 | | | | (1.95 | ) | | | (0.84 | ) | | | (1.74 | ) | | | (1.20 | ) | | | (1.18 | ) |
Net asset value, end of period | | | $16.83 | | | | $17.04 | | | | $14.57 | | | | $12.55 | | | | $16.70 | | | | $14.61 | |
Total return2 | | | (1.23 | )% | | | 32.91 | % | | | 23.39 | % | | | (14.94 | )% | | | 23.32 | % | | | 11.30 | % |
Ratios to average net assets (annualized) | | | | | | | | | | | | | | | | | | | | | | | | |
Gross expenses3 | | | 1.35 | % | | | 1.36 | % | | | 1.36 | % | | | 1.35 | % | | | 1.39 | % | | | 1.39 | % |
Net expenses3 | | | 1.30 | % | | | 1.35 | % | | | 1.35 | % | | | 1.35 | % | | | 1.37 | % | | | 1.37 | % |
Net investment loss3 | | | (0.97 | )% | | | (1.01 | )% | | | (0.72 | )% | | | (0.92 | )% | | | (1.20 | )% | | | (1.20 | )% |
Supplemental data | | | | | | | | | | | | | | | | | | | | | | | | |
Portfolio turnover rate4 | | | 39 | % | | | 47 | % | | | 115 | % | | | 68 | % | | | 56 | % | | | 63 | % |
Net assets, end of period (000s omitted) | | | $149,435 | | | | $153,526 | | | | $129,724 | | | | $127,154 | | | | $131,638 | | | | $130,403 | |
| 1 | Calculated based upon average shares outstanding |
| 2 | Total return calculations do not include any sales charges. Returns for periods of less than one year are not annualized. |
| 3 | Ratios include net expenses allocated from the affiliated Master Portfolio which were as follows: |
| | | | |
Six months ended November 30, 2018 (unaudited) | | | 0.80 | % |
Year ended May 31, 2018 | | | 0.81 | % |
Year ended May 31, 2017 | | | 0.81 | % |
Year ended May 31, 2016 | | | 0.80 | % |
Year ended May 31, 2015 | | | 0.80 | % |
Year ended May 31, 2014 | | | 0.80 | % |
| 4 | Portfolio turnover rate is calculated by multiplying the affiliated Master Portfolio’s percentage of the Fund’s total investments in securities at the end of the period by the affiliated Master Portfolio’s portfolio turnover rate. |
The accompanying notes are an integral part of these financial statements.
| | | | |
| 14 | | Wells Fargo Emerging Growth Fund | | Financial highlights |
(For a share outstanding throughout each period)
| | | | | | | | | | | | | | | | | | | | | | | | |
| | | Six months ended
November 30, 2018 (unaudited) | | | Year ended May 31 | |
| CLASS C | | 2018 | | | 2017 | | | 2016 | | | 2015 | | | 2014 | |
Net asset value, beginning of period | | | $15.19 | | | | $13.28 | | | | $11.58 | | | | $15.67 | | | | $13.88 | | | | $13.55 | |
Net investment loss | | | (0.14 | )1 | | | (0.25 | )1 | | | (0.19 | )1 | | | (0.21 | ) | | | (0.33 | ) | | | (0.32 | ) |
Net realized and unrealized gains (losses) on investments | | | (0.10 | ) | | | 4.11 | | | | 2.73 | | | | (2.14 | ) | | | 3.32 | | | | 1.83 | |
| | | | | | | | | | | | | | | | | | | | | | | | |
Total from investment operations | | | (0.24 | ) | | | 3.86 | | | | 2.54 | | | | (2.35 | ) | | | 2.99 | | | | 1.51 | |
Distributions to shareholders from | | | | | | | | | | | | | | | | | | | | | | | | |
Net realized gains | | | 0.00 | | | | (1.95 | ) | | | (0.84 | ) | | | (1.74 | ) | | | (1.20 | ) | | | (1.18 | ) |
Net asset value, end of period | | | $14.95 | | | | $15.19 | | | | $13.28 | | | | $11.58 | | | | $15.67 | | | | $13.88 | |
Total return2 | | | (1.58 | )% | | | 31.82 | % | | | 22.56 | % | | | (15.59 | )% | | | 22.35 | % | | | 10.40 | % |
Ratios to average net assets (annualized) | | | | | | | | | | | | | | | | | | | | | | | | |
Gross expenses3 | | | 2.10 | % | | | 2.11 | % | | | 2.11 | % | | | 2.10 | % | | | 2.14 | % | | | 2.14 | % |
Net expenses3 | | | 2.05 | % | | | 2.10 | % | | | 2.10 | % | | | 2.10 | % | | | 2.12 | % | | | 2.12 | % |
Net investment loss3 | | | (1.72 | )% | | | (1.76 | )% | | | (1.46 | )% | | | (1.70 | )% | | | (1.95 | )% | | | (1.95 | )% |
Supplemental data | | | | | | | | | | | | | | | | | | | | | | | | |
Portfolio turnover rate4 | | | 39 | % | | | 47 | % | | | 115 | % | | | 68 | % | | | 56 | % | | | 63 | % |
Net assets, end of period (000s omitted) | | | $4,261 | | | | $4,190 | | | | $3,328 | | | | $3,815 | | | | $5,101 | | | | $4,816 | |
| 1 | Calculated based upon average shares outstanding |
| 2 | Total return calculations do not include any sales charges. Returns for periods of less than one year are not annualized. |
| 3 | Ratios include net expenses allocated from the affiliated Master Portfolio which were as follows: |
| | | | |
Six months ended November 30, 2018 (unaudited) | | | 0.80 | % |
Year ended May 31, 2018 | | | 0.81 | % |
Year ended May 31, 2017 | | | 0.81 | % |
Year ended May 31, 2016 | | | 0.80 | % |
Year ended May 31, 2015 | | | 0.80 | % |
Year ended May 31, 2014 | | | 0.80 | % |
| 4 | Portfolio turnover rate is calculated by multiplying the affiliated Master Portfolio’s percentage of the Fund’s total investments in securities at the end of the period by the affiliated Master Portfolio’s portfolio turnover rate. |
The accompanying notes are an integral part of these financial statements.
| | | | | | |
| Financial highlights | | Wells Fargo Emerging Growth Fund | | | 15 | |
(For a share outstanding throughout the period)
| | | | |
| CLASS R6 | | Period ended
November 30, 20181 (unaudited) | |
Net asset value, beginning of period | | | $18.70 | |
Net investment loss | | | (0.02 | ) |
Net realized and unrealized gains (losses) on investments | | | (0.56 | ) |
| | | | |
Total from investment operations | | | (0.58 | ) |
Net asset value, end of period | | | $18.12 | |
Total return2 | | | (3.10 | )% |
Ratios to average net assets (annualized) | | | | |
Gross expenses3 | | | 0.92 | % |
Net expenses3 | | | 0.85 | % |
Net investment loss3 | | | (0.39 | )% |
Supplemental data | | | | |
Portfolio turnover rate4 | | | 39 | % |
Net assets, end of period (000s omitted) | | | $252 | |
| 1 | For the period from July, 31, 2018 (commencement of class operations) to November 30, 2018 |
| 2 | Returns for periods of less than one year are not annualized. |
| 3 | Ratio includes net expenses allocated from the affiliated Master Portfolio in the amount of 0.81%. |
| 4 | Portfolio turnover rate is calculated by multiplying the affiliated Master Portfolio’s percentage of the Fund’s total investments in securities at the end of the period by the affiliated Master Portfolio’s portfolio turnover rate. |
The accompanying notes are an integral part of these financial statements.
| | | | |
| 16 | | Wells Fargo Emerging Growth Fund | | Financial highlights |
(For a share outstanding throughout each period)
| | | | | | | | | | | | | | | | | | | | | | | | |
| | | Six months ended
November 30, 2018 (unaudited) | | | Year ended May 31 | |
| ADMINISTRATOR CLASS | | 2018 | | | 2017 | | | 2016 | | | 2015 | | | 2014 | |
Net asset value, beginning of period | | | $17.54 | | | | $14.93 | | | | $12.82 | | | | $17.00 | | | | $14.83 | | | | $14.28 | |
Net investment loss | | | (0.08 | )1 | | | (0.14 | )1 | | | (0.07 | )1 | | | (0.12 | )1 | | | (0.16 | )1 | | | (0.17 | )1 |
Net realized and unrealized gains (losses) on investments | | | (0.12 | ) | | | 4.70 | | | | 3.02 | | | | (2.32 | ) | | | 3.53 | | | | 1.90 | |
| | | | | | | | | | | | | | | | | | | | | | | | |
Total from investment operations | | | (0.20 | ) | | | 4.56 | | | | 2.95 | | | | (2.44 | ) | | | 3.37 | | | | 1.73 | |
Distributions to shareholders from | | | | | | | | | | | | | | | | | | | | | | | | |
Net realized gains | | | 0.00 | | | | (1.95 | ) | | | (0.84 | ) | | | (1.74 | ) | | | (1.20 | ) | | | (1.18 | ) |
Net asset value, end of period | | | $17.34 | | | | $17.54 | | | | $14.93 | | | | $12.82 | | | | $17.00 | | | | $14.83 | |
Total return2 | | | (1.14 | )% | | | 33.06 | % | | | 23.60 | % | | | (14.80 | )% | | | 23.45 | % | | | 11.45 | % |
Ratios to average net assets (annualized) | | | | | | | | | | | | | | | | | | | | | | | | |
Gross expenses3 | | | 1.27 | % | | | 1.28 | % | | | 1.26 | % | | | 1.23 | % | | | 1.21 | % | | | 1.22 | % |
Net expenses3 | | | 1.20 | % | | | 1.20 | % | | | 1.20 | % | | | 1.20 | % | | | 1.20 | % | | | 1.20 | % |
Net investment loss3 | | | (0.87 | )% | | | (0.86 | )% | | | (0.48 | )% | | | (0.80 | )% | | | (1.03 | )% | | | (1.03 | )% |
Supplemental data | | | | | | | | | | | | | | | | | | | | | | | | |
Portfolio turnover rate4 | | | 39 | % | | | 47 | % | | | 47 | % | | | 68 | % | | | 56 | % | | | 63 | % |
Net assets, end of period (000s omitted) | | | $48,341 | | | | $52,335 | | | | $52,335 | | | | $99,792 | | | | $159,813 | | | | $190,126 | |
| 1 | Calculated based upon average shares outstanding |
| 2 | Returns for periods of less than one year are not annualized. |
| 3 | Ratios include net expenses allocated from the affiliated Master Portfolio which were as follows: |
| | | | |
Six months ended November 30, 2018 (unaudited) | | | 0.80 | % |
Year ended May 31, 2018 | | | 0.81 | % |
Year ended May 31, 2017 | | | 0.81 | % |
Year ended May 31, 2016 | | | 0.80 | % |
Year ended May 31, 2015 | | | 0.80 | % |
Year ended May 31, 2014 | | | 0.80 | % |
| 4 | Portfolio turnover rate is calculated by multiplying the affiliated Master Portfolio’s percentage of the Fund’s total investments in securities at the end of the period by the affiliated Master Portfolio’s portfolio turnover rate. |
The accompanying notes are an integral part of these financial statements.
| | | | | | |
| Financial highlights | | Wells Fargo Emerging Growth Fund | | | 17 | |
(For a share outstanding throughout each period)
| | | | | | | | | | | | | | | | | | | | | | | | |
| | | Six months ended
November 30, 2018 (unaudited) | | | Year ended May 31 | |
| INSTITUTIONAL CLASS | | 2018 | | | 2017 | | | 2016 | | | 2015 | | | 2014 | |
Net asset value, beginning of period | | | $18.30 | | | | $15.46 | | | | $13.20 | | | | $17.40 | | | | $15.11 | | | | $14.49 | |
Net investment loss | | | (0.05 | ) | | | (0.09 | ) | | | (0.04 | )1 | | | (0.07 | ) | | | (0.12 | ) | | | (0.11 | ) |
Net realized and unrealized gains (losses) on investments | | | (0.13 | ) | | | 4.88 | | | | 3.14 | | | | (2.39 | ) | | | 3.61 | | | | 1.91 | |
| | | | | | | | | | | | | | | | | | | | | | | | |
Total from investment operations | | | (0.18 | ) | | | 4.79 | | | | 3.10 | | | | 2.46 | | | | 3.49 | | | | 1.80 | |
Distributions to shareholders from | | | | | | | | | | | | | | | | | | | | | | | | |
Net realized gains | | | 0.00 | | | | (1.95 | ) | | | (0.84 | ) | | | (1.74 | ) | | | (1.20 | ) | | | (1.18 | ) |
Net asset value, end of period | | | $18.12 | | | | $18.30 | | | | $15.46 | | | | $13.20 | | | | $17.40 | | | | $15.11 | |
Total return2 | | | (0.98 | )% | | | 33.44 | % | | | 24.08 | % | | | (14.62 | )% | | | 23.89 | % | | | 11.77 | % |
Ratios to average net assets (annualized) | | | | | | | | | | | | | | | | | | | | | | | | |
Gross expenses3 | | | 1.02 | % | | | 1.03 | % | | | 1.03 | % | | | 1.01 | % | | | 0.96 | % | | | 0.96 | % |
Net expenses3 | | | 0.90 | % | | | 0.90 | % | | | 0.90 | % | | | 0.90 | % | | | 0.90 | % | | | 0.90 | % |
Net investment loss3 | | | (0.57 | )% | | | (0.56 | )% | | | (0.24 | )% | | | (0.50 | )% | | | (0.73 | )% | | | (0.73 | )% |
Supplemental data | | | | | | | | | | | | | | | | | | | | | | | | |
Portfolio turnover rate4 | | | 39 | % | | | 47 | % | | | 115 | % | | | 68 | % | | | 56 | % | | | 63 | % |
Net assets, end of period (000s omitted) | | | $587,072 | | | | $606,729 | | | | $534,846 | | | | $583,843 | | | | $723,946 | | | | $650,650 | |
| 1 | Calculated based upon average shares outstanding |
| 2 | Returns for periods of less than one year are not annualized. |
| 3 | Ratios include net expenses allocated from the affiliated Master Portfolio which were as follows: |
| | | | |
Six months ended November 30, 2018 (unaudited) | | | 0.80 | % |
Year ended May 31, 2018 | | | 0.81 | % |
Year ended May 31, 2017 | | | 0.81 | % |
Year ended May 31, 2016 | | | 0.80 | % |
Year ended May 31, 2015 | | | 0.80 | % |
Year ended May 31, 2014 | | | 0.80 | % |
| 4 | Portfolio turnover rate is calculated by multiplying the affiliated Master Portfolio’s percentage of the Fund’s total investments in securities at the end of the period by the affiliated Master Portfolio’s portfolio turnover rate. |
The accompanying notes are an integral part of these financial statements.
| | | | |
| 18 | | Wells Fargo Emerging Growth Fund | | Notes to financial statements (unaudited) |
1. ORGANIZATION
Wells Fargo Funds Trust (the “Trust”), a Delaware statutory trust organized on March 10, 1999, is an open-end management investment company registered under the Investment Company Act of 1940, as amended (the “1940 Act”). As an investment company, the Trust follows the accounting and reporting guidance in Financial Accounting Standards Board (“FASB”) Accounting Standards Codification Topic 946, Financial Services – Investment Companies. These financial statements report on the Wells Fargo Emerging Growth Fund (the “Fund”) which is a diversified series of the Trust.
The Fund is a feeder fund in a master-feeder structure that invests substantially all of its assets in a single master portfolio with a substantially identical investment objective and substantially similar investment strategies. The Fund seeks to achieve its investment objective by investing all investable assets in a separate diversified portfolio (the “affiliated Master Portfolio”) of Wells Fargo Master Trust, a registered open-end management investment company. The affiliated Master Portfolio directly acquires portfolio securities and the Fund acquires an indirect interest in those securities. The Fund accounts for its investment in the affiliated Master Portfolio as a partnership investment and records on a daily basis its share of the affiliated Master Portfolio’s income, expense and realized and unrealized gains and losses. The financial statements of the affiliated Master Portfolio for the six months ended November 30, 2018 are included in this report and should be read in conjunction with the Fund’s financial statements. As of November 30, 2018, the Fund owned 89% of Wells Fargo Emerging Growth Portfolio.
2. SIGNIFICANT ACCOUNTING POLICIES
The following significant accounting policies, which are consistently followed in the preparation of the financial statements of the Fund, are in conformity with U.S. generally accepted accounting principles which require management to make estimates and assumptions that affect the reported amounts of assets and liabilities, disclosure of contingent assets and liabilities at the date of the financial statements, and the reported amounts of revenues and expenses during the reporting period. Actual results could differ from those estimates.
Securities valuation
All investments are valued each business day as of the close of regular trading on the New York Stock Exchange (generally 4 p.m. Eastern Time), although the Fund may deviate from this calculation time under unusual or unexpected circumstances.
Investments in the affiliated Master Portfolio are valued daily based on the Fund’s proportionate share of the affiliated Master Portfolio’s net assets, which are also valued daily. Securities held in the affiliated Master Portfolio are valued as discussed in the Notes to Financial Statements of the affiliated Master Portfolio, which are included elsewhere in this report.
Investment transactions, income and expenses
Investments in the affiliated Master Portfolio are recorded on a trade basis.
The Fund records daily its proportionate share of the affiliated Master Portfolio’s interest and dividend income, expenses and realized and unrealized gains or losses. The Fund also accrues its own expenses.
Distributions to shareholders
Distributions to shareholders from net investment income and any net realized gains are recorded on the ex-dividend date and paid at least annually. Such distributions are determined in accordance with income tax regulations and may differ from U.S. generally accepted accounting principles. Dividend sources are estimated at the time of declaration. The tax character of distributions is determined as of the Fund’s fiscal year end. Therefore, a portion of the Fund’s distributions made prior to the Fund’s fiscal year end may be categorized as a tax return of capital at year end.
Federal and other taxes
The Fund intends to continue to qualify as a regulated investment company by distributing substantially all of its investment company taxable income and any net realized capital gains (after reduction for capital loss carryforwards) sufficient to relieve it from all, or substantially all, federal income taxes. Accordingly, no provision for federal income taxes was required.
The Fund’s income and federal excise tax returns and all financial records supporting those returns for the prior three fiscal years are subject to examination by the federal and Delaware revenue authorities. Management has analyzed the Fund’s tax positions taken on federal, state, and foreign tax returns for all open tax years and does not believe that there are any uncertain tax positions that require recognition of a tax liability.
| | | | | | |
| Notes to financial statements (unaudited) | | Wells Fargo Emerging Growth Fund | | | 19 | |
As of November 30, 2018, the aggregate cost of all investments for federal income tax purposes was $549,635,880 and the unrealized gains (losses) consisted of:
| | | | |
Gross unrealized gains | | $ | 238,726,004 | |
Gross unrealized losses | | | 0 | |
Net unrealized gains | | $ | 238,726,004 | |
Class allocations
The separate classes of shares offered by the Fund differ principally in applicable sales charges, distribution, shareholder servicing, and administration fees. Class specific expenses are charged directly to that share class. Investment income, common expenses, and realized and unrealized gains (losses) on investments are allocated daily to each class of shares based on the relative proportion of net assets of each class.
3. FAIR VALUATION MEASUREMENTS
At November 30, 2018, the affiliated Master Portfolio was measured at fair value using the net asset value per share (or its equivalent) as a practical expedient. The investment objective and the value of the affiliate Master Portfolio was as follows:
| | | | | | |
| Affiliated Master Portfolio | | Investment objective | | Value of
affiliated Master
Portfolio | |
Wells Fargo Emerging Growth Portfolio | | Seeks long-term capital appreciation | | | $788,361,884 | |
The affiliated Master Portfolio does not have a redemption period notice, can be redeemed daily and does not have any unfunded commitments.
4. TRANSACTIONS WITH AFFILIATES
Management fee
Wells Fargo Funds Management, LLC (“Funds Management”), an indirect wholly owned subsidiary of Wells Fargo & Company (“Wells Fargo”), is the manager of the Fund and provides advisory and fund-level administrative services under an investment management agreement. Under the investment management agreement, Funds Management is responsible for, among other services, implementing the investment objectives and strategies of the Fund, supervising the subadviser and providing fund-level administrative services in connection with the Fund’s operations. As long as the Fund continues to invest substantially all of its assets in a single affiliated Master Portfolio, the Fund pays Funds Management an investment management fee only for fund-level administrative services at an annual rate starting at 0.05% and declining to 0.03% as the average daily net assets of the Fund increase. For the six months ended November 30, 2018, the management fee was equivalent to an annual rate of 0.05% of the Fund’s average daily net assets.
Funds Management also serves as the adviser to the affiliated Master Portfolio and is entitled to receive a fee from the affiliated Master Portfolio for those services.
Administration fees
Under a class-level administration agreement, Funds Management provides class-level administrative services to the Fund, which includes paying fees and expenses for services provided by the transfer agent, sub-transfer agents, omnibus account servicers and record-keepers. As compensation for its services under the class-level administration agreement, Funds Management receives an annual fee which is calculated based on the average daily net assets of each class as follows:
| | | | |
| | | Class-level
administration fee | |
Class A, Class C | | | 0.21 | % |
Class R6 | | | 0.03 | |
Administrator Class, Institutional Class | | | 0.13 | |
| | | | |
| 20 | | Wells Fargo Emerging Growth Fund | | Notes to financial statements (unaudited) |
Funds Management has contractually waived and/or reimbursed management and administration fees to the extent necessary to maintain certain net operating expense ratios for the Fund. When each class of the Fund has exceeded its expense cap, Funds Management has waived fees and/or reimbursed expenses from fund level expenses on a proportionate basis and then from class specific expenses; otherwise, waivers and/or reimbursements are applied against class specific expenses before fund level expenses. Net expenses from the affiliated Master Portfolio are included in the expense cap. Funds Management has committed through September 30, 2019 to waive fees and/or reimburse expenses to the extent necessary to cap each Fund’s expenses at 1.28% for Class A shares, 2.03% for Class C shares, 0.85% for Class R6 shares, 1.20% for Class Administrator Class shares, and 0.90% for Institutional Class shares. After this time, the cap may be increased or the commitment to maintain the cap may be terminated only with the approval of the Board of Trustees.Prior to August 1, 2018, the Fund’s expenses were capped at 1.35% for Class A shares and 2.10% for Class C shares.
Distribution fee
The Trust has adopted a distribution plan for Class C shares of the Fund pursuant to Rule 12b-1 under the 1940 Act. A distribution fee is charged to Class C shares and paid to Wells Fargo Funds Distributor, LLC (“Funds Distributor”), the principal underwriter, at an annual rate of 0.75% of the average daily net assets of Class C shares.
In addition, Funds Distributor is entitled to receive the front-end sales charge from the purchase of Class A shares and a contingent deferred sales charge on the redemption of certain Class A shares. Funds Distributor is also entitled to receive the contingent deferred sales charges from redemptions of Class C shares. For the six months ended November 30, 2018, Funds Distributor received $1,852 from the sale of Class A shares. No contingent deferred sales charges were incurred by Class A and Class C shares for the six months ended November 30, 2018.
Shareholder servicing fees
The Trust has entered into contracts with one or more shareholder servicing agents, whereby Class A, Class C, and Administrator Class of the Fund are charged a fee at an annual rate of 0.25% of the average daily net assets of each respective class.
A portion of these total shareholder servicing fees were paid to affiliates of Wells Fargo.
5. INVESTMENT PORTFOLIO TRANSACTIONS
The Fund seeks to achieve its investment objective by investing substantially all of its investable assets in a single affiliated Master Portfolio. Purchases and sales have been calculated by multiplying the Fund’s ownership percentage of the affiliated Master Portfolio by the affiliated Master Portfolio’s purchases and sales. Purchases and sales of investments, excluding U.S. government obligations (if any) and short-term securities, for the six months ended November 30, 2018 were $325,877,495 and $322,249,252, respectively.
6. BANK BORROWINGS
The Trust (excluding the money market funds), Wells Fargo Master Trust and Wells Fargo Variable Trust are parties to a $280,000,000 revolving credit agreement whereby the Fund is permitted to use bank borrowings for temporary or emergency purposes, such as to fund shareholder redemption requests. Interest under the credit agreement is charged to the Fund based on a borrowing rate equal to the higher of the Federal Funds rate in effect on that day plus 1.25% or the overnight LIBOR rate in effect on that day plus 1.25%. In addition, an annual commitment fee equal to 0.25% of the unused balance is allocated to each participating fund.
For the six months ended November 30, 2018, there were no borrowings by the Fund under the agreement.
7. DISTRIBUTIONS TO SHAREHOLDERS
Effective for all filings after November 4, 2018, the Securities and Exchange Commission eliminated the requirement to separately state the components of distributions to shareholders. The amounts of distributions to shareholders for the year ended May 31, 2018 were as follows:
| | | | |
| | | Net realized gains | |
Class A | | | $16,172,743 | |
Class C | | | 446,164 | |
Administrator Class | | | 5,883,416 | |
Institutional Class | | | 62,422,402 | |
| | | | | | |
| Notes to financial statements (unaudited) | | Wells Fargo Emerging Growth Fund | | | 21 | |
8. CONCENTRATION RISK
Concentration risk result from exposure to a limited number of sectors. Through its investment in the affiliated Master Portfolio which may invest a substantial portion of its assets in any sector, the Fund may in turn be more affected by changes in that sector than a fund whose investments are not heavily weighted in any sector.
9. INDEMNIFICATION
Under the Trust’s organizational documents, the officers and Trustees have been granted certain indemnification rights against certain liabilities that may arise out of performance of their duties to the Trust. Additionally, in the normal course of business, the Trust may enter into contracts with service providers that contain a variety of indemnification clauses. The Trust’s maximum exposure under these arrangements is dependent on future claims that may be made against the Fund and, therefore, cannot be estimated.
10. NEW ACCOUNTING PRONOUNCEMENT
In August 2018, FASB issued Accounting Standards Update (“ASU”) No. 2018-13, Fair Value Measurement (Topic 820) Disclosure Framework—Changes to the Disclosure Requirements for Fair Value Measurement.ASU 2018-13 updates the disclosure requirements for fair value measurements by modifying or removing certain disclosures and adding certain new disclosures. The amendments are effective for fiscal years, and interim periods within those fiscal years, beginning after December 15, 2019. Early adoption is permitted. Management has adopted the removal and modification of disclosures early, as permitted, and will adopt the additional new disclosures at the effective date.
11. SUBSEQUENT DISTRIBUTION
On December 12, 2018, the Fund declared distributions from short-term capital gains and long-term capital gains to shareholders of record on December 11, 2018. The per share amounts payable on December 13, 2018 were as follows:
| | | | | | | | |
| | | Short-term
capital gains | | | Long-term
capital gains | |
Class A | | | $0.33298 | | | | $2.84278 | |
Class C | | | 0. 33298 | | | | 2.84278 | |
Class R6 | | | 0. 33298 | | | | 2.84278 | |
Administrator Class | | | 0. 33298 | | | | 2.84278 | |
Institutional Class | | | 0. 33298 | | | | 2.84278 | |
These distributions are not reflected in the accompanying financial statements.
| | | | |
| 22 | | Wells Fargo Emerging Growth Portfolio | | Portfolio of investments—November 30, 2018 (unaudited) |
| | | | | | | | | | | | | | | | |
| Security name | | | | | | | | Shares | | | Value | |
| | | | |
Common Stocks: 98.68% | | | | | | | | | | | | | | | | |
| | | | |
Communication Services: 1.36% | | | | | | | | | | | | | | | | |
| | | | |
| Interactive Media & Services: 0.23% | | | | | | | | | | | | | | | | |
Eventbrite Incorporated Class A † | | | | | | | | | | | 67,105 | | | $ | 1,993,690 | |
| | | | | | | | | | | | | | | | |
| | | | |
| Media: 1.13% | | | | | | | | | | | | | | | | |
Nexstar Media Group Incorporated Class A | | | | | | | | | | | 120,500 | | | | 9,958,120 | |
| | | | | | | | | | | | | | | | |
| | | | |
Consumer Discretionary: 12.50% | | | | | | | | | | | | | | | | |
| | | | |
| Auto Components: 0.44% | | | | | | | | | | | | | | | | |
Cooper-Standard Holdings Incorporated † | | | | | | | | | | | 52,360 | | | | 3,828,563 | |
| | | | | | | | | | | | | | | | |
| | | | |
| Diversified Consumer Services: 2.74% | | | | | | | | | | | | | | | | |
Chegg Incorporated † | | | | | | | | | | | 486,614 | | | | 13,600,861 | |
Grand Canyon Education Incorporated † | | | | | | | | | | | 86,360 | | | | 10,567,010 | |
| |
| | | | 24,167,871 | |
| | | | | | | | | | | | | | | | |
| | | | |
| Hotels, Restaurants & Leisure: 3.37% | | | | | | | | | | | | | | | | |
Golden Entertainment Incorporated † | | | | | | | | | | | 23,460 | | | | 424,391 | |
Planet Fitness Incorporated Class A † | | | | | | | | | | | 283,960 | | | | 15,680,271 | |
Playa Hotels & Resorts NV † | | | | | | | | | | | 536,680 | | | | 4,068,034 | |
Wingstop Incorporated | | | | | | | | | | | 144,718 | | | | 9,496,395 | |
| |
| | | | 29,669,091 | |
| | | | | | | | | | | | | | | | |
| | | | |
| Internet & Direct Marketing Retail: 0.28% | | | | | | | | | | | | | | | | |
Farfetch Limited Class A † | | | | | | | | | | | 110,022 | | | | 2,503,001 | |
| | | | | | | | | | | | | | | | |
| | | | |
| Leisure Products: 1.01% | | | | | | | | | | | | | | | | |
Mastercraft Boat Holdings Incorporated † | | | | | | | | | | | 190,716 | | | | 4,941,452 | |
Yeti Holdings Incorporated † | | | | | | | | | | | 234,648 | | | | 3,951,472 | |
| |
| | | | 8,892,924 | |
| | | | | | | | | | | | | | | | |
| | | | |
| Multiline Retail: 1.64% | | | | | | | | | | | | | | | | |
Ollie’s Bargain Outlet Holdings Incorporated † | | | | | | | | | | | 163,260 | | | | 14,481,162 | |
| | | | | | | | | | | | | | | | |
| | | | |
| Specialty Retail: 3.02% | | | | | | | | | | | | | | | | |
At Home Group Incorporated † | | | | | | | | | | | 239,000 | | | | 6,811,500 | |
Five Below Incorporated † | | | | | | | | | | | 56,097 | | | | 5,878,405 | |
Lithia Motors Incorporated Class A | | | | | | | | | | | 117,980 | | | | 9,775,823 | |
National Vision Holdings Incorporated † | | | | | | | | | | | 112,066 | | | | 4,120,667 | |
| |
| | | | 26,586,395 | |
| | | | | | | | | | | | | | | | |
| | | | |
Consumer Staples: 1.18% | | | | | | | | | | | | | | | | |
| | | | |
| Food & Staples Retailing: 0.76% | | | | | | | | | | | | | | | | |
The Chef’s Warehouse Incorporated † | | | | | | | | | | | 176,100 | | | | 6,711,171 | |
| | | | | | | | | | | | | | | | |
| | | | |
| Food Products: 0.42% | | | | | | | | | | | | | | | | |
Freshpet Incorporated † | | | | | | | | | | | 112,300 | | | | 3,705,900 | |
| | | | | | | | | | | | | | | | |
The accompanying notes are an integral part of these financial statements.
| | | | | | |
| Portfolio of investments—November 30, 2018 (unaudited) | | Wells Fargo Emerging Growth Portfolio | | | 23 | |
| | | | | | | | | | | | | | | | |
| Security name | | | | | | | | Shares | | | Value | |
| | | | |
Energy: 1.39% | | | | | | | | | | | | | | | | |
| | | | |
| Energy Equipment & Services: 0.68% | | | | | | | | | | | | | | | | |
Cactus Incorporated Class A † | | | | | | | | | | | 121,729 | | | $ | 3,515,534 | |
FTS International Incorporated † | | | | | | | | | | | 252,133 | | | | 2,491,074 | |
| | | | |
| | | | | | | | | | | | | | | 6,006,608 | |
| | | | | | | | | | | | | | | | |
| | | | |
| Oil, Gas & Consumable Fuels: 0.71% | | | | | | | | | | | | | | | | |
Matador Resources Company † | | | | | | | | | | | 171,736 | | | | 3,915,581 | |
PDC Energy Incorporated † | | | | | | | | | | | 67,790 | | | | 2,300,793 | |
| | | | |
| | | | | | | | | | | | | | | 6,216,374 | |
| | | | | | | | | | | | | | | | |
| | | | |
Financials: 5.38% | | | | | | | | | | | | | | | | |
| | | | |
| Capital Markets: 1.39% | | | | | | | | | | | | | | | | |
Stifel Financial Corporation | | | | | | | | | | | 254,200 | | | | 12,270,234 | |
| | | | | | | | | | | | | | | | |
| | | | |
| Insurance: 3.07% | | | | | | | | | | | | | | | | |
Kinsale Capital Group Incorporated | | | | | | | | | | | 325,084 | | | | 20,223,476 | |
Trupanion Incorporated Ǡ | | | | | | | | | | | 227,400 | | | | 6,806,082 | |
| | | | |
| | | | | | | | | | | | | | | 27,029,558 | |
| | | | | | | | | | | | | | | | |
| | | | |
| Thrifts & Mortgage Finance: 0.92% | | | | | | | | | | | | | | | | |
LendingTree Incorporated † | | | | | | | | | | | 31,332 | | | | 8,156,973 | |
| | | | | | | | | | | | | | | | |
| | | | |
Health Care: 28.40% | | | | | | | | | | | | | | | | |
| | | | |
| Biotechnology: 7.84% | | | | | | | | | | | | | | | | |
Audentes Therapeutics Incorporated † | | | | | | | | | | | 77,042 | | | | 1,883,677 | |
CareDx Incorporated † | | | | | | | | | | | 221,984 | | | | 6,497,472 | |
Heron Therapeutics Incorporated † | | | | | | | | | | | 198,450 | | | | 5,701,469 | |
Ligand Pharmaceuticals Incorporated † | | | | | | | | | | | 143,501 | | | | 22,640,153 | |
Repligen Corporation † | | | | | | | | | | | 360,240 | | | | 23,296,721 | |
Translate Bio Incorporated † | | | | | | | | | | | 27,538 | | | | 199,100 | |
Vanda Pharmaceuticals Incorporated † | | | | | | | | | | | 355,000 | | | | 8,889,200 | |
| | | | |
| | | | | | | | | | | | | | | 69,107,792 | |
| | | | | | | | | | | | | | | | |
| | | | |
| Health Care Equipment & Supplies: 9.74% | | | | | | | | | | | | | | | | |
Axogen Incorporated † | | | | | | | | | | | 437,777 | | | | 14,656,774 | |
Glaukos Corporation † | | | | | | | | | | | 89,339 | | | | 5,885,653 | |
Inogen Incorporated † | | | | | | | | | | | 58,550 | | | | 8,627,928 | |
iRhythm Technologies Incorporated † | | | | | | | | | | | 178,762 | | | | 13,242,689 | |
Merit Medical Systems Incorporated † | | | | | | | | | | | 250,800 | | | | 15,812,940 | |
Neogen Corporation † | | | | | | | | | | | 56,100 | | | | 3,638,646 | |
Neuronetics Incorporated † | | | | | | | | | | | 188,118 | | | | 3,356,025 | |
Nevro Corporation † | | | | | | | | | | | 33,645 | | | | 1,396,604 | |
NxStage Medical Incorporated † | | | | | | | | | | | 200,540 | | | | 5,663,250 | |
SI-BONE Incorporated † | | | | | | | | | | | 242,597 | | | | 4,357,042 | |
Tactile Systems Technology Class I † | | | | | | | | | | | 92,273 | | | | 5,189,434 | |
Vapotherm Incorporated † | | | | | | | | | | | 217,308 | | | | 3,996,294 | |
| | | | |
| | | | | | | | | | | | | | | 85,823,279 | |
| | | | | | | | | | | | | | | | |
The accompanying notes are an integral part of these financial statements.
| | | | |
| 24 | | Wells Fargo Emerging Growth Portfolio | | Portfolio of investments—November 30, 2018 (unaudited) |
| | | | | | | | | | | | | | | | |
| Security name | | | | | | | | Shares | | | Value | |
| | | | |
| Health Care Providers & Services: 3.28% | | | | | | | | | | | | | | | | |
Amedisys Incorporated † | | | | | | | | | | | 77,200 | | | $ | 10,518,500 | |
HealthEquity Incorporated † | | | | | | | | | | | 207,012 | | | | 18,359,894 | |
| | | | |
| | | | | | | | | | | | | | | 28,878,394 | |
| | | | | | | | | | | | | | | | |
| | | | |
| Health Care Technology: 4.16% | | | | | | | | | | | | | | | | |
Tabula Rasa Healthcare Incorporated † | | | | | | | | | | | 117,500 | | | | 8,868,900 | |
Teladoc Incorporated Ǡ | | | | | | | | | | | 242,679 | | | | 15,155,304 | |
Vocera Communications Incorporated † | | | | | | | | | | | 317,000 | | | | 12,597,580 | |
| | | | |
| | | | | | | | | | | | | | | 36,621,784 | |
| | | | | | | | | | | | | | | | |
| | | | |
| Life Sciences Tools & Services: 2.11% | | | | | | | | | | | | | | | | |
Codexis Incorporated † | | | | | | | | | | | 850,438 | | | | 18,641,601 | |
| | | | | | | | | | | | | | | | |
| | | | |
| Pharmaceuticals: 1.27% | | | | | | | | | | | | | | | | |
Dova Pharmaceuticals Incorporated Ǡ | | | | | | | | | | | 115,559 | | | | 1,721,829 | |
Optinose Incorporated Ǡ | | | | | | | | | | | 123,187 | | | | 969,482 | |
Supernus Pharmaceuticals Incorporated † | | | | | | | | | | | 178,500 | | | | 8,464,470 | |
| | | | |
| | | | | | | | | | | | | | | 11,155,781 | |
| | | | | | | | | | | | | | | | |
| | | | |
Industrials: 16.84% | | | | | | | | | | | | | | | | |
| | | | |
| Aerospace & Defense: 1.84% | | | | | | | | | | | | | | | | |
AAR Corporation | | | | | | | | | | | 49,000 | | | | 2,140,810 | |
Mercury Computer Systems Incorporated † | | | | | | | | | | | 272,345 | | | | 14,110,194 | |
| | | | |
| | | | | | | | | | | | | | | 16,251,004 | |
| | | | | | | | | | | | | | | | |
| | | | |
| Airlines: 1.61% | | | | | | | | | | | | | | | | |
SkyWest Incorporated | | | | | | | | | | | 245,730 | | | | 14,173,706 | |
| | | | | | | | | | | | | | | | |
| | | | |
| Commercial Services & Supplies: 1.05% | | | | | | | | | | | | | | | | |
Advanced Disposal Services Incorporated † | | | | | | | | | | | 342,902 | | | | 9,241,209 | |
| | | | | | | | | | | | | | | | |
| | | | |
| Construction & Engineering: 2.81% | | | | | | | | | | | | | | | | |
Dycom Industries Incorporated † | | | | | | | | | | | 62,230 | | | | 4,123,360 | |
Granite Construction Incorporated | | | | | | | | | | | 118,950 | | | | 6,022,439 | |
MasTec Incorporated † | | | | | | | | | | | 323,900 | | | | 14,604,651 | |
| | | | |
| | | | | | | | | | | | | | | 24,750,450 | |
| | | | | | | | | | | | | | | | |
| | | | |
| Electrical Equipment: 0.27% | | | | | | | | | | | | | | | | |
Bloom Energy Corporation Class A Ǡ | | | | | | | | | | | 144,401 | | | | 2,375,396 | |
| | | | | | | | | | | | | | | | |
| | | | |
| Machinery: 4.56% | | | | | | | | | | | | | | | | |
John Bean Technologies Corporation | | | | | | | | | | | 59,990 | | | | 4,951,575 | |
Milacron Holdings Corporation † | | | | | | | | | | | 565,758 | | | | 8,062,052 | |
Mueller Water Products Incorporated Class A | | | | | | | | | | | 304,980 | | | | 3,211,439 | |
RBC Bearings Incorporated † | | | | | | | | | | | 45,900 | | | | 7,023,618 | |
Rexnord Corporation † | | | | | | | | | | | 598,110 | | | | 16,932,494 | |
| | | | |
| | | | | | | | | | | | | | | 40,181,178 | |
| | | | | | | | | | | | | | | | |
The accompanying notes are an integral part of these financial statements.
| | | | | | |
| Portfolio of investments—November 30, 2018 (unaudited) | | Wells Fargo Emerging Growth Portfolio | | | 25 | |
| | | | | | | | | | | | | | | | |
| Security name | | | | | | | | Shares | | | Value | |
| | | | |
| Professional Services: 3.75% | | | | | | | | | | | | | | | | |
ASGN Incorporated † | | | | | | | | | | | 404,343 | | | $ | 28,000,753 | |
Korn/Ferry International | | | | | | | | | | | 103,000 | | | | 5,043,910 | |
| | | | |
| | | | | | | | | | | | | | | 33,044,663 | |
| | | | | | | | | | | | | | | | |
| | | | |
| Trading Companies & Distributors: 0.95% | | | | | | | | | | | | | | | | |
BMC Stock Holdings Incorporated † | | | | | | | | | | | 101,390 | | | | 1,724,644 | |
SiteOne Landscape Supply Incorporated † | | | | | | | | | | | 108,200 | | | | 6,669,448 | |
| | | | |
| | | | | | | | | | | | | | | 8,394,092 | |
| | | | | | | | | | | | | | | | |
| | | | |
Information Technology: 30.90% | | | | | | | | | | | | | | | | |
| | | | |
| Electronic Equipment, Instruments & Components: 2.67% | | | | | | | | | | | | | | | | |
Littelfuse Incorporated | | | | | | | | | | | 25,540 | | | | 4,887,079 | |
nLight Incorporated Ǡ | | | | | | | | | | | 185,561 | | | | 3,544,215 | |
Novanta Incorporated † | | | | | | | | | | | 232,720 | | | | 15,110,505 | |
| | | | |
| | | | | | | | | | | | | | | 23,541,799 | |
| | | | | | | | | | | | | | | | |
| | | | |
| IT Services: 4.73% | | | | | | | | | | | | | | | | |
Carbonite Incorporated † | | | | | | | | | | | 66,400 | | | | 1,881,112 | |
Endava plc Sponsored ADR † | | | | | | | | | | | 114,914 | | | | 2,838,376 | |
EVO Payments Incorporated Class A † | | | | | | | | | | | 256,677 | | | | 6,722,371 | |
InterXion Holding NV † | | | | | | | | | | | 431,720 | | | | 26,883,204 | |
Wix.com Limited † | | | | | | | | | | | 35,810 | | | | 3,372,586 | |
| | | | |
| | | | | | | | | | | | | | | 41,697,649 | |
| | | | | | | | | | | | | | | | |
| | | | |
| Semiconductors & Semiconductor Equipment: 2.86% | | | | | | | | | | | | | | | | |
Diodes Incorporated † | | | | | | | | | | | 291,331 | | | | 10,147,059 | |
Monolithic Power Systems Incorporated | | | | | | | | | | | 44,980 | | | | 5,940,509 | |
Semtech Corporation † | | | | | | | | | | | 170,700 | | | | 9,105,138 | |
| | | | |
| | | | | | | | | | | | | | | 25,192,706 | |
| | | | | | | | | | | | | | | | |
| | | | |
| Software: 20.64% | | | | | | | | | | | | | | | | |
2U Incorporated † | | | | | | | | | | | 70,950 | | | | 4,142,771 | |
Alarm.com Holdings Incorporated † | | | | | | | | | | | 28,000 | | | | 1,423,800 | |
Altair Engineering Incorporated Class A † | | | | | | | | | | | 274,253 | | | | 8,861,114 | |
Anaplan Incorporated † | | | | | | | | | | | 184,656 | | | | 5,170,368 | |
BlackLine Incorporated † | | | | | | | | | | | 209,423 | | | | 8,977,964 | |
Bottomline Technologies (DE) Incorporated † | | | | | | | | | | | 226,650 | | | | 12,481,616 | |
Cision Limited † | | | | | | | | | | | 605,250 | | | | 7,577,730 | |
Envestnet Incorporated † | | | | | | | | | | | 326,692 | | | | 17,850,451 | |
Five9 Incorporated † | | | | | | | | | | | 463,560 | | | | 19,877,453 | |
Globant SA † | | | | | | | | | | | 59,000 | | | | 3,460,350 | |
Instructure Incorporated † | | | | | | | | | | | 167,270 | | | | 6,317,788 | |
Proofpoint Incorporated † | | | | | | | | | | | 76,230 | | | | 7,395,072 | |
Q2 Holdings Incorporated † | | | | | | | | | | | 411,543 | | | | 22,342,669 | |
Rapid7 Incorporated † | | | | | | | | | | | 414,836 | | | | 13,191,785 | |
RealPage Incorporated † | | | | | | | | | | | 149,600 | | | | 7,716,368 | |
SailPoint Technologies Holdings Incorporated † | | | | | | | | | | | 313,447 | | | | 8,159,025 | |
SendGrid Incorporated † | | | | | | | | | | | 187,779 | | | | 8,564,600 | |
The accompanying notes are an integral part of these financial statements.
| | | | |
| 26 | | Wells Fargo Emerging Growth Portfolio | | Portfolio of investments—November 30, 2018 (unaudited) |
| | | | | | | | | | | | | | | | |
| Security name | | | | | | | | Shares | | | Value | |
| | | | |
| Software(continued) | | | | | | | | | | | | | | | | |
SPS Commerce Incorporated † | | | | | | | | | | | 102,448 | | | $ | 8,731,643 | |
Talend SA ADR † | | | | | | | | | | | 211,018 | | | | 7,330,765 | |
Tenable Holdings Incorporated † | | | | | | | | | | | 81,498 | | | | 2,321,063 | |
| | | | |
| | | | | | | | | | | | | | | 181,894,395 | |
| | | | | | | | | | | | | | | | |
| | | | |
Materials: 0.73% | | | | | | | | | | | | | | | | |
| | | | |
| Chemicals: 0.73% | | | | | | | | | | | | | | | | |
PQ Group Holdings Incorporated † | | | | | | | | | | | 416,720 | | | | 6,396,652 | |
| | | | | | | | | | | | | | | | |
| | | | |
Total Common Stocks (Cost $602,947,827) | | | | | | | | | | | | | | | 869,541,165 | |
| | | | | | | | | | | | | | | | |
| | | | |
Exchange-Traded Funds: 0.30% | | | | | | | | | | | | | | | | |
iShares Russell 2000 Growth Index ETF « | | | | | | | | | | | 13,800 | | | | 2,632,488 | |
| | | | | | | | | | | | | | | | |
| | | | |
Total Exchange-Traded Funds (Cost $2,725,086) | | | | | | | | | | | | | | | 2,632,488 | |
| | | | | | | | | | | | | | | | |
| | | | |
| | | Yield | | | | | | | | | | |
| Short-Term Investments: 3.76% | | | | | | | | | | | | | | | | |
| | | | |
| Investment Companies: 3.76% | | | | | | | | | | | | | | | | |
Securities Lending Cash Investments LLC (l)(r)(u) | | | 2.38 | % | | | | | | | 30,605,024 | | | | 30,608,085 | |
Wells Fargo Government Money Market Fund Select Class (l)(u) | | | 2.13 | | | | | | | | 2,494,626 | | | | 2,494,626 | |
| |
Total Short-Term Investments (Cost $33,100,419) | | | | 33,102,711 | |
| | | | | | | | | | | | | | | | |
| | | | | | | | |
| Total investments in securities (Cost $638,773,332) | | | 102.74 | % | | | 905,276,364 | |
Other assets and liabilities, net | | | (2.74 | ) | | | (24,107,001 | ) |
| | | | | | | | |
| Total net assets | | | 100.00 | % | | $ | 881,169,363 | |
| | | | | | | | |
| † | Non-income-earning security |
| « | All or a portion of this security is on loan. |
| (l) | The issuer of the security is an affiliated person of the Portfolio as defined in the Investment Company Act of 1940. |
| (r) | The investment is a non-registered investment company purchased with cash collateral received from securities on loan. |
| (u) | The rate represents the 7-day annualized yield at period end. |
Abbreviations:
| ADR | American depositary receipt |
The accompanying notes are an integral part of these financial statements.
| | | | | | |
| Portfolio of investments—November 30, 2018 (unaudited) | | Wells Fargo Emerging Growth Portfolio | | | 27 | |
Investments in Affiliates
An affiliated investment is an investment in which the Portfolio owns at least 5% of the outstanding voting shares of the issuer or as a result of other relationships, such as the Portfolio and the issuer having the same adviser or investment manager. Transactions with issuers that were either affiliated persons of the Portfolio at the beginning of the period or the end of the period were as follows:
| | | | | | | | | | | | | | | | | | | | | | | | | | | | | | | | | | | | |
| | | Shares,
beginning of
period | | | Shares
purchased | | | Shares
sold | | | Shares,
end of
period | | | Net
realized
gains
(losses) | | | Net
change in
unrealized
gains
(losses) | | | Income
from
affiliated
securities | | | Value,
end
of period | | | % of
net
assets | |
Short-Term Investments | | | | | | | | | | | | | | | | | | | | | | | | | | | | | | | | | | | | |
Investment Companies | | | | | | | | | | | | | | | | | | | | | | | | | | | | | | | | | | | | |
Securities Lending Cash Investments LLC | | | 46,370,791 | | | | 214,715,099 | | | | 230,480,866 | | | | 30,605,024 | | | $ | 11,640 | | | $ | 0 | | | $ | 401,413 | | | $ | 30,608,085 | | | | | |
Wells Fargo Government Money Market Fund Select Class | | | 2,952,741 | | | | 252,573,192 | | | | 253,031,307 | | | | 2,494,626 | | | | 0 | | | | 0 | | | | 212,973 | | | | 2,494,626 | | | | | |
| | | | | | | | | | | | | | | | | | | | | | | | | | | | | | | | | | | | |
| | | | | | | | | | | | | | | | | | $ | 11,640 | | | $ | 0 | | | $ | 614,386 | | | $ | 33,102,711 | | | | 3.76 | % |
| | | | | | | | | | | | | | | | | | | | | | | | | | | | | | | | | | | | |
The accompanying notes are an integral part of these financial statements.
| | | | |
| 28 | | Wells Fargo Emerging Growth Portfolio | | Statement of assets and liabilities—November 30, 2018 (unaudited) |
| | | | |
| | | | |
| |
Assets | | | | |
Investments in unaffiliated securities (including $29,881,154 of securities loaned), at value (cost $605,672,913) | | $ | 872,173,653 | |
Investments in affiliated securities, at value (cost $33,100,419) | | | 33,102,711 | |
Receivable for investments sold | | | 7,983,837 | |
Receivable for dividends | | | 546,613 | |
Receivable for securities lending income | | | 54,860 | |
Prepaid expenses and other assets | | | 1,443 | |
| | | | |
Total assets | | | 913,863,117 | |
| | | | |
| |
Liabilities | | | | |
Payable upon receipt of securities loaned | | | 30,585,946 | |
Payable for investments purchased | | | 1,376,170 | |
Advisory fee payable | | | 611,579 | |
Accrued expenses and other liabilities | | | 120,059 | |
| | | | |
Total liabilities | | | 32,693,754 | |
| | | | |
Total net assets | | $ | 881,169,363 | |
| | | | |
The accompanying notes are an integral part of these financial statements.
| | | | | | |
| Statement of operations—six months ended November 30, 2018 (unaudited) | | Wells Fargo Emerging Growth Portfolio | | | 29 | |
| | | | |
| | | | |
| |
Investment income | | | | |
Dividends | | $ | 963,437 | |
Securities lending income from affiliates, net | | | 401,413 | |
Income from affiliated securities | | | 212,973 | |
| | | | |
Total investment income | | | 1,577,823 | |
| | | | |
| |
Expenses | | | | |
Advisory fee | | | 3,761,484 | |
Custody and accounting fees | | | 21,218 | |
Professional fees | | | 23,751 | |
Shareholder report expenses | | | 2,287 | |
Trustees’ fees and expenses | | | 11,192 | |
Other fees and expenses | | | 17,203 | |
| | | | |
Net expenses | | | 3,837,135 | |
| | | | |
Net investment loss | | | (2,259,312 | ) |
| | | | |
| |
REALIZED AND UNREALIZED GAINS (LOSSES) ON INVESTMENTS | | | | |
| |
Net realized gains on: | | | | |
Unaffiliated securities | | | 81,569,363 | |
Affiliated securities | | | 11,640 | |
| | | | |
Net realized gains on investments | | | 81,581,003 | |
Net change in unrealized gains (losses) on investments | | | (87,983,668 | ) |
| | | | |
Net realized and unrealized gains (losses) on investments | | | (6,402,665 | ) |
| | | | |
Net decrease in net assets resulting from operations | | $ | (8,661,977 | ) |
| | | | |
The accompanying notes are an integral part of these financial statements.
| | | | |
| 30 | | Wells Fargo Emerging Growth Portfolio | | Statement of changes in net assets |
| | | | | | | | |
| | | Six months ended
November 30, 2018
(unaudited) | | | Year ended
May 31, 2018 | |
| | |
Operations | | | | | | | | |
Net investment loss | | $ | (2,259,312 | ) | | $ | (3,833,027 | ) |
Net realized gains on investments | | | 81,581,003 | | | | 122,582,157 | |
Net change in unrealized gains (losses) on investments | | | (87,983,668 | ) | | | 120,331,062 | |
| | | | |
Net increase (decrease) in net assets resulting from operations | | | (8,661,977 | ) | | | 239,080,192 | |
| | | | |
| |
Capital transactions | | | | |
Transactions in investors’ beneficial interests | | | | | | | | |
Contributions | | | 81,155,703 | | | | 20,933,192 | |
Withdrawals | | | (70,827,606 | ) | | | (175,150,153 | ) |
| | | | |
Net increase (decrease) in net assets resulting from capital transactions | | | 10,328,097 | | | | (154,216,961 | ) |
| | | | |
Total increase in net assets | | | 1,666,120 | | | | 84,863,231 | |
| | | | |
| |
Net assets | | | | |
Beginning of period | | | 879,503,243 | | | | 794,640,012 | |
| | | | |
End of period | | $ | 881,169,363 | | | $ | 879,503,243 | |
| | | | |
The accompanying notes are an integral part of these financial statements.
| | | | | | |
| Financial highlights | | Wells Fargo Emerging Growth Portfolio | | | 31 | |
| | | | | | | | | | | | | | | | | | | | | | | | |
| | | Six months ended
November 30, 2018 (unaudited) | | | Year ended May 31 | |
| | | 2018 | | | 2017 | | | 2016 | | | 2015 | | | 2014 | |
Total return1 | | | (0.92 | )% | | | 33.60 | % | | | 23.97 | % | | | (14.47 | )% | | | 24.02 | % | | | 11.92 | % |
Ratios to average net assets (annualized) | | | | | | | | | | | | | | | | | | | | | | | | |
Gross expenses | | | 0.80 | % | | | 0.81 | % | | | 0.81 | % | | | 0.80 | % | | | 0.80 | % | | | 0.80 | % |
Net expenses | | | 0.80 | % | | | 0.81 | % | | | 0.81 | % | | | 0.80 | % | | | 0.80 | % | | | 0.80 | % |
Net investment loss | | | (0.47 | )% | | | (0.47 | )% | | | (0.15 | )% | | | (0.40 | )% | | | (0.63 | )% | | | (0.62 | )% |
Supplemental data | | | | | | | | | | | | | | | | | | | | | | | | |
Portfolio turnover rate | | | 39 | % | | | 47 | % | | | 115 | % | | | 66 | % | | | 56 | % | | | 63 | % |
| 1 | Returns for periods of less than one year are not annualized |
The accompanying notes are an integral part of these financial statements.
| | | | |
| 32 | | Wells Fargo Emerging Growth Portfolio | | Notes to financial statements (unaudited) |
1. ORGANIZATION
Wells Fargo Master Trust (the “Trust”), a Delaware statutory trust organized on March 10, 1999, is an open-end management investment company registered under the Investment Company Act of 1940, as amended (the “1940 Act”). As an investment company, the Trust follows the accounting and reporting guidance in Financial Accounting Standards Board (“FASB”) Accounting Standards Codification Topic 946, Financial Services – Investment Companies. These financial statements report on the Wells Fargo Emerging Growth Portfolio (“Emerging Growth Portfolio”) which is a diversified series of the Trust.
2. SIGNIFICANT ACCOUNTING POLICIES
The following significant accounting policies, which are consistently followed in the preparation of the financial statements of the Portfolio, are in conformity with U.S. generally accepted accounting principles which require management to make estimates and assumptions that affect the reported amounts of assets and liabilities, disclosure of contingent assets and liabilities at the date of the financial statements, and the reported amounts of revenues and expenses during the reporting period. Actual results could differ from those estimates.
Securities valuation
All investments are valued each business day as of the close of regular trading on the New York Stock Exchange (generally 4 p.m. Eastern Time), although the Portfolio may deviate from this calculation time under unusual or unexpected circumstances.
Equity securities that are listed on a foreign or domestic exchange or market are valued at the official closing price or, if none, the last sales price. If no sale occurs on the principal exchange or market that day, a fair value price will be determined in accordance with the Portfolio’s Valuation Procedures.
Investments in registered open-end investment companies are valued at net asset value. Interests in non-registered investment companies that are redeemable at net asset value are fair valued normally at net asset value.
Investments which are not valued using any of the methods discussed above are valued at their fair value, as determined in good faith by the Board of Trustees of the Portfolio. The Board of Trustees has established a Valuation Committee comprised of the Trustees and has delegated to it the authority to take any actions regarding the valuation of portfolio securities that the Valuation Committee deems necessary or appropriate, including determining the fair value of portfolio securities, unless the determination has been delegated to the Wells Fargo Asset Management Pricing Committee at Wells Fargo Funds Management, LLC (“Funds Management”). The Board of Trustees retains the authority to make or ratify any valuation decisions or approve any changes to the Valuation Procedures as it deems appropriate. On a quarterly basis, the Board of Trustees receives reports on any valuation actions taken by the Valuation Committee or the Wells Fargo Asset Management Pricing Committee which may include items for ratification.
Securities lending
The Portfolio may lend its securities from time to time in order to earn additional income in the form of fees or interest on securities received as collateral or the investment of any cash received as collateral. The Portfolio continues to receive interest or dividends on the securities loaned. The Portfolio receives collateral in the form of cash or securities with a value at least equal to the value of the securities on loan. The value of the loaned securities is determined at the close of each business day and any additional required collateral is delivered to the Portfolio on the next business day. In a securities lending transaction, the net asset value of the Portfolio will be affected by an increase or decrease in the value of the securities loaned and by an increase or decrease in the value of the instrument in which collateral is invested. The amount of securities lending activity undertaken by the Portfolio fluctuates from time to time. In the event of default or bankruptcy by the borrower, the Portfolio may be prevented from recovering the loaned securities or gaining access to the collateral or may experience delays or costs in doing so. In addition, the investment of any cash collateral received may lose all or part of its value. The Portfolio has the right under the lending agreement to recover the securities from the borrower on demand.
The Portfolio lends its securities through an unaffiliated securities lending agent. Cash collateral received in connection with its securities lending transactions is invested in Securities Lending Cash Investments, LLC (the “Securities Lending Fund”). The Securities Lending Fund is exempt from registration under Section 3(c)(7) of the 1940 Act and is managed by Funds Management and is subadvised by Wells Capital Management Incorporated (“WellsCap”), an affiliate of Funds Management and an indirect wholly owned subsidiary of Wells Fargo & Company (“Wells Fargo”). Funds Management receives an advisory fee starting at 0.05% and declining to 0.01% as the average daily net assets of the Securities Lending Fund increase. All of the fees received by Funds Management are paid to WellsCap for its services as subadviser. The
| | | | | | |
| Notes to financial statements (unaudited) | | Wells Fargo Emerging Growth Portfolio | | | 33 | |
Securities Lending Fund seeks to provide a positive return compared to the daily Fed Funds Open Rate by investing in high-quality, U.S. dollar-denominated short-term money market instruments. Securities Lending Fund investments are valued at the evaluated bid price provided by an independent pricing service. Income earned from investment in the Securities Lending Fund is included in securities lending income from affiliates (net of fees and rebates) on the Statement of Operations.
Security transactions and income recognition
Securities transactions are recorded on a trade date basis. Realized gains or losses are recorded on the basis of identified cost.
Dividend income is recognized on the ex-dividend date.
Federal and other taxes
The Portfolio is treated as a separate entity for federal income tax purposes. The Portfolio is not required to pay federal income taxes on its net investment income and net capital gains as it is treated as a partnership for federal income tax purposes. All interest, dividends, gains and losses of the Portfolio are deemed to have been “passed through” to the interest holders in proportion to their holdings of the Portfolio regardless of whether such interest, dividends and gains have been distributed by the Portfolio.
The Portfolio’s income tax returns and all financial records supporting those returns for the prior three fiscal years are subject to examination by the federal revenue authority. Management has analyzed the Portfolio’s tax positions taken on federal, state, and foreign tax returns for all open tax years and does not believe that there are any uncertain tax positions that require recognition of a tax liability.
As of November 30, 2018, the aggregate cost of all investments for federal income tax purposes was $639,205,435 and the unrealized gains (losses) consisted of:
| | | | |
Gross unrealized gains | | $ | 295,531,370 | |
Gross unrealized losses | | | (29,460,441 | ) |
Net unrealized gains | | $ | 266,070,929 | |
3. FAIR VALUATION MEASUREMENTS
Fair value measurements of investments are determined within a framework that has established a fair value hierarchy based upon the various data inputs utilized in determining the value of the Portfolio’s investments. The three-level hierarchy gives the highest priority to unadjusted quoted prices in active markets for identical assets or liabilities (Level 1) and the lowest priority to unobservable inputs (Level 3). The Portfolio’s investments are classified within the fair value hierarchy based on the lowest level of input that is significant to the fair value measurement. The inputs are summarized into three broad levels as follows:
| ∎ | | Level 1 – quoted prices in active markets for identical securities |
| ∎ | | Level 2 – other significant observable inputs (including quoted prices for similar securities, interest rates, prepayment speeds, credit risk, etc.) |
| ∎ | | Level 3 – significant unobservable inputs (including the Portfolio’s own assumptions in determining the fair value of investments) |
The inputs or methodologies used for valuing investments in securities are not necessarily an indication of the risk associated with investing in those securities.
| | | | |
| 34 | | Wells Fargo Emerging Growth Portfolio | | Notes to financial statements (unaudited) |
The following is a summary of the inputs used in valuing the Portfolio’s assets and liabilities as of November 30, 2018:
| | | | | | | | | | | | | | | | |
| | | Quoted prices
(Level 1) | | | Other significant
observable inputs
(Level 2) | | | Significant
unobservable inputs
(Level 3) | | | Total | |
Assets | | | | | | | | | | | | | | | | |
Investments in: | | | | | | | | | | | | | | | | |
| | | | |
Common stocks | | | | | | | | | | | | | | | | |
Communication services | | $ | 11,951,810 | | | $ | 0 | | | $ | 0 | | | $ | 11,951,810 | |
Consumer discretionary | | | 110,129,007 | | | | 0 | | | | 0 | | | | 110,129,007 | |
Consumer staples | | | 10,417,071 | | | | 0 | | | | 0 | | | | 10,417,071 | |
Energy | | | 12,222,982 | | | | 0 | | | | 0 | | | | 12,222,982 | |
Financials | | | 47,456,765 | | | | 0 | | | | 0 | | | | 47,456,765 | |
Health care | | | 250,228,631 | | | | 0 | | | | 0 | | | | 250,228,631 | |
Industrials | | | 148,411,698 | | | | 0 | | | | 0 | | | | 148,411,698 | |
Information technology | | | 272,326,549 | | | | 0 | | | | 0 | | | | 272,326,549 | |
Materials | | | 6,396,652 | | | | 0 | | | | 0 | | | | 6,396,652 | |
| | | | |
Exchange-traded funds | | | 2,632,488 | | | | 0 | | | | 0 | | | | 2,632,488 | |
| | | | |
Short-term investments | | | | | | | | | | | | | | | | |
Investment companies | | | 2,494,626 | | | | 30,608,085 | | | | 0 | | | | 33,102,711 | |
Total assets | | $ | 874,668,279 | | | $ | 30,608,085 | | | $ | 0 | | | $ | 905,276,364 | |
Additional sector, industry or geographic detail is included in the Portfolio of Investments.
At November 30, 2018, the Portfolio did not have any transfers into/out of Level 3.
4. TRANSACTIONS WITH AFFILIATES
Advisory fee
The Trust has entered into an advisory contract with Funds Management, an indirect wholly owned subsidiary of Wells Fargo. The adviser is responsible for implementing investment policies and guidelines and for supervising the subadviser, who is responsible for day-to-day portfolio management of the Portfolio. Pursuant to the contract, Funds Management is entitled to receive an annual advisory fee starting at 0.80% and declining to 0.68% as the average daily net assets of the Portfolio increase. For the six months ended November 30, 2018, the management fee was equivalent to an annual rate of 0.79% of the Portfolio’s average daily net assets.
Funds Management has retained the services of a subadviser to provide daily portfolio management to the Portfolio. The fee for subadvisory services is borne by Funds Management. WellsCap is the subadviser to the Portfolio and is entitled to receive a fee from Funds Management at an annual rate starting at 0.55% and declining to 0.40% as the average daily net assets of the Portfolio increase.
Interfund transactions
The Portfolio may purchase or sell portfolio investment securities to certain other Wells Fargo affiliates pursuant to Rule 17a-7 under the 1940 Act and under procedures adopted by the Board of Trustees. The procedures have been designed to ensure that these interfund transactions, which do not incur broker commissions, are effected at current market prices.
5. INVESTMENT PORTFOLIO TRANSACTIONS
Purchases and sales of investments, excluding U.S. government obligations (if any) and short-term securities, for the six months ended November 30, 2018 were $364,240,421 and $360,185,055, respectively.
6. BANK BORROWINGS
Effective August 28, 2018, the Trust, along with Wells Fargo Variable Trust and Wells Fargo Funds Trust (excluding the money market funds), are parties to a $280,000,000 revolving credit agreement whereby the Portfolio is permitted to use bank borrowings for temporary or emergency purposes, such as to fund shareholder redemption requests. Interest under the credit agreement is charged to the Portfolio based on a borrowing rate equal to the higher of the Federal Funds rate in effect on that day plus 1.25% or the overnight LIBOR rate in effect on that day plus 1.25%. In addition, an annual commitment fee equal to 0.25% of the unused balance is allocated to each participating fund.
| | | | | | |
| Notes to financial statements (unaudited) | | Wells Fargo Emerging Growth Portfolio | | | 35 | |
For the six months ended November 30, 2018, there were no borrowings by the Portfolio under the agreement.
7. CONCENTRATION RISK
Concentration risks result from exposure to a limited number of sectors. A portfolios that invest a substantial portion of its assets in a sector may be more affected by changes in that sector than would be a portfolio whose investments are not heavily weighted in any sector.
8. INDEMNIFICATION
Under the Trust’s organizational documents, the officers and Trustees have been granted certain indemnification rights against certain liabilities that may arise out of performance of their duties to the Trust. Additionally, in the normal course of business, the Trust may enter into contracts with service providers that contain a variety of indemnification clauses. The Trust’s maximum exposure under these arrangements is dependent on future claims that may be made against the Portfolio and, therefore, cannot be estimated.
9. NEW ACCOUNTING PRONOUNCEMENT
In August 2018, FASB issued Accounting Standards Update (“ASU”) No. 2018-13, Fair Value Measurement (Topic 820)Disclosure Framework—Changes to the Disclosure Requirements for Fair Value Measurement. ASU 2018-13 updates the disclosure requirements for fair value measurements by modifying or removing certain disclosures and adding certain new disclosures. The amendments are effective for fiscal years, and interim periods within those fiscal years, beginning after December 15, 2019. Early adoption is permitted. Management has adopted the removal and modification of disclosures early, as permitted, and will adopt the additional new disclosures at the effective date.
| | | | |
| 36 | | Wells Fargo Emerging Growth Fund | | Other information (unaudited) |
PROXY VOTING INFORMATION
A description of the policies and procedures used to determine how to vote proxies relating to portfolio securities is available without charge, upon request, by calling1-800-222-8222, visiting our website at wellsfargofunds.com, or visiting the SEC website at sec.gov. Information regarding how the proxies related to portfolio securities were voted during the most recent 12-month period ended June 30 is available on the website atwellsfargofunds.comor by visiting the SEC website at sec.gov.
PORTFOLIO HOLDINGS INFORMATION
The complete portfolio holdings are publicly available on the website (wellsfargofunds.com) on a one-month delayed basis. In addition, top ten holdings information (excluding derivative positions) is publicly available on the website on a monthly, seven-day or more delayed basis. The Fund and the Portfolio each file their complete schedule of portfolio holdings with the SEC for the first and third quarters of each fiscal year on Form N-Q, which is available by visiting the SEC website at sec.gov. In addition, each Form N-Q may be reviewed and copied at the SEC’s Public Reference Room in Washington, DC, and at regional offices in New York City, at 233 Broadway, and in Chicago, at 175 West Jackson Boulevard, Suite 900. Information about the Public Reference Room may be obtained by calling 1-800-SEC-0330.
| | | | | | |
| Other information (unaudited) | | Wells Fargo Emerging Growth Fund | | | 37 | |
BOARD OF TRUSTEES AND OFFICERS
Each of the Trustees and Officers1 listed in the table below acts in identical capacities for each fund in the Wells Fargo family of funds, which consists of 152 mutual funds comprising the Wells Fargo Funds Trust, Wells Fargo Variable Trust, Wells Fargo Master Trust and four closed-end funds (collectively the “Fund Complex”). This table should be read in conjunction with the Prospectus and the Statement of Additional Information2. The mailing address of each Trustee and Officer is 525 Market Street, 12th Floor, San Francisco, CA 94105. Each Trustee and Officer serves an indefinite term, however, each Trustee serves such term until reaching the mandatory retirement age established by the Trustees.
Independent Trustees
| | | | | | |
Name and year of birth | | Position held and length of service* | | Principal occupations during past five years or longer | | Current other
public company or
investment company
directorships |
William R. Ebsworth (Born 1957) | | Trustee, since 2015 | | Retired. From 1984 to 2013, equities analyst, portfolio manager, research director and chief investment officer at Fidelity Management and Research Company in Boston, Tokyo, and Hong Kong, and retired in 2013 as Chief Investment Officer of Fidelity Strategic Advisers, Inc. where he led a team of investment professionals managing client assets. Prior thereto, Board member of Hong Kong Securities Clearing Co., Hong Kong Options Clearing Corp., the Thailand International Fund, Ltd., Fidelity Investments Life Insurance Company, and Empire Fidelity Investments Life Insurance Company. Board member of the Vincent Memorial Hospital Endowment (non-profit organization), where he serves on the Investment Committee and as a Chair of the Audit Committee. Mr. Ebsworth is a CFA® charterholder. | | N/A |
Jane A. Freeman (Born 1953) | | Trustee, since 2015; Chair Liaison, since 2018 | | Retired. From 2012 to 2014 and 1999 to 2008, Chief Financial Officer of Scientific Learning Corporation. From 2008 to 2012, Ms. Freeman provided consulting services related to strategic business projects. Prior to 1999, Portfolio Manager at Rockefeller & Co. and Scudder, Stevens & Clark. Board member of the Harding Loevner Funds from 1996 to 2014, serving as both Lead Independent Director and chair of the Audit Committee. Board member of the Russell Exchange Traded Funds Trust from 2011 to 2012 and the chair of the Audit Committee. Ms. Freeman is a Board Member of The Ruth Bancroft Garden (non-profit organization). She is also an inactive Chartered Financial Analyst. | | N/A |
Isaiah Harris, Jr.3 (Born 1952) | | Trustee, since 2009 | | Retired. Chairman of the Board of CIGNA Corporation since 2009, and Director since 2005. From 2003 to 2011, Director of Deluxe Corporation. Prior thereto, President and CEO of BellSouth Advertising and Publishing Corp. from 2005 to 2007, President and CEO of BellSouth Enterprises from 2004 to 2005 and President of BellSouth Consumer Services from 2000 to 2003. Emeritus member of the Iowa State University Foundation Board of Governors. Emeritus Member of the Advisory Board of Iowa State University School of Business. Advisory Board Member, Palm Harbor Academy (private school). Advisory Board Member, Child Evangelism Fellowship (non-profit). Mr. Harris is a certified public accountant (inactive status). | | CIGNA Corporation |
Judith M. Johnson3 (Born 1949) | | Trustee, since 2008; Audit Committee Chairman, since 2009 | | Retired. Prior thereto, Chief Executive Officer and Chief Investment Officer of Minneapolis Employees Retirement Fund from 1996 to 2008. Ms. Johnson is an attorney, certified public accountant and a certified managerial accountant. | | N/A |
David F. Larcker (Born 1950) | | Trustee, since 2009 | | James Irvin Miller Professor of Accounting at the Graduate School of Business, Stanford University, Director of the Corporate Governance Research Initiative and Senior Faculty of The Rock Center for Corporate Governance since 2006. From 2005 to 2008, Professor of Accounting at the Graduate School of Business, Stanford University. Prior thereto, Ernst & Young Professor of Accounting at The Wharton School, University of Pennsylvania from 1985 to 2005. | | N/A |
| | | | |
| 38 | | Wells Fargo Emerging Growth Fund | | Other information (unaudited) |
| | | | | | |
Name and year of birth | | Position held and length of service* | | Principal occupations during past five years or longer | | Current other
public company or
investment company
directorships |
Olivia S. Mitchell (Born 1953) | | Trustee, since 2006; Nominating and Governance Committee Chairman, since 2018 | | International Foundation of Employee Benefit Plans Professor, Wharton School of the University of Pennsylvania since 1993. Director of Wharton’s Pension Research Council and Boettner Center on Pensions & Retirement Research, and Research Associate at the National Bureau of Economic Research. Previously, Cornell University Professor from 1978 to 1993. | | N/A |
Timothy J. Penny (Born 1951) | | Trustee, since 1996; Chairman, since 2018; Vice Chairman, from 2017 to 2018 | | President and Chief Executive Officer of Southern Minnesota Initiative Foundation, a non-profit organization, since 2007. Member of the Board of Trustees of NorthStar Education Finance, Inc., a non-profit organization, since 2007. | | N/A |
James G. Polisson (Born 1959) | | Trustee, since 2018; Advisory Board Member, from 2017 to 2018 | | Retired. Chief Marketing Officer, Source (ETF) UK Services, Ltd, from 2015 to 2017. From 2012 to 2015, Principal of The Polisson Group, LLC, a management consulting, corporate advisory and principal investing company. Chief Executive Officer and Managing Director at Russell Investments, Global Exchange Traded Funds from 2010 to 2012. Managing Director of Barclays Global Investors from 1998 to 2010 and Global Chief Marketing Officer for iShares and Barclays Global Investors from 2000 to 2010. Trustee of the San Francisco Mechanics’ Institute, a non-profit organization, from 2013 to 2015. Board member of the Russell Exchange Traded Fund Trust from 2011 to 2012. Director of Barclays Global Investors Holdings Deutschland GmbH from 2006 to 2009. Mr. Polisson is an attorney and has a retired status with the Massachusetts and District of Columbia Bar Associations. | | N/A |
Michael S. Scofield4 (Born 1943) | | Trustee, since 2010 | | Served on the Investment Company Institute’s Board of Governors and Executive Committee from 2008-2011 as well the Governing Council of the Independent Directors Council from 2006-2011 and the Independent Directors Council Executive Committee from 2008-2011. Trustee of the Evergreen Fund complex (and its predecessors) from 1984 to 2010. Chairman of the Evergreen Funds from 2000-2010. Former Trustee of the Mentor Funds. Retired Attorney, Law Offices of Michael S. Scofield. | | N/A |
Pamela Wheelock (Born 1959) | | Trustee, since 2018; Advisory Board Member, from 2017 to 2018 | | Chief Operating Officer, Twin Cities Habitat for Humanity, since January, 2017. Vice President of University Services, University of Minnesota from 2012 to 2017. Prior thereto, on the Board of Directors, Governance Committee and Finance Committee for the Minnesota Philanthropy Partners (Saint Paul Foundation) from 2012 to 2018, Interim President and Chief Executive Officer of Blue Cross Blue Shield of Minnesota from 2010 to 2011, Chairman of the Board from 2009 to 2011 and Board Director from 2003 to 2015. Vice President, Leadership and Community Engagement, Bush Foundation, Saint Paul, Minnesota (a private foundation) from 2009 to 2011. Executive Vice President and Chief Financial Officer, Minnesota Sports and Entertainment from 2004 to 2009 and Senior Vice President from 2002 to 2004. Commissioner of Finance, State of Minnesota, from 1999 to 2002. Currently the Board Chair of the Minnesota Wild Foundation since 2010. | | N/A |
| * | Length of service dates reflect the Trustee’s commencement of service with the Trust’s predecessor entities, where applicable. |
| | | | | | |
| Other information (unaudited) | | Wells Fargo Emerging Growth Fund | | | 39 | |
Officers
| | | | | | |
Name and year of birth | | Position held and length of service | | Principal occupations during past five years or longer | | |
Andrew Owen (Born 1960) | | President, since 2017 | | Executive Vice President of Wells Fargo & Company and Head of Affiliated Managers, Wells Fargo Asset Management, since 2014. In addition, Mr. Owen is currently President, Chief Executive Officer and Director of Wells Fargo Funds Management, LLC since 2017. Prior thereto, Executive Vice President responsible for marketing, investments and product development for Wells Fargo Funds Management, LLC, from 2009 to 2014. | | |
Nancy Wiser1 (Born 1967) | | Treasurer, since 2012 | | Executive Vice President of Wells Fargo Funds Management, LLC since 2011. Chief Operating Officer and Chief Compliance Officer at LightBox Capital Management LLC, from 2008 to 2011. | | |
Alexander Kymn (Born 1973) | | Secretary, since 2018; Chief Legal Officer, since 2018 | | Senior Company Counsel of Wells Fargo Bank, N.A. since 2018 (previously Senior Counsel from 2007 to 2018). Vice President of Wells Fargo Funds Management, LLC from 2008 to 2014. | | |
Michael H. Whitaker (Born 1967) | | Chief Compliance Officer, since 2016 | | Senior Vice President and Chief Compliance Officer since 2016. Senior Vice President and Chief Compliance Officer for Fidelity Investments from 2007 to 2016. | | |
David Berardi (Born 1975) | | Assistant Treasurer, since 2009 | | Vice President of Wells Fargo Funds Management, LLC since 2009. Vice President of Evergreen Investment Management Company, LLC from 2008 to 2010. Manager of Fund Reporting and Control for Evergreen Investment Management Company, LLC from 2004 to 2010. | | |
Jeremy DePalma1 (Born 1974) | | Assistant Treasurer, since 2009 | | Senior Vice President of Wells Fargo Funds Management, LLC since 2009. Senior Vice President of Evergreen Investment Management Company, LLC from 2008 to 2010 and head of the Fund Reporting and Control Team within Fund Administration from 2005 to 2010. | | |
| 1 | Nancy Wiser acts as Treasurer of 76 funds in the Fund Complex. Jeremy DePalma acts as Treasurer of 76 funds and Assistant Treasurer of 76 funds in the Fund Complex. |
| 2 | The Statement of Additional Information includes additional information about the Trustees and is available, without charge, upon request, by calling1-800-222-8222 or by visiting the website atwellsfargofunds.com. |
| 3 | Mr. Harris will replace Ms. Johnson as the Chairman of the Audit Committee effective January 1, 2019. |
| 4 | Mr. Scofield is expected to retire on December 31, 2018. |
| | | | |
| 40 | | Wells Fargo Emerging Growth Fund | | Appendix A (unaudited) |
SALES CHARGE REDUCTIONS AND WAIVERS FOR CERTAIN INTERMEDIARIES
Raymond James & Associates, Inc., Raymond James Financial Services & Raymond James affiliates (“Raymond James”)
Effective on or about March 1, 2019, shareholders purchasing Fund shares through a Raymond James platform or account will be eligible only for the following load waivers (front-end sales charge waivers and contingent deferred, or back-end, sales charge waivers) and discounts, which may differ from those disclosed elsewhere in the Fund’s Prospectus or SAI.
Front-end Sales Load Waivers on Class A shares Available at Raymond James
| | • | | Shares purchased in an investment advisory program. |
| | • | | Shares purchased through reinvestment of capital gains distributions and dividend reinvestment when purchasing shares of the same fund (but not any other fund within the fund family). |
| | • | | Employees and registered representatives of Raymond James or its affiliates and their family members as designated by Raymond James. |
| | • | | Shares purchased from the proceeds of redemptions within the same fund family, provided (1) the repurchase occurs within 90 days following the redemption, (2) the redemption and purchase occur in the same account, and (3) redeemed shares were subject to a front-end or deferred sales load (known as Rights of Reinstatement). |
| | • | | A shareholder in the fund’s Class C shares will have their shares automatically exchanged at net asset value to Class A shares (or the appropriate share class) of the fund if the shares are no longer subject to a CDSC and the exchange is in line with the policies and procedures of Raymond James. |
CDSC Waivers on Class A and C Shares Available at Raymond James
| | • | | Death or disability of the shareholder. |
| | • | | Shares sold as part of a systematic withdrawal plan as described in the Fund’s Prospectus. |
| | • | | Return of excess contributions from an IRA Account. |
| | • | | Shares sold as part of a required minimum distribution for IRA and retirement accounts due to the shareholder reaching age 70½ as described in the Fund’s prospectus. |
| | • | | Shares sold to pay Raymond James fees but only if the transaction is initiated by Raymond James. |
| | • | | Shares acquired through a right of reinstatement. |
Front-end Load Discounts Available at Raymond James: Breakpoints, and/or Rights of Accumulation
| | • | | Breakpoints as described in the Fund’s Prospectus. |
| | • | | Rights of accumulation which entitle shareholders to breakpoint discounts will be automatically calculated based on the aggregated holding of fund family assets held by accounts within the purchaser’s household at Raymond James. Eligible fund family assets not held at Raymond James may be included in the rights of accumulation calculation only if the shareholder notifies his or her financial advisor about such assets. |

For more information
More information about Wells Fargo Funds is available free upon request. To obtain literature, please write, visit the Fund’s website, or call:
Wells Fargo Funds
P.O. Box 219967
Kansas City, MO 64121-9967
Website: wellsfargofunds.com
Individual investors: 1-800-222-8222
Retail investment professionals: 1-888-877-9275
Institutional investment professionals:1-866-765-0778
This report and the financial statements contained herein are submitted for the general information of the shareholders of the Fund. If this report is used for promotional purposes, distribution of the report must be accompanied or preceded by a current prospectus. Before investing, please consider the investment objectives, risks, charges, and expenses of the investment. For a current prospectus and, if available, a summary prospectus, containing this information, call1-800-222-8222 or visit the Fund’s website atwellsfargofunds.com. Read the prospectus carefully before you invest or send money.
Wells Fargo Asset Management (WFAM) is the trade name for certain investment advisory/management firms owned by Wells Fargo & Company. These firms include but are not limited to Wells Capital Management Incorporated and Wells Fargo Funds Management, LLC. Certain products managed by WFAM entities are distributed by Wells Fargo Funds Distributor, LLC (a broker/dealer and Member FINRA).
This material is for general informational and educational purposes only and is NOT intended to provide investment advice or a recommendation of any kind—including a recommendation for any specific investment, strategy, or plan.
INVESTMENT PRODUCTS: NOT FDIC INSURED ◾ NO BANK GUARANTEE ◾ MAY LOSE VALUE
© 2019 Wells Fargo Funds Management, LLC. All rights reserved.
| | |
 | | 318976 01-19 SA282/SAR282 11-18 |
Semi-Annual Report
November 30, 2018

Wells Fargo Index Fund

Beginning on January 1, 2021, as permitted by new regulations adopted by the Securities and Exchange Commission, paper copies of the Wells Fargo Funds’ annual and semi-annual shareholder reports issued after this date will no longer be sent by mail, unless you specifically request paper copies of the reports. Instead, the reports will be made available on the Funds’ website, and you will be notified by mail each time a report is posted and provided with a website address to access the report.
If you already elected to receive shareholder reports electronically, you will not be affected by this change and you need not take any action. You may elect to receive shareholder reports and other communications from the Fund electronically at any time by contacting your financial intermediary (such as a broker-dealer or bank) or, if you are a direct investor, by calling 1-800-222-8222 or by enrolling at wellsfargo.com/advantagedelivery.
You may elect to receive all future reports in paper free of charge. If you invest through a financial intermediary, you can contact your financial intermediary to request that you continue to receive paper copies of your shareholder reports; if you invest directly with the Fund, you can call 1-800-222-8222. Your election to receive reports in paper will apply to all Wells Fargo Funds held in your account with your financial intermediary or, if you are a direct investor, to all Wells Fargo Funds that you hold.

Reduce clutter. Save trees.
Sign up for electronic delivery of prospectuses and shareholder reports atwellsfargo.com/advantagedelivery
Contents
The views expressed and any forward-looking statements are as of November 30, 2018, unless otherwise noted, and are those of the Fund managers and/or Wells Fargo Funds Management, LLC. Discussions of individual securities, or the markets generally, or any Wells Fargo Fund are not intended as individual recommendations. Future events or results may vary significantly from those expressed in any forward-looking statements. The views expressed are subject to change at any time in response to changing circumstances in the market. Wells Fargo Funds Management, LLC and the Fund disclaim any obligation to publicly update or revise any views expressed or forward-looking statements.
INVESTMENT PRODUCTS: NOT FDIC INSURED ◾ NO BANK GUARANTEE ◾ MAY LOSE VALUE
| | | | |
| 2 | | Wells Fargo Index Fund | | Letter to shareholders (unaudited) |

Andrew Owen
President
Wells Fargo Funds
Global trade tensions escalated during the third quarter of 2018.
Dear Shareholder:
We are pleased to offer you this semi-annual report for the Wells Fargo Index Fund for thesix-month period that ended November 30, 2018. During the reporting period, the U.S. generated encouraging economic and business data that was offset by less positive and more inconsistent data from international markets. Investment returns were restrained in comparison with recent periods as geopolitical tensions and uncertainty tended to distract investors from more favorable underlying trends.
For the period, U.S. stocks, as measured by the S&P 500 Index,1 gained 3.02% and international stocks, as measured by the MSCI ACWI ex USA Index (Net),2 declined 8.37%. Based on the MSCI EM Index (Net),3 emerging market stocks lost 9.89%. For bond investors, the Bloomberg Barclays U.S. Aggregate Bond Index4 declined 0.30% while the Bloomberg Barclays Global Aggregateex-USD Index5 fell 3.67%. The Bloomberg Barclays Municipal Bond Index6 gained 0.42%. The ICE BofAML U.S. High Yield Index7 was up 0.19%.
Global trade tensions prompted investor concerns.
Global trade tensions escalated during the third quarter of 2018. The U.S. government’s decision during the second quarter to impose tariffs on a wide range of products manufactured overseas drew retaliatory responses from foreign governments, which punished U.S. commodity producers and product manufacturers. Investors were left to wonder about next steps in what appeared to be an escalating divergence in global economic policies and growth prospects.
Inflation trended higher. TheCPI-U8 added 0.1% in September after an increase of 0.2% in both July and August. On a year-over-year basis, theall-items index rose 2.3% for the 12 months that ended September 30, 2018, after a seasonal adjustment. The rate of increase was slower than that recorded during the first half of 2018. The index for all items less food and energy rose 2.2% for the same12-month period.
| 1 | The S&P 500 Index consists of 500 stocks chosen for market size, liquidity, and industry group representation. It is a market-value-weighted index with each stock’s weight in the index proportionate to its market value. You cannot invest directly in an index. |
| 2 | The Morgan Stanley Capital International (MSCI) All Country World Index (ACWI) ex USA Index (Net) is a free-float-adjusted market-capitalization-weighted index that is designed to measure the equity market performance of developed markets, excluding the U.S. and Canada. Source: MSCI. MSCI makes no express or implied warranties or representations and shall have no liability whatsoever with respect to any MSCI data contained herein. The MSCI data may not be further redistributed or used as a basis for other indices or any securities or financial products. This report is not approved, reviewed, or produced by MSCI. You cannot invest directly in an index. |
| 3 | The MSCI Emerging Markets (EM) Index (Net) is a free-float-adjusted market-capitalization-weighted index that is designed to measure large- andmid-cap equity market performance of emerging markets. The MSCI EM Index (Net) consists of the following 24 emerging market country indices: Brazil, Chile, China, Colombia, the Czech Republic, Egypt, Greece, Hungary, India, Indonesia, Korea, Malaysia, Mexico, Pakistan, Peru, the Philippines, Poland, Qatar, Russia, South Africa, Taiwan, Thailand, Turkey, and the United Arab Emirates. You cannot invest directly in an index. |
| 4 | The Bloomberg Barclays U.S. Aggregate Bond Index is a broad-based benchmark that measures the investment-grade, U.S.-dollar-denominated, fixed-rate taxable bond market, including Treasuries, government-related and corporate securities, mortgage-backed securities (agency fixed-rate and hybrid adjustable-rate mortgage pass-throughs), asset-backed securities, and commercial mortgage-backed securities. You cannot invest directly in an index. |
| 5 | The Bloomberg Barclays Global Aggregateex-USD Index is an unmanaged index that provides a broad-based measure of the global investment-grade fixed-income markets excluding the U.S.-dollar-denominated debt market. You cannot invest directly in an index. |
| 6 | The Bloomberg Barclays Municipal Bond Index is an unmanaged index composed of long-termtax-exempt bonds with a minimum credit rating of Baa. You cannot invest directly in an index. |
| 7 | The ICE BofAML U.S. High Yield Index is a market-capitalization-weighted index of domestic and Yankee high-yield bonds. The index tracks the performance of high-yield securities traded in the U.S. bond market. You cannot invest directly in an index. Copyright 2018. ICE Data Indices, LLC. All rights reserved. |
| 8 | The Consumer Price Index for All Urban Consumers(CPI-U) measures the changes in the price of a basket of goods and services purchased by urban consumers. The urban consumer population is deemed by many as a better representative measure of the general public because close to 90% of the country’s population lives in highly populated areas. You cannot invest directly in an index. |
| | | | | | |
| Letter to shareholders (unaudited) | | Wells Fargo Index Fund | | | 3 | |
U.S. stocks gained following positive economic data while international stocks and bonds declined.
During the summer months, the U.S. economy strengthened. Revised second-quarter gross domestic product (GDP) data released in August showed the U.S. economy growing at a 4.2% rate. The unemployment rate in the U.S. was 3.7% by the end of September, according to the U.S. Department of Labor. Wages showed more consistent growth, and consumer confidence remained strong. Several U.S. equity market indices reached records during August, with the S&P 500 Index gaining 7.20% for the three-month period that ended September 30, 2018. In contrast, the MSCI ACWI ex USA Index (Net) gained 0.71% while the MSCI EM Index (Net) declined 1.09% during the same three-month period.
In June, the Federal Reserve increased the target range for the federal funds rate to range from 1.75% to 2.00%. It raised the range again in September to range from 2.00% to 2.25%. Long-term interest rates in the U.S. remained at higher levels relative to the prior 10 years. Rates on10-year and30-year Treasury bonds—2.46% and 2.81%, respectively, on January 1, 2018—were 3.01% and 3.30%, respectively, on November 30, 2018. Investor concerns about an inverted yield curve reemerged, only to be replaced by concerns about the potentially negative influence of higher interest rates on economic activity.
November saw improvement in many equity markets.
As interest rates and bond yields gained during October, stock markets struggled. For the month, the S&P 500 Index fell 6.84%, the MSCI ACWI ex USA Index (Net) dropped 8.13%, and the MSCI EM Index (Net) lost 8.71%. The Bureau of Economic Analysis released its first estimate of third-quarter GDP, which, at an annualized 3.5% rate, indicated growth may be slowing compared with the second quarter. Readings on consumer sentiment and business spending were mixed. Markets rebounded somewhat in November as the S&P 500 Index gained 2.04%, the MSCI ACWI ex USA Index (Net) added 0.95%, and the MSCI EM Index (Net) was up 4.12% as the uncertainty leading up to midterm elections in the U.S. was resolved and progress seemed to be possible on several international trade issues.
Economic signals overseas were mixed as the third quarter ended and the fourth quarter began. In early August, the Bank of England’s Monetary Policy Committee increased its key interest rate to 0.75%. The European Central Bank and the Bank of Japan maintained low interest rates and accommodative monetary policies. Amid rising trade uncertainty, the People’s Bank of China cut reserve requirement ratios and accelerated infrastructure spending and tax cuts for business enterprises and individuals. Nevertheless, a strengthening U.S. dollar and the trade tensions remained headwinds for investors overseas.
Don’t let short-term uncertainty derail long-term investment goals.
Periods of investment uncertainty can present challenges, but experience has taught us that maintaining long-term investment goals can be an effective way to plan for the future. To help you create a sound strategy based on your personal goals and risk tolerance, Wells Fargo Funds offers more than 100 mutual funds spanning a wide range of asset classes and investment styles. Although diversification cannot guarantee an investment profit or prevent losses, we believe it can be an effective way to manage investment risk and potentially smooth out overall portfolio performance. We encourage investors to know their investments and to understand that appropriate levels of risk-taking may unlock opportunities.
Economic signals overseas were mixed as the third quarter ended and the fourth quarter began.
| | | | |
| 4 | | Wells Fargo Index Fund | | Letter to shareholders (unaudited) |
Thank you for choosing to invest with Wells Fargo Funds. We appreciate your confidence in us and remain committed to helping you meet your financial needs.
Sincerely,

Andrew Owen
President
Wells Fargo Funds
Notice to shareholders
At a meeting held on August 14-15, 2018, the Board of Trustees of the Fund approved the following policy which will be effective on or about February 5, 2019:
Class C shares will convert automatically into Class A shares ten years after the initial date of purchase or, if you acquired your Class C shares through an exchange or conversion from another share class, ten years after the date you acquired your Class C shares. When Class C shares that you acquired through a purchase or exchange convert, any other Class C shares that you purchased with reinvested dividends and distributions also will convert into Class A shares on a pro rata basis. A shorter holding period may also apply depending on your intermediary. Please see “Appendix A—Sales Charge Reductions and Waivers for Certain Intermediaries” in the Fund’s prospectus or at the end of this report.
For further information about your Fund, contact your investment professional, visit our website atwellsfargofunds.com, or call us directly at1-800-222-8222.
This page is intentionally left blank.
| | | | |
| 6 | | Wells Fargo Index Fund | | Performance highlights (unaudited) |
Investment objective
The Fund seeks to replicate the total return of S&P 500 Index, before fees and expenses.
Manager
Wells Fargo Funds Management, LLC
Subadviser for the affiliated master portfolio
Wells Capital Management Incorporated
Portfolio managers
John R. Campbell, CFA®‡
David Neal, CFA®‡
Robert M. Wicentowski, CFA®‡
Average annual total returns (%) as of November 30, 20182
| | | | | | | | | | | | | | | | | | | | | | | | | | | | | | | | | | |
| | | | | Including sales charge | | | Excluding sales charge | | | Expense ratios3 (%) | |
| | | Inception date | | 1 year | | | 5 year | | | 10 year | | | 1 year | | | 5 year | | | 10 year | | | Gross | | | Net4 | |
| Class A (WFILX) | | 11-4-1998 | | | (0.31 | ) | | | 9.28 | | | | 13.08 | | | | 5.77 | | | | 10.58 | | | | 13.75 | | | | 0.63 | | | | 0.45 | |
| Class C (WFINX) | | 4-30-1999 | | | 3.97 | | | | 9.76 | | | | 12.90 | | | | 4.97 | | | | 9.76 | | | | 12.90 | | | | 1.38 | | | | 1.20 | |
| Administrator Class (WFIOX) | | 2-14-1985 | | | – | | | | – | | | | – | | | | 5.98 | | | | 10.85 | | | | 14.06 | | | | 0.40 | | | | 0.25 | |
| S&P 500 Index5 | | – | | | – | | | | – | | | | – | | | | 6.27 | | | | 11.12 | | | | 14.32 | | | | – | | | | – | |
Figures quoted represent past performance, which is no guarantee of future results, and do not reflect taxes that a shareholder may pay on fund distributions or the redemption of fund shares. Investment return and principal value of an investment will fluctuate so that an investor’s shares, when redeemed, may be worth more or less than their original cost. Performance shown without sales charges would be lower if sales charges were reflected. Current performance may be lower or higher than the performance data quoted, which assumes the reinvestment of dividends and capital gains. Currentmonth-end performance is available on the Fund’s website,wellsfargofunds.com.
Index returns do not include transaction costs associated with buying and selling securities, any mutual fund fees or expenses, or any taxes. It is not possible to invest directly in an index.
For Class A shares, the maximumfront-end sales charge is 5.75%. For Class C shares, the maximum contingent deferred sales charge is 1.00%. Performance including a contingent deferred sales charge assumes the sales charge for the corresponding time period. Administrator Class shares are sold without afront-end sales charge or contingent deferred sales charge.
Stock values fluctuate in response to the activities of individual companies and general market and economic conditions. The use of derivatives may reduce returns and/or increase volatility. Consult the Fund’s prospectus for additional information on these and other risks.
Please see footnotes on page 7.
| | | | | | |
| Performance highlights (unaudited) | | Wells Fargo Index Fund | | | 7 | |
| | | | |
| Ten largest holdings (%) as of November 30, 20186 | |
Microsoft Corporation | | | 3.56 | |
Apple Incorporated | | | 3.43 | |
Amazon.com Incorporated | | | 2.90 | |
Berkshire Hathaway Incorporated Class B | | | 1.78 | |
Johnson & Johnson | | | 1.65 | |
JPMorgan Chase & Company | | | 1.57 | |
Facebook Incorporated Class A | | | 1.42 | |
Alphabet Incorporated Class C | | | 1.41 | |
Exxon Mobil Corporation | | | 1.41 | |
Alphabet Incorporated Class A | | | 1.39 | |
|
| Sector distribution as of November 30, 20187 |
|
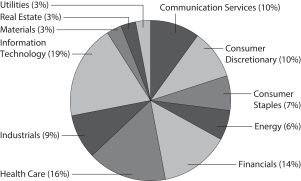
|
| ‡ | CFA® and Chartered Financial Analyst® are trademarks owned by CFA Institute. |
| 1 | The Fund is a gateway feeder fund that invests substantially all of its assets in a single affiliated master portfolio of the Wells Fargo Master Trust with a substantially identical investment objective and substantially similar investment strategies. References to the investment activities of the Fund are intended to refer to the investment activities of the affiliated master portfolio in which it invests. |
| 2 | Historical performance shown for all classes of the Fund prior to July 19, 2010, is based on the performance of the Fund’s predecessor, Evergreen Equity Index Fund. |
| 3 | Reflects the expense ratios as stated in the most recent prospectuses. The expense ratios shown are subject to change and may differ from the annualized expense ratios shown in the financial highlights of this report. |
| 4 | The manager has contractually committed through September 30, 2019, to waive fees and/or reimburse expenses to the extent necessary to cap the Fund’s Total Annual Fund Operating Expenses After Fee Waivers at the amounts shown. After this time, the caps may be increased or the commitment to maintain the caps may be terminated only with the approval of the Board of Trustees. Brokerage commissions, stamp duty fees, interest, taxes, acquired money market fund fees and expenses (if any) from funds in which the affiliated master portfolio invests, and extraordinary expenses are excluded from the expense cap. Net expenses from the affiliated master portfolio are included in the expense cap. Without this cap, the Fund’s returns would have been lower. The expense ratio paid by an investor is the net expense ratio (the total annual fund operating expenses after fee waivers) as stated in the prospectuses. |
| 5 | The S&P 500 Index consists of 500 stocks chosen for market size, liquidity, and industry group representation. It is a market-value-weighted index with each stock’s weight in the index proportionate to its market value. You cannot invest directly in an index. |
| 6 | The ten largest holdings, excluding cash, cash equivalents and any money market funds, are calculated based on the value of the securities of the affiliated master portfolio allocable to the Fund divided by the total net assets of the Fund. Holdings are subject to change and may have changed since the date specified. |
| 7 | Amounts represent the sector distribution of the affiliated master portfolio which are calculated based on the total long-term investments of the affiliated master portfolio. These amounts are subject to change and may have changed since the date specified. |
| | | | |
| 8 | | Wells Fargo Index Fund | | Fund expenses (unaudited) |
As a shareholder of the Fund, you incur two types of costs: (1) transaction costs, including sales charges (loads) on purchase payments and contingent deferred sales charges (if any) on redemptions and (2) ongoing costs, including management fees, distribution(12b-1) and/or shareholder servicing fees, and other Fund expenses. This example is intended to help you understand your ongoing costs (in dollars) of investing in the Fund and to compare these costs with the ongoing costs of investing in other mutual funds.
The example is based on an investment of $1,000 invested at the beginning of thesix-month period and held for the entire period from June 1, 2018 to November 30, 2018.
Actual expenses
The “Actual” line of the table below provides information about actual account values and actual expenses. You may use the information in this line, together with the amount you invested, to estimate the expenses that you paid over the period. Simply divide your account value by $1,000 (for example, an $8,600 account value divided by $1,000 = 8.6), then multiply the result by the number in the “Actual” line under the heading entitled “Expenses paid during period” for your applicable class of shares to estimate the expenses you paid on your account during this period.
Hypothetical example for comparison purposes
The “Hypothetical” line of the table below provides information about hypothetical account values and hypothetical expenses based on the Fund’s actual expense ratio and an assumed rate of return of 5% per year before expenses, which is not the Fund’s actual return. The hypothetical account values and expenses may not be used to estimate the actual ending account balance or expenses you paid for the period. You may use this information to compare the ongoing costs of investing in the Fund and other funds. To do so, compare this 5% hypothetical example with the 5% hypothetical examples that appear in the shareholder reports of the other funds.
Please note that the expenses shown in the table are meant to highlight your ongoing costs only and do not reflect any transactional costs, such as sales charges (loads) and contingent deferred sales charges. Therefore, the “Hypothetical” line of the table is useful in comparing ongoing costs only and will not help you determine the relative total costs of owning different funds. In addition, if these transactional costs were included, your costs would have been higher.
| | | | | | | | | | | | | | | | |
| | | Beginning
account value
6-1-2018 | | | Ending
account value
11-30-2018 | | | Expenses
paid during
the period1,2 | | | Annualized net
expense ratio2 | |
Class A | | | | | | | | | | | | | | | | |
Actual | | $ | 1,000.00 | | | $ | 1,027.78 | | | $ | 2.29 | | | | 0.45 | % |
Hypothetical (5% return before expenses) | | $ | 1,000.00 | | | $ | 1,022.81 | | | $ | 2.28 | | | | 0.45 | % |
Class C | | | | | | | | | | | | | | | | |
Actual | | $ | 1,000.00 | | | $ | 1,023.87 | | | $ | 6.09 | | | | 1.20 | % |
Hypothetical (5% return before expenses) | | $ | 1,000.00 | | | $ | 1,019.05 | | | $ | 6.07 | | | | 1.20 | % |
Administrator Class | | | | | | | | | | | | | | | | |
Actual | | $ | 1,000.00 | | | $ | 1,028.89 | | | $ | 1.27 | | | | 0.25 | % |
Hypothetical (5% return before expenses) | | $ | 1,000.00 | | | $ | 1,023.82 | | | $ | 1.27 | | | | 0.25 | % |
| 1 | Amounts reflect net expenses allocated from the affiliated Master Portfolio in which the Fund invests. |
| 2 | Expenses paid is equal to the annualized net expense ratio of each class multiplied by the average account value over the period, multiplied by the number of days in the most recent fiscal half-year divided by the number of days in the fiscal year (to reflect theone-half-year period). |
| | | | | | |
| Portfolio of investments—November 30, 2018 (unaudited) | | Wells Fargo Index Fund | | | 9 | |
| | | | | | | | | | | | | | | | |
| Security name | | | | | | | | | | | Value | |
| | | | |
Investment Companies: 100.04% | | | | | | | | | | | | | | | | |
| | | | |
| Affiliated Master Portfolio: 100.04% | | | | | | | | | | | | | | | | |
Wells Fargo Index Portfolio | | | | | | | | | | | | | | $ | 1,491,002,810 | |
| | | | | | | | | | | | | | | | |
| | | | |
Total Investment Companies (Cost $342,861,618) | | | | | | | | | | | | | | | 1,491,002,810 | |
| | | | | | | | | | | | | | | | |
| | | | | | | | |
| Total investments in securities (Cost $342,861,618) | | | 100.04 | % | | | 1,491,002,810 | |
Other assets and liabilities, net | | | (0.04 | ) | | | (589,832 | ) |
| | | | | | | | |
| Total net assets | | | 100.00 | % | | $ | 1,490,412,978 | |
| | | | | | | | |
Transactions with the affiliated Master Portfolio were as follows:
| | | | | | | | | | | | | | | | | | | | | | | | | | | | | | | | | | | | |
| | | % of
ownership,
beginning of
period | | | % of
ownership,
end of
period | | | Net
realized
gains
(losses) on
securities
transactions
allocated
from
affiliated
Master
Portfolio | | | Net
change in
unrealized
gains
(losses) on
securities
transactions
allocated
from
affiliated
Master
Portfolio | | | Dividends
allocated
from
affiliated
Master
Portfolio | | | Affiliated
income
allocated
from
affiliated
Master
Portfolio | | | Interest
allocated
from
affiliated
Master
Portfolio | | | Value,
end of period | | | % of
net
assets | |
Wells Fargo Index Portfolio | | | 97 | % | | | 97 | % | | $ | 116,637,394 | | | $ | (83,307,615 | ) | | $ | 15,833,099 | | | $ | 309,037 | | | $ | 23,778 | | | $ | 1,491,002,810 | | | | 100.04 | % |
The accompanying notes are an integral part of these financial statements.
| | | | |
| 10 | | Wells Fargo Index Fund | | Statement of assets and liabilities—November 30, 2018 (unaudited) |
| | | | |
| | | | |
| |
Assets | | | | |
Investments in affiliated Master Portfolio, at value (cost $342,861,618) | | $ | 1,491,002,810 | |
Receivable for Fund shares sold | | | 678,746 | |
Receivable from manager | | | 160,456 | |
Prepaid expenses and other assets | | | 264,613 | |
| | | | |
Total assets | | | 1,492,106,625 | |
| | | | |
| |
Liabilities | | | | |
Payable for Fund shares redeemed | | | 1,058,706 | |
Shareholder servicing fees payable | | | 226,231 | |
Administration fees payable | | | 220,663 | |
Distribution fee payable | | | 41,637 | |
Trustees’ fees and expense payable | | | 2,505 | |
Accrued expenses and other liabilities | | | 143,905 | |
| | | | |
Total liabilities | | | 1,693,647 | |
| | | | |
Total net assets | | $ | 1,490,412,978 | |
| | | | |
| |
NET ASSETS CONSIST OF | | | | |
Paid-in capital | | $ | (21,849,880 | ) |
Total distributable earnings | | | 1,512,262,858 | |
| | | | |
Total net assets | | $ | 1,490,412,978 | |
| | | | |
| |
COMPUTATION OF NET ASSET VALUE AND OFFERING PRICE PER SHARE | | | | |
Net assets – Class A | | $ | 692,599,355 | |
Shares outstanding – Class A¹ | | | 10,637,768 | |
Net asset value per share – Class A | | | $65.11 | |
Maximum offering price per share – Class A² | | | $69.08 | |
Net assets – Class C | | $ | 63,162,487 | |
Shares outstanding – Class C¹ | | | 968,900 | |
Net asset value per share – Class C | | | $65.19 | |
Net assets – Administrator Class | | $ | 734,651,136 | |
Shares outstanding – Administrator Class¹ | | | 11,150,053 | |
Net asset value per share – Administrator Class | | | $65.89 | |
| 1 | The Fund has an unlimited number of authorized shares. |
| 2 | Maximum offering price is computed as 100/94.25 of net asset value. On investments of $50,000 or more, the offering price is reduced. |
The accompanying notes are an integral part of these financial statements.
| | | | | | |
| Statement of operations—six months ended November 30, 2018 (unaudited) | | Wells Fargo Index Fund | | | 11 | |
| | | | |
| | | | |
| |
Investment income | | | | |
Dividends allocated from affiliated Master Portfolio (net of foreign withholding taxes of $149) | | $ | 15,833,099 | |
Affiliated income allocated from affiliated Master Portfolio | | | 309,037 | |
Interest allocated from affiliated Master Portfolio | | | 23,778 | |
Expenses allocated from affiliated Master Portfolio | | | (842,614 | ) |
| | | | |
Total investment income | | | 15,323,300 | |
| | | | |
| |
Expenses | | | | |
Management fee | | | 400,386 | |
Administration fees | | | | |
Class A | | | 761,301 | |
Class C | | | 70,995 | |
Administrator Class | | | 525,772 | |
Shareholder servicing fees | | | | |
Class A | | | 906,311 | |
Class C | | | 84,518 | |
Administrator Class | | | 394,930 | |
Distribution fee | | | | |
Class C | | | 253,553 | |
Custody and accounting fees | | | 37,821 | |
Professional fees | | | 16,138 | |
Registration fees | | | 39,268 | |
Shareholder report expenses | | | 56,839 | |
Trustees’ fees and expenses | | | 11,297 | |
Other fees and expenses | | | 7,682 | |
| | | | |
Total expenses | | | 3,566,811 | |
Less: Fee waivers and/or expense reimbursements | | | (1,361,281 | ) |
| | | | |
Net expenses | | | 2,205,530 | |
| | | | |
Net investment income | | | 13,117,770 | |
| | | | |
| |
REALIZED AND UNREALIZED GAINS (LOSSES) ON INVESTMENTS | | | | |
Net realized gains on securities transactions allocated from affiliated Master Portfolio | | | 116,637,394 | |
Net change in unrealized gains (losses) on securities transactions allocated from affiliated Master Portfolio | | | (83,307,615 | ) |
| | | | |
Net realized and unrealized gains (losses) on investments | | | 33,329,779 | |
| | | | |
Net increase in net assets resulting from operations | | $ | 46,447,549 | |
| | | | |
The accompanying notes are an integral part of these financial statements.
| | | | |
| 12 | | Wells Fargo Index Fund | | Statement of changes in net assets |
| | | | | | | | | | | | | | | | |
| | | Six months ended
November 30, 2018 (unaudited) | | | Year ended
May 31, 2018 | |
| | | | |
Operations | | | | | | | | | | | | | | | | |
Net investment income | | | | | | $ | 13,117,770 | | | | | | | $ | 28,480,595 | |
Net realized gains on investments | | | | | | | 116,637,394 | | | | | | | | 342,171,321 | |
Net change in unrealized gains (losses) on investments | | | | | | | (83,307,615 | ) | | | | | | | (126,133,995 | ) |
| | | | |
Net increase in net assets resulting from operations | | | | | | | 46,447,549 | | | | | | | | 244,517,921 | |
| | | | |
|
Distributions to shareholders from net investment income and net realized gains | |
Class A | | | | | | | 0 | | | | | | | | (123,045,671 | ) |
Class C | | | | | | | 0 | | | | | | | | (11,221,352 | ) |
Administrator Class | | | | | | | 0 | | | | | | | | (188,746,345 | ) |
| | | | |
Total distributions to shareholders | | | | | | | 0 | | | | | | | | (323,013,368 | ) |
| | | | |
| | | | |
Capital share transactions | | | Shares | | | | | | | | Shares | | | | | |
Proceeds from shares sold | | | | | | | | | | | | | | | | |
Class A | | | 234,921 | | | | 15,355,148 | | | | 473,086 | | | | 31,179,127 | |
Class C | | | 32,854 | | | | 2,174,652 | | | | 87,293 | | | | 5,748,674 | |
Administrator Class | | | 532,963 | | | | 35,531,393 | | | | 1,710,651 | | | | 115,109,719 | |
| | | | |
| | | | | | | 53,061,193 | | | | | | | | 152,037,520 | |
| | | | |
Reinvestment of distributions | | | | | | | | | | | | | | | | |
Class A | | | 0 | | | | 0 | | | | 1,867,730 | | | | 117,353,642 | |
Class C | | | 0 | | | | 0 | | | | 157,810 | | | | 9,921,751 | |
Administrator Class | | | 0 | | | | 0 | | | | 1,928,218 | | | | 122,530,422 | |
| | | | |
| | | | | | | 0 | | | | | | | | 249,805,815 | |
| | | | |
Payment for shares redeemed | | | | | | | | | | | | | | | | |
Class A | | | (692,146 | ) | | | (45,837,880 | ) | | | (1,478,098 | ) | | | (97,820,940 | ) |
Class C | | | (102,351 | ) | | | (6,706,603 | ) | | | (215,384 | ) | | | (14,322,037 | ) |
Administrator Class | | | (2,327,074 | ) | | | (154,538,231 | ) | | | (7,771,521 | ) | | | (516,434,208 | ) |
| | | | |
| | | | | | | (207,082,714 | ) | | | | | | | (628,577,185 | ) |
| | | | |
Net decrease in net assets resulting from capital share transactions | | | | | | | (154,021,521 | ) | | | | | | | (226,733,850 | ) |
| | | | |
Total decrease in net assets | | | | | | | (107,573,972 | ) | | | | | | | (305,229,297 | ) |
| | | | |
| | | | |
Net assets | | | | | | | | | | | | | | | | |
Beginning of period | | | | | | | 1,597,986,950 | | | | | | | | 1,903,216,247 | |
| | | | |
End of period1 | | | | | | $ | 1,490,412,978 | | | | | | | $ | 1,597,986,950 | |
| | | | |
| 1 | Effective for all filings after November 4, 2018, the SEC prospectively eliminated the requirement to parenthetically disclose undistributed net investment income at the end of the period and permitted the aggregation of distributions, with the exception of tax basis returns of capital. Undistributed net investment income at May 31, 2018 was $10,188,054. The disaggregated distributions information for the year ended May 31, 2018 is included in Note 7,Distributions to Shareholders,in the notes to the financial statements. |
The accompanying notes are an integral part of these financial statements.
| | | | | | |
| Financial highlights | | Wells Fargo Index Fund | | | 13 | |
(For a share outstanding throughout each period)
| | | | | | | | | | | | | | | | | | | | | | | | |
| | | Six months ended
November 30, 2018 (unaudited) | | | Year ended May 31 | |
| CLASS A | | 2018 | | | 2017 | | | 2016 | | | 2015 | | | 2014 | |
Net asset value, beginning of period | | | $63.35 | | | | $66.85 | | | | $62.85 | | | | $62.32 | | | | $62.14 | | | | $54.00 | |
Net investment income | | | 0.53 | | | | 0.99 | 1 | | | 1.05 | | | | 0.81 | | | | 1.00 | | | | 0.90 | |
Net realized and unrealized gains (losses) on investments | | | 1.23 | | | | 7.99 | | | | 9.09 | | | | (0.17 | ) | | | 5.91 | | | | 9.59 | |
| | | | | | | | | | | | | | | | | | | | | | | | |
Total from investment operations | | | 1.76 | | | | 8.98 | | | | 10.14 | | | | 0.64 | | | | 6.91 | | | | 10.49 | |
Distributions to shareholders from | | | | | | | | | | | | | | | | | | | | | | | | |
Net investment income | | | 0.00 | | | | (1.02 | ) | | | (1.16 | ) | | | (1.08 | ) | | | (0.96 | ) | | | (0.85 | ) |
Net realized gains | | | 0.00 | | | | (11.46 | ) | | | (4.98 | ) | | | (4.03 | ) | | | (0.77 | ) | | | (1.50 | ) |
| | | | | | | | | | | | | | | | | | | | | | | | |
Total distributions to shareholders | | | 0.00 | | | | (12.48 | ) | | | (6.14 | ) | | | (5.11 | ) | | | (1.73 | ) | | | (2.35 | ) |
Net asset value, end of period | | | $65.11 | | | | $63.35 | | | | $66.85 | | | | $62.85 | | | | $67.32 | | | | $62.14 | |
Total return2 | | | 2.78 | % | | | 13.87 | % | | | 16.94 | % | | | 1.24 | % | | | 11.21 | % | | | 19.77 | % |
Ratios to average net assets (annualized) | | | | | | | | | | | | | | | | | | | | | | | | |
Gross expenses3 | | | 0.64 | % | | | 0.63 | % | | | 0.62 | % | | | 0.63 | % | | | 0.68 | % | | | 0.67 | % |
Net expenses3 | | | 0.45 | % | | | 0.45 | % | | | 0.45 | % | | | 0.48 | % | | | 0.56 | % | | | 0.56 | % |
Net investment income3 | | | 1.57 | % | | | 1.49 | % | | | 1.68 | % | | | 1.78 | % | | | 1.50 | % | | | 1.53 | % |
Supplemental data | | | | | | | | | | | | | | | | | | | | | | | | |
Portfolio turnover rate4 | | | 2 | % | | | 3 | % | | | 9 | % | | | 4 | % | | | 4 | % | | | 5 | % |
Net assets, end of period (000s omitted) | | | $692,599 | | | | $702,866 | | | | $684,004 | | | | $639,496 | | | | $445,088 | | | | $432,448 | |
| 1 | Calculated based upon average shares outstanding |
| 2 | Total return calculations do not include any sales charges. Returns for periods of less than one year are not annualized. |
| 3 | Ratios include net expenses allocated from the affiliated Master Portfolio which were as follows: |
| | | | |
Six months ended November 30, 2018 (unaudited) | | | 0.11 | % |
Year ended May 31, 2018 | | | 0.10 | % |
Year ended May 31, 2017 | | | 0.10 | % |
Year ended May 31, 2016 | | | 0.10 | % |
Year ended May 31, 2015 | | | 0.11 | % |
Year ended May 31, 2014 | | | 0.10 | % |
| 4 | Portfolio turnover rate is calculated by multiplying the affiliated Master Portfolio’s percentage of the Fund’s total investments in securities at the end of the period by the affiliated Master Portfolio’s portfolio turnover rate. |
The accompanying notes are an integral part of these financial statements.
| | | | |
| 14 | | Wells Fargo Index Fund | | Financial highlights |
(For a share outstanding throughout each period)
| | | | | | | | | | | | | | | | | | | | | | | | |
| | | Six months ended
November 30, 2018 (unaudited) | | | Year ended May 31 | |
| CLASS C | | 2018 | | | 2017 | | | 2016 | | | 2015 | | | 2014 | |
Net asset value, beginning of period | | | $63.67 | | | | $67.11 | | | | $62.12 | | | | $67.55 | | | | $62.37 | | | | $54.22 | |
Net investment income | | | 0.32 | | | | 0.50 | 1 | | | 0.66 | | | | 0.62 | 1 | | | 0.50 | | | | 0.47 | |
Net realized and unrealized gains (losses) on investments | | | 1.20 | | | | 8.00 | | | | 9.02 | | | | (0.45 | ) | | | 5.94 | | | | 9.62 | |
| | | | | | | | | | | | | | | | | | | | | | | | |
Total from investment operations | | | 1.52 | | | | 8.50 | | | | 9.68 | | | | 0.17 | | | | 6.44 | | | | 10.09 | |
Distributions to shareholders from | | | | | | | | | | | | | | | | | | | | | | | | |
Net investment income | | | 0.00 | | | | (0.48 | ) | | | (0.71 | ) | | | (0.57 | ) | | | (0.49 | ) | | | (0.44 | ) |
Net realized gains | | | 0.00 | | | | (11.46 | ) | | | (4.98 | ) | | | (4.03 | ) | | | (0.77 | ) | | | (1.50 | ) |
| | | | | | | | | | | | | | | | | | | | | | | | |
Total distributions to shareholders | | | 0.00 | | | | (11.94 | ) | | | (5.69 | ) | | | (4.60 | ) | | | (1.26 | ) | | | (1.94 | ) |
Net asset value, end of period | | | $65.19 | | | | $63.67 | | | | $67.11 | | | | $63.12 | | | | $67.55 | | | | $62.37 | |
Total return2 | | | 2.39 | % | | | 13.02 | % | | | 16.07 | % | | | 0.48 | % | | | 10.38 | % | | | 18.89 | % |
Ratios to average net assets (annualized) | | | | | | | | | | | | | | | | | | | | | | | | |
Gross expenses3 | | | 1.39 | % | | | 1.38 | % | | | 1.37 | % | | | 1.38 | % | | | 1.43 | % | | | 1.42 | % |
Net expenses3 | | | 1.20 | % | | | 1.20 | % | | | 1.20 | % | | | 1.24 | % | | | 1.31 | % | | | 1.31 | % |
Net investment income3 | | | 0.82 | % | | | 0.72 | % | | | 0.93 | % | | | 0.99 | % | | | 0.75 | % | | | 0.78 | % |
Supplemental data | | | | | | | | | | | | | | | | | | | | | | | | |
Portfolio turnover rate4 | | | 2 | % | | | 3 | % | | | 9 | % | | | 4 | % | | | 4 | % | | | 5 | % |
Net assets, end of period (000s omitted) | | | $63,162 | | | | $66,117 | | | | $67,691 | | | | $79,858 | | | | $83,718 | | | | $78,118 | |
| 1 | Calculated based upon average shares outstanding |
| 2 | Total return calculations do not include any sales charges. Returns for periods of less than one year are not annualized. |
| 3 | Ratios include net expenses allocated from the affiliated Master Portfolio which were as follows: |
| | | | |
Six months ended November 30, 2018 (unaudited) | | | 0.11 | % |
Year ended May 31, 2018 | | | 0.10 | % |
Year ended May 31, 2017 | | | 0.10 | % |
Year ended May 31, 2016 | | | 0.10 | % |
Year ended May 31, 2015 | | | 0.11 | % |
Year ended May 31, 2014 | | | 0.10 | % |
| 4 | Portfolio turnover rate is calculated by multiplying the affiliated Master Portfolio’s percentage of the Fund’s total investments in securities at the end of the period by the affiliated Master Portfolio’s portfolio turnover rate. |
The accompanying notes are an integral part of these financial statements.
| | | | | | |
| Financial highlights | | Wells Fargo Index Fund | | | 15 | |
(For a share outstanding throughout each period)
| | | | | | | | | | | | | | | | | | | | | | | | |
| | | Six months ended
November 30, 2018 (unaudited) | | | Year ended May 31 | |
| ADMINISTRATOR CLASS | | 2018 | | | 2017 | | | 2016 | | | 2015 | | | 2014 | |
Net asset value, beginning of period | | | $64.04 | | | | $67.43 | | | | $63.33 | | | | $67.80 | | | | $62.56 | | | | $54.34 | |
Net investment income | | | 0.59 | 1 | | | 1.26 | | | | 1.41 | | | | 1.31 | | | | 1.27 | | | | 1.08 | |
Net realized and unrealized gains (losses) on investments | | | 1.26 | | | | 7.94 | | | | 8.94 | | | | (0.51 | ) | | | 5.90 | | | | 9.66 | |
| | | | | | | | | | | | | | | | | | | | | | | | |
Total from investment operations | | | 1.85 | | | | 9.20 | | | | 10.35 | | | | 0.80 | | | | 7.17 | | | | 10.74 | |
Distributions to shareholders from | | | | | | | | | | | | | | | | | | | | | | | | |
Net investment income | | | 0.00 | | | | (1.13 | ) | | | (1.27 | ) | | | (1.24 | ) | | | (1.16 | ) | | | (1.02 | ) |
Net realized gains | | | 0.00 | | | | (11.46 | ) | | | (4.98 | ) | | | (4.03 | ) | | | (0.77 | ) | | | (1.50 | ) |
| | | | | | | | | | | | | | | | | | | | | | | | |
Total distributions to shareholders | | | 0.00 | | | | (12.59 | ) | | | (6.25 | ) | | | (5.27 | ) | | | (1.93 | ) | | | (2.52 | ) |
Net asset value, end of period | | | $65.89 | | | | $64.04 | | | | $67.43 | | | | $63.33 | | | | $67.80 | | | | $62.56 | |
Total return2 | | | 2.89 | % | | | 14.10 | % | | | 17.18 | % | | | 1.49 | % | | | 11.56 | % | | | 20.13 | % |
Ratios to average net assets (annualized) | | | | | | | | | | | | | | | | | | | | | | | | |
Gross expenses3 | | | 0.40 | % | | | 0.40 | % | | | 0.39 | % | | | 0.40 | % | | | 0.37 | % | | | 0.36 | % |
Net expenses3 | | | 0.25 | % | | | 0.25 | % | | | 0.25 | % | | | 0.25 | % | | | 0.25 | % | | | 0.25 | % |
Net investment income3 | | | 1.76 | % | | | 1.70 | % | | | 1.88 | % | | | 1.97 | % | | | 1.81 | % | | | 1.84 | % |
Supplemental data | | | | | | | | | | | | | | | | | | | | | | | | |
Portfolio turnover rate4 | | | 2 | % | | | 3 | % | | | 9 | % | | | 4 | % | | | 4 | % | | | 5 | % |
Net assets, end of period (000s omitted) | | | $734,651 | | | | $829,004 | | | | $1,151,522 | | | | $1,502,276 | | | | $1,832,814 | | | | $1,984,845 | |
| 1 | Calculated based upon average shares outstanding |
| 2 | Returns for periods of less than one year are not annualized. |
| 3 | Ratios include net expenses allocated from the affiliated Master Portfolio which were as follows: |
| | | | |
Six months ended November 30, 2018 (unaudited) | | | 0.11 | % |
Year ended May 31, 2018 | | | 0.10 | % |
Year ended May 31, 2017 | | | 0.10 | % |
Year ended May 31, 2016 | | | 0.10 | % |
Year ended May 31, 2015 | | | 0.11 | % |
Year ended May 31, 2014 | | | 0.10 | % |
| 4 | Portfolio turnover rate is calculated by multiplying the affiliated Master Portfolio’s percentage of the Fund’s total investments in securities at the end of the period by the affiliated Master Portfolio’s portfolio turnover rate. |
The accompanying notes are an integral part of these financial statements.
| | | | |
| 16 | | Wells Fargo Index Fund | | Notes to financial statements (unaudited) |
1. ORGANIZATION
Wells Fargo Funds Trust (the “Trust”), a Delaware statutory trust organized on March 10, 1999, is anopen-end management investment company registered under the Investment Company Act of 1940, as amended (the “1940 Act”). As an investment company, the Trust follows the accounting and reporting guidance in Financial Accounting Standards Board (“FASB”)Accounting Standards Codification Topic 946, Financial Services – Investment Companies. These financial statements report on the Wells Fargo Index Fund (the “Fund”) which is a diversified series of the Trust.
The Fund is a feeder fund in a master-feeder structure that invests substantially all of its assets in a single master portfolio with a substantially identical investment objective and substantially similar investment strategies. The Fund seeks to achieve its investment objective by investing all investable assets in a separate diversified portfolio (the “affiliated Master Portfolio”) of Wells Fargo Master Trust, a registeredopen-end management investment company. The affiliated Master Portfolio directly acquires portfolio securities and the Fund acquires an indirect interest in those securities. The Fund accounts for its investment in the affiliated Master Portfolio as a partnership investment and records on a daily basis its share of the affiliated Master Portfolio’s income, expense and realized and unrealized gains and losses. The financial statements of the affiliated Master Portfolio for the six months ended November 30, 2018 are included in this report and should be read in conjunction with the Fund’s financial statements. As of November 30, 2018, the Fund owned 97% of Wells Fargo Index Portfolio.
2. SIGNIFICANT ACCOUNTING POLICIES
The following significant accounting policies, which are consistently followed in the preparation of the financial statements of the Fund, are in conformity with U.S. generally accepted accounting principles which require management to make estimates and assumptions that affect the reported amounts of assets and liabilities, disclosure of contingent assets and liabilities at the date of the financial statements, and the reported amounts of revenues and expenses during the reporting period. Actual results could differ from those estimates.
Securities valuation
All investments are valued each business day as of the close of regular trading on the New York Stock Exchange (generally 4 p.m. Eastern Time), although the Fund may deviate from this calculation time under unusual or unexpected circumstances.
Investments in the affiliated Master Portfolio are valued daily based on the Fund’s proportionate share of the affiliated Master Portfolio’s net assets, which are also valued daily. Securities held in the affiliated Master Portfolio are valued as discussed in the Notes to Financial Statements of the affiliated Master Portfolio, which are included elsewhere in this report.
Investment transactions, income and expenses
Investments in the affiliated Master Portfolio are recorded on a trade basis.
The Fund records daily its proportionate share of the affiliated Master Portfolio’s interest and dividend income, expenses and realized and unrealized gains or losses. The Fund also accrues its own expenses.
Distributions to shareholders
Distributions to shareholders from net investment income and any net realized gains are recorded on theex-dividend date and paid at least annually. Such distributions are determined in accordance with income tax regulations and may differ from U.S. generally accepted accounting principles. Dividend sources are estimated at the time of declaration. The tax character of distributions is determined as of the Fund’s fiscal year end. Therefore, a portion of the Fund’s distributions made prior to the Fund’s fiscal year end may be categorized as a tax return of capital at year end.
Federal and other taxes
The Fund intends to continue to qualify as a regulated investment company by distributing substantially all of its investment company taxable income and any net realized capital gains (after reduction for capital loss carryforwards) sufficient to relieve it from all, or substantially all, federal income taxes. Accordingly, no provision for federal income taxes was required.
The Fund’s income and federal excise tax returns and all financial records supporting those returns for the prior three fiscal years are subject to examination by the federal and Delaware revenue authorities. Management has analyzed the Fund’s tax positions taken on federal, state, and foreign tax returns for all open tax years and does not believe that there are any uncertain tax positions that require recognition of a tax liability.
| | | | | | |
| Notes to financial statements (unaudited) | | Wells Fargo Index Fund | | | 17 | |
As of November 30, 2018, the aggregate cost of all investments for federal income tax purposes was $356,664,227 and the unrealized gains (losses) consisted of:
| | | | |
Gross unrealized gains | | $ | 1,134,338,583 | |
Gross unrealized losses | | | 0 | |
Net unrealized gains | | $ | 1,134,338,583 | |
Class allocations
The separate classes of shares offered by the Fund differ principally in applicable sales charges, distribution, shareholder servicing, and administration fees. Class specific expenses are charged directly to that share class. Investment income, common expenses, and realized and unrealized gains (losses) on investments are allocated daily to each class of shares based on the relative proportion of net assets of each class.
3. FAIR VALUATION MEASUREMENTS
At November 30, 2018, the affiliated Master Portfolio was measured at fair value using the net asset value per share (or its equivalent) as a practical expedient. The investment objective and the value of the affiliate Master Portfolio was as follows:
| | | | | | |
| Affiliated Master Portfolio | | Investment objective | | Value of affiliated
Master Portfolio | |
Wells Fargo Index Portfolio | | Seeks to replicate the total return of the
S&P 500 Index, before fees and expenses | | | $1,491,002,810 | |
The affiliated Master Portfolio does not have a redemption period notice, can be redeemed daily and does not have any
unfunded commitments.
4. TRANSACTIONS WITH AFFILIATES
Management fee
Wells Fargo Funds Management, LLC (“Funds Management”), an indirect wholly owned subsidiary of Wells Fargo & Company (“Wells Fargo”), is the manager of the Fund and provides advisory and fund-level administrative services under an investment management agreement. Under the investment management agreement, Funds Management is responsible for, among other services, implementing the investment objectives and strategies of the Fund, supervising the subadviser and providing fund-level administrative services in connection with the Fund’s operations. As long as the Fund continues to invest substantially all of its assets in a single affiliated Master Portfolio, the Fund pays Funds Management an investment management fee only for fund-level administrative services at an annual rate starting at 0.05% and declining to 0.03% as the average daily net assets of the Fund increase. For the six months ended November 30, 2018, the management fee was equivalent to an annual rate of 0.05% of the Fund’s average daily net assets.
Funds Management also serves as the adviser to the affiliated Master Portfolio and is entitled to receive a fee from the affiliated Master Portfolio for those services.
Administration fees
Under a class-level administration agreement, Funds Management provides class-level administrative services to the Fund, which includes paying fees and expenses for services provided by the transfer agent,sub-transfer agents, omnibus account servicers and record-keepers. As compensation for its services under the class-level administration agreement, Funds Management receives an annual fee which is calculated based on the average daily net assets of each class as follows:
| | | | |
| | | Class-level
administration fee | |
Class A, Class C | | | 0.21 | % |
Administrator Class | | | 0.13 | |
Funds Management has contractually waived and/or reimbursed management and administration fees to the extent necessary to maintain certain net operating expense ratios for the Fund. When each class of the Fund has exceeded its
| | | | |
| 18 | | Wells Fargo Index Fund | | Notes to financial statements (unaudited) |
expense cap, Funds Management has waived fees and/or reimbursed expenses from fund level expenses on a proportionate basis and then from class specific expenses; otherwise, waivers and/or reimbursements are applied against class specific expenses before fund level expenses. Net expenses from the affiliated Master Portfolio are included in the expense cap. Funds Management has committed through September 30, 2019 to waive fees and/or reimburse expenses to the extent necessary to cap each Fund’s expenses at 0.45% for Class A shares, 1.20% for Class C shares, and 0.25% for Administrator Class shares. After this time, the cap may be increased or the commitment to maintain the cap may be terminated only with the approval of the Board of Trustees.
Distribution fee
The Trust has adopted a distribution plan for Class C shares of the Fund pursuant to Rule12b-1 under the 1940 Act. A distribution fee is charged to Class C shares and paid to Wells Fargo Funds Distributor, LLC (“Funds Distributor”), the principal underwriter, at an annual rate of 0.75% of the average daily net assets of Class C shares.
In addition, Funds Distributor is entitled to receive thefront-end sales charge from the purchase of Class A shares and a contingent deferred sales charge on the redemption of certain Class A shares. Funds Distributor is also entitled to receive the contingent deferred sales charges from redemptions of Class C shares. For the six months ended November 30, 2018, Funds Distributor received $6,085 from the sale of Class A shares and $12 in contingent deferred sales charges from redemptions of Class C shares. No contingent deferred sales charges were incurred by Class A shares for the six months ended November 30, 2018.
Shareholder servicing fees
The Trust has entered into contracts with one or more shareholder servicing agents, whereby Class A and Class C of the Fund are charged a fee at an annual rate of 0.25% of the average daily net assets of each respective class. Administrator Class is charged a fee at an annual rate of 0.10% of its average daily net assets.
A portion of these total shareholder servicing fees were paid to affiliates of Wells Fargo.
5. INVESTMENT PORTFOLIO TRANSACTIONS
The Fund seeks to achieve its investment objective by investing substantially all of its investable assets in a single affiliated Master Portfolio. Purchases and sales have been calculated by multiplying the Fund’s ownership percentage of the affiliated Master Portfolio by the affiliated Master Portfolio’s purchases and sales. Purchases and sales of investments, excluding short-term securities, for the six months ended November 30, 2018 were $35,698,731 and $176,960,427, respectively.
6. BANK BORROWINGS
The Trust (excluding the money market funds), Wells Fargo Master Trust and Wells Fargo Variable Trust are parties to a $280,000,000 revolving credit agreement whereby the Fund is permitted to use bank borrowings for temporary or emergency purposes, such as to fund shareholder redemption requests. Interest under the credit agreement is charged to the Fund based on a borrowing rate equal to the higher of the Federal Funds rate in effect on that day plus 1.25% or the overnight LIBOR rate in effect on that day plus 1.25%. In addition, an annual commitment fee equal to 0.25% of the unused balance is allocated to each participating fund.
For the six months ended November 30, 2018, there were no borrowings by the Fund under the agreement.
7. DISTRIBUTIONS TO SHAREHOLDERS
Effective for all filings after November 4, 2018, the Securities and Exchange Commission eliminated the requirement to separately state the components of distributions to shareholders. The amounts of distributions to shareholders for the year ended May 31, 2018 were as follows:
| | | | | | | | |
| | | Net
investment
income | | | Net realized
gains | |
Class A | | | $11,646,335 | | | | $111,399,336 | |
Class C | | | 516,619 | | | | 10,704,733 | |
Administrator Class | | | 18,709,88 | | | | 170,036,456 | |
| | | | | | |
| Notes to financial statements (unaudited) | | Wells Fargo Index Fund | | | 19 | |
8. INDEMNIFICATION
Under the Trust’s organizational documents, the officers and Trustees have been granted certain indemnification rights against certain liabilities that may arise out of performance of their duties to the Trust. Additionally, in the normal course of business, the Trust may enter into contracts with service providers that contain a variety of indemnification clauses. The Trust’s maximum exposure under these arrangements is dependent on future claims that may be made against the Fund and, therefore, cannot be estimated.
9. NEW ACCOUNTING PRONOUNCEMENT
In August 2018, FASB issued Accounting Standards Update (“ASU”) No. 2018-13, Fair Value Measurement (Topic 820)Disclosure Framework—Changes to the Disclosure Requirements for Fair Value Measurement. ASU 2018-13 updates the disclosure requirements for fair value measurements by modifying or removing certain disclosures and adding certain new disclosures. The amendments are effective for fiscal years, and interim periods within those fiscal years, beginning after December 15, 2019. Early adoption is permitted. Management has adopted the removal and modification of disclosures early, as permitted, and will adopt the additional new disclosures at the effective date.
10. SUBSEQUENT DISTRIBUTIONS
On December 12, 2018 the Fund declared distributions from short-term capital gains and long-term capital gains to shareholders of record on December 11, 2018. The per share amounts payable on December 13, 2018 were as follows:
| | | | | | | | |
| | | Short-term
capital gains | | | Long-term
capital gains | |
Class A | | | $0.06533 | | | | $14.26560 | |
Class C | | | 0.06533 | | | | 14.26560 | |
Administrator Class | | | 0.06533 | | | | 14.26560 | |
On December 14, 2018 the Fund declared distributions from net investment income to shareholders of record on December 13, 2018. The per share amounts payable on December 17, 2018 were as follows:
| | | | |
| | | Net investment
income | |
Class A | | | $0.03751 | |
Class C | | | 0.00000 | |
Administrator Class | | | 0.05500 | |
Institutional Class | | | 0.06929 | |
These distributions are not reflected in the accompanying financial statements.
| | | | |
| 20 | | Wells Fargo Index Portfolio | | Portfolio of investments—November 30, 2018 (unaudited) |
| | | | | | | | | | | | | | | | |
| Security name | | | | | | | | Shares | | | Value | |
|
Common Stocks: 97.59% | |
|
Communication Services: 9.64% | |
|
| Diversified Telecommunication Services: 2.07% | |
AT&T Incorporated | | | | | | | | | | | 466,098 | | | $ | 14,560,902 | |
CenturyLink Incorporated | | | | | | | | | | | 61,007 | | | | 1,146,932 | |
Verizon Communications Incorporated | | | | | | | | | | | 265,201 | | | | 15,991,620 | |
| | | | |
| | | | | | | | | | | | | | | 31,699,454 | |
| | | | | | | | | | | | | | | | |
|
| Entertainment: 1.93% | |
Activision Blizzard Incorporated | | | | | | | | | | | 48,934 | | | | 2,440,828 | |
Electronic Arts Incorporated † | | | | | | | | | | | 19,564 | | | | 1,644,745 | |
Netflix Incorporated † | | | | | | | | | | | 27,949 | | | | 7,997,047 | |
Take-Two Interactive Software Incorporated † | | | | | | | | | | | 7,306 | | | | 801,249 | |
The Walt Disney Company | | | | | | | | | | | 95,456 | | | | 11,024,213 | |
Twenty-First Century Fox Incorporated Class A | | | | | | | | | | | 67,653 | | | | 3,346,794 | |
Twenty-First Century Fox Incorporated Class B | | | | | | | | | | | 31,264 | | | | 1,532,874 | |
Viacom Incorporated Class B | | | | | | | | | | | 22,684 | | | | 700,028 | |
| | | | |
| | | | | | | | | | | | | | | 29,487,778 | |
| | | | | | | | | | | | | | | | |
|
| Interactive Media & Services: 4.34% | |
Alphabet Incorporated Class A † | | | | | | | | | | | 19,185 | | | | 21,288,635 | |
Alphabet Incorporated Class C † | | | | | | | | | | | 19,762 | | | | 21,628,126 | |
Facebook Incorporated Class A † | | | | | | | | | | | 154,789 | | | | 21,764,881 | |
TripAdvisor Incorporated † | | | | | | | | | | | 6,565 | | | | 420,554 | |
Twitter Incorporated † | | | | | | | | | | | 46,209 | | | | 1,453,273 | |
| | | | |
| | | | | | | | | | | | | | | 66,555,469 | |
| | | | | | | | | | | | | | | | |
|
| Media: 1.30% | |
CBS Corporation Class B | | | | | | | | | | | 21,728 | | | | 1,177,223 | |
Charter Communications Incorporated Class A † | | | | | | | | | | | 11,459 | | | | 3,772,303 | |
Comcast Corporation Class A | | | | | | | | | | | 293,477 | | | | 11,448,538 | |
Discovery Communications Incorporated Class A †« | | | | | | | | | | | 10,028 | | | | 308,060 | |
Discovery Communications Incorporated Class C † | | | | | | | | | | | 23,085 | | | | 644,764 | |
DISH Network Corporation Class A † | | | | | | | | | | | 14,703 | | | | 481,670 | |
Interpublic Group of Companies Incorporated | | | | | | | | | | | 24,633 | | | | 578,876 | |
News Corporation Class A | | | | | | | | | | | 24,607 | | | | 319,399 | |
News Corporation Class B | | | | | | | | | | | 7,944 | | | | 106,450 | |
Omnicom Group Incorporated | | | | | | | | | | | 14,401 | | | | 1,108,445 | |
| | | | |
| | | | | | | | | | | | | | | 19,945,728 | |
| | | | | | | | | | | | | | | | |
|
Consumer Discretionary: 9.62% | |
|
| Auto Components: 0.14% | |
Aptiv plc | | | | | | | | | | | 16,992 | | | | 1,221,725 | |
BorgWarner Incorporated | | | | | | | | | | | 13,406 | | | | 530,609 | |
The Goodyear Tire & Rubber Company | | | | | | | | | | | 15,212 | | | | 352,310 | |
| | | | |
| | | | | | | | | | | | | | | 2,104,644 | |
| | | | | | | | | | | | | | | | |
|
| Automobiles: 0.39% | |
Ford Motor Company | | | | | | | | | | | 251,269 | | | | 2,364,441 | |
The accompanying notes are an integral part of these financial statements.
| | | | | | |
| Portfolio of investments—November 30, 2018 (unaudited) | | Wells Fargo Index Portfolio | | | 21 | |
| | | | | | | | | | | | | | | | |
| Security name | | | | | | | | Shares | | | Value | |
|
| Automobiles(continued) | |
General Motors Company | | | | | | | | | | | 84,216 | | | $ | 3,195,997 | |
Harley-Davidson Incorporated | | | | | | | | | | | 10,690 | | | | 452,080 | |
| | | | |
| | | | | | | | | | | | | | | 6,012,518 | |
| | | | | | | | | | | | | | | | |
|
| Distributors: 0.10% | |
Genuine Parts Company | | | | | | | | | | | 9,419 | | | | 976,844 | |
LKQ Corporation † | | | | | | | | | | | 20,416 | | | | 568,381 | |
| | | | |
| | | | | | | | | | | | | | | 1,545,225 | |
| | | | | | | | | | | | | | | | |
|
| Diversified Consumer Services: 0.02% | |
H&R Block Incorporated | | | | | | | | | | | 13,191 | | | | 356,289 | |
| | | | | | | | | | | | | | | | |
|
| Hotels, Restaurants & Leisure: 1.75% | |
Carnival Corporation | | | | | | | | | | | 25,883 | | | | 1,560,486 | |
Chipotle Mexican Grill Incorporated † | | | | | | | | | | | 1,570 | | | | 742,940 | |
Darden Restaurants Incorporated | | | | | | | | | | | 7,963 | | | | 880,230 | |
Hilton Worldwide Holdings Incorporated | | | | | | | | | | | 19,139 | | | | 1,445,760 | |
Marriott International Incorporated Class A | | | | | | | | | | | 18,485 | | | | 2,126,330 | |
McDonald’s Corporation | | | | | | | | | | | 49,793 | | | | 9,386,478 | |
MGM Resorts International | | | | | | | | | | | 32,798 | | | | 884,234 | |
Norwegian Cruise Line Holdings Limited † | | | | | | | | | | | 14,108 | | | | 724,023 | |
Royal Caribbean Cruises Limited | | | | | | | | | | | 10,998 | | | | 1,243,544 | |
Starbucks Corporation | | | | | | | | | | | 79,626 | | | | 5,312,647 | |
Wynn Resorts Limited | | | | | | | | | | | 6,276 | | | | 686,594 | |
Yum! Brands Incorporated | | | | | | | | | | | 20,369 | | | | 1,878,429 | |
| | | | |
| | | | | | | | | | | | | | | 26,871,695 | |
| | | | | | | | | | | | | | | | |
|
| Household Durables: 0.30% | |
D.R. Horton Incorporated | | | | | | | | | | | 22,023 | | | | 819,696 | |
Garmin Limited | | | | | | | | | | | 7,755 | | | | 516,948 | |
Leggett & Platt Incorporated | | | | | | | | | | | 8,354 | | | | 323,634 | |
Lennar Corporation Class A | | | | | | | | | | | 18,724 | | | | 800,077 | |
Mohawk Industries Incorporated † | | | | | | | | | | | 4,070 | | | | 521,204 | |
Newell Rubbermaid Incorporated | | | | | | | | | | | 27,900 | | | | 652,860 | |
Pulte Group Incorporated | | | | | | | | | | | 16,771 | | | | 444,767 | |
Whirlpool Corporation | | | | | | | | | | | 4,144 | | | | 522,683 | |
| | | | |
| | | | | | | | | | | | | | | 4,601,869 | |
| | | | | | | | | | | | | | | | |
|
| Internet & Direct Marketing Retail: 3.46% | |
Amazon.com Incorporated † | | | | | | | | | | | 26,296 | | | | 44,444,710 | |
Booking Holdings Incorporated † | | | | | | | | | | | 3,047 | | | | 5,764,558 | |
eBay Incorporated † | | | | | | | | | | | 59,702 | | | | 1,782,105 | |
Expedia Incorporated | | | | | | | | | | | 7,631 | | | | 921,748 | |
| | | | |
| | | | | | | | | | | | | | | 52,913,121 | |
| | | | | | | | | | | | | | | | |
|
| Leisure Products: 0.07% | |
Hasbro Incorporated | | | | | | | | | | | 7,496 | | | | 682,136 | |
Mattel Incorporated †« | | | | | | | | | | | 22,089 | | | | 307,037 | |
| | | | |
| | | | | | | | | | | | | | | 989,173 | |
| | | | | | | | | | | | | | | | |
The accompanying notes are an integral part of these financial statements.
| | | | |
| 22 | | Wells Fargo Index Portfolio | | Portfolio of investments—November 30, 2018 (unaudited) |
| | | | | | | | | | | | | | | | |
| Security name | | | | | | | | Shares | | | Value | |
|
| Multiline Retail: 0.48% | |
Dollar General Corporation | | | | | | | | | | | 17,043 | | | $ | 1,891,603 | |
Dollar Tree Incorporated † | | | | | | | | | | | 15,268 | | | | 1,324,804 | |
Kohl’s Corporation | | | | | | | | | | | 10,700 | | | | 718,719 | |
Macy’s Incorporated | | | | | | | | | | | 19,703 | | | | 674,237 | |
Nordstrom Incorporated | | | | | | | | | | | 7,357 | | | | 388,965 | |
Target Corporation | | | | | | | | | | | 33,783 | | | | 2,397,242 | |
| | | | |
| | | | | | | | | | | | | | | 7,395,570 | |
| | | | | | | | | | | | | | | | |
|
| Specialty Retail: 2.20% | |
Advance Auto Parts Incorporated | | | | | | | | | | | 4,755 | | | | 845,011 | |
AutoZone Incorporated † | | | | | | | | | | | 1,697 | | | | 1,372,992 | |
Best Buy Company Incorporated | | | | | | | | | | | 15,601 | | | | 1,007,669 | |
CarMax Incorporated † | | | | | | | | | | | 11,332 | | | | 748,705 | |
Foot Locker Incorporated | | | | | | | | | | | 7,504 | | | | 423,226 | |
L Brands Incorporated | | | | | | | | | | | 14,653 | | | | 485,161 | |
Lowe’s Companies Incorporated | | | | | | | | | | | 52,053 | | | | 4,912,242 | |
O’Reilly Automotive Incorporated † | | | | | | | | | | | 5,171 | | | | 1,793,199 | |
Ross Stores Incorporated | | | | | | | | | | | 24,168 | | | | 2,117,117 | |
The Gap Incorporated | | | | | | | | | | | 13,927 | | | | 380,068 | |
The Home Depot Incorporated | | | | | | | | | | | 73,434 | | | | 13,241,619 | |
The TJX Companies Incorporated | | | | | | | | | | | 80,494 | | | | 3,932,132 | |
Tiffany & Company | | | | | | | | | | | 6,992 | | | | 636,272 | |
Tractor Supply Company | | | | | | | | | | | 7,818 | | | | 743,726 | |
ULTA Beauty Incorporated † | | | | | | | | | | | 3,644 | | | | 1,085,147 | |
| | | | |
| | | | | | | | | | | | | | | 33,724,286 | |
| | | | | | | | | | | | | | | | |
|
| Textiles, Apparel & Luxury Goods: 0.71% | |
HanesBrands Incorporated | | | | | | | | | | | 23,138 | | | | 368,126 | |
Michael Kors Holdings Limited † | | | | | | | | | | | 9,584 | | | | 419,300 | |
Nike Incorporated Class B | | | | | | | | | | | 82,186 | | | | 6,173,812 | |
PVH Corporation | | | | | | | | | | | 4,924 | | | | 544,151 | |
Ralph Lauren Corporation | | | | | | | | | | | 3,546 | | | | 395,024 | |
Tapestry Incorporated | | | | | | | | | | | 18,487 | | | | 719,699 | |
Under Armour Incorporated Class A †« | | | | | | | | | | | 11,942 | | | | 285,175 | |
Under Armour Incorporated Class C † | | | | | | | | | | | 12,244 | | | | 273,409 | |
VF Corporation | | | | | | | | | | | 20,866 | | | | 1,696,197 | |
| | | | |
| | | | | | | | | | | | | | | 10,874,893 | |
| | | | | | | | | | | | | | | | |
|
Consumer Staples: 7.23% | |
|
| Beverages: 1.85% | |
Brown-Forman Corporation Class B | | | | | | | | | | | 10,817 | | | | 516,187 | |
Constellation Brands Incorporated Class A | | | | | | | | | | | 10,774 | | | | 2,109,118 | |
Molson Coors Brewing Company Class B | | | | | | | | | | | 12,013 | | | | 790,095 | |
Monster Beverage Corporation † | | | | | | | | | | | 25,533 | | | | 1,523,809 | |
PepsiCo Incorporated | | | | | | | | | | | 90,776 | | | | 11,069,225 | |
The Coca-Cola Company | | | | | | | | | | | 245,670 | | | | 12,381,768 | |
| | | | |
| | | | | | | | | | | | | | | 28,390,202 | |
| | | | | | | | | | | | | | | | |
The accompanying notes are an integral part of these financial statements.
| | | | | | |
| Portfolio of investments—November 30, 2018 (unaudited) | | Wells Fargo Index Portfolio | | | 23 | |
| | | | | | | | | | | | | | | | |
| Security name | | | | | | | | Shares | | | Value | |
|
| Food & Staples Retailing: 1.54% | |
Costco Wholesale Corporation | | | | | | | | | | | 28,147 | | | $ | 6,509,838 | |
Sysco Corporation | | | | | | | | | | | 30,692 | | | | 2,068,641 | |
The Kroger Company | | | | | | | | | | | 51,133 | | | | 1,516,605 | |
Wal-Mart Stores Incorporated | | | | | | | | | | | 92,108 | | | | 8,994,346 | |
Walgreens Boots Alliance Incorporated | | | | | | | | | | | 54,142 | | | | 4,584,203 | |
| | | | |
| | | | | | | | | | | | | | | 23,673,633 | |
| | | | | | | | | | | | | | | | |
|
| Food Products: 1.15% | |
Archer Daniels Midland Company | | | | | | | | | | | 35,926 | | | | 1,653,315 | |
Campbell Soup Company « | | | | | | | | | | | 12,350 | | | | 484,120 | |
ConAgra Foods Incorporated | | | | | | | | | | | 30,104 | | | | 973,563 | |
General Mills Incorporated | | | | | | | | | | | 38,251 | | | | 1,618,400 | |
Hormel Foods Corporation « | | | | | | | | | | | 17,451 | | | | 786,866 | |
Kellogg Company | | | | | | | | | | | 16,243 | | | | 1,033,867 | |
Lamb Weston Holdings Incorporated | | | | | | | | | | | 9,398 | | | | 720,827 | |
McCormick & Company Incorporated | | | | | | | | | | | 7,784 | | | | 1,167,600 | |
Mondelez International Incorporated Class A | | | | | | | | | | | 94,129 | | | | 4,233,922 | |
The Hershey Company | | | | | | | | | | | 8,971 | | | | 971,559 | |
The J.M. Smucker Company | | | | | | | | | | | 7,300 | | | | 762,923 | |
The Kraft Heinz Company | | | | | | | | | | | 39,910 | | | | 2,040,199 | |
Tyson Foods Incorporated Class A | | | | | | | | | | | 18,993 | | | | 1,119,637 | |
| | | | |
| | | | | | | | | | | | | | | 17,566,798 | |
| | | | | | | | | | | | | | | | |
|
| Household Products: 1.54% | |
Church & Dwight Company Incorporated | | | | | | | | | | | 15,751 | | | | 1,042,559 | |
Colgate-Palmolive Company | | | | | | | | | | | 55,694 | | | | 3,537,683 | |
Kimberly-Clark Corporation | | | | | | | | | | | 22,314 | | | | 2,574,366 | |
The Clorox Company | | | | | | | | | | | 8,221 | | | | 1,361,562 | |
The Procter & Gamble Company | | | | | | | | | | | 159,762 | | | | 15,099,107 | |
| | | | |
| | | | | | | | | | | | | | | 23,615,277 | |
| | | | | | | | | | | | | | | | |
|
| Personal Products: 0.15% | |
Coty Incorporated Class A | | | | | | | | | | | 28,913 | | | | 241,134 | |
The Estee Lauder Companies Incorporated Class A | | | | | | | | | | | 14,386 | | | | 2,052,307 | |
| | | | |
| | | | | | | | | | | | | | | 2,293,441 | |
| | | | | | | | | | | | | | | | |
|
| Tobacco: 1.00% | |
Altria Group Incorporated | | | | | | | | | | | 120,997 | | | | 6,634,266 | |
Philip Morris International Incorporated | | | | | | | | | | | 99,773 | | | | 8,633,358 | |
| | | | |
| | | | | | | | | | | | | | | 15,267,624 | |
| | | | | | | | | | | | | | | | |
|
Energy: 5.38% | |
|
| Energy Equipment & Services: 0.55% | |
Baker Hughes Incorporated | | | | | | | | | | | 32,632 | | | | 744,662 | |
Halliburton Company | | | | | | | | | | | 56,475 | | | | 1,775,009 | |
Helmerich & Payne Incorporated | | | | | | | | | | | 6,992 | | | | 423,715 | |
National Oilwell Varco Incorporated | | | | | | | | | | | 24,558 | | | | 788,557 | |
The accompanying notes are an integral part of these financial statements.
| | | | |
| 24 | | Wells Fargo Index Portfolio | | Portfolio of investments—November 30, 2018 (unaudited) |
| | | | | | | | | | | | | | | | |
| Security name | | | | | | | | Shares | | | Value | |
|
| Energy Equipment & Services(continued) | |
Schlumberger Limited | | | | | | | | | | | 88,837 | | | $ | 4,006,549 | |
TechnipFMC plc | | | | | | | | | | | 27,421 | | | | 633,151 | |
| | | | |
| | | | | | | | | | | | | | | 8,371,643 | |
| | | | | | | | | | | | | | | | |
|
| Oil, Gas & Consumable Fuels: 4.83% | |
Anadarko Petroleum Corporation | | | | | | | | | | | 32,867 | | | | 1,738,664 | |
Apache Corporation | | | | | | | | | | | 24,549 | | | | 862,406 | |
Cabot Oil & Gas Corporation | | | | | | | | | | | 28,316 | | | | 712,431 | |
Chevron Corporation | | | | | | | | | | | 122,984 | | | | 14,627,717 | |
Cimarex Energy Company | | | | | | | | | | | 6,120 | | | | 501,718 | |
Concho Resources Incorporated † | | | | | | | | | | | 12,854 | | | | 1,675,390 | |
ConocoPhillips | | | | | | | | | | | 74,587 | | | | 4,936,168 | |
Devon Energy Corporation | | | | | | | | | | | 30,051 | | | | 812,279 | |
Diamondback Energy Incorporated | | | | | | | | | | | 9,741 | | | | 1,075,212 | |
EOG Resources Incorporated | | | | | | | | | | | 37,175 | | | | 3,840,549 | |
Exxon Mobil Corporation | | | | | | | | | | | 271,740 | | | | 21,603,330 | |
Hess Corporation | | | | | | | | | | | 16,157 | | | | 870,701 | |
HollyFrontier Corporation | | | | | | | | | | | 10,403 | | | | 649,875 | |
Kinder Morgan Incorporated | | | | | | | | | | | 121,812 | | | | 2,079,331 | |
Marathon Oil Corporation | | | | | | | | | | | 54,822 | | | | 914,979 | |
Marathon Petroleum Corporation | | | | | | | | | | | 43,034 | | | | 2,804,095 | |
Newfield Exploration Company † | | | | | | | | | | | 12,827 | | | | 217,418 | |
Noble Energy Incorporated | | | | | | | | | | | 31,008 | | | | 736,130 | |
Occidental Petroleum Corporation | | | | | | | | | | | 49,082 | | | | 3,448,992 | |
ONEOK Incorporated | | | | | | | | | | | 26,395 | | | | 1,621,445 | |
Phillips 66 Company | | | | | | | | | | | 27,414 | | | | 2,563,757 | |
Pioneer Natural Resources Company | | | | | | | | | | | 10,937 | | | | 1,615,942 | |
The Williams Companies Incorporated | | | | | | | | | | | 77,621 | | | | 1,965,364 | |
Valero Energy Corporation | | | | | | | | | | | 27,432 | | | | 2,191,817 | |
| | | | |
| | | | | | | | | | | | | | | 74,065,710 | |
| | | | | | | | | | | | | | | | |
|
Financials: 13.38% | |
|
| Banks: 5.89% | |
Bank of America Corporation | | | | | | | | | | | 596,203 | | | | 16,932,165 | |
BB&T Corporation | | | | | | | | | | | 49,706 | | | | 2,539,977 | |
Citigroup Incorporated | | | | | | | | | | | 161,524 | | | | 10,465,140 | |
Citizens Financial Group Incorporated | | | | | | | | | | | 30,548 | | | | 1,110,725 | |
Comerica Incorporated | | | | | | | | | | | 10,378 | | | | 821,730 | |
Fifth Third Bancorp | | | | | | | | | | | 42,768 | | | | 1,194,510 | |
Huntington Bancshares Incorporated | | | | | | | | | | | 70,873 | | | | 1,034,037 | |
JPMorgan Chase & Company | | | | | | | | | | | 215,712 | | | | 23,985,017 | |
KeyCorp | | | | | | | | | | | 67,523 | | | | 1,238,372 | |
M&T Bank Corporation | | | | | | | | | | | 9,229 | | | | 1,559,793 | |
People’s United Financial Incorporated | | | | | | | | | | | 23,923 | | | | 403,342 | |
PNC Financial Services Group Incorporated | | | | | | | | | | | 29,800 | | | | 4,046,244 | |
Regions Financial Corporation | | | | | | | | | | | 66,357 | | | | 1,091,573 | |
SunTrust Banks Incorporated | | | | | | | | | | | 29,571 | | | | 1,853,806 | |
SVB Financial Group † | | | | | | | | | | | 3,415 | | | | 870,176 | |
US Bancorp | | | | | | | | | | | 98,284 | | | | 5,352,547 | |
The accompanying notes are an integral part of these financial statements.
| | | | | | |
| Portfolio of investments—November 30, 2018 (unaudited) | | Wells Fargo Index Portfolio | | | 25 | |
| | | | | | | | | | | | | | | | |
| Security name | | | | | | | | Shares | | | Value | |
|
| Banks(continued) | |
Wells Fargo & Company (l) | | | | | | | | | | | 278,204 | | | $ | 15,100,913 | |
Zions Bancorporation | | | | | | | | | | | 12,477 | | | | 607,131 | |
| | | | |
| | | | | | | | | | | | | | | 90,207,198 | |
| | | | | | | | | | | | | | | | |
|
| Capital Markets: 2.70% | |
Affiliated Managers Group Incorporated | | | | | | | | | | | 3,429 | | | | 381,030 | |
Ameriprise Financial Incorporated | | | | | | | | | | | 9,105 | | | | 1,181,374 | |
Bank of New York Mellon Corporation | | | | | | | | | | | 59,045 | | | | 3,029,599 | |
BlackRock Incorporated | | | | | | | | | | | 7,887 | | | | 3,375,715 | |
CBOE Holdings Incorporated | | | | | | | | | | | 7,177 | | | | 772,389 | |
CME Group Incorporated | | | | | | | | | | | 22,713 | | | | 4,317,287 | |
E*TRADE Financial Corporation | | | | | | | | | | | 16,667 | | | | 871,517 | |
Franklin Resources Incorporated | | | | | | | | | | | 19,620 | | | | 664,922 | |
Intercontinental Exchange Incorporated | | | | | | | | | | | 36,805 | | | | 3,007,705 | |
Invesco Limited | | | | | | | | | | | 26,370 | | | | 536,630 | |
Moody’s Corporation | | | | | | | | | | | 10,716 | | | | 1,704,594 | |
Morgan Stanley | | | | | | | | | | | 85,110 | | | | 3,778,033 | |
MSCI Incorporated | | | | | | | | | | | 5,702 | | | | 895,727 | |
Northern Trust Corporation | | | | | | | | | | | 14,331 | | | | 1,422,065 | |
Raymond James Financial Incorporated | | | | | | | | | | | 8,427 | | | | 671,885 | |
S&P Global Incorporated | | | | | | | | | | | 16,142 | | | | 2,951,726 | |
State Street Corporation | | | | | | | | | | | 24,352 | | | | 1,778,183 | |
T. Rowe Price Group Incorporated | | | | | | | | | | | 15,609 | | | | 1,550,910 | |
The Charles Schwab Corporation | | | | | | | | | | | 77,177 | | | | 3,457,530 | |
The Goldman Sachs Group Incorporated | | | | | | | | | | | 22,536 | | | | 4,297,390 | |
The NASDAQ OMX Group Incorporated | | | | | | | | | | | 7,391 | | | | 674,946 | |
| | | | |
| | | | | | | | | | | | | | | 41,321,157 | |
| | | | | | | | | | | | | | | | |
|
| Consumer Finance: 0.69% | |
American Express Company | | | | | | | | | | | 45,317 | | | | 5,087,740 | |
Capital One Financial Corporation | | | | | | | | | | | 30,707 | | | | 2,753,804 | |
Discover Financial Services | | | | | | | | | | | 21,993 | | | | 1,568,101 | |
Synchrony Financial | | | | | | | | | | | 43,736 | | | | 1,136,261 | |
| | | | |
| | | | | | | | | | | | | | | 10,545,906 | |
| | | | | | | | | | | | | | | | |
|
| Diversified Financial Services: 1.81% | |
Berkshire Hathaway Incorporated Class B † | | | | | | | | | | | 125,121 | | | | 27,306,407 | |
Jefferies Financial Group Incorporated | | | | | | | | | | | 18,613 | | | | 406,694 | |
| | | | |
| | | | | | | | | | | | | | | 27,713,101 | |
| | | | | | | | | | | | | | | | |
|
| Insurance: 2.29% | |
AFLAC Incorporated | | | | | | | | | | | 49,280 | | | | 2,254,067 | |
American International Group Incorporated | | | | | | | | | | | 57,023 | | | | 2,466,245 | |
Aon plc | | | | | | | | | | | 15,574 | | | | 2,571,423 | |
Arthur J. Gallagher & Company | | | | | | | | | | | 11,721 | | | | 903,337 | |
Assurant Incorporated | | | | | | | | | | | 3,388 | | | | 329,449 | |
Brighthouse Financial Incorporated † | | | | | | | | | | | 7,688 | | | | 309,519 | |
Chubb Limited | | | | | | | | | | | 29,733 | | | | 3,976,491 | |
Cincinnati Financial Corporation | | | | | | | | | | | 9,709 | | | | 793,517 | |
The accompanying notes are an integral part of these financial statements.
| | | | |
| 26 | | Wells Fargo Index Portfolio | | Portfolio of investments—November 30, 2018 (unaudited) |
| | | | | | | | | | | | | | | | |
| Security name | | | | | | | | Shares | | | Value | |
|
| Insurance(continued) | |
Everest Reinsurance Group Limited | | | | | | | | | | | 2,622 | | | $ | 582,294 | |
Lincoln National Corporation | | | | | | | | | | | 13,907 | | | | 875,724 | |
Loews Corporation | | | | | | | | | | | 17,847 | | | | 857,727 | |
Marsh & McLennan Companies Incorporated | | | | | | | | | | | 32,411 | | | | 2,874,856 | |
MetLife Incorporated | | | | | | | | | | | 63,852 | | | | 2,849,715 | |
Principal Financial Group Incorporated | | | | | | | | | | | 16,997 | | | | 838,292 | |
Prudential Financial Incorporated | | | | | | | | | | | 26,764 | | | | 2,509,393 | |
The Allstate Corporation | | | | | | | | | | | 22,222 | | | | 1,981,980 | |
The Hartford Financial Services Group Incorporated | | | | | | | | | | | 23,004 | | | | 1,016,547 | |
The Progressive Corporation | | | | | | | | | | | 37,425 | | | | 2,480,903 | |
The Travelers Companies Incorporated | | | | | | | | | | | 17,181 | | | | 2,239,887 | |
Torchmark Corporation | | | | | | | | | | | 6,654 | | | | 574,972 | |
Unum Group | | | | | | | | | | | 14,037 | | | | 504,069 | |
Willis Towers Watson plc | | | | | | | | | | | 8,393 | | | | 1,338,264 | |
| | | | |
| | | | | | | | | | | | | | | 35,128,671 | |
| | | | | | | | | | | | | | | | |
|
Health Care: 15.21% | |
|
| Biotechnology: 2.52% | |
AbbVie Incorporated | | | | | | | | | | | 97,191 | | | | 9,162,196 | |
Alexion Pharmaceuticals Incorporated † | | | | | | | | | | | 14,304 | | | | 1,761,538 | |
Amgen Incorporated | | | | | | | | | | | 41,544 | | | | 8,651,538 | |
Biogen Idec Incorporated † | | | | | | | | | | | 12,929 | | | | 4,314,666 | |
Celgene Corporation † | | | | | | | | | | | 45,144 | | | | 3,260,300 | |
Gilead Sciences Incorporated | | | | | | | | | | | 83,203 | | | | 5,985,624 | |
Incyte Corporation † | | | | | | | | | | | 11,324 | | | | 727,567 | |
Regeneron Pharmaceuticals Incorporated † | | | | | | | | | | | 4,973 | | | | 1,818,377 | |
Vertex Pharmaceuticals Incorporated † | | | | | | | | | | | 16,403 | | | | 2,965,498 | |
| | | | |
| | | | | | | | | | | | | | | 38,647,304 | |
| | | | | | | | | | | | | | | | |
|
| Health Care Equipment & Supplies: 3.21% | |
Abbott Laboratories | | | | | | | | | | | 112,598 | | | | 8,337,882 | |
ABIOMED Incorporated † | | | | | | | | | | | 2,880 | | | | 958,118 | |
Align Technology Incorporated † | | | | | | | | | | | 4,691 | | | | 1,078,414 | |
Baxter International Incorporated | | | | | | | | | | | 31,891 | | | | 2,186,128 | |
Becton Dickinson & Company | | | | | | | | | | | 17,173 | | | | 4,340,476 | |
Boston Scientific Corporation † | | | | | | | | | | | 88,761 | | | | 3,343,627 | |
Danaher Corporation | | | | | | | | | | | 39,523 | | | | 4,329,349 | |
Dentsply Sirona Incorporated | | | | | | | | | | | 14,271 | | | | 539,158 | |
Edwards Lifesciences Corporation † | | | | | | | | | | | 13,439 | | | | 2,177,252 | |
Hologic Incorporated † | | | | | | | | | | | 17,466 | | | | 775,665 | |
IDEXX Laboratories Incorporated † | | | | | | | | | | | 5,558 | | | | 1,132,498 | |
Intuitive Surgical Incorporated † | | | | | | | | | | | 7,301 | | | | 3,875,882 | |
Medtronic plc | | | | | | | | | | | 86,680 | | | | 8,453,900 | |
ResMed Incorporated | | | | | | | | | | | 9,161 | | | | 1,024,108 | |
Stryker Corporation | | | | | | | | | | | 19,923 | | | | 3,495,690 | |
The Cooper Companies Incorporated | | | | | | | | | | | 3,154 | | | | 879,430 | |
Varian Medical Systems Incorporated † | | | | | | | | | | | 5,876 | | | | 725,040 | |
Zimmer Biomet Holdings Incorporated | | | | | | | | | | | 13,060 | | | | 1,528,281 | |
| | | | |
| | | | | | | | | | | | | | | 49,180,898 | |
| | | | | | | | | | | | | | | | |
The accompanying notes are an integral part of these financial statements.
| | | | | | |
| Portfolio of investments—November 30, 2018 (unaudited) | | Wells Fargo Index Portfolio | | | 27 | |
| | | | | | | | | | | | | | | | |
| Security name | | | | | | | | Shares | | | Value | |
|
| Health Care Providers & Services: 3.37% | |
AmerisourceBergen Corporation | | | | | | | | | | | 10,276 | | | $ | 913,536 | |
Anthem Incorporated | | | | | | | | | | | 16,685 | | | | 4,839,818 | |
Cardinal Health Incorporated | | | | | | | | | | | 19,822 | | | | 1,086,840 | |
Centene Corporation † | | | | | | | | | | | 13,174 | | | | 1,874,002 | |
CIGNA Corporation | | | | | | | | | | | 15,620 | | | | 3,489,196 | |
CVS Health Corporation | | | | | | | | | | | 82,932 | | | | 6,651,128 | |
DaVita HealthCare Partners Incorporated † | | | | | | | | | | | 8,141 | | | | 537,794 | |
Express Scripts Holding Company † | | | | | | | | | | | 36,086 | | | | 3,661,646 | |
HCA Holdings Incorporated | | | | | | | | | | | 17,324 | | | | 2,494,483 | |
Henry Schein Incorporated † | | | | | | | | | | | 9,827 | | | | 876,568 | |
Humana Incorporated | | | | | | | | | | | 8,842 | | | | 2,913,174 | |
Laboratory Corporation of America Holdings † | | | | | | | | | | | 6,540 | | | | 952,486 | |
McKesson Corporation | | | | | | | | | | | 12,822 | | | | 1,596,339 | |
Quest Diagnostics Incorporated | | | | | | | | | | | 8,772 | | | | 776,936 | |
UnitedHealth Group Incorporated | | | | | | | | | | | 61,775 | | | | 17,381,014 | |
Universal Health Services Incorporated Class B | | | | | | | | | | | 5,525 | | | | 762,395 | |
WellCare Health Plans Incorporated † | | | | | | | | | | | 3,208 | | | | 817,655 | |
| | | | |
| | | | | | | | | | | | | | | 51,625,010 | |
| | | | | | | | | | | | | | | | |
|
| Health Care Technology: 0.08% | |
Cerner Corporation † | | | | | | | | | | | 21,117 | | | | 1,222,885 | |
| | | | | | | | | | | | | | | | |
|
| Life Sciences Tools & Services: 0.98% | |
Agilent Technologies Incorporated | | | | | | | | | | | 20,460 | | | | 1,480,281 | |
Illumina Incorporated † | | | | | | | | | | | 9,435 | | | | 3,184,313 | |
IQVIA Holdings Incorporated † | | | | | | | | | | | 10,402 | | | | 1,300,978 | |
Mettler-Toledo International Incorporated † | | | | | | | | | | | 1,618 | | | | 1,030,116 | |
PerkinElmer Incorporated | | | | | | | | | | | 7,107 | | | | 618,735 | |
Thermo Fisher Scientific Incorporated | | | | | | | | | | | 25,853 | | | | 6,451,616 | |
Waters Corporation † | | | | | | | | | | | 4,946 | | | | 982,177 | |
| | | | |
| | | | | | | | | | | | | | | 15,048,216 | |
| | | | | | | | | | | | | | | | |
|
| Pharmaceuticals: 5.05% | |
Allergan plc | | | | | | | | | | | 20,479 | | | | 3,207,011 | |
Bristol-Myers Squibb Company | | | | | | | | | | | 104,739 | | | | 5,599,347 | |
Eli Lilly & Company | | | | | | | | | | | 61,349 | | | | 7,278,445 | |
Johnson & Johnson | | | | | | | | | | | 172,188 | | | | 25,294,417 | |
Merck & Company Incorporated | | | | | | | | | | | 170,697 | | | | 13,543,100 | |
Mylan NV † | | | | | | | | | | | 33,091 | | | | 1,120,461 | |
Nektar Therapeutics † | | | | | | | | | | | 11,070 | | | | 447,117 | |
Perrigo Company plc | | | | | | | | | | | 8,080 | | | | 503,222 | |
Pfizer Incorporated | | | | | | | | | | | 376,249 | | | | 17,393,991 | |
Zoetis Incorporated | | | | | | | | | | | 30,925 | | | | 2,902,930 | |
| | | | |
| | | | | | | | | | | | | | | 77,290,041 | |
| | | | | | | | | | | | | | | | |
|
Industrials: 9.14% | |
|
| Aerospace & Defense: 2.45% | |
Arconic Incorporated | | | | | | | | | | | 27,588 | | | | 592,590 | |
General Dynamics Corporation | | | | | | | | | | | 17,875 | | | | 3,304,909 | |
The accompanying notes are an integral part of these financial statements.
| | | | |
| 28 | | Wells Fargo Index Portfolio | | Portfolio of investments—November 30, 2018 (unaudited) |
| | | | | | | | | | | | | | | | |
| Security name | | | | | | | | Shares | | | Value | |
|
| Aerospace & Defense(continued) | |
Harris Corporation | | | | | | | | | | | 7,542 | | | $ | 1,078,129 | |
Huntington Ingalls Industries Incorporated | | | | | | | | | | | 2,780 | | | | 599,090 | |
L-3 Technologies Incorporated | | | | | | | | | | | 5,027 | | | | 921,399 | |
Lockheed Martin Corporation | | | | | | | | | | | 15,902 | | | | 4,777,438 | |
Northrop Grumman Corporation | | | | | | | | | | | 11,176 | | | | 2,904,419 | |
Raytheon Company | | | | | | | | | | | 18,309 | | | | 3,210,300 | |
Textron Incorporated | | | | | | | | | | | 15,944 | | | | 895,096 | |
The Boeing Company | | | | | | | | | | | 34,293 | | | | 11,891,441 | |
TransDigm Group Incorporated † | | | | | | | | | | | 3,108 | | | | 1,124,070 | |
United Technologies Corporation | | | | | | | | | | | 51,994 | | | | 6,334,935 | |
| | | | |
| | | | | | | | | | | | | | | 37,633,816 | |
| | | | | | | | | | | | | | | | |
|
| Air Freight & Logistics: 0.68% | |
C.H. Robinson Worldwide Incorporated | | | | | | | | | | | 8,892 | | | | 820,998 | |
Expeditors International of Washington Incorporated | | | | | | | | | | | 11,189 | | | | 851,371 | |
FedEx Corporation | | | | | | | | | | | 15,615 | | | | 3,575,835 | |
United Parcel Service Incorporated Class B | | | | | | | | | | | 44,504 | | | | 5,130,866 | |
| | | | |
| | | | | | | | | | | | | | | 10,379,070 | |
| | | | | | | | | | | | | | | | |
|
| Airlines: 0.48% | |
Alaska Air Group Incorporated | | | | | | | | | | | 7,904 | | | | 579,047 | |
American Airlines Group Incorporated | | | | | | | | | | | 26,306 | | | | 1,056,449 | |
Delta Air Lines Incorporated | | | | | | | | | | | 40,378 | | | | 2,451,348 | |
Southwest Airlines Company | | | | | | | | | | | 33,100 | | | | 1,807,591 | |
United Continental Holdings Incorporated † | | | | | | | | | | | 14,697 | | | | 1,421,200 | |
| | | | |
| | | | | | | | | | | | | | | 7,315,635 | |
| | | | | | | | | | | | | | | | |
|
| Building Products: 0.27% | |
A.O. Smith Corporation | | | | | | | | | | | 9,277 | | | | 439,544 | |
Allegion plc | | | | | | | | | | | 6,098 | | | | 558,516 | |
Fortune Brands Home & Security Incorporated | | | | | | | | | | | 9,141 | | | | 400,376 | |
Johnson Controls International plc | | | | | | | | | | | 59,364 | | | | 2,064,680 | |
Masco Corporation | | | | | | | | | | | 19,735 | | | | 625,402 | |
| | | | |
| | | | | | | | | | | | | | | 4,088,518 | |
| | | | | | | | | | | | | | | | |
|
| Commercial Services & Supplies: 0.36% | |
Cintas Corporation | | | | | | | | | | | 5,525 | | | | 1,035,275 | |
Copart Incorporated † | | | | | | | | | | | 13,119 | | | | 671,430 | |
Republic Services Incorporated | | | | | | | | | | | 13,991 | | | | 1,082,064 | |
Rollins Incorporated | | | | | | | | | | | 6,301 | | | | 400,492 | |
Waste Management Incorporated | | | | | | | | | | | 25,315 | | | | 2,373,281 | |
| | | | |
| | | | | | | | | | | | | | | 5,562,542 | |
| | | | | | | | | | | | | | | | |
|
| Construction & Engineering: 0.08% | |
Fluor Corporation | | | | | | | | | | | 9,025 | | | | 369,393 | |
Jacobs Engineering Group Incorporated | | | | | | | | | | | 7,651 | | | | 502,441 | |
Quanta Services Incorporated † | | | | | | | | | | | 9,551 | | | | 335,240 | |
| | | | |
| | | | | | | | | | | | | | | 1,207,074 | |
| | | | | | | | | | | | | | | | |
The accompanying notes are an integral part of these financial statements.
| | | | | | |
| Portfolio of investments—November 30, 2018 (unaudited) | | Wells Fargo Index Portfolio | | | 29 | |
| | | | | | | | | | | | | | | | |
| Security name | | | | | | | | Shares | | | Value | |
|
| Electrical Equipment: 0.48% | |
AMETEK Incorporated | | | | | | | | | | | 14,884 | | | $ | 1,092,932 | |
Eaton Corporation plc | | | | | | | | | | | 27,811 | | | | 2,139,778 | |
Emerson Electric Company | | | | | | | | | | | 40,337 | | | | 2,723,554 | |
Rockwell Automation Incorporated | | | | | | | | | | | 7,905 | | | | 1,378,158 | |
| | | | |
| | | | | | | | | | | | | | | 7,334,422 | |
| | | | | | | | | | | | | | | | |
|
| Industrial Conglomerates: 1.37% | |
3M Company | | | | | | | | | | | 37,651 | | | | 7,828,396 | |
General Electric Company | | | | | | | | | | | 557,822 | | | | 4,183,665 | |
Honeywell International Incorporated | | | | | | | | | | | 47,663 | | | | 6,994,545 | |
Roper Industries Incorporated | | | | | | | | | | | 6,633 | | | | 1,973,914 | |
| | | | |
| | | | | | | | | | | | | | | 20,980,520 | |
| | | | | | | | | | | | | | | | |
|
| Machinery: 1.50% | |
Caterpillar Incorporated | | | | | | | | | | | 38,146 | | | | 5,175,268 | |
Cummins Incorporated | | | | | | | | | | | 9,643 | | | | 1,456,672 | |
Deere & Company | | | | | | | | | | | 20,646 | | | | 3,197,652 | |
Dover Corporation | | | | | | | | | | | 9,480 | | | | 804,757 | |
Flowserve Corporation | | | | | | | | | | | 8,399 | | | | 407,435 | |
Fortive Corporation | | | | | | | | | | | 19,741 | | | | 1,501,698 | |
Illinois Tool Works Incorporated | | | | | | | | | | | 19,802 | | | | 2,753,468 | |
Ingersoll-Rand plc | | | | | | | | | | | 15,745 | | | | 1,629,922 | |
Paccar Incorporated | | | | | | | | | | | 22,499 | | | | 1,399,888 | |
Parker-Hannifin Corporation | | | | | | | | | | | 8,495 | | | | 1,461,480 | |
Pentair plc | | | | | | | | | | | 10,357 | | | | 442,244 | |
Snap-on Incorporated | | | | | | | | | | | 3,620 | | | | 601,789 | |
Stanley Black & Decker Incorporated | | | | | | | | | | | 9,821 | | | | 1,285,078 | |
Xylem Incorporated | | | | | | | | | | | 11,528 | | | | 841,313 | |
| | | | |
| | | | | | | | | | | | | | | 22,958,664 | |
| | | | | | | | | | | | | | | | |
|
| Professional Services: 0.29% | |
Equifax Incorporated | | | | | | | | | | | 7,728 | | | | 793,434 | |
IHS Markit Limited † | | | | | | | | | | | 22,896 | | | | 1,221,960 | |
Nielsen Holdings plc | | | | | | | | | | | 22,864 | | | | 621,215 | |
Robert Half International Incorporated | | | | | | | | | | | 7,859 | | | | 485,922 | |
Verisk Analytics Incorporated † | | | | | | | | | | | 10,571 | | | | 1,303,616 | |
| | | | |
| | | | | | | | | | | | | | | 4,426,147 | |
| | | | | | | | | | | | | | | | |
|
| Road & Rail: 1.01% | |
CSX Corporation | | | | | | | | | | | 52,365 | | | | 3,803,270 | |
J.B. Hunt Transport Services Incorporated | | | | | | | | | | | 5,614 | | | | 597,105 | |
Kansas City Southern | | | | | | | | | | | 6,557 | | | | 675,699 | |
Norfolk Southern Corporation | | | | | | | | | | | 17,973 | | | | 3,068,710 | |
Union Pacific Corporation | | | | | | | | | | | 47,463 | | | | 7,298,860 | |
| | | | |
| | | | | | | | | | | | | | | 15,443,644 | |
| | | | | | | | | | | | | | | | |
|
| Trading Companies & Distributors: 0.17% | |
Fastenal Company | | | | | | | | | | | 18,417 | | | | 1,091,391 | |
United Rentals Incorporated † | | | | | | | | | | | 5,311 | | | | 622,077 | |
The accompanying notes are an integral part of these financial statements.
| | | | |
| 30 | | Wells Fargo Index Portfolio | | Portfolio of investments—November 30, 2018 (unaudited) |
| | | | | | | | | | | | | | | | |
| Security name | | | | | | | | Shares | | | Value | |
|
| Trading Companies & Distributors(continued) | |
W.W. Grainger Incorporated | | | | | | | | | | | 2,918 | | | $ | 916,369 | |
| | | | |
| | | | | | | | | | | | | | | 2,629,837 | |
| | | | | | | | | | | | | | | | |
|
Information Technology: 19.55% | |
|
| Communications Equipment: 1.14% | |
Arista Networks Incorporated † | | | | | | | | | | | 3,314 | | | | 790,323 | |
Cisco Systems Incorporated | | | | | | | | | | | 293,403 | | | | 14,045,202 | |
F5 Networks Incorporated † | | | | | | | | | | | 3,903 | | | | 671,199 | |
Juniper Networks Incorporated | | | | | | | | | | | 22,130 | | | | 635,352 | |
Motorola Solutions Incorporated | | | | | | | | | | | 10,415 | | | | 1,366,969 | |
| | | | |
| | | | | | | | | | | | | | | 17,509,045 | |
| | | | | | | | | | | | | | | | |
|
| Electronic Equipment, Instruments & Components: 0.43% | |
Amphenol Corporation Class A | | | | | | | | | | | 19,278 | | | | 1,695,307 | |
Corning Incorporated | | | | | | | | | | | 51,989 | | | | 1,675,086 | |
FLIR Systems Incorporated | | | | | | | | | | | 8,859 | | | | 406,274 | |
IPG Photonics Corporation † | | | | | | | | | | | 2,312 | | | | 328,651 | |
Keysight Technologies Incorporated † | | | | | | | | | | | 12,030 | | | | 743,695 | |
TE Connectivity Limited | | | | | | | | | | | 22,365 | | | | 1,720,539 | |
| | | | |
| | | | | | | | | | | | | | | 6,569,552 | |
| | | | | | | | | | | | | | | | |
|
| IT Services: 4.62% | |
Accenture plc Class A | | | | | | | | | | | 41,125 | | | | 6,765,885 | |
Akamai Technologies Incorporated † | | | | | | | | | | | 10,879 | | | | 747,931 | |
Alliance Data Systems Corporation | | | | | | | | | | | 3,033 | | | | 607,692 | |
Automatic Data Processing Incorporated | | | | | | | | | | | 28,118 | | | | 4,145,156 | |
Broadridge Financial Solutions Incorporated | | | | | | | | | | | 7,466 | | | | 790,425 | |
Cognizant Technology Solutions Corporation Class A | | | | | | | | | | | 37,241 | | | | 2,652,676 | |
DXC Technology Company | | | | | | | | | | | 18,046 | | | | 1,137,620 | |
Fidelity National Information Services Incorporated | | | | | | | | | | | 21,105 | | | | 2,278,285 | |
Fiserv Incorporated † | | | | | | | | | | | 25,990 | | | | 2,056,589 | |
FleetCor Technologies Incorporated † | | | | | | | | | | | 5,673 | | | | 1,097,158 | |
Gartner Incorporated † | | | | | | | | | | | 5,829 | | | | 892,945 | |
Global Payments Incorporated | | | | | | | | | | | 10,153 | | | | 1,135,207 | |
International Business Machines Corporation | | | | | | | | | | | 58,584 | | | | 7,280,234 | |
Jack Henry & Associates Incorporated | | | | | | | | | | | 4,954 | | | | 692,074 | |
MasterCard Incorporated Class A | | | | | | | | | | | 58,554 | | | | 11,773,453 | |
Paychex Incorporated | | | | | | | | | | | 20,547 | | | | 1,453,906 | |
PayPal Holdings Incorporated † | | | | | | | | | | | 75,972 | | | | 6,519,157 | |
Total System Services Incorporated | | | | | | | | | | | 10,772 | | | | 941,150 | |
VeriSign Incorporated † | | | | | | | | | | | 6,886 | | | | 1,074,629 | |
Visa Incorporated Class A | | | | | | | | | | | 114,032 | | | | 16,159,475 | |
Western Union Company | | | | | | | | | | | 28,706 | | | | 537,663 | |
| | | | |
| | | | | | | | | | | | | | | 70,739,310 | |
| | | | | | | | | | | | | | | | |
|
| Semiconductors & Semiconductor Equipment: 3.55% | |
Advanced Micro Devices Incorporated † | | | | | | | | | | | 55,062 | | | | 1,172,821 | |
Analog Devices Incorporated | | | | | | | | | | | 23,855 | | | | 2,192,752 | |
Applied Materials Incorporated | | | | | | | | | | | 63,092 | | | | 2,352,070 | |
The accompanying notes are an integral part of these financial statements.
| | | | | | |
| Portfolio of investments—November 30, 2018 (unaudited) | | Wells Fargo Index Portfolio | | | 31 | |
| | | | | | | | | | | | | | | | |
| Security name | | | | | | | | Shares | | | Value | |
| | | | |
| Semiconductors & Semiconductor Equipment(continued) | | | | | | | | | | | | | | | | |
Broadcom Incorporated | | | | | | | | | | | 27,707 | | | $ | 6,577,919 | |
Intel Corporation | | | | | | | | | | | 295,949 | | | | 14,593,245 | |
KLA-Tencor Corporation | | | | | | | | | | | 10,021 | | | | 987,670 | |
Lam Research Corporation | | | | | | | | | | | 10,114 | | | | 1,587,493 | |
Maxim Integrated Products Incorporated | | | | | | | | | | | 17,844 | | | | 997,836 | |
Microchip Technology Incorporated « | | | | | | | | | | | 15,119 | | | | 1,133,925 | |
Micron Technology Incorporated † | | | | | | | | | | | 74,440 | | | | 2,870,406 | |
NVIDIA Corporation | | | | | | | | | | | 39,023 | | | | 6,377,529 | |
Qorvo Incorporated † | | | | | | | | | | | 8,064 | | | | 530,692 | |
QUALCOMM Incorporated | | | | | | | | | | | 77,801 | | | | 4,532,686 | |
Skyworks Solutions Incorporated | | | | | | | | | | | 11,488 | | | | 835,982 | |
Texas Instruments Incorporated | | | | | | | | | | | 62,399 | | | | 6,230,540 | |
Xilinx Incorporated | | | | | | | | | | | 16,233 | | | | 1,501,228 | |
| | | | |
| | | | | | | | | | | | | | | 54,474,794 | |
| | | | | | | | | | | | | | | | |
|
| Software: 5.93% | |
Adobe Systems Incorporated † | | | | | | | | | | | 31,428 | | | | 7,884,971 | |
Ansys Incorporated † | | | | | | | | | | | 5,411 | | | | 876,690 | |
Autodesk Incorporated † | | | | | | | | | | | 14,032 | | | | 2,027,624 | |
Cadence Design Systems Incorporated † | | | | | | | | | | | 18,152 | | | | 817,566 | |
Citrix Systems Incorporated | | | | | | | | | | | 8,272 | | | | 901,400 | |
Fortinet Incorporated † | | | | | | | | | | | 9,227 | | | | 681,322 | |
Intuit Incorporated | | | | | | | | | | | 16,602 | | | | 3,561,627 | |
Microsoft Corporation | | | | | | | | | | | 492,171 | | | | 54,576,842 | |
Oracle Corporation | | | | | | | | | | | 181,422 | | | | 8,846,137 | |
Red Hat Incorporated † | | | | | | | | | | | 11,384 | | | | 2,032,727 | |
Salesforce.com Incorporated † | | | | | | | | | | | 48,567 | | | | 6,933,425 | |
Symantec Corporation | | | | | | | | | | | 39,892 | | | | 882,012 | |
Synopsys Incorporated † | | | | | | | | | | | 9,537 | | | | 876,832 | |
| | | | |
| | | | | | | | | | | | | | | 90,899,175 | |
| | | | | | | | | | | | | | | | |
|
| Technology Hardware, Storage & Peripherals: 3.88% | |
Apple Incorporated | | | | | | | | | | | 294,500 | | | | 52,591,810 | |
Hewlett Packard Enterprise Company | | | | | | | | | | | 94,455 | | | | 1,416,825 | |
HP Incorporated | | | | | | | | | | | 101,564 | | | | 2,335,972 | |
NetApp Incorporated | | | | | | | | | | | 16,641 | | | | 1,112,784 | |
Seagate Technology plc | | | | | | | | | | | 16,774 | | | | 722,792 | |
Western Digital Corporation | | | | | | | | | | | 18,700 | | | | 848,793 | |
Xerox Corporation | | | | | | | | | | | 13,306 | | | | 358,198 | |
| | | | |
| | | | | | | | | | | | | | | 59,387,174 | |
| | | | | | | | | | | | | | | | |
|
Materials: 2.55% | |
|
| Chemicals: 1.92% | |
Air Products & Chemicals Incorporated | | | | | | | | | | | 14,074 | | | | 2,264,084 | |
Albemarle Corporation « | | | | | | | | | | | 6,961 | | | | 670,484 | |
CF Industries Holdings Incorporated | | | | | | | | | | | 14,985 | | | | 632,217 | |
DowDuPont Incorporated | | | | | | | | | | | 148,095 | | | | 8,567,296 | |
Eastman Chemical Company | | | | | | | | | | | 9,068 | | | | 714,740 | |
Ecolab Incorporated | | | | | | | | | | | 16,318 | | | | 2,618,876 | |
The accompanying notes are an integral part of these financial statements.
| | | | |
| 32 | | Wells Fargo Index Portfolio | | Portfolio of investments—November 30, 2018 (unaudited) |
| | | | | | | | | | | | | | | | |
| Security name | | | | | | | | Shares | | | Value | |
| | | | |
| Chemicals(continued) | | | | | | | | | | | | | | | | |
FMC Corporation | | | | | | | | | | | 8,641 | | | $ | 714,956 | |
International Flavors & Fragrances Incorporated | | | | | | | | | | | 6,496 | | | | 920,028 | |
Linde plc | | | | | | | | | | | 35,347 | | | | 5,621,940 | |
LyondellBasell Industries NV Class A | | | | | | | | | | | 20,490 | | | | 1,911,922 | |
PPG Industries Incorporated | | | | | | | | | | | 15,533 | | | | 1,698,223 | |
The Mosaic Company | | | | | | | | | | | 22,761 | | | | 819,396 | |
The Sherwin-Williams Company | | | | | | | | | | | 5,274 | | | | 2,236,545 | |
| | | | |
| | | | | | | | | | | | | | | 29,390,707 | |
| | | | | | | | | | | | | | | | |
|
| Construction Materials: 0.11% | |
Martin Marietta Materials Incorporated | | | | | | | | | | | 4,044 | | | | 771,150 | |
Vulcan Materials Company | | | | | | | | | | | 8,489 | | | | 897,372 | |
| | | | |
| | | | | | | | | | | | | | | 1,668,522 | |
| | | | | | | | | | | | | | | | |
|
| Containers & Packaging: 0.30% | |
Avery Dennison Corporation | | | | | | | | | | | 5,611 | | | | 540,900 | |
Ball Corporation | | | | | | | | | | | 22,073 | | | | 1,084,005 | |
International Paper Company | | | | | | | | | | | 26,243 | | | | 1,212,164 | |
Packaging Corporation of America | | | | | | | | | | | 6,065 | | | | 593,278 | |
Sealed Air Corporation | | | | | | | | | | | 10,193 | | | | 372,350 | |
WestRock Company | | | | | | | | | | | 16,374 | | | | 771,379 | |
| | | | |
| | | | | | | | | | | | | | | 4,574,076 | |
| | | | | | | | | | | | | | | | |
|
| Metals & Mining: 0.22% | |
Freeport-McMoRan Incorporated | | | | | | | | | | | 93,002 | | | | 1,110,444 | |
Newmont Mining Corporation | | | | | | | | | | | 34,235 | | | | 1,107,160 | |
Nucor Corporation | | | | | | | | | | | 20,304 | | | | 1,226,565 | |
| | | | |
| | | | | | | | | | | | | | | 3,444,169 | |
| | | | | | | | | | | | | | | | |
|
Real Estate: 2.83% | |
|
| Equity REITs: 2.77% | |
Alexandria Real Estate Equities Incorporated | | | | | | | | | | | 6,788 | | | | 845,106 | |
American Tower Corporation | | | | | | | | | | | 28,294 | | | | 4,654,080 | |
Apartment Investment & Management Company Class A | | | | | | | | | | | 10,099 | | | | 475,562 | |
AvalonBay Communities Incorporated | | | | | | | | | | | 8,871 | | | | 1,690,546 | |
Boston Properties Incorporated | | | | | | | | | | | 9,911 | | | | 1,300,323 | |
Crown Castle International Corporation | | | | | | | | | | | 26,626 | | | | 3,059,327 | |
Digital Realty Trust Incorporated | | | | | | | | | | | 13,228 | | | | 1,521,749 | |
Duke Realty Corporation | | | | | | | | | | | 22,931 | | | | 652,616 | |
Equinix Incorporated | | | | | | | | | | | 5,103 | | | | 1,966,084 | |
Equity Residential Company Limited | | | | | | | | | | | 23,638 | | | | 1,684,208 | |
Essex Property Trust Incorporated | | | | | | | | | | | 4,239 | | | | 1,112,780 | |
Extra Space Storage Incorporated | | | | | | | | | | | 8,119 | | | | 779,262 | |
Federal Realty Investment Trust | | | | | | | | | | | 4,717 | | | | 623,069 | |
HCP Incorporated | | | | | | | | | | | 30,155 | | | | 882,335 | |
Host Hotels & Resorts Incorporated | | | | | | | | | | | 47,603 | | | | 904,457 | |
Iron Mountain Incorporated | | | | | | | | | | | 18,366 | | | | 623,893 | |
Kimco Realty Corporation | | | | | | | | | | | 27,046 | | | | 442,202 | |
Mid-America Apartment Communities Incorporated | | | | | | | | | | | 7,305 | | | | 756,506 | |
The accompanying notes are an integral part of these financial statements.
| | | | | | |
| Portfolio of investments—November 30, 2018 (unaudited) | | Wells Fargo Index Portfolio | | | 33 | |
| | | | | | | | | | | | | | | | |
| Security name | | | | | | | | Shares | | | Value | |
| | | | |
| Equity REITs(continued) | | | | | | | | | | | | | | | | |
Prologis Incorporated | | | | | | | | | | | 40,405 | | | $ | 2,720,873 | |
Public Storage Incorporated | | | | | | | | | | | 9,618 | | | | 2,051,135 | |
Realty Income Corporation | | | | | | | | | | | 18,616 | | | | 1,193,099 | |
Regency Centers Corporation | | | | | | | | | | | 10,875 | | | | 692,303 | |
SBA Communications Corporation † | | | | | | | | | | | 7,371 | | | | 1,259,041 | |
Simon Property Group Incorporated | | | | | | | | | | | 19,846 | | | | 3,685,204 | |
SL Green Realty Corporation | | | | | | | | | | | 5,556 | | | | 535,710 | |
The Macerich Company | | | | | | | | | | | 6,790 | | | | 341,469 | |
UDR Incorporated | | | | | | | | | | | 17,180 | | | | 732,212 | |
Ventas Incorporated | | | | | | | | | | | 22,877 | | | | 1,452,461 | |
Vornado Realty Trust | | | | | | | | | | | 11,111 | | | | 799,548 | |
Welltower Incorporated | | | | | | | | | | | 23,878 | | | | 1,727,096 | |
Weyerhaeuser Company | | | | | | | | | | | 48,630 | | | | 1,284,318 | |
| | | | |
| | | | | | | | | | | | | | | 42,448,574 | |
| | | | | | | | | | | | | | | | |
|
| Real Estate Management & Development: 0.06% | |
CBRE Group Incorporated Class A † | | | | | | | | | | | 20,283 | | | | 885,961 | |
| | | | | | | | | | | | | | | | |
|
Utilities: 3.06% | |
|
| Electric Utilities: 1.90% | |
Alliant Energy Corporation | | | | | | | | | | | 15,004 | | | | 681,032 | |
American Electric Power Company Incorporated | | | | | | | | | | | 31,638 | | | | 2,459,538 | |
Duke Energy Corporation | | | | | | | | | | | 45,721 | | | | 4,049,509 | |
Edison International | | | | | | | | | | | 20,912 | | | | 1,156,852 | |
Entergy Corporation | | | | | | | | | | | 11,608 | | | | 1,010,592 | |
Evergy Incorporated | | | | 17,438 | | | | 1,035,294 | |
Eversource Energy | | | | 20,339 | | | | 1,389,967 | |
Exelon Corporation | | | | 61,995 | | | | 2,875,948 | |
FirstEnergy Corporation | | | | 31,185 | | | | 1,179,729 | |
NextEra Energy Incorporated | | | | 30,269 | | | | 5,500,180 | |
PG&E Corporation † | | | | 33,192 | | | | 875,605 | |
Pinnacle West Capital Corporation | | | | 7,187 | | | | 642,230 | |
PPL Corporation | | | | 44,901 | | | | 1,373,522 | |
The Southern Company | | | | 65,091 | | | | 3,080,757 | |
Xcel Energy Incorporated | | | | 32,675 | | | | 1,713,804 | |
| | | | |
| | | | | | | | | | | | | | | 29,024,559 | |
| | | | | | | | | | | | | | | | |
|
| Independent Power & Renewable Electricity Producers: 0.09% | |
AES Corporation | | | | 42,469 | | | | 657,845 | |
NRG Energy Incorporated | | | | 19,475 | | | | 748,424 | |
| | | | |
| | | | | | | | | | | | | | | 1,406,269 | |
| | | | | | | | | | | | | | | | |
|
| Multi-Utilities: 1.00% | |
Ameren Corporation | | | | 15,663 | | | | 1,074,795 | |
CenterPoint Energy Incorporated | | | | 31,585 | | | | 884,696 | |
CMS Energy Corporation | | | | 18,181 | | | | 947,048 | |
Consolidated Edison Incorporated | | | | 19,968 | | | | 1,604,429 | |
Dominion Energy Incorporated | | | | 41,961 | | | | 3,126,095 | |
DTE Energy Company | | | | 11,667 | | | | 1,397,007 | |
The accompanying notes are an integral part of these financial statements.
| | | | |
| 34 | | Wells Fargo Index Portfolio | | Portfolio of investments—November 30, 2018 (unaudited) |
| | | | | | | | | | | | | | | | |
| Security name | | | | | | | | Shares | | | Value | |
| | | | |
| Multi-Utilities(continued) | | | | | | | | | | | | | | | | |
NiSource Incorporated | | | | 23,301 | | | $ | 615,612 | |
Public Service Enterprise Group Incorporated | | | | 32,433 | | | | 1,813,005 | |
SCANA Corporation | | | | 9,154 | | | | 427,126 | |
Sempra Energy | | | | 17,551 | | | | 2,022,226 | |
WEC Energy Group Incorporated | | | | 20,252 | | | | 1,467,865 | |
| | | | |
| | | | | | | | | | | | | | | 15,379,904 | |
| | | | | | | | | | | | | | | | |
|
| Water Utilities: 0.07% | |
American Water Works Company Incorporated | | | | 11,585 | | | | 1,105,320 | |
| | | | | | | | | | | | | | | | |
| | |
Total Common Stocks (Cost $505,943,754) | | | | | | | | 1,495,119,427 | |
| | | | | | | | | | | | | | | | |
| | | | |
| | | Yield | | | | | | | | | | |
| Short-Term Investments: 2.53% | | | | | | | | | | | | | | | | |
| | | | |
| Investment Companies: 2.39% | | | | | | | | | | | | | | | | |
Securities Lending Cash Investments LLC (l)(r)(u) | | | 2.38 | % | | | | | | | 3,737,121 | | | | 3,737,495 | |
Wells Fargo Government Money Market Fund Select Class (l)(u) | | | 2.13 | | | | | | | | 32,948,855 | | | | 32,948,855 | |
| | | | |
| | | | | | | | | | | | | | | 36,686,350 | |
| | | | | | | | | | | | | | | | |
| | | | |
| | | | | | Maturity date | | | Principal | | | | |
| U.S. Treasury Securities: 0.14% | |
U.S. Treasury Bill (z)# | | | 1.61 | | | | 12-13-2018 | | | $ | 2,140,000 | | | | 2,138,720 | |
| | | | | | | | | | | | | | | | |
| | | | |
Total Short-Term Investments (Cost $38,824,866) | | | | | | | | | | | | | | | 38,825,070 | |
| | | | | | | | | | | | | | | | |
| | | | | | | | |
| Total investments in securities (Cost $544,768,620) | | | 100.12 | % | | | 1,533,944,497 | |
Other assets and liabilities, net | | | (0.12 | ) | | | (1,845,625 | ) |
| | | | | | | | |
| Total net assets | | | 100.00 | % | | $ | 1,532,098,872 | |
| | | | | | | | |
| † | Non-income-earning security |
| « | All or a portion of this security is on loan. |
| (l) | The issuer of the security is an affiliated person of the Portfolio as defined in the Investment Company Act of 1940. |
| (r) | The investment is anon-registered investment company purchased with cash collateral received from securities on loan. |
| (u) | The rate represents the7-day annualized yield at period end. |
| (z) | Zero coupon security. The rate represents the current yield to maturity. |
| # | All or a portion of this security is segregated as collateral for investments in derivative instruments. |
Abbreviations:
| REIT | Real estate investment trust |
Futures Contracts
| | | | | | | | | | | | | | | | | | | | | | | | |
| Description | | Number of contracts | | | Expiration date | | | Notional cost | | | Notional value | | | Unrealized gains | | | Unrealized losses | |
Long | | | | | | | | | | | | | | | | | | | | | | | | |
S&P 500 Index | | | 52 | | | | 12-20-2018 | | | $ | 36,372,075 | | | $ | 35,857,900 | | | $ | 0 | | | $ | (514,175 | ) |
The accompanying notes are an integral part of these financial statements.
| | | | | | |
| Portfolio of investments—November 30, 2018 (unaudited) | | Wells Fargo Index Portfolio | | | 35 | |
Investments in Affiliates
An affiliated investment is an investment in which the Portfolio owns at least 5% of the outstanding voting shares of the issuer or as a result of other relationships, such as the Portfolio and the issuer having the same adviser or investment manager.. Transactions with issuers that were either affiliated persons of the Portfolio at the beginning of the period or the end of the period were as follows:
| | | | | | | | | | | | | | | | | | | | | | | | | | | | | | | | | | | | |
| | | Shares, beginning of period | | | Shares purchased | | | Shares sold | | | Shares, end of period | | | Net realized gains (losses) | | | Net change in unrealized gains (losses) | | | Income from affiliated securities | | | Value, end of period | | | % of net assets | |
Common Stocks | | | | | | | | | | | | | | | | | | | | | | | | | | | | | | | | | | | | |
Financials | | | | | | | | | | | | | | | | | | | | | | | | | | | | | | | | | | | | |
Banks | | | | | | | | | | | | | | | | | | | | | | | | | | | | | | | | | | | | |
Wells Fargo & Company | | | 308,208 | | | | 890 | | | | 30,894 | | | | 278,204 | | | $ | 830,021 | | | $ | (720,382 | ) | | $ | 245,725 | | | $ | 15,100,913 | | | | 0.99 | % |
| | | | | | | | | |
Short-Term Investments | | | | | | | | | | | | | | | | | | | | | | | | | | | | | | | | | | | | |
Investment Companies | | | | | | | | | | | | | | | | | | | | | | | | | | | | | | | | | | | | |
Securities Lending Cash Investments LLC | | | 6,535,529 | | | | 31,725,054 | | | | 34,523,462 | | | | 3,737,121 | | | | 47 | | | | (115 | ) | | | 11,011 | | | | 3,737,495 | | | | | |
Wells Fargo Government Money Market Fund Select Class | | | 17,497,109 | | | | 173,688,226 | | | | 158,236,480 | | | | 32,948,855 | | | | 0 | | | | 0 | | | | 306,486 | | | | 32,948,855 | | | | | |
| | | | | | | | | | | | | | | | | | | | | | | | | | | | | | | 36,686,350 | | | | 2.39 | |
| | | | | | | | | | | | | | | | | | | | | | | | | | | | | | | | | | | | |
| | | | | | | | | | | | | | | | | | $ | 830,068 | | | $ | (720,497 | ) | | $ | 563,222 | | | $ | 51,787,263 | | | | 3.38 | % |
| | | | | | | | | | | | | | | | | | | | | | | | | | | | | | | | | | | | |
The accompanying notes are an integral part of these financial statements.
| | | | |
| 36 | | Wells Fargo Index Portfolio | | Statement of assets and liabilities—November 30, 2018 (unaudited) |
| | | | |
| | | | |
| |
Assets | | | | |
Investments in unaffiliated securities (including $3,654,221 of securities loaned), at value (cost $501,300,603) | | $ | 1,482,157,234 | |
Investments in affiliated securities, at value (cost $43,468,017) | | | 51,787,263 | |
Receivable for dividends | | | 3,792,038 | |
Receivable for investments sold | | | 759,747 | |
Receivable for daily variation margin on open futures | | | 261,080 | |
Receivable for securities lending income | | | 1,081 | |
Prepaid expenses and other assets | | | 187,948 | |
| | | | |
Total assets | | | 1,538,946,391 | |
| | | | |
| |
Liabilities | | | | |
Payable upon receipt of securities loaned | | | 3,735,462 | |
Payable for investments purchased | | | 2,847,037 | |
Advisory fee payable | | | 121,668 | |
Due to custodian bank | | | 87,385 | |
Accrued expenses and other liabilities | | | 55,967 | |
| | | | |
Total liabilities | | | 6,847,519 | |
| | | | |
Total net assets | | $ | 1,532,098,872 | |
| | | | |
The accompanying notes are an integral part of these financial statements.
| | | | | | |
| Statement of operations—six months ended November 30, 2018 (unaudited) | | Wells Fargo Index Portfolio | | | 37 | |
| | | | |
| | | | |
| |
Investment income | | | | |
Dividends (net of foreign dividend withholding taxes of $153) | | $ | 16,021,489 | |
Income from affiliated securities | | | 563,222 | |
Interest | | | 23,827 | |
| | | | |
Total investment income | | | 16,608,538 | |
| | | | |
| |
Expenses | | | | |
Advisory fee | | | 743,792 | |
Custody and accounting fees | | | 60,044 | |
Professional fees | | | 30,693 | |
Shareholder report expenses | | | 3,600 | |
Trustees’ fees and expenses | | | 11,825 | |
Other fees and expenses | | | 15,734 | |
| | | | |
Total expenses | | | 865,688 | |
| | | | |
Net investment income | | | 15,742,850 | |
| | | | |
| |
REALIZED AND UNREALIZED GAINS (LOSSES) ON INVESTMENTS | | | | |
| |
Net realized gains on: | | | | |
Unaffiliated securities | | | 118,178,593 | |
Affiliated securities | | | 830,068 | |
Futures contracts | | | 803,960 | |
| | | | |
Net realized gains on investments | | | 119,812,621 | |
| | | | |
| |
Net change in unrealized gains (losses) on: | | | | |
Unaffiliated securities | | | (83,919,810 | ) |
Affiliated securities | | | (720,497 | ) |
Futures contracts | | | (981,535 | ) |
| | | | |
Net change in unrealized gains (losses) on investments | | | (85,621,842 | ) |
| | | | |
Net realized and unrealized gains (losses) on investments | | | 34,190,779 | |
| | | | |
Net increase in net assets resulting from operations | | $ | 49,933,629 | |
| | | | |
The accompanying notes are an integral part of these financial statements.
| | | | |
| 38 | | Wells Fargo Index Portfolio | | Statement of changes in net assets |
| | | | | | | | |
| | | Six months ended
November 30, 2018
(unaudited) | | | Year ended
May 31, 2018 | |
| | |
Operations | | | | | | | | |
Net investment income | | $ | 15,742,850 | | | $ | 34,477,982 | |
Net realized gains on investments | | | 119,812,621 | | | | 356,446,608 | |
Net change in unrealized gains (losses) on investments | | | (85,621,842 | ) | | | (130,957,468 | ) |
| | | | |
Net increase in net assets resulting from operations | | | 49,933,629 | | | | 259,967,123 | |
| | | | |
| | |
Capital transactions | | | | | | | | |
Transactions in investors’ beneficial interests | | | | | | | | |
Contributions | | | 3,401,559 | | | | 15,647,891 | |
Withdrawals | | | (175,204,231 | ) | | | (637,181,697 | ) |
| | | | |
Net decrease in net assets resulting from capital transactions | | | (171,802,672 | ) | | | (621,533,806 | ) |
| | | | |
Total decrease in net assets | | | (121,869,043 | ) | | | (361,566,683 | ) |
| | | | |
| | |
Net assets | | | | | | | | |
Beginning of period | | | 1,653,967,915 | | | | 2,015,534,598 | |
| | | | |
End of period | | $ | 1,532,098,872 | | | $ | 1,653,967,915 | |
| | | | |
The accompanying notes are an integral part of these financial statements.
| | | | | | |
| Financial highlights | | Wells Fargo Index Portfolio | | | 39 | |
| | | | | | | | | | | | | | | | | | | | | | | | |
| | | Six months ended November 30, 2018 (unaudited) | | | Year ended May 31 | |
| | | 2018 | | | 2017 | | | 2016 | | | 2015 | | | 2014 | |
Total return¹ | | | 2.95 | % | | | 14.27 | % | | | 17.36 | % | | | 1.62 | % | | | 11.69 | % | | | 20.33 | % |
Ratios to average net assets (annualized) | | | | | | | | | | | | | | | | | | | | | | | | |
Gross expenses | | | 0.11 | % | | | 0.10 | % | | | 0.10 | % | | | 0.11 | % | | | 0.11 | % | | | 0.10 | % |
Net expenses | | | 0.11 | % | | | 0.10 | % | | | 0.10 | % | | | 0.10 | % | | | 0.11 | % | | | 0.10 | % |
Net investment income | | | 1.91 | % | | | 1.84 | % | | | 2.03 | % | | | 2.12 | % | | | 1.96 | % | | | 1.99 | % |
Supplemental data | | | | | | | | | | | | | | | | | | | | | | | | |
Portfolio turnover rate | | | 2 | % | | | 3 | % | | | 9 | % | | | 4 | % | | | 4 | % | | | 5 | % |
| 1 | Returns for periods of less than one year are not annualized. |
The accompanying notes are an integral part of these financial statements.
| | | | |
| 40 | | Wells Fargo Index Portfolio | | Notes to financial statements (unaudited) |
1. ORGANIZATION
Wells Fargo Master Trust (the “Trust”), a Delaware statutory trust organized on March 10, 1999, is anopen-end management investment company registered under the Investment Company Act of 1940, as amended (the “1940 Act”). As an investment company, the Trust follows the accounting and reporting guidance in Financial Accounting Standards Board (“FASB”) Accounting Standards Codification Topic 946, Financial Services – Investment Companies. These financial statements report on the Wells Fargo Index Portfolio (the “Portfolio”) which is a diversified series of the Trust.
2. SIGNIFICANT ACCOUNTING POLICIES
The following significant accounting policies, which are consistently followed in the preparation of the financial statements of the Portfolio, are in conformity with U.S. generally accepted accounting principles which require management to make estimates and assumptions that affect the reported amounts of assets and liabilities, disclosure of contingent assets and liabilities at the date of the financial statements, and the reported amounts of revenues and expenses during the reporting period. Actual results could differ from those estimates.
Securities valuation
All investments are valued each business day as of the close of regular trading on the New York Stock Exchange (generally 4 p.m. Eastern Time), although the Portfolio may deviate from this calculation time under unusual or unexpected circumstances.
Equity securities and futures contracts that are listed on a foreign or domestic exchange or market are valued at the official closing price or, if none, the last sales price. If no sale occurs on the principal exchange or market that day, a fair value price will be determined in accordance with the Portfolio’s Valuation Procedures.
Debt securities are valued at the evaluated bid price provided by an independent pricing service service (e.g. taking into account various factors, including yields, maturities, or credit ratings) or, if a reliable price is not available, the quoted bid price from an independent broker-dealer.
Investments in registeredopen-end investment companies are valued at net asset value. Interests innon-registered investment companies that are redeemable at net asset value are fair valued normally at net asset value.
Investments which are not valued using any of the methods discussed above are valued at their fair value, as determined in good faith by the Board of Trustees of the Portfolio. The Board of Trustees has established a Valuation Committee comprised of the Trustees and has delegated to it the authority to take any actions regarding the valuation of portfolio securities that the Valuation Committee deems necessary or appropriate, including determining the fair value of portfolio securities, unless the determination has been delegated to the Wells Fargo Asset Management Pricing Committee at Wells Fargo Funds Management, LLC (“Funds Management”).The Board of Trustees retains the authority to make or ratify any valuation decisions or approve any changes to the Valuation Procedures as it deems appropriate. On a quarterly basis, the Board of Trustees receives reports on any valuation actions taken by the Valuation Committee or the Wells Fargo Asset Management Pricing Committee which may include items for ratification.
Securities lending
The Portfolio may lend its securities from time to time in order to earn additional income in the form of fees or interest on securities received as collateral or the investment of any cash received as collateral. The Portfolio continues to receive interest or dividends on the securities loaned. The Portfolio receives collateral in the form of cash or securities with a value at least equal to the value of the securities on loan. The value of the loaned securities is determined at the close of each business day and any additional required collateral is delivered to the Portfolio on the next business day. In a securities lending transaction, the net asset value of the Portfolio will be affected by an increase or decrease in the value of the securities loaned and by an increase or decrease in the value of the instrument in which collateral is invested. The amount of securities lending activity undertaken by the Portfolio fluctuates from time to time. In the event of default or bankruptcy by the borrower, the Portfolio may be prevented from recovering the loaned securities or gaining access to the collateral or may experience delays or costs in doing so. In addition, the investment of any cash collateral received may lose all or part of its value. The Portfolio has the right under the lending agreement to recover the securities from the borrower on demand.
The Portfolio lends its securities through an unaffiliated securities lending agent. Cash collateral received in connection with its securities lending transactions is invested in Securities Lending Cash Investments, LLC (the “Securities Lending Fund”). The Securities Lending Fund is exempt from registration under Section 3(c)(7) of the 1940 Act and is managed by Funds Management and is subadvised by Wells Capital Management Incorporated (“WellsCap”), an affiliate of Funds Management and an indirect wholly owned subsidiary of Wells Fargo & Company (“Wells Fargo”). Funds Management
| | | | | | |
| Notes to financial statements (unaudited) | | Wells Fargo Index Portfolio | | | 41 | |
receives an advisory fee starting at 0.05% and declining to 0.01% as the average daily net assets of the Securities Lending Fund increase. All of the fees received by Funds Management are paid to WellsCap for its services as subadviser. The Securities Lending Fund seeks to provide a positive return compared to the daily Fed Funds Open Rate by investing in high-quality, U.S. dollar-denominated short-term money market instruments. Securities Lending Fund investments are valued at the evaluated bid price provided by an independent pricing service. Income earned from investment in the Securities Lending Fund, if any, is included in income from affiliated securities on the Statement of Operations.
Futures contracts
The Portfolio is subject to equity price risk in the normal course of pursuing its investment objectives. Futures contracts are agreements between the Portfolio and a counterparty to buy or sell a specific amount of a commodity, financial instrument or currency at specified price and on a specified date. The Portfolio may buy and sell futures contracts in order to gain exposure to, or protect against, changes in security values. The primary risks associated with the use of futures contracts are the imperfect correlation between changes in market values of securities held by the Portfolio and the prices of futures contracts, and the possibility of an illiquid market. Futures contracts are generally entered into on a regulated futures exchange and cleared through a clearinghouse associated with the exchange. With futures contracts, there is minimal counterparty risk to the Portfolio since futures contracts are exchange traded and the exchange’s clearinghouse, as counterparty to all exchange traded futures, guarantees the futures contracts against default.
Upon entering into a futures contracts, the Portfolio is required to deposit either cash or securities (initial margin) with the broker in an amount equal to a certain percentage of the contract value. Subsequent payments (variation margin) are paid to or from the broker each day equal to the daily changes in the contract value. Such payments are recorded as unrealized gains or losses and, if any, shown as variation margin receivable (payable) in the Statement of Assets and Liabilities. Should the Portfolio fail to make requested variation margin payments, the broker can gain access to the initial margin to satisfy the Portfolio’s payment obligations. When the contracts are closed, a realized gain or loss is recorded in the Statement of Operations.
Security transactions and income recognition
Securities transactions are recorded on a trade date basis. Realized gains or losses are recorded on the basis of identified cost.
Dividend income is recognized on theex-dividend date. Dividend income from foreign securities is recorded net of foreign taxes withheld where recovery of such taxes is not assured.
Interest income is accrued daily and bond discounts are accreted and premiums are amortized daily.To the extent debt obligations are placed onnon-accrual status, any related interest income may be reduced by writing off interest receivables when the collection of all or a portion of interest has been determined to be doubtful based on consistently applied procedures and the fair value has decreased. If the issuer subsequently resumes interest payments or when the collectability of interest is reasonably assured, the debt obligation is removed fromnon-accrual status.
Federal and other taxes
The Portfolio is treated as a separate entity for federal income tax purposes. The Portfolio is not required to pay federal income taxes on its net investment income and net capital gains as it is treated as a partnership for federal income tax purposes. All interest, dividends, gains and losses of the Portfolio are deemed to have been “passed through” to the interest holders in proportion to their holdings of the Portfolio regardless of whether such interest, dividends and gains have been distributed by the Portfolio.
The Portfolio’s income tax returns and all financial records supporting those returns for the prior three fiscal years are subject to examination by the federal revenue authority. Management has analyzed the Portfolio’s tax positions taken on federal, state, and foreign tax returns for all open tax years and does not believe that there are any uncertain tax positions that require recognition of a tax liability.
As of November 30, 2018, the aggregate cost of all investments for federal income tax purposes was $544,019,950 and the unrealized gains (losses) consisted of:
| | | | |
Gross unrealized gains | | $ | 1,007,430,653 | |
Gross unrealized losses | | | (18,020,281 | ) |
Net unrealized gains | | $ | 989,410,372 | |
| | | | |
| 42 | | Wells Fargo Index Portfolio | | Notes to financial statements (unaudited) |
3. FAIR VALUATION MEASUREMENTS
Fair value measurements of investments are determined within a framework that has established a fair value hierarchy based upon the various data inputs utilized in determining the value of the Portfolio’s investments. The three-level hierarchy gives the highest priority to unadjusted quoted prices in active markets for identical assets or liabilities (Level 1) and the lowest priority to unobservable inputs (Level 3). The Portfolio’s investments are classified within the fair value hierarchy based on the lowest level of input that is significant to the fair value measurement. The inputs are summarized into three broad levels as follows:
| ∎ | | Level 1 – quoted prices in active markets for identical securities |
| ∎ | | Level 2 – other significant observable inputs (including quoted prices for similar securities, interest rates, prepayment speeds, credit risk, etc.) |
| ∎ | | Level 3 – significant unobservable inputs (including the Portfolio’s own assumptions in determining the fair value of investments) |
The inputs or methodologies used for valuing investments in securities are not necessarily an indication of the risk associated with investing in those securities.
The following is a summary of the inputs used in valuing the Portfolio’s assets and liabilities as of November 30, 2018:
| | | | | | | | | | | | | | | | |
| | | Quoted prices (Level 1) | | | Other significant
observable inputs
(Level 2) | | | Significant
unobservable inputs (Level 3) | | | Total | |
Assets | | | | | | | | | | | | | | | | |
Investments in: | | | | | | | | | | | | | | | | |
| | | | |
Common stocks | | | | | | | | | | | | | | | | |
Communication services | | $ | 147,688,429 | | | $ | 0 | | | $ | 0 | | | $ | 147,688,429 | |
Consumer discretionary | | | 147,389,283 | | | | 0 | | | | 0 | | | | 147,389,283 | |
Consumer staples | | | 110,806,975 | | | | 0 | | | | 0 | | | | 110,806,975 | |
Energy | | | 82,437,353 | | | | 0 | | | | 0 | | | | 82,437,353 | |
Financials | | | 204,916,033 | | | | 0 | | | | 0 | | | | 204,916,033 | |
Health care | | | 233,014,354 | | | | 0 | | | | 0 | | | | 233,014,354 | |
Industrials | | | 139,959,889 | | | | 0 | | | | 0 | | | | 139,959,889 | |
Information technology | | | 299,579,050 | | | | 0 | | | | 0 | | | | 299,579,050 | |
Materials | | | 39,077,474 | | | | 0 | | | | 0 | | | | 39,077,474 | |
Real estate | | | 43,334,535 | | | | 0 | | | | 0 | | | | 43,334,535 | |
Utilities | | | 46,916,052 | | | | 0 | | | | 0 | | | | 46,916,052 | |
Short-term investments | | | | | | | | | | | | | | | | |
Investment companies | | | 32,948,855 | | | | 3,737,495 | | | | 0 | | | | 36,686,350 | |
U.S. Treasury securities | | | 2,138,720 | | | | 0 | | | | 0 | | | | 2,138,720 | |
Total assets | | $ | 1,530,207,002 | | | $ | 3,737,495 | | | $ | 0 | | | $ | 1,533,944,497 | |
Liabilities | | | | | | | | | | | | | | | | |
Futures contracts | | $ | 514,175 | | | $ | 0 | | | $ | 0 | | | $ | 514,175 | |
Total liabilities | | $ | 514,175 | | | $ | 0 | | | $ | 0 | | | $ | 514,175 | |
Additional sector, industry or geographic detail is included in the Portfolio of Investments.
Futures contracts are reported at their cumulative unrealized gains (losses) at measurement date as reported in the table following the Portfolio of Investments. For futures contracts, the current day’s variation margin is reported on the Statement of Assets and Liabilities. All other assets and liabilities are reported at their market value at measurement date.
At November 30, 2018, the Portfolio did not have any transfers into/out of Level 3.
| | | | | | |
| Notes to financial statements (unaudited) | | Wells Fargo Index Portfolio | | | 43 | |
4. TRANSACTIONS WITH AFFILIATES
Advisory fee
The Trust has entered into an advisory contract with Funds Management, an indirect wholly owned subsidiary of Wells Fargo. The adviser is responsible for implementing investment policies and guidelines and for supervising the subadviser, who is responsible forday-to-day portfolio management of the Portfolio. Pursuant to the contract, Funds Management is entitled to receive an annual advisory fee starting at 0.10% and declining to 0.05% as the average daily net assets of the Portfolio increase. For six month ended November 30, 2018, the advisory fee was equivalent to an annual rate of 0.09% of the Portfolio’s average daily net assets.
Funds Management has retained the services of a subadviser to provide daily portfolio management to the Portfolio. The fee for subadvisory services is borne by Funds Management. WellsCap is the subadviser to the Portfolio and is entitled to receive a fee from Funds Management at an annual rate starting at 0.05% and declining to 0.02% as the average daily net assets of the Portfolio increase.
Interfund transactions
The Portfolio may purchase or sell portfolio investment securities to certain other Wells Fargo affiliates pursuant toRule 17a-7 under the 1940 Act and under procedures adopted by the Board of Trustees. The procedures have been designed to ensure that these interfund transactions, which do not incur broker commissions, are effected at current market prices.
5. INVESTMENT PORTFOLIO TRANSACTIONS
Purchases and sales of investments, excluding U.S. government obligations (if any) and short-term securities, for the six months ended November 30, 2018 were $36,682,684 and $181,837,933, respectively.
6. DERIVATIVE TRANSACTIONS
During the six months ended November 30, 2018, the Portfolio entered into futures contracts to gain market exposure. The Portfolio had an average notional amount of $38,705,971 in long futures contracts during the six months ended November 30, 2018.
The fair value, realized gains or losses and change in unrealized gains or losses, if any, on derivative instruments are reflected in the corresponding financial statement captions.
7. BANK BORROWINGS
Effective August 28, 2018, the Trust, along with Wells Fargo Variable Trust and Wells Fargo Funds Trust (excluding the money market funds), are parties to a $280,000,000 revolving credit agreement whereby the Portfolio is permitted to use bank borrowings for temporary or emergency purposes, such as to fund shareholder redemption requests. Interest under the credit agreement is charged to the Portfolio based on a borrowing rate equal to the higher of the Federal Funds rate in effect on that day plus 1.25% or the overnight LIBOR rate in effect on that day plus 1.25%. In addition, an annual commitment fee equal to 0.25% of the unused balance is allocated to each participating fund.
For the six months ended November 30, 2018, there were no borrowings by the Portfolio under the agreement.
8. INDEMNIFICATION
Under the Trust’s organizational documents, the officers and Trustees have been granted certain indemnification rights against certain liabilities that may arise out of performance of their duties to the Trust. Additionally, in the normal course of business, the Trust may enter into contracts with service providers that contain a variety of indemnification clauses. The Trust’s maximum exposure under these arrangements is dependent on future claims that may be made against the Portfolio and, therefore, cannot be estimated.
9. NEW ACCOUNTING PRONOUNCEMENT
In August 2018, FASB issued Accounting Standards Update (“ASU”)No. 2018-13, Fair Value Measurement (Topic 820) Disclosure Framework—Changes to the Disclosure Requirements for Fair Value Measurement. ASU2018-13 updates the disclosure requirements for fair value measurements by modifying or removing certain disclosures and adding certain new disclosures. The amendments are effective for fiscal years, and interim periods within those fiscal years, beginning after December 15, 2019. Early adoption is permitted. Management has adopted the removal and modification of disclosures early, as permitted, and will adopt the additional new disclosures at the effective date.
| | | | |
| 44 | | Wells Fargo Index Fund | | Other information (unaudited) |
PROXY VOTING INFORMATION
A description of the policies and procedures used to determine how to vote proxies relating to portfolio securities is available, upon request, by calling1-800-222-8222, visiting our website atwellsfargofunds.com, or visiting the SEC website at sec.gov. Information regarding how the Fund voted proxies relating to portfolio securities during the most recent12-month period ended June 30 is available on the Fund’s website atwellsfargofunds.comor by visiting the SEC website at sec.gov.
PORTFOLIO HOLDINGS INFORMATION
The complete portfolio holdings are publicly available on the website (wellsfargofunds.com) on aone-month delayed basis. In addition, top ten holdings information (excluding derivative positions) is publicly available on the website on a monthly,seven-day or more delayed basis. The Fund and the Portfolio each file their complete schedule of portfolio holdings with the SEC for the first and third quarters of each fiscal year on FormN-Q, which is available by visiting the SEC website at sec.gov. In addition, each FormN-Q may be reviewed and copied at the SEC’s Public Reference Room in Washington, DC, and at regional offices in New York City, at 233 Broadway, and in Chicago, at 175 West Jackson Boulevard, Suite 900. Information about the Public Reference Room may be obtained by calling1-800-SEC-0330.
| | | | | | |
| Other information (unaudited) | | Wells Fargo Index Fund | | | 45 | |
BOARD OF TRUSTEES AND OFFICERS
Each of the Trustees and Officers1 listed in the table below acts in identical capacities for each fund in the Wells Fargo family of funds, which consists of 152 mutual funds comprising the Wells Fargo Funds Trust, Wells Fargo Variable Trust, Wells Fargo Master Trust and fourclosed-end funds (collectively the “Fund Complex”). This table should be read in conjunction with the Prospectus and the Statement of Additional Information2. The mailing address of each Trustee and Officer is 525 Market Street, 12th Floor, San Francisco, CA 94105. Each Trustee and Officer serves an indefinite term, however, each Trustee serves such term until reaching the mandatory retirement age established by the Trustees.
Independent Trustees
| | | | | | |
Name and
year of birth | | Position held and
length of service* | | Principal occupations during past five years or longer | | Current other
public company or
investment company
directorships |
William R. Ebsworth
(Born 1957) | | Trustee, since 2015 | | Retired. From 1984 to 2013, equities analyst, portfolio manager, research director and chief investment officer at Fidelity Management and Research Company in Boston, Tokyo, and Hong Kong, and retired in 2013 as Chief Investment Officer of Fidelity Strategic Advisers, Inc. where he led a team of investment professionals managing client assets. Prior thereto, Board member of Hong Kong Securities Clearing Co., Hong Kong Options Clearing Corp., the Thailand International Fund, Ltd., Fidelity Investments Life Insurance Company, and Empire Fidelity Investments Life Insurance Company. Board member of the Vincent Memorial Hospital Endowment(non-profit organization), where he serves on the Investment Committee and as a Chair of the Audit Committee. Mr. Ebsworth is a CFA® charterholder. | | N/A |
Jane A. Freeman
(Born 1953) | | Trustee, since 2015; Chair Liaison, since 2018 | | Retired. From 2012 to 2014 and 1999 to 2008, Chief Financial Officer of Scientific Learning Corporation. From 2008 to 2012, Ms. Freeman provided consulting services related to strategic business projects. Prior to 1999, Portfolio Manager at Rockefeller & Co. and Scudder, Stevens & Clark. Board member of the Harding Loevner Funds from 1996 to 2014, serving as both Lead Independent Director and chair of the Audit Committee. Board member of the Russell Exchange Traded Funds Trust from 2011 to 2012 and the chair of the Audit Committee. Ms. Freeman is a Board Member of The Ruth Bancroft Garden(non-profit organization). She is also an inactive Chartered Financial Analyst. | | N/A |
Isaiah Harris, Jr.3
(Born 1952) | | Trustee, since 2009 | | Retired. Chairman of the Board of CIGNA Corporation since 2009, and Director since 2005. From 2003 to 2011, Director of Deluxe Corporation. Prior thereto, President and CEO of BellSouth Advertising and Publishing Corp. from 2005 to 2007, President and CEO of BellSouth Enterprises from 2004 to 2005 and President of BellSouth Consumer Services from 2000 to 2003. Emeritus member of the Iowa State University Foundation Board of Governors. Emeritus Member of the Advisory Board of Iowa State University School of Business. Advisory Board Member, Palm Harbor Academy (private school). Advisory Board Member, Child Evangelism Fellowship(non-profit). Mr. Harris is a certified public accountant (inactive status). | | CIGNA Corporation |
Judith M. Johnson3
(Born 1949) | | Trustee, since 2008; Audit Committee Chairman, since 2009 | | Retired. Prior thereto, Chief Executive Officer and Chief Investment Officer of Minneapolis Employees Retirement Fund from 1996 to 2008. Ms. Johnson is an attorney, certified public accountant and a certified managerial accountant. | | N/A |
| David F. Larcker (Born 1950) | | Trustee, since 2009 | | James Irvin Miller Professor of Accounting at the Graduate School of Business, Stanford University, Director of the Corporate Governance Research Initiative and Senior Faculty of The Rock Center for Corporate Governance since 2006. From 2005 to 2008, Professor of Accounting at the Graduate School of Business, Stanford University. Prior thereto, Ernst & Young Professor of Accounting at The Wharton School, University of Pennsylvania from 1985 to 2005. | | N/A |
| | | | |
| 46 | | Wells Fargo Index Fund | | Other information (unaudited) |
| | | | | | |
Name and
year of birth | | Position held and
length of service* | | Principal occupations during past five years or longer | | Current other
public company or
investment company
directorships |
Olivia S. Mitchell
(Born 1953) | | Trustee, since 2006; Nominating and Governance Committee Chairman, since 2018 | | International Foundation of Employee Benefit Plans Professor, Wharton School of the University of Pennsylvania since 1993. Director of Wharton’s Pension Research Council and Boettner Center on Pensions & Retirement Research, and Research Associate at the National Bureau of Economic Research. Previously, Cornell University Professor from 1978 to 1993. | | N/A |
Timothy J. Penny
(Born 1951) | | Trustee, since 1996; Chairman, since 2018; Vice Chairman, from 2017 to 2018 | | President and Chief Executive Officer of Southern Minnesota Initiative Foundation, anon-profit organization, since 2007. Member of the Board of Trustees of NorthStar Education Finance, Inc., anon-profit organization, since 2007. | | N/A |
James G. Polisson
(Born 1959) | | Trustee, since 2018; Advisory Board Member, from 2017 to 2018 | | Retired. Chief Marketing Officer, Source (ETF) UK Services, Ltd, from 2015 to 2017. From 2012 to 2015, Principal of The Polisson Group, LLC, a management consulting, corporate advisory and principal investing company. Chief Executive Officer and Managing Director at Russell Investments, Global Exchange Traded Funds from 2010 to 2012. Managing Director of Barclays Global Investors from 1998 to 2010 and Global Chief Marketing Officer for iShares and Barclays Global Investors from 2000 to 2010. Trustee of the San Francisco Mechanics’ Institute, anon-profit organization, from 2013 to 2015. Board member of the Russell Exchange Traded Fund Trust from 2011 to 2012. Director of Barclays Global Investors Holdings Deutschland GmbH from 2006 to 2009. Mr. Polisson is an attorney and has a retired status with the Massachusetts and District of Columbia Bar Associations. | | N/A |
Michael S. Scofield4 (Born 1943) | | Trustee, since 2010 | | Served on the Investment Company Institute’s Board of Governors and Executive Committee from 2008-2011 as well the Governing Council of the Independent Directors Council from 2006-2011 and the Independent Directors Council Executive Committee from 2008-2011. Trustee of the Evergreen Fund complex (and its predecessors) from 1984 to 2010. Chairman of the Evergreen Funds from 2000-2010. Former Trustee of the Mentor Funds. Retired Attorney, Law Offices of Michael S. Scofield. | | N/A |
Pamela Wheelock
(Born 1959) | | Trustee, since 2018; Advisory Board Member, from 2017 to 2018 | | Chief Operating Officer, Twin Cities Habitat for Humanity, since January, 2017. N/A Vice President of University Services, University of Minnesota from 2012 to 2017. Prior thereto, on the Board of Directors, Governance Committee and Finance Committee for the Minnesota Philanthropy Partners (Saint Paul Foundation) from 2012 to 2018, Interim President and Chief Executive Officer of Blue Cross Blue Shield of Minnesota from 2010 to 2011, Chairman of the Board from 2009 to 2011 and Board Director from 2003 to 2015. Vice President, Leadership and Community Engagement, Bush Foundation, Saint Paul, Minnesota (a private foundation) from 2009 to 2011. Executive Vice President and Chief Financial Officer, Minnesota Sports and Entertainment from 2004 to 2009 and Senior Vice President from 2002 to 2004. Commissioner of Finance, State of Minnesota, from 1999 to 2002. Currently the Board Chair of the Minnesota Wild Foundation since 2010. | | N/A |
| * | Length of service dates reflect the Trustee’s commencement of service with the Trust’s predecessor entities, where applicable. |
| | | | | | |
| Other information (unaudited) | | Wells Fargo Index Fund | | | 47 | |
Officers
| | | | | | |
Name and
year of birth | | Position held and
length of service | | Principal occupations during past five years or longer | | |
Andrew Owen
(Born 1960) | | President, since 2017 | | Executive Vice President of Wells Fargo & Company and Head of Affiliated Managers, Wells Fargo Asset Management, since 2014. In addition, Mr. Owen is currently President, Chief Executive Officer and Director of Wells Fargo Funds Management, LLC since 2017. Prior thereto, Executive Vice President responsible for marketing, investments and product development for Wells Fargo Funds Management, LLC, from 2009 to 2014. | | |
Nancy Wiser1
(Born 1967) | | Treasurer, since 2012 | | Executive Vice President of Wells Fargo Funds Management, LLC since 2011. Chief Operating Officer and Chief Compliance Officer at LightBox Capital Management LLC, from 2008 to 2011. | | |
Alexander Kymn
(Born 1973) | | Secretary, since 2018; Chief Legal Officer, since 2018 | | Senior Company Counsel of Wells Fargo Bank, N.A. since 2018 (previously Senior Counsel from 2007 to 2018). Vice President of Wells Fargo Funds Management, LLC from 2008 to 2014. | | |
Michael H. Whitaker
(Born 1967) | | Chief Compliance Officer, since 2016 | | Senior Vice President and Chief Compliance Officer since 2016. Senior Vice President and Chief Compliance Officer for Fidelity Investments from 2007 to 2016. | | |
David Berardi
(Born 1975) | | Assistant Treasurer, since 2009 | | Vice President of Wells Fargo Funds Management, LLC since 2009. Vice President of Evergreen Investment Management Company, LLC from 2008 to 2010. Manager of Fund Reporting and Control for Evergreen Investment Management Company, LLC from 2004 to 2010. | | |
Jeremy DePalma1
(Born 1974) | | Assistant Treasurer, since 2009 | | Senior Vice President of Wells Fargo Funds Management, LLC since 2009. Senior Vice President of Evergreen Investment Management Company, LLC from 2008 to 2010 and head of the Fund Reporting and Control Team within Fund Administration from 2005 to 2010. | | |
| 1 | Nancy Wiser acts as Treasurer of 76 funds in the Fund Complex. Jeremy DePalma acts as Treasurer of 76 funds and Assistant Treasurer of 76 funds in the Fund Complex. |
| 2 | The Statement of Additional Information includes additional information about the Trustees and is available, without charge, upon request, by calling1-800-222-8222 or by visiting the website atwellsfargofunds.com. |
| 3 | Mr. Harris will replace Ms. Johnson as the Chairman of the Audit Committee effective January 1, 2019. |
| 4 | Mr. Scofield is expected to retire on December 31, 2018. |
| | | | |
| 48 | | Wells Fargo Index Fund | | Appendix A (unaudited) |
SALES CHARGE REDUCTIONS AND WAIVERS FOR CERTAIN INTERMEDIARIES
Raymond James & Associates, Inc., Raymond James Financial Services & Raymond James affiliates (“Raymond James”)
Effective on or about March 1, 2019, shareholders purchasing Fund shares through a Raymond James platform or account will be eligible only for the following load waivers(front-end sales charge waivers and contingent deferred, orback-end, sales charge waivers) and discounts, which may differ from those disclosed elsewhere in the Fund’s Prospectus or SAI.
Front-end Sales Load Waivers on Class A shares Available at Raymond James
| | • | | Shares purchased in an investment advisory program. |
| | • | | Shares purchased through reinvestment of capital gains distributions and dividend reinvestment when purchasing shares of the same fund (but not any other fund within the fund family). |
| | • | | Employees and registered representatives of Raymond James or its affiliates and their family members as designated by Raymond James. |
| | • | | Shares purchased from the proceeds of redemptions within the same fund family, provided (1) the repurchase occurs within 90 days following the redemption, (2) the redemption and purchase occur in the same account, and (3) redeemed shares were subject to afront-end or deferred sales load (known as Rights of Reinstatement). |
| | • | | A shareholder in the fund’s Class C shares will have their shares automatically exchanged at net asset value to Class A shares (or the appropriate share class) of the fund if the shares are no longer subject to a CDSC and the exchange is in line with the policies and procedures of Raymond James. |
CDSC Waivers on Class A and C Shares Available at Raymond James
| | • | | Death or disability of the shareholder. |
| | • | | Shares sold as part of a systematic withdrawal plan as described in the Fund’s Prospectus. |
| | • | | Return of excess contributions from an IRA Account. |
| | • | | Shares sold as part of a required minimum distribution for IRA and retirement accounts due to the shareholder reaching age 70½ as described in the Fund’s prospectus. |
| | • | | Shares sold to pay Raymond James fees but only if the transaction is initiated by Raymond James. |
| | • | | Shares acquired through a right of reinstatement. |
Front-end Load Discounts Available at Raymond James: Breakpoints, and/or Rights of Accumulation
| | • | | Breakpoints as described in the Fund’s Prospectus. |
| | • | | Rights of accumulation which entitle shareholders to breakpoint discounts will be automatically calculated based on the aggregated holding of fund family assets held by accounts within the purchaser’s household at Raymond James. Eligible fund family assets not held at Raymond James may be included in the rights of accumulation calculation only if the shareholder notifies his or her financial advisor about such assets. |

For more information
More information about Wells Fargo Funds is available free upon request. To obtain literature, please write, visit the Fund’s website, or call:
Wells Fargo Funds
P.O. Box 219967
Kansas City, MO 64121-9967
Website: wellsfargofunds.com
Individual investors: 1-800-222-8222
Retail investment professionals: 1-888-877-9275
Institutional investment professionals: 1-866-765-0778
This report and the financial statements contained herein are submitted for the general information of the shareholders of the Fund. If this report is used for promotional purposes, distribution of the report must be accompanied or preceded by a current prospectus. Before investing, please consider the investment objectives, risks, charges, and expenses of the investment. For a current prospectus and, if available, a summary prospectus, containing this information, call1-800-222-8222 or visit the Fund’s website atwellsfargofunds.com. Read the prospectus carefully before you invest or send money.
Wells Fargo Asset Management (WFAM) is the trade name for certain investment advisory/management firms owned by Wells Fargo & Company. These firms include but are not limited to Wells Capital Management Incorporated and Wells Fargo Funds Management, LLC. Certain products managed by WFAM entities are distributed by Wells Fargo Funds Distributor, LLC (a broker/dealer and Member FINRA).
This material is for general informational and educational purposes only and is NOT intended to provide investment advice or a recommendation of any kind—including a recommendation for any specific investment, strategy, or plan.
INVESTMENT PRODUCTS: NOT FDIC INSURED ◾ NO BANK GUARANTEE ◾ MAY LOSE VALUE
© 2019 Wells Fargo Funds Management, LLC. All rights reserved.
| | |
 | | 318977 01-19 SA283/SAR283 11-18 |
Semi-Annual Report
November 30, 2018

Wells Fargo International Value Fund

Beginning on January 1, 2021, as permitted by new regulations adopted by the Securities and Exchange Commission, paper copies of the Wells Fargo Funds’ annual and semi-annual shareholder reports issued after this date will no longer be sent by mail, unless you specifically request paper copies of the reports. Instead, the reports will be made available on the Funds’ website, and you will be notified by mail each time a report is posted and provided with a website address to access the report.
If you already elected to receive shareholder reports electronically, you will not be affected by this change and you need not take any action. You may elect to receive shareholder reports and other communications from the Fund electronically at any time by contacting your financial intermediary (such as a broker-dealer or bank) or, if you are a direct investor, by calling 1-800-222-8222 or by enrolling at wellsfargo.com/advantagedelivery.
You may elect to receive all future reports in paper free of charge. If you invest through a financial intermediary, you can contact your financial intermediary to request that you continue to receive paper copies of your shareholder reports; if you invest directly with the Fund, you can call 1-800-222-8222. Your election to receive reports in paper will apply to all Wells Fargo Funds held in your account with your financial intermediary or, if you are a direct investor, to all Wells Fargo Funds that you hold.

Reduce clutter. Save trees.
Sign up for electronic delivery of prospectuses and shareholder reports atwellsfargo.com/advantagedelivery
Contents
The views expressed and any forward-looking statements are as of November 30, 2018, unless otherwise noted, and are those of the Fund managers and/or Wells Fargo Funds Management, LLC. Discussions of individual securities, or the markets generally, or any Wells Fargo Fund are not intended as individual recommendations. Future events or results may vary significantly from those expressed in any forward-looking statements. The views expressed are subject to change at any time in response to changing circumstances in the market. Wells Fargo Funds Management, LLC and the Fund disclaim any obligation to publicly update or revise any views expressed or forward-looking statements.
INVESTMENT PRODUCTS: NOT FDIC INSURED ◾ NO BANK GUARANTEE ◾ MAY LOSE VALUE
| | | | |
| 2 | | Wells Fargo International Value Fund | | Letter to shareholders (unaudited) |

Andrew Owen
President
Wells Fargo Funds
Global trade tensions escalated during the third quarter of 2018.
Dear Shareholder:
We are pleased to offer you this semi-annual report for the Wells Fargo International Value Fund for thesix-month period that ended November 30, 2018. During the reporting period, the U.S. generated encouraging economic and business data that was offset by less positive and more inconsistent data from international markets. Investment returns were restrained in comparison with recent periods as geopolitical tensions and uncertainty tended to distract investors from more favorable underlying trends.
For the period, U.S. stocks, as measured by the S&P 500 Index,1 gained 3.02% and international stocks, as measured by the MSCI ACWI ex USA Index (Net),2 declined 8.37%. Based on the MSCI EM Index (Net),3 emerging market stocks lost 9.89%. For bond investors, the Bloomberg Barclays U.S. Aggregate Bond Index4 declined 0.30% while the Bloomberg Barclays Global Aggregateex-USD Index5 fell 3.67%. The Bloomberg Barclays Municipal Bond Index6 gained 0.42%. The ICE BofAML U.S. High Yield Index7 was up 0.19%.
Global trade tensions prompted investor concerns.
Global trade tensions escalated during the third quarter of 2018. The U.S. government’s decision during the second quarter to impose tariffs on a wide range of products manufactured overseas drew retaliatory responses from foreign governments, which punished U.S. commodity producers and product manufacturers. Investors were left to wonder about next steps in what appeared to be an escalating divergence in global economic policies and growth prospects.
Inflation trended higher. TheCPI-U8 added 0.1% in September after an increase of 0.2% in both July and August. On a year-over-year basis, theall-items index rose 2.3% for the 12 months that ended September 30, 2018, after a seasonal adjustment. The rate of increase was slower than that recorded during the first half of 2018. The index for all items less food and energy rose 2.2% for the same12-month period.
| 1 | The S&P 500 Index consists of 500 stocks chosen for market size, liquidity, and industry group representation. It is a market-value-weighted index with each stock’s weight in the index proportionate to its market value. You cannot invest directly in an index. |
| 2 | The Morgan Stanley Capital International (MSCI) All Country World Index (ACWI) ex USA Index (Net) is a free-float-adjusted market-capitalization-weighted index that is designed to measure the equity market performance of developed markets, excluding the U.S. and Canada. Source: MSCI. MSCI makes no express or implied warranties or representations and shall have no liability whatsoever with respect to any MSCI data contained herein. The MSCI data may not be further redistributed or used as a basis for other indices or any securities or financial products. This report is not approved, reviewed, or produced by MSCI. You cannot invest directly in an index. |
| 3 | The MSCI Emerging Markets (EM) Index (Net) is a free-float-adjusted market-capitalization-weighted index that is designed to measure large- andmid-cap equity market performance of emerging markets. The MSCI EM Index (Net) consists of the following 24 emerging market country indices: Brazil, Chile, China, Colombia, Czech Republic, Egypt, Greece, Hungary, India, Indonesia, Korea, Malaysia, Mexico, Pakistan, Peru, the Philippines, Poland, Qatar, Russia, South Africa, Taiwan, Thailand, Turkey, and the United Arab Emirates. You cannot invest directly in an index. |
| 4 | The Bloomberg Barclays U.S. Aggregate Bond Index is a broad-based benchmark that measures the investment-grade, U.S.-dollar-denominated, fixed-rate taxable bond market, including Treasuries, government-related and corporate securities, mortgage-backed securities (agency fixed-rate and hybrid adjustable-rate mortgage pass-throughs), asset-backed securities, and commercial mortgage-backed securities. You cannot invest directly in an index. |
| 5 | The Bloomberg Barclays Global Aggregateex-USD Index is an unmanaged index that provides a broad-based measure of the global investment-grade fixed-income markets excluding the U.S.-dollar-denominated debt market. You cannot invest directly in an index. |
| 6 | The Bloomberg Barclays Municipal Bond Index is an unmanaged index composed of long-termtax-exempt bonds with a minimum credit rating of Baa. You cannot invest directly in an index. |
| 7 | The ICE BofAML U.S. High Yield Index is a market-capitalization-weighted index of domestic and Yankee high-yield bonds. The index tracks the performance of high-yield securities traded in the U.S. bond market. You cannot invest directly in an index. Copyright 2018. ICE Data Indices, LLC. All rights reserved. |
| 8 | The Consumer Price Index for All Urban Consumers(CPI-U) measures the changes in the price of a basket of goods and services purchased by urban consumers. The urban consumer population is deemed by many as a better representative measure of the general public because close to 90% of the country’s population lives in highly populated areas. You cannot invest directly in an index. |
| | | | | | |
| Letter to shareholders (unaudited) | | Wells Fargo International Value Fund | | | 3 | |
U.S. stocks gained following positive economic data while international stocks and bonds declined.
During the summer months, the U.S. economy strengthened. Revised second-quarter gross domestic product (GDP) data released in August showed the U.S. economy growing at a 4.2% rate. The unemployment rate in the U.S. was 3.7% by the end of September, according to the U.S. Department of Labor. Wages showed more consistent growth, and consumer confidence remained strong. Several U.S. equity market indices reached records during August, with the S&P 500 Index gaining 7.20% for the three-month period that ended September 30, 2018. In contrast, the MSCI ACWI ex USA Index (Net) gained 0.71% while the MSCI EM Index (Net) declined 1.09% during the same three-month period.
In June, the Federal Reserve increased the target range for the federal funds rate to range from 1.75% to 2.00%. It raised the range again in September to range from 2.00% to 2.25%. Long-term interest rates in the U.S. remained at higher levels relative to the prior 10 years. Rates on10-year and30-year Treasury bonds—2.46% and 2.81%, respectively, on January 1, 2018—were 3.01% and 3.30%, respectively, on November 30, 2018. Investor concerns about an inverted yield curve reemerged, only to be replaced by concerns about the potentially negative influence of higher interest rates on economic activity.
November saw improvement in many equity markets.
As interest rates and bond yields gained during October, stock markets struggled. For the month, the S&P 500 Index fell 6.84%, the MSCI ACWI ex USA Index (Net) dropped 8.13%, and the MSCI EM Index (Net) lost 8.71%. The Bureau of Economic Analysis released its first estimate of third-quarter GDP, which, at an annualized 3.5% rate, indicated growth may be slowing compared with the second quarter. Readings on consumer sentiment and business spending were mixed. Markets rebounded somewhat in November as the S&P 500 Index gained 2.04%, the MSCI ACWI ex USA Index (Net) added 0.95%, and the MSCI EM Index (Net) was up 4.12% as the uncertainty leading up to midterm elections in the U.S. was resolved and progress seemed to be possible on several international trade issues.
Economic signals overseas were mixed as the third quarter ended and the fourth quarter began. In early August, the Bank of England’s Monetary Policy Committee increased its key interest rate to 0.75%. The European Central Bank and the Bank of Japan maintained low interest rates and accommodative monetary policies. Amid rising trade uncertainty, the People’s Bank of China cut reserve requirement ratios and accelerated infrastructure spending and tax cuts for business enterprises and individuals. Nevertheless, a strengthening U.S. dollar and the trade tensions remained headwinds for investors overseas.
Don’t let short-term uncertainty derail long-term investment goals.
Periods of investment uncertainty can present challenges, but experience has taught us that maintaining long-term investment goals can be an effective way to plan for the future. To help you create a sound strategy based on your personal goals and risk tolerance, Wells Fargo Funds offers more than 100 mutual funds spanning a wide range of asset classes and investment styles. Although diversification cannot guarantee an investment profit or prevent losses, we believe it can be an effective way to manage investment risk and potentially smooth out overall portfolio performance. We encourage investors to know their investments and to understand that appropriate levels of risk-taking may unlock opportunities.
Economic signals overseas were mixed as the third quarter ended and the fourth quarter began.
| | | | |
| 4 | | Wells Fargo International Value Fund | | Letter to shareholders (unaudited) |
Thank you for choosing to invest with Wells Fargo Funds. We appreciate your confidence in us and remain committed to helping you meet your financial needs.
Sincerely,

Andrew Owen
President
Wells Fargo Funds
Notice to shareholders
At a meeting held on August 14-15, 2018, the Board of Trustees of the Fund approved the following policy which will be effective on or about February 5, 2019:
Class C shares will convert automatically into Class A shares ten years after the initial date of purchase or, if you acquired your Class C shares through an exchange or conversion from another share class, ten years after the date you acquired your Class C shares. When Class C shares that you acquired through a purchase or exchange convert, any other Class C shares that you purchased with reinvested dividends and distributions also will convert into Class A shares on a pro rata basis. A shorter holding period may also apply depending on your intermediary. Please see “Appendix A—Sales Charge Reductions and Waivers for Certain Intermediaries” in the Fund’s prospectus or at the end of this report.
For further information about your Fund, contact your investment professional, visit our website atwellsfargofunds.com, or call us directly at1-800-222-8222.
This page is intentionally left blank.
| | | | |
| 6 | | Wells Fargo International Value Fund1 | | Performance highlights (unaudited) |
Investment objective
The Fund seeks long-term capital appreciation.
Manager
Wells Fargo Funds Management, LLC
Subadviser for the affiliated master portfolio
LSV Asset Management
Portfolio managers
Josef Lakonishok, Ph.D.
Puneet Mansharamani, CFA®‡
Menno Vermeulen, CFA®‡
Average annual total returns (%) as of November 30, 20182
| | | | | | | | | | | | | | | | | | | | | | | | | | | | | | | | | | |
| | | | | Including sales charge | | | Excluding sales charge | | | Expense ratios3 (%) | |
| | | Inception date | | 1 year | | | 5 year | | | 10 year | | | 1 year | | | 5 year | | | 10 year | | | Gross | | | Net4 | |
| Class A (WFFAX) | | 10-31-2003 | | | (15.03 | ) | | | (0.33 | ) | | | 6.08 | | | | (9.84 | ) | | | 0.86 | | | | 6.72 | | | | 1.35 | | | | 1.35 | |
| Class C (WFVCX) | | 4-8-2005 | | | (11.48 | ) | | | 0.11 | | | | 5.90 | | | | (10.48 | ) | | | 0.11 | | | | 5.90 | | | | 2.10 | | | | 2.10 | |
| Class R6 (WFRVX) | | 7-31-2018 | | | – | | | | – | | | | – | | | | (9.52 | ) | | | 1.25 | | | | 7.14 | | | | 0.92 | | | | 0.90 | |
| Administrator Class (WFVDX) | | 4-8-2005 | | | – | | | | – | | | | – | | | | (9.79 | ) | | | 0.96 | | | | 6.87 | | | | 1.27 | | | | 1.25 | |
| Institutional Class (WFVIX) | | 8-31-2006 | | | – | | | | – | | | | – | | | | (9.58 | ) | | | 1.23 | | | | 7.13 | | | | 1.02 | | | | 1.00 | |
| MSCI EAFE Value Index (Net)5 | | – | | | – | | | | – | | | | – | | | | (9.02 | ) | | | 0.66 | | | | 6.61 | | | | – | | | | – | |
Figures quoted represent past performance, which is no guarantee of future results, and do not reflect taxes that a shareholder may pay on fund distributions or the redemption of fund shares. Investment return and principal value of an investment will fluctuate so that an investor’s shares, when redeemed, may be worth more or less than their original cost. Performance shown without sales charges would be lower if sales charges were reflected. Current performance may be lower or higher than the performance data quoted, which assumes the reinvestment of dividends and capital gains. Currentmonth-end performance is available on the Fund’s website, wellsfargofunds.com.
Index returns do not include transaction costs associated with buying and selling securities, any mutual fund fees or expenses, or any taxes. It is not possible to invest directly in an index.
For Class A shares, the maximumfront-end sales charge is 5.75%. For Class C shares, the maximum contingent deferred sales charge is 1.00%. Performance including a contingent deferred sales charge assumes the sales charge for the corresponding time period. Class R6, Administrator Class, and Institutional Class shares are sold without afront-end sales charge or contingent deferred sales charge.
Stock values fluctuate in response to the activities of individual companies and general market and economic conditions. Foreign investments are especially volatile and can rise or fall dramatically due to differences in the political and economic conditions of the host country. These risks are generally intensified in emerging markets. The use of derivatives may reduce returns and/or increase volatility. Certain investment strategies tend to increase the total risk of an investment (relative to the broader market). The Fund is exposed to smaller company securities risk. Consult the Fund’s prospectus for additional information on these and other risks.
Please see footnotes on page 7.
| | | | | | |
| Performance highlights (unaudited) | | Wells Fargo International Value Fund | | | 7 | |
| | | | |
| Ten largest holdings (%) as of November 30, 20186 | |
Roche Holding AG | | | 2.27 | |
Royal Dutch Shell plc Class B | | | 2.14 | |
Sanofi SA | | | 1.92 | |
GlaxoSmithKline plc | | | 1.78 | |
Total SA | | | 1.63 | |
Orange SA | | | 1.29 | |
Nippon Telegraph & Telephone Corporation | | | 1.19 | |
BP plc | | | 1.19 | |
KDDI Corporation | | | 1.14 | |
Swiss Life Holding AG | | | 1.03 | |
|
| Sector distribution as of November 30, 20187 |
|
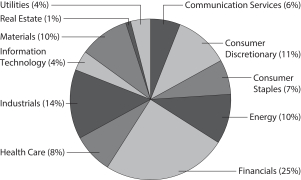 |
|
| Country allocation as of November 30, 20187 |
|
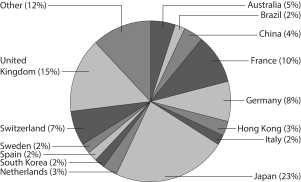 |
| ‡ | CFA® and Chartered Financial Analyst® are trademarks owned by CFA Institute. |
| 1 | The Fund is a gateway feeder fund that invests substantially all of its assets in a single affiliated master portfolio of the Wells Fargo Master Trust with a substantially identical investment objective and substantially similar investment strategies. References to the investment activities of the Fund are intended to refer to the investment activities of the affiliated master portfolio in which it invests. |
| 2 | Historical performance shown for the Class R6 shares prior to their inception reflects the performance of the Institutional Class shares, and is not adjusted to reflect Class R6 expenses. If these expenses had been included, returns for Class R6 shares would be higher. |
| 3 | Reflects the expense ratios as stated in the most recent prospectuses. The expense ratios shown are subject to change and may differ from the annualized expense ratios shown in the financial highlights of this report. |
| 4 | The manager has contractually committed through September 30, 2019, to waive fees and/or reimburse expenses to the extent necessary to cap the Fund’s Total Annual Fund Operating Expenses After Fee Waivers at the amounts shown. After this time, the cap may be increased or the commitment to maintain the cap may be terminated only with the approval of the Board of Trustees. Brokerage commissions, stamp duty fees, interest, taxes, acquired money market fund fees and expenses (if any) from funds in which the underlying master portfolio invests, and extraordinary expenses are excluded from the expense cap. Net expenses from the underlying affiliated master portfolio are included in the expense cap. Without this cap, the Fund’s returns would have been lower. The expense ratio paid by an investor is the net expense ratio (the total annual fund operating expenses after fee waivers) as stated in the prospectuses. |
| 5 | The Morgan Stanley Capital International (MSCI) Europe, Australasia, Far East (EAFE) Value Index (Net) is a free-float-adjusted market capitalization-weighted index that is designed to measure the equity market performance of value securities within developed equity markets, excluding the United States and Canada. The MSCI EAFE Value Index (Net) consists of the following 21 developed markets country indexes: Australia, Austria, Belgium, Denmark, Finland, France, Germany, Hong Kong, Ireland, Israel, Italy, Japan, the Netherlands, New Zealand, Norway, Portugal, Singapore, Spain, Sweden, Switzerland, and the United Kingdom. Source: MSCI. MSCI makes no express or implied warranties or representations and shall have no liability whatsoever with respect to any MSCI data contained herein. The MSCI data may not be further redistributed or used as a basis for other indexes or any securities or financial products. This report is not approved, reviewed, or produced by MSCI. You cannot invest directly in an index. |
| 6 | The ten largest holdings, excluding cash, cash equivalents and any money market funds, are calculated based on the value of the securities of the affiliated master portfolio allocable to the Fund divided by the total net assets of the Fund. Holdings are subject to change and may have changed since the date specified. |
| 7 | Amounts represent the composition of the affiliated master portfolio which are calculated based on the total long-term investments of the affiliated master portfolio. These amounts are subject to change and may have changed since the date specified. |
| | | | |
| 8 | | Wells Fargo International Value Fund | | Fund expenses (unaudited) |
As a shareholder of the Fund, you incur two types of costs: (1) transaction costs, including sales charges (loads) on purchase payments and contingent deferred sales charges (if any) on redemptions and (2) ongoing costs, including management fees, distribution(12b-1) and/or shareholder servicing fees, and other Fund expenses. This example is intended to help you understand your ongoing costs (in dollars) of investing in the Fund and to compare these costs with the ongoing costs of investing in other mutual funds.
The example is based on an investment of $1,000 invested at the beginning of thesix-month period and held for the entire period from June 1, 2018 to November 30, 2018.
Actual expenses
The “Actual” line of the table below provides information about actual account values and actual expenses. You may use the information in this line, together with the amount you invested, to estimate the expenses that you paid over the period. Simply divide your account value by $1,000 (for example, an $8,600 account value divided by $1,000 = 8.6), then multiply the result by the number in the “Actual” line under the heading entitled “Expenses paid during period” for your applicable class of shares to estimate the expenses you paid on your account during this period.
Hypothetical example for comparison purposes
The “Hypothetical” line of the table below provides information about hypothetical account values and hypothetical expenses based on the Fund’s actual expense ratio and an assumed rate of return of 5% per year before expenses, which is not the Fund’s actual return. The hypothetical account values and expenses may not be used to estimate the actual ending account balance or expenses you paid for the period. You may use this information to compare the ongoing costs of investing in the Fund and other funds. To do so, compare this 5% hypothetical example with the 5% hypothetical examples that appear in the shareholder reports of the other funds.
Please note that the expenses shown in the table are meant to highlight your ongoing costs only and do not reflect any transactional costs, such as sales charges (loads) and contingent deferred sales charges. Therefore, the “Hypothetical” line of the table is useful in comparing ongoing costs only and will not help you determine the relative total costs of owning different funds. In addition, if these transactional costs were included, your costs would have been higher.
| | | | | | | | | | | | | | | | |
| | | Beginning
account value
6-1-2018 | | | Ending
account value
11-30-2018 | | | Expenses
paid during
the period1,2 | | | Annualized net
expense ratio1 | |
Class A | | | | | | | | | | | | | | | | |
Actual | | $ | 1,000.00 | | | $ | 910.08 | | | $ | 6.32 | | | | 1.32 | % |
Hypothetical (5% return before expenses) | | $ | 1,000.00 | | | $ | 1,018.45 | | | $ | 6.68 | | | | 1.32 | % |
Class C | | | | | | | | | | | | | | | | |
Actual | | $ | 1,000.00 | | | $ | 906.82 | | | $ | 9.89 | | | | 2.07 | % |
Hypothetical (5% return before expenses) | | $ | 1,000.00 | | | $ | 1,014.69 | | | $ | 10.45 | | | | 2.07 | % |
Class R6 | | | | | | | | | | | | | | | | |
Actual | | $ | 1,000.00 | | | $ | 912.14 | | | $ | 4.12 | | | | 0.86 | % |
Hypothetical (5% return before expenses) | | $ | 1,000.00 | | | $ | 1,020.76 | | | $ | 4.36 | | | | 0.86 | % |
Administrator Class | | | | | | | | | | | | | | | | |
Actual | | $ | 1,000.00 | | | $ | 910.53 | | | $ | 5.94 | | | | 1.24 | % |
Hypothetical (5% return before expenses) | | $ | 1,000.00 | | | $ | 1,018.85 | | | $ | 6.28 | | | | 1.24 | % |
Institutional Class | | | | | | | | | | | | | | | | |
Actual | | $ | 1,000.00 | | | $ | 911.50 | | | $ | 4.74 | | | | 0.99 | % |
Hypothetical (5% return before expenses) | | $ | 1,000.00 | | | $ | 1,020.10 | | | $ | 5.01 | | | | 0.99 | % |
| 1 | Amounts reflect net expenses allocated from the affiliated Master Portfolio in which the Fund invests. |
| 2 | Expenses paid is equal to the annualized net expense ratio of each class multiplied by the average account value over the period, multiplied by the number of days in the most recent fiscal half-year divided by the number of days in the fiscal year (to reflect theone-half-year period). |
| | | | | | |
| Portfolio of investments—November 30, 2018 (unaudited) | | Wells Fargo International Value Fund | | | 9 | |
| | | | | | | | | | | | | | | | |
| Security name | | | | | | | | | | | Value | |
| | | | |
Investment Companies: 99.62% | | | | | | | | | | | | | | | | |
| | | | |
| Affiliated Master Portfolio: 99.62% | | | | | | | | | | | | | | | | |
Wells Fargo International Value Portfolio | | | | | | | | | | | | | | $ | 860,731,443 | |
| | | | | | | | | | | | | | | | |
| | | | |
Total Investment Companies (Cost $887,284,289) | | | | | | | | | | | | | | | 860,731,443 | |
| | | | | | | | | | | | | | | | |
| | | | | | | | |
| Total investments in securities (Cost $887,284,289) | | | 99.62 | % | | | 860,731,443 | |
Other assets and liabilities, net | | | 0.38 | | | | 3,276,714 | |
| | | | | | | | |
| Total net assets | | | 100.00 | % | | $ | 864,008,157 | |
| | | | | | | | |
Transactions with the affiliated Master Portfolio were as follows:
| | | | | | | | | | | | | | | | | | | | | | | | | | | | | | | | |
| | | % of
ownership,
beginning of
period | | | % of
ownership,
end of
period | | | Net
realized
gains
(losses) on
securities
transactions
allocated
from
affiliated
Master
Portfolio | | | Net
change in
unrealized
gains
(losses) on
securities
transactions
allocated
from
affiliated
Master
Portfolio | | | Dividends
allocated
from
affiliated
Master
Portfolio | | | Affiliated
income
allocated
from
affiliated
Master
Portfolio | | | Value,
end
of period | | | % of
net
assets | |
Wells Fargo International Value Portfolio | | | 95 | % | | | 77 | % | | $ | (779,078 | ) | | $ | (89,484,820 | ) | | $ | 13,834,503 | | | $ | 545,811 | | | $ | 860,731,443 | | | | 99.62 | % |
The accompanying notes are an integral part of these financial statements.
| | | | |
| 10 | | Wells Fargo International Value Fund | | Statement of assets and liabilities—November 30, 2018 (unaudited) |
| | | | |
| | | | |
| |
Assets | | | | |
Investments in affiliated Master Portfolio, at value (cost $887,284,289) | | $ | 860,731,443 | |
Receivable for Fund shares sold | | | 4,558,433 | |
Prepaid expenses and other assets | | | 350,557 | |
| | | | |
Total assets | | | 865,640,433 | |
| | | | |
| |
Liabilities | | | | |
Payable for Fund shares redeemed | | | 1,559,237 | |
Management fee payable | | | 37,563 | |
Administration fees payable | | | 32,217 | |
Trustees’ fees and expenses payable | | | 2,548 | |
Distribution fee payable | | | 711 | |
| | | | |
Total liabilities | | | 1,632,276 | |
| | | | |
Total net assets | | $ | 864,008,157 | |
| | | | |
| |
NET ASSETS CONSIST OF | | | | |
Paid-in capital | | $ | 879,576,273 | |
Total distributable loss | | | (15,568,116 | ) |
| | | | |
Total net assets | | $ | 864,008,157 | |
| | | | |
| |
COMPUTATION OF NET ASSET VALUE AND OFFERING PRICE PER SHARE | | | | |
Net assets – Class A | | $ | 58,269,098 | |
Shares outstanding – Class A1 | | | 4,083,184 | |
Net asset value per share – Class A | | | $14.27 | |
Maximum offering price per share – Class A2 | | | $15.14 | |
Net assets – Class C | | $ | 1,057,401 | |
Shares outstanding – Class C1 | | | 76,538 | |
Net asset value per share – Class C | | | $13.82 | |
Net assets – Class R6 | | $ | 22,864 | |
Shares outstanding – Class R61 | | | 1,619 | |
Net asset value per share – Class R6 | | | $14.12 | |
Net assets – Administrator Class | | $ | 3,725,413 | |
Shares outstanding – Administrator Class1 | | | 259,589 | |
Net asset value per share – Administrator Class | | | $14.35 | |
Net assets – Institutional Class | | $ | 800,933,381 | |
Shares outstanding – Institutional Class1 | | | 56,750,902 | |
Net asset value per share – Institutional Class | | | $14.11 | |
| 1 | The Fund has an unlimited number of authorized shares. |
| 2 | Maximum offering price is computed as 100/94.25 of net asset value. On investments of $50,000 or more, the offering price is reduced. |
The accompanying notes are an integral part of these financial statements.
| | | | | | |
| Statement of operations—six months ended November 30, 2018 (unaudited) | | Wells Fargo International Value Fund | | | 11 | |
| | | | |
| | | | |
| |
Investment income | | | | |
Dividends allocated from affiliated Master Portfolio (net of foreign withholding taxes of $1,387,837) | | $ | 13,834,503 | |
Affiliated income allocated from affiliated Master Portfolio | | | 545,811 | |
Expenses allocated from affiliated Master Portfolio | | | (3,510,713 | ) |
| | | | |
Total investment income | | | 10,869,601 | |
| | | | |
| |
Expenses | | | | |
Management fee | | | 221,531 | |
Administration fees | | | | |
Class A | | | 52,937 | |
Class C | | | 1,204 | |
Class R6 | | | 2 | 1 |
Administrator Class | | | 2,996 | |
Institutional Class | | | 539,459 | |
Shareholder servicing fees | | | | |
Class A | | | 63,021 | |
Class C | | | 1,433 | |
Administrator Class | | | 5,762 | |
Distribution fee | | | | |
Class C | | | 4,300 | |
Custody and accounting fees | | | 8,142 | |
Professional fees | | | 17,113 | |
Registration fees | | | 26,971 | |
Shareholder report expenses | | | 16,885 | |
Trustees’ fees and expenses | | | 11,090 | |
Other fees and expenses | | | 5,187 | |
| | | | |
Total expenses | | | 978,033 | |
Less: Fee waivers and/or expense reimbursements | | | (5,533 | ) |
| | | | |
Net expenses | | | 972,500 | |
| | | | |
Net investment income | | | 9,897,101 | |
| | | | |
| |
REALIZED AND UNREALIZED GAINS (LOSSES) ON INVESTMENTS | | | | |
Net realized losses on securities transactions allocated from affiliated Master Portfolio | | | (779,078 | ) |
Net change in unrealized gains (losses) on securities transactions allocated from affiliated Master Portfolio | | | (89,484,820 | ) |
| | | | |
Net realized and unrealized gains (losses) on investments | | | (90,263,898 | ) |
| | | | |
Net decrease in net assets resulting from operations | | $ | (80,366,797 | ) |
| | | | |
| 1 | For the period from July 31, 2018 (commencement of class operations) to November 30, 2018 |
The accompanying notes are an integral part of these financial statements.
| | | | |
| 12 | | Wells Fargo International Value Fund | | Statement of changes in net assets |
| | | | | | | | | | | | | | | | |
| | | Six months ended
November 30, 2018 (unaudited) | | | Year ended
May 31, 20181 | |
| | | | |
Operations | | | | | | | | | | | | | | | | |
Net investment income | | | | | | $ | 9,897,101 | | | | | | | $ | 19,745,024 | |
Net realized gains (losses) on investments | | | | | | | (779,078 | ) | | | | | | | 14,310,484 | |
Net change in unrealized gains (losses) on investments | | | | | | | (89,484,820 | ) | | | | | | | 21,273,653 | |
| | | | |
Net increase (decrease) in net assets resulting from operations | | | | | | | (80,366,797 | ) | | | | | | | 55,329,161 | |
| | | | |
| | | | |
Distributions to shareholders from net investment income and net realized gains | | | | | | | | | | | | | | | | |
Class A | | | | | | | 0 | | | | | | | | (53,028 | ) |
Class C | | | | | | | 0 | | | | | | | | (19,938 | ) |
Administrator Class | | | | | | | 0 | | | | | | | | (104,265 | ) |
Institutional Class | | | | | | | 0 | | | | | | | | (22,325,915 | ) |
| | | | |
Total distributions to shareholders | | | | | | | 0 | | | | | | | | (22,503,146 | ) |
| | | | |
| | | | |
Capital share transactions | | | Shares | | | | | | | | Shares | | | | | |
Proceeds from shares sold | | | | | | | | | | | | | | | | |
Class A | | | 2,376,271 | | | | 35,309,929 | | | | 2,633,442 | | | | 42,441,930 | |
Class C | | | 11,758 | | | | 176,464 | | | | 31,890 | | | | 496,381 | |
Class R6 | | | 1,619 | 2 | | | 25,000 | 2 | | | N/A | | | | N/A | |
Administrator Class | | | 19,508 | | | | 290,258 | | | | 150,614 | | | | 2,424,464 | |
Institutional Class | | | 8,930,766 | | | | 132,814,828 | | | | 18,051,179 | | | | 284,422,225 | |
| | | | |
| | | | | | | 168,616,479 | | | | | | | | 329,785,000 | |
| | | | |
Reinvestment of distributions | | | | | | | | | | | | | | | | |
Class A | | | 0 | | | | 0 | | | | 3,299 | | | | 52,993 | |
Class C | | | 0 | | | | 0 | | | | 1,271 | | | | 19,890 | |
Administrator Class | | | 0 | | | | 0 | | | | 6,369 | | | | 102,738 | |
Institutional Class | | | 0 | | | | 0 | | | | 1,408,571 | | | | 22,297,672 | |
| | | | |
| | | | | | | 0 | | | | | | | | 22,473,293 | |
| | | | |
Payment for shares redeemed | | | | | | | | | | | | | | | | |
Class A | | | (760,130 | ) | | | (11,198,328 | ) | | | (342,547 | ) | | | (5,580,817 | ) |
Class C | | | (9,734 | ) | | | (141,985 | ) | | | (15,622 | ) | | | (244,651 | ) |
Administrator Class | | | (138,157 | ) | | | (2,124,890 | ) | | | (138,280 | ) | | | (2,200,897 | ) |
Institutional Class | | | (5,495,962 | ) | | | (81,797,283 | ) | | | (14,341,542 | ) | | | (228,026,971 | ) |
| | | | |
| | | | | | | (95,262,486 | ) | | | | | | | (236,053,336 | ) |
| | | | |
Net increase in net assets resulting from capital share transactions | | | | | | | 73,353,993 | | | | | | | | 116,204,957 | |
| | | | |
Total increase (decrease) in net assets | | | | | | | (7,012,804 | ) | | | | | | | 149,030,972 | |
| | | | |
| | | | |
Net assets | | | | | | | | | | | | | | | | |
Beginning of period | | | | | | | 871,020,961 | | | | | | | | 721,989,989 | |
| | | | |
End of period | | | | | | $ | 864,008,157 | | | | | | | $ | 871,020,961 | |
| | | | |
| 1 | Effective for all filings after November 4, 2018, the SEC prospectively eliminated the requirements to parenthetically disclose undistributed net investment income at the end of the period and permitted the aggregation of distributions, with the exception of tax basis returns of capital. Undistributed net investment income at May 31, 2018 was $9,444,288. The disaggregated distributions information for the year ended May 31, 2018 is included in Note 7,Distributions to Shareholders, in the notes to the financial statements. |
| 2 | For the period from July 31, 2018 (commencement of class operations) to November 30, 2018 |
The accompanying notes are an integral part of these financial statements.
| | | | | | |
| Financial highlights | | Wells Fargo International Value Fund | | | 13 | |
(For a share outstanding throughout each period)
| | | | | | | | | | | | | | | | | | | | | | | | |
| | | Six months ended
November 30, 2018
(unaudited) | | | Year ended May 31 | |
| CLASS A | | 2018 | | | 2017 | | | 2016 | | | 2015 | | | 2014 | |
Net asset value, beginning of period | | | $15.68 | | | | $14.88 | | | | $12.83 | | | | $14.85 | | | | $15.45 | | | | $13.40 | |
Net investment income | | | 0.15 | 1 | | | 0.72 | 1 | | | 0.09 | 1 | | | 0.26 | | | | 0.26 | 1 | | | 0.36 | |
Net realized and unrealized gains (losses) on investments | | | (1.56 | ) | | | 0.35 | | | | 2.26 | | | | (2.08 | ) | | | (0.53 | ) | | | 1.97 | |
| | | | | | | | | | | | | | | | | | | | | | | | |
Total from investment operations | | | (1.41 | ) | | | 1.07 | | | | 2.35 | | | | (1.82 | ) | | | (0.27 | ) | | | 2.33 | |
Distributions to shareholders from | | | | | | | | | | | | | | | | | | | | | | | | |
Net investment income | | | 0.00 | | | | (0.27 | ) | | | (0.30 | ) | | | (0.20 | ) | | | (0.33 | ) | | | (0.28 | ) |
Net asset value, end of period | | | $14.27 | | | | $15.68 | | | | $14.88 | | | | $12.83 | | | | $14.85 | | | | $15.45 | |
Total return2 | | | (8.99 | )% | | | 7.12 | % | | | 18.65 | % | | | (12.31 | )% | | | (1.55 | )% | | | 17.48 | % |
Ratios to average net assets (annualized) | | | | | | | | | | | | | | | | | | | | | | | | |
Gross expenses3 | | | 1.32 | % | | | 1.34 | % | | | 1.39 | % | | | 1.46 | % | | | 1.50 | % | | | 1.51 | % |
Net expenses3 | | | 1.32 | % | | | 1.34 | % | | | 1.35 | % | | | 1.39 | % | | | 1.49 | % | | | 1.50 | % |
Net investment income3 | | | 1.91 | % | | | 4.48 | % | | | 0.69 | % | | | 1.98 | % | | | 1.80 | % | | | 2.45 | % |
Supplemental data | | | | | | | | | | | | | | | | | | | | | | | | |
Portfolio turnover rate4 | | | 6 | % | | | 15 | % | | | 41 | % | | | 14 | % | | | 18 | % | | | 11 | % |
Net assets, end of period (000s omitted) | | | $58,269 | | | | $38,677 | | | | $2,571 | | | | $4,981 | | | | $5,768 | | | | $6,725 | |
| 1 | Calculated based upon average shares outstanding |
| 2 | Total return calculations do not include any sales charges. Returns for periods of less than one year are not annualized. |
| 3 | Ratios include net expenses allocated from the affiliated Master Portfolio which were as follows: |
| | | | |
Six months ended November 30, 2018 (unaudited) | | | 0.79 | % |
Year ended May 31, 2018 | | | 0.81 | % |
Year ended May 31, 2017 | | | 0.85 | % |
Year ended May 31, 2016 | | | 0.91 | % |
Year ended May 31, 2015 | | | 0.91 | % |
Year ended May 31, 2014 | | | 0.91 | % |
| 4 | Portfolio turnover rate is calculated by multiplying the affiliated Master Portfolio’s percentage of the Fund’s total investments in securities at the end of the period by the affiliated Master Portfolio’s portfolio turnover rate. |
The accompanying notes are an integral part of these financial statements.
| | | | |
| 14 | | Wells Fargo International Value Fund | | Financial highlights |
(For a share outstanding throughout each period)
| | | | | | | | | | | | | | | | | | | | | | | | |
| | | Six months ended
November 30, 2018 (unaudited) | | | Year ended May 31 | |
| CLASS C | | 2018 | | | 2017 | | | 2016 | | | 2015 | | | 2014 | |
Net asset value, beginning of period | | | $15.24 | | | | $14.60 | | | | $12.56 | | | | $14.54 | | | | $15.16 | | | | $13.18 | |
Net investment income | | | 0.04 | | | | 0.21 | | | | 0.23 | | | | 0.17 | | | | 0.13 | | | | 0.19 | |
Net realized and unrealized gains (losses) on investments | | | (1.46 | ) | | | 0.73 | | | | 1.97 | | | | (2.05 | ) | | | (0.51 | ) | | | 2.00 | |
| | | | | | | | | | | | | | | | | | | | | | | | |
Total from investment operations | | | (1.42 | ) | | | 0.94 | | | | 2.20 | | | | (1.88 | ) | | | (0.38 | ) | | | 2.19 | |
Distributions to shareholders from | | | | | | | | | | | | | | | | | | | | | | | | |
Net investment income | | | 0.00 | | | | (0.30 | ) | | | (0.16 | ) | | | (0.10 | ) | | | (0.24 | ) | | | (0.21 | ) |
Net asset value, end of period | | | $13.82 | | | | $15.24 | | | | $14.60 | | | | $12.56 | | | | $14.54 | | | | $15.16 | |
Total return1 | | | (9.32 | )% | | | 6.36 | % | | | 17.69 | % | | | (12.95 | )% | | | (2.37 | )% | | | 16.64 | % |
Ratios to average net assets (annualized) | | | | | | | | | | | | | | | | | | | | | | | | |
Gross expenses2 | | | 2.07 | % | | | 2.10 | % | | | 2.16 | % | | | 2.21 | % | | | 2.25 | % | | | 2.26 | % |
Net expenses2 | | | 2.07 | % | | | 2.10 | % | | | 2.10 | % | | | 2.14 | % | | | 2.24 | % | | | 2.25 | % |
Net investment income2 | | | 1.17 | % | | | 1.40 | % | | | 1.57 | % | | | 1.25 | % | | | 1.07 | % | | | 1.88 | % |
Supplemental data | | | | | | | | | | | | | | | | | | | | | | | | |
Portfolio turnover rate3 | | | 6 | % | | | 15 | % | | | 41 | % | | | 14 | % | | | 18 | % | | | 11 | % |
Net assets, end of period (000s omitted) | | | $1,057 | | | | $1,135 | | | | $832 | | | | $783 | | | | $920 | | | | $920 | |
| 1 | Total return calculations do not include any sales charges. Returns for periods of less than one year are not annualized. |
| 2 | Ratios include net expenses allocated from the affiliated Master Portfolio which were as follows: |
| | | | |
Six months ended November 30, 2018 (unaudited) | | | 0.79 | % |
Year ended May 31, 2018 | | | 0.82 | % |
Year ended May 31, 2017 | | | 0.87 | % |
Year ended May 31, 2016 | | | 0.91 | % |
Year ended May 31, 2015 | | | 0.91 | % |
Year ended May 31, 2014 | | | 0.91 | % |
| 3 | Portfolio turnover rate is calculated by multiplying the affiliated Master Portfolio’s percentage of the Fund’s total investments in securities at the end of the period by the affiliated Master Portfolio’s portfolio turnover rate. |
The accompanying notes are an integral part of these financial statements.
| | | | | | |
| Financial highlights | | Wells Fargo International Value Fund | | | 15 | |
(For a share outstanding throughout the period)
| | | | |
| | | Period ended
November 30, 20181 (unaudited) | |
| CLASS R6 |
Net asset value, beginning of period | | | $15.44 | |
Net investment income | | | 0.13 | 2 |
Net realized and unrealized gains (losses) on investments | | | (1.45 | ) |
| | | | |
Total from investment operations | | | (1.32 | ) |
Distributions to shareholders from | | | | |
Net investment income | | | 0.00 | |
Net asset value, end of period | | | $14.12 | |
Total return3 | | | (8.55 | )% |
Ratios to average net assets (annualized) | | | | |
Gross expenses4 | | | 0.87 | % |
Net expenses4 | | | 0.86 | % |
Net investment income4 | | | 2.63 | % |
Supplemental data | | | | |
Portfolio turnover rate5 | | | 6 | % |
Net assets, end of period (000s omitted) | | | $23 | |
| 1 | For the period from July 31, 2018 (commencement of class operations) to November 30, 2018 |
| 2 | Calculated based upon average shares outstanding |
| 3 | Returns for periods of less than one year are not annualized. |
| 4 | Ratios include net expenses allocated from the affiliated Master Portfolio in the amount of 0.78%. |
| 5 | Portfolio turnover rate is calculated by multiplying the affiliated Master Portfolio’s percentage of the Fund’s total investments in securities at the end of the period by the affiliated Master Portfolio’s portfolio turnover rate. |
The accompanying notes are an integral part of these financial statements.
| | | | |
| 16 | | Wells Fargo International Value Fund | | Financial highlights |
(For a share outstanding throughout each period)
| | | | | | | | | | | | | | | | | | | | | | | | |
| | | Six months ended
November 30, 2018
(unaudited) | | | Year ended May 31 | |
| ADMINISTRATOR CLASS | | 2018 | | | 2017 | | | 2016 | | | 2015 | | | 2014 | |
Net asset value, beginning of period | | | $15.76 | | | | $15.04 | | | | $12.91 | | | | $14.73 | | | | $15.35 | | | | $13.31 | |
Net investment income | | | 0.15 | 1 | | | 0.37 | 1 | | | 0.33 | 1 | | | 0.14 | 1 | | | 0.28 | | | | 0.38 | |
Net realized and unrealized gains (losses) on investments | | | (1.56 | ) | | | 0.73 | | | | 2.05 | | | | (1.96 | ) | | | (0.52 | ) | | | 1.98 | |
| | | | | | | | | | | | | | | | | | | | | | | | |
Total from investment operations | | | (1.41 | ) | | | 1.10 | | | | 2.38 | | | | (1.82 | ) | | | (0.24 | ) | | | 2.36 | |
Distributions to shareholders from | | | | | | | | | | | | | | | | | | | | | | | | |
Net investment income | | | 0.00 | | | | (0.38 | ) | | | (0.25 | ) | | | 0.00 | | | | (0.38 | ) | | | (0.32 | ) |
Net asset value, end of period | | | $14.35 | | | | $15.76 | | | | $15.04 | | | | $12.91 | | | | $14.73 | | | | $15.35 | |
Total return2 | | | (8.95 | )% | | | 7.25 | % | | | 18.66 | % | | | (12.36 | )% | | | (1.35 | )% | | | 17.81 | % |
Ratios to average net assets (annualized) | | | | | | | | | | | | | | | | | | | | | | | | |
Gross expenses3 | | | 1.24 | % | | | 1.27 | % | | | 1.33 | % | | | 1.36 | % | | | 1.34 | % | | | 1.34 | % |
Net expenses3 | | | 1.24 | % | | | 1.25 | % | | | 1.25 | % | | | 1.25 | % | | | 1.25 | % | | | 1.25 | % |
Net investment income3 | | | 1.97 | % | | | 2.30 | % | | | 2.46 | % | | | 0.99 | % | | | 2.12 | % | | | 2.76 | % |
Supplemental data | | | | | | | | | | | | | | | | | | | | | | | | |
Portfolio turnover rate4 | | | 6 | % | | | 15 | % | | | 41 | % | | | 14 | % | | | 18 | % | | | 11 | % |
Net assets, end of period (000s omitted) | | | $3,725 | | | | $5,961 | | | | $5,407 | | | | $11,873 | | | | $487,582 | | | | $459,415 | |
| 1 | Calculated based upon average shares outstanding |
| 2 | Returns for periods of less than one year are not annualized. |
| 3 | Ratios include net expenses allocated from the affiliated Master Portfolio which were as follows: |
| | | | |
Six months ended November 30, 2018 (unaudited) | | | 0.79 | % |
Year ended May 31, 2018 | | | 0.82 | % |
Year ended May 31, 2017 | | | 0.87 | % |
Year ended May 31, 2016 | | | 0.91 | % |
Year ended May 31, 2015 | | | 0.91 | % |
Year ended May 31, 2014 | | | 0.91 | % |
| 4 | Portfolio turnover rate is calculated by multiplying the affiliated Master Portfolio’s percentage of the Fund’s total investments in securities at the end of the period by the affiliated Master Portfolio’s portfolio turnover rate. |
The accompanying notes are an integral part of these financial statements.
| | | | | | |
| Financial highlights | | Wells Fargo International Value Fund | | | 17 | |
(For a share outstanding throughout each period)
| | | | | | | | | | | | | | | | | | | | | | | | |
| | | Six months ended
November 30, 2018 (unaudited) | | | Year ended May 31 | |
| INSTITUTIONAL CLASS | | 2018 | | | 2017 | | | 2016 | | | 2015 | | | 2014 | |
Net asset value, beginning of period | | | $15.48 | | | | $14.80 | | | | $12.73 | | | | $14.75 | | | | $15.38 | | | | $13.34 | |
Net investment income | | | 0.17 | 1 | | | 0.41 | | | | 0.39 | | | | 0.36 | | | | 0.29 | | | | 0.41 | |
Net realized and unrealized gains (losses) on investments | | | (1.54 | ) | | | 0.71 | | | | 1.99 | | | | (2.12 | ) | | | (0.51 | ) | | | 1.98 | |
| | | | | | | | | | | | | | | | | | | | | | | | |
Total from investment operations | | | (1.37 | ) | | | 1.12 | | | | 2.38 | | | | (1.76 | ) | | | (0.22 | ) | | | 2.39 | |
Distributions to shareholders from | | | | | | | | | | | | | | | | | | | | | | | | |
Net investment income | | | 0.00 | | | | (0.44 | ) | | | (0.31 | ) | | | (0.26 | ) | | | (0.41 | ) | | | (0.35 | ) |
Net asset value, end of period | | | $14.11 | | | | $15.48 | | | | $14.80 | | | | $12.73 | | | | $14.75 | | | | $15.38 | |
Total return2 | | | (8.85 | )% | | | 7.51 | % | | | 19.04 | % | | | (11.98 | )% | | | (1.19 | )% | | | 18.07 | % |
Ratios to average net assets (annualized) | | | | | | | | | | | | | | | | | | | | | | | | |
Gross expenses3 | | | 0.99 | % | | | 1.02 | % | | | 1.07 | % | | | 1.13 | % | | | 1.07 | % | | | 1.08 | % |
Net expenses3 | | | 0.99 | % | | | 1.00 | % | | | 1.00 | % | | | 1.01 | % | | | 1.05 | % | | | 1.05 | % |
Net investment income3 | | | 2.26 | % | | | 2.43 | % | | | 2.95 | % | | | 2.81 | % | | | 2.42 | % | | | 2.91 | % |
Supplemental data | | | | | | | | | | | | | | | | | | | | | | | | |
Portfolio turnover rate4 | | | 6 | % | | | 15 | % | | | 41 | % | | | 14 | % | | | 18 | % | | | 11 | % |
Net assets, end of period (000s omitted) | | | $800,933 | | | | $825,247 | | | | $713,180 | | | | $456,239 | | | | $3,793 | | | | $2,359 | |
| 1 | Calculated based upon average shares outstanding |
| 2 | Returns for periods of less than one year are not annualized. |
| 3 | Ratios include net expenses allocated from the affiliated Master Portfolio which were as follows: |
| | | | |
Six months ended November 30, 2018 (unaudited) | | | 0.79 | % |
Year ended May 31, 2018 | | | 0.82 | % |
Year ended May 31, 2017 | | | 0.86 | % |
Year ended May 31, 2016 | | | 0.91 | % |
Year ended May 31, 2015 | | | 0.91 | % |
Year ended May 31, 2014 | | | 0.91 | % |
| 4 | Portfolio turnover rate is calculated by multiplying the affiliated Master Portfolio’s percentage of the Fund’s total investments in securities at the end of the period by the affiliated Master Portfolio’s portfolio turnover rate. |
The accompanying notes are an integral part of these financial statements.
| | | | |
| 18 | | Wells Fargo International Value Fund | | Notes to financial statements (unaudited) |
1. ORGANIZATION
Wells Fargo Funds Trust (the “Trust”), a Delaware statutory trust organized on March 10, 1999, is anopen-end management investment company registered under the Investment Company Act of 1940, as amended (the “1940 Act”). As an investment company, the Trust follows the accounting and reporting guidance in Financial Accounting Standards Board (“FASB”)Accounting Standards Codification Topic 946, Financial Services – Investment Companies. These financial statements report on the Wells Fargo International Value Fund (the “Fund”) which is a diversified series of the Trust.
The Fund is a feeder fund in a master-feeder structure that invests substantially all of its assets in a single master portfolio with a substantially identical investment objective and substantially similar investment strategies. The Fund seeks to achieve its investment objective by investing all investable assets in a separate diversified portfolio (the “affiliated Master Portfolio”) of Wells Fargo Master Trust, a registeredopen-end management investment company. The affiliated Master Portfolio directly acquires portfolio securities and the Fund acquires an indirect interest in those securities. The Fund accounts for its investment in the affiliated Master Portfolio as a partnership investment and records on a daily basis its share of the affiliated Master Portfolio’s income, expense and realized and unrealized gains and losses. The financial statements of the affiliated Master Portfolio for the six months ended November 30, 2018 are included in this report and should be read in conjunction with the Fund’s financial statements. As of November 30, 2018, the Fund owned 77% of Wells Fargo International Value Portfolio.
2. SIGNIFICANT ACCOUNTING POLICIES
The following significant accounting policies, which are consistently followed in the preparation of the financial statements of the Fund, are in conformity with U.S. generally accepted accounting principles which require management to make estimates and assumptions that affect the reported amounts of assets and liabilities, disclosure of contingent assets and liabilities at the date of the financial statements, and the reported amounts of revenues and expenses during the reporting period. Actual results could differ from those estimates.
Securities valuation
All investments are valued each business day as of the close of regular trading on the New York Stock Exchange (generally 4 p.m. Eastern Time), although the Fund may deviate from this calculation time under unusual or unexpected circumstances.
Investments in the affiliated Master Portfolio are valued daily based on the Fund’s proportionate share of the affiliated Master Portfolio’s net assets, which are also valued daily. Securities held in the affiliated Master Portfolio are valued as discussed in the Notes to Financial Statements of the affiliated Master Portfolio, which are included elsewhere in this report.
Investment transactions, income and expenses
Investments in the affiliated Master Portfolio are recorded on a trade basis.
The Fund records daily its proportionate share of the affiliated Master Portfolio’s interest and dividend income, expenses and realized and unrealized gains or losses. The Fund also accrues its own expenses.
Distributions to shareholders
Distributions to shareholders from net investment income and any net realized gains are recorded on theex-dividend date and paid at least annually. Such distributions are determined in accordance with income tax regulations and may differ from U.S. generally accepted accounting principles. Dividend sources are estimated at the time of declaration. The tax character of distributions is determined as of the Fund’s fiscal year end. Therefore, a portion of the Fund’s distributions made prior to the Fund’s fiscal year end may be categorized as a tax return of capital at year end.
Federal and other taxes
The Fund intends to continue to qualify as a regulated investment company by distributing substantially all of its investment company taxable income and any net realized capital gains (after reduction for capital loss carryforwards) sufficient to relieve it from all, or substantially all, federal income taxes. Accordingly, no provision for federal income taxes was required.
The Fund’s income and federal excise tax returns and all financial records supporting those returns for the prior three fiscal years are subject to examination by the federal and Delaware revenue authorities. Management has analyzed the Fund’s tax positions taken on federal, state, and foreign tax returns for all open tax years and does not believe that there are any uncertain tax positions that require recognition of a tax liability.
| | | | | | |
| Notes to financial statements (unaudited) | | Wells Fargo International Value Fund | | | 19 | |
As of November 30, 2018, the aggregate cost of all investments for federal income tax purposes was $887,284,289 and the unrealized gains (losses) consisted of:
| | | | |
Gross unrealized gains | | $ | 0 | |
Gross unrealized losses | | | (26,552,846 | ) |
Net unrealized losses | | $ | (26,552,846 | ) |
Class allocations
The separate classes of shares offered by the Fund differ principally in applicable sales charges, distribution, shareholder servicing, and administration fees. Class specific expenses are charged directly to that share class. Investment income, common expenses, and realized gains (losses) on investments are allocated daily to each class of shares based on the relative proportion of net assets of each class.
3. FAIR VALUATION MEASUREMENTS
At November 30, 2018, the affiliated Master Portfolio was measured at fair value using the net asset value per share (or its equivalent) as a practical expedient. The investment objective and the value of the affiliate Master Portfolio was as follows:
| | | | | | |
| Affilated Master Portfolio | | Investment objective | | Value of affiliated Master Portfolio | |
Wells Fargo International Value Portfolio | | Seeks long-term capital appreciation | | | $860,731,443 | |
The affiliated Master Portfolio does not have a redemption period notice, can be redeemed daily and does not have any unfunded commitments.
4. TRANSACTIONS WITH AFFILIATES
Management fee
Wells Fargo Funds Management, LLC (“Funds Management”), an indirect wholly owned subsidiary of Wells Fargo & Company (“Wells Fargo”), is the manager of the Fund and provides advisory and fund-level administrative services under an investment management agreement. Under the investment management agreement, Funds Management is responsible for, among other services, implementing the investment objectives and strategies of the Fund, supervising the subadviser, and providing fund-level administrative services in connection with the Fund’s operations. As long as the Fund continues to invest substantially all of its assets in a single affiliated Master Portfolio, the Fund pays Funds Management an investment management fee only for fund-level administrative services at an annual rate starting at 0.05% and declining to 0.03% as the average daily net assets of the Fund increase. For the six months ended November 30, 2018, the management fee was equivalent to an annual rate of 0.05% of the Fund’s average daily net assets.
Funds Management also serves as the adviser to the affiliated Master Portfolio and is entitled to receive a fee from the affiliated Master Portfolio for those services.
Administration fees
Under a class-level administration agreement, Funds Management provides class-level administrative services to the Fund, which includes paying fees and expenses for services provided by the transfer agent,sub-transfer agents, omnibus account servicers and record-keepers. As compensation for its services under the class-level administration agreement, Funds Management receives an annual fee which is calculated based on the average daily net assets of each class as follows:
| | | | |
| | | Class-level
administration fee | |
Class A, Class C | | | 0.21 | % |
Class R6 | | | 0.03 | |
Administrator Class, Institutional Class | | | 0.13 | |
| | | | |
| 20 | | Wells Fargo International Value Fund | | Notes to financial statements (unaudited) |
Funds Management has contractually waived and/or reimbursed management and administration fees to the extent necessary to maintain certain net operating expense ratios for the Fund. When each class of the Fund has exceeded its expense cap, Funds Management has waived fees and/or reimbursed expenses from fund level expenses on a proportionate basis and then from class specific expenses; otherwise, waivers and/or reimbursements are applied against class specific expenses before fund level expenses. Net expenses from the affiliated Master Portfolio are included in the expense cap. Funds Management has committed through September 30, 2019 to waive fees and/or reimburse expenses to the extent necessary to cap the Fund’s expenses at 1.35% for Class A shares, 2.10% for Class C shares, 0.90% for Class R6 shares, 1.25% for Administrator Class shares, and 1.00% for Institutional Class shares. After this time, the cap may be increased or the commitment to maintain the cap may be terminated only with the approval of the Board of Trustees.
Distribution fee
The Trust has adopted a Distribution Plan for Class C shares of the Fund pursuant to Rule12b-1 under the 1940 Act. A distribution fee is charged to Class C shares and paid to Wells Fargo Funds Distributor, LLC (“Funds Distributor”), the principal underwriter, at an annual rate of 0.75% of the average daily net assets of Class C shares.
In addition, Funds Distributor is entitled to receive thefront-end sales charge from the purchase of Class A shares and a contingent deferred sales charge on the redemption of certain Class A shares. Funds Distributor is also entitled to receive the contingent deferred sales charges from redemptions of Class C shares. For the six months ended November 30, 2018, Funds Distributor received $218 from the sale of Class A shares. No contingent deferred sales charges were incurred by Class A and Class C shares for the six months ended November 30, 2018.
Shareholder servicing fees
The Trust has entered into contracts with one or more shareholder servicing agents, whereby Class A, Class C, and Administrator Class of each applicable Fund are charged a fee at an annual rate of 0.25% of the average daily net assets of each respective class.
A portion of these total shareholder servicing fees were paid to affiliates of Wells Fargo.
5. INVESTMENT PORTFOLIO TRANSACTIONS
The Fund seeks to achieve its investment objective by investing substantially all of its investable assets in a single affiliated Master Portfolio. Purchases and sales have been calculated by multiplying the Fund’s ownership percentage of the affiliated Master Portfolio by the affiliated Master Portfolio’s purchases and sales. Purchases and sales of investments, excluding U.S. government obligations (if any) and short-term securities, for the six months ended November 30, 2018 were $300,265,180 and $54,850,096, respectively.
6. BANK BORROWINGS
The Trust (excluding the money market funds), Wells Fargo Master Trust and Wells Fargo Variable Trust are parties to a $280,000,000 revolving credit agreement whereby the Fund is permitted to use bank borrowings for temporary or emergency purposes, such as to fund shareholder redemption requests. Interest under the credit agreement is charged to the Fund based on a borrowing rate equal to the higher of the Federal Funds rate in effect on that day plus 1.25% or the overnight LIBOR rate in effect on that day plus 1.25%. In addition, an annual commitment fee equal to 0.25% of the unused balance is allocated to each participating fund.
For the six months ended November 30, 2018, there were no borrowings by the Fund under the agreement.
7. DISTRIBUTIONS TO SHAREHOLDERS
Effective for all filings after November 4, 2018, the Securities and Exchange Commission eliminated the requirement to separately state the components of distributions to shareholders. The amounts of distributions to shareholders for the year ended May 31, 2018 were as follows:
| | | | |
| | | Net investment
income | |
Class A | | $ | 53,028 | |
Class C | | | 19,938 | |
Administrator Class | | | 104,265 | |
Institutional Class | | | 22,325,915 | |
| | | | | | |
| Notes to financial statements (unaudited) | | Wells Fargo International Value Fund | | | 21 | |
8. CONCENTRATION RISK
Concentration risks result from exposure to a limited number of sectors. Through its investment in the affiliated Master Portfolio which may invest a substantial portion of its assets in any sector, the Fund may in turn be more affected by changes in that sector than a fund whose investments are not heavily weighted in any sector.
9. INDEMNIFICATION
Under the Trust’s organizational documents, the officers and Trustees have been granted certain indemnification rights against certain liabilities that may arise out of performance of their duties to the Trust. Additionally, in the normal course of business, the Trust may enter into contracts with service providers that contain a variety of indemnification clauses. The Trust’s maximum exposure under these arrangements is dependent on future claims that may be made against the Fund and, therefore, cannot be estimated.
10. NEW ACCOUNTING PRONOUNCEMENT
In August 2018, FASB issued Accounting Standards Update (“ASU”)No. 2018-13, Fair Value Measurement (Topic 820)Disclosure Framework—Changes to the Disclosure Requirements for Fair Value Measurement. ASU2018-13 updates the disclosure requirements for fair value measurements by modifying or removing certain disclosures and adding certain new disclosures. The amendments are effective for fiscal years, and interim periods within those fiscal years, beginning after December 15, 2019. Early adoption is permitted. Management has adopted the removal and modification of disclosures early, as permitted, and will adopt the additional new disclosures at the effective date.
11. SUBSEQUENT DISTRIBUTIONS
On December 27, 2018, the Fund declared distributions from net investment income to shareholders of record on December 26, 2018. The per share amounts payable on December 28, 2018 were as follows:
| | | | |
| | | Net investment income | |
Class A | | | $0.32558 | |
Class C | | | 0.18817 | |
Class R6 | | | 0.36845 | |
Administrator Class | | | 0.30162 | |
Institutional Class | | | 0.35227 | |
These distributions are not reflected in the accompanying financial statements.
| | | | |
| 22 | | Wells Fargo International Value Portfolio | | Portfolio of investments—November 30, 2018 (unaudited) |
| | | | | | | | | | | | | | | | |
| Security name | | | | | | | | Shares | | | Value | |
| | | | |
Common Stocks: 95.48% | | | | | | | | | | | | | | | | |
| | | | |
| Australia: 4.82% | | | | | | | | | | | | | | | | |
Asaleo Care Limited (Consumer Staples, Personal Products) | | | | | | | | | | | 1,262,800 | | | $ | 604,540 | |
Automotive Holdings Group Limited (Consumer Discretionary, Specialty Retail) | | | | | | | | | | | 410,016 | | | | 488,480 | |
Bendigo Bank Limited (Financials, Banks) | | | | | | | | | | | 272,500 | | | | 2,127,139 | |
BlueScope Steel Limited (Materials, Metals & Mining) | | | | | | | | | | | 266,242 | | | | 2,185,317 | |
Coca-Cola Amatil Limited (Consumer Staples, Beverages) | | | | | | | | | | | 960,600 | | | | 6,066,167 | |
CSR Limited (Materials, Construction Materials) | | | | | | | | | | | 897,866 | | | | 1,968,751 | |
Fortescue Metals Group Limited (Materials, Metals & Mining) | | | | | | | | | | | 927,200 | | | | 2,710,762 | |
Harvey Norman Holdings Limited (Consumer Discretionary, Multiline Retail) « | | | | | | | | | | | 1,226,186 | | | | 2,832,054 | |
Lendlease Corporation Limited (Real Estate, Real Estate Management & Development) | | | | | | | | | | | 407,700 | | | | 3,772,528 | |
Macquarie Group Limited (Financials, Capital Markets) | | | | | | | | | | | 67,700 | | | | 5,661,723 | |
Metcash Limited (Consumer Staples, Food & Staples Retailing) | | | | | | | | | | | 1,164,200 | | | | 2,357,032 | |
Mineral Resources Limited (Materials, Metals & Mining) | | | | | | | | | | | 300,500 | | | | 3,349,441 | |
Mirvac Group (Real Estate, Equity REITs) | | | | | | | | | | | 2,065,070 | | | | 3,305,498 | |
Myer Holdings Limited (Consumer Discretionary, Multiline Retail) Ǡ | | | | | | | | | | | 1,702,400 | | | | 566,149 | |
Qantas Airways Limited (Industrials, Airlines) | | | | | | | | | | | 1,142,785 | | | | 4,978,160 | |
Retail Food Group Limited (Consumer Discretionary, Food Products) Ǡ | | | | | | | | | | | 269,500 | | | | 73,867 | |
Rio Tinto Limited (Materials, Metals & Mining) | | | | | | | | | | | 134,687 | | | | 7,213,884 | |
South32 Limited (Materials, Metals & Mining) | | | | | | | | | | | 1,583,900 | | | | 3,588,785 | |
| | | | |
| | | | | | | | | | | | | | | 53,850,277 | |
| | | | | | | | | | | | | | | | |
| | | | |
| Austria: 0.91% | | | | | | | | | | | | | | | | |
OMV AG (Energy, Oil, Gas & Consumable Fuels) | | | | | | | | | | | 89,986 | | | | 4,545,581 | |
Raiffeisen Bank International AG (Financials, Banks) | | | | | | | | | | | 111,330 | | | | 3,281,996 | |
Voestalpine AG (Materials, Metals & Mining) | | | | | | | | | | | 69,168 | | | | 2,298,255 | |
| | | | |
| | | | | | | | | | | | | | | 10,125,832 | |
| | | | | | | | | | | | | | | | |
| | | | |
| Belgium: 0.66% | | | | | | | | | | | | | | | | |
Bpost SA (Industrials, Air Freight & Logistics) | | | | | | | | | | | 68,200 | | | | 880,957 | |
UCB SA (Health Care, Pharmaceuticals) | | | | | | | | | | | 77,200 | | | | 6,488,438 | |
| | | | |
| | | | | | | | | | | | | | | 7,369,395 | |
| | | | | | | | | | | | | | | | |
| | | | |
| Brazil: 0.83% | | | | | | | | | | | | | | | | |
Banco de Brasil SA (Financials, Banks) | | | | | | | | | | | 268,900 | | | | 3,103,441 | |
Companhia de Saneamento de Minas Gerais SA (Utilities, Water Utilities) | | | | | | | | | | | 282,500 | | | | 3,742,559 | |
JBS SA (Consumer Staples, Food Products) | | | | | | | | | | | 805,600 | | | | 2,452,007 | |
| | | | |
| | | | | | | | | | | | | | | 9,298,007 | |
| | | | | | | | | | | | | | | | |
| | | | |
| Canada: 1.13% | | | | | | | | | | | | | | | | |
George Weston Limited (Consumer Staples, Food & Staples Retailing) | | | | | | | | | | | 14,998 | | | | 1,084,453 | |
Loblaw Companies Limited (Consumer Staples, Food & Staples Retailing) | | | | | | | | | | | 111,100 | | | | 5,124,991 | |
Magna International Incorporated (Consumer Discretionary, Auto Components) « | | | | | | | | | | | 90,400 | | | | 4,511,665 | |
WestJet Airlines Limited (Industrials, Airlines) | | | | | | | | | | | 120,000 | | | | 1,861,438 | |
| | | | |
| | | | | | | | | | | | | | | 12,582,547 | |
| | | | | | | | | | | | | | | | |
The accompanying notes are an integral part of these financial statements.
| | | | | | |
| Portfolio of investments—November 30, 2018 (unaudited) | | Wells Fargo International Value Portfolio | | | 23 | |
| | | | | | | | | | | | | | | | |
| Security name | | | | | | | | Shares | | | Value | |
| | | | |
| China: 3.40% | | | | | | | | | | | | | | | | |
Agile Property Holdings Limited (Real Estate, Real Estate Management & Development) | | | | | | | | | | | 1,900,000 | | | $ | 2,578,988 | |
China Communications Services Corporation Limited H Shares (Communication Services, Diversified Telecommunication Services) | | | | | | | | | | | 2,836,000 | | | | 2,366,958 | |
China Petroleum & Chemical Corporation H Shares (Energy, Oil, Gas & Consumable Fuels) | | | | | | | | | | | 6,634,000 | | | | 5,638,561 | |
China Railway Construction Corporation Limited H Shares (Industrials, Construction & Engineering) | | | | | | | | | | | 3,201,500 | | | | 4,100,081 | |
China Resources Cement Holdings Limited (Materials, Construction Materials) | | | | | | | | | | | 4,106,000 | | | | 4,009,438 | |
China Telecom Corporation Limited H Shares (Communication Services, Diversified Telecommunication Services) | | | | | | | | | | | 10,590,000 | | | | 5,698,351 | |
Dongfeng Motor Group Company Limited H Shares (Consumer Discretionary, Automobiles) | | | | | | | | | | | 3,154,000 | | | | 3,043,546 | |
PICC Property & Casualty Company Limited H Shares (Financials, Insurance) | | | | | | | | | | | 4,298,000 | | | | 4,411,163 | |
Shanghai Pharmaceuticals Holding Company Limited H Shares (Health Care, Health Care Providers & Services) | | | | | | | | | | | 1,061,600 | | | | 2,618,722 | |
Shenzhen International Holdings Limited H Shares (Industrials, Transportation Infrastructure) | | | | | | | | | | | 1,777,300 | | | | 3,566,412 | |
| | | | |
| | | | | | | | | | | | | | | 38,032,220 | |
| | | | | | | | | | | | | | | | |
| | | | |
| Denmark: 0.69% | | | | | | | | | | | | | | | | |
Danske Bank AS (Financials, Banks) | | | | | | | | | | | 150,300 | | | | 2,995,763 | |
DFDS AS (Industrials, Marine) | | | | | | | | | | | 59,227 | | | | 2,224,455 | |
Sydbank AS (Financials, Banks) | | | | | | | | | | | 102,782 | | | | 2,535,075 | |
| | | | |
| | | | | | | | | | | | | | | 7,755,293 | |
| | | | | | | | | | | | | | | | |
| | | | |
| Finland: 0.45% | | | | | | | | | | | | | | | | |
Outokumpu Oyj (Materials, Metals & Mining) | | | | | | | | | | | 447,093 | | | | 1,859,610 | |
UPM-Kymmene Oyj (Materials, Paper & Forest Products) | | | | | | | | | | | 118,000 | | | | 3,143,322 | |
| | | | |
| | | | | | | | | | | | | | | 5,002,932 | |
| | | | | | | | | | | | | | | | |
| | | | |
| France: 9.66% | | | | | | | | | | | | | | | | |
AirFrance-KLM (Industrials, Airlines) † | | | | | | | | | | | 288,100 | | | | 3,320,289 | |
Arkema SA (Materials, Chemicals) | | | | | | | | | | | 42,992 | | | | 4,078,651 | |
AXA SA (Financials, Insurance) | | | | | | | | | | | 233,600 | | | | 5,689,827 | |
BNP Paribas SA (Financials, Banks) | | | | | | | | | | | 123,579 | | | | 6,208,232 | |
Compagnie de Saint-Gobain SA (Industrials, Building Products) | | | | | | | | | | | 152,637 | | | | 5,656,621 | |
Compagnie Generale des Etablissements Michelin SCA (Consumer Discretionary, Auto Components) | | | | | | | | | | | 32,700 | | | | 3,421,359 | |
Credit Agricole SA (Financials, Banks) | | | | | | | | | | | 219,328 | | | | 2,723,368 | |
Engie SA (Utilities, Multi-Utilities) | | | | | | | | | | | 171,900 | | | | 2,417,032 | |
Natixis SA (Financials, Capital Markets) | | | | | | | | | | | 1,548,200 | | | | 8,553,262 | |
Neopost SA (Information Technology, Technology Hardware, Storage & Peripherals) | | | | | | | | | | | 66,600 | | | | 1,844,232 | |
Orange SA (Communication Services, Diversified Telecommunication Services) « | | | | | | | | | | | 844,700 | | | | 14,497,282 | |
Renault SA (Consumer Discretionary, Automobiles) | | | | | | | | | | | 55,900 | | | | 3,926,797 | |
Sanofi SA (Health Care, Pharmaceuticals) | | | | | | | | | | | 238,389 | | | | 21,539,142 | |
SCOR SE (Financials, Insurance) | | | | | | | | | | | 70,800 | | | | 3,401,680 | |
Societe Generale SA (Financials, Banks) | | | | | | | | | | | 63,400 | | | | 2,329,822 | |
Total SA (Energy, Oil, Gas & Consumable Fuels) « | | | | | | | | | | | 329,000 | | | | 18,312,044 | |
| | | | |
| | | | | | | | | | | | | | | 107,919,640 | |
| | | | | | | | | | | | | | | | |
| | | | |
| Germany: 7.37% | | | | | | | | | | | | | | | | |
Allianz AG (Financials, Insurance) | | | | | | | | | | | 44,428 | | | | 9,380,381 | |
Aurubis AG (Materials, Metals & Mining) | | | | | | | | | | | 43,296 | | | | 2,356,661 | |
BASF SE (Materials, Chemicals) | | | | | | | | | | | 130,090 | | | | 9,480,087 | |
Bayer AG (Health Care, Pharmaceuticals) | | | | | | | | | | | 11,900 | | | | 870,021 | |
Bayerische Motoren Werke AG (Consumer Discretionary, Automobiles) | | | | | | | | | | | 91,500 | | | | 7,480,030 | |
The accompanying notes are an integral part of these financial statements.
| | | | |
| 24 | | Wells Fargo International Value Portfolio | | Portfolio of investments—November 30, 2018 (unaudited) |
| | | | | | | | | | | | | | | | |
| Security name | | | | | | | | Shares | | | Value | |
| | | | |
| Germany(continued) | | | | | | | | | | | | | | | | |
Covestro AG (Materials, Chemicals) 144A | | | | | | | | | | | 132,837 | | | $ | 7,648,571 | |
Daimler AG (Consumer Discretionary, Automobiles) | | | | | | | | | | | 106,990 | | | | 6,019,228 | |
Deutsche Lufthansa AG (Industrials, Airlines) | | | | | | | | | | | 223,600 | | | | 5,442,459 | |
Deutsche Post AG (Industrials, Air Freight & Logistics) | | | | | | | | | | | 85,100 | | | | 2,709,129 | |
Gerresheimer AG (Health Care, Life Sciences Tools & Services) | | | | | | | | | | | 32,790 | | | | 2,334,947 | |
Kloeckner & Company SE (Industrials, Trading Companies & Distributors) | | | | | | | | | | | 344,100 | | | | 2,767,793 | |
Leoni AG (Consumer Discretionary, Auto Components) « | | | | | | | | | | | 72,900 | | | | 2,328,174 | |
Metro AG (Consumer Staples, Food & Staples Retailing) « | | | | | | | | | | | 269,900 | | | | 4,141,783 | |
Muenchener Rueckversicherungs Gesellschaft AG (Financials, Insurance) | | | | | | | | | | | 28,119 | | | | 6,108,854 | |
Siemens AG (Industrials, Industrial Conglomerates) | | | | | | | | | | | 34,200 | | | | 3,964,706 | |
Siltronic AG (Information Technology, Semiconductors & Semiconductor Equipment) | | | | | | | | | | | 27,422 | | | | 2,477,347 | |
Volkswagen AG (Consumer Discretionary, Automobiles) | | | | | | | | | | | 41,837 | | | | 6,910,361 | |
| | | | |
| | | | | | | | | | | | | | | 82,420,532 | |
| | | | | | | | | | | | | | | | |
| | | | |
| Hong Kong: 2.97% | | | | | | | | | | | | | | | | |
China Water Affairs Group Limited (Utilities, Water Utilities) | | | | | | | | | | | 1,965,000 | | | | 2,210,123 | |
Kingboard Laminates Holdings Limited (Information Technology, Electronic Equipment, Instruments & Components) | | | | | | | | | | | 3,948,000 | | | | 3,759,279 | |
Lee & Man Paper Manufacturing Limited (Materials, Paper & Forest Products) | | | | | | | | | | | 3,155,000 | | | | 2,859,017 | |
Nine Dragons Paper Holdings Limited (Materials, Paper & Forest Products) | | | | | | | | | | | 3,216,000 | | | | 3,259,571 | |
Sinotruk Hong Kong Limited (Industrials, Machinery) | | | | | | | | | | | 3,571,500 | | | | 5,861,204 | |
Skyworth Digital Holdings Limited (Consumer Discretionary, Household Durables) | | | | | | | | | | | 8,404,000 | | | | 2,062,331 | |
WH Group Limited (Consumer Staples, Food Products) 144A | | | | | | | | | | | 5,899,000 | | | | 4,305,124 | |
Wheelock & Company Limited (Real Estate, Real Estate Management & Development) | | | | | | | | | | | 379,000 | | | | 2,174,987 | |
Xinyi Glass Holdings Limited (Consumer Discretionary, Auto Components) | | | | | | | | | | | 2,816,000 | | | | 3,026,912 | |
Yue Yuen Industrial Holdings Limited (Consumer Discretionary, Textiles, Apparel & Luxury Goods) | | | | | | | | | | | 1,257,000 | | | | 3,655,004 | |
| | | | |
| | | | | | | | | | | | | | | 33,173,552 | |
| | | | | | | | | | | | | | | | |
| | | | |
| India: 0.29% | | | | | | | | | | | | | | | | |
Tech Mahindra Limited (Information Technology, IT Services) | | | | | | | | | | | 321,500 | | | | 3,256,517 | |
| | | | | | | | | | | | | | | | |
| | | | |
| Ireland: 0.59% | | | | | | | | | | | | | | | | |
C&C Group plc (Consumer Staples, Beverages) | | | | | | | | | | | 240,000 | | | | 828,697 | |
Grafton Group plc (Industrials, Trading Companies & Distributors) | | | | | | | | | | | 248,800 | | | | 2,244,598 | |
Smurfit Kappa Group plc (Materials, Containers & Packaging) | | | | | | | | | | | 130,200 | | | | 3,514,003 | |
| | | | |
| | | | | | | | | | | | | | | 6,587,298 | |
| | | | | | | | | | | | | | | | |
| | | | |
| Israel: 0.46% | | | | | | | | | | | | | | | | |
Bank Hapoalim Limited (Financials, Banks) (a) | | | | | | | | | | | 320,800 | | | | 2,203,869 | |
Teva Pharmaceutical Industries Limited (Health Care, Pharmaceuticals) (a) | | | | | | | | | | | 136,844 | | | | 2,942,894 | |
| | | | |
| | | | | | | | | | | | | | | 5,146,763 | |
| | | | | | | | | | | | | | | | |
| | | | |
| Italy: 2.19% | | | | | | | | | | | | | | | | |
A2A SpA (Utilities, Multi-Utilities) | | | | | | | | | | | 2,121,107 | | | | 3,568,340 | |
Enel SpA (Utilities, Electric Utilities) | | | | | | | | | | | 1,706,600 | | | | 9,254,483 | |
Leonardo SpA (Industrials, Aerospace & Defense) | | | | | | | | | | | 342,737 | | | | 3,378,038 | |
Mediobanca SpA (Financials, Banks) | | | | | | | | | | | 371,363 | | | | 3,281,800 | |
UnipolSai Assicurazioni SpA (Financials, Insurance) « | | | | | | | | | | | 2,160,500 | | | | 5,028,776 | |
| | | | |
| | | | | | | | | | | | | | | 24,511,437 | |
| | | | | | | | | | | | | | | | |
The accompanying notes are an integral part of these financial statements.
| | | | | | |
| Portfolio of investments—November 30, 2018 (unaudited) | | Wells Fargo International Value Portfolio | | | 25 | |
| | | | | | | | | | | | | | | | |
| Security name | | | | | | | | Shares | | | Value | |
| | | | |
| Japan: 22.11% | | | | | | | | | | | | | | | | |
Adeka Corporation (Materials, Chemicals) | | | | | | | | | | | 203,500 | | | $ | 3,225,094 | |
Aisin Seiki Company Limited (Consumer Discretionary, Auto Components) | | | | | | | | | | | 119,800 | | | | 4,738,598 | |
Aozora Bank Limited (Financials, Banks) | | | | | | | | | | | 64,900 | | | | 2,132,555 | |
Asahi Glass Company Limited (Industrials, Building Products) | | | | | | | | | | | 121,800 | | | | 4,136,361 | |
Brother Industries Limited (Information Technology, Technology Hardware, Storage & Peripherals) | | | | | | | | | | | 200,800 | | | | 3,355,659 | |
Central Glass Company Limited (Industrials, Building Products) | | | | | | | | | | | 88,800 | | | | 2,188,807 | |
Credit Saison Company Limited (Financials, Consumer Finance) | | | | | | | | | | | 329,900 | | | | 4,234,368 | |
DCM Holdings Company Limited (Consumer Discretionary, Specialty Retail) | | | | | | | | | | | 243,900 | | | | 2,419,340 | |
Denka Company Limited (Materials, Chemicals) | | | | | | | | | | | 99,700 | | | | 3,214,571 | |
DIC Incorporated (Materials, Chemicals) | | | | | | | | | | | 124,900 | | | | 3,966,564 | |
Dowa Mining Company Limited (Materials, Metals & Mining) | | | | | | | | | | | 56,900 | | | | 1,874,695 | |
Eizo Corporation (Information Technology, Technology Hardware, Storage & Peripherals) | | | | | | | | | | | 63,300 | | | | 2,648,769 | |
Fujikura Limited (Industrials, Electrical Equipment) | | | | | | | | | | | 435,200 | | | | 1,890,090 | |
Geo Holdings Corporation (Consumer Discretionary, Specialty Retail) | | | | | | | | | | | 133,700 | | | | 2,250,810 | |
Hitachi Limited (Information Technology, Electronic Equipment, Instruments & Components) | | | | | | | | | | | 165,800 | | | | 4,802,453 | |
Isuzu Motors Limited (Consumer Discretionary, Automobiles) | | | | | | | | | | | 263,900 | | | | 3,756,881 | |
Itochu Corporation (Industrials, Trading Companies & Distributors) | | | | | | | | | | | 356,200 | | | | 6,326,029 | |
Japan Airlines Company Limited (Industrials, Airlines) | | | | | | | | | | | 108,600 | | | | 3,916,737 | |
JFE Holdings Incorporated (Materials, Metals & Mining) | | | | | | | | | | | 263,600 | | | | 4,647,803 | |
JTEKT Corporation (Industrials, Machinery) | | | | | | | | | | | 322,100 | | | | 4,097,365 | |
JXTG Holdings Incorporated (Energy, Oil, Gas & Consumable Fuels) | | | | | | | | | | | 754,900 | | | | 4,564,048 | |
Kaken Pharmaceutical Company Limited (Health Care, Pharmaceuticals) | | | | | | | | | | | 44,700 | | | | 2,287,865 | |
KDDI Corporation (Communication Services, Wireless Telecommunication Services) | | | | | | | | | | | 544,200 | | | | 12,771,429 | |
Keihin Corporation (Consumer Discretionary, Auto Components) | | | | | | | | | | | 180,400 | | | | 3,121,223 | |
Maeda Road Construction Company Limited (Industrials, Construction & Engineering) | | | | | | | | | | | 148,000 | | | | 2,907,457 | |
Makino Milling Machine Company Limited (Industrials, Machinery) | | | | | | | | | | | 79,400 | | | | 3,221,046 | |
Marubeni Corporation (Industrials, Trading Companies & Distributors) | | | | | | | | | | | 812,100 | | | | 6,063,117 | |
Mazda Motor Corporation (Consumer Discretionary, Automobiles) | | | | | | | | | | | 283,200 | | | | 3,018,738 | |
Mitsubishi Electric Corporation (Industrials, Electrical Equipment) | | | | | | | | | | | 431,500 | | | | 5,694,287 | |
Mitsubishi Gas Chemical Company Incorporated (Materials, Chemicals) | | | | | | | | | | | 195,500 | | | | 3,210,254 | |
Mitsubishi UFJ Financial Group Incorporated (Financials, Banks) | | | | | | | | | | | 921,500 | | | | 5,069,610 | |
Mitsubishi UFJ Lease & Finance Company Limited (Financials, Diversified Financial Services) | | | | | | | | | | | 699,300 | | | | 3,813,300 | |
Mitsui Chemicals Incorporated (Materials, Chemicals) | | | | | | | | | | | 177,100 | | | | 4,494,781 | |
Mixi Incorporated (Communication Services, Interactive Media & Services) | | | | | | | | | | | 54,400 | | | | 1,282,424 | |
Mizuho Financial Group Incorporated (Financials, Banks) | | | | | | | | | | | 3,425,200 | | | | 5,681,762 | |
Morinaga Milk Industry Company Limited (Consumer Staples, Food Products) | | | | | | | | | | | 134,500 | | | | 3,939,678 | |
Nippon Telegraph & Telephone Corporation (Communication Services, Diversified Telecommunication Services) | | | | | | | | | | | 324,200 | | | | 13,366,128 | |
Nissan Motor Company Limited (Consumer Discretionary, Automobiles) | | | | | | | | | | | 587,500 | | | | 5,146,027 | |
Nisshinbo Holdings Incorporated (Industrials, Industrial Conglomerates) | | | | | | | | | | | 226,100 | | | | 2,057,537 | |
Nomura Holdings Incorporated (Financials, Capital Markets) | | | | | | | | | | | 1,144,100 | | | | 5,154,321 | |
NTN Corporation (Industrials, Machinery) | | | | | | | | | | | 1,133,600 | | | | 3,804,798 | |
NTT DOCOMO Incorporated (Communication Services, Wireless Telecommunication Services) | | | | | | | | | | | 98,600 | | | | 2,283,135 | |
ORIX Corporation (Financials, Diversified Financial Services) | | | | | | | | | | | 469,600 | | | | 7,609,824 | |
Resona Holdings Incorporated (Financials, Banks) | | | | | | | | | | | 1,348,600 | | | | 7,150,794 | |
Ryobi Limited (Industrials, Machinery) | | | | | | | | | | | 117,400 | | | | 3,200,925 | |
Sawai Pharmaceutical Company Limited (Health Care, Pharmaceuticals) | | | | | | | | | | | 42,000 | | | | 2,219,971 | |
SCREEN Holdings Company Limited (Information Technology, Semiconductors & Semiconductor Equipment) | | | | | | | | | | | 50,100 | | | | 2,506,876 | |
Showa Shell Sekiyu KK (Energy, Oil, Gas & Consumable Fuels) | | | | | | | | | | | 145,400 | | | | 2,253,082 | |
Sojitz Corporation (Industrials, Trading Companies & Distributors) | | | | | | | | | | | 1,855,500 | | | | 6,571,035 | |
Sompo Holdings Incorporated (Financials, Insurance) | | | | | | | | | | | 25,100 | | | | 969,815 | |
The accompanying notes are an integral part of these financial statements.
| | | | |
| 26 | | Wells Fargo International Value Portfolio | | Portfolio of investments—November 30, 2018 (unaudited) |
| | | | | | | | | | | | | | | | |
| Security name | | | | | | | | Shares | | | Value | |
| | | | |
| Japan(continued) | | | | | | | | | | | | | | | | |
Sumitomo Heavy Industries Limited (Industrials, Machinery) | | | | | | | | | | | 140,900 | | | $ | 4,673,290 | |
Sumitomo Mitsui Financial Group Incorporated (Financials, Banks) | | | | | | | | | | | 173,200 | | | | 6,382,378 | |
Sumitomo Osaka Cement Company (Materials, Construction Materials) | | | | | | | | | | | 34,900 | | | | 1,567,987 | |
Teijin Limited (Materials, Chemicals) | | | | | | | | | | | 279,600 | | | | 4,827,697 | |
The Keiyo Bank Limited (Financials, Banks) | | | | | | | | | | | 224,300 | | | | 1,580,760 | |
The Yokohama Rubber Company Limited (Consumer Discretionary, Auto Components) | | | | | | | | | | | 172,900 | | | | 3,618,997 | |
Toho Holdings Company Limited (Health Care, Health Care Providers & Services) | | | | | | | | | | | 63,000 | | | | 1,673,303 | |
Tokyo Electron Limited (Information Technology, Semiconductors & Semiconductor Equipment) | | | | | | | | | | | 21,000 | | | | 2,936,837 | |
Toyo Ink SC Holding Company Limited (Materials, Chemicals) | | | | | | | | | | | 75,000 | | | | 1,854,601 | |
Toyo Tire & Rubber Company Limited (Consumer Discretionary, Auto Components) | | | | | | | | | | | 165,400 | | | | 2,612,538 | |
Toyota Boshoku Corporation (Consumer Discretionary, Auto Components) | | | | | | | | | | | 180,900 | | | | 2,787,245 | |
UBE Industries Limited (Materials, Chemicals) | | | | | | | | | | | 149,300 | | | | 3,402,538 | |
ULVAC Incorporated (Information Technology, Semiconductors & Semiconductor Equipment) | | | | | | | | | | | 107,300 | | | | 3,941,691 | |
| | | | |
| | | | | | | | | | | | | | | 247,118,698 | |
| | | | | | | | | | | | | | | | |
| | | | |
| Liechtenstein: 0.09% | | | | | | | | | | | | | | | | |
VP Bank AG (Financials, Capital Markets) | | | | | | | | | | | 6,558 | | | | 1,025,334 | |
| | | | | | | | | | | | | | | | |
| | | | |
| Malaysia: 0.32% | | | | | | | | | | | | | | | | |
Tenaga Nasional Bhd (Utilities, Electric Utilities) | | | | | | | | | | | 1,062,400 | | | | 3,615,384 | |
| | | | | | | | | | | | | | | | |
| | | | |
| Netherlands: 2.98% | | | | | | | | | | | | | | | | |
ABN AMRO Group NV (Financials, Banks) 144A | | | | | | | | | | | 233,218 | | | | 5,945,869 | |
Aegon NV (Financials, Insurance) | | | | | | | | | | | 566,623 | | | | 3,154,128 | |
ASR Nederland NV (Financials, Insurance) | | | | | | | | | | | 83,831 | | | | 3,615,884 | |
ING Groep NV (Financials, Banks) | | | | | | | | | | | 282,500 | | | | 3,416,939 | |
Koninklijke Ahold Delhaize NV (Consumer Staples, Food & Staples Retailing) | | | | | | | | | | | 437,386 | | | | 11,242,717 | |
Philips Lighting NV (Industrials, Electrical Equipment) 144A | | | | | | | | | | | 97,200 | | | | 2,584,843 | |
RHI Magnesita NV (Materials, Construction Materials) « | | | | | | | | | | | 64,721 | | | | 2,986,512 | |
X5 Retail Group NV GDR (Consumer Staples, Food & Staples Retailing) | | | | | | | | | | | 14,352 | | | | 365,976 | |
| | | | |
| | | | | | | | | | | | | | | 33,312,868 | |
| | | | | | | | | | | | | | | | |
| | | | |
| Norway: 1.41% | | | | | | | | | | | | | | | | |
Den Norske Bank ASA (Financials, Banks) | | | | | | | | | | | 221,600 | | | | 3,802,975 | |
Grieg Seafood ASA (Consumer Staples, Food Products) | | | | | | | | | | | 336,787 | | | | 4,427,876 | |
Leroy Seafood Group ASA (Consumer Staples, Food Products) | | | | | | | | | | | 558,599 | | | | 4,752,236 | |
Marine Harvest ASA (Consumer Staples, Food Products) | | | | | | | | | | | 117,900 | | | | 2,758,593 | |
| | | | |
| | | | | | | | | | | | | | | 15,741,680 | |
| | | | | | | | | | | | | | | | |
| | | | |
| Poland: 0.12% | | | | | | | | | | | | | | | | |
Asseco Poland SA (Information Technology, Software) | | | | | | | | | | | 101,400 | | | | 1,284,953 | |
| | | | | | | | | | | | | | | | |
| | | | |
| Russia: 1.30% | | | | | | | | | | | | | | | | |
Gazprom PAO ADR (Energy, Oil, Gas & Consumable Fuels) | | | | | | | | | | | 781,547 | | | | 3,720,164 | |
Gazprom Neft ADR - London Exchange (Energy, Oil, Gas & Consumable Fuels) | | | | | | | | | | | 136,114 | | | | 3,722,718 | |
Gazprom Neft ADR (Energy, Oil, Gas & Consumable Fuels) | | | | | | | | | | | 886 | | | | 24,201 | |
Lukoil OAO ADR (Energy, Oil, Gas & Consumable Fuels) « | | | | | | | | | | | 46,800 | | | | 3,425,760 | |
Lukoil PJSC ADR (Energy, Oil, Gas & Consumable Fuels) | | | | | | | | | | | 50,101 | | | | 3,682,424 | |
| | | | |
| | | | | | | | | | | | | | | 14,575,267 | |
| | | | | | | | | | | | | | | | |
The accompanying notes are an integral part of these financial statements.
| | | | | | |
| Portfolio of investments—November 30, 2018 (unaudited) | | Wells Fargo International Value Portfolio | | | 27 | |
| | | | | | | | | | | | | | | | |
| Security name | | | | | | | | Shares | | | Value | |
| | | | |
| Singapore: 0.60% | | | | | | | | | | | | | | | | |
DBS Group Holdings Limited (Financials, Banks) | | | | | | | | | | | 185,700 | | | $ | 3,300,070 | |
United Overseas Bank Limited (Financials, Banks) | | | | | | | | | | | 184,100 | | | | 3,374,965 | |
| | | | |
| | | | | | | | | | | | | | | 6,675,035 | |
| | | | | | | | | | | | | | | | |
| | | | |
| South Africa: 0.31% | | | | | | | | | | | | | | | | |
Absa Group Limited (Financials, Banks) | | | | | | | | | | | 274,900 | | | | 3,054,720 | |
Petra Diamonds Limited (Materials, Metals & Mining) Ǡ | | | | | | | | | | | 842,600 | | | | 452,450 | |
| | | | |
| | | | | | | | | | | | | | | 3,507,170 | |
| | | | | | | | | | | | | | | | |
| | | | |
| South Korea: 2.56% | | | | | | | | | | | | | | | | |
BNK Financial Group Incorporated (Financials, Banks) | | | | | | | | | | | 440,300 | | | | 3,012,713 | |
E-MART Incorporated (Consumer Staples, Food & Staples Retailing) | | | | | | | | | | | 8,500 | | | | 1,478,657 | |
Industrial Bank of Korea (Financials, Banks) | | | | | | | | | | | 264,500 | | | | 3,492,216 | |
JB Financial Group Company Limited (Financials, Banks) | | | | | | | | | | | 25,418 | | | | 129,250 | |
KB Financial Group Incorporated (Financials, Banks) | | | | | | | | | | | 79,300 | | | | 3,339,096 | |
KT&G Corporation (Consumer Staples, Tobacco) | | | | | | | | | | | 38,400 | | | | 3,562,692 | |
LG Uplus Corporation (Communication Services, Diversified Telecommunication Services) | | | | | | | | | | | 351,800 | | | | 5,554,985 | |
SK Telecom Company Limited (Communication Services, Wireless Telecommunication Services) | | | | | | | | | | | 17,400 | | | | 4,493,778 | |
Woori Bank (Financials, Banks) | | | | | | | | | | | 254,400 | | | | 3,551,773 | |
| | | | |
| | | | | | | | | | | | | | | 28,615,160 | |
| | | | | | | | | | | | | | | | |
| | | | |
| Spain: 1.93% | | | | | | | | | | | | | | | | |
Banco Santander Central Hispano SA (Financials, Banks) | | | | | | | | | | | 731,000 | | | | 3,463,361 | |
Distribuidora Internacional SA (Consumer Staples, Food & Staples Retailing) « | | | | | | | | | | | 483,500 | | | | 362,250 | |
Iberdrola SA (Utilities, Electric Utilities) | | | | | | | | | | | 543,200 | | | | 4,052,566 | |
International Consolidated Airlines Group SA (Industrials, Airlines) | | | | | | | | | | | 548,044 | | | | 4,368,849 | |
Repsol YPF SA (Energy, Oil, Gas & Consumable Fuels) | | | | | | | | | | | 542,137 | | | | 9,359,740 | |
| | | | |
| | | | | | | | | | | | | | | 21,606,766 | |
| | | | | | | | | | | | | | | | |
| | | | |
| Sweden: 1.94% | | | | | | | | | | | | | | | | |
Boliden AB (Materials, Metals & Mining) | | | | | | | | | | | 102,400 | | | | 2,293,515 | |
Electrolux AB Class B (Consumer Discretionary, Household Durables) | | | | | | | | | | | 162,100 | | | | 3,682,290 | |
Nordea Bank AB (Financials, Banks) | | | | | | | | | | | 365,491 | | | | 3,243,536 | |
Skandinaviska Enskilda Banken AB Class A (Financials, Banks) | | | | | | | | | | | 272,700 | | | | 2,839,736 | |
Volvo AB Class B (Industrials, Machinery) | | | | | | | | | | | 689,107 | | | | 9,583,073 | |
| | | | |
| | | | | | | | | | | | | | | 21,642,150 | |
| | | | | | | | | | | | | | | | |
| | | | |
| Switzerland: 6.63% | | | | | | | | | | | | | | | | |
Baloise Holding AG (Financials, Insurance) | | | | | | | | | | | 39,946 | | | | 5,869,649 | |
Credit Suisse Group AG (Financials, Capital Markets) | | | | | | | | | | | 168,600 | | | | 1,987,997 | |
Helvetia Holding AG (Financials, Insurance) | | | | | | | | | | | 6,293 | | | | 3,892,772 | |
Roche Holding AG (Health Care, Pharmaceuticals) | | | | | | | | | | | 98,077 | | | | 25,435,915 | |
Swiss Life Holding AG (Financials, Insurance) | | | | | | | | | | | 29,400 | | | | 11,532,816 | |
Swiss Reinsurance AG (Financials, Insurance) | | | | | | | | | | | 91,400 | | | | 8,349,096 | |
UBS Group AG (Financials, Capital Markets) | | | | | | | | | | | 424,002 | | | | 5,727,348 | |
Valiant Holding AG (Financials, Banks) | | | | | | | | | | | 22,700 | | | | 2,508,463 | |
Zurich Insurance Group AG (Financials, Insurance) | | | | | | | | | | | 27,970 | | | | 8,776,933 | |
| | | | |
| | | | | | | | | | | | | | | 74,080,989 | |
| | | | | | | | | | | | | | | | |
The accompanying notes are an integral part of these financial statements.
| | | | |
| 28 | | Wells Fargo International Value Portfolio | | Portfolio of investments—November 30, 2018 (unaudited) |
| | | | | | | | | | | | | | | | |
| Security name | | | | | | | | Shares | | | Value | |
| | | | |
| Taiwan: 0.68% | | | | | | | | | | | | | | | | |
Catcher Technology Company Limited (Information Technology, Technology Hardware, Storage & Peripherals) | | | | | | | | | | | 328,000 | | | $ | 2,816,616 | |
Pegatron Corporation (Information Technology, Technology Hardware, Storage & Peripherals) | | | | | | | | | | | 1,035,000 | | | | 1,757,398 | |
Powertech Technology Incorporated (Information Technology, Semiconductors & Semiconductor Equipment) | | | | | | | | | | | 1,283,000 | | | | 3,011,571 | |
| | | | |
| | | | | | | | | | | | | | | 7,585,585 | |
| | | | | | | | | | | | | | | | |
| | | | |
| Thailand: 0.98% | | | | | | | | | | | | | | | | |
Bangchak Corporation PCL (Energy, Oil, Gas & Consumable Fuels) | | | | | | | | | | | 2,367,100 | | | | 2,429,179 | |
Krung Thai Bank PCL ADR (Financials, Banks) | | | | | | | | | | | 5,181,900 | | | | 3,182,801 | |
Thai Oil PCL (Energy, Oil, Gas & Consumable Fuels) | | | | | | | | | | | 1,286,500 | | | | 2,972,984 | |
Thanachart Capital PCL (Financials, Banks) | | | | | | | | | | | 1,481,500 | | | | 2,387,518 | |
| | | | |
| | | | | | | | | | | | | | | 10,972,482 | |
| | | | | | | | | | | | | | | | |
| | | | |
| Turkey: 0.52% | | | | | | | | | | | | | | | | |
Koç Holding AS (Industrials, Industrial Conglomerates) | | | | | | | | | | | 1,184,300 | | | | 3,493,390 | |
TAV Havalimanlari Holding AS (Industrials, Transportation Infrastructure) | | | | | | | | | | | 522,900 | | | | 2,350,743 | |
| | | | |
| | | | | | | | | | | | | | | 5,844,133 | |
| | | | | | | | | | | | | | | | |
| | | | |
| United Kingdom: 14.58% | | | | | | | | | | | | | | | | |
3i Group plc (Financials, Capital Markets) | | | | | | | | | | | 456,100 | | | | 4,844,764 | |
Anglo American plc (Materials, Metals & Mining) | | | | | | | | | | | 267,586 | | | | 5,340,297 | |
Aviva plc (Financials, Insurance) | | | | | | | | | | | 704,391 | | | | 3,653,113 | |
BAE Systems plc (Industrials, Aerospace & Defense) | | | | | | | | | | | 1,220,400 | | | | 7,640,184 | |
Barclays plc (Financials, Banks) | | | | | | | | | | | 715,000 | | | | 1,483,982 | |
Barratt Developments plc (Consumer Discretionary, Household Durables) | | | | | | | | | | | 480,975 | | | | 2,832,744 | |
Bellway plc (Consumer Discretionary, Household Durables) | | | | | | | | | | | 80,100 | | | | 2,594,555 | |
Bovis Homes Group plc (Consumer Discretionary, Household Durables) | | | | | | | | | | | 244,800 | | | | 2,680,783 | |
BP plc (Energy, Oil, Gas & Consumable Fuels) | | | | | | | | | | | 2,015,036 | | | | 13,351,836 | |
BT Group plc (Communication Services, Diversified Telecommunication Services) | | | | | | | | | | | 1,099,700 | | | | 3,671,389 | |
Centrica plc (Utilities, Multi-Utilities) | | | | | | | | | | | 898,500 | | | | 1,577,119 | |
Chemring Group plc (Industrials, Aerospace & Defense) | | | | | | | | | | | 294,466 | | | | 628,875 | |
Crest Nicholson Holdings plc (Consumer Discretionary, Household Durables) | | | | | | | | | | | 345,400 | | | | 1,506,112 | |
Debenhams plc (Consumer Discretionary, Multiline Retail) « | | | | | | | | | | | 1,238,200 | | | | 103,660 | |
Firstgroup plc (Industrials, Road & Rail) † | | | | | | | | | | | 952,400 | | | | 1,082,528 | |
GlaxoSmithKline plc (Health Care, Pharmaceuticals) | | | | | | | | | | | 965,207 | | | | 19,944,311 | |
Highland Gold Mining Limited (Materials, Metals & Mining) | | | | | | | | | | | 1,280,734 | | | | 2,426,748 | |
Imperial Tobacco Group plc (Consumer Staples, Tobacco) | | | | | | | | | | | 202,991 | | | | 6,233,740 | |
Inchcape plc (Consumer Discretionary, Distributors) | | | | | | | | | | | 423,425 | | | | 3,137,481 | |
J Sainsbury plc (Consumer Staples, Food & Staples Retailing) | | | | | | | | | | | 1,270,500 | | | | 4,937,753 | |
Kingfisher plc (Consumer Discretionary, Specialty Retail) | | | | | | | | | | | 1,323,253 | | | | 4,215,390 | |
Legal & General Group plc (Financials, Insurance) | | | | | | | | | | | 2,314,194 | | | | 7,221,766 | |
Lloyds Banking Group plc (Financials, Banks) | | | | | | | | | | | 8,916,700 | | | | 6,290,064 | |
Marks & Spencer Group plc (Consumer Discretionary, Multiline Retail) | | | | | | | | | | | 705,000 | | | | 2,629,461 | |
Marston’s plc (Consumer Discretionary, Hotels, Restaurants & Leisure) | | | | | | | | | | | 893,000 | | | | 1,160,664 | |
Mitchells & Butlers plc (Consumer Discretionary, Hotels, Restaurants & Leisure) | | | | | | | | | | | 367,200 | | | | 1,286,738 | |
Paragon Group of Companies plc (Financials, Thrifts & Mortgage Finance) | | | | | | | | | | | 501,100 | | | | 2,683,090 | |
Petrofac Limited (Energy, Energy Equipment & Services) | | | | | | | | | | | 522,047 | | | | 3,384,633 | |
Premier Foods plc (Consumer Staples, Food Products) † | | | | | | | | | | | 73,926 | | | | 33,677 | |
QinetiQ Group plc (Industrials, Aerospace & Defense) | | | | | | | | | | | 773,800 | | | | 2,927,479 | |
Quilter plc (Financials, Capital Markets) 144A | | | | | | | | | | | 687,346 | | | | 1,016,863 | |
The accompanying notes are an integral part of these financial statements.
| | | | | | |
| Portfolio of investments—November 30, 2018 (unaudited) | | Wells Fargo International Value Portfolio | | | 29 | |
| | | | | | | | | | | | | | | | |
| Security name | | | | | | | | Shares | | | Value | |
| | | | |
| United Kingdom(continued) | | | | | | | | | | | | | | | | |
Redrow plc (Consumer Discretionary, Household Durables) | | | | | | | | | | | 441,068 | | | $ | 2,637,050 | |
Royal Dutch Shell plc Class B (Energy, Oil, Gas & Consumable Fuels) | | | | | | | | | | | 786,300 | | | | 24,001,550 | |
Royal Mail plc (Industrials, Air Freight & Logistics) | | | | | | | | | | | 539,626 | | | | 2,199,005 | |
SSE plc (Utilities, Electric Utilities) | | | | | | | | | | | 259,800 | | | | 3,626,656 | |
Tate & Lyle plc (Consumer Staples, Food Products) | | | | | | | | | | | 497,300 | | | | 4,549,857 | |
The Berkeley Group Holdings plc (Consumer Discretionary, Household Durables) | | | | | | | | | | | 75,800 | | | | 3,115,935 | |
The Restaurant Group plc (Consumer Discretionary, Hotels, Restaurants & Leisure) | | | | | | | | | | | 138,516 | | | | 254,166 | |
| | | | |
| | | | | | | | | | | | | | | 162,906,018 | |
| | | | | | | | | | | | | | | | |
| | | | |
Total Common Stocks (Cost $1,114,472,456) | | | | | | | | | | | | | | | 1,067,141,914 | |
| | | | | | | | | | | | | | | | |
| | | | |
| | | Dividend yield | | | | | | | | | | |
| Preferred Stocks: 1.52% | | | | | | | | | | | | | | | | |
| | | | |
| Brazil: 1.52% | | | | | | | | | | | | | | | | |
Banco do Estado do Rio Grande do Sul SA (Financials, Banks) | | | 1.53 | % | | | | | | | 957,800 | | | | 5,406,975 | |
Companhia Energetica de Minas Gerais SA (Utilities, Electric Utilities) | | | 4.30 | | | | | | | | 2,031,400 | | | | 6,676,776 | |
Itausa Investimentos Itau SA (Financials, Banks) | | | 0.32 | | | | | | | | 1,524,600 | | | | 4,865,157 | |
| | | | |
Total Preferred Stocks (Cost $13,937,411) | | | | | | | | | | | | | | | 16,948,908 | |
| | | | | | | | | | | | | | | | |
| | | | |
| | | | | | Expiration date | | | | | | | |
| Rights: 0.01% | | | | | | | | | | | | | | | | |
| | | | |
| United Kingdom: 0.01% | | | | | | | | | | | | | | | | |
The Restaurant Group plc (Consumer Discretionary, Hotels, Restaurants & Leisure) †(a) | | | | | | | 12-13-2018 | | | | 200,079 | | | | 96,881 | |
| | | | | | | | | | | | | | | | |
| | | | |
Total Rights (Cost $160,017) | | | | | | | | | | | | | | | 96,881 | |
| | | | | | | | | | | | | | | | |
| | | | |
| | | Yield | | | | | | | | | | |
| Short-Term Investments: 5.37% | | | | | | | | | | | | | | | | |
| | | | |
| Investment Companies: 5.37% | | | | | | | | | | | | | | | | |
Securities Lending Cash Investments LLC (l)(r)(u) | | | 2.38 | | | | | | | | 48,831,268 | | | | 48,836,152 | |
Wells Fargo Government Money Market Fund Select Class (l)(u) | | | 2.13 | | | | | | | | 11,223,222 | | | | 11,223,222 | |
| | | | |
Total Short-Term Investments (Cost $60,059,079) | | | | | | | | | | | | | | | 60,059,374 | |
| | | | | | | | | | | | | | | | |
| | | | | | | | |
| Total investments in securities (Cost $1,188,628,963) | | | 102.38 | % | | | 1,144,247,077 | |
Other assets and liabilities, net | | | (2.38 | ) | | | (26,582,607 | ) |
| | | | | | | | |
| Total net assets | | | 100.00 | % | | $ | 1,117,664,470 | |
| | | | | | | | |
| « | All or a portion of this security is on loan. |
| † | Non-income-earning security |
| 144A | The security may be resold in transactions exempt from registration, normally to qualified institutional buyers, pursuant to Rule 144A under the Securities Act of 1933. |
| (a) | The security is fair valued in accordance with procedures approved by the Board of Trustees. |
| (l) | The issuer of the security is an affiliated person of the Portfolio as defined in the Investment Company Act of 1940. |
| (r) | The investment is anon-registered investment company purchased with cash collateral received from securities on loan. |
| (u) | The rate represents the7-day annualized yield at period end. |
The accompanying notes are an integral part of these financial statements.
| | | | |
| 30 | | Wells Fargo International Value Portfolio | | Portfolio of investments—November 30, 2018 (unaudited) |
Abbreviations:
| ADR | American depositary receipt |
| GDR | Global depositary receipt |
| REIT | Real estate investment trust |
The following table shows the percent of total long-term investments by sector as of November 30, 2018:
| | | | |
Financials | | | 25.29 | % |
Industrials | | | 13.89 | |
Consumer Discretionary | | | 10.68 | |
Materials | | | 10.64 | |
Energy | | | 9.72 | |
Health Care | | | 8.15 | |
Consumer Staples | | | 6.97 | |
Communication Services | | | 6.08 | |
Utilities | | | 3.76 | |
Information Technology | | | 3.73 | |
Real Estate | | | 1.09 | |
| | | | |
| | | 100.00 | % |
| | | | |
Investments in Affiliates
An affiliated investment is an investment in which the Portfolio owns at least 5% of the outstanding voting shares of the issuer or as a result of other relationships, such as the Portfolio and the issuer having the same adviser or investment manager. Transactions with issuers that were either affiliated persons of the Portfolio at the beginning of the period or the end of the period were as follows:
| | | | | | | | | | | | | | | | | | | | | | | | | | | | | | | | | | | | |
| | | Shares,
beginning of
period | | | Shares
purchased | | | Shares
sold | | | Shares,
end of
period | | | Net
realized
gains
(losses) | | | Net
change in
unrealized
gains
(losses) | | | Income
from
affiliated
securities | | | Value,
end
of period | | | % of
net
assets | |
Short-Term Investments | | | | | | | | | | | | | | | | | | | | | | | | | | | | | | | | | | | | |
Investment Companies | | | | | | | | | | | | | | | | | | | | | | | | | | | | | | | | | | | | |
Securities Lending Cash Investments LLC | | | 25,301,762 | | | | 210,581,079 | | | | 187,051,573 | | | | 48,831,268 | | | $ | 1,929 | | | $ | 0 | | | $ | 557,714 | | | $ | 48,836,152 | | | | | |
Wells Fargo Government Money Market Fund Select Class | | | 22,685,533 | | | | 98,384,278 | | | | 109,846,589 | | | | 11,223,222 | | | | 0 | | | | 0 | | | | 132,004 | | | | 11,223,222 | | | | | |
| | | | | | | | | | | | | | | | | | | | | | | | | | | | | | | | | | | | |
| | | | | | | | | | | | | | | | | | $ | 1,929 | | | $ | 0 | | | $ | 689,718 | | | $ | 60,059,374 | | | | 5.37 | % |
| | | | | | | | | | | | | | | | | | | | | | | | | | | | | | | | | | | | |
The accompanying notes are an integral part of these financial statements.
| | | | | | |
| Statement of assets and liabilities—November 30, 2018 (unaudited) | | Wells Fargo International Value Portfolio | | | 31 | |
| | | | |
| | | | |
| |
Assets | | | | |
Investments in unaffiliated securities (including $48,512,666 securities on loan), at value (cost $1,128,569,884) | | $ | 1,084,187,703 | |
Investments in affiliated securities, at value (cost $60,059,079) | | | 60,059,374 | |
Foreign currency, at value (cost $18,182,302) | | | 18,142,177 | |
Receivable for dividends | | | 5,445,819 | |
Receivable for investments sold | | | 2,790,201 | |
Receivable for securities lending income | | | 49,534 | |
| | | | |
Total assets | | | 1,170,674,808 | |
| | | | |
| |
Liabilities | | | | |
Payable upon receipt of securities loaned | | | 48,831,866 | |
Payable for investments purchased | | | 3,261,730 | |
Advisory fee payable | | | 749,861 | |
Accrued expenses and other liabilities | | | 166,881 | |
| | | | |
Total liabilities | | | 53,010,338 | |
| | | | |
Total net assets | | $ | 1,117,664,470 | |
| | | | |
The accompanying notes are an integral part of these financial statements.
| | | | |
| 32 | | Wells Fargo International Value Portfolio | | Statement of operations—six months ended November 30, 2018 (unaudited) |
| | | | |
| | | | |
| |
Investment income | | | | |
Dividends (net of foreign withholding taxes of $1,783,247) | | $ | 18,109,414 | |
Income from affiliated securities | | | 689,718 | |
| | | | |
Total investment income | | | 18,799,132 | |
| | | | |
| |
Expenses | | | | |
Advisory fee | | | 4,438,087 | |
Custody and accounting fees | | | 99,012 | |
Professional fees | | | 30,749 | |
Shareholder report expenses | | | 1,338 | |
Trustees’ fees and expenses | | | 11,048 | |
Other fees and expenses | | | 22,263 | |
| | | | |
Total expenses | | | 4,602,497 | |
| | | | |
Net investment income | | | 14,196,635 | |
| | | | |
| |
REALIZED AND UNREALIZED GAINS (LOSSES) ON INVESTMENTS | | | | |
|
Net realized gains (losses) on: | |
Unaffiliated securities | | | (3,100,819 | ) |
Affiliated securities | | | 1,929 | |
| | | | |
Net realized losses on investments | | | (3,098,890 | ) |
Net change in unrealized gains (losses) on investments | | | (107,647,600 | ) |
| | | | |
Net realized and unrealized gains (losses) on investments | | | (110,746,490 | ) |
| | | | |
Net decrease in net assets resulting from operations | | $ | (96,549,855 | ) |
| | | | |
The accompanying notes are an integral part of these financial statements.
| | | | | | |
| Statement of changes in net assets | | Wells Fargo International Value Portfolio | | | 33 | |
| | | | | | | | |
| | | Six months ended
November 30, 2018
(unaudited) | | | Year ended
May 31, 2018 | |
|
Operations | |
Net investment income | | $ | 14,196,635 | | | $ | 22,286,555 | |
Net realized gains (losses) on investments | | | (3,098,890 | ) | | | 15,107,292 | |
Net change in unrealized gains (losses) on investments | | | (107,647,600 | ) | | | 21,851,248 | |
| | | | |
Net increase (decrease) in net assets resulting from operations | | | (96,549,855 | ) | | | 59,245,095 | |
| | | | |
| | |
Capital transactions | | | | | | | | |
Transactions in investors’ beneficial interests | |
Contributions | | | 442,181,431 | | | | 197,415,479 | |
Withdrawals | | | (127,897,174 | ) | | | (109,368,233 | ) |
| | | | |
Net increase in net assets resulting from capital transactions | | | 314,284,257 | | | | 88,047,246 | |
| | | | |
Total increase in net assets | | | 217,734,402 | | | | 147,292,341 | |
| | | | |
| | |
Net assets | | | | | | | | |
Beginning of period | | | 899,930,068 | | | | 752,637,727 | |
| | | | |
End of period | | $ | 1,117,664,470 | | | $ | 899,930,068 | |
| | | | |
The accompanying notes are an integral part of these financial statements.
| | | | |
| 34 | | Wells Fargo International Value Portfolio | | Financial highlights |
| | | | | | | | | | | | | | | | | | | | | | | | |
| | | Six months ended
November 30, 2018 (unaudited) | | | Year ended May 31 | |
| | | 2018 | | | 2017 | | | 2016 | | | 2015 | | | 2014 | |
Total return1 | | | (8.74 | )% | | | 7.74 | % | | | 19.16 | % | | | (11.85 | )% | | | (1.04 | )% | | | 18.22 | % |
Ratios to average net assets (annualized) | | | | | | | | | | | | | | | | | | | | | | | | |
Gross expenses | | | 0.79 | % | | | 0.82 | % | | | 0.87 | % | | | 0.91 | % | | | 0.91 | % | | | 0.91 | % |
Net expenses | | | 0.79 | % | | | 0.82 | % | | | 0.87 | % | | | 0.91 | % | | | 0.91 | % | | | 0.91 | % |
Net investment income | | | 2.45 | % | | | 2.65 | % | | | 3.03 | % | | | 2.50 | % | | | 2.45 | % | | | 3.09 | % |
Supplemental data | | | | | | | | | | | | | | | | | | | | | | | | |
Portfolio turnover rate | | | 6 | % | | | 15 | % | | | 41 | % | | | 14 | % | | | 18 | % | | | 11 | % |
| 1 | Returns for periods of less than one year are not annualized. |
The accompanying notes are an integral part of these financial statements.
| | | | | | |
| Notes to financial statements (unaudited) | | Wells Fargo International Value Portfolio | | | 35 | |
1. ORGANIZATION
Wells Fargo Master Trust (the “Trust”), a Delaware statutory trust organized on March 10, 1999, is anopen-end management investment company registered under the Investment Company Act of 1940, as amended (the “1940 Act”). As an investment company, the Trust follows the accounting and reporting guidance in Financial Accounting Standards Board (“FASB”)Accounting Standards Codification Topic 946, Financial Services – Investment Companies. These financial statements report on the Wells Fargo International Value Portfolio ( “International Value Portfolio”) which is a diversified series of the Trust.
2. SIGNIFICANT ACCOUNTING POLICIES
The following significant accounting policies, which are consistently followed in the preparation of the financial statements of the Portfolio, are in conformity with U.S. generally accepted accounting principles which require management to make estimates and assumptions that affect the reported amounts of assets and liabilities, disclosure of contingent assets and liabilities at the date of the financial statements, and the reported amounts of revenues and expenses during the reporting period. Actual results could differ from those estimates.
Securities valuation
All investments are valued each business day as of the close of regular trading on the New York Stock Exchange (generally 4 p.m. Eastern Time), although the Portfolio may deviate from this calculation time under unusual or unexpected circumstances.
Equity securities that are listed on a foreign or domestic exchange or market are valued at the official closing price or, if none, the last sales price. If no sale occurs on the principal exchange or market that day, a fair value price will be determined in accordance with the Portfolio’s Valuation Procedures.
The values of securities denominated in foreign currencies are translated into U.S. dollars at rates provided by an independent foreign currency pricing source at a time each business day specified by the Wells Fargo Asset Management Pricing Committee at Wells Fargo Funds Management, LLC (“Funds Management”).
Many securities markets and exchanges outside the U.S. close prior to the close of the New York Stock Exchange and therefore may not fully reflect trading or events that occur after the close of the principal exchange in which the foreign securities are traded, but before the close of the New York Stock Exchange. If such trading or events are expected to materially affect the value of such securities, then fair value pricing procedures approved by the Board of Trustees of the Fund are applied. These procedures take into account multiple factors including movements in U.S. securities markets after foreign exchanges close. Foreign securities that are fair valued under these procedures are categorized as Level 2 and the application of these procedures may result in transfers between Level 1 and Level 2. Depending on market activity, such fair valuations may be frequent. Such fair value pricing may result in net asset values that are higher or lower than net asset values based on the last reported sales price or latest quoted bid price. On November 30, 2018, such fair value pricing was used in pricing foreign securities.
Investments in registeredopen-end investment companies are valued at net asset value. Interests innon-registered investment companies that are redeemable at net asset value are fair valued normally at net asset value.
Investments which are not valued using any of the methods discussed above are valued at their fair value, as determined in good faith by the Board of Trustees. The Board of Trustees has established a Valuation Committee comprised of the Trustees and has delegated to it the authority to take any actions regarding the valuation of portfolio securities that the Valuation Committee deems necessary or appropriate, including determining the fair value of portfolio securities, unless the determination has been delegated to the Wells Fargo Asset Management Pricing Committee.The Board of Trustees retains the authority to make or ratify any valuation decisions or approve any changes to the Valuation Procedures as it deems appropriate. On a quarterly basis, the Board of Trustees receives reports on any valuation actions taken by the Valuation Committee or the Wells Fargo Asset Management Pricing Committee which may include items for ratification.
Foreign currency translation
The accounting records of the Portfolio are maintained in U.S. dollars. The values of other assets and liabilities denominated in foreign currencies are translated into U.S. dollars at rates provided by an independent foreign currency pricing source at a time each business day specified by the Wells Fargo Asset Management Pricing Committee. Purchases and sales of securities, and income and expenses are converted at the rate of exchange on the respective dates of such transactions. Net realized foreign exchange gains or losses arise from sales of foreign currencies, currency gains or losses realized between the trade and settlement dates on securities transactions, and the difference between the amounts of dividends, interest and foreign withholding taxes recorded and the U.S. dollar equivalent of the amounts actually paid or received. Net unrealized foreign exchange gains and losses arise from changes in the fair value of assets and liabilities other than investments in securities resulting from changes in exchange rates. The changes in net assets arising from changes in exchange rates of securities and the changes in net assets resulting from changes in market prices of securities are not separately presented. Such changes are included in net realized and unrealized gains or losses from investments.
| | | | |
| 36 | | Wells Fargo International Value Portfolio | | Notes to financial statements (unaudited) |
Securities lending
The Portfolio may lend its securities from time to time in order to earn additional income in the form of fees or interest on securities received as collateral or the investment of any cash received as collateral. The Portfolio continues to receive interest or dividends on the securities loaned. The Portfolio receives collateral in the form of cash or securities with a value at least equal to the value of the securities on loan. The value of the loaned securities is determined at the close of each business day and any additional required collateral is delivered to the Portfolio on the next business day. In a securities lending transaction, the net asset value of the Portfolio will be affected by an increase or decrease in the value of the securities loaned and by an increase or decrease in the value of the instrument in which collateral is invested. The amount of securities lending activity undertaken by the Portfolio fluctuates from time to time. In the event of default or bankruptcy by the borrower, the Portfolio may be prevented from recovering the loaned securities or gaining access to the collateral or may experience delays or costs in doing so. In addition, the investment of any cash collateral received may lose all or part of its value. The Portfolio has the right under the lending agreement to recover the securities from the borrower on demand.
The Portfolio lends its securities through an unaffiliated securities lending agent. Cash collateral received in connection with its securities lending transactions is invested in Securities Lending Cash Investments, LLC (the “Securities Lending Fund”). The Securities Lending Fund is exempt from registration under Section 3(c)(7) of the 1940 Act and is managed by Funds Management and is subadvised by Wells Capital Management Incorporated (“WellsCap”), an affiliate of Funds Management and an indirect wholly owned subsidiary of Wells Fargo & Company (“Wells Fargo”). Funds Management receives an advisory fee starting at 0.05% and declining to 0.01% as the average daily net assets of the Securities Lending Fund increase. All of the fees received by Funds Management are paid to WellsCap for its services as subadviser. The Securities Lending Fund seeks to provide a positive return compared to the daily Fed Funds Open Rate by investing in high-quality, U.S. dollar-denominated short-term money market instruments. Securities Lending Fund investments are valued at the evaluated bid price provided by an independent pricing service. Income earned from investment in the Securities Lending Fund, if any, is included in income from affiliated securities on the Statement of Operations.
Security transactions and income recognition
Securities transactions are recorded on a trade date basis. Realized gains or losses are recorded on the basis of identified cost.
Dividend income is recognized on the ex-dividend date, except for certain dividends from foreign securities, which are recorded as soon as the custodian verifies the ex-dividend date. Dividend income from foreign securities is recorded net of foreign taxes withheld where recovery of such taxes is not assured.
Federal and other taxes
The Portfolio is treated as a separate entity for federal income tax purposes. The Portfolio is not required to pay federal income taxes on its net investment income and net capital gains as it is treated as a partnership for federal income tax purposes. All interest, dividends, gains and losses of the Portfolio are deemed to have been “passed through” to the interest holders in proportion to their holdings of the Portfolio regardless of whether such interest, dividends and gains have been distributed by the Portfolio.
The Portfolio’s income tax returns and all financial records supporting those returns for the prior three fiscal years are subject to examination by the federal revenue authority. Management has analyzed the Portfolio’s tax positions taken on federal, state, and foreign tax returns for all open tax years and does not believe that there are any uncertain tax positions that require recognition of a tax liability.
As of November 30, 2018, the aggregate cost of all investments for federal income tax purposes was $1,188,628,963 and the unrealized gains (losses) consisted of:
| | | | |
Gross unrealized gains | | $ | 86,712,123 | |
Gross unrealized losses | | | (131,094,009 | ) |
Net unrealized losses | | $ | (44,381,886 | ) |
3. FAIR VALUATION MEASUREMENTS
Fair value measurements of investments are determined within a framework that has established a fair value hierarchy based upon the various data inputs utilized in determining the value of the Portfolio’s investments. The three-level hierarchy gives the highest priority to unadjusted quoted prices in active markets for identical assets or liabilities (Level 1) and the lowest priority to unobservable inputs (Level 3). The Portfolio’s investments are classified within the fair value hierarchy based on the lowest level of input that is significant to the fair value measurement. The inputs are summarized into three broad levels as follows:
| | | | | | |
| Notes to financial statements (unaudited) | | Wells Fargo International Value Portfolio | | | 37 | |
| ∎ | | Level 1 – quoted prices in active markets for identical securities |
| ∎ | | Level 2 – other significant observable inputs (including quoted prices for similar securities, interest rates, prepayment speeds, credit risk, etc.) |
| ∎ | | Level 3 – significant unobservable inputs (including the Portfolio’s own assumptions in determining the fair value of investments) |
The inputs or methodologies used for valuing investments in securities are not necessarily an indication of the risk associated with investing in those securities.
The following is a summary of the inputs used in valuing the Portfolio’s assets and liabilities as of November 30, 2018:
| | | | | | | | | | | | | | | | |
| | | Quoted prices
(Level 1) | | | Other significant
observable inputs
(Level 2) | | | Significant
unobservable inputs
(Level 3) | | | Total | |
Assets | | | | | | | | | | | | | | | | |
Investments in: | | | | | | | | | | | | | | | | |
| | | | |
Common stocks | | | | | | | | | | | | | | | | |
Australia | | $ | 53,850,277 | | | $ | 0 | | | $ | 0 | | | $ | 53,850,277 | |
Austria | | | 10,125,832 | | | | 0 | | | | 0 | | | | 10,125,832 | |
Belgium | | | 7,369,395 | | | | 0 | | | | 0 | | | | 7,369,395 | |
Brazil | | | 9,298,007 | | | | 0 | | | | 0 | | | | 9,298,007 | |
Canada | | | 12,582,547 | | | | 0 | | | | 0 | | | | 12,582,547 | |
China | | | 38,032,220 | | | | 0 | | | | 0 | | | | 38,032,220 | |
Denmark | | | 7,755,293 | | | | 0 | | | | 0 | | | | 7,755,293 | |
Finland | | | 5,002,932 | | | | 0 | | | | 0 | | | | 5,002,932 | |
France | | | 107,919,640 | | | | 0 | | | | 0 | | | | 107,919,640 | |
Germany | | | 82,420,532 | | | | 0 | | | | 0 | | | | 82,420,532 | |
Hong Kong | | | 33,173,552 | | | | 0 | | | | 0 | | | | 33,173,552 | |
India | | | 3,256,517 | | | | 0 | | | | 0 | | | | 3,256,517 | |
Ireland | | | 6,587,298 | | | | 0 | | | | 0 | | | | 6,587,298 | |
Israel | | | 0 | | | | 5,146,763 | | | | 0 | | | | 5,146,763 | |
Italy | | | 24,511,437 | | | | 0 | | | | 0 | | | | 24,511,437 | |
Japan | | | 247,118,698 | | | | 0 | | | | 0 | | | | 247,118,698 | |
Liechtenstein | | | 1,025,334 | | | | 0 | | | | 0 | | | | 1,025,334 | |
Malaysia | | | 3,615,384 | | | | 0 | | | | 0 | | | | 3,615,384 | |
Netherlands | | | 33,312,868 | | | | 0 | | | | 0 | | | | 33,312,868 | |
Norway | | | 15,741,680 | | | | 0 | | | | 0 | | | | 15,741,680 | |
Poland | | | 1,284,953 | | | | 0 | | | | 0 | | | | 1,284,953 | |
Russia | | | 14,575,267 | | | | 0 | | | | 0 | | | | 14,575,267 | |
Singapore | | | 6,675,035 | | | | 0 | | | | 0 | | | | 6,675,035 | |
South Africa | | | 3,507,170 | | | | 0 | | | | 0 | | | | 3,507,170 | |
South Korea | | | 28,615,160 | | | | 0 | | | | 0 | | | | 28,615,160 | |
Spain | | | 21,606,766 | | | | 0 | | | | 0 | | | | 21,606,766 | |
Sweden | | | 21,642,150 | | | | 0 | | | | 0 | | | | 21,642,150 | |
Switzerland | | | 74,080,989 | | | | 0 | | | | 0 | | | | 74,080,989 | |
Taiwan | | | 7,585,585 | | | | 0 | | | | 0 | | | | 7,585,585 | |
Thailand | | | 10,972,482 | | | | 0 | | | | 0 | | | | 10,972,482 | |
Turkey | | | 5,844,133 | | | | 0 | | | | 0 | | | | 5,844,133 | |
United Kingdom | | | 162,906,018 | | | | 0 | | | | 0 | | | | 162,906,018 | |
| | | | |
Preferred stocks | | | | | | | | | | | | | | | | |
Brazil | | | 16,948,908 | | | | 0 | | | | 0 | | | | 16,948,908 | |
| | | | |
Rights | | | | | | | | | | | | | | | | |
United Kingdom | | | 0 | | | | 96,881 | | | | 0 | | | | 96,881 | |
| | | | |
Short-term investments | | | | | | | | | | | | | | | | |
Investment companies | | | 11,223,222 | | | | 48,836,152 | | | | 0 | | | | 60,059,374 | |
Total assets | | $ | 1,090,167,281 | | | $ | 54,079,796 | | | $ | 0 | | | $ | 1,144,247,077 | |
| | | | |
| 38 | | Wells Fargo International Value Portfolio | | Notes to financial statements (unaudited) |
Additional sector, industry or geographic detail is included in the Portfolio of Investments.
At November 30, 2018, the Portfolio did not have any transfers into/out of Level 3.
4. TRANSACTIONS WITH AFFILIATES AND OTHER EXPENSES
Advisory fee
The Trust has entered into an advisory contract with Funds Management, an indirect wholly owned subsidiary of Wells Fargo. The adviser is responsible for implementing investment policies and guidelines and for supervising the subadviser, who is responsible forday-to-day portfolio management of the Portfolio. Pursuant to the contract, Funds Management is entitled to receive an annual advisory fee starting at 0.80% and declining to 0.65% as the average daily net assets of the Portfolio increase. For the six months ended November 30, 2018, the advisory fee was equivalent to an annual rate of 0.76% of the Portfolio’s average daily net assets.
Funds Management has retained the services of a subadviser to provide daily portfolio management to the Portfolio. The fee for subadvisory services is borne by Funds Management. LSV Asset Management, which is not an affiliate of Funds Management, is the subadviser to the Portfolio and is entitled to receive a fee from Funds Management at an annual rate starting at 0.35% and declining to 0.30% as the average daily net assets of the of Portfolio increase.
Interfund transactions
The Portfolio may purchase or sell portfolio investment securities to certain other Wells Fargo affiliates pursuant toRule 17a-7 under the 1940 Act and under procedures adopted by the Board of Trustees. The procedures have been designed to ensure that these interfund transactions, which do not incur broker commissions, are effected at current market prices.
5. INVESTMENT PORTFOLIO TRANSACTIONS
Purchases and sales of investments, excluding U.S. government obligations (if any) and short-term securities, for the six months ended November 30, 2018 were $389,895,973 and $70,938,544, respectively.
6. BANK BORROWINGS
Effective August 28, 2018, the Trust, along with Wells Fargo Variable Trust and Wells Fargo Funds Trust (excluding the money market funds), are parties to a $280,000,000 revolving credit agreement whereby the Portfolio is permitted to use bank borrowings for temporary or emergency purposes, such as to fund shareholder redemption requests. Interest under the credit agreement is charged to the Portfolio based on a borrowing rate equal to the higher of the Federal Funds rate in effect on that day plus 1.25% or the overnight LIBOR rate in effect on that day plus 1.25%. In addition, an annual commitment fee equal to 0.25% of the unused balance is allocated to each participating fund.
For the six months ended November 30, 2018, there were no borrowings by the Portfolio under the agreement.
7. CONCENTRATION RISK
Concentration risks result from exposure to a limited number of sectors. A portfolio that invests a substantial portion of its assets in a sector may be more affected by changes in that sector than would be a portfolio whose investments are not heavily weighted in any sector.
8. INDEMNIFICATION
Under the Trust’s organizational documents, the officers and Trustees have been granted certain indemnification rights against certain liabilities that may arise out of performance of their duties to the Trust. Additionally, in the normal course of business, the Trust may enter into contracts with service providers that contain a variety of indemnification clauses. The Trust’s maximum exposure under these arrangements is dependent on future claims that may be made against the Portfolio and, therefore, cannot be estimated.
9. NEW ACCOUNTING PRONOUNCEMENT
In August 2018, FASB issued Accounting Standards Update (“ASU”)No. 2018-13, Fair Value Measurement (Topic 820)Disclosure Framework—Changes to the Disclosure Requirements for Fair Value Measurement. ASU2018-13 updates the disclosure requirements for fair value measurements by modifying or removing certain disclosures and adding certain new disclosures. The amendments are effective for fiscal years, and interim periods within those fiscal years, beginning after December 15, 2019. Early adoption is permitted. Management has adopted the removal and modification of disclosures early, as permitted, and will adopt the additional new disclosures at the effective date.
| | | | | | |
| Other information (unaudited) | | Wells Fargo International Value Fund | | | 39 | |
TAX INFORMATION
Pursuant to Section 853 of the Internal Revenue Code, the following amounts have been designated as foreign taxes paid for the fiscal year ended May 31, 2018. These amounts may be less than the actual foreign taxes paid for financial statement purposes. Foreign taxes paid or withheld should be included in taxable income with an offsetting deduction from gross income or as a credit for taxes paid to foreign governments. None of the income was derived from ineligible foreign sources as defined under Section 901(j) of the Internal Revenue Code.
| | | | |
Creditable foreign taxes paid | | Per share amount | | Foreign income as % of ordinary income distributions |
| $2,550,505 | | $0.04535 | | 100% |
PROXY VOTING INFORMATION
A description of the policies and procedures used to determine how to vote proxies relating to portfolio securities is available, upon request, by calling1-800-222-8222, visiting our website atwellsfargofunds.com, or visiting the SEC website at sec.gov. Information regarding how the Fund voted proxies relating to portfolio securities during the most recent12-month period ended June 30 is available on the Fund’s website atwellsfargofunds.comor by visiting the SEC website at sec.gov.
PORTFOLIO HOLDINGS INFORMATION
The complete portfolio holdings are publicly available on the website (wellsfargofunds.com) on aone-month delayed basis. In addition, top ten holdings information (excluding derivative positions) is publicly available on the website on a monthly,seven-day or more delayed basis. The Fund and the Portfolio each file their complete schedule of portfolio holdings with the SEC for the first and third quarters of each fiscal year on FormN-Q, which is available by visiting the SEC website at sec.gov. In addition, each FormN-Q may be reviewed and copied at the SEC’s Public Reference Room in Washington, DC, and at regional offices in New York City, at 233 Broadway, and in Chicago, at 175 West Jackson Boulevard, Suite 900. Information about the Public Reference Room may be obtained by calling1-800-SEC-0330.
| | | | |
| 40 | | Wells Fargo International Value Fund | | Other information (unaudited) |
BOARD OF TRUSTEES AND OFFICERS
Each of the Trustees and Officers1 listed in the table below acts in identical capacities for each fund in the Wells Fargo family of funds, which consists of 152 mutual funds comprising the Wells Fargo Funds Trust, Wells Fargo Variable Trust, Wells Fargo Master Trust and fourclosed-end funds (collectively the “Fund Complex”). This table should be read in conjunction with the Prospectus and the Statement of Additional Information2. The mailing address of each Trustee and Officer is 525 Market Street, 12th Floor, San Francisco, CA 94105. Each Trustee and Officer serves an indefinite term, however, each Trustee serves such term until reaching the mandatory retirement age established by the Trustees.
Independent Trustees
| | | | | | |
Name and
year of birth | | Position held and
length of service* | | Principal occupations during past five years or longer | | Current other
public company or
investment company
directorships |
William R. Ebsworth (Born 1957) | | Trustee, since 2015 | | Retired. From 1984 to 2013, equities analyst, portfolio manager, research director and chief investment officer at Fidelity Management and Research Company in Boston, Tokyo, and Hong Kong, and retired in 2013 as Chief Investment Officer of Fidelity Strategic Advisers, Inc. where he led a team of investment professionals managing client assets. Prior thereto, Board member of Hong Kong Securities Clearing Co., Hong Kong Options Clearing Corp., the Thailand International Fund, Ltd., Fidelity Investments Life Insurance Company, and Empire Fidelity Investments Life Insurance Company. Board member of the Vincent Memorial Hospital Endowment(non-profit organization), where he serves on the Investment Committee and as a Chair of the Audit Committee. Mr. Ebsworth is a CFA® charterholder. | | N/A |
Jane A. Freeman (Born 1953) | | Trustee, since 2015; Chair Liaison, since 2018 | | Retired. From 2012 to 2014 and 1999 to 2008, Chief Financial Officer of Scientific Learning Corporation. From 2008 to 2012, Ms. Freeman provided consulting services related to strategic business projects. Prior to 1999, Portfolio Manager at Rockefeller & Co. and Scudder, Stevens & Clark. Board member of the Harding Loevner Funds from 1996 to 2014, serving as both Lead Independent Director and chair of the Audit Committee. Board member of the Russell Exchange Traded Funds Trust from 2011 to 2012 and the chair of the Audit Committee. Ms. Freeman is a Board Member of The Ruth Bancroft Garden(non-profit organization). She is also an inactive Chartered Financial Analyst. | | N/A |
Isaiah Harris, Jr.3 (Born 1952) | | Trustee, since 2009 | | Retired. Chairman of the Board of CIGNA Corporation since 2009, and Director since 2005. From 2003 to 2011, Director of Deluxe Corporation. Prior thereto, President and CEO of BellSouth Advertising and Publishing Corp. from 2005 to 2007, President and CEO of BellSouth Enterprises from 2004 to 2005 and President of BellSouth Consumer Services from 2000 to 2003. Emeritus member of the Iowa State University Foundation Board of Governors. Emeritus Member of the Advisory Board of Iowa State University School of Business. Advisory Board Member, Palm Harbor Academy (private school). Advisory Board Member, Child Evangelism Fellowship(non-profit). Mr. Harris is a certified public accountant (inactive status). | | CIGNA Corporation |
Judith M. Johnson3 (Born 1949) | | Trustee, since 2008; Audit Committee Chairman, since 2009 | | Retired. Prior thereto, Chief Executive Officer and Chief Investment Officer of Minneapolis Employees Retirement Fund from 1996 to 2008. Ms. Johnson is an attorney, certified public accountant and a certified managerial accountant. | | N/A |
David F. Larcker (Born 1950) | | Trustee, since 2009 | | James Irvin Miller Professor of Accounting at the Graduate School of Business, Stanford University, Director of the Corporate Governance Research Initiative and Senior Faculty of The Rock Center for Corporate Governance since 2006. From 2005 to 2008, Professor of Accounting at the Graduate School of Business, Stanford University. Prior thereto, Ernst & Young Professor of Accounting at The Wharton School, University of Pennsylvania from 1985 to 2005. | | N/A |
| | | | | | |
| Other information (unaudited) | | Wells Fargo International Value Fund | | | 41 | |
| | | | | | |
Name and
year of birth | | Position held and
length of service* | | Principal occupations during past five years or longer | | Current other
public company or
investment company
directorships |
Olivia S. Mitchell (Born 1953) | | Trustee, since 2006; Nominating and Governance Committee Chairman, since 2018 | | International Foundation of Employee Benefit Plans Professor, Wharton School of the University of Pennsylvania since 1993. Director of Wharton’s Pension Research Council and Boettner Center on Pensions & Retirement Research, and Research Associate at the National Bureau of Economic Research. Previously, Cornell University Professor from 1978 to 1993. | | N/A |
Timothy J. Penny (Born 1951) | | Trustee, since 1996; Chairman, since 2018; Vice Chairman, from 2017 to 2018 | | President and Chief Executive Officer of Southern Minnesota Initiative Foundation, anon-profit organization, since 2007. Member of the Board of Trustees of NorthStar Education Finance, Inc., anon-profit organization, since 2007. | | N/A |
James G. Polisson (Born 1959) | | Trustee, since 2018; Advisory Board Member, from 2017 to 2018 | | Retired. Chief Marketing Officer, Source (ETF) UK Services, Ltd, from 2015 to 2017. From 2012 to 2015, Principal of The Polisson Group, LLC, a management consulting, corporate advisory and principal investing company. Chief Executive Officer and Managing Director at Russell Investments, Global Exchange Traded Funds from 2010 to 2012. Managing Director of Barclays Global Investors from 1998 to 2010 and Global Chief Marketing Officer for iShares and Barclays Global Investors from 2000 to 2010. Trustee of the San Francisco Mechanics’ Institute, anon-profit organization, from 2013 to 2015. Board member of the Russell Exchange Traded Fund Trust from 2011 to 2012. Director of Barclays Global Investors Holdings Deutschland GmbH from 2006 to 2009. Mr. Polisson is an attorney and has a retired status with the Massachusetts and District of Columbia Bar Associations. | | N/A |
Michael S. Scofield4 (Born 1943) | | Trustee, since 2010 | | Served on the Investment Company Institute’s Board of Governors and Executive Committee from 2008-2011 as well the Governing Council of the Independent Directors Council from 2006-2011 and the Independent Directors Council Executive Committee from 2008-2011. Trustee of the Evergreen Fund complex (and its predecessors) from 1984 to 2010. Chairman of the Evergreen Funds from 2000-2010. Former Trustee of the Mentor Funds. Retired Attorney, Law Offices of Michael S. Scofield. | | N/A |
Pamela Wheelock (Born 1959) | | Trustee, since 2018; Advisory Board Member, from 2017 to 2018 | | Chief Operating Officer, Twin Cities Habitat for Humanity, since January, 2017. Vice President of University Services, University of Minnesota from 2012 to 2017. Prior thereto, on the Board of Directors, Governance Committee and Finance Committee for the Minnesota Philanthropy Partners (Saint Paul Foundation) from 2012 to 2018, Interim President and Chief Executive Officer of Blue Cross Blue Shield of Minnesota from 2010 to 2011, Chairman of the Board from 2009 to 2011 and Board Director from 2003 to 2015. Vice President, Leadership and Community Engagement, Bush Foundation, Saint Paul, Minnesota (a private foundation) from 2009 to 2011. Executive Vice President and Chief Financial Officer, Minnesota Sports and Entertainment from 2004 to 2009 and Senior Vice President from 2002 to 2004. Commissioner of Finance, State of Minnesota, from 1999 to 2002. Currently the Board Chair of the Minnesota Wild Foundation since 2010. | | N/A |
| * | Length of service dates reflect the Trustee’s commencement of service with the Trust’s predecessor entities, where applicable. |
| | | | |
| 42 | | Wells Fargo International Value Fund | | Other information (unaudited) |
Officers
| | | | | | |
Name and
year of birth | | Position held and
length of service | | Principal occupations during past five years or longer | | |
Andrew Owen (Born 1960) | | President, since 2017 | | Executive Vice President of Wells Fargo & Company and Head of Affiliated Managers, Wells Fargo Asset Management, since 2014. In addition, Mr. Owen is currently President, Chief Executive Officer and Director of Wells Fargo Funds Management, LLC since 2017. Prior thereto, Executive Vice President responsible for marketing, investments and product development for Wells Fargo Funds Management, LLC, from 2009 to 2014. | | |
Jeremy DePalma1 (Born 1974) | | Treasurer, since 2012 | | Senior Vice President of Wells Fargo Funds Management, LLC since 2009. Senior Vice President of Evergreen Investment Management Company, LLC from 2008 to 2010 and head of the Fund Reporting and Control Team within Fund Administration from 2005 to 2010. | | |
Alexander Kymn (Born 1973) | | Secretary, since 2018; Chief Legal Officer, since 2018 | | Senior Company Counsel of Wells Fargo Bank, N.A. since 2018 (previously Senior Counsel from 2007 to 2018). Vice President of Wells Fargo Funds Management, LLC from 2008 to 2014. | | |
Michael H. Whitaker (Born 1967) | | Chief Compliance Officer, since 2016 | | Senior Vice President and Chief Compliance Officer since 2016. Senior Vice President and Chief Compliance Officer for Fidelity Investments from 2007 to 2016. | | |
David Berardi (Born 1975) | | Assistant Treasurer, since 2009 | | Vice President of Wells Fargo Funds Management, LLC since 2009. Vice President of Evergreen Investment Management Company, LLC from 2008 to 2010. Manager of Fund Reporting and Control for Evergreen Investment Management Company, LLC from 2004 to 2010. | | |
| 1 | Jeremy DePalma acts as Treasurer of 76 funds and Assistant Treasurer of 76 funds in the Fund Complex. |
| 2 | The Statement of Additional Information includes additional information about the Trustees and is available, without charge, upon request, by calling1-800-222-8222 or by visiting the website atwellsfargofunds.com. |
| 3 | Mr. Harris will replace Ms. Johnson as the Chairman of the Audit Committee effective January 1, 2019. |
| 4 | Mr. Scofield is expected to retire on December 31, 2018. |
| | | | | | |
| Appendix A (unaudited) | | Wells Fargo International Value Fund | | | 43 | |
SALES CHARGE REDUCTIONS AND WAIVERS FOR CERTAIN INTERMEDIARIES
Raymond James & Associates, Inc., Raymond James Financial Services & Raymond James affiliates (“Raymond James”)
Effective on or about March 1, 2019, shareholders purchasing Fund shares through a Raymond James platform or account will be eligible only for the following load waivers(front-end sales charge waivers and contingent deferred, orback-end, sales charge waivers) and discounts, which may differ from those disclosed elsewhere in the Fund’s Prospectus or SAI.
Front-end Sales Load Waivers on Class A shares Available at Raymond James
| | • | | Shares purchased in an investment advisory program. |
| | • | | Shares purchased through reinvestment of capital gains distributions and dividend reinvestment when purchasing shares of the same fund (but not any other fund within the fund family). |
| | • | | Employees and registered representatives of Raymond James or its affiliates and their family members as designated by Raymond James. |
| | • | | Shares purchased from the proceeds of redemptions within the same fund family, provided (1) the repurchase occurs within 90 days following the redemption, (2) the redemption and purchase occur in the same account, and (3) redeemed shares were subject to afront-end or deferred sales load (known as Rights of Reinstatement). |
| | • | | A shareholder in the fund’s Class C shares will have their shares automatically exchanged at net asset value to Class A shares (or the appropriate share class) of the fund if the shares are no longer subject to a CDSC and the exchange is in line with the policies and procedures of Raymond James. |
CDSC Waivers on Class A and C Shares Available at Raymond James
| | • | | Death or disability of the shareholder. |
| | • | | Shares sold as part of a systematic withdrawal plan as described in the Fund’s Prospectus. |
| | • | | Return of excess contributions from an IRA Account. |
| | • | | Shares sold as part of a required minimum distribution for IRA and retirement accounts due to the shareholder reaching age 70½ as described in the Fund’s prospectus. |
| | • | | Shares sold to pay Raymond James fees but only if the transaction is initiated by Raymond James. |
| | • | | Shares acquired through a right of reinstatement. |
Front-end Load Discounts Available at Raymond James: Breakpoints, and/or Rights of Accumulation
| | • | | Breakpoints as described in the Fund’s Prospectus. |
| | • | | Rights of accumulation which entitle shareholders to breakpoint discounts will be automatically calculated based on the aggregated holding of fund family assets held by accounts within the purchaser’s household at Raymond James. Eligible fund family assets not held at Raymond James may be included in the rights of accumulation calculation only if the shareholder notifies his or her financial advisor about such assets. |
This page is intentionally left blank.

For more information
More information about Wells Fargo Funds is available free upon request. To obtain literature, please write, visit the Fund’s website, or call:
Wells Fargo Funds
P.O. Box 219967
Kansas City, MO 64121-9967
Website: wellsfargofunds.com
Individual investors: 1-800-222-8222
Retail investment professionals: 1-888-877-9275
Institutional investment professionals: 1-866-765-0778
This report and the financial statements contained herein are submitted for the general information of the shareholders of the Fund. If this report is used for promotional purposes, distribution of the report must be accompanied or preceded by a current prospectus. Before investing, please consider the investment objectives, risks, charges, and expenses of the investment. For a current prospectus and, if available, a summary prospectus, containing this information, call1-800-222-8222 or visit the Fund’s website atwellsfargofunds.com. Read the prospectus carefully before you invest or send money.
Wells Fargo Asset Management (WFAM) is the trade name for certain investment advisory/management firms owned by Wells Fargo & Company. These firms include but are not limited to Wells Capital Management Incorporated and Wells Fargo Funds Management, LLC. Certain products managed by WFAM entities are distributed by Wells Fargo Funds Distributor, LLC (a broker/dealer and Member FINRA).
This material is for general informational and educational purposes only and is NOT intended to provide investment advice or a recommendation of any kind—including a recommendation for any specific investment, strategy, or plan.
INVESTMENT PRODUCTS: NOT FDIC INSURED ◾ NO BANK GUARANTEE ◾ MAY LOSE VALUE
© 2019 Wells Fargo Funds Management, LLC. All rights reserved.
| | |
 | | 318978 01-19 SA284/SAR284 11-18 |
Semi-Annual Report
November 30, 2018

Wells Fargo Small Company Growth Fund

Beginning on January 1, 2021, as permitted by new regulations adopted by the Securities and Exchange Commission, paper copies of the Wells Fargo Funds’ annual and semi-annual shareholder reports issued after this date will no longer be sent by mail, unless you specifically request paper copies of the reports. Instead, the reports will be made available on the Funds’ website, and you will be notified by mail each time a report is posted and provided with a website address to access the report.
If you already elected to receive shareholder reports electronically, you will not be affected by this change and you need not take any action. You may elect to receive shareholder reports and other communications from the Fund electronically at any time by contacting your financial intermediary (such as a broker-dealer or bank) or, if you are a direct investor, by calling 1-800-222-8222 or by enrolling at wellsfargo.com/advantagedelivery.
You may elect to receive all future reports in paper free of charge. If you invest through a financial intermediary, you can contact your financial intermediary to request that you continue to receive paper copies of your shareholder reports; if you invest directly with the Fund, you can call 1-800-222-8222. Your election to receive reports in paper will apply to all Wells Fargo Funds held in your account with your financial intermediary or, if you are a direct investor, to all Wells Fargo Funds that you hold.

Reduce clutter. Save trees.
Sign up for electronic delivery of prospectuses and shareholder reports atwellsfargo.com/advantagedelivery
Contents
The views expressed and any forward-looking statements are as of November 30, 2018, unless otherwise noted, and are those of the Fund managers and/or Wells Fargo Funds Management, LLC. Discussions of individual securities, or the markets generally, or any Wells Fargo Fund are not intended as individual recommendations. Future events or results may vary significantly from those expressed in any forward-looking statements. The views expressed are subject to change at any time in response to changing circumstances in the market. Wells Fargo Funds Management, LLC and the Fund disclaim any obligation to publicly update or revise any views expressed or forward-looking statements.
INVESTMENT PRODUCTS: NOT FDIC INSURED ◾ NO BANK GUARANTEE ◾ MAY LOSE VALUE
| | | | |
| 2 | | Wells Fargo Small Company Growth Fund | | Letter to shareholders (unaudited) |

Andrew Owen
President
Wells Fargo Funds
Global trade tensions escalated during the third quarter of 2018.
Dear Shareholder:
We are pleased to offer you this semi-annual report for the Wells Fargo Small Company Growth Fund for thesix-month period that ended November 30, 2018. During the reporting period, the U.S. generated encouraging economic and business data that was offset by less positive and more inconsistent data from international markets. Investment returns were restrained in comparison with recent periods as geopolitical tensions and uncertainty tended to distract investors from more favorable underlying trends.
For the period, U.S. stocks, as measured by the S&P 500 Index,1 gained 3.02% and international stocks, as measured by the MSCI ACWI ex USA Index (Net),2 declined 8.37%. Based on the MSCI EM Index (Net),3 emerging market stocks lost 9.89%. For bond investors, the Bloomberg Barclays U.S. Aggregate Bond Index4 declined 0.30% while the Bloomberg Barclays Global Aggregateex-USD Index5 fell 3.67%. The Bloomberg Barclays Municipal Bond Index6 gained 0.42%. The ICE BofAML U.S. High Yield Index7 was up 0.19%.
Global trade tensions prompted investor concerns.
Global trade tensions escalated during the third quarter of 2018. The U.S. government’s decision during the second quarter to impose tariffs on a wide range of products manufactured overseas drew retaliatory responses from foreign governments, which punished U.S. commodity producers and product manufacturers. Investors were left to wonder about next steps in what appeared to be an escalating divergence in global economic policies and growth prospects.
Inflation trended higher. TheCPI-U8 added 0.1% in September after an increase of 0.2% in both July and August. On a year-over-year basis, theall-items index rose 2.3% for the 12 months that ended September 30, 2018, after a seasonal adjustment. The rate of increase was slower than that recorded during the first half of 2018. The index for all items less food and energy rose 2.2% for the same12-month period.
| 1 | The S&P 500 Index consists of 500 stocks chosen for market size, liquidity, and industry group representation. It is a market-value-weighted index with each stock’s weight in the index proportionate to its market value. You cannot invest directly in an index. |
| 2 | The Morgan Stanley Capital International (MSCI) All Country World Index (ACWI) ex USA Index (Net) is a free-float-adjusted market-capitalization-weighted index that is designed to measure the equity market performance of developed markets, excluding the U.S. and Canada. Source: MSCI. MSCI makes no express or implied warranties or representations and shall have no liability whatsoever with respect to any MSCI data contained herein. The MSCI data may not be further redistributed or used as a basis for other indices or any securities or financial products. This report is not approved, reviewed, or produced by MSCI. You cannot invest directly in an index. |
| 3 | The MSCI Emerging Markets (EM) Index (Net) is a free-float-adjusted market-capitalization-weighted index that is designed to measure large- andmid-cap equity market performance of emerging markets. The MSCI EM Index (Net) consists of the following 24 emerging market country indices: Brazil, Chile, China, Colombia, Czech Republic, Egypt, Greece, Hungary, India, Indonesia, Korea, Malaysia, Mexico, Pakistan, Peru, the Philippines, Poland, Qatar, Russia, South Africa, Taiwan, Thailand, Turkey, and the United Arab Emirates. You cannot invest directly in an index. |
| 4 | The Bloomberg Barclays U.S. Aggregate Bond Index is a broad-based benchmark that measures the investment-grade, U.S.-dollar-denominated, fixed-rate taxable bond market, including Treasuries, government-related and corporate securities, mortgage-backed securities (agency fixed-rate and hybrid adjustable-rate mortgage pass-throughs), asset-backed securities, and commercial mortgage-backed securities. You cannot invest directly in an index. |
| 5 | The Bloomberg Barclays Global Aggregateex-USD Index is an unmanaged index that provides a broad-based measure of the global investment-grade fixed-income markets excluding the U.S.-dollar-denominated debt market. You cannot invest directly in an index. |
| 6 | The Bloomberg Barclays Municipal Bond Index is an unmanaged index composed of long-termtax-exempt bonds with a minimum credit rating of Baa. You cannot invest directly in an index. |
| 7 | The ICE BofAML U.S. High Yield Index is a market-capitalization-weighted index of domestic and Yankee high-yield bonds. The index tracks the performance of high-yield securities traded in the U.S. bond market. You cannot invest directly in an index. Copyright 2018. ICE Data Indices, LLC. All rights reserved. |
| 8 | The Consumer Price Index for All Urban Consumers(CPI-U) measures the changes in the price of a basket of goods and services purchased by urban consumers. The urban consumer population is deemed by many as a better representative measure of the general public because close to 90% of the country’s population lives in highly populated areas. You cannot invest directly in an index. |
| | | | | | |
| Letter to shareholders (unaudited) | | Wells Fargo Small Company Growth Fund | | | 3 | |
U.S. stocks gained following positive economic data while international stocks and bonds declined.
During the summer months, the U.S. economy strengthened. Revised second-quarter gross domestic product (GDP) data released in August showed the U.S. economy growing at a 4.2% rate. The unemployment rate in the U.S. was 3.7% by the end of September, according to the U.S. Department of Labor. Wages showed more consistent growth, and consumer confidence remained strong. Several U.S. equity market indices reached records during August, with the S&P 500 Index gaining 7.20% for the three-month period that ended September 30, 2018. In contrast, the MSCI ACWI ex USA Index (Net) gained 0.71% while the MSCI EM Index (Net) declined 1.09% during the same three-month period.
In June, the Federal Reserve increased the target range for the federal funds rate to range from 1.75% to 2.00%. It raised the range again in September to range from 2.00% to 2.25%. Long-term interest rates in the U.S. remained at higher levels relative to the prior 10 years. Rates on10-year and30-year Treasury bonds—2.46% and 2.81%, respectively, on January 1, 2018—were 3.01% and 3.30%, respectively, on November 30, 2018. Investor concerns about an inverted yield curve reemerged, only to be replaced by concerns about the potentially negative influence of higher interest rates on economic activity.
November saw improvement in many equity markets.
As interest rates and bond yields gained during October, stock markets struggled. For the month, the S&P 500 Index fell 6.84%, the MSCI ACWI ex USA Index (Net) dropped 8.13%, and the MSCI EM Index (Net) lost 8.71%. The Bureau of Economic Analysis released its first estimate of third-quarter GDP, which, at an annualized 3.5% rate, indicated growth may be slowing compared with the second quarter. Readings on consumer sentiment and business spending were mixed. Markets rebounded somewhat in November as the S&P 500 Index gained 2.04%, the MSCI ACWI ex USA Index (Net) added 0.95%, and the MSCI EM Index (Net) was up 4.12% as the uncertainty leading up to midterm elections in the U.S. was resolved and progress seemed to be possible on several international trade issues.
Economic signals overseas were mixed as the third quarter ended and the fourth quarter began. In early August, the Bank of England’s Monetary Policy Committee increased its key interest rate to 0.75%. The European Central Bank and the Bank of Japan maintained low interest rates and accommodative monetary policies. Amid rising trade uncertainty, the People’s Bank of China cut reserve requirement ratios and accelerated infrastructure spending and tax cuts for business enterprises and individuals. Nevertheless, a strengthening U.S. dollar and the trade tensions remained headwinds for investors overseas.
Don’t let short-term uncertainty derail long-term investment goals.
Periods of investment uncertainty can present challenges, but experience has taught us that maintaining long-term investment goals can be an effective way to plan for the future. To help you create a sound strategy based on your personal goals and risk tolerance, Wells Fargo Funds offers more than 100 mutual funds spanning a wide range of asset classes and investment styles. Although diversification cannot guarantee an investment profit or prevent losses, we believe it can be an effective way to manage investment risk and potentially smooth out overall portfolio performance. We encourage investors to know their investments and to understand that appropriate levels of risk-taking may unlock opportunities.
Economic signals overseas were mixed as the third quarter ended and the fourth quarter began.
| | | | |
| 4 | | Wells Fargo Small Company Growth Fund | | Letter to shareholders (unaudited) |
Thank you for choosing to invest with Wells Fargo Funds. We appreciate your confidence in us and remain committed to helping you meet your financial needs.
Sincerely,

Andrew Owen
President
Wells Fargo Funds
Notice to shareholders
At a meeting held on August 14-15, 2018, the Board of Trustees of the Fund approved the following policy which will be effective on or about February 5, 2019:
Class C shares will convert automatically into Class A shares ten years after the initial date of purchase or, if you acquired your Class C shares through an exchange or conversion from another share class, ten years after the date you acquired your Class C shares. When Class C shares that you acquired through a purchase or exchange convert, any other Class C shares that you purchased with reinvested dividends and distributions also will convert into Class A shares on a pro rata basis. A shorter holding period may also apply depending on your intermediary. Please see “Appendix A—Sales Charge Reductions and Waivers for Certain Intermediaries” in the Fund’s prospectus or at the end of this report.
For further information about your Fund, contact your investment professional, visit our website atwellsfargofunds.com, or call us directly at1-800-222-8222.
This page is intentionally left blank.
| | | | |
| 6 | | Wells Fargo Small Company Growth Fund1 | | Performance highlights (unaudited) |
The Fund is currently closed to most new investors.2
Investment objective
The Fund seeks long-term capital appreciation.
Manager
Wells Fargo Funds Management, LLC
Subadviser for the affiliated master portfolio
Peregrine Capital Management, LLC
Portfolio managers
William A. Grierson, CFA®‡
Daniel J. Hagen, CFA®‡
James P. Ross, CFA®‡
Paul E. von Kuster, CFA®‡
Average annual total returns (%) as of November 30, 20183
| | | | | | | | | | | | | | | | | | | | | | | | | | | | | | | | | | |
| | | | | Including sales charge | | | Excluding sales charge | | | Expense ratios4 (%) | |
| | | Inception date | | 1 year | | | 5 year | | | 10 year | | | 1 year | | | 5 year | | | 10 year | | | Gross | | | Net5 | |
| Class A (WFSAX) | | 1-30-2004 | | | 3.83 | | | | 7.14 | | | | 16.65 | | | | 10.16 | | | | 8.41 | | | | 17.34 | | | | 1.33 | | | | 1.33 | |
| Class C (WSMCX) | | 1-30-2004 | | | 8.34 | | | | 7.60 | | | | 16.48 | | | | 9.34 | | | | 7.60 | | | | 16.48 | | | | 2.08 | | | | 2.08 | |
| Class R6 (WSCRX) | | 10-31-2014 | | | – | | | | – | | | | – | | | | 10.64 | | | | 8.90 | | | | 17.89 | | | | 0.90 | | | | 0.90 | |
| Administrator Class (NVSCX) | | 11-11-1994 | | | – | | | | – | | | | – | | | | 10.29 | | | | 8.59 | | | | 17.59 | | | | 1.25 | | | | 1.20 | |
| Institutional Class (WSCGX) | | 3-31-2008 | | | – | | | | – | | | | – | | | | 10.56 | | | | 8.85 | | | | 17.87 | | | | 1.00 | | | | 0.95 | |
| Russell 2000® Growth Index6 | | – | | | – | | | | – | | | | – | | | | 2.81 | | | | 8.22 | | | | 15.55 | | | | – | | | | – | |
Figures quoted represent past performance, which is no guarantee of future results, and do not reflect taxes that a shareholder may pay on fund distributions or the redemption of fund shares. Investment return and principal value of an investment will fluctuate so that an investor’s shares, when redeemed, may be worth more or less than their original cost. Performance shown without sales charges would be lower if sales charges were reflected. Current performance may be lower or higher than the performance data quoted, which assumes the reinvestment of dividends and capital gains. Currentmonth-end performance is available on the Fund’s website, wellsfargofunds.com.
Index returns do not include transaction costs associated with buying and selling securities, any mutual fund fees or expenses, or any taxes. It is not possible to invest directly in an index.
For Class A shares, the maximumfront-end sales charge is 5.75%. For Class C shares, the maximum contingent deferred sales charge is 1.00%. Performance including a contingent deferred sales charge assumes the sales charge for the corresponding time period. Class R6, Administrator Class, and Institutional Class shares are sold without afront-end sales charge or contingent deferred sales charge.
Stock values fluctuate in response to the activities of individual companies and general market and economic conditions. Smaller-company stocks tend to be more volatile and less liquid than those of larger companies. Certain investment strategies tend to increase the total risk of an investment (relative to the broader market). The Fund is exposed to foreign investment risk. Consult the Fund’s prospectus for additional information on these and other risks.
Please see footnotes on page 7.
| | | | | | |
| Performance highlights (unaudited) | | Wells Fargo Small Company Growth Fund | | | 7 | |
| | | | |
| Ten largest holdings (%) as of November 30, 20187 | |
Eldorado Resorts Incorporated | | | 1.53 | |
Copart Incorporated | | | 1.42 | |
LiveRamp Holdings Incorporated | | | 1.39 | |
PTC Incorporated | | | 1.36 | |
SS&C Technologies Holdings Incorporated | | | 1.33 | |
Evercore Partners Incorporated Class A | | | 1.33 | |
ICON plc ADR | | | 1.31 | |
RealPage Incorporated | | | 1.31 | |
ASGN Incorporated | | | 1.31 | |
Syneos Health Incorporated | | | 1.28 | |
|
| Sector distribution as of November 30, 20188 |
|
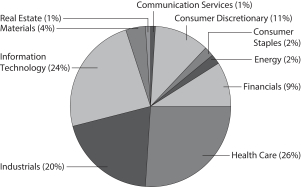 |
| ‡ | CFA® and Chartered Financial Analyst® are trademarks owned by CFA Institute. |
| 1 | The Fund is a gateway feeder fund that invests substantially all of its assets in a single affiliated master portfolio of the Wells Fargo Master Trust with a substantially identical investment objective and substantially similar investment strategies. References to the investment activities of the Fund are intended to refer to the investment activities of the affiliated master portfolio in which it invests. |
| 2 | Please see the Fund’s current Statement of Additional Information for further details. |
| 3 | Historical performance shown for Class R6 shares prior to their inception reflects the performance of Institutional Class shares, and includes the higher expenses applicable to Institutional Class shares. If these expenses had not been included, returns for Class R6 shares would be higher. |
| 4 | Reflects the expense ratios as stated in the most recent prospectuses, which include the impact of 0.01% in acquired fund fees and expenses. The expense ratios shown are subject to change and may differ from the annualized expense ratios shown in the financial highlights of this report. |
| 5 | The manager has contractually committed through September 30, 2019, to waive fees and/or reimburse expenses to the extent necessary to cap the Fund’s Total Annual Fund Operating Expenses After Fee Waivers at 1.35% for Class A, 2.10% for Class C, 0.90% for Class R6, 1.20% for Administrator Class, and 0.95% for Institutional Class. After this time, the cap may be increased or the commitment to maintain the cap may be terminated only with the approval of the Board of Trustees. Brokerage commissions, stamp duty fees, interest, taxes, acquired fund fees and expenses (if any) from funds in which the affiliated master portfolio invests, and extraordinary expenses are excluded from the expense cap. Net expenses from the affiliated master portfolio are included in the expense cap. Without this cap, the Fund’s returns would have been lower. The expense ratio paid by an investor is the net expense ratio (the total annual fund operating expenses after fee waivers) as stated in the prospectuses. |
| 6 | The Russell 2000® Growth Index measures the performance of those Russell 2000 companies with higher price/book ratios and higher forecasted growth values. You cannot invest directly in an index. |
| 7 | The ten largest holdings, excluding cash, cash equivalents and any money market funds, are calculated based on the value of the securities of the affiliated master portfolio allocable to the Fund divided by the total net assets of the Fund. Holdings are subject to change and may have changed since the date specified. |
| 8 | Amounts represent the sector distribution of the affiliated master portfolio which are calculated based on the total long-term investments of the affiliated master portfolio. These amounts are subject to change and may have changed since the date specified. |
| | | | |
| 8 | | Wells Fargo Small Company Growth Fund | | Fund expenses (unaudited) |
As a shareholder of the Fund, you incur two types of costs: (1) transaction costs, including sales charges (loads) on purchase payments and contingent deferred sales charges (if any) on redemptions and (2) ongoing costs, including management fees, distribution(12b-1) and/or shareholder servicing fees, and other Fund expenses. This example is intended to help you understand your ongoing costs (in dollars) of investing in the Fund and to compare these costs with the ongoing costs of investing in other mutual funds.
The example is based on an investment of $1,000 invested at the beginning of thesix-month period and held for the entire period from June 1, 2018 to November 30, 2018.
Actual expenses
The “Actual” line of the table below provides information about actual account values and actual expenses. You may use the information in this line, together with the amount you invested, to estimate the expenses that you paid over the period. Simply divide your account value by $1,000 (for example, an $8,600 account value divided by $1,000 = 8.6), then multiply the result by the number in the “Actual” line under the heading entitled “Expenses paid during period” for your applicable class of shares to estimate the expenses you paid on your account during this period.
Hypothetical example for comparison purposes
The “Hypothetical” line of the table below provides information about hypothetical account values and hypothetical expenses based on the Fund’s actual expense ratio and an assumed rate of return of 5% per year before expenses, which is not the Fund’s actual return. The hypothetical account values and expenses may not be used to estimate the actual ending account balance or expenses you paid for the period. You may use this information to compare the ongoing costs of investing in the Fund and other funds. To do so, compare this 5% hypothetical example with the 5% hypothetical examples that appear in the shareholder reports of the other funds.
Please note that the expenses shown in the table are meant to highlight your ongoing costs only and do not reflect any transactional costs, such as sales charges (loads) and contingent deferred sales charges. Therefore, the “Hypothetical” line of the table is useful in comparing ongoing costs only and will not help you determine the relative total costs of owning different funds. In addition, if these transactional costs were included, your costs would have been higher.
| | | | | | | | | | | | | | | | |
| | | Beginning
account value
6-1-2018 | | | Ending
account value
11-30-2018 | | | Expenses
paid during
the period1,2 | | | Annualized net
expense ratio1 | |
Class A | | | | | | | | | | | | | | | | |
Actual | | $ | 1,000.00 | | | $ | 968.23 | | | $ | 6.46 | | | | 1.31 | % |
Hypothetical (5% return before expenses) | | $ | 1,000.00 | | | $ | 1,018.50 | | | $ | 6.63 | | | | 1.31 | % |
Class C | | | | | | | | | | | | | | | | |
Actual | | $ | 1,000.00 | | | $ | 964.67 | | | $ | 10.15 | | | | 2.06 | % |
Hypothetical (5% return before expenses) | | $ | 1,000.00 | | | $ | 1,014.74 | | | $ | 10.40 | | | | 2.06 | % |
Class R6 | | | | | | | | | | | | | | | | |
Actual | | $ | 1,000.00 | | | $ | 970.32 | | | $ | 4.35 | | | | 0.88 | % |
Hypothetical (5% return before expenses) | | $ | 1,000.00 | | | $ | 1,020.66 | | | $ | 4.46 | | | | 0.88 | % |
Administrator Class | | | | | | | | | | | | | | | | |
Actual | | $ | 1,000.00 | | | $ | 968.73 | | | $ | 5.92 | | | | 1.20 | % |
Hypothetical (5% return before expenses) | | $ | 1,000.00 | | | $ | 1,019.05 | | | $ | 6.07 | | | | 1.20 | % |
Institutional Class | | | | | | | | | | | | | | | | |
Actual | | $ | 1,000.00 | | | $ | 970.10 | | | $ | 4.69 | | | | 0.95 | % |
Hypothetical (5% return before expenses) | | $ | 1,000.00 | | | $ | 1,020.31 | | | $ | 4.81 | | | | 0.95 | % |
| 1 | Amounts reflect net expenses allocated from the affiliated Master Portfolio in which the Fund invests. |
| 2 | Expenses paid is equal to the annualized net expense ratio of each class multiplied by the average account value over the period, multiplied by the number of days in the most recent fiscal half-year divided by the number of days in the fiscal year (to reflect theone-half-year period). |
| | | | | | |
| Portfolio of investments—November 30, 2018 (unaudited) | | Wells Fargo Small Company Growth Fund | | | 9 | |
| | | | | | | | | | | | | | | | |
| Security name | | | | | | | | | | | Value | |
| | | | |
Investment Companies: 99.99% | | | | | | | | | | | | | | | | |
| | | | |
| Affiliated Master Portfolio: 99.99% | | | | | | | | | | | | | | | | |
Wells Fargo Small Company Growth Portfolio | | | | | | | | | | | | | | $ | 1,940,297,388 | |
| | | | | | | | | | | | | | | | |
| | | | |
Total Investment Companies (Cost $1,492,235,770) | | | | | | | | | | | | | | | 1,940,297,388 | |
| | | | | | | | | | | | | | | | |
| | | | | | | | |
| Total investments in securities (Cost $1,492,235,770) | | | 99.99 | % | | | 1,940,297,388 | |
Other assets and liabilities, net | | | 0.01 | | | | 107,193 | |
| | | | | | | | |
| Total net assets | | | 100.00 | % | | $ | 1,940,404,581 | |
| | | | | | | | |
Transactions with the affiliated Master Portfolio were as follows:
| | | | | | | | | | | | | | | | | | | | | | | | | | | | | | | | | | | | |
| | | % of
ownership,
beginning of
period | | | % of
ownership,
end of
period | | | Net realized
gains
(losses) on
securities
transactions
allocated
from
affiliated
Master
Portfolio | | | Net change in
unrealized
gains (losses) on
securities
transactions
allocated
from
affiliated
Master
Portfolio | | | Dividends
allocated
from
affiliated
Master
Portfolio | | | Affiliated
income
allocated
from
affiliated
Master
Portfolio | | | Securities
lending
income
allocated
from
affiliated
Master
Portfolio | | | Value,
end of period | | | % of
net
assets | |
Wells Fargo Small Company Growth Portfolio | | | 99 | % | | | 98 | % | | $ | 129,622,159 | | | $ | (185,190,642 | ) | | $ | 5,957,460 | | | $ | 792,156 | | | $ | 376,362 | | | $ | 1,940,297,388 | | | | 99.99 | % |
The accompanying notes are an integral part of these financial statements.
| | | | |
| 10 | | Wells Fargo Small Company Growth Fund | | Statement of assets and liabilities—November 30, 2018 (unaudited) |
| | | | |
| | | | |
| |
Assets | | | | |
Investments in affiliated Master Portfolio, at value (cost $1,492,235,770) | | $ | 1,940,297,388 | |
Receivable for Fund shares sold | | | 2,277,707 | |
Prepaid expenses and other assets | | | 79,193 | |
| | | | |
Total assets | | | 1,942,654,288 | |
| | | | |
| |
Liabilities | | | | |
Payable for Fund shares redeemed | | | 1,834,865 | |
Administration fees payable | | | 170,385 | |
Management fee payable | | | 43,842 | |
Distribution fee payable | | | 11,461 | |
Trustees’ fees and expenses payable | | | 2,743 | |
Accrued expenses and other liabilities | | | 186,411 | |
| | | | |
Total liabilities | | | 2,249,707 | |
| | | | |
Total net assets | | $ | 1,940,404,581 | |
| | | | |
| |
NET ASSETS CONSIST OF | | | | |
Paid-in capital | | $ | 1,374,480,400 | |
Total distributable earnings | | | 565,924,181 | |
| | | | |
Total net assets | | $ | 1,940,404,581 | |
| | | | |
| |
COMPUTATION OF NET ASSET VALUE AND OFFERING PRICE PER SHARE | | | | |
Net assets – Class A | | $ | 64,897,754 | |
Shares outstanding – Class A1 | | | 1,182,888 | |
Net asset value per share – Class A | | | $54.86 | |
Maximum offering price per share – Class A2 | | | $58.21 | |
Net assets – Class C | | $ | 17,531,269 | |
Shares outstanding – Class C1 | | | 360,741 | |
Net asset value per share – Class C | | | $48.60 | |
Net assets – Class R6 | | $ | 617,247,844 | |
Shares outstanding – Class R61 | | | 10,546,282 | |
Net asset value per share – Class R6 | | | $58.53 | |
Net assets – Administrator Class | | $ | 108,876,120 | |
Shares outstanding – Administrator Class1 | | | 1,909,640 | |
Net asset value per share – Administrator Class | | | $57.01 | |
Net assets – Institutional Class | | $ | 1,131,851,594 | |
Shares outstanding – Institutional Class1 | | | 19,381,006 | |
Net asset value per share – Institutional Class | | | $58.40 | |
| 1 | The Fund has an unlimited number of authorized shares. |
| 2 | Maximum offering price is computed as 100/94.25 of net asset value. On investments of $50,000 or more, the offering price is reduced. |
The accompanying notes are an integral part of these financial statements.
| | | | | | |
| Statement of operations—six months ended November 30, 2018 (unaudited) | | Wells Fargo Small Company Growth Fund | | | 11 | |
| | | | |
| | | | |
| |
Investment income | | | | |
Dividends allocated from affiliated Master Portfolio (net of foreign withholding taxes of $49,519) | | $ | 5,957,460 | |
Affiliated income allocated from affiliated Master Portfolio | | | 792,156 | |
Securities lending income allocated from affiliated Master Portfolio | | | 376,362 | |
Expenses allocated from affiliated Master Portfolio | | | (8,106,179 | ) |
| | | | |
Total investment income | | | (980,201 | ) |
| | | | |
| |
Expenses | | | | |
Management fee | | | 523,269 | |
Administration fees | | | | |
Class A | | | 79,143 | |
Class C | | | 20,684 | |
Class R6 | | | 101,235 | |
Administrator Class | | | 77,092 | |
Institutional Class | | | 782,925 | |
Shareholder servicing fees | | | | |
Class A | | | 94,218 | |
Class C | | | 24,623 | |
Administrator Class | | | 148,254 | |
Distribution fee | | | | |
Class C | | | 73,870 | |
Custody and accounting fees | | | 28,553 | |
Professional fees | | | 15,176 | |
Registration fees | | | 87,694 | |
Shareholder report expenses | | | 124,022 | |
Trustees’ fees and expenses | | | 11,724 | |
Other fees and expenses | | | 11,901 | |
| | | | |
Total expenses | | | 2,204,383 | |
Less: Fee waivers and/or expense reimbursements | | | (207,417 | ) |
| | | | |
Net expenses | | | 1,996,966 | |
| | | | |
Net investment loss | | | (2,977,167 | ) |
| | | | |
| |
REALIZED AND UNREALIZED GAINS (LOSSES) ON INVESTMENTS | | | | |
Net realized gains on securities transactions allocated from affiliated Master Portfolio | | | 129,622,159 | |
Net change in unrealized gains (losses) on securities transactions allocated from affiliated Master Portfolio | | | (185,190,642 | ) |
| | | | |
Net realized and unrealized gains (losses) on investments | | | (55,568,483 | ) |
| | | | |
Net decrease in net assets resulting from operations | | $ | (58,545,650 | ) |
| | | | |
The accompanying notes are an integral part of these financial statements.
| | | | |
| 12 | | Wells Fargo Small Company Growth Fund | | Statement of changes in net assets |
| | | | | | | | | | | | | | | | |
| | | Six months ended
November 30, 2018
(unaudited) | | | Year ended
May 31, 2018¹ | |
| | | |
Operations | | | | | | | | | | | | |
Net investment loss | | | | | | $ | (2,977,167 | ) | | | | | | $ | (6,731,559 | ) |
Net realized gains on investments | | | | | | | 129,622,159 | | | | | | | | 118,893,213 | |
Net change in unrealized gains (losses) on investments | | | | | | | (185,190,642 | ) | | | | | | | 342,601,168 | |
| | | | |
Net increase (decrease) in net assets resulting from operations | | | | | | | (58,545,650 | ) | | | | | | | 454,762,822 | |
| | | | |
| | | | |
Capital share transactions | | | Shares | | | | | | | | Shares | | | | | |
Proceeds from shares sold | | | | | | | | | | | | | | | | |
Class A | | | 203,013 | | | | 11,810,907 | | | | 418,324 | | | | 20,519,628 | |
Class C | | | 4,503 | | | | 232,818 | | | | 16,011 | | | | 676,399 | |
Class R6 | | | 1,943,279 | | | | 121,150,949 | | | | 3,523,131 | | | | 188,048,494 | |
Administrator Class | | | 287,391 | | | | 17,332,747 | | | | 359,239 | | | | 18,697,115 | |
Institutional Class | | | 3,112,756 | | | | 191,235,820 | | | | 5,366,558 | | | | 285,015,561 | |
| | | | |
| | | | | | | 341,763,241 | | | | | | | | 512,957,197 | |
| | | | |
Payment for shares redeemed | | | | | | | | | | | | | | | | |
Class A | | | (362,517 | ) | | | (21,080,175 | ) | | | (795,177 | ) | | | (39,090,958 | ) |
Class C | | | (40,306 | ) | | | (2,057,557 | ) | | | (184,692 | ) | | | (8,044,725 | ) |
Class R6 | | | (1,652,011 | ) | | | (103,405,519 | ) | | | (2,181,955 | ) | | | (117,000,267 | ) |
Administrator Class | | | (322,229 | ) | | | (19,382,166 | ) | | | (1,253,278 | ) | | | (62,203,048 | ) |
Institutional Class | | | (3,158,280 | ) | | | (195,439,195 | ) | | | (7,602,523 | ) | | | (404,594,261 | ) |
| | | | |
| | | | | | | (341,364,612 | ) | | | | | | | (630,933,259 | ) |
| | | | |
Net increase (decrease) in net assets resulting from capital share transactions | | | | | | | 398,629 | | | | | | | | (117,976,062 | ) |
| | | | |
Total increase (decrease) in net assets | | | | | | | (58,147,021 | ) | | | | | | | 336,786,760 | |
| | | | |
| | | |
Net assets | | | | | | | | | | | | |
Beginning of period | | | | | | | 1,998,551,602 | | | | | | | | 1,661,764,842 | |
| | | | |
End of period | | | | | | $ | 1,940,404,581 | | | | | | | $ | 1,998,551,602 | |
| | | | |
| ¹ | Effective for all filings after November 4, 2018, the SEC prospectively eliminated the requirement to parenthetically disclose undistributed net investment income at the end of the period and permitted the aggregation of distributions, with the exception of tax basis returns of capital. Accumulated net investment loss at May 31, 2018 was $3,054,501. |
The accompanying notes are an integral part of these financial statements.
| | | | | | |
| Financial highlights | | Wells Fargo Small Company Growth Fund | | | 13 | |
(For a share outstanding throughout each period)
| | | | | | | | | | | | | | | | | | | | | | | | |
| | | Six months ended
November 30, 2018 (unaudited) | | | Year ended May 31 | |
| CLASS A | | 2018 | | | 2017 | | | 2016 | | | 2015 | | | 2014 | |
Net asset value, beginning of period | | | $56.66 | | | | $44.26 | | | | $37.69 | | | | $44.23 | | | | $39.44 | | | | $34.23 | |
Net investment loss | | | (0.19 | )1 | | | (0.35 | )1 | | | (0.28 | )1 | | | (0.22 | )1 | | | (0.37 | )1 | | | (0.37 | )1 |
Net realized and unrealized gains (losses) on investments | | | (1.61 | ) | | | 12.75 | | | | 6.85 | | | | (6.05 | ) | | | 7.08 | | | | 7.98 | |
| | | | | | | | | | | | | | | | | | | | | | | | |
Total from investment operations | | | (1.80 | ) | | | 12.40 | | | | 6.57 | | | | (6.27 | ) | | | 6.71 | | | | 7.61 | |
Distributions to shareholders from | | | | | | | | | | | | | | | | | | | | | | | | |
Net realized gains | | | 0.00 | | | | 0.00 | | | | 0.00 | | | | (0.27 | ) | | | (1.92 | ) | | | (2.40 | ) |
Net asset value, end of period | | | $54.86 | | | | $56.66 | | | | $44.26 | | | | $37.69 | | | | $44.23 | | | | $39.44 | |
Total return2 | | | (3.18 | )% | | | 28.02 | % | | | 17.43 | % | | | (14.20 | )% | | | 17.51 | % | | | 22.63 | % |
Ratios to average net assets (annualized) | | | | | | | | | | | | | | | | | | | | | | | | |
Gross expenses3 | | | 1.31 | % | | | 1.32 | % | | | 1.33 | % | | | 1.34 | % | | | 1.41 | % | | | 1.45 | % |
Net expenses3 | | | 1.31 | % | | | 1.32 | % | | | 1.33 | % | | | 1.34 | % | | | 1.40 | % | | | 1.41 | % |
Net investment loss3 | | | (0.64 | )% | | | (0.71 | )% | | | (0.68 | )% | | | (0.57 | )% | | | (0.90 | )% | | | (0.96 | )% |
Supplemental data | | | | | | | | | | | | | | | | | | | | | | | | |
Portfolio turnover rate4 | | | 30 | % | | | 37 | % | | | 82 | % | | | 49 | % | | | 58 | % | | | 77 | % |
Net assets, end of period (000s omitted) | | | $64,898 | | | | $76,065 | | | | $76,087 | | | | $128,675 | | | | $85,588 | | | | $30,364 | |
| 1 | Calculated based upon average shares outstanding |
| 2 | Total return calculations do not include any sales charges. Returns for periods of less than one year are not annualized. |
| 3 | Ratios include net expenses allocated from the affiliated Master Portfolio which were as follows: |
| | | | |
Six months ended November 30, 2018 (unaudited) | | | 0.77 | % |
Year ended May 31, 2018 | | | 0.78 | % |
Year ended May 31, 2017 | | | 0.78 | % |
Year ended May 31, 2016 | | | 0.80 | % |
Year ended May 31, 2015 | | | 0.81 | % |
Year ended May 31, 2014 | | | 0.83 | % |
| 4 | Portfolio turnover rate is calculated by multiplying the affiliated Master Portfolio’s percentage of the Fund’s total investments in securities at the end of the period by the affiliated Master Portfolio’s portfolio turnover rate. |
The accompanying notes are an integral part of these financial statements.
| | | | |
| 14 | | Wells Fargo Small Company Growth Fund | | Financial highlights |
(For a share outstanding throughout each period)
| | | | | | | | | | | | | | | | | | | | | | | | |
| | | Six months ended
November 30, 2018 (unaudited) | | | Year ended May 31 | |
| CLASS C | | 2018 | | | 2017 | | | 2016 | | | 2015 | | | 2014 | |
Net asset value, beginning of period | | | $50.38 | | | | $39.65 | | | | $34.02 | | | | $40.25 | | | | $36.32 | | | | $31.91 | |
Net investment loss | | | (0.36 | )1 | | | (0.64 | )1 | | | (0.54 | )1 | | | (0.46 | )1 | | | (0.63 | )1 | | | (0.62 | )1 |
Net realized and unrealized gains (losses) on investments | | | (1.42 | ) | | | 11.37 | | | | 6.17 | | | | (5.50 | ) | | | 6.48 | | | | 7.43 | |
| | | | | | | | | | | | | | | | | | | | | | | | |
Total from investment operations | | | (1.78 | ) | | | 10.73 | | | | 5.63 | | | | (5.96 | ) | | | 5.85 | | | | 6.81 | |
Distributions to shareholders from | | | | | | | | | | | | | | | | | | | | | | | | |
Net realized gains | | | 0.00 | | | | 0.00 | | | | 0.00 | | | | (0.27 | ) | | | (1.92 | ) | | | (2.40 | ) |
Net asset value, end of period | | | $48.60 | | | | $50.38 | | | | $39.65 | | | | $34.02 | | | | $40.25 | | | | $36.32 | |
Total return2 | | | (3.53 | )% | | | 27.06 | % | | | 16.55 | % | | | (14.84 | )% | | | 16.62 | % | | | 21.75 | % |
Ratios to average net assets (annualized) | | | | | | | | | | | | | | | | | | | | | | | | |
Gross expenses3 | | | 2.06 | % | | | 2.07 | % | | | 2.08 | % | | | 2.09 | % | | | 2.16 | % | | | 2.20 | % |
Net expenses3 | | | 2.06 | % | | | 2.07 | % | | | 2.08 | % | | | 2.09 | % | | | 2.15 | % | | | 2.16 | % |
Net investment loss3 | | | (1.38 | )% | | | (1.47 | )% | | | (1.43 | )% | | | (1.32 | )% | | | (1.64 | )% | | | (1.71 | )% |
Supplemental data | | | | | | | | | | | | | | | | | | | | | | | | |
Portfolio turnover rate4 | | | 30 | % | | | 37 | % | | | 82 | % | | | 49 | % | | | 58 | % | | | 77 | % |
Net assets, end of period (000s omitted) | | | $17,531 | | | | $19,979 | | | | $22,410 | | | | $26,946 | | | | $17,334 | | | | $6,546 | |
| 1 | Calculated based upon average shares outstanding |
| 2 | Total return calculations do not include any sales charges. Returns for periods of less than one year are not annualized. |
| 3 | Ratios include net expenses allocated from the affiliated Master Portfolio which were as follows: |
| | | | |
Six months ended November 30, 2018 (unaudited) | | | 0.77 | % |
Year ended May 31, 2018 | | | 0.78 | % |
Year ended May 31, 2017 | | | 0.78 | % |
Year ended May 31, 2016 | | | 0.80 | % |
Year ended May 31, 2015 | | | 0.81 | % |
Year ended May 31, 2014 | | | 0.83 | % |
| 4 | Portfolio turnover rate is calculated by multiplying the affiliated Master Portfolio’s percentage of the Fund’s total investments in securities at the end of the period by the affiliated Master Portfolio’s portfolio turnover rate. |
The accompanying notes are an integral part of these financial statements.
| | | | | | |
| Financial highlights | | Wells Fargo Small Company Growth Fund | | | 15 | |
(For a share outstanding throughout each period)
| | | | | | | | | | | | | | | | | | | | |
| | | Six months ended
November 30, 2018 (unaudited) | | | Year ended May 31 | |
| CLASS R6 | | 2018 | | | 2017 | | | 2016 | | | 20151 | |
Net asset value, beginning of period | | | $60.31 | | | | $46.91 | | | | $39.77 | | | | $46.45 | | | | $42.98 | |
Net investment loss | | | (0.06 | ) | | | (0.14 | ) | | | (0.11 | ) | | | (0.03 | ) | | | (0.09 | )2 |
Net realized and unrealized gains (losses) on investments | | | (1.72 | ) | | | 13.54 | | | | 7.25 | | | | (6.38 | ) | | | 5.48 | |
| | | | | | | | | | | | | | | | | | | | |
Total from investment operations | | | (1.78 | ) | | | 13.40 | | | | 7.14 | | | | (6.41 | ) | | | 5.39 | |
Distributions to shareholders from | | | | | | | | | | | | | | | | | | | | |
Net realized gains | | | 0.00 | | | | 0.00 | | | | 0.00 | | | | (0.27 | ) | | | (1.92 | ) |
Net asset value, end of period | | | $58.53 | | | | $60.31 | | | | $46.91 | | | | $39.77 | | | | $46.45 | |
Total return3 | | | (2.97 | )% | | | 28.59 | % | | | 17.95 | % | | | (13.83 | )% | | | 13.00 | % |
Ratios to average net assets (annualized) | | | | | | | | | | | | | | | | | | | | |
Gross expenses4 | | | 0.88 | % | | | 0.89 | % | | | 0.90 | % | | | 0.91 | % | | | 0.91 | % |
Net expenses4 | | | 0.88 | % | | | 0.89 | % | | | 0.90 | % | | | 0.90 | % | | | 0.90 | % |
Net investment loss4 | | | (0.20 | )% | | | (0.29 | )% | | | (0.25 | )% | | | (0.09 | )% | | | (0.34 | )% |
Supplemental data | | | | | | | | | | | | | | | | | | | | |
Portfolio turnover rate5 | | | 30 | % | | | 37 | % | | | 82 | % | | | 49 | % | | | 58 | % |
Net assets, end of period (000s omitted) | | | $617,248 | | | | $618,523 | | | | $418,111 | | | | $229,391 | | | | $644 | |
| 1 | For the period from October 31, 2014 (commencement of class operations) to May 31, 2015 |
| 2 | Calculated based upon average shares outstanding |
| 3 | Returns for periods of less than one year are not annualized. |
| 4 | Ratios include net expenses allocated from the affiliated Master Portfolio which were as follows: |
| | | | |
Six months ended November 30, 2018 (unaudited) | | | 0.77 | % |
Year ended May 31, 2018 | | | 0.78 | % |
Year ended May 31, 2017 | | | 0.78 | % |
Year ended May 31, 2016 | | | 0.80 | % |
Year ended May 31, 20151 | | | 0.81 | % |
| 5 | Portfolio turnover rate is calculated by multiplying the affiliated Master Portfolio’s percentage of the Fund’s total investments in securities at the end of the period by the affiliated Master Portfolio’s portfolio turnover rate. |
The accompanying notes are an integral part of these financial statements.
| | | | |
| 16 | | Wells Fargo Small Company Growth Fund | | Financial highlights |
(For a share outstanding throughout each period)
| | | | | | | | | | | | | | | | | | | | | | | | |
| | | Six months ended
November 30, 2018 (unaudited) | | | Year ended May 31 | |
| ADMINISTRATOR CLASS | | 2018 | | | 2017 | | | 2016 | | | 2015 | | | 2014 | |
Net asset value, beginning of period | | | $58.85 | | | | $45.91 | | | | $39.05 | | | | $45.73 | | | | $40.64 | | | | $35.13 | |
Net investment loss | | | (0.18 | ) | | | (0.30 | )1 | | | (0.24 | )1 | | | (0.19 | )1 | | | (0.30 | )1 | | | (0.26 | )1 |
Net realized and unrealized gains (losses) on investments | | | (1.66 | ) | | | 13.24 | | | | 7.10 | | | | (6.22 | ) | | | 7.31 | | | | 8.17 | |
| | | | | | | | | | | | | | | | | | | | | | | | |
Total from investment operations | | | (1.84 | ) | | | 12.94 | | | | 6.86 | | | | (6.41 | ) | | | 7.01 | | | | 7.91 | |
Distributions to shareholders from | | | | | | | | | | | | | | | | | | | | | | | | |
Net realized gains | | | 0.00 | | | | 0.00 | | | | 0.00 | | | | (0.27 | ) | | | (1.92 | ) | | | (2.40 | ) |
Net asset value, end of period | | | $57.01 | | | | $58.85 | | | | $45.91 | | | | $39.05 | | | | $45.73 | | | | $40.64 | |
Total return2 | | | (3.13 | )% | | | 28.19 | % | | | 17.57 | % | | | (14.04 | )% | | | 17.73 | % | | | 22.92 | % |
Ratios to average net assets (annualized) | | | | | | | | | | | | | | | | | | | | | | | | |
Gross expenses3 | | | 1.23 | % | | | 1.24 | % | | | 1.25 | % | | | 1.25 | % | | | 1.24 | % | | | 1.29 | % |
Net expenses3 | | | 1.20 | % | | | 1.20 | % | | | 1.20 | % | | | 1.20 | % | | | 1.20 | % | | | 1.20 | % |
Net investment loss3 | | | (0.52 | )% | | | (0.60 | )% | | | (0.55 | )% | | | (0.46 | )% | | | (0.70 | )% | | | (0.74 | )% |
Supplemental data | | | | | | | | | | | | | | | | | | | | | | | | |
Portfolio turnover rate4 | | | 30 | % | | | 37 | % | | | 82 | % | | | 49 | % | | | 58 | % | | | 77 | % |
Net assets, end of period (000s omitted) | | | $108,876 | | | | $114,429 | | | | $130,311 | | | | $130,104 | | | | $185,267 | | | | $118,456 | |
| 1 | Calculated based upon average shares outstanding |
| 2 | Returns for periods of less than one year are not annualized. |
| 3 | Ratios include net expenses allocated from the affiliated Master Portfolio which were as follows: |
| | | | |
Six months ended November 30, 2018 (unaudited) | | | 0.77 | % |
Year ended May 31, 2018 | | | 0.78 | % |
Year ended May 31, 2017 | | | 0.78 | % |
Year ended May 31, 2016 | | | 0.80 | % |
Year ended May 31, 2015 | | | 0.81 | % |
Year ended May 31, 2014 | | | 0.83 | % |
| 4 | Portfolio turnover rate is calculated by multiplying the affiliated Master Portfolio’s percentage of the Fund’s total investments in securities at the end of the period by the affiliated Master Portfolio’s portfolio turnover rate. |
The accompanying notes are an integral part of these financial statements.
| | | | | | |
| Financial highlights | | Wells Fargo Small Company Growth Fund | | | 17 | |
(For a share outstanding throughout each period)
| | | | | | | | | | | | | | | | | | | | | | | | |
| | | Six months ended
November 30, 2018 (unaudited) | | | Year ended May 31 | |
| INSTITUTIONAL CLASS | | 2018 | | | 2017 | | | 2016 | | | 2015 | | | 2014 | |
Net asset value, beginning of period | | | $60.20 | | | | $46.85 | | | | $39.75 | | | | $46.44 | | | | $41.14 | | | | $35.46 | |
Net investment loss | | | (0.08 | ) | | | (0.19 | ) | | | (0.15 | ) | | | (0.09 | ) | | | (0.20 | )1 | | | (0.20 | )1 |
Net realized and unrealized gains (losses) on investments | | | (1.72 | ) | | | 13.54 | | | | 7.25 | | | | (6.33 | ) | | | 7.42 | | | | 8.28 | |
| | | | | | | | | | | | | | | | | | | | | | | | |
Total from investment operations | | | (1.80 | ) | | | 13.35 | | | | 7.10 | | | | (6.42 | ) | | | 7.22 | | | | 8.08 | |
Distributions to shareholders from | | | | | | | | | | | | | | | | | | | | | | | | |
Net realized gains | | | 0.00 | | | | 0.00 | | | | 0.00 | | | | (0.27 | ) | | | (1.92 | ) | | | (2.40 | ) |
Net asset value, end of period | | | $58.40 | | | | $60.20 | | | | $46.85 | | | | $39.75 | | | | $46.44 | | | | $41.14 | |
Total return2 | | | (2.99 | )% | | | 28.50 | % | | | 17.86 | % | | | (13.85 | )% | | | 18.03 | % | | | 23.19 | % |
Ratios to average net assets (annualized) | | | | | | | | | | | | | | | | | | | | | | | | |
Gross expenses3 | | | 0.98 | % | | | 0.99 | % | | | 1.00 | % | | | 1.01 | % | | | 0.98 | % | | | 1.02 | % |
Net expenses3 | | | 0.95 | % | | | 0.95 | % | | | 0.95 | % | | | 0.95 | % | | | 0.95 | % | | | 0.95 | % |
Net investment loss3 | | | (0.27 | )% | | | (0.35 | )% | | | (0.31 | )% | | | (0.18 | )% | | | (0.45 | )% | | | (0.49 | )% |
Supplemental data | | | | | | | | | | | | | | | | | | | | | | | | |
Portfolio turnover rate4 | | | 30 | % | | | 37 | % | | | 82 | % | | | 49 | % | | | 58 | % | | | 77 | % |
Net assets, end of period (000s omitted) | | | $1,131,852 | | | | $1,169,555 | | | | $1,014,847 | | | | $678,699 | | | | $457,542 | | | | $186,581 | |
| 1 | Calculated based upon average shares outstanding |
| 2 | Returns for periods of less than one year are not annualized. |
| 3 | Ratios include net expenses allocated from the affiliated Master Portfolio which were as follows: |
| | | | |
Six months ended November 30, 2018 (unaudited) | | | 0.77 | % |
Year ended May 31, 2018 | | | 0.78 | % |
Year ended May 31, 2017 | | | 0.78 | % |
Year ended May 31, 2016 | | | 0.80 | % |
Year ended May 31, 2015 | | | 0.81 | % |
Year ended May 31, 2014 | | | 0.83 | % |
| 4 | Portfolio turnover rate is calculated by multiplying the affiliated Master Portfolio’s percentage of the Fund’s total investments in securities at the end of the period by the affiliated Master Portfolio’s portfolio turnover rate. |
The accompanying notes are an integral part of these financial statements.
| | | | |
| 18 | | Wells Fargo Small Company Growth Fund | | Notes to financial statements (unaudited) |
1. ORGANIZATION
Wells Fargo Funds Trust (the “Trust”), a Delaware statutory trust organized on March 10, 1999, is anopen-end management investment company registered under the Investment Company Act of 1940, as amended (the “1940 Act”). As an investment company, the Trust follows the accounting and reporting guidance in Financial Accounting Standards Board(“FASB”) Accounting Standards Codification Topic 946, Financial Services – Investment Companies. These financial statements report on the Wells Fargo Small Company Growth Fund (the “Fund”) which is a diversified series of the Trust.
The Fund is a feeder fund in a master-feeder structure that invests substantially all of its assets in a single master portfolio with a substantially identical investment objective and substantially similar investment strategies. The Fund seeks to achieve its investment objective by investing all investable assets in a separate diversified portfolio (the “affiliated Master Portfolio”) of Wells Fargo Master Trust, a registeredopen-end management investment company. The affiliated Master Portfolio directly acquires portfolio securities and the Fund acquires an indirect interest in those securities. The Fund accounts for its investment in the affiliated Master Portfolio as a partnership investment and records on a daily basis its share of the affiliated Master Portfolio’s income, expense and realized and unrealized gains and losses. The financial statements of the affiliated Master Portfolio for the six months ended November 30, 2018 are included in this report and should be read in conjunction with the Fund’s financial statements. As of November 30, 2018, the Fund owned 98% of Wells Fargo Small Company Growth Portfolio.
2. SIGNIFICANT ACCOUNTING POLICIES
The following significant accounting policies, which are consistently followed in the preparation of the financial statements of the Fund, are in conformity with U.S. generally accepted accounting principles which require management to make estimates and assumptions that affect the reported amounts of assets and liabilities, disclosure of contingent assets and liabilities at the date of the financial statements, and the reported amounts of revenues and expenses during the reporting period. Actual results could differ from those estimates.
Securities valuation
All investments are valued each business day as of the close of regular trading on the New York Stock Exchange (generally 4 p.m. Eastern Time), although the Fund may deviate from this calculation time under unusual or unexpected circumstances.
Investments in the affiliated Master Portfolio are valued daily based on the Fund’s proportionate share of the affiliated Master Portfolio’s net assets, which are also valued daily. Securities held in the affiliated Master Portfolio are valued as discussed in the Notes to Financial Statements of the affiliated Master Portfolio, which are included elsewhere in this report.
Investment transactions, income and expenses
Investments in the affiliated Master Portfolio are recorded on a trade basis.
The Fund records daily its proportionate share of the affiliated Master Portfolio’s interest and dividend income, expenses and realized and unrealized gains or losses. The Fund also accrues its own expenses.
Distributions to shareholders
Distributions to shareholders from net investment income and any net realized gains are recorded on theex-dividend date and paid at least annually. Such distributions are determined in accordance with income tax regulations and may differ from U.S. generally accepted accounting principles. Dividend sources are estimated at the time of declaration. The tax character of distributions is determined as of the Fund’s fiscal year end. Therefore, a portion of the Fund’s distributions made prior to the Fund’s fiscal year end may be categorized as a tax return of capital at year end.
Federal and other taxes
The Fund intends to continue to qualify as a regulated investment company by distributing substantially all of its investment company taxable income and any net realized capital gains (after reduction for capital loss carryforwards) sufficient to relieve it from all, or substantially all, federal income taxes. Accordingly, no provision for federal income taxes was required.
The Fund’s income and federal excise tax returns and all financial records supporting those returns for the prior three fiscal years are subject to examination by the federal and Delaware revenue authorities. Management has analyzed the Fund’s tax positions taken on federal, state, and foreign tax returns for all open tax years and does not believe that there are any uncertain tax positions that require recognition of a tax liability.
| | | | | | |
| Notes to financial statements (unaudited) | | Wells Fargo Small Company Growth Fund | | | 19 | |
As of November 30, 2018, the aggregate cost of all investments for federal income tax purposes was $1,508,464,441 and the unrealized gains (losses) consisted of:
| | | | |
Gross unrealized gains | | $ | 431,832,947 | |
Gross unrealized losses | | | 0 | |
Net unrealized gains | | $ | 431,832,947 | |
As of May 31, 2018, the Fund had a qualified late-year ordinary loss of $3,158,480 which was recognized on the first day of the current fiscal year.
Class allocations
The separate classes of shares offered by the Fund differ principally in applicable sales charges, distribution, shareholder servicing, and administration fees. Class specific expenses are charged directly to that share class. Investment income, common expenses, and realized and unrealized gains (losses) on investments are allocated daily to each class of shares based on the relative proportion of net assets of each class.
3. FAIR VALUATION MEASUREMENTS
At November 30, 2018, the affiliated Master Portfolio was measured at fair value using the net asset value per share (or its equivalent) as a practical expedient. The investment objective and the value of the affiliate Master Portfolio was as follows:
| | | | | | |
| Affiliated Master Portfolio | | Investment objective | | Value of
affiliated Master
Portfolio | |
Wells Fargo Small Company Growth Portfolio | | Seeks long-term capital appreciation | | | $1,940,297,388 | |
The affiliated Master Portfolio does not have a redemption period notice, can be redeemed daily and does not have any unfunded commitments.
4. TRANSACTIONS WITH AFFILIATES
Management fee
Wells Fargo Funds Management, LLC (“Funds Management”), an indirect wholly owned subsidiary of Wells Fargo & Company (“Wells Fargo”), is the manager of the Fund and provides advisory and fund-level administrative services under an investment management agreement. Under the investment management agreement, Funds Management is responsible for, among other services, implementing the investment objectives and strategies of the Fund, supervising the subadviser and providing fund-level administrative services in connection with the Fund’s operations. As long as the Fund continues to invest substantially all of its assets in a single affiliated Master Portfolio, the Fund pays Funds Management an investment management fee only for fund-level administrative services at an annual rate starting at 0.05% and declining to 0.03% as the average daily net assets of the Fund increase. For the six months ended November 30, 2018, the management fee was equivalent to an annual rate of 0.05% of the Fund’s average daily net assets.
Funds Management also serves as the adviser to the affiliated Master Portfolio and is entitled to receive a fee from the affiliated Master Portfolio for those services.
Administration fees
Under a class-level administration agreement, Funds Management provides class-level administrative services to the Fund, which includes paying fees and expenses for services provided by the transfer agent,sub-transfer agents, omnibus account servicers and record-keepers. As compensation for its services under the class-level administration agreement, Funds Management receives an annual fee which is calculated based on the average daily net assets of each class as follows:
| | | | |
| | | Class-level
administration fee | |
Class A, Class C | | | 0.21 | % |
Class R6 | | | 0.03 | |
Administrator Class, Institutional Class | | | 0.13 | |
| | | | |
| 20 | | Wells Fargo Small Company Growth Fund | | Notes to financial statements (unaudited) |
Funds Management has contractually waived and/or reimbursed management and administration fees to the extent necessary to maintain certain net operating expense ratios for the Fund. When each class of the Fund has exceeded its expense cap, Funds Management has waived fees and/or reimbursed expenses from fund level expenses on a proportionate basis and then from class specific expenses; otherwise, waivers and/or reimbursements are applied against class specific expenses before fund level expenses. Net expenses from the affiliated Master Portfolio are included in the expense cap. Funds Management has committed through September 30, 2019 to waive fees and/or reimburse expenses to the extent necessary to cap each Fund’s expenses at 1.35% for Class A shares, 2.10% for Class C shares, 0.90% for Class R6 shares, 1.20% for Administrator Class shares, and 0.95% for Institutional Class shares. After this time, the cap may be increased or the commitment to maintain the cap may be terminated only with the approval of the Board of Trustees.
Distribution fee
The Trust has adopted a distribution plan for Class C shares of the Fund pursuant to Rule12b-1 under the 1940 Act. A distribution fee is charged to Class C shares and paid to Wells Fargo Funds Distributor, LLC (“Funds Distributor”), the principal underwriter, at an annual rate of 0.75% of the average daily net assets of Class C shares.
In addition, Funds Distributor is entitled to receive thefront-end sales charge from the purchase of Class A shares and a contingent deferred sales charge on the redemption of certain Class A shares. Funds Distributor is also entitled to receive the contingent deferred sales charges from redemptions of Class C shares. For the six months ended November 30, 2018, Funds Distributor received $928 from the sale of Class A shares and $11 in contingent deferred sales charges from redemptions of Class C shares. No contingent deferred sales charges were incurred by Class A shares for the six months ended November 30, 2018.
Shareholder servicing fees
The Trust has entered into contracts with one or more shareholder servicing agents, whereby Class A, Class C, and Administrator Class of the Fund are charged a fee at an annual rate of 0.25% of the average daily net assets of each respective class.
A portion of these total shareholder servicing fees were paid to affiliates of Wells Fargo.
5. INVESTMENT PORTFOLIO TRANSACTIONS
The Fund seeks to achieve its investment objective by investing substantially all of its investable assets in a single affiliated Master Portfolio. Purchases and sales have been calculated by multiplying the Fund’s ownership percentage of the affiliated Master Portfolio by the affiliated Master Portfolio’s purchases and sales. Purchases and sales of investments, excluding U.S. government obligations (if any) and short-term securities, for the six months ended November 30, 2018 were $648,806,803 and $598,073,839, respectively.
6. BANK BORROWINGS
The Trust (excluding the money market funds), Wells Fargo Master Trust and Wells Fargo Variable Trust are parties to a $280,000,000 revolving credit agreement whereby the Fund is permitted to use bank borrowings for temporary or emergency purposes, such as to fund shareholder redemption requests. Interest under the credit agreement is charged to the Fund based on a borrowing rate equal to the higher of the Federal Funds rate in effect on that day plus 1.25% or the overnight LIBOR rate in effect on that day plus 1.25%. In addition, an annual commitment fee equal to 0.25% of the unused balance is allocated to each participating fund.
For the six months ended November 30, 2018, there were no borrowings by the Fund under the agreement.
7. CONCENTRATION RISK
Concentration risks result from exposure to a limited number of sectors. Through its investment in the affiliated Master Portfolio which may invest a substantial portion of its assets in any sector, the Fund may in turn be more affected by changes in that sector than a fund whose investments are not heavily weighted in any sector.
8. INDEMNIFICATION
Under the Trust’s organizational documents, the officers and Trustees have been granted certain indemnification rights against certain liabilities that may arise out of performance of their duties to the Trust. Additionally, in the normal course of business, the Trust may enter into contracts with service providers that contain a variety of indemnification clauses. The Trust’s maximum exposure under these arrangements is dependent on future claims that may be made against the Fund and, therefore, cannot be estimated.
| | | | | | |
| Notes to financial statements (unaudited) | | Wells Fargo Small Company Growth Fund | | | 21 | |
9. NEW ACCOUNTING PRONOUNCEMENT
In August 2018, FASB issued Accounting Standards Update (“ASU”)No. 2018-13, Fair Value Measurement (Topic 820) Disclosure Framework—Changes to the Disclosure Requirements for Fair Value Measurement. ASU2018-13 updates the disclosure requirements for fair value measurements by modifying or removing certain disclosures and adding certain new disclosures. The amendments are effective for fiscal years, and interim periods within those fiscal years, beginning after December 15, 2019. Early adoption is permitted. Management has adopted the removal and modification of disclosures early, as permitted, and will adopt the additional new disclosures at the effective date.
10. SUBSEQUENT DISTRIBUTIONS
On December 12, 2018, the Fund declared distributions from short-term capital gains and long-term capital gains to shareholders of record on December 11, 2018. The per share amounts payable on December 13, 2018 were as follows:
| | | | | | | | |
| | | Short-term
capital gains | | | Long-term
capital gains | |
Class A | | | $0.96615 | | | | $3.13850 | |
Class C | | | 0.96615 | | | | 3.13850 | |
Class R6 | | | 0.96615 | | | | 3.13850 | |
Administrator Class | | | 0.96615 | | | | 3.13850 | |
Institutional Class | | | 0.96615 | | | | 3.13850 | |
These distributions are not reflected in the accompanying financial statements.
| | | | |
| 22 | | Wells Fargo Small Company Growth Portfolio | | Portfolio of investments—November 30, 2018 (unaudited) |
| | | | | | | | | | | | | | | | |
| Security name | | | | | | | | Shares | | | Value | |
| | | | |
Common Stocks: 95.97% | | | | | | | | | | | | | | | | |
| | | | |
Communication Services: 0.78% | | | | | | | | | | | | | | | | |
| | | | |
| Entertainment: 0.78% | | | | | | | | | | | | | | | | |
Lions Gate Entertainment Class A « | | | | | | | | | | | 220,943 | | | $ | 4,288,504 | |
Lions Gate Entertainment Class B | | | | | | | | | | | 625,131 | | | | 11,271,108 | |
| |
| | | | 15,559,612 | |
| | | | | | | | | | | | | | | | |
| | | | |
Consumer Discretionary: 10.24% | | | | | | | | | | | | | | | | |
| | | | |
| Auto Components: 0.81% | | | | | | | | | | | | | | | | |
Fox Factory Holding Corporation † | | | | | | | | | | | 252,595 | | | | 16,092,827 | |
| | | | | | | | | | | | | | | | |
| | | | |
| Diversified Consumer Services: 1.45% | | | | | | | | | | | | | | | | |
Houghton Mifflin Harcourt Company † | | | | | | | | | | | 1,185,804 | | | | 11,798,750 | |
Strategic Education Incorporated | | | | | | | | | | | 125,366 | | | | 17,111,205 | |
| |
| | | | 28,909,955 | |
| | | | | | | | | | | | | | | | |
| | | | |
| Hotels, Restaurants & Leisure: 4.66% | | | | | | | | | | | | | | | | |
Dave & Buster’s Entertainment Incorporated | | | | | | | | | | | 302,658 | | | | 17,209,134 | |
Eldorado Resorts Incorporated † | | | | | | | | | | | 691,750 | | | | 30,423,165 | |
Extended Stay America Incorporated | | | | | | | | | | | 1,390,010 | | | | 25,298,182 | |
International Game Technology « | | | | | | | | | | | 1,138,045 | | | | 19,585,754 | |
| |
| | | | 92,516,235 | |
| | | | | | | | | | | | | | | | |
| | | | |
| Specialty Retail: 2.54% | | | | | | | | | | | | | | | | |
At Home Group Incorporated † | | | | | | | | | | | 546,990 | | | | 15,589,215 | |
Burlington Stores Incorporated † | | | | | | | | | | | 120,802 | | | | 20,024,140 | |
Monro Muffler Brake Incorporated | | | | | | | | | | | 181,704 | | | | 14,776,169 | |
| |
| | | | 50,389,524 | |
| | | | | | | | | | | | | | | | |
| | | | |
| Textiles, Apparel & Luxury Goods: 0.78% | | | | | | | | | | | | | | | | |
G-III Apparel Group Limited † | | | | | | | | | | | 388,967 | | | | 15,589,797 | |
| | | | | | | | | | | | | | | | |
| | | | |
Consumer Staples: 2.23% | | | | | | | | | | | | | | | | |
| | | | |
| Food & Staples Retailing: 1.26% | | | | | | | | | | | | | | | | |
Performance Food Group Company † | | | | | | | | | | | 726,749 | | | | 25,043,771 | |
| | | | | | | | | | | | | | | | |
| | | | |
| Household Products: 0.97% | | | | | | | | | | | | | | | | |
Central Garden & Pet Company Class A † | | | | | | | | | | | 621,308 | | | | 19,322,679 | |
| | | | | | | | | | | | | | | | |
| | | | |
Energy: 1.96% | | | | | | | | | | | | | | | | |
| | | | |
| Oil, Gas & Consumable Fuels: 1.96% | | | | | | | | | | | | | | | | |
Berry Petroleum Corporation | | | | | | | | | | | 528,221 | | | | 6,544,658 | |
Diamondback Energy Incorporated « | | | | | | | | | | | 52,888 | | | | 5,837,777 | |
GasLog Limited | | | | | | | | | | | 676,288 | | | | 14,039,739 | |
Parsley Energy Incorporated Class A † | | | | | | | | | | | 620,416 | | | | 12,488,974 | |
| |
| | | | 38,911,148 | |
| | | | | | | | | | | | | | | | |
The accompanying notes are an integral part of these financial statements.
| | | | | | |
| Portfolio of investments—November 30, 2018 (unaudited) | | Wells Fargo Small Company Growth Portfolio | | | 23 | |
| | | | | | | | | | | | | | | | |
| Security name | | | | | | | | Shares | | | Value | |
| | | | |
Financials: 8.26% | | | | | | | | | | | | | | | | |
| | | | |
| Banks: 1.40% | | | | | | | | | | | | | | | | |
ServisFirst Bancshares Incorporated | | | | | | | | | | | 383,691 | | | $ | 15,105,915 | |
Triumph Bancorp Incorporated † | | | | | | | | | | | 330,617 | | | | 12,656,019 | |
| |
| | | | 27,761,934 | |
| | | | | | | | | | | | | | | | |
| | | | |
| Capital Markets: 3.77% | | | | | | | | | | | | | | | | |
Evercore Partners Incorporated Class A | | | | | | | | | | | 319,055 | | | | 26,341,181 | |
Focus Financial Partners Class A † | | | | | | | | | | | 145,447 | | | | 4,497,221 | |
Stifel Financial Corporation | | | | | | | | | | | 390,803 | | | | 18,864,061 | |
Virtu Financial Incorporated Class A | | | | | | | | | | | 519,566 | | | | 13,077,476 | |
Virtus Investment Partners Incorporated | | | | | | | | | | | 127,020 | | | | 12,066,900 | |
| |
| | | | 74,846,839 | |
| | | | | | | | | | | | | | | | |
| | | | |
| Consumer Finance: 0.75% | | | | | | | | | | | | | | | | |
FirstCash Financial Services Incorporated | | | | | | | | | | | 165,860 | | | | 14,769,833 | |
| | | | | | | | | | | | | | | | |
| | | | |
| Insurance: 1.23% | | | | | | | | | | | | | | | | |
Argo Group International Holdings Limited | | | | | | | | | | | 353,036 | | | | 24,472,456 | |
| | | | | | | | | | | | | | | | |
| | | | |
| Thrifts & Mortgage Finance: 1.11% | | | | | | | | | | | | | | | | |
Essent Group Limited † | | | | | | | | | | | 573,620 | | | | 22,118,787 | |
| | | | | | | | | | | | | | | | |
| | | | |
Health Care: 25.97% | | | | | | | | | | | | | | | | |
| | | | |
| Biotechnology: 6.15% | | | | | | | | | | | | | | | | |
ACADIA Pharmaceuticals Incorporated Ǡ | | | | | | | | | | | 509,830 | | | | 9,717,360 | |
Alnylam Pharmaceuticals Incorporated † | | | | | | | | | | | 149,068 | | | | 12,098,359 | |
Array BioPharma Incorporated † | | | | | | | | | | | 833,745 | | | | 13,281,558 | |
CareDx Incorporated † | | | | | | | | | | | 421,470 | | | | 12,336,427 | |
Emergent BioSolutions Incorporated † | | | | | | | | | | | 182,790 | | | | 13,314,424 | |
Flexion Therapeutics Incorporated Ǡ | | | | | | | | | | | 580,141 | | | | 9,462,100 | |
Galapagos NV † | | | | | | | | | | | 66,089 | | | | 6,656,484 | |
Intercept Pharmaceuticals Incorporated Ǡ | | | | | | | | | | | 80,509 | | | | 8,929,253 | |
Intrexon Corporation Ǡ | | | | | | | | | | | 479,975 | | | | 4,703,755 | |
Ionis Pharmaceuticals Incorporated † | | | | | | | | | | | 200,971 | | | | 11,714,600 | |
Natera Incorporated † | | | | | | | | | | | 399,827 | | | | 6,925,004 | |
Portola Pharmaceuticals Incorporated Ǡ | | | | | | | | | | | 340,606 | | | | 7,442,241 | |
Sangamo Biosciences Incorporated Ǡ | | | | | | | | | | | 456,301 | | | | 5,644,443 | |
| |
| | | | 122,226,008 | |
| | | | | | | | | | | | | | | | |
| | | | |
| Health Care Equipment & Supplies: 9.41% | | | | | | | | | | | | | | | | |
Atricure Incorporated † | | | | | | | | | | | 500,465 | | | | 16,760,573 | |
Axogen Incorporated † | | | | | | | | | | | 281,727 | | | | 9,432,220 | |
Cerus Corporation † | | | | | | | | | | | 1,467,085 | | | | 7,702,196 | |
DexCom Incorporated † | | | | | | | | | | | 170,041 | | | | 22,035,613 | |
Glaukos Corporation † | | | | | | | | | | | 202,464 | | | | 13,338,328 | |
Inogen Incorporated † | | | | | | | | | | | 121,572 | | | | 17,914,850 | |
Merit Medical Systems Incorporated † | | | | | | | | | | | 305,452 | | | | 19,258,749 | |
Novocure Limited † | | | | | | | | | | | 378,607 | | | | 12,993,792 | |
Nuvectra Corporation † | | | | | | | | | | | 497,704 | | | | 9,939,149 | |
The accompanying notes are an integral part of these financial statements.
| | | | |
| 24 | | Wells Fargo Small Company Growth Portfolio | | Portfolio of investments—November 30, 2018 (unaudited) |
| | | | | | | | | | | | | | | | |
| Security name | | | | | | | | Shares | | | Value | |
| | | | |
| Health Care Equipment & Supplies(continued) | | | | | | | | | | | | | | | | |
OraSure Technologies Incorporated † | | | | | | | | | | | 800,567 | | | $ | 10,167,201 | |
SI-BONE Incorporated † | | | | | | | | | | | 257,699 | | | | 4,628,274 | |
Tactile Systems Technology Class I † | | | | | | | | | | | 404,047 | | | | 22,723,603 | |
Wright Medical Group NV Ǡ | | | | | | | | | | | 718,547 | | | | 20,090,574 | |
| |
| | | | 186,985,122 | |
| | | | | | | | | | | | | | | | |
| | | | |
| Health Care Providers & Services: 2.62% | | | | | | | | | | | | | | | | |
AMN Healthcare Services Incorporated † | | | | | | | | | | | 297,397 | | | | 18,944,189 | |
HealthEquity Incorporated † | | | | | | | | | | | 210,851 | | | | 18,700,375 | |
PetIQ Incorporated Ǡ | | | | | | | | | | | 463,699 | | | | 14,467,409 | |
| |
| | | | 52,111,973 | |
| | | | | | | | | | | | | | | | |
| | | | |
| Health Care Technology: 4.82% | | | | | | | | | | | | | | | | |
Allscripts Healthcare Solutions Incorporated † | | | | | | | | | | | 932,344 | | | | 9,519,232 | |
athenahealth Incorporated † | | | | | | | | | | | 97,523 | | | | 12,980,311 | |
Evolent Health Incorporated Class A Ǡ | | | | | | | | | | | 641,487 | | | | 16,486,216 | |
Medidata Solutions Incorporated † | | | | | | | | | | | 229,240 | | | | 17,699,620 | |
Tabula Rasa Healthcare Incorporated † | | | | | | | | | | | 179,975 | | | | 13,584,513 | |
Teladoc Incorporated Ǡ | | | | | | | | | | | 246,318 | | | | 15,382,559 | |
Vocera Communications Incorporated † | | | | | | | | | | | 253,145 | | | | 10,059,982 | |
| |
| | | | 95,712,433 | |
| | | | | | | | | | | | | | | | |
| | | | |
| Life Sciences Tools & Services: 2.60% | | | | | | | | | | | | | | | | |
ICON plc ADR † | | | | | | | | | | | 180,191 | | | | 26,077,242 | |
Syneos Health Incorporated † | | | | | | | | | | | 492,660 | | | | 25,480,375 | |
| |
| | | | 51,557,617 | |
| | | | | | | | | | | | | | | | |
| | | | |
| Pharmaceuticals: 0.37% | | | | | | | | | | | | | | | | |
Pacira Pharmaceuticals Incorporated † | | | | | | | | | | | 150,978 | | | | 7,296,767 | |
| | | | | | | | | | | | | | | | |
| | | | |
Industrials: 18.86% | | | | | | | | | | | | | | | | |
| | | | |
| Aerospace & Defense: 1.29% | | | | | | | | | | | | | | | | |
AAR Corporation | | | | | | | | | | | 260,688 | | | | 11,389,459 | |
Kratos Defense & Security Solutions Incorporated † | | | | | | | | | | | 1,064,071 | | | | 14,152,144 | |
| |
| | | | 25,541,603 | |
| | | | | | | | | | | | | | | | |
| | | | |
| Air Freight & Logistics: 0.63% | | | | | | | | | | | | | | | | |
Hub Group Incorporated Class A † | | | | | | | | | | | 282,319 | | | | 12,546,256 | |
| | | | | | | | | | | | | | | | |
| | | | |
| Building Products: 2.93% | | | | | | | | | | | | | | | | |
A.O. Smith Corporation | | | | | | | | | | | 428,901 | | | | 20,321,329 | |
JELD-WEN Holding Incorporated † | | | | | | | | | | | 435,177 | | | | 8,294,474 | |
Masonite International Corporation † | | | | | | | | | | | 197,029 | | | | 10,574,546 | |
NCI Building Systems Incorporated † | | | | | | | | | | | 495,287 | | | | 5,621,507 | |
PGT Incorporated † | | | | | | | | | | | 696,997 | | | | 13,431,132 | |
| |
| | | | 58,242,988 | |
| | | | | | | | | | | | | | | | |
The accompanying notes are an integral part of these financial statements.
| | | | | | |
| Portfolio of investments—November 30, 2018 (unaudited) | | Wells Fargo Small Company Growth Portfolio | | | 25 | |
| | | | | | | | | | | | | | | | |
| Security name | | | | | | | | Shares | | | Value | |
| | | | |
| Commercial Services & Supplies: 2.43% | | | | | | | | | | | | | | | | |
Copart Incorporated † | | | | | | | | | | | 550,542 | | | $ | 28,176,740 | |
KAR Auction Services Incorporated | | | | | | | | | | | 352,923 | | | | 20,166,020 | |
| |
| | | | 48,342,760 | |
| | | | | | | | | | | | | | | | |
| | | | |
| Construction & Engineering: 1.56% | | | | | | | | | | | | | | | | |
Dycom Industries Incorporated † | | | | | | | | | | | 132,817 | | | | 8,800,454 | |
Granite Construction Incorporated | | | | | | | | | | | 438,270 | | | | 22,189,610 | |
| |
| | | | 30,990,064 | |
| | | | | | | | | | | | | | | | |
| | | | |
| Electrical Equipment: 0.78% | | | | | | | | | | | | | | | | |
GrafTech International Limited | | | | | | | | | | | 981,817 | | | | 15,522,527 | |
| | | | | | | | | | | | | | | | |
| | | | |
| Machinery: 4.71% | | | | | | | | | | | | | | | | |
AGCO Corporation | | | | | | | | | | | 275,107 | | | | 16,418,386 | |
Circor International Incorporated | | | | | | | | | | | 426,144 | | | | 14,105,366 | |
Gardner Denver Holdings Incorporated † | | | | | | | | | | | 778,945 | | | | 19,278,889 | |
Gates Industrial Corporation plc † | | | | | | | | | | | 909,134 | | | | 13,391,544 | |
SPX Corporation † | | | | | | | | | | | 640,610 | | | | 18,949,244 | |
Wabash National Corporation | | | | | | | | | | | 736,405 | | | | 11,443,734 | |
| |
| | | | 93,587,163 | |
| | | | | | | | | | | | | | | | |
| | | | |
| Professional Services: 1.86% | | | | | | | | | | | | | | | | |
ASGN Incorporated † | | | | | | | | | | | 375,130 | | | | 25,977,753 | |
ICF International Incorporated | | | | | | | | | | | 155,000 | | | | 10,854,650 | |
| |
| | | | 36,832,403 | |
| | | | | | | | | | | | | | | | |
| | | | |
| Road & Rail: 2.67% | | | | | | | | | | | | | | | | |
Genesee & Wyoming Incorporated Class A † | | | | | | | | | | | 265,911 | | | | 22,145,068 | |
Knight-Swift Transportation Holdings Incorporated « | | | | | | | | | | | 390,442 | | | | 13,532,720 | |
Schneider National Incorporated Class B | | | | | | | | | | | 776,605 | | | | 17,341,590 | |
| |
| | | | 53,019,378 | |
| | | | | | | | | | | | | | | | |
| | | | |
Information Technology: 23.30% | | | | | | | | | | | | | | | | |
| | | | |
| Communications Equipment: 1.90% | | | | | | | | | | | | | | | | |
Ciena Corporation † | | | | | | | | | | | 595,130 | | | | 19,413,141 | |
Lumentum Holdings Incorporated † | | | | | | | | | | | 411,808 | | | | 18,313,102 | |
| |
| | | | 37,726,243 | |
| | | | | | | | | | | | | | | | |
| | | | |
| Electronic Equipment, Instruments & Components: 0.70% | | | | | | | | | | | | | | | | |
Tech Data Corporation † | | | | | | | | | | | 155,175 | | | | 13,957,991 | |
| | | | | | | | | | | | | | | | |
| | | | |
| IT Services: 1.39% | | | | | | | | | | | | | | | | |
LiveRamp Holdings incorporated † | | | | | | | | | | | 582,466 | | | | 27,550,642 | |
| | | | | | | | | | | | | | | | |
| | | | |
| Semiconductors & Semiconductor Equipment: 4.25% | | | | | | | | | | | | | | | | |
Axcelis Technologies Incorporated † | | | | | | | | | | | 622,577 | | | | 12,401,734 | |
Cypress Semiconductor Corporation | | | | | | | | | | | 1,604,817 | | | | 22,306,956 | |
FormFactor Incorporated † | | | | | | | | | | | 849,007 | | | | 14,000,125 | |
The accompanying notes are an integral part of these financial statements.
| | | | |
| 26 | | Wells Fargo Small Company Growth Portfolio | | Portfolio of investments—November 30, 2018 (unaudited) |
| | | | | | | | | | | | | | | | |
| Security name | | | | | | | | Shares | | | Value | |
| | | | |
| Semiconductors & Semiconductor Equipment(continued) | | | | | | | | | | | | | | | | |
Nanometrics Incorporated † | | | | | | | | | | | 230,720 | | | $ | 7,410,726 | |
Silicon Motion Technology Corporation ADR | | | | | | | | | | | 287,295 | | | | 10,305,272 | |
Teradyne Incorporated | | | | | | | | | | | 507,440 | | | | 18,110,534 | |
| |
| | | | 84,535,347 | |
| | | | | | | | | | | | | | | | |
| | | | |
| Software: 15.06% | | | | | | | | | | | | | | | | |
2U Incorporated † | | | | | | | | | | | 273,473 | | | | 15,968,088 | |
Benefitfocus Incorporated Ǡ | | | | | | | | | | | 284,255 | | | | 14,241,176 | |
Box Incorporated Class A † | | | | | | | | | | | 949,878 | | | | 17,848,208 | |
Cadence Design Systems Incorporated † | | | | | | | | | | | 513,817 | | | | 23,142,318 | |
Cloudera Incorporated Ǡ | | | | | | | | | | | 541,404 | | | | 6,680,925 | |
Cornerstone OnDemand Incorporated † | | | | | | | | | | | 401,905 | | | | 21,952,051 | |
CyberArk Software Limited † | | | | | | | | | | | 244,869 | | | | 18,154,588 | |
Hortonworks Incorporated † | | | | | | | | | | | 515,977 | | | | 8,307,230 | |
Mimecast Limited † | | | | | | | | | | | 336,245 | | | | 12,518,401 | |
New Relic Incorporated † | | | | | | | | | | | 166,057 | | | | 14,478,510 | |
Nuance Communications Incorporated † | | | | | | | | | | | 1,050,477 | | | | 16,797,127 | |
PTC Incorporated † | | | | | | | | | | | 311,553 | | | | 26,946,219 | |
RealPage Incorporated † | | | | | | | | | | | 504,512 | | | | 26,022,729 | |
SS&C Technologies Holdings Incorporated | | | | | | | | | | | 548,287 | | | | 26,400,019 | |
Talend SA ADR † | | | | | | | | | | | 166,575 | | | | 5,786,816 | |
The Ultimate Software Group Incorporated † | | | | | | | | | | | 58,642 | | | | 15,476,797 | |
Zendesk Incorporated † | | | | | | | | | | | 317,025 | | | | 18,840,796 | |
Zuora Incorporated † | | | | 503,332 | | | | 9,578,408 | |
| |
| | | | 299,140,406 | |
| | | | | | | | | | | | | | | | |
| | | | |
Materials: 3.55% | | | | | | | | | | | | | | | | |
| | | | |
| Chemicals: 1.64% | | | | | | | | | | | | | | | | |
Orion Engineered Carbons SA | | | | 587,687 | | | | 15,350,384 | |
Platform Specialty Products Corporation † | | | | 1,457,436 | | | | 17,154,022 | |
| |
| | | | 32,504,406 | |
| | | | | | | | | | | | | | | | |
| | | | |
| Construction Materials: 0.57% | | | | | | | | | | | | | | | | |
US Concrete Incorporated Ǡ | | | | 289,129 | | | | 11,371,444 | |
| | | | | | | | | | | | | | | | |
| | | | |
| Metals & Mining: 0.68% | | | | | | | | | | | | | | | | |
Steel Dynamics Incorporated | | | | 382,553 | | | | 13,465,866 | |
| | | | | | | | | | | | | | | | |
| | | | |
| Paper & Forest Products: 0.66% | | | | | | | | | | | | | | | | |
Boise Cascade Company | | | | 493,778 | | | | 13,124,619 | |
| | | | | | | | | | | | | | | | |
| | | | |
Real Estate: 0.82% | | | | | | | | | | | | | | | | |
| | | | |
| Equity REITs: 0.82% | | | | | | | | | | | | | | | | |
QTS Realty Trust Incorporated Class A | | | | 402,225 | | | | 16,326,313 | |
| | | | | | | | | | | | | | | | |
| |
Total Common Stocks (Cost $1,415,576,158) | | | | 1,906,523,736 | |
| | | | | | | | | | | | | | | | |
The accompanying notes are an integral part of these financial statements.
| | | | | | |
| Portfolio of investments—November 30, 2018 (unaudited) | | Wells Fargo Small Company Growth Portfolio | | | 27 | |
| | | | | | | | | | | | | | | | |
| Security name | | | | | Expiration date | | | Shares | | | Value | |
| | | | |
Rights: 0.00% | | | | | | | | | | | | | | | | |
| | | | |
Consumer Discretionary: 0.00% | | | | | | | | | | | | | | | | |
| | | | |
| Media: 0.00% | | | | | | | | | | | | | | | | |
Media General Incorporated †(a) | | | | | | | 12-31-2018 | | �� | | 347,897 | | | $ | 0 | |
| | | | | | | | | | | | | | | | |
| |
Total Rights (Cost $0) | | | | 0 | |
| | | | | | | | | | | | | | | | |
| | |
| | | Yield | | | | |
| Short-Term Investments: 9.12% | | | | | | | | | | | | | | | | |
| | | | |
| Investment Companies: 9.12% | | | | | | | | | | | | | | | | |
Securities Lending Cash Investments LLC (l)(r)(u) | | | 2.38 | % | | | | | | | 103,665,092 | | | | 103,675,459 | |
Wells Fargo Government Money Market Fund Select Class (l)(u) | | | 2.13 | | | | | | | | 77,472,520 | | | | 77,472,520 | |
| |
Total Short-Term Investments (Cost $181,139,512) | | | | 181,147,979 | |
| | | | | | | | | | | | | | | | |
| | | | | | | | |
| Total investments in securities (Cost $1,596,715,670) | | | 105.09 | % | | | 2,087,671,715 | |
Other assets and liabilities, net | | | (5.09 | ) | | | (101,115,828 | ) |
| | | | | | | | |
| Total net assets | | | 100.00 | % | | $ | 1,986,555,887 | |
| | | | | | | | |
| « | All or a portion of this security is on loan. |
| † | Non-income-earning security |
| (a) | The security is fair valued in accordance with procedures approved by the Board of Trustees. |
| (l) | The issuer of the security is an affiliated person of the Portfolio as defined in the Investment Company Act of 1940. |
| (r) | The investment is a non-registered investment company purchased with cash collateral received from securities on loan. |
| (u) | The rate represents the 7-day annualized yield at period end. |
Abbreviations:
| ADR | American depositary receipt |
| REIT | Real estate investment trust |
Investments in Affiliates
An affiliated investment is an investment in which the Portfolio owns at least 5% of the outstanding voting shares of the issuer or as a result of other relationships, such as the Portfolio and the issuer having the same adviser or investment manager. Transactions with issuers that were either affiliated persons of the Portfolio at the beginning of the period or the end of the period were as follows:
| | | | | | | | | | | | | | | | | | | | | | | | | | | | | | | | | | | | |
| | | Shares,
beginning of
period | | | Shares
purchased | | | Shares
sold | | | Shares,
end of
period | | | Net
realized
gains
(losses) | | | Net
change in
unrealized
gains
(losses) | | | Income
from
affiliated
securities | | | Value,
end
of period | | | % of
net
assets | |
Short-Term Investments | | | | | | | | | | | | | | | | | | | | | | | | | | | | | | | | | | | | |
Investment Companies | | | | | | | | | | | | | | | | | | | | | | | | | | | | | | | | | | | | |
Securities Lending Cash Investments LLC | | | 217,573,353 | | | | 363,958,132 | | | | 477,866,393 | | | | 103,665,092 | | | $ | 3,725 | | | $ | (4,399 | ) | | $ | 384,087 | | | $ | 103,675,459 | | | | | |
Wells Fargo Government Money Market Fund Select Class | | | 48,273,067 | | | | 451,113,402 | | | | 421,913,949 | | | | 77,472,520 | | | | 0 | | | | 0 | | | | 809,041 | | | | 77,472,520 | | | | | |
| | | | | | | | | | | | | | | | | | | | | | | | | | | | | | | | | | | | |
| | | | | | | | | | | | | | | | | | $ | 3,725 | | | $ | (4,399 | ) | | $ | 1,193,128 | | | $ | 181,147,979 | | | | 9.12 | % |
| | | | | | | | | | | | | | | | | | | | | | | | | | | | | | | | | | | | |
The accompanying notes are an integral part of these financial statements.
| | | | |
| 28 | | Wells Fargo Small Company Growth Portfolio | | Statement of assets and liabilities—November 30, 2018 (unaudited) |
| | | | |
| | | | |
| |
Assets | | | | |
Investments in unaffiliated securities (including $101,132,649 of securities loaned), at value (cost $1,415,576,158) | | $ | 1,906,523,736 | |
Investments in affiliated securities, at value (cost $181,139,512) | | | 181,147,979 | |
Receivable for investments sold | | | 11,888,851 | |
Receivable for dividends | | | 986,814 | |
Receivable for securities lending income | | | 32,421 | |
Prepaid expenses and other assets | | | 14,232 | |
| | | | |
Total assets | | | 2,100,594,033 | |
| | | | |
| |
Liabilities | | | | |
Payable upon receipt of securities loaned | | | 103,658,299 | |
Payable for investments purchased | | | 8,986,856 | |
Advisory fee payable | | | 1,317,939 | |
Accrued expenses and other liabilities | | | 75,052 | |
| | | | |
Total liabilities | | | 114,038,146 | |
| | | | |
Total net assets | | $ | 1,986,555,887 | |
| | | | |
The accompanying notes are an integral part of these financial statements.
| | | | | | |
| Statement of operations—six months ended November 30, 2018 (unaudited) | | Wells Fargo Small Company Growth Portfolio | | | 29 | |
| | | | |
| | | | |
| |
Investment income | | | | |
Dividends (net of foreign dividend withholding taxes of $50,627) | | $ | 6,087,195 | |
Income from affiliated securities | | | 809,041 | |
Securities lending income from affiliates, net | | | 384,087 | |
| | | | |
Total investment income | | | 7,280,323 | |
| | | | |
| |
Expenses | | | | |
Advisory fee | | | 8,181,488 | |
Custody and accounting fees | | | 43,093 | |
Professional fees | | | 24,562 | |
Shareholder report expenses | | | 1,003 | |
Trustees’ fees and expenses | | | 11,037 | |
Other fees and expenses | | | 12,652 | |
| | | | |
Net expenses | | | 8,273,835 | |
| | | | |
Net investment loss | | | (993,512 | ) |
| | | | |
| |
REALIZED AND UNREALIZED GAINS (LOSSES) ON INVESTMENTS | | | | |
| |
Net realized gains on: | | | | |
Unaffiliated securities | | | 132,393,856 | |
Affiliated securities | | | 3,725 | |
| | | | |
Net realized gains on investments | | | 132,397,581 | |
| | | | |
| |
Net change in unrealized gains (losses) on: | | | | |
Unaffiliated securities | | | (190,112,536 | ) |
Affiliated securities | | | (4,399 | ) |
| | | | |
Net change in unrealized gains (losses) on investments | | | (190,116,935 | ) |
| | | | |
Net realized and unrealized gains (losses) on investments | | | (57,719,354 | ) |
| | | | |
Net decrease in net assets resulting from operations | | $ | (58,712,866 | ) |
| | | | |
The accompanying notes are an integral part of these financial statements.
| | | | |
| 30 | | Wells Fargo Small Company Growth Portfolio | | Statement of changes in net assets |
| | | | | | | | |
| | | Six months ended
November 30, 2018
(unaudited) | | | Year ended
May 31, 2018 | |
| | |
Operations | | | | | | | | |
Net investment loss | | $ | (993,512 | ) | | $ | (3,185,500 | ) |
Net realized gains on investments | | | 132,397,581 | | | | 120,175,795 | |
Net change in unrealized gains (losses) on investments | | | (190,116,935 | ) | | | 344,244,383 | |
| | | | |
Net increase (decrease) in net assets resulting from operations | | | (58,712,866 | ) | | | 461,234,678 | |
| | | | |
| |
Capital transactions | | | | |
Transactions in investors’ beneficial interests | | | | | | | | |
Contributions | | | 147,344,346 | | | | 105,533,154 | |
Withdrawals | | | (110,569,303 | ) | | | (231,798,568 | ) |
| | | | |
Net increase (decrease) in net assets resulting from capital transactions | | | 36,775,043 | | | | (126,265,414 | ) |
| | | | |
Total increase (decrease) in net assets | | | (21,937,823 | ) | | | 334,969,264 | |
| | | | |
| |
Net assets | | | | |
Beginning of period | | | 2,008,493,710 | | | | 1,673,524,446 | |
| | | | |
End of period | | $ | 1,986,555,887 | | | $ | 2,008,493,710 | |
| | | | |
The accompanying notes are an integral part of these financial statements.
| | | | | | |
| Financial highlights | | Wells Fargo Small Company Growth Portfolio | | | 31 | |
| | | | | | | | | | | | | | | | | | | | | | | | |
| | | Six months ended
November 30, 2018
(unaudited) | | | Year ended May 31 | |
| | | 2018 | | | 2017 | | | 2016 | | | 2015 | | | 2014 | |
Total return¹ | | | (2.93 | )% | | | 28.74 | % | | | 18.15 | % | | | (13.86 | )% | | | 18.07 | % | | | 23.47 | % |
Ratios to average net assets (annualized) | | | | | | | | | | | | | | | | | | | | | | | | |
Gross expenses | | | 0.78 | % | | | 0.78 | % | | | 0.79 | % | | | 0.80 | % | | | 0.82 | % | | | 0.83 | % |
Net expenses | | | 0.78 | % | | | 0.78 | % | | | 0.79 | % | | | 0.80 | % | | | 0.82 | % | | | 0.83 | % |
Net investment loss | | | (0.09 | )% | | | (0.18 | )% | | | (0.14 | )% | | | (0.03 | )% | | | (0.32 | )% | | | (0.37 | )% |
Supplemental data | | | | | | | | | | | | | | | | | | | | | | | | |
Portfolio turnover rate | | | 30 | % | | | 37 | % | | | 82 | % | | | 49 | % | | | 58 | % | | | 77 | % |
| ¹ | Returns for periods of less than one year are not annualized. |
The accompanying notes are an integral part of these financial statements.
| | | | |
| 32 | | Wells Fargo Small Company Growth Portfolio | | Notes to financial statements (unaudited) |
1. ORGANIZATION
Wells Fargo Master Trust (the “Trust”), a Delaware statutory trust organized on March 10, 1999, is an open-end management investment company registered under the Investment Company Act of 1940, as amended (the “1940 Act”). As an investment company, the Trust follows the accounting and reporting guidance in Financial Accounting Standards Board (“FASB”) Accounting Standards Codification Topic 946, Financial Services – Investment Companies. These financial statements report on the Wells Fargo Small Company Growth Portfolio (the “Portfolio”) which is a diversified series of the Trust.
2. SIGNIFICANT ACCOUNTING POLICIES
The following significant accounting policies, which are consistently followed in the preparation of the financial statements of the Portfolio, are in conformity with U.S. generally accepted accounting principles which require management to make estimates and assumptions that affect the reported amounts of assets and liabilities, disclosure of contingent assets and liabilities at the date of the financial statements, and the reported amounts of revenues and expenses during the reporting period. Actual results could differ from those estimates.
Securities valuation
All investments are valued each business day as of the close of regular trading on the New York Stock Exchange (generally 4 p.m. Eastern Time), although the Portfolio may deviate from this calculation time under unusual or unexpected circumstances.
Equity securities that are listed on a foreign or domestic exchange or market are valued at the official closing price or, if none, the last sales price. If no sale occurs on the principal exchange or market that day, a fair value price will be determined in accordance with the Portfolio’s Valuation Procedures.
Investments in registered open-end investment companies are valued at net asset value. Interests in non-registered investment companies that are redeemable at net asset value are fair valued normally at net asset value.
Investments which are not valued using any of the methods discussed above are valued at their fair value, as determined in good faith by the Board of Trustees of the Portfolio. The Board of Trustees has established a Valuation Committee comprised of the Trustees and has delegated to it the authority to take any actions regarding the valuation of portfolio securities that the Valuation Committee deems necessary or appropriate, including determining the fair value of portfolio securities, unless the determination has been delegated to the Wells Fargo Asset Management Pricing Committee at Wells Fargo Funds Management, LLC (“Funds Management”). The Board of Trustees retains the authority to make or ratify any valuation decisions or approve any changes to the Valuation Procedures as it deems appropriate. On a quarterly basis, the Board of Trustees receives reports on any valuation actions taken by the Valuation Committee or the Wells Fargo Asset Management Pricing Committee which may include items for ratification.
Securities lending
The Portfolio may lend its securities from time to time in order to earn additional income in the form of fees or interest on securities received as collateral or the investment of any cash received as collateral. The Portfolio continues to receive interest or dividends on the securities loaned. The Portfolio receives collateral in the form of cash or securities with a value at least equal to the value of the securities on loan. The value of the loaned securities is determined at the close of each business day and any additional required collateral is delivered to the Portfolio on the next business day. In a securities lending transaction, the net asset value of the Portfolio will be affected by an increase or decrease in the value of the securities loaned and by an increase or decrease in the value of the instrument in which collateral is invested. The amount of securities lending activity undertaken by the Portfolio fluctuates from time to time. In the event of default or bankruptcy by the borrower, the Portfolio may be prevented from recovering the loaned securities or gaining access to the collateral or may experience delays or costs in doing so. In addition, the investment of any cash collateral received may lose all or part of its value. The Portfolio has the right under the lending agreement to recover the securities from the borrower on demand.
The Portfolio lends its securities through an unaffiliated securities lending agent. Cash collateral received in connection with its securities lending transactions is invested in Securities Lending Cash Investments, LLC (the “Securities Lending Fund”). The Securities Lending Fund is exempt from registration under Section 3(c)(7) of the 1940 Act and is managed by Funds Management and is subadvised by Wells Capital Management Incorporated (“WellsCap”), an affiliate of Funds Management and an indirect wholly owned subsidiary of Wells Fargo & Company (“Wells Fargo”). Funds Management receives an advisory fee starting at 0.05% and declining to 0.01% as the average daily net assets of the Securities Lending Fund increase. All of the fees received by Funds Management are paid to WellsCap for its services as subadviser. The
| | | | | | |
| Notes to financial statements (unaudited) | | Wells Fargo Small Company Growth Portfolio | | | 33 | |
Securities Lending Fund seeks to provide a positive return compared to the daily Fed Funds Open Rate by investing in high-quality, U.S. dollar-denominated short-term money market instruments. Securities Lending Fund investments are valued at the evaluated bid price provided by an independent pricing service. Income earned from investment in the Securities Lending Fund is included in securities lending income from affiliates (net of fees and rebates) on the Statement of Operations.
Security transactions and income recognition
Securities transactions are recorded on a trade date basis. Realized gains or losses are recorded on the basis of identified cost.
Dividend income is recognized on the ex-dividend date. Dividend income is recorded net of foreign taxes withheld where recovery of such taxes is not assured.
Federal and other taxes
The Portfolio is treated as a separate entity for federal income tax purposes. The Portfolio is not required to pay federal income taxes on its net investment income and net capital gains as it is treated as a partnership for federal income tax purposes. All interest, dividends, gains and losses of the Portfolio are deemed to have been “passed through” to the interest holders in proportion to their holdings of the Portfolio regardless of whether such interest, dividends and gains have been distributed by the Portfolio.
The Portfolio’s income tax returns and all financial records supporting those returns for the prior three fiscal years are subject to examination by the federal revenue authority. Management has analyzed the Portfolio’s tax positions taken on federal, state, and foreign tax returns for all open tax years and does not believe that there are any uncertain tax positions that require recognition of a tax liability.
As of November 30, 2018, the aggregate cost of all investments for federal income tax purposes was $1,615,904,005 and the unrealized gains (losses) consisted of:
| | | | |
Gross unrealized gains | | $ | 570,893,431 | |
Gross unrealized losses | | | (99,125,721 | ) |
Net unrealized gains | | $ | 471,767,710 | |
3. FAIR VALUATION MEASUREMENTS
Fair value measurements of investments are determined within a framework that has established a fair value hierarchy based upon the various data inputs utilized in determining the value of the Portfolio’s investments. The three-level hierarchy gives the highest priority to unadjusted quoted prices in active markets for identical assets or liabilities (Level 1) and the lowest priority to unobservable inputs (Level 3). The Portfolio’s investments are classified within the fair value hierarchy based on the lowest level of input that is significant to the fair value measurement. The inputs are summarized into three broad levels as follows:
| ∎ | | Level 1 – quoted prices in active markets for identical securities |
| ∎ | | Level 2 – other significant observable inputs (including quoted prices for similar securities, interest rates, prepayment speeds, credit risk, etc.) |
| ∎ | | Level 3 – significant unobservable inputs (including the Portfolio’s own assumptions in determining the fair value of investments) |
The inputs or methodologies used for valuing investments in securities are not necessarily an indication of the risk associated with investing in those securities.
| | | | |
| 34 | | Wells Fargo Small Company Growth Portfolio | | Notes to financial statements (unaudited) |
The following is a summary of the inputs used in valuing the Portfolio’s assets and liabilities as of November 30, 2018:
| | | | | | | | | | | | | | | | |
| | | Quoted prices
(Level 1) | | | Other significant
observable inputs
(Level 2) | | | Significant
unobservable inputs (Level 3) | | | Total | |
Assets | | | | | | | | | | | | | | | | |
Investments in: | | | | | | | | | | | | | | | | |
| | | | |
Common stocks | | | | | | | | | | | | | | | | |
Communication services | | $ | 15,559,612 | | | $ | 0 | | | $ | 0 | | | $ | 15,559,612 | |
Consumer discretionary | | | 203,498,338 | | | | 0 | | | | 0 | | | | 203,498,338 | |
Consumer staples | | | 44,366,450 | | | | 0 | | | | 0 | | | | 44,366,450 | |
Energy | | | 38,911,148 | | | | 0 | | | | 0 | | | | 38,911,148 | |
Financials | | | 163,969,849 | | | | 0 | | | | 0 | | | | 163,969,849 | |
Health care | | | 515,889,920 | | | | 0 | | | | 0 | | | | 515,889,920 | |
Industrials | | | 374,625,142 | | | | 0 | | | | 0 | | | | 374,625,142 | |
Information technology | | | 462,910,629 | | | | 0 | | | | 0 | | | | 462,910,629 | |
Materials | | | 70,466,335 | | | | 0 | | | | 0 | | | | 70,466,335 | |
Real estate | | | 16,326,313 | | | | 0 | | | | 0 | | | | 16,326,313 | |
| | | | |
Rights | | | | | | | | | | | | | | | | |
Consumer discretionary | | | 0 | | | | 0 | | | | 0 | | | | 0 | |
| | | | |
Short-term investments | | | | | | | | | | | | | | | | |
Investment companies | | | 77,472,520 | | | | 103,675,459 | | | | 0 | | | | 181,147,979 | |
Total assets | | $ | 1,983,996,256 | | | $ | 103,675,459 | | | $ | 0 | | | $ | 2,087,671,715 | |
Additional sector, industry or geographic detail is included in the Portfolio of Investments.
At November 30, 2018, the Portfolio did not have any transfers into/out of Level 3.
4. TRANSACTIONS WITH AFFILIATES AND OTHER EXPENSES
Advisory fee
The Trust has entered into an advisory contract with Funds Management, an indirect wholly owned subsidiary of Wells Fargo. The adviser is responsible for implementing investment policies and guidelines and for supervising the subadviser, who is responsible for day-to-day portfolio management of the Portfolio. Pursuant to the contract, Funds Management is entitled to receive an annual advisory fee starting at 0.80% and declining to 0.68% as the average daily net assets of the Portfolio increase. For the six months ended November 30, 2018, the advisory fee was equivalent to an annual rate of 0.77% of the Portfolio’s average daily net assets.
Funds Management has retained the services of a subadviser to provide daily portfolio management to the Portfolio. The fee for subadvisory services is borne by Funds Management. Peregrine Capital Management, LLC, which is not an affiliate of Funds Management, is the subadviser to the Portfolio and is entitled to receive a fee from Funds Management at an annual rate starting at 0.50% and declining to 0.45% as the average daily net assets of the of Portfolio increase.
Interfund transactions
The Portfolio may purchase or sell portfolio investment securities to certain other Wells Fargo affiliates pursuant to Rule 17a-7 under the 1940 Act and under procedures adopted by the Board of Trustees. The procedures have been designed to ensure that these interfund transactions, which do not incur broker commissions, are effected at current market prices.
5. INVESTMENT PORTFOLIO TRANSACTIONS
Purchases and sales of investments, excluding U.S. government obligations (if any) and short-term securities, for the six months ended November 30, 2018 were $664,274,962 and $612,332,477, respectively.
6. BANK BORROWINGS
Effective August 28, 2018, the Trust, along with Wells Fargo Variable Trust and Wells Fargo Funds Trust (excluding the money market funds), are parties to a $280,000,000 revolving credit agreement whereby the Portfolio is permitted to use bank borrowings for temporary or emergency purposes, such as to fund shareholder redemption requests. Interest under
| | | | | | |
| Notes to financial statements (unaudited) | | Wells Fargo Small Company Growth Portfolio | | | 35 | |
the credit agreement is charged to the Portfolio based on a borrowing rate equal to the higher of the Federal Funds rate in effect on that day plus 1.25% or the overnight LIBOR rate in effect on that day plus 1.25%. In addition, an annual commitment fee equal to 0.25% of the unused balance is allocated to each participating fund.
For the six months ended November 30, 2018, there were no borrowings by the Portfolio under the agreement.
7. CONCENTRATION RISK
Concentration risks result from exposure to a limited number of sectors. A portfolio that invest a substantial portion of their assets in a sector may be more affected by changes in that sector than would be a portfolio whose investments are not heavily weighted in any sector.
8. INDEMNIFICATION
Under the Trust’s organizational documents, the officers and Trustees have been granted certain indemnification rights against certain liabilities that may arise out of performance of their duties to the Trust. Additionally, in the normal course of business, the Trust may enter into contracts with service providers that contain a variety of indemnification clauses. The Trust’s maximum exposure under these arrangements is dependent on future claims that may be made against the Portfolio and, therefore, cannot be estimated.
9. NEW ACCOUNTING PRONOUNCEMENT
In August 2018, FASB issued Accounting Standards Update (“ASU”) No. 2018-13, Fair Value Measurement (Topic 820)Disclosure Framework—Changes to the Disclosure Requirements for Fair Value Measurement. ASU 2018-13 updates the disclosure requirements for fair value measurements by modifying or removing certain disclosures and adding certain new disclosures. The amendments are effective for fiscal years, and interim periods within those fiscal years, beginning after December 15, 2019. Early adoption is permitted. Management has adopted the removal and modification of disclosures early, as permitted, and will adopt the additional new disclosures at the effective date.
| | | | |
| 36 | | Wells Fargo Small Company Growth Fund | | Other information (unaudited) |
PROXY VOTING INFORMATION
A description of the policies and procedures used to determine how to vote proxies relating to portfolio securities is available, upon request, by calling1-800-222-8222, visiting our website at wellsfargofunds.com, or visiting the SEC website at sec.gov. Information regarding how the Fund voted proxies relating to portfolio securities during the most recent 12-month period ended June 30 is available on the Fund’s website atwellsfargofunds.comor by visiting the SEC website at sec.gov.
PORTFOLIO HOLDINGS INFORMATION
The complete portfolio holdings are publicly available on the website (wellsfargofunds.com) on a one-month delayed basis. In addition, top ten holdings information (excluding derivative positions) is publicly available on the website on a monthly, seven-day or more delayed basis. The Fund and the Portfolio each file their complete schedule of portfolio holdings with the SEC for the first and third quarters of each fiscal year on Form N-Q, which is available by visiting the SEC website at sec.gov. In addition, each Form N-Q may be reviewed and copied at the SEC’s Public Reference Room in Washington, DC, and at regional offices in New York City, at 233 Broadway, and in Chicago, at 175 West Jackson Boulevard, Suite 900. Information about the Public Reference Room may be obtained by calling 1-800-SEC-0330.
| | | | | | |
| Other information (unaudited) | | Wells Fargo Small Company Growth Fund | | | 37 | |
BOARD OF TRUSTEES AND OFFICERS
Each of the Trustees and Officers1 listed in the table below acts in identical capacities for each fund in the Wells Fargo family of funds, which consists of 152 mutual funds comprising the Wells Fargo Funds Trust, Wells Fargo Variable Trust, Wells Fargo Master Trust and four closed-end funds (collectively the “Fund Complex”). This table should be read in conjunction with the Prospectus and the Statement of Additional Information2. The mailing address of each Trustee and Officer is 525 Market Street, 12th Floor, San Francisco, CA 94105. Each Trustee and Officer serves an indefinite term, however, each Trustee serves such term until reaching the mandatory retirement age established by the Trustees.
Independent Trustees
| | | | | | |
Name and year of birth | | Position held and
length of service* | | Principal occupations during past five years or longer | | Current other public company or
investment company
directorships |
| William R. Ebsworth (Born 1957) | | Trustee, since 2015 | | Retired. From 1984 to 2013, equities analyst, portfolio manager, research director and chief investment officer at Fidelity Management and Research Company in Boston, Tokyo, and Hong Kong, and retired in 2013 as Chief Investment Officer of Fidelity Strategic Advisers, Inc. where he led a team of investment professionals managing client assets. Prior thereto, Board member of Hong Kong Securities Clearing Co., Hong Kong Options Clearing Corp., the Thailand International Fund, Ltd., Fidelity Investments Life Insurance Company, and Empire Fidelity Investments Life Insurance Company. Board member of the Vincent Memorial Hospital Endowment (non-profit organization), where he serves on the Investment Committee and as a Chair of the Audit Committee. Mr. Ebsworth is a CFA® charterholder. | | N/A |
| Jane A. Freeman (Born 1953) | | Trustee, since 2015; Chair Liaison, since 2018 | | Retired. From 2012 to 2014 and 1999 to 2008, Chief Financial Officer of Scientific Learning Corporation. From 2008 to 2012, Ms. Freeman provided consulting services related to strategic business projects. Prior to 1999, Portfolio Manager at Rockefeller & Co. and Scudder, Stevens & Clark. Board member of the Harding Loevner Funds from 1996 to 2014, serving as both Lead Independent Director and chair of the Audit Committee. Board member of the Russell Exchange Traded Funds Trust from 2011 to 2012 and the chair of the Audit Committee. Ms. Freeman is a Board Member of The Ruth Bancroft Garden (non-profit organization). She is also an inactive Chartered Financial Analyst. | | N/A |
Isaiah Harris, Jr.3 (Born 1952) | | Trustee, since 2009 | | Retired. Chairman of the Board of CIGNA Corporation since 2009, and Director since 2005. From 2003 to 2011, Director of Deluxe Corporation. Prior thereto, President and CEO of BellSouth Advertising and Publishing Corp. from 2005 to 2007, President and CEO of BellSouth Enterprises from 2004 to 2005 and President of BellSouth Consumer Services from 2000 to 2003. Emeritus member of the Iowa State University Foundation Board of Governors. Emeritus Member of the Advisory Board of Iowa State University School of Business. Advisory Board Member, Palm Harbor Academy (private school). Advisory Board Member, Child Evangelism Fellowship (non-profit). Mr. Harris is a certified public accountant (inactive status). | | CIGNA Corporation |
Judith M. Johnson3 (Born 1949) | | Trustee, since 2008; Audit Committee Chairman, since 2009 | | Retired. Prior thereto, Chief Executive Officer and Chief Investment Officer of Minneapolis Employees Retirement Fund from 1996 to 2008. Ms. Johnson is an attorney, certified public accountant and a certified managerial accountant. | | N/A |
David F. Larcker (Born 1950) | | Trustee, since 2009 | | James Irvin Miller Professor of Accounting at the Graduate School of Business, Stanford University, Director of the Corporate Governance Research Initiative and Senior Faculty of The Rock Center for Corporate Governance since 2006. From 2005 to 2008, Professor of Accounting at the Graduate School of Business, Stanford University. Prior thereto, Ernst & Young Professor of Accounting at The Wharton School, University of Pennsylvania from 1985 to 2005. | | N/A |
| | | | |
| 38 | | Wells Fargo Small Company Growth Fund | | Other information (unaudited) |
| | | | | | |
Name and year of birth | | Position held and
length of service* | | Principal occupations during past five years or longer | | Current other public company or
investment company
directorships |
Olivia S. Mitchell (Born 1953) | | Trustee, since 2006; Nominating and Governance Committee Chairman, since 2018 | | International Foundation of Employee Benefit Plans Professor, Wharton School of the University of Pennsylvania since 1993. Director of Wharton’s Pension Research Council and Boettner Center on Pensions & Retirement Research, and Research Associate at the National Bureau of Economic Research. Previously, Cornell University Professor from 1978 to 1993. | | N/A |
Timothy J. Penny (Born 1951) | | Trustee, since 1996; Chairman, since 2018; Vice Chairman, from 2017 to 2018 | | President and Chief Executive Officer of Southern Minnesota Initiative Foundation, a non-profit organization, since 2007. Member of the Board of Trustees of NorthStar Education Finance, Inc., a non-profit organization, since 2007. | | N/A |
James G. Polisson (Born 1959) | | Trustee, since 2018; Advisory Board Member, from 2017 to 2018 | | Retired. Chief Marketing Officer, Source (ETF) UK Services, Ltd, from 2015 to 2017. From 2012 to 2015, Principal of The Polisson Group, LLC, a management consulting, corporate advisory and principal investing company. Chief Executive Officer and Managing Director at Russell Investments, Global Exchange Traded Funds from 2010 to 2012. Managing Director of Barclays Global Investors from 1998 to 2010 and Global Chief Marketing Officer for iShares and Barclays Global Investors from 2000 to 2010. Trustee of the San Francisco Mechanics’ Institute, a non-profit organization, from 2013 to 2015. Board member of the Russell Exchange Traded Fund Trust from 2011 to 2012. Director of Barclays Global Investors Holdings Deutschland GmbH from 2006 to 2009. Mr. Polisson is an attorney and has a retired status with the Massachusetts and District of Columbia Bar Associations. | | N/A |
Michael S. Scofield4 (Born 1943) | | Trustee, since 2010 | | Served on the Investment Company Institute’s Board of Governors and Executive Committee from 2008-2011 as well the Governing Council of the Independent Directors Council from 2006-2011 and the Independent Directors Council Executive Committee from 2008-2011. Trustee of the Evergreen Fund complex (and its predecessors) from 1984 to 2010. Chairman of the Evergreen Funds from 2000-2010. Former Trustee of the Mentor Funds. Retired Attorney, Law Offices of Michael S. Scofield. | | N/A |
Pamela Wheelock (Born 1959) | | Trustee, since 2018; Advisory Board Member, from 2017 to 2018 | | Chief Operating Officer, Twin Cities Habitat for Humanity, since January, 2017. Vice President of University Services, University of Minnesota from 2012 to 2017. Prior thereto, on the Board of Directors, Governance Committee and Finance Committee for the Minnesota Philanthropy Partners (Saint Paul Foundation) from 2012 to 2018, Interim President and Chief Executive Officer of Blue Cross Blue Shield of Minnesota from 2010 to 2011, Chairman of the Board from 2009 to 2011 and Board Director from 2003 to 2015. Vice President, Leadership and Community Engagement, Bush Foundation, Saint Paul, Minnesota (a private foundation) from 2009 to 2011. Executive Vice President and Chief Financial Officer, Minnesota Sports and Entertainment from 2004 to 2009 and Senior Vice President from 2002 to 2004. Commissioner of Finance, State of Minnesota, from 1999 to 2002. Currently the Board Chair of the Minnesota Wild Foundation since 2010. | | N/A |
| * | Length of service dates reflect the Trustee’s commencement of service with the Trust’s predecessor entities, where applicable. |
| | | | | | |
| Other information (unaudited) | | Wells Fargo Small Company Growth Fund | | | 39 | |
Officers
| | | | | | |
Name and year of birth | | Position held and length of service | | Principal occupations during past five years or longer | | |
Andrew Owen (Born 1960) | | President, since 2017 | | Executive Vice President of Wells Fargo & Company and Head of Affiliated Managers, Wells Fargo Asset Management, since 2014. In addition, Mr. Owen is currently President, Chief Executive Officer and Director of Wells Fargo Funds Management, LLC since 2017. Prior thereto, Executive Vice President responsible for marketing, investments and product development for Wells Fargo Funds Management, LLC, from 2009 to 2014. | | |
Nancy Wiser1 (Born 1967) | | Treasurer, since 2012 | | Executive Vice President of Wells Fargo Funds Management, LLC since 2011. Chief Operating Officer and Chief Compliance Officer at LightBox Capital Management LLC, from 2008 to 2011. | | |
Alexander Kymn (Born 1973) | | Secretary, since 2018; Chief Legal Officer, since 2018 | | Senior Company Counsel of Wells Fargo Bank, N.A. since 2018 (previously Senior Counsel from 2007 to 2018). Vice President of Wells Fargo Funds Management, LLC from 2008 to 2014. | | |
Michael H. Whitaker (Born 1967) | | Chief Compliance Officer, since 2016 | | Senior Vice President and Chief Compliance Officer since 2016. Senior Vice President and Chief Compliance Officer for Fidelity Investments from 2007 to 2016. | | |
David Berardi (Born 1975) | | Assistant Treasurer, since 2009 | | Vice President of Wells Fargo Funds Management, LLC since 2009. Vice President of Evergreen Investment Management Company, LLC from 2008 to 2010. Manager of Fund Reporting and Control for Evergreen Investment Management Company, LLC from 2004 to 2010. | | |
Jeremy DePalma1 (Born 1974) | | Assistant Treasurer, since 2009 | | Senior Vice President of Wells Fargo Funds Management, LLC since 2009. Senior Vice President of Evergreen Investment Management Company, LLC from 2008 to 2010 and head of the Fund Reporting and Control Team within Fund Administration from 2005 to 2010. | | |
| 1 | Nancy Wiser acts as Treasurer of 76 funds in the Fund Complex. Jeremy DePalma acts as Treasurer of 76 funds and Assistant Treasurer of 76 funds in the Fund Complex. |
| 2 | The Statement of Additional Information includes additional information about the Trustees and is available, without charge, upon request, by calling1-800-222-8222 or by visiting the website atwellsfargofunds.com. |
| 3 | Mr. Harris will replace Ms. Johnson as the Chairman of the Audit Committee effective January 1, 2019. |
| 4 | Mr. Scofield is expected to retire on December 31, 2018. |
| | | | |
| 40 | | Wells Fargo Small Company Growth Fund | | Appendix A (unaudited) |
SALES CHARGE REDUCTIONS AND WAIVERS FOR CERTAIN INTERMEDIARIES
Raymond James & Associates, Inc., Raymond James Financial Services & Raymond James affiliates (“Raymond James”)
Effective on or about March 1, 2019, shareholders purchasing Fund shares through a Raymond James platform or account will be eligible only for the following load waivers (front-end sales charge waivers and contingent deferred, or back-end, sales charge waivers) and discounts, which may differ from those disclosed elsewhere in the Fund’s Prospectus or SAI.
Front-end Sales Load Waivers on Class A shares Available at Raymond James
| | • | | Shares purchased in an investment advisory program. |
| | • | | Shares purchased through reinvestment of capital gains distributions and dividend reinvestment when purchasing shares of the same fund (but not any other fund within the fund family). |
| | • | | Employees and registered representatives of Raymond James or its affiliates and their family members as designated by Raymond James. |
| | • | | Shares purchased from the proceeds of redemptions within the same fund family, provided (1) the repurchase occurs within 90 days following the redemption, (2) the redemption and purchase occur in the same account, and (3) redeemed shares were subject to a front-end or deferred sales load (known as Rights of Reinstatement). |
| | • | | A shareholder in the fund’s Class C shares will have their shares automatically exchanged at net asset value to Class A shares (or the appropriate share class) of the fund if the shares are no longer subject to a CDSC and the exchange is in line with the policies and procedures of Raymond James. |
CDSC Waivers on Class A and C Shares Available at Raymond James
| | • | | Death or disability of the shareholder. |
| | • | | Shares sold as part of a systematic withdrawal plan as described in the Fund’s Prospectus. |
| | • | | Return of excess contributions from an IRA Account. |
| | • | | Shares sold as part of a required minimum distribution for IRA and retirement accounts due to the shareholder reaching age 70½ as described in the Fund’s prospectus. |
| | • | | Shares sold to pay Raymond James fees but only if the transaction is initiated by Raymond James. |
| | • | | Shares acquired through a right of reinstatement. |
Front-end Load Discounts Available at Raymond James: Breakpoints, and/or Rights of Accumulation
| | • | | Breakpoints as described in the Fund’s Prospectus. |
| | • | | Rights of accumulation which entitle shareholders to breakpoint discounts will be automatically calculated based on the aggregated holding of fund family assets held by accounts within the purchaser’s household at Raymond James. Eligible fund family assets not held at Raymond James may be included in the rights of accumulation calculation only if the shareholder notifies his or her financial advisor about such assets. |

For more information
More information about Wells Fargo Funds is available free upon request. To obtain literature, please write, visit the Fund’s website, or call:
Wells Fargo Funds
P.O. Box 219967
Kansas City, MO 64121-9967
Website: wellsfargofunds.com
Individual investors: 1-800-222-8222
Retail investment professionals: 1-888-877-9275
Institutional investment professionals:1-866-765-0778
This report and the financial statements contained herein are submitted for the general information of the shareholders of the Fund. If this report is used for promotional purposes, distribution of the report must be accompanied or preceded by a current prospectus. Before investing, please consider the investment objectives, risks, charges, and expenses of the investment. For a current prospectus and, if available, a summary prospectus, containing this information, call1-800-222-8222 or visit the Fund’s website atwellsfargofunds.com. Read the prospectus carefully before you invest or send money.
Wells Fargo Asset Management (WFAM) is the trade name for certain investment advisory/management firms owned by Wells Fargo & Company. These firms include but are not limited to Wells Capital Management Incorporated and Wells Fargo Funds Management, LLC. Certain products managed by WFAM entities are distributed by Wells Fargo Funds Distributor, LLC (a broker/dealer and Member FINRA).
This material is for general informational and educational purposes only and is NOT intended to provide investment advice or a recommendation of any kind—including a recommendation for any specific investment, strategy, or plan.
INVESTMENT PRODUCTS: NOT FDIC INSURED ◾ NO BANK GUARANTEE ◾ MAY LOSE VALUE
© 2019 Wells Fargo Funds Management, LLC. All rights reserved.
| | |
 | | 318979 01-19 SA285/SAR285 11-18 |
Semi-Annual Report
November 30, 2018

Small Company Value Fund

Beginning on January 1, 2021, as permitted by new regulations adopted by the Securities and Exchange Commission, paper copies of the Wells Fargo Funds’ annual and semi-annual shareholder reports issued after this date will no longer be sent by mail, unless you specifically request paper copies of the reports. Instead, the reports will be made available on the Funds’ website, and you will be notified by mail each time a report is posted and provided with a website address to access the report.
If you already elected to receive shareholder reports electronically, you will not be affected by this change and you need not take any action. You may elect to receive shareholder reports and other communications from the Fund electronically at any time by contacting your financial intermediary (such as a broker-dealer or bank) or, if you are a direct investor, by calling 1-800-222-8222 or by enrolling at wellsfargo.com/advantagedelivery.
You may elect to receive all future reports in paper free of charge. If you invest through a financial intermediary, you can contact your financial intermediary to request that you continue to receive paper copies of your shareholder reports; if you invest directly with the Fund, you can call 1-800-222-8222. Your election to receive reports in paper will apply to all Wells Fargo Funds held in your account with your financial intermediary or, if you are a direct investor, to all Wells Fargo Funds that you hold.

Reduce clutter. Save trees.
Sign up for electronic delivery of prospectuses and shareholder reports atwellsfargo.com/advantagedelivery
Contents
The views expressed and any forward-looking statements are as of November 30, 2018, unless otherwise noted, and are those of the Fund managers and/or Wells Fargo Funds Management, LLC. Discussions of individual securities, or the markets generally, or any Wells Fargo Fund are not intended as individual recommendations. Future events or results may vary significantly from those expressed in any forward-looking statements. The views expressed are subject to change at any time in response to changing circumstances in the market. Wells Fargo Funds Management, LLC and the Fund disclaim any obligation to publicly update or revise any views expressed or forward-looking statements.
INVESTMENT PRODUCTS: NOT FDIC INSURED ◾ NO BANK GUARANTEE ◾ MAY LOSE VALUE
| | | | |
| 2 | | Wells Fargo Small Company Value Fund | | Letter to shareholders (unaudited) |

Andrew Owen
President
Wells Fargo Funds
Global trade tensions escalated during the third quarter of 2018.
Dear Shareholder:
We are pleased to offer you this semi-annual report for the Wells Fargo Small Company Value Fund for thesix-month period that ended November 30, 2018. During the reporting period, the U.S. generated encouraging economic and business data that was offset by less positive and more inconsistent data from international markets. Investment returns were restrained in comparison with recent periods as geopolitical tensions and uncertainty tended to distract investors from more favorable underlying trends.
For the period, U.S. stocks, as measured by the S&P 500 Index,1 gained 3.02% and international stocks, as measured by the MSCI ACWI ex USA Index (Net),2 declined 8.37%. Based on the MSCI EM Index (Net),3 emerging market stocks lost 9.89%. For bond investors, the Bloomberg Barclays U.S. Aggregate Bond Index4 declined 0.30% while the Bloomberg Barclays Global Aggregateex-USD Index5 fell 3.67%. The Bloomberg Barclays Municipal Bond Index6 gained 0.42%. The ICE BofAML U.S. High Yield Index7 was up 0.19%.
Global trade tensions prompted investor concerns.
Global trade tensions escalated during the third quarter of 2018. The U.S. government’s decision during the second quarter to impose tariffs on a wide range of products manufactured overseas drew retaliatory responses from foreign governments, which punished U.S. commodity producers and product manufacturers. Investors were left to wonder about next steps in what appeared to be an escalating divergence in global economic policies and growth prospects.
Inflation trended higher. TheCPI-U8 added 0.1% in September after an increase of 0.2% in both July and August. On a year-over-year basis, theall-items index rose 2.3% for the 12 months that ended September 30, 2018, after a seasonal adjustment. The rate of increase was slower than that recorded during the first half of 2018. The index for all items less food and energy rose 2.2% for the same12-month period.
| 1 | The S&P 500 Index consists of 500 stocks chosen for market size, liquidity, and industry group representation. It is a market-value-weighted index with each stock’s weight in the index proportionate to its market value. You cannot invest directly in an index. |
| 2 | The Morgan Stanley Capital International (MSCI) All Country World Index (ACWI) ex USA Index (Net) is a free-float-adjusted market-capitalization-weighted index that is designed to measure the equity market performance of developed markets, excluding the U.S. and Canada. Source: MSCI. MSCI makes no express or implied warranties or representations and shall have no liability whatsoever with respect to any MSCI data contained herein. The MSCI data may not be further redistributed or used as a basis for other indices or any securities or financial products. This report is not approved, reviewed, or produced by MSCI. You cannot invest directly in an index. |
| 3 | The MSCI Emerging Markets (EM) Index (Net) is a free-float-adjusted market-capitalization-weighted index that is designed to measure large- andmid-cap equity market performance of emerging markets. The MSCI EM Index (Net) consists of the following 24 emerging market country indices: Brazil, Chile, China, Colombia, Czech Republic, Egypt, Greece, Hungary, India, Indonesia, Korea, Malaysia, Mexico, Pakistan, Peru, the Philippines, Poland, Qatar, Russia, South Africa, Taiwan, Thailand, Turkey, and the United Arab Emirates. You cannot invest directly in an index. |
| 4 | The Bloomberg Barclays U.S. Aggregate Bond Index is a broad-based benchmark that measures the investment-grade, U.S.-dollar-denominated, fixed-rate taxable bond market, including Treasuries, government-related and corporate securities, mortgage-backed securities (agency fixed-rate and hybrid adjustable-rate mortgage pass-throughs), asset-backed securities, and commercial mortgage-backed securities. You cannot invest directly in an index. |
| 5 | The Bloomberg Barclays Global Aggregateex-USD Index is an unmanaged index that provides a broad-based measure of the global investment-grade fixed-income markets excluding the U.S.-dollar-denominated debt market. You cannot invest directly in an index. |
| 6 | The Bloomberg Barclays Municipal Bond Index is an unmanaged index composed of long-termtax-exempt bonds with a minimum credit rating of Baa. You cannot invest directly in an index. |
| 7 | The ICE BofAML U.S. High Yield Index is a market-capitalization-weighted index of domestic and Yankee high-yield bonds. The index tracks the performance of high-yield securities traded in the U.S. bond market. You cannot invest directly in an index. Copyright 2018. ICE Data Indices, LLC. All rights reserved. |
| 8 | The Consumer Price Index for All Urban Consumers(CPI-U) measures the changes in the price of a basket of goods and services purchased by urban consumers. The urban consumer population is deemed by many as a better representative measure of the general public because close to 90% of the country’s population lives in highly populated areas. You cannot invest directly in an index. |
| | | | | | |
| Letter to shareholders (unaudited) | | Wells Fargo Small Company Value Fund | | | 3 | |
U.S. stocks gained following positive economic data while international stocks and bonds declined.
During the summer months, the U.S. economy strengthened. Revised second-quarter gross domestic product (GDP) data released in August showed the U.S. economy growing at a 4.2% rate. The unemployment rate in the U.S. was 3.7% by the end of September, according to the U.S. Department of Labor. Wages showed more consistent growth, and consumer confidence remained strong. Several U.S. equity market indices reached records during August, with the S&P 500 Index gaining 7.20% for the three-month period that ended September 30, 2018. In contrast, the MSCI ACWI ex USA Index (Net) gained 0.71% while the MSCI EM Index (Net) declined 1.09% during the same three-month period.
In June, the Federal Reserve increased the target range for the federal funds rate to range from 1.75% to 2.00%. It raised the range again in September to range from 2.00% to 2.25%. Long-term interest rates in the U.S. remained at higher levels relative to the prior 10 years. Rates on10-year and30-year Treasury bonds—2.46% and 2.81%, respectively, on January 1, 2018—were 3.01% and 3.30%, respectively, on November 30, 2018. Investor concerns about an inverted yield curve reemerged, only to be replaced by concerns about the potentially negative influence of higher interest rates on economic activity.
November saw improvement in many equity markets.
As interest rates and bond yields gained during October, stock markets struggled. For the month, the S&P 500 Index fell 6.84%, the MSCI ACWI ex USA Index (Net) dropped 8.13%, and the MSCI EM Index (Net) lost 8.71%. The Bureau of Economic Analysis released its first estimate of third-quarter GDP, which, at an annualized 3.5% rate, indicated growth may be slowing compared with the second quarter. Readings on consumer sentiment and business spending were mixed. Markets rebounded somewhat in November as the S&P 500 Index gained 2.04%, the MSCI ACWI ex USA Index (Net) added 0.95%, and the MSCI EM Index (Net) was up 4.12% as the uncertainty leading up to midterm elections in the U.S. was resolved and progress seemed to be possible on several international trade issues.
Economic signals overseas were mixed as the third quarter ended and the fourth quarter began. In early August, the Bank of England’s Monetary Policy Committee increased its key interest rate to 0.75%. The European Central Bank and the Bank of Japan maintained low interest rates and accommodative monetary policies. Amid rising trade uncertainty, the People’s Bank of China cut reserve requirement ratios and accelerated infrastructure spending and tax cuts for business enterprises and individuals. Nevertheless, a strengthening U.S. dollar and the trade tensions remained headwinds for investors overseas.
Don’t let short-term uncertainty derail long-term investment goals.
Periods of investment uncertainty can present challenges, but experience has taught us that maintaining long-term investment goals can be an effective way to plan for the future. To help you create a sound strategy based on your personal goals and risk tolerance, Wells Fargo Funds offers more than 100 mutual funds spanning a wide range of asset classes and investment styles. Although diversification cannot guarantee an investment profit or prevent losses, we believe it can be an effective way to manage investment risk and potentially smooth out overall portfolio performance. We encourage investors to know their investments and to understand that appropriate levels of risk-taking may unlock opportunities.
Economic signals overseas were mixed as the third quarter ended and the fourth quarter began.
| | | | |
| 4 | | Wells Fargo Small Company Value Fund | | Letter to shareholders (unaudited) |
Thank you for choosing to invest with Wells Fargo Funds. We appreciate your confidence in us and remain committed to helping you meet your financial needs.
Sincerely,

Andrew Owen
President
Wells Fargo Funds
Notice to shareholders
At a meeting held on August 14-15, 2018, the Board of Trustees of the Fund approved the following policy which will be effective on or about February 5, 2019:
Class C shares will convert automatically into Class A shares ten years after the initial date of purchase or, if you acquired your Class C shares through an exchange or conversion from another share class, ten years after the date you acquired your Class C shares. When Class C shares that you acquired through a purchase or exchange convert, any other Class C shares that you purchased with reinvested dividends and distributions also will convert into Class A shares on a pro rata basis. A shorter holding period may also apply depending on your intermediary. Please see “Appendix A—Sales Charge Reductions and Waivers for Certain Intermediaries” in the Fund’s prospectus or at the end of this report.
For further information about your Fund, contact your investment professional, visit our website atwellsfargofunds.com, or call us directly at1-800-222-8222.
This page is intentionally left blank.
| | | | |
| 6 | | Wells Fargo Small Company Value Fund1 | | Performance highlights (unaudited) |
Investment objective
The Fund seeks long-term capital appreciation.
Manager
Wells Fargo Funds Management, LLC
Subadviser for the affiliated master portfolio
Wells Capital Management Incorporated
Portfolio managers
Jeff Goverman
Garth R. Nisbet, CFA®‡
Craig Pieringer, CFA®‡
Average annual total returns (%) as of November 30, 20182
| | | | | | | | | | | | | | | | | | | | | | | | | | | | | | | | | | |
| | | | | Including sales charge | | | Excluding sales charge | | | Expense ratios3 (%) | |
| | | Inception date | | 1 year | | | 5 year | | | 10 year | | | 1 year | | | 5 year | | | 10 year | | | Gross | | | Net4 | |
| Class A (SCVAX) | | 1-31-2002 | | | (8.24 | ) | | | 4.92 | | | | 14.32 | | | | (2.64 | ) | | | 6.17 | | | | 15.00 | | | | 1.46 | | | | 1.15 | |
| Class C (SCVFX) | | 8-30-2002 | | | (4.39 | ) | | | 5.37 | | | | 14.15 | | | | (3.39 | ) | | | 5.37 | | | | 14.15 | | | | 2.21 | | | | 1.90 | |
| Class R6 (SCVJX) | | 10-31-2016 | | | – | | | | – | | | | – | | | | (2.24 | ) | | | 6.50 | | | | 15.35 | | | | 1.03 | | | | 0.75 | |
| Administrator Class (SCVIX) | | 1-31-2002 | | | – | | | | – | | | | – | | | | (2.53 | ) | | | 6.34 | | | | 15.25 | | | | 1.38 | | | | 1.05 | |
| Institutional Class (SCVNX) | | 7-30-2010 | | | – | | | | – | | | | – | | | | (2.29 | ) | | | 6.55 | | | | 15.44 | | | | 1.13 | | | | 0.85 | |
| Russell 2000® Value Index5 | | – | | | – | | | | – | | | | – | | | | (1.83 | ) | | | 6.71 | | | | 12.50 | | | | – | | | | – | |
Figures quoted represent past performance, which is no guarantee of future results, and do not reflect taxes that a shareholder may pay on fund distributions or the redemption of fund shares. Investment return and principal value of an investment will fluctuate so that an investor’s shares, when redeemed, may be worth more or less than their original cost. Performance shown without sales charges would be lower if sales charges were reflected. Current performance may be lower or higher than the performance data quoted, which assumes the reinvestment of dividends and capital gains. Currentmonth-end performance is available on the Fund’s website, wellsfargofunds.com.
Index returns do not include transaction costs associated with buying and selling securities, any mutual fund fees or expenses, or any taxes. It is not possible to invest directly in an index.
For Class A shares, the maximumfront-end sales charge is 5.75%. For Class C shares, the maximum contingent deferred sales charge is 1.00%. Performance including a contingent deferred sales charge assumes the sales charge for the corresponding time period. Class R6, Administrator Class, and Institutional Class shares are sold without afront-end sales charge or contingent deferred sales charge.
Stock values fluctuate in response to the activities of individual companies and general market and economic conditions. Smaller-company stocks tend to be more volatile and less liquid than those of larger companies. Certain investment strategies tend to increase the total risk of an investment (relative to the broader market). Consult the Fund’s prospectus for additional information on these and other risks.
Please see footnotes on page 7.
| | | | | | |
| Performance highlights (unaudited) | | Wells Fargo Small Company Value Fund | | | 7 | |
| | | | |
| Ten largest holdings (%) as of November 30, 20186 | |
Hawaiian Electric Industries Incorporated | | | 1.34 | |
CareTrust REIT Incorporated | | | 1.24 | |
Armada Hoffler Properties Incorporated | | | 1.19 | |
Independence Realty Trust Incorporated | | | 1.19 | |
CBIZ Incorporated | | | 1.17 | |
EnerSys | | | 1.13 | |
Potlatch Corporation | | | 1.12 | |
State Auto Financial Corporation | | | 1.07 | |
Agree Realty Corporation | | | 1.05 | |
Royal Gold Incorporated | | | 1.05 | |
|
| Sector distribution as of November 30, 20187 |
|
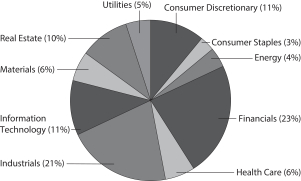
|
| ‡ | CFA® and Chartered Financial Analyst® are trademarks owned by CFA Institute. |
| 1 | The Fund is a gateway feeder fund that invests substantially all of its assets in a single affiliated master portfolio of the Wells Fargo Master Trust with a substantially identical investment objective and substantially similar investment strategies. References to the investment activities of the Fund are intended to refer to the investment activities of the affiliated master portfolio in which it invests. |
| 2 | Historical performance shown for the Class R6 shares prior to their inception reflects the performance of the Institutional Class shares and includes the higher expenses applicable to Institutional Class shares. If these expenses had been included, returns for Class R6 shares would be higher. Historical performance shown for Institutional Class shares prior to their inception reflects the performance of Administrator Class shares and includes the higher expenses applicable to Administrator Class shares. If these expenses had not been included, returns for Institutional Class shares would be higher. |
| 3 | Reflects the expense ratios as stated in the most recent prospectuses. The expense ratios shown are subject to change and may differ from the annualized expense ratios shown in the financial highlights of this report. |
| 4 | The manager has contractually committed through September 30, 2019 to waive fees and/or reimburse expenses to the extent necessary to cap the Fund’s Total Annual Fund Operating Expenses After Fee Waivers at the amounts shown. After this time, the cap may be increased or the commitment to maintain the cap may be terminated only with the approval of the Board of Trustees. Brokerage commissions, stamp duty fees, interest, taxes, acquired fund fees and expenses from funds in which the affiliated master portfolio invests (if any), and extraordinary expenses are excluded from the expense cap. Net expenses from the affiliated master portfolio are included in the expense cap. Without this cap, the Fund’s returns would have been lower. The expense ratio paid by an investor is the net expense ratio (the total annual fund operating expenses after fee waivers) as stated in the prospectuses. |
| 5 | The Russell 2000® Value Index measures the performance of those Russell 2000 companies with lower price/book ratios and lower forecasted growth values. You cannot invest directly in an index. |
| 6 | The ten largest holdings, excluding cash, cash equivalents and any money market funds, are calculated based on the value of the securities of the affiliated master portfolio allocable to the Fund divided by the total net assets of the Fund. Holdings are subject to change and may have changed since the date specified. |
| 7 | Amounts represent the sector distribution of the affiliated master portfolio which are calculated based on the total long-term investments of the affiliated master portfolio. These amounts are subject to change and may have changed since the date specified. |
| | | | |
| 8 | | Wells Fargo Small Company Value Fund | | Fund expenses (unaudited) |
As a shareholder of the Fund, you incur two types of costs: (1) transaction costs, including sales charges (loads) on purchase payments and contingent deferred sales charges (if any) on redemptions and (2) ongoing costs, including management fees, distribution(12b-1) and/or shareholder servicing fees, and other Fund expenses. This example is intended to help you understand your ongoing costs (in dollars) of investing in the Fund and to compare these costs with the ongoing costs of investing in other mutual funds.
The example is based on an investment of $1,000 invested at the beginning of thesix-month period and held for the entire period from June 1, 2018 to November 30, 2018.
Actual expenses
The “Actual” line of the table below provides information about actual account values and actual expenses. You may use the information in this line, together with the amount you invested, to estimate the expenses that you paid over the period. Simply divide your account value by $1,000 (for example, an $8,600 account value divided by $1,000 = 8.6), then multiply the result by the number in the “Actual” line under the heading entitled “Expenses paid during period” for your applicable class of shares to estimate the expenses you paid on your account during this period.
Hypothetical example for comparison purposes
The “Hypothetical” line of the table below provides information about hypothetical account values and hypothetical expenses based on the Fund’s actual expense ratio and an assumed rate of return of 5% per year before expenses, which is not the Fund’s actual return. The hypothetical account values and expenses may not be used to estimate the actual ending account balance or expenses you paid for the period. You may use this information to compare the ongoing costs of investing in the Fund and other funds. To do so, compare this 5% hypothetical example with the 5% hypothetical examples that appear in the shareholder reports of the other funds.
Please note that the expenses shown in the table are meant to highlight your ongoing costs only and do not reflect any transactional costs, such as sales charges (loads) and contingent deferred sales charges. Therefore, the “Hypothetical” line of the table is useful in comparing ongoing costs only and will not help you determine the relative total costs of owning different funds. In addition, if these transactional costs were included, your costs would have been higher.
| | | | | | | | | | | | | | | | |
| | | Beginning
account value
6-1-2018 | | | Ending
account value
11-30-2018 | | | Expenses
paid during
the period1,2 | | | Annualized net
expense ratio1 | |
Class A | | | | | | | | | | | | | | | | |
Actual | | $ | 1,000.00 | | | $ | 925.17 | | | $ | 5.55 | | | | 1.15 | % |
Hypothetical (5% return before expenses) | | $ | 1,000.00 | | | $ | 1,019.30 | | | $ | 5.82 | | | | 1.15 | % |
Class C | | | | | | | | | | | | | | | | |
Actual | | $ | 1,000.00 | | | $ | 921.20 | | | $ | 9.15 | | | | 1.90 | % |
Hypothetical (5% return before expenses) | | $ | 1,000.00 | | | $ | 1,015.54 | | | $ | 9.60 | | | | 1.90 | % |
Class R6 | | | | | | | | | | | | | | | | |
Actual | | $ | 1,000.00 | | | $ | 926.63 | | | $ | 3.62 | | | | 0.75 | % |
Hypothetical (5% return before expenses) | | $ | 1,000.00 | | | $ | 1,021.31 | | | $ | 3.80 | | | | 0.75 | % |
Administrator Class | | | | | | | | | | | | | | | | |
Actual | | $ | 1,000.00 | | | $ | 925.42 | | | $ | 5.07 | | | | 1.05 | % |
Hypothetical (5% return before expenses) | | $ | 1,000.00 | | | $ | 1,019.80 | | | $ | 5.32 | | | | 1.05 | % |
Institutional Class | | | | | | | | | | | | | | | | |
Actual | | $ | 1,000.00 | | | $ | 926.53 | | | $ | 4.11 | | | | 0.85 | % |
Hypothetical (5% return before expenses) | | $ | 1,000.00 | | | $ | 1,020.81 | | | $ | 4.31 | | | | 0.85 | % |
| 1 | Amounts reflect net expenses allocated from the affiliated Master Portfolio in which the Fund invests. |
| 2 | Expenses paid is equal to the annualized net expense ratio of each class multiplied by the average account value over the period, multiplied by the number of days in the most recent fiscal half-year divided by the number of days in the fiscal year (to reflect theone-half-year period). |
| | | | | | |
| Portfolio of investments—November 30, 2018 (unaudited) | | Wells Fargo Small Company Value Fund | | | 9 | |
| | | | | | | | | | | | | | | | |
| Security name | | | | | | | | | | | Value | |
| | | | |
Investment Companies: 99.11% | | | | | | | | | | | | | | | | |
| | | | |
| Affiliated Master Portfolio: 99.11% | | | | | | | | | | | | | | | | |
Wells Fargo Small Company Value Portfolio | | | | | | | | | | | | | | $ | 82,862,034 | |
| | | | | | | | | | | | | | | | |
| | | | |
Total Investment Companies (Cost $88,928,679) | | | | | | | | | | | | | | | 82,862,034 | |
| | | | | | | | | | | | | | | | |
| | | | | | | | |
| Total investments in securities (Cost $88,928,679) | | | 99.11 | % | | | 82,862,034 | |
Other assets and liabilities, net | | | 0.89 | | | | 740,493 | |
| | | | | | | | |
| Total net assets | | | 100.00 | % | | $ | 83,602,527 | |
| | | | | | | | |
Transactions with the affiliated Master Portfolio were as follows:
| | | | | | | | | | | | | | | | | | | | | | | | | | | | | | | | | | | | |
| | | % of
ownership,
beginning of
period | | | % of
ownership,
end of
period | | | Net
realized
gains
(losses) on
securities
transactions
allocated
from
affiliated
Master
Portfolio | | | Net
change in
unrealized
gains
(losses) on
securities
transactions
allocated
from
affiliated
Master
Portfolio | | | Dividends
allocated
from
affiliated
Master
Portfolio | | | Securities
lending
income
allocated
from
affiliated
Master
Portfolio | | | Affiliated
income
allocated
from
affiliated
Master
Portfolio | | | Value,
end
of period | | | % of
net
assets | |
Wells Fargo Small Company Value Portfolio | | | 87 | % | | | 48 | % | | $ | (5,181,839 | ) | | $ | (3,772,725 | ) | | $ | 909,176 | | | $ | 49,609 | | | $ | 11,827 | | | $ | 82,862,034 | | | | 99.11 | % |
The accompanying notes are an integral part of these financial statements.
| | | | |
| 10 | | Wells Fargo Small Company Value Fund | | Statement of assets and liabilities—November 30, 2018 (unaudited) |
| | | | |
| | | | |
| |
Assets | | | | |
Investments in affiliated Master Portfolio, at value (cost $88,928,679) | | $ | 82,862,034 | |
Receivable for Fund shares sold | | | 641,133 | |
Receivable from manager | | | 17,224 | |
Prepaid expenses and other assets | | | 146,563 | |
| | | | |
Total assets | | | 83,666,954 | |
| | | | |
| |
Liabilities | | | | |
Payable for Fund shares redeemed | | | 33,454 | |
Administration fees payable | | | 11,721 | |
Shareholder servicing fees payable | | | 9,077 | |
Custodian and accounting fees payable | | | 6,893 | |
Trustees’ fees and expenses payable | | | 2,070 | |
Distribution fee payable | | | 1,212 | |
| | | | |
Total liabilities | | | 64,427 | |
| | | | |
Total net assets | | $ | 83,602,527 | |
| | | | |
| |
NET ASSETS CONSIST OF | | | | |
Paid-in capital | | $ | 98,760,807 | |
Total distributable loss | | | (15,158,280 | ) |
| | | | |
Total net assets | | $ | 83,602,527 | |
| | | | |
| |
COMPUTATION OF NET ASSET VALUE AND OFFERING PRICE PER SHARE | | | | |
Net assets – Class A | | $ | 13,196,997 | |
Shares outstanding – Class A1 | | | 498,827 | |
Net asset value per share – Class A | | | $26.46 | |
Maximum offering price per share – Class A2 | | | $28.07 | |
Net assets – Class C | | $ | 1,834,019 | |
Shares outstanding – Class C1 | | | 78,429 | |
Net asset value per share – Class C | | | $23.38 | |
Net assets – Class R6 | | $ | 463,673 | |
Shares outstanding – Class R61 | | | 16,996 | |
Net asset value per share – Class R6 | | | $27.28 | |
Net assets – Administrator Class | | $ | 15,225,471 | |
Shares outstanding – Administrator Class1 | | | 562,953 | |
Net asset value per share – Administrator Class | | | $27.05 | |
Net assets – Institutional Class | | $ | 52,882,367 | |
Shares outstanding – Institutional Class1 | | | 1,941,584 | |
Net asset value per share – Institutional Class | | | $27.24 | |
| 1 | The Fund has an unlimited number of authorized shares. |
| 2 | Maximum offering price is computed as 100/94.25 of net asset value. On investments of $50,000 or more, the offering price is reduced. |
The accompanying notes are an integral part of these financial statements.
| | | | | | |
| Statement of operations—six months ended November 30, 2018 (unaudited) | | Wells Fargo Small Company Value Fund | | | 11 | |
| | | | |
| | | | |
| |
Investment income | | | | |
Dividends allocated from affiliated Master Portfolio (net of foreign withholding taxes of $891) | | $ | 909,176 | |
Securities lending income allocated from affiliated Master Portfolio | | | 49,609 | |
Affiliated income allocated from affiliated Master Portfolio | | | 11,827 | |
Expenses allocated from affiliated Master Portfolio | | | (523,645 | ) |
Waivers allocated from affiliated Master Portfolio | | | 59,005 | |
| | | | |
Total investment income | | | 505,972 | |
| | | | |
| |
Expenses | | | | |
Management fee | | | 30,974 | |
Administration fees | | | | |
Class A | | | 15,490 | |
Class C | | | 2,080 | |
Class R6 | | | 66 | |
Administrator Class | | | 30,298 | |
Institutional Class | | | 39,073 | |
Shareholder servicing fees | | | | |
Class A | | | 18,440 | |
Class C | | | 2,476 | |
Administrator Class | | | 58,060 | |
Distribution fee | | | | |
Class C | | | 7,427 | |
Custody and accounting fees | | | 6,104 | |
Professional fees | | | 13,746 | |
Registration fees | | | 36,097 | |
Shareholder report expenses | | | 5,613 | |
Trustees’ fees and expenses | | | 11,201 | |
Other fees and expenses | | | 4,539 | |
| | | | |
Total expenses | | | 281,684 | |
Less: Fee waivers and/or expense reimbursements | | | (139,786 | ) |
| | | | |
Net expenses | | | 141,898 | |
| | | | |
Net investment income | | | 364,074 | |
| | | | |
| |
REALIZED AND UNREALIZED GAINS (LOSSES) ON INVESTMENTS | | | | |
Net realized losses on securities transactions allocated from affiliated Master Portfolio | | | (5,181,839 | ) |
Net change in unrealized gains (losses) on securities transactions allocated from affiliated Master Portfolio | | | (3,772,725 | ) |
| | | | |
Net realized and unrealized gains (losses) on investments | | | (8,954,564 | ) |
| | | | |
Net decrease in net assets resulting from operations | | $ | (8,590,490 | ) |
| | | | |
The accompanying notes are an integral part of these financial statements.
| | | | |
| 12 | | Wells Fargo Small Company Value Fund | | Statement of changes in net assets |
| | | | | | | | | | | | | | | | |
| | | Six months ended
November 30, 2018
(unaudited) | | | Year ended
May 31, 20181 | |
| | | | |
Operations | | | | | | | | | | | | | | | | |
Net investment income | | | | | | $ | 364,074 | | | | | | | $ | 872,024 | |
Net realized gains (losses) on investments | | | | | | | (5,181,839 | ) | | | | | | | 41,508,619 | |
Net change in unrealized gains (losses) on investments | | | | | | | (3,772,725 | ) | | | | | | | (18,058,560 | ) |
| | | | |
Net increase (decrease) in net assets resulting from operations | | | | | | | (8,590,490 | ) | | | | | | | 24,322,083 | |
| | | | |
| | | | |
Distributions to shareholders from net investment income and net realized gains | | | | | | | | | | | | | | | | |
Class A | | | | | | | 0 | | | | | | | | (52,718 | ) |
Class R6 | | | | | | | 0 | | | | | | | | (2,568 | ) |
Administrator Class | | | | | | | 0 | | | | | | | | (283,478 | ) |
Institutional Class | | | | | | | 0 | | | | | | | | (383,137 | ) |
| | | | |
Total distributions to shareholders | | | | | | | 0 | | | | | | | | (721,901 | ) |
| | | | |
| | | | |
Capital share transactions | | | Shares | | | | | | | | Shares | | | | | |
Proceeds from shares sold | | | | | | | | | | | | | | | | |
Class A | | | 44,620 | | | | 1,284,047 | | | | 60,419 | | | | 1,605,930 | |
Class C | | | 5,317 | | | | 137,283 | | | | 14,660 | | | | 329,415 | |
Class R6 | | | 10,495 | | | | 307,465 | | | | 15,174 | | | | 412,649 | |
Administrator Class | | | 100,747 | | | | 2,997,805 | | | | 100,581 | | | | 2,701,458 | |
Institutional Class | | | 624,291 | | | | 18,319,092 | | | | 431,742 | | | | 11,786,334 | |
| | | | |
| | | | | | | 23,045,692 | | | | | | | | 16,835,786 | |
| | | | |
Reinvestment of distributions | | | | | | | | | | | | | | | | |
Class A | | | 0 | | | | 0 | | | | 1,785 | | | | 48,755 | |
Class R6 | | | 0 | | | | 0 | | | | 84 | | | | 2,350 | |
Administrator Class | | | 0 | | | | 0 | | | | 10,156 | | | | 283,362 | |
Institutional Class | | | 0 | | | | 0 | | | | 13,529 | | | | 379,367 | |
| | | | |
| | | | | | | 0 | | | | | | | | 713,834 | |
| | | | |
Payment for shares redeemed | | | | | | | | | | | | | | | | |
Class A | | | (93,449 | ) | | | (2,675,508 | ) | | | (192,694 | ) | | | (5,099,087 | ) |
Class C | | | (4,923 | ) | | | (123,732 | ) | | | (28,318 | ) | | | (663,810 | ) |
Class R6 | | | (4,430 | ) | | | (125,350 | ) | | | (5,501 | ) | | | (154,810 | ) |
Administrator Class | | | (1,603,499 | ) | | | (45,312,886 | ) | | | (392,453 | ) | | | (10,624,027 | ) |
Institutional Class | | | (756,487 | ) | | | (21,935,144 | ) | | | (481,774 | ) | | | (13,221,590 | ) |
| | | | |
| | | | | | | (70,172,620 | ) | | | | | | | (29,763,324 | ) |
| | | | |
Net decrease in net assets resulting from capital share transactions | | | | | | | (47,126,928 | ) | | | | | | | (12,213,704 | ) |
| | | | |
Total increase (decrease) in net assets | | | | | | | (55,717,418 | ) | | | | | | | 11,386,478 | |
| | | | |
| | | | |
Net assets | | | | | | | | | | | | | | | | |
Beginning of period | | | | | | | 139,319,945 | | | | | | | | 127,933,467 | |
| | | | |
End of period | | | | | | $ | 83,602,527 | | | | | | | $ | 139,319,945 | |
| | | | |
| 1 | Effective for all filings after November 4, 2018, the SEC prospectively eliminated the requirement to parenthetically disclose undistributed net investment income at the end of the period and permitted the aggregation of distributions, with the exception of tax basis returns of capital. Undistributed net investment income at May 31, 2018 was $358,050. The disaggregated distributions information for the year ended May 31, 2018 is included in Note 7,Distributions to Shareholders, in the notes to the financial statements |
The accompanying notes are an integral part of these financial statements.
| | | | | | |
| Financial highlights | | Wells Fargo Small Company Value Fund | | | 13 | |
(For a share outstanding throughout each period)
| | | | | | | | | | | | | | | | | | | | | | | | |
| | | Six months ended
November 30, 2018 (unaudited) | | | Year ended May 31 | |
| CLASS A | | 2018 | | | 2017 | | | 2016 | | | 2015 | | | 2014 | |
Net asset value, beginning of period | | | $28.60 | | | | $24.01 | | | | $20.22 | | | | $21.42 | | | | $20.08 | | | | $17.10 | |
Net investment income | | | 0.05 | | | | 0.09 | | | | 0.05 | | | | 0.08 | | | | 0.07 | | | | 0.06 | |
Net realized and unrealized gains (losses) on investments | | | (2.19 | ) | | | 4.58 | | | | 3.75 | | | | (1.25 | ) | | | 1.27 | | | | 2.92 | |
| | | | | | | | | | | | | | | | | | | | | | | | |
Total from investment operations | | | (2.14 | ) | | | 4.67 | | | | 3.80 | | | | (1.17 | ) | | | 1.34 | | | | 2.98 | |
Distributions to shareholders from | | | | | | | | | | | | | | | | | | | | | | | | |
Net investment income | | | 0.00 | | | | (0.08 | ) | | | (0.01 | ) | | | (0.03 | ) | | | 0.00 | | | | 0.00 | |
Net asset value, end of period | | | $26.46 | | | | $28.60 | | | | $24.01 | | | | $20.22 | | | | $21.42 | | | | $20.08 | |
Total return1 | | | (7.48 | )% | | | 19.48 | % | | | 18.86 | % | | | (5.48 | )% | | | 6.62 | % | | | 17.43 | % |
Ratios to average net assets (annualized) | | | | | | | | | | | | | | | | | | | | | | | | |
Gross expenses2 | | | 1.39 | % | | | 1.47 | % | | | 1.47 | % | | | 1.48 | % | | | 1.50 | % | | | 1.56 | % |
Net expenses2 | | | 1.15 | % | | | 1.33 | % | | | 1.35 | % | | | 1.37 | % | | | 1.40 | % | | | 1.42 | % |
Net investment income2 | | | 0.42 | % | | | 0.46 | % | | | 0.20 | % | | | 0.11 | % | | | 0.33 | % | | | 0.33 | % |
Supplemental data | | | | | | | | | | | | | | | | | | | | | | | | |
Portfolio turnover rate3 | | | 86 | % | | | 144 | % | | | 110 | % | | | 72 | % | | | 54 | % | | | 47 | % |
Net assets, end of period (000s omitted) | | | $13,197 | | | | $15,665 | | | | $16,280 | | | | $23,151 | | | | $26,339 | | | | $26,517 | |
| 1 | Total return calculations do not include any sales charges. Returns for periods of less than one year are not annualized. |
| 2 | Ratios include net expenses allocated from the affiliated Master Portfolio which were as follows: |
| | | | |
Six months ended November 30, 2018 (unaudited) | | | 0.75 | % |
Year ended May 31, 2018 | | | 0.84 | % |
Year ended May 31, 2017 | | | 0.84 | % |
Year ended May 31, 2016 | | | 0.84 | % |
Year ended May 31, 2015 | | | 0.84 | % |
Year ended May 31, 2014 | | | 0.85 | % |
| 3 | Portfolio turnover rate is calculated by multiplying the affiliated Master Portfolio’s percentage of the Fund’s total investments in securities at the end of the period by the affiliated Master Portfolio’s portfolio turnover rate. |
The accompanying notes are an integral part of these financial statements.
| | | | |
| 14 | | Wells Fargo Small Company Value Fund | | Financial highlights |
(For a share outstanding throughout each period)
| | | | | | | | | | | | | | | | | | | | | | | | |
| | | Six months ended
November 30, 2018 (unaudited) | | | Year ended May 31 | |
| CLASS C | | 2018 | | | 2017 | | | 2016 | | | 2015 | | | 2014 | |
Net asset value, beginning of period | | | $25.38 | | | | $21.40 | | | | $18.15 | | | | $19.34 | | | | $18.27 | | | | $15.68 | |
Net investment loss | | | (0.02 | ) | | | (0.07 | )1 | | | (0.11 | )1 | | | (0.11 | )1 | | | (0.08 | )1 | | | (0.07 | )1 |
Net realized and unrealized gains (losses) on investments | | | (1.98 | ) | | | 4.05 | | | | 3.36 | | | | (1.08 | ) | | | 1.15 | | | | 2.66 | |
| | | | | | | | | | | | | | | | | | | | | | | | |
Total from investment operations | | | (2.00 | ) | | | 3.98 | | | | 3.25 | | | | (1.19 | ) | | | 1.07 | | | | 2.59 | |
Net asset value, end of period | | | $23.38 | | | | $25.38 | | | | $21.40 | | | | $18.15 | | | | $19.34 | | | | $18.27 | |
Total return2 | | | (7.88 | )% | | | 18.60 | % | | | 17.97 | % | | | (6.20 | )% | | | 5.86 | % | | | 16.52 | % |
Ratios to average net assets (annualized) | | | | | | | | | | | | | | | | | | | | | | | | |
Gross expenses3 | | | 2.14 | % | | | 2.21 | % | | | 2.22 | % | | | 2.23 | % | | | 2.26 | % | | | 2.31 | % |
Net expenses3 | | | 1.90 | % | | | 2.08 | % | | | 2.10 | % | | | 2.12 | % | | | 2.15 | % | | | 2.17 | % |
Net investment loss3 | | | (0.32 | )% | | | (0.29 | )% | | | (0.54 | )% | | | (0.62 | )% | | | (0.42 | )% | | | (0.42 | )% |
Supplemental data | | | | | | | | | | | | | | | | | | | | | | | | |
Portfolio turnover rate4 | | | 86 | % | | | 144 | % | | | 110 | % | | | 72 | % | | | 54 | % | | | 47 | % |
Net assets, end of period (000s omitted) | | | $1,834 | | | | $1,980 | | | | $1,962 | | | | $2,004 | | | | $2,602 | | | | $2,192 | |
| 1 | Calculated based upon average shares outstanding |
| 2 | Total return calculations do not include any sales charges. Returns for periods of less than one year are not annualized. |
| 3 | Ratios include net expenses allocated from the affiliated Master Portfolio which were as follows: |
| | | | |
Six months ended November 30, 2018 (unaudited) | | | 0.75 | % |
Year ended May 31, 2018 | | | 0.84 | % |
Year ended May 31, 2017 | | | 0.84 | % |
Year ended May 31, 2016 | | | 0.84 | % |
Year ended May 31, 2015 | | | 0.84 | % |
Year ended May 31, 2014 | | | 0.85 | % |
| 4 | Portfolio turnover rate is calculated by multiplying the affiliated Master Portfolio’s percentage of the Fund’s total investments in securities at the end of the period by the affiliated Master Portfolio’s portfolio turnover rate. |
The accompanying notes are an integral part of these financial statements.
| | | | | | |
| Financial highlights | | Wells Fargo Small Company Value Fund | | | 15 | |
(For a share outstanding throughout each period)
| | | | | | | | | | | | |
| | | Six months ended
November 30, 2018 (unaudited) | | | Year ended May 31 | |
| CLASS R6 | | 2018 | | | 20171 | |
Net asset value, beginning of period | | | $29.44 | | | | $24.69 | | | | $21.37 | |
Net investment income | | | 0.13 | 2 | | | 0.29 | 2 | | | 0.08 | |
Net realized and unrealized gains (losses) on investments | | | (2.29 | ) | | | 4.65 | | | | 3.33 | |
| | | | | | | | | | | | |
Total from investment operations | | | (2.16 | ) | | | 4.94 | | | | 3.41 | |
Distributions to shareholders from | | | | | | | | | | | | |
Net investment income | | | 0.00 | | | | (0.19 | ) | | | (0.09 | ) |
Net asset value, end of period | | | $27.28 | | | | $29.44 | | | | $24.69 | |
Total return3 | | | (7.34 | )% | | | 20.03 | % | | | 15.95 | % |
Ratios to average net assets (annualized) | | | | | | | | | | | | |
Gross expenses4 | | | 0.96 | % | | | 1.03 | % | | | 1.02 | % |
Net expenses4 | | | 0.75 | % | | | 0.88 | % | | | 0.90 | % |
Net investment income4 | | | 0.87 | % | | | 1.04 | % | | | 0.58 | % |
Supplemental data | | | | | | | | | | | | |
Portfolio turnover rate5 | | | 86 | % | | | 144 | % | | | 110 | % |
Net assets, end of period (000s omitted) | | | $464 | | | | $322 | | | | $29 | |
| 1 | For the period from October 31, 2016 (commencement of class operations) to May 31, 2017 |
| 2 | Calculated based upon average shares outstanding |
| 3 | Returns for periods of less than one year are not annualized. |
| 4 | Ratios include net expenses allocated from the affiliated Master Portfolio which were as follows: |
| | | | |
Six months ended November 30, 2018 (unaudited) | | | 0.75 | % |
Year ended May 31, 2018 | | | 0.84 | % |
Year ended May 31, 2017 | | | 0.84 | % |
Year ended May 31, 2016 | | | 0.84 | % |
Year ended May 31, 2015 | | | 0.84 | % |
Year ended May 31, 2014 | | | 0.85 | % |
| 5 | Portfolio turnover rate is calculated by multiplying the affiliated Master Portfolio’s percentage of the Fund’s total investments in securities at the end of the period by the affiliated Master Portfolio’s portfolio turnover rate. |
The accompanying notes are an integral part of these financial statements.
| | | | |
| 16 | | Wells Fargo Small Company Value Fund | | Financial highlights |
(For a share outstanding throughout each period)
| | | | | | | | | | | | | | | | | | | | | | | | |
| | | Six months ended
November 30, 2018 (unaudited) | | | Year ended May 31 | |
| ADMINISTRATOR CLASS | | 2018 | | | 2017 | | | 2016 | | | 2015 | | | 2014 | |
Net asset value, beginning of period | | | $29.23 | | | | $24.53 | | | | $20.66 | | | | $21.90 | | | | $20.49 | | | | $17.42 | |
Net investment income | | | 0.08 | 1 | | | 0.20 | | | | 0.08 | 1 | | | 0.13 | | | | 0.11 | | | | 0.12 | |
Net realized and unrealized gains (losses) on investments | | | (2.26 | ) | | | 4.63 | | | | 3.83 | | | | (1.30 | ) | | | 1.30 | | | | 2.95 | |
| | | | | | | | | | | | | | | | | | | | | | | | |
Total from investment operations | | | (2.18 | ) | | | 4.83 | | | | 3.91 | | | | (1.17 | ) | | | 1.41 | | | | 3.07 | |
Distributions to shareholders from | | | | | | | | | | | | | | | | | | | | | | | | |
Net investment income | | | 0.00 | | | | (0.13 | ) | | | (0.04 | ) | | | (0.07 | ) | | | 0.00 | | | | 0.00 | |
Net asset value, end of period | | | $27.05 | | | | $29.23 | | | | $24.53 | | | | $20.66 | | | | $21.90 | | | | $20.49 | |
Total return2 | | | (7.46 | )% | | | 19.71 | % | | | 19.00 | % | | | (5.36 | )% | | | 6.88 | % | | | 17.62 | % |
Ratios to average net assets (annualized) | | | | | | | | | | | | | | | | | | | | | | | | |
Gross expenses3 | | | 1.30 | % | | | 1.38 | % | | | 1.39 | % | | | 1.39 | % | | | 1.34 | % | | | 1.39 | % |
Net expenses3 | | | 1.05 | % | | | 1.19 | % | | | 1.20 | % | | | 1.20 | % | | | 1.20 | % | | | 1.20 | % |
Net investment income3 | | | 0.51 | % | | | 0.59 | % | | | 0.36 | % | | | 0.28 | % | | | 0.52 | % | | | 0.55 | % |
Supplemental data | | | | | | | | | | | | | | | | | | | | | | | | |
Portfolio turnover rate4 | | | 86 | % | | | 144 | % | | | 110 | % | | | 72 | % | | | 54 | % | | | 47 | % |
Net assets, end of period (000s omitted) | | | $15,225 | | | | $60,379 | | | | $57,591 | | | | $64,023 | | | | $71,034 | | | | $68,358 | |
| 1 | Calculated based upon average shares outstanding |
| 2 | Returns for periods of less than one year are not annualized. |
| 3 | Ratios include net expenses allocated from the affiliated Master Portfolio which were as follows: |
| | | | |
Six months ended November 30, 2018 (unaudited) | | | 0.75 | % |
Year ended May 31, 2018 | | | 0.84 | % |
Year ended May 31, 2017 | | | 0.84 | % |
Year ended May 31, 2016 | | | 0.84 | % |
Year ended May 31, 2015 | | | 0.84 | % |
Year ended May 31, 2014 | | | 0.85 | % |
| 4 | Portfolio turnover rate is calculated by multiplying the affiliated Master Portfolio’s percentage of the Fund’s total investments in securities at the end of the period by the affiliated Master Portfolio’s portfolio turnover rate. |
The accompanying notes are an integral part of these financial statements.
| | | | | | |
| Financial highlights | | Wells Fargo Small Company Value Fund | | | 17 | |
(For a share outstanding throughout each period)
| | | | | | | | | | | | | | | | | | | | | | | | |
| | | Six months ended
November 30, 2018 (unaudited) | | | Year ended May 31 | |
| INSTITUTIONAL CLASS | | 2018 | | | 2017 | | | 2016 | | | 2015 | | | 2014 | |
Net asset value, beginning of period | | | $29.40 | | | | $24.68 | | | | $20.77 | | | | $22.02 | | | | $20.57 | | | | $17.45 | |
Net investment income | | | 0.11 | | | | 0.21 | | | | 0.11 | | | | 0.08 | 1 | | | 0.14 | | | | 0.13 | |
Net realized and unrealized gains (losses) on investments | | | (2.27 | ) | | | 4.69 | | | | 3.89 | | | | (1.22 | ) | | | 1.31 | | | | 2.99 | |
| | | | | | | | | | | | | | | | | | | | | | | | |
Total from investment operations | | | (2.16 | ) | | | 4.90 | | | | 4.00 | | | | (1.14 | ) | | | 1.45 | | | | 3.12 | |
Distributions to shareholders from | | | | | | | | | | | | | | | | | | | | | | | | |
Net investment income | | | 0.00 | | | | (0.18 | ) | | | (0.09 | ) | | | (0.11 | ) | | | 0.00 | | | | 0.00 | |
Net asset value, end of period | | | $27.24 | | | | $29.40 | | | | $24.68 | | | | $20.77 | | | | $22.02 | | | | $20.57 | |
Total return2 | | | (7.35 | )% | | | 19.90 | % | | | 13.70 | % | | | (5.13 | )% | | | 7.05 | % | | | 17.88 | % |
Ratios to average net assets (annualized) | | | | | | | | | | | | | | | | | | | | | | | | |
Gross expenses3 | | | 1.06 | % | | | 1.14 | % | | | 1.14 | % | | | 1.14 | % | | | 1.07 | % | | | 1.13 | % |
Net expenses3 | | | 0.85 | % | | | 0.99 | % | | | 1.00 | % | | | 1.00 | % | | | 1.00 | % | | | 1.00 | % |
Net investment income3 | | | 0.71 | % | | | 0.78 | % | | | 0.55 | % | | | 0.40 | % | | | 0.75 | % | | | 0.75 | % |
Supplemental data | | | | | | | | | | | | | | | | | | | | | | | | |
Portfolio turnover rate4 | | | 86 | % | | | 144 | % | | | 110 | % | | | 72 | % | | | 54 | % | | | 47 | % |
Net assets, end of period (000s omitted) | | | $52,882 | | | | $60,973 | | | | $52,072 | | | | $31,768 | | | | $16,850 | | | | $11,967 | |
| 1 | Calculated based upon average shares outstanding |
| 2 | Returns for periods of less than one year are not annualized. |
| 3 | Ratios include net expenses allocated from the affiliated Master Portfolio which were as follows: |
| | | | |
Six months ended November 30, 2018 (unaudited) | | | 0.75 | % |
Year ended May 31, 2018 | | | 0.84 | % |
Year ended May 31, 2017 | | | 0.84 | % |
Year ended May 31, 2016 | | | 0.84 | % |
Year ended May 31, 2015 | | | 0.84 | % |
Year ended May 31, 2014 | | | 0.85 | % |
| 4 | Portfolio turnover rate is calculated by multiplying the affiliated Master Portfolio’s percentage of the Fund’s total investments in securities at the end of the period by the affiliated Master Portfolio’s portfolio turnover rate. |
The accompanying notes are an integral part of these financial statements.
| | | | |
| 18 | | Wells Fargo Small Company Value Fund | | Notes to financial statements (unaudited) |
1. ORGANIZATION
Wells Fargo Funds Trust (the “Trust”), a Delaware statutory trust organized on March 10, 1999, is anopen-end management investment company registered under the Investment Company Act of 1940, as amended (the “1940 Act”). As an investment company, the Trust follows the accounting and reporting guidance in Financial Accounting Standards Board (“FASB”)Accounting Standards Codification Topic 946, Financial Services – Investment Companies. These financial statements report on the Wells Fargo Small Company Value Fund (the “Fund”) which is a diversified series of the Trust.
The Fund is a feeder fund in a master-feeder structure that invests substantially all of its assets in a single master portfolio with a substantially identical investment objective and substantially similar investment strategies. The Fund seeks to achieve its investment objective by investing all investable assets in a separate diversified portfolio (the “affiliated Master Portfolio”) of Wells Fargo Master Trust, a registeredopen-end management investment company. The affiliated Master Portfolio directly acquires portfolio securities and the Fund acquires an indirect interest in those securities. The Fund accounts for its investment in the affiliated Master Portfolio as a partnership investment and records on a daily basis its share of the affiliated Master Portfolio’s income, expense and realized and unrealized gains and losses. The financial statements of the affiliated Master Portfolio for the six months ended November 30, 2018 are included in this report and should be read in conjunction with the Fund’s financial statements. As of November 30, 2018, the Fund owned 48% of Wells Fargo Small Company Value Portfolio.
2. SIGNIFICANT ACCOUNTING POLICIES
The following significant accounting policies, which are consistently followed in the preparation of the financial statements of the Fund, are in conformity with U.S. generally accepted accounting principles which require management to make estimates and assumptions that affect the reported amounts of assets and liabilities, disclosure of contingent assets and liabilities at the date of the financial statements, and the reported amounts of revenues and expenses during the reporting period. Actual results could differ from those estimates.
Securities valuation
All investments are valued each business day as of the close of regular trading on the New York Stock Exchange (generally 4 p.m. Eastern Time), although the Fund may deviate from this calculation time under unusual or unexpected circumstances.
Investments in the affiliated Master Portfolio are valued daily based on the Fund’s proportionate share of the affiliated Master Portfolio’s net assets, which are also valued daily. Securities held in the affiliated Master Portfolio are valued as discussed in the Notes to Financial Statements of the affiliated Master Portfolio, which are included elsewhere in this report.
Investment transactions, income and expenses
Investments in the affiliated Master Portfolio are recorded on a trade basis.
The Fund records daily its proportionate share of the affiliated Master Portfolio’s interest and dividend income, expenses and realized and unrealized gains or losses. The Fund also accrues its own expenses.
Distributions to shareholders
Distributions to shareholders from net investment income and any net realized gains are recorded on theex-dividend date and paid at least annually. Such distributions are determined in accordance with income tax regulations and may differ from U.S. generally accepted accounting principles. Dividend sources are estimated at the time of declaration. The tax character of distributions is determined as of the Fund’s fiscal year end. Therefore, a portion of the Fund’s distributions made prior to the Fund’s fiscal year end may be categorized as a tax return of capital at year end.
Federal and other taxes
The Fund intends to continue to qualify as a regulated investment company by distributing substantially all of its investment company taxable income and any net realized capital gains (after reduction for capital loss carryforwards) sufficient to relieve it from all, or substantially all, federal income taxes. Accordingly, no provision for federal income taxes was required.
The Fund’s income and federal excise tax returns and all financial records supporting those returns for the prior three fiscal years are subject to examination by the federal and Delaware revenue authorities. Management has analyzed the Fund’s tax positions taken on federal, state, and foreign tax returns for all open tax years and does not believe that there are any uncertain tax positions that require recognition of a tax liability.
| | | | | | |
| Notes to financial statements (unaudited) | | Wells Fargo Small Company Value Fund | | | 19 | |
As of November 30, 2018, the aggregate cost of all investments for federal income tax purposes was $88,793,050 and the unrealized gains (losses) consisted of:
| | | | |
Gross unrealized gains | | $ | 0 | |
Gross unrealized losses | | | (5,931,016 | ) |
Net unrealized losses | | $ | (5,931,016 | ) |
Class allocations
The separate classes of shares offered by the Fund differ principally in applicable sales charges, distribution, shareholder servicing, and administration fees. Class specific expenses are charged directly to that share class. Investment income, common expenses, and realized and unrealized gains (losses) on investments are allocated daily to each class of shares based on the relative proportion of net assets of each class.
3. FAIR VALUATION MEASUREMENTS
At November 30, 2018, the affiliated Master Portfolio was measured at fair value using the net asset value per share (or its equivalent) as a practical expedient. The investment objective and the value of the affiliate Master Portfolio was as follows:
| | | | | | |
| Affiliated Master Portfolio | | Investment objective | | Value of
affiliated Master
Portfolio | |
Wells Fargo Small Company Value Portfolio | | Seeks long-term capital appreciation | | | $82,862,034 | |
The affiliated Master Portfolio does not have a redemption period notice, can be redeemed daily and does not have any unfunded commitments.
4. TRANSACTIONS WITH AFFILIATES
Management fee
Wells Fargo Funds Management, LLC (“Funds Management”), an indirect wholly owned subsidiary of Wells Fargo & Company (“Wells Fargo”), is the manager of the Fund and provides advisory and fund-level administrative services under an investment management agreement. Under the investment management agreement, Funds Management is responsible for, among other services, implementing the investment objectives and strategies of the Fund, supervising the subadviser, and providing fund-level administrative services in connection with the Fund’s operations. As long as the Fund continues to invest substantially all of its assets in a single affiliated Master Portfolio, the Fund pays Funds Management an investment management fee only for fund-level administrative services at an annual rate starting at 0.05% and declining to 0.03% as the average daily net assets of the Fund increase. For the six months ended November 30, 2018, the management fee was equivalent to an annual rate of 0.05% of the Fund’s average daily net assets.
Funds Management also serves as the adviser to the affiliated Master Portfolio and is entitled to receive a fee from the affiliated Master Portfolio for those services.
Administration fees
Under a class-level administration agreement, Funds Management provides class-level administrative services to the Fund, which includes paying fees and expenses for services provided by the transfer agent,sub-transfer agents, omnibus account servicers and record-keepers. As compensation for its services under the class-level administration agreement, Funds Management receives an annual fee which is calculated based on the average daily net assets of each class as follows:
| | | | |
| | | Class-level
administration fee | |
Class A, Class C | | | 0.21 | % |
Class R6 | | | 0.03 | |
Administrator Class, Institutional Class | | | 0.13 | |
Funds Management has contractually waived and/or reimbursed management and administration fees to the extent necessary to maintain certain net operating expense ratios for the Fund. When each class of the Fund has exceeded its expense cap, Funds Management has waived fees and/or reimbursed expenses from fund level expenses on a proportionate basis and then from class specific expenses; otherwise, waivers and/or reimbursements are applied against
| | | | |
| 20 | | Wells Fargo Small Company Value Fund | | Notes to financial statements (unaudited) |
class specific expenses before fund level expenses. Net expenses from the affiliated Master Portfolio are included in the expense cap. Funds Management has committed through September 30, 2019 to waive fees and/or reimburse expenses to the extent necessary to cap the Fund’s expenses at 1.15% for Class A shares, 1.90% for Class C shares, 0.75% for Class R6 shares, 1.05% for Administrator Class shares, and 0.85% for Institutional Class shares. After this time, the cap may be increased or the commitment to maintain the cap may be terminated only with the approval of the Board of Trustees.
Distribution fee
The Trust has adopted a distribution plan for Class C shares of the Fund pursuant to Rule12b-1 under the 1940 Act. A distribution fee is charged to Class C shares and paid to Wells Fargo Funds Distributor, LLC (“Funds Distributor”), the principal underwriter, at an annual rate of 0.75% of the average daily net assets of Class C shares.
In addition, Funds Distributor is entitled to receive thefront-end sales charge from the purchase of Class A shares and a contingent deferred sales charge on the redemption of certain Class A shares. Funds Distributor is also entitled to receive the contingent deferred sales charges from redemptions of Class C shares. For the six months ended November 30, 2018, Funds Distributor received $786 from the sale of Class A shares. Funds Distributor did not receive any contingent deferred sales charges from Class A or Class C shares for the six months ended November 30, 2018.
Shareholder servicing fees
The Trust has entered into contracts with one or more shareholder servicing agents, whereby Class A, Class C, and Administrator Class of the Fund are charged a fee at an annual rate of 0.25% of the average daily net assets of each respective class.
A portion of these total shareholder servicing fees were paid to affiliates of Wells Fargo.
5. INVESTMENT PORTFOLIO TRANSACTIONS
The Fund seeks to achieve its investment objective by investing substantially all of its investable assets in a single affiliated Master Portfolio. Purchases and sales have been calculated by multiplying the Fund’s ownership percentage of the affiliated Master Portfolio by the affiliated Master Portfolio’s purchases and sales. Purchases and sales of investments, excluding short-term securities, for the six months ended November 30, 2018 were $98,127,722 and $82,681,488, respectively.
6. BANK BORROWINGS
The Trust (excluding the money market funds), Wells Fargo Master Trust and Wells Fargo Variable Trust are parties to a $280,000,000 revolving credit agreement whereby the Fund is permitted to use bank borrowings for temporary or emergency purposes, such as to fund shareholder redemption requests. Interest under the credit agreement is charged to the Fund based on a borrowing rate equal to the higher of the Federal Funds rate in effect on that day plus 1.25% or the overnight LIBOR rate in effect on that day plus 1.25%. In addition, an annual commitment fee equal to 0.25% of the unused balance is allocated to each participating fund.
For the six months ended November 30, 2018, there were no borrowings by the Fund under the agreement.
7. DISTRIBUTIONS TO SHAREHOLDERS
Effective for all filings after November 4, 2018, the Securities and Exchange Commission eliminated the requirement to separately state the components of distributions to shareholders. The amounts of distributions to shareholders for the year ended May 31, 2018 were as follows:
| | | | |
| | | Net investment income | |
Class A | | | $ 52,718 | |
Class R6 | | | 2,568 | |
Administrator Class, | | | 283,478 | |
Institutional Class | | | 383,137 | |
8. INDEMNIFICATION
Under the Trust’s organizational documents, the officers and Trustees have been granted certain indemnification rights against certain liabilities that may arise out of performance of their duties to the Trust. Additionally, in the normal course of business, the Trust may enter into contracts with service providers that contain a variety of indemnification clauses. The Trust’s maximum exposure under these arrangements is dependent on future claims that may be made against the Fund and, therefore, cannot be estimated.
| | | | | | |
| Notes to financial statements (unaudited) | | Wells Fargo Small Company Value Fund | | | 21 | |
9. NEW ACCOUNTING PRONOUNCEMENT
In August 2018, FASB issued Accounting Standards Update (“ASU”)No. 2018-13, Fair Value Measurement (Topic 820)Disclosure Framework—Changes to the Disclosure Requirements for Fair Value Measurement. ASU2018-13 updates the disclosure requirements for fair value measurements by modifying or removing certain disclosures and adding certain new disclosures. The amendments are effective for fiscal years, and interim periods within those fiscal years, beginning after December 15, 2019. Early adoption is permitted. Management has adopted the removal and modification of disclosures early, as permitted, and will adopt the additional new disclosures at the effective date.
10. SUBSEQUENT DISTRIBUTIONS
On December 18, 2018, the Fund declared distributions from net investment income to shareholders of record on December 17, 2018. The per share amounts payable on December 19, 2018 were as follows:
| | | | |
| | | Net investment
income | |
Class A | | | $0.16455 | |
Class R6 | | | 0.27926 | |
Administrator Class | | | 0.14485 | |
Institutional Class | | | 0.28004 | |
These distributions are not reflected in the accompanying financial statements.
| | | | |
| 22 | | Wells Fargo Small Company Value Portfolio | | Portfolio of investments—November 30, 2018 (unaudited) |
| | | | | | | | | | | | | | | | |
| Security name | | | | | | | | Shares | | | Value | |
| | | | |
Common Stocks: 99.51% | | | | | | | | | | | | | | | | |
| | | | |
Communication Services: 0.11% | | | | | | | | | | | | | | | | |
| | | | |
| Media: 0.11% | | | | | | | | | | | | | | | | |
Entercom Communications Corporation | | | | | | | | | | | 29,462 | | | $ | 192,387 | |
| | | | | | | | | | | | | | | | |
| | | | |
Consumer Discretionary: 10.98% | | | | | | | | | | | | | | | | |
| | | | |
| Auto Components: 0.40% | | | | | | | | | | | | | | | | |
Cooper-Standard Holdings Incorporated † | | | | | | | | | | | 9,632 | | | | 704,292 | |
| | | | | | | | | | | | | | | | |
| | | | |
| Diversified Consumer Services: 0.25% | | | | | | | | | | | | | | | | |
Collectors Universe Incorporated | | | | | | | | | | | 32,065 | | | | 427,747 | |
| | | | | | | | | | | | | | | | |
| | | | |
| Hotels, Restaurants & Leisure: 2.06% | | | | | | | | | | | | | | | | |
Cracker Barrel Old Country Store Incorporated « | | | | | | | | | | | 6,368 | | | | 1,151,398 | |
El Pollo Loco Holdings Incorporated † | | | | | | | | | | | 70,821 | | | | 1,081,437 | |
Noodles & Company † | | | | | | | | | | | 122,630 | | | | 970,003 | |
Red Lion Hotels Corporation † | | | | | | | | | | | 43,229 | | | | 389,926 | |
| | | | |
| | | | | | | | | | | | | | | 3,592,764 | |
| | | | | | | | | | | | | | | | |
| | | | |
| Household Durables: 0.69% | | | | | | | | | | | | | | | | |
Hooker Furniture Corporation | | | | | | | | | | | 39,780 | | | | 1,198,571 | |
| | | | | | | | | | | | | | | | |
| | | | |
| Internet & Direct Marketing Retail: 0.37% | | | | | | | | | | | | | | | | |
Nutrisystem Incorporated | | | | | | | | | | | 17,442 | | | | 648,668 | |
| | | | | | | | | | | | | | | | |
| | | | |
| Leisure Products: 1.90% | | | | | | | | | | | | | | | | |
Johnson Outdoors Incorporated Class A | | | | | | | | | | | 22,608 | | | | 1,611,950 | |
Malibu Boats Incorporated Class A † | | | | | | | | | | | 31,699 | | | | 1,534,866 | |
Nautilus Group Incorporated † | | | | | | | | | | | 12,564 | | | | 162,201 | |
| | | | |
| | | | | | | | | | | | | | | 3,309,017 | |
| | | | | | | | | | | | | | | | |
| | | | |
| Specialty Retail: 3.53% | | | | | | | | | | | | | | | | |
Barnes & Noble Incorporated | | | | | | | | | | | 35,993 | | | | 272,467 | |
Children’s Place Retail Stores Incorporated | | | | | | | | | | | 7,283 | | | | 944,168 | |
Destination Maternity Corporation † | | | | | | | | | | | 144,964 | | | | 636,392 | |
Dick’s Sporting Goods Incorporated | | | | | | | | | | | 27,633 | | | | 994,235 | |
Sally Beauty Holdings Incorporated † | | | | | | | | | | | 46,825 | | | | 988,476 | |
Shoe Carnival Incorporated « | | | | | | | | | | | 32,162 | | | | 1,219,905 | |
Tailored Brands Incorporated | | | | | | | | | | | 47,720 | | | | 1,092,788 | |
| | | | |
| | | | | | | | | | | | | | | 6,148,431 | |
| | | | | | | | | | | | | | | | |
| | | | |
| Textiles, Apparel & Luxury Goods: 1.78% | | | | | | | | | | | | | | | | |
Carter’s Incorporated | | | | | | | | | | | 11,501 | | | | 1,063,843 | |
Charles & Colvard Limited † | | | | | | | | | | | 80,363 | | | | 73,669 | |
Lakeland Industries Incorporated † | | | | | | | | | | | 55,539 | | | | 735,892 | |
Rocky Brands Incorporated | | | | | | | | | | | 47,761 | | | | 1,236,532 | |
| | | | |
| | | | | | | | | | | | | | | 3,109,936 | |
| | | | | | | | | | | | | | | | |
The accompanying notes are an integral part of these financial statements.
| | | | | | |
| Portfolio of investments—November 30, 2018 (unaudited) | | Wells Fargo Small Company Value Portfolio | | | 23 | |
| | | | | | | | | | | | | | | | |
| Security name | | | | | | | | Shares | | | Value | |
| | | | |
Consumer Staples: 2.87% | | | | | | | | | | | | | | | | |
| | | | |
| Food & Staples Retailing: 1.27% | | | | | | | | | | | | | | | | |
Ingles Markets Incorporated Class A | | | | | | | | | | | 54,357 | | | $ | 1,581,245 | |
Village Super Market Class A | | | | | | | | | | | 16,900 | | | | 461,201 | |
Weis Markets Incorporated | | | | | | | | | | | 4,020 | | | | 184,116 | |
| | | | |
| | | | | | | | | | | | | | | 2,226,562 | |
| | | | | | | | | | | | | | | | |
| | | | |
| Food Products: 1.60% | | | | | | | | | | | | | | | | |
Hostess Brands Incorporated † | | | | | | | | | | | 88,884 | | | | 1,035,499 | |
Pilgrim’s Pride Corporation † | | | | | | | | | | | 88,269 | | | | 1,751,257 | |
| | | | |
| | | | | | | | | | | | | | | 2,786,756 | |
| | | | | | | | | | | | | | | | |
| | | | |
Energy: 4.21% | | | | | | | | | | | | | | | | |
| | | | |
| Energy Equipment & Services: 1.68% | | | | | | | | | | | | | | | | |
Newpark Resources Incorporated † | | | | | | | | | | | 202,777 | | | | 1,559,355 | |
Patterson-UTI Energy Incorporated | | | | | | | | | | | 66,525 | | | | 923,367 | |
Tetra Technologies Incorporated † | | | | | | | | | | | 187,885 | | | | 435,893 | |
| | | | |
| | | | | | | | | | | | | | | 2,918,615 | |
| | | | | | | | | | | | | | | | |
| | | | |
| Oil, Gas & Consumable Fuels: 2.53% | | | | | | | | | | | | | | | | |
Carrizo Oil & Gas Incorporated † | | | | | | | | | | | 95,241 | | | | 1,629,574 | |
Southwestern Energy Company † | | | | | | | | | | | 272,264 | | | | 1,312,312 | |
Teekay Tankers Limited Class A | | | | | | | | | | | 369,345 | | | | 417,360 | |
W&T Offshore Incorporated † | | | | | | | | | | | 181,772 | | | | 1,056,095 | |
| | | | |
| | | | | | | | | | | | | | | 4,415,341 | |
| | | | | | | | | | | | | | | | |
| | | | |
Financials: 23.01% | | | | | | | | | | | | | | | | |
| | | | |
| Banks: 15.15% | | | | | | | | | | | | | | | | |
Banc of California Incorporated | | | | | | | | | | | 49,883 | | | | 857,988 | |
Bank of the Ozarks Incorporated | | | | | | | | | | | 45,096 | | | | 1,222,102 | |
Banner Corporation | | | | | | | | | | | 28,226 | | | | 1,693,560 | |
Customers Bancorp Incorporated † | | | | | | | | | | | 43,679 | | | | 852,177 | |
FB Financial Corporation | | | | | | | | | | | 43,792 | | | | 1,692,561 | |
Fidelity Southern Corporation | | | | | | | | | | | 72,679 | | | | 1,724,673 | |
First Foundation Incorporated † | | | | | | | | | | | 70,427 | | | | 1,127,536 | |
First Interstate BancSystem Class A | | | | | | | | | | | 40,271 | | | | 1,748,970 | |
Great Southern Bancorp Incorporated | | | | | | | | | | | 30,837 | | | | 1,673,832 | |
Heritage Financial Corporation | | | | | | | | | | | 51,432 | | | | 1,798,577 | |
Independent Bank Corporation | | | | | | | | | | | 67,416 | | | | 1,549,220 | |
Midland States Bancorp Incorporated | | | | | | | | | | | 58,793 | | | | 1,525,678 | |
OFG Bancorp | | | | | | | | | | | 53,790 | | | | 977,902 | |
Orrstown Financial Services Incorporated | | | | | | | | | | | 19,574 | | | | 403,616 | |
Popular Incorporated | | | | | | | | | | | 17,982 | | | | 1,014,185 | |
Triumph Bancorp Incorporated † | | | | | | | | | | | 41,012 | | | | 1,569,939 | |
Umpqua Holdings Corporation | | | | | | | | | | | 61,274 | | | | 1,178,912 | |
Union Bankshares Corporation | | | | | | | | | | | 19,929 | | | | 705,487 | |
Univest Corporation of Pennsylvania | | | | | | | | | | | 69,825 | | | | 1,780,538 | |
Western Alliance Bancorp † | | | | | | | | | | | 28,189 | | | | 1,321,218 | |
| | | | |
| | | | | | | | | | | | | | | 26,418,671 | |
| | | | | | | | | | | | | | | | |
The accompanying notes are an integral part of these financial statements.
| | | | |
| 24 | | Wells Fargo Small Company Value Portfolio | | Portfolio of investments—November 30, 2018 (unaudited) |
| | | | | | | | | | | | | | | | |
| Security name | | | | | | | | Shares | | | Value | |
| | | | |
| Capital Markets: 1.61% | | | | | | | | | | | | | | | | |
Blucora Incorporated † | | | | | | | | | | | 35,136 | | | $ | 1,087,811 | |
Piper Jaffray Companies Incorporated | | | | | | | | | | | 24,125 | | | | 1,721,801 | |
| | | | |
| | | | | | | | | | | | | | | 2,809,612 | |
| | | | | | | | | | | | | | | | |
| | | | |
| Consumer Finance: 0.30% | | | | | | | | | | | | | | | | |
Enova International Incorporated † | | | | | | | | | | | 23,561 | | | | 521,641 | |
| | | | | | | | | | | | | | | | |
| | | | |
| Insurance: 3.05% | | | | | | | | | | | | | | | | |
American Equity Investment Life Holding Company | | | | | | | | | | | 49,189 | | | | 1,678,821 | |
FBL Financial Group Incorporated | | | | | | | | | | | 24,979 | | | | 1,756,773 | |
State Auto Financial Corporation | | | | | | | | | | | 53,786 | | | | 1,882,510 | |
| | | | |
| | | | | | | | | | | | | | | 5,318,104 | |
| | | | | | | | | | | | | | | | |
| | | | |
| Thrifts & Mortgage Finance: 2.90% | | | | | | | | | | | | | | | | |
Homestreet Incorporated † | | | | | | | | | | | 32,687 | | | | 870,128 | |
NMI Holdings Incorporated Class A † | | | | | | | | | | | 64,090 | | | | 1,252,319 | |
OceanFirst Financial Corporation | | | | | | | | | | | 66,981 | | | | 1,726,100 | |
Walker & Dunlop Incorporated | | | | | | | | | | | 25,492 | | | | 1,203,987 | |
| | | | |
| | | | | | | | | | | | | | | 5,052,534 | |
| | | | | | | | | | | | | | | | |
| | | | |
Health Care: 5.70% | | | | | | | | | | | | | | | | |
| | | | |
| Health Care Equipment & Supplies: 0.35% | | | | | | | | | | | | | | | | |
Fonar Corporation † | | | | | | | | | | | 28,147 | | | | 620,078 | |
| | | | | | | | | | | | | | | | |
| | | | |
| Health Care Providers & Services: 5.35% | | | | | | | | | | | | | | | | |
Amedisys Incorporated † | | | | | | | | | | | 9,612 | | | | 1,309,635 | |
AMN Healthcare Services Incorporated † | | | | | | | | | | | 25,681 | | | | 1,635,880 | |
BioScrip Incorporated † | | | | | | | | | | | 79,959 | | | | 315,838 | |
Encompass Health Corporation | | | | | | | | | | | 11,220 | | | | 843,856 | |
Ensign Group Incorporated | | | | | | | | | | | 36,491 | | | | 1,655,597 | |
Hanger Incorporated † | | | | | | | | | | | 36,420 | | | | 729,493 | |
LHC Group Incorporated † | | | | | | | | | | | 12,907 | | | | 1,353,557 | |
Molina Healthcare Incorporated † | | | | | | | | | | | 5,956 | | | | 832,113 | |
Premier Incorporated Class A † | | | | | | | | | | | 16,406 | | | | 650,662 | |
| | | | |
| | | | | | | | | | | | | | | 9,326,631 | |
| | | | | | | | | | | | | | | | |
| | | | |
Industrials: 21.26% | | | | | | | | | | | | | | | | |
| | | | |
| Building Products: 0.28% | | | | | | | | | | | | | | | | |
Patrick Industries Incorporated † | | | | | | | | | | | 12,265 | | | | 487,166 | |
| | | | | | | | | | | | | | | | |
| | | | |
| Commercial Services & Supplies: 2.80% | | | | | | | | | | | | | | | | |
ACCO Brands Corporation | | | | | | | | | | | 99,835 | | | | 810,660 | |
Casella Waste Systems Incorporated Class A † | | | | | | | | | | | 43,278 | | | | 1,413,027 | |
Ennis Incorporated | | | | | | | | | | | 87,080 | | | | 1,700,672 | |
Hudson Technologies Incorporated Ǡ | | | | | | | | | | | 33,920 | | | | 36,973 | |
TEAM Incorporated Ǡ | | | | | | | | | | | 55,449 | | | | 926,553 | |
| | | | |
| | | | | | | | | | | | | | | 4,887,885 | |
| | | | | | | | | | | | | | | | |
The accompanying notes are an integral part of these financial statements.
| | | | | | |
| Portfolio of investments—November 30, 2018 (unaudited) | | Wells Fargo Small Company Value Portfolio | | | 25 | |
| | | | | | | | | | | | | | | | |
| Security name | | | | | | | | Shares | | | Value | |
| | | | |
| Construction & Engineering: 2.36% | | | | | | | | | | | | | | | | |
MYR Group Incorporated † | | | | | | | | | | | 48,420 | | | $ | 1,515,546 | |
Sterling Construction Company Incorporated † | | | | | | | | | | | 120,861 | | | | 1,555,481 | |
Tutor Perini Corporation † | | | | | | | | | | | 56,321 | | | | 1,048,134 | |
| | | | |
| | | | | | | | | | | | | | | 4,119,161 | |
| | | | | | | | | | | | | | | | |
| | | | |
| Electrical Equipment: 3.12% | | | | | | | | | | | | | | | | |
Encore Wire Corporation | | | | | | | | | | | 35,243 | | | | 1,760,740 | |
EnerSys | | | | | | | | | | | 22,842 | | | | 1,995,706 | |
Generac Holdings Incorporated † | | | | | | | | | | | 29,573 | | | | 1,683,295 | |
| | | | |
| | | | | | | | | | | | | | | 5,439,741 | |
| | | | | | | | | | | | | | | | |
| | | | |
| Machinery: 5.79% | | | | | | | | | | | | | | | | |
Columbus McKinnon Corporation | | | | | | | | | | | 21,927 | | | | 763,060 | |
Hyster Yale Materials Handeling Incorporated | | | | | | | | | | | 8,293 | | | | 542,943 | |
Kadant Incorporated | | | | | | | | | | | 18,532 | | | | 1,687,895 | |
Kennametal Incorporated | | | | | | | | | | | 37,875 | | | | 1,583,933 | |
Manitex International Incorporated † | | | | | | | | | | | 8,184 | | | | 59,661 | |
Miller Industries Incorporated | | | | | | | | | | | 39,742 | | | | 1,115,161 | |
Mueller Industries Incorporated | | | | | | | | | | | 32,138 | | | | 765,527 | |
Spartan Motors Incorporated | | | | | | | | | | | 82,193 | | | | 661,654 | |
Standex International Corporation | | | | | | | | | | | 16,813 | | | | 1,339,996 | |
The Greenbrier Companies Incorporated | | | | | | | | | | | 32,403 | | | | 1,584,831 | |
| | | | |
| | | | | | | | | | | | | | | 10,104,661 | |
| | | | | | | | | | | | | | | | |
| | | | |
| Professional Services: 3.62% | | | | | | | | | | | | | | | | |
Barrett Business Services Incorporated | | | | | | | | | | | 7,806 | | | | 549,152 | |
CBIZ Incorporated † | | | | | | | | | | | 97,298 | | | | 2,052,015 | |
Kelly Services Incorporated Class A | | | | | | | | | | | 73,960 | | | | 1,695,163 | |
Korn/Ferry International | | | | | | | | | | | 34,200 | | | | 1,674,774 | |
WageWorks Incorporated † | | | | | | | | | | | 10,293 | | | | 343,066 | |
| | | | |
| | | | | | | | | | | | | | | 6,314,170 | |
| | | | | | | | | | | | | | | | |
| | | | |
| Road & Rail: 1.51% | | | | | | | | | | | | | | | | |
Avis Budget Group Incorporated † | | | | | | | | | | | 32,341 | | | | 947,268 | |
Genesee & Wyoming Incorporated Class A † | | | | | | | | | | | 20,256 | | | | 1,686,920 | |
| | | | |
| | | | | | | | | | | | | | | 2,634,188 | |
| | | | | | | | | | | | | | | | |
| | | | |
| Trading Companies & Distributors: 1.78% | | | | | | | | | | | | | | | | |
CAI International Incorporated † | | | | | | | | | | | 61,351 | | | | 1,503,713 | |
DXP Enterprises Incorporated † | | | | | | | | | | | 36,917 | | | | 1,337,503 | |
Fly Leasing Limited ADR † | | | | | | | | | | | 20,939 | | | | 254,618 | |
| | | | |
| | | | | | | | | | | | | | | 3,095,834 | |
| | | | | | | | | | | | | | | | |
| | | | |
Information Technology: 10.33% | | | | | | | | | | | | | | | | |
| | | | |
| Communications Equipment: 0.64% | | | | | | | | | | | | | | | | |
Silicom Limited Ǡ | | | | | | | | | | | 29,986 | | | | 1,120,277 | |
| | | | | | | | | | | | | | | | |
The accompanying notes are an integral part of these financial statements.
| | | | |
| 26 | | Wells Fargo Small Company Value Portfolio | | Portfolio of investments—November 30, 2018 (unaudited) |
| | | | | | | | | | | | | | | | |
| Security name | | | | | | | | Shares | | | Value | |
| | | | |
| Electronic Equipment, Instruments & Components: 3.78% | | | | | | | | | | | | | | | | |
Belden Incorporated | | | | | | | | | | | 6,302 | | | $ | 351,526 | |
Eplus Incorporated † | | | | | | | | | | | 14,668 | | | | 1,199,109 | |
Insight Enterprises Incorporated † | | | | | | | | | | | 26,818 | | | | 1,195,546 | |
Kemet Corporation | | | | | | | | | | | 55,112 | | | | 1,128,694 | |
Methode Electronics Incorporated | | | | | | | | | | | 7,546 | | | | 228,644 | |
Napco Security Technologies Incorporated † | | | | | | | | | | | 70,789 | | | | 1,170,850 | |
PC Connection Incorporated | | | | | | | | | | | 41,966 | | | | 1,315,214 | |
| | | | |
| | | | | | | | | | | | | | | 6,589,583 | |
| | | | | | | | | | | | | | | | |
| | | | |
| IT Services: 1.84% | | | | | | | | | | | | | | | | |
EVERTEC Incorporated | | | | | | | | | | | 31,688 | | | | 866,033 | |
Hackett Group Incorporated | | | | | | | | | | | 70,042 | | | | 1,236,241 | |
TTEC Holdings Incorporated | | | | | | | | | | | 26,601 | | | | 778,079 | |
Unisys Corporation Ǡ | | | | | | | | | | | 24,234 | | | | 327,644 | |
| | | | |
| | | | | | | | | | | | | | | 3,207,997 | |
| | | | | | | | | | | | | | | | |
| | | | |
| Semiconductors & Semiconductor Equipment: 2.64% | | | | | | | | | | | | | | | | |
Entegris Incorporated | | | | | | | | | | | 11,998 | | | | 352,741 | |
FormFactor Incorporated † | | | | | | | | | | | 108,437 | | | | 1,788,126 | |
Rudolph Technologies Incorporated † | | | | | | | | | | | 75,768 | | | | 1,607,797 | |
Synaptics Incorporated † | | | | | | | | | | | 22,374 | | | | 860,504 | |
| | | | |
| | | | | | | | | | | | | | | 4,609,168 | |
| | | | | | | | | | | | | | | | |
| | | | |
| Software: 1.13% | | | | | | | | | | | | | | | | |
American Software Incorporated Class A | | | | | | | | | | | 32,559 | | | | 338,614 | |
LogMeIn Incorporated | | | | | | | | | | | 17,638 | | | | 1,626,753 | |
| | | | |
| | | | | | | | | | | | | | | 1,965,367 | |
| | | | | | | | | | | | | | | | |
| | | | |
| Technology Hardware, Storage & Peripherals: 0.30% | | | | | | | | | | | | | | | | |
Immersion Corporation † | | | | | | | | | | | 55,311 | | | | 524,901 | |
| | | | | | | | | | | | | | | | |
| | | | |
Materials: 6.24% | | | | | | | | | | | | | | | | |
| | | | |
| Chemicals: 1.74% | | | | | | | | | | | | | | | | |
Advansix Incorporated † | | | | | | | | | | | 14,639 | | | | 420,286 | |
Stepan Company | | | | | | | | | | | 20,782 | | | | 1,679,601 | |
Trinseo SA | | | | | | | | | | | 18,562 | | | | 937,938 | |
| | | | |
| | | | | | | | | | | | | | | 3,037,825 | |
| | | | | | | | | | | | | | | | |
| | | | |
| Construction Materials: 0.60% | | | | | | | | | | | | | | | | |
Eagle Materials Incorporated | | | | | | | | | | | 14,461 | | | | 1,055,653 | |
| | | | | | | | | | | | | | | | |
| | | | |
| Metals & Mining: 2.95% | | | | | | | | | | | | | | | | |
Kaiser Aluminum Corporation | | | | | | | | | | | 15,812 | | | | 1,545,307 | |
Royal Gold Incorporated | | | | | | | | | | | 25,167 | | | | 1,840,966 | |
Schnitzer Steel Industries Incorporated Class A | | | | | | | | | | | 62,721 | | | | 1,756,815 | |
| | | | |
| | | | | | | | | | | | | | | 5,143,088 | |
| | | | | | | | | | | | | | | | |
The accompanying notes are an integral part of these financial statements.
| | | | | | |
| Portfolio of investments—November 30, 2018 (unaudited) | | Wells Fargo Small Company Value Portfolio | | | 27 | |
| | | | | | | | | | | | | | | | |
| Security name | | | | | | | | Shares | | | Value | |
| | | | |
| Paper & Forest Products: 0.95% | | | | | | | | | | | | | | | | |
Boise Cascade Company | | | | | | | | | | | 26,210 | | | $ | 696,662 | |
Verso Corporation Class A † | | | | | | | | | | | 37,816 | | | | 953,720 | |
| | | | |
| | | | | | | | | | | | | | | 1,650,382 | |
| | | | | | | | | | | | | | | | |
| | | | |
Real Estate: 9.82% | | | | | | | | | | | | | | | | |
| | | | |
| Equity REITs: 8.82% | | | | | | | | | | | | | | | | |
Agree Realty Corporation | | | | | | | | | | | 31,038 | | | | 1,848,934 | |
Armada Hoffler Properties Incorporated | | | | | | | | | | | 137,895 | | | | 2,097,383 | |
CareTrust REIT Incorporated | | | | | | | | | | | 109,224 | | | | 2,186,664 | |
Independence Realty Trust Incorporated | | | | | | | | | | | 207,450 | | | | 2,095,245 | |
Monmouth Real Estate Investment Corporation | | | | | | | | | | | 130,020 | | | | 1,811,179 | |
National Storage Affiliates Trust | | | | | | | | | | | 54,858 | | | | 1,534,378 | |
One Liberty Properties Incorporated | | | | | | | | | | | 69,626 | | | | 1,839,519 | |
Potlatch Corporation | | | | | | | | | | | 53,256 | | | | 1,975,792 | |
| | | | |
| | | | | | | | | | | | | | | 15,389,094 | |
| | | | | | | | | | | | | | | | |
| | | | |
| Real Estate Management & Development: 1.00% | | | | | | | | | | | | | | | | |
Marcus & Millichap Incorporated † | | | | | | | | | | | 47,571 | | | | 1,735,866 | |
| | | | | | | | | | | | | | | | |
| | | | |
Utilities: 4.98% | | | | | | | | | | | | | | | | |
| | | | |
| Electric Utilities: 1.36% | | | | | | | | | | | | | | | | |
Hawaiian Electric Industries Incorporated | | | | | | | | | | | 61,713 | | | | 2,364,842 | |
| | | | | | | | | | | | | | | | |
| | | | |
| Gas Utilities: 1.95% | | | | | | | | | | | | | | | | |
National Fuel Gas Company | | | | | | | | | | | 31,991 | | | | 1,722,715 | |
Northwest Natural Holding Company | | | | | | | | | | | 25,389 | | | | 1,684,052 | |
| | | | |
| | | | | | | | | | | | | | | 3,406,767 | |
| | | | | | | | | | | | | | | | |
| | | | |
| Multi-Utilities: 0.94% | | | | | | | | | | | | | | | | |
MDU Resources Group Incorporated | | | | | | | | | | | 61,830 | | | | 1,636,640 | |
| | | | | | | | | | | | | | | | |
| | | | |
| Water Utilities: 0.73% | | | | | | | | | | | | | | | | |
Artesian Resources Corporation Class A | | | | | | | | | | | 34,992 | | | | 1,272,309 | |
| | | | | | | | | | | | | | | | |
| | | | |
Total Common Stocks (Cost $174,260,441) | | | | | | | | | | | | | | | 173,538,923 | |
| | | | | | | | | | | | | | | | |
| | | | |
| | | Yield | | | | | | | | | | |
| Short-Term Investments: 2.65% | | | | | | | | | | | | | | | | |
| | | | |
| Investment Companies: 2.65% | | | | | | | | | | | | | | | | |
Securities Lending Cash Investments LLC (l)(r)(u) | | | 2.38 | % | | | | | | | 3,662,272 | | | | 3,662,638 | |
Wells Fargo Government Money Market Fund Select Class (l)(u) | | | 2.13 | | | | | | | | 968,194 | | | | 968,194 | |
| | | | |
Total Short-Term Investments (Cost $4,630,483) | | | | | | | | | | | | | | | 4,630,832 | |
| | | | | | | | | | | | | | | | |
| | | | | | | | |
| Total investments in securities (Cost $178,890,924) | | | 102.16 | % | | | 178,169,755 | |
Other assets and liabilities, net | | | (2.16 | ) | | | (3,774,455 | ) |
| | | | | | | | |
| Total net assets | | | 100.00 | % | | $ | 174,395,300 | |
| | | | | | | | |
The accompanying notes are an integral part of these financial statements.
| | | | |
| 28 | | Wells Fargo Small Company Value Portfolio | | Portfolio of investments—November 30, 2018 (unaudited) |
| † | Non-income-earning security |
| « | All or a portion of this security is on loan. |
| (l) | The issuer of the security is an affiliated person of the Portfolio as defined in the Investment Company Act of 1940. |
| (r) | The investment is a non-registered investment company purchased with cash collateral received from securities on loan. |
| (u) | The rate represents the 7-day annualized yield at period end. |
Abbreviations:
| ADR | American depositary receipt |
| REIT | Real estate investment trust |
Investments in Affiliates
An affiliated investment is an investment in which the Portfolio owns at least 5% of the outstanding voting shares of the issuer or as a result of other relationships, such as the Portfolio and the issuer having the same adviser or investment manager. Transactions with issuers that were either affiliated persons of the Portfolio at the beginning of the period or the end of the period were as follows:
| | | | | | | | | | | | | | | | | | | | | | | | | | | | | | | | | | | | |
| | | Shares,
beginning of
period | | | Shares
purchased | | | Shares
sold | | | Shares,
end of
period | | | Net
realized
gains
(losses) | | | Net
change in
unrealized
gains
(losses) | | | Income
from
affiliated
securities | | | Value,
end
of period | | | % of
net
assets | |
Short-Term Investments | | | | | | | | | | | | | | | | | | | | | | | | | | | | | | | | | | | | |
Investment Companies | | | | | | | | | | | | | | | | | | | | | | | | | | | | | | | | | | | | |
Securities Lending Cash Investments LLC | | | 5,546,867 | | | | 59,278,399 | | | | 61,162,994 | | | | 3,662,272 | | | $ | (497 | ) | | $ | (3 | ) | | $ | 83,602 | | | $ | 3,662,638 | | | | | |
Wells Fargo Government Money Market Fund Select Class | | | 851,216 | | | | 117,515,182 | | | | 117,398,204 | | | | 968,194 | | | | 0 | | | | 0 | | | | 20,040 | | | | 968,194 | | | | | |
| | | | | | | | | | | | | | | | | | | | | | | | | | | | | | | | | | | | |
| | | | | | | | | | | | | | | | | | $ | (497 | ) | | $ | (3 | ) | | $ | 103,642 | | | $ | 4,630,832 | | | | 2.65 | % |
| | | | | | | | | | | | | | | | | | | | | | | | | | | | | | | | | | | | |
The accompanying notes are an integral part of these financial statements.
| | | | | | |
| Statement of assets and liabilities—November 30, 2018 (unaudited) | | Wells Fargo Small Company Value Portfolio | | | 29 | |
| | | | |
| | | | |
| |
Assets | | | | |
Investments in unaffiliated securities (including $3,574,560 of securities loaned), at value (cost $174,260,441) | | $ | 173,538,923 | |
Investments in affiliated securities, at value (cost 4,630,483) | | | 4,630,832 | |
Receivable for investments sold | | | 1,693,824 | |
Receivable for dividends | | | 132,888 | |
Receivable for securities lending income | | | 5,187 | |
Prepaid expenses and other assets | | | 11,385 | |
| | | | |
Total assets | | | 180,013,039 | |
| | | | |
| |
Liabilities | | | | |
Payable upon receipt of securities loaned | | | 3,662,421 | |
Payable for investments purchased | | | 1,810,362 | |
Advisory fee payable | | | 113,751 | |
Accrued expenses and other liabilities | | | 31,205 | |
| | | | |
Total liabilities | | | 5,617,739 | |
| | | | |
Total net assets | | $ | 174,395,300 | |
| | | | |
The accompanying notes are an integral part of these financial statements.
| | | | |
| 30 | | Wells Fargo Small Company Value Portfolio | | Statement of operations—six months ended November 30, 2018 (unaudited) |
| | | | |
| | | | |
| |
Investment income | | | | |
Dividends (net of foreign withholding taxes of $1,538) | | $ | 1,558,946 | |
Securities lending income from affiliates, net | | | 83,602 | |
Income from affiliated securities | | | 20,040 | |
| | | | |
Total investment income | | | 1,662,588 | |
| | | | |
| |
Expenses | | | | |
Advisory fee | | | 842,896 | |
Custody and accounting fees | | | 8,736 | |
Professional fees | | | 23,584 | |
Shareholder report expenses | | | 1,410 | |
Trustees’ fees and expenses | | | 11,088 | |
Other fees and expenses | | | 5,025 | |
| | | | |
Total expenses | | | 892,739 | |
Less: Fee waivers and/or expense reimbursements | | | (100,272 | ) |
| | | | |
Net expenses | | | 792,467 | |
| | | | |
Net investment income | | | 870,121 | |
| | | | |
| |
REALIZED AND UNREALIZED GAINS (LOSSES) ON INVESTMENTS | | | | |
| |
Net realized losses on: | | | | |
Unaffiliated securities | | | (9,489,316 | ) |
Affiliated securities | | | (497 | ) |
| | | | |
Net realized losses on investments | | | (9,489,813 | ) |
| | | | |
| |
Net change in unrealized gains (losses) on: | | | | |
Unaffiliated securities | | | (7,948,439 | ) |
Affiliated securities | | | (3 | ) |
| | | | |
Net change in unrealized gains (losses) on investments | | | (7,948,442 | ) |
| | | | |
Net realized and unrealized gains (losses) on investments | | | (17,438,255 | ) |
| | | | |
Net decrease in net assets resulting from operations | | $ | (16,568,134 | ) |
| | | | |
The accompanying notes are an integral part of these financial statements.
| | | | | | |
| Statement of changes in net assets | | Wells Fargo Small Company Value Portfolio | | | 31 | |
| | | | | | | | |
| | | Six months ended
November 30, 2018
(unaudited) | | | Year ended
May 31, 2018 | |
| | |
Operations | | | | | | | | |
Net investment income | | $ | 870,121 | | | $ | 1,619,419 | |
Net realized gains (losses) on investments | | | (9,489,813 | ) | | | 35,399,955 | |
Net change in unrealized gains (losses) on investments | | | (7,948,442 | ) | | | (24,205,675 | ) |
| | | | |
Net increase (decrease) in net assets resulting from operations | | | (16,568,134 | ) | | | 33,813,699 | |
| | | | |
| |
Capital transactions | | | | |
Transactions in investors’ beneficial interests | | | | | | | | |
Contributions | | | 101,491,419 | | | | 10,857,996 | |
Withdrawals | | | (69,926,430 | ) | | | (99,498,049 | ) |
| | | | |
Net increase (decrease) in net assets resulting from capital transactions | | | 31,564,989 | | | | (88,640,053 | ) |
| | | | |
Total increase (decrease) in net assets | | | 14,996,855 | | | | (54,826,354 | ) |
| | | | |
| |
Net assets | | | | |
Beginning of period | | | 159,398,445 | | | | 214,224,799 | |
| | | | |
End of period | | $ | 174,395,300 | | | $ | 159,398,445 | |
| | | | |
The accompanying notes are an integral part of these financial statements.
| | | | |
| 32 | | Wells Fargo Small Company Value Portfolio | | Financial highlights |
| | | | | | | | | | | | | | | | | | | | | | | | |
| | | Six months ended
November 30, 2018
(unaudited) | | | Year ended May 31 | |
| | | 2018 | | | 2017 | | | 2016 | | | 2015 | | | 2014 | |
Total return1 | | | (7.42 | )% | | | 20.10 | % | | | 19.44 | % | | | (4.96 | )% | | | 7.29 | % | | | 18.09 | % |
Ratios to average net assets (annualized) | | | | | | | | | | | | | | | | | | | | | | | | |
Gross expenses | | | 0.85 | % | | | 0.85 | % | | | 0.84 | % | | | 0.85 | % | | | 0.84 | % | | | 0.85 | % |
Net expenses | | | 0.75 | % | | | 0.84 | % | | | 0.84 | % | | | 0.85 | % | | | 0.84 | % | | | 0.85 | % |
Net investment income | | | 0.83 | % | | | 0.87 | % | | | 0.72 | % | | | 0.62 | % | | | 0.89 | % | | | 0.89 | % |
Supplemental data | | | | | | | | | | | | | | | | | | | | | | | | |
Portfolio turnover rate | | | 86 | % | | | 144 | % | | | 110 | % | | | 72 | % | | | 54 | % | | | 47 | % |
| 1 | Returns for periods of less than one year are not annualized. |
The accompanying notes are an integral part of these financial statements.
| | | | | | |
| Notes to financial statements (unaudited) | | Wells Fargo Small Company Value Portfolio | | | 33 | |
1. ORGANIZATION
Wells Fargo Master Trust (the “Trust”), a Delaware statutory trust organized on March 10, 1999, is anopen-end management investment company registered under the Investment Company Act of 1940, as amended (the “1940 Act”). As an investment company, the Trust follows the accounting and reporting guidance in Financial Accounting Standards Board (“FASB”)Accounting Standards Codification Topic 946, Financial Services – Investment Companies. These financial statements report on the Wells Fargo Small Company Value Portfolio (the “Portfolio”) which is a diversified series of the Trust.
2. SIGNIFICANT ACCOUNTING POLICIES
The following significant accounting policies, which are consistently followed in the preparation of the financial statements of the Portfolio, are in conformity with U.S. generally accepted accounting principles which require management to make estimates and assumptions that affect the reported amounts of assets and liabilities, disclosure of contingent assets and liabilities at the date of the financial statements, and the reported amounts of revenues and expenses during the reporting period. Actual results could differ from those estimates.
Securities valuation
All investments are valued each business day as of the close of regular trading on the New York Stock Exchange (generally 4 p.m. Eastern Time), although the Portfolio may deviate from this calculation time under unusual or unexpected circumstances.
Equity securities that are listed on a foreign or domestic exchange or market are valued at the official closing price or, if none, the last sales price. If no sale occurs on the principal exchange or market that day, a fair value price will be determined in accordance with the Portfolio’s Valuation Procedures.
Investments in registeredopen-end investment companies are valued at net asset value. Interests innon-registered investment companies that are redeemable at net asset value are fair valued normally at net asset value.
Investments which are not valued using any of the methods discussed above are valued at their fair value, as determined in good faith by the Board of Trustees of the Portfolio. The Board of Trustees has established a Valuation Committee comprised of the Trustees and has delegated to it the authority to take any actions regarding the valuation of portfolio securities that the Valuation Committee deems necessary or appropriate, including determining the fair value of portfolio securities, unless the determination has been delegated to the Wells Fargo Asset Management Pricing Committee at Wells Fargo Funds Management, LLC (“Funds Management”).The Board of Trustees retains the authority to make or ratify any valuation decisions or approve any changes to the Valuation Procedures as it deems appropriate. On a quarterly basis, the Board of Trustees receives reports on any valuation actions taken by the Valuation Committee or the Wells Fargo Asset Management Pricing Committee which may include items for ratification.
Securities lending
The Portfolio may lend its securities from time to time in order to earn additional income in the form of fees or interest on securities received as collateral or the investment of any cash received as collateral. The Portfolio continues to receive interest or dividends on the securities loaned. The Portfolio receives collateral in the form of cash or securities with a value at least equal to the value of the securities on loan. The value of the loaned securities is determined at the close of each business day and any additional required collateral is delivered to the Portfolio on the next business day. In a securities lending transaction, the net asset value of the Portfolio will be affected by an increase or decrease in the value of the securities loaned and by an increase or decrease in the value of the instrument in which collateral is invested. The amount of securities lending activity undertaken by the Portfolio fluctuates from time to time. In the event of default or bankruptcy by the borrower, the Portfolio may be prevented from recovering the loaned securities or gaining access to the collateral or may experience delays or costs in doing so. In addition, the investment of any cash collateral received may lose all or part of its value. The Portfolio has the right under the lending agreement to recover the securities from the borrower on demand.
The Portfolio lends its securities through an unaffiliated securities lending agent. Cash collateral received in connection with its securities lending transactions is invested in Securities Lending Cash Investments, LLC (the “Securities Lending Fund”). The Securities Lending Fund is exempt from registration under Section 3(c)(7) of the 1940 Act and is managed by Funds Management and is subadvised by Wells Capital Management Incorporated (“WellsCap”), an affiliate of Funds Management and an indirect wholly owned subsidiary of Wells Fargo & Company (“Wells Fargo”). Funds Management receives an advisory fee starting at 0.05% and declining to 0.01% as the average daily net assets of the Securities Lending Fund increase. All of the fees received by Funds Management are paid to WellsCap for its services as subadviser. The Securities Lending Fund seeks to provide a positive return compared to the daily Fed Funds Open Rate by investing in
| | | | |
| 34 | | Wells Fargo Small Company Value Portfolio | | Notes to financial statements (unaudited) |
high-quality, U.S. dollar-denominated short-term money market instruments. Securities Lending Fund investments are valued at the evaluated bid price provided by an independent pricing service. Income earned from investment in the Securities Lending Fund is included in securities lending income from affiliates (net of fees and rebates) on the Statement of Operations.
Security transactions and income recognition
Securities transactions are recorded on a trade date basis. Realized gains or losses are recorded on the basis of identified cost.
Dividend income is recognized on theex-dividend date. Dividend income is recorded net of foreign taxes withheld where recovery of such taxes is not assured.
Federal and other taxes
The Portfolio is treated as a separate entity for federal income tax purposes. The Portfolio is not required to pay federal income taxes on its net investment income and net capital gains as it is treated as a partnership for federal income tax purposes. All interest, dividends, gains and losses of the Portfolio are deemed to have been “passed through” to the interest holders in proportion to their holdings of the Portfolio regardless of whether such interest, dividends and gains have been distributed by the Portfolio.
The Portfolio’s income tax returns and all financial records supporting those returns for the prior three fiscal years are subject to examination by the federal revenue authority. Management has analyzed the Portfolio’s tax positions taken on federal, state, and foreign tax returns for all open tax years and does not believe that there are any uncertain tax positions that require recognition of a tax liability.
As of November 30, 2018, the aggregate cost of all investments for federal income tax purposes was $179,231,246 and the unrealized gains (losses) consisted of:
| | | | |
Gross unrealized gains | | $ | 0 | |
Gross unrealized losses | | | (1,061,491 | ) |
Net unrealized losses | | $ | (1,061,491 | ) |
3. FAIR VALUATION MEASUREMENTS
Fair value measurements of investments are determined within a framework that has established a fair value hierarchy based upon the various data inputs utilized in determining the value of the Portfolio’s investments. The three-level hierarchy gives the highest priority to unadjusted quoted prices in active markets for identical assets or liabilities (Level 1) and the lowest priority to unobservable inputs (Level 3). The Portfolio’s investments are classified within the fair value hierarchy based on the lowest level of input that is significant to the fair value measurement. The inputs are summarized into three broad levels as follows:
| ∎ | | Level 1 – quoted prices in active markets for identical securities |
| ∎ | | Level 2 – other significant observable inputs (including quoted prices for similar securities, interest rates, prepayment speeds, credit risk, etc.) |
| ∎ | | Level 3 – significant unobservable inputs (including the Portfolio’s own assumptions in determining the fair value of investments) |
The inputs or methodologies used for valuing investments in securities are not necessarily an indication of the risk associated with investing in those securities.
| | | | | | |
| Notes to financial statements (unaudited) | | Wells Fargo Small Company Value Portfolio | | | 35 | |
The following is a summary of the inputs used in valuing the Portfolio’s assets and liabilities as of November 30, 2018:
| | | | | | | | | | | | | | | | |
| | | Quoted prices
(Level 1) | | | Other significant
observable inputs
(Level 2) | | | Significant
unobservable inputs (Level 3) | | | Total | |
Assets | | | | | | | | | | | | | | | | |
Investments in: | | | | | | | | | | | | | | | | |
| | | | |
Common stocks | | | | | | | | | | | | | | | | |
Communication services | | $ | 192,387 | | | $ | 0 | | | $ | 0 | | | $ | 192,387 | |
Consumer discretionary | | | 19,139,426 | | | | 0 | | | | 0 | | | | 19,139,426 | |
Consumer staples | | | 5,013,318 | | | | 0 | | | | 0 | | | | 5,013,318 | |
Energy | | | 7,333,956 | | | | 0 | | | | 0 | | | | 7,333,956 | |
Financials | | | 40,120,562 | | | | 0 | | | | 0 | | | | 40,120,562 | |
Health care | | | 9,946,709 | | | | 0 | | | | 0 | | | | 9,946,709 | |
Industrials | | | 37,082,806 | | | | 0 | | | | 0 | | | | 37,082,806 | |
Information technology | | | 18,017,293 | | | | 0 | | | | 0 | | | | 18,017,293 | |
Materials | | | 10,886,948 | | | | 0 | | | | 0 | | | | 10,886,948 | |
Real estate | | | 17,124,960 | | | | 0 | | | | 0 | | | | 17,124,960 | |
Utilities | | | 8,680,558 | | | | 0 | | | | 0 | | | | 8,680,558 | |
| | | | |
Short-term investments | | | | | | | | | | | | | | | | |
Investment companies | | | 968,194 | | | | 3,662,638 | | | | 0 | | | | 4,630,832 | |
Total assets | | $ | 174,507,117 | | | $ | 3,662,638 | | | $ | 0 | | | $ | 178,169,755 | |
Additional sector, industry or geographic detail is included in the Portfolio of Investments.
At November 30, 2018, the Portfolio did not have any transfers into/out of Level 3.
4. TRANSACTIONS WITH AFFILIATES
Advisory fee
The Trust has entered into an advisory contract with Funds Management, an indirect wholly owned subsidiary of Wells Fargo. The adviser is responsible for implementing investment policies and guidelines and for supervising the subadviser, who is responsible forday-to-day portfolio management of the Portfolio. Pursuant to the contract, Funds Management is entitled to receive an annual advisory fee starting at 0.80% and declining to 0.68% as the average daily net assets of the Portfolio increase. For the six months ended November 30, 2018, the advisory fee was equivalent to an annual rate of 0.80% of the Portfolio’s average daily net assets.
Funds Management has retained the services of a subadviser to provide daily portfolio management to the Portfolio. The fee for subadvisory services is borne by Funds Management. WellsCap is the subadviser to the Portfolio and is entitled to receive a fee from Funds Management at an annual rate starting at 0.55% and declining to 0.40% as the average daily net assets of the Portfolio increase.
Funds Management has voluntarily waived and/or reimbursed advisory fees to the extent necessary to maintain the net operating expense ratio of the Portfolio.
Interfund transactions
The Portfolio may purchase or sell portfolio investment securities to certain other Wells Fargo affiliates pursuant toRule 17a-7 under the 1940 Act and under procedures adopted by the Board of Trustees. The procedures have been designed to ensure that these interfund transactions, which do not incur broker commissions, are effected at current market prices.
5. INVESTMENT PORTFOLIO TRANSACTIONS
Purchases and sales of investments, excluding U.S. government obligations (if any) and short-term securities, for the six months ended November 30, 2018 were $206.524,178 and $174,015,314, respectively.
6. BANK BORROWINGS
Effective August 28, 2018, the Trust, along with Wells Fargo Variable Trust and Wells Fargo Funds Trust (excluding the money market funds), are parties to a $280,000,000 revolving credit agreement whereby the Portfolio is permitted to use
| | | | |
| 36 | | Wells Fargo Small Company Value Portfolio | | Notes to financial statements (unaudited) |
bank borrowings for temporary or emergency purposes, such as to fund shareholder redemption requests. Interest under the credit agreement is charged to the Portfolio based on a borrowing rate equal to the higher of the Federal Funds rate in effect on that day plus 1.25% or the overnight LIBOR rate in effect on that day plus 1.25%. In addition, an annual commitment fee equal to 0.25% of the unused balance is allocated to each participating fund.
For the six months ended November 30, 2018, there were no borrowings by the Portfolio under the agreement.
7. INDEMNIFICATION
Under the Trust’s organizational documents, the officers and Trustees have been granted certain indemnification rights against certain liabilities that may arise out of performance of their duties to the Trust. Additionally, in the normal course of business, the Trust may enter into contracts with service providers that contain a variety of indemnification clauses. The Trust’s maximum exposure under these arrangements is dependent on future claims that may be made against the Portfolio and, therefore, cannot be estimated.
8. NEW ACCOUNTING PRONOUNCEMENT
In August 2018, FASB issued Accounting Standards Update (“ASU”)No. 2018-13, Fair Value Measurement (Topic 820)Disclosure Framework—Changes to the Disclosure Requirements for Fair Value Measurement. ASU2018-13 updates the disclosure requirements for fair value measurements by modifying or removing certain disclosures and adding certain new disclosures. The amendments are effective for fiscal years, and interim periods within those fiscal years, beginning after December 15, 2019. Early adoption is permitted. Management has adopted the removal and modification of disclosures early, as permitted, and will adopt the additional new disclosures at the effective date.
| | | | | | |
| Other information (unaudited) | | Wells Fargo Small Company Value Fund | | | 37 | |
PROXY VOTING INFORMATION
A description of the policies and procedures used to determine how to vote proxies relating to portfolio securities is available, upon request, by calling1-800-222-8222, visiting our website atwellsfargofunds.com, or visiting the SEC website at sec.gov. Information regarding how the Fund voted proxies relating to portfolio securities during the most recent12-month period ended June 30 is available on the Fund’s website atwellsfargofunds.comor by visiting the SEC website at sec.gov.
PORTFOLIO HOLDINGS INFORMATION
The complete portfolio holdings for the Fund are publicly available monthly on the Fund’s website (wellsfargofunds.com), on aone-month delayed basis. In addition, top ten holdings information (excluding derivative positions) for the Fund is publicly available on the Fund’s website on a monthly,seven-day or more delayed basis. The Fund files its complete schedule of portfolio holdings with the SEC for the first and third quarters of each fiscal year on FormN-Q, which is available by visiting the SEC website at sec.gov. In addition, the Fund’s FormN-Q may be reviewed and copied at the SEC’s Public Reference Room in Washington, DC, and at regional offices in New York City, at 233 Broadway, and in Chicago, at 175 West Jackson Boulevard, Suite 900. Information about the Public Reference Room may be obtained by calling1-800-SEC-0330.
| | | | |
| 38 | | Wells Fargo Small Company Value Fund | | Other information (unaudited) |
BOARD OF TRUSTEES AND OFFICERS
Each of the Trustees and Officers1 listed in the table below acts in identical capacities for each fund in the Wells Fargo family of funds, which consists of 152 mutual funds comprising the Wells Fargo Funds Trust, Wells Fargo Variable Trust, Wells Fargo Master Trust and fourclosed-end funds (collectively the “Fund Complex”). This table should be read in conjunction with the Prospectus and the Statement of Additional Information2. The mailing address of each Trustee and Officer is 525 Market Street, 12th Floor, San Francisco, CA 94105. Each Trustee and Officer serves an indefinite term, however, each Trustee serves such term until reaching the mandatory retirement age established by the Trustees.
Independent Trustees
| | | | | | |
Name and year of birth | | Position held and
length of service* | | Principal occupations during past five years or longer | | Current other
public company or
investment company
directorships |
William R. Ebsworth (Born 1957) | | Trustee, since 2015 | | Retired. From 1984 to 2013, equities analyst, portfolio manager, research director and chief investment officer at Fidelity Management and Research Company in Boston, Tokyo, and Hong Kong, and retired in 2013 as Chief Investment Officer of Fidelity Strategic Advisers, Inc. where he led a team of investment professionals managing client assets. Prior thereto, Board member of Hong Kong Securities Clearing Co., Hong Kong Options Clearing Corp., the Thailand International Fund, Ltd., Fidelity Investments Life Insurance Company, and Empire Fidelity Investments Life Insurance Company. Board member of the Vincent Memorial Hospital Endowment(non-profit organization), where he serves on the Investment Committee and as a Chair of the Audit Committee. Mr. Ebsworth is a CFA® charterholder. | | N/A |
Jane A. Freeman (Born 1953) | | Trustee, since 2015; Chair Liaison, since 2018 | | Retired. From 2012 to 2014 and 1999 to 2008, Chief Financial Officer of Scientific Learning Corporation. From 2008 to 2012, Ms. Freeman provided consulting services related to strategic business projects. Prior to 1999, Portfolio Manager at Rockefeller & Co. and Scudder, Stevens & Clark. Board member of the Harding Loevner Funds from 1996 to 2014, serving as both Lead Independent Director and chair of the Audit Committee. Board member of the Russell Exchange Traded Funds Trust from 2011 to 2012 and the chair of the Audit Committee. Ms. Freeman is a Board Member of The Ruth Bancroft Garden(non-profit organization). She is also an inactive Chartered Financial Analyst. | | N/A |
| Isaiah Harris, Jr.3 (Born 1952) | | Trustee, since 2009 | | Retired. Chairman of the Board of CIGNA Corporation since 2009, and Director since 2005. From 2003 to 2011, Director of Deluxe Corporation. Prior thereto, President and CEO of BellSouth Advertising and Publishing Corp. from 2005 to 2007, President and CEO of BellSouth Enterprises from 2004 to 2005 and President of BellSouth Consumer Services from 2000 to 2003. Emeritus member of the Iowa State University Foundation Board of Governors. Emeritus Member of the Advisory Board of Iowa State University School of Business. Advisory Board Member, Palm Harbor Academy (private school). Advisory Board Member, Child Evangelism Fellowship(non-profit). Mr. Harris is a certified public accountant (inactive status). | | CIGNA Corporation |
Judith M. Johnson3 (Born 1949) | | Trustee, since 2008; Audit Committee Chairman, since 2009 | | Retired. Prior thereto, Chief Executive Officer and Chief Investment Officer of Minneapolis Employees Retirement Fund from 1996 to 2008. Ms. Johnson is an attorney, certified public accountant and a certified managerial accountant. | | N/A |
David F. Larcker (Born 1950) | | Trustee, since 2009 | | James Irvin Miller Professor of Accounting at the Graduate School of Business, Stanford University, Director of the Corporate Governance Research Initiative and Senior Faculty of The Rock Center for Corporate Governance since 2006. From 2005 to 2008, Professor of Accounting at the Graduate School of Business, Stanford University. Prior thereto, Ernst & Young Professor of Accounting at The Wharton School, University of Pennsylvania from 1985 to 2005. | | N/A |
| | | | | | |
| Other information (unaudited) | | Wells Fargo Small Company Value Fund | | | 39 | |
| | | | | | |
Name and year of birth | | Position held and
length of service* | | Principal occupations during past five years or longer | | Current other
public company or
investment company
directorships |
Olivia S. Mitchell (Born 1953) | | Trustee, since 2006; Nominating and Governance Committee Chairman, since 2018 | | International Foundation of Employee Benefit Plans Professor, Wharton School of the University of Pennsylvania since 1993. Director of Wharton’s Pension Research Council and Boettner Center on Pensions & Retirement Research, and Research Associate at the National Bureau of Economic Research. Previously, Cornell University Professor from 1978 to 1993. | | N/A |
Timothy J. Penny (Born 1951) | | Trustee, since 1996; Chairman, since 2018; Vice Chairman, from 2017 to 2018 | | President and Chief Executive Officer of Southern Minnesota Initiative Foundation, anon-profit organization, since 2007. Member of the Board of Trustees of NorthStar Education Finance, Inc., anon-profit organization, since 2007. | | N/A |
James G. Polisson (Born 1959) | | Trustee, since 2018; Advisory Board Member, from 2017 to 2018 | | Retired. Chief Marketing Officer, Source (ETF) UK Services, Ltd, from 2015 to 2017. From 2012 to 2015, Principal of The Polisson Group, LLC, a management consulting, corporate advisory and principal investing company. Chief Executive Officer and Managing Director at Russell Investments, Global Exchange Traded Funds from 2010 to 2012. Managing Director of Barclays Global Investors from 1998 to 2010 and Global Chief Marketing Officer for iShares and Barclays Global Investors from 2000 to 2010. Trustee of the San Francisco Mechanics’ Institute, anon-profit organization, from 2013 to 2015. Board member of the Russell Exchange Traded Fund Trust from 2011 to 2012. Director of Barclays Global Investors Holdings Deutschland GmbH from 2006 to 2009. Mr. Polisson is an attorney and has a retired status with the Massachusetts and District of Columbia Bar Associations. | | N/A |
Michael S. Scofield4 (Born 1943) | | Trustee, since 2010 | | Served on the Investment Company Institute’s Board of Governors and Executive Committee from 2008-2011 as well the Governing Council of the Independent Directors Council from 2006-2011 and the Independent Directors Council Executive Committee from 2008-2011. Trustee of the Evergreen Fund complex (and its predecessors) from 1984 to 2010. Chairman of the Evergreen Funds from 2000-2010. Former Trustee of the Mentor Funds. Retired Attorney, Law Offices of Michael S. Scofield. | | N/A |
Pamela Wheelock (Born 1959) | | Trustee, since 2018; Advisory Board Member, from 2017 to 2018 | | Chief Operating Officer, Twin Cities Habitat for Humanity, since January, 2017. Vice President of University Services, University of Minnesota from 2012 to 2017. Prior thereto, on the Board of Directors, Governance Committee and Finance Committee for the Minnesota Philanthropy Partners (Saint Paul Foundation) from 2012 to 2018, Interim President and Chief Executive Officer of Blue Cross Blue Shield of Minnesota from 2010 to 2011, Chairman of the Board from 2009 to 2011 and Board Director from 2003 to 2015. Vice President, Leadership and Community Engagement, Bush Foundation, Saint Paul, Minnesota (a private foundation) from 2009 to 2011. Executive Vice President and Chief Financial Officer, Minnesota Sports and Entertainment from 2004 to 2009 and Senior Vice President from 2002 to 2004. Commissioner of Finance, State of Minnesota, from 1999 to 2002. Currently the Board Chair of the Minnesota Wild Foundation since 2010. | | N/A |
| * | Length of service dates reflect the Trustee’s commencement of service with the Trust’s predecessor entities, where applicable. |
| | | | |
| 40 | | Wells Fargo Small Company Value Fund | | Other information (unaudited) |
Officers
| | | | | | |
Name and year of birth | | Position held and
length of service | | Principal occupations during past five years or longer | | |
Andrew Owen (Born 1960) | | President, since 2017 | | Executive Vice President of Wells Fargo & Company and Head of Affiliated Managers, Wells Fargo Asset Management, since 2014. In addition, Mr. Owen is currently President, Chief Executive Officer and Director of Wells Fargo Funds Management, LLC since 2017. Prior thereto, Executive Vice President responsible for marketing, investments and product development for Wells Fargo Funds Management, LLC, from 2009 to 2014. | | |
Nancy Wiser1 (Born 1967) | | Treasurer, since 2012 | | Executive Vice President of Wells Fargo Funds Management, LLC since 2011. Chief Operating Officer and Chief Compliance Officer at LightBox Capital Management LLC, from 2008 to 2011. | | |
Alexander Kymn (Born 1973) | | Secretary, since 2018; Chief Legal Officer, since 2018 | | Senior Company Counsel of Wells Fargo Bank, N.A. since 2018 (previously Senior Counsel from 2007 to 2018). Vice President of Wells Fargo Funds Management, LLC from 2008 to 2014. | | |
Michael H. Whitaker (Born 1967) | | Chief Compliance Officer, since 2016 | | Senior Vice President and Chief Compliance Officer since 2016. Senior Vice President and Chief Compliance Officer for Fidelity Investments from 2007 to 2016. | | |
David Berardi (Born 1975) | | Assistant Treasurer, since 2009 | | Vice President of Wells Fargo Funds Management, LLC since 2009. Vice President of Evergreen Investment Management Company, LLC from 2008 to 2010. Manager of Fund Reporting and Control for Evergreen Investment Management Company, LLC from 2004 to 2010. | | |
Jeremy DePalma1 (Born 1974) | | Assistant Treasurer, since 2009 | | Senior Vice President of Wells Fargo Funds Management, LLC since 2009. Senior Vice President of Evergreen Investment Management Company, LLC from 2008 to 2010 and head of the Fund Reporting and Control Team within Fund Administration from 2005 to 2010. | | |
| 1 | Nancy Wiser acts as Treasurer of 76 funds in the Fund Complex. Jeremy DePalma acts as Treasurer of 76 funds and Assistant Treasurer of 76 funds in the Fund Complex. |
| 2 | The Statement of Additional Information includes additional information about the Trustees and is available, without charge, upon request, by calling1-800-222-8222 or by visiting the website atwellsfargofunds.com. |
| 3 | Mr. Harris will replace Ms. Johnson as the Chairman of the Audit Committee effective January 1, 2019. |
| 4 | Mr. Scofield is expected to retire on December 31, 2018. |
| | | | | | |
| Appendix A (unaudited) | | Wells Fargo Small Company Value Fund | | | 41 | |
SALES CHARGE REDUCTIONS AND WAIVERS FOR CERTAIN INTERMEDIARIES
Raymond James & Associates, Inc., Raymond James Financial Services & Raymond James affiliates (“Raymond James”)
Effective on or about March 1, 2019, shareholders purchasing Fund shares through a Raymond James platform or account will be eligible only for the following load waivers(front-end sales charge waivers and contingent deferred, orback-end, sales charge waivers) and discounts, which may differ from those disclosed elsewhere in the Fund’s Prospectus or SAI.
Front-end Sales Load Waivers on Class A shares Available at Raymond James
| | • | | Shares purchased in an investment advisory program. |
| | • | | Shares purchased through reinvestment of capital gains distributions and dividend reinvestment when purchasing shares of the same fund (but not any other fund within the fund family). |
| | • | | Employees and registered representatives of Raymond James or its affiliates and their family members as designated by Raymond James. |
| | • | | Shares purchased from the proceeds of redemptions within the same fund family, provided (1) the repurchase occurs within 90 days following the redemption, (2) the redemption and purchase occur in the same account, and (3) redeemed shares were subject to afront-end or deferred sales load (known as Rights of Reinstatement). |
| | • | | A shareholder in the fund’s Class C shares will have their shares automatically exchanged at net asset value to Class A shares (or the appropriate share class) of the fund if the shares are no longer subject to a CDSC and the exchange is in line with the policies and procedures of Raymond James. |
CDSC Waivers on Class A and C Shares Available at Raymond James
| | • | | Death or disability of the shareholder. |
| | • | | Shares sold as part of a systematic withdrawal plan as described in the Fund’s Prospectus. |
| | • | | Return of excess contributions from an IRA Account. |
| | • | | Shares sold as part of a required minimum distribution for IRA and retirement accounts due to the shareholder reaching age 70½ as described in the Fund’s prospectus. |
| | • | | Shares sold to pay Raymond James fees but only if the transaction is initiated by Raymond James. |
| | • | | Shares acquired through a right of reinstatement. |
Front-end Load Discounts Available at Raymond James: Breakpoints, and/or Rights of Accumulation
| | • | | Breakpoints as described in the Fund’s Prospectus. |
| | • | | Rights of accumulation which entitle shareholders to breakpoint discounts will be automatically calculated based on the aggregated holding of fund family assets held by accounts within the purchaser’s household at Raymond James. Eligible fund family assets not held at Raymond James may be included in the rights of accumulation calculation only if the shareholder notifies his or her financial advisor about such assets. |
This page is intentionally left blank.
This page is intentionally left blank.
This page is intentionally left blank.

For more information
More information about Wells Fargo Funds is available free upon request. To obtain literature, please write, visit the Fund’s website, or call:
Wells Fargo Funds
P.O. Box 219967
Kansas City, MO 64121-9967
Website: wellsfargofunds.com
Individual investors: 1-800-222-8222
Retail investment professionals: 1-888-877-9275
Institutional investment professionals:1-866-765-0778
This report and the financial statements contained herein are submitted for the general information of the shareholders of the Fund. If this report is used for promotional purposes, distribution of the report must be accompanied or preceded by a current prospectus. Before investing, please consider the investment objectives, risks, charges, and expenses of the investment. For a current prospectus and, if available, a summary prospectus, containing this information, call1-800-222-8222 or visit the Fund’s website atwellsfargofunds.com. Read the prospectus carefully before you invest or send money.
Wells Fargo Asset Management (WFAM) is the trade name for certain investment advisory/management firms owned by Wells Fargo & Company. These firms include but are not limited to Wells Capital Management Incorporated and Wells Fargo Funds Management, LLC. Certain products managed by WFAM entities are distributed by Wells Fargo Funds Distributor, LLC (a broker/dealer and Member FINRA).
This material is for general informational and educational purposes only and is NOT intended to provide investment advice or a recommendation of any kind—including a recommendation for any specific investment, strategy, or plan.
INVESTMENT PRODUCTS: NOT FDIC INSURED ◾ NO BANK GUARANTEE ◾ MAY LOSE VALUE
© 2019 Wells Fargo Funds Management, LLC. All rights reserved.
| | |
 | | 318980 01-19 SA286/SAR286 11-18 |
Semi-Annual Report
November 30, 2018

Wells Fargo Core Bond Fund

Beginning on January 1, 2021, as permitted by new regulations adopted by the Securities and Exchange Commission, paper copies of the Wells Fargo Funds’ annual and semi-annual shareholder reports issued after this date will no longer be sent by mail, unless you specifically request paper copies of the reports. Instead, the reports will be made available on the Funds’ website, and you will be notified by mail each time a report is posted and provided with a website address to access the report.
If you already elected to receive shareholder reports electronically, you will not be affected by this change and you need not take any action. You may elect to receive shareholder reports and other communications from the Fund electronically at any time by contacting your financial intermediary (such as a broker-dealer or bank) or, if you are a direct investor, by calling 1-800-222-8222 or by enrolling at wellsfargo.com/advantagedelivery.
You may elect to receive all future reports in paper free of charge. If you invest through a financial intermediary, you can contact your financial intermediary to request that you continue to receive paper copies of your shareholder reports; if you invest directly with the Fund, you can call 1-800-222-8222. Your election to receive reports in paper will apply to all Wells Fargo Funds held in your account with your financial intermediary or, if you are a direct investor, to all Wells Fargo Funds that you hold.

Reduce clutter. Save trees.
Sign up for electronic delivery of prospectuses and shareholder reports atwellsfargo.com/advantagedelivery
Contents
The views expressed and any forward-looking statements are as of November 30, 2018, unless otherwise noted, and are those of the Fund managers and/or Wells Fargo Funds Management, LLC. Discussions of individual securities, or the markets generally, or any Wells Fargo Fund are not intended as individual recommendations. Future events or results may vary significantly from those expressed in any forward-looking statements. The views expressed are subject to change at any time in response to changing circumstances in the market. Wells Fargo Funds Management, LLC and the Fund disclaim any obligation to publicly update or revise any views expressed or forward-looking statements.
INVESTMENT PRODUCTS: NOT FDIC INSURED ◾ NO BANK GUARANTEE ◾ MAY LOSE VALUE
| | | | |
| 2 | | Wells Fargo Core Bond Fund | | Letter to shareholders (unaudited) |

Andrew Owen
President
Wells Fargo Funds
Global trade tensions escalated during the third quarter of 2018.
Dear Shareholder:
We are pleased to offer you this semi-annual report for the Wells Fargo Core Bond Fund for thesix-month period that ended November 30, 2018. During the reporting period, the U.S. generated encouraging economic and business data that was offset by less positive and more inconsistent data from international markets. Investment returns were restrained in comparison with recent periods as geopolitical tensions and uncertainty tended to distract investors from more favorable underlying trends.
For the period, U.S. stocks, as measured by the S&P 500 Index,1 gained 3.02% and international stocks, as measured by the MSCI ACWI ex USA Index (Net),2 declined 8.37%. Based on the MSCI EM Index (Net),3 emerging market stocks lost 9.89%. For bond investors, the Bloomberg Barclays U.S. Aggregate Bond Index4 declined 0.30% while the Bloomberg Barclays Global Aggregateex-USD Index5 fell 3.67%. The Bloomberg Barclays Municipal Bond Index6 gained 0.42%. The ICE BofAML U.S. High Yield Index7 was up 0.19%.
Global trade tensions prompted investor concerns.
Global trade tensions escalated during the third quarter of 2018. The U.S. government’s decision during the second quarter to impose tariffs on a wide range of products manufactured overseas drew retaliatory responses from foreign governments, which punished U.S. commodity producers and product manufacturers. Investors were left to wonder about next steps in what appeared to be an escalating divergence in global economic policies and growth prospects.
Inflation trended higher. TheCPI-U8 added 0.1% in September after an increase of 0.2% in both July and August. On a year-over-year basis, theall-items index rose 2.3% for the 12 months that ended September 30, 2018, after a seasonal adjustment. The rate of increase was slower than that recorded during the first half of 2018. The index for all items less food and energy rose 2.2% for the same12-month period.
| 1 | The S&P 500 Index consists of 500 stocks chosen for market size, liquidity, and industry group representation. It is a market-value-weighted index with each stock’s weight in the index proportionate to its market value. You cannot invest directly in an index. |
| 2 | The Morgan Stanley Capital International (MSCI) All Country World Index (ACWI) ex USA Index (Net) is a free-float-adjusted market-capitalization-weighted index that is designed to measure the equity market performance of developed markets, excluding the U.S. and Canada. Source: MSCI. MSCI makes no express or implied warranties or representations and shall have no liability whatsoever with respect to any MSCI data contained herein. The MSCI data may not be further redistributed or used as a basis for other indices or any securities or financial products. This report is not approved, reviewed, or produced by MSCI. You cannot invest directly in an index. |
| 3 | The MSCI Emerging Markets (EM) Index (Net) is a free-float-adjusted market-capitalization-weighted index that is designed to measure large- andmid-cap equity market performance of emerging markets. The MSCI EM Index (Net) consists of the following 24 emerging market country indices: Brazil, Chile, China, Colombia, Czech Republic, Egypt, Greece, Hungary, India, Indonesia, Korea, Malaysia, Mexico, Pakistan, Peru, the Philippines, Poland, Qatar, Russia, South Africa, Taiwan, Thailand, Turkey, and the United Arab Emirates. You cannot invest directly in an index. |
| 4 | The Bloomberg Barclays U.S. Aggregate Bond Index is a broad-based benchmark that measures the investment-grade, U.S.-dollar-denominated, fixed-rate taxable bond market, including Treasuries, government-related and corporate securities, mortgage-backed securities (agency fixed-rate and hybrid adjustable-rate mortgage pass-throughs), asset-backed securities, and commercial mortgage-backed securities. You cannot invest directly in an index. |
| 5 | The Bloomberg Barclays Global Aggregateex-USD Index is an unmanaged index that provides a broad-based measure of the global investment-grade fixed-income markets excluding the U.S.-dollar-denominated debt market. You cannot invest directly in an index. |
| 6 | The Bloomberg Barclays Municipal Bond Index is an unmanaged index composed of long-termtax-exempt bonds with a minimum credit rating of Baa. You cannot invest directly in an index. |
| 7 | The ICE BofAML U.S. High Yield Index is a market-capitalization-weighted index of domestic and Yankee high-yield bonds. The index tracks the performance of high-yield securities traded in the U.S. bond market. You cannot invest directly in an index. Copyright 2018. ICE Data Indices, LLC. All rights reserved. |
| 8 | The Consumer Price Index for All Urban Consumers(CPI-U) measures the changes in the price of a basket of goods and services purchased by urban consumers. The urban consumer population is deemed by many as a better representative measure of the general public because close to 90% of the country’s population lives in highly populated areas. You cannot invest directly in an index. |
| | | | | | |
| Letter to shareholders (unaudited) | | Wells Fargo Core Bond Fund | | | 3 | |
U.S. stocks gained following positive economic data while international stocks and bonds declined.
During the summer months, the U.S. economy strengthened. Revised second-quarter gross domestic product (GDP) data released in August showed the U.S. economy growing at a 4.2% rate. The unemployment rate in the U.S. was 3.7% by the end of September, according to the U.S. Department of Labor. Wages showed more consistent growth, and consumer confidence remained strong. Several U.S. equity market indices reached records during August, with the S&P 500 Index gaining 7.20% for the three-month period that ended September 30, 2018. In contrast, the MSCI ACWI ex USA Index (Net) gained 0.71% while the MSCI EM Index (Net) declined 1.09% during the same three-month period.
In June, the Federal Reserve increased the target range for the federal funds rate to range from 1.75% to 2.00%. It raised the range again in September to range from 2.00% to 2.25%. Long-term interest rates in the U.S. remained at higher levels relative to the prior 10 years. Rates on10-year and30-year Treasury bonds—2.46% and 2.81%, respectively, on January 1, 2018—were 3.01% and 3.30%, respectively, on November 30, 2018. Investor concerns about an inverted yield curve reemerged, only to be replaced by concerns about the potentially negative influence of higher interest rates on economic activity.
November saw improvement in many equity markets.
As interest rates and bond yields gained during October, stock markets struggled. For the month, the S&P 500 Index fell 6.84%, the MSCI ACWI ex USA Index (Net) dropped 8.13%, and the MSCI EM Index (Net) lost 8.71%. The Bureau of Economic Analysis released its first estimate of third-quarter GDP, which, at an annualized 3.5% rate, indicated growth may be slowing compared with the second quarter. Readings on consumer sentiment and business spending were mixed. Markets rebounded somewhat in November as the S&P 500 Index gained 2.04%, the MSCI ACWI ex USA Index (Net) added 0.95%, and the MSCI EM Index (Net) was up 4.12% as the uncertainty leading up to midterm elections in the U.S. was resolved and progress seemed to be possible on several international trade issues.
Economic signals overseas were mixed as the third quarter ended and the fourth quarter began. In early August, the Bank of England’s Monetary Policy Committee increased its key interest rate to 0.75%. The European Central Bank and the Bank of Japan maintained low interest rates and accommodative monetary policies. Amid rising trade uncertainty, the People’s Bank of China cut reserve requirement ratios and accelerated infrastructure spending and tax cuts for business enterprises and individuals. Nevertheless, a strengthening U.S. dollar and the trade tensions remained headwinds for investors overseas.
Don’t let short-term uncertainty derail long-term investment goals.
Periods of investment uncertainty can present challenges, but experience has taught us that maintaining long-term investment goals can be an effective way to plan for the future. To help you create a sound strategy based on your personal goals and risk tolerance, Wells Fargo Funds offers more than 100 mutual funds spanning a wide range of asset classes and investment styles. Although diversification cannot guarantee an investment profit or prevent losses, we believe it can be an effective way to manage investment risk and potentially smooth out overall portfolio performance. We encourage investors to know their investments and to understand that appropriate levels of risk-taking may unlock opportunities.
Economic signals overseas were mixed as the third quarter ended and the fourth quarter began.
| | | | |
| 4 | | Wells Fargo Core Bond Fund | | Letter to shareholders (unaudited) |
Thank you for choosing to invest with Wells Fargo Funds. We appreciate your confidence in us and remain committed to helping you meet your financial needs.
Sincerely,

Andrew Owen
President
Wells Fargo Funds
Notice to shareholders
At a meeting held on August 14-15, 2018, the Board of Trustees of the Fund approved the following policy which will be effective on or about February 5, 2019:
Class C shares will convert automatically into Class A shares ten years after the initial date of purchase or, if you acquired your Class C shares through an exchange or conversion from another share class, ten years after the date you acquired your Class C shares. When Class C shares that you acquired through a purchase or exchange convert, any other Class C shares that you purchased with reinvested dividends and distributions also will convert into Class A shares on a pro rata basis. A shorter holding period may also apply depending on your intermediary. Please see “Appendix A—Sales Charge Reductions and Waivers for Certain Intermediaries” in the Fund’s prospectus or at the end of this report.
For further information about your Fund, contact your investment professional, visit our website atwellsfargofunds.com, or call us directly at1-800-222-8222.
This page is intentionally left blank.
| | | | |
| 6 | | Wells Fargo Core Bond Fund1 | | Performance highlights (unaudited) |
Investment objective
The Fund seeks total return, consisting of income and capital appreciation.
Manager
Wells Fargo Funds Management, LLC
Subadviser for the affiliated master portfolio
Wells Capital Management Incorporated
Portfolio managers
Maulik Bhansali, CFA®‡
Thomas O’Connor, CFA®‡
Jarad Vasquez
Average annual total returns (%) as of November 30, 20182
| | | | | | | | | | | | | | | | | | | | | | | | | | | | | | | | | | |
| | | | | Including sales charge | | | Excluding sales charge | | | Expense ratios3 (%) | |
| | | Inception date | | 1 year | | | 5 year | | | 10 year | | | 1 year | | | 5 year | | | 10 year | | | Gross | | | Net4 | |
| Class A (MBFAX) | | 10-31-2001 | | | (6.31 | ) | | | 0.77 | | | | 3.80 | | | | (1.90 | ) | | | 1.70 | | | | 4.28 | | | | 0.83 | | | | 0.78 | |
| Class C (MBFCX) | | 10-31-2001 | | | (3.60 | ) | | | 0.94 | | | | 3.46 | | | | (2.60 | ) | | | 0.94 | | | | 3.46 | | | | 1.58 | | | | 1.53 | |
| Class R (WTRRX) | | 7-9-2010 | | | – | | | | – | | | | – | | | | (2.09 | ) | | | 1.45 | | | | 3.98 | | | | 1.08 | | | | 1.03 | |
| Class R4 (MBFRX) | | 11-30-2012 | | | – | | | | – | | | | – | | | | (1.59 | ) | | | 1.97 | | | | 4.53 | | | | 0.60 | | | | 0.52 | |
| Class R6 (WTRIX) | | 11-30-2012 | | | – | | | | – | | | | – | | | | (1.52 | ) | | | 2.10 | | | | 4.65 | | | | 0.45 | | | | 0.37 | |
| Administrator Class (MNTRX) | | 6-30-1997 | | | – | | | | – | | | | – | | | | (1.77 | ) | | | 1.78 | | | | 4.35 | | | | 0.77 | | | | 0.70 | |
| Institutional Class (MBFIX) | | 10-31-2001 | | | – | | | | – | | | | – | | | | (1.57 | ) | | | 2.07 | | | | 4.62 | | | | 0.50 | | | | 0.42 | |
| Bloomberg Barclays U.S. Aggregate Bond Index5 | | – | | | – | | | | – | | | | – | | | | (1.34 | ) | | | 2.03 | | | | 3.67 | | | | – | | | | – | |
Figures quoted represent past performance, which is no guarantee of future results, and do not reflect taxes that a shareholder may pay on fund distributions or the redemption of fund shares. Investment return and principal value of an investment will fluctuate so that an investor’s shares, when redeemed, may be worth more or less than their original cost. Performance shown without sales charges would be lower if sales charges were reflected. Current performance may be lower or higher than the performance data quoted, which assumes the reinvestment of dividends and capital gains. Currentmonth-end performance is available on the Fund’s website, wellsfargofunds.com.
Index returns do not include transaction costs associated with buying and selling securities, any mutual fund fees or expenses, or any taxes. It is not possible to invest directly in an index.
For Class A shares, the maximumfront-end sales charge is 4.50%. For Class C shares, the maximum contingent deferred sales charge is 1.00%. Performance including a contingent deferred sales charge assumes the sales charge for the corresponding time period. Class R, Class R4, Class R6, Administrator Class, and Institutional Class shares are sold without afront-end sales charge or contingent deferred sales charge.
Bond values fluctuate in response to the financial condition of individual issuers, general market and economic conditions, and changes in interest rates. Changes in market conditions and government policies may lead to periods of heightened volatility in the bond market and reduced liquidity for certain bonds held by the Fund. In general, when interest rates rise, bond values fall and investors may lose principal value. Interest-rate changes and their impact on the Fund and its share price can be sudden and unpredictable. The use of derivatives may reduce returns and/or increase volatility. Certain investment strategies tend to increase the total risk of an investment (relative to the broader market). Securities issued by U.S. government agencies or government-sponsored entities may not be guaranteed by the U.S. Treasury. The Fund is exposed to foreign investment risk and mortgage- and asset-backed securities risk. Consult the Fund’s prospectus for additional information on these and other risks.
Please see footnotes on page 7.
| | | | | | |
| Performance highlights (unaudited) | | Wells Fargo Core Bond Fund | | | 7 | |
| | | | |
| Ten largest holdings (%) as of November 30, 20186 | |
U.S. Treasury Bond, 3.13%, 11-15-2028 | | | 2.28 | |
U.S. Treasury Note, 2.88%, 9-30-2023 | | | 2.10 | |
U.S. Treasury Note, 2.88%, 10-31-2023 | | | 2.09 | |
FHLMC, 4.00%, 11-1-2048 | | | 1.75 | |
GNMA, 5.00%, 1-23-2049 | | | 1.67 | |
U.S. Treasury Note, 2.88%, 10-15-2021 | | | 1.48 | |
GNMA, 4.50%, 10-20-2048 | | | 1.42 | |
U.S. Treasury Note, 2.75%, 2-15-2028 | | | 1.38 | |
U.S. Treasury Note, 1.88%, 1-31-2022 | | | 1.24 | |
U.S. Treasury Bond, 3.13%, 5-15-2048 | | | 1.20 | |
|
| Portfolio allocation as of November 30, 20187 |
|
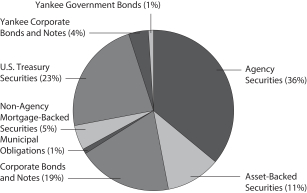 |
| ‡ | CFA® and Chartered Financial Analyst® are trademarks owned by CFA Institute. |
| 1 | The Fund is a gateway feeder fund that invests substantially all of its assets in a single affiliated master portfolio of the Wells Fargo Master Trust with a substantially identical investment objective and substantially similar investment strategies. References to the investment activities of the Fund are intended to refer to the investment activities of the affiliated master portfolio in which it invests. |
| 2 | Historical performance shown for Class R shares prior to their inception reflects the performance of Administrator Class shares, adjusted to reflect the higher expenses applicable to Class R shares. Historical performance shown for Class R4 shares prior to their inception reflects the performance of Institutional Class shares, adjusted to reflect the higher expenses applicable to Class R4 shares. Historical performance shown for Class R6 shares prior to their inception reflects the performance of Institutional Class shares and includes the higher expenses applicable to Institutional Class shares. If these expenses had not been included, returns for Class R6 shares would be higher. |
| 3 | Reflects the expense ratios as stated in the most recent prospectuses. The expense ratios shown are subject to change and may differ from the annualized expense ratios shown in the financial highlights of this report. |
| 4 | The manager has contractually committed through September 30, 2019, to waive fees and/or reimburse expenses to the extent necessary to cap the Fund’s Total Annual Fund Operating Expenses After Fee Waivers at the amounts shown. After this time, the cap may be increased or the commitment to maintain the cap may be terminated only with the approval of the Board of Trustees. Brokerage commissions, stamp duty fees, interest, taxes, acquired fund fees and expenses (if any) from funds in which the affiliated master portfolio invests, and extraordinary expenses are excluded from the expense cap. Net expenses from the affiliated master portfolio are included in the expense cap. Without this cap, the Fund’s returns would have been lower. The expense ratio paid by an investor is the net expense ratio (the total annual fund operating expenses after fee waivers) as stated in the prospectuses. |
| 5 | The Bloomberg Barclays U.S. Aggregate Bond Index is a broad-based benchmark that measures the investment-grade, U.S. dollar–denominated, fixed-rate taxable bond market, including Treasuries, government-related and corporate securities, mortgage-backed securities (agency fixed-rate and hybrid adjustable-rate mortgage pass-throughs), asset-backed securities, and commercial mortgage-backed securities. You cannot invest directly in an index. |
| 6 | The ten largest holdings, excluding cash, cash equivalents and any money market funds, are calculated based on the value of the securities of the affiliated master portfolio allocable to the Fund divided by the total net assets of the Fund. Holdings are subject to change and may have changed since the date specified. |
| 7 | Amounts represent the portfolio allocation of the affiliated master portfolio which are calculated based on the total long-term investments of the affiliated master portfolio. These amounts are subject to change and may have changed since the date specified. |
| | | | |
| 8 | | Wells Fargo Core Bond Fund | | Fund expenses (unaudited) |
As a shareholder of the Fund, you incur two types of costs: (1) transaction costs, including sales charges (loads) on purchase payments and contingent deferred sales charges (if any) on redemptions and (2) ongoing costs, including management fees, distribution(12b-1) and/or shareholder servicing fees, and other Fund expenses. This example is intended to help you understand your ongoing costs (in dollars) of investing in the Fund and to compare these costs with the ongoing costs of investing in other mutual funds.
The example is based on an investment of $1,000 invested at the beginning of thesix-month period and held for the entire period from June 1, 2018 to November 30, 2018.
Actual expenses
The “Actual” line of the table below provides information about actual account values and actual expenses. You may use the information in this line, together with the amount you invested, to estimate the expenses that you paid over the period. Simply divide your account value by $1,000 (for example, an $8,600 account value divided by $1,000 = 8.6), then multiply the result by the number in the “Actual” line under the heading entitled “Expenses paid during period” for your applicable class of shares to estimate the expenses you paid on your account during this period.
Hypothetical example for comparison purposes
The “Hypothetical” line of the table below provides information about hypothetical account values and hypothetical expenses based on the Fund’s actual expense ratio and an assumed rate of return of 5% per year before expenses, which is not the Fund’s actual return. The hypothetical account values and expenses may not be used to estimate the actual ending account balance or expenses you paid for the period. You may use this information to compare the ongoing costs of investing in the Fund and other funds. To do so, compare this 5% hypothetical example with the 5% hypothetical examples that appear in the shareholder reports of the other funds.
Please note that the expenses shown in the table are meant to highlight your ongoing costs only and do not reflect any transactional costs, such as sales charges (loads) and contingent deferred sales charges. Therefore, the “Hypothetical” line of the table is useful in comparing ongoing costs only and will not help you determine the relative total costs of owning different funds. In addition, if these transactional costs were included, your costs would have been higher.
| | | | | | | | | | | | | | | | |
| | | Beginning
account value
6-1-2018 | | | Ending
account value
11-30-2018 | | | Expenses
paid during
the period1,2 | | | Annualized net
expense ratio1 | |
Class A | | | | | | | | | | | | | | | | |
Actual | | $ | 1,000.00 | | | $ | 995.79 | | | $ | 3.90 | | | | 0.78 | % |
Hypothetical (5% return before expenses) | | $ | 1,000.00 | | | $ | 1,021.16 | | | $ | 3.95 | | | | 0.78 | % |
Class C | | | | | | | | | | | | | | | | |
Actual | | $ | 1,000.00 | | | $ | 991.90 | | | $ | 7.64 | | | | 1.53 | % |
Hypothetical (5% return before expenses) | | $ | 1,000.00 | | | $ | 1,017.40 | | | $ | 7.74 | | | | 1.53 | % |
Class R | | | | | | | | | | | | | | | | |
Actual | | $ | 1,000.00 | | | $ | 994.94 | | | $ | 5.15 | | | | 1.03 | % |
Hypothetical (5% return before expenses) | | $ | 1,000.00 | | | $ | 1,019.90 | | | $ | 5.22 | | | | 1.03 | % |
Class R4 | | | | | | | | | | | | | | | | |
Actual | | $ | 1,000.00 | | | $ | 996.67 | | | $ | 2.60 | | | | 0.52 | % |
Hypothetical (5% return before expenses) | | $ | 1,000.00 | | | $ | 1,022.46 | | | $ | 2.64 | | | | 0.52 | % |
Class R6 | | | | | | | | | | | | | | | | |
Actual | | $ | 1,000.00 | | | $ | 997.41 | | | $ | 1.85 | | | | 0.37 | % |
Hypothetical (5% return before expenses) | | $ | 1,000.00 | | | $ | 1,023.21 | | | $ | 1.88 | | | | 0.37 | % |
Administrator Class | | | | | | | | | | | | | | | | |
Actual | | $ | 1,000.00 | | | $ | 995.79 | | | $ | 3.50 | | | | 0.70 | % |
Hypothetical (5% return before expenses) | | $ | 1,000.00 | | | $ | 1,021.56 | | | $ | 3.55 | | | | 0.70 | % |
Institutional Class | | | | | | | | | | | | | | | | |
Actual | | $ | 1,000.00 | | | $ | 997.16 | | | $ | 2.10 | | | | 0.42 | % |
Hypothetical (5% return before expenses) | | $ | 1,000.00 | | | $ | 1,022.96 | | | $ | 2.13 | | | | 0.42 | % |
| 1 | Amounts reflect net expenses allocated from the affiliated Master Portfolio in which the Fund invests. |
| 2 | Expenses paid is equal to the annualized net expense ratio of each class multiplied by the average account value over the period, multiplied by the number of days in the most recent fiscal half-year divided by the number of days in the fiscal year (to reflect theone-half-year period). |
| | | | | | |
| Portfolio of investments—November 30, 2018 (unaudited) | | Wells Fargo Core Bond Fund | | | 9 | |
| | | | | | | | | | | | | | | | |
| Security name | | | | | | | | | | | Value | |
| | | | |
Investment Companies: 100.11% | | | | | | | | | | | | | | | | |
| | | | |
| Affiliated Master Portfolios: 100.11% | | | | | | | | | | | | | | | | |
Wells Fargo Core Bond Portfolio | | | | | | | | | | | | | | $ | 5,152,746,583 | |
| | | | | | | | | | | | | | | | |
| | | | |
Total Investment Companies (Cost $5,223,381,132) | | | | | | | | | | | | | | | 5,152,746,583 | |
| | | | | | | | | | | | | | | | |
| | | | | | | | |
| Total investments in securities (Cost $5,223,381,132) | | | 100.11 | % | | | 5,152,746,583 | |
Other assets and liabilities, net | | | (0.11 | ) | | | (5,744,529 | ) |
| | | | | | | | |
| Total net assets | | | 100.00 | % | | $ | 5,147,002,054 | |
| | | | | | | | |
Transactions with the affiliated Master Portfolio were as follows:
| | | | | | | | | | | | | | | | | | | | | | | | | | | | | | | | |
| | | % of
ownership, beginning of
period | | | % of
ownership, end of
period | | | Net realized
gains
(losses) on
securities
transactions
allocated
from
affiliated
Master
Portfolio | | | Net
change in
unrealized
gains
(losses) on
securities
transactions
allocated
from
affiliated
Master
Portfolio | | | Interest
allocated
from
affiliated
Master
Portfolio | | | Affiliated
income
allocated
from
affiliated
Master
Portfolio | | | Value,
end
of period | | | % of
net
assets | |
Wells Fargo Core Bond Portfolio | | | 95 | % | | | 92 | % | | $ | (83,336,439 | ) | | $ | (5,082,443 | ) | | $ | 85,418,390 | | | $ | 882,546 | | | $ | 5,152,746,583 | | | | 100.11 | % |
The accompanying notes are an integral part of these financial statements.
| | | | |
| 10 | | Wells Fargo Core Bond Fund | | Statement of assets and liabilities—November 30, 2018 (unaudited) |
| | | | |
| | | | |
| |
Assets | | | | |
Investments in affiliated Master Portfolio (cost $5,223,381,132) | | $ | 5,152,746,583 | |
Receivable for Fund shares sold | | | 7,587,425 | |
Receivable from manager | | | 122,625 | |
Prepaid expenses and other assets | | | 204,031 | |
| | | | |
Total assets | | | 5,160,660,664 | |
| | | | |
| |
Liabilities | | | | |
Payable for Fund shares redeemed | | | 10,851,296 | |
Dividends payable | | | 1,785,112 | |
Administration fees payable | | | 294,424 | |
Distribution fees payable | | | 31,320 | |
Trustees’ fees and expenses payable | | | 2,460 | |
Accrued expenses and other liabilities | | | 693,998 | |
| | | | |
Total liabilities | | | 13,658,610 | |
| | | | |
Total net assets | | $ | 5,147,002,054 | |
| | | | |
| |
NET ASSETS CONSIST OF | | | | |
Paid-in capital | | $ | 5,417,315,592 | |
Total distributable loss | | | (270,313,538 | ) |
| | | | |
Total net assets | | $ | 5,147,002,054 | |
| | | | |
| |
COMPUTATION OF NET ASSET VALUE AND OFFERING PRICE PER SHARE | | | | |
Net assets – Class A | | $ | 296,976,226 | |
Shares outstanding – Class A1 | | | 23,479,180 | |
Net asset value per share – Class A | | | $12.65 | |
Maximum offering price per share – Class A2 | | | $13.24 | |
Net assets – Class C | | $ | 43,177,243 | |
Shares outstanding – Class C1 | | | 3,446,644 | |
Net asset value per share – Class C | | | $12.53 | |
Net assets – Class R | | $ | 12,028,357 | |
Shares outstanding – Class R1 | | | 974,179 | |
Net asset value per share – Class R | | | $12.35 | |
Net assets – Class R4 | | $ | 11,242,263 | |
Shares outstanding – Class R41 | | | 910,918 | |
Net asset value per share – Class R4 | | | $12.34 | |
Net assets – Class R6 | | $ | 2,184,335,876 | |
Shares outstanding – Class R61 | | | 177,096,376 | |
Net asset value per share – Class R6 | | | $12.33 | |
Net assets – Administrator Class | | $ | 242,063,045 | |
Shares outstanding – Administrator Class1 | | | 19,603,274 | |
Net asset value per share – Administrator Class | | | $12.35 | |
Net assets – Institutional Class | | $ | 2,357,179,044 | |
Shares outstanding – Institutional Class1 | | | 191,169,811 | |
Net asset value per share – Institutional Class | | | $12.33 | |
| 1 | The Fund has an unlimited number of authorized shares. |
| 2 | Maximum offering price is computed as 100/95.50 of net asset value. On investments of $50,000 or more, the offering price is reduced. |
The accompanying notes are an integral part of these financial statements.
| | | | | | |
| Statement of operations—six months ended November 30, 2018 (unaudited) | | Wells Fargo Core Bond Fund | | | 11 | |
| | | | |
| | | | |
| |
Investment income | | | | |
Interest allocated from affiliated Master Portfolio (net of foreign withholding taxes of $14,043) | | $ | 85,418,390 | |
Affiliated income allocated from affiliated Master Portfolio | | | 882,546 | |
Expenses allocated from affiliated Master Portfolio | | | (9,325,083 | ) |
| | | | |
Total investment income | | | 76,975,853 | |
| | | | |
| |
Expenses | | | | |
Management fee | | | 1,323,887 | |
Administration fees | | | | |
Class A | | | 251,074 | |
Class C | | | 37,040 | |
Class R | | | 9,895 | |
Class R4 | | | 4,681 | |
Class R6 | | | 331,935 | |
Administrator Class | | | 132,991 | |
Institutional Class | | | 995,687 | |
Shareholder servicing fees | | | | |
Class A | | | 392,304 | |
Class C | | | 57,875 | |
Class R | | | 15,220 | |
Class R4 | | | 5,852 | |
Administrator Class | | | 325,560 | |
Distribution fees | | | | |
Class C | | | 173,624 | |
Class R | | | 15,461 | |
Custody and accounting fees | | | 93,586 | |
Professional fees | | | 13,224 | |
Registration fees | | | 120,587 | |
Shareholder report expenses | | | 165,462 | |
Trustees’ fees and expenses | | | 110,427 | |
Other fees and expenses | | | 23,113 | |
| | | | |
Total expenses | | | 4,599,485 | |
Less: Fee waivers and/or expense reimbursements | | | (2,000,111 | ) |
| | | | |
Net expenses | | | 2,599,374 | |
| | | | |
Net investment income | | | 74,376,479 | |
| | | | |
| |
REALIZED AND UNREALIZED GAINS (LOSSES) ON INVESTMENTS | | | | |
Net realized losses on securities transactions allocated from affiliated Master Portfolio | | | (83,336,439 | ) |
Net change in unrealized gains (losses) on securities transactions allocated from affiliated Master Portfolio | | | (5,082,443 | ) |
| | | | |
Net realized and unrealized gains (losses) on investments | | | (88,418,882 | ) |
| | | | |
Net decrease in net assets resulting from operations | | $ | (14,042,403 | ) |
| | | | |
The accompanying notes are an integral part of these financial statements.
| | | | |
| 12 | | Wells Fargo Core Bond Fund | | Statement of changes in net assets |
| | | | | | | | | | | | | | | | |
| | | Six months ended
November 30, 2018
(unaudited) | | | Year ended
May 31, 20181 | |
| | | |
Operations | | | | | | | | | | | | |
Net investment income | | | | | | $ | 74,376,479 | | | | | | | $ | 109,290,228 | |
Net realized losses on investments | | | | | | | (83,336,439 | ) | | | | | | | (51,477,064 | ) |
Net change in unrealized gains (losses) on investments | | | | | | | (5,082,443 | ) | | | | | | | (93,493,410 | ) |
| | | | |
Net decrease in net assets resulting from operations | | | | | | | (14,042,403 | ) | | | | | | | (35,680,246 | ) |
| | | | |
| | |
Distributions to shareholders from net investment income and net realized gains | | | | | | | | | |
Class A | | | | | | | (3,830,253 | ) | | | | | | | (6,146,453 | ) |
Class C | | | | | | | (391,332 | ) | | | | | | | (561,310 | ) |
Class R | | | | | | | (135,754 | ) | | | | | | | (203,058 | ) |
Class R4 | | | | | | | (158,202 | ) | | | | | | | (706,139 | ) |
Class R6 | | | | | | | (31,643,162 | ) | | | | | | | (24,689,238 | ) |
Administrator Class | | | | | | | (3,348,333 | ) | | | | | | | (6,023,458 | ) |
Institutional Class | | | | | | | (34,846,053 | ) | | | | | | | (70,984,919 | ) |
| | | | |
Total distributions to shareholders | | | | | | | (74,353,089 | ) | | | | | | | (109,314,575 | ) |
| | | | |
| | | | |
Capital share transactions | | | Shares | | | | | | | | Shares | | | | | |
Proceeds from shares sold | | | | | | | | | | | | | | | | |
Class A | | | 2,325,324 | | | | 29,622,480 | | | | 5,948,905 | | | | 78,111,325 | |
Class C | | | 165,552 | | | | 2,092,760 | | | | 660,100 | | | | 8,585,693 | |
Class R | | | 121,656 | | | | 1,517,591 | | | | 314,720 | | | | 4,024,861 | |
Class R4 | | | 130,448 | | | | 1,623,597 | | | | 636,388 | | | | 8,152,388 | |
Class R6 | | | 89,845,786 | | | | 1,122,140,411 | | | | 65,439,055 | | | | 837,238,882 | |
Administrator Class | | | 2,156,188 | | | | 26,895,925 | | | | 6,358,669 | | | | 81,613,591 | |
Institutional Class | | | 24,204,858 | | | | 301,105,302 | | | | 109,824,335 | | | | 1,402,149,298 | |
| | | | |
| | | | | | | 1,484,998,066 | | | | | | | | 2,419,876,038 | |
| | | | |
Reinvestment of distributions | | | | | | | | | | | | | | | | |
Class A | | | 260,467 | | | | 3,319,731 | | | | 406,222 | | | | 5,315,016 | |
Class C | | | 15,827 | | | | 199,780 | | | | 23,283 | | | | 301,658 | |
Class R | | | 1,347 | | | | 16,760 | | | | 2,181 | | | | 27,892 | |
Class R4 | | | 12,709 | | | | 158,058 | | | | 51,321 | | | | 658,202 | |
Class R6 | | | 2,355,513 | | | | 29,269,348 | | | | 1,705,109 | | | | 21,706,594 | |
Administrator Class | | | 258,711 | | | | 3,219,319 | | | | 457,541 | | | | 5,851,867 | |
Institutional Class | | | 2,267,447 | | | | 28,175,508 | | | | 4,338,888 | | | | 55,292,897 | |
| | | | |
| | | | | | | 64,358,504 | | | | | | | | 89,154,126 | |
| | | | |
Payment for shares redeemed | | | | | | | | | | | | | | | | |
Class A | | | (4,004,263 | ) | | | (51,001,075 | ) | | | (8,713,141 | ) | | | (114,094,388 | ) |
Class C | | | (490,722 | ) | | | (6,194,053 | ) | | | (1,437,868 | ) | | | (18,650,713 | ) |
Class R | | | (122,963 | ) | | | (1,530,518 | ) | | | (414,247 | ) | | | (5,296,848 | ) |
Class R4 | | | (162,981 | ) | | | (2,023,698 | ) | | | (3,109,817 | ) | | | (39,224,105 | ) |
Class R6 | | | (23,623,691 | ) | | | (293,537,076 | ) | | | (20,533,471 | ) | | | (261,667,805 | ) |
Administrator Class | | | (4,240,970 | ) | | | (52,729,832 | ) | | | (14,295,796 | ) | | | (183,753,304 | ) |
Institutional Class | | | (99,993,456 | ) | | | (1,247,096,858 | ) | | | (95,212,522 | ) | | | (1,214,837,005 | ) |
| | | | |
| | | | | | | (1,654,113,110 | ) | | | | | | | (1,837,524,168 | ) |
| | | | |
Net increase (decrease) in net assets resulting from capital share transactions | | | | | | | (104,756,540 | ) | | | | | | | 671,505,996 | |
| | | | |
Total increase (decrease) in net assets | | | | | | | (193,152,032 | ) | | | | | | | 526,511,175 | |
| | | | |
| | | |
Net assets | | | | | | | | | | | | |
Beginning of period | | | | | | | 5,340,154,086 | | | | | | | | 4,813,642,911 | |
| | | | |
End of period | | | | | | $ | 5,147,002,054 | | | | | | | $ | 5,340,154,086 | |
| | | | |
| 1 | Effective for all filings after November 4, 2018, the SEC prospectively eliminated the requirement to parenthetically disclose undistributed net investment income at the end of the period and permitted the aggregation of distributions, with the exception of tax basis returns of capital. Overdistributed net investment income at May 31, 2018 was $140,624. The disaggregated distributions information for the year ended May 31, 2018 is included in Note 7,Distributions to Shareholders, in the notes to the financial statements |
The accompanying notes are an integral part of these financial statements.
| | | | | | |
| Financial highlights | | Wells Fargo Core Bond Fund | | | 13 | |
(For a share outstanding throughout each period)
| | | | | | | | | | | | | | | | | | | | | | | | |
| | | Six months ended
November 30, 2018 (unaudited) | | | Year ended May 31 | |
| CLASS A | | 2018 | | | 2017 | | | 2016 | | | 2015 | | | 2014 | |
Net asset value, beginning of period | | | $12.86 | | | | $13.22 | | | | $13.28 | | | | $13.16 | | | | $12.98 | | | | $13.02 | |
Net investment income | | | 0.16 | | | | 0.24 | | | | 0.19 | 1 | | | 0.19 | 1 | | | 0.18 | | | | 0.19 | |
Net realized and unrealized gains (losses) on investments | | | (0.21 | ) | | | (0.36 | ) | | | 0.00 | | | | 0.12 | | | | 0.19 | | | | 0.12 | |
| | | | | | | | | | | | | | | | | | | | | | | | |
Total from investment operations | | | (0.05 | ) | | | (0.12 | ) | | | 0.19 | | | | 0.31 | | | | 0.37 | | | | 0.31 | |
Distributions to shareholders from | | | | | | | | | | | | | | | | | | | | | | | | |
Net investment income | | | (0.16 | ) | | | (0.24 | ) | | | (0.19 | ) | | | (0.19 | ) | | | (0.19 | ) | | | (0.20 | ) |
Net realized gains | | | 0.00 | | | | 0.00 | | | | (0.06 | ) | | | 0.00 | | | | 0.00 | | | | (0.15 | ) |
| | | | | | | | | | | | | | | | | | | | | | | | |
Total distributions to shareholders | | | (0.16 | ) | | | (0.24 | ) | | | (0.25 | ) | | | (0.19 | ) | | | (0.19 | ) | | | (0.35 | ) |
Net asset value, end of period | | | $12.65 | | | | $12.86 | | | | $13.22 | | | | $13.28 | | | | $13.16 | | | | $12.98 | |
Total return2 | | | (0.42 | )% | | | (0.96 | )% | | | 1.48 | % | | | 2.36 | % | | | 2.85 | % | | | 2.46 | % |
Ratios to average net assets (annualized) | | | | | | | | | | | | | | | | | | | | | | | | |
Gross expenses3 | | | 0.83 | % | | | 0.83 | % | | | 0.83 | % | | | 0.83 | % | | | 0.85 | % | | | 0.83 | % |
Net expenses3 | | | 0.78 | % | | | 0.78 | % | | | 0.78 | % | | | 0.78 | % | | | 0.78 | % | | | 0.78 | % |
Net investment income3 | | | 2.44 | % | | | 1.79 | % | | | 1.40 | % | | | 1.43 | % | | | 1.39 | % | | | 1.52 | % |
Supplemental data | | | | | | | | | | | | | | | | | | | | | | | | |
Portfolio turnover rate4 | | | 280 | % | | | 542 | % | | | 614 | % | | | 667 | % | | | 586 | % | | | 646 | % |
Net assets, end of period (000s omitted) | | | $296,976 | | | | $320,208 | | | | $360,276 | | | | $699,273 | | | | $506,043 | | | | $397,780 | |
| 1 | Calculated based upon average shares outstanding |
| 2 | Total return calculations do not include any sales charges. Returns for periods of less than one year are not annualized. |
| 3 | Ratios include net expenses allocated from the affiliated Master Portfolio which were as follows: |
| | | | |
Six months ended November 30, 2018 (unaudited) | | | 0.35 | % |
Year ended May 31, 2018 | | | 0.35 | % |
Year ended May 31, 2017 | | | 0.35 | % |
Year ended May 31, 2016 | | | 0.35 | % |
Year ended May 31, 2015 | | | 0.35 | % |
Year ended May 31, 2014 | | | 0.35 | % |
| 4 | Portfolio turnover rate is calculated by multiplying the affiliated Master Portfolio’s percentage of the Fund’s total investments in securities at the end of the period by the affiliated Master Portfolio’s portfolio turnover rate. |
The accompanying notes are an integral part of these financial statements.
| | | | |
| 14 | | Wells Fargo Core Bond Fund | | Financial highlights |
(For a share outstanding throughout each period)
| | | | | | | | | | | | | | | | | | | | | | | | |
| | | Six months ended
November 30, 2018 (unaudited) | | | Year ended May 31 | |
| CLASS C | | 2018 | | | 2017 | | | 2016 | | | 2015 | | | 2014 | |
Net asset value, beginning of period | | | $12.74 | | | | $13.09 | | | | $13.15 | | | | $13.03 | | | | $12.86 | | | | $12.90 | |
Net investment income | | | 0.11 | | | | 0.14 | | | | 0.09 | | | | 0.09 | | | | 0.09 | | | | 0.10 | |
Net realized and unrealized gains (losses) on investments | | | (0.21 | ) | | | (0.35 | ) | | | 0.00 | | | | 0.12 | | | | 0.17 | | | | 0.12 | |
| | | | | | | | | | | | | | | | | | | | | | | | |
Total from investment operations | | | (0.10 | ) | | | (0.21 | ) | | | 0.09 | | | | 0.21 | | | | 0.26 | | | | 0.22 | |
Distributions to shareholders from | | | | | | | | | | | | | | | | | | | | | | | | |
Net investment income | | | (0.11 | ) | | | (0.14 | ) | | | (0.09 | ) | | | (0.09 | ) | | | (0.09 | ) | | | (0.11 | ) |
Net realized gains | | | 0.00 | | | | 0.00 | | | | (0.06 | ) | | | 0.00 | | | | 0.00 | | | | (0.15 | ) |
| | | | | | | | | | | | | | | | | | | | | | | | |
Total distributions to shareholders | | | (0.11 | ) | | | (0.14 | ) | | | (0.15 | ) | | | (0.09 | ) | | | (0.09 | ) | | | (0.26 | ) |
Net asset value, end of period | | | $12.53 | | | | $12.74 | | | | $13.09 | | | | $13.15 | | | | $13.03 | | | | $12.86 | |
Total return1 | | | (0.81 | )% | | | (1.65 | )% | | | 0.72 | % | | | 1.61 | % | | | 2.02 | % | | | 1.71 | % |
Ratios to average net assets (annualized) | | | | | | | | | | | | | | | | | | | | | | | | |
Gross expenses2 | | | 1.58 | % | | | 1.58 | % | | | 1.58 | % | | | 1.58 | % | | | 1.58 | % | | | 1.58 | % |
Net expenses2 | | | 1.53 | % | | | 1.53 | % | | | 1.53 | % | | | 1.53 | % | | | 1.53 | % | | | 1.53 | % |
Net investment income2 | | | 1.69 | % | | | 1.04 | % | | | 0.68 | % | | | 0.68 | % | | | 0.65 | % | | | 0.77 | % |
Supplemental data | | | | | | | | | | | | | | | | | | | | | | | | |
Portfolio turnover rate3 | | | 280 | % | | | 542 | % | | | 614 | % | | | 667 | % | | | 586 | % | | | 646 | % |
Net assets, end of period (000s omitted) | | | $43,177 | | | | $47,843 | | | | $59,049 | | | | $66,612 | | | | $72,798 | | | | $81,187 | |
| 1 | Total return calculations do not include any sales charges. Returns for periods of less than one year are not annualized. |
| 2 | Ratios include net expenses allocated from the affiliated Master Portfolio which were as follows: |
| | | | |
Six months ended November 30, 2018 (unaudited) | | | 0.35 | % |
Year ended May 31, 2018 | | | 0.35 | % |
Year ended May 31, 2017 | | | 0.35 | % |
Year ended May 31, 2016 | | | 0.35 | % |
Year ended May 31, 2015 | | | 0.35 | % |
Year ended May 31, 2014 | | | 0.35 | % |
| 3 | Portfolio turnover rate is calculated by multiplying the affiliated Master Portfolio’s percentage of the Fund’s total investments in securities at the end of the period by the affiliated Master Portfolio’s portfolio turnover rate. |
The accompanying notes are an integral part of these financial statements.
| | | | | | |
| Financial highlights | | Wells Fargo Core Bond Fund | | | 15 | |
(For a share outstanding throughout each period)
| | | | | | | | | | | | | | | | | | | | | | | | |
| | | Six months ended
November 30, 2018 (unaudited) | | | Year ended May 31 | |
| CLASS R | | 2018 | | | 2017 | | | 2016 | | | 2015 | | | 2014 | |
Net asset value, beginning of period | | | $12.55 | | | | $12.90 | | | | $12.97 | | | | $12.85 | | | | $12.67 | | | | $12.71 | |
Net investment income | | | 0.14 | | | | 0.20 | 1 | | | 0.15 | 1 | | | 0.15 | 1 | | | 0.15 | 1 | | | 0.16 | 1 |
Net realized and unrealized gains (losses) on investments | | | (0.20 | ) | | | (0.35 | ) | | | (0.01 | ) | | | 0.12 | | | | 0.18 | | | | 0.12 | |
| | | | | | | | | | | | | | | | | | | | | | | | |
Total from investment operations | | | (0.06 | ) | | | (0.15 | ) | | | 0.14 | | | | 0.27 | | | | 0.33 | | | | 0.28 | |
Distributions to shareholders from | | | | | | | | | | | | | | | | | | | | | | | | |
Net investment income | | | (0.14 | ) | | | (0.20 | ) | | | (0.15 | ) | | | (0.15 | ) | | | (0.15 | ) | | | (0.17 | ) |
Net realized gains | | | 0.00 | | | | 0.00 | | | | (0.06 | ) | | | 0.00 | | | | 0.00 | | | | (0.15 | ) |
| | | | | | | | | | | | | | | | | | | | | | | | |
Total distributions to shareholders | | | (0.14 | ) | | | (0.20 | ) | | | (0.21 | ) | | | (0.15 | ) | | | (0.15 | ) | | | (0.32 | ) |
Net asset value, end of period | | | $12.35 | | | | $12.55 | | | | $12.90 | | | | $12.97 | | | | $12.85 | | | | $12.67 | |
Total return2 | | | (0.51 | )% | | | (1.19 | )% | | | 1.15 | % | | | 2.13 | % | | | 2.63 | % | | | 2.23 | % |
Ratios to average net assets (annualized) | | | | | | | | | | | | | | | | | | | | | | | | |
Gross expenses3 | | | 1.07 | % | | | 1.08 | % | | | 1.08 | % | | | 1.08 | % | | | 1.08 | % | | | 1.08 | % |
Net expenses3 | | | 1.03 | % | | | 1.03 | % | | | 1.03 | % | | | 1.03 | % | | | 1.03 | % | | | 1.03 | % |
Net investment income3 | | | 2.20 | % | | | 1.54 | % | | | 1.18 | % | | | 1.18 | % | | | 1.15 | % | | | 1.27 | % |
Supplemental data | | | | | | | | | | | | | | | | | | | | | | | | |
Portfolio turnover rate4 | | | 280 | % | | | 542 | % | | | 614 | % | | | 667 | % | | | 586 | % | | | 646 | % |
Net assets, end of period (000s omitted) | | | $12,028 | | | | $12,230 | | | | $13,826 | | | | $17,985 | | | | $16,411 | | | | $17,077 | |
| 1 | Calculated based upon average shares outstanding |
| 2 | Returns for periods of less than one year are not annualized. |
| 3 | Ratios include net expenses allocated from the affiliated Master Portfolio which were as follows: |
| | | | |
Six months ended November 30, 2018 (unaudited) | | | 0.35 | % |
Year ended May 31, 2018 | | | 0.35 | % |
Year ended May 31, 2017 | | | 0.35 | % |
Year ended May 31, 2016 | | | 0.35 | % |
Year ended May 31, 2015 | | | 0.35 | % |
Year ended May 31, 2014 | | | 0.35 | % |
| 4 | Portfolio turnover rate is calculated by multiplying the affiliated Master Portfolio’s percentage of the Fund’s total investments in securities at the end of the period by the affiliated Master Portfolio’s portfolio turnover rate. |
The accompanying notes are an integral part of these financial statements.
| | | | |
| 16 | | Wells Fargo Core Bond Fund | | Financial highlights |
(For a share outstanding throughout each period)
| | | | | | | | | | | | | | | | | | | | | | | | |
| | | Six months ended
November 30, 2018 (unaudited) | | | Year ended May 31 | |
| CLASS R4 | | 2018 | | | 2017 | | | 2016 | | | 2015 | | | 2014 | |
Net asset value, beginning of period | | | $12.55 | | | | $12.89 | | | | $12.95 | | | | $12.83 | | | | $12.66 | | | | $12.70 | |
Net investment income | | | 0.17 | | | | 0.26 | 1 | | | 0.22 | | | | 0.22 | | | | 0.21 | | | | 0.22 | |
Net realized and unrealized gains (losses) on investments | | | (0.21 | ) | | | (0.34 | ) | | | 0.00 | | | | 0.12 | | | | 0.18 | | | | 0.12 | |
| | | | | | | | | | | | | | | | | | | | | | | | |
Total from investment operations | | | (0.04 | ) | | | (0.08 | ) | | | 0.22 | | | | 0.34 | | | | 0.39 | | | | 0.34 | |
Distributions to shareholders from | | | | | | | | | | | | | | | | | | | | | | | | |
Net investment income | | | (0.17 | ) | | | (0.26 | ) | | | (0.22 | ) | | | (0.22 | ) | | | (0.22 | ) | | | (0.23 | ) |
Net realized gains | | | 0.00 | | | | 0.00 | | | | (0.06 | ) | | | 0.00 | | | | 0.00 | | | | (0.15 | ) |
| | | | | | | | | | | | | | | | | | | | | | | | |
Total distributions to shareholders | | | (0.17 | ) | | | (0.26 | ) | | | (0.28 | ) | | | (0.22 | ) | | | (0.22 | ) | | | (0.38 | ) |
Net asset value, end of period | | | $12.34 | | | | $12.55 | | | | $12.89 | | | | $12.95 | | | | $12.83 | | | | $12.66 | |
Total return2 | | | (0.33 | )% | | | (0.61 | )% | | | 1.74 | % | | | 2.65 | % | | | 3.07 | % | | | 2.75 | % |
Ratios to average net assets (annualized) | | | | | | | | | | | | | | | | | | | | | | | | |
Gross expenses3 | | | 0.60 | % | | | 0.60 | % | | | 0.60 | % | | | 0.60 | % | | | 0.59 | % | | | 0.58 | % |
Net expenses3 | | | 0.52 | % | | | 0.52 | % | | | 0.52 | % | | | 0.52 | % | | | 0.52 | % | | | 0.52 | % |
Net investment income3 | | | 2.70 | % | | | 2.01 | % | | | 1.70 | % | | | 1.69 | % | | | 1.53 | % | | | 1.78 | % |
Supplemental data | | | | | | | | | | | | | | | | | | | | | | | | |
Portfolio turnover rate4 | | | 280 | % | | | 542 | % | | | 614 | % | | | 667 | % | | | 586 | % | | | 646 | % |
Net assets, end of period (000s omitted) | | | $11,242 | | | | $11,680 | | | | $43,205 | | | | $41,272 | | | | $49,261 | | | | $17 | |
| 1 | Calculated based upon average shares outstanding |
| 2 | Returns for periods of less than one year are not annualized. |
| 3 | Ratios include net expenses allocated from the affiliated Master Portfolio which were as follows: |
| | | | |
Six months ended November 30, 2018 (unaudited) | | | 0.35 | % |
Year ended May 31, 2018 | | | 0.35 | % |
Year ended May 31, 2017 | | | 0.35 | % |
Year ended May 31, 2016 | | | 0.35 | % |
Year ended May 31, 2015 | | | 0.35 | % |
Year ended May 31, 2014 | | | 0.35 | % |
| 4 | Portfolio turnover rate is calculated by multiplying the affiliated Master Portfolio’s percentage of the Fund’s total investments in securities at the end of the period by the affiliated Master Portfolio’s portfolio turnover rate. |
The accompanying notes are an integral part of these financial statements.
| | | | | | |
| Financial highlights | | Wells Fargo Core Bond Fund | | | 17 | |
(For a share outstanding throughout each period)
| | | | | | | | | | | | | | | | | | | | | | | | |
| | | Six months ended
November 30, 2018 (unaudited) | | | Year ended May 31 | |
| CLASS R6 | | 2018 | | | 2017 | | | 2016 | | | 2015 | | | 2014 | |
Net asset value, beginning of period | | | $12.54 | | | | $12.89 | | | | $12.95 | | | | $12.83 | | | | $12.66 | | | | $12.70 | |
Net investment income | | | 0.18 | | | | 0.28 | | | | 0.24 | | | | 0.24 | | | | 0.23 | | | | 0.24 | |
Net realized and unrealized gains (losses) on investments | | | (0.21 | ) | | | (0.35 | ) | | | 0.00 | | | | 0.12 | | | | 0.17 | | | | 0.12 | |
| | | | | | | | | | | | | | | | | | | | | | | | |
Total from investment operations | | | (0.03 | ) | | | (0.07 | ) | | | 0.24 | | | | 0.36 | | | | 0.40 | | | | 0.36 | |
Distributions to shareholders from | | | | | | | | | | | | | | | | | | | | | | | | |
Net investment income | | | (0.18 | ) | | | (0.28 | ) | | | (0.24 | ) | | | (0.24 | ) | | | (0.23 | ) | | | (0.25 | ) |
Net realized gains | | | 0.00 | | | | 0.00 | | | | (0.06 | ) | | | 0.00 | | | | 0.00 | | | | (0.15 | ) |
| | | | | | | | | | | | | | | | | | | | | | | | |
Total distributions to shareholders | | | (0.18 | ) | | | (0.28 | ) | | | (0.30 | ) | | | (0.24 | ) | | | (0.23 | ) | | | (0.40 | ) |
Net asset value, end of period | | | $12.33 | | | | $12.54 | | | | $12.89 | | | | $12.95 | | | | $12.83 | | | | $12.66 | |
Total return1 | | | (0.26 | )% | | | (0.54 | )% | | | 1.90 | % | | | 2.81 | % | | | 3.23 | % | | | 2.91 | % |
Ratios to average net assets (annualized) | | | | | | | | | | | | | | | | | | | | | | | | |
Gross expenses2 | | | 0.45 | % | | | 0.45 | % | | | 0.45 | % | | | 0.45 | % | | | 0.45 | % | | | 0.45 | % |
Net expenses2 | | | 0.37 | % | | | 0.37 | % | | | 0.37 | % | | | 0.37 | % | | | 0.37 | % | | | 0.37 | % |
Net investment income2 | | | 2.86 | % | | | 2.24 | % | | | 1.87 | % | | | 1.84 | % | | | 1.76 | % | | | 1.94 | % |
Supplemental data | | | | | | | | | | | | | | | | | | | | | | | | |
Portfolio turnover rate3 | | | 280 | % | | | 542 | % | | | 614 | % | | | 667 | % | | | 586 | % | | | 646 | % |
Net assets, end of period (000s omitted) | | | $2,184,336 | | | | $1,360,847 | | | | $797,896 | | | | $450,791 | | | | $726,165 | | | | $290,977 | |
| 1 | Returns for periods of less than one year are not annualized. |
| 2 | Ratios include net expenses allocated from the affiliated Master Portfolio which were as follows: |
| | | | |
Six months ended November 30, 2018 (unaudited) | | | 0.35 | % |
Year ended May 31, 2018 | | | 0.35 | % |
Year ended May 31, 2017 | | | 0.35 | % |
Year ended May 31, 2016 | | | 0.35 | % |
Year ended May 31, 2015 | | | 0.35 | % |
Year ended May 31, 2014 | | | 0.35 | % |
| 3 | Portfolio turnover rate is calculated by multiplying the affiliated Master Portfolio’s percentage of the Fund’s total investments in securities at the end of the period by the affiliated Master Portfolio’s portfolio turnover rate. |
The accompanying notes are an integral part of these financial statements.
| | | | |
| 18 | | Wells Fargo Core Bond Fund | | Financial highlights |
(For a share outstanding throughout each period)
| | | | | | | | | | | | | | | | | | | | | | | | |
| | | Six months ended
November 30, 2018 (unaudited) | | | Year ended May 31 | |
| ADMINISTRATOR CLASS | | 2018 | | | 2017 | | | 2016 | | | 2015 | | | 2014 | |
Net asset value, beginning of period | | | $12.56 | | | | $12.90 | | | | $12.97 | | | | $12.85 | | | | $12.67 | | | | $12.71 | |
Net investment income | | | 0.16 | | | | 0.24 | 1 | | | 0.21 | | | | 0.19 | | | | 0.19 | 1 | | | 0.21 | |
Net realized and unrealized gains (losses) on investments | | | (0.21 | ) | | | (0.34 | ) | | | (0.02 | ) | | | 0.12 | | | | 0.18 | | | | 0.11 | |
| | | | | | | | | | | | | | | | | | | | | | | | |
Total from investment operations | | | (0.05 | ) | | | (0.10 | ) | | | 0.19 | | | | 0.31 | | | | 0.37 | | | | 0.32 | |
Distributions to shareholders from | | | | | | | | | | | | | | | | | | | | | | | | |
Net investment income | | | (0.16 | ) | | | (0.24 | ) | | | (0.20 | ) | | | (0.19 | ) | | | (0.19 | ) | | | (0.21 | ) |
Net realized gains | | | 0.00 | | | | 0.00 | | | | (0.06 | ) | | | 0.00 | | | | 0.00 | | | | (0.15 | ) |
| | | | | | | | | | | | | | | | | | | | | | | | |
Total distributions to shareholders | | | (0.16 | ) | | | (0.24 | ) | | | (0.26 | ) | | | (0.19 | ) | | | (0.19 | ) | | | (0.36 | ) |
Net asset value, end of period | | | $12.35 | | | | $12.56 | | | | $12.90 | | | | $12.97 | | | | $12.85 | | | | $12.67 | |
Total return2 | | | (0.42 | )% | | | (0.79 | )% | | | 1.48 | % | | | 2.47 | % | | | 2.96 | % | | | 2.57 | % |
Ratios to average net assets (annualized) | | | | | | | | | | | | | | | | | | | | | | | | |
Gross expenses3 | | | 0.76 | % | | | 0.77 | % | | | 0.77 | % | | | 0.77 | % | | | 0.77 | % | | | 0.77 | % |
Net expenses3 | | | 0.70 | % | | | 0.70 | % | | | 0.70 | % | | | 0.70 | % | | | 0.70 | % | | | 0.70 | % |
Net investment income3 | | | 2.52 | % | | | 1.86 | % | | | 1.50 | % | | | 1.51 | % | | | 1.47 | % | | | 1.60 | % |
Supplemental data | | | | | | | | | | | | | | | | | | | | | | | | |
Portfolio turnover rate4 | | | 280 | % | | | 542 | % | | | 614 | % | | | 667 | % | | | 586 | % | | | 646 | % |
Net assets, end of period (000s omitted) | | | $242,063 | | | | $269,057 | | | | $373,042 | | | | $529,530 | | | | $487,981 | | | | $412,419 | |
| 1 | Calculated based upon average shares outstanding |
| 2 | Returns for periods of less than one year are not annualized. |
| 3 | Ratios include net expenses allocated from the affiliated Master Portfolio which were as follows: |
| | | | |
Six months ended November 30, 2018 (unaudited) | | | 0.35 | % |
Year ended May 31, 2018 | | | 0.35 | % |
Year ended May 31, 2017 | | | 0.35 | % |
Year ended May 31, 2016 | | | 0.35 | % |
Year ended May 31, 2015 | | | 0.35 | % |
Year ended May 31, 2014 | | | 0.35 | % |
| 4 | Portfolio turnover rate is calculated by multiplying the affiliated Master Portfolio’s percentage of the Fund’s total investments in securities at the end of the period by the affiliated Master Portfolio’s portfolio turnover rate. |
The accompanying notes are an integral part of these financial statements.
| | | | | | |
| Financial highlights | | Wells Fargo Core Bond Fund | | | 19 | |
(For a share outstanding throughout each period)
| | | | | | | | | | | | | | | | | | | | | | | | |
| | | Six months ended
November 30, 2018 (unaudited) | | | Year ended May 31 | |
| INSTITUTIONAL CLASS | | 2018 | | | 2017 | | | 2016 | | | 2015 | | | 2014 | |
Net asset value, beginning of period | | | $12.54 | | | | $12.88 | | | | $12.95 | | | | $12.83 | | | | $12.66 | | | | $12.70 | |
Net investment income | | | 0.18 | | | | 0.28 | | | | 0.23 | | | | 0.23 | | | | 0.22 | | | | 0.23 | |
Net realized and unrealized gains (losses) on investments | | | (0.21 | ) | | | (0.34 | ) | | | (0.01 | ) | | | 0.12 | | | | 0.18 | | | | 0.12 | |
| | | | | | | | | | | | | | | | | | | | | | | | |
Total from investment operations | | | (0.03 | ) | | | (0.06 | ) | | | 0.22 | | | | 0.35 | | | | 0.40 | | | | 0.35 | |
Distributions to shareholders from | | | | | | | | | | | | | | | | | | | | | | | | |
Net investment income | | | (0.18 | ) | | | (0.28 | ) | | | (0.23 | ) | | | (0.23 | ) | | | (0.23 | ) | | | (0.24 | ) |
Net realized gains | | | 0.00 | | | | 0.00 | | | | (0.06 | ) | | | 0.00 | | | | 0.00 | | | | (0.15 | ) |
| | | | | | | | | | | | | | | | | | | | | | | | |
Total distributions to shareholders | | | (0.18 | ) | | | (0.28 | ) | | | (0.29 | ) | | | (0.23 | ) | | | (0.23 | ) | | | (0.39 | ) |
Net asset value, end of period | | | $12.33 | | | | $12.54 | | | | $12.88 | | | | $12.95 | | | | $12.83 | | | | $12.66 | |
Total return1 | | | (0.28 | )% | | | (0.51 | )% | | | 1.77 | % | | | 2.76 | % | | | 3.17 | % | | | 2.85 | % |
Ratios to average net assets (annualized) | | | | | | | | | | | | | | | | | | | | | | | | |
Gross expenses2 | | | 0.50 | % | | | 0.50 | % | | | 0.50 | % | | | 0.50 | % | | | 0.50 | % | | | 0.50 | % |
Net expenses2 | | | 0.42 | % | | | 0.42 | % | | | 0.42 | % | | | 0.42 | % | | | 0.42 | % | | | 0.42 | % |
Net investment income2 | | | 2.80 | % | | | 2.16 | % | | | 1.82 | % | | | 1.79 | % | | | 1.75 | % | | | 1.88 | % |
Supplemental data | | | | | | | | | | | | | | | | | | | | | | | | |
Portfolio turnover rate3 | | | 280 | % | | | 542 | % | | | 614 | % | | | 667 | % | | | 586 | % | | | 646 | % |
Net assets, end of period (000s omitted) | | | $2,357,179 | | | | $3,318,290 | | | | $3,166,348 | | | | $2,102,073 | | | | $1,360,398 | | | | $1,208,745 | |
| 1 | Returns for periods of less than one year are not annualized. |
| 2 | Ratios include net expenses allocated from the affiliated Master Portfolio which were as follows: |
| | | | |
Six months ended November 30, 2018 (unaudited) | | | 0.35 | % |
Year ended May 31, 2018 | | | 0.35 | % |
Year ended May 31, 2017 | | | 0.35 | % |
Year ended May 31, 2016 | | | 0.35 | % |
Year ended May 31, 2015 | | | 0.35 | % |
Year ended May 31, 2014 | | | 0.35 | % |
| 3 | Portfolio turnover rate is calculated by multiplying the affiliated Master Portfolio’s percentage of the Fund’s total investments in securities at the end of the period by the affiliated Master Portfolio’s portfolio turnover rate. |
The accompanying notes are an integral part of these financial statements.
| | | | |
| 20 | | Wells Fargo Core Bond Fund | | Notes to financial statements (unaudited) |
1. ORGANIZATION
Wells Fargo Funds Trust (the “Trust”), a Delaware statutory trust organized on March 10, 1999, is anopen-end management investment company registered under the Investment Company Act of 1940, as amended (the “1940 Act”). As an investment company, the Trust follows the accounting and reporting guidance in Financial Accounting Standards Board (“FASB”)Accounting Standards Codification Topic 946, Financial Services – Investment Companies. These financial statements report on the Wells Fargo Core Bond Fund (the “Fund”) which is a diversified series of the Trust.
The Fund is a feeder fund in a master-feeder structure that invests substantially all of its assets in a single master portfolio with a substantially identical investment objective and substantially similar investment strategies. The Fund seeks to achieve its investment objective by investing all investable assets in a separate diversified portfolio (the “affiliated Master Portfolio”) of Wells Fargo Master Trust, a registeredopen-end management investment company. The affiliated Master Portfolio directly acquires portfolio securities and the Fund acquires an indirect interest in those securities. The Fund accounts for its investment in the affiliated Master Portfolio as a partnership investment and records on a daily basis its share of the affiliated Master Portfolio’s income, expense and realized and unrealized gains and losses. The financial statements of the affiliated Master Portfolio for the six months ended November 30, 2018 are included in this report and should be read in conjunction with the Fund’s financial statements. As of November 30, 2018, the Fund owned 92% of Wells Fargo Core Bond Portfolio.
2. SIGNIFICANT ACCOUNTING POLICIES
The following significant accounting policies, which are consistently followed in the preparation of the financial statements of the Fund, are in conformity with U.S. generally accepted accounting principles which require management to make estimates and assumptions that affect the reported amounts of assets and liabilities, disclosure of contingent assets and liabilities at the date of the financial statements, and the reported amounts of revenues and expenses during the reporting period. Actual results could differ from those estimates.
Securities valuation
All investments are valued each business day as of the close of regular trading on the New York Stock Exchange (generally 4 p.m. Eastern Time), although the Fund may deviate from this calculation time under unusual or unexpected circumstances.
Investments in the affiliated Master Portfolio are valued daily based on the Fund’s proportionate share of the affiliated Master Portfolio’s net assets, which are also valued daily. Securities held in the affiliated Master Portfolio are valued as discussed in the Notes to Financial Statements of the affiliated Master Portfolio, which are included elsewhere in this report.
Investment transactions, income and expenses
Investments in the affiliated Master Portfolio are recorded on a trade basis.
The Fund records daily its proportionate share of the affiliated Master Portfolio’s interest income, expenses and realized and unrealized gains or losses. The Fund also accrues its own expenses.
Distributions to shareholders
Distributions to shareholders from net investment income are declared daily and paid monthly. Distributions from net realized gains, if any, are recorded on the ex-dividend date and paid at least annually. Such distributions are determined in accordance with income tax regulations and may differ from U.S. generally accepted accounting principles. Dividend sources are estimated at the time of declaration. The tax character of distributions is determined as of the Fund’s fiscal year end. Therefore, a portion of the Fund’s distributions made prior to the Fund’s fiscal year end may be categorized as a tax return of capital at year end.
Federal and other taxes
The Fund intends to continue to qualify as a regulated investment company by distributing substantially all of its investment company taxable income and any net realized capital gains (after reduction for capital loss carryforwards) sufficient to relieve it from all, or substantially all, federal income taxes. Accordingly, no provision for federal income taxes was required.
The Fund’s income and federal excise tax returns and all financial records supporting those returns for the prior three fiscal years are subject to examination by the federal and Delaware revenue authorities. Management has analyzed the Fund’s tax positions taken on federal, state, and foreign tax returns for all open tax years and does not believe that there are any uncertain tax positions that require recognition of a tax liability.
| | | | | | |
| Notes to financial statements (unaudited) | | Wells Fargo Core Bond Fund | | | 21 | |
As of November 30, 2018, the aggregate cost of all investments for federal income tax purposes was $5,246,291,065 and the unrealized gains (losses) consisted of:
| | | | |
Gross unrealized gains | | $ | 0 | |
Gross unrealized losses | | | (93,544,482 | ) |
Net unrealized losses | | $ | (93,544,482 | ) |
As of May 31, 2018, the Fund had capital loss carryforwards which consist of $38,917,295 in short-term capital losses.
As of May 31, 2018, the Fund had current year deferred post-October capital losses consisting of $55,203,707 which were recognized on the first day of the current fiscal year.
Class allocations
The separate classes of shares offered by the Fund differ principally in applicable sales charges, distribution, shareholder servicing, and administration fees. Class specific expenses are charged directly to that share class. Investment income, common expenses, and realized and unrealized gains (losses) on investments are allocated daily to each class of shares based on the relative proportion of net assets of each class.
3. FAIR VALUATION MEASUREMENTS
At November 30, 2018, the affiliated Master Portfolio was measured at fair value using the net asset value per share (or its equivalent) as a practical expedient. The investment objective and the value of the affiliate Master Portfolio was as follows:
| | | | | | |
| Affiliated Master Portfolio | | Investment objective | | Value of affiliated
Master Portfolio | |
Wells Fargo Core Bond Portfolio | | Seeks total return, consisting of income and capital appreciation | | $ | 5,152,746,583 | |
The affiliated Master Portfolio does not have a redemption period notice, can be redeemed daily and does not have any unfunded commitments.
4. TRANSACTIONS WITH AFFILIATES
Management fee
Wells Fargo Funds Management, LLC (“Funds Management”), an indirect wholly owned subsidiary of Wells Fargo & Company (“Wells Fargo”), is the manager of the Fund and provides advisory and fund-level administrative services under an investment management agreement. Under the investment management agreement, Funds Management is responsible for, among other services, implementing the investment objectives and strategies of the Fund, supervising the subadviser, and providing fund-level administrative services in connection with the Fund’s operations. As long as the Fund continues to invest substantially all of its assets in a single affiliated Master Portfolio, the Fund pays Funds Management an investment management fee only for fund-level administrative services at an annual rate starting at 0.05% and declining to 0.03% as the average daily net assets of the Fund increase. For the six months ended November 30, 2018, the management fee was equivalent to an annual rate of 0.05% of the Fund’s average daily net assets.
Funds Management also serves as the adviser to the affiliated Master Portfolio and is entitled to receive a fee from the affiliated Master Portfolio for those services.
Administration fees
Under a class-level administration agreement, Funds Management provides class-level administrative services to the Fund, which includes paying fees and expenses for services provided by the transfer agent,sub-transfer agents, omnibus account servicers and record-keepers. As compensation for its services under the class-level administration agreement, Funds Management receives an annual fee which is calculated based on the average daily net assets of each class as follows:
| | | | |
| | | Class-level
administration fee | |
Class A, Class C, Class R | | | 0.16 | % |
Class R4, Institutional Class | | | 0.08 | |
Class R6 | | | 0.03 | |
Administrator Class | | | 0.10 | |
| | | | |
| 22 | | Wells Fargo Core Bond Fund | | Notes to financial statements (unaudited) |
Funds Management has contractually waived and/or reimbursed management and administration fees to the extent necessary to maintain certain net operating expense ratios for the Fund. When each class of the Fund has exceeded its expense cap, Funds Management has waived fees and/or reimbursed expenses from fund level expenses on a proportionate basis and then from class specific expenses; otherwise, waivers and/or reimbursements are applied against class specific expenses before fund level expenses. Net expenses from the affiliated Master Portfolio are included in the expense cap. Funds Management has committed through September 30, 2019 to waive fees and/or reimburse expenses to the extent necessary to cap the Fund’s expenses at 0.78% for Class A shares, 1.53% for Class C shares, 1.03% for Class R shares, 0.52% for Class R4 shares, 0.37% for Class R6 shares, 0.70% for Administrator Class shares, and 0.42% for Institutional Class shares. After this time, the cap may be increased or the commitment to maintain the cap may be terminated only with the approval of the Board of Trustees.
Distribution fees
The Trust has adopted a distribution plan for Class C and Class R shares of the Fund pursuant to Rule12b-1 under the 1940 Act. Distribution fees are charged to Class C and Class R shares and paid to Wells Fargo Funds Distributor, LLC (“Funds Distributor”), the principal underwriter, at an annual rate of 0.75% of the average daily net assets of Class C shares and 0.25% of the average daily net assets of Class R shares.
In addition, Funds Distributor is entitled to receive thefront-end sales charge from the purchase of Class A shares and a contingent deferred sales charge on the redemption of certain Class A shares. Funds Distributor is also entitled to receive the contingent deferred sales charges from redemptions of Class C shares. For the six months ended November 30, 2018, Funds Distributor received $2,381 from the sale of Class A shares. Funds Distributor did not receive any contingent deferred sales charges from Class A or Class C shares for the six months ended November 30, 2018.
Shareholder servicing fees
The Trust has entered into contracts with one or more shareholder servicing agents, whereby Class A, Class C, Class R and Administrator Class of the Fund are charged a fee at an annual rate of 0.25% of the average daily net assets of each respective class. Class R4 is charged a fee at an annual rate of 0.10% of its average daily net assets.
A portion of these total shareholder servicing fees were paid to affiliates of Wells Fargo.
5. INVESTMENT PORTFOLIO TRANSACTIONS
The Fund seeks to achieve its investment objective by investing substantially all of its investable assets in a single affiliated Master Portfolio. Purchases and sales have been calculated by multiplying the Fund’s ownership percentage of the affiliated Master Portfolio by the affiliated Master Portfolio’s purchases and sales. Purchases and sales of investments, excluding short-term securities, for the six months ended November 30, 2018 were as follows:
| | | | | | |
Purchases at cost | | Sales proceeds |
U.S.
government | | Non-U.S.
government | | U.S.
government | | Non-U.S.
government |
| $13,620,244,376 | | $1,963,048,100 | | $13,708,500,058 | | $1,991,449,077 |
6. BANK BORROWINGS
The Trust (excluding the money market funds), Wells Fargo Master Trust and Wells Fargo Variable Trust are parties to a $280,000,000 revolving credit agreement whereby the Fund is permitted to use bank borrowings for temporary or emergency purposes, such as to fund shareholder redemption requests. Interest under the credit agreement is charged to the Fund based on a borrowing rate equal to the higher of the Federal Funds rate in effect on that day plus 1.25% or the overnight LIBOR rate in effect on that day plus 1.25%. In addition, an annual commitment fee equal to 0.25% of the unused balance is allocated to each participating fund.
For the six months ended November 30, 2018, there were no borrowings by the Fund under the agreement.
| | | | | | |
| Notes to financial statements (unaudited) | | Wells Fargo Core Bond Fund | | | 23 | |
7. DISTRIBUTIONS TO SHAREHOLDERS
Effective for all filings after November 4, 2018, the Securities and Exchange Commission eliminated the requirement to separately state the components of distributions to shareholders. The amounts of distributions to shareholders for the year ended May 31, 2018 were as follows:
| | | | |
| | | Net investment income | |
Class A | | $ | 6,146,453 | |
Class C | | | 561,310 | |
Class R | | | 203,058 | |
Class R4 | | | 706,139 | |
Class R6 | | | 24,689,238 | |
Administrator Class | | | 6,023,458 | |
Institutional Class | | | 70,984,919 | |
8. INDEMNIFICATION
Under the Trust’s organizational documents, the officers and Trustees have been granted certain indemnification rights against certain liabilities that may arise out of performance of their duties to the Trust. Additionally, in the normal course of business, the Trust may enter into contracts with service providers that contain a variety of indemnification clauses. The Trust’s maximum exposure under these arrangements is dependent on future claims that may be made against the Fund and, therefore, cannot be estimated.
9. NEW ACCOUNTING PRONOUNCEMENT
In August 2018, FASB issued Accounting Standards Update (“ASU”)No. 2018-13, Fair Value Measurement (Topic 820)Disclosure Framework—Changes to the Disclosure Requirements for Fair Value Measurement. ASU2018-13 updates the disclosure requirements for fair value measurements by modifying or removing certain disclosures and adding certain new disclosures. The amendments are effective for fiscal years, and interim periods within those fiscal years, beginning after December 15, 2019. Early adoption is permitted. Management has adopted the removal and modification of disclosures early, as permitted, and will adopt the additional new disclosures at the effective date.
| | | | |
| 24 | | Wells Fargo Core Bond Portfolio | | Portfolio of investments—November 30, 2018 (unaudited) |
| | | | | | | | | | | | | | | | |
| Security name | | Interest rate | | | Maturity date | | | Principal | | | Value | |
|
Agency Securities: 36.90% | |
FHLMC (12 Month LIBOR +1.64%) ± | | | 2.80 | % | | | 1-1-2047 | | | $ | 4,968,798 | | | $ | 4,919,291 | |
FHLMC | | | 3.00 | | | | 10-15-2047 | | | | 34,535,212 | | | | 33,502,716 | |
FHLMC | | | 3.00 | | | | 11-15-2047 | | | | 11,482,354 | | | | 11,089,364 | |
FHLMC | | | 3.00 | | | | 6-15-2048 | | | | 18,722,167 | | | | 17,973,888 | |
FHLMC | | | 3.50 | | | | 12-1-2047 | | | | 2,328,847 | | | | 2,285,412 | |
FHLMC | | | 3.50 | | | | 2-1-2048 | | | | 3,491,358 | | | | 3,425,775 | |
FHLMC | | | 3.50 | | | | 3-1-2048 | | | | 20,624,189 | | | | 20,257,500 | |
FHLMC (12 Month LIBOR +1.64%) ± | | | 3.86 | | | | 7-1-2048 | | | | 3,173,685 | | | | 3,213,886 | |
FHLMC | | | 4.00 | | | | 4-1-2034 | | | | 3,146,209 | | | | 3,189,441 | |
FHLMC | | | 4.00 | | | | 6-1-2034 | | | | 185,758 | | | | 188,320 | |
FHLMC | | | 4.00 | | | | 1-1-2035 | | | | 227,586 | | | | 233,119 | |
FHLMC | | | 4.00 | | | | 1-1-2036 | | | | 359,755 | | | | 366,496 | |
FHLMC | | | 4.00 | | | | 10-1-2036 | | | | 2,357,849 | | | | 2,400,574 | |
FHLMC | | | 4.00 | | | | 3-1-2037 | | | | 298,070 | | | | 303,943 | |
FHLMC | | | 4.00 | | | | 3-1-2037 | | | | 358,138 | | | | 365,528 | |
FHLMC | | | 4.00 | | | | 3-1-2037 | | | | 577,429 | | | | 588,272 | |
FHLMC | | | 4.00 | | | | 4-1-2037 | | | | 2,413,829 | | | | 2,459,158 | |
FHLMC | | | 4.00 | | | | 4-1-2037 | | | | 3,022,029 | | | | 3,095,549 | |
FHLMC | | | 4.00 | | | | 8-1-2044 | | | | 1,002,828 | | | | 1,012,818 | |
FHLMC | | | 4.00 | | | | 12-1-2045 | | | | 1,022,865 | | | | 1,031,571 | |
FHLMC | | | 4.00 | | | | 2-1-2046 | | | | 1,248,924 | | | | 1,259,556 | |
FHLMC | | | 4.00 | | | | 6-1-2046 | | | | 2,161,018 | | | | 2,179,415 | |
FHLMC | | | 4.00 | | | | 4-1-2048 | | | | 3,494,987 | | | | 3,526,577 | |
FHLMC | | | 4.00 | | | | 6-1-2048 | | | | 4,924,399 | | | | 4,968,910 | |
FHLMC | | | 4.00 | | | | 6-1-2048 | | | | 4,152,759 | | | | 4,190,296 | |
FHLMC | | | 4.00 | | | | 8-1-2048 | | | | 23,351,967 | | | | 23,502,547 | |
FHLMC | | | 4.00 | | | | 9-1-2048 | | | | 4,576,772 | | | | 4,606,285 | |
FHLMC | | | 4.00 | | | | 10-1-2048 | | | | 51,587,414 | | | | 51,918,743 | |
FHLMC | | | 4.00 | | | | 11-1-2048 | | | | 97,039,474 | | | | 97,662,731 | |
FHLMC | | | 4.50 | | | | 6-1-2039 | | | | 259,509 | | | | 271,455 | |
FHLMC | | | 4.50 | | | | 7-1-2039 | | | | 282,336 | | | | 295,324 | |
FHLMC | | | 4.50 | | | | 11-1-2048 | | | | 43,171,570 | | | | 44,428,590 | |
FHLMC | | | 5.00 | | | | 6-1-2044 | | | | 3,380,058 | | | | 3,623,422 | |
FHLMC | | | 5.00 | | | | 5-1-2048 | | | | 12,517,733 | | | | 13,336,582 | |
FHLMC | | | 5.00 | | | | 6-1-2048 | | | | 728,696 | | | | 770,956 | |
FHLMC | | | 5.00 | | | | 11-1-2048 | | | | 17,099,000 | | | | 17,937,275 | |
FHLMC | | | 6.50 | | | | 4-1-2021 | | | | 368 | | | | 373 | |
FHLMC Series 1590 Class IA (1 Month LIBOR +1.05%) ± | | | 3.36 | | | | 10-15-2023 | | | | 15,360 | | | | 15,660 | |
FHLMC Series 1897 Class K | | | 7.00 | | | | 9-15-2026 | | | | 567 | | | | 611 | |
FHLMC Series 1935 Class FL (1 Month LIBOR +0.70%) ± | | | 2.98 | | | | 2-15-2027 | | | | 1,765 | | | | 1,794 | |
FHLMC Series 2423 Class MC | | | 7.00 | | | | 3-15-2032 | | | | 10,495 | | | | 11,636 | |
FHLMC Series 264 Class 30 | | | 3.00 | | | | 7-15-2042 | | | | 19,147,384 | | | | 18,499,741 | |
FHLMC Series 326 Class 300 | | | 3.00 | | | | 3-15-2044 | | | | 15,395,942 | | | | 14,881,062 | |
FHLMC Series 356 Class 300 | | | 3.00 | | | | 9-15-2047 | | | | 5,000,004 | | | | 4,806,167 | |
FHLMC Series 3838 Class QE | | | 3.50 | | | | 1-15-2029 | | | | 65,908 | | | | 65,836 | |
FHLMC Series 4640 Class LD | | | 4.00 | | | | 9-15-2043 | | | | 15,632,376 | | | | 16,024,494 | |
FHLMC Series 4700 Class QJ | | | 4.00 | | | | 7-15-2044 | | | | 10,775,646 | | | | 11,058,928 | |
FHLMC Series 4705 Class A | | | 4.50 | | | | 9-15-2042 | | | | 7,324,389 | | | | 7,626,480 | |
FHLMC Series 4763 Class CA | | | 3.00 | | | | 9-15-2038 | | | | 2,056,611 | | | | 2,030,796 | |
FHLMC Series 4767 Class KA | | | 3.00 | | | | 3-15-2048 | | | | 10,316,572 | | | | 10,179,129 | |
The accompanying notes are an integral part of these financial statements.
| | | | | | |
| Portfolio of investments—November 30, 2018 (unaudited) | | Wells Fargo Core Bond Portfolio | | | 25 | |
| | | | | | | | | | | | | | | | |
| Security name | | Interest rate | | | Maturity date | | | Principal | | | Value | |
|
Agency Securities (continued) | |
FHLMC Series 4786 Class DP | | | 4.50 | % | | | 7-15-2042 | | | $ | 5,782,456 | | | $ | 5,972,506 | |
FHLMC Series 4787 Class AK | | | 3.00 | | | | 5-15-2048 | | | | 15,909,702 | | | | 15,256,863 | |
FHLMC Series 4796 Class AK | | | 3.00 | | | | 5-15-2048 | | | | 19,800,202 | | | | 18,987,721 | |
FNMA | | | 1.50 | | | | 4-25-2043 | | | | 1,923,146 | | | | 1,762,045 | |
FNMA (12 Month LIBOR +1.60%) ± | | | 2.95 | | | | 8-1-2047 | | | | 4,183,473 | | | | 4,158,314 | |
FNMA | | | 3.00 | | | | 11-1-2046 | | | | 8,443,176 | | | | 8,160,162 | |
FNMA (12 Month LIBOR +1.62%) ± | | | 3.14 | | | | 3-1-2047 | | | | 6,446,702 | | | | 6,447,302 | |
FNMA | | | 3.50 | | | | 9-1-2033 | | | | 863,233 | | | | 869,545 | |
FNMA | | | 3.50 | | | | 8-1-2034 | | | | 2,512,371 | | | | 2,530,748 | |
FNMA | | | 3.50 | | | | 5-1-2036 | | | | 7,776,794 | | | | 7,833,737 | |
FNMA | | | 3.50 | | | | 9-1-2036 | | | | 1,307,090 | | | | 1,316,650 | |
FNMA | | | 3.50 | | | | 12-1-2036 | | | | 8,524,392 | | | | 8,526,877 | |
FNMA | | | 3.50 | | | | 2-1-2041 | | | | 28,362,921 | | | | 28,176,722 | |
FNMA | | | 3.50 | | | | 2-1-2042 | | | | 25,655,799 | | | | 25,487,283 | |
FNMA | | | 3.50 | | | | 5-1-2042 | | | | 20,129,693 | | | | 20,069,223 | |
FNMA | | | 3.50 | | | | 5-1-2042 | | | | 20,564,757 | | | | 20,429,816 | |
FNMA | | | 3.50 | | | | 6-1-2042 | | | | 36,901,982 | | | | 36,659,781 | |
FNMA | | | 3.50 | | | | 11-1-2046 | | | | 7,658,698 | | | | 7,620,050 | |
FNMA | | | 3.50 | | | | 11-1-2047 | | | | 2,809,964 | | | | 2,759,650 | |
FNMA | | | 3.50 | | | | 12-1-2047 | | | | 7,571,137 | | | | 7,444,774 | |
FNMA | | | 3.50 | | | | 1-1-2048 | | | | 23,311,445 | | | | 22,898,769 | |
FNMA | | | 3.50 | | | | 2-1-2048 | | | | 9,807,669 | | | | 9,636,314 | |
FNMA %% | | | 3.50 | | | | 12-13-2048 | | | | 7,000,000 | | | | 6,865,340 | |
FNMA | | | 3.50 | | | | 9-1-2052 | | | | 31,134,593 | | | | 30,601,592 | |
FNMA (12 Month LIBOR +1.62%) ± | | | 3.73 | | | | 8-1-2048 | | | | 5,915,781 | | | | 6,004,545 | |
FNMA (12 Month LIBOR +1.62%) ± | | | 3.74 | | | | 7-1-2048 | | | | 5,520,633 | | | | 5,601,964 | |
FNMA (12 Month LIBOR +1.62%) ± | | | 3.75 | | | | 8-1-2048 | | | | 3,066,658 | | | | 3,114,636 | |
FNMA (12 Month LIBOR +1.62%) ± | | | 3.85 | | | | 10-1-2048 | | | | 5,147,014 | | | | 5,240,871 | |
FNMA | | | 4.00 | | | | 7-1-2033 | | | | 3,916,444 | | | | 4,001,342 | |
FNMA | | | 4.00 | | | | 9-1-2033 | | | | 6,822,307 | | | | 6,969,999 | |
FNMA | | | 4.00 | | | | 12-1-2033 | | | | 534,223 | | | | 547,164 | |
FNMA | | | 4.00 | | | | 4-1-2034 | | | | 5,027,718 | | | | 5,149,505 | |
FNMA | | | 4.00 | | | | 7-1-2035 | | | | 8,491,553 | | | | 8,697,231 | |
FNMA | | | 4.00 | | | | 11-1-2035 | | | | 855,235 | | | | 875,957 | |
FNMA | | | 4.00 | | | | 11-1-2035 | | | | 3,809,904 | | | | 3,902,202 | |
FNMA | | | 4.00 | | | | 1-1-2036 | | | | 7,386,007 | | | | 7,564,959 | |
FNMA | | | 4.00 | | | | 1-1-2036 | | | | 497,252 | | | | 507,458 | |
FNMA | | | 4.00 | | | | 7-1-2036 | | | | 6,157,427 | | | | 6,276,190 | |
FNMA | | | 4.00 | | | | 9-1-2036 | | | | 2,460,342 | | | | 2,505,369 | |
FNMA | | | 4.00 | | | | 11-1-2036 | | | | 1,863,322 | | | | 1,908,469 | |
FNMA | | | 4.00 | | | | 12-1-2036 | | | | 6,517,332 | | | | 6,643,035 | |
FNMA | | | 4.00 | | | | 12-1-2036 | | | | 206,113 | | | | 209,963 | |
FNMA | | | 4.00 | | | | 12-1-2036 | | | | 395,731 | | | | 403,122 | |
FNMA | | | 4.00 | | | | 1-1-2037 | | | | 309,955 | | | | 315,743 | |
FNMA | | | 4.00 | | | | 2-1-2037 | | | | 550,615 | | | | 560,902 | |
FNMA | | | 4.00 | | | | 2-1-2037 | | | | 459,147 | | | | 467,724 | |
FNMA | | | 4.00 | | | | 3-1-2037 | | | | 947,805 | | | | 965,805 | |
FNMA | | | 4.00 | | | | 3-1-2037 | | | | 1,808,611 | | | | 1,842,398 | |
FNMA | | | 4.00 | | | | 3-1-2037 | | | | 1,276,588 | | | | 1,299,649 | |
FNMA | | | 4.00 | | | | 3-1-2037 | | | | 685,112 | | | | 698,111 | |
The accompanying notes are an integral part of these financial statements.
| | | | |
| 26 | | Wells Fargo Core Bond Portfolio | | Portfolio of investments—November 30, 2018 (unaudited) |
| | | | | | | | | | | | | | | | |
| Security name | | Interest rate | | | Maturity date | | | Principal | | | Value | |
|
Agency Securities (continued) | |
FNMA | | | 4.00 | % | | | 3-1-2037 | | | $ | 1,010,923 | | | $ | 1,029,810 | |
FNMA | | | 4.00 | | | | 3-1-2037 | | | | 871,690 | | | | 887,436 | |
FNMA | | | 4.00 | | | | 3-1-2037 | | | | 241,727 | | | | 246,243 | |
FNMA | | | 4.00 | | | | 3-1-2037 | | | | 514,124 | | | | 523,730 | |
FNMA | | | 4.00 | | | | 3-1-2037 | | | | 198,445 | | | | 202,214 | |
FNMA | | | 4.00 | | | | 4-1-2037 | | | | 882,250 | | | | 898,734 | |
FNMA | | | 4.00 | | | | 4-1-2037 | | | | 1,817,751 | | | | 1,851,711 | |
FNMA | | | 4.00 | | | | 5-1-2037 | | | | 552,528 | | | | 563,022 | |
FNMA | | | 4.00 | | | | 5-1-2037 | | | | 906,869 | | | | 923,812 | |
FNMA | | | 4.00 | | | | 5-1-2037 | | | | 972,643 | | | | 990,816 | |
FNMA | | | 4.00 | | | | 5-1-2037 | | | | 1,138,001 | | | | 1,159,261 | |
FNMA | | | 4.00 | | | | 6-1-2037 | | | | 2,195,145 | | | | 2,236,837 | |
FNMA | | | 4.00 | | | | 7-1-2037 | | | | 1,142,416 | | | | 1,161,041 | |
FNMA | | | 4.00 | | | | 7-1-2037 | | | | 554,815 | | | | 563,859 | |
FNMA | | | 4.00 | | | | 7-1-2037 | | | | 7,310,569 | | | | 7,444,859 | |
FNMA | | | 4.00 | | | | 9-1-2037 | | | | 1,143,616 | | | | 1,165,336 | |
FNMA | | | 4.00 | | | | 9-1-2037 | | | | 2,248,527 | | | | 2,290,541 | |
FNMA | | | 4.00 | | | | 9-1-2037 | | | | 1,976,878 | | | | 2,012,593 | |
FNMA | | | 4.00 | | | | 10-1-2037 | | | | 1,214,088 | | | | 1,237,148 | |
FNMA | | | 4.00 | | | | 10-1-2037 | | | | 3,246,585 | | | | 3,325,150 | |
FNMA | | | 4.00 | | | | 11-1-2037 | | | | 1,798,119 | | | | 1,830,605 | |
FNMA | | | 4.00 | | | | 12-1-2037 | | | | 1,096,949 | | | | 1,117,785 | |
FNMA | | | 4.00 | | | | 12-1-2037 | | | | 1,978,949 | | | | 2,015,926 | |
FNMA | | | 4.00 | | | | 1-1-2038 | | | | 966,433 | | | | 984,791 | |
FNMA | | | 4.00 | | | | 1-1-2038 | | | | 2,345,534 | | | | 2,389,363 | |
FNMA | | | 4.00 | | | | 1-1-2038 | | | | 1,567,662 | | | | 1,599,864 | |
FNMA | | | 4.00 | | | | 9-1-2038 | | | | 2,465,870 | | | | 2,512,708 | |
FNMA | | | 4.00 | | | | 5-1-2041 | | | | 15,548,976 | | | | 15,924,943 | |
FNMA | | | 4.00 | | | | 5-1-2045 | | | | 8,034,745 | | | | 8,105,433 | |
FNMA | | | 4.00 | | | | 5-1-2045 | | | | 1,302,842 | | | | 1,319,362 | |
FNMA | | | 4.00 | | | | 9-1-2045 | | | | 1,525,680 | | | | 1,553,130 | |
FNMA | | | 4.00 | | | | 10-1-2045 | | | | 976,086 | | | | 984,556 | |
FNMA | | | 4.00 | | | | 12-1-2045 | | | | 535,676 | | | | 539,516 | |
FNMA | | | 4.00 | | | | 12-1-2045 | | | | 165,230 | | | | 167,174 | |
FNMA | | | 4.00 | | | | 12-1-2045 | | | | 343,170 | | | | 346,838 | |
FNMA | | | 4.00 | | | | 5-1-2046 | | | | 5,007,489 | | | | 5,059,049 | |
FNMA | | | 4.00 | | | | 7-1-2046 | | | | 321,845 | | | | 325,515 | |
FNMA | | | 4.00 | | | | 4-1-2047 | | | | 889,073 | | | | 902,282 | |
FNMA | | | 4.00 | | | | 4-1-2047 | | | | 1,015,332 | | | | 1,024,806 | |
FNMA | | | 4.00 | | | | 4-1-2047 | | | | 994,387 | | | | 1,007,547 | |
FNMA | | | 4.00 | | | | 5-1-2047 | | | | 3,971,781 | | | | 4,006,988 | |
FNMA | | | 4.00 | | | | 10-1-2047 | | | | 815,986 | | | | 828,111 | |
FNMA | | | 4.00 | | | | 10-1-2047 | | | | 769,449 | | | | 779,750 | |
FNMA | | | 4.00 | | | | 11-1-2047 | | | | 33,800,371 | | | | 34,176,152 | |
FNMA | | | 4.00 | | | | 2-1-2048 | | | | 7,422,003 | | | | 7,475,863 | |
FNMA | | | 4.00 | | | | 3-1-2048 | | | | 4,795,000 | | | | 4,837,873 | |
FNMA | | | 4.00 | | | | 3-1-2048 | | | | 4,656,070 | | | | 4,697,700 | |
FNMA | | | 4.00 | | | | 3-1-2048 | | | | 27,257,948 | | | | 27,430,344 | |
FNMA | | | 4.00 | | | | 4-1-2048 | | | | 17,996,685 | | | | 18,121,556 | |
FNMA | | | 4.00 | | | | 5-1-2048 | | | | 7,819,258 | | | | 7,889,175 | |
The accompanying notes are an integral part of these financial statements.
| | | | | | |
| Portfolio of investments—November 30, 2018 (unaudited) | | Wells Fargo Core Bond Portfolio | | | 27 | |
| | | | | | | | | | | | | | | | |
| Security name | | Interest rate | | | Maturity date | | | Principal | | | Value | |
|
Agency Securities (continued) | |
FNMA | | | 4.00 | % | | | 5-1-2048 | | | $ | 2,111,468 | | | $ | 2,133,324 | |
FNMA | | | 4.00 | | | | 6-1-2048 | | | | 4,123,858 | | | | 4,160,735 | |
FNMA | | | 4.00 | | | | 7-1-2048 | | | | 4,549,963 | | | | 4,590,649 | |
FNMA | | | 4.00 | | | | 8-1-2048 | | | | 53,895,419 | | | | 54,269,712 | |
FNMA | | | 4.00 | | | | 9-1-2048 | | | | 40,660,227 | | | | 40,917,411 | |
FNMA | | | 4.00 | | | | 9-1-2048 | | | | 5,375,956 | | | | 5,448,054 | |
FNMA | | | 4.00 | | | | 10-1-2048 | | | | 5,672,669 | | | | 5,723,395 | |
FNMA %% | | | 4.00 | | | | 12-13-2048 | | | | 21,200,000 | | | | 21,323,390 | |
FNMA | | | 4.50 | | | | 5-1-2034 | | | | 1,896,182 | | | | 1,969,097 | |
FNMA | | | 4.50 | | | | 6-1-2041 | | | | 319,676 | | | | 330,935 | |
FNMA | | | 4.50 | | | | 3-1-2043 | | | | 3,626,799 | | | | 3,773,217 | |
FNMA | | | 4.50 | | | | 3-1-2044 | | | | 1,129,539 | | | | 1,171,109 | |
FNMA | | | 4.50 | | | | 10-1-2045 | | | | 6,019,142 | | | | 6,214,414 | |
FNMA | | | 4.50 | | | | 2-1-2046 | | | | 145,348 | | | | 149,944 | |
FNMA | | | 4.50 | | | | 8-1-2048 | | | | 46,211,595 | | | | 47,547,722 | |
FNMA ## | | | 4.50 | | | | 11-1-2048 | | | | 49,987,364 | | | | 51,478,504 | |
FNMA %% | | | 4.50 | | | | 12-13-2048 | | | | 1,700,000 | | | | 1,747,928 | |
FNMA | | | 5.00 | | | | 7-1-2044 | | | | 640,105 | | | | 674,560 | |
FNMA | | | 5.00 | | | | 5-1-2048 | | | | 6,306,677 | | | | 6,653,105 | |
FNMA | | | 5.00 | | | | 6-1-2048 | | | | 1,798,208 | | | | 1,897,110 | |
FNMA | | | 5.00 | | | | 6-1-2048 | | | | 1,597,100 | | | | 1,689,884 | |
FNMA | | | 5.00 | | | | 6-1-2048 | | | | 13,175,470 | | | | 14,063,101 | |
FNMA | | | 5.00 | | | | 11-1-2048 | | | | 16,599,073 | | | | 17,707,915 | |
FNMA | | | 5.00 | | | | 8-1-2056 | | | | 21,946,164 | | | | 23,202,414 | |
FNMA | | | 6.00 | | | | 4-1-2022 | | | | 5,793 | | | | 6,234 | |
FNMA | | | 6.00 | | | | 2-1-2029 | | | | 5,601 | | | | 6,091 | |
FNMA | | | 6.00 | | | | 3-1-2033 | | | | 40,055 | | | | 43,804 | |
FNMA | | | 6.00 | | | | 11-1-2033 | | | | 14,495 | | | | 15,854 | |
FNMA Series1998-38 Class PL | | | 6.00 | | | | 11-25-2028 | | | | 265,452 | | | | 285,324 | |
FNMA Series1999-54 Class LH | | | 6.50 | | | | 11-25-2029 | | | | 9,654 | | | | 10,406 | |
FNMA Series2005-31 Class PB | | | 5.50 | | | | 4-25-2035 | | | | 70,000 | | | | 75,713 | |
FNMA Series2014-40 Class EP | | | 3.50 | | | | 10-25-2042 | | | | 3,298,402 | | | | 3,322,337 | |
FNMA Series2017-13 Class PA | | | 3.00 | | | | 8-25-2046 | | | | 6,048,797 | | | | 5,942,060 | |
FNMA Series2017-M7 Class A2 ±± | | | 2.96 | | | | 2-25-2027 | | | | 2,108,000 | | | | 2,006,437 | |
FNMA Series2018-12 Class P | | | 3.00 | | | | 3-25-2046 | | | | 7,253,031 | | | | 7,084,311 | |
FNMA Series2018-14 Class KC | | | 3.00 | | | | 3-25-2048 | | | | 6,543,878 | | | | 6,527,518 | |
FNMA Series2018-15 Class AB | | | 3.00 | | | | 3-25-2048 | | | | 2,283,484 | | | | 2,253,776 | |
FNMA Series2018-15 Class CA | | | 3.00 | | | | 3-25-2048 | | | | 2,437,529 | | | | 2,396,965 | |
FNMA Series2018-38 Class LA | | | 3.00 | | | | 6-25-2048 | | | | 19,645,449 | | | | 18,636,997 | |
FNMA Series2018-4 Class HC | | | 2.50 | | | | 12-25-2047 | | | | 6,120,506 | | | | 5,818,291 | |
FNMA Series2018-43 Class CT | | | 3.00 | | | | 6-25-2048 | | | | 18,725,710 | | | | 18,042,918 | |
FNMA Series2018-45 Class GA | | | 3.00 | | | | 6-25-2048 | | | | 40,647,812 | | | | 39,165,679 | |
FNMA Series2018-50 Class BA | | | 3.00 | | | | 7-25-2048 | | | | 39,991,090 | | | | 38,250,957 | |
FNMA Series2018-56 Class CH | | | 3.00 | | | | 8-25-2048 | | | | 9,284,237 | | | | 8,954,836 | |
FNMA Series2018-57 Class PT | | | 3.00 | | | | 8-25-2048 | | | | 7,396,876 | | | | 7,097,549 | |
FNMA Series2018-59 Class DA | | | 3.00 | | | | 8-25-2048 | | | | 20,807,622 | | | | 19,962,052 | |
FNMA Series2018-63 Class DA | | | 3.50 | | | | 9-25-2048 | | | | 5,785,280 | | | | 5,758,756 | |
FNMA Series2018-8 Class KL | | | 2.50 | | | | 3-25-2047 | | | | 7,502,000 | | | | 7,130,171 | |
FNMA Series 414 Class A35 | | | 3.50 | | | | 10-25-2042 | | | | 17,256,763 | | | | 17,144,764 | |
GNMA | | | 3.50 | | | | 9-20-2045 | | | | 34,604,826 | | | | 34,299,502 | |
The accompanying notes are an integral part of these financial statements.
| | | | |
| 28 | | Wells Fargo Core Bond Portfolio | | Portfolio of investments—November 30, 2018 (unaudited) |
| | | | | | | | | | | | | | | | |
| Security name | | Interest rate | | | Maturity date | | | Principal | | | Value | |
|
Agency Securities (continued) | |
GNMA | | | 3.50 | % | | | 5-20-2046 | | | $ | 4,042,647 | | | $ | 4,010,554 | |
GNMA | | | 3.50 | | | | 7-20-2046 | | | | 16,904,576 | | | | 16,808,088 | |
GNMA | | | 3.50 | | | | 1-20-2047 | | | | 3,478,298 | | | | 3,446,207 | |
GNMA | | | 3.50 | | | | 1-20-2048 | | | | 12,095,587 | | | | 11,976,057 | |
GNMA | | | 3.50 | | | | 1-20-2048 | | | | 6,730,626 | | | | 6,664,791 | |
GNMA | | | 3.50 | | | | 1-20-2048 | | | | 2,181,388 | | | | 2,163,537 | |
GNMA | | | 3.50 | | | | 1-20-2048 | | | | 6,167,614 | | | | 6,101,824 | |
GNMA | | | 4.00 | | | | 3-20-2048 | | | | 2,602,466 | | | | 2,640,358 | |
GNMA | | | 4.00 | | | | 4-20-2048 | | | | 3,949,616 | | | | 4,007,124 | |
GNMA | | | 4.00 | | | | 4-20-2048 | | | | 2,987,593 | | | | 3,035,376 | |
GNMA | | | 4.00 | | | | 4-20-2048 | | | | 1,978,568 | | | | 2,011,767 | |
GNMA | | | 4.50 | | | | 10-20-2048 | | | | 76,761,115 | | | | 79,234,688 | |
GNMA | | | 4.50 | | | | 11-20-2048 | | | | 5,731,553 | | | | 5,917,824 | |
GNMA %% | | | 4.50 | | | | 12-20-2048 | | | | 6,175,253 | | | | 6,377,154 | |
GNMA %% | | | 4.50 | | | | 1-23-2049 | | | | 400,000 | | | | 412,012 | |
GNMA | | | 5.00 | | | | 12-20-2039 | | | | 251,406 | | | | 272,102 | |
GNMA | | | 5.00 | | | | 11-20-2045 | | | | 408,220 | | | | 443,520 | |
GNMA | | | 5.00 | | | | 4-20-2048 | | | | 1,453,644 | | | | 1,544,985 | |
GNMA | | | 5.00 | | | | 8-20-2048 | | | | 41,556,316 | | | | 43,456,171 | |
GNMA | | | 5.00 | | | | 9-20-2048 | | | | 28,845,223 | | | | 30,173,996 | |
GNMA | | | 5.00 | | | | 11-20-2048 | | | | 21,879,558 | | | | 22,887,471 | |
GNMA %% | | | 5.00 | | | | 12-19-2048 | | | | 6,300,000 | | | | 6,572,542 | |
GNMA %% | | | 5.00 | | | | 12-20-2048 | | | | 17,892,998 | | | | 18,706,825 | |
GNMA %% | | | 5.00 | | | | 1-23-2049 | | | | 89,300,000 | | | | 93,027,137 | |
GNMA %% | | | 5.00 | | | | 2-21-2049 | | | | 57,000,000 | | | | 59,299,433 | |
GNMA Series2012-141 Class WA ±± | | | 4.53 | | | | 11-16-2041 | | | | 1,858,865 | | | | 1,956,149 | |
GNMA Series2017-167 Class BQ | | | 2.50 | | | | 8-20-2044 | | | | 9,714,861 | | | | 9,350,112 | |
| |
Total Agency Securities (Cost $2,069,752,173) | | | | 2,056,573,682 | |
| | | | | |
|
Asset-Backed Securities: 10.91% | |
Ally Auto Receivables Trust Series2015-1 Class A4 | | | 1.75 | | | | 5-15-2020 | | | | 1,456,050 | | | | 1,454,335 | |
Ally Auto Receivables Trust Series2015-2 Class A4 | | | 1.84 | | | | 6-15-2020 | | | | 1,637,129 | | | | 1,633,263 | |
Ally Master Owner Trust Series2017-1 Class A (1 Month LIBOR +0.40%) ± | | | 2.71 | | | | 2-15-2021 | | | | 2,468,000 | | | | 2,468,815 | |
American Express Credit Account Master Trust2018-9 Class A (1 Month LIBOR +0.38%) ± | | | 2.69 | | | | 4-15-2026 | | | | 2,909,000 | | | | 2,910,253 | |
Americredit Automobile Receivables Series2018-1 Class A3 | | | 3.07 | | | | 12-19-2022 | | | | 2,541,000 | | | | 2,534,197 | |
Avis Budget Rental Car Funding LLC Series2017-1a Class A 144A | | | 3.07 | | | | 9-20-2023 | | | | 3,164,000 | | | | 3,090,985 | |
Barclays Dryrock Issuance Trust Series2018-1 Class A (1 Month LIBOR +0.33%) ± | | | 2.64 | | | | 7-15-2024 | | | | 6,116,000 | | | | 6,126,721 | |
Capital Auto Receivables Asset Trust Series2015-3 Class A4 | | | 2.13 | | | | 5-20-2020 | | | | 881,317 | | | | 880,542 | |
Capital Auto Receivables Asset Trust Series2015-4 Class A4 | | | 2.01 | | | | 7-20-2020 | | | | 3,406,270 | | | | 3,399,375 | |
Capital Auto Receivables Asset Trust Series2016-1 Class A4 | | | 1.98 | | | | 10-20-2020 | | | | 2,455,000 | | | | 2,447,692 | |
Capital Auto Receivables Asset Trust Series2016-2 Class A4 | | | 1.63 | | | | 1-20-2021 | | | | 964,000 | | | | 957,516 | |
College Avenue Student Loan Trust Series2017-A Class A1 (1 Month LIBOR +1.65%) 144A ± | | | 3.97 | | | | 11-26-2046 | | | | 4,424,963 | | | | 4,514,125 | |
College Avenue Student Loan Trust Series2018-A Class A2 144A | | | 4.13 | | | | 12-26-2047 | | | | 3,093,621 | | | | 3,100,985 | |
Discover Card Execution Note Trust Series 2014 Class A4 | | | 2.12 | | | | 12-15-2021 | | | | 4,440,000 | | | | 4,419,568 | |
Ford Credit Auto Owner Trust Series2015-A Class A4 | | | 1.64 | | | | 6-15-2020 | | | | 994,520 | | | | 993,168 | |
Ford Credit Auto Owner Trust Series2017-1 Class A 144A | | | 2.62 | | | | 8-15-2028 | | | | 2,218,000 | | | | 2,163,873 | |
Ford Credit Auto Owner Trust Series2017-2 Class A 144A | | | 2.36 | | | | 3-15-2029 | | | | 5,889,000 | | | | 5,659,072 | |
Ford Credit Auto Owner Trust Series2017-A Class A4 | | | 1.92 | | | | 4-15-2022 | | | | 3,576,000 | | | | 3,507,406 | |
The accompanying notes are an integral part of these financial statements.
| | | | | | |
| Portfolio of investments—November 30, 2018 (unaudited) | | Wells Fargo Core Bond Portfolio | | | 29 | |
| | | | | | | | | | | | | | | | |
| Security name | | Interest rate | | | Maturity date | | | Principal | | | Value | |
|
Asset-Backed Securities(continued) | |
Ford Credit Auto Owner Trust Series2018-1 Class A 144A | | | 3.19 | % | | | 7-15-2031 | | | $ | 8,597,000 | | | $ | 8,346,661 | |
Ford Credit Auto Owner Trust Series2018-2 Class A 144A | | | 3.47 | | | | 1-15-2030 | | | | 6,074,000 | | | | 6,048,809 | |
Hertz Vehicle Financing LLC Series2015-1A Class A 144A | | | 2.73 | | | | 3-25-2021 | | | | 17,213,000 | | | | 17,072,717 | |
Hertz Vehicle Financing LLC Series2015-3A Class A 144A | | | 2.67 | | | | 9-25-2021 | | | | 9,811,000 | | | | 9,649,291 | |
Hertz Vehicle Financing LLC Series2016-2A Class A2 144A | | | 2.95 | | | | 3-25-2022 | | | | 3,863,000 | | | | 3,813,875 | |
Hertz Vehicle Financing LLC Series2016-3A Class B 144A | | | 3.11 | | | | 7-25-2020 | | | | 2,186,000 | | | | 2,178,279 | |
Hertz Vehicle Financing LLC Series2016-4A Class A 144A | | | 2.65 | | | | 7-25-2022 | | | | 10,270,000 | | | | 9,982,797 | |
Hertz Vehicle Financing LLC Series2017-1A Class A 144A | | | 2.96 | | | | 10-25-2021 | | | | 4,777,000 | | | | 4,707,739 | |
Hertz Vehicle Financing LLC Series2017-2A Class A 144A | | | 3.29 | | | | 10-25-2023 | | | | 7,635,000 | | | | 7,441,797 | |
Hertz Vehicle Financing LLC Series2018-2A Class A 144A | | | 3.65 | | | | 6-27-2022 | | | | 5,490,000 | | | | 5,488,584 | |
Hertz Vehicle Financing LLC Series2018-3A Class A 144A | | | 4.03 | | | | 7-25-2024 | | | | 8,575,000 | | | | 8,574,989 | |
Navient Student Loan Trust Series2014-1 Class A3 (1 Month LIBOR +0.51%) ± | | | 2.79 | | | | 6-25-2031 | | | | 4,771,688 | | | | 4,780,906 | |
Navient Student Loan Trust Series2014-AA Class A3 (1 Month LIBOR +1.60%) 144A± | | | 3.91 | | | | 10-15-2031 | | | | 6,169,000 | | | | 6,365,704 | |
Navient Student Loan Trust Series2014-CTA Class A (1 Month LIBOR +0.70%) 144A± | | | 3.01 | | | | 9-16-2024 | | | | 1,525,692 | | | | 1,528,601 | |
Navient Student Loan Trust Series2015-1 Class A2 (1 Month LIBOR +0.60%) ± | | | 2.91 | | | | 4-25-2040 | | | | 5,044,244 | | | | 5,039,720 | |
Navient Student Loan Trust Series2015-CA Class B 144A | | | 3.25 | | | | 5-15-2040 | | | | 2,766,000 | | | | 2,764,142 | |
Navient Student Loan Trust Series2016-3A Class A2 (1 Month LIBOR +0.85%) 144A± | | | 3.17 | | | | 6-25-2065 | | | | 2,867,782 | | | | 2,882,074 | |
Navient Student Loan Trust Series2016-AA Class A2B (1 Month LIBOR +2.15%) 144A± | | | 4.46 | | | | 12-15-2045 | | | | 3,047,823 | | | | 3,179,788 | |
Navient Student Loan Trust Series2017-2A Class A (1 Month LIBOR +0.77%) 144A± | | | 3.08 | | | | 9-25-2065 | | | | 8,793,948 | | | | 8,846,924 | |
Navient Student Loan Trust Series2017-3A Class A (1 Month LIBOR +0.85%) 144A± | | | 3.16 | | | | 2-25-2066 | | | | 9,189,978 | | | | 9,271,847 | |
Navient Student Loan Trust Series2017-4A Class A2 (1 Month LIBOR +0.50%) 144A± | | | 2.82 | | | | 9-27-2066 | | | | 8,147,000 | | | | 8,171,787 | |
Navient Student Loan Trust Series2017-A Class A2B (1 Month LIBOR +0.90%) 144A± | | | 3.21 | | | | 12-16-2058 | | | | 8,966,000 | | | | 8,959,175 | |
Navient Student Loan Trust Series2018-BA Class A2B (1 Month LIBOR +0.72%) 144A± | | | 3.03 | | | | 12-15-2059 | | | | 3,840,000 | | | | 3,826,056 | |
Navient Student Loan Trust Series2018-A Class A2 144A | | | 3.19 | | | | 2-18-2042 | | | | 2,233,000 | | | | 2,186,913 | |
Navient Student Loan Trust Series2018-CA Class A2 144A | | | 3.52 | | | | 6-16-2042 | | | | 2,507,000 | | | | 2,499,287 | |
Navient Student Loan Trust Series2018-DA Class A2A 144A | | | 4.00 | | | | 12-15-2059 | | | | 13,496,000 | | | | 13,595,036 | |
Navient Student Loan Trust Series2018-EA Class A2 144A | | | 4.00 | | | | 12-15-2059 | | | | 6,822,000 | | | | 6,890,414 | |
Nelnet Student Loan Trust Series2004-4 Class A5 (3 Month LIBOR +0.16%) ± | | | 2.65 | | | | 1-25-2037 | | | | 4,414,426 | | | | 4,387,732 | |
Nelnet Student Loan Trust Series2004-5 Class A5 (3 Month LIBOR +0.18%) ± | | | 2.67 | | | | 10-27-2036 | | | | 3,083,203 | | | | 3,048,804 | |
Nelnet Student Loan Trust Series2005-1 Class A5 (3 Month LIBOR +0.11%) ± | | | 2.60 | | | | 10-25-2033 | | | | 17,128,377 | | | | 17,021,104 | |
Nelnet Student Loan Trust Series2005-2 Class A5 (3 Month LIBOR +0.10%) ± | | | 2.47 | | | | 3-23-2037 | | | | 21,561,131 | | | | 21,349,314 | |
Nelnet Student Loan Trust Series2005-3 Class A5 (3 Month LIBOR +0.12%) ± | | | 2.49 | | | | 12-24-2035 | | | | 19,346,326 | | | | 19,201,820 | |
Nelnet Student Loan Trust Series2005-4 Class A4 (3 Month LIBOR +0.18%) ± | | | 2.55 | | | | 3-22-2032 | | | | 4,392,772 | | | | 4,294,066 | |
Nelnet Student Loan Trust Series2010-4A Class A (1 Month LIBOR +0.80%) 144A± | | | 3.12 | | | | 4-25-2046 | | | | 1,639,089 | | | | 1,651,158 | |
Nelnet Student Loan TrustClass 2010-2A Class A (3 Month LIBOR +0.85%) 144A± | | | 3.22 | | | | 9-25-2048 | | | | 18,698,941 | | | | 18,938,285 | |
Nelnet Student Loan Trust Series2012-4A Class A (1 Month LIBOR +0.70%) 144A± | | | 3.02 | | | | 9-27-2038 | | | | 16,433,486 | | | | 16,552,887 | |
Nelnet Student Loan Trust Series2014-1A Class A (1 Month LIBOR +0.57%) 144A± | | | 2.88 | | | | 9-25-2041 | | | | 2,449,603 | | | | 2,453,684 | |
Nelnet Student Loan Trust Series2016-1A Class A (1 Month LIBOR +0.80%) 144A± | | | 3.12 | | | | 9-25-2065 | | | | 8,561,276 | | | | 8,637,266 | |
Nelnet Student Loan Trust Series2018-3A Class A2 (1 Month LIBOR +0.44%) 144A± | | | 2.76 | | | | 9-27-2066 | | | | 2,846,000 | | | | 2,849,614 | |
SLM Student Loan Trust Series2006-10 Class A6 (3 Month LIBOR +0.15%) ± | | | 2.64 | | | | 3-25-2044 | | | | 20,830,000 | | | | 20,159,614 | |
SLM Student Loan Trust Series2013-4 Class A (1 Month LIBOR +0.55%) ± | | | 2.87 | | | | 6-25-2043 | | | | 1,921,658 | | | | 1,924,585 | |
SLM Student Loan Trust Series2003-1 Class A5C (3 Month LIBOR +0.75%) 144A± | | | 3.08 | | | | 12-15-2032 | | | | 3,910,775 | | | | 3,831,947 | |
SLM Student Loan Trust Series2004-10 Class A7A (3 Month LIBOR +0.60%) 144A± | | | 3.09 | | | | 10-25-2029 | | | | 12,249,000 | | | | 12,293,008 | |
SLM Student Loan Trust Series2005-10 Class A5 (3 Month LIBOR +0.13%) ± | | | 2.62 | | | | 7-26-2021 | | | | 2,833,553 | | | | 2,806,003 | |
SLM Student Loan Trust Series2006-1 Class A5 (3 Month LIBOR +0.11%) ± | | | 2.60 | | | | 7-26-2021 | | | | 13,093,374 | | | | 12,905,300 | |
SLM Student Loan Trust Series2006-3 Class A5 (3 Month LIBOR +0.10%) ± | | | 2.59 | | | | 1-25-2021 | | | | 7,478,107 | | | | 7,404,982 | |
SLM Student Loan Trust Series2007-1 Class A5 (3 Month LIBOR +0.09%) ± | | | 2.58 | | | | 1-26-2026 | | | | 1,440,006 | | | | 1,436,755 | |
SLM Student Loan Trust Series2007-2 Class A4 (3 Month LIBOR +0.06%) ± | | | 2.55 | | | | 7-25-2022 | | | | 11,939,000 | | | | 11,664,408 | |
SLM Student Loan Trust Series2010-1 Class A (1 Month LIBOR +0.40%) ± | | | 2.72 | | | | 3-25-2025 | | | | 1,954,706 | | | | 1,911,095 | |
The accompanying notes are an integral part of these financial statements.
| | | | |
| 30 | | Wells Fargo Core Bond Portfolio | | Portfolio of investments—November 30, 2018 (unaudited) |
| | | | | | | | | | | | | | | | |
| Security name | | Interest rate | | | Maturity date | | | Principal | | | Value | |
|
Asset-Backed Securities(continued) | |
SLM Student Loan Trust Series2012-1 Class A3 (1 Month LIBOR +0.95%) ± | | | 3.26 | % | | | 9-25-2028 | | | $ | 13,790,819 | | | $ | 13,812,940 | |
SLM Student Loan Trust Series2012-2 Class A (1 Month LIBOR +0.70%) ± | | | 3.02 | | | | 1-25-2029 | | | | 11,856,848 | | | | 11,783,544 | |
SLM Student Loan Trust Series2012-6 Class A3 (1 Month LIBOR +0.75%) ± | | | 3.07 | | | | 5-26-2026 | | | | 3,178,447 | | | | 3,178,444 | |
SLM Student Loan Trust Series2013-B Class A2B (1 Month LIBOR +1.10%) 144A± | | | 3.41 | | | | 6-17-2030 | | | | 406,153 | | | | 407,447 | |
SMB Private Education Loan Trust Series2015-A Class A2B (1 Month LIBOR +1.00%) 144A± | | | 3.31 | | | | 6-15-2027 | | | | 4,531,370 | | | | 4,571,247 | |
SMB Private Education Loan Trust Series2015-B Class A2A 144A | | | 2.98 | | | | 7-15-2027 | | | | 2,558,098 | | | | 2,539,138 | |
SMB Private Education Loan Trust Series2015-C Class A2B (1 Month LIBOR +1.40%) 144A± | | | 3.71 | | | | 7-15-2027 | | | | 2,450,306 | | | | 2,485,035 | |
SMB Private Education Loan Trust Series2016-A Class A2A 144A | | | 2.70 | | | | 5-15-2031 | | | | 10,077,111 | | | | 9,926,111 | |
SMB Private Education Loan Trust Series2016-A Class A2B (1 Month LIBOR +1.50%) 144A± | | | 3.81 | | | | 5-15-2031 | | | | 13,250,703 | | | | 13,548,458 | |
SMB Private Education Loan Trust Series2016-B Class A2A 144A | | | 2.43 | | | | 2-17-2032 | | | | 8,056,154 | | | | 7,815,791 | |
SMB Private Education Loan Trust Series2016-B Class A2B (1 Month LIBOR +1.45%) 144A± | | | 3.76 | | | | 2-17-2032 | | | | 13,186,880 | | | | 13,462,900 | |
SMB Private Education Loan Trust Series2016-C Class A2A 144A | | | 2.34 | | | | 9-15-2034 | | | | 11,556,402 | | | | 11,234,414 | |
SMB Private Education Loan Trust Series2016-C Class A2B (1 Month LIBOR +1.10%) 144A± | | | 3.41 | | | | 9-15-2034 | | | | 10,266,076 | | | | 10,389,703 | |
SMB Private Education Loan Trust Series2017-A Class A2B (1 Month LIBOR +0.90%) 144A± | | | 3.21 | | | | 9-15-2034 | | | | 3,756,000 | | | | 3,776,894 | |
SMB Private Education Loan Trust Series2017-B Class A2B (1 Month LIBOR +0.75%) 144A± | | | 3.06 | | | | 10-15-2035 | | | | 7,998,000 | | | | 7,997,987 | |
SMB Private Education Loan Trust Series2018-C Class A2A 144A | | | 3.63 | | | | 11-15-2035 | | | | 6,580,000 | | | | 6,580,442 | |
SMB Private Education Loan Trust Series2018-C Class A2B (1 Month LIBOR +0.75%) 144A± | | | 3.06 | | | | 11-15-2035 | | | | 7,851,000 | | | | 7,863,284 | |
SMB Private Education Loan Trust Series2018-A Class A2B (1 Month LIBOR +0.80%) 144A± | | | 3.11 | | | | 2-15-2036 | | | | 4,315,000 | | | | 4,327,464 | |
SMB Private Education Loan Trust Series2018-B Class A2B (1 Month LIBOR +0.72%) 144A± | | | 3.03 | | | | 1-15-2037 | | | | 7,041,000 | | | | 7,024,414 | |
Structured Asset Securities Corporation Series1998-2 Class A (1 Month LIBOR +0.52%) ± | | | 2.84 | | | | 2-25-2028 | | | | 12,224 | | | | 12,142 | |
Synchrony Credit Card Master Note Trust Series2018-2 Class A | | | 3.47 | | | | 5-15-2026 | | | | 2,324,000 | | | | 2,326,946 | |
World Financial Network Credit Card Master Trust Series2014-B Class A4 | | | 1.68 | | | | 12-15-2020 | | | | 1,459,810 | | | | 1,459,343 | |
World Financial Network Credit Card Master Trust Series2015-B Class A | | | 2.55 | | | | 6-17-2024 | | | | 444,000 | | | | 437,654 | |
World Financial Network Credit Card Master Trust Series2016-A Class A | | | 2.03 | | | | 4-15-2025 | | | | 8,931,000 | | | | 8,643,098 | |
World Financial Network Credit Card Master Trust Series2016-C Class A | | | 1.72 | | | | 8-15-2023 | | | | 3,854,000 | | | | 3,807,162 | |
World Financial Network Credit Card Master Trust Series2017-A Class A | | | 2.12 | | | | 3-15-2024 | | | | 7,015,000 | | | | 6,903,617 | |
World Financial Network Credit Card Master Trust Series2017-C Class A | | | 2.31 | | | | 8-15-2024 | | | | 12,914,000 | | | | 12,678,309 | |
World Omni Auto Receivables Trust Series2016-A Class A4 | | | 1.95 | | | | 5-16-2022 | | | | 6,143,000 | | | | 6,061,027 | |
| |
Total Asset-Backed Securities (Cost $607,613,026) | | | | 608,134,189 | |
| | | | | |
|
Corporate Bonds and Notes: 19.76% | |
|
Communication Services: 2.05% | |
|
| Diversified Telecommunication Services: 0.79% | |
AT&T Incorporated | | | 3.40 | | | | 5-15-2025 | | | | 4,226,000 | | | | 3,933,734 | |
AT&T Incorporated 144A | | | 5.15 | | | | 2-15-2050 | | | | 6,594,000 | | | | 5,919,713 | |
AT&T Incorporated | | | 4.75 | | | | 5-15-2046 | | | | 2,074,000 | | | | 1,789,431 | |
AT&T Incorporated | | | 5.25 | | | | 3-1-2037 | | | | 3,950,000 | | | | 3,760,343 | |
AT&T Incorporated | | | 5.45 | | | | 3-1-2047 | | | | 5,713,000 | | | | 5,412,456 | |
The accompanying notes are an integral part of these financial statements.
| | | | | | |
| Portfolio of investments—November 30, 2018 (unaudited) | | Wells Fargo Core Bond Portfolio | | | 31 | |
| | | | | | | | | | | | | | | | |
| Security name | | Interest rate | | | Maturity date | | | Principal | | | Value | |
|
| Diversified Telecommunication Services(continued) | |
Verizon Communications Incorporated | | | 4.13 | % | | | 8-15-2046 | | | $ | 6,119,000 | | | $ | 5,277,203 | |
Verizon Communications Incorporated | | | 4.15 | | | | 3-15-2024 | | | | 2,074,000 | | | | 2,095,402 | |
Verizon Communications Incorporated | | | 4.27 | | | | 1-15-2036 | | | | 1,988,000 | | | | 1,823,957 | |
Verizon Communications Incorporated | | | 4.33 | | | | 9-21-2028 | | | | 5,618,000 | | | | 5,583,779 | |
Verizon Communications Incorporated | | | 4.40 | | | | 11-1-2034 | | | | 4,503,000 | | | | 4,272,178 | |
Verizon Communications Incorporated | | | 4.67 | | | | 3-15-2055 | | | | 1,054,000 | | | | 948,197 | |
Verizon Communications Incorporated | | | 5.50 | | | | 3-16-2047 | | | | 3,068,000 | | | | 3,204,281 | |
| | | | |
| | | | | | | | | | | | | | | 44,020,674 | |
| | | | | | | | | | | | | | | | |
|
| Media: 1.26% | |
21st Century Fox America Incorporated | | | 4.95 | | | | 10-15-2045 | | | | 2,048,000 | | | | 2,170,464 | |
Charter Communications Operating LLC | | | 4.46 | | | | 7-23-2022 | | | | 2,031,000 | | | | 2,034,246 | |
Charter Communications Operating LLC | | | 5.38 | | | | 5-1-2047 | | | | 1,409,000 | | | | 1,257,243 | |
Charter Communications Operating LLC | | | 5.38 | | | | 4-1-2038 | | | | 1,812,000 | | | | 1,651,972 | |
Charter Communications Operating LLC | | | 5.75 | | | | 4-1-2048 | | | | 5,419,000 | | | | 5,051,479 | |
Comcast Corporation | | | 3.30 | | | | 10-1-2020 | | | | 11,789,000 | | | | 11,788,219 | |
Comcast Corporation | | | 3.45 | | | | 10-1-2021 | | | | 9,472,000 | | | | 9,482,687 | |
Comcast Corporation | | | 3.70 | | | | 4-15-2024 | | | | 8,211,000 | | | | 8,185,385 | |
Comcast Corporation | | | 3.95 | | | | 10-15-2025 | | | | 5,791,000 | | | | 5,770,810 | |
Comcast Corporation | | | 4.00 | | | | 3-1-2048 | | | | 3,155,000 | | | | 2,774,972 | |
Comcast Corporation | | | 4.15 | | | | 10-15-2028 | | | | 4,736,000 | | | | 4,696,248 | |
Comcast Corporation | | | 4.60 | | | | 10-15-2038 | | | | 4,416,000 | | | | 4,325,208 | |
Comcast Corporation | | | 4.95 | | | | 10-15-2058 | | | | 4,641,000 | | | | 4,558,159 | |
Time Warner Cable Incorporated | | | 3.80 | | | | 2-15-2027 | | | | 1,685,000 | | | | 1,570,234 | |
Time Warner Cable Incorporated | | | 6.55 | | | | 5-1-2037 | | | | 1,469,000 | | | | 1,490,939 | |
Walt Disney Company « | | | 4.13 | | | | 6-1-2044 | | | | 1,054,000 | | | | 1,021,802 | |
Warner Media LLC | | | 5.35 | | | | 12-15-2043 | | | | 1,037,000 | | | | 972,752 | |
Warner Media LLC | | | 5.38 | | | | 10-15-2041 | | | | 1,659,000 | | | | 1,576,416 | |
| | | | |
| | | | | | | | | | | | | | | 70,379,235 | |
| | | | | | | | | | | | | | | | |
|
Consumer Discretionary: 0.74% | |
|
| Automobiles: 0.31% | |
General Motors Company | | | 5.00 | | | | 10-1-2028 | | | | 1,054,000 | | | | 989,044 | |
General Motors Company | | | 5.95 | | | | 4-1-2049 | | | | 6,554,000 | | | | 5,913,362 | |
Volkswagen Group America Company 144A | | | 4.75 | | | | 11-13-2028 | | | | 10,905,000 | | | | 10,413,486 | |
| | | | |
| | | | | | | | | | | | | | | 17,315,892 | |
| | | | | | | | | | | | | | | | |
|
| Hotels, Restaurants & Leisure: 0.36% | |
GLP Capital LP / GLP FInancing II Incorporated | | | 5.30 | | | | 1-15-2029 | | | | 4,148,000 | | | | 4,002,820 | |
Starbucks Corporation | | | 3.80 | | | | 8-15-2025 | | | | 11,443,000 | | | | 11,257,448 | |
Starbucks Corporation | | | 4.00 | | | | 11-15-2028 | | | | 4,827,000 | | | | 4,732,645 | |
| | | | |
| | | | | | | | | | | | | | | 19,992,913 | |
| | | | | | | | | | | | | | | | |
|
| Internet & Direct Marketing Retail: 0.07% | |
Amazon.com Incorporated | | | 2.80 | | | | 8-22-2024 | | | | 3,929,000 | | | | 3,757,591 | |
| | | | | | | | | | | | | | | | |
The accompanying notes are an integral part of these financial statements.
| | | | |
| 32 | | Wells Fargo Core Bond Portfolio | | Portfolio of investments—November 30, 2018 (unaudited) |
| | | | | | | | | | | | | | | | |
| Security name | | Interest rate | | | Maturity date | | | Principal | | | Value | |
|
Consumer Staples: 2.22% | |
|
| Beverages: 0.59% | |
Anheuser Busch InBev Worldwide Incorporated | | | 3.50 | % | | | 1-12-2024 | | | $ | 7,297,000 | | | $ | 7,037,406 | |
Constellation Brands Incorporated | | | 3.20 | | | | 2-15-2023 | | | | 7,372,000 | | | | 7,127,476 | |
Constellation Brands Incorporated | | | 3.60 | | | | 2-15-2028 | | | | 5,972,000 | | | | 5,501,859 | |
Constellation Brands Incorporated | | | 3.70 | | | | 12-6-2026 | | | | 1,685,000 | | | | 1,583,316 | |
Constellation Brands Incorporated | | | 4.40 | | | | 11-15-2025 | | | | 2,429,000 | | | | 2,419,836 | |
Constellation Brands Incorporated | | | 4.50 | | | | 5-9-2047 | | | | 907,000 | | | | 804,425 | |
Constellation Brands Incorporated | | | 4.65 | | | | 11-15-2028 | | | | 5,704,000 | | | | 5,700,376 | |
Constellation Brands Incorporated | | | 5.25 | | | | 11-15-2048 | | | | 2,532,000 | | | | 2,517,989 | |
| | | | |
| | | | | | | | | | | | | | | 32,692,683 | |
| | | | | | | | | | | | | | | | |
|
| Food & Staples Retailing: 0.60% | |
Costco Wholesale Corporation | | | 2.75 | | | | 5-18-2024 | | | | 4,563,000 | | | | 4,410,623 | |
Costco Wholesale Corporation | | | 3.00 | | | | 5-18-2027 | | | | 7,113,000 | | | | 6,724,122 | |
CVS Caremark Corporation | | | 4.00 | | | | 12-5-2023 | | | | 3,129,000 | | | | 3,106,218 | |
Walmart Incorporated | | | 3.40 | | | | 6-26-2023 | | | | 5,600,000 | | | | 5,589,521 | |
Walmart Incorporated | | | 3.70 | | | | 6-26-2028 | | | | 13,028,000 | | | | 12,896,751 | |
Walmart Incorporated | | | 4.05 | | | | 6-29-2048 | | | | 1,059,000 | | | | 1,017,195 | |
| | | | |
| | | | | | | | | | | | | | | 33,744,430 | |
| | | | | | | | | | | | | | | | |
|
| Food Products: 0.71% | |
Kraft Heinz Foods Company | | | 2.80 | | | | 7-2-2020 | | | | 6,292,000 | | | | 6,214,129 | |
Kraft Heinz Foods Company | | | 4.38 | | | | 6-1-2046 | | | | 3,340,000 | | | | 2,715,704 | |
Nestle Holdings Incorporated 144A | | | 3.10 | | | | 9-24-2021 | | | | 6,978,000 | | | | 6,968,867 | |
Nestle Holdings Incorporated 144A | | | 3.35 | | | | 9-24-2023 | | | | 8,492,000 | | | | 8,434,565 | |
Nestle Holdings Incorporated 144A | | | 3.50 | | | | 9-24-2025 | | | | 3,399,000 | | | | 3,372,203 | |
Nestle Holdings Incorporated 144A | | | 3.63 | | | | 9-24-2028 | | | | 6,638,000 | | | | 6,550,863 | |
Nestle Holdings Incorporated 144A | | | 3.90 | | | | 9-24-2038 | | | | 2,404,000 | | | | 2,292,366 | |
Nestle Holdings Incorporated 144A | | | 4.00 | | | | 9-24-2048 | | | | 3,104,000 | | | | 2,932,588 | |
| | | | |
| | | | | | | | | | | | | | | 39,481,285 | |
| | | | | | | | | | | | | | | | |
|
| Household Products: 0.08% | |
Church & Dwight Company Incorporated | | | 2.45 | | | | 8-1-2022 | | | | 1,599,000 | | | | 1,525,175 | |
Church & Dwight Company Incorporated | | | 3.15 | | | | 8-1-2027 | | | | 2,636,000 | | | | 2,428,381 | |
Church & Dwight Company Incorporated | | | 3.95 | | | | 8-1-2047 | | | | 786,000 | | | | 685,196 | |
| | | | |
| | | | | | | | | | | | | | | 4,638,752 | |
| | | | | | | | | | | | | | | | |
|
| Tobacco: 0.24% | |
Bat Capital Corporation | | | 2.30 | | | | 8-14-2020 | | | | 3,189,000 | | | | 3,102,255 | |
Bat Capital Corporation | | | 2.76 | | | | 8-15-2022 | | | | 1,904,000 | | | | 1,803,392 | |
Bat Capital Corporation | | | 3.56 | | | | 8-15-2027 | | | | 2,022,000 | | | | 1,801,221 | |
Bat Capital Corporation | | | 4.54 | | | | 8-15-2047 | | | | 3,211,000 | | | | 2,607,710 | |
Reynolds American Incorporated | | | 5.85 | | | | 8-15-2045 | | | | 4,053,000 | | | | 3,921,175 | |
| | | | |
| | | | | | | | | | | | | | | 13,235,753 | |
| | | | | | | | | | | | | | | | |
|
Energy: 2.14% | |
|
| Electric Utilities: 0.04% | |
Emera US Finance LP | | | 4.75 | | | | 6-15-2046 | | | | 2,558,000 | | | | 2,386,665 | |
| | | | | | | | | | | | | | | | |
The accompanying notes are an integral part of these financial statements.
| | | | | | |
| Portfolio of investments—November 30, 2018 (unaudited) | | Wells Fargo Core Bond Portfolio | | | 33 | |
| | | | | | | | | | | | | | | | |
| Security name | | Interest rate | | | Maturity date | | | Principal | | | Value | |
|
| Energy Equipment & Services: 0.10% | |
Schlumberger Holdings Corporation 144A | | | 4.00 | % | | | 12-21-2025 | | | $ | 5,722,000 | | | $ | 5,610,520 | |
| | | | | | | | | | | | | | | | |
|
| Oil, Gas & Consumable Fuels: 2.00% | |
Anadarko Petroleum Corporation | | | 3.45 | | | | 7-15-2024 | | | | 3,414,000 | | | | 3,254,574 | |
Anadarko Petroleum Corporation | | | 4.85 | | | | 3-15-2021 | | | | 2,359,000 | | | | 2,407,796 | |
Andeavor Logistics LP | | | 3.50 | | | | 12-1-2022 | | | | 2,403,000 | | | | 2,322,197 | |
BP Capital Markets America Incorporated | | | 3.80 | | | | 9-21-2025 | | | | 6,309,000 | | | | 6,244,657 | |
BP Capital Markets America Incorporated | | | 3.94 | | | | 9-21-2028 | | | | 15,521,000 | | | | 15,264,907 | |
Cimarex Energy Company | | | 4.38 | | | | 6-1-2024 | | | | 7,243,000 | | | | 7,077,000 | |
Dominion Gas Holdings LLC | | | 4.80 | | | | 11-1-2043 | | | | 294,000 | | | | 286,978 | |
Enbridge Energy Partners LP | | | 7.38 | | | | 10-15-2045 | | | | 1,167,000 | | | | 1,426,796 | |
Energy Transfer Partners LP | | | 5.50 | | | | 6-1-2027 | | | | 4,926,000 | | | | 4,913,685 | |
Energy Transfer Partners LP | | | 6.00 | | | | 6-15-2048 | | | | 2,947,000 | | | | 2,837,594 | |
Energy Transfer Partners LP | | | 6.13 | | | | 12-15-2045 | | | | 3,587,000 | | | | 3,442,741 | |
Energy Transfer Partners LP | | | 6.50 | | | | 2-1-2042 | | | | 1,132,000 | | | | 1,141,099 | |
Enterprise Products Operating LLC | | | 3.50 | | | | 2-1-2022 | | | | 6,949,000 | | | | 6,898,838 | |
Enterprise Products Operating LLC | | | 4.15 | | | | 10-16-2028 | | | | 4,632,000 | | | | 4,520,814 | |
Hess Corporation | | | 5.60 | | | | 2-15-2041 | | | | 838,000 | | | | 742,909 | |
Hess Corporation | | | 5.80 | | | | 4-1-2047 | | | | 2,904,000 | | | | 2,598,739 | |
HollyFrontier Corporation | | | 5.88 | | | | 4-1-2026 | | | | 2,731,000 | | | | 2,799,578 | |
Kinder Morgan Energy Partners LP | | | 4.25 | | | | 9-1-2024 | | | | 1,599,000 | | | | 1,578,609 | |
Kinder Morgan Incorporated 144A | | | 5.00 | | | | 2-15-2021 | | | | 6,413,000 | | | | 6,532,389 | |
Kinder Morgan Incorporated | | | 5.55 | | | | 6-1-2045 | | | | 2,532,000 | | | | 2,472,194 | |
Marathon Petroleum Corporation | | | 4.75 | | | | 9-15-2044 | | | | 2,273,000 | | | | 2,023,236 | |
MPLX LP | | | 4.13 | | | | 3-1-2027 | | | | 2,069,000 | | | | 1,943,536 | |
MPLX LP | | | 4.70 | | | | 4-15-2048 | | | | 968,000 | | | | 826,244 | |
MPLX LP | | | 4.80 | | | | 2-15-2029 | | | | 1,136,000 | | | | 1,117,857 | |
MPLX LP | | | 5.20 | | | | 3-1-2047 | | | | 2,074,000 | | | | 1,870,743 | |
MPLX LP | | | 5.50 | | | | 2-15-2049 | | | | 2,778,000 | | | | 2,654,318 | |
Newfield Exploration Company | | | 5.63 | | | | 7-1-2024 | | | | 7,844,000 | | | | 8,020,490 | |
Newfield Exploration Company | | | 5.75 | | | | 1-30-2022 | | | | 1,435,000 | | | | 1,463,700 | |
Northwest Pipeline LLC 144A | | | 4.00 | | | | 4-1-2027 | | | | 5,505,000 | | | | 5,284,716 | |
Western Gas Partners LP | | | 5.50 | | | | 8-15-2048 | | | | 296,000 | | | | 262,643 | |
Williams Companies Incorporated | | | 4.55 | | | | 6-24-2024 | | | | 2,576,000 | | | | 2,579,114 | |
Williams Companies Incorporated | | | 5.40 | | | | 3-4-2044 | | | | 2,092,000 | | | | 1,969,024 | |
Williams Companies Incorporated | | | 5.75 | | | | 6-24-2044 | | | | 2,740,000 | | | | 2,696,149 | |
| | | | |
| | | | | | | | | | | | | | | 111,475,864 | |
| | | | | | | | | | | | | | | | |
|
Financials: 3.63% | |
|
| Banks: 2.20% | |
Bank of America Corporation | | | 3.25 | | | | 10-21-2027 | | | | 4,969,000 | | | | 4,566,890 | |
Bank of America Corporation | | | 3.30 | | | | 1-11-2023 | | | | 5,782,000 | | | | 5,638,540 | |
Bank of America Corporation (3 Month LIBOR +1.37%) ± | | | 3.59 | | | | 7-21-2028 | | | | 2,022,000 | | | | 1,905,361 | |
Bank of America Corporation (3 Month LIBOR +1.51%) ± | | | 3.71 | | | | 4-24-2028 | | | | 7,713,000 | | | | 7,282,448 | |
Bank of America Corporation (3 Month LIBOR +0.94%) ± | | | 3.86 | | | | 7-23-2024 | | | | 18,677,000 | | | | 18,497,565 | |
Bank of America Corporation | | | 4.00 | | | | 4-1-2024 | | | | 5,237,000 | | | | 5,219,675 | |
Bank of America Corporation (3 Month LIBOR +1.81%) ± | | | 4.24 | | | | 4-24-2038 | | | | 312,000 | | | | 291,221 | |
Bank of America Corporation | | | 4.45 | | | | 3-3-2026 | | | | 3,258,000 | | | | 3,200,185 | |
Capital One NA | | | 2.65 | | | | 8-8-2022 | | | | 3,432,000 | | | | 3,275,500 | |
The accompanying notes are an integral part of these financial statements.
| | | | |
| 34 | | Wells Fargo Core Bond Portfolio | | Portfolio of investments—November 30, 2018 (unaudited) |
| | | | | | | | | | | | | | | | |
| Security name | | Interest rate | | | Maturity date | | | Principal | | | Value | |
|
| Banks(continued) | |
Citigroup Incorporated | | | 3.20 | % | | | 10-21-2026 | | | $ | 6,767,000 | | | $ | 6,182,287 | |
Citigroup Incorporated (3 Month LIBOR +1.39%) ± | | | 3.67 | | | | 7-24-2028 | | | | 2,277,000 | | | | 2,132,114 | |
Citigroup Incorporated (3 Month LIBOR +1.02%) ± | | | 4.04 | | | | 6-1-2024 | | | | 7,415,000 | | | | 7,366,715 | |
Citigroup Incorporated (3 Month LIBOR +1.19%) ± | | | 4.08 | | | | 4-23-2029 | | | | 2,040,000 | | | | 1,960,250 | |
Citigroup Incorporated | | | 4.45 | | | | 9-29-2027 | | | | 8,608,000 | | | | 8,313,918 | |
Comerica Incorporated | | | 3.70 | | | | 7-31-2023 | | | | 9,639,000 | | | | 9,551,434 | |
JPMorgan Chase & Company (3 Month LIBOR +0.61%) ± | | | 3.51 | | | | 6-18-2022 | | | | 2,109,000 | | | | 2,100,989 | |
JPMorgan Chase & Company (3 Month LIBOR +1.36%) ± | | | 3.88 | | | | 7-24-2038 | | | | 5,353,000 | | | | 4,773,124 | |
JPMorgan Chase & Company (3 Month LIBOR +1.00%) ±%% | | | 4.02 | | | | 12-5-2024 | | | | 6,215,000 | | | | 6,200,657 | |
JPMorgan Chase & Company (3 Month LIBOR +1.58%) ± | | | 4.26 | | | | 2-22-2048 | | | | 2,152,000 | | | | 1,959,316 | |
JPMorgan Chase & Company (3 Month LIBOR +1.33%) ±%% | | | 4.45 | | | | 12-5-2029 | | | | 4,147,000 | | | | 4,149,443 | |
KeyCorp | | | 4.15 | | | | 10-29-2025 | | | | 2,141,000 | | | | 2,147,867 | |
PNC Bank | | | 4.05 | | | | 7-26-2028 | | | | 2,040,000 | | | | 2,009,973 | |
Santander Holdings USA %% | | | 4.45 | | | | 12-3-2021 | | | | 13,639,000 | | | | 13,664,049 | |
| | | | |
| | | | | | | | | | | | | | | 122,389,521 | |
| | | | | | | | | | | | | | | | |
|
| Capital Markets: 0.52% | |
Goldman Sachs Group Incorporated | | | 3.50 | | | | 11-16-2026 | | | | 2,982,000 | | | | 2,748,229 | |
Goldman Sachs Group Incorporated (3 Month LIBOR +1.37%) ± | | | 4.02 | | | | 10-31-2038 | | | | 2,083,000 | | | | 1,820,877 | |
Goldman Sachs Group Incorporated (3 Month LIBOR +1.30%) ± | | | 4.22 | | | | 5-1-2029 | | | | 6,180,000 | | | | 5,910,307 | |
Goldman Sachs Group Incorporated (3 Month LIBOR +1.43%) ± | | | 4.41 | | | | 4-23-2039 | | | | 5,661,000 | | | | 5,199,686 | |
Lazard Group LLC | | | 4.50 | | | | 9-19-2028 | | | | 5,013,000 | | | | 4,893,796 | |
Morgan Stanley | | | 2.63 | | | | 11-17-2021 | | | | 5,730,000 | | | | 5,539,865 | |
Morgan Stanley | | | 2.75 | | | | 5-19-2022 | | | | 24,000 | | | | 23,119 | |
PPL Capital Funding Incorporated | | | 3.10 | | | | 5-15-2026 | | | | 3,111,000 | | | | 2,874,968 | |
| | | | |
| | | | | | | | | | | | | | | 29,010,847 | |
| | | | | | | | | | | | | | | | |
|
| Consumer Finance: 0.32% | |
Capital One Financial Corporation | | | 2.40 | | | | 10-30-2020 | | | | 3,870,000 | | | | 3,779,052 | |
Capital One Financial Corporation | | | 3.20 | | | | 1-30-2023 | | | | 2,930,000 | | | | 2,831,198 | |
Capital One Financial Corporation | | | 4.25 | | | | 4-30-2025 | | | | 4,874,000 | | | | 4,800,925 | |
ERAC USA Finance LLC 144A | | | 4.50 | | | | 2-15-2045 | | | | 382,000 | | | | 349,685 | |
Ford Motor Credit Company LLC « | | | 3.82 | | | | 11-2-2027 | | | | 1,034,000 | | | | 871,736 | |
Ford Motor Credit Company LLC | | | 4.14 | | | | 2-15-2023 | | | | 1,178,000 | | | | 1,116,467 | |
Ford Motor Credit Company LLC | | | 5.29 | | | | 12-8-2046 | | | | 2,828,000 | | | | 2,274,374 | |
General Motors Financial Company Incorporated | | | 5.15 | | | | 4-1-2038 | | | | 1,996,000 | | | | 1,699,229 | |
| | | | |
| | | | | | | | | | | | | | | 17,722,666 | |
| | | | | | | | | | | | | | | | |
|
| Diversified Financial Services: 0.12% | |
Voya Financial Incorporated | | | 3.13 | | | | 7-15-2024 | | | | 6,050,000 | | | | 5,695,738 | |
Voya Financial Incorporated | | | 4.80 | | | | 6-15-2046 | | | | 994,000 | | | | 930,989 | |
| | | | |
| | | | | | | | | | | | | | | 6,626,727 | |
| | | | | | | | | | | | | | | | |
|
| Insurance: 0.47% | |
American International Group Incorporated | | | 4.20 | | | | 4-1-2028 | | | | 3,224,000 | | | | 3,075,168 | |
American International Group Incorporated | | | 4.38 | | | | 1-15-2055 | | | | 1,616,000 | | | | 1,309,689 | |
American International Group Incorporated | | | 6.25 | | | | 5-1-2036 | | | | 1,546,000 | | | | 1,645,520 | |
The accompanying notes are an integral part of these financial statements.
| | | | | | |
| Portfolio of investments—November 30, 2018 (unaudited) | | Wells Fargo Core Bond Portfolio | | | 35 | |
| | | | | | | | | | | | | | | | |
| Security name | | Interest rate | | | Maturity date | | | Principal | | | Value | |
|
| Insurance(continued) | |
Brighthouse Financial | | | 3.70 | % | | | 6-22-2027 | | | $ | 2,161,000 | | | $ | 1,840,544 | |
Liberty Mutual Group Incorporated 144A | | | 4.25 | | | | 6-15-2023 | | | | 2,092,000 | | | | 2,107,013 | |
MetLife Incorporated | | | 4.60 | | | | 5-13-2046 | | | | 2,593,000 | | | | 2,546,407 | |
Prudential Financial Incorporated | | | 4.60 | | | | 5-15-2044 | | | | 1,037,000 | | | | 996,938 | |
Torchmark Corporation | | | 4.55 | | | | 9-15-2028 | | | | 6,309,000 | | | | 6,309,725 | |
Willis North America Incorporated | | | 4.50 | | | | 9-15-2028 | | | | 6,534,000 | | | | 6,406,828 | |
| | | | |
| | | | | | | | | | | | | | | 26,237,832 | |
| | | | | | | | | | | | | | | | |
|
Health Care: 2.60% | |
|
| Biotechnology: 0.72% | |
AbbVie Incorporated | | | 2.50 | | | | 5-14-2020 | | | | 7,994,000 | | | | 7,876,377 | |
AbbVie Incorporated | | | 3.75 | | | | 11-14-2023 | | | | 4,581,000 | | | | 4,508,057 | |
AbbVie Incorporated | | | 4.25 | | | | 11-14-2028 | | | | 9,896,000 | | | | 9,488,667 | |
AbbVie Incorporated | | | 4.88 | | | | 11-14-2048 | | | | 4,849,000 | | | | 4,421,176 | |
Celgene Corporation | | | 2.75 | | | | 2-15-2023 | | | | 7,485,000 | | | | 7,101,078 | |
Celgene Corporation | | | 2.88 | | | | 2-19-2021 | | | | 2,074,000 | | | | 2,035,950 | |
Celgene Corporation | | | 4.35 | | | | 11-15-2047 | | | | 1,305,000 | | | | 1,091,651 | |
Celgene Corporation | | | 4.55 | | | | 2-20-2048 | | | | 4,352,000 | | | | 3,773,277 | |
| | | | |
| | | | | | | | | | | | | | | 40,296,233 | |
| | | | | | | | | | | | | | | | |
|
| Health Care Equipment & Supplies: 0.65% | |
Abbott Laboratories | | | 3.75 | | | | 11-30-2026 | | | | 3,811,000 | | | | 3,727,833 | |
Abbott Laboratories | | | 4.90 | | | | 11-30-2046 | | | | 3,112,000 | | | | 3,214,403 | |
Becton Dickinson & Company | | | 2.40 | | | | 6-5-2020 | | | | 7,001,000 | | | | 6,871,420 | |
Becton Dickinson & Company | | | 3.70 | | | | 6-6-2027 | | | | 3,463,000 | | | | 3,228,414 | |
Becton Dickinson & Company | | | 3.73 | | | | 12-15-2024 | | | | 5,575,000 | | | | 5,382,717 | |
Becton Dickinson & Company | | | 4.67 | | | | 6-6-2047 | | | | 1,438,000 | | | | 1,336,718 | |
Becton Dickinson & Company | | | 4.69 | | | | 12-15-2044 | | | | 5,073,000 | | | | 4,658,450 | |
Boston Scientific Corporation | | | 4.00 | | | | 3-1-2028 | | | | 1,043,000 | | | | 994,254 | |
Edwards Lifesciences Corporation | | | 4.30 | | | | 6-15-2028 | | | | 6,892,000 | | | | 6,867,050 | |
| | | | |
| | | | | | | | | | | | | | | 36,281,259 | |
| | | | | | | | | | | | | | | | |
|
| Health Care Providers & Services: 1.02% | |
Anthem Incorporated | | | 2.95 | | | | 12-1-2022 | | | | 2,316,000 | | | | 2,234,431 | |
CVS Health Corporation | | | 3.70 | | | | 3-9-2023 | | | | 10,518,000 | | | | 10,350,577 | |
CVS Health Corporation | | | 4.30 | | | | 3-25-2028 | | | | 12,579,000 | | | | 12,252,908 | |
CVS Health Corporation | | | 4.78 | | | | 3-25-2038 | | | | 6,404,000 | | | | 6,118,765 | |
CVS Health Corporation | | | 5.05 | | | | 3-25-2048 | | | | 4,321,000 | | | | 4,185,661 | |
Halfmoon Parent Incorporated 144A | | | 4.90 | | | | 12-15-2048 | | | | 3,917,000 | | | | 3,740,345 | |
Halfmoon Parent Incorporated 144A | | | 3.40 | | | | 9-17-2021 | | | | 4,728,000 | | | | 4,687,505 | |
Halfmoon Parent Incorporated 144A | | | 3.75 | | | | 7-15-2023 | | | | 7,959,000 | | | | 7,852,084 | |
Halfmoon Parent Incorporated 144A | | | 4.38 | | | | 10-15-2028 | | | | 4,876,000 | | | | 4,787,935 | |
Halfmoon Parent Incorporated 144A | | | 4.80 | | | | 8-15-2038 | | | | 458,000 | | | | 443,356 | |
| | | | |
| | | | | | | | | | | | | | | 56,653,567 | |
| | | | | | | | | | | | | | | | |
|
| Pharmaceuticals: 0.21% | |
GlaxoSmithKline Capital Incorporated | | | 3.38 | | | | 5-15-2023 | | | | 10,345,000 | | | | 10,240,001 | |
Pfizer Incorporated | | | 4.20 | | | | 9-15-2048 | | | | 1,673,000 | | | | 1,631,600 | |
| | | | |
| | | | | | | | | | | | | | | 11,871,601 | |
| | | | | | | | | | | | | | | | |
The accompanying notes are an integral part of these financial statements.
| | | | |
| 36 | | Wells Fargo Core Bond Portfolio | | Portfolio of investments—November 30, 2018 (unaudited) |
| | | | | | | | | | | | | | | | |
| Security name | | Interest rate | | | Maturity date | | | Principal | | | Value | |
|
Industrials: 1.70% | |
|
| Aerospace & Defense: 0.80% | |
Northrop Grumman Corporation | | | 2.08 | % | | | 10-15-2020 | | | $ | 4,840,000 | | | $ | 4,728,519 | |
Northrop Grumman Corporation | | | 2.55 | | | | 10-15-2022 | | | | 6,793,000 | | | | 6,492,869 | |
Northrop Grumman Corporation | | | 2.93 | | | | 1-15-2025 | | | | 302,000 | | | | 285,033 | |
Northrop Grumman Corporation | | | 3.25 | | | | 8-1-2023 | | | | 6,266,000 | | | | 6,105,420 | |
Northrop Grumman Corporation | | | 3.25 | | | | 1-15-2028 | | | | 2,878,000 | | | | 2,676,638 | |
Northrop Grumman Corporation | | | 4.03 | | | | 10-15-2047 | | | | 1,971,000 | | | | 1,764,124 | |
The Boeing Company | | | 3.55 | | | | 3-1-2038 | | | | 888,000 | | | | 815,584 | |
United Technologies Corporation | | | 3.65 | | | | 8-16-2023 | | | | 8,046,000 | | | | 7,930,277 | |
United Technologies Corporation | | | 4.13 | | | | 11-16-2028 | | | | 8,159,000 | | | | 8,013,560 | |
United Technologies Corporation | | | 4.45 | | | | 11-16-2038 | | | | 3,882,000 | | | | 3,748,997 | |
United Technologies Corporation | | | 4.63 | | | | 11-16-2048 | | | | 2,326,000 | | | | 2,230,262 | |
| | | | |
| | | | | | | | | | | | | | | 44,791,283 | |
| | | | | | | | | | | | | | | | |
|
| Air Freight & Logistics: 0.14% | |
FedEx Corporation | | | 4.40 | | | | 1-15-2047 | | | | 1,253,000 | | | | 1,112,133 | |
FedEx Corporation | | | 4.55 | | | | 4-1-2046 | | | | 3,371,000 | | | | 3,067,078 | |
FedEx Corporation | | | 4.95 | | | | 10-17-2048 | | | | 3,932,000 | | | | 3,824,859 | |
| | | | |
| | | | | | | | | | | | | | | 8,004,070 | |
| | | | | | | | | | | | | | | | |
|
| Airlines: 0.09% | |
Delta Air Lines Incorporated | | | 3.80 | | | | 4-19-2023 | | | | 3,785,000 | | | | 3,696,249 | |
Delta Air Lines Incorporated | | | 4.38 | | | | 4-19-2028 | | | | 1,428,000 | | | | 1,363,500 | |
| | | | |
| | | | | | | | | | | | | | | 5,059,749 | |
| | | | | | | | | | | | | | | | |
|
| Construction & Engineering: 0.06% | |
Valmont Industries Incorporated | | | 5.00 | | | | 10-1-2044 | | | | 2,031,000 | | | | 1,776,017 | |
Valmont Industries Incorporated | | | 5.25 | | | | 10-1-2054 | | | | 2,014,000 | | | | 1,750,961 | |
| | | | |
| | | | | | | | | | | | | | | 3,526,978 | |
| | | | | | | | | | | | | | | | |
|
| Industrial Conglomerates: 0.04% | |
General Electric Capital Corporation | | | 5.88 | | | | 1-14-2038 | | | | 2,564,000 | | | | 2,382,044 | |
| | | | | | | | | | | | | | | | |
|
| Machinery: 0.14% | |
Wabtec Corporation | | | 4.15 | | | | 3-15-2024 | | | | 3,457,000 | | | | 3,337,469 | |
Wabtec Corporation | | | 4.70 | | | | 9-15-2028 | | | | 4,581,000 | | | | 4,336,564 | |
| | | | |
| | | | | | | | | | | | | | | 7,674,033 | |
| | | | | | | | | | | | | | | | |
|
| Road & Rail: 0.14% | |
Burlington Northern Santa Fe LLC | | | 4.05 | | | | 6-15-2048 | | | | 3,155,000 | | | | 2,906,037 | |
CSX Corporation | | | 4.25 | | | | 3-15-2029 | | | | 2,107,000 | | | | 2,107,356 | |
CSX Corporation | | | 4.75 | | | | 11-15-2048 | | | | 2,530,000 | | | | 2,494,797 | |
| | | | |
| | | | | | | | | | | | | | | 7,508,190 | |
| | | | | | | | | | | | | | | | |
|
| Trading Companies & Distributors: 0.23% | |
Air Lease Corporation | | | 3.50 | | | | 1-15-2022 | | | | 2,669,000 | | | | 2,624,089 | |
Air Lease Corporation | | | 3.63 | | | | 4-1-2027 | | | | 5,618,000 | | | | 5,023,645 | |
Air Lease Corporation | | | 3.63 | | | | 12-1-2027 | | | | 5,488,000 | | | | 4,780,970 | |
The accompanying notes are an integral part of these financial statements.
| | | | | | |
| Portfolio of investments—November 30, 2018 (unaudited) | | Wells Fargo Core Bond Portfolio | | | 37 | |
| | | | | | | | | | | | | | | | |
| Security name | | Interest rate | | | Maturity date | | | Principal | | | Value | |
|
| Trading Companies & Distributors(continued) | |
Air Lease Corporation | | | 4.63 | % | | | 10-1-2028 | | | $ | 305,000 | | | $ | 292,629 | |
| | | | |
| | | | | | | | | | | | | | | 12,721,333 | |
| | | | | | | | | | | | | | | | |
|
| Transportation Infrastructure: 0.06% | |
Crowley Conro LLC | | | 4.18 | | | | 8-15-2043 | | | | 2,968,000 | | | | 2,994,212 | |
| | | | | | | | | | | | | | | | |
|
Information Technology: 1.15% | |
|
| IT Services: 0.17% | |
Fiserv Incorporated | | | 3.80 | | | | 10-1-2023 | | | | 3,469,000 | | | | 3,463,763 | |
Fiserv Incorporated | | | 4.20 | | | | 10-1-2028 | | | | 5,929,000 | | | | 5,861,587 | |
| | | | |
| | | | | | | | | | | | | | | 9,325,350 | |
| | | | | | | | | | | | | | | | |
|
| Software: 0.48% | |
Microsoft Corporation | | | 2.00 | | | | 8-8-2023 | | | | 5,229,000 | | | | 4,917,903 | |
Microsoft Corporation | | | 3.30 | | | | 2-6-2027 | | | | 4,170,000 | | | | 4,059,110 | |
Microsoft Corporation | | | 4.00 | | | | 2-12-2055 | | | | 1,661,000 | | | | 1,565,024 | |
Microsoft Corporation | | | 4.10 | | | | 2-6-2037 | | | | 3,448,000 | | | | 3,457,313 | |
Microsoft Corporation | | | 4.25 | | | | 2-6-2047 | | | | 4,676,000 | | | | 4,730,246 | |
Microsoft Corporation | | | 4.50 | | | | 2-6-2057 | | | | 2,504,000 | | | | 2,575,157 | |
Oracle Corporation | | | 2.63 | | | | 2-15-2023 | | | | 2,843,000 | | | | 2,745,203 | |
Oracle Corporation | | | 2.95 | | | | 11-15-2024 | | | | 1,521,000 | | | | 1,454,824 | |
Oracle Corporation | | | 3.80 | | | | 11-15-2037 | | | | 1,556,000 | | | | 1,425,358 | |
| | | | |
| | | | | | | | | | | | | | | 26,930,138 | |
| | | | | | | | | | | | | | | | |
|
| Technology Hardware, Storage & Peripherals: 0.50% | |
Apple Incorporated | | | 2.85 | | | | 5-11-2024 | | | | 3,941,000 | | | | 3,797,526 | |
Apple Incorporated | | | 3.20 | | | | 5-13-2025 | | | | 1,269,000 | | | | 1,228,362 | |
Apple Incorporated | | | 3.20 | | | | 5-11-2027 | | | | 10,924,000 | | | | 10,390,300 | |
Apple Incorporated | | | 3.75 | | | | 11-13-2047 | | | | 735,000 | | | | 656,493 | |
Apple Incorporated | | | 4.25 | | | | 2-9-2047 | | | | 4,123,000 | | | | 4,007,018 | |
Apple Incorporated | | | 4.38 | | | | 5-13-2045 | | | | 1,945,000 | | | | 1,923,134 | |
Apple Incorporated | | | 4.50 | | | | 2-23-2036 | | | | 2,082,000 | | | | 2,156,158 | |
Hewlett Packard Enterprise Company | | | 6.35 | | | | 10-15-2045 | | | | 4,174,000 | | | | 3,870,387 | |
| | | | |
| | | | | | | | | | | | | | | 28,029,378 | |
| | | | | | | | | | | | | | | | |
|
Materials: 0.82% | |
|
| Chemicals: 0.39% | |
CF Industries Incorporated 144A | | | 3.40 | | | | 12-1-2021 | | | | 6,370,000 | | | | 6,260,969 | |
CF Industries Incorporated 144A | | | 4.50 | | | | 12-1-2026 | | | | 4,287,000 | | | | 4,204,300 | |
Dow Chemical Company 144A | | | 4.80 | | | | 11-30-2028 | | | | 2,729,000 | | | | 2,736,272 | |
Dow Chemical Company 144A | | | 5.55 | | | | 11-30-2048 | | | | 1,658,000 | | | | 1,678,096 | |
Eastman Chemical Company | | | 4.65 | | | | 10-15-2044 | | | | 2,377,000 | | | | 2,082,642 | |
The Sherwin-Williams Company | | | 2.75 | | | | 6-1-2022 | | | | 2,967,000 | | | | 2,845,531 | |
Westlake Chemical Corporation | | | 3.60 | | | | 8-15-2026 | | | | 2,107,000 | | | | 1,928,827 | |
| | | | |
| | | | | | | | | | | | | | | 21,736,637 | |
| | | | | | | | | | | | | | | | |
The accompanying notes are an integral part of these financial statements.
| | | | |
| 38 | | Wells Fargo Core Bond Portfolio | | Portfolio of investments—November 30, 2018 (unaudited) |
| | | | | | | | | | | | | | | | |
| Security name | | Interest rate | | | Maturity date | | | Principal | | | Value | |
|
| Construction Materials: 0.01% | |
Vulcan Materials Company | | | 4.50 | % | | | 6-15-2047 | | | $ | 732,000 | | | $ | 597,683 | |
| | | | | | | | | | | | | | | | |
|
| Containers & Packaging: 0.27% | |
Avery Dennison Corporation %% | | | 4.88 | | | | 12-6-2028 | | | | 4,428,000 | | | | 4,414,145 | |
International Paper Company | | | 4.35 | | | | 8-15-2048 | | | | 1,819,000 | | | | 1,513,409 | |
International Paper Company | | | 4.40 | | | | 8-15-2047 | | | | 631,000 | | | | 532,457 | |
International Paper Company | | | 5.15 | | | | 5-15-2046 | | | | 5,471,000 | | | | 5,086,097 | |
Westrock Company 144A | | | 4.00 | | | | 3-15-2028 | | | | 1,905,000 | | | | 1,801,046 | |
Westrock Company 144A%% | | | 4.90 | | | | 3-15-2029 | | | | 1,450,000 | | | | 1,457,822 | |
| | | | |
| | | | | | | | | | | | | | | 14,804,976 | |
| | | | | | | | | | | | | | | | |
|
| Metals & Mining: 0.15% | |
Barrick Gold Finance Company LLC | | | 5.70 | | | | 5-30-2041 | | | | 2,494,000 | | | | 2,596,376 | |
Nucor Corporation | | | 3.95 | | | | 5-1-2028 | | | | 1,357,000 | | | | 1,334,286 | |
Nucor Corporation | | | 4.40 | | | | 5-1-2048 | | | | 1,043,000 | | | | 968,708 | |
Southern Copper Corporation | | | 5.88 | | | | 4-23-2045 | | | | 2,550,000 | | | | 2,518,618 | |
Southern Copper Corporation | | | 7.50 | | | | 7-27-2035 | | | | 995,000 | | | | 1,134,300 | |
| | | | |
| | | | | | | | | | | | | | | 8,552,288 | |
| | | | | | | | | | | | | | | | |
|
Real Estate: 0.93% | |
|
| Equity REITs: 0.93% | |
Boston Properties LP | | | 4.50 | | | | 12-1-2028 | | | | 3,843,000 | | | | 3,845,719 | |
DDR Corporation « | | | 4.25 | | | | 2-1-2026 | | | | 926,000 | | | | 893,543 | |
DDR Corporation | | | 4.63 | | | | 7-15-2022 | | | | 5,834,000 | | | | 5,976,436 | |
ERP Operating LP | |
| 4.15
|
| |
| 12/1/2028
|
| | | 1,592,000 | | | | 1,591,622 | |
Mid-America Apartments LP | | | 3.60 | | | | 6-1-2027 | | | | 2,066,000 | | | | 1,945,440 | |
Mid-America Apartments LP | | | 3.75 | | | | 6-15-2024 | | | | 5,142,000 | | | | 5,017,735 | |
Mid-America Apartments LP | | | 4.00 | | | | 11-15-2025 | | | | 2,636,000 | | | | 2,580,137 | |
Mid-America Apartments LP | | | 4.30 | | | | 10-15-2023 | | | | 2,204,000 | | | | 2,221,937 | |
Public Storage | | | 2.37 | | | | 9-15-2022 | | | | 5,721,000 | | | | 5,491,191 | |
Public Storage | | | 3.09 | | | | 9-15-2027 | | | | 4,537,000 | | | | 4,216,895 | |
Regency Centers LP | | | 3.60 | | | | 2-1-2027 | | | | 2,092,000 | | | | 1,971,033 | |
Regency Centers LP | | | 4.13 | | | | 3-15-2028 | | | | 1,413,000 | | | | 1,367,196 | |
Store Capital Corporation | | | 4.50 | | | | 3-15-2028 | | | | 8,098,000 | | | | 7,847,161 | |
Tanger Properties LP | | | 3.75 | | | | 12-1-2024 | | | | 2,550,000 | | | | 2,444,745 | |
Tanger Properties LP | | | 3.88 | | | | 12-1-2023 | | | | 2,769,000 | | | | 2,698,960 | |
Washington Prime Group Incorporated « | | | 5.95 | | | | 8-15-2024 | | | | 1,988,000 | | | | 1,846,043 | |
| | | | |
| | | | | | | | | | | | | | | 51,955,793 | |
| | | | | | | | | | | | | | | | |
|
Utilities: 1.78% | |
|
| Electric Utilities: 1.35% | |
Alliant Energy Finance LLC 144A | | | 4.25 | | | | 6-15-2028 | | | | 3,446,000 | | | | 3,387,451 | |
American Electric Power Company Incorporated | | | 4.30 | | | | 12-1-2028 | | | | 4,560,000 | | | | 4,547,264 | |
American Transmission Systems Incorporated 144A | | | 5.00 | | | | 9-1-2044 | | | | 1,141,000 | | | | 1,172,492 | |
Appalachian Power Company | | | 3.30 | | | | 6-1-2027 | | | | 1,383,000 | | | | 1,300,162 | |
Duke Energy Corporation | | | 1.80 | | | | 9-1-2021 | | | | 4,537,000 | | | | 4,315,341 | |
Duquesne Light Holdings Incorporated 144A | | | 3.62 | | | | 8-1-2027 | | | | 6,534,000 | | | | 6,065,974 | |
Emera US Finance LP | | | 3.55 | | | | 6-15-2026 | | | | 2,085,000 | | | | 1,948,678 | |
FirstEnergy Corporation | | | 4.85 | | | | 7-15-2047 | | | | 1,059,000 | | | | 1,019,306 | |
The accompanying notes are an integral part of these financial statements.
| | | | | | |
| Portfolio of investments—November 30, 2018 (unaudited) | | Wells Fargo Core Bond Portfolio | | | 39 | |
| | | | | | | | | | | | | | | | |
| Security name | | Interest rate | | | Maturity date | | | Principal | | | Value | |
|
| Electric Utilities(continued) | |
| | | | |
FirstEnergy Transmission LLC 144A | | | 5.45 | % | | | 7-15-2044 | | | $ | 873,000 | | | $ | 920,694 | |
| | | | |
Indiana Michigan Power Company | | | 4.55 | | | | 3-15-2046 | | | | 2,117,000 | | | | 2,102,357 | |
| | | | |
IPALCO Enterprises Incorporated | | | 3.70 | | | | 9-1-2024 | | | | 5,075,000 | | | | 4,847,868 | |
| | | | |
Mid-Atlantic Interstate Transmission LLC 144A | | | 4.10 | | | | 5-15-2028 | | | | 4,123,000 | | | | 3,991,154 | |
| | | | |
Mississippi Power Company | | | 3.95 | | | | 3-30-2028 | | | | 5,239,000 | | | | 5,076,370 | |
| | | | |
Pacific Gas & Electric Company | | | 2.95 | | | | 3-1-2026 | | | | 3,132,000 | | | | 2,584,442 | |
| | | | |
Pacific Gas & Electric Company | | | 3.30 | | | | 3-15-2027 | | | | 3,641,000 | | | | 2,996,824 | |
| | | | |
Pacific Gas & Electric Company | | | 3.30 | | | | 12-1-2027 | | | | 3,221,000 | | | | 2,657,644 | |
| | | | |
Pacific Gas & Electric Company | | | 4.00 | | | | 12-1-2046 | | | | 1,058,000 | | | | 808,291 | |
| | | | |
Pacific Gas & Electric Company | | | 4.25 | | | | 3-15-2046 | | | | 1,055,000 | | | | 817,184 | |
| | | | |
Pacific Gas & Electric Company | | | 5.80 | | | | 3-1-2037 | | | | 327,000 | | | | 302,189 | |
| | | | |
Pacific Gas & Electric Company | | | 6.05 | | | | 3-1-2034 | | | | 1,898,000 | | | | 1,819,530 | |
| | | | |
South Carolina Edison Company | | | 3.70 | | | | 8-1-2025 | | | | 2,489,000 | | | | 2,432,052 | |
| | | | |
South Carolina Edison Company | | | 4.13 | | | | 3-1-2048 | | | | 7,770,000 | | | | 6,933,626 | |
| | | | |
South Carolina Electric & Gas Company | | | 4.25 | | | | 8-15-2028 | | | | 3,440,000 | | | | 3,443,491 | |
| | | | |
Southern California Edison Company | | | 3.40 | | | | 6-1-2023 | | | | 2,771,000 | | | | 2,706,465 | |
| | | | |
Southern California Edison Company | | | 3.50 | | | | 10-1-2023 | | | | 1,719,000 | | | | 1,672,692 | |
| | | | |
Southwestern Electric Power Company | | | 2.75 | | | | 10-1-2026 | | | | 985,000 | | | | 902,717 | |
| | | | |
Southwestern Electric Power Company | | | 3.85 | | | | 2-1-2048 | | | | 1,572,000 | | | | 1,341,450 | |
| | | | |
Southwestern Electric Power Company | | | 3.90 | | | | 4-1-2045 | | | | 1,383,000 | | | | 1,207,811 | |
| | | | |
Virginia Electric Power Company | | | 4.60 | | | | 12-1-2048 | | | | 1,821,000 | | | | 1,816,402 | |
| | | | |
| | | | | | | | | | | | | | | 75,137,921 | |
| | | | | | | | | | | | | | | | |
|
| Multi-Utilities: 0.43% | |
| | | | |
Ameren Illinois Company | | | 4.50 | | | | 3-15-2049 | | | | 3,162,000 | | | | 3,192,021 | |
| | | | |
Consumers Energy Company | | | 3.45 | | | | 8-15-2027 | | | | 1,054,000 | | | | 997,859 | |
| | | | |
Consumers Energy Company | | | 3.80 | | | | 11-15-2028 | | | | 1,059,000 | | | | 1,056,707 | |
| | | | |
Dominion Energy Incorporated | | | 4.25 | | | | 6-1-2028 | | | | 3,915,000 | | | | 3,867,054 | |
| | | | |
Dominion Resources Incorporated | | | 1.60 | | | | 8-15-2019 | | | | 3,915,000 | | | | 3,869,419 | |
| | | | |
Dominion Resources Incorporated | | | 2.00 | | | | 8-15-2021 | | | | 3,025,000 | | | | 2,880,821 | |
| | | | |
Pacific Gas & Electric Corporation | | | 4.75 | | | | 2-15-2044 | | | | 737,000 | | | | 616,368 | |
| | | | |
Sempra Energy | | | 4.00 | | | | 2-1-2048 | | | | 6,410,000 | | | | 5,294,160 | |
| | | | |
Sempra Energy | | | 2.90 | | | | 2-1-2023 | | | | 2,347,000 | | | | 2,241,019 | |
| | | | |
| | | | | | | | | | | | | | | 24,015,428 | |
| | | | | | | | | | | | | | | | |
| |
Total Corporate Bonds and Notes (Cost $1,135,799,378) | | | | 1,101,569,994 | |
| | | | | | | | | | | | | | | | |
|
Foreign Corporate Bonds and Notes @: 0.04% | |
|
Energy: 0.04% | |
|
| Oil, Gas & Consumable Fuels: 0.04% | |
| | | | |
EnCana Corporation (CAD) | | | 6.63 | | | | 8-15-2037 | | | | 1,945,000 | | | | 2,102,382 | |
| | | | | | | | | | | | | | | | |
| |
Total Foreign Corporate Bonds and Notes (Cost $2,343,120) | | | | 2,102,382 | |
| | | | | | | | | | | | | | | | |
|
Municipal Obligations: 0.52% | |
|
California: 0.16% | |
|
| GO Revenue: 0.16% | |
| | | | |
California Build America Bonds | | | 7.60 | | | | 11-1-2040 | | | $ | 1,580,000 | | | | 2,267,142 | |
| | | | |
Los Angeles CA Community College District Build America Bonds | | | 6.75 | | | | 8-1-2049 | | | | 4,670,000 | | | | 6,515,724 | |
| | | | |
| | | | | | | | | | | | | | | 8,782,866 | |
| | | | | | | | | | | | | | | | |
The accompanying notes are an integral part of these financial statements.
| | | | |
| 40 | | Wells Fargo Core Bond Portfolio | | Portfolio of investments—November 30, 2018 (unaudited) |
| | | | | | | | | | | | | | | | |
| Security name | | Interest rate | | | Maturity date | | | Principal | | | Value | |
|
Illinois: 0.02% | |
|
| GO Revenue: 0.02% | |
Illinois Taxable Pension | | | 5.10 | % | | | 6-1-2033 | | | $ | 1,065,000 | | | $ | 1,009,663 | |
| | | | | | | | | | | | | | | | |
|
Nevada: 0.08% | |
|
| Airport Revenue: 0.08% | |
Clark County NV Airport Authority Build America Bonds Series C | | | 6.82 | | | | 7-1-2045 | | | | 3,365,000 | | | | 4,614,593 | |
| | | | | | | | | | | | | | | | |
|
New York: 0.12% | |
|
| Airport Revenue: 0.12% | |
Port Authority of New York & New Jersey Consolidated Bonds Series 174 | | | 4.46 | | | | 10-1-2062 | | | | 6,705,000 | | | | 6,643,314 | |
| | | | | | | | | | | | | | | | |
|
Ohio: 0.03% | |
|
| Education Revenue: 0.03% | |
Ohio State University General Receipts Taxable Bonds Series A | | | 4.80 | | | | 6-1-2111 | | | | 1,957,000 | | | | 1,994,790 | |
| | | | | | | | | | | | | | | | |
|
Texas: 0.11% | |
|
| Transportation Revenue: 0.11% | |
North Texas Tollway Authority | | | 6.72 | | | | 1-1-2049 | | | | 4,460,000 | | | | 6,059,624 | |
| | | | | | | | | | | | | | | | |
| |
Total Municipal Obligations (Cost $26,493,760) | | | | 29,104,850 | |
| | | | | | | | | | | | | | | | |
|
Non-Agency Mortgage-Backed Securities: 4.82% | |
Benchmark Mortgage Trust Series2018-B1 Class ASB ±± | | | 3.60 | | | | 1-15-2051 | | | | 1,620,000 | | | | 1,607,012 | |
CD Commercial Mortgage Trust Series2016-CD1 Class A1 | | | 1.44 | | | | 8-10-2049 | | | | 1,206,223 | | | | 1,175,085 | |
CD Commercial Mortgage Trust Series2016-CD1 Class ASB | | | 2.62 | | | | 8-10-2049 | | | | 4,881,000 | | | | 4,667,789 | |
CD Commercial Mortgage Trust Series2017-CD4 Class ASB | | | 3.32 | | | | 5-10-2050 | | | | 2,105,000 | | | | 2,074,109 | |
CD Commercial Mortgage Trust Series2017-CD6 Class ASB | | | 3.33 | | | | 11-13-2050 | | | | 5,323,000 | | | | 5,188,726 | |
CD Commercial Mortgage Trust Series2018-CD7 Class A4 | | | 4.28 | | | | 8-15-2051 | | | | 938,000 | | | | 960,392 | |
CFCRE Commercial Mortgage Trust Series2016-C3 Class A1 | | | 1.79 | | | | 1-10-2048 | | | | 1,595,053 | | | | 1,570,470 | |
CFCRE Commercial Mortgage Trust Series2016-C4 Class A4 | | | 3.28 | | | | 5-10-2058 | | | | 2,857,000 | | | | 2,734,221 | |
CFCRE Commercial Mortgage Trust Series2016-C7 Class A2 | | | 3.59 | | | | 12-10-2054 | | | | 2,861,000 | | | | 2,793,399 | |
CFCRE Commercial Mortgage Trust Series2016-C7 Class A3 | | | 3.84 | | | | 12-10-2054 | | | | 4,014,000 | | | | 3,980,638 | |
CFCRE Commercial Mortgage Trust Series2017-C8 Class A1 | | | 1.96 | | | | 6-15-2050 | | | | 1,360,878 | | | | 1,331,010 | |
CFCRE Commercial Mortgage Trust Series2017-C8 Class ASB | | | 3.37 | | | | 6-15-2050 | | | | 2,014,000 | | | | 1,983,802 | |
Citigroup Commercial Mortgage Trust Series 2015-GC29 Class AS | | | 3.46 | | | | 4-10-2048 | | | | 1,353,000 | | | | 1,322,393 | |
Commercial Mortgage Pass-Through Certificate Series2012-CR3 Class A3 | | | 2.82 | | | | 10-15-2045 | | | | 2,240,762 | | | | 2,186,927 | |
Commercial Mortgage Pass-Through Certificate Series 2012-UBS5 Class A3 | | | 3.55 | | | | 9-10-2047 | | | | 1,038,000 | | | | 1,040,226 | |
Commercial Mortgage Pass-Through Certificate Series 2013-CR10 Class A2 | | | 2.97 | | | | 8-10-2046 | | | | 60,931 | | | | 60,107 | |
Commercial Mortgage Pass-Through Certificate Series 2013-CR12 Class A4 | | | 4.05 | | | | 10-10-2046 | | | | 2,289,000 | | | | 2,336,253 | |
Commercial Mortgage Pass-Through Certificate Series 2014-UBS2 Class A5 | | | 3.96 | | | | 3-10-2047 | | | | 1,747,000 | | | | 1,769,311 | |
Commercial Mortgage Pass-Through Certificate Series2016-C1 Class ASB | | | 2.97 | | | | 10-10-2049 | | | | 2,071,000 | | | | 2,011,600 | |
Commercial Mortgage Trust Series2012-CR4 Class A2 | | | 1.80 | | | | 10-15-2045 | | | | 493,295 | | | | 470,436 | |
Commercial Mortgage Trust Series 2013-CR11 Class A1 | | | 1.47 | | | | 8-10-2050 | | | | 77,286 | | | | 77,186 | |
Commercial Mortgage Trust Series 2014-UBS4 Class AM | | | 3.97 | | | | 8-10-2047 | | | | 3,113,000 | | | | 3,096,604 | |
Commercial Mortgage Trust Series 2014-UBS6 Class A5 | | | 3.64 | | | | 12-10-2047 | | | | 4,020,000 | | | | 3,997,919 | |
Commercial Mortgage Trust Series2015-DC1 Class A5 | | | 3.35 | | | | 2-10-2048 | | | | 3,271,000 | | | | 3,191,773 | |
Commercial Mortgage Trust Series 2018-COR3 Class A3 | | | 4.23 | | | | 5-10-2051 | | | | 2,336,000 | | | | 2,376,339 | |
Commercial Real Estate Products & Resources Estate Series2016-C4 Class ASB | | | 3.09 | | | | 5-10-2058 | | | | 2,871,000 | | | | 2,805,302 | |
Credit Suisse Mortgage Trust Series 2016-NSXR Class A4 ±± | | | 3.79 | | | | 12-15-2049 | | | | 7,167,000 | | | | 7,084,346 | |
CSAIL Commercial Mortgage Trust Series2015-C3 Class A4 | | | 3.72 | | | | 8-15-2048 | | | | 2,954,000 | | | | 2,941,428 | |
CSAIL Commercial Mortgage Trust Series2015-C4 Class A4 | | | 3.81 | | | | 11-15-2048 | | | | 6,095,200 | | | | 6,078,863 | |
The accompanying notes are an integral part of these financial statements.
| | | | | | |
| Portfolio of investments—November 30, 2018 (unaudited) | | Wells Fargo Core Bond Portfolio | | | 41 | |
| | | | | | | | | | | | | | | | |
| Security name | | Interest rate | | | Maturity date | | | Principal | | | Value | |
|
Non-Agency Mortgage-Backed Securities(continued) | |
CSAIL Commercial Mortgage Trust Series2016-C5 Class ASB | | | 3.53 | % | | | 11-15-2048 | | | $ | 865,000 | | | $ | 863,288 | |
DBGS Mortgage Trust Series2018-C1 Class A4 | | | 4.47 | | | | 10-15-2051 | | | | 6,526,000 | | | | 6,769,361 | |
Deutsche Bank Commercial Mortgage Trust Series2017-C6 Class ASB | | | 3.12 | | | | 6-10-2050 | | | | 1,249,000 | | | | 1,208,454 | |
GS Mortgage Securities Trust Series 2012-GCJ7 Class AAB | | | 2.94 | | | | 5-10-2045 | | | | 335,161 | | | | 333,894 | |
GS Mortgage Securities Trust Series 2014-GCJ18 Class A3 | | | 3.80 | | | | 1-10-2047 | | | | 1,904,000 | | | | 1,916,427 | |
GS Mortgage Securities Trust Series 2015-GC34 Class A4 | | | 3.51 | | | | 10-10-2048 | | | | 2,820,000 | | | | 2,773,252 | |
GS Mortgage Securities Trust Series2016-GS3 Class A4 | | | 2.85 | | | | 10-10-2049 | | | | 2,075,000 | | | | 1,939,750 | |
GS Mortgage Securities Trust Series2016-GS3 Class AAB | | | 2.78 | | | | 10-10-2049 | | | | 3,117,000 | | | | 3,013,923 | |
Impact Funding LLC Series2010-1 Class A1 144A | | | 5.31 | | | | 1-25-2051 | | | | 7,797,966 | | | | 8,224,456 | |
JPMDB Commercial Mortgage Securities Series2014-C23 Class A4 | | | 3.67 | | | | 9-15-2047 | | | | 2,419,000 | | | | 2,416,358 | |
JPMDB Commercial Mortgage Securities Series2017-C5 Class ASB | | | 3.49 | | | | 3-15-2050 | | | | 861,000 | | | | 850,253 | |
JPMDB Commercial Mortgage Securities Series2018-C8 Class ASB | | | 4.15 | | | | 6-15-2051 | | | | 2,714,000 | | | | 2,774,203 | |
JPMorgan Chase Commercial Mortgage Securities Corporation Series2016-JP3 Class A4 | | | 2.63 | | | | 8-15-2049 | | | | 5,015,000 | | | | 4,626,031 | |
JPMorgan Chase Commercial Mortgage Securities Corporation Series2012-CBX Class A4 | | | 3.48 | | | | 6-15-2045 | | | | 3,623,000 | | | | 3,616,201 | |
JPMorgan Chase Commercial Mortgage Securities Corporation Series2013-C13 Class A2 | | | 2.67 | | | | 1-15-2046 | | | | 1,499,237 | | | | 1,494,590 | |
JPMorgan Chase Commercial Mortgage Securities Corporation Series2014-C20 Class A2 | | | 2.87 | | | | 7-15-2047 | | | | 1,927,816 | | | | 1,924,173 | |
JPMorgan Chase Commercial Mortgage Securities Corporation Series2016-JP2 Class A1 | | | 1.32 | | | | 8-15-2049 | | | | 2,430,530 | | | | 2,380,987 | |
JPMorgan Chase Commercial Mortgage Securities Corporation Series2017-JP5 Class ASB | | | 3.55 | | | | 3-15-2050 | | | | 6,129,000 | | | | 6,070,643 | |
JPMorgan Chase Commercial Mortgage Securities Corporation Series2017-JP6 Class ASB | | | 3.28 | | | | 7-15-2050 | | | | 2,343,000 | | | | 2,286,525 | |
JPMorgan Chase Commercial Mortgage Securities Trust Series2015-C28 Class A2 | | | 2.77 | | | | 10-15-2048 | | | | 1,790,120 | | | | 1,777,307 | |
JPMorgan Chase Commercial Mortgage Securities Trust Series2015-C28 Class A3 | �� | | 2.91 | | | | 10-15-2048 | | | | 10,965,000 | | | | 10,513,285 | |
JPMorgan Chase Commercial Mortgage Securities Trust Series2015-JP1 Class ASB | | | 3.73 | | | | 1-15-2049 | | | | 2,582,000 | | | | 2,598,830 | |
JPMorgan Chase Commercial Mortgage Securities Trust Series2015-JP2 Class ASB | | | 2.71 | | | | 8-15-2049 | | | | 2,765,000 | | | | 2,654,304 | |
JPMorgan Mortgage Trust Series2016-5 Class A1 144A ±± | | | 2.64 | | | | 12-25-2046 | | | | 3,073,172 | | | | 3,021,763 | |
JPMorgan Mortgage Trust Series2017-5 Class A1 144A ±± | | | 3.17 | | | | 10-26-2048 | | | | 28,330,788 | | | | 27,938,016 | |
Morgan Stanley Bank of America Merrill Lynch Trust Series2015-C25 Class A5 | | | 3.64 | | | | 10-15-2048 | | | | 2,838,000 | | | | 2,813,274 | |
Morgan Stanley Bank of America Merrill Lynch Trust Series2015-C27 Class A4 | | | 3.75 | | | | 12-15-2047 | | | | 754,000 | | | | 752,601 | |
Morgan Stanley Bank of America Merrill Lynch Trust Series2016-C28 Class A4 | | | 3.54 | | | | 1-15-2049 | | | | 1,448,000 | | | | 1,422,970 | |
Morgan Stanley Bank of America Merrill Lynch Trust Series2016-C30 Class A4 | | | 2.60 | | | | 9-15-2049 | | | | 5,637,000 | | | | 5,182,064 | |
Morgan Stanley Bank of America Merrill Lynch Trust Series2016-C30 Class ASB | | | 2.73 | | | | 9-15-2049 | | | | 9,888,000 | | | | 9,501,417 | |
Morgan Stanley Capital I Trust Series 2016-UB11 Class A1 | | | 1.45 | | | | 8-15-2049 | | | | 2,688,832 | | | | 2,632,235 | |
Morgan Stanley Capital I Trust Series 2016-UB11 Class ASB | | | 2.61 | | | | 8-15-2049 | | | | 2,119,000 | | | | 2,020,632 | |
Morgan Stanley Capital I Trust Series 2016-UBS9 Class A1 | | | 1.71 | | | | 3-15-2049 | | | | 1,394,593 | | | | 1,368,484 | |
Perpetual Savings Bank Series1990-1 Class 1 ±± | | | 4.93 | | | | 3-1-2020 | | | | 2,955 | | | | 2,955 | |
SoFi Professional Loan Program LLC Series2016-A Class A2 144A | | | 2.76 | | | | 12-26-2036 | | | | 3,652,844 | | | | 3,595,617 | |
SoFi Professional Loan Program LLC Series2016-D Class A1 (1 Month LIBOR +0.95%) 144A ± | | | 3.27 | | | | 1-25-2039 | | | | 771,143 | | | | 776,076 | |
SoFi Professional Loan Program LLC Series2016-E Class A1 (1 Month LIBOR +0.85%) 144A ± | | | 3.17 | | | | 7-25-2039 | | | | 1,779,703 | | | | 1,787,797 | |
SoFi Professional Loan Program LLC Series2017-A Class A1 (1 Month LIBOR +0.70%) 144A ± | | | 3.02 | | | | 3-26-2040 | | | | 1,731,753 | | | | 1,736,454 | |
SoFi Professional Loan Program LLC Series2017-D Class A2 144A | | | 2.65 | | | | 9-25-2040 | | | | 666,000 | | | | 646,344 | |
SoFi Professional Loan Program LLC Series2017-E Class A1 (1 Month LIBOR +0.50%) 144A ± | | | 2.82 | | | | 11-26-2040 | | | | 1,601,902 | | | | 1,606,320 | |
SoFi Professional Loan Program LLC Series2017-E Class A2B 144A | | | 2.72 | | | | 11-26-2040 | | | | 9,979,000 | | | | 9,747,659 | |
The accompanying notes are an integral part of these financial statements.
| | | | |
| 42 | | Wells Fargo Core Bond Portfolio | | Portfolio of investments—November 30, 2018 (unaudited) |
| | | | | | | | | | | | | | | | |
| Security name | | Interest rate | | | Maturity date | | | Principal | | | Value | |
|
Non-Agency Mortgage-Backed Securities(continued) | |
SoFi Professional Loan Program LLC Series2018-B Class A2FX 144A | | | 3.34 | % | | | 8-25-2047 | | | $ | 8,978,000 | | | $ | 8,846,736 | |
SoFi Professional Loan Program LLC Series2018-C Class A2FX 144A | | | 3.59 | | | | 1-25-2048 | | | | 11,480,000 | | | | 11,508,770 | |
SoFi Professional Loan Program LLC Series2018-D Class A2FX 144A | | | 3.60 | | | | 2-25-2048 | | | | 11,751,000 | | | | 11,784,093 | |
UBS Barclays Commercial Mortgage Trust Series2012-C2 Class A4 | | | 3.53 | | | | 5-10-2063 | | | | 3,453,000 | | | | 3,448,160 | |
UBS Barclays Commercial Mortgage Trust Series2017-C7 Class A4 | | | 3.68 | | | | 12-15-2050 | | | | 660,000 | | | | 643,754 | |
UBS Commercial Mortgage Trust Series2018-C10 Class A4 | | | 4.31 | | | | 5-15-2051 | | | | 2,033,000 | | | | 2,080,462 | |
UBS Commercial Mortgage Trust Series2018-C13 Class A4 | | | 4.33 | | | | 10-15-2051 | | | | 3,459,000 | | | | 3,546,020 | |
UBS Commercial Mortgage Trust Series2018-C9 Class A4 ±± | | | 4.12 | | | | 3-15-2051 | | | | 4,422,000 | | | | 4,458,017 | |
| |
TotalNon-Agency Mortgage-Backed Securities (Cost $274,913,791) | | | | 268,808,851 | |
| | | | | | | | | | | | | | | | |
|
U.S. Treasury Securities: 23.77% | |
U.S. Treasury Bond | | | 2.50 | | | | 2-15-2046 | | | | 34,137,000 | | | | 29,172,467 | |
U.S. Treasury Bond | | | 2.50 | | | | 5-15-2046 | | | | 19,764,000 | | | | 16,874,287 | |
U.S. Treasury Bond | | | 2.75 | | | | 8-15-2047 | | | | 19,448,000 | | | | 17,434,828 | |
U.S. Treasury Bond | | | 2.75 | | | | 11-15-2047 | | | | 48,941,000 | | | | 43,840,430 | |
U.S. Treasury Bond | | | 2.88 | | | | 5-15-2028 | | | | 3,293,000 | | | | 3,257,240 | |
U.S. Treasury Bond | | | 2.88 | | | | 11-15-2046 | | | | 29,715,000 | | | | 27,374,944 | |
U.S. Treasury Bond | | | 3.00 | | | | 2-15-2047 | | | | 8,596,000 | | | | 8,116,169 | |
U.S. Treasury Bond | | | 3.00 | | | | 2-15-2048 | | | | 1,485,000 | | | | 1,398,858 | |
U.S. Treasury Bond | | | 3.00 | | | | 8-15-2048 | | | | 31,229,000 | | | | 29,419,914 | |
U.S. Treasury Bond | | | 3.13 | | | | 5-15-2048 | | | | 68,944,000 | | | | 66,555,198 | |
U.S. Treasury Bond | | | 3.13 | | | | 11-15-2028 | | | | 125,463,000 | | | | 126,732,333 | |
U.S. Treasury Bond | | | 3.38 | | | | 11-15-2048 | | | | 39,145,000 | | | | 39,674,069 | |
U.S. Treasury Bond | | | 3.75 | | | | 11-15-2043 | | | | 10,778,000 | | | | 11,599,823 | |
U.S. Treasury Note | | | 1.50 | | | | 8-15-2020 | | | | 10,000,000 | | | | 9,784,766 | |
U.S. Treasury Note | | | 1.50 | | | | 8-15-2026 | | | | 34,448,000 | | | | 31,026,076 | |
U.S. Treasury Note | | | 1.88 | | | | 1-31-2022 | | | | 71,367,000 | | | | 69,306,835 | |
U.S. Treasury Note | | | 2.00 | | | | 10-31-2021 | | | | 35,231,000 | | | | 34,421,788 | |
U.S. Treasury Note | | | 2.00 | | | | 12-31-2021 | | | | 25,657,000 | | | | 25,038,626 | |
U.S. Treasury Note | | | 2.00 | | | | 10-31-2022 | | | | 21,986,000 | | | | 21,301,514 | |
U.S. Treasury Note | | | 2.00 | | | | 11-15-2026 | | | | 57,425,000 | | | | 53,526,381 | |
U.S. Treasury Note | | | 2.38 | | | | 1-31-2023 | | | | 7,359,000 | | | | 7,224,181 | |
U.S. Treasury Note | | | 2.63 | | | | 5-15-2021 | | | | 11,460,000 | | | | 11,407,624 | |
U.S. Treasury Note | | | 2.63 | | | | 6-15-2021 | | | | 2,407,000 | | | | 2,395,529 | |
U.S. Treasury Note | | | 2.63 | | | | 6-30-2023 | | | | 16,555,000 | | | | 16,401,090 | |
U.S. Treasury Note | | | 2.75 | | | | 2-15-2028 | | | | 78,301,000 | | | | 76,719,687 | |
U.S. Treasury Note | | | 2.75 | | | | 4-30-2023 | | | | 3,903,000 | | | | 3,887,906 | |
U.S. Treasury Note | | | 2.75 | | | | 8-31-2023 | | | | 8,263,000 | | | | 8,231,368 | |
U.S. Treasury Note | | | 2.88 | | | | 10-31-2020 | | | | 57,778,000 | | | | 57,834,424 | |
U.S. Treasury Note | | | 2.88 | | | | 11-15-2021 | | | | 60,593,000 | | | | 60,678,209 | |
U.S. Treasury Note | | | 2.88 | | | | 10-15-2021 | | | | 82,298,000 | | | | 82,400,873 | |
U.S. Treasury Note ## | | | 2.88 | | | | 9-30-2023 | | | | 116,535,000 | | | | 116,671,565 | |
U.S. Treasury Note | | | 2.88 | | | | 10-31-2023 | | | | 116,003,000 | | | | 116,161,598 | |
U.S. Treasury Note | | | 2.88 | | | | 11-30-2023 | | | | 58,329,000 | | | | 58,431,531 | |
U.S. Treasury Note | | | 2.88 | | | | 8-15-2028 | | | | 13,887,000 | | | | 13,728,601 | |
U.S. Treasury Note | | | 3.00 | | | | 9-30-2025 | | | | 15,947,000 | | | | 16,029,850 | |
U.S. Treasury Note | | | 3.00 | | | | 10-31-2025 | | | | 10,825,000 | | | | 10,882,931 | |
| |
Total U.S. Treasury Securities (Cost $1,333,662,183) | | | | 1,324,943,513 | |
| | | | | | | | | | | | | | | | |
The accompanying notes are an integral part of these financial statements.
| | | | | | |
| Portfolio of investments—November 30, 2018 (unaudited) | | Wells Fargo Core Bond Portfolio | | | 43 | |
| | | | | | | | | | | | | | | | |
| Security name | | Interest rate | | | Maturity date | | | Principal | | | Value | |
|
Yankee Corporate Bonds and Notes: 4.24% | |
|
Communication Services: 0.09% | |
|
| Diversified Telecommunication Services: 0.02% | |
Telefonica Emisiones SAU | | | 5.21 | % | | | 3-8-2047 | | | $ | 1,358,000 | | | $ | 1,232,772 | |
| | | | | | | | | | | | | | | | |
|
| Wireless Telecommunication Services: 0.07% | |
Vodafone Group plc | | | 3.75 | | | | 1-16-2024 | | | | 4,010,000 | | | | 3,908,536 | |
| | | | | | | | | | | | | | | | |
|
Consumer Staples: 0.21% | |
|
| Food & Staples Retailing: 0.01% | |
Alimentation Couche-Tard Company 144A | | | 4.50 | | | | 7-26-2047 | | | | 372,000 | | | | 340,654 | |
| | | | | | | | | | | | | | | | |
|
| Food Products: 0.20% | |
Danone SA 144A | | | 2.95 | | | | 11-2-2026 | | | | 12,506,000 | | | | 11,307,122 | |
| | | | | | | | | | | | | | | | |
|
Energy: 0.76% | |
|
| Energy Equipment & Services: 0.14% | |
Schlumberger Limited 144A | | | 2.65 | | | | 11-20-2022 | | | | 8,349,000 | | | | 8,027,767 | |
| | | | | | | | | | | | | | | | |
|
| Oil, Gas & Consumable Fuels: 0.62% | |
Ecopetrol SA | | | 5.88 | | | | 5-28-2045 | | | | 1,426,000 | | | | 1,303,721 | |
Enbridge Incorporated | | | 2.90 | | | | 7-15-2022 | | | | 4,987,000 | | | | 4,796,730 | |
Encana Corporation | | | 6.50 | | | | 2-1-2038 | | | | 3,241,000 | | | | 3,593,356 | |
Petroleos Mexicanos Company | | | 2.38 | | | | 4-15-2025 | | | | 2,358,850 | | | | 2,302,029 | |
Petroleos Mexicanos Company | | | 2.46 | | | | 12-15-2025 | | | | 6,048,750 | | | | 5,915,835 | |
Petroleos Mexicanos Company 144A | | | 6.35 | | | | 2-12-2048 | | | | 2,074,000 | | | | 1,654,845 | |
Petroleos Mexicanos Company | | | 6.50 | | | | 3-13-2027 | | | | 3,371,000 | | | | 3,153,571 | |
Petroleos Mexicanos 144A | | | 6.50 | | | | 1-23-2029 | | | | 3,163,000 | | | | 2,912,807 | |
Petroleos Mexicanos Company | | | 6.75 | | | | 9-21-2047 | | | | 2,420,000 | | | | 2,002,550 | |
Transcanada Pipelines Limited | | | 5.10 | | | | 3-15-2049 | | | | 6,949,000 | | | | 6,775,579 | |
| | | | |
| | | | | | | | | | | | | | | 34,411,023 | |
| | | | | | | | | | | | | | | | |
|
Financials: 2.52% | |
|
| Banks: 1.92% | |
Aib Group plc 144A | | | 4.75 | | | | 10-12-2023 | | | | 8,949,000 | | | | 8,798,372 | |
Banco Santander SA | | | 3.80 | | | | 2-23-2028 | | | | 4,100,000 | | | | 3,617,207 | |
Banco Santander SA | | | 4.38 | | | | 4-12-2028 | | | | 5,200,000 | | | | 4,795,854 | |
Bank of Ireland Group 144A | | | 4.50 | | | | 11-25-2023 | | | | 5,700,000 | | | | 5,551,863 | |
Banque Federative du Credit Mutuel SA 144A | | | 3.75 | | | | 7-20-2023 | | | | 6,975,000 | | | | 6,890,271 | |
Barclays plc (3 Month LIBOR +1.40%) ± | | | 4.61 | | | | 2-15-2023 | | | | 8,072,000 | | | | 7,978,923 | |
BNP Paribas SA 144A | | | 3.50 | | | | 3-1-2023 | | | | 10,424,000 | | | | 10,047,596 | |
Danske Bank A/S 144A | | | 3.88 | | | | 9-12-2023 | | | | 4,753,000 | | | | 4,542,473 | |
Danske Bank A/S 144A | | | 4.38 | | | | 6-12-2028 | | | | 1,590,000 | | | | 1,493,047 | |
DNB Bank ASA 144A | | | 2.13 | | | | 10-2-2020 | | | | 5,064,000 | | | | 4,946,865 | |
Export Import Bank of Korea | | | 3.00 | | | | 11-1-2022 | | | | 5,215,000 | | | | 5,095,681 | |
Intesa Sanpaolo SpA 144A | | | 3.88 | | | | 7-14-2027 | | | | 8,764,000 | | | | 7,146,336 | |
Intesa Sanpaolo SpA 144A | | | 3.88 | | | | 1-12-2028 | | | | 5,199,000 | | | | 4,195,982 | |
Intesa Sanpaolo SpA 144A | | | 4.38 | | | | 1-12-2048 | | | | 2,290,000 | | | | 1,625,944 | |
Lloyds Banking Group plc | | | 4.05 | | | | 8-16-2023 | | | | 5,804,000 | | | | 5,662,949 | |
Lloyds Banking Group plc | | | 4.34 | | | | 1-9-2048 | | | | 1,939,000 | | | | 1,516,041 | |
Lloyds Banking Group plc | | | 4.38 | | | | 3-22-2028 | | | | 4,240,000 | | | | 3,984,198 | |
The accompanying notes are an integral part of these financial statements.
| | | | |
| 44 | | Wells Fargo Core Bond Portfolio | | Portfolio of investments—November 30, 2018 (unaudited) |
| | | | | | | | | | | | | | | | |
| Security name | | Interest rate | | | Maturity date | | | Principal | | | Value | |
|
| Banks(continued) | |
Royal Bank of Scotland Group plc (3 Month LIBOR +1.75%) ± | | | 4.89 | % | | | 5-18-2029 | | | $ | 3,692,000 | | | $ | 3,491,799 | |
Royal Bank of Scotland Group plc (3 Month LIBOR +1.91%) ± | | | 5.08 | | | | 1-27-2030 | | | | 4,326,000 | | | | 4,134,556 | |
Santander UK Group Holdings plc (3 Month LIBOR +1.57%) ± | | �� | 4.80 | | | | 11-15-2024 | | | | 5,889,000 | | | | 5,833,564 | |
Svenska Handelsbanken AB | | | 3.90 | | | | 11-20-2023 | | | | 457,000 | | | | 457,095 | |
UBS Group Funding Company 144A | | | 2.65 | | | | 2-1-2022 | | | | 5,356,000 | | | | 5,150,750 | |
| | | | |
| | | | | | | | | | | | | | | 106,957,366 | |
| | | | | | | | | | | | | | | | |
|
| Consumer Finance: 0.16% | |
Shell International Finance Company | | | 3.50 | | | | 11-13-2023 | | | | 8,702,000 | | | | 8,670,085 | |
| | | | | | | | | | | | | | | | |
|
| Diversified Consumer Services: 0.24% | |
NXP BV / NXP Funding LLC 144A | | | 4.63 | | | | 6-1-2023 | | | | 13,733,000 | | | | 13,466,854 | |
| | | | | | | | | | | | | | | | |
|
| Diversified Financial Services: 0.14% | |
Enel Finance International NV 144A | | | 4.25 | | | | 9-14-2023 | | | | 5,714,000 | | | | 5,471,790 | |
Enel Finance International NV 144A | | | 4.88 | | | | 6-14-2029 | | | | 2,591,000 | | | | 2,389,640 | |
| | | | |
| | | | | | | | | | | | | | | 7,861,430 | |
| | | | | | | | | | | | | | | | |
|
| Insurance: 0.06% | |
Aon plc | | | 3.88 | | | | 12-15-2025 | | | | 3,543,000 | | | | 3,455,666 | |
| | | | | | | | | | | | | | | | |
|
Health Care: 0.35% | |
|
| Pharmaceuticals: 0.35% | |
Sanofi SA | | | 3.38 | | | | 6-19-2023 | | | | 9,213,000 | | | | 9,152,358 | |
Sanofi SA | | | 3.63 | | | | 6-19-2028 | | | | 10,233,000 | | | | 10,125,876 | |
| | | | |
| | | | | | | | | | | | | | | 19,278,234 | |
| | | | | | | | | | | | | | | | |
|
Information Technology: 0.07% | |
|
| Semiconductors & Semiconductor Equipment: 0.07% | |
NXP Funding LLC 144A | | | 3.88 | | | | 9-1-2022 | | | | 4,189,000 | | | | 4,058,094 | |
| | | | | | | | | | | | | | | | |
|
Materials: 0.13% | |
|
| Chemicals: 0.03% | |
Syngenta Finance NV 144A | | | 5.68 | | | | 4-24-2048 | | | | 2,605,000 | | | | 2,099,873 | |
| | | | | | | | | | | | | | | | |
|
| Metals & Mining: 0.07% | |
Goldcorp Incorporated | | | 5.45 | | | | 6-9-2044 | | | | 1,604,000 | | | | 1,591,650 | |
Southern Copper Corporation | | | 3.88 | | | | 4-23-2025 | | | | 2,378,000 | | | | 2,230,726 | |
| | | | |
| | | | | | | | | | | | | | | 3,822,376 | |
| | | | | | | | | | | | | | | | |
|
| Paper & Forest Products: 0.03% | |
Suzano Austria GmbH Company 144A | | | 7.00 | | | | 3-16-2047 | | | | 1,548,000 | | | | 1,572,768 | |
| | | | | | | | | | | | | | | | |
|
Utilities: 0.11% | |
|
| Electric Utilities: 0.11% | |
Electricite de France SA 144A | | | 6.00 | | | | 1-22-2114 | | | | 1,322,000 | | | | 1,282,459 | |
Electricite de France SA 144A | | | 4.88 | | | | 9-21-2038 | | | | 3,530,000 | | | | 3,196,350 | |
Electricite de France SA 144A | | | 5.00 | | | | 9-21-2048 | | | | 1,814,000 | | | | 1,617,507 | |
| | | | |
| | | | | | | | | | | | | | | 6,096,316 | |
| | | | | | | | | | | | | | | | |
| |
Total Yankee Corporate Bonds and Notes (Cost $245,421,283) | | | | 236,566,936 | |
| | | | | | | | | | | | | | | | |
The accompanying notes are an integral part of these financial statements.
| | | | | | |
| Portfolio of investments—November 30, 2018 (unaudited) | | Wells Fargo Core Bond Portfolio | | | 45 | |
| | | | | | | | | | | | | | | | |
| Security name | | Interest rate | | | Maturity date | | | Principal | | | Value | |
|
Yankee Government Bonds: 0.69% | |
Republic of Colombia | | | 4.50 | % | | | 3-15-2029 | | | $ | 3,862,000 | | | $ | 3,777,075 | |
Republic of Colombia | | | 5.00 | | | | 6-15-2045 | | | | 2,047,000 | | | | 1,911,898 | |
Republic of Indonesia | | | 2.95 | | | | 1-11-2023 | | | | 7,042,000 | | | | 6,678,274 | |
Republic of Korea | | | 3.50 | | | | 9-20-2028 | | | | 3,555,000 | | | | 3,493,071 | |
Republic of Korea | | | 3.88 | | | | 9-20-2048 | | | | 2,115,000 | | | | 2,013,319 | |
Republic of Panama | | | 4.50 | | | | 4-16-2050 | | | | 3,108,000 | | | | 2,898,210 | |
Republic of Paraguay 144A | | | 6.10 | | | | 8-11-2044 | | | | 4,895,000 | | | | 4,882,763 | |
United Mexican States | | | 3.75 | | | | 1-11-2028 | | | | 2,368,000 | | | | 2,190,400 | |
United Mexican States | | | 4.60 | | | | 2-10-2048 | | | | 12,021,000 | | | | 10,356,213 | |
| |
Total Yankee Government Bonds (Cost $39,008,165) | | | | 38,201,223 | |
| | | | | | | | | | | | | | | | |
| | | | |
| | | Yield | | | | | | Shares | | | | |
| Short-Term Investments: 1.43% | | | | | | | | | | | | | | | | |
|
| Investment Companies: 1.43% | |
Securities Lending Cash Investments LLC (l)(r)(u) | | | 2.38 | | | | | | | | 3,674,870 | | | | 3,675,237 | |
Wells Fargo Government Money Market Fund Select Class ##(l)(u) | | | 2.13 | | | | | | | | 76,099,209 | | | | 76,099,209 | |
| |
Total Short-Term Investments (Cost $79,774,446) | | | | 79,774,446 | |
| | | | | | | | | | | | | | | | |
| | | | | | | | |
| Total investments in securities (Cost $5,814,781,325) | | | 103.08 | % | | | 5,745,780,066 | |
Other assets and liabilities, net | | | (3.08 | ) | | | (171,837,374 | ) |
| | | | | | | | |
| Total net assets | | | 100.00 | % | | $ | 5,573,942,692 | |
| | | | | | | | |
| ± | Variable rate investment. The rate shown is the rate in effect at period end. |
| %% | The security is issued on a when-issued basis. |
| ±± | The coupon of the security is adjusted based on the principal and interest payments received from the underlying pool of mortgages as well as the credit quality and the actual prepayment speed of the underlying mortgages. |
| 144A | The security may be resold in transactions exempt from registration, normally to qualified institutional buyers, pursuant to Rule 144A under the Securities Act of 1933. |
| « | All or a portion of this security is on loan. |
| @ | Foreign bond principal is denominated in the local currency of the issuer. |
| ## | All or a portion of this security is segregated for when-issued securities. |
| (l) | The issuer of the security is an affiliated person of the Portfolio as defined in the Investment Company Act of 1940. |
| (r) | The investment is anon-registered investment company purchased with cash collateral received from securities on loan. |
| (u) | The rate represents the7-day annualized yield at period end. |
Abbreviations:
| FHLMC | Federal Home Loan Mortgage Corporation |
| FNMA | Federal National Mortgage Association |
| GNMA | Government National Mortgage Association |
| LIBOR | London Interbank Offered Rate |
| REIT | Real estate investment trust |
The accompanying notes are an integral part of these financial statements.
| | | | |
| 46 | | Wells Fargo Core Bond Portfolio | | Portfolio of investments—November 30, 2018 (unaudited) |
Investments in Affiliates
An affiliated investment is an investment in which the Portfolio owns at least 5% of the outstanding voting shares of the issuer or as a result of other relationships, such as the Portfolio and the issuer having the same adviser or investment manager. Transactions with issuers that were either affiliated persons of the Portfolio at the beginning of the period or the end of the period were as follows:
| | | | | | | | | | | | | | | | | | | | | | | | | | | | | | | | | | | | |
| | | Shares,
beginning of
period | | | Shares
purchased | | | Shares
sold | | | Shares,
end of
period | | | Net
realized
gains
(losses) | | | Net
change in
unrealized
gains
(losses) | | | Income
from
affiliated
securities | | | Value, end
of period | | | % of
net
assets | |
Short-Term Investments | | | | | | | | | | | | | | | | | | | | | | | | | | | | | | | | | | | | |
Investment Companies | | | | | | | | | | | | | | | | | | | | | | | | | | | | | | | | | | | | |
Securities Lending Cash Investments LLC | | | 57,959,204 | | | | 289,934,512 | | | | 344,218,846 | | | | 3,674,870 | | | $ | 19 | | | $ | 0 | | | $ | 66,862 | | | $ | 3,675,237 | | | | | |
Wells Fargo Government Money Market Fund Select Class | | | 118,801,553 | | | | 2,247,076,629 | | | | 2,289,778,973 | | | | 76,099,209 | | | | 0 | | | | 0 | | | | 890,892 | | | | 76,099,209 | | | | | |
| | | | | | | | | | | | | | | | | | | | | | | | | | | | | | | | | | | | |
| | | | | | | | | | | | | | | | | | $ | 19 | | | $ | 0 | | | $ | 957,754 | | | $ | 79,774,446 | | | | 1.43 | % |
| | | | | | | | | | | | | | | | | | | | | | | | | | | | | | | | | | | | |
The accompanying notes are an integral part of these financial statements.
| | | | | | |
| Statement of assets and liabilities—November 30, 2018 (unaudited) | | Wells Fargo Core Bond Portfolio | | | 47 | |
| | | | |
| | | | |
| |
Assets | | | | |
Investments in unaffiliated securities (including $3,603,381of securities loaned), at value (cost $5,735,006,879) | | $ | 5,666,005,620 | |
Investments in affiliated securities, at value (cost $79,774,446) | | | 79,774,446 | |
Cash | | | 1,962,972 | |
Receivable for investments sold | | | 808,216,457 | |
Principal paydown receivable | | | 16,491 | |
Receivable for interest | | | 28,644,694 | |
Receivable for securities lending income | | | 3,817 | |
Prepaid expenses and other assets | | | 140,077 | |
| | | | |
Total assets | | | 6,584,764,574 | |
| | | | |
| |
Liabilities | | | | |
Payable for investments purchased | | | 1,005,307,980 | |
Payable upon receipt of securities loaned | | | 3,675,219 | |
Advisory fee payable | | | 1,679,353 | |
Accrued expenses and other liabilities | | | 159,330 | |
| | | | |
Total liabilities | | | 1,010,821,882 | |
| | | | |
Total net assets | | $ | 5,573,942,692 | |
| | | | |
The accompanying notes are an integral part of these financial statements.
| | | | |
| 48 | | Wells Fargo Core Bond Portfolio | | Statement of operations—six months ended November 30, 2018 (unaudited) |
| | | | |
| | | | |
| |
Investment income | | | | |
Interest | | $ | 92,663,520 | |
Income from affiliated securities | | | 957,754 | |
| | | | |
Total investment income | | | 93,621,274 | |
| | | | |
| |
Expenses | | | | |
Advisory fee | | | 9,923,617 | |
Custody and accounting fees | | | 127,075 | |
Professional fees | | | 39,631 | |
Shareholder report expenses | | | 2,055 | |
Trustees’ fees and expenses | | | 11,085 | |
Other fees and expenses | | | 11,651 | |
| | | | |
Total expenses | | | 10,115,114 | |
| | | | |
Net investment income | | | 83,506,160 | |
| | | | |
| |
REALIZED AND UNREALIZED GAINS (LOSSES) ON INVESTMENTS | | | | |
| |
Net realized gains (losses) on: | | | | |
Unaffiliated securities | | | (90,341,275 | ) |
Affiliated securities | | | 19 | |
| | | | |
Net realized losses on investments | | | (90,341,256 | ) |
| | | | |
Net change in unrealized gains (losses) on investments | | | (5,193,362 | ) |
| | | | |
Net realized and unrealized gains (losses) on investments | | | (95,534,618 | ) |
| | | | |
Net decrease in net assets resulting from operations | | $ | (12,028,458 | ) |
| | | | |
The accompanying notes are an integral part of these financial statements.
| | | | | | |
| Statement of changes in net assets | | Wells Fargo Core Bond Portfolio | | | 49 | |
| | | | | | | | | | | | | | | | |
| | | | | | Six months ended
November 30, 2018
(unaudited) | | | Year ended
May 31, 2018 | |
| | | | |
Operations | | | | | | | | | | | | | | | | |
Net investment income | | | | | | $ | 83,506,160 | | | | | | | $ | 122,888,295 | |
Net realized losses on investments | | | | | | | (90,341,256 | ) | | | | | | | (55,887,139 | ) |
Net change in unrealized gains (losses) on investments | | | | | | | (5,193,362 | ) | | | | | | | (99,688,813 | ) |
| | | | |
Net decrease in net assets resulting from operations | | | | | | | (12,028,458 | ) | | | | | | | (32,687,657 | ) |
| | | | |
| | | | |
Capital transactions | | | | | | | | | | | | | | | | |
Transactions in investors’ beneficial interests | | | | | | | | | | | | | | | | |
Contributions | | | | | | | 352,247,126 | | | | | | | | 910,938,479 | |
Withdrawals | | | | | | | (439,518,250 | ) | | | | | | | (395,554,370 | ) |
| | | | |
Net increase (decrease) in net assets resulting from capital transactions | | | | | | | (87,271,124 | ) | | | | | | | 515,384,109 | |
| | | | |
Total increase (decrease) in net assets | | | | | | | (99,299,582 | ) | | | | | | | 482,696,452 | |
| | | | |
| | | | |
Net assets | | | | | | | | | | | | | | | | |
Beginning of period | | | | | | | 5,673,242,274 | | | | | | | | 5,190,545,822 | |
| | | | |
End of period | | | | | | $ | 5,573,942,692 | | | | | | | $ | 5,673,242,274 | |
| | | | |
The accompanying notes are an integral part of these financial statements.
| | | | |
| 50 | | Wells Fargo Core Bond Portfolio | | Financial highlights |
| | | | | | | | | | | | | | | | | | | | | | | | |
| | | Six months ended
November 30, 2018 (unaudited) | | | Year ended May 31 | |
| | | 2018 | | | 2017 | | | 2016 | | | 2015 | | | 2014 | |
Total return1 | | | (0.21 | )% | | | (0.53 | )% | | | 1.89 | % | | | 2.78 | % | | | 3.22 | % | | | 2.90 | % |
Ratios to average net assets (annualized) | | | | | | | | | | | | | | | | | | | | | | | | |
Gross expenses | | | 0.35 | % | | | 0.35 | % | | | 0.35 | % | | | 0.36 | % | | | 0.37 | % | | | 0.37 | % |
Net expenses | | | 0.35 | % | | | 0.35 | % | | | 0.35 | % | | | 0.35 | % | | | 0.35 | % | | | 0.35 | % |
Net investment income | | | 2.87 | % | | | 2.23 | % | | | 1.87 | % | | | 1.86 | % | | | 1.82 | % | | | 1.94 | % |
Supplemental data | | | | | | | | | | | | | | | | | | | | | | | | |
Portfolio turnover rate | | | 280 | % | | | 542 | % | | | 614 | % | | | 667 | % | | | 586 | % | | | 646 | % |
| 1 | Returns for periods of less than one year are not annualized. |
The accompanying notes are an integral part of these financial statements.
| | | | | | |
| Notes to financial statements (unaudited) | | Wells Fargo Core Bond Portfolio | | | 51 | |
1. ORGANIZATION
Wells Fargo Master Trust (the “Trust”), a Delaware statutory trust organized on March 10, 1999, is anopen-end management investment company registered under the Investment Company Act of 1940, as amended (the “1940 Act”). As an investment company, the Trust follows the accounting and reporting guidance in Financial Accounting Standards Board (“FASB”)Accounting Standards Codification Topic 946, Financial Services – Investment Companies. These financial statements report on the Wells Fargo Core Bond Portfolio (the “Portfolio”) which is a diversified series of the Trust.
2. SIGNIFICANT ACCOUNTING POLICIES
The following significant accounting policies, which are consistently followed in the preparation of the financial statements of the Portfolio, are in conformity with U.S. generally accepted accounting principles which require management to make estimates and assumptions that affect the reported amounts of assets and liabilities, disclosure of contingent assets and liabilities at the date of the financial statements, and the reported amounts of revenues and expenses during the reporting period. Actual results could differ from those estimates.
Securities valuation
All investments are valued each business day as of the close of regular trading on the New York Stock Exchange (generally 4 p.m. Eastern Time), although the Portfolio may deviate from this calculation time under unusual or unexpected circumstances.
Debt securities are valued at the evaluated bid price provided by an independent pricing service service (e.g. taking into account various factors, including yields, maturities, or credit ratings) or, if a reliable price is not available, the quoted bid price from an independent broker-dealer.
The values of securities denominated in foreign currencies are translated into U.S. dollars at rates provided by an independent foreign currency pricing source at a time each business day specified by the Wells Fargo Asset Management Pricing Committee at Wells Fargo Funds Management, LLC (“Funds Management”).
Investments in registeredopen-end investment companies are valued at net asset value. Interests innon-registered investment companies that are redeemable at net asset value are fair valued normally at net asset value.
Investments which are not valued using any of the methods discussed above are valued at their fair value, as determined in good faith by the Board of Trustees of the Portfolio. The Board of Trustees has established a Valuation Committee comprised of the Trustees and has delegated to it the authority to take any actions regarding the valuation of portfolio securities that the Valuation Committee deems necessary or appropriate, including determining the fair value of portfolio securities, unless the determination has been delegated to the Wells Fargo Asset Management Pricing Committee.The Board of Trustees retains the authority to make or ratify any valuation decisions or approve any changes to the Valuation Procedures as it deems appropriate. On a quarterly basis, the Board of Trustees receives reports on any valuation actions taken by the Valuation Committee or the Wells Fargo Asset Management Pricing Committee which may include items for ratification.
Foreign currency translation
The accounting records of the Portfolio are maintained in U.S. dollars. The values of other assets and liabilities denominated in foreign currencies are translated into U.S. dollars at rates provided by an independent foreign currency pricing source at a time each business day specified by the Wells Fargo Asset Management Pricing Committee. Purchases and sales of securities, and income and expenses are converted at the rate of exchange on the respective dates of such transactions. Net realized foreign exchange gains or losses arise from sales of foreign currencies, currency gains or losses realized between the trade and settlement dates on securities transactions, and the difference between the amounts of dividends, interest and foreign withholding taxes recorded and the U.S. dollar equivalent of the amounts actually paid or received. Net unrealized foreign exchange gains and losses arise from changes in the fair value of assets and liabilities other than investments in securities resulting from changes in exchange rates. The changes in net assets arising from changes in exchange rates of securities and the changes in net assets resulting from changes in market prices of securities are not separately presented. Such changes are included in net realized and unrealized gains or losses from investments.
Securities lending
The Portfolio may lend its securities from time to time in order to earn additional income in the form of fees or interest on securities received as collateral or the investment of any cash received as collateral. The Portfolio continues to receive interest or dividends on the securities loaned. The Portfolio receives collateral in the form of cash or securities with a value at least equal to the value of the securities on loan. The value of the loaned securities is determined at the close of
| | | | |
| 52 | | Wells Fargo Core Bond Portfolio | | Notes to financial statements (unaudited) |
each business day and any additional required collateral is delivered to the Portfolio on the next business day. In a securities lending transaction, the net asset value of the Portfolio will be affected by an increase or decrease in the value of the securities loaned and by an increase or decrease in the value of the instrument in which collateral is invested. The amount of securities lending activity undertaken by the Portfolio fluctuates from time to time. In the event of default or bankruptcy by the borrower, the Portfolio may be prevented from recovering the loaned securities or gaining access to the collateral or may experience delays or costs in doing so. In addition, the investment of any cash collateral received may lose all or part of its value. The Portfolio has the right under the lending agreement to recover the securities from the borrower on demand.
The Portfolio lends its securities through an unaffiliated securities lending agent. Cash collateral received in connection with its securities lending transactions is invested in Securities Lending Cash Investments, LLC (the “Securities Lending Fund”). The Securities Lending Fund is exempt from registration under Section 3(c)(7) of the 1940 Act and is managed by Funds Management and is subadvised by Wells Capital Management Incorporated (“WellsCap”), an affiliate of Funds Management and an indirect wholly owned subsidiary of Wells Fargo & Company (“Wells Fargo”). Funds Management receives an advisory fee starting at 0.05% and declining to 0.01% as the average daily net assets of the Securities Lending Fund increase. All of the fees received by Funds Management are paid to WellsCap for its services as subadviser. The Securities Lending Fund seeks to provide a positive return compared to the daily Fed Funds Open Rate by investing in high-quality, U.S. dollar-denominated short-term money market instruments. Securities Lending Fund investments are valued at the evaluated bid price provided by an independent pricing service. Income earned from investment in the Securities Lending Fund, if any, is included in income from affiliated securities on the Statement of Operations.
When-issued transactions
The Portfolio may purchase securities on a forward commitment or when-issued basis. The Portfolio records a when-issued transaction on the trade date and will segregate assets in an amount at least equal in value to the Portfolio’s commitment to purchase when-issued securities. Securities purchased on a when-issued basis are marked-to-market daily and the Portfolio begins earning interest on the settlement date. Losses may arise due to changes in the market value of the underlying securities or if the counterparty does not perform under the contract.
Security transactions and income recognition
Securities transactions are recorded on a trade date basis. Realized gains or losses are recorded on the basis of identified cost.
Interest income is accrued daily and bond discounts are accreted and premiums are amortized daily.To the extent debt obligations are placed onnon-accrual status, any related interest income may be reduced by writing off interest receivables when the collection of all or a portion of interest has been determined to be doubtful based on consistently applied procedures and the fair value has decreased. If the issuer subsequently resumes interest payments or when the collectability of interest is reasonably assured, the debt obligation is removed fromnon-accrual status.
Income from foreign securities is recorded net of foreign taxes withheld where recovery of such taxes is not assured.
Federal and other taxes
The Portfolio is treated as a separate entity for federal income tax purposes. The Portfolio is not required to pay federal income taxes on its net investment income and net capital gains as it is treated as a partnership for federal income tax purposes. All interest, dividends, gains and losses of the Portfolio are deemed to have been “passed through” to the interest holders in proportion to their holdings of the Portfolio regardless of whether such interest, dividends and gains have been distributed by the Portfolio.
The Portfolio’s income tax returns and all financial records supporting those returns for the prior three fiscal years are subject to examination by the federal revenue authority. Management has analyzed the Portfolio’s tax positions taken on federal, state, and foreign tax returns for all open tax years and does not believe that there are any uncertain tax positions that require recognition of a tax liability.
As of November 30, 2018, the aggregate cost of all investments for federal income tax purposes was $5,819,208,917 and the unrealized gains (losses) consisted of:
| | | | |
| |
Gross unrealized gains | | $ | 16,606,387 | |
| |
Gross unrealized losses | | | (90,035,238 | ) |
| |
Net unrealized losses | | $ | (73,428,851 | ) |
| | | | | | |
| Notes to financial statements (unaudited) | | Wells Fargo Core Bond Portfolio | | | 53 | |
3. FAIR VALUATION MEASUREMENTS
Fair value measurements of investments are determined within a framework that has established a fair value hierarchy based upon the various data inputs utilized in determining the value of the Portfolio’s investments. The three-level hierarchy gives the highest priority to unadjusted quoted prices in active markets for identical assets or liabilities (Level 1) and the lowest priority to unobservable inputs (Level 3). The Portfolio’s investments are classified within the fair value hierarchy based on the lowest level of input that is significant to the fair value measurement. The inputs are summarized into three broad levels as follows:
| ∎ | | Level 1 – quoted prices in active markets for identical securities |
| ∎ | | Level 2 – other significant observable inputs (including quoted prices for similar securities, interest rates, prepayment speeds, credit risk, etc.) |
| ∎ | | Level 3 – significant unobservable inputs (including the Portfolio’s own assumptions in determining the fair value of investments) |
The inputs or methodologies used for valuing investments in securities are not necessarily an indication of the risk associated with investing in those securities.
The following is a summary of the inputs used in valuing the Portfolio’s assets and liabilities as of November 30, 2018:
| | | | | | | | | | | | | | | | |
| | | | |
| | | Quoted prices
(Level 1) | | | Other significant
observable inputs
(Level 2) | | | Significant
unobservable inputs (Level 3) | | | Total | |
| | | | |
Assets | | | | | | | | | | | | | | | | |
Investments in: | | | | | | | | | | | | | | | | |
| | | | |
Agency securities | | $ | 0 | | | $ | 2,056,573,682 | | | $ | 0 | | | $ | 2,056,573,682 | |
| | | | |
Asset-backed securities | | | 0 | | | | 608,134,189 | | | | 0 | | | | 608,134,189 | |
| | | | |
Corporate bonds and notes | | | 0 | | | | 1,101,569,994 | | | | 0 | | | | 1,101,569,994 | |
| | | | |
Foreign corporate bonds and notes | | | 0 | | | | 2,102,382 | | | | 0 | | | | 2,102,382 | |
| | | | |
Municipal obligations | | | 0 | | | | 29,104,850 | | | | 0 | | | | 29,104,850 | |
| | | | |
Non-agency mortgage-back securities | | | 0 | | | | 268,808,851 | | | | 0 | | | | 268,808,851 | |
| | | | |
U.S. Treasury securities | | | 1,324,943,513 | | | | 0 | | | | 0 | | | | 1,324,943,513 | |
| | | | |
Yankee corporate bonds and notes | | | 0 | | | | 236,566,936 | | | | 0 | | | | 236,566,936 | |
| | | | |
Yankee government bonds | | | 0 | | | | 38,201,223 | | | | 0 | | | | 38,201,223 | |
| | | | |
Short-term investments | | | | | | | | | | | | | | | | |
| | | | |
Investment companies | | | 76,099,209 | | | | 3,675,237 | | | | 0 | | | | 79,774,446 | |
| | | | |
Total assets | | $ | 1,401,042,722 | | | $ | 4,344,737,344 | | | $ | 0 | | | $ | 5,745,780,066 | |
Additional sector, industry or geographic detail is included in the Portfolio of Investments.
At November 30, 2018, the Portfolio did not have any transfers into/out of Level 3.
4. TRANSACTIONS WITH AFFILIATES
Advisory fee
The Trust has entered into an advisory contract with Funds Management, an indirect wholly owned subsidiary of Wells Fargo. The adviser is responsible for implementing investment policies and guidelines and for supervising the subadviser, who is responsible forday-to-day portfolio management of the Portfolio. Pursuant to the contract, Funds Management is entitled to receive an annual advisory fee starting at 0.40% and declining to 0.29% as the average daily net assets of the Portfolio increase. For the six months ended November 30, 2018, the advisory fee was equivalent to an annual rate of 0.34% of the Portfolio’s average daily net assets.
| | | | |
| 54 | | Wells Fargo Core Bond Portfolio | | Notes to financial statements (unaudited) |
Funds Management has retained the services of a subadviser to provide daily portfolio management to the Portfolio. The fee for subadvisory services is borne by Funds Management. WellsCap is the subadviser to the Portfolio and is entitled to receive a fee from Funds Management at an annual rate starting at 0.20% and declining to 0.10% as the average daily net assets of the Portfolio increase.
Interfund transactions
The Portfolio may purchase or sell portfolio investment securities to certain other Wells Fargo affiliates pursuant to Rule17a-7 under the 1940 Act and under procedures adopted by the Board of Trustees. The procedures have been designed to ensure that these interfund transactions, which do not incur broker commissions, are effected at current market prices.
5. INVESTMENT PORTFOLIO TRANSACTIONS
Purchases and sales of investments, excluding short-term securities, for the six months ended November 30, 2018 were as follows:
| | | | | | |
Purchases at cost | | Sales proceeds |
U.S.
government | | Non-U.S.
government | | U.S.
government | | Non-U.S.
government |
| $14,734,145,798 | | $2,123,591,627 | | $14,829,619,275 | | $2,154,315,315 |
6. BANK BORROWINGS
Effective August 28, 2018, the Trust, along with Wells Fargo Variable Trust and Wells Fargo Funds Trust (excluding the money market funds), are parties to a $280,000,000 revolving credit agreement whereby the Portfolio is permitted to use bank borrowings for temporary or emergency purposes, such as to fund shareholder redemption requests. Interest under the credit agreement is charged to the Portfolio based on a borrowing rate equal to the higher of the Federal Funds rate in effect on that day plus 1.25% or the overnight LIBOR rate in effect on that day plus 1.25%. In addition, an annual commitment fee equal to 0.25% of the unused balance is allocated to each participating fund.
For the six months ended November 30, 2018, there were no borrowings by the Portfolio under the agreement.
7. INDEMNIFICATION
Under the Trust’s organizational documents, the officers and Trustees have been granted certain indemnification rights against certain liabilities that may arise out of performance of their duties to the Trust. Additionally, in the normal course of business, the Trust may enter into contracts with service providers that contain a variety of indemnification clauses. The Trust’s maximum exposure under these arrangements is dependent on future claims that may be made against the Portfolio and, therefore, cannot be estimated.
8. NEW ACCOUNTING PRONOUNCEMENT
In August 2018, FASB issued Accounting Standards Update (“ASU”) No. 2018-13, Fair Value Measurement (Topic 820) Disclosure Framework—Changes to the Disclosure Requirements for Fair Value Measurement. ASU 2018-13 updates the disclosure requirements for fair value measurements by modifying or removing certain disclosures and adding certain new disclosures. The amendments are effective for fiscal years, and interim periods within those fiscal years, beginning after December 15, 2019. Early adoption is permitted. Management has adopted the removal and modification of disclosures early, as permitted, and will adopt the additional new disclosures at the effective date.
| | | | | | |
| Other information (unaudited) | | Wells Fargo Core Bond Fund | | | 55 | |
PROXY VOTING INFORMATION
A description of the policies and procedures used to determine how to vote proxies relating to portfolio securities is available, upon request, by calling1-800-222-8222, visiting our website atwellsfargofunds.com, or visiting the SEC website at sec.gov. Information regarding how the Fund voted proxies relating to portfolio securities during the most recent12-month period ended June 30 is available on the Fund’s website atwellsfargofunds.comor by visiting the SEC website at sec.gov.
PORTFOLIO HOLDINGS INFORMATION
The complete portfolio holdings for the Fund are publicly available monthly on the Fund’s website (wellsfargofunds.com), on aone-month delayed basis. In addition, top ten holdings information (excluding derivative positions) for the Fund is publicly available on the Fund’s website on a monthly,seven-day or more delayed basis. The Fund and the Portfolio each file their complete schedule of portfolio holdings with the SEC for the first and third quarters of each fiscal year on FormN-Q, which is available by visiting the SEC website at sec.gov. In addition, the Fund’s FormN-Q may be reviewed and copied at the SEC’s Public Reference Room in Washington, DC, and at regional offices in New York City, at 233 Broadway, and in Chicago, at 175 West Jackson Boulevard, Suite 900. Information about the Public Reference Room may be obtained by calling1-800-SEC-0330.
| | | | |
| 56 | | Wells Fargo Core Bond Fund | | Other information (unaudited) |
BOARD OF TRUSTEES AND OFFICERS
Each of the Trustees and Officers1 listed in the table below acts in identical capacities for each fund in the Wells Fargo family of funds, which consists of 152 mutual funds comprising the Wells Fargo Funds Trust, Wells Fargo Variable Trust, Wells Fargo Master Trust and fourclosed-end funds (collectively the “Fund Complex”). This table should be read in conjunction with the Prospectus and the Statement of Additional Information2. The mailing address of each Trustee and Officer is 525 Market Street, 12th Floor, San Francisco, CA 94105. Each Trustee and Officer serves an indefinite term, however, each Trustee serves such term until reaching the mandatory retirement age established by the Trustees.
Independent Trustees
| | | | | | |
Name and year of birth | | Position held and
length of service* | | Principal occupations during past five years or longer | | Current other public company or
investment company
directorships |
William R. Ebsworth
(Born 1957) | | Trustee, since 2015 | | Retired. From 1984 to 2013, equities analyst, portfolio manager, research director and chief investment officer at Fidelity Management and Research Company in Boston, Tokyo, and Hong Kong, and retired in 2013 as Chief Investment Officer of Fidelity Strategic Advisers, Inc. where he led a team of investment professionals managing client assets. Prior thereto, Board member of Hong Kong Securities Clearing Co., Hong Kong Options Clearing Corp., the Thailand International Fund, Ltd., Fidelity Investments Life Insurance Company, and Empire Fidelity Investments Life Insurance Company. Board member of the Vincent Memorial Hospital Endowment(non-profit organization), where he serves on the Investment Committee and as a Chair of the Audit Committee. Mr. Ebsworth is a CFA® charterholder. | | N/A |
| Jane A. Freeman (Born 1953) | | Trustee, since 2015; Chair Liaison, since 2018 | | Retired. From 2012 to 2014 and 1999 to 2008, Chief Financial Officer of Scientific Learning Corporation. From 2008 to 2012, Ms. Freeman provided consulting services related to strategic business projects. Prior to 1999, Portfolio Manager at Rockefeller & Co. and Scudder, Stevens & Clark. Board member of the Harding Loevner Funds from 1996 to 2014, serving as both Lead Independent Director and chair of the Audit Committee. Board member of the Russell Exchange Traded Funds Trust from 2011 to 2012 and the chair of the Audit Committee. Ms. Freeman is a Board Member of The Ruth Bancroft Garden(non-profit organization). She is also an inactive Chartered Financial Analyst. | | N/A |
| Isaiah Harris, Jr.3(Born 1952) | | Trustee, since 2009 | | Retired. Chairman of the Board of CIGNA Corporation since 2009, and Director since 2005. From 2003 to 2011, Director of Deluxe Corporation. Prior thereto, President and CEO of BellSouth Advertising and Publishing Corp. from 2005 to 2007, President and CEO of BellSouth Enterprises from 2004 to 2005 and President of BellSouth Consumer Services from 2000 to 2003. Emeritus member of the Iowa State University Foundation Board of Governors. Emeritus Member of the Advisory Board of Iowa State University School of Business. Advisory Board Member, Palm Harbor Academy (private school). Advisory Board Member, Child Evangelism Fellowship(non-profit). Mr. Harris is a certified public accountant (inactive status). | | CIGNA Corporation |
Judith M. Johnson3
(Born 1949) | | Trustee, since 2008; Audit Committee Chairman, since 2009 | | Retired. Prior thereto, Chief Executive Officer and Chief Investment Officer of Minneapolis Employees Retirement Fund from 1996 to 2008. Ms. Johnson is an attorney, certified public accountant and a certified managerial accountant. | | N/A |
David F. Larcker
(Born 1950) | | Trustee, since 2009 | | James Irvin Miller Professor of Accounting at the Graduate School of Business, Stanford University, Director of the Corporate Governance Research Initiative and Senior Faculty of The Rock Center for Corporate Governance since 2006. From 2005 to 2008, Professor of Accounting at the Graduate School of Business, Stanford University. Prior thereto, Ernst & Young Professor of Accounting at The Wharton School, University of Pennsylvania from 1985 to 2005. | | N/A |
| | | | | | |
| Other information (unaudited) | | Wells Fargo Core Bond Fund | | | 57 | |
| | | | | | |
Name and year of birth | | Position held and
length of service* | | Principal occupations during past five years or longer | | Current other public company or
investment company
directorships |
Olivia S. Mitchell
(Born 1953) | | Trustee, since 2006; Nominating and Governance Committee Chairman, since 2018 | | International Foundation of Employee Benefit Plans Professor, Wharton School of the University of Pennsylvania since 1993. Director of Wharton’s Pension Research Council and Boettner Center on Pensions & Retirement Research, and Research Associate at the National Bureau of Economic Research. Previously, Cornell University Professor from 1978 to 1993. | | N/A |
Timothy J. Penny
(Born 1951) | | Trustee, since 1996; Chairman, since 2018; Vice Chairman, from 2017 to 2018 | | President and Chief Executive Officer of Southern Minnesota Initiative Foundation, anon-profit organization, since 2007. Member of the Board of Trustees of NorthStar Education Finance, Inc., anon-profit organization, since 2007. | | N/A |
James G. Polisson
(Born 1959) | | Trustee, since 2018; Advisory Board Member, from 2017 to 2018 | | Retired. Chief Marketing Officer, Source (ETF) UK Services, Ltd, from 2015 to 2017. From 2012 to 2015, Principal of The Polisson Group, LLC, a management consulting, corporate advisory and principal investing company. Chief Executive Officer and Managing Director at Russell Investments, Global Exchange Traded Funds from 2010 to 2012. Managing Director of Barclays Global Investors from 1998 to 2010 and Global Chief Marketing Officer for iShares and Barclays Global Investors from 2000 to 2010. Trustee of the San Francisco Mechanics’ Institute, anon-profit organization, from 2013 to 2015. Board member of the Russell Exchange Traded Fund Trust from 2011 to 2012. Director of Barclays Global Investors Holdings Deutschland GmbH from 2006 to 2009. Mr. Polisson is an attorney and has a retired status with the Massachusetts and District of Columbia Bar Associations. | | N/A |
Michael S. Scofield4 (Born 1943) | | Trustee, since 2010 | | Served on the Investment Company Institute’s Board of Governors and Executive Committee from 2008-2011 as well the Governing Council of the Independent Directors Council from 2006-2011 and the Independent Directors Council Executive Committee from 2008-2011. Trustee of the Evergreen Fund complex (and its predecessors) from 1984 to 2010. Chairman of the Evergreen Funds from 2000-2010. Former Trustee of the Mentor Funds. Retired Attorney, Law Offices of Michael S. Scofield. | | N/A |
Pamela Wheelock
(Born 1959) | | Trustee, since 2018; Advisory Board Member, from 2017 to 2018 | | Chief Operating Officer, Twin Cities Habitat for Humanity, since January, 2017. Vice President of University Services, University of Minnesota from 2012 to 2017. Prior thereto, on the Board of Directors, Governance Committee and Finance Committee for the Minnesota Philanthropy Partners (Saint Paul Foundation) from 2012 to 2018, Interim President and Chief Executive Officer of Blue Cross Blue Shield of Minnesota from 2010 to 2011, Chairman of the Board from 2009 to 2011 and Board Director from 2003 to 2015. Vice President, Leadership and Community Engagement, Bush Foundation, Saint Paul, Minnesota (a private foundation) from 2009 to 2011. Executive Vice President and Chief Financial Officer, Minnesota Sports and Entertainment from 2004 to 2009 and Senior Vice President from 2002 to 2004. Commissioner of Finance, State of Minnesota, from 1999 to 2002. Currently the Board Chair of the Minnesota Wild Foundation since 2010. | | N/A |
| * | Length of service dates reflect the Trustee’s commencement of service with the Trust’s predecessor entities, where applicable. |
| | | | |
| 58 | | Wells Fargo Core Bond Fund | | Other information (unaudited) |
Officers
| | | | | | |
Name and year of birth | | Position held and
length of service | | Principal occupations during past five years or longer | | |
Andrew Owen
(Born 1960) | | President, since 2017 | | Executive Vice President of Wells Fargo & Company and Head of Affiliated Managers, Wells Fargo Asset Management, since 2014. In addition, Mr. Owen is currently President, Chief Executive Officer and Director of Wells Fargo Funds Management, LLC since 2017. Prior thereto, Executive Vice President responsible for marketing, investments and product development for Wells Fargo Funds Management, LLC, from 2009 to 2014. | | |
Nancy Wiser1
(Born 1967) | | Treasurer, since 2012 | | Executive Vice President of Wells Fargo Funds Management, LLC since 2011. Chief Operating Officer and Chief Compliance Officer at LightBox Capital Management LLC, from 2008 to 2011. | | |
Alexander Kymn
(Born 1973) | | Secretary, since 2018; Chief Legal Officer, since 2018 | | Senior Company Counsel of Wells Fargo Bank, N.A. since 2018 (previously Senior Counsel from 2007 to 2018). Vice President of Wells Fargo Funds Management, LLC from 2008 to 2014. | | |
| Michael H. Whitaker(Born 1967) | | Chief Compliance Officer, since 2016 | | Senior Vice President and Chief Compliance Officer since 2016. Senior Vice President and Chief Compliance Officer for Fidelity Investments from 2007 to 2016. | | |
David Berardi
(Born 1975) | | Assistant Treasurer, since 2009 | | Vice President of Wells Fargo Funds Management, LLC since 2009. Vice President of Evergreen Investment Management Company, LLC from 2008 to 2010. Manager of Fund Reporting and Control for Evergreen Investment Management Company, LLC from 2004 to 2010. | | |
Jeremy DePalma1
(Born 1974) | | Assistant Treasurer, since 2009 | | Senior Vice President of Wells Fargo Funds Management, LLC since 2009. Senior Vice President of Evergreen Investment Management Company, LLC from 2008 to 2010 and head of the Fund Reporting and Control Team within Fund Administration from 2005 to 2010. | | |
| 1 | Nancy Wiser acts as Treasurer of 76 funds in the Fund Complex. Jeremy DePalma acts as Treasurer of 76 funds and Assistant Treasurer of 76 funds in the Fund Complex. |
| 2 | The Statement of Additional Information includes additional information about the Trustees and is available, without charge, upon request, by calling1-800-222-8222 or by visiting the website atwellsfargofunds.com. |
| 3 | Mr. Harris will replace Ms. Johnson as the Chairman of the Audit Committee effective January 1, 2019. |
| 4 | Mr. Scofield is expected to retire on December 31, 2018. |
| | | | | | |
| Appendix A (unaudited) | | Wells Fargo Core Bond Fund | | | 59 | |
SALES CHARGE REDUCTIONS AND WAIVERS FOR CERTAIN INTERMEDIARIES
Raymond James & Associates, Inc., Raymond James Financial Services & Raymond James affiliates (“Raymond James”)
Effective on or about March 1, 2019, shareholders purchasing Fund shares through a Raymond James platform or account will be eligible only for the following load waivers(front-end sales charge waivers and contingent deferred, orback-end, sales charge waivers) and discounts, which may differ from those disclosed elsewhere in the Fund’s Prospectus or SAI.
Front-end Sales Load Waivers on Class A shares Available at Raymond James
| | • | | Shares purchased in an investment advisory program. |
| | • | | Shares purchased through reinvestment of capital gains distributions and dividend reinvestment when purchasing shares of the same fund (but not any other fund within the fund family). |
| | • | | Employees and registered representatives of Raymond James or its affiliates and their family members as designated by Raymond James. |
| | • | | Shares purchased from the proceeds of redemptions within the same fund family, provided (1) the repurchase occurs within 90 days following the redemption, (2) the redemption and purchase occur in the same account, and (3) redeemed shares were subject to afront-end or deferred sales load (known as Rights of Reinstatement). |
| | • | | A shareholder in the fund’s Class C shares will have their shares automatically exchanged at net asset value to Class A shares (or the appropriate share class) of the fund if the shares are no longer subject to a CDSC and the exchange is in line with the policies and procedures of Raymond James. |
CDSC Waivers on Class A and C Shares Available at Raymond James
| | • | | Death or disability of the shareholder. |
| | • | | Shares sold as part of a systematic withdrawal plan as described in the Fund’s Prospectus. |
| | • | | Return of excess contributions from an IRA Account. |
| | • | | Shares sold as part of a required minimum distribution for IRA and retirement accounts due to the shareholder reaching age 70½ as described in the Fund’s prospectus. |
| | • | | Shares sold to pay Raymond James fees but only if the transaction is initiated by Raymond James. |
| | • | | Shares acquired through a right of reinstatement. |
Front-end Load Discounts Available at Raymond James: Breakpoints, and/or Rights of Accumulation
| | • | | Breakpoints as described in the Fund’s Prospectus. |
| | • | | Rights of accumulation which entitle shareholders to breakpoint discounts will be automatically calculated based on the aggregated holding of fund family assets held by accounts within the purchaser’s household at Raymond James. Eligible fund family assets not held at Raymond James may be included in the rights of accumulation calculation only if the shareholder notifies his or her financial advisor about such assets. |
This page is intentionally left blank.

For more information
More information about Wells Fargo Funds is available free upon request. To obtain literature, please write, visit the Fund’s website, or call:
Wells Fargo Funds
P.O. Box 219967
Kansas City, MO 64121-9967
Website: wellsfargofunds.com
Individual investors: 1-800-222-8222
Retail investment professionals: 1-888-877-9275
Institutional investment professionals: 1-866-765-0778
This report and the financial statements contained herein are submitted for the general information of the shareholders of the Fund. If this report is used for promotional purposes, distribution of the report must be accompanied or preceded by a current prospectus. Before investing, please consider the investment objectives, risks, charges, and expenses of the investment. For a current prospectus and, if available, a summary prospectus, containing this information, call1-800-222-8222 or visit the Fund’s website atwellsfargofunds.com. Read the prospectus carefully before you invest or send money.
Wells Fargo Asset Management (WFAM) is the trade name for certain investment advisory/management firms owned by Wells Fargo & Company. These firms include but are not limited to Wells Capital Management Incorporated and Wells Fargo Funds Management, LLC. Certain products managed by WFAM entities are distributed by Wells Fargo Funds Distributor, LLC (a broker/dealer and Member FINRA).
This material is for general informational and educational purposes only and is NOT intended to provide investment advice or a recommendation of any kind—including a recommendation for any specific investment, strategy, or plan.
INVESTMENT PRODUCTS: NOT FDIC INSURED ◾ NO BANK GUARANTEE ◾ MAY LOSE VALUE
© 2019 Wells Fargo Funds Management, LLC. All rights reserved.
| | |
 | | 318981 01-19 SA287/SAR287 11-18 |
Semi-Annual Report
November 30, 2018

Wells Fargo Real Return Fund

Beginning on January 1, 2021, as permitted by new regulations adopted by the Securities and Exchange Commission, paper copies of the Wells Fargo Funds’ annual and semi-annual shareholder reports issued after this date will no longer be sent by mail, unless you specifically request paper copies of the reports. Instead, the reports will be made available on the Funds’ website, and you will be notified by mail each time a report is posted and provided with a website address to access the report.
If you already elected to receive shareholder reports electronically, you will not be affected by this change and you need not take any action. You may elect to receive shareholder reports and other communications from the Fund electronically at any time by contacting your financial intermediary (such as a broker-dealer or bank) or, if you are a direct investor, by calling 1-800-222-8222 or by enrolling at wellsfargo.com/advantagedelivery.
You may elect to receive all future reports in paper free of charge. If you invest through a financial intermediary, you can contact your financial intermediary to request that you continue to receive paper copies of your shareholder reports; if you invest directly with the Fund, you can call 1-800-222-8222. Your election to receive reports in paper will apply to all Wells Fargo Funds held in your account with your financial intermediary or, if you are a direct investor, to all Wells Fargo Funds that you hold.

Reduce clutter. Save trees.
Sign up for electronic delivery of prospectuses and shareholder reports atwellsfargo.com/advantagedelivery
Contents
The views expressed and any forward-looking statements are as of November 30, 2018, unless otherwise noted, and are those of the Fund managers and/or Wells Fargo Funds Management, LLC. Discussions of individual securities, or the markets generally, or any Wells Fargo Fund are not intended as individual recommendations. Future events or results may vary significantly from those expressed in any forward-looking statements. The views expressed are subject to change at any time in response to changing circumstances in the market. Wells Fargo Funds Management, LLC and the Fund disclaim any obligation to publicly update or revise any views expressed or forward-looking statements.
INVESTMENT PRODUCTS: NOT FDIC INSURED ◾ NO BANK GUARANTEE ◾ MAY LOSE VALUE
| | | | |
| 2 | | Wells Fargo Real Return Fund | | Letter to shareholders (unaudited) |

Andrew Owen
President
Wells Fargo Funds
Global trade tensions escalated during the third quarter of 2018.
Dear Shareholder:
We are pleased to offer you this semi-annual report for the Wells Fargo Real Return Fund for the six-month period that ended November 30, 2018. During the reporting period, the U.S. generated encouraging economic and business data that was offset by less positive and more inconsistent data from international markets. Investment returns were restrained in comparison with recent periods as geopolitical tensions and uncertainty tended to distract investors from more favorable underlying trends.
For the period, U.S. stocks, as measured by the S&P 500 Index,1 gained 3.02% and international stocks, as measured by the MSCI ACWI ex USA Index (Net),2 declined 8.37%. Based on the MSCI EM Index (Net),3 emerging market stocks lost 9.89%. For bond investors, the Bloomberg Barclays U.S. Aggregate Bond Index4 declined 0.30% while the Bloomberg Barclays Global Aggregate ex-USD Index5 fell 3.67%. The Bloomberg Barclays Municipal Bond Index6 gained 0.42%. The ICE BofAML U.S. High Yield Index7 was up 0.19%.
Global trade tensions prompted investor concerns.
Global trade tensions escalated during the third quarter of 2018. The U.S. government’s decision during the second quarter to impose tariffs on a wide range of products manufactured overseas drew retaliatory responses from foreign governments, which punished U.S. commodity producers and product manufacturers. Investors were left to wonder about next steps in what appeared to be an escalating divergence in global economic policies and growth prospects.
Inflation trended higher. The CPI-U8 added 0.1% in September after an increase of 0.2% in both July and August. On a year-over-year basis, the all-items index rose 2.3% for the 12 months that ended September 30, 2018, after a seasonal adjustment. The rate of increase was slower than that recorded during the first half of 2018. The index for all items less food and energy rose 2.2% for the same 12-month period.
| 1 | The S&P 500 Index consists of 500 stocks chosen for market size, liquidity, and industry group representation. It is a market-value-weighted index with each stock’s weight in the index proportionate to its market value. You cannot invest directly in an index. |
| 2 | The Morgan Stanley Capital International (MSCI) All Country World Index (ACWI) ex USA Index (Net) is a free-float-adjusted market-capitalization-weighted index that is designed to measure the equity market performance of developed markets, excluding the U.S. and Canada. Source: MSCI. MSCI makes no express or implied warranties or representations and shall have no liability whatsoever with respect to any MSCI data contained herein. The MSCI data may not be further redistributed or used as a basis for other indices or any securities or financial products. This report is not approved, reviewed, or produced by MSCI. You cannot invest directly in an index. |
| 3 | The MSCI Emerging Markets (EM) Index (Net) is a free-float-adjusted market-capitalization-weighted index that is designed to measure large- and mid-cap equity market performance of emerging markets. The MSCI EM Index (Net) consists of the following 24 emerging market country indices: Brazil, Chile, China, Colombia, Czech Republic, Egypt, Greece, Hungary, India, Indonesia, Korea, Malaysia, Mexico, Pakistan, Peru, the Philippines, Poland, Qatar, Russia, South Africa, Taiwan, Thailand, Turkey, and the United Arab Emirates. You cannot invest directly in an index. |
| 4 | The Bloomberg Barclays U.S. Aggregate Bond Index is a broad-based benchmark that measures the investment-grade, U.S.-dollar-denominated, fixed-rate taxable bond market, including Treasuries, government-related and corporate securities, mortgage-backed securities (agency fixed-rate and hybrid adjustable-rate mortgage pass-throughs), asset-backed securities, and commercial mortgage-backed securities. You cannot invest directly in an index. |
| 5 | The Bloomberg Barclays Global Aggregate ex-USD Index is an unmanaged index that provides a broad-based measure of the global investment-grade fixed-income markets excluding the U.S.-dollar-denominated debt market. You cannot invest directly in an index. |
| 6 | The Bloomberg Barclays Municipal Bond Index is an unmanaged index composed of long-term tax-exempt bonds with a minimum credit rating of Baa. You cannot invest directly in an index. |
| 7 | The ICE BofAML U.S. High Yield Index is a market-capitalization-weighted index of domestic and Yankee high-yield bonds. The index tracks the performance of high-yield securities traded in the U.S. bond market. You cannot invest directly in an index. Copyright 2018. ICE Data Indices, LLC. All rights reserved. |
| 8 | The Consumer Price Index for All Urban Consumers (CPI-U) measures the changes in the price of a basket of goods and services purchased by urban consumers. The urban consumer population is deemed by many as a better representative measure of the general public because close to 90% of the country’s population lives in highly populated areas. You cannot invest directly in an index. |
| | | | | | |
| Letter to shareholders (unaudited) | | Wells Fargo Real Return Fund | | | 3 | |
U.S. stocks gained following positive economic data while international stocks and bonds declined.
During the summer months, the U.S. economy strengthened. Revised second-quarter gross domestic product (GDP) data released in August showed the U.S. economy growing at a 4.2% rate. The unemployment rate in the U.S. was 3.7% by the end of September, according to the U.S. Department of Labor. Wages showed more consistent growth, and consumer confidence remained strong. Several U.S. equity market indices reached records during August, with the S&P 500 Index gaining 7.20% for the three-month period that ended September 30, 2018. In contrast, the MSCI ACWI ex USA Index (Net) gained 0.71% while the MSCI EM Index (Net) declined 1.09% during the same three-month period.
In June, the Federal Reserve increased the target range for the federal funds rate to range from 1.75% to 2.00%. It raised the range again in September to range from 2.00% to 2.25%. Long-term interest rates in the U.S. remained at higher levels relative to the prior 10 years. Rates on 10-year and 30-year Treasury bonds—2.46% and 2.81%, respectively, on January 1, 2018—were 3.01% and 3.30%, respectively, on November 30, 2018. Investor concerns about an inverted yield curve reemerged, only to be replaced by concerns about the potentially negative influence of higher interest rates on economic activity.
November saw improvement in many equity markets.
As interest rates and bond yields gained during October, stock markets struggled. For the month, the S&P 500 Index fell 6.84%, the MSCI ACWI ex USA Index (Net) dropped 8.13%, and the MSCI EM Index (Net) lost 8.71%. The Bureau of Economic Analysis released its first estimate of third-quarter GDP, which, at an annualized 3.5% rate, indicated growth may be slowing compared with the second quarter. Readings on consumer sentiment and business spending were mixed. Markets rebounded somewhat in November as the S&P 500 Index gained 2.04%, the MSCI ACWI ex USA Index (Net) added 0.95%, and the MSCI EM Index (Net) was up 4.12% as the uncertainty leading up to midterm elections in the U.S. was resolved and progress seemed to be possible on several international trade issues.
Economic signals overseas were mixed as the third quarter ended and the fourth quarter began. In early August, the Bank of England’s Monetary Policy Committee increased its key interest rate to 0.75%. The European Central Bank and the Bank of Japan maintained low interest rates and accommodative monetary policies. Amid rising trade uncertainty, the People’s Bank of China cut reserve requirement ratios and accelerated infrastructure spending and tax cuts for business enterprises and individuals. Nevertheless, a strengthening U.S. dollar and the trade tensions remained headwinds for investors overseas.
Don’t let short-term uncertainty derail long-term investment goals.
Periods of investment uncertainty can present challenges, but experience has taught us that maintaining long-term investment goals can be an effective way to plan for the future. To help you create a sound strategy based on your personal goals and risk tolerance, Wells Fargo Funds offers more than 100 mutual funds spanning a wide range of asset classes and investment styles. Although diversification cannot guarantee an investment profit or prevent losses, we believe it can be an effective way to manage investment risk and potentially smooth out overall portfolio performance. We encourage investors to know their investments and to understand that appropriate levels of risk-taking may unlock opportunities.
Economic signals overseas were mixed as the third quarter ended and the fourth quarter began.
| | | | |
| 4 | | Wells Fargo Real Return Fund | | Letter to shareholders (unaudited) |
Thank you for choosing to invest with Wells Fargo Funds. We appreciate your confidence in us and remain committed to helping you meet your financial needs.
Sincerely,

Andrew Owen
President
Wells Fargo Funds
Notice to shareholders
At a meeting held on August 14-15, 2018, the Board of Trustees of the Fund approved the following policy which will be effective on or about February 5, 2019:
Class C shares will convert automatically into Class A shares ten years after the initial date of purchase or, if you acquired your Class C shares through an exchange or conversion from another share class, ten years after the date you acquired your Class C shares. When Class C shares that you acquired through a purchase or exchange convert, any other Class C shares that you purchased with reinvested dividends and distributions also will convert into Class A shares on a pro rata basis. A shorter holding period may also apply depending on your intermediary. Please see “Appendix A—Sales Charge Reductions and Waivers for Certain Intermediaries” in the Fund’s prospectus or at the end of this report.
For further information about your Fund, contact your investment professional, visit our website atwellsfargofunds.com, or call us directly at1-800-222-8222.
This page is intentionally left blank.
| | | | |
| 6 | | Wells Fargo Real Return Fund1 | | Performance highlights (unaudited) |
Investment objective
The Fund seeks returns that exceed the rate of inflation over the long-term.
Manager
Wells Fargo Funds Management, LLC
Subadviser for the affiliated master portfolio
Wells Capital Management Incorporated
Portfolio managers
Kandarp R. Acharya, CFA®‡, FRM
Petros N. Bocray, CFA®‡, FRM
Michael Bradshaw, CFA®‡
Christian L. Chan, CFA®‡
Kayvan Malek
Ann M. Miletti
Jay N. Mueller, CFA®‡
Thomas M. Price, CFA®‡
Dale Winner, CFA®‡
Average annual total returns (%) as of November 30, 20182
| | | | | | | | | | | | | | | | | | | | | | | | | | | | | | | | | | |
| | | | | Including sales charge | | | Excluding sales charge | | | Expense ratios3 (%) | |
| | | Inception date | | 1 year | | | 5 year | | | 10 year | | | 1 year | | | 5 year | | | 10 year | | | Gross | | | Net4 | |
| Class A (IPBAX) | | 2-28-2003 | | | (5.84 | ) | | | 0.57 | | | | 3.24 | | | | (1.41 | ) | | | 1.50 | | | | 3.71 | | | | 1.04 | | | | 0.78 | |
| Class C (IPBCX) | | 2-28-2003 | | | (3.23 | ) | | | 0.72 | | | | 2.97 | | | | (2.23 | ) | | | 0.72 | | | | 2.97 | | | | 1.79 | | | | 1.53 | |
| Class R6 (IPBJX) | | 10-31-2016 | | | – | | | | – | | | | – | | | | (1.01 | ) | | | 1.81 | | | | 4.03 | | | | 0.66 | | | | 0.40 | |
| Administrator Class (IPBIX) | | 2-28-2003 | | | – | | | | – | | | | – | | | | (1.33 | ) | | | 1.73 | | | | 3.99 | | | | 0.98 | | | | 0.60 | |
| Institutional Class (IPBNX) | | 10-31-2016 | | | – | | | | – | | | | – | | | | (1.16 | ) | | | 1.79 | | | | 4.02 | | | | 0.71 | | | | 0.45 | |
| Bloomberg Barclays U.S. TIPS Index5 | | – | | | – | | | | – | | | | – | | | | (0.90 | ) | | | 1.28 | | | | 4.09 | | | | – | | | | – | |
| CPI6 | | – | | | – | | | | – | | | | – | | | | 2.18 | | | | 1.58 | | | | 1.72 | | | | – | | | | – | |
Figures quoted represent past performance, which is no guarantee of future results, and do not reflect taxes that a shareholder may pay on fund distributions or the redemption of fund shares. Investment return and principal value of an investment will fluctuate so that an investor’s shares, when redeemed, may be worth more or less than their original cost. Performance shown without sales charges would be lower if sales charges were reflected. Current performance may be lower or higher than the performance data quoted, which assumes the reinvestment of dividends and capital gains. Current month-end performance is available on the Fund’s website, wellsfargofunds.com.
Index returns do not include transaction costs associated with buying and selling securities, any mutual fund fees or expenses, or any taxes. It is not possible to invest directly in an index.
For Class A shares, the maximum front-end sales charge is 4.50%. For Class C shares, the maximum contingent deferred sales charge is 1.00%. Performance including a contingent deferred sales charge assumes the sales charge for the corresponding time period. Class R6, Administrator Class, and Institutional Class shares are sold without a front-end sales charge or contingent deferred sales charge.
Bond values fluctuate in response to the financial condition of individual issuers, general market and economic conditions, and changes in interest rates. Changes in market conditions and government policies may lead to periods of heightened volatility in the bond market and reduced liquidity for certain bonds held by the Fund. In general, when interest rates rise, bond values fall and investors may lose principal value. Interest rate changes and their impact on the Fund and its share price can be sudden and unpredictable. Stock values fluctuate in response to the activities of individual companies and general market and economic conditions. High-yield securities have a greater risk of default and tend to be more volatile than higher-rated debt securities. Loans are subject to risks similar to those associated with other below investment-grade bond investments, such as credit risk (for example, risk of issuer default), below-investment-grade bond risk (for example, risk of greater volatility in value), and risk that the loan may become illiquid or difficult to price. The use of derivatives may reduce returns and/or increase volatility. Foreign investments are especially volatile and can rise or fall dramatically due to differences in the political and economic conditions of the host country. These risks are generally intensified in emerging markets. The Fund is exposed to mortgage- and asset-backed securities risk and small company securities risk. Securities issued by U.S. government agencies or government-sponsored entities may not be guaranteed by the U.S. Treasury. Consult the Fund’s prospectus for additional information on these and other risks.
Please see footnotes on page 7.
| | | | | | |
| Performance highlights (unaudited) | | Wells Fargo Real Return Fund | | | 7 | |
| | | | |
| Ten largest holdings (%) as of November 30, 20187 | |
TIPS, 0.63%, 1-15-2024 | �� | | 2.92 | |
TIPS, 0.38%, 7-15-2023 | | | 2.91 | |
TIPS, 0.13%, 1-15-2023 | | | 2.90 | |
TIPS, 0.38%, 7-15-2025 | | | 2.83 | |
TIPS, 0.13%, 1-15-2022 | | | 2.83 | |
TIPS, 0.25%, 1-15-2025 | | | 2.81 | |
TIPS, 0.13%, 7-15-2024 | | | 2.80 | |
TIPS, 0.13%, 4-15-2020 | | | 2.70 | |
TIPS, 0.63%, 7-15-2021 | | | 2.61 | |
TIPS, 0.63%, 1-15-2026 | | | 2.51 | |
|
| Portfolio allocation as of November 30, 20188 |
|
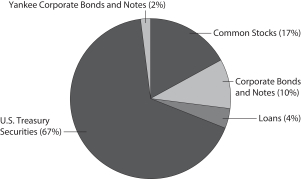 |
| ‡ | CFA® and Chartered Financial Analyst® are trademarks owned by CFA Institute. |
| 1 | The Fund is a gateway feeder fund that invests substantially all of its assets in a single affiliated master portfolio of the Wells Fargo Master Trust with a substantially identical investment objective and substantially similar investment strategies. References to the investment activities of the Fund are intended to refer to the investment activities of the affiliated master portfolio in which it invests. |
| 2 | Historical performance shown for the Class R6 shares prior to their inception reflects the performance of the Administrator Class shares, and is not adjusted to reflect Class R6 expenses. If these expenses had been included, returns for Class R6 shares would be higher. Historical performance shown for the Institutional Class shares prior to their inception reflects the performance of the Administrator Class shares, and is not adjusted to reflect Institutional Class expenses. If these expenses had not been included, returns for the Institutional Class shares would be higher. |
| 3 | Reflects the expense ratios as stated in the most recent prospectuses. The expense ratios shown are subject to change and may differ from the annualized expense ratios shown in the financial highlights of this report. |
| 4 | The manager has contractually committed through September 30, 2019, to waive fees and/or reimburse expenses to the extent necessary to cap the Fund’s Total Annual Fund Operating Expenses After Fee Waivers at the amounts shown. After this time, the cap may be increased or the commitment to maintain the cap may be terminated only with the approval of the Board of Trustees. Brokerage commissions, stamp duty fees, interest, taxes, acquired fund fees and expenses (if any) from funds in which the underlying affiliated master portfolio invests, and extraordinary expenses are excluded from the expense cap. Net expenses from the affiliated master portfolio are included in the expense cap. Without this cap, the Fund’s returns would have been lower. The expense ratio paid by an investor is the net expense ratio (the total annual fund operating expenses after fee waivers) as stated in the prospectuses. |
| 5 | The Bloomberg Barclays U.S. Treasury Inflation-Protected Securities (TIPS) Index is an index of inflation-indexed-linked U.S. Treasury securities. You cannot invest directly in an index. |
| 6 | The Consumer Price Index (CPI) for All Urban Consumers in U.S. is a measure of the average change over time in the prices paid by urban consumers for a market basket of consumer goods and services. You cannot invest directly in an index. |
| 7 | The ten largest holdings, excluding cash, cash equivalents and any money market funds, are calculated based on the value of the securities of the affiliated master portfolio allocable to the Fund divided by the total net assets of the Fund. Holdings are subject to change and may have changed since the date specified. |
| 8 | Amounts represent the portfolio allocation of the affiliated master portfolio which are calculated based on the total long-term investments of the affiliated master portfolio. These amounts are subject to change and may have changed since the date specified. |
| | | | |
| 8 | | Wells Fargo Real Return Fund | | Fund expenses (unaudited) |
As a shareholder of the Fund, you incur two types of costs: (1) transaction costs, including sales charges (loads) on purchase payments and contingent deferred sales charges (if any) on redemptions and (2) ongoing costs, including management fees, distribution (12b-1) and/or shareholder servicing fees, and other Fund expenses. This example is intended to help you understand your ongoing costs (in dollars) of investing in the Fund and to compare these costs with the ongoing costs of investing in other mutual funds.
The example is based on an investment of $1,000 invested at the beginning of the six-month period and held for the entire period from June 1, 2018 to November 30, 2018.
Actual expenses
The “Actual” line of the table below provides information about actual account values and actual expenses. You may use the information in this line, together with the amount you invested, to estimate the expenses that you paid over the period. Simply divide your account value by $1,000 (for example, an $8,600 account value divided by $1,000 = 8.6), then multiply the result by the number in the “Actual” line under the heading entitled “Expenses paid during period” for your applicable class of shares to estimate the expenses you paid on your account during this period.
Hypothetical example for comparison purposes
The “Hypothetical” line of the table below provides information about hypothetical account values and hypothetical expenses based on the Fund’s actual expense ratio and an assumed rate of return of 5% per year before expenses, which is not the Fund’s actual return. The hypothetical account values and expenses may not be used to estimate the actual ending account balance or expenses you paid for the period. You may use this information to compare the ongoing costs of investing in the Fund and other funds. To do so, compare this 5% hypothetical example with the 5% hypothetical examples that appear in the shareholder reports of the other funds.
Please note that the expenses shown in the table are meant to highlight your ongoing costs only and do not reflect any transactional costs, such as sales charges (loads) and contingent deferred sales charges. Therefore, the “Hypothetical” line of the table is useful in comparing ongoing costs only and will not help you determine the relative total costs of owning different funds. In addition, if these transactional costs were included, your costs would have been higher.
| | | | | | | | | | | | | | | | |
| | | Beginning account value 6-1-2018 | | | Ending account value 11-30-2018 | | | Expenses paid during the period1,2 | | | Annualized net expense ratio1 | |
Class A | | | | | | | | | | | | | | | | |
Actual | | $ | 1,000.00 | | | $ | 982.75 | | | $ | 3.88 | | | | 0.78 | % |
Hypothetical (5% return before expenses) | | $ | 1,000.00 | | | $ | 1,021.16 | | | $ | 3.95 | | | | 0.78 | % |
Class C | | | | | | | | | | | | | | | | |
Actual | | $ | 1,000.00 | | | $ | 978.79 | | | $ | 7.59 | | | | 1.53 | % |
Hypothetical (5% return before expenses) | | $ | 1,000.00 | | | $ | 1,017.40 | | | $ | 7.74 | | | | 1.53 | % |
Class R6 | | | | | | | | | | | | | | | | |
Actual | | $ | 1,000.00 | | | $ | 984.86 | | | $ | 1.99 | | | | 0.40 | % |
Hypothetical (5% return before expenses) | | $ | 1,000.00 | | | $ | 1,023.06 | | | $ | 2.03 | | | | 0.40 | % |
Administrator Class | | | | | | | | | | | | | | | | |
Actual | | $ | 1,000.00 | | | $ | 983.17 | | | $ | 2.98 | | | | 0.60 | % |
Hypothetical (5% return before expenses) | | $ | 1,000.00 | | | $ | 1,022.06 | | | $ | 3.04 | | | | 0.60 | % |
Institutional Class | | | | | | | | | | | | | | | | |
Actual | | $ | 1,000.00 | | | $ | 983.61 | | | $ | 2.24 | | | | 0.45 | % |
Hypothetical (5% return before expenses) | | $ | 1,000.00 | | | $ | 1,022.81 | | | $ | 2.28 | | | | 0.45 | % |
| 1 | Amounts reflect net expenses allocated from the affiliated Master Portfolio in which the Fund invests. |
| 2 | Expenses paid is equal to the annualized net expense ratio of each class multiplied by the average account value over the period, multiplied by the number of days in the most recent fiscal half-year divided by the number of days in the fiscal year (to reflect the one-half-year period). |
| | | | | | |
| Portfolio of investments—November 30, 2018 (unaudited) | | Wells Fargo Real Return Fund | | | 9 | |
| | | | | | | | | | | | | | | | |
| Security name | | | | | | | | | | | Value | |
| | | | |
Investment Companies: 100.07% | | | | | | | | | | | | | | | | |
| | | | |
| Affiliated Master Portfolio: 100.07% | | | | | | | | | | | | | | | | |
Wells Fargo Real Return Portfolio | | | | | | | | | | | | | | $ | 66,683,186 | |
| | | | | | | | | | | | | | | | |
| | | | |
Total Investment Companies (Cost $65,377,636) | | | | | | | | | | | | | | | 66,683,186 | |
| | | | | | | | | | | | | | | | |
| | | | | | | | |
| Total investments in securities (Cost $65,377,636) | | | 100.07 | % | | | 66,683,186 | |
Other assets and liabilities, net | | | (0.07 | ) | | | (44,348 | ) |
| | | | | | | | |
| Total net assets | | | 100.00 | % | | $ | 66,638,838 | |
| | | | | | | | |
Transactions with the affiliated Master Portfolio were as follows:
| | | | | | | | | | | | | | | | | | | | | | | | | | | | | | | | | | | | |
| | | % of ownership, beginning of period | | | % of ownership, end of period | | | Net realized gains (losses) on securities transactions allocated from affiliated Master Portfolio | | | Net change in unrealized gains (losses) on securities transactions allocated from affiliated Master Portfolio | | | Interest allocated from affiliated Master Portfolio | | | Dividends allocated from affiliated Master Portfolio | | | Affiliated income allocated from affiliated Master Portfolio | | | Value, end of period | | | % of net assets | |
Wells Fargo Real Return Portfolio | | | 53 | % | | | 33 | % | | $ | (600,125 | ) | | $ | (1,442,979 | ) | | $ | 926,525 | | | $ | 141,005 | | | $ | 10,684 | | | $ | 66,683,186 | | | | 100.07 | % |
The accompanying notes are an integral part of these financial statements.
| | | | |
| 10 | | Wells Fargo Real Return Fund | | Statement of assets and liabilities—November 30, 2018 (unaudited) |
| | | | |
| | | | |
| |
Assets | | | | |
Investments in affiliated Master Portfolio, at value (cost $65,377,636) | | $ | 66,683,186 | |
Receivable for Fund shares sold | | | 45,416 | |
Receivable from manager | | | 14,037 | |
Prepaid expenses and other assets | | | 243,444 | |
| | | | |
Total assets | | | 66,986,083 | |
| | | | |
| |
Liabilities | | | | |
Payable for Fund shares redeemed | | | 334,979 | |
Administration fees payable | | | 6,335 | |
Trustees’ fees and expenses payable | | | 3,657 | |
Distribution fee payable | | | 2,274 | |
| | | | |
Total liabilities | | | 347,245 | |
| | | | |
Total net assets | | $ | 66,638,838 | |
| | | | |
| |
NET ASSETS CONSIST OF | | | | |
Paid-in capital | | $ | 68,293,050 | |
Total distributable loss | | | (1,654,212 | ) |
| | | | |
Total net assets | | $ | 66,638,838 | |
| | | | |
| |
COMPUTATION OF NET ASSET VALUE AND OFFERING PRICE PER SHARE | | | | |
Net assets – Class A | | $ | 21,914,470 | |
Shares outstanding – Class A1 | | | 2,290,903 | |
Net asset value per share – Class A | | | $9.57 | |
Maximum offering price per share – Class A2 | | | $10.02 | |
Net assets – Class C | | $ | 3,476,545 | |
Shares outstanding – Class C1 | | | 368,633 | |
Net asset value per share – Class C | | | $9.43 | |
Net assets – Class R6 | | $ | 11,947,056 | |
Shares outstanding – Class R61 | | | 1,237,002 | |
Net asset value per share – Class R6 | | | $9.66 | |
Net assets – Administrator Class | | $ | 15,248,913 | |
Shares outstanding – Administrator Class1 | | | 1,573,390 | |
Net asset value per share – Administrator Class | | | $9.69 | |
Net assets – Institutional Class | | $ | 14,051,854 | |
Shares outstanding – Institutional Class1 | | | 1,454,294 | |
Net asset value per share – Institutional Class | | | $9.66 | |
| 1 | The Fund has an unlimited number of authorized shares. |
| 2 | Maximum offering price is computed as 100/95.50 of net asset value. On investments of $50,000 or more, the offering price is reduced. |
The accompanying notes are an integral part of these financial statements.
| | | | | | |
| Statement of operations—six months ended November 30, 2018 (unaudited) | | Wells Fargo Real Return Fund | | | 11 | |
| | | | |
| | | | |
| |
Investment income | | | | |
Interest allocated from affiliated Master Portfolio | | $ | 926,525 | |
Dividends allocated from affiliated Master Portfolio (net of foreign withholding taxes of $3,699) | | | 141,005 | |
Affiliated income allocated from affiliated Master Portfolio | | | 10,684 | |
Expenses allocated from affiliated Master Portfolio | | | (162,758 | ) |
Waivers allocated from affiliated Master Portfolio | | | 16,486 | |
| | | | |
Total investment income | | | 931,942 | |
| | | | |
| |
Expenses | | | | |
Management fee | | | 18,330 | |
Administration fees | | | | |
Class A | | | 19,378 | |
Class C | | | 2,899 | |
Class R6 | | | 1,778 | |
Administrator Class | | | 9,625 | |
Institutional Class | | | 5,750 | |
Shareholder servicing fees | | | | |
Class A | | | 30,278 | |
Class C | | | 4,529 | |
Administrator Class | | | 24,061 | |
Distribution fee | | | | |
Class C | | | 13,587 | |
Custody and accounting fees | | | 6,042 | |
Professional fees | | | 15,304 | |
Registration fees | | | 28,089 | |
Shareholder report expenses | | | 185 | |
Trustees’ fees and expenses | | | 11,867 | |
Other fees and expenses | | | 953 | |
| | | | |
Total expenses | | | 192,655 | |
Less: Fee waivers and/or expense reimbursements | | | (102,947 | ) |
| | | | |
Net expenses | | | 89,708 | |
| | | | |
Net investment income | | | 842,234 | |
| | | | |
| |
REALIZED AND UNREALIZED GAINS (LOSSES) ON INVESTMENTS | | | | |
Net realized losses on securities transactions allocated from affiliated Master Portfolio | | | (600,125 | ) |
Net change in unrealized gains (losses) on securities transactions allocated from affiliated Master Portfolio | | | (1,442,979 | ) |
| | | | |
Net realized and unrealized gains (losses) on investments | | | (2,043,104 | ) |
| | | | |
Net decrease in net assets resulting from operations | | $ | (1,200,870 | ) |
| | | | |
The accompanying notes are an integral part of these financial statements.
| | | | |
| 12 | | Wells Fargo Real Return Fund | | Statement of changes in net assets |
| | | | | | | | | | | | | | | | |
| | | Six months ended
November 30, 2018 (unaudited) | | | Year ended
May 31, 20181 | |
| | | | |
Operations | | | | | | | | | | | | | | | | |
Net investment income | | | | | | $ | 842,234 | | | | | | | $ | 1,558,167 | |
Net realized gains (losses) on investments | | | | | | | (600,125 | ) | | | | | | | 225,688 | |
Net change in unrealized gains (losses) on investments | | | | | | | (1,442,979 | ) | | | | | | | (853,775 | ) |
| | | | |
Net increase (decrease) in net assets resulting from operations | | | | | | | (1,200,870 | ) | | | | | | | 930,080 | |
| | | | |
| | | | |
Distributions to shareholders from net investment income and net realized gains | | | | | | | | | | | | | | | | |
Class A | | | | | | | (318,216 | ) | | | | | | | (582,466 | ) |
Class C | | | | | | | (35,611 | ) | | | | | | | (55,795 | ) |
Class R6 | | | | | | | (177,999 | ) | | | | | | | (290,979 | ) |
Administrator Class | | | | | | | (253,872 | ) | | | | | | | (468,083 | ) |
Institutional Class | | | | | | | (214,635 | ) | | | | | | | (187,449 | ) |
| | | | |
Total distributions to shareholders | | | | | | | (1,000,333 | ) | | | | | | | (1,584,772 | ) |
| | | | |
| | | | |
Capital share transactions | | | Shares | | | | | | | | Shares | | | | | |
Proceeds from shares sold | | | | | | | | | | | | | | | | |
Class A | | | 289,350 | | | | 2,822,871 | | | | 1,095,946 | | | | 10,872,363 | |
Class C | | | 101,609 | | | | 979,316 | | | | 43,761 | | | | 428,445 | |
Class R6 | | | 90,496 | | | | 888,434 | | | | 459,934 | | | | 4,603,532 | |
Administrator Class | | | 263,109 | | | | 2,610,423 | | | | 1,231,825 | | | | 12,417,678 | |
Institutional Class | | | 573,864 | | | | 5,687,143 | | | | 946,110 | | | | 9,485,356 | |
| | | | |
| | | | | | | 12,988,187 | | | | | | | | 37,807,374 | |
| | | | |
Reinvestment of distributions | | | | | | | | | | | | | | | | |
Class A | | | 22,755 | | | | 222,253 | | | | 43,842 | | | | 435,779 | |
Class C | | | 3,324 | | | | 32,045 | | | | 5,160 | | | | 50,665 | |
Class R6 | | | 7,277 | | | | 71,655 | | | | 23,584 | | | | 236,978 | |
Administrator Class | | | 25,477 | | | | 252,231 | | | | 44,920 | | | | 451,385 | |
Institutional Class | | | 21,693 | | | | 213,853 | | | | 18,407 | | | | 184,327 | |
| | | | |
| | | | | | | 792,037 | | | | | | | | 1,359,134 | |
| | | | |
Payment for shares redeemed | | | | | | | | | | | | | | | | |
Class A | | | (669,203 | ) | | | (6,535,981 | ) | | | (1,472,315 | ) | | | (14,617,222 | ) |
Class C | | | (97,640 | ) | | | (937,240 | ) | | | (153,785 | ) | | | (1,504,494 | ) |
Class R6 | | | (40,025 | ) | | | (397,291 | ) | | | (44,403 | ) | | | (444,996 | ) |
Administrator Class | | | (1,050,523 | ) | | | (10,411,460 | ) | | | (1,534,899 | ) | | | (15,428,057 | ) |
Institutional Class | | | (356,170 | ) | | | (3,498,922 | ) | | | (269,640 | ) | | | (2,701,769 | ) |
| | | | |
| | | | | | | (21,780,894 | ) | | | | | | | (34,696,538 | ) |
| | | | |
Net increase (decrease) in net assets resulting from capital share transactions | | | | | | | (8,000,670 | ) | | | | | | | 4,469,970 | |
| | | | |
Total increase (decrease) in net assets | | | | | | | (10,201,873 | ) | | | | | | | 3,815,278 | |
| | | | |
| | | | |
Net assets | | | | | | | | | | | | | | | | |
Beginning of period | | | | | | | 76,840,711 | | | | | | | | 73,025,433 | |
| | | | |
End of period | | | | | | $ | 66,638,838 | | | | | | | $ | 76,840,711 | |
| | | | |
| 1 | Effective for all filings after November 4, 2018, the SEC prospectively eliminated the requirements to parenthetically disclose undistributed net investment income at the end of the period and permitted the aggregation of distributions, with the exception of tax basis returns of capital. Undistributed net investment income at May 31, 2018 was $231,384. The disaggregated distributions information for the year ended May 31, 2018 is included in Note 7,Distributions to Shareholders,in the notes to the financial statements. |
The accompanying notes are an integral part of these financial statements.
| | | | | | |
| Financial highlights | | Wells Fargo Real Return Fund | | | 13 | |
(For a share outstanding throughout each period)
| | | | | | | | | | | | | | | | | | | | | | | | |
| | | Six months ended
November 30, 2018 (unaudited) | | | Year ended May 31 | |
| CLASS A | | 2018 | | | 2017 | | | 2016 | | | 2015 | | | 2014 | |
Net asset value, beginning of period | | | $9.87 | | | | $9.96 | | | | $9.95 | | | | $10.07 | | | | $10.11 | | | | $10.85 | |
Net investment income | | | 0.10 | | | | 0.21 | | | | 0.19 | 1 | | | 0.10 | 1 | | | 0.05 | 1 | | | 0.10 | 1 |
Net realized and unrealized gains (losses) on investments | | | (0.27 | ) | | | (0.09 | ) | | | 0.03 | | | | (0.01 | ) | | | 0.07 | | | | (0.21 | ) |
| | | | | | | | | | | | | | | | | | | | | | | | |
Total from investment operations | | | (0.17 | ) | | | 0.12 | | | | 0.22 | | | | 0.09 | | | | 0.12 | | | | (0.11 | ) |
Distributions to shareholders from | | | | | | | | | | | | | | | | | | | | | | | | |
Net investment income | | | (0.13 | ) | | | (0.21 | ) | | | (0.20 | ) | | | (0.07 | ) | | | (0.08 | ) | | | (0.09 | ) |
Net realized gain | | | 0.00 | | | | 0.00 | | | | (0.01 | ) | | | (0.14 | ) | | | (0.08 | ) | | | (0.54 | ) |
| | | | | | | | | | | | | | | | | | | | | | | | |
Total distributions to shareholders | | | (0.13 | ) | | | (0.21 | ) | | | (0.21 | ) | | | (0.21 | ) | | | (0.16 | ) | | | (0.63 | ) |
Net asset value, end of period | | | $9.57 | | | | $9.87 | | | | $9.96 | | | | $9.95 | | | | $10.07 | | | | $10.11 | |
Total return2 | | | (1.73 | )% | | | 1.25 | % | | | 2.23 | % | | | 1.01 | % | | | 1.24 | % | | | (0.76 | )% |
Ratios to average net assets (annualized) | | | | | | | | | | | | | | | | | | | | | | | | |
Gross expenses3 | | | 1.03 | % | | | 1.04 | % | | | 1.11 | % | | | 1.20 | % | | | 1.31 | % | | | 1.20 | % |
Net expenses3 | | | 0.78 | % | | | 0.80 | % | | | 0.85 | % | | | 0.85 | % | | | 0.85 | % | | | 0.85 | % |
Net investment income3 | | | 2.16 | % | | | 2.15 | % | | | 1.92 | % | | | 0.98 | % | | | 0.47 | % | | | 0.96 | % |
Supplemental data | | | | | | | | | | | | | | | | | | | | | | | | |
Portfolio turnover rate4 | | | 16 | % | | | 29 | % | | | 25 | % | | | 29 | % | | | 57 | % | | | 9 | % |
Net assets, end of period (000s omitted) | | | $21,914 | | | | $26,133 | | | | $29,678 | | | | $18,938 | | | | $12,977 | | | | $15,415 | |
| 1 | Calculated based upon average shares outstanding |
| 2 | Total return calculations do not include any sales charges. Returns for periods of less than one year are not annualized. |
| 3 | Ratios include net expenses allocated from the affiliated Master Portfolio which were as follows: |
| | | | |
Six months ended November 30, 2018 (unaudited) | | | 0.40 | % |
Year ended May 31, 2018 | | | 0.41 | % |
Year ended May 31, 2017 | | | 0.44 | % |
Year ended May 31, 2016 | | | 0.44 | % |
Year ended May 31, 2015 | | | 0.44 | % |
Year ended May 31, 2014 | | | 0.44 | % |
| 4 | Portfolio turnover rate is calculated by multiplying the affiliated Master Portfolio’s percentage of the Fund’s total investments in securities at the end of the period by the affiliated Master Portfolio’s portfolio turnover rate. |
The accompanying notes are an integral part of these financial statements.
| | | | |
| 14 | | Wells Fargo Real Return Fund | | Financial highlights |
(For a share outstanding throughout each period)
| | | | | | | | | | | | | | | | | | | | | | | | |
| | | Six months ended
November 30, 2018 (unaudited) | | | Year ended May 31 | |
| CLASS C | | 2018 | | | 2017 | | | 2016 | | | 2015 | | | 2014 | |
Net asset value, beginning of period | | | $9.73 | | | | $9.82 | | | | $9.77 | | | | $9.92 | | | | $10.00 | | | | $10.76 | |
Net investment income (loss) | | | 0.08 | | | | 0.03 | | | | 0.04 | | | | 0.03 | 1 | | | (0.03 | )1 | | | 0.03 | 1 |
Net realized and unrealized gains (losses) on investments | | | (0.28 | ) | | | 0.02 | | | | 0.10 | | | | (0.02 | ) | | | 0.08 | | | | (0.21 | ) |
| | | | | | | | | | | | | | | | | | | | | | | | |
Total from investment operations | | | (0.20 | ) | | | 0.05 | | | | 0.14 | | | | 0.01 | | | | 0.05 | | | | (0.18 | ) |
Distributions to shareholders from | | | | | | | | | | | | | | | | | | | | | | | | |
Net investment income | | | (0.10 | ) | | | (0.14 | ) | | | (0.08 | ) | | | (0.02 | ) | | | (0.05 | ) | | | (0.04 | ) |
Net realized gain | | | 0.00 | | | | 0.00 | | | | (0.01 | ) | | | (0.14 | ) | | | (0.08 | ) | | | (0.54 | ) |
| | | | | | | | | | | | | | | | | | | | | | | | |
Total distributions to shareholders | | | (0.10 | ) | | | (0.14 | ) | | | (0.09 | ) | | | (0.16 | ) | | | (0.13 | ) | | | (0.58 | ) |
Net asset value, end of period | | | $9.43 | | | | $9.73 | | | | $9.82 | | | | $9.77 | | | | $9.92 | | | | $10.00 | |
Total return2 | | | (2.12 | )% | | | 0.53 | % | | | 1.44 | % | | | 0.21 | % | | | 0.46 | % | | | (1.46 | )% |
Ratios to average net assets (annualized) | | | | | | | | | | | | | | | | | | | | | | | | |
Gross expenses3 | | | 1.78 | % | | | 1.79 | % | | | 1.86 | % | | | 1.95 | % | | | 2.06 | % | | | 1.95 | % |
Net expenses3 | | | 1.53 | % | | | 1.56 | % | | | 1.60 | % | | | 1.60 | % | | | 1.60 | % | | | 1.60 | % |
Net investment income (loss)3 | | | 1.37 | % | | | 1.39 | % | | | 1.23 | % | | | 0.30 | % | | | (0.33 | )% | | | 0.29 | % |
Supplemental data | | | | | | | | | | | | | | | | | | | | | | | | |
Portfolio turnover rate4 | | | 16 | % | | | 29 | % | | | 25 | % | | | 29 | % | | | 57 | % | | | 9 | % |
Net assets, end of period (000s omitted) | | | $3,477 | | | | $3,517 | | | | $4,580 | | | | $5,654 | | | | $7,471 | | | | $9,095 | |
| 1 | Calculated based upon average shares outstanding |
| 2 | Total return calculations do not include any sales charges. Returns for periods of less than one year are not annualized. |
| 3 | Ratios include net expenses allocated from the affiliated Master Portfolio which were as follows: |
| | | | |
Six months ended November 30, 2018 (unaudited) | | | 0.40 | % |
Year ended May 31, 2018 | | | 0.41 | % |
Year ended May 31, 2017 | | | 0.44 | % |
Year ended May 31, 2016 | | | 0.44 | % |
Year ended May 31, 2015 | | | 0.44 | % |
Year ended May 31, 2014 | | | 0.44 | % |
| 4 | Portfolio turnover rate is calculated by multiplying the affiliated Master Portfolio’s percentage of the Fund’s total investments in securities at the end of the period by the affiliated Master Portfolio’s portfolio turnover rate. |
The accompanying notes are an integral part of these financial statements.
| | | | | | |
| Financial highlights | | Wells Fargo Real Return Fund | | | 15 | |
(For a share outstanding throughout each period)
| | | | | | | | | | | | |
| | | Six months ended
November 30, 2018 (unaudited) | | | Year ended May 31 | |
| CLASS R6 | | 2018 | | | 20171 | |
Net asset value, beginning of period | | | $9.96 | | | | $10.05 | | | | $10.17 | |
Net investment income | | | 0.13 | 2 | | | 0.22 | | | | 0.10 | |
Net realized and unrealized gains (losses) on investments | | | (0.28 | ) | | | (0.06 | ) | | | (0.07 | ) |
| | | | | | | | | | | | |
Total from investment operations | | | (0.15 | ) | | | 0.16 | | | | 0.03 | |
Distributions to shareholders from | | | | | | | | | | | | |
Net investment income | | | (0.15 | ) | | | (0.25 | ) | | | (0.14 | ) |
Net realized gain | | | 0.00 | | | | 0.00 | | | | (0.01 | ) |
| | | | | | | | | | | | |
Total distributions to shareholders | | | (0.15 | ) | | | (0.25 | ) | | | (0.15 | ) |
Net asset value, end of period | | | $9.66 | | | | $9.96 | | | | $10.05 | |
Total return3 | | | (1.51 | )% | | | 1.63 | % | | | 0.36 | % |
Ratios to average net assets (annualized) | | | | | | | | | | | | |
Gross expenses4 | | | 0.65 | % | | | 0.66 | % | | | 0.69 | % |
Net expenses4 | | | 0.40 | % | | | 0.42 | % | | | 0.47 | % |
Net investment income4 | | | 2.50 | % | | | 2.52 | % | | | 1.32 | % |
Supplemental data | | | | | | | | | | | | |
Portfolio turnover rate5 | | | 16 | % | | | 29 | % | | | 25 | % |
Net assets, end of period (000s omitted) | | | $11,947 | | | | $11,750 | | | | $7,438 | |
| 1 | For the period from October 31, 2016 (commencement of class operations) to May 31, 2017 |
| 2 | Calculated based upon average shares outstanding |
| 3 | Returns for periods of less than one year are not annualized. |
| 4 | Ratios include net expenses allocated from the affiliated Master Portfolio which were as follows: |
| | | | |
Six months ended November 30, 2018 (unaudited) | | | 0.40 | % |
Year ended May 31, 2018 | | | 0.41 | % |
Year ended May 31, 20171 | | | 0.44 | % |
| 5 | Portfolio turnover rate is calculated by multiplying the affiliated Master Portfolio’s percentage of the Fund’s total investments in securities at the end of the period by the affiliated Master Portfolio’s portfolio turnover rate. |
The accompanying notes are an integral part of these financial statements.
| | | | |
| 16 | | Wells Fargo Real Return Fund | | Financial highlights |
(For a share outstanding throughout each period)
| | | | | | | | | | | | | | | | | | | | | | | | |
| | | Six months ended
November 30, 2018 (unaudited) | | | Year ended May 31 | |
| ADMINISTRATOR CLASS | | 2018 | | | 2017 | | | 2016 | | | 2015 | | | 2014 | |
Net asset value, beginning of period | | | $9.99 | | | | $10.06 | | | | $10.03 | | | | $10.15 | | | | $10.17 | | | | $10.90 | |
Net investment income | | | 0.12 | 1 | | | 0.24 | 1 | | | 0.22 | 1 | | | 0.13 | 1 | | | 0.10 | 1 | | | 0.13 | 1 |
Net realized and unrealized gains (losses) on investments | | | (0.29 | ) | | | (0.09 | ) | | | 0.02 | | | | (0.02 | ) | | | 0.06 | | | | (0.22 | ) |
| | | | | | | | | | | | | | | | | | | | | | | | |
Total from investment operations | | | (0.17 | ) | | | 0.15 | | | | 0.24 | | | | 0.11 | | | | 0.16 | | | | (0.09 | ) |
Distributions to shareholders from | | | | | | | | | | | | | | | | | | | | | | | | |
Net investment income | | | (0.13 | ) | | | (0.22 | ) | | | (0.20 | ) | | | (0.09 | ) | | | (0.10 | ) | | | (0.10 | ) |
Net realized gain | | | 0.00 | | | | 0.00 | | | | (0.01 | ) | | | (0.14 | ) | | | (0.08 | ) | | | (0.54 | ) |
| | | | | | | | | | | | | | | | | | | | | | | | |
Total distributions to shareholders | | | (0.13 | ) | | | (0.22 | ) | | | (0.21 | ) | | | (0.23 | ) | | | (0.18 | ) | | | (0.64 | ) |
Net asset value, end of period | | | $9.69 | | | | $9.99 | | | | $10.06 | | | | $10.03 | | | | $10.15 | | | | $10.17 | |
Total return2 | | | (1.68 | )% | | | 1.50 | % | | | 2.46 | % | | | 1.21 | % | | | 1.56 | % | | | (0.51 | )% |
Ratios to average net assets (annualized) | | | | | | | | | | | | | | | | | | | | | | | | |
Gross expenses3 | | | 0.97 | % | | | 0.97 | % | | | 1.04 | % | | | 1.13 | % | | | 1.27 | % | | | 1.14 | % |
Net expenses3 | | | 0.60 | % | | | 0.60 | % | | | 0.60 | % | | | 0.60 | % | | | 0.60 | % | | | 0.60 | % |
Net investment income3 | | | 2.41 | % | | | 2.39 | % | | | 2.20 | % | | | 1.30 | % | | | 0.99 | % | | | 1.31 | % |
Supplemental data | | | | | | | | | | | | | | | | | | | | | | | | |
Portfolio turnover rate4 | | | 16 | % | | | 29 | % | | | 25 | % | | | 29 | % | | | 57 | % | | | 9 | % |
Net assets, end of period (000s omitted) | | | $15,249 | | | | $23,331 | | | | $26,100 | | | | $20,607 | | | | $10,679 | | | | $6,320 | |
| 1 | Calculated based upon average shares outstanding |
| 2 | Returns for period of less than one year are not annualized. |
| 3 | Ratios include net expenses allocated from the affiliated Master Portfolio which were as follows: |
| | | | |
Six months ended November 30, 2018 (unaudited) | | | 0.40 | % |
Year ended May 31, 2018 | | | 0.41 | % |
Year ended May 31, 2017 | | | 0.44 | % |
Year ended May 31, 2016 | | | 0.44 | % |
Year ended May 31, 2015 | | | 0.44 | % |
Year ended May 31, 2014 | | | 0.44 | % |
| 4 | Portfolio turnover rate is calculated by multiplying the affiliated Master Portfolio’s percentage of the Fund’s total investments in securities at the end of the period by the affiliated Master Portfolio’s portfolio turnover rate. |
The accompanying notes are an integral part of these financial statements.
| | | | | | |
| Financial highlights | | Wells Fargo Real Return Fund | | | 17 | |
(For a share outstanding throughout each period)
| | | | | | | | | | | | |
| | | Six months ended
November 30, 2018 (unaudited) | | | Year ended May 31 | |
| INSTITUTIONAL CLASS | | 2018 | | | 20171 | |
Net asset value, beginning of period | | | $9.97 | | | | $10.06 | | | | $10.17 | |
Net investment income | | | 0.13 | | | | 0.24 | | | | 0.14 | |
Net realized and unrealized gains (losses) on investments | | | (0.29 | ) | | | (0.08 | ) | | | (0.10 | ) |
| | | | | | | | | | | | |
Total from investment operations | | | (0.16 | ) | | | 0.16 | | | | 0.04 | |
Distributions to shareholders from | | | | | | | | | | | | |
Net investment income | | | (0.15 | ) | | | (0.25 | ) | | | (0.14 | ) |
Net realized gain | | | 0.00 | | | | 0.00 | | | | (0.01 | ) |
| | | | | | | | | | | | |
Total distributions to shareholders | | | (0.15 | ) | | | (0.25 | ) | | | (0.15 | ) |
Net asset value, end of period | | | $9.66 | | | | $9.97 | | | | $10.06 | |
Total return2 | | | (1.64 | )% | | | 1.57 | % | | | 0.41 | % |
Ratios to average net assets (annualized) | | | | | | | | | | | | |
Gross expenses3 | | | 0.70 | % | | | 0.71 | % | | | 0.76 | % |
Net expenses3 | | | 0.45 | % | | | 0.47 | % | | | 0.52 | % |
Net investment income3 | | | 2.44 | % | | | 2.62 | % | | | 2.24 | % |
Supplemental data | | | | | | | | | | | | |
Portfolio turnover rate4 | | | 16 | % | | | 29 | % | | | 25 | % |
Net assets, end of period (000s omitted) | | | $14,052 | | | | $12,110 | | | | $5,229 | |
| 1 | For the period from October 31, 2016 (commencement of class operations) to May 31, 2017 |
| 2 | Returns for periods of less than one year are not annualized. |
| 3 | Ratios include net expenses allocated from the affiliated Master Portfolio which were as follows: |
| | | | |
Six months ended November 30, 2018 (unaudited) | | | 0.40 | % |
Year ended May 31, 2018 | | | 0.41 | % |
Year ended May 31, 20171 | | | 0.44 | % |
| 4 | Portfolio turnover rate is calculated by multiplying the affiliated Master Portfolio’s percentage of the Fund’s total investments in securities at the end of the period by the affiliated Master Portfolio’s portfolio turnover rate. |
The accompanying notes are an integral part of these financial statements.
| | | | |
| 18 | | Wells Fargo Real Return Fund | | Notes to financial statements (unaudited) |
1. ORGANIZATION
Wells Fargo Funds Trust (the “Trust”), a Delaware statutory trust organized on March 10, 1999, is anopen-end management investment company registered under the Investment Company Act of 1940, as amended (the “1940 Act”). As an investment company, the Trust follows the accounting and reporting guidance in Financial Accounting Standards Board (“FASB”)Accounting Standards Codification Topic 946, Financial Services – Investment Companies. These financial statements report on the Wells Fargo Real Return Fund (the “Fund”) which is a diversified series of the Trust.
The Fund is a feeder fund in a master-feeder structure that invests substantially all of its assets in a single master portfolio with a substantially identical investment objective and substantially similar investment strategies. The Fund seeks to achieve its investment objective by investing all investable assets in a separate diversified portfolio (the “affiliated Master Portfolio”) of Wells Fargo Master Trust, a registeredopen-end management investment company. The affiliated Master Portfolio directly acquires portfolio securities and the Fund acquires an indirect interest in those securities. The Fund accounts for its investment in the affiliated Master Portfolio as a partnership investment and records on a daily basis its share of the affiliated Master Portfolio’s income, expense and realized and unrealized gains and losses. The financial statements of the affiliated Master Portfolio for the six months ended November 30, 2018 are included in this report and should be read in conjunction with the Fund’s financial statements. As of November 30, 2018, the Fund owned 33% of Wells Fargo Real Return Portfolio.
2. SIGNIFICANT ACCOUNTING POLICIES
The following significant accounting policies, which are consistently followed in the preparation of the financial statements of the Fund, are in conformity with U.S. generally accepted accounting principles which require management to make estimates and assumptions that affect the reported amounts of assets and liabilities, disclosure of contingent assets and liabilities at the date of the financial statements, and the reported amounts of revenues and expenses during the reporting period. Actual results could differ from those estimates.
Securities valuation
All investments are valued each business day as of the close of regular trading on the New York Stock Exchange (generally 4 p.m. Eastern Time), although the Fund may deviate from this calculation time under unusual or unexpected circumstances.
Investments in the affiliated Master Portfolio are valued daily based on the Fund’s proportionate share of the affiliated Master Portfolio’s net assets, which are also valued daily. Securities held in the affiliated Master Portfolio are valued as discussed in the Notes to Financial Statements of the affiliated Master Portfolio, which are included elsewhere in this report.
Investment transactions, income and expenses
Investments in the affiliated Master Portfolio are recorded on a trade basis.
The Fund records daily its proportionate share of the affiliated Master Portfolio’s interest and dividend income, expenses and realized and unrealized gains or losses. The Fund also accrues its own expenses.
Distributions to shareholders
Distributions to shareholders are recorded on theex-dividend date and paid from net investment income monthly and any net realized gains are paid at least annually. Such distributions are determined in accordance with income tax regulations and may differ from U.S. generally accepted accounting principles. Dividend sources are estimated at the time of declaration. The tax character of distributions is determined as of the Fund’s fiscal year end. Therefore, a portion of the Fund’s distributions made prior to the Fund’s fiscal year end may be categorized as a tax return of capital at year end.
Federal and other taxes
The Fund intends to continue to qualify as a regulated investment company by distributing substantially all of its investment company taxable income and any net realized capital gains (after reduction for capital loss carryforwards) sufficient to relieve it from all, or substantially all, federal income taxes. Accordingly, no provision for federal income taxes was required.
The Fund’s income and federal excise tax returns and all financial records supporting those returns for the prior three fiscal years are subject to examination by the federal and Delaware revenue authorities. Management has analyzed the Fund’s tax positions taken on federal, state, and foreign tax returns for all open tax years and does not believe that there are any uncertain tax positions that require recognition of a tax liability.
| | | | | | |
| Notes to financial statements (unaudited) | | Wells Fargo Real Return Fund | | | 19 | |
As of November 30, 2018, the aggregate cost of all investments for federal income tax purposes was $65,521,116 and the unrealized gains (losses) consisted of:
| | | | |
Gross unrealized gains | | $ | 1,162,070 | |
Gross unrealized losses | | | 0 | |
Net unrealized gains | | $ | 1,162,070 | |
Class allocations
The separate classes of shares offered by the Fund differ principally in applicable sales charges, distribution, shareholder servicing, and administration fees. Class specific expenses are charged directly to that share class. Investment income, common expenses, and realized and unrealized gains (losses) on investments are allocated daily to each class of shares based on the relative proportion of net assets of each class.
3. FAIR VALUATION MEASUREMENTS
At November 30, 2018, the affiliated Master Portfolio was measured at fair value using the net asset value per share (or its equivalent) as a practical expedient. The investment objective and the value of the affiliate Master Portfolio was as follows:
| | | | | | |
| Affiliated Master Portfolio | | Investment objective | | Value of
affiliated Master
Portfolio | |
Wells Fargo Real Return Portfolio | | Seeks returns that exceed the rate of inflation over the long-term | | | $66,683,186 | |
The affiliated Master Portfolio does not have a redemption period notice, can be redeemed daily and does not have any unfunded commitments.
4. TRANSACTIONS WITH AFFILIATES
Management fee
Wells Fargo Funds Management, LLC (“Funds Management”), an indirect wholly owned subsidiary of Wells Fargo & Company (“Wells Fargo”), is the manager of the Fund and provides advisory and fund-level administrative services under an investment management agreement. Under the investment management agreement, Funds Management is responsible for, among other services, implementing the investment objectives and strategies of the Fund, supervising the subadviser, and providing fund-level administrative services in connection with the Fund’s operations. As long as the Fund continues to invest substantially all of its assets in a single affiliated Master Portfolio, the Fund pays Funds Management an investment management fee only for fund-level administrative services at an annual rate starting at 0.05% and declining to 0.03% as the average daily net assets of the Fund increase. For the six months ended November 30, 2018, the management fee was equivalent to an annual rate of 0.05% of the Fund’s average daily net assets.
Funds Management also serves as the adviser to the affiliated Master Portfolio and is entitled to receive a fee from the affiliated Master Portfolio for those services.
Administration fees
Under a class-level administration agreement, Funds Management provides class-level administrative services to the Fund, which includes paying fees and expenses for services provided by the transfer agent,sub-transfer agents, omnibus account servicers and record-keepers. As compensation for its services under the class-level administration agreement, Funds Management receives an annual fee which is calculated based on the average daily net assets of each class as follows:
| | | | |
| | | Class-level
administration fee | |
Class A, Class C | | | 0.16 | % |
Class R6 | | | 0.03 | |
Administrator Class | | | 0.10 | |
Institutional Class | | | 0.08 | |
| | | | |
| 20 | | Wells Fargo Real Return Fund | | Notes to financial statements (unaudited) |
Funds Management has contractually waived and/or reimbursed management and administration fees to the extent necessary to maintain certain net operating expense ratios for the Fund. When each class of the Fund has exceeded its expense cap, Funds Management has waived fees and/or reimbursed expenses from fund level expenses on a proportionate basis and then from class specific expenses; otherwise, waivers and/or reimbursements are applied against class specific expenses before fund level expenses. Net expenses from the affiliated Master Portfolio are included in the expense cap. Funds Management has committed through September 30, 2019 to waive fees and/or reimburse expenses to the extent necessary to cap the Fund’s expenses at 0.78% for Class A shares, 1.53% for Class C shares, 0.40% for Class R6 shares, 0.60% for Administrator Class shares, and 0.45% for Institutional Class shares. After this time, the cap may be increased or the commitment to maintain the cap may be terminated only with the approval of the Board of Trustees.
Distribution fee
The Trust has adopted a distribution plan for Class C shares of the Fund pursuant to Rule12b-1 under the 1940 Act. A distribution fee is charged to Class C shares and paid to Wells Fargo Funds Distributor, LLC (“Funds Distributor”), the principal underwriter, at an annual rate of 0.75% of the average daily net assets of Class C shares.
In addition, Funds Distributor is entitled to receive thefront-end sales charge from the purchase of Class A shares and a contingent deferred sales charge on the redemption of certain Class A shares. Funds Distributor is also entitled to receive the contingent deferred sales charges from redemptions of Class C shares. For the six months ended November 30, 2018, Funds Distributor received $166 from the sale of Class A shares. No contingent deferred sales charges were incurred by Class A or Class C shares for the six months ended November 30, 2018.
Shareholder servicing fees
The Trust has entered into contracts with one or more shareholder servicing agents, whereby Class A, Class C, and Administrator Class of the Fund are charged a fee at an annual rate of 0.25% of the average daily net assets of each respective class.
A portion of these total shareholder servicing fees were paid to affiliates of Wells Fargo.
5. INVESTMENT PORTFOLIO TRANSACTIONS
The Fund seeks to achieve its investment objective by investing substantially all of its investable assets in a single affiliated Master Portfolio. Purchases and sales have been calculated by multiplying the Fund’s ownership percentage of the affiliated Master Portfolio by the affiliated Master Portfolio’s purchases and sales. Purchases and sales of investments, excluding short-term securities, for the six months ended November 30, 2018 were as follows:
| | | | | | |
| Purchases at cost | | Sales proceeds |
U.S.
government | | Non-U.S.
government | | U.S.
government | | Non-U.S.
government |
| $20,395,906 | | $12,239,748 | | $6,980,459 | | $3,963,226 |
6. BANK BORROWINGS
The Trust (excluding the money market funds), Wells Fargo Master Trust and Wells Fargo Variable Trust are parties to a $280,000,000 revolving credit agreement whereby the Fund is permitted to use bank borrowings for temporary or emergency purposes, such as to fund shareholder redemption requests. Interest under the credit agreement is charged to the Fund based on a borrowing rate equal to the higher of the Federal Funds rate in effect on that day plus 1.25% or the overnight LIBOR rate in effect on that day plus 1.25%. In addition, an annual commitment fee equal to 0.25% of the unused balance is allocated to each participating fund.
For the six months ended November 30, 2018, there were no borrowings by the Funds under the agreement.
| | | | | | |
| Notes to financial statements (unaudited) | | Wells Fargo Real Return Fund | | | 21 | |
7. DISTRIBUTIONS TO SHAREHOLDERS
Effective for all filings after November 4, 2018, the Securities and Exchange Commission eliminated the requirement to separately state the components of distributions to shareholders. The amounts of distributions to shareholders for the year ended May 31, 2018 were as follows:
| | | | |
| | | Net investment income | |
Class A | | | $582,466 | |
Class C | | | 55,795 | |
Class R6 | | | 290,979 | |
Administrator Class | | | 468,083 | |
Institutional Class | | | 187,449 | |
8. INDEMNIFICATION
Under the Trust’s organizational documents, the officers and Trustees have been granted certain indemnification rights against certain liabilities that may arise out of performance of their duties to the Trust. Additionally, in the normal course of business, the Trust may enter into contracts with service providers that contain a variety of indemnification clauses. The Trust’s maximum exposure under these arrangements is dependent on future claims that may be made against the Fund and, therefore, cannot be estimated.
9. NEW ACCOUNTING PRONOUNCEMENT
In August 2018, FASB issued Accounting Standards Update (“ASU”)No. 2018-13, Fair Value Measurement (Topic 820)Disclosure Framework—Changes to the Disclosure Requirements for Fair Value Measurement.ASU2018-13 updates the disclosure requirements for fair value measurements by modifying or removing certain disclosures and adding certain new disclosures. The amendments are effective for fiscal years, and interim periods within those fiscal years, beginning after December 15, 2019. Early adoption is permitted. Management has adopted the removal and modification of disclosures early, as permitted, and will adopt the additional new disclosures at the effective date.
10. SUBSEQUENT DISTRIBUTIONS
On December 12, 2018, the Fund declared distributions from short-term capital gains and long-term capital gains to shareholders of record on December 11, 2018. The per share amounts payable on December 13, 2018 were as follows:
| | | | | | | | |
| | | Short-term
capital gains | | | Long-term
capital gains | |
Class A | | $ | 0.00062 | | | $ | 0.03284 | |
Class C | | | 0.00062 | | | | 0.03284 | |
Class R6 | | | 0.00062 | | | | 0.03284 | |
Administrator Class | | | 0.00062 | | | | 0.03284 | |
Institutional Class | | | 0.00062 | | | | 0.03284 | |
On December 27, 2018, the Fund declared distributions from net investment income to shareholders of record on December 26, 2018. The per share amounts payable on December 28, 2018 were as follows:
| | | | |
| | | Net investment
income | |
Class A | | | $0.01356 | |
Class C | | | 0.00571 | |
Class R6 | | | 0.01837 | |
Administrator Class | | | 0.01458 | |
Institutional Class | | | 0.01773 | |
These distributions are not reflected in the accompanying financial statements.
| | | | |
| 22 | | Wells Fargo Real Return Portfolio | | Portfolio of investments—November 30, 2018 (unaudited) |
| | | | | | | | | | | | | | | | |
| Security name | | | | | | | | Shares | | | Value | |
| | | | |
Common Stocks: 17.13% | | | | | | | | | | | | | | | | |
| | | | |
Consumer Staples: 5.20% | | | | | | | | | | | | | | | | |
| | | | |
| Beverages: 0.85% | | | | | | | | | | | | | | | | |
Molson Coors Brewing Company Class B | | | | | | | | | | | 6,466 | | | $ | 425,269 | |
The Coca-Cola Company | | | | | | | | | | | 26,047 | | | | 1,312,769 | |
| | | | |
| | | | | | | | | | | | | | | 1,738,038 | |
| | | | | | | | | | | | | | | | |
| | | | |
| Food & Staples Retailing: 1.10% | | | | | | | | | | | | | | | | |
Costco Wholesale Corporation | | | | | | | | | | | 1,985 | | | | 459,091 | |
Metro AG « | | | | | | | | | | | 53,643 | | | | 823,185 | |
Wal-Mart Stores Incorporated | | | | | | | | | | | 6,735 | | | | 657,673 | |
Walgreens Boots Alliance Incorporated | | | | | | | | | | | 3,478 | | | | 294,482 | |
| | | | |
| | | | | | | | | | | | | | | 2,234,431 | |
| | | | | | | | | | | | | | | | |
| | | | |
| Food Products: 1.29% | | | | | | | | | | | | | | | | |
Greencore Group plc | | | | | | | | | | | 105,732 | | | | 253,425 | |
Health & Happiness (H&H) International Holdings Limited † | | | | | | | | | | | 81,000 | | | | 520,744 | |
Marine Harvest ASA | | | | | | | | | | | 39,104 | | | | 914,945 | |
Mondelez International Incorporated Class A | | | | | | | | | | | 12,497 | | | | 562,115 | |
The Kraft Heinz Company | | | | | | | | | | | 7,542 | | | | 385,547 | |
| | | | |
| | | | | | | | | | | | | | | 2,636,776 | |
| | | | | | | | | | | | | | | | |
| | | | |
| Household Products: 1.16% | | | | | | | | | | | | | | | | |
Church & Dwight Company Incorporated | | | | | | | | | | | 9,797 | | | | 648,463 | |
The Clorox Company | | | | | | | | | | | 2,545 | | | | 421,503 | |
The Procter & Gamble Company | | | | | | | | | | | 13,661 | | | | 1,291,101 | |
| | | | |
| | | | | | | | | | | | | | | 2,361,067 | |
| | | | | | | | | | | | | | | | |
| | | | |
| Tobacco: 0.80% | | | | | | | | | | | | | | | | |
Altria Group Incorporated | | | | | | | | | | | 16,173 | | | | 886,766 | |
Philip Morris International Incorporated | | | | | | | | | | | 8,497 | | | | 735,245 | |
| | | | |
| | | | | | | | | | | | | | | 1,622,011 | |
| | | | | | | | | | | | | | | | |
| | | | |
Energy: 4.06% | | | | | | | | | | | | | | | | |
| | | | |
| Energy Equipment & Services: 0.67% | | | | | | | | | | | | | | | | |
Halliburton Company | | | | | | | | | | | 8,804 | | | | 276,710 | |
John Wood Group plc | | | | | | | | | | | 97,291 | | | | 787,229 | |
Schlumberger Limited | | | | | | | | | | | 6,611 | | | | 298,156 | |
| | | | |
| | | | | | | | | | | | | | | 1,362,095 | |
| | | | | | | | | | | | | | | | |
| | | | |
| Oil, Gas & Consumable Fuels: 3.39% | | | | | | | | | | | | | | | | |
Anadarko Petroleum Corporation | | | | | | | | | | | 7,600 | | | | 402,040 | |
BP plc | | | | | | | | | | | 77,799 | | | | 515,504 | |
Chevron Corporation | | | | | | | | | | | 9,823 | | | | 1,168,348 | |
Cimarex Energy Company | | | | | | | | | | | 5,559 | | | | 455,727 | |
Concho Resources Incorporated † | | | | | | | | | | | 5,161 | | | | 672,685 | |
Cosan Limited Class A | | | | | | | | | | | 71,848 | | | | 638,729 | |
Eni SpA | | | | | | | | | | | 17,844 | | | | 287,786 | |
The accompanying notes are an integral part of these financial statements.
| | | | | | |
| Portfolio of investments—November 30, 2018 (unaudited) | | Wells Fargo Real Return Portfolio | | | 23 | |
| | | | | | | | | | | | | | | | |
| Security name | | | | | | | | Shares | | | Value | |
| | | | |
| Oil, Gas & Consumable Fuels(continued) | | | | | | | | | | | | | | | | |
EOG Resources Incorporated | | | | | | | | | | | 9,698 | | | $ | 1,001,900 | |
Noble Energy Incorporated | | | | | | | | | | | 13,477 | | | | 319,944 | |
Occidental Petroleum Corporation | | | | | | | | | | | 8,038 | | | | 564,830 | |
Origin Energy Limited † | | | | | | | | | | | 105,525 | | | | 499,791 | |
Phillips 66 Company | | | | | | | | | | | 4,128 | | | | 386,051 | |
| | | | |
| | | | | | | | | | | | | | | 6,913,335 | |
| | | | | | | | | | | | | | | | |
| | | | |
Industrials: 0.22% | | | | | | | | | | | | | | | | |
| | | | |
| Industrial Conglomerates: 0.22% | | | | | | | | | | | | | | | | |
Keppel Corporation Limited | | | | | | | | | | | 102,800 | | | | 454,091 | |
| | | | | | | | | | | | | | | | |
| | | | |
Materials: 3.33% | | | | | | | | | | | | | | | | |
| | | | |
| Chemicals: 1.56% | | | | | | | | | | | | | | | | |
Axalta Coating Systems Limited † | | | | | | | | | | | 12,794 | | | | 320,234 | |
DowDuPont Incorporated | | | | | | | | | | | 12,198 | | | | 705,654 | |
Ecolab Incorporated | | | | | | | | | | | 1,833 | | | | 294,178 | |
LyondellBasell Industries NV Class A | | | | | | | | | | | 4,939 | | | | 460,858 | |
OCI NV † | | | | | | | | | | | 33,997 | | | | 775,149 | |
Sasol Limited | | | | | | | | | | | 8,693 | | | | 254,842 | |
The Sherwin-Williams Company | | | | | | | | | | | 867 | | | | 367,669 | |
| | | | |
| | | | | | | | | | | | | | | 3,178,584 | |
| | | | | | | | | | | | | | | | |
| | | | |
| Construction Materials: 0.14% | | | | | | | | | | | | | | | | |
Martin Marietta Materials Incorporated | | | | | | | | | | | 1,450 | | | | 276,501 | |
| | | | | | | | | | | | | | | | |
| | | | |
| Containers & Packaging: 0.11% | | | | | | | | | | | | | | | | |
Crown Holdings Incorporated † | | | | | | | | | | | 4,413 | | | | 226,299 | |
| | | | | | | | | | | | | | | | |
| | | | |
| Metals & Mining: 1.52% | | | | | | | | | | | | | | | | |
Agnico Eagle MinesLimited-U.S. Exchange Traded Shares | | | | | | | | | | | 4,500 | | | | 158,040 | |
Alamos Gold Incorporated Class A | | | | | | | | | | | 9,500 | | | | 30,531 | |
B2Gold Corporation † | | | | | | | | | | | 20,000 | | | | 49,223 | |
Barrick Gold Corporation « | | | | | | | | | | | 5,800 | | | | 73,950 | |
Detour Gold Corporation † | | | | | | | | | | | 5,200 | | | | 38,629 | |
Endeavour Mining Corporation † | | | | | | | | | | | 3,000 | | | | 37,391 | |
Evolution Mining Limited | | | | | | | | | | | 33,000 | | | | 75,736 | |
Franco-Nevada Corporation | | | | | | | | | | | 1,900 | | | | 131,562 | |
Fresnillo plc | | | | | | | | | | | 7,000 | | | | 67,201 | |
GoldcorpIncorporated-U.S. Exchange Traded Shares | | | | | | | | | | | 8,000 | | | | 74,240 | |
IAMGOLD Corporation † | | | | | | | | | | | 17,000 | | | | 51,564 | |
Kinross Gold Corporation † | | | | | | | | | | | 35,000 | | | | 94,833 | |
Kirkland Lake Gold Limited | | | | | | | | | | | 6,500 | | | | 134,731 | |
Lundin Mining Corporation | | | | | | | | | | | 133,449 | | | | 581,545 | |
Mag Silver Corporation † | | | | | | | | | | | 4,000 | | | | 27,035 | |
Newcrest Mining Limited | | | | | | | | | | | 10,500 | | | | 159,245 | |
Newmont Mining Corporation | | | | | | | | | | | 5,500 | | | | 177,870 | |
Northern Star Resources Limited | | | | | | | | | | | 8,000 | | | | 46,661 | |
Randgold Resources Limited ADR | | | | | | | | | | | 2,150 | | | | 172,366 | |
Royal Gold Incorporated | | | | | | | | | | | 7,872 | | | | 575,837 | |
The accompanying notes are an integral part of these financial statements.
| | | | |
| 24 | | Wells Fargo Real Return Portfolio | | Portfolio of investments—November 30, 2018 (unaudited) |
| | | | | | | | | | | | | | | | |
| Security name | | | | | | | | Shares | | | Value | |
| | | | |
| Metals & Mining(continued) | | | | | | | | | | | | | | | | |
Semafo Incorporated † | | | | | | | | | | | 19,000 | | | $ | 34,321 | |
SSR Mining Incorporated † | | | | | | | | | | | 2,000 | | | | 21,280 | |
Steel Dynamics Incorporated | | | | | | | | | | | 4,970 | | | | 174,944 | |
Torex Gold Resources Incorporated † | | | | | | | | | | | 5,000 | | | | 39,250 | |
Wheaton Precious Metals Corporation | | | | | | | | | | | 4,000 | | | | 62,801 | |
| | | | |
| | | | | | | | | | | | | | | 3,090,786 | |
| | | | | | | | | | | | | | | | |
| | | | |
Real Estate: 4.32% | | | | | | | | | | | | | | | | |
| | | | |
| Equity REITs: 4.32% | | | | | | | | | | | | | | | | |
Alexandria Real Estate Equities Incorporated | | | | | | | | | | | 3,449 | | | | 429,401 | |
American Homes 4 Rent Class A | | | | | | | | | | | 13,842 | | | | 288,329 | |
American Tower Corporation | | | | | | | | | | | 6,248 | | | | 1,027,734 | |
Camden Property Trust | | | | | | | | | | | 3,753 | | | | 357,135 | |
CoreSite Realty Corporation | | | | | | | | | | | 875 | | | | 85,278 | |
Equinix Incorporated | | | | | | | | | | | 1,852 | | | | 713,539 | |
Equity Residential | | | | | | | | | | | 4,556 | | | | 324,615 | |
Essex Property Trust Incorporated | | | | | | | | | | | 720 | | | | 189,007 | |
Four Corners Property Trust Incorporated | | | | | | | | | | | 12,090 | | | | 335,377 | |
Healthcare Trust of America Incorporated Class A | | | | | | | | | | | 7,093 | | | | 199,455 | |
Host Hotels & Resorts Incorporated | | | | | | | | | | | 17,516 | | | | 332,804 | |
Hudson Pacific Properties Incorporated | | | | | | | | | | | 12,418 | | | | 383,219 | |
Invitation Homes Incorporated | | | | | | | | | | | 14,621 | | | | 313,767 | |
Physicians Realty Trust | | | | | | | | | | | 37,189 | | | | 662,336 | |
Prologis Incorporated | | | | | | | | | | | 10,430 | | | | 702,356 | |
Public Storage Incorporated | | | | | | | | | | | 1,289 | | | | 274,892 | |
Retail Opportunity Investment Corporation | | | | | | | | | | | 24,159 | | | | 437,278 | |
SBA Communications Corporation † | | | | | | | | | | | 1,554 | | | | 265,439 | |
Simon Property Group Incorporated | | | | | | | | | | | 4,112 | | | | 763,557 | |
Sun Communities Incorporated | | | | | | | | | | | 3,700 | | | | 385,170 | |
Taubman Centers Incorporated | | | | | | | | | | | 3,013 | | | | 159,508 | |
Ventas Incorporated | | | | | | | | | | | 2,780 | | | | 176,502 | |
| | | | |
| | | | | | | | | | | | | | | 8,806,698 | |
| | | | | | | | | | | | | | | | |
| |
Total Common Stocks (Cost $34,046,010) | | | | 34,900,712 | |
| | | | | | | | | | | | | | | | |
| | | | |
| | | Interest rate | | | Maturity date | | | Principal | | | | |
| Corporate Bonds and Notes: 10.49% | |
|
Communication Services: 0.82% | |
| | | | |
| Diversified Telecommunication Services: 0.11% | | | | | | | | | | | | | | | | |
Hughes Satellite Systems Corporation | | | 6.50 | % | | | 6-15-2019 | | | $ | 230,000 | | | | 233,163 | |
| | | | | | | | | | | | | | | | |
|
| Media: 0.48% | |
National CineMedia LLC | | | 6.00 | | | | 4-15-2022 | | | | 100,000 | | | | 100,375 | |
Nexstar Broadcasting Group Incorporated | | | 5.88 | | | | 11-15-2022 | | | | 365,000 | | | | 368,650 | |
Nexstar Broadcasting Group Incorporated 144A | | | 6.13 | | | | 2-15-2022 | | | | 105,000 | | | | 106,313 | |
Outfront Media Capital Corporation | | | 5.25 | | | | 2-15-2022 | | | | 400,000 | | | | 401,500 | |
| | | | |
| | | | | | | | | | | | | | | 976,838 | |
| | | | | | | | | | | | | | | | |
The accompanying notes are an integral part of these financial statements.
| | | | | | |
| Portfolio of investments—November 30, 2018 (unaudited) | | Wells Fargo Real Return Portfolio | | | 25 | |
| | | | | | | | | | | | | | | | |
| Security name | | Interest rate | | | Maturity date | | | Principal | | | Value | |
|
| Wireless Telecommunication Services: 0.23% | |
Sprint Corporation | | | 7.25 | % | | | 9-15-2021 | | | $ | 165,000 | | | $ | 172,013 | |
Sprint Spectrum LP 144A | | | 3.36 | | | | 3-20-2023 | | | | 131,250 | | | | 129,773 | |
T-Mobile USA Incorporated | | | 4.00 | | | | 4-15-2022 | | | | 175,000 | | | | 172,156 | |
| | | | |
| | | | | | | | | | | | | | | 473,942 | |
| | | | | | | | | | | | | | | | |
|
Consumer Discretionary: 3.27% | |
|
| Auto Components: 0.10% | |
American Axle & Manufacturing Incorporated | | | 7.75 | | | | 11-15-2019 | | | | 177,000 | | | | 181,868 | |
Cooper Tire & Rubber Company | | | 8.00 | | | | 12-15-2019 | | | | 20,000 | | | | 20,750 | |
| | | | |
| | | | | | | | | | | | | | | 202,618 | |
| | | | | | | | | | | | | | | | |
|
| Diversified Consumer Services: 0.09% | |
Service Corporation International | | | 5.38 | | | | 1-15-2022 | | | | 100,000 | | | | 100,500 | |
TRI Pointe Group Incorporated | | | 4.38 | | | | 6-15-2019 | | | | 92,000 | | | | 91,512 | |
| | | | |
| | | | | | | | | | | | | | | 192,012 | |
| | | | | | | | | | | | | | | | |
|
| Hotels, Restaurants & Leisure: 0.62% | |
GLP Capital LP | | | 4.88 | | | | 11-1-2020 | | | | 405,000 | | | | 407,025 | |
MGM Resorts International | | | 5.25 | | | | 3-31-2020 | | | | 270,000 | | | | 273,375 | |
MGM Resorts International | | | 6.75 | | | | 10-1-2020 | | | | 120,000 | | | | 125,040 | |
NCL Corporation Limited 144A | | | 4.75 | | | | 12-15-2021 | | | | 448,000 | | | | 449,120 | |
| | | | |
| | | | | | | | | | | | | | | 1,254,560 | |
| | | | | | | | | | | | | | | | |
| | | |
| Household Durables: 0.59% | | | | | | | | | | | | | |
KB Home | | | 4.75 | | | | 5-15-2019 | | | | 60,000 | | | | 60,000 | |
Lennar Corporation | | | 4.50 | | | | 6-15-2019 | | | | 150,000 | | | | 150,094 | |
Lennar Corporation | | | 4.50 | | | | 11-15-2019 | | | | 50,000 | | | | 50,094 | |
Lennar Corporation | | | 6.63 | | | | 5-1-2020 | | | | 305,000 | | | | 315,294 | |
Pulte Group Incorporated | | | 4.25 | | | | 3-1-2021 | | | | 400,000 | | | | 400,500 | |
Toll Brothers Finance Corporation | | | 5.88 | | | | 2-15-2022 | | | | 225,000 | | | | 229,500 | |
| | | | |
| | | | | | | | | | | | | | | 1,205,482 | |
| | | | | | | | | | | | | | | | |
|
| Internet & Direct Marketing Retail: 0.22% | |
Netflix Incorporated | | | 5.38 | | | | 2-1-2021 | | | | 450,000 | | | | 459,000 | |
| | | | | | | | | | | | | | | | |
|
| Media: 0.93% | |
Cable One Incorporated 144A | | | 5.75 | | | | 6-15-2022 | | | | 515,000 | | | | 520,794 | |
DISH DBS Corporation | | | 7.88 | | | | 9-1-2019 | | | | 210,000 | | | | 215,513 | |
Sinclair Television Group Incorporated | | | 6.13 | | | | 10-1-2022 | | | | 400,000 | | | | 405,500 | |
Sirius XM Radio Incorporated 144A | | | 3.88 | | | | 8-1-2022 | | | | 430,000 | | | | 414,731 | |
TEGNA Incorporated | | | 5.13 | | | | 10-15-2019 | | | | 27,000 | | | | 27,016 | |
TEGNA Incorporated | | | 5.13 | | | | 7-15-2020 | | | | 305,000 | | | | 305,000 | |
| | | | |
| | | | | | | | | | | | | | | 1,888,554 | |
| | | | | | | | | | | | | | | | |
|
| Specialty Retail: 0.66% | |
Gap Incorporated | | | 5.95 | | | | 4-12-2021 | | | | 310,000 | | | | 319,251 | |
Group 1 Automotive Incorporated | | | 5.00 | | | | 6-1-2022 | | | | 280,000 | | | | 273,000 | |
L Brands Incorporated | | | 6.63 | | | | 4-1-2021 | | | | 295,000 | | | | 308,275 | |
Penske Auto Group Incorporated | | | 3.75 | | | | 8-15-2020 | | | | 335,000 | | | | 333,744 | |
Penske Auto Group Incorporated | | | 5.75 | | | | 10-1-2022 | | | | 110,000 | | | | 110,550 | |
| | | | |
| | | | | | | | | | | | | | | 1,344,820 | |
| | | | | | | | | | | | | | | | |
The accompanying notes are an integral part of these financial statements.
| | | | |
| 26 | | Wells Fargo Real Return Portfolio | | Portfolio of investments—November 30, 2018 (unaudited) |
| | | | | | | | | | | | | | | | |
| | | | |
| Security name | | Interest rate | | | Maturity date | | | Principal | | | Value | |
|
| Textiles, Apparel & Luxury Goods: 0.06% | |
The William Carter Company | | | 5.25 | % | | | 8-15-2021 | | | $ | 120,000 | | | $ | 120,150 | |
| | | | | | | | | | | | | | | | |
|
Consumer Staples: 0.26% | |
|
| Food Products: 0.08% | |
B&G Foods Incorporated | | | 4.63 | | | | 6-1-2021 | | | | 155,000 | | | | 152,288 | |
| | | | | | | | | | | | | | | | |
|
| Personal Products: 0.18% | |
Edgewell Personal Care Company | | | 4.70 | | | | 5-19-2021 | | | | 380,000 | | | | 375,250 | |
| | | | | | | | | | | | | | | | |
|
Energy: 1.14% | |
|
| Oil, Gas & Consumable Fuels: 1.14% | |
Andeavor Logistics LP | | | 5.50 | | | | 10-15-2019 | | | | 75,000 | | | | 75,938 | |
DCP Midstream Operating LP | | | 2.70 | | | | 4-1-2019 | | | | 175,000 | | | | 174,125 | |
DCP Midstream Operating LP 144A | | | 5.35 | | | | 3-15-2020 | | | | 320,000 | | | | 323,200 | |
Rockies Express Pipeline LLC 144A | | | 5.63 | | | | 4-15-2020 | | | | 405,000 | | | | 409,050 | |
Rockies Express Pipeline LLC 144A | | | 6.00 | | | | 1-15-2019 | | | | 210,000 | | | | 210,194 | |
Sabine Pass Liquefaction LLC | | | 6.25 | | | | 3-15-2022 | | | | 250,000 | | | | 263,285 | |
Southern Star Central Corporation 144A | | | 5.13 | | | | 7-15-2022 | | | | 375,000 | | | | 368,438 | |
Targa Resources Partners LP | | | 4.13 | | | | 11-15-2019 | | | | 510,000 | | | | 506,813 | |
| | | | |
| | | | | | | | | | | | | | | 2,331,043 | |
| | | | | | | | | | | | | | | | |
|
Financials: 0.85% | |
|
| Consumer Finance: 0.68% | |
Ally Financial Incorporated | | | 3.75 | | | | 11-18-2019 | | | | 605,000 | | | | 604,395 | |
Navient Corporation | | | 5.50 | | | | 1-15-2019 | | | | 465,000 | | | | 465,233 | |
Springleaf Finance Corporation | | | 5.25 | | | | 12-15-2019 | | | | 315,000 | | | | 316,181 | |
| | | | |
| | | | | | | | | | | | | | | 1,385,809 | |
| | | | | | | | | | | | | | | | |
| | | | |
| Diversified Financial Services: 0.08% | | | | | | | | | | | | | | | | |
General Electric Capital Corporation | | | 5.55 | | | | 5-4-2020 | | | | 165,000 | | | | 166,589 | |
| | | | | | | | | | | | | | | | |
|
| Real Estate Management & Development: 0.09% | |
Realogy Group LLC 144A | | | 4.50 | | | | 4-15-2019 | | | | 100,000 | | | | 99,750 | |
Realogy Group LLC 144A | | | 5.25 | | | | 12-1-2021 | | | | 70,000 | | | | 68,163 | |
| | | | |
| | | | | | | | | | | | | | | 167,913 | |
| | | | | | | | | | | | | | | | |
| | | | |
Health Care: 0.91% | | | | | | | | | | | | | | | | |
| | | | |
| Health Care Equipment & Supplies: 0.14% | | | | | | | | | | | | | | | | |
Kinetics Concepts Incorporated 144A | | | 7.88 | | | | 2-15-2021 | | | | 270,000 | | | | 274,725 | |
| | | | | | | | | | | | | | | | |
| | | | |
| Health Care Providers & Services: 0.77% | | | | | | | | | | | | | | | | |
Acadia Healthcare Company Incorporated | | | 5.13 | | | | 7-1-2022 | | | | 162,000 | | | | 158,760 | |
Centene Corporation | | | 4.75 | | | | 5-15-2022 | | | | 345,000 | | | | 346,294 | |
DaVita HealthCare Partners Incorporated | | | 5.75 | | | | 8-15-2022 | | | | 350,000 | | | | 354,813 | |
HCA Incorporated | | | 6.50 | | | | 2-15-2020 | | | | 255,000 | | | | 262,013 | |
Select Medical Corporation | | | 6.38 | | | | 6-1-2021 | | | | 155,000 | | | | 156,116 | |
Tenet Healthcare Corporation | | | 6.00 | | | | 10-1-2020 | | | | 290,000 | | | | 295,800 | |
| | | | |
| | | | | | | | | | | | | | | 1,573,796 | |
| | | | | | | | | | | | | | | | |
The accompanying notes are an integral part of these financial statements.
| | | | | | |
| Portfolio of investments—November 30, 2018 (unaudited) | | Wells Fargo Real Return Portfolio | | | 27 | |
| | | | | | | | | | | | | | | | |
| Security name | | Interest rate | | | Maturity date | | | Principal | | | Value | |
| | | | |
Industrials: 0.88% | | | | | | | | | | | | | | | | |
| | | | |
| Aerospace & Defense: 0.39% | | | | | | | | | | | | | | | | |
Alcoa Incorporated | | | 6.15 | % | | | 8-15-2020 | | | $ | 350,000 | | | $ | 360,476 | |
Moog Incorporated 144A | | | 5.25 | | | | 12-1-2022 | | | | 445,000 | | | | 445,000 | |
| | | | |
| | | | | | | | | | | | | | | 805,476 | |
| | | | | | | | | | | | | | | | |
| | | | |
| Commercial Services & Supplies: 0.20% | | | | | | | | | | | | | | | | |
Clean Harbors Incorporated | | | 5.13 | | | | 6-1-2021 | | | | 400,000 | | | | 400,744 | |
| | | | | | | | | | | | | | | | |
| | | | |
| Trading Companies & Distributors: 0.29% | | | | | | | | | | | | | | | | |
Aircastle Limited | | | 4.63 | | | | 12-15-2018 | | | | 100,000 | | | | 100,021 | |
Aircastle Limited | | | 5.13 | | | | 3-15-2021 | | | | 275,000 | | | | 279,054 | |
Aircastle Limited | | | 6.25 | | | | 12-1-2019 | | | | 200,000 | | | | 204,469 | |
| | | | |
| | | | | | | | | | | | | | | 583,544 | |
| | | | | | | | | | | | | | | | |
| | | | |
Information Technology: 0.69% | | | | | | | | | | | | | | | | |
| | | | |
| Electronic Equipment, Instruments & Components: 0.05% | | | | | | | | | | | | | | | | |
Sanmina Corporation 144A | | | 4.38 | | | | 6-1-2019 | | | | 105,000 | | | | 104,869 | |
| | | | | | | | | | | | | | | | |
| | | | |
| Software: 0.23% | | | | | | | | | | | | | | | | |
CDK Global Incorporated | | | 3.80 | | | | 10-15-2019 | | | | 110,000 | | | | 109,588 | |
Symantec Corporation | | | 4.20 | | | | 9-15-2020 | | | | 360,000 | | | | 361,168 | |
| | | | |
| | | | | | | | | | | | | | | 470,756 | |
| | | | | | | | | | | | | | | | |
| | | | |
| Technology Hardware, Storage & Peripherals: 0.41% | | | | | | | | | | | | | | | | |
Dell International LLC/EMC Corporation 144A | | | 3.48 | | | | 6-1-2019 | | | | 40,000 | | | | 39,914 | |
EMC Corporation | | | 2.65 | | | | 6-1-2020 | | | | 525,000 | | | | 511,244 | |
NCR Corporation | | | 4.63 | | | | 2-15-2021 | | | | 280,000 | | | | 275,800 | |
| | | | |
| | | | | | | | | | | | | | | 826,958 | |
| | | | | | | | | | | | | | | | |
| | | | |
Materials: 0.95% | | | | | | | | | | | | | | | | |
| | | | |
| Chemicals: 0.15% | | | | | | | | | | | | | | | | |
Huntsman International LLC | | | 4.88 | | | | 11-15-2020 | | | | 305,000 | | | | 308,050 | |
| | | | | | | | | | | | | | | | |
| | | | |
| Containers & Packaging: 0.47% | | | | | | | | | | | | | | | | |
Ball Corporation | | | 4.38 | | | | 12-15-2020 | | | | 545,000 | | | | 548,531 | |
Reynolds Group Holdings | | | 5.75 | | | | 10-15-2020 | | | | 416,716 | | | | 416,195 | |
| | | | |
| | | | | | | | | | | | | | | 964,726 | |
| | | | | | | | | | | | | | | | |
| | | | |
| Metals & Mining: 0.33% | | | | | | | | | | | | | | | | |
Freeport-McMoRan Incorporated | | | 3.10 | | | | 3-15-2020 | | | | 320,000 | | | | 315,200 | |
Steel Dynamics Incorporated | | | 5.13 | | | | 10-1-2021 | | | | 351,000 | | | | 351,878 | |
| | | | |
| | | | | | | | | | | | | | | 667,078 | |
| | | | | | | | | | | | | | | | |
| | | | |
Real Estate: 0.72% | | | | | | | | | | | | | | | | |
| | | | |
| Equity REITs: 0.53% | | | | | | | | | | | | | | | | |
CoreCivic Incorporated « | | | 4.13 | | | | 4-1-2020 | | | | 230,000 | | | | 227,700 | |
Equinix Incorporated | | | 5.38 | | | | 1-1-2022 | | | | 230,000 | | | | 233,091 | |
The accompanying notes are an integral part of these financial statements.
| | | | |
| 28 | | Wells Fargo Real Return Portfolio | | Portfolio of investments—November 30, 2018 (unaudited) |
| | | | | | | | | | | | | | | | |
| Security name | | Interest rate | | | Maturity date | | | Principal | | | Value | |
| | | | |
| Equity REITs(continued) | | | | | | | | | | | | | | | | |
Sabra Health Care REIT Incorporated | | | 5.50 | % | | | 2-1-2021 | | | $ | 483,000 | | | $ | 489,038 | |
VEREIT Operating Partnership LP | | | 3.00 | | | | 2-6-2019 | | | | 120,000 | | | | 119,940 | |
VEREIT Operating Partnership LP | | | 4.13 | | | | 6-1-2021 | | | | 10,000 | | | | 10,047 | |
| | | | |
| | | | | | | | | | | | | | | 1,079,816 | |
| | | | | | | | | | | | | | | | |
| | | | |
| Real Estate Management & Development: 0.19% | | | | | | | | | | | | | | | | |
Taylor Morrison Communities Incorporated 144A | | | 5.25 | | | | 4-15-2021 | | | | 395,000 | | | | 393,144 | |
| | | | | | | | | | | | | | | | |
| | | | |
Total Corporate Bonds and Notes (Cost $21,678,357) | | | | | | | | | | | | | | | 21,383,713 | |
| | | | | | | | | | | | | | | | |
| | | | |
Loans: 4.04% | | | | | | | | | | | | | | | | |
| | | | |
Communication Services: 0.59% | | | | | | | | | | | | | | | | |
| | | | |
| Diversified Telecommunication Services: 0.06% | | | | | | | | | | | | | | | | |
Level 3 Financing Incorporated (1 Month LIBOR +2.25%) ± | | | 4.56 | | | | 2-22-2024 | | | | 129,470 | | | | 127,771 | |
| | | | | | | | | | | | | | | | |
| | | | |
| Media: 0.32% | | | | | | | | | | | | | | | | |
CSC Holdings LLC (1 Month LIBOR +2.50%) ± | | | 4.81 | | | | 1-25-2026 | | | | 509,440 | | | | 501,345 | |
Neptune Finco Corporation (3 Month LIBOR +2.25%) ± | | | 4.99 | | | | 1-15-2026 | | | | 150,000 | | | | 147,188 | |
| | | | |
| | | | | | | | | | | | | | | 648,533 | |
| | | | | | | | | | | | | | | | |
| | | | |
| Wireless Telecommunication Services: 0.21% | | | | | | | | | | | | | | | | |
SBA Senior Finance II LLC (1 Month LIBOR +2.00%) ± | | | 4.35 | | | | 4-11-2025 | | | | 437,365 | | | | 432,104 | |
| | | | | | | | | | | | | | | | |
| | | | |
Consumer Discretionary: 0.42% | | | | | | | | | | | | | | | | |
| | | | |
| Auto Components: 0.10% | | | | | | | | | | | | | | | | |
Allison Transmission Incorporated (1 Month LIBOR +1.75%) ± | | | 4.07 | | | | 9-23-2022 | | | | 54,671 | | | | 54,319 | |
Belron Finance US LLC (3 Month LIBOR +2.25%) ౠ| | | 4.84 | | | | 11-7-2024 | | | | 158,800 | | | | 157,014 | |
| | | | |
| | | | | | | | | | | | | | | 211,333 | |
| | | | | | | | | | | | | | | | |
| | | | |
| Hotels, Restaurants & Leisure: 0.11% | | | | | | | | | | | | | | | | |
Wyndham Hotels & Resorts Incorporated (1 Month LIBOR +1.75%) ± | | | 4.09 | | | | 5-30-2025 | | | | 220,000 | | | | 217,635 | |
| | | | | | | | | | | | | | | | |
| | | | |
| Household Products: 0.13% | | | | | | | | | | | | | | | | |
Michaels Stores Incorporated (1 Month LIBOR +2.50%) ±‡ | | | 4.83 | | | | 1-28-2023 | | | | 228,352 | | | | 223,073 | |
The ServiceMaster Company LLC (1 Month LIBOR +2.50%) ± | | | 4.84 | | | | 11-8-2023 | | | | 52,630 | | | | 52,476 | |
| | | | |
| | | | | | | | | | | | | | | 275,549 | |
| | | | | | | | | | | | | | | | |
| | | | |
| Media: 0.07% | | | | | | | | | | | | | | | | |
Live Nation Entertainment Incorporated (1 Month LIBOR +1.75%) ± | | | 4.13 | | | | 10-31-2023 | | | | 138,246 | | | | 137,612 | |
| | | | | | | | | | | | | | | | |
| | | | |
| Specialty Retail: 0.01% | | | | | | | | | | | | | | | | |
Sally Beauty Holdings Incorporated (1 Month LIBOR +2.25%) ±‡ | | | 4.60 | | | | 7-5-2024 | | | | 24,750 | | | | 24,224 | |
| | | | | | | | | | | | | | | | |
| | | | |
Consumer Staples: 0.11% | | | | | | | | | | | | | | | | |
| | | | |
| Food Products: 0.11% | | | | | | | | | | | | | | | | |
Post Holdings Incorporated (1 Month LIBOR +2.00%) ± | | | 4.32 | | | | 5-24-2024 | | | | 74,403 | | | | 73,920 | |
Prestige Brands Incorporated (1 Month LIBOR +2.00%) ± | | | 4.34 | | | | 1-26-2024 | | | | 151,986 | | | | 150,308 | |
| | | | |
| | | | | | | | | | | | | | | 224,228 | |
| | | | | | | | | | | | | | | | |
The accompanying notes are an integral part of these financial statements.
| | | | | | |
| Portfolio of investments—November 30, 2018 (unaudited) | | Wells Fargo Real Return Portfolio | | | 29 | |
| | | | | | | | | | | | | | | | |
| Security name | | Interest rate | | | Maturity date | | | Principal | | | Value | |
| | | | |
Financials: 0.38% | | | | | | | | | | | | | | | | |
| | | | |
| Diversified Consumer Services: 0.19% | | | | | | | | | | | | | | | | |
TransUnion (1 Month LIBOR +2.00%) ± | | | 4.34 | % | | | 6-19-2025 | | | $ | 379,050 | | | $ | 375,396 | |
| | | | | | | | | | | | | | | | |
| | | | |
| Diversified Financial Services: 0.19% | | | | | | | | | | | | | | | | |
Delos Finance SARL (3 Month LIBOR +1.75%) ± | | | 4.14 | | | | 10-6-2023 | | | | 200,000 | | | | 199,150 | |
LPL Holdings Incorporated (3 Month LIBOR +2.25%) ±‡ | | | 4.55 | | | | 9-23-2024 | | | | 194,719 | | | | 193,015 | |
| | | | |
| | | | | | | | | | | | | | | 392,165 | |
| | | | | | | | | | | | | | | | |
| | | | |
Health Care: 0.25% | | | | | | | | | | | | | | | | |
| | | | |
| Health Care Providers & Services: 0.21% | | | | | | | | | | | | | | | | |
HCA Incorporated (1 Month LIBOR +1.75%) ± | | | 4.09 | | | | 3-18-2023 | | | | 372,693 | | | | 370,479 | |
Select Medical Corporation (1 Month LIBOR +2.50%) ±‡ | | | 4.81 | | | | 3-6-2025 | | | | 54,175 | | | | 53,633 | |
| | | | |
| | | | | | | | | | | | | | | 424,112 | |
| | | | | | | | | | | | | | | | |
| | | | |
| Pharmaceuticals: 0.04% | | | | | | | | | | | | | | | | |
Endo Finance LLC (1 Month LIBOR +4.25%) ± | | | 6.63 | | | | 4-29-2024 | | | | 88,875 | | | | 88,357 | |
| | | | | | | | | | | | | | | | |
| | | | |
Industrials: 1.11% | | | | | | | | | | | | | | | | |
| | | | |
| Airlines: 0.04% | | | | | | | | | | | | | | | | |
United Airlines Incorporated (1 Month LIBOR +1.75%) ± | | | 4.09 | | | | 4-1-2024 | | | | 68,950 | | | | 68,304 | |
| | | | | | | | | | | | | | | | |
| | | | |
| Commercial Services & Supplies: 0.52% | | | | | | | | | | | | | | | | |
Advanced Disposal Services Incorporated (1 Month LIBOR +2.25%) ± | | | 4.47 | | | | 11-10-2023 | | | | 179,546 | | | | 177,571 | |
Aramark Services Incorporated (3 Month LIBOR +1.75%) ± | | | 4.09 | | | | 3-28-2024 | | | | 45,322 | | | | 44,982 | |
Aramark Services Incorporated (3 Month LIBOR +1.75%) ± | | | 4.09 | | | | 3-11-2025 | | | | 364,323 | | | | 361,477 | |
KAR Auction Services Incorporated (3 Month LIBOR +2.25%) ± | | | 4.69 | | | | 3-11-2021 | | | | 149,874 | | | | 148,422 | |
Multi-Color Corporation (3 Month LIBOR +2.00%) ± | | | 4.34 | | | | 10-31-2024 | | | | 178,650 | | | | 175,970 | |
Sensata Technologies BV (2 Month LIBOR +1.75%) ± | | | 4.21 | | | | 10-14-2021 | | | | 158,275 | | | | 157,813 | |
| | | | |
| | | | | | | | | | | | | | | 1,066,235 | |
| | | | | | | | | | | | | | | | |
| | | | |
| Communications Equipment: 0.43% | | | | | | | | | | | | | | | | |
Charter Communications Operating LLC (1 Month LIBOR +2.00%) ± | | | 4.35 | | | | 4-30-2025 | | | | 382,113 | | | | 377,768 | |
Virgin Media Bristol LLC (1 Month LIBOR +2.50%) ± | | | 4.81 | | | | 1-15-2026 | | | | 500,000 | | | | 493,280 | |
| | | | |
| | | | | | | | | | | | | | | 871,048 | |
| | | | | | | | | | | | | | | | |
| | | | |
| Machinery: 0.12% | | | | | | | | | | | | | | | | |
Columbus McKinnon Corporation (3 Month LIBOR +2.50%) ±‡ | | | 4.89 | | | | 1-31-2024 | | | | 51,191 | | | | 50,935 | |
RBS Global Incorporated (3 Month LIBOR +2.25%) ± | | | 4.35 | | | | 8-21-2024 | | | | 200,000 | | | | 198,472 | |
| | | | |
| | | | | | | | | | | | | | | 249,407 | |
| | | | | | | | | | | | | | | | |
| | | | |
Information Technology: 0.48% | | | | | | | | | | | | | | | | |
| | | | |
| Communications Equipment: 0.02% | | | | | | | | | | | | | | | | |
CommScope Incorporated (1 Month LIBOR +2.00%) ±‡ | | | 4.35 | | | | 12-29-2022 | | | | 46,574 | | | | 45,846 | |
| | | | | | | | | | | | | | | | |
| | | | |
| Electronic Equipment, Instruments & Components: 0.20% | | | | | | | | | | | | | | | | |
CDW LLC (1 Month LIBOR +1.75%) ± | | | 4.10 | | | | 8-17-2023 | | | | 198,982 | | | | 196,308 | |
Dell Incorporated (1 Month LIBOR +2.00%) ± | | | 4.35 | | | | 9-7-2023 | | | | 40,592 | | | | 40,066 | |
Zebra Technologies Corporation (3 Month LIBOR +1.75%) ± | | | 4.09 | | | | 11-15-2021 | | | | 159,169 | | | | 158,528 | |
| | | | |
| | | | | | | | | | | | | | | 394,902 | |
| | | | | | | | | | | | | | | | |
The accompanying notes are an integral part of these financial statements.
| | | | |
| 30 | | Wells Fargo Real Return Portfolio | | Portfolio of investments—November 30, 2018 (unaudited) |
| | | | | | | | | | | | | | | | |
| Security name | | Interest rate | | | Maturity date | | | Principal | | | Value | |
| | | | |
| IT Services: 0.15% | | | | | | | | | | | | | | | | |
First Data Corporation (1 Month LIBOR +2.00%) ± | | | 4.32 | % | | | 7-8-2022 | | | $ | 120,327 | | | $ | 118,508 | |
Zayo Group LLC (1 Month LIBOR +2.25%) ± | | | 4.59 | | | | 1-19-2024 | | | | 195,805 | | | | 193,847 | |
| | | | |
| | | | | | | | | | | | | | | 312,355 | |
| | | | | | | | | | | | | | | | |
| | | | |
| Semiconductors & Semiconductor Equipment: 0.11% | | | | | | | | | | | | | | | | |
Micron Technology Incorporated (1 Month LIBOR +1.75%) ± | | | 4.10 | | | | 4-26-2022 | | | | 217,574 | | | | 216,486 | |
| | | | | | | | | | | | | | | | |
| | | | |
Materials: 0.59% | | | | | | | | | | | | | | | | |
| | | | |
| Chemicals: 0.37% | | | | | | | | | | | | | | | | |
Ashland LLC (1 Month LIBOR +1.75%) ± | | | 4.07 | | | | 5-17-2024 | | | | 278,179 | | | | 277,019 | |
Ineos US Finance LLC (1 Month LIBOR +2.00%) ± | | | 4.34 | | | | 3-31-2024 | | | | 497,303 | | | | 487,202 | |
| | | | |
| | | | | | | | | | | | | | | 764,221 | |
| | | | | | | | | | | | | | | | |
| | | | |
| Containers & Packaging: 0.22% | | | | | | | | | | | | | | | | |
Berry Global Incorporated (1 Month LIBOR +1.75%) ± | | | 4.07 | | | | 2-8-2020 | | | | 429,665 | | | | 426,623 | |
Reynolds Group Holdings Incorporated (1 Month LIBOR +2.75%) ± | | | 5.09 | | | | 2-5-2023 | | | | 15,523 | | | | 15,317 | |
| | | | |
| | | | | | | | | | | | | | | 441,940 | |
| | | | | | | | | | | | | | | | |
| | | | |
Real Estate: 0.11% | | | | | | | | | | | | | | | | |
| | | | |
| Equity REITs: 0.11% | | | | | | | | | | | | | | | | |
MGM Growth Properties LLC (1 Month LIBOR +2.00%) ± | | | 4.34 | | | | 3-21-2025 | | | | 221,845 | | | | 217,630 | |
| | | | | | | | | | | | | | | | |
| | | | |
Total Loans (Cost $8,343,019) | | | | | | | | | | | | | | | 8,227,393 | |
| | | | | | | | | | | | | | | | |
| | | | |
| | | | | | Expiration date | | | Shares | | | | |
| | | | |
Participation Notes: 0.11% | | | | | | | | | | | | | | | | |
| | | | |
Financials: 0.11% | | | | | | | | | | | | | | | | |
| | | | |
| Capital Markets: 0.11% | | | | | | | | | | | | | | | | |
UBS AG (Kweichow Moutai Company Limited) †(a) | | | | | | | 8-13-2019 | | | | 2,900 | | | | 235,912 | |
| | | | | | | | | | | | | | | | |
| | | | |
Total Participation Notes (Cost $286,162) | | | | | | | | | | | | | | | 235,912 | |
| | | | | | | | | | | | | | | | |
| | | | |
| | | | | | Maturity date | | | Principal | | | | |
| | | | |
U.S. Treasury Securities: 65.87% | | | | | | | | | | | | | | | | |
TIPS | | | 0.13 | | | | 4-15-2020 | | | $ | 1,299,026 | | | | 1,273,638 | |
TIPS | | | 0.13 | | | | 4-15-2021 | | | | 4,399,152 | | | | 4,281,269 | |
TIPS | | | 0.13 | | | | 1-15-2022 | | | | 5,928,351 | | | | 5,754,220 | |
TIPS | | | 0.13 | | | | 4-15-2022 | | | | 5,683,433 | | | | 5,492,505 | |
TIPS | | | 0.13 | | | | 7-15-2022 | | | | 3,979,525 | | | | 3,860,032 | |
TIPS | | | 0.13 | | | | 1-15-2023 | | | | 6,135,713 | | | | 5,908,931 | |
TIPS | | | 0.13 | | | | 7-15-2024 | | | | 5,969,868 | | | | 5,698,888 | |
TIPS | | | 0.13 | | | | 7-15-2026 | | | | 4,944,774 | | | | 4,629,867 | |
TIPS | | | 0.25 | | | | 1-15-2025 | | | | 5,984,804 | | | | 5,714,205 | |
TIPS | | | 0.38 | | | | 7-15-2023 | | | | 6,091,152 | | | | 5,934,710 | |
TIPS | | | 0.38 | | | | 7-15-2025 | | | | 5,982,827 | | | | 5,758,237 | |
TIPS | | | 0.38 | | | | 1-15-2027 | | | | 3,109,173 | | | | 2,942,945 | |
TIPS | | | 0.38 | | | | 7-15-2027 | | | | 4,685,416 | | | | 4,433,819 | |
The accompanying notes are an integral part of these financial statements.
| | | | | | |
| Portfolio of investments—November 30, 2018 (unaudited) | | Wells Fargo Real Return Portfolio | | | 31 | |
| | | | | | | | | | | | | | | | |
| Security name | | Interest rate | | | Maturity date | | | Principal | | | Value | |
| | | | |
U.S. Treasury Securities(continued) | | | | | | | | | | | | | | | | |
TIPS | | | 0.50 | % | | | 1-15-2028 | | | $ | 3,269,955 | | | $ | 3,107,649 | |
TIPS | | | 0.63 | | | | 7-15-2021 | | | | 5,365,279 | | | | 5,310,428 | |
TIPS | | | 0.63 | | | | 4-15-2023 | | | | 4,929,298 | | | | 4,836,360 | |
TIPS | | | 0.63 | | | | 1-15-2024 | | | | 6,069,796 | | | | 5,950,829 | |
TIPS | | | 0.63 | | | | 1-15-2026 | | | | 5,253,865 | | | | 5,104,253 | |
TIPS | | | 0.63 | | | | 2-15-2043 | | | | 2,014,922 | | | | 1,746,003 | |
TIPS | | | 0.75 | | | | 7-15-2028 | | | | 2,227,691 | | | | 2,168,924 | |
TIPS | | | 0.75 | | | | 2-15-2042 | | | | 2,720,504 | | | | 2,440,377 | |
TIPS | | | 0.75 | | | | 2-15-2045 | | | | 2,369,275 | | | | 2,094,741 | |
TIPS | | | 0.88 | | | | 2-15-2047 | | | | 2,881,234 | | | | 2,613,782 | |
TIPS | | | 1.00 | | | | 2-15-2046 | | | | 2,482,499 | | | | 2,328,862 | |
TIPS | | | 1.00 | | | | 2-15-2048 | | | | 1,888,819 | | | | 1,767,226 | |
TIPS | | | 1.13 | | | | 1-15-2021 | | | | 3,162,124 | | | | 3,158,097 | |
TIPS | | | 1.25 | | | | 7-15-2020 | | | | 2,911,339 | | | | 2,916,864 | |
TIPS | | | 1.38 | | | | 2-15-2044 | | | | 2,745,963 | | | | 2,808,855 | |
TIPS | | | 1.75 | | | | 1-15-2028 | | | | 2,307,671 | | | | 2,442,225 | |
TIPS | | | 2.00 | | | | 1-15-2026 | | | | 2,861,888 | | | | 3,049,974 | |
TIPS | | | 2.13 | | | | 2-15-2040 | | | | 1,214,730 | | | | 1,414,259 | |
TIPS | | | 2.13 | | | | 2-15-2041 | | | | 1,550,516 | | | | 1,814,608 | |
TIPS | | | 2.38 | | | | 1-15-2025 | | | | 3,930,846 | | | | 4,248,058 | |
TIPS | | | 2.38 | | | | 1-15-2027 | | | | 2,121,886 | | | | 2,337,138 | |
TIPS | | | 2.50 | | | | 1-15-2029 | | | | 2,222,338 | | | | 2,519,575 | |
TIPS | | | 3.38 | | | | 4-15-2032 | | | | 896,030 | | | | 1,144,328 | |
TIPS | | | 3.63 | | | | 4-15-2028 | | | | 1,802,793 | | | | 2,206,356 | |
TIPS | | | 3.88 | | | | 4-15-2029 | | | | 2,364,932 | | | | 3,000,322 | |
| | | | |
Total U.S. Treasury Securities (Cost $138,128,551) | | | | | | | | | | | | | | | 134,213,359 | |
| | | | | | | | | | | | | | | | |
| | | | |
Yankee Corporate Bonds and Notes: 1.50% | | | | | | | | | | | | | | | | |
| | | | |
Consumer Discretionary: 0.26% | | | | | | | | | | | | | | | | |
| | | | |
| Auto Components: 0.21% | | | | | | | | | | | | | | | | |
IHO Verwaltungs GmbH 144A | | | 4.13 | | | | 9-15-2021 | | | | 450,000 | | | | 434,250 | |
| | | | | | | | | | | | | | | | |
| | | | |
| Automobiles: 0.05% | | | | | | | | | | | | | | | | |
Jaguar Land Rover Automotive plc 144A | | | 4.13 | | | | 12-15-2018 | | | | 100,000 | | | | 99,968 | |
| | | | | | | | | | | | | | | | |
| | | | |
Financials: 0.55% | | | | | | | | | | | | | | | | |
| | | | |
| Banks: 0.23% | | | | | | | | | | | | | | | | |
Nielsen Holding and Finance BV 144A | | | 5.50 | | | | 10-1-2021 | | | | 465,000 | | | | 466,600 | |
| | | | | | | | | | | | | | | | |
| | | | |
| Diversified Financial Services: 0.32% | | | | | | | | | | | | | | | | |
General Electric Capital International Funding Company | | | 2.34 | | | | 11-15-2020 | | | | 175,000 | | | | 166,346 | |
Park Aerospace Holdings Company 144A | | | 3.63 | | | | 3-15-2021 | | | | 400,000 | | | | 390,000 | |
Virgin Media Finance plc | | | 5.25 | | | | 1-15-2021 | | | | 95,000 | | | | 96,069 | |
| | | | |
| | | | | | | | | | | | | | | 652,415 | |
| | | | | | | | | | | | | | | | |
| | | | |
Health Care: 0.49% | | | | | | | | | | | | | | | | |
| | | | |
| Pharmaceuticals: 0.49% | | | | | | | | | | | | | | | | |
Bausch Health Companies Incorporated 144A | | | 6.50 | | | | 3-15-2022 | | | | 430,000 | | | | 444,513 | |
Teva Pharmaceuticals Industries Incorporated | | | 1.70 | | | | 7-19-2019 | | | | 570,000 | | | | 562,194 | |
| | | | |
| | | | | | | | | | | | | | | 1,006,707 | |
| | | | | | | | | | | | | | | | |
The accompanying notes are an integral part of these financial statements.
| | | | |
| 32 | | Wells Fargo Real Return Portfolio | | Portfolio of investments—November 30, 2018 (unaudited) |
| | | | | | | | | | | | | | | | |
| Security name | | Interest rate | | | Maturity date | | | Principal | | | Value | |
| | | | |
Information Technology: 0.02% | | | | | | | | | | | | | | | | |
| | | | |
| Communications Equipment: 0.02% | | | | | | | | | | | | | | | | |
Nokia Corporation | | | 5.38 | % | | | 5-15-2019 | | | $ | 31,000 | | | $ | 31,078 | |
| | | | | | | | | | | | | | | | |
| | | | |
Materials: 0.18% | | | | | | | | | | | | | | | | |
| | | | |
| Metals & Mining: 0.18% | | | | | | | | | | | | | | | | |
ArcelorMittal SA | | | 5.50 | | | | 3-1-2021 | | | | 355,000 | | | | 364,588 | |
| | | | | | | | | | | | | | | | |
| | | | |
Total Yankee Corporate Bonds and Notes (Cost $3,094,968) | | | | | | | | | | | | | | | 3,055,606 | |
| | | | | | | | | | | | | | | | |
| | | | |
| | | Yield | | | | | | Shares | | | | |
| Short-Term Investments: 1.26% | | | | | | | | | | | | | | | | |
| | | | |
| Investment Companies: 1.22% | | | | | | | | | | | | | | | | |
Securities Lending Cash Investments LLC (l)(r)(u) | | | 2.38 | | | | | | | | 1,052,560 | | | | 1,052,665 | |
Wells Fargo Government Money Market Fund Select Class (l)(u) | | | 2.13 | | | | | | | | 1,435,230 | | | | 1,435,230 | |
| | | | |
| | | | | | | | | | | | | | | 2,487,895 | |
| | | | | | | | | | | | | | | | |
| | | | |
| | | | | | | | | Principal | | | | |
| U.S. Treasury Securities: 0.04% | | | | | | | | | | | | | | | | |
U.S. Treasury Bill (z)# | | | 1.66 | | | | 12-13-2018 | | | $ | 75,000 | | | | 74,955 | |
| | | | | | | | | | | | | | | | |
| | | | |
Total Short-Term Investments (Cost $2,562,850) | | | | | | | | | | | | | | | 2,562,850 | |
| | | | | | | | | | | | | | | | |
| | | | | | | | |
| Total investments in securities (Cost $208,139,917) | | | 100.40 | % | | | 204,579,545 | |
Other assets and liabilities, net | | | (0.40 | ) | | | (818,798 | ) |
| | | | | | | | |
| Total net assets | | | 100.00 | % | | $ | 203,760,747 | |
| | | | | | | | |
| « | All or a portion of this security is on loan. |
| † | Non-income-earning security |
| 144A | The security may be resold in transactions exempt from registration, normally to qualified institutional buyers, pursuant to Rule 144A under the Securities Act of 1933. |
| ± | Variable rate investment. The rate shown is the rate in effect at period end. |
| ‡ | Security is valued using significant unobservable inputs. |
| (a) | The security is fair valued in accordance with procedures approved by the Board of Trustees. |
| (l) | The issuer of the security is an affiliated person of the Portfolio as defined in the Investment Company Act of 1940. |
| (r) | The investment is anon-registered investment company purchased with cash collateral received from securities on loan. |
| (u) | The rate represents the7-day annualized yield at period end. |
| (z) | Zero coupon security. The rate represents the current yield to maturity. |
| # | All or portion of this security is segregated as collateral for investments in derivative instruments. |
Abbreviations:
| ADR | American depositary receipt |
| LIBOR | London Interbank Offered Rate |
| REIT | Real estate investment trust |
| TIPS | Treasury inflation-protected securities |
The accompanying notes are an integral part of these financial statements.
| | | | | | |
| Portfolio of investments—November 30, 2018 (unaudited) | | Wells Fargo Real Return Portfolio | | | 33 | |
Futures Contracts
| | | | | | | | | | | | | | | | | | | | | | | | |
| Description | | Number of
contracts | | | Expiration
date | | | Notional
cost | | | Notional
value | | | Unrealized
gains | | | Unrealized
losses | |
Long | | | | | | | | | | | | | | | | | | | | | | | | |
2-Year U.S. Treasury Notes | | | 5 | | | | 3-29-2019 | | | $ | 1,054,773 | | | $ | 1,054,922 | | | $ | 149 | | | $ | 0 | |
Short | | | | | | | | | | | | | | | | | | | | | | | | |
U.S. Ultra Bond | | | (6) | | | | 3-20-2019 | | | | (915,097 | ) | | | (914,438 | ) | | | 659 | | | | 0 | |
5-Year U.S. Treasury Notes | | | (45) | | | | 3-29-2019 | | | | (5,078,600 | ) | | | (5,083,242 | ) | | | 0 | | | | (4,642 | ) |
10-Year U.S. Treasury Notes | | | (4) | | | | 3-20-2019 | | | | (476,556 | ) | | | (477,813 | ) | | | 0 | | | | (1,257 | ) |
| | | | | | | | | | | | | | | | | | | | | | | | |
| | | | | | | | | | | | | | | | | | $ | 808 | | | $ | (5,899 | ) |
| | | | | | | | | | | | | | | | | | | | | | | | |
The accompanying notes are an integral part of these financial statements.
| | | | |
| 34 | | Wells Fargo Real Return Portfolio | | Portfolio of investments—November 30, 2018 (unaudited) |
Investments in Affiliates
An affiliated investment is an investment in which the Portfolio owns at least 5% of the outstanding voting shares of the issuer or as a result of other relationships, such as the Portfolio and the issuer having the same adviser or investment manager. Transactions with issuers that were either affiliated persons of the Portfolio at the beginning of the period or the end of the period were as follows:
| | | | | | | | | | | | | | | | | | | | | | | | | | | | | | | | | | | | |
| | | Shares,
beginning of
period | | | Shares
purchased | | | Shares
sold | | | Shares,
end of
period | | | Net
realized
gains
(losses) | | | Net
change in
unrealized
gains
(losses) | | | Income
from
affiliated
securities | | | Value,
end
of period | | | % of
net
assets | |
Short-Term Investments | | | | | | | | | | | | | | | | | | | | | | | | | | | | | | | | | | | | |
Investment Companies | | | | | | | | | | | | | | | | | | | | | | | | | | | | | | | | | | | | |
Securities Lending Cash Investments LLC | | | 1,733,169 | | | | 7,294,591 | | | | 7,975,200 | | | | 1,052,560 | | | $ | 0 | | | $ | 0 | | | $ | 5,856 | | | $ | 1,052,665 | | | | | |
Wells Fargo Government Money Market Fund Select Class | | | 2,901,798 | | | | 110,473,486 | | | | 111,940,054 | | | | 1,435,230 | | | | 0 | | | | 0 | | | | 25,628 | | | | 1,435,230 | | | | | |
| | | | | | | | | | | | | | | | | | | | | | | | | | | | | | | | | | | | |
| | | | | | | | | | | | | | | | | | $ | 0 | | | $ | 0 | | | $ | 31,484 | | | $ | 2,487,895 | | | | 1.22 | % |
| | | | | | | | | | | | | | | | | | | | | | | | | | | | | | | | | | | | |
The accompanying notes are an integral part of these financial statements.
| | | | | | |
| Statement of assets and liabilities—November 30, 2018 (unaudited) | | Wells Fargo Real Return Portfolio | | | 35 | |
| | | | |
| | | | |
| |
Assets | | | | |
Investments in unaffiliated securities, (including $1,006,250 of securities loaned) at value (cost $205,652,022) | | $ | 202,091,650 | |
Investments in affiliated securities, at value (cost $2,487,895) | | | 2,487,895 | |
Foreign currency, at value (cost $15,547) | | | 15,152 | |
Receivable for investments sold | | | 221,681 | |
Receivable for dividends and interest | | | 737,442 | |
Receivable for daily variation margin on open futures contract | | | 78 | |
Receivable for securities lending income | | | 374 | |
| | | | |
Total assets | | | 205,554,272 | |
| | | | |
| |
Liabilities | | | | |
Payable upon receipt of securities loaned | | | 1,052,672 | |
Payable for investments purchased | | | 656,064 | |
Advisory fee payable | | | 63,978 | |
Payable for daily variation margin on open futures contracts | | | 4,219 | |
Accrued expenses and other liabilities | | | 16,592 | |
| | | | |
Total liabilities | | | 1,793,525 | |
| | | | |
Total net assets | | $ | 203,760,747 | |
| | | | |
The accompanying notes are an integral part of these financial statements.
| | | | |
| 36 | | Wells Fargo Real Return Portfolio | | Statement of operations—six months ended November 30, 2018 (unaudited) |
| | | | |
| | | | |
| |
Investment income | | | | |
Interest | | $ | 2,701,525 | |
Dividends (net of foreign withholding taxes of $11,448) | | | 417,086 | |
Income from affiliated securities | | | 31,484 | |
| | | | |
Total investment income | | | 3,150,095 | |
| | | | |
| |
Expenses | | | | |
Advisory fee | | | 436,081 | |
Custody and accounting fees | | | 7,261 | |
Professional fees | | | 23,669 | |
Shareholder report expenses | | | 725 | |
Trustees’ fees and expenses | | | 12,260 | |
Other fees and expenses | | | 4,335 | |
| | | | |
Total expenses | | | 484,331 | |
Less: Fee waivers and/or expense reimbursements | | | (48,250 | ) |
| | | | |
Net expenses | | | 436,081 | |
| | | | |
Net investment income | | | 2,714,014 | |
| | | | |
| |
REALIZED AND UNREALIZED GAINS (LOSSES) ON INVESTMENTS | | | | |
| |
Net realized gains (losses) on: | | | | |
Unaffiliated securities | | | (1,930,476 | ) |
Futures contracts | | | 79,581 | |
| | | | |
Net realized losses on investments | | | (1,850,895 | ) |
| | | | |
| |
Net change in unrealized gains (losses) on: | | | | |
Unaffiliated securities | | | (4,363,738 | ) |
Futures contracts | | | (355 | ) |
| | | | |
Net change in unrealized gains (losses) on investments | | | (4,364,093 | ) |
| | | | |
Net realized and unrealized gains (losses) on investments | | | (6,214,988 | ) |
| | | | |
Net decrease in net assets resulting from operations | | $ | (3,500,974 | ) |
| | | | |
The accompanying notes are an integral part of these financial statements.
| | | | | | |
| Statement of changes in net assets | | Wells Fargo Real Return Portfolio | | | 37 | |
| | | | | | | | |
| | | Six months ended
November 30, 2018
(unaudited) | | | Year ended
May 31, 2018 | |
| | |
Operations | | | | | | | | |
Net investment income | | $ | 2,714,014 | | | $ | 2,993,334 | |
Net realized gains (losses) on investments | | | (1,850,895 | ) | | | 261,172 | |
Net change in unrealized gains (losses) on investments | | | (4,364,093 | ) | | | (1,297,441 | ) |
| | | | |
Net increase (decrease) in net assets resulting from operations | | | (3,500,974 | ) | | | 1,957,065 | |
| | | | |
| | |
Capital transactions | | | | | | | | |
Transactions in investors’ beneficial interests | | | | | | | | |
Contributions | | | 99,792,854 | | | | 92,220,550 | |
Withdrawals | | | (37,676,838 | ) | | | (38,625,765 | ) |
| | | | |
Net increase in net assets resulting from capital transactions | | | 62,116,016 | | | | 53,594,785 | |
| | | | |
Total increase in net assets | | | 58,615,042 | | | | 55,551,850 | |
| | | | |
| | |
Net assets | | | | | | | | |
Beginning of period | | | 145,145,705 | | | | 89,593,855 | |
| | | | |
End of period | | $ | 203,760,747 | | | $ | 145,145,705 | |
| | | | |
The accompanying notes are an integral part of these financial statements.
| | | | |
| 38 | | Wells Fargo Real Return Portfolio | | Financial highlights |
| | | | | | | | | | | | | | | | | | | | | | | | |
| | | Six months ended
November 30, 2018
(unaudited) | | | Year ended May 31 | |
| | | 2018 | | | 2017 | | | 2016 | | | 2015 | | | 2014 | |
Total return1 | | | (1.58 | )% | | | 1.67 | % | | | 2.65 | % | | | 1.29 | % | | | 1.50 | % | | | (0.26 | )% |
Ratios to average net assets (annualized) | | | | | | | | | | | | | | | | | | | | | | | | |
Gross expenses | | | 0.44 | % | | | 0.48 | % | | | 0.52 | % | | | 0.56 | % | | | 0.57 | % | | | 0.53 | % |
Net expenses | | | 0.40 | % | | | 0.41 | % | | | 0.44 | % | | | 0.44 | % | | | 0.44 | % | | | 0.44 | % |
Net investment income | | | 2.49 | % | | | 2.40 | % | | | 2.36 | % | | | 1.45 | % | | | 0.89 | % | | | 1.45 | % |
Supplemental data | | | | | | | | | | | | | | | | | | | | | | | | |
Portfolio turnover rate | | | 16 | % | | | 29 | % | | | 25 | % | | | 29 | % | | | 57 | % | | | 9 | % |
| 1 | Returns for periods of less than one year are not annualized. |
The accompanying notes are an integral part of these financial statements.
| | | | | | |
| Notes to financial statements (unaudited) | | Wells Fargo Real Return Portfolio | | | 39 | |
1. ORGANIZATION
Wells Fargo Master Trust (the “Trust”), a Delaware statutory trust organized on March 10, 1999, is anopen-end management investment company registered under the Investment Company Act of 1940, as amended (the “1940 Act”). As an investment company, the Trust follows the accounting and reporting guidance in Financial Accounting Standards Board (“FASB”)Accounting Standards Codification Topic 946, Financial Services – Investment Companies. These financial statements report on the Wells Fargo Real Return Portfolio (the “Portfolio”) which is a diversified series of the Trust.
2. SIGNIFICANT ACCOUNTING POLICIES
The following significant accounting policies, which are consistently followed in the preparation of the financial statements of the Portfolio, are in conformity with U.S. generally accepted accounting principles which require management to make estimates and assumptions that affect the reported amounts of assets and liabilities, disclosure of contingent assets and liabilities at the date of the financial statements, and the reported amounts of revenues and expenses during the reporting period. Actual results could differ from those estimates.
Securities valuation
All investments are valued each business day as of the close of regular trading on the New York Stock Exchange (generally 4 p.m. Eastern Time), although the Portfolio may deviate from this calculation time under unusual or unexpected circumstances.
Debt securities are valued at the evaluated bid price provided by an independent pricing service (e.g. taking into account various factors, including yields, maturities, or credit ratings) or, if a reliable price is not available, the quoted bid price from an independent broker-dealer.
Equity securities and futures contracts that are listed on a foreign or domestic exchange or market are valued at the official closing price or, if none, the last sales price. If no sale occurs on the principal exchange or market that day, a fair value price will be determined in accordance with the Portfolio’s Valuation Procedures.
Many securities markets and exchanges outside the U.S. close prior to the close of the New York Stock Exchange and therefore may not fully reflect trading or events that occur after the close of the principal exchange in which the foreign securities are traded, but before the close of the New York Stock Exchange. If such trading or events are expected to materially affect the value of such securities, then fair value pricing procedures approved by the Board of Trustees of the Portfolio are applied. These procedures take into account multiple factors including movements in U.S. securities markets after foreign exchanges close. Foreign securities that are fair valued under these procedures are categorized as Level 2 and the application of these procedures may result in transfers between Level 1 and Level 2. Depending on market activity, such fair valuations may be frequent. Such fair value pricing may result in net asset values that are higher or lower than net asset values based on the last reported sales price or latest quoted bid price. On November 30, 2018, such fair value pricing was not used in pricing foreign securities.
Investments in registeredopen-end investment companies are valued at net asset value. Interests innon-registered investment companies that are redeemable at net asset value are fair valued normally at net asset value.
Investments which are not valued using any of the methods discussed above are valued at their fair value, as determined in good faith by the Board of Trustees . The Board of Trustees has established a Valuation Committee comprised of the Trustees and has delegated to it the authority to take any actions regarding the valuation of portfolio securities that the Valuation Committee deems necessary or appropriate, including determining the fair value of portfolio securities, unless the determination has been delegated to the Wells Fargo Asset Management Pricing Committee at Wells Fargo Funds Management, LLC (“Funds Management”). The Board of Trustees retains the authority to make or ratify any valuation decisions or approve any changes to the Valuation Procedures as it deems appropriate. On a quarterly basis, the Board of Trustees receives reports on any valuation actions taken by the Valuation Committee or the Wells Fargo Asset Management Pricing Committee which may include items for ratification.
Foreign currency translation
The accounting records of the Portfolio are maintained in U.S. dollars. The values of other assets and liabilities denominated in foreign currencies are translated into U.S. dollars at rates provided by an independent foreign currency pricing source at a time each business day specified by the Wells Fargo Asset Management Pricing Committee. Purchases and sales of securities, and income and expenses are converted at the rate of exchange on the respective dates of such transactions. Net realized foreign exchange gains or losses arise from sales of foreign currencies, currency gains or losses realized between the trade and settlement dates on securities transactions, and the difference between the amounts of
| | | | |
| 40 | | Wells Fargo Real Return Portfolio | | Notes to financial statements (unaudited) |
dividends, interest and foreign withholding taxes recorded and the U.S. dollar equivalent of the amounts actually paid or received. Net unrealized foreign exchange gains and losses arise from changes in the fair value of assets and liabilities other than investments in securities resulting from changes in exchange rates. The changes in net assets arising from changes in exchange rates of securities and the changes in net assets resulting from changes in market prices of securities are not separately presented. Such changes are included in net realized and unrealized gains or losses from investments.
Participation notes
The Portfolio may invest in participation notes to gain exposure to securities in certain foreign markets. Participation notes are issued by banks or broker-dealers and are designed to offer a return linked to a particular underlying foreign security. Participation notes involve transaction costs, which may be higher than those applicable to the underlying foreign security. The holder of the participation note is entitled to receive from the bank or broker-dealer, an amount equal to the dividend paid by the issuer of the underlying foreign security; however, the holder is not entitled to the same rights (i.e. voting rights) as an owner of the underlying foreign security. Investments in participation notes involve risks beyond those normally associated with a direct investment in an underlying security. The Portfolio has no rights against the issuer of the underlying foreign security and participation notes expose the Portfolio to counterparty risk in the event the counterparty does not perform. There is also no assurance there will be a secondary trading market for the participation note or that the trading price of the participation note will equal the underlying value of the foreign security that it seeks to replicate.
Securities lending
The Portfolio may lend its securities from time to time in order to earn additional income in the form of fees or interest on securities received as collateral or the investment of any cash received as collateral. The Portfolio continues to receive interest or dividends on the securities loaned. The Portfolio receives collateral in the form of cash or securities with a value at least equal to the value of the securities on loan. The value of the loaned securities is determined at the close of each business day and any additional required collateral is delivered to the Portfolio on the next business day. In a securities lending transaction, the net asset value of the Portfolio will be affected by an increase or decrease in the value of the securities loaned and by an increase or decrease in the value of the instrument in which collateral is invested. The amount of securities lending activity undertaken by the Portfolio fluctuates from time to time. In the event of default or bankruptcy by the borrower, the Portfolio may be prevented from recovering the loaned securities or gaining access to the collateral or may experience delays or costs in doing so. In addition, the investment of any cash collateral received may lose all or part of its value. The Portfolio has the right under the lending agreement to recover the securities from the borrower on demand.
The Portfolio lends its securities through an unaffiliated securities lending agent. Cash collateral received in connection with its securities lending transactions is invested in Securities Lending Cash Investments, LLC (the “Securities Lending Fund”). The Securities Lending Fund is exempt from registration under Section 3(c)(7) of the 1940 Act and is managed by Funds Management and is subadvised by Wells Capital Management Incorporated (“WellsCap”), an affiliate of Funds Management and an indirect wholly owned subsidiary of Wells Fargo & Company (“Wells Fargo”). Funds Management receives an advisory fee starting at 0.05% and declining to 0.01% as the average daily net assets of the Securities Lending Fund increase. All of the fees received by Funds Management are paid to WellsCap for its services as subadviser. The Securities Lending Fund seeks to provide a positive return compared to the daily Fed Funds Open Rate by investing in high-quality, U.S. dollar-denominated short-term money market instruments. Securities Lending Fund investments are valued at the evaluated bid price provided by an independent pricing service. Income earned from investment in the Securities Lending Fund, if any, is included in income from affiliated securities on the Statement of Operations.
When-issued transactions
The Portfolio may purchase securities on a forward commitment or when-issued basis. A Portfolio records a when-issued transaction on the trade date and will segregate assets in an amount at least equal in value to the Portfolio’s commitment to purchase when-issued securities. Securities purchased on a when-issued basis aremarked-to-market daily and the Portfolio begins earning interest on the settlement date. Losses may arise due to changes in the market value of the underlying securities or if the counterparty does not perform under the contract.
Loans
The Portfolio may invest in direct debt instruments which are interests in amounts owed to lenders by corporate or other borrowers. The loans pay interest at rates which are periodically reset by reference to a base lending rate plus a spread. Investments in loans may be in the form of participations in loans or assignments of all or a portion of loans from third parties. When the Portfolio purchases participations, it generally has no rights to enforce compliance with terms of the
| | | | | | |
| Notes to financial statements (unaudited) | | Wells Fargo Real Return Portfolio | | | 41 | |
loan agreement with the borrower. As a result, the Portfolio assumes the credit risk of both the borrower and the lender that is selling the participation. When the Portfolio purchases assignments from lenders, it acquires direct rights against the borrower on the loan and may enforce compliance by the borrower with the terms of the loan agreement. Loans may include fully funded term loans or unfunded loan commitments, which are contractual obligations for future funding.
Futures contracts
The Portfolio is subject to interest rate risk in the normal course of pursuing its investment objectives. Futures contracts are agreements between the Portfolio and a counterparty to buy or sell a specific amount of a commodity, financial instrument or currency at specified price and on a specified date. The Portfolio may buy and sell futures contracts in order to gain exposure to, or protect against, changes in interest rates and security values. The primary risks associated with the use of futures contracts are the imperfect correlation between changes in market values of securities held by the Portfolio and the prices of futures contracts, and the possibility of an illiquid market. Futures contracts are generally entered into on a regulated futures exchange and cleared through a clearinghouse associated with the exchange. With futures contracts, there is minimal counter party risk to the Portfolio since futures contracts are exchange traded and the exchange’s clearinghouse, as counterparty to all exchange traded futures, guarantees the futures contracts against default.
Upon entering into a futures contracts, the Portfolio is required to deposit either cash or securities (initial margin) with the broker in an amount equal to a certain percentage of the contract value. Subsequent payments (variation margin) are paid to or from the broker each day equal to the daily changes in the contract value. Such payments are recorded as unrealized gains or losses and, if any, shown as variation margin receivable (payable) in the Statement of Assets and Liabilities. Should the Portfolio fail to make requested variation margin payments, the broker can gain access to the initial margin to satisfy the Portfolio’s payment obligations. When the contracts are closed, a realized gain or loss is recorded in the Statement of Operations.
Inflation-indexed bonds and TIPS
The Portfolio may invest in inflation-indexed bonds, including Treasury inflation-protected securities (TIPS). Inflation-indexed bonds are fixed income securities whose principal value is periodically adjusted according to the rate of inflation. If the index measuring inflation falls, the principal value of inflation-indexed bonds (other than municipal inflation-indexed bonds and certain corporate inflation-indexed bonds) will be adjusted downward, and consequently the interest payable on these securities (calculated with respect to a smaller principal amount) will be reduced. Repayment of the original bond principal upon maturity (as adjusted for inflation) is guaranteed in the case of U.S. Treasury inflation-indexed bonds. For bonds that do not provide a similar guarantee, the adjusted principal value of the bond repaid at maturity may be less than the original principal. The value of inflation-indexed bonds is expected to change in response to changes in real interest rates. Real interest rates are tied to the relationship between nominal interest rates and the rate of inflation. If nominal interest rates increase at a faster rate than inflation, real interest rates may rise, leading to a decrease in value of inflation-indexed bonds. Inflation-indexed bonds, including TIPS, decline in value when real interest rates rise. In certain interest rate environments, such as when real interest rates are rising faster than nominal interest rates, inflation-indexed bonds may experience greater losses than other fixed income securities with similar durations.
Security transactions and income recognition
Securities transactions are recorded on a trade date basis. Realized gains or losses are recorded on the basis of identified cost.
Interest income is accrued daily and bond discounts are accreted and premiums are amortized daily. To the extent debt obligations are placed onnon-accrual status, any related interest income may be reduced by writing off interest receivables when the collection of all or a portion of interest has been determined to be doubtful based on consistently applied procedures and the fair value has decreased. If the issuer subsequently resumes interest payments or when the collectability of interest is reasonably assured, the debt obligation is removed fromnon-accrual status.
Dividend income is recognized on theex-dividend date, except for certain dividends from foreign securities, which are recorded as soon as the custodian verifies theex-dividend date. Dividend income from foreign securities is recorded net of foreign taxes withheld where recovery of such taxes is not assured.
Federal and other taxes
The Portfolio is treated as a separate entity for federal income tax purposes. The Portfolio is not required to pay federal income taxes on its net investment income and net capital gains as it is treated as a partnership for federal income tax purposes. All interest, dividends, gains and losses of the Portfolio are deemed to have been “passed through” to the interest holders in proportion to their holdings of the Portfolio regardless of whether such interest, dividends and gains have been distributed by the Portfolio.
| | | | |
| 42 | | Wells Fargo Real Return Portfolio | | Notes to financial statements (unaudited) |
The Portfolio’s income tax returns and all financial records supporting those returns for the prior three fiscal years are subject to examination by the federal revenue authority. Management has analyzed the Portfolio’s tax positions taken on federal, state, and foreign tax returns for all open tax years and does not believe that there are any uncertain tax positions that require recognition of a tax liability.
As of November 30, 2018, the aggregate cost of all investments for federal income tax purposes was $208,561,455 and the unrealized gains (losses) consisted of:
| | | | |
Gross unrealized gains | | $ | 2,857,436 | |
Gross unrealized losses | | | (6,844,437 | ) |
Net unrealized losses | | $ | (3,987,001 | ) |
3. FAIR VALUATION MEASUREMENTS
Fair value measurements of investments are determined within a framework that has established a fair value hierarchy based upon the various data inputs utilized in determining the value of the Portfolio’s investments. The three-level hierarchy gives the highest priority to unadjusted quoted prices in active markets for identical assets or liabilities (Level 1) and the lowest priority to unobservable inputs (Level 3). The Portfolio’s investments are classified within the fair value hierarchy based on the lowest level of input that is significant to the fair value measurement. The inputs are summarized into three broad levels as follows:
| ∎ | | Level 1 – quoted prices in active markets for identical securities |
| ∎ | | Level 2 – other significant observable inputs (including quoted prices for similar securities, interest rates, prepayment speeds, credit risk, etc.) |
| ∎ | | Level 3 – significant unobservable inputs (including the Portfolio’s own assumptions in determining the fair value of investments) |
The inputs or methodologies used for valuing investments in securities are not necessarily an indication of the risk associated with investing in those securities.
| | | | | | |
| Notes to financial statements (unaudited) | | Wells Fargo Real Return Portfolio | | | 43 | |
The following is a summary of the inputs used in valuing the Portfolio’s assets and liabilities as of November 30, 2018:
| | | | | | | | | | | | | | | | |
| | | Quoted prices
(Level 1) | | | Other significant
observable inputs
(Level 2) | | | Significant
unobservable inputs
(Level 3) | | | Total | |
Assets | | | | | | | | | | | | | | | | |
Investments in: | | | | | | | | | | | | | | | | |
| | | | |
Common stocks | | | | | | | | | | | | | | | | |
Consumer staples | | $ | 10,592,323 | | | $ | 0 | | | $ | 0 | | | $ | 10,592,323 | |
Energy | | | 8,275,430 | | | | 0 | | | | 0 | | | | 8,275,430 | |
Industrial | | | 454,091 | | | | 0 | | | | 0 | | | | 454,091 | |
Materials | | | 6,772,170 | | | | 0 | | | | 0 | | | | 6,772,170 | |
Real estate | | | 8,806,698 | | | | 0 | | | | 0 | | | | 8,806,698 | |
| | | | |
Corporate bonds and notes | | | 0 | | | | 21,383,713 | | | | 0 | | | | 21,383,713 | |
| | | | |
Loans | | | 0 | | | | 7,479,653 | | | | 747,740 | | | | 8,227,393 | |
| | | | |
Participation notes | | | | | | | | | | | | | | | | |
Financials | | | | | | | 235,912 | | | | 0 | | | | 235,912 | |
| | | | |
U.S. Treasury securities | | | 134,213,359 | | | | 0 | | | | 0 | | | | 134,213,359 | |
| | | | |
Yankee corporate bonds and notes | | | 0 | | | | 3,055,606 | | | | 0 | | | | 3,055,606 | |
| | | | |
Short-term investments | | | | | | | | | | | | | | | | |
Investment companies | | | 1,435,230 | | | | 1,052,665 | | | | 0 | | | | 2,487,895 | |
U.S. Treasury securities | | | 74,955 | | | | 0 | | | | 0 | | | | 74,955 | |
| | | | |
| | | 170,624,256 | | | | 33,207,549 | | | | 747,740 | | | | 204,579,545 | |
Futures contracts | | | 808 | | | | 0 | | | | 0 | | | | 808 | |
Total assets | | $ | 170,625,064 | | | $ | 33,207,549 | | | $ | 747,740 | | | $ | 204,580,353 | |
Liabilities | | | | | | | | | | | | | | | | |
Futures contracts | | $ | 5,899 | | | $ | 0 | | | $ | 0 | | | $ | 5,899 | |
Total liabilities | | $ | 5,899 | | | $ | 0 | | | $ | 0 | | | $ | 5,899 | |
Additional sector, industry or geographic detail is included in the Portfolio of Investments.
Futures contracts are reported at their cumulative unrealized gains (losses) at measurement date as reported in the table following the Portfolio of Investments. For futures contracts, the current day’s variation margin is reported on the Statement of Assets and Liabilities. All other assets and liabilities are reported at their market value at measurement date.
At November 30, 2018, the Portfolio has no material transfers into/out of Level 3.
4. TRANSACTIONS WITH AFFILIATES
Advisory fee
The Trust has entered into an advisory contract with Funds Management, an indirect wholly owned subsidiary of Wells Fargo. The adviser is responsible for implementing investment policies and guidelines and for supervising the subadviser, who is responsible forday-to-day portfolio management of the Portfolio. Pursuant to the contract, Funds Management is entitled to receive an annual advisory fee starting at 0.40% and declining to 0.29% as the average daily net assets of the Portfolio increase. For the six months ended November 30, 2018, the advisory fee was equivalent to an annual rate of 0.40% of the Portfolio’s average daily net assets.
Funds Management has retained the services of a subadviser to provide daily portfolio management to the Portfolio. The fee for subadvisory services is borne by Funds Management. WellsCap is the subadviser to the Portfolio and is entitled to receive a fee from Funds Management at an annual rate starting at 0.28% and declining to 0.18% as the average daily net assets of the Portfolio increase.
Funds Management has voluntarily waived and/or reimbursed advisory fees to the extent necessary to maintain certain net operating expense ratios for the Portfolio.
| | | | |
| 44 | | Wells Fargo Real Return Portfolio | | Notes to financial statements (unaudited) |
Interfund transactions
The Portfolio may purchase or sell portfolio investment securities to certain other Wells Fargo affiliates pursuant toRule 17a-7 of the 1940 Act and under procedures adopted by the Board of Trustees. The procedures have been designed to ensure that these interfund transactions, which do not incur broker commissions, are effected at current market prices.
5. INVESTMENT PORTFOLIO TRANSACTIONS
Purchases and sales of investments, excluding short-term securities, for the six months ended November 30, 2018 were as follows:
| | | | | | |
Purchases at cost | | Sales proceeds |
U.S.
government | | Non-U.S.
government | | U.S.
government | | Non-U.S.
government |
| $62,322,833 | | $37,400,436 | | $21,329,867 | | $12,110,246 |
6. DERIVATIVE TRANSACTIONS
During the six months ended November 30, 2018, the Portfolio entered into futures contract to speculate on interest rates and to help manage the duration of its portfolio. The Portfolio had an average notional amount of $2,023,638 in long futures contracts and $9,808,367 in short futures contracts during the six months ended November 30, 2018.
The fair value, realized gains or losses and change in unrealized gains or losses, if any, on derivative instruments are reflected in the corresponding financial statement captions.
7. BORROWINGS
Effective August 28, 2018, the Trust, along with Wells Fargo Variable Trust and Wells Fargo Funds Trust (excluding the money market funds), are parties to a $280,000,000 revolving credit agreement whereby the Portfolio is permitted to use bank borrowings for temporary or emergency purposes, such as to fund shareholder redemption requests. Interest under the credit agreement is charged to the Portfolio based on a borrowing rate equal to the higher of the Federal Funds rate in effect on that day plus 1.25% or the overnight LIBOR rate in effect on that day plus 1.25%. In addition, an annual commitment fee equal to 0.25% of the unused balance is allocated to each participating fund.
For the six months ended November 30, 2018, there were no borrowings by the Portfolio under the agreement.
8. INDEMNIFICATION
Under the Trust’s organizational documents, the officers and Trustees have been granted certain indemnification rights against certain liabilities that may arise out of performance of their duties to the Trust. Additionally, in the normal course of business, the Trust may enter into contracts with service providers that contain a variety of indemnification clauses. The Trust’s maximum exposure under these arrangements is dependent on future claims that may be made against the Portfolios and, therefore, cannot be estimated.
9. NEW ACCOUNTING PRONOUNCEMENT
In August 2018, FASB issued Accounting Standards Update (“ASU”)No. 2018-13, Fair Value Measurement (Topic 820) Disclosure Framework—Changes to the Disclosure Requirements for Fair Value Measurement. ASU2018-13 updates the disclosure requirements for fair value measurements by modifying or removing certain disclosures and adding certain new disclosures. The amendments are effective for fiscal years, and interim periods within those fiscal years, beginning after December 15, 2019. Early adoption is permitted. Management has adopted the removal and modification of disclosures early, as permitted, and will adopt the additional new disclosures at the effective date.
| | | | | | |
| Other information (unaudited) | | Wells Fargo Real Return Fund | | | 45 | |
PROXY VOTING INFORMATION
A description of the policies and procedures used to determine how to vote proxies relating to portfolio securities is available, upon request, by calling1-800-222-8222, visiting our website atwellsfargofunds.com, or visiting the SEC website at sec.gov. Information regarding how the Fund voted proxies relating to portfolio securities during the most recent12-month period ended June 30 is available on the Fund’s website atwellsfargofunds.comor by visiting the SEC website at sec.gov.
PORTFOLIO HOLDINGS INFORMATION
The complete portfolio holdings are publicly available on the website (wellsfargofunds.com) on a one-month delayed basis. In addition, top ten holdings information (excluding derivative positions) is publicly available on the website on a monthly, seven-day or more delayed basis. The Fund and the Portfolio each file their complete schedule of portfolio holdings with the SEC for the first and third quarters of each fiscal year on Form N-Q, which is available by visiting the SEC website at sec.gov. In addition, each Form N-Q may be reviewed and copied at the SEC’s Public Reference Room in Washington, DC, and at regional offices in New York City, at 233 Broadway, and in Chicago, at 175 West Jackson Boulevard, Suite 900. Information about the Public Reference Room may be obtained by calling 1-800-SEC-0330.
| | | | |
| 46 | | Wells Fargo Real Return Fund | | Other information (unaudited) |
BOARD OF TRUSTEES AND OFFICERS
Each of the Trustees and Officers1 listed in the table below acts in identical capacities for each fund in the Wells Fargo family of funds, which consists of 152 mutual funds comprising the Wells Fargo Funds Trust, Wells Fargo Variable Trust, Wells Fargo Master Trust and fourclosed-end funds (collectively the “Fund Complex”). This table should be read in conjunction with the Prospectus and the Statement of Additional Information2. The mailing address of each Trustee and Officer is 525 Market Street, 12th Floor, San Francisco, CA 94105. Each Trustee and Officer serves an indefinite term, however, each Trustee serves such term until reaching the mandatory retirement age established by the Trustees.
Independent Trustees
| | | | | | |
Name and
year of birth | | Position held and
length of service* | | Principal occupations during past five years or longer | | Current other
public company or
investment company
directorships |
William R. Ebsworth (Born 1957) | | Trustee, since 2015 | | Retired. From 1984 to 2013, equities analyst, portfolio manager, research director and chief investment officer at Fidelity Management and Research Company in Boston, Tokyo, and Hong Kong, and retired in 2013 as Chief Investment Officer of Fidelity Strategic Advisers, Inc. where he led a team of investment professionals managing client assets. Prior thereto, Board member of Hong Kong Securities Clearing Co., Hong Kong Options Clearing Corp., the Thailand International Fund, Ltd., Fidelity Investments Life Insurance Company, and Empire Fidelity Investments Life Insurance Company. Board member of the Vincent Memorial Hospital Endowment(non-profit organization), where he serves on the Investment Committee and as a Chair of the Audit Committee. Mr. Ebsworth is a CFA® charterholder. | | N/A |
Jane A. Freeman (Born 1953) | | Trustee, since 2015; Chair Liaison, since 2018 | | Retired. From 2012 to 2014 and 1999 to 2008, Chief Financial Officer of Scientific Learning Corporation. From 2008 to 2012, Ms. Freeman provided consulting services related to strategic business projects. Prior to 1999, Portfolio Manager at Rockefeller & Co. and Scudder, Stevens & Clark. Board member of the Harding Loevner Funds from 1996 to 2014, serving as both Lead Independent Director and chair of the Audit Committee. Board member of the Russell Exchange Traded Funds Trust from 2011 to 2012 and the chair of the Audit Committee. Ms. Freeman is a Board Member of The Ruth Bancroft Garden(non-profit organization). She is also an inactive Chartered Financial Analyst. | | N/A |
Isaiah Harris, Jr.3 (Born 1952) | | Trustee, since 2009 | | Retired. Chairman of the Board of CIGNA Corporation since 2009, and Director since 2005. From 2003 to 2011, Director of Deluxe Corporation. Prior thereto, President and CEO of BellSouth Advertising and Publishing Corp. from 2005 to 2007, President and CEO of BellSouth Enterprises from 2004 to 2005 and President of BellSouth Consumer Services from 2000 to 2003. Emeritus member of the Iowa State University Foundation Board of Governors. Emeritus Member of the Advisory Board of Iowa State University School of Business. Advisory Board Member, Palm Harbor Academy (private school). Advisory Board Member, Child Evangelism Fellowship(non-profit). Mr. Harris is a certified public accountant (inactive status). | | CIGNA Corporation |
Judith M. Johnson3 (Born 1949) | | Trustee, since 2008; Audit Committee Chairman, since 2009 | | Retired. Prior thereto, Chief Executive Officer and Chief Investment Officer of Minneapolis Employees Retirement Fund from 1996 to 2008. Ms. Johnson is an attorney, certified public accountant and a certified managerial accountant. | | N/A |
David F. Larcker (Born 1950) | | Trustee, since 2009 | | James Irvin Miller Professor of Accounting at the Graduate School of Business, Stanford University, Director of the Corporate Governance Research Initiative and Senior Faculty of The Rock Center for Corporate Governance since 2006. From 2005 to 2008, Professor of Accounting at the Graduate School of Business, Stanford University. Prior thereto, Ernst & Young Professor of Accounting at The Wharton School, University of Pennsylvania from 1985 to 2005. | | N/A |
| | | | | | |
| Other information (unaudited) | | Wells Fargo Real Return Fund | | | 47 | |
| | | | | | |
Name and
year of birth | | Position held and
length of service* | | Principal occupations during past five years or longer | | Current other
public company or
investment company
directorships |
Olivia S. Mitchell (Born 1953) | | Trustee, since 2006; Nominating and Governance Committee Chairman, since 2018 | | International Foundation of Employee Benefit Plans Professor, Wharton School of the University of Pennsylvania since 1993. Director of Wharton’s Pension Research Council and Boettner Center on Pensions & Retirement Research, and Research Associate at the National Bureau of Economic Research. Previously, Cornell University Professor from 1978 to 1993. | | N/A |
Timothy J. Penny (Born 1951) | | Trustee, since 1996; Chairman, since 2018; Vice Chairman, from 2017 to 2018 | | President and Chief Executive Officer of Southern Minnesota Initiative Foundation, anon-profit organization, since 2007. Member of the Board of Trustees of NorthStar Education Finance, Inc., anon-profit organization, since 2007. | | N/A |
James G. Polisson (Born 1959) | | Trustee, since 2018; Advisory Board Member, from 2017 to 2018 | | Retired. Chief Marketing Officer, Source (ETF) UK Services, Ltd, from 2015 to 2017. From 2012 to 2015, Principal of The Polisson Group, LLC, a management consulting, corporate advisory and principal investing company. Chief Executive Officer and Managing Director at Russell Investments, Global Exchange Traded Funds from 2010 to 2012. Managing Director of Barclays Global Investors from 1998 to 2010 and Global Chief Marketing Officer for iShares and Barclays Global Investors from 2000 to 2010. Trustee of the San Francisco Mechanics’ Institute, anon-profit organization, from 2013 to 2015. Board member of the Russell Exchange Traded Fund Trust from 2011 to 2012. Director of Barclays Global Investors Holdings Deutschland GmbH from 2006 to 2009. Mr. Polisson is an attorney and has a retired status with the Massachusetts and District of Columbia Bar Associations. | | N/A |
Michael S. Scofield4 (Born 1943) | | Trustee, since 2010 | | Served on the Investment Company Institute’s Board of Governors and Executive Committee from 2008-2011 as well the Governing Council of the Independent Directors Council from 2006-2011 and the Independent Directors Council Executive Committee from 2008-2011. Trustee of the Evergreen Fund complex (and its predecessors) from 1984 to 2010. Chairman of the Evergreen Funds from 2000-2010. Former Trustee of the Mentor Funds. Retired Attorney, Law Offices of Michael S. Scofield. | | N/A |
Pamela Wheelock (Born 1959) | | Trustee, since 2018; Advisory Board Member, from 2017 to 2018 | | Chief Operating Officer, Twin Cities Habitat for Humanity, since January, 2017. Vice President of University Services, University of Minnesota from 2012 to 2017. Prior thereto, on the Board of Directors, Governance Committee and Finance Committee for the Minnesota Philanthropy Partners (Saint Paul Foundation) from 2012 to 2018, Interim President and Chief Executive Officer of Blue Cross Blue Shield of Minnesota from 2010 to 2011, Chairman of the Board from 2009 to 2011 and Board Director from 2003 to 2015. Vice President, Leadership and Community Engagement, Bush Foundation, Saint Paul, Minnesota (a private foundation) from 2009 to 2011. Executive Vice President and Chief Financial Officer, Minnesota Sports and Entertainment from 2004 to 2009 and Senior Vice President from 2002 to 2004. Commissioner of Finance, State of Minnesota, from 1999 to 2002. Currently the Board Chair of the Minnesota Wild Foundation since 2010. | | N/A |
| * | Length of service dates reflect the Trustee’s commencement of service with the Trust’s predecessor entities, where applicable. |
| | | | |
| 48 | | Wells Fargo Real Return Fund | | Other information (unaudited) |
Officers
| | | | | | |
Name and
year of birth | | Position held and
length of service | | Principal occupations during past five years or longer | | |
Andrew Owen (Born 1960) | | President, since 2017 | | Executive Vice President of Wells Fargo & Company and Head of Affiliated Managers, Wells Fargo Asset Management, since 2014. In addition, Mr. Owen is currently President, Chief Executive Officer and Director of Wells Fargo Funds Management, LLC since 2017. Prior thereto, Executive Vice President responsible for marketing, investments and product development for Wells Fargo Funds Management, LLC, from 2009 to 2014. | | |
Nancy Wiser1 (Born 1967) | | Treasurer, since 2012 | | Executive Vice President of Wells Fargo Funds Management, LLC since 2011. Chief Operating Officer and Chief Compliance Officer at LightBox Capital Management LLC, from 2008 to 2011. | | |
Alexander Kymn (Born 1973) | | Secretary, since 2018; Chief Legal Officer, since 2018 | | Senior Company Counsel of Wells Fargo Bank, N.A. since 2018 (previously Senior Counsel from 2007 to 2018). Vice President of Wells Fargo Funds Management, LLC from 2008 to 2014. | | |
Michael H. Whitaker (Born 1967) | | Chief Compliance Officer, since 2016 | | Senior Vice President and Chief Compliance Officer since 2016. Senior Vice President and Chief Compliance Officer for Fidelity Investments from 2007 to 2016. | | |
David Berardi (Born 1975) | | Assistant Treasurer, since 2009 | | Vice President of Wells Fargo Funds Management, LLC since 2009. Vice President of Evergreen Investment Management Company, LLC from 2008 to 2010. Manager of Fund Reporting and Control for Evergreen Investment Management Company, LLC from 2004 to 2010. | | |
Jeremy DePalma1 (Born 1974) | | Assistant Treasurer, since 2009 | | Senior Vice President of Wells Fargo Funds Management, LLC since 2009. Senior Vice President of Evergreen Investment Management Company, LLC from 2008 to 2010 and head of the Fund Reporting and Control Team within Fund Administration from 2005 to 2010. | | |
| 1 | Nancy Wiser acts as Treasurer of 76 funds in the Fund Complex. Jeremy DePalma acts as Treasurer of 76 funds and Assistant Treasurer of 76 funds in the Fund Complex. |
| 2 | The Statement of Additional Information includes additional information about the Trustees and is available, without charge, upon request, by calling1-800-222-8222 or by visiting the website atwellsfargofunds.com. |
| 3 | Mr. Harris will replace Ms. Johnson as the Chairman of the Audit Committee effective January 1, 2019. |
| 4 | Mr. Scofield is expected to retire on December 31, 2018. |
| | | | | | |
| Appendix A (unaudited) | | Wells Fargo Real Return Fund | | | 49 | |
SALES CHARGE REDUCTIONS AND WAIVERS FOR CERTAIN INTERMEDIARIES
Raymond James & Associates, Inc., Raymond James Financial Services & Raymond James affiliates (“Raymond James”)
Effective on or about March 1, 2019, shareholders purchasing Fund shares through a Raymond James platform or account will be eligible only for the following load waivers(front-end sales charge waivers and contingent deferred, orback-end, sales charge waivers) and discounts, which may differ from those disclosed elsewhere in the Fund’s Prospectus or SAI.
Front-end Sales Load Waivers on Class A shares Available at Raymond James
| | • | | Shares purchased in an investment advisory program. |
| | • | | Shares purchased through reinvestment of capital gains distributions and dividend reinvestment when purchasing shares of the same fund (but not any other fund within the fund family). |
| | • | | Employees and registered representatives of Raymond James or its affiliates and their family members as designated by Raymond James. |
| | • | | Shares purchased from the proceeds of redemptions within the same fund family, provided (1) the repurchase occurs within 90 days following the redemption, (2) the redemption and purchase occur in the same account, and (3) redeemed shares were subject to afront-end or deferred sales load (known as Rights of Reinstatement). |
| | • | | A shareholder in the fund’s Class C shares will have their shares automatically exchanged at net asset value to Class A shares (or the appropriate share class) of the fund if the shares are no longer subject to a CDSC and the exchange is in line with the policies and procedures of Raymond James. |
CDSC Waivers on Class A and C Shares Available at Raymond James
| | • | | Death or disability of the shareholder. |
| | • | | Shares sold as part of a systematic withdrawal plan as described in the Fund’s Prospectus. |
| | • | | Return of excess contributions from an IRA Account. |
| | • | | Shares sold as part of a required minimum distribution for IRA and retirement accounts due to the shareholder reaching age 70½ as described in the Fund’s prospectus. |
| | • | | Shares sold to pay Raymond James fees but only if the transaction is initiated by Raymond James. |
| | • | | Shares acquired through a right of reinstatement. |
Front-end Load Discounts Available at Raymond James: Breakpoints, and/or Rights of Accumulation
| | • | | Breakpoints as described in the Fund’s Prospectus. |
| | • | | Rights of accumulation which entitle shareholders to breakpoint discounts will be automatically calculated based on the aggregated holding of fund family assets held by accounts within the purchaser’s household at Raymond James. Eligible fund family assets not held at Raymond James may be included in the rights of accumulation calculation only if the shareholder notifies his or her financial advisor about such assets. |
This page is intentionally left blank.
This page is intentionally left blank.
This page is intentionally left blank.

For more information
More information about Wells Fargo Funds is available free upon request. To obtain literature, please write, visit the Fund’s website, or call:
Wells Fargo Funds
P.O. Box 219967
Kansas City, MO 64121-9967
Website: wellsfargofunds.com
Individual investors: 1-800-222-8222
Retail investment professionals: 1-888-877-9275
Institutional investment professionals: 1-866-765-0778
This report and the financial statements contained herein are submitted for the general information of the shareholders of the Fund. If this report is used for promotional purposes, distribution of the report must be accompanied or preceded by a current prospectus. Before investing, please consider the investment objectives, risks, charges, and expenses of the investment. For a current prospectus and, if available, a summary prospectus, containing this information, call1-800-222-8222 or visit the Fund’s website atwellsfargofunds.com. Read the prospectus carefully before you invest or send money.
Wells Fargo Asset Management (WFAM) is the trade name for certain investment advisory/management firms owned by Wells Fargo & Company. These firms include but are not limited to Wells Capital Management Incorporated and Wells Fargo Funds Management, LLC. Certain products managed by WFAM entities are distributed by Wells Fargo Funds Distributor, LLC (a broker/dealer and Member FINRA).
This material is for general informational and educational purposes only and is NOT intended to provide investment advice or a recommendation of any kind—including a recommendation for any specific investment, strategy, or plan.
INVESTMENT PRODUCTS: NOT FDIC INSURED ◾ NO BANK GUARANTEE ◾ MAY LOSE VALUE
© 2019 Wells Fargo Funds Management, LLC. All rights reserved.
| | |
 | | 318982 01-19 SA288/SAR288 11-18 |
ITEM 2. CODE OF ETHICS
Not applicable.
ITEM 3. AUDIT COMMITTEE FINANCIAL EXPERT
Not applicable.
ITEM 4. PRINCIPAL ACCOUNTANT FEES AND SERVICES
Not applicable.
ITEM 5. AUDIT COMMITTEE OF LISTED REGISTRANTS
Not applicable.
ITEM 6. INVESTMENTS
A Portfolio of Investments for each series of Wells Fargo Master Trust is included as part of the report to shareholders filed under Item 1 of this Form.
ITEM 7. DISCLOSURE OF PROXY VOTING POLICIES AND PROCEDURES FORCLOSED-END MANAGEMENT INVESTMENT COMPANIES
Not applicable.
ITEM 8. PORTFOLIO MANAGERS OFCLOSED-END MANAGEMENT INVESTMENT COMPANIES
Not applicable.
ITEM 9. PURCHASES OF EQUITY SECURITIES BYCLOSED-END MANAGEMENT INVESTMENT COMPANY AND AFFILIATED PURCHASERS
Not applicable.
ITEM 10. SUBMISSION OF MATTERS TO A VOTE OF SECURITY HOLDERS
There have been no material changes to the procedures by which shareholders may recommend nominees to the registrant’s Board of Trustees that have been implemented since the registrant’s last provided disclosure in response to the requirements of this Item.
ITEM 11. CONTROLS AND PROCEDURES
(a) The President and Treasurer have concluded that the Wells Fargo Master Trust (the “Trust”) disclosure controls and procedures (as defined in Rule30a-3(c) under the Investment Company Act of 1940) provide reasonable assurances that material information relating to the Trust is made known to them by the appropriate persons, based on their evaluation of these controls and procedures as of a date within 90 days of the filing of this report.
(b) There were no significant changes in the Trust’s internal controls over financial reporting (as defined in Rule30a-3(d) under the Investment Company Act of 1940) that occurred during the second fiscal quarter of the period covered by this report that materially affected, or is reasonably likely to materially affect, the registrant’s internal control over financial reporting.
ITEM 12. DISCLOSURES OF SECURITIES LENDING ACTIVITIES FORCLOSED-END MANAGEMENT INVESTMENT COMPANIES
Not applicable.
ITEM 13. EXHIBITS
(a)(1) Not applicable.
(a)(2) Certification pursuant to Rule30a-2(a) under the Investment Company Act of 1940 (17 CFR270.30a-2(a)) is filed and attached hereto as Exhibit 99.CERT.
(a)(3) Not applicable.
(b) Certification pursuant to Rule30a-2(b) under the Investment Company Act of 1940 (17 CFR270.30a-2(b)) is filed and attached hereto as Exhibit 99.906CERT.
SIGNATURES
Pursuant to the requirements of the Securities Exchange Act of 1934 and the Investment Company Act of 1940, the registrant has duly caused this report to be signed on its behalf by the undersigned, thereunto duly authorized.
| | |
| Wells Fargo Master Trust |
| |
| By: | | |
| | /s/ Andrew Owen |
| |
| | Andrew Owen |
| | President |
| |
| Date: | | January 25, 2019 |
Pursuant to the requirements of the Securities Exchange Act of 1934 and the Investment Company Act of 1940, this report has been signed below by the following persons on behalf of the registrant and in the capacities and on the date indicated.
| | |
| Wells Fargo Master Trust |
| |
| By: | | |
| | /s/ Andrew Owen |
| |
| | Andrew Owen |
| | President |
| |
| Date: | | January 25, 2019 |
| |
| By: | | |
| | /s/ Nancy Wiser |
| |
| | Nancy Wiser |
| | Treasurer |
| |
| Date: | | January 25, 2019 |
| |
| By: | | |
| | /s/ Jeremy DePalma |
| |
| | Jeremy DePalma |
| | Treasurer |
| |
| Date: | | January 25, 2019 |


