
UNITED STATES
SECURITIES AND EXCHANGE COMMISSION
Washington, D.C. 20549
FORM N-CSRS
CERTIFIED SHAREHOLDER REPORT OF REGISTERED
MANAGEMENT INVESTMENT COMPANIES
Investment Company Act file number: 811-09689
Wells Fargo Master Trust
(Exact name of registrant as specified in charter)
525 Market St., San Francisco, CA 94105
(Address of principal executive offices) (Zip code)
Catherine Kennedy
Wells Fargo Funds Management, LLC
525 Market St., San Francisco, CA 94105
(Name and address of agent for service)
Registrant’s telephone number, including area code: 800-222-8222
Date of fiscal year end: February 28
Registrant is making a filing for 11 of its series:
Wells Fargo Bloomberg Barclays US Aggregate ex-Corporate Portfolio, Wells Fargo Emerging Markets Bond Portfolio, Wells Fargo Factor Enhanced Emerging Markets Equity Portfolio, Wells Fargo Factor Enhanced International Equity Portfolio, Wells Fargo Factor Enhanced U.S. Large Cap Equity Portfolio, Wells Fargo Factor Enhanced U.S. Small Cap Equity Portfolio, Wells Fargo Factor Enhanced U.S. Low Volatility Equity Portfolio, Wells Fargo High Yield Corporate Bond Portfolio, Wells Fargo Investment Grade Corporate Bond Portfolio, Wells Fargo Strategic Retirement Bond Portfolio, and Wells Fargo U.S. REIT Portfolio.
Date of reporting period: August 31, 2020
ITEM 1. REPORT TO STOCKHOLDERS
Semi-Annual Report
August 31, 2020
Wells Fargo Bloomberg Barclays US Aggregate ex-Corporate Portfolio
Contents
INVESTMENT PRODUCTS: NOT FDIC INSURED ◾ NO BANK GUARANTEE ◾ MAY LOSE VALUE
Wells Fargo Bloomberg Barclays US Aggregate ex-Corporate Portfolio | 1
Portfolio information (unaudited)
Investment objective
The Portfolio seeks to replicate the total return of the Bloomberg Barclays US Aggregate ex-Corporate Index, before fees and expenses.
Adviser
Wells Fargo Funds Management, LLC
Subadviser
Wells Capital Management Incorporated
Portfolio managers
Manjunath Boraiah†
Christopher Y. Kauffman, CFA®‡
Janet S. Rilling, CFA®‡, CPA
Michal Stanczyk
| | | | |
|
| Ten largest holdings (%) as of August 31, 20201 | |
| | |
U.S. Treasury Bond, 3.00% 5-15-2047 | | | 3.93 | |
| | |
FNMA 3.00%, 9-14-2050 | | | 2.77 | |
| | |
FHLMC 3.00%, 2-1-2047 | | | 2.48 | |
| | |
GNMA 3.50%, 2-20-2045 | | | 2.01 | |
| | |
FHLMC 3.50%, 2-1-2044 | | | 2.00 | |
| | |
FNMA 2.50%, 9-14-2050 | | | 1.78 | |
| | |
FNMA 4.00%, 6-1-2042 | | | 1.63 | |
| | |
U.S. Treasury Note 2.38%, 5-15-2027 | | | 1.44 | |
| | |
GNMA 3.00%, 9-21-2050 | | | 1.39 | |
| | |
FNMA 4.50%, 9-1-2040 | | | 1.36 | |
|
|
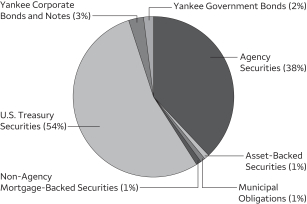
| Portfolio composition as of August 31, 20202 |
|
|
| † | Mr. Boraiah became a portfolio manager of the Portfolio on August 28, 2020. |
| ‡ | CFA® and Chartered Financial Analyst® are trademarks owned by CFA Institute. |
| 1 | The ten largest holdings, excluding cash, cash equivalents and any money market funds, are calculated based on the value of the investments divided by the total net assets of the Portfolio. Holdings are subject to change and may have changed since the date specified. |
| 2 | Amounts are calculated based on the total long-term investments of the Portfolio. These amounts are subject to change and may have changed since the date specified. |
2 | Wells Fargo Bloomberg Barclays US Aggregate ex-Corporate Portfolio
Portfolio of investments—August 31, 2020 (unaudited)
| | | | | | | | | | | | | | | | |
| | | Interest
rate | | | Maturity
date | | | Principal | | | Value | |
| Agency Securities: 37.67% | | | | | | | | | | | | |
FFCB %% | | | 0.48 | % | | | 9-3-2024 | | | $ | 880,000 | | | $ | 879,560 | |
FFCB | | | 0.57 | | | | 7-2-2024 | | | | 180,000 | | | | 179,916 | |
FFCB | | | 0.59 | | | | 3-25-2024 | | | | 10,000 | | | | 9,982 | |
FFCB %% | | | 1.12 | | | | 9-1-2028 | | | | 630,000 | | | | 630,000 | |
FFCB | | | 1.46 | | | | 3-3-2023 | | | | 210,000 | | | | 211,001 | |
FFCB | | | 1.84 | | | | 9-9-2022 | | | | 10,000 | | | | 10,004 | |
FFCB | | | 1.85 | | | | 3-3-2022 | | | | 70,000 | | | | 70,005 | |
FHLB | | | 1.50 | | | | 8-15-2024 | | | | 10,000 | | | | 10,485 | |
FHLB | | | 2.13 | | | | 6-9-2023 | | | | 70,000 | | | | 73,596 | |
FHLB | | | 2.38 | | | | 9-8-2023 | | | | 30,000 | | | | 31,867 | |
FHLB | | | 2.50 | | | | 3-11-2022 | | | | 350,000 | | | | 362,444 | |
FHLB | | | 2.75 | | | | 12-13-2024 | | | | 10,000 | | | | 11,003 | |
FHLB | | | 3.00 | | | | 10-12-2021 | | | | 70,000 | | | | 72,227 | |
FHLB | | | 3.00 | | | | 3-10-2028 | | | | 10,000 | | | | 11,618 | |
FHLB | | | 3.38 | | | | 9-8-2023 | | | | 30,000 | | | | 32,794 | |
FHLB | | | 3.38 | | | | 12-8-2023 | | | | 280,000 | | | | 308,012 | |
FHLB | | | 5.38 | | | | 8-15-2024 | | | | 690,000 | | | | 826,507 | |
FHLB | | | 5.63 | | | | 3-14-2036 | | | | 10,000 | | | | 15,612 | |
FHLMC | | | 0.30 | | | | 6-30-2022 | | | | 890,000 | | | | 890,617 | |
FHLMC %% | | | 0.40 | | | | 12-1-2023 | | | | 940,000 | | | | 940,000 | |
FHLMC | | | 2.38 | | | | 1-13-2022 | | | | 20,000 | | | | 20,605 | |
FHLMC | | | 2.50 | | | | 3-1-2032 | | | | 2,930,950 | | | | 3,082,819 | |
FHLMC | | | 2.50 | | | | 2-1-2035 | | | | 1,536,173 | | | | 1,612,469 | |
FHLMC | | | 2.75 | | | | 6-19-2023 | | | | 220,000 | | | | 235,296 | |
FHLMC | | | 3.00 | | | | 2-1-2047 | | | | 13,659,600 | | | | 14,423,637 | |
FHLMC | | | 3.00 | | | | 3-1-2048 | | | | 133,348 | | | | 140,717 | |
FHLMC | | | 3.50 | | | | 2-1-2044 | | | | 10,705,489 | | | | 11,594,519 | |
FHLMC | | | 3.50 | | | | 4-1-2045 | | | | 436,992 | | | | 473,533 | |
FHLMC | | | 3.50 | | | | 8-1-2047 | | | | 5,825,044 | | | | 6,171,187 | |
FHLMC | | | 3.50 | | | | 4-1-2050 | | | | 3,469,619 | | | | 3,660,459 | |
FHLMC | | | 6.00 | | | | 7-1-2040 | | | | 2,028,630 | | | | 2,382,376 | |
FHLMC | | | 6.75 | | | | 3-15-2031 | | | | 330,000 | | | | 514,984 | |
FHLMC Series K015 Class A2 | | | 3.23 | | | | 7-25-2021 | | | | 56,553 | | | | 57,608 | |
FHLMC Series K028 Class A1 | | | 2.18 | | | | 11-25-2022 | | | | 77,584 | | | | 78,519 | |
FHLMC Series K029 Class A2 | | | 3.32 | | | | 2-25-2023 | | | | 545,000 | | | | 580,470 | |
FHLMC Series K030 Class A2 ±± | | | 3.25 | | | | 4-25-2023 | | | | 305,000 | | | | 325,037 | |
FHLMC Series K032 Class A2 ±± | | | 3.31 | | | | 5-25-2023 | | | | 50,000 | | | | 53,532 | |
FHLMC Series K034 Class A2 ±± | | | 3.53 | | | | 7-25-2023 | | | | 60,000 | | | | 64,771 | |
FHLMC Series K035 Class A2 ±± | | | 3.46 | | | | 8-25-2023 | | | | 55,000 | | | | 59,313 | |
FHLMC Series K048 Class A2 ±± | | | 3.28 | | | | 6-25-2025 | | | | 215,000 | | | | 239,629 | |
FHLMC Series K062 Class A2 | | | 3.41 | | | | 12-25-2026 | | | | 750,000 | | | | 862,474 | |
FHLMC Series K063 Class A2 ±± | | | 3.43 | | | | 1-25-2027 | | | | 45,000 | | | | 51,781 | |
FHLMC Series K070 Class A2 ±± | | | 3.30 | | | | 11-25-2027 | | | | 425,000 | | | | 491,061 | |
FHLMC Series K152 Class A1 | | | 2.83 | | | | 5-25-2030 | | | | 313,980 | | | | 345,848 | |
FHLMC Series K152 Class A2 | | | 3.08 | | | | 1-25-2031 | | | | 125,000 | | | | 144,523 | |
FHLMC Series K153 Class A3 ±± | | | 3.12 | | | | 10-25-2031 | | | | 70,000 | | | | 81,374 | |
FHLMC Series K155 Class A3 | | | 3.75 | | | | 4-25-2033 | | | | 40,000 | | | | 49,407 | |
FHLMC Series K717 Class A2 | | | 2.99 | | | | 9-25-2021 | | | | 656,206 | | | | 668,209 | |
FNMA | | | 0.25 | | | | 5-22-2023 | | | | 330,000 | | | | 330,189 | |
FNMA | | | 0.63 | | | | 4-22-2025 | | | | 650,000 | | | | 655,656 | |
FNMA %% | | | 2.00 | | | | 9-14-2050 | | | | 2,010,000 | | | | 2,072,970 | |
FNMA | | | 2.13 | | | | 4-24-2026 | | | | 180,000 | | | | 196,527 | |
FNMA | | | 2.25 | | | | 4-12-2022 | | | | 880,000 | | | | 910,143 | |
FNMA | | | 2.50 | | | | 12-1-2027 | | | | 578,740 | | | | 608,429 | |
FNMA | | | 2.50 | | | | 9-1-2031 | | | | 2,016,992 | | | | 2,122,095 | |
FNMA %% | | | 2.50 | | | | 9-17-2035 | | | | 1,900,000 | | | | 1,993,441 | |
The accompanying notes are an integral part of these financial statements.
Wells Fargo Bloomberg Barclays US Aggregate ex-Corporate Portfolio | 3
Portfolio of investments—August 31, 2020 (unaudited)
| | | | | | | | | | | | | | | | |
| | | Interest
rate | | | Maturity
date | | | Principal | | | Value | |
| Agency Securities (continued) | | | | | | | | | | | | |
FNMA %% | | | 2.50 | % | | | 9-14-2050 | | | $ | 9,800,000 | | | $ | 10,314,883 | |
FNMA | | | 3.00 | | | | 12-1-2026 | | | | 2,419,662 | | | | 2,543,033 | |
FNMA | | | 3.00 | | | | 12-1-2030 | | | | 433,893 | | | | 461,283 | |
FNMA | | | 3.00 | | | | 7-1-2032 | | | | 2,885,363 | | | | 3,027,524 | |
FNMA | | | 3.00 | | | | 1-1-2034 | | | | 511,338 | | | | 536,762 | |
FNMA | | | 3.00 | | | | 8-1-2036 | | | | 177,098 | | | | 187,628 | |
FNMA | | | 3.00 | | | | 2-1-2037 | | | | 3,469,464 | | | | 3,675,372 | |
FNMA | | | 3.00 | | | | 8-1-2043 | | | | 2,308,488 | | | | 2,474,541 | |
FNMA | | | 3.00 | | | | 11-1-2046 | | | | 2,387,046 | | | | 2,559,359 | |
FNMA | | | 3.00 | | | | 12-1-2047 | | | | 1,677,627 | | | | 1,769,975 | |
FNMA %% | | | 3.00 | | | | 9-14-2050 | | | | 15,245,000 | | | | 16,077,520 | |
FNMA | | | 3.50 | | | | 4-1-2034 | | | | 3,348,138 | | | | 3,549,379 | |
FNMA | | | 3.50 | | | | 1-1-2035 | | | | 153,297 | | | | 165,538 | |
FNMA | | | 3.50 | | | | 3-1-2036 | | | | 1,923,325 | | | | 2,076,250 | |
FNMA | | | 3.50 | | | | 4-1-2037 | | | | 916,502 | | | | 974,079 | |
FNMA | | | 3.50 | | | | 6-1-2042 | | | | 455,751 | | | | 494,613 | |
FNMA | | | 3.50 | | | | 7-1-2042 | | | | 830,833 | | | | 897,923 | |
FNMA | | | 3.50 | | | | 9-1-2043 | | | | 1,737,742 | | | | 1,884,020 | |
FNMA | | | 3.50 | | | | 3-1-2048 | | | | 729,179 | | | | 771,520 | |
FNMA | | | 3.50 | | | | 5-1-2050 | | | | 2,586,674 | | | | 2,731,966 | |
FNMA | | | 3.50 | | | | 6-1-2050 | | | | 1,017,047 | | | | 1,076,054 | |
FNMA %% | | | 3.50 | | | | 9-14-2050 | | | | 1,965,000 | | | | 2,072,614 | |
FNMA | | | 4.00 | | | | 6-1-2042 | | | | 8,551,989 | | | | 9,442,277 | |
FNMA | | | 4.00 | | | | 6-1-2042 | | | | 729,423 | | | | 793,965 | |
FNMA | | | 4.00 | | | | 8-1-2043 | | | | 4,844,203 | | | | 5,270,486 | |
FNMA | | | 4.00 | | | | 12-1-2047 | | | | 3,167,690 | | | | 3,381,596 | |
FNMA | | | 4.00 | | | | 2-1-2048 | | | | 2,142,139 | | | | 2,440,171 | |
FNMA | | | 4.00 | | | | 6-1-2048 | | | | 935,591 | | | | 998,076 | |
FNMA | | | 4.00 | | | | 8-1-2048 | | | | 611,529 | | | | 650,720 | |
FNMA | | | 4.00 | | | | 2-1-2050 | | | | 1,752,098 | | | | 1,867,844 | |
FNMA | | | 4.50 | | | | 5-1-2040 | | | | 343,064 | | | | 383,367 | |
FNMA | | | 4.50 | | | | 9-1-2040 | | | | 7,153,829 | | | | 7,904,784 | |
FNMA | | | 4.50 | | | | 2-1-2047 | | | | 2,508,741 | | | | 2,743,097 | |
FNMA | | | 4.50 | | | | 4-1-2048 | | | | 905,607 | | | | 983,332 | |
FNMA | | | 4.50 | | | | 8-1-2048 | | | | 67,057 | | | | 72,587 | |
FNMA | | | 5.00 | | | | 1-1-2042 | | | | 278,619 | | | | 320,141 | |
FNMA | | | 5.00 | | | | 6-1-2045 | | | | 1,111,222 | | | | 1,278,513 | |
FNMA | | | 5.00 | | | | 7-1-2045 | | | | 1,836,917 | | | | 2,113,544 | |
FNMA | | | 5.50 | | | | 9-1-2040 | | | | 2,104,107 | | | | 2,436,273 | |
FNMA | | | 6.00 | | | | 5-1-2041 | | | | 115,885 | | | | 137,290 | |
FNMA | | | 6.21 | | | | 8-6-2038 | | | | 60,000 | | | | 100,790 | |
FNMA | | | 6.25 | | | | 5-15-2029 | | | | 100,000 | | | | 144,266 | |
FNMA | | | 7.13 | | | | 1-15-2030 | | | | 250,000 | | | | 386,393 | |
FNMA | | | 7.25 | | | | 5-15-2030 | | | | 80,000 | | | | 125,739 | |
FNMA Series 2012-M14 Class AI ±± | | | 2.99 | | | | 9-25-2027 | | | | 165,033 | | | | 179,001 | |
FNMA Series 2016-M5 Class A2 | | | 2.47 | | | | 4-25-2026 | | | | 220,000 | | | | 236,660 | |
FNMA Series 2016-M7 Class A2 | | | 2.50 | | | | 9-25-2026 | | | | 175,000 | | | | 188,520 | |
FNMA Series 2017-M1 Class A2 ±± | | | 2.50 | | | | 10-25-2026 | | | | 275,000 | | | | 295,844 | |
FNMA Series 2017-M11 Class A2 | | | 2.98 | | | | 8-25-2029 | | | | 1,370,000 | | | | 1,568,974 | |
FNMA Series 2017-M5 Class A2 ±± | | | 3.29 | | | | 4-25-2029 | | | | 70,000 | | | | 80,284 | |
FNMA Series 2018-M13 Class A2 ±± | | | 3.82 | | | | 9-25-2030 | | | | 90,000 | | | | 109,619 | |
FNMA Series 2019-M7 Class A2 | | | 3.14 | | | | 4-25-2029 | | | | 225,000 | | | | 256,960 | |
GNMA %% | | | 2.50 | | | | 9-21-2050 | | | | 3,895,000 | | | | 4,105,117 | |
GNMA | | | 3.00 | | | | 4-20-2045 | | | | 5,626,590 | | | | 5,965,417 | |
GNMA | | | 3.00 | | | | 11-20-2045 | | | | 436,286 | | | | 461,343 | |
GNMA | | | 3.00 | | | | 3-20-2046 | | | | 984,511 | | | | 1,042,192 | |
The accompanying notes are an integral part of these financial statements.
4 | Wells Fargo Bloomberg Barclays US Aggregate ex-Corporate Portfolio
Portfolio of investments—August 31, 2020 (unaudited)
| | | | | | | | | | | | | | | | |
| | | Interest
rate | | | Maturity
date | | | Principal | | | Value | |
| Agency Securities (continued) | | | | | | | | | | | | |
GNMA | | | 3.00 | % | | | 12-20-2049 | | | $ | 2,536,578 | | | $ | 2,672,928 | |
GNMA %% | | | 3.00 | | | | 9-21-2050 | | | | 7,670,000 | | | | 8,076,270 | |
GNMA | | | 3.50 | | | | 2-20-2045 | | | | 10,928,970 | | | | 11,666,050 | |
GNMA | | | 3.50 | | | | 6-20-2045 | | | | 1,770,620 | | | | 1,889,979 | |
GNMA | | | 3.50 | | | | 11-20-2045 | | | | 2,067,698 | | | | 2,207,015 | |
GNMA | | | 3.50 | | | | 7-20-2047 | | | | 543,366 | | | | 576,829 | |
GNMA | | | 3.50 | | | | 5-20-2048 | | | | 153,879 | | | | 163,221 | |
GNMA | | | 4.00 | | | | 7-20-2044 | | | | 2,000,741 | | | | 2,184,056 | |
GNMA | | | 4.00 | | | | 8-20-2044 | | | | 982,199 | | | | 1,071,968 | |
GNMA | | | 4.00 | | | | 9-20-2044 | | | | 2,032,678 | | | | 2,218,351 | |
GNMA | | | 4.00 | | | | 12-20-2047 | | | | 3,383,024 | | | | 3,638,041 | |
TVA | | | 1.88 | | | | 8-15-2022 | | | | 218,000 | | | | 224,934 | |
TVA | | | 2.88 | | | | 2-1-2027 | | | | 35,000 | | | | 39,743 | |
TVA | | | 4.63 | | | | 9-15-2060 | | | | 55,000 | | | | 85,001 | |
TVA | | | 5.38 | | | | 4-1-2056 | | | | 10,000 | | | | 17,137 | |
TVA | | | 5.50 | | | | 6-15-2038 | | | | 140,000 | | | | 215,820 | |
TVA | | | 6.75 | | | | 11-1-2025 | | | | 120,000 | | | | 157,331 | |
| | | | |
Total Agency Securities (Cost $212,254,512) | | | | | | | | | | | | | | | 218,824,549 | |
| | | | | | | | | | | | | | | | |
| | | | |
| Asset-Backed Securities: 0.69% | | | | | | | | | | | | |
Bank of America Credit Card Trust Series 2018-A1 Class A1 | | | 2.70 | | | | 7-17-2023 | | | | 40,000 | | | | 40,443 | |
Capital One Multi Asset Execution Trust Series 2017-A3 Class A3 | | | 2.43 | | | | 1-15-2025 | | | | 110,000 | | | | 113,556 | |
CarMax Auto Owner Trust Series 2016-3 Class A4 | | | 1.60 | | | | 1-18-2022 | | | | 7,566 | | | | 7,575 | |
CarMax Auto Owner Trust Series 2017-2 Class A4 | | | 2.25 | | | | 9-15-2022 | | | | 195,000 | | | | 197,347 | |
CarMax Auto Owner Trust Series 2017-3 Class A4 | | | 2.22 | | | | 11-15-2022 | | | | 89,000 | | | | 90,359 | |
CarMax Auto Owner Trust Series 2018-3 Class D | | | 3.91 | | | | 1-15-2025 | | | | 80,000 | | | | 81,187 | |
Chase Issuance Trust Series 2012-A7 Class A7 | | | 2.16 | | | | 9-15-2024 | | | | 205,000 | | | | 212,717 | |
Citibank Credit Card Issuance Trust Series 2014-A5 Class A5 | | | 2.68 | | | | 6-7-2023 | | | | 110,000 | | | | 112,032 | |
Citibank Credit Card Issuance Trust Series 2018-A3 Class A3 | | | 3.29 | | | | 5-23-2025 | | | | 180,000 | | | | 194,170 | |
Citibank Credit Card Issuance Trust Series 2018-A7 Class A7 | | | 3.96 | | | | 10-13-2030 | | | | 130,000 | | | | 158,484 | |
Discover Card Execution Note Trust Series 2017-A2 Class A2 | | | 2.39 | | | | 7-15-2024 | | | | 335,000 | | | | 344,651 | |
Ford Credit Floorplan Master Owner Trust Series 2017-3 Class A | | | 2.48 | | | | 9-15-2024 | | | | 50,000 | | | | 51,773 | |
Ford Credit Floorplan Master Owner Trust Series 2018-2 Class A | | | 3.17 | | | | 3-15-2025 | | | | 100,000 | | | | 105,123 | |
Ford Credit Floorplan Master Owner Trust Series 2018-3 Class A1 | | | 3.52 | | | | 10-15-2023 | | | | 105,000 | | | | 108,560 | |
Ford Credit Floorplan Master Owner Trust Series 2019-2 Class A | | | 3.06 | | | | 4-15-2026 | | | | 65,000 | | | | 70,301 | |
Nissan Auto Receivables Owner Trust Series 2017-A Class A4 | | | 2.11 | | | | 5-15-2023 | | | | 15,000 | | | | 15,096 | |
Nissan Auto Receivables Owner Trust Series 2017-C Class A4 | | | 2.28 | | | | 2-15-2024 | | | | 95,000 | | | | 96,811 | |
Nissan Auto Receivables Owner Trust Series 2018-B Class A4 | | | 3.16 | | | | 12-16-2024 | | | | 195,000 | | | | 203,571 | |
Nissan Auto Receivables Owner Trust Series 2018-C Class A4 | | | 3.27 | | | | 6-16-2025 | | | | 155,000 | | | | 163,809 | |
Santander Drive Auto Receivables Trust Series 2019-1 Class C | | | 3.42 | | | | 4-15-2025 | | | | 140,000 | | | | 143,789 | |
Synchrony Credit Card Master Note Trust Series 2016-2 Class A | | | 2.21 | | | | 5-15-2024 | | | | 175,000 | | | | 177,232 | |
Synchrony Credit Card Master Note Trust Series 2018-2 Class A | | | 3.47 | | | | 5-15-2026 | | | | 105,000 | | | | 112,386 | |
Toyota Auto Receivables Owner Trust Series 2017-D Class A4 | | | 2.12 | | | | 2-15-2023 | | | | 155,000 | | | | 157,423 | |
World Financial Network Credit Card Master Trust Series 2016-A Class A | | | 2.03 | | | | 4-15-2025 | | | | 237,000 | | | | 239,375 | |
World Omni Auto Receivables Trust Series 2016-B Class A4 | | | 1.48 | | | | 11-15-2022 | | | | 192,000 | | | | 192,408 | |
World Omni Auto Receivables Trust Series 2017-A Class A4 | | | 2.24 | | | | 6-15-2023 | | | | 210,000 | | | | 212,726 | |
World Omni Auto Receivables Trust Series 2017-B Class A4 | | | 2.25 | | | | 10-16-2023 | | | | 205,000 | | | | 208,964 | |
World Omni Auto Receivables Trust Series 2018-D Class A4 | | | 3.44 | | | | 12-16-2024 | | | | 28,000 | | | | 29,773 | |
World Omni Auto Receivables Trust Series 2019-A Class A3 | | | 2.94 | | | | 5-16-2022 | | | | 185,000 | | | | 188,409 | |
| | | | |
Total Asset-Backed Securities (Cost $3,923,401) | | | | | | | | | | | | | | | 4,030,050 | |
| | | | | | | | | | | | | | | | |
|
Municipal Obligations: 0.82% | |
|
| California: 0.32% | |
|
| Education Revenue: 0.02% | |
California Series B | | | 3.90 | | | | 11-1-2047 | | | | 15,000 | | | | 17,819 | |
University of California Series AD | | | 4.86 | | | | 5-15-2112 | | | | 70,000 | | | | 101,189 | |
| | | | |
| | | | | | | | | | | | | | | 119,008 | |
| | | | | | | | | | | | | | | | |
The accompanying notes are an integral part of these financial statements.
Wells Fargo Bloomberg Barclays US Aggregate ex-Corporate Portfolio | 5
Portfolio of investments—August 31, 2020 (unaudited)
| | | | | | | | | | | | | | | | |
| | | Interest
rate | | | Maturity
date | | | Principal | | | Value | |
| GO Revenue: 0.16% | |
California Build America Bonds | | | 5.70 | % | | | 11-1-2021 | | | $ | 90,000 | | | $ | 95,756 | |
California Build America Bonds | | | 7.55 | | | | 4-1-2039 | | | | 170,000 | | | | 300,458 | |
California Build America Bonds | | | 7.60 | | | | 11-1-2040 | | | | 15,000 | | | | 27,402 | |
California Build America Bonds Taxable Various Purpose | | | 7.50 | | | | 4-1-2034 | | | | 100,000 | | | | 167,160 | |
Los Angeles CA Community College District Build America Bonds | | | 6.75 | | | | 8-1-2049 | | | | 5,000 | | | | 9,183 | |
Los Angeles CA Unified School District Build America Bonds | | | 5.75 | | | | 7-1-2034 | | | | 15,000 | | | | 21,014 | |
Los Angeles CA Unified School District Build America Bonds | | | 5.76 | | | | 7-1-2029 | | | | 60,000 | | | | 76,849 | |
Los Angeles CA Unified School District Build America Bonds | | | 6.76 | | | | 7-1-2034 | | | | 160,000 | | | | 239,485 | |
| | | | |
| | | | | | | | | | | | | | | 937,307 | |
| | | | | | | | | | | | | | | | |
| | | | |
| Transportation Revenue: 0.08% | | | | | | | | | | | | |
Bay Area CA Toll Authority Series 1 | | | 6.26 | | | | 4-1-2049 | | | | 100,000 | | | | 181,580 | |
Bay Area CA Toll Authority Series 1 | | | 6.92 | | | | 4-1-2040 | | | | 15,000 | | | | 23,519 | |
Bay Area CA Toll Authority Series 1 | | | 7.04 | | | | 4-1-2050 | | | | 140,000 | | | | 253,357 | |
| | | | |
| | | | | | | | | | | | | | | 458,456 | |
| | | | | | | | | | | | | | | | |
| | | | |
| Utilities Revenue: 0.06% | | | | | | | | | | | | |
California Department of Water Resources Series P | | | 2.00 | | | | 5-1-2022 | | | | 55,000 | | | | 56,532 | |
Los Angeles CA Department of Water & Power Build America Bonds Series A | | | 5.72 | | | | 7-1-2039 | | | | 100,000 | | | | 152,979 | |
Los Angeles CA Department of Water & Power Build America Bonds Series D | | | 6.57 | | | | 7-1-2045 | | | | 55,000 | | | | 95,987 | |
| | | | |
| | | | | | | | | | | | | | | 305,498 | |
| | | | | | | | | | | | | | | | |
| | | | |
| | | | | | | | | | | | | | | 1,820,269 | |
| | | | | | | | | | | | | | | | |
| | | | |
| Georgia: 0.00% | | | | | | | | | | | | |
| | | | |
| Utilities Revenue: 0.00% | | | | | | | | | | | | |
Municipal Electric Authority of Georgia Build America Bonds | | | 7.06 | | | | 4-1-2057 | | | | 10,000 | | | | 14,464 | |
| | | | | | | | | | | | | | | | |
| | | | |
| Illinois: 0.08% | | | | | | | | | | | | |
| | | | |
| GO Revenue: 0.02% | | | | | | | | | | | | |
Chicago IL Series B | | | 6.31 | | | | 1-1-2044 | | | | 50,000 | | | | 53,413 | |
Illinois Taxable Pension | | | 5.10 | | | | 6-1-2033 | | | | 50,000 | | | | 51,179 | |
| | | | |
| | | | | | | | | | | | | | | 104,592 | |
| | | | | | | | | | | | | | | | |
| | | | |
| Miscellaneous Revenue: 0.01% | | | | | | | | | | | | |
Illinois Build America Bonds Series 3 | | | 6.73 | | | | 4-1-2035 | | | | 45,000 | | | | 50,449 | |
| | | | | | | | | | | | | | | | |
| | | | |
| Tax Revenue: 0.05% | | | | | | | | | | | | |
Chicago IL Transit Authority Series B | | | 6.90 | | | | 12-1-2040 | | | | 210,000 | | | | 300,518 | |
| | | | | | | | | | | | | | | | |
| | | | |
| | | | | | | | | | | | | | | 455,559 | |
| | | | | | | | | | | | | | | | |
| | | | |
| Kansas: 0.00% | | | | | | | | | | | | |
| | | | |
| Miscellaneous Revenue: 0.00% | | | | | | | | | | | | |
Kansas Development Finance Authority Series H | | | 4.93 | | | | 4-15-2045 | | | | 5,000 | | | | 6,639 | |
| | | | | | | | | | | | | | | | |
| | | | |
| Massachusetts: 0.03% | | | | | | | | | | | | |
| | | | |
| GO Revenue: 0.03% | | | | | | | | | | | | |
Massachusetts Build America Bonds Series A | | | 4.91 | | | | 5-1-2029 | | | | 130,000 | | | | 167,760 | |
Massachusetts Build America Bonds Series D | | | 4.50 | | | | 8-1-2031 | | | | 5,000 | | | | 6,399 | |
| | | | |
| | | | | | | | | | | | | | | 174,159 | |
| | | | | | | | | | | | | | | | |
The accompanying notes are an integral part of these financial statements.
6 | Wells Fargo Bloomberg Barclays US Aggregate ex-Corporate Portfolio
Portfolio of investments—August 31, 2020 (unaudited)
| | | | | | | | | | | | | | | | |
| | | Interest
rate | | | Maturity
date | | | Principal | | | Value | |
| New Jersey: 0.06% | | | | | | | | | | | | |
| | | | |
| Miscellaneous Revenue: 0.02% | | | | | | | | | | | | |
New Jersey EDA Series A (National Insured) | | | 7.43 | % | | | 2-15-2029 | | | $ | 95,000 | | | $ | 118,904 | |
| | | | | | | | | | | | | | | | |
| | | | |
| Transportation Revenue: 0.04% | | | | | | | | | | | | |
New Jersey Transportation Trust | | | 6.56 | | | | 12-15-2040 | | | | 60,000 | | | | 77,591 | |
New Jersey Turnpike Authority Build America Bonds Series A | | | 7.10 | | | | 1-1-2041 | | | | 70,000 | | | | 118,058 | |
| | | | |
| | | | | | | | | | | | | | | 195,649 | |
| | | | | | | | | | | | | | | | |
| | | | |
| | | | | | | | | | | | | | | 314,553 | |
| | | | | | | | | | | | | | | | |
| | | | |
| New York: 0.19% | | | | | | | | | | | | |
| | | | |
| Airport Revenue: 0.07% | | | | | | | | | | | | |
Port Authority of New York & New Jersey Consolidated Bonds Series 174 | | | 4.46 | | | | 10-1-2062 | | | | 190,000 | | | | 248,174 | |
Port Authority of New York & New Jersey Consolidated Bonds Series 201 | | | 4.23 | | | | 10-15-2057 | | | | 100,000 | | | | 125,186 | |
Port Authority of New York & New Jersey Consolidated Bonds Series 210 | | | 4.03 | | | | 9-1-2048 | | | | 50,000 | | | | 59,843 | |
| | | | |
| | | | | | | | | | | | | | | 433,203 | |
| | | | | | | | | | | | | | | | |
| | | | |
| Tax Revenue: 0.12% | | | | | | | | | | | | |
New York Metropolitan Transportation Authority Dedicated Tax Fund Build America Bonds | | | 7.34 | | | | 11-15-2039 | | | | 220,000 | | | | 355,881 | |
New York NY Transitional Finance Authority Build America Bonds Subseries B-1 | | | 5.57 | | | | 11-1-2038 | | | | 130,000 | | | | 180,174 | |
New York NY Transitional Finance Authority Build America Bonds Subseries C-2 | | | 5.77 | | | | 8-1-2036 | | | | 100,000 | | | | 133,932 | |
| | | | |
| | | | | | | | | | | | | | | 669,987 | |
| | | | | | | | | | | | | | | | |
| | | | |
| Water & Sewer Revenue: 0.00% | | | | | | | | | | | | |
New York NY Municipal Water Finance Authority Series AA | | | 5.44 | | | | 6-15-2043 | | | | 10,000 | | | | 15,641 | |
| | | | | | | | | | | | | | | | |
| | | | |
| | | | | | | | | | | | | | | 1,118,831 | |
| | | | | | | | | | | | | | | | |
| | | | |
| Ohio: 0.04% | | | | | | | | | | | | |
| | | | |
| Education Revenue: 0.00% | | | | | | | | | | | | |
Ohio State University Build America Bonds | | | 4.91 | | | | 6-1-2040 | | | | 5,000 | | | | 7,116 | |
| | | | | | | | | | | | | | | | |
| | | | |
| Utilities Revenue: 0.04% | | | | | | | | | | | | |
American Municipal Power Ohio Incorporated Build America Bonds | | | 5.94 | | | | 2-15-2047 | | | | 150,000 | | | | 223,932 | |
American Municipal Power Ohio Incorporated Build America Bonds Series E | | | 6.27 | | | | 2-15-2050 | | | | 10,000 | | | | 14,452 | |
| | | | |
| | | | | | | | | | | | | | | 238,384 | |
| | | | | | | | | | | | | | | | |
| | | | |
| | | | | | | | | | | | | | | 245,500 | |
| | | | | | | | | | | | | | | | |
| | | | |
| Oregon: 0.03% | | | | | | | | | | | | |
| | | | |
| Tax Revenue: 0.03% | | | | | | | | | | | | |
Oregon Department of Transportation Build America Bonds Series A | | | 5.83 | | | | 11-15-2034 | | | | 50,000 | | | | 72,245 | |
Oregon GO Pension Bonds Series 2003 | | | 5.76 | | | | 6-1-2023 | | | | 107,224 | | | | 117,595 | |
| | | | |
| | | | | | | | | | | | | | | 189,840 | |
| | | | | | | | | | | | | | | | |
| | | | |
| Pennsylvania: 0.00% | | | | | | | | | | | | |
|
| Transportation Revenue: 0.00% | |
Pennsylvania Turnpike Commission Series B | | | 5.51 | | | | 12-1-2045 | | | | 5,000 | | | | 7,807 | |
| | | | | | | | | | | | | | | | |
The accompanying notes are an integral part of these financial statements.
Wells Fargo Bloomberg Barclays US Aggregate ex-Corporate Portfolio | 7
Portfolio of investments—August 31, 2020 (unaudited)
| | | | | | | | | | | | | | | | |
| | | Interest
rate | | | Maturity
date | | | Principal | | | Value | |
| Texas: 0.05% | | | | | | | | | | | | |
|
| Transportation Revenue: 0.02% | |
Grand Parkway Transportation Corporation Series 2013E | | | 5.18 | % | | | 10-1-2042 | | | $ | 50,000 | | | $ | 72,404 | |
Texas Private Activity Bond North Tarrant Express Managed Lanes Project Series B | | | 3.92 | | | | 12-31-2049 | | | | 50,000 | | | | 56,339 | |
| | | | |
| | | | | | | | | | | | | | | 128,743 | |
| | | | | | | | | | | | | | | | |
| | | | |
| Utilities Revenue: 0.03% | | | | | | | | | | | | |
San Antonio TX | | | 4.43 | | | | 2-1-2042 | | | | 140,000 | | | | 179,281 | |
| | | | | | | | | | | | | | | | |
| | | | |
| | | | | | | | | | | | | | | 308,024 | |
| | | | | | | | | | | | | | | | |
| | | | |
| Wisconsin: 0.02% | | | | | | | | | | | | |
|
| Tax Revenue: 0.02% | |
Wisconsin General Fund Annual Appropriations Series C | | | 3.15 | | | | 5-1-2027 | | | | 80,000 | | | | 90,164 | |
| | | | | | | | | | | | | | | | |
| |
Total Municipal Obligations (Cost $4,217,660) | | | | 4,745,809 | |
| | | | | | | | | | | | | | | | |
|
| Non-Agency Mortgage-Backed Securities: 1.33% | |
Benchmark Mortgage Trust Series 2018-B1 Class A2 | | | 3.57 | | | | 1-15-2051 | | | | 480,000 | | | | 499,177 | |
Benchmark Mortgage Trust Series 2018-B1 Class A4 | | | 3.40 | | | | 1-15-2051 | | | | 25,000 | | | | 27,749 | |
Benchmark Mortgage Trust Series 2018-B6 Class A4 | | | 4.26 | | | | 10-10-2051 | | | | 135,000 | | | | 161,159 | |
CenterPoint Energy Transition Restoration Bond Company LLC | | | 4.24 | | | | 8-15-2023 | | | | 62,658 | | | | 65,576 | |
CFCRE Commercial Mortgage Trust Series 2016-C7 Class A3 | | | 3.84 | | | | 12-10-2054 | | | | 20,000 | | | | 22,335 | |
Citigroup Commercial Mortgage Trust Series 2015-GC27 Class A5 | | | 3.14 | | | | 2-10-2048 | | | | 55,000 | | | | 59,166 | |
Citigroup Commercial Mortgage Trust Series 2016 GC37 Class B | | | 4.23 | | | | 4-10-2049 | | | | 535,000 | | | | 564,744 | |
Citigroup Commercial Mortgage Trust Series 2016-GC36 Class A5 | | | 3.62 | | | | 2-10-2049 | | | | 680,000 | | | | 758,569 | |
Citigroup Commercial Mortgage Trust Series 2016-GC36 Class B ±± | | | 4.91 | | | | 2-10-2049 | | | | 40,000 | | | | 42,778 | |
Citigroup Commercial Mortgage Trust Series 2016-GC36 Class C ±± | | | 4.91 | | | | 2-10-2049 | | | | 95,000 | | | | 89,936 | |
Citigroup Commercial Mortgage Trust Series 2016-P4 Class A4 | | | 2.90 | | | | 7-10-2049 | | | | 135,000 | | | | 146,234 | |
Citigroup Commercial Mortgage Trust Series 2016-P5 Class A2 | | | 2.40 | | | | 10-10-2049 | | | | 141,000 | | | | 141,482 | |
Citigroup Commercial Mortgage Trust Series 2018-C6 Class A4 | | | 4.41 | | | | 11-10-2051 | | | | 520,000 | | | | 625,666 | |
Commercial Mortgage Trust Pass-Through Certificate Series 2012-CR2 Class ASB | | | 2.75 | | | | 8-15-2045 | | | | 17,969 | | | | 18,073 | |
Commercial Mortgage Trust Pass-Through Certificate Series 2012-CR3 Class A3 | | | 2.82 | | | | 10-15-2045 | | | | 53,783 | | | | 54,865 | |
Commercial Mortgage Trust Series 2012-LC4 Class A4 | | | 3.29 | | | | 12-10-2044 | | | | 158,742 | | | | 162,203 | |
Commercial Mortgage Trust Series 2013-CR6 Class A4 | | | 3.10 | | | | 3-10-2046 | | | | 60,000 | | | | 62,126 | |
Commercial Mortgage Trust Series 2014 UBS5 Class C ±± | | | 4.76 | | | | 9-10-2047 | | | | 195,000 | | | | 177,875 | |
Commercial Mortgage Trust Series 2014-UBS6 Class C ±± | | | 4.59 | | | | 12-10-2047 | | | | 60,000 | | | | 56,549 | |
Commercial Mortgage Trust Series 2015-CR23 Class A3 | | | 3.23 | | | | 5-10-2048 | | | | 60,000 | | | | 65,037 | |
Commercial Mortgage Trust Series 2016-COR1 Class C ±± | | | 4.53 | | | | 10-10-2049 | | | | 65,000 | | | | 66,673 | |
Commercial Mortgage Trust Series 2016-CR28 Class A4 | | | 3.76 | | | | 2-10-2049 | | | | 215,000 | | | | 241,525 | |
Goldman Sachs Mortgage Securities Trust Series 2012-GCJ9 Class AS | | | 3.12 | | | | 11-10-2045 | | | | 40,000 | | | | 41,168 | |
Goldman Sachs Mortgage Securities Trust Series 2013-GC14 Class A5 | | | 4.24 | | | | 8-10-2046 | | | | 265,000 | | | | 285,736 | |
Goldman Sachs Mortgage Securities Trust Series 2014-GC18 Class B ±± | | | 4.89 | | | | 1-10-2047 | | | | 80,000 | | | | 74,846 | |
Goldman Sachs Mortgage Securities Trust Series 2017-GS5 Class A3 | | | 3.41 | | | | 3-10-2050 | | | | 600,000 | | | | 667,842 | |
Goldman Sachs Mortgage Securities Trust Series 2018-GS10 Class AAB ±± | | | 4.11 | | | | 7-10-2051 | | | | 180,000 | | | | 206,351 | |
Goldman Sachs Mortgage Securities Trust Series 2018-GS9 Class A4 ±± | | | 3.99 | | | | 3-10-2051 | | | | 140,000 | | | | 159,068 | |
JPMorgan Chase Commercial Mortgage Securities Corporation Series 2013-C15 Class A4 | | | 4.10 | | | | 11-15-2045 | | | | 14,387 | | | | 15,587 | |
JPMorgan Chase Commercial Mortgage Securities Corporation Series 2015-C31 Class A3 | | | 3.80 | | | | 8-15-2048 | | | | 195,000 | | | | 217,431 | |
JPMorgan Chase Commercial Mortgage Securities Trust Series 2015-C29 Class A4 | | | 3.61 | | | | 5-15-2048 | | | | 200,000 | | | | 220,204 | |
Morgan Stanley Bank of America Merrill Lynch Trust Series 2012-C5 Class A4 | | | 3.18 | | | | 8-15-2045 | | | | 60,000 | | | | 62,028 | |
The accompanying notes are an integral part of these financial statements.
8 | Wells Fargo Bloomberg Barclays US Aggregate ex-Corporate Portfolio
Portfolio of investments—August 31, 2020 (unaudited)
| | | | | | | | | | | | | | | | |
| | | Interest
rate | | | Maturity
date | | | Principal | | | Value | |
|
| Non-Agency Mortgage-Backed Securities (continued) | |
Morgan Stanley Bank of America Merrill Lynch Trust Series 2013-C11 Class AS ±± | | | 4.50 | % | | | 8-15-2046 | | | $ | 360,000 | | | $ | 386,053 | |
Morgan Stanley Bank of America Merrill Lynch Trust Series 2013-C8 Class A4 | | | 3.13 | | | | 12-15-2048 | | | | 50,000 | | | | 52,027 | |
Morgan Stanley Bank of America Merrill Lynch Trust Series 2015-C22 Class A4 | | | 3.31 | | | | 4-15-2048 | | | | 60,000 | | | | 64,699 | |
Morgan Stanley Bank of America Merrill Lynch Trust Series 2015-C22 Class B ±± | | | 3.88 | | | | 4-15-2048 | | | | 285,000 | | | | 293,894 | |
Morgan Stanley Bank of America Merrill Lynch Trust Series 2015-C24 Class A4 | | | 3.73 | | | | 5-15-2048 | | | | 400,000 | | | | 444,105 | |
Morgan Stanley Bank of America Merrill Lynch Trust Series 2016-C30 Class B ±± | | | 3.31 | | | | 9-15-2049 | | | | 425,000 | | | | 425,878 | |
| |
Total Non-Agency Mortgage-Backed Securities (Cost $7,359,735) | | | | 7,726,414 | |
| | | | | | | | | | | | | | | | |
|
| U.S. Treasury Securities: 53.03% | |
U.S. Treasury Bond | | | 0.25 | | | | 6-30-2025 | | | | 1,295,000 | | | | 1,294,292 | |
U.S. Treasury Bond | | | 0.25 | | | | 8-31-2025 | | | | 925,000 | | | | 923,988 | |
U.S. Treasury Bond | | | 0.38 | | | | 7-31-2027 | | | | 1,860,000 | | | | 1,845,759 | |
U.S. Treasury Bond | | | 0.50 | | | | 8-31-2027 | | | | 2,015,000 | | | | 2,015,787 | |
U.S. Treasury Bond | | | 0.63 | | | | 8-15-2030 | | | | 1,180,000 | | | | 1,170,136 | |
U.S. Treasury Bond | | | 1.13 | | | | 5-15-2040 | | | | 810,000 | | | | 795,192 | |
U.S. Treasury Bond | | | 1.13 | | | | 8-15-2040 | | | | 855,000 | | | | 836,230 | |
U.S. Treasury Bond | | | 1.25 | | | | 5-15-2050 | | | | 1,295,000 | | | | 1,221,347 | |
U.S. Treasury Bond | | | 1.38 | | | | 8-15-2050 | | | | 1,000,000 | | | | 974,922 | |
U.S. Treasury Bond | | | 1.50 | | | | 1-31-2027 | | | | 1,350,000 | | | | 1,440,861 | |
U.S. Treasury Bond | | | 1.50 | | | | 2-15-2030 | | | | 2,090,000 | | | | 2,248,709 | |
U.S. Treasury Bond | | | 2.00 | | | | 2-15-2050 | | | | 2,515,000 | | | | 2,830,554 | |
U.S. Treasury Bond | | | 2.13 | | | | 9-30-2024 | | | | 3,270,000 | | | | 3,523,042 | |
U.S. Treasury Bond | | | 2.13 | | | | 11-30-2024 | | | | 995,000 | | | | 1,074,717 | |
U.S. Treasury Bond | | | 2.25 | | | | 8-15-2049 | | | | 1,725,000 | | | | 2,040,621 | |
U.S. Treasury Bond | | | 2.38 | | | | 11-15-2049 | | | | 1,660,000 | | | | 2,016,641 | |
U.S. Treasury Bond | | | 2.50 | | | | 2-15-2046 | | | | 100,000 | | | | 122,539 | |
U.S. Treasury Bond | | | 2.50 | | | | 5-15-2046 | | | | 1,065,000 | | | | 1,306,289 | |
U.S. Treasury Bond | | | 2.75 | | | | 8-15-2042 | | | | 6,035,000 | | | | 7,681,423 | |
U.S. Treasury Bond | | | 2.75 | | | | 11-15-2042 | | | | 1,920,000 | | | | 2,441,025 | |
U.S. Treasury Bond | | | 2.75 | | | | 11-15-2047 | | | | 1,110,000 | | | | 1,433,851 | |
U.S. Treasury Bond | | | 2.88 | | | | 5-15-2028 | | | | 2,295,000 | | | | 2,697,521 | |
U.S. Treasury Bond | | | 2.88 | | | | 5-15-2043 | | | | 1,200,000 | | | | 1,555,594 | |
U.S. Treasury Bond | | | 3.00 | | | | 5-15-2042 | | | | 145,000 | | | | 191,485 | |
U.S. Treasury Bond | | | 3.00 | | | | 11-15-2044 | | | | 585,000 | | | | 776,176 | |
U.S. Treasury Bond | | | 3.00 | | | | 5-15-2045 | | | | 105,000 | | | | 139,679 | |
U.S. Treasury Bond | | | 3.00 | | | | 11-15-2045 | | | | 35,000 | | | | 46,691 | |
U.S. Treasury Bond | | | 3.00 | | | | 2-15-2047 | | | | 1,050,000 | | | | 1,410,404 | |
U.S. Treasury Bond | | | 3.00 | | | | 5-15-2047 | | | | 16,986,000 | | | | 22,847,497 | |
U.S. Treasury Bond | | | 3.00 | | | | 2-15-2048 | | | | 435,000 | | | | 587,624 | |
U.S. Treasury Bond | | | 3.00 | | | | 8-15-2048 | | | | 585,000 | | | | 793,109 | |
U.S. Treasury Bond | | | 3.00 | | | | 2-15-2049 | | | | 1,330,000 | | | | 1,809,164 | |
U.S. Treasury Bond | | | 3.13 | | | | 11-15-2041 | | | | 1,105,000 | | | | 1,483,506 | |
U.S. Treasury Bond | | | 3.13 | | | | 2-15-2042 | | | | 370,000 | | | | 497,809 | |
U.S. Treasury Bond | | | 3.13 | | | | 2-15-2043 | | | | 2,010,000 | | | | 2,706,120 | |
U.S. Treasury Bond | | | 3.38 | | | | 5-15-2044 | | | | 20,000 | | | | 28,040 | |
U.S. Treasury Bond | | | 3.50 | | | | 2-15-2039 | | | | 15,000 | | | | 20,948 | |
U.S. Treasury Bond | | | 3.63 | | | | 8-15-2043 | | | | 110,000 | | | | 159,358 | |
U.S. Treasury Bond | | | 3.63 | | | | 2-15-2044 | | | | 35,000 | | | | 50,801 | |
U.S. Treasury Bond | | | 3.75 | | | | 8-15-2041 | | | | 35,000 | | | | 51,081 | |
U.S. Treasury Bond | | | 3.75 | | | | 11-15-2043 | | | | 350,000 | | | | 516,387 | |
U.S. Treasury Bond | | | 4.25 | | | | 11-15-2040 | | | | 480,000 | | | | 741,919 | |
U.S. Treasury Bond | | | 4.38 | | | | 5-15-2040 | | | | 800,000 | | | | 1,249,250 | |
U.S. Treasury Bond | | | 4.50 | | | | 8-15-2039 | | | | 550,000 | | | | 864,961 | |
The accompanying notes are an integral part of these financial statements.
Wells Fargo Bloomberg Barclays US Aggregate ex-Corporate Portfolio | 9
Portfolio of investments—August 31, 2020 (unaudited)
| | | | | | | | | | | | | | | | |
| | | Interest
rate | | | Maturity
date | | | Principal | | | Value | |
|
| U.S. Treasury Securities (continued) | |
U.S. Treasury Bond | | | 4.75 | % | | | 2-15-2041 | | | $ | 120,000 | | | $ | 196,950 | |
U.S. Treasury Bond | | | 5.00 | | | | 5-15-2037 | | | | 1,574,000 | | | | 2,542,625 | |
U.S. Treasury Bond | | | 5.38 | | | | 2-15-2031 | | | | 1,592,000 | | | | 2,345,153 | |
U.S. Treasury Bond | | | 5.50 | | | | 8-15-2028 | | | | 430,000 | | | | 596,037 | |
U.S. Treasury Bond | | | 6.13 | | | | 11-15-2027 | | | | 245,000 | | | | 343,316 | |
U.S. Treasury Bond | | | 6.13 | | | | 8-15-2029 | | | | 1,280,000 | | | | 1,897,050 | |
U.S. Treasury Bond | | | 6.25 | | | | 5-15-2030 | | | | 905,000 | | | | 1,381,999 | |
U.S. Treasury Bond | | | 6.38 | | | | 8-15-2027 | | | | 50,000 | | | | 70,277 | |
U.S. Treasury Bond | | | 6.88 | | | | 8-15-2025 | | | | 335,000 | | | | 443,770 | |
U.S. Treasury Note | | | 2.63 | | | | 12-31-2025 | | | | 2,015,000 | | | | 2,260,657 | |
U.S. Treasury Note | | | 0.13 | | | | 4-30-2022 | | | | 3,030,000 | | | | 3,029,171 | |
U.S. Treasury Note | | | 0.13 | | | | 5-31-2022 | | | | 2,595,000 | | | | 2,594,088 | |
U.S. Treasury Note | | | 0.13 | | | | 6-30-2022 | | | | 3,085,000 | | | | 3,084,036 | |
U.S. Treasury Note | | | 0.13 | | | | 8-31-2022 | | | | 1,700,000 | | | | 1,699,668 | |
U.S. Treasury Note | | | 0.13 | | | | 5-15-2023 | | | | 2,815,000 | | | | 2,813,241 | |
U.S. Treasury Note | | | 0.13 | | | | 7-15-2023 | | | | 545,000 | | | | 544,617 | |
U.S. Treasury Note | | | 0.25 | | | | 4-15-2023 | | | | 1,475,000 | | | | 1,478,976 | |
U.S. Treasury Note | | | 0.25 | | | | 5-31-2025 | | | | 1,790,000 | | | | 1,789,580 | |
U.S. Treasury Note | | | 0.38 | | | | 3-31-2022 | | | | 2,895,000 | | | | 2,905,404 | |
U.S. Treasury Note | | | 0.50 | | | | 3-15-2023 | | | | 750,000 | | | | 756,826 | |
U.S. Treasury Note | | | 0.50 | | | | 3-31-2025 | | | | 2,925,000 | | | | 2,958,706 | |
U.S. Treasury Note | | | 0.50 | | | | 5-31-2027 | | | | 1,645,000 | | | | 1,647,956 | |
U.S. Treasury Note | | | 0.63 | | | | 3-31-2027 | | | | 1,865,000 | | | | 1,885,326 | |
U.S. Treasury Note | | | 0.63 | | | | 5-15-2030 | | | | 1,095,000 | | | | 1,087,472 | |
U.S. Treasury Note | | | 1.13 | | | | 9-30-2021 | | | | 1,610,000 | | | | 1,626,603 | |
U.S. Treasury Note | | | 1.13 | | | | 2-28-2022 | | | | 2,515,000 | | | | 2,551,644 | |
U.S. Treasury Note | | | 1.13 | | | | 2-28-2025 | | | | 1,855,000 | | | | 1,928,475 | |
U.S. Treasury Note | | | 1.25 | | | | 10-31-2021 | | | | 2,820,000 | | | | 2,855,691 | |
U.S. Treasury Note | | | 1.25 | | | | 7-31-2023 | | | | 630,000 | | | | 650,081 | |
U.S. Treasury Note | | | 1.25 | | | | 8-31-2024 | | | | 810,000 | | | | 843,349 | |
U.S. Treasury Note | | | 1.38 | | | | 1-31-2022 | | | | 2,915,000 | | | | 2,965,329 | |
U.S. Treasury Note | | | 1.38 | | | | 6-30-2023 | | | | 4,245,000 | | | | 4,391,253 | |
U.S. Treasury Note | | | 1.38 | | | | 8-31-2023 | | | | 435,000 | | | | 450,888 | |
U.S. Treasury Note | | | 1.38 | | | | 9-30-2023 | | | | 6,135,000 | | | | 6,364,104 | |
U.S. Treasury Note | | | 1.38 | | | | 8-31-2026 | | | | 1,290,000 | | | | 1,365,032 | |
U.S. Treasury Note | | | 1.50 | | | | 1-31-2022 | | | | 3,290,000 | | | | 3,352,459 | |
U.S. Treasury Note | | | 1.50 | | | | 8-15-2022 | | | | 2,480,000 | | | | 2,545,875 | |
U.S. Treasury Note | | | 1.50 | | | | 1-15-2023 | | | | 1,695,000 | | | | 1,749,624 | |
U.S. Treasury Note | | | 1.50 | | | | 2-28-2023 | | | | 3,560,000 | | | | 3,680,289 | |
U.S. Treasury Note | | | 1.50 | | | | 3-31-2023 | | | | 6,085,000 | | | | 6,297,737 | |
U.S. Treasury Note | | | 1.50 | | | | 9-30-2024 | | | | 3,215,000 | | | | 3,382,406 | |
U.S. Treasury Note | | | 1.50 | | | | 10-31-2024 | | | | 225,000 | | | | 236,892 | |
U.S. Treasury Note | | | 1.50 | | | | 8-15-2026 | | | | 545,000 | | | | 580,510 | |
U.S. Treasury Note | | | 1.63 | | | | 8-15-2022 | | | | 175,000 | | | | 180,079 | |
U.S. Treasury Note | | | 1.63 | | | | 4-30-2023 | | | | 280,000 | | | | 291,014 | |
U.S. Treasury Note | | | 1.63 | | | | 5-31-2023 | | | | 3,090,000 | | | | 3,215,411 | |
U.S. Treasury Note | | | 1.63 | | | | 10-31-2023 | | | | 2,540,000 | | | | 2,657,177 | |
U.S. Treasury Note | | | 1.63 | | | | 2-15-2026 | | | | 6,240,000 | | | | 6,674,363 | |
U.S. Treasury Note | | | 1.63 | | | | 5-15-2026 | | | | 625,000 | | | | 669,556 | |
U.S. Treasury Note | | | 1.63 | | | | 9-30-2026 | | | | 1,395,000 | | | | 1,497,554 | |
U.S. Treasury Note | | | 1.63 | | | | 10-31-2026 | | | | 915,000 | | | | 982,553 | |
U.S. Treasury Note | | | 1.63 | | | | 8-15-2029 | | | | 2,005,000 | | | | 2,176,991 | |
U.S. Treasury Note | | | 1.75 | | | | 11-30-2021 | | | | 1,975,000 | | | | 2,014,500 | |
U.S. Treasury Note | | | 1.75 | | | | 2-28-2022 | | | | 1,030,000 | | | | 1,054,704 | |
U.S. Treasury Note | | | 1.75 | | | | 3-31-2022 | | | | 2,585,000 | | | | 2,650,332 | |
U.S. Treasury Note | | | 1.75 | | | | 4-30-2022 | | | | 2,465,000 | | | | 2,530,765 | |
The accompanying notes are an integral part of these financial statements.
10 | Wells Fargo Bloomberg Barclays US Aggregate ex-Corporate Portfolio
Portfolio of investments—August 31, 2020 (unaudited)
| | | | | | | | | | | | | | | | |
| | | Interest
rate | | | Maturity
date | | | Principal | | | Value | |
|
| U.S. Treasury Securities (continued) | |
U.S. Treasury Note | | | 1.75 | % | | | 5-15-2022 | | | $ | 3,030,000 | | | $ | 3,112,378 | |
U.S. Treasury Note | | | 1.75 | | | | 5-31-2022 | | | | 3,425,000 | | | | 3,520,927 | |
U.S. Treasury Note | | | 1.75 | | | | 6-15-2022 | | | | 3,520,000 | | | | 3,620,925 | |
U.S. Treasury Note | | | 1.75 | | | | 6-30-2022 | | | | 2,820,000 | | | | 2,902,617 | |
U.S. Treasury Note | | | 1.75 | | | | 9-30-2022 | | | | 10,000 | | | | 10,336 | |
U.S. Treasury Note | | | 1.75 | | | | 5-15-2023 | | | | 410,000 | | | | 427,665 | |
U.S. Treasury Note | | | 1.75 | | | | 6-30-2024 | | | | 3,510,000 | | | | 3,716,761 | |
U.S. Treasury Note | | | 1.75 | | | | 12-31-2026 | | | | 2,720,000 | | | | 2,944,931 | |
U.S. Treasury Note | | | 1.75 | | | | 11-15-2029 | | | | 830,000 | | | | 911,573 | |
U.S. Treasury Note | | | 1.88 | | | | 11-30-2021 | | | | 50,000 | | | | 51,066 | |
U.S. Treasury Note | | | 1.88 | | | | 1-31-2022 | | | | 2,805,000 | | | | 2,872,824 | |
U.S. Treasury Note | | | 1.88 | | | | 2-28-2022 | | | | 345,000 | | | | 353,921 | |
U.S. Treasury Note | | | 1.88 | | | | 7-31-2022 | | | | 1,865,000 | | | | 1,926,705 | |
U.S. Treasury Note | | | 1.88 | | | | 8-31-2024 | | | | 3,290,000 | | | | 3,507,320 | |
U.S. Treasury Note | | | 2.00 | | | | 10-31-2021 | | | | 1,160,000 | | | | 1,184,831 | |
U.S. Treasury Note | | | 2.00 | | | | 10-31-2022 | | | | 1,990,000 | | | | 2,069,989 | |
U.S. Treasury Note | | | 2.00 | | | | 2-15-2023 | | | | 30,000 | | | | 31,366 | |
U.S. Treasury Note | | | 2.00 | | | | 6-30-2024 | | | | 4,751,000 | | | | 5,076,147 | |
U.S. Treasury Note | | | 2.00 | | | | 2-15-2025 | | | | 340,000 | | | | 366,443 | |
U.S. Treasury Note | | | 2.00 | | | | 8-15-2025 | | | | 1,200,000 | | | | 1,301,672 | |
U.S. Treasury Note | | | 2.13 | | | | 9-30-2021 | | | | 725,000 | | | | 740,350 | |
U.S. Treasury Note | | | 2.13 | | | | 12-31-2022 | | | | 1,700,000 | | | | 1,778,359 | |
U.S. Treasury Note | | | 2.13 | | | | 11-30-2023 | | | | 750,000 | | | | 797,402 | |
U.S. Treasury Note | | | 2.13 | | | | 7-31-2024 | | | | 10,000 | | | | 10,748 | |
U.S. Treasury Note | | | 2.13 | | | | 5-15-2025 | | | | 880,000 | | | | 956,553 | |
U.S. Treasury Note | | | 2.25 | | | | 12-31-2023 | | | | 15,000 | | | | 16,032 | |
U.S. Treasury Note | | | 2.25 | | | | 4-30-2024 | | | | 605,000 | | | | 650,375 | |
U.S. Treasury Note | | | 2.25 | | | | 10-31-2024 | | | | 2,035,000 | | | | 2,206,067 | |
U.S. Treasury Note | | | 2.25 | | | | 11-15-2024 | | | | 2,435,000 | | | | 2,641,499 | |
U.S. Treasury Note | | | 2.25 | | | | 12-31-2024 | | | | 1,485,000 | | | | 1,613,603 | |
U.S. Treasury Note | | | 2.25 | | | | 11-15-2025 | | | | 1,805,000 | | | | 1,986,205 | |
U.S. Treasury Note | | | 2.25 | | | | 3-31-2026 | | | | 3,200,000 | | | | 3,536,500 | |
U.S. Treasury Note | | | 2.25 | | | | 2-15-2027 | | | | 400,000 | | | | 446,109 | |
U.S. Treasury Note | | | 2.25 | | | | 11-15-2027 | | | | 20,000 | | | | 22,470 | |
U.S. Treasury Note | | | 2.38 | | | | 8-15-2024 | | | | 490,000 | | | | 531,746 | |
U.S. Treasury Note | | | 2.38 | | | | 5-15-2027 | | | | 7,413,000 | | | | 8,348,891 | |
U.S. Treasury Note | | | 2.38 | | | | 5-15-2029 | | | | 690,000 | | | | 792,314 | |
U.S. Treasury Note | | | 2.50 | | | | 1-15-2022 | | | | 3,175,000 | | | | 3,277,071 | |
U.S. Treasury Note | | | 2.50 | | | | 8-15-2023 | | | | 1,975,000 | | | | 2,111,321 | |
U.S. Treasury Note | | | 2.50 | | | | 1-31-2024 | | | | 895,000 | | | | 965,621 | |
U.S. Treasury Note | | | 2.50 | | | | 1-31-2025 | | | | 1,670,000 | | | | 1,835,695 | |
U.S. Treasury Note | | | 2.50 | | | | 2-28-2026 | | | | 800,000 | | | | 894,469 | |
U.S. Treasury Note | | | 2.63 | | | | 1-31-2026 | | | | 2,230,000 | | | | 2,505,266 | |
U.S. Treasury Note | | | 2.63 | | | | 2-15-2029 | | | | 3,060,000 | | | | 3,567,888 | |
U.S. Treasury Note | | | 2.75 | | | | 7-31-2023 | | | | 2,665,000 | | | | 2,866,228 | |
U.S. Treasury Note | | | 2.75 | | | | 11-15-2023 | | | | 2,040,000 | | | | 2,207,902 | |
U.S. Treasury Note | | | 2.75 | | | | 2-28-2025 | | | | 1,410,000 | | | | 1,567,854 | |
U.S. Treasury Note | | | 2.75 | | | | 6-30-2025 | | | | 1,270,000 | | | | 1,421,408 | |
U.S. Treasury Note | | | 2.75 | | | | 8-31-2025 | | | | 2,185,000 | | | | 2,452,833 | |
U.S. Treasury Note | | | 2.75 | | | | 2-15-2028 | | | | 2,685,000 | | | | 3,121,313 | |
U.S. Treasury Note | | | 2.88 | | | | 11-30-2023 | | | | 2,400,000 | | | | 2,609,813 | |
U.S. Treasury Note | | | 2.88 | | | | 4-30-2025 | | | | 2,440,000 | | | | 2,736,613 | |
U.S. Treasury Note | | | 2.88 | | | | 11-30-2025 | | | | 1,145,000 | | | | 1,298,099 | |
U.S. Treasury Note | | | 2.88 | | | | 8-15-2028 | | | | 1,875,000 | | | | 2,211,182 | |
U.S. Treasury Note | | | 3.13 | | | | 11-15-2028 | | | | 2,375,000 | | | | 2,857,236 | |
U.S. Treasury Note | | | 6.00 | | | | 2-15-2026 | | | | 450,000 | | | | 588,023 | |
The accompanying notes are an integral part of these financial statements.
Wells Fargo Bloomberg Barclays US Aggregate ex-Corporate Portfolio | 11
Portfolio of investments—August 31, 2020 (unaudited)
| | | | | | | | | | | | | | | | |
| | | Interest
rate | | | Maturity
date | | | Principal | | | Value | |
|
| U.S. Treasury Securities (continued) | |
U.S. Treasury Note | | | 6.50 | % | | | 11-15-2026 | | | $ | 745,000 | | | $ | 1,024,521 | |
U.S. Treasury Note | | | 7.25 | | | | 8-15-2022 | | | | 1,740,000 | | | | 1,982,648 | |
U.S. Treasury Note | | | 7.50 | | | | 11-15-2024 | | | | 695,000 | | | | 906,758 | |
U.S. Treasury Note | | | 8.00 | | | | 11-15-2021 | | | | 760,000 | | | | 831,963 | |
| | | | |
Total U.S. Treasury Securities (Cost $285,087,674) | | | | | | | | | | | | | | | 308,056,535 | |
| | | | | | | | | | | | | | | | |
| | | | |
Yankee Corporate Bonds and Notes: 2.80% | | | | | | | | | | | | | | | | |
| | | | |
Energy: 0.23% | | | | | | | | | | | | | | | | |
| | | | |
| Oil, Gas & Consumable Fuels: 0.23% | | | | | | | | | | | | |
CNOOC Petroleum North America ULC | | | 7.50 | | | | 7-30-2039 | | | | 60,000 | | | | 100,185 | |
Ecopetrol SA | | | 5.88 | | | | 9-18-2023 | | | | 210,000 | | | | 232,050 | |
Ecopetrol SA | | | 7.38 | | | | 9-18-2043 | | | | 200,000 | | | | 259,300 | |
Equinor ASA | | | 3.00 | | | | 4-6-2027 | | | | 150,000 | | | | 166,498 | |
Equinor ASA | | | 3.13 | | | | 4-6-2030 | | | | 160,000 | | | | 179,912 | |
Equinor ASA | | | 3.95 | | | | 5-15-2043 | | | | 100,000 | | | | 115,950 | |
Equinor ASA | | | 4.80 | | | | 11-8-2043 | | | | 200,000 | | | | 261,618 | |
| | | | |
| | | | | | | | | | | | | | | 1,315,513 | |
| | | | | | | | | | | | | | | | |
Financials: 2.57% | | | | | | | | | | | | | | | | |
| | | | |
| Banks: 2.57% | | | | | | | | | | | | |
African Development Bank | | | 0.75 | | | | 4-3-2023 | | | | 410,000 | | | | 415,167 | |
Asian Development Bank | | | 1.50 | | | | 10-18-2024 | | | | 360,000 | | | | 377,348 | |
Asian Development Bank | | | 1.75 | | | | 9-19-2029 | | | | 160,000 | | | | 172,355 | |
Asian Development Bank | | | 1.88 | | | | 1-24-2030 | | | | 110,000 | | | | 120,166 | |
Asian Development Bank | | | 2.00 | | | | 2-16-2022 | | | | 760,000 | | | | 779,160 | |
Asian Development Bank | | | 2.00 | | | | 4-24-2026 | | | | 60,000 | | | | 65,084 | |
Asian Development Bank | | | 2.63 | | | | 1-12-2027 | | | | 270,000 | | | | 303,540 | |
Asian Development Bank | | | 5.82 | | | | 6-16-2028 | | | | 10,000 | | | | 13,650 | |
Asian Development Bank | | | 6.22 | | | | 8-15-2027 | | | | 80,000 | | | | 107,851 | |
Corporación Andina de Fomento | | | 2.13 | | | | 9-27-2021 | | | | 10,000 | | | | 10,125 | |
Corporación Andina de Fomento | | | 3.75 | | | | 11-23-2023 | | | | 130,000 | | | | 140,994 | |
Corporación Andina de Fomento | | | 4.38 | | | | 6-15-2022 | | | | 120,000 | | | | 126,901 | |
European Bank for Reconstruction & Development | | | 0.50 | | | | 5-19-2025 | | | | 430,000 | | | | 430,510 | |
European Bank for Reconstruction & Development | | | 2.13 | | | | 3-7-2022 | | | | 10,000 | | | | 10,281 | |
European Investment Bank | | | 0.25 | | | | 9-15-2023 | | | | 470,000 | | | | 469,882 | |
European Investment Bank | | | 0.88 | | | | 5-17-2030 | | | | 120,000 | | | | 120,365 | |
European Investment Bank | | | 1.88 | | | | 2-10-2025 | | | | 110,000 | | | | 117,302 | |
European Investment Bank | | | 2.00 | | | | 12-15-2022 | | | | 390,000 | | | | 405,893 | |
European Investment Bank | | | 2.13 | | | | 10-15-2021 | | | | 130,000 | | | | 132,781 | |
European Investment Bank | | | 2.25 | | | | 6-24-2024 | | | | 640,000 | | | | 687,515 | |
European Investment Bank | | | 2.50 | | | | 3-15-2023 | | | | 200,000 | | | | 211,471 | |
European Investment Bank | | | 3.25 | | | | 1-29-2024 | | | | 270,000 | | | | 297,158 | |
European Investment Bank | | | 4.88 | | | | 2-15-2036 | | | | 70,000 | | | | 104,864 | |
FMS Wertmanagement | | | 2.00 | | | | 8-1-2022 | | | | 260,000 | | | | 268,839 | |
Inter-American Development Bank | | | 1.75 | | | | 4-14-2022 | | | | 580,000 | | | | 594,217 | |
Inter-American Development Bank | | | 1.75 | | | | 9-14-2022 | | | | 250,000 | | | | 257,697 | |
Inter-American Development Bank | | | 1.75 | | | | 3-14-2025 | | | | 560,000 | | | | 593,748 | |
Inter-American Development Bank | | | 2.00 | | | | 6-2-2026 | | | | 60,000 | | | | 64,987 | |
Inter-American Development Bank | | | 2.13 | | | | 1-18-2022 | | | | 60,000 | | | | 61,532 | |
Inter-American Development Bank | | | 2.13 | | | | 1-15-2025 | | | | 150,000 | | | | 161,173 | |
Inter-American Development Bank | | | 2.38 | | | | 7-7-2027 | | | | 30,000 | | | | 33,387 | |
International Bank for Reconstruction & Development | | | 0.75 | | | | 8-26-2030 | | | | 130,000 | | | | 128,349 | |
International Bank for Reconstruction & Development | | | 1.50 | | | | 8-28-2024 | | | | 400,000 | | | | 418,563 | |
International Bank for Reconstruction & Development | | | 1.88 | | | | 10-7-2022 | | | | 540,000 | | | | 558,644 | |
The accompanying notes are an integral part of these financial statements.
12 | Wells Fargo Bloomberg Barclays US Aggregate ex-Corporate Portfolio
Portfolio of investments—August 31, 2020 (unaudited)
| | | | | | | | | | | | | | | | |
| | | Interest
rate | | | Maturity
date | | | Principal | | | Value | |
| | | | |
| Banks (continued) | | | | | | | | | | | | |
International Bank for Reconstruction & Development | | | 1.88 | % | | | 6-19-2023 | | | $ | 470,000 | | | $ | 491,073 | |
International Bank for Reconstruction & Development | | | 2.00 | | | | 1-26-2022 | | | | 30,000 | | | | 30,744 | |
International Bank for Reconstruction & Development | | | 2.50 | | | | 3-19-2024 | | | | 480,000 | | | | 516,533 | |
International Bank for Reconstruction & Development | | | 2.50 | | | | 7-29-2025 | | | | 20,000 | | | | 22,039 | |
International Bank for Reconstruction & Development | | | 2.50 | | | | 11-22-2027 | | | | 370,000 | | | | 417,699 | |
International Finance Corporation | | | 1.38 | | | | 10-16-2024 | | | | 100,000 | | | | 104,219 | |
International Finance Corporation | | | 2.13 | | | | 4-7-2026 | | | | 100,000 | | | | 109,128 | |
KfW ¤ | | | 0.00 | | | | 4-18-2036 | | | | 80,000 | | | | 65,003 | |
KfW ¤ | | | 0.00 | | | | 6-29-2037 | | | | 50,000 | | | | 40,435 | |
KfW | | | 0.75 | | | | 9-30-2030 | | | | 260,000 | | | | 257,773 | |
KfW | | | 2.00 | | | | 11-30-2021 | | | | 250,000 | | | | 255,551 | |
KfW | | | 2.00 | | | | 5-2-2025 | | | | 40,000 | | | | 43,034 | |
KfW | | | 2.13 | | | | 3-7-2022 | | | | 530,000 | | | | 545,367 | |
KfW | | | 2.13 | | | | 6-15-2022 | | | | 110,000 | | | | 113,759 | |
KfW | | | 2.13 | | | | 1-17-2023 | | | | 870,000 | | | | 909,015 | |
KfW | | | 2.50 | | | | 2-15-2022 | | | | 140,000 | | | | 144,623 | |
KfW | | | 2.88 | | | | 4-3-2028 | | | | 180,000 | | | | 209,984 | |
Landwirtschaftliche Rentenbank | | | 1.75 | | | | 7-27-2026 | | | | 10,000 | | | | 10,696 | |
Landwirtschaftliche Rentenbank | | | 2.00 | | | | 1-13-2025 | | | | 150,000 | | | | 160,489 | |
Landwirtschaftliche Rentenbank | | | 2.25 | | | | 10-1-2021 | | | | 60,000 | | | | 61,295 | |
Nordic Investment Bank | | | 1.38 | | | | 10-17-2022 | | | | 230,000 | | | | 235,617 | |
Oesterreichische Kontrollbank AG | | | 2.88 | | | | 3-13-2023 | | | | 260,000 | | | | 276,874 | |
Swedish Export Credit ¤ | | | 0.00 | | | | 5-11-2037 | | | | 65,000 | | | | 45,530 | |
Swedish Export Credit | | | 0.50 | | | | 8-26-2025 | | | | 810,000 | | | | 809,700 | |
Swedish Export Credit | | | 1.63 | | | | 9-12-2021 | | | | 320,000 | | | | 324,339 | |
| | | | |
| | | | | | | | | | | | | | | 14,962,018 | |
| | | | | | | | | | | | | | | | |
| | | | |
Total Yankee Corporate Bonds and Notes (Cost $15,690,660) | | | | | | | | | | | | | | | 16,277,531 | |
| | | | | | | | | | | | | | | | |
| | | | |
| Yankee Government Bonds: 2.06% | | | | | | | | | | | | |
Canada Government | | | 2.00 | | | | 11-15-2022 | | | | 60,000 | | | | 62,288 | |
Canada Government | | | 2.63 | | | | 1-25-2022 | | | | 260,000 | | | | 268,910 | |
Export Development Canada | | | 2.63 | | | | 2-21-2024 | | | | 430,000 | | | | 464,325 | |
Export-Import Bank of Korea | | | 2.88 | | | | 1-21-2025 | | | | 400,000 | | | | 433,988 | |
Japan Bank for International Cooperation | | | 2.00 | | | | 11-4-2021 | | | | 490,000 | | | | 499,316 | |
Japan Bank for International Cooperation | | | 2.75 | | | | 11-16-2027 | | | | 360,000 | | | | 407,246 | |
Japan Bank for International Cooperation | | | 3.38 | | | | 10-31-2023 | | | | 270,000 | | | | 294,680 | |
Korea Development Bank | | | 2.63 | | | | 2-27-2022 | | | | 330,000 | | | | 340,058 | |
Oriental Republic of Uruguay | | | 4.38 | | | | 1-23-2031 | | | | 75,000 | | | | 89,813 | |
Oriental Republic of Uruguay | | | 4.98 | | | | 4-20-2055 | | | | 200,000 | | | | 274,002 | |
Oriental Republic of Uruguay | | | 5.10 | | | | 6-18-2050 | | | | 85,000 | | | | 117,088 | |
Province of Alberta | | | 2.20 | | | | 7-26-2022 | | | | 250,000 | | | | 258,505 | |
Province of British Columbia | | | 2.00 | | | | 10-23-2022 | | | | 15,000 | | | | 15,546 | |
Province of British Columbia | | | 7.25 | | | | 9-1-2036 | | | | 100,000 | | | | 169,706 | |
Province of Manitoba | | | 2.10 | | | | 9-6-2022 | | | | 120,000 | | | | 124,058 | |
Province of Ontario | | | 2.00 | | | | 10-2-2029 | | | | 90,000 | | | | 97,084 | |
Province of Ontario | | | 2.20 | | | | 10-3-2022 | | | | 120,000 | | | | 124,514 | |
Province of Ontario | | | 2.30 | | | | 6-15-2026 | | | | 70,000 | | | | 76,167 | |
Province of Ontario | | | 2.40 | | | | 2-8-2022 | | | | 450,000 | | | | 463,347 | |
Province of Ontario | | | 2.50 | | | | 4-27-2026 | | | | 70,000 | | | | 76,925 | |
Province of Ontario | | | 3.20 | | | | 5-16-2024 | | | | 5,000 | | | | 5,497 | |
Province of Ontario | | | 3.40 | | | | 10-17-2023 | | | | 110,000 | | | | 120,062 | |
Province of Quebec | | | 1.35 | | | | 5-28-2030 | | | | 100,000 | | | | 103,000 | |
Province of Quebec | | | 2.50 | | | | 4-9-2024 | | | | 70,000 | | | | 75,227 | |
Province of Quebec | | | 2.50 | | | | 4-20-2026 | | | | 75,000 | | | | 82,310 | |
The accompanying notes are an integral part of these financial statements.
Wells Fargo Bloomberg Barclays US Aggregate ex-Corporate Portfolio | 13
Portfolio of investments—August 31, 2020 (unaudited)
| | | | | | | | | | | | | | | | |
| | | Interest
rate | | | Maturity
date | | | Principal | | | Value | |
| | | | |
| Yankee Government Bonds (continued) | | | | | | | | | | | | |
Province of Quebec | | | 2.63 | % | | | 2-13-2023 | | | $ | 60,000 | | | $ | 63,246 | |
Province of Quebec | | | 7.13 | | | | 2-9-2024 | | | | 110,000 | | | | 134,301 | |
Province of Quebec | | | 7.50 | | | | 7-15-2023 | | | | 80,000 | | | | 95,624 | |
Republic of Chile | | | 3.24 | | | | 2-6-2028 | | | | 250,000 | | | | 278,875 | |
Republic of Colombia | | | 3.88 | | | | 4-25-2027 | | | | 200,000 | | | | 217,200 | |
Republic of Colombia | | | 6.13 | | | | 1-18-2041 | | | | 225,000 | | | | 293,063 | |
Republic of Colombia | | | 7.38 | | | | 9-18-2037 | | | | 140,000 | | | | 199,500 | |
Republic of Colombia | | | 8.13 | | | | 5-21-2024 | | | | 80,000 | | | | 97,000 | |
Republic of Hungary | | | 5.38 | | | | 3-25-2024 | | | | 19,000 | | | | 21,847 | |
Republic of Hungary | | | 7.63 | | | | 3-29-2041 | | | | 112,000 | | | | 199,707 | |
Republic of Indonesia | | | 3.50 | | | | 1-11-2028 | | | | 200,000 | | | | 220,052 | |
Republic of Indonesia | | | 4.35 | | | | 1-11-2048 | | | | 205,000 | | | | 242,823 | |
Republic of Italy | | | 2.88 | | | | 10-17-2029 | | | | 215,000 | | | | 220,303 | |
Republic of Italy | | | 5.38 | | | | 6-15-2033 | | | | 145,000 | | | | 181,743 | |
Republic of Korea | | | 3.88 | | | | 9-11-2023 | | | | 210,000 | | | | 230,486 | |
Republic of Panama | | | 3.87 | | | | 7-23-2060 | | | | 200,000 | | | | 237,000 | |
Republic of Panama | | | 9.38 | | | | 4-1-2029 | | | | 250,000 | | | | 388,125 | |
Republic of Peru | | | 2.84 | | | | 6-20-2030 | | | | 180,000 | | | | 197,280 | |
Republic of Peru | | | 5.63 | | | | 11-18-2050 | | | | 140,000 | | | | 230,230 | |
Republic of Philippines | | | 5.50 | | | | 3-30-2026 | | | | 410,000 | | | | 503,025 | |
Republic of Philippines | | | 6.38 | | | | 10-23-2034 | | | | 185,000 | | | | 270,137 | |
Republic of Philippines | | | 9.50 | | | | 2-2-2030 | | | | 55,000 | | | | 90,372 | |
Republic of Poland | | | 3.00 | | | | 3-17-2023 | | | | 215,000 | | | | 228,405 | |
Republic of Poland | | | 3.25 | | | | 4-6-2026 | | | | 10,000 | | | | 11,281 | |
State of Israel | | | 3.38 | | | | 1-15-2050 | | | | 350,000 | | | | 385,455 | |
State of Israel | | | 5.50 | | | | 12-4-2023 | | | | 120,000 | | | | 140,133 | |
State of Israel | | | 5.50 | | | | 9-18-2033 | | | | 6,000 | | | | 8,922 | |
United Mexican States | | | 4.00 | | | | 10-2-2023 | | | | 10,000 | | | | 10,895 | |
United Mexican States | | | 4.13 | | | | 1-21-2026 | | | | 150,000 | | | | 166,800 | |
United Mexican States | | | 4.15 | | | | 3-28-2027 | | | | 205,000 | | | | 227,960 | |
United Mexican States | | | 4.35 | | | | 1-15-2047 | | | | 225,000 | | | | 239,963 | |
United Mexican States | | | 4.75 | | | | 3-8-2044 | | | | 184,000 | | | | 205,988 | |
United Mexican States | | | 5.55 | | | | 1-21-2045 | | | | 320,000 | | | | 397,440 | |
United Mexican States | | | 5.75 | | | | 10-12-2099 | | | | 21,000 | | | | 25,557 | |
United Mexican States | | | 6.05 | | | | 1-11-2040 | | | | 40,000 | | | | 51,315 | |
United Mexican States | | | 7.50 | | | | 4-8-2033 | | | | 110,000 | | | | 155,375 | |
United Mexican States | | | 8.30 | | | | 8-15-2031 | | | | 60,000 | | | | 87,445 | |
| | | | |
Total Yankee Government Bonds (Cost $11,156,739) | | | | | | | | | | | | | | | 11,998,535 | |
| | | | | | | | | | | | | | | | |
| | | | |
| | | | | | | | | | | | | | | | |
| | | Yield | | | | | | Shares | | | | |
| Short-Term Investments: 10.01% | | | | | | | | | | | | |
| | | | |
| Investment Companies: 10.01% | | | | | | | | | | | | |
Wells Fargo Government Money Market Fund Select Class (l)(u)## | | | 0.06 | | | | | | | | 58,129,957 | | | | 58,129,957 | |
| | | | | | | | | | | | | | | | |
| | | | |
Total Short-Term Investments (Cost $58,129,957) | | | | | | | | | | | | | | | 58,129,957 | |
| | | | | | | | | | | | | | | | |
| | | | | | | | |
| Total investments in securities (Cost $597,820,338) | | | 108.41 | % | | | 629,789,380 | |
| | |
Other assets and liabilities, net | | | (8.41 | ) | | | (48,846,106 | ) |
| | | | | | | | |
| Total net assets | | | 100.00 | % | | $ | 580,943,274 | |
| | | | | | | | |
The accompanying notes are an integral part of these financial statements.
14 | Wells Fargo Bloomberg Barclays US Aggregate ex-Corporate Portfolio
Portfolio of investments—August 31, 2020 (unaudited)
| %% | The security is purchased on a when-issued basis. |
| ±± | The coupon of the security is adjusted based on the principal and interest payments received from the underlying pool of mortgages as well as the credit quality and the actual prepayment speed of the underlying mortgages. |
| ¤ | The security is issued in zero coupon form with no periodic interest payments. |
| (l) | The issuer of the security is an affiliated person of the Portfolio as defined in the Investment Company Act of 1940. |
| (u) | The rate represents the 7-day annualized yield at period end. |
| ## | All or a portion of this security is segregated for when-issued securities. |
Abbreviations:
| EDA | Economic Development Authority |
| FFCB | Federal Farm Credit Banks |
| FHLB | Federal Home Loan Bank |
| FHLMC | Federal Home Loan Mortgage Corporation |
| FNMA | Federal National Mortgage Association |
| GNMA | Government National Mortgage Association |
| National | National Public Finance Guarantee Corporation |
| TVA | Tennessee Valley Authority |
Investments in Affiliates
An affiliated investment is an investment in which the Portfolio owns at least 5% of the outstanding voting shares of the issuer or as a result of other relationships, such as the Portfolio and the issuer having the same adviser or investment manager. Transactions with issuers that were either affiliated persons of the Portfolio at the beginning of the period or the end of the period were as follows:
| | | | | | | | | | | | | | | | | | | | | | | | | | | | | | | | |
| | | Value,
beginning of
period | | | Purchases | | | Sales
proceeds | | | Net
realized
gains
(losses) | | | Net
change in
unrealized
gains
(losses) | | | Income
from
affiliated
securities | | | Value,
end
of period | | | % of
net
assets | |
| | | | | | | | |
| Short-Term Investments | | | | | | | | | | | | | | | | | | | | | | | | |
Investment Companies | | | | | | | | | | | | | | | | | | | | | | | | | | | | | | | | |
Wells Fargo Government Money Market Fund Select Class | | $ | 11,379,432 | | | $ | 148,876,932 | | | ($ | 102,126,407 | ) | | $ | 0 | | | $ | 0 | | | $ | 14,306 | | | $ | 58,129,957 | | | | 10.01 | % |
| | | | | | | | | | | | | | | | | | | | | | | | | | | | | | | | |
The accompanying notes are an integral part of these financial statements.
Wells Fargo Bloomberg Barclays US Aggregate ex-Corporate Portfolio | 15
Statement of assets and liabilities—August 31, 2020 (unaudited)
| | | | |
| | | | |
| |
Assets | | | | |
Investments in unaffiliated securities, at value (cost $539,690,381) | | $ | 571,659,423 | |
Investments in affiliated securities, at value (cost $58,129,957) | | | 58,129,957 | |
Cash | | | 202 | |
Receivable for investments sold | | | 6,956,336 | |
Receivable for interest | | | 1,967,658 | |
Prepaid expenses and other assets | | | 15,517 | |
| | | | |
Total assets | | | 638,729,093 | |
| | | | |
| |
Liabilities | | | | |
Payable for investments purchased | | | 57,567,843 | |
Advisory fee payable | | | 15,309 | |
Trustees’ fees and expenses payable | | | 1,876 | |
Accrued expenses and other liabilities | | | 200,791 | |
| | | | |
Total liabilities | | | 57,785,819 | |
| | | | |
Total net assets | | $ | 580,943,274 | |
| | | | |
The accompanying notes are an integral part of these financial statements.
16 | Wells Fargo Bloomberg Barclays US Aggregate ex-Corporate Portfolio
Statement of operations—six months ended August 31, 2020 (unaudited)
| | | | |
| | | | |
| |
Investment income | | | | |
Interest (net of foreign withholding taxes of $439) | | $ | 5,104,420 | |
Income from affiliated securities | | | 14,306 | |
| | | | |
Total investment income | | | 5,118,726 | |
| | | | |
| |
Expenses | | | | |
Advisory fee | | | 140,625 | |
Custody and accounting fees | | | 17,316 | |
Professional fees | | | 22,430 | |
Shareholder report expenses | | | 3,510 | |
Trustees’ fees and expenses | | | 9,898 | |
Other fees and expenses | | | 8,079 | |
| | | | |
Total expenses | | | 201,858 | |
Less: Fee waivers and/or expense reimbursements | | | (44,603 | ) |
| | | | |
Net expenses | | | 157,255 | |
| | | | |
Net investment income | | | 4,961,471 | |
| | | | |
| |
Realized and unrealized gains (losses) on investments | | | | |
Net realized gains on investments | | | 10,765,404 | |
Net change in unrealized gains (losses) on investments | | | (2,046,121 | ) |
| | | | |
Net realized and unrealized gains (losses) on investments | | | 8,719,283 | |
| | | | |
Net increase in net assets resulting from operations | | $ | 13,680,754 | |
| | | | |
The accompanying notes are an integral part of these financial statements.
Wells Fargo Bloomberg Barclays US Aggregate ex-Corporate Portfolio | 17
Statement of changes in net assets
| | | | | | | | |
| | | Six months ended
August 31, 2020
(unaudited) | | | Year ended
February 29, 2020 | |
| | |
Operations | | | | | | | | |
Net investment income | | $ | 4,961,471 | | | $ | 14,752,004 | |
Net realized gains on investments | | | 10,765,404 | | | | 2,813,519 | |
Net change in unrealized gains (losses) on investments | | | (2,046,121 | ) | | | 44,821,599 | |
| | | | | | | | |
Net increase in net assets resulting from operations | | | 13,680,754 | | | | 62,387,122 | |
| | | | | | | | |
| |
Capital transactions | | | | |
Transactions in investors’ beneficial interests | | | | | | | | |
Contributions | | | 102,493,641 | | | | 135,893,333 | |
Withdrawals | | | (200,666,457 | ) | | | (144,584,522 | ) |
| | | | | | | | |
Net decrease in net assets resulting from capital transactions | | | (98,172,816 | ) | | | (8,691,189 | ) |
| | | | | | | | |
Total increase (decrease) in net assets | | | (84,492,062 | ) | | | 53,695,933 | |
| | | | | | | | |
| |
Net assets | | | | |
Beginning of period | | | 665,435,336 | | | | 611,739,403 | |
| | | | | | | | |
End of period | | $ | 580,943,274 | | | $ | 665,435,336 | |
| | | | | | | | |
The accompanying notes are an integral part of these financial statements.
18 | Wells Fargo Bloomberg Barclays US Aggregate ex-Corporate Portfolio
Financial highlights
| | | | | | | | | | | | | | | | |
| | | Six months ended
August 31, 2020
(unaudited) | | | Year ended
February 29, 2020 | | | Year ended February 28 | |
| | | 2019 | | | 20181 | |
Total return2 | | | 2.42 | % | | | 10.34 | % | | | 3.23 | % | | | (1.39 | )% |
Ratios to average net assets (annualized) | | | | | | | | | | | | | | | | |
Gross expenses | | | 0.07 | % | | | 0.07 | % | | | 0.08 | % | | | 0.08 | % |
Net expenses | | | 0.06 | % | | | 0.06 | % | | | 0.07 | % | | | 0.07 | % |
Net investment income | | | 1.76 | % | | | 2.32 | % | | | 2.38 | % | | | 2.03 | % |
Supplemental data | | | | | | | | | | | | | | | | |
Portfolio turnover rate | | | 47 | % | | | 46 | % | | | 72 | % | | | 221 | % |
| 1 | For the period from May 23, 2017 (commencement of operations) to February 28, 2018 |
| 2 | Returns for periods of less than one year are not annualized. |
The accompanying notes are an integral part of these financial statements.
Wells Fargo Bloomberg Barclays US Aggregate ex-Corporate Portfolio | 19
Notes to financial statements (unaudited)
1. ORGANIZATION
Wells Fargo Master Trust (the “Trust”), a Delaware statutory trust organized on March 10, 1999, is an open-end management investment company registered under the Investment Company Act of 1940, as amended (the “1940 Act”). As an investment company, the Trust follows the accounting and reporting guidance in Financial Accounting Standards Board (“FASB”) Accounting Standards Codification Topic 946, Financial Services – Investment Companies. These financial statements report on the Wells Fargo Bloomberg Barclays US Aggregate ex-Corporate Portfolio (the “Portfolio”) which is a diversified series of the Trust.
Interests in the Portfolio are available solely through private placement transactions that do not involve any “public offering” within the meaning of Section 4(2) of the Investment Company Act of 1933.
2. SIGNIFICANT ACCOUNTING POLICIES
The following significant accounting policies, which are consistently followed in the preparation of the financial statements of the Portfolio, are in conformity with U.S. generally accepted accounting principles which require management to make estimates and assumptions that affect the reported amounts of assets and liabilities, disclosure of contingent assets and liabilities at the date of the financial statements, and the reported amounts of revenues and expenses during the reporting period. Actual results could differ from those estimates.
Securities valuation
All investments are valued each business day as of the close of regular trading on the New York Stock Exchange (generally 4 p.m. Eastern Time), although the Portfolio may deviate from this calculation time under unusual or unexpected circumstances.
Debt securities are valued at the evaluated bid price provided by an independent pricing service (e.g. taking into account various factors, including yields, maturities, or credit ratings) or, if a reliable price is not available, the quoted bid price from an independent broker-dealer.
Investments in registered open-end investment companies are valued at net asset value.
Investments which are not valued using any of the methods discussed above are valued at their fair value, as determined in good faith by the Board of Trustees of the Portfolio. The Board of Trustees has established a Valuation Committee comprised of the Trustees and has delegated to it the authority to take any actions regarding the valuation of portfolio securities that the Valuation Committee deems necessary or appropriate, including determining the fair value of portfolio securities, unless the determination has been delegated to the Wells Fargo Asset Management Pricing Committee at Wells Fargo Funds Management, LLC (“Funds Management”). The Board of Trustees retains the authority to make or ratify any valuation decisions or approve any changes to the Valuation Procedures as it deems appropriate. On a quarterly basis, the Board of Trustees receives reports on any valuation actions taken by the Valuation Committee or the Wells Fargo Asset Management Pricing Committee which may include items for ratification.
When-issued transactions
The Portfolio may purchase securities on a forward commitment or when-issued basis. The Portfolio records a when-issued transaction on the trade date and will segregate assets in an amount at least equal in value to the Portfolio’s commitment to purchase when-issued securities. Securities purchased on a when-issued basis are marked-to-market daily and the Portfolio begins earning interest on the settlement date. Losses may arise due to changes in the market value of the underlying securities or if the counterparty does not perform under the contract.
Security transactions and income recognition
Securities transactions are recorded on a trade date basis. Realized gains or losses are recorded on the basis of identified cost.
Interest income is accrued daily and bond discounts are accreted and premiums are amortized daily. To the extent debt obligations are placed on non-accrual status, any related interest income may be reduced by writing off interest receivables when the collection of all or a portion of interest has been determined to be doubtful based on consistently applied procedures and the fair value has decreased. If the issuer subsequently resumes interest payments or when the collectability of interest is reasonably assured, the debt obligation is removed from non-accrual status.
Income is recorded net of foreign taxes withheld where recovery of such taxes is not assured.
20 | Wells Fargo Bloomberg Barclays US Aggregate ex-Corporate Portfolio
Notes to financial statements (unaudited)
Federal and other taxes
The Portfolio is not required to pay federal income taxes on its net investment income and net capital gains as it is treated as a partnership for federal income tax purposes. All income, gains and losses of the Portfolio are deemed to have been “passed through” to the interest holders in proportion to their holdings of the Portfolio regardless of whether income and gains have been distributed by the Portfolio.
The Portfolio’s income tax returns and all financial records supporting those returns for the prior three fiscal years are subject to examination by the federal revenue authority. Management has analyzed the Portfolio’s tax positions taken on federal, state, and foreign tax returns for all open tax years and does not believe that there are any uncertain tax positions that require recognition of a tax liability.
As of August 31, 2020, the aggregate cost of all investments for federal income tax purposes was $597,537,784 and the unrealized gains (losses) consisted of:
| | | | |
| |
Gross unrealized gains | | $ | 32,580,344 | |
| |
Gross unrealized losses | | | (328,748 | ) |
| |
Net unrealized gains | | $ | 32,251,596 | |
3. FAIR VALUATION MEASUREMENTS
Fair value measurements of investments are determined within a framework that has established a fair value hierarchy based upon the various data inputs utilized in determining the value of the Portfolio’s investments. The three-level hierarchy gives the highest priority to unadjusted quoted prices in active markets for identical assets or liabilities (Level 1) and the lowest priority to unobservable inputs (Level 3). The Portfolio’s investments are classified within the fair value hierarchy based on the lowest level of input that is significant to the fair value measurement. The inputs are summarized into three broad levels as follows:
| ∎ | | Level 1 – quoted prices in active markets for identical securities |
| ∎ | | Level 2 – other significant observable inputs (including quoted prices for similar securities, interest rates, prepayment speeds, credit risk, etc.) |
| ∎ | | Level 3 – significant unobservable inputs (including the Portfolio’s own assumptions in determining the fair value of investments) |
The inputs or methodologies used for valuing investments in securities are not necessarily an indication of the risk associated with investing in those securities.
The following is a summary of the inputs used in valuing the Portfolio’s assets and liabilities as of August 31, 2020:
| | | | | | | | | | | | | | | | |
| | | | |
| | | Quoted prices
(Level 1) | | | Other significant
observable inputs
(Level 2) | | | Significant
unobservable inputs (Level 3) | | | Total | |
| | | | |
Assets | | | | | | | | | | | | | | | | |
Investments in: | | | | | | | | | | | | | | | | |
| | | | |
Agency securities | | $ | 0 | | | $ | 218,824,549 | | | $ | 0 | | | $ | 218,824,549 | |
| | | | |
Asset-backed securities | | | 0 | | | | 4,030,050 | | | | 0 | | | | 4,030,050 | |
| | | | |
Municipal obligations | | | 0 | | | | 4,745,809 | | | | 0 | | | | 4,745,809 | |
| | | | |
Non-agency mortgage-backed securities | | | 0 | | | | 7,726,414 | | | | 0 | | | | 7,726,414 | |
| | | | |
U.S. Treasury securities | | | 308,056,535 | | | | 0 | | | | 0 | | | | 308,056,535 | |
| | | | |
Yankee corporate bonds and notes | | | 0 | | | | 16,277,531 | | | | 0 | | | | 16,277,531 | |
| | | | |
Yankee government bonds | | | 0 | | | | 11,998,535 | | | | 0 | | | | 11,998,535 | |
| | | | |
Short-term investments | | | | | | | | | | | | | | | | |
| | | | |
Investment companies | | | 58,129,957 | | | | 0 | | | | 0 | | | | 58,129,957 | |
| | | | |
Total assets | | $ | 366,186,492 | | | $ | 263,602,888 | | | $ | 0 | | | $ | 629,789,380 | |
Additional sector, industry or geographic detail is included in the Portfolio of Investments.
For the six months ended August 31, 2020, the Portfolio did not have any transfers into/out of Level 3.
Wells Fargo Bloomberg Barclays US Aggregate ex-Corporate Portfolio | 21
Notes to financial statements (unaudited)
4. TRANSACTIONS WITH AFFILIATES
Advisory fee
The Trust has entered into an advisory contract with Funds Management, an indirect wholly owned subsidiary of Wells Fargo & Company (“Wells Fargo”). The adviser is responsible for implementing investment policies and guidelines and for supervising the subadviser, who is responsible for day-to-day portfolio management of the Portfolio. Pursuant to the contract, Funds Management is entitled to receive an advisory fee at the following annual rate based on the Portfolio’s average daily net assets:
| | | | |
| |
| Average daily net assets | | Advisory fee | |
| |
First $5 billion | | | 0.05 | % |
| |
Next $5 billion | | | 0.04 | |
| |
Over $10 billion | | | 0.03 | |
For the six months ended August 31, 2020, the advisory fee was equivalent to an annual rate of 0.05% of the Portfolio’s average daily net assets.
Funds Management has retained the services of a subadviser to provide daily portfolio management to the Portfolio. The fee for subadvisory services is borne by Funds Management. Wells Capital Management Incorporated, an affiliate of Funds Management and an indirect wholly owned subsidiary of Wells Fargo, is a subadviser to the Portfolio and is entitled to receive a fee from Funds Management at an annual rate starting at 0.04% and declining to 0.03% as the average daily net assets of the Portfolio increase.
Funds Management has voluntarily waived and/or reimbursed advisory fees to reduce the net operating expenses ratio of the Portfolio.
Interfund transactions
The Portfolio may purchase or sell portfolio investment securities to certain other Wells Fargo affiliates pursuant to Rule 17a-7 under the 1940 Act and under procedures adopted by the Board of Trustees. The procedures have been designed to ensure that these interfund transactions, which do not incur broker commissions, are effected at current market prices.
5. INVESTMENT PORTFOLIO TRANSACTIONS
Purchases and sales of investments, excluding U.S. government obligations (if any) and short-term securities, for the six months ended August 31, 2020 were $413,341,188 and $431,431,367, respectively.
6. BANK BORROWINGS
The Trust, along with Wells Fargo Variable Trust and Wells Fargo Funds Trust (excluding the money market funds), are parties to a $350,000,000 revolving credit agreement whereby the Portfolio is permitted to use bank borrowings for temporary or emergency purposes, such as to fund shareholder redemption requests. Interest under the credit agreement is charged to the Portfolio based on a borrowing rate equal to the higher of the Federal Funds rate in effect on that day plus 1.25% or the overnight LIBOR rate in effect on that day plus 1.25%. In addition, an annual commitment fee equal to 0.25% of the unused balance is allocated to each participating fund.
For the six months ended August 31, 2020, there were no borrowings by the Portfolio under the agreement.
7. INDEMNIFICATION
Under the Portfolio’s organizational documents, the officers and Trustees have been granted certain indemnification rights against certain liabilities that may arise out of performance of their duties to the Portfolio. The Portfolio has entered into a separate agreement with each Trustee that converts indemnification rights currently existing under the Portfolio’s organizational documents into contractual rights that cannot be changed in the future without the consent of the Trustee. Additionally, in the normal course of business, the Portfolio may enter into contracts with service providers that contain a variety of indemnification clauses. The Portfolio’s maximum exposure under these arrangements is dependent on future claims that may be made against the Portfolio and, therefore, cannot be estimated.
22 | Wells Fargo Bloomberg Barclays US Aggregate ex-Corporate Portfolio
Notes to financial statements (unaudited)
8. NEW ACCOUNTING PRONOUNCEMENT
In August 2018, FASB issued Accounting Standards Update (“ASU”) No. 2018-13, Fair Value Measurement (Topic 820) Disclosure Framework—Changes to the Disclosure Requirements for Fair Value Measurement. ASU 2018-13 updates the disclosure requirements on fair value measurements in Topic 820, Fair Value Measurements. The amendments are effective for fiscal years, and interim periods within those fiscal years, beginning after December 15, 2019. Management has adopted this guidance which did not have a material impact on the financial statements.
9. CORONAVIRUS (COVID-19) PANDEMIC
On March 11, 2020, the World Health Organization announced that it had made the assessment that coronavirus disease 2019 (“COVID-19”) is a pandemic. The impacts of COVID-19 are adversely affecting the entire global economy, individual companies and investment products, and the market in general. There is significant uncertainty around the extent and duration of business disruptions related to COVID-19 and the impacts may be short term or may last for an extended period of time. The risk of further spreading of COVID-19 has led to significant uncertainty and volatility in the financial markets.
Wells Fargo Bloomberg Barclays US Aggregate ex-Corporate Portfolio | 23
Other information (unaudited)
PROXY VOTING INFORMATION
A description of the policies and procedures used to determine how to vote proxies relating to portfolio securities is available, upon request, by calling 1-800-222-8222, visiting our website at wfam.com, or visiting the SEC website at sec.gov. Information regarding how the proxies related to portfolio securities were voted during the most recent 12-month period ended June 30 is available on the website at wfam.com or by visiting the SEC website at sec.gov.
QUARTERLY PORTFOLIO HOLDINGS INFORMATION
The Portfolio files its complete schedule of portfolio holdings with the SEC for the first and third quarters of each fiscal year as an exhibit to its reports on Form N-PORT. Shareholders may view the filed Form N-PORT by visiting the SEC website at sec.gov.
24 | Wells Fargo Bloomberg Barclays US Aggregate ex-Corporate Portfolio
Other information (unaudited)
BOARD OF TRUSTEES AND OFFICERS
Each of the Trustees and Officers1 listed in the table below acts in identical capacities for each fund in the Wells Fargo family of funds, which consists of 142 mutual funds comprising the Wells Fargo Funds Trust, Wells Fargo Variable Trust, Wells Fargo Master Trust and four closed-end funds (collectively the “Fund Complex”). This table should be read in conjunction with the Prospectus and the Statement of Additional Information2. The mailing address of each Trustee and Officer is 525 Market Street, 12th Floor, San Francisco, CA 94105. Each Trustee and Officer serves an indefinite term, however, each Trustee serves such term until reaching the mandatory retirement age established by the Trustees.
Independent Trustees
| | | | | | |
Name and year of birth | | Position held and length of service* | | Principal occupations during past five years or longer | | Current other public company or investment company directorships |
| | | |
William R. Ebsworth (Born 1957) | | Trustee, since 2015 | | Retired. From 1984 to 2013, equities analyst, portfolio manager, research director and chief investment officer at Fidelity Management and Research Company in Boston, Tokyo, and Hong Kong, and retired in 2013 as Chief Investment Officer of Fidelity Strategic Advisers, Inc. where he led a team of investment professionals managing client assets. Prior thereto, Board member of Hong Kong Securities Clearing Co., Hong Kong Options Clearing Corp., the Thailand International Fund, Ltd., Fidelity Investments Life Insurance Company, and Empire Fidelity Investments Life Insurance Company. Audit Committee Chair and Investment Committee Chair of the Vincent Memorial Hospital Endowment (non-profit organization). Mr. Ebsworth is a CFA® charterholder. | | N/A |
| | | |
Jane A. Freeman (Born 1953) | | Trustee, since 2015; Chair Liaison, since 2018 | | Retired. From 2012 to 2014 and 1999 to 2008, Chief Financial Officer of Scientific Learning Corporation. From 2008 to 2012, Ms. Freeman provided consulting services related to strategic business projects. Prior to 1999, Portfolio Manager at Rockefeller & Co. and Scudder, Stevens & Clark. Board member of the Harding Loevner Funds from 1996 to 2014, serving as both Lead Independent Director and chair of the Audit Committee. Board member of the Russell Exchange Traded Funds Trust from 2011 to 2012 and the chair of the Audit Committee. Ms. Freeman is also an inactive Chartered Financial Analyst. | | N/A |
| | | |
Isaiah Harris, Jr. (Born 1952) | | Trustee, since 2009; Audit Committee Chairman, since 2019 | | Retired. Chairman of the Board of CIGNA Corporation since 2009, and Director since 2005. From 2003 to 2011, Director of Deluxe Corporation. Prior thereto, President and CEO of BellSouth Advertising and Publishing Corp. from 2005 to 2007, President and CEO of BellSouth Enterprises from 2004 to 2005 and President of BellSouth Consumer Services from 2000 to 2003. Emeritus member of the Iowa State University Foundation Board of Governors. Emeritus Member of the Advisory Board of Iowa State University School of Business. Advisory Board Member, Palm Harbor Academy (private school). Mr. Harris is a certified public accountant (inactive status). | | CIGNA Corporation |
| | | |
Judith M. Johnson (Born 1949) | | Trustee, since 2008 | | Retired. Prior thereto, Chief Executive Officer and Chief Investment Officer of Minneapolis Employees Retirement Fund from 1996 to 2008. Ms. Johnson is an attorney, certified public accountant and a certified managerial accountant. | | N/A |
| | | |
David F. Larcker (Born 1950) | | Trustee, since 2009 | | James Irvin Miller Professor of Accounting at the Graduate School of Business (Emeritus), Stanford University, Director of the Corporate Governance Research Initiative and Senior Faculty of The Rock Center for Corporate Governance since 2006. From 2005 to 2008, Professor of Accounting at the Graduate School of Business, Stanford University. Prior thereto, Ernst & Young Professor of Accounting at The Wharton School, University of Pennsylvania from 1985 to 2005. | | N/A |
Wells Fargo Bloomberg Barclays US Aggregate ex-Corporate Portfolio | 25
Other information (unaudited)
| | | | | | |
Name and year of birth | | Position held and length of service* | | Principal occupations during past five years or longer | | Current other public company or investment company directorships |
| | | |
Olivia S. Mitchell (Born 1953) | | Trustee, since 2006; Nominating and Governance Committee Chair, since 2018 | | International Foundation of Employee Benefit Plans Professor, Wharton School of the University of Pennsylvania since 1993. Director of Wharton’s Pension Research Council and Boettner Center on Pensions & Retirement Research, and Research Associate at the National Bureau of Economic Research. Previously, Cornell University Professor from 1978 to 1993. | | N/A |
| | | |
Timothy J. Penny (Born 1951) | | Trustee, since 1996; Chairman, since 2018 | | President and Chief Executive Officer of Southern Minnesota Initiative Foundation, a non-profit organization, since 2007. Member of the Board of Trustees of NorthStar Education Finance, Inc., a non-profit organization, since 2007. | | N/A |
| | | |
James G. Polisson (Born 1959) | | Trustee, since 2018 | | Retired. Chief Marketing Officer, Source (ETF) UK Services, Ltd, from 2015 to 2017. From 2012 to 2015, Principal of The Polisson Group, LLC, a management consulting, corporate advisory and principal investing company. Chief Executive Officer and Managing Director at Russell Investments, Global Exchange Traded Funds from 2010 to 2012. Managing Director of Barclays Global Investors from 1998 to 2010 and Global Chief Marketing Officer for iShares and Barclays Global Investors from 2000 to 2010. Trustee of the San Francisco Mechanics’ Institute, a non-profit organization, from 2013 to 2015. Board member of the Russell Exchange Traded Fund Trust from 2011 to 2012. Director of Barclays Global Investors Holdings Deutschland GmbH from 2006 to 2009. Mr. Polisson is an attorney and has a retired status with the Massachusetts and District of Columbia Bar Associations. | | N/A |
| | | |
Pamela Wheelock (Born 1959) | | Trustee, since January 2020; previously Trustee from January 2018 to July 2019 | | Board member of the Destination Medical Center Economic Development Agency, Rochester, Minnesota since 2019. Interim President of the McKnight Foundation from January to September 2020. Acting Commissioner, Minnesota Department of Human Services, July 2019 through September 2019. Human Services Manager (part-time), Minnesota Department of Human Services, October 2019 through December 2019. Chief Operating Officer, Twin Cities Habitat for Humanity from 2017 to 2019. Vice President of University Services, University of Minnesota from 2012 to 2016. Prior thereto, on the Board of Directors, Governance Committee and Finance Committee for the Minnesota Philanthropy Partners (Saint Paul Foundation) from 2012 to 2018, Interim Chief Executive Officer of Blue Cross Blue Shield of Minnesota from 2011 to 2012, Chairman of the Board from 2009 to 2012 and Board Director from 2003 to 2015. Vice President, Leadership and Community Engagement, Bush Foundation, Saint Paul, Minnesota (a private foundation) from 2009 to 2011. Executive Vice President and Chief Financial Officer, Minnesota Sports and Entertainment from 2004 to 2009 and Senior Vice President from 2002 to 2004. Executive Vice President of the Minnesota Wild Foundation from 2004 to 2008. Commissioner of Finance, State of Minnesota, from 1999 to 2002. Currently Board Chair of the Minnesota Wild Foundation since 2010. | | N/A |
| * | Length of service dates reflect the Trustee’s commencement of service with the Trust’s predecessor entities, where applicable. |
26 | Wells Fargo Bloomberg Barclays US Aggregate ex-Corporate Portfolio
Other information (unaudited)
Officers
| | | | |
Name and year of birth | | Position held and length of service | | Principal occupations during past five years or longer |
| | |
Andrew Owen (Born 1960) | | President, since 2017 | | Executive Vice President of Wells Fargo & Company and Head of Affiliated Managers, Wells Fargo Asset Management, since 2014. In addition, Mr. Owen is currently President, Chief Executive Officer and Director of Wells Fargo Funds Management, LLC since 2017. Prior thereto, Executive Vice President responsible for marketing, investments and product development for Wells Fargo Funds Management, LLC, from 2009 to 2014. |
| | |
Jeremy DePalma1 (Born 1974) | | Treasurer, since 2012 | | Senior Vice President of Wells Fargo Funds Management, LLC since 2009. Senior Vice President of Evergreen Investment Management Company, LLC from 2008 to 2010 and head of the Fund Reporting and Control Team within Fund Administration from 2005 to 2010. |
| | |
Michelle Rhee (Born 1966) | | Chief Legal Officer, since 2019 | | Secretary of Wells Fargo Funds Management, LLC, Chief Legal Counsel of Wells Fargo Asset Management and Assistant General Counsel of Wells Fargo Bank, N.A. since 2018. Associate General Counsel and Managing Director of Bank of America Corporation from 2004 to 2018. |
| | |
Catherine Kennedy (Born 1969) | | Secretary, since 2019 | | Vice President of Wells Fargo Funds Management, LLC and Senior Counsel of the Wells Fargo Legal Department since 2010. Vice President and Senior Counsel of Evergreen Investment Management Company, LLC from 1998 to 2010. |
| | |
Michael H. Whitaker (Born 1967) | | Chief Compliance Officer, since 2016 | | Chief Compliance Officer of Wells Fargo Asset Management since 2016. Senior Vice President and Chief Compliance Officer for Fidelity Investments from 2007 to 2016. |
| | |
David Berardi (Born 1975) | | Assistant Treasurer, since 2009 | | Vice President of Wells Fargo Funds Management, LLC since 2009. Vice President of Evergreen Investment Management Company, LLC from 2008 to 2010. Manager of Fund Reporting and Control for Evergreen Investment Management Company, LLC from 2004 to 2010. |
| 1 | Jeremy DePalma acts as Treasurer of 77 funds and Assistant Treasurer of 65 funds in the Fund Complex. |
| 2 | The Statement of Additional Information includes additional information about the Trustees and is available, without charge, upon request, by calling 1-800-222-8222 or by visiting the website at wfam.com. |
Wells Fargo Bloomberg Barclays US Aggregate ex-Corporate Portfolio | 27
Other information (unaudited)
BOARD CONSIDERATION OF INVESTMENT MANAGEMENT, ADVISORY AND SUB-ADVISORY AGREEMENTS:
Wells Fargo Emerging Markets Bond Fund, Wells Fargo High Yield Corporate Bond Fund, Wells Fargo International Government Bond Fund, Wells Fargo U.S. Core Bond Fund, Wells Fargo Bloomberg Barclays US Aggregate ex-Corporate Credit Portfolio, Wells Fargo Factor Enhanced Emerging Markets Equity Portfolio, Wells Fargo Emerging Markets Bond Portfolio, Wells Fargo Factor Enhanced International Equity Portfolio, Wells Fargo Factor Enhanced U.S. Large Cap Portfolio, Wells Fargo Factor Enhanced U.S. Small Cap Portfolio, Wells Fargo International Government Bond Portfolio, Wells Fargo Investment Grade Corporate Bond Portfolio, Wells Fargo High Yield Corporate Bond Portfolio, Wells Fargo Strategic Retirement Bond Portfolio, and Wells Fargo U.S. REIT Portfolio
Under the Investment Company Act of 1940 (the “1940 Act”), the Board of Trustees (each, a “Board” and collectively, the “Boards”) of each of Wells Fargo Funds Trust (“Funds Trust”) and Wells Fargo Master Trust (“Master Trust”) (collectively, the “Trusts”) must determine annually whether to approve the continuation of the Trusts’ investment management, advisory and sub-advisory agreements, as applicable. In this regard, at a meeting held on May 26, 2020 and May 28, 2020 (together, the “Meeting”), the Board of Funds Trust, all the members of which have no direct or indirect interest in the investment management agreement and are not “interested persons” of the Trusts, as defined in the 1940 Act (the “Independent Trustees”), reviewed and approved for each of the funds of Funds Trust identified in the table below (individually, an “Index Fund” and collectively, the “Index Funds”) an investment management agreement (the “Management Agreement”) with Wells Fargo Funds Management, LLC (“Funds Management”).
|
|
| Index Funds |
|
Wells Fargo Emerging Markets Bond Fund |
|
Wells Fargo High Yield Corporate Bond Fund |
|
Wells Fargo International Government Bond Fund |
|
Wells Fargo U.S. Core Bond Fund |
In addition, the Funds Trust Board reviewed and approved an investment sub-advisory agreement with Wells Capital Management Incorporated (“WellsCap”) for the U.S. Core Bond Fund (the “Core Bond Fund Sub-Advisory Agreement”).
At the Meeting, the Board of Master Trust, all the members of which have no direct or indirect interest in the investment advisory and sub-advisory agreements and are Independent Trustees, reviewed and approved for each of the portfolios of Master Trust identified in the table below (individually, a “Master Portfolio” and collectively, the “Master Portfolios”): (i) an investment advisory agreement (the “Master Portfolio Advisory Agreement”) with Funds Management; and (ii) an investment sub-advisory agreement (each, a “Master Portfolio Sub-Advisory Agreement”, and collectively, the “Master Portfolio Sub-Advisory Agreements”) with the sub-adviser(s) identified in the chart below (each, a “Sub-Adviser”, and collectively, the “Sub-Advisers”) for the corresponding Master Portfolio identified.
| | |
| |
| Master Portfolios | | Sub-Advisers |
| |
Wells Fargo Bloomberg Barclays US Aggregate ex-Corporate Credit Portfolio | | WellsCap |
| |
Wells Fargo Factor Enhanced Emerging Markets Equity Portfolio | | WellsCap |
| |
Wells Fargo Emerging Markets Bond Portfolio | | Wells Fargo Asset Management (International), Limited (“WFAM International”) |
| |
Wells Fargo Factor Enhanced International Equity Portfolio | | WellsCap |
| |
Wells Fargo Factor Enhanced U.S. Large Cap Portfolio | | WellsCap |
| |
Wells Fargo Factor Enhanced U.S. Small Cap Portfolio | | WellsCap |
| |
Wells Fargo International Government Bond Portfolio | | WFAM International |
| |
Wells Fargo Investment Grade Corporate Bond Portfolio | | WellsCap |
| |
Wells Fargo High Yield Corporate Bond Portfolio | | WellsCap |
| |
Wells Fargo Strategic Retirement Bond Portfolio | | WellsCap |
| |
Wells Fargo U.S. REIT Portfolio | | WellsCap |
28 | Wells Fargo Bloomberg Barclays US Aggregate ex-Corporate Portfolio
Other information (unaudited)
The Index Funds and the Master Portfolios are collectively referred to as the “Funds.” The Management Agreement, the Core Bond Fund Sub-Advisory Agreement, the Master Portfolio Advisory Agreement and the Master Portfolio Sub-Advisory Agreements are collectively referred to as the “Advisory Agreements.”
The Boards noted that each of the Index Funds is a feeder fund that invests all of its assets in its corresponding Master Portfolio, with the exception of the U.S. Core Bond Fund, which invests in multiple Master Portfolios. Information provided to the Boards regarding the Index Funds is also applicable to the Master Portfolios identified above, as relevant.
At the Meeting, the Boards considered the factors and reached the conclusions described below relating to the selection of Funds Management and the Sub-Advisers and the approval of the Advisory Agreements. Prior to the Meeting, including at a Board meeting held in April 2020, the Trustees conferred extensively among themselves and with representatives of Funds Management about these matters. Also, the Boards have adopted a team-based approach, with each team consisting of a sub-set of Trustees, to assist the full Boards in the discharge of their duties in reviewing investment performance and other matters throughout the year. The Independent Trustees were assisted in their evaluation of the Advisory Agreements by independent legal counsel, from whom they received separate legal advice and with whom they met separately.
In providing information to the Boards, Funds Management and the Sub-Advisers were guided by a detailed set of requests for information submitted to them by independent legal counsel on behalf of the Independent Trustees at the start of the Boards’ annual contract renewal process earlier in 2020. In considering and approving the Advisory Agreements, the Trustees considered the information they believed relevant, including but not limited to the information discussed below. The Boards considered not only the specific information presented in connection with the Meeting, but also the knowledge gained over time through interaction with Funds Management and the Sub-Advisers about various topics. In this regard, the Boards reviewed reports of Funds Management at each of their quarterly meetings, which included, among other things, portfolio reviews and investment performance reports. In addition, the Boards and the teams mentioned above confer with portfolio managers at various times throughout the year. The Boards did not identify any particular information or consideration that was all-important or controlling, and each individual Trustee may have attributed different weights to various factors.
After its deliberations, the Board of Funds Trust unanimously approved the continuation of the Management Agreement and the Core Bond Fund Sub-Advisory Agreement for a one-year period. Additionally, after its deliberations, the Board of Master Trust unanimously approved the continuation of the Master Portfolio Advisory Agreement and each Master Portfolio Sub-Advisory Agreement for a one-year term. The Boards also determined that the compensation or the absence of compensation payable to Funds Management and to each of the Sub-Advisers under each of the Advisory Agreements was reasonable. The Boards considered the approval of the Advisory Agreements for the Funds as part of their consideration of agreements for funds across the complex, but their approvals were made on a fund-by-fund basis. The following summarizes a number of important, but not necessarily all, factors considered by the Boards in support of their approvals.
Nature, extent and quality of services
The Boards received and considered various information regarding the nature, extent and quality of services provided to the Funds by Funds Management and the Sub-Advisers under the Advisory Agreements. This information included a description of the investment advisory services and Fund-level administrative services covered by the Advisory Agreements, as well as, among other things, a summary of the background and experience of senior management of Wells Fargo Asset Management (“WFAM”), of which Funds Management and the Sub-Advisers are a part, and a summary of investments made in the business of WFAM. The Boards also received a description of Funds Management’s and the Sub-Advisers’ business continuity plans and of their approaches to data privacy and cybersecurity, and related testing. The Boards also received and reviewed information about Funds Management’s role as administrator of the Funds’ liquidity risk management program, Funds Management’s approach to risk management, and Funds Management’s intermediary and vendor oversight program.
The Boards also considered the qualifications, background, tenure and responsibilities of each of the portfolio managers primarily responsible for the day-to-day portfolio management of the Funds. The Board of Master Trust noted that each of the Master Portfolios replicates the performance of a proprietary index provided by an affiliate of Funds Management, except that the Wells Fargo Bloomberg Barclays US Aggregate ex-Corporate Credit Portfolio, the Wells Fargo Emerging Markets Bond Portfolio, and the Wells Fargo Strategic Retirement Bond Portfolio track the performance of third-party indexes. The Boards evaluated the ability of Funds Management and the Sub-Advisers to attract and retain qualified investment professionals, including research, advisory and supervisory personnel. The Boards further considered the compliance programs and compliance records of Funds Management and the Sub-Advisers. In addition, the Boards took into account the full range of services provided to the Funds by Funds Management and its affiliates.
Wells Fargo Bloomberg Barclays US Aggregate ex-Corporate Portfolio | 29
Other information (unaudited)
Fund investment performance and expenses
The Boards considered the investment performance results for each of the Master Portfolios for the one-year period ended December 31, 2019. The Boards also considered more current results for the one-year period ended March 31, 2020. The Boards considered these results in comparison to the investment performance of funds in a universe that was determined by Broadridge Inc. (“Broadridge”) to be similar to the respective Master Portfolios (each, a “Universe”), and in comparison to each Master Portfolio’s benchmark index and to other comparative data. Broadridge is an independent provider of investment company data. The Boards received a description of the methodology used by Broadridge to select the mutual funds in each performance Universe.
The Boards noted the short performance history of the Master Portfolios. For the one-year period ended December 31, 2019, the Boards noted that the investment performance of each Master Portfolio relative to its respective Universe was as follows: (i) the investment performance of each of the Wells Fargo Bloomberg Barclays US Aggregate ex-Corporate Credit Portfolio, the Wells Fargo Emerging Markets Bond Portfolio, the Wells Fargo Factor Enhanced International Equity Portfolio, the Wells Fargo Factor Enhanced U.S. Large Cap Portfolio, the Wells Fargo High Yield Corporate Bond Portfolio and the Wells Fargo Investment Grade Corporate Bond Portfolio was higher than or in range of the average investment performance of such Master Portfolio’s respective Universe; and (ii) the Wells Fargo Factor Enhanced Emerging Markets Equity Portfolio, the Wells Fargo Factor Enhanced U.S. Small Cap Portfolio, the Wells Fargo International Government Bond Portfolio, the Wells Fargo Strategic Retirement Bond Portfolio and the Wells Fargo U.S. REIT Portfolio was lower than the average investment performance of such Master Portfolio’s respective Universe. For the one-year period ended March 31, 2020, the Boards noted that the investment performance of each Master Portfolio relative to its respective Universe was as follows: (i) the Wells Fargo Emerging Markets Bond Portfolio, the Wells Fargo Factor Enhanced U.S. Large Cap Portfolio, the Wells Fargo Factor Enhanced U.S. Small Cap Portfolio, the Wells Fargo International Government Bond Portfolio, and the Wells Fargo Investment Grade Corporate Bond Portfolio was higher than or in range of the average investment performance of such Master Portfolio’s respective Universe, and (ii) the Wells Fargo Bloomberg Barclays US Aggregate ex-Corporate Credit Portfolio, the Wells Fargo Factor Enhanced Emerging Markets Equity Portfolio, the Wells Fargo Factor Enhanced International Equity Portfolio, the Wells Fargo High Yield Corporate Bond Portfolio, the Wells Fargo Strategic Retirement Bond Portfolio and the Wells Fargo U.S. REIT Portfolio was lower than the average investment performance of such Master Portfolio’s respective Universe.
The Boards also noted that the investment performance of each Master Portfolio to its respective benchmark index for the one-year period ended December 31, 2019, was as follows: (i) the investment performance of each of the Wells Fargo Bloomberg Barclays US Aggregate ex-Corporate Credit Portfolio, the Wells Fargo Factor Enhanced Emerging Markets Equity Portfolio, the Wells Fargo Factor Enhanced U.S. Large Cap Portfolio, the Wells Fargo Factor Enhanced U.S. Small Cap Portfolio, the Wells Fargo High Yield Corporate Bond Portfolio, the Wells Fargo U.S. REIT Portfolio and the Wells Fargo Strategic Retirement Bond Portfolio was higher than or in range of the average investment performance of such Master Portfolio’s respective benchmark, and (ii) the investment performance of each of the Wells Fargo Emerging Markets Bond Portfolio, the Wells Fargo Factor Enhanced International Equity Portfolio, the Wells Fargo International Government Bond Portfolio and the Wells Fargo Investment Grade Corporate Bond Portfolio was lower than the average investment performance of such Master Portfolio’s respective benchmark. For the one-year period ended March 31, 2020, the Boards also noted that the investment performance of each Master Portfolio to its respective benchmark index, was as follows: (i) the investment performance of each of the Wells Fargo Bloomberg Barclays US Aggregate ex-Corporate Credit Portfolio, the Wells Fargo Factor Enhanced Emerging Markets Equity Portfolio, the Wells Fargo Factor Enhanced International Equity Portfolio, the Wells Fargo Factor Enhanced U.S. Large Cap Portfolio, the Wells Fargo Factor Enhanced U.S. Small Cap Portfolio, the Wells Fargo U.S. REIT Portfolio, the Wells Fargo Investment Grade Corporate Bond Portfolio and the Wells Fargo Strategic Retirement Bond Portfolio was higher than, equal to or in range of the average investment performance of such Master Portfolio’s respective benchmark, and (ii) the investment performance of each of the Wells Fargo Emerging Markets Bond Portfolio, the Wells Fargo High Yield Corporate Bond Portfolio and the Wells Fargo International Government Bond Portfolio was lower than the average investment performance of such Master Portfolio’s respective benchmark.
The Boards received information concerning, and discussed factors contributing to, the underperformance of certain Master Portfolios, relative to the Universe and benchmark index, for the periods identified above. The Board took note of the explanations for the relative underperformance during these periods, including with respect to investment decisions and market factors that affected the Fund’s investment performance.
The Board of Funds Trust took note of the investment performance of the Master Portfolios in the context of reviewing the investment performance of the Index Funds. The Board of Funds Trust also received and considered information regarding the “zero fee and expense” structure of each Index Fund. Specifically, the Funds Trust Board noted that each Index Fund’s gross operating expense ratio and each of its various components, including management fees, administration fees, custody fees, Rule 12b-1 fees, and other fees, are zero. The Funds Trust Board also noted that Funds Management assumes and pays or
30 | Wells Fargo Bloomberg Barclays US Aggregate ex-Corporate Portfolio
Other information (unaudited)
reimburses all of the ordinary operating expenses of each Index Fund, including acquired fund fees and expenses, pursuant to an agreement with each of the Index Funds (the “Fee and Expense Agreement”). The Funds Trust Board further noted that Funds Management receives a fee from Wells Fargo Wealth and Investment Management (“WIM”) pursuant to an intercompany agreement equal to the Master Portfolio fees and expenses absorbed by Funds Management through its Fee and Expense Agreement with each of the Index Funds.
With respect to the Master Portfolios, the Board of Master Trust received and considered information regarding the fee rates that are payable to Funds Management for investment advisory services (as discussed below), which are the only fees charged at the Master Portfolio level, relative to corresponding class-specific expense groups that were determined by Broadridge to be similar to the Funds (the “Groups”). The Boards received a description of the methodology used by Broadridge to select the mutual funds in the expense Groups and an explanation of how funds comprising expense groups and their expense ratios may vary from year-to-year.
The Boards took into account the Funds’ expense information and the Master Portfolios’ performance information provided to them among the factors considered in deciding to re-approve the Advisory Agreements.
Investment management, advisory and sub-advisory fee rates
The Board of Funds Trust reviewed and considered that the contractual investment management fee rate payable by each Index Fund to Funds Management for investment management services zero, and also reviewed and considered that each Fund’s other expenses would normally be zero, because of Funds Management’s commitment to assume and pay or reimburse all of the ordinary operating expenses of each Fund, including acquired fund fees and expenses, under the Fee and Expense Agreement. The Board of Funds Trust also reviewed and considered that the contractual investment sub-advisory fee rate payable by Funds Management to WellsCap for investment sub-advisory services for the U.S. Core Bond Fund is also zero.
The Board of Master Trust reviewed and considered the contractual fee rates payable by the Master Portfolios to Funds Management under the Master Portfolio Advisory Agreement (the “Advisory Agreement Rates”). The Board of Master Trust also reviewed and considered the contractual investment sub-advisory fee rates that are payable by Funds Management to the Sub-Advisers for investment sub-advisory services (the “Sub-Advisory Agreement Rates”).
The Board of Master Trust reviewed a comparison of the Advisory Agreement Rates of each Master Portfolio with those of other funds in each Master Portfolio’s respective expense Groups at a common asset level. The Board of Master Trust noted that the Advisory Agreement Rates of each Master Portfolio were lower than or equal to the median rate for such Master Portfolio’s expense Groups.
The Boards also received and considered information about the portions of the total management fees that were retained by Funds Management after payment of the fees to the Sub-Advisers for sub-advisory services. In assessing the reasonableness of these amounts, the Boards received and evaluated information about the nature and extent of responsibilities retained and risks assumed by Funds Management and not delegated to or assumed by the Sub-Advisers, and about Funds Management’s on-going oversight services. Given the affiliation between Funds Management and the Sub-Advisers, the Boards ascribed limited relevance to the allocation of fees between them.
The Boards also received and considered information about the nature and extent of services offered and fee rates charged by Funds Management and the Sub-Advisers to other types of clients with investment strategies similar to those of certain Funds. In this regard, the Boards received information about the significantly greater scope of services, and compliance, reporting and other legal burdens and risks of managing proprietary mutual funds compared with those associated with managing assets of other types of clients, including third-party sub-advised fund clients and non-mutual fund clients such as institutional separate accounts.
Based on its consideration of the factors and information it deemed relevant, including those described here, the Board of Fund Trust determined that the compensation received by Funds Management from WIM pursuant to the intercompany agreement, and the absence of compensation payable by the Funds to Funds Management pursuant to the Management Agreement or to WellsCap pursuant to the Core Bond Fund Sub-Advisory Agreement, was reasonable. Based on its consideration of the factors and information it deemed relevant, including those described here, the Board of Master Trust determined that the Advisory Agreement Rates and the Sub-Advisory Agreement Rates for each Master Portfolio were reasonable.
Wells Fargo Bloomberg Barclays US Aggregate ex-Corporate Portfolio | 31
Other information (unaudited)
Profitability
The Boards received and considered information concerning the profitability of Funds Management, as well as the profitability of both WFAM and Wells Fargo & Co. (“Wells Fargo”) from providing services to the fund family as a whole. The Boards noted that the Sub-Advisers’ profitability information with respect to providing services to the Funds and other funds in the family was subsumed in the WFAM and Wells Fargo profitability analysis.
Funds Management reported on the methodologies and estimates used in calculating profitability, including a description of the methodology used to allocate certain expenses. Among other things, the Boards noted that the levels of profitability reported on a fund-by-fund basis varied widely, depending on factors such as the size, type and age of fund.
Based on its review, the Boards did not deem the profits reported by Funds Management, WFAM or Wells Fargo from services provided to the Funds to be at a level that would prevent them from approving the continuation of the Advisory Agreements.
Economies of scale
The Boards received and considered information about the potential for Funds Management to experience economies of scale in the provision of management services to the Funds, the difficulties of calculating economies of scale at an individual fund level, and the extent to which potential scale benefits are shared with shareholders. The Boards noted the existence of breakpoints in the each Master Portfolio’s advisory fee structure and each Index Fund’s management fee structure, which operate generally to reduce the Funds’ expense ratios as the Funds grow in size, and the size of the Funds in relation to such breakpoints. The Boards considered that in addition to management fee breakpoints, Funds Management shares potential economies of scale from its management business in a variety of ways, including through fee waiver and expense reimbursement arrangements, services that benefit shareholders, competitive management fee rates set at the outset without regard to breakpoints, and investments in the business intended to enhance services available to shareholders.
The Boards concluded that Funds Management’s arrangements with respect to the Funds, including contractual breakpoints, constituted a reasonable approach to sharing potential economies of scale with the Funds and their shareholders.
Other benefits to Funds Management and the Sub-Advisers
The Boards received and considered information regarding potential “fall-out” or ancillary benefits received by Funds Management and its affiliates, including WellsCap and WFAM International, as a result of their relationships with the Funds. Ancillary benefits could include, among others, benefits directly attributable to other relationships with the Funds and benefits potentially derived from an increase in Funds Management’s and the Sub-Advisers’ business as a result of their relationships with the Funds. The Boards noted that various affiliates of Funds Management may receive distribution-related fees, shareholder servicing payments and sub-transfer agency fees in respect of shares sold or held through them and services provided.
The Boards also reviewed information about soft dollar credits earned and utilized by the Sub-Advisers, fees earned by Funds Management and WellsCap from managing a private investment vehicle for the fund family’s securities lending collateral, and commissions earned by an affiliated broker from portfolio transactions.
Based on their consideration of the factors and information they deemed relevant, including those described here, the Boards did not find that any ancillary benefits received by Funds Management and its affiliates, including WellsCap and WFAM International, were unreasonable.
Conclusion
At the Meeting, after considering the above-described factors and based on its deliberations and its evaluation of the information described above, the Funds Trust Board unanimously approved the continuation of the Management Agreement and the Core Bond Fund Sub-Advisory Agreement for a one-year period. Additionally, after its deliberations, the Master Trust Board unanimously approved the continuation of the Master Portfolio Advisory Agreement and each Master Portfolio Sub-Advisory Agreement for a one-year term. The Boards also determined that the compensation or the absence of compensation payable to Funds Management and to each of the Sub-Advisers was reasonable.
32 | Wells Fargo Bloomberg Barclays US Aggregate ex-Corporate Portfolio
Other information (unaudited)
LIQUIDITY RISK MANAGEMENT PROGRAM
In accordance with Rule 22e-4 under the Investment Company Act of 1940, as amended (the “Liquidity Rule”), Wells Fargo Master Trust (the “Trust”) has adopted and implemented a liquidity risk management program (the “Program”) on behalf of each of its series, including each Portfolio, which is reasonably designed to assess and manage the Portfolio’s liquidity risk. “Liquidity risk” is defined as the risk that a Portfolio is unable to meet redemption requests without significantly diluting remaining investors’ interests in the Portfolio. The Trust’s Board of Trustees (the “Board”) previously approved the designation of Wells Fargo Funds Management, LLC (“Funds Management”), each Portfolio’s investment adviser, as the administrator of the Program, and Funds Management has established a Liquidity Risk Management Council composed of personnel from multiple departments within Funds Management and its affiliates to assist Funds Management in the implementation and on-going administration of the Program.
The Program is comprised of various components designed to support the assessment and/or management of liquidity risk, including: (1) the periodic assessment (no less frequently than annually) of certain factors that influence a Portfolio’s liquidity risk; (2) the periodic classification (no less frequently than monthly) of a Portfolio’s investments into one of four liquidity categories that reflect an estimate of their liquidity under current market conditions; (3) a 15% limit on the acquisition of “illiquid investments” (as defined under the Liquidity Rule); (4) to the extent a Portfolio does not invest primarily in “highly liquid investments” (as defined under the Liquidity Rule), the determination of a minimum percentage of the Portfolio’s assets that generally will be invested in highly liquid investments (an “HLIM”); (5) if a Portfolio has established an HLIM, the periodic review (no less frequently than annually) of the HLIM and the adoption of policies and procedures for responding to a shortfall of the Portfolio’s “highly liquid investments” below its HLIM; and (6) periodic reporting to the Board.
At a meeting of the Board held on May 26 and 28, 2020, the Board received a written report (the “Report”) from Funds Management that addressed the operation of the Program and assessed its adequacy and effectiveness of implementation. The Report covered the initial period from December 1, 2018 through December 31, 2019 (the “Reporting Period”). No significant liquidity events impacting any Portfolio were noted in the Report. There were no material changes to the Program during the Reporting Period. The Report concluded that the Program is operating effectively to assess and manage each Portfolio’s liquidity risk, and that the Program has been and continues to be adequately and effectively implemented to monitor and, as applicable, respond to the Portfolio’s liquidity developments.
Wells Fargo Bloomberg Barclays US Aggregate ex-Corporate Portfolio | 33
This page is intentionally left blank.
This page is intentionally left blank.
This page is intentionally left blank.

For more information
More information about Wells Fargo Funds is available free upon request. To obtain literature, please write, visit the Portfolio’s website, or call:
Wells Fargo Funds
P.O. Box 219967
Kansas City, MO 64121-9967
Website: wfam.com
Individual investors: 1-800-222-8222
Retail investment professionals: 1-888-877-9275
Institutional investment professionals: 1-866-765-0778
This report and the financial statements contained herein are submitted for the general information of the shareholders of the Portfolio. If this report is used for promotional purposes, distribution of the report must be accompanied or preceded by a current prospectus. Before investing, please consider the investment objectives, risks, charges, and expenses of the investment. For a current prospectus and, if available, a summary prospectus, containing this information, call 1-800-222-8222 or visit the Portfolio’s website at wfam.com. Read the prospectus carefully before you invest or send money.
Wells Fargo Asset Management (WFAM) is the trade name for certain investment advisory/management firms owned by Wells Fargo & Company. These firms include but are not limited to Wells Capital Management Incorporated and Wells Fargo Funds Management, LLC. Certain products managed by WFAM entities are distributed by Wells Fargo Funds Distributor, LLC (a broker-dealer and Member FINRA).
This material is for general informational and educational purposes only and is NOT intended to provide investment advice or a recommendation of any kind—including a recommendation for any specific investment, strategy, or plan.
INVESTMENT PRODUCTS: NOT FDIC INSURED ◾ NO BANK GUARANTEE ◾ MAY LOSE VALUE
© 2020 Wells Fargo & Company. All rights reserved.
Semi-Annual Report
August 31, 2020
Wells Fargo
Factor Enhanced U.S. Low Volatility Equity Portfolio
Contents
INVESTMENT PRODUCTS: NOT FDIC INSURED ◾ NO BANK GUARANTEE ◾ MAY LOSE VALUE
Wells Fargo Factor Enhanced U.S. Low Volatility Equity Portfolio | 1
Portfolio information (unaudited)
Investment objective
The Portfolio seeks long-term capital appreciation.
Adviser
Wells Fargo Funds Management, LLC
Subadviser
Wells Capital Management Incorporated
Portfolio managers
Dennis Beinn, CFA®‡
Harindra de Silva, Ph.D., CFA®‡
Monisha Jayakumar
| | | | |
|
| Ten largest holdings (%) as of August 31, 20201 | |
| | |
NextEra Energy Incorporated | | | 1.66 | |
| | |
Microsoft Corporation | | | 1.65 | |
| | |
T-Mobile US Incorporated | | | 1.62 | |
| | |
Verizon Communications Incorporated | | | 1.61 | |
| | |
McDonald’s Corporation | | | 1.60 | |
| | |
PepsiCo Incorporated | | | 1.58 | |
| | |
Accenture plc Class A | | | 1.57 | |
| | |
Merck & Company Incorporated | | | 1.53 | |
| | |
Visa Incorporated Class A | | | 1.49 | |
| | |
Johnson & Johnson | | | 1.44 | |
|
|
| Portfolio composition as of August 31, 20202 |
|
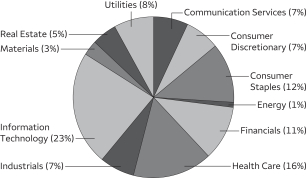
|
| ‡ | CFA® and Chartered Financial Analyst® are trademarks owned by CFA Institute. |
| 1 | The ten largest holdings, excluding cash, cash equivalents and any money market funds, are calculated based on the value of the investments divided by the total net assets of the Portfolio. Holdings are subject to change and may have changed since the date specified. |
| 2 | Amounts are calculated based on the total long-term investments of the Portfolio. These amounts are subject to change and may have changed since the date specified. |
2 | Wells Fargo Factor Enhanced U.S. Low Volatility Equity Portfolio
Portfolio of investments—August 31, 2020 (unaudited)
| | | | | | | | | | | | | | | | |
| | | | | | | | | Shares | | | Value | |
| Common Stocks: 100.22% | |
|
Communication Services: 6.65% | |
|
| Diversified Telecommunication Services: 2.48% | |
AT&T Incorporated | | | | | | | | | | | 7,133 | | | $ | 212,635 | |
Verizon Communications Incorporated | | | | | | | | | | | 6,656 | | | | 394,501 | |
| |
| | | | 607,136 | |
| | | | | |
|
| Entertainment: 1.21% | |
Activision Blizzard Incorporated | | | | | | | | | | | 22 | | | | 1,837 | |
Take-Two Interactive Software Incorporated † | | | | | | | | | | | 752 | | | | 128,735 | |
The Walt Disney Company | | | | | | | | | | | 1,271 | | | | 167,607 | |
| |
| | | | 298,179 | |
| | | | | |
|
| Interactive Media & Services: 0.14% | |
Alphabet Incorporated Class C † | | | | | | | | | | | 21 | | | | 34,318 | |
| | | | | | | | | | | | | | | | |
|
| Media: 1.20% | |
Charter Communications Incorporated Class A † | | | | | | | | | | | 135 | | | | 83,107 | |
Comcast Corporation Class A | | | | | | | | | | | 3,046 | | | | 136,491 | |
Discovery Incorporated Class A † | | | | | | | | | | | 743 | | | | 16,394 | |
Fox Corporation Class A | | | | | | | | | | | 230 | | | | 6,408 | |
Omnicom Group Incorporated | | | | | | | | | | | 463 | | | | 25,044 | |
Sirius XM Holdings Incorporated | | | | | | | | | | | 4,444 | | | | 26,086 | |
| |
| | | | 293,530 | |
| | | | | |
|
| Wireless Telecommunication Services: 1.62% | |
T-Mobile US Incorporated † | | | | | | | | | | | 3,409 | | | | 397,762 | |
| | | | | | | | | | | | | | | | |
|
Consumer Discretionary: 6.92% | |
|
| Automobiles: 0.02% | |
General Motors Company | | | | | | | | | | | 172 | | | | 5,096 | |
| | | | | | | | | | | | | | | | |
|
| Distributors: 0.10% | |
Genuine Parts Company | | | | | | | | | | | 256 | | | | 24,177 | |
| | | | | | | | | | | | | | | | |
|
| Hotels, Restaurants & Leisure: 2.26% | |
Aramark | | | | | | | | | | | 203 | | | | 5,595 | |
Domino’s Pizza Incorporated | | | | | | | | | | | 24 | | | | 9,815 | |
McDonald’s Corporation | | | | | | | | | | | 1,832 | | | | 391,169 | |
Starbucks Corporation | | | | | | | | | | | 1,753 | | | | 148,076 | |
| |
| | | | 554,655 | |
| | | | | |
|
| Household Durables: 0.17% | |
Garmin Limited | | | | | | | | | | | 407 | | | | 42,169 | |
| | | | | | | | | | | | | | | | |
|
| Internet & Direct Marketing Retail: 0.13% | |
eBay Incorporated | | | | | | | | | | | 595 | | | | 32,594 | |
| | | | | | | | | | | | | | | | |
|
| Multiline Retail: 1.27% | |
Dollar General Corporation | | | | | | | | | | | 838 | | | | 169,175 | |
Dollar Tree Incorporated † | | | | | | | | | | | 673 | | | | 64,790 | |
Target Corporation | | | | | | | | | | | 505 | | | | 76,361 | |
| |
| | | | 310,326 | |
| | | | | |
The accompanying notes are an integral part of these financial statements.
Wells Fargo Factor Enhanced U.S. Low Volatility Equity Portfolio | 3
Portfolio of investments—August 31, 2020 (unaudited)
| | | | | | | | | | | | | | | | |
| | | | | | | | | Shares | | | Value | |
| Specialty Retail: 2.59% | |
Advance Auto Parts Incorporated | | | | | | | | | | | 30 | | | $ | 4,689 | |
AutoZone Incorporated | | | | | | | | | | | 98 | | | | 117,238 | |
Best Buy Company Incorporated | | | | | | | | | | | 74 | | | | 8,207 | |
Burlington Stores Incorporated † | | | | | | | | | | | 65 | | | | 12,800 | |
O’Reilly Automotive Incorporated † | | | | | | | | | | | 169 | | | | 78,691 | |
Ross Stores Incorporated | | | | | | | | | | | 447 | | | | 40,713 | |
The Home Depot Incorporated | | | | | | | | | | | 814 | | | | 232,023 | |
The TJX Companies Incorporated | | | | | | | | | | | 2,537 | | | | 139,002 | |
| |
| | | | 633,363 | |
| | | | | |
|
| Textiles, Apparel & Luxury Goods: 0.38% | |
Nike Incorporated Class B | | | | | | | | | | | 797 | | | | 89,176 | |
Ralph Lauren Corporation | | | | | | | | | | | 62 | | | | 4,267 | |
| |
| | | | 93,443 | |
| | | | | |
|
Consumer Staples: 12.52% | |
|
| Beverages: 3.13% | |
Brown-Forman Corporation Class B | | | | | | | | | | | 342 | | | | 25,024 | |
Molson Coors Brewing Company Class B | | | | | | | | | | | 148 | | | | 5,571 | |
Monster Beverage Corporation † | | | | | | | | | | | 130 | | | | 10,902 | |
PepsiCo Incorporated | | | | | | | | | | | 2,759 | | | | 386,426 | |
The Coca-Cola Company | | | | | | | | | | | 6,841 | | | | 338,835 | |
| |
| | | | 766,758 | |
| | | | | |
|
| Food & Staples Retailing: 1.13% | |
Costco Wholesale Corporation | | | | | | | | | | | 57 | | | | 19,817 | |
The Kroger Company | | | | | | | | | | | 2,193 | | | | 78,246 | |
Walmart Incorporated | | | | | | | | | | | 1,285 | | | | 178,422 | |
| |
| | | | 276,485 | |
| | | | | |
|
| Food Products: 4.61% | |
Archer Daniels Midland Company | | | | | | | | | | | 476 | | | | 21,306 | |
Bunge Limited | | | | | | | | | | | 132 | | | | 6,022 | |
Campbell Soup Company | | | | | | | | | | | 1,191 | | | | 62,659 | |
General Mills Incorporated | | | | | | | | | | | 772 | | | | 49,369 | |
Hormel Foods Corporation | | | | | | | | | | | 4,826 | | | | 246,029 | |
Ingredion Incorporated | | | | | | | | | | | 197 | | | | 15,847 | |
Kellogg Company | | | | | | | | | | | 1,998 | | | | 141,678 | |
McCormick & Company Incorporated | | | | | | | | | | | 585 | | | | 120,627 | |
Mondelez International Incorporated Class A | | | | | | | | | | | 1,848 | | | | 107,960 | |
The Hershey Company | | | | | | | | | | | 1,886 | | | | 280,335 | |
The J.M. Smucker Company | | | | | | | | | | | 540 | | | | 64,897 | |
Tyson Foods Incorporated Class A | | | | | | | | | | | 207 | | | | 13,000 | |
| |
| | | | 1,129,729 | |
| | | | | |
|
| Household Products: 3.29% | |
Church & Dwight Company Incorporated | | | | | | | | | | | 969 | | | | 92,859 | |
Colgate-Palmolive Company | | | | | | | | | | | 1,301 | | | | 103,117 | |
Kimberly-Clark Corporation | | | | | | | | | | | 808 | | | | 127,470 | |
The Clorox Company | | | | | | | | | | | 693 | | | | 154,886 | |
The Procter & Gamble Company | | | | | | | | | | | 2,380 | | | | 329,225 | |
| |
| | | | 807,557 | |
| | | | | |
The accompanying notes are an integral part of these financial statements.
4 | Wells Fargo Factor Enhanced U.S. Low Volatility Equity Portfolio
Portfolio of investments—August 31, 2020 (unaudited)
| | | | | | | | | | | | | | | | |
| | | | | | | | | Shares | | | Value | |
| Tobacco: 0.36% | |
Altria Group Incorporated | | | | | | | | | | | 1,302 | | | $ | 56,949 | |
Philip Morris International Incorporated | | | | | | | | | | | 388 | | | | 30,959 | |
| |
| | | | 87,908 | |
| | | | | |
|
Energy: 0.98% | |
|
| Energy Equipment & Services: 0.02% | |
National Oilwell Varco Incorporated | | | | | | | | | | | 331 | | | | 3,972 | |
Schlumberger Limited | | | | | | | | | | | 126 | | | | 2,395 | |
| |
| | | | 6,367 | |
| | | | | |
|
| Oil, Gas & Consumable Fuels: 0.96% | |
Cabot Oil & Gas Corporation | | | | | | | | | | | 1,201 | | | | 22,783 | |
Cheniere Energy Incorporated † | | | | | | | | | | | 446 | | | | 23,214 | |
Chevron Corporation | | | | | | | | | | | 101 | | | | 8,477 | |
ConocoPhillips | | | | | | | | | | | 72 | | | | 2,728 | |
Exxon Mobil Corporation | | | | | | | | | | | 2,669 | | | | 106,600 | |
Kinder Morgan Incorporated | | | | | | | | | | | 3,136 | | | | 43,340 | |
Phillips 66 | | | | | | | | | | | 355 | | | | 20,757 | |
Valero Energy Corporation | | | | | | | | | | | 139 | | | | 7,310 | |
| |
| | | | 235,209 | |
| | | | | |
|
Financials: 10.97% | |
|
| Banks: 0.33% | |
East West Bancorp Incorporated | | | | | | | | | | | 163 | | | | 5,995 | |
M&T Bank Corporation | | | | | | | | | | | 153 | | | | 15,799 | |
Regions Financial Corporation | | | | | | | | | | | 285 | | | | 3,295 | |
Signature Bank | | | | | | | | | | | 63 | | | | 6,113 | |
US Bancorp | | | | | | | | | | | 1,260 | | | | 45,864 | |
Zions Bancorporation | | | | | | | | | | | 105 | | | | 3,377 | |
| |
| | | | 80,443 | |
| | | | | |
|
| Capital Markets: 1.79% | |
Ameriprise Financial Incorporated | | | | | | | | | | | 58 | | | | 9,094 | |
BlackRock Incorporated | | | | | | | | | | | 14 | | | | 8,319 | |
Cboe Global Markets Incorporated | | | | | | | | | | | 753 | | | | 69,118 | |
CME Group Incorporated | | | | | | | | | | | 721 | | | | 126,802 | |
Intercontinental Exchange Incorporated | | | | | | | | | | | 1,299 | | | | 137,993 | |
MarketAxess Holdings Incorporated | | | | | | | | | | | 26 | | | | 12,634 | |
Morgan Stanley | | | | | | | | | | | 29 | | | | 1,516 | |
S&P Global Incorporated | | | | | | | | | | | 44 | | | | 16,122 | |
SEI Investments Company | | | | | | | | | | | 458 | | | | 23,981 | |
T. Rowe Price Group Incorporated | | | | | | | | | | | 128 | | | | 17,819 | |
The NASDAQ OMX Group Incorporated | | | | | | | | | | | 112 | | | | 15,055 | |
| |
| | | | 438,453 | |
| | | | | |
|
| Diversified Financial Services: 0.07% | |
Berkshire Hathaway Incorporated Class B | | | | | | | | | | | 31 | | | | 6,759 | |
Equitable Holdings Incorporated | | | | | | | | | | | 478 | | | | 10,129 | |
| |
| | | | 16,888 | |
| | | | | |
|
| Insurance: 8.74% | |
Alleghany Corporation | | | | | | | | | | | 68 | | | | 37,710 | |
Allstate Corporation | | | | | | | | | | | 2,064 | | | | 191,952 | |
The accompanying notes are an integral part of these financial statements.
Wells Fargo Factor Enhanced U.S. Low Volatility Equity Portfolio | 5
Portfolio of investments—August 31, 2020 (unaudited)
| | | | | | | | | | | | | | | | |
| | | | | | | | | Shares | | | Value | |
|
| Insurance (continued) | |
Aon plc Class A | | | | | | | | | | | 936 | | | $ | 187,191 | |
Arch Capital Group Limited † | | | | | | | | | | | 2,409 | | | | 75,980 | |
Arthur J. Gallagher & Company | | | | | | | | | | | 1,398 | | | | 147,209 | |
Assurant Incorporated | | | | | | | | | | | 122 | | | | 14,830 | |
Athene Holding Limited Class A † | | | | | | | | | | | 49 | | | | 1,791 | |
Brown & Brown Incorporated | | | | | | | | | | | 2,777 | | | | 128,853 | |
Chubb Limited | | | | | | | | | | | 1,624 | | | | 203,000 | |
Cincinnati Financial Corporation | | | | | | | | | | | 232 | | | | 18,423 | |
Erie Indemnity Company Class A | | | | | | | | | | | 81 | | | | 17,289 | |
Everest Reinsurance Group Limited | | | | | | | | | | | 764 | | | | 168,141 | |
Globe Life Incorporated | | | | | | | | | | | 86 | | | | 7,093 | |
Markel Corporation † | | | | | | | | | | | 66 | | | | 71,731 | |
Marsh & McLennan Companies Incorporated | | | | | | | | | | | 1,739 | | | | 199,828 | |
Reinsurance Group of America Incorporated | | | | | | | | | | | 75 | | | | 6,876 | |
RenaissanceRe Holdings Limited | | | | | | | | | | | 760 | | | | 139,642 | |
The Hartford Financial Services Group Incorporated | | | | | | | | | | | 1,695 | | | | 68,563 | |
The Progressive Corporation | | | | | | | | | | | 1,518 | | | | 144,271 | |
Travelers Companies Incorporated | | | | | | | | | | | 820 | | | | 95,153 | |
Willis Towers Watson plc | | | | | | | | | | | 321 | | | | 65,975 | |
WR Berkley Corporation | | | | | | | | | | | 2,451 | | | | 152,085 | |
| |
| | | | 2,143,586 | |
| | | | | |
|
| Mortgage REITs: 0.04% | |
AGNC Investment Corporation | | | | | | | | | | | 503 | | | | 7,097 | |
Annaly Capital Management Incorporated | | | | | | | | | | | 461 | | | | 3,388 | |
| |
| | | | 10,485 | |
| | | | | |
|
Health Care: 16.36% | |
|
| Biotechnology: 4.56% | |
AbbVie Incorporated | | | | | | | | | | | 116 | | | | 11,109 | |
Alexion Pharmaceuticals Incorporated | | | | | | | | | | | 14 | | | | 1,599 | |
Amgen Incorporated | | | | | | | | | | | 312 | | | | 79,036 | |
Biogen Incorporated † | | | | | | | | | | | 92 | | | | 26,463 | |
BioMarin Pharmaceutical Incorporated † | | | | | | | | | | | 213 | | | | 16,620 | |
Gilead Sciences Incorporated | | | | | | | | | | | 4,380 | | | | 292,365 | |
Incyte Corporation † | | | | | | | | | | | 348 | | | | 33,530 | |
Regeneron Pharmaceuticals Incorporated † | | | | | | | | | | | 532 | | | | 329,803 | |
Vertex Pharmaceuticals Incorporated † | | | | | | | | | | | 1,172 | | | | 327,129 | |
| |
| | | | 1,117,654 | |
| | | | | |
|
| Health Care Equipment & Supplies: 4.18% | |
Abbott Laboratories | | | | | | | | | | | 784 | | | | 85,824 | |
Baxter International Incorporated | | | | | | | | | | | 1,858 | | | | 161,776 | |
Becton Dickinson & Company | | | | | | | | | | | 214 | | | | 51,953 | |
Danaher Corporation | | | | | | | | | | | 1,068 | | | | 220,510 | |
Dentsply Sirona Incorporated | | | | | | | | | | | 220 | | | | 9,871 | |
Edwards Lifesciences Corporation | | | | | | | | | | | 45 | | | | 3,863 | |
Medtronic plc | | | | | | | | | | | 2,685 | | | | 288,557 | |
ResMed Incorporated | | | | | | | | | | | 27 | | | | 4,881 | |
Stryker Corporation | | | | | | | | | | | 662 | | | | 131,182 | |
The Cooper Companies Incorporated | | | | | | | | | | | 199 | | | | 62,562 | |
West Pharmaceutical Services Incorporated | | | | | | | | | | | 11 | | | | 3,124 | |
Zimmer Biomet Holdings Incorporated | | | | | | | | | | | 15 | | | | 2,113 | |
| |
| | | | 1,026,216 | |
| | | | | |
The accompanying notes are an integral part of these financial statements.
6 | Wells Fargo Factor Enhanced U.S. Low Volatility Equity Portfolio
Portfolio of investments—August 31, 2020 (unaudited)
| | | | | | | | | | | | | | | | |
| | | | | | | | | Shares | | | Value | |
| Health Care Providers & Services: 1.70% | |
AmerisourceBergen Corporation | | | | | | | | | | | 147 | | | $ | 14,263 | |
Anthem Incorporated | | | | | | | | | | | 394 | | | | 110,919 | |
CVS Health Corporation | | | | | | | | | | | 82 | | | | 5,094 | |
Humana Incorporated | | | | | | | | | | | 256 | | | | 106,284 | |
Molina Healthcare Incorporated † | | | | | | | | | | | 30 | | | | 5,549 | |
UnitedHealth Group Incorporated | | | | | | | | | | | 485 | | | | 151,587 | |
Universal Health Services Incorporated Class B | | | | | | | | | | | 206 | | | | 22,732 | |
| |
| | | | 416,428 | |
| | | | | |
|
| Health Care Technology: 0.13% | |
Cerner Corporation | | | | | | | | | | | 426 | | | | 31,256 | |
| | | | | | | | | | | | | | | | |
|
| Pharmaceuticals: 5.79% | |
Bristol-Myers Squibb Company | | | | | | | | | | | 1,375 | | | | 85,525 | |
Eli Lilly & Company | | | | | | | | | | | 1,924 | | | | 285,502 | |
Jazz Pharmaceuticals plc † | | | | | | | | | | | 38 | | | | 5,107 | |
Johnson & Johnson | | | | | | | | | | | 2,304 | | | | 353,457 | |
Merck & Company Incorporated | | | | | | | | | | | 4,389 | | | | 374,250 | |
Perrigo Company plc | | | | | | | | | | | 37 | | | | 1,935 | |
Pfizer Incorporated | | | | | | | | | | | 5,863 | | | | 221,563 | |
Zoetis Incorporated | | | | | | | | | | | 570 | | | | 91,257 | |
| |
| | | | 1,418,596 | |
| | | | | |
|
Industrials: 7.49% | |
|
| Aerospace & Defense: 1.43% | |
Huntington Ingalls Industries Incorporated | | | | | | | | | | | 77 | | | | 11,667 | |
L3Harris Technologies Incorporated | | | | | | | | | | | 554 | | | | 100,130 | |
Lockheed Martin Corporation | | | | | | | | | | | 536 | | | | 209,179 | |
Northrop Grumman Corporation | | | | | | | | | | | 81 | | | | 27,751 | |
Teledyne Technologies Incorporated † | | | | | | | | | | | 3 | | | | 941 | |
| |
| | | | 349,668 | |
| | | | | |
|
| Air Freight & Logistics: 0.94% | |
C.H. Robinson Worldwide Incorporated | | | | | | | | | | | 2,258 | | | | 221,961 | |
Expeditors International of Washington Incorporated | | | | | | | | | | | 104 | | | | 9,193 | |
| |
| | | | 231,154 | |
| | | | | |
|
| Airlines: 0.01% | |
Southwest Airlines Company | | | | | | | | | | | 59 | | | | 2,217 | |
| | | | | | | | | | | | | | | | |
|
| Building Products: 0.10% | |
Carrier Global Corporation | | | | | | | | | | | 518 | | | | 15,462 | |
Masco Corporation | | | | | | | | | | | 156 | | | | 9,095 | |
| |
| | | | 24,557 | |
| | | | | |
|
| Commercial Services & Supplies: 3.81% | |
Republic Services Incorporated | | | | | | | | | | | 3,617 | | | | 335,368 | |
Waste Connections Incorporated | | | | | | | | | | | 2,712 | | | | 271,281 | |
Waste Management Incorporated | | | | | | | | | | | 2,868 | | | | 326,952 | |
| |
| | | | 933,601 | |
| | | | | |
|
| Industrial Conglomerates: 0.27% | |
Honeywell International Incorporated | | | | | | | | | | | 403 | | | | 66,717 | |
| | | | | | | | | | | | | | | | |
The accompanying notes are an integral part of these financial statements.
Wells Fargo Factor Enhanced U.S. Low Volatility Equity Portfolio | 7
Portfolio of investments—August 31, 2020 (unaudited)
| | | | | | | | | | | | | | | | |
| | | | | | | | | Shares | | | Value | |
| Machinery: 0.26% | |
Cummins Incorporated | | | | | | | | | | | 30 | | | $ | 6,218 | |
Dover Corporation | | | | | | | | | | | 22 | | | | 2,416 | |
Illinois Tool Works Incorporated | | | | | | | | | | | 137 | | | | 27,064 | |
Otis Worldwide Corporation | | | | | | | | | | | 255 | | | | 16,040 | |
PACCAR Incorporated | | | | | | | | | | | 97 | | | | 8,326 | |
Pentair plc | | | | | | | | | | | 70 | | | | 3,160 | |
Snap-on Incorporated | | | | | | | | | | | 11 | | | | 1,631 | |
| |
| | | | 64,855 | |
| | | | | |
|
| Professional Services: 0.41% | |
Robert Half International Incorporated | | | | | | | | | | | 499 | | | | 26,547 | |
Verisk Analytics Incorporated | | | | | | | | | | | 398 | | | | 74,295 | |
| |
| | | | 100,842 | |
| | | | | |
|
| Road & Rail: 0.26% | |
AMERCO | | | | | | | | | | | 55 | | | | 19,519 | |
J.B. Hunt Transport Services Incorporated | | | | | | | | | | | 174 | | | | 24,454 | |
Knight-Swift Transportation Holdings Incorporated | | | | | | | | | | | 101 | | | | 4,591 | |
Old Dominion Freight Line Incorporated | | | | | | | | | | | 69 | | | | 13,950 | |
| |
| | | | 62,514 | |
| | | | | |
|
Information Technology: 22.96% | |
|
| Communications Equipment: 1.65% | |
Cisco Systems Incorporated | | | | | | | | | | | 3,887 | | | | 164,109 | |
Juniper Networks Incorporated | | | | | | | | | | | 1,504 | | | | 37,600 | |
Motorola Solutions Incorporated | | | | | | | | | | | 1,313 | | | | 203,187 | |
| |
| | | | 404,896 | |
| | | | | |
|
| Electronic Equipment, Instruments & Components: 1.59% | |
Amphenol Corporation Class A | | | | | | | | | | | 1,241 | | | | 136,262 | |
Arrow Electronics Incorporated | | | | | | | | | | | 637 | | | | 50,043 | |
CDW Corporation of Delaware | | | | | | | | | | | 92 | | | | 10,456 | |
FLIR Systems Incorporated | | | | | | | | | | | 585 | | | | 21,587 | |
Keysight Technologies Incorporated † | | | | | | | | | | | 1,644 | | | | 161,967 | |
TE Connectivity Limited | | | | | | | | | | | 109 | | | | 10,529 | |
| |
| | | | 390,844 | |
| | | | | |
|
| IT Services: 12.55% | |
Accenture plc Class A | | | | | | | | | | | 1,600 | | | | 383,888 | |
Akamai Technologies Incorporated † | | | | | | | | | | | 1,175 | | | | 136,805 | |
Automatic Data Processing Incorporated | | | | | | | | | | | 833 | | | | 115,862 | |
Black Knight Incorporated † | | | | | | | | | | | 2,537 | | | | 213,362 | |
Booz Allen Hamilton Holding Corporation | | | | | | | | | | | 1,119 | | | | 98,539 | |
Broadridge Financial Solutions Incorporated | | | | | | | | | | | 648 | | | | 89,035 | |
Cognizant Technology Solutions Corporation Class A | | | | | | | | | | | 1,844 | | | | 123,290 | |
Fidelity National Information Services Incorporated | | | | | | | | | | | 1,583 | | | | 238,796 | |
Fiserv Incorporated † | | | | | | | | | | | 1,677 | | | | 166,996 | |
FleetCor Technologies Incorporated † | | | | | | | | | | | 194 | | | | 48,781 | |
International Business Machines Corporation | | | | | | | | | | | 726 | | | | 89,523 | |
Jack Henry & Associates Incorporated | | | | | | | | | | | 1,400 | | | | 231,588 | |
Leidos Holdings Incorporated | | | | | | | | | | | 272 | | | | 24,613 | |
MasterCard Incorporated Class A | | | | | | | | | | | 625 | | | | 223,869 | |
Paychex Incorporated | | | | | | | | | | | 3,270 | | | | 250,057 | |
The Western Union Company | | | | | | | | | | | 7,760 | | | | 183,058 | |
The accompanying notes are an integral part of these financial statements.
8 | Wells Fargo Factor Enhanced U.S. Low Volatility Equity Portfolio
Portfolio of investments—August 31, 2020 (unaudited)
| | | | | | | | | | | | | | | | |
| | | | | | | | | Shares | | | Value | |
|
| IT Services (continued) | |
Verisign Incorporated | | | | | | | | | | | 440 | | | $ | 94,512 | |
Visa Incorporated Class A | | | | | | | | | | | 1,718 | | | | 364,199 | |
| |
| | | | 3,076,773 | |
| | | | | |
|
| Semiconductors & Semiconductor Equipment: 0.56% | |
Applied Materials Incorporated | | | | | | | | | | | 17 | | | | 1,047 | |
Broadcom Incorporated | | | | | | | | | | | 118 | | | | 40,964 | |
Intel Corporation | | | | | | | | | | | 535 | | | | 27,258 | |
KLA Corporation | | | | | | | | | | | 18 | | | | 3,693 | |
QUALCOMM Incorporated | | | | | | | | | | | 19 | | | | 2,263 | |
Texas Instruments Incorporated | | | | | | | | | | | 444 | | | | 63,115 | |
| |
| | | | 138,340 | |
| | | | | |
|
| Software: 6.42% | |
Adobe Incorporated † | | | | | | | | | | | 577 | | | | 296,226 | |
CDK Global Incorporated | | | | | | | | | | | 793 | | | | 36,970 | |
Citrix Systems Incorporated | | | | | | | | | | | 2,096 | | | | 304,339 | |
Intuit Incorporated | | | | | | | | | | | 179 | | | | 61,825 | |
Microsoft Corporation | | | | | | | | | | | 1,798 | | | | 405,503 | |
NortonLifeLock Incorporated | | | | | | | | | | | 1,282 | | | | 30,153 | |
Oracle Corporation | | | | | | | | | | | 3,414 | | | | 195,349 | |
Palo Alto Networks Incorporated † | | | | | | | | | | | 91 | | | | 23,424 | |
SS&C Technologies Holdings Incorporated | | | | | | | | | | | 66 | | | | 4,206 | |
Tyler Technologies Incorporated † | | | | | | | | | | | 622 | | | | 214,783 | |
| |
| | | | 1,572,778 | |
| | | | | |
|
| Technology Hardware, Storage & Peripherals: 0.19% | |
Apple Incorporated | | | | | | | | | | | 352 | | | | 45,422 | |
| | | | | | | | | | | | | | | | |
|
Materials: 2.57% | |
|
| Chemicals: 0.97% | |
Air Products & Chemicals Incorporated | | | | | | | | | | | 239 | | | | 69,850 | |
Celanese Corporation Series A | | | | | | | | | | | 64 | | | | 6,474 | |
Eastman Chemical Company | | | | | | | | | | | 26 | | | | 1,901 | |
Ecolab Incorporated | | | | | | | | | | | 671 | | | | 132,241 | |
FMC Corporation | | | | | | | | | | | 48 | | | | 5,129 | |
Linde plc | | | | | | | | | | | 11 | | | | 2,747 | |
LyondellBasell Industries NV Class A | | | | | | | | | | | 38 | | | | 2,488 | |
RPM International Incorporated | | | | | | | | | | | 89 | | | | 7,545 | |
The Sherwin-Williams Company | | | | | | | | | | | 15 | | | | 10,066 | |
| |
| | | | 238,441 | |
| | | | | |
|
| Containers & Packaging: 0.24% | |
Amcor plc | | | | | | | | | | | 3,866 | | | | 42,758 | |
Crown Holdings Incorporated † | | | | | | | | | | | 170 | | | | 13,065 | |
Packaging Corporation of America | | | | | | | | | | | 23 | | | | 2,329 | |
| |
| | | | 58,152 | |
| | | | | |
|
| Metals & Mining: 1.36% | |
Newmont Corporation | | | | | | | | | | | 4,758 | | | | 320,118 | |
Steel Dynamics Incorporated | | | | | | | | | | | 494 | | | | 14,583 | |
| |
| | | | 334,701 | |
| | | | | |
The accompanying notes are an integral part of these financial statements.
Wells Fargo Factor Enhanced U.S. Low Volatility Equity Portfolio | 9
Portfolio of investments—August 31, 2020 (unaudited)
| | | | | | | | | | | | | | | | |
| | | | | | | | | Shares | | | Value | |
Real Estate: 4.76% | |
|
| Equity REITs: 4.71% | |
American Tower Corporation | | | | | | | | | | | 871 | | | $ | 217,010 | |
AvalonBay Communities Incorporated | | | | | | | | | | | 316 | | | | 49,947 | |
Camden Property Trust | | | | | | | | | | | 902 | | | | 82,028 | |
Crown Castle International Corporation | | | | | | | | | | | 1,024 | | | | 167,168 | |
Duke Realty Corporation | | | | | | | | | | | 205 | | | | 7,903 | |
Equinix Incorporated | | | | | | | | | | | 40 | | | | 31,591 | |
Equity Lifestyle Properties Incorporated | | | | | | | | | | | 61 | | | | 4,044 | |
Equity Residential | | | | | | | | | | | 2,097 | | | | 118,376 | |
Essex Property Trust Incorporated | | | | | | | | | | | 256 | | | | 55,427 | |
Extra Space Storage Incorporated | | | | | | | | | | | 754 | | | | 80,339 | |
Iron Mountain Incorporated | | | | | | | | | | | 49 | | | | 1,474 | |
Medical Properties Trust Incorporated | | | | | | | | | | | 326 | | | | 6,057 | |
Mid-America Apartment Communities Incorporated | | | | | | | | | | | 516 | | | | 60,434 | |
Public Storage Incorporated | | | | | | | | | | | 1,038 | | | | 220,471 | |
SBA Communications Corporation | | | | | | | | | | | 109 | | | | 33,362 | |
UDR Incorporated | | | | | | | | | | | 487 | | | | 16,952 | |
Vornado Realty Trust | | | | | | | | | | | 28 | | | | 1,003 | |
| |
| | | | 1,153,586 | |
| | | | | |
|
| Real Estate Management & Development: 0.05% | |
Jones Lang LaSalle Incorporated | | | | | | | | | | | 120 | | | | 12,365 | |
| | | | | | | | | | | | | | | | |
|
Utilities: 8.04% | |
|
| Electric Utilities: 5.61% | |
Alliant Energy Corporation | | | | | | | | | | | 581 | | | | 31,461 | |
American Electric Power Company Incorporated | | | | | | | | | | | 1,050 | | | | 82,772 | |
Duke Energy Corporation | | | | | | | | | | | 2,768 | | | | 222,381 | |
Evergy Incorporated | | | | | | | | | | | 1,061 | | | | 56,466 | |
Eversource Energy | | | | | | | | | | | 678 | | | | 58,111 | |
NextEra Energy Incorporated | | | | | | | | | | | 1,457 | | | | 406,751 | |
NRG Energy Incorporated | | | | | | | | | | | 358 | | | | 12,319 | |
PPL Corporation | | | | | | | | | | | 163 | | | | 4,504 | |
The Southern Company | | | | | | | | | | | 4,433 | | | | 231,314 | |
Xcel Energy Incorporated | | | | | | | | | | | 3,880 | | | | 269,563 | |
| |
| | | | 1,375,642 | |
| | | | | |
|
| Multi-Utilities: 2.36% | |
Ameren Corporation | | | | | | | | | | | 58 | | | | 4,588 | |
CMS Energy Corporation | | | | | | | | | | | 998 | | | | 60,369 | |
Consolidated Edison Incorporated | | | | | | | | | | | 3,072 | | | | 219,156 | |
Dominion Energy Incorporated | | | | | | | | | | | 1,294 | | | | 101,501 | |
Public Service Enterprise Group Incorporated | | | | | | | | | | | 53 | | | | 2,769 | |
WEC Energy Group Incorporated | | | | | | | | | | | 2,006 | | | | 188,724 | |
| |
| | | | 577,107 | |
| | | | | |
|
| Water Utilities: 0.07% | |
American Water Works Company Incorporated | | | | | | | | | | | 122 | | | | 17,241 | |
| | | | | | | | | | | | | | | | |
| |
Total Common Stocks (Cost $23,059,169) | | | | 24,569,179 | |
| | | | | |
| | | | | | | | |
| Total investments in securities (Cost $23,059,169) | | | 100.22 | % | | | 24,569,179 | |
| | |
Other assets and liabilities, net | | | (0.22 | ) | | | (53,551 | ) |
| | | | | | | | |
| Total net assets | | | 100.00 | % | | $ | 24,515,628 | |
| | | | | | | | |
The accompanying notes are an integral part of these financial statements.
10 | Wells Fargo Factor Enhanced U.S. Low Volatility Equity Portfolio
Portfolio of investments—August 31, 2020 (unaudited)
| † | Non-income-earning security |
Abbreviations:
| REIT | Real estate investment trust |
Futures Contracts
| | | | | | | | | | | | | | | | | | | | | | | | |
| Description | | Number of contracts | | | Expiration date | | | Notional cost | | | Notional value | | | Unrealized gains | | | Unrealized losses | |
| | | | | | |
Long | | | | | | | | | | | | | | | | | | | | | | | | |
| | | | | | |
S&P 500 E-Mini Index | | | 1 | | | | 9-18-2020 | | | $ | 166,414 | | | $ | 174,945 | | | $ | 8,531 | | | $ | 0 | |
Investments in Affiliates
An affiliated investment is an investment in which the Portfolio owns at least 5% of the outstanding voting shares of the issuer or as a result of other relationships, such as the Portfolio and the issuer having the same adviser or investment manager. Transactions with issuers that were either affiliated persons of the Portfolio at the beginning of the period or the end of the period were as follows:
| | | | | | | | | | | | | | | | | | | | | | | | | | | | | | | | |
| | | Value, beginning of period | | | Purchases | | | Shares proceeds | | | Net realized gains (losses) | | | Net change in unrealized gains (losses) | | | Income from affiliated securities | | | Value, end of period | | | % of net assets | |
| | | | | | | | |
| Short-Term Investments | | | | | | | | | | | | | | | | | | | | | | | | |
Investment Companies | | | | | | | | | | | | | | | | | | | | | | | | | | | | | | | | |
Wells Fargo Government Money Market Fund Select Class * | | $ | 0 | | | $ | 24,358,715 | | | $ | (24,358,715 | ) | | $ | 0 | | | $ | 0 | | | $ | 322 | | | $ | 0 | | | | 0 | % |
| * | No longer held at the end of the period. |
The accompanying notes are an integral part of these financial statements.
Wells Fargo Factor Enhanced U.S. Low Volatility Equity Portfolio | 11
Statement of assets and liabilities—August 31, 2020 (unaudited)
| | | | |
| | | | |
| |
Assets | | | | |
Investments in unaffiliated securities, at value (cost $23,059,169) | | $ | 24,569,179 | |
Segregated cash for futures contracts | | | 40,000 | |
Receivable for investments sold | | | 70,835 | |
Receivable for dividends | | | 38,649 | |
Receivable from adviser | | | 8,145 | |
Prepaid expenses and other assets | | | 186 | |
| | | | |
Total assets | | | 24,726,994 | |
| | | | |
| |
Liabilities | | | | |
Payable for daily variation margin on open futures contracts | | | 274 | |
Overdraft due to custodian bank | | | 195,387 | |
Trustees’ fees and expenses payable | | | 3,129 | |
Accrued expenses and other liabilities | | | 12,576 | |
| | | | |
Total liabilities | | | 211,366 | |
| | | | |
Total net assets | | $ | 24,515,628 | |
| | | | |
The accompanying notes are an integral part of these financial statements.
12 | Wells Fargo Factor Enhanced U.S. Low Volatility Equity Portfolio
Statement of operations—period ended August 31, 2020 (unaudited)1
| | | | |
| | | | |
| |
Investment income | | | | |
Dividends (net of foreign withholding taxes of $75) | | $ | 63,256 | |
Income from affiliated securities | | | 322 | |
| | | | |
Total investment income | | | 63,578 | |
| | | | |
| |
Expenses | | | | |
Advisory fee | | | 3,826 | |
Custody and accounting fees | | | 2,841 | |
Professional fees | | | 11,965 | |
Shareholder report expenses | | | 1,494 | |
Trustees’ fees and expenses | | | 3,221 | |
Other fees and expenses | | | 2,256 | |
| | | | |
Total expenses | | | 25,603 | |
Less: Fee waivers and/or expense reimbursements | | | (20,247 | ) |
| | | | |
Net expenses | | | 5,356 | |
| | | | |
Net investment income | | | 58,222 | |
| | | | |
| |
Realized and unrealized gains (losses) on investments | | | | |
Net realized gains on investments | | | 14,914 | |
| |
Net change in unrealized gains (losses) on | | | | |
Unaffiliated securities | | | 1,510,010 | |
Futures contracts | | | 8,531 | |
| | | | |
Net change in unrealized gains (losses) on investments | | | 1,518,541 | |
| | | | |
Net realized and unrealized gains (losses) on investments | | | 1,533,455 | |
| | | | |
Net increase in net assets resulting from operations | | $ | 1,591,677 | |
| | | | |
| 1 | For the period from July 1, 2020 (commencement of operations) to August 31, 2020 |
The accompanying notes are an integral part of these financial statements.
Wells Fargo Factor Enhanced U.S. Low Volatility Equity Portfolio | 13
Statement of changes in net assets
| | | | |
| | | Period ended
August 31, 20201 | |
| |
Operations | | | | |
Net investment income | | $ | 58,222 | |
Net realized gains on investments | | | 14,914 | |
Net change in unrealized gains (losses) on investments | | | 1,518,541 | |
| | | | |
Net increase in net assets resulting from operations | | | 1,591,677 | |
| | | | |
| |
Capital transactions | | | | |
Transactions in investors’ beneficial interests | | | | |
Contributions | | | 24,046,079 | |
Withdrawals | | | (1,122,128 | ) |
| | | | |
Net increase in net assets resulting from capital transactions | | | 22,923,951 | |
| | | | |
Total increase in net assets | | | 24,515,628 | |
| | | | |
| |
Net assets | | | | |
Beginning of period | | | 0 | |
| | | | |
End of period | | $ | 24,515,628 | |
| | | | |
| 1 | For the period from July 1, 2020 (commencement of operations) to August 31, 2020 |
The accompanying notes are an integral part of these financial statements.
14 | Wells Fargo Factor Enhanced U.S. Low Volatility Equity Portfolio
Financial highlights
| | | | |
| | | Period ended
August 31, 2020
(unaudited)1 | |
Total return2 | | | 6.71 | % |
Ratios to average net assets (annualized) | | | | |
Gross expenses | | | 0.67 | % |
Net expenses | | | 0.14 | % |
Net investment income | | | 1.52 | % |
Supplemental data | | | | |
Portfolio turnover rate | | | 2 | % |
| 1 | For the period from July 1, 2020 (commencement of operations) to August 31, 2020 |
| 2 | Returns for periods of less than one year are not annualized. |
The accompanying notes are an integral part of these financial statements.
Wells Fargo Factor Enhanced U.S. Low Volatility Equity Portfolio | 15
Notes to financial statements (unaudited)
1. ORGANIZATION
Wells Fargo Master Trust (the “Trust”), a Delaware statutory trust organized on March 10, 1999, is an open-end management investment company registered under the Investment Company Act of 1940, as amended (the “1940 Act”). As an investment company, the Trust follows the accounting and reporting guidance in Financial Accounting Standards Board (“FASB”) Accounting Standards Codification Topic 946, Financial Services – Investment Companies. These financial statements report on the Wells Fargo Factor Enhanced U.S. Low Volatility Equity Portfolio (the “Portfolio”) which is a diversified series of the Trust.
Interests in the Portfolio are available solely through private placement transactions that do not involve any “public offering” within the meaning of Section 4(2) of the Investment Company Act of 1933.
2. SIGNIFICANT ACCOUNTING POLICIES
The following significant accounting policies, which are consistently followed in the preparation of the financial statements of the Portfolio, are in conformity with U.S. generally accepted accounting principles which require management to make estimates and assumptions that affect the reported amounts of assets and liabilities, disclosure of contingent assets and liabilities at the date of the financial statements, and the reported amounts of revenues and expenses during the reporting period. Actual results could differ from those estimates.
Securities valuation
All investments are valued each business day as of the close of regular trading on the New York Stock Exchange (generally 4 p.m. Eastern Time), although the Portfolio may deviate from this calculation time under unusual or unexpected circumstances.
Equity securities and futures that are listed on a foreign or domestic exchange or market are valued at the official closing price or, if none, the last sales price. If no sale occurs on the principal exchange or market that day, a fair value price will be determined in accordance with the Portfolio’s Valuation Procedures.
Investments in registered open-end investment companies are valued at net asset value.
Investments which are not valued using any of the methods discussed above are valued at their fair value, as determined in good faith by the Board of Trustees of the Portfolio. The Board of Trustees has established a Valuation Committee comprised of the Trustees and has delegated to it the authority to take any actions regarding the valuation of portfolio securities that the Valuation Committee deems necessary or appropriate, including determining the fair value of portfolio securities, unless the determination has been delegated to the Wells Fargo Asset Management Pricing Committee at Wells Fargo Funds Management, LLC (“Funds Management”). The Board of Trustees retains the authority to make or ratify any valuation decisions or approve any changes to the Valuation Procedures as it deems appropriate. On a quarterly basis, the Board of Trustees receives reports on any valuation actions taken by the Valuation Committee or the Wells Fargo Asset Management Pricing Committee which may include items for ratification.
Futures contracts
Futures contracts are agreements between the Portfolio and a counterparty to buy or sell a specific amount of a commodity, financial instrument or currency at a specified price and on a specified date. The Portfolio may buy and sell futures contracts in order to gain exposure to, or protect against, changes in security values and is subject to equity price risk. The primary risks associated with the use of futures contracts are the imperfect correlation between changes in market values of securities held by the Portfolio and the prices of futures contracts, and the possibility of an illiquid market. Futures contracts are generally entered into on a regulated futures exchange and cleared through a clearinghouse associated with the exchange. With futures contracts, there is minimal counterparty risk to the Portfolio since futures contracts are exchange traded and the exchange’s clearinghouse, as the counterparty to all exchange traded futures, guarantees the futures contracts against default.
Upon entering into a futures contracts, the Portfolio is required to deposit either cash or securities (initial margin) with the broker in an amount equal to a certain percentage of the contract value. Subsequent payments (variation margin) are paid to or from the broker each day equal to the daily changes in the contract value. Such payments are recorded as unrealized gains or losses and, if any, shown as variation margin receivable (payable) in the Statement of Assets and Liabilities. Should the Portfolio fail to make requested variation margin payments, the broker can gain access to the initial margin to satisfy the Portfolio’s payment obligations. When the contracts are closed, a realized gain or loss is recorded in the Statement of Operations.
Security transactions and income recognition
Securities transactions are recorded on a trade date basis. Realized gains or losses are recorded on the basis of identified cost.
Dividend income is recognized on the ex-dividend date. Dividend income is recorded net of foreign taxes withheld where recovery of such taxes is not assured.
16 | Wells Fargo Factor Enhanced U.S. Low Volatility Equity Portfolio
Notes to financial statements (unaudited)
Federal and other taxes
The Portfolio is not required to pay federal income taxes on its net investment income and net capital gains as it is treated as a partnership for federal income tax purposes. All dividends, gains and losses of the Portfolio are deemed to have been “passed through” to the interest holders in proportion to their holdings of the Portfolio regardless of whether dividends and gains have been distributed by the Portfolio.
The Fund is not subject to examination by federal and state tax authorities for taxes before 2020, the year the Fund commenced operations.
As of August 31, 2020, the aggregate cost of all investments for federal income tax purposes was $23,059,169 and the unrealized gains (losses) consisted of:
| | | | |
| |
Gross unrealized gains | | $ | 1,794,451 | |
| |
Gross unrealized losses | | | (275,910 | ) |
| |
Net unrealized gains | | $ | 1,518,541 | |
3. FAIR VALUATION MEASUREMENTS
Fair value measurements of investments are determined within a framework that has established a fair value hierarchy based upon the various data inputs utilized in determining the value of the Portfolio’s investments. The three-level hierarchy gives the highest priority to unadjusted quoted prices in active markets for identical assets or liabilities (Level 1) and the lowest priority to unobservable inputs (Level 3). The Portfolio’s investments are classified within the fair value hierarchy based on the lowest level of input that is significant to the fair value measurement. The inputs are summarized into three broad levels as follows:
| ∎ | | Level 1 – quoted prices in active markets for identical securities |
| ∎ | | Level 2 – other significant observable inputs (including quoted prices for similar securities, interest rates, prepayment speeds, credit risk, etc.) |
| ∎ | | Level 3 – significant unobservable inputs (including the Portfolio’s own assumptions in determining the fair value of investments) |
The inputs or methodologies used for valuing investments in securities are not necessarily an indication of the risk associated with investing in those securities.
The following is a summary of the inputs used in valuing the Portfolio’s assets and liabilities as of August 31, 2020:
| | | | | | | | | | | | | | | | |
| | | | |
| | | Quoted prices (Level 1) | | | Other significant observable inputs (Level 2) | | | Significant unobservable inputs (Level 3) | | | Total | |
| | | | |
Assets | | | | | | | | | | | | | | | | |
Investments in: | | | | | | | | | | | | | | | | |
| | | | |
Common stocks | | | | | | | | | | | | | | | | |
| | | | |
Communication services | | $ | 1,630,925 | | | $ | 0 | | | $ | 0 | | | $ | 1,630,925 | |
| | | | |
Consumer discretionary | | | 1,695,823 | | | | 0 | | | | 0 | | | | 1,695,823 | |
| | | | |
Consumer staples | | | 3,068,437 | | | | 0 | | | | 0 | | | | 3,068,437 | |
| | | | |
Energy | | | 241,576 | | | | 0 | | | | 0 | | | | 241,576 | |
| | | | |
Financials | | | 2,689,855 | | | | 0 | | | | 0 | | | | 2,689,855 | |
| | | | |
Health care | | | 4,010,150 | | | | 0 | | | | 0 | | | | 4,010,150 | |
| | | | |
Industrials | | | 1,836,125 | | | | 0 | | | | 0 | | | | 1,836,125 | |
| | | | |
Information technology | | | 5,629,053 | | | | 0 | | | | 0 | | | | 5,629,053 | |
| | | | |
Materials | | | 631,294 | | | | 0 | | | | 0 | | | | 631,294 | |
| | | | |
Real estate | | | 1,165,951 | | | | 0 | | | | 0 | | | | 1,165,951 | |
| | | | |
Utilities | | | 1,969,990 | | | | 0 | | | | 0 | | | | 1,969,990 | |
| | | | |
| | | 24,569,179 | | | | 0 | | | | 0 | | | | 24,569,179 | |
| | | | |
Futures contracts | | | 8,531 | | | | 0 | | | | 0 | | | | 8,531 | |
| | | | |
Total assets | | $ | 24,577,710 | | | $ | 0 | | | $ | 0 | | | $ | 24,577,710 | |
Additional sector, industry or geographic detail is included in the Portfolio of Investments.
Wells Fargo Factor Enhanced U.S. Low Volatility Equity Portfolio | 17
Notes to financial statements (unaudited)
Futures contracts are reported at their cumulative unrealized gains (losses) at measurement date as reported in the table following the Portfolio of Investments. For futures contracts, the current day’s variation margin is reported on the Statement of Assets and Liabilities. All other assets and liabilities are reported at their market value at measurement date.
For the period from July 1, 2020 (commencement of operations) to August 31, 2020, the Portfolio did not have any transfers into/out of Level 3.
4. TRANSACTIONS WITH AFFILIATES
Advisory fee
The Trust has entered into an advisory contract with Funds Management, an indirect wholly owned subsidiary of Wells Fargo. The adviser is responsible for implementing investment policies and guidelines and for supervising the subadviser, who is responsible for day-to-day portfolio management of the Portfolio. Pursuant to the contract, Funds Management is entitled to receive an advisory fee at the following annual rate based on the Portfolio’s average daily net assets:
| | | | |
| |
| Average daily net assets | | Advisory fee | |
| |
First $5 million | | | 0.10 | % |
| |
Next $5 million | | | 0.08 | |
| |
Over $10 billion | | | 0.06 | |
For the period from July 1, 2020 (commencement of operations) to August 31, 2020, the advisory fee was equivalent to an annual rate of 0.10% of the Portfolio’s average daily net assets.
Funds Management has retained the services of a subadviser to provide daily portfolio management to the Portfolio. The fee for subadvisory services is borne by Funds Management. Wells Capital Management Incorporated, an affiliate of Funds Management and an indirect wholly owned subsidiary of Wells Fargo, is the subadviser to the Portfolio and is entitled to receive a fee from Funds Management at an annual rate starting at 0.06% and declining to 0.04% as the average daily net assets of the Portfolio increase.
Funds Management has voluntarily waived and/or reimbursed advisory fees to reduce the net operating expense ratio of the Portfolio.
Interfund transactions
The Portfolio may purchase or sell portfolio investment securities to certain other Wells Fargo affiliates pursuant to Rule 17a-7 under the 1940 Act and under procedures adopted by the Board of Trustees. The procedures have been designed to ensure that these interfund transactions, which do not incur broker commissions, are effected at current market prices.
5. INVESTMENT PORTFOLIO TRANSACTIONS
Purchases and sales of investments, excluding U.S. government obligations (if any) and short-term securities, for the period from July 1, 2020 (commencement of operations) to August 31, 2020 were $23,521,361 and $477,157, respectively.
6. DERIVATIVE TRANSACTIONS
During the period from July 1, 2020 (commencement of operations) to August 31, 2020, the Portfolio entered into futures contracts to gain market exposure. The Portfolio had an average notional amount of $57,290 in long futures contracts during the period from July 1, 2020 (commencement of operations) to August 31, 2020.
The fair value, realized gains or losses and change in unrealized gains or losses, if any, on derivative instruments are reflected in the corresponding financial statement captions.
7. INDEMNIFICATION
Under the Portfolio’s organizational documents, the officers and Trustees have been granted certain indemnification rights against certain liabilities that may arise out of performance of their duties to the Portfolio. The Portfolio has entered into a separate agreement with each Trustee that converts indemnification rights currently existing under the Portfolio’s organizational documents into contractual rights that cannot be changed in the future without the consent of the Trustee. Additionally, in the normal course of business, the Portfolio may enter into contracts with service providers that contain a variety of indemnification clauses. The Portfolio’s maximum exposure under these arrangements is dependent on future claims that may be made against the Portfolio and, therefore, cannot be estimated.
18 | Wells Fargo Factor Enhanced U.S. Low Volatility Equity Portfolio
Notes to financial statements (unaudited)
8. NEW ACCOUNTING PRONOUNCEMENT
In August 2018, FASB issued Accounting Standards Update (“ASU”) No. 2018-13, Fair Value Measurement (Topic 820) Disclosure Framework—Changes to the Disclosure Requirements for Fair Value Measurement. ASU 2018-13 updates the disclosure requirements on fair value measurements in Topic 820, Fair Value Measurements. The amendments are effective for fiscal years, and interim periods within those fiscal years, beginning after December 15, 2019. Management has adopted this guidance which did not have a material impact on the financial statements.
9. CORONAVIRUS (COVID-19) PANDEMIC
On March 11, 2020, the World Health Organization announced that it had made the assessment that coronavirus disease 2019 (“COVID-19”) is a pandemic. The impacts of COVID-19 are adversely affecting the entire global economy, individual companies and investment products, and the market in general. There is significant uncertainty around the extent and duration of business disruptions related to COVID-19 and the impacts may be short term or may last for an extended period of time. The risk of further spreading of COVID-19 has led to significant uncertainty and volatility in the financial markets.
Wells Fargo Factor Enhanced U.S. Low Volatility Equity Portfolio | 19
Other information (unaudited)
PROXY VOTING INFORMATION
A description of the policies and procedures used to determine how to vote proxies relating to portfolio securities is available, upon request, by calling 1-800-222-8222, visiting our website at wfam.com, or visiting the SEC website at sec.gov. Information regarding how the proxies related to portfolio securities were voted during the most recent 12-month period ended June 30 is available on the website at wfam.com or by visiting the SEC website at sec.gov.
QUARTERLY PORTFOLIO HOLDINGS INFORMATION
The Portfolio files its complete schedule of portfolio holdings with the SEC for the first and third quarters of each fiscal year as an exhibit to its reports on Form N-PORT. Shareholders may view the filed Form N-PORT by visiting the SEC website at sec.gov.
20 | Wells Fargo Factor Enhanced U.S. Low Volatility Equity Portfolio
Other information (unaudited)
BOARD OF TRUSTEES AND OFFICERS
Each of the Trustees and Officers1 listed in the table below acts in identical capacities for each fund in the Wells Fargo family of funds, which consists of 142 mutual funds comprising the Wells Fargo Funds Trust, Wells Fargo Variable Trust, Wells Fargo Master Trust and four closed-end funds (collectively the “Fund Complex”). This table should be read in conjunction with the Prospectus and the Statement of Additional Information2. The mailing address of each Trustee and Officer is 525 Market Street, 12th Floor, San Francisco, CA 94105. Each Trustee and Officer serves an indefinite term, however, each Trustee serves such term until reaching the mandatory retirement age established by the Trustees.
Independent Trustees
| | | | | | |
Name and year of birth | | Position held and length of service* | | Principal occupations during past five years or longer | | Current other public company or investment company directorships |
| | | |
William R. Ebsworth (Born 1957) | | Trustee, since 2015 | | Retired. From 1984 to 2013, equities analyst, portfolio manager, research director and chief investment officer at Fidelity Management and Research Company in Boston, Tokyo, and Hong Kong, and retired in 2013 as Chief Investment Officer of Fidelity Strategic Advisers, Inc. where he led a team of investment professionals managing client assets. Prior thereto, Board member of Hong Kong Securities Clearing Co., Hong Kong Options Clearing Corp., the Thailand International Fund, Ltd., Fidelity Investments Life Insurance Company, and Empire Fidelity Investments Life Insurance Company. Audit Committee Chair and Investment Committee Chair of the Vincent Memorial Hospital Endowment (non-profit organization). Mr. Ebsworth is a CFA® charterholder. | | N/A |
| | | |
Jane A. Freeman (Born 1953) | | Trustee, since 2015; Chair Liaison, since 2018 | | Retired. From 2012 to 2014 and 1999 to 2008, Chief Financial Officer of Scientific Learning Corporation. From 2008 to 2012, Ms. Freeman provided consulting services related to strategic business projects. Prior to 1999, Portfolio Manager at Rockefeller & Co. and Scudder, Stevens & Clark. Board member of the Harding Loevner Funds from 1996 to 2014, serving as both Lead Independent Director and chair of the Audit Committee. Board member of the Russell Exchange Traded Funds Trust from 2011 to 2012 and the chair of the Audit Committee. Ms. Freeman is also an inactive Chartered Financial Analyst. | | N/A |
| | | |
Isaiah Harris, Jr. (Born 1952) | | Trustee, since 2009; Audit Committee Chairman, since 2019 | | Retired. Chairman of the Board of CIGNA Corporation since 2009, and Director since 2005. From 2003 to 2011, Director of Deluxe Corporation. Prior thereto, President and CEO of BellSouth Advertising and Publishing Corp. from 2005 to 2007, President and CEO of BellSouth Enterprises from 2004 to 2005 and President of BellSouth Consumer Services from 2000 to 2003. Emeritus member of the Iowa State University Foundation Board of Governors. Emeritus Member of the Advisory Board of Iowa State University School of Business. Advisory Board Member, Palm Harbor Academy (private school). Mr. Harris is a certified public accountant (inactive status). | | CIGNA Corporation |
| | | |
Judith M. Johnson (Born 1949) | | Trustee, since 2008 | | Retired. Prior thereto, Chief Executive Officer and Chief Investment Officer of Minneapolis Employees Retirement Fund from 1996 to 2008. Ms. Johnson is an attorney, certified public accountant and a certified managerial accountant. | | N/A |
| | | |
David F. Larcker (Born 1950) | | Trustee, since 2009 | | James Irvin Miller Professor of Accounting at the Graduate School of Business (Emeritus), Stanford University, Director of the Corporate Governance Research Initiative and Senior Faculty of The Rock Center for Corporate Governance since 2006. From 2005 to 2008, Professor of Accounting at the Graduate School of Business, Stanford University. Prior thereto, Ernst & Young Professor of Accounting at The Wharton School, University of Pennsylvania from 1985 to 2005. | | N/A |
Wells Fargo Factor Enhanced U.S. Low Volatility Equity Portfolio | 21
Other information (unaudited)
| | | | | | |
Name and year of birth | | Position held and length of service* | | Principal occupations during past five years or longer | | Current other public company or investment company directorships |
| | | |
Olivia S. Mitchell (Born 1953) | | Trustee, since 2006; Nominating and Governance Committee Chair, since 2018 | | International Foundation of Employee Benefit Plans Professor, Wharton School of the University of Pennsylvania since 1993. Director of Wharton’s Pension Research Council and Boettner Center on Pensions & Retirement Research, and Research Associate at the National Bureau of Economic Research. Previously, Cornell University Professor from 1978 to 1993. | | N/A |
| | | |
Timothy J. Penny (Born 1951) | | Trustee, since 1996; Chairman, since 2018 | | President and Chief Executive Officer of Southern Minnesota Initiative Foundation, a non-profit organization, since 2007. Member of the Board of Trustees of NorthStar Education Finance, Inc., a non-profit organization, since 2007. | | N/A |
| | | |
James G. Polisson (Born 1959) | | Trustee, since 2018 | | Retired. Chief Marketing Officer, Source (ETF) UK Services, Ltd, from 2015 to 2017. From 2012 to 2015, Principal of The Polisson Group, LLC, a management consulting, corporate advisory and principal investing company. Chief Executive Officer and Managing Director at Russell Investments, Global Exchange Traded Funds from 2010 to 2012. Managing Director of Barclays Global Investors from 1998 to 2010 and Global Chief Marketing Officer for iShares and Barclays Global Investors from 2000 to 2010. Trustee of the San Francisco Mechanics’ Institute, a non-profit organization, from 2013 to 2015. Board member of the Russell Exchange Traded Fund Trust from 2011 to 2012. Director of Barclays Global Investors Holdings Deutschland GmbH from 2006 to 2009. Mr. Polisson is an attorney and has a retired status with the Massachusetts and District of Columbia Bar Associations. | | N/A |
| | | |
Pamela Wheelock (Born 1959) | | Trustee, since January 2020; previously Trustee from January 2018 to July 2019 | | Board member of the Destination Medical Center Economic Development Agency, Rochester, Minnesota since 2019. Interim President of the McKnight Foundation from January to September 2020. Acting Commissioner, Minnesota Department of Human Services, July 2019 through September 2019. Human Services Manager (part-time), Minnesota Department of Human Services, October 2019 through December 2019. Chief Operating Officer, Twin Cities Habitat for Humanity from 2017 to 2019. Vice President of University Services, University of Minnesota from 2012 to 2016. Prior thereto, on the Board of Directors, Governance Committee and Finance Committee for the Minnesota Philanthropy Partners (Saint Paul Foundation) from 2012 to 2018, Interim Chief Executive Officer of Blue Cross Blue Shield of Minnesota from 2011 to 2012, Chairman of the Board from 2009 to 2012 and Board Director from 2003 to 2015. Vice President, Leadership and Community Engagement, Bush Foundation, Saint Paul, Minnesota (a private foundation) from 2009 to 2011. Executive Vice President and Chief Financial Officer, Minnesota Sports and Entertainment from 2004 to 2009 and Senior Vice President from 2002 to 2004. Executive Vice President of the Minnesota Wild Foundation from 2004 to 2008. Commissioner of Finance, State of Minnesota, from 1999 to 2002. Currently Board Chair of the Minnesota Wild Foundation since 2010. | | N/A |
| * | Length of service dates reflect the Trustee’s commencement of service with the Trust’s predecessor entities, where applicable. |
22 | Wells Fargo Factor Enhanced U.S. Low Volatility Equity Portfolio
Other information (unaudited)
Officers
| | | | |
Name and year of birth | | Position held and length of service | | Principal occupations during past five years or longer |
| | |
Andrew Owen (Born 1960) | | President, since 2017 | | Executive Vice President of Wells Fargo & Company and Head of Affiliated Managers, Wells Fargo Asset Management, since 2014. In addition, Mr. Owen is currently President, Chief Executive Officer and Director of Wells Fargo Funds Management, LLC since 2017. Prior thereto, Executive Vice President responsible for marketing, investments and product development for Wells Fargo Funds Management, LLC, from 2009 to 2014. |
| | |
Jeremy DePalma1 (Born 1974) | | Treasurer, since 2012 | | Senior Vice President of Wells Fargo Funds Management, LLC since 2009. Senior Vice President of Evergreen Investment Management Company, LLC from 2008 to 2010 and head of the Fund Reporting and Control Team within Fund Administration from 2005 to 2010. |
| | |
Michelle Rhee (Born 1966) | | Chief Legal Officer, since 2019 | | Secretary of Wells Fargo Funds Management, LLC, Chief Legal Counsel of Wells Fargo Asset Management and Assistant General Counsel of Wells Fargo Bank, N.A. since 2018. Associate General Counsel and Managing Director of Bank of America Corporation from 2004 to 2018. |
| | |
Catherine Kennedy (Born 1969) | | Secretary, since 2019 | | Vice President of Wells Fargo Funds Management, LLC and Senior Counsel of the Wells Fargo Legal Department since 2010. Vice President and Senior Counsel of Evergreen Investment Management Company, LLC from 1998 to 2010. |
| | |
Michael H. Whitaker (Born 1967) | | Chief Compliance Officer, since 2016 | | Chief Compliance Officer of Wells Fargo Asset Management since 2016. Senior Vice President and Chief Compliance Officer for Fidelity Investments from 2007 to 2016. |
| | |
David Berardi (Born 1975) | | Assistant Treasurer, since 2009 | | Vice President of Wells Fargo Funds Management, LLC since 2009. Vice President of Evergreen Investment Management Company, LLC from 2008 to 2010. Manager of Fund Reporting and Control for Evergreen Investment Management Company, LLC from 2004 to 2010. |
| 1 | Jeremy DePalma acts as Treasurer of 77 funds and Assistant Treasurer of 65 funds in the Fund Complex. |
| 2 | The Statement of Additional Information includes additional information about the Trustees and is available, without charge, upon request, by calling 1-800-222-8222 or by visiting the website at wfam.com. |
Wells Fargo Factor Enhanced U.S. Low Volatility Equity Portfolio | 23
This page is intentionally left blank.

For more information
More information about Wells Fargo Funds is available free upon request. To obtain literature, please write, visit the Portfolio’s website, or call:
Wells Fargo Funds
P.O. Box 219967
Kansas City, MO 64121-9967
Website: wfam.com
Individual investors: 1-800-222-8222
Retail investment professionals: 1-888-877-9275
Institutional investment professionals: 1-866-765-0778
This report and the financial statements contained herein are submitted for the general information of the shareholders of the Portfolio. If this report is used for promotional purposes, distribution of the report must be accompanied or preceded by a current prospectus. Before investing, please consider the investment objectives, risks, charges, and expenses of the investment. For a current prospectus and, if available, a summary prospectus, containing this information, call 1-800-222-8222 or visit the Portfolio’s website at wfam.com. Read the prospectus carefully before you invest or send money.
Wells Fargo Asset Management (WFAM) is the trade name for certain investment advisory/management firms owned by Wells Fargo & Company. These firms include but are not limited to Wells Capital Management Incorporated and Wells Fargo Funds Management, LLC. Certain products managed by WFAM entities are distributed by Wells Fargo Funds Distributor, LLC (a broker-dealer and Member FINRA).
This material is for general informational and educational purposes only and is NOT intended to provide investment advice or a recommendation of any kind—including a recommendation for any specific investment, strategy, or plan.
INVESTMENT PRODUCTS: NOT FDIC INSURED ◾ NO BANK GUARANTEE ◾ MAY LOSE VALUE
© 2020 Wells Fargo & Company. All rights reserved.
Semi-Annual Report
August 31, 2020
Wells Fargo
Emerging Markets Bond Portfolio
Contents
INVESTMENT PRODUCTS: NOT FDIC INSURED ◾ NO BANK GUARANTEE ◾ MAY LOSE VALUE
Wells Fargo Emerging Markets Bond Portfolio | 1
Portfolio information (unaudited)
Investment objective
The Portfolio seeks to replicate the total return of the JP Morgan EMBI Global Diversified Index before fees and expenses.
Adviser
Wells Fargo Funds Management, LLC
Subadviser
Wells Fargo Asset Management (International) Limited
Portfolio managers
Michael Lee
Alex Perrin
| | | | |
|
| Ten largest holdings (%) as of August 31, 20201 | |
| | |
Republic of Panama 4.00%, 9-22-2024 | | | 1.72 | |
| | |
Qatar Government 4.63%, 6-2-2046 | | | 1.66 | |
| | |
Republic of South Africa 4.85%, 9-30-2029 | | | 1.63 | |
| | |
Republic of Peru 6.55%, 3-14-2037 | | | 1.57 | |
| | |
Qatar Government 4.00%, 3-14-2029 | | | 1.30 | |
| | |
Republic of Philippines 3.70%, 2-2-2042 | | | 1.29 | |
| | |
Kingdom of Bahrain 7.00%, 10-12-2028 | | | 1.27 | |
| | |
Republic of Poland 3.25%, 4-6-2026 | | | 1.25 | |
| | |
Republic of Panama 4.25%, 5-15-2047 | | | 1.25 | |
| | |
Federation of Malaysia 3.18%, 4-27-2026 | | | 1.23 | |
|
|
| Portfolio composition as of August 31, 20202 |
|
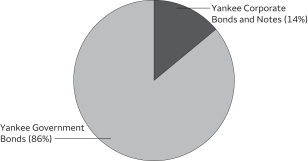
|
| 1 | The ten largest holdings, excluding cash, cash equivalents and any money market funds, are calculated based on the value of the investments divided by the total net assets of the Portfolio. Holdings are subject to change and may have changed since the date specified. |
| 2 | Amounts are calculated based on the total long-term investments of the Portfolio. These amounts are subject to change and may have changed since the date specified. |
2 | Wells Fargo Emerging Markets Bond Portfolio
Portfolio of investments—August 31, 2020 (unaudited)
| | | | | | | | | | | | | | | | |
| | | Interest rate | | | Maturity date | | | Principal | | | Value | |
| Yankee Corporate Bonds and Notes: 13.22% | | | | | | | | | | | | | | | | |
| | | | |
| Azerbaijan: 0.58% | | | | | | | | | | | | |
State Oil Company of the Azerbaijan Republic (Energy, Oil, Gas & Consumable Fuels) | | | 4.75 | % | | | 3-13-2023 | | | $ | 200,000 | | | $ | 210,426 | |
| | | | | | | | | | | | | | | | |
| | | | |
| Bahrain: 0.61% | | | | | | | | | | | | |
Oil & Gas Holding Company (Energy, Oil, Gas & Consumable Fuels) | | | 7.63 | | | | 11-7-2024 | | | | 200,000 | | | | 219,500 | |
| | | | | | | | | | | | | | | | |
| | | | |
| Chile: 1.66% | | | | | | | | | | | | |
Codelco Incorporated (Materials, Metals & Mining) | | | 4.25 | | | | 7-17-2042 | | | | 250,000 | | | | 283,225 | |
Codelco Incorporated (Materials, Metals & Mining) | | | 4.88 | | | | 11-4-2044 | | | | 250,000 | | | | 313,738 | |
| | | | |
| | | | | | | | | | | | | | | 596,963 | |
| | | | | | | | | | | | | | | | |
| | | | |
| China: 1.78% | | | | | | | | | | | | |
Sinopec Group Overseas Development (2015) Limited (Energy, Oil, Gas & Consumable Fuels) | | | 3.00 | | | | 4-12-2022 | | | | 200,000 | | | | 206,277 | |
Sinopec Group Overseas Development (2015) Limited (Energy, Oil, Gas & Consumable Fuels) | | | 3.25 | | | | 4-28-2025 | | | | 200,000 | | | | 217,443 | |
State Grid Overseas Investment (2016) Limited (Utilities, Electric Utilities) | | | 2.88 | | | | 5-18-2026 | | | | 200,000 | | | | 217,918 | |
| | | | |
| | | | | | | | | | | | | | | 641,638 | |
| | | | | | | | | | | | | | | | |
| | | | |
| Hong Kong: 0.60% | | | | | | | | | | | | |
CNAC Hong Kong Finbridge Company Limited (Materials, Chemicals) | | | 4.63 | | | | 3-14-2023 | | | | 200,000 | | | | 214,545 | |
| | | | | | | | | | | | | | | | |
| | | | |
| Indonesia: 1.28% | | | | | | | | | | | | |
PT Indonesia Asahan Aluminium Persero Tbk (Materials, Metals & Mining) | | | 5.71 | | | | 11-15-2023 | | | | 200,000 | | | | 221,300 | |
PT Pertamina Persero Tbk (Energy, Oil, Gas & Consumable Fuels) | | | 5.63 | | | | 5-20-2043 | | | | 200,000 | | | | 240,000 | |
| | | | |
| | | | | | | | | | | | | | | 461,300 | |
| | | | | | | | | | | | | | | | |
| | | | |
| Kazakhstan: 0.70% | | | | | | | | | | | | |
KazMunayGas National Company JSC (Energy, Oil, Gas & Consumable Fuels) | | | 5.75 | | | | 4-19-2047 | | | | 200,000 | | | | 250,021 | |
| | | | | | | | | | | | | | | | |
| | | | |
| Malaysia: 1.07% | | | | | | | | | | | | |
Petronas Capital Limited (Energy, Oil, Gas & Consumable Fuels) | | | 4.50 | | | | 3-18-2045 | | | | 300,000 | | | | 384,909 | |
| | | | | | | | | | | | | | | | |
| | | | |
| Mexico: 2.19% | | | | | | | | | | | | |
Petroleos Mexicanos Company (Energy, Oil, Gas & Consumable Fuels) | | | 5.63 | | | | 1-23-2046 | | | | 250,000 | | | | 195,000 | |
Petroleos Mexicanos Company (Energy, Oil, Gas & Consumable Fuels) 144A | | | 5.95 | | | | 1-28-2031 | | | | 470,000 | | | | 424,598 | |
Petroleos Mexicanos Company (Energy, Oil, Gas & Consumable Fuels) | | | 6.75 | | | | 9-21-2047 | | | | 200,000 | | | | 166,980 | |
| | | | |
| | | | | | | | | | | | | | | 786,578 | |
| | | | | | | | | | | | | | | | |
| | | | |
| Netherlands: 0.80% | | | | | | | | | | | | |
MDC-GMTN BV (Financials, Diversified Financial Services) | | | 3.75 | | | | 4-19-2029 | | | | 250,000 | | | | 287,290 | |
| | | | | | | | | | | | | | | | |
| | | | |
| Peru: 0.62% | | | | | | | | | | | | |
Corporacion Financiera de Desarollo SA (Financials, Diversified Financial Services) | | | 4.75 | | | | 7-15-2025 | | | | 200,000 | | | | 224,302 | |
| | | | | | | | | | | | | | | | |
| | | | |
| Saudi Arabia: 0.57% | | | | | | | | | | | | |
KSA Sukuk Limited (Financials, Diversified Financial Services) | | | 2.89 | | | | 4-20-2022 | | | | 200,000 | | | | 206,056 | |
| | | | | | | | | | | | | | | | |
| | | | |
| United Arab Emirates: 0.68% | | | | | | | | | | | | |
Abu Dhabi Crude Oil Pipeline LLC (Energy, Oil, Gas & Consumable Fuels) | | | 4.60 | | | | 11-2-2047 | | | | 200,000 | | | | 243,984 | |
| | | | | | | | | | | | | | | | |
| | | | |
| Venezuela: 0.08% | | | | | | | | | | | | |
Petroleos de Venezuela SA (Energy, Oil, Gas & Consumable Fuels) † | | | 5.38 | | | | 4-12-2027 | | | | 200,000 | | | | 5,000 | |
Petroleos de Venezuela SA (Energy, Oil, Gas & Consumable Fuels) † | | | 5.38 | | | | 4-12-2027 | | | | 350,000 | | | | 8,750 | |
The accompanying notes are an integral part of these financial statements.
Wells Fargo Emerging Markets Bond Portfolio | 3
Portfolio of investments—August 31, 2020 (unaudited)
| | | | | | | | | | | | | | | | |
| | | Interest rate | | | Maturity date | | | Principal | | | Value | |
| | | | |
| Venezuela (continued) | | | | | | | | | | | | |
Petroleos de Venezuela SA (Energy, Oil, Gas & Consumable Fuels) † | | | 5.50 | % | | | 4-12-2037 | | | $ | 200,000 | | | $ | 5,000 | |
Petroleos de Venezuela SA (Energy, Oil, Gas & Consumable Fuels) † | | | 9.00 | | | | 11-17-2021 | | | | 400,000 | | | | 10,000 | |
| | | | |
| | | | | | | | | | | | | | | 28,750 | |
| | | | | | | | | | | | | | | | |
| | | | |
Total Yankee Corporate Bonds and Notes (Cost $4,974,139) | | | | | | | | | | | | | | | 4,756,262 | |
| | | | | | | | | | | | | | | | |
| | | | |
| Yankee Government Bonds: 83.26% | | | | | | | | | | | | |
Abu Dhabi Government | | | 2.50 | | | | 10-11-2022 | | | | 200,000 | | | | 206,967 | |
Abu Dhabi Government | | | 3.13 | | | | 9-30-2049 | | | | 200,000 | | | | 215,000 | |
Abu Dhabi Government | | | 3.88 | | | | 4-16-2050 | | | | 200,000 | | | | 243,421 | |
Arab Republic of Egypt | | | 5.88 | | | | 6-11-2025 | | | | 200,000 | | | | 205,856 | |
Arab Republic of Egypt | | | 6.13 | | | | 1-31-2022 | | | | 200,000 | | | | 205,426 | |
Arab Republic of Egypt | | | 8.50 | | | | 1-31-2047 | | | | 250,000 | | | | 256,205 | |
Arab Republic of Egypt | | | 8.70 | | | | 3-1-2049 | | | | 200,000 | | | | 205,344 | |
China Development Bank | | | 4.00 | | | | 1-24-2037 | | | | 350,000 | | | | 413,361 | |
China Government | | | 1.88 | | | | 12-3-2022 | | | | 200,000 | | | | 205,776 | |
Dominican Republic | | | 5.88 | | | | 1-30-2060 | | | | 200,000 | | | | 191,400 | |
Dominican Republic | | | 5.95 | | | | 1-25-2027 | | | | 350,000 | | | | 375,025 | |
Dominican Republic | | | 6.00 | | | | 7-19-2028 | | | | 200,000 | | | | 215,400 | |
Export-Import Bank of India | | | 4.00 | | | | 1-14-2023 | | | | 250,000 | | | | 263,188 | |
Federation of Malaysia | | | 3.18 | | | | 4-27-2026 | | | | 400,000 | | | | 441,980 | |
Federative Republic of Brazil | | | 2.63 | | | | 1-5-2023 | | | | 200,000 | | | | 206,200 | |
Federative Republic of Brazil | | | 4.50 | | | | 5-30-2029 | | | | 200,000 | | | | 216,500 | |
Federative Republic of Brazil | | | 4.63 | | | | 1-13-2028 | | | | 400,000 | | | | 441,600 | |
Federative Republic of Brazil | | | 5.63 | | | | 1-7-2041 | | | | 250,000 | | | | 280,125 | |
Government of Jamaica | | | 7.88 | | | | 7-28-2045 | | | | 300,000 | | | | 393,600 | |
Islamic Republic of Pakistan | | | 8.25 | | | | 4-15-2024 | | | | 350,000 | | | | 380,905 | |
Kingdom of Bahrain | | | 6.75 | | | | 9-20-2029 | | | | 200,000 | | | | 225,250 | |
Kingdom of Bahrain | | | 7.00 | | | | 10-12-2028 | | | | 400,000 | | | | 455,904 | |
Kingdom of Jordan | | | 5.75 | | | | 1-31-2027 | | | | 300,000 | | | | 308,494 | |
Kingdom of Morocco | | | 4.25 | | | | 12-11-2022 | | | | 200,000 | | | | 210,213 | |
Kuwait Government | | | 3.50 | | | | 3-20-2027 | | | | 200,000 | | | | 226,248 | |
Lebanese Republic † | | | 6.60 | | | | 11-27-2026 | | | | 300,000 | | | | 47,784 | |
Lebanese Republic † | | | 7.05 | | | | 11-2-2035 | | | | 200,000 | | | | 32,000 | |
Lebanese Republic † | | | 8.25 | | | | 4-12-2021 | | | | 350,000 | | | | 62,825 | |
Oman Government | | | 3.88 | | | | 3-8-2022 | | | | 300,000 | | | | 297,024 | |
Oman Government | | | 6.50 | | | | 3-8-2047 | | | | 400,000 | | | | 354,496 | |
Oriental Republic of Uruguay | | | 4.38 | | | | 10-27-2027 | | | | 200,000 | | | | 232,300 | |
Oriental Republic of Uruguay | | | 5.10 | | | | 6-18-2050 | | | | 250,000 | | | | 344,378 | |
Oriental Republic of Uruguay | | | 7.88 | | | | 1-15-2033 | | | | 125,000 | | | | 195,188 | |
Perusahaan Penerbit SBSN Indonesia III | | | 4.55 | | | | 3-29-2026 | | | | 200,000 | | | | 229,822 | |
Perusahaan Penerbit SBSN Indonesia III | | | 4.45 | | | | 2-20-2029 | | | | 200,000 | | | | 233,342 | |
Qatar Government | | | 3.25 | | | | 6-2-2026 | | | | 200,000 | | | | 220,716 | |
Qatar Government | | | 4.00 | | | | 3-14-2029 | | | | 400,000 | | | | 467,795 | |
Qatar Government | | | 4.63 | | | | 6-2-2046 | | | | 450,000 | | | | 597,380 | |
Republic of Angola | | | 8.25 | | | | 5-9-2028 | | | | 200,000 | | | | 169,775 | |
Republic of Angola | | | 9.50 | | | | 11-12-2025 | | | | 200,000 | | | | 184,000 | |
Republic of Argentina † | | | 4.63 | | | | 1-11-2023 | | | | 100,000 | | | | 47,001 | |
Republic of Argentina † | | | 5.63 | | | | 1-26-2022 | | | | 350,000 | | | | 166,250 | |
Republic of Argentina † | | | 7.50 | | | | 4-22-2026 | | | | 350,000 | | | | 159,254 | |
Republic of Argentina † | | | 7.63 | | | | 4-22-2046 | | | | 250,000 | | | | 109,378 | |
Republic of Azerbaijan | | | 3.50 | | | | 9-1-2032 | | | | 200,000 | | | | 204,008 | |
Republic of Belarus | | | 7.63 | | | | 6-29-2027 | | | | 200,000 | | | | 198,248 | |
Republic of Chile | | | 3.50 | | | | 1-25-2050 | | | | 200,000 | | | | 234,502 | |
Republic of Chile | | | 3.86 | | | | 6-21-2047 | | | | 150,000 | | | | 184,650 | |
The accompanying notes are an integral part of these financial statements.
4 | Wells Fargo Emerging Markets Bond Portfolio
Portfolio of investments—August 31, 2020 (unaudited)
| | | | | | | | | | | | | | | | |
| | | Interest rate | | | Maturity date | | | Principal | | | Value | |
| | | | |
| Yankee Government Bonds (continued) | | | | | | | | | | | | |
Republic of Colombia | | | 3.88 | % | | | 4-25-2027 | | | $ | 200,000 | | | $ | 217,200 | |
Republic of Colombia | | | 4.50 | | | | 1-28-2026 | | | | 200,000 | | | | 221,500 | |
Republic of Colombia | | | 5.00 | | | | 6-15-2045 | | | | 286,000 | | | | 340,769 | |
Republic of Colombia | | | 7.38 | | | | 9-18-2037 | | | | 250,000 | | | | 356,250 | |
Republic of Costa Rica | | | 7.00 | | | | 4-4-2044 | | | | 350,000 | | | | 319,375 | |
Republic of Cote d’Ivoire | | | 6.13 | | | | 6-15-2033 | | | | 200,000 | | | | 201,500 | |
Republic of Croatia | | | 6.00 | | | | 1-26-2024 | | | | 200,000 | | | | 231,968 | |
Republic of Ecuador | | | 7.95 | | | | 7-31-2040 | | | | 350,000 | | | | 196,000 | |
Republic of Ecuador | | | 7.95 | | | | 7-31-2040 | | | | 200,000 | | | | 112,000 | |
Republic of Ecuador | | | 9.63 | | | | 7-31-2040 | | | | 300,000 | | | | 155,250 | |
Republic of El Salvador | | | 7.65 | | | | 6-15-2035 | | | | 347,000 | | | | 326,701 | |
Republic of Gabon | | | 6.38 | | | | 12-12-2024 | | | | 150,000 | | | | 148,448 | |
Republic of Ghana | | | 7.63 | | | | 5-16-2029 | | | | 300,000 | | | | 286,565 | |
Republic of Ghana | | | 8.63 | | | | 6-16-2049 | | | | 200,000 | | | | 181,750 | |
Republic of Guatemala | | | 4.38 | | | | 6-5-2027 | | | | 200,000 | | | | 217,100 | |
Republic of Hungary | | | 5.38 | | | | 2-21-2023 | | | | 270,000 | | | | 298,074 | |
Republic of Hungary | | | 5.38 | | | | 3-25-2024 | | | | 200,000 | | | | 229,968 | |
Republic of Indonesia | | | 4.10 | | | | 4-24-2028 | | | | 300,000 | | | | 342,360 | |
Republic of Indonesia | | | 5.13 | | | | 1-15-2045 | | | | 200,000 | | | | 258,262 | |
Republic of Indonesia | | | 7.75 | | | | 1-17-2038 | | | | 25,000 | | | | 39,421 | |
Republic of Iraq | | | 5.80 | | | | 1-15-2028 | | | | 234,375 | | | | 219,750 | |
Republic of Kazakhstan | | | 4.88 | | | | 10-14-2044 | | | | 300,000 | | | | 407,800 | |
Republic of Kazakhstan | | | 5.13 | | | | 7-21-2025 | | | | 200,000 | | | | 234,032 | |
Republic of Kenya | | | 6.88 | | | | 6-24-2024 | | | | 200,000 | | | | 205,610 | |
Republic of Kenya | | | 8.25 | | | | 2-28-2048 | | | | 200,000 | | | | 201,000 | |
Republic of Nigeria | | | 7.63 | | | | 11-21-2025 | | | | 200,000 | | | | 211,984 | |
Republic of Nigeria | | | 7.88 | | | | 2-16-2032 | | | | 300,000 | | | | 303,180 | |
Republic of Panama | | | 4.00 | | | | 9-22-2024 | | | | 563,000 | | | | 617,898 | |
Republic of Panama | | | 4.50 | | | | 5-15-2047 | | | | 350,000 | | | | 449,400 | |
Republic of Paraguay | | | 5.00 | | | | 4-15-2026 | | | | 250,000 | | | | 287,500 | |
Republic of Peru | | | 4.13 | | | | 8-25-2027 | | | | 100,000 | | | | 116,500 | |
Republic of Peru | | | 6.55 | | | | 3-14-2037 | | | | 365,000 | | | | 566,480 | |
Republic of Peru | | | 7.35 | | | | 7-21-2025 | | | | 100,000 | | | | 128,550 | |
Republic of Peru | | | 8.75 | | | | 11-21-2033 | | | | 25,000 | | | | 42,488 | |
Republic of Philippines | | | 3.70 | | | | 2-2-2042 | | | | 400,000 | | | | 463,760 | |
Republic of Philippines | | | 4.20 | | | | 1-21-2024 | | | | 200,000 | | | | 221,454 | |
Republic of Philippines | | | 5.50 | | | | 3-30-2026 | | | | 150,000 | | | | 184,034 | |
Republic of Philippines | | | 6.38 | | | | 1-15-2032 | | | | 300,000 | | | | 422,760 | |
Republic of Poland | | | 3.25 | | | | 4-6-2026 | | | | 400,000 | | | | 451,248 | |
Republic of Poland | | | 4.00 | | | | 1-22-2024 | | | | 200,000 | | | | 222,984 | |
Republic of South Africa | | | 4.85 | | | | 9-30-2029 | | | | 600,000 | | | | 584,916 | |
Republic of South Africa | | | 6.25 | | | | 3-8-2041 | | | | 200,000 | | | | 199,000 | |
Republic of Sri Lanka | | | 5.75 | | | | 1-18-2022 | | | | 250,000 | | | | 232,500 | |
Republic of Sri Lanka | | | 6.75 | | | | 4-18-2028 | | | | 300,000 | | | | 243,750 | |
Republic of Turkey | | | 5.60 | | | | 11-14-2024 | | | | 200,000 | | | | 195,162 | |
Republic of Turkey | | | 6.63 | | | | 2-17-2045 | | | | 400,000 | | | | 359,000 | |
Republic of Turkey | | | 7.38 | | | | 2-5-2025 | | | | 200,000 | | | | 207,872 | |
Republic of Turkey | | | 7.63 | | | | 4-26-2029 | | | | 200,000 | | | | 208,200 | |
Republic of Venezuela † | | | 6.00 | | | | 12-9-2020 | | | | 225,000 | | | | 15,750 | |
Republic of Venezuela † | | | 7.00 | | | | 3-31-2038 | | | | 200,000 | | | | 14,000 | |
Republic of Venezuela † | | | 9.00 | | | | 5-7-2023 | | | | 1,010,000 | | | | 70,700 | |
Republic of Zambia | | | 8.50 | | | | 4-14-2024 | | | | 200,000 | | | | 103,787 | |
Romania Government | | | 4.38 | | | | 8-22-2023 | | | | 200,000 | | | | 215,620 | |
Romania Government | | | 4.88 | | | | 1-22-2024 | | | | 250,000 | | | | 274,726 | |
Romania Government | | | 5.13 | | | | 6-15-2048 | | | | 200,000 | | | | 236,829 | |
Russian Federation | | | 4.50 | | | | 4-4-2022 | | | | 200,000 | | | | 209,824 | |
The accompanying notes are an integral part of these financial statements.
Wells Fargo Emerging Markets Bond Portfolio | 5
Portfolio of investments—August 31, 2020 (unaudited)
| | | | | | | | | | | | | | | | |
| | | Interest rate | | | Maturity date | | | Principal | | | Value | |
| | | | |
| Yankee Government Bonds (continued) | | | | | | | | | | | | |
Russian Federation | | | 4.88 | % | | | 9-16-2023 | | | $ | 200,000 | | | $ | 220,400 | |
Russian Federation | | | 12.75 | | | | 6-24-2028 | | | | 250,000 | | | | 431,028 | |
Russian Federation | | | 5.63 | | | | 4-4-2042 | | | | 200,000 | | | | 271,644 | |
Saudi Government | | | 2.88 | | | | 3-4-2023 | | | | 200,000 | | | | 208,280 | |
Saudi Government | | | 3.63 | | | | 3-4-2028 | | | | 200,000 | | | | 221,656 | |
Saudi Government | | | 4.50 | | | | 4-17-2030 | | | | 200,000 | | | | 238,448 | |
Saudi Government | | | 4.50 | | | | 10-26-2046 | | | | 200,000 | | | | 241,780 | |
Saudi Government | | | 4.63 | | | | 10-4-2047 | | | | 200,000 | | | | 245,284 | |
Trinidad & Tobago Government | | | 4.50 | | | | 8-4-2026 | | | | 200,000 | | | | 205,800 | |
Ukraine Government | | | 7.38 | | | | 9-25-2032 | | | | 200,000 | | | | 202,475 | |
Ukraine Government | | | 7.75 | | | | 9-1-2023 | | | | 200,000 | | | | 212,500 | |
Ukraine Government | | | 7.75 | | | | 9-1-2025 | | | | 400,000 | | | | 421,466 | |
United Mexican States | | | 4.00 | | | | 10-2-2023 | | | | 200,000 | | | | 217,900 | |
United Mexican States | | | 4.50 | | | | 1-31-2050 | | | | 200,000 | | | | 218,450 | |
United Mexican States | | | 4.60 | | | | 2-10-2048 | | | | 200,000 | | | | 219,550 | |
United Mexican States | | | 6.75 | | | | 9-27-2034 | | | | 150,000 | | | | 204,596 | |
| | | | |
Total Yankee Government Bonds (Cost $30,918,400) | | | | | | | | | | | | | | | 29,953,270 | |
| | | | | | | | | | | | | | | | |
| | | | |
| | | | | | | | | | | | | | | | |
| | | Yield | | | | | | Shares | | | | |
| Short-Term Investments: 2.27% | | | | | | | | | | | | | | | | |
| | | | |
| Investment Companies: 2.27% | | | | | | | | | | | | |
Wells Fargo Government Money Market Fund Select Class (l)(u) | | | 0.06 | | | | | | | | 816,002 | | | | 816,002 | |
| | | | | | | | | | | | | | | | |
| | | | |
Total Short-Term Investments (Cost $816,002) | | | | | | | | | | | | | | | 816,002 | |
| | | | | | | | | | | | | | | | |
| | | | | | | | |
| Total investments in securities (Cost $36,708,541) | | | 98.75 | % | | | 35,525,534 | |
| | |
Other assets and liabilities, net | | | 1.25 | | | | 450,176 | |
| | | | | | | | |
| Total net assets | | | 100.00 | % | | $ | 35,975,710 | |
| | | | | | | | |
| 144A | The security may be resold in transactions exempt from registration, normally to qualified institutional buyers, pursuant to Rule 144A under the Securities Act of 1933. |
| † | Non-income-earning security |
| (l) | The issuer of the security is an affiliated person of the Portfolio as defined in the Investment Company Act of 1940. |
| (u) | The rate represents the 7-day annualized yield at period end. |
Investments in Affiliates
An affiliated investment is an investment in which the Portfolio owns at least 5% of the outstanding voting shares of the issuer or as a result of other relationships, such as the Portfolio and the issuer having the same adviser or investment manager. Transactions with issuers that were either affiliated persons of the Portfolio at the beginning of the period or the end of the period were as follows:
| | | | | | | | | | | | | | | | | | | | | | | | | | | | | | | | |
| | | Value,
beginning of
period | | | Purchases | | | Sales proceeds | | | Net
realized
gains
(losses) | | | Net
change in
unrealized
gains
(losses) | | | Income
from
affiliated
securities | | | Value,
end of
period | | | % of
net
assets | |
| | | | | | | | |
| Short-Term Investments | | | | | | | | | | | | | | | | | | | | | | | | |
Investment Companies | | | | | | | | | | | | | | | | | | | | | | | | | | | | | | | | |
Wells Fargo Government Money Market Fund Select Class | | $ | 922,295 | | | $ | 6,740,656 | | | ($ | 6,846,949 | ) | | $ | 0 | | | $ | 0 | | | $ | 397 | | | $ | 816,002 | | | | 2.27 | % |
The accompanying notes are an integral part of these financial statements.
6 | Wells Fargo Emerging Markets Bond Portfolio
Statement of assets and liabilities—August 31, 2020 (unaudited)
| | | | |
| | | | |
| |
Assets | | | | |
Investments in unaffiliated securities, at value (cost $35,892,539) | | $ | 34,709,532 | |
Investments in affiliated securities, at value (cost $816,002) | | | 816,002 | |
Receivable for interest | | | 496,016 | |
Prepaid expenses and other assets | | | 641 | |
| | | | |
Total assets | | | 36,022,191 | |
| | | | |
| |
Liabilities | | | | |
Shareholder report expenses payable | | | 16,371 | |
Advisory fee payable | | | 13,175 | |
Professional fees payable | | | 13,917 | |
Trustees’ fees and expenses payable | | | 1,876 | |
Accrued expenses and other liabilities | | | 1,142 | |
| | | | |
Total liabilities | | | 46,481 | |
| | | | |
Total net assets | | $ | 35,975,710 | |
| | | | |
The accompanying notes are an integral part of these financial statements.
Wells Fargo Emerging Markets Bond Portfolio | 7
Statement of operations—six months ended August 31, 2020 (unaudited)
| | | | |
| | | | |
| |
Investment income | | | | |
Interest | | $ | 916,696 | |
Income from affiliated securities | | | 397 | |
| | | | |
Total investment income | | | 917,093 | |
| | | | |
| |
Expenses | | | | |
Advisory fee | | | 45,155 | |
Custody and accounting fees | | | 6,878 | |
Professional fees | | | 27,834 | |
Shareholder report expenses | | | 4,155 | |
Trustees’ fees and expenses | | | 9,898 | |
Other fees and expenses | | | 4,031 | |
| | | | |
Total expenses | | | 97,951 | |
Less: Fee waivers and/or expense reimbursements | | | (43,511 | ) |
| | | | |
Net expenses | | | 54,440 | |
| | | | |
Net investment income | | | 862,653 | |
| | | | |
| |
Realized and unrealized gains (losses) on investments | | | | |
Net realized gains on investments | | | 55,207 | |
Net change in unrealized gains (losses) on investments | | | (949,086 | ) |
| | | | |
Net realized and unrealized gains (losses) on investments | | | (893,879 | ) |
| | | | |
Net decrease in net assets resulting from operations | | $ | (31,226 | ) |
| | | | |
The accompanying notes are an integral part of these financial statements.
8 | Wells Fargo Emerging Markets Bond Portfolio
Statement of changes in net assets
| | | | | | | | |
| | | Six months ended
August 31, 2020
(unaudited) | | | Year ended
February 29, 2020 | |
| | |
Operations | | | | | | | | |
Net investment income | | $ | 862,653 | | | $ | 2,165,344 | |
Net realized gains on investments | | | 55,207 | | | | 332,518 | |
Net change in unrealized gains (losses) on investments | | | (949,086 | ) | | | 1,113,039 | |
| | | | |
Net increase (decrease) in net assets resulting from operations | | | (31,226 | ) | | | 3,610,901 | |
| | | | |
| | |
Capital transactions | | | | | | | | |
Transactions in investors’ beneficial interests | | | | | | | | |
Contributions | | | 4,329,562 | | | | 5,447,656 | |
Withdrawals | | | (10,870,314 | ) | | | (10,607,041 | ) |
| | | | |
Net decrease in net assets resulting from capital transactions | | | (6,540,752 | ) | | | (5,159,385 | ) |
| | | | |
Total decrease in net assets | | | (6,571,978 | ) | | | (1,548,484 | ) |
| | | | |
| | |
Net assets | | | | | | | | |
Beginning of period | | | 42,547,688 | | | | 44,096,172 | |
| | | | |
End of period | | $ | 35,975,710 | | | $ | 42,547,688 | |
| | | | |
The accompanying notes are an integral part of these financial statements.
Wells Fargo Emerging Markets Bond Portfolio | 9
Financial highlights
| | | | | | | | | | | | | | | | |
| | | Six months ended
August 31, 2020
(unaudited) | | | Year ended
February 29, 2020 | | | Year ended February 28 | |
| | | 2019 | | | 20181 | |
Total return2 | | | (0.07 | )% | | | 8.59 | % | | | 2.84 | % | | | 0.62 | % |
Ratios to average net assets (annualized) | | | | | | | | | | | | | | | | |
Gross expenses | | | 0.54 | % | | | 0.51 | % | | | 0.44 | % | | | 0.44 | % |
Net expenses | | | 0.30 | % | | | 0.35 | % | | | 0.40 | % | | | 0.43 | % |
Net investment income | | | 4.78 | % | | | 4.95 | % | | | 4.70 | % | | | 4.19 | % |
Supplemental data | | | | | | | | | | | | | | | | |
Portfolio turnover rate | | | 14 | % | | | 36 | % | | | 38 | % | | | 174 | % |
| 1 | For the period from May 23, 2017 (commencement of operations) to February 28, 2018 |
| 2 | Returns for periods of less than one year are not annualized. |
The accompanying notes are an integral part of these financial statements.
10 | Wells Fargo Emerging Markets Bond Portfolio
Notes to financial statements (unaudited)
1. ORGANIZATION
Wells Fargo Master Trust (the “Trust”), a Delaware statutory trust organized on March 10, 1999, is an open-end management investment company registered under the Investment Company Act of 1940, as amended (the “1940 Act”). As an investment company, the Trust follows the accounting and reporting guidance in Financial Accounting Standards Board (“FASB”) Accounting Standards Codification Topic 946, Financial Services – Investment Companies. These financial statements report on the Wells Fargo Emerging Markets Bond Portfolio (the “Portfolio”) which is a diversified series of the Trust.
Interests in the Portfolio are available solely through private placement transactions that do not involve any “public offering” within the meaning of Section 4(2) of the Investment Company Act of 1933.
2. SIGNIFICANT ACCOUNTING POLICIES
The following significant accounting policies, which are consistently followed in the preparation of the financial statements of the Portfolio, are in conformity with U.S. generally accepted accounting principles which require management to make estimates and assumptions that affect the reported amounts of assets and liabilities, disclosure of contingent assets and liabilities at the date of the financial statements, and the reported amounts of revenues and expenses during the reporting period. Actual results could differ from those estimates.
Securities valuation
All investments are valued each business day as of the close of regular trading on the New York Stock Exchange (generally 4 p.m. Eastern Time), although the Portfolio may deviate from this calculation time under unusual or unexpected circumstances.
Debt securities are valued at the evaluated bid price provided by an independent pricing service (e.g. taking into account various factors, including yields, maturities, or credit ratings) or, if a reliable price is not available, the quoted bid price from an independent broker-dealer.
Investments in registered open-end investment companies are valued at net asset value.
Investments which are not valued using any of the methods discussed above are valued at their fair value, as determined in good faith by the Board of Trustees of the Portfolio. The Board of Trustees has established a Valuation Committee comprised of the Trustees and has delegated to it the authority to take any actions regarding the valuation of portfolio securities that the Valuation Committee deems necessary or appropriate, including determining the fair value of portfolio securities, unless the determination has been delegated to the Wells Fargo Asset Management Pricing Committee at Wells Fargo Funds Management, LLC (“Funds Management”). The Board of Trustees retains the authority to make or ratify any valuation decisions or approve any changes to the Valuation Procedures as it deems appropriate. On a quarterly basis, the Board of Trustees receives reports on any valuation actions taken by the Valuation Committee or the Wells Fargo Asset Management Pricing Committee which may include items for ratification.
Security transactions and income recognition
Securities transactions are recorded on a trade date basis. Realized gains or losses are recorded on the basis of identified cost.
Interest income is accrued daily and bond discounts are accreted and premiums are amortized daily. To the extent debt obligations are placed on non-accrual status, any related interest income may be reduced by writing off interest receivables when the collection of all or a portion of interest has been determined to be doubtful based on consistently applied procedures and the fair value has decreased. If the issuer subsequently resumes interest payments or when the collectability of interest is reasonably assured, the debt obligation is removed from non-accrual status.
Federal and other taxes
The Portfolio is not required to pay federal income taxes on its net investment income and net capital gains as it is treated as a partnership for federal income tax purposes. All income, gains and losses of the Portfolio are deemed to have been “passed through” to the interest holders in proportion to their holdings of the Portfolio regardless of whether income and gains have been distributed by the Portfolio.
The Portfolio’s income tax returns and all financial records supporting those returns for the prior three fiscal years are subject to examination by the federal revenue authority. Management has analyzed the Portfolio’s tax positions taken on federal, state, and foreign tax returns for all open tax years and does not believe that there are any uncertain tax positions that require recognition of a tax liability.
Wells Fargo Emerging Markets Bond Portfolio | 11
Notes to financial statements (unaudited)
As of August 31, 2020, the aggregate cost of all investments for federal income tax purposes was $36,717,230 and the unrealized gains (losses) consisted of:
| | | | |
| |
Gross unrealized gains | | $ | 2,492,857 | |
| |
Gross unrealized losses | | | (3,684,553 | ) |
| |
Net unrealized losses | | $ | (1,191,696 | ) |
3. FAIR VALUATION MEASUREMENTS
Fair value measurements of investments are determined within a framework that has established a fair value hierarchy based upon the various data inputs utilized in determining the value of the Portfolio’s investments. The three-level hierarchy gives the highest priority to unadjusted quoted prices in active markets for identical assets or liabilities (Level 1) and the lowest priority to unobservable inputs (Level 3). The Portfolio’s investments are classified within the fair value hierarchy based on the lowest level of input that is significant to the fair value measurement. The inputs are summarized into three broad levels as follows:
| ∎ | | Level 1 – quoted prices in active markets for identical securities |
| ∎ | | Level 2 – other significant observable inputs (including quoted prices for similar securities, interest rates, prepayment speeds, credit risk, etc.) |
| ∎ | | Level 3 – significant unobservable inputs (including the Portfolio’s own assumptions in determining the fair value of investments) |
The inputs or methodologies used for valuing investments in securities are not necessarily an indication of the risk associated with investing in those securities.
The following is a summary of the inputs used in valuing the Portfolio’s assets and liabilities as of August 31, 2020:
| | | | | | | | | | | | | | | | |
| | | | |
| | | Quoted prices (Level 1) | | | Other significant observable inputs (Level 2) | | | Significant unobservable inputs (Level 3) | | | Total | |
| | | | |
Assets | | | | | | | | | | | | | | | | |
Investments in: | | | | | | | | | | | | | | | | |
| | | | |
Yankee corporate bonds and notes | | $ | 0 | | | $ | 4,756,262 | | | $ | 0 | | | $ | 4,756,262 | |
| | | | |
Yankee government bonds | | | 0 | | | | 29,953,270 | | | | 0 | | | | 29,953,270 | |
| | | | |
Short-term investments | | | | | | | | | | | | | | | | |
| | | | |
Investment companies | | | 816,002 | | | | 0 | | | | 0 | | | | 816,002 | |
| | | | |
Total assets | | $ | 816,002 | | | $ | 34,709,532 | | | $ | 0 | | | $ | 35,525,534 | |
Additional sector, industry or geographic detail is included in the Portfolio of Investments.
For the six months ended August 31, 2020, the Portfolio did not have any transfers into/out of Level 3.
4. TRANSACTIONS WITH AFFILIATES
Advisory fee
The Trust has entered into an advisory contract with Funds Management, an indirect wholly owned subsidiary of Wells Fargo & Company (“Wells Fargo”). The adviser is responsible for implementing investment policies and guidelines and for supervising the subadviser, who is responsible for day-to-day portfolio management of the Portfolio. Pursuant to the contract, Funds Management is entitled to receive an advisory fee at the following annual rate based on the Portfolio’s average daily net assets:
| | | | |
| |
| Average daily net assets | | Advisory fee | |
| |
First $5 billion | | | 0.25 | % |
| |
Next $5 billion | | | 0.23 | |
| |
Over $10 billion | | | 0.21 | |
12 | Wells Fargo Emerging Markets Bond Portfolio
Notes to financial statements (unaudited)
For the six months ended August 31, 2020, the advisory fee was equivalent to an annual rate of 0.25% of the Portfolio’s average daily net assets.
Funds Management has retained the services of a subadviser to provide daily portfolio management to the Portfolio. The fee for subadvisory services is borne by Funds Management. Wells Fargo Asset Management (International) Limited, an affiliate of Funds Management and an indirect wholly owned subsidiary of Wells Fargo, is a subadviser to the Portfolio and is entitled to receive a fee from Funds Management at an annual rate starting at 0.09% and declining to 0.07% as the average daily net assets of the Portfolio increase.
Funds Management has voluntarily waived and/or reimbursed advisory fees to reduce the net operating expenses ratio of the Portfolio.
Interfund transactions
The Portfolio may purchase or sell portfolio investment securities to certain other Wells Fargo affiliates pursuant to Rule 17a-7 under the 1940 Act and under procedures adopted by the Board of Trustees. The procedures have been designed to ensure that these interfund transactions, which do not incur broker commissions, are effected at current market prices.
5. INVESTMENT PORTFOLIO TRANSACTIONS
Purchases and sales of investments, excluding U.S. government obligations (if any) and short-term securities, for the six months ended August 31, 2020 were $12,230,679 and $18,357,586, respectively.
6. BANK BORROWINGS
The Trust, along with Wells Fargo Variable Trust and Wells Fargo Funds Trust (excluding the money market funds), are parties to a $350,000,000 revolving credit agreement whereby the Portfolio is permitted to use bank borrowings for temporary or emergency purposes, such as to fund shareholder redemption requests. Interest under the credit agreement is charged to the Portfolio based on a borrowing rate equal to the higher of the Federal Funds rate in effect on that day plus 1.25% or the overnight LIBOR rate in effect on that day plus 1.25%. In addition, an annual commitment fee equal to 0.25% of the unused balance is allocated to each participating fund.
For the six months ended August 31, 2020, there were no borrowings by the Portfolio under the agreement.
7. INDEMNIFICATION
Under the Portfolio’s organizational documents, the officers and Trustees have been granted certain indemnification rights against certain liabilities that may arise out of performance of their duties to the Portfolio. The Portfolio has entered into a separate agreement with each Trustee that converts indemnification rights currently existing under the Portfolio’s organizational documents into contractual rights that cannot be changed in the future without the consent of the Trustee. Additionally, in the normal course of business, the Portfolio may enter into contracts with service providers that contain a variety of indemnification clauses. The Portfolio’s maximum exposure under these arrangements is dependent on future claims that may be made against the Portfolio and, therefore, cannot be estimated.
8. NEW ACCOUNTING PRONOUNCEMENT
In August 2018, FASB issued Accounting Standards Update (“ASU”) No. 2018-13, Fair Value Measurement (Topic 820) Disclosure Framework—Changes to the Disclosure Requirements for Fair Value Measurement. ASU 2018-13 updates the disclosure requirements on fair value measurements in Topic 820, Fair Value Measurements. The amendments are effective for fiscal years, and interim periods within those fiscal years, beginning after December 15, 2019. Management has adopted this guidance which did not have a material impact on the financial statements.
9. CORONAVIRUS (COVID-19) PANDEMIC
On March 11, 2020, the World Health Organization announced that it had made the assessment that coronavirus disease 2019 (“COVID-19”) is a pandemic. The impacts of COVID-19 are adversely affecting the entire global economy, individual companies and investment products, and the market in general. There is significant uncertainty around the extent and duration of business disruptions related to COVID-19 and the impacts may be short term or may last for an extended period of time. The risk of further spreading of COVID-19 has led to significant uncertainty and volatility in the financial markets.
Wells Fargo Emerging Markets Bond Portfolio | 13
Other information (unaudited)
PROXY VOTING INFORMATION
A description of the policies and procedures used to determine how to vote proxies relating to portfolio securities is available, upon request, by calling 1-800-222-8222, visiting our website at wfam.com, or visiting the SEC website at sec.gov. Information regarding how the proxies related to portfolio securities were voted during the most recent 12-month period ended June 30 is available on the website at wfam.com or by visiting the SEC website at sec.gov.
QUARTERLY PORTFOLIO HOLDINGS INFORMATION
The Portfolio files its complete schedule of portfolio holdings with the SEC for the first and third quarters of each fiscal year as an exhibit to its reports on Form N-PORT. Shareholders may view the filed Form N-PORT by visiting the SEC website at sec.gov.
14 | Wells Fargo Emerging Markets Bond Portfolio
Other information (unaudited)
BOARD OF TRUSTEES AND OFFICERS
Each of the Trustees and Officers1 listed in the table below acts in identical capacities for each fund in the Wells Fargo family of funds, which consists of 142 mutual funds comprising the Wells Fargo Funds Trust, Wells Fargo Variable Trust, Wells Fargo Master Trust and four closed-end funds (collectively the “Fund Complex”). This table should be read in conjunction with the Prospectus and the Statement of Additional Information2. The mailing address of each Trustee and Officer is 525 Market Street, 12th Floor, San Francisco, CA 94105. Each Trustee and Officer serves an indefinite term, however, each Trustee serves such term until reaching the mandatory retirement age established by the Trustees.
Independent Trustees
| | | | | | |
Name and year of birth | | Position held and length of service* | | Principal occupations during past five years or longer | | Current other public company or investment company directorships |
| | | |
William R. Ebsworth (Born 1957) | | Trustee, since 2015 | | Retired. From 1984 to 2013, equities analyst, portfolio manager, research director and chief investment officer at Fidelity Management and Research Company in Boston, Tokyo, and Hong Kong, and retired in 2013 as Chief Investment Officer of Fidelity Strategic Advisers, Inc. where he led a team of investment professionals managing client assets. Prior thereto, Board member of Hong Kong Securities Clearing Co., Hong Kong Options Clearing Corp., the Thailand International Fund, Ltd., Fidelity Investments Life Insurance Company, and Empire Fidelity Investments Life Insurance Company. Audit Committee Chair and Investment Committee Chair of the Vincent Memorial Hospital Endowment (non-profit organization). Mr. Ebsworth is a CFA® charterholder. | | N/A |
| | | |
Jane A. Freeman (Born 1953) | | Trustee, since 2015; Chair Liaison, since 2018 | | Retired. From 2012 to 2014 and 1999 to 2008, Chief Financial Officer of Scientific Learning Corporation. From 2008 to 2012, Ms. Freeman provided consulting services related to strategic business projects. Prior to 1999, Portfolio Manager at Rockefeller & Co. and Scudder, Stevens & Clark. Board member of the Harding Loevner Funds from 1996 to 2014, serving as both Lead Independent Director and chair of the Audit Committee. Board member of the Russell Exchange Traded Funds Trust from 2011 to 2012 and the chair of the Audit Committee. Ms. Freeman is also an inactive Chartered Financial Analyst. | | N/A |
| | | |
Isaiah Harris, Jr. (Born 1952) | | Trustee, since 2009; Audit Committee Chairman, since 2019 | | Retired. Chairman of the Board of CIGNA Corporation since 2009, and Director since 2005. From 2003 to 2011, Director of Deluxe Corporation. Prior thereto, President and CEO of BellSouth Advertising and Publishing Corp. from 2005 to 2007, President and CEO of BellSouth Enterprises from 2004 to 2005 and President of BellSouth Consumer Services from 2000 to 2003. Emeritus member of the Iowa State University Foundation Board of Governors. Emeritus Member of the Advisory Board of Iowa State University School of Business. Advisory Board Member, Palm Harbor Academy (private school). Mr. Harris is a certified public accountant (inactive status). | | CIGNA Corporation |
| | | |
Judith M. Johnson (Born 1949) | | Trustee, since 2008 | | Retired. Prior thereto, Chief Executive Officer and Chief Investment Officer of Minneapolis Employees Retirement Fund from 1996 to 2008. Ms. Johnson is an attorney, certified public accountant and a certified managerial accountant. | | N/A |
| | | |
David F. Larcker (Born 1950) | | Trustee, since 2009 | | James Irvin Miller Professor of Accounting at the Graduate School of Business (Emeritus), Stanford University, Director of the Corporate Governance Research Initiative and Senior Faculty of The Rock Center for Corporate Governance since 2006. From 2005 to 2008, Professor of Accounting at the Graduate School of Business, Stanford University. Prior thereto, Ernst & Young Professor of Accounting at The Wharton School, University of Pennsylvania from 1985 to 2005. | | N/A |
Wells Fargo Emerging Markets Bond Portfolio | 15
Other information (unaudited)
| | | | | | |
Name and year of birth | | Position held and length of service* | | Principal occupations during past five years or longer | | Current other public company or investment company directorships |
| | | |
Olivia S. Mitchell (Born 1953) | | Trustee, since 2006; Nominating and Governance Committee Chair, since 2018 | | International Foundation of Employee Benefit Plans Professor, Wharton School of the University of Pennsylvania since 1993. Director of Wharton’s Pension Research Council and Boettner Center on Pensions & Retirement Research, and Research Associate at the National Bureau of Economic Research. Previously, Cornell University Professor from 1978 to 1993. | | N/A |
| | | |
Timothy J. Penny (Born 1951) | | Trustee, since 1996; Chairman, since 2018 | | President and Chief Executive Officer of Southern Minnesota Initiative Foundation, a non-profit organization, since 2007. Member of the Board of Trustees of NorthStar Education Finance, Inc., a non-profit organization, since 2007. | | N/A |
| | | |
James G. Polisson (Born 1959) | | Trustee, since 2018 | | Retired. Chief Marketing Officer, Source (ETF) UK Services, Ltd, from 2015 to 2017. From 2012 to 2015, Principal of The Polisson Group, LLC, a management consulting, corporate advisory and principal investing company. Chief Executive Officer and Managing Director at Russell Investments, Global Exchange Traded Funds from 2010 to 2012. Managing Director of Barclays Global Investors from 1998 to 2010 and Global Chief Marketing Officer for iShares and Barclays Global Investors from 2000 to 2010. Trustee of the San Francisco Mechanics’ Institute, a non-profit organization, from 2013 to 2015. Board member of the Russell Exchange Traded Fund Trust from 2011 to 2012. Director of Barclays Global Investors Holdings Deutschland GmbH from 2006 to 2009. Mr. Polisson is an attorney and has a retired status with the Massachusetts and District of Columbia Bar Associations. | | N/A |
| | | |
Pamela Wheelock (Born 1959) | | Trustee, since January 2020; previously Trustee from January 2018 to July 2019 | | Board member of the Destination Medical Center Economic Development Agency, Rochester, Minnesota since 2019. Interim President of the McKnight Foundation from January to September 2020. Acting Commissioner, Minnesota Department of Human Services, July 2019 through September 2019. Human Services Manager (part-time), Minnesota Department of Human Services, October 2019 through December 2019. Chief Operating Officer, Twin Cities Habitat for Humanity from 2017 to 2019. Vice President of University Services, University of Minnesota from 2012 to 2016. Prior thereto, on the Board of Directors, Governance Committee and Finance Committee for the Minnesota Philanthropy Partners (Saint Paul Foundation) from 2012 to 2018, Interim Chief Executive Officer of Blue Cross Blue Shield of Minnesota from 2011 to 2012, Chairman of the Board from 2009 to 2012 and Board Director from 2003 to 2015. Vice President, Leadership and Community Engagement, Bush Foundation, Saint Paul, Minnesota (a private foundation) from 2009 to 2011. Executive Vice President and Chief Financial Officer, Minnesota Sports and Entertainment from 2004 to 2009 and Senior Vice President from 2002 to 2004. Executive Vice President of the Minnesota Wild Foundation from 2004 to 2008. Commissioner of Finance, State of Minnesota, from 1999 to 2002. Currently Board Chair of the Minnesota Wild Foundation since 2010. | | N/A |
| * | Length of service dates reflect the Trustee’s commencement of service with the Trust’s predecessor entities, where applicable. |
16 | Wells Fargo Emerging Markets Bond Portfolio
Other information (unaudited)
Officers
| | | | |
Name and year of birth | | Position held and length of service | | Principal occupations during past five years or longer |
| | |
Andrew Owen (Born 1960) | | President, since 2017 | | Executive Vice President of Wells Fargo & Company and Head of Affiliated Managers, Wells Fargo Asset Management, since 2014. In addition, Mr. Owen is currently President, Chief Executive Officer and Director of Wells Fargo Funds Management, LLC since 2017. Prior thereto, Executive Vice President responsible for marketing, investments and product development for Wells Fargo Funds Management, LLC, from 2009 to 2014. |
| | |
Jeremy DePalma1 (Born 1974) | | Treasurer, since 2012 | | Senior Vice President of Wells Fargo Funds Management, LLC since 2009. Senior Vice President of Evergreen Investment Management Company, LLC from 2008 to 2010 and head of the Fund Reporting and Control Team within Fund Administration from 2005 to 2010. |
| | |
Michelle Rhee (Born 1966) | | Chief Legal Officer, since 2019 | | Secretary of Wells Fargo Funds Management, LLC, Chief Legal Counsel of Wells Fargo Asset Management and Assistant General Counsel of Wells Fargo Bank, N.A. since 2018. Associate General Counsel and Managing Director of Bank of America Corporation from 2004 to 2018. |
| | |
Catherine Kennedy (Born 1969) | | Secretary, since 2019 | | Vice President of Wells Fargo Funds Management, LLC and Senior Counsel of the Wells Fargo Legal Department since 2010. Vice President and Senior Counsel of Evergreen Investment Management Company, LLC from 1998 to 2010. |
| | |
Michael H. Whitaker (Born 1967) | | Chief Compliance Officer, since 2016 | | Chief Compliance Officer of Wells Fargo Asset Management since 2016. Senior Vice President and Chief Compliance Officer for Fidelity Investments from 2007 to 2016. |
| | |
David Berardi (Born 1975) | | Assistant Treasurer, since 2009 | | Vice President of Wells Fargo Funds Management, LLC since 2009. Vice President of Evergreen Investment Management Company, LLC from 2008 to 2010. Manager of Fund Reporting and Control for Evergreen Investment Management Company, LLC from 2004 to 2010. |
| 1 | Jeremy DePalma acts as Treasurer of 77 funds and Assistant Treasurer of 65 funds in the Fund Complex. |
| 2 | The Statement of Additional Information includes additional information about the Trustees and is available, without charge, upon request, by calling 1-800-222-8222 or by visiting the website at wfam.com. |
Wells Fargo Emerging Markets Bond Portfolio | 17
Other information (unaudited)
BOARD CONSIDERATION OF INVESTMENT MANAGEMENT, ADVISORY AND SUB-ADVISORY AGREEMENTS:
Wells Fargo Emerging Markets Bond Fund, Wells Fargo High Yield Corporate Bond Fund, Wells Fargo International Government Bond Fund, Wells Fargo U.S. Core Bond Fund, Wells Fargo Bloomberg Barclays US Aggregate ex-Corporate Credit Portfolio, Wells Fargo Factor Enhanced Emerging Markets Equity Portfolio, Wells Fargo Emerging Markets Bond Portfolio, Wells Fargo Factor Enhanced International Equity Portfolio, Wells Fargo Factor Enhanced U.S. Large Cap Portfolio, Wells Fargo Factor Enhanced U.S. Small Cap Portfolio, Wells Fargo International Government Bond Portfolio, Wells Fargo Investment Grade Corporate Bond Portfolio, Wells Fargo High Yield Corporate Bond Portfolio, Wells Fargo Strategic Retirement Bond Portfolio, and Wells Fargo U.S. REIT Portfolio
Under the Investment Company Act of 1940 (the “1940 Act”), the Board of Trustees (each, a “Board” and collectively, the “Boards”) of each of Wells Fargo Funds Trust (“Funds Trust”) and Wells Fargo Master Trust (“Master Trust”) (collectively, the “Trusts”) must determine annually whether to approve the continuation of the Trusts’ investment management, advisory and sub-advisory agreements, as applicable. In this regard, at a meeting held on May 26, 2020 and May 28, 2020 (together, the “Meeting”), the Board of Funds Trust, all the members of which have no direct or indirect interest in the investment management agreement and are not “interested persons” of the Trusts, as defined in the 1940 Act (the “Independent Trustees”), reviewed and approved for each of the funds of Funds Trust identified in the table below (individually, an “Index Fund” and collectively, the “Index Funds”) an investment management agreement (the “Management Agreement”) with Wells Fargo Funds Management, LLC (“Funds Management”).
|
|
| Index Funds |
|
Wells Fargo Emerging Markets Bond Fund |
|
Wells Fargo High Yield Corporate Bond Fund |
|
Wells Fargo International Government Bond Fund |
|
Wells Fargo U.S. Core Bond Fund |
In addition, the Funds Trust Board reviewed and approved an investment sub-advisory agreement with Wells Capital Management Incorporated (“WellsCap”) for the U.S. Core Bond Fund (the “Core Bond Fund Sub-Advisory Agreement”).
At the Meeting, the Board of Master Trust, all the members of which have no direct or indirect interest in the investment advisory and sub-advisory agreements and are Independent Trustees, reviewed and approved for each of the portfolios of Master Trust identified in the table below (individually, a “Master Portfolio” and collectively, the “Master Portfolios”): (i) an investment advisory agreement (the “Master Portfolio Advisory Agreement”) with Funds Management; and (ii) an investment sub-advisory agreement (each, a “Master Portfolio Sub-Advisory Agreement”, and collectively, the “Master Portfolio Sub-Advisory Agreements”) with the sub-adviser(s) identified in the chart below (each, a “Sub-Adviser”, and collectively, the “Sub-Advisers”) for the corresponding Master Portfolio identified.
| | |
| |
| Master Portfolios | | Sub-Advisers |
| |
Wells Fargo Bloomberg Barclays US Aggregate ex-Corporate Credit Portfolio | | WellsCap |
| |
Wells Fargo Factor Enhanced Emerging Markets Equity Portfolio | | WellsCap |
| |
Wells Fargo Emerging Markets Bond Portfolio | | Wells Fargo Asset Management (International), Limited (“WFAM International”) |
| |
Wells Fargo Factor Enhanced International Equity Portfolio | | WellsCap |
| |
Wells Fargo Factor Enhanced U.S. Large Cap Portfolio | | WellsCap |
| |
Wells Fargo Factor Enhanced U.S. Small Cap Portfolio | | WellsCap |
| |
Wells Fargo International Government Bond Portfolio | | WFAM International |
| |
Wells Fargo Investment Grade Corporate Bond Portfolio | | WellsCap |
| |
Wells Fargo High Yield Corporate Bond Portfolio | | WellsCap |
| |
Wells Fargo Strategic Retirement Bond Portfolio | | WellsCap |
| |
Wells Fargo U.S. REIT Portfolio | | WellsCap |
18 | Wells Fargo Emerging Markets Bond Portfolio
Other information (unaudited)
The Index Funds and the Master Portfolios are collectively referred to as the “Funds.” The Management Agreement, the Core Bond Fund Sub-Advisory Agreement, the Master Portfolio Advisory Agreement and the Master Portfolio Sub-Advisory Agreements are collectively referred to as the “Advisory Agreements.”
The Boards noted that each of the Index Funds is a feeder fund that invests all of its assets in its corresponding Master Portfolio, with the exception of the U.S. Core Bond Fund, which invests in multiple Master Portfolios. Information provided to the Boards regarding the Index Funds is also applicable to the Master Portfolios identified above, as relevant.
At the Meeting, the Boards considered the factors and reached the conclusions described below relating to the selection of Funds Management and the Sub-Advisers and the approval of the Advisory Agreements. Prior to the Meeting, including at a Board meeting held in April 2020, the Trustees conferred extensively among themselves and with representatives of Funds Management about these matters. Also, the Boards have adopted a team-based approach, with each team consisting of a sub-set of Trustees, to assist the full Boards in the discharge of their duties in reviewing investment performance and other matters throughout the year. The Independent Trustees were assisted in their evaluation of the Advisory Agreements by independent legal counsel, from whom they received separate legal advice and with whom they met separately.
In providing information to the Boards, Funds Management and the Sub-Advisers were guided by a detailed set of requests for information submitted to them by independent legal counsel on behalf of the Independent Trustees at the start of the Boards’ annual contract renewal process earlier in 2020. In considering and approving the Advisory Agreements, the Trustees considered the information they believed relevant, including but not limited to the information discussed below. The Boards considered not only the specific information presented in connection with the Meeting, but also the knowledge gained over time through interaction with Funds Management and the Sub-Advisers about various topics. In this regard, the Boards reviewed reports of Funds Management at each of their quarterly meetings, which included, among other things, portfolio reviews and investment performance reports. In addition, the Boards and the teams mentioned above confer with portfolio managers at various times throughout the year. The Boards did not identify any particular information or consideration that was all-important or controlling, and each individual Trustee may have attributed different weights to various factors.
After its deliberations, the Board of Funds Trust unanimously approved the continuation of the Management Agreement and the Core Bond Fund Sub-Advisory Agreement for a one-year period. Additionally, after its deliberations, the Board of Master Trust unanimously approved the continuation of the Master Portfolio Advisory Agreement and each Master Portfolio Sub-Advisory Agreement for a one-year term. The Boards also determined that the compensation or the absence of compensation payable to Funds Management and to each of the Sub-Advisers under each of the Advisory Agreements was reasonable. The Boards considered the approval of the Advisory Agreements for the Funds as part of their consideration of agreements for funds across the complex, but their approvals were made on a fund-by-fund basis. The following summarizes a number of important, but not necessarily all, factors considered by the Boards in support of their approvals.
Nature, extent and quality of services
The Boards received and considered various information regarding the nature, extent and quality of services provided to the Funds by Funds Management and the Sub-Advisers under the Advisory Agreements. This information included a description of the investment advisory services and Fund-level administrative services covered by the Advisory Agreements, as well as, among other things, a summary of the background and experience of senior management of Wells Fargo Asset Management (“WFAM”), of which Funds Management and the Sub-Advisers are a part, and a summary of investments made in the business of WFAM. The Boards also received a description of Funds Management’s and the Sub-Advisers’ business continuity plans and of their approaches to data privacy and cybersecurity, and related testing. The Boards also received and reviewed information about Funds Management’s role as administrator of the Funds’ liquidity risk management program, Funds Management’s approach to risk management, and Funds Management’s intermediary and vendor oversight program.
The Boards also considered the qualifications, background, tenure and responsibilities of each of the portfolio managers primarily responsible for the day-to-day portfolio management of the Funds. The Board of Master Trust noted that each of the Master Portfolios replicates the performance of a proprietary index provided by an affiliate of Funds Management, except that the Wells Fargo Bloomberg Barclays US Aggregate ex-Corporate Credit Portfolio, the Wells Fargo Emerging Markets Bond Portfolio, and the Wells Fargo Strategic Retirement Bond Portfolio track the performance of third-party indexes. The Boards evaluated the ability of Funds Management and the Sub-Advisers to attract and retain qualified investment professionals, including research, advisory and supervisory personnel. The Boards further considered the compliance programs and compliance records of Funds Management and the Sub-Advisers. In addition, the Boards took into account the full range of services provided to the Funds by Funds Management and its affiliates.
Wells Fargo Emerging Markets Bond Portfolio | 19
Other information (unaudited)
Fund investment performance and expenses
The Boards considered the investment performance results for each of the Master Portfolios for the one-year period ended December 31, 2019. The Boards also considered more current results for the one-year period ended March 31, 2020. The Boards considered these results in comparison to the investment performance of funds in a universe that was determined by Broadridge Inc. (“Broadridge”) to be similar to the respective Master Portfolios (each, a “Universe”), and in comparison to each Master Portfolio’s benchmark index and to other comparative data. Broadridge is an independent provider of investment company data. The Boards received a description of the methodology used by Broadridge to select the mutual funds in each performance Universe.
The Boards noted the short performance history of the Master Portfolios. For the one-year period ended December 31, 2019, the Boards noted that the investment performance of each Master Portfolio relative to its respective Universe was as follows: (i) the investment performance of each of the Wells Fargo Bloomberg Barclays US Aggregate ex-Corporate Credit Portfolio, the Wells Fargo Emerging Markets Bond Portfolio, the Wells Fargo Factor Enhanced International Equity Portfolio, the Wells Fargo Factor Enhanced U.S. Large Cap Portfolio, the Wells Fargo High Yield Corporate Bond Portfolio and the Wells Fargo Investment Grade Corporate Bond Portfolio was higher than or in range of the average investment performance of such Master Portfolio’s respective Universe; and (ii) the Wells Fargo Factor Enhanced Emerging Markets Equity Portfolio, the Wells Fargo Factor Enhanced U.S. Small Cap Portfolio, the Wells Fargo International Government Bond Portfolio, the Wells Fargo Strategic Retirement Bond Portfolio and the Wells Fargo U.S. REIT Portfolio was lower than the average investment performance of such Master Portfolio’s respective Universe. For the one-year period ended March 31, 2020, the Boards noted that the investment performance of each Master Portfolio relative to its respective Universe was as follows: (i) the Wells Fargo Emerging Markets Bond Portfolio, the Wells Fargo Factor Enhanced U.S. Large Cap Portfolio, the Wells Fargo Factor Enhanced U.S. Small Cap Portfolio, the Wells Fargo International Government Bond Portfolio, and the Wells Fargo Investment Grade Corporate Bond Portfolio was higher than or in range of the average investment performance of such Master Portfolio’s respective Universe, and (ii) the Wells Fargo Bloomberg Barclays US Aggregate ex-Corporate Credit Portfolio, the Wells Fargo Factor Enhanced Emerging Markets Equity Portfolio, the Wells Fargo Factor Enhanced International Equity Portfolio, the Wells Fargo High Yield Corporate Bond Portfolio, the Wells Fargo Strategic Retirement Bond Portfolio and the Wells Fargo U.S. REIT Portfolio was lower than the average investment performance of such Master Portfolio’s respective Universe.
The Boards also noted that the investment performance of each Master Portfolio to its respective benchmark index for the one-year period ended December 31, 2019, was as follows: (i) the investment performance of each of the Wells Fargo Bloomberg Barclays US Aggregate ex-Corporate Credit Portfolio, the Wells Fargo Factor Enhanced Emerging Markets Equity Portfolio, the Wells Fargo Factor Enhanced U.S. Large Cap Portfolio, the Wells Fargo Factor Enhanced U.S. Small Cap Portfolio, the Wells Fargo High Yield Corporate Bond Portfolio, the Wells Fargo U.S. REIT Portfolio and the Wells Fargo Strategic Retirement Bond Portfolio was higher than or in range of the average investment performance of such Master Portfolio’s respective benchmark, and (ii) the investment performance of each of the Wells Fargo Emerging Markets Bond Portfolio, the Wells Fargo Factor Enhanced International Equity Portfolio, the Wells Fargo International Government Bond Portfolio and the Wells Fargo Investment Grade Corporate Bond Portfolio was lower than the average investment performance of such Master Portfolio’s respective benchmark. For the one-year period ended March 31, 2020, the Boards also noted that the investment performance of each Master Portfolio to its respective benchmark index, was as follows: (i) the investment performance of each of the Wells Fargo Bloomberg Barclays US Aggregate ex-Corporate Credit Portfolio, the Wells Fargo Factor Enhanced Emerging Markets Equity Portfolio, the Wells Fargo Factor Enhanced International Equity Portfolio, the Wells Fargo Factor Enhanced U.S. Large Cap Portfolio, the Wells Fargo Factor Enhanced U.S. Small Cap Portfolio, the Wells Fargo U.S. REIT Portfolio, the Wells Fargo Investment Grade Corporate Bond Portfolio and the Wells Fargo Strategic Retirement Bond Portfolio was higher than, equal to or in range of the average investment performance of such Master Portfolio’s respective benchmark, and (ii) the investment performance of each of the Wells Fargo Emerging Markets Bond Portfolio, the Wells Fargo High Yield Corporate Bond Portfolio and the Wells Fargo International Government Bond Portfolio was lower than the average investment performance of such Master Portfolio’s respective benchmark.
The Boards received information concerning, and discussed factors contributing to, the underperformance of certain Master Portfolios, relative to the Universe and benchmark index, for the periods identified above. The Board took note of the explanations for the relative underperformance during these periods, including with respect to investment decisions and market factors that affected the Fund’s investment performance.
The Board of Funds Trust took note of the investment performance of the Master Portfolios in the context of reviewing the investment performance of the Index Funds. The Board of Funds Trust also received and considered information regarding the “zero fee and expense” structure of each Index Fund. Specifically, the Funds Trust Board noted that each Index Fund’s gross operating expense ratio and each of its various components, including management fees, administration fees, custody fees,
20 | Wells Fargo Emerging Markets Bond Portfolio
Other information (unaudited)
Rule 12b-1 fees, and other fees, are zero. The Funds Trust Board also noted that Funds Management assumes and pays or reimburses all of the ordinary operating expenses of each Index Fund, including acquired fund fees and expenses, pursuant to an agreement with each of the Index Funds (the “Fee and Expense Agreement”). The Funds Trust Board further noted that Funds Management receives a fee from Wells Fargo Wealth and Investment Management (“WIM”) pursuant to an intercompany agreement equal to the Master Portfolio fees and expenses absorbed by Funds Management through its Fee and Expense Agreement with each of the Index Funds.
With respect to the Master Portfolios, the Board of Master Trust received and considered information regarding the fee rates that are payable to Funds Management for investment advisory services (as discussed below), which are the only fees charged at the Master Portfolio level, relative to corresponding class-specific expense groups that were determined by Broadridge to be similar to the Funds (the “Groups”). The Boards received a description of the methodology used by Broadridge to select the mutual funds in the expense Groups and an explanation of how funds comprising expense groups and their expense ratios may vary from year-to-year.
The Boards took into account the Funds’ expense information and the Master Portfolios’ performance information provided to them among the factors considered in deciding to re-approve the Advisory Agreements.
Investment management, advisory and sub-advisory fee rates
The Board of Funds Trust reviewed and considered that the contractual investment management fee rate payable by each Index Fund to Funds Management for investment management services zero, and also reviewed and considered that each Fund’s other expenses would normally be zero, because of Funds Management’s commitment to assume and pay or reimburse all of the ordinary operating expenses of each Fund, including acquired fund fees and expenses, under the Fee and Expense Agreement. The Board of Funds Trust also reviewed and considered that the contractual investment sub-advisory fee rate payable by Funds Management to WellsCap for investment sub-advisory services for the U.S. Core Bond Fund is also zero.
The Board of Master Trust reviewed and considered the contractual fee rates payable by the Master Portfolios to Funds Management under the Master Portfolio Advisory Agreement (the “Advisory Agreement Rates”). The Board of Master Trust also reviewed and considered the contractual investment sub-advisory fee rates that are payable by Funds Management to the Sub-Advisers for investment sub-advisory services (the “Sub-Advisory Agreement Rates”).
The Board of Master Trust reviewed a comparison of the Advisory Agreement Rates of each Master Portfolio with those of other funds in each Master Portfolio’s respective expense Groups at a common asset level. The Board of Master Trust noted that the Advisory Agreement Rates of each Master Portfolio were lower than or equal to the median rate for such Master Portfolio’s expense Groups.
The Boards also received and considered information about the portions of the total management fees that were retained by Funds Management after payment of the fees to the Sub-Advisers for sub-advisory services. In assessing the reasonableness of these amounts, the Boards received and evaluated information about the nature and extent of responsibilities retained and risks assumed by Funds Management and not delegated to or assumed by the Sub-Advisers, and about Funds Management’s on-going oversight services. Given the affiliation between Funds Management and the Sub-Advisers, the Boards ascribed limited relevance to the allocation of fees between them.
The Boards also received and considered information about the nature and extent of services offered and fee rates charged by Funds Management and the Sub-Advisers to other types of clients with investment strategies similar to those of certain Funds. In this regard, the Boards received information about the significantly greater scope of services, and compliance, reporting and other legal burdens and risks of managing proprietary mutual funds compared with those associated with managing assets of other types of clients, including third-party sub-advised fund clients and non-mutual fund clients such as institutional separate accounts.
Based on its consideration of the factors and information it deemed relevant, including those described here, the Board of Fund Trust determined that the compensation received by Funds Management from WIM pursuant to the intercompany agreement, and the absence of compensation payable by the Funds to Funds Management pursuant to the Management Agreement or to WellsCap pursuant to the Core Bond Fund Sub-Advisory Agreement, was reasonable. Based on its consideration of the factors and information it deemed relevant, including those described here, the Board of Master Trust determined that the Advisory Agreement Rates and the Sub-Advisory Agreement Rates for each Master Portfolio were reasonable.
Profitability
The Boards received and considered information concerning the profitability of Funds Management, as well as the profitability of both WFAM and Wells Fargo & Co. (“Wells Fargo”) from providing services to the fund family as a whole. The Boards noted that the Sub-Advisers’ profitability information with respect to providing services to the Funds and other funds in the family was subsumed in the WFAM and Wells Fargo profitability analysis.
Wells Fargo Emerging Markets Bond Portfolio | 21
Other information (unaudited)
Funds Management reported on the methodologies and estimates used in calculating profitability, including a description of the methodology used to allocate certain expenses. Among other things, the Boards noted that the levels of profitability reported on a fund-by-fund basis varied widely, depending on factors such as the size, type and age of fund.
Based on its review, the Boards did not deem the profits reported by Funds Management, WFAM or Wells Fargo from services provided to the Funds to be at a level that would prevent them from approving the continuation of the Advisory Agreements.
Economies of scale
The Boards received and considered information about the potential for Funds Management to experience economies of scale in the provision of management services to the Funds, the difficulties of calculating economies of scale at an individual fund level, and the extent to which potential scale benefits are shared with shareholders. The Boards noted the existence of breakpoints in the each Master Portfolio’s advisory fee structure and each Index Fund’s management fee structure, which operate generally to reduce the Funds’ expense ratios as the Funds grow in size, and the size of the Funds in relation to such breakpoints. The Boards considered that in addition to management fee breakpoints, Funds Management shares potential economies of scale from its management business in a variety of ways, including through fee waiver and expense reimbursement arrangements, services that benefit shareholders, competitive management fee rates set at the outset without regard to breakpoints, and investments in the business intended to enhance services available to shareholders.
The Boards concluded that Funds Management’s arrangements with respect to the Funds, including contractual breakpoints, constituted a reasonable approach to sharing potential economies of scale with the Funds and their shareholders.
Other benefits to Funds Management and the Sub-Advisers
The Boards received and considered information regarding potential “fall-out” or ancillary benefits received by Funds Management and its affiliates, including WellsCap and WFAM International, as a result of their relationships with the Funds. Ancillary benefits could include, among others, benefits directly attributable to other relationships with the Funds and benefits potentially derived from an increase in Funds Management’s and the Sub-Advisers’ business as a result of their relationships with the Funds. The Boards noted that various affiliates of Funds Management may receive distribution-related fees, shareholder servicing payments and sub-transfer agency fees in respect of shares sold or held through them and services provided.
The Boards also reviewed information about soft dollar credits earned and utilized by the Sub-Advisers, fees earned by Funds Management and WellsCap from managing a private investment vehicle for the fund family’s securities lending collateral, and commissions earned by an affiliated broker from portfolio transactions.
Based on their consideration of the factors and information they deemed relevant, including those described here, the Boards did not find that any ancillary benefits received by Funds Management and its affiliates, including WellsCap and WFAM International, were unreasonable.
Conclusion
At the Meeting, after considering the above-described factors and based on its deliberations and its evaluation of the information described above, the Funds Trust Board unanimously approved the continuation of the Management Agreement and the Core Bond Fund Sub-Advisory Agreement for a one-year period. Additionally, after its deliberations, the Master Trust Board unanimously approved the continuation of the Master Portfolio Advisory Agreement and each Master Portfolio Sub-Advisory Agreement for a one-year term. The Boards also determined that the compensation or the absence of compensation payable to Funds Management and to each of the Sub-Advisers was reasonable.
22 | Wells Fargo Emerging Markets Bond Portfolio
Other information (unaudited)
LIQUIDITY RISK MANAGEMENT PROGRAM
In accordance with Rule 22e-4 under the Investment Company Act of 1940, as amended (the “Liquidity Rule”), Wells Fargo Master Trust (the “Trust”) has adopted and implemented a liquidity risk management program (the “Program”) on behalf of each of its series, including each Portfolio, which is reasonably designed to assess and manage the Portfolio’s liquidity risk. “Liquidity risk” is defined as the risk that a Portfolio is unable to meet redemption requests without significantly diluting remaining investors’ interests in the Portfolio. The Trust’s Board of Trustees (the “Board”) previously approved the designation of Wells Fargo Funds Management, LLC (“Funds Management”), each Portfolio’s investment adviser, as the administrator of the Program, and Funds Management has established a Liquidity Risk Management Council composed of personnel from multiple departments within Funds Management and its affiliates to assist Funds Management in the implementation and on-going administration of the Program.
The Program is comprised of various components designed to support the assessment and/or management of liquidity risk, including: (1) the periodic assessment (no less frequently than annually) of certain factors that influence a Portfolio’s liquidity risk; (2) the periodic classification (no less frequently than monthly) of a Portfolio’s investments into one of four liquidity categories that reflect an estimate of their liquidity under current market conditions; (3) a 15% limit on the acquisition of “illiquid investments” (as defined under the Liquidity Rule); (4) to the extent a Portfolio does not invest primarily in “highly liquid investments” (as defined under the Liquidity Rule), the determination of a minimum percentage of the Portfolio’s assets that generally will be invested in highly liquid investments (an “HLIM”); (5) if a Portfolio has established an HLIM, the periodic review (no less frequently than annually) of the HLIM and the adoption of policies and procedures for responding to a shortfall of the Portfolio’s “highly liquid investments” below its HLIM; and (6) periodic reporting to the Board.
At a meeting of the Board held on May 26 and 28, 2020, the Board received a written report (the “Report”) from Funds Management that addressed the operation of the Program and assessed its adequacy and effectiveness of implementation. The Report covered the initial period from December 1, 2018 through December 31, 2019 (the “Reporting Period”). No significant liquidity events impacting any Portfolio were noted in the Report. There were no material changes to the Program during the Reporting Period. The Report concluded that the Program is operating effectively to assess and manage each Portfolio’s liquidity risk, and that the Program has been and continues to be adequately and effectively implemented to monitor and, as applicable, respond to the Portfolio’s liquidity developments.
Wells Fargo Emerging Markets Bond Portfolio | 23
This page is intentionally left blank.

For more information
More information about Wells Fargo Funds is available free upon request. To obtain literature, please write, visit the Portfolio’s website, or call:
Wells Fargo Funds
P.O. Box 219967
Kansas City, MO 64121-9967
Website: wfam.com
Individual investors: 1-800-222-8222
Retail investment professionals: 1-888-877-9275
Institutional investment professionals: 1-866-765-0778
This report and the financial statements contained herein are submitted for the general information of the shareholders of the Portfolio. If this report is used for promotional purposes, distribution of the report must be accompanied or preceded by a current prospectus. Before investing, please consider the investment objectives, risks, charges, and expenses of the investment. For a current prospectus and, if available, a summary prospectus, containing this information, call 1-800-222-8222 or visit the Portfolio’s website at wfam.com. Read the prospectus carefully before you invest or send money.
Wells Fargo Asset Management (WFAM) is the trade name for certain investment advisory/management firms owned by Wells Fargo & Company. These firms include but are not limited to Wells Capital Management Incorporated and Wells Fargo Funds Management, LLC. Certain products managed by WFAM entities are distributed by Wells Fargo Funds Distributor, LLC (a broker-dealer and Member FINRA).
This material is for general informational and educational purposes only and is NOT intended to provide investment advice or a recommendation of any kind—including a recommendation for any specific investment, strategy, or plan.
INVESTMENT PRODUCTS: NOT FDIC INSURED ◾ NO BANK GUARANTEE ◾ MAY LOSE VALUE
© 2020 Wells Fargo & Company. All rights reserved.
Semi-Annual Report
August 31, 2020
Wells Fargo
Factor Enhanced Emerging Markets Equity Portfolio
(formerly Wells Fargo Factor Enhanced Emerging Markets Portfolio)
INVESTMENT PRODUCTS: NOT FDIC INSURED ◾ NO BANK GUARANTEE ◾ MAY LOSE VALUE
Wells Fargo Factor Enhanced Emerging Markets Equity Portfolio | 1
Portfolio information (unaudited)
Investment objective
The Portfolio seeks long-term capital appreciation.
Adviser
Wells Fargo Funds Management, LLC
Subadviser
Wells Capital Management Incorporated
Portfolio managers
Dennis Beinn, CFA®‡
Harindra de Silva, Ph.D., CFA®‡
Monisha Jayakumar
| | | | |
|
| Ten largest holdings (%) as of August 31, 20201 | |
| | |
Taiwan Semiconductor Manufacturing Company Limited | | | 4.83 | |
| | |
Alibaba Group Holding Limited ADR | | | 4.16 | |
| | |
Tencent Holdings Limited | | | 3.24 | |
| | |
Samsung Electronics Company Limited | | | 3.16 | |
| | |
Meituan Dianping | | | 1.60 | |
| | |
Reliance Industries Limited | | | 1.08 | |
| | |
JD.com Incorporated ADR | | | 1.04 | |
| | |
China Construction Bank Class H | | | 0.89 | |
| | |
Kweichow Moutai Company Limited Class A | | | 0.80 | |
| | |
NetEase Incorporated ADR | | | 0.67 | |
|
|
| Sector allocation as of August 31, 20202 |
|
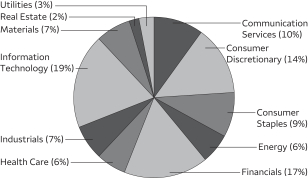
|
|
|
| Country allocation as of August 31, 20202 |
|
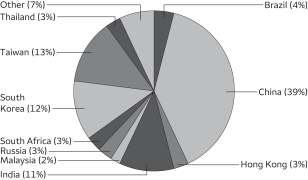 |
| ‡ | CFA® and Chartered Financial Analyst® are trademarks owned by CFA Institute. |
| 1 | The ten largest holdings, excluding cash, cash equivalents and any money market funds, are calculated based on the value of the investments divided by the total net assets of the Portfolio. Holdings are subject to change and may have changed since the date specified. |
| 2 | Amounts are calculated based on the total long-term investments of the Portfolio. These amounts are subject to change and may have changed since the date specified. |
2 | Wells Fargo Factor Enhanced Emerging Markets Equity Portfolio
Portfolio of investments—August 31, 2020 (unaudited)
| | | | | | | | | | | | | | | | |
| | | | | | | | | Shares | | | Value | |
| Common Stocks: 95.25% | |
|
| Argentina: 0.05% | |
Telecom Argentina SA ADR (Communication Services, Diversified Telecommunication Services) | | | | | | | | | | | 16,243 | | | $ | 109,803 | |
| | | | | | | | | | | | | | | | |
|
| Belgium: 0.01% | |
Titan Cement International SA (Materials, Construction Materials) | | | | | | | | | | | 667 | | | | 9,058 | |
| | | | | | | | | | | | | | | | |
|
| Bermuda: 0.45% | |
Alibaba Health Information Technology Limited (Health Care, Health Care Technology) † | | | | | | | | | | | 40,000 | | | | 96,617 | |
Beijing Enterprises Water Group Limited (Utilities, Water Utilities) | | | | | | | | | | | 60,667 | | | | 23,875 | |
Brilliance China Automotive Holdings Limited (Consumer Discretionary, Automobiles) | | | | | | | | | | | 140,000 | | | | 125,365 | |
Central European Media Enterprises Limited Class A (Communication Services, Media) † | | | | | | | | | | | 1,899 | | | | 8,058 | |
China Gas Holdings Limited (Utilities, Gas Utilities) | | | | | | | | | | | 34,467 | | | | 94,504 | |
China Resources Gas Group Limited (Utilities, Gas Utilities) | | | | | | | | | | | 10,667 | | | | 50,099 | |
COSCO SHIPPING Ports Limited (Industrials, Transportation Infrastructure) | | | | | | | | | | | 24,667 | | | | 13,972 | |
Credicorp Limited (Financials, Banks) | | | | | | | | | | | 1,174 | | | | 153,184 | |
GOME Retail Holdings Limited (Consumer Discretionary, Specialty Retail) † | | | | | | | | | | | 134,000 | | | | 19,192 | |
Haier Electronics Group Company (Consumer Discretionary, Household Durables) | | | | | | | | | | | 15,000 | | | | 51,386 | |
Kunlun Energy Company Limited (Utilities, Gas Utilities) | | | | | | | | | | | 46,000 | | | | 34,306 | |
Luye Pharma Group Limited (Health Care, Pharmaceuticals) 144A | | | | | | | | | | | 38,500 | | | | 20,864 | |
Nine Dragons Paper Holdings Limited (Materials, Paper & Forest Products) | | | | | | | | | | | 217,000 | | | | 240,794 | |
Yuexiu Transport Infrastructure Limited (Industrials, Transportation Infrastructure) | | | | | | | | | | | 14,000 | | | | 8,309 | |
| | | | |
| | | | | | | | | | | | | | | 940,525 | |
| | | | | | | | | | | | | | | | |
|
| Brazil: 2.61% | |
Aliansce Sonae Shopping Centers SA (Real Estate, Real Estate Management & Development) † | | | | | | | | | | | 1,867 | | | | 9,004 | |
Ambev SA (Consumer Staples, Beverages) | | | | | | | | | | | 54,367 | | | | 122,161 | |
Arezzo Industria e Comercio SA (Consumer Discretionary, Textiles, Apparel & Luxury Goods) | | | | | | | | | | | 467 | | | | 4,784 | |
Atacadao Distribuicao Comercio e Industria Limitada (Consumer Staples, Food & Staples Retailing) | | | | | | | | | | | 5,267 | | | | 18,795 | |
B2W Companhia Digital (Consumer Discretionary, Internet & Direct Marketing Retail) † | | | | | | | | | | | 2,312 | | | | 47,303 | |
B3 Brasil Bolsa Balcao SA (Financials, Capital Markets) | | | | | | | | | | | 61,000 | | | | 654,705 | |
Banco BTG Pactual SA (Financials, Capital Markets) | | | | | | | | | | | 10,300 | | | | 151,027 | |
Banco do Brasil SA (Financials, Banks) | | | | | | | | | | | 49,200 | | | | 293,215 | |
Banco Santander Brasil SA (Financials, Banks) | | | | | | | | | | | 30,200 | | | | 155,892 | |
BB Seguridade Participacoes SA (Financials, Insurance) | | | | | | | | | | | 66,200 | | | | 318,765 | |
BK Brasil Operacao e Assessoria a Restaurantes SA (Consumer Discretionary, Hotels, Restaurants & Leisure) | | | | | | | | | | | 2,967 | | | | 5,957 | |
BR Malls Participacoes SA (Real Estate, Real Estate Management & Development) | | | | | | | | | | | 13,300 | | | | 22,529 | |
BRF SA (Consumer Staples, Food Products) † | | | | | | | | | | | 27,250 | | | | 97,440 | |
CCR SA (Industrials, Transportation Infrastructure) | | | | | | | | | | | 19,982 | | | | 48,619 | |
Centrais Electricas Brasileiras SA (Utilities, Electric Utilities) | | | | | | | | | | | 4,400 | | | | 28,519 | |
Cia de Locacao das Americas (Industrials, Road & Rail) | | | | | | | | | | | 3,734 | | | | 13,904 | |
Cia Siderurgica Nacional SA (Materials, Metals & Mining) | | | | | | | | | | | 59,900 | | | | 166,301 | |
Cielo SA (Information Technology, IT Services) | | | | | | | | | | | 14,900 | | | | 12,402 | |
Cogna Educacao (Consumer Discretionary, Diversified Consumer Services) | | | | | | | | | | | 19,490 | | | | 20,278 | |
Companhia Brasileira de Distribuicao (Consumer Staples, Food & Staples Retailing) | | | | | | | | | | | 1,700 | | | | 19,707 | |
Companhia de Saneamento Basico do Estado de Sao Paulo SA (Utilities, Water Utilities) | | | | | | | | | | | 14,341 | | | | 124,995 | |
Companhia de Saneamento de Minas Gerais SA (Utilities, Water Utilities) | | | | | | | | | | | 820 | | | | 7,125 | |
Companhia Hering SA (Consumer Discretionary, Textiles, Apparel & Luxury Goods) | | | | | | | | | | | 1,804 | | | | 6,023 | |
Construtora Tenda SA (Consumer Discretionary, Household Durables) | | | | | | | | | | | 1,000 | | | | 5,602 | |
Cosan SA Industria e Comercio (Energy, Oil, Gas & Consumable Fuels) | | | | | | | | | | | 6,300 | | | | 95,733 | |
CPFL Energia SA (Utilities, Electric Utilities) | | | | | | | | | | | 8,400 | | | | 44,066 | |
CVC Brasil Operadora e Agencia de Viagens SA (Consumer Discretionary, Hotels, Restaurants & Leisure) | | | | | | | | | | | 2,088 | | | | 6,975 | |
Cyrela Brazil Realty SA Empreendimentos e Participacoes (Consumer Discretionary, Household Durables) | | | | | | | | | | | 3,167 | | | | 13,937 | |
Duratex SA (Materials, Paper & Forest Products) | | | | | | | | | | | 3,434 | | | | 9,973 | |
Ecorodovias Infraestrutura Logistica SA (Industrials, Transportation Infrastructure) † | | | | | | | | | | | 2,367 | | | | 5,582 | |
EDP Energias do Brasil SA (Utilities, Electric Utilities) | | | | | | | | | | | 3,650 | | | | 12,452 | |
The accompanying notes are an integral part of these financial statements.
Wells Fargo Factor Enhanced Emerging Markets Equity Portfolio | 3
Portfolio of investments—August 31, 2020 (unaudited)
| | | | | | | | | | | | | | | | |
| | | | | | | | | Shares | | | Value | |
|
| Brazil (continued) | |
Embraer SA (Industrials, Aerospace & Defense) † | | | | | | | | | | | 10,410 | | | $ | 13,947 | |
Eneva SA (Utilities, Independent Power & Renewable Electricity Producers) † | | | | | | | | | | | 2,034 | | | | 18,378 | |
Engie Brasil Energia SA (Utilities, Independent Power & Renewable Electricity Producers) | | | | | | | | | | | 2,034 | | | | 15,827 | |
Equatorial Energia SA (Utilities, Electric Utilities) | | | | | | | | | | | 12,970 | | | | 54,925 | |
EZTEC Empreendimentos e Participacoes SA (Consumer Discretionary, Household Durables) | | | | | | | | | | | 1,835 | | | | 13,009 | |
Fleury SA (Health Care, Health Care Providers & Services) | | | | | | | | | | | 2,502 | | | | 11,920 | |
Grendene SA (Consumer Discretionary, Textiles, Apparel & Luxury Goods) | | | | | | | | | | | 2,907 | | | | 4,054 | |
Hapvida Participacoes e Investimentos SA (Health Care, Health Care Providers & Services) 144A | | | | | | | | | | | 2,734 | | | | 32,303 | |
Hypermarcas SA (Health Care, Pharmaceuticals) | | | | | | | | | | | 5,212 | | | | 30,110 | |
Iguatemi Empresa de Shopping Centers SA (Real Estate, Real Estate Management & Development) | | | | | | | | | | | 994 | | | | 5,980 | |
IRB-Brasil Resseguros SA (Financials, Insurance) | | | | | | | | | | | 125,400 | | | | 163,202 | |
JBS SA (Consumer Staples, Food Products) | | | | | | | | | | | 37,329 | | | | 152,900 | |
Klabin SA (Materials, Containers & Packaging) | | | | | | | | | | | 10,700 | | | | 50,194 | |
Light SA (Utilities, Electric Utilities) † | | | | | | | | | | | 2,834 | | | | 7,827 | |
Linx SA (Information Technology, Software) | | | | | | | | | | | 2,067 | | | | 13,424 | |
Localiza Rent A Car SA (Industrials, Road & Rail) | | | | | | | | | | | 7,160 | | | | 63,033 | |
Lojas Renner SA (Consumer Discretionary, Multiline Retail) | | | | | | | | | | | 9,386 | | | | 74,475 | |
M. Dias Branco SA (Consumer Staples, Food Products) | | | | | | | | | | | 1,819 | | | | 11,790 | |
Magazine Luiza SA (Consumer Discretionary, Multiline Retail) | | | | | | | | | | | 10,200 | | | | 173,559 | |
Marfrig Global Foods SA (Consumer Staples, Food Products) † | | | | | | | | | | | 4,934 | | | | 16,031 | |
Minerva SA (Consumer Staples, Food Products) † | | | | | | | | | | | 3,500 | | | | 8,363 | |
MRV Engenharia e Participacoes SA (Consumer Discretionary, Household Durables) | | | | | | | | | | | 3,134 | | | | 10,280 | |
Multiplan Empreendimentos Imobiliarios SA (Real Estate, Real Estate Management & Development) | | | | | | | | | | | 3,500 | | | | 13,301 | |
Natura & Company Holding SA (Consumer Staples, Personal Products) | | | | | | | | | | | 8,318 | | | | 74,913 | |
Neoenergia SA (Utilities, Electric Utilities) | | | | | | | | | | | 2,900 | | | | 9,867 | |
Notre Dame Intermedica Participacoes SA (Health Care, Health Care Providers & Services) | | | | | | | | | | | 6,267 | | | | 84,765 | |
Odontoprev SA (Health Care, Health Care Providers & Services) | | | | | | | | | | | 2,621 | | | | 6,129 | |
Oi SA ADR (Communication Services, Diversified Telecommunication Services) † | | | | | | | | | | | 73,967 | | | | 22,952 | |
Omega Geracao SA (Utilities, Independent Power & Renewable Electricity Producers) † | | | | | | | | | | | 1,000 | | | | 7,402 | |
Petro Rio SA (Energy, Oil, Gas & Consumable Fuels) † | | | | | | | | | | | 2,000 | | | | 15,293 | |
Petrobras Distribuidora SA (Consumer Discretionary, Specialty Retail) | | | | | | | | | | | 66,400 | | | | 258,643 | |
Petroleo Brasileiro SA (Energy, Oil, Gas & Consumable Fuels) | | | | | | | | | | | 27,500 | | | | 112,038 | |
Porto Seguro SA (Financials, Insurance) | | | | | | | | | | | 18,368 | | | | 177,226 | |
Qualicorp SA (Health Care, Health Care Providers & Services) | | | | | | | | | | | 2,768 | | | | 15,784 | |
Raia Drogasil SA (Consumer Staples, Food & Staples Retailing) | | | | | | | | | | | 3,533 | | | | 69,519 | |
Rumo SA (Industrials, Road & Rail) † | | | | | | | | | | | 14,067 | | | | 58,029 | |
Sao Martinho SA (Consumer Staples, Food Products) | | | | | | | | | | | 2,304 | | | | 10,165 | |
Sul America SA (Financials, Insurance) | | | | | | | | | | | 23,300 | | | | 183,644 | |
Suzano Papel e Celulose SA (Materials, Paper & Forest Products) † | | | | | | | | | | | 7,352 | | | | 67,367 | |
Tim Participacoes SA (Communication Services, Wireless Telecommunication Services) | | | | | | | | | | | 59,100 | | | | 154,479 | |
Totvs SA (Information Technology, Software) | | | | | | | | | | | 5,667 | | | | 29,853 | |
Ultrapar Participacoes SA (Energy, Oil, Gas & Consumable Fuels) | | | | | | | | | | | 64,796 | | | | 229,923 | |
Via Varejo SA (Consumer Discretionary, Specialty Retail) † | | | | | | | | | | | 10,567 | | | | 39,541 | |
WEG SA (Industrials, Electrical Equipment) | | | | | | | | | | | 26,933 | | | | 317,680 | |
YDUQS Part SA (Consumer Discretionary, Diversified Consumer Services) | | | | | | | | | | | 3,812 | | | | 18,752 | |
| | | | |
| | | | | | | | | | | | | | | 5,466,566 | |
| | | | | | | | | | | | | | | | |
|
| Chile: 0.50% | |
Aguas Andinas SA Class A (Utilities, Water Utilities) | | | | | | | | | | | 48,599 | | | | 14,564 | |
Antarchile SA (Industrials, Industrial Conglomerates) | | | | | | | | | | | 1,585 | | | | 13,147 | |
Banco de Chile (Financials, Banks) | | | | | | | | | | | 415,453 | | | | 34,728 | |
Banco de Credito e Inversiones (Financials, Banks) | | | | | | | | | | | 808 | | | | 25,461 | |
Banco Santander Chile SA (Financials, Banks) | | | | | | | | | | | 461,689 | | | | 17,755 | |
CAP SA (Materials, Metals & Mining) † | | | | | | | | | | | 1,024 | | | | 9,088 | |
Cencosud SA (Consumer Staples, Food & Staples Retailing) | | | | | | | | | | | 52,057 | | | | 76,998 | |
Cencosud Shopping SA (Real Estate, Real Estate Management & Development) | | | | | | | | | | | 5,933 | | | | 8,860 | |
The accompanying notes are an integral part of these financial statements.
4 | Wells Fargo Factor Enhanced Emerging Markets Equity Portfolio
Portfolio of investments—August 31, 2020 (unaudited)
| | | | | | | | | | | | | | | | |
| | | | | | | | | Shares | | | Value | |
|
| Chile (continued) | |
Cia Sud Americana de Vapores SA (Industrials, Marine) † | | | | | | | | | | | 202,275 | | | $ | 5,489 | |
Colbun SA (Utilities, Independent Power & Renewable Electricity Producers) | | | | | | | | | | | 1,494,196 | | | | 230,618 | |
Compania Cervecerias Unidas SA (Consumer Staples, Beverages) | | | | | | | | | | | 1,846 | | | | 12,135 | |
Empresa Nacional de Telecomunicaciones SA (Communication Services, Wireless Telecommunication Services) | | | | | | | | | | | 11,934 | | | | 72,240 | |
Empresas CMPC SA (Materials, Paper & Forest Products) | | | | | | | | | | | 15,854 | | | | 32,932 | |
Empresas Copec SA (Energy, Oil, Gas & Consumable Fuels) | | | | | | | | | | | 6,510 | | | | 47,735 | |
Enel Americas SA (Utilities, Electric Utilities) | | | | | | | | | | | 1,271,993 | | | | 183,022 | |
Enel Chile SA (Utilities, Electric Utilities) | | | | | | | | | | | 1,509,589 | | | | 116,109 | |
Engie Energia Chile SA (Utilities, Electric Utilities) | | | | | | | | | | | 5,379 | | | | 7,264 | |
Gener SA (Utilities, Independent Power & Renewable Electricity Producers) | | | | | | | | | | | 32,131 | | | | 5,227 | |
Grupo Security SA (Financials, Banks) | | | | | | | | | | | 28,421 | | | | 5,593 | |
Hortifrut SA (Consumer Staples, Food Products) | | | | | | | | | | | 4,391 | | | | 5,145 | |
Inversiones Aguas Metropolitanas SA (Utilities, Water Utilities) | | | | | | | | | | | 3,918 | | | | 3,172 | |
Itau CorpBanca SA (Financials, Banks) | | | | | | | | | | | 2,677,841 | | | | 8,163 | |
LATAM Airlines Group SA (Industrials, Airlines) † | | | | | | | | | | | 4,752 | | | | 8,007 | |
Parque Arauco SA (Real Estate, Real Estate Management & Development) | | | | | | | | | | | 7,754 | | | | 12,018 | |
Plaza SA (Real Estate, Real Estate Management & Development) | | | | | | | | | | | 3,756 | | | | 5,990 | |
Quinenco SA (Industrials, Industrial Conglomerates) | | | | | | | | | | | 3,681 | | | | 5,729 | |
S.A.C.I. Falabella (Consumer Discretionary, Multiline Retail) | | | | | | | | | | | 15,005 | | | | 47,283 | |
Sigdo Koppers SA (Industrials, Industrial Conglomerates) | | | | | | | | | | | 6,228 | | | | 6,689 | |
SMU SA (Consumer Staples, Food & Staples Retailing) | | | | | | | | | | | 33,974 | | | | 5,681 | |
Sociedad Matriz SAAM SA (Industrials, Transportation Infrastructure) | | | | | | | | | | | 64,705 | | | | 4,827 | |
Sonda SA (Information Technology, IT Services) | | | | | | | | | | | 7,719 | | | | 5,956 | |
Vina Concha y Toro SA (Consumer Staples, Beverages) | | | | | | | | | | | 7,643 | | | | 13,261 | |
| | | | |
| | | | | | | | | | | | | | | 1,050,886 | |
| | | | | | | | | | | | | | | | |
|
| China: 37.77% | |
3SBio Incorporated (Health Care, Biotechnology) 144A† | | | | | | | | | | | 14,167 | | | | 16,634 | |
58.com Incorporated ADR (Communication Services, Interactive Media & Services) † | | | | | | | | | | | 2,945 | | | | 163,035 | |
A Living Services Company Limited Class H (Industrials, Commercial Services & Supplies) | | | | | | | | | | | 23,250 | | | | 119,997 | |
Agile Property Holdings Limited (Real Estate, Real Estate Management & Development) | | | | | | | | | | | 94,000 | | | | 129,777 | |
Agricultural Bank of China Limited Class H (Financials, Banks) | | | | | | | | | | | 859,000 | | | | 287,065 | |
Aier Eye Hospital Group Company Limited Class A (Health Care, Health Care Providers & Services) | | | | | | | | | | | 28,400 | | | | 215,316 | |
Air China Limited Class H (Industrials, Airlines) | | | | | | | | | | | 104,000 | | | | 71,658 | |
AK Medical Holdings Limited (Health Care, Health Care Equipment & Supplies) | | | | | | | | | | | 16,000 | | | | 40,918 | |
Alibaba Group Holding Limited ADR (Consumer Discretionary, Internet & Direct Marketing Retail) † | | | | | | | | | | | 30,389 | | | | 8,722,546 | |
Aluminum Corporation of China Limited Class H (Materials, Metals & Mining) † | | | | | | | | | | | 29,334 | | | | 7,191 | |
Angel Yeast Company Limited Class A (Consumer Staples, Food Products) | | | | | | | | | | | 10,000 | | | | 101,389 | |
Anhui Conch Cement Company Limited Class A (Materials, Construction Materials) | | | | | | | | | | | 24,400 | | | | 216,812 | |
Anhui Conch Cement Company Limited Class H (Materials, Construction Materials) | | | | | | | | | | | 70,500 | | | | 511,226 | |
Anhui Gujing Distillery Company Class A (Consumer Staples, Beverages) | | | | | | | | | | | 1,900 | | | | 71,612 | |
Anhui Gujing Distillery Company Class B (Consumer Staples, Beverages) | | | | | | | | | | | 16,913 | | | | 214,735 | |
ANTA Sports Products Limited (Consumer Discretionary, Textiles, Apparel & Luxury Goods) | | | | | | | | | | | 15,000 | | | | 148,157 | |
Apeloa Pharmaceutical Company Class A (Health Care, Biotechnology) | | | | | | | | | | | 43,300 | | | | 179,711 | |
Asymchem Laboratories (Tianjin) Company Limited Class A (Health Care, Biotechnology) | | | | | | | | | | | 6,600 | | | | 263,815 | |
Autohome Incorporated ADR (Communication Services, Interactive Media & Services) | | | | | | | | | | | 1,327 | | | | 106,478 | |
AVIC Aircraft Company Limited Class A (Industrials, Aerospace & Defense) | | | | | | | | | | | 14,300 | | | | 50,484 | |
AVIC Electromechanical Systems Company Limited Class A (Industrials, Aerospace & Defense) | | | | | | | | | | | 68,800 | | | | 103,680 | |
AVIC Shenyang Aircraft Company Limited Class A (Industrials, Aerospace & Defense) | | | | | | | | | | | 5,600 | | | | 48,241 | |
AviChina Industry & Technology Company Limited Class H (Industrials, Aerospace & Defense) | | | | | | | | | | | 87,000 | | | | 54,332 | |
BAIC Motor Corporation Limited Class H (Consumer Discretionary, Automobiles) 144A | | | | | | | | | | | 429,000 | | | | 205,361 | |
Baidu Incorporated ADR (Communication Services, Interactive Media & Services) † | | | | | | | | | | | 6,226 | | | | 775,573 | |
Bank of China Limited Class H (Financials, Banks) | | | | | | | | | | | 3,007,000 | | | | 985,495 | |
Bank of Communications Limited Class H (Financials, Banks) | | | | | | | | | | | 542,000 | | | | 283,231 | |
Bank of Hangzhou Company Limited Class A (Financials, Banks) | | | | | | | | | | | 12,200 | | | | 23,048 | |
The accompanying notes are an integral part of these financial statements.
Wells Fargo Factor Enhanced Emerging Markets Equity Portfolio | 5
Portfolio of investments—August 31, 2020 (unaudited)
| | | | | | | | | | | | | | | | |
| | | | | | | | | Shares | | | Value | |
|
| China (continued) | |
Bank of Ningbo Company Limited Class A (Financials, Banks) | | | | | | | | | | | 14,100 | | | $ | 73,022 | |
Baozun Incorporated ADR (Consumer Discretionary, Internet & Direct Marketing Retail) † | | | | | | | | | | | 633 | | | | 26,232 | |
BBMG Corporation Class H (Materials, Construction Materials) | | | | | | | | | | | 19,334 | | | | 4,066 | |
Beijing Capital International Airport Company Limited Class H (Industrials, Transportation Infrastructure) | | | | | | | | | | | 56,000 | | | | 39,596 | |
Beijing Dabeinong Technology Group Company Limited Class A (Consumer Staples, Food Products) | | | | | | | | | | | 31,300 | | | | 51,917 | |
Beijing E-Hualu Information Technology Company Limited Class A (Information Technology, IT Services) | | | | | | | | | | | 6,120 | | | | 34,882 | |
Beijing Enlight Media Company Limited Class A (Communication Services, Media) | | | | | | | | | | | 46,200 | | | | 109,185 | |
Beijing Kunlun Tech Company Limited Class A (Communication Services, Interactive Media & Services) | | | | | | | | | | | 30,400 | | | | 123,511 | |
Beijing Oriental Yuhong Waterproof Technology Company Limited Class A (Materials, Construction Materials) | | | | | | | | | | | 11,600 | | | | 101,433 | |
Beijing Shunxin Agriculture Company Limited Class A (Consumer Staples, Beverages) | | | | | | | | | | | 3,500 | | | | 38,422 | |
Beijing Sinnet Technology Company Limited Class A (Information Technology, IT Services) | | | | | | | | | | | 38,300 | | | | 147,282 | |
Beijing Thunisoft Corporation Limited Class A (Information Technology, Software) | | | | | | | | | | | 46,600 | | | | 179,199 | |
Beijing Tiantan Biological Products Corporation Limited Class A (Health Care, Biotechnology) | | | | | | | | | | | 21,800 | | | | 134,620 | |
Beijing Yanjing Brewery Company Limited Class A (Consumer Staples, Beverages) | | | | | | | | | | | 53,100 | | | | 61,971 | |
Betta Pharmaceuticals Company Limited Class A (Health Care, Biotechnology) | | | | | | | | | | | 700 | | | | 13,361 | |
BGI Genomics Company Limited Class A (Health Care, Health Care Equipment & Supplies) | | | | | | | | | | | 5,900 | | | | 126,094 | |
Bilibili Incorporated ADR (Communication Services, Entertainment) † | | | | | | | | | | | 3,349 | | | | 158,240 | |
BTG Hotels Group Company Limited Class A (Consumer Discretionary, Hotels, Restaurants & Leisure) | | | | | | | | | | | 43,400 | | | | 122,005 | |
BYD Company Limited Class A (Consumer Discretionary, Automobiles) | | | | | | | | | | | 5,200 | | | | 64,480 | |
BYD Company Limited Class H (Consumer Discretionary, Automobiles) | | | | | | | | | | | 9,000 | | | | 89,417 | |
C&S Paper Company Limited Class A (Consumer Staples, Household Products) | | | | | | | | | | | 21,100 | | | | 75,476 | |
Centre Testing International Group Company Limited Class A (Industrials, Commercial Services & Supplies) | | | | | | | | | | | 52,100 | | | | 207,950 | |
CGN Power Company Limited Class H (Utilities, Independent Power & Renewable Electricity Producers) 144A | | | | | | | | | | | 677,000 | | | | 146,752 | |
Chacha Food Company Limited Class A (Consumer Staples, Food Products) | | | | | | | | | | | 19,700 | | | | 199,017 | |
Changchun High & New Technology Industry (Group) Incorporated Class A (Health Care, Biotechnology) | | | | | | | | | | | 2,600 | | | | 177,359 | |
Changzhou Xingyu Automotive Lighting Systems Company Limited Class A (Consumer Discretionary, Auto Components) | | | | | | | | | | | 1,900 | | | | 45,901 | |
Chaozhou Three-Circle Group Company Limited Class A (Information Technology, Electronic Equipment, Instruments & Components) | | | | | | | | | | | 10,668 | | | | 43,545 | |
China Aerospace Times Electronics Technology Company Limited Class A (Industrials, Aerospace & Defense) | | | | | | | | | | | 24,400 | | | | 27,658 | |
China Aoyuan Group Limited (Real Estate, Real Estate Management & Development) | | | | | | | | | | | 56,000 | | | | 64,597 | |
China Cinda Asset Management Company Limited Class H (Financials, Capital Markets) | | | | | | | | | | | 241,000 | | | | 46,022 | |
China CITIC Bank Class H (Financials, Banks) | | | | | | | | | | | 949,351 | | | | 396,880 | |
China Coal Energy Company Limited Class H (Energy, Oil, Gas & Consumable Fuels) | | | | | | | | | | | 50,000 | | | | 12,580 | |
China Communications Construction Company Limited Class H (Industrials, Construction & Engineering) | | | | | | | | | | | 112,000 | | | | 62,863 | |
China Communications Services Corporation Limited Class H (Industrials, Construction & Engineering) | | | | | | | | | | | 430,000 | | | | 282,406 | |
China Conch Venture Holdings Limited (Industrials, Machinery) | | | | | | | | | | | 85,000 | | | | 368,507 | |
China Construction Bank Class H (Financials, Banks) | | | | | | | | | | | 2,645,000 | | | | 1,873,636 | |
China Eastern Airlines Company Class H (Industrials, Airlines) | | | | | | | | | | | 192,000 | | | | 79,275 | |
China Energy Engineering Corporation Limited Class H (Industrials, Construction & Engineering) | | | | | | | | | | | 89,582 | | | | 8,669 | |
China Everbright Bank Company Limited Class A (Financials, Banks) | | | | | | | | | | | 147,200 | | | | 82,460 | |
China Everbright Bank Company Limited Class H (Financials, Banks) | | | | | | | | | | | 76,000 | | | | 27,261 | |
China Evergrande Group (Real Estate, Real Estate Management & Development) | | | | | | | | | | | 24,000 | | | | 56,050 | |
China Feihe Limited (Consumer Staples, Food Products) 144A | | | | | | | | | | | 34,667 | | | | 70,227 | |
China Galaxy Securities Company Limited Class H (Financials, Capital Markets) | | | | | | | | | | | 505,500 | | | | 304,597 | |
China Hongqiao Group Limited (Materials, Metals & Mining) | | | | | | | | | | | 142,000 | | | | 91,611 | |
China Huarong Asset Management Company Limited Class H (Financials, Capital Markets) 144A | | | | | | | | | | | 84,334 | | | | 9,685 | |
China International Capital Corporation Limited Class H (Financials, Capital Markets) 144A† | | | | | | | | | | | 61,200 | | | | 145,455 | |
China Lesso Group Holdings Limited Class L (Industrials, Building Products) | | | | | | | | | | | 69,000 | | | | 128,737 | |
China Life Insurance Company Class H (Financials, Insurance) | | | | | | | | | | | 210,000 | | | | 511,574 | |
China Literature Limited (Communication Services, Media) 144A† | | | | | | | | | | | 12,800 | | | | 79,523 | |
The accompanying notes are an integral part of these financial statements.
6 | Wells Fargo Factor Enhanced Emerging Markets Equity Portfolio
Portfolio of investments—August 31, 2020 (unaudited)
| | | | | | | | | | | | | | | | |
| | | | | | | | | Shares | | | Value | |
|
| China (continued) | |
China Longyuan Power Group Corporation Class H (Utilities, Independent Power & Renewable Electricity Producers) | | | | | | | | | | | 429,000 | | | $ | 270,678 | |
China Medical System Holding Limited (Health Care, Pharmaceuticals) | | | | | | | | | | | 221,000 | | | | 249,510 | |
China Mengniu Dairy Company Limited (Consumer Staples, Food Products) | | | | | | | | | | | 30,334 | | | | 149,122 | |
China Merchants Bank Company Limited Class A (Financials, Banks) | | | | | | | | | | | 69,800 | | | | 383,784 | |
China Merchants Bank Company Limited H Shares (Financials, Banks) | | | | | | | | | | | 135,500 | | | | 646,887 | |
China Merchants Securities Class H (Financials, Capital Markets) † | | | | | | | | | | | 4,200 | | | | 5,419 | |
China Merchants Securities Company Limited Class A (Financials, Capital Markets) | | | | | | | | | | | 21,700 | | | | 68,220 | |
China Minsheng Banking Corporation Limited Class A (Financials, Banks) | | | | | | | | | | | 21,900 | | | | 17,731 | |
China Minsheng Banking Corporation Limited Class H (Financials, Banks) | | | | | | | | | | | 254,700 | | | | 155,117 | |
China Molybdenum Company Limited Class H (Materials, Metals & Mining) | | | | | | | | | | | 399,000 | | | | 162,170 | |
China National Accord Medicines Corporation Limited Class A (Health Care, Health Care Providers & Services) | | | | | | | | | | | 8,900 | | | | 70,423 | |
China National Building Material Company Limited Class H (Materials, Construction Materials) | | | | | | | | | | | 280,000 | | | | 393,796 | |
China National Medicines Corporation Limited Class A (Health Care, Health Care Equipment & Supplies) | | | | | | | | | | | 20,400 | | | | 133,415 | |
China Oilfield Services Limited Class H (Energy, Energy Equipment & Services) | | | | | | | | | | | 294,000 | | | | 231,021 | |
China Overseas Property Holding Limited (Real Estate, Real Estate Management & Development) | | | | | | | | | | | 145,000 | | | | 130,777 | |
China Pacific Insurance Class H (Financials, Insurance) | | | | | | | | | | | 25,800 | | | | 71,739 | |
China Petroleum & Chemical Corporation Class H (Energy, Oil, Gas & Consumable Fuels) | | | | | | | | | | | 392,000 | | | | 181,074 | |
China Railway Construction Corporation Limited Class H (Industrials, Construction & Engineering) | | | | | | | | | | | 306,000 | | | | 235,318 | |
China Railway Group Limited Class H (Industrials, Construction & Engineering) | | | | | | | | | | | 380,000 | | | | 195,143 | |
China Railway Signal & Communication Corporation Limited Class H (Information Technology, Electronic Equipment, Instruments & Components) 144A | | | | | | | | | | | 14,667 | | | | 5,942 | |
China Reinsurance Group Corporation Class H (Financials, Insurance) | | | | | | | | | | | 676,000 | | | | 72,396 | |
China Resources Cement Holdings Limited (Materials, Construction Materials) | | | | | | | | | | | 282,000 | | | | 411,164 | |
China Resources Land Limited (Real Estate, Real Estate Management & Development) | | | | | | | | | | | 58,000 | | | | 268,290 | |
China Resources Phoenix Healthcare Holdings Company Limited (Health Care, Health Care Providers & Services) | | | | | | | | | | | 8,500 | | | | 6,153 | |
China Shenhua Energy Company Limited Class H (Energy, Oil, Gas & Consumable Fuels) | | | | | | | | | | | 298,500 | | | | 498,386 | |
China Southern Airlines Company Class H (Industrials, Airlines) † | | | | | | | | | | | 30,000 | | | | 15,832 | |
China Spacesat Company Limited Class A (Information Technology, Communications Equipment) | | | | | | | | | | | 5,700 | | | | 32,812 | |
China State Construction International Holdings (Industrials, Construction & Engineering) | | | | | | | | | | | 16,667 | | | | 12,925 | |
China Telecom Corporation Limited Class H (Communication Services, Diversified Telecommunication Services) | | | | | | | | | | | 516,000 | | | | 169,110 | |
China Tourism Group Duty Free Corporation Limited Class A (Consumer Discretionary, Specialty Retail) | | | | | | | | | | | 7,600 | | | | 230,612 | |
China Tower Corporation Limited H Shares (Communication Services, Diversified Telecommunication Services) 144A | | | | | | | | | | | 488,667 | | | | 93,317 | |
China TransInfo Technology Company Limited Class A (Information Technology, IT Services) | | | | | | | | | | | 21,400 | | | | 76,362 | |
China Vanke Company Limited Class H (Real Estate, Real Estate Management & Development) | | | | | | | | | | | 15,534 | | | | 48,304 | |
China Yangtze Power Company Limited Class A (Utilities, Independent Power & Renewable Electricity Producers) | | | | | | | | | | | 118,112 | | | | 332,550 | |
China Yongda Automobile Service Holding Company (Consumer Discretionary, Specialty Retail) | | | | | | | | | | | 15,667 | | | | 18,800 | |
China YuHua Education Corporation Limited (Consumer Discretionary, Diversified Consumer Services) 144A | | | | | | | | | | | 72,000 | | | | 69,025 | |
Chinasoft International Limited (Information Technology, IT Services) | | | | | | | | | | | 23,334 | | | | 16,589 | |
Chinese Universe Publishing & Media Group Company Limited Class A (Communication Services, Media) | | | | | | | | | | | 48,400 | | | | 93,272 | |
Chongqing Brewery Company Limited Class A (Consumer Staples, Beverages) | | | | | | | | | | | 16,840 | | | | 223,680 | |
Chongqing Changchun Automobile Class B (Consumer Discretionary, Automobiles) † | | | | | | | | | | | 10,634 | | | | 5,680 | |
Chongqing Fuling Zhacai Group Company Limited Class A (Consumer Staples, Food Products) | | | | | | | | | | | 17,800 | | | | 132,822 | |
Chongqing Rural Commercial Bank Class H (Financials, Banks) | | | | | | | | | | | 34,000 | | | | 13,863 | |
Chongqing Zhifei Biological Products Company Limited Class A (Health Care, Health Care Equipment & Supplies) | | | | | | | | | | | 11,000 | | | | 216,877 | |
CIFI Holdings Group Company Limited (Real Estate, Real Estate Management & Development) | | | | | | | | | | | 90,000 | | | | 76,643 | |
CITIC Securities Company Limited Class A (Financials, Capital Markets) | | | | | | | | | | | 18,800 | | | | 87,215 | |
CITIC Securities Company Limited Class H (Financials, Capital Markets) | | | | | | | | | | | 32,000 | | | | 76,881 | |
COFCO Meat Holdings Limited (Consumer Staples, Food Products) | | | | | | | | | | | 20,667 | | | | 9,653 | |
Contemporary Amperex Technology Company Limited Class A (Energy, Energy Equipment & Services) | | | | | | | | | | | 9,000 | | | | 270,927 | |
The accompanying notes are an integral part of these financial statements.
Wells Fargo Factor Enhanced Emerging Markets Equity Portfolio | 7
Portfolio of investments—August 31, 2020 (unaudited)
| | | | | | | | | | | | | | | | |
| | | | | | | | | Shares | | | Value | |
|
| China (continued) | |
COSCO SHIPPING Development Company Limited Class H (Industrials, Marine) | | | | | | | | | | | 22,667 | | | $ | 2,311 | |
COSCO SHIPPING Energy Transportation Company Limited Class H (Industrials, Marine) | | | | | | | | | | | 566,000 | | | | 260,718 | |
COSCO SHIPPING Holdings Company Limited Class H (Industrials, Marine) † | | | | | | | | | | | 123,750 | | | | 62,113 | |
Country Garden Holdings Company Limited (Real Estate, Real Estate Management & Development) | | | | | | | | | | | 199,000 | | | | 246,754 | |
Country Garden Services Holdings Company Limited (Industrials, Commercial Services & Supplies) | | | | | | | | | | | 20,000 | | | | 139,480 | |
CRRC Corporation Limited Class H (Industrials, Machinery) | | | | | | | | | | | 128,500 | | | | 58,031 | |
CSC Financial Company Limited Class A (Financials, Capital Markets) | | | | | | | | | | | 7,600 | | | | 57,952 | |
CSC Financial Company Limited Class H (Financials, Capital Markets) | | | | | | | | | | | 6,667 | | | | 9,910 | |
Da An Gene Company Limited of Sun Yat-Sen University Class A (Health Care, Health Care Equipment & Supplies) | | | | | | | | | | | 14,100 | | | | 78,987 | |
Dali Foods Group Company Limited (Consumer Staples, Food Products) 144A | | | | | | | | | | | 248,500 | | | | 152,303 | |
Daqin Railway Company Limited Class A (Industrials, Transportation Infrastructure) | | | | | | | | | | | 115,400 | | | | 111,447 | |
Datang International Power Generation Company Limited Class H (Utilities, Independent Power & Renewable Electricity Producers) | | | | | | | | | | | 9,334 | | | | 1,253 | |
DHC Software Company Limited Class A (Information Technology, Technology Hardware, Storage & Peripherals) | | | | | | | | | | | 62,700 | | | | 106,653 | |
Dongfeng Motor Group Company Limited Class H (Consumer Discretionary, Automobiles) | | | | | | | | | | | 166,000 | | | | 115,233 | |
Dongxing Securities Company Limited Class A (Financials, Capital Markets) | | | | | | | | | | | 14,300 | | | | 27,850 | |
East Money Information Company Limited Class A (Financials, Capital Markets) | | | | | | | | | | | 11,600 | | | | 44,269 | |
ENN Energy Holdings Limited (Utilities, Gas Utilities) | | | | | | | | | | | 14,100 | | | | 156,460 | |
EVE Energy Company Limited Class A (Energy, Energy Equipment & Services) | | | | | | | | | | | 9,400 | | | | 67,208 | |
Everbright Securities Company Limited Class A (Financials, Capital Markets) | | | | | | | | | | | 22,400 | | | | 71,630 | |
First Capital Securities Company Limited Class A (Financials, Capital Markets) | | | | | | | | | | | 28,300 | | | | 44,381 | |
Focus Media Information Technology Company Limited Class A (Communication Services, Media) | | | | | | | | | | | 69,500 | | | | 76,447 | |
Foshan Haitian Flavouring & Food Company Limited Class A (Consumer Staples, Food Products) | | | | | | | | | | | 12,300 | | | | 328,727 | |
Founder Securities Company Limited Class A (Financials, Capital Markets) | | | | | | | | | | | 52,700 | | | | 67,424 | |
Foxconn Industrial Internet Company Limited Class A (Information Technology, Technology Hardware, Storage & Peripherals) | | | | | | | | | | | 50,700 | | | | 109,021 | |
Fu Shou Yuan International Group Limited (Consumer Discretionary, Diversified Consumer Services) | | | | | | | | | | | 15,000 | | | | 15,522 | |
Fujian Star-net Communication Company Limited Class A (Communication Services, Wireless Telecommunication Services) | | | | | | | | | | | 23,800 | | | | 102,286 | |
Fujian Sunner Development Company Limited Class A (Consumer Staples, Food Products) | | | | | | | | | | | 40,900 | | | | 160,383 | |
Fuyao Glass Industry Group Company Limited Class H (Consumer Discretionary, Auto Components) | | | | | | | | | | | 5,467 | | | | 17,600 | |
G-bits Network Technology (Xiamen) Company Limited Class A (Information Technology, Software) | | | | | | | | | | | 3,200 | | | | 289,073 | |
Ganfeng Lithium Company Limited Class A (Materials, Metals & Mining) | | | | | | | | | | | 12,000 | | | | 88,423 | |
GEM Company Limited Class A (Industrials, Commercial Services & Supplies) | | | | | | | | | | | 21,400 | | | | 16,921 | |
GF Securities Company Limited Class A (Financials, Capital Markets) | | | | | | | | | | | 70,100 | | | | 165,361 | |
GF Securities Company Limited H Shares (Financials, Capital Markets) | | | | | | | | | | | 176,800 | | | | 209,189 | |
Giant Network Group Company Limited Class A (Information Technology, Software) | | | | | | | | | | | 16,600 | | | | 50,104 | |
GigaDevice Semiconductor (Beijing) Incorporated Class A (Information Technology, Semiconductors & Semiconductor Equipment) | | | | | | | | | | | 900 | | | | 26,197 | |
Glodon Company Limited Class A (Information Technology, Software) | | | | | | | | | | | 11,700 | | | | 118,932 | |
GoerTek Incorporated Class A (Information Technology, Electronic Equipment, Instruments & Components) | | | | | | | | | | | 9,600 | | | | 57,546 | |
Great Wall Motor Company Limited Class H (Consumer Discretionary, Automobiles) | | | | | | | | | | | 250,500 | | | | 271,826 | |
Greentown Service Group Company Limited (Industrials, Commercial Services & Supplies) | | | | | | | | | | | 16,667 | | | | 22,408 | |
Guangdong Haid Group Company Limited Class A (Consumer Staples, Food Products) | | | | | | | | | | | 19,700 | | | | 203,386 | |
Guangdong Hongda Blasting Company Limited Class A (Energy, Oil, Gas & Consumable Fuels) | | | | | | | | | | | 6,900 | | | | 54,356 | |
Guangzhou Automobile Group Company Limited Class H (Consumer Discretionary, Automobiles) | | | | | | | | | | | 120,400 | | | | 103,464 | |
Guangzhou Baiyun International Airport Company Limited Class A (Industrials, Transportation Infrastructure) | | | | | | | | | | | 6,900 | | | | 15,320 | |
Guangzhou Kingmed Diagnostics Group Company Limited Class A (Health Care, Health Care Providers & Services) | | | | | | | | | | | 8,900 | | | | 139,807 | |
Guangzhou R&F Properties Company Limited Class H (Real Estate, Real Estate Management & Development) | | | | | | | | | | | 156,000 | | | | 198,467 | |
Guangzhou Wondfo Biotech Company Limited Class A (Health Care, Health Care Equipment & Supplies) | | | | | | | | | | | 12,700 | | | | 183,048 | |
Guocheng Mining Company Limited Class A (Materials, Metals & Mining) † | | | | | | | | | | | 24,300 | | | | 81,321 | |
The accompanying notes are an integral part of these financial statements.
8 | Wells Fargo Factor Enhanced Emerging Markets Equity Portfolio
Portfolio of investments—August 31, 2020 (unaudited)
| | | | | | | | | | | | | | | | |
| | | | | | | | | Shares | | | Value | |
|
| China (continued) | |
Guotai Junan Securities Company Limited H Shares (Financials, Capital Markets) 144A | | | | | | | | | | | 6,667 | | | $ | 10,409 | |
Haidilao International Holding Limited (Consumer Discretionary, Hotels, Restaurants & Leisure) 144A | | | | | | | | | | | 9,486 | | | | 61,198 | |
Hainan Airlines Holding Company Limited Class A (Consumer Discretionary, Airlines) † | | | | | | | | | | | 58,300 | | | | 13,948 | |
Haitong Securities Company Limited Class H (Financials, Capital Markets) † | | | | | | | | | | | 25,734 | | | | 23,376 | |
Hangzhou Hikvision Digital Technology Company Limited Class A (Information Technology, Technology Hardware, Storage & Peripherals) | | | | | | | | | | | 19,400 | | | | 105,904 | |
Hangzhou Robam Appliances Company Limited (Consumer Discretionary, Household Durables) | | | | | | | | | | | 2,600 | | | | 14,793 | |
Hangzhou Tigermed Consulting Company Limited Class A (Health Care, Health Care Providers & Services) | | | | | | | | | | | 4,200 | | | | 68,623 | |
Hansoh Pharmaceutical Group (Health Care, Pharmaceuticals) † | | | | | | | | | | | 14,000 | | | | 66,385 | |
Hefei Meiya Optoelectronic Technology Incorporation Class A (Industrials, Electrical Equipment) | | | | | | | | | | | 22,709 | | | | 193,305 | |
Heilongjiang Agriculture Company Limited Class A (Consumer Staples, Food Products) | | | | | | | | | | | 37,200 | | | | 109,405 | |
Henan Shuanghui Investment & Development Company Limited Class A (Consumer Staples, Food Products) | | | | | | | | | | | 27,100 | | | | 251,043 | |
Hengan International Group Company Limited (Consumer Staples, Personal Products) | | | | | | | | | | | 40,500 | | | | 319,289 | |
Hithink RoyalFlush Information Network Company Limited Class A (Information Technology, IT Services) | | | | | | | | | | | 5,000 | | | | 122,484 | |
Hongfa Technology Company Limited Class A (Industrials, Machinery) | | | | | | | | | | | 18,900 | | | | 128,706 | |
Huaan Securities Company Limited Class A (Financials, Capital Markets) | | | | | | | | | | | 28,700 | | | | 37,682 | |
Huagong Tech Company Limited Class A (Information Technology, Electronic Equipment, Instruments & Components) | | | | | | | | | | | 14,000 | | | | 49,732 | |
Hualan Biological Engineer Incorporated Class A (Health Care, Biotechnology) | | | | | | | | | | | 31,200 | | | | 262,170 | |
Huaneng Power International Incorporated Class H (Utilities, Independent Power & Renewable Electricity Producers) | | | | | | | | | | | 43,334 | | | | 18,060 | |
Huatai Securities Company Limited Class H (Financials, Capital Markets) 144A | | | | | | | | | | | 15,534 | | | | 27,259 | |
Huaxin Cement Company Limited Class A (Materials, Construction Materials) | | | | | | | | | | | 34,100 | | | | 139,090 | |
Huaxin Cement Company Limited Class B (Materials, Construction Materials) | | | | | | | | | | | 3,534 | | | | 8,181 | |
Huazhu Group Limited ADR (Consumer Discretionary, Hotels, Restaurants & Leisure) | | | | | | | | | | | 3,368 | | | | 150,651 | |
Hubei Kaile Science & Technology Company Limited Class A (Industrials, Transportation Infrastructure) | | | | | | | | | | | 120,300 | | | | 234,640 | |
Hunan Valin Steel Company Limited Class A (Materials, Metals & Mining) | | | | | | | | | | | 106,200 | | | | 75,450 | |
Hundsun Technologies Incorporated Class A (Information Technology, Software) | | | | | | | | | | | 10,900 | | | | 177,204 | |
Industrial & Commercial Bank of China Limited Class H (Financials, Banks) | | | | | | | | | | | 2,282,000 | | | | 1,277,887 | |
Industrial Bank Company Limited Class A (Financials, Banks) | | | | | | | | | | | 17,400 | | | | 41,020 | |
Inner Mongolia Yili Industrial Group Company Limited Class A (Consumer Staples, Food Products) | | | | | | | | | | | 3,800 | | | | 23,250 | |
Inner Mongolia Yitai Coal Company Limited Class B (Energy, Oil, Gas & Consumable Fuels) | | | | | | | | | | | 360,135 | | | | 252,095 | |
Innovent Biologics Incorporated (Health Care, Biotechnology) 144A† | | | | | | | | | | | 12,667 | | | | 84,417 | |
Inspur Electronic Information Industry Company Limited Class A (Information Technology, Technology Hardware, Storage & Peripherals) | | | | | | | | | | | 11,400 | | | | 60,037 | |
Jafron Biomedical Company Limited Class A (Health Care, Health Care Equipment & Supplies) | | | | | | | | | | | 4,100 | | | | 45,583 | |
JD.com Incorporated ADR (Consumer Discretionary, Internet & Direct Marketing Retail) † | | | | | | | | | | | 27,744 | | | | 2,181,788 | |
Jiangsu Changshu Rural Commercial Bank Company Limited Class A (Financials, Banks) | | | | | | | | | | | 26,500 | | | | 32,938 | |
Jiangsu Express Company Limited Class H (Industrials, Transportation Infrastructure) | | | | | | | | | | | 208,000 | | | | 208,263 | |
Jiangsu Hengli Hydraulic Company Limited Class A (Industrials, Machinery) | | | | | | | | | | | 44,100 | | | | 421,455 | |
Jiangsu Hengrui Medicine Company Limited Class A (Health Care, Pharmaceuticals) | | | | | | | | | | | 21,300 | | | | 294,791 | |
Jiangsu King’s Luck Brewery JSC Limited Class A (Consumer Staples, Beverages) | | | | | | | | | | | 16,000 | | | | 127,163 | |
Jiangsu Shagang Company Limited Class A (Materials, Metals & Mining) | | | | | | | | | | | 109,400 | | | | 189,919 | |
Jiangsu Yanghe Brewery Joint-Stock Company Limited Class A (Consumer Staples, Beverages) | | | | | | | | | | | 2,000 | | | | 41,165 | |
Jiangsu Yangnong Chemical Company Limited Class A (Materials, Chemicals) | | | | | | | | | | | 6,500 | | | | 86,774 | |
Jiangsu Zhongtian Technology Company Limited Class A (Information Technology, Communications Equipment) | | | | | | | | | | | 64,800 | | | | 106,822 | |
Jiangxi Copper Company Limited Class H (Materials, Metals & Mining) | | | | | | | | | | | 128,000 | | | | 150,954 | |
Jinxin Fertility Group Limited (Health Care, Health Care Providers & Services) 144A | | | | | | | | | | | 12,667 | | | | 17,880 | |
Jinyu Bio-Technology Company Limited Class A (Health Care, Biotechnology) | | | | | | | | | | | 68,900 | | | | 289,479 | |
Joincare Pharmaceutical Group Industry Company Limited Class A (Health Care, Pharmaceuticals) | | | | | | | | | | | 61,400 | | | | 174,576 | |
Jointown Pharmaceutical Group Company Limited Class A (Health Care, Pharmaceuticals) † | | | | | | | | | | | 82,763 | | | | 213,946 | |
Jonjee High-Tech Industrial and Commercial Holding Company Limited Class A (Consumer Staples, Food Products) | | | | | | | | | | | 13,200 | | | | 157,134 | |
The accompanying notes are an integral part of these financial statements.
Wells Fargo Factor Enhanced Emerging Markets Equity Portfolio | 9
Portfolio of investments—August 31, 2020 (unaudited)
| | | | | | | | | | | | | | | | |
| | | | | | | | | Shares | | | Value | |
|
| China (continued) | |
Joyoung Company Limited Class A (Consumer Discretionary, Household Durables) | | | | | | | | | | | 38,567 | | | $ | 248,119 | |
JOYY Incorporated ADR (Communication Services, Interactive Media & Services) | | | | | | | | | | | 732 | | | | 62,542 | |
Juewei Food Company Limited Class A (Consumer Staples, Food Products) | | | | | | | | | | | 2,700 | | | | 37,104 | |
Kaisa Group Holdings Limited (Real Estate, Real Estate Management & Development) | | | | | | | | | | | 434,000 | | | | 218,394 | |
Kingdee International Software Group Company Limited (Information Technology, Software) | | | | | | | | | | | 66,000 | | | | 168,274 | |
Kingsoft Corporation Limited (Information Technology, Software) | | | | | | | | | | | 10,000 | | | | 53,547 | |
Kweichow Moutai Company Limited Class A (Consumer Staples, Beverages) | | | | | | | | | | | 6,400 | | | | 1,667,970 | |
Lao Feng Xiang Company Limited Class B (Consumer Discretionary, Textiles, Apparel & Luxury Goods) | | | | | | | | | | | 1,704 | | | | 5,107 | |
Laobaixing Pharmacy Chain JSC Class A (Consumer Staples, Food & Staples Retailing) | | | | | | | | | | | 4,060 | | | | 52,666 | |
Legend Holdings Corporation H Shares (Information Technology, Technology Hardware, Storage & Peripherals) 144A | | | | | | | | | | | 5,800 | | | | 8,546 | |
Lens Technology Company Limited Class A (Information Technology, Technology Hardware, Storage & Peripherals) | | | | | | | | | | | 18,600 | | | | 93,668 | |
Leo Group Company Limited Class A (Communication Services, Media) | | | | | | | | | | | 394,300 | | | | 176,017 | |
Li Ning Company Limited (Consumer Discretionary, Textiles, Apparel & Luxury Goods) | | | | | | | | | | | 38,500 | | | | 162,938 | |
Liaoning Cheng Da Company Limited Class A (Consumer Discretionary, Distributors) | | | | | | | | | | | 15,500 | | | | 59,266 | |
Livzon Pharmaceutical Group Incorporated Class A (Health Care, Pharmaceuticals) | | | | | | | | | | | 26,100 | | | | 203,704 | |
Logan Property Holdings Company Limited (Real Estate, Real Estate Management & Development) | | | | | | | | | | | 82,000 | | | | 152,781 | |
Lomon Billions Group Company Limited (Materials, Chemicals) | | | | | | | | | | | 4,800 | | | | 16,435 | |
Longfor Properties Company Limited (Real Estate, Real Estate Management & Development) | | | | | | | | | | | 36,000 | | | | 190,679 | |
LONGi Green Energy Technology Company Limited Class A (Information Technology, Semiconductors & Semiconductor Equipment) | | | | | | | | | | | 2,200 | | | | 20,309 | |
Luenmei Quantum Company Limited Class A (Industrials, Construction & Engineering) | | | | | | | | | | | 38,700 | | | | 76,442 | |
Luxshare Precision Industry Company Limited Class A (Information Technology, Electronic Equipment, Instruments & Components) | | | | | | | | | | | 33,100 | | | | 265,580 | |
Luzhou Laojiao Company Limited Class A (Consumer Staples, Beverages) | | | | | | | | | | | 2,100 | | | | 45,800 | |
Mango Excellent Media Company Limited Class A (Consumer Discretionary, Multiline Retail) | | | | | | | | | | | 20,300 | | | | 210,261 | |
Meituan Dianping (Consumer Discretionary, Internet & Direct Marketing Retail) † | | | | | | | | | | | 101,500 | | | | 3,347,449 | |
Metallurgical Corporation of China Limited Class H (Industrials, Construction & Engineering) | | | | | | | | | | | 29,000 | | | | 4,977 | |
Midea Group Company Limited Class A (Consumer Discretionary, Household Durables) | | | | | | | | | | | 7,101 | | | | 73,074 | |
Momo Incorporated ADR (Communication Services, Interactive Media & Services) | | | | | | | | | | | 1,941 | | | | 39,596 | |
Muyuan Foodstuff Company Limited Class A (Consumer Staples, Food Products) | | | | | | | | | | | 4,000 | | | | 51,234 | |
Nanji E-Commerce Company Limited Class A (Communication Services, Interactive Media & Services) | | | | | | | | | | | 35,800 | | | | 96,775 | |
Nanjing King-friend Biochemical Pharmaceuticals Company Limited Class A (Health Care, Biotechnology) | | | | | | | | | | | 9,800 | | | | 70,353 | |
Nanyang Topsec Technologies Group Incorporated Class A (Industrials, Electronic Equipment, Instruments & Components) † | | | | | | | | | | | 29,500 | | | | 93,990 | |
Nari Technology Company Limited (Industrials, Electrical Equipment) | | | | | | | | | | | 18,600 | | | | 60,781 | |
NetEase Incorporated ADR (Communication Services, Entertainment) | | | | | | | | | | | 2,867 | | | | 1,396,831 | |
New China Life Insurance Company Limited Class H (Financials, Insurance) | | | | | | | | | | | 8,734 | | | | 34,879 | |
New Hope Liuhe Company Limited Class A (Consumer Staples, Food Products) | | | | | | | | | | | 7,700 | | | | 42,685 | |
New Oriental Education & Technology Group Incorporated ADR (Consumer Discretionary, Diversified Consumer Services) † | | | | | | | | | | | 2,061 | | | | 302,204 | |
Newland Digital Technology Company Limited Class A (Information Technology, Technology Hardware, Storage & Peripherals) | | | | | | | | | | | 16,300 | | | | 41,209 | |
Nexteer Automotive Group Limited (Consumer Discretionary, Auto Components) | | | | | | | | | | | 11,000 | | | | 7,168 | |
Ningbo Joyson Electronic Corporation Class A (Consumer Discretionary, Auto Components) | | | | | | | | | | | 52,200 | | | | 174,843 | |
Ningbo Tuopu Group Company Limited Class A (Consumer Discretionary, Auto Components) | | | | | | | | | | | 14,500 | | | | 87,954 | |
Northeast Securities Company Limited Class A (Financials, Capital Markets) | | | | | | | | | | | 37,300 | | | | 58,332 | |
Offcn Education Technology Company Limited Class A (Consumer Discretionary, Diversified Consumer Services) | | | | | | | | | | | 22,900 | | | | 119,297 | |
OFILM Group Company Limited Class A (Information Technology, Electronic Equipment, Instruments & Components) | | | | | | | | | | | 34,500 | | | | 95,173 | |
Orient Securities Company Limited of China Class H (Financials, Diversified Financial Services) | | | | | | | | | | | 4,667 | | | | 2,951 | |
People’s Insurance Company Group of China Limited Class H (Financials, Insurance) | | | | | | | | | | | 479,000 | | | | 156,366 | |
Perfect World Company Limited Class A (Information Technology, Software) | | | | | | | | | | | 36,000 | | | | 192,268 | |
PetroChina Company Limited Class H (Energy, Oil, Gas & Consumable Fuels) | | | | | | | | | | | 274,898 | | | | 95,059 | |
PICC Property & Casualty Company Limited Class H (Financials, Insurance) | | | | | | | | | | | 272,000 | | | | 210,224 | |
The accompanying notes are an integral part of these financial statements.
10 | Wells Fargo Factor Enhanced Emerging Markets Equity Portfolio
Portfolio of investments—August 31, 2020 (unaudited)
| | | | | | | | | | | | | | | | |
| | | | | | | | | Shares | | | Value | |
|
| China (continued) | |
Pinduoduo Incorporated ADR (Consumer Discretionary, Internet & Direct Marketing Retail) † | | | | | | | | | | | 6,012 | | | $ | 534,707 | |
Ping An Bank Company Limited Class A (Financials, Banks) | | | | | | | | | | | 37,200 | | | | 81,837 | |
Ping An Healthcare and Technology Company Limited (Health Care, Health Care Technology) 144A† | | | | | | | | | | | 4,900 | | | | 71,443 | |
Ping An Insurance (Group) Company of China Limited Class A (Financials, Insurance) | | | | | | | | | | | 26,700 | | | | 298,441 | |
Ping An Insurance Group Company Class H (Financials, Insurance) | | | | | | | | | | | 129,500 | | | | 1,379,348 | |
Poly Property Services Company Limited (Real Estate, Real Estate Management & Development) | | | | | | | | | | | 1,800 | | | | 15,758 | |
Postal Savings Bank of China Company Limited Class H (Financials, Banks) | | | | | | | | | | | 931,000 | | | | 440,862 | |
S.F. Holding Company Limited Class A (Industrials, Air Freight & Logistics) | | | | | | | | | | | 18,000 | | | | 223,464 | |
Sanan Optoelectronics Company Limited Class A (Information Technology, Semiconductors & Semiconductor Equipment) | | | | | | | | | | | 47,900 | | | | 189,649 | |
Sangfor Technologies Incorporated Class A (Information Technology, IT Services) | | | | | | | | | | | 2,100 | | | | 67,392 | |
Sansteel Minguang Company Limited Class A (Materials, Metals & Mining) | | | | | | | | | | | 122,805 | | | | 124,511 | |
Sany Heavy Industry Company Limited Class A (Industrials, Machinery) | | | | | | | | | | | 38,200 | | | | 123,380 | |
SDIC Power Holdings Company Limited Class A (Utilities, Independent Power & Renewable Electricity Producers) | | | | | | | | | | | 31,600 | | | | 41,766 | |
Seazen Group Limited (Real Estate, Real Estate Management & Development) | | | | | | | | | | | 87,000 | | | | 78,915 | |
Semiconductor Manufacturing International Corporation (Information Technology, Semiconductors & Semiconductor Equipment) † | | | | | | | | | | | 31,834 | | | | 102,277 | |
SG Micro Corporation Class A (Information Technology, Semiconductors & Semiconductor Equipment) | | | | | | | | | | | 3,200 | | | | 133,115 | |
Shandong Buchang Pharmaceuticals Company Limited Class A (Health Care, Biotechnology) | | | | | | | | | | | 35,200 | | | | 142,550 | |
Shandong Gold Mining Company Limited Class H (Materials, Metals & Mining) 144A | | | | | | | | | | | 4,750 | | | | 13,361 | |
Shandong Hualu Hengsheng Chemical Company Limited Class A (Materials, Chemicals) | | | | | | | | | | | 62,807 | | | | 246,288 | |
Shandong Linglong Tyre Company Limited Class A (Consumer Discretionary, Auto Components) | | | | | | | | | | | 14,800 | | | | 51,623 | |
Shandong Sinocera Functional Material Company Limited Class A (Materials, Chemicals) | | | | | | | | | | | 19,100 | | | | 114,492 | |
Shandong Sun Paper Industry Joint Stock Company Limited Class A (Materials, Paper & Forest Products) | | | | | | | | | | | 35,800 | | | | 72,908 | |
Shandong Weigao Group Medical Polymer Company Limited Class H (Health Care, Health Care Equipment & Supplies) | | | | | | | | | | | 26,667 | | | | 62,279 | |
Shanghai Baosight Software Company Limited Class A (Information Technology, IT Services) | | | | | | | | | | | 20,700 | | | | 209,935 | |
Shanghai Baosight Software Company Limited Class B (Information Technology, Software) | | | | | | | | | | | 4,100 | | | | 14,006 | |
Shanghai Electric Group Company Limited Class H (Industrials, Electrical Equipment) † | | | | | | | | | | | 96,000 | | | | 28,242 | |
Shanghai Fosun Pharmaceutical Company Limited Class H (Health Care, Pharmaceuticals) | | | | | | | | | | | 6,667 | | | | 28,173 | |
Shanghai Jahwa United Company Limited Class A (Consumer Staples, Personal Products) | | | | | | | | | | | 14,800 | | | | 89,731 | |
Shanghai Jinjiang International Hotels Company Limited Class A (Consumer Discretionary, Hotels, Restaurants & Leisure) | | | | | | | | | | | 18,400 | | | | 111,665 | |
Shanghai Lujiazui Finance & Trade Zone Development Company Limited (Real Estate, Real Estate Management & Development) | | | | | | | | | | | 94,470 | | | | 81,150 | |
Shanghai M&G Stationery Incorporated Class A (Consumer Discretionary, Specialty Retail) | | | | | | | | | | | 4,300 | | | | 43,597 | |
Shanghai Pharmaceuticals Holding Company Limited Class A (Health Care, Health Care Equipment & Supplies) | | | | | | | | | | | 10,000 | | | | 32,386 | |
Shanghai Pharmaceuticals Holding Company Limited Class H (Health Care, Health Care Providers & Services) | | | | | | | | | | | 8,534 | | | | 15,218 | |
Shanghai Pudong Development Bank Company Limited Class A (Financials, Banks) | | | | | | | | | | | 36,000 | | | | 54,409 | |
Shanghai Putailai New Energy Technology Company Limited Class A (Materials, Chemicals) | | | | | | | | | | | 1,100 | | | | 15,893 | |
Shanghai RAAS Blood Products Company Limited Class A (Health Care, Biotechnology) | | | | | | | | | | | 26,100 | | | | 34,230 | |
Shanxi Taigang Stainless Steel Company Limited Class A (Materials, Metals & Mining) | | | | | | | | | | | 61,700 | | | | 32,944 | |
Shanxi Xinghuacun Fen Wine Factory Company Limited Class A (Consumer Staples, Beverages) | | | | | | | | | | | 6,800 | | | | 195,643 | |
Shenergy Company Limited Class A (Utilities, Independent Power & Renewable Electricity Producers) | | | | | | | | | | | 85,600 | | | | 71,554 | |
Shennan Circuit Company Limited Class A (Information Technology, Electronic Equipment, Instruments & Components) | | | | | | | | | | | 2,100 | | | | 42,476 | |
Shenwan Hongyuan Group Company Limited Class H (Financials, Capital Markets) | | | | | | | | | | | 16,100 | | | | 13,247 | |
Shenzhen Expressway Company Limited (Industrials, Transportation Infrastructure) | | | | | | | | | | | 378,000 | | | | 342,386 | |
Shenzhen International Holdings Limited Class H (Industrials, Transportation Infrastructure) | | | | | | | | | | | 105,000 | | | | 168,538 | |
Shenzhen Kangtai Biological Products Company Limited Class A (Health Care, Biotechnology) | | | | | | | | | | | 8,100 | | | | 233,967 | |
Shenzhen Kingdom Sci-tech Company Limited Class A (Information Technology, Software) | | | | | | | | | | | 9,800 | | | | 28,736 | |
Shenzhen Mindray Bio-Medical Electronics Company Limited Class A (Health Care, Biotechnology) | | | | | | | | | | | 2,200 | | | | 109,907 | |
Shenzhen Salubris Pharmaceuticals Company Limited Class A (Health Care, Pharmaceuticals) | | | | | | | | | | | 11,100 | | | | 61,064 | |
The accompanying notes are an integral part of these financial statements.
Wells Fargo Factor Enhanced Emerging Markets Equity Portfolio | 11
Portfolio of investments—August 31, 2020 (unaudited)
| | | | | | | | | | | | | | | | |
| | | | | | | | | Shares | | | Value | |
|
| China (continued) | |
Shenzhen Sunway Communication Company Limited Class A (Communication Services, Diversified Telecommunication Services) | | | | | | | | | | | 3,900 | | | $ | 35,286 | |
Shijiazhuang Yiling Pharmaceutical Company Limited Class A (Health Care, Pharmaceuticals) | | | | | | | | | | | 26,500 | | | | 110,488 | |
Shui On Land Limited (Financials, Real Estate Management & Development) | | | | | | | | | | | 542,500 | | | | 74,198 | |
Sichuan Swellfun Company Limited Class A (Consumer Staples, Beverages) | | | | | | | | | | | 7,400 | | | | 82,142 | |
Sinolink Securities Company Limited Class A (Financials, Capital Markets) | | | | | | | | | | | 51,000 | | | | 115,767 | |
Sinopec Engineering Group Class H (Industrials, Construction & Engineering) | | | | | | | | | | | 347,000 | | | | 154,019 | |
Sinopec Shanghai Petrochemical Company Limited H Shares (Materials, Chemicals) | | | | | | | | | | | 1,522,000 | | | | 314,211 | |
Sinopharm Group Company Limited Class H (Health Care, Health Care Providers & Services) | | | | | | | | | | | 85,200 | | | | 209,751 | |
Sinotrans Limited Class H (Industrials, Air Freight & Logistics) | | | | | | | | | | | 28,667 | | | | 6,806 | |
SOHO China Limited (Financials, Real Estate Management & Development) † | | | | | | | | | | | 79,500 | | | | 24,516 | |
Songcheng Performance Development Company Limited Class A (Communication Services, Entertainment) | | | | | | | | | | | 58,300 | | | | 152,069 | |
Southern Copper Corporation (Materials, Metals & Mining) | | | | | | | | | | | 478 | | | | 22,992 | |
Spring Airlines Company Limited Class A (Industrials, Airlines) | | | | | | | | | | | 7,300 | | | | 46,985 | |
Sunac China Holdings Limited (Financials, Real Estate Management & Development) | | | | | | | | | | | 53,000 | | | | 222,936 | |
Sunny Optical Technology Company Limited (Information Technology, Electronic Equipment, Instruments & Components) | | | | | | | | | | | 14,500 | | | | 214,969 | |
Suofeiya Home Collection Company Limited Class A (Consumer Discretionary, Household Durables) | | | | | | | | | | | 22,500 | | | | 87,311 | |
Suzhou Dongshan Precision Manufacturing Company Limited Class A (Industrials, Building Products) | | | | | | | | | | | 28,400 | | | | 115,136 | |
TAL Education Group ADR (Consumer Discretionary, Diversified Consumer Services) † | | | | | | | | | | | 7,885 | | | | 581,992 | |
Tangshan Jidong Cement Company Limited Class A (Materials, Construction Materials) | | | | | | | | | | | 28,500 | | | | 74,505 | |
TCL Technology Group Corporation Class A (Communication Services, Diversified Telecommunication Services) | | | | | | | | | | | 72,200 | | | | 74,572 | |
Tencent Holdings Limited (Communication Services, Interactive Media & Services) | | | | | | | | | | | 99,100 | | | | 6,783,380 | |
Tencent Music Entertainment ADR (Communication Services, Entertainment) † | | | | | | | | | | | 4,452 | | | | 69,585 | |
The Pacific Securities Company Limited of China Class A (Financials, Capital Markets) † | | | | | | | | | | | 38,500 | | | | 23,870 | |
Thunder Software Technology Company Limited Class A (Industrials, Commercial Services & Supplies) | | | | | | | | | | | 13,200 | | | | 177,161 | |
Tianjin Chase Sun Pharmaceutical Company Limited Class A (Health Care, Pharmaceuticals) | | | | | | | | | | | 47,500 | | | | 39,290 | |
Tianjin Zhonghuan Semiconductor Company Limited Class A (Information Technology, Semiconductors & Semiconductor Equipment) | | | | | | | | | | | 6,900 | | | | 21,813 | |
Tingyi Holding Corporation (Consumer Staples, Food Products) | | | | | | | | | | | 62,000 | | | | 116,477 | |
Tong Ren Tang Technologies Company Limited H Shares (Health Care, Pharmaceuticals) | | | | | | | | | | | 8,667 | | | | 6,710 | |
Tongcheng-Elong Holdings Limited (Communication Services, Interactive Media & Services) † | | | | | | | | | | | 9,200 | | | | 18,043 | |
Tonghua Dongbao Pharmaceutical Company Limited Class A (Health Care, Pharmaceuticals) | | | | | | | | | | | 30,900 | | | | 64,146 | |
Tongkun Group Company Limited Class A (Consumer Discretionary, Textiles, Apparel & Luxury Goods) | | | | | | | | | | | 38,000 | | | | 89,418 | |
Topchoice Medical Cororation Class A (Health Care, Health Care Providers & Services) † | | | | | | | | | | | 5,000 | | | | 165,060 | |
Travelsky Technology Limited Class H (Information Technology, IT Services) | | | | | | | | | | | 29,000 | | | | 60,318 | |
Trip.com Group Limited ADR (Consumer Discretionary, Internet & Direct Marketing Retail) † | | | | | | | | | | | 7,478 | | | | 226,135 | |
Tsingtao Brewery Company Limited Class H (Consumer Staples, Beverages) | | | | | | | | | | | 10,300 | | | | 131,267 | |
Tsingtao Brewery Company Limited Class H (Consumer Staples, Beverages) | | | | | | | | | | | 10,000 | | | | 91,094 | |
Uni-President China Holdings Limited (Consumer Staples, Food Products) | | | | | | | | | | | 16,667 | | | | 15,183 | |
Universal Scientific Industrial (Shanghai) Company Limited Class A (Information Technology, Electronic Equipment, Instruments & Components) | | | | | | | | | | | 19,200 | | | | 65,514 | |
Venustech Group Incorporated Class A (Information Technology, Software) | | | | | | | | | | | 13,500 | | | | 75,114 | |
Vipshop Holdings Limited ADR (Consumer Discretionary, Internet & Direct Marketing Retail) † | | | | | | | | | | | 14,465 | | | | 238,817 | |
Walvax Biotechnology Company Limited Class A (Health Care, Biotechnology) † | | | | | | | | | | | 9,000 | | | | 83,372 | |
Wanhua Chemical Group Company Limited Class A (Materials, Chemicals) | | | | | | | | | | | 10,300 | | | | 110,125 | |
Want Want China Holdings Limited (Consumer Staples, Food Products) | | | | | | | | | | | 281,000 | | | | 192,888 | |
Weibo Corporation ADR (Communication Services, Interactive Media & Services) † | | | | | | | | | | | 1,355 | | | | 50,542 | |
Weichai Power Company Limited Class H (Consumer Discretionary, Auto Components) | | | | | | | | | | | 16,900 | | | | 36,538 | |
Weichai Power Company Limited Class H (Industrials, Machinery) | | | | | | | | | | | 155,000 | | | | 313,192 | |
Weifu High-Technology Group Company Limited Class A (Consumer Discretionary, Auto Components) | | | | | | | | | | | 20,100 | | | | 73,072 | |
Weihai Guangwei Composites Company Limited Class A (Materials, Chemicals) | | | | | | | | | | | 12,300 | | | | 139,960 | |
Winning Health Technology Group Company Limited Class A (Information Technology, Software) | | | | | | | | | | | 10,300 | | | | 31,855 | |
Wonders Information Company Limited Class A (Information Technology, Software) † | | | | | | | | | | | 6,900 | | | | 26,725 | |
The accompanying notes are an integral part of these financial statements.
12 | Wells Fargo Factor Enhanced Emerging Markets Equity Portfolio
Portfolio of investments—August 31, 2020 (unaudited)
| | | | | | | | | | | | | | | | |
| | | | | | | | | Shares | | | Value | |
|
| China (continued) | |
Wuhan Guide Infrared Company Limited Class A (Information Technology, Electronic Equipment, Instruments & Components) | | | | | | | | | | | 2,800 | | | $ | 15,673 | |
Wuhu Sanqi Interactive Entertainment Network Technology Group Company Limited Class A (Consumer Discretionary, Auto Components) | | | | | | | | | | | 54,500 | | | | 362,469 | |
Wuhu Token Science Company Limited Class A (Information Technology, Electronic Equipment, Instruments & Components) | | | | | | | | | | | 115,100 | | | | 197,968 | |
Wuliangye Yibin Company Limited Class A (Consumer Staples, Beverages) | | | | | | | | | | | 16,600 | | | | 581,199 | |
WUS Printed Circuit (Kunshan) Company Limited Class A (Information Technology, Electronic Equipment, Instruments & Components) | | | | | | | | | | | 18,800 | | | | 57,704 | |
WuXi AppTec Company Limited (Health Care, Life Sciences Tools & Services) 144A | | | | | | | | | | | 11,380 | | | | 168,566 | |
WuXi AppTec Company Limited Class H (Health Care, Pharmaceuticals) | | | | | | | | | | | 9,200 | | | | 147,513 | |
WuXi Biologics Cayman Incorporated (Health Care, Life Sciences Tools & Services) 144A† | | | | | | | | | | | 4,500 | | | | 116,939 | |
Wuxi Taiji Industry Company Limited Class A (Consumer Discretionary, Textiles, Apparel & Luxury Goods) | | | | | | | | | | | 55,600 | | | | 91,331 | |
Xiamen Intretech Incorporated Class A (Information Technology, Electrical Equipment) | | | | | | | | | | | 2,500 | | | | 21,481 | |
Xiaomi Corporation Class B (Information Technology, Technology Hardware, Storage & Peripherals) 144A† | | | | | | | | | | | 96,400 | | | | 292,302 | |
Xinyi Solar Holdings Limited (Information Technology, Semiconductors & Semiconductor Equipment) | | | | | | | | | | | 106,000 | | | | 133,898 | |
Yantai Changyu Pioneer Wine Company Limited Class B (Consumer Staples, Beverages) | | | | | | | | | | | 3,734 | | | | 7,420 | |
Yanzhou Coal Mining Company Limited Class A (Energy, Oil, Gas & Consumable Fuels) | | | | | | | | | | | 116,600 | | | | 157,853 | |
Yanzhou Coal Mining Company Limited H Shares (Energy, Oil, Gas & Consumable Fuels) | | | | | | | | | | | 810,000 | | | | 623,945 | |
Yealink Network Technology Company Limited Class A (Information Technology, Technology Hardware, Storage & Peripherals) | | | | | | | | | | | 2,900 | | | | 23,840 | |
Yifan Pharmaceutical Company Limited Class A (Health Care, Biotechnology) | | | | | | | | | | | 25,900 | | | | 113,276 | |
Yifeng Pharmacy Chain Company Limited Class A (Consumer Staples, Food & Staples Retailing) | | | | | | | | | | | 15,500 | | | | 227,928 | |
Yihai International Holding (Consumer Staples, Food Products) | | | | | | | | | | | 9,000 | | | | 141,442 | |
Yonyou Network Technology Company Limited Class A (Information Technology, Software) | | | | | | | | | | | 21,400 | | | | 130,839 | |
Yum China Holdings Incorporated (Consumer Discretionary, Hotels, Restaurants & Leisure) | | | | | | | | | | | 3,262 | | | | 188,250 | |
Yuzhou Properties Company (Real Estate, Real Estate Management & Development) | | | | | | | | | | | 363,000 | | | | 169,552 | |
Zhaojin Mining Industry Company Limited H Shares (Materials, Metals & Mining) | | | | | | | | | | | 9,667 | | | | 10,827 | |
Zhejiang Chint Electrics Company Limited Class A (Industrials, Electrical Equipment) | | | | | | | | | | | 9,600 | | | | 48,274 | |
Zhejiang Dahua Technology Company Limited Class A (Information Technology, Electronic Equipment, Instruments & Components) | | | | | | | | | | | 15,600 | | | | 52,024 | |
Zhejiang Expressway Company Limited H Shares (Industrials, Transportation Infrastructure) | | | | | | | | | | | 118,000 | | | | 79,629 | |
Zhejiang Huahai Pharmaceutical Company Limited Class A (Health Care, Pharmaceuticals) | | | | | | | | | | | 7,500 | | | | 47,999 | |
Zhejiang Jingsheng Mechanical & Electrical Company Limited Class A (Information Technology, Electrical Equipment) | | | | | | | | | | | 12,300 | | | | 46,761 | |
Zhejiang Juhua Company Limited Class A (Materials, Chemicals) | | | | | | | | | | | 103,800 | | | | 105,999 | |
Zhejiang Sanhua Intelligent Controls Company Limited Class A (Industrials, Machinery) | | | | | | | | | | | 61,200 | | | | 201,774 | |
Zhejiang Wolwo Bio-Pharmaceutical Company Limited Class A (Health Care, Biotechnology) | | | | | | | | | | | 6,100 | | | | 53,180 | |
Zhengzhou Yutong Bus Company Limited Class A (Industrials, Machinery) | | | | | | | | | | | 32,300 | | | | 66,958 | |
Zhenro Properties Group Limited (Real Estate, Real Estate Management & Development) | | | | | | | | | | | 28,000 | | | | 16,366 | |
ZhongAn Online P & C Insurance Company Limited (Financials, Insurance) 144A† | | | | | | | | | | | 3,500 | | | | 23,054 | |
Zhongsheng Group Holdings Limited (Consumer Discretionary, Specialty Retail) | | | | | | | | | | | 51,000 | | | | 318,495 | |
Zhuzhou CSR Times Electric Company Limited Class H (Industrials, Electrical Equipment) | | | | | | | | | | | 5,000 | | | | 16,064 | |
Zijin Mining Group Company Limited Class A (Materials, Metals & Mining) | | | | | | | | | | | 75,200 | | | | 78,877 | |
Zijin Mining Group Company Limited Class H (Materials, Metals & Mining) | | | | | | | | | | | 390,000 | | | | 266,200 | |
Zoomlion Heavy Industry Science & Technology Company Limited Class A (Industrials, Machinery) | | | | | | | | | | | 53,100 | | | | 65,999 | |
Zoomlion Heavy Industry Science and Technology Company Limited Class H (Industrials, Machinery) † | | | | | | | | | | | 158,400 | | | | 158,600 | |
ZTE Corporation Class A (Information Technology, Communications Equipment) | | | | | | | | | | | 4,300 | | | | 24,465 | |
ZTE Corporation H Shares (Information Technology, Communications Equipment) | | | | | | | | | | | 73,800 | | | | 214,729 | |
ZTO Express (Cayman) Incorporated ADR (Industrials, Air Freight & Logistics) | | | | | | | | | | | 11,555 | | | | 387,439 | |
| | | | |
| | | | | | | | | | | | | | | 79,149,676 | |
| | | | | | | | | | | | | | | | |
|
| Colombia: 0.09% | |
Banco de Bogota SA (Financials, Banks) | | | | | | | | | | | 716 | | | | 13,206 | |
Cementos Argos SA (Materials, Construction Materials) | | | | | | | | | | | 6,963 | | | | 9,306 | |
Corporacion Financiera Colombiana SA (Financials, Diversified Financial Services) | | | | | | | | | | | 1,391 | | | | 10,076 | |
The accompanying notes are an integral part of these financial statements.
Wells Fargo Factor Enhanced Emerging Markets Equity Portfolio | 13
Portfolio of investments—August 31, 2020 (unaudited)
| | | | | | | | | | | | | | | | |
| | | | | | | | | Shares | | | Value | |
|
| Colombia (continued) | |
Ecopetrol SA (Energy, Oil, Gas & Consumable Fuels) | | | | | | | | | | | 75,544 | | | $ | 44,224 | |
Grupo Argos SA (Materials, Construction Materials) | | | | | | | | | | | 4,467 | | | | 14,233 | |
Grupo Bolivar SA (Financials, Banks) | | | | | | | | | | | 296 | | | | 5,151 | |
Grupo de Inversiones Suramericana SA (Financials, Diversified Financial Services) | | | | | | | | | | | 3,432 | | | | 19,265 | |
Grupo Energia Bogota SA (Utilities, Gas Utilities) | | | | | | | | | | | 33,455 | | | | 21,999 | |
Grupo Nutresa SA (Consumer Staples, Food Products) | | | | | | | | | | | 3,703 | | | | 21,777 | |
Interconexion Electrica SA (Utilities, Electric Utilities) | | | | | | | | | | | 5,412 | | | | 30,293 | |
Promigas SA (Utilities, Gas Utilities) | | | | | | | | | | | 3,569 | | | | 6,688 | |
| | | | |
| | | | | | | | | | | | | | | 196,218 | |
| | | | | | | | | | | | | | | | |
|
| Czech Republic: 0.13% | |
CEZ AS (Utilities, Electric Utilities) | | | | | | | | | | | 2,852 | | | | 58,760 | |
Komercni Banka AS (Financials, Banks) † | | | | | | | | | | | 2,441 | | | | 58,776 | |
Moneta Money Bank (Financials, Banks) 144A | | | | | | | | | | | 55,044 | | | | 138,791 | |
O2 Czech Republic AS (Communication Services, Diversified Telecommunication Services) | | | | | | | | | | | 1,903 | | | | 19,150 | |
| | | | |
| | | | | | | | | | | | | | | 275,477 | |
| | | | | | | | | | | | | | | | |
|
| Egypt: 0.11% | |
Commercial International Bank ADR (Financials, Banks) | | | | | | | | | | | 54,372 | | | | 233,256 | |
| | | | | | | | | | | | | | | | |
|
| Greece: 0.23% | |
Alpha Bank AE (Financials, Banks) † | | | | | | | | | | | 22,105 | | | | 14,630 | |
FF Group (Consumer Discretionary, Specialty Retail) †(a) | | | | | | | | | | | 3,820 | | | | 0 | |
Hellenic Petroleum SA (Energy, Oil, Gas & Consumable Fuels) | | | | | | | | | | | 1,951 | | | | 11,897 | |
Hellenic Telecommunications Organization SA (Communication Services, Diversified Telecommunication Services) | | | | | | | | | | | 14,122 | | | | 230,879 | |
Jumbo SA (Consumer Discretionary, Specialty Retail) | | | | | | | | | | | 2,020 | | | | 35,074 | |
LAMDA Development SA (Real Estate, Real Estate Management & Development) † | | | | | | | | | | | 1,110 | | | | 7,484 | |
Motor Oil (Hellas) Corinth Refineries SA (Energy, Oil, Gas & Consumable Fuels) | | | | | | | | | | | 7,510 | | | | 105,304 | |
Mytilineos Holdings SA (Industrials, Industrial Conglomerates) | | | | | | | | | | | 1,421 | | | | 13,379 | |
National Bank of Greece SA (Financials, Banks) † | | | | | | | | | | | 8,045 | | | | 10,949 | |
OPAP SA (Consumer Discretionary, Hotels, Restaurants & Leisure) | | | | | | | | | | | 3,709 | | | | 33,993 | |
Piraeus Bank SA (Financials, Banks) † | | | | | | | | | | | 5,155 | | | | 7,425 | |
Public Power Corporation SA (Utilities, Electric Utilities) † | | | | | | | | | | | 1,519 | | | | 7,265 | |
Terna Energy SA (Utilities, Independent Power & Renewable Electricity Producers) | | | | | | | | | | | 556 | | | | 7,869 | |
| | | | |
| | | | | | | | | | | | | | | 486,148 | |
| | | | | | | | | | | | | | | | |
|
| Hong Kong: 3.27% | |
Bosideng International Holdings Limited (Consumer Discretionary, Textiles, Apparel & Luxury Goods) | | | | | | | | | | | 8,000 | | | | 2,292 | |
BYD Electronic International Company Limited (Information Technology, Communications Equipment) | | | | | | | | | | | 35,000 | | | | 148,351 | |
China Everbright Limited (Financials, Capital Markets) | | | | | | | | | | | 166,000 | | | | 255,741 | |
China Insurance International Holdings Company Limited (Financials, Insurance) | | | | | | | | | | | 14,400 | | | | 22,891 | |
China Jinmao Holdings Group Limited (Real Estate, Real Estate Management & Development) | | | | | | | | | | | 120,000 | | | | 75,095 | |
China Merchants Port Holdings Company Limited (Industrials, Transportation Infrastructure) | | | | | | | | | | | 80,000 | | | | 91,559 | |
China Mobile Limited (Communication Services, Wireless Telecommunication Services) | | | | | | | | | | | 168,000 | | | | 1,173,802 | |
China Overseas Grand Oceans Group Limited (Real Estate, Real Estate Management & Development) | | | | | | | | | | | 18,667 | | | | 12,163 | |
China Overseas Land & Investment Limited (Real Estate, Real Estate Management & Development) | | | | | | | | | | | 100,000 | | | | 289,670 | |
China Power International Development Limited (Utilities, Independent Power & Renewable Electricity Producers) | | | | | | | | | | | 497,000 | | | | 96,191 | |
China Resources Beer Holdings Company Limited (Consumer Staples, Beverages) | | | | | | | | | | | 20,000 | | | | 130,061 | |
China Resources Pharmaceutical Group Limited (Health Care, Pharmaceuticals) | | | | | | | | | | | 23,167 | | | | 13,123 | |
China Resources Power Holdings Company (Utilities, Independent Power & Renewable Electricity Producers) | | | | | | | | | | | 174,000 | | | | 206,550 | |
China Traditional Chinese Medicine Holdings Company Limited (Health Care, Pharmaceuticals) | | | | | | | | | | | 384,000 | | | | 164,001 | |
China Unicom Hong Kong Limited (Communication Services, Diversified Telecommunication Services) | | | | | | | | | | | 74,000 | | | | 52,419 | |
CITIC Pacific Limited (Industrials, Industrial Conglomerates) | | | | | | | | | | | 74,000 | | | | 67,505 | |
The accompanying notes are an integral part of these financial statements.
14 | Wells Fargo Factor Enhanced Emerging Markets Equity Portfolio
Portfolio of investments—August 31, 2020 (unaudited)
| | | | | | | | | | | | | | | | |
| | | | | | | | | Shares | | | Value | |
|
| Hong Kong (continued) | |
CNOOC Limited (Energy, Oil, Gas & Consumable Fuels) | | | | | | | | | | | 181,000 | | | $ | 205,984 | |
CSPC Pharmaceutical Group Limited (Health Care, Pharmaceuticals) | | | | | | | | | | | 118,000 | | | | 262,182 | |
Far East Horizon Limited (Financials, Diversified Financial Services) | | | | | | | | | | | 258,000 | | | | 228,366 | |
Fosun International (Industrials, Industrial Conglomerates) | | | | | | | | | | | 120,000 | | | | 133,622 | |
Geely Automobile Holdings Limited (Consumer Discretionary, Automobiles) | | | | | | | | | | | 114,000 | | | | 240,938 | |
Guangdong Investment Limited (Utilities, Water Utilities) | | | | | | | | | | | 33,334 | | | | 52,043 | |
Haitian International Holdings Limited (Industrials, Machinery) | | | | | | | | | | | 61,000 | | | | 147,656 | |
Hutchison China MediTech Limited ADR (Health Care, Pharmaceuticals) † | | | | | | | | | | | 1,614 | | | | 53,617 | |
Kingboard Chemicals Holdings Limited (Information Technology, Electronic Equipment, Instruments & Components) | | | | | | | | | | | 93,000 | | | | 299,392 | |
Kingboard Laminates Holdings Limited (Information Technology, Electronic Equipment, Instruments & Components) | | | | | | | | | | | 345,500 | | | | 435,542 | |
KWG Property Holding Limited (Real Estate, Real Estate Management & Development) | | | | | | | | | | | 161,500 | | | | 307,155 | |
Lee & Man Paper Manufacturing Limited (Materials, Paper & Forest Products) | | | | | | | | | | | 274,000 | | | | 164,042 | |
Lenovo Group Limited (Information Technology, Technology Hardware, Storage & Peripherals) | | | | | | | | | | | 76,667 | | | | 51,242 | |
MMG Limited (Materials, Metals & Mining) † | | | | | | | | | | | 20,000 | | | | 5,342 | |
Poly Property Group Company Limited (Real Estate, Real Estate Management & Development) | | | | | | | | | | | 23,334 | | | | 7,346 | |
Shanghai Industrial Holdings Limited (Industrials, Industrial Conglomerates) | | | | | | | | | | | 132,000 | | | | 198,250 | |
Shenzhen Investment Limited (Real Estate, Real Estate Management & Development) | | | | | | | | | | | 364,000 | | | | 123,522 | |
Shenzhou International Group Holdings Limited (Consumer Discretionary, Textiles, Apparel & Luxury Goods) | | | | | | | | | | | 200 | | | | 3,226 | |
Shimao Property Holding Limited (Real Estate, Real Estate Management & Development) | | | | | | | | | | | 48,000 | | | | 216,149 | |
Shougang Fushan Resources Group Limited (Materials, Metals & Mining) | | | | | | | | | | | 39,334 | | | | 8,932 | |
Sino Biopharmaceutical Limited Sino Biopharmaceutical(Health Care, Pharmaceuticals) | | | | | | | | | | | 168,500 | | | | 194,585 | |
Sino-Ocean Land Holdings Limited (Real Estate, Real Estate Management & Development) | | | | | | | | | | | 265,000 | | | | 61,205 | |
Sinotruk Hong Kong Limited (Industrials, Machinery) | | | | | | | | | | | 82,500 | | | | 214,494 | |
Sun Art Retail Group Limited (Consumer Staples, Food & Staples Retailing) | | | | | | | | | | | 225,000 | | | | 293,218 | |
Topsports International Holdings Limited (Consumer Discretionary, Textiles, Apparel & Luxury Goods) 144A | | | | | | | | | | | 12,334 | | | | 15,262 | |
Universal Medical Financial & Technical Advisory Services Company Limited (Health Care, Health Care Providers & Services) 144A | | | | | | | | | | | 6,834 | | | | 4,762 | |
Vinda International Holdings Limited (Consumer Staples, Household Products) | | | | | | | | | | | 33,000 | | | | 112,836 | |
Yuexiu Property Company Limited (Real Estate, Real Estate Management & Development) | | | | | | | | | | | 64,667 | | | | 12,349 | |
| | | | |
| | | | | | | | | | | | | | | 6,854,673 | |
| | | | | | | | | | | | | | | | |
|
| Hungary: 0.34% | |
Magyar Telekom Telecommunications plc (Communication Services, Diversified Telecommunication Services) | | | | | | | | | | | 18,251 | | | | 22,419 | |
MOL Hungarian Oil & Gas plc (Energy, Oil, Gas & Consumable Fuels) † | | | | | | | | | | | 15,803 | | | | 88,893 | |
OTP Bank plc (Financials, Banks) † | | | | | | | | | | | 8,989 | | | | 302,901 | |
Richter Gedeon (Health Care, Pharmaceuticals) | | | | | | | | | | | 12,105 | | | | 295,362 | |
| | | | |
| | | | | | | | | | | | | | | 709,575 | |
| | | | | | | | | | | | | | | | |
|
| India: 10.14% | |
3M India Limited (Industrials, Industrial Conglomerates) † | | | | | | | | | | | 35 | | | | 9,636 | |
Aarti Industries Limited (Materials, Chemicals) | | | | | | | | | | | 2,148 | | | | 30,574 | |
Aavas Financiers Limited (Financials, Thrifts & Mortgage Finance) † | | | | | | | | | | | 466 | | | | 8,882 | |
ABB India Limited (Industrials, Electrical Equipment) | | | | | | | | | | | 716 | | | | 9,248 | |
ACC Limited (Materials, Construction Materials) | | | | | | | | | | | 1,059 | | | | 19,017 | |
Adani Enterprises Limited (Industrials, Trading Companies & Distributors) | | | | | | | | | | | 4,658 | | | | 17,690 | |
Adani Gas Limited (Utilities, Gas Utilities) | | | | | | | | | | | 3,732 | | | | 8,607 | |
Adani Green Energy Limited (Utilities, Independent Power & Renewable Electricity Producers) † | | | | | | | | | | | 5,455 | | | | 33,553 | |
Adani Ports & Special Economic Zone Limited (Industrials, Transportation Infrastructure) | | | | | | | | | | | 11,176 | | | | 54,014 | |
Adani Power Limited (Utilities, Independent Power & Renewable Electricity Producers) † | | | | | | | | | | | 14,141 | | | | 7,156 | |
Adani Transmissions Limited (Utilities, Electric Utilities) † | | | | | | | | | | | 5,180 | | | | 17,826 | |
Aditya Birla Capital Limited (Financials, Diversified Financial Services) † | | | | | | | | | | | 10,327 | | | | 8,593 | |
The accompanying notes are an integral part of these financial statements.
Wells Fargo Factor Enhanced Emerging Markets Equity Portfolio | 15
Portfolio of investments—August 31, 2020 (unaudited)
| | | | | | | | | | | | | | | | |
| | | | | | | | | Shares | | | Value | |
|
| India (continued) | |
Aditya Birla Fashion & Retail Limited (Consumer Discretionary, Textiles, Apparel & Luxury Goods) † | | | | | | | | | | | 4,769 | | | $ | 9,064 | |
Aegis Logistics Limited (Energy, Oil, Gas & Consumable Fuels) | | | | | | | | | | | 3,068 | | | | 8,857 | |
Aia Engineering Limited (Industrials, Machinery) | | | | | | | | | | | 403 | | | | 9,864 | |
Ajanta Pharma Limited (Health Care, Pharmaceuticals) | | | | | | | | | | | 362 | | | | 7,301 | |
Alembic Pharmaceuticals Limited (Health Care, Pharmaceuticals) | | | | | | | | | | | 766 | | | | 9,804 | |
Alkem Laboratories Limited (Health Care, Pharmaceuticals) | | | | | | | | | | | 772 | | | | 28,556 | |
Amara Raja Batteries Limited (Industrials, Electrical Equipment) | | | | | | | | | | | 782 | | | | 7,734 | |
Ambuja Cements Limited (Materials, Construction Materials) | | | | | | | | | | | 9,559 | | | | 27,343 | |
Apollo Hospitals Enterprise Limited (Health Care, Health Care Providers & Services) | | | | | | | | | | | 1,259 | | | | 27,958 | |
Apollo Tyres Limited (Consumer Discretionary, Auto Components) | | | | | | | | | | | 4,959 | | | | 8,324 | |
Ashok Leyland Limited (Industrials, Machinery) | | | | | | | | | | | 21,977 | | | | 20,198 | |
Asian Paints Limited (Materials, Chemicals) | | | | | | | | | | | 10,873 | | | | 280,527 | |
Astral Poly Technik Limited (Industrials, Building Products) | | | | | | | | | | | 745 | | | | 11,357 | |
Atul Limited (Materials, Chemicals) | | | | | | | | | | | 241 | | | | 18,926 | |
AU Small Finance Bank Limited (Financials, Banks) 144A† | | | | | | | | | | | 2,728 | | | | 24,757 | |
Aurobindo Pharma Limited (Health Care, Pharmaceuticals) | | | | | | | | | | | 6,895 | | | | 75,772 | |
Avenue Supermarts Limited (Consumer Staples, Food & Staples Retailing) † | | | | | | | | | | | 9,589 | | | | 293,275 | |
Axis Bank Limited (Financials, Banks) † | | | | | | | | | | | 73,033 | | | | 492,873 | |
Bajaj Auto Limited (Consumer Discretionary, Automobiles) | | | | | | | | | | | 4,855 | | | | 195,697 | |
Bajaj Finance Limited (Financials, Consumer Finance) | | | | | | | | | | | 2,847 | | | | 134,902 | |
Bajaj Finserv Limited (Financials, Insurance) | | | | | | | | | | | 856 | | | | 71,989 | |
Bajaj Holdings & Investment Limited (Financials, Diversified Financial Services) | | | | | | | | | | | 838 | | | | 30,497 | |
Balkrishna Industries Limited (Consumer Discretionary, Auto Components) | | | | | | | | | | | 1,102 | | | | 19,791 | |
Bandhan Bank Limited (Financials, Banks) 144A† | | | | | | | | | | | 5,397 | | | | 22,422 | |
Bank of Baroda (Financials, Banks) † | | | | | | | | | | | 19,339 | | | | 12,861 | |
Bata India Limited (Consumer Discretionary, Textiles, Apparel & Luxury Goods) | | | | | | | | | | | 714 | | | | 12,601 | |
Bayer CropScience Limited (Materials, Chemicals) | | | | | | | | | | | 180 | | | | 14,220 | |
Berger Paints India Limited (Materials, Chemicals) | | | | | | | | | | | 4,303 | | | | 31,433 | |
Bharat Electronics Limited (Industrials, Aerospace & Defense) | | | | | | | | | | | 13,267 | | | | 19,123 | |
Bharat Forge Limited (Consumer Discretionary, Auto Components) | | | | | | | | | | | 3,149 | | | | 21,014 | |
Bharat Heavy Electricals Limited (Industrials, Electrical Equipment) | | | | | | | | | | | 16,775 | | | | 8,785 | |
Bharat Petroleum Corporation Limited (Energy, Oil, Gas & Consumable Fuels) | | | | | | | | | | | 56,147 | | | | 311,065 | |
Bharti Airtel Limited (Communication Services, Wireless Telecommunication Services) | | | | | | | | | | | 26,967 | | | | 187,980 | |
Bharti Infratel Limited (Communication Services, Diversified Telecommunication Services) | | | | | | | | | | | 65,175 | | | | 175,804 | |
Biocon Limited (Health Care, Biotechnology) † | | | | | | | | | | | 15,044 | | | | 76,878 | |
Blue Star Limited (Industrials, Building Products) | | | | | | | | | | | 1,037 | | | | 8,957 | |
Bosch Limited (Consumer Discretionary, Auto Components) | | | | | | | | | | | 96 | | | | 16,712 | |
Britannia Industries Limited (Consumer Staples, Food Products) | | | | | | | | | | | 1,500 | | | | 75,931 | |
Cadila Healthcare Limited (Health Care, Pharmaceuticals) | | | | | | | | | | | 3,294 | | | | 16,614 | |
Carborundum Universal Limited (Industrials, Machinery) | | | | | | | | | | | 2,317 | | | | 8,485 | |
Castrol India Limited (Materials, Chemicals) | | | | | | | | | | | 4,234 | | | | 6,897 | |
CESC Limited (Utilities, Electric Utilities) | | | | | | | | | | | 904 | | | | 7,374 | |
Chambal Fertilisers and Chemicals Limited (Materials, Chemicals) | | | | | | | | | | | 2,910 | | | | 5,867 | |
Cholamandalam Financial Holdings Limited (Financials, Consumer Finance) | | | | | | | | | | | 1,443 | | | | 8,560 | |
Cholamandalam Investment & Finance Company Limited (Financials, Consumer Finance) | | | | | | | | | | | 4,929 | | | | 15,549 | |
Cipla India Limited (Health Care, Pharmaceuticals) | | | | | | | | | | | 8,340 | | | | 80,848 | |
City Union Bank Limited (Financials, Banks) | | | | | | | | | | | 10,186 | | | | 18,682 | |
Coal India Limited (Energy, Oil, Gas & Consumable Fuels) | | | | | | | | | | | 22,098 | | | | 40,334 | |
Colgate-Palmolive Company India Limited (Consumer Staples, Personal Products) | | | | | | | | | | | 8,268 | | | | 153,128 | |
Container Corporation of India Limited (Industrials, Transportation Infrastructure) | | | | | | | | | | | 36,941 | | | | 197,233 | |
Coromandel International Limited (Materials, Chemicals) | | | | | | | | | | | 1,450 | | | | 14,972 | |
CRISIL Limited (Financials, Capital Markets) | | | | | | | | | | | 183 | | | | 4,352 | |
Crompton Greaves Consumer Electricals Limited (Consumer Discretionary, Household Durables) † | | | | | | | | | | | 5,629 | | | | 20,785 | |
Cummins India Limited (Industrials, Machinery) | | | | | | | | | | | 1,583 | | | | 9,941 | |
Dabur India Limited (Consumer Staples, Personal Products) | | | | | | | | | | | 8,379 | | | | 54,025 | |
Dalmia Bharat Limited (Materials, Construction Materials) | | | | | | | | | | | 1,287 | | | | 13,109 | |
Deepak Nitrite Limited (Materials, Chemicals) | | | | | | | | | | | 1,064 | | | | 9,879 | |
The accompanying notes are an integral part of these financial statements.
16 | Wells Fargo Factor Enhanced Emerging Markets Equity Portfolio
Portfolio of investments—August 31, 2020 (unaudited)
| | | | | | | | | | | | | | | | |
| | | | | | | | | Shares | | | Value | |
|
| India (continued) | |
Divi’s Laboratories Limited (Health Care, Life Sciences Tools & Services) | | | | | | | | | | | 8,473 | | | $ | 359,467 | |
Dixon Technologies (India) Limited (Consumer Discretionary, Household Durables) | | | | | | | | | | | 81 | | | | 8,908 | |
DLF Limited (Real Estate, Real Estate Management & Development) | | | | | | | | | | | 13,010 | | | | 27,988 | |
Dr. Lal Pathlabs Limited (Health Care, Health Care Providers & Services) 144A | | | | | | | | | | | 298 | | | | 7,185 | |
Dr. Reddy’s Laboratories Limited (Health Care, Pharmaceuticals) | | | | | | | | | | | 4,547 | | | | 263,446 | |
Dr. Reddy’s Laboratories Limited ADR (Health Care, Pharmaceuticals) | | | | | | | | | | | 1,251 | | | | 72,771 | |
Edelweiss Financial Services Limited (Financials, Capital Markets) † | | | | | | | | | | | 9,982 | | | | 10,856 | |
Eicher Motors Limited (Consumer Discretionary, Automobiles) | | | | | | | | | | | 1,860 | | | | 52,863 | |
Emami Limited (Consumer Staples, Personal Products) | | | | | | | | | | | 2,888 | | | | 14,005 | |
Endurance Technologies Limited (Consumer Discretionary, Auto Components) 144A | | | | | | | | | | | 467 | | | | 6,974 | |
Escorts Limited (Industrials, Machinery) | | | | | | | | | | | 814 | | | | 12,027 | |
Exide Industries Limited (Consumer Discretionary, Auto Components) | | | | | | | | | | | 5,673 | | | | 12,643 | |
Federal Bank Limited (Financials, Banks) † | | | | | | | | | | | 26,949 | | | | 20,246 | |
Finolex Industries Limited (Materials, Chemicals) | | | | | | | | | | | 887 | | | | 6,090 | |
Fortis Healthcare Limited (Health Care, Health Care Providers & Services) † | | | | | | | | | | | 6,309 | | | | 11,382 | |
Gail India Limited (Utilities, Gas Utilities) | | | | | | | | | | | 123,566 | | | | 160,569 | |
Galaxy Surfactants Limited (Materials, Chemicals) | | | | | | | | | | | 216 | | | | 5,122 | |
Gillette India Limited (Consumer Staples, Personal Products) | | | | | | | | | | | 70 | | | | 5,163 | |
GlaxoSmithKline Pharmaceuticals Limited (Health Care, Pharmaceuticals) | | | | | | | | | | | 400 | | | | 8,512 | |
Glenmark Pharmaceuticals Limited (Health Care, Pharmaceuticals) | | | | | | | | | | | 2,165 | | | | 13,812 | |
GMR Infrastructure Limited (Industrials, Transportation Infrastructure) † | | | | | | | | | | | 27,730 | | | | 8,872 | |
Godrej Consumer Products Limited (Consumer Staples, Personal Products) | | | | | | | | | | | 16,984 | | | | 150,279 | |
Godrej Industries Limited (Industrials, Industrial Conglomerates) † | | | | | | | | | | | 3,682 | | | | 21,982 | |
Godrej Properties Limited (Real Estate, Real Estate Management & Development) † | | | | | | | | | | | 1,354 | | | | 16,799 | |
Grasim Industries Limited (Materials, Construction Materials) | | | | | | | | | | | 4,990 | | | | 45,749 | |
Grindwell Norton Limited (Industrials, Machinery) | | | | | | | | | | | 799 | | | | 5,478 | |
Gujarat Gas Limited (Utilities, Gas Utilities) | | | | | | | | | | | 3,107 | | | | 13,737 | |
Gujarat State Petronet Limited (Utilities, Gas Utilities) | | | | | | | | | | | 4,513 | | | | 12,480 | |
Hatsun Agro Products Limited (Consumer Staples, Food Products) | | | | | | | | | | | 851 | | | | 8,618 | |
Havells India Limited (Industrials, Electrical Equipment) | | | | | | | | | | | 19,489 | | | | 162,979 | |
HCL Technologies Limited (Information Technology, IT Services) | | | | | | | | | | | 33,278 | | | | 313,939 | |
HDFC Asset Management Company Limited (Financials, Capital Markets) 144A | | | | | | | | | | | 4,267 | | | | 139,759 | |
HDFC Bank Limited (Financials, Banks) † | | | | | | | | | | | 51,281 | | | | 777,392 | |
HDFC Life Insurance Company Limited (Financials, Insurance) † | | | | | | | | | | | 21,938 | | | | 171,314 | |
Hemisphere Properties India Limited (Real Estate, Real Estate Management & Development) †(a)‡ | | | | | | | | | | | 5,373 | | | | 12,176 | |
Hero Motorcorp Limited (Consumer Discretionary, Automobiles) | | | | | | | | | | | 4,550 | | | | 185,817 | |
Hexaware Technologies Limited (Information Technology, IT Services) | | | | | | | | | | | 1,523 | | | | 8,202 | |
Hindalco Industries Limited (Materials, Metals & Mining) | | | | | | | | | | | 123,713 | | | | 311,352 | |
Hindustan Petroleum Corporation Limited (Energy, Oil, Gas & Consumable Fuels) | | | | | | | | | | | 118,077 | | | | 323,315 | |
Hindustan Unilever Limited (Consumer Staples, Household Products) | | | | | | | | | | | 21,776 | | | | 626,396 | |
Hindustan Zinc Limited (Materials, Metals & Mining) | | | | | | | | | | | 2,210 | | | | 6,803 | |
Honeywell Automation India Limited (Information Technology, Electronic Equipment, Instruments & Components) | | | | | | | | | | | 28 | | | | 12,410 | |
Housing Development Finance Corporation Limited (Financials, Thrifts & Mortgage Finance) | | | | | | | | | | | 40,028 | | | | 996,574 | |
ICICI Bank Limited (Financials, Banks) † | | | | | | | | | | | 166,525 | | | | 892,718 | |
ICICI Lombard General Insurance Company Limited (Financials, Insurance) 144A | | | | | | | | | | | 5,039 | | | | 86,031 | |
ICICI Prudential Life Insurance Company Limited (Financials, Insurance) 144A | | | | | | | | | | | 4,443 | | | | 25,511 | |
Idea Cellular Limited (Communication Services, Wireless Telecommunication Services) † | | | | | | | | | | | 188,925 | | | | 26,180 | |
IDFC Bank Limited (Financials, Banks) † | | | | | | | | | | | 27,732 | | | | 12,056 | |
IIFL Wealth Management Limited (Financials, Diversified Financial Services) | | | | | | | | | | | 876 | | | | 12,181 | |
Indiabulls Housing Finance Limited (Financials, Thrifts & Mortgage Finance) | | | | | | | | | | | 3,701 | | | | 10,468 | |
Indiabulls Ventures Limited (Financials, Capital Markets) | | | | | | | | | | | 4,172 | | | | 11,152 | |
IndiaMART InterMESH Limited (Industrials, Trading Companies & Distributors) 144A | | | | | | | | | | | 190 | | | | 9,514 | |
Indian Energy Exchange Limited (Financials, Capital Markets) | | | | | | | | | | | 2,761 | | | | 7,234 | |
Indian Hotels Company Limited (Consumer Discretionary, Hotels, Restaurants & Leisure) | | | | | | | | | | | 10,377 | | | | 14,619 | |
Indian Oil Corporation Limited (Energy, Oil, Gas & Consumable Fuels) | | | | | | | | | | | 84,396 | | | | 98,376 | |
Indraprastha Gas Limited (Utilities, Gas Utilities) | | | | | | | | | | | 14,184 | | | | 76,010 | |
The accompanying notes are an integral part of these financial statements.
Wells Fargo Factor Enhanced Emerging Markets Equity Portfolio | 17
Portfolio of investments—August 31, 2020 (unaudited)
| | | | | | | | | | | | | | | | |
| | | | | | | | | Shares | | | Value | |
|
| India (continued) | |
Info Edge India Limited (Communication Services, Interactive Media & Services) | | | | | | | | | | | 3,419 | | | $ | 151,594 | |
Infosys Limited (Information Technology, IT Services) | | | | | | | | | | | 103,163 | | | | 1,301,459 | |
Infosys Limited ADR (Information Technology, IT Services) | | | | | | | | | | | 6,535 | | | | 82,341 | |
Interglobe Aviation Limited (Industrials, Airlines) | | | | | | | | | | | 1,054 | | | | 17,171 | |
Ipca Laboratories Limited (Health Care, Pharmaceuticals) | | | | | | | | | | | 1,061 | | | | 27,208 | |
ITC Limited (Consumer Staples, Tobacco) | | | | | | | | | | | 138,146 | | | | 358,655 | |
J. B. Chemicals & Pharmaceuticals Pvt Limited (Health Care, Pharmaceuticals) | | | | | | | | | | | 546 | | | | 5,714 | |
Jindal Steel & Power Limited (Materials, Metals & Mining) † | | | | | | | | | | | 6,116 | | | | 17,042 | |
JK Cement Limited (Materials, Construction Materials) | | | | | | | | | | | 431 | | | | 8,722 | |
JM Financial Limited (Financials, Capital Markets) | | | | | | | | | | | 4,678 | | | | 5,189 | |
JSW Steel Limited (Materials, Metals & Mining) | | | | | | | | | | | 24,923 | | | | 91,352 | |
Jubilant Foodworks Limited (Consumer Discretionary, Hotels, Restaurants & Leisure) | | | | | | | | | | | 1,007 | | | | 28,688 | |
Jubilant Organosys Limited (Health Care, Pharmaceuticals) | | | | | | | | | | | 1,234 | | | | 13,131 | |
Jyothy Laboratories Limited (Consumer Staples, Household Products) | | | | | | | | | | | 2,137 | | | | 4,127 | |
Kajaria Ceramics Limited (Industrials, Building Products) | | | | | | | | | | | 1,490 | | | | 8,829 | |
Kansai Nerolac Paints Limited (Materials, Chemicals) | | | | | | | | | | | 1,893 | | | | 12,288 | |
KEC International Limited (Industrials, Construction & Engineering) | | | | | | | | | | | 1,771 | | | | 7,750 | |
Kotak Mahindra Bank Limited (Financials, Banks) † | | | | | | | | | | | 15,730 | | | | 299,470 | |
KRBL Limited (Consumer Staples, Food Products) | | | | | | | | | | | 2,497 | | | | 8,886 | |
L&T Finance Holdings Limited (Financials, Diversified Financial Services) | | | | | | | | | | | 8,462 | | | | 7,708 | |
L&T Technology Services Limited (Industrials, Professional Services) 144A | | | | | | | | | | | 337 | | | | 7,166 | |
Larsen & Toubro Infotech Limited (Information Technology, IT Services) 144A | | | | | | | | | | | 584 | | | | 19,504 | |
Larsen & Toubro Limited (Industrials, Construction & Engineering) | | | | | | | | | | | 13,002 | | | | 166,916 | |
Laurus Labs Limited (Health Care, Pharmaceuticals) 144A | | | | | | | | | | | 825 | | | | 12,702 | |
LIC Housing Finance Limited (Financials, Thrifts & Mortgage Finance) | | | | | | | | | | | 19,503 | | | | 79,832 | |
Lupin Limited (Health Care, Pharmaceuticals) | | | | | | | | | | | 3,329 | | | | 41,950 | |
Mahanagar Gas Limited (Utilities, Gas Utilities) | | | | | | | | | | | 759 | | | | 9,817 | |
Mahindra & Mahindra Financial Services Limited (Financials, Consumer Finance) † | | | | | | | | | | | 5,264 | | | | 9,633 | |
Mahindra & Mahindra Limited (Consumer Discretionary, Automobiles) | | | | | | | | | | | 27,887 | | | | 229,931 | |
Manappuram Finance Limited (Financials, Consumer Finance) | | | | | | | | | | | 5,452 | | | | 10,962 | |
Marico Limited (Consumer Staples, Personal Products) | | | | | | | | | | | 16,470 | | | | 82,543 | |
Maruti Suzuki India Limited (Consumer Discretionary, Automobiles) | | | | | | | | | | | 3,329 | | | | 309,346 | |
Max Financial Services Limited (Financials, Insurance) † | | | | | | | | | | | 2,212 | | | | 17,708 | |
Metropolis Healthcare Limited (Health Care, Health Care Providers & Services) 144A | | | | | | | | | | | 232 | | | | 5,795 | |
Minda Industries Limited (Consumer Discretionary, Auto Components) | | | | | | | | | | | 1,259 | | | | 5,815 | |
Mindtree Limited (Information Technology, IT Services) | | | | | | | | | | | 826 | | | | 12,969 | |
Motherson Sumi Systems Limited (Consumer Discretionary, Auto Components) | | | | | | | | | | | 67,437 | | | | 100,504 | |
Motilal Oswal Financial Services Limited (Financials, Capital Markets) | | | | | | | | | | | 487 | | | | 4,525 | |
Mphasis Limited (Information Technology, IT Services) | | | | | | | | | | | 1,108 | | | | 16,612 | |
MRF Limited (Consumer Discretionary, Auto Components) | | | | | | | | | | | 44 | | | | 34,663 | |
Multi Commodity Exchange of India Limited (Financials, Capital Markets) | | | | | | | | | | | 493 | | | | 10,706 | |
Muthoot Finance Limited (Financials, Consumer Finance) | | | | | | | | | | | 2,168 | | | | 33,776 | |
Natco Pharma Limited (Health Care, Pharmaceuticals) | | | | | | | | | | | 1,369 | | | | 13,981 | |
National Aluminum Company Limited (Materials, Metals & Mining) | | | | | | | | | | | 5,846 | | | | 2,847 | |
Navin Fluorine International Limited (Materials, Chemicals) | | | | | | | | | | | 464 | | | | 12,305 | |
Nestle India Limited (Consumer Staples, Food Products) | | | | | | | | | | | 2,175 | | | | 471,287 | |
NHPC Limited (Utilities, Independent Power & Renewable Electricity Producers) | | | | | | | | | | | 25,255 | | | | 7,428 | |
NIIT Technologies Limited (Information Technology, IT Services) | | | | | | | | | | | 239 | | | | 6,247 | |
NMDC Limited (Materials, Metals & Mining) | | | | | | | | | | | 7,021 | | | | 9,267 | |
NTPC Limited (Utilities, Independent Power & Renewable Electricity Producers) | | | | | | | | | | | 125,980 | | | | 164,990 | |
Oberoi Realty Limited (Real Estate, Real Estate Management & Development) | | | | | | | | | | | 1,599 | | | | 8,470 | |
Oil & Natural Gas Corporation Limited (Energy, Oil, Gas & Consumable Fuels) | | | | | | | | | | | 131,831 | | | | 146,772 | |
Oil India Limited (Energy, Oil, Gas & Consumable Fuels) | | | | | | | | | | | 13,930 | | | | 17,931 | |
Oracle Financials Services Limited (Information Technology, Software) | | | | | | | | | | | 307 | | | | 12,648 | |
Orient Electric Limited (Industrials, Electrical Equipment) | | | | | | | | | | | 2,402 | | | | 6,520 | |
Page Industries Limited (Consumer Discretionary, Textiles, Apparel & Luxury Goods) | | | | | | | | | | | 593 | | | | 152,970 | |
Persistent Systems Limited (Information Technology, IT Services) | | | | | | | | | | | 696 | | | | 9,061 | |
The accompanying notes are an integral part of these financial statements.
18 | Wells Fargo Factor Enhanced Emerging Markets Equity Portfolio
Portfolio of investments—August 31, 2020 (unaudited)
| | | | | | | | | | | | | | | | |
| | | | | | | | | Shares | | | Value | |
|
| India (continued) | |
Petronet LNG Limited (Energy, Oil, Gas & Consumable Fuels) | | | | | | | | | | | 53,917 | | | $ | 176,055 | |
Pfizer Limited (Health Care, Pharmaceuticals) | | | | | | | | | | | 206 | | | | 12,863 | |
Phoenix Mills Limited (Real Estate, Real Estate Management & Development) | | | | | | | | | | | 1,022 | | | | 8,953 | |
PI Industries Limited (Materials, Chemicals) | | | | | | | | | | | 743 | | | | 18,558 | |
Pidilite Industries Limited (Materials, Chemicals) | | | | | | | | | | | 3,678 | | | | 70,095 | |
Piramal Enterprises Limited (Health Care, Pharmaceuticals) | | | | | | | | | | | 1,569 | | | | 29,145 | |
Polycab India Limited (Industrials, Electrical Equipment) | | | | | | | | | | | 807 | | | | 9,789 | |
Power Finance Corporation Limited (Financials, Diversified Financial Services) | | | | | | | | | | | 12,026 | | | | 15,366 | |
Power Grid Corporation of India Limited (Utilities, Electric Utilities) | | | | | | | | | | | 29,515 | | | | 71,755 | |
Prestige Estates Projects Limited (Real Estate, Real Estate Management & Development) | | | | | | | | | | | 2,610 | | | | 8,790 | |
Procter & Gamble Health Limited (Health Care, Pharmaceuticals) † | | | | | | | | | | | 106 | | | | 6,908 | |
Procter & Gamble Hygiene & Healthcare Limited (Consumer Staples, Personal Products) | | | | | | | | | | | 113 | | | | 15,332 | |
Punjab National Bank (Financials, Banks) † | | | | | | | | | | | 38,420 | | | | 18,295 | |
PVR Limited (Communication Services, Entertainment) | | | | | | | | | | | 401 | | | | 7,145 | |
Rajesh Exports Limited (Consumer Discretionary, Textiles, Apparel & Luxury Goods) | | | | | | | | | | | 1,211 | | | | 7,345 | |
Ratnamani Metals & Tubes Limited (Materials, Metals & Mining) | | | | | | | | | | | 539 | | | | 8,625 | |
RBL Bank Limited (Financials, Banks) 144A | | | | | | | | | | | 5,860 | | | | 15,600 | |
REC Limited (Financials, Diversified Financial Services) | | | | | | | | | | | 11,736 | | | | 16,925 | |
Relaxo Footwears Limited (Consumer Discretionary, Textiles, Apparel & Luxury Goods) | | | | | | | | | | | 1,697 | | | | 15,110 | |
Reliance Industries Limited (Energy, Oil, Gas & Consumable Fuels) | | | | | | | | | | | 80,302 | | | | 2,269,937 | |
Reliance Nippon Life Asset Management Limited (Financials, Diversified Financial Services) | | | | | | | | | | | 2,029 | | | | 7,514 | |
Sanofi India Limited (Health Care, Pharmaceuticals) | | | | | | | | | | | 117 | | | | 13,063 | |
SBI Life Insurance Company Limited (Financials, Insurance) 144A† | | | | | | | | | | | 4,501 | | | | 50,616 | |
Schaeffler India Limited (Industrials, Machinery) | | | | | | | | | | | 107 | | | | 5,766 | |
Shree Cement Limited (Materials, Construction Materials) | | | | | | | | | | | 228 | | | | 62,827 | |
Shriram Transport Finance Company Limited (Financials, Consumer Finance) | | | | | | | | | | | 18,603 | | | | 177,532 | |
Siemens India Limited (Industrials, Industrial Conglomerates) | | | | | | | | | | | 862 | | | | 13,583 | |
SKF India Limited (Industrials, Machinery) | | | | | | | | | | | 359 | | | | 7,928 | |
Solar Industries India Limited (Materials, Chemicals) | | | | | | | | | | | 338 | | | | 5,155 | |
SRF Limited (Materials, Chemicals) | | | | | | | | | | | 317 | | | | 17,459 | |
State Bank of India (Financials, Banks) † | | | | | | | | | | | 93,726 | | | | 269,944 | |
Strides Shasun Limited (Health Care, Pharmaceuticals) | | | | | | | | | | | 966 | | | | 7,929 | |
Sun Pharmaceutical Industries Limited (Health Care, Pharmaceuticals) | | | | | | | | | | | 31,268 | | | | 220,999 | |
Sun TV Network Limited (Communication Services, Media) | | | | | | | | | | | 923 | | | | 5,675 | |
Sundaram Finance Limited (Financials, Consumer Finance) | | | | | | | | | | | 1,529 | | | | 33,466 | |
Sundram Fasteners Limited (Consumer Discretionary, Auto Components) | | | | | | | | | | | 1,508 | | | | 9,235 | |
Supreme Industries Limited (Materials, Chemicals) | | | | | | | | | | | 857 | | | | 15,565 | |
Syngene International Limited (Health Care, Life Sciences Tools & Services) 144A† | | | | | | | | | | | 1,526 | | | | 9,831 | |
Tata Chemicals Limited (Materials, Chemicals) | | | | | | | | | | | 2,006 | | | | 8,516 | |
Tata Communications Limited (Communication Services, Diversified Telecommunication Services) | | | | | | | | | | | 5,374 | | | | 63,565 | |
Tata Consultancy Services Limited (Information Technology, IT Services) | | | | | | | | | | | 28,897 | | | | 886,156 | |
Tata Elxsi Limited (Information Technology, Software) | | | | | | | | | | | 520 | | | | 7,593 | |
Tata Motors Limited (Consumer Discretionary, Automobiles) † | | | | | | | | | | | 22,086 | | | | 42,967 | |
Tata Power Company Limited (Utilities, Electric Utilities) | | | | | | | | | | | 16,608 | | | | 13,256 | |
Tata Steel Limited (Materials, Metals & Mining) | | | | | | | | | | | 8,105 | | | | 45,476 | |
Tata Tea Limited (Consumer Staples, Food Products) | | | | | | | | | | | 9,809 | | | | 70,941 | |
Tech Mahindra Limited (Information Technology, IT Services) | | | | | | | | | | | 21,496 | | | | 216,398 | |
The Great Eastern Shipping Company Limited (Energy, Oil, Gas & Consumable Fuels) | | | | | | | | | | | 2,051 | | | | 7,087 | |
The Ramco Cements Limited (Materials, Construction Materials) | | | | | | | | | | | 1,924 | | | | 18,115 | |
Thermax India Limited (Industrials, Machinery) | | | | | | | | | | | 658 | | | | 6,835 | |
Titan Industries Limited (Consumer Discretionary, Textiles, Apparel & Luxury Goods) | | | | | | | | | | | 5,160 | | | | 77,147 | |
Torrent Pharmaceuticals Limited (Health Care, Pharmaceuticals) | | | | | | | | | | | 3,643 | | | | 131,729 | |
Torrent Power Limited (Utilities, Electric Utilities) | | | | | | | | | | | 1,833 | | | | 8,290 | |
Trent Limited (Consumer Discretionary, Multiline Retail) | | | | | | | | | | | 2,836 | | | | 24,628 | |
TTK Prestige Limited (Consumer Discretionary, Household Durables) | | | | | | | | | | | 74 | | | | 5,722 | |
Tube Investments of India Limited (Consumer Discretionary, Auto Components) | | | | | | | | | | | 1,654 | | | | 14,559 | |
TVS Motor Company Limited (Consumer Discretionary, Automobiles) | | | | | | | | | | | 2,187 | | | | 12,861 | |
The accompanying notes are an integral part of these financial statements.
Wells Fargo Factor Enhanced Emerging Markets Equity Portfolio | 19
Portfolio of investments—August 31, 2020 (unaudited)
| | | | | | | | | | | | | | | | |
| | | | | | | | | Shares | | | Value | |
|
| India (continued) | |
Ultra Tech Cement Limited (Materials, Construction Materials) | | | | | | | | | | | 1,615 | | | $ | 85,653 | |
United Breweries Limited (Consumer Staples, Beverages) | | | | | | | | | | | 1,093 | | | | 15,007 | |
United Spirits Limited (Consumer Staples, Beverages) † | | | | | | | | | | | 4,052 | | | | 30,092 | |
UPL Limited (Materials, Chemicals) | | | | | | | | | | | 6,433 | | | | 44,218 | |
V-Guard Industries Limited (Industrials, Electrical Equipment) | | | | | | | | | | | 2,540 | | | | 5,773 | |
Varun Beverages Limited (Consumer Staples, Beverages) | | | | | | | | | | | 1,346 | | | | 13,459 | |
Vedanta Limited (Materials, Metals & Mining) | | | | | | | | | | | 134,786 | | | | 235,577 | |
Vinati Organics Limited (Materials, Chemicals) | | | | | | | | | | | 346 | | | | 4,736 | |
Voltas Limited (Industrials, Construction & Engineering) | | | | | | | | | | | 2,910 | | | | 25,094 | |
Wabco India Limited (Consumer Discretionary, Auto Components) | | | | | | | | | | | 55 | | | | 5,211 | |
Whirlpool of India Limited (Consumer Discretionary, Household Durables) | | | | | | | | | | | 362 | | | | 10,433 | |
Wipro Limited (Information Technology, IT Services) | | | | | | | | | | | 42,166 | | | | 155,414 | |
Yes Bank Limited (Financials, Banks) † | | | | | | | | | | | 163,898 | | | | 31,952 | |
Zee Entertainment Enterprises Limited (Communication Services, Media) † | | | | | | | | | | | 15,354 | | | | 42,459 | |
| | | | |
| | | | | | | | | | | | | | | 21,244,103 | |
| | | | | | | | | | | | | | | | |
|
| Indonesia: 1.18% | |
PT Ace Hardware Incorporated Indonesia Tbk (Consumer Discretionary, Specialty Retail) | | | | | | | | | | | 76,434 | | | | 8,109 | |
PT Adaro Energy Tbk (Energy, Oil, Gas & Consumable Fuels) | | | | | | | | | | | 3,370,800 | | | | 251,146 | |
PT Aneka Tambang Tbk (Materials, Metals & Mining) | | | | | | | | | | | 27,900 | | | | 1,571 | |
PT Astra International Tbk (Consumer Discretionary, Automobiles) | | | | | | | | | | | 418,600 | | | | 146,600 | |
PT Asuransi Kresna Mitra Tbk (Financials, Insurance) † | | | | | | | | | | | 10,900 | | | | 853 | |
PT Bank Central Asia Tbk (Financials, Banks) | | | | | | | | | | | 222,800 | | | | 480,024 | |
PT Bank Mandiri Persero Tbk (Financials, Banks) | | | | | | | | | | | 233,500 | | | | 95,404 | |
PT Bank Negara Indonesia Persero Tbk (Financials, Banks) | | | | | | | | | | | 300,200 | | | | 105,134 | |
PT Bank Rakyat Indonesia Tbk (Financials, Banks) | | | | | | | | | | | 992,200 | | | | 239,150 | |
PT Bank Tabungan Pensiunan Nasional Syariah Tbk (Financials, Banks) | | | | | | | | | | | 27,500 | | | | 7,365 | |
PT Bank Tabungan Pensiunan Nasional Tbk (Financials, Banks) † | | | | | | | | | | | 102,171 | | | | 16,628 | |
PT Barito Pacific Tbk (Materials, Chemicals) † | | | | | | | | | | | 316,700 | | | | 18,268 | |
PT Bayan Resources Group Tbk (Energy, Oil, Gas & Consumable Fuels) † | | | | | | | | | | | 1,275 | | | | 1,125 | |
PT Bumi Serpong Damai Tbk (Real Estate, Real Estate Management & Development) † | | | | | | | | | | | 115,734 | | | | 6,159 | |
PT Charoen Pokphand Indonesia Tbk (Consumer Staples, Food Products) | | | | | | | | | | | 217,800 | | | | 94,224 | |
PT Ciputra Development Tbk (Real Estate, Real Estate Management & Development) | | | | | | | | | | | 95,767 | | | | 5,064 | |
PT Gudang Garam Tbk (Consumer Staples, Tobacco) † | | | | | | | | | | | 24,400 | | | | 79,588 | |
PT Hanjaya Mandala Sampoerna Tbk (Consumer Staples, Tobacco) | | | | | | | | | | | 103,500 | | | | 11,727 | |
PT Hanson International Tbk (Real Estate, Real Estate Management & Development) †‡ | | | | | | | | | | | 10,045,000 | | | | 34,489 | |
PT Indah Kiat Pulp and Paper Corporation Tbk (Materials, Paper & Forest Products) | | | | | | | | | | | 23,200 | | | | 14,816 | |
PT Indocement Tunggal Prakarsa Tbk (Materials, Construction Materials) | | | | | | | | | | | 23,267 | | | | 18,973 | |
PT Indofood CBP Sukses Makmur Tbk (Consumer Staples, Food Products) | | | | | | | | | | | 26,367 | | | | 18,513 | |
PT Indofood Sukses Makmur Tbk (Consumer Staples, Food Products) | | | | | | | | | | | 393,200 | | | | 205,882 | |
PT International Nickel Indonesia Tbk (Materials, Metals & Mining) † | | | | | | | | | | | 16,700 | | | | 4,346 | |
PT Jasa Marga (Persero) Tbk (Industrials, Transportation Infrastructure) | | | | | | | | | | | 25,167 | | | | 6,757 | |
PT Kalbe Farma Tbk (Health Care, Pharmaceuticals) | | | | | | | | | | | 237,534 | | | | 25,772 | |
PT Mayora Indah Tbk (Consumer Staples, Food Products) | | | | | | | | | | | 39,496 | | | | 6,374 | |
PT Media Nusantara Citra Tbk (Communication Services, Media) † | | | | | | | | | | | 70,267 | | | | 4,294 | |
PT Merdeka Copper Gold Tbk (Materials, Metals & Mining) † | | | | | | | | | | | 93,667 | | | | 11,192 | |
PT Mitra Adiperkasa Tbk (Consumer Discretionary, Multiline Retail) † | | | | | | | | | | | 94,900 | | | | 4,431 | |
PT Mitra Keluarga Karyasehat Tbk (Health Care, Health Care Providers & Services) | | | | | | | | | | | 61,367 | | | | 9,987 | |
PT Perusahaan Gas Negara Persero Tbk (Utilities, Gas Utilities) | | | | | | | | | | | 119,500 | | | | 10,299 | |
PT Pollux Properti Indonesia Tbk (Real Estate, Real Estate Management & Development) † | | | | | | | | | | | 19,561 | | | | 4,876 | |
PT Sarana Menara Nusantara Tbk (Communication Services, Diversified Telecommunication Services) | | | | | | | | | | | 295,800 | | | | 21,023 | |
PT Semen Gresik Persero Tbk (Materials, Construction Materials) | | | | | | | | | | | 37,200 | | | | 26,950 | |
PT Sumber Alfaria Trijaya Tbk (Consumer Staples, Food & Staples Retailing) | | | | | | | | | | | 248,848 | | | | 12,218 | |
PT Summarecon Agung Tbk (Real Estate, Real Estate Management & Development) † | | | | | | | | | | | 112,034 | | | | 4,962 | |
PT Surya Citra Media Tbk (Communication Services, Media) | | | | | | | | | | | 54,834 | | | | 4,669 | |
PT Tambang Batubara Bukit Asam Tbk (Energy, Oil, Gas & Consumable Fuels) | | | | | | | | | | | 56,434 | | | | 7,906 | |
The accompanying notes are an integral part of these financial statements.
20 | Wells Fargo Factor Enhanced Emerging Markets Equity Portfolio
Portfolio of investments—August 31, 2020 (unaudited)
| | | | | | | | | | | | | | | | |
| | | | | | | | | Shares | | | Value | |
|
| Indonesia (continued) | |
PT Telekomunikasi Indonesia Persero Tbk (Communication Services, Diversified Telecommunication Services) | | | | | | | | | | | 1,018,900 | | | $ | 200,107 | |
PT Tower Bersama Infrastructure Tbk (Communication Services, Diversified Telecommunication Services) | | | | | | | | | | | 125,934 | | | | 11,285 | |
PT Transcoal Pacific Tbk (Industrials, Marine) | | | | | | | | | | | 15,367 | | | | 4,569 | |
PT Ultrajaya Milk Industry & Trading Company Tbk (Consumer Staples, Food Products) | | | | | | | | | | | 40,833 | | | | 4,977 | |
PT Unilever Indonesia Tbk (Consumer Staples, Household Products) | | | | | | | | | | | 68,834 | | | | 38,878 | |
PT United Tractors Tbk (Energy, Oil, Gas & Consumable Fuels) | | | | | | | | | | | 87,300 | | | | 137,882 | |
PT XL Axiata Tbk (Communication Services, Wireless Telecommunication Services) | | | | | | | | | | | 257,650 | | | | 43,170 | |
| | | | |
| | | | | | | | | | | | | | | 2,467,736 | |
| | | | | | | | | | | | | | | | |
|
| Luxembourg: 0.02% | |
Globant SA (Information Technology, Software) † | | | | | | | | | | | 259 | | | | 45,993 | |
| | | | | | | | | | | | | | | | |
|
| Malaysia: 2.22% | |
AFFIN Bank Bhd (Financials, Banks) | | | | | | | | | | | 26,067 | | | | 9,305 | |
AirAsia Bhd (Industrials, Airlines) † | | | | | | | | | | | 27,167 | | | | 4,293 | |
Alliance Financial Group Bhd (Financials, Banks) | | | | | | | | | | | 16,567 | | | | 8,705 | |
AMMB Holdings Bhd (Financials, Banks) | | | | | | | | | | | 257,700 | | | | 180,577 | |
Asiatic Development Bhd (Consumer Staples, Food Products) | | | | | | | | | | | 5,000 | | | | 11,859 | |
Astro Malaysia Holdings Bhd (Communication Services, Media) | | | | | | | | | | | 17,834 | | | | 3,296 | |
Axiata Group Bhd (Communication Services, Wireless Telecommunication Services) | | | | | | | | | | | 94,000 | | | | 67,811 | |
Axis Real Estate Investment Trust REIT (Real Estate, Equity REITs) | | | | | | | | | | | 13,600 | | | | 7,085 | |
Batu Kawan Bhd (Materials, Chemicals) | | | | | | | | | | | 2,565 | | | | 9,267 | |
Berjaya Sports Toto Bhd (Consumer Discretionary, Hotels, Restaurants & Leisure) | | | | | | | | | | | 11,200 | | | | 5,618 | |
Boustead Holdings Bhd (Industrials, Industrial Conglomerates) † | | | | | | | | | | | 37,800 | | | | 6,343 | |
British American Tobacco Malaysia Bhd (Consumer Staples, Tobacco) | | | | | | | | | | | 2,067 | | | | 5,062 | |
Bursa Malaysia Bhd (Financials, Capital Markets) | | | | | | | | | | | 5,734 | | | | 13,312 | |
Carlsberg Brewery Malaysia Bhd (Consumer Staples, Beverages) | | | | | | | | | | | 70,400 | | | | 368,554 | |
CIMB Group Holdings Bhd (Financials, Banks) | | | | | | | | | | | 169,000 | | | | 133,789 | |
Dialog Group Bhd (Energy, Energy Equipment & Services) | | | | | | | | | | | 59,834 | | | | 51,476 | |
Digi.com Bhd (Communication Services, Wireless Telecommunication Services) | | | | | | | | | | | 29,300 | | | | 27,745 | |
Felda Global Ventures Holdings Bhd (Consumer Staples, Food Products) | | | | | | | | | | | 24,267 | | | | 7,138 | |
Fraser & Neave Holdings Bhd (Consumer Staples, Beverages) | | | | | | | | | | | 5,567 | | | | 40,883 | |
Gamuda Bhd (Industrials, Construction & Engineering) | | | | | | | | | | | 268,200 | | | | 218,739 | |
Genting Bhd (Consumer Discretionary, Hotels, Restaurants & Leisure) | | | | | | | | | | | 85,700 | | | | 72,211 | |
Genting Malaysia Bhd (Consumer Discretionary, Hotels, Restaurants & Leisure) | | | | | | | | | | | 164,050 | | | | 89,803 | |
HAP Seng Consolidated Bhd (Industrials, Industrial Conglomerates) | | | | | | | | | | | 8,800 | | | | 15,194 | |
Hartalega Holdings Bhd (Health Care, Health Care Equipment & Supplies) | | | | | | | | | | | 28,800 | | | | 114,387 | |
Heineken Malaysia Bhd (Consumer Staples, Beverages) | | | | | | | | | | | 2,234 | | | | 11,025 | |
Hong Leong Bank Bhd (Financials, Banks) | | | | | | | | | | | 20,000 | | | | 67,239 | |
Hong Leong Financial Group Bhd (Financials, Banks) | | | | | | | | | | | 15,167 | | | | 44,987 | |
IGB REIT Bhd (Real Estate, Equity REITs) | | | | | | | | | | | 16,867 | | | | 7,491 | |
IHH Healthcare Bhd (Health Care, Health Care Providers & Services) | | | | | | | | | | | 31,000 | | | | 39,884 | |
IJM Corporation Bhd (Industrials, Construction & Engineering) | | | | | | | | | | | 32,867 | | | | 9,455 | |
Inari Amertron Bhd (Information Technology, Electronic Equipment, Instruments & Components) | | | | | | | | | | | 25,734 | | | | 13,949 | |
IOI Corporation Bhd (Consumer Staples, Food Products) | | | | | | | | | | | 123,100 | | | | 131,584 | |
IOI Properties Group Bhd (Real Estate, Real Estate Management & Development) | | | | | | | | | | | 20,900 | | | | 4,563 | |
Kossan Rubber Industries Bhd (Health Care, Health Care Equipment & Supplies) | | | | | | | | | | | 5,334 | | | | 20,521 | |
Kuala Lumpur Kepong Bhd (Consumer Staples, Food Products) | | | | | | | | | | | 4,434 | | | | 23,945 | |
LPI Capital Bhd (Financials, Insurance) | | | | | | | | | | | 1,986 | | | | 6,513 | |
Magnum Bhd (Consumer Discretionary, Hotels, Restaurants & Leisure) | | | | | | | | | | | 13,034 | | | | 6,973 | |
Malayan Banking Bhd (Financials, Banks) | | | | | | | | | | | 159,800 | | | | 280,986 | |
Malaysia Airports Holdings Bhd (Industrials, Transportation Infrastructure) | | | | | | | | | | | 12,867 | | | | 15,743 | |
Malaysia Building Society Bhd (Financials, Thrifts & Mortgage Finance) | | | | | | | | | | | 48,434 | | | | 6,742 | |
Maxis Bhd (Communication Services, Wireless Telecommunication Services) | | | | | | | | | | | 58,600 | | | | 70,276 | |
The accompanying notes are an integral part of these financial statements.
Wells Fargo Factor Enhanced Emerging Markets Equity Portfolio | 21
Portfolio of investments—August 31, 2020 (unaudited)
| | | | | | | | | | | | | | | | |
| | | | | | | | | Shares | | | Value | |
|
| Malaysia (continued) | |
Mega First Corporation Bhd (Utilities, Independent Power & Renewable Electricity Producers) | | | | | | | | | | | 4,600 | | | $ | 8,572 | |
MISC Bhd (Industrials, Marine) | | | | | | | | | | | 145,800 | | | | 265,921 | |
MyEG Services Bhd (Information Technology, IT Services) † | | | | | | | | | | | 32,567 | | | | 11,647 | |
Nestle Malaysia Bhd (Consumer Staples, Food Products) | | | | | | | | | | | 3,200 | | | | 106,797 | |
Oriental Holdings Bhd (Consumer Discretionary, Automobiles) | | | | | | | | | | | 3,916 | | | | 4,928 | |
Pentamaster Corporation Bhd (Industrials, Machinery) | | | | | | | | | | | 7,401 | | | | 8,461 | |
Petronas Chemicals Group Bhd (Materials, Chemicals) | | | | | | | | | | | 58,650 | | | | 76,792 | |
Petronas Dagangan Bhd (Energy, Oil, Gas & Consumable Fuels) | | | | | | | | | | | 17,100 | | | | 84,392 | |
Petronas Gas Bhd (Utilities, Gas Utilities) | | | | | | | | | | | 29,600 | | | | 117,215 | |
PPB Group Bhd (Consumer Staples, Food Products) | | | | | | | | | | | 14,867 | | | | 64,104 | |
Press Metal Bhd (Materials, Metals & Mining) | | | | | | | | | | | 47,767 | | | | 59,691 | |
Public Bank Bhd (Financials, Banks) | | | | | | | | | | | 35,400 | | | | 139,472 | |
Ql Resources Bhd (Consumer Staples, Food Products) | | | | | | | | | | | 65,960 | | | | 151,626 | |
RHB Bank Bhd (Financials, Banks) | | | | | | | | | | | 220,300 | | | | 241,867 | |
Scientex Bhd (Materials, Chemicals) | | | | | | | | | | | 3,467 | | | | 7,825 | |
Serba Dinamik Holdings Bhd (Energy, Energy Equipment & Services) | | | | | | | | | | | 24,784 | | | | 10,740 | |
Sime Darby Bhd (Industrials, Industrial Conglomerates) | | | | | | | | | | | 302,500 | | | | 158,743 | |
Sime Darby Plantation Bhd (Consumer Staples, Food Products) | | | | | | | | | | | 28,500 | | | | 34,886 | |
Sime Darby Property Bhd (Real Estate, Real Estate Management & Development) | | | | | | | | | | | 34,234 | | | | 5,373 | |
Sunway Bhd (Real Estate, Real Estate Management & Development) | | | | | | | | | | | 21,617 | | | | 7,262 | |
Sunway REIT Bhd (Real Estate, Equity REITs) | | | | | | | | | | | 11,100 | | | | 4,259 | |
Supermax Corporation Berhad (Health Care, Health Care Equipment & Supplies) † | | | | | | | | | | | 6,300 | | | | 33,561 | |
Telecom Malaysia Bhd (Communication Services, Diversified Telecommunication Services) | | | | | | | | | | | 253,700 | | | | 252,341 | |
Tenaga Nasional Bhd (Utilities, Electric Utilities) | | | | | | | | | | | 30,267 | | | | 78,790 | |
TIME dotCom Bhd (Communication Services, Diversified Telecommunication Services) | | | | | | | | | | | 4,367 | | | | 12,108 | |
Top Glove Corporation Bhd (Health Care, Health Care Equipment & Supplies) | | | | | | | | | | | 37,750 | | | | 238,431 | |
United Plantations Bhd (Consumer Staples, Food Products) | | | | | | | | | | | 2,425 | | | | 8,313 | |
Vitrox Corporation Bhd (Information Technology, Semiconductors & Semiconductor Equipment) | | | | | | | | | | | 2,200 | | | | 6,391 | |
VS Industry Bhd (Information Technology, Electronic Equipment, Instruments & Components) | | | | | | | | | | | 17,892 | | | | 8,066 | |
Westports Holdings Bhd (Industrials, Transportation Infrastructure) | | | | | | | | | | | 201,400 | | | | 175,785 | |
Yinson Holdings Bhd (Energy, Energy Equipment & Services) | | | | | | | | | | | 13,367 | | | | 20,268 | |
YTL Corporation Bhd (Utilities, Multi-Utilities) | | | | | | | | | | | 65,588 | | | | 10,527 | |
YTL Power International Bhd (Utilities, Multi-Utilities) | | | | | | | | | | | 20,334 | | | | 3,365 | |
| | | | |
| | | | | | | | | | | | | | | 4,652,847 | |
| | | | | | | | | | | | | | | | |
|
| Mexico: 1.56% | |
Alfa SAB de CV Class A (Industrials, Industrial Conglomerates) | | | | | | | | | | | 339,400 | | | | 218,387 | |
Alsea SAB de CV (Consumer Discretionary, Hotels, Restaurants & Leisure) † | | | | | | | | | | | 7,792 | | | | 8,080 | |
America Movil SAB de CV Series L (Communication Services, Wireless Telecommunication Services) | | | | | | | | | | | 1,127,023 | | | | 685,011 | |
Arca Continental SAB de CV (Consumer Staples, Beverages) | | | | | | | | | | | 10,723 | | | | 48,744 | |
Banco del Bajio SA (Financials, Banks) 144A† | | | | | | | | | | | 18,067 | | | | 14,449 | |
Banco Santander Mexico SA (Financials, Banks) | | | | | | | | | | | 9,826 | | | | 6,264 | |
Becle SAB de CV ADR (Consumer Staples, Beverages) | | | | | | | | | | | 8,367 | | | | 16,037 | |
Cemex SAB de CV ADR (Materials, Construction Materials) | | | | | | | | | | | 21,532 | | | | 69,118 | |
CFE Capital S de RL de CV (Utilities, Electric Utilities) | | | | | | | | | | | 10,993 | | | | 12,394 | |
Coca-Cola Femsa SAB de CV (Consumer Staples, Beverages) | | | | | | | | | | | 39,228 | | | | 163,226 | |
Controladora Vuela Compania de Aviacion SAB de CV Class A (Industrials, Airlines) † | | | | | | | | | | | 8,600 | | | | 6,917 | |
Corporacion Inmobiliaria Vesta SAB de CV (Real Estate, Real Estate Management & Development) | | | | | | | | | | | 6,934 | | | | 10,299 | |
El Puerto de Liverpool SAB de CV (Consumer Discretionary, Multiline Retail) | | | | | | | | | | | 2,945 | | | | 7,758 | |
Fibra Uno Administracion SAB de CV (Real Estate, Equity REITs) | | | | | | | | | | | 50,218 | | | | 39,289 | |
Fomento Economico Mexicano SAB de CV (Consumer Staples, Beverages) | | | | | | | | | | | 30,310 | | | | 176,275 | |
Genomma Lab Internacional SAB de CV Class B (Health Care, Pharmaceuticals) † | | | | | | | | | | | 10,698 | | | | 11,269 | |
Gentera SAB de CV (Financials, Consumer Finance) † | | | | | | | | | | | 18,750 | | | | 6,144 | |
GMexico Transportes SAB de CV (Industrials, Road & Rail) 144A | | | | | | | | | | | 8,100 | | | | 10,328 | |
Gruma SAB de CV Class B (Consumer Staples, Food Products) | | | | | | | | | | | 14,570 | | | | 172,121 | |
Grupo Aeroportuario del Centro Norte SAB de CV (Industrials, Transportation Infrastructure) † | | | | | | | | | | | 4,937 | | | | 22,609 | |
The accompanying notes are an integral part of these financial statements.
22 | Wells Fargo Factor Enhanced Emerging Markets Equity Portfolio
Portfolio of investments—August 31, 2020 (unaudited)
| | | | | | | | | | | | | | | | |
| | | | | | | | | Shares | | | Value | |
|
| Mexico (continued) | |
Grupo Aeroportuario del Pacifico SAB de CV Class B (Industrials, Transportation Infrastructure) | | | | | | | | | | | 12,315 | | | $ | 95,776 | |
Grupo Aeroportuario del Sureste SAB de CV Class B (Industrials, Transportation Infrastructure) † | | | | | | | | | | | 5,468 | | | | 62,099 | |
Grupo Carso SAB de CV (Industrials, Industrial Conglomerates) | | | | | | | | | | | 6,634 | | | | 13,218 | |
Grupo Cementos de Chihuahua SAB de CV (Materials, Construction Materials) | | | | | | | | | | | 2,534 | | | | 11,422 | |
Grupo Comercial Chedraui SAB de CV (Consumer Staples, Food & Staples Retailing) | | | | | | | | | | | 5,782 | | | | 6,643 | |
Grupo Elektra SAB de CV (Financials, Banks) | | | | | | | | | | | 860 | | | | 47,356 | |
Grupo Financiero Banorte SAB de CV (Financials, Banks) † | | | | | | | | | | | 121,900 | | | | 418,923 | |
Grupo Financiero Inbursa SAB de CV (Financials, Banks) † | | | | | | | | | | | 167,200 | | | | 122,256 | |
Grupo Lala SAB de CV (Consumer Staples, Food Products) | | | | | | | | | | | 10,123 | | | | 6,393 | |
Grupo Mexico SAB de CV Series B (Materials, Metals & Mining) | | | | | | | | | | | 110,900 | | | | 295,977 | |
Grupo Televisa SAB ADR (Communication Services, Media) † | | | | | | | | | | | 5,851 | | | | 36,393 | |
Industrias Bachoco SAB de CV Series B (Consumer Staples, Food Products) | | | | | | | | | | | 2,919 | | | | 9,232 | |
Industrias CH SAB de CV Series B (Materials, Metals & Mining) | | | | | | | | | | | 234 | | | | 877 | |
Industrias Penoles SAB de CV (Materials, Metals & Mining) | | | | | | | | | | | 1,462 | | | | 24,187 | |
Infraestructura Energetica Nova SAB de CV (Utilities, Gas Utilities) | | | | | | | | | | | 6,934 | | | | 20,157 | |
Macquarie Mexico Real Estate Management SA de CV (Real Estate, Equity REITs) 144A | | | | | | | | | | | 11,002 | | | | 12,801 | |
Megacable Holdings SAB de CV (Communication Services, Media) | | | | | | | | | | | 20,000 | | | | 57,764 | |
Orbia Advance Corporation SAB de CV (Materials, Chemicals) | | | | | | | | | | | 12,808 | | | | 20,580 | |
PLA Administradora Industrial S de RL de CV (Real Estate, Equity REITs) | | | | | | | | | | | 10,302 | | | | 13,277 | |
Prologis Property Mexico SA de CV (Real Estate, Equity REITs) | | | | | | | | | | | 7,298 | | | | 14,508 | |
Promotora y Operadora de Infraestructura SAB de CV (Industrials, Transportation Infrastructure) † | | | | | | | | | | | 3,262 | | | | 24,153 | |
Regional SAB de CV (Financials, Banks) † | | | | | | | | | | | 3,600 | | | | 8,999 | |
Telesites SAB de CV (Communication Services, Diversified Telecommunication Services) † | | | | | | | | | | | 39,500 | | | | 29,604 | |
Walmart de Mexico SAB de CV (Consumer Staples, Food & Staples Retailing) | | | | | | | | | | | 90,739 | | | | 217,289 | |
| | | | |
| | | | | | | | | | | | | | | 3,274,603 | |
| | | | | | | | | | | | | | | | |
|
| Netherlands: 0.02% | |
X5 Retail Group NV GDR (Consumer Staples, Food & Staples Retailing) | | | | | | | | | | | 1,321 | | | | 48,409 | |
| | | | | | | | | | | | | | | | |
|
| Philippines: 1.14% | |
Aboitiz Equity Ventures Incorporated (Industrials, Industrial Conglomerates) | | | | | | | | | | | 28,934 | | | | 28,659 | |
Aboitiz Power Corporation (Utilities, Independent Power & Renewable Electricity Producers) | | | | | | | | | | | 102,300 | | | | 56,261 | |
Alliance Global Group Incorporated (Industrials, Industrial Conglomerates) † | | | | | | | | | | | 88,100 | | | | 11,221 | |
Ayala Corporation (Industrials, Industrial Conglomerates) | | | | | | | | | | | 3,804 | | | | 57,527 | |
Ayala Land Incorporated (Real Estate, Real Estate Management & Development) | | | | | | | | | | | 100,704 | | | | 59,713 | |
Bank of the Philippine Islands (Financials, Banks) | | | | | | | | | | | 83,300 | | | | 115,271 | |
BDO Unibank Incorporated (Financials, Banks) | | | | | | | | | | | 28,410 | | | | 50,386 | |
Bloomberry Resorts Corporation (Consumer Discretionary, Hotels, Restaurants & Leisure) | | | | | | | | | | | 50,767 | | | | 6,407 | |
Century Pacific Food Incorporated (Consumer Staples, Food Products) | | | | | | | | | | | 18,200 | | | | 6,085 | |
China Banking Corporation (Financials, Banks) | | | | | | | | | | | 22,806 | | | | 9,689 | |
Cosco Capital Incorporated (Consumer Staples, Food & Staples Retailing) | | | | | | | | | | | 53,063 | | | | 5,259 | |
DMCI Holdings Incorporated (Industrials, Industrial Conglomerates) | | | | | | | | | | | 47,100 | | | | 3,886 | |
Energy Development Corporation (Utilities, Independent Power & Renewable Electricity Producers) †(a)‡ | | | | | | | | | | | 231,800 | | | | 32,845 | |
First Gen Corporation (Utilities, Independent Power & Renewable Electricity Producers) | | | | | | | | | | | 15,200 | | | | 7,625 | |
Globe Telecom Incorporated (Communication Services, Wireless Telecommunication Services) | | | | | | | | | | | 6,980 | | | | 300,317 | |
Golden Bria Holdings Incorporated (Consumer Discretionary, Diversified Consumer Services) † | | | | | | | | | | | 3,382 | | | | 20,856 | |
GT Capital Holdings Incorporated (Industrials, Industrial Conglomerates) | | | | | | | | | | | 15,103 | | | | 124,522 | |
International Container Term Services Incorporated (Industrials, Transportation Infrastructure) | | | | | | | | | | | 22,147 | | | | 47,880 | |
JG Summit Holdings (Industrials, Industrial Conglomerates) | | | | | | | | | | | 55,607 | | | | 73,413 | |
Jollibee Foods Corporation (Consumer Discretionary, Hotels, Restaurants & Leisure) | | | | | | | | | | | 8,987 | | | | 25,006 | |
LT Group Incorporated (Industrials, Industrial Conglomerates) | | | | | | | | | | | 38,188 | | | | 6,641 | |
Manila Electric Company (Utilities, Electric Utilities) | | | | | | | | | | | 3,340 | | | | 18,523 | |
Megaworld Corporation (Real Estate, Real Estate Management & Development) † | | | | | | | | | | | 166,467 | | | | 9,982 | |
Metro Pacific Investments Corporation (Financials, Diversified Financial Services) | | | | | | | | | | | 3,384,100 | | | | 234,511 | |
Metropolitan Bank & Trust Company (Financials, Banks) | | | | | | | | | | | 112,077 | | | | 77,411 | |
Philippine National Bank (Financials, Banks) † | | | | | | | | | | | 19,474 | | | | 7,896 | |
PLDT Incorporated (Communication Services, Wireless Telecommunication Services) | | | | | | | | | | | 10,710 | | | | 323,837 | |
The accompanying notes are an integral part of these financial statements.
Wells Fargo Factor Enhanced Emerging Markets Equity Portfolio | 23
Portfolio of investments—August 31, 2020 (unaudited)
| | | | | | | | | | | | | | | | |
| | | | | | | | | Shares | | | Value | |
|
| Philippines (continued) | |
Puregold Price Club Incorporated (Consumer Staples, Food & Staples Retailing) | | | | | | | | | | | 189,210 | | | $ | 210,551 | |
Rizal Commercial Banking (Financials, Banks) | | | | | | | | | | | 12,967 | | | | 4,313 | |
Robinsons Land Company (Real Estate, Real Estate Management & Development) | | | | | | | | | | | 27,300 | | | | 8,229 | |
Robinsons Retail Holdings Incorporated (Consumer Staples, Food & Staples Retailing) | | | | | | | | | | | 7,834 | | | | 11,317 | |
San Miguel Corporation (Industrials, Industrial Conglomerates) | | | | | | | | | | | 5,640 | | | | 11,796 | |
San Miguel Food & Beverage Incorporated (Consumer Staples, Food Products) | | | | | | | | | | | 64,157 | | | | 90,916 | |
Security Bank Corporation (Financials, Banks) | | | | | | | | | | | 7,364 | | | | 14,760 | |
Semirara Mining & Power Corporation (Energy, Oil, Gas & Consumable Fuels) | | | | | | | | | | | 28,200 | | | | 5,476 | |
SM Investments Corporation (Industrials, Industrial Conglomerates) | | | | | | | | | | | 8,556 | | | | 150,044 | |
SM Prime Holdings Incorporated (Real Estate, Real Estate Management & Development) | | | | | | | | | | | 194,967 | | | | 117,399 | |
Universal Robina Corporation (Consumer Staples, Food Products) | | | | | | | | | | | 13,064 | | | | 37,049 | |
Wilcon Depot Incorporated (Consumer Discretionary, Specialty Retail) | | | | | | | | | | | 10,334 | | | | 3,448 | |
| | | | |
| | | | | | | | | | | | | | | 2,386,927 | |
| | | | | | | | | | | | | | | | |
|
| Poland: 0.55% | |
Bank Pekao SA (Financials, Banks) † | | | | | | | | | | | 3,299 | | | | 46,848 | |
Bank Zachodni WBK SA (Financials, Banks) † | | | | | | | | | | | 1,371 | | | | 56,398 | |
CD Projekt SA (Communication Services, Entertainment) † | | | | | | | | | | | 1,569 | | | | 186,811 | |
Cyfrowy Polsat SA (Consumer Discretionary, Media) † | | | | | | | | | | | 1,644 | | | | 12,838 | |
Dino Polska SA (Consumer Staples, Food & Staples Retailing) † | | | | | | | | | | | 3,190 | | | | 193,675 | |
Grupa Lotos SA (Energy, Oil, Gas & Consumable Fuels) | | | | | | | | | | | 14,173 | | | | 155,703 | |
KGHM Polska Miedz SA (Materials, Metals & Mining) † | | | | | | | | | | | 5,884 | | | | 218,639 | |
Orange Polska SA (Communication Services, Diversified Telecommunication Services) † | | | | | | | | | | | 34,829 | | | | 68,326 | |
Polski Koncern Naftowy Orlen SA (Energy, Oil, Gas & Consumable Fuels) | | | | | | | | | | | 11,076 | | | | 152,295 | |
Polskie Gornictwo Naftowe Gazownictwo SA (Energy, Oil, Gas & Consumable Fuels) | | | | | | | | | | | 29,908 | | | | 41,660 | |
Powszechny Zaklad Ubezpieczen SA (Financials, Insurance) | | | | | | | | | | | 2,779 | | | | 20,502 | |
| | | | |
| | | | | | | | | | | | | | | 1,153,695 | |
| | | | | | | | | | | | | | | | |
|
| Russia: 3.01% | |
Aeroflot PJSC (Industrials, Airlines) † | | | | | | | | | | | 7,283 | | | | 7,884 | |
Alrosa PJSC (Materials, Metals & Mining) | | | | | | | | | | | 38,110 | | | | 34,024 | |
Credit Bank of Moscow PJSC (Financials, Banks) † | | | | | | | | | | | 167,734 | | | | 13,431 | |
Detsky Mir PJSC (Consumer Discretionary, Multiline Retail) | | | | | | | | | | | 6,007 | | | | 9,341 | |
Federal Grid Company Unified Energy System PJSC (Utilities, Electric Utilities) | | | | | | | | | | | 3,206,667 | | | | 8,521 | |
Gazprom Neft PJSC (Energy, Oil, Gas & Consumable Fuels) | | | | | | | | | | | 606 | | | | 2,595 | |
Gazprom PJSC (Energy, Oil, Gas & Consumable Fuels) | | | | | | | | | | | 295,260 | | | | 721,085 | |
Inter Rao Ues PJSC (Utilities, Electric Utilities) | | | | | | | | | | | 3,270,002 | | | | 228,522 | |
LSR Group PJSC (Real Estate, Real Estate Management & Development) | | | | | | | | | | | 655 | | | | 6,924 | |
Lukoil PJSC (Energy, Oil, Gas & Consumable Fuels) | | | | | | | | | | | 16,589 | | | | 1,114,742 | |
Magnit PJSC (Consumer Staples, Food & Staples Retailing) | | | | | | | | | | | 1,223 | | | | 73,424 | |
Magnitogorsk Iron & Steel Works PJSC (Materials, Metals & Mining) | | | | | | | | | | | 329,000 | | | | 167,537 | |
MMC Norilsk Nickel PJSC (Materials, Metals & Mining) | | | | | | | | | | | 2,671 | | | | 695,006 | |
Mobile TeleSystems PJSC (Communication Services, Wireless Telecommunication Services) | | | | | | | | | | | 12,088 | | | | 55,387 | |
Mobile TeleSystems PJSC ADR (Communication Services, Wireless Telecommunication Services) | | | | | | | | | | | 16,602 | | | | 154,731 | |
Moscow Exchange MICEX-RTS PJSC (Financials, Capital Markets) | | | | | | | | | | | 28,685 | | | | 52,996 | |
Nizhnekamskneftekhim PJSC (Materials, Chemicals) | | | | | | | | | | | 12,698 | | | | 15,694 | |
Novatek PJSC (Energy, Oil, Gas & Consumable Fuels) | | | | | | | | | | | 19,813 | | | | 296,369 | |
Novolipetsk Steel PJSC (Materials, Metals & Mining) | | | | | | | | | | | 115,610 | | | | 242,294 | |
Novorossiysk Commercial Sea Port PJSC (Industrials, Transportation Infrastructure) | | | | | | | | | | | 73,234 | | | | 8,770 | |
PhosAgro PJSC (Materials, Chemicals) | | | | | | | | | | | 585 | | | | 22,098 | |
PhosAgro PJSC GDR (Materials, Chemicals) 144A | | | | | | | | | | | 870 | | | | 10,296 | |
PIK Group PJSC (Real Estate, Real Estate Management & Development) † | | | | | | | | | | | 3,544 | | | | 24,071 | |
Polyus PJSC (Materials, Metals & Mining) | | | | | | | | | | | 1,476 | | | | 359,622 | |
Rosgosstrakh PJSC (Financials, Insurance) † | | | | | | | | | | | 9,149,167 | | | | 18,453 | |
Rosneft Oil Company PJSC (Energy, Oil, Gas & Consumable Fuels) | | | | | | | | | | | 41,490 | | | | 208,759 | |
Rostelecom PJSC (Communication Services, Diversified Telecommunication Services) | | | | | | | | | | | 13,667 | | | | 17,700 | |
The accompanying notes are an integral part of these financial statements.
24 | Wells Fargo Factor Enhanced Emerging Markets Equity Portfolio
Portfolio of investments—August 31, 2020 (unaudited)
| | | | | | | | | | | | | | | | |
| | | | | | | | | Shares | | | Value | |
|
| Russia (continued) | |
Rushydro PJSC (Utilities, Electric Utilities) † | | | | | | | | | | | 1,760,000 | | | $ | 17,291 | |
RussNeft PJSC (Energy, Oil, Gas & Consumable Fuels) † | | | | | | | | | | | 1,614 | | | | 9,914 | |
Safmar Financial Investment PJSC (Financials, Consumer Finance) † | | | | | | | | | | | 674 | | | | 4,806 | |
Sberbank of Russia PJSC (Financials, Banks) † | | | | | | | | | | | 345,040 | | | | 1,052,972 | |
Severstal PJSC (Materials, Metals & Mining) | | | | | | | | | | | 9,167 | | | | 115,144 | |
Sistema PJSFC (Communication Services, Wireless Telecommunication Services) | | | | | | | | | | | 41,634 | | | | 12,022 | |
Surgutneftegas PJSC (Energy, Oil, Gas & Consumable Fuels) | | | | | | | | | | | 415,200 | | | | 205,771 | |
Tatneft PJSC (Energy, Oil, Gas & Consumable Fuels) | | | | | | | | | | | 41,908 | | | | 309,589 | |
Unipro PJSC (Utilities, Independent Power & Renewable Electricity Producers) | | | | | | | | | | | 131,000 | | | | 4,768 | |
United Wagon PJSC (Industrials, Road & Rail) † | | | | | | | | | | | 1,143 | | | | 3,578 | |
VTB Bank PJSC (Financials, Banks) † | | | | | | | | | | | 17,390,000 | | | | 8,353 | |
| | | | |
| | | | | | | | | | | | | | | 6,314,484 | |
| | | | | | | | | | | | | | | | |
|
| Singapore: 0.01% | |
BOC Aviation Limited (Industrials, Trading Companies & Distributors) 144A | | | | | | | | | | | 2,434 | | | | 18,105 | |
| | | | | | | | | | | | | | | | |
|
| South Africa: 2.54% | |
Absa Group Limited (Financials, Banks) | | | | | | | | | | | 28,079 | | | | 127,961 | |
AECI Limited (Materials, Chemicals) | | | | | | | | | | | 1,440 | | | | 7,143 | |
African Rainbow Minerals Limited (Materials, Metals & Mining) | | | | | | | | | | | 994 | | | | 12,481 | |
Anglo American Platinum Limited (Materials, Metals & Mining) | | | | | | | | | | | 2,222 | | | | 165,710 | |
Anglogold Ashanti Limited (Materials, Metals & Mining) | | | | | | | | | | | 8,633 | | | | 251,922 | |
Aspen Pharmacare Holdings Limited (Health Care, Pharmaceuticals) † | | | | | | | | | | | 22,728 | | | | 182,173 | |
Astral Foods Limited (Consumer Staples, Food Products) | | | | | | | | | | | 772 | | | | 6,070 | |
Avi Limited (Consumer Staples, Food Products) | | | | | | | | | | | 3,687 | | | | 15,023 | |
Barloworld Limited (Industrials, Trading Companies & Distributors) | | | | | | | | | | | 2,642 | | | | 9,320 | |
Bid Corporation Limited (Consumer Staples, Food & Staples Retailing) | | | | | | | | | | | 10,360 | | | | 171,071 | |
Capitec Bank Holdings Limited (Financials, Banks) | | | | | | | | | | | 1,720 | | | | 84,725 | |
Clicks Group Limited (Consumer Staples, Food & Staples Retailing) | | | | | | | | | | | 6,226 | | | | 84,476 | |
Coronation Fund Managers Limited (Financials, Capital Markets) | | | | | | | | | | | 1,748 | | | | 4,415 | |
Dis-Chem Pharmacies Limited (Consumer Staples, Food & Staples Retailing) | | | | | | | | | | | 5,311 | | | | 5,721 | |
Discovery Holdings Limited (Financials, Insurance) | | | | | | | | | | | 4,911 | | | | 35,064 | |
Distell Group Holdings Limited (Consumer Staples, Beverages) | | | | | | | | | | | 2,352 | | | | 9,971 | |
Equites Property Fund Limited (Real Estate, Equity REITs) | | | | | | | | | | | 6,582 | | | | 6,679 | |
Exxaro Resources Limited (Energy, Oil, Gas & Consumable Fuels) | | | | | | | | | | | 28,408 | | | | 229,895 | |
FirstRand Limited (Financials, Diversified Financial Services) | | | | | | | | | | | 73,811 | | | | 164,811 | |
Fortress REIT Limited (Real Estate, Equity REITs) | | | | | | | | | | | 14,768 | | | | 10,977 | |
Foschini Limited (Consumer Discretionary, Specialty Retail) | | | | | | | | | | | 4,018 | | | | 18,102 | |
Gold Fields Limited (Materials, Metals & Mining) | | | | | | | | | | | 19,251 | | | | 248,791 | |
Growthpoint Properties Limited (Real Estate, Equity REITs) | | | | | | | | | | | 29,813 | | | | 21,474 | |
Harmony Gold Mining Company Limited (Materials, Metals & Mining) † | | | | | | | | | | | 4,027 | | | | 26,277 | |
Impala Platinum Holdings Limited (Materials, Metals & Mining) | | | | | | | | | | | 22,893 | | | | 211,181 | |
Imperial Holdings Limited (Consumer Discretionary, Distributors) | | | | | | | | | | | 2,568 | | | | 5,252 | |
Investec Limited (Financials, Capital Markets) | | | | | | | | | | | 3,857 | | | | 7,154 | |
Italtile Limited (Consumer Discretionary, Specialty Retail) | | | | | | | | | | | 9,356 | | | | 7,286 | |
JSE Limited (Financials, Capital Markets) | | | | | | | | | | | 979 | | | | 6,850 | |
KAP Industrial Holdings Limited (Industrials, Industrial Conglomerates) | | | | | | | | | | | 34,901 | | | | 5,662 | |
Kumba Iron Ore Limited (Materials, Metals & Mining) | | | | | | | | | | | 6,883 | | | | 215,611 | |
Liberty Holdings Limited (Financials, Insurance) | | | | | | | | | | | 1,498 | | | | 5,347 | |
Life Healthcare Group Holdings Limited (Health Care, Health Care Providers & Services) | | | | | | | | | | | 14,062 | | | | 13,721 | |
Momentum Metropolitan Holdings Limited (Financials, Insurance) | | | | | | | | | | | 162,552 | | | | 145,375 | |
Mr Price Group Limited (Consumer Discretionary, Specialty Retail) | | | | | | | | | | | 2,804 | | | | 19,168 | |
MTN Group Limited (Communication Services, Wireless Telecommunication Services) | | | | | | | | | | | 14,636 | | | | 52,729 | |
MultiChoice Group Limited (Communication Services, Media) † | | | | | | | | | | | 4,737 | | | | 27,076 | |
Naspers Limited (Consumer Discretionary, Internet & Direct Marketing Retail) | | | | | | | | | | | 7,401 | | | | 1,350,310 | |
Nedbank Group Limited (Financials, Banks) | | | | | | | | | | | 11,680 | | | | 66,140 | |
The accompanying notes are an integral part of these financial statements.
Wells Fargo Factor Enhanced Emerging Markets Equity Portfolio | 25
Portfolio of investments—August 31, 2020 (unaudited)
| | | | | | | | | | | | | | | | |
| | | | | | | | | Shares | | | Value | |
|
| South Africa (continued) | |
Netcare Limited (Health Care, Health Care Providers & Services) | | | | | | | | | | | 13,217 | | | $ | 9,746 | |
Northam Platinum Limited (Materials, Metals & Mining) † | | | | | | | | | | | 12,914 | | | | 121,931 | |
Old Mutual Limited (Financials, Insurance) | | | | | | | | | | | 56,091 | | | | 37,027 | |
Pepkor Holdings Limited (Consumer Discretionary, Household Durables) | | | | | | | | | | | 14,537 | | | | 8,319 | |
Pick n Pay Stores Limited (Consumer Staples, Food & Staples Retailing) | | | | | | | | | | | 62,707 | | | | 154,370 | |
PSG Group Limited (Financials, Diversified Financial Services) | | | | | | | | | | | 2,114 | | | | 5,612 | |
Rand Merchant Investment Holdings Limited (Financials, Insurance) | | | | | | | | | | | 86,814 | | | | 154,000 | |
Redefine Properties Limited (Real Estate, Equity REITs) | | | | | | | | | | | 59,292 | | | | 8,640 | |
Remgro Limited (Financials, Diversified Financial Services) | | | | | | | | | | | 5,648 | | | | 29,294 | |
Resilient REIT Limited (Real Estate, Equity REITs) | | | | | | | | | | | 3,642 | | | | 8,414 | |
Reunert Limited (Industrials, Industrial Conglomerates) | | | | | | | | | | | 2,516 | | | | 4,631 | |
RMB Holdings Limited (Financials, Diversified Financial Services) | | | | | | | | | | | 34,406 | | | | 2,497 | |
Sanlam Limited (Financials, Insurance) | | | | | | | | | | | 20,593 | | | | 66,792 | |
Santam Limited (Financials, Insurance) | | | | | | | | | | | 402 | | | | 5,805 | |
Sappi Limited (Materials, Paper & Forest Products) † | | | | | | | | | | | 6,579 | | | | 8,651 | |
Sasol Limited (Materials, Chemicals) † | | | | | | | | | | | 5,663 | | | | 46,293 | |
Shoprite Holdings Limited (Consumer Staples, Food & Staples Retailing) | | | | | | | | | | | 5,672 | | | | 36,974 | |
Sibanye Stillwater Limited (Materials, Metals & Mining) † | | | | | | | | | | | 54,901 | | | | 166,116 | |
SPAR Group Limited (Consumer Staples, Food & Staples Retailing) | | | | | | | | | | | 7,072 | | | | 67,444 | |
Standard Bank Group Limited (Financials, Banks) | | | | | | | | | | | 22,571 | | | | 140,596 | |
Super Group Limited (Consumer Staples, Food & Staples Retailing) † | | | | | | | | | | | 4,993 | | | | 5,314 | |
The Bidvest Group Limited (Industrials, Industrial Conglomerates) | | | | | | | | | | | 3,513 | | | | 28,208 | |
Tiger Brands Limited (Consumer Staples, Food Products) | | | | | | | | | | | 3,818 | | | | 38,837 | |
Truworths International Limited (Consumer Discretionary, Specialty Retail) | | | | | | | | | | | 5,222 | | | | 9,365 | |
Vodacom Group Limited (Communication Services, Wireless Telecommunication Services) | | | | | | | | | | | 12,062 | | | | 90,988 | |
Vukile Property Fund Limited REIT (Real Estate, Equity REITs) | | | | | | | | | | | 11,295 | | | | 3,318 | |
Woolworths Holdings Limited (Consumer Discretionary, Multiline Retail) | | | | | | | | | | | 11,183 | | | | 20,972 | |
| | | | |
| | | | | | | | | | | | | | | 5,319,268 | |
| | | | | | | | | | | | | | | | |
|
| South Korea: 10.88% | |
AfreecaTV Company Limited (Communication Services, Interactive Media & Services) | | | | | | | | | | | 137 | | | | 6,689 | |
Alteogen Incorporated (Health Care, Biotechnology) † | | | | | | | | | | | 280 | | | | 49,263 | |
Amorepacific Corporation (Consumer Staples, Personal Products) | | | | | | | | | | | 544 | | | | 76,936 | |
Amorepacific Group (Consumer Staples, Personal Products) | | | | | | | | | | | 462 | | | | 19,835 | |
Ananti Incorporated (Consumer Discretionary, Hotels, Restaurants & Leisure) † | | | | | | | | | | | 736 | | | | 5,638 | |
BGF Retail Company Limited (Consumer Staples, Food & Staples Retailing) | | | | | | | | | | | 127 | | | | 13,631 | |
BH Company Limited (Information Technology, Electronic Equipment, Instruments & Components) † | | | | | | | | | | | 318 | | | | 5,434 | |
BNK Financial Group Incorporated (Financials, Banks) | | | | | | | | | | | 64,486 | | | | 275,771 | |
Bukwang Pharmaceutical Company (Health Care, Pharmaceuticals) | | | | | | | | | | | 555 | | | | 17,661 | |
Cellivery Therapeutics Incorporated (Health Care, Life Sciences Tools & Services) † | | | | | | | | | | | 81 | | | | 16,283 | |
Celltrion Healthcare Company Limited (Health Care, Health Care Providers & Services) † | | | | | | | | | | | 1,356 | | | | 114,265 | |
Celltrion Incorporated (Health Care, Pharmaceuticals) † | | | | | | | | | | | 2,175 | | | | 543,796 | |
Celltrion Pharm Incorporated (Health Care, Pharmaceuticals) † | | | | | | | | | | | 201 | | | | 18,799 | |
Chabiotech Company Limited (Health Care, Health Care Providers & Services) † | | | | | | | | | | | 543 | | | | 9,942 | |
Cheil Worldwide Incorporated (Communication Services, Media) | | | | | | | | | | | 960 | | | | 14,749 | |
Chong Kun Dang Pharmaceutical Corporation (Health Care, Pharmaceuticals) | | | | | | | | | | | 61 | | | | 9,962 | |
Chunbo Company Limited (Materials, Chemicals) | | | | | | | | | | | 63 | | | | 8,719 | |
CJ Cheiljedang Corporation (Consumer Staples, Food Products) | | | | | | | | | | | 96 | | | | 32,892 | |
CJ Corporation (Industrials, Industrial Conglomerates) | | | | | | | | | | | 638 | | | | 43,504 | |
CJ ENM Company Limited (Consumer Discretionary, Internet & Direct Marketing Retail) | | | | | | | | | | | 1,361 | | | | 135,997 | |
CJ Korea Express Corporation (Industrials, Road & Rail) † | | | | | | | | | | | 896 | | | | 114,272 | |
Com2us Corporation (Communication Services, Entertainment) | | | | | | | | | | | 122 | | | | 11,410 | |
Cosmax Incorporated (Consumer Staples, Personal Products) | | | | | | | | | | | 82 | | | | 7,041 | |
Coway Company Limited (Consumer Discretionary, Household Durables) | | | | | | | | | | | 622 | | | | 41,784 | |
CrystalGenomics Incorporated (Health Care, Biotechnology) † | | | | | | | | | | | 554 | | | | 9,467 | |
Daeduck Electronics Company Limited (Information Technology, Electronic Equipment, Instruments & Components) † | | | | | | | | | | | 592 | | | | 5,457 | |
The accompanying notes are an integral part of these financial statements.
26 | Wells Fargo Factor Enhanced Emerging Markets Equity Portfolio
Portfolio of investments—August 31, 2020 (unaudited)
| | | | | | | | | | | | |
| | | | | | | Shares | | | Value | |
|
| South Korea (continued) | |
Daelim Industrial Company Limited (Industrials, Construction & Engineering) | | | | | | | 2,741 | | | $ | 200,516 | |
Daesang Corporation (Consumer Staples, Food Products) | | | | | | | 327 | | | | 7,955 | |
Daewoo Engineering & Construction Company Limited (Industrials, Construction & Engineering) † | | | | | | | 71,095 | | | | 176,256 | |
Daewoo Shipbuilding & Marine Engineering Company Limited (Industrials, Machinery) † | | | | | | | 1,494 | | | | 27,858 | |
Daewoong Company Limited (Health Care, Pharmaceuticals) | | | | | | | 561 | | | | 16,883 | |
Daewoong Pharmaceutical Company (Health Care, Pharmaceuticals) | | | | | | | 88 | | | | 8,593 | |
Daishin Securities Company Limited (Financials, Capital Markets) | | | | | | | 109 | | | | 941 | |
Daou Technology Incorporated (Financials, Capital Markets) | | | | | | | 259 | | | | 4,241 | |
DB HiTek Company Limited (Information Technology, Semiconductors & Semiconductor Equipment) | | | | | | | 478 | | | | 14,305 | |
Dentium Company Limited (Health Care, Health Care Equipment & Supplies) † | | | | | | | 110 | | | | 3,468 | |
DGB Financial Group Incorporated (Financials, Banks) | | | | | | | 2,298 | | | | 10,234 | |
Dong-A ST Company Limited (Health Care, Pharmaceuticals) | | | | | | | 81 | | | | 6,451 | |
Dongbu Insurance Company Limited (Financials, Insurance) | | | | | | | 2,087 | | | | 76,688 | |
Dongjin Semichem Company Limited (Materials, Chemicals) | | | | | | | 449 | | | | 12,549 | |
Dongkook Pharmaceutical Company Limited (Health Care, Pharmaceuticals) (a) | | | | | | | 60 | | | | 7,632 | |
Dongsuh Company Incorporated (Consumer Staples, Food & Staples Retailing) | | | | | | | 680 | | | | 14,626 | |
Doosan Bobcat Incorporated (Industrials, Machinery) | | | | | | | 1,246 | | | | 27,586 | |
Doosan Corporation (Industrials, Industrial Conglomerates) | | | | | | | 1 | | | | 39 | |
Doosan Fuel Cell Company Limited (Industrials, Electrical Equipment) † | | | | | | | 450 | | | | 15,759 | |
Doosan Heavy Industries & Construction Company Limited (Industrials, Electrical Equipment) † | | | | | | | 1,618 | | | | 21,929 | |
Doosan Infracore Company Limited (Industrials, Machinery) † | | | | | | | 2,033 | | | | 13,760 | |
Doosan Solus Company Limited (Information Technology, Electronic Equipment, Instruments & Components) † | | | | | | | 231 | | | | 7,778 | |
DoubleUGames Company Limited (Consumer Discretionary, Hotels, Restaurants & Leisure) | | | | | | | 146 | | | | 8,984 | |
Douzone Bizon Company Limited (Information Technology, Software) | | | | | | | 242 | | | | 20,576 | |
E-MART Incorporated (Consumer Staples, Food & Staples Retailing) | | | | | | | 774 | | | | 78,188 | |
Ecopro BM Company Limited (Industrials, Electrical Equipment) | | | | | | | 86 | | | | 11,221 | |
EO Technics Company Limited (Information Technology, Semiconductors & Semiconductor Equipment) | | | | | | | 92 | | | | 8,697 | |
F&F Company Limited (Consumer Discretionary, Textiles, Apparel & Luxury Goods) | | | | | | | 104 | | | | 8,449 | |
Fila Korea Limited (Consumer Discretionary, Textiles, Apparel & Luxury Goods) | | | | | | | 563 | | | | 16,446 | |
G-treeBNT Company Limited (Health Care, Biotechnology) † | | | | | | | 259 | | | | 6,530 | |
GemVax & KAEL Company Limited (Information Technology, Semiconductors & Semiconductor Equipment) † | | | | | | | 338 | | | | 6,317 | |
Genexine Company Limited (Health Care, Biotechnology) † | | | | | | | 226 | | | | 34,207 | |
Grand Korea Leisure Company Limited (Consumer Discretionary, Hotels, Restaurants & Leisure) | | | | | | | 406 | | | | 4,050 | |
Green Cross Corporation (Health Care, Biotechnology) | | | | | | | 70 | | | | 15,645 | |
Green Cross Holdings Corporation (Health Care, Biotechnology) | | | | | | | 438 | | | | 10,140 | |
GS Engineering & Construction Corporation (Industrials, Construction & Engineering) | | | | | | | 6,185 | | | | 128,605 | |
GS Holdings Corporation (Energy, Oil, Gas & Consumable Fuels) | | | | | | | 4,387 | | | | 120,025 | |
GS Home Shopping Incorporated (Consumer Discretionary, Internet & Direct Marketing Retail) | | | | | | | 51 | | | | 5,023 | |
GS Retail Company Limited (Consumer Staples, Food & Staples Retailing) | | | | | | | 4,922 | | | | 136,527 | |
Hana Financial Group Incorporated (Financials, Banks) | | | | | | | 12,352 | | | | 293,229 | |
Hana Tour Service Incorporated (Consumer Discretionary, Hotels, Restaurants & Leisure) | | | | | | | 185 | | | | 5,980 | |
Hanall Biopharma Company Limited (Health Care, Pharmaceuticals) † | | | | | | | 486 | | | | 14,135 | |
Handsome Company Limited (Consumer Discretionary, Textiles, Apparel & Luxury Goods) | | | | | | | 215 | | | | 5,692 | |
Hanjin Kal Corporation (Industrials, Airlines) | | | | | | | 158 | | | | 10,095 | |
Hankook Tire Company Limited (Consumer Discretionary, Auto Components) | | | | | | | 3,274 | | | | 81,306 | |
Hanmi Pharm Company Limited (Health Care, Pharmaceuticals) | | | | | | | 72 | | | | 18,577 | |
Hanmi Science Company Limited (Health Care, Pharmaceuticals) | | | | | | | 405 | | | | 19,979 | |
Hanon Systems (Consumer Discretionary, Auto Components) | | | | | | | 1,740 | | | | 18,896 | |
Hansol Chemical Company Limited (Materials, Chemicals) | | | | | | | 107 | | | | 14,547 | |
Hanssem Company Limited (Consumer Discretionary, Household Durables) | | | | | | | 176 | | | | 14,416 | |
Hanwha Chem Corporation (Materials, Chemicals) | | | | | | | 1,803 | | | | 60,636 | |
Hanwha Corporation (Industrials, Industrial Conglomerates) | | | | | | | 3,683 | | | | 85,262 | |
Hanwha Life Insurance Company Limited (Financials, Insurance) | | | | | | | 5,025 | | | | 6,472 | |
Hanwha Techwin Company Limited (Industrials, Aerospace & Defense) † | | | | | | | 466 | | | | 10,121 | |
HDC Holdings Company Limited (Industrials, Construction & Engineering) | | | | | | | 648 | | | | 6,137 | |
The accompanying notes are an integral part of these financial statements.
Wells Fargo Factor Enhanced Emerging Markets Equity Portfolio | 27
Portfolio of investments—August 31, 2020 (unaudited)
| | | | | | | | | | | | |
| | | | | | | Shares | | | Value | |
|
| South Korea (continued) | |
HDC Hyundai Development Co-Engineering & Construction (Industrials, Construction & Engineering) | | | | | | | 567 | | | $ | 10,978 | |
Hite Jinro Company Limited (Consumer Staples, Beverages) | | | | | | | 468 | | | | 14,538 | |
HLB Company Limited (Consumer Discretionary, Leisure Products) † | | | | | | | 643 | | | | 46,984 | |
HLB Life Science Company Limited (Health Care, Health Care Providers & Services) † | | | | | | | 479 | | | | 7,278 | |
Hotel Shilla Company Limited (Consumer Discretionary, Specialty Retail) | | | | | | | 440 | | | | 26,039 | |
Hugel Incorporated (Health Care, Biotechnology) † | | | | | | | 81 | | | | 11,169 | |
Hyosung Corporation (Materials, Chemicals) | | | | | | | 100 | | | | 5,640 | |
Hyundai Department Store Company Limited (Consumer Discretionary, Multiline Retail) | | | | | | | 4,279 | | | | 193,436 | |
Hyundai Elevator Company (Industrials, Machinery) | | | | | | | 341 | | | | 11,784 | |
Hyundai Engineering & Construction Company Limited (Industrials, Construction & Engineering) | | | | | | | 3,310 | | | | 89,862 | |
Hyundai Glovis Company Limited (Industrials, Air Freight & Logistics) | | | | | | | 902 | | | | 110,482 | |
Hyundai Greenfood Company Limited (Consumer Staples, Food & Staples Retailing) | | | | | | | 1,014 | | | | 6,180 | |
Hyundai Heavy Industries Company Limited (Industrials, Machinery) | | | | | | | 137 | | | | 26,064 | |
Hyundai Home Shopping Network Corporation (Consumer Discretionary, Internet & Direct Marketing Retail) | | | | | | | 109 | | | | 5,992 | |
Hyundai Marine & Fire Insurance Company Limited (Financials, Insurance) | | | | | | | 8,706 | | | | 161,969 | |
Hyundai Merchant Marine Company Limited (Industrials, Marine) † | | | | | | | 3,240 | | | | 15,710 | |
Hyundai Mipo Dockyard Company Limited (Industrials, Machinery) | | | | | | | 349 | | | | 9,034 | |
Hyundai Mobis Company (Consumer Discretionary, Auto Components) | | | | | | | 1,156 | | | | 217,985 | |
Hyundai Motor Company (Consumer Discretionary, Automobiles) | | | | | | | 2,762 | | | | 410,382 | |
Hyundai Rotem Company (Industrials, Machinery) † | | | | | | | 599 | | | | 7,639 | |
Hyundai Steel Company (Materials, Metals & Mining) | | | | | | | 1,062 | | | | 22,440 | |
Hyundai Wia Corporation (Consumer Discretionary, Auto Components) | | | | | | | 212 | | | | 7,433 | |
Iljin Materials Company Limited (Information Technology, Electronic Equipment, Instruments & Components) | | | | | | | 267 | | | | 11,205 | |
Ilyang Pharmaceutical Company Limited (Health Care, Pharmaceuticals) | | | | | | | 177 | | | | 12,129 | |
Industrial Bank of Korea (Financials, Banks) | | | | | | | 2,310 | | | | 15,732 | |
Innocean Worldwide Incorporated (Communication Services, Media) | | | | | | | 90 | | | | 4,167 | |
ITM Semiconductor Company Limited (Information Technology, Semiconductors & Semiconductor Equipment) † | | | | | | | 88 | | | | 4,260 | |
JB Financial Group Company Limited (Financials, Banks) | | | | | | | 2,041 | | | | 7,371 | |
JYP Entertainment Corporation (Communication Services, Entertainment) | | | | | | | 252 | | | | 7,393 | |
Kakao Corporation (Communication Services, Interactive Media & Services) | | | | | | | 981 | | | | 336,112 | |
Kangwon Land Incorporated (Consumer Discretionary, Hotels, Restaurants & Leisure) | | | | | | | 1,381 | | | | 24,007 | |
KB Financial Group Incorporated (Financials, Banks) | | | | | | | 11,564 | | | | 358,728 | |
KEPCO Plant Service & Engineering Company Limited (Industrials, Commercial Services & Supplies) | | | | | | | 235 | | | | 5,500 | |
Kia Motors Corporation (Consumer Discretionary, Automobiles) | | | | | | | 5,260 | | | | 187,968 | |
Kiwoom Securities Company (Financials, Capital Markets) | | | | | | | 127 | | | | 11,653 | |
KMW Company Limited (Information Technology, Communications Equipment) † | | | | | | | 367 | | | | 23,604 | |
Koh Young Technology Incorporated (Information Technology, Semiconductors & Semiconductor Equipment) | | | | | | | 133 | | | | 10,077 | |
Kolmar Korea Company Limited (Consumer Staples, Personal Products) | | | | | | | 105 | | | | 4,048 | |
Kolon Industries Incorporated (Materials, Chemicals) | | | | | | | 222 | | | | 5,980 | |
Komipharm International Company (Health Care, Pharmaceuticals) † | | | | | | | 593 | | | | 7,713 | |
Korea Aerospace Industries Limited (Industrials, Aerospace & Defense) | | | | | | | 1,220 | | | | 23,057 | |
Korea Electric Power Corporation (Utilities, Electric Utilities) † | | | | | | | 4,242 | | | | 73,206 | |
Korea Gas Corporation (Utilities, Gas Utilities) | | | | | | | 661 | | | | 13,132 | |
Korea Investment Holdings Company Limited (Financials, Capital Markets) | | | | | | | 2,926 | | | | 150,007 | |
Korea Petrochemical Industrial Company Limited (Materials, Chemicals) | | | | | | | 63 | | | | 6,258 | |
Korea Reinsurance Company (Financials, Insurance) | | | | | | | 1,291 | | | | 7,977 | |
Korea Shipbuilding & Offshore Engineering Company Limited (Industrials, Machinery) † | | | | | | | 592 | | | | 42,959 | |
Korea Zinc Company Limited (Materials, Metals & Mining) | | | | | | | 149 | | | | 49,984 | |
Korean Air Lines Company Limited (Industrials, Airlines) † | | | | | | | 1,198 | | | | 17,800 | |
KT Corporation (Communication Services, Diversified Telecommunication Services) | | | | | | | 3,207 | | | | 64,523 | |
KT&G Corporation (Consumer Staples, Tobacco) | | | | | | | 2,898 | | | | 202,731 | |
Kuk-il Paper Manufacturing Company Limited (Materials, Paper & Forest Products) † | | | | | | | 1,193 | | | | 5,011 | |
Kumho Petrochemical Company Limited (Materials, Chemicals) | | | | | | | 3,841 | | | | 324,960 | |
The accompanying notes are an integral part of these financial statements.
28 | Wells Fargo Factor Enhanced Emerging Markets Equity Portfolio
Portfolio of investments—August 31, 2020 (unaudited)
| | | | | | | | | | | | |
| | | | | | | Shares | | | Value | |
|
| South Korea (continued) | |
L&C BIO Company Limited (Health Care, Biotechnology) | | | | | | | 64 | | | $ | 7,106 | |
L&F Company Limited (Information Technology, Electronic Equipment, Instruments & Components) | | | | | | | 209 | | | | 7,390 | |
LEENO Industrial Incorporated (Information Technology, Semiconductors & Semiconductor Equipment) | | | | | | | 125 | | | | 13,364 | |
LG Chem Limited (Materials, Chemicals) | | | | | | | 972 | | | | 605,506 | |
LG Corporation (Industrials, Industrial Conglomerates) | | | | | | | 2,975 | | | | 207,116 | |
LG Display Company Limited (Information Technology, Electronic Equipment, Instruments & Components) † | | | | | | | 2,573 | | | | 31,624 | |
LG Electronics Incorporated (Consumer Discretionary, Household Durables) | | | | | | | 3,119 | | | | 221,079 | |
LG Household & Health Care Limited (Consumer Staples, Personal Products) | | | | | | | 234 | | | | 290,161 | |
LG Innotek Company Limited (Information Technology, Electronic Equipment, Instruments & Components) | | | | | | | 2,330 | | | | 284,409 | |
LG Uplus Corporation (Communication Services, Diversified Telecommunication Services) | | | | | | | 12,790 | | | | 128,664 | |
Lotte Chemical Corporation (Materials, Chemicals) | | | | | | | 590 | | | | 94,120 | |
Lotte Corporation (Industrials, Industrial Conglomerates) | | | | | | | 974 | | | | 24,598 | |
LOTTE Fine Chemical Company Limited (Materials, Chemicals) | | | | | | | 151 | | | | 5,682 | |
LOTTE REIT Company Limited (Real Estate, Equity REITs) | | | | | | | 1,085 | | | | 4,640 | |
Lotte Shopping Company Limited (Consumer Discretionary, Multiline Retail) | | | | | | | 129 | | | | 8,253 | |
Lotte Tour Development Company Limited (Consumer Discretionary, Hotels, Restaurants & Leisure) †(a) | | | | | | | 518 | | | | 8,242 | |
LS Corporation (Industrials, Electrical Equipment) | | | | | | | 399 | | | | 15,199 | |
LS Industrial Systems Company Limited (Industrials, Electrical Equipment) | | | | | | | 206 | | | | 9,382 | |
Mando Corporation (Consumer Discretionary, Auto Components) | | | | | | | 390 | | | | 10,309 | |
Medipost Company Limited (Health Care, Health Care Providers & Services) † | | | | | | | 193 | | | | 4,671 | |
Medy-Tox Incorporated (Health Care, Biotechnology) | | | | | | | 40 | | | | 8,408 | |
Meritz Financial Group Incorporated (Financials, Diversified Financial Services) | | | | | | | 448 | | | | 3,481 | |
Meritz Fire & Marine Insurance Company Limited (Financials, Insurance) | | | | | | | 554 | | | | 5,946 | |
Meritz Securities Company Limited (Financials, Capital Markets) | | | | | | | 3,206 | | | | 8,650 | |
Mezzion Pharma Company Limited (Health Care, Pharmaceuticals) † | | | | | | | 108 | | | | 15,474 | |
Mirae Asset Daewoo Company Limited (Financials, Capital Markets) | | | | | | | 5,030 | | | | 39,380 | |
NATURECELL Company Limited (Consumer Staples, Food Products) † | | | | | | | 665 | | | | 5,962 | |
Naver Corporation (Communication Services, Interactive Media & Services) | | | | | | | 4,118 | | | | 1,117,986 | |
NCsoft Corporation (Communication Services, Entertainment) | | | | | | | 598 | | | | 415,313 | |
NEPES Corporation (Information Technology, Semiconductors & Semiconductor Equipment) | | | | | | | 230 | | | | 5,663 | |
Netmarble Games Corporation (Communication Services, Entertainment) 144A† | | | | | | | 263 | | | | 36,863 | |
NH Investment & Securities Company Limited (Financials, Capital Markets) | | | | | | | 3,169 | | | | 23,903 | |
NHN Entertainment Corporation (Communication Services, Entertainment) † | | | | | | | 163 | | | | 10,003 | |
NHN KCP Corporation (Information Technology, IT Services) | | | | | | | 178 | | | | 10,774 | |
Nice Information Service Company (Industrials, Professional Services) | | | | | | | 416 | | | | 6,304 | |
NongShim Company Limited (Consumer Staples, Food Products) | | | | | | | 51 | | | | 15,434 | |
OIC Company Limited (Materials, Chemicals) † | | | | | | | 214 | | | | 11,656 | |
Orion Corporation of Republic of Korea (Consumer Staples, Food Products) | | | | | | | 2,376 | | | | 281,024 | |
Osstem Implant Company Limited (Health Care, Health Care Equipment & Supplies) † | | | | | | | 129 | | | | 4,029 | |
Ottogi Corporation (Consumer Staples, Food Products) | | | | | | | 150 | | | | 76,017 | |
Pan Ocean Company Limited (Industrials, Marine) † | | | | | | | 19,844 | | | | 56,714 | |
Paradise Company Limited (Consumer Discretionary, Hotels, Restaurants & Leisure) | | | | | | | 819 | | | | 9,170 | |
Partron Company Limited (Information Technology, Electronic Equipment, Instruments & Components) | | | | | | | 559 | | | | 4,800 | |
Pearl Abyss Corporation (Communication Services, Entertainment) † | | | | | | | 1,430 | | | | 219,093 | |
Pharmicell Company Limited (Health Care, Biotechnology) † | | | | | | | 660 | | | | 12,445 | |
POSCO (Materials, Metals & Mining) | | | | | | | 2,266 | | | | 351,946 | |
POSCO Chemtech Company Limited (Materials, Construction Materials) | | | | | | | 282 | | | | 21,128 | |
POSCO INTERNATIONAL Corporation (Industrials, Trading Companies & Distributors) | | | | | | | 23,641 | | | | 270,660 | |
RFHIC Corporation (Information Technology, Semiconductors & Semiconductor Equipment) | | | | | | | 182 | | | | 6,014 | |
S-Oil Corporation (Energy, Oil, Gas & Consumable Fuels) | | | | | | | 645 | | | | 30,678 | |
S1 Corporation Incorporated (Industrials, Commercial Services & Supplies) | | | | | | | 308 | | | | 22,609 | |
Sam Chun Dang Pharmaceutical Company Limited (Health Care, Pharmaceuticals) | | | | | | | 188 | | | | 9,274 | |
Samsung Biologics Company Limited (Health Care, Life Sciences Tools & Services) † | | | | | | | 471 | | | | 308,475 | |
Samsung C&T Corporation (Industrials, Industrial Conglomerates) | | | | | | | 2,000 | | | | 181,833 | |
Samsung Card Company Limited (Financials, Consumer Finance) | | | | | | | 266 | | | | 6,438 | |
The accompanying notes are an integral part of these financial statements.
Wells Fargo Factor Enhanced Emerging Markets Equity Portfolio | 29
Portfolio of investments—August 31, 2020 (unaudited)
| | | | | | | | | | | | |
| | | | | | | Shares | | | Value | |
|
| South Korea (continued) | |
Samsung Electro-Mechanics Company Limited (Information Technology, Electronic Equipment, Instruments & Components) | | | | | | | 2,880 | | | $ | 301,844 | |
Samsung Electronics Company Limited (Information Technology, Technology Hardware, Storage & Peripherals) | | | | | | | 145,857 | | | | 6,630,422 | |
Samsung Engineering Company Limited (Industrials, Construction & Engineering) † | | | | | | | 18,231 | | | | 173,424 | |
Samsung Fire & Marine Insurance (Financials, Insurance) | | | | | | | 490 | | | | 77,136 | |
Samsung Heavy Industries Company Limited (Industrials, Machinery) † | | | | | | | 7,139 | | | | 31,010 | |
Samsung Life Insurance Company Limited (Financials, Insurance) | | | | | | | 1,277 | | | | 65,790 | |
Samsung SDI Company Limited (Information Technology, Electronic Equipment, Instruments & Components) | | | | | | | 1,150 | | | | 438,063 | |
Samsung SDS Company Limited (Information Technology, Technology Hardware, Storage & Peripherals) | | | | | | | 499 | | | | 66,161 | |
Samsung Securities Company Limited (Financials, Capital Markets) | | | | | | | 619 | | | | 15,711 | |
Seegene Incorporated (Health Care, Biotechnology) | | | | | | | 220 | | | | 48,708 | |
Seoul Semiconductor Company Limited (Information Technology, Semiconductors & Semiconductor Equipment) | | | | | | | 476 | | | | 6,532 | |
SFA Engineering Corporation (Information Technology, Electronic Equipment, Instruments & Components) | | | | | | | 305 | | | | 8,511 | |
Shinhan Financial Group Company Limited (Financials, Banks) | | | | | | | 5,674 | | | | 141,623 | |
Shinsegae Company Limited (Consumer Discretionary, Multiline Retail) | | | | | | | 1,305 | | | | 223,011 | |
Shinsegae International Company Limited (Consumer Discretionary, Specialty Retail) | | | | | | | 38 | | | | 4,335 | |
Sillajen Incorporated (Health Care, Biotechnology) †(a)‡ | | | | | | | 2,972 | | | | 30,273 | |
SK Chemicals Company Limited (Materials, Chemicals) | | | | | | | 80 | | | | 26,501 | |
SK Company Limited (Industrials, Industrial Conglomerates) | | | | | | | 975 | | | | 175,646 | |
SK Hynix Incorporated (Information Technology, Semiconductors & Semiconductor Equipment) | | | | | | | 17,677 | | | | 1,117,554 | |
SK Innovation Company Limited (Energy, Oil, Gas & Consumable Fuels) | | | | | | | 797 | | | | 97,285 | |
SK Materials Company Limited (Materials, Chemicals) | | | | | | | 67 | | | | 13,909 | |
SK Networks Company Limited (Industrials, Trading Companies & Distributors) | | | | | | | 1,889 | | | | 8,253 | |
SK Telecom Company Limited (Communication Services, Wireless Telecommunication Services) | | | | | | | 1,011 | | | | 211,068 | |
SKC Company Limited (Materials, Chemicals) | | | | | | | 252 | | | | 19,623 | |
SM Entertainment Company (Communication Services, Entertainment) † | | | | | | | 189 | | | | 5,473 | |
Soulbrain Company Limited (Materials, Chemicals) † | | | | | | | 31 | | | | 5,658 | |
Soulbrain Company Limited (Materials, Chemicals) | | | | | | | 78 | | | | 3,053 | |
Ssangyong Cement Industrial Company Limited (Materials, Construction Materials) | | | | | | | 1,273 | | | | 6,044 | |
Studio Dragon Corporation (Communication Services, Entertainment) † | | | | | | | 93 | | | | 6,263 | |
Taeyoung Engineering & Construction Company Limited (Industrials, Construction & Engineering) (a) | | | | | | | 446 | | | | 8,110 | |
Toptec Corporation (Information Technology, Semiconductors & Semiconductor Equipment) | | | | | | | 318 | | | | 4,417 | |
Wonik IPS Company Limited (Information Technology, Semiconductors & Semiconductor Equipment) † | | | | | | | 412 | | | | 11,099 | |
Woori Financial Group Incorporated (Financials, Banks) | | | | | | | 22,422 | | | | 159,685 | |
Young Poong Corporation (Materials, Metals & Mining) | | | | | | | 8 | | | | 3,297 | |
Youngone Corporation (Consumer Discretionary, Textiles, Apparel & Luxury Goods) | | | | | | | 297 | | | | 7,851 | |
Yuhan Corporation (Health Care, Pharmaceuticals) | | | | | | | 661 | | | | 37,282 | |
Yungjin Pharmaceutical Company (Health Care, Pharmaceuticals) † | | | | | | | 1,168 | | | | 6,706 | |
Zinus Incorporated (Consumer Discretionary, Household Durables) | | | | | | | 101 | | | | 7,176 | |
| | | | |
| | | | | | | | | | | 22,808,193 | |
| | | | | | | | | | | | |
|
| Taiwan: 13.03% | |
Accton Technology Corporation (Information Technology, Communications Equipment) | | | | | | | 20,000 | | | | 159,501 | |
Acer Incorporated (Information Technology, Technology Hardware, Storage & Peripherals) | | | | | | | 40,000 | | | | 31,832 | |
Advantech Company Limited (Information Technology, Technology Hardware, Storage & Peripherals) | | | | | | | 8,248 | | | | 85,315 | |
Aerospace industrial Development Corporation (Industrials, Aerospace & Defense) | | | | | | | 7,000 | | | | 7,634 | |
Airtac International Group (Industrials, Machinery) | | | | | | | 3,000 | | | | 66,561 | |
Alchip Technologies Limited (Information Technology, Semiconductors & Semiconductor Equipment) | | | | | | | 667 | | | | 11,980 | |
Arcadyan Technology Corporation (Information Technology, Communications Equipment) | | | | | | | 2,334 | | | | 7,318 | |
ASE Technology Holding Company Limited (Information Technology, Semiconductors & Semiconductor Equipment) | | | | | | | 101,000 | | | | 210,664 | |
Asia Cement Corporation (Materials, Construction Materials) | | | | | | | 139,000 | | | | 201,336 | |
The accompanying notes are an integral part of these financial statements.
30 | Wells Fargo Factor Enhanced Emerging Markets Equity Portfolio
Portfolio of investments—August 31, 2020 (unaudited)
| | | | | | | | | | | | |
| | | | | | | Shares | | | Value | |
|
| Taiwan (continued) | |
Asia Optical Company Incorporated (Information Technology, Electronic Equipment, Instruments & Components) | | | | | | | 3,334 | | | $ | 7,499 | |
Asia Pacific Telecom Company Limited (Communication Services, Diversified Telecommunication Services) † | | | | | | | 42,000 | | | | 10,621 | |
Asia Vital Components Company Limited (Information Technology, Technology Hardware, Storage & Peripherals) | | | | | | | 4,000 | | | | 9,570 | |
ASMedia Technology Incorporated (Information Technology, Semiconductors & Semiconductor Equipment) | | | | | | | 334 | | | | 20,091 | |
Asustek Computer Incorporated (Information Technology, Technology Hardware, Storage & Peripherals) | | | | | | | 17,000 | | | | 140,790 | |
AU Optronics Corporation (Information Technology, Electronic Equipment, Instruments & Components) † | | | | | | | 109,667 | | | | 39,058 | |
BizLink Holding Incorporated (Industrials, Electrical Equipment) | | | | | | | 1,667 | | | | 14,033 | |
Capital Securities Corporation (Financials, Capital Markets) | | | | | | | 26,234 | | | | 9,835 | |
Career Technology Company Limited (Information Technology, Electronic Equipment, Instruments & Components) | | | | | | | 6,746 | | | | 6,484 | |
Catcher Technology Company Limited (Information Technology, Technology Hardware, Storage & Peripherals) | | | | | | | 24,000 | | | | 164,000 | |
Cathay Financial Holding Company (Financials, Insurance) | | | | | | | 259,000 | | | | 351,759 | |
Cathay No.1 REIT (Real Estate, Equity REITs) | | | | | | | 21,682 | | | | 13,316 | |
Cathay No.2 REIT (Real Estate, Equity REITs) | | | | | | | 11,167 | | | | 6,984 | |
Cathay Real Estate Development Company Limited (Real Estate, Real Estate Management & Development) | | | | | | | 6,667 | | | | 4,431 | |
Century Iron & Steel Industrial Company Limited (Materials, Metals & Mining) | | | | | | | 3,000 | | | | 12,576 | |
Chailease Holding Company Limited (Financials, Diversified Financial Services) | | | | | | | 22,379 | | | | 98,771 | |
Chang Hwa Commercial Bank (Financials, Banks) | | | | | | | 92,597 | | | | 57,594 | |
Charoen Pokphand Enterprise (Taiwan) Company Limited (Consumer Staples, Food Products) | | | | | | | 3,000 | | | | 6,973 | |
Cheng Loong Corporation (Materials, Containers & Packaging) | | | | | | | 14,334 | | | | 14,802 | |
Cheng Shin Rubber Industry Company Limited (Consumer Discretionary, Auto Components) | | | | | | | 27,334 | | | | 33,537 | |
Cheng Uei Precision Industry Company Limited (Information Technology, Electronic Equipment, Instruments & Components) | | | | | | | 3,334 | | | | 4,767 | |
Chicony Electronics Company Limited (Information Technology, Technology Hardware, Storage & Peripherals) | | | | | | | 57,335 | | | | 172,934 | |
Chicony Power Technology Company (Industrials, Electrical Equipment) | | | | | | | 2,000 | | | | 5,044 | |
Chilisin Electronics Corporation (Information Technology, Electronic Equipment, Instruments & Components) | | | | | | | 2,409 | | | | 8,103 | |
Chin Poon Industrial Company Limited (Information Technology, Electronic Equipment, Instruments & Components) | | | | | | | 8,000 | | | | 6,939 | |
China Airlines (Industrials, Airlines) † | | | | | | | 26,334 | | | | 7,665 | |
China Bills Finance Corporation (Financials, Capital Markets) | | | | | | | 10,846 | | | | 5,397 | |
China Development Financial Holding Corporation (Financials, Insurance) | | | | | | | 190,000 | | | | 55,301 | |
China Life Insurance Company—Taiwan Exchange (Financials, Insurance) | | | | | | | 141,000 | | | | 98,753 | |
China Petrochemical Development Corporation (Materials, Chemicals) | | | | | | | 56,117 | | | | 16,486 | |
China Steel Chemical Corporation (Materials, Chemicals) | | | | | | | 1,334 | | | | 4,201 | |
China Steel Corporation (Materials, Metals & Mining) | | | | | | | 168,667 | | | | 114,393 | |
ChipMOS Technologies Incorporated (Information Technology, Semiconductors & Semiconductor Equipment) | | | | | | | 5,667 | | | | 5,620 | |
Chong Hong Construction Company Limited (Real Estate, Real Estate Management & Development) | | | | | | | 2,334 | | | | 6,666 | |
Chroma ATE Incorporated (Information Technology, Electronic Equipment, Instruments & Components) | | | | | | | 5,334 | | | | 29,268 | |
Chunghwa Telecom Company Limited (Communication Services, Diversified Telecommunication Services) | | | | | | | 150,000 | | | | 554,675 | |
Cleanaway Company Limited (Industrials, Commercial Services & Supplies) | | | | | | | 1,334 | | | | 7,229 | |
Clevo Company (Information Technology, Technology Hardware, Storage & Peripherals) | | | | | | | 8,667 | | | | 8,743 | |
Compal Electronic Incorporated (Information Technology, Technology Hardware, Storage & Peripherals) | | | | | | | 422,000 | | | | 266,074 | |
Compeq Manufacturing Company Limited (Information Technology, Electronic Equipment, Instruments & Components) | | | | | | | 15,000 | | | | 22,315 | |
CTBC Financial Holding Company Limited (Financials, Banks) | | | | | | | 666,000 | | | | 430,131 | |
CTCI Corporation (Industrials, Construction & Engineering) | | | | | | | 7,667 | | | | 9,407 | |
Cub Elecparts Incorporated (Consumer Discretionary, Auto Components) | | | | | | | 1,024 | | | | 5,846 | |
The accompanying notes are an integral part of these financial statements.
Wells Fargo Factor Enhanced Emerging Markets Equity Portfolio | 31
Portfolio of investments—August 31, 2020 (unaudited)
| | | | | | | | | | | | |
| | | | | | | Shares | | | Value | |
|
| Taiwan (continued) | |
Delta Electronics Incorporated (Information Technology, Electronic Equipment, Instruments & Components) | | | | | | | 39,000 | | | $ | 251,214 | |
E.SUN Financial Holding Company Limited (Financials, Banks) | | | | | | | 464,093 | | | | 430,221 | |
Eclat Textile Company Limited (Consumer Discretionary, Textiles, Apparel & Luxury Goods) | | | | | | | 4,667 | | | | 61,635 | |
Elan Microelectronics Corporation (Information Technology, Semiconductors & Semiconductor Equipment) | | | | | | | 3,034 | | | | 14,683 | |
Elite Material Company Limited (Information Technology, Electronic Equipment, Instruments & Components) | | | | | | | 3,667 | | | | 21,246 | |
Elite Semiconductor Memory Technology Incorporated (Information Technology, Semiconductors & Semiconductor Equipment) | | | | | | | 4,000 | | | | 4,962 | |
Ennoconn Corporation (Information Technology, Technology Hardware, Storage & Peripherals) † | | | | | | | 667 | | | | 6,729 | |
EnTie Commercial Bank (Financials, Banks) | | | | | | | 14,728 | | | | 6,952 | |
Epistar Corporation (Information Technology, Semiconductors & Semiconductor Equipment) † | | | | | | | 13,000 | | | | 17,678 | |
Eternal Chemical Company Limited (Materials, Chemicals) | | | | | | | 10,485 | | | | 12,346 | |
Eva Airways Corporation (Industrials, Airlines) | | | | | | | 23,624 | | | | 9,259 | |
Evergreen Marine Corporation (Taiwan) Limited (Industrials, Marine) † | | | | | | | 54,617 | | | | 32,389 | |
Everlight Electronics Company Limited (Information Technology, Semiconductors & Semiconductor Equipment) | | | | | | | 6,667 | | | | 7,850 | |
Far Eastern Department Stores Company Limited (Consumer Discretionary, Multiline Retail) | | | | | | | 12,667 | | | | 11,203 | |
Far Eastern International Bank (Financials, Banks) | | | | | | | 52,087 | | | | 19,882 | |
Far Eastern New Century Corporation (Industrials, Industrial Conglomerates) | | | | | | | 51,000 | | | | 45,974 | |
Far EasTone Telecommunications Company Limited (Communication Services, Wireless Telecommunication Services) | | | | | | | 55,500 | | | | 115,950 | |
Feng Hsin Iron & Steel Company (Materials, Metals & Mining) | | | | | | | 8,836 | | | | 17,165 | |
Feng Tay Enterprise Company Limited (Consumer Discretionary, Textiles, Apparel & Luxury Goods) | | | | | | | 8,160 | | | | 47,417 | |
First Financial Holding Company Limited (Financials, Banks) | | | | | | | 298,898 | | | | 216,471 | |
Flexium Interconnect Incorporated (Information Technology, Electronic Equipment, Instruments & Components) | | | | | | | 3,000 | | | | 12,883 | |
Formosa Chemicals & Fibre Corporation (Materials, Chemicals) | | | | | | | 90,500 | | | | 209,120 | |
Formosa Petrochemical Corporation (Energy, Oil, Gas & Consumable Fuels) | | | | | | | 28,000 | | | | 78,251 | |
Formosa Plastics Corporation (Materials, Chemicals) | | | | | | | 119,000 | | | | 317,155 | |
Formosa Taffeta Company Limited (Consumer Discretionary, Textiles, Apparel & Luxury Goods) | | | | | | | 88,500 | | | | 95,463 | |
Foxconn Technology Company Limited (Information Technology, Electronic Equipment, Instruments & Components) | | | | | | | 51,500 | | | | 91,621 | |
Foxsemicon Integrated Technology Incorporated Class H (Information Technology, Semiconductors & Semiconductor Equipment) | | | | | | | 1,000 | | | | 6,510 | |
Fubon Financial Holding Company Limited (Financials, Insurance) | | | | | | | 236,000 | | | | 344,250 | |
Fulgent Sun International Holding Company Limited (Consumer Discretionary, Textiles, Apparel & Luxury Goods) | | | | | | | 2,000 | | | | 8,589 | |
Fusheng Precision Company Limited (Consumer Discretionary, Leisure Products) | | | | | | | 1,667 | | | | 9,829 | |
General Interface Solution Holding Limited (Information Technology, Electronic Equipment, Instruments & Components) | | | | | | | 3,000 | | | | 13,292 | |
Genius Electronic Optical Company (Information Technology, Electronic Equipment, Instruments & Components) | | | | | | | 1,000 | | | | 19,495 | |
Getac Technology Corporation (Information Technology, Technology Hardware, Storage & Peripherals) | | | | | | | 4,334 | | | | 7,208 | |
Giant Manufacturing Company Limited (Consumer Discretionary, Leisure Products) | | | | | | | 22,000 | | | | 228,686 | |
Gigabyte Technology Company Limited (Information Technology, Technology Hardware, Storage & Peripherals) | | | | | | | 6,667 | | | | 19,291 | |
Global Lighting Technologies Incorporated (Information Technology, Semiconductors & Semiconductor Equipment) | | | | | | | 1,000 | | | | 4,311 | |
Global Unichip Corporation (Information Technology, Semiconductors & Semiconductor Equipment) | | | | | | | 1,000 | | | | 9,015 | |
Globalwafers Company Limited (Information Technology, Semiconductors & Semiconductor Equipment) | | | | | | | 12,000 | | | | 161,137 | |
Gold Circuit Electronics Limited (Information Technology, Electronic Equipment, Instruments & Components) † | | | | | | | 6,000 | | | | 10,511 | |
Goldsun Development & Construction Company Limited (Materials, Construction Materials) | | | | | | | 16,000 | | | | 11,806 | |
Gourmet Master Company Limited (Consumer Discretionary, Hotels, Restaurants & Leisure) | | | | | | | 1,646 | | | | 5,604 | |
Grand Pacific Petrochemical Corporation (Materials, Chemicals) † | | | | | | | 22,667 | | | | 14,832 | |
The accompanying notes are an integral part of these financial statements.
32 | Wells Fargo Factor Enhanced Emerging Markets Equity Portfolio
Portfolio of investments—August 31, 2020 (unaudited)
| | | | | | | | | | | | |
| | | | | | | Shares | | | Value | |
|
| Taiwan (continued) | |
Grape King Bio Limited (Consumer Staples, Personal Products) | | | | | | | 1,334 | | | $ | 8,184 | |
Great Taipei Gas Company Limited (Utilities, Gas Utilities) | | | | | | | 6,667 | | | | 7,032 | |
Great Wall Enterprises Company Limited (Consumer Staples, Food Products) | | | | | | | 10,793 | | | | 16,645 | |
Greatek Electronic Incorporated (Information Technology, Semiconductors & Semiconductor Equipment) | | | | | | | 3,334 | | | | 5,704 | |
Hannstar Board Corporation (Information Technology, Electronic Equipment, Instruments & Components) | | | | | | | 4,000 | | | | 5,937 | |
Hannstar Display Corporation (Information Technology, Electronic Equipment, Instruments & Components) † | | | | | | | 38,334 | | | | 10,504 | |
Hey Song Corporation (Consumer Staples, Beverages) | | | | | | | 11,810 | | | | 12,920 | |
Highwealth Construction Corporation (Real Estate, Real Estate Management & Development) | | | | | | | 9,000 | | | | 14,232 | |
Hiwin Technologies Corporation (Industrials, Machinery) | | | | | | | 6,567 | | | | 72,068 | |
Holtek Semiconductor Incorporated (Information Technology, Semiconductors & Semiconductor Equipment) | | | | | | | 2,000 | | | | 4,349 | |
Holy Stone Enterprise Company Limited (Information Technology, Electronic Equipment, Instruments & Components) | | | | | | | 2,334 | | | | 8,273 | |
Hon Hai Precision Industry Company Limited (Information Technology, Electronic Equipment, Instruments & Components) | | | | | | | 426,400 | | | | 1,117,535 | |
Hota Industrial Manufacturing Company Limited (Consumer Discretionary, Auto Components) | | | | | | | 3,334 | | | | 11,874 | |
Hotai Finance Company Limited (Financials, Consumer Finance) | | | | | | | 2,000 | | | | 5,508 | |
Hotai Motor Company Limited (Consumer Discretionary, Specialty Retail) | | | | | | | 7,000 | | | | 142,426 | |
Hua Nan Financial Holdings Company Limited Class C (Financials, Banks) | | | | | | | 329,031 | | | | 202,410 | |
Huaku Development Company Limited (Real Estate, Real Estate Management & Development) | | | | | | | 2,667 | | | | 8,144 | |
IBF Financial Holdings Company Limited (Financials, Capital Markets) | | | | | | | 23,990 | | | | 9,443 | |
Innolux Display Corporation (Information Technology, Electronic Equipment, Instruments & Components) | | | | | | | 114,667 | | | | 35,641 | |
International CSRC Investment Holdings Company Limited (Materials, Chemicals) | | | | | | | 11,402 | | | | 8,005 | |
Inventec Company Limited (Information Technology, Technology Hardware, Storage & Peripherals) | | | | | | | 83,834 | | | | 65,001 | |
ITEQ Corporation (Information Technology, Electronic Equipment, Instruments & Components) | | | | | | | 3,000 | | | | 12,218 | |
Jentech Precision Industrial Company Limited (Information Technology, Semiconductors & Semiconductor Equipment) | | | | | | | 1,000 | | | | 10,429 | |
Kenda Rubber Industrial Company Limited (Consumer Discretionary, Auto Components) | | | | | | | 9,292 | | | | 10,134 | |
King Slide Works Company Limited (Information Technology, Technology Hardware, Storage & Peripherals) | | | | | | | 667 | | | | 6,922 | |
King Yuan Electronics Company Limited (Information Technology, Semiconductors & Semiconductor Equipment) | | | | | | | 11,667 | | | | 12,406 | |
King’s Town Bank Company Limited (Financials, Banks) | | | | | | | 14,334 | | | | 17,856 | |
Kinpo Electronics Incorporated (Consumer Discretionary, Household Durables) | | | | | | | 19,000 | | | | 7,447 | |
Kinsus Interconnect Technology Corporation (Information Technology, Semiconductors & Semiconductor Equipment) | | | | | | | 3,334 | | | | 7,249 | |
Largan Precision Company Limited (Information Technology, Electronic Equipment, Instruments & Components) | | | | | | | 1,000 | | | | 115,366 | |
Lien Hwa Industrial Corporation (Consumer Staples, Food Products) | | | | | | | 15,505 | | | | 22,221 | |
Lite-On Technology Corporation (Information Technology, Technology Hardware, Storage & Peripherals) | | | | | | | 142,000 | | | | 224,556 | |
LOTES Company Limited (Information Technology, Electronic Equipment, Instruments & Components) | | | | | | | 1,000 | | | | 14,587 | |
Machvision Incorporated (Information Technology, Semiconductors & Semiconductor Equipment) | | | | | | | 667 | | | | 6,342 | |
Macronix International Company Limited (Information Technology, Semiconductors & Semiconductor Equipment) | | | | | | | 23,179 | | | | 23,857 | |
Makalot Industrial Company Limited (Consumer Discretionary, Textiles, Apparel & Luxury Goods) | | | | | | | 2,934 | | | | 19,749 | |
Mediatek Incorporated (Information Technology, Semiconductors & Semiconductor Equipment) | | | | | | | 36,000 | | | | 682,174 | |
Mega Financial Holding Company Limited (Financials, Banks) | | | | | | | 320,000 | | | | 319,002 | |
Mercuries Life Insurance Company (Financials, Insurance) † | | | | | | | 26,768 | | | | 8,594 | |
Merida Industry Company Limited (Consumer Discretionary, Leisure Products) | | | | | | | 2,334 | | | | 19,489 | |
Merry Electronics Company Limited (Information Technology, Electronic Equipment, Instruments & Components) | | | | | | | 2,667 | | | | 13,998 | |
Micro-Star International Company Limited (Information Technology, Technology Hardware, Storage & Peripherals) | | | | | | | 39,000 | | | | 180,103 | |
Mitac Holdings Corporation (Information Technology, Technology Hardware, Storage & Peripherals) | | | | | | | 11,855 | | | | 11,677 | |
Momo.com Incorporated (Consumer Discretionary, Internet & Direct Marketing Retail) | | | | | | | 667 | | | | 16,572 | |
The accompanying notes are an integral part of these financial statements.
Wells Fargo Factor Enhanced Emerging Markets Equity Portfolio | 33
Portfolio of investments—August 31, 2020 (unaudited)
| | | | | | | | | | | | |
| | | | | | | Shares | | | Value | |
|
| Taiwan (continued) | |
Nan Kang Rubber Tire Company Limited (Consumer Discretionary, Auto Components) | | | | | | | 6,000 | | | $ | 9,601 | |
Nan Liu Enterprise Company Limited (Consumer Discretionary, Textiles, Apparel & Luxury Goods) | | | | | | | 1,000 | | | | 9,202 | |
Nan Ya Plastics Corporation (Materials, Chemicals) | | | | | | | 138,000 | | | | 289,249 | |
Nan Ya Printed Circuit Board Corporation (Information Technology, Electronic Equipment, Instruments & Components) | | | | | | | 2,000 | | | | 8,214 | |
Nantex Industry Company Limited (Materials, Chemicals) | | | | | | | 5,000 | | | | 8,001 | |
Nanya Technology Corporation (Information Technology, Semiconductors & Semiconductor Equipment) | | | | | | | 53,000 | | | | 93,748 | |
Nien Made Enterprise Company Limited (Consumer Discretionary, Household Durables) | | | | | | | 1,667 | | | | 19,203 | |
Novatek Microelectronics Corporation Limited (Information Technology, Semiconductors & Semiconductor Equipment) | | | | | | | 40,000 | | | | 327,182 | |
Oriental Union Chemical Corporation (Materials, Chemicals) | | | | | | | 9,334 | | | | 5,424 | |
Pegatron Corporation (Information Technology, Technology Hardware, Storage & Peripherals) | | | | | | | 173,000 | | | | 368,505 | |
Pharmally International Holding Company Limited (Health Care, Pharmaceuticals) (a) | | | | | | | 2,064 | | | | 3,981 | |
Phison Electronics Corporation (Information Technology, Semiconductors & Semiconductor Equipment) | | | | | | | 19,000 | | | | 179,371 | |
Pou Chen Corporation (Consumer Discretionary, Textiles, Apparel & Luxury Goods) | | | | | | | 66,667 | | | | 62,937 | |
Powertech Technology Incorporated (Information Technology, Semiconductors & Semiconductor Equipment) | | | | | | | 103,000 | | | | 303,297 | |
President Chain Store Corporation (Consumer Staples, Food & Staples Retailing) | | | | | | | 14,334 | | | | 131,901 | |
President Securities Corporation (Financials, Capital Markets) | | | | | | | 21,930 | | | | 12,183 | |
Primax Electronics Limited (Information Technology, Technology Hardware, Storage & Peripherals) | | | | | | | 6,000 | | | | 9,141 | |
Prince Housing & Development Corporation (Real Estate, Real Estate Management & Development) | | | | | | | 20,934 | | | | 7,313 | |
Qisda Corporation (Information Technology, Technology Hardware, Storage & Peripherals) | | | | | | | 18,000 | | | | 11,410 | |
Quanta Computer Incorporated (Information Technology, Technology Hardware, Storage & Peripherals) | | | | | | | 119,000 | | | | 312,288 | |
Radiant Opto-Electronics Corporation (Information Technology, Semiconductors & Semiconductor Equipment) | | | | | | | 6,000 | | | | 22,085 | |
Realtek Semiconductor Corporation (Information Technology, Semiconductors & Semiconductor Equipment) | | | | | | | 12,000 | | | | 155,411 | |
Rexon Industrial Corporation Limited (Industrials, Machinery) | | | | | | | 2,000 | | | | 6,850 | |
Ruentex Development Company Limited (Real Estate, Real Estate Management & Development) | | | | | | | 13,440 | | | | 19,788 | |
Ruentex Industries Limited (Consumer Discretionary, Textiles, Apparel & Luxury Goods) | | | | | | | 5,000 | | | | 11,860 | |
Run Long Construction Company Limited (Industrials, Construction & Engineering) | | | | | | | 1,334 | | | | 3,214 | |
Sanyang Industry Company Limited (Consumer Discretionary, Automobiles) | | | | | | | 8,334 | | | | 6,732 | |
Sercomm Corporation (Information Technology, Communications Equipment) | | | | | | | 3,000 | | | | 7,955 | |
Shihlin Electric & Engineering Corporation (Industrials, Electrical Equipment) | | | | | | | 5,696 | | | | 9,522 | |
Shin Kong Financial Holding Company Limited (Financials, Insurance) | | | | | | | 283,000 | | | | 80,054 | |
Shin Kong No.1 REIT (Real Estate, Equity REITs) | | | | | | | 16,422 | | | | 11,099 | |
Shin Zu Shing Company Limited (Industrials, Machinery) | | | | | | | 2,334 | | | | 12,011 | |
Shinkong Synthetic Fibers Corporation (Materials, Chemicals) | | | | | | | 19,000 | | | | 7,900 | |
Sigurd Microelectronics Corporation (Information Technology, Semiconductors & Semiconductor Equipment) | | | | | | | 4,000 | | | | 5,201 | |
Silergy Corporation (Information Technology, Semiconductors & Semiconductor Equipment) | | | | | | | 3,000 | | | | 190,686 | |
Sinbon Electronics Company Limited (Information Technology, Electronic Equipment, Instruments & Components) | | | | | | | 2,667 | | | | 16,407 | |
Sinopac Financial Holdings Company Limited (Financials, Banks) | | | | | | | 334,400 | | | | 123,086 | |
Sitronix Technology Corporation (Information Technology, Semiconductors & Semiconductor Equipment) | | | | | | | 1,667 | | | | 8,181 | |
Standard Foods Corporation (Consumer Staples, Food Products) | | | | | | | 30,167 | | | | 65,492 | |
Synnex Technology International Corporation (Information Technology, Electronic Equipment, Instruments & Components) | | | | | | | 294,000 | | | | 437,871 | |
Systex Corporation (Information Technology, IT Services) | | | | | | | 3,000 | | | | 8,926 | |
Ta Chen Stainless Pipe Company (Materials, Metals & Mining) | | | | | | | 14,566 | | | | 10,549 | |
Taichung Commercial Bank (Financials, Banks) | | | | | | | 49,334 | | | | 18,747 | |
Tainan Spinning Company Limited (Consumer Discretionary, Textiles, Apparel & Luxury Goods) | | | | | | | 23,000 | | | | 9,171 | |
Taishin Financial Holdings Company Limited (Financials, Banks) | | | | | | | 349,381 | | | | 157,773 | |
Taiwan Business Bank (Financials, Banks) | | | | | | | 140,790 | | | | 47,983 | |
Taiwan Cement Corporation (Materials, Construction Materials) | | | | | | | 197,843 | | | | 289,265 | |
Taiwan Cogeneration Corporation (Utilities, Independent Power & Renewable Electricity Producers) | | | | | | | 5,334 | | | | 6,817 | |
Taiwan Cooperative Financial Holdings Company Limited (Financials, Banks) | | | | | | | 164,727 | | | | 112,563 | |
The accompanying notes are an integral part of these financial statements.
34 | Wells Fargo Factor Enhanced Emerging Markets Equity Portfolio
Portfolio of investments—August 31, 2020 (unaudited)
| | | | | | | | | | | | |
| | | | | | | Shares | | | Value | |
|
| Taiwan (continued) | |
Taiwan Fertilizer Company Limited (Materials, Chemicals) | | | | | | | 8,667 | | | $ | 16,039 | |
Taiwan Glass Industrial Corporation (Industrials, Building Products) † | | | | | | | 25,667 | | | | 10,060 | |
Taiwan High Speed Rail Corporation (Industrials, Transportation Infrastructure) | | | | | | | 41,334 | | | | 45,783 | |
Taiwan Hon Chuan Enterprise Company Limited (Materials, Containers & Packaging) | | | | | | | 3,667 | | | | 7,349 | |
Taiwan Mobile Company Limited (Communication Services, Wireless Telecommunication Services) | | | | | | | 77,000 | | | | 266,363 | |
Taiwan Paiho Limited (Consumer Discretionary, Textiles, Apparel & Luxury Goods) | | | | | | | 3,334 | | | | 8,977 | |
Taiwan Secom Company Limited (Industrials, Commercial Services & Supplies) | | | | | | | 4,000 | | | | 11,588 | |
Taiwan Semiconductor Manufacturing Company Limited (Information Technology, Semiconductors & Semiconductor Equipment) | | | | | | | 697,000 | | | | 10,131,401 | |
Taiwan Shin Kong Security Company (Industrials, Commercial Services & Supplies) | | | | | | | 10,613 | | | | 13,148 | |
Taiwan Surface Mounting Technology Corporation (Information Technology, Semiconductors & Semiconductor Equipment) | | | | | | | 3,667 | | | | 14,872 | |
TECO Electric & Machinery Company Limited (Industrials, Electrical Equipment) | | | | | | | 26,667 | | | | 26,629 | |
The Shanghai Commercial & Savings Bank Limited (Financials, Banks) | | | | | | | 69,000 | | | | 98,298 | |
Tong Hsing Electronic Industries Limited (Information Technology, Electronic Equipment, Instruments & Components) | | | | | | | 1,334 | | | | 6,024 | |
Tong Yang Industry Company Limited (Consumer Discretionary, Auto Components) | | | | | | | 6,334 | | | | 8,354 | |
Topco Scientific Company Limited (Information Technology, Semiconductors & Semiconductor Equipment) | | | | | | | 1,000 | | | | 4,090 | |
TPK Holding Company Limited (Information Technology, Electronic Equipment, Instruments & Components) † | | | | | | | 5,000 | | | | 8,384 | |
Transcend Information Incorporated (Information Technology, Technology Hardware, Storage & Peripherals) | | | | | | | 2,334 | | | | 5,242 | |
Tripod Technology Corporation (Information Technology, Electronic Equipment, Instruments & Components) | | | | | | | 6,000 | | | | 23,721 | |
TSRC Corporation (Materials, Chemicals) | | | | | | | 10,667 | | | | 6,380 | |
Tung Ho Steel Enterprise Corporation (Materials, Metals & Mining) | | | | | | | 13,000 | | | | 11,852 | |
TXC Corporation (Information Technology, Electronic Equipment, Instruments & Components) | | | | | | | 3,334 | | | | 8,783 | |
U-Ming Marine Transport Corporation (Industrials, Marine) | | | | | | | 8,000 | | | | 8,180 | |
Uni-President Enterprises Corporation (Consumer Staples, Food Products) | | | | | | | 88,334 | | | | 200,503 | |
Unimicron Technology Corporation (Information Technology, Electronic Equipment, Instruments & Components) | | | | | | | 14,667 | | | | 36,791 | |
Union Bank of Taiwan (Financials, Banks) | | | | | | | 74,009 | | | | 25,854 | |
Unitech Printed Circuit Board Corporation (Information Technology, Technology Hardware, Storage & Peripherals) | | | | | | | 8,667 | | | | 6,114 | |
United Integrated Services Company Limited (Industrials, Construction & Engineering) | | | | | | | 2,334 | | | | 16,386 | |
United Microelectronics Corporation (Information Technology, Semiconductors & Semiconductor Equipment) | | | | | | | 338,000 | | | | 244,214 | |
United Renewable Energy Company Limited (Information Technology, Semiconductors & Semiconductor Equipment) † | | | | | | | 21,000 | | | | 8,266 | |
Vanguard International Semiconductor Corporation (Information Technology, Semiconductors & Semiconductor Equipment) | | | | | | | 17,000 | | | | 54,172 | |
Visual Photonics Epitaxy Company Limited (Information Technology, Semiconductors & Semiconductor Equipment) | | | | | | | 2,334 | | | | 6,133 | |
Voltronic Power Technology Corporation (Industrials, Electrical Equipment) | | | | | | | 1,067 | | | | 37,638 | |
Walsin Lihwa Corporation (Industrials, Electrical Equipment) | | | | | | | 39,334 | | | | 22,588 | |
Walsin Technology Corporation (Information Technology, Electronic Equipment, Instruments & Components) | | | | | | | 46,000 | | | | 250,839 | |
Wan Hai Lines Limited (Industrials, Marine) | | | | | | | 21,000 | | | | 15,173 | |
Win Semiconductors Corporation (Information Technology, Semiconductors & Semiconductor Equipment) | | | | | | | 1,000 | | | | 9,747 | |
Windbond Electronics Corporation (Information Technology, Semiconductors & Semiconductor Equipment) | | | | | | | 37,334 | | | | 15,460 | |
Wistron Corporation (Information Technology, Technology Hardware, Storage & Peripherals) | | | | | | | 239,607 | | | | 260,500 | |
Wistron Neweb Corporation (Information Technology, Communications Equipment) | | | | | | | 3,867 | | | | 10,873 | |
Wiwynn Corporation (Information Technology, Technology Hardware, Storage & Peripherals) | | | | | | | 6,000 | | | | 159,910 | |
WPG Holdings Company Limited (Information Technology, Electronic Equipment, Instruments & Components) | | | | | | | 167,440 | | | | 234,541 | |
The accompanying notes are an integral part of these financial statements.
Wells Fargo Factor Enhanced Emerging Markets Equity Portfolio | 35
Portfolio of investments—August 31, 2020 (unaudited)
| | | | | | | | | | | | |
| | | | | | | Shares | | | Value | |
|
| Taiwan (continued) | |
WT Microelectronics Company Limited (Information Technology, Electronic Equipment, Instruments & Components) | | | | | | | 5,667 | | | $ | 7,542 | |
Yageo Corporation (Information Technology, Electronic Equipment, Instruments & Components) | | | | | | | 26,566 | | | | 301,501 | |
YFY Incorporated (Materials, Paper & Forest Products) | | | | | | | 19,000 | | | | 11,850 | |
Yieh Phui Enterprise Company Limited (Materials, Metals & Mining) | | | | | | | 40,005 | | | | 12,953 | |
Yuanta Financial Holding Company Limited (Financials, Diversified Financial Services) | | | | | | | 222,560 | | | | 139,567 | |
Yulon Finance Corporation (Financials, Consumer Finance) | | | | | | | 2,603 | | | | 8,845 | |
Yulon Motor Company Limited (Consumer Discretionary, Automobiles) † | | | | | | | 12,000 | | | | 10,347 | |
YungShin Global Holding Corporation (Health Care, Pharmaceuticals) | | | | | | | 5,000 | | | | 7,506 | |
Zhen Ding Technology Holding (Information Technology, Electronic Equipment, Instruments & Components) | | | | | | | 47,000 | | | | 197,025 | |
| | | | |
| | | | | | | | | | | 27,305,395 | |
| | | | | | | | | | | | |
|
| Thailand: 2.60% | |
Advanced Info Service PCL (Communication Services, Wireless Telecommunication Services) | | | | | | | 50,600 | | | | 297,528 | |
Aeon Thana Sinsap PCL (Financials, Consumer Finance) | | | | | | | 834 | | | | 2,867 | |
Airports of Thailand PCL (Industrials, Transportation Infrastructure) | | | | | | | 60,934 | | | | 109,641 | |
Amata Corporation PCL (Real Estate, Real Estate Management & Development) | | | | | | | 13,667 | | | | 5,797 | |
AP Thailand PCL (Real Estate, Real Estate Management & Development) | | | | | | | 33,767 | | | | 6,835 | |
B.Grimm PCL (Utilities, Independent Power & Renewable Electricity Producers) | | | | | | | 53,500 | | | | 79,504 | |
Bangchak Corporation PCL (Energy, Oil, Gas & Consumable Fuels) | | | | | | | 21,134 | | | | 12,019 | |
Bangkok Bank PCL (Financials, Banks) | | | | | | | 18,367 | | | | 62,851 | |
Bangkok Chain Hospital PCL (Health Care, Health Care Providers & Services) | | | | | | | 12,600 | | | | 6,316 | |
Bangkok Commercial Asset Management PCL (Financials, Capital Markets) | | | | | | | 66,800 | | | | 50,010 | |
Bangkok Dusit Medical Services PCL (Health Care, Health Care Providers & Services) | | | | | | | 280,000 | | | | 187,132 | |
Bangkok Expressway and Metro PCL (Industrials, Transportation Infrastructure) | | | | | | | 114,934 | | | | 33,421 | |
Bangkok Insurance PCL (Financials, Insurance) | | | | | | | 1,282 | | | | 11,616 | |
Bangkok Life Assurance PCL (Financials, Insurance) | | | | | | | 19,434 | | | | 10,053 | |
Bangkokland PCL (Real Estate, Real Estate Management & Development) | | | | | | | 239,934 | | | | 7,632 | |
Bank of Ayudhya PCL (Financials, Banks) | | | | | | | 27,934 | | | | 19,118 | |
Banpu PCL (Energy, Oil, Gas & Consumable Fuels) | | | | | | | 73,067 | | | | 13,499 | |
Berli Jucker PCL (Consumer Staples, Food & Staples Retailing) | | | | | | | 19,100 | | | | 22,707 | |
BTS Group Holdings PCL (Industrials, Road & Rail) | | | | | | | 147,367 | | | | 49,245 | |
Bumrungrad Hospital PCL (Health Care, Health Care Providers & Services) | | | | | | | 5,434 | | | | 19,293 | |
Carabao Group PCL (Consumer Staples, Beverages) | | | | | | | 5,967 | | | | 23,199 | |
Central Pattana PCL (Real Estate, Real Estate Management & Development) † | | | | | | | 43,200 | | | | 65,239 | |
Central Plaza Hotel PCL (Consumer Discretionary, Hotels, Restaurants & Leisure) † | | | | | | | 18,500 | | | | 16,198 | |
CH Karnchang PCL (Industrials, Construction & Engineering) | | | | | | | 15,900 | | | | 9,860 | |
Charoen Pokphand Foods PCL (Consumer Staples, Food Products) | | | | | | | 318,600 | | | | 330,142 | |
Chularat Hospital PCL (Health Care, Health Care Providers & Services) | | | | | | | 56,600 | | | | 4,728 | |
Com7 PCL (Consumer Discretionary, Specialty Retail) | | | | | | | 7,700 | | | | 10,144 | |
CP All PCL (Consumer Staples, Food & Staples Retailing) | | | | | | | 182,200 | | | | 371,747 | |
Delta Electronics Thailand PCL (Information Technology, Electronic Equipment, Instruments & Components) | | | | | | | 8,200 | | | | 30,431 | |
Electricity Genera PCL (Utilities, Independent Power & Renewable Electricity Producers) | | | | | | | 28,900 | | | | 206,147 | |
Energy Absolute PCL (Utilities, Independent Power & Renewable Electricity Producers) | | | | | | | 27,600 | | | | 37,246 | |
GFPT PCL (Consumer Staples, Food Products) | | | | | | | 20,567 | | | | 8,525 | |
Global Power Synergy PCL (Utilities, Independent Power & Renewable Electricity Producers) | | | | | | | 8,900 | | | | 18,302 | |
Gulf Energy Development PCL (Utilities, Independent Power & Renewable Electricity Producers) | | | | | | | 86,184 | | | | 87,229 | |
Gunkul Engineering PCL (Industrials, Electrical Equipment) | | | | | | | 44,100 | | | | 3,599 | |
Hana Microelectronics PCL (Information Technology, Electronic Equipment, Instruments & Components) | | | | | | | 7,000 | | | | 8,940 | |
Home Product Center PCL (Consumer Discretionary, Specialty Retail) | | | | | | | 360,300 | | | | 172,495 | |
Impact Growth REIT (Real Estate, Equity REITs) | | | | | | | 8,567 | | | | 5,065 | |
Indorama Ventures PCL (Materials, Chemicals) | | | | | | | 206,800 | | | | 157,480 | |
Intouch Holdings PCL (Communication Services, Wireless Telecommunication Services) | | | | | | | 187,200 | | | | 327,814 | |
IRPC PCL (Energy, Oil, Gas & Consumable Fuels) | | | | | | | 181,334 | | | | 13,634 | |
The accompanying notes are an integral part of these financial statements.
36 | Wells Fargo Factor Enhanced Emerging Markets Equity Portfolio
Portfolio of investments—August 31, 2020 (unaudited)
| | | | | | | | | | | | |
| | | | | | | Shares | | | Value | |
|
| Thailand (continued) | |
Jasmine International PCL (Communication Services, Diversified Telecommunication Services) | | | | | | | 62,834 | | | $ | 5,855 | |
Kasikornbank PCL—Non-voting (Financials, Banks) | | | | | | | 46,100 | | | | 124,795 | |
KCE Electronics PCL (Information Technology, Electronic Equipment, Instruments & Components) | | | | | | | 10,434 | | | | 9,806 | |
Kiatnakin Bank PCL (Financials, Banks) | | | | | | | 11,300 | | | | 14,432 | |
Krung Thai Bank PCL (Financials, Banks) | | | | | | | 192,300 | | | | 59,008 | |
Krungthai Card PCL (Financials, Consumer Finance) | | | | | | | 11,034 | | | | 10,902 | |
Land & Houses PCL (Real Estate, Real Estate Management & Development) | | | | | | | 137,667 | | | | 32,733 | |
Major Cineplex Group PCL (Communication Services, Entertainment) | | | | | | | 7,900 | | | | 4,442 | |
MBK PCL (Real Estate, Real Estate Management & Development) | | | | | | | 13,034 | | | | 5,235 | |
Mega Lifesciences PCL (Health Care, Pharmaceuticals) | | | | | | | 5,400 | | | | 6,550 | |
Minor International PCL (Consumer Discretionary, Hotels, Restaurants & Leisure) † | | | | | | | 51,334 | | | | 36,947 | |
MK Restaurants Group PCL (Consumer Discretionary, Hotels, Restaurants & Leisure) | | | | | | | 4,667 | | | | 7,760 | |
Muangthai Leasing PCL (Financials, Consumer Finance) | | | | | | | 8,467 | | | | 13,535 | |
Osotspa PCL (Consumer Staples, Beverages) | | | | | | | 129,600 | | | | 161,362 | |
Plan B Media PCL (Communication Services, Media) | | | | | | | 29,034 | | | | 5,131 | |
Pruksa Holding PCL (Real Estate, Real Estate Management & Development) | | | | | | | 12,400 | | | | 4,622 | |
PTG Energy PCL (Consumer Discretionary, Specialty Retail) | | | | | | | 11,034 | | | | 6,843 | |
PTT Exploration & Production plc NVDR (Energy, Oil, Gas & Consumable Fuels) | | | | | | | 50,600 | | | | 144,699 | |
PTT Global Chemical PCL (Materials, Chemicals) | | | | | | | 123,700 | | | | 183,826 | |
PTT PCL (Energy, Oil, Gas & Consumable Fuels) | | | | | | | 409,700 | | | | 473,908 | |
Quality Houses PCL (Real Estate, Real Estate Management & Development) | | | | | | | 97,900 | | | | 6,983 | |
Ramkamhaeng Hospital PCL (Health Care, Health Care Providers & Services) | | | | | | | 1,534 | | | | 6,851 | |
Ratchaburi Electricity Generating Holding PCL (Utilities, Independent Power & Renewable Electricity Producers) | | | | | | | 169,700 | | | | 305,348 | |
Sansiri PCL (Real Estate, Real Estate Management & Development) | | | | | | | 212,434 | | | | 4,983 | |
Siam City Cement PCL (Materials, Construction Materials) | | | | | | | 1,100 | | | | 5,019 | |
Siam Commercial Bank PCL (Financials, Banks) | | | | | | | 94,500 | | | | 220,138 | |
Siam Global House PCL (Consumer Discretionary, Specialty Retail) | | | | | | | 27,564 | | | | 18,156 | |
Sino Thai Engineering & Construction PCL (Industrials, Construction & Engineering) | | | | | | | 15,500 | | | | 6,574 | |
Sri Trang Agro-Industry PCL (Consumer Discretionary, Auto Components) | | | | | | | 13,200 | | | | 11,027 | |
Srisawad Power 1979 PCL (Financials, Diversified Financial Services) | | | | | | | 59,940 | | | | 88,112 | |
Star Petroleum Refining PCL (Energy, Oil, Gas & Consumable Fuels) | | | | | | | 36,634 | | | | 8,063 | |
STARK Corporation PCL (Communication Services, Media) † | | | | | | | 96,567 | | | | 6,392 | |
Supalai PCL (Real Estate, Real Estate Management & Development) | | | | | | | 19,934 | | | | 10,760 | |
Super Energy Corporation Public Company Limited NVDR (Utilities, Independent Power & Renewable Electricity Producers) | | | | | | | 209,500 | | | | 5,520 | |
Thai Oil PCL (Energy, Oil, Gas & Consumable Fuels) | | | | | | | 37,000 | | | | 49,337 | |
Thai President Foods PCL (Consumer Staples, Food Products) | | | | | | | 2,234 | | | | 14,249 | |
Thai Union Group PCL (Consumer Staples, Food Products) | | | | | | | 51,100 | | | | 23,151 | |
Thai Vegetable Oil PCL (Consumer Staples, Food Products) | | | | | | | 9,867 | | | | 8,560 | |
Thanachart Capital PCL (Financials, Banks) | | | | | | | 10,734 | | | | 11,123 | |
The Siam Cement PCL (Materials, Construction Materials) | | | | | | | 19,800 | | | | 225,213 | |
Thonburi Healthcare Group PCL (Health Care, Health Care Providers & Services) | | | | | | | 5,000 | | | | 3,117 | |
Tipco Asphalt PCL (Materials, Construction Materials) | | | | | | | 15,734 | | | | 12,538 | |
Tisco Financial Group PCL (Financials, Banks) | | | | | | | 9,000 | | | | 19,447 | |
TMB Bank PCL (Financials, Banks) | | | | | | | 571,700 | | | | 17,267 | |
TOA Paint Thailand PCL (Materials, Chemicals) | | | | | | | 8,500 | | | | 10,788 | |
Total Access Communication PCL (Communication Services, Wireless Telecommunication Services) | | | | | | | 39,100 | | | | 44,914 | |
TPI Polene PCL (Materials, Construction Materials) | | | | | | | 144,534 | | | | 5,851 | |
TPI Polene Power PCL (Utilities, Independent Power & Renewable Electricity Producers) | | | | | | | 21,000 | | | | 2,915 | |
True Corporation PCL (Communication Services, Diversified Telecommunication Services) | | | | | | | 276,467 | | | | 29,492 | |
TTW PCL (Utilities, Water Utilities) | | | | | | | 15,367 | | | | 6,616 | |
VGI Global Media PCL (Communication Services, Media) | | | | | | | 36,834 | | | | 8,285 | |
Vibhavadi Medical Center PCL (Health Care, Health Care Providers & Services) | | | | | | | 64,769 | | | | 3,184 | |
WHA Corporation PCL (Real Estate, Real Estate Management & Development) | | | | | | | 153,434 | | | | 15,776 | |
WHA Premium Growth Freehold & Leasehold REIT (Real Estate, Equity REITs) | | | | | | | 21,367 | | | | 10,230 | |
| | | | |
| | | | | | | | | | | 5,453,618 | |
| | | | | | | | | | | | |
The accompanying notes are an integral part of these financial statements.
Wells Fargo Factor Enhanced Emerging Markets Equity Portfolio | 37
Portfolio of investments—August 31, 2020 (unaudited)
| | | | | | | | | | | | | | | | |
| | | | | | | | | Shares | | | Value | |
| Turkey: 0.78% | | | | | | | | | | | | |
Akbank TAS (Financials, Banks) † | | | | | | | | | | | 202,121 | | | $ | 134,637 | |
Anadolu Efes Biracilik ve Malt Sanayii AS (Consumer Staples, Beverages) | | | | | | | | | | | 2,611 | | | | 6,911 | |
Arcelik AS (Consumer Discretionary, Household Durables) † | | | | | | | | | | | 3,184 | | | | 9,134 | |
Aselsan Elektronik Sanayi ve Ticaret AS (Industrials, Aerospace & Defense) | | | | | | | | | | | 41,679 | | | | 92,204 | |
Bim Birlesik Magazalar AS (Consumer Staples, Food & Staples Retailing) | | | | | | | | | | | 6,640 | | | | 61,371 | |
Coca-Cola Icecek Uretim AS (Consumer Staples, Beverages) | | | | | | | | | | | 1,259 | | | | 7,412 | |
Emlak Konut Gayrimenkul Yati AS (Real Estate, Equity REITs) | | | | | | | | | | | 28,393 | | | | 6,807 | |
Enka Insaat ve Sanayi AS (Industrials, Industrial Conglomerates) | | | | | | | | | | | 25,604 | | | | 22,287 | |
Eregli Demir ve Celik Fabrikalari TAS (Materials, Metals & Mining) | | | | | | | | | | | 126,680 | | | | 150,477 | |
Ford Otomotiv Sanayi AS (Consumer Discretionary, Automobiles) | | | | | | | | | | | 932 | | | | 10,728 | |
Haci Omer Sabanci Holding AS (Financials, Diversified Financial Services) | | | | | | | | | | | 103,991 | | | | 109,501 | |
Koc Holding AS (Industrials, Industrial Conglomerates) | | | | | | | | | | | 14,483 | | | | 29,396 | |
Koza Altin Isletmeleri AS (Materials, Metals & Mining) † | | | | | | | | | | | 400 | | | | 4,234 | |
Pegasus Hava Tasimaciligi AS (Industrials, Airlines) † | | | | | | | | | | | 440 | | | | 2,745 | |
Petkim Petrokimya Holding AS (Materials, Chemicals) † | | | | | | | | | | | 14,917 | | | | 7,945 | |
Soda Sanayii AS (Materials, Chemicals) | | | | | | | | | | | 4,354 | | | | 4,039 | |
Sok Marketler Ticaret AS (Consumer Staples, Food & Staples Retailing) † | | | | | | | | | | | 4,888 | | | | 8,556 | |
TAV Havalimanlari Holding AS (Industrials, Transportation Infrastructure) | | | | | | | | | | | 2,827 | | | | 5,776 | |
Tekfen Holding AS (Industrials, Construction & Engineering) | | | | | | | | | | | 2,680 | | | | 5,414 | |
Tofas Turk Otomobil Fabrikasi AS (Consumer Discretionary, Automobiles) | | | | | | | | | | | 1,341 | | | | 4,103 | |
Tupras Turkiye Petrol Rafinerileri AS (Energy, Oil, Gas & Consumable Fuels) † | | | | | | | | 2,278 | | | | 24,825 | |
Turk Hava Yollari Anonim Ortakligi AS (Industrials, Airlines) † | | | | | | | | | | | 62,579 | | | | 90,020 | |
Turk Sise ve Cam Fabrikalari AS (Industrials, Industrial Conglomerates) | | | | | | | | | | | 6,713 | | | | 5,523 | |
Turk Telekomunikasyon AS (Communication Services, Diversified Telecommunication Services) | | | | | | | | | | | 7,376 | | | | 6,863 | |
Turkcell Iletisim Hizmetleri AS (Communication Services, Wireless Telecommunication Services) | | | | | | | | | | | 119,130 | | | | 232,385 | |
Turkiye Garanti Bankasi AS (Financials, Banks) † | | | | | | | | | | | 219,217 | | | | 201,867 | |
Turkiye Is Bankasi Class C AS (Financials, Banks) † | | | | | | | | | | | 293,498 | | | | 196,305 | |
Turkiye Vakiflar Bankasi TAO AS (Financials, Banks) † | | | | | | | | | | | 22,698 | | | | 12,584 | |
Ulker Biskuvi Sanayi AS (Consumer Staples, Food Products) † | | | | | | | | | | | 2,962 | | | | 9,240 | |
Yapi Ve Kredi Bankasi AS (Financials, Banks) † | | | | | | | | | | | 579,231 | | | | 160,174 | |
| | | | |
| | | | | | | | | | | | | | | 1,623,463 | |
| | | | | | | | | | | | | | | | |
| | | | |
| United Kingdom: 0.01% | | | | | | | | | | | | |
NEPI Rockcastle plc (Real Estate, Real Estate Management & Development) | | | | | | | | 3,857 | | | | 18,041 | |
| | | | | | | | | | | | | | | | |
| | | | |
Total Common Stocks (Cost $187,339,187) | | | | | | | | | | | | | | | 199,616,741 | |
| | | | | | | | | | | | | | | | |
| | | | |
| | | | | | | | | | | | | | | | |
| | | Interest rate | | | Maturity
date | | | Principal | | | | |
| Foreign Corporate Bonds and Notes: 0.00% | | | | | | | | | | | | |
| | | | |
| India: 0.00% | | | | | | | | | | | | |
Britannia Industries Limited (Consumer Staples, Food Products ) | | | 8.00 | % | | | 8-28-2022 | | | INR | 229,650 | | | | 3,287 | |
| | | | | | | | | | | | | | | | |
| | | | |
Total Foreign Corporate Bonds and Notes (Cost $3,255) | | | | | | | | | | | | | | | 3,287 | |
| | | | | | | | | | | | | | | | |
| | | | |
| | | | | | | | | | | | | | | | |
| | | Dividend yield | | | | | | Shares | | | | |
| Preferred Stocks: 2.10% | |
|
| Brazil: 1.68% | |
Alpargatas SA (Consumer Staples, Personal Products) | | | 0.19 | | | | | | | | 2,414 | | | | 16,414 | |
Azul SA (Industrials, Transportation Infrastructure) † | | | 0.00 | | | | | | | | 3,167 | | | | 12,839 | |
Banco Bradesco SA (Financials, Banks) | | | 10.89 | | | | | | | | 141,856 | | | | 537,025 | |
The accompanying notes are an integral part of these financial statements.
38 | Wells Fargo Factor Enhanced Emerging Markets Equity Portfolio
Portfolio of investments—August 31, 2020 (unaudited)
| | | | | | | | | | | | | | | | |
| | | Dividend yield | | | | | | Shares | | | Value | |
|
| Brazil (continued) | |
Banco do Estado do Rio Grande do Sul SA Class B (Financials, Banks) | | | 6.33 | % | | | | | | | 2,900 | | | $ | 6,945 | |
Banco Inter SA (Financials, Banks) | | | 0.48 | | | | | | | | 2,734 | | | | 11,184 | |
Banco Santander Brasil SA (Financials, Banks) | | | 13.19 | | | | | | | | 5,300 | | | | 13,892 | |
Braskem SA Class A (Materials, Chemicals) | | | 2.77 | | | | | | | | 1,704 | | | | 6,622 | |
Centrais Electricas Brasileiras SA (Utilities, Electric Utilities) | | | 3.85 | | | | | | | | 26,700 | | | | 174,913 | |
Companhia de Saneamento do Parana (Utilities, Water Utilities) | | | 4.73 | | | | | | | | 13,740 | | | | 13,267 | |
Companhia de Transmissao de Energia Electrica Paulista (Utilities, Electric Utilities) | | | 7.70 | | | | | | | | 2,140 | | | | 8,371 | |
Companhia Energetica de Minas Gerais SA (Utilities, Electric Utilities) | | | 5.28 | | | | | | | | 165,069 | | | | 317,272 | |
Companhia Energetica de Sao Paulo Class B (Utilities, Independent Power & Renewable Electricity Producers) | | | 6.33 | | | | | | | | 2,067 | | | | 11,357 | |
Companhia Paranaense de Energia-Copel Class B (Utilities, Electric Utilities) | | | 4.12 | | | | | | | | 29,700 | | | | 334,921 | |
Energisa SA (Utilities, Electric Utilities) | | | 1.72 | | | | | | | | 9,513 | | | | 13,475 | |
Gerdau SA (Materials, Metals & Mining) | | | 1.73 | | | | | | | | 69,900 | | | | 243,569 | |
Gol Linhas Aereas Inteligentes SA (Industrials, Airlines) † | | | 0.00 | | | | | | | | 1,867 | | | | 6,097 | |
Itau Unibanco Holding SA (Financials, Banks) | | | 6.68 | | | | | | | | 148,270 | | | | 637,357 | |
Itaúsa Investimentos Itaú SA (Financials, Banks) | | | 6.58 | | | | | | | | 264,361 | | | | 455,038 | |
Klabin SA (Materials, Containers & Packaging) | | | 5.70 | | | | | | | | 35,967 | | | | 33,088 | |
Lojas Americanas SA (Consumer Discretionary, Multiline Retail) | | | 0.94 | | | | | | | | 22,300 | | | | 131,354 | |
Marcopolo SA (Industrials, Machinery) | | | 1.34 | | | | | | | | 9,067 | | | | 4,667 | |
Metalurgica Gerdau SA (Materials, Metals & Mining) | | | 2.16 | | | | | | | | 8,934 | | | | 14,334 | |
Petroleo Brasileiro SA (Energy, Oil, Gas & Consumable Fuels) | | | 2.85 | | | | | | | | 111,700 | | | | 446,311 | |
Telefonica Brasil SA (Communication Services, Diversified Telecommunication Services) | | | 7.51 | | | | | | | | 7,255 | | | | 63,353 | |
Transmissora Alianca de Energia Eletrica SA (Utilities, Electric Utilities) | | | 7.97 | | | | | | | | 5,000 | | | | 8,643 | |
Usinas Siderurgicas de Minas Gerais SA Class A (Materials, Metals & Mining) | | | 1.76 | | | | | | | | 6,000 | | | | 11,116 | |
| | | | |
| | | | | | | | | | | | | | | 3,533,424 | |
| | | | | | | | | | | | | | | | |
|
| Chile: 0.03% | |
Coca-Cola Embonor SA Class B (Consumer Staples, Food Products) | | | 4.86 | | | | | | | | 2,444 | | | | 3,236 | |
Embotelladora Andina SA Class B (Consumer Staples, Food & Staples Retailing) | | | 6.43 | | | | | | | | 14,061 | | | | 29,949 | |
Sociedad Quimica y Minera de Chile SA Class B (Materials, Chemicals) | | | 3.55 | | | | | | | | 875 | | | | 27,351 | |
| | | | |
| | | | | | | | | | | | | | | 60,536 | |
| | | | | | | | | | | | | | | | |
|
| Colombia: 0.03% | |
Banco Davivienda SA (Financials, Banks) | | | 3.19 | | | | | | | | 1,447 | | | | 11,209 | |
Bancolombia SA (Financials, Banks) | | | 6.56 | | | | | | | | 6,158 | | | | 43,983 | |
| | | | |
| | | | | | | | | | | | | | | 55,192 | |
| | | | | | | | | | | | | | | | |
|
| Russia: 0.00% | |
Bashneft PAO (Energy, Oil, Gas & Consumable Fuels) | | | 9.04 | | | | | | | | 209 | | | | 3,757 | |
Transneft PJSC (Energy, Oil, Gas & Consumable Fuels) † | | | 5.96 | | | | | | | | 2 | | | | 3,749 | |
| | | | |
| | | | | | | | | | | | | | | 7,506 | |
| | | | | | | | | | | | | | | | |
|
| South Korea: 0.36% | |
Amorepacific Corporation (Consumer Staples, Household Products) | | | 1.12 | | | | | | | | 3,309 | | | | 166,300 | |
LG Chem Limited (Materials, Chemicals) | | | 1.18 | | | | | | | | 190 | | | | 59,980 | |
LG Household & Health Care Limited (Consumer Staples, Personal Products) | | | 1.43 | | | | | | | | 127 | | | | 74,945 | |
Samsung Electronics Company Limited (Information Technology, Technology Hardware, Storage & Peripherals) | | | 3.06 | | | | | | | | 11,300 | | | | 451,848 | |
| | | | |
| | | | | | | | | | | | | | | 753,073 | |
| | | | | | | | | | | | | | | | |
| |
Total Preferred Stocks (Cost $5,252,829) | | | | 4,409,731 | |
| | | | | | | | | | | | | | | | |
| | | | |
| | | | | | | | | | | | | | | | |
The accompanying notes are an integral part of these financial statements.
Wells Fargo Factor Enhanced Emerging Markets Equity Portfolio | 39
Portfolio of investments—August 31, 2020 (unaudited)
| | | | | | | | | | | | | | | | |
| | | | | | Expiration
date | | | Shares | | | Value | |
| Rights: 0.00% | |
|
| Chile: 0.00% | |
Compania Sud Americana de Vapores SA (Industrials, Marine)†(a) | | | | | | | 9-25-2020 | | | | 79,834 | | | $ | 307 | |
| | | | | | | | | | | | | | | | |
|
| Hong Kong: 0.00% | |
Legend Holdings Corporation Class H (Financials, Diversified Financial Services)†(a) | | | | | | | 5-9-2029 | | | | 3,061 | | | | 0 | |
| | | | | | | | | | | | | | | | |
|
| India: 0.00% | |
Minda Industries Limited (Consumer Discretionary, Auto Components)† | | | | | | | 9-8-2020 | | | | 46 | | | | 44 | |
| | | | | | | | | | | | | | | | |
|
| Thailand: 0.00% | |
Gulf Energy Development PCL (Utilities, Electric Utilities)†(a) | | | | | | | 9-18-2020 | | | | 17,940 | | | | 865 | |
| | | | | | | | | | | | | | | | |
| |
Total Rights (Cost $0) | | | | 1,216 | |
| | | | | | | | | | | | | | | | |
|
| Warrants: 0.00% | |
|
Thailand: 0.00% | |
BTS Group Holdings PCL (Industrials, Road & Rail) † | | | | | | | | 51,660 | | | | 1,477 | |
Minor International PCL (Consumer Discretionary, Hotels, Restaurants & Leisure) † | | | | | | | | 12,585 | | | | 291 | |
Minor International PCL (Consumer Discretionary, Hotels, Restaurants & Leisure) † | | | | | | | | 3,416 | | | | 1,081 | |
Srisawad Corporation PCL (Financials, Consumer Finance) †(a) | | | | | | | | 3,702 | | | | 0 | |
| |
Total Warrants (Cost $0) | | | | 2,849 | |
| | | | | | | | | | | | | | | | |
| | | | |
| | | | | | | | | | | | | | | | |
| | | Yield | | | | | | | | | | |
| Short-Term Investments: 2.18% | |
|
| Investment Companies: 2.18% | |
Wells Fargo Government Money Market Fund Select Class (l)(u) | | | 0.06 | % | | | | | | | 4,556,938 | | | | 4,556,938 | |
| | | | | | | | | | | | | | | | |
| |
Total Short-Term Investments (Cost $4,556,938) | | | | 4,556,938 | |
| | | | | | | | | | | | | | | | |
| | | | | | | | |
| Total investments in securities (Cost $197,152,209) | | | 99.53 | % | | | 208,590,762 | |
| | |
Other assets and liabilities, net | | | 0.47 | | | | 986,211 | |
| | | | | | | | |
| Total net assets | | | 100.00 | % | | $ | 209,576,973 | |
| | | | | | | | |
| † | Non-income-earning security |
| 144A | The security may be resold in transactions exempt from registration, normally to qualified institutional buyers, pursuant to Rule 144A under the Securities Act of 1933. |
| (a) | The security is fair valued in accordance with procedures approved by the Board of Trustees. |
| ‡ | Security is valued using significant unobservable inputs. |
| (l) | The issuer of the security is an affiliated person of the Portfolio as defined in the Investment Company Act of 1940. |
| (u) | The rate represents the 7-day annualized yield at period end. |
Abbreviations:
| ADR | American depositary receipt |
| GDR | Global depositary receipt |
| REIT | Real estate investment trust |
Futures Contracts
| | | | | | | | | | | | | | | | | | | | | | | | |
| Description | | Number of
contracts | | | Expiration
date | | | Notional
cost | | | Notional
value | | | Unrealized
gains | | | Unrealized
losses | |
| | | | | | |
Long | | | | | | | | | | | | | | | | | | | | | | | | |
| | | | | | |
MSCI Emerging Markets Index | | | 103 | | | | 9-18-2020 | | | $ | 5,604,698 | | | $ | 5,667,060 | | | $ | 62,362 | | | $ | 0 | |
The accompanying notes are an integral part of these financial statements.
40 | Wells Fargo Factor Enhanced Emerging Markets Equity Portfolio
Portfolio of investments—August 31, 2020 (unaudited)
Investments in Affiliates
An affiliated investment is an investment in which the Portfolio owns at least 5% of the outstanding voting shares of the issuer or as a result of other relationships, such as the Portfolio and the issuer having the same adviser or investment manager. Transactions with issuers that were either affiliated persons of the Portfolio at the beginning of the period or the end of the period were as follows:
| | | | | | | | | | | | | | | | | | | | | | | | | | | | | | | | |
| | | Value,
beginning of
period | | | Purchases | | | Sales
proceeds | | | Net
realized
gains
(losses) | | | Net
change in
unrealized
gains
(losses) | | | Income
from
affiliated
securities | | | Value,
end of period | | | % of
net
assets | |
| | | | | | | | |
| Short-Term Investments | | | | | | | | | | | | | | | | | | | | | | | | |
Investment Companies | | | | | | | | | | | | | | | | | | | | | | | | | | | | | | | | |
Wells Fargo Government Money Market Fund Select Class | | $ | 6,720,374 | | | $ | 50,913,253 | | | $ | (53,076,689 | ) | | $ | 0 | | | $ | 0 | | | $ | 7,613 | | | $ | 4,556,938 | | | | 2.18 | % |
The accompanying notes are an integral part of these financial statements.
Wells Fargo Factor Enhanced Emerging Markets Equity Portfolio | 41
Statement of assets and liabilities—August 31, 2020 (unaudited)
| | | | |
| | | | |
| |
Assets | | | | |
Investments in unaffiliated securities, at value (cost $192,595,271) | | $ | 204,033,824 | |
Investments in affiliated securities, at value (cost $4,556,938) | | | 4,556,938 | |
Segregated cash for futures contracts | | | 721,650 | |
Foreign currency, at value (cost $1,270,410) | | | 1,276,937 | |
Receivable for investments sold | | | 371,760 | |
Receivable for dividends and interest | | | 295,683 | |
Prepaid expenses and other assets | | | 67 | |
| | | | |
Total assets | | | 211,256,859 | |
| | | | |
| |
Liabilities | | | | |
Payable for investments purchased | | | 811,507 | |
Payable for daily variation margin on open futures contracts | | | 127,720 | |
Advisory fee payable | | | 43,837 | |
Custody and accounting fees payable | | | 672,897 | |
Trustees’ fees and expenses payable | | | 1,876 | |
Accrued expenses and other liabilities | | | 22,049 | |
| | | | |
Total liabilities | | | 1,679,886 | |
| | | | |
Total net assets | | $ | 209,576,973 | |
| | | | |
The accompanying notes are an integral part of these financial statements.
42 | Wells Fargo Factor Enhanced Emerging Markets Equity Portfolio
Statement of operations—six months ended August 31, 2020 (unaudited)
| | | | |
| | | | |
| |
Investment income | | | | |
Dividends (net of foreign withholding taxes of $500,269) | | $ | 3,372,568 | |
Income from affiliated securities | | | 7,613 | |
Interest | | | 690 | |
| | | | |
Total investment income | | | 3,380,871 | |
| | | | |
| |
Expenses | | | | |
Advisory fee | | | 150,842 | |
Custody and accounting fees | | | 330,411 | |
Professional fees | | | 22,556 | |
Shareholder report expenses | | | 5,695 | |
Trustees’ fees and expenses | | | 9,898 | |
Other fees and expenses | | | 18,997 | |
| | | | |
Total expenses | | | 538,399 | |
Less: Fee waivers and/or expense reimbursements | | | (288,577 | ) |
| | | | |
Net expenses | | | 249,822 | |
| | | | |
Net investment income | | | 3,131,049 | |
| | | | |
| |
Realized and unrealized gains (losses) on investments | | | | |
Net realized gains (losses) on | |
Unaffiliated securities | | | (17,725,075 | ) |
Futures contracts | | | 1,317,208 | |
Foreign currency and foreign currency translations | | | (411,213 | ) |
| | | | |
Net realized losses on investments | | | (16,819,080 | ) |
| | | | |
|
Net change in unrealized gains (losses) on | |
Unaffiliated securities | | | 20,692,396 | |
Futures contracts | | | 545,622 | |
Foreign currency and foreign currency translations | | | 25,372 | |
| | | | |
Net change in unrealized gains (losses) on investments | | | 21,263,390 | |
| | | | |
Net realized and unrealized gains (losses) on investments | | | 4,444,310 | |
| | | | |
Net increase in net assets resulting from operations | | $ | 7,575,359 | |
| | | | |
The accompanying notes are an integral part of these financial statements.
Wells Fargo Factor Enhanced Emerging Markets Equity Portfolio | 43
Statement of changes in net assets
| | | | | | | | |
| | | Six months ended
August 31, 2020 (unaudited) | | | Year ended
February 29, 2020 | |
|
Operations | |
Net investment income | | $ | 3,131,049 | | | $ | 6,263,029 | |
Net realized losses on investments | | | (16,819,080 | ) | | | (7,712,386 | ) |
Net change in unrealized gains (losses) on investments | | | 21,263,390 | | | | (11,714,226 | ) |
| | | | |
Net increase (decrease) in net assets resulting from operations | | | 7,575,359 | | | | (13,163,583 | ) |
| | | | |
| | |
Capital transactions | | | | | | | | |
Transactions in investors’ beneficial interests | |
Contributions | | | 37,098,603 | | | | 33,085,504 | |
Withdrawals | | | (52,118,348 | ) | | | (59,525,153 | ) |
| | | | |
Net decrease in net assets resulting from capital transactions | | | (15,019,745 | ) | | | (26,439,649 | ) |
| | | | |
Total decrease in net assets | | | (7,444,386 | ) | | | (39,603,232 | ) |
| | | | |
| | |
Net assets | | | | | | | | |
Beginning of period | | | 217,021,359 | | | | 256,624,591 | |
| | | | |
End of period | | $ | 209,576,973 | | | $ | 217,021,359 | |
| | | | |
The accompanying notes are an integral part of these financial statements.
44 | Wells Fargo Factor Enhanced Emerging Markets Equity Portfolio
Financial highlights
| | | | | | | | | | | | | | | | |
| | | Six months ended
August 31, 2020
(unaudited) | | | Year ended
February 29, 2020 | | | Year ended February 28 | |
| | | 2019 | | | 20181 | |
Total return2 | | | 2.81 | % | | | (6.15 | )% | | | (11.16 | )% | | | 13.43 | % |
Ratios to average net assets (annualized) | | | | | | | | | | | | | | | | |
Gross expenses | | | 0.54 | % | | | 0.52 | % | | | 0.58 | % | | | 0.49 | % |
Net expenses | | | 0.25 | % | | | 0.39 | % | | | 0.45 | % | | | 0.49 | % |
Net investment income | | | 3.19 | % | | | 2.51 | % | | | 2.33 | % | | | 1.56 | % |
Supplemental data | | | | | | | | | | | | | | | | |
Portfolio turnover rate | | | 89 | % | | | 59 | % | | | 81 | % | | | 136 | % |
| 1 | For the period from May 23, 2017 (commencement of operations) to February 28, 2018 |
| 2 | Returns for periods of less than one year are not annualized. |
The accompanying notes are an integral part of these financial statements.
Wells Fargo Factor Enhanced Emerging Markets Equity Portfolio | 45
Notes to financial statements (unaudited)
1. ORGANIZATION
Wells Fargo Master Trust (the “Trust”), a Delaware statutory trust organized on March 10, 1999, is an open-end management investment company registered under the Investment Company Act of 1940, as amended (the “1940 Act”). As an investment company, the Trust follows the accounting and reporting guidance in Financial Accounting Standards Board (“FASB”) Accounting Standards Codification Topic 946, Financial Services – Investment Companies. These financial statements report on the Wells Fargo Factor Enhanced Emerging Markets Equity Portfolio (formerly, Wells Fargo Factor Enhanced Emerging Markets Portfolio) (the “Portfolio”) which is a diversified series of the Trust.
Interests in the Portfolio are available solely through private placement transactions that do not involve any “public offering” within the meaning of Section 4(2) of the Investment Company Act of 1933
2. SIGNIFICANT ACCOUNTING POLICIES
The following significant accounting policies, which are consistently followed in the preparation of the financial statements of the Portfolio, are in conformity with U.S. generally accepted accounting principles which require management to make estimates and assumptions that affect the reported amounts of assets and liabilities, disclosure of contingent assets and liabilities at the date of the financial statements, and the reported amounts of revenues and expenses during the reporting period. Actual results could differ from those estimates.
Securities valuation
All investments are valued each business day as of the close of regular trading on the New York Stock Exchange (generally 4 p.m. Eastern Time), although the Portfolio may deviate from this calculation time under unusual or unexpected circumstances.
Equity securities and futures contracts that are listed on a foreign or domestic exchange or market are valued at the official closing price or, if none, the last sales price. If no sale occurs on the principal exchange or market that day, a fair value price will be determined in accordance with the Portfolio’s Valuation Procedures.
Debt securities are valued at the evaluated bid price provided by an independent pricing service (e.g. taking into account various factors, including yields, maturities, or credit ratings) or, if a reliable price is not available, the quoted bid price from an independent broker-dealer.
The values of securities denominated in foreign currencies are translated into U.S. dollars at rates provided by an independent foreign currency pricing source at a time each business day specified by the Wells Fargo Asset Management Pricing Committee at Wells Fargo Funds Management, LLC (“Funds Management”).
Many securities markets and exchanges outside the U.S. close prior to the close of the New York Stock Exchange and therefore may not fully reflect trading or events that occur after the close of the principal exchange in which the foreign securities are traded, but before the close of the New York Stock Exchange. If such trading or events are expected to materially affect the value of such securities, then fair value pricing procedures approved by the Board of Trustees of the Portfolio are applied. These procedures take into account multiple factors including movements in U.S. securities markets after foreign exchanges close. Foreign securities that are fair valued under these procedures are categorized as Level 2 and the application of these procedures may result in transfers between Level 1 and Level 2. Depending on market activity, such fair valuations may be frequent. Such fair value pricing may result in net asset values that are higher or lower than net asset values based on the last reported sales price or latest quoted bid price. On August 31, 2020, such fair value pricing was used in pricing certain foreign securities.
Investments in registered open-end investment companies are valued at net asset value.
Investments which are not valued using any of the methods discussed above are valued at their fair value, as determined in good faith by the Board of Trustees of the Portfolio. The Board of Trustees has established a Valuation Committee comprised of the Trustees and has delegated to it the authority to take any actions regarding the valuation of portfolio securities that the Valuation Committee deems necessary or appropriate, including determining the fair value of portfolio securities, unless the determination has been delegated to the Wells Fargo Asset Management Pricing Committee. The Board of Trustees retains the authority to make or ratify any valuation decisions or approve any changes to the Valuation Procedures as it deems appropriate. On a quarterly basis, the Board of Trustees receives reports on any valuation actions taken by the Valuation Committee or the Wells Fargo Asset Management Pricing Committee which may include items for ratification.
Foreign currency translation
The accounting records of the Portfolio are maintained in U.S. dollars. The values of other assets and liabilities denominated in foreign currencies are translated into U.S. dollars at rates provided by an independent foreign currency pricing source at a time
46 | Wells Fargo Factor Enhanced Emerging Markets Equity Portfolio
Notes to financial statements (unaudited)
each business day specified by the Wells Fargo Asset Management Pricing Committee. Purchases and sales of securities, and income and expenses are converted at the rate of exchange on the respective dates of such transactions. Net realized foreign exchange gains or losses arise from sales of foreign currencies, currency gains or losses realized between the trade and settlement dates on securities transactions, and the difference between the amounts of dividends, interest and foreign withholding taxes recorded and the U.S. dollar equivalent of the amounts actually paid or received. Net unrealized foreign exchange gains and losses arise from changes in the fair value of assets and liabilities other than investments in securities resulting from changes in exchange rates. The changes in net assets arising from changes in exchange rates of securities and the changes in net assets resulting from changes in market prices of securities are not separately presented. Such changes are included in net realized and unrealized gains or losses from investments.
Futures contracts
Futures contracts are agreements between the Portfolio and a counterparty to buy or sell a specific amount of a commodity, financial instrument or currency at a specified price and on a specified date. The Portfolio may buy and sell futures contracts in order to gain exposure to, or protect against, changes in security values and is subject to equity price risk. The primary risks associated with the use of futures contracts are the imperfect correlation between changes in market values of securities held by the Portfolio and the prices of futures contracts, and the possibility of an illiquid market. Futures contracts are generally entered into on a regulated futures exchange and cleared through a clearinghouse associated with the exchange. With futures contracts, there is minimal counterparty risk to the Portfolio since futures contracts are exchange traded and the exchange’s clearinghouse, as the counterparty to all exchange traded futures, guarantees the futures contracts against default.
Upon entering into a futures contracts, the Portfolio is required to deposit either cash or securities (initial margin) with the broker in an amount equal to a certain percentage of the contract value. Subsequent payments (variation margin) are paid to or from the broker each day equal to the daily changes in the contract value. Such payments are recorded as unrealized gains or losses and, if any, shown as variation margin receivable (payable) in the Statement of Assets and Liabilities. Should the Portfolio fail to make requested variation margin payments, the broker can gain access to the initial margin to satisfy the Portfolio’s payment obligations. When the contracts are closed, a realized gain or loss is recorded in the Statement of Operations.
Security transactions and income recognition
Securities transactions are recorded on a trade date basis. Realized gains or losses are recorded on the basis of identified cost.
Dividend income is recognized on the ex-dividend date. Income from foreign securities is recorded net of foreign taxes withheld where recovery of such taxes is not assured.
Interest income is accrued daily and bond discounts are accreted and premiums are amortized daily. To the extent debt obligations are placed on non-accrual status, any related interest income may be reduced by writing off interest receivables when the collection of all or a portion of interest has been determined to be doubtful based on consistently applied procedures and the fair value has decreased. If the issuer subsequently resumes interest payments or when the collectability of interest is reasonably assured, the debt obligation is removed from non-accrual status
Federal and other taxes
The Portfolio is not required to pay federal income taxes on its net investment income and net capital gains as it is treated as a partnership for federal income tax purposes. All income, gains and losses of the Portfolio are deemed to have been “passed through” to the interest holders in proportion to their holdings of the Portfolio regardless of whether income and gains have been distributed by the Portfolio.
The Portfolio’s income tax returns and all financial records supporting those returns for the prior three fiscal years are subject to examination by the federal revenue authority. Management has analyzed the Portfolio’s tax positions taken on federal, state, and foreign tax returns for all open tax years and does not believe that there are any uncertain tax positions that require recognition of a tax liability.
As of August 31, 2020, the aggregate cost of all investments for federal income tax purposes was $218,647,032 and the unrealized gains (losses) consisted of:
| | | | |
| |
Gross unrealized gains | | $ | 23,095,449 | |
| |
Gross unrealized losses | | | (33,089,357 | ) |
| |
Net unrealized losses | | $ | (9,993,908 | ) |
Wells Fargo Factor Enhanced Emerging Markets Equity Portfolio | 47
Notes to financial statements (unaudited)
3. FAIR VALUATION MEASUREMENTS
Fair value measurements of investments are determined within a framework that has established a fair value hierarchy based upon the various data inputs utilized in determining the value of the Portfolio’s investments. The three-level hierarchy gives the highest priority to unadjusted quoted prices in active markets for identical assets or liabilities (Level 1) and the lowest priority to unobservable inputs (Level 3). The Portfolio’s investments are classified within the fair value hierarchy based on the lowest level of input that is significant to the fair value measurement. The inputs are summarized into three broad levels as follows:
| ∎ | | Level 1 – quoted prices in active markets for identical securities |
| ∎ | | Level 2 – other significant observable inputs (including quoted prices for similar securities, interest rates, prepayment speeds, credit risk, etc.) |
| ∎ | | Level 3 – significant unobservable inputs (including the Portfolio’s own assumptions in determining the fair value of investments) |
The inputs or methodologies used for valuing investments in securities are not necessarily an indication of the risk associated with investing in those securities.
48 | Wells Fargo Factor Enhanced Emerging Markets Equity Portfolio
Notes to financial statements (unaudited)
The following is a summary of the inputs used in valuing the Portfolio’s assets and liabilities as of August 31, 2020:
| | | | | | | | | | | | | | | | |
| | | | |
| | | Quoted prices
(Level 1) | | | Other significant
observable inputs
(Level 2) | | | Significant
unobservable inputs (Level 3) | | | Total | |
| | | | |
Assets | | | | | | | | | | | | | | | | |
Investments in: | | | | | | | | | | | | | | | | |
| | | | |
Common stocks | | | | | | | | | | | | | | | | |
| | | | |
Argentina | | $ | 109,803 | | | $ | 0 | | | $ | 0 | | | $ | 109,803 | |
| | | | |
Belgium | | | 9,058 | | | | 0 | | | | 0 | | | | 9,058 | |
| | | | |
Bermuda | | | 940,525 | | | | 0 | | | | 0 | | | | 940,525 | |
| | | | |
Brazil | | | 5,466,566 | | | | 0 | | | | 0 | | | | 5,466,566 | |
| | | | |
Chile | | | 1,050,886 | | | | 0 | | | | 0 | | | | 1,050,886 | |
| | | | |
China | | | 79,149,676 | | | | 0 | | | | 0 | | | | 79,149,676 | |
| | | | |
Colombia | | | 196,218 | | | | 0 | | | | 0 | | | | 196,218 | |
| | | | |
Czech Republic | | | 275,477 | | | | 0 | | | | 0 | | | | 275,477 | |
| | | | |
Egypt | | | 233,256 | | | | 0 | | | | 0 | | | | 233,256 | |
| | | | |
Greece | | | 486,148 | | | | 0 | | | | 0 | | | | 486,148 | |
| | | | |
Hong Kong | | | 6,854,673 | | | | 0 | | | | 0 | | | | 6,854,673 | |
| | | | |
Hungary | | | 709,575 | | | | 0 | | | | 0 | | | | 709,575 | |
| | | | |
India | | | 21,231,927 | | | | 0 | | | | 12,176 | | | | 21,244,103 | |
| | | | |
Indonesia | | | 2,432,122 | | | | 1,125 | | | | 34,489 | | | | 2,467,736 | |
| | | | |
Luxembourg | | | 45,993 | | | | 0 | | | | 0 | | | | 45,993 | |
| | | | |
Malaysia | | | 29,280 | | | | 4,623,567 | | | | 0 | | | | 4,652,847 | |
| | | | |
Mexico | | | 3,274,603 | | | | 0 | | | | 0 | | | | 3,274,603 | |
| | | | |
Netherlands | | | 0 | | | | 48,409 | | | | 0 | | | | 48,409 | |
| | | | |
Philippines | | | 28,752 | | | | 2,325,330 | | | | 32,845 | | | | 2,386,927 | |
| | | | |
Poland | | | 1,153,695 | | | | 0 | | | | 0 | | | | 1,153,695 | |
| | | | |
Russia | | | 6,304,188 | | | | 10,296 | | | | 0 | | | | 6,314,484 | |
| | | | |
Singapore | | | 18,105 | | | | 0 | | | | 0 | | | | 18,105 | |
| | | | |
South Africa | | | 5,319,268 | | | | 0 | | | | 0 | | | | 5,319,268 | |
| | | | |
South Korea | | | 22,753,936 | | | | 23,984 | | | | 30,273 | | | | 22,808,193 | |
| | | | |
Taiwan | | | 27,301,414 | | | | 3,981 | | | | 0 | | | | 27,305,395 | |
| | | | |
Thailand | | | 5,453,618 | | | | 0 | | | | 0 | | | | 5,453,618 | |
| | | | |
Turkey | | | 1,623,463 | | | | 0 | | | | 0 | | | | 1,623,463 | |
| | | | |
United Kingdom | | | 18,041 | | | | 0 | | | | 0 | | | | 18,041 | |
| | | | |
Foreign government bonds | | | 0 | | | | 3,287 | | | | 0 | | | | 3,287 | |
| | | | |
Preferred stocks | | | | | | | | | | | | | | | | |
| | | | |
Brazil | | | 3,533,424 | | | | 0 | | | | 0 | | | | 3,533,424 | |
| | | | |
Chile | | | 60,536 | | | | 0 | | | | 0 | | | | 60,536 | |
| | | | |
Colombia | | | 55,192 | | | | 0 | | | | 0 | | | | 55,192 | |
| | | | |
Russia | | | 7,506 | | | | 0 | | | | 0 | | | | 7,506 | |
| | | | |
South Korea | | | 753,073 | | | | 0 | | | | 0 | | | | 753,073 | |
| | | | |
Rights | | | | | | | | | | | | | | | | |
| | | | |
Chile | | | 0 | | | | 307 | | | | 0 | | | | 307 | |
| | | | |
Hong Kong | | | 0 | | | | 0 | | | | 0 | | | | 0 | |
| | | | |
India | | | 0 | | | | 44 | | | | 0 | | | | 44 | |
| | | | |
Thailand | | | 0 | | | | 865 | | | | 0 | | | | 865 | |
| | | | |
Warrants | | | | | | | | | | | | | | | | |
| | | | |
Thailand | | | 0 | | | | 2,849 | | | | 0 | | | | 2,849 | |
| | | | |
Short-term investments | | | | | | | | | | | | | | | | |
| | | | |
Investment companies | | | 4,556,938 | | | | 0 | | | | 0 | | | | 4,556,938 | |
| | | | |
| | | 201,436,935 | | | | 7,044,044 | | | | 109,783 | | | | 208,590,762 | |
| | | | |
Futures contracts | | | 62,362 | | | | 0 | | | | 0 | | | | 62,362 | |
| | | | |
Total assets | | $ | 201,499,297 | | | $ | 7,044,044 | | | $ | 109,783 | | | $ | 208,653,124 | |
Wells Fargo Factor Enhanced Emerging Markets Equity Portfolio | 49
Notes to financial statements (unaudited)
Additional sector, industry or geographic detail is included in the Portfolio of Investments.
Futures contracts are reported at their cumulative unrealized gains (losses) at measurement date as reported in the table following the Portfolio of Investments. For futures contracts, the current day’s variation margin is reported on the Statement of Assets and Liabilities. All other assets and liabilities are reported at their market value at measurement date.
For the six months ended August 31, 2020, the Portfolio had no material transfers into/out of Level 3.
4. TRANSACTIONS WITH AFFILIATES
Advisory fee
The Trust has entered into an advisory contract with Funds Management, an indirect wholly owned subsidiary of Wells Fargo & Company (“Wells Fargo”). The adviser is responsible for implementing investment policies and guidelines and for supervising the subadviser, who is responsible for day-to-day portfolio management of the Portfolio. Pursuant to the contract, Funds Management is entitled to receive an annual advisory fee at the following annual rate based on the Portfolio’s average daily net assets:
| | | | |
| |
| Average daily net assets | | Advisory fee | |
| |
First $5 billion | | | 0.15 | % |
| |
Next $5 billion | | | 0.13 | |
| |
Over $10 billion | | | 0.11 | |
For the six months ended August 31, 2020, the advisory fee was equivalent to an annual rate of 0.15% of the Portfolio’s average daily net assets.
Funds Management has retained the services of a subadviser to provide daily portfolio management to the Portfolio. The fee for subadvisory services is borne by Funds Management. Wells Capital Management Incorporated, an affiliate of Funds Management and an indirect wholly owned subsidiary of Wells Fargo, is the subadviser to the Portfolio and is entitled to receive a fee from Funds Management at an annual rate starting at 0.08% and declining to 0.05% as the average daily net assets of the Portfolio increase.
Funds Management has voluntarily waived and/or reimbursed advisory fees to reduce the net operating expense ratio of the Portfolio.
Interfund transactions
The Portfolio may purchase or sell portfolio investment securities to certain other Wells Fargo affiliates pursuant to Rule 17a-7 under the 1940 Act and under procedures adopted by the Board of Trustees. The procedures have been designed to ensure that these interfund transactions, which do not incur broker commissions, are effected at current market prices.
5. INVESTMENT PORTFOLIO TRANSACTIONS
Purchases and sales of investments, excluding U.S. government obligations (if any) and short-term securities, for the six months ended August 31, 2020 were $171,875,269 and $177,989,145, respectively.
6. DERIVATIVE TRANSACTIONS
During the six months ended August 31, 2020, the Portfolio entered into futures contracts to gain market exposure. The Portfolio had an average notional amount of $8,112,679 in long futures contracts during the six months ended August 31, 2020.
The fair value, realized gains or losses and change in unrealized gains or losses, if any, on derivative instruments are reflected in the corresponding financial statement captions.
7. BANK BORROWINGS
The Trust, along with Wells Fargo Variable Trust and Wells Fargo Funds Trust (excluding the money market funds), are parties to a $350,000,000 revolving credit agreement whereby the Portfolio is permitted to use bank borrowings for temporary or emergency purposes, such as to fund shareholder redemption requests. Interest under the credit agreement is charged to the Portfolio based on a borrowing rate equal to the higher of the Federal Funds rate in effect on that day plus 1.25% or the overnight LIBOR rate in effect on that day plus 1.25%. In addition, an annual commitment fee equal to 0.25% of the unused balance is allocated to each participating fund.
50 | Wells Fargo Factor Enhanced Emerging Markets Equity Portfolio
Notes to financial statements (unaudited)
For the six months ended August 31, 2020, there were no borrowings by the Portfolio under the agreement.
8. INDEMNIFICATION
Under the Portfolio’s organizational documents, the officers and Trustees have been granted certain indemnification rights against certain liabilities that may arise out of performance of their duties to the Portfolio. The Portfolio has entered into a separate agreement with each Trustee that converts indemnification rights currently existing under the Portfolio’s organizational documents into contractual rights that cannot be changed in the future without the consent of the Trustee. Additionally, in the normal course of business, the Portfolio may enter into contracts with service providers that contain a variety of indemnification clauses. The Portfolio’s maximum exposure under these arrangements is dependent on future claims that may be made against the Portfolio and, therefore, cannot be estimated.
9. NEW ACCOUNTING PRONOUNCEMENT
In August 2018, FASB issued Accounting Standards Update (“ASU”) No. 2018-13, Fair Value Measurement (Topic 820) Disclosure Framework—Changes to the Disclosure Requirements for Fair Value Measurement. ASU 2018-13 updates the disclosure requirements on fair value measurements in Topic 820, Fair Value Measurements. The amendments are effective for fiscal years, and interim periods within those fiscal years, beginning after December 15, 2019. Management has adopted this guidance which did not have a material impact on the financial statements.
10. CORONAVIRUS (COVID-19) PANDEMIC
On March 11, 2020, the World Health Organization announced that it had made the assessment that coronavirus disease 2019 (“COVID-19”) is a pandemic. The impacts of COVID-19 are adversely affecting the entire global economy, individual companies and investment products, and the market in general. There is significant uncertainty around the extent and duration of business disruptions related to COVID-19 and the impacts may be short term or may last for an extended period of time. The risk of further spreading of COVID-19 has led to significant uncertainty and volatility in the financial markets.
Wells Fargo Factor Enhanced Emerging Markets Equity Portfolio | 51
Other information (unaudited)
PROXY VOTING INFORMATION
A description of the policies and procedures used to determine how to vote proxies relating to portfolio securities is available, upon request, by calling 1-800-222-8222, visiting our website at wfam.com, or visiting the SEC website at sec.gov. Information regarding how the proxies related to portfolio securities were voted during the most recent 12-month period ended June 30 is available on the website at wfam.com or by visiting the SEC website at sec.gov.
QUARTERLY PORTFOLIO HOLDINGS INFORMATION
The Portfolio files its complete schedule of portfolio holdings with the SEC for the first and third quarters of each fiscal as an exhibit to its reports on Form N-PORT. Shareholders may view the filed Form N-PORT by visiting the SEC website at sec.gov.
52 | Wells Fargo Factor Enhanced Emerging Markets Equity Portfolio
Other information (unaudited)
BOARD OF TRUSTEES AND OFFICERS
Each of the Trustees and Officers1 listed in the table below acts in identical capacities for each fund in the Wells Fargo family of funds, which consists of 142 mutual funds comprising the Wells Fargo Funds Trust, Wells Fargo Variable Trust, Wells Fargo Master Trust and four closed-end funds (collectively the “Fund Complex”). This table should be read in conjunction with the Prospectus and the Statement of Additional Information2. The mailing address of each Trustee and Officer is 525 Market Street, 12th Floor, San Francisco, CA 94105. Each Trustee and Officer serves an indefinite term, however, each Trustee serves such term until reaching the mandatory retirement age established by the Trustees.
Independent Trustees
| | | | | | |
Name and year of birth | | Position held and length of service* | | Principal occupations during past five years or longer | | Current other public company or investment company directorships |
| | | |
William R. Ebsworth (Born 1957) | | Trustee, since 2015 | | Retired. From 1984 to 2013, equities analyst, portfolio manager, research director and chief investment officer at Fidelity Management and Research Company in Boston, Tokyo, and Hong Kong, and retired in 2013 as Chief Investment Officer of Fidelity Strategic Advisers, Inc. where he led a team of investment professionals managing client assets. Prior thereto, Board member of Hong Kong Securities Clearing Co., Hong Kong Options Clearing Corp., the Thailand International Fund, Ltd., Fidelity Investments Life Insurance Company, and Empire Fidelity Investments Life Insurance Company. Audit Committee Chair and Investment Committee Chair of the Vincent Memorial Hospital Endowment (non-profit organization). Mr. Ebsworth is a CFA® charterholder. | | N/A |
| | | |
Jane A. Freeman (Born 1953) | | Trustee, since 2015; Chair Liaison, since 2018 | | Retired. From 2012 to 2014 and 1999 to 2008, Chief Financial Officer of Scientific Learning Corporation. From 2008 to 2012, Ms. Freeman provided consulting services related to strategic business projects. Prior to 1999, Portfolio Manager at Rockefeller & Co. and Scudder, Stevens & Clark. Board member of the Harding Loevner Funds from 1996 to 2014, serving as both Lead Independent Director and chair of the Audit Committee. Board member of the Russell Exchange Traded Funds Trust from 2011 to 2012 and the chair of the Audit Committee. Ms. Freeman is also an inactive Chartered Financial Analyst. | | N/A |
| | | |
Isaiah Harris, Jr. (Born 1952) | | Trustee, since 2009; Audit Committee Chairman, since 2019 | | Retired. Chairman of the Board of CIGNA Corporation since 2009, and Director since 2005. From 2003 to 2011, Director of Deluxe Corporation. Prior thereto, President and CEO of BellSouth Advertising and Publishing Corp. from 2005 to 2007, President and CEO of BellSouth Enterprises from 2004 to 2005 and President of BellSouth Consumer Services from 2000 to 2003. Emeritus member of the Iowa State University Foundation Board of Governors. Emeritus Member of the Advisory Board of Iowa State University School of Business. Advisory Board Member, Palm Harbor Academy (private school). Mr. Harris is a certified public accountant (inactive status). | | CIGNA Corporation |
| | | |
Judith M. Johnson (Born 1949) | | Trustee, since 2008 | | Retired. Prior thereto, Chief Executive Officer and Chief Investment Officer of Minneapolis Employees Retirement Fund from 1996 to 2008. Ms. Johnson is an attorney, certified public accountant and a certified managerial accountant. | | N/A |
| | | |
David F. Larcker (Born 1950) | | Trustee, since 2009 | | James Irvin Miller Professor of Accounting at the Graduate School of Business (Emeritus), Stanford University, Director of the Corporate Governance Research Initiative and Senior Faculty of The Rock Center for Corporate Governance since 2006. From 2005 to 2008, Professor of Accounting at the Graduate School of Business, Stanford University. Prior thereto, Ernst & Young Professor of Accounting at The Wharton School, University of Pennsylvania from 1985 to 2005. | | N/A |
Wells Fargo Factor Enhanced Emerging Markets Equity Portfolio | 53
Other information (unaudited)
| | | | | | |
Name and year of birth | | Position held and length of service* | | Principal occupations during past five years or longer | | Current other public company or investment company directorships |
| | | |
Olivia S. Mitchell (Born 1953) | | Trustee, since 2006; Nominating and Governance Committee Chair, since 2018 | | International Foundation of Employee Benefit Plans Professor, Wharton School of the University of Pennsylvania since 1993. Director of Wharton’s Pension Research Council and Boettner Center on Pensions & Retirement Research, and Research Associate at the National Bureau of Economic Research. Previously, Cornell University Professor from 1978 to 1993. | | N/A |
| | | |
Timothy J. Penny (Born 1951) | | Trustee, since 1996; Chairman, since 2018 | | President and Chief Executive Officer of Southern Minnesota Initiative Foundation, a non-profit organization, since 2007. Member of the Board of Trustees of NorthStar Education Finance, Inc., a non-profit organization, since 2007. | | N/A |
| | | |
James G. Polisson (Born 1959) | | Trustee, since 2018 | | Retired. Chief Marketing Officer, Source (ETF) UK Services, Ltd, from 2015 to 2017. From 2012 to 2015, Principal of The Polisson Group, LLC, a management consulting, corporate advisory and principal investing company. Chief Executive Officer and Managing Director at Russell Investments, Global Exchange Traded Funds from 2010 to 2012. Managing Director of Barclays Global Investors from 1998 to 2010 and Global Chief Marketing Officer for iShares and Barclays Global Investors from 2000 to 2010. Trustee of the San Francisco Mechanics’ Institute, a non-profit organization, from 2013 to 2015. Board member of the Russell Exchange Traded Fund Trust from 2011 to 2012. Director of Barclays Global Investors Holdings Deutschland GmbH from 2006 to 2009. Mr. Polisson is an attorney and has a retired status with the Massachusetts and District of Columbia Bar Associations. | | N/A |
| | | |
Pamela Wheelock (Born 1959) | | Trustee, since January 2020; previously Trustee from January 2018 to July 2019 | | Board member of the Destination Medical Center Economic Development Agency, Rochester, Minnesota since 2019. Interim President of the McKnight Foundation from January to September 2020. Acting Commissioner, Minnesota Department of Human Services, July 2019 through September 2019. Human Services Manager (part-time), Minnesota Department of Human Services, October 2019 through December 2019. Chief Operating Officer, Twin Cities Habitat for Humanity from 2017 to 2019. Vice President of University Services, University of Minnesota from 2012 to 2016. Prior thereto, on the Board of Directors, Governance Committee and Finance Committee for the Minnesota Philanthropy Partners (Saint Paul Foundation) from 2012 to 2018, Interim Chief Executive Officer of Blue Cross Blue Shield of Minnesota from 2011 to 2012, Chairman of the Board from 2009 to 2012 and Board Director from 2003 to 2015. Vice President, Leadership and Community Engagement, Bush Foundation, Saint Paul, Minnesota (a private foundation) from 2009 to 2011. Executive Vice President and Chief Financial Officer, Minnesota Sports and Entertainment from 2004 to 2009 and Senior Vice President from 2002 to 2004. Executive Vice President of the Minnesota Wild Foundation from 2004 to 2008. Commissioner of Finance, State of Minnesota, from 1999 to 2002. Currently Board Chair of the Minnesota Wild Foundation since 2010. | | N/A |
| * | Length of service dates reflect the Trustee’s commencement of service with the Trust’s predecessor entities, where applicable. |
54 | Wells Fargo Factor Enhanced Emerging Markets Equity Portfolio
Other information (unaudited)
Officers
| | | | |
Name and year of birth | | Position held and length of service | | Principal occupations during past five years or longer |
| | |
Andrew Owen (Born 1960) | | President, since 2017 | | Executive Vice President of Wells Fargo & Company and Head of Affiliated Managers, Wells Fargo Asset Management, since 2014. In addition, Mr. Owen is currently President, Chief Executive Officer and Director of Wells Fargo Funds Management, LLC since 2017. Prior thereto, Executive Vice President responsible for marketing, investments and product development for Wells Fargo Funds Management, LLC, from 2009 to 2014. |
| | |
Jeremy DePalma1 (Born 1974) | | Treasurer, since 2012 | | Senior Vice President of Wells Fargo Funds Management, LLC since 2009. Senior Vice President of Evergreen Investment Management Company, LLC from 2008 to 2010 and head of the Fund Reporting and Control Team within Fund Administration from 2005 to 2010. |
| | |
Michelle Rhee (Born 1966) | | Chief Legal Officer, since 2019 | | Secretary of Wells Fargo Funds Management, LLC, Chief Legal Counsel of Wells Fargo Asset Management and Assistant General Counsel of Wells Fargo Bank, N.A. since 2018. Associate General Counsel and Managing Director of Bank of America Corporation from 2004 to 2018. |
| | |
Catherine Kennedy (Born 1969) | | Secretary, since 2019 | | Vice President of Wells Fargo Funds Management, LLC and Senior Counsel of the Wells Fargo Legal Department since 2010. Vice President and Senior Counsel of Evergreen Investment Management Company, LLC from 1998 to 2010. |
| | |
Michael H. Whitaker (Born 1967) | | Chief Compliance Officer, since 2016 | | Chief Compliance Officer of Wells Fargo Asset Management since 2016. Senior Vice President and Chief Compliance Officer for Fidelity Investments from 2007 to 2016. |
| | |
David Berardi (Born 1975) | | Assistant Treasurer, since 2009 | | Vice President of Wells Fargo Funds Management, LLC since 2009. Vice President of Evergreen Investment Management Company, LLC from 2008 to 2010. Manager of Fund Reporting and Control for Evergreen Investment Management Company, LLC from 2004 to 2010. |
| 1 | Jeremy DePalma acts as Treasurer of 77 funds and Assistant Treasurer of 65 funds in the Fund Complex. |
| 2 | The Statement of Additional Information includes additional information about the Trustees and is available, without charge, upon request, by calling 1-800-222-8222 or by visiting the website at wfam.com. |
Wells Fargo Factor Enhanced Emerging Markets Equity Portfolio | 55
Other information (unaudited)
BOARD CONSIDERATION OF INVESTMENT MANAGEMENT, ADVISORY AND SUB-ADVISORY AGREEMENTS:
Wells Fargo Emerging Markets Bond Fund, Wells Fargo High Yield Corporate Bond Fund, Wells Fargo International Government Bond Fund, Wells Fargo U.S. Core Bond Fund, Wells Fargo Bloomberg Barclays US Aggregate ex-Corporate Credit Portfolio, Wells Fargo Factor Enhanced Emerging Markets Equity Portfolio, Wells Fargo Emerging Markets Bond Portfolio, Wells Fargo Factor Enhanced International Equity Portfolio, Wells Fargo Factor Enhanced U.S. Large Cap Portfolio, Wells Fargo Factor Enhanced U.S. Small Cap Portfolio, Wells Fargo International Government Bond Portfolio, Wells Fargo Investment Grade Corporate Bond Portfolio, Wells Fargo High Yield Corporate Bond Portfolio, Wells Fargo Strategic Retirement Bond Portfolio, and Wells Fargo U.S. REIT Portfolio
Under the Investment Company Act of 1940 (the “1940 Act”), the Board of Trustees (each, a “Board” and collectively, the “Boards”) of each of Wells Fargo Funds Trust (“Funds Trust”) and Wells Fargo Master Trust (“Master Trust”) (collectively, the “Trusts”) must determine annually whether to approve the continuation of the Trusts’ investment management, advisory and sub-advisory agreements, as applicable. In this regard, at a meeting held on May 26, 2020 and May 28, 2020 (together, the “Meeting”), the Board of Funds Trust, all the members of which have no direct or indirect interest in the investment management agreement and are not “interested persons” of the Trusts, as defined in the 1940 Act (the “Independent Trustees”), reviewed and approved for each of the funds of Funds Trust identified in the table below (individually, an “Index Fund” and collectively, the “Index Funds”) an investment management agreement (the “Management Agreement”) with Wells Fargo Funds Management, LLC (“Funds Management”).
|
|
| Index Funds |
|
Wells Fargo Emerging Markets Bond Fund |
|
Wells Fargo High Yield Corporate Bond Fund |
|
Wells Fargo International Government Bond Fund |
|
Wells Fargo U.S. Core Bond Fund |
In addition, the Funds Trust Board reviewed and approved an investment sub-advisory agreement with Wells Capital Management Incorporated (“WellsCap”) for the U.S. Core Bond Fund (the “Core Bond Fund Sub-Advisory Agreement”).
At the Meeting, the Board of Master Trust, all the members of which have no direct or indirect interest in the investment advisory and sub-advisory agreements and are Independent Trustees, reviewed and approved for each of the portfolios of Master Trust identified in the table below (individually, a “Master Portfolio” and collectively, the “Master Portfolios”): (i) an investment advisory agreement (the “Master Portfolio Advisory Agreement”) with Funds Management; and (ii) an investment sub-advisory agreement (each, a “Master Portfolio Sub-Advisory Agreement”, and collectively, the “Master Portfolio Sub-Advisory Agreements”) with the sub-adviser(s) identified in the chart below (each, a “Sub-Adviser”, and collectively, the “Sub-Advisers”) for the corresponding Master Portfolio identified.
| | |
| |
| Master Portfolios | | Sub-Advisers |
| |
Wells Fargo Bloomberg Barclays US Aggregate ex-Corporate Credit Portfolio | | WellsCap |
| |
Wells Fargo Factor Enhanced Emerging Markets Equity Portfolio | | WellsCap |
| |
Wells Fargo Emerging Markets Bond Portfolio | | Wells Fargo Asset Management (International), Limited (“WFAM International”) |
| |
Wells Fargo Factor Enhanced International Equity Portfolio | | WellsCap |
| |
Wells Fargo Factor Enhanced U.S. Large Cap Portfolio | | WellsCap |
| |
Wells Fargo Factor Enhanced U.S. Small Cap Portfolio | | WellsCap |
| |
Wells Fargo International Government Bond Portfolio | | WFAM International |
| |
Wells Fargo Investment Grade Corporate Bond Portfolio | | WellsCap |
| |
Wells Fargo High Yield Corporate Bond Portfolio | | WellsCap |
| |
Wells Fargo Strategic Retirement Bond Portfolio | | WellsCap |
| |
Wells Fargo U.S. REIT Portfolio | | WellsCap |
56 | Wells Fargo Factor Enhanced Emerging Markets Equity Portfolio
Other information (unaudited)
The Index Funds and the Master Portfolios are collectively referred to as the “Funds.” The Management Agreement, the Core Bond Fund Sub-Advisory Agreement, the Master Portfolio Advisory Agreement and the Master Portfolio Sub-Advisory Agreements are collectively referred to as the “Advisory Agreements.”
The Boards noted that each of the Index Funds is a feeder fund that invests all of its assets in its corresponding Master Portfolio, with the exception of the U.S. Core Bond Fund, which invests in multiple Master Portfolios. Information provided to the Boards regarding the Index Funds is also applicable to the Master Portfolios identified above, as relevant.
At the Meeting, the Boards considered the factors and reached the conclusions described below relating to the selection of Funds Management and the Sub-Advisers and the approval of the Advisory Agreements. Prior to the Meeting, including at a Board meeting held in April 2020, the Trustees conferred extensively among themselves and with representatives of Funds Management about these matters. Also, the Boards have adopted a team-based approach, with each team consisting of a sub-set of Trustees, to assist the full Boards in the discharge of their duties in reviewing investment performance and other matters throughout the year. The Independent Trustees were assisted in their evaluation of the Advisory Agreements by independent legal counsel, from whom they received separate legal advice and with whom they met separately.
In providing information to the Boards, Funds Management and the Sub-Advisers were guided by a detailed set of requests for information submitted to them by independent legal counsel on behalf of the Independent Trustees at the start of the Boards’ annual contract renewal process earlier in 2020. In considering and approving the Advisory Agreements, the Trustees considered the information they believed relevant, including but not limited to the information discussed below. The Boards considered not only the specific information presented in connection with the Meeting, but also the knowledge gained over time through interaction with Funds Management and the Sub-Advisers about various topics. In this regard, the Boards reviewed reports of Funds Management at each of their quarterly meetings, which included, among other things, portfolio reviews and investment performance reports. In addition, the Boards and the teams mentioned above confer with portfolio managers at various times throughout the year. The Boards did not identify any particular information or consideration that was all-important or controlling, and each individual Trustee may have attributed different weights to various factors.
After its deliberations, the Board of Funds Trust unanimously approved the continuation of the Management Agreement and the Core Bond Fund Sub-Advisory Agreement for a one-year period. Additionally, after its deliberations, the Board of Master Trust unanimously approved the continuation of the Master Portfolio Advisory Agreement and each Master Portfolio Sub-Advisory Agreement for a one-year term. The Boards also determined that the compensation or the absence of compensation payable to Funds Management and to each of the Sub-Advisers under each of the Advisory Agreements was reasonable. The Boards considered the approval of the Advisory Agreements for the Funds as part of their consideration of agreements for funds across the complex, but their approvals were made on a fund-by-fund basis. The following summarizes a number of important, but not necessarily all, factors considered by the Boards in support of their approvals.
Nature, extent and quality of services
The Boards received and considered various information regarding the nature, extent and quality of services provided to the Funds by Funds Management and the Sub-Advisers under the Advisory Agreements. This information included a description of the investment advisory services and Fund-level administrative services covered by the Advisory Agreements, as well as, among other things, a summary of the background and experience of senior management of Wells Fargo Asset Management (“WFAM”), of which Funds Management and the Sub-Advisers are a part, and a summary of investments made in the business of WFAM. The Boards also received a description of Funds Management’s and the Sub-Advisers’ business continuity plans and of their approaches to data privacy and cybersecurity, and related testing. The Boards also received and reviewed information about Funds Management’s role as administrator of the Funds’ liquidity risk management program, Funds Management’s approach to risk management, and Funds Management’s intermediary and vendor oversight program.
The Boards also considered the qualifications, background, tenure and responsibilities of each of the portfolio managers primarily responsible for the day-to-day portfolio management of the Funds. The Board of Master Trust noted that each of the Master Portfolios replicates the performance of a proprietary index provided by an affiliate of Funds Management, except that the Wells Fargo Bloomberg Barclays US Aggregate ex-Corporate Credit Portfolio, the Wells Fargo Emerging Markets Bond Portfolio, and the Wells Fargo Strategic Retirement Bond Portfolio track the performance of third-party indexes. The Boards evaluated the ability of Funds Management and the Sub-Advisers to attract and retain qualified investment professionals, including research, advisory and supervisory personnel. The Boards further considered the compliance programs and compliance records of Funds Management and the Sub-Advisers. In addition, the Boards took into account the full range of services provided to the Funds by Funds Management and its affiliates.
Wells Fargo Factor Enhanced Emerging Markets Equity Portfolio | 57
Other information (unaudited)
Fund investment performance and expenses
The Boards considered the investment performance results for each of the Master Portfolios for the one-year period ended December 31, 2019. The Boards also considered more current results for the one-year period ended March 31, 2020. The Boards considered these results in comparison to the investment performance of funds in a universe that was determined by Broadridge Inc. (“Broadridge”) to be similar to the respective Master Portfolios (each, a “Universe”), and in comparison to each Master Portfolio’s benchmark index and to other comparative data. Broadridge is an independent provider of investment company data. The Boards received a description of the methodology used by Broadridge to select the mutual funds in each performance Universe.
The Boards noted the short performance history of the Master Portfolios. For the one-year period ended December 31, 2019, the Boards noted that the investment performance of each Master Portfolio relative to its respective Universe was as follows: (i) the investment performance of each of the Wells Fargo Bloomberg Barclays US Aggregate ex-Corporate Credit Portfolio, the Wells Fargo Emerging Markets Bond Portfolio, the Wells Fargo Factor Enhanced International Equity Portfolio, the Wells Fargo Factor Enhanced U.S. Large Cap Portfolio, the Wells Fargo High Yield Corporate Bond Portfolio and the Wells Fargo Investment Grade Corporate Bond Portfolio was higher than or in range of the average investment performance of such Master Portfolio’s respective Universe; and (ii) the Wells Fargo Factor Enhanced Emerging Markets Equity Portfolio, the Wells Fargo Factor Enhanced U.S. Small Cap Portfolio, the Wells Fargo International Government Bond Portfolio, the Wells Fargo Strategic Retirement Bond Portfolio and the Wells Fargo U.S. REIT Portfolio was lower than the average investment performance of such Master Portfolio’s respective Universe. For the one-year period ended March 31, 2020, the Boards noted that the investment performance of each Master Portfolio relative to its respective Universe was as follows: (i) the Wells Fargo Emerging Markets Bond Portfolio, the Wells Fargo Factor Enhanced U.S. Large Cap Portfolio, the Wells Fargo Factor Enhanced U.S. Small Cap Portfolio, the Wells Fargo International Government Bond Portfolio, and the Wells Fargo Investment Grade Corporate Bond Portfolio was higher than or in range of the average investment performance of such Master Portfolio’s respective Universe, and (ii) the Wells Fargo Bloomberg Barclays US Aggregate ex-Corporate Credit Portfolio, the Wells Fargo Factor Enhanced Emerging Markets Equity Portfolio, the Wells Fargo Factor Enhanced International Equity Portfolio, the Wells Fargo High Yield Corporate Bond Portfolio, the Wells Fargo Strategic Retirement Bond Portfolio and the Wells Fargo U.S. REIT Portfolio was lower than the average investment performance of such Master Portfolio’s respective Universe.
The Boards also noted that the investment performance of each Master Portfolio to its respective benchmark index for the one-year period ended December 31, 2019, was as follows: (i) the investment performance of each of the Wells Fargo Bloomberg Barclays US Aggregate ex-Corporate Credit Portfolio, the Wells Fargo Factor Enhanced Emerging Markets Equity Portfolio, the Wells Fargo Factor Enhanced U.S. Large Cap Portfolio, the Wells Fargo Factor Enhanced U.S. Small Cap Portfolio, the Wells Fargo High Yield Corporate Bond Portfolio, the Wells Fargo U.S. REIT Portfolio and the Wells Fargo Strategic Retirement Bond Portfolio was higher than or in range of the average investment performance of such Master Portfolio’s respective benchmark, and (ii) the investment performance of each of the Wells Fargo Emerging Markets Bond Portfolio, the Wells Fargo Factor Enhanced International Equity Portfolio, the Wells Fargo International Government Bond Portfolio and the Wells Fargo Investment Grade Corporate Bond Portfolio was lower than the average investment performance of such Master Portfolio’s respective benchmark. For the one-year period ended March 31, 2020, the Boards also noted that the investment performance of each Master Portfolio to its respective benchmark index, was as follows: (i) the investment performance of each of the Wells Fargo Bloomberg Barclays US Aggregate ex-Corporate Credit Portfolio, the Wells Fargo Factor Enhanced Emerging Markets Equity Portfolio, the Wells Fargo Factor Enhanced International Equity Portfolio, the Wells Fargo Factor Enhanced U.S. Large Cap Portfolio, the Wells Fargo Factor Enhanced U.S. Small Cap Portfolio, the Wells Fargo U.S. REIT Portfolio, the Wells Fargo Investment Grade Corporate Bond Portfolio and the Wells Fargo Strategic Retirement Bond Portfolio was higher than, equal to or in range of the average investment performance of such Master Portfolio’s respective benchmark, and (ii) the investment performance of each of the Wells Fargo Emerging Markets Bond Portfolio, the Wells Fargo High Yield Corporate Bond Portfolio and the Wells Fargo International Government Bond Portfolio was lower than the average investment performance of such Master Portfolio’s respective benchmark.
The Boards received information concerning, and discussed factors contributing to, the underperformance of certain Master Portfolios, relative to the Universe and benchmark index, for the periods identified above. The Board took note of the explanations for the relative underperformance during these periods, including with respect to investment decisions and market factors that affected the Fund’s investment performance.
The Board of Funds Trust took note of the investment performance of the Master Portfolios in the context of reviewing the investment performance of the Index Funds. The Board of Funds Trust also received and considered information regarding the “zero fee and expense” structure of each Index Fund. Specifically, the Funds Trust Board noted that each Index Fund’s gross operating expense ratio and each of its various components, including management fees, administration fees, custody fees,
58 | Wells Fargo Factor Enhanced Emerging Markets Equity Portfolio
Other information (unaudited)
Rule 12b-1 fees, and other fees, are zero. The Funds Trust Board also noted that Funds Management assumes and pays or reimburses all of the ordinary operating expenses of each Index Fund, including acquired fund fees and expenses, pursuant to an agreement with each of the Index Funds (the “Fee and Expense Agreement”). The Funds Trust Board further noted that Funds Management receives a fee from Wells Fargo Wealth and Investment Management (“WIM”) pursuant to an intercompany agreement equal to the Master Portfolio fees and expenses absorbed by Funds Management through its Fee and Expense Agreement with each of the Index Funds.
With respect to the Master Portfolios, the Board of Master Trust received and considered information regarding the fee rates that are payable to Funds Management for investment advisory services (as discussed below), which are the only fees charged at the Master Portfolio level, relative to corresponding class-specific expense groups that were determined by Broadridge to be similar to the Funds (the “Groups”). The Boards received a description of the methodology used by Broadridge to select the mutual funds in the expense Groups and an explanation of how funds comprising expense groups and their expense ratios may vary from year-to-year.
The Boards took into account the Funds’ expense information and the Master Portfolios’ performance information provided to them among the factors considered in deciding to re-approve the Advisory Agreements.
Investment management, advisory and sub-advisory fee rates
The Board of Funds Trust reviewed and considered that the contractual investment management fee rate payable by each Index Fund to Funds Management for investment management services zero, and also reviewed and considered that each Fund’s other expenses would normally be zero, because of Funds Management’s commitment to assume and pay or reimburse all of the ordinary operating expenses of each Fund, including acquired fund fees and expenses, under the Fee and Expense Agreement. The Board of Funds Trust also reviewed and considered that the contractual investment sub-advisory fee rate payable by Funds Management to WellsCap for investment sub-advisory services for the U.S. Core Bond Fund is also zero.
The Board of Master Trust reviewed and considered the contractual fee rates payable by the Master Portfolios to Funds Management under the Master Portfolio Advisory Agreement (the “Advisory Agreement Rates”). The Board of Master Trust also reviewed and considered the contractual investment sub-advisory fee rates that are payable by Funds Management to the Sub-Advisers for investment sub-advisory services (the “Sub-Advisory Agreement Rates”).
The Board of Master Trust reviewed a comparison of the Advisory Agreement Rates of each Master Portfolio with those of other funds in each Master Portfolio’s respective expense Groups at a common asset level. The Board of Master Trust noted that the Advisory Agreement Rates of each Master Portfolio were lower than or equal to the median rate for such Master Portfolio’s expense Groups.
The Boards also received and considered information about the portions of the total management fees that were retained by Funds Management after payment of the fees to the Sub-Advisers for sub-advisory services. In assessing the reasonableness of these amounts, the Boards received and evaluated information about the nature and extent of responsibilities retained and risks assumed by Funds Management and not delegated to or assumed by the Sub-Advisers, and about Funds Management’s on-going oversight services. Given the affiliation between Funds Management and the Sub-Advisers, the Boards ascribed limited relevance to the allocation of fees between them.
The Boards also received and considered information about the nature and extent of services offered and fee rates charged by Funds Management and the Sub-Advisers to other types of clients with investment strategies similar to those of certain Funds. In this regard, the Boards received information about the significantly greater scope of services, and compliance, reporting and other legal burdens and risks of managing proprietary mutual funds compared with those associated with managing assets of other types of clients, including third-party sub-advised fund clients and non-mutual fund clients such as institutional separate accounts.
Based on its consideration of the factors and information it deemed relevant, including those described here, the Board of Fund Trust determined that the compensation received by Funds Management from WIM pursuant to the intercompany agreement, and the absence of compensation payable by the Funds to Funds Management pursuant to the Management Agreement or to WellsCap pursuant to the Core Bond Fund Sub-Advisory Agreement, was reasonable. Based on its consideration of the factors and information it deemed relevant, including those described here, the Board of Master Trust determined that the Advisory Agreement Rates and the Sub-Advisory Agreement Rates for each Master Portfolio were reasonable.
Profitability
The Boards received and considered information concerning the profitability of Funds Management, as well as the profitability of both WFAM and Wells Fargo & Co. (“Wells Fargo”) from providing services to the fund family as a whole. The Boards noted that the Sub-Advisers’ profitability information with respect to providing services to the Funds and other funds in the family was subsumed in the WFAM and Wells Fargo profitability analysis.
Wells Fargo Factor Enhanced Emerging Markets Equity Portfolio | 59
Other information (unaudited)
Funds Management reported on the methodologies and estimates used in calculating profitability, including a description of the methodology used to allocate certain expenses. Among other things, the Boards noted that the levels of profitability reported on a fund-by-fund basis varied widely, depending on factors such as the size, type and age of fund.
Based on its review, the Boards did not deem the profits reported by Funds Management, WFAM or Wells Fargo from services provided to the Funds to be at a level that would prevent them from approving the continuation of the Advisory Agreements.
Economies of scale
The Boards received and considered information about the potential for Funds Management to experience economies of scale in the provision of management services to the Funds, the difficulties of calculating economies of scale at an individual fund level, and the extent to which potential scale benefits are shared with shareholders. The Boards noted the existence of breakpoints in the each Master Portfolio’s advisory fee structure and each Index Fund’s management fee structure, which operate generally to reduce the Funds’ expense ratios as the Funds grow in size, and the size of the Funds in relation to such breakpoints. The Boards considered that in addition to management fee breakpoints, Funds Management shares potential economies of scale from its management business in a variety of ways, including through fee waiver and expense reimbursement arrangements, services that benefit shareholders, competitive management fee rates set at the outset without regard to breakpoints, and investments in the business intended to enhance services available to shareholders.
The Boards concluded that Funds Management’s arrangements with respect to the Funds, including contractual breakpoints, constituted a reasonable approach to sharing potential economies of scale with the Funds and their shareholders.
Other benefits to Funds Management and the Sub-Advisers
The Boards received and considered information regarding potential “fall-out” or ancillary benefits received by Funds Management and its affiliates, including WellsCap and WFAM International, as a result of their relationships with the Funds. Ancillary benefits could include, among others, benefits directly attributable to other relationships with the Funds and benefits potentially derived from an increase in Funds Management’s and the Sub-Advisers’ business as a result of their relationships with the Funds. The Boards noted that various affiliates of Funds Management may receive distribution-related fees, shareholder servicing payments and sub-transfer agency fees in respect of shares sold or held through them and services provided.
The Boards also reviewed information about soft dollar credits earned and utilized by the Sub-Advisers, fees earned by Funds Management and WellsCap from managing a private investment vehicle for the fund family’s securities lending collateral, and commissions earned by an affiliated broker from portfolio transactions.
Based on their consideration of the factors and information they deemed relevant, including those described here, the Boards did not find that any ancillary benefits received by Funds Management and its affiliates, including WellsCap and WFAM International, were unreasonable.
Conclusion
At the Meeting, after considering the above-described factors and based on its deliberations and its evaluation of the information described above, the Funds Trust Board unanimously approved the continuation of the Management Agreement and the Core Bond Fund Sub-Advisory Agreement for a one-year period. Additionally, after its deliberations, the Master Trust Board unanimously approved the continuation of the Master Portfolio Advisory Agreement and each Master Portfolio Sub-Advisory Agreement for a one-year term. The Boards also determined that the compensation or the absence of compensation payable to Funds Management and to each of the Sub-Advisers was reasonable.
60 | Wells Fargo Factor Enhanced Emerging Markets Equity Portfolio
Other information (unaudited)
LIQUIDITY RISK MANAGEMENT PROGRAM
In accordance with Rule 22e-4 under the Investment Company Act of 1940, as amended (the “Liquidity Rule”), Wells Fargo Master Trust (the “Trust”) has adopted and implemented a liquidity risk management program (the “Program”) on behalf of each of its series, including each Portfolio, which is reasonably designed to assess and manage the Portfolio’s liquidity risk. “Liquidity risk” is defined as the risk that a Portfolio is unable to meet redemption requests without significantly diluting remaining investors’ interests in the Portfolio. The Trust’s Board of Trustees (the “Board”) previously approved the designation of Wells Fargo Funds Management, LLC (“Funds Management”), each Portfolio’s investment adviser, as the administrator of the Program, and Funds Management has established a Liquidity Risk Management Council composed of personnel from multiple departments within Funds Management and its affiliates to assist Funds Management in the implementation and on-going administration of the Program.
The Program is comprised of various components designed to support the assessment and/or management of liquidity risk, including: (1) the periodic assessment (no less frequently than annually) of certain factors that influence a Portfolio’s liquidity risk; (2) the periodic classification (no less frequently than monthly) of a Portfolio’s investments into one of four liquidity categories that reflect an estimate of their liquidity under current market conditions; (3) a 15% limit on the acquisition of “illiquid investments” (as defined under the Liquidity Rule); (4) to the extent a Portfolio does not invest primarily in “highly liquid investments” (as defined under the Liquidity Rule), the determination of a minimum percentage of the Portfolio’s assets that generally will be invested in highly liquid investments (an “HLIM”); (5) if a Portfolio has established an HLIM, the periodic review (no less frequently than annually) of the HLIM and the adoption of policies and procedures for responding to a shortfall of the Portfolio’s “highly liquid investments” below its HLIM; and (6) periodic reporting to the Board.
At a meeting of the Board held on May 26 and 28, 2020, the Board received a written report (the “Report”) from Funds Management that addressed the operation of the Program and assessed its adequacy and effectiveness of implementation. The Report covered the initial period from December 1, 2018 through December 31, 2019 (the “Reporting Period”). No significant liquidity events impacting any Portfolio were noted in the Report. There were no material changes to the Program during the Reporting Period. The Report concluded that the Program is operating effectively to assess and manage each Portfolio’s liquidity risk, and that the Program has been and continues to be adequately and effectively implemented to monitor and, as applicable, respond to the Portfolio’s liquidity developments.
Wells Fargo Factor Enhanced Emerging Markets Equity Portfolio | 61
This page is intentionally left blank.

For more information
More information about Wells Fargo Funds is available free upon request. To obtain literature, please write, visit the Portfolio’s website, or call:
Wells Fargo Funds
P.O. Box 219967
Kansas City, MO 64121-9967
Website: wfam.com
Individual investors: 1-800-222-8222
Retail investment professionals: 1-888-877-9275
Institutional investment professionals: 1-866-765-0778
This report and the financial statements contained herein are submitted for the general information of the shareholders of the Portfolio. If this report is used for promotional purposes, distribution of the report must be accompanied or preceded by a current prospectus. Before investing, please consider the investment objectives, risks, charges, and expenses of the investment. For a current prospectus and, if available, a summary prospectus, containing this information, call 1-800-222-8222 or visit the Portfolio’s website at wfam.com. Read the prospectus carefully before you invest or send money.
Wells Fargo Asset Management (WFAM) is the trade name for certain investment advisory/management firms owned by Wells Fargo & Company. These firms include but are not limited to Wells Capital Management Incorporated and Wells Fargo Funds Management, LLC. Certain products managed by WFAM entities are distributed by Wells Fargo Funds Distributor, LLC (a broker-dealer and Member FINRA).
This material is for general informational and educational purposes only and is NOT intended to provide investment advice or a recommendation of any kind—including a recommendation for any specific investment, strategy, or plan.
INVESTMENT PRODUCTS: NOT FDIC INSURED ◾ NO BANK GUARANTEE ◾ MAY LOSE VALUE
© 2020 Wells Fargo & Company. All rights reserved.
Semi-Annual Report
August 31, 2020
Wells Fargo
Factor Enhanced International Equity Portfolio
(formerly Wells Fargo Factor Enhanced International Portfolio)
Contents
INVESTMENT PRODUCTS: NOT FDIC INSURED ◾ NO BANK GUARANTEE ◾ MAY LOSE VALUE
Wells Fargo Factor Enhanced International Equity Portfolio | 1
Portfolio information (unaudited)
Investment objective
The Portfolio seeks long-term capital appreciation.
Adviser
Wells Fargo Funds Management, LLC
Subadviser
Wells Capital Management Incorporated
Portfolio managers
Dennis Beinn, CFA®‡
Harindra de Silva, Ph.D., CFA®‡
Monisha Jayakumar
| | | | |
| |
| Ten largest holdings (%) as of August 31, 20201 | | | |
| | |
Nestle SA | | | 2.65 | |
| | |
Roche Holding AG | | | 1.83 | |
| | |
Novo Nordisk AS Class B | | | 0.92 | |
| | |
CSL Limited | | | 0.78 | |
| | |
Royal Bank of Canada | | | 0.78 | |
| | |
Novartis AG | | | 0.76 | |
| | |
GlaxoSmithKline plc | | | 0.70 | |
| | |
Unilever NV | | | 0.63 | |
| | |
SAP SE | | | 0.63 | |
| | |
British American Tobacco plc | | | 0.61 | |
|
|
| Sector allocation as of August 31, 20202 |
|
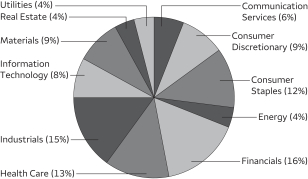
|
|
|
| Country allocation as of August 31, 20202 |
|
 |
| ‡ | CFA® and Chartered Financial Analyst® are trademarks owned by CFA Institute. |
| 1 | The ten largest holdings, excluding cash, cash equivalents and any money market funds, are calculated based on the value of the investments divided by the total net assets of the Portfolio. Holdings are subject to change and may have changed since the date specified. |
| 2 | Amounts are calculated based on the total long-term investments of the Portfolio. These amounts are subject to change and may have changed since the date specified. |
2 | Wells Fargo Factor Enhanced International Equity Portfolio
Portfolio of investments—August 31, 2020 (unaudited)
| | | | | | | | | | | | | | | | |
| | | | | | | | | Shares | | | Value | |
| Common Stocks: 96.94% | |
|
| Australia: 6.08% | |
AGL Energy Limited (Utilities, Multi-Utilities) | | | | | | | | | | | 37,412 | | | $ | 408,380 | |
ALS Limited (Industrials, Professional Services) | | | | | | | | | | | 9,894 | | | | 63,706 | |
Altium Limited (Information Technology, Software) | | | | | | | | | | | 2,588 | | | | 69,747 | |
Alumina Limited (Materials, Metals & Mining) | | | | | | | | | | | 55,617 | | | | 64,402 | |
AMP Limited (Financials, Diversified Financial Services) † | | | | | | | | | | | 15,886 | | | | 17,927 | |
Ampol Limited (Energy, Oil, Gas & Consumable Fuels) | | | | | | | | | | | 11,882 | | | | 228,028 | |
Ansell Limited (Health Care, Health Care Equipment & Supplies) | | | | | | | | | | | 2,875 | | | | 82,019 | |
APA Group (Utilities, Gas Utilities) | | | | | | | | | | | 22,416 | | | | 172,438 | |
Appen Limited (Information Technology, IT Services) | | | | | | | | | | | 2,292 | | | | 58,676 | |
Aristocrat Leisure Limited (Consumer Discretionary, Hotels, Restaurants & Leisure) | | | | | | | | | | | 20,083 | | | | 420,223 | |
ASX Limited (Financials, Capital Markets) | | | | | | | | | | | 4,708 | | | | 303,278 | |
Atlas Arteria Stapled Securities (Industrials, Transportation Infrastructure) | | | | | | | | | | | 19,991 | | | | 95,838 | |
Aurizon Holdings Limited (Industrials, Road & Rail) | | | | | | | | | | | 223,394 | | | | 716,725 | |
AusNet Services (Utilities, Electric Utilities) | | | | | | | | | | | 39,631 | | | | 53,344 | |
Australia & New Zealand Banking Group Limited (Financials, Banks) | | | | | | | | | | | 36,099 | | | | 486,702 | |
Bank of Queensland Limited (Financials, Banks) | | | | | | | | | | | 9,635 | | | | 43,562 | |
Beach Petroleum Limited (Energy, Oil, Gas & Consumable Fuels) | | | | | | | | | | | 36,102 | | | | 40,473 | |
Bendigo Bank Limited (Financials, Banks) | | | | | | | | | | | 11,541 | | | | 55,669 | |
BlueScope Steel Limited (Materials, Metals & Mining) | | | | | | | | | | | 34,407 | | | | 322,033 | |
Boral Limited (Materials, Construction Materials) | | | | | | | | | | | 26,959 | | | | 79,733 | |
Brambles Limited (Industrials, Commercial Services & Supplies) | | | | | | | | | | | 58,249 | | | | 476,444 | |
Carsales.com Limited (Communication Services, Interactive Media & Services) | | | | | | | | | | | 5,501 | | | | 84,351 | |
Charter Hall Group (Real Estate, Equity REITs) | | | | | | | | | | | 10,479 | | | | 96,687 | |
Cleanaway Waste Management Limited (Industrials, Commercial Services & Supplies) | | | | | | | | | | | 46,447 | | | | 88,383 | |
Coca-Cola Amatil Limited (Consumer Staples, Beverages) | | | | | | | | | | | 78,176 | | | | 524,694 | |
Cochlear Limited (Health Care, Health Care Equipment & Supplies) | | | | | | | | | | | 1,459 | | | | 206,770 | |
Coles Group Limited (Consumer Staples, Food & Staples Retailing) | | | | | | | | | | | 65,037 | | | | 850,474 | |
Commonwealth Bank of Australia (Financials, Banks) | | | | | | | | | | | 39,254 | | | | 1,976,828 | |
Computershare Limited (Information Technology, IT Services) | | | | | | | | | | | 35,829 | | | | 351,197 | |
Crown Limited (Consumer Discretionary, Hotels, Restaurants & Leisure) | | | | | | | | | | | 63,538 | | | | 422,231 | |
CSL Limited (Health Care, Biotechnology) | | | | | | | | | | | 23,317 | | | | 4,918,637 | |
Dexus Property Group (Real Estate, Equity REITs) | | | | | | | | | | | 35,156 | | | | 228,956 | |
Domino’s Pizza Enterprises Limited (Consumer Discretionary, Hotels, Restaurants & Leisure) | | | | | | | | | | | 1,361 | | | | 81,057 | |
Downer EDI Limited (Industrials, Commercial Services & Supplies) | | | | | | | | | | | 12,850 | | | | 42,554 | |
Evolution Mining Limited (Materials, Metals & Mining) | | | | | | | | | | | 137,783 | | | | 564,001 | |
Fortescue Metals Group Limited (Materials, Metals & Mining) | | | | | | | | | | | 141,988 | | | | 1,824,279 | |
Goodman Group (Real Estate, Equity REITs) | | | | | | | | | | | 77,214 | | | | 1,042,740 | |
Harvey Norman Holdings Limited (Consumer Discretionary, Multiline Retail) | | | | | | | | | | | 12,246 | | | | 39,922 | |
Incitec Pivot Limited (Materials, Chemicals) | | | | | | | | | | | 39,523 | | | | 61,215 | |
JB Hi-Fi Limited (Consumer Discretionary, Specialty Retail) | | | | | | | | | | | 2,438 | | | | 90,195 | |
Lendlease Corporation Limited (Real Estate, Real Estate Management & Development) | | | | | | | | | | | 83,097 | | | | 712,169 | |
Link Administration Holdings Limited (Information Technology, IT Services) | | | | | | | | | | | 11,099 | | | | 33,399 | |
Macquarie Group Limited (Financials, Capital Markets) | | | | | | | | | | | 11,571 | | | | 1,089,816 | |
Magellan Financial Group Limited (Financials, Capital Markets) | | | | | | | | | | | 9,856 | | | | 430,706 | |
Medibank Private Limited (Financials, Insurance) | | | | | | | | | | | 147,258 | | | | 296,506 | |
Metcash Limited (Consumer Staples, Food & Staples Retailing) | | | | | | | | | | | 22,082 | | | | 47,557 | |
Mineral Resources Limited (Materials, Metals & Mining) | | | | | | | | | | | 3,219 | | | | 69,278 | |
Mirvac Group (Real Estate, Equity REITs) | | | | | | | | | | | 288,949 | | | | 449,671 | |
National Australia Bank Limited (Financials, Banks) | | | | | | | | | | | 47,373 | | | | 626,474 | |
Newcrest Mining Limited (Materials, Metals & Mining) | | | | | | | | | | | 26,175 | | | | 617,000 | |
NextDC Limited (Information Technology, IT Services) † | | | | | | | | | | | 8,887 | | | | 79,966 | |
Northern Star Resources Limited (Materials, Metals & Mining) | | | | | | | | | | | 26,788 | | | | 269,690 | |
Oil Search Limited (Energy, Oil, Gas & Consumable Fuels) | | | | | | | | | | | 70,393 | | | | 169,773 | |
Orica Limited (Materials, Chemicals) | | | | | | | | | | | 8,755 | | | | 112,227 | |
Origin Energy Limited (Energy, Oil, Gas & Consumable Fuels) | | | | | | | | | | | 195,203 | | | | 806,243 | |
The accompanying notes are an integral part of these financial statements.
Wells Fargo Factor Enhanced International Equity Portfolio | 3
Portfolio of investments—August 31, 2020 (unaudited)
| | | | | | | | | | | | | | | | |
| | | | | | | | | Shares | | | Value | |
|
| Australia (continued) | |
Orora Limited (Materials, Containers & Packaging) | | | | | | | | | | | 21,357 | | | $ | 35,284 | |
OZ Minerals Limited (Materials, Metals & Mining) | | | | | | | | | | | 6,358 | | | | 68,558 | |
Qantas Airways Limited (Industrials, Airlines) | | | | | | | | | | | 337,212 | | | | 979,920 | |
QBE Insurance Group Limited (Financials, Insurance) | | | | | | | | | | | 5,319 | | | | 41,623 | |
Qube Holdings Limited (Industrials, Transportation Infrastructure) | | | | | | | | | | | 40,310 | | | | 81,462 | |
Ramsay Health Care Limited (Health Care, Health Care Providers & Services) | | | | | | | | | | | 4,121 | | | | 197,746 | |
REA Group Limited (Communication Services, Interactive Media & Services) | | | | | | | | | | | 1,220 | | | | 102,731 | |
Reece Limited (Industrials, Trading Companies & Distributors) | | | | | | | | | | | 8,898 | | | | 80,065 | |
Reliance Worldwide Corporation Limited (Industrials, Building Products) | | | | | | | | | | | 18,281 | | | | 51,506 | |
Rio Tinto Limited (Materials, Metals & Mining) | | | | | | | | | | | 26,066 | | | | 1,884,048 | |
Santos Limited (Energy, Oil, Gas & Consumable Fuels) | | | | | | | | | | | 244,239 | | | | 1,021,385 | |
Saracen Mineral Holdings Limited (Materials, Metals & Mining) † | | | | | | | | | | | 21,358 | | | | 82,229 | |
Scentre Group (Real Estate, Equity REITs) | | | | | | | | | | | 623,869 | | | | 1,039,904 | |
SEEK Limited (Industrials, Professional Services) | | | | | | | | | | | 8,030 | | | | 122,419 | |
Sonic Healthcare Limited (Health Care, Health Care Providers & Services) | | | | | | | | | | | 13,945 | | | | 329,639 | |
Spark Infrastructure Group (Utilities, Electric Utilities) | | | | | | | | | | | 37,439 | | | | 61,577 | |
Steadfast Group Limited (Financials, Insurance) | | | | | | | | | | | 19,082 | | | | 50,525 | |
Stockland Corporation Limited (Real Estate, Equity REITs) | | | | | | | | | | | 322,924 | | | | 943,164 | |
Suncorp Group Limited (Financials, Insurance) | | | | | | | | | | | 32,866 | | | | 225,435 | |
Sydney Airport Holdings Limited (Industrials, Transportation Infrastructure) | | | | | | | | | | | 62,350 | | | | 263,041 | |
Tabcorp Holdings Limited (Consumer Discretionary, Hotels, Restaurants & Leisure) | | | | | | | | | | | 145,622 | | | | 388,801 | |
Telstra Corporation Limited (Communication Services, Diversified Telecommunication Services) | | | | | | | | | | | 313,013 | | | | 667,193 | |
The GPT Group (Real Estate, Equity REITs) | | | | | | | | | | | 146,207 | | | | 413,008 | |
The Star Entertainment Group Limited (Consumer Discretionary, Hotels, Restaurants & Leisure) | | | | | | | | | | | 21,121 | | | | 45,955 | |
TPG Telecom Limited (Communication Services, Diversified Telecommunication Services) | | | | | | | | | | | 11,769 | | | | 71,438 | |
Transurban Group (Industrials, Transportation Infrastructure) | | | | | | | | | | | 64,642 | | | | 641,729 | |
Treasury Wine Estates Limited (Consumer Staples, Beverages) | | | | | | | | | | | 26,392 | | | | 180,055 | |
Vicinity Centres (Real Estate, Equity REITs) | | | | | | | | | | | 644,583 | | | | 686,971 | |
Washington H. Soul Pattinson & Company Limited (Energy, Oil, Gas & Consumable Fuels) | | | | | | | | | | | 18,507 | | | | 285,691 | |
Wesfarmers Limited (Consumer Discretionary, Multiline Retail) | | | | | | | | | | | 45,881 | | | | 1,608,055 | |
Westpac Banking Corporation (Financials, Banks) | | | | | | | | | | | 57,289 | | | | 741,127 | |
Wisetech Global Limited (Information Technology, Software) | | | | | | | | | | | 3,259 | | | | 67,736 | |
Woodside Petroleum Limited (Energy, Oil, Gas & Consumable Fuels) | | | | | | | | | | | 10,642 | | | | 153,684 | |
Woolworths Group Limited (Consumer Staples, Food & Staples Retailing) | | | | | | | | | | | 42,182 | | | | 1,240,409 | |
WorleyParsons Limited (Energy, Energy Equipment & Services) | | | | | | | | | | | 6,440 | | | | 45,693 | |
| |
| | | | 38,464,799 | |
| | | | | |
|
| Austria: 0.25% | |
Andritz AG (Industrials, Machinery) | | | | | | | | | | | 10,439 | | | | 349,305 | |
Bawag Group AG (Financials, Banks) 144A† | | | | | | | | | | | 1,376 | | | | 51,823 | |
Erste Bank Der Oesterreichischen Sparkassen AG (Financials, Banks) † | | | | | | | | | | | 15,912 | | | | 386,987 | |
OMV AG (Energy, Oil, Gas & Consumable Fuels) † | | | | | | | | | | | 6,942 | | | | 225,828 | |
Raiffeisen Bank International AG (Financials, Banks) † | | | | | | | | | | | 22,707 | | | | 406,461 | |
Verbund AG (Utilities, Electric Utilities) | | | | | | | | | | | 1,415 | | | | 75,987 | |
Voestalpine AG (Materials, Metals & Mining) | | | | | | | | | | | 859 | | | | 21,332 | |
Wienerberger AG (Materials, Construction Materials) † | | | | | | | | | | | 2,501 | | | | 67,511 | |
| |
| | | | 1,585,234 | |
| | | | | |
|
| Belgium: 0.76% | |
Ackermans & Van Haaren NV (Financials, Diversified Financial Services) † | | | | | | | | | | | 617 | | | | 87,693 | |
Aedifica SA (Real Estate, Equity REITs) | | | | | | | | | | | 695 | | | | 81,860 | |
Ageas NV (Financials, Insurance) | | | | | | | | | | | 5,665 | | | | 237,964 | |
Anheuser-Busch InBev NV (Consumer Staples, Beverages) | | | | | | | | | | | 10,976 | | | | 639,258 | |
Cofinimmo SA (Real Estate, Equity REITs) | | | | | | | | | | | 686 | | | | 100,529 | |
Colruyt SA (Consumer Staples, Food & Staples Retailing) | | | | | | | | | | | 5,158 | | | | 326,231 | |
Elia System Operator SA/NV (Utilities, Electric Utilities) | | | | | | | | | | | 5,952 | | | | 639,964 | |
The accompanying notes are an integral part of these financial statements.
4 | Wells Fargo Factor Enhanced International Equity Portfolio
Portfolio of investments—August 31, 2020 (unaudited)
| | | | | | | | | | | | | | | | |
| | | | | | | | | Shares | | | Value | |
|
| Belgium (continued) | |
KBC Group NV (Financials, Banks) | | | | | | | | | | | 5,323 | | | $ | 305,541 | |
Proximus SA (Communication Services, Diversified Telecommunication Services) | | | | | | | | | | | 4,269 | | | | 84,516 | |
Sofina SA (Financials, Diversified Financial Services) | | | | | | | | | | | 1,021 | | | | 306,430 | |
Solvay SA (Materials, Chemicals) | | | | | | | | | | | 84 | | | | 7,282 | |
Telenet Group Holding NV (Communication Services, Media) | | | | | | | | | | | 5,474 | | | | 212,826 | |
UCB SA (Health Care, Pharmaceuticals) | | | | | | | | | | | 7,325 | | | | 869,933 | |
Umicore SA (Materials, Chemicals) | | | | | | | | | | | 17,696 | | | | 812,814 | |
Warehouses De Pauw SCA (Real Estate, Equity REITs) | | | | | | | | | | | 3,045 | | | | 107,559 | |
| |
| | | | 4,820,400 | |
| | | | | |
|
| Bermuda: 0.06% | |
Hong Kong Land Holdings Limited (Real Estate, Real Estate Management & Development) | | | | | | | | | | | 8,800 | | | | 33,704 | |
Jardine Matheson Holdings Limited (Industrials, Industrial Conglomerates) | | | | | | | | | | | 5,776 | | | | 242,592 | |
Jardine Strategic Holdings Limited (Industrials, Industrial Conglomerates) | | | | | | | | | | | 3,773 | | | | 75,686 | |
| |
| | | | 351,982 | |
| | | | | |
|
| Cambodia: 0.01% | |
NagaCorp Limited (Consumer Discretionary, Hotels, Restaurants & Leisure) | | | | | | | | | | | 32,667 | | | | 39,494 | |
| | | | | | | | | | | | | | | | |
|
| Canada: 9.82% | |
Agnico-Eagle Mines Limited-U.S. Exchange Traded Shares (Materials, Metals & Mining) | | | | | | | | | | | 6,595 | | | | 543,739 | |
Air Canada (Industrials, Airlines) † | | | | | | | | | | | 21,733 | | | | 293,250 | |
Algonquin Power & Utilities Corporation (Utilities, Multi-Utilities) | | | | | | | | | | | 24,600 | | | | 340,988 | |
Alimentation Couche-Tard Incorporated Class B (Consumer Staples, Food & Staples Retailing) | | | | | | | | | | | 41,670 | | | | 1,359,982 | |
Altagas Limited (Energy, Oil, Gas & Consumable Fuels) | | | | | | | | | | | 54,700 | | | | 707,470 | |
ATCO Limited Class I (Utilities, Multi-Utilities) | | | | | | | | | | | 15,500 | | | | 472,243 | |
B2Gold Corporation (Materials, Metals & Mining) | | | | | | | | | | | 83,100 | | | | 560,094 | |
Bank of Montreal (Financials, Banks) | | | | | | | | | | | 26,591 | | | | 1,687,586 | |
Barrick Gold Corporation (Materials, Metals & Mining) | | | | | | | | | | | 74,771 | | | | 2,215,012 | |
Bausch Health Companies Incorporated (Health Care, Pharmaceuticals) † | | | | | | | | | | | 9,100 | | | | 151,045 | |
BCE Incorporated (Communication Services, Diversified Telecommunication Services) | | | | | | | | | | | 21,958 | | | | 943,739 | |
Brookfield Asset Management Incorporated Class A (Financials, Capital Markets) | | | | | | | | | | | 56,428 | | | | 1,904,367 | |
CAE Incorporated (Industrials, Aerospace & Defense) | | | | | | | | | | | 8,800 | | | | 139,521 | |
Cameco Corporation (Energy, Oil, Gas & Consumable Fuels) | | | | | | | | | | | 14,900 | | | | 172,606 | |
Canadian Apartment Properties (Real Estate, Equity REITs) | | | | | | | | | | | 4,400 | | | | 151,800 | |
Canadian Imperial Bank of Commerce (Financials, Banks) | | | | | | | | | | | 21,774 | | | | 1,728,766 | |
Canadian National Railway Company (Industrials, Road & Rail) | | | | | | | | | | | 32,037 | | | | 3,366,421 | |
Canadian Natural Resources Limited (Energy, Oil, Gas & Consumable Fuels) | | | | | | | | | | | 42,400 | | | | 836,070 | |
Canadian Pacific Railway Limited (Industrials, Road & Rail) | | | | | | | | | | | 7,282 | | | | 2,154,369 | |
Canadian Tire Corporation Limited Class A (Consumer Discretionary, Multiline Retail) | | | | | | | | | | | 3,400 | | | | 355,679 | |
Canadian Utilities Limited Class A (Utilities, Multi-Utilities) | | | | | | | | | | | 13,300 | | | | 333,838 | |
Cenovus Energy Incorporated (Energy, Oil, Gas & Consumable Fuels) | | | | | | | | | | | 7,200 | | | | 34,003 | |
CGI Incorporated (Information Technology, IT Services) † | | | | | | | | | | | 11,265 | | | | 791,275 | |
CI Financial Corporation (Financials, Capital Markets) | | | | | | | | | | | 20,400 | | | | 289,652 | |
Constellation Software Incorporated (Information Technology, Software) | | | | | | | | | | | 1,128 | | | | 1,305,837 | |
Dollarama Incorporated (Consumer Discretionary, Multiline Retail) | | | | | | | | | | | 7,777 | | | | 303,603 | |
Emera Incorporated (Utilities, Electric Utilities) | | | | | | | | | | | 7,300 | | | | 298,022 | |
Empire Company Limited Class A (Consumer Staples, Food & Staples Retailing) | | | | | | | | | | | 10,200 | | | | 265,489 | |
Enbridge Incorporated (Energy, Oil, Gas & Consumable Fuels) | | | | | | | | | | | 104,300 | | | | 3,336,864 | |
Fairfax Financial Holdings Limited (Financials, Insurance) | | | | | | | | | | | 800 | | | | 246,615 | |
First Capital REIT (Real Estate, Equity REITs) | | | | | | | | | | | 38,100 | | | | 399,592 | |
Fortis Incorporated (Utilities, Electric Utilities) | | | | | | | | | | | 17,844 | | | | 713,705 | |
Franco-Nevada Corporation (Materials, Metals & Mining) | | | | | | | | | | | 8,208 | | | | 1,234,457 | |
Gildan Activewear Incorporated (Consumer Discretionary, Textiles, Apparel & Luxury Goods) | | | | | | | | | | | 16,000 | | | | 310,223 | |
Great-West Lifeco Incorporated (Financials, Insurance) | | | | | | | | | | | 1,400 | | | | 28,561 | |
Hydro One Limited (Utilities, Electric Utilities) 144A | | | | | | | | | | | 5,600 | | | | 115,920 | |
The accompanying notes are an integral part of these financial statements.
Wells Fargo Factor Enhanced International Equity Portfolio | 5
Portfolio of investments—August 31, 2020 (unaudited)
| | | | | | | | | | | | | | | | |
| | | | | | | | | Shares | | | Value | |
|
| Canada (continued) | |
iA Financial Corporation (Financials, Insurance) | | | | | | | | | | | 14,700 | | | $ | 529,126 | |
IGM Financial Incorporated (Financials, Capital Markets) | | | | | | | | | | | 22,600 | | | | 551,507 | |
Intact Financial Corporation (Financials, Insurance) | | | | | | | | | | | 6,575 | | | | 704,254 | |
Inter Pipeline Limited (Energy, Oil, Gas & Consumable Fuels) | | | | | | | | | | | 19,100 | | | | 201,638 | |
Keyera Corporation (Energy, Oil, Gas & Consumable Fuels) | | | | | | | | | | | 21,400 | | | | 390,806 | |
Kinross Gold Corporation (Materials, Metals & Mining) † | | | | | | | | | | | 52,300 | | | | 464,424 | |
Kinross Gold Corporation (Materials, Metals & Mining) † | | | | | | | | | | | 20,900 | | | | 185,550 | |
Kirkland Lake Gold Limited (Materials, Metals & Mining) | | | | | | | | | | | 11,400 | | | | 607,429 | |
Loblaw Companies Limited (Consumer Staples, Food & Staples Retailing) | | | | | | | | | | | 3,985 | | | | 205,948 | |
Lundin Mining Corporation (Materials, Metals & Mining) | | | | | | | | | | | 22,100 | | | | 138,427 | |
Magna International Incorporated (Consumer Discretionary, Auto Components) | | | | | | | | | | | 24,227 | | | | 1,179,821 | |
Manulife Financial Corporation (Financials, Insurance) | | | | | | | | | | | 98,300 | | | | 1,449,988 | |
Metro Incorporated (Consumer Staples, Food & Staples Retailing) | | | | | | | | | | | 14,930 | | | | 674,417 | |
National Bank of Canada (Financials, Banks) | | | | | | | | | | | 21,708 | | | | 1,193,287 | |
Onex Corporation (Financials, Diversified Financial Services) | | | | | | | | | | | 13,200 | | | | 640,899 | |
Open Text Corporation (Information Technology, Software) | | | | | | | | | | | 1,800 | | | | 81,641 | |
Open Text Corporation (Information Technology, Software) | | | | | | | | | | | 15,218 | | | | 690,593 | |
Pan American Silver Corporation (Materials, Metals & Mining) | | | | | | | | | | | 2,900 | | | | 104,697 | |
Parkland Corporation (Energy, Oil, Gas & Consumable Fuels) | | | | | | | | | | | 3,700 | | | | 104,871 | |
Pembina Pipeline Corporation (Energy, Oil, Gas & Consumable Fuels) | | | | | | | | | | | 25,152 | | | | 622,846 | |
Power Corporation of Canada (Financials, Insurance) | | | | | | | | | | | 33,896 | | | | 676,699 | |
Quebecor Incorporated Class B (Communication Services, Media) | | | | | | | | | | | 13,000 | | | | 322,321 | |
Restaurant Brands International Incorporated (Consumer Discretionary, Hotels, Restaurants & Leisure) | | | | | | | | | | | 10,903 | | | | 590,727 | |
RioCan REIT (Real Estate, Equity REITs) | | | | | | | | | | | 20,900 | | | | 243,714 | |
Ritchie Bros. Auctioneers Incorporated (Industrials, Commercial Services & Supplies) | | | | | | | | | | | 2,900 | | | | 169,685 | |
Rogers Communications Incorporated Class B (Communication Services, Wireless Telecommunication Services) | | | | | | | | | | | 8,674 | | | | 360,832 | |
Royal Bank of Canada (Financials, Banks) | | | | | | | | | | | 64,531 | | | | 4,914,221 | |
Shaw Communications Incorporated Class B (Communication Services, Media) | | | | | | | | | | | 15,405 | | | | 288,058 | |
Shopify Incorporated Class A (Information Technology, Software) † | | | | | | | | | | | 1,800 | | | | 1,922,654 | |
Smart REIT (Real Estate, Equity REITs) | | | | | | | | | | | 28,700 | | | | 451,948 | |
Sun Life Financial Incorporated (Financials, Insurance) | | | | | | | | | | | 28,558 | | | | 1,191,933 | |
Suncor Energy Incorporated (Energy, Oil, Gas & Consumable Fuels) | | | | | | | | | | | 41,262 | | | | 662,103 | |
TC Energy Corporation (Energy, Oil, Gas & Consumable Fuels) | | | | | | | | | | | 47,900 | | | | 2,239,752 | |
Telus Corporation (Communication Services, Diversified Telecommunication Services) | | | | | | | | | | | 16,088 | | | | 296,265 | |
The Bank of Nova Scotia (Financials, Banks) | | | | | | | | | | | 53,808 | | | | 2,325,416 | |
The Toronto-Dominion Bank (Financials, Banks) | | | | | | | | | | | 35,818 | | | | 1,786,850 | |
Thomson Reuters Corporation (Industrials, Professional Services) | | | | | | | | | | | 3,918 | | | | 299,508 | |
TMX Group Limited (Financials, Capital Markets) | | | | | | | | | | | 2,900 | | | | 304,863 | |
Waste Connections Incorporated—Toronto Exchange (Industrials, Commercial Services & Supplies) | | | | | | | | | | | 5,767 | | | | 576,722 | |
Wheaton Precious Metals Corporation (Materials, Metals & Mining) | | | | | | | | | | | 15,976 | | | | 853,213 | |
WSP Global Incorporated (Industrials, Construction & Engineering) | | | | | | | | | | | 700 | | | | 47,490 | |
Yamana Gold Incorporated (Materials, Metals & Mining) | | | | | | | | | | | 122,600 | | | | 759,465 | |
| |
| | | | 62,099,011 | |
| | | | | |
|
| China: 0.28% | |
AAC Technologies Holdings Incorporated (Information Technology, Electronic Equipment, Instruments & Components) | | | | | | | | | | | 12,500 | | | | 78,869 | |
Beigene Limited (Health Care, Biotechnology) † | | | | | | | | | | | 16,700 | | | | 313,736 | |
Beigene Limited ADR (Health Care, Biotechnology) † | | | | | | | | | | | 880 | | | | 212,582 | |
MicroPort Scientific Corporation (Health Care, Health Care Equipment & Supplies) | | | | | | | | | | | 14,000 | | | | 63,676 | |
Sands China Limited (Consumer Discretionary, Hotels, Restaurants & Leisure) | | | | | | | | | | | 116,400 | | | | 513,649 | |
Wynn Macau Limited (Consumer Discretionary, Hotels, Restaurants & Leisure) | | | | | | | | | | | 33,845 | | | | 63,671 | |
Xiaomi Corporation Class B (Information Technology, Technology Hardware, Storage & Peripherals) 144A† | | | | | | | | | | | 182,600 | | | | 553,676 | |
| |
| | | | 1,799,859 | |
| | | | | |
The accompanying notes are an integral part of these financial statements.
6 | Wells Fargo Factor Enhanced International Equity Portfolio
Portfolio of investments—August 31, 2020 (unaudited)
| | | | | | | | | | | | | | | | |
| | | | | | | | | Shares | | | Value | |
| Denmark: 2.48% | |
A.P. Moller Maersk AS Class B (Industrials, Marine) | | | | | | | | | | | 36 | | | $ | 55,198 | |
Ambu AS Class B (Health Care, Health Care Equipment & Supplies) | | | | | | | | | | | 8,162 | | | | 239,980 | |
Bakkafrost PF (Consumer Staples, Food Products) † | | | | | | | | | | | 1,175 | | | | 73,575 | |
Carlsberg AS Class B (Consumer Staples, Beverages) | | | | | | | | | | | 6,874 | | | | 966,029 | |
Christian Hansen Holding AS (Materials, Chemicals) | | | | | | | | | | | 2,248 | | | | 258,113 | |
Coloplast AS Class B (Health Care, Health Care Equipment & Supplies) | | | | | | | | | | | 6,760 | | | | 1,147,140 | |
Danske Bank AS (Financials, Banks) † | | | | | | | | | | | 22,932 | | | | 354,918 | |
DSV Panalpina AS (Industrials, Air Freight & Logistics) | | | | | | | | | | | 5,648 | | | | 883,195 | |
Genmab AS (Health Care, Biotechnology) † | | | | | | | | | | | 3,677 | | | | 1,388,826 | |
GN Store Nord AS (Health Care, Health Care Equipment & Supplies) | | | | | | | | | | | 2,915 | | | | 211,183 | |
H. Lundbeck AS (Health Care, Pharmaceuticals) | | | | | | | | | | | 1,429 | | | | 46,918 | |
ISS AS (Industrials, Commercial Services & Supplies) † | | | | | | | | | | | 3,603 | | | | 55,475 | |
Netcompany Group AS (Information Technology, IT Services) † | | | | | | | | | | | 892 | | | | 77,221 | |
Novo Nordisk AS Class B (Health Care, Pharmaceuticals) | | | | | | | | | | | 87,371 | | | | 5,787,008 | |
Novozymes AS Class B (Materials, Chemicals) | | | | | | | | | | | 9,667 | | | | 572,025 | |
Orsted AS (Utilities, Electric Utilities) 144A | | | | | | | | | | | 4,506 | | | | 637,579 | |
Pandora AS (Consumer Discretionary, Textiles, Apparel & Luxury Goods) | | | | | | | | | | | 18,042 | | | | 1,317,794 | |
Rockwool International AS B Shares (Industrials, Building Products) | | | | | | | | | | | 190 | | | | 72,191 | |
Royal Unibrew AS (Consumer Staples, Beverages) | | | | | | | | | | | 892 | | | | 93,524 | |
SimCorp AS (Information Technology, Software) | | | | | | | | | | | 871 | | | | 110,731 | |
Topdanmark AS (Financials, Insurance) | | | | | | | | | | | 997 | | | | 42,964 | |
Tryg AS (Financials, Insurance) | | | | | | | | | | | 2,686 | | | | 82,462 | |
Vestas Wind Systems AS (Industrials, Electrical Equipment) | | | | | | | | | | | 7,377 | | | | 1,121,632 | |
William Demant Holding (Health Care, Health Care Equipment & Supplies) † | | | | | | | | | | | 1,754 | | | | 52,359 | |
| |
| | | | 15,648,040 | |
| | | | | |
|
| Finland: 1.22% | |
Elisa Oyj (Communication Services, Diversified Telecommunication Services) | | | | | | | | | | | 13,949 | | | | 820,483 | |
Fortum Oyj (Utilities, Electric Utilities) | | | | | | | | | | | 12,769 | | | | 269,939 | |
Huhtamaki Oyj (Materials, Containers & Packaging) † | | | | | | | | | | | 2,206 | | | | 106,723 | |
Kesko Oyj Class B (Consumer Staples, Food & Staples Retailing) | | | | | | | | | | | 5,899 | | | | 130,866 | |
Kojamo Oyj (Real Estate, REITs) | | | | | | | | | | | 4,146 | | | | 100,437 | |
Kone Oyj Class B (Industrials, Machinery) | | | | | | | | | | | 14,166 | | | | 1,214,455 | |
Neste Oil Oyj (Energy, Oil, Gas & Consumable Fuels) | | | | | | | | | | | 21,412 | | | | 1,144,986 | |
Nokia Oyj (Information Technology, Communications Equipment) † | | | | | | | | | | | 112,570 | | | | 547,081 | |
Nokian Renkaat Oyj (Consumer Discretionary, Auto Components) | | | | | | | | | | | 2,956 | | | | 82,298 | |
Nordea Bank AB (Financials, Banks) † | | | | | | | | | | | 78,480 | | | | 631,756 | |
Orion Oyj Class B (Health Care, Pharmaceuticals) | | | | | | | | | | | 20,833 | | | | 977,537 | |
Sampo Oyj Class A (Financials, Insurance) | | | | | | | | | | | 19,807 | | | | 797,265 | |
Stora Enso Oyj (Materials, Paper & Forest Products) | | | | | | | | | | | 13,839 | | | | 203,627 | |
UPM-Kymmene Oyj (Materials, Paper & Forest Products) | | | | | | | | | | | 20,042 | | | | 607,734 | |
Valmet Corporation Oyj (Industrials, Machinery) | | | | | | | | | | | 2,964 | | | | 81,070 | |
| |
| | | | 7,716,257 | |
| | | | | |
|
| France: 7.31% | |
Aeroports de Paris SA (Industrials, Transportation Infrastructure) | | | | | | | | | | | 757 | | | | 79,316 | |
Air Liquide SA (Materials, Chemicals) | | | | | | | | | | | 21,352 | | | | 3,543,051 | |
Alstom SA (Industrials, Machinery) † | | | | | | | | | | | 8,962 | | | | 498,806 | |
Alten SA (Information Technology, IT Services) † | | | | | | | | | | | 736 | | | | 63,809 | |
Amundi SA (Financials, Capital Markets) 144A† | | | | | | | | | | | 5,339 | | | | 414,771 | |
Arkema SA (Materials, Chemicals) | | | | | | | | | | | 7,216 | | | | 799,982 | |
Atos Origin SA (Information Technology, IT Services) † | | | | | | | | | | | 12,416 | | | | 1,074,206 | |
AXA SA (Financials, Insurance) | | | | | | | | | | | 67,224 | | | | 1,369,867 | |
BioMerieux (Health Care, Health Care Equipment & Supplies) | | | | | | | | | | | 3,975 | | | | 602,433 | |
BNP Paribas SA (Financials, Banks) † | | | | | | | | | | | 35,376 | | | | 1,543,626 | |
Bouygues SA (Industrials, Construction & Engineering) † | | | | | | | | | | | 11,600 | | | | 460,275 | |
The accompanying notes are an integral part of these financial statements.
Wells Fargo Factor Enhanced International Equity Portfolio | 7
Portfolio of investments—August 31, 2020 (unaudited)
| | | | | | | | | | | | | | | | |
| | | | | | | | | Shares | | | Value | |
|
| France (continued) | |
Bureau Veritas SA (Industrials, Professional Services) † | | | | | | | | | | | 6,379 | | | $ | 144,597 | |
Capgemini SE (Information Technology, IT Services) | | | | | | | | | | | 4,635 | | | | 641,617 | |
Casino Guichard Perrachon SA (Consumer Staples, Food & Staples Retailing) † | | | | | | | | | | | 1,100 | | | | 28,551 | |
CNP Assurances SA (Financials, Insurance) † | | | | | | | | | | | 25,140 | | | | 336,609 | |
Compagnie de Saint-Gobain SA (Industrials, Building Products) † | | | | | | | | | | | 18,294 | | | | 741,822 | |
Compagnie Generale des Etablissements Michelin SCA (Consumer Discretionary, Auto Components) | | | | | | | | | | | 7,746 | | | | 874,638 | |
Covivio (Real Estate, Equity REITs) | | | | | | | | | | | 7,347 | | | | 544,464 | |
Credit Agricole SA (Financials, Banks) † | | | | | | | | | | | 21,957 | | | | 225,026 | |
Danone SA (Consumer Staples, Food Products) | | | | | | | | | | | 7,058 | | | | 464,089 | |
Dassault Aviation SA (Industrials, Aerospace & Defense) † | | | | | | | | | | | 612 | | | | 556,877 | |
Dassault Systemes SA (Information Technology, Software) | | | | | | | | | | | 4,661 | | | | 877,994 | |
Eiffage SA (Industrials, Construction & Engineering) † | | | | | | | | | | | 4,382 | | | | 403,803 | |
Electricite de France SA (Utilities, Electric Utilities) | | | | | | | | | | | 10,583 | | | | 111,162 | |
Elis SA (Industrials, Commercial Services & Supplies) † | | | | | | | | | | | 3,969 | | | | 51,390 | |
Engie SA (Utilities, Multi-Utilities) † | | | | | | | | | | | 25,574 | | | | 355,696 | |
EssilorLuxottica SA (Health Care, Health Care Equipment & Supplies) † | | | | | | | | | | | 5,672 | | | | 758,769 | |
Faurecia SE (Consumer Discretionary, Auto Components) † | | | | | | | | | | | 7,674 | | | | 334,350 | |
Gecina SA (Real Estate, Equity REITs) | | | | | | | | | | | 5,210 | | | | 716,239 | |
Getlink SE (Industrials, Transportation Infrastructure) † | | | | | | | | | | | 24,664 | | | | 377,917 | |
Hermes International SA (Consumer Discretionary, Textiles, Apparel & Luxury Goods) | | | | | | | | | | | 1,644 | | | | 1,411,368 | |
Icade SA (Real Estate, Equity REITs) | | | | | | | | | | | 3,544 | | | | 229,436 | |
Iliad SA (Communication Services, Diversified Telecommunication Services) | | | | | | | | | | | 2,980 | | | | 636,557 | |
Ingenico SA (Information Technology, Electronic Equipment, Instruments & Components) † | | | | | | | | | | | 3,224 | | | | 547,095 | |
Kering SA (Consumer Discretionary, Textiles, Apparel & Luxury Goods) | | | | | | | | | | | 1,922 | | | | 1,180,296 | |
Klepierre SA (Real Estate, Equity REITs) | | | | | | | | | | | 27,137 | | | | 446,575 | |
L’Oreal SA (Consumer Staples, Personal Products) | | | | | | | | | | | 6,625 | | | | 2,189,156 | |
La Francaise Des Jeux SA (Consumer Discretionary, Hotels, Restaurants & Leisure) 144A | | | | | | | | | | | 2,875 | | | | 106,666 | |
Legrand SA (Industrials, Electrical Equipment) | | | | | | | | | | | 11,486 | | | | 958,107 | |
LVMH Moet Hennessy Louis Vuitton SA (Consumer Discretionary, Textiles, Apparel & Luxury Goods) | | | | | | | | | | | 6,356 | | | | 2,979,362 | |
Natixis SA (Financials, Capital Markets) † | | | | | | | | | | | 13,191 | | | | 36,284 | |
Orange SA (Communication Services, Diversified Telecommunication Services) | | | | | | | | | | | 25,421 | | | | 283,036 | |
Orpea SA (Health Care, Health Care Providers & Services) † | | | | | | | | | | | 1,198 | | | | 143,893 | |
Pernod-Ricard SA (Consumer Staples, Beverages) | | | | | | | | | | | 9,081 | | | | 1,555,083 | |
Peugeot SA (Consumer Discretionary, Automobiles) † | | | | | | | | | | | 16,546 | | | | 283,738 | |
Publicis Groupe SA (Communication Services, Media) † | | | | | | | | | | | 7,423 | | | | 260,166 | |
Remy Cointreau SA (Consumer Staples, Beverages) | | | | | | | | | | | 577 | | | | 94,953 | |
Rubis SCA (Utilities, Gas Utilities) | | | | | | | | | | | 2,238 | | | | 105,707 | |
Safran SA (Industrials, Aerospace & Defense) † | | | | | | | | | | | 8,804 | | | | 1,019,317 | |
Sanofi SA (Health Care, Pharmaceuticals) | | | | | | | | | | | 30,704 | | | | 3,109,690 | |
Sartorius Stedim Biotech SA (Health Care, Life Sciences Tools & Services) | | | | | | | | | | | 1,276 | | | | 456,510 | |
Schneider Electric SE (Industrials, Electrical Equipment) | | | | | | | | | | | 15,557 | | | | 1,926,113 | |
SCOR SE (Financials, Insurance) † | | | | | | | | | | | 20,641 | | | | 552,248 | |
Societe Generale SA (Financials, Banks) † | | | | | | | | | | | 32,069 | | | | 519,777 | |
Sodexo SA (Consumer Discretionary, Hotels, Restaurants & Leisure) | | | | | | | | | | | 4,739 | | | | 339,091 | |
Sopra Steria Group (Information Technology, IT Services) † | | | | | | | | | | | 341 | | | | 55,465 | |
Spie SA (Industrials, Commercial Services & Supplies) | | | | | | | | | | | 2,975 | | | | 50,520 | |
Suez Environnement Company SA (Utilities, Multi-Utilities) | | | | | | | | | | | 8,894 | | | | 153,951 | |
Teleperformance SE (Industrials, Professional Services) | | | | | | | | | | | 3,227 | | | | 995,083 | |
Thales SA (Industrials, Aerospace & Defense) | | | | | | | | | | | 3,308 | | | | 258,568 | |
Total SA (Energy, Oil, Gas & Consumable Fuels) | | | | | | | | | | | 55,049 | | | | 2,174,429 | |
Valeo SA (Consumer Discretionary, Auto Components) | | | | | | | | | | | 7,521 | | | | 229,765 | |
Veolia Environnement SA (Utilities, Multi-Utilities) | | | | | | | | | | | 17,690 | | | | 426,429 | |
Vinci SA (Industrials, Construction & Engineering) | | | | | | | | | | | 10,595 | | | | 993,530 | |
Vivendi SA (Communication Services, Entertainment) | | | | | | | | | | | 12,250 | | | | 347,921 | |
Worldline SA (Information Technology, IT Services) 144A† | | | | | | | | | | | 1,823 | | | | 167,555 | |
| |
| | | | 46,219,192 | |
| | | | | |
The accompanying notes are an integral part of these financial statements.
8 | Wells Fargo Factor Enhanced International Equity Portfolio
Portfolio of investments—August 31, 2020 (unaudited)
| | | | | | | | | | | | | | | | |
| | | | | | | | | Shares | | | Value | |
| Germany: 6.59% | | | | | | | | | | | | |
adidas AG (Consumer Discretionary, Textiles, Apparel & Luxury Goods) † | | | | | | | | | | | 8,001 | | | $ | 2,430,919 | |
Allianz AG (Financials, Insurance) | | | | | | | | | | | 6,195 | | | | 1,341,942 | |
Alstria Office REIT AG (Real Estate, Equity REITs) † | | | | | | | | | | | 4,064 | | | | 60,768 | |
BASF SE (Materials, Chemicals) | | | | | | | | | | | 17,907 | | | | 1,091,118 | |
Bayer AG (Health Care, Pharmaceuticals) | | | | | | | | | | | 29,005 | | | | 1,922,413 | |
Bayerische Motoren Werke AG (Consumer Discretionary, Automobiles) | | | | | | | | | | | 7,217 | | | | 518,036 | |
Bechtle AG (Information Technology, IT Services) | | | | | | | | | | | 577 | | | | 116,505 | |
Beiersdorf AG (Consumer Staples, Personal Products) | | | | | | | | | | | 3,575 | | | | 412,971 | |
Brenntag AG (Industrials, Trading Companies & Distributors) | | | | | | | | | | | 9,611 | | | | 601,679 | |
Cancom SE (Information Technology, IT Services) | | | | | | | | | | | 837 | | | | 46,186 | |
Carl Zeiss Meditec AG (Health Care, Health Care Equipment & Supplies) † | | | | | | | | | | | 801 | | | | 90,234 | |
Covestro AG (Materials, Chemicals) 144A | | | | | | | | | | | 3,971 | | | | 188,888 | |
CTS Eventim AG & Company KGaA (Communication Services, Entertainment) † | | | | | | | | | | | 1,286 | | | | 63,872 | |
Daimler AG (Consumer Discretionary, Automobiles) | | | | | | | | | | | 18,073 | | | | 919,743 | |
Delivery Hero AG (Consumer Discretionary, Internet & Direct Marketing Retail) 144A† | | | | | | | | | | | 2,773 | | | | 297,891 | |
Deutsche Boerse AG (Financials, Capital Markets) | | | | | | | | | | | 10,160 | | | | 1,920,511 | |
Deutsche Lufthansa AG (Industrials, Airlines) † | | | | | | | | | | | 13,700 | | | | 142,726 | |
Deutsche Post AG (Industrials, Air Freight & Logistics) | | | | | | | | | | | 29,711 | | | | 1,351,569 | |
Deutsche Telekom AG (Communication Services, Diversified Telecommunication Services) | | | | | | | | | | | 147,624 | | | | 2,598,465 | |
Deutsche Wohnen AG (Real Estate, Real Estate Management & Development) | | | | | | | | | | | 19,810 | | | | 1,055,302 | |
E.ON SE (Utilities, Multi-Utilities) | | | | | | | | | | | 56,745 | | | | 671,072 | |
Evonik Industries AG (Materials, Chemicals) | | | | | | | | | | | 7,082 | | | | 205,367 | |
Evotec AG (Health Care, Life Sciences Tools & Services) † | | | | | | | | | | | 2,837 | | | | 75,836 | |
Fraport AG (Industrials, Transportation Infrastructure) † | | | | | | | | | | | 1,571 | | | | 71,541 | |
Freenet AG (Communication Services, Wireless Telecommunication Services) | | | | | | | | | | | 3,181 | | | | 68,689 | |
Fresenius Medical Care AG & Company KGaA (Health Care, Health Care Providers & Services) | | | | | | | | | | | 9,680 | | | | 820,859 | |
Fresenius SE & Company KGaA (Health Care, Health Care Providers & Services) | | | | | | | | | | | 18,735 | | | | 867,468 | |
GEA Group AG (Industrials, Machinery) | | | | | | | | | | | 5,830 | | | | 212,613 | |
Gerresheimer AG (Health Care, Life Sciences Tools & Services) | | | | | | | | | | | 568 | | | | 67,003 | |
Hannover Rueck SE (Financials, Insurance) | | | | | | | | | | | 3,544 | | | | 603,089 | |
Heidelbergcement AG (Materials, Construction Materials) | | | | | | | | | | | 668 | | | | 42,425 | |
Hellofresh SE (Consumer Discretionary, Internet & Direct Marketing Retail) † | | | | | | | | | | | 2,879 | | | | 148,077 | |
Infineon Technologies AG (Information Technology, Semiconductors & Semiconductor Equipment) | | | | | | | | | | | 19,530 | | | | 539,770 | |
Kion Group AG (Industrials, Machinery) † | | | | | | | | | | | 4,350 | | | | 367,839 | |
Knorr Bremse AG (Industrials, Machinery) | | | | | | | | | | | 1,055 | | | | 134,057 | |
LANXESS AG (Materials, Chemicals) | | | | | | | | | | | 10,400 | | | | 608,255 | |
LEG Immobilien AG (Real Estate, Real Estate Management & Development) | | | | | | | | | | | 3,923 | | | | 577,043 | |
Merck KGaA (Health Care, Pharmaceuticals) | | | | | | | | | | | 7,356 | | | | 997,652 | |
Metro AG (Consumer Staples, Food & Staples Retailing) | | | | | | | | | | | 1,332 | | | | 13,180 | |
MTU Aero Engines AG (Industrials, Aerospace & Defense) † | | | | | | | | | | | 3,412 | | | | 632,133 | |
Muenchener Rueckversicherungs Gesellschaft AG (Financials, Insurance) | | | | | | | | | | | 7,059 | | | | 2,036,047 | |
Nemetschek SE (Information Technology, Software) | | | | | | | | | | | 3,828 | | | | 304,238 | |
ProSiebenSat.1 Media AG (Communication Services, Media) † | | | | | | | | | | | 4,511 | | | | 51,044 | |
Puma AG Rudolf Dassler Sport (Consumer Discretionary, Textiles, Apparel & Luxury Goods) † | | | | | | | | | | | 6,703 | | | | 553,373 | |
Rational AG (Industrials, Machinery) | | | | | | | | | | | 114 | | | | 72,918 | |
Rheinmetall AG (Industrials, Industrial Conglomerates) | | | | | | | | | | | 958 | | | | 88,646 | |
RWE AG (Utilities, Multi-Utilities) | | | | | | | | | | | 14,718 | | | | 584,872 | |
SAP SE (Information Technology, Software) | | | | | | | | | | | 24,120 | | | | 3,973,289 | |
Scout24 AG (Communication Services, Interactive Media & Services) 144A | | | | | | | | | | | 9,210 | | | | 856,729 | |
Siemens AG (Industrials, Industrial Conglomerates) | | | | | | | | | | | 18,985 | | | | 2,620,364 | |
Siemens Healthineers AG (Health Care, Health Care Equipment & Supplies) 144A | | | | | | | | | | | 7,222 | | | | 328,360 | |
Symrise AG (Materials, Chemicals) | | | | | | | | | | | 3,766 | | | | 519,300 | |
TAG Immobilien AG (Real Estate, Real Estate Management & Development) | | | | | | | | | | | 3,142 | | | | 93,888 | |
TeamViewer AG (Information Technology, Software) † | | | | | | | | | | | 751 | | | | 40,661 | |
Telefónica Deutschland Holding AG (Communication Services, Diversified Telecommunication Services) | | | | | | | | | | | 23,741 | | | | 65,615 | |
TUI AG (Consumer Discretionary, Hotels, Restaurants & Leisure) | | | | | | | | | | | 9,648 | | | | 41,926 | |
The accompanying notes are an integral part of these financial statements.
Wells Fargo Factor Enhanced International Equity Portfolio | 9
Portfolio of investments—August 31, 2020 (unaudited)
| | | | | | | | | | | | | | | | |
| | | | | | | | | Shares | | | Value | |
| | | | |
| Germany (continued) | | | | | | | | | | | | |
Uniper SE (Utilities, Independent Power & Renewable Electricity Producers) | | | | | | | | | | | 25,679 | | | $ | 840,872 | |
United Internet AG (Communication Services, Diversified Telecommunication Services) | | | | | | | | | | | 17,614 | | | | 864,749 | |
Vonovia SE (Real Estate, Real Estate Management & Development) | | | | | | | | | | | 21,460 | | | | 1,536,558 | |
Zalando SE (Consumer Discretionary, Internet & Direct Marketing Retail) 144A† | | | | | | | | | | | 14,859 | | | | 1,296,918 | |
| |
| | | | 41,666,073 | |
| | | | | |
|
| Hong Kong: 2.56% | |
AIA Group Limited (Financials, Insurance) | | | | | | | | | | | 233,200 | | | | 2,401,146 | |
ASM Pacific Technology (Information Technology, Semiconductors & Semiconductor Equipment) | | | | | | | | | | | 13,144 | | | | 141,358 | |
BOC Hong Kong Holdings Limited (Financials, Banks) | | | | | | | | | | | 178,000 | | | | 505,277 | |
Budweiser Brewing Company (Consumer Staples, Beverages) 144A | | | | | | | | | | | 181,000 | | | | 610,713 | |
CK Asset Holdings Limited (Real Estate, Real Estate Management & Development) | | | | | | | | | | | 165,190 | | | | 897,332 | |
CK Hutchison Holdings Limited (Industrials, Industrial Conglomerates) | | | | | | | | | | | 223,070 | | | | 1,460,711 | |
CK Infrastructure Holdings Limited (Utilities, Electric Utilities) | | | | | | | | | | | 18,750 | | | | 99,191 | |
CLP Holdings Limited (Utilities, Electric Utilities) | | | | | | | | | | | 88,500 | | | | 869,561 | |
ESR Cayman Limited (Real Estate, Real Estate Management & Development) † | | | | | | | | | | | 27,200 | | | | 81,247 | |
Fosun International (Industrials, Industrial Conglomerates) | | | | | | | | | | | 52,167 | | | | 58,089 | |
Galaxy Entertainment Group Limited (Consumer Discretionary, Hotels, Restaurants & Leisure) | | | | | | | | | | | 152,000 | | | | 1,197,337 | |
Hang Lung Group Limited (Real Estate, Real Estate Management & Development) | | | | | | | | | | | 16,569 | | | | 42,758 | |
Hang Lung Properties Limited (Real Estate, Real Estate Management & Development) | | | | | | | | | | | 84,332 | | | | 237,756 | |
Hang Seng Bank Limited (Financials, Banks) | | | | | | | | | | | 927 | | | | 14,580 | |
Henderson Land Development Company Limited (Real Estate, Real Estate Management & Development) | | | | | | | | | | | 61,198 | | | | 241,232 | |
HK Electric Investments Limited (Utilities, Electric Utilities) 144A | | | | | | | | | | | 117,500 | | | | 119,619 | |
Hong Kong & China Gas Company Limited (Utilities, Gas Utilities) | | | | | | | | | | | 238,092 | | | | 346,530 | |
Hong Kong Exchanges & Clearing Limited (Financials, Capital Markets) | | | | | | | | | | | 24,600 | | | | 1,241,712 | |
Hong Kong Telecommunications Trust & Hong Kong Trust Limited (Communication Services, Diversified Telecommunication Services) | | | | | | | | | | | 199,574 | | | | 285,319 | |
Hysan Development Company Limited (Real Estate, Real Estate Management & Development) | | | | | | | | | | | 14,192 | | | | 44,864 | |
Kerry Properties Limited (Real Estate, Real Estate Management & Development) | | | | | | | | | | | 120,166 | | | | 312,424 | |
New World Development Company Limited (Real Estate, Real Estate Management & Development) | | | | | | | | | | | 46,493 | | | | 241,457 | |
PCCW Limited (Communication Services, Diversified Telecommunication Services) | | | | | | | | | | | 220,000 | | | | 137,958 | |
Power Assets Holdings Limited (Utilities, Electric Utilities) | | | | | | | | | | | 49,417 | | | | 283,104 | |
Shenzhou International Group Holdings Limited (Consumer Discretionary, Textiles, Apparel & Luxury Goods) | | | | | | | | | | | 16,600 | | | | 267,735 | |
Sino Land Company (Real Estate, Real Estate Management & Development) | | | | | | | | | | | 225,899 | | | | 263,202 | |
SJM Holdings Limited (Consumer Discretionary, Hotels, Restaurants & Leisure) | | | | | | | | | | | 100,000 | | | | 137,545 | |
Sun Hung Kai Properties Limited (Real Estate, Real Estate Management & Development) | | | | | | | | | | | 60,000 | | | | 806,689 | |
Swire Pacific Limited Class A (Real Estate, Real Estate Management & Development) | | | | | | | | | | | 64,978 | | | | 353,807 | |
Techtronic Industries Company Limited (Industrials, Machinery) | | | | | | | | | | | 86,743 | | | | 1,101,328 | |
The Bank of East Asia Limited (Financials, Banks) | | | | | | | | | | | 9,600 | | | | 21,652 | |
Vitasoy International Holdings Limited (Consumer Staples, Food Products) | | | | | | | | | | | 19,669 | | | | 70,045 | |
WH Group Limited (Consumer Staples, Food Products) 144A | | | | | | | | | | | 1,171,000 | | | | 1,010,811 | |
Wharf Holdings Limited (Real Estate, Real Estate Management & Development) | | | | | | | | | | | 17,472 | | | | 34,086 | |
Wharf Real Estate Investment Company Limited (Real Estate, Real Estate Management & Development) | | | | | | | | | | | 39,296 | | | | 163,518 | |
Xinyi Glass Holdings Limited (Consumer Discretionary, Auto Components) | | | | | | | | | | | 45,334 | | | | 78,382 | |
| |
| | | | 16,180,075 | |
| | | | | |
|
| Ireland: 1.19% | |
Bank of Ireland Group plc (Financials, Banks) † | | | | | | | | | | | 25,388 | | | | 57,140 | |
CRH plc (Materials, Construction Materials) | | | | | | | | | | | 10,303 | | | | 381,148 | |
DCC plc (Industrials, Industrial Conglomerates) | | | | | | | | | | | 7,931 | | | | 704,592 | |
Flutter Entertainment plc (Consumer Discretionary, Hotels, Restaurants & Leisure) | | | | | | | | | | | 5,140 | | | | 866,709 | |
Glanbia plc (Consumer Staples, Food Products) | | | | | | | | | | | 5,324 | | | | 61,310 | |
Kerry Group plc Class A (Consumer Staples, Food Products) | | | | | | | | | | | 6,089 | | | | 799,294 | |
Kingspan Group plc (Industrials, Building Products) | | | | | | | | | | | 9,691 | | | | 832,084 | |
Linde plc (Materials, Chemicals) | | | | | | | | | | | 11,892 | | | | 2,991,530 | |
The accompanying notes are an integral part of these financial statements.
10 | Wells Fargo Factor Enhanced International Equity Portfolio
Portfolio of investments—August 31, 2020 (unaudited)
| | | | | | | | | | | | | | | | |
| | | | | | | | | Shares | | | Value | |
|
| Ireland (continued) | |
Smurfit Kappa Group plc (Materials, Containers & Packaging) | | | | | | | | | | | 22,119 | | | $ | 783,425 | |
UDG Healthcare plc (Health Care, Health Care Providers & Services) | | | | | | | | | | | 5,784 | | | | 55,939 | |
| |
| | | | 7,533,171 | |
| | | | | |
|
| Israel: 0.37% | |
Bank Hapoalim Limited (Financials, Banks) | | | | | | | | | | | 28,505 | | | | 172,843 | |
Check Point Software Technologies Limited (Information Technology, Software) † | | | | | | | | | | | 7,071 | | | | 892,784 | |
Israel Chemicals Limited (Materials, Chemicals) | | | | | | | | | | | 46,334 | | | | 172,521 | |
Israel Discount Bank Limited Class A (Financials, Banks) | | | | | | | | | | | 29,356 | | | | 94,165 | |
Mizrahi Tefahot Bank Limited (Financials, Banks) | | | | | | | | | | | 15,493 | | | | 315,961 | |
Nice Systems Limited (Information Technology, Software) † | | | | | | | | | | | 2,971 | | | | 680,209 | |
| |
| | | | 2,328,483 | |
| | | | | |
|
| Italy: 1.55% | |
A2A SpA (Utilities, Multi-Utilities) | | | | | | | | | | | 36,567 | | | | 53,368 | |
Amplifon SpA (Health Care, Health Care Providers & Services) † | | | | | | | | | | | 2,701 | | | | 89,993 | |
Assicurazioni Generali SpA (Financials, Insurance) | | | | | | | | | | | 60,668 | | | | 941,538 | |
Atlantia SpA (Industrials, Transportation Infrastructure) † | | | | | | | | | | | 24,865 | | | | 395,536 | |
Banco BPM SpA (Financials, Banks) † | | | | | | | | | | | 34,398 | | | | 57,961 | |
DiaSorin SpA (Health Care, Health Care Equipment & Supplies) | | | | | | | | | | | 1,877 | | | | 339,348 | |
Enel SpA (Utilities, Electric Utilities) | | | | | | | | | | | 183,418 | | | | 1,661,095 | |
FinecoBank SpA (Financials, Banks) † | | | | | | | | | | | 20,861 | | | | 316,160 | |
Hera SpA (Utilities, Multi-Utilities) | | | | | | | | | | | 20,414 | | | | 78,004 | |
Infrastrutture Wireless Italiane SpA (Communication Services, Diversified Telecommunication Services) 144A | | | | | | | | | | | 479 | | | | 4,667 | |
Interpump Group SpA (Industrials, Machinery) | | | | | | | | | | | 1,898 | | | | 66,364 | |
Intesa Sanpaolo SpA (Financials, Banks) † | | | | | | | | | | | 457,348 | | | | 985,235 | |
Italgas SpA (Utilities, Gas Utilities) | | | | | | | | | | | 10,155 | | | | 65,379 | |
Leonardo SpA (Industrials, Aerospace & Defense) | | | | | | | | | | | 107,123 | | | | 724,570 | |
Mediobanca SpA (Financials, Banks) | | | | | | | | | | | 56,656 | | | | 492,339 | |
Moncler SpA (Consumer Discretionary, Textiles, Apparel & Luxury Goods) † | | | | | | | | | | | 6,461 | | | | 250,197 | |
Nexi SpA (Information Technology, IT Services) 144A† | | | | | | | | | | | 13,117 | | | | 233,467 | |
Pirelli & C. SpA (Consumer Discretionary, Auto Components) 144A† | | | | | | | | | | | 10,522 | | | | 45,467 | |
Poste Italiane SpA (Financials, Insurance) 144A | | | | | | | | | | | 14,514 | | | | 133,193 | |
Prysmian SpA (Industrials, Electrical Equipment) | | | | | | | | | | | 30,646 | | | | 857,234 | |
Recordati SpA (Health Care, Pharmaceuticals) | | | | | | | | | | | 7,818 | | | | 426,083 | |
Snam SpA (Utilities, Gas Utilities) | | | | | | | | | | | 57,079 | | | | 292,214 | |
Telecom Italia RSP (Communication Services, Diversified Telecommunication Services) | | | | | | | | | | | 49,236 | | | | 23,256 | |
Telecom Italia SpA (Communication Services, Diversified Telecommunication Services) | | | | | | | | | | | 207,914 | | | | 98,948 | |
Terna SpA (Utilities, Electric Utilities) | | | | | | | | | | | 84,948 | | | | 614,116 | |
UniCredit SpA (Financials, Banks) † | | | | | | | | | | | 53,113 | | | | 522,905 | |
Unione di Banche SpA (Financials, Banks) † | | | | | | | | | | | 10,027 | | | | 43,436 | |
| |
| | | | 9,812,073 | |
| | | | | |
|
| Japan: 23.01% | |
ABC-Mart Incorporated (Consumer Discretionary, Specialty Retail) | | | | | | | | | | | 1,100 | | | | 57,952 | |
Acom Company Limited (Financials, Consumer Finance) | | | | | | | | | | | 12,100 | | | | 47,296 | |
Activia Properties Incorporated (Real Estate, Equity REITs) | | | | | | | | | | | 17 | | | | 64,122 | |
Advance Residence Investment Corporation (Real Estate, Equity REITs) | | | | | | | | | | | 29 | | | | 85,975 | |
Advantest Corporation (Information Technology, Semiconductors & Semiconductor Equipment) | | | | | | | | | | | 10,500 | | | | 502,620 | |
Aeon Financial Service Company Limited (Financials, Consumer Finance) | | | | | | | | | | | 1,550 | | | | 13,800 | |
Aica Kogyo Company Limited (Industrials, Building Products) | | | | | | | | | | | 1,500 | | | | 51,551 | |
Air Water Incorporated (Materials, Chemicals) | | | | | | | | | | | 9,500 | | | | 133,645 | |
Aisin Seiki Company Limited (Consumer Discretionary, Auto Components) | | | | | | | | | | | 5,300 | | | | 182,396 | |
Ajinomoto Company Incorporated (Consumer Staples, Food Products) | | | | | | | | | | | 13,100 | | | | 244,400 | |
Alfresa Holdings Corporation (Health Care, Health Care Providers & Services) | | | | | | | | | | | 17,200 | | | | 345,900 | |
The accompanying notes are an integral part of these financial statements.
Wells Fargo Factor Enhanced International Equity Portfolio | 11
Portfolio of investments—August 31, 2020 (unaudited)
| | | | | | | | | | | | | | | | |
| | | | | | | | | Shares | | | Value | |
|
| Japan (continued) | |
All Nippon Airways Company Limited (Industrials, Airlines) † | | | | | | | | | | | 8,800 | | | $ | 219,969 | |
Alps Electric Company Limited (Information Technology, Electronic Equipment, Instruments & Components) | | | | | | | | | | | 4,700 | | | | 74,817 | |
Amada Holdings Company Limited (Industrials, Machinery) | | | | | | | | | | | 14,700 | | | | 131,018 | |
Anritsu Corporation Anritsu Corp(Information Technology, Electronic Equipment, Instruments & Components) | | | | | | | | | | | 3,300 | | | | 72,097 | |
Aozora Bank Limited (Financials, Banks) | | | | | | | | | | | 30,900 | | | | 555,771 | |
Asahi Glass Company Limited (Industrials, Building Products) | | | | | | | | | | | 6,300 | | | | 178,742 | |
Asahi Group Holdings Limited (Consumer Staples, Beverages) | | | | | | | | | | | 24,600 | | | | 862,388 | |
Asahi Intecc Company Limited (Health Care, Health Care Equipment & Supplies) | | | | | | | | | | | 5,434 | | | | 161,355 | |
Asahi Kasei Corporation (Materials, Chemicals) | | | | | | | | | | | 38,400 | | | | 322,674 | |
ASICS Corporation (Consumer Discretionary, Textiles, Apparel & Luxury Goods) | | | | | | | | | | | 4,400 | | | | 60,819 | |
Astellas Pharma Incorporated (Health Care, Pharmaceuticals) | | | | | | | | | | | 117,300 | | | | 1,843,420 | |
Azbil Corporation (Information Technology, Electronic Equipment, Instruments & Components) | | | | | | | | | | | 3,200 | | | | 100,609 | |
Bandai Namco Holdings Incorporated (Consumer Discretionary, Leisure Products) | | | | | | | | | | | 9,300 | | | | 578,380 | |
Benesse Corporation (Consumer Discretionary, Diversified Consumer Services) | | | | | | | | | | | 1,767 | | | | 45,061 | |
Bridgestone Corporation (Consumer Discretionary, Auto Components) | | | | | | | | | | | 14,600 | | | | 463,302 | |
Brother Industries Limited (Information Technology, Technology Hardware, Storage & Peripherals) | | | | | | | | | | | 51,500 | | | | 853,349 | |
Calbee Incorporated (Consumer Staples, Food Products) | | | | | | | | | | | 10,500 | | | | 327,645 | |
Capcom Company Limited (Communication Services, Entertainment) | | | | | | | | | | | 1,967 | | | | 95,457 | |
Casio Computer Company Limited (Consumer Discretionary, Household Durables) | | | | | | | | | | | 27,400 | | | | 442,115 | |
Central Japan Railway Company (Industrials, Road & Rail) | | | | | | | | | | | 7,000 | | | | 1,050,182 | |
Chiba Bank Limited (Financials, Banks) | | | | | | | | | | | 139,100 | | | | 722,325 | |
Chubu Electric Power Company Incorporated (Utilities, Electric Utilities) | | | | | | | | | | | 36,800 | | | | 454,984 | |
Chugai Pharmaceutical Company Limited (Health Care, Pharmaceuticals) | | | | | | | | | | | 32,900 | | | | 1,466,467 | |
Comsys Holdings Corporation (Industrials, Construction & Engineering) | | | | | | | | | | | 2,867 | | | | 80,178 | |
Concordia Financial Group Limited (Financials, Banks) | | | | | | | | | | | 50,100 | | | | 166,503 | |
Cosmos Pharmaceutical Corporation (Consumer Staples, Food & Staples Retailing) | | | | | | | | | | | 3,000 | | | | 528,254 | |
Credit Saison Company Limited (Financials, Consumer Finance) | | | | | | | | | | | 3,767 | | | | 43,000 | |
CyberAgent Incorporated (Communication Services, Media) | | | | | | | | | | | 6,900 | | | | 368,078 | |
Dai Nippon Printing Company Limited (Industrials, Commercial Services & Supplies) | | | | | | | | | | | 15,700 | | | | 334,115 | |
Dai-ichi Life Holdings Incorporated (Financials, Insurance) | | | | | | | | | | | 42,500 | | | | 644,231 | |
Daicel Corporation (Materials, Chemicals) | | | | | | | | | | | 50,600 | | | | 367,861 | |
Daifuku Company Limited (Industrials, Machinery) | | | | | | | | | | | 5,600 | | | | 493,301 | |
Daiichi Sankyo Company Limited (Health Care, Pharmaceuticals) | | | | | | | | | | | 8,100 | | | | 722,473 | |
Daiichikosho Company Limited (Communication Services, Entertainment) | | | | | | | | | | | 1,067 | | | | 33,345 | |
Daikin Industries Limited (Industrials, Building Products) | | | | | | | | | | | 5,066 | | | | 954,942 | |
Daito Trust Construction Company Limited (Real Estate, Real Estate Management & Development) | | | | | | | | | | | 6,200 | | | | 550,311 | |
Daiwa House Industry Company Limited (Real Estate, Real Estate Management & Development) | | | | | | | | | | | 33,000 | | | | 885,016 | |
Daiwa House Residential Investment Corporation (Real Estate, Equity REITs) | | | | | | | | | | | 39 | | | | 101,997 | |
Daiwa Office Investment Corporation (Real Estate, Equity REITs) | | | | | | | | | | | 7 | | | | 40,580 | |
Daiwa Securities Group Incorporated (Financials, Capital Markets) | | | | | | | | | | | 71,400 | | | | 322,232 | |
Denka Company Limited (Materials, Chemicals) | | | | | | | | | | | 2,000 | | | | 56,309 | |
Denso Corporation (Consumer Discretionary, Auto Components) | | | | | | | | | | | 3,900 | | | | 164,116 | |
DIC Incorporated (Materials, Chemicals) | | | | | | | | | | | 1,767 | | | | 42,092 | |
Disco Corporation (Information Technology, Semiconductors & Semiconductor Equipment) | | | | | | | | | | | 1,200 | | | | 280,187 | |
Dowa Mining Company Limited (Materials, Metals & Mining) | | | | | | | | | | | 1,300 | | | | 40,443 | |
East Japan Railway Company (Industrials, Road & Rail) | | | | | | | | | | | 9,034 | | | | 588,278 | |
Ebara Corporation (Industrials, Machinery) | | | | | | | | | | | 2,134 | | | | 55,045 | |
Eisai Company Limited (Health Care, Pharmaceuticals) | | | | | | | | | | | 5,100 | | | | 446,127 | |
Electric Power Development Company Limited (Utilities, Independent Power & Renewable Electricity Producers) | | | | | | | | | | | 6,450 | | | | 97,376 | |
Ezaki Glico Company Limited (Consumer Staples, Food Products) | | | | | | | | | | | 1,334 | | | | 56,678 | |
FANCL Corporation (Consumer Staples, Personal Products) | | | | | | | | | | | 1,934 | | | | 63,271 | |
FANUC Corporation (Industrials, Machinery) | | | | | | | | | | | 2,200 | | | | 386,451 | |
Fast Retailing Company Limited (Consumer Discretionary, Specialty Retail) | | | | | | | | | | | 200 | | | | 119,492 | |
Fuji Electric Holdings Company Limited (Industrials, Electrical Equipment) | | | | | | | | | | | 10,800 | | | | 338,026 | |
The accompanying notes are an integral part of these financial statements.
12 | Wells Fargo Factor Enhanced International Equity Portfolio
Portfolio of investments—August 31, 2020 (unaudited)
| | | | | | | | | | | | | | | | |
| | | | | | | | | Shares | | | Value | |
|
| Japan (continued) | |
Fuji Television Network Incorporated (Communication Services, Media) | | | | | | | | | | | 3,667 | | | $ | 36,457 | |
FUJIFILM Holdings Corporation (Information Technology, Technology Hardware, Storage & Peripherals) | | | | | | | | | | | 11,700 | | | | 557,411 | |
Fujitsu Limited (Information Technology, IT Services) | | | | | | | | | | | 13,400 | | | | 1,748,459 | |
Fukuoka Financial Group Incorporated (Financials, Banks) | | | | | | | | | | | 48,100 | | | | 797,012 | |
GLP J-REIT (Real Estate, Equity REITs) | | | | | | | | | | | 91 | | | | 140,562 | |
GMO Payment Gateway Incorporated (Information Technology, IT Services) | | | | | | | | | | | 900 | | | | 95,256 | |
Goldwin Incorporated (Consumer Discretionary, Textiles, Apparel & Luxury Goods) | | | | | | | | | | | 967 | | | | 69,844 | |
Hakuhodo DY Holdings Incorporated (Communication Services, Media) | | | | | | | | | | | 18,100 | | | | 225,577 | |
Hamamatsu Photonics (Information Technology, Electronic Equipment, Instruments & Components) | | | | | | | | | | | 3,200 | | | | 145,928 | |
Hankyu Hanshin Holdings Incorporated (Industrials, Road & Rail) | | | | | | | | | | | 14,200 | | | | 461,870 | |
Haseko Corporation (Consumer Discretionary, Household Durables) | | | | | | | | | | | 6,800 | | | | 92,901 | |
Hikari Tsushin Incorporated (Consumer Discretionary, Specialty Retail) | | | | | | | | | | | 500 | | | | 120,946 | |
Hino Motors Limited (Industrials, Machinery) | | | | | | | | | | | 13,600 | | | | 91,681 | |
Hirose Electric Company Limited (Information Technology, Electronic Equipment, Instruments & Components) | | | | | | | | | | | 2,100 | | | | 238,125 | |
Hisamitsu Pharmaceutical Company Incorporated (Health Care, Pharmaceuticals) | | | | | | | | | | | 13,700 | | | | 632,517 | |
Hitachi Construction Machinery Company Limited (Industrials, Machinery) | | | | | | | | | | | 5,100 | | | | 179,125 | |
Hitachi Limited (Information Technology, Electronic Equipment, Instruments & Components) | | | | | | | | | | | 27,300 | | | | 909,871 | |
Honda Motor Company Limited (Consumer Discretionary, Automobiles) | | | | | | | | | | | 35,300 | | | | 909,538 | |
Horiba Limited (Information Technology, Electronic Equipment, Instruments & Components) | | | | | | | | | | | 967 | | | | 53,045 | |
Hoshizaki Electric Company Limited (Industrials, Machinery) | | | | | | | | | | | 2,000 | | | | 153,142 | |
House Foods Group Incorporated (Consumer Staples, Food Products) | | | | | | | | | | | 1,900 | | | | 64,221 | |
Hoya Corporation (Health Care, Health Care Equipment & Supplies) | | | | | | | | | | | 16,600 | | | | 1,632,337 | |
Hulic Company Limited (Real Estate, Real Estate Management & Development) | | | | | | | | | | | 34,200 | | | | 311,922 | |
Ibiden Company Limited (Information Technology, Electronic Equipment, Instruments & Components) | | | | | | | | | | | 2,967 | | | | 93,143 | |
Idemitsu Kosan Company Limited (Energy, Oil, Gas & Consumable Fuels) | | | | | | | | | | | 10,300 | | | | 227,171 | |
IHI Corporation (Industrials, Machinery) | | | | | | | | | | | 3,567 | | | | 53,043 | |
Iida Group Holdings Company Limited (Consumer Discretionary, Household Durables) | | | | | | | | | | | 11,200 | | | | 218,893 | |
Industrial & Infrastructure Fund Investment Corporation (Real Estate, Equity REITs) | | | | | | | | | | | 39 | | | | 68,194 | |
Inpex Holdings Incorporated (Energy, Oil, Gas & Consumable Fuels) | | | | | | | | | | | 62,900 | | | | 400,151 | |
Invincible Investment Corporation (Real Estate, Equity REITs) | | | | | | | | | | | 153 | | | | 45,792 | |
Isetan Mitsukoshi Holdings Limited (Consumer Discretionary, Multiline Retail) | | | | | | | | | | | 9,000 | | | | 49,625 | |
Isuzu Motors Limited (Consumer Discretionary, Automobiles) | | | | | | | | | | | 29,700 | | | | 294,154 | |
ITO EN Limited (Consumer Staples, Beverages) | | | | | | | | | | | 9,300 | | | | 562,838 | |
Itochu Corporation (Industrials, Trading Companies & Distributors) | | | | | | | | | | | 80,600 | | | | 2,072,550 | |
Itochu Techno-Solutions Corporation (Information Technology, IT Services) | | | | | | | | | | | 16,400 | | | | 594,590 | |
J.Front Retailing Company Limited (Consumer Discretionary, Multiline Retail) | | | | | | | | | | | 6,200 | | | | 43,201 | |
Japan Airlines Company Limited (Industrials, Airlines) | | | | | | | | | | | 9,367 | | | | 186,960 | |
Japan Airport Terminal Company Limited (Industrials, Transportation Infrastructure) | | | | | | | | | | | 1,867 | | | | 84,082 | |
Japan Excellent Incorporated (Real Estate, Equity REITs) | | | | | | | | | | | 30 | | | | 35,604 | |
Japan Exchange Group Incorporated (Financials, Capital Markets) | | | | | | | | | | | 11,400 | | | | 295,777 | |
Japan Hotel REIT Investment Corporation (Real Estate, Equity REITs) | | | | | | | | | | | 105 | | | | 48,775 | |
Japan Logistics Fund Incorporated (Real Estate, Equity REITs) | | | | | | | | | | | 20 | | | | 53,817 | |
Japan Post Holding Company Limited (Financials, Insurance) | | | | | | | | | | | 12,000 | | | | 191,927 | |
Japan Prime Realty Investment Corporation (Real Estate, Equity REITs) | | | | | | | | | | | 53 | | | | 160,379 | |
Japan Real Estate Investment Corporation (Real Estate, Equity REITs) | | | | | | | | | | | 31 | | | | 173,856 | |
Japan Retail Fund Investment Corporation (Real Estate, Equity REITs) | | | | | | | | | | | 62 | | | | 93,601 | |
JCR Pharmaceuticals Company Limited (Health Care, Pharmaceuticals) | | | | | | | | | | | 500 | | | | 53,770 | |
JFE Holdings Incorporated (Materials, Metals & Mining) | | | | | | | | | | | 12,900 | | | | 97,802 | |
JGC Corporation (Industrials, Construction & Engineering) | | | | | | | | | | | 5,867 | | | | 64,866 | |
JSR Corporation (Materials, Chemicals) | | | | | | | | | | | 9,800 | | | | 209,111 | |
JustSystems Corporation (Information Technology, Software) | | | | | | | | | | | 700 | | | | 53,666 | |
JXTG Holdings Incorporated (Energy, Oil, Gas & Consumable Fuels) | | | | | | | | | | | 147,800 | | | | 579,953 | |
K’s Holdings Corporation (Consumer Discretionary, Specialty Retail) | | | | | | | | | | | 4,800 | | | | 68,115 | |
Kagome Company Limited (Consumer Staples, Food Products) | | | | | | | | | | | 2,034 | | | | 63,277 | |
Kajima Corporation (Industrials, Construction & Engineering) | | | | | | | | | | | 31,100 | | | | 387,887 | |
Kakaku.com Incorporated (Communication Services, Interactive Media & Services) | | | | | | | | | | | 10,300 | | | | 274,920 | |
The accompanying notes are an integral part of these financial statements.
Wells Fargo Factor Enhanced International Equity Portfolio | 13
Portfolio of investments—August 31, 2020 (unaudited)
| | | | | | | | | | | | | | | | |
| | | | | | | | | Shares | | | Value | |
|
| Japan (continued) | |
Kaken Pharmaceutical Company Limited (Health Care, Pharmaceuticals) | | | | | | | | | | | 934 | | | $ | 43,210 | |
Kamigumi Company Limited (Industrials, Transportation Infrastructure) | | | | | | | | | | | 39,300 | | | | 812,604 | |
Kaneka Corporation (Materials, Chemicals) | | | | | | | | | | | 1,500 | | | | 38,068 | |
Kansai Electric Power Company Incorporated (Utilities, Electric Utilities) | | | | | | | | | | | 25,734 | | | | 253,659 | |
Kansai Paint Company Limited (Materials, Chemicals) | | | | | | | | | | | 6,650 | | | | 158,786 | |
Kao Corporation (Consumer Staples, Personal Products) | | | | | | | | | | | 24,300 | | | | 1,851,265 | |
Kawasaki Heavy Industries Limited (Industrials, Machinery) | | | | | | | | | | | 5,200 | | | | 73,742 | |
KDDI Corporation (Communication Services, Wireless Telecommunication Services) | | | | | | | | | | | 96,300 | | | | 2,798,578 | |
Keihan Electric Railway Company Limited (Industrials, Industrial Conglomerates) | | | | | | | | | | | 4,900 | | | | 211,424 | |
Keikyu Corporation (Industrials, Road & Rail) | | | | | | | | | | | 15,200 | | | | 227,035 | |
Keio Corporation (Industrials, Road & Rail) | | | | | | | | | | | 3,000 | | | | 181,561 | |
Keisei Electric Railway Company Limited (Industrials, Road & Rail) | | | | | | | | | | | 4,200 | | | | 123,722 | |
Kenedix Realty Investment Corporation (Real Estate, Equity REITs) | | | | | | | | | | | 10 | | | | 59,387 | |
Kewpie Corporation (Consumer Staples, Food Products) | | | | | | | | | | | 3,067 | | | | 58,146 | |
Keyence Corporation (Information Technology, Electronic Equipment, Instruments & Components) | | | | | | | | | | | 3,300 | | | | 1,360,940 | |
Kikkoman Corporation (Consumer Staples, Food Products) | | | | | | | | | | | 8,200 | | | | 445,943 | |
Kinden Corporation (Industrials, Construction & Engineering) | | | | | | | | | | | 3,134 | | | | 51,782 | |
Kintetsu Group Holdings Company Limited (Industrials, Road & Rail) | | | | | | | | | | | 6,800 | | | | 299,183 | |
Kirin Brewery Company Limited (Consumer Staples, Beverages) | | | | | | | | | | | 45,600 | | | | 897,663 | |
Kobayashi Pharmaceutical Company Limited (Consumer Staples, Personal Products) | | | | | | | | | | | 6,500 | | | | 579,332 | |
Kobe Bussan Company Limited (Consumer Staples, Food & Staples Retailing) | | | | | | | | | | | 2,900 | | | | 171,128 | |
Koito Manufacturing Company Limited (Consumer Discretionary, Auto Components) | | | | | | | | | | | 2,867 | | | | 139,134 | |
Komatsu Limited (Industrials, Machinery) | | | | | | | | | | | 31,600 | | | | 687,404 | |
Konami Holdings Corporation (Communication Services, Entertainment) | | | | | | | | | | | 2,400 | | | | 92,565 | |
Konica Minolta Holdings Incorporated (Information Technology, Technology Hardware, Storage & Peripherals) | | | | | | | | | | | 11,200 | | | | 36,271 | |
Kubota Corporation (Industrials, Machinery) | | | | | | | | | | | 900 | | | | 16,285 | |
Kurita Water Industries Limited (Industrials, Machinery) | | | | | | | | | | | 13,200 | | | | 413,766 | |
Kyowa Exeo Corporation (Industrials, Construction & Engineering) | | | | | | | | | | | 2,467 | | | | 62,167 | |
Kyowa Hakko Kogyo Company Limited (Health Care, Pharmaceuticals) | | | | | | | | | | | 14,300 | | | | 370,208 | |
Kyushu Electric Power Company Incorporated (Utilities, Electric Utilities) | | | | | | | | | | | 10,500 | | | | 93,089 | |
Kyushu Financial Group Incorporated (Financials, Banks) | | | | | | | | | | | 9,800 | | | | 45,061 | |
Kyushu Railway Company (Industrials, Road & Rail) | | | | | | | | | | | 14,000 | | | | 309,040 | |
LaSalle Logiport REIT (Real Estate, Equity REITs) | | | | | | | | | | | 28 | | | | 47,057 | |
Lasertec Corporation (Information Technology, Semiconductors & Semiconductor Equipment) | | | | | | | | | | | 4,900 | | | | 370,108 | |
Lawson Incorporated (Consumer Staples, Food & Staples Retailing) | | | | | | | | | | | 1,034 | | | | 51,058 | |
Lion Corporation (Consumer Staples, Household Products) | | | | | | | | | | | 13,600 | | | | 288,397 | |
LIXIL Group Corporation (Industrials, Building Products) | | | | | | | | | | | 4,600 | | | | 84,691 | |
M3 Incorporated (Health Care, Health Care Technology) | | | | | | | | | | | 8,700 | | | | 504,348 | |
Mabuchi Motor Company Limited (Industrials, Electrical Equipment) | | | | | | | | | | | 1,534 | | | | 54,095 | |
Makita Corporation (Industrials, Machinery) | | | | | | | | | | | 6,800 | | | | 314,592 | |
Mani Incorporated (Health Care, Health Care Equipment & Supplies) | | | | | | | | | | | 1,800 | | | | 45,682 | |
Marubeni Corporation (Industrials, Trading Companies & Distributors) | | | | | | | | | | | 114,700 | | | | 692,651 | |
Marui Group Company Limited (Consumer Discretionary, Multiline Retail) | | | | | | | | | | | 5,400 | | | | 98,757 | |
Maruichi Steel Tube Limited (Materials, Metals & Mining) | | | | | | | | | | | 9,600 | | | | 257,686 | |
Matsumotokiyoshi Holdings Company Limited (Consumer Staples, Food & Staples Retailing) | | | | | | | | | | | 2,134 | | | | 74,750 | |
McDonald’s Holdings Company Japan Limited (Consumer Discretionary, Hotels, Restaurants & Leisure) | | | | | | | | | | | 5,600 | | | | 274,937 | |
Mebuki Financial Group Incorporated (Financials, Banks) | | | | | | | | | | | 218,300 | | | | 529,699 | |
MediPal Holdings Corporation (Health Care, Health Care Providers & Services) | | | | | | | | | | | 36,700 | | | | 702,364 | |
Meiji Holdings Company Limited (Consumer Staples, Food Products) | | | | | | | | | | | 6,600 | | | | 533,409 | |
MinebeaMitsumi Incorporated (Industrials, Machinery) | | | | | | | | | | | 30,800 | | | | 534,780 | |
Misumi Group Incorporated (Industrials, Machinery) | | | | | | | | | | | 10,700 | | | | 281,050 | |
Mitsubishi Chemical Holdings Corporation (Materials, Chemicals) | | | | | | | | | | | 32,367 | | | | 189,407 | |
Mitsubishi Corporation (Industrials, Trading Companies & Distributors) | | | | | | | | | | | 22,700 | | | | 538,486 | |
Mitsubishi Electric Corporation (Industrials, Electrical Equipment) | | | | | | | | | | | 94,200 | | | | 1,301,181 | |
Mitsubishi Gas Chemical Company Incorporated (Materials, Chemicals) | | | | | | | | | | | 27,400 | | | | 489,974 | |
Mitsubishi Logistics Corporation (Industrials, Transportation Infrastructure) | | | | | | | | | | | 1,967 | | | | 59,707 | |
The accompanying notes are an integral part of these financial statements.
14 | Wells Fargo Factor Enhanced International Equity Portfolio
Portfolio of investments—August 31, 2020 (unaudited)
| | | | | | | | | | | | | | | | |
| | | | | | | | | Shares | | | Value | |
|
| Japan (continued) | |
Mitsubishi Materials Corporation (Materials, Metals & Mining) | | | | | | | | | | | 4,200 | | | $ | 88,350 | |
Mitsubishi Motors Corporation (Consumer Discretionary, Automobiles) | | | | | | | | | | | 15,467 | | | | 37,238 | |
Mitsubishi UFJ Financial Group Incorporated (Financials, Banks) | | | | | | | | | | | 278,900 | | | | 1,165,210 | |
Mitsubishi UFJ Lease & Finance Company Limited (Financials, Diversified Financial Services) | | | | | | | | | | | 93,300 | | | | 441,328 | |
Mitsui & Company Limited (Industrials, Trading Companies & Distributors) | | | | | | | | | | | 60,000 | | | | 1,084,266 | |
Mitsui Chemicals Incorporated (Materials, Chemicals) | | | | | | | | | | | 12,100 | | | | 284,807 | |
Mitsui OSK Lines Limited (Industrials, Marine) | | | | | | | | | | | 2,734 | | | | 50,671 | |
Miura Company Limited (Industrials, Machinery) | | | | | | | | | | | 6,800 | | | | 278,639 | |
Mizuho Financial Group Incorporated (Financials, Banks) | | | | | | | | | | | 7,600 | | | | 10,318 | |
MonotaRO Company Limited (Industrials, Trading Companies & Distributors) | | | | | | | | | | | 2,600 | | | | 102,856 | |
Mori Hills REIT Corporation (Real Estate, Equity REITs) | | | | | | | | | | | 36 | | | | 44,900 | |
Morinaga & Company Limited (Consumer Staples, Food Products) | | | | | | | | | | | 1,100 | | | | 40,348 | |
MS&AD Insurance Group Holdings Incorporated (Financials, Insurance) | | | | | | | | | | | 19,184 | | | | 532,693 | |
Murata Manufacturing Company Limited (Information Technology, Electronic Equipment, Instruments & Components) | | | | | | | | | | | 12,300 | | | | 729,302 | |
Nabtesco Corporation (Industrials, Machinery) | | | | | | | | | | | 9,400 | | | | 297,758 | |
Nagase & Company Limited (Industrials, Trading Companies & Distributors) | | | | | | | | | | | 2,767 | | | | 36,078 | |
Nagoya Railroad Company Limited (Industrials, Road & Rail) | | | | | | | | | | | 10,100 | | | | 282,169 | |
Nankai Electric Railway Company Limited (Industrials, Road & Rail) | | | | | | | | | | | 2,667 | | | | 58,746 | |
NEC Corporation (Information Technology, IT Services) | | | | | | | | | | | 14,600 | | | | 770,561 | |
Net One Systems Company Limited (Information Technology, IT Services) | | | | | | | | | | | 1,900 | | | | 73,101 | |
Nexon Company Limited (Communication Services, Entertainment) | | | | | | | | | | | 21,100 | | | | 494,654 | |
NGK Insulators Limited (Industrials, Machinery) | | | | | | | | | | | 14,300 | | | | 203,466 | |
NGK Spark Plug Company Limited (Consumer Discretionary, Auto Components) | | | | | | | | | | | 15,967 | | | | 275,124 | |
NH Foods Limited (Consumer Staples, Food Products) | | | | | | | | | | | 9,600 | | | | 435,519 | |
Nichirei Corporation (Consumer Staples, Food Products) | | | | | | | | | | | 3,200 | | | | 83,599 | |
Nidec Corporation (Industrials, Electrical Equipment) | | | | | | | | | | | 100 | | | | 8,413 | |
Nifco Incorporated (Consumer Discretionary, Auto Components) | | | | | | | | | | | 2,134 | | | | 54,783 | |
Nihon Kohden Corporation (Health Care, Health Care Equipment & Supplies) | | | | | | | | | | | 2,067 | | | | 70,744 | |
Nihon M&A Center Incorporated (Industrials, Professional Services) | | | | | | | | | | | 6,600 | | | | 329,019 | |
Nihon Unisys Limited (Information Technology, IT Services) | | | | | | | | | | | 1,767 | | | | 50,717 | |
Nikon Corporation (Consumer Discretionary, Household Durables) | | | | | | | | | | | 9,500 | | | | 74,626 | |
Nintendo Company Limited (Communication Services, Entertainment) | | | | | | | | | | | 3,000 | | | | 1,607,138 | |
Nippon Accommodations Fund Incorporated (Real Estate, Equity REITs) | | | | | | | | | | | 10 | | | | 61,653 | |
Nippon Building Fund Incorporated (Real Estate, Equity REITs) | | | | | | | | | | | 33 | | | | 199,094 | |
Nippon Express Company Limited (Industrials, Road & Rail) | | | | | | | | | | | 19,300 | | | | 1,142,529 | |
Nippon Kayaku Company Limited (Materials, Chemicals) | | | | | | | | | | | 4,167 | | | | 41,074 | |
Nippon Paint Company Limited (Materials, Chemicals) | | | | | | | | | | | 4,300 | | | | 369,447 | |
Nippon Paper Industries Company Limited (Materials, Paper & Forest Products) | | | | | | | | | | | 2,600 | | | | 33,140 | |
Nippon Prologis REIT Incorporated (Real Estate, Equity REITs) | | | | | | | | | | | 53 | | | | 173,639 | |
Nippon Shinyaku Company Limited (Health Care, Pharmaceuticals) | | | | | | | | | | | 4,000 | | | | 330,454 | |
Nippon Shokubai Company Limited (Materials, Chemicals) | | | | | | | | | | | 800 | | | | 42,147 | |
Nippon Suisan Kaisha Limited (Consumer Staples, Food Products) | | | | | | | | | | | 6,967 | | | | 31,311 | |
Nippon Telegraph & Telephone Corporation (Communication Services, Diversified Telecommunication Services) | | | | | | | | | | | 86,300 | | | | 1,964,901 | |
Nippon Television Network Corporation (Communication Services, Media) | | | | | | | | | | | 4,467 | | | | 52,804 | |
Nippon Yusen Kabushiki Kaisha (Industrials, Marine) | | | | | | | | | | | 7,800 | | | | 122,102 | |
Nishi-Nippon Railroad Company Limited (Industrials, Road & Rail) | | | | | | | | | | | 1,900 | | | | 55,342 | |
Nissan Chemical Industries Limited (Materials, Chemicals) | | | | | | | | | | | 7,200 | | | | 382,042 | |
Nissin Food Products Company Limited (Consumer Staples, Food Products) | | | | | | | | | | | 6,000 | | | | 600,482 | |
Nitori Holdings Company Limited (Consumer Discretionary, Specialty Retail) | | | | | | | | | | | 3,600 | | | | 753,888 | |
Nitto Boseki Company Limited (Industrials, Building Products) | | | | | | | | | | | 900 | | | | 36,241 | |
Nitto Denko Corporation (Materials, Chemicals) | | | | | | | | | | | 13,400 | | | | 814,767 | |
NOF Corporation (Materials, Chemicals) | | | | | | | | | | | 1,767 | | | | 71,738 | |
Nomura Holdings Incorporated (Financials, Capital Markets) | | | | | | | | | | | 81,700 | | | | 420,013 | |
Nomura Real Estate Holding Incorporated (Real Estate, Real Estate Management & Development) | | | | | | | | | | | 19,100 | | | | 365,896 | |
Nomura Real Estate Master Fund Incorporated (Real Estate, Equity REITs) | | | | | | | | | | | 105 | | | | 134,726 | |
The accompanying notes are an integral part of these financial statements.
Wells Fargo Factor Enhanced International Equity Portfolio | 15
Portfolio of investments—August 31, 2020 (unaudited)
| | | | | | | | | | | | | | | | |
| | | | | | | | | Shares | | | Value | |
|
| Japan (continued) | |
Nomura Research Institute Limited (Information Technology, IT Services) | | | | | | | | | | | 36,000 | | | $ | 958,165 | |
NSK Limited (Industrials, Machinery) | | | | | | | | | | | 26,167 | | | | 200,857 | |
NTT Data Corporation (Information Technology, IT Services) | | | | | | | | | | | 14,734 | | | | 168,603 | |
NTT DOCOMO Incorporated (Communication Services, Wireless Telecommunication Services) | | | | | | | | | | | 72,500 | | | | 2,025,469 | |
Obayashi Corporation (Industrials, Construction & Engineering) | | | | | | | | | | | 69,500 | | | | 680,465 | |
OBIC Company Limited (Information Technology, IT Services) | | | | | | | | | | | 3,200 | | | | 567,701 | |
Odakyu Electric Railway Company Limited (Industrials, Road & Rail) | | | | | | | | | | | 9,400 | | | | 232,792 | |
Oji Holdings Corporation (Materials, Paper & Forest Products) | | | | | | | | | | | 91,300 | | | | 412,904 | |
Olympus Corporation (Health Care, Health Care Equipment & Supplies) | | | | | | | | | | | 63,700 | | | | 1,262,392 | |
Omron Corporation (Information Technology, Electronic Equipment, Instruments & Components) | | | | | | | | | | | 12,400 | | | | 909,673 | |
Ono Pharmaceutical Company Limited (Health Care, Pharmaceuticals) | | | | | | | | | | | 31,300 | | | | 945,368 | |
Oracle Corporation (Japan) (Information Technology, Software) | | | | | | | | | | | 1,700 | | | | 199,670 | |
Oriental Land Company Limited (Consumer Discretionary, Hotels, Restaurants & Leisure) | | | | | | | | | | | 400 | | | | 54,345 | |
ORIX Corporation (Financials, Diversified Financial Services) | | | | | | | | | | | 54,400 | | | | 679,005 | |
ORIX JREIT Incorporated (Real Estate, Equity REITs) | | | | | | | | | | | 63 | | | | 93,803 | |
Osaka Gas Company Limited (Utilities, Gas Utilities) | | | | | | | | | | | 20,300 | | | | 397,318 | |
Otsuka Corporation (Information Technology, IT Services) | | | | | | | | | | | 12,600 | | | | 618,609 | |
Otsuka Holdings Company Limited (Health Care, Pharmaceuticals) | | | | | | | | | | | 24,000 | | | | 1,055,261 | |
Pan Pacific International Holdings (Consumer Discretionary, Multiline Retail) | | | | | | | | | | | 12,450 | | | | 292,810 | |
Panasonic Corporation (Consumer Discretionary, Household Durables) | | | | | | | | | | | 54,300 | | | | 501,345 | |
Park24 Company Limited (Industrials, Commercial Services & Supplies) | | | | | | | | | | | 2,967 | | | | 53,673 | |
Persol Holdings Company Limited (Industrials, Professional Services) | | | | | | | | | | | 22,700 | | | | 354,704 | |
Pigeon Corporation (Consumer Staples, Household Products) | | | | | | | | | | | 3,700 | | | | 169,254 | |
Pola Orbis Holdings Incorporated (Consumer Staples, Personal Products) | | | | | | | | | | | 10,000 | | | | 181,372 | |
Recruit Holdings Company Limited (Industrials, Professional Services) | | | | | | | | | | | 18,400 | | | | 699,414 | |
Relo Holdings Incorporated (Real Estate, Real Estate Management & Development) | | | | | | | | | | | 2,667 | | | | 60,685 | |
Rengo Company Limited (Materials, Containers & Packaging) | | | | | | | | | | | 5,667 | | | | 41,895 | |
Resona Holdings Incorporated (Financials, Banks) | | | | | | | | | | | 146,500 | | | | 539,442 | |
Ricoh Company Limited (Information Technology, Technology Hardware, Storage & Peripherals) | | | | | | | | | | | 20,600 | | | | 154,235 | |
Rinnai Corporation (Consumer Discretionary, Household Durables) | | | | | | | | | | | 3,700 | | | | 342,699 | |
Rohto Pharmaceutical Company Limited (Consumer Staples, Personal Products) | | | | | | | | | | | 2,667 | | | | 84,859 | |
Ryohin Keikaku Company Limited (Consumer Discretionary, Multiline Retail) | | | | | | | | | | | 24,900 | | | | 390,256 | |
Sankyu Incorporated (Industrials, Road & Rail) | | | | | | | | | | | 1,367 | | | | 57,176 | |
Santen Pharmaceutical Company Limited (Health Care, Pharmaceuticals) | | | | | | | | | | | 28,100 | | | | 536,186 | |
Sanwa Holdings Corporation (Industrials, Building Products) | | | | | | | | | | | 5,267 | | | | 53,110 | |
Sawai Pharmaceutical Company Limited (Health Care, Pharmaceuticals) | | | | | | | | | | | 1,100 | | | | 56,290 | |
SBI Holdings Incorporated (Financials, Capital Markets) | | | | | | | | | | | 6,250 | | | | 142,390 | |
SCREEN Holdings Company Limited (Information Technology, Semiconductors & Semiconductor Equipment) | | | | | | | | | | | 1,034 | | | | 50,472 | |
SCSK Corporation (Information Technology, IT Services) | | | | | | | | | | | 10,500 | | | | 569,041 | |
Secom Company Limited (Industrials, Commercial Services & Supplies) | | | | | | | | | | | 6,400 | | | | 605,769 | |
Sega Sammy Holdings Incorporated (Consumer Discretionary, Leisure Products) | | | | | | | | | | | 7,317 | | | | 84,904 | |
Seibu Holdings Incorporated (Industrials, Road & Rail) | | | | | | | | | | | 6,734 | | | | 74,133 | |
Seiko Epson Corporation (Information Technology, Technology Hardware, Storage & Peripherals) | | | | | | | | | | | 14,800 | | | | 176,904 | |
SEINO Holdings Company Limited (Industrials, Road & Rail) | | | | | | | | | | | 3,867 | | | | 59,183 | |
Sekisui Chemical Company Limited (Consumer Discretionary, Household Durables) | | | | | | | | | | | 19,700 | | | | 315,639 | |
Sekisui House Limited (Consumer Discretionary, Household Durables) | | | | | | | | | | | 35,800 | | | | 708,462 | |
Sekisui House REIT Incorporated (Real Estate, Equity REITs) | | | | | | | | | | | 95 | | | | 67,181 | |
Seven & I Holdings Company Limited (Consumer Staples, Food & Staples Retailing) | | | | | | | | | | | 32,200 | | | | 1,043,692 | |
Seven Bank Limited (Financials, Banks) | | | | | | | | | | | 185,300 | | | | 465,371 | |
SG Holdings Company Limited (Industrials, Air Freight & Logistics) | | | | | | | | | | | 10,600 | | | | 487,891 | |
Shikoku Electric Power Company Incorporated (Utilities, Electric Utilities) | | | | | | | | | | | 4,534 | | | | 34,503 | |
Shimadzu Corporation (Information Technology, Electronic Equipment, Instruments & Components) | | | | | | | | | | | 11,100 | | | | 331,695 | |
Shimamura Company Limited (Consumer Discretionary, Specialty Retail) | | | | | | | | | | | 7,100 | | | | 586,555 | |
Shimano Incorporated (Consumer Discretionary, Leisure Products) | | | | | | | | | | | 2,000 | | | | 423,925 | |
Shimizu Corporation (Industrials, Construction & Engineering) | | | | | | | | | | | 86,200 | | | | 664,110 | |
Shin-Etsu Chemical Company Limited (Materials, Chemicals) | | | | | | | | | | | 18,400 | | | | 2,238,436 | |
The accompanying notes are an integral part of these financial statements.
16 | Wells Fargo Factor Enhanced International Equity Portfolio
Portfolio of investments—August 31, 2020 (unaudited)
| | | | | | | | | | | | | | | | |
| | | | | | | | | Shares | | | Value | |
|
| Japan (continued) | |
Shinsei Bank Limited (Financials, Banks) | | | | | | | | | | | 16,100 | | | $ | 188,339 | |
Shionogi & Company Limited (Health Care, Pharmaceuticals) | | | | | | | | | | | 14,500 | | | | 805,396 | |
Shizuoka Bank Limited (Financials, Banks) | | | | | | | | | | | 19,600 | | | | 136,385 | |
Sho-Bond Holdings Company Limited (Industrials, Construction & Engineering) | | | | | | | | | | | 1,100 | | | | 52,032 | |
Showa Denko KK (Materials, Chemicals) | | | | | | | | | | | 13,100 | | | | 255,655 | |
Skylark Holdings Company Limited (Consumer Discretionary, Hotels, Restaurants & Leisure) | | | | | | | | | | | 4,667 | | | | 74,291 | |
SMC Corporation (Industrials, Machinery) | | | | | | | | | | | 1,400 | | | | 769,957 | |
SoftBank Corporation (Communication Services, Wireless Telecommunication Services) | | | | | | | | | | | 82,000 | | | | 1,078,081 | |
SoftBank Group Corporation (Communication Services, Wireless Telecommunication Services) | | | | | | | | | | | 33,000 | | | | 2,055,743 | |
Sohgo Security Services Company Limited (Industrials, Commercial Services & Supplies) | | | | | | | | | | | 5,500 | | | | 257,305 | |
Sojitz Corporation (Industrials, Trading Companies & Distributors) | | | | | | | | | | | 27,767 | | | | 63,706 | |
Sompo Holdings Incorporated (Financials, Insurance) | | | | | | | | | | | 16,800 | | | | 631,299 | |
Sony Corporation (Consumer Discretionary, Household Durables) | | | | | | | | | | | 23,400 | | | | 1,835,723 | |
Sotetsu Holdings Incorporated (Industrials, Road & Rail) | | | | | | | | | | | 2,100 | | | | 57,241 | |
Square Enix Company Limited (Communication Services, Entertainment) | | | | | | | | | | | 13,000 | | | | 857,952 | |
Stanley Electric Company Limited (Consumer Discretionary, Auto Components) | | | | | | | | | | | 14,200 | | | | 407,572 | |
Subaru Corporation (Consumer Discretionary, Automobiles) | | | | | | | | | | | 46,100 | | | | 958,648 | |
Sugi Pharmacy Company Limited (Consumer Staples, Food & Staples Retailing) | | | | | | | | | | | 934 | | | | 67,461 | |
Sumco Corporation (Information Technology, Semiconductors & Semiconductor Equipment) | | | | | | | | | | | 30,433 | | | | 413,187 | |
Sumitomo Chemical Company Limited (Materials, Chemicals) | | | | | | | | | | | 36,700 | | | | 119,544 | |
Sumitomo Corporation (Industrials, Trading Companies & Distributors) | | | | | | | | | | | 37,350 | | | | 484,705 | |
Sumitomo Dainippon Pharma Company Limited (Health Care, Pharmaceuticals) | | | | | | | | | | | 4,434 | | | | 56,181 | |
Sumitomo Electric Industries Limited (Industrials, Electrical Equipment) | | | | | | | | | | | 42,300 | | | | 498,822 | |
Sumitomo Foresting Company Limited (Consumer Discretionary, Household Durables) | | | | | | | | | | | 3,967 | | | | 63,560 | |
Sumitomo Heavy Industries Limited (Industrials, Machinery) | | | | | | | | | | | 8,900 | | | | 202,764 | |
Sumitomo Mitsui Financial Group Incorporated (Financials, Banks) | | | | | | | | | | | 64,800 | | | | 1,907,628 | |
Sumitomo Mitsui Trust Holdings Incorporated (Financials, Banks) | | | | | | | | | | | 8,400 | | | | 243,558 | |
Sumitomo Realty & Development Company Limited (Real Estate, Real Estate Management & Development) | | | | | | | | | | | 900 | | | | 26,605 | |
Sumitomo Rubber Industries Limited (Consumer Discretionary, Auto Components) | | | | | | | | | | | 20,900 | | | | 201,472 | |
Sundrug Company Limited (Consumer Staples, Food & Staples Retailing) | | | | | | | | | | | 9,100 | | | | 338,946 | |
Suntory Beverage & Food Limited (Consumer Staples, Beverages) | | | | | | | | | | | 8,700 | | | | 335,958 | |
Sushiro Global Holdings Limited (Consumer Discretionary, Hotels, Restaurants & Leisure) | | | | | | | | | | | 2,300 | | | | 53,550 | |
Suzuken Company Limited (Health Care, Health Care Providers & Services) | | | | | | | | | | | 3,100 | | | | 115,319 | |
Suzuki Motor Corporation (Consumer Discretionary, Automobiles) | | | | | | | | | | | 13,033 | | | | 535,151 | |
Sysmex Corporation (Health Care, Health Care Equipment & Supplies) | | | | | | | | | | | 5,900 | | | | 515,662 | |
T&D Holdings Incorporated (Financials, Insurance) | | | | | | | | | | | 46,100 | | | | 483,133 | |
Taiheiyo Cement Corporation (Materials, Construction Materials) | | | | | | | | | | | 28,600 | | | | 727,995 | |
Taisei Corporation (Industrials, Construction & Engineering) | | | | | | | | | | | 16,500 | | | | 570,953 | |
Taiyo Nippon Sanso Corporation (Materials, Chemicals) | | | | | | | | | | | 4,867 | | | | 85,746 | |
Taiyo Yuden Company Limited (Information Technology, Electronic Equipment, Instruments & Components) | | | | | | | | | | | 2,834 | | | | 76,419 | |
Takara Holdings Incorporated (Consumer Staples, Beverages) | | | | | | | | | | | 4,600 | | | | 43,127 | |
Takashimaya Company Limited (Consumer Discretionary, Multiline Retail) | | | | | | | | | | | 3,667 | | | | 28,944 | |
Takeda Pharmaceutical Company Limited (Health Care, Pharmaceuticals) | | | | | | | | | | | 300 | | | | 11,214 | |
TDK Corporation (Information Technology, Electronic Equipment, Instruments & Components) | | | | | | | | | | | 6,500 | | | | 675,683 | |
TechnoPro Holdings Incorporated (Industrials, Professional Services) | | | | | | | | | | | 867 | | | | 46,332 | |
Teijin Limited (Materials, Chemicals) | | | | | | | | | | | 29,800 | | | | 468,179 | |
Terumo Corporation (Health Care, Health Care Equipment & Supplies) | | | | | | | | | | | 31,000 | | | | 1,261,483 | |
The Bank of Kyoto Limited (Financials, Banks) | | | | | | | | | | | 1,700 | | | | 72,549 | |
The Chugoku Electric Power Company Incorporated (Utilities, Electric Utilities) | | | | | | | | | | | 39,500 | | | | 481,839 | |
The Hachijuni Bank Limited (Financials, Banks) | | | | | | | | | | | 11,367 | | | | 44,002 | |
The Yokohama Rubber Company Limited (Consumer Discretionary, Auto Components) | | | | | | | | | �� | | 19,100 | | | | 299,534 | |
THK Company Limited (Industrials, Machinery) | | | | | | | | | | | 2,867 | | | | 67,293 | |
TIS Incorporated (Information Technology, IT Services) | | | | | | | | | | | 40,800 | | | | 816,655 | |
Tobu Railway Company Limited (Industrials, Road & Rail) | | | | | | | | | | | 12,500 | | | | 390,643 | |
Toho Company Limited Tokyo (Communication Services, Entertainment) | | | | | | | | | | | 4,900 | | | | 186,442 | |
The accompanying notes are an integral part of these financial statements.
Wells Fargo Factor Enhanced International Equity Portfolio | 17
Portfolio of investments—August 31, 2020 (unaudited)
| | | | | | | | | | | | | | | | |
| | | | | | | | | Shares | | | Value | |
|
| Japan (continued) | |
Toho Gas Company Limited (Utilities, Gas Utilities) | | | | | | | | | | | 4,600 | | | $ | 202,823 | |
Tohoku Electric Power Company Incorporated (Utilities, Electric Utilities) | | | | | | | | | | | 60,400 | | | | 613,039 | |
Tokai Carbon Company Limited (Materials, Chemicals) | | | | | | | | | | | 4,767 | | | | 44,783 | |
Tokio Marine Holdings Incorporated (Financials, Insurance) | | | | | | | | | | | 23,200 | | | | 1,071,123 | |
Tokyo Broadcasting System Incorporated (Communication Services, Media) | | | | | | | | | | | 3,967 | | | | 68,617 | |
Tokyo Century Corporation (Financials, Diversified Financial Services) | | | | | | | | | | | 1,784 | | | | 91,630 | |
Tokyo Electric Power Company Holdings Incorporated (Utilities, Electric Utilities) † | | | | | | | | | | | 37,434 | | | | 110,272 | |
Tokyo Electron Limited (Information Technology, Semiconductors & Semiconductor Equipment) | | | | | | | | | | | 4,600 | | | | 1,179,153 | |
Tokyo Gas Company Limited (Utilities, Gas Utilities) | | | | | | | | | | | 15,100 | | | | 335,960 | |
Tokyo Tatemono Company Limited (Real Estate, Real Estate Management & Development) | | | | | | | | | | | 4,900 | | | | 59,726 | |
Tokyu Corporation (Industrials, Road & Rail) | | | | | | | | | | | 14,434 | | | | 193,244 | |
Tokyu Fudosan Holdings Corporation (Real Estate, Real Estate Management & Development) | | | | | | | | | | | 55,600 | | | | 239,377 | |
Toppan Printing Company Limited (Industrials, Commercial Services & Supplies) | | | | | | | | | | | 31,600 | | | | 491,685 | |
Toray Industries Incorporated (Materials, Chemicals) | | | | | | | | | | | 37,600 | | | | 178,814 | |
Toshiba Corporation (Industrials, Industrial Conglomerates) | | | | | | | | | | | 10,100 | | | | 291,323 | |
Tosoh Corporation (Materials, Chemicals) | | | | | | | | | | | 54,900 | | | | 816,386 | |
TOTO Limited (Industrials, Building Products) | | | | | | | | | | | 7,700 | | | | 338,418 | |
Toyo Suisan Kaisha Limited (Consumer Staples, Food Products) | | | | | | | | | | | 8,000 | | | | 454,704 | |
Toyoda Gosei Company Limited (Consumer Discretionary, Auto Components) | | | | | | | | | | | 700 | | | | 15,300 | |
Toyota Industries Corporation (Consumer Discretionary, Auto Components) | | | | | | | | | | | 400 | | | | 23,339 | |
Toyota Motor Corporation (Consumer Discretionary, Automobiles) | | | | | | | | | | | 51,100 | | | | 3,380,131 | |
Toyota Tsusho Corporation (Industrials, Trading Companies & Distributors) | | | | | | | | | | | 17,000 | | | | 495,964 | |
Trend Micro Incorporated (Information Technology, Software) | | | | | | | | | | | 13,600 | | | | 842,336 | |
Tsumura & Company (Health Care, Pharmaceuticals) | | | | | | | | | | | 1,734 | | | | 49,279 | |
Tsuruha Holdings Incorporated (Consumer Staples, Food & Staples Retailing) | | | | | | | | | | | 4,400 | | | | 588,245 | |
UBE Industries Limited (Materials, Chemicals) | | | | | | | | | | | 2,300 | | | | 41,151 | |
Unicharm Corporation (Consumer Staples, Household Products) | | | | | | | | | | | 18,700 | | | | 814,632 | |
United Urban Investment Corporation (Real Estate, Equity REITs) | | | | | | | | | | | 74 | | | | 82,443 | |
USS Company Limited (Consumer Discretionary, Specialty Retail) | | | | | | | | | | | 5,400 | | | | 91,313 | |
Welcia Holdings Company Limiited (Consumer Staples, Food & Staples Retailing) | | | | | | | | | | | 6,200 | | | | 265,468 | |
West Japan Railway Company (Industrials, Road & Rail) | | | | | | | | | | | 4,767 | | | | 250,738 | |
Yakult Honsha Company Limited (Consumer Staples, Food Products) | | | | | | | | | | | 3,900 | | | | 222,773 | |
Yamada Denki Company Limited (Consumer Discretionary, Specialty Retail) | | | | | | | | | | | 147,700 | | | | 793,479 | |
Yamaguchi Financial Group (Financials, Banks) | | | | | | | | | | | 5,667 | | | | 37,614 | |
Yamaha Corporation (Consumer Discretionary, Leisure Products) | | | | | | | | | | | 3,733 | | | | 182,218 | |
Yamaha Motor Company Limited (Consumer Discretionary, Automobiles) | | | | | | | | | | | 14,300 | | | | 225,608 | |
Yamato Holdings Company Limited (Industrials, Air Freight & Logistics) | | | | | | | | | | | 16,000 | | | | 418,751 | |
Yamazaki Baking Company Limited (Consumer Staples, Food Products) | | | | | | | | | | | 18,200 | | | | 296,589 | |
Yokogawa Electric Corporation (Information Technology, Electronic Equipment, Instruments & Components) | | | | | | | | | | | 1,700 | | | | 27,816 | |
Z Holdings Corporation (Communication Services, Interactive Media & Services) | | | | | | | | | | | 65,366 | | | | 435,094 | |
Zenkoku Hosho Company Limited (Financials, Diversified Financial Services) | | | | | | | | | | | 1,567 | | | | 55,555 | |
Zensho Holdings Company Limited (Consumer Discretionary, Hotels, Restaurants & Leisure) | | | | | | | | | | | 2,400 | | | | 54,111 | |
Zeon Corporation (Materials, Chemicals) | | | | | | | | | | | 4,567 | | | | 48,121 | |
ZOZO Incorporated (Consumer Discretionary, Internet & Direct Marketing Retail) | | | | | | | | | | | 34,100 | | | | 960,718 | |
| |
| | | | 145,475,220 | |
| | | | | |
|
| Luxembourg: 0.26% | |
ArcelorMittal SA (Materials, Metals & Mining) † | | | | | | | | | | | 7,342 | | | | 92,890 | |
Aroundtown SA (Real Estate, Real Estate Management & Development) † | | | | | | | | | | | 26,801 | | | | 146,546 | |
B&M European Value Retail SA (Consumer Discretionary, Multiline Retail) | | | | | | | | | | | 16,701 | | | | 106,020 | |
Eurofins Scientific SE (Health Care, Life Sciences Tools & Services) † | | | | | | | | | | | 825 | | | | 661,200 | |
Grand City Properties SA (Real Estate, Real Estate Management & Development) | | | | | | | | | | | 2,290 | | | | 58,755 | |
SES SA (Communication Services, Media) | | | | | | | | | | | 48,130 | | | | 341,744 | |
Tenaris SA (Energy, Energy Equipment & Services) | | | | | | | | | | | 35,195 | | | | 206,640 | |
| |
| | | | 1,613,795 | |
| | | | | |
The accompanying notes are an integral part of these financial statements.
18 | Wells Fargo Factor Enhanced International Equity Portfolio
Portfolio of investments—August 31, 2020 (unaudited)
| | | | | | | | | | | | | | | | |
| | | | | | | | | Shares | | | Value | |
| Netherlands: 4.08% | |
Aalberts Industries NV (Industrials, Machinery) | | | | | | | | | | | 2,178 | | | $ | 82,236 | |
Adyen NV (Information Technology, IT Services) 144A† | | | | | | | | | | | 807 | | | | 1,360,766 | |
Aegon NV (Financials, Insurance) | | | | | | | | | | | 118,783 | | | | 330,702 | |
AerCap Holdings NV (Industrials, Trading Companies & Distributors) † | | | | | | | | | | | 18,215 | | | | 538,618 | |
Airbus SE (Industrials, Aerospace & Defense) † | | | | | | | | | | | 11,205 | | | | 920,493 | |
Akzo Nobel NV (Materials, Chemicals) | | | | | | | | | | | 10,344 | | | | 1,023,813 | |
Altice NV Class A (Communication Services, Media) † | | | | | | | | | | | 13,810 | | | | 61,108 | |
ASM International NV (Information Technology, Semiconductors & Semiconductor Equipment) | | | | | | | | | | | 1,035 | | | | 155,748 | |
ASML Holding NV (Information Technology, Semiconductors & Semiconductor Equipment) | | | | | | | | | | | 10,186 | | | | 3,820,463 | |
ASR Nederland NV (Financials, Insurance) | | | | | | | | | | | 3,097 | | | | 107,363 | |
Davide Campari-Milano NV (Consumer Staples, Beverages) | | | | | | | | | | | 10,217 | | | | 104,758 | |
Euronext NV (Financials, Capital Markets) 144A | | | | | | | | | | | 1,155 | | | | 140,313 | |
Exor NV (Financials, Diversified Financial Services) | | | | | | | | | | | 4,656 | | | | 274,478 | |
Ferrari NV (Consumer Discretionary, Automobiles) | | | | | | | | | | | 1,367 | | | | 266,230 | |
Fiat Chrysler Automobiles NV (Consumer Discretionary, Automobiles) † | | | | | | | | | | | 27,612 | | | | 304,169 | |
Heineken Holding NV (Consumer Staples, Beverages) | | | | | | | | | | | 2,078 | | | | 170,237 | |
Heineken NV (Consumer Staples, Beverages) | | | | | | | | | | | 7,731 | | | | 715,552 | |
IMCD Group NV (Industrials, Trading Companies & Distributors) | | | | | | | | | | | 1,186 | | | | 126,642 | |
ING Groep NV (Financials, Banks) | | | | | | | | | | | 92,998 | | | | 755,102 | |
Just Eat Takeaway.com NV (Consumer Discretionary, Internet & Direct Marketing Retail) 144A† | | | | | | | | | | | 3,719 | | | | 415,336 | |
Koninklijke Ahold Delhaize NV (Consumer Staples, Food & Staples Retailing) | | | | | | | | | | | 60,466 | | | | 1,819,802 | |
Koninklijke DSM NV (Materials, Chemicals) | | | | | | | | | | | 9,057 | | | | 1,453,159 | |
Koninklijke KPN NV (Communication Services, Diversified Telecommunication Services) | | | | | | | | | | | 130,438 | | | | 341,981 | |
Koninklijke Philips NV (Health Care, Health Care Equipment & Supplies) † | | | | | | | | | | | 20,726 | | | | 980,307 | |
Koninklijke Vopak NV (Energy, Oil, Gas & Consumable Fuels) | | | | | | | | | | | 3,207 | | | | 176,122 | |
NN Group NV (Financials, Insurance) | | | | | | | | | | | 18,114 | | | | 681,996 | |
Prosus NV (Consumer Discretionary, Internet & Direct Marketing Retail) † | | | | | | | | | | | 14,023 | | | | 1,403,008 | |
Qiagen NV (Health Care, Life Sciences Tools & Services) † | | | | | | | | | | | 5,151 | | | | 261,676 | |
Randstad Holdings NV (Industrials, Professional Services) | | | | | | | | | | | 15,818 | | | | 824,333 | |
SBM Offshore NV (Energy, Energy Equipment & Services) | | | | | | | | | | | 3,192 | | | | 55,176 | |
Signify NV (Industrials, Electrical Equipment) 144A† | | | | | | | | | | | 2,880 | | | | 96,197 | |
STMicroelectronics NV (Information Technology, Semiconductors & Semiconductor Equipment) | | | | | | | | | | | 16,143 | | | | 485,652 | |
STMicroelectronics NV (Information Technology, Semiconductors & Semiconductor Equipment) | | | | | | | | | | | 14,898 | | | | 446,952 | |
Unilever NV (Consumer Staples, Personal Products) | | | | | | | | | | | 68,839 | | | | 3,985,050 | |
Wolters Kluwer NV (Communication Services, Media) | | | | | | | | | | | 13,157 | | | | 1,080,222 | |
| |
| | | | 25,765,760 | |
| | | | | |
|
| New Zealand: 0.45% | |
A2 Milk Company Limited (Consumer Staples, Food Products) † | | | | | | | | | | | 25,966 | | | | 325,152 | |
Auckland International Airport Limited (Industrials, Transportation Infrastructure) | | | | | | | | | | | 28,959 | | | | 129,330 | |
Chorus Limited (Communication Services, Diversified Telecommunication Services) | | | | | | | | | | | 10,407 | | | | 59,376 | |
Contact Energy Limited (Utilities, Electric Utilities) | | | | | | | | | | | 16,121 | | | | 67,869 | |
Fisher & Paykel Healthcare Corporation (Health Care, Health Care Equipment & Supplies) | | | | | | | | | | | 40,722 | | | | 1,010,808 | |
Fletcher Building Limited (Materials, Construction Materials) | | | | | | | | | | | 18,457 | | | | 44,633 | |
Infratil Limited (Utilities, Electric Utilities) | | | | | | | | | | | 14,769 | | | | 49,344 | |
Mainfreight Limited (Industrials, Air Freight & Logistics) | | | | | | | | | | | 1,851 | | | | 59,836 | |
Mercury LTD (Utilities, Electric Utilities) | | | | | | | | | | | 14,334 | | | | 50,111 | |
Meridian Energy Limited (Utilities, Independent Power & Renewable Electricity Producers) | | | | | | | | | | | 27,562 | | | | 94,314 | |
Ryman Healthcare Limited (Health Care, Health Care Providers & Services) | | | | | | | | | | | 9,469 | | | | 85,725 | |
Spark New Zealand Limited (Communication Services, Diversified Telecommunication Services) | | | | | | | | | | | 209,196 | | | | 680,616 | |
Xero Limited (Information Technology, Software) † | | | | | | | | | | | 2,575 | | | | 191,761 | |
| |
| | | | 2,848,875 | |
| | | | | |
|
| Norway: 0.63% | |
Adevinta ASA (Communication Services, Interactive Media & Services) † | | | | | | | | | | | 5,189 | | | | 96,822 | |
DNB ASA (Financials, Banks) † | | | | | | | | | | | 50,502 | | | | 810,511 | |
The accompanying notes are an integral part of these financial statements.
Wells Fargo Factor Enhanced International Equity Portfolio | 19
Portfolio of investments—August 31, 2020 (unaudited)
| | | | | | | | | | | | | | | | |
| | | | | | | | | Shares | | | Value | |
|
| Norway (continued) | |
Entra ASA (Real Estate, Real Estate Management & Development) 144A | | | | | | | | | | | 3,588 | | | $ | 49,041 | |
Equinor ASA (Energy, Oil, Gas & Consumable Fuels) | | | | | | | | | | | 26,651 | | | | 431,995 | |
Gjensidige Forsikring ASA (Financials, Insurance) † | | | | | | | | | | | 34,629 | | | | 737,715 | |
Mowi ASA (Consumer Staples, Food Products) | | | | | | | | | | | 14,791 | | | | 289,278 | |
Norsk Hydro ASA (Materials, Metals & Mining) † | | | | | | | | | | | 42,290 | | | | 135,017 | |
Orkla ASA (Consumer Staples, Food Products) | | | | | | | | | | | 52,161 | | | | 530,943 | |
Salmar ASA (Consumer Staples, Food Products) † | | | | | | | | | | | 1,237 | | | | 67,049 | |
Schibsted ASA Class A (Communication Services, Media) † | | | | | | | | | | | 1,793 | | | | 78,077 | |
Storebrand ASA (Financials, Insurance) † | | | | | | | | | | | 9,619 | | | | 59,086 | |
Telenor ASA (Communication Services, Diversified Telecommunication Services) | | | | | | | | | | | 15,195 | | | | 247,171 | |
TGS Nopec Geophysical Company ASA (Energy, Energy Equipment & Services) | | | | | | | | | | | 2,484 | | | | 32,316 | |
Tomra Systems ASA (Industrials, Commercial Services & Supplies) † | | | | | | | | | | | 2,403 | | | | 116,496 | |
Yara International ASA (Materials, Chemicals) | | | | | | | | | | | 7,315 | | | | 306,477 | |
| |
| | | | 3,987,994 | |
| | | | | |
|
| Poland: 0.11% | |
Bank Pekao SA (Financials, Banks) † | | | | | | | | | | | 3,889 | | | | 55,227 | |
CD Projekt SA (Communication Services, Entertainment) † | | | | | | | | | | | 1,551 | | | | 184,668 | |
KGHM Polska Miedz SA (Materials, Metals & Mining) † | | | | | | | | | | | 2,740 | | | | 101,814 | |
LPP SA (Consumer Discretionary, Textiles, Apparel & Luxury Goods) † | | | | | | | | | | | 27 | | | | 52,675 | |
PKO Bank Polski SA (Financials, Banks) † | | | | | | | | | | | 19,565 | | | | 114,588 | |
Polski Koncern Naftowy Orlen SA (Energy, Oil, Gas & Consumable Fuels) | | | | | | | | | | | 7,048 | | | | 96,910 | |
Powszechny Zaklad Ubezpieczen SA (Financials, Insurance) | | | | | | | | | | | 12,876 | | | | 94,991 | |
| |
| | | | 700,873 | |
| | | | | |
|
| Portugal: 0.16% | |
Energias de Portugal SA (Utilities, Electric Utilities) | | | | | | | | | | | 130,345 | | | | 659,831 | |
Galp Energia SGPS SA (Energy, Oil, Gas & Consumable Fuels) | | | | | | | | | | | 24,945 | | | | 267,080 | |
Jeronimo Martins SA (Consumer Staples, Food & Staples Retailing) | | | | | | | | | | | 5,547 | | | | 91,051 | |
| |
| | | | 1,017,962 | |
| | | | | |
|
| Singapore: 1.11% | |
Ascendas REIT (Real Estate, Equity REITs) | | | | | | | | | | | 91,700 | | | | 223,765 | |
CapitaLand Commercial Trust Limited (Real Estate, Equity REITs) | | | | | | | | | | | 57,967 | | | | 71,577 | |
CapitaLand Limited (Real Estate, Real Estate Management & Development) | | | | | | | | | | | 58,022 | | | | 118,129 | |
CapitaLand Mall Trust (Real Estate, Equity REITs) | | | | | | | | | | | 65,384 | | | | 94,192 | |
City Developments Limited (Real Estate, Real Estate Management & Development) | | | | | | | | | | | 10,326 | | | | 60,944 | |
ComfortDelGro Corporation Limited (Industrials, Road & Rail) | | | | | | | | | | | 44,080 | | | | 47,950 | |
DBS Group Holdings Limited (Financials, Banks) | | | | | | | | | | | 75,013 | | | | 1,150,653 | |
Frasers Logistics & Commercial Trust REIT (Real Estate, Equity REITs) | | | | | | | | | | | 63,300 | | | | 62,344 | |
Genting Singapore Limited (Consumer Discretionary, Hotels, Restaurants & Leisure) | | | | | | | | | | | 389,424 | | | | 200,358 | |
Jardine Cycle & Carriage Limited (Consumer Discretionary, Distributors) | | | | | | | | | | | 1,660 | | | | 23,121 | |
Keppel Corporation Limited (Industrials, Industrial Conglomerates) | | | | | | | | | | | 41,800 | | | | 140,711 | |
Keppel DC REIT (Real Estate, Equity REITs) | | | | | | | | | | | 27,867 | | | | 59,603 | |
Mapletree Commercial Trust (Real Estate, Equity REITs) | | | | | | | | | | | 122,600 | | | | 173,012 | |
Mapletree Industrial Trust (Real Estate, Equity REITs) | | | | | | | | | | | 33,167 | | | | 74,352 | |
Mapletree Logistics Trust (Real Estate, Equity REITs) | | | | | | | | | | | 368,500 | | | | 560,652 | |
NetLink NBN Trust Unit (Communication Services, Diversified Telecommunication Services) | | | | | | | | | | | 76,567 | | | | 54,588 | |
Oversea-Chinese Banking Corporation Limited (Financials, Banks) | | | | | | | | | | | 117,996 | | | | 751,920 | |
Singapore Airlines Limited (Industrials, Airlines) | | | | | | | | | | | 58,300 | | | | 156,404 | |
Singapore Exchange Limited (Financials, Capital Markets) | | | | | | | | | | | 43,774 | | �� | | 277,016 | |
Singapore Press Holdings Limited (Communication Services, Media) | | | | | | | | | | | 35,567 | | | | 28,494 | |
Singapore Technologies Engineering Limited (Industrials, Aerospace & Defense) | | | | | | | | | | | 50,069 | | | | 125,122 | |
Suntec REIT (Real Estate, Equity REITs) | | | | | | | | | | | 107,400 | | | | 110,514 | |
United Overseas Bank Limited (Financials, Banks) | | | | | | | | | | | 57,586 | | | | 827,887 | |
UOL Group Limited (Real Estate, Real Estate Management & Development) | | | | | | | | | | | 18,673 | | | | 90,171 | |
The accompanying notes are an integral part of these financial statements.
20 | Wells Fargo Factor Enhanced International Equity Portfolio
Portfolio of investments—August 31, 2020 (unaudited)
| | | | | | | | | | | | | | | | |
| | | | | | | | | Shares | | | Value | |
|
| Singapore (continued) | |
Venture Corporation Limited (Information Technology, Electronic Equipment, Instruments & Components) | | | | | | | | | | | 44,300 | | | $ | 646,323 | |
Wilmar International Limited (Consumer Staples, Food Products) | | | | | | | | | | | 134,785 | | | | 431,930 | |
Yangzijiang Shipbuilding Holdings Limited (Industrials, Machinery) | | | | | | | | | | | 657,700 | | | | 442,318 | |
| |
| | | | 7,004,050 | |
| | | | | |
|
| South Africa: 0.01% | |
Old Mutual Limited (Financials, Insurance) | | | | | | | | | | | 83,569 | | | | 57,664 | |
| | | | | | | | | | | | | | | | |
|
| Spain: 1.91% | |
Acciona SA (Utilities, Electric Utilities) | | | | | | | | | | | 444 | | | | 53,091 | |
Actividades de Construccion y Servicios SA (Industrials, Construction & Engineering) | | | | | | | | | | | 10,940 | | | | 267,894 | |
Aena SA (Industrials, Transportation Infrastructure) 144A† | | | | | | | | | | | 5,754 | | | | 859,004 | |
Amadeus IT Holding SA Class A (Information Technology, IT Services) | | | | | | | | | | | 4,754 | | | | 266,129 | |
Banco Bilbao Vizcaya Argentaria SA (Financials, Banks) | | | | | | | | | | | 261,791 | | | | 766,338 | |
Banco de Sabade SA (Financials, Banks) | | | | | | | | | | | 121,812 | | | | 49,162 | |
Banco Santander Central Hispano SA (Financials, Banks) | | | | | | | | | | | 320,487 | | | | 712,434 | |
Bankinter SA (Financials, Banks) | | | | | | | | | | | 81,861 | | | | 440,284 | |
CaixaBank SA (Financials, Banks) | | | | | | | | | | | 314,238 | | | | 690,743 | |
Cellnex Telecom SA (Communication Services, Diversified Telecommunication Services) 144A | | | | | | | | | | | 5,453 | | | | 349,314 | |
Enagás SA (Utilities, Gas Utilities) | | | | | | | | | | | 31,983 | | | | 782,040 | |
Endesa SA (Utilities, Electric Utilities) | | | | | | | | | | | 3,670 | | | | 101,738 | |
Gamesa Corporación Tecnologica SA (Industrials, Electrical Equipment) | | | | | | | | | | | 6,613 | | | | 177,088 | |
Gas Natural SDG SA (Utilities, Gas Utilities) | | | | | | | | | | | 7,565 | | | | 145,888 | |
Grifols SA (Health Care, Biotechnology) | | | | | | | | | | | 25,595 | | | | 693,650 | |
Iberdrola SA (Utilities, Electric Utilities) | | | | | | | | | | | 274,163 | | | | 3,451,670 | |
Industria de Diseno Textil SA (Consumer Discretionary, Specialty Retail) | | | | | | | | | | | 16,280 | | | | 457,523 | |
Inmobiliaria Colonial Socimi SA (Real Estate, Equity REITs) | | | | | | | | | | | 6,024 | | | | 53,017 | |
International Consolidated Airlines Group SA (Industrials, Airlines) | | | | | | | | | | | 26,276 | | | | 73,731 | |
Mapfre SA (Financials, Insurance) | | | | | | | | | | | 194,217 | | | | 368,049 | |
Merlin Properties Socimi SA (Real Estate, Equity REITs) | | | | | | | | | | | 8,221 | | | | 73,775 | |
Red Eléctrica de Espana SA (Utilities, Electric Utilities) | | | | | | | | | | | 15,516 | | | | 296,719 | |
Repsol SA (Energy, Oil, Gas & Consumable Fuels) | | | | | | | | | | | 63,917 | | | | 505,095 | |
Telefonica SA (Communication Services, Diversified Telecommunication Services) | | | | | | | | | | | 101,842 | | | | 402,396 | |
Viscofan SA (Consumer Staples, Food Products) | | | | | | | | | | | 832 | | | | 61,558 | |
| |
| | | | 12,098,330 | |
| | | | | |
|
| Sweden: 3.39% | |
AAK AB (Consumer Staples, Food Products) † | | | | | | | | | | | 3,974 | | | | 78,724 | |
Addtech AB Class B (Industrials, Trading Companies & Distributors) | | | | | | | | | | | 1,459 | | | | 75,566 | |
Alfa Laval AB (Industrials, Machinery) † | | | | | | | | | | | 11,605 | | | | 283,625 | |
Assa Abloy AB Class B (Industrials, Building Products) | | | | | | | | | | | 30,946 | | | | 715,531 | |
Atlas Copco AB Class A (Industrials, Machinery) | | | | | | | | | | | 29,996 | | | | 1,386,784 | |
Atlas Copco AB Class B (Industrials, Machinery) | | | | | | | | | | | 8,723 | | | | 350,239 | |
Axfood AB (Consumer Staples, Food & Staples Retailing) | | | | | | | | | | | 2,297 | | | | 50,774 | |
BillerudKorsnas AB (Materials, Containers & Packaging) | | | | | | | | | | | 3,952 | | | | 66,432 | |
Boliden AB (Materials, Metals & Mining) | | | | | | | | | | | 24,573 | | | | 732,662 | |
Castellum AB (Real Estate, Real Estate Management & Development) | | | | | | | | | | | 5,340 | | | | 109,272 | |
Dometic Group AB (Consumer Discretionary, Auto Components) 144A† | | | | | | | | | | | 6,509 | | | | 80,066 | |
Elekta AB Class B (Health Care, Health Care Equipment & Supplies) | | | | | | | | | | | 8,298 | | | | 104,039 | |
Epiroc AB Class A (Industrials, Machinery) | | | | | | | | | | | 35,459 | | | | 527,798 | |
Epiroc AB Class B (Industrials, Machinery) | | | | | | | | | | | 17,053 | | | | 245,155 | |
EQT AB (Financials, Capital Markets) | | | | | | | | | | | 12,976 | | | | 239,274 | |
Ericsson LM Class B (Information Technology, Communications Equipment) | | | | | | | | | | | 156,579 | | | | 1,814,729 | |
Essity Aktiebolag AB (Consumer Staples, Household Products) † | | | | | | | | | | | 24,456 | | | | 841,419 | |
Evolution Gaming Group AB (Consumer Discretionary, Hotels, Restaurants & Leisure) 144A | | | | | | | | | | | 11,551 | | | | 865,076 | |
The accompanying notes are an integral part of these financial statements.
Wells Fargo Factor Enhanced International Equity Portfolio | 21
Portfolio of investments—August 31, 2020 (unaudited)
| | | | | | | | | | | | | | | | |
| | | | | | | | | Shares | | | Value | |
|
| Sweden (continued) | |
Fabege AB (Real Estate, Real Estate Management & Development) | | | | | | | | | | | 6,275 | | | $ | 76,426 | |
Fastighets AB Balder B Shares (Real Estate, Real Estate Management & Development) † | | | | | | | | | | | 2,198 | | | | 87,566 | |
Getinge AB Class B (Health Care, Health Care Equipment & Supplies) | | | | | | | | | | | 4,591 | | | | 101,960 | |
Hennes & Mauritz AB Class B (Consumer Discretionary, Specialty Retail) | | | | | | | | | | | 36,432 | | | | 580,820 | |
Hexagon AB Class B (Information Technology, Electronic Equipment, Instruments & Components) † | | | | | | | | | | | 1,416 | | | | 102,544 | |
Hexpol AB (Materials, Chemicals) † | | | | | | | | | | | 5,575 | | | | 45,987 | |
Holmen AB Class B (Materials, Paper & Forest Products) † | | | | | | | | | | | 2,040 | | | | 72,593 | |
Husqvarna AB Class B (Consumer Discretionary, Household Durables) | | | | | | | | | | | 8,849 | | | | 96,144 | |
ICA Gruppen AB (Consumer Staples, Food & Staples Retailing) | | | | | | | | | | | 2,008 | | | | 98,476 | |
Industrivarden AB Class A (Financials, Diversified Financial Services) † | | | | | | | | | | | 3,726 | | | | 98,903 | |
Industrivarden AB Class C (Financials, Diversified Financial Services) † | | | | | | | | | | | 2,750 | | | | 72,455 | |
Indutrade AB (Industrials, Trading Companies & Distributors) † | | | | | | | | | | | 1,929 | | | | 101,604 | |
Investment AB Latour Class B (Industrials, Industrial Conglomerates) | | | | | | | | | | | 2,942 | | | | 65,610 | |
Investor AB Class B (Financials, Diversified Financial Services) | | | | | | | | | | | 20,497 | | | | 1,306,625 | |
Kinnevik AB Class B (Financials, Diversified Financial Services) | | | | | | | | | | | 28,595 | | | | 1,104,321 | |
Kinnevik AB Class B (Financials, Diversified Financial Services) † | | | | | | | | | | | 28,595 | | | | 22,976 | |
Lifco AB Class B (Industrials, Industrial Conglomerates) | | | | | | | | | | | 984 | | | | 78,267 | |
Loomis AB (Industrials, Commercial Services & Supplies) † | | | | | | | | | | | 1,828 | | | | 45,902 | |
Lundbergforetagen AB Class B (Financials, Diversified Financial Services) † | | | | | | | | | | | 3,353 | | | | 153,117 | |
Lundin Petroleum AB (Energy, Oil, Gas & Consumable Fuels) | | | | | | | | | | | 8,720 | | | | 213,116 | |
Nibe Industrier AB Class B (Industrials, Building Products) † | | | | | | | | | | | 8,411 | | | | 236,291 | |
Saab AB Class B (Industrials, Aerospace & Defense) † | | | | | | | | | | | 1,778 | | | | 53,444 | |
Samhallsbyggnadsbolaget I Norben AB (Real Estate, Real Estate Management & Development) | | | | | | | | | | | 20,496 | | | | 56,964 | |
Sandvik AB (Industrials, Machinery) † | | | | | | | | | | | 29,582 | | | | 580,710 | |
Securitas AB Class B (Industrials, Commercial Services & Supplies) † | | | | | | | | | | | 10,757 | | | | 153,089 | |
Sinch AB (Information Technology, Software) 144A† | | | | | | | | | | | 946 | | | | 96,024 | |
Skandinaviska Enskilda Banken AB Class A (Financials, Banks) † | | | | | | | | | | | 73,180 | | | | 725,387 | |
Skanska AB Class B (Industrials, Construction & Engineering) † | | | | | | | | | | | 21,225 | | | | 432,362 | |
SKF AB Class B (Industrials, Machinery) | | | | | | | | | | | 31,867 | | | | 635,881 | |
Svenska Cellulosa AB Class B (Materials, Paper & Forest Products) † | | | | | | | | | | | 25,870 | | | | 333,327 | |
Svenska Handelsbanken AB Class A (Financials, Banks) † | | | | | | | | | | | 87,400 | | | | 879,274 | |
Sweco AB Class B (Industrials, Construction & Engineering) | | | | | | | | | | | 1,415 | | | | 87,356 | |
Swedbank AB Class A (Financials, Banks) † | | | | | | | | | | | 45,200 | | | | 766,171 | |
Swedish Match AB (Consumer Staples, Tobacco) | | | | | | | | | | | 15,747 | | | | 1,195,343 | |
Swedish Orphan Biovitrum AB (Health Care, Biotechnology) † | | | | | | | | | | | 4,965 | | | | 111,213 | |
Tele2 AB Class B (Communication Services, Wireless Telecommunication Services) | | | | | | | | | | | 38,782 | | | | 549,462 | |
The Thule Group AB (Consumer Discretionary, Leisure Products) 144A | | | | | | | | | | | 2,217 | | | | 70,023 | |
Volvo AB Class B (Industrials, Machinery) † | | | | | | | | | | | 67,894 | | | | 1,297,473 | |
Wallenstam AB Class B (Real Estate, Real Estate Management & Development) | | | | | | | | | | | 4,526 | | | | 59,284 | |
Wihlborgs Fastigheter AB (Real Estate, Real Estate Management & Development) | | | | | | | | | | | 3,127 | | | | 49,997 | |
| |
| | | | 21,461,652 | |
| | | | | |
|
| Switzerland: 9.75% | |
ABB Limited (Industrials, Electrical Equipment) | | | | | | | | | | | 39,472 | | | | 1,003,011 | |
Adecco SA (Industrials, Professional Services) | | | | | | | | | | | 14,792 | | | | 773,350 | |
Alcon Incorporated (Health Care, Health Care Equipment & Supplies) † | | | | | | | | | | | 1,559 | | | | 88,578 | |
Allreal Holding AG (Real Estate, Real Estate Management & Development) | | | | | | | | | | | 318 | | | | 65,855 | |
Baloise Holding AG (Financials, Insurance) | | | | | | | | | | | 2,095 | | | | 325,624 | |
Banque Cantonale Vaudoise (Financials, Banks) | | | | | | | | | | | 5,846 | | | | 624,082 | |
Barry Callebaut AG (Consumer Staples, Food Products) | | | | | | | | | | | 78 | | | | 172,576 | |
BB Biotech AG (Health Care, Biotechnology) | | | | | | | | | | | 48,398 | | | | 3,654,144 | |
Belimo Holding AG (Industrials, Building Products) | | | | | | | | | | | 11 | | | | 96,012 | |
Cembra Money Bank AG (Financials, Consumer Finance) | | | | | | | | | | | 663 | | | | 79,066 | |
Chocoladefabriken Lindt & Sprungli AG (Consumer Staples, Food Products) | | | | | | | | | | | 13 | | | | 110,664 | |
Chocoladefabriken Lindt & Sprungli AG (Consumer Staples, Food Products) | | | | | | | | | | | 2 | | | | 176,558 | |
Coca-Cola HBC AG (Consumer Staples, Beverages) | | | | | | | | | | | 14,018 | | | | 372,364 | |
Compagnie Financiere Richemont SA (Consumer Discretionary, Textiles, Apparel & Luxury Goods) | | | | | | | | | | | 4,074 | | | | 269,332 | |
Credit Suisse Group AG (Financials, Capital Markets) | | | | | | | | | | | 67,174 | | | | 738,212 | |
The accompanying notes are an integral part of these financial statements.
22 | Wells Fargo Factor Enhanced International Equity Portfolio
Portfolio of investments—August 31, 2020 (unaudited)
| | | | | | | | | | | | | | | | |
| | | | | | | | | Shares | | | Value | |
|
| Switzerland (continued) | |
EMS-Chemie Holdings AG (Materials, Chemicals) | | | | | | | | | | | 622 | | | $ | 560,450 | |
Flughafen Zuerich AG (Industrials, Transportation Infrastructure) † | | | | | | | | | | | 417 | | | | 62,738 | |
Galenica AG (Health Care, Pharmaceuticals) | | | | | | | | | | | 1,073 | | | | 77,037 | |
Geberit AG (Industrials, Building Products) | | | | | | | | | | | 1,644 | | | | 946,807 | |
Georg Fischer AG (Industrials, Machinery) | | | | | | | | | | | 91 | | | | 90,401 | |
Givaudan SA (Materials, Chemicals) | | | | | | | | | | | 391 | | | | 1,639,350 | |
Helvetia Holding AG (Financials, Insurance) | | | | | | | | | | | 734 | | | | 69,060 | |
Julius Baer Group Limited (Financials, Capital Markets) | | | | | | | | | | | 10,498 | | | | 502,863 | |
Kuehne & Nagel International AG (Industrials, Marine) † | | | | | | | | | | | 3,193 | | | | 618,325 | |
LafargeHolcim Limited (Materials, Construction Materials) | | | | | | | | | | | 15,372 | | | | 729,530 | |
Logitech International SA (Information Technology, Technology Hardware, Storage & Peripherals) | | | | | | | | | | | 13,861 | | | | 1,024,605 | |
Lonza Group AG (Health Care, Life Sciences Tools & Services) | | | | | | | | | | | 3,566 | | | | 2,210,727 | |
Nestle SA (Consumer Staples, Food Products) | | | | | | | | | | | 139,645 | | | | 16,770,686 | |
Novartis AG (Health Care, Pharmaceuticals) | | | | | | | | | | | 55,463 | | | | 4,788,243 | |
Partners Group Holding AG (Financials, Capital Markets) | | | | | | | | | | | 796 | | | | 808,196 | |
PSP Swiss Property AG (Real Estate, Real Estate Management & Development) | | | | | | | | | | | 966 | | | | 115,307 | |
Roche Holding AG (Health Care, Pharmaceuticals) | | | | | | | | | | | 33,064 | | | | 11,547,436 | |
Schindler Holding AG (Industrials, Machinery) | | | | | | | | | | | 420 | | | | 110,488 | |
Schindler Holding AG (Industrials, Machinery) | | | | | | | | | | | 3,046 | | | | 812,424 | |
SGS SA (Industrials, Professional Services) | | | | | | | | | | | 258 | | | | 667,298 | |
Sig Combibloc Group AG (Materials, Containers & Packaging) | | | | | | | | | | | 5,351 | | | | 105,013 | |
Sika AG (Materials, Chemicals) | | | | | | | | | | | 4,511 | | | | 1,080,903 | |
Sonova Holding AG (Health Care, Health Care Equipment & Supplies) † | | | | | | | | | | | 1,906 | | | | 445,109 | |
Straumann Holding AG (Health Care, Health Care Equipment & Supplies) | | | | | | | | | | | 248 | | | | 243,844 | |
Sunrise Communications Group AG (Communication Services, Diversified Telecommunication Services) 144A | | | | | | | | | | | 860 | | | | 102,273 | |
Swatch Group AG Class B (Consumer Discretionary, Textiles, Apparel & Luxury Goods) | | | | | | | | | | | 965 | | | | 203,900 | |
Swiss Life Holding AG (Financials, Insurance) | | | | | | | | | | | 1,127 | | | | 454,815 | |
Swiss Prime Site AG (Real Estate, Real Estate Management & Development) | | | | | | | | | | | 4,411 | | | | 396,963 | |
Swiss Reinsurance AG (Financials, Insurance) | | | | | | | | | | | 941 | | | | 75,617 | |
Swisscom AG (Communication Services, Diversified Telecommunication Services) | | | | | | | | | | | 2,029 | | | | 1,122,297 | |
Tecan Group AG (Health Care, Life Sciences Tools & Services) | | | | | | | | | | | 213 | | | | 96,185 | |
Temenos AG (Information Technology, Software) | | | | | | | | | | | 1,382 | | | | 222,906 | |
UBS Group AG (Financials, Capital Markets) | | | | | | | | | | | 106,078 | | | | 1,289,083 | |
VAT Group AG (Industrials, Machinery) 144A | | | | | | | | | | | 573 | | | | 111,564 | |
Vifor Pharma AG (Health Care, Pharmaceuticals) | | | | | | | | | | | 1,716 | | | | 253,333 | |
Zurich Insurance Group AG (Financials, Insurance) | | | | | | | | | | | 7,448 | | | | 2,751,958 | |
| |
| | | | 61,657,162 | |
| | | | | |
|
| Thailand: 0.01% | |
Thai Beverage plc (Consumer Staples, Beverages) | | | | | | | | | | | 186,867 | | | | 84,468 | |
| | | | | | | | | | | | | | | | |
| | | | |
| United Kingdom: 11.53% | | | | | | | | | | | | |
3i Group plc (Financials, Capital Markets) | | | | | | | | | | | 64,320 | | | | 790,397 | |
Admiral Group plc (Financials, Insurance) | | | | | | | | | | | 16,054 | | | | 560,149 | |
Anglo American plc (Materials, Metals & Mining) | | | | | | | | | | | 35,255 | | | | 866,381 | |
Antofagasta plc (Materials, Metals & Mining) | | | | | | | | | | | 3,531 | | | | 50,625 | |
Ashmore Group plc (Financials, Capital Markets) | | | | | | | | | | | 9,977 | | | | 56,081 | |
Ashtead Group plc (Industrials, Trading Companies & Distributors) | | | | | | | | | | | 2,898 | | | | 100,481 | |
Associated British Foods plc (Consumer Staples, Food Products) | | | | | | | | | | | 7,665 | | | | 207,265 | |
Assura plc REIT (Real Estate, Equity REITs) | | | | | | | | | | | 59,224 | | | | 64,126 | |
AstraZeneca plc (Health Care, Pharmaceuticals) | | | | | | | | | | | 30,775 | | | | 3,416,032 | |
Auto Trader Group plc (Communication Services, Interactive Media & Services) 144A | | | | | | | | | | | 65,741 | | | | 491,472 | |
Avast plc (Information Technology, Software) 144A | | | | | | | | | | | 13,877 | | | | 99,232 | |
AVEVA Group plc (Information Technology, Software) | | | | | | | | | | | 1,428 | | | | 96,468 | |
Aviva plc (Financials, Insurance) | | | | | | | | | | | 185,309 | | | | 698,425 | |
The accompanying notes are an integral part of these financial statements.
Wells Fargo Factor Enhanced International Equity Portfolio | 23
Portfolio of investments—August 31, 2020 (unaudited)
| | | | | | | | | | | | | | | | |
| | | | | | | | | Shares | | | Value | |
| | | | |
| United Kingdom (continued) | | | | | | | | | | | | |
BAE Systems plc (Industrials, Aerospace & Defense) | | | | | | | | | | | 222,730 | | | $ | 1,546,209 | |
Barclays plc (Financials, Banks) | | | | | | | | | | | 570,443 | | | | 835,203 | |
Barratt Developments plc (Consumer Discretionary, Household Durables) | | | | | | | | | | | 72,180 | | | | 504,040 | |
Beazley plc (Financials, Insurance) | | | | | | | | | | | 13,296 | | | | 76,243 | |
Bellway plc (Consumer Discretionary, Household Durables) | | | | | | | | | | | 2,642 | | | | 83,930 | |
BHP Group plc (Materials, Metals & Mining) | | | | | | | | | | | 74,090 | | | | 1,686,456 | |
Bovis Homes Group plc (Consumer Discretionary, Household Durables) | | | | | | | | | | | 4,671 | | | | 39,786 | |
BP plc (Energy, Oil, Gas & Consumable Fuels) | | | | | | | | | | | 321,938 | | | | 1,123,170 | |
British American Tobacco plc (Consumer Staples, Tobacco) | | | | | | | | | | | 114,106 | | | | 3,845,945 | |
Britvic plc (Consumer Staples, Beverages) | | | | | | | | | | | 5,852 | | | | 66,385 | |
BT Group plc (Communication Services, Diversified Telecommunication Services) | | | | | | | | | | | 571,027 | | | | 795,101 | |
Bunzl plc (Industrials, Trading Companies & Distributors) | | | | | | | | | | | 9,122 | | | | 294,269 | |
Burberry Group plc (Consumer Discretionary, Textiles, Apparel & Luxury Goods) | | | | | | | | | | | 16,412 | | | | 313,355 | |
Carnival plc (Consumer Discretionary, Hotels, Restaurants & Leisure) | | | | | | | | | | | 5,793 | | | | 79,413 | |
Centamin plc (Materials, Metals & Mining) | | | | | | | | | | | 24,291 | | | | 68,238 | |
Close Brothers Group plc (Financials, Capital Markets) | | | | | | | | | | | 3,268 | | | | 49,005 | |
Coca-Cola European Partners plc (Consumer Staples, Beverages) | | | | | | | | | | | 2,850 | | | | 117,306 | |
Compass Group plc (Consumer Discretionary, Hotels, Restaurants & Leisure) | | | | | | | | | | | 49,546 | | | | 801,751 | |
ConvaTec Limited (Health Care, Health Care Equipment & Supplies) 144A | | | | | | | | | | | 35,686 | | | | 91,117 | |
Cranswick plc (Consumer Staples, Food Products) | | | | | | | | | | | 1,127 | | | | 55,865 | |
Croda International plc (Materials, Chemicals) | | | | | | | | | | | 6,260 | | | | 492,731 | |
Dechra Pharmaceuticals plc (Health Care, Pharmaceuticals) | | | | | | | | | | | 2,238 | | | | 93,454 | |
Derwent Valley Holdings plc (Real Estate, Equity REITs) | | | | | | | | | | | 2,236 | | | | 84,371 | |
Diageo plc (Consumer Staples, Beverages) | | | | | | | | | | | 97,638 | | | | 3,262,195 | |
Dialog Semiconductor plc (Information Technology, Semiconductors & Semiconductor Equipment) † | | | | | | | | | | | 1,477 | | | | 63,964 | |
Diploma plc (Industrials, Trading Companies & Distributors) | | | | | | | | | | | 2,427 | | | | 62,632 | |
Direct Line Insurance Group plc (Financials, Insurance) | | | | | | | | | | | 135,367 | | | | 534,971 | |
DS Smith plc (Materials, Containers & Packaging) | | | | | | | | | | | 34,496 | | | | 118,689 | |
easyJet plc (Industrials, Airlines) | | | | | | | | | | | 5,577 | | | | 47,365 | |
Electrocomponents plc (Information Technology, Electronic Equipment, Instruments & Components) | | | | | | | | | | | 10,174 | | | | 92,041 | |
EVRAZ plc (Materials, Metals & Mining) | | | | | | | | | | | 26,077 | | | | 111,565 | |
Experian Group Limited plc (Industrials, Professional Services) | | | | | | | | | | | 33,123 | | | | 1,237,559 | |
Ferguson plc (Industrials, Trading Companies & Distributors) | | | | | | | | | | | 10,873 | | | | 1,066,265 | |
G4S plc (Industrials, Commercial Services & Supplies) | | | | | | | | | | | 32,841 | | | | 63,304 | |
Games Workshop Group plc (Consumer Discretionary, Leisure Products) | | | | | | | | | | | 697 | | | | 85,644 | |
Genus plc (Health Care, Biotechnology) | | | | | | | | | | | 1,830 | | | | 81,325 | |
GlaxoSmithKline plc (Health Care, Pharmaceuticals) | | | | | | | | | | | 226,357 | | | | 4,421,504 | |
Glencore plc (Materials, Metals & Mining) | | | | | | | | | | | 303,085 | | | | 745,233 | |
Grainger plc (Real Estate, Real Estate Management & Development) | | | | | | | | | | | 14,565 | | | | 60,855 | |
Great Portland Estates plc (Real Estate, Equity REITs) | | | | | | | | | | | 5,108 | | | | 41,240 | |
Greggs plc (Consumer Discretionary, Hotels, Restaurants & Leisure) | | | | | | | | | | | 2,393 | | | | 45,208 | |
GVC Holdings plc (Consumer Discretionary, Hotels, Restaurants & Leisure) | | | | | | | | | | | 76,906 | | | | 813,109 | |
Halma plc (Information Technology, Electronic Equipment, Instruments & Components) | | | | | | | | | | | 16,258 | | | | 482,063 | |
Hargreaves Lansdown plc (Financials, Capital Markets) | | | | | | | | | | | 7,610 | | | | 163,820 | |
Hays plc (Industrials, Professional Services) | | | | | | | | | | | 36,030 | | | | 57,959 | |
Hikma Pharmaceuticals plc (Health Care, Pharmaceuticals) | | | | | | | | | | | 24,054 | | | | 762,376 | |
HomeServe plc (Industrials, Commercial Services & Supplies) | | | | | | | | | | | 6,695 | | | | 115,590 | |
Howden Joinery Group plc (Industrials, Trading Companies & Distributors) | | | | | | | | | | | 13,556 | | | | 101,265 | |
HSBC Holdings plc (Financials, Banks) | | | | | | | | | | | 341,053 | | | | 1,462,869 | |
IG Group Holdings plc (Financials, Capital Markets) | | | | | | | | | | | 7,809 | | | | 81,320 | |
IMI plc (Industrials, Machinery) | | | | | | | | | | | 6,200 | | | | 86,268 | |
Imperial Brands plc (Consumer Staples, Tobacco) | | | | | | | | | | | 34,631 | | | | 577,806 | |
Inchcape plc (Consumer Discretionary, Distributors) † | | | | | | | | | | | 8,829 | | | | 59,476 | |
Informa plc (Communication Services, Media) | | | | | | | | | | | 33,099 | | | | 182,623 | |
Intertek Group plc (Industrials, Professional Services) | | | | | | | | | | | 6,623 | | | | 518,925 | |
ITV plc (Communication Services, Media) | | | | | | | | | | | 1,219,210 | | | | 975,833 | |
J Sainsbury plc (Consumer Staples, Food & Staples Retailing) | | | | | | | | | | | 116,069 | | | | 285,193 | |
The accompanying notes are an integral part of these financial statements.
24 | Wells Fargo Factor Enhanced International Equity Portfolio
Portfolio of investments—August 31, 2020 (unaudited)
| | | | | | | | | | | | | | | | |
| | | | | | | | | Shares | | | Value | |
| | | | |
| United Kingdom (continued) | | | | | | | | | | | | |
JD Sports Fashion plc (Consumer Discretionary, Specialty Retail) | | | | | | | | | | | 9,083 | | | $ | 87,410 | |
Johnson Matthey plc (Materials, Chemicals) | | | | | | | | | | | 9,403 | | | | 296,563 | |
Kingfisher plc (Consumer Discretionary, Specialty Retail) | | | | | | | | | | | 118,819 | | | | 432,094 | |
Land Securities Group plc (Real Estate, Equity REITs) | | | | | | | | | | | 672 | | | | 5,208 | |
Legal & General Group plc (Financials, Insurance) | | | | | | | | | | | 291,307 | | | | 837,342 | |
Lloyds Banking Group plc (Financials, Banks) | | | | | | | | | | | 1,218,046 | | | | 459,273 | |
London Stock Exchange Group plc (Financials, Capital Markets) | | | | | | | | | | | 5,138 | | | | 606,905 | |
M&G plc (Financials, Diversified Financial Services) | | | | | | | | | | | 191,709 | | | | 443,035 | |
Man Group plc (Financials, Capital Markets) | | | | | | | | | | | 33,879 | | | | 55,693 | |
Marks & Spencer Group plc (Consumer Discretionary, Multiline Retail) | | | | | | | | | | | 43,487 | | | | 64,400 | |
Meggitt plc (Industrials, Aerospace & Defense) | | | | | | | | | | | 16,139 | | | | 62,153 | |
Melrose Industries plc (Industrials, Electrical Equipment) | | | | | | | | | | | 176,449 | | | | 235,430 | |
Micro Focus International plc (Information Technology, Software) | | | | | | | | | | | 9,323 | | | | 36,987 | |
Mondi plc (Materials, Paper & Forest Products) | | | | | | | | | | | 9,944 | | | | 195,661 | |
Moneysupermarket.com Group plc (Consumer Discretionary, Internet & Direct Marketing Retail) | | | | | | | | | | | 11,982 | | | | 48,571 | |
National Grid plc (Utilities, Multi-Utilities) | | | | | | | | | | | 151,441 | | | | 1,696,152 | |
Network International Holding (Financials, Diversified Financial Services) 144A† | | | | | | | | | | | 9,591 | | | | 48,001 | |
Next plc (Consumer Discretionary, Multiline Retail) | | | | | | | | | | | 6,003 | | | | 481,002 | |
NMC Health plc (Health Care, Health Care Providers & Services) †(a)‡ | | | | | | | | | | | 7,509 | | | | 94,193 | |
Ocado Group plc (Consumer Discretionary, Internet & Direct Marketing Retail) † | | | | | | | | | | | 27,404 | | | | 912,690 | |
Pearson plc (Communication Services, Media) | | | | | | | | | | | 17,376 | | | | 128,026 | |
Pennon Group plc (Utilities, Water Utilities) | | | | | | | | | | | 9,690 | | | | 129,468 | |
Persimmon plc (Consumer Discretionary, Household Durables) | | | | | | | | | | | 27,021 | | | | 938,932 | |
Phoenix Group Holdings plc (Financials, Insurance) | | | | | | | | | | | 16,056 | | | | 148,487 | |
Polymetal International plc (Materials, Metals & Mining) | | | | | | | | | | | 8,763 | | | | 237,809 | |
Primary Health Properties REIT (Financials, Insurance) | | | | | | | | | | | 27,754 | | | | 56,728 | |
Prudential plc (Financials, Insurance) | | | | | | | | | | | 79,378 | | | | 1,279,682 | |
Quilter plc (Financials, Capital Markets) | | | | | | | | | | | 36,592 | | | | 69,386 | |
Reckitt Benckiser Group plc (Consumer Staples, Household Products) | | | | | | | | | | | 36,137 | | | | 3,627,392 | |
Redrow plc (Consumer Discretionary, Household Durables) | | | | | | | | | | | 6,046 | | | | 36,593 | |
RELX plc (Industrials, Professional Services) | | | | | | | | | | | 86,423 | | | | 1,961,183 | |
Rentokil Initial plc (Industrials, Commercial Services & Supplies) | | | | | | | | | | | 44,600 | | | | 317,579 | |
Rightmove plc (Communication Services, Interactive Media & Services) | | | | | | | | | | | 19,730 | | | | 165,575 | |
Rio Tinto plc (Materials, Metals & Mining) | | | | | | | | | | | 33,397 | | | | 2,076,973 | |
Rotork plc (Industrials, Machinery) | | | | | | | | | | | 19,540 | | | | 78,287 | |
Royal Bank of Scotland Group plc (Financials, Banks) | | | | | | | | | | | 178,516 | | | | 265,768 | |
Royal Dutch Shell plc Class A (Energy, Oil, Gas & Consumable Fuels) | | | | | | | | | | | 58,701 | | | | 864,058 | |
Royal Dutch Shell plc Class B (Energy, Oil, Gas & Consumable Fuels) | | | | | | | | | | | 54,358 | | | | 764,747 | |
Royal Mail plc (Industrials, Air Freight & Logistics) | | | | | | | | | | | 22,439 | | | | 53,607 | |
RSA Insurance Group plc (Financials, Insurance) | | | | | | | | | | | 67,047 | | | | 400,161 | |
Schroders plc (Financials, Capital Markets) | | | | | | | | | | | 5,792 | | | | 224,258 | |
Segro plc (Real Estate, Equity REITs) | | | | | | | | | | | 63,980 | | | | 813,455 | |
Severn Trent plc (Utilities, Water Utilities) | | | | | | | | | | | 10,395 | | | | 322,424 | |
Signature Aviation PLC (Industrials, Transportation Infrastructure) | | | | | | | | | | | 15,095 | | | | 52,320 | |
Smith & Nephew plc (Health Care, Health Care Equipment & Supplies) | | | | | | | | | | | 30,296 | | | | 611,392 | |
Spectris plc (Information Technology, Electronic Equipment, Instruments & Components) | | | | | | | | | | | 2,673 | | | | 90,851 | |
Spirax-Sarco Engineering plc (Industrials, Machinery) | | | | | | | | | | | 1,629 | | | | 221,961 | |
SSE plc (Utilities, Electric Utilities) | | | | | | | | | | | 57,050 | | | | 961,572 | |
Standard Chartered plc (Financials, Banks) | | | | | | | | | | | 22,234 | | | | 115,873 | |
Standard Life Aberdeen plc (Financials, Capital Markets) | | | | | | | | | | | 121,576 | | | | 380,418 | |
Tate & Lyle plc (Consumer Staples, Food Products) | | | | | | | | | | | 10,914 | | | | 98,956 | |
Taylor Wimpey plc (Consumer Discretionary, Household Durables) | | | | | | | | | | | 163,673 | | | | 264,620 | |
TechnipFMC plc - BATS Exchange (Energy, Energy Equipment & Services) | | | | | | | | | | | 9,862 | | | | 76,544 | |
Tesco plc (Consumer Staples, Food & Staples Retailing) | | | | | | | | | | | 516,340 | | | | 1,507,836 | |
The Berkeley Group Holdings plc (Consumer Discretionary, Household Durables) | | | | | | | | | | | 6,220 | | | | 375,896 | |
The British Land Company plc (Real Estate, Equity REITs) | | | | | | | | | | | 38,547 | | | | 188,128 | |
The Sage Group plc (Information Technology, Software) | | | | | | | | | | | 41,173 | | | | 406,531 | |
TP Icap plc (Financials, Capital Markets) | | | | | | | | | | | 12,074 | | | | 48,181 | |
Trainline plc (Consumer Discretionary, Internet & Direct Marketing Retail) 144A† | | | | | | | | | | | 10,823 | | | | 56,759 | |
The accompanying notes are an integral part of these financial statements.
Wells Fargo Factor Enhanced International Equity Portfolio | 25
Portfolio of investments—August 31, 2020 (unaudited)
| | | | | | | | | | | | | | | | |
| | | | | | | | | Shares | | | Value | |
| | | | |
| United Kingdom (continued) | | | | | | | | | | | | |
Travis Perkins plc (Industrials, Trading Companies & Distributors) | | | | | | | | | | | 5,552 | | | $ | 90,886 | |
Tritax Big Box REIT plc (Real Estate, Equity REITs) | | | | | | | | | | | 37,100 | | | | 77,418 | |
Unilever plc (Consumer Staples, Personal Products) | | | | | | | | | | | 58,033 | | | | 3,431,021 | |
United Utilities Group plc (Utilities, Water Utilities) | | | | | | | | | | | 19,470 | | | | 213,930 | |
Victrex plc (Materials, Chemicals) | | | | | | | | | | | 1,924 | | | | 49,379 | |
Vodafone Group plc (Communication Services, Wireless Telecommunication Services) | | | | | | | | | | | 412,687 | | | | 605,099 | |
Whitbread plc (Consumer Discretionary, Hotels, Restaurants & Leisure) | | | | | | | | | | | 4,609 | | | | 155,439 | |
William Morrison Supermarkets plc (Consumer Staples, Food & Staples Retailing) | | | | | | | | | | | 202,933 | | | | 519,295 | |
WPP plc (Communication Services, Media) | | | | | | | | | | | 89,720 | | | | 759,907 | |
| |
| | | | 72,928,084 | |
| | | | |
| | | | | |
| | | | |
Total Common Stocks (Cost $547,691,327) | | | | | | | | | | | | | | | 612,966,032 | |
| | | | | | | | | | | | | | | | |
| | | | |
| | | | | | | | | | | | | | | | |
| | | Dividend yield | | | | | | | | | | |
| Preferred Stocks: 0.65% | | | | | | | | | | | | |
| | | | |
| Germany: 0.65% | | | | | | | | | | | | |
Bayerische Motoren Werke AG (Consumer Discretionary, Automobiles) | | | 6.36 | % | | | | | | | 4,364 | | | | 245,286 | |
Fuchs Petrolub SE (Materials, Chemicals) | | | 2.20 | | | | | | | | 17,707 | | | | 837,196 | |
Henkel AG & Company KGaA (Consumer Staples, Household Products) | | | 2.01 | | | | | | | | 10,581 | | | | 1,080,352 | |
Porsche Automobil Holding SE (Consumer Discretionary, Automobiles) † | | | 3.33 | | | | | | | | 18,671 | | | | 1,143,017 | |
Sartorius AG Vorzug (Health Care, Health Care Equipment & Supplies) | | | 0.32 | | | | | | | | 1,885 | | | | 798,560 | |
| | | | |
Total Preferred Stocks (Cost $3,543,972) | | | | | | | | | | | | | | | 4,104,411 | |
| | | | | | | | | | | | | | | | |
| | | | |
| | | | | | | | | | | | | | | | |
| | | | | | Expiration
date | | | | | | | |
| Rights: 0.00% | | | | | | | | | | | | |
| | | | |
| Australia: 0.00% | | | | | | | | | | | | |
Tabcorp Holdings Limited (Consumer Discretionary, Hotels, Restaurants & Leisure) † | | | | | | | 9-10-2020 | | | | 13,238 | | | | 3,613 | |
| | | | | | | | | | | | | | | | |
| | | | |
Total Rights (Cost $0) | | | | | | | | | | | | | | | 3,613 | |
| | | | | | | | | | | | | | | | |
| | | | |
| | | | | | | | | | | | | | | | |
| | | Yield | | | | | | | | | | |
| Short-Term Investments: 1.44% | | | | | | | | | | | | |
| | | | |
| Investment Companies: 1.44% | | | | | | | | | | | | |
Wells Fargo Government Money Market Fund Select Class (l)(u) | | | 0.06 | | | | | | | | 9,103,835 | | | | 9,103,835 | |
| | | | | | | | | | | | | | | | |
| | | | |
Total Short-Term Investments (Cost $9,103,835) | | | | | | | | | | | | | | | 9,103,835 | |
| | | | | | | | | | | | | | | | |
| | | | | | | | |
| Total investments in securities (Cost $560,339,134) | | | 99.03 | % | | | 626,177,891 | |
| | |
Other assets and liabilities, net | | | 0.97 | | | | 6,164,234 | |
| | | | | | | | |
| Total net assets | | | 100.00 | % | | $ | 632,342,125 | |
| | | | | | | | |
| † | Non-income-earning security |
| 144A | The security may be resold in transactions exempt from registration, normally to qualified institutional buyers, pursuant to Rule 144A under the Securities Act of 1933. |
| (a) | The security is fair valued in accordance with procedures approved by the Board of Trustees. |
| ‡ | Security is valued using significant unobservable inputs. |
| (l) | The issuer of the security is an affiliated person of the Portfolio as defined in the Investment Company Act of 1940. |
| (u) | The rate represents the 7-day annualized yield at period end. |
Abbreviations:
| ADR | American depositary receipt |
| REIT | Real estate investment trust |
The accompanying notes are an integral part of these financial statements.
26 | Wells Fargo Factor Enhanced International Equity Portfolio
Portfolio of investments—August 31, 2020 (unaudited)
Futures Contracts
| | | | | | | | | | | | | | | | | | | | | | | | |
| Description | | Number of
contracts | | | Expiration
date | | | Notional
cost | | | Notional
value | | | Unrealized
gains | | | Unrealized
losses | |
| | | | | | |
Long | | | | | | | | | | | | | | | | | | | | | | | | |
| | | | | | |
MSCI EAFE Index | | | 106 | | | | 9-18-2020 | | | $ | 9,751,376 | | | $ | 10,070,530 | | | $ | 319,154 | | | $ | 0 | |
Investments in Affiliates
An affiliated investment is an investment in which the Portfolio owns at least 5% of the outstanding voting shares of the issuer or as a result of other relationships, such as the Portfolio and the issuer having the same adviser or investment manager. Transactions with issuers that were either affiliated persons of the Portfolio at the beginning of the period or the end of the period were as follows:
| | | | | | | | | | | | | | | | | | | | | | | | | | | | | | | | |
| | | Value,
beginning of
period | | | Purchases | | | Sales
proceeds | | | Net
realized
gains
(losses) | | | Net
change in
unrealized
gains
(losses) | | | Income
from
affiliated
securities | | | Value,
end of
period | | | % of
net
assets | |
| | | | | | | | |
| Short-Term Investments | | | | | | | | | | | | | | | | | | | | | | | | |
Investment Companies | | | | | | | | | | | | | | | | | | | | | | | | | | | | | | | | |
Wells Fargo Government Money Market Fund Select Class | | $ | 24,301,039 | | | $ | 260,504,436 | | | $ | (275,701,640 | ) | | $ | 0 | | | $ | 0 | | | $ | 25,301 | | | $ | 9,103,835 | | | | 1.44 | % |
The accompanying notes are an integral part of these financial statements.
Wells Fargo Factor Enhanced International Equity Portfolio | 27
Statement of assets and liabilities—August 31, 2020 (unaudited)
| | | | |
| | | | |
| |
Assets | | | | |
Investments in unaffiliated securities, at value (cost $551,235,299) | | $ | 617,074,056 | |
Investments in affiliated securities, at value (cost $9,103,835) | | | 9,103,835 | |
Segregated cash for futures contracts | | | 1,410,220 | |
Foreign currency, at value (cost $1,353,047) | | | 1,369,458 | |
Receivable for investments sold | | | 249,023 | |
Receivable for dividends | | | 3,495,715 | |
Prepaid expenses and other assets | | | 496,629 | |
| | | | |
Total assets | | | 633,198,936 | |
| | | | |
| |
Liabilities | | | | |
Payable for daily variation margin on open futures contracts | | | 81,931 | |
Advisory fee payable | | | 279,676 | |
Custody and accounting fees payable | | | 461,425 | |
Trustees’ fees and expenses payable | | | 1,876 | |
Accrued expenses and other liabilities | | | 31,903 | |
| | | | |
Total liabilities | | | 856,811 | |
| | | | |
Total net assets | | $ | 632,342,125 | |
| | | | |
The accompanying notes are an integral part of these financial statements.
28 | Wells Fargo Factor Enhanced International Equity Portfolio
Statement of operations—six months ended August 31, 2020 (unaudited)
| | | | |
| | | | |
| |
Investment income | | | | |
Dividends (net of foreign withholding taxes of $1,022,920) | | $ | 9,070,864 | |
Income from affiliated securities | | | 25,301 | |
| | | | |
Total investment income | | | 9,096,165 | |
| | | | |
| |
Expenses | | | | |
Advisory fee | | | 422,156 | |
Custody and accounting fees | | | 154,753 | |
Professional fees | | | 22,618 | |
Shareholder report expenses | | | 5,567 | |
Trustees’ fees and expenses | | | 9,898 | |
Other fees and expenses | | | 21,048 | |
| | | | |
Total expenses | | | 636,040 | |
Less: Fee waivers and/or expense reimbursements | | | (164,806 | ) |
| | | | |
Net expenses | | | 471,234 | |
| | | | |
Net investment income | | | 8,624,931 | |
| | | | |
| |
Realized and unrealized gains (losses) on investments | | | | |
Net realized gains (losses) on | |
Unaffiliated securities | | | (15,247,251 | ) |
Futures contracts | | | (353,852 | ) |
Foreign currency and foreign currency translations | | | 106,801 | |
| | | | |
Net realized losses on investments | | | (15,494,302 | ) |
| | | | |
|
Net change in unrealized gains (losses) on | |
Unaffiliated securities | | | 51,746,213 | |
Futures contracts | | | 3,265,428 | |
Foreign currency and foreign currency translations | | | 18,806 | |
| | | | |
Net change in unrealized gains (losses) on investments | | | 55,030,447 | |
| | | | |
Net realized and unrealized gains (losses) on investments | | | 39,536,145 | |
| | | | |
Net increase in net assets resulting from operations | | $ | 48,161,076 | |
| | | | |
The accompanying notes are an integral part of these financial statements.
Wells Fargo Factor Enhanced International Equity Portfolio | 29
Statement of changes in net assets
| | | | | | | | |
| | | Six months ended
August 31, 2020 (unaudited) | | | Year ended
February 29, 2020 | |
|
Operations | |
Net investment income | | $ | 8,624,931 | | | $ | 17,563,924 | |
Net realized gains (losses) on investments | | | (15,494,302 | ) | | | 147,794 | |
Net change in unrealized gains (losses) on investments | | | 55,030,447 | | | | (3,240,452 | ) |
| | | | |
Net increase in net assets resulting from operations | | | 48,161,076 | | | | 14,471,266 | |
| | | | |
| | |
Capital transactions | | | | | | | | |
Transactions in investors’ beneficial interests | |
Contributions | | | 151,813,646 | | | | 33,306,923 | |
Withdrawals | | | (153,477,883 | ) | | | (159,917,517 | ) |
| | | | |
Net decrease in net assets resulting from capital transactions | | | (1,664,237 | ) | | | (126,610,594 | ) |
| | | | |
Total increase (decrease) in net assets | | | 46,496,839 | | | | (112,139,328 | ) |
| | | | |
| | |
Net assets | | | | | | | | |
Beginning of period | | | 585,845,286 | | | | 697,984,614 | |
| | | | |
End of period | | $ | 632,342,125 | | | $ | 585,845,286 | |
| | | | |
The accompanying notes are an integral part of these financial statements.
30 | Wells Fargo Factor Enhanced International Equity Portfolio
Financial highlights
| | | | | | | | | | | | | | | | |
| | | Six months ended
August 31, 2020
(unaudited) | | | Year ended
February 29, 2020 | | | Year ended February 28 | |
| | | 2019 | | | 20181 | |
Total return2 | | | 8.03 | % | | | 1.23 | % | | | (2.91 | )% | | | 8.99 | % |
Ratios to average net assets (annualized) | | | | | | | | | | | | | | | | |
Gross expenses | | | 0.23 | % | | | 0.24 | % | | | 0.23 | % | | | 0.21 | % |
Net expenses | | | 0.17 | % | | | 0.19 | % | | | 0.20 | % | | | 0.21 | % |
Net investment income | | | 3.06 | % | | | 2.58 | % | | | 3.03 | % | | | 1.74 | % |
Supplemental data | | | | | | | | | | | | | | | | |
Portfolio turnover rate | | | 65 | % | | | 44 | % | | | 47 | % | | | 106 | % |
| 1 | For the period from May 23, 2017 (commencement of operations) to February 28, 2018 |
| 2 | Returns for periods of less than one year are not annualized. |
The accompanying notes are an integral part of these financial statements.
Wells Fargo Factor Enhanced International Equity Portfolio | 31
Notes to financial statements (unaudited)
1. ORGANIZATION
Wells Fargo Master Trust (the “Trust”), a Delaware statutory trust organized on March 10, 1999, is an open-end management investment company registered under the Investment Company Act of 1940, as amended (the “1940 Act”). As an investment company, the Trust follows the accounting and reporting guidance in Financial Accounting Standards Board (“FASB”) Accounting Standards Codification Topic 946, Financial Services – Investment Companies. These financial statements report on the Wells Fargo Factor Enhanced International Equity Portfolio (formerly, Wells Fargo Factor Enhanced International Portfolio) (the “Portfolio”) which is a diversified series of the Trust.
Interests in the Portfolio are available solely through private placement transactions that do not involve any “public offering” within the meaning of Section 4(2) of the Investment Company Act of 1933.
2. SIGNIFICANT ACCOUNTING POLICIES
The following significant accounting policies, which are consistently followed in the preparation of the financial statements of the Portfolio, are in conformity with U.S. generally accepted accounting principles which require management to make estimates and assumptions that affect the reported amounts of assets and liabilities, disclosure of contingent assets and liabilities at the date of the financial statements, and the reported amounts of revenues and expenses during the reporting period. Actual results could differ from those estimates.
Securities valuation
All investments are valued each business day as of the close of regular trading on the New York Stock Exchange (generally 4 p.m. Eastern Time), although the Portfolio may deviate from this calculation time under unusual or unexpected circumstances.
Equity securities and futures contracts that are listed on a foreign or domestic exchange or market are valued at the official closing price or, if none, the last sales price. If no sale occurs on the principal exchange or market that day, a fair value price will be determined in accordance with the Portfolio’s Valuation Procedures.
The values of securities denominated in foreign currencies are translated into U.S. dollars at rates provided by an independent foreign currency pricing source at a time each business day specified by the Wells Fargo Asset Management Pricing Committee at Wells Fargo Funds Management, LLC (“Funds Management”).
Many securities markets and exchanges outside the U.S. close prior to the close of the New York Stock Exchange and therefore may not fully reflect trading or events that occur after the close of the principal exchange in which the foreign securities are traded, but before the close of the New York Stock Exchange. If such trading or events are expected to materially affect the value of such securities, then fair value pricing procedures approved by the Board of Trustees of the Portfolio are applied. These procedures take into account multiple factors including movements in U.S. securities markets after foreign exchanges close. Foreign securities that are fair valued under these procedures are categorized as Level 2 and the application of these procedures may result in transfers between Level 1 and Level 2. Depending on market activity, such fair valuations may be frequent. Such fair value pricing may result in net asset values that are higher or lower than net asset values based on the last reported sales price or latest quoted bid price. On August 31, 2020, such fair value pricing was used in pricing certain foreign securities.
Investments in registered open-end investment companies are valued at net asset value.
Investments which are not valued using any of the methods discussed above are valued at their fair value, as determined in good faith by the Board of Trustees. The Board of Trustees has established a Valuation Committee comprised of the Trustees and has delegated to it the authority to take any actions regarding the valuation of portfolio securities that the Valuation Committee deems necessary or appropriate, including determining the fair value of portfolio securities, unless the determination has been delegated to the Wells Fargo Asset Management Pricing Committee. The Board of Trustees retains the authority to make or ratify any valuation decisions or approve any changes to the Valuation Procedures as it deems appropriate. On a quarterly basis, the Board of Trustees receives reports on any valuation actions taken by the Valuation Committee or the Wells Fargo Asset Management Pricing Committee which may include items for ratification.
Foreign currency translation
The accounting records of the Portfolio are maintained in U.S. dollars. The values of other assets and liabilities denominated in foreign currencies are translated into U.S. dollars at rates provided by an independent foreign currency pricing source at a time each business day specified by the Wells Fargo Asset Management Pricing Committee. Purchases and sales of securities, and income and expenses are converted at the rate of exchange on the respective dates of such transactions. Net realized foreign exchange gains or losses arise from sales of foreign currencies, currency gains or losses realized between the trade and settlement dates on securities transactions, and the difference between the amounts of dividends, interest and foreign withholding taxes recorded and the U.S. dollar equivalent of the amounts actually paid or received. Net unrealized foreign exchange gains and losses arise from changes in the fair value of assets and liabilities other than investments in securities
32 | Wells Fargo Factor Enhanced International Equity Portfolio
Notes to financial statements (unaudited)
resulting from changes in exchange rates. The changes in net assets arising from changes in exchange rates of securities and the changes in net assets resulting from changes in market prices of securities are not separately presented. Such changes are included in net realized and unrealized gains or losses from investments.
Futures contracts
Futures contracts are agreements between the Portfolio and a counterparty to buy or sell a specific amount of a commodity, financial instrument or currency at a specified price and on a specified date. The Portfolio may buy and sell futures contracts in order to gain exposure to, or protect against, changes in security values and is subject to equity price risk. The primary risks associated with the use of futures contracts are the imperfect correlation between changes in market values of securities held by the Portfolio and the prices of futures contracts, and the possibility of an illiquid market. Futures contracts are generally entered into on a regulated futures exchange and cleared through a clearinghouse associated with the exchange. With futures contracts, there is minimal counterparty risk to the Portfolio since futures contracts are exchange traded and the exchange’s clearinghouse, as the counterparty to all exchange traded futures, guarantees the futures contracts against default.
Upon entering into a futures contracts, the Portfolio is required to deposit either cash or securities (initial margin) with the broker in an amount equal to a certain percentage of the contract value. Subsequent payments (variation margin) are paid to or from the broker each day equal to the daily changes in the contract value. Such payments are recorded as unrealized gains or losses and, if any, shown as variation margin receivable (payable) in the Statement of Assets and Liabilities. Should the Portfolio fail to make requested variation margin payments, the broker can gain access to the initial margin to satisfy the Portfolio’s payment obligations. When the contracts are closed, a realized gain or loss is recorded in the Statement of Operations.
Security transactions and income recognition
Securities transactions are recorded on a trade date basis. Realized gains or losses are recorded on the basis of identified cost.
Dividend income is recognized on the ex-dividend date. Dividend income is recorded net of foreign taxes withheld where recovery of such taxes is not assured.
Federal and other taxes
The Portfolio is not required to pay federal income taxes on its net investment income and net capital gains as it is treated as a partnership for federal income tax purposes. All income, gains and losses of the Portfolio are deemed to have been “passed through” to the interest holders in proportion to their holdings of the Portfolio regardless of whether income and gains have been distributed by the Portfolio.
The Portfolio’s income tax returns and all financial records supporting those returns for the prior three fiscal years are subject to examination by the federal revenue authority. Management has analyzed the Portfolio’s tax positions taken on federal, state, and foreign tax returns for all open tax years and does not believe that there are any uncertain tax positions that require recognition of a tax liability.
As of August 31, 2020, the aggregate cost of all investments for federal income tax purposes was $557,422,803 and the unrealized gains (losses) consisted of:
| | | | |
| |
Gross unrealized gains | | $ | 80,493,911 | |
| |
Gross unrealized losses | | | (11,419,669 | ) |
| |
Net unrealized gains | | $ | 69,074,242 | |
3. FAIR VALUATION MEASUREMENTS
Fair value measurements of investments are determined within a framework that has established a fair value hierarchy based upon the various data inputs utilized in determining the value of the Portfolio’s investments. The three-level hierarchy gives the highest priority to unadjusted quoted prices in active markets for identical assets or liabilities (Level 1) and the lowest priority to unobservable inputs (Level 3). The Portfolio’s investments are classified within the fair value hierarchy based on the lowest level of input that is significant to the fair value measurement. The inputs are summarized into three broad levels as follows:
| ∎ | | Level 1 – quoted prices in active markets for identical securities |
| ∎ | | Level 2 – other significant observable inputs (including quoted prices for similar securities, interest rates, prepayment speeds, credit risk, etc.) |
| ∎ | | Level 3 – significant unobservable inputs (including the Portfolio’s own assumptions in determining the fair value of investments) |
Wells Fargo Factor Enhanced International Equity Portfolio | 33
Notes to financial statements (unaudited)
The inputs or methodologies used for valuing investments in securities are not necessarily an indication of the risk associated with investing in those securities.
The following is a summary of the inputs used in valuing the Portfolio’s assets and liabilities as of August 31, 2020:
| | | | | | | | | | | | | | | | |
| | | | |
| | | Quoted prices
(Level 1) | | | Other significant
observable inputs
(Level 2) | | | Significant
unobservable inputs (Level 3) | | | Total | |
| | | | |
Assets | | | | | | | | | | | | | | | | |
Investments in: | | | | | | | | | | | | | | | | |
| | | | |
Common stocks | | | | | | | | | | | | | | | | |
| | | | |
Australia | | $ | 38,464,799 | | | $ | 0 | | | $ | 0 | | | $ | 38,464,799 | |
| | | | |
Austria | | | 1,585,234 | | | | 0 | | | | 0 | | | | 1,585,234 | |
| | | | |
Belgium | | | 4,820,400 | | | | 0 | | | | 0 | | | | 4,820,400 | |
| | | | |
Bermuda | | | 351,982 | | | | 0 | | | | 0 | | | | 351,982 | |
| | | | |
Cambodia | | | 39,494 | | | | 0 | | | | 0 | | | | 39,494 | |
| | | | |
Canada | | | 61,802,746 | | | | 296,265 | | | | 0 | | | | 62,099,011 | |
| | | | |
China | | | 1,799,859 | | | | 0 | | | | 0 | | | | 1,799,859 | |
| | | | |
Denmark | | | 15,648,040 | | | | 0 | | | | 0 | | | | 15,648,040 | |
| | | | |
Finland | | | 7,716,257 | | | | 0 | | | | 0 | | | | 7,716,257 | |
| | | | |
France | | | 46,219,192 | | | | 0 | | | | 0 | | | | 46,219,192 | |
| | | | |
Germany | | | 41,624,147 | | | | 41,926 | | | | 0 | | | | 41,666,073 | |
| | | | |
Hong Kong | | | 16,180,075 | | | | 0 | | | | 0 | | | | 16,180,075 | |
| | | | |
Ireland | | | 6,772,640 | | | | 760,531 | | | | 0 | | | | 7,533,171 | |
| | | | |
Israel | | | 2,328,483 | | | | 0 | | | | 0 | | | | 2,328,483 | |
| | | | |
Italy | | | 9,812,073 | | | | 0 | | | | 0 | | | | 9,812,073 | |
| | | | |
Japan | | | 145,475,220 | | | | 0 | | | | 0 | | | | 145,475,220 | |
| | | | |
Luxembourg | | | 1,507,775 | | | | 106,020 | | | | 0 | | | | 1,613,795 | |
| | | | |
Netherlands | | | 25,350,424 | | | | 415,336 | | | | 0 | | | | 25,765,760 | |
| | | | |
New Zealand | | | 2,848,875 | | | | 0 | | | | 0 | | | | 2,848,875 | |
| | | | |
Norway | | | 3,987,994 | | | | 0 | | | | 0 | | | | 3,987,994 | |
| | | | |
Poland | | | 700,873 | | | | 0 | | | | 0 | | | | 700,873 | |
| | | | |
Portugal | | | 1,017,962 | | | | 0 | | | | 0 | | | | 1,017,962 | |
| | | | |
Singapore | | | 7,004,050 | | | | 0 | | | | 0 | | | | 7,004,050 | |
| | | | |
South Africa | | | 0 | | | | 57,664 | | | | 0 | | | | 57,664 | |
| | | | |
Spain | | | 12,024,599 | | | | 73,731 | | | | 0 | | | | 12,098,330 | |
| | | | |
Sweden | | | 21,461,652 | | | | 0 | | | | 0 | | | | 21,461,652 | |
| | | | |
Switzerland | | | 61,284,798 | | | | 372,364 | | | | 0 | | | | 61,657,162 | |
| | | | |
Thailand | | | 84,468 | | | | 0 | | | | 0 | | | | 84,468 | |
| | | | |
United Kingdom | | | 1,132,317 | | | | 71,701,574 | | | | 94,193 | | | | 72,928,084 | |
| | | | |
Preferred stocks | | | | | | | | | | | | | | | | |
| | | | |
Germany | | | 4,104,411 | | | | 0 | | | | 0 | | | | 4,104,411 | |
| | | | |
Rights | | | | | | | | | | | | | | | | |
| | | | |
Australia | | | 0 | | | | 3,613 | | | | 0 | | | | 3,613 | |
| | | | |
Short-term investments | | | | | | | | | | | | | | | | |
| | | | |
Investment companies | | | 9,103,835 | | | | 0 | | | | 0 | | | | 9,103,835 | |
| | | | |
| | | 552,254,674 | | | | 73,829,024 | | | | 94,193 | | | | 626,177,891 | |
| | | | |
Futures contracts | | | 319,154 | | | | 0 | | | | 0 | | | | 319,154 | |
| | | | |
Total assets | | $ | 552,573,828 | | | $ | 73,829,024 | | | $ | 94,193 | | | $ | 626,497,045 | |
Additional sector, industry or geographic detail is included in the Portfolio of Investments.
Futures contracts are reported at their cumulative unrealized gains (losses) at measurement date as reported in the table following the Portfolio of Investments. For futures contracts, the current day’s variation margin is reported on the Statement of Assets and Liabilities. All other assets and liabilities are reported at their market value at measurement date.
34 | Wells Fargo Factor Enhanced International Equity Portfolio
Notes to financial statements (unaudited)
For the six months ended August 31, 2020, the Portfolio had no material transfers into/out of Level 3.
4. TRANSACTIONS WITH AFFILIATES
Advisory fee
The Trust has entered into an advisory contract with Funds Management, an indirect wholly owned subsidiary of Wells Fargo & Company (“Wells Fargo”). The adviser is responsible for implementing investment policies and guidelines and for supervising the subadviser, who is responsible for day-to-day portfolio management of the Portfolio. Pursuant to the contract, Funds Management is entitled to receive an annual advisory fee at the following annual rate based on the Portfolio’s average daily net assets:
| | | | |
| |
| Average daily net assets | | Advisory fee | |
| |
First $5 billion | | | 0.15 | % |
| |
Next $5 billion | | | 0.13 | |
| |
Over $10 billion | | | 0.11 | |
For the six months ended August 31, 2020, the advisory fee was equivalent to an annual rate of 0.15% of the Portfolio’s average daily net assets.
Funds Management has retained the services of a subadviser to provide daily portfolio management to the Portfolio. The fee for subadvisory services is borne by Funds Management. Wells Capital Management Incorporated, an affiliate of Funds Management and an indirect wholly owned subsidiary of Wells Fargo, is the subadviser to the Portfolio and is entitled to receive a fee from Funds Management at an annual rate starting at 0.08% and declining to 0.05% as the average daily net assets of the Portfolio increase.
Funds Management has voluntarily waived and/or reimbursed advisory fees to reduce the net operating expense ratio of the Portfolio.
Interfund transactions
The Portfolio may purchase or sell portfolio investment securities to certain other Wells Fargo affiliates pursuant to Rule 17a-7 under the 1940 Act and under procedures adopted by the Board of Trustees. The procedures have been designed to ensure that these interfund transactions, which do not incur broker commissions, are effected at current market prices.
5. INVESTMENT PORTFOLIO TRANSACTIONS
Purchases and sales of investments, excluding U.S. government obligations (if any) and short-term securities, for the six months ended August 31, 2020 were $379,417,085 and $353,875,536, respectively.
6. DERIVATIVE TRANSACTIONS
During the six months ended August 31, 2020, the Portfolio entered into futures contracts to gain market exposure. The Portfolio had an average notional amount of $20,683,340 in long futures contracts during the six months ended August 31, 2020.
The fair value, realized gains or losses and change in unrealized gains or losses, if any, on derivative instruments are reflected in the corresponding financial statement captions.
7. BANK BORROWINGS
The Trust, along with Wells Fargo Variable Trust and Wells Fargo Funds Trust (excluding the money market funds), are parties to a $350,000,000 revolving credit agreement whereby the Portfolio is permitted to use bank borrowings for temporary or emergency purposes, such as to fund shareholder redemption requests. Interest under the credit agreement is charged to the Portfolio based on a borrowing rate equal to the higher of the Federal Funds rate in effect on that day plus 1.25% or the overnight LIBOR rate in effect on that day plus 1.25%. In addition, an annual commitment fee equal to 0.25% of the unused balance is allocated to each participating fund.
For the six months ended August 31, 2020, there were no borrowings by the Portfolio under the agreement.
8. INDEMNIFICATION
Under the Portfolio’s organizational documents, the officers and Trustees have been granted certain indemnification rights against certain liabilities that may arise out of performance of their duties to the Portfolio. The Portfolio has entered into a
Wells Fargo Factor Enhanced International Equity Portfolio | 35
Notes to financial statements (unaudited)
separate agreement with each Trustee that converts indemnification rights currently existing under the Portfolio’s organizational documents into contractual rights that cannot be changed in the future without the consent of the Trustee. Additionally, in the normal course of business, the Portfolio may enter into contracts with service providers that contain a variety of indemnification clauses. The Portfolio’s maximum exposure under these arrangements is dependent on future claims that may be made against the Portfolio and, therefore, cannot be estimated.
9. NEW ACCOUNTING PRONOUNCEMENT
In August 2018, FASB issued Accounting Standards Update (“ASU”) No. 2018-13, Fair Value Measurement (Topic 820) Disclosure Framework—Changes to the Disclosure Requirements for Fair Value Measurement. ASU 2018-13 updates the disclosure requirements on fair value measurements in Topic 820, Fair Value Measurements. The amendments are effective for fiscal years, and interim periods within those fiscal years, beginning after December 15, 2019. Management has adopted this guidance which did not have a material impact on the financial statements.
10. CORONAVIRUS (COVID-19) PANDEMIC
On March 11, 2020, the World Health Organization announced that it had made the assessment that coronavirus disease 2019 (“COVID-19”) is a pandemic. The impacts of COVID-19 are adversely affecting the entire global economy, individual companies and investment products, and the market in general. There is significant uncertainty around the extent and duration of business disruptions related to COVID-19 and the impacts may be short term or may last for an extended period of time. The risk of further spreading of COVID-19 has led to significant uncertainty and volatility in the financial markets.
36 | Wells Fargo Factor Enhanced International Equity Portfolio
Other information (unaudited)
PROXY VOTING INFORMATION
A description of the policies and procedures used to determine how to vote proxies relating to portfolio securities is available, upon request, by calling 1-800-222-8222, visiting our website at wfam.com, or visiting the SEC website at sec.gov. Information regarding how the proxies related to portfolio securities were voted during the most recent 12-month period ended June 30 is available on the website at wfam.com or by visiting the SEC website at sec.gov.
QUARTERLY PORTFOLIO HOLDINGS INFORMATION
The Portfolio files its complete schedule of portfolio holdings with the SEC for the first and third quarters of each fiscal as an exhibit to its reports on Form N-PORT. Shareholders may view the filed Form N-PORT by visiting the SEC website at sec.gov.
Wells Fargo Factor Enhanced International Equity Portfolio | 37
Other information (unaudited)
BOARD OF TRUSTEES AND OFFICERS
Each of the Trustees and Officers1 listed in the table below acts in identical capacities for each fund in the Wells Fargo family of funds, which consists of 142 mutual funds comprising the Wells Fargo Funds Trust, Wells Fargo Variable Trust, Wells Fargo Master Trust and four closed-end funds (collectively the “Fund Complex”). This table should be read in conjunction with the Prospectus and the Statement of Additional Information2. The mailing address of each Trustee and Officer is 525 Market Street, 12th Floor, San Francisco, CA 94105. Each Trustee and Officer serves an indefinite term, however, each Trustee serves such term until reaching the mandatory retirement age established by the Trustees.
Independent Trustees
| | | | | | |
Name and year of birth | | Position held and length of service* | | Principal occupations during past five years or longer | | Current other public company or investment company directorships |
| | | |
William R. Ebsworth (Born 1957) | | Trustee, since 2015 | | Retired. From 1984 to 2013, equities analyst, portfolio manager, research director and chief investment officer at Fidelity Management and Research Company in Boston, Tokyo, and Hong Kong, and retired in 2013 as Chief Investment Officer of Fidelity Strategic Advisers, Inc. where he led a team of investment professionals managing client assets. Prior thereto, Board member of Hong Kong Securities Clearing Co., Hong Kong Options Clearing Corp., the Thailand International Fund, Ltd., Fidelity Investments Life Insurance Company, and Empire Fidelity Investments Life Insurance Company. Audit Committee Chair and Investment Committee Chair of the Vincent Memorial Hospital Endowment (non-profit organization). Mr. Ebsworth is a CFA® charterholder. | | N/A |
| | | |
Jane A. Freeman (Born 1953) | | Trustee, since 2015; Chair Liaison, since 2018 | | Retired. From 2012 to 2014 and 1999 to 2008, Chief Financial Officer of Scientific Learning Corporation. From 2008 to 2012, Ms. Freeman provided consulting services related to strategic business projects. Prior to 1999, Portfolio Manager at Rockefeller & Co. and Scudder, Stevens & Clark. Board member of the Harding Loevner Funds from 1996 to 2014, serving as both Lead Independent Director and chair of the Audit Committee. Board member of the Russell Exchange Traded Funds Trust from 2011 to 2012 and the chair of the Audit Committee. Ms. Freeman is also an inactive Chartered Financial Analyst. | | N/A |
| | | |
Isaiah Harris, Jr. (Born 1952) | | Trustee, since 2009; Audit Committee Chairman, since 2019 | | Retired. Chairman of the Board of CIGNA Corporation since 2009, and Director since 2005. From 2003 to 2011, Director of Deluxe Corporation. Prior thereto, President and CEO of BellSouth Advertising and Publishing Corp. from 2005 to 2007, President and CEO of BellSouth Enterprises from 2004 to 2005 and President of BellSouth Consumer Services from 2000 to 2003. Emeritus member of the Iowa State University Foundation Board of Governors. Emeritus Member of the Advisory Board of Iowa State University School of Business. Advisory Board Member, Palm Harbor Academy (private school). Mr. Harris is a certified public accountant (inactive status). | | CIGNA Corporation |
| | | |
Judith M. Johnson (Born 1949) | | Trustee, since 2008 | | Retired. Prior thereto, Chief Executive Officer and Chief Investment Officer of Minneapolis Employees Retirement Fund from 1996 to 2008. Ms. Johnson is an attorney, certified public accountant and a certified managerial accountant. | | N/A |
| | | |
David F. Larcker (Born 1950) | | Trustee, since 2009 | | James Irvin Miller Professor of Accounting at the Graduate School of Business (Emeritus), Stanford University, Director of the Corporate Governance Research Initiative and Senior Faculty of The Rock Center for Corporate Governance since 2006. From 2005 to 2008, Professor of Accounting at the Graduate School of Business, Stanford University. Prior thereto, Ernst & Young Professor of Accounting at The Wharton School, University of Pennsylvania from 1985 to 2005. | | N/A |
38 | Wells Fargo Factor Enhanced International Equity Portfolio
Other information (unaudited)
| | | | | | |
Name and year of birth | | Position held and length of service* | | Principal occupations during past five years or longer | | Current other public company or investment company directorships |
| | | |
Olivia S. Mitchell (Born 1953) | | Trustee, since 2006; Nominating and Governance Committee Chair, since 2018 | | International Foundation of Employee Benefit Plans Professor, Wharton School of the University of Pennsylvania since 1993. Director of Wharton’s Pension Research Council and Boettner Center on Pensions & Retirement Research, and Research Associate at the National Bureau of Economic Research. Previously, Cornell University Professor from 1978 to 1993. | | N/A |
| | | |
Timothy J. Penny (Born 1951) | | Trustee, since 1996; Chairman, since 2018 | | President and Chief Executive Officer of Southern Minnesota Initiative Foundation, a non-profit organization, since 2007. Member of the Board of Trustees of NorthStar Education Finance, Inc., a non-profit organization, since 2007. | | N/A |
| | | |
James G. Polisson (Born 1959) | | Trustee, since 2018 | | Retired. Chief Marketing Officer, Source (ETF) UK Services, Ltd, from 2015 to 2017. From 2012 to 2015, Principal of The Polisson Group, LLC, a management consulting, corporate advisory and principal investing company. Chief Executive Officer and Managing Director at Russell Investments, Global Exchange Traded Funds from 2010 to 2012. Managing Director of Barclays Global Investors from 1998 to 2010 and Global Chief Marketing Officer for iShares and Barclays Global Investors from 2000 to 2010. Trustee of the San Francisco Mechanics’ Institute, a non-profit organization, from 2013 to 2015. Board member of the Russell Exchange Traded Fund Trust from 2011 to 2012. Director of Barclays Global Investors Holdings Deutschland GmbH from 2006 to 2009. Mr. Polisson is an attorney and has a retired status with the Massachusetts and District of Columbia Bar Associations. | | N/A |
| | | |
Pamela Wheelock (Born 1959) | | Trustee, since January 2020; previously Trustee from January 2018 to July 2019 | | Board member of the Destination Medical Center Economic Development Agency, Rochester, Minnesota since 2019. Interim President of the McKnight Foundation from January to September 2020. Acting Commissioner, Minnesota Department of Human Services, July 2019 through September 2019. Human Services Manager (part-time), Minnesota Department of Human Services, October 2019 through December 2019. Chief Operating Officer, Twin Cities Habitat for Humanity from 2017 to 2019. Vice President of University Services, University of Minnesota from 2012 to 2016. Prior thereto, on the Board of Directors, Governance Committee and Finance Committee for the Minnesota Philanthropy Partners (Saint Paul Foundation) from 2012 to 2018, Interim Chief Executive Officer of Blue Cross Blue Shield of Minnesota from 2011 to 2012, Chairman of the Board from 2009 to 2012 and Board Director from 2003 to 2015. Vice President, Leadership and Community Engagement, Bush Foundation, Saint Paul, Minnesota (a private foundation) from 2009 to 2011. Executive Vice President and Chief Financial Officer, Minnesota Sports and Entertainment from 2004 to 2009 and Senior Vice President from 2002 to 2004. Executive Vice President of the Minnesota Wild Foundation from 2004 to 2008. Commissioner of Finance, State of Minnesota, from 1999 to 2002. Currently Board Chair of the Minnesota Wild Foundation since 2010. | | N/A |
| * | Length of service dates reflect the Trustee’s commencement of service with the Trust’s predecessor entities, where applicable. |
Wells Fargo Factor Enhanced International Equity Portfolio | 39
Other information (unaudited)
Officers
| | | | |
Name and year of birth | | Position held and length of service | | Principal occupations during past five years or longer |
| | |
Andrew Owen (Born 1960) | | President, since 2017 | | Executive Vice President of Wells Fargo & Company and Head of Affiliated Managers, Wells Fargo Asset Management, since 2014. In addition, Mr. Owen is currently President, Chief Executive Officer and Director of Wells Fargo Funds Management, LLC since 2017. Prior thereto, Executive Vice President responsible for marketing, investments and product development for Wells Fargo Funds Management, LLC, from 2009 to 2014. |
| | |
Jeremy DePalma1 (Born 1974) | | Treasurer, since 2012 | | Senior Vice President of Wells Fargo Funds Management, LLC since 2009. Senior Vice President of Evergreen Investment Management Company, LLC from 2008 to 2010 and head of the Fund Reporting and Control Team within Fund Administration from 2005 to 2010. |
| | |
Michelle Rhee (Born 1966) | | Chief Legal Officer, since 2019 | | Secretary of Wells Fargo Funds Management, LLC, Chief Legal Counsel of Wells Fargo Asset Management and Assistant General Counsel of Wells Fargo Bank, N.A. since 2018. Associate General Counsel and Managing Director of Bank of America Corporation from 2004 to 2018. |
| | |
Catherine Kennedy (Born 1969) | | Secretary, since 2019 | | Vice President of Wells Fargo Funds Management, LLC and Senior Counsel of the Wells Fargo Legal Department since 2010. Vice President and Senior Counsel of Evergreen Investment Management Company, LLC from 1998 to 2010. |
| | |
Michael H. Whitaker (Born 1967) | | Chief Compliance Officer, since 2016 | | Chief Compliance Officer of Wells Fargo Asset Management since 2016. Senior Vice President and Chief Compliance Officer for Fidelity Investments from 2007 to 2016. |
| | |
David Berardi (Born 1975) | | Assistant Treasurer, since 2009 | | Vice President of Wells Fargo Funds Management, LLC since 2009. Vice President of Evergreen Investment Management Company, LLC from 2008 to 2010. Manager of Fund Reporting and Control for Evergreen Investment Management Company, LLC from 2004 to 2010. |
| 1 | Jeremy DePalma acts as Treasurer of 77 funds and Assistant Treasurer of 65 funds in the Fund Complex. |
| 2 | The Statement of Additional Information includes additional information about the Trustees and is available, without charge, upon request, by calling 1-800-222-8222 or by visiting the website at wfam.com. |
40 | Wells Fargo Factor Enhanced International Equity Portfolio
Other information (unaudited)
BOARD CONSIDERATION OF INVESTMENT MANAGEMENT, ADVISORY AND SUB-ADVISORY AGREEMENTS:
Wells Fargo Emerging Markets Bond Fund, Wells Fargo High Yield Corporate Bond Fund, Wells Fargo International Government Bond Fund, Wells Fargo U.S. Core Bond Fund, Wells Fargo Bloomberg Barclays US Aggregate ex-Corporate Credit Portfolio, Wells Fargo Factor Enhanced Emerging Markets Equity Portfolio, Wells Fargo Emerging Markets Bond Portfolio, Wells Fargo Factor Enhanced International Equity Portfolio, Wells Fargo Factor Enhanced U.S. Large Cap Portfolio, Wells Fargo Factor Enhanced U.S. Small Cap Portfolio, Wells Fargo International Government Bond Portfolio, Wells Fargo Investment Grade Corporate Bond Portfolio, Wells Fargo High Yield Corporate Bond Portfolio, Wells Fargo Strategic Retirement Bond Portfolio, and Wells Fargo U.S. REIT Portfolio
Under the Investment Company Act of 1940 (the “1940 Act”), the Board of Trustees (each, a “Board” and collectively, the “Boards”) of each of Wells Fargo Funds Trust (“Funds Trust”) and Wells Fargo Master Trust (“Master Trust”) (collectively, the “Trusts”) must determine annually whether to approve the continuation of the Trusts’ investment management, advisory and sub-advisory agreements, as applicable. In this regard, at a meeting held on May 26, 2020 and May 28, 2020 (together, the “Meeting”), the Board of Funds Trust, all the members of which have no direct or indirect interest in the investment management agreement and are not “interested persons” of the Trusts, as defined in the 1940 Act (the “Independent Trustees”), reviewed and approved for each of the funds of Funds Trust identified in the table below (individually, an “Index Fund” and collectively, the “Index Funds”) an investment management agreement (the “Management Agreement”) with Wells Fargo Funds Management, LLC (“Funds Management”).
|
|
| Index Funds |
|
Wells Fargo Emerging Markets Bond Fund |
|
Wells Fargo High Yield Corporate Bond Fund |
|
Wells Fargo International Government Bond Fund |
|
Wells Fargo U.S. Core Bond Fund |
In addition, the Funds Trust Board reviewed and approved an investment sub-advisory agreement with Wells Capital Management Incorporated (“WellsCap”) for the U.S. Core Bond Fund (the “Core Bond Fund Sub-Advisory Agreement”).
At the Meeting, the Board of Master Trust, all the members of which have no direct or indirect interest in the investment advisory and sub-advisory agreements and are Independent Trustees, reviewed and approved for each of the portfolios of Master Trust identified in the table below (individually, a “Master Portfolio” and collectively, the “Master Portfolios”): (i) an investment advisory agreement (the “Master Portfolio Advisory Agreement”) with Funds Management; and (ii) an investment sub-advisory agreement (each, a “Master Portfolio Sub-Advisory Agreement”, and collectively, the “Master Portfolio Sub-Advisory Agreements”) with the sub-adviser(s) identified in the chart below (each, a “Sub-Adviser”, and collectively, the “Sub-Advisers”) for the corresponding Master Portfolio identified.
| | |
| |
| Master Portfolios | | Sub-Advisers |
| |
Wells Fargo Bloomberg Barclays US Aggregate ex-Corporate Credit Portfolio | | WellsCap |
| |
Wells Fargo Factor Enhanced Emerging Markets Equity Portfolio | | WellsCap |
| |
Wells Fargo Emerging Markets Bond Portfolio | | Wells Fargo Asset Management (International), Limited (“WFAM International”) |
| |
Wells Fargo Factor Enhanced International Equity Portfolio | | WellsCap |
| |
Wells Fargo Factor Enhanced U.S. Large Cap Portfolio | | WellsCap |
| |
Wells Fargo Factor Enhanced U.S. Small Cap Portfolio | | WellsCap |
| |
Wells Fargo International Government Bond Portfolio | | WFAM International |
| |
Wells Fargo Investment Grade Corporate Bond Portfolio | | WellsCap |
| |
Wells Fargo High Yield Corporate Bond Portfolio | | WellsCap |
| |
Wells Fargo Strategic Retirement Bond Portfolio | | WellsCap |
| |
Wells Fargo U.S. REIT Portfolio | | WellsCap |
Wells Fargo Factor Enhanced International Equity Portfolio | 41
Other information (unaudited)
The Index Funds and the Master Portfolios are collectively referred to as the “Funds.” The Management Agreement, the Core Bond Fund Sub-Advisory Agreement, the Master Portfolio Advisory Agreement and the Master Portfolio Sub-Advisory Agreements are collectively referred to as the “Advisory Agreements.”
The Boards noted that each of the Index Funds is a feeder fund that invests all of its assets in its corresponding Master Portfolio, with the exception of the U.S. Core Bond Fund, which invests in multiple Master Portfolios. Information provided to the Boards regarding the Index Funds is also applicable to the Master Portfolios identified above, as relevant.
At the Meeting, the Boards considered the factors and reached the conclusions described below relating to the selection of Funds Management and the Sub-Advisers and the approval of the Advisory Agreements. Prior to the Meeting, including at a Board meeting held in April 2020, the Trustees conferred extensively among themselves and with representatives of Funds Management about these matters. Also, the Boards have adopted a team-based approach, with each team consisting of a sub-set of Trustees, to assist the full Boards in the discharge of their duties in reviewing investment performance and other matters throughout the year. The Independent Trustees were assisted in their evaluation of the Advisory Agreements by independent legal counsel, from whom they received separate legal advice and with whom they met separately.
In providing information to the Boards, Funds Management and the Sub-Advisers were guided by a detailed set of requests for information submitted to them by independent legal counsel on behalf of the Independent Trustees at the start of the Boards’ annual contract renewal process earlier in 2020. In considering and approving the Advisory Agreements, the Trustees considered the information they believed relevant, including but not limited to the information discussed below. The Boards considered not only the specific information presented in connection with the Meeting, but also the knowledge gained over time through interaction with Funds Management and the Sub-Advisers about various topics. In this regard, the Boards reviewed reports of Funds Management at each of their quarterly meetings, which included, among other things, portfolio reviews and investment performance reports. In addition, the Boards and the teams mentioned above confer with portfolio managers at various times throughout the year. The Boards did not identify any particular information or consideration that was all-important or controlling, and each individual Trustee may have attributed different weights to various factors.
After its deliberations, the Board of Funds Trust unanimously approved the continuation of the Management Agreement and the Core Bond Fund Sub-Advisory Agreement for a one-year period. Additionally, after its deliberations, the Board of Master Trust unanimously approved the continuation of the Master Portfolio Advisory Agreement and each Master Portfolio Sub-Advisory Agreement for a one-year term. The Boards also determined that the compensation or the absence of compensation payable to Funds Management and to each of the Sub-Advisers under each of the Advisory Agreements was reasonable. The Boards considered the approval of the Advisory Agreements for the Funds as part of their consideration of agreements for funds across the complex, but their approvals were made on a fund-by-fund basis. The following summarizes a number of important, but not necessarily all, factors considered by the Boards in support of their approvals.
Nature, extent and quality of services
The Boards received and considered various information regarding the nature, extent and quality of services provided to the Funds by Funds Management and the Sub-Advisers under the Advisory Agreements. This information included a description of the investment advisory services and Fund-level administrative services covered by the Advisory Agreements, as well as, among other things, a summary of the background and experience of senior management of Wells Fargo Asset Management (“WFAM”), of which Funds Management and the Sub-Advisers are a part, and a summary of investments made in the business of WFAM. The Boards also received a description of Funds Management’s and the Sub-Advisers’ business continuity plans and of their approaches to data privacy and cybersecurity, and related testing. The Boards also received and reviewed information about Funds Management’s role as administrator of the Funds’ liquidity risk management program, Funds Management’s approach to risk management, and Funds Management’s intermediary and vendor oversight program.
The Boards also considered the qualifications, background, tenure and responsibilities of each of the portfolio managers primarily responsible for the day-to-day portfolio management of the Funds. The Board of Master Trust noted that each of the Master Portfolios replicates the performance of a proprietary index provided by an affiliate of Funds Management, except that the Wells Fargo Bloomberg Barclays US Aggregate ex-Corporate Credit Portfolio, the Wells Fargo Emerging Markets Bond Portfolio, and the Wells Fargo Strategic Retirement Bond Portfolio track the performance of third-party indexes. The Boards evaluated the ability of Funds Management and the Sub-Advisers to attract and retain qualified investment professionals, including research, advisory and supervisory personnel. The Boards further considered the compliance programs and compliance records of Funds Management and the Sub-Advisers. In addition, the Boards took into account the full range of services provided to the Funds by Funds Management and its affiliates.
Fund investment performance and expenses
The Boards considered the investment performance results for each of the Master Portfolios for the one-year period ended December 31, 2019. The Boards also considered more current results for the one-year period ended March 31, 2020. The Boards
42 | Wells Fargo Factor Enhanced International Equity Portfolio
Other information (unaudited)
considered these results in comparison to the investment performance of funds in a universe that was determined by Broadridge Inc. (“Broadridge”) to be similar to the respective Master Portfolios (each, a “Universe”), and in comparison to each Master Portfolio’s benchmark index and to other comparative data. Broadridge is an independent provider of investment company data. The Boards received a description of the methodology used by Broadridge to select the mutual funds in each performance Universe.
The Boards noted the short performance history of the Master Portfolios. For the one-year period ended December 31, 2019, the Boards noted that the investment performance of each Master Portfolio relative to its respective Universe was as follows: (i) the investment performance of each of the Wells Fargo Bloomberg Barclays US Aggregate ex-Corporate Credit Portfolio, the Wells Fargo Emerging Markets Bond Portfolio, the Wells Fargo Factor Enhanced International Equity Portfolio, the Wells Fargo Factor Enhanced U.S. Large Cap Portfolio, the Wells Fargo High Yield Corporate Bond Portfolio and the Wells Fargo Investment Grade Corporate Bond Portfolio was higher than or in range of the average investment performance of such Master Portfolio’s respective Universe; and (ii) the Wells Fargo Factor Enhanced Emerging Markets Equity Portfolio, the Wells Fargo Factor Enhanced U.S. Small Cap Portfolio, the Wells Fargo International Government Bond Portfolio, the Wells Fargo Strategic Retirement Bond Portfolio and the Wells Fargo U.S. REIT Portfolio was lower than the average investment performance of such Master Portfolio’s respective Universe. For the one-year period ended March 31, 2020, the Boards noted that the investment performance of each Master Portfolio relative to its respective Universe was as follows: (i) the Wells Fargo Emerging Markets Bond Portfolio, the Wells Fargo Factor Enhanced U.S. Large Cap Portfolio, the Wells Fargo Factor Enhanced U.S. Small Cap Portfolio, the Wells Fargo International Government Bond Portfolio, and the Wells Fargo Investment Grade Corporate Bond Portfolio was higher than or in range of the average investment performance of such Master Portfolio’s respective Universe, and (ii) the Wells Fargo Bloomberg Barclays US Aggregate ex-Corporate Credit Portfolio, the Wells Fargo Factor Enhanced Emerging Markets Equity Portfolio, the Wells Fargo Factor Enhanced International Equity Portfolio, the Wells Fargo High Yield Corporate Bond Portfolio, the Wells Fargo Strategic Retirement Bond Portfolio and the Wells Fargo U.S. REIT Portfolio was lower than the average investment performance of such Master Portfolio’s respective Universe.
The Boards also noted that the investment performance of each Master Portfolio to its respective benchmark index for the one-year period ended December 31, 2019, was as follows: (i) the investment performance of each of the Wells Fargo Bloomberg Barclays US Aggregate ex-Corporate Credit Portfolio, the Wells Fargo Factor Enhanced Emerging Markets Equity Portfolio, the Wells Fargo Factor Enhanced U.S. Large Cap Portfolio, the Wells Fargo Factor Enhanced U.S. Small Cap Portfolio, the Wells Fargo High Yield Corporate Bond Portfolio, the Wells Fargo U.S. REIT Portfolio and the Wells Fargo Strategic Retirement Bond Portfolio was higher than or in range of the average investment performance of such Master Portfolio’s respective benchmark, and (ii) the investment performance of each of the Wells Fargo Emerging Markets Bond Portfolio, the Wells Fargo Factor Enhanced International Equity Portfolio, the Wells Fargo International Government Bond Portfolio and the Wells Fargo Investment Grade Corporate Bond Portfolio was lower than the average investment performance of such Master Portfolio’s respective benchmark. For the one-year period ended March 31, 2020, the Boards also noted that the investment performance of each Master Portfolio to its respective benchmark index, was as follows: (i) the investment performance of each of the Wells Fargo Bloomberg Barclays US Aggregate ex-Corporate Credit Portfolio, the Wells Fargo Factor Enhanced Emerging Markets Equity Portfolio, the Wells Fargo Factor Enhanced International Equity Portfolio, the Wells Fargo Factor Enhanced U.S. Large Cap Portfolio, the Wells Fargo Factor Enhanced U.S. Small Cap Portfolio, the Wells Fargo U.S. REIT Portfolio, the Wells Fargo Investment Grade Corporate Bond Portfolio and the Wells Fargo Strategic Retirement Bond Portfolio was higher than, equal to or in range of the average investment performance of such Master Portfolio’s respective benchmark, and (ii) the investment performance of each of the Wells Fargo Emerging Markets Bond Portfolio, the Wells Fargo High Yield Corporate Bond Portfolio and the Wells Fargo International Government Bond Portfolio was lower than the average investment performance of such Master Portfolio’s respective benchmark.
The Boards received information concerning, and discussed factors contributing to, the underperformance of certain Master Portfolios, relative to the Universe and benchmark index, for the periods identified above. The Board took note of the explanations for the relative underperformance during these periods, including with respect to investment decisions and market factors that affected the Fund’s investment performance.
The Board of Funds Trust took note of the investment performance of the Master Portfolios in the context of reviewing the investment performance of the Index Funds. The Board of Funds Trust also received and considered information regarding the “zero fee and expense” structure of each Index Fund. Specifically, the Funds Trust Board noted that each Index Fund’s gross operating expense ratio and each of its various components, including management fees, administration fees, custody fees, Rule 12b-1 fees, and other fees, are zero. The Funds Trust Board also noted that Funds Management assumes and pays or reimburses all of the ordinary operating expenses of each Index Fund, including acquired fund fees and expenses, pursuant to an agreement with each of the Index Funds (the “Fee and Expense Agreement”). The Funds Trust Board further noted that Funds Management receives a fee from Wells Fargo Wealth and Investment Management (“WIM”) pursuant to an intercompany agreement equal to the Master Portfolio fees and expenses absorbed by Funds Management through its Fee and Expense Agreement with each of the Index Funds.
Wells Fargo Factor Enhanced International Equity Portfolio | 43
Other information (unaudited)
With respect to the Master Portfolios, the Board of Master Trust received and considered information regarding the fee rates that are payable to Funds Management for investment advisory services (as discussed below), which are the only fees charged at the Master Portfolio level, relative to corresponding class-specific expense groups that were determined by Broadridge to be similar to the Funds (the “Groups”). The Boards received a description of the methodology used by Broadridge to select the mutual funds in the expense Groups and an explanation of how funds comprising expense groups and their expense ratios may vary from year-to-year.
The Boards took into account the Funds’ expense information and the Master Portfolios’ performance information provided to them among the factors considered in deciding to re-approve the Advisory Agreements.
Investment management, advisory and sub-advisory fee rates
The Board of Funds Trust reviewed and considered that the contractual investment management fee rate payable by each Index Fund to Funds Management for investment management services zero, and also reviewed and considered that each Fund’s other expenses would normally be zero, because of Funds Management’s commitment to assume and pay or reimburse all of the ordinary operating expenses of each Fund, including acquired fund fees and expenses, under the Fee and Expense Agreement. The Board of Funds Trust also reviewed and considered that the contractual investment sub-advisory fee rate payable by Funds Management to WellsCap for investment sub-advisory services for the U.S. Core Bond Fund is also zero.
The Board of Master Trust reviewed and considered the contractual fee rates payable by the Master Portfolios to Funds Management under the Master Portfolio Advisory Agreement (the “Advisory Agreement Rates”). The Board of Master Trust also reviewed and considered the contractual investment sub-advisory fee rates that are payable by Funds Management to the Sub-Advisers for investment sub-advisory services (the “Sub-Advisory Agreement Rates”).
The Board of Master Trust reviewed a comparison of the Advisory Agreement Rates of each Master Portfolio with those of other funds in each Master Portfolio’s respective expense Groups at a common asset level. The Board of Master Trust noted that the Advisory Agreement Rates of each Master Portfolio were lower than or equal to the median rate for such Master Portfolio’s expense Groups.
The Boards also received and considered information about the portions of the total management fees that were retained by Funds Management after payment of the fees to the Sub-Advisers for sub-advisory services. In assessing the reasonableness of these amounts, the Boards received and evaluated information about the nature and extent of responsibilities retained and risks assumed by Funds Management and not delegated to or assumed by the Sub-Advisers, and about Funds Management’s on-going oversight services. Given the affiliation between Funds Management and the Sub-Advisers, the Boards ascribed limited relevance to the allocation of fees between them.
The Boards also received and considered information about the nature and extent of services offered and fee rates charged by Funds Management and the Sub-Advisers to other types of clients with investment strategies similar to those of certain Funds. In this regard, the Boards received information about the significantly greater scope of services, and compliance, reporting and other legal burdens and risks of managing proprietary mutual funds compared with those associated with managing assets of other types of clients, including third-party sub-advised fund clients and non-mutual fund clients such as institutional separate accounts.
Based on its consideration of the factors and information it deemed relevant, including those described here, the Board of Fund Trust determined that the compensation received by Funds Management from WIM pursuant to the intercompany agreement, and the absence of compensation payable by the Funds to Funds Management pursuant to the Management Agreement or to WellsCap pursuant to the Core Bond Fund Sub-Advisory Agreement, was reasonable. Based on its consideration of the factors and information it deemed relevant, including those described here, the Board of Master Trust determined that the Advisory Agreement Rates and the Sub-Advisory Agreement Rates for each Master Portfolio were reasonable.
Profitability
The Boards received and considered information concerning the profitability of Funds Management, as well as the profitability of both WFAM and Wells Fargo & Co. (“Wells Fargo”) from providing services to the fund family as a whole. The Boards noted that the Sub-Advisers’ profitability information with respect to providing services to the Funds and other funds in the family was subsumed in the WFAM and Wells Fargo profitability analysis.
Funds Management reported on the methodologies and estimates used in calculating profitability, including a description of the methodology used to allocate certain expenses. Among other things, the Boards noted that the levels of profitability reported on a fund-by-fund basis varied widely, depending on factors such as the size, type and age of fund.
Based on its review, the Boards did not deem the profits reported by Funds Management, WFAM or Wells Fargo from services provided to the Funds to be at a level that would prevent them from approving the continuation of the Advisory Agreements.
44 | Wells Fargo Factor Enhanced International Equity Portfolio
Other information (unaudited)
Economies of scale
The Boards received and considered information about the potential for Funds Management to experience economies of scale in the provision of management services to the Funds, the difficulties of calculating economies of scale at an individual fund level, and the extent to which potential scale benefits are shared with shareholders. The Boards noted the existence of breakpoints in the each Master Portfolio’s advisory fee structure and each Index Fund’s management fee structure, which operate generally to reduce the Funds’ expense ratios as the Funds grow in size, and the size of the Funds in relation to such breakpoints. The Boards considered that in addition to management fee breakpoints, Funds Management shares potential economies of scale from its management business in a variety of ways, including through fee waiver and expense reimbursement arrangements, services that benefit shareholders, competitive management fee rates set at the outset without regard to breakpoints, and investments in the business intended to enhance services available to shareholders.
The Boards concluded that Funds Management’s arrangements with respect to the Funds, including contractual breakpoints, constituted a reasonable approach to sharing potential economies of scale with the Funds and their shareholders.
Other benefits to Funds Management and the Sub-Advisers
The Boards received and considered information regarding potential “fall-out” or ancillary benefits received by Funds Management and its affiliates, including WellsCap and WFAM International, as a result of their relationships with the Funds. Ancillary benefits could include, among others, benefits directly attributable to other relationships with the Funds and benefits potentially derived from an increase in Funds Management’s and the Sub-Advisers’ business as a result of their relationships with the Funds. The Boards noted that various affiliates of Funds Management may receive distribution-related fees, shareholder servicing payments and sub-transfer agency fees in respect of shares sold or held through them and services provided.
The Boards also reviewed information about soft dollar credits earned and utilized by the Sub-Advisers, fees earned by Funds Management and WellsCap from managing a private investment vehicle for the fund family’s securities lending collateral, and commissions earned by an affiliated broker from portfolio transactions.
Based on their consideration of the factors and information they deemed relevant, including those described here, the Boards did not find that any ancillary benefits received by Funds Management and its affiliates, including WellsCap and WFAM International, were unreasonable.
Conclusion
At the Meeting, after considering the above-described factors and based on its deliberations and its evaluation of the information described above, the Funds Trust Board unanimously approved the continuation of the Management Agreement and the Core Bond Fund Sub-Advisory Agreement for a one-year period. Additionally, after its deliberations, the Master Trust Board unanimously approved the continuation of the Master Portfolio Advisory Agreement and each Master Portfolio Sub-Advisory Agreement for a one-year term. The Boards also determined that the compensation or the absence of compensation payable to Funds Management and to each of the Sub-Advisers was reasonable.
Wells Fargo Factor Enhanced International Equity Portfolio | 45
Other information (unaudited)
LIQUIDITY RISK MANAGEMENT PROGRAM
In accordance with Rule 22e-4 under the Investment Company Act of 1940, as amended (the “Liquidity Rule”), Wells Fargo Master Trust (the “Trust”) has adopted and implemented a liquidity risk management program (the “Program”) on behalf of each of its series, including the Portfolio, which is reasonably designed to assess and manage the Portfolio’s liquidity risk. “Liquidity risk” is defined as the risk that the Portfolio is unable to meet redemption requests without significantly diluting remaining investors’ interests in the Portfolio. The Trust’s Board of Trustees (the “Board”) previously approved the designation of Wells Fargo Funds Management, LLC (“Funds Management”), the Portfolio’s investment adviser, as the administrator of the Program, and Funds Management has established a Liquidity Risk Management Council composed of personnel from multiple departments within Funds Management and its affiliates to assist Funds Management in the implementation and on-going administration of the Program.
The Program is comprised of various components designed to support the assessment and/or management of liquidity risk, including: (1) the periodic assessment (no less frequently than annually) of certain factors that influence the Portfolio’s liquidity risk; (2) the periodic classification (no less frequently than monthly) of the Portfolio’s investments into one of four liquidity categories that reflect an estimate of their liquidity under current market conditions; (3) a 15% limit on the acquisition of “illiquid investments” (as defined under the Liquidity Rule); (4) to the extent the Portfolio does not invest primarily in “highly liquid investments” (as defined under the Liquidity Rule), the determination of a minimum percentage of the /Portfolio’s assets that generally will be invested in highly liquid investments (an “HLIM”); (5) if the Portfolio has established an HLIM, the periodic review (no less frequently than annually) of the HLIM and the adoption of policies and procedures for responding to a shortfall of the Portfolio’s “highly liquid investments” below its HLIM; and (6) periodic reporting to the Board.
At a meeting of the Board held on May 26 and 28, 2020, the Board received a written report (the “Report”) from Funds Management that addressed the operation of the Program and assessed its adequacy and effectiveness of implementation. The Report covered the initial period from December 1, 2018 through December 31, 2019 (the “Reporting Period”). No significant liquidity events impacting the Portfolio were noted in the Report, except that certain securities held by the Portfolio were subject to extended foreign market holiday closures, which caused the Portfolio to reclassify such securities as illiquid temporarily and resulted in the Portfolio temporarily breaching its 15% limit on illiquid investments. This breach was anticipated in advance and communicated to the Board prior to the closure. There were no material changes to the Program during the Reporting Period. The Report concluded that the Program is operating effectively to assess and manage the Portfolio’s liquidity risk, and that the Program has been and continues to be adequately and effectively implemented to monitor and, as applicable, respond to the Portfolio’s liquidity developments.
46 | Wells Fargo Factor Enhanced International Equity Portfolio
This page is intentionally left blank.
This page is intentionally left blank.

For more information
More information about Wells Fargo Funds is available free upon request. To obtain literature, please write, visit the Portfolio’s website, or call:
Wells Fargo Funds
P.O. Box 219967
Kansas City, MO 64121-9967
Website: wfam.com
Individual investors: 1-800-222-8222
Retail investment professionals: 1-888-877-9275
Institutional investment professionals: 1-866-765-0778
This report and the financial statements contained herein are submitted for the general information of the shareholders of the Portfolio. If this report is used for promotional purposes, distribution of the report must be accompanied or preceded by a current prospectus. Before investing, please consider the investment objectives, risks, charges, and expenses of the investment. For a current prospectus and, if available, a summary prospectus, containing this information, call 1-800-222-8222 or visit the Portfolio’s website at wfam.com. Read the prospectus carefully before you invest or send money.
Wells Fargo Asset Management (WFAM) is the trade name for certain investment advisory/management firms owned by Wells Fargo & Company. These firms include but are not limited to Wells Capital Management Incorporated and Wells Fargo Funds Management, LLC. Certain products managed by WFAM entities are distributed by Wells Fargo Funds Distributor, LLC (a broker-dealer and Member FINRA).
This material is for general informational and educational purposes only and is NOT intended to provide investment advice or a recommendation of any kind—including a recommendation for any specific investment, strategy, or plan.
INVESTMENT PRODUCTS: NOT FDIC INSURED ◾ NO BANK GUARANTEE ◾ MAY LOSE VALUE
© 2020 Wells Fargo & Company. All rights reserved.
Semi-Annual Report
August 31, 2020
Wells Fargo
Factor Enhanced U.S. Large Cap Equity Portfolio
(formerly Wells Fargo Factor Enhanced Large Cap Portfolio)
INVESTMENT PRODUCTS: NOT FDIC INSURED ◾ NO BANK GUARANTEE ◾ MAY LOSE VALUE
Wells Fargo Factor Enhanced U.S. Large Cap Equity Portfolio | 1
Portfolio information (unaudited)
Investment objective
The Portfolio seeks long-term capital appreciation.
Adviser
Wells Fargo Funds Management, LLC
Subadviser
Wells Capital Management Incorporated
Portfolio managers
Dennis Beinn, CFA®‡
Harindra de Silva, Ph.D., CFA®‡
Monisha Jayakumar
| | | | |
|
| Ten largest holdings (%) as of August 31, 20201 | |
| | |
Apple Incorporated | | | 4.42 | |
| | |
Microsoft Corporation | | | 3.59 | |
| | |
Amazon.com Incorporated | | | 3.04 | |
| | |
Alphabet Incorporated Class A | | | 1.82 | |
| | |
Alphabet Incorporated Class C | | | 1.76 | |
| | |
Johnson & Johnson | | | 1.49 | |
| | |
Facebook Incorporated Class A | | | 1.48 | |
| | |
The Procter & Gamble Company | | | 1.14 | |
| | |
Berkshire Hathaway Incorporated Class B | | | 1.13 | |
| | |
The Home Depot Incorporated | | | 1.10 | |
|
|
| Portfolio composition as of August 31, 20202 |
|
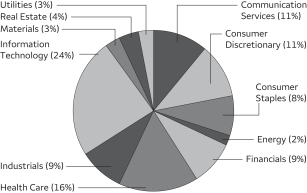 |
| ‡ | CFA® and Chartered Financial Analyst® are trademarks owned by CFA Institute. |
| 1 | The ten largest holdings, excluding cash, cash equivalents and any money market funds, are calculated based on the value of the investments divided by the total net assets of the Portfolio. Holdings are subject to change and may have changed since the date specified. |
| 2 | Amounts are calculated based on the total long-term investments of the Portfolio. These amounts are subject to change and may have changed since the date specified. |
2 | Wells Fargo Factor Enhanced U.S. Large Cap Equity Portfolio
Portfolio of investments—August 31, 2020 (unaudited)
| | | | | | | | | | | | | | | | |
| | | | | | | | | Shares | | | Value | |
| Common Stocks: 98.49% | |
|
Communication Services: 11.16% | |
|
| Diversified Telecommunication Services: 1.76% | |
AT&T Incorporated | | | | | | | | | | | 230,097 | | | $ | 6,859,178 | |
CenturyLink Incorporated | | | | | | | | | | | 72,008 | | | | 774,086 | |
Cogent Communications Group Incorporated | | | | | | | | | | | 574 | | | | 38,607 | |
Verizon Communications Incorporated | | | | | | | | | | | 134,631 | | | | 7,979,579 | |
| | | | |
| | | | | | | | | | | | | | | 15,651,450 | |
| | | | | | | | | | | | | | | | |
|
| Entertainment: 2.32% | |
Activision Blizzard Incorporated | | | | | | | | | | | 32,275 | | | | 2,695,608 | |
Electronic Arts Incorporated † | | | | | | | | | | | 10,195 | | | | 1,421,897 | |
Lions Gate Entertainment Class A † | | | | | | | | | | | 31,437 | | | | 306,196 | |
Lions Gate Entertainment Class B † | | | | | | | | | | | 38,328 | | | | 347,252 | |
Live Nation Entertainment Incorporated † | | | | | | | | | | | 2,474 | | | | 140,523 | |
Netflix Incorporated † | | | | | | | | | | | 12,755 | | | | 6,754,538 | |
Roku Incorporated † | | | | | | | | | | | 1,857 | | | | 322,152 | |
Spotify Technology † | | | | | | | | | | | 1,709 | | | | 482,211 | |
Take-Two Interactive Software Incorporated † | | | | | | | | | | | 4,236 | | | | 725,161 | |
The Madison Square Garden Company Class A | | | | | | | | | | | 248 | | | | 40,672 | |
The Walt Disney Company | | | | | | | | | | | 52,370 | | | | 6,906,032 | |
Zynga Incorporated Class A † | | | | | | | | | | | 52,354 | | | | 474,327 | |
| | | | |
| | | | | | | | | | | | | | | 20,616,569 | |
| | | | | | | | | | | | | | | | |
|
| Interactive Media & Services: 5.30% | |
Alphabet Incorporated Class A † | | | | | | | | | | | 9,932 | | | | 16,184,492 | |
Alphabet Incorporated Class C † | | | | | | | | | | | 9,611 | | | | 15,706,104 | |
Facebook Incorporated Class A † | | | | | | | | | | | 44,786 | | | | 13,131,255 | |
InterActive Corporation † | | | | | | | | | | | 1,382 | | | | 183,792 | |
Match Group Incorporated † | | | | | | | | | | | 8,994 | | | | 1,004,450 | |
Zillow Group Incorporated Class A † | | | | | | | | | | | 5,813 | | | | 495,733 | |
Zillow Group Incorporated Class C † | | | | | | | | | | | 5,826 | | | | 499,638 | |
| | | | |
| | | | | | | | | | | | | | | 47,205,464 | |
| | | | | | | | | | | | | | | | |
|
| Media: 1.58% | |
Altice USA Incorporated † | | | | | | | | | | | 7,469 | | | | 205,995 | |
Cable One Incorporated | | | | | | | | | | | 196 | | | | 360,705 | |
Charter Communications Incorporated Class A † | | | | | | | | | | | 5,417 | | | | 3,334,759 | |
Comcast Corporation Class A | | | | | | | | | | | 135,831 | | | | 6,086,587 | |
Discovery Incorporated Class A † | | | | | | | | | | | 22,150 | | | | 488,740 | |
DISH Network Corporation Class A † | | | | | | | | | | | 8,333 | | | | 295,988 | |
Fox Corporation Class A | | | | | | | | | | | 11,022 | | | | 307,073 | |
Interpublic Group of Companies Incorporated | | | | | | | | | | | 19,581 | | | | 347,759 | |
News Corporation Class A | | | | | | | | | | | 30,905 | | | | 467,284 | |
News Corporation Class B | | | | | | | | | | | 39,034 | | | | 588,242 | |
Nexstar Media Group Incorporated Class A | | | | | | | | | | | 1,836 | | | | 176,274 | |
Omnicom Group Incorporated | | | | | | | | | | | 2,788 | | | | 150,803 | |
Sirius XM Holdings Incorporated | | | | | | | | | | | 70,296 | | | | 412,638 | |
Tegna Incorporated | | | | | | | | | | | 3,019 | | | | 37,798 | |
The New York Times Company Class A | | | | | | | | | | | 12,425 | | | | 538,375 | |
ViacomCBS Incorporated Class B | | | | | | | | | | | 9,822 | | | | 273,543 | |
| | | | |
| | | | | | | | | | | | | | | 14,072,563 | |
| | | | | | | | | | | | | | | | |
|
| Wireless Telecommunication Services: 0.20% | |
T-Mobile US Incorporated † | | | | | | | | | | | 15,428 | | | | 1,800,139 | |
| | | | | | | | | | | | | | | | |
The accompanying notes are an integral part of these financial statements.
Wells Fargo Factor Enhanced U.S. Large Cap Equity Portfolio | 3
Portfolio of investments—August 31, 2020 (unaudited)
| | | | | | | | | | | | | | | | |
| | | | | | | | | Shares | | | Value | |
| Consumer Discretionary: 10.60% | |
|
| Auto Components: 0.09% | |
BorgWarner Incorporated | | | | | | | | | | | 6,118 | | | $ | 248,330 | |
Gentex Corporation | | | | | | | | | | | 6,089 | | | | 164,707 | |
Lear Corporation | | | | | | | | | | | 3,249 | | | | 370,159 | |
| | | | |
| | | | | | | | | | | | | | | 783,196 | |
| | | | | | | | | | | | | | | | |
|
| Automobiles: 0.26% | |
Ford Motor Company | | | | | | | | | | | 44,688 | | | | 304,772 | |
General Motors Company | | | | | | | | | | | 30,354 | | | | 899,389 | |
Harley-Davidson Incorporated | | | | | | | | | | | 1,669 | | | | 46,248 | |
Thor Industries Incorporated | | | | | | | | | | | 11,419 | | | | 1,078,296 | |
| | | | |
| | | | | | | | | | | | | | | 2,328,705 | |
| | | | | | | | | | | | | | | | |
|
| Distributors: 0.10% | |
Genuine Parts Company | | | | | | | | | | | 1,829 | | | | 172,731 | |
LKQ Corporation † | | | | | | | | | | | 9,862 | | | | 313,020 | |
Pool Corporation | | | | | | | | | | | 1,213 | | | | 397,670 | |
| | | | |
| | | | | | | | | | | | | | | 883,421 | |
| | | | | | | | | | | | | | | | |
|
| Diversified Consumer Services: 0.12% | |
Bright Horizons Family Solutions Incorporated † | | | | | | | | | | | 929 | | | | 123,566 | |
Chegg Incorporated † | | | | | | | | | | | 1,675 | | | | 123,515 | |
Frontdoor Incorporated † | | | | | | | | | | | 10,241 | | | | 446,200 | |
Grand Canyon Education Incorporated † | | | | | | | | | | | 958 | | | | 90,090 | |
H&R Block Incorporated | | | | | | | | | | | 5,126 | | | | 74,327 | |
Service Corporation International | | | | | | | | | | | 2,433 | | | | 111,066 | |
ServiceMaster Global Holdings Incorporated † | | | | | | | | | | | 2,437 | | | | 97,236 | |
Strategic Education Incorporated | | | | | | | | | | | 297 | | | | 30,463 | |
| | | | |
| | | | | | | | | | | | | | | 1,096,463 | |
| | | | | | | | | | | | | | | | |
|
| Hotels, Restaurants & Leisure: 1.73% | |
Aramark | | | | | | | | | | | 7,291 | | | | 200,940 | |
Carnival Corporation | | | | | | | | | | | 4,918 | | | | 81,049 | |
Chipotle Mexican Grill Incorporated † | | | | | | | | | | | 1,281 | | | | 1,678,469 | |
Choice Hotels International Incorporated | | | | | | | | | | | 1,091 | | | | 108,325 | |
Churchill Downs Incorporated | | | | | | | | | | | 448 | | | | 78,292 | |
Cracker Barrel Old Country Store Incorporated | | | | | | | | | | | 294 | | | | 39,311 | |
Darden Restaurants Incorporated | | | | | | | | | | | 3,527 | | | | 305,685 | |
Domino’s Pizza Incorporated | | | | | | | | | | | 4,853 | | | | 1,984,683 | |
Dunkin Brands Group Incorporated | | | | | | | | | | | 1,044 | | | | 79,428 | |
Extended Stay America Incorporated | | | | | | | | | | | 2,184 | | | | 27,278 | |
Hilton Worldwide Holdings Incorporated | | | | | | | | | | | 4,870 | | | | 440,053 | |
Hyatt Hotels Corporation Class A | | | | | | | | | | | 658 | | | | 37,170 | |
Las Vegas Sands Corporation | | | | | | | | | | | 7,093 | | | | 359,686 | |
Marriott International Incorporated Class A | | | | | | | | | | | 4,662 | | | | 479,766 | |
Marriott Vacations Worldwide Corporation | | | | | | | | | | | 470 | | | | 44,495 | |
McDonald’s Corporation | | | | | | | | | | | 19,552 | | | | 4,174,743 | |
MGM Resorts International | | | | | | | | | | | 5,265 | | | | 118,463 | |
Norwegian Cruise Line Holdings Limited † | | | | | | | | | | | 2,101 | | | | 35,948 | |
Six Flags Entertainment Corporation | | | | | | | | | | | 151 | | | | 3,281 | |
Starbucks Corporation | | | | | | | | | | | 31,308 | | | | 2,644,587 | |
Texas Roadhouse Incorporated | | | | | | | | | | | 846 | | | | 53,290 | |
The Wendy’s Company | | | | | | | | | | | 17,925 | | | | 375,350 | |
Vail Resorts Incorporated | | | | | | | | | | | 556 | | | | 121,025 | |
Wingstop Incorporated | | | | | | | | | | | 400 | | | | 65,360 | |
The accompanying notes are an integral part of these financial statements.
4 | Wells Fargo Factor Enhanced U.S. Large Cap Equity Portfolio
Portfolio of investments—August 31, 2020 (unaudited)
| | | | | | | | | | | | | | | | |
| | | | | | | | | Shares | | | Value | |
|
| Hotels, Restaurants & Leisure (continued) | |
Wyndham Hotels & Resorts Incorporated | | | | | | | | | | | 8,754 | | | $ | 458,359 | |
Wyndham Worldwide Corporation | | | | | | | | | | | 27,657 | | | | 801,776 | |
Wynn Resorts Limited | | | | | | | | | | | 1,168 | | | | 102,142 | |
Yum China Holdings Incorporated | | | | | | | | | | | 204 | | | | 11,773 | |
Yum! Brands Incorporated | | | | | | | | | | | 4,773 | | | | 457,492 | |
| | | | |
| | | | | | | | | | | | | | | 15,368,219 | |
| | | | | | | | | | | | | | | | |
|
| Household Durables: 0.32% | |
D.R. Horton Incorporated | | | | | | | | | | | 6,899 | | | | 492,382 | |
Garmin Limited | | | | | | | | | | | 1,808 | | | | 187,327 | |
Helen of Troy Limited † | | | | | | | | | | | 339 | | | | 70,112 | |
Leggett & Platt Incorporated | | | | | | | | | | | 1,603 | | | | 65,723 | |
Lennar Corporation Class A | | | | | | | | | | | 8,953 | | | | 669,863 | |
Lennar Corporation Class B | | | | | | | | | | | 835 | | | | 49,516 | |
Mohawk Industries Incorporated † | | | | | | | | | | | 1,109 | | | | 102,394 | |
Newell Rubbermaid Incorporated | | | | | | | | | | | 11,476 | | | | 183,386 | |
NVR Incorporated † | | | | | | | | | | | 46 | | | | 191,744 | |
Pulte Group Incorporated | | | | | | | | | | | 3,398 | | | | 151,517 | |
Tempur-Pedic International Incorporated † | | | | | | | | | | | 625 | | | | 53,463 | |
Toll Brothers Incorporated | | | | | | | | | | | 1,540 | | | | 65,019 | |
TopBuild Corporation † | | | | | | | | | | | 430 | | | | 66,134 | |
Whirlpool Corporation | | | | | | | | | | | 2,822 | | | | 501,526 | |
| | | | |
| | | | | | | | | | | | | | | 2,850,106 | |
| | | | | | | | | | | | | | | | |
|
| Internet & Direct Marketing Retail: 3.46% | |
Amazon.com Incorporated † | | | | | | | | | | | 7,834 | | | | 27,034,821 | |
Booking Holdings Incorporated † | | | | | | | | | | | 455 | | | | 869,255 | |
Chewy Incorporated Class A † | | | | | | | | | | | 712 | | | | 43,482 | |
eBay Incorporated | | | | | | | | | | | 30,604 | | | | 1,676,487 | |
Expedia Group Incorporated | | | | | | | | | | | 1,690 | | | | 165,874 | |
Qurate Retail Incorporated † | | | | | | | | | | | 4,622 | | | | 51,073 | |
Wayfair Incorporated Class A † | | | | | | | | | | | 3,270 | | | | 969,751 | |
| | | | |
| | | | | | | | | | | | | | | 30,810,743 | |
| | | | | | | | | | | | | | | | |
|
| Leisure Products: 0.26% | |
Hasbro Incorporated | | | | | | | | | | | 1,643 | | | | 129,698 | |
Mattel Incorporated † | | | | | | | | | | | 10,397 | | | | 111,716 | |
Polaris Industries Incorporated | | | | | | | | | | | 7,672 | | | | 775,179 | |
The Brunswick Corporation | | | | | | | | | | | 20,752 | | | | 1,284,341 | |
| | | | |
| | | | | | | | | | | | | | | 2,300,934 | |
| | | | | | | | | | | | | | | | |
|
| Multiline Retail: 0.68% | |
Dollar General Corporation | | | | | | | | | | | 10,433 | | | | 2,106,214 | |
Dollar Tree Incorporated † | | | | | | | | | | | 4,390 | | | | 422,625 | |
Kohl’s Corporation | | | | | | | | | | | 1,659 | | | | 35,436 | |
Target Corporation | | | | | | | | | | | 23,159 | | | | 3,501,872 | |
| | | | |
| | | | | | | | | | | | | | | 6,066,147 | |
| | | | | | | | | | | | | | | | |
|
| Specialty Retail: 2.66% | |
Advance Auto Parts Incorporated | | | | | | | | | | | 913 | | | | 142,711 | |
AutoNation Incorporated † | | | | | | | | | | | 32,304 | | | | 1,836,805 | |
AutoZone Incorporated † | | | | | | | | | | | 321 | | | | 384,016 | |
Best Buy Company Incorporated | | | | | | | | | | | 13,381 | | | | 1,484,087 | |
Burlington Stores Incorporated † | | | | | | | | | | | 879 | | | | 173,101 | |
CarMax Incorporated † | | | | | | | | | | | 2,077 | | | | 222,094 | |
The accompanying notes are an integral part of these financial statements.
Wells Fargo Factor Enhanced U.S. Large Cap Equity Portfolio | 5
Portfolio of investments—August 31, 2020 (unaudited)
| | | | | | | | | | | | | | | | |
| | | | | | | | | Shares | | | Value | |
|
| Specialty Retail (continued) | |
Dick’s Sporting Goods Incorporated | | | | | | | | | | | 5,943 | | | $ | 321,635 | |
Foot Locker Incorporated | | | | | | | | | | | 4,306 | | | | 130,601 | |
L Brands Incorporated | | | | | | | | | | | 5,680 | | | | 166,992 | |
Lithia Motors Incorporated Class A | | | | | | | | | | | 274 | | | | 68,215 | |
Lowe’s Companies Incorporated | | | | | | | | | | | 26,175 | | | | 4,310,761 | |
Murphy USA Incorporated † | | | | | | | | | | | 381 | | | | 51,382 | |
O’Reilly Automotive Incorporated † | | | | | | | | | | | 1,141 | | | | 531,284 | |
Penske Auto Group Incorporated | | | | | | | | | | | 23,894 | | | | 1,127,080 | |
Ross Stores Incorporated | | | | | | | | | | | 4,753 | | | | 432,903 | |
The Gap Incorporated | | | | | | | | | | | 3,118 | | | | 54,222 | |
The Home Depot Incorporated | | | | | | | | | | | 34,273 | | | | 9,769,176 | |
The TJX Companies Incorporated | | | | | | | | | | | 21,973 | | | | 1,203,901 | |
Tiffany & Company | | | | | | | | | | | 1,696 | | | | 207,760 | |
Tractor Supply Company | | | | | | | | | | | 3,204 | | | | 476,851 | |
Ulta Beauty Incorporated † | | | | | | | | | | | 753 | | | | 174,832 | |
Williams-Sonoma Incorporated | | | | | | | | | | | 4,994 | | | | 438,273 | |
| | | | |
| | | | | | | | | | | | | | | 23,708,682 | |
| | | | | | | | | | | | | | | | |
|
| Textiles, Apparel & Luxury Goods: 0.92% | |
Capri Holdings Limited † | | | | | | | | | | | 27,231 | | | | 431,339 | |
Carter’s Incorporated | | | | | | | | | | | 7,046 | | | | 561,003 | |
Deckers Outdoor Corporation † | | | | | | | | | | | 342 | | | | 69,724 | |
HanesBrands Incorporated | | | | | | | | | | | 40,651 | | | | 621,554 | |
Lululemon Athletica Incorporated † | | | | | | | | | | | 2,237 | | | | 840,374 | |
Nike Incorporated Class B | | | | | | | | | | | 40,655 | | | | 4,548,888 | |
PVH Corporation | | | | | | | | | | | 1,178 | | | | 65,685 | |
Ralph Lauren Corporation | | | | | | | | | | | 607 | | | | 41,780 | |
Skechers USA Incorporated Class A † | | | | | | | | | | | 14,883 | | | | 444,258 | |
Tapestry Incorporated | | | | | | | | | | | 19,810 | | | | 291,801 | |
VF Corporation | | | | | | | | | | | 3,899 | | | | 256,359 | |
| | | | |
| | | | | | | | | | | | | | | 8,172,765 | |
| | | | | | | | | | | | | | | | |
|
Consumer Staples: 7.44% | |
|
| Beverages: 1.66% | |
Boston Beer Company Incorporated Class A † | | | | | | | | | | | 1,065 | | | | 939,309 | |
Brown-Forman Corporation Class B | | | | | | | | | | | 8,971 | | | | 656,408 | |
Constellation Brands Incorporated Class A | | | | | | | | | | | 3,244 | | | | 598,453 | |
Keurig Dr. Pepper Incorporated | | | | | | | | | | | 3,916 | | | | 116,814 | |
Molson Coors Brewing Company Class B | | | | | | | | | | | 2,390 | | | | 89,960 | |
Monster Beverage Corporation † | | | | | | | | | | | 12,327 | | | | 1,033,742 | |
PepsiCo Incorporated | | | | | | | | | | | 44,259 | | | | 6,198,916 | |
The Coca-Cola Company | | | | | | | | | | | 103,700 | | | | 5,136,261 | |
| | | | |
| | | | | | | | | | | | | | | 14,769,863 | |
| | | | | | | | | | | | | | | | |
|
| Food & Staples Retailing: 1.69% | |
BJ’s Wholesale Club Holdings Incorporated † | | | | | | | | | | | 1,932 | | | | 85,800 | |
Casey’s General Stores Incorporated | | | | | | | | | | | 503 | | | | 89,459 | |
Costco Wholesale Corporation | | | | | | | | | | | 14,023 | | | | 4,875,236 | |
Performance Food Group Company † | | | | | | | | | | | 1,651 | | | | 60,278 | |
Sprouts Farmers Market Incorporated † | | | | | | | | | | | 30,680 | | | | 716,378 | |
Sysco Corporation | | | | | | | | | | | 6,420 | | | | 386,099 | |
The Kroger Company | | | | | | | | | | | 62,397 | | | | 2,226,325 | |
US Foods Holding Corporation † | | | | | | | | | | | 2,688 | | | | 65,453 | |
Walgreens Boots Alliance Incorporated | | | | | | | | | | | 9,753 | | | | 370,809 | |
Walmart Incorporated | | | | | | | | | | | 44,468 | | | | 6,174,382 | |
| | | | |
| | | | | | | | | | | | | | | 15,050,219 | |
| | | | | | | | | | | | | | | | |
The accompanying notes are an integral part of these financial statements.
6 | Wells Fargo Factor Enhanced U.S. Large Cap Equity Portfolio
Portfolio of investments—August 31, 2020 (unaudited)
| | | | | | | | | | | | | | | | |
| | | | | | | | | Shares | | | Value | |
| Food Products: 1.39% | |
Archer Daniels Midland Company | | | | | | | | | | | 24,447 | | | $ | 1,094,248 | |
Beyond Meat Incorporated † | | | | | | | | | | | 495 | | | | 67,246 | |
Bunge Limited | | | | | | | | | | | 1,790 | | | | 81,660 | |
Campbell Soup Company | | | | | | | | | | | 21,709 | | | | 1,142,110 | |
ConAgra Foods Incorporated | | | | | | | | | | | 19,742 | | | | 757,303 | |
Darling Ingredients Incorporated † | | | | | | | | | | | 2,155 | | | | 68,895 | |
Flowers Foods Incorporated | | | | | | | | | | | 7,686 | | | | 188,000 | |
Freshpet Incorporated † | | | | | | | | | | | 505 | | | | 57,368 | |
General Mills Incorporated | | | | | | | | | | | 19,986 | | | | 1,278,105 | |
Hain Celestial Group Incorporated † | | | | | | | | | | | 28,900 | | | | 947,631 | |
Hormel Foods Corporation | | | | | | | | | | | 10,579 | | | | 539,317 | |
Ingredion Incorporated | | | | | | | | | | | 10,244 | | | | 824,027 | |
Kellogg Company | | | | | | | | | | | 14,682 | | | | 1,041,101 | |
Lamb Weston Holdings Incorporated | | | | | | | | | | | 1,750 | | | | 109,988 | |
Lancaster Colony Corporation | | | | | | | | | | | 248 | | | | 44,075 | |
McCormick & Company Incorporated | | | | | | | | | | | 1,690 | | | | 348,478 | |
Mondelez International Incorporated Class A | | | | | | | | | | | 26,637 | | | | 1,556,134 | |
Pilgrim’s Pride Corporation † | | | | | | | | | | | 26,497 | | | | 423,952 | |
Post Holdings Incorporated † | | | | | | | | | | | 1,285 | | | | 113,106 | |
Sanderson Farms Incorporated | | | | | | | | | | | 275 | | | | 32,164 | |
The Hershey Company | | | | | | | | | | | 2,043 | | | | 303,672 | |
The J.M. Smucker Company | | | | | | | | | | | 1,566 | | | | 188,202 | |
The Kraft Heinz Company | | | | | | | | | | | 8,137 | | | | 285,120 | |
TreeHouse Foods Incorporated † | | | | | | | | | | | 10,160 | | | | 434,950 | |
Tyson Foods Incorporated Class A | | | | | | | | | | | 6,622 | | | | 415,862 | |
| | | | |
| | | | | | | | | | | | | | | 12,342,714 | |
| | | | | | | | | | | | | | | | |
|
| Household Products: 1.79% | |
Church & Dwight Company Incorporated | | | | | | | | | | | 3,314 | | | | 317,581 | |
Colgate-Palmolive Company | | | | | | | | | | | 17,548 | | | | 1,390,854 | |
Energizer Holdings Incorporated | | | | | | | | | | | 10,770 | | | | 498,543 | |
Kimberly-Clark Corporation | | | | | | | | | | | 11,640 | | | | 1,836,326 | |
Spectrum Brands Holdings Incorporated | | | | | | | | | | | 11,177 | | | | 666,149 | |
The Clorox Company | | | | | | | | | | | 5,074 | | | | 1,134,039 | |
The Procter & Gamble Company | | | | | | | | | | | 73,172 | | | | 10,121,883 | |
| | | | |
| | | | | | | | | | | | | | | 15,965,375 | |
| | | | | | | | | | | | | | | | |
|
| Personal Products: 0.19% | |
Herbalife Nutrition Limited † | | | | | | | | | | | 14,044 | | | | 690,263 | |
NU Skin Enterprises Incorporated Class A | | | | | | | | | | | 8,130 | | | | 384,305 | |
The Estee Lauder Companies Incorporated Class A | | | | | | | | | | | 2,672 | | | | 592,436 | |
| | | | |
| | | | | | | | | | | | | | | 1,667,004 | |
| | | | | | | | | | | | | | | | |
|
| Tobacco: 0.72% | |
Altria Group Incorporated | | | | | | | | | | | 54,550 | | | | 2,386,017 | |
Philip Morris International Incorporated | | | | | | | | | | | 50,128 | | | | 3,999,713 | |
| | | | |
| | | | | | | | | | | | | | | 6,385,730 | |
| | | | | | | | | | | | | | | | |
|
Energy: 2.06% | |
|
| Energy Equipment & Services: 0.21% | |
Baker Hughes Incorporated | | | | | | | | | | | 42,406 | | | | 605,558 | |
Halliburton Company | | | | | | | | | | | 33,799 | | | | 546,868 | |
Helmerich & Payne Incorporated | | | | | | | | | | | 793 | | | | 13,069 | |
Nabors Industries | | | | | | | | | | | 73 | | | | 2,919 | |
The accompanying notes are an integral part of these financial statements.
Wells Fargo Factor Enhanced U.S. Large Cap Equity Portfolio | 7
Portfolio of investments—August 31, 2020 (unaudited)
| | | | | | | | | | | | | | | | |
| | | | | | | | | Shares | | | Value | |
|
| Energy Equipment & Services (continued) | |
National Oilwell Varco Incorporated | | | | | | | | | | | 30,529 | | | $ | 366,348 | |
Schlumberger Limited | | | | | | | | | | | 18,507 | | | | 351,818 | |
| | | | |
| | | | | | | | | | | | | | | 1,886,580 | |
| | | | | | | | | | | | | | | | |
|
| Oil, Gas & Consumable Fuels: 1.85% | |
Antero Midstream Corporation | | | | | | | | | | | 130,919 | | | | 886,322 | |
Apache Corporation | | | | | | | | | | | 29,674 | | | | 439,175 | |
Cabot Oil & Gas Corporation | | | | | | | | | | | 16,387 | | | | 310,861 | |
Cheniere Energy Incorporated † | | | | | | | | | | | 4,376 | | | | 227,771 | |
Chevron Corporation | | | | | | | | | | | 31,447 | | | | 2,639,347 | |
Cimarex Energy Company | | | | | | | | | | | 13,483 | | | | 374,558 | |
Concho Resources Incorporated | | | | | | | | | | | 3,919 | | | | 203,710 | |
ConocoPhillips | | | | | | | | | | | 14,738 | | | | 558,423 | |
Devon Energy Corporation | | | | | | | | | | | 50,434 | | | | 548,218 | |
EQT Corporation | | | | | | | | | | | 20,220 | | | | 320,891 | |
Equitrans Midstream Corporation | | | | | | | | | | | 11,926 | | | | 122,599 | |
Exxon Mobil Corporation | | | | | | | | | | | 114,186 | | | | 4,560,589 | |
HollyFrontier Corporation | | | | | | | | | | | 5,149 | | | | 122,907 | |
Marathon Oil Corporation | | | | | | | | | | | 13,586 | | | | 71,734 | |
Marathon Petroleum Corporation | | | | | | | | | | | 35,704 | | | | 1,266,064 | |
Murphy Oil Corporation | | | | | | | | | | | 955 | | | | 13,122 | |
Occidental Petroleum Corporation | | | | | | | | | | | 8,118 | | | | 103,423 | |
ONEOK Incorporated | | | | | | | | | | | 3,482 | | | | 95,685 | |
Parsley Energy Incorporated Class A | | | | | | | | | | | 5,137 | | | | 55,223 | |
Phillips 66 | | | | | | | | | | | 38,751 | | | | 2,265,771 | |
Pioneer Natural Resources Company | | | | | | | | | | | 2,039 | | | | 211,913 | |
The Williams Companies Incorporated | | | | | | | | | | | 3,193 | | | | 66,287 | |
Valero Energy Corporation | | | | | | | | | | | 18,695 | | | | 983,170 | |
| | | | |
| | | | | | | | | | | | | | | 16,447,763 | |
| | | | | | | | | | | | | | | | |
|
Financials: 8.71% | |
|
| Banks: 2.07% | |
Associated Banc Corporation | | | | | | | | | | | 495 | | | | 6,653 | |
Bank of America Corporation | | | | | | | | | | | 128,443 | | | | 3,306,123 | |
Bank of Hawaii Corporation | | | | | | | | | | | 1,312 | | | | 72,212 | |
Bank OZK | | | | | | | | | | | 23,695 | | | | 545,933 | |
BOK Financial Corporation | | | | | | | | | | | 575 | | | | 32,281 | |
Citigroup Incorporated | | | | | | | | | | | 33,373 | | | | 1,706,028 | |
Citizens Financial Group Incorporated | | | | | | | | | | | 8,998 | | | | 232,778 | |
Comerica Incorporated | | | | | | | | | | | 1,674 | | | | 66,173 | |
Commerce Bancshares Incorporated | | | | | | | | | | | 8,488 | | | | 505,630 | |
Community Bank System Incorporated | | | | | | | | | | | 702 | | | | 42,239 | |
Cullen Frost Bankers Incorporated | | | | | | | | | | | 1,447 | | | | 100,509 | |
CVB Financial Corporation | | | | | | | | | | | 1,755 | | | | 31,959 | |
East West Bancorp Incorporated | | | | | | | | | | | 13,150 | | | | 483,657 | |
Fifth Third Bancorp | | | | | | | | | | | 22,145 | | | | 457,516 | |
First Financial Bankshares Incorporated | | | | | | | | | | | 1,853 | | | | 56,100 | |
First Hawaiian Incorporated | | | | | | | | | | | 1,643 | | | | 27,159 | |
First Horizon National Corporation | | | | | | | | | | | 12,480 | | | | 119,184 | |
First Republic Bank | | | | | | | | | | | 2,337 | | | | 263,871 | |
FNB Corporation | | | | | | | | | | | 4,193 | | | | 31,448 | |
Glacier Bancorp Incorporated | | | | | | | | | | | 1,311 | | | | 45,996 | |
Huntington Bancshares Incorporated | | | | | | | | | | | 11,902 | | | | 111,998 | |
JPMorgan Chase & Company | | | | | | | | | | | 51,807 | | | | 5,190,543 | |
KeyCorp | | | | | | | | | | | 13,944 | | | | 171,790 | |
The accompanying notes are an integral part of these financial statements.
8 | Wells Fargo Factor Enhanced U.S. Large Cap Equity Portfolio
Portfolio of investments—August 31, 2020 (unaudited)
| | | | | | | | | | | | | | | | |
| | | | | | | | | Shares | | | Value | |
|
| Banks (continued) | |
M&T Bank Corporation | | | | | | | | | | | 1,571 | | | $ | 162,221 | |
PacWest Bancorp | | | | | | | | | | | 4,126 | | | | 78,724 | |
People’s United Financial Incorporated | | | | | | | | | | | 5,138 | | | | 54,360 | |
Pinnacle Financial Partners Incorporated | | | | | | | | | | | 935 | | | | 37,353 | |
PNC Financial Services Group Incorporated | | | | | | | | | | | 9,555 | | | | 1,062,516 | |
Popular Incorporated | | | | | | | | | | | 1,243 | | | | 46,041 | |
Prosperity Bancshares Incorporated | | | | | | | | | | | 119 | | | | 6,488 | |
Regions Financial Corporation | | | | | | | | | | | 51,435 | | | | 594,589 | |
Signature Bank | | | | | | | | | | | 3,851 | | | | 373,663 | |
Sterling Bancorp | | | | | | | | | | | 3,674 | | | | 42,876 | |
SVB Financial Group † | | | | | | | | | | | 1,184 | | | | 302,370 | |
Synovus Financial Corporation | | | | | | | | | | | 6,757 | | | | 147,776 | |
TCF Financial Corporation | | | | | | | | | | | 4,374 | | | | 117,573 | |
Truist Financial Corporation | | | | | | | | | | | 3,993 | | | | 154,968 | |
UMB Financial Corporation | | | | | | | | | | | 579 | | | | 31,104 | |
Umpqua Holdings Corporation | | | | | | | | | | | 35,974 | | | | 405,787 | |
United Bankshares Incorporated | | | | | | | | | | | 1,409 | | | | 36,831 | |
US Bancorp | | | | | | | | | | | 16,923 | | | | 615,997 | |
Valley National Bancorp | | | | | | | | | | | 5,127 | | | | 38,504 | |
Webster Financial Corporation | | | | | | | | | | | 3,005 | | | | 82,638 | |
Western Alliance Bancorp | | | | | | | | | | | 5,454 | | | | 192,526 | |
Wintrust Financial Corporation | | | | | | | | | | | 921 | | | | 40,082 | |
Zions Bancorporation | | | | | | | | | | | 7,113 | | | | 228,754 | |
| | | | |
| | | | | | | | | | | | | | | 18,461,521 | |
| | | | | | | | | | | | | | | | |
|
| Capital Markets: 2.51% | |
Affiliated Managers Group Incorporated | | | | | | | | | | | 10,833 | | | | 743,685 | |
Ameriprise Financial Incorporated | | | | | | | | | | | 4,994 | | | | 783,059 | |
Apollo Global Management Incorporated | | | | | | | | | | | 2,558 | | | | 119,893 | |
Ares Management Corporation Class A | | | | | | | | | | | 8,202 | | | | 331,771 | |
Bank of New York Mellon Corporation | | | | | | | | | | | 10,046 | | | | 371,501 | |
BlackRock Incorporated | | | | | | | | | | | 3,101 | | | | 1,842,583 | |
Carlyle Group Incorporated | | | | | | | | | | | 4,359 | | | | 112,506 | |
Cboe Global Markets Incorporated | | | | | | | | | | | 8,198 | | | | 752,494 | |
Eaton Vance Corporation | | | | | | | | | | | 6,795 | | | | 278,731 | |
Evercore Partners Incorporated Class A | | | | | | | | | | | 3,981 | | | | 246,344 | |
FactSet Research Systems Incorporated | | | | | | | | | | | 1,695 | | | | 593,928 | |
Franklin Resources Incorporated | | | | | | | | | | | 3,200 | | | | 67,392 | |
Houlihan Lokey Incorporated | | | | | | | | | | | 602 | | | | 35,277 | |
Interactive Brokers Group Incorporated Class A | | | | | | | | | | | 964 | | | | 51,111 | |
Intercontinental Exchange Incorporated | | | | | | | | | | | 8,345 | | | | 886,489 | |
Invesco Limited | | | | | | | | | | | 4,525 | | | | 46,155 | |
KKR & Company Incorporated Class A | | | | | | | | | | | 6,594 | | | | 236,197 | |
Lazard Limited Class A | | | | | | | | | | | 1,236 | | | | 39,144 | |
LPL Financial Holdings Incorporated | | | | | | | | | | | 13,237 | | | | 1,087,552 | |
MarketAxess Holdings Incorporated | | | | | | | | | | | 721 | | | | 350,363 | |
Moody’s Corporation | | | | | | | | | | | 5,477 | | | | 1,613,743 | |
Morgan Stanley | | | | | | | | | | | 17,519 | | | | 915,543 | |
Morningstar Incorporated | | | | | | | | | | | 303 | | | | 48,525 | |
MSCI Incorporated | | | | | | | | | | | 2,718 | | | | 1,014,548 | |
Northern Trust Corporation | | | | | | | | | | | 2,385 | | | | 195,308 | |
Raymond James Financial Incorporated | | | | | | | | | | | 1,558 | | | | 117,972 | |
S&P Global Incorporated | | | | | | | | | | | 8,820 | | | | 3,231,824 | |
SEI Investments Company | | | | | | | | | | | 12,120 | | | | 634,603 | |
State Street Corporation | | | | | | | | | | | 4,174 | | | | 284,208 | |
Stifel Financial Corporation | | | | | | | | | | | 854 | | | | 43,306 | |
The accompanying notes are an integral part of these financial statements.
Wells Fargo Factor Enhanced U.S. Large Cap Equity Portfolio | 9
Portfolio of investments—August 31, 2020 (unaudited)
| | | | | | | | | | | | | | | | |
| | | | | | | | | Shares | | | Value | |
|
| Capital Markets (continued) | |
T. Rowe Price Group Incorporated | | | | | | | | | | | 12,176 | | | $ | 1,695,021 | |
TD Ameritrade Holding Corporation | | | | | | | | | | | 3,174 | | | | 121,818 | |
The Blackstone Group Incorporated Class A | | | | | | | | | | | 9,056 | | | | 479,515 | |
The Goldman Sachs Group Incorporated | | | | | | | | | | | 8,076 | | | | 1,654,530 | |
The NASDAQ OMX Group Incorporated | | | | | | | | | | | 7,648 | | | | 1,028,044 | |
Tradeweb Markets Incorporated Class A | | | | | | | | | | | 3,226 | | | | 184,818 | |
VIRTU Financial Incorporated Class A | | | | | | | | | | | 5,245 | | | | 135,478 | |
| | | | |
| | | | | | | | | | | | | | | 22,374,979 | |
| | | | | | | | | | | | | | | | |
|
| Consumer Finance: 0.23% | |
Ally Financial Incorporated | | | | | | | | | | | 4,283 | | | | 97,995 | |
American Express Company | | | | | | | | | | | 6,600 | | | | 670,494 | |
Capital One Financial Corporation | | | | | | | | | | | 444 | | | | 30,649 | |
Credit Acceptance Corporation † | | | | | | | | | | | 110 | | | | 42,548 | |
FirstCash Financial Services Incorporated | | | | | | | | | | | 514 | | | | 30,712 | |
Lending Tree Incorporated † | | | | | | | | | | | 69 | | | | 21,317 | |
One Main Holdings Incorporated | | | | | | | | | | | 2,787 | | | | 81,046 | |
SLM Corporation | | | | | | | | | | | 58,671 | | | | 448,246 | |
Synchrony Financial | | | | | | | | | | | 25,120 | | | | 623,227 | |
| | | | |
| | | | | | | | | | | | | | | 2,046,234 | |
| | | | | | | | | | | | | | | | |
|
| Diversified Financial Services: 1.29% | |
Berkshire Hathaway Incorporated Class B † | | | | | | | | | | | 45,969 | | | | 10,023,081 | |
Equitable Holdings Incorporated | | | | | | | | | | | 52,999 | | | | 1,123,049 | |
Jefferies Financial Group Incorporated | | | | | | | | | | | 5,735 | | | | 100,592 | |
Voya Financial Incorporated | | | | | | | | | | | 4,681 | | | | 242,991 | |
| | | | |
| | | | | | | | | | | | | | | 11,489,713 | |
| | | | | | | | | | | | | | | | |
|
| Insurance: 2.15% | |
AFLAC Incorporated | | | | | | | | | | | 8,713 | | | | 316,456 | |
Alleghany Corporation | | | | | | | | | | | 185 | | | | 102,594 | |
American Financial Group Incorporated | | | | | | | | | | | 955 | | | | 63,842 | |
American International Group Incorporated | | | | | | | | | | | 6,255 | | | | 182,271 | |
Aon plc Class A | | | | | | | | | | | 3,128 | | | | 625,569 | |
Arch Capital Group Limited † | | | | | | | | | | | 4,719 | | | | 148,837 | |
Arthur J. Gallagher & Company | | | | | | | | | | | 5,626 | | | | 592,418 | |
Assurant Incorporated | | | | | | | | | | | 9,021 | | | | 1,096,593 | |
Assured Guaranty Limited | | | | | | | | | | | 1,717 | | | | 36,830 | |
Athene Holding Limited Class A † | | | | | | | | | | | 9,210 | | | | 336,718 | |
Axis Capital Holdings Limited | | | | | | | | | | | 985 | | | | 47,044 | |
Brown & Brown Incorporated | | | | | | | | | | | 9,421 | | | | 437,134 | |
Chubb Limited | | | | | | | | | | | 4,787 | | | | 598,375 | |
Cincinnati Financial Corporation | | | | | | | | | | | 1,959 | | | | 155,564 | |
eHealth Incorporated † | | | | | | | | | | | 398 | | | | 25,122 | |
Erie Indemnity Company Class A | | | | | | | | | | | 335 | | | | 71,502 | |
Everest Reinsurance Group Limited | | | | | | | | | | | 1,731 | | | | 380,958 | |
Fidelity National Financial Incorporated | | | | | | | | | | | 3,446 | | | | 113,132 | |
First American Financial Corporation | | | | | | | | | | | 6,152 | | | | 323,411 | |
Globe Life Incorporated | | | | | | | | | | | 5,014 | | | | 413,555 | |
Kemper Corporation | | | | | | | | | | | 1,766 | | | | 137,148 | |
Lincoln National Corporation | | | | | | | | | | | 13,911 | | | | 501,492 | |
Loews Corporation | | | | | | | | | | | 3,158 | | | | 113,246 | |
Markel Corporation † | | | | | | | | | | | 166 | | | | 180,414 | |
Marsh & McLennan Companies Incorporated | | | | | | | | | | | 18,597 | | | | 2,136,981 | |
MetLife Incorporated | | | | | | | | | | | 24,962 | | | | 960,039 | |
Old Republic International Corporation | | | | | | | | | | | 6,154 | | | | 99,141 | |
The accompanying notes are an integral part of these financial statements.
10 | Wells Fargo Factor Enhanced U.S. Large Cap Equity Portfolio
Portfolio of investments—August 31, 2020 (unaudited)
| | | | | | | | | | | | | | | | |
| | | | | | | | | Shares | | | Value | |
|
| Insurance (continued) | |
Primerica Incorporated | | | | | | | | | | | 3,498 | | | $ | 436,725 | |
Principal Financial Group Incorporated | | | | | | | | | | | 10,980 | | | | 462,368 | |
Prudential Financial Incorporated | | | | | | | | | | | 10,918 | | | | 739,913 | |
Reinsurance Group of America Incorporated | | | | | | | | | | | 1,302 | | | | 119,367 | |
RLI Corporation | | | | | | | | | | | 554 | | | | 51,960 | |
Selective Insurance Group Incorporated | | | | | | | | | | | 799 | | | | 47,788 | |
The Allstate Corporation | | | | | | | | | | | 19,048 | | | | 1,771,464 | |
The Hanover Insurance Group Incorporated | | | | | | | | | | | 4,437 | | | | 454,748 | |
The Hartford Financial Services Group Incorporated | | | | | | | | | | | 7,214 | | | | 291,806 | |
The Progressive Corporation | | | | | | | | | | | 24,061 | | | | 2,286,757 | |
The Travelers Companies Incorporated | | | | | | | | | | | 3,068 | | | | 356,011 | |
Unum Group | | | | | | | | | | | 46,070 | | | | 851,374 | |
W.R. Berkley Corporation | | | | | | | | | | | 2,216 | | | | 137,503 | |
White Mountains Insurance Group Limited | | | | | | | | | | | 44 | | | | 39,222 | |
Willis Towers Watson plc | | | | | | | | | | | 4,183 | | | | 859,732 | |
| | | | |
| | | | | | | | | | | | | | | 19,103,124 | |
| | | | | | | | | | | | | | | | |
|
| Mortgage REITs: 0.43% | |
AGNC Investment Corporation | | | | | | | | | | | 103,345 | | | | 1,458,198 | |
Annaly Capital Management Incorporated | | | | | | | | | | | 152,378 | | | | 1,119,978 | |
Blackstone Mortgage Trust Incorporated Class A | | | | | | | | | | | 1,600 | | | | 38,032 | |
New Residential Investment Corporation | | | | | | | | | | | 135,775 | | | | 1,050,899 | |
Starwood Property Trust Incorporated | | | | | | | | | | | 8,375 | | | | 130,650 | |
| | | | |
| | | | | | | | | | | | | | | 3,797,757 | |
| | | | | | | | | | | | | | | | |
|
| Thrifts & Mortgage Finance: 0.03% | |
Essent Group Limited | | | | | | | | | | | 1,113 | | | | 39,734 | |
MGIC Investment Corporation | | | | | | | | | | | 10,450 | | | | 95,827 | |
New York Community Bancorp Incorporated | | | | | | | | | | | 9,651 | | | | 87,342 | |
Radian Group Incorporated | | | | | | | | | | | 2,569 | | | | 39,665 | |
| | | | |
| | | | | | | | | | | | | | | 262,568 | |
| | | | | | | | | | | | | | | | |
|
Health Care: 15.77% | |
|
| Biotechnology: 3.27% | |
AbbVie Incorporated | | | | | | | | | | | 63,122 | | | | 6,045,194 | |
ACADIA Pharmaceuticals Incorporated † | | | | | | | | | | | 7,956 | | | | 314,978 | |
Acceleron Pharma Incorporated † | | | | | | | | | | | 3,856 | | | | 375,844 | |
Alexion Pharmaceuticals Incorporated † | | | | | | | | | | | 6,005 | | | | 685,891 | |
Alkermes plc † | | | | | | | | | | | 12,039 | | | | 199,125 | |
Amgen Incorporated | | | | | | | | | | | 22,559 | | | | 5,714,646 | |
Biogen Incorporated † | | | | | | | | | | | 6,338 | | | | 1,823,062 | |
BioMarin Pharmaceutical Incorporated † | | | | | | | | | | | 5,692 | | | | 444,147 | |
Emergent BioSolutions Incorporated † | | | | | | | | | | | 710 | | | | 80,976 | |
Exelixis Incorporated † | | | | | | | | | | | 12,536 | | | | 278,550 | |
Gilead Sciences Incorporated | | | | | | | | | | | 55,303 | | | | 3,691,475 | |
Halozyme Therapeutics Incorporated † | | | | | | | | | | | 1,898 | | | | 55,033 | |
Incyte Corporation † | | | | | | | | | | | 8,593 | | | | 827,936 | |
Ionis Pharmaceuticals Incorporated † | | | | | | | | | | | 2,273 | | | | 123,879 | |
Moderna Incorporated † | | | | | | | | | | | 1,228 | | | | 79,685 | |
Natera Incorporated † | | | | | | | | | | | 1,049 | | | | 66,832 | |
Neurocrine Biosciences Incorporated † | | | | | | | | | | | 2,852 | | | | 332,030 | |
PTC Therapeutics Incorporated † | | | | | | | | | | | 811 | | | | 40,084 | |
Regeneron Pharmaceuticals Incorporated † | | | | | | | | | | | 3,998 | | | | 2,478,480 | |
Seattle Genetics Incorporated † | | | | | | | | | | | 5,217 | | | | 826,060 | |
The accompanying notes are an integral part of these financial statements.
Wells Fargo Factor Enhanced U.S. Large Cap Equity Portfolio | 11
Portfolio of investments—August 31, 2020 (unaudited)
| | | | | | | | | | | | | | | | |
| | | | | | | | | Shares | | | Value | |
|
| Biotechnology (continued) | |
United Therapeutics Corporation † | | | | | | | | | | | 15,139 | | | $ | 1,619,267 | |
Vertex Pharmaceuticals Incorporated † | | | | | | | | | | | 10,694 | | | | 2,984,909 | |
| | | | |
| | | | | | | | | | | | | | | 29,088,083 | |
| | | | | | | | | | | | | | | | |
|
| Health Care Equipment & Supplies: 3.67% | |
Abbott Laboratories | | | | | | | | | | | 55,789 | | | | 6,107,222 | |
ABIOMED Incorporated † | | | | | | | | | | | 785 | | | | 241,482 | |
Align Technology Incorporated † | | | | | | | | | | | 970 | | | | 288,071 | |
Baxter International Incorporated | | | | | | | | | | | 14,801 | | | | 1,288,723 | |
Becton Dickinson & Company | | | | | | | | | | | 8,180 | | | | 1,985,859 | |
Boston Scientific Corporation † | | | | | | | | | | | 19,670 | | | | 806,863 | |
Danaher Corporation | | | | | | | | | | | 15,598 | | | | 3,220,519 | |
Dentsply Sirona Incorporated | | | | | | | | | | | 4,146 | | | | 186,031 | |
DexCom Incorporated † | | | | | | | | | | | 3,331 | | | | 1,417,041 | |
Edwards Lifesciences Corporation † | | | | | | | | | | | 17,934 | | | | 1,539,455 | |
Envista Holdings Corporation † | | | | | | | | | | | 9,096 | | | | 218,213 | |
Globus Medical Incorporated Class A † | | | | | | | | | | | 2,887 | | | | 163,173 | |
Haemonetics Corporation † | | | | | | | | | | | 2,345 | | | | 210,253 | |
Hill-Rom Holdings Incorporated | | | | | | | | | | | 2,987 | | | | 280,151 | |
Hologic Incorporated † | | | | | | | | | | | 8,516 | | | | 508,576 | |
ICU Medical Incorporated † | | | | | | | | | | | 284 | | | | 56,868 | |
IDEXX Laboratories Incorporated † | | | | | | | | | | | 2,558 | | | | 1,000,331 | |
Insulet Corporation † | | | | | | | | | | | 1,544 | | | | 336,978 | |
Integra LifeSciences Holdings Corporation † | | | | | | | | | | | 1,016 | | | | 48,555 | |
Intuitive Surgical Incorporated † | | | | | | | | | | | 1,047 | | | | 765,189 | |
iRhythm Technologies Incorporated † | | | | | | | | | | | 394 | | | | 86,751 | |
LivaNova plc † | | | | | | | | | | | 709 | | | | 33,252 | |
Masimo Corporation † | | | | | | | | | | | 2,940 | | | | 658,560 | |
Medtronic plc | | | | | | | | | | | 38,301 | | | | 4,116,208 | |
Neogen Corporation † | | | | | | | | | | | 717 | | | | 54,635 | |
Nevro Corporation † | | | | | | | | | | | 418 | | | | 57,492 | |
NuVasive Incorporated † | | | | | | | | | | | 715 | | | | 37,273 | |
Penumbra Incorporated † | | | | | | | | | | | 434 | | | | 90,771 | |
Quidel Corporation † | | | | | | | | | | | 4,646 | | | | 817,510 | |
ResMed Incorporated | | | | | | | | | | | 6,535 | | | | 1,181,397 | |
STERIS plc | | | | | | | | | | | 2,652 | | | | 423,365 | |
Stryker Corporation | | | | | | | | | | | 6,876 | | | | 1,362,548 | |
Tandem Diabetes Care Incorporated † | | | | | | | | | | | 1,332 | | | | 150,143 | |
Teleflex Incorporated | | | | | | | | | | | 644 | | | | 253,060 | |
The Cooper Companies Incorporated | | | | | | | | | | | 776 | | | | 243,959 | |
Varian Medical Systems Incorporated † | | | | | | | | | | | 1,258 | | | | 218,477 | |
West Pharmaceutical Services Incorporated | | | | | | | | | | | 5,544 | | | | 1,574,274 | |
Wright Medical Group NV † | | | | | | | | | | | 1,670 | | | | 50,484 | |
Zimmer Biomet Holdings Incorporated | | | | | | | | | | | 4,381 | | | | 617,195 | |
| | | | |
| | | | | | | | | | | | | | | 32,696,907 | |
| | | | | | | | | | | | | | | | |
|
| Health Care Providers & Services: 2.23% | |
Amedisys Incorporated † | | | | | | | | | | | 471 | | | | 113,935 | |
AmerisourceBergen Corporation | | | | | | | | | | | 3,022 | | | | 293,225 | |
Anthem Incorporated | | | | | | | | | | | 6,825 | | | | 1,921,374 | |
Cardinal Health Incorporated | | | | | | | | | | | 6,078 | | | | 308,519 | |
Centene Corporation † | | | | | | | | | | | 15,462 | | | | 948,130 | |
Chemed Corporation | | | | | | | | | | | 222 | | | | 114,798 | |
Cigna Corporation | | | | | | | | | | | 13,489 | | | | 2,392,544 | |
CVS Health Corporation | | | | | | | | | | | 49,779 | | | | 3,092,271 | |
DaVita HealthCare Partners Incorporated † | | | | | | | | | | | 9,724 | | | | 843,654 | |
The accompanying notes are an integral part of these financial statements.
12 | Wells Fargo Factor Enhanced U.S. Large Cap Equity Portfolio
Portfolio of investments—August 31, 2020 (unaudited)
| | | | | | | | | | | | | | | | |
| | | | | | | | | Shares | | | Value | |
|
| Health Care Providers & Services (continued) | |
Encompass Health Corporation | | | | | | | | | | | 1,403 | | | $ | 91,532 | |
HCA Healthcare Incorporated | | | | | | | | | | | 3,689 | | | | 500,671 | |
Henry Schein Incorporated † | | | | | | | | | | | 1,994 | | | | 132,481 | |
Humana Incorporated | | | | | | | | | | | 5,063 | | | | 2,102,006 | |
LHC Group Incorporated † | | | | | | | | | | | 410 | | | | 85,460 | |
McKesson Corporation | | | | | | | | | | | 2,269 | | | | 348,155 | |
Molina Healthcare Incorporated † | | | | | | | | | | | 6,700 | | | | 1,239,299 | |
Quest Diagnostics Incorporated | | | | | | | | | | | 1,937 | | | | 215,472 | |
UnitedHealth Group Incorporated | | | | | | | | | | | 15,955 | | | | 4,986,735 | |
Universal Health Services Incorporated Class B | | | | | | | | | | | 1,096 | | | | 120,944 | |
| | | | |
| | | | | | | | | | | | | | | 19,851,205 | |
| | | | | | | | | | | | | | | | |
|
| Health Care Technology: 0.38% | |
Cerner Corporation | | | | | | | | | | | 18,911 | | | | 1,387,500 | |
Omnicell Incorporated † | | | | | | | | | | | 573 | | | | 38,208 | |
Teladoc Incorporated † | | | | | | | | | | | 5,053 | | | | 1,089,882 | |
Veeva Systems Incorporated Class A † | | | | | | | | | | | 2,938 | | | | 829,309 | |
| | | | |
| | | | | | | | | | | | | | | 3,344,899 | |
| | | | | | | | | | | | | | | | |
|
| Life Sciences Tools & Services: 1.40% | |
Agilent Technologies Incorporated | | | | | | | | | | | 11,989 | | | | 1,203,935 | |
Avantor Incorporated † | | | | | | | | | | | 27,634 | | | | 623,699 | |
Bio-Rad Laboratories Incorporated Class A † | | | | | | | | | | | 617 | | | | 313,800 | |
Bio-Techne Corporation | | | | | | | | | | | 542 | | | | 138,459 | |
Bruker Corporation | | | | | | | | | | | 1,443 | | | | 60,635 | |
Charles River Laboratories International Incorporated † | | | | | | | | | | | 2,149 | | | | 470,524 | |
Illumina Incorporated † | | | | | | | | | | | 666 | | | | 237,909 | |
IQVIA Holdings Incorporated † | | | | | | | | | | | 5,252 | | | | 860,015 | |
Mettler-Toledo International Incorporated † | | | | | | | | | | | 408 | | | | 396,078 | |
Neogenomics Incorporated † | | | | | | | | | | | 1,320 | | | | 51,414 | |
PerkinElmer Incorporated | | | | | | | | | | | 2,538 | | | | 298,773 | |
PPD Incorporated † | | | | | | | | | | | 533 | | | | 18,303 | |
PRA Health Sciences Incorporated † | | | | | | | | | | | 6,976 | | | | 745,804 | |
Qiagen N.V. † | | | | | | | | | | | 3,025 | | | | 154,154 | |
Repligen Corporation † | | | | | | | | | | | 711 | | | | 110,141 | |
Syneos Health Incorporated † | | | | | | | | | | | 12,243 | | | | 772,533 | |
Thermo Fisher Scientific Incorporated | | | | | | | | | | | 12,443 | | | | 5,337,798 | |
Waters Corporation † | | | | | | | | | | | 2,919 | | | | 631,263 | |
| | | | |
| | | | | | | | | | | | | | | 12,425,237 | |
| | | | | | | | | | | | | | | | |
|
| Pharmaceuticals: 4.82% | |
Bristol-Myers Squibb Company | | | | | | | | | | | 83,681 | | | | 5,204,958 | |
Catalent Incorporated † | | | | | | | | | | | 2,578 | | | | 238,465 | |
Elanco Animal Health Incorporated † | | | | | | | | | | | 5,068 | | | | 147,276 | |
Eli Lilly & Company | | | | | | | | | | | 31,063 | | | | 4,609,439 | |
Horizon Therapeutics plc † | | | | | | | | | | | 12,996 | | | | 976,260 | |
Jazz Pharmaceuticals plc † | | | | | | | | | | | 4,021 | | | | 540,382 | |
Johnson & Johnson | | | | | | | | | | | 86,302 | | | | 13,239,590 | |
Merck & Company Incorporated | | | | | | | | | | | 81,559 | | | | 6,954,536 | |
Mylan NV † | | | | | | | | | | | 63,697 | | | | 1,043,357 | |
Perrigo Company plc | | | | | | | | | | | 14,435 | | | | 754,951 | |
Pfizer Incorporated | | | | | | | | | | | 172,630 | | | | 6,523,688 | |
Zoetis Incorporated | | | | | | | | | | | 16,694 | | | | 2,672,709 | |
| | | | |
| | | | | | | | | | | | | | | 42,905,611 | |
| | | | | | | | | | | | | | | | |
The accompanying notes are an integral part of these financial statements.
Wells Fargo Factor Enhanced U.S. Large Cap Equity Portfolio | 13
Portfolio of investments—August 31, 2020 (unaudited)
| | | | | | | | | | | | | | | | |
| | | | | | | | | Shares | | | Value | |
| Industrials: 9.17% | |
|
| Aerospace & Defense: 1.77% | |
Aerojet Rocketdyne Holdings Incorporated † | | | | | | | | | | | 1,030 | | | $ | 42,611 | |
Axon Enterprise Incorporated † | | | | | | | | | | | 954 | | | | 81,739 | |
BWX Technologies Incorporated | | | | | | | | | | | 18,375 | | | | 1,021,834 | |
Curtiss-Wright Corporation | | | | | | | | | | | 3,402 | | | | 348,093 | |
General Dynamics Corporation | | | | | | | | | | | 6,094 | | | | 910,139 | |
HEICO Corporation | | | | | | | | | | | 508 | | | | 55,839 | |
Hexcel Corporation | | | | | | | | | | | 930 | | | | 36,633 | |
Howmet Aerospace Incorporated | | | | | | | | | | | 12,990 | | | | 227,585 | |
Huntington Ingalls Industries Incorporated | | | | | | | | | | | 5,540 | | | | 839,421 | |
L3Harris Technologies Incorporated | | | | | | | | | | | 5,476 | | | | 989,732 | |
Lockheed Martin Corporation | | | | | | | | | | | 10,470 | | | | 4,086,022 | |
Mercury Computer Systems Incorporated † | | | | | | | | | | | 1,933 | | | | 146,405 | |
Northrop Grumman Corporation | | | | | | | | | | | 6,690 | | | | 2,292,061 | |
Raytheon Technologies Corporation | | | | | | | | | | | 48,485 | | | | 2,957,585 | |
Teledyne Technologies Incorporated † | | | | | | | | | | | 3,479 | | | | 1,091,049 | |
Textron Incorporated | | | | | | | | | | | 2,700 | | | | 106,461 | |
The Boeing Company | | | | | | | | | | | 655 | | | | 112,542 | |
TransDigm Group Incorporated | | | | | | | | | | | 726 | | | | 362,760 | |
| | | | |
| | | | | | | | | | | | | | | 15,708,511 | |
| | | | | | | | | | | | | | | | |
|
| Air Freight & Logistics: 0.58% | |
C.H. Robinson Worldwide Incorporated | | | | | | | | | | | 8,542 | | | | 839,679 | |
Expeditors International of Washington Incorporated | | | | | | | | | | | 10,957 | | | | 968,489 | |
United Parcel Service Incorporated Class B | | | | | | | | | | | 18,273 | | | | 2,989,828 | |
XPO Logistics Incorporated † | | | | | | | | | | | 4,348 | | | | 383,798 | |
| | | | |
| | | | | | | | | | | | | | | 5,181,794 | |
| | | | | | | | | | | | | | | | |
|
| Airlines: 0.22% | |
Alaska Air Group Incorporated | | | | | | | | | | | 14,586 | | | | 568,125 | |
American Airlines Group Incorporated | | | | | | | | | | | 3,117 | | | | 40,677 | |
Copa Holdings SA Class A | | | | | | | | | | | 6,733 | | | | 358,532 | |
Delta Air Lines Incorporated | | | | | | | | | | | 6,253 | | | | 192,905 | |
JetBlue Airways Corporation † | | | | | | | | | | | 25,739 | | | | 296,513 | |
Southwest Airlines Company | | | | | | | | | | | 11,147 | | | | 418,904 | |
United Airlines Holdings Incorporated † | | | | | | | | | | | 2,635 | | | | 94,860 | |
| | | | |
| | | | | | | | | | | | | | | 1,970,516 | |
| | | | | | | | | | | | | | | | |
|
| Building Products: 0.54% | |
A.O. Smith Corporation | | | | | | | | | | | 6,094 | | | | 298,423 | |
Allegion plc | | | | | | | | | | | 1,169 | | | | 120,863 | |
Armstrong World Industries Incorporated | | | | | | | | | | | 616 | | | | 45,424 | |
Carrier Global Corporation | | | | | | | | | | | 26,809 | | | | 800,249 | |
Fortune Brands Home & Security Incorporated | | | | | | | | | | | 6,464 | | | | 543,493 | |
Johnson Controls International plc | | | | | | | | | | | 9,123 | | | | 371,580 | |
Lennox International Incorporated | | | | | | | | | | | 478 | | | | 133,998 | |
Masco Corporation | | | | | | | | | | | 20,908 | | | | 1,218,936 | |
Owens Corning Incorporated | | | | | | | | | | | 7,423 | | | | 502,092 | |
Simpson Manufacturing Company Incorporated | | | | | | | | | | | 589 | | | | 57,922 | |
Trane Technologies plc | | | | | | | | | | | 3,117 | | | | 369,022 | |
Trex Company Incorporated † | | | | | | | | | | | 2,438 | | | | 364,457 | |
| | | | |
| | | | | | | | | | | | | | | 4,826,459 | |
| | | | | | | | | | | | | | | | |
The accompanying notes are an integral part of these financial statements.
14 | Wells Fargo Factor Enhanced U.S. Large Cap Equity Portfolio
Portfolio of investments—August 31, 2020 (unaudited)
| | | | | | | | | | | | | | | | |
| | | | | | | | | Shares | | | Value | |
|
| Commercial Services & Supplies: 0.38% | |
ADT Incorporated | | | | | | | | | | | 48,611 | | | $ | 517,707 | |
Cintas Corporation | | | | | | | | | | | 1,114 | | | | 371,229 | |
Clean Harbors Incorporated † | | | | | | | | | | | 1,054 | | | | 64,399 | |
Copart Incorporated † | | | | | | | | | | | 2,891 | | | | 298,698 | |
IAA Incorporated † | | | | | | | | | | | 1,736 | | | | 90,828 | |
MSA Safety Incorporated | | | | | | | | | | | 4,413 | | | | 555,817 | |
Republic Services Incorporated | | | | | | | | | | | 4,429 | | | | 410,657 | |
Rollins Incorporated | | | | | | | | | | | 1,970 | | | | 108,626 | |
Stericycle Incorporated † | | | | | | | | | | | 3,106 | | | | 199,126 | |
Tetra Tech Incorporated | | | | | | | | | | | 749 | | | | 69,140 | |
The Brink’s Company | | | | | | | | | | | 544 | | | | 26,308 | |
Waste Management Incorporated | | | | | | | | | | | 5,729 | | | | 653,106 | |
| | | | |
| | | | | | | | | | | | | | | 3,365,641 | |
| | | | | | | | | | | | | | | | |
|
| Construction & Engineering: 0.08% | |
AECOM Technology Corporation † | | | | | | | | | | | 8,799 | | | | 347,648 | |
EMCOR Group Incorporated | | | | | | | | | | | 734 | | | | 55,057 | |
Jacobs Engineering Group Incorporated | | | | | | | | | | | 1,817 | | | | 164,021 | |
Quanta Services Incorporated | | | | | | | | | | | 2,874 | | | | 147,293 | |
| | | | |
| | | | | | | | | | | | | | | 714,019 | |
| | | | | | | | | | | | | | | | |
|
| Electrical Equipment: 0.61% | |
Acuity Brands Incorporated | | | | | | | | | | | 450 | | | | 49,181 | |
Eaton Corporation plc | | | | | | | | | | | 9,944 | | | | 1,015,282 | |
Emerson Electric Company | | | | | | | | | | | 13,322 | | | | 925,479 | |
Generac Holdings Incorporated † | | | | | | | | | | | 7,059 | | | | 1,341,069 | |
GrafTech International Limited | | | | | | | | | | | 15,440 | | | | 102,830 | |
Hubbell Incorporated | | | | | | | | | | | 2,898 | | | | 419,978 | |
nVent Electric plc | | | | | | | | | | | 1,995 | | | | 38,144 | |
Regal-Beloit Corporation | | | | | | | | | | | 5,265 | | | | 520,498 | |
Rockwell Automation Incorporated | | | | | | | | | | | 3,918 | | | | 903,217 | |
Sensata Technologies Holding plc † | | | | | | | | | | | 1,959 | | | | 81,573 | |
| | | | |
| | | | | | | | | | | | | | | 5,397,251 | |
| | | | | | | | | | | | | | | | |
|
| Industrial Conglomerates: 1.00% | |
3M Company | | | | | | | | | | | 18,472 | | | | 3,011,305 | |
Carlisle Companies Incorporated | | | | | | | | | | | 1,644 | | | | 215,282 | |
General Electric Company | | | | | | | | | | | 255,123 | | | | 1,617,480 | |
Honeywell International Incorporated | | | | | | | | | | | 21,775 | | | | 3,604,851 | |
Roper Technologies Incorporated | | | | | | | | | | | 1,107 | | | | 472,899 | |
| | | | |
| | | | | | | | | | | | | | | 8,921,817 | |
| | | | | | | | | | | | | | | | |
|
| Machinery: 1.86% | |
AGCO Corporation | | | | | | | | | | | 2,075 | | | | 147,533 | |
Allison Transmission Holdings Incorporated | | | | | | | | | | | 2,684 | | | | 96,275 | |
Caterpillar Incorporated | | | | | | | | | | | 14,849 | | | | 2,113,161 | |
Colfax Corporation † | | | | | | | | | | | 21,528 | | | | 716,452 | |
Crane Company | | | | | | | | | | | 672 | | | | 37,995 | |
Cummins Incorporated | | | | | | | | | | | 7,116 | | | | 1,474,791 | |
Deere & Company | | | | | | | | | | | 5,922 | | | | 1,243,975 | |
Donaldson Company Incorporated | | | | | | | | | | | 6,678 | | | | 336,304 | |
Dover Corporation | | | | | | | | | | | 5,323 | | | | 584,678 | |
Flowserve Corporation | | | | | | | | | | | 1,602 | | | | 47,547 | |
Graco Incorporated | | | | | | | | | | | 2,152 | | | | 124,859 | |
IDEX Corporation | | | | | | | | | | | 1,038 | | | | 187,079 | |
The accompanying notes are an integral part of these financial statements.
Wells Fargo Factor Enhanced U.S. Large Cap Equity Portfolio | 15
Portfolio of investments—August 31, 2020 (unaudited)
| | | | | | | | | | | | | | | | |
| | | | | | | | | Shares | | | Value | |
|
| Machinery (continued) | |
Illinois Tool Works Incorporated | | | | | | | | | | | 11,831 | | | $ | 2,337,214 | |
ITT Incorporated | | | | | | | | | | | 1,476 | | | | 92,708 | |
John Bean Technologies Corporation | | | | | | | | | | | 432 | | | | 44,284 | |
Lincoln Electric Holdings Incorporated | | | | | | | | | | | 8,473 | | | | 819,424 | |
Nordson Corporation | | | | | | | | | | | 2,051 | | | | 382,491 | |
Oshkosh Corporation | | | | | | | | | | | 8,760 | | | | 674,608 | |
Otis Worldwide Corporation | | | | | | | | | | | 16,350 | | | | 1,028,415 | |
PACCAR Incorporated | | | | | | | | | | | 14,316 | | | | 1,228,885 | |
Parker-Hannifin Corporation | | | | | | | | | | | 3,502 | | | | 721,447 | |
Pentair plc | | | | | | | | | | | 6,762 | | | | 305,237 | |
Rexnord Corporation | | | | | | | | | | | 1,643 | | | | 47,581 | |
Snap-on Incorporated | | | | | | | | | | | 1,200 | | | | 177,924 | |
Stanley Black & Decker Incorporated | | | | | | | | | | | 357 | | | | 57,584 | |
The Middleby Corporation † | | | | | | | | | | | 917 | | | | 89,774 | |
The Timken Company | | | | | | | | | | | 10,124 | | | | 548,620 | |
The Toro Company | | | | | | | | | | | 2,988 | | | | 224,937 | |
Wabtec Corporation | | | | | | | | | | | 5,690 | | | | 378,670 | |
Woodward Governor Company | | | | | | | | | | | 1,038 | | | | 88,946 | |
Xylem Incorporated | | | | | | | | | | | 2,419 | | | | 193,955 | |
| | | | |
| | | | | | | | | | | | | | | 16,553,353 | |
| | | | | | | | | | | | | | | | |
|
| Marine: 0.00% | |
Kirby Corporation † | | | | | | | | | | | 716 | | | | 30,387 | |
| | | | | | | | | | | | | | | | |
|
| Professional Services: 0.54% | |
CoreLogic Incorporated | | | | | | | | | | | 2,297 | | | | 152,521 | |
CoStar Group Incorporated † | | | | | | | | | | | 459 | | | | 389,507 | |
Equifax Incorporated | | | | | | | | | | | 1,437 | | | | 241,804 | |
Exponent Incorporated | | | | | | | | | | | 690 | | | | 55,514 | |
FTI Consulting Incorporated † | | | | | | | | | | | 7,327 | | | | 840,847 | |
IHS Markit Limited | | | | | | | | | | | 4,767 | | | | 380,979 | |
ManpowerGroup Incorporated | | | | | | | | | | | 15,762 | | | | 1,155,512 | |
Nielsen Holdings plc | | | | | | | | | | | 6,497 | | | | 99,274 | |
Robert Half International Incorporated | | | | | | | | | | | 16,089 | | | | 855,935 | |
TransUnion | | | | | | | | | | | 2,435 | | | | 211,163 | |
Verisk Analytics Incorporated | | | | | | | | | | | 2,249 | | | | 419,821 | |
| | | | |
| | | | | | | | | | | | | | | 4,802,877 | |
| | | | | | | | | | | | | | | | |
|
| Road & Rail: 1.35% | |
AMERCO | | | | | | | | | | | 159 | | | | 56,428 | |
CSX Corporation | | | | | | | | | | | 3,990 | | | | 305,075 | |
J.B. Hunt Transport Services Incorporated | | | | | | | | | | | 11,957 | | | | 1,680,437 | |
Kansas City Southern | | | | | | | | | | | 2,855 | | | | 519,724 | |
Knight-Swift Transportation Holdings Incorporated | | | | | | | | | | | 16,928 | | | | 769,547 | |
Landstar System Incorporated | | | | | | | | | | | 15,269 | | | | 2,032,151 | |
Lyft Incorporated Class A † | | | | | | | | | | | 2,366 | | | | 70,199 | |
Norfolk Southern Corporation | | | | | | | | | | | 3,374 | | | | 717,076 | |
Old Dominion Freight Line Incorporated | | | | | | | | | | | 9,128 | | | | 1,845,499 | |
Ryder System Incorporated | | | | | | | | | | | 81 | | | | 3,313 | |
Schneider National Incorporated Class B | | | | | | | | | | | 20,516 | | | | 555,163 | |
Union Pacific Corporation | | | | | | | | | | | 17,671 | | | | 3,400,607 | |
| | | | |
| | | | | | | | | | | | | | | 11,955,219 | |
| | | | | | | | | | | | | | | | |
|
| Trading Companies & Distributors: 0.24% | |
Fastenal Company | | | | | | | | | | | 11,802 | | | | 576,646 | |
HD Supply Holdings Incorporated † | | | | | | | | | | | 1,926 | | | | 76,385 | |
The accompanying notes are an integral part of these financial statements.
16 | Wells Fargo Factor Enhanced U.S. Large Cap Equity Portfolio
Portfolio of investments—August 31, 2020 (unaudited)
| | | | | | | | | | | | | | | | |
| | | | | | | | | Shares | | | Value | |
|
| Trading Companies & Distributors (continued) | |
MSC Industrial Direct Company Class A | | | | | | | | | | | 3,250 | | | $ | 214,175 | |
SiteOne Landscape Supply Incorporated † | | | | | | | | | | | 544 | | | | 68,027 | |
United Rentals Incorporated † | | | | | | | | | | | 153 | | | | 27,089 | |
Univar Incorporated † | | | | | | | | | | | 25,099 | | | | 456,551 | |
W.W. Grainger Incorporated | | | | | | | | | | | 1,025 | | | | 374,566 | |
Watsco Incorporated | | | | | | | | | | | 1,474 | | | | 361,115 | |
| | | | |
| | | | | | | | | | | | | | | 2,154,554 | |
| | | | | | | | | | | | | | | | |
|
Information Technology: 24.10% | |
|
| Communications Equipment: 0.78% | |
Acacia Communications Incorporated † | | | | | | | | | | | 481 | | | | 32,458 | |
Arista Networks Incorporated † | | | | | | | | | | | 745 | | | | 166,470 | |
Ciena Corporation † | | | | | | | | | | | 18,464 | | | | 1,048,201 | |
Cisco Systems Incorporated | | | | | | | | | | | 69,644 | | | | 2,940,370 | |
CommScope Holdings Incorporated † | | | | | | | | | | | 2,804 | | | | 28,881 | |
F5 Networks Incorporated † | | | | | | | | | | | 827 | | | | 109,437 | |
Juniper Networks Incorporated | | | | | | | | | | | 14,470 | | | | 361,750 | |
Lumentum Holdings Incorporated † | | | | | | | | | | | 8,897 | | | | 765,142 | |
Motorola Solutions Incorporated | | | | | | | | | | | 2,928 | | | | 453,108 | |
Ubiquiti Incorporated | | | | | | | | | | | 4,964 | | | | 902,207 | |
Viasat Incorporated † | | | | | | | | | | | 1,063 | | | | 42,265 | |
Viavi Solutions Incorporated † | | | | | | | | | | | 2,711 | | | | 36,151 | |
| | | | |
| | | | | | | | | | | | | | | 6,886,440 | |
| | | | | | | | | | | | | | | | |
|
| Electronic Equipment, Instruments & Components: 0.94% | |
Amphenol Corporation Class A | | | | | | | | | | | 3,899 | | | | 428,110 | |
Arrow Electronics Incorporated † | | | | | | | | | | | 23,207 | | | | 1,823,142 | |
Avnet Incorporated | | | | | | | | | | | 3,241 | | | | 89,160 | |
CDW Corporation of Delaware | | | | | | | | | | | 7,548 | | | | 857,830 | |
Coherent Incorporated † | | | | | | | | | | | 1,318 | | | | 148,486 | |
Dolby Laboratories Incorporated Class A | | | | | | | | | | | 761 | | | | 53,156 | |
FLIR Systems Incorporated | | | | | | | | | | | 3,023 | | | | 111,549 | |
II-VI Incorporated † | | | | | | | | | | | 1,160 | | | | 51,620 | |
Jabil Circuit Incorporated | | | | | | | | | | | 44,553 | | | | 1,521,485 | |
Keysight Technologies Incorporated † | | | | | | | | | | | 3,394 | | | | 334,377 | |
Littelfuse Incorporated | | | | | | | | | | | 306 | | | | 55,337 | |
National Instruments Corporation | | | | | | | | | | | 1,585 | | | | 56,886 | |
SYNNEX Corporation | | | | | | | | | | | 11,656 | | | | 1,482,060 | |
TE Connectivity Limited | | | | | | | | | | | 4,509 | | | | 435,569 | |
Trimble Navigation Limited † | | | | | | | | | | | 4,723 | | | | 247,532 | |
Zebra Technologies Corporation Class A † | | | | | | | | | | | 2,444 | | | | 700,279 | |
| | | | |
| | | | | | | | | | | | | | | 8,396,578 | |
| | | | | | | | | | | | | | | | |
|
| IT Services: 5.17% | |
Accenture plc Class A | | | | | | | | | | | 21,025 | | | | 5,044,528 | |
Akamai Technologies Incorporated † | | | | | | | | | | | 6,451 | | | | 751,090 | |
Alliance Data Systems Corporation | | | | | | | | | | | 17,209 | | | | 776,298 | |
Amdocs Limited | | | | | | | | | | | 11,159 | | | | 683,266 | |
Automatic Data Processing Incorporated | | | | | | | | | | | 8,430 | | | | 1,172,529 | |
Black Knight Incorporated † | | | | | | | | | | | 2,637 | | | | 221,772 | |
Booz Allen Hamilton Holding Corporation | | | | | | | | | | | 16,294 | | | | 1,434,850 | |
Broadridge Financial Solutions Incorporated | | | | | | | | | | | 1,487 | | | | 204,314 | |
CACI International Incorporated Class A † | | | | | | | | | | | 6,731 | | | | 1,576,333 | |
Cognizant Technology Solutions Corporation Class A | | | | | | | | | | | 18,633 | | | | 1,245,802 | |
DXC Technology Company | | | | | | | | | | | 61,404 | | | | 1,226,852 | |
The accompanying notes are an integral part of these financial statements.
Wells Fargo Factor Enhanced U.S. Large Cap Equity Portfolio | 17
Portfolio of investments—August 31, 2020 (unaudited)
| | | | | | | | | | | | | | | | |
| | | | | | | | | Shares | | | Value | |
|
| IT Services (continued) | |
EPAM Systems Incorporated † | | | | | | | | | | | 2,494 | | | $ | 815,787 | |
Euronet Worldwide Incorporated † | | | | | | | | | | | 590 | | | | 60,994 | |
Fidelity National Information Services Incorporated | | | | | | | | | | | 11,745 | | | | 1,771,733 | |
Fiserv Incorporated † | | | | | | | | | | | 13,548 | | | | 1,349,110 | |
FleetCor Technologies Incorporated † | | | | | | | | | | | 1,585 | | | | 398,548 | |
Gartner Incorporated † | | | | | | | | | | | 1,159 | | | | 150,461 | |
Genpact Limited | | | | | | | | | | | 3,815 | | | | 160,917 | |
GoDaddy Incorporated Class A † | | | | | | | | | | | 4,765 | | | | 398,735 | |
International Business Machines Corporation | | | | | | | | | | | 27,225 | | | | 3,357,115 | |
Jack Henry & Associates Incorporated | | | | | | | | | | | 6,427 | | | | 1,063,154 | |
KBR Incorporated | | | | | | | | | | | 1,782 | | | | 44,532 | |
Leidos Holdings Incorporated | | | | | | | | | | | 19,352 | | | | 1,751,162 | |
MasterCard Incorporated Class A | | | | | | | | | | | 13,790 | | | | 4,939,440 | |
MAXIMUS Incorporated | | | | | | | | | | | 866 | | | | 67,158 | |
Paychex Incorporated | | | | | | | | | | | 12,778 | | | | 977,134 | |
PayPal Holdings Incorporated † | | | | | | | | | | | 17,872 | | | | 3,648,390 | |
Perspecta Incorporated | | | | | | | | | | | 1,606 | | | | 33,357 | |
Science Applications International Corporation | | | | | | | | | | | 20,181 | | | | 1,684,306 | |
Square Incorporated Class A † | | | | | | | | | | | 6,412 | | | | 1,023,099 | |
Switch Incorporated Class A | | | | | | | | | | | 8,188 | | | | 140,834 | |
The Western Union Company | | | | | | | | | | | 51,672 | | | | 1,218,942 | |
VeriSign Incorporated † | | | | | | | | | | | 2,881 | | | | 618,839 | |
Visa Incorporated Class A | | | | | | | | | | | 28,183 | | | | 5,974,514 | |
WEX Incorporated † | | | | | | | | | | | 173 | | | | 27,630 | |
| | | | |
| | | | | | | | | | | | | | | 46,013,525 | |
| | | | | | | | | | | | | | | | |
|
| Semiconductors & Semiconductor Equipment: 4.38% | |
Advanced Micro Devices Incorporated † | | | | | | | | | | | 45,001 | | | | 4,086,991 | |
Analog Devices Incorporated | | | | | | | | | | | 352 | | | | 41,142 | |
Applied Materials Incorporated | | | | | | | | | | | 33,048 | | | | 2,035,757 | |
Broadcom Incorporated | | | | | | | | | | | 4,840 | | | | 1,680,206 | |
Brooks Automation Incorporated | | | | | | | | | | | 953 | | | | 49,203 | |
Cabot Microelectronics Corporation | | | | | | | | | | | 400 | | | | 60,916 | |
Cirrus Logic Incorporated † | | | | | | | | | | | 13,372 | | | | 810,209 | |
Enphase Energy Incorporated † | | | | | | | | | | | 3,874 | | | | 299,189 | |
Entegris Incorporated | | | | | | | | | | | 7,044 | | | | 471,173 | |
First Solar Incorporated † | | | | | | | | | | | 1,297 | | | | 99,337 | |
Inphi Corporation † | | | | | | | | | | | 3,893 | | | | 443,724 | |
Intel Corporation | | | | | | | | | | | 142,607 | | | | 7,265,827 | |
KLA Corporation | | | | | | | | | | | 8,560 | | | | 1,755,998 | |
Lam Research Corporation | | | | | | | | | | | 6,516 | | | | 2,191,591 | |
Lattice Semiconductor Corporation † | | | | | | | | | | | 1,657 | | | | 47,390 | |
Maxim Integrated Products Incorporated | | | | | | | | | | | 3,510 | | | | 240,224 | |
Microchip Technology Incorporated | | | | | | | | | | | 1,932 | | | | 211,940 | |
Micron Technology Incorporated † | | | | | | | | | | | 24,888 | | | | 1,132,653 | |
MKS Instruments Incorporated | | | | | | | | | | | 5,664 | | | | 677,018 | |
Monolithic Power Systems Incorporated | | | | | | | | | | | 1,416 | | | | 378,256 | |
NVIDIA Corporation | | | | | | | | | | | 11,374 | | | | 6,084,863 | |
ON Semiconductor Corporation † | | | | | | | | | | | 4,600 | | | | 98,302 | |
Power Integrations Incorporated | | | | | | | | | | | 723 | | | | 40,466 | |
Qorvo Incorporated † | | | | | | | | | | | 4,845 | | | | 621,468 | |
QUALCOMM Incorporated | | | | | | | | | | | 20,879 | | | | 2,486,689 | |
Semtech Corporation † | | | | | | | | | | | 917 | | | | 53,782 | |
Silicon Laboratories Incorporated † | | | | | | | | | | | 540 | | | | 55,301 | |
Skyworks Solutions Incorporated | | | | | | | | | | | 7,349 | | | | 1,064,503 | |
Solaredge Technologies Incorporated † | | | | | | | | | | | 908 | | | | 200,804 | |
The accompanying notes are an integral part of these financial statements.
18 | Wells Fargo Factor Enhanced U.S. Large Cap Equity Portfolio
Portfolio of investments—August 31, 2020 (unaudited)
| | | | | | | | | | | | | | | | |
| | | | | | | | | Shares | | | Value | |
|
| Semiconductors & Semiconductor Equipment (continued) | |
Teradyne Incorporated | | | | | | | | | | | 8,447 | | | $ | 717,742 | |
Texas Instruments Incorporated | | | | | | | | | | | 25,287 | | | | 3,594,547 | |
| | | | |
| | | | | | | | | | | | | | | 38,997,211 | |
| | | | | | | | | | | | | | | | |
|
| Software: 8.15% | |
2U Incorporated † | | | | | | | | | | | 3,498 | | | | 144,782 | |
ACI Worldwide Incorporated † | | | | | | | | | | | 1,563 | | | | 45,921 | |
Adobe Incorporated † | | | | | | | | | | | 9,321 | | | | 4,785,308 | |
ANSYS Incorporated † | | | | | | | | | | | 2,655 | | | | 900,072 | |
Aspen Technology Incorporated † | | | | | | | | | | | 946 | | | | 120,170 | |
Atlassian Corporation plc Class A † | | | | | | | | | | | 1,185 | | | | 227,236 | |
Autodesk Incorporated † | | | | | | | | | | | 3,258 | | | | 800,491 | |
Avalara Incorporated † | | | | | | | | | | | 987 | | | | 130,689 | |
Blackbaud Incorporated | | | | | | | | | | | 659 | | | | 42,077 | |
BlackLine Incorporated † | | | | | | | | | | | 654 | | | | 57,140 | |
Cadence Design Systems Incorporated † | | | | | | | | | | | 8,933 | | | | 990,759 | |
CDK Global Incorporated | | | | | | | | | | | 20,854 | | | | 972,213 | |
Citrix Systems Incorporated | | | | | | | | | | | 12,335 | | | | 1,791,042 | |
Cloudflare Incorporated Class A † | | | | | | | | | | | 2,699 | | | | 103,264 | |
DocuSign Incorporated † | | | | | | | | | | | 8,175 | | | | 1,823,025 | |
Dropbox Incorporated Class A † | | | | | | | | | | | 9,517 | | | | 201,475 | |
Envestnet Incorporated † | | | | | | | | | | | 662 | | | | 54,939 | |
Everbridge Incorporated † | | | | | | | | | | | 773 | | | | 114,876 | |
Fair Isaac Corporation † | | | | | | | | | | | 1,383 | | | | 581,953 | |
FireEye Incorporated † | | | | | | | | | | | 2,918 | | | | 42,836 | |
Five9 Incorporated † | | | | | | | | | | | 7,055 | | | | 899,089 | |
Fortinet Incorporated † | | | | | | | | | | | 9,672 | | | | 1,276,752 | |
Globant SA † | | | | | | | | | | | 2,353 | | | | 417,846 | |
Guidewire Software Incorporated † | | | | | | | | | | | 1,076 | | | | 120,846 | |
Intuit Incorporated | | | | | | | | | | | 8,200 | | | | 2,832,198 | |
J2 Global Incorporated † | | | | | | | | | | | 636 | | | | 44,514 | |
LogMeIn Incorporated | | | | | | | | | | | 12,501 | | | | 1,075,586 | |
Manhattan Associates Incorporated † | | | | | | | | | | | 12,429 | | | | 1,208,720 | |
Microsoft Corporation | | | | | | | | | | | 141,688 | | | | 31,954,895 | |
New Relic Incorporated † | | | | | | | | | | | 895 | | | | 54,980 | |
NortonLifeLock Incorporated | | | | | | | | | | | 88,947 | | | | 2,092,033 | |
Nuance Communications Incorporated | | | | | | | | | | | 45,876 | | | | 1,374,445 | |
Nutanix Incorporated Class A † | | | | | | | | | | | 5,902 | | | | 169,446 | |
Oracle Corporation | | | | | | | | | | | 66,425 | | | | 3,800,839 | |
Palo Alto Networks Incorporated † | | | | | | | | | | | 1,734 | | | | 446,349 | |
Pegasystems Incorporated | | | | | | | | | | | 1,658 | | | | 213,003 | |
Proofpoint Incorporated † | | | | | | | | | | | 797 | | | | 87,407 | |
PTC Incorporated † | | | | | | | | | | | 1,392 | | | | 127,243 | |
Q2 Holdings Incorporated † | | | | | | | | | | | 604 | | | | 58,763 | |
Qualys Incorporated † | | | | | | | | | | | 481 | | | | 51,053 | |
RealPage Incorporated † | | | | | | | | | | | 1,124 | | | | 70,385 | |
RingCentral Incorporated Class A † | | | | | | | | | | | 3,028 | | | | 880,452 | |
Salesforce.com Incorporated † | | | | | | | | | | | 12,255 | | | | 3,341,326 | |
ServiceNow Incorporated † | | | | | | | | | | | 2,956 | | | | 1,424,851 | |
Splunk Incorporated † | | | | | | | | | | | 1,449 | | | | 317,809 | |
SS&C Technologies Holdings Incorporated | | | | | | | | | | | 15,216 | | | | 969,564 | |
Synopsys Incorporated † | | | | | | | | | | | 5,980 | | | | 1,323,374 | |
Teradata Corporation † | | | | | | | | | | | 3,510 | | | | 85,469 | |
Tyler Technologies Incorporated † | | | | | | | | | | | 3,018 | | | | 1,042,146 | |
Verint Systems Incorporated † | | | | | | | | | | | 885 | | | | 42,091 | |
The accompanying notes are an integral part of these financial statements.
Wells Fargo Factor Enhanced U.S. Large Cap Equity Portfolio | 19
Portfolio of investments—August 31, 2020 (unaudited)
| | | | | | | | | | | | | | | | |
| | | | | | | | | Shares | | | Value | |
|
| Software (continued) | |
VMware Incorporated Class A † | | | | | | | | | | | 1,188 | | | $ | 171,595 | |
Zoom Video Communications Incorporated † | | | | | | | | | | | 1,842 | | | | 598,834 | |
| | | | |
| | | | | | | | | | | | | | | 72,504,171 | |
| | | | | | | | | | | | | | | | |
|
| Technology Hardware, Storage & Peripherals: 4.68% | |
Apple Incorporated | | | | | | | | | | | 304,528 | | | | 39,296,293 | |
Dell Technologies Incorporated † | | | | | | | | | | | 3,333 | | | | 220,245 | |
Hewlett Packard Enterprise Company | | | | | | | | | | | 16,273 | | | | 157,360 | |
HP Incorporated | | | | | | | | | | | 55,845 | | | | 1,091,770 | |
NCR Corporation † | | | | | | | | | | | 1,626 | | | | 33,235 | |
NetApp Incorporated | | | | | | | | | | | 2,948 | | | | 139,706 | |
Seagate Technology plc | | | | | | | | | | | 3,064 | | | | 147,041 | |
Western Digital Corporation | | | | | | | | | | | 13,080 | | | | 502,534 | |
Xerox Holdings Corporation | | | | | | | | | | | 2,165 | | | | 40,832 | |
| | | | |
| | | | | | | | | | | | | | | 41,629,016 | |
| | | | | | | | | | | | | | | | |
|
Materials: 2.81% | |
|
| Chemicals: 1.83% | |
Air Products & Chemicals Incorporated | | | | | | | | | | | 4,790 | | | | 1,399,925 | |
Albemarle Corporation | | | | | | | | | | | 1,886 | | | | 171,645 | |
Ashland Global Holdings Incorporated | | | | | | | | | | | 801 | | | | 59,026 | |
Axalta Coating Systems Limited † | | | | | | | | | | | 2,872 | | | | 68,497 | |
Balchem Corporation | | | | | | | | | | | 471 | | | | 46,017 | |
Cabot Corporation | | | | | | | | | | | 16,168 | | | | 598,378 | |
Celanese Corporation Series A | | | | | | | | | | | 3,314 | | | | 335,211 | |
CF Industries Holdings Incorporated | | | | | | | | | | | 3,770 | | | | 123,015 | |
Corteva Incorporated | | | | | | | | | | | 25,038 | | | | 714,835 | |
Dow Incorporated | | | | | | | | | | | 22,020 | | | | 993,542 | |
DuPont de Nemours Incorporated | | | | | | | | | | | 5,591 | | | | 311,754 | |
Eastman Chemical Company | | | | | | | | | | | 6,717 | | | | 491,080 | |
Ecolab Incorporated | | | | | | | | | | | 4,576 | | | | 901,838 | |
Element Solutions Incorporated † | | | | | | | | | | | 37,161 | | | | 399,481 | |
FMC Corporation | | | | | | | | | | | 7,683 | | | | 821,005 | |
Huntsman Corporation | | | | | | | | | | | 13,176 | | | | 284,865 | |
International Flavors & Fragrances Incorporated | | | | | | | | | | | 1,481 | | | | 183,333 | |
Linde plc | | | | | | | | | | | 7,862 | | | | 1,963,456 | |
LyondellBasell Industries NV Class A | | | | | | | | | | | 11,384 | | | | 745,424 | |
NewMarket Corporation | | | | | | | | | | | 128 | | | | 47,679 | |
Olin Corporation | | | | | | | | | | | 2,958 | | | | 33,278 | |
PPG Industries Incorporated | | | | | | | | | | | 3,781 | | | | 455,232 | |
RPM International Incorporated | | | | | | | | | | | 8,897 | | | | 754,199 | |
Scotts Miracle-Gro Company Class A | | | | | | | | | | | 5,318 | | | | 896,243 | |
The Chemours Company | | | | | | | | | | | 49,965 | | | | 1,032,277 | |
The Mosaic Company | | | | | | | | | | | 4,564 | | | | 83,202 | |
The Sherwin-Williams Company | | | | | | | | | | | 3,256 | | | | 2,184,939 | |
Valvoline Incorporated | | | | | | | | | | | 8,213 | | | | 167,545 | |
W.R. Grace & Company | | | | | | | | | | | 902 | | | | 36,720 | |
| | | | |
| | | | | | | | | | | | | | | 16,303,641 | |
| | | | | | | | | | | | | | | | |
|
| Construction Materials: 0.08% | |
Eagle Materials Incorporated | | | | | | | | | | | 2,688 | | | | 219,798 | |
Martin Marietta Materials Incorporated | | | | | | | | | | | 1,491 | | | | 302,479 | |
Vulcan Materials Company | | | | | | | | | | | 1,669 | | | | 200,280 | |
| | | | |
| | | | | | | | | | | | | | | 722,557 | |
| | | | | | | | | | | | | | | | |
The accompanying notes are an integral part of these financial statements.
20 | Wells Fargo Factor Enhanced U.S. Large Cap Equity Portfolio
Portfolio of investments—August 31, 2020 (unaudited)
| | | | | | | | | | | | | | | | |
| | | | | | | | | Shares | | | Value | |
| Containers & Packaging: 0.45% | |
AptarGroup Incorporated | | | | | | | | | | | 897 | | | $ | 106,196 | |
Avery Dennison Corporation | | | | | | | | | | | 1,088 | | | | 125,544 | |
Ball Corporation | | | | | | | | | | | 6,539 | | | | 525,539 | |
Berry Global Group Incorporated † | | | | | | | | | | | 1,825 | | | | 94,061 | |
Crown Holdings Incorporated † | | | | | | | | | | | 11,161 | | | | 857,723 | |
Graphic Packaging Holding Company | | | | | | | | | | | 47,028 | | | | 657,451 | |
International Paper Company | | | | | | | | | | | 5,032 | | | | 182,511 | |
Packaging Corporation of America | | | | | | | | | | | 4,550 | | | | 460,642 | |
Sealed Air Corporation | | | | | | | | | | | 3,295 | | | | 129,494 | |
Silgan Holdings Incorporated | | | | | | | | | | | 17,319 | | | | 659,161 | |
Sonoco Products Company | | | | | | | | | | | 1,370 | | | | 72,651 | |
WestRock Company | | | | | | | | | | | 3,398 | | | | 103,061 | |
| | | | |
| | | | | | | | | | | | | | | 3,974,034 | |
| | | | | | | | | | | | | | | | |
|
| Metals & Mining: 0.45% | |
Freeport-McMoRan Incorporated | | | | | | | | | | | 9,189 | | | | 143,440 | |
Newmont Corporation | | | | | | | | | | | 16,016 | | | | 1,077,556 | |
Nucor Corporation | | | | | | | | | | | 8,756 | | | | 398,048 | |
Reliance Steel & Aluminum Company | | | | | | | | | | | 13,481 | | | | 1,413,752 | |
Royal Gold Incorporated | | | | | | | | | | | 957 | | | | 130,458 | |
Steel Dynamics Incorporated | | | | | | | | | | | 27,785 | | | | 820,213 | |
| | | | |
| | | | | | | | | | | | | | | 3,983,467 | |
| | | | | | | | | | | | | | | | |
|
Real Estate: 3.68% | |
|
| Equity REITs: 3.49% | |
Agree Realty Corporation | | | | | | | | | | | 597 | | | | 39,951 | |
Alexandria Real Estate Equities Incorporated | | | | | | | | | | | 1,989 | | | | 334,908 | |
American Campus Communities Incorporated | | | | | | | | | | | 1,607 | | | | 54,477 | |
American Homes 4 Rent Class A | | | | | | | | | | | 11,711 | | | | 335,403 | |
American Tower Corporation | | | | | | | | | | | 16,164 | | | | 4,027,261 | |
Americold Realty Trust | | | | | | | | | | | 13,234 | | | | 507,524 | |
Apartment Investment & Management Company Class A | | | | | | | | | | | 1,818 | | | | 65,503 | |
AvalonBay Communities Incorporated | | | | | | | | | | | 1,751 | | | | 276,763 | |
Boston Properties Incorporated | | | | | | | | | | | 1,660 | | | | 144,204 | |
Brandywine Realty Trust | | | | | | | | | | | 1,800 | | | | 20,034 | |
Brixmor Property Group Incorporated | | | | | | | | | | | 13,239 | | | | 156,220 | |
Brookfield Property REIT Incorporated Class A | | | | | | | | | | | 14,961 | | | | 172,500 | |
Camden Property Trust | | | | | | | | | | | 1,211 | | | | 110,128 | |
CoreSite Realty Corporation | | | | | | | | | | | 4,611 | | | | 564,617 | |
Corporate Office Properties Trust | | | | | | | | | | | 18,688 | | | | 460,472 | |
Cousins Properties Incorporated | | | | | | | | | | | 1,865 | | | | 55,670 | |
Crown Castle International Corporation | | | | | | | | | | | 17,291 | | | | 2,822,756 | |
CubeSmart | | | | | | | | | | | 4,028 | | | | 127,365 | |
CyrusOne Incorporated | | | | | | | | | | | 7,396 | | | | 617,788 | |
Digital Realty Trust Incorporated | | | | | | | | | | | 7,334 | | | | 1,141,537 | |
Douglas Emmett Incorporated | | | | | | | | | | | 3,171 | | | | 88,534 | |
Duke Realty Corporation | | | | | | | | | | | 15,205 | | | | 586,153 | |
EastGroup Properties Incorporated | | | | | | | | | | | 485 | | | | 64,583 | |
Equinix Incorporated | | | | | | | | | | | 4,177 | | | | 3,298,911 | |
Equity Commonwealth | | | | | | | | | | | 5,579 | | | | 175,125 | |
Equity Lifestyle Properties Incorporated | | | | | | | | | | | 8,041 | | | | 533,038 | |
Equity Residential | | | | | | | | | | | 4,586 | | | | 258,880 | |
Essex Property Trust Incorporated | | | | | | | | | | | 846 | | | | 183,167 | |
Extra Space Storage Incorporated | | | | | | | | | | | 1,673 | | | | 178,258 | |
Federal Realty Investment Trust | | | | | | | | | | | 1,333 | | | | 105,627 | |
The accompanying notes are an integral part of these financial statements.
Wells Fargo Factor Enhanced U.S. Large Cap Equity Portfolio | 21
Portfolio of investments—August 31, 2020 (unaudited)
| | | | | | | | | | | | | | | | |
| | | | | | | | | Shares | | | Value | |
|
| Equity REITs (continued) | |
First Industrial Realty Trust Incorporated | | | | | | | | | | | 4,164 | | | $ | 177,595 | |
Gaming and Leisure Properties Incorporated | | | | | | | | | | | 18,920 | | | | 687,742 | |
Healthcare Realty Trust Incorporated | | | | | | | | | | | 1,716 | | | | 49,507 | |
Healthcare Trust of America Incorporated Class A | | | | | | | | | | | 4,198 | | | | 110,785 | |
Healthpeak Properties Incorporated | | | | | | | | | | | 5,985 | | | | 165,425 | |
Highwoods Properties Incorporated | | | | | | | | | | | 8,858 | | | | 330,049 | |
Host Hotels & Resorts Incorporated | | | | | | | | | | | 8,595 | | | | 96,522 | |
Hudson Pacific Properties Incorporated | | | | | | | | | | | 1,825 | | | | 42,851 | |
Invitation Homes Incorporated | | | | | | | | | | | 12,055 | | | | 345,135 | |
Iron Mountain Incorporated | | | | | | | | | | | 18,050 | | | | 543,125 | |
JBG Smith Properties | | | | | | | | | | | 1,597 | | | | 44,189 | |
Kilroy Realty Corporation | | | | | | | | | | | 1,318 | | | | 77,129 | |
Kimco Realty Corporation | | | | | | | | | | | 10,853 | | | | 130,127 | |
Lamar Advertising Company Class A | | | | | | | | | | | 7,562 | | | | 523,517 | |
Lexington Corporate Properties Trust | | | | | | | | | | | 3,099 | | | | 35,236 | |
Life Storage Incorporated | | | | | | | | | | | 4,281 | | | | 451,346 | |
Medical Properties Trust Incorporated | | | | | | | | | | | 14,862 | | | | 276,136 | |
MGM Growth Properties LLC Class A | | | | | | | | | | | 1,683 | | | | 47,242 | |
Mid-America Apartment Communities Incorporated | | | | | | | | | | | 4,609 | | | | 539,806 | |
National Health Investors Incorporated | | | | | | | | | | | 533 | | | | 33,179 | |
National Retail Properties Incorporated | | | | | | | | | | | 1,979 | | | | 70,136 | |
Omega Healthcare Investors Incorporated | | | | | | | | | | | 7,116 | | | | 220,383 | |
Outfront Media Incorporated | | | | | | | | | | | 2,084 | | | | 35,282 | |
Physicians Realty Trust | | | | | | | | | | | 2,557 | | | | 46,410 | |
Prologis Incorporated | | | | | | | | | | | 19,297 | | | | 1,965,592 | |
PS Business Parks Incorporated | | | | | | | | | | | 264 | | | | 33,317 | |
Public Storage Incorporated | | | | | | | | | | | 3,130 | | | | 664,812 | |
QTS Realty Trust Incorporated Class A | | | | | | | | | | | 813 | | | | 55,138 | |
Rayonier Incorporated | | | | | | | | | | | 7,280 | | | | 213,158 | |
Realty Income Corporation | | | | | | | | | | | 4,143 | | | | 256,990 | |
Regency Centers Corporation | | | | | | | | | | | 1,945 | | | | 77,236 | |
Rexford Industrial Realty Incorporated | | | | | | | | | | | 1,462 | | | | 70,147 | |
Sabra Health Care REIT Incorporated | | | | | | | | | | | 2,425 | | | | 35,963 | |
SBA Communications Corporation | | | | | | | | | | | 6,380 | | | | 1,952,727 | |
Simon Property Group Incorporated | | | | | | | | | | | 3,060 | | | | 207,621 | |
SL Green Realty Corporation | | | | | | | | | | | 820 | | | | 38,343 | |
Spirit Realty Capital Incorporated REIT | | | | | | | | | | | 1,097 | | | | 38,954 | |
STAG Industrial Incorporated | | | | | | | | | | | 1,885 | | | | 60,886 | |
STORE Capital Corporation | | | | | | | | | | | 3,703 | | | | 100,129 | |
Sun Communities Incorporated | | | | | | | | | | | 1,485 | | | | 221,384 | |
Taubman Centers Incorporated | | | | | | | | | | | 1,129 | | | | 43,241 | |
Terreno Realty Corporation | | | | | | | | | | | 840 | | | | 50,098 | |
UDR Incorporated | | | | | | | | | | | 3,619 | | | | 125,977 | |
Ventas Incorporated | | | | | | | | | | | 4,335 | | | | 178,645 | |
VEREIT Incorporated | | | | | | | | | | | 18,202 | | | | 122,317 | |
VICI Properties Incorporated | | | | | | | | | | | 7,624 | | | | 170,320 | |
Vornado Realty Trust | | | | | | | | | | | 2,064 | | | | 73,953 | |
Weingarten Realty Investors | | | | | | | | | | | 346 | | | | 6,045 | |
Welltower Incorporated | | | | | | | | | | | 7,620 | | | | 438,302 | |
Weyerhaeuser Company | | | | | | | | | | | 36,911 | | | | 1,118,772 | |
WP Carey Incorporated | | | | | | | | | | | 1,944 | | | | 134,855 | |
| | | | |
| | | | | | | | | | | | | | | 31,041,133 | |
| | | | | | | | | | | | | | | | |
|
| Real Estate Management & Development: 0.19% | |
CBRE Group Incorporated Class A † | | | | | | | | | | | 23,425 | | | | 1,101,678 | |
Jones Lang LaSalle Incorporated | | | | | | | | | | | 6,083 | | | | 626,792 | |
| | | | |
| | | | | | | | | | | | | | | 1,728,470 | |
| | | | | | | | | | | | | | | | |
The accompanying notes are an integral part of these financial statements.
22 | Wells Fargo Factor Enhanced U.S. Large Cap Equity Portfolio
Portfolio of investments—August 31, 2020 (unaudited)
| | | | | | | | | | | | | | | | |
| | | | | | | | | Shares | | | Value | |
| Utilities: 2.99% | |
|
| Electric Utilities: 1.73% | |
ALLETE Incorporated | | | | | | | | | | | 704 | | | $ | 37,988 | |
Alliant Energy Corporation | | | | | | | | | | | 5,379 | | | | 291,273 | |
American Electric Power Company Incorporated | | | | | | | | | | | 13,140 | | | | 1,035,826 | |
Avangrid Incorporated | | | | | | | | | | | 787 | | | | 37,807 | |
Duke Energy Corporation | | | | | | | | | | | 19,037 | | | | 1,529,433 | |
Edison International | | | | | | | | | | | 4,959 | | | | 260,248 | |
Entergy Corporation | | | | | | | | | | | 5,297 | | | | 525,145 | |
Evergy Incorporated | | | | | | | | | | | 8,486 | | | | 451,625 | |
Eversource Energy | | | | | | | | | | | 10,244 | | | | 878,013 | |
Exelon Corporation | | | | | | | | | | | 13,947 | | | | 514,784 | |
FirstEnergy Corporation | | | | | | | | | | | 19,955 | | | | 570,513 | |
Hawaiian Electric Industries Incorporated | | | | | | | | | | | 2,365 | | | | 81,853 | |
IDACORP Incorporated | | | | | | | | | | | 720 | | | | 64,728 | |
NextEra Energy Incorporated | | | | | | | | | | | 15,226 | | | | 4,250,642 | |
NRG Energy Incorporated | | | | | | | | | | | 26,810 | | | | 922,532 | |
OGE Energy Corporation | | | | | | | | | | | 4,143 | | | | 131,996 | |
PG&E Corporation † | | | | 18,370 | | | | 170,106 | |
Pinnacle West Capital Corporation | | | | 2,348 | | | | 172,226 | |
PNM Resources Incorporated | | | | 1,114 | | | | 48,660 | |
Portland General Electric Company | | | | 1,267 | | | | 48,336 | |
PPL Corporation | | | | 22,748 | | | | 628,527 | |
The Southern Company | | | | 31,493 | | | | 1,643,305 | |
Xcel Energy Incorporated | | | | 15,497 | | | | 1,076,654 | |
| | | | |
| | | | | | | | | | | | | | | 15,372,220 | |
| | | | | | | | | | | | | | | | |
|
| Gas Utilities: 0.09% | |
Atmos Energy Corporation | | | | 3,851 | | | | 384,407 | |
National Fuel Gas Company | | | | 1,712 | | | | 78,136 | |
New Jersey Resources Corporation | | | | 1,399 | | | | 42,166 | |
ONE Gas Incorporated | | | | 753 | | | | 55,812 | |
South Jersey Industries Incorporated | | | | 1,385 | | | | 30,678 | |
Southwest Gas Holdings Incorporated | | | | 754 | | | | 47,404 | |
Spire Incorporated | | | | 709 | | | | 41,271 | |
UGI Corporation | | | | 2,804 | | | | 96,822 | |
| | | | |
| | | | | | | | | | | | | | | 776,696 | |
| | | | | | | | | | | | | | | | |
|
| Independent Power & Renewable Electricity Producers: 0.08% | |
AES Corporation | | | | 13,254 | | | | 235,259 | |
Nextera Energy Partners LP | | | | 900 | | | | 54,288 | |
Vistra Energy Corporation | | | | 23,483 | | | | 451,578 | |
| | | | |
| | | | | | | | | | | | | | | 741,125 | |
| | | | | | | | | | | | | | | | |
|
| Multi-Utilities: 0.95% | |
Ameren Corporation | | | | 8,585 | | | | 679,159 | |
Avista Corporation | | | | 951 | | | | 35,054 | |
Black Hills Corporation | | | | 896 | | | | 50,248 | |
CenterPoint Energy Incorporated | | | | 17,800 | | | | 357,246 | |
CMS Energy Corporation | | | | 8,825 | | | | 533,824 | |
Consolidated Edison Incorporated | | | | 6,793 | | | | 484,613 | |
Dominion Energy Incorporated | | | | 27,725 | | | | 2,174,749 | |
DTE Energy Company | | | | 2,598 | | | | 308,305 | |
MDU Resources Group Incorporated | | | | 37,558 | | | | 887,120 | |
NiSource Incorporated | | | | 7,984 | | | | 176,925 | |
Northwestern Corporation | | | | 719 | | | | 37,129 | |
The accompanying notes are an integral part of these financial statements.
Wells Fargo Factor Enhanced U.S. Large Cap Equity Portfolio | 23
Portfolio of investments—August 31, 2020 (unaudited)
| | | | | | | | | | | | | | | | |
| | | | | | | | | Shares | | | Value | |
|
| Multi-Utilities (continued) | |
Public Service Enterprise Group Incorporated | | | | 10,651 | | | $ | 556,408 | |
Sempra Energy | | | | 8,382 | | | | 1,036,434 | |
WEC Energy Group Incorporated | | | | 12,411 | | | | 1,167,627 | |
| | | | |
| | | | | | | | | | | | | | | 8,484,841 | |
| | | | | | | | | | | | | | | | |
|
| Water Utilities: 0.14% | |
American States Water Company | | | | 520 | | | | 39,562 | |
American Water Works Company Incorporated | | | | 7,140 | | | | 1,009,168 | |
Essential Utilities Incorporated | | | | 4,494 | | | | 190,995 | |
| | | | |
| | | | | | | | | | | | | | | 1,239,725 | |
| | | | | | | | | | | | | | | | |
| |
Total Common Stocks (Cost $691,929,006) | | | | 876,455,900 | |
| | | | | | | | | | | | | | | | |
| | | | |
| | | | | | | | | | | | | | | | |
| | | | | | Expiration
date | | | | | | | |
| Warrants: 0.00% | |
|
Energy: 0.00% | |
|
| Oil, Gas & Consumable Fuels: 0.00% | |
Occidental Petroleum Corporation † | | | | | | | 8-3-2027 | | | | 2,463 | | | | 7,266 | |
| | | | | | | | | | | | | | | | |
| |
Total Warrants (Cost $12,192) | | | | 7,266 | |
| | | | | | | | | | | | | | | | |
| | | | |
| | | | | | | | | | | | | | | | |
| | | Yield | | | | | | | | | | |
| Short-Term Investments: 1.19% | |
|
| Investment Companies: 1.19% | |
Wells Fargo Government Money Market Fund Select Class (l)(u) | | | 0.06 | % | | | | | | | 10,590,725 | | | | 10,590,725 | |
| | | | | | | | | | | | | | | | |
| |
Total Short-Term Investments (Cost $10,590,725) | | | | 10,590,725 | |
| | | | | | | | | | | | | | | | |
| | | | | | | | |
| Total investments in securities (Cost $702,531,923) | | | 99.68 | % | | | 887,053,891 | |
| | |
Other assets and liabilities, net | | | 0.32 | | | | 2,826,236 | |
| | | | | | | | |
| Total net assets | | | 100.00 | % | | $ | 889,880,127 | |
| | | | | | | | |
| † | Non-income-earning security |
| (l) | The issuer of the security is an affiliated person of the Portfolio as defined in the Investment Company Act of 1940. |
| (u) | The rate represents the 7-day annualized yield at period end. |
Abbreviations:
| REIT | Real estate investment trust |
Futures Contracts
| | | | | | | | | | | | | | | | | | | | | | | | |
| Description | | Number of
contracts | | | Expiration
date | | | Notional
cost | | | Notional
value | | | Unrealized
gains | | | Unrealized
losses | |
| | | | | | |
Long | | | | | | | | | | | | | | | | | | | | | | | | |
| | | | | | |
S&P 500 E-Mini Index | | | 69 | | | | 9-18-2020 | | | $ | 11,984,458 | | | $ | 12,071,205 | | | $ | 86,747 | | | $ | 0 | |
The accompanying notes are an integral part of these financial statements.
24 | Wells Fargo Factor Enhanced U.S. Large Cap Equity Portfolio
Portfolio of investments—August 31, 2020 (unaudited)
Investments in Affiliates
An affiliated investment is an investment in which the Portfolio owns at least 5% of the outstanding voting shares of the issuer or as a result of other relationships, such as the Portfolio and the issuer having the same adviser or investment manager. Transactions with issuers that were either affiliated persons of the Portfolio at the beginning of the period or the end of the period were as follows:
| | | | | | | | | | | | | | | | | | | | | | | | | | | | | | | | |
| | | Value,
beginning of
period | | | Purchases | | | Sales
proceeds | | | Net
realized
gains
(losses) | | | Net
change in
unrealized
gains
(losses) | | | Income
from
affiliated
securities | | | Value,
end of period | | | % of
net
assets | |
| | | | | | | | |
| Short-Term Investments | | | | | | | | | | | | | | | | | | | | | | | | |
Investment Companies | | | | | | | | | | | | | | | | | | | | | | | | | | | | | | | | |
Wells Fargo Government Money Market Fund Select Class | | $ | 37,548,710 | | | $ | 221,692,997 | | | $ | (248,650,982 | ) | | $ | 0 | | | $ | 0 | | | $ | 44,039 | | | $ | 10,590,725 | | | | 1.19 | % |
The accompanying notes are an integral part of these financial statements.
Wells Fargo Factor Enhanced U.S. Large Cap Equity Portfolio | 25
Statement of assets and liabilities—August 31, 2020 (unaudited)
| | | | |
| | | | |
| |
Assets | | | | |
Investments in unaffiliated securities, at value (cost $ 691,941,198) | | $ | 876,463,166 | |
Investments in affiliated securities, at value (cost $ 10,590,725) | | | 10,590,725 | |
Cash | | | 1,075,711 | |
Segregated cash for futures contracts | | | 1,795,600 | |
Receivable for dividends | | | 1,497,508 | |
Prepaid expenses and other assets | | | 5,808 | |
| | | | |
Total assets | | | 891,428,518 | |
| | | | |
| |
Liabilities | | | | |
Payable for daily variation margin on open futures contracts | | | 46,030 | |
Due to broker | | | 1,075,711 | |
Advisory fee payable | | | 263,479 | |
Custody and accounting fees payable | | | 137,496 | |
Trustees’ fees and expenses payable | | | 1,876 | |
Accrued expenses and other liabilities | | | 23,799 | |
| | | | |
Total liabilities | | | 1,548,391 | |
| | | | |
Total net assets | | $ | 889,880,127 | |
| | | | |
The accompanying notes are an integral part of these financial statements.
26 | Wells Fargo Factor Enhanced U.S. Large Cap Equity Portfolio
Statement of operations—six months ended August 31, 2020 (unaudited)
| | | | |
| | | | |
| |
Investment income | | | | |
Dividends (net of foreign withholding taxes of $101,960) | | $ | 9,610,350 | |
Income from affiliated securities | | | 44,039 | |
Interest | | | 6,160 | |
| | | | |
Total investment income | | | 9,660,549 | |
| | | | |
| |
Expenses | | | | |
Advisory fee | | | 445,118 | |
Custody and accounting fees | | | 35,637 | |
Professional fees | | | 22,498 | |
Trustees’ fees and expenses | | | 9,898 | |
Shareholder report expenses | | | 3,751 | |
Other fees and expenses | | | 12,424 | |
| | | | |
Total expenses | | | 529,326 | |
Less: Fee waivers and/or expense reimbursements | | | (62,717 | ) |
| | | | |
Net expenses | | | 466,609 | |
| | | | |
Net investment income | | | 9,193,940 | |
| | | | |
| |
Realized and unrealized gains (losses) on investments | | | | |
Net realized gains (losses) on | |
Unaffiliated securities | | | 38,066,738 | |
Futures contracts | | | (2,414,438 | ) |
| | | | |
Net realized gains on investments | | | 35,652,300 | |
| | | | |
|
Net change in unrealized gains (losses) on | |
Unaffiliated securities | | | 43,832,809 | |
Futures contracts | | | 5,894,150 | |
| | | | |
Net change in unrealized gains (losses) on investments | | | 49,726,959 | |
| | | | |
Net realized and unrealized gains (losses) on investments | | | 85,379,259 | |
| | | | |
Net increase in net assets resulting from operations | | $ | 94,573,199 | |
| | | | |
The accompanying notes are an integral part of these financial statements.
Wells Fargo Factor Enhanced U.S. Large Cap Equity Portfolio | 27
Statement of changes in net assets
| | | | | | | | |
| | | Six months ended
August 31, 2020
(unaudited) | | | Year ended
February 29, 2020 | |
|
Operations | |
Net investment income | | $ | 9,193,940 | | | $ | 23,966,798 | |
Net realized gains on investments | | | 35,652,300 | | | | 81,060,499 | |
Net change in unrealized gains (losses) on investments | | | 49,726,959 | | | | (45,841,488 | ) |
| | | | |
Net increase in net assets resulting from operations | | | 94,573,199 | | | | 59,185,809 | |
| | | | |
| | |
Capital transactions | | | | | | | | |
Transactions in investors’ beneficial interests | |
Contributions | | | 132,502,122 | | | | 30,265,251 | |
Withdrawals | | | (298,624,803 | ) | | | (301,569,041 | ) |
| | | | |
Net decrease in net assets resulting from capital transactions | | | (166,122,681 | ) | | | (271,303,790 | ) |
| | | | |
Total decrease in net assets | | | (71,549,482 | ) | | | (212,117,981 | ) |
| | | | |
| | |
Net assets | | | | | | | | |
Beginning of period | | | 961,429,609 | | | | 1,173,547,590 | |
| | | | |
End of period | | $ | 889,880,127 | | | $ | 961,429,609 | |
| | | | |
The accompanying notes are an integral part of these financial statements.
28 | Wells Fargo Factor Enhanced U.S. Large Cap Equity Portfolio
Financial highlights
| | | | | | | | | | | | | | | | |
| | | Six months ended
August 31, 2020
(unaudited) | | | Year Ended
February 29, 2020 | | | Year ended February 28 | |
| | | 2019 | | | 20181 | |
Total return2 | | | 11.10 | % | | | 4.00 | % | | | 7.60 | % | | | 11.92 | % |
Ratios to average net assets (annualized) | | | | | | | | | | | | | | | | |
Gross expenses | | | 0.12 | % | | | 0.12 | % | | | 0.12 | % | | | 0.12 | % |
Net expenses | | | 0.10 | % | | | 0.11 | % | | | 0.11 | % | | | 0.12 | % |
Net investment income | | | 2.07 | % | | | 2.10 | % | | | 2.09 | % | | | 1.94 | % |
Supplemental data | | | | | | | | | | | | | | | | |
Portfolio turnover rate | | | 44 | % | | | 25 | % | | | 23 | % | | | 75 | % |
| 1 | For the period from May 23, 2017 (commencement of operations) to February 28, 2018 |
| 2 | Returns for periods of less than one year are not annualized. |
The accompanying notes are an integral part of these financial statements.
Wells Fargo Factor Enhanced U.S. Large Cap Equity Portfolio | 29
Notes to financial statements (unaudited)
1. ORGANIZATION
Wells Fargo Master Trust (the “Trust”), a Delaware statutory trust organized on March 10, 1999, is an open-end management investment company registered under the Investment Company Act of 1940, as amended (the “1940 Act”). As an investment company, the Trust follows the accounting and reporting guidance in Financial Accounting Standards Board (“FASB”) Accounting Standards Codification Topic 946, Financial Services – Investment Companies. These financial statements report on the Wells Fargo Factor Enhanced U.S. Large Cap Equity Portfolio (formerly, Wells Fargo Factor Enhanced Large Cap Portfolio) (the “Portfolio”) which is a diversified series of the Trust.
Interests in the Portfolio are available solely through private placement transactions that do not involve any “public offering” within the meaning of Section 4(2) of the Investment Company Act of 1933.
2. SIGNIFICANT ACCOUNTING POLICIES
The following significant accounting policies, which are consistently followed in the preparation of the financial statements of the Portfolio, are in conformity with U.S. generally accepted accounting principles which require management to make estimates and assumptions that affect the reported amounts of assets and liabilities, disclosure of contingent assets and liabilities at the date of the financial statements, and the reported amounts of revenues and expenses during the reporting period. Actual results could differ from those estimates.
Securities valuation
All investments are valued each business day as of the close of regular trading on the New York Stock Exchange (generally 4 p.m. Eastern Time), although the Portfolio may deviate from this calculation time under unusual or unexpected circumstances.
Equity securities and futures contracts that are listed on a foreign or domestic exchange or market are valued at the official closing price or, if none, the last sales price. If no sale occurs on the principal exchange or market that day, a fair value price will be determined in accordance with the Portfolio’s Valuation Procedures.
Investments in registered open-end investment companies are valued at net asset value.
Investments which are not valued using any of the methods discussed above are valued at their fair value, as determined in good faith by the Board of Trustees of the Portfolio. The Board of Trustees has established a Valuation Committee comprised of the Trustees and has delegated to it the authority to take any actions regarding the valuation of portfolio securities that the Valuation Committee deems necessary or appropriate, including determining the fair value of portfolio securities, unless the determination has been delegated to the Wells Fargo Asset Management Pricing Committee at Wells Fargo Funds Management, LLC (“Funds Management”). The Board of Trustees retains the authority to make or ratify any valuation decisions or approve any changes to the Valuation Procedures as it deems appropriate. On a quarterly basis, the Board of Trustees receives reports on any valuation actions taken by the Valuation Committee or the Wells Fargo Asset Management Pricing Committee which may include items for ratification.
Futures contracts
Futures contracts are agreements between the Portfolio and a counterparty to buy or sell a specific amount of a commodity, financial instrument or currency at a specified price and on a specified date. The Portfolio may buy and sell futures contracts in order to gain exposure to, or protect against, changes in security values and is subject to equity price risk. The primary risks associated with the use of futures contracts are the imperfect correlation between changes in market values of securities held by the Portfolio and the prices of futures contracts, and the possibility of an illiquid market. Futures contracts are generally entered into on a regulated futures exchange and cleared through a clearinghouse associated with the exchange. With futures contracts, there is minimal counterparty risk to the Portfolio since futures contracts are exchange traded and the exchange’s clearinghouse, as the counterparty to all exchange traded futures, guarantees the futures contracts against default.
Upon entering into a futures contracts, the Portfolio is required to deposit either cash or securities (initial margin) with the broker in an amount equal to a certain percentage of the contract value. Subsequent payments (variation margin) are paid to or from the broker each day equal to the daily changes in the contract value. Such payments are recorded as unrealized gains or losses and, if any, shown as variation margin receivable (payable) in the Statement of Assets and Liabilities. Should the Portfolio fail to make requested variation margin payments, the broker can gain access to the initial margin to satisfy the Portfolio’s payment obligations. When the contracts are closed, a realized gain or loss is recorded in the Statement of Operations.
Security transactions and income recognition
Securities transactions are recorded on a trade date basis. Realized gains or losses are recorded on the basis of identified cost.
Dividend income is recognized on the ex-dividend date. Dividend income is recorded net of foreign taxes withheld where recovery of such taxes is not assured.
30 | Wells Fargo Factor Enhanced U.S. Large Cap Equity Portfolio
Notes to financial statements (unaudited)
Federal and other taxes
The Portfolio is not required to pay federal income taxes on its net investment income and net capital gains as it is treated as a partnership for federal income tax purposes. All dividends, gains and losses of the Portfolio are deemed to have been “passed through” to the interest holders in proportion to their holdings of the Portfolio regardless of whether dividends and gains have been distributed by the Portfolio.
The Portfolio’s income tax returns and all financial records supporting those returns for the prior three fiscal years are subject to examination by the federal revenue authority. Management has analyzed the Portfolio’s tax positions taken on federal, state, and foreign tax returns for all open tax years and does not believe that there are any uncertain tax positions that require
recognition of a tax liability.
As of August 31, 2020, the aggregate cost of all investments for federal income tax purposes was $693,686,329 and the unrealized gains (losses) consisted of:
| | | | |
| |
Gross unrealized gains | | $ | 204,632,214 | |
| |
Gross unrealized losses | | | (11,177,905 | ) |
| |
Net unrealized gains | | $ | 193,454,309 | |
3. FAIR VALUATION MEASUREMENTS
Fair value measurements of investments are determined within a framework that has established a fair value hierarchy based upon the various data inputs utilized in determining the value of the Portfolio’s investments. The three-level hierarchy gives the highest priority to unadjusted quoted prices in active markets for identical assets or liabilities (Level 1) and the lowest priority to unobservable inputs (Level 3). The Portfolio’s investments are classified within the fair value hierarchy based on the lowest level of input that is significant to the fair value measurement. The inputs are summarized into three broad levels as follows:
| ∎ | | Level 1 – quoted prices in active markets for identical securities |
| ∎ | | Level 2 – other significant observable inputs (including quoted prices for similar securities, interest rates, prepayment speeds, credit risk, etc.) |
| ∎ | | Level 3 – significant unobservable inputs (including the Portfolio’s own assumptions in determining the fair value of investments) |
The inputs or methodologies used for valuing investments in securities are not necessarily an indication of the risk associated with investing in those securities.
The following is a summary of the inputs used in valuing the Portfolio’s assets and liabilities as of August 31, 2020:
| | | | | | | | | | | | | | | | |
| | | | |
| | | Quoted prices
(Level 1) | | | Other significant
observable inputs
(Level 2) | | | Significant
unobservable inputs (Level 3) | | | Total | |
| | | | |
Assets | | | | | | | | | | | | | | | | |
Investments in: | | | | | | | | | | | | | | | | |
| | | | |
Common stocks | | | | | | | | | | | | | | | | |
| | | | |
Communication services | | $ | 99,346,185 | | | $ | 0 | | | $ | 0 | | | $ | 99,346,185 | |
| | | | |
Consumer discretionary | | | 94,369,381 | | | | 0 | | | | 0 | | | | 94,369,381 | |
| | | | |
Consumer staples | | | 66,180,905 | | | | 0 | | | | 0 | | | | 66,180,905 | |
| | | | |
Energy | | | 18,334,343 | | | | 0 | | | | 0 | | | | 18,334,343 | |
| | | | |
Financials | | | 77,535,896 | | | | 0 | | | | 0 | | | | 77,535,896 | |
| | | | |
Health care | | | 140,311,942 | | | | 0 | | | | 0 | | | | 140,311,942 | |
| | | | |
Industrials | | | 81,429,877 | | | | 0 | | | | 0 | | | | 81,429,877 | |
| | | | |
Information technology | | | 214,579,462 | | | | 0 | | | | 0 | | | | 214,579,462 | |
| | | | |
Materials | | | 24,983,699 | | | | 0 | | | | 0 | | | | 24,983,699 | |
| | | | |
Real estate | | | 32,769,603 | | | | 0 | | | | 0 | | | | 32,769,603 | |
| | | | |
Utilities | | | 26,614,607 | | | | 0 | | | | 0 | | | | 26,614,607 | |
| | | | |
Warrants | | | | | | | | | | | | | | | | |
| | | | |
Energy | | | 0 | | | | 7,266 | | | | 0 | | | | 7,266 | |
| | | | |
Short-term investments | | | | | | | | | | | | | | | | |
| | | | |
Investment companies | | | 10,590,725 | | | | 0 | | | | 0 | | | | 10,590,725 | |
| | | | |
| | | 887,046,625 | | | | 7,266 | | | | 0 | | | | 887,053,891 | |
| | | | |
Futures contracts | | | 86,747 | | | | 0 | | | | 0 | | | | 86,747 | |
| | | | |
Total assets | | $ | 887,133,372 | | | $ | 7,266 | | | $ | 0 | | | $ | 887,140,638 | |
Wells Fargo Factor Enhanced U.S. Large Cap Equity Portfolio | 31
Notes to financial statements (unaudited)
Additional sector, industry or geographic detail is included in the Portfolio of Investments.
Futures contracts are reported at their cumulative unrealized gains (losses) at measurement date as reported in the table following the Portfolio of Investments. For futures contracts, the current day’s variation margin is reported on the Statement of Assets and Liabilities. All other assets and liabilities are reported at their market value at measurement date.
For the six months ended August 31, 2020, the Portfolio did not have any transfers into/out of Level 3.
4. TRANSACTIONS WITH AFFILIATES
Advisory fee
The Trust has entered into an advisory contract with Funds Management, an indirect wholly owned subsidiary of Wells Fargo. The adviser is responsible for implementing investment policies and guidelines and for supervising the subadviser, who is responsible for day-to-day portfolio management of the Portfolio. Pursuant to the contract, Funds Management is entitled to receive an annual advisory fee at the following annual rate based on the Portfolio’s average daily net assets:
| | | | |
| |
| Average daily net assets | | Advisory fee | |
| |
First $5 billion | | | 0.10 | % |
| |
Next $5 billion | | | 0.08 | |
| |
Over $10 billion | | | 0.06 | |
For the six months ended August 31, 2020, the advisory fee was equivalent to an annual rate of 0.10% of the Portfolio’s average daily net assets.
Funds Management has retained the services of a subadviser to provide daily portfolio management to the Portfolio. The fee for subadvisory services is borne by Funds Management. Wells Capital Management Incorporated, an affiliate of Funds Management and an indirect wholly owned subsidiary of Wells Fargo, is the subadviser to the Portfolio and is entitled to receive a fee from Funds Management at an annual rate starting at 0.06% and declining to 0.04% as the average daily net assets of the Portfolio increase.
Funds Management has voluntarily waived and/or reimbursed advisory fees to reduce the net operating expense ratio of the Portfolio.
Interfund transactions
The Portfolio may purchase or sell portfolio investment securities to certain other Wells Fargo affiliates pursuant to Rule 17a-7 under the 1940 Act and under procedures adopted by the Board of Trustees. The procedures have been designed to ensure that these interfund transactions, which do not incur broker commissions, are effected at current market prices.
5. INVESTMENT PORTFOLIO TRANSACTIONS
Purchases and sales of investments, excluding U.S. government obligations (if any) and short-term securities, for the six months ended August 31, 2020 were $374,649,636 and $492,127,093, respectively.
6. DERIVATIVE TRANSACTIONS
During the six months ended August 31, 2020, the Portfolio entered into futures contracts to gain market exposure. The Portfolio had an average notional amount of $32,991,276 in long futures contracts during the six months ended August 31, 2020.
The fair value, realized gains or losses and change in unrealized gains or losses, if any, on derivative instruments are reflected in the corresponding financial statement captions.
7. BANK BORROWINGS
The Trust, along with Wells Fargo Variable Trust and Wells Fargo Funds Trust (excluding the money market funds), are parties to a $350,000,000 revolving credit agreement whereby the Portfolio is permitted to use bank borrowings for temporary or emergency purposes, such as to fund shareholder redemption requests. Interest under the credit agreement is charged to the Portfolio based on a borrowing rate equal to the higher of the Federal Funds rate in effect on that day plus 1.25% or the overnight LIBOR rate in effect on that day plus 1.25%. In addition, an annual commitment fee equal to 0.25% of the unused balance is allocated to each participating fund.
32 | Wells Fargo Factor Enhanced U.S. Large Cap Equity Portfolio
Notes to financial statements (unaudited)
For the six months ended August 31, 2020, there were no borrowings by the Portfolio under the agreement.
8. INDEMNIFICATION
Under the Portfolio’s organizational documents, the officers and Trustees have been granted certain indemnification rights against certain liabilities that may arise out of performance of their duties to the Portfolio. The Portfolio has entered into a separate agreement with each Trustee that converts indemnification rights currently existing under the Portfolio’s organizational documents into contractual rights that cannot be changed in the future without the consent of the Trustee. Additionally, in the normal course of business, the Portfolio may enter into contracts with service providers that contain a variety of indemnification clauses. The Portfolio’s maximum exposure under these arrangements is dependent on future claims that may be made against the Portfolio and, therefore, cannot be estimated.
9. NEW ACCOUNTING PRONOUNCEMENT
In August 2018, FASB issued Accounting Standards Update (“ASU”) No. 2018-13, Fair Value Measurement (Topic 820) Disclosure Framework—Changes to the Disclosure Requirements for Fair Value Measurement. ASU 2018-13 updates the disclosure requirements on fair value measurements in Topic 820, Fair Value Measurements. The amendments are effective for fiscal years, and interim periods within those fiscal years, beginning after December 15, 2019. Management has adopted this guidance which did not have a material impact on the financial statements.
10. CORONAVIRUS (COVID-19) PANDEMIC
On March 11, 2020, the World Health Organization announced that it had made the assessment that coronavirus disease 2019 (“COVID-19”) is a pandemic. The impacts of COVID-19 are adversely affecting the entire global economy, individual companies and investment products, and the market in general. There is significant uncertainty around the extent and duration of business disruptions related to COVID-19 and the impacts may be short term or may last for an extended period of time. The risk of further spreading of COVID-19 has led to significant uncertainty and volatility in the financial markets.
Wells Fargo Factor Enhanced U.S. Large Cap Equity Portfolio | 33
Other information (unaudited)
PROXY VOTING INFORMATION
A description of the policies and procedures used to determine how to vote proxies relating to portfolio securities is available, upon request, by calling 1-800-222-8222, visiting our website at wfam.com, or visiting the SEC website at sec.gov. Information regarding how the proxies related to portfolio securities were voted during the most recent 12-month period ended June 30 is available on the website at wfam.com or by visiting the SEC website at sec.gov.
QUARTERLY PORTFOLIO HOLDINGS INFORMATION
The Portfolio files its complete schedule of portfolio holdings with the SEC for the first and third quarters of each fiscal as an exhibit to its reports on Form N-PORT. Shareholders may view the filed Form N-PORT by visiting the SEC website at sec.gov.
34 | Wells Fargo Factor Enhanced U.S. Large Cap Equity Portfolio
Other information (unaudited)
BOARD OF TRUSTEES AND OFFICERS
Each of the Trustees and Officers1 listed in the table below acts in identical capacities for each fund in the Wells Fargo family of funds, which consists of 142 mutual funds comprising the Wells Fargo Funds Trust, Wells Fargo Variable Trust, Wells Fargo Master Trust and four closed-end funds (collectively the “Fund Complex”). This table should be read in conjunction with the Prospectus and the Statement of Additional Information2. The mailing address of each Trustee and Officer is 525 Market Street, 12th Floor, San Francisco, CA 94105. Each Trustee and Officer serves an indefinite term, however, each Trustee serves such term until reaching the mandatory retirement age established by the Trustees.
Independent Trustees
| | | | | | |
Name and year of birth | | Position held and length of service* | | Principal occupations during past five years or longer | | Current other public company or investment company directorships |
| | | |
William R. Ebsworth (Born 1957) | | Trustee, since 2015 | | Retired. From 1984 to 2013, equities analyst, portfolio manager, research director and chief investment officer at Fidelity Management and Research Company in Boston, Tokyo, and Hong Kong, and retired in 2013 as Chief Investment Officer of Fidelity Strategic Advisers, Inc. where he led a team of investment professionals managing client assets. Prior thereto, Board member of Hong Kong Securities Clearing Co., Hong Kong Options Clearing Corp., the Thailand International Fund, Ltd., Fidelity Investments Life Insurance Company, and Empire Fidelity Investments Life Insurance Company. Audit Committee Chair and Investment Committee Chair of the Vincent Memorial Hospital Endowment (non-profit organization). Mr. Ebsworth is a CFA® charterholder. | | N/A |
| | | |
Jane A. Freeman (Born 1953) | | Trustee, since 2015; Chair Liaison, since 2018 | | Retired. From 2012 to 2014 and 1999 to 2008, Chief Financial Officer of Scientific Learning Corporation. From 2008 to 2012, Ms. Freeman provided consulting services related to strategic business projects. Prior to 1999, Portfolio Manager at Rockefeller & Co. and Scudder, Stevens & Clark. Board member of the Harding Loevner Funds from 1996 to 2014, serving as both Lead Independent Director and chair of the Audit Committee. Board member of the Russell Exchange Traded Funds Trust from 2011 to 2012 and the chair of the Audit Committee. Ms. Freeman is also an inactive Chartered Financial Analyst. | | N/A |
| | | |
Isaiah Harris, Jr. (Born 1952) | | Trustee, since 2009; Audit Committee Chairman, since 2019 | | Retired. Chairman of the Board of CIGNA Corporation since 2009, and Director since 2005. From 2003 to 2011, Director of Deluxe Corporation. Prior thereto, President and CEO of BellSouth Advertising and Publishing Corp. from 2005 to 2007, President and CEO of BellSouth Enterprises from 2004 to 2005 and President of BellSouth Consumer Services from 2000 to 2003. Emeritus member of the Iowa State University Foundation Board of Governors. Emeritus Member of the Advisory Board of Iowa State University School of Business. Advisory Board Member, Palm Harbor Academy (private school). Mr. Harris is a certified public accountant (inactive status). | | CIGNA Corporation |
| | | |
Judith M. Johnson (Born 1949) | | Trustee, since 2008 | | Retired. Prior thereto, Chief Executive Officer and Chief Investment Officer of Minneapolis Employees Retirement Fund from 1996 to 2008. Ms. Johnson is an attorney, certified public accountant and a certified managerial accountant. | | N/A |
| | | |
David F. Larcker (Born 1950) | | Trustee, since 2009 | | James Irvin Miller Professor of Accounting at the Graduate School of Business (Emeritus), Stanford University, Director of the Corporate Governance Research Initiative and Senior Faculty of The Rock Center for Corporate Governance since 2006. From 2005 to 2008, Professor of Accounting at the Graduate School of Business, Stanford University. Prior thereto, Ernst & Young Professor of Accounting at The Wharton School, University of Pennsylvania from 1985 to 2005. | | N/A |
Wells Fargo Factor Enhanced U.S. Large Cap Equity Portfolio | 35
Other information (unaudited)
| | | | | | |
Name and year of birth | | Position held and length of service* | | Principal occupations during past five years or longer | | Current other public company or investment company directorships |
| | | |
Olivia S. Mitchell (Born 1953) | | Trustee, since 2006; Nominating and Governance Committee Chair, since 2018 | | International Foundation of Employee Benefit Plans Professor, Wharton School of the University of Pennsylvania since 1993. Director of Wharton’s Pension Research Council and Boettner Center on Pensions & Retirement Research, and Research Associate at the National Bureau of Economic Research. Previously, Cornell University Professor from 1978 to 1993. | | N/A |
| | | |
Timothy J. Penny (Born 1951) | | Trustee, since 1996; Chairman, since 2018 | | President and Chief Executive Officer of Southern Minnesota Initiative Foundation, a non-profit organization, since 2007. Member of the Board of Trustees of NorthStar Education Finance, Inc., a non-profit organization, since 2007. | | N/A |
| | | |
James G. Polisson (Born 1959) | | Trustee, since 2018 | | Retired. Chief Marketing Officer, Source (ETF) UK Services, Ltd, from 2015 to 2017. From 2012 to 2015, Principal of The Polisson Group, LLC, a management consulting, corporate advisory and principal investing company. Chief Executive Officer and Managing Director at Russell Investments, Global Exchange Traded Funds from 2010 to 2012. Managing Director of Barclays Global Investors from 1998 to 2010 and Global Chief Marketing Officer for iShares and Barclays Global Investors from 2000 to 2010. Trustee of the San Francisco Mechanics’ Institute, a non-profit organization, from 2013 to 2015. Board member of the Russell Exchange Traded Fund Trust from 2011 to 2012. Director of Barclays Global Investors Holdings Deutschland GmbH from 2006 to 2009. Mr. Polisson is an attorney and has a retired status with the Massachusetts and District of Columbia Bar Associations. | | N/A |
| | | |
Pamela Wheelock (Born 1959) | | Trustee, since January 2020; previously Trustee from January 2018 to July 2019 | | Board member of the Destination Medical Center Economic Development Agency, Rochester, Minnesota since 2019. Interim President of the McKnight Foundation from January to September 2020. Acting Commissioner, Minnesota Department of Human Services, July 2019 through September 2019. Human Services Manager (part-time), Minnesota Department of Human Services, October 2019 through December 2019. Chief Operating Officer, Twin Cities Habitat for Humanity from 2017 to 2019. Vice President of University Services, University of Minnesota from 2012 to 2016. Prior thereto, on the Board of Directors, Governance Committee and Finance Committee for the Minnesota Philanthropy Partners (Saint Paul Foundation) from 2012 to 2018, Interim Chief Executive Officer of Blue Cross Blue Shield of Minnesota from 2011 to 2012, Chairman of the Board from 2009 to 2012 and Board Director from 2003 to 2015. Vice President, Leadership and Community Engagement, Bush Foundation, Saint Paul, Minnesota (a private foundation) from 2009 to 2011. Executive Vice President and Chief Financial Officer, Minnesota Sports and Entertainment from 2004 to 2009 and Senior Vice President from 2002 to 2004. Executive Vice President of the Minnesota Wild Foundation from 2004 to 2008. Commissioner of Finance, State of Minnesota, from 1999 to 2002. Currently Board Chair of the Minnesota Wild Foundation since 2010. | | N/A |
| * | Length of service dates reflect the Trustee’s commencement of service with the Trust’s predecessor entities, where applicable. |
36 | Wells Fargo Factor Enhanced U.S. Large Cap Equity Portfolio
Other information (unaudited)
Officers
| | | | |
Name and year of birth | | Position held and length of service | | Principal occupations during past five years or longer |
| | |
Andrew Owen (Born 1960) | | President, since 2017 | | Executive Vice President of Wells Fargo & Company and Head of Affiliated Managers, Wells Fargo Asset Management, since 2014. In addition, Mr. Owen is currently President, Chief Executive Officer and Director of Wells Fargo Funds Management, LLC since 2017. Prior thereto, Executive Vice President responsible for marketing, investments and product development for Wells Fargo Funds Management, LLC, from 2009 to 2014. |
| | |
Jeremy DePalma1 (Born 1974) | | Treasurer, since 2012 | | Senior Vice President of Wells Fargo Funds Management, LLC since 2009. Senior Vice President of Evergreen Investment Management Company, LLC from 2008 to 2010 and head of the Fund Reporting and Control Team within Fund Administration from 2005 to 2010. |
| | |
Michelle Rhee (Born 1966) | | Chief Legal Officer, since 2019 | | Secretary of Wells Fargo Funds Management, LLC, Chief Legal Counsel of Wells Fargo Asset Management and Assistant General Counsel of Wells Fargo Bank, N.A. since 2018. Associate General Counsel and Managing Director of Bank of America Corporation from 2004 to 2018. |
| | |
Catherine Kennedy (Born 1969) | | Secretary, since 2019 | | Vice President of Wells Fargo Funds Management, LLC and Senior Counsel of the Wells Fargo Legal Department since 2010. Vice President and Senior Counsel of Evergreen Investment Management Company, LLC from 1998 to 2010. |
| | |
Michael H. Whitaker (Born 1967) | | Chief Compliance Officer, since 2016 | | Chief Compliance Officer of Wells Fargo Asset Management since 2016. Senior Vice President and Chief Compliance Officer for Fidelity Investments from 2007 to 2016. |
| | |
David Berardi (Born 1975) | | Assistant Treasurer, since 2009 | | Vice President of Wells Fargo Funds Management, LLC since 2009. Vice President of Evergreen Investment Management Company, LLC from 2008 to 2010. Manager of Fund Reporting and Control for Evergreen Investment Management Company, LLC from 2004 to 2010. |
| 1 | Jeremy DePalma acts as Treasurer of 77 funds and Assistant Treasurer of 65 funds in the Fund Complex. |
| 2 | The Statement of Additional Information includes additional information about the Trustees and is available, without charge, upon request, by calling 1-800-222-8222 or by visiting the website at wfam.com. |
Wells Fargo Factor Enhanced U.S. Large Cap Equity Portfolio | 37
Other information (unaudited)
BOARD CONSIDERATION OF INVESTMENT MANAGEMENT, ADVISORY AND SUB-ADVISORY AGREEMENTS:
Wells Fargo Emerging Markets Bond Fund, Wells Fargo High Yield Corporate Bond Fund, Wells Fargo International Government Bond Fund, Wells Fargo U.S. Core Bond Fund, Wells Fargo Bloomberg Barclays US Aggregate ex-Corporate Credit Portfolio, Wells Fargo Factor Enhanced Emerging Markets Equity Portfolio, Wells Fargo Emerging Markets Bond Portfolio, Wells Fargo Factor Enhanced International Equity Portfolio, Wells Fargo Factor Enhanced U.S. Large Cap Portfolio, Wells Fargo Factor Enhanced U.S. Small Cap Portfolio, Wells Fargo International Government Bond Portfolio, Wells Fargo Investment Grade Corporate Bond Portfolio, Wells Fargo High Yield Corporate Bond Portfolio, Wells Fargo Strategic Retirement Bond Portfolio, and Wells Fargo U.S. REIT Portfolio
Under the Investment Company Act of 1940 (the “1940 Act”), the Board of Trustees (each, a “Board” and collectively, the “Boards”) of each of Wells Fargo Funds Trust (“Funds Trust”) and Wells Fargo Master Trust (“Master Trust”) (collectively, the “Trusts”) must determine annually whether to approve the continuation of the Trusts’ investment management, advisory and sub-advisory agreements, as applicable. In this regard, at a meeting held on May 26, 2020 and May 28, 2020 (together, the “Meeting”), the Board of Funds Trust, all the members of which have no direct or indirect interest in the investment management agreement and are not “interested persons” of the Trusts, as defined in the 1940 Act (the “Independent Trustees”), reviewed and approved for each of the funds of Funds Trust identified in the table below (individually, an “Index Fund” and collectively, the “Index Funds”) an investment management agreement (the “Management Agreement”) with Wells Fargo Funds Management, LLC (“Funds Management”).
|
|
| Index Funds |
|
Wells Fargo Emerging Markets Bond Fund |
|
Wells Fargo High Yield Corporate Bond Fund |
|
Wells Fargo International Government Bond Fund |
|
Wells Fargo U.S. Core Bond Fund |
In addition, the Funds Trust Board reviewed and approved an investment sub-advisory agreement with Wells Capital Management Incorporated (“WellsCap”) for the U.S. Core Bond Fund (the “Core Bond Fund Sub-Advisory Agreement”).
At the Meeting, the Board of Master Trust, all the members of which have no direct or indirect interest in the investment advisory and sub-advisory agreements and are Independent Trustees, reviewed and approved for each of the portfolios of Master Trust identified in the table below (individually, a “Master Portfolio” and collectively, the “Master Portfolios”): (i) an investment advisory agreement (the “Master Portfolio Advisory Agreement”) with Funds Management; and (ii) an investment sub-advisory agreement (each, a “Master Portfolio Sub-Advisory Agreement”, and collectively, the “Master Portfolio Sub-Advisory Agreements”) with the sub-adviser(s) identified in the chart below (each, a “Sub-Adviser”, and collectively, the “Sub-Advisers”) for the corresponding Master Portfolio identified.
| | |
| |
| Master Portfolios | | Sub-Advisers |
| |
Wells Fargo Bloomberg Barclays US Aggregate ex-Corporate Credit Portfolio | | WellsCap |
| |
Wells Fargo Factor Enhanced Emerging Markets Equity Portfolio | | WellsCap |
| |
Wells Fargo Emerging Markets Bond Portfolio | | Wells Fargo Asset Management (International), Limited (“WFAM International”) |
| |
Wells Fargo Factor Enhanced International Equity Portfolio | | WellsCap |
| |
Wells Fargo Factor Enhanced U.S. Large Cap Portfolio | | WellsCap |
| |
Wells Fargo Factor Enhanced U.S. Small Cap Portfolio | | WellsCap |
| |
Wells Fargo International Government Bond Portfolio | | WFAM International |
| |
Wells Fargo Investment Grade Corporate Bond Portfolio | | WellsCap |
| |
Wells Fargo High Yield Corporate Bond Portfolio | | WellsCap |
| |
Wells Fargo Strategic Retirement Bond Portfolio | | WellsCap |
| |
Wells Fargo U.S. REIT Portfolio | | WellsCap |
38 | Wells Fargo Factor Enhanced U.S. Large Cap Equity Portfolio
Other information (unaudited)
The Index Funds and the Master Portfolios are collectively referred to as the “Funds.” The Management Agreement, the Core Bond Fund Sub-Advisory Agreement, the Master Portfolio Advisory Agreement and the Master Portfolio Sub-Advisory Agreements are collectively referred to as the “Advisory Agreements.”
The Boards noted that each of the Index Funds is a feeder fund that invests all of its assets in its corresponding Master Portfolio, with the exception of the U.S. Core Bond Fund, which invests in multiple Master Portfolios. Information provided to the Boards regarding the Index Funds is also applicable to the Master Portfolios identified above, as relevant.
At the Meeting, the Boards considered the factors and reached the conclusions described below relating to the selection of Funds Management and the Sub-Advisers and the approval of the Advisory Agreements. Prior to the Meeting, including at a Board meeting held in April 2020, the Trustees conferred extensively among themselves and with representatives of Funds Management about these matters. Also, the Boards have adopted a team-based approach, with each team consisting of a sub-set of Trustees, to assist the full Boards in the discharge of their duties in reviewing investment performance and other matters throughout the year. The Independent Trustees were assisted in their evaluation of the Advisory Agreements by independent legal counsel, from whom they received separate legal advice and with whom they met separately.
In providing information to the Boards, Funds Management and the Sub-Advisers were guided by a detailed set of requests for information submitted to them by independent legal counsel on behalf of the Independent Trustees at the start of the Boards’ annual contract renewal process earlier in 2020. In considering and approving the Advisory Agreements, the Trustees considered the information they believed relevant, including but not limited to the information discussed below. The Boards considered not only the specific information presented in connection with the Meeting, but also the knowledge gained over time through interaction with Funds Management and the Sub-Advisers about various topics. In this regard, the Boards reviewed reports of Funds Management at each of their quarterly meetings, which included, among other things, portfolio reviews and investment performance reports. In addition, the Boards and the teams mentioned above confer with portfolio managers at various times throughout the year. The Boards did not identify any particular information or consideration that was all-important or controlling, and each individual Trustee may have attributed different weights to various factors.
After its deliberations, the Board of Funds Trust unanimously approved the continuation of the Management Agreement and the Core Bond Fund Sub-Advisory Agreement for a one-year period. Additionally, after its deliberations, the Board of Master Trust unanimously approved the continuation of the Master Portfolio Advisory Agreement and each Master Portfolio Sub-Advisory Agreement for a one-year term. The Boards also determined that the compensation or the absence of compensation payable to Funds Management and to each of the Sub-Advisers under each of the Advisory Agreements was reasonable. The Boards considered the approval of the Advisory Agreements for the Funds as part of their consideration of agreements for funds across the complex, but their approvals were made on a fund-by-fund basis. The following summarizes a number of important, but not necessarily all, factors considered by the Boards in support of their approvals.
Nature, extent and quality of services
The Boards received and considered various information regarding the nature, extent and quality of services provided to the Funds by Funds Management and the Sub-Advisers under the Advisory Agreements. This information included a description of the investment advisory services and Fund-level administrative services covered by the Advisory Agreements, as well as, among other things, a summary of the background and experience of senior management of Wells Fargo Asset Management (“WFAM”), of which Funds Management and the Sub-Advisers are a part, and a summary of investments made in the business of WFAM. The Boards also received a description of Funds Management’s and the Sub-Advisers’ business continuity plans and of their approaches to data privacy and cybersecurity, and related testing. The Boards also received and reviewed information about Funds Management’s role as administrator of the Funds’ liquidity risk management program, Funds Management’s approach to risk management, and Funds Management’s intermediary and vendor oversight program.
The Boards also considered the qualifications, background, tenure and responsibilities of each of the portfolio managers primarily responsible for the day-to-day portfolio management of the Funds. The Board of Master Trust noted that each of the Master Portfolios replicates the performance of a proprietary index provided by an affiliate of Funds Management, except that the Wells Fargo Bloomberg Barclays US Aggregate ex-Corporate Credit Portfolio, the Wells Fargo Emerging Markets Bond Portfolio, and the Wells Fargo Strategic Retirement Bond Portfolio track the performance of third-party indexes. The Boards evaluated the ability of Funds Management and the Sub-Advisers to attract and retain qualified investment professionals, including research, advisory and supervisory personnel. The Boards further considered the compliance programs and compliance records of Funds Management and the Sub-Advisers. In addition, the Boards took into account the full range of services provided to the Funds by Funds Management and its affiliates.
Wells Fargo Factor Enhanced U.S. Large Cap Equity Portfolio | 39
Other information (unaudited)
Fund investment performance and expenses
The Boards considered the investment performance results for each of the Master Portfolios for the one-year period ended December 31, 2019. The Boards also considered more current results for the one-year period ended March 31, 2020. The Boards considered these results in comparison to the investment performance of funds in a universe that was determined by Broadridge Inc. (“Broadridge”) to be similar to the respective Master Portfolios (each, a “Universe”), and in comparison to each Master Portfolio’s benchmark index and to other comparative data. Broadridge is an independent provider of investment company data. The Boards received a description of the methodology used by Broadridge to select the mutual funds in each performance Universe.
The Boards noted the short performance history of the Master Portfolios. For the one-year period ended December 31, 2019, the Boards noted that the investment performance of each Master Portfolio relative to its respective Universe was as follows: (i) the investment performance of each of the Wells Fargo Bloomberg Barclays US Aggregate ex-Corporate Credit Portfolio, the Wells Fargo Emerging Markets Bond Portfolio, the Wells Fargo Factor Enhanced International Equity Portfolio, the Wells Fargo Factor Enhanced U.S. Large Cap Portfolio, the Wells Fargo High Yield Corporate Bond Portfolio and the Wells Fargo Investment Grade Corporate Bond Portfolio was higher than or in range of the average investment performance of such Master Portfolio’s respective Universe; and (ii) the Wells Fargo Factor Enhanced Emerging Markets Equity Portfolio, the Wells Fargo Factor Enhanced U.S. Small Cap Portfolio, the Wells Fargo International Government Bond Portfolio, the Wells Fargo Strategic Retirement Bond Portfolio and the Wells Fargo U.S. REIT Portfolio was lower than the average investment performance of such Master Portfolio’s respective Universe. For the one-year period ended March 31, 2020, the Boards noted that the investment performance of each Master Portfolio relative to its respective Universe was as follows: (i) the Wells Fargo Emerging Markets Bond Portfolio, the Wells Fargo Factor Enhanced U.S. Large Cap Portfolio, the Wells Fargo Factor Enhanced U.S. Small Cap Portfolio, the Wells Fargo International Government Bond Portfolio, and the Wells Fargo Investment Grade Corporate Bond Portfolio was higher than or in range of the average investment performance of such Master Portfolio’s respective Universe, and (ii) the Wells Fargo Bloomberg Barclays US Aggregate ex-Corporate Credit Portfolio, the Wells Fargo Factor Enhanced Emerging Markets Equity Portfolio, the Wells Fargo Factor Enhanced International Equity Portfolio, the Wells Fargo High Yield Corporate Bond Portfolio, the Wells Fargo Strategic Retirement Bond Portfolio and the Wells Fargo U.S. REIT Portfolio was lower than the average investment performance of such Master Portfolio’s respective Universe.
The Boards also noted that the investment performance of each Master Portfolio to its respective benchmark index for the one-year period ended December 31, 2019, was as follows: (i) the investment performance of each of the Wells Fargo Bloomberg Barclays US Aggregate ex-Corporate Credit Portfolio, the Wells Fargo Factor Enhanced Emerging Markets Equity Portfolio, the Wells Fargo Factor Enhanced U.S. Large Cap Portfolio, the Wells Fargo Factor Enhanced U.S. Small Cap Portfolio, the Wells Fargo High Yield Corporate Bond Portfolio, the Wells Fargo U.S. REIT Portfolio and the Wells Fargo Strategic Retirement Bond Portfolio was higher than or in range of the average investment performance of such Master Portfolio’s respective benchmark, and (ii) the investment performance of each of the Wells Fargo Emerging Markets Bond Portfolio, the Wells Fargo Factor Enhanced International Equity Portfolio, the Wells Fargo International Government Bond Portfolio and the Wells Fargo Investment Grade Corporate Bond Portfolio was lower than the average investment performance of such Master Portfolio’s respective benchmark. For the one-year period ended March 31, 2020, the Boards also noted that the investment performance of each Master Portfolio to its respective benchmark index, was as follows: (i) the investment performance of each of the Wells Fargo Bloomberg Barclays US Aggregate ex-Corporate Credit Portfolio, the Wells Fargo Factor Enhanced Emerging Markets Equity Portfolio, the Wells Fargo Factor Enhanced International Equity Portfolio, the Wells Fargo Factor Enhanced U.S. Large Cap Portfolio, the Wells Fargo Factor Enhanced U.S. Small Cap Portfolio, the Wells Fargo U.S. REIT Portfolio, the Wells Fargo Investment Grade Corporate Bond Portfolio and the Wells Fargo Strategic Retirement Bond Portfolio was higher than, equal to or in range of the average investment performance of such Master Portfolio’s respective benchmark, and (ii) the investment performance of each of the Wells Fargo Emerging Markets Bond Portfolio, the Wells Fargo High Yield Corporate Bond Portfolio and the Wells Fargo International Government Bond Portfolio was lower than the average investment performance of such Master Portfolio’s respective benchmark.
The Boards received information concerning, and discussed factors contributing to, the underperformance of certain Master Portfolios, relative to the Universe and benchmark index, for the periods identified above. The Board took note of the explanations for the relative underperformance during these periods, including with respect to investment decisions and market factors that affected the Fund’s investment performance.
The Board of Funds Trust took note of the investment performance of the Master Portfolios in the context of reviewing the investment performance of the Index Funds. The Board of Funds Trust also received and considered information regarding the “zero fee and expense” structure of each Index Fund. Specifically, the Funds Trust Board noted that each Index Fund’s gross operating expense ratio and each of its various components, including management fees, administration fees, custody fees,
40 | Wells Fargo Factor Enhanced U.S. Large Cap Equity Portfolio
Other information (unaudited)
Rule 12b-1 fees, and other fees, are zero. The Funds Trust Board also noted that Funds Management assumes and pays or reimburses all of the ordinary operating expenses of each Index Fund, including acquired fund fees and expenses, pursuant to an agreement with each of the Index Funds (the “Fee and Expense Agreement”). The Funds Trust Board further noted that Funds Management receives a fee from Wells Fargo Wealth and Investment Management (“WIM”) pursuant to an intercompany agreement equal to the Master Portfolio fees and expenses absorbed by Funds Management through its Fee and Expense Agreement with each of the Index Funds.
With respect to the Master Portfolios, the Board of Master Trust received and considered information regarding the fee rates that are payable to Funds Management for investment advisory services (as discussed below), which are the only fees charged at the Master Portfolio level, relative to corresponding class-specific expense groups that were determined by Broadridge to be similar to the Funds (the “Groups”). The Boards received a description of the methodology used by Broadridge to select the mutual funds in the expense Groups and an explanation of how funds comprising expense groups and their expense ratios may vary from year-to-year.
The Boards took into account the Funds’ expense information and the Master Portfolios’ performance information provided to them among the factors considered in deciding to re-approve the Advisory Agreements.
Investment management, advisory and sub-advisory fee rates
The Board of Funds Trust reviewed and considered that the contractual investment management fee rate payable by each Index Fund to Funds Management for investment management services zero, and also reviewed and considered that each Fund’s other expenses would normally be zero, because of Funds Management’s commitment to assume and pay or reimburse all of the ordinary operating expenses of each Fund, including acquired fund fees and expenses, under the Fee and Expense Agreement. The Board of Funds Trust also reviewed and considered that the contractual investment sub-advisory fee rate payable by Funds Management to WellsCap for investment sub-advisory services for the U.S. Core Bond Fund is also zero.
The Board of Master Trust reviewed and considered the contractual fee rates payable by the Master Portfolios to Funds Management under the Master Portfolio Advisory Agreement (the “Advisory Agreement Rates”). The Board of Master Trust also reviewed and considered the contractual investment sub-advisory fee rates that are payable by Funds Management to the Sub-Advisers for investment sub-advisory services (the “Sub-Advisory Agreement Rates”).
The Board of Master Trust reviewed a comparison of the Advisory Agreement Rates of each Master Portfolio with those of other funds in each Master Portfolio’s respective expense Groups at a common asset level. The Board of Master Trust noted that the Advisory Agreement Rates of each Master Portfolio were lower than or equal to the median rate for such Master Portfolio’s expense Groups.
The Boards also received and considered information about the portions of the total management fees that were retained by Funds Management after payment of the fees to the Sub-Advisers for sub-advisory services. In assessing the reasonableness of these amounts, the Boards received and evaluated information about the nature and extent of responsibilities retained and risks assumed by Funds Management and not delegated to or assumed by the Sub-Advisers, and about Funds Management’s on-going oversight services. Given the affiliation between Funds Management and the Sub-Advisers, the Boards ascribed limited relevance to the allocation of fees between them.
The Boards also received and considered information about the nature and extent of services offered and fee rates charged by Funds Management and the Sub-Advisers to other types of clients with investment strategies similar to those of certain Funds. In this regard, the Boards received information about the significantly greater scope of services, and compliance, reporting and other legal burdens and risks of managing proprietary mutual funds compared with those associated with managing assets of other types of clients, including third-party sub-advised fund clients and non-mutual fund clients such as institutional separate accounts.
Based on its consideration of the factors and information it deemed relevant, including those described here, the Board of Fund Trust determined that the compensation received by Funds Management from WIM pursuant to the intercompany agreement, and the absence of compensation payable by the Funds to Funds Management pursuant to the Management Agreement or to WellsCap pursuant to the Core Bond Fund Sub-Advisory Agreement, was reasonable. Based on its consideration of the factors and information it deemed relevant, including those described here, the Board of Master Trust determined that the Advisory Agreement Rates and the Sub-Advisory Agreement Rates for each Master Portfolio were reasonable.
Profitability
The Boards received and considered information concerning the profitability of Funds Management, as well as the profitability of both WFAM and Wells Fargo & Co. (“Wells Fargo”) from providing services to the fund family as a whole. The Boards noted that the Sub-Advisers’ profitability information with respect to providing services to the Funds and other funds in the family was subsumed in the WFAM and Wells Fargo profitability analysis.
Wells Fargo Factor Enhanced U.S. Large Cap Equity Portfolio | 41
Other information (unaudited)
Funds Management reported on the methodologies and estimates used in calculating profitability, including a description of the methodology used to allocate certain expenses. Among other things, the Boards noted that the levels of profitability reported on a fund-by-fund basis varied widely, depending on factors such as the size, type and age of fund.
Based on its review, the Boards did not deem the profits reported by Funds Management, WFAM or Wells Fargo from services provided to the Funds to be at a level that would prevent them from approving the continuation of the Advisory Agreements.
Economies of scale
The Boards received and considered information about the potential for Funds Management to experience economies of scale in the provision of management services to the Funds, the difficulties of calculating economies of scale at an individual fund level, and the extent to which potential scale benefits are shared with shareholders. The Boards noted the existence of breakpoints in the each Master Portfolio’s advisory fee structure and each Index Fund’s management fee structure, which operate generally to reduce the Funds’ expense ratios as the Funds grow in size, and the size of the Funds in relation to such breakpoints. The Boards considered that in addition to management fee breakpoints, Funds Management shares potential economies of scale from its management business in a variety of ways, including through fee waiver and expense reimbursement arrangements, services that benefit shareholders, competitive management fee rates set at the outset without regard to breakpoints, and investments in the business intended to enhance services available to shareholders.
The Boards concluded that Funds Management’s arrangements with respect to the Funds, including contractual breakpoints, constituted a reasonable approach to sharing potential economies of scale with the Funds and their shareholders.
Other benefits to Funds Management and the Sub-Advisers
The Boards received and considered information regarding potential “fall-out” or ancillary benefits received by Funds Management and its affiliates, including WellsCap and WFAM International, as a result of their relationships with the Funds. Ancillary benefits could include, among others, benefits directly attributable to other relationships with the Funds and benefits potentially derived from an increase in Funds Management’s and the Sub-Advisers’ business as a result of their relationships with the Funds. The Boards noted that various affiliates of Funds Management may receive distribution-related fees, shareholder servicing payments and sub-transfer agency fees in respect of shares sold or held through them and services provided.
The Boards also reviewed information about soft dollar credits earned and utilized by the Sub-Advisers, fees earned by Funds Management and WellsCap from managing a private investment vehicle for the fund family’s securities lending collateral, and commissions earned by an affiliated broker from portfolio transactions.
Based on their consideration of the factors and information they deemed relevant, including those described here, the Boards did not find that any ancillary benefits received by Funds Management and its affiliates, including WellsCap and WFAM International, were unreasonable.
Conclusion
At the Meeting, after considering the above-described factors and based on its deliberations and its evaluation of the information described above, the Funds Trust Board unanimously approved the continuation of the Management Agreement and the Core Bond Fund Sub-Advisory Agreement for a one-year period. Additionally, after its deliberations, the Master Trust Board unanimously approved the continuation of the Master Portfolio Advisory Agreement and each Master Portfolio Sub-Advisory Agreement for a one-year term. The Boards also determined that the compensation or the absence of compensation payable to Funds Management and to each of the Sub-Advisers was reasonable.
42 | Wells Fargo Factor Enhanced U.S. Large Cap Equity Portfolio
This page is intentionally left blank.
This page is intentionally left blank.

For more information
More information about Wells Fargo Funds is available free upon request. To obtain literature, please write, visit the Portfolio’s website, or call:
Wells Fargo Funds
P.O. Box 219967
Kansas City, MO 64121-9967
Website: wfam.com
Individual investors: 1-800-222-8222
Retail investment professionals: 1-888-877-9275
Institutional investment professionals: 1-866-765-0778
This report and the financial statements contained herein are submitted for the general information of the shareholders of the Portfolio. If this report is used for promotional purposes, distribution of the report must be accompanied or preceded by a current prospectus. Before investing, please consider the investment objectives, risks, charges, and expenses of the investment. For a current prospectus and, if available, a summary prospectus, containing this information, call 1-800-222-8222 or visit the Portfolio’s website at wfam.com. Read the prospectus carefully before you invest or send money.
Wells Fargo Asset Management (WFAM) is the trade name for certain investment advisory/management firms owned by Wells Fargo & Company. These firms include but are not limited to Wells Capital Management Incorporated and Wells Fargo Funds Management, LLC. Certain products managed by WFAM entities are distributed by Wells Fargo Funds Distributor, LLC (a broker-dealer and Member FINRA).
This material is for general informational and educational purposes only and is NOT intended to provide investment advice or a recommendation of any kind—including a recommendation for any specific investment, strategy, or plan.
INVESTMENT PRODUCTS: NOT FDIC INSURED ◾ NO BANK GUARANTEE ◾ MAY LOSE VALUE
© 2020 Wells Fargo & Company. All rights reserved.
Semi-Annual Report
August 31, 2020
Wells Fargo
Factor Enhanced U.S. Small Cap Equity Portfolio
(formerly Wells Fargo Factor Enhanced Small Cap Portfolio)
INVESTMENT PRODUCTS: NOT FDIC INSURED ◾ NO BANK GUARANTEE ◾ MAY LOSE VALUE
Wells Fargo Factor Enhanced U.S. Small Cap Equity Portfolio | 1
Portfolio information (unaudited)
Investment objective
The Portfolio seeks long-term capital appreciation.
Adviser
Wells Fargo Funds Management, LLC
Subadviser
Wells Capital Management Incorporated
Portfolio managers
Dennis Beinn, CFA®‡
Harindra de Silva, Ph.D., CFA®‡
Monisha Jayakumar
| | | | |
|
| Ten largest holdings (%) as of August 31, 20201 | |
| | |
Novavax Incorporated | | | 0.41 | |
| | |
Stamps.com Incorporated | | | 0.32 | |
| | |
Medpace Holdings Incorporated | | | 0.31 | |
| | |
Emergent BioSolutions Incorporated | | | 0.29 | |
| | |
Builders FirstSource Incorporated | | | 0.27 | |
| | |
Tenet Healthcare Corporation | | | 0.27 | |
| | |
UFP Industries Incorporated | | | 0.27 | |
| | |
Momenta Pharmaceuticals Incorporated | | | 0.26 | |
| | |
Hannon Armstrong Sustainable Infrastructure Capital Incorporated | | | 0.26 | |
| | |
Varonis Systems Incorporated | | | 0.24 | |
|
|
| Sector allocation as of August 31, 20202 |
|
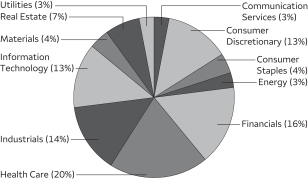 |
| ‡ | CFA® and Chartered Financial Analyst® are trademarks owned by CFA Institute. |
| 1 | The ten largest holdings, excluding cash, cash equivalents and any money market funds, are calculated based on the value of the investments divided by the total net assets of the Portfolio. Holdings are subject to change and may have changed since the date specified. |
| 2 | Amounts are calculated based on the total long-term investments of the Portfolio. These amounts are subject to change and may have changed since the date specified. |
2 | Wells Fargo Factor Enhanced U.S. Small Cap Equity Portfolio
Portfolio of investments—August 31, 2020 (unaudited)
| | | | | | | | | | | | | | | | |
| | | | | | | | | Shares | | | Value | |
| Common Stocks: 97.24% | | | | | | | | | | | | | | | | |
| | | | |
Communication Services: 2.67% | | | | | | | | | | | | | | | | |
| | | | |
| Diversified Telecommunication Services: 0.72% | | | | | | | | | | | | |
Alaska Communications Systems Group Incorporated | | | | | | | | | | | 24,152 | | | $ | 54,100 | |
ATN International Incorporated | | | | | | | | | | | 1,956 | | | | 113,448 | |
Bandwidth Incorporated Class A † | | | | | | | | | | | 1,422 | | | | 223,937 | |
Cincinnati Bell Incorporated † | | | | | | | | | | | 3,761 | | | | 56,641 | |
Cogent Communications Group Incorporated | | | | | | | | | | | 2,378 | | | | 159,944 | |
Consolidated Communications Holdings Incorporated † | | | | | | | | | | | 28,261 | | | | 219,871 | |
Frontier Communications Corporation † | | | | | | | | | | | 7,468 | | | | 1,436 | |
Globalstar Incorporated † | | | | | | | | | | | 26,727 | | | | 8,940 | |
IDT Corporation Class B † | | | | | | | | | | | 15,567 | | | | 101,497 | |
Intelsat SA † | | | | | | | | | | | 4,785 | | | | 2,680 | |
Iridium Communications Incorporated † | | | | | | | | | | | 6,343 | | | | 177,667 | |
Liberty Latin America Limited Class C † | | | | | | | | | | | 2,298 | | | | 21,923 | |
Ooma Incorporated † | | | | | | | | | | | 4,890 | | | | 66,700 | |
ORBCOMM Incorporated † | | | | | | | | | | | 3,148 | | | | 12,623 | |
Pareteum Corporation † | | | | | | | | | | | 4,681 | | | | 3,183 | |
Vonage Holdings Corporation † | | | | | | | | | | | 33,640 | | | | 385,178 | |
| | | | |
| | | | | | | | | | | | | | | 1,609,768 | |
| | | | | | | | | | | | | | | | |
|
| Entertainment: 0.29% | |
Akazoo SA †(a)‡ | | | | | | | | | | | 5,400 | | | | 6,480 | |
AMC Entertainment Holdings Class A | | | | | | | | | | | 2,610 | | | | 15,347 | |
Cinemark Holdings Incorporated | | | | | | | | | | | 14,571 | | | | 213,465 | |
Gaia Incorporated † | | | | | | | | | | | 3,619 | | | | 42,342 | |
Glu Mobile Incorporated † | | | | | | | | | | | 21,003 | | | | 166,764 | |
Marcus Corporation | | | | | | | | | | | 4,493 | | | | 70,405 | |
Reading International Incorporated Class A † | | | | | | | | | | | 751 | | | | 3,079 | |
SciPlay Corporation Class A † | | | | | | | | | | | 1,376 | | | | 18,143 | |
World Wrestling Entertainment Incorporated Class A | | | | | | | | | | | 2,716 | | | | 119,694 | |
| | | | |
| | | | | | | | | | | | | | | 655,719 | |
| | | | | | | | | | | | | | | | |
|
| Interactive Media & Services: 0.43% | |
Actua Corporation †(a)‡ | | | | | | | | | | | 9,483 | | | | 474 | |
ANGI Homeservices Incorporated Class A † | | | | | | | | | | | 3,871 | | | | 53,710 | |
CarGurus Incorporated † | | | | | | | | | | | 11,906 | | | | 290,268 | |
Cars.com Incorporated † | | | | | | | | | | | 1,055 | | | | 9,157 | |
DHI Group Incorporated † | | | | | | | | | | | 17,427 | | | | 42,348 | |
EverQuote Incorporated Class A † | | | | | | | | | | | 2,453 | | | | 87,082 | |
Liberty TripAdvisor Holdings Incorporated Class A † | | | | | | | | | | | 4,063 | | | | 11,376 | |
QuinStreet Incorporated † | | | | | | | | | | | 5,555 | | | | 73,048 | |
The Meet Group Incorporated † | | | | | | | | | | | 3,696 | | | | 23,285 | |
TripAdvisor Incorporated | | | | | | | | | | | 5,605 | | | | 130,989 | |
Yelp Incorporated † | | | | | | | | | | | 10,266 | | | | 237,350 | |
| | | | |
| | | | | | | | | | | | | | | 959,087 | |
| | | | | | | | | | | | | | | | |
|
| Media: 0.88% | |
AMC Networks Incorporated Class A † | | | | | | | | | | | 12,037 | | | | 292,379 | |
Cardlytics Incorporated † | | | | | | | | | | | 1,144 | | | | 86,772 | |
Clear Channel Outdoor Holdings Incorporated † | | | | | | | | | | | 15,946 | | | | 18,657 | |
Cumulus Media Incorporated Class A † | | | | | | | | | | | 729 | | | | 3,623 | |
Daily Journal Corporation † | | | | | | | | | | | 55 | | | | 15,136 | |
Emerald Holding Incorporated | | | | | | | | | | | 1,134 | | | | 3,130 | |
Entravision Communications Corporation Class A | | | | | | | | | | | 4,886 | | | | 7,427 | |
The accompanying notes are an integral part of these financial statements.
Wells Fargo Factor Enhanced U.S. Small Cap Equity Portfolio | 3
Portfolio of investments—August 31, 2020 (unaudited)
| | | | | | | | | | | | | | | | |
| | | | | | | | | Shares | | | Value | |
|
| Media (continued) | |
Fluent Incorporated † | | | | | | | | | | | 1,677 | | | $ | 5,199 | |
Gannett Company Incorporated | | | | | | | | | | | 4,779 | | | | 8,268 | |
Gray Television Incorporated † | | | | | | | | | | | 22,743 | | | | 352,971 | |
Hemisphere Media Group Incorporated † | | | | | | | | | | | 855 | | | | 7,610 | |
iHeartMedia Incorporated Class A † | | | | | | | | | | | 8,188 | | | | 75,493 | |
IMAX Corporation † | | | | | | | | | | | 3,897 | | | | 59,897 | |
John Wiley & Sons Incorporated Class A | | | | | | | | | | | 2,756 | | | | 87,227 | |
Lee Enterprises Incorporated † | | | | | | | | | | | 3,003 | | | | 2,650 | |
Liberty Latin America Limited Class A † | | | | | | | | | | | 2,704 | | | | 26,499 | |
Marchex Incorporated Class B † | | | | | | | | | | | 2,042 | | | | 3,655 | |
Meredith Corporation | | | | | | | | | | | 5,647 | | | | 79,058 | |
MSG Networks Incorporated Class A † | | | | | | | | | | | 6,008 | | | | 58,518 | |
National CineMedia Incorporated | | | | | | | | | | | 3,006 | | | | 10,852 | |
Saga Communications Incorporated Class A | | | | | | | | | | | 425 | | | | 9,563 | |
Scholastic Corporation | | | | | | | | | | | 1,728 | | | | 38,880 | |
Sinclair Broadcast Group Incorporated Class A | | | | | | | | | | | 3,344 | | | | 69,589 | |
Techtarget † | | | | | | | | | | | 4,211 | | | | 167,092 | |
Tegna Incorporated | | | | | | | | | | | 18,912 | | | | 236,778 | |
Tribune Publishing Company | | | | | | | | | | | 5,368 | | | | 60,927 | |
TrueCar Incorporated † | | | | | | | | | | | 7,763 | | | | 36,719 | |
WideOpenWest Incorporated † | | | | | | | | | | | 21,793 | | | | 125,310 | |
| | | | |
| | | | | | | | | | | | | | | 1,949,879 | |
| | | | | | | | | | | | | | | | |
|
| Wireless Telecommunication Services: 0.35% | |
Boingo Wireless Incorporated † | | | | | | | | | | | 4,593 | | | | 59,663 | |
Gogo Incorporated † | | | | | | | | | | | 2,341 | | | | 12,033 | |
NII Holdings Incorporated †(a)‡ | | | | | | | | | | | 14,979 | | | | 32,504 | |
Shenandoah Telecommunications Company | | | | | | | | | | | 8,870 | | | | 490,511 | |
Spok Holdings Incorporated | | | | | | | | | | | 985 | | | | 10,677 | |
Telephone & Data Systems Incorporated | | | | | | | | | | | 5,780 | | | | 133,691 | |
United States Cellular Corporation † | | | | | | | | | | | 841 | | | | 30,596 | |
| | | | |
| | | | | | | | | | | | | | | 769,675 | |
| | | | | | | | | | | | | | | | |
|
Consumer Discretionary: 12.60% | |
|
| Auto Components: 1.42% | |
Adient plc † | | | | | | | | | | | 8,893 | | | | 154,205 | |
American Axle & Manufacturing Holdings Incorporated † | | | | | | | | | | | 5,896 | | | | 45,871 | |
Cooper Tire & Rubber Company | | | | | | | | | | | 9,211 | | | | 318,424 | |
Cooper-Standard Holdings Incorporated † | | | | | | | | | | | 653 | | | | 11,832 | |
Dana Incorporated | | | | | | | | | | | 36,547 | | | | 509,831 | |
Dorman Products Incorporated † | | | | | | | | | | | 2,840 | | | | 240,520 | |
Fox Factory Holding Corporation † | | | | | | | | | | | 1,576 | | | | 158,877 | |
Gentherm Incorporated † | | | | | | | | | | | 4,454 | | | | 201,454 | |
LCI Industries | | | | | | | | | | | 3,281 | | | | 372,820 | |
Modine Manufacturing Company † | | | | | | | | | | | 6,798 | | | | 46,022 | |
Motorcar Parts of America Incorporated † | | | | | | | | | | | 1,035 | | | | 18,019 | |
Standard Motor Products Incorporated | | | | | | | | | | | 5,791 | | | | 263,143 | |
Stoneridge Incorporated † | | | | | | | | | | | 5,989 | | | | 120,978 | |
Strattec Security Corporation | | | | | | | | | | | 141 | | | | 2,950 | |
Tenneco Incorporated † | | | | | | | | | | | 3,438 | | | | 27,951 | |
The Goodyear Tire & Rubber Company | | | | | | | | | | | 26,202 | | | | 251,408 | |
Visteon Corporation † | | | | | | | | | | | 4,208 | | | | 317,409 | |
Xpel Incorporated † | | | | | | | | | | | 4,132 | | | | 102,887 | |
| | | | |
| | | | | | | | | | | | | | | 3,164,601 | |
| | | | | | | | | | | | | | | | |
The accompanying notes are an integral part of these financial statements.
4 | Wells Fargo Factor Enhanced U.S. Small Cap Equity Portfolio
Portfolio of investments—August 31, 2020 (unaudited)
| | | | | | | | | | | | | | | | |
| | | | | | | | | Shares | | | Value | |
| Automobiles: 0.06% | |
Winnebago Industries Incorporated | | | | | | | | | | | 2,702 | | | $ | 145,854 | |
| | | | | | | | | | | | | | | | |
|
| Distributors: 0.10% | |
Core Mark Holding Company Incorporated | | | | | | | | | | | 6,397 | | | | 213,788 | |
Funko Incorporated Class A † | | | | | | | | | | | 1,538 | | | | 8,982 | |
Weyco Group Incorporated | | | | | | | | | | | 360 | | | | 6,480 | |
| | | | |
| | | | | | | | | | | | | | | 229,250 | |
| | | | | | | | | | | | | | | | |
|
| Diversified Consumer Services: 0.80% | |
Adtalem Global Education Incorporated † | | | | | | | | | | | 7,860 | | | | 260,952 | |
American Public Education Incorporated † | | | | | | | | | | | 2,953 | | | | 92,842 | |
Aspen Group Incorporated † | | | | | | | | | | | 2,132 | | | | 27,247 | |
Carriage Services Incorporated | | | | | | | | | | | 941 | | | | 20,834 | |
Collectors Universe Incorporated | | | | | | | | | | | 1,110 | | | | 49,384 | |
Franchise Group Incorporated | | | | | | | | | | | 767 | | | | 18,838 | |
Graham Holdings Company Class B | | | | | | | | | | | 248 | | | | 106,132 | |
K12 Incorporated † | | | | | | | | | | | 3,179 | | | | 118,291 | |
Laureate Education Incorporated Class A † | | | | | | | | | | | 28,141 | | | | 352,325 | |
Morgan Group Holding Company † | | | | | | | | | | | 1 | | | | 7 | |
Perdoceo Education Corporation † | | | | | | | | | | | 14,020 | | | | 201,467 | |
Regis Corporation † | | | | | | | | | | | 1,725 | | | | 12,748 | |
Strategic Education Incorporated | | | | | | | | | | | 1,641 | | | | 168,317 | |
Universal Technical Institute Incorporated † | | | | | | | | | | | 10,249 | | | | 72,255 | |
Vivint Smart Home Incorporated † | | | | | | | | | | | 1,097 | | | | 19,472 | |
WW International Incorporated † | | | | | | | | | | | 11,080 | | | | 260,158 | |
| | | | |
| | | | | | | | | | | | | | | 1,781,269 | |
| | | | | | | | | | | | | | | | |
|
| Hotels, Restaurants & Leisure: 3.03% | |
Accel Entertainment Incorporated † | | | | | | | | | | | 3,447 | | | | 40,881 | |
BBX Capital Corporation | | | | | | | | | | | 566 | | | | 8,716 | |
Biglari Holdings Incorporated Class A † | | | | | | | | | | | 52 | | | | 24,206 | |
Biglari Holdings Incorporated Class B † | | | | | | | | | | | 63 | | | | 6,243 | |
BJ’s Restaurants Incorporated | | | | | | | | | | | 6,922 | | | | 218,181 | |
Bloomin’ Brands Incorporated | | | | | | | | | | | 22,827 | | | | 327,339 | |
Boyd Gaming Corporation | | | | | | | | | | | 5,156 | | | | 138,078 | |
Brinker International Incorporated | | | | | | | | | | | 11,147 | | | | 502,061 | |
Caesars Entertainment Incorporated † | | | | | | | | | | | 4,437 | | | | 203,215 | |
Carrols Restaurant Group Incorporated † | | | | | | | | | | | 2,826 | | | | 18,821 | |
Century Casinos Incorporated † | | | | | | | | | | | 1,386 | | | | 8,524 | |
Churchill Downs Incorporated | | | | | | | | | | | 2,061 | | | | 360,180 | |
Chuy’s Holding Incorporated † | | | | | | | | | | | 2,216 | | | | 49,284 | |
Cracker Barrel Old Country Store Incorporated | | | | | | | | | | | 2,058 | | | | 275,175 | |
Dave & Buster’s Entertainment Incorporated | | | | | | | | | | | 5,645 | | | | 93,876 | |
Del Taco Restaurants Incorporated † | | | | | | | | | | | 1,475 | | | | 12,405 | |
Denny’s Corporation † | | | | | | | | | | | 21,100 | | | | 241,806 | |
Dine Brands Global Incorporated | | | | | | | | | | | 4,687 | | | | 279,158 | |
El Pollo Loco Holdings Incorporated † | | | | | | | | | | | 8,843 | | | | 158,024 | |
Fiesta Restaurant Group Incorporated † | | | | | | | | | | | 5,328 | | | | 53,387 | |
GAN Limited † | | | | | | | | | | | 1,330 | | | | 27,332 | |
Golden Entertainment Incorporated † | | | | | | | | | | | 1,048 | | | | 13,456 | |
Hilton Grand Vacations Incorporated † | | | | | | | | | | | 14,281 | | | | 312,897 | |
Hyatt Hotels Corporation Class A | | | | | | | | | | | 2,055 | | | | 116,087 | |
International Game Technology | | | | | | | | | | | 16,049 | | | | 178,625 | |
J. Alexander’s Holdings Incorporated † | | | | | | | | | | | 612 | | | | 2,503 | |
Jack in the Box Incorporated | | | | | | | | | | | 3,097 | | | | 255,162 | |
Lindblad Expeditions Holding † | | | | | | | | | | | 1,399 | | | | 13,857 | |
The accompanying notes are an integral part of these financial statements.
Wells Fargo Factor Enhanced U.S. Small Cap Equity Portfolio | 5
Portfolio of investments—August 31, 2020 (unaudited)
| | | | | | | | | | | | | | | | |
| | | | | | | | | Shares | | | Value | |
|
| Hotels, Restaurants & Leisure (continued) | |
Marriott Vacations Worldwide Corporation | | | | | | | | | | | 3,132 | | | $ | 296,506 | |
Monarch Casino & Resort Incorporated † | | | | | | | | | | | 1,294 | | | | 59,537 | |
Nathan S Famous Incorporated | | | | | | | | | | | 114 | | | | 5,979 | |
Noodles & Company † | | | | | | | | | | | 2,825 | | | | 21,498 | |
Papa John’s International Incorporated | | | | | | | | | | | 4,946 | | | | 486,142 | |
Penn National Gaming Incorporated † | | | | | | | | | | | 6,167 | | | | 315,134 | |
Playa Hotels & Resorts NV † | | | | | | | | | | | 2,879 | | | | 12,149 | |
Potbelly Corporation † | | | | | | | | | | | 722 | | | | 3,090 | |
RCI Hospitality Holdings Incorporated | | | | | | | | | | | 16,624 | | | | 317,851 | |
Red Robin Gourmet Burgers Incorporated † | | | | | | | | | | | 793 | | | | 8,802 | |
Ruth’s Chris Steak House Incorporated | | | | | | | | | | | 3,486 | | | | 35,819 | |
SeaWorld Entertainment Incorporated † | | | | | | | | | | | 9,372 | | | | 191,189 | |
Shake Shack Incorporated Class A † | | | | | | | | | | | 1,593 | | | | 108,722 | |
Six Flags Entertainment Corporation | | | | | | | | | | | 4,764 | | | | 103,522 | |
Target Hospitality Corporation † | | | | | | | | | | | 1,635 | | | | 2,371 | |
Texas Roadhouse Incorporated | | | | | | | | | | | 6,222 | | | | 391,924 | |
The Cheesecake Factory Incorporated | | | | | | | | | | | 3,169 | | | | 93,581 | |
Twin River Worldwide Holdings Incorporated | | | | | | | | | | | 1,170 | | | | 27,998 | |
Wingstop Incorporated | | | | | | | | | | | 1,960 | | | | 320,264 | |
| | | | |
| | | | | | | | | | | | | | | 6,741,557 | |
| | | | | | | | | | | | | | | | |
|
| Household Durables: 1.91% | |
Bassett Furniture Industries Incorporated | | | | | | | | | | | 500 | | | | 6,300 | |
Beazer Homes Incorporated † | | | | | | | | | | | 2,103 | | | | 25,741 | |
Cavco Industries Incorporated † | | | | | | | | | | | 1,041 | | | | 198,737 | |
Century Communities Incorporated † | | | | | | | | | | | 5,750 | | | | 205,160 | |
Ethan Allen Interiors Incorporated | | | | | | | | | | | 1,312 | | | | 18,683 | |
Flexsteel Industries Incorporated | | | | | | | | | | | 322 | | | | 5,339 | |
Green Brick Partners Incorporated † | | | | | | | | | | | 6,865 | | | | 97,758 | |
Hamilton Beach Brand Class A | | | | | | | | | | | 14,989 | | | | 327,510 | |
Helen of Troy Limited † | | | | | | | | | | | 1,650 | | | | 341,253 | |
Hooker Furniture Corporation | | | | | | | | | | | 2,114 | | | | 52,110 | |
Installed Building Products Incorporated † | | | | | | | | | | | 844 | | | | 73,276 | |
iRobot Corporation † | | | | | | | | | | | 2,668 | | | | 197,512 | |
KB Home Incorporated | | | | | | | | | | | 10,017 | | | | 358,208 | |
La-Z-Boy Incorporated | | | | | | | | | | | 2,701 | | | | 87,783 | |
Legacy Housing Corporation † | | | | | | | | | | | 284 | | | | 4,337 | |
LGI Homes Incorporated † | | | | | | | | | | | 1,949 | | | | 218,015 | |
Lifetime Brands Incorporated | | | | | | | | | | | 1,024 | | | | 10,056 | |
M/I Homes Incorporated † | | | | | | | | | | | 4,675 | | | | 198,968 | |
MDC Holdings Incorporated | | | | | | | | | | | 7,581 | | | | 328,864 | |
Meritage Corporation † | | | | | | | | | | | 2,974 | | | | 285,593 | |
Purple Innovation Incorporated † | | | | | | | | | | | 805 | | | | 15,223 | |
Skyline Champion Corporation † | | | | | | | | | | | 6,263 | | | | 178,746 | |
Sonos Incorporated † | | | | | | | | | | | 4,627 | | | | 65,102 | |
Taylor Morrison Home Corporation † | | | | | | | | | | | 6,676 | | | | 157,086 | |
TopBuild Corporation † | | | | | | | | | | | 2,397 | | | | 368,659 | |
TRI Pointe Homes Incorporated † | | | | | | | | | | | 13,478 | | | | 227,509 | |
Tupperware Brands Corporation | | | | | | | | | | | 3,828 | | | | 62,358 | |
Turtle Beach Corporation † | | | | | | | | | | | 1,069 | | | | 20,920 | |
Universal Electronics Incorporated † | | | | | | | | | | | 2,472 | | | | 101,550 | |
Voxx International Corporation † | | | | | | | | | | | 851 | | | | 5,344 | |
Zagg Incorporated † | | | | | | | | | | | 1,357 | | | | 4,315 | |
| | | | |
| | | | | | | | | | | | | | | 4,248,015 | |
| | | | | | | | | | | | | | | | |
The accompanying notes are an integral part of these financial statements.
6 | Wells Fargo Factor Enhanced U.S. Small Cap Equity Portfolio
Portfolio of investments—August 31, 2020 (unaudited)
| | | | | | | | | | | | | | | | |
| | | | | | | | | Shares | | | Value | |
| Internet & Direct Marketing Retail: 0.96% | |
1-800-Flowers.com Incorporated Class A † | | | | | | | | | | | 6,900 | | | $ | 206,517 | |
Blue Apron Holdings Incorporated Class A † | | | | | | | | | | | 409 | | | | 2,744 | |
Carparts.com Incorporated † | | | | | | | | | | | 6,160 | | | | 86,548 | |
Duluth Holdings Incorporated Class B † | | | | | | | | | | | 1,291 | | | | 12,497 | |
Lands End Incorporated † | | | | | | | | | | | 531 | | | | 7,105 | |
Liquidity Services Incorporated † | | | | | | | | | | | 2,441 | | | | 17,600 | |
Magnite Incorporated † | | | | | | | | | | | 11,491 | | | | 84,459 | |
Overstock.com Incorporated | | | | | | | | | | | 5,914 | | | | 517,475 | |
PetMed Express Incorporated | | | | | | | | | | | 5,095 | | | | 177,102 | |
Revolve Group Incorporated † | | | | | | | | | | | 834 | | | | 16,747 | |
Shutterstock Incorporated | | | | | | | | | | | 2,323 | | | | 116,893 | |
Stamps.com Incorporated † | | | | | | | | | | | 2,830 | | | | 705,632 | |
Stitch Fix Incorporated Class A † | | | | | | | | | | | 7,014 | | | | 169,388 | |
Waitr Holdings Incorporated † | | | | | | | | | | | 3,709 | | | | 14,947 | |
| | | | |
| | | | | | | | | | | | | | | 2,135,654 | |
| | | | | | | | | | | | | | | | |
|
| Leisure Products: 0.71% | |
Acushnet Holdings Corporation | | | | | | | | | | | 4,599 | | | | 162,299 | |
American Outdoor Brands Incorporated † | | | | | | | | | | | 1,172 | | | | 17,846 | |
Callaway Golf Company | | | | | | | | | | | 11,131 | | | | 232,193 | |
Clarus Corporation | | | | | | | | | | | 1,833 | | | | 23,076 | |
Escalade Incorporated | | | | | | | | | | | 431 | | | | 7,814 | |
Johnson Outdoors Incorporated Class A | | | | | | | | | | | 628 | | | | 53,826 | |
Malibu Boats Incorporated Class A † | | | | | | | | | | | 3,283 | | | | 170,224 | |
Marine Products Corporation | | | | | | | | | | | 4,479 | | | | 64,722 | |
Mastercraft Boat Holdings Incorporated † | | | | | | | | | | | 3,322 | | | | 69,463 | |
Nautilus Group Incorporated † | | | | | | | | | | | 5,363 | | | | 63,552 | |
Smith & Wesson Brands Incorporated | | | | | | | | | | | 4,579 | | | | 83,613 | |
Sturm, Ruger & Company Incorporated | | | | | | | | | | | 1,891 | | | | 133,996 | |
Vista Outdoor Incorporated † | | | | | | | | | | | 5,854 | | | | 113,626 | |
YETI Holdings Incorporated † | | | | | | | | | | | 7,465 | | | | 383,552 | |
| | | | |
| | | | | | | | | | | | | | | 1,579,802 | |
| | | | | | | | | | | | | | | | |
|
| Multiline Retail: 0.37% | |
Big Lots Stores Incorporated | | | | | | | | | | | 9,805 | | | | 462,306 | |
Dillard’s Incorporated Class A | | | | | | | | | | | 1,846 | | | | 55,768 | |
JCPenny Company Incorporated † | | | | | | | | | | | 13,646 | | | | 3,016 | |
Macy’s Incorporated | | | | | | | | | | | 31,813 | | | | 221,737 | |
Nordstrom Incorporated | | | | | | | | | | | 5,516 | | | | 88,256 | |
| | | | |
| | | | | | | | | | | | | | | 831,083 | |
| | | | | | | | | | | | | | | | |
|
| Specialty Retail: 2.50% | |
Aaron’s Incorporated | | | | | | | | | | | 4,191 | | | | 234,235 | |
Abercrombie & Fitch Company Class A | | | | | | | | | | | 3,500 | | | | 45,535 | |
America’s Car-Mart Incorporated † | | | | | | | | | | | 1,015 | | | | 102,008 | |
American Eagle Outfitters Incorporated | | | | | | | | | | | 6,452 | | | | 81,360 | |
Asbury Automotive Group Incorporated † | | | | | | | | | | | 3,325 | | | | 351,752 | |
Barnes & Noble Education Incorporated † | | | | | | | | | | | 1,815 | | | | 4,138 | |
Bed Bath & Beyond Incorporated | | | | | | | | | | | 10,072 | | | | 122,677 | |
Boot Barn Holdings Incorporated † | | | | | | | | | | | 1,620 | | | | 45,733 | |
Caleres Incorporated | | | | | | | | | | | 2,093 | | | | 16,346 | |
Camping World Holdings Incorporated Class A | | | | | | | | | | | 1,851 | | | | 53,790 | |
Chico’s FAS Incorporated | | | | | | | | | | | 6,220 | | | | 7,962 | |
Children’s Place Retail Stores Incorporated | | | | | | | | | | | 2,260 | | | | 45,121 | |
Citi Trends Incorporated | | | | | | | | | | | 617 | | | | 11,927 | |
The accompanying notes are an integral part of these financial statements.
Wells Fargo Factor Enhanced U.S. Small Cap Equity Portfolio | 7
Portfolio of investments—August 31, 2020 (unaudited)
| | | | | | | | | | | | | | | | |
| | | | | | | | | Shares | | | Value | |
|
| Specialty Retail (continued) | |
Conn’s Incorporated † | | | | | | | | | | | 747 | | | $ | 9,547 | |
Designer Brands Incorporated Class A | | | | | | | | | | | 3,145 | | | | 22,172 | |
Dick’s Sporting Goods Incorporated | | | | | | | | | | | 3,094 | | | | 167,447 | |
Envela Corporation † | | | | | | | | | | | 3,133 | | | | 12,156 | |
Express Incorporated † | | | | | | | | | | | 3,203 | | | | 3,555 | |
GameStop Corporation Class A † | | | | | | | | | | | 2,474 | | | | 16,526 | |
Genesco Incorporated † | | | | | | | | | | | 1,663 | | | | 32,429 | |
Group 1 Automotive Incorporated | | | | | | | | | | | 4,465 | | | | 385,955 | |
GrowGeneration Corporation † | | | | | | | | | | | 1,482 | | | | 23,645 | |
Guess? Incorporated | | | | | | | | | | | 4,046 | | | | 46,529 | |
Haverty Furniture Companies Incorporated | | | | | | | | | | | 3,003 | | | | 63,423 | |
Hibbett Sports Incorporated † | | | | | | | | | | | 3,275 | | | | 109,287 | |
Hudson Limited Class A † | | | | | | | | | | | 1,918 | | | | 14,462 | |
Lithia Motors Incorporated Class A | | | | | | | | | | | 1,837 | | | | 457,340 | |
Lumber Liquidators Holdings Incorporated † | | | | | | | | | | | 5,165 | | | | 123,908 | |
MarineMax Incorporated † | | | | | | | | | | | 3,844 | | | | 113,052 | |
Murphy USA Incorporated † | | | | | | | | | | | 3,012 | | | | 406,198 | |
National Vision Holdings Incorporated † | | | | | | | | | | | 1,629 | | | | 61,202 | |
OneWater Marine Incorporated Class A † | | | | | | | | | | | 4,586 | | | | 131,068 | |
Penske Auto Group Incorporated | | | | | | | | | | | 1,645 | | | | 77,595 | |
Rent-A-Center Incorporated | | | | | | | | | | | 12,014 | | | | 368,830 | |
Restoration Hardware Incorporated † | | | | | | | | | | | 1,061 | | | | 350,714 | |
Sally Beauty Holdings Incorporated † | | | | | | | | | | | 21,883 | | | | 244,214 | |
Shoe Carnival Incorporated | | | | | | | | | | | 2,210 | | | | 72,665 | |
Sleep Number Corporation † | | | | | | | | | | | 3,854 | | | | 184,992 | |
Sonic Automotive Incorporated Class A | | | | | | | | | | | 4,998 | | | | 211,215 | |
Sportsman’s Warehouse Holdings Incorporated † | | | | | | | | | | | 5,772 | | | | 90,592 | |
Tailored Brands Incorporated | | | | | | | | | | | 3,374 | | | | 384 | |
The Buckle Incorporated | | | | | | | | | | | 6,574 | | | | 123,197 | |
The Cato Corporation Class A | | | | | | | | | | | 1,296 | | | | 10,368 | |
The Michaels Companies Incorporated † | | | | | | | | | | | 8,666 | | | | 97,493 | |
The ODP Corporation | | | | | | | | | | | 8,517 | | | | 199,127 | |
Tilly’s Incorporated Class A | | | | | | | | | | | 1,245 | | | | 7,893 | |
TravelCenters of America Incorporated † | | | | | | | | | | | 342 | | | | 7,305 | |
Urban Outfitters Incorporated † | | | | | | | | | | | 4,756 | | | | 111,956 | |
Winmark Corporation | | | | | | | | | | | 130 | | | | 20,079 | |
Zumiez Incorporated † | | | | | | | | | | | 2,717 | | | | 69,773 | |
| | | | |
| | | | | | | | | | | | | | | 5,570,877 | |
| | | | | | | | | | | | | | | | |
|
| Textiles, Apparel & Luxury Goods: 0.74% | |
Crocs Incorporated † | | | | | | | | | | | 9,537 | | | | 380,622 | |
Culp Incorporated | | | | | | | | | | | 586 | | | | 7,032 | |
Deckers Outdoor Corporation † | | | | | | | | | | | 1,627 | | | | 331,696 | |
Delta Apparel Incorporated † | | | | | | | | | | | 279 | | | | 3,939 | |
Fossil Group Incorporated † | | | | | | | | | | | 1,620 | | | | 10,425 | |
G-III Apparel Group Limited † | | | | | | | | | | | 1,816 | | | | 20,085 | |
Kontoor Brands Incorporated | | | | | | | | | | | 6,806 | | | | 150,413 | |
Lakeland Industries Incorporated † | | | | | | | | | | | 2,709 | | | | 55,345 | |
Levi Strauss & Company Class A | | | | | | | | | | | 3,227 | | | | 39,757 | |
Movado Group Incorporated | | | | | | | | | | | 735 | | | | 8,019 | |
Oxford Industries Incorporated | | | | | | | | | | | 870 | | | | 43,091 | |
Rocky Brands Incorporated | | | | | | | | | | | 2,203 | | | | 53,048 | |
Steven Madden Limited | | | | | | | | | | | 10,958 | | | | 231,871 | |
Superior Uniform Group Incorporated | | | | | | | | | | | 1,170 | | | | 27,074 | |
Unifi Incorporated † | | | | | | | | | | | 1,178 | | | | 14,407 | |
Vera Bradley Incorporated † | | | | | | | | | | | 6,773 | | | | 35,694 | |
Wolverine World Wide Incorporated | | | | | | | | | | | 9,477 | | | | 236,735 | |
| | | | |
| | | | | | | | | | | | | | | 1,649,253 | |
| | | | | | | | | | | | | | | | |
The accompanying notes are an integral part of these financial statements.
8 | Wells Fargo Factor Enhanced U.S. Small Cap Equity Portfolio
Portfolio of investments—August 31, 2020 (unaudited)
| | | | | | | | | | | | | | | | |
| | | | | | | | | Shares | | | Value | |
| Consumer Staples: 3.55% | |
|
| Beverages: 0.30% | |
Celsius Holdings Incorporated † | | | | | | | | | | | 1,516 | | | $ | 29,441 | |
Coca Cola Bottling Corporation | | | | | | | | | | | 705 | | | | 192,677 | |
Craft Brew Alliance Incorporated † | | | | | | | | | | | 1,071 | | | | 16,729 | |
MGP Ingredients Incorporated | | | | | | | | | | | 1,823 | | | | 64,808 | |
National Beverage Corporation † | | | | | | | | | | | 3,048 | | | | 247,863 | |
Primo Water Corporation | | | | | | | | | | | 9,677 | | | | 132,381 | |
| | | | |
| | | | | | | | | | | | | | | 683,899 | |
| | | | | | | | | | | | | | | | |
|
| Food & Staples Retailing: 0.84% | |
BJ’s Wholesale Club Holdings Incorporated † | | | | | | | | | | | 8,625 | | | | 383,036 | |
HF Foods Group Incorporated † | | | | | | | | | | | 1,965 | | | | 15,602 | |
Ingles Markets Incorporated Class A | | | | | | | | | | | 3,461 | | | | 139,824 | |
Natural Grocers by Vitamin Cottage Incorporated | | | | | | | | | | | 795 | | | | 9,317 | |
Performance Food Group Company † | | | | | | | | | | | 7,348 | | | | 268,275 | |
Pricesmart Incorporated | | | | | | | | | | | 2,759 | | | | 181,404 | |
Rite Aid Corporation † | | | | | | | | | | | 8,159 | | | | 106,230 | |
SpartanNash Company | | | | | | | | | | | 12,049 | | | | 240,739 | |
Sprouts Farmers Market Incorporated † | | | | | | | | | | | 7,385 | | | | 172,440 | |
The Andersons Incorporated | | | | | | | | | | | 1,651 | | | | 29,272 | |
United Natural Foods Incorporated † | | | | | | | | | | | 10,373 | | | | 187,233 | |
Village Super Market Class A | | | | | | | | | | | 457 | | | | 11,626 | |
Weis Markets Incorporated | | | | | | | | | | | 2,460 | | | | 121,106 | |
| | | | |
| | | | | | | | | | | | | | | 1,866,104 | |
| | | | | | | | | | | | | | | | |
|
| Food Products: 1.36% | |
Alico Incorporated | | | | | | | | | | | 745 | | | | 24,078 | |
B&G Foods Incorporated | | | | | | | | | | | 10,459 | | | | 325,693 | |
Cal-Maine Foods Incorporated † | | | | | | | | | | | 3,873 | | | | 149,459 | |
Calavo Growers Incorporated | | | | | | | | | | | 998 | | | | 63,343 | |
Darling Ingredients Incorporated † | | | | | | | | | | | 10,763 | | | | 344,093 | |
Dean Foods Company † | | | | | | | | | | | 6,343 | | | | 131 | |
Farmer Bros Corporation † | | | | | | | | | | | 1,594 | | | | 10,026 | |
Fresh Del Monte Produce Incorporated | | | | | | | | | | | 4,327 | | | | 100,343 | |
Freshpet Incorporated † | | | | | | | | | | | 1,676 | | | | 190,394 | |
Hain Celestial Group Incorporated † | | | | | | | | | | | 4,715 | | | | 154,605 | |
Hostess Brands Incorporated † | | | | | | | | | | | 12,304 | | | | 157,983 | |
J & J Snack Foods Corporation | | | | | | | | | | | 1,443 | | | | 196,176 | |
John B. Sanfilippo & Son Incorporated | | | | | | | | | | | 3,003 | | | | 239,159 | |
Lancaster Colony Corporation | | | | | | | | | | | 1,338 | | | | 237,789 | |
Landec Corporation † | | | | | | | | | | | 1,546 | | | | 15,831 | |
Limoneira Corporation | | | | | | | | | | | 811 | | | | 11,735 | |
Pilgrim’s Pride Corporation † | | | | | | | | | | | 3,472 | | | | 55,552 | |
Sanderson Farms Incorporated | | | | | | | | | | | 1,601 | | | | 187,253 | |
Seaboard Corporation | | | | | | | | | | | 13 | | | | 34,879 | |
Seneca Foods Corporation Class A † | | | | | | | | | | | 3,515 | | | | 166,470 | |
The Simply Good Foods Company † | | | | | | | | | | | 12,387 | | | | 307,817 | |
Tootsie Roll Industries Incorporated | | | | | | | | | | | 1,654 | | | | 52,911 | |
| | | | |
| | | | | | | | | | | | | | | 3,025,720 | |
| | | | | | | | | | | | | | | | |
|
| Household Products: 0.31% | |
Central Garden & Pet Company † | | | | | | | | | | | 2,244 | | | | 91,308 | |
Central Garden & Pet Company Class A † | | | | | | | | | | | 3,024 | | | | 112,372 | |
Energizer Holdings Incorporated | | | | | | | | | | | 3,470 | | | | 160,626 | |
Oil Dri Corporation of America | | | | | | | | | | | 310 | | | | 10,856 | |
The accompanying notes are an integral part of these financial statements.
Wells Fargo Factor Enhanced U.S. Small Cap Equity Portfolio | 9
Portfolio of investments—August 31, 2020 (unaudited)
| | | | | | | | | | | | | | | | |
| | | | | | | | | Shares | | | Value | |
|
| Household Products (continued) | |
Tejon Ranch Company † | | | | | | | | | | | 1,058 | | | $ | 15,140 | |
WD-40 Company | | | | | | | | | | | 1,452 | | | | 296,760 | |
| | | | |
| | | | | | | | | | | | | | | 687,062 | |
| | | | | | | | | | | | | | | | |
|
| Personal Products: 0.59% | |
Bellring Brands Incorporated Class A † | | | | | | | | | | | 4,555 | | | | 88,549 | |
e.l.f. Beauty Incorporated † | | | | | | | | | | | 3,584 | | | | 69,996 | |
Edgewell Personal Care Company † | | | | | | | | | | | 6,379 | | | | 183,141 | |
Inter Parfums Incorporated | | | | | | | | | | | 992 | | | | 44,313 | |
Lifevantage Corporation † | | | | | | | | | | | 12,222 | | | | 183,574 | |
Medifast Incorporated | | | | | | | | | | | 2,014 | | | | 327,718 | |
Natures Sunshine Products Incorporated † | | | | | | | | | | | 515 | | | | 5,686 | |
NU Skin Enterprises Incorporated Class A | | | | | | | | | | | 2,991 | | | | 141,385 | |
Revlon Incorporated Class A † | | | | | | | | | | | 365 | | | | 2,672 | |
USANA Health Sciences Incorporated † | | | | | | | | | | | 3,253 | | | | 255,068 | |
Veru Incorporated † | | | | | | | | | | | 3,160 | | | | 8,753 | |
| | | | |
| | | | | | | | | | | | | | | 1,310,855 | |
| | | | | | | | | | | | | | | | |
|
| Tobacco: 0.15% | |
Turning Point Brands Incorporated | | | | | | | | | | | 451 | | | | 13,034 | |
Universal Corporation | | | | | | | | | | | 2,213 | | | | 96,066 | |
Vector Group Limited | | | | | | | | | | | 22,669 | | | | 228,277 | |
| | | | |
| | | | | | | | | | | | | | | 337,377 | |
| | | | | | | | | | | | | | | | |
|
Energy: 2.57% | |
|
| Energy Equipment & Services: 0.90% | |
Archrock Incorporated | | | | | | | | | | | 15,737 | | | | 103,235 | |
Aspen Aerogels Incorporated † | | | | | | | | | | | 6,350 | | | | 53,975 | |
Bristow Group Incorporated † | | | | | | | | | | | 531 | | | | 10,041 | |
Cactus Incorporated Class A | | | | | | | | | | | 12,887 | | | | 284,674 | |
ChampionX Corporation † | | | | | | | | | | | 16,914 | | | | 173,199 | |
DMC Global Incorporated | | | | | | | | | | | 1,955 | | | | 69,266 | |
Dril-Quip Incorporated † | | | | | | | | | | | 2,669 | | | | 88,424 | |
Exterran Corporation † | | | | | | | | | | | 1,525 | | | | 7,015 | |
Geospace Technologies Corporation † | | | | | | | | | | | 782 | | | | 5,122 | |
Helix Energy Solutions Group Incorporated † | | | | | | | | | | | 43,873 | | | | 157,065 | |
Liberty Oilfield Services Class A | | | | | | | | | | | 34,680 | | | | 223,686 | |
Matrix Service Company † | | | | | | | | | | | 12,448 | | | | 115,020 | |
National Energy Services Reunited Corporation † | | | | | | | | | | | 14,874 | | | | 112,150 | |
Natural Gas Services Group Incoporated † | | | | | | | | | | | 643 | | | | 5,260 | |
Newpark Resources Incorporated † | | | | | | | | | | | 26,286 | | | | 51,258 | |
Nextier Oilfield Solutions Incorporated † | | | | | | | | | | | 9,222 | | | | 23,239 | |
Noble Corporation plc † | | | | | | | | | | | 5,139 | | | | 140 | |
Oceaneering International Incorporated † | | | | | | | | | | | 8,052 | | | | 43,400 | |
Patterson-UTI Energy Incorporated | | | | | | | | | | | 7,728 | | | | 29,753 | |
ProPetro Holding Corporation † | | | | | | | | | | | 41,776 | | | | 262,353 | |
RPC Incorporated † | | | | | | | | | | | 3,568 | | | | 11,168 | |
Seacor Holdings Incorporated † | | | | | | | | | | | 3,126 | | | | 98,813 | |
Seacor Marine Holdings Incorporated † | | | | | | | | | | | 526 | | | | 1,410 | |
Select Energy Services Incorporated Class A † | | | | | | | | | | | 4,991 | | | | 23,807 | |
Solaris Oilfield Infrastructure Incorporated Class A | | | | | | | | | | | 7,655 | | | | 59,556 | |
| | | | |
| | | | | | | | | | | | | | | 2,013,029 | |
| | | | | | | | | | | | | | | | |
The accompanying notes are an integral part of these financial statements.
10 | Wells Fargo Factor Enhanced U.S. Small Cap Equity Portfolio
Portfolio of investments—August 31, 2020 (unaudited)
| | | | | | | | | | | | | | | | |
| | | | | | | | | Shares | | | Value | |
| Oil, Gas & Consumable Fuels: 1.67% | |
Adams Resources & Energy Incorporated | | | | | | | | | | | 3,719 | | | $ | 79,103 | |
Antero Resources Corporation † | | | | | | | | | | | 17,835 | | | | 57,429 | |
Arch Resources Incorporated | | | | | | | | | | | 2,210 | | | | 83,251 | |
Ardmore Shipping Corporation | | | | | | | | | | | 5,011 | | | | 18,541 | |
Berry Petroleum Corporation | | | | | | | | | | | 3,249 | | | | 12,801 | |
Bonanza Creek Energy Incorporated † | | | | | | | | | | | 2,571 | | | | 51,523 | |
Brigham Minerals Incorporated Class A | | | | | | | | | | | 1,737 | | | | 20,514 | |
California Resources Corporation † | | | | | | | | | | | 2,710 | | | | 266 | |
Callon Petroleum Company † | | | | | | | | | | | 542 | | | | 3,593 | |
Centennial Resource Development Class A † | | | | | | | | | | | 8,951 | | | | 6,500 | |
Chesapeake Energy Corporation † | | | | | | | | | | | 629 | | | | 2,510 | |
CNX Resources Corporation † | | | | | | | | | | | 20,097 | | | | 220,263 | |
Comstock Resources Incorporated † | | | | | | | | | | | 7,673 | | | | 44,196 | |
Consol Energy Incorporated † | | | | | | | | | | | 1,179 | | | | 6,095 | |
Contura Energy Incorporated † | | | | | | | | | | | 1,092 | | | | 4,521 | |
Core Laboratories NV | | | | | | | | | | | 2,183 | | | | 45,690 | |
CVR Energy Incorporated | | | | | | | | | | | 3,024 | | | | 50,471 | |
Delek US Holdings Incorporated | | | | | | | | | | | 5,968 | | | | 93,877 | |
Denbury Resources Incorporated † | | | | | | | | | | | 15,260 | | | | 412 | |
DHT Holdings Incorporated | | | | | | | | | | | 6,640 | | | | 35,126 | |
Diamond S Shipping Incorporated † | | | | | | | | | | | 1,914 | | | | 15,676 | |
Dorian LPG Limited † | | | | | | | | | | | 8,559 | | | | 72,238 | |
Earthstone Energy Incorporated Class A † | | | | | | | | | | | 1,243 | | | | 3,642 | |
Evolution Petroleum Corporation | | | | | | | | | | | 9,630 | | | | 26,290 | |
Extraction Oil & Gas Incorporated † | | | | | | | | | | | 3,728 | | | | 309 | |
Falcon Minerals Corporation | | | | | | | | | | | 4,863 | | | | 13,665 | |
Goodrich Petroleum Corporation † | | | | | | | | | | | 15,892 | | | | 131,109 | |
Green Plains Renewable Energy Incorporated † | | | | | | | | | | | 1,372 | | | | 18,357 | |
Hess Midstream LP | | | | | | | | | | | 1,011 | | | | 17,874 | |
International Seaways Incorporated | | | | | | | | | | | 7,142 | | | | 121,128 | |
Laredo Petroleum Incorporated † | | | | | | | | | | | 484 | | | | 7,913 | |
Magnolia Oil & Gas Corporation † | | | | | | | | | | | 10,624 | | | | 68,419 | |
Matador Resources Company † | | | | | | | | | | | 13,994 | | | | 136,162 | |
Montage Resources Corporation † | | | | | | | | | | | 20,653 | | | | 106,569 | |
Nacco Industries Class A | | | | | | | | | | | 177 | | | | 3,629 | |
Navigator Holdings Limited † | | | | | | | | | | | 1,840 | | | | 17,038 | |
New Fortress Energy LLC | | | | | | | | | | | 958 | | | | 25,646 | |
Nordic American Tanker Limited | | | | | | | | | | | 20,562 | | | | 89,650 | |
Oasis Petroleum Incorporated † | | | | | | | | | | | 7,385 | | | | 4,102 | |
Overseas Shipholding Group Class A † | | | | | | | | | | | 4,237 | | | | 8,940 | |
Ovintiv Incorporated | | | | | | | | | | | 41,826 | | | | 463,432 | |
Par Pacific Holdings Incorporated † | | | | | | | | | | | 2,276 | | | | 19,756 | |
PBF Energy Incorporated Class A | | | | | | | | | | | 5,048 | | | | 43,211 | |
Peabody Energy Corporation | | | | | | | | | | | 3,525 | | | | 9,200 | |
Penn Virginia Corporation † | | | | | | | | | | | 887 | | | | 10,130 | |
Plains GP Holdings LP Class A | | | | | | | | | | | 9,984 | | | | 72,983 | |
QEP Resources Incorporated | | | | | | | | | | | 6,879 | | | | 8,943 | |
Range Resources Corporation | | | | | | | | | | | 10,363 | | | | 77,308 | |
Renewable Energy Group Incorporated † | | | | | | | | | | | 13,442 | | | | 449,366 | |
Rex American Resources Corporation † | | | | | | | | | | | 275 | | | | 16,990 | |
SFL Corporation Limited | | | | | | | | | | | 9,323 | | | | 81,856 | |
Southwestern Energy Company † | | | | | | | | | | | 61,326 | | | | 170,486 | |
Talos Energy Incorporated † | | | | | | | | | | | 7,175 | | | | 53,884 | |
Vaalco Energy Incorporated † | | | | | | | | | | | 1,961 | | | | 2,079 | |
Viper Energy Partners LP | | | | | | | | | | | 3,429 | | | | 34,907 | |
W&T Offshore Incorporated † | | | | | | | | | | | 42,146 | | | | 93,986 | |
The accompanying notes are an integral part of these financial statements.
Wells Fargo Factor Enhanced U.S. Small Cap Equity Portfolio | 11
Portfolio of investments—August 31, 2020 (unaudited)
| | | | | | | | | | | | | | | | |
| | | | | | | | | Shares | | | Value | |
| Oil, Gas & Consumable Fuels (continued) | |
Whiting Petroleum Corporation † | | | | | | | | | | | 2,185 | | | $ | 1,747 | |
World Fuel Services Corporation | | | | | | | | | | | 14,157 | | | | 373,745 | |
| | | | |
| | | | | | | | | | | | | | | 3,709,047 | |
| | | | | | | | | | | | | | | | |
|
Financials: 15.93% | |
|
| Banks: 7.74% | |
1st Constitution Bancorp | | | | | | | | | | | 542 | | | | 6,596 | |
1st Source Corporation | | | | | | | | | | | 1,861 | | | | 64,111 | |
ACNB Corporation | | | | | | | | | | | 500 | | | | 10,510 | |
Allegiance Bancshares Incorporated | | | | | | | | | | | 1,246 | | | | 31,673 | |
Altabancorp | | | | | | | | | | | 2,018 | | | | 41,611 | |
Amalgamated Bank of New York Class A | | | | | | | | | | | 915 | | | | 10,770 | |
Amerant Bancorp Incorporated Class A † | | | | | | | | | | | 1,154 | | | | 15,175 | |
American National Bankshares Incorporated | | | | | | | | | | | 643 | | | | 14,493 | |
Ameris Bancorp | | | | | | | | | | | 6,224 | | | | 152,612 | |
AMES National Corporation | | | | | | | | | | | 477 | | | | 9,516 | |
Arrow Financial Corporation | | | | | | | | | | | 1,329 | | | | 38,076 | |
Associated Banc Corporation | | | | | | | | | | | 8,696 | | | | 116,874 | |
Atlantic Capital Bancshares † | | | | | | | | | | | 4,751 | | | | 54,803 | |
Atlantic Union Bankshares Corporation | | | | | | | | | | | 7,274 | | | | 169,193 | |
Auburn National Bancorporation Incorporated | | | | | | | | | | | 134 | | | | 5,465 | |
Banc of California Incorporated | | | | | | | | | | | 2,646 | | | | 29,080 | |
BancFirst Corporation | | | | | | | | | | | 2,888 | | | | 127,072 | |
Banco Latinoamericano de Comercio Exterior SA | | | | | | | | | | | 315 | | | | 3,837 | |
BancorpSouth Bank | | | | | | | | | | | 11,424 | | | | 246,530 | |
Bank First Corporation | | | | | | | | | | | 440 | | | | 27,456 | |
Bank of Commerce Holdings | | | | | | | | | | | 6,355 | | | | 46,709 | |
Bank of Marin Bancorp | | | | | | | | | | | 847 | | | | 26,960 | |
Bank of N.T. Butterfield & Son Limited | | | | | | | | | | | 5,610 | | | | 141,372 | |
Bank of South Carolina Corporation | | | | | | | | | | | 221 | | | | 3,591 | |
Bank7 Corporation | | | | | | | | | | | 6,626 | | | | 67,850 | |
BankFinancial Corporation | | | | | | | | | | | 904 | | | | 6,563 | |
BankUnited Incorporated | | | | | | | | | | | 11,148 | | | | 260,640 | |
Bankwell Financial Group Incorporated | | | | | | | | | | | 717 | | | | 11,185 | |
Banner Corporation | | | | | | | | | | | 4,309 | | | | 155,641 | |
Bar Harbor Bankshares | | | | | | | | | | | 889 | | | | 18,011 | |
Baycom Corporation † | | | | | | | | | | | 744 | | | | 8,619 | |
BCB Bancorp Incorporated | | | | | | | | | | | 749 | | | | 6,101 | |
Berkshire Hills Bancorp Incorporated | | | | | | | | | | | 2,752 | | | | 25,263 | |
BOK Financial Corporation | | | | | | | | | | | 1,515 | | | | 85,052 | |
Boston Private Financial Holdings Incorporated | | | | | | | | | | | 5,012 | | | | 29,771 | |
Bridge Bancorp Incorporated | | | | | | | | | | | 1,839 | | | | 36,798 | |
Brookline Bancorp Incorporated | | | | | | | | | | | 4,421 | | | | 42,442 | |
Bryn Mawr Bank Corporation | | | | | | | | | | | 1,182 | | | | 32,079 | |
Business First Bancshares Incorporated | | | | | | | | | | | 725 | | | | 10,491 | |
Byline Bancorp Incorporated | | | | | | | | | | | 1,359 | | | | 17,178 | |
C&F Financial Corporation | | | | | | | | | | | 200 | | | | 6,394 | |
Cadence Bancorp | | | | | | | | | | | 6,785 | | | | 64,458 | |
California Bancorp Incorporated † | | | | | | | | | | | 451 | | | | 5,868 | |
Cambridge Bancorp | | | | | | | | | | | 434 | | | | 23,801 | |
Camden National Corporation | | | | | | | | | | | 1,974 | | | | 64,461 | |
Capital Bancorp Incorporated † | | | | | | | | | | | 6,484 | | | | 67,498 | |
Capital City Bank Group Incorporated | | | | | | | | | | | 1,456 | | | | 29,513 | |
Capstar Financial Holdings Class I | | | | | | | | | | | 2,649 | | | | 26,993 | |
Carter Bank & Trust | | | | | | | | | | | 1,224 | | | | 8,678 | |
Cathay General Bancorp | | | | | | | | | | | 12,802 | | | | 316,081 | |
The accompanying notes are an integral part of these financial statements.
12�� | Wells Fargo Factor Enhanced U.S. Small Cap Equity Portfolio
Portfolio of investments—August 31, 2020 (unaudited)
| | | | | | | | | | | | | | | | |
| | | | | | | | | Shares | | | Value | |
|
| Banks (continued) | |
CB Financial Services Incorporated | | | | | | | | | | | 3,001 | | | $ | 55,819 | |
CBTX Incorporated | | | | | | | | | | | 1,146 | | | | 18,050 | |
Central Pacific Financial Company | | | | | | | | | | | 1,530 | | | | 23,700 | |
Central Valley Community Bancorp | | | | | | | | | | | 5,702 | | | | 68,595 | |
Century Bancorp Incorporated Class A | | | | | | | | | | | 168 | | | | 11,836 | |
Chemung Financial Corporation | | | | | | | | | | | 196 | | | | 5,627 | |
ChoiceOne Financial Services Incorporated | | | | | | | | | | | 373 | | | | 10,634 | |
CIT Group Incorporated | | | | | | | | | | | 4,296 | | | | 84,502 | |
Citizens & Northern Corporation | | | | | | | | | | | 740 | | | | 12,684 | |
Citizens Community Bancorp Incorporated | | | | | | | | | | | 627 | | | | 4,333 | |
City Holding Company | | | | | | | | | | | 2,003 | | | | 128,152 | |
Civista Bancshares Incorporated | | | | | | | | | | | 2,409 | | | | 32,160 | |
CNB Financial Corporation | | | | | | | | | | | 1,219 | | | | 19,443 | |
Coastal Financial Corporation † | | | | | | | | | | | 4,774 | | | | 65,643 | |
Codorus Valley Bancorp Incorporated | | | | | | | | | | | 499 | | | | 6,437 | |
Colony Bankcorp Incorporated | | | | | | | | | | | 448 | | | | 4,928 | |
Columbia Banking System Incorporated | | | | | | | | | | | 6,035 | | | | 168,437 | |
Community Bank System Incorporated | | | | | | | | | | | 2,838 | | | | 170,762 | |
Community Bankers Trust Corporation | | | | | | | | | | | 13,272 | | | | 68,085 | |
Community Financial Corporation | | | | | | | | | | | 393 | | | | 8,740 | |
Community Trust Bancorp | | | | | | | | | | | 2,208 | | | | 71,252 | |
ConnectOne Bancorp Incorporated | | | | | | | | | | | 5,055 | | | | 76,432 | |
County Bancorp Incorporated | | | | | | | | | | | 1,644 | | | | 31,729 | |
CrossFirst Bankshares Incorporated † | | | | | | | | | | | 2,821 | | | | 26,038 | |
Customers Bancorp Incorporated † | | | | | | | | | | | 8,181 | | | | 104,471 | |
CVB Financial Corporation | | | | | | | | | | | 10,834 | | | | 197,287 | |
Dime Community Bancshares | | | | | | | | | | | 1,721 | | | | 22,201 | |
Eagle Bancorp Incorporated | | | | | | | | | | | 4,640 | | | | 133,539 | |
Eagle Bancorp Montana Incorporated | | | | | | | | | | | 9,253 | | | | 163,130 | |
Enterprise Bancorp Incorporated | | | | | | | | | | | 483 | | | | 10,496 | |
Enterprise Financial Services Corporation | | | | | | | | | | | 3,701 | | | | 110,697 | |
Equity Bancshares Incorporated Class A † | | | | | | | | | | | 1,991 | | | | 31,657 | |
Esquire Financial Holdings Class I † | | | | | | | | | | | 6,259 | | | | 103,274 | |
Evans Bancorp Incorporated | | | | | | | | | | | 4,687 | | | | 106,864 | |
Farmers & Merchants Banco | | | | | | | | | | | 610 | | | | 13,146 | |
Farmers National Banc Corporation | | | | | | | | | | | 1,885 | | | | 21,979 | |
FB Financial Corporation | | | | | | | | | | | 1,711 | | | | 46,197 | |
Fidelity D&D Bancorp Incorporated | | | | | | | | | | | 162 | | | | 7,326 | |
Financial Institutions Incorporated | | | | | | | | | | | 1,795 | | | | 30,928 | |
First Bancorp Incorporated | | | | | | | | | | | 613 | | | | 13,045 | |
First Bancorp of North Carolina | | | | | | | | | | | 4,084 | | | | 83,518 | |
First Bancorp Puerto Rico | | | | | | | | | | | 18,695 | | | | 107,122 | |
First Bancshares Incorporated | | | | | | | | | | | 2,816 | | | | 60,375 | |
First Bank | | | | | | | | | | | 996 | | | | 6,494 | |
First Busey Corporation | | | | | | | | | | | 5,404 | | | | 96,272 | |
First Business Financial Services Incorporated | | | | | | | | | | | 5,760 | | | | 89,280 | |
First Capital Incorporated | | | | | | | | | | | 172 | | | | 10,504 | |
First Choice Bancorp | | | | | | | | | | | 4,966 | | | | 70,269 | |
First Citizens BancShares Corporation Class A | | | | | | | | | | | 215 | | | | 84,527 | |
First Commonwealth Financial Corporation | | | | | | | | | | | 6,017 | | | | 49,339 | |
First Community Bancshares | | | | | | | | | | | 913 | | | | 17,566 | |
First Community Corporation | | | | | | | | | | | 1,525 | | | | 19,337 | |
First Financial Bancorp | | | | | | | | | | | 11,294 | | | | 154,954 | |
First Financial Bankshares Incorporated | | | | | | | | | | | 6,290 | | | | 190,430 | |
First Financial Corporation | | | | | | | | | | | 673 | | | | 23,144 | |
First Financial Northwest | | | | | | | | | | | 406 | | | | 3,889 | |
First Foundation Incorporated | | | | | | | | | | | 9,137 | | | | 138,791 | |
The accompanying notes are an integral part of these financial statements.
Wells Fargo Factor Enhanced U.S. Small Cap Equity Portfolio | 13
Portfolio of investments—August 31, 2020 (unaudited)
| | | | | | | | | | | | | | | | |
| | | | | | | | | Shares | | | Value | |
|
| Banks (continued) | |
First Guaranty Bancshares Incorporated | | | | | | | | | | | 2,174 | | | $ | 27,892 | |
First Internet Bancorp | | | | | | | | | | | 5,386 | | | | 78,689 | |
First Interstate BancSystem Class A | | | | | | | | | | | 6,905 | | | | 226,484 | |
First Merchants Corporation | | | | | | | | | | | 5,605 | | | | 143,376 | |
First Mid-Illinois Bancshares | | | | | | | | | | | 2,438 | | | | 63,486 | |
First Midwest Bancorp Incorporated | | | | | | | | | | | 10,271 | | | | 127,977 | |
First National Community Bancorp Incorporated | | | | | | | | | | | 930 | | | | 5,441 | |
First Northwest Bancorp | | | | | | | | | | | 481 | | | | 5,339 | |
First of Long Island Corporation | | | | | | | | | | | 3,328 | | | | 51,135 | |
First Savings Financial Group Incorporated | | | | | | | | | | | 1,836 | | | | 79,866 | |
First United Corporation | | | | | | | | | | | 690 | | | | 7,901 | |
First Western Financial Incorporated † | | | | | | | | | | | 2,145 | | | | 29,065 | |
Flushing Financial Corporation | | | | | | | | | | | 1,579 | | | | 19,153 | |
Franklin Financial Services Corporation | | | | | | | | | | | 256 | | | | 6,103 | |
Fulton Financial Corporation | | | | | | | | | | | 13,792 | | | | 134,886 | |
FVCBankcorp Incorporated † | | | | | | | | | | | 622 | | | | 6,556 | |
German American Bancorp | | | | | | | | | | | 3,936 | | | | 111,586 | |
Glacier Bancorp Incorporated | | | | | | | | | | | 6,195 | | | | 217,352 | |
Great Southern Bancorp Incorporated | | | | | | | | | | | 676 | | | | 26,053 | |
Great Western Bancorp Incorporated | | | | | | | | | | | 3,199 | | | | 44,562 | |
Guaranty Bancshares Incorporated | | | | | | | | | | | 392 | | | | 10,368 | |
Hancock Holding Company | | | | | | | | | | | 2,974 | | | | 59,510 | |
Hanmi Financial Corporation | | | | | | | | | | | 1,702 | | | | 16,220 | |
HarborOne Bancorp Incorporated | | | | | | | | | | | 888 | | | | 7,681 | |
Hawthorn Bancshares Incorporated | | | | | | | | | | | 320 | | | | 5,862 | |
HBT Financial Incorporated | | | | | | | | | | | 8,460 | | | | 100,251 | |
Heartland Financial USA Incorporated | | | | | | | | | | | 4,383 | | | | 150,907 | |
Heritage Commerce Corporation | | | | | | | | | | | 3,504 | | | | 24,283 | |
Heritage Financial Corporation | | | | | | | | | | | 2,243 | | | | 44,725 | |
Hilltop Holdings Incorporated | | | | | | | | | | | 13,056 | | | | 268,954 | |
Home BancShares Incorporated | | | | | | | | | | | 23,716 | | | | 384,436 | |
Hometrust Bancshares Incorporated | | | | | | | | | | | 917 | | | | 12,866 | |
Hope Bancorp Incorporated | | | | | | | | | | | 21,420 | | | | 181,213 | |
Horizon Bancorp Indiana | | | | | | | | | | | 11,768 | | | | 131,566 | |
Howard Bancorp Incorporated † | | | | | | | | | | | 721 | | | | 7,073 | |
Independent Bank Corporation | | | | | | | | | | | 3,652 | | | | 229,528 | |
Independent Bank Corporation | | | | | | | | | | | 4,671 | | | | 69,645 | |
Independent Bank Group Incorporated | | | | | | | | | | | 6,991 | | | | 325,082 | |
International Bancshares Corporation | | | | | | | | | | | 5,290 | | | | 167,058 | |
Investar Holding Corporation | | | | | | | | | | | 534 | | | | 7,262 | |
Investors Bancorp Incorporated | | | | | | | | | | | 31,847 | | | | 246,814 | |
Lakeland Bancorp Incorporated | | | | | | | | | | | 4,885 | | | | 51,928 | |
Lakeland Financial Corporation | | | | | | | | | | | 4,306 | | | | 196,741 | |
Landmark Bancorp Incorporated | | | | | | | | | | | 2,521 | | | | 52,966 | |
LCNB Corporation | | | | | | | | | | | 5,395 | | | | 79,091 | |
Level One Bancorp Incorporated | | | | | | | | | | | 1,775 | | | | 28,578 | |
Limestone Bancorp Incorporated † | | | | | | | | | | | 1,514 | | | | 16,276 | |
Live Oak Bancshares Incorporated | | | | | | | | | | | 1,480 | | | | 32,826 | |
Macatawa Bank Corporation | | | | | | | | | | | 1,929 | | | | 14,120 | |
Mackinac Financial Corporation | | | | | | | | | | | 9,049 | | | | 90,671 | |
MainStreet Bancshares Incorporated † | | | | | | | | | | | 419 | | | | 5,372 | |
Malvern Bancorp Incorporated † | | | | | | | | | | | 445 | | | | 5,496 | |
Mercantile Bank Corporation | | | | | | | | | | | 2,396 | | | | 52,329 | |
Meridian Corporation | | | | | | | | | | | 6,323 | | | | 92,758 | |
MetroCity Bankshares Incorporated | | | | | | | | | | | 10,088 | | | | 137,600 | |
Metropolitan Bank Holding Corporation † | | | | | | | | | | | 567 | | | | 17,560 | |
Mid Penn Bancorp Incorporated | | | | | | | | | | | 1,535 | | | | 29,533 | |
The accompanying notes are an integral part of these financial statements.
14 | Wells Fargo Factor Enhanced U.S. Small Cap Equity Portfolio
Portfolio of investments—August 31, 2020 (unaudited)
| | | | | | | | | | | | | | | | |
| | | | | | | | | Shares | | | Value | |
|
| Banks (continued) | |
Middlefield Banc Corporation | | | | | | | | | | | 4,107 | | | $ | 78,033 | |
Midland States Bancorp Incorporated | | | | | | | | | | | 1,213 | | | | 17,722 | |
Midwestone Financial Group Class I | | | | | | | | | | | 847 | | | | 16,085 | |
MVB Financial Corporation | | | | | | | | | | | 5,942 | | | | 84,376 | |
National Bank Holdings Corporation Class A | | | | | | | | | | | 2,876 | | | | 81,793 | |
National Bankshares Incorporated | | | | | | | | | | | 1,118 | | | | 27,760 | |
NBT Bancorp Incorporated | | | | | | | | | | | 4,215 | | | | 128,431 | |
Nicolet Bankshares Incorporated † | | | | | | | | | | | 1,134 | | | | 68,063 | |
Northeast Bank | | | | | | | | | | | 8,609 | | | | 160,644 | |
Northrim BanCorp Incorporated | | | | | | | | | | | 382 | | | | 10,280 | |
Norwood Financial Corporation | | | | | | | | | | | 339 | | | | 8,390 | |
Oak Valley Bancorp | | | | | | | | | | | 460 | | | | 6,210 | |
OceanFirst Financial Corporation | | | | | | | | | | | 3,413 | | | | 53,277 | |
Ohio Valley Banc Corporation | | | | | | | | | | | 229 | | | | 5,221 | |
Old National Bancorp | | | | | | | | | | | 19,920 | | | | 278,482 | |
Old Point Financial Corporation | | | | | | | | | | | 198 | | | | 3,099 | |
Old Second Bancorp Incorporated | | | | | | | | | | | 10,368 | | | | 84,707 | |
Origin Bancorp Incorporated | | | | | | | | | | | 1,305 | | | | 30,902 | |
Orrstown Financial Services Incorporated | | | | | | | | | | | 578 | | | | 7,959 | |
Pacific Mercantile Bancorp † | | | | | | | | | | | 1,058 | | | | 3,925 | |
Pacific Premier Bancorp Incorporated | | | | | | | | | | | 11,942 | | | | 269,770 | |
Park National Corporation | | | | | | | | | | | 761 | | | | 68,422 | |
Parke Bancorp Incorporated | | | | | | | | | | | 632 | | | | 7,774 | |
PCB Bancorp | | | | | | | | | | | 751 | | | | 7,172 | |
Peapack-Gladstone Financial Corporation | | | | | | | | | | | 1,058 | | | | 17,986 | |
Penns Woods Bancorp Incorporated | | | | | | | | | | | 392 | | | | 8,134 | |
Peoples Bancorp Incorporated | | | | | | | | | | | 1,080 | | | | 22,831 | |
Peoples Bancorp of North Carolina Incorporated | | | | | | | | | | | 248 | | | | 4,216 | |
Peoples Financial Services Corporation | | | | | | | | | | | 393 | | | | 14,321 | |
Plumas Bancorp | | | | | | | | | | | 453 | | | | 8,951 | |
Preferred Bank | | | | | | | | | | | 4,411 | | | | 164,971 | |
Premier Financial Bancorp | | | | | | | | | | | 702 | | | | 9,000 | |
Professional Holding Corporation Class A † | | | | | | | | | | | 481 | | | | 5,565 | |
QCR Holdings Incorporated | | | | | | | | | | | 4,870 | | | | 145,954 | |
RBB Bancorp | | | | | | | | | | | 2,312 | | | | 29,987 | |
Red River Bancshares Incorporated | | | | | | | | | | | 734 | | | | 31,944 | |
Reliant Bancorp Incorporated | | | | | | | | | | | 838 | | | | 12,151 | |
Renasant Corporation | | | | | | | | | | | 4,491 | | | | 113,937 | |
Republic Bancorp Incorporated Class A | | | | | | | | | | | 556 | | | | 17,103 | |
Republic First Bancorp Incorporated † | | | | | | | | | | | 2,390 | | | | 4,995 | |
S&T Bancorp Incorporated | | | | | | | | | | | 2,258 | | | | 45,600 | |
Salisbury Bancorp Incorporated | | | | | | | | | | | 2,296 | | | | 81,990 | |
Sandy Spring Bancorp Incorporated | | | | | | | | | | | 6,406 | | | | 153,232 | |
SB Financial Group Incorporated | | | | | | | | | | | 6,222 | | | | 86,112 | |
Seacoast Banking Corporation † | | | | | | | | | | | 7,739 | | | | 156,637 | |
Select Bancorp Incorporated † | | | | | | | | | | | 665 | | | | 5,087 | |
ServisFirst Bancshares Incorporated | | | | | | | | | | | 7,653 | | | | 280,482 | |
Shore Bancshares Incorporated | | | | | | | | | | | 1,776 | | | | 17,316 | |
Sierra Bancorp | | | | | | | | | | | 4,049 | | | | 72,356 | |
Silvergate Capital Corporation Class A † | | | | | | | | | | | 812 | | | | 12,123 | |
Simmons First National Corporation Class A | | | | | | | | | | | 14,236 | | | | 243,009 | |
Smartfinancial Incorporated | | | | | | | | | | | 798 | | | | 10,988 | |
South Plains Financial Incorporated | | | | | | | | | | | 798 | | | | 11,395 | |
South State Corporation | | | | | | | | | | | 6,891 | | | | 383,691 | |
Southern First Bancshares † | | | | | | | | | | | 865 | | | | 22,404 | |
Southern National Bancorp of Virginia | | | | | | | | | | | 1,802 | | | | 15,407 | |
Southside Bancshares Incorporated | | | | | | | | | | | 1,898 | | | | 52,299 | |
The accompanying notes are an integral part of these financial statements.
Wells Fargo Factor Enhanced U.S. Small Cap Equity Portfolio | 15
Portfolio of investments—August 31, 2020 (unaudited)
| | | | | | | | | | | | | | | | |
| | | | | | | | | Shares | | | Value | |
|
| Banks (continued) | |
Spirit of Texas Bancshares Incorporated † | | | | | | | | | | | 826 | | | $ | 10,325 | |
Stock Yards Bancorp Incorporated | | | | | | | | | | | 2,930 | | | | 125,785 | |
Summit Financial Group Incorporated | | | | | | | | | | | 711 | | | | 10,487 | |
Texas Capital Bancshares Incorporated † | | | | | | | | | | | 5,233 | | | | 169,497 | |
The Bancorp Incorporated † | | | | | | | | | | | 13,748 | | | | 130,606 | |
The Bank of Princeton | | | | | | | | | | | 303 | | | | 5,902 | |
Tompkins Trust Company Incorporated | | | | | | | | | | | 1,026 | | | | 67,901 | |
Towne Bank | | | | | | | | | | | 4,804 | | | | 85,175 | |
TriCo Bancshares | | | | | | | | | | | 2,966 | | | | 82,129 | |
TriState Capital Holdings Incorporated † | | | | | | | | | | | 2,361 | | | | 32,818 | |
Triumph Bancorp Incorporated † | | | | | | | | | | | 1,510 | | | | 43,126 | |
Trustmark Corporation | | | | | | | | | | | 5,823 | | | | 136,724 | |
UMB Financial Corporation | | | | | | | | | | | 3,970 | | | | 213,268 | |
Union Bankshares Incorporated | | | | | | | | | | | 207 | | | | 4,010 | |
United Bankshares Incorporated | | | | | | | | | | | 8,017 | | | | 209,564 | |
United Community Bank | | | | | | | | | | | 11,939 | | | | 216,335 | |
United Security Bancshare | | | | | | | | | | | 859 | | | | 5,231 | |
Unity Bancorp Incorporated | | | | | | | | | | | 9,250 | | | | 122,840 | |
Univest Corporation of Pennsylvania | | | | | | | | | | | 1,655 | | | | 26,629 | |
Valley National Bancorp | | | | | | | | | | | 20,166 | | | | 151,447 | |
Veritex Holdings Incorporated | | | | | | | | | | | 8,976 | | | | 161,388 | |
Washington Trust Bancorp | | | | | | | | | | | 859 | | | | 28,673 | |
WesBanco Incorporated | | | | | | | | | | | 3,939 | | | | 87,525 | |
West Bancorporation | | | | | | | | | | | 3,001 | | | | 52,818 | |
Westamerica Bancorporation | | | | | | | | | | | 3,559 | | | | 216,601 | |
| | | | |
| | | | | | | | | | | | | | | 17,253,106 | |
| | | | | | | | | | | | | | | | |
|
| Capital Markets: 1.67% | |
Artisan Partners Asset Management Incorporated Class A | | | | | | | | | | | 9,995 | | | | 386,906 | |
Associated Capital Group Class A | | | | | | | | | | | 120 | | | | 4,638 | |
B. Riley Financial Incorporated | | | | | | | | | | | 814 | | | | 21,799 | |
BGC Partners Incorporated Class A | | | | | | | | | | | 15,532 | | | | 39,141 | |
BrightSphere Investment Group Incorporated | | | | | | | | | | | 18,309 | | | | 253,763 | |
Churchill Capital Corporation II Class A † | | | | | | | | | | | 3,860 | | | | 40,491 | |
Cohen & Steers Incorporated | | | | | | | | | | | 4,559 | | | | 275,820 | |
Cowen Incorporated Class A | | | | | | | | | | | 1,467 | | | | 26,538 | |
Diamond Hill Investment Group Incorporated | | | | | | | | | | | 255 | | | | 31,597 | |
Donnelley Financial Solutions Incorporated † | | | | | | | | | | | 14,081 | | | | 153,483 | |
Evercore Partners Incorporated Class A | | | | | | | | | | | 1,867 | | | | 115,530 | |
Federated Investors Incorporated Class B | | | | | | | | | | | 13,374 | | | | 319,772 | |
Focus Financial Partners Incorporated Class A † | | | | | | | | | | | 511 | | | | 18,084 | |
Gamco Investors Incorporated Class A | | | | | | | | | | | 11,844 | | | | 149,471 | |
Greenhill & Company Incorporated | | | | | | | | | | | 633 | | | | 7,102 | |
Hamilton Lane Incorporated Class A | | | | | | | | | | | 3,229 | | | | 236,072 | |
Houlihan Lokey Incorporated | | | | | | | | | | | 3,639 | | | | 213,245 | |
Moelis Company Class A | | | | | | | | | | | 5,630 | | | | 179,653 | |
Oppenheimer Holdings Incorporated Class A | | | | | | | | | | | 461 | | | | 11,262 | |
Piper Jaffray Companies Incorporated | | | | | | | | | | | 894 | | | | 67,452 | |
PJT Partners Incorporated Class A | | | | | | | | | | | 3,792 | | | | 224,411 | |
Pzena Investment Management Incorporated Class A | | | | | | | | | | | 13,717 | | | | 67,899 | |
Sculptor Capital Management Incorporated | | | | | | | | | | | 1,942 | | | | 24,799 | |
Silvercrest Asset Management Group Incorporated Class A | | | | | | | | | | | 6,370 | | | | 79,880 | |
Stifel Financial Corporation | | | | | | | | | | | 3,935 | | | | 199,544 | |
Stonex Group Incorporated † | | | | | | | | | | | 1,806 | | | | 102,400 | |
Victory Capital Holdings Incorporated Class A | | | | | | | | | | | 1,003 | | | | 17,442 | |
VIRTU Financial Incorporated Class A | | | | | | | | | | | 4,498 | | | | 116,183 | |
The accompanying notes are an integral part of these financial statements.
16 | Wells Fargo Factor Enhanced U.S. Small Cap Equity Portfolio
Portfolio of investments—August 31, 2020 (unaudited)
| | | | | | | | | | | | | | | | |
| | | | | | | | | Shares | | | Value | |
|
| Capital Markets (continued) | |
Virtus Investment Partners Incorporated | | | | | | | | | | | 972 | | | $ | 137,927 | |
Waddell & Reed Financial Incorporated Class A | | | | | | | | | | | 12,478 | | | | 196,529 | |
Westwood Holdings Group Incorporated | | | | | | | | | | | 471 | | | | 5,360 | |
| | | | |
| | | | | | | | | | | | | | | 3,724,193 | |
| | | | | | | | | | | | | | | | |
|
| Consumer Finance: 0.53% | |
Atlanticus Holdings Corporation † | | | | | | | | | | | 752 | | | | 6,392 | |
Curo Group Holdings Corporation | | | | | | | | | | | 766 | | | | 5,898 | |
Encore Capital Group Incorporated † | | | | | | | | | | | 6,370 | | | | 292,638 | |
Enova International Incorporated † | | | | | | | | | | | 4,222 | | | | 72,112 | |
Ezcorp Incorporated † | | | | | | | | | | | 2,452 | | | | 13,192 | |
FirstCash Financial Services Incorporated | | | | | | | | | | | 293 | | | | 17,507 | |
Green Dot Corporation Class A † | | | | | | | | | | | 2,577 | | | | 134,159 | |
Medallion Financial Corporation † | | | | | | | | | | | 1,036 | | | | 2,808 | |
Navient Corporation | | | | | | | | | | | 10,665 | | | | 96,945 | |
Nelnet Incorporated Class A | | | | | | | | | | | 1,631 | | | | 106,814 | |
Oportun Financial Corporation † | | | | | | | | | | | 2,395 | | | | 30,057 | |
PRA Group Incorporated † | | | | | | | | | | | 5,759 | | | | 268,801 | |
Regional Management Corporation † | | | | | | | | | | | 3,512 | | | | 64,234 | |
Repay Holdings Corporation † | | | | | | | | | | | 1,824 | | | | 46,147 | |
World Acceptance Corporation † | | | | | | | | | | | 311 | | | | 28,298 | |
| | | | |
| | | | | | | | | | | | | | | 1,186,002 | |
| | | | | | | | | | | | | | | | |
|
| Diversified Financial Services: 0.20% | |
A-Mark Precious Metals Incorporated † | | | | | | | | | | | 270 | | | | 6,458 | |
Alerus Financial Corporation | | | | | | | | | | | 370 | | | | 7,618 | |
Cannae Holdings Incorporated † | | | | | | | | | | | 11,053 | | | | 417,030 | |
Marlin Business Services Incorporated | | | | | | | | | | | 484 | | | | 3,243 | |
On Deck Capital Incorporated † | | | | | | | | | | | 2,143 | | | | 3,472 | |
| | | | |
| | | | | | | | | | | | | | | 437,821 | |
| | | | | | | | | | | | | | | | |
|
| Insurance: 2.51% | |
American Equity Investment Life Holding Company | | | | | | | | | | | 14,970 | | | | 357,933 | |
American National Group Incorporated | | | | | | | | | | | 224 | | | | 16,802 | |
Amerisafe Incorporated | | | | | | | | | | | 4,113 | | | | 274,460 | |
Argo Group International Holdings Limited | | | | | | | | | | | 1,757 | | | | 65,255 | |
BRP Group Incorporated Class A † | | | | | | | | | | | 442 | | | | 12,159 | |
Citizens Incorporated † | | | | | | | | | | | 2,833 | | | | 16,573 | |
CNA Financial Corporation | | | | | | | | | | | 1,561 | | | | 50,217 | |
CNO Financial Group Incorporated | | | | | | | | | | | 28,966 | | | | 472,146 | |
Crawford & Company Class A | | | | | | | | | | | 1,492 | | | | 10,235 | |
Donegal Group Incorporated Class A | | | | | | | | | | | 2,799 | | | | 40,390 | |
eHealth Incorporated † | | | | | | | | | | | 2,035 | | | | 128,449 | |
Employers Holdings Incorporated | | | | | | | | | | | 2,667 | | | | 86,891 | |
Enstar Group Limited † | | | | | | | | | | | 1,278 | | | | 228,749 | |
FBL Financial Group Incorporated | | | | | | | | | | | 922 | | | | 34,160 | |
FedNat Holding Company | | | | | | | | | | | 4,293 | | | | 36,448 | |
Genworth Financial Incorporated Class A † | | | | | | | | | | | 58,395 | | | | 176,353 | |
Global Indemnity Group LLC Class A | | | | | | | | | | | 5,260 | | | | 122,190 | |
Goosehead Insurance Incorporated Class A | | | | | | | | | | | 1,776 | | | | 182,502 | |
Greenlight Capital Limited † | | | | | | | | | | | 4,323 | | | | 31,428 | |
HCI Group Incorporated | | | | | | | | | | | 911 | | | | 49,850 | |
Heritage Insurance Holdings Incorporated | | | | | | | | | | | 6,134 | | | | 80,049 | |
Horace Mann Educators Corporation | | | | | | | | | | | 6,831 | | | | 266,819 | |
Independence Holding Company | | | | | | | | | | | 444 | | | | 15,540 | |
The accompanying notes are an integral part of these financial statements.
Wells Fargo Factor Enhanced U.S. Small Cap Equity Portfolio | 17
Portfolio of investments—August 31, 2020 (unaudited)
| | | | | | | | | | | | | | | | |
| | | | | | | | | Shares | | | Value | |
|
| Insurance (continued) | |
Investors Title Company | | | | | | | | | | | 93 | | | $ | 12,654 | |
James River Group Holdings Limited | | | | | | | | | | | 1,586 | | | | 77,254 | |
Kingstone Company Incorporated | | | | | | | | | | | 502 | | | | 2,997 | |
Kinsale Capital Group Incorporated | | | | | | | | | | | 2,382 | | | | 493,622 | |
Mercury General Corporation | | | | | | | | | | | 1,561 | | | | 69,824 | |
National General Holdings Corporation | | | | | | | | | | | 11,031 | | | | 375,606 | |
National Western Life Group Class A | | | | | | | | | | | 298 | | | | 65,557 | |
NI Holdings Incorporated † | | | | | | | | | | | 425 | | | | 6,936 | |
Palomar Holdings Incorporated † | | | | | | | | | | | 3,193 | | | | 358,734 | |
ProAssurance Corporation | | | | | | | | | | | 2,996 | | | | 45,899 | |
ProSight Global Incorporated † | | | | | | | | | | | 6,886 | | | | 65,279 | |
Protective Insurance Corporation Class B | | | | | | | | | | | 678 | | | | 9,736 | |
RLI Corporation | | | | | | | | | | | 1,808 | | | | 169,572 | |
Safety Insurance Group Incorporated | | | | | | | | | | | 2,076 | | | | 150,302 | |
Selective Insurance Group Incorporated | | | | | | | | | | | 2,295 | | | | 137,264 | |
State Auto Financial Corporation | | | | | | | | | | | 1,456 | | | | 22,466 | |
Stewart Information Services Corporation | | | | | | | | | | | 7,297 | | | | 311,363 | |
Third Point Reinsurance Limited † | | | | | | | | | | | 6,727 | | | | 57,583 | |
Tiptree Incorporated | | | | | | | | | | | 1,245 | | | | 7,022 | |
Trupanion Incorporated † | | | | | | | | | | | 2,291 | | | | 143,714 | |
United Fire Group Incorporated | | | | | | | | | | | 1,817 | | | | 45,752 | |
United Insurance Holdings Company | | | | | | | | | | | 1,620 | | | | 12,263 | |
Universal Insurance Holdings Company | | | | | | | | | | | 8,142 | | | | 151,034 | |
Watford Holdings Limited † | | | | | | | | | | | 2,847 | | | | 45,552 | |
| | | | |
| | | | | | | | | | | | | | | 5,593,583 | |
| | | | | | | | | | | | | | | | |
|
| Mortgage REITs: 1.56% | |
AG Mortgage Investment Trust Incorporated | | | | | | | | | | | 989 | | | | 2,749 | |
Anworth Mortgage Asset Corporation | | | | | | | | | | | 1,651 | | | | 2,856 | |
Apollo Commercial Real Estate Finance Incorporated | | | | | | | | | | | 17,461 | | | | 156,101 | |
Arbor Realty Trust Incorporated | | | | | | | | | | | 19,187 | | | | 217,197 | |
Ares Commercial Real Estate | | | | | | | | | | | 2,411 | | | | 24,014 | |
Arlington Asset Investment Class A | | | | | | | | | | | 1,862 | | | | 5,065 | |
ARMOUR Residential REIT Incorporated | | | | | | | | | | | 8,681 | | | | 84,119 | |
Blackstone Mortgage Trust Incorporated Class A | | | | | | | | | | | 13,383 | | | | 318,114 | |
Broadmark Realty Capital Incorporated REIT | | | | | | | | | | | 43,706 | | | | 428,319 | |
Capstead Mortgage Corporation | | | | | | | | | | | 8,935 | | | | 55,129 | |
Cherry Hill Mortgage Investment REIT | | | | | | | | | | | 10,371 | | | | 99,147 | |
Chimera Investment Corporation | | | | | | | | | | | 32,505 | | | | 288,969 | |
Ellington Financial Incorporated | | | | | | | | | | | 3,134 | | | | 39,050 | |
Ellington Residential Mortgage REIT | | | | | | | | | | | 12,809 | | | | 145,510 | |
Exantas Capital Corporation REIT | | | | | | | | | | | 1,289 | | | | 3,003 | |
Granite Point Mortgage Trust Incorporated | | | | | | | | | | | 2,329 | | | | 15,465 | |
Great Ajax Corporation REIT | | | | | | | | | | | 22,319 | | | | 203,549 | |
Hannon Armstrong Sustainable Infrastructure Capital Incorporated | | | | | | | | | | | 13,532 | | | | 574,569 | |
Invesco Mortgage Capital Incorporated | | | | | | | | | | | 5,687 | | | | 17,061 | |
KKR Real Estate Finance Trust | | | | | | | | | | | 8,029 | | | | 146,128 | |
Ladder Capital Corporation | | | | | | | | | | | 5,736 | | | | 42,733 | |
MFA Financial Incorporated | | | | | | | | | | | 17,559 | | | | 47,058 | |
New York Mortgage Trust Incorporated | | | | | | | | | | | 30,907 | | | | 81,594 | |
Orchid Island Capital Incorporated REIT | | | | | | | | | | | 3,619 | | | | 18,493 | |
PennyMac Mortgage Investment Trust | | | | | | | | | | | 5,804 | | | | 99,481 | |
Ready Capital Corporation | | | | | | | | | | | 1,655 | | | | 16,931 | |
Redwood Trust Incorporated | | | | | | | | | | | 4,903 | | | | 33,978 | |
TPG Real Estate Finance Trust Incorporated | | | | | | | | | | | 3,040 | | | | 26,813 | |
Two Harbors Investment Corporation | | | | | | | | | | | 50,719 | | | | 276,419 | |
Western Asset Mortgage Capital REIT | | | | | | | | | | | 2,215 | | | | 5,028 | |
| | | | |
| | | | | | | | | | | | | | | 3,474,642 | |
| | | | | | | | | | | | | | | | |
The accompanying notes are an integral part of these financial statements.
18 | Wells Fargo Factor Enhanced U.S. Small Cap Equity Portfolio
Portfolio of investments—August 31, 2020 (unaudited)
| | | | | | | | | | | | | | | | |
| | | | | | | | | Shares | | | Value | |
| Thrifts & Mortgage Finance: 1.72% | |
Axos Financial Incorporated † | | | | | | | | | | | 11,437 | | | $ | 283,409 | |
Bridgewater Bancshares Incorporated † | | | | | | | | | | | 1,199 | | | | 11,654 | |
Capitol Federal Financial Incorporated | | | | | | | | | | | 7,981 | | | | 74,543 | |
Columbia Financial Incorporated † | | | | | | | | | | | 2,745 | | | | 29,289 | |
Essa Bancorp Incorporated | | | | | | | | | | | 496 | | | | 6,349 | |
Essent Group Limited | | | | | | | | | | | 8,468 | | | | 302,308 | |
Federal Agricultural Mortgage Corporation Class C | | | | | | | | | | | 1,245 | | | | 84,847 | |
Flagstar Bancorp Incorporated | | | | | | | | | | | 5,863 | | | | 184,215 | |
FS Bancorp Incorporated | | | | | | | | | | | 1,731 | | | | 68,582 | |
Greene County Bancorp Incorporated | | | | | | | | | | | 186 | | | | 4,364 | |
Hingham Institution For Savings Corporation | | | | | | | | | | | 87 | | | | 15,952 | |
Home Bancorp Incorporated | | | | | | | | | | | 401 | | | | 9,688 | |
Homestreet Incorporated | | | | | | | | | | | 3,013 | | | | 82,466 | |
Kearny Financial Corporation | | | | | | | | | | | 4,635 | | | | 35,968 | |
Luther Burbank Corporation | | | | | | | | | | | 907 | | | | 8,426 | |
Merchants Bancorp Incorporated | | | | | | | | | | | 2,837 | | | | 57,818 | |
Meridian Bancorp Incorporated | | | | | | | | | | | 2,815 | | | | 32,767 | |
Meta Financial Group Incorporated | | | | | | | | | | | 10,889 | | | | 209,940 | |
MMA Capital Management LLC † | | | | | | | | | | | 240 | | | | 5,635 | |
Mr. Cooper Group Incorporated † | | | | | | | | | | | 22,927 | | | | 420,137 | |
NMI Holdings Incorporated Class A † | | | | | | | | | | | 15,671 | | | | 268,758 | |
Northfield Bancorp Incorporated | | | | | | | | | | | 2,622 | | | | 25,329 | |
Northwest Bancshares Incorporated | | | | | | | | | | | 5,802 | | | | 58,658 | |
OP Bancorp | | | | | | | | | | | 681 | | | | 4,154 | |
PCSB Financial Corporation | | | | | | | | | | | 738 | | | | 9,358 | |
PDL Community Bancorp † | | | | | | | | | | | 350 | | | | 2,839 | |
PennyMac Financial Services Incorporated | | | | | | | | | | | 7,929 | | | | 418,017 | |
Pioneer Bancorp Incorporated † | | | | | | | | | | | 621 | | | | 4,993 | |
Premier Financial Corporation | | | | | | | | | | | 2,141 | | | | 39,127 | |
Provident Bancorp Incorporated | | | | | | | | | | | 186 | | | | 1,447 | |
Provident Financial Holdings Incorporated | | | | | | | | | | | 258 | | | | 3,073 | |
Provident Financial Services Incorporated | | | | | | | | | | | 4,909 | | | | 64,701 | |
Prudential Bancorp Incorporated | | | | | | | | | | | 404 | | | | 3,996 | |
Radian Group Incorporated | | | | | | | | | | | 15,037 | | | | 232,171 | |
Riverview Bancorp Incorporated | | | | | | | | | | | 11,683 | | | | 48,251 | |
Southern Missouri Bancorp | | | | | | | | | | | 371 | | | | 8,785 | |
Standard AVB Financial Corporation | | | | | | | | | | | 219 | | | | 4,041 | |
Sterling Bancorp Incorporated | | | | | | | | | | | 4,146 | | | | 12,314 | |
Territorial Bancorp Incorporated | | | | | | | | | | | 437 | | | | 9,247 | |
Timberland Bancorp Incorporated | | | | | | | | | | | 428 | | | | 7,486 | |
Trustco Bank Corporation | | | | | | | | | | | 10,919 | | | | 65,077 | |
Walker & Dunlop Incorporated | | | | | | | | | | | 4,853 | | | | 265,847 | |
Washington Federal Incorporated | | | | | | | | | | | 4,903 | | | | 114,975 | |
Waterstone Financial Incorporated | | | | | | | | | | | 1,311 | | | | 20,307 | |
Western New England Bancorp | | | | | | | | | | | 1,107 | | | | 5,668 | |
WSFS Financial Corporation | | | | | | | | | | | 6,804 | | | | 199,357 | |
| | | | |
| | | | | | | | | | | | | | | 3,826,333 | |
| | | | | | | | | | | | | | | | |
|
Health Care: 19.65% | |
|
| Biotechnology: 9.43% | |
Acorda Therapeutics Incorporated † | | | | | | | | | | | 2,323 | | | | 1,292 | |
Adamas Pharmaceuticals Incorporated † | | | | | | | | | | | 1,265 | | | | 6,553 | |
ADMA Biologics Incorporated † | | | | | | | | | | | 7,733 | | | | 19,719 | |
Aduro Biotech Incorporated † | | | | | | | | | | | 35,778 | | | | 110,912 | |
Adverum Biotechnologies Incorporated † | | | | | | | | | | | 89 | | | | 1,086 | |
Aeglea BioTherapeutics Incorporated † | | | | | | | | | | | 12,074 | | | | 87,838 | |
The accompanying notes are an integral part of these financial statements.
Wells Fargo Factor Enhanced U.S. Small Cap Equity Portfolio | 19
Portfolio of investments—August 31, 2020 (unaudited)
| | | | | | | | | | | | | | | | |
| | | | | | | | | Shares | | | Value | |
|
| Biotechnology (continued) | |
Affimed NV † | | | | | | | | | | | 27,668 | | | $ | 95,455 | |
Agenus Incorporated † | | | | | | | | | | | 38,252 | | | | 166,587 | |
AIM ImmunoTech Incorporated † | | | | | | | | | | | 1,788 | | | | 4,023 | |
Akcea Therapeutics Incorporated † | | | | | | | | | | | 2,413 | | | | 44,110 | |
Akebia Therapeutics Incorporated † | | | | | | | | | | | 30,473 | | | | 317,224 | |
Akero Therapeutics Incorporated † | | | | | | | | | | | 237 | | | | 7,726 | |
Albireo Pharma Incorporated † | | | | | | | | | | | 879 | | | | 24,454 | |
Alector Incorporated † | | | | | | | | | | | 2,017 | | | | 26,060 | |
Allakos Incorporated † | | | | | | | | | | | 406 | | | | 36,369 | |
Allogene Therapeutics Incorporated † | | | | | | | | | | | 1,386 | | | | 49,411 | |
AMAG Pharmaceuticals Incorporated † | | | | | | | | | | | 2,857 | | | | 29,599 | |
Amicus Therapeutics Incorporated † | | | | | | | | | | | 22,885 | | | | 334,121 | |
AnaptysBio Incorporated † | | | | | | | | | | | 1,002 | | | | 17,365 | |
Anavex Life Sciences Corporation † | | | | | | | | | | | 5,498 | | | | 23,312 | |
Anika Therapeutics Incorporated † | | | | | | | | | | | 1,908 | | | | 73,134 | |
Apellis Pharmaceuticals Incorporated † | | | | | | | | | | | 261 | | | | 8,047 | |
Applied Genetic Technologies Corporation † | | | | | | | | | | | 1,131 | | | | 5,813 | |
Aptinyx Incorporated † | | | | | | | | | | | 1,429 | | | | 4,730 | |
Aravive Incorporated † | | | | | | | | | | | 4,679 | | | | 26,670 | |
Arcturus Therapeutics Holdings Incorporated † | | | | | | | | | | | 2,753 | | | | 132,805 | |
Arcus Biosciences Incorporated † | | | | | | | | | | | 10,596 | | | | 252,185 | |
Ardelyx Incorporated † | | | | | | | | | | | 6,057 | | | | 34,767 | |
Arena Pharmaceuticals Incorporated † | | | | | | | | | | | 6,720 | | | | 469,190 | |
Arrowhead Pharmaceuticals Incorporated † | | | | | | | | | | | 6,140 | | | | 259,354 | |
Artara Therapeutics Incorporated † | | | | | | | | | | | 4,599 | | | | 98,419 | |
Atara Biotherapeutics Incorporated † | | | | | | | | | | | 1,821 | | | | 24,547 | |
Athenex Incorporated † | | | | | | | | | | | 8,296 | | | | 95,321 | |
Athersys Incorporated † | | | | | | | | | | | 44,856 | | | | 97,786 | |
Atreca Incorporated Class A † | | | | | | | | | | | 314 | | | | 4,465 | |
Aveo Pharmaceuticals Incorporated † | | | | | | | | | | | 19,693 | | | | 93,739 | |
Avid Bioservices Incorporated † | | | | | | | | | | | 7,788 | | | | 65,341 | |
BeyondSpring Incorporated † | | | | | | | | | | | 1,555 | | | | 19,329 | |
Biocryst Pharmaceuticals Incorporated † | | | | | | | | | | | 22,944 | | | | 95,218 | |
Biohaven Pharmaceutical Holding Company † | | | | | | | | | | | 2,369 | | | | 150,171 | |
BioSpecifics Technologies Corporation † | | | | | | | | | | | 2,230 | | | | 143,835 | |
Bioxcel Therapeutics Incorporated † | | | | | | | | | | | 75 | | | | 3,056 | |
Blueprint Medicines Corporation † | | | | | | | | | | | 1,654 | | | | 128,069 | |
Brainstorm Cell Therapeutics Incorporated † | | | | | | | | | | | 1,612 | | | | 20,327 | |
BridgeBio Pharma Incorporated † | | | | | | | | | | | 1,825 | | | | 54,495 | |
Calyxt Incorporated † | | | | | | | | | | | 6,328 | | | | 34,393 | |
CareDx Incorporated † | | | | | | | | | | | 5,640 | | | | 192,606 | |
Casi Pharmaceuticals Incorporated † | | | | | | | | | | | 25,997 | | | | 44,455 | |
Cassava Sciences Incorporated † | | | | | | | | | | | 6,731 | | | | 21,135 | |
Castle Biosciences Incorporated † | | | | | | | | | | | 3,262 | | | | 149,171 | |
Catabasis Pharmaceuticals Incorporated † | | | | | | | | | | | 962 | | | | 6,349 | |
Catalyst Biosciences Incorporated † | | | | | | | | | | | 5,106 | | | | 26,653 | |
Catalyst Pharmaceuticals Incorporated † | | | | | | | | | | | 13,477 | | | | 44,205 | |
Cel-Sci Corporation † | | | | | | | | | | | 2,098 | | | | 27,127 | |
Cellular Biomedicine Group Class I † | | | | | | | | | | | 793 | | | | 14,734 | |
Checkpoint Therapeutics Incorporated † | | | | | | | | | | | 3,808 | | | | 8,301 | |
Chemocentryx Incorporated † | | | | | | | | | | | 8,391 | | | | 448,919 | |
Chimerix Incorporated † | | | | | | | | | | | 21,019 | | | | 59,063 | |
Cidara Therapeutics Incorporated † | | | | | | | | | | | 7,504 | | | | 23,863 | |
Clovis Oncology Incorporated † | | | | | | | | | | | 6,463 | | | | 33,672 | |
Cohbar Incorporated † | | | | | | | | | | | 89,541 | | | | 83,542 | |
Coherus Biosciences Incorporated † | | | | | | | | | | | 9,780 | | | | 185,527 | |
Constellation Pharmaceuticals Incorporated † | | | | | | | | | | | 2,186 | | | | 46,015 | |
The accompanying notes are an integral part of these financial statements.
20 | Wells Fargo Factor Enhanced U.S. Small Cap Equity Portfolio
Portfolio of investments—August 31, 2020 (unaudited)
| | | | | | | | | | | | | | | | |
| | | | | | | | | Shares | | | Value | |
|
| Biotechnology (continued) | |
Contrafect Corporation † | | | | | | | | | | | 5,097 | | | $ | 27,881 | |
Corbus Pharmaceuticals Holdings † | | | | | | | | | | | 28,328 | | | | 263,025 | |
Crinetics Pharmaceuticals Incorporated † | | | | | | | | | | | 334 | | | | 5,354 | |
Cue Biopharma Incorporated † | | | | | | | | | | | 3,316 | | | | 59,257 | |
Cytokinetics Incorporated † | | | | | | | | | | | 8,117 | | | | 194,483 | |
CytomX Therapeutics Incorporated † | | | | | | | | | | | 9,299 | | | | 67,883 | |
Deciphera Pharmaceuticals Incorporated † | | | | | | | | | | | 4,223 | | | | 190,077 | |
Denali Therapeutics Incorporated † | | | | | | | | | | | 3,943 | | | | 125,782 | |
DermTech Incorporated † | | | | | | | | | | | 750 | | | | 8,828 | |
Dicerna Pharmaceuticals Incorporated † | | | | | | | | | | | 8,290 | | | | 153,531 | |
Dyadic International Incorporated † | | | | | | | | | | | 2,330 | | | | 18,524 | |
Dynavax Technologies Corporation † | | | | | | | | | | | 12,762 | | | | 76,317 | |
Eagle Pharmaceuticals Incorporated † | | | | | | | | | | | 3,838 | | | | 152,292 | |
Editas Medicine Incorporated † | | | | | | | | | | | 2,865 | | | | 100,934 | |
Eidos Therapeutics Incorporated † | | | | | | | | | | | 1,860 | | | | 80,501 | |
Eiger BioPharmaceuticals Incorporated † | | | | | | | | | | | 1,619 | | | | 18,084 | |
Emergent BioSolutions Incorporated † | | | | | | | | | | | 5,664 | | | | 645,979 | |
Enanta Pharmaceuticals Incorporated † | | | | | | | | | | | 3,443 | | | | 179,690 | |
Enochian Biosciences Incorporated † | | | | | | | | | | | 2,045 | | | | 8,344 | |
Epizyme Incorporated † | | | | | | | | | | | 5,277 | | | | 68,601 | |
Esperion Therapeutics Incorporated † | | | | | | | | | | | 3,476 | | | | 125,484 | |
Evelo Biosciences Incorporated † | | | | | | | | | | | 864 | | | | 3,836 | |
Exicure Incorporated † | | | | | | | | | | | 4,031 | | | | 8,022 | |
Fate Therapeutics Incorporated † | | | | | | | | | | | 2,879 | | | | 104,796 | |
Fennec Pharmaceuticals Incorporated † | | | | | | | | | | | 20,587 | | | | 112,817 | |
Fibrogen Incorporated † | | | | | | | | | | | 4,767 | | | | 213,705 | |
Five Prime Therapeutics Incorporated † | | | | | | | | | | | 5,716 | | | | 24,407 | |
Flexion Therapeutics Incorporated † | | | | | | | | | | | 9,045 | | | | 105,465 | |
Fortress Biotech Incorporated † | | | | | | | | | | | 15,832 | | | | 62,616 | |
Frequency Therapeutics Incorporated † | | | | | | | | | | | 2,252 | | | | 43,554 | |
G1 Therapeutics Incorporated † | | | | | | | | | | | 2,603 | | | | 39,956 | |
Geron Corporation † | | | | | | | | | | | 6,099 | | | | 12,503 | |
Gossamer Bio Incorporated † | | | | | | | | | | | 892 | | | | 12,399 | |
Halozyme Therapeutics Incorporated † | | | | | | | | | | | 12,958 | | | | 375,717 | |
Harpoon Therapeutics Incorporated † | | | | | | | | | | | 1,700 | | | | 23,392 | |
Heron Therapeutics Incorporated † | | | | | | | | | | | 12,636 | | | | 180,695 | |
Hookipa Pharma Incorporated † | | | | | | | | | | | 3,163 | | | | 28,277 | |
iBio Incorporated † | | | | | | | | | | | 6,196 | | | | 12,950 | |
Immunic Incorporated † | | | | | | | | | | | 2,556 | | | | 41,024 | |
Immunogen Incorporated † | | | | | | | | | | | 60,727 | | | | 224,690 | |
Immunovant Incorporated † | | | | | | | | | | | 6,067 | | | | 206,035 | |
Inovio Pharmaceuticals Incorporated † | | | | | | | | | | | 19,642 | | | | 235,508 | |
Insmed Incorporated † | | | | | | | | | | | 6,103 | | | | 172,044 | |
Intellia Therapeutics Incorporated † | | | | | | | | | | | 7,531 | | | | 162,519 | |
Intercept Pharmaceuticals Incorporated † | | | | | | | | | | | 1,651 | | | | 82,352 | |
Invitae Corporation † | | | | | | | | | | | 5,709 | | | | 199,587 | |
Ironwood Pharmaceuticals Incorporated † | | | | | | | | | | | 44,251 | | | | 446,935 | |
Iveric Bio Incorporated † | | | | | | | | | | | 9,522 | | | | 42,754 | |
Jounce Therapeutics Incorporated † | | | | | | | | | | | 19,236 | | | | 93,102 | |
Kadmon Holdings Incorporated † | | | | | | | | | | | 47,851 | | | | 239,255 | |
KalVista Pharmaceuticals Incorporated † | | | | | | | | | | | 3,410 | | | | 44,671 | |
Karuna Therapeutics Incorporated † | | | | | | | | | | | 286 | | | | 21,850 | |
Karyopharm Therapeutics Incorporated † | | | | | | | | | | | 12,570 | | | | 191,190 | |
Keros Therapeutics Incorporated † | | | | | | | | | | | 299 | | | | 16,008 | |
Kezar Life Sciences Incorporated † | | | | | | | | | | | 2,256 | | | | 10,964 | |
Kindred Biosciences Incorporated † | | | | | | | | | | | 4,841 | | | | 24,011 | |
Kiniksa Pharmaceuticals Limited Class A † | | | | | | | | | | | 5,119 | | | | 90,453 | |
The accompanying notes are an integral part of these financial statements.
Wells Fargo Factor Enhanced U.S. Small Cap Equity Portfolio | 21
Portfolio of investments—August 31, 2020 (unaudited)
| | | | | | | | | | | | | | | | |
| | | | | | | | | Shares | | | Value | |
|
| Biotechnology (continued) | |
Kodiak Sciences Incorporated † | | | | | | | | | | | 1,121 | | | $ | 58,953 | |
Krystal Biotech Incorporated † | | | | | | | | | | | 816 | | | | 39,013 | |
Kura Oncology Incorporated † | | | | | | | | | | | 347 | | | | 8,637 | |
La Jolla Pharmaceutical Company † | | | | | | | | | | | 1,355 | | | | 5,691 | |
Lexicon Pharmaceuticals Incorporated † | | | | | | | | | | | 3,290 | | | | 5,758 | |
Ligand Pharmaceuticals Incorporated † | | | | | | | | | | | 3,641 | | | | 371,382 | |
Lineage Cell Therapeutics Incorporated † | | | | | | | | | | | 5,133 | | | | 4,697 | |
Macrogenics Incorporated † | | | | | | | | | | | 9,080 | | | | 262,775 | |
Madrigal Pharmaceuticals Incorporated † | | | | | | | | | | | 982 | | | | 105,761 | |
Mannkind Corporation † | | | | | | | | | | | 102,419 | | | | 178,209 | |
Marker Therapeutics Incorporated † | | | | | | | | | | | 3,276 | | | | 5,897 | |
Matinas BioPharma Holdings Incorporated Class I † | | | | | | | | | | | 11,047 | | | | 8,640 | |
Medicinova Incorporated † | | | | | | | | | | | 1,931 | | | | 10,118 | |
Mei Pharma Incorporated † | | | | | | | | | | | 14,608 | | | | 39,734 | |
Mersana Therapeutics Incorporated † | | | | | | | | | | | 9,996 | | | | 191,523 | |
Minerva Neurosciences Incorporated † | | | | | | | | | | | 4,227 | | | | 13,442 | |
Mirati Therapeutics Incorporated † | | | | | | | | | | | 619 | | | | 92,460 | |
Molecular Templates Incorporated † | | | | | | | | | | | 6,048 | | | | 70,217 | |
Moleculin Biotech Incorporated † | | | | | | | | | | | 3,239 | | | | 2,840 | |
Momenta Pharmaceuticals Incorporated † | | | | | | | | | | | 11,015 | | | | 574,653 | |
Morphic Holding Incorporated † | | | | | | | | | | | 1,121 | | | | 29,707 | |
Myriad Genetics Incorporated † | | | | | | | | | | | 10,712 | | | | 143,219 | |
Nantkwest Incorporated † | | | | | | | | | | | 8,250 | | | | 60,225 | |
Natera Incorporated † | | | | | | | | | | | 4,429 | | | | 282,172 | |
Neoleukin Therapeutics Incorporated † | | | | | | | | | | | 1,142 | | | | 14,515 | |
Neubase Therapeutics Incorporated † | | | | | | | | | | | 11,459 | | | | 92,016 | |
Neurobo Pharmaceuticals Incorporated † | | | | | | | | | | | 244 | | | | 1,484 | |
NextCure Incorporated † | | | | | | | | | | | 2,313 | | | | 20,794 | |
Novavax Incorporated † | | | | | | | | | | | 8,228 | | | | 907,834 | |
Nymox Pharmaceutical Corporation † | | | | | | | | | | | 11,072 | | | | 27,901 | |
OPKO Health Incorporated † | | | | | | | | | | | 75,060 | | | | 243,194 | |
Organogenesis Holdings Incorporated † | | | | | | | | | | | 6,133 | | | | 26,403 | |
Orgenesis Incorporated † | | | | | | | | | | | 7,936 | | | | 41,823 | |
ORIC Pharmaceuticals Incorporated † | | | | | | | | | | | 884 | | | | 22,144 | |
Otonomy Incorporated † | | | | | | | | | | | 1,484 | | | | 5,669 | |
Ovid Therapeutics Incorporated † | | | | | | | | | | | 7,985 | | | | 45,834 | |
Palatin Technologies Incorporated † | | | | | | | | | | | 10,195 | | | | 5,635 | |
PDL BioPharma Incorporated | | | | | | | | | | | 17,463 | | | | 58,501 | |
Pfenex Incorporated † | | | | | | | | | | | 4,376 | | | | 54,831 | |
Pieris Pharmaceuticals Incorporated † | | | | | | | | | | | 40,826 | | | | 116,762 | |
Precigen Incorporated † | | | | | | | | | | | 2,018 | | | | 12,209 | |
Precision BioSciences Incorporated † | | | | | | | | | | | 2,043 | | | | 11,523 | |
Principia Biopharma Incorporated † | | | | | | | | | | | 3,815 | | | | 381,538 | |
Protagonist Therapeutics Incorporated † | | | | | | | | | | | 329 | | | | 7,370 | |
Proteostasis Therapeutics Incorporated † | | | | | | | | | | | 2,585 | | | | 3,490 | |
PTC Therapeutics Incorporated † | | | | | | | | | | | 3,555 | | | | 175,706 | |
Puma Biotechnology Incorporated † | | | | | | | | | | | 17,654 | | | | 181,660 | |
Radius Health Incorporated † | | | | | | | | | | | 9,527 | | | | 117,944 | |
REGENXBIO Incorporated † | | | | | | | | | | | 3,114 | | | | 95,039 | |
Retrophin Incorporated † | | | | | | | | | | | 10,790 | | | | 211,376 | |
Revolution Medicines Incorporated † | | | | | | | | | | | 816 | | | | 23,125 | |
Rigel Pharmaceuticals Incorporated † | | | | | | | | | | | 90,693 | | | | 225,826 | |
Sangamo Therapeutics Incorporated † | | | | | | | | | | | 18,783 | | | | 207,270 | |
Savara Incorporated † | | | | | | | | | | | 2,339 | | | | 3,415 | |
Scholar Rock Holding Corporation † | | | | | | | | | | | 4,833 | | | | 72,978 | |
Selecta Biosciences Incorporated † | | | | | | | | | | | 8,784 | | | | 22,838 | |
Seres Therapeutics Incorporated † | | | | | | | | | | | 16,269 | | | | 430,966 | |
The accompanying notes are an integral part of these financial statements.
22 | Wells Fargo Factor Enhanced U.S. Small Cap Equity Portfolio
Portfolio of investments—August 31, 2020 (unaudited)
| | | | | | | | | | | | | | | | |
| | | | | | | | | Shares | | | Value | |
|
| Biotechnology (continued) | |
Soleno Therapeutics Incorporated † | | | | | | | | | | | 15,851 | | | $ | 33,921 | |
Sorrento Therapeutics Incorporated † | | | | | | | | | | | 33,446 | | | | 267,902 | |
Spectrum Pharmaceuticals Incorporated † | | | | | | | | | | | 1,408 | | | | 5,928 | |
Spero Therapeutics Incorporated † | | | | | | | | | | | 1,210 | | | | 13,153 | |
Springworks Therapeutics Incorporated † | | | | | | | | | | | 48 | | | | 2,132 | |
Sutro Biopharma Incorporated † | | | | | | | | | | | 7,190 | | | | 71,972 | |
Syndax Pharmaceuticals Incorporated † | | | | | | | | | | | 2,368 | | | | 38,622 | |
Syros Pharmaceuticals Incorporated † | | | | | | | | | | | 2,236 | | | | 29,627 | |
T2 Biosystems Incorporated † | | | | | | | | | | | 3,735 | | | | 5,827 | |
TCR2 Therapeutics Incorporated † | | | | | | | | | | | 1,895 | | | | 38,317 | |
TG Therapeutics Incorporated † | | | | | | | | | | | 7,052 | | | | 174,925 | |
Translate Bio Incorporated † | | | | | | | | | | | 5,619 | | | | 79,172 | |
Turning Point Therapeutics Incorporated † | | | | | | | | | | | 282 | | | | 22,047 | |
Twist Bioscience Corporation † | | | | | | | | | | | 3,437 | | | | 240,349 | |
Tyme Technologies Incorporated † | | | | | | | | | | | 4,334 | | | | 4,377 | |
Ultragenyx Pharmaceutical Incorporated † | | | | | | | | | | | 3,339 | | | | 284,015 | |
Unity Biotechnology Incorporated † | | | | | | | | | | | 366 | | | | 1,149 | |
Vanda Pharmaceuticals Incorporated † | | | | | | | | | | | 8,363 | | | | 86,055 | |
Vaxart Incorporated † | | | | | | | | | | | 10,128 | | | | 60,059 | |
VBI Vaccines Incorporated † | | | | | | | | | | | 21,084 | | | | 89,818 | |
Veracyte Incorporated † | | | | | | | | | | | 6,725 | | | | 224,010 | |
Verastem Incorporated † | | | | | | | | | | | 38,426 | | | | 48,417 | |
Vericel Corporation † | | | | | | | | | | | 13,436 | | | | 212,961 | |
Viela Bio Incorporated † | | | | | | | | | | | 1,485 | | | | 50,030 | |
Viking Therapeutics Incorporated † | | | | | | | | | | | 10,748 | | | | 71,904 | |
Vir Biotechnology Incorporated † | | | | | | | | | | | 1,587 | | | | 64,242 | |
Voyager Therapeutics Incorporated † | | | | | | | | | | | 6,771 | | | | 79,830 | |
vTv Therapeutics Incorporated Class A † | | | | | | | | | | | 64,430 | | | | 134,014 | |
Xbiotech Incorporated † | | | | | | | | | | | 4,152 | | | | 78,556 | |
Xencor Incorporated † | | | | | | | | | | | 7,662 | | | | 273,917 | |
XOMA Corporation † | | | | | | | | | | | 1,153 | | | | 21,930 | |
Y-mAbs Therapeutics Incorporated † | | | | | | | | | | | 1,536 | | | | 66,094 | |
| | | | |
| | | | | | | | | | | | | | | 21,005,277 | |
| | | | | | | | | | | | | | | | |
|
| Health Care Equipment & Supplies: 3.47% | |
Accuray Incorporated † | | | | | | | | | | | 18,519 | | | | 43,149 | |
Alphatec Holdings Incorporated † | | | | | | | | | | | 3,178 | | | | 19,036 | |
AngioDynamics Incorporated † | | | | | | | | | | | 2,195 | | | | 20,556 | |
Antares Pharma Incorporated † | | | | | | | | | | | 32,769 | | | | 92,736 | |
Apyx Medical Corporation † | | | | | | | | | | | 1,513 | | | | 6,945 | |
Aspira Women’s Health Incorporated † | | | | | | | | | | | 2,274 | | | | 6,515 | |
Atricure Incorporated † | | | | | | | | | | | 3,637 | | | | 162,683 | |
Atrion Corporation | | | | | | | | | | | 228 | | | | 144,032 | |
Avanos Medical Incorporated † | | | | | | | | | | | 6,860 | | | | 222,264 | |
Axogen Incorporated † | | | | | | | | | | | 3,451 | | | | 40,963 | |
Bellerophon Therapeutics Incorporated † | | | | | | | | | | | 3,054 | | | | 32,953 | |
BioLife Solutions Incorporated † | | | | | | | | | | | 7,461 | | | | 159,069 | |
Biomerica Incorporated † | | | | | | | | | | | 632 | | | | 4,588 | |
Cantel Medical Corporation | | | | | | | | | | | 4,208 | | | | 220,836 | |
Cardiovascular Systems Incorporated † | | | | | | | | | | | 4,921 | | | | 160,769 | |
Cerus Corporation † | | | | | | | | | | | 11,647 | | | | 74,191 | |
Chembio Diagnostics Incorporated † | | | | | | | | | | | 878 | | | | 3,600 | |
Co-Diagnostics Incorporated † | | | | | | | | | | | 4,575 | | | | 49,868 | |
ConforMIS Incorporated † | | | | | | | | | | | 3,893 | | | | 2,764 | |
CONMED Corporation | | | | | | | | | | | 5,149 | | | | 444,410 | |
CryoLife Incorporated † | | | | | | | | | | | 4,357 | | | | 88,099 | |
The accompanying notes are an integral part of these financial statements.
Wells Fargo Factor Enhanced U.S. Small Cap Equity Portfolio | 23
Portfolio of investments—August 31, 2020 (unaudited)
| | | | | | | | | | | | | | | | |
| | | | | | | | | Shares | | | Value | |
|
| Health Care Equipment & Supplies (continued) | |
Cryoport Incorporated † | | | | | | | | | | | 3,278 | | | $ | 181,863 | |
Cutera Incorporated † | | | | | | | | | | | 6,823 | | | | 111,693 | |
Cytosorbents Corporation † | | | | | | | | | | | 3,219 | | | | 27,168 | |
Electromed Incorporated † | | | | | | | | | | | 916 | | | | 11,340 | |
Fonar Corporation † | | | | | | | | | | | 4,578 | | | | 116,144 | |
Genmark Diagnostics Incorporated † | | | | | | | | | | | 6,616 | | | | 85,810 | |
Heska Corporation † | | | | | | | | | | | 417 | | | | 43,201 | |
Inogen Incorporated † | | | | | | | | | | | 2,814 | | | | 85,067 | |
Integer Holdings Corporation † | | | | | | | | | | | 5,822 | | | | 403,232 | |
Intricon Corporation † | | | | | | | | | | | 5,722 | | | | 69,465 | |
Invacare Corporation | | | | | | | | | | | 2,616 | | | | 17,736 | |
IRadimed Corporation † | | | | | | | | | | | 3,942 | | | | 83,570 | |
iRhythm Technologies Incorporated † | | | | | | | | | | | 1,112 | | | | 244,840 | |
Lantheus Holdings Incorporated † | | | | | | | | | | | 15,622 | | | | 209,647 | |
LeMaitre Vascular Incorporated | | | | | | | | | | | 5,591 | | | | 180,477 | |
LivaNova plc † | | | | | | | | | | | 3,962 | | | | 185,818 | |
Meridian Bioscience Incorporated † | | | | | | | | | | | 8,628 | | | | 122,000 | |
Merit Medical Systems Incorporated † | | | | | | | | | | | 7,862 | | | | 386,024 | |
Mesa Laboratories Incorporated | | | | | | | | | | | 309 | | | | 75,989 | |
Milestone Scientific Incorporated † | | | | | | | | | | | 55,083 | | | | 82,625 | |
Misonix Incorporated † | | | | | | | | | | | 867 | | | | 11,436 | |
Natus Medical Incorporated † | | | | | | | | | | | 7,907 | | | | 143,591 | |
Neogen Corporation † | | | | | | | | | | | 4,441 | | | | 338,404 | |
Nevro Corporation † | | | | | | | | | | | 2,145 | | | | 295,023 | |
NuVasive Incorporated † | | | | | | | | | | | 4,774 | | | | 248,869 | |
Nuvectra Corporation †(a) | | | | | | | | | | | 3,733 | | | | 0 | |
OraSure Technologies Incorporated † | | | | | | | | | | | 16,086 | | | | 188,528 | |
Orthofix Medical Incorporated † | | | | | | | | | | | 2,112 | | | | 64,078 | |
Orthopediatrics Corporation † | | | | | | | | | | | 1,013 | | | | 51,055 | |
Oxford Immunotec Global plc † | | | | | | | | | | | 1,336 | | | | 18,183 | |
Repro-Med Systems Incorporated † | | | | | | | | | | | 12,061 | | | | 104,810 | |
Retractable Technologies Incorporated † | | | | | | | | | | | 20,800 | | | | 131,456 | |
Rockwell Medical Incorporated † | | | | | | | | | | | 3,848 | | | | 5,041 | |
Seaspine Holdings Corporation † | | | | | | | | | | | 1,231 | | | | 16,385 | |
SI-BONE Incorporated † | | | | | | | | | | | 1,304 | | | | 28,453 | |
Silk Road Medical Incorporated † | | | | | | | | | | | 2,122 | | | | 129,400 | |
SmileDirectClub Incorporated † | | | | | | | | | | | 4,398 | | | | 35,712 | |
STAAR Surgical Company † | | | | | | | | | | | 6,235 | | | | 298,968 | |
Stereotaxis Incorporated † | | | | | | | | | | | 2,793 | | | | 9,831 | |
Surgalign Holdings Incorporated † | | | | | | | | | | | 8,666 | | | | 19,239 | |
Surmodics Incorporated † | | | | | | | | | | | 2,197 | | | | 99,414 | |
Tactile Systems Technology Class I † | | | | | | | | | | | 3,696 | | | | 142,037 | |
TransMedics Group Incorporated † | | | | | | | | | | | 1,274 | | | | 22,715 | |
Utah Medical Products Incorporated | | | | | | | | | | | 2,085 | | | | 171,283 | |
Vapotherm Incorporated † | | | | | | | | | | | 756 | | | | 23,519 | |
Varex Imaging Corporation † | | | | | | | | | | | 5,430 | | | | 60,219 | |
Venus Concept Incorporated † | | | | | | | | | | | 1,451 | | | | 4,164 | |
Wright Medical Group NV † | | | | | | | | | | | 8,656 | | | | 261,671 | |
Zynex Incorporated † | | | | | | | | | | | 6,064 | | | | 89,747 | |
| | | | |
| | | | | | | | | | | | | | | 7,736,966 | |
| | | | | | | | | | | | | | | | |
|
| Health Care Providers & Services: 2.51% | |
AdaptHealth Corporation † | | | | | | | | | | | 575 | | | | 12,207 | |
Addus Homecare Corporation † | | | | | | | | | | | 1,995 | | | | 186,852 | |
American Renal Associates Holdings † | | | | | | | | | | | 728 | | | | 4,907 | |
AMN Healthcare Services Incorporated † | | | | | | | | | | | 5,978 | | | | 321,856 | |
The accompanying notes are an integral part of these financial statements.
24 | Wells Fargo Factor Enhanced U.S. Small Cap Equity Portfolio
Portfolio of investments—August 31, 2020 (unaudited)
| | | | | | | | | | | | | | | | |
| | | | | | | | | Shares | | | Value | |
|
| Health Care Providers & Services (continued) | |
Apollo Medical Holdings Incorporated † | | | | | | | | | | | 1,752 | | | $ | 33,095 | |
BioTelemetry Incorporated † | | | | | | | | | | | 2,154 | | | | 85,255 | |
Community Health Systems Incorporated † | | | | | | | | | | | 10,315 | | | | 53,329 | |
CorVel Corporation † | | | | | | | | | | | 598 | | | | 49,646 | |
Covetrus Incorporated † | | | | | | | | | | | 5,909 | | | | 135,375 | |
Cross Country Healthcare Incorporated † | | | | | | | | | | | 2,768 | | | | 17,688 | |
Enzo Biochem Incorporated † | | | | | | | | | | | 15,909 | | | | 33,886 | |
Exagen Incorporated † | | | | | | | | | | | 338 | | | | 4,874 | |
Five Star Senior Living Incorporated † | | | | | | | | | | | 54,694 | | | | 282,768 | |
Fulgent Genetics Incorporated † | | | | | | | | | | | 712 | | | | 21,047 | |
Genesis Healthcare Incorporated † | | | | | | | | | | | 4,052 | | | | 2,690 | |
Hanger Incorporated † | | | | | | | | | | | 5,611 | | | | 110,873 | |
HealthEquity Incorporated † | | | | | | | | | | | 1,599 | | | | 91,911 | |
InfuSystem Holdings Incorporated † | | | | | | | | | | | 3,048 | | | | 44,348 | |
LHC Group Incorporated † | | | | | | | | | | | 1,296 | | | | 270,138 | |
Magellan Health Services Incorporated † | | | | | | | | | | | 3,226 | | | | 243,434 | |
MEDNAX Incorporated † | | | | | | | | | | | 4,044 | | | | 75,138 | |
National Healthcare Corporation | | | | | | | | | | | 1,161 | | | | 73,956 | |
National Research Corporation Class A | | | | | | | | | | | 2,361 | | | | 132,216 | |
Ontrak Incorporated † | | | | | | | | | | | 664 | | | | 48,439 | |
Option Care Health Incorporated † | | | | | | | | | | | 97 | | | | 1,127 | |
Owens & Minor Incorporated | | | | | | | | | | | 25,347 | | | | 420,253 | |
Patterson Companies Incorporated | | | | | | | | | | | 13,841 | | | | 401,527 | |
PetIQ Incorporated † | | | | | | | | | | | 1,813 | | | | 63,781 | |
Premier Incorporated Class A | | | | | | | | | | | 4,334 | | | | 141,939 | |
Providence Service Corporation † | | | | | | | | | | | 1,887 | | | | 174,717 | |
R1 RCM Incorporated † | | | | | | | | | | | 14,769 | | | | 214,151 | |
RadNet Incorporated † | | | | | | | | | | | 4,830 | | | | 69,649 | |
Select Medical Holdings Corporation † | | | | | | | | | | | 23,920 | | | | 480,074 | |
Sharps Compliance Corporation † | | | | | | | | | | | 4,168 | | | | 31,823 | |
Tenet Healthcare Corporation † | | | | | | | | | | | 21,479 | | | | 605,278 | |
The Ensign Group Incorporated | | | | | | | | | | | 8,127 | | | | 475,755 | |
The Joint Corporation † | | | | | | | | | | | 953 | | | | 17,021 | |
The Pennant Group Incorporated † | | | | | | | | | | | 1,317 | | | | 48,782 | |
Triple-S Management Corporation Class B † | | | | | | | | | | | 793 | | | | 14,750 | |
U.S. Physical Therapy Incorporated | | | | | | | | | | | 982 | | | | 87,300 | |
Viemed Healthcare Incorporated † | | | | | | | | | | | 907 | | | | 9,859 | |
| | | | |
| | | | | | | | | | | | | | | 5,593,714 | |
| | | | | | | | | | | | | | | | |
|
| Health Care Technology: 1.24% | |
Allscripts Healthcare Solutions Incorporated † | | | | | | | | | | | 19,447 | | | | 173,662 | |
Castlight Health Incorporated Class B † | | | | | | | | | | | 4,980 | | | | 6,872 | |
Computer Programs & Systems Incorporated | | | | | | | | | | | 9,471 | | | | 259,127 | |
Evolent Health Incorporated Class A † | | | | | | | | | | | 10,802 | | | | 154,793 | |
Health Catalyst Incorporated † | | | | | | | | | | | 1,303 | | | | 40,628 | |
HealthStream Incorporated † | | | | | | | | | | | 4,478 | | | | 92,762 | |
HMS Holdings Corporation † | | | | | | | | | | | 12,479 | | | | 348,039 | |
iCAD Incorporated † | | | | | | | | | | | 1,122 | | | | 12,151 | |
Inovalon Holdings Incorporated Class A † | | | | | | | | | | | 15,996 | | | | 395,821 | |
Inspire Medical Systems Incorporated † | | | | | | | | | | | 3,667 | | | | 438,023 | |
NantHealth Incorporated † | | | | | | | | | | | 1,510 | | | | 4,802 | |
NextGen Healthcare Incorporated † | | | | | | | | | | | 3,615 | | | | 47,935 | |
Omnicell Incorporated † | | | | | | | | | | | 3,877 | | | | 258,518 | |
OptimizeRx Corporation † | | | | | | | | | | | 998 | | | | 20,120 | |
Phreesia Incorporated † | | | | | | | | | | | 1,126 | | | | 35,514 | |
Simulations Plus Incorporated | | | | | | | | | | | 4,163 | | | | 248,032 | |
The accompanying notes are an integral part of these financial statements.
Wells Fargo Factor Enhanced U.S. Small Cap Equity Portfolio | 25
Portfolio of investments—August 31, 2020 (unaudited)
| | | | | | | | | | | | | | | | |
| | | | | | | | | Shares | | | Value | |
|
| Health Care Technology (continued) | |
Tabula Rasa Healthcare Incorporated † | | | | | | | | | | | 3,414 | | | $ | 172,748 | |
Vocera Communications Incorporated † | | | | | | | | | | | 1,926 | | | | 53,909 | |
| | | | |
| | | | | | | | | | | | | | | 2,763,456 | |
| | | | | | | | | | | | | | | | |
|
| Life Sciences Tools & Services: 0.81% | |
Accelerate Diagnostics Incorporated † | | | | | | | | | | | 88 | | | | 1,072 | |
Champions Oncology Incorporated † | | | | | | | | | | | 9,777 | | | | 80,954 | |
Chromadex Corporation † | | | | | | | | | | | 9,904 | | | | 49,025 | |
Codexis Incorporated † | | | | | | | | | | | 4,795 | | | | 66,171 | |
Harvard Bioscience Incorporated † | | | | | | | | | | | 47,552 | | | | 159,299 | |
Luminex Corporation | | | | | | | | | | | 9,337 | | | | 249,205 | |
Medpace Holdings Incorporated † | | | | | | | | | | | 5,251 | | | | 681,527 | |
Nanostring Technologies Incorporated † | | | | | | | | | | | 2,820 | | | | 114,154 | |
Neogenomics Incorporated † | | | | | | | | | | | 7,555 | | | | 294,267 | |
Personalis Incorporated † | | | | | | | | | | | 1,495 | | | | 34,116 | |
Quanterix Corporation † | | | | | | | | | | | 2,049 | | | | 72,944 | |
| | | | |
| | | | | | | | | | | | | | | 1,802,734 | |
| | | | | | | | | | | | | | | | |
|
| Pharmaceuticals: 2.19% | |
Akorn Incorporated † | | | | | | | | | | | 5,696 | | | | 196 | |
Amneal Pharmaceuticals Incorporated † | | | | | | | | | | | 47,232 | | | | 194,124 | |
Amphastar Pharmaceuticals Incorporated † | | | | | | | | | | | 12,238 | | | | 249,410 | |
Ampio Pharmaceuticals Incorporated † | | | | | | | | | | | 10,184 | | | | 7,292 | |
ANI Pharmaceuticals Incorporated † | | | | | | | | | | | 1,371 | | | | 42,995 | |
Aquestive Therapeutics Incorporated † | | | | | | | | | | | 9,338 | | | | 73,397 | |
Arvinas Incorporated † | | | | | | | | | | | 1,951 | | | | 50,628 | |
Assembly Biosciences Incorporated † | | | | | | | | | | | 4,623 | | | | 101,105 | |
Assertio Holdings Incorporated † | | | | | | | | | | | 5,117 | | | | 4,145 | |
Avenue Therapeutics Incorporated † | | | | | | | | | | | 8,062 | | | | 89,730 | |
Axsome Therapeutics Incorporated † | | | | | | | | | | | 465 | | | | 34,089 | |
Aytu Bioscience Incorporated † | | | | | | | | | | | 5,407 | | | | 5,731 | |
BioDelivery Sciences International Incorporated † | | | | | | | | | | | 29,056 | | | | 113,609 | |
Cerecor Incorporated † | | | | | | | | | | | 14,065 | | | | 34,600 | |
Clearside Biomedical Incorporated † | | | | | | | | | | | 1,818 | | | | 3,127 | |
Collegium Pharmaceutical Incorporated † | | | | | | | | | | | 9,802 | | | | 186,826 | |
Corcept Therapeutics Incorporated † | | | | | | | | | | | 29,261 | | | | 371,615 | |
Dova Pharmaceuticals Incorporated †(a) | | | | | | | | | | | 2,458 | | | | 0 | |
Durect Corporation † | | | | | | | | | | | 35,084 | | | | 60,871 | |
Endo International plc † | | | | | | | | | | | 14,412 | | | | 43,380 | |
Eton Pharmaceuticals Incorporated † | | | | | | | | | | | 701 | | | | 5,496 | |
Eyepoint Pharmaceuticals Incorporated † | | | | | | | | | | | 5,050 | | | | 2,702 | |
Harrow Health Incorporated † | | | | | | | | | | | 2,990 | | | | 20,601 | |
Innoviva Incorporated † | | | | | | | | | | | 33,334 | | | | 390,341 | |
Intersect ENT Incorporated † | | | | | | | | | | | 4,182 | | | | 83,975 | |
Kala Pharmaceuticals Incorporated † | | | | | | | | | | | 2,875 | | | | 25,588 | |
Lannett Company Incorporated † | | | | | | | | | | | 4,155 | | | | 21,855 | |
Liquidia Technologies Incorporated † | | | | | | | | | | | 2,533 | | | | 12,969 | |
Mallinckrodt plc † | | | | | | | | | | | 5,517 | | | | 8,717 | |
MyoKardia Incorporated † | | | | | | | | | | | 3,605 | | | | 394,531 | |
Nabriva Therapeutics plc † | | | | | | | | | | | 7,160 | | | | 4,435 | |
NGM Biopharmaceuticals Incorporated † | | | | | | | | | | | 1,001 | | | | 18,669 | |
Ocular Therapeutix Incorporated † | | | | | | | | | | | 6,509 | | | | 56,628 | |
Omeros Corporation † | | | | | | | | | | | 7,312 | | | | 87,378 | |
Optinose Incorporated † | | | | | | | | | | | 1,763 | | | | 8,022 | |
Osmotica Pharmaceuticals plc † | | | | | | | | | | | 10,211 | | | | 60,653 | |
Pacira Pharmaceuticals Incorporated † | | | | | | | | | | | 7,286 | | | | 455,521 | |
The accompanying notes are an integral part of these financial statements.
26 | Wells Fargo Factor Enhanced U.S. Small Cap Equity Portfolio
Portfolio of investments—August 31, 2020 (unaudited)
| | | | | | | | | | | | | | | | |
| | | | | | | | | Shares | | | Value | |
|
| Pharmaceuticals (continued) | |
Paratek Pharmaceuticals Incorporated † | | | | | | | | | | | 3,968 | | | $ | 18,253 | |
Phibro Animal Health Corporation Class A | | | | | | | | | | | 12,828 | | | | 275,289 | |
Prestige Consumer Healthcare Incorporated † | | | | | | | | | | | 14,183 | | | | 516,687 | |
Recro Pharma Incorporated | | | | | | | | | | | 2,698 | | | | 7,420 | |
Relmada Therapeutics Incorporated † | | | | | | | | | | | 665 | | | | 23,727 | |
Scpharmaceuticals Incorporated † | | | | | | | | | | | 600 | | | | 5,136 | |
Siga Technologies Incorporated † | | | | | | | | | | | 17,812 | | | | 123,793 | |
Strongbridge Biopharma plc † | | | | | | | | | | | 18,768 | | | | 72,069 | |
Supernus Pharmaceuticals Incorporated † | | | | | | | | | | | 15,425 | | | | 339,196 | |
Theravance Biopharma Incorporated † | | | | | | | | | | | 9,219 | | | | 168,984 | |
| | | | |
| | | | | | | | | | | | | | | 4,875,505 | |
| | | | | | | | | | | | | | | | |
|
Industrials: 14.12% | |
|
| Aerospace & Defense: 0.96% | |
AAR Corporation | | | | | | | | | | | 6,005 | | | | 121,181 | |
Aerojet Rocketdyne Holdings Incorporated † | | | | | | | | | | | 6,427 | | | | 265,885 | |
AeroVironment Incorporated † | | | | | | | | | | | 3,056 | | | | 233,448 | |
Astronics Corporation † | | | | | | | | | | | 1,100 | | | | 9,944 | |
Cubic Corporation | | | | | | | | | | | 3,000 | | | | 141,240 | |
Ducommun Incorporated † | | | | | | | | | | | 2,743 | | | | 102,506 | |
Kratos Defense & Security Solutions Incorporated † | | | | | | | | | | | 3,102 | | | | 60,644 | |
Maxar Technologies Incorporated | | | | | | | | | | | 12,373 | | | | 286,435 | |
Moog Incorporated Class A | | | | | | | | | | | 5,285 | | | | 318,633 | |
National Presto Industries Incorporated | | | | | | | | | | | 1,041 | | | | 93,617 | |
PAE Incorporated † | | | | | | | | | | | 9,104 | | | | 80,434 | |
Park Aerospace Corporation | | | | | | | | | | | 1,078 | | | | 11,955 | |
Parsons Corporation † | | | | | | | | | | | 2,600 | | | | 86,476 | |
Spirit AeroSystems Holdings Incorporated Class A | | | | | | | | | | | 4,669 | | | | 95,995 | |
Vectrus Incorporated † | | | | | | | | | | | 5,075 | | | | 220,306 | |
| | | | |
| | | | | | | | | | | | | | | 2,128,699 | |
| | | | | | | | | | | | | | | | |
|
| Air Freight & Logistics: 0.34% | |
Air Transport Services Group Incorporated † | | | | | | | | | | | 8,153 | | | | 207,249 | |
Atlas Air Worldwide Holdings Incorporated † | | | | | | | | | | | 731 | | | | 41,221 | |
Echo Global Logistics Incorporated † | | | | | | | | | | | 4,735 | | | | 129,360 | |
Forward Air Corporation | | | | | | | | | | | 1,612 | | | | 95,092 | |
Hub Group Incorporated Class A † | | | | | | | | | | | 5,036 | | | | 271,138 | |
Radiant Logistics Incorporated † | | | | | | | | | | | 2,057 | | | | 10,861 | |
| | | | |
| | | | | | | | | | | | | | | 754,921 | |
| | | | | | | | | | | | | | | | |
|
| Airlines: 0.25% | |
Allegiant Travel Company | | | | | | | | | | | 528 | | | | 67,901 | |
Hawaiian Holdings Incorporated | | | | | | | | | | | 2,293 | | | | 30,818 | |
Mesa Air Group Incorporated † | | | | | | | | | | | 36,936 | | | | 135,186 | |
SkyWest Incorporated | | | | | | | | | | | 6,519 | | | | 219,364 | |
Spirit Airlines Incorporated † | | | | | | | | | | | 6,013 | | | | 107,512 | |
| | | | |
| | | | | | | | | | | | | | | 560,781 | |
| | | | | | | | | | | | | | | | |
|
| Building Products: 1.54% | |
Aaon Incorporated | | | | | | | | | | | 5,099 | | | | 290,286 | |
Alpha Pro Tech Limited † | | | | | | | | | | | 1,168 | | | | 16,387 | |
American Woodmark Corporation † | | | | | | | | | | | 1,952 | | | | 170,800 | |
Apogee Enterprises Incorporated | | | | | | | | | | | 2,851 | | | | 59,671 | |
Builders FirstSource Incorporated † | | | | | | | | | | | 19,850 | | | | 607,807 | |
Cornerstone Building Brands Incorporated † | | | | | | | | | | | 3,046 | | | | 24,246 | |
The accompanying notes are an integral part of these financial statements.
Wells Fargo Factor Enhanced U.S. Small Cap Equity Portfolio | 27
Portfolio of investments—August 31, 2020 (unaudited)
| | | | | | | | | | | | | | | | |
| | | | | | | | | Shares | | | Value | |
|
| Building Products (continued) | |
CSW Industrials Incorporated | | | | | | | | | | | 2,465 | | | $ | 178,096 | |
Gibraltar Industries Incorporated † | | | | | | | | | | | 4,796 | | | | 299,486 | |
Griffon Corporation | | | | | | | | | | | 7,182 | | | | 156,065 | |
Insteel Industries Incorporated | | | | | | | | | | | 1,941 | | | | 35,792 | |
JELD-WEN Holding Incorporated † | | | | | | | | | | | 5,477 | | | | 115,291 | |
Masonite International Corporation † | | | | | | | | | | | 2,122 | | | | 193,717 | |
Patrick Industries Incorporated | | | | | | | | | | | 4,131 | | | | 232,204 | |
PGT Incorporated † | | | | | | | | | | | 6,577 | | | | 119,241 | |
Quanex Building Products Corporation | | | | | | | | | | | 1,756 | | | | 29,518 | |
Resideo Technologies Incorporated † | | | | | | | | | | | 1,577 | | | | 21,069 | |
Simpson Manufacturing Company Incorporated | | | | | | | | | | | 2,835 | | | | 278,794 | |
UFP Industries Incorporated | | | | | | | | | | | 10,111 | | | | 600,088 | |
| | | | |
| | | | | | | | | | | | | | | 3,428,558 | |
| | | | | | | | | | | | | | | | |
|
| Commercial Services & Supplies: 1.97% | |
ABM Industries Incorporated | | | | | | | | | | | 9,085 | | | | 346,502 | |
ACCO Brands Corporation | | | | | | | | | | | 37,419 | | | | 242,475 | |
Acme United Corporation | | | | | | | | | | | 142 | | | | 3,130 | |
Advanced Disposal Services Incorporated † | | | | | | | | | | | 3,927 | | | | 118,321 | |
Brady Corporation Class A | | | | | | | | | | | 7,264 | | | | 340,609 | |
Casella Waste Systems Incorporated Class A † | | | | | | | | | | | 4,658 | | | | 261,547 | |
Ceco Environmental Corporation † | �� | | | | | | | | | | 2,118 | | | | 17,950 | |
Cimpress plc † | | | | | | | | | | | 2,651 | | | | 245,748 | |
Deluxe Corporation | | | | | | | | | | | 1,101 | | | | 31,268 | |
Ennis Incorporated | | | | | | | | | | | 3,895 | | | | 71,395 | |
Healthcare Services Group Incorporated | | | | | | | | | | | 10,601 | | | | 220,501 | |
Heritage Crystal Clean Incorporated † | | | | | | | | | | | 984 | | | | 14,445 | |
Herman Miller Incorporated | | | | | | | | | | | 7,392 | | | | 176,151 | |
HNI Corporation | | | | | | | | | | | 7,745 | | | | 246,678 | |
Interface Incorporated | | | | | | | | | | | 8,076 | | | | 61,055 | |
KAR Auction Services Incorporated | | | | | | | | | | | 17,185 | | | | 297,988 | |
Kimball International Incorporated Class B | | | | | | | | | | | 2,588 | | | | 29,011 | |
Knoll Incorporated | | | | | | | | | | | 5,747 | | | | 73,964 | |
Matthews International Corporation Class A | | | | | | | | | | | 1,867 | | | | 40,887 | |
McGrath RentCorp | | | | | | | | | | | 3,766 | | | | 249,912 | |
Perma-Fix Environmental Services Incorporated † | | | | | | | | | | | 637 | | | | 4,555 | |
PICO Holdings Incorporated † | | | | | | | | | | | 699 | | | | 6,214 | |
Pitney Bowes Incorporated | | | | | | | | | | | 11,780 | | | | 64,672 | |
Quad Graphics Incorporated | | | | | | | | | | | 1,656 | | | | 5,779 | |
RR Donnelley & Sons Company | | | | | | | | | | | 3,416 | | | | 4,509 | |
SP Plus Corporation † | | | | | | | | | | | 3,341 | | | | 68,524 | |
Steelcase Incorporated Class A | | | | | | | | | | | 18,214 | | | | 190,336 | |
TEAM Incorporated † | | | | | | | | | | | 2,002 | | | | 12,753 | |
Tetra Tech Incorporated | | | | | | | | | | | 3,060 | | | | 282,469 | |
The Brink’s Company | | | | | | | | | | | 1,711 | | | | 82,744 | |
UniFirst Corporation | | | | | | | | | | | 1,966 | | | | 378,691 | |
US Ecology Incorporated | | | | | | | | | | | 2,275 | | | | 84,471 | |
Viad Corporation | | | | | | | | | | | 1,055 | | | | 22,609 | |
VSE Corporation | | | | | | | | | | | 3,398 | | | | 98,644 | |
| | | | |
| | | | | | | | | | | | | | | 4,396,507 | |
| | | | | | | | | | | | | | | | |
|
| Construction & Engineering: 1.25% | |
Aegion Corporation † | | | | | | | | | | | 1,739 | | | | 28,146 | |
Ameresco Incorporated Class A † | | | | | | | | | | | 3,383 | | | | 115,496 | |
APi Group Corporation 144A† | | | | | | | | | | | 11,517 | | | | 162,850 | |
Arcosa Incorporated | | | | | | | | | | | 5,364 | | | | 248,300 | |
The accompanying notes are an integral part of these financial statements.
28 | Wells Fargo Factor Enhanced U.S. Small Cap Equity Portfolio
Portfolio of investments—August 31, 2020 (unaudited)
| | | | | | | | | | | | | | | | |
| | | | | | | | | Shares | | | Value | |
|
| Construction & Engineering (continued) | |
Comfort Systems Incorporated | | | | | | | | | | | 3,792 | | | $ | 192,141 | |
Concrete Pumping Holdings Incorporated † | | | | | | | | | | | 1,313 | | | | 4,766 | |
Construction Partners Incorporated Class A † | | | | | | | | | | | 2,626 | | | | 49,080 | |
Dycom Industries Incorporated † | | | | | | | | | | | 2,825 | | | | 173,766 | |
EMCOR Group Incorporated | | | | | | | | | | | 2,733 | | | | 205,002 | |
Fluor Corporation | | | | | | | | | | | 18,215 | | | | 173,407 | |
Goldfield Corporation † | | | | | | | | | | | 1,274 | | | | 5,567 | |
Granite Construction Incorporated | | | | | | | | | | | 6,543 | | | | 121,634 | |
Great Lakes Dredge & Dock Company † | | | | | | | | | | | 8,932 | | | | 83,693 | |
HC2 Holdings Incorporated † | | | | | | | | | | | 1,873 | | | | 4,683 | |
IES Holdings Incorporated † | | | | | | | | | | | 474 | | | | 13,665 | |
MasTec Incorporated † | | | | | | | | | | | 10,449 | | | | 482,848 | |
MYR Group Incorporated † | | | | | | | | | | | 2,925 | | | | 113,519 | |
Northwest Pipe Company † | | | | | | | | | | | 2,398 | | | | 67,935 | |
Orion Marine Group Incorporated † | | | | | | | | | | | 1,586 | | | | 4,139 | |
Primoris Services Corporation | | | | | | | | | | | 8,113 | | | | 154,634 | |
Sterling Construction Company Incorporated † | | | | | | | | | | | 5,071 | | | | 71,704 | |
Tutor Perini Corporation † | | | | | | | | | | | 1,915 | | | | 24,033 | |
Valmont Industries Incorporated | | | | | | | | | | | 1,282 | | | | 162,878 | |
WillScot Mobile Mini Holdings Corporation Class A † | | | | | | | | | | | 6,272 | | | | 112,269 | |
| | | | |
| | | | | | | | | | | | | | | 2,776,155 | |
| | | | | | | | | | | | | | | | |
|
| Electrical Equipment: 1.07% | |
Allied Motion Technologies Incorporated | | | | | | | | | | | 1,519 | | | | 64,694 | |
Atkore International Incorporated † | | | | | | | | | | | 12,498 | | | | 334,072 | |
AZZ Incorporated | | | | | | | | | | | 4,470 | | | | 155,243 | |
Bloom Energy Corporation Class A † | | | | | | | | | | | 4,228 | | | | 66,210 | |
Encore Wire Corporation | | | | | | | | | | | 3,276 | | | | 169,074 | |
EnerSys | | | | | | | | | | | 6,063 | | | | 436,415 | |
GrafTech International Limited | | | | | | | | | | | 3,578 | | | | 23,829 | |
LSI Industries Incorporated | | | | | | | | | | | 3,437 | | | | 23,578 | |
Orion Energy Systems Incorporated † | | | | | | | | | | | 36,449 | | | | 232,545 | |
Plug Power Incorporated † | | | | | | | | | | | 7,369 | | | | 95,650 | |
Powell Industries Incorporated | | | | | | | | | | | 1,459 | | | | 39,378 | |
Preformed Line Products Company | | | | | | | | | | | 54 | | | | 2,938 | |
Sunrun Incorporated † | | | | | | | | | | | 3,225 | | | | 182,390 | |
Thermon Group Holdings Incorporated † | | | | | | | | | | | 2,754 | | | | 36,243 | |
TPI mposites Incorporated † | | | | | | | | | | | 4,033 | | | | 123,853 | |
Ultralife Batteries Incorporated † | | | | | | | | | | | 598 | | | | 3,779 | |
Vertiv Holdings Corporation † | | | | | | | | | | | 10,190 | | | | 165,384 | |
Vicor Corporation † | | | | | | | | | | | 2,564 | | | | 223,145 | |
| | | | |
| | | | | | | | | | | | | | | 2,378,420 | |
| | | | | | | | | | | | | | | | |
|
| Industrial Conglomerates: 0.05% | |
Raven Industries Incorporated | | | | | | | | | | | 4,704 | | | | 116,894 | |
| | | | | | | | | | | | | | | | |
|
| Machinery: 3.47% | |
Alamo Group Incorporated | | | | | | | | | | | 1,135 | | | | 125,872 | |
Albany International Corporation Class A | | | | | | | | | | | 4,069 | | | | 211,181 | |
Altra Industrial Motion Corporation | | | | | | | | | | | 3,890 | | | | 151,905 | |
Astec Industries Incorporated | | | | | | | | | | | 4,232 | | | | 223,111 | |
Barnes Group Incorporated | | | | | | | | | | | 3,679 | | | | 145,688 | |
Blue Bird Corporation † | | | | | | | | | | | 5,849 | | | | 66,562 | |
Briggs & Stratton Corporation | | | | | | | | | | | 1,838 | | | | 268 | |
Chart Industries Incorporated † | | | | | | | | | | | 1,200 | | | | 78,864 | |
Circor International Incorporated † | | | | | | | | | | | 920 | | | | 27,278 | |
The accompanying notes are an integral part of these financial statements.
Wells Fargo Factor Enhanced U.S. Small Cap Equity Portfolio | 29
Portfolio of investments—August 31, 2020 (unaudited)
| | | | | | | | | | | | | | | | |
| | | | | | | | | Shares | | | Value | |
|
| Machinery (continued) | |
Columbus McKinnon Corporation | | | | | | | | | | | 2,612 | | | $ | 95,012 | |
Douglas Dynamics Incorporated | | | | | | | | | | | 2,906 | | | | 111,561 | |
Eastern Company | | | | | | | | | | | 276 | | | | 6,044 | |
Enerpac Tool Group Corporation | | | | | | | | | | | 4,442 | | | | 92,394 | |
ESCO Technologies Incorporated | | | | | | | | | | | 2,641 | | | | 237,479 | |
Evoqua Water Technologies Company † | | | | | | | | | | | 12,274 | | | | 251,126 | |
Federal Signal Corporation | | | | | | | | | | | 8,877 | | | | 285,129 | |
Foster Company Class A † | | | | | | | | | | | 1,283 | | | | 19,181 | |
Franklin Electric Company Incorporated | | | | | | | | | | | 6,999 | | | | 415,461 | |
Gates Industrial Corporation plc † | | | | | | | | | | | 2,439 | | | | 27,536 | |
Gencor Industries Incorporated † | | | | | | | | | | | 479 | | | | 6,040 | |
Gorman Rupp Company | | | | | | | | | | | 2,893 | | | | 92,431 | |
Graham Corporation | | | | | | | | | | | 492 | | | | 6,460 | |
Helios Technologies Incorporated | | | | | | | | | | | 1,824 | | | | 74,985 | |
Hurco Companies Incorporated | | | | | | | | | | | 381 | | | | 10,775 | |
Hyster Yale Materials Handeling Incorporated | | | | | | | | | | | 2,216 | | | | 89,393 | |
John Bean Technologies Corporation | | | | | | | | | | | 1,231 | | | | 126,190 | |
Kadant Incorporated | | | | | | | | | | | 2,075 | | | | 241,613 | |
Kennametal Incorporated | | | | | | | | | | | 6,146 | | | | 178,357 | |
Lindsay Manufacturing Company | | | | | | | | | | | 1,278 | | | | 127,711 | |
Lydall Incorporated † | | | | | | | | | | | 765 | | | | 14,367 | |
Manitex International Incorporated † | | | | | | | | | | | 831 | | | | 3,748 | |
Manitowoc Company Incorporated † | | | | | | | | | | | 4,739 | | | | 44,641 | |
Meritor Incorporated † | | | | | | | | | | | 18,033 | | | | 410,431 | |
Miller Industries Incorporated | | | | | | | | | | | 1,621 | | | | 50,851 | |
Mueller Industries Incorporated | | | | | | | | | | | 8,538 | | | | 253,579 | |
Mueller Water Products Incorporated Class A | | | | | | | | | | | 23,855 | | | | 257,634 | |
Navistar International Corporation † | | | | | | | | | | | 8,339 | | | | 266,681 | |
NN Incorporated | | | | | | | | | | | 2,148 | | | | 9,773 | |
Omega Flex Incorporated | | | | | | | | | | | 1,481 | | | | 195,107 | |
Park Ohio Holdings Corporation | | | | | | | | | | | 1,145 | | | | 18,114 | |
Proto Labs Incorporated † | | | | | | | | | | | 1,529 | | | | 224,763 | |
RBC Bearings Incorporated † | | | | | | | | | | | 971 | | | | 128,211 | |
REV Group Incorporated | | | | | | | | | | | 1,420 | | | | 11,005 | |
Rexnord Corporation | | | | | | | | | | | 7,133 | | | | 206,572 | |
SPX Corporation † | | | | | | | | | | | 7,101 | | | | 297,035 | |
SPX FLOW Incorporated † | | | | | | | | | | | 2,961 | | | | 128,744 | |
Standex International Corporation | | | | | | | | | | | 1,959 | | | | 113,309 | |
Tennant Company | | | | | | | | | | | 2,161 | | | | 143,642 | |
Terex Corporation | | | | | | | | | | | 9,761 | | | | 191,023 | |
The ExOne Company † | | | | | | | | | | | 801 | | | | 9,788 | |
The Greenbrier Companies Incorporated | | | | | | | | | | | 4,884 | | | | 132,796 | |
The Shyft Group Incorporated | | | | | | | | | | | 13,333 | | | | 266,260 | |
The Timken Company | | | | | | | | | | | 3,839 | | | | 208,035 | |
Titan International Incorporated | | | | | | | | | | | 2,348 | | | | 5,588 | |
Trimas Corporation † | | | | | | | | | | | 2,582 | | | | 65,273 | |
Trinity Industries Incorporated | | | | | | | | | | | 4,715 | | | | 96,516 | |
Twin Disc Incorporated † | | | | | | | | | | | 613 | | | | 3,709 | |
Wabash National Corporation | | | | | | | | | | | 3,070 | | | | 37,485 | |
Watts Water Technologies Incorporated | | | | | | | | | | | 3,054 | | | | 292,421 | |
Welbilt Incorporated † | | | | | | | | | | | 16,356 | | | | 120,707 | |
| | | | |
| | | | | | | | | | | | | | | 7,733,415 | |
| | | | | | | | | | | | | | | | |
|
| Marine: 0.15% | |
Costamare Incorporated | | | | | | | | | | | 26,121 | | | | 131,911 | |
Genco Shipping & Trading Limited | | | | | | | | | | | 1,059 | | | | 7,529 | |
The accompanying notes are an integral part of these financial statements.
30 | Wells Fargo Factor Enhanced U.S. Small Cap Equity Portfolio
Portfolio of investments—August 31, 2020 (unaudited)
| | | | | | | | | | | | | | | | |
| | | | | | | | | Shares | | | Value | |
|
| Marine (continued) | |
Matson Incorporated | | | | | | | | | | | 3,596 | | | $ | 144,092 | |
Pangaea Logistics Solutions Limited | | | | | | | | | | | 18,979 | | | | 46,499 | |
Scorpio Bulkers Incorporated | | | | | | | | | | | 314 | | | | 4,387 | |
| | | | |
| | | | | | | | | | | | | | | 334,418 | |
| | | | | | | | | | | | | | | | |
|
| Professional Services: 0.97% | |
Akerna Corporation † | | | | | | | | | | | 367 | | | | 2,220 | |
ASGN Incorporated † | | | | | | | | | | | 4,101 | | | | 294,329 | |
Barrett Business Services Incorporated | | | | | | | | | | | 1,529 | | | | 88,025 | |
BG Staffing Incorporated | | | | | | | | | | | 10,016 | | | | 93,950 | |
CBIZ Incorporated † | | | | | | | | | | | 5,418 | | | | 131,766 | |
CRA International Incorporated | | | | | | | | | | | 762 | | | | 32,393 | |
Exponent Incorporated | | | | | | | | | | | 3,895 | | | | 313,372 | |
Franklin Covey Company † | | | | | | | | | | | 593 | | | | 11,706 | |
GP Strategies Corporation † | | | | | | | | | | | 1,763 | | | | 17,031 | |
Heidrick & Struggles International Incorporated | | | | | | | | | | | 1,148 | | | | 24,831 | |
Hill International Incorporated † | | | | | | | | | | | 2,241 | | | | 3,294 | |
Huron Consulting Group Incorporated † | | | | | | | | | | | 1,441 | | | | 62,511 | |
ICF International Incorporated | | | | | | | | | | | 1,552 | | | | 106,017 | |
InnerWorkings Incorporated † | | | | | | | | | | | 2,080 | | | | 5,907 | |
Insperity Incorporated | | | | | | | | | | | 4,550 | | | | 306,534 | |
Kelly Services Incorporated Class A | | | | | | | | | | | 3,553 | | | | 67,471 | |
Kforce Incorporated | | | | | | | | | | | 6,309 | | | | 216,651 | |
Korn Ferry International | | | | | | | | | | | 5,293 | | | | 161,437 | |
Mistras Group Incorporated † | | | | | | | | | | | 1,327 | | | | 6,317 | |
Red Violet Incorporated † | | | | | | | | | | | 217 | | | | 4,511 | |
Resources Connection Incorporated | | | | | | | | | | | 1,722 | | | | 21,163 | |
TriNet Group Incorporated † | | | | | | | | | | | 2,007 | | | | 136,155 | |
TrueBlue Incorporated † | | | | | | | | | | | 2,097 | | | | 35,481 | |
Willdan Group Incorporated † | | | | | | | | | | | 1,001 | | | | 28,208 | |
| | | | |
| | | | | | | | | | | | | | | 2,171,280 | |
| | | | | | | | | | | | | | | | |
|
| Road & Rail: 0.76% | |
Arcbest Corporation | | | | | | | | | | | 2,623 | | | | 88,710 | |
Avis Budget Group Incorporated † | | | | | | | | | | | 5,153 | | | | 175,769 | |
Covenant Transport Incorporated Class A † | | | | | | | | | | | 1,247 | | | | 22,858 | |
Heartland Express Incorporated | | | | | | | | | | | 5,280 | | | | 109,217 | |
Marten Transport Limited | | | | | | | | | | | 12,066 | | | | 219,119 | |
P.A.M. Transportation Services Incorporated † | | | | | | | | | | | 105 | | | | 3,833 | |
Saia Incorporated † | | | | | | | | | | | 3,481 | | | | 467,150 | |
Schneider National Incorporated Class B | | | | | | | | | | | 3,560 | | | | 96,334 | |
Universal Logistics Holdings Incorporated | | | | | | | | | | | 962 | | | | 20,683 | |
US Xpress Enterprises Incorporated Class A † | | | | | | | | | | | 3,629 | | | | 34,730 | |
Werner Enterprises Incorporated | | | | | | | | | | | 9,899 | | | | 455,453 | |
YRC Worldwide Incorporated † | | | | | | | | | | | 1,490 | | | | 6,213 | |
| | | | |
| | | | | | | | | | | | | | | 1,700,069 | |
| | | | | | | | | | | | | | | | |
|
| Trading Companies & Distributors: 1.34% | |
Alta Equipment Group Incorporated † | | | | | | | | | | | 717 | | | | 5,987 | |
Applied Industrial Technologies Incorporated | | | | | | | | | | | 4,252 | | | | 256,013 | |
Beacon Roofing Supply Incorporated † | | | | | | | | | | | 526 | | | | 17,826 | |
BMC Stock Holdings Incorporated † | | | | | | | | | | | 10,260 | | | | 409,579 | |
CAI International Incorporated † | | | | | | | | | | | 3,033 | | | | 66,150 | |
DXP Enterprises Incorporated † | | | | | | | | | | | 2,607 | | | | 50,159 | |
EVI Industries Incorporated † | | | | | | | | | | | 162 | | | | 3,979 | |
The accompanying notes are an integral part of these financial statements.
Wells Fargo Factor Enhanced U.S. Small Cap Equity Portfolio | 31
Portfolio of investments—August 31, 2020 (unaudited)
| | | | | | | | | | | | | | | | |
| | | | | | | | | Shares | | | Value | |
|
| Trading Companies & Distributors (continued) | |
Foundation Building Materials Incorporated † | | | | | | | | | | | 2,799 | | | $ | 45,428 | |
GATX Corporation | | | | | | | | | | | 722 | | | | 48,287 | |
General Finance Corporation † | | | | | | | | | | | 770 | | | | 4,990 | |
GMS Incorporated † | | | | | | | | | | | 9,945 | | | | 263,443 | |
H&E Equipment Services Incorporated | | | | | | | | | | | 3,977 | | | | 80,574 | |
Herc Holdings Incorporated † | | | | | | | | | | | 1,461 | | | | 59,828 | |
Kaman Corporation | | | | | | | | | | | 390 | | | | 18,038 | |
Lawson Products Incorporated † | | | | | | | | | | | 1,009 | | | | 36,223 | |
MRC Global Incorporated † | | | | | | | | | | | 4,596 | | | | 26,151 | |
Rush Enterprises Incorporated | | | | | | | | | | | 5,692 | | | | 275,037 | |
Rush Enterprises Incorporated Class B | | | | | | | | | | | 3,735 | | | | 156,086 | |
SiteOne Landscape Supply Incorporated † | | | | | | | | | | | 2,301 | | | | 287,740 | |
Systemax Incorporated | | | | | | | | | | | 4,208 | | | | 93,376 | |
Textainer Group Holdings Limited † | | | | | | | | | | | 328 | | | | 3,851 | |
Titan Machinery Incorporated † | | | | | | | | | | | 1,088 | | | | 14,688 | |
Transcat Incorporated † | | | | | | | | | | | 377 | | | | 11,088 | |
Triton International Limited | | | | | | | | | | | 7,311 | | | | 263,635 | |
Veritiv Corporation † | | | | | | | | | | | 4,060 | | | | 70,563 | |
WESCO International Incorporated † | | | | | | | | | | | 8,796 | | | | 412,093 | |
Willis Lease Finance Corporation † | | | | | | | | | | | 108 | | | | 2,309 | |
| | | | |
| | | | | | | | | | | | | | | 2,983,121 | |
| | | | | | | | | | | | | | | | |
|
Information Technology: 13.18% | |
|
| Communications Equipment: 1.08% | |
Acacia Communications Incorporated † | | | | | | | | | | | 2,915 | | | | 196,704 | |
ADTRAN Incorporated | | | | | | | | | | | 5,702 | | | | 63,235 | |
Applied Optoelectronics Incorporated † | | | | | | | | | | | 1,491 | | | | 17,340 | |
Calamp Corporation † | | | | | | | | | | | 2,590 | | | | 21,160 | |
Calix Networks Incorporated † | | | | | | | | | | | 11,089 | | | | 215,681 | |
Casa Systems Incorporated † | | | | | | | | | | | 1,865 | | | | 8,486 | |
Clearfield Incorporated † | | | | | | | | | | | 2,332 | | | | 41,043 | |
Comtech Telecommunications Corporation | | | | | | | | | | | 3,349 | | | | 55,593 | |
Digi International Incorporated † | | | | | | | | | | | 2,204 | | | | 30,018 | |
DZS Incorporated † | | | | | | | | | | | 838 | | | | 8,732 | |
Echostar Corporation | | | | | | | | | | | 2,873 | | | | 84,409 | |
Emcore Corporation † | | | | | | | | | | | 1,464 | | | | 5,168 | |
Extreme Networks Incorporated † | | | | | | | | | | | 7,696 | | | | 33,632 | |
Genasys Incorporated † | | | | | | | | | | | 1,570 | | | | 7,850 | |
Harmonic Incorporated † | | | | | | | | | | | 5,235 | | | | 30,887 | |
Infinera Corporation † | | | | | | | | | | | 18,603 | | | | 135,616 | |
Inseego Corporation † | | | | | | | | | | | 13,054 | | | | 149,860 | |
InterDigital Incorporated | | | | | | | | | | | 4,572 | | | | 279,578 | |
KVH Industries Incorporated † | | | | | | | | | | | 939 | | | | 8,442 | |
NETGEAR Incorporated † | | | | | | | | | | | 7,812 | | | | 260,530 | |
NetScout Systems Incorporated † | | | | | | | | | | | 11,245 | | | | 260,209 | |
PCTEL Incorporated | | | | | | | | | | | 20,128 | | | | 127,612 | |
Plantronics Incorporated | | | | | | | | | | | 2,623 | | | | 32,420 | |
Ribbon Communications Incorporated † | | | | | | | | | | | 3,447 | | | | 14,753 | |
Ubiquiti Incorporated | | | | | | | | | | | 493 | | | | 89,603 | |
Viavi Solutions Incorporated † | | | | | | | | | | | 17,884 | | | | 238,483 | |
| | | | |
| | | | | | | | | | | | | | | 2,417,044 | |
| | | | | | | | | | | | | | | | |
|
| Electronic Equipment, Instruments & Components: 2.23% | |
Airgain Incorporated † | | | | | | | | | | | 443 | | | | 5,892 | |
Badger Meter Incorporated | | | | | | | | | | | 4,506 | | | | 277,975 | |
The accompanying notes are an integral part of these financial statements.
32 | Wells Fargo Factor Enhanced U.S. Small Cap Equity Portfolio
Portfolio of investments—August 31, 2020 (unaudited)
| | | | | | | | | | | | | | | | |
| | | | | | | | | Shares | | | Value | |
|
| Electronic Equipment, Instruments & Components (continued) | |
Bel Fuse Incorporated Class B | | | | | | | | | | | 4,252 | | | $ | 51,109 | |
Belden Incorporated | | | | | | | | | | | 3,496 | | | | 117,745 | |
Benchmark Electronics Incorporated | | | | | | | | | | | 6,316 | | | | 123,857 | |
CTS Corporation | | | | | | | | | | | 1,897 | | | | 39,647 | |
Daktronics Incorporated | | | | | | | | | | | 1,991 | | | | 8,800 | |
ePlus Incorporated † | | | | | | | | | | | 3,765 | | | | 288,851 | |
Fabrinet † | | | | | | | | | | | 4,273 | | | | 298,170 | |
FARO Technologies Incorporated † | | | | | | | | | | | 637 | | | | 35,991 | |
Fitbit Incorporated Class A † | | | | | | | | | | | 18,621 | | | | 118,430 | |
IEC Electronics Corporation † | | | | | | | | | | | 438 | | | | 3,679 | |
II-VI Incorporated † | | | | | | | | | | | 3,706 | | | | 164,917 | |
Insight Enterprises Incorporated † | | | | | | | | | | | 7,031 | | | | 420,489 | |
Intellicheck Incorporated † | | | | | | | | | | | 653 | | | | 4,114 | |
Iteris Incorporated † | | | | | | | | | | | 3,556 | | | | 16,251 | |
Itron Incorporated † | | | | | | | | | | | 2,740 | | | | 163,222 | |
Kimball Electronics Incorporated † | | | | | | | | | | | 14,542 | | | | 196,099 | |
Knowles Corporation † | | | | | | | | | | | 8,084 | | | | 121,745 | |
Luna Innovations Incorporated † | | | | | | | | | | | 12,947 | | | | 82,861 | |
Methode Electronics Incorporated | | | | | | | | | | | 9,259 | | | | 262,122 | |
MTS Systems Corporation | | | | | | | | | | | 1,050 | | | | 25,620 | |
Napco Security Technologies Incorporated † | | | | | | | | | | | 633 | | | | 15,768 | |
Novanta Incorporated † | | | | | | | | | | | 1,659 | | | | 177,795 | |
OSI Systems Incorporated † | | | | | | | | | | | 1,538 | | | | 121,118 | |
PC Connection Incorporated | | | | | | | | | | | 1,887 | | | | 83,575 | |
Plexus Corporation † | | | | | | | | | | | 5,376 | | | | 408,952 | |
PowerFleet Incorporated † | | | | | | | | | | | 2,261 | | | | 12,707 | |
Rogers Corporation † | | | | | | | | | | | 316 | | | | 35,806 | |
Sanmina Corporation † | | | | | | | | | | | 13,647 | | | | 386,210 | |
ScanSource Incorporated † | | | | | | | | | | | 7,594 | | | | 187,496 | |
TTM Technologies Incorporated † | | | | | | | | | | | 24,010 | | | | 275,155 | |
Vishay Intertechnology Incorporated | | | | | | | | | | | 25,475 | | | | 407,345 | |
Vishay Precision Group Incorporated † | | | | | | | | | | | 567 | | | | 14,124 | |
Wayside Technology Group Incorporated | | | | | | | | | | | 236 | | | | 5,865 | |
| | | | |
| | | | | | | | | | | | | | | 4,959,502 | |
| | | | | | | | | | | | | | | | |
|
| IT Services: 2.12% | |
Alliance Data Systems Corporation | | | | | | | | | | | 2,380 | | | | 107,362 | |
Brightcove Incorporated † | | | | | | | | | | | 2,249 | | | | 25,009 | |
Cardtronics Incorporated Class A † | | | | | | | | | | | 8,788 | | | | 190,787 | |
Cass Information Systems Incorporated | | | | | | | | | | | 732 | | | | 28,665 | |
CSG Systems International Incorporated | | | | | | | | | | | 6,266 | | | | 266,744 | |
Endurance International Group Holdings † | | | | | | | | | | | 6,904 | | | | 44,945 | |
Evertec Incorporated | | | | | | | | | | | 6,723 | | | | 235,439 | |
EVO Payments Incorporated Class A † | | | | | | | | | | | 4,963 | | | | 142,587 | |
ExlService Holdings Incorporated † | | | | | | | | | | | 4,565 | | | | 290,745 | |
GreenSky Incorporated Class A † | | | | | | | | | | | 2,472 | | | | 10,753 | |
Grid Dynamics Holdings Incorporated † | | | | | | | | | | | 2,838 | | | | 21,058 | |
GTT Communications Incorporated † | | | | | | | | | | | 1,641 | | | | 8,172 | |
Hackett Group Incorporated | | | | | | | | | | | 6,583 | | | | 83,012 | |
I3 Verticals Incorporated Class A † | | | | | | | | | | | 248 | | | | 6,917 | |
Information Services Group Incorporated † | | | | | | | | | | | 39,039 | | | | 80,225 | |
International Money Express Incorporated † | | | | | | | | | | | 10,394 | | | | 175,866 | |
KBR Incorporated | | | | | | | | | | | 9,774 | | | | 244,252 | |
Limelight Networks Incorporated † | | | | | | | | | | | 15,391 | | | | 87,267 | |
LiveRamp Holdings Incorporated † | | | | | | | | | | | 2,542 | | | | 141,945 | |
ManTech International Corporation Class A | | | | | | | | | | | 5,362 | | | | 401,346 | |
The accompanying notes are an integral part of these financial statements.
Wells Fargo Factor Enhanced U.S. Small Cap Equity Portfolio | 33
Portfolio of investments—August 31, 2020 (unaudited)
| | | | | | | | | | | | | | | | |
| | | | | | | | | Shares | | | Value | |
|
| IT Services (continued) | |
Mastech Holdings Incorporated † | | | | | | | | | | | 8,111 | | | $ | 150,054 | |
MAXIMUS Incorporated | | | | | | | | | | | 3,407 | | | | 264,213 | |
Moneygram International Incorporated † | | | | | | | | | | | 6,282 | | | | 18,343 | |
NIC Incorporated | | | | | | | | | | | 11,733 | | | | 250,852 | |
PaySign Incorporated † | | | | | | | | | | | 1,292 | | | | 8,320 | |
Perficient Incorporated † | | | | | | | | | | | 5,754 | | | | 246,904 | |
Perspecta Incorporated | | | | | | | | | | | 5,952 | | | | 123,623 | |
PFSweb Incorporated † | | | | | | | | | | | 13,917 | | | | 117,599 | |
PRGX Global Incorporated † | | | | | | | | | | | 1,170 | | | | 6,458 | |
Sabre Corporation | | | | | | | | | | | 12,785 | | | | 89,367 | |
ServiceSource International Incorporated † | | | | | | | | | | | 8,326 | | | | 12,531 | |
Switch Incorporated Class A | | | | | | | | | | | 2,431 | | | | 41,813 | |
Sykes Enterprises Incorporated † | | | | | | | | | | | 10,628 | | | | 351,840 | |
TTEC Holdings Incorporated | | | | | | | | | | | 1,545 | | | | 87,586 | |
Tucows Incorporated Class A † | | | | | | | | | | | 125 | | | | 7,903 | |
Unisys Corporation † | | | | | | | | | | | 3,584 | | | | 41,789 | |
Verra Mobility Corporation † | | | | | | | | | | | 17,892 | | | | 189,029 | |
Virtusa Corporation † | | | | | | | | | | | 2,936 | | | | 116,089 | |
| | | | |
| | | | | | | | | | | | | | | 4,717,409 | |
| | | | | | | | | | | | | | | | |
|
| Semiconductors & Semiconductor Equipment: 2.30% | |
Acm Research Incorporated Class A † | | | | | | | | | | | 632 | | | | 56,128 | |
Advanced Energy Industries Incorporated † | | | | | | | | | | | 1,811 | | | | 134,231 | |
Alpha & Omega Semiconductor Limited † | | | | | | | | | | | 5,405 | | | | 73,238 | |
Ambarella Incorporated † | | | | | | | | | | | 457 | | | | 24,084 | |
Amkor Technology Incorporated † | | | | | | | | | | | 23,065 | | | | 281,278 | |
Axcelis Technologies Incorporated † | | | | | | | | | | | 8,653 | | | | 204,470 | |
AXT Incorporated † | | | | | | | | | | | 2,394 | | | | 13,502 | |
Brooks Automation Incorporated | | | | | | | | | | | 4,693 | | | | 242,300 | |
Cabot Microelectronics Corporation | | | | | | | | | | | 1,737 | | | | 264,528 | |
Ceva Incorporated † | | | | | | | | | | | 2,383 | | | | 100,682 | |
Cohu Incorporated | | | | | | | | | | | 4,567 | | | | 78,552 | |
Cyberoptics Corporation † | | | | | | | | | | | 1,140 | | | | 36,537 | |
Diodes Incorporated † | | | | | | | | | | | 6,184 | | | | 302,150 | |
DSP Group Incorporated † | | | | | | | | | | | 1,254 | | | | 17,982 | |
FormFactor Incorporated † | | | | | | | | | | | 12,885 | | | | 336,685 | |
GSI Technology Incorporated † | | | | | | | | | | | 1,035 | | | | 6,583 | |
Ichor Holdings Limited † | | | | | | | | | | | 5,456 | | | | 137,273 | |
Lattice Semiconductor Corporation † | | | | | | | | | | | 10,811 | | | | 309,195 | |
MACOM Technology Solutions Holdings Incorporated † | | | | | | | | | | | 2,945 | | | | 104,930 | |
Maxeon Solar Technologies Pte Limited † | | | | | | | | | | | 1,357 | | | | 28,196 | |
MaxLinear Incorporated Class A † | | | | | | | | | | | 2,812 | | | | 68,472 | |
Neophotonics Corporation † | | | | | | | | | | | 15,682 | | | | 104,442 | |
NVE Corporation | | | | | | | | | | | 1,752 | | | | 93,609 | |
Onto Innovation Incorporated † | | | | | | | | | | | 2,565 | | | | 80,131 | |
PDF Solutions Incorporated † | | | | | | | | | | | 2,543 | | | | 52,640 | |
Photronics Incorporated † | | | | | | | | | | | 8,894 | | | | 89,207 | |
Pixelworks Incorporated † | | | | | | | | | | | 2,727 | | | | 6,218 | |
Power Integrations Incorporated | | | | | | | | | | | 5,790 | | | | 324,066 | |
Rambus Incorporated † | | | | | | | | | | | 5,622 | | | | 75,503 | |
Semtech Corporation † | | | | | | | | | | | 4,711 | | | | 276,300 | |
Silicon Laboratories Incorporated † | | | | | | | | | | | 1,547 | | | | 158,428 | |
Sitime Corporation † | | | | | | | | | | | 259 | | | | 17,063 | |
Smart Global Holdings Incorporated † | | | | | | | | | | | 3,617 | | | | 91,148 | |
SunPower Corporation | | | | | | | | | | | 10,894 | | | | 121,904 | |
Synaptics Incorporated † | | | | | | | | | | | 6,117 | | | | 521,964 | |
The accompanying notes are an integral part of these financial statements.
34 | Wells Fargo Factor Enhanced U.S. Small Cap Equity Portfolio
Portfolio of investments—August 31, 2020 (unaudited)
| | | | | | | | | | | | | | | | |
| | | | | | | | | Shares | | | Value | |
|
| Semiconductors & Semiconductor Equipment (continued) | |
Ultra Clean Holdings Incorporated † | | | | | | | | | | | 9,268 | | | $ | 227,251 | |
Veeco Instruments Incorporated † | | | | | | | | | | | 5,053 | | | | 60,080 | |
| | | | |
| | | | | | | | | | | | | | | 5,120,950 | |
| | | | | | | | | | | | | | | | |
|
| Software: 5.34% | |
A10 Networks Incorporated † | | | | | | | | | | | 7,009 | | | | 59,927 | |
ACI Worldwide Incorporated † | | | | | | | | | | | 5,121 | | | | 150,455 | |
Agilysys Incorporated † | | | | | | | | | | | 2,924 | | | | 74,182 | |
Alarm.com Holdings Incorporated † | | | | | | | | | | | 5,270 | | | | 315,515 | |
Altair Engineering Incorporated Class A † | | | | | | | | | | | 4,813 | | | | 202,242 | |
American Software Incorporated Class A | | | | | | | | | | | 9,212 | | | | 130,442 | |
AppFolio Incorporated Class A † | | | | | | | | | | | 2,447 | | | | 411,169 | |
Appian Corporation † | | | | | | | | | | | 4,781 | | | | 292,788 | |
Asure Software Incorporated † | | | | | | | | | | | 8,049 | | | | 54,170 | |
Avaya Holdings Corporation † | | | | | | | | | | | 24,843 | | | | 385,563 | |
Benefitfocus Incorporated † | | | | | | | | | | | 5,371 | | | | 55,536 | |
Blackbaud Incorporated | | | | | | | | | | | 2,772 | | | | 176,992 | |
BlackLine Incorporated † | | | | | | | | | | | 1,205 | | | | 105,281 | |
Bottomline Technologies (DE) Incorporated † | | | | | | | | | | | 6,134 | | | | 292,162 | |
Box Incorporated Class A † | | | | | | | | | | | 17,578 | | | | 345,056 | |
Cerence Incorporated † | | | | | | | | | | | 4,779 | | | | 254,243 | |
ChannelAdvisor Corporation † | | | | | | | | | | | 11,345 | | | | 190,823 | |
Cloudera Incorporated † | | | | | | | | | | | 17,503 | | | | 231,215 | |
CommVault Systems Incorporated † | | | | | | | | | | | 4,992 | | | | 215,804 | |
Cornerstone OnDemand Incorporated † | | | | | | | | | | | 6,288 | | | | 221,778 | |
Digital Turbine Incorporated † | | | | | | | | | | | 11,111 | | | | 268,775 | |
Domo Incorporated Class B † | | | | | | | | | | | 2,998 | | | | 122,079 | |
Ebix Incorporated | | | | | | | | | | | 3,554 | | | | 81,991 | |
eGain Corporation † | | | | | | | | | | | 11,632 | | | | 155,636 | |
Envestnet Incorporated † | | | | | | | | | | | 2,272 | | | | 188,553 | |
GTY Technology Holdings Incorporated † | | | | | | | | | | | 2,229 | | | | 7,278 | |
Ideanomics Incorporated † | | | | | | | | | | | 2,676 | | | | 3,425 | |
Intelligent Systems Corporation † | | | | | | | | | | | 2,953 | | | | 111,003 | |
J2 Global Incorporated † | | | | | | | | | | | 5,310 | | | | 371,647 | |
LivePerson Incorporated † | | | | | | | | | | | 8,168 | | | | 487,303 | |
MicroStrategy Incorporated Class A † | | | | | | | | | | | 2,082 | | | | 300,724 | |
Mimecast Limited † | | | | | | | | | | | 2,621 | | | | 129,058 | |
Mitek Systems Incorporated † | | | | | | | | | | | 7,950 | | | | 100,886 | |
MobileIron Incorporated † | | | | | | | | | | | 8,239 | | | | 53,801 | |
Model N Incorporated † | | | | | | | | | | | 5,459 | | | | 214,648 | |
OneSpan Incorporated † | | | | | | | | | | | 8,654 | | | | 186,494 | |
Park City Group Incorporated † | | | | | | | | | | | 32,104 | | | | 159,236 | |
Ping Identity Holding Corporation † | | | | | | | | | | | 867 | | | | 29,885 | |
Progress Software Corporation | | | | | | | | | | | 7,538 | | | | 285,615 | |
PROS Holdings Incorporated † | | | | | | | | | | | 1,119 | | | | 43,641 | |
Q2 Holdings Incorporated † | | | | | | | | | | | 1,213 | | | | 118,013 | |
Qad Incorporated Class A | | | | | | | | | | | 3,669 | | | | 166,866 | |
Qualys Incorporated † | | | | | | | | | | | 3,434 | | | | 364,485 | |
Rapid7 Incorporated † | | | | | | | | | | | 1,395 | | | | 90,075 | |
Rimini Street Incorporated † | | | | | | | | | | | 11,180 | | | | 48,968 | |
Rosetta Stone Incorporated † | | | | | | | | | | | 3,060 | | | | 92,963 | |
SailPoint Technologies Holdings Incorporated † | | | | | | | | | | | 10,389 | | | | 407,560 | |
Sapiens International Corporation | | | | | | | | | | | 5,490 | | | | 184,135 | |
Seachange International Incorporated † | | | | | | | | | | | 4,952 | | | | 6,636 | |
Secureworks Corporation Class A † | | | | | | | | | | | 16,564 | | | | 214,173 | |
SharpSpring Incorporated † | | | | | | | | | | | 677 | | | | 7,433 | |
The accompanying notes are an integral part of these financial statements.
Wells Fargo Factor Enhanced U.S. Small Cap Equity Portfolio | 35
Portfolio of investments—August 31, 2020 (unaudited)
| | | | | | | | | | | | | | | | |
| | | | | | | | | Shares | | | Value | |
|
| Software (continued) | |
Shotspotter Incorporated † | | | | | | | | | | | 1,167 | | | $ | 34,963 | |
Smith Micro Software Incorporated † | | | | | | | | | | | 30,233 | | | | 116,095 | |
Solarwinds Corporation † | | | | | | | | | | | 3,427 | | | | 72,070 | |
Sprout Social Incorporated Class A † | | | | | | | | | | | 1,017 | | | | 39,409 | |
SPS Commerce Incorporated † | | | | | | | | | | | 6,025 | | | | 481,277 | |
SVMK Incorporated † | | | | | | | | | | | 13,533 | | | | 336,836 | |
Synchronoss Technologies Incorporated † | | | | | | | | | | | 3,315 | | | | 14,553 | |
TeleNav Incorporated † | | | | | | | | | | | 1,805 | | | | 8,285 | |
Tenable Holdings Incorporated † | | | | | | | | | | | 2,298 | | | | 86,497 | |
Upland Software Incorporated † | | | | | | | | | | | 1,957 | | | | 76,754 | |
Varonis Systems Incorporated † | | | | | | | | | | | 4,382 | | | | 541,308 | |
Verint Systems Incorporated † | | | | | | | | | | | 5,889 | | | | 280,081 | |
Veritone Incorporated † | | | | | | | | | | | 1,310 | | | | 10,834 | |
Workiva Incorporated † | | | | | | | | | | | 1,875 | | | | 110,625 | |
Xperi Holding Corporation | | | | | | | | | | | 20,808 | | | | 260,724 | |
Yext Incorporated † | | | | | | | | | | | 5,156 | | | | 102,398 | |
Zix Corporation † | | | | | | | | | | | 15,005 | | | | 90,930 | |
Zuora Incorporated † | | | | | | | | | | | 5,210 | | | | 70,804 | |
| | | | |
| | | | | | | | | | | | | | | 11,902,771 | |
| | | | | | | | | | | | | | | | |
|
| Technology Hardware, Storage & Peripherals: 0.11% | |
Avid Technology Incorporated † | | | | | | | | | | | 2,057 | | | | 16,662 | |
Eastman Kodak Company † | | | | | | | | | | | 2,268 | | | | 13,563 | |
Intevac Incorporated † | | | | | | | | | | | 1,174 | | | | 7,044 | |
Quantum Corporation † | | | | | | | | | | | 2,213 | | | | 12,083 | |
Super Micro Computer Incorporated † | | | | | | | | | | | 6,884 | | | | 188,553 | |
| | | | |
| | | | | | | | | | | | | | | 237,905 | |
| | | | | | | | | | | | | | | | |
|
Materials: 3.86% | |
|
| Chemicals: 1.78% | |
Advanced Emissions Solutions Incorporated | | | | | | | | | | | 18,827 | | | | 72,860 | |
Advansix Incorporated † | | | | | | | | | | | 7,016 | | | | 89,314 | |
Agrofresh Solutions Incorporated † | | | | | | | | | | | 1,963 | | | | 4,868 | |
American Vanguard Corporation | | | | | | | | | | | 2,904 | | | | 41,092 | |
Avient Corporation | | | | | | | | | | | 4,691 | | | | 119,714 | |
Balchem Corporation | | | | | | | | | | | 1,631 | | | | 159,349 | |
Cabot Corporation | | | | | | | | | | | 2,865 | | | | 106,034 | |
Chase Corporation | | | | | | | | | | | 477 | | | | 46,541 | |
Ferro Corporation † | | | | | | | | | | | 13,647 | | | | 170,178 | |
Futurefuel Corporation | | | | | | | | | | | 3,154 | | | | 38,163 | |
GCP Applied Technologies Incorporated † | | | | | | | | | | | 1,571 | | | | 40,940 | |
Hawkins Incorporated | | | | | | | | | | | 2,950 | | | | 148,149 | |
HB Fuller Company | | | | | | | | | | | 7,842 | | | | 377,749 | |
Ingevity Corporation † | | | | | | | | | | | 6,253 | | | | 351,231 | |
Innospec Incorporated | | | | | | | | | | | 3,506 | | | | 261,863 | |
Intrepid Potash Incorporated † | | | | | | | | | | | 743 | | | | 6,940 | |
Kooper Holdings Incorporated † | | | | | | | | | | | 11,425 | | | | 274,886 | |
Kraton Performance Polymers Incorporated † | | | | | | | | | | | 14,129 | | | | 198,371 | |
Kronos Worldwide Incorporated | | | | | | | | | | | 2,321 | | | | 28,989 | |
Livent Corporation † | | | | | | | | | | | 13,178 | | | | 111,749 | |
Minerals Technologies Incorporated | | | | | | | | | | | 6,562 | | | | 333,022 | |
Northern Technologies International Corporation | | | | | | | | | | | 362 | | | | 3,008 | |
Orion Engineered Carbons SA | | | | | | | | | | | 4,721 | | | | 57,360 | |
PQ Group Holdings Incorporated † | | | | | | | | | | | 2,460 | | | | 28,659 | |
Rayonier Advanced Materials Incorporated † | | | | | | | | | | | 2,937 | | | | 9,281 | |
The accompanying notes are an integral part of these financial statements.
36 | Wells Fargo Factor Enhanced U.S. Small Cap Equity Portfolio
Portfolio of investments—August 31, 2020 (unaudited)
| | | | | | | | | | | | | | | | |
| | | | | | | | | Shares | | | Value | |
|
| Chemicals (continued) | |
Sensient Technologies Corporation | | | | | | | | | | | 4,276 | | | $ | 236,121 | |
Stepan Company | | | | | | | | | | | 3,427 | | | | 395,099 | |
Trecora Resources † | | | | | | | | | | | 1,553 | | | | 9,334 | |
Tredegar Corporation | | | | | | | | | | | 2,580 | | | | 43,679 | |
Trinseo SA | | | | | | | | | | | 5,774 | | | | 143,830 | |
Tronox Holdings plc Class A | | | | | | | | | | | 5,964 | | | | 53,437 | |
Venator Materials plc † | | | | | | | | | | | 1,966 | | | | 4,227 | |
| | | | |
| | | | | | | | | | | | | | | 3,966,037 | |
| | | | | | | | | | | | | | | | |
|
| Construction Materials: 0.10% | |
Forterra Incorporated † | | | | | | | | | | | 4,011 | | | | 53,146 | |
Summit Materials Incorporated Class A † | | | | | | | | | | | 8,424 | | | | 125,433 | |
United States Lime & Minerals Incorporated | | | | | | | | | | | 126 | | | | 11,608 | |
US Concrete Incorporated † | | | | | | | | | | | 967 | | | | 25,809 | |
| | | | |
| | | | | | | | | | | | | | | 215,996 | |
| | | | | | | | | | | | | | | | |
|
| Containers & Packaging: 0.20% | |
Ardagh Group SA | | | | | | | | | | | 1,012 | | | | 15,403 | |
Greif Incorporated Class A | | | | | | | | | | | 7,060 | | | | 260,161 | |
Greif Incorporated Class B | | | | | | | | | | | 81 | | | | 3,323 | |
Myers Industries Incorporated | | | | | | | | | | | 5,190 | | | | 79,407 | |
O-I Glass Incorporated | | | | | | | | | | | 2,254 | | | | 24,524 | |
Ranpak Holdings Corporation † | | | | | | | | | | | 1,738 | | | | 15,538 | |
UFP Technologies Incorporated † | | | | | | | | | | | 801 | | | | 33,009 | |
| | | | |
| | | | | | | | | | | | | | | 431,365 | |
| | | | | | | | | | | | | | | | |
|
| Metals & Mining: 1.32% | |
Alcoa Corporation † | | | | | | | | | | | 6,500 | | | | 95,030 | |
Allegheny Technologies Incorporated † | | | | | | | | | | | 10,199 | | | | 84,958 | |
Arconic Corporation † | | | | | | | | | | | 5,372 | | | | 119,527 | |
Caledonia Mining Corporation plc | | | | | | | | | | | 5,478 | | | | 99,590 | |
Carpenter Technology Corporation | | | | | | | | | | | 6,472 | | | | 136,106 | |
Cleveland Cliffs Incorporated | | | | | | | | | | | 4,702 | | | | 30,939 | |
Coeur D’alene Mines Corporation † | | | | | | | | | | | 12,584 | | | | 106,461 | |
Commercial Metals Company | | | | | | | | | | | 25,052 | | | | 522,835 | |
Compass Minerals International Incorporated | | | | | | | | | | | 5,978 | | | | 340,328 | |
Gold Resource Corporation | | | | | | | | | | | 5,987 | | | | 23,828 | |
Haynes International Incorporated | | | | | | | | | | | 720 | | | | 13,493 | |
Hecla Mining Company | | | | | | | | | | | 62,686 | | | | 377,370 | |
Kaiser Aluminum Corporation | | | | | | | | | | | 1,844 | | | | 118,532 | |
Materion Corporation | | | | | | | | | | | 2,850 | | | | 155,582 | |
Olympic Steel Incorporated | | | | | | | | | | | 9,170 | | | | 100,870 | |
Ryerson Holding Corporation † | | | | | | | | | | | 10,845 | | | | 59,756 | |
Schnitzer Steel Industries Incorporated Class A | | | | | | | | | | | 1,716 | | | | 33,874 | |
Synalloy Corporation † | | | | | | | | | | | 441 | | | | 2,783 | |
Universal Stainless & Alloy Products Incorporated † | | | | | | | | | | | 407 | | | | 2,735 | |
Warrior Met Coal Incorporated | | | | | | | | | | | 15,479 | | | | 239,460 | |
Worthington Industries Incorporated | | | | | | | | | | | 6,701 | | | | 278,293 | |
| | | | |
| | | | | | | | | | | | | | | 2,942,350 | |
| | | | | | | | | | | | | | | | |
|
| Paper & Forest Products: 0.46% | |
Boise Cascade Company | | | | | | | | | | | 7,718 | | | | 353,484 | |
Clearwater Paper Corporation † | | | | | | | | | | | 2,547 | | | | 85,732 | |
Domtar Corporation | | | | | | | | | | | 3,012 | | | | 85,902 | |
Louisiana-Pacific Corporation | | | | | | | | | | | 5,642 | | | | 185,847 | |
The accompanying notes are an integral part of these financial statements.
Wells Fargo Factor Enhanced U.S. Small Cap Equity Portfolio | 37
Portfolio of investments—August 31, 2020 (unaudited)
| | | | | | | | | | | | | | | | |
| | | | | | | | | Shares | | | Value | |
|
| Paper & Forest Products (continued) | |
Neenah Incorporated | | | | | | | | | | | 1,376 | | | $ | 60,929 | |
PH Glatfelter Company | | | | | | | | | | | 2,455 | | | | 36,800 | |
Schweitzer-Mauduit International Incorporated | | | | | | | | | | | 5,199 | | | | 157,686 | |
Verso Corporation Class A | | | | | | | | | | | 4,963 | | | | 65,065 | |
| | | | |
| | | | | | | | | | | | | | | 1,031,445 | |
| | | | | | | | | | | | | | | | |
|
Real Estate: 6.55% | |
|
| Equity REITs: 5.88% | |
Acadia Realty Trust | | | | | | | | | | | 6,417 | | | | 72,769 | |
Agree Realty Corporation | | | | | | | | | | | 4,143 | | | | 277,250 | |
Alexander & Baldwin Incorporated | | | | | | | | | | | 832 | | | | 10,076 | |
Alexander’s Incorporated | | | | | | | | | | | 120 | | | | 30,608 | |
Alpine Income Property Trust REIT | | | | | | | | | | | 2,901 | | | | 42,094 | |
American Assets Trust Incorporated | | | | | | | | | | | 3,077 | | | | 78,617 | |
American Finance Trust Incorporated | | | | | | | | | | | 13,038 | | | | 89,115 | |
Apple Hospitality REIT Incorporated | | | | | | | | | | | 11,057 | | | | 112,450 | |
Armada Hoffler Properties Incorporated | | | | | | | | | | | 3,835 | | | | 38,734 | |
Ashford Hospitality Trust REIT | | | | | | | | | | | 470 | | | | 1,448 | |
Bluerock Residential Growth REIT Incorporated | | | | | | | | | | | 1,051 | | | | 7,788 | |
Braemar Hotels & Resorts Incorporated REIT | | | | | | | | | | | 1,655 | | | | 3,955 | |
Brandywine Realty Trust | | | | | | | | | | | 9,011 | | | | 100,292 | |
Brookfield Property REIT Incorporated Class A | | | | | | | | | | | 2,950 | | | | 34,014 | |
BRT Apartments Corporation REIT | | | | | | | | | | | 1,320 | | | | 17,622 | |
CareTrust REIT Incorporated | | | | | | | | | | | 9,565 | | | | 185,274 | |
Cedar Shopping Centers Incorporated | | | | | | | | | | | 3,174 | | | | 2,667 | |
Chatham Lodging Trust | | | | | | | | | | | 3,688 | | | | 25,521 | |
CIM Commercial Trust Corporation REIT | | | | | | | | | | | 568 | | | | 5,867 | |
Clipper Realty Incorporated | | | | | | | | | | | 1,690 | | | | 11,272 | |
Columbia Property Trust Incorporated | | | | | | | | | | | 3,323 | | | | 39,211 | |
Community Healthcare Trust Incorporated | | | | | | | | | | | 2,747 | | | | 128,285 | |
CoreCivic Incorporated | | | | | | | | | | | 31,950 | | | | 297,455 | |
CorEnergy Infrastructure Trust Incorporated | | | | | | | | | | | 661 | | | | 5,909 | |
DiamondRock Hospitality Company | | | | | | | | | | | 14,622 | | | | 77,497 | |
Easterly Government Properties Incorporated | | | | | | | | | | | 11,610 | | | | 280,846 | |
EastGroup Properties Incorporated | | | | | | | | | | | 2,803 | | | | 373,247 | |
Empire State Realty Trust Incorporated Class A | | | | | | | | | | | 9,707 | | | | 61,154 | |
Essential Properties Realty Trust Incorporated | | | | | | | | | | | 11,459 | | | | 194,459 | |
Farmland Partners REIT Incorporated | | | | | | | | | | | 12,230 | | | | 81,819 | |
Four Corners Property Trust Incorporated | | | | | | | | | | | 13,441 | | | | 339,385 | |
Franklin Street Properties Corporation | | | | | | | | | | | 11,472 | | | | 50,821 | |
Front Yard Residential Corporation REIT | | | | | | | | | | | 2,408 | | | | 23,478 | |
Getty Realty Corporation | | | | | | | | | | | 7,192 | | | | 210,654 | |
Gladstone Commercial Corporation | | | | | | | | | | | 1,894 | | | | 37,141 | |
Gladstone Land REIT Corporation | | | | | | | | | | | 1,492 | | | | 23,484 | |
Global Medical REIT Incorporated | | | | | | | | | | | 3,223 | | | | 41,222 | |
Global Net Lease Incorporated | | | | | | | | | | | 10,568 | | | | 184,940 | |
Healthcare Realty Trust Incorporated | | | | | | | | | | | 8,323 | | | | 240,119 | |
Hersha Hospitality Trust Class A | | | | | | | | | | | 5,878 | | | | 37,796 | |
Independence Realty Trust Incorporated | | | | | | | | | | | 15,403 | | | | 180,369 | |
Industrial Logistics Properties Trust | | | | | | | | | | | 8,449 | | | | 182,245 | |
Innovative Industrial Properties Incorporated | | | | | | | | | | | 1,817 | | | | 223,655 | |
Investors Real Estate Trust | | | | | | | | | | | 3,900 | | | | 277,290 | |
iStar Financial Incorporated | | | | | | | | | | | 5,555 | | | | 68,771 | |
Jernigan Capital Incorporated | | | | | | | | | | | 1,015 | | | | 17,499 | |
Kite Realty Group Trust | | | | | | | | | | | 11,271 | | | | 126,686 | |
Lexington Corporate Properties Trust | | | | | | | | | | | 25,840 | | | | 293,801 | |
The accompanying notes are an integral part of these financial statements.
38 | Wells Fargo Factor Enhanced U.S. Small Cap Equity Portfolio
Portfolio of investments—August 31, 2020 (unaudited)
| | | | | | | | | | | | | | | | |
| | | | | | | | | Shares | | | Value | |
|
| Equity REITs (continued) | |
LTC Properties Incorporated | | | | | | | | | | | 10,355 | | | $ | 377,854 | |
Mack-Cali Realty Corporation | | | | | | | | | | | 4,421 | | | | 55,837 | |
Monmouth Real Estate Investment Corporation | | | | | | | | | | | 8,968 | | | | 130,126 | |
National Health Investors Incorporated | | | | | | | | | | | 5,101 | | | | 317,537 | |
National Storage Affiliates Trust | | | | | | | | | | | 8,588 | | | | 294,654 | |
New Senior Investment Group Incorporated | | | | | | | | | | | 3,836 | | | | 16,802 | |
New York REIT Liquidating LLC †(a)‡ | | | | | | | | | | | 4,209 | | | | 67,578 | |
NexPoint Residential Trust Incorporated | | | | | | | | | | | 5,348 | | | | 221,407 | |
Office Properties Income Trust | | | | | | | | | | | 8,239 | | | | 196,418 | |
One Liberty Properties Incorporated | | | | | | | | | | | 3,027 | | | | 57,997 | |
Outfront Media Incorporated | | | | | | | | | | | 7,401 | | | | 125,299 | |
Paramount Group Incorporated | | | | | | | | | | | 10,554 | | | | 78,100 | |
Park Hotels & Resorts Incorporated | | | | | | | | | | | 12,094 | | | | 114,772 | |
Pebblebrook Hotel Trust | | | | | | | | | | | 15,180 | | | | 191,572 | |
Pennsylvania REIT | | | | | | | | | | | 3,090 | | | | 3,399 | |
Physicians Realty Trust | | | | | | | | | | | 12,526 | | | | 227,347 | |
Piedmont Office Realty Trust Incorporated Class A | | | | | | | | | | | 20,856 | | | | 319,305 | |
Plymouth Industrial Incorporated | | | | | | | | | | | 1,271 | | | | 16,968 | |
Postal Realty Trust Incorporated Class A | | | | | | | | | | | 261 | | | | 3,967 | |
PotlatchDeltic Corporation | | | | | | | | | | | 9,490 | | | | 436,920 | |
Preferred Apartment Communities Incorporated Class A | | | | | | | | | | | 2,351 | | | | 15,517 | |
PS Business Parks Incorporated | | | | | | | | | | | 1,358 | | | | 171,380 | |
QTS Realty Trust Incorporated Class A | | | | | | | | | | | 5,014 | | | | 340,049 | |
Retail Opportunity Investment Corporation | | | | | | | | | | | 16,886 | | | | 187,941 | |
Retail Properties of America Incorporated Class A | | | | | | | | | | | 23,970 | | | | 151,251 | |
Retail Value Incorporated | | | | | | | | | | | 7,834 | | | | 99,570 | |
RLJ Lodging Trust | | | | | | | | | | | 23,663 | | | | 223,379 | |
RPT Realty | | | | | | | | | | | 13,578 | | | | 79,567 | |
Ryman Hospitality Properties Incorporated | | | | | | | | | | | 6,297 | | | | 240,294 | |
Sabra Health Care REIT Incorporated | | | | | | | | | | | 17,251 | | | | 255,832 | |
Safehold Incorporated REIT | | | | | | | | | | | 1,779 | | | | 98,681 | |
Saul Centers Incorporated | | | | | | | | | | | 584 | | | | 16,364 | |
Service Properties Trust | | | | | | | | | | | 6,696 | | | | 54,974 | |
SITE Centers Corporation | | | | | | | | | | | 23,094 | | | | 173,436 | |
Spirit MTA REIT (a) | | | | | | | | | | | 6,981 | | | | 0 | |
STAG Industrial Incorporated | | | | | | | | | | | 8,193 | | | | 264,634 | |
Summit Hotel Properties Incorporated | | | | | | | | | | | 19,449 | | | | 114,555 | |
Sunstone Hotel Investors Incorporated | | | | | | | | | | | 14,866 | | | | 123,834 | |
Tanger Factory Outlet Centers Incorporated | | | | | | | | | | | 5,909 | | | | 33,622 | |
Taubman Centers Incorporated | | | | | | | | | | | 3,763 | | | | 144,123 | |
Terreno Realty Corporation | | | | | | | | | | | 3,901 | | | | 232,656 | |
The Geo Group Incorporated | | | | | | | | | | | 16,854 | | | | 188,091 | |
The Macerich Company | | | | | | | | | | | 17,158 | | | | 136,063 | |
UMH Properties Incorporated | | | | | | | | | | | 3,015 | | | | 43,838 | |
Uniti Group Incorporated | | | | | | | | | | | 25,569 | | | | 251,088 | |
Universal Health Realty Income Trust | | | | | | | | | | | 2,978 | | | | 198,692 | |
Urban Edge Properties | | | | | | | | | | | 23,231 | | | | 245,319 | |
Urstadt Biddle Properties Incorporated | | | | | | | | | | | 13,695 | | | | 127,364 | |
Washington Prime Group Incorporated | | | | | | | | | | | 6,818 | | | | 4,636 | |
Washington REIT | | | | | | | | | | | 8,338 | | | | 182,936 | |
Weingarten Realty Investors | | | | | | | | | | | 6,161 | | | | 107,633 | |
Whitestone REIT | | | | | | | | | | | 7,276 | | | | 46,785 | |
Xenia Hotels & Resorts Incorporated | | | | | | | | | | | 5,227 | | | | 46,938 | |
| | | | |
| | | | | | | | | | | | | | | 13,101,572 | |
| | | | | | | | | | | | | | | | |
The accompanying notes are an integral part of these financial statements.
Wells Fargo Factor Enhanced U.S. Small Cap Equity Portfolio | 39
Portfolio of investments—August 31, 2020 (unaudited)
| | | | | | | | | | | | | | | | |
| | | | | | | | | Shares | | | Value | |
| Real Estate Management & Development: 0.67% | |
Altisource Portfolio Solutions SA † | | | | | | | | | | | 587 | | | $ | 6,615 | |
CTO Realty Growth Incorporated | | | | | | | | | | | 240 | | | | 10,121 | |
Cushman & Wakefield plc † | | | | | | | | | | | 14,528 | | | | 168,670 | |
eXp World Holdings Incorporated † | | | | | | | | | | | 3,298 | | | | 146,695 | |
Five Point Holdings LLC Class A † | | | | | | | | | | | 2,622 | | | | 13,634 | |
Forestar Group Incorporated † | | | | | | | | | | | 978 | | | | 17,379 | |
FRP Holdings Incorporated † | | | | | | | | | | | 292 | | | | 11,995 | |
Kennedy Wilson Holdings Incorporated | | | | | | | | | | | 17,566 | | | | 251,018 | |
Marcus & Millichap Incorporated † | | | | | | | | | | | 3,270 | | | | 92,247 | |
Maui Land & Pineapple Company Incorporated † | | | | | | | | | | | 287 | | | | 3,346 | |
Newmark Group Incorporated Class A | | | | | | | | | | | 10,288 | | | | 45,576 | |
RE/MAX Holdings Incorporated Class A | | | | | | | | | | | 4,226 | | | | 148,502 | |
Realogy Holdings Corporation | | | | | | | | | | | 12,816 | | | | 142,001 | |
Redfin Corporation † | | | | | | | | | | | 6,623 | | | | 315,056 | |
The RMR Group Incorporated Class A | | | | | | | | | | | 2,284 | | | | 64,454 | |
The St. Joe Company † | | | | | | | | | | | 2,483 | | | | 57,630 | |
| | | | |
| | | | | | | | | | | | | | | 1,494,939 | |
| | | | | | | | | | | | | | | | |
|
Utilities: 2.56% | |
|
| Electric Utilities: 0.53% | |
ALLETE Incorporated | | | | | | | | | | | 1,762 | | | | 95,078 | |
Genie Energy Limited Class B | | | | | | | | | | | 1,824 | | | | 16,124 | |
MGE Energy Incorporated | | | | | | | | | | | 3,962 | | | | 257,490 | |
Otter Tail Corporation | | | | | | | | | | | 4,501 | | | | 174,864 | |
PNM Resources Incorporated | | | | | | | | | | | 4,138 | | | | 180,748 | |
Portland General Electric Company | | | | | | | | | | | 6,015 | | | | 229,472 | |
Spark Energy Incorporated Class A | | | | | | | | | | | 24,921 | | | | 229,024 | |
| | | | |
| | | | | | | | | | | | | | | 1,182,800 | |
| | | | | | | | | | | | | | | | |
|
| Gas Utilities: 0.75% | |
Brookfield Infrastructure Corporation Class A | | | | | | | | | | | 2,817 | | | | 140,625 | |
Chesapeake Utilities Corporation | | | | | | | | | | | 3,231 | | | | 264,296 | |
New Jersey Resources Corporation | | | | | | | | | | | 4,351 | | | | 131,139 | |
Northwest Natural Holding Company | | | | | | | | | | | 4,152 | | | | 212,209 | |
ONE Gas Incorporated | | | | | | | | | | | 4,525 | | | | 335,393 | |
RGC Resources Incorporated | | | | | | | | | | | 1,472 | | | | 34,327 | |
South Jersey Industries Incorporated | | | | | | | | | | | 6,321 | | | | 140,010 | |
Southwest Gas Holdings Incorporated | | | | | | | | | | | 3,468 | | | | 218,033 | |
Spire Incorporated | | | | | | | | | | | 2,864 | | | | 166,713 | |
Star Group LP | | | | | | | | | | | 2,201 | | | | 21,570 | |
| | | | |
| | | | | | | | | | | | | | | 1,664,315 | |
| | | | | | | | | | | | | | | | |
|
| Independent Power & Renewable Electricity Producers: 0.45% | |
Brookfield Renewable Corporation Class A | | | | | | | | | | | 1,336 | | | | 68,029 | |
Clearway Energy Incorporated Class A | | | | | | | | | | | 9,172 | | | | 221,504 | |
Clearway Energy Incorporated Class C | | | | | | | | | | | 13,918 | | | | 355,048 | |
Ormat Technologies Incorporated | | | | | | | | | | | 6,081 | | | | 370,150 | |
| | | | |
| | | | | | | | | | | | | | | 1,014,731 | |
| | | | | | | | | | | | | | | | |
|
| Multi-Utilities: 0.34% | |
Avista Corporation | | | | | | | | | | | 5,450 | | | | 200,887 | |
Black Hills Corporation | | | | | | | | | | | 4,666 | | | | 261,669 | |
Northwestern Corporation | | | | | | | | | | | 4,429 | | | | 228,714 | |
Unitil Corporation | | | | | | | | | | | 1,573 | | | | 66,381 | |
| | | | |
| | | | | | | | | | | | | | | 757,651 | |
| | | | | | | | | | | | | | | | |
The accompanying notes are an integral part of these financial statements.
40 | Wells Fargo Factor Enhanced U.S. Small Cap Equity Portfolio
Portfolio of investments—August 31, 2020 (unaudited)
| | | | | | | | | | | | | | | | |
| | | | | | | | | Shares | | | Value | |
| Water Utilities: 0.49% | |
American States Water Company | | | | | | | | | | | 3,147 | | | $ | 239,424 | |
Artesian Resources Corporation Class A | | | | | | | | | | | 1,062 | | | | 37,372 | |
Cadiz Incorporated † | | | | | | | | | | | 1,246 | | | | 13,033 | |
California Water Service Group | | | | | | | | | | | 5,537 | | | | 251,048 | |
Consolidated Water Company | | | | | | | | | | | 3,025 | | | | 36,391 | |
Global Water Resources Incorporated | | | | | | | | | | | 886 | | | | 9,790 | |
Middlesex Water Company | | | | | | | | | | | 2,535 | | | | 162,570 | |
Pure Cycle Corporation † | | | | | | | | | | | 1,250 | | | | 12,200 | |
SJW Corporation | | | | | | | | | | | 2,922 | | | | 182,713 | |
York Water Company | | | | | | | | | | | 3,211 | | | | 146,454 | |
| | | | |
| | | | | | | | | | | | | | | 1,090,995 | |
| | | | | | | | | | | | | | | | |
| |
Total Common Stocks (Cost $192,695,021) | | | | 216,640,783 | |
| | | | | |
| | | | |
| | | | | | | | | | | | | | | | |
| | | | | | Expiration
date | | | | | | | |
| Rights: 0.00% | |
|
Financials: 0.00% | |
|
| Thrifts & Mortgage Finance: 0.00% | |
NewStar Financial Incorporated †(a) | | | | | | | 12-26-2027 | | | | 9,129 | | | | 0 | |
| | | | | | | | | | | | | | | | |
|
Health Care: 0.00% | |
|
| Pharmaceuticals: 0.00% | |
Elanco Animal Health Incorporated †(a) | | | | | | | 12-31-2021 | | | | 8,956 | | | | 0 | |
| | | | | | | | | | | | | | | | |
| |
Total Rights (Cost $225) | | | | 0 | |
| | | | | |
|
Warrants: 0.00% | |
|
Energy: 0.00% | |
|
| Energy Equipment & Services: 0.00% | |
Parker Drilling Company †(a) | | | | | | | 9-16-2024 | | | | 373 | | | | 0 | |
| | | | | | | | | | | | | | | | |
|
| Oil, Gas & Consumable Fuels: 0.00% | |
Battalion Oil Corporation †(a) | | | | | | | 10-8-2022 | | | | 375 | | | | 0 | |
Battalion Oil Corporation †(a) | | | | | | | 10-8-2022 | | | | 300 | | | | 0 | |
Battalion Oil Corporation †(a) | | | | | | | 10-8-2022 | | | | 482 | | | | 0 | |
| | | | |
| | | | | | | | | | | | | | | 0 | |
| | | | | | | | | | | | | | | | |
| |
Total Warrants (Cost $0) | | | | 0 | |
| | | | | |
| | | | |
| | | | | | | | | | | | | | | | |
| | | Yield | | | | | | | | | | |
| Short-Term Investments: 4.03% | | | | | | | | | | | | |
| | | | |
Investment Companies: 4.03% | | | | | | | | | | | | | | | | |
Wells Fargo Government Money Market Fund Select Class (l)(u) | | | 0.06 | % | | | | | | | 8,970,027 | | | | 8,970,027 | |
| | | | | | | | | | | | | | | | |
| |
Total Short-Term Investments (Cost $8,970,027) | | | | 8,970,027 | |
| | | | | | | | | | | | | | | | |
| | | | | | | | |
| Total investments in securities (Cost $201,665,273) | | | 101.27 | % | | | 225,610,810 | |
| | |
Other assets and liabilities, net | | | (1.27 | ) | | | (2,827,022 | ) |
| | | | | | | | |
| Total net assets | | | 100.00 | % | | $ | 222,783,788 | |
| | | | | | | | |
The accompanying notes are an integral part of these financial statements.
Wells Fargo Factor Enhanced U.S. Small Cap Equity Portfolio | 41
Portfolio of investments—August 31, 2020 (unaudited)
| † | Non-income-earning security |
| (a) | The security is fair valued in accordance with procedures approved by the Board of Trustees. |
| ‡ | Security is valued using significant unobservable inputs. |
| 144A | The security may be resold in transactions exempt from registration, normally to qualified institutional buyers, pursuant to Rule 144A under the Securities Act of 1933. |
| (l) | The issuer of the security is an affiliated person of the Portfolio as defined in the Investment Company Act of 1940. |
| (u) | The rate represents the 7-day annualized yield at period end. |
Abbreviations:
| REIT | Real estate investment trust |
Futures Contracts
| | | | | | | | | | | | | | | | | | | | | | | | |
| Description | | Number of
contracts | | | Expiration
date | | | Notional
cost | | | Notional
value | | | Unrealized
gains | | | Unrealized
losses | |
| | | | | | |
Long | | | | | | | | | | | | | | | | | | | | | | | | |
| | | | | | |
E-Mini Russell 2000 Index | | | 70 | | | | 9-18-2020 | | | $ | 5,328,379 | | | $ | 5,464,550 | | | $ | 136,171 | | | $ | 0 | |
Investments in Affiliates
An affiliated investment is an investment in which the Portfolio owns at least 5% of the outstanding voting shares of the issuer or as a result of other relationships, such as the Portfolio and the issuer having the same adviser or investment manager. Transactions with issuers that were either affiliated persons of the Portfolio at the beginning of the period or the end of the period were as follows:
| | | | | | | | | | | | | | | | | | | | | | | | | | | | | | | | |
| | | Value,
beginning of
period | | | Purchases | | | Sales
proceeds | | | Net
realized
gains
(losses) | | | Net
change in
unrealized
gains
(losses) | | | Income
from
affiliated
securities | | | Value,
end of
period | | | % of
net
assets | |
| | | | | | | | |
| Short-Term Investments | | | | | | | | | | | | | | | | | | | | | | | | |
Investment Companies | | | | | | | | | | | | | | | | | | | | | | | | | | | | | | | | |
Wells Fargo Government Money Market Fund Select Class | | $ | 6,867,519 | | | $ | 74,456,859 | | | $ | (72,354,351 | ) | | $ | 0 | | | $ | 0 | | | $ | 12,833 | | | $ | 8,970,027 | | | | 4.03 | % |
The accompanying notes are an integral part of these financial statements.
42 | Wells Fargo Factor Enhanced U.S. Small Cap Equity Portfolio
Statement of assets and liabilities—August 31, 2020 (unaudited)
| | | | |
| | | | |
| |
Assets | | | | |
Investments in unaffiliated securities, at value (cost $192,695,246) | | $ | 216,640,783 | |
Investments in affiliated securities, at value (cost 8,970,027) | | | 8,970,027 | |
Segregated cash for futures contracts | | | 543,440 | |
Receivable for investments sold | | | 192,179 | |
Receivable for dividends | | | 165,045 | |
| | | | |
Total assets | | | 226,511,474 | |
| | | | |
| |
Liabilities | | | | |
Payable for investments purchased | | | 3,552,251 | |
Payable for daily variation margin on open futures contracts | | | 50,400 | |
Advisory fee payable | | | 17,650 | |
Trustees’ fees and expenses payable | | | 1,876 | |
Accrued expenses and other liabilities | | | 105,509 | |
| | | | |
Total liabilities | | | 3,727,686 | |
| | | | |
Total net assets | | $ | 222,783,788 | |
| | | | |
The accompanying notes are an integral part of these financial statements.
Wells Fargo Factor Enhanced U.S. Small Cap Equity Portfolio | 43
Statement of operations—six months ended August 31, 2020 (unaudited)
| | | | |
| | | | |
| |
Investment income | | | | |
Dividends (net of foreign withholding taxes of $1,442) | | $ | 1,837,549 | |
Income from affiliated securities | | | 12,833 | |
| | | | |
Total investment income | | | 1,850,382 | |
| | | | |
| |
Expenses | | | | |
Advisory fee | | | 161,740 | |
Custody and accounting fees | | | 28,176 | |
Professional fees | | | 22,488 | |
Shareholder report expenses | | | 3,881 | |
Trustees’ fees and expenses | | | 9,898 | |
Other fees and expenses | | | 10,544 | |
| | | | |
Total expenses | | | 236,727 | |
Less: Fee waivers and/or expense reimbursements | | | (61,642 | ) |
| | | | |
Net expenses | | | 175,085 | |
| | | | |
Net investment income | | | 1,675,297 | |
| | | | |
| |
Realized and unrealized gains (losses) on investments | | | | |
Net realized losses on | |
Unaffiliated securities | | | (18,515,674 | ) |
Futures contracts | | | (729,694 | ) |
| | | | |
Net realized losses on investments | | | (19,245,368 | ) |
| | | | |
|
Net change in unrealized gains (losses) on | |
Unaffiliated securities | | | 27,662,928 | |
Futures contracts | | | 1,166,422 | |
| | | | |
Net change in unrealized gains (losses) on investments | | | 28,829,350 | |
| | | | |
Net realized and unrealized gains (losses) on investments | | | 9,583,982 | |
| | | | |
Net increase in net assets resulting from operations | | $ | 11,259,279 | |
| | | | |
The accompanying notes are an integral part of these financial statements.
44 | Wells Fargo Factor Enhanced U.S. Small Cap Equity Portfolio
Statement of changes in net assets
| | | | | | | | |
| | | Six months ended
August 31, 2020 (unaudited) | | | Year ended
February 29, 2020 | |
| | |
Operations | | | | | | | | |
Net investment income | | $ | 1,675,297 | | | $ | 3,637,096 | |
Net realized gains (losses) on investments | | | (19,245,368 | ) | | | 7,452,037 | |
Net change in unrealized gains (losses) on investments | | | 28,829,350 | | | | (23,775,422 | ) |
| | | | |
Net increase (decrease) in net assets resulting from operations | | | 11,259,279 | | | | (12,686,289 | ) |
| | | | |
| |
Capital transactions | | | | |
Transactions in investors’ beneficial interests | | | | | | | | |
Contributions | | | 66,820,820 | | | | 31,716,956 | |
Withdrawals | | | (84,863,556 | ) | | | (67,498,202 | ) |
| | | | |
Net decrease in net assets resulting from capital transactions | | | (18,042,736 | ) | | | (35,781,246 | ) |
| | | | |
Total decrease in net assets | | | (6,783,457 | ) | | | (48,467,535 | ) |
| | | | |
| |
Net assets | | | | |
Beginning of period | | | 229,567,245 | | | | 278,034,780 | |
| | | | |
End of period | | $ | 222,783,788 | | | $ | 229,567,245 | |
| | | | | | | | |
The accompanying notes are an integral part of these financial statements.
Wells Fargo Factor Enhanced U.S. Small Cap Equity Portfolio | 45
Financial highlights
| | | | | | | | | | | | | | | | |
| | | Six months ended
August 31, 2020
(unaudited) | | | Year ended
February 29, 2020 | | | Year ended February 28 | |
| | | 2019 | | | 20181 | |
Total return2 | | | 3.00 | % | | | (5.94 | )% | | | 7.05 | % | | | 8.75 | % |
Ratios to average net assets (annualized) | | | | | | | | | | | | | | | | |
Gross expenses | | | 0.22 | % | | | 0.23 | % | | | 0.21 | % | | | 0.19 | % |
Net expenses | | | 0.16 | % | | | 0.18 | % | | | 0.19 | % | | | 0.19 | % |
Net investment income | | | 1.55 | % | | | 1.35 | % | | | 1.29 | % | | | 1.23 | % |
Supplemental data | | | | | | | | | | | | | | | | |
Portfolio turnover rate | | | 62 | % | | | 40 | % | | | 37 | % | | | 85 | % |
| 1 | For the period from May 23, 2017 (commencement of operations) to February 28, 2018 |
| 2 | Returns for periods of less than one year are not annualized. |
The accompanying notes are an integral part of these financial statements.
46 | Wells Fargo Factor Enhanced U.S. Small Cap Equity Portfolio
Notes to financial statements (unaudited)
1. ORGANIZATION
Wells Fargo Master Trust (the “Trust”), a Delaware statutory trust organized on March 10, 1999, is an open-end management investment company registered under the Investment Company Act of 1940, as amended (the “1940 Act”). As an investment company, the Trust follows the accounting and reporting guidance in Financial Accounting Standards Board (“FASB”) Accounting Standards Codification Topic 946, Financial Services – Investment Companies. These financial statements report on the Wells Fargo Factor Enhanced U.S. Small Cap Equity Portfolio (formerly, Wells Fargo Factor Enhanced Small Cap Portfolio) (the “Portfolio”) which is a diversified series of the Trust.
Interests in the Portfolio are available solely through private placement transactions that do not involve any “public offering” within the meaning of Section 4(2) of the Investment Company Act of 1933.
2. SIGNIFICANT ACCOUNTING POLICIES
The following significant accounting policies, which are consistently followed in the preparation of the financial statements of the Portfolio, are in conformity with U.S. generally accepted accounting principles which require management to make estimates and assumptions that affect the reported amounts of assets and liabilities, disclosure of contingent assets and liabilities at the date of the financial statements, and the reported amounts of revenues and expenses during the reporting period. Actual results could differ from those estimates.
Securities valuation
All investments are valued each business day as of the close of regular trading on the New York Stock Exchange (generally 4 p.m. Eastern Time), although the Portfolio may deviate from this calculation time under unusual or unexpected circumstances.
Equity securities and futures contracts that are listed on a foreign or domestic exchange or market are valued at the official closing price or, if none, the last sales price. If no sale occurs on the principal exchange or market that day, a fair value price will be determined in accordance with the Portfolio’s Valuation Procedures.
Investments in registered open-end investment companies are valued at net asset value.
Investments which are not valued using any of the methods discussed above are valued at their fair value, as determined in good faith by the Board of Trustees of the Portfolio. The Board of Trustees has established a Valuation Committee comprised of the Trustees and has delegated to it the authority to take any actions regarding the valuation of portfolio securities that the Valuation Committee deems necessary or appropriate, including determining the fair value of portfolio securities, unless the determination has been delegated to the Wells Fargo Asset Management Pricing Committee at Wells Fargo Funds Management, LLC (“Funds Management”). The Board of Trustees retains the authority to make or ratify any valuation decisions or approve any changes to the Valuation Procedures as it deems appropriate. On a quarterly basis, the Board of Trustees receives reports on any valuation actions taken by the Valuation Committee or the Wells Fargo Asset Management Pricing Committee which may include items for ratification.
Futures contracts
Futures contracts are agreements between the Portfolio and a counterparty to buy or sell a specific amount of a commodity, financial instrument or currency at a specified price and on a specified date. The Portfolio may buy and sell futures contracts in order to gain exposure to, or protect against, changes in security values and is subject to equity price risk. The primary risks associated with the use of futures contracts are the imperfect correlation between changes in market values of securities held by the Portfolio and the prices of futures contracts, and the possibility of an illiquid market. Futures contracts are generally entered into on a regulated futures exchange and cleared through a clearinghouse associated with the exchange. With futures contracts, there is minimal counterparty risk to the Portfolio since futures contracts are exchange traded and the exchange’s clearinghouse, as the counterparty to all exchange traded futures, guarantees the futures contracts against default.
Upon entering into a futures contracts, the Portfolio is required to deposit either cash or securities (initial margin) with the broker in an amount equal to a certain percentage of the contract value. Subsequent payments (variation margin) are paid to or from the broker each day equal to the daily changes in the contract value. Such payments are recorded as unrealized gains or losses and, if any, shown as variation margin receivable (payable) in the Statement of Assets and Liabilities. Should the Portfolio fail to make requested variation margin payments, the broker can gain access to the initial margin to satisfy the Portfolio’s payment obligations. When the contracts are closed, a realized gain or loss is recorded in the Statement of Operations.
Security transactions and income recognition
Securities transactions are recorded on a trade date basis. Realized gains or losses are recorded on the basis of identified cost.
Wells Fargo Factor Enhanced U.S. Small Cap Equity Portfolio | 47
Notes to financial statements (unaudited)
Dividend income is recognized on the ex-dividend date. Dividend income is recorded net of foreign taxes withheld where recovery of such taxes is not assured.
Federal and other taxes
The Portfolio is not required to pay federal income taxes on its net investment income and net capital gains as it is treated as a partnership for federal income tax purposes. All income, gains and losses of the Portfolio are deemed to have been “passed through” to the interest holders in proportion to their holdings of the Portfolio regardless of whether income and gains have been distributed by the Portfolio.
The Portfolio’s income tax returns and all financial records supporting those returns for the prior three fiscal years are subject to examination by the federal revenue authority. Management has analyzed the Portfolio’s tax positions taken on federal, state, and foreign tax returns for all open tax years and does not believe that there are any uncertain tax positions that require recognition of a tax liability.
As of August 31, 2020, the aggregate cost of all investments for federal income tax purposes was $207,859,215 and the unrealized gains (losses) consisted of:
| | | | |
| |
Gross unrealized gains | | $ | 37,183,201 | |
| |
Gross unrealized losses | | | (19,295,435 | ) |
| |
Net unrealized gains | | $ | 17,887,766 | |
3. FAIR VALUATION MEASUREMENTS
Fair value measurements of investments are determined within a framework that has established a fair value hierarchy based upon the various data inputs utilized in determining the value of the Portfolio’s investments. The three-level hierarchy gives the highest priority to unadjusted quoted prices in active markets for identical assets or liabilities (Level 1) and the lowest priority to unobservable inputs (Level 3). The Portfolio’s investments are classified within the fair value hierarchy based on the lowest level of input that is significant to the fair value measurement. The inputs are summarized into three broad levels as follows:
| ∎ | | Level 1 – quoted prices in active markets for identical securities |
| ∎ | | Level 2 – other significant observable inputs (including quoted prices for similar securities, interest rates, prepayment speeds, credit risk, etc.) |
| ∎ | | Level 3 – significant unobservable inputs (including the Portfolio’s own assumptions in determining the fair value of investments) |
The inputs or methodologies used for valuing investments in securities are not necessarily an indication of the risk associated with investing in those securities.
48 | Wells Fargo Factor Enhanced U.S. Small Cap Equity Portfolio
Notes to financial statements (unaudited)
The following is a summary of the inputs used in valuing the Portfolio’s assets and liabilities as of August 31, 2020:
| | | | | | | | | | | | | | | | |
| | | | |
| | | Quoted prices
(Level 1) | | | Other significant
observable inputs
(Level 2) | | | Significant
unobservable inputs (Level 3) | | | Total | |
| | | | |
Assets | | | | | | | | | | | | | | | | |
Investments in: | | | | | | | | | | | | | | | | |
| | | | |
Common stocks | | | | | | | | | | | | | | | | |
| | | | |
Communication services | | $ | 5,904,670 | | | $ | 0 | | | $ | 39,458 | | | $ | 5,944,128 | |
| | | | |
Consumer discretionary | | | 28,077,215 | | | | 0 | | | | 0 | | | | 28,077,215 | |
| | | | |
Consumer staples | | | 7,911,017 | | | | 0 | | | | 0 | | | | 7,911,017 | |
| | | | |
Energy | | | 5,722,076 | | | | 0 | | | | 0 | | | | 5,722,076 | |
| | | | |
Financials | | | 35,495,680 | | | | 0 | | | | 0 | | | | 35,495,680 | |
| | | | |
Health care | | | 43,777,652 | | | | 0 | | | | 0 | | | | 43,777,652 | |
| | | | |
Industrials | | | 31,463,238 | | | | 0 | | | | 0 | | | | 31,463,238 | |
| | | | |
Information technology | | | 29,355,581 | | | | 0 | | | | 0 | | | | 29,355,581 | |
| | | | |
Materials | | | 8,587,193 | | | | 0 | | | | 0 | | | | 8,587,193 | |
| | | | |
Real estate | | | 14,528,933 | | | | 0 | | | | 67,578 | | | | 14,596,511 | |
| | | | |
Utilities | | | 5,710,492 | | | | 0 | | | | 0 | | | | 5,710,492 | |
| | | | |
Rights | | | | | | | | | | | | | | | | |
| | | | |
Financials | | | 0 | | | | 0 | | | | 0 | | | | 0 | |
| | | | |
Health Care | | | 0 | | | | 0 | | | | 0 | | | | 0 | |
| | | | |
Warrants | | | | | | | | | | | | | | | | |
| | | | |
Energy | | | 0 | | | | 0 | | | | 0 | | | | 0 | |
| | | | |
Short-term investments | | | | | | | | | | | | | | | | |
| | | | |
Investment companies | | | 8,970,027 | | | | 0 | | | | 0 | | | | 8,970,027 | |
| | | | |
| | | 225,503,774 | | | | 0 | | | | 107,036 | | | | 225,610,810 | |
| | | | |
Futures contracts | | | 136,171 | | | | 0 | | | | 0 | | | | 136,171 | |
| | | | |
Total assets | | $ | 225,639,945 | | | $ | 0 | | | $ | 107,036 | | | $ | 225,746,981 | |
Additional sector, industry or geographic detail is included in the Portfolio of Investments.
Futures contracts are reported at their cumulative unrealized gains (losses) at measurement date as reported in the table following the Portfolio of Investments. For futures contracts, the current day’s variation margin is reported on the Statement of Assets and Liabilities. All other assets and liabilities are reported at their market value at measurement date.
For the six months ended August 31, 2020, the Portfolio had no material transfers into/out of Level 3.
4. TRANSACTIONS WITH AFFILIATES
Advisory fee
The Trust has entered into an advisory contract with Funds Management, an indirect wholly owned subsidiary of Wells Fargo & Company (“Wells Fargo”). The adviser is responsible for implementing investment policies and guidelines and for supervising the subadviser, who is responsible for day-to-day portfolio management of the Portfolio. Pursuant to the contract, Funds Management is entitled to receive an annual advisory fee at the following annual rate based on the Portfolio’s average daily net assets:
| | | | |
| |
| Average daily net assets | | Advisory fee | |
| |
First $5 billion | | | 0.15 | % |
| |
Next $5 billion | | | 0.13 | |
| |
Over $10 billion | | | 0.11 | |
For the six months ended August 31, 2020, the advisory fee was equivalent to an annual rate of 0.15% of the Portfolio’s average daily net assets.
Wells Fargo Factor Enhanced U.S. Small Cap Equity Portfolio | 49
Notes to financial statements (unaudited)
Funds Management has retained the services of a subadviser to provide daily portfolio management to the Portfolio. The fee for subadvisory services is borne by Funds Management. Wells Capital Management Incorporated, an affiliate of Funds Management and an indirect wholly owned subsidiary of Wells Fargo, is the subadviser to the Portfolio and is entitled to receive a fee from Funds Management at an annual rate starting at 0.08% and declining to 0.05% as the average daily net assets of the Portfolio increase.
Funds Management has voluntarily waived and/or reimbursed advisory fees to reduce the net operating expense ratio of the Portfolio.
Interfund transactions
The Portfolio may purchase or sell portfolio investment securities to certain other Wells Fargo affiliates pursuant to Rule 17a-7 under the 1940 Act and under procedures adopted by the Board of Trustees. The procedures have been designed to ensure that these interfund transactions, which do not incur broker commissions, are effected at current market prices.
5. INVESTMENT PORTFOLIO TRANSACTIONS
Purchases and sales of investments, excluding U.S. government obligations (if any) and short-term securities, for the six months ended August 31, 2020 were $130,005,440 and $140,010,841, respectively.
6. DERIVATIVE TRANSACTIONS
During the six months ended August 31, 2020, the Portfolio entered into futures contracts to gain market exposure. The Portfolio had an average notional amount of $9,185,735 in long futures contracts during the six months ended August 31, 2020.
The fair value, realized gains or losses and change in unrealized gains or losses, if any, on derivative instruments are reflected in the corresponding financial statement captions.
7. BANK BORROWINGS
The Trust, along with Wells Fargo Variable Trust and Wells Fargo Funds Trust (excluding the money market funds), are parties to a $350,000,000 revolving credit agreement whereby the Portfolio is permitted to use bank borrowings for temporary or emergency purposes, such as to fund shareholder redemption requests. Interest under the credit agreement is charged to the Portfolio based on a borrowing rate equal to the higher of the Federal Funds rate in effect on that day plus 1.25% or the overnight LIBOR rate in effect on that day plus 1.25%. In addition, an annual commitment fee equal to 0.25% of the unused balance is allocated to each participating fund.
For the six months ended August 31, 2020, there were no borrowings by the Portfolio under the agreement.
8. INDEMNIFICATION
Under the Portfolio’s organizational documents, the officers and Trustees have been granted certain indemnification rights against certain liabilities that may arise out of performance of their duties to the Portfolio. The Portfolio has entered into a separate agreement with each Trustee that converts indemnification rights currently existing under the Portfolio’s organizational documents into contractual rights that cannot be changed in the future without the consent of the Trustee. Additionally, in the normal course of business, the Portfolio may enter into contracts with service providers that contain a variety of indemnification clauses. The Portfolio’s maximum exposure under these arrangements is dependent on future claims that may be made against the Portfolio and, therefore, cannot be estimated.
9. NEW ACCOUNTING PRONOUNCEMENT
In August 2018, FASB issued Accounting Standards Update (“ASU”) No. 2018-13, Fair Value Measurement (Topic 820) Disclosure Framework—Changes to the Disclosure Requirements for Fair Value Measurement. ASU 2018-13 updates the disclosure requirements on fair value measurements in Topic 820, Fair Value Measurements. The amendments are effective for fiscal years, and interim periods within those fiscal years, beginning after December 15, 2019. Management has adopted this guidance which did not have a material impact on the financial statements.
10. CORONAVIRUS (COVID-19) PANDEMIC
On March 11, 2020, the World Health Organization announced that it had made the assessment that coronavirus disease 2019 (“COVID-19”) is a pandemic. The impacts of COVID-19 are adversely affecting the entire global economy, individual companies and investment products, and the market in general. There is significant uncertainty around the extent and duration of business disruptions related to COVID-19 and the impacts may be short term or may last for an extended period of time. The risk of further spreading of COVID-19 has led to significant uncertainty and volatility in the financial markets.
50 | Wells Fargo Factor Enhanced U.S. Small Cap Equity Portfolio
Other information (unaudited)
PROXY VOTING INFORMATION
A description of the policies and procedures used to determine how to vote proxies relating to portfolio securities is available, upon request, by calling 1-800-222-8222, visiting our website at wfam.com, or visiting the SEC website at sec.gov. Information regarding how the proxies related to portfolio securities were voted during the most recent 12-month period ended June 30 is available on the website at wfam.com or by visiting the SEC website at sec.gov.
QUARTERLY PORTFOLIO HOLDINGS INFORMATION
The Portfolio files its complete schedule of portfolio holdings with the SEC for the first and third quarters of each fiscal as an exhibit to its reports on Form N-PORT. Shareholders may view the filed Form N-PORT by visiting the SEC website at sec.gov.
Wells Fargo Factor Enhanced U.S. Small Cap Equity Portfolio | 51
Other information (unaudited)
BOARD OF TRUSTEES AND OFFICERS
Each of the Trustees and Officers1 listed in the table below acts in identical capacities for each fund in the Wells Fargo family of funds, which consists of 142 mutual funds comprising the Wells Fargo Funds Trust, Wells Fargo Variable Trust, Wells Fargo Master Trust and four closed-end funds (collectively the “Fund Complex”). This table should be read in conjunction with the Prospectus and the Statement of Additional Information2. The mailing address of each Trustee and Officer is 525 Market Street, 12th Floor, San Francisco, CA 94105. Each Trustee and Officer serves an indefinite term, however, each Trustee serves such term until reaching the mandatory retirement age established by the Trustees.
Independent Trustees
| | | | | | |
Name and year of birth | | Position held and length of service* | | Principal occupations during past five years or longer | | Current other public company or investment company directorships |
| | | |
William R. Ebsworth (Born 1957) | | Trustee, since 2015 | | Retired. From 1984 to 2013, equities analyst, portfolio manager, research director and chief investment officer at Fidelity Management and Research Company in Boston, Tokyo, and Hong Kong, and retired in 2013 as Chief Investment Officer of Fidelity Strategic Advisers, Inc. where he led a team of investment professionals managing client assets. Prior thereto, Board member of Hong Kong Securities Clearing Co., Hong Kong Options Clearing Corp., the Thailand International Fund, Ltd., Fidelity Investments Life Insurance Company, and Empire Fidelity Investments Life Insurance Company. Audit Committee Chair and Investment Committee Chair of the Vincent Memorial Hospital Endowment (non-profit organization). Mr. Ebsworth is a CFA® charterholder. | | N/A |
| | | |
Jane A. Freeman (Born 1953) | | Trustee, since 2015; Chair Liaison, since 2018 | | Retired. From 2012 to 2014 and 1999 to 2008, Chief Financial Officer of Scientific Learning Corporation. From 2008 to 2012, Ms. Freeman provided consulting services related to strategic business projects. Prior to 1999, Portfolio Manager at Rockefeller & Co. and Scudder, Stevens & Clark. Board member of the Harding Loevner Funds from 1996 to 2014, serving as both Lead Independent Director and chair of the Audit Committee. Board member of the Russell Exchange Traded Funds Trust from 2011 to 2012 and the chair of the Audit Committee. Ms. Freeman is also an inactive Chartered Financial Analyst. | | N/A |
| | | |
Isaiah Harris, Jr. (Born 1952) | | Trustee, since 2009; Audit Committee Chairman, since 2019 | | Retired. Chairman of the Board of CIGNA Corporation since 2009, and Director since 2005. From 2003 to 2011, Director of Deluxe Corporation. Prior thereto, President and CEO of BellSouth Advertising and Publishing Corp. from 2005 to 2007, President and CEO of BellSouth Enterprises from 2004 to 2005 and President of BellSouth Consumer Services from 2000 to 2003. Emeritus member of the Iowa State University Foundation Board of Governors. Emeritus Member of the Advisory Board of Iowa State University School of Business. Advisory Board Member, Palm Harbor Academy (private school). Mr. Harris is a certified public accountant (inactive status). | | CIGNA Corporation |
| | | |
Judith M. Johnson (Born 1949) | | Trustee, since 2008 | | Retired. Prior thereto, Chief Executive Officer and Chief Investment Officer of Minneapolis Employees Retirement Fund from 1996 to 2008. Ms. Johnson is an attorney, certified public accountant and a certified managerial accountant. | | N/A |
| | | |
David F. Larcker (Born 1950) | | Trustee, since 2009 | | James Irvin Miller Professor of Accounting at the Graduate School of Business (Emeritus), Stanford University, Director of the Corporate Governance Research Initiative and Senior Faculty of The Rock Center for Corporate Governance since 2006. From 2005 to 2008, Professor of Accounting at the Graduate School of Business, Stanford University. Prior thereto, Ernst & Young Professor of Accounting at The Wharton School, University of Pennsylvania from 1985 to 2005. | | N/A |
52 | Wells Fargo Factor Enhanced U.S. Small Cap Equity Portfolio
Other information (unaudited)
| | | | | | |
Name and year of birth | | Position held and length of service* | | Principal occupations during past five years or longer | | Current other public company or investment company directorships |
| | | |
Olivia S. Mitchell (Born 1953) | | Trustee, since 2006; Nominating and Governance Committee Chair, since 2018 | | International Foundation of Employee Benefit Plans Professor, Wharton School of the University of Pennsylvania since 1993. Director of Wharton’s Pension Research Council and Boettner Center on Pensions & Retirement Research, and Research Associate at the National Bureau of Economic Research. Previously, Cornell University Professor from 1978 to 1993. | | N/A |
| | | |
Timothy J. Penny (Born 1951) | | Trustee, since 1996; Chairman, since 2018 | | President and Chief Executive Officer of Southern Minnesota Initiative Foundation, a non-profit organization, since 2007. Member of the Board of Trustees of NorthStar Education Finance, Inc., a non-profit organization, since 2007. | | N/A |
| | | |
James G. Polisson (Born 1959) | | Trustee, since 2018 | | Retired. Chief Marketing Officer, Source (ETF) UK Services, Ltd, from 2015 to 2017. From 2012 to 2015, Principal of The Polisson Group, LLC, a management consulting, corporate advisory and principal investing company. Chief Executive Officer and Managing Director at Russell Investments, Global Exchange Traded Funds from 2010 to 2012. Managing Director of Barclays Global Investors from 1998 to 2010 and Global Chief Marketing Officer for iShares and Barclays Global Investors from 2000 to 2010. Trustee of the San Francisco Mechanics’ Institute, a non-profit organization, from 2013 to 2015. Board member of the Russell Exchange Traded Fund Trust from 2011 to 2012. Director of Barclays Global Investors Holdings Deutschland GmbH from 2006 to 2009. Mr. Polisson is an attorney and has a retired status with the Massachusetts and District of Columbia Bar Associations. | | N/A |
| | | |
Pamela Wheelock (Born 1959) | | Trustee, since January 2020; previously Trustee from January 2018 to July 2019 | | Board member of the Destination Medical Center Economic Development Agency, Rochester, Minnesota since 2019. Interim President of the McKnight Foundation from January to September 2020. Acting Commissioner, Minnesota Department of Human Services, July 2019 through September 2019. Human Services Manager (part-time), Minnesota Department of Human Services, October 2019 through December 2019. Chief Operating Officer, Twin Cities Habitat for Humanity from 2017 to 2019. Vice President of University Services, University of Minnesota from 2012 to 2016. Prior thereto, on the Board of Directors, Governance Committee and Finance Committee for the Minnesota Philanthropy Partners (Saint Paul Foundation) from 2012 to 2018, Interim Chief Executive Officer of Blue Cross Blue Shield of Minnesota from 2011 to 2012, Chairman of the Board from 2009 to 2012 and Board Director from 2003 to 2015. Vice President, Leadership and Community Engagement, Bush Foundation, Saint Paul, Minnesota (a private foundation) from 2009 to 2011. Executive Vice President and Chief Financial Officer, Minnesota Sports and Entertainment from 2004 to 2009 and Senior Vice President from 2002 to 2004. Executive Vice President of the Minnesota Wild Foundation from 2004 to 2008. Commissioner of Finance, State of Minnesota, from 1999 to 2002. Currently Board Chair of the Minnesota Wild Foundation since 2010. | | N/A |
| * | Length of service dates reflect the Trustee’s commencement of service with the Trust’s predecessor entities, where applicable. |
Wells Fargo Factor Enhanced U.S. Small Cap Equity Portfolio | 53
Other information (unaudited)
Officers
| | | | |
Name and year of birth | | Position held and length of service | | Principal occupations during past five years or longer |
| | |
Andrew Owen (Born 1960) | | President, since 2017 | | Executive Vice President of Wells Fargo & Company and Head of Affiliated Managers, Wells Fargo Asset Management, since 2014. In addition, Mr. Owen is currently President, Chief Executive Officer and Director of Wells Fargo Funds Management, LLC since 2017. Prior thereto, Executive Vice President responsible for marketing, investments and product development for Wells Fargo Funds Management, LLC, from 2009 to 2014. |
| | |
Jeremy DePalma1 (Born 1974) | | Treasurer, since 2012 | | Senior Vice President of Wells Fargo Funds Management, LLC since 2009. Senior Vice President of Evergreen Investment Management Company, LLC from 2008 to 2010 and head of the Fund Reporting and Control Team within Fund Administration from 2005 to 2010. |
| | |
Michelle Rhee (Born 1966) | | Chief Legal Officer, since 2019 | | Secretary of Wells Fargo Funds Management, LLC, Chief Legal Counsel of Wells Fargo Asset Management and Assistant General Counsel of Wells Fargo Bank, N.A. since 2018. Associate General Counsel and Managing Director of Bank of America Corporation from 2004 to 2018. |
| | |
Catherine Kennedy (Born 1969) | | Secretary, since 2019 | | Vice President of Wells Fargo Funds Management, LLC and Senior Counsel of the Wells Fargo Legal Department since 2010. Vice President and Senior Counsel of Evergreen Investment Management Company, LLC from 1998 to 2010. |
| | |
Michael H. Whitaker (Born 1967) | | Chief Compliance Officer, since 2016 | | Chief Compliance Officer of Wells Fargo Asset Management since 2016. Senior Vice President and Chief Compliance Officer for Fidelity Investments from 2007 to 2016. |
| | |
David Berardi (Born 1975) | | Assistant Treasurer, since 2009 | | Vice President of Wells Fargo Funds Management, LLC since 2009. Vice President of Evergreen Investment Management Company, LLC from 2008 to 2010. Manager of Fund Reporting and Control for Evergreen Investment Management Company, LLC from 2004 to 2010. |
| 1 | Jeremy DePalma acts as Treasurer of 77 funds and Assistant Treasurer of 65 funds in the Fund Complex. |
| 2 | The Statement of Additional Information includes additional information about the Trustees and is available, without charge, upon request, by calling 1-800-222-8222 or by visiting the website at wfam.com. |
54 | Wells Fargo Factor Enhanced U.S. Small Cap Equity Portfolio
Other information (unaudited)
BOARD CONSIDERATION OF INVESTMENT MANAGEMENT, ADVISORY AND SUB-ADVISORY AGREEMENTS:
Wells Fargo Emerging Markets Bond Fund, Wells Fargo High Yield Corporate Bond Fund, Wells Fargo International Government Bond Fund, Wells Fargo U.S. Core Bond Fund, Wells Fargo Bloomberg Barclays US Aggregate ex-Corporate Credit Portfolio, Wells Fargo Factor Enhanced Emerging Markets Equity Portfolio, Wells Fargo Emerging Markets Bond Portfolio, Wells Fargo Factor Enhanced International Equity Portfolio, Wells Fargo Factor Enhanced U.S. Large Cap Portfolio, Wells Fargo Factor Enhanced U.S. Small Cap Portfolio, Wells Fargo International Government Bond Portfolio, Wells Fargo Investment Grade Corporate Bond Portfolio, Wells Fargo High Yield Corporate Bond Portfolio, Wells Fargo Strategic Retirement Bond Portfolio, and Wells Fargo U.S. REIT Portfolio
Under the Investment Company Act of 1940 (the “1940 Act”), the Board of Trustees (each, a “Board” and collectively, the “Boards”) of each of Wells Fargo Funds Trust (“Funds Trust”) and Wells Fargo Master Trust (“Master Trust”) (collectively, the “Trusts”) must determine annually whether to approve the continuation of the Trusts’ investment management, advisory and sub-advisory agreements, as applicable. In this regard, at a meeting held on May 26, 2020 and May 28, 2020 (together, the “Meeting”), the Board of Funds Trust, all the members of which have no direct or indirect interest in the investment management agreement and are not “interested persons” of the Trusts, as defined in the 1940 Act (the “Independent Trustees”), reviewed and approved for each of the funds of Funds Trust identified in the table below (individually, an “Index Fund” and collectively, the “Index Funds”) an investment management agreement (the “Management Agreement”) with Wells Fargo Funds Management, LLC (“Funds Management”).
| | | | |
| |
| Index Funds | | | |
| |
Wells Fargo Emerging Markets Bond Fund | | | | |
| |
Wells Fargo High Yield Corporate Bond Fund | | | | |
| |
Wells Fargo International Government Bond Fund | | | | |
| |
Wells Fargo U.S. Core Bond Fund | | | | |
In addition, the Funds Trust Board reviewed and approved an investment sub-advisory agreement with Wells Capital Management Incorporated (“WellsCap”) for the U.S. Core Bond Fund (the “Core Bond Fund Sub-Advisory Agreement”).
At the Meeting, the Board of Master Trust, all the members of which have no direct or indirect interest in the investment advisory and sub-advisory agreements and are Independent Trustees, reviewed and approved for each of the portfolios of Master Trust identified in the table below (individually, a “Master Portfolio” and collectively, the “Master Portfolios”): (i) an investment advisory agreement (the “Master Portfolio Advisory Agreement”) with Funds Management; and (ii) an investment sub-advisory agreement (each, a “Master Portfolio Sub-Advisory Agreement”, and collectively, the “Master Portfolio Sub-Advisory Agreements”) with the sub-adviser(s) identified in the chart below (each, a “Sub-Adviser”, and collectively, the “Sub-Advisers”) for the corresponding Master Portfolio identified.
| | |
| |
| Master Portfolios | | Sub-Advisers |
| |
Wells Fargo Bloomberg Barclays US Aggregate ex-Corporate Credit Portfolio | | WellsCap |
| |
Wells Fargo Factor Enhanced Emerging Markets Equity Portfolio | | WellsCap |
| |
Wells Fargo Emerging Markets Bond Portfolio | | Wells Fargo Asset Management (International), Limited (“WFAM International”)) |
| |
Wells Fargo Factor Enhanced International Equity Portfolio | | WellsCap |
| |
Wells Fargo Factor Enhanced U.S. Large Cap Portfolio | | WellsCap |
| |
Wells Fargo Factor Enhanced U.S. Small Cap Portfolio | | WellsCap |
| |
Wells Fargo International Government Bond Portfolio | | WFAM International |
| |
Wells Fargo Investment Grade Corporate Bond Portfolio | | WellsCap |
| |
Wells Fargo High Yield Corporate Bond Portfolio | | WellsCap |
| |
Wells Fargo Strategic Retirement Bond Portfolio | | WellsCap |
| |
Wells Fargo U.S. REIT Portfolio | | WellsCap |
Wells Fargo Factor Enhanced U.S. Small Cap Equity Portfolio | 55
Other information (unaudited)
The Index Funds and the Master Portfolios are collectively referred to as the “Funds.” The Management Agreement, the Core Bond Fund Sub-Advisory Agreement, the Master Portfolio Advisory Agreement and the Master Portfolio Sub-Advisory Agreements are collectively referred to as the “Advisory Agreements.”
The Boards noted that each of the Index Funds is a feeder fund that invests all of its assets in its corresponding Master Portfolio, with the exception of the U.S. Core Bond Fund, which invests in multiple Master Portfolios. Information provided to the Boards regarding the Index Funds is also applicable to the Master Portfolios identified above, as relevant.
At the Meeting, the Boards considered the factors and reached the conclusions described below relating to the selection of Funds Management and the Sub-Advisers and the approval of the Advisory Agreements. Prior to the Meeting, including at a Board meeting held in April 2020, the Trustees conferred extensively among themselves and with representatives of Funds Management about these matters. Also, the Boards have adopted a team-based approach, with each team consisting of a sub-set of Trustees, to assist the full Boards in the discharge of their duties in reviewing investment performance and other matters throughout the year. The Independent Trustees were assisted in their evaluation of the Advisory Agreements by independent legal counsel, from whom they received separate legal advice and with whom they met separately.
In providing information to the Boards, Funds Management and the Sub-Advisers were guided by a detailed set of requests for information submitted to them by independent legal counsel on behalf of the Independent Trustees at the start of the Boards’ annual contract renewal process earlier in 2020. In considering and approving the Advisory Agreements, the Trustees considered the information they believed relevant, including but not limited to the information discussed below. The Boards considered not only the specific information presented in connection with the Meeting, but also the knowledge gained over time through interaction with Funds Management and the Sub-Advisers about various topics. In this regard, the Boards reviewed reports of Funds Management at each of their quarterly meetings, which included, among other things, portfolio reviews and investment performance reports. In addition, the Boards and the teams mentioned above confer with portfolio managers at various times throughout the year. The Boards did not identify any particular information or consideration that was all-important or controlling, and each individual Trustee may have attributed different weights to various factors.
After its deliberations, the Board of Funds Trust unanimously approved the continuation of the Management Agreement and the Core Bond Fund Sub-Advisory Agreement for a one-year period. Additionally, after its deliberations, the Board of Master Trust unanimously approved the continuation of the Master Portfolio Advisory Agreement and each Master Portfolio Sub-Advisory Agreement for a one-year term. The Boards also determined that the compensation or the absence of compensation payable to Funds Management and to each of the Sub-Advisers under each of the Advisory Agreements was reasonable. The Boards considered the approval of the Advisory Agreements for the Funds as part of their consideration of agreements for funds across the complex, but their approvals were made on a fund-by-fund basis. The following summarizes a number of important, but not necessarily all, factors considered by the Boards in support of their approvals.
Nature, extent and quality of services
The Boards received and considered various information regarding the nature, extent and quality of services provided to the Funds by Funds Management and the Sub-Advisers under the Advisory Agreements. This information included a description of the investment advisory services and Fund-level administrative services covered by the Advisory Agreements, as well as, among other things, a summary of the background and experience of senior management of Wells Fargo Asset Management (“WFAM”), of which Funds Management and the Sub-Advisers are a part, and a summary of investments made in the business of WFAM. The Boards also received a description of Funds Management’s and the Sub-Advisers’ business continuity plans and of their approaches to data privacy and cybersecurity, and related testing. The Boards also received and reviewed information about Funds Management’s role as administrator of the Funds’ liquidity risk management program, Funds Management’s approach to risk management, and Funds Management’s intermediary and vendor oversight program.
The Boards also considered the qualifications, background, tenure and responsibilities of each of the portfolio managers primarily responsible for the day-to-day portfolio management of the Funds. The Board of Master Trust noted that each of the Master Portfolios replicates the performance of a proprietary index provided by an affiliate of Funds Management, except that the Wells Fargo Bloomberg Barclays US Aggregate ex-Corporate Credit Portfolio, the Wells Fargo Emerging Markets Bond Portfolio, and the Wells Fargo Strategic Retirement Bond Portfolio track the performance of third-party indexes. The Boards evaluated the ability of Funds Management and the Sub-Advisers to attract and retain qualified investment professionals, including research, advisory and supervisory personnel. The Boards further considered the compliance programs and compliance records of Funds Management and the Sub-Advisers. In addition, the Boards took into account the full range of services provided to the Funds by Funds Management and its affiliates.
56 | Wells Fargo Factor Enhanced U.S. Small Cap Equity Portfolio
Other information (unaudited)
Fund investment performance and expenses
The Boards considered the investment performance results for each of the Master Portfolios for the one-year period ended December 31, 2019. The Boards also considered more current results for the one-year period ended March 31, 2020. The Boards considered these results in comparison to the investment performance of funds in a universe that was determined by Broadridge Inc. (“Broadridge”) to be similar to the respective Master Portfolios (each, a “Universe”), and in comparison to each Master Portfolio’s benchmark index and to other comparative data. Broadridge is an independent provider of investment company data. The Boards received a description of the methodology used by Broadridge to select the mutual funds in each performance Universe.
The Boards noted the short performance history of the Master Portfolios. For the one-year period ended December 31, 2019, the Boards noted that the investment performance of each Master Portfolio relative to its respective Universe was as follows: (i) the investment performance of each of the Wells Fargo Bloomberg Barclays US Aggregate ex-Corporate Credit Portfolio, the Wells Fargo Emerging Markets Bond Portfolio, the Wells Fargo Factor Enhanced International Equity Portfolio, the Wells Fargo Factor Enhanced U.S. Large Cap Portfolio, the Wells Fargo High Yield Corporate Bond Portfolio and the Wells Fargo Investment Grade Corporate Bond Portfolio was higher than or in range of the average investment performance of such Master Portfolio’s respective Universe; and (ii) the Wells Fargo Factor Enhanced Emerging Markets Equity Portfolio, the Wells Fargo Factor Enhanced U.S. Small Cap Portfolio, the Wells Fargo International Government Bond Portfolio, the Wells Fargo Strategic Retirement Bond Portfolio and the Wells Fargo U.S. REIT Portfolio was lower than the average investment performance of such Master Portfolio’s respective Universe. For the one-year period ended March 31, 2020, the Boards noted that the investment performance of each Master Portfolio relative to its respective Universe was as follows: (i) the Wells Fargo Emerging Markets Bond Portfolio, the Wells Fargo Factor Enhanced U.S. Large Cap Portfolio, the Wells Fargo Factor Enhanced U.S. Small Cap Portfolio, the Wells Fargo International Government Bond Portfolio, and the Wells Fargo Investment Grade Corporate Bond Portfolio was higher than or in range of the average investment performance of such Master Portfolio’s respective Universe, and (ii) the Wells Fargo Bloomberg Barclays US Aggregate ex-Corporate Credit Portfolio, the Wells Fargo Factor Enhanced Emerging Markets Equity Portfolio, the Wells Fargo Factor Enhanced International Equity Portfolio, the Wells Fargo High Yield Corporate Bond Portfolio, the Wells Fargo Strategic Retirement Bond Portfolio and the Wells Fargo U.S. REIT Portfolio was lower than the average investment performance of such Master Portfolio’s respective Universe.
The Boards also noted that the investment performance of each Master Portfolio to its respective benchmark index for the one-year period ended December 31, 2019, was as follows: (i) the investment performance of each of the Wells Fargo Bloomberg Barclays US Aggregate ex-Corporate Credit Portfolio, the Wells Fargo Factor Enhanced Emerging Markets Equity Portfolio, the Wells Fargo Factor Enhanced U.S. Large Cap Portfolio, the Wells Fargo Factor Enhanced U.S. Small Cap Portfolio, the Wells Fargo High Yield Corporate Bond Portfolio, the Wells Fargo U.S. REIT Portfolio and the Wells Fargo Strategic Retirement Bond Portfolio was higher than or in range of the average investment performance of such Master Portfolio’s respective benchmark, and (ii) the investment performance of each of the Wells Fargo Emerging Markets Bond Portfolio, the Wells Fargo Factor Enhanced International Equity Portfolio, the Wells Fargo International Government Bond Portfolio and the Wells Fargo Investment Grade Corporate Bond Portfolio was lower than the average investment performance of such Master Portfolio’s respective benchmark. For the one-year period ended March 31, 2020, the Boards also noted that the investment performance of each Master Portfolio to its respective benchmark index, was as follows: (i) the investment performance of each of the Wells Fargo Bloomberg Barclays US Aggregate ex-Corporate Credit Portfolio, the Wells Fargo Factor Enhanced Emerging Markets Equity Portfolio, the Wells Fargo Factor Enhanced International Equity Portfolio, the Wells Fargo Factor Enhanced U.S. Large Cap Portfolio, the Wells Fargo Factor Enhanced U.S. Small Cap Portfolio, the Wells Fargo U.S. REIT Portfolio, the Wells Fargo Investment Grade Corporate Bond Portfolio and the Wells Fargo Strategic Retirement Bond Portfolio was higher than, equal to or in range of the average investment performance of such Master Portfolio’s respective benchmark, and (ii) the investment performance of each of the Wells Fargo Emerging Markets Bond Portfolio, the Wells Fargo High Yield Corporate Bond Portfolio and the Wells Fargo International Government Bond Portfolio was lower than the average investment performance of such Master Portfolio’s respective benchmark.
The Boards received information concerning, and discussed factors contributing to, the underperformance of certain Master Portfolios, relative to the Universe and benchmark index, for the periods identified above. The Board took note of the explanations for the relative underperformance during these periods, including with respect to investment decisions and market factors that affected the Fund’s investment performance.
The Board of Funds Trust took note of the investment performance of the Master Portfolios in the context of reviewing the investment performance of the Index Funds. The Board of Funds Trust also received and considered information regarding the “zero fee and expense” structure of each Index Fund. Specifically, the Funds Trust Board noted that each Index Fund’s gross operating expense ratio and each of its various components, including management fees, administration fees, custody fees,
Wells Fargo Factor Enhanced U.S. Small Cap Equity Portfolio | 57
Other information (unaudited)
Rule 12b-1 fees, and other fees, are zero. The Funds Trust Board also noted that Funds Management assumes and pays or reimburses all of the ordinary operating expenses of each Index Fund, including acquired fund fees and expenses, pursuant to an agreement with each of the Index Funds (the “Fee and Expense Agreement”). The Funds Trust Board further noted that Funds Management receives a fee from Wells Fargo Wealth and Investment Management (“WIM”) pursuant to an intercompany agreement equal to the Master Portfolio fees and expenses absorbed by Funds Management through its Fee and Expense Agreement with each of the Index Funds.
With respect to the Master Portfolios, the Board of Master Trust received and considered information regarding the fee rates that are payable to Funds Management for investment advisory services (as discussed below), which are the only fees charged at the Master Portfolio level, relative to corresponding class-specific expense groups that were determined by Broadridge to be similar to the Funds (the “Groups”). The Boards received a description of the methodology used by Broadridge to select the mutual funds in the expense Groups and an explanation of how funds comprising expense groups and their expense ratios may vary from year-to-year.
The Boards took into account the Funds’ expense information and the Master Portfolios’ performance information provided to them among the factors considered in deciding to re-approve the Advisory Agreements.
Investment management, advisory and sub-advisory fee rates
The Board of Funds Trust reviewed and considered that the contractual investment management fee rate payable by each Index Fund to Funds Management for investment management services zero, and also reviewed and considered that each Fund’s other expenses would normally be zero, because of Funds Management’s commitment to assume and pay or reimburse all of the ordinary operating expenses of each Fund, including acquired fund fees and expenses, under the Fee and Expense Agreement. The Board of Funds Trust also reviewed and considered that the contractual investment sub-advisory fee rate payable by Funds Management to WellsCap for investment sub-advisory services for the U.S. Core Bond Fund is also zero.
The Board of Master Trust reviewed and considered the contractual fee rates payable by the Master Portfolios to Funds Management under the Master Portfolio Advisory Agreement (the “Advisory Agreement Rates”). The Board of Master Trust also reviewed and considered the contractual investment sub-advisory fee rates that are payable by Funds Management to the Sub-Advisers for investment sub-advisory services (the “Sub-Advisory Agreement Rates”).
The Board of Master Trust reviewed a comparison of the Advisory Agreement Rates of each Master Portfolio with those of other funds in each Master Portfolio’s respective expense Groups at a common asset level. The Board of Master Trust noted that the Advisory Agreement Rates of each Master Portfolio were lower than or equal to the median rate for such Master Portfolio’s expense Groups.
The Boards also received and considered information about the portions of the total management fees that were retained by Funds Management after payment of the fees to the Sub-Advisers for sub-advisory services. In assessing the reasonableness of these amounts, the Boards received and evaluated information about the nature and extent of responsibilities retained and risks assumed by Funds Management and not delegated to or assumed by the Sub-Advisers, and about Funds Management’s on-going oversight services. Given the affiliation between Funds Management and the Sub-Advisers, the Boards ascribed limited relevance to the allocation of fees between them.
The Boards also received and considered information about the nature and extent of services offered and fee rates charged by Funds Management and the Sub-Advisers to other types of clients with investment strategies similar to those of certain Funds. In this regard, the Boards received information about the significantly greater scope of services, and compliance, reporting and other legal burdens and risks of managing proprietary mutual funds compared with those associated with managing assets of other types of clients, including third-party sub-advised fund clients and non-mutual fund clients such as institutional separate accounts.
Based on its consideration of the factors and information it deemed relevant, including those described here, the Board of Fund Trust determined that the compensation received by Funds Management from WIM pursuant to the intercompany agreement, and the absence of compensation payable by the Funds to Funds Management pursuant to the Management Agreement or to WellsCap pursuant to the Core Bond Fund Sub-Advisory Agreement, was reasonable. Based on its consideration of the factors and information it deemed relevant, including those described here, the Board of Master Trust determined that the Advisory Agreement Rates and the Sub-Advisory Agreement Rates for each Master Portfolio were reasonable.
Profitability
The Boards received and considered information concerning the profitability of Funds Management, as well as the profitability of both WFAM and Wells Fargo & Co. (“Wells Fargo”) from providing services to the fund family as a whole. The Boards noted that the Sub-Advisers’ profitability information with respect to providing services to the Funds and other funds in the family was subsumed in the WFAM and Wells Fargo profitability analysis.
58 | Wells Fargo Factor Enhanced U.S. Small Cap Equity Portfolio
Other information (unaudited)
Funds Management reported on the methodologies and estimates used in calculating profitability, including a description of the methodology used to allocate certain expenses. Among other things, the Boards noted that the levels of profitability reported on a fund-by-fund basis varied widely, depending on factors such as the size, type and age of fund.
Based on its review, the Boards did not deem the profits reported by Funds Management, WFAM or Wells Fargo from services provided to the Funds to be at a level that would prevent them from approving the continuation of the Advisory Agreements.
Economies of scale
The Boards received and considered information about the potential for Funds Management to experience economies of scale in the provision of management services to the Funds, the difficulties of calculating economies of scale at an individual fund level, and the extent to which potential scale benefits are shared with shareholders. The Boards noted the existence of breakpoints in the each Master Portfolio’s advisory fee structure and each Index Fund’s management fee structure, which operate generally to reduce the Funds’ expense ratios as the Funds grow in size, and the size of the Funds in relation to such breakpoints. The Boards considered that in addition to management fee breakpoints, Funds Management shares potential economies of scale from its management business in a variety of ways, including through fee waiver and expense reimbursement arrangements, services that benefit shareholders, competitive management fee rates set at the outset without regard to breakpoints, and investments in the business intended to enhance services available to shareholders.
The Boards concluded that Funds Management’s arrangements with respect to the Funds, including contractual breakpoints, constituted a reasonable approach to sharing potential economies of scale with the Funds and their shareholders.
Other benefits to Funds Management and the Sub-Advisers
The Boards received and considered information regarding potential “fall-out” or ancillary benefits received by Funds Management and its affiliates, including WellsCap and WFAM International, as a result of their relationships with the Funds. Ancillary benefits could include, among others, benefits directly attributable to other relationships with the Funds and benefits potentially derived from an increase in Funds Management’s and the Sub-Advisers’ business as a result of their relationships with the Funds. The Boards noted that various affiliates of Funds Management may receive distribution-related fees, shareholder servicing payments and sub-transfer agency fees in respect of shares sold or held through them and services provided.
The Boards also reviewed information about soft dollar credits earned and utilized by the Sub-Advisers, fees earned by Funds Management and WellsCap from managing a private investment vehicle for the fund family’s securities lending collateral, and commissions earned by an affiliated broker from portfolio transactions.
Based on their consideration of the factors and information they deemed relevant, including those described here, the Boards did not find that any ancillary benefits received by Funds Management and its affiliates, including WellsCap and WFAM International, were unreasonable.
Conclusion
At the Meeting, after considering the above-described factors and based on its deliberations and its evaluation of the information described above, the Funds Trust Board unanimously approved the continuation of the Management Agreement and the Core Bond Fund Sub-Advisory Agreement for a one-year period. Additionally, after its deliberations, the Master Trust Board unanimously approved the continuation of the Master Portfolio Advisory Agreement and each Master Portfolio Sub-Advisory Agreement for a one-year term. The Boards also determined that the compensation or the absence of compensation payable to Funds Management and to each of the Sub-Advisers was reasonable.
Wells Fargo Factor Enhanced U.S. Small Cap Equity Portfolio | 59
Other information (unaudited)
LIQUIDITY RISK MANAGEMENT PROGRAM
In accordance with Rule 22e-4 under the Investment Company Act of 1940, as amended (the “Liquidity Rule”), Wells Fargo Master Trust (the “Trust”) has adopted and implemented a liquidity risk management program (the “Program”) on behalf of each of its series, including each Portfolio, which is reasonably designed to assess and manage the Portfolio’s liquidity risk. “Liquidity risk” is defined as the risk that a Portfolio is unable to meet redemption requests without significantly diluting remaining investors’ interests in the Portfolio. The Trust’s Board of Trustees (the “Board”) previously approved the designation of Wells Fargo Funds Management, LLC (“Funds Management”), each Portfolio’s investment adviser, as the administrator of the Program, and Funds Management has established a Liquidity Risk Management Council composed of personnel from multiple departments within Funds Management and its affiliates to assist Funds Management in the implementation and on-going administration of the Program.
The Program is comprised of various components designed to support the assessment and/or management of liquidity risk, including: (1) the periodic assessment (no less frequently than annually) of certain factors that influence a Portfolio’s liquidity risk; (2) the periodic classification (no less frequently than monthly) of a Portfolio’s investments into one of four liquidity categories that reflect an estimate of their liquidity under current market conditions; (3) a 15% limit on the acquisition of “illiquid investments” (as defined under the Liquidity Rule); (4) to the extent a Portfolio does not invest primarily in “highly liquid investments” (as defined under the Liquidity Rule), the determination of a minimum percentage of the Portfolio’s assets that generally will be invested in highly liquid investments (an “HLIM”); (5) if a Portfolio has established an HLIM, the periodic review (no less frequently than annually) of the HLIM and the adoption of policies and procedures for responding to a shortfall of the Portfolio’s “highly liquid investments” below its HLIM; and (6) periodic reporting to the Board.
At a meeting of the Board held on May 26 and 28, 2020, the Board received a written report (the “Report”) from Funds Management that addressed the operation of the Program and assessed its adequacy and effectiveness of implementation. The Report covered the initial period from December 1, 2018 through December 31, 2019 (the “Reporting Period”). No significant liquidity events impacting any Portfolio were noted in the Report. There were no material changes to the Program during the Reporting Period. The Report concluded that the Program is operating effectively to assess and manage each Portfolio’s liquidity risk, and that the Program has been and continues to be adequately and effectively implemented to monitor and, as applicable, respond to the Portfolio’s liquidity developments.
60 | Wells Fargo Factor Enhanced U.S. Small Cap Equity Portfolio

For more information
More information about Wells Fargo Funds is available free upon request. To obtain literature, please write, visit the Portfolio’s website, or call:
Wells Fargo Funds
P.O. Box 219967
Kansas City, MO 64121-9967
Website: wfam.com
Individual investors: 1-800-222-8222
Retail investment professionals: 1-888-877-9275
Institutional investment professionals: 1-866-765-0778
This report and the financial statements contained herein are submitted for the general information of the shareholders of the Portfolio. If this report is used for promotional purposes, distribution of the report must be accompanied or preceded by a current prospectus. Before investing, please consider the investment objectives, risks, charges, and expenses of the investment. For a current prospectus and, if available, a summary prospectus, containing this information, call 1-800-222-8222 or visit the Portfolio’s website at wfam.com. Read the prospectus carefully before you invest or send money.
Wells Fargo Asset Management (WFAM) is the trade name for certain investment advisory/management firms owned by Wells Fargo & Company. These firms include but are not limited to Wells Capital Management Incorporated and Wells Fargo Funds Management, LLC. Certain products managed by WFAM entities are distributed by Wells Fargo Funds Distributor, LLC (a broker-dealer and Member FINRA).
This material is for general informational and educational purposes only and is NOT intended to provide investment advice or a recommendation of any kind—including a recommendation for any specific investment, strategy, or plan.
INVESTMENT PRODUCTS: NOT FDIC INSURED ◾ NO BANK GUARANTEE ◾ MAY LOSE VALUE
© 2020 Wells Fargo & Company. All rights reserved.
Semi-Annual Report
August 31, 2020
Wells Fargo
High Yield Corporate Bond Portfolio
INVESTMENT PRODUCTS: NOT FDIC INSURED ◾ NO BANK GUARANTEE ◾ MAY LOSE VALUE
Wells Fargo High Yield Corporate Bond Portfolio | 1
Portfolio information (unaudited)
Investment objective
The Portfolio seeks to replicate the total return of the Wells Fargo U.S. High Yield Bond Index, before fees and expenses.
Adviser
Wells Fargo Funds Management, LLC
Subadviser
Wells Capital Management Incorporated
Portfolio managers
Manjunath Boraiah†
Janet S. Rilling, CFA®‡, CPA
Michael J. Schueller, CFA®‡
| | | | |
|
| Ten largest holdings (%) as of August 31, 20201 | |
| | |
New Red Finance Incorporated, 5.00%, 10-15-2025 | | | 0.73 | |
| | |
Apache Corporation, 5.10%, 9-1-2040 | | | 0.69 | |
| | |
Calpine Corporation, 5.00%, 2-1-2031 | | | 0.69 | |
| | |
Post Holdings Incorporated, 5.75%, 3-1-2027 | | | 0.64 | |
| | |
EQT Corporation, 7.88%, 2-1-2025 | | | 0.63 | |
| | |
Deutsche Bank AG, 4.88%, 12-1-2032 | | | 0.62 | |
| | |
L Brands Incorporated, 6.88%, 11-1-2035 | | | 0.62 | |
| | |
International Game Technology plc, 6.25%, 1-15-2027 | | | 0.60 | |
| | |
Uniti Group Incorporated, 8.25%, 10-15-2023 | | | 0.60 | |
| | |
Ball Corporation, 4.88%, 3-15-2026 | | | 0.60 | |
|
|
| Credit quality as of August 31, 20202 |
|
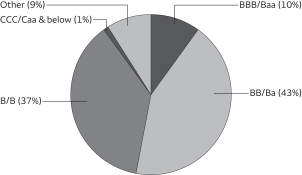
|
| † | Mr. Boraiah became a portfolio manager of the Portfolio on August 28, 2020. |
| ‡ | CFA® and Chartered Financial Analyst® are trademarks owned by CFA Institute. |
| 1 | The ten largest holdings, excluding cash, cash equivalents and any money market funds, are calculated based on the value of the investments divided by the total net assets of the Portfolio. Holdings are subject to change and may have changed since the date specified. |
| 2 | The credit quality distribution of portfolio holdings reflected in the chart is based on ratings from Standard & Poor’s, Moody’s Investors Service, and/or Fitch Ratings Ltd. Credit quality ratings apply to the underlying holdings of the affiliated master portfolio and not to the Fund itself. The percentages of the Fund’s portfolio with the ratings depicted in the chart are calculated based on the total market value of fixed income securities held by the affiliated master portfolio. If a security was rated by all three rating agencies, the middle rating was utilized. If rated by two of three rating agencies, the lower rating was utilized, and if rated by one of the rating agencies, that rating was utilized. Standard & Poor’s rates the creditworthiness of bonds, ranging from AAA (highest) to D (lowest). Ratings from A to CCC may be modified by the addition of a plus (+) or minus (-) sign to show relative standing within the rating categories. Standard & Poor’s rates the creditworthiness of short-term notes from SP-1 (highest) to SP-3 (lowest). Moody’s rates the creditworthiness of bonds, ranging from Aaa (highest) to C (lowest). Ratings Aa to B may be modified by the addition of a number 1 (highest) to 3 (lowest) to show relative standing within the ratings categories. Moody’s rates the creditworthiness of short-term U.S. tax-exempt municipal securities from MIG 1/VMIG 1 (highest) to SG (lowest). Fitch rates the creditworthiness of bonds, ranging from AAA (highest) to D (lowest). Credit quality distribution is subject to change and may have changed since the date specified. |
2 | Wells Fargo High Yield Corporate Bond Portfolio
Portfolio of investments—August 31, 2020 (unaudited)
| | | | | | | | | | | | | | | | |
| | | Interest rate | | | Maturity date | | | Principal | | | Value | |
| Corporate Bonds and Notes: 80.61% | |
|
Communication Services: 11.90% | |
|
| Diversified Telecommunication Services: 1.74% | |
CenturyLink Incorporated | | | 5.80 | % | | | 3-15-2022 | | | $ | 240,000 | | | $ | 250,780 | |
CenturyLink Incorporated | | | 6.75 | | | | 12-1-2023 | | | | 800,000 | | | | 886,008 | |
Level 3 Financing Incorporated | | | 5.25 | | | | 3-15-2026 | | | | 900,000 | | | | 938,340 | |
Level 3 Financing Incorporated | | | 5.38 | | | | 1-15-2024 | | | | 200,000 | | | | 202,250 | |
Zayo Group LLC 144A | | | 4.00 | | | | 3-1-2027 | | | | 900,000 | | | | 889,875 | |
| |
| | | | 3,167,253 | |
| | | | | |
|
| Entertainment: 1.07% | |
AMC Entertainment Holdings Incorporated 144A | | | 12.00 | | | | 6-15-2026 | | | | 195,000 | | | | 72,189 | |
Live Nation Entertainment Incorporated 144A | | | 4.88 | | | | 11-1-2024 | | | | 800,000 | | | | 786,080 | |
Netflix Incorporated | | | 4.88 | | | | 4-15-2028 | | | | 220,000 | | | | 254,650 | |
Netflix Incorporated | | | 5.50 | | | | 2-15-2022 | | | | 800,000 | | | | 842,000 | |
| |
| | | | 1,954,919 | |
| | | | | |
|
| Interactive Media & Services: 0.29% | |
Match Group Incorporated 144A | | | 5.00 | | | | 12-15-2027 | | | | 500,000 | | | | 533,125 | |
| | | | | | | | | | | | | | | | |
|
| Media: 7.12% | |
AMC Networks Incorporated | | | 4.75 | | | | 8-1-2025 | | | | 300,000 | | | | 310,500 | |
CCO Holdings LLC 144A | | | 4.00 | | | | 3-1-2023 | | | | 800,000 | | | | 811,000 | |
CCO Holdings LLC 144A | | | 5.88 | | | | 5-1-2027 | | | | 300,000 | | | | 315,375 | |
Clear Channel Worldwide Holdings Incorporated 144A | | | 9.25 | | | | 2-15-2024 | | | | 540,000 | | | | 529,200 | |
CSC Holdings LLC 144A | | | 5.50 | | | | 4-15-2027 | | | | 200,000 | | | | 213,292 | |
CSC Holdings LLC 144A | | | 5.75 | | | | 1-15-2030 | | | | 900,000 | | | | 981,000 | |
Diamond Sports Group LLC 144A | | | 5.38 | | | | 8-15-2026 | | | | 1,080,000 | | | | 842,400 | |
DISH DBS Corporation | | | 5.00 | | | | 3-15-2023 | | | | 1,000,000 | | | | 1,035,000 | |
DISH DBS Corporation | | | 5.88 | | | | 7-15-2022 | | | | 200,000 | | | | 211,100 | |
DISH DBS Corporation | | | 5.88 | | | | 11-15-2024 | | | | 200,000 | | | | 211,395 | |
Gray Television Incorporated 144A | | | 5.88 | | | | 7-15-2026 | | | | 200,000 | | | | 207,500 | |
Gray Television Incorporated 144A | | | 7.00 | | | | 5-15-2027 | | | | 570,000 | | | | 618,450 | |
Grubhub Holdings Incorporated 144A | | | 5.50 | | | | 7-1-2027 | | | | 400,000 | | | | 418,500 | |
iHeartCommunications Incorporated | | | 6.38 | | | | 5-1-2026 | | | | 340,000 | | | | 353,600 | |
iHeartCommunications Incorporated | | | 8.38 | | | | 5-1-2027 | | | | 1,000,000 | | | | 1,005,000 | |
Lamar Media Corporation | | | 5.00 | | | | 5-1-2023 | | | | 100,000 | | | | 101,125 | |
Meredith Corporation | | | 6.88 | | | | 2-1-2026 | | | | 200,000 | | | | 173,738 | |
Nexstar Broadcasting Incorporated 144A | | | 5.63 | | | | 7-15-2027 | | | | 600,000 | | | | 633,000 | |
Outfront Media Capital Corporation 144A | | | 4.63 | | | | 3-15-2030 | | | | 200,000 | | | | 193,500 | |
QVC Incorporated | | | 4.75 | | | | 2-15-2027 | | | | 800,000 | | | | 851,256 | |
Sinclair Television Group Incorporated 144A | | | 5.50 | | | | 3-1-2030 | | | | 200,000 | | | | 195,440 | |
Sirius XM Radio Incorporated 144A | | | 4.63 | | | | 7-15-2024 | | | | 700,000 | | | | 728,000 | |
Sirius XM Radio Incorporated 144A | | | 5.00 | | | | 8-1-2027 | | | | 300,000 | | | | 318,204 | |
Tegna Incorporated 144A | | | 4.63 | | | | 3-15-2028 | | | | 900,000 | | | | 909,000 | |
Univision Communications Incorporated 144A | | | 5.13 | | | | 2-15-2025 | | | | 800,000 | | | | 805,000 | |
| |
| | | | 12,971,575 | |
| | | | | |
|
| Wireless Telecommunication Services: 1.68% | |
Connect U.S. Finco LLC 144A | | | 6.75 | | | | 10-1-2026 | | | | 800,000 | | | | 826,000 | |
Sprint Capital Corporation | | | 6.88 | | | | 11-15-2028 | | | | 200,000 | | | | 255,848 | |
Sprint Corporation | | | 7.88 | | | | 9-15-2023 | | | | 900,000 | | | | 1,046,813 | |
T-Mobile USA Incorporated | | | 4.50 | | | | 2-1-2026 | | | | 900,000 | | | | 929,079 | |
| |
| | | | 3,057,740 | |
| | | | | |
The accompanying notes are an integral part of these financial statements.
Wells Fargo High Yield Corporate Bond Portfolio | 3
Portfolio of investments—August 31, 2020 (unaudited)
| | | | | | | | | | | | | | | | |
| | | Interest rate | | | Maturity date | | | Principal | | | Value | |
| Consumer Discretionary: 15.64% | |
|
| Auto Components: 2.66% | |
Adient US LLC 144A | | | 9.00 | % | | | 4-15-2025 | | | $ | 500,000 | | | $ | 555,000 | |
Allison Transmission Incorporated 144A | | | 5.00 | | | | 10-1-2024 | | | | 600,000 | | | | 606,018 | |
Allison Transmission Incorporated 144A | | | 5.88 | | | | 6-1-2029 | | | | 200,000 | | | | 219,000 | |
American Axle & Manufacturing Incorporated | | | 6.25 | | | | 3-15-2026 | | | | 910,000 | | | | 927,497 | |
Clarios Global LP 144A | | | 6.25 | | | | 5-15-2026 | | | | 940,000 | | | | 996,988 | |
Dana Incorporated | | | 5.63 | | | | 6-15-2028 | | | | 610,000 | | | | 643,550 | |
Goodyear Tire & Rubber Company | | | 5.13 | | | | 11-15-2023 | | | | 900,000 | | | | 902,259 | |
| |
| | | | 4,850,312 | |
| | | | | |
|
| Automobiles: 0.96% | |
Ford Motor Company | | | 4.75 | | | | 1-15-2043 | | | | 330,000 | | | | 305,663 | |
Ford Motor Company | | | 8.50 | | | | 4-21-2023 | | | | 800,000 | | | | 884,324 | |
Ford Motor Company | | | 9.00 | | | | 4-22-2025 | | | | 300,000 | | | | 351,080 | |
Tesla Incorporated 144A | | | 5.30 | | | | 8-15-2025 | | | | 200,000 | | | | 207,776 | |
| |
| | | | 1,748,843 | |
| | | | | |
|
| Commercial Services & Supplies: 0.75% | |
Aramark Services Incorporated 144A | | | 5.00 | | | | 2-1-2028 | | | | 530,000 | | | | 530,663 | |
Aramark Services Incorporated | | | 4.75 | | | | 6-1-2026 | | | | 300,000 | | | | 298,257 | |
Verscend Technologies Incorporated 144A | | | 9.75 | | | | 8-15-2026 | | | | 500,000 | | | | 542,500 | |
| |
| | | | 1,371,420 | |
| | | | | |
|
| Diversified Consumer Services: 0.68% | |
Prime Security Services Borrower LLC 144A | | | 5.25 | | | | 4-15-2024 | | | | 960,000 | | | | 1,017,600 | |
Service Corporation International | | | 4.63 | | | | 12-15-2027 | | | | 200,000 | | | | 215,500 | |
| |
| | | | 1,233,100 | |
| | | | | |
|
| Hotels, Restaurants & Leisure: 5.44% | |
Boyd Gaming Corporation | | | 4.75 | | | | 12-1-2027 | | | | 800,000 | | | | 797,000 | |
Boyd Gaming Corporation | | | 6.00 | | | | 8-15-2026 | | | | 200,000 | | | | 209,750 | |
Caesars Resort Collection LLC 144A | | | 5.25 | | | | 10-15-2025 | | | | 200,000 | | | | 191,474 | |
Caesars Resort Collection LLC 144A | | | 5.75 | | | | 7-1-2025 | | | | 790,000 | | | | 827,525 | |
Cedar Fair LP | | | 5.25 | | | | 7-15-2029 | | | | 200,000 | | | | 193,824 | |
Cedar Fair LP | | | 5.38 | | | | 4-15-2027 | | | | 700,000 | | | | 696,073 | |
Golden Nugget Incorporated 144A | | | 6.75 | | | | 10-15-2024 | | | | 300,000 | | | | 256,500 | |
Hilton Domestic Operating Company | | | 4.25 | | | | 9-1-2024 | | | | 200,000 | | | | 200,250 | |
Hilton Domestic Operating Company | | | 4.88 | | | | 1-15-2030 | | | | 600,000 | | | | 618,000 | |
KFC Holding Company 144A | | | 5.00 | | | | 6-1-2024 | | | | 300,000 | | | | 309,534 | |
MGM Resorts International | | | 4.63 | | | | 9-1-2026 | | | | 154,000 | | | | 156,695 | |
MGM Resorts International | | | 6.75 | | | | 5-1-2025 | | | | 700,000 | | | | 749,000 | |
Scientific Games International Incorporated 144A | | | 7.25 | | | | 11-15-2029 | | | | 200,000 | | | | 198,044 | |
Scientific Games International Incorporated 144A | | | 8.25 | | | | 3-15-2026 | | | | 700,000 | | | | 721,091 | |
Six Flags Entertainment Company 144A | | | 4.88 | | | | 7-31-2024 | | | | 200,000 | | | | 193,940 | |
Wyndham Destinations Incorporated | | | 4.25 | | | | 3-1-2022 | | | | 200,000 | | | | 201,944 | |
Wyndham Destinations Incorporated 144A | | | 4.63 | | | | 3-1-2030 | | | | 780,000 | | | | 733,200 | |
Wynn Las Vegas LLC 144A | | | 5.25 | | | | 5-15-2027 | | | | 1,000,000 | | | | 974,000 | |
Wynn Las Vegas LLC 144A | | | 5.50 | | | | 3-1-2025 | | | | 200,000 | | | | 198,000 | |
Wynn Resorts Finance LLC 144A | | | 5.13 | | | | 10-1-2029 | | | | 600,000 | | | | 585,000 | |
Yum! Brands Incorporated 144A | | | 7.75 | | | | 4-1-2025 | | | | 800,000 | | | | 893,000 | |
| |
| | | | 9,903,844 | |
| | | | | |
The accompanying notes are an integral part of these financial statements.
4 | Wells Fargo High Yield Corporate Bond Portfolio
Portfolio of investments—August 31, 2020 (unaudited)
| | | | | | | | | | | | | | | | |
| | | Interest rate | | | Maturity date | | | Principal | | | Value | |
| Household Durables: 1.70% | |
Lennar Corporation | | | 4.13 | % | | | 1-15-2022 | | | $ | 800,000 | | | $ | 818,000 | |
Lennar Corporation | | | 4.50 | | | | 4-30-2024 | | | | 300,000 | | | | 321,750 | |
Newell Brands Incorporated | | | 4.35 | | | | 4-1-2023 | | | | 290,000 | | | | 306,675 | |
Newell Brands Incorporated | | | 6.00 | | | | 4-1-2046 | | | | 700,000 | | | | 787,500 | |
PulteGroup Incorporated | | | 5.50 | | | | 3-1-2026 | | | | 200,000 | | | | 229,756 | |
Toll Brothers Finance Corporation | | | 5.88 | | | | 2-15-2022 | | | | 600,000 | | | | 625,500 | |
| |
| | | | 3,089,181 | |
| | | | | |
|
| Household Products: 0.33% | |
Avon International Operations Incorporated 144A | | | 7.88 | | | | 8-15-2022 | | | | 600,000 | | | | 607,272 | |
| | | | | | | | | | | | | | | | |
|
| Leisure Products: 0.75% | |
Mattel Incorporated 144A | | | 5.88 | | | | 12-15-2027 | | | | 700,000 | | | | 761,320 | |
Mattel Incorporated 144A | | | 6.75 | | | | 12-31-2025 | | | | 200,000 | | | | 212,250 | |
Sabre Global Corporation 144A | | | 5.25 | | | | 11-15-2023 | | | | 400,000 | | | | 397,000 | |
| |
| | | | 1,370,570 | |
| | | | | |
|
| Multiline Retail: 0.40% | |
Macy’s Retail Holdings Incorporated | | | 3.88 | | | | 1-15-2022 | | | | 800,000 | | | | 732,000 | |
| | | | | | | | | | | | | | | | |
|
| Specialty Retail: 1.77% | |
ABC Supply Company Incorporated 144A | | | 4.00 | | | | 1-15-2028 | | | | 200,000 | | | | 206,000 | |
L Brands Incorporated | | | 6.88 | | | | 11-1-2035 | | | | 1,100,000 | | | | 1,124,970 | |
PetSmart Incorporated 144A | | | 7.13 | | | | 3-15-2023 | | | | 200,000 | | | | 201,478 | |
PetSmart Incorporated 144A | | | 8.88 | | | | 6-1-2025 | | | | 700,000 | | | | 726,600 | |
Staples Incorporated 144A | | | 7.50 | | | | 4-15-2026 | | | | 210,000 | | | | 186,942 | |
The Gap Incorporated 144A | | | 8.63 | | | | 5-15-2025 | | | | 700,000 | | | | 781,375 | |
| |
| | | | 3,227,365 | |
| | | | | |
|
| Textiles, Apparel & Luxury Goods: 0.20% | |
HanesBrands Incorporated 144A | | | 4.63 | | | | 5-15-2024 | | | | 200,000 | | | | 210,000 | |
Wolverine World Wide Incorporated 144A | | | 8.50 | | | | 11-15-2024 | | | | 200,000 | | | | 154,000 | |
| |
| | | | 364,000 | |
| | | | | |
|
Consumer Staples: 3.97% | |
|
| Food & Staples Retailing: 1.07% | |
Albertsons Companies Incorporated 144A | | | 4.63 | | | | 1-15-2027 | | | | 940,000 | | | | 993,242 | |
Albertsons Companies Incorporated | | | 6.63 | | | | 6-15-2024 | | | | 500,000 | | | | 516,100 | |
Albertsons Companies Incorporated 144A | | | 7.50 | | | | 3-15-2026 | | | | 200,000 | | | | 223,460 | |
Performance Food Group Company 144A | | | 5.50 | | | | 10-15-2027 | | | | 200,000 | | | | 208,500 | |
| |
| | | | 1,941,302 | |
| | | | | |
|
| Food Products: 2.56% | |
B&G Foods Incorporated | | | 5.25 | | | | 9-15-2027 | | | | 200,000 | | | | 213,874 | |
Kraft Foods Group Incorporated | | | 5.00 | | | | 6-4-2042 | | | | 200,000 | | | | 220,629 | |
Kraft Heinz Foods Company | | | 4.38 | | | | 6-1-2046 | | | | 400,000 | | | | 408,476 | |
Kraft Heinz Foods Company | | | 4.63 | | | | 1-30-2029 | | | | 740,000 | | | | 837,739 | |
Lamb Weston Holdings Incorporated 144A | | | 4.88 | | | | 11-1-2026 | | | | 200,000 | | | | 209,276 | |
Pilgrim’s Pride Corporation 144A | | | 5.88 | | | | 9-30-2027 | | | | 800,000 | | | | 850,000 | |
Post Holdings Incorporated 144A | | | 5.50 | | | | 12-15-2029 | | | | 230,000 | | | | 252,126 | |
Post Holdings Incorporated 144A | | | 5.75 | | | | 3-1-2027 | | | | 1,100,000 | | | | 1,161,875 | |
US Foods Incorporated 144A | | | 5.88 | | | | 6-15-2024 | | | | 500,000 | | | | 507,500 | |
| |
| | | | 4,661,495 | |
| | | | | |
The accompanying notes are an integral part of these financial statements.
Wells Fargo High Yield Corporate Bond Portfolio | 5
Portfolio of investments—August 31, 2020 (unaudited)
| | | | | | | | | | | | | | | | |
| | | Interest rate | | | Maturity date | | | Principal | | | Value | |
| Tobacco: 0.34% | |
Vector Group Incorporated 144A | | | 10.50 | % | | | 11-1-2026 | | | $ | 600,000 | | | $ | 623,526 | |
| | | | | | | | | | | | | | | | |
|
Energy: 11.77% | |
|
| Energy Equipment & Services: 0.22% | |
Hilcorp Energy Company 144A | | | 5.75 | | | | 10-1-2025 | | | | 200,000 | | | | 188,000 | |
USA Compression Partners LP | | | 6.88 | | | | 4-1-2026 | | | | 200,000 | | | | 206,000 | |
| |
| | | | 394,000 | |
| | | | | |
|
| Oil, Gas & Consumable Fuels: 11.55% | |
Antero Midstream Partners LP 144A | | | 5.75 | | | | 1-15-2028 | | | | 200,000 | | | | 176,790 | |
Antero Resources Corporation | | | 5.00 | | | | 3-1-2025 | | | | 900,000 | | | | 620,190 | |
Apache Corporation | | | 5.10 | | | | 9-1-2040 | | | | 1,300,000 | | | | 1,264,497 | |
Buckeye Partners LP | | | 4.15 | | | | 7-1-2023 | | | | 1,000,000 | | | | 1,000,000 | |
Buckeye Partners LP | | | 5.85 | | | | 11-15-2043 | | | | 200,000 | | | | 194,116 | |
Callon Petroleum Company | | | 6.13 | | | | 10-1-2024 | | | | 500,000 | | | | 163,281 | |
Callon Petroleum Company | | | 6.25 | | | | 4-15-2023 | | | | 500,000 | | | | 176,885 | |
Cheniere Energy Partners LP | | | 4.50 | | | | 10-1-2029 | | | | 800,000 | | | | 831,656 | |
Cheniere Energy Partners LP | | | 5.25 | | | | 10-1-2025 | | | | 200,000 | | | | 204,648 | |
Continental Resources Incorporated | | | 3.80 | | | | 6-1-2024 | | | | 250,000 | | | | 246,490 | |
Continental Resources Incorporated | | | 4.50 | | | | 4-15-2023 | | | | 700,000 | | | | 704,375 | |
Crestwood Midstream Partners LP | | | 6.25 | | | | 4-1-2023 | | | | 700,000 | | | | 689,353 | |
CrownRock LP 144A | | | 5.63 | | | | 10-15-2025 | | | | 200,000 | | | | 198,000 | |
CVR Energy Incorporated 144A | | | 5.25 | | | | 2-15-2025 | | | | 560,000 | | | | 529,676 | |
DCP Midstream Operating LP | | | 3.88 | | | | 3-15-2023 | | | | 200,000 | | | | 202,500 | |
DCP Midstream Operating LP (3 Month LIBOR +3.85%) 144A± | | | 5.85 | | | | 5-21-2043 | | | | 800,000 | | | | 619,000 | |
EnLink Midstream Partners LP | | | 4.15 | | | | 6-1-2025 | | | | 700,000 | | | | 623,854 | |
EnLink Midstream Partners LP | | | 5.45 | | | | 6-1-2047 | | | | 350,000 | | | | 228,830 | |
EQM Midstream Partners LP | | | 4.75 | | | | 7-15-2023 | | | | 1,000,000 | | | | 1,019,010 | |
EQT Corporation | | | 7.88 | | | | 2-1-2025 | | | | 1,000,000 | | | | 1,147,930 | |
Genesis Energy Company | | | 6.25 | | | | 5-15-2026 | | | | 210,000 | | | | 177,530 | |
Genesis Energy Company | | | 6.50 | | | | 10-1-2025 | | | | 700,000 | | | | 605,290 | |
Gulfport Energy Corporation | | | 6.38 | | | | 1-15-2026 | | | | 900,000 | | | | 526,500 | |
Moss Creek Resources Holdings Incorporated 144A | | | 10.50 | | | | 5-15-2027 | | | | 1,000,000 | | | | 708,180 | |
Murphy Oil Corporation | | | 6.88 | | | | 8-15-2024 | | | | 200,000 | | | | 203,060 | |
Nabors Industries Incorporated | | | 5.75 | | | | 2-1-2025 | | | | 200,000 | | | | 57,500 | |
NuStar Logistics LP | | | 6.00 | | | | 6-1-2026 | | | | 600,000 | | | | 627,942 | |
Oasis Petroleum Incorporated | | | 6.88 | | | | 3-15-2022 | | | | 190,000 | | | | 36,931 | |
Occidental Petroleum Corporation | | | 2.70 | | | | 2-15-2023 | | | | 800,000 | | | | 769,392 | |
Occidental Petroleum Corporation | | | 4.30 | | | | 8-15-2039 | | | | 1,000,000 | | | | 770,000 | |
Parsley Energy LLC 144A | | | 5.63 | | | | 10-15-2027 | | | | 500,000 | | | | 517,500 | |
Peabody Energy Corporation 144A | | | 6.38 | | | | 3-31-2025 | | | | 200,000 | | | | 67,000 | |
Range Resources Corporation | | | 4.88 | | | | 5-15-2025 | | | | 200,000 | | | | 186,500 | |
SM Energy Company | | | 6.75 | | | | 9-15-2026 | | | | 200,000 | | | | 98,000 | |
Southwestern Energy Company | | | 7.50 | | | | 4-1-2026 | | | | 700,000 | | | | 703,500 | |
Southwestern Energy Company | | | 7.75 | | | | 10-1-2027 | | | | 200,000 | | | | 204,520 | |
Sunoco LP | | | 4.88 | | | | 1-15-2023 | | | | 210,000 | | | | 213,425 | |
Sunoco LP | | | 6.00 | | | | 4-15-2027 | | | | 700,000 | | | | 745,143 | |
Tallgrass Energy Partners LP 144A | | | 5.50 | | | | 1-15-2028 | | | | 200,000 | | | | 183,000 | |
Targa Resources Partners LP | | | 4.25 | | | | 11-15-2023 | | | | 200,000 | | | | 201,256 | |
Targa Resources Partners LP | | | 5.13 | | | | 2-1-2025 | | | | 200,000 | | | | 204,254 | |
Targa Resources Partners LP | | | 5.38 | | | | 2-1-2027 | | | | 610,000 | | | | 629,825 | |
Western Gas Partners LP | | | 4.65 | | | | 7-1-2026 | | | | 610,000 | | | | 623,725 | |
Western Midstream Operating LP | | | 5.05 | | | | 2-1-2030 | | | | 220,000 | | | | 225,544 | |
WPX Energy Incorporated | | | 5.25 | | | | 9-15-2024 | | | | 900,000 | | | | 917,550 | |
| |
| | | | 21,044,148 | |
| | | | | |
The accompanying notes are an integral part of these financial statements.
6 | Wells Fargo High Yield Corporate Bond Portfolio
Portfolio of investments—August 31, 2020 (unaudited)
| | | | | | | | | | | | | | | | |
| | | Interest rate | | | Maturity date | | | Principal | | | Value | |
| Financials: 4.21% | |
|
| Banks: 0.11% | |
CIT Group Incorporated | | | 5.00 | % | | | 8-1-2023 | | | $ | 200,000 | | | $ | 211,760 | |
| | | | | | | | | | | | | | | | |
|
| Capital Markets: 1.20% | |
Banff Merger Subordinate Incorporated 144A | | | 9.75 | | | | 9-1-2026 | | | | 800,000 | | | | 853,080 | |
MSCI Incorporated 144A | | | 5.38 | | | | 5-15-2027 | | | | 500,000 | | | | 539,858 | |
MSCI Incorporated 144A | | | 3.88 | | | | 2-15-2031 | | | | 490,000 | | | | 517,563 | |
MSCI Incorporated 144A | | | 4.75 | | | | 8-1-2026 | | | | 260,000 | | | | 270,400 | |
| |
| | | | 2,180,901 | |
| | | | | |
|
| Consumer Finance: 1.39% | |
Curo Group Holdings Corporation 144A | | | 8.25 | | | | 9-1-2025 | | | | 400,000 | | | | 330,000 | |
Navient Corporation | | | 5.00 | | | | 3-15-2027 | | | | 530,000 | | | | 511,906 | |
Navient Corporation | | | 5.88 | | | | 10-25-2024 | | | | 200,000 | | | | 205,750 | |
Navient Corporation | | | 6.75 | | | | 6-25-2025 | | | | 200,000 | | | | 208,500 | |
OneMain Finance Corporation | | | 5.63 | | | | 3-15-2023 | | | | 800,000 | | | | 848,000 | |
OneMain Finance Corporation | | | 7.13 | | | | 3-15-2026 | | | | 370,000 | | | | 424,573 | |
| |
| | | | 2,528,729 | |
| | | | | |
|
| Diversified Financial Services: 0.35% | |
Refinitiv U.S Holdings Company 144A | | | 6.25 | | | | 5-15-2026 | | | | 600,000 | | | | 644,250 | |
| | | | | | | | | | | | | | | | |
|
| Insurance: 0.34% | |
Acrisure LLC 144A | | | 7.00 | | | | 11-15-2025 | | | | 200,000 | | | | 203,000 | |
Genworth Holdings Incorporated | | | 7.63 | | | | 9-24-2021 | | | | 200,000 | | | | 204,500 | |
HUB International Limited 144A | | | 7.00 | | | | 5-1-2026 | | | | 200,000 | | | | 207,500 | |
| |
| | | | 615,000 | |
| | | | | |
|
| Mortgage REITs: 0.11% | |
Starwood Property Trust Incorporated | | | 5.00 | | | | 12-15-2021 | | | | 200,000 | | | | 203,000 | |
| | | | | | | | | | | | | | | | |
|
| Thrifts & Mortgage Finance: 0.71% | |
Nationstar Mortgage Holdings Incorporated 144A | | | 9.13 | | | | 7-15-2026 | | | | 200,000 | | | | 217,564 | |
Quicken Loans Incorporated 144A | | | 5.25 | | | | 1-15-2028 | | | | 200,000 | | | | 213,251 | |
Quicken Loans Incorporated 144A | | | 5.75 | | | | 5-1-2025 | | | | 600,000 | | | | 618,000 | |
Radian Group Incorporated | | | 6.63 | | | | 3-15-2025 | | | | 230,000 | | | | 247,250 | |
| |
| | | | 1,296,065 | |
| | | | | |
|
Health Care: 5.73% | |
|
| Health Care Equipment & Supplies: 0.11% | |
Hologic Incorporated 144A | | | 4.38 | | | | 10-15-2025 | | | | 200,000 | | | | 204,130 | |
| | | | | | | | | | | | | | | | |
|
| Health Care Providers & Services: 5.15% | |
Centene Corporation | | | 4.75 | | | | 1-15-2025 | | | | 800,000 | | | | 822,864 | |
Centene Corporation 144A | | | 5.25 | | | | 4-1-2025 | | | | 200,000 | | | | 207,500 | |
Community Health Systems Incorporated | | | 6.25 | | | | 3-31-2023 | | | | 960,000 | | | | 962,400 | |
Community Health Systems Incorporated 144A | | | 6.63 | | | | 2-15-2025 | | | | 400,000 | | | | 408,000 | |
Encompass Health Corporation | | | 5.75 | | | | 11-1-2024 | | | | 116,000 | | | | 116,579 | |
Envision Healthcare Corporation 144A | | | 8.75 | | | | 10-15-2026 | | | | 200,000 | | | | 88,000 | |
HCA Incorporated | | | 5.88 | | | | 5-1-2023 | | | | 220,000 | | | | 240,900 | |
HCA Incorporated | | | 5.88 | | | | 2-15-2026 | | | | 700,000 | | | | 801,500 | |
Lifepoint Health Incorporated 144A | | | 6.75 | | | | 4-15-2025 | | | | 700,000 | | | | 756,000 | |
MEDNAX Incorporated 144A | | | 6.25 | | | | 1-15-2027 | | | | 900,000 | | | | 954,000 | |
MPH Acquisition Holdings LLC 144A | | | 7.13 | | | | 6-1-2024 | | | | 900,000 | | | | 913,770 | |
The accompanying notes are an integral part of these financial statements.
Wells Fargo High Yield Corporate Bond Portfolio | 7
Portfolio of investments—August 31, 2020 (unaudited)
| | | | | | | | | | | | | | | | |
| | | Interest rate | | | Maturity date | | | Principal | | | Value | |
|
| Health Care Providers & Services (continued) | |
MPT Operating Partnership LP | | | 4.63 | % | | | 8-1-2029 | | | $ | 1,000,000 | | | $ | 1,067,460 | |
MPT Operating Partnership LP | | | 5.00 | | | | 10-15-2027 | | | | 200,000 | | | | 211,500 | |
RegionalCare Hospital Partners 144A | | | 9.75 | | | | 12-1-2026 | | | | 200,000 | | | | 216,738 | |
Tenet Healthcare Corporation | | | 5.13 | | | | 5-1-2025 | | | | 300,000 | | | | 306,000 | |
Tenet Healthcare Corporation 144A | | | 6.25 | | | | 2-1-2027 | | | | 220,000 | | | | 231,000 | |
Tenet Healthcare Corporation | | | 8.13 | | | | 4-1-2022 | | | | 1,000,000 | | | | 1,079,500 | |
| |
| | | | 9,383,711 | |
| | | | | |
|
| Health Care Technology: 0.12% | |
IQVIA Incorporated 144A | | | 5.00 | | | | 5-15-2027 | | | | 200,000 | | | | 210,521 | |
| | | | | | | | | | | | | | | | |
|
| Life Sciences Tools & Services: 0.17% | |
Avantor Incorporated 144A | | | 6.00 | | | | 10-1-2024 | | | | 300,000 | | | | 314,250 | |
| | | | | | | | | | | | | | | | |
|
| Pharmaceuticals: 0.18% | |
Bausch Health Companies Incorporated 144A | | | 8.50 | | | | 1-31-2027 | | | | 300,000 | | | | 330,000 | |
| | | | | | | | | | | | | | | | |
|
Industrials: 7.39% | |
|
| Aerospace & Defense: 2.10% | |
Signature Aviation US Holdings Incorporated 144A | | | 4.00 | | | | 3-1-2028 | | | | 600,000 | | | | 586,614 | |
Spirit AeroSystems Holdings Incorporated | | | 4.60 | | | | 6-15-2028 | | | | 1,000,000 | | | | 785,000 | |
SSL Robotics LLC 144A | | | 9.75 | | | | 12-31-2023 | | | | 500,000 | | | | 565,000 | |
TransDigm Group Incorporated | | | 6.38 | | | | 6-15-2026 | | | | 200,000 | | | | 204,466 | |
TransDigm Group Incorporated | | | 6.50 | | | | 7-15-2024 | | | | 200,000 | | | | 201,000 | |
TransDigm Group Incorporated | | | 6.50 | | | | 5-15-2025 | | | | 900,000 | | | | 906,750 | |
Triumph Group Incorporated 144A | | | 6.25 | | | | 9-15-2024 | | | | 700,000 | | | | 572,607 | |
| |
| | | | 3,821,437 | |
| | | | | |
|
| Air Freight & Logistics: 0.41% | |
XPO Logistics Incorporated 144A | | | 6.25 | | | | 5-1-2025 | | | | 700,000 | | | | 747,250 | |
| | | | | | | | | | | | | | | | |
|
| Airlines: 0.79% | |
American Airlines Group Company 144A | | | 5.00 | | | | 6-1-2022 | | | | 910,000 | | | | 586,950 | |
Delta Air Lines Incorporated | | | 2.90 | | | | 10-28-2024 | | | | 700,000 | | | | 642,775 | |
Delta Air Lines Incorporated | | | 3.80 | | | | 4-19-2023 | | | | 220,000 | | | | 212,646 | |
| |
| | | | 1,442,371 | |
| | | | | |
|
| Building Products: 0.36% | |
Builders FirstSource Incorporated 144A | | | 6.75 | | | | 6-1-2027 | | | | 600,000 | | | | 654,000 | |
| | | | | | | | | | | | | | | | |
|
| Commercial Services & Supplies: 0.66% | |
ADT Corporation | | | 3.50 | | | | 7-15-2022 | | | | 700,000 | | | | 717,178 | |
ADT Corporation | | | 4.13 | | | | 6-15-2023 | | | | 200,000 | | | | 209,003 | |
APTIM Corporation 144A | | | 7.75 | | | | 6-15-2025 | | | | 200,000 | | | | 102,000 | |
West Corporation Company 144A | | | 8.50 | | | | 10-15-2025 | | | | 200,000 | | | | 177,063 | |
| |
| | | | 1,205,244 | |
| | | | | |
|
| Construction & Engineering: 0.60% | |
AECOM | | | 5.88 | | | | 10-15-2024 | | | | 700,000 | | | | 779,625 | |
United Rentals North America Incorporated | | | 5.50 | | | | 5-15-2027 | | | | 300,000 | | | | 320,955 | |
| |
| | | | 1,100,580 | |
| | | | | |
|
| Electrical Equipment: 0.43% | |
Allied Universal Security Services 144A | | | 9.75 | | | | 7-15-2027 | | | | 700,000 | | | | 775,250 | |
| | | | | | | | | | | | | | | | |
The accompanying notes are an integral part of these financial statements.
8 | Wells Fargo High Yield Corporate Bond Portfolio
Portfolio of investments—August 31, 2020 (unaudited)
| | | | | | | | | | | | | | | | |
| | | Interest rate | | | Maturity date | | | Principal | | | Value | |
| Electronic Equipment, Instruments & Components: 0.51% | |
Wesco Distribution Incorporated Company 144A | | | 7.13 | % | | | 6-15-2025 | | | $ | 850,000 | | | $ | 934,091 | |
| | | | | | | | | | | | | | | | |
|
| Machinery: 0.56% | |
Navistar International Corporation 144A | | | 6.63 | | | | 11-1-2025 | | | | 1,000,000 | | | | 1,020,700 | |
| | | | | | | | | | | | | | | | |
|
| Road & Rail: 0.64% | |
Uber Technologies Incorporated 144A | | | 7.50 | | | | 9-15-2027 | | | | 500,000 | | | | 524,175 | |
Uber Technologies Incorporated 144A | | | 8.00 | | | | 11-1-2026 | | | | 600,000 | | | | 635,754 | |
| |
| | | | 1,159,929 | |
| | | | | |
|
| Trading Companies & Distributors: 0.33% | |
Beacon Escrow Corporation 144A | | | 4.88 | | | | 11-1-2025 | | | | 200,000 | | | | 198,274 | |
FXI Holdings Incorporated 144A | | | 7.88 | | | | 11-1-2024 | | | | 200,000 | | | | 194,000 | |
Herc Holdings Incorporated 144A | | | 5.50 | | | | 7-15-2027 | | | | 200,000 | | | | 209,500 | |
| |
| | | | 601,774 | |
| | | | | |
|
Information Technology: 3.58% | |
|
| Communications Equipment: 0.83% | |
CommScope Incorporated 144A | | | 6.00 | | | | 3-1-2026 | | | | 200,000 | | | | 212,500 | |
CommScope Incorporated 144A | | | 8.25 | | | | 3-1-2027 | | | | 550,000 | | | | 595,370 | |
CommScope Technologies Finance LLC 144A | | | 5.00 | | | | 3-15-2027 | | | | 200,000 | | | | 198,500 | |
CommScope Technologies Finance LLC 144A | | | 6.00 | | | | 6-15-2025 | | | | 280,000 | | | | 287,059 | |
Viasat Incorporated 144A | | | 5.63 | | | | 4-15-2027 | | | | 200,000 | | | | 212,000 | |
| |
| | | | 1,505,429 | |
| | | | | |
|
| Electronic Equipment, Instruments & Components: 0.53% | |
CDW LLC | | | 4.25 | | | | 4-1-2028 | | | | 710,000 | | | | 741,950 | |
CDW LLC | | | 5.50 | | | | 12-1-2024 | | | | 200,000 | | | | 221,937 | |
| |
| | | | 963,887 | |
| | | | | |
|
| IT Services: 0.12% | |
VeriSign Incorporated | | | 5.25 | | | | 4-1-2025 | | | | 200,000 | | | | 224,000 | |
| | | | | | | | | | | | | | | | |
|
| Semiconductors & Semiconductor Equipment: 0.29% | |
Qorvo Incorporated | | | 4.38 | | | | 10-15-2029 | | | | 500,000 | | | | 536,250 | |
| | | | | | | | | | | | | | | | |
|
| Software: 0.86% | |
CDK Global Incorporated 144A | | | 5.25 | | | | 5-15-2029 | | | | 200,000 | | | | 218,184 | |
Open Text Corporation 144A | | | 4.13 | | | | 2-15-2030 | | | | 900,000 | | | | 933,093 | |
Solera Finance Incorporated 144A | | | 10.50 | | | | 3-1-2024 | | | | 200,000 | | | | 209,750 | |
SS&C Technologies Incorporated 144A | | | 5.50 | | | | 9-30-2027 | | | | 200,000 | | | | 214,220 | |
| |
| | | | 1,575,247 | |
| | | | | |
|
| Technology Hardware, Storage & Peripherals: 0.95% | |
EMC Corporation | | | 3.38 | | | | 6-1-2023 | | | | 760,000 | | | | 784,700 | |
NCR Corporation 144A | | | 5.75 | | | | 9-1-2027 | | | | 200,000 | | | | 210,000 | |
Western Digital Corporation | | | 4.75 | | | | 2-15-2026 | | | | 200,000 | | | | 216,428 | |
Xerox Corporation | | | 4.13 | | | | 3-15-2023 | | | | 500,000 | | | | 513,240 | |
| |
| | | | 1,724,368 | |
| | | | | |
The accompanying notes are an integral part of these financial statements.
Wells Fargo High Yield Corporate Bond Portfolio | 9
Portfolio of investments—August 31, 2020 (unaudited)
| | | | | | | | | | | | | | | | |
| | | Interest rate | | | Maturity date | | | Principal | | | Value | |
| Materials: 7.62% | |
|
| Chemicals: 1.97% | |
Calumet Specialty Products Partners LP | | | 7.63 | % | | | 1-15-2022 | | | $ | 176,000 | | | $ | 174,240 | |
Calumet Specialty Products Partners LP 144A | | | 9.25 | | | | 7-15-2024 | | | | 324,000 | | | | 344,655 | |
CF Industries Incorporated | | | 3.45 | | | | 6-1-2023 | | | | 900,000 | | | | 935,739 | |
CF Industries Incorporated | | | 4.95 | | | | 6-1-2043 | | | | 200,000 | | | | 236,000 | |
Chemours Company | | | 5.38 | | | | 5-15-2027 | | | | 700,000 | | | | 703,500 | |
Chemours Company | | | 6.63 | | | | 5-15-2023 | | | | 200,000 | | | | 200,998 | |
Olin Corporation | | | 5.00 | | | | 2-1-2030 | | | | 200,000 | | | | 193,000 | |
Olin Corporation | | | 5.63 | | | | 8-1-2029 | | | | 600,000 | | | | 600,000 | |
Tronox Incorporated 144A | | | 6.50 | | | | 4-15-2026 | | | | 200,000 | | | | 205,932 | |
| |
| | | | 3,594,064 | |
| | | | | |
|
| Construction Materials: 0.46% | |
Standard Industries Incorporated 144A | | | 5.00 | | | | 2-15-2027 | | | | 300,000 | | | | 313,257 | |
Standard Industries Incorporated 144A | | | 4.75 | | | | 1-15-2028 | | | | 500,000 | | | | 526,250 | |
| |
| | | | 839,507 | |
| | | | | |
|
| Containers & Packaging: 2.59% | |
Ardagh Packaging Finance plc 144A | | | 5.25 | | | | 8-15-2027 | | | | 200,000 | | | | 208,076 | |
Ball Corporation | | | 4.88 | | | | 3-15-2026 | | | | 970,000 | | | | 1,086,400 | |
Ball Corporation | | | 5.25 | | | | 7-1-2025 | | | | 200,000 | | | | 226,654 | |
Berry Global Incorporated 144A | | | 4.88 | | | | 7-15-2026 | | | | 900,000 | | | | 956,250 | |
Berry Global Incorporated 144A | | | 5.63 | | | | 7-15-2027 | | | | 200,000 | | | | 211,500 | |
Crown Americas Capital Corporation IV | | | 4.50 | | | | 1-15-2023 | | | | 200,000 | | | | 210,004 | |
Flex Acquisition Company Incorporated 144A | | | 6.88 | | | | 1-15-2025 | | | | 200,000 | | | | 203,860 | |
Mauser Packaging Solutions Holding Company 144A | | | 5.50 | | | | 4-15-2024 | | | | 210,000 | | | | 213,150 | |
Mauser Packaging Solutions Holding Company 144A | | | 7.25 | | | | 4-15-2025 | | | | 1,000,000 | | | | 972,210 | |
Reynolds Group Holding Limited 144A | | | 5.13 | | | | 7-15-2023 | | | | 200,000 | | | | 202,940 | |
Sealed Air Corporation 144A | | | 5.50 | | | | 9-15-2025 | | | | 200,000 | | | | 224,000 | |
| |
| | | | 4,715,044 | |
| | | | | |
|
| Metals & Mining: 2.04% | |
Cleveland-Cliffs Incorporated | | | 5.75 | | | | 3-1-2025 | | | | 200,000 | | | | 186,000 | |
Cleveland-Cliffs Incorporated 144A | | | 6.75 | | | | 3-15-2026 | | | | 900,000 | | | | 919,125 | |
Freeport-McMoRan Incorporated | | | 5.00 | | | | 9-1-2027 | | | | 700,000 | | | | 740,688 | |
Freeport-McMoRan Incorporated | | | 5.40 | | | | 11-14-2034 | | | | 200,000 | | | | 226,078 | |
Kaiser Aluminum Corporation 144A | | | 4.63 | | | | 3-1-2028 | | | | 560,000 | | | | 553,907 | |
Novelis Corporation 144A | | | 4.75 | | | | 1-30-2030 | | | | 200,000 | | | | 202,694 | |
Novelis Corporation 144A | | | 5.88 | | | | 9-30-2026 | | | | 700,000 | | | | 731,360 | |
United States Steel Corporation | | | 6.88 | | | | 8-15-2025 | | | | 200,000 | | | | 146,500 | |
| |
| | | | 3,706,352 | |
| | | | | |
|
| Paper & Forest Products: 0.56% | |
Vertical US Newco Incorporated 144A | | | 5.25 | | | | 7-15-2027 | | | | 980,000 | | | | 1,020,425 | |
| | | | | | | | | | | | | | | | |
|
Real Estate: 4.85% | |
|
| Equity REITs: 4.16% | |
ESH Hospitality Incorporated 144A | | | 5.25 | | | | 5-1-2025 | | | | 700,000 | | | | 710,500 | |
Iron Mountain Incorporated 144A | | | 4.88 | | | | 9-15-2029 | | | | 600,000 | | | | 623,400 | |
Iron Mountain Incorporated 144A | | | 5.00 | | | | 7-15-2028 | | | | 440,000 | | | | 456,500 | |
Iron Mountain Incorporated 144A | | | 5.25 | | | | 3-15-2028 | | | | 260,000 | | | | 273,489 | |
iStar Incorporated | | | 4.25 | | | | 8-1-2025 | | | | 200,000 | | | | 194,000 | |
iStar Incorporated | | | 5.25 | | | | 9-15-2022 | | | | 700,000 | | | | 710,010 | |
The accompanying notes are an integral part of these financial statements.
10 | Wells Fargo High Yield Corporate Bond Portfolio
Portfolio of investments—August 31, 2020 (unaudited)
| | | | | | | | | | | | | | | | |
| | | Interest rate | | | Maturity date | | | Principal | | | Value | |
|
| Equity REITs (continued) | |
MGM Growth Properties Operating Partnership LP | | | 4.50 | % | | | 9-1-2026 | | | $ | 300,000 | | | $ | 315,000 | |
SBA Communications Corporation | | | 4.88 | | | | 9-1-2024 | | | | 1,000,000 | | | | 1,027,200 | |
Service Properties Trust Company | | | 4.38 | | | | 2-15-2030 | | | | 1,100,000 | | | | 951,500 | |
Uniti Group Incorporated 144A | | | 6.00 | | | | 4-15-2023 | | | | 200,000 | | | | 202,050 | |
Uniti Group Incorporated | | | 8.25 | | | | 10-15-2023 | | | | 1,100,000 | | | | 1,089,000 | |
VICI Properties Incorporated 144A | | | 4.25 | | | | 12-1-2026 | | | | 1,000,000 | | | | 1,022,500 | |
| |
| | | | 7,575,149 | |
| | | | | |
|
| Real Estate Management & Development: 0.58% | |
Icahn Enterprises Company | | | 6.25 | | | | 2-1-2022 | | | | 300,000 | | | | 303,375 | |
Icahn Enterprises Company | | | 5.25 | | | | 5-15-2027 | | | | 700,000 | | | | 743,750 | |
| |
| | | | 1,047,125 | |
| | | | | |
|
| Real Estate Management & Development: 0.11% | |
Realogy Group LLC 144A | | | 9.38 | | | | 4-1-2027 | | | | 200,000 | | | | 208,000 | |
| | | | | | | | | | | | | | | | |
|
Utilities: 3.95% | |
|
| Electric Utilities: 1.76% | |
DPL Incorporated 144A | | | 4.13 | | | | 7-1-2025 | | | | 500,000 | | | | 527,500 | |
NextEra Energy Operating Partners LP 144A | | | 4.50 | | | | 9-15-2027 | | | | 770,000 | | | | 841,225 | |
NRG Energy Incorporated 144A | | | 5.25 | | | | 6-15-2029 | | | | 700,000 | | | | 763,000 | |
NRG Energy Incorporated | | | 5.75 | | | | 1-15-2028 | | | | 200,000 | | | | 217,500 | |
PG&E Corporation | | | 5.25 | | | | 7-1-2030 | | | | 720,000 | | | | 718,157 | |
Talen Energy Supply LLC | | | 6.50 | | | | 6-1-2025 | | | | 200,000 | | | | 139,250 | |
| |
| | | | 3,206,632 | |
| | | | | |
|
| Gas Utilities: 0.26% | |
AmeriGas Partners LP | | | 5.63 | | | | 5-20-2024 | | | | 200,000 | | | | 218,354 | |
Ferrellgas LP | | | 6.75 | | | | 6-15-2023 | | | | 300,000 | | | | 259,500 | |
| |
| | | | 477,854 | |
| | | | | |
|
| Independent Power & Renewable Electricity Producers: 1.93% | |
Calpine Corporation 144A | | | 5.00 | | | | 2-1-2031 | | | | 1,200,000 | | | | 1,254,264 | |
Calpine Corporation 144A | | | 5.13 | | | | 3-15-2028 | | | | 230,000 | | | | 241,500 | |
Calpine Corporation 144A | | | 5.25 | | | | 6-1-2026 | | | | 600,000 | | | | 626,310 | |
TerraForm Power Operating LLC 144A | | | 4.75 | | | | 1-15-2030 | | | | 220,000 | | | | 235,400 | |
The AES Corporation | | | 5.50 | | | | 4-15-2025 | | | | 200,000 | | | | 206,017 | |
Vistra Operations Company LLC 144A | | | 5.63 | | | | 2-15-2027 | | | | 900,000 | | | | 951,750 | |
| |
| | | | 3,515,241 | |
| | | | | |
| |
Total Corporate Bonds and Notes (Cost $142,944,831) | | | | 146,866,507 | |
| | | | | |
|
Yankee Corporate Bonds and Notes: 17.03% | |
|
Communication Services: 4.14% | |
|
| Diversified Telecommunication Services: 0.96% | |
Altice France SA 144A | | | 7.38 | | | | 5-1-2026 | | | | 300,000 | | | | 318,495 | |
Telecom Italia Capital SpA 144A | | | 5.30 | | | | 5-30-2024 | | | | 700,000 | | | | 772,772 | |
Telecom Italia Capital SpA | | | 6.00 | | | | 9-30-2034 | | | | 200,000 | | | | 243,000 | |
Virgin Media Finance plc 144A | | | 4.50 | | | | 8-15-2030 | | | | 390,000 | | | | 410,573 | |
| |
| | | | 1,744,840 | |
| | | | | |
The accompanying notes are an integral part of these financial statements.
Wells Fargo High Yield Corporate Bond Portfolio | 11
Portfolio of investments—August 31, 2020 (unaudited)
| | | | | | | | | | | | | | | | |
| | | Interest rate | | | Maturity date | | | Principal | | | Value | |
| Media: 2.81% | |
Altice Finco SA 144A | | | 5.00 | % | | | 1-15-2028 | | | $ | 800,000 | | | $ | 822,000 | |
Altice Finco SA 144A | | | 10.50 | | | | 5-15-2027 | | | | 900,000 | | | | 1,031,625 | |
Nielsen Holding and Finance BV 144A | | | 5.00 | | | | 2-1-2025 | | | | 920,000 | | | | 936,100 | |
Quebecor Media Incorporated | | | 5.75 | | | | 1-15-2023 | | | | 900,000 | | | | 965,250 | |
Videotron Limited 144A | | | 5.13 | | | | 4-15-2027 | | | | 200,000 | | | | 211,500 | |
Ziggo BV 144A | | | 4.88 | | | | 1-15-2030 | | | | 200,000 | | | | 212,142 | |
Ziggo BV 144A | | | 5.13 | | | | 2-28-2030 | | | | 900,000 | | | | 954,000 | |
| |
| | | | 5,132,617 | |
| | | | | |
|
| Wireless Telecommunication Services: 0.37% | |
C&W Senior Financing Designated Activity Company 144A | | | 6.88 | | | | 9-15-2027 | | | | 200,000 | | | | 209,450 | |
VEON Holdings BV 144A | | | 4.00 | | | | 4-9-2025 | | | | 210,000 | | | | 218,400 | |
Vodafone Group plc (USD Swap Semi Annual (vs. 3 Month LIBOR) 5 Year +4.87%) ± | | | 7.00 | | | | 4-4-2079 | | | | 200,000 | | | | 240,629 | |
| |
| | | | 668,479 | |
| | | | | |
|
Consumer Discretionary: 2.39% | |
|
| Auto Components: 0.10% | |
Adient Global Holdings Limited 144A | | | 4.88 | | | | 8-15-2026 | | | | 200,000 | | | | 187,500 | |
| | | | | | | | | | | | | | | | |
|
| Automobiles: 0.35% | |
Fiat Chrysler Automobiles NV | | | 5.25 | | | | 4-15-2023 | | | | 200,000 | | | | 212,000 | |
IHO Verwaltungs GmbH (PIK at 7.13%) 144A¥ | | | 6.38 | | | | 5-15-2029 | | | | 240,000 | | | | 257,088 | |
Jaguar Land Rover Automotive plc 144A | | | 4.50 | | | | 10-1-2027 | | | | 200,000 | | | | 168,000 | |
| |
| | | | 637,088 | |
| | | | | |
|
| Hotels, Restaurants & Leisure: 1.85% | |
International Game Technology plc 144A | | | 6.25 | | | | 1-15-2027 | | | | 1,000,000 | | | | 1,095,700 | |
International Game Technology plc 144A | | | 6.50 | | | | 2-15-2025 | | | | 200,000 | | | | 217,500 | |
Melco Resorts & Entertainment Limited 144A | | | 5.38 | | | | 12-4-2029 | | | | 200,000 | | | | 204,800 | |
MGM China Holdings Limited 144A | | | 5.88 | | | | 5-15-2026 | | | | 220,000 | | | | 232,980 | |
Royal Caribbean Cruises LTD | | | 5.25 | | | | 11-15-2022 | | | | 700,000 | | | | 626,500 | |
Wynn Macau Limited 144A | | | 5.13 | | | | 12-15-2029 | | | | 1,000,000 | | | | 982,500 | |
| |
| | | | 3,359,980 | |
| | | | | |
|
| Leisure Products: 0.09% | |
VOC Escrow Limited 144A | | | 5.00 | | | | 2-15-2028 | | | | 200,000 | | | | 166,000 | |
| | | | | | | | | | | | | | | | |
|
Consumer Staples: 0.66% | |
|
| Food Products: 0.66% | |
JBS USA Finance Incorporated 144A | | | 5.75 | | | | 6-15-2025 | | | | 300,000 | | | | 309,750 | |
JBS USA Finance Incorporated 144A | | | 6.75 | | | | 2-15-2028 | | | | 800,000 | | | | 886,000 | |
| |
| | | | 1,195,750 | |
| | | | | |
|
Energy: 2.81% | |
|
| Energy Equipment & Services: 0.46% | |
Alcoa Nederland Holding Company BV 144A | | | 6.75 | | | | 9-30-2024 | | | | 800,000 | | | | 827,504 | |
| | | | | | | | | | | | | | | | |
|
| Oil, Gas & Consumable Fuels: 2.35% | |
Cenovus Energy Incorporated | | | 5.40 | | | | 6-15-2047 | | | | 900,000 | | | | 804,084 | |
Cenovus Energy Incorporated | | | 4.25 | | | | 4-15-2027 | | | | 230,000 | | | | 220,807 | |
Husky Energy Incorporated (PIK at 13.75%) 144A¥ | | | 13.00 | | | | 2-15-2025 | | | | 500,000 | | | | 527,500 | |
MEG Energy Corporation 144A | | | 7.00 | | | | 3-31-2024 | | | | 700,000 | | | | 694,750 | |
The accompanying notes are an integral part of these financial statements.
12 | Wells Fargo High Yield Corporate Bond Portfolio
Portfolio of investments—August 31, 2020 (unaudited)
| | | | | | | | | | | | | | | | |
| | | Interest rate | | | Maturity date | | | Principal | | | Value | |
|
| Oil, Gas & Consumable Fuels (continued) | |
Seven Generations Energy Company 144A | | | 6.88 | % | | | 6-30-2023 | | | $ | 800,000 | | | $ | 809,776 | |
Transocean Incorporated | | | 6.80 | | | | 3-15-2038 | | | | 300,000 | | | | 59,250 | |
Transocean Poseidon Limited 144A | | | 6.88 | | | | 2-1-2027 | | | | 600,000 | | | | 498,000 | |
Weatherford International Limited 144A | | | 11.00 | | | | 12-1-2024 | | | | 1,000,000 | | | | 670,000 | |
| |
| | | | 4,284,167 | |
| | | | | |
|
Financials: 3.16% | |
|
| Banks: 1.48% | |
Deutsche Bank AG (USD ICE Swap Rate 11:00am NY 5 Year +2.55%) ± | | | 4.88 | | | | 12-1-2032 | | | | 1,130,000 | | | | 1,125,333 | |
Intesa Sanpaolo SpA 144A | | | 5.02 | | | | 6-26-2024 | | | | 500,000 | | | | 539,091 | |
Intesa Sanpaolo SpA 144A | | | 5.71 | | | | 1-15-2026 | | | | 260,000 | | | | 288,881 | |
UniCredit SpA (USD ICE Swap Rate 11:00am NY 5 Year +3.70%) 144A± | | | 5.86 | | | | 6-19-2032 | | | | 700,000 | | | | 742,892 | |
| |
| | | | 2,696,197 | |
| | | | | |
|
| Diversified Financial Services: 1.68% | |
Global Aircraft Leasing Company Limited 144A | | | 6.50 | | | | 9-15-2024 | | | | 1,000,000 | | | | 589,550 | |
Intelsat Jackson Holdings SA 144A | | | 8.00 | | | | 2-15-2024 | | | | 200,000 | | | | 204,000 | |
New Red Finance Incorporated 144A | | | 5.00 | | | | 10-15-2025 | | | | 1,300,000 | | | | 1,334,975 | |
New Red Finance Incorporated 144A | | | 3.88 | | | | 1-15-2028 | | | | 200,000 | | | | 205,000 | |
Trivium Packaging Finance BV 144A | | | 8.50 | | | | 8-15-2027 | | | | 200,000 | | | | 220,000 | |
Tronox Finance plc 144A | | | 5.75 | | | | 10-1-2025 | | | | 500,000 | | | | 506,355 | |
| |
| | | | 3,059,880 | |
| | | | | |
|
Health Care: 1.40% | |
|
| Pharmaceuticals: 1.40% | |
Bausch Health Companies Incorporated 144A | | | 5.25 | | | | 1-30-2030 | | | | 800,000 | | | | 795,192 | |
Bausch Health Companies Incorporated 144A | | | 7.25 | | | | 5-30-2029 | | | | 720,000 | | | | 790,200 | |
Endo Limited 144A | | | 6.00 | | | | 7-15-2023 | | | | 200,000 | | | | 160,500 | |
Endo Limited 144A | | | 9.50 | | | | 7-31-2027 | | | | 750,000 | | | | 811,875 | |
| |
| | | | 2,557,767 | |
| | | | | |
|
Industrials: 1.20% | |
|
| Aerospace & Defense: 0.14% | |
Bombardier Incorporated 144A | | | 6.00 | | | | 10-15-2022 | | | | 300,000 | | | | 255,000 | |
| | | | | | | | | | | | | | | | |
|
| Commercial Services & Supplies: 0.29% | |
GFL Environmental Incorporated 144A | | | 5.13 | | | | 12-15-2026 | | | | 500,000 | | | | 527,919 | |
| | | | | | | | | | | | | | | | |
|
| Electrical Equipment: 0.48% | |
Sensata Technologies BV 144A | | | 5.00 | | | | 10-1-2025 | | | | 200,000 | | | | 217,340 | |
Sensata Technologies BV 144A | | | 5.63 | | | | 11-1-2024 | | | | 600,000 | | | | 654,000 | |
| |
| | | | 871,340 | |
| | | | | |
|
| Metals & Mining: 0.29% | |
FMG Resources Proprietary Limited 144A | | | 5.13 | | | | 5-15-2024 | | | | 500,000 | | | | 540,000 | |
| | | | | | | | | | | | | | | | |
|
Information Technology: 0.42% | |
|
| Communications Equipment: 0.30% | |
Nokia OYJ | | | 4.38 | | | | 6-12-2027 | | | | 500,000 | | | | 547,250 | |
| | | | | | | | | | | | | | | | |
|
| Software: 0.12% | |
Open Text Corporation 144A | | | 5.88 | | | | 6-1-2026 | | | | 200,000 | | | | 210,000 | |
| | | | | | | | | | | | | | | | |
The accompanying notes are an integral part of these financial statements.
Wells Fargo High Yield Corporate Bond Portfolio | 13
Portfolio of investments—August 31, 2020 (unaudited)
| | | | | | | | | | | | | | | | |
| | | Interest rate | | | Maturity date | | | Principal | | | Value | |
| Materials: 0.75% | |
|
| Chemicals: 0.11% | |
Ineos Group Limited 144A | | | 5.63 | % | | | 8-1-2024 | | | $ | 200,000 | | | $ | 202,433 | |
| | | | | | | | | | | | | | | | |
|
| Containers & Packaging: 0.23% | |
Ardagh Packaging Finance plc 144A | | | 5.25 | | | | 8-15-2027 | | | | 400,000 | | | | 416,152 | |
| | | | | | | | | | | | | | | | |
|
| Metals & Mining: 0.41% | |
ArcelorMittal SA | | | 4.55 | | | | 3-11-2026 | | | | 420,000 | | | | 460,572 | |
FMG Resources Proprietary Limited 144A | | | 5.13 | | | | 3-15-2023 | | | | 280,000 | | | | 294,419 | |
| |
| | | | 754,991 | |
| | | | | |
|
Real Estate: 0.10% | |
|
| Real Estate Management & Development: 0.10% | |
Brookfield Property Partners LP 144A | | | 4.88 | | | | 2-15-2030 | | | | 200,000 | | | | 187,374 | |
| | | | | | | | | | | | | | | | |
| |
Total Yankee Corporate Bonds and Notes (Cost $30,389,362) | | | | 31,030,228 | |
| | | | | |
| | | | |
| | | | | | | | | | | | | | | | |
| | | Yield | | | | | | Shares | | | | |
| Short-Term Investments: 0.81% | |
|
| Investment Companies: 0.81% | |
Wells Fargo Government Money Market Fund Select Class (l)(u) | | | 0.06 | | | | | | | | 1,476,214 | | | | 1,476,214 | |
| | | | | | | | | | | | | | | | |
| | | | |
Total Short-Term Investments (Cost $1,476,214) | | | | | | | | | | | | | | | 1,476,214 | |
| | | | | | | | | | | | | | | | |
| | | | | | | | |
| Total investments in securities (Cost $174,810,407) | | | 98.45 | % | | | 179,372,949 | |
| | |
Other assets and liabilities, net | | | 1.55 | | | | 2,831,850 | |
| | | | | | | | |
| Total net assets | | | 100.00 | % | | $ | 182,204,799 | |
| | | | | | | | |
| 144A | The security may be resold in transactions exempt from registration, normally to qualified institutional buyers, pursuant to Rule 144A under the Securities Act of 1933. |
| ± | Variable rate investment. The rate shown is the rate in effect at period end. |
| ¥ | A payment-in-kind (PIK) security is a security in which the issuer may make interest or dividend payments in cash or additional securities or a combination of both. The rate shown is the rate in effect at period end. |
| (l) | The issuer of the security is an affiliated person of the Portfolio as defined in the Investment Company Act of 1940. |
| (u) | The rate represents the 7-day annualized yield at period end. |
Abbreviations:
| LIBOR | London Interbank Offered Rate |
| REIT | Real estate investment trust |
Investments in Affiliates
An affiliated investment is an investment in which the Portfolio owns at least 5% of the outstanding voting shares of the issuer or as a result of other relationships, such as the Portfolio and the issuer having the same adviser or investment manager. Transactions with issuers that were either affiliated persons of the Portfolio at the beginning of the period or the end of the period were as follows:
| | | | | | | | | | | | | | | | | | | | | | | | | | | | | | | | |
| | | Value,
beginning of
period | | | Purchases | | | Sales
proceeds | | | Net
realized
gains
(losses) | | | Net
change in
unrealized
gains
(losses) | | | Income
from
affiliated
securities | | | Value,
end of
period | | | % of
net
assets | |
| | | | | | | | |
| Short-Term Investments | | | | | | | | | | | | | | | | | | | | | | | | |
Investment Companies | | | | | | | | | | | | | | | | | | | | | | | | | | | | | | | | |
Wells Fargo Government Money Market Fund Select Class | | $ | 1,339,300 | | | $ | 139,453,469 | | | $ | (139,316,555 | ) | | $ | 0 | | | $ | 0 | | | $ | 3,181 | | | $ | 1,476,214 | | | | 0.81 | % |
The accompanying notes are an integral part of these financial statements.
14 | Wells Fargo High Yield Corporate Bond Portfolio
Statement of assets and liabilities—August 31, 2020 (unaudited)
| | | | |
| | | | |
| |
Assets | | | | |
Investments in unaffiliated securities, at value (cost $173,334,193) | | $ | 177,896,735 | |
Investments in affiliated securities, at value (cost $1,476,214) | | | 1,476,214 | |
Cash | | | 1,333 | |
Receivable for interest | | | 2,877,241 | |
Prepaid expenses and other assets | | | 669 | |
| | | | |
Total assets | | | 182,252,192 | |
| | | | |
| |
Liabilities | | | | |
Advisory fee payable | | | 33,128 | |
Professional fees payable | | | 9,452 | |
Custody and accounting fees payable | | | 2,937 | |
Trustees’ fees and expenses payable | | | 1,876 | |
| | | | |
Total liabilities | | | 47,393 | |
| | | | |
Total net assets | | $ | 182,204,799 | |
| | | | |
The accompanying notes are an integral part of these financial statements.
Wells Fargo High Yield Corporate Bond Portfolio | 15
Statement of operations—six months ended August 31, 2020 (unaudited)
| | | | |
| | | | |
| |
Investment income | | | | |
Interest (net of foreign withholding taxes of $5,248) | | $ | 3,420,945 | |
Income from affiliated securities | | | 3,181 | |
| | | | |
Total investment income | | | 3,424,126 | |
| | | | |
| |
Expenses | | | | |
Advisory fee | | | 144,125 | |
Custody and accounting fees | | | 4,978 | |
Professional fees | | | 27,665 | |
Shareholder report expenses | | | 4,208 | |
Trustees’ fees and expenses | | | 9,898 | |
Other fees and expenses | | | 4,642 | |
| | | | |
Total expenses | | | 195,516 | |
Less: Fee waivers and/or expense reimbursements | | | (37,957 | ) |
| | | | |
Net expenses | | | 157,559 | |
| | | | |
Net investment income | | | 3,266,567 | |
| | | | |
| |
Realized and unrealized gains (losses) on investments | | | | |
Net realized losses on investments | | | (2,137,468 | ) |
Net change in unrealized gains (losses) on investments | | | 6,236,762 | |
| | | | |
Net realized and unrealized gains (losses) on investments | | | 4,099,294 | |
| | | | |
Net increase in net assets resulting from operations | | $ | 7,365,861 | |
| | | | |
The accompanying notes are an integral part of these financial statements.
16 | Wells Fargo High Yield Corporate Bond Portfolio
Statement of changes in net assets
| | | | | | | | |
| | | Six months ended
August 31, 2020 (unaudited) | | | Year ended
February 29, 2020 | |
| | |
Operations | | | | | | | | |
Net investment income | | $ | 3,266,567 | | | $ | 3,528,771 | |
Net realized losses on investments | | | (2,137,468 | ) | | | (1,300,689 | ) |
Net change in unrealized gains (losses) on investments | | | 6,236,762 | | | | 811,481 | |
| | | | |
Net increase in net assets resulting from operations | | | 7,365,861 | | | | 3,039,563 | |
| | | | |
| | |
Capital transactions | | | | | | | | |
Transactions in investors’ beneficial interests | | | | | | | | |
Contributions | | | 133,553,085 | | | | 8,823,305 | |
Withdrawals | | | (12,703,179 | ) | | | (45,182,920 | ) |
| | | | |
Net increase (decrease) in net assets resulting from capital transactions | | | 120,849,906 | | | | (36,359,615 | ) |
| | | | |
Total increase (decrease) in net assets | | | 128,215,767 | | | | (33,320,052 | ) |
| | | | |
| | |
Net assets | | | | | | | | |
Beginning of period | | | 53,989,032 | | | | 87,309,084 | |
| | | | |
End of period | | $ | 182,204,799 | | | $ | 53,989,032 | |
| | | | |
The accompanying notes are an integral part of these financial statements.
Wells Fargo High Yield Corporate Bond Portfolio | 17
Financial highlights
| | | | | | | | | | | | | | | | |
| | | Six months ended
August 31, 2020
(unaudited) | | | Year ended
February 29, 2020 | | | Year ended February 28 | |
| | | 2019 | | | 20181 | |
Total return2 | | | 0.74 | % | | | 3.97 | % | | | 3.70 | % | | | 0.49 | % |
Ratios to average net assets (annualized) | | | | | | | | | | | | | | | | |
Gross expenses | | | 0.34 | % | | | 0.42 | % | | | 0.34 | % | | | 0.37 | % |
Net expenses | | | 0.27 | % | | | 0.30 | % | | | 0.32 | % | | | 0.37 | % |
Net investment income | | | 5.67 | % | | | 5.54 | % | | | 6.06 | % | | | 5.36 | % |
Supplemental data | | | | | | | | | | | | | | | | |
Portfolio turnover rate | | | 20 | % | | | 52 | % | | | 47 | % | | | 122 | % |
| 1 | For the period from May 23, 2017 (commencement of operations) to February 28, 2018 |
| 2 | Returns for periods of less than one year are not annualized. |
The accompanying notes are an integral part of these financial statements.
18 | Wells Fargo High Yield Corporate Bond Portfolio
Notes to financial statements (unaudited)
1. ORGANIZATION
Wells Fargo Master Trust (the “Trust”), a Delaware statutory trust organized on March 10, 1999, is an open-end management investment company registered under the Investment Company Act of 1940, as amended (the “1940 Act”). As an investment company, the Trust follows the accounting and reporting guidance in Financial Accounting Standards Board (“FASB”) Accounting Standards Codification Topic 946, Financial Services – Investment Companies. These financial statements report on the Wells Fargo High Yield Corporate Bond Portfolio (the “Portfolio”) which is a diversified series of the Trust.
Interests in the Portfolio are available solely through private placement transactions that do not involve any “public offering” within the meaning of Section 4(2) of the Investment Company Act of 1933.
2. SIGNIFICANT ACCOUNTING POLICIES
The following significant accounting policies, which are consistently followed in the preparation of the financial statements of the Portfolio, are in conformity with U.S. generally accepted accounting principles which require management to make estimates and assumptions that affect the reported amounts of assets and liabilities, disclosure of contingent assets and liabilities at the date of the financial statements, and the reported amounts of revenues and expenses during the reporting period. Actual results could differ from those estimates.
Securities valuation
All investments are valued each business day as of the close of regular trading on the New York Stock Exchange (generally 4 p.m. Eastern Time), although the Portfolio may deviate from this calculation time under unusual or unexpected circumstances.
Debt securities are valued at the evaluated bid price provided by an independent pricing service (e.g. taking into account various factors, including yields, maturities, or credit ratings) or, if a reliable price is not available, the quoted bid price from an independent broker-dealer.
Investments in registered open-end investment companies are valued at net asset value.
Investments which are not valued using any of the methods discussed above are valued at their fair value, as determined in good faith by the Board of Trustees of the Portfolio. The Board of Trustees has established a Valuation Committee comprised of the Trustees and has delegated to it the authority to take any actions regarding the valuation of portfolio securities that the Valuation Committee deems necessary or appropriate, including determining the fair value of portfolio securities, unless the determination has been delegated to the Wells Fargo Asset Management Pricing Committee at Wells Fargo Funds Management, LLC (“Funds Management”). The Board of Trustees retains the authority to make or ratify any valuation decisions or approve any changes to the Valuation Procedures as it deems appropriate. On a quarterly basis, the Board of Trustees receives reports on any valuation actions taken by the Valuation Committee or the Wells Fargo Asset Management Pricing Committee which may include items for ratification.
Security transactions and income recognition
Securities transactions are recorded on a trade date basis. Realized gains or losses are recorded on the basis of identified cost.
Interest income is accrued daily and bond discounts are accreted and premiums are amortized daily. To the extent debt obligations are placed on non-accrual status, any related interest income may be reduced by writing off interest receivables when the collection of all or a portion of interest has been determined to be doubtful based on consistently applied procedures and the fair value has decreased. If the issuer subsequently resumes interest payments or when the collectability of interest is reasonably assured, the debt obligation is removed from non-accrual status.
Income from foreign securities is recorded net of foreign taxes withheld where recovery of such taxes is not assured.
Federal and other taxes
The Portfolio is not required to pay federal income taxes on its net investment income and net capital gains as it is treated as a partnership for federal income tax purposes. All income, gains and losses of the Portfolio are deemed to have been “passed through” to the interest holders in proportion to their holdings of the Portfolio regardless of whether income and gains have been distributed by the Portfolio.
The Portfolio’s income tax returns and all financial records supporting those returns for the prior three fiscal years are subject to examination by the federal revenue authority. Management has analyzed the Portfolio’s tax positions taken on federal, state, and foreign tax returns for all open tax years and does not believe that there are any uncertain tax positions that require recognition of a tax liability.
Wells Fargo High Yield Corporate Bond Portfolio | 19
Notes to financial statements (unaudited)
As of August 31, 2020, the aggregate cost of all investments for federal income tax purposes was $174,885,665 and the unrealized gains (losses) consisted of:
| | | | |
| |
Gross unrealized gains | | $ | 7,027,339 | |
| |
Gross unrealized losses | | | (2,540,055 | ) |
| |
Net unrealized gains | | $ | 4,487,284 | |
3. FAIR VALUATION MEASUREMENTS
Fair value measurements of investments are determined within a framework that has established a fair value hierarchy based upon the various data inputs utilized in determining the value of the Portfolio’s investments. The three-level hierarchy gives the highest priority to unadjusted quoted prices in active markets for identical assets or liabilities (Level 1) and the lowest priority to unobservable inputs (Level 3). The Portfolio’s investments are classified within the fair value hierarchy based on the lowest level of input that is significant to the fair value measurement. The inputs are summarized into three broad levels as follows:
| ∎ | | Level 1 – quoted prices in active markets for identical securities |
| ∎ | | Level 2 – other significant observable inputs (including quoted prices for similar securities, interest rates, prepayment speeds, credit risk, etc.) |
| ∎ | | Level 3 – significant unobservable inputs (including the Portfolio’s own assumptions in determining the fair value of investments) |
The inputs or methodologies used for valuing investments in securities are not necessarily an indication of the risk associated with investing in those securities.
The following is a summary of the inputs used in valuing the Portfolio’s assets and liabilities as of August 31, 2020:
| | | | | | | | | | | | | | | | |
| | | | |
| | | Quoted prices (Level 1) | | | Other significant observable inputs (Level 2) | | | Significant unobservable inputs (Level 3) | | | Total | |
| | | | |
Assets | | | | | | | | | | | | | | | | |
Investments in: | | | | | | | | | | | | | | | | |
| | | | |
Corporate bonds and notes | | $ | 0 | | | $ | 146,866,507 | | | $ | 0 | | | $ | 146,866,507 | |
| | | | |
Yankee corporate bonds and notes | | | 0 | | | | 31,030,228 | | | | 0 | | | | 31,030,228 | |
| | | | |
Short-term investments | | | | | | | | | | | | | | | | |
| | | | |
Investment companies | | | 1,476,214 | | | | 0 | | | | 0 | | | | 1,476,214 | |
| | | | |
Total assets | | $ | 1,476,214 | | | $ | 177,896,735 | | | $ | 0 | | | $ | 179,372,949 | |
Additional sector, industry or geographic detail is included in the Portfolio of Investments.
For the six months ended August 31, 2020, the Portfolio did not have any transfers into/out of Level 3.
4. TRANSACTIONS WITH AFFILIATES
Advisory fee
The Trust has entered into an advisory contract with Funds Management, an indirect wholly owned subsidiary of Wells Fargo & Company (“Wells Fargo”). The adviser is responsible for implementing investment policies and guidelines and for supervising the subadviser, who is responsible for day-to-day portfolio management of the Portfolio. Pursuant to the contract, Funds Management is entitled to receive an annual advisory fee at the following annual rate based on the Portfolio’s average daily net assets:
| | | | |
| |
| Average daily net assets | | Advisory fee | |
| |
First $5 billion | | | 0.25 | % |
| |
Next $5 billion | | | 0.23 | |
| |
Over $10 billion | | | 0.21 | |
20 | Wells Fargo High Yield Corporate Bond Portfolio
Notes to financial statements (unaudited)
For the six months ended August 31, 2020, the advisory fee was equivalent to an annual rate of 0.25% of the Portfolio’s average daily net assets.
Funds Management has retained the services of a subadviser to provide daily portfolio management to the Portfolio. The fee for subadvisory services is borne by Funds Management. Wells Capital Management Incorporated, an affiliate of Funds Management and an indirect wholly owned subsidiary of Wells Fargo, is the subadviser to the Portfolio and is entitled to receive a fee from Funds Management at an annual rate starting at 0.09% and declining to 0.07% as the average daily net assets of the Portfolio increase.
Funds Management has voluntarily waived and/or reimbursed advisory fees to reduce the net operating expense ratio of the Portfolio.
Interfund transactions
The Portfolio may purchase or sell portfolio investment securities to certain other Wells Fargo affiliates pursuant to Rule 17a-7 under the 1940 Act and under procedures adopted by the Board of Trustees. The procedures have been designed to ensure that these interfund transactions, which do not incur broker commissions, are effected at current market prices.
5. INVESTMENT PORTFOLIO TRANSACTIONS
Purchases and sales of investments, excluding U.S. government obligations (if any) and short-term securities, for the six months ended August 31, 2020 were $147,318,027 and $23,610,344, respectively.
6. BANK BORROWINGS
The Trust, along with Wells Fargo Variable Trust and Wells Fargo Funds Trust (excluding the money market funds), are parties to a $350,000,000 revolving credit agreement whereby the Portfolio is permitted to use bank borrowings for temporary or emergency purposes, such as to fund shareholder redemption requests. Interest under the credit agreement is charged to the Portfolio based on a borrowing rate equal to the higher of the Federal Funds rate in effect on that day plus 1.25% or the overnight LIBOR rate in effect on that day plus 1.25%. In addition, an annual commitment fee equal to 0.25% of the unused balance is allocated to each participating fund.
For the six months ended August 31, 2020, there were no borrowings by the Portfolio under the agreement.
7. INDEMNIFICATION
Under the Portfolio’s organizational documents, the officers and Trustees have been granted certain indemnification rights against certain liabilities that may arise out of performance of their duties to the Portfolio. The Portfolio has entered into a separate agreement with each Trustee that converts indemnification rights currently existing under the Portfolio’s organizational documents into contractual rights that cannot be changed in the future without the consent of the Trustee. Additionally, in the normal course of business, the Portfolio may enter into contracts with service providers that contain a variety of indemnification clauses. The Portfolio’s maximum exposure under these arrangements is dependent on future claims that may be made against the Portfolio and, therefore, cannot be estimated.
8. NEW ACCOUNTING PRONOUNCEMENT
In August 2018, FASB issued Accounting Standards Update (“ASU”) No. 2018-13, Fair Value Measurement (Topic 820) Disclosure Framework—Changes to the Disclosure Requirements for Fair Value Measurement. ASU 2018-13 updates the disclosure requirements on fair value measurements in Topic 820, Fair Value Measurements. The amendments are effective for fiscal years, and interim periods within those fiscal years, beginning after December 15, 2019. Management has adopted this guidance which did not have a material impact on the financial statements.
9. CORONAVIRUS (COVID-19) PANDEMIC
On March 11, 2020, the World Health Organization announced that it had made the assessment that coronavirus disease 2019 (“COVID-19”) is a pandemic. The impacts of COVID-19 are adversely affecting the entire global economy, individual companies and investment products, and the market in general. There is significant uncertainty around the extent and duration of business disruptions related to COVID-19 and the impacts may be short term or may last for an extended period of time. The risk of further spreading of COVID-19 has led to significant uncertainty and volatility in the financial markets.
Wells Fargo High Yield Corporate Bond Portfolio | 21
Other information (unaudited)
PROXY VOTING INFORMATION
A description of the policies and procedures used to determine how to vote proxies relating to portfolio securities is available, upon request, by calling 1-800-222-8222, visiting our website at wfam.com, or visiting the SEC website at sec.gov. Information regarding how the proxies related to portfolio securities were voted during the most recent 12-month period ended June 30 is available on the website at wfam.com or by visiting the SEC website at sec.gov.
QUARTERLY PORTFOLIO HOLDINGS INFORMATION
The Portfolio files its complete schedule of portfolio holdings with the SEC for the first and third quarters of each fiscal as an exhibit to its reports on Form N-PORT. Shareholders may view the filed Form N-PORT by visiting the SEC website at sec.gov.
22 | Wells Fargo High Yield Corporate Bond Portfolio
Other information (unaudited)
BOARD OF TRUSTEES AND OFFICERS
Each of the Trustees and Officers1 listed in the table below acts in identical capacities for each fund in the Wells Fargo family of funds, which consists of 142 mutual funds comprising the Wells Fargo Funds Trust, Wells Fargo Variable Trust, Wells Fargo Master Trust and four closed-end funds (collectively the “Fund Complex”). This table should be read in conjunction with the Prospectus and the Statement of Additional Information2. The mailing address of each Trustee and Officer is 525 Market Street, 12th Floor, San Francisco, CA 94105. Each Trustee and Officer serves an indefinite term, however, each Trustee serves such term until reaching the mandatory retirement age established by the Trustees.
Independent Trustees
| | | | | | |
Name and year of birth | | Position held and length of service* | | Principal occupations during past five years or longer | | Current other public company or investment company directorships |
| | | |
William R. Ebsworth (Born 1957) | | Trustee, since 2015 | | Retired. From 1984 to 2013, equities analyst, portfolio manager, research director and chief investment officer at Fidelity Management and Research Company in Boston, Tokyo, and Hong Kong, and retired in 2013 as Chief Investment Officer of Fidelity Strategic Advisers, Inc. where he led a team of investment professionals managing client assets. Prior thereto, Board member of Hong Kong Securities Clearing Co., Hong Kong Options Clearing Corp., the Thailand International Fund, Ltd., Fidelity Investments Life Insurance Company, and Empire Fidelity Investments Life Insurance Company. Audit Committee Chair and Investment Committee Chair of the Vincent Memorial Hospital Endowment (non-profit organization). Mr. Ebsworth is a CFA® charterholder. | | N/A |
| | | |
Jane A. Freeman (Born 1953) | | Trustee, since 2015; Chair Liaison, since 2018 | | Retired. From 2012 to 2014 and 1999 to 2008, Chief Financial Officer of Scientific Learning Corporation. From 2008 to 2012, Ms. Freeman provided consulting services related to strategic business projects. Prior to 1999, Portfolio Manager at Rockefeller & Co. and Scudder, Stevens & Clark. Board member of the Harding Loevner Funds from 1996 to 2014, serving as both Lead Independent Director and chair of the Audit Committee. Board member of the Russell Exchange Traded Funds Trust from 2011 to 2012 and the chair of the Audit Committee. Ms. Freeman is also an inactive Chartered Financial Analyst. | | N/A |
| | | |
Isaiah Harris, Jr. (Born 1952) | | Trustee, since 2009; Audit Committee Chairman, since 2019 | | Retired. Chairman of the Board of CIGNA Corporation since 2009, and Director since 2005. From 2003 to 2011, Director of Deluxe Corporation. Prior thereto, President and CEO of BellSouth Advertising and Publishing Corp. from 2005 to 2007, President and CEO of BellSouth Enterprises from 2004 to 2005 and President of BellSouth Consumer Services from 2000 to 2003. Emeritus member of the Iowa State University Foundation Board of Governors. Emeritus Member of the Advisory Board of Iowa State University School of Business. Advisory Board Member, Palm Harbor Academy (private school). Mr. Harris is a certified public accountant (inactive status). | | CIGNA Corporation |
| | | |
Judith M. Johnson (Born 1949) | | Trustee, since 2008 | | Retired. Prior thereto, Chief Executive Officer and Chief Investment Officer of Minneapolis Employees Retirement Fund from 1996 to 2008. Ms. Johnson is an attorney, certified public accountant and a certified managerial accountant. | | N/A |
| | | |
David F. Larcker (Born 1950) | | Trustee, since 2009 | | James Irvin Miller Professor of Accounting at the Graduate School of Business (Emeritus), Stanford University, Director of the Corporate Governance Research Initiative and Senior Faculty of The Rock Center for Corporate Governance since 2006. From 2005 to 2008, Professor of Accounting at the Graduate School of Business, Stanford University. Prior thereto, Ernst & Young Professor of Accounting at The Wharton School, University of Pennsylvania from 1985 to 2005. | | N/A |
Wells Fargo High Yield Corporate Bond Portfolio | 23
Other information (unaudited)
| | | | | | |
Name and year of birth | | Position held and length of service* | | Principal occupations during past five years or longer | | Current other public company or investment company directorships |
| | | |
Olivia S. Mitchell (Born 1953) | | Trustee, since 2006; Nominating and Governance Committee Chair, since 2018 | | International Foundation of Employee Benefit Plans Professor, Wharton School of the University of Pennsylvania since 1993. Director of Wharton’s Pension Research Council and Boettner Center on Pensions & Retirement Research, and Research Associate at the National Bureau of Economic Research. Previously, Cornell University Professor from 1978 to 1993. | | N/A |
| | | |
Timothy J. Penny (Born 1951) | | Trustee, since 1996; Chairman, since 2018 | | President and Chief Executive Officer of Southern Minnesota Initiative Foundation, a non-profit organization, since 2007. Member of the Board of Trustees of NorthStar Education Finance, Inc., a non-profit organization, since 2007. | | N/A |
| | | |
James G. Polisson (Born 1959) | | Trustee, since 2018 | | Retired. Chief Marketing Officer, Source (ETF) UK Services, Ltd, from 2015 to 2017. From 2012 to 2015, Principal of The Polisson Group, LLC, a management consulting, corporate advisory and principal investing company. Chief Executive Officer and Managing Director at Russell Investments, Global Exchange Traded Funds from 2010 to 2012. Managing Director of Barclays Global Investors from 1998 to 2010 and Global Chief Marketing Officer for iShares and Barclays Global Investors from 2000 to 2010. Trustee of the San Francisco Mechanics’ Institute, a non-profit organization, from 2013 to 2015. Board member of the Russell Exchange Traded Fund Trust from 2011 to 2012. Director of Barclays Global Investors Holdings Deutschland GmbH from 2006 to 2009. Mr. Polisson is an attorney and has a retired status with the Massachusetts and District of Columbia Bar Associations. | | N/A |
| | | |
Pamela Wheelock (Born 1959) | | Trustee, since January 2020; previously Trustee from January 2018 to July 2019 | | Board member of the Destination Medical Center Economic Development Agency, Rochester, Minnesota since 2019. Interim President of the McKnight Foundation from January to September 2020. Acting Commissioner, Minnesota Department of Human Services, July 2019 through September 2019. Human Services Manager (part-time), Minnesota Department of Human Services, October 2019 through December 2019. Chief Operating Officer, Twin Cities Habitat for Humanity from 2017 to 2019. Vice President of University Services, University of Minnesota from 2012 to 2016. Prior thereto, on the Board of Directors, Governance Committee and Finance Committee for the Minnesota Philanthropy Partners (Saint Paul Foundation) from 2012 to 2018, Interim Chief Executive Officer of Blue Cross Blue Shield of Minnesota from 2011 to 2012, Chairman of the Board from 2009 to 2012 and Board Director from 2003 to 2015. Vice President, Leadership and Community Engagement, Bush Foundation, Saint Paul, Minnesota (a private foundation) from 2009 to 2011. Executive Vice President and Chief Financial Officer, Minnesota Sports and Entertainment from 2004 to 2009 and Senior Vice President from 2002 to 2004. Executive Vice President of the Minnesota Wild Foundation from 2004 to 2008. Commissioner of Finance, State of Minnesota, from 1999 to 2002. Currently Board Chair of the Minnesota Wild Foundation since 2010. | | N/A |
| * | Length of service dates reflect the Trustee’s commencement of service with the Trust’s predecessor entities, where applicable. |
24 | Wells Fargo High Yield Corporate Bond Portfolio
Other information (unaudited)
Officers
| | | | |
Name and year of birth | | Position held and length of service | | Principal occupations during past five years or longer |
| | |
Andrew Owen (Born 1960) | | President, since 2017 | | Executive Vice President of Wells Fargo & Company and Head of Affiliated Managers, Wells Fargo Asset Management, since 2014. In addition, Mr. Owen is currently President, Chief Executive Officer and Director of Wells Fargo Funds Management, LLC since 2017. Prior thereto, Executive Vice President responsible for marketing, investments and product development for Wells Fargo Funds Management, LLC, from 2009 to 2014. |
| | |
Jeremy DePalma1 (Born 1974) | | Treasurer, since 2012 | | Senior Vice President of Wells Fargo Funds Management, LLC since 2009. Senior Vice President of Evergreen Investment Management Company, LLC from 2008 to 2010 and head of the Fund Reporting and Control Team within Fund Administration from 2005 to 2010. |
| | |
Michelle Rhee (Born 1966) | | Chief Legal Officer, since 2019 | | Secretary of Wells Fargo Funds Management, LLC, Chief Legal Counsel of Wells Fargo Asset Management and Assistant General Counsel of Wells Fargo Bank, N.A. since 2018. Associate General Counsel and Managing Director of Bank of America Corporation from 2004 to 2018. |
| | |
Catherine Kennedy (Born 1969) | | Secretary, since 2019 | | Vice President of Wells Fargo Funds Management, LLC and Senior Counsel of the Wells Fargo Legal Department since 2010. Vice President and Senior Counsel of Evergreen Investment Management Company, LLC from 1998 to 2010. |
| | |
Michael H. Whitaker (Born 1967) | | Chief Compliance Officer, since 2016 | | Chief Compliance Officer of Wells Fargo Asset Management since 2016. Senior Vice President and Chief Compliance Officer for Fidelity Investments from 2007 to 2016. |
| | |
David Berardi (Born 1975) | | Assistant Treasurer, since 2009 | | Vice President of Wells Fargo Funds Management, LLC since 2009. Vice President of Evergreen Investment Management Company, LLC from 2008 to 2010. Manager of Fund Reporting and Control for Evergreen Investment Management Company, LLC from 2004 to 2010. |
| 1 | Jeremy DePalma acts as Treasurer of 77 funds and Assistant Treasurer of 65 funds in the Fund Complex. |
| 2 | The Statement of Additional Information includes additional information about the Trustees and is available, without charge, upon request, by calling 1-800-222-8222 or by visiting the website at wfam.com. |
Wells Fargo High Yield Corporate Bond Portfolio | 25
Other information (unaudited)
BOARD CONSIDERATION OF INVESTMENT MANAGEMENT, ADVISORY AND SUB-ADVISORY AGREEMENTS:
Wells Fargo Emerging Markets Bond Fund, Wells Fargo High Yield Corporate Bond Fund, Wells Fargo International Government Bond Fund, Wells Fargo U.S. Core Bond Fund, Wells Fargo Bloomberg Barclays US Aggregate ex-Corporate Credit Portfolio, Wells Fargo Factor Enhanced Emerging Markets Equity Portfolio, Wells Fargo Emerging Markets Bond Portfolio, Wells Fargo Factor Enhanced International Equity Portfolio, Wells Fargo Factor Enhanced U.S. Large Cap Portfolio, Wells Fargo Factor Enhanced U.S. Small Cap Portfolio, Wells Fargo International Government Bond Portfolio, Wells Fargo Investment Grade Corporate Bond Portfolio, Wells Fargo High Yield Corporate Bond Portfolio, Wells Fargo Strategic Retirement Bond Portfolio, and Wells Fargo U.S. REIT Portfolio
Under the Investment Company Act of 1940 (the “1940 Act”), the Board of Trustees (each, a “Board” and collectively, the “Boards”) of each of Wells Fargo Funds Trust (“Funds Trust”) and Wells Fargo Master Trust (“Master Trust”) (collectively, the “Trusts”) must determine annually whether to approve the continuation of the Trusts’ investment management, advisory and sub-advisory agreements, as applicable. In this regard, at a meeting held on May 26, 2020 and May 28, 2020 (together, the “Meeting”), the Board of Funds Trust, all the members of which have no direct or indirect interest in the investment management agreement and are not “interested persons” of the Trusts, as defined in the 1940 Act (the “Independent Trustees”), reviewed and approved for each of the funds of Funds Trust identified in the table below (individually, an “Index Fund” and collectively, the “Index Funds”) an investment management agreement (the “Management Agreement”) with Wells Fargo Funds Management, LLC (“Funds Management”).
|
|
| Index Funds |
|
Wells Fargo Emerging Markets Bond Fund |
|
Wells Fargo High Yield Corporate Bond Fund |
|
Wells Fargo International Government Bond Fund |
|
Wells Fargo U.S. Core Bond Fund |
In addition, the Funds Trust Board reviewed and approved an investment sub-advisory agreement with Wells Capital Management Incorporated (“WellsCap”) for the U.S. Core Bond Fund (the “Core Bond Fund Sub-Advisory Agreement”).
At the Meeting, the Board of Master Trust, all the members of which have no direct or indirect interest in the investment advisory and sub-advisory agreements and are Independent Trustees, reviewed and approved for each of the portfolios of Master Trust identified in the table below (individually, a “Master Portfolio” and collectively, the “Master Portfolios”): (i) an investment advisory agreement (the “Master Portfolio Advisory Agreement”) with Funds Management; and (ii) an investment sub-advisory agreement (each, a “Master Portfolio Sub-Advisory Agreement”, and collectively, the “Master Portfolio Sub-Advisory Agreements”) with the sub-adviser(s) identified in the chart below (each, a “Sub-Adviser”, and collectively, the “Sub-Advisers”) for the corresponding Master Portfolio identified.
| | |
| |
| Master Portfolios | | Sub-Advisers |
| |
Wells Fargo Bloomberg Barclays US Aggregate ex-Corporate Credit Portfolio | | WellsCap |
| |
Wells Fargo Factor Enhanced Emerging Markets Equity Portfolio | | WellsCap |
| |
Wells Fargo Emerging Markets Bond Portfolio | | Wells Fargo Asset Management (International), Limited (“WFAM International”) |
| |
Wells Fargo Factor Enhanced International Equity Portfolio | | WellsCap |
| |
Wells Fargo Factor Enhanced U.S. Large Cap Portfolio | | WellsCap |
| |
Wells Fargo Factor Enhanced U.S. Small Cap Portfolio | | WellsCap |
| |
Wells Fargo International Government Bond Portfolio | | WFAM International |
| |
Wells Fargo Investment Grade Corporate Bond Portfolio | | WellsCap |
| |
Wells Fargo High Yield Corporate Bond Portfolio | | WellsCap |
| |
Wells Fargo Strategic Retirement Bond Portfolio | | WellsCap |
| |
Wells Fargo U.S. REIT Portfolio | | WellsCap |
26 | Wells Fargo High Yield Corporate Bond Portfolio
Other information (unaudited)
The Index Funds and the Master Portfolios are collectively referred to as the “Funds.” The Management Agreement, the Core Bond Fund Sub-Advisory Agreement, the Master Portfolio Advisory Agreement and the Master Portfolio Sub-Advisory Agreements are collectively referred to as the “Advisory Agreements.”
The Boards noted that each of the Index Funds is a feeder fund that invests all of its assets in its corresponding Master Portfolio, with the exception of the U.S. Core Bond Fund, which invests in multiple Master Portfolios. Information provided to the Boards regarding the Index Funds is also applicable to the Master Portfolios identified above, as relevant.
At the Meeting, the Boards considered the factors and reached the conclusions described below relating to the selection of Funds Management and the Sub-Advisers and the approval of the Advisory Agreements. Prior to the Meeting, including at a Board meeting held in April 2020, the Trustees conferred extensively among themselves and with representatives of Funds Management about these matters. Also, the Boards have adopted a team-based approach, with each team consisting of a sub-set of Trustees, to assist the full Boards in the discharge of their duties in reviewing investment performance and other matters throughout the year. The Independent Trustees were assisted in their evaluation of the Advisory Agreements by independent legal counsel, from whom they received separate legal advice and with whom they met separately.
In providing information to the Boards, Funds Management and the Sub-Advisers were guided by a detailed set of requests for information submitted to them by independent legal counsel on behalf of the Independent Trustees at the start of the Boards’ annual contract renewal process earlier in 2020. In considering and approving the Advisory Agreements, the Trustees considered the information they believed relevant, including but not limited to the information discussed below. The Boards considered not only the specific information presented in connection with the Meeting, but also the knowledge gained over time through interaction with Funds Management and the Sub-Advisers about various topics. In this regard, the Boards reviewed reports of Funds Management at each of their quarterly meetings, which included, among other things, portfolio reviews and investment performance reports. In addition, the Boards and the teams mentioned above confer with portfolio managers at various times throughout the year. The Boards did not identify any particular information or consideration that was all-important or controlling, and each individual Trustee may have attributed different weights to various factors.
After its deliberations, the Board of Funds Trust unanimously approved the continuation of the Management Agreement and the Core Bond Fund Sub-Advisory Agreement for a one-year period. Additionally, after its deliberations, the Board of Master Trust unanimously approved the continuation of the Master Portfolio Advisory Agreement and each Master Portfolio Sub-Advisory Agreement for a one-year term. The Boards also determined that the compensation or the absence of compensation payable to Funds Management and to each of the Sub-Advisers under each of the Advisory Agreements was reasonable. The Boards considered the approval of the Advisory Agreements for the Funds as part of their consideration of agreements for funds across the complex, but their approvals were made on a fund-by-fund basis. The following summarizes a number of important, but not necessarily all, factors considered by the Boards in support of their approvals.
Nature, extent and quality of services
The Boards received and considered various information regarding the nature, extent and quality of services provided to the Funds by Funds Management and the Sub-Advisers under the Advisory Agreements. This information included a description of the investment advisory services and Fund-level administrative services covered by the Advisory Agreements, as well as, among other things, a summary of the background and experience of senior management of Wells Fargo Asset Management (“WFAM”), of which Funds Management and the Sub-Advisers are a part, and a summary of investments made in the business of WFAM. The Boards also received a description of Funds Management’s and the Sub-Advisers’ business continuity plans and of their approaches to data privacy and cybersecurity, and related testing. The Boards also received and reviewed information about Funds Management’s role as administrator of the Funds’ liquidity risk management program, Funds Management’s approach to risk management, and Funds Management’s intermediary and vendor oversight program.
The Boards also considered the qualifications, background, tenure and responsibilities of each of the portfolio managers primarily responsible for the day-to-day portfolio management of the Funds. The Board of Master Trust noted that each of the Master Portfolios replicates the performance of a proprietary index provided by an affiliate of Funds Management, except that the Wells Fargo Bloomberg Barclays US Aggregate ex-Corporate Credit Portfolio, the Wells Fargo Emerging Markets Bond Portfolio, and the Wells Fargo Strategic Retirement Bond Portfolio track the performance of third-party indexes. The Boards evaluated the ability of Funds Management and the Sub-Advisers to attract and retain qualified investment professionals, including research, advisory and supervisory personnel. The Boards further considered the compliance programs and compliance records of Funds Management and the Sub-Advisers. In addition, the Boards took into account the full range of services provided to the Funds by Funds Management and its affiliates.
Wells Fargo High Yield Corporate Bond Portfolio | 27
Other information (unaudited)
Fund investment performance and expenses
The Boards considered the investment performance results for each of the Master Portfolios for the one-year period ended December 31, 2019. The Boards also considered more current results for the one-year period ended March 31, 2020. The Boards considered these results in comparison to the investment performance of funds in a universe that was determined by Broadridge Inc. (“Broadridge”) to be similar to the respective Master Portfolios (each, a “Universe”), and in comparison to each Master Portfolio’s benchmark index and to other comparative data. Broadridge is an independent provider of investment company data. The Boards received a description of the methodology used by Broadridge to select the mutual funds in each performance Universe.
The Boards noted the short performance history of the Master Portfolios. For the one-year period ended December 31, 2019, the Boards noted that the investment performance of each Master Portfolio relative to its respective Universe was as follows: (i) the investment performance of each of the Wells Fargo Bloomberg Barclays US Aggregate ex-Corporate Credit Portfolio, the Wells Fargo Emerging Markets Bond Portfolio, the Wells Fargo Factor Enhanced International Equity Portfolio, the Wells Fargo Factor Enhanced U.S. Large Cap Portfolio, the Wells Fargo High Yield Corporate Bond Portfolio and the Wells Fargo Investment Grade Corporate Bond Portfolio was higher than or in range of the average investment performance of such Master Portfolio’s respective Universe; and (ii) the Wells Fargo Factor Enhanced Emerging Markets Equity Portfolio, the Wells Fargo Factor Enhanced U.S. Small Cap Portfolio, the Wells Fargo International Government Bond Portfolio, the Wells Fargo Strategic Retirement Bond Portfolio and the Wells Fargo U.S. REIT Portfolio was lower than the average investment performance of such Master Portfolio’s respective Universe. For the one-year period ended March 31, 2020, the Boards noted that the investment performance of each Master Portfolio relative to its respective Universe was as follows: (i) the Wells Fargo Emerging Markets Bond Portfolio, the Wells Fargo Factor Enhanced U.S. Large Cap Portfolio, the Wells Fargo Factor Enhanced U.S. Small Cap Portfolio, the Wells Fargo International Government Bond Portfolio, and the Wells Fargo Investment Grade Corporate Bond Portfolio was higher than or in range of the average investment performance of such Master Portfolio’s respective Universe, and (ii) the Wells Fargo Bloomberg Barclays US Aggregate ex-Corporate Credit Portfolio, the Wells Fargo Factor Enhanced Emerging Markets Equity Portfolio, the Wells Fargo Factor Enhanced International Equity Portfolio, the Wells Fargo High Yield Corporate Bond Portfolio, the Wells Fargo Strategic Retirement Bond Portfolio and the Wells Fargo U.S. REIT Portfolio was lower than the average investment performance of such Master Portfolio’s respective Universe.
The Boards also noted that the investment performance of each Master Portfolio to its respective benchmark index for the one-year period ended December 31, 2019, was as follows: (i) the investment performance of each of the Wells Fargo Bloomberg Barclays US Aggregate ex-Corporate Credit Portfolio, the Wells Fargo Factor Enhanced Emerging Markets Equity Portfolio, the Wells Fargo Factor Enhanced U.S. Large Cap Portfolio, the Wells Fargo Factor Enhanced U.S. Small Cap Portfolio, the Wells Fargo High Yield Corporate Bond Portfolio, the Wells Fargo U.S. REIT Portfolio and the Wells Fargo Strategic Retirement Bond Portfolio was higher than or in range of the average investment performance of such Master Portfolio’s respective benchmark, and (ii) the investment performance of each of the Wells Fargo Emerging Markets Bond Portfolio, the Wells Fargo Factor Enhanced International Equity Portfolio, the Wells Fargo International Government Bond Portfolio and the Wells Fargo Investment Grade Corporate Bond Portfolio was lower than the average investment performance of such Master Portfolio’s respective benchmark. For the one-year period ended March 31, 2020, the Boards also noted that the investment performance of each Master Portfolio to its respective benchmark index, was as follows: (i) the investment performance of each of the Wells Fargo Bloomberg Barclays US Aggregate ex-Corporate Credit Portfolio, the Wells Fargo Factor Enhanced Emerging Markets Equity Portfolio, the Wells Fargo Factor Enhanced International Equity Portfolio, the Wells Fargo Factor Enhanced U.S. Large Cap Portfolio, the Wells Fargo Factor Enhanced U.S. Small Cap Portfolio, the Wells Fargo U.S. REIT Portfolio, the Wells Fargo Investment Grade Corporate Bond Portfolio and the Wells Fargo Strategic Retirement Bond Portfolio was higher than, equal to or in range of the average investment performance of such Master Portfolio’s respective benchmark, and (ii) the investment performance of each of the Wells Fargo Emerging Markets Bond Portfolio, the Wells Fargo High Yield Corporate Bond Portfolio and the Wells Fargo International Government Bond Portfolio was lower than the average investment performance of such Master Portfolio’s respective benchmark.
The Boards received information concerning, and discussed factors contributing to, the underperformance of certain Master Portfolios, relative to the Universe and benchmark index, for the periods identified above. The Board took note of the explanations for the relative underperformance during these periods, including with respect to investment decisions and market factors that affected the Fund’s investment performance.
The Board of Funds Trust took note of the investment performance of the Master Portfolios in the context of reviewing the investment performance of the Index Funds. The Board of Funds Trust also received and considered information regarding the “zero fee and expense” structure of each Index Fund. Specifically, the Funds Trust Board noted that each Index Fund’s gross operating expense ratio and each of its various components, including management fees, administration fees, custody fees, Rule 12b-1 fees, and other fees, are zero. The Funds Trust Board also noted that Funds Management assumes and pays or reimburses all of the ordinary operating expenses of each Index Fund, including acquired fund fees and expenses, pursuant to an
28 | Wells Fargo High Yield Corporate Bond Portfolio
Other information (unaudited)
agreement with each of the Index Funds (the “Fee and Expense Agreement”). The Funds Trust Board further noted that Funds Management receives a fee from Wells Fargo Wealth and Investment Management (“WIM”) pursuant to an intercompany agreement equal to the Master Portfolio fees and expenses absorbed by Funds Management through its Fee and Expense Agreement with each of the Index Funds.
With respect to the Master Portfolios, the Board of Master Trust received and considered information regarding the fee rates that are payable to Funds Management for investment advisory services (as discussed below), which are the only fees charged at the Master Portfolio level, relative to corresponding class-specific expense groups that were determined by Broadridge to be similar to the Funds (the “Groups”). The Boards received a description of the methodology used by Broadridge to select the mutual funds in the expense Groups and an explanation of how funds comprising expense groups and their expense ratios may vary from year-to-year.
The Boards took into account the Funds’ expense information and the Master Portfolios’ performance information provided to them among the factors considered in deciding to re-approve the Advisory Agreements.
Investment management, advisory and sub-advisory fee rates
The Board of Funds Trust reviewed and considered that the contractual investment management fee rate payable by each Index Fund to Funds Management for investment management services zero, and also reviewed and considered that each Fund’s other expenses would normally be zero, because of Funds Management’s commitment to assume and pay or reimburse all of the ordinary operating expenses of each Fund, including acquired fund fees and expenses, under the Fee and Expense Agreement. The Board of Funds Trust also reviewed and considered that the contractual investment sub-advisory fee rate payable by Funds Management to WellsCap for investment sub-advisory services for the U.S. Core Bond Fund is also zero.
The Board of Master Trust reviewed and considered the contractual fee rates payable by the Master Portfolios to Funds Management under the Master Portfolio Advisory Agreement (the “Advisory Agreement Rates”). The Board of Master Trust also reviewed and considered the contractual investment sub-advisory fee rates that are payable by Funds Management to the Sub-Advisers for investment sub-advisory services (the “Sub-Advisory Agreement Rates”).
The Board of Master Trust reviewed a comparison of the Advisory Agreement Rates of each Master Portfolio with those of other funds in each Master Portfolio’s respective expense Groups at a common asset level. The Board of Master Trust noted that the Advisory Agreement Rates of each Master Portfolio were lower than or equal to the median rate for such Master Portfolio’s expense Groups.
The Boards also received and considered information about the portions of the total management fees that were retained by Funds Management after payment of the fees to the Sub-Advisers for sub-advisory services. In assessing the reasonableness of these amounts, the Boards received and evaluated information about the nature and extent of responsibilities retained and risks assumed by Funds Management and not delegated to or assumed by the Sub-Advisers, and about Funds Management’s on-going oversight services. Given the affiliation between Funds Management and the Sub-Advisers, the Boards ascribed limited relevance to the allocation of fees between them.
The Boards also received and considered information about the nature and extent of services offered and fee rates charged by Funds Management and the Sub-Advisers to other types of clients with investment strategies similar to those of certain Funds. In this regard, the Boards received information about the significantly greater scope of services, and compliance, reporting and other legal burdens and risks of managing proprietary mutual funds compared with those associated with managing assets of other types of clients, including third-party sub-advised fund clients and non-mutual fund clients such as institutional separate accounts.
Based on its consideration of the factors and information it deemed relevant, including those described here, the Board of Fund Trust determined that the compensation received by Funds Management from WIM pursuant to the intercompany agreement, and the absence of compensation payable by the Funds to Funds Management pursuant to the Management Agreement or to WellsCap pursuant to the Core Bond Fund Sub-Advisory Agreement, was reasonable. Based on its consideration of the factors and information it deemed relevant, including those described here, the Board of Master Trust determined that the Advisory Agreement Rates and the Sub-Advisory Agreement Rates for each Master Portfolio were reasonable.
Profitability
The Boards received and considered information concerning the profitability of Funds Management, as well as the profitability of both WFAM and Wells Fargo & Co. (“Wells Fargo”) from providing services to the fund family as a whole. The Boards noted that the Sub-Advisers’ profitability information with respect to providing services to the Funds and other funds in the family was subsumed in the WFAM and Wells Fargo profitability analysis.
Wells Fargo High Yield Corporate Bond Portfolio | 29
Other information (unaudited)
Funds Management reported on the methodologies and estimates used in calculating profitability, including a description of the methodology used to allocate certain expenses. Among other things, the Boards noted that the levels of profitability reported on a fund-by-fund basis varied widely, depending on factors such as the size, type and age of fund.
Based on its review, the Boards did not deem the profits reported by Funds Management, WFAM or Wells Fargo from services provided to the Funds to be at a level that would prevent them from approving the continuation of the Advisory Agreements.
Economies of scale
The Boards received and considered information about the potential for Funds Management to experience economies of scale in the provision of management services to the Funds, the difficulties of calculating economies of scale at an individual fund level, and the extent to which potential scale benefits are shared with shareholders. The Boards noted the existence of breakpoints in the each Master Portfolio’s advisory fee structure and each Index Fund’s management fee structure, which operate generally to reduce the Funds’ expense ratios as the Funds grow in size, and the size of the Funds in relation to such breakpoints. The Boards considered that in addition to management fee breakpoints, Funds Management shares potential economies of scale from its management business in a variety of ways, including through fee waiver and expense reimbursement arrangements, services that benefit shareholders, competitive management fee rates set at the outset without regard to breakpoints, and investments in the business intended to enhance services available to shareholders.
The Boards concluded that Funds Management’s arrangements with respect to the Funds, including contractual breakpoints, constituted a reasonable approach to sharing potential economies of scale with the Funds and their shareholders.
Other benefits to Funds Management and the Sub-Advisers
The Boards received and considered information regarding potential “fall-out” or ancillary benefits received by Funds Management and its affiliates, including WellsCap and WFAM International, as a result of their relationships with the Funds. Ancillary benefits could include, among others, benefits directly attributable to other relationships with the Funds and benefits potentially derived from an increase in Funds Management’s and the Sub-Advisers’ business as a result of their relationships with the Funds. The Boards noted that various affiliates of Funds Management may receive distribution-related fees, shareholder servicing payments and sub-transfer agency fees in respect of shares sold or held through them and services provided.
The Boards also reviewed information about soft dollar credits earned and utilized by the Sub-Advisers, fees earned by Funds Management and WellsCap from managing a private investment vehicle for the fund family’s securities lending collateral, and commissions earned by an affiliated broker from portfolio transactions.
Based on their consideration of the factors and information they deemed relevant, including those described here, the Boards did not find that any ancillary benefits received by Funds Management and its affiliates, including WellsCap and WFAM International, were unreasonable.
Conclusion
At the Meeting, after considering the above-described factors and based on its deliberations and its evaluation of the information described above, the Funds Trust Board unanimously approved the continuation of the Management Agreement and the Core Bond Fund Sub-Advisory Agreement for a one-year period. Additionally, after its deliberations, the Master Trust Board unanimously approved the continuation of the Master Portfolio Advisory Agreement and each Master Portfolio Sub-Advisory Agreement for a one-year term. The Boards also determined that the compensation or the absence of compensation payable to Funds Management and to each of the Sub-Advisers was reasonable.
30 | Wells Fargo High Yield Corporate Bond Portfolio
Other information (unaudited)
LIQUIDITY RISK MANAGEMENT PROGRAM
In accordance with Rule 22e-4 under the Investment Company Act of 1940, as amended (the “Liquidity Rule”), Wells Fargo Master Trust (the “Trust”) has adopted and implemented a liquidity risk management program (the “Program”) on behalf of each of its series, including each Portfolio, which is reasonably designed to assess and manage the Portfolio’s liquidity risk. “Liquidity risk” is defined as the risk that a Portfolio is unable to meet redemption requests without significantly diluting remaining investors’ interests in the Portfolio. The Trust’s Board of Trustees (the “Board”) previously approved the designation of Wells Fargo Funds Management, LLC (“Funds Management”), each Portfolio’s investment adviser, as the administrator of the Program, and Funds Management has established a Liquidity Risk Management Council composed of personnel from multiple departments within Funds Management and its affiliates to assist Funds Management in the implementation and on-going administration of the Program.
The Program is comprised of various components designed to support the assessment and/or management of liquidity risk, including: (1) the periodic assessment (no less frequently than annually) of certain factors that influence a Portfolio’s liquidity risk; (2) the periodic classification (no less frequently than monthly) of a Portfolio’s investments into one of four liquidity categories that reflect an estimate of their liquidity under current market conditions; (3) a 15% limit on the acquisition of “illiquid investments” (as defined under the Liquidity Rule); (4) to the extent a Portfolio does not invest primarily in “highly liquid investments” (as defined under the Liquidity Rule), the determination of a minimum percentage of the Portfolio’s assets that generally will be invested in highly liquid investments (an “HLIM”); (5) if a Portfolio has established an HLIM, the periodic review (no less frequently than annually) of the HLIM and the adoption of policies and procedures for responding to a shortfall of the Portfolio’s “highly liquid investments” below its HLIM; and (6) periodic reporting to the Board.
At a meeting of the Board held on May 26 and 28, 2020, the Board received a written report (the “Report”) from Funds Management that addressed the operation of the Program and assessed its adequacy and effectiveness of implementation. The Report covered the initial period from December 1, 2018 through December 31, 2019 (the “Reporting Period”). No significant liquidity events impacting any Portfolio were noted in the Report. There were no material changes to the Program during the Reporting Period. The Report concluded that the Program is operating effectively to assess and manage each Portfolio’s liquidity risk, and that the Program has been and continues to be adequately and effectively implemented to monitor and, as applicable, respond to the Portfolio’s liquidity developments.
Wells Fargo High Yield Corporate Bond Portfolio | 31
This page is intentionally left blank.

For more information
More information about Wells Fargo Funds is available free upon request. To obtain literature, please write, visit the Portfolio’s website, or call:
Wells Fargo Funds
P.O. Box 219967
Kansas City, MO 64121-9967
Website: wfam.com
Individual investors: 1-800-222-8222
Retail investment professionals: 1-888-877-9275
Institutional investment professionals: 1-866-765-0778
This report and the financial statements contained herein are submitted for the general information of the shareholders of the Portfolio. If this report is used for promotional purposes, distribution of the report must be accompanied or preceded by a current prospectus. Before investing, please consider the investment objectives, risks, charges, and expenses of the investment. For a current prospectus and, if available, a summary prospectus, containing this information, call 1-800-222-8222 or visit the Portfolio’s website at wfam.com. Read the prospectus carefully before you invest or send money.
Wells Fargo Asset Management (WFAM) is the trade name for certain investment advisory/management firms owned by Wells Fargo & Company. These firms include but are not limited to Wells Capital Management Incorporated and Wells Fargo Funds Management, LLC. Certain products managed by WFAM entities are distributed by Wells Fargo Funds Distributor, LLC (a broker-dealer and Member FINRA).
This material is for general informational and educational purposes only and is NOT intended to provide investment advice or a recommendation of any kind—including a recommendation for any specific investment, strategy, or plan.
INVESTMENT PRODUCTS: NOT FDIC INSURED ◾ NO BANK GUARANTEE ◾ MAY LOSE VALUE
© 2020 Wells Fargo & Company. All rights reserved.
Semi-Annual Report
August 31, 2020
Wells Fargo
Investment Grade Corporate Bond Portfolio
Contents
INVESTMENT PRODUCTS: NOT FDIC INSURED ◾ NO BANK GUARANTEE ◾ MAY LOSE VALUE
Wells Fargo Investment Grade Corporate Bond Portfolio | 1
Portfolio information (unaudited)
Investment objective
The Portfolio seeks to replicate the total return of the Wells Fargo U.S. Investment Grade Corporate Bond Index, before fees and expenses.
Adviser
Wells Fargo Funds Management, LLC
Subadviser
Wells Capital Management Incorporated
Portfolio managers
Manjunath Boraiah†
Mark Clegg, CFA®‡
Janet S. Rilling, CFA®‡
Michael J. Schueller, CFA®‡
Noah M. Wise, CFA®‡
| | | | |
|
| Ten largest holdings (%) as of August 31, 20201 | |
| | |
Goldman Sachs Group Incorporated, 4.75%, 10-21-2045 | | | 0.90 | |
| | |
CVS Caremark Corporation, 5.05%, 3-25-2048 | | | 0.76 | |
| | |
Home Depot Incorporated, 2.70%, 4-15-2030 | | | 0.65 | |
| | |
Mitsubishi UFJ Financial Group Incorporated, 3.22%, 3-7-2022 | | | 0.60 | |
| | |
Broadcom Incorporated, 3.63%, 10-15-2024 | | | 0.59 | |
| | |
Blackrock Incorporated, 3.25%, 4-30-2029 | | | 0.58 | |
| | |
Walmart Incorporated, 3.95%, 6-28-2038 | | | 0.56 | |
| | |
Credit Suisse Group Funding Limited, 4.55%, 4-17-2026 | | | 0.50 | |
| | |
ING Banking Group plc, 4.55%, 10-2-2028 | | | 0.49 | |
| | |
T Mobile US Incorporated, 4.38%, 4-15-2040 | | | 0.49 | |
|
|
| Portfolio composition as of August 31, 20202 |
|
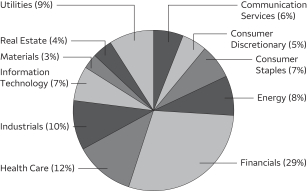
|
| † | Mr. Boraiah became a portfolio manager of the Portfolio on August 28, 2020. |
| ‡ | CFA® and Chartered Financial Analyst® are trademarks owned by CFA Institute. |
| 1 | The ten largest holdings, excluding cash, cash equivalents and any money market funds, are calculated based on the value of the investments divided by the total net assets of the Portfolio. Holdings are subject to change and may have changed since the date specified. |
| 2 | Amounts are calculated based on the total long-term investments of the Portfolio. These amounts are subject to change and may have changed since the date specified. |
2 | Wells Fargo Investment Grade Corporate Bond Portfolio
Portfolio of investments—August 31, 2020 (unaudited)
| | | | | | | | | | | | | | | | |
| | | Interest rate | | | Maturity date | | | Principal | | | Value | |
| Corporate Bonds and Notes: 80.00% | | | | | | | | | | | | | | | | |
| | | | |
Communication Services: 4.27% | | | | | | | | | | | | | | | | |
| | | | |
| Diversified Telecommunication Services: 1.45% | | | | | | | | | | | | |
AT&T Incorporated | | | 4.30 | % | | | 12-15-2042 | | | $ | 350,000 | | | $ | 397,115 | |
AT&T Incorporated | | | 4.50 | | | | 5-15-2035 | | | | 230,000 | | | | 274,942 | |
AT&T Incorporated | | | 4.90 | | | | 6-15-2042 | | | | 36,000 | | | | 43,718 | |
T Mobile US Incorporated 144A | | | 4.38 | | | | 4-15-2040 | | | | 900,000 | | | | 1,082,394 | |
Verizon Communications Incorporated | | | 3.85 | | | | 11-1-2042 | | | | 260,000 | | | | 309,379 | |
Verizon Communications Incorporated | | | 4.13 | | | | 3-16-2027 | | | | 200,000 | | | | 235,958 | |
Verizon Communications Incorporated | | | 4.67 | | | | 3-15-2055 | | | | 655,000 | | | | 889,699 | |
| | | | |
| | | | | | | | | | | | | | | 3,233,205 | |
| | | | | | | | | | | | | | | | |
| | | | |
| Entertainment: 0.32% | | | | | | | | | | | | |
TWDC Enterprises 18 Corporation | | | 2.55 | | | | 2-15-2022 | | | | 175,000 | | | | 180,606 | |
TWDC Enterprises 18 Corporation | | | 4.13 | | | | 12-1-2041 | | | | 175,000 | | | | 207,751 | |
Walt Disney Company | | | 2.20 | | | | 1-13-2028 | | | | 300,000 | | | | 317,955 | |
| | | | |
| | | | | | | | | | | | | | | 706,312 | |
| | | | | | | | | | | | | | | | |
| | | | |
| Interactive Media & Services: 0.04% | | | | | | | | | | | | |
Alphabet Incorporated | | | 3.38 | | | | 2-25-2024 | | | | 87,000 | | | | 95,896 | |
| | | | | | | | | | | | | | | | |
| | | | |
| Media: 2.46% | | | | | | | | | | | | |
CBS Corporation | | | 3.70 | | | | 8-15-2024 | | | | 350,000 | | | | 383,919 | |
CBS Corporation | | | 4.85 | | | | 7-1-2042 | | | | 140,000 | | | | 156,215 | |
CBS Corporation | | | 4.90 | | | | 8-15-2044 | | | | 350,000 | | | | 392,942 | |
Charter Communications Operating LLC | | | 4.46 | | | | 7-23-2022 | | | | 400,000 | | | | 426,236 | |
Charter Communications Operating LLC | | | 4.91 | | | | 7-23-2025 | | | | 400,000 | | | | 465,389 | |
Comcast Corporation | | | 2.35 | | | | 1-15-2027 | | | | 210,000 | | | | 225,478 | |
Comcast Corporation | | | 4.00 | | | | 11-1-2049 | | | | 200,000 | | | | 241,517 | |
Comcast Corporation | | | 4.40 | | | | 8-15-2035 | | | | 210,000 | | | | 267,628 | |
Comcast Corporation | | | 4.75 | | | | 3-1-2044 | | | | 262,000 | | | | 345,483 | |
Discovery Communications LLC | | | 6.35 | | | | 6-1-2040 | | | | 175,000 | | | | 234,543 | |
Discovery Communications LLC | | | 3.95 | | | | 3-20-2028 | | | | 400,000 | | | | 452,477 | |
Omnicom Group Incorporated | | | 3.63 | | | | 5-1-2022 | | | | 175,000 | | | | 183,821 | |
Time Warner Cable Incorporated | | | 5.50 | | | | 9-1-2041 | | | | 210,000 | | | | 256,956 | |
Time Warner Cable Incorporated | | | 6.55 | | | | 5-1-2037 | | | | 300,000 | | | | 400,281 | |
Time Warner Cable Incorporated | | | 8.38 | | | | 3-15-2023 | | | | 175,000 | | | | 208,060 | |
Time Warner Entertainment Company LP | | | 8.38 | | | | 7-15-2033 | | | | 210,000 | | | | 326,301 | |
Viacom Incorporated | | | 5.50 | | | | 5-15-2033 | | | | 140,000 | | | | 166,509 | |
Viacom Incorporated | | | 6.88 | | | | 4-30-2036 | | | | 238,000 | | | | 325,822 | |
| | | | |
| | | | | | | | | | | | | | | 5,459,577 | |
| | | | | | | | | | | | | | | | |
| | | | |
Consumer Discretionary: 4.43% | | | | | | | | | | | | | | | | |
| | | | |
| Automobiles: 0.28% | | | | | | | | | | | | |
General Motors Company | | | 6.25 | | | | 10-2-2043 | | | | 175,000 | | | | 203,390 | |
General Motors Company | | | 6.60 | | | | 4-1-2036 | | | | 350,000 | | | | 419,162 | |
| | | | |
| | | | | | | | | | | | | | | 622,552 | |
| | | | | | | | | | | | | | | | |
| | | | |
| Hotels, Restaurants & Leisure: 0.94% | | | | | | | | | | | | |
GLP Capital LP | | | 5.30 | | | | 1-15-2029 | | | | 400,000 | | | | 442,392 | |
McDonald’s Corporation | | | 2.63 | | | | 1-15-2022 | | | | 250,000 | | | | 257,968 | |
McDonald’s Corporation | | | 3.38 | | | | 5-26-2025 | | | | 245,000 | | | | 273,356 | |
McDonald’s Corporation | | | 4.60 | | | | 5-26-2045 | | | | 175,000 | | | | 218,467 | |
The accompanying notes are an integral part of these financial statements.
Wells Fargo Investment Grade Corporate Bond Portfolio | 3
Portfolio of investments—August 31, 2020 (unaudited)
| | | | | | | | | | | | | | | | |
| | | Interest rate | | | Maturity date | | | Principal | | | Value | |
| | | | |
| Hotels, Restaurants & Leisure (continued) | | | | | | | | | | | | |
McDonald’s Corporation | | | 6.30 | % | | | 10-15-2037 | | | $ | 210,000 | | | $ | 307,727 | |
Starbucks Corporation | | | 4.00 | | | | 11-15-2028 | | | | 500,000 | | | | 588,910 | |
| | | | |
| | | | | | | | | | | | | | | 2,088,820 | |
| | | | | | | | | | | | | | | | |
| | | | |
| Household Durables: 0.11% | | | | | | | | | | | | |
Whirlpool Corporation | | | 4.00 | | | | 3-1-2024 | | | | 87,000 | | | | 94,813 | |
Whirlpool Corporation | | | 4.70 | | | | 6-1-2022 | | | | 140,000 | | | | 149,518 | |
| | | | |
| | | | | | | | | | | | | | | 244,331 | |
| | | | | | | | | | | | | | | | |
| | | | |
| Internet & Direct Marketing Retail: 0.79% | | | | | | | | | | | | |
Amazon.com Incorporated | | | 4.05 | | | | 8-22-2047 | | | | 400,000 | | | | 517,083 | |
Amazon.com Incorporated | | | 4.25 | | | | 8-22-2057 | | | | 400,000 | | | | 544,482 | |
Amazon.com Incorporated | | | 4.95 | | | | 12-5-2044 | | | | 300,000 | | | | 428,150 | |
eBay Incorporated | | | 4.00 | | | | 7-15-2042 | | | | 175,000 | | | | 193,585 | |
Expedia Incorporated | | | 4.50 | | | | 8-15-2024 | | | | 70,000 | | | | 73,540 | |
| | | | |
| | | | | | | | | | | | | | | 1,756,840 | |
| | | | | | | | | | | | | | | | |
| | | | |
| Leisure Products: 0.06% | | | | | | | | | | | | |
Hasbro Incorporated | | | 6.35 | | | | 3-15-2040 | | | | 108,000 | | | | 129,328 | |
| | | | | | | | | | | | | | | | |
| | | | |
| Multiline Retail: 0.46% | | | | | | | | | | | | |
Dollar General Corporation | | | 3.25 | | | | 4-15-2023 | | | | 245,000 | | | | 260,317 | |
Kohl’s Corporation | | | 3.25 | | | | 2-1-2023 | | | | 105,000 | | | | 105,158 | |
Nordstrom Incorporated | | | 4.00 | | | | 10-15-2021 | | | | 175,000 | | | | 174,947 | |
Nordstrom Incorporated | | | 5.00 | | | | 1-15-2044 | | | | 70,000 | | | | 49,262 | |
Target Corporation | | | 2.90 | | | | 1-15-2022 | | | | 175,000 | | | | 181,294 | |
Target Corporation | | | 3.63 | | | | 4-15-2046 | | | | 210,000 | | | | 258,440 | |
| | | | |
| | | | | | | | | | | | | | | 1,029,418 | |
| | | | | | | | | | | | | | | | |
| | | | |
| Specialty Retail: 1.72% | | | | | | | | | | | | |
AutoZone Incorporated | | | 2.88 | | | | 1-15-2023 | | | | 175,000 | | | | 183,634 | |
AutoZone Incorporated | | | 3.13 | | | | 7-15-2023 | | | | 105,000 | | | | 112,165 | |
Home Depot Incorporated | | | 2.70 | | | | 4-15-2030 | | | | 1,300,000 | | | | 1,439,440 | |
Home Depot Incorporated | | | 3.50 | | | | 9-15-2056 | | | | 260,000 | | | | 308,024 | |
Home Depot Incorporated | | | 3.75 | | | | 2-15-2024 | | | | 350,000 | | | | 387,147 | |
Lowe’s Companies Incorporated | | | 2.50 | | | | 4-15-2026 | | | | 350,000 | | | | 380,507 | |
Lowe’s Companies Incorporated | | | 3.12 | | | | 4-15-2022 | | | | 140,000 | | | | 145,363 | |
Lowe’s Companies Incorporated | | | 3.88 | | | | 9-15-2023 | | | | 175,000 | | | | 191,798 | |
Lowe’s Companies Incorporated | | | 4.25 | | | | 9-15-2044 | | | | 175,000 | | | | 207,534 | |
Lowe’s Companies Incorporated | | | 4.38 | | | | 9-15-2045 | | | | 200,000 | | | | 243,903 | |
O’Reilly Automotive Incorporated | | | 3.80 | | | | 9-1-2022 | | | | 105,000 | | | | 110,908 | |
O’Reilly Automotive Incorporated | | | 4.63 | | | | 9-15-2021 | | | | 105,000 | | | | 108,204 | |
| | | | |
| | | | | | | | | | | | | | | 3,818,627 | |
| | | | | | | | | | | | | | | | |
| | | | |
| Textiles, Apparel & Luxury Goods: 0.07% | | | | | | | | | | | | |
Nike Incorporated | | | 2.25 | | | | 5-1-2023 | | | | 70,000 | | | | 73,366 | |
Nike Incorporated | | | 3.63 | | | | 5-1-2043 | | | | 70,000 | | | | 82,834 | |
| | | | |
| | | | | | | | | | | | | | | 156,200 | |
| | | | | | | | | | | | | | | | |
| | | | |
Consumer Staples: 6.74% | | | | | | | | | | | | | | | | |
| | | | |
| Beverages: 2.00% | | | | | | | | | | | | |
Anheuser-Busch InBev Finance Company | | | 4.00 | | | | 1-17-2043 | | | | 210,000 | | | | 228,650 | |
Anheuser-Busch InBev Finance Company | | | 4.63 | | | | 2-1-2044 | | | | 245,000 | | | | 288,247 | |
The accompanying notes are an integral part of these financial statements.
4 | Wells Fargo Investment Grade Corporate Bond Portfolio
Portfolio of investments—August 31, 2020 (unaudited)
| | | | | | | | | | | | | | | | |
| | | Interest rate | | | Maturity date | | | Principal | | | Value | |
| | | | |
| Beverages (continued) | | | | | | | | | | | | |
Anheuser-Busch InBev Worldwide Incorporated | | | 3.75 | % | | | 7-15-2042 | | | $ | 252,000 | | | $ | 268,669 | |
Anheuser-Busch InBev Worldwide Incorporated | | | 4.75 | | | | 4-15-2058 | | | | 400,000 | | | | 494,805 | |
Constellation Brands Incorporated | | | 3.15 | | | | 8-1-2029 | | | | 300,000 | | | | 326,113 | |
Constellation Brands Incorporated | | | 4.25 | | | | 5-1-2023 | | | | 360,000 | | | | 394,097 | |
Keurig Dr Pepper Incorporated | | | 4.60 | | | | 5-25-2028 | | | | 700,000 | | | | 845,468 | |
PepsiCo Incorporated | | | 2.75 | | | | 3-5-2022 | | | | 259,000 | | | | 268,655 | |
PepsiCo Incorporated | | | 3.60 | | | | 8-13-2042 | | | | 285,000 | | | | 348,711 | |
PepsiCo Incorporated | | | 4.00 | | | | 3-5-2042 | | | | 175,000 | | | | 221,140 | |
PepsiCo Incorporated | | | 4.25 | | | | 10-22-2044 | | | | 140,000 | | | | 181,020 | |
The Coca-Cola Company | | | 2.88 | | | | 10-27-2025 | | | | 200,000 | | | | 221,537 | |
The Coca-Cola Company | | | 3.20 | | | | 11-1-2023 | | | | 280,000 | | | | 304,775 | |
The Coca-Cola Company | | | 3.30 | | | | 9-1-2021 | | | | 49,000 | | | | 50,525 | |
| | | | |
| | | | | | | | | | | | | | | 4,442,412 | |
| | | | | | | | | | | | | | | | |
| | | | |
| Food & Staples Retailing: 1.85% | | | | | | | | | | | | |
Sysco Corporation | | | 3.30 | | | | 7-15-2026 | | | | 200,000 | | | | 216,563 | |
Sysco Corporation | | | 5.38 | | | | 9-21-2035 | | | | 200,000 | | | | 244,897 | |
The Kroger Company | | | 3.40 | | | | 4-15-2022 | | | | 175,000 | | | | 181,931 | |
The Kroger Company | | | 3.85 | | | | 8-1-2023 | | | | 175,000 | | | | 190,096 | |
The Kroger Company | | | 5.00 | | | | 4-15-2042 | | | | 175,000 | | | | 221,947 | |
The Kroger Company | | | 5.15 | | | | 8-1-2043 | | | | 105,000 | | | | 134,829 | |
The Kroger Company | | | 6.90 | | | | 4-15-2038 | | | | 210,000 | | | | 305,338 | |
Wal-Mart Stores Incorporated | | | 3.95 | | | | 6-28-2038 | | | | 1,000,000 | | | | 1,245,158 | |
Wal-Mart Stores Incorporated | | | 4.88 | | | | 7-8-2040 | | | | 175,000 | | | | 237,730 | |
Wal-Mart Stores Incorporated | | | 5.63 | | | | 4-1-2040 | | | | 180,000 | | | | 264,098 | |
Wal-Mart Stores Incorporated | | | 5.88 | | | | 4-5-2027 | | | | 70,000 | | | | 91,454 | |
Walgreens Boots Alliance Incorporated | | | 3.45 | | | | 6-1-2026 | | | | 200,000 | | | | 219,815 | |
Walgreens Boots Alliance Incorporated | | | 3.80 | | | | 11-18-2024 | | | | 200,000 | | | | 220,823 | |
Walgreens Boots Alliance Incorporated | | | 4.80 | | | | 11-18-2044 | | | | 300,000 | | | | 328,818 | |
| | | | |
| | | | | | | | | | | | | | | 4,103,497 | |
| | | | | | | | | | | | | | | | |
| | | | |
| Food Products: 0.97% | | | | | | | | | | | | |
Archer-Daniels-Midland Company | | | 4.54 | | | | 3-26-2042 | | | | 175,000 | | | | 233,128 | |
Campbell Soup Company | | | 2.50 | | | | 8-2-2022 | | | | 85,000 | | | | 88,087 | |
Conagra Brands Incorporated | | | 4.60 | | | | 11-1-2025 | | | | 200,000 | | | | 232,418 | |
Conagra Brands Incorporated | | | 8.25 | | | | 9-15-2030 | | | | 84,000 | | | | 126,448 | |
General Mills Incorporated | | | 3.65 | | | | 2-15-2024 | | | | 175,000 | | | | 192,273 | |
J.M. Smucker Company | | | 3.50 | | | | 10-15-2021 | | | | 210,000 | | | | 217,310 | |
Mead Johnson Nutrition Company | | | 5.90 | | | | 11-1-2039 | | | | 70,000 | | | | 100,322 | |
Tyson Foods Incorporated | | | 4.35 | | | | 3-1-2029 | | | | 300,000 | | | | 361,949 | |
Tyson Foods Incorporated | | | 4.50 | | | | 6-15-2022 | | | | 350,000 | | | | 371,887 | |
Tyson Foods Incorporated | | | 4.88 | | | | 8-15-2034 | | | | 175,000 | | | | 229,310 | |
| | | | |
| | | | | | | | | | | | | | | 2,153,132 | |
| | | | | | | | | | | | | | | | |
| | | | |
| Household Products: 0.44% | | | | | | | | | | | | |
Clorox Company | | | 3.05 | | | | 9-15-2022 | | | | 113,000 | | | | 118,505 | |
Clorox Company | | | 3.50 | | | | 12-15-2024 | | | | 140,000 | | | | 154,870 | |
Colgate-Palmolive Company | | | 2.30 | | | | 5-3-2022 | | | | 350,000 | | | | 361,923 | |
Kimberly-Clark Corporation | | | 2.40 | | | | 6-1-2023 | | | | 105,000 | | | | 110,692 | |
Kimberly-Clark Corporation | | | 6.63 | | | | 8-1-2037 | | | | 140,000 | | | | 224,802 | |
| | | | |
| | | | | | | | | | | | | | | 970,792 | |
| | | | | | | | | | | | | | | | |
| | | | |
| Personal Products: 0.09% | | | | | | | | | | | | |
Estee Lauder Companies Incorporated | | | 6.00 | | | | 5-15-2037 | | | | 140,000 | | | | 202,614 | |
| | | | | | | | | | | | | | | | |
The accompanying notes are an integral part of these financial statements.
Wells Fargo Investment Grade Corporate Bond Portfolio | 5
Portfolio of investments—August 31, 2020 (unaudited)
| | | | | | | | | | | | | | | | |
| | | Interest rate | | | Maturity date | | | Principal | | | Value | |
| Tobacco: 1.39% | | | | | | | | | | | | |
Altria Group Incorporated | | | 4.00 | % | | | 1-31-2024 | | | $ | 62,000 | | | $ | 68,551 | |
Altria Group Incorporated | | | 4.25 | | | | 8-9-2042 | | | | 350,000 | | | | 370,032 | |
Altria Group Incorporated | | | 4.50 | | | | 5-2-2043 | | | | 175,000 | | | | 191,198 | |
Philip Morris International Incorporated | | | 2.50 | | | | 8-22-2022 | | | | 175,000 | | | | 182,587 | |
Philip Morris International Incorporated | | | 2.63 | | | | 3-6-2023 | | | | 122,000 | | | | 128,493 | |
Philip Morris International Incorporated | | | 3.25 | | | | 11-10-2024 | | | | 210,000 | | | | 232,772 | |
Philip Morris International Incorporated | | | 4.13 | | | | 3-4-2043 | | | | 210,000 | | | | 247,648 | |
Philip Morris International Incorporated | | | 4.25 | | | | 11-10-2044 | | | | 210,000 | | | | 255,370 | |
Philip Morris International Incorporated | | | 4.50 | | | | 3-20-2042 | | | | 140,000 | | | | 171,306 | |
Reynolds American Incorporated | | | 4.00 | | | | 6-12-2022 | | | | 280,000 | | | | 296,688 | |
Reynolds American Incorporated | | | 4.45 | | | | 6-12-2025 | | | | 350,000 | | | | 398,443 | |
Reynolds American Incorporated | | | 5.70 | | | | 8-15-2035 | | | | 210,000 | | | | 259,701 | |
Reynolds American Incorporated | | | 6.15 | | | | 9-15-2043 | | | | 87,000 | | | | 108,998 | |
Reynolds American Incorporated | | | 7.25 | | | | 6-15-2037 | | | | 140,000 | | | | 187,443 | |
| | | | |
| | | | | | | | | | | | | | | 3,099,230 | |
| | | | | | | | | | | | | | | | |
| | | | |
Energy: 6.58% | | | | | | | | | | | | | | | | |
| | | | |
| Energy Equipment & Services: 0.50% | | | | | | | | | | | | |
Halliburton Company | | | 3.50 | | | | 8-1-2023 | | | | 350,000 | | | | 373,021 | |
Halliburton Company | | | 3.80 | | | | 11-15-2025 | | | | 350,000 | | | | 383,889 | |
Halliburton Company | | | 4.50 | | | | 11-15-2041 | | | | 175,000 | | | | 175,752 | |
Halliburton Company | | | 4.75 | | | | 8-1-2043 | | | | 175,000 | | | | 181,747 | |
| | | | |
| | | | | | | | | | | | | | | 1,114,409 | |
| | | | | | | | | | | | | | | | |
| | | | |
| Oil, Gas & Consumable Fuels: 6.08% | | | | | | | | | | | | |
Boardwalk Pipelines LP | | | 3.38 | | | | 2-1-2023 | | | | 70,000 | | | | 71,625 | |
BP Capital Markets America Incorporated | | | 3.94 | | | | 9-21-2028 | | | | 200,000 | | | | 233,816 | |
Chevron Corporation | | | 2.36 | | | | 12-5-2022 | | | | 525,000 | | | | 546,220 | |
Columbia Pipeline Group Incorporated | | | 5.80 | | | | 6-1-2045 | | | | 140,000 | | | | 178,367 | |
ConocoPhillips Company | | | 4.30 | | | | 11-15-2044 | | | | 210,000 | | | | 266,069 | |
ConocoPhillips Company | | | 5.90 | | | | 10-15-2032 | | | | 175,000 | | | | 242,289 | |
ConocoPhillips Company | | | 6.95 | | | | 4-15-2029 | | | | 210,000 | | | | 293,326 | |
Devon Energy Corporation | | | 7.95 | | | | 4-15-2032 | | | | 150,000 | | | | 194,585 | |
Enbridge Energy Partners LP | | | 5.50 | | | | 9-15-2040 | | | | 140,000 | | | | 170,353 | |
Energy Transfer Partners LP | | | 4.75 | | | | 1-15-2026 | | | | 280,000 | | | | 305,410 | |
Energy Transfer Partners LP | | | 4.90 | | | | 2-1-2024 | | | | 210,000 | | | | 226,221 | |
Energy Transfer Partners LP | | | 5.95 | | | | 10-1-2043 | | | | 140,000 | | | | 137,213 | |
Energy Transfer Partners LP | | | 7.50 | | | | 7-1-2038 | | | | 70,000 | | | | 82,138 | |
Enterprise Products Operating LLC | | | 4.45 | | | | 2-15-2043 | | | | 355,000 | | | | 389,235 | |
Enterprise Products Operating LLC | | | 4.85 | | | | 3-15-2044 | | | | 280,000 | | | | 322,474 | |
Enterprise Products Operating LLC | | | 5.70 | | | | 2-15-2042 | | | | 140,000 | | | | 176,506 | |
Enterprise Products Operating LLC | | | 5.95 | | | | 2-1-2041 | | | | 70,000 | | | | 89,089 | |
Enterprise Products Operating LLC | | | 7.55 | | | | 4-15-2038 | | | | 70,000 | | | | 97,238 | |
Exxon Mobil Corporation | | | 2.71 | | | | 3-6-2025 | | | | 350,000 | | | | 379,345 | |
Exxon Mobil Corporation | | | 3.04 | | | | 3-1-2026 | | | | 500,000 | | | | 556,783 | |
Hess Corporation | | | 7.30 | | | | 8-15-2031 | | | | 269,000 | | | | 331,163 | |
Kinder Morgan Energy Partners LP | | | 3.45 | | | | 2-15-2023 | | | | 175,000 | | | | 183,924 | |
Kinder Morgan Energy Partners LP | | | 5.00 | | | | 8-15-2042 | | | | 175,000 | | | | 194,933 | |
Kinder Morgan Energy Partners LP | | | 5.00 | | | | 3-1-2043 | | | | 157,000 | | | | 177,232 | |
Kinder Morgan Energy Partners LP | | | 5.50 | | | | 3-1-2044 | | | | 210,000 | | | | 252,923 | |
Kinder Morgan Energy Partners LP | | | 5.80 | | | | 3-15-2035 | | | | 70,000 | | | | 86,565 | |
Magellan Midstream Partners LP | | | 5.15 | | | | 10-15-2043 | | | | 140,000 | | | | 164,072 | |
Marathon Oil Corporation | | | 3.85 | | | | 6-1-2025 | | | | 245,000 | | | | 254,228 | |
Marathon Oil Corporation | | | 5.20 | | | | 6-1-2045 | | | | 140,000 | | | | 139,128 | |
The accompanying notes are an integral part of these financial statements.
6 | Wells Fargo Investment Grade Corporate Bond Portfolio
Portfolio of investments—August 31, 2020 (unaudited)
| | | | | | | | | | | | | | | | |
| | | Interest rate | | | Maturity date | | | Principal | | | Value | |
| | | | |
| Oil, Gas & Consumable Fuels (continued) | | | | | | | | | | | | |
Marathon Petroleum Corporation | | | 3.63 | % | | | 9-15-2024 | | | $ | 350,000 | | | $ | 377,333 | |
Marathon Petroleum Corporation | | | 3.80 | | | | 4-1-2028 | | | | 385,000 | | | | 422,438 | |
MPLX LP | | | 4.13 | | | | 3-1-2027 | | | | 200,000 | | | | 221,221 | |
MPLX LP | | | 4.88 | | | | 6-1-2025 | | | | 200,000 | | | | 228,451 | |
MPLX LP | | | 5.20 | | | | 3-1-2047 | | | | 220,000 | | | | 248,900 | |
Noble Energy Incorporated | | | 3.90 | | | | 11-15-2024 | | | | 210,000 | | | | 232,937 | |
ONEOK Incorporated | | | 4.00 | | | | 7-13-2027 | | | | 200,000 | | | | 208,766 | |
ONEOK Incorporated | | | 4.55 | | | | 7-15-2028 | | | | 500,000 | | | | 531,595 | |
ONEOK Partners LP | | | 3.38 | | | | 10-1-2022 | | | | 350,000 | | | | 364,563 | |
Ovintiv Incorporated | | | 6.50 | | | | 8-15-2034 | | | | 200,000 | | | | 194,440 | |
Phillips 66 | | | 4.65 | | | | 11-15-2034 | | | | 140,000 | | | | 170,442 | |
Plains All American Pipeline LP | | | 3.60 | | | | 11-1-2024 | | | | 210,000 | | | | 219,781 | |
Plains All American Pipeline LP | | | 3.85 | | | | 10-15-2023 | | | | 350,000 | | | | 370,449 | |
Plains All American Pipeline LP | | | 4.90 | | | | 2-15-2045 | | | | 175,000 | | | | 167,151 | |
Plains All American Pipeline LP | | | 6.65 | | | | 1-15-2037 | | | | 140,000 | | | | 158,019 | |
Sabine Pass Liquefaction LLC | | | 5.00 | | | | 3-15-2027 | | | | 400,000 | | | | 454,580 | |
Sabine Pass Liquefaction LLC | | | 5.63 | | | | 3-1-2025 | | | | 200,000 | | | | 232,752 | |
Sabine Pass Liquefaction LLC | | | 5.88 | | | | 6-30-2026 | | | | 200,000 | | | | 240,456 | |
Spectra Energy Partners LP | | | 3.38 | | | | 10-15-2026 | | | | 300,000 | | | | 330,527 | |
Spectra Energy Partners LP | | | 4.75 | | | | 3-15-2024 | | | | 245,000 | | | | 275,125 | |
Sunoco Logistics Partner LP | | | 3.45 | | | | 1-15-2023 | | | | 140,000 | | | | 144,586 | |
Sunoco Logistics Partner LP | | | 4.95 | | | | 1-15-2043 | | | | 105,000 | | | | 95,152 | |
Sunoco Logistics Partner LP | | | 5.35 | | | | 5-15-2045 | | | | 140,000 | | | | 133,815 | |
Tennessee Gas Pipeline Company | | | 7.00 | | | | 10-15-2028 | | | | 175,000 | | | | 226,034 | |
Williams Partners LP | | | 3.35 | | | | 8-15-2022 | | | | 175,000 | | | | 182,501 | |
Williams Partners LP | | | 6.30 | | | | 4-15-2040 | | | | 273,000 | | | | 343,198 | |
| | | | |
| | | | | | | | | | | | | | | 13,517,682 | |
| | | | | | | | | | | | | | | | |
| | | | |
Financials: 17.43% | | | | | | | | | | | | | | | | |
| | | | |
| Banks: 5.51% | | | | | | | | | | | | |
ABB Finance (USA) Incorporated | | | 4.38 | | | | 5-8-2042 | | | | 26,000 | | | | 33,199 | |
Bank of America Corporation | | | 3.25 | | | | 10-21-2027 | | | | 525,000 | | | | 584,384 | |
Bank of America Corporation (3 Month LIBOR +1.19%) ± | | | 3.95 | | | | 1-23-2049 | | | | 200,000 | | | | 244,212 | |
Bank of America Corporation | | | 4.18 | | | | 11-25-2027 | | | | 560,000 | | | | 645,604 | |
Bank of America Corporation | | | 4.25 | | | | 10-22-2026 | | | | 280,000 | | | | 323,926 | |
Bank One Corporation | | | 7.63 | | | | 10-15-2026 | | | | 168,000 | | | | 225,323 | |
BBVA USA | | | 3.88 | | | | 4-10-2025 | | | | 250,000 | | | | 268,731 | |
Citigroup Incorporated | | | 2.75 | | | | 4-25-2022 | | | | 200,000 | | | | 207,211 | |
Citigroup Incorporated | | | 4.60 | | | | 3-9-2026 | | | | 200,000 | | | | 232,244 | |
Citigroup Incorporated | | | 4.65 | | | | 7-30-2045 | | | | 300,000 | | | | 386,326 | |
Citigroup Incorporated | | | 4.75 | | | | 5-18-2046 | | | | 300,000 | | | | 383,245 | |
Citizens Financial Group Incorporated | | | 4.30 | | | | 12-3-2025 | | | | 200,000 | | | | 230,083 | |
Discover Bank | | | 4.20 | | | | 8-8-2023 | | | | 310,000 | | | | 341,217 | |
Discover Bank | | | 4.25 | | | | 3-13-2026 | | | | 250,000 | | | | 283,718 | |
Discover Bank | | | 4.65 | | | | 9-13-2028 | | | | 250,000 | | | | 292,722 | |
Fifth Third Bank | | | 2.88 | | | | 10-1-2021 | | | | 300,000 | | | | 307,270 | |
Fifth Third Bank | | | 3.95 | | | | 3-14-2028 | | | | 400,000 | | | | 470,646 | |
Huntington Bancshares Incorporated | | | 2.30 | | | | 1-14-2022 | | | | 300,000 | | | | 307,516 | |
JPMorgan Chase & Company | | | 2.95 | | | | 10-1-2026 | | | | 325,000 | | | | 359,990 | |
JPMorgan Chase & Company | | | 3.20 | | | | 1-25-2023 | | | | 200,000 | | | | 213,183 | |
JPMorgan Chase & Company | | | 4.13 | | | | 12-15-2026 | | | | 500,000 | | | | 584,013 | |
JPMorgan Chase & Company (3 Month LIBOR +1.58%) ± | | | 4.26 | | | | 2-22-2048 | | | | 240,000 | | | | 303,771 | |
Key Bank NA | | | 3.18 | | | | 10-15-2027 | | | | 250,000 | | | | 260,984 | |
Key Bank NA | | | 3.30 | | | | 6-1-2025 | | | | 250,000 | | | | 280,309 | |
KeyCorp Incorporated | | | 4.10 | | | | 4-30-2028 | | | | 400,000 | | | | 469,353 | |
The accompanying notes are an integral part of these financial statements.
Wells Fargo Investment Grade Corporate Bond Portfolio | 7
Portfolio of investments—August 31, 2020 (unaudited)
| | | | | | | | | | | | | | | | |
| | | Interest rate | | | Maturity date | | | Principal | | | Value | |
| | | | |
| Banks (continued) | | | | | | | | | | | | |
MUFG Americas Holdings Corporation | | | 3.50 | % | | | 6-18-2022 | | | $ | 140,000 | | | $ | 147,364 | |
People’s United Financial Incorporated | | | 3.65 | | | | 12-6-2022 | | | | 105,000 | | | | 111,548 | |
PNC Bank NA | | | 2.95 | | | | 1-30-2023 | | | | 300,000 | | | | 316,395 | |
PNC Bank NA | | | 3.30 | | | | 10-30-2024 | | | | 500,000 | | | | 553,571 | |
PNC Bank NA | | | 4.20 | | | | 11-1-2025 | | | | 250,000 | | | | 291,507 | |
Santander Holdings USA Incorporated | | | 4.50 | | | | 7-17-2025 | | | | 350,000 | | | | 387,059 | |
Truist Bank | | | 3.30 | | | | 5-15-2026 | | | | 200,000 | | | | 225,525 | |
Truist Bank | | | 2.85 | | | | 10-26-2024 | | | | 500,000 | | | | 546,231 | |
Truist Bank | | | 3.80 | | | | 10-30-2026 | | | | 400,000 | | | | 465,821 | |
US Bancorp | | | 2.38 | | | | 7-22-2026 | | | | 190,000 | | | | 208,076 | |
US Bancorp | | | 3.00 | | | | 3-15-2022 | | | | 350,000 | | | | 363,935 | |
US Bancorp | | | 3.60 | | | | 9-11-2024 | | | | 350,000 | | | | 389,483 | |
| | | | |
| | | | | | | | | | | | | | | 12,245,695 | |
| | | | | | | | | | | | | | | | |
| | | | |
| Capital Markets: 4.21% | | | | | | | | | | | | |
Bank of New York Mellon Corporation | | | 2.95 | | | | 1-29-2023 | | | | 300,000 | | | | 317,897 | |
Bank of New York Mellon Corporation | | | 3.40 | | | | 1-29-2028 | | | | 300,000 | | | | 348,502 | |
Bank of New York Mellon Corporation | | | 3.55 | | | | 9-23-2021 | | | | 420,000 | | | | 433,354 | |
Blackrock Incorporated | | | 3.25 | | | | 4-30-2029 | | | | 1,100,000 | | | | 1,287,484 | |
CME Group Incorporated | | | 4.15 | | | | 6-15-2048 | | | | 200,000 | | | | 261,724 | |
Goldman Sachs Group Incorporated | | | 3.75 | | | | 5-22-2025 | | | | 350,000 | | | | 391,971 | |
Goldman Sachs Group Incorporated | | | 4.75 | | | | 10-21-2045 | | | | 1,500,000 | | | | 1,992,330 | |
Goldman Sachs Group Incorporated | | | 6.13 | | | | 2-15-2033 | | | | 200,000 | | | | 282,884 | |
Jefferies Group Incorporated | | | 5.13 | | | | 1-20-2023 | | | | 175,000 | | | | 191,349 | |
Jefferies Group Incorporated | | | 6.45 | | | | 6-8-2027 | | | | 105,000 | | | | 126,236 | |
Legg Mason Incorporated | | | 4.75 | | | | 3-15-2026 | | | | 190,000 | | | | 225,879 | |
Moody’s Corporation | | | 4.50 | | | | 9-1-2022 | | | | 175,000 | | | | 187,646 | |
Moody’s Corporation | | | 5.25 | | | | 7-15-2044 | | | | 210,000 | | | | 288,514 | |
Morgan Stanley | | | 4.30 | | | | 1-27-2045 | | | | 350,000 | | | | 456,496 | |
Morgan Stanley | | | 5.00 | | | | 11-24-2025 | | | | 200,000 | | | | 235,176 | |
Morgan Stanley | | | 6.25 | | | | 8-9-2026 | | | | 300,000 | | | | 386,256 | |
Morgan Stanley | | | 7.25 | | | | 4-1-2032 | | | | 329,000 | | | | 502,228 | |
Northern Trust Corporation | | | 3.95 | | | | 10-30-2025 | | | | 175,000 | | | | 202,907 | |
PPL Capital Funding Incorporated | | | 3.10 | | | | 5-15-2026 | | | | 100,000 | | | | 111,207 | |
PPL Capital Funding Incorporated | | | 4.20 | | | | 6-15-2022 | | | | 140,000 | | | | 147,950 | |
PPL Capital Funding Incorporated | | | 4.70 | | | | 6-1-2043 | | | | 87,000 | | | | 107,218 | |
S&P Global Incorporated | | | 4.00 | | | | 6-15-2025 | | | | 227,000 | | | | 259,908 | |
State Street Corporation | | | 2.65 | | | | 5-19-2026 | | | | 400,000 | | | | 442,847 | |
TD Ameritrade Holding Corporation | | | 3.63 | | | | 4-1-2025 | | | | 140,000 | | | | 157,427 | |
| | | | |
| | | | | | | | | | | | | | | 9,345,390 | |
| | | | | | | | | | | | | | | | |
| | | | |
| Consumer Finance: 2.48% | | | | | | | | | | | | |
American Express Company | | | 2.50 | | | | 8-1-2022 | | | | 400,000 | | | | 415,204 | |
American Express Company | | | 2.65 | | | | 12-2-2022 | | | | 402,000 | | | | 421,956 | |
American Express Company | | | 4.20 | | | | 11-6-2025 | | | | 200,000 | | | | 233,810 | |
American Honda Finance Corporation | | | 2.90 | | | | 2-16-2024 | | | | 200,000 | | | | 214,506 | |
American Honda Finance Corporation | | | 3.45 | | | | 7-14-2023 | | | | 200,000 | | | | 215,944 | |
Capital One Financial Corporation | | | 3.75 | | | | 7-28-2026 | | | | 525,000 | | | | 575,721 | |
Caterpillar Financial Services Corporation | | | 2.63 | | | | 3-1-2023 | | | | 260,000 | | | | 274,361 | |
Caterpillar Financial Services Corporation | | | 3.25 | | | | 12-1-2024 | | | | 200,000 | | | | 221,280 | |
Caterpillar Financial Services Corporation | | | 3.75 | | | | 11-24-2023 | | | | 175,000 | | | | 193,489 | |
Discover Financial Services | | | 3.95 | | | | 11-6-2024 | | | | 200,000 | | | | 220,166 | |
General Motors Financial Company Incorporated | | | 3.70 | | | | 5-9-2023 | | | | 380,000 | | | | 398,171 | |
Synchrony Financial | | | 3.70 | | | | 8-4-2026 | | | | 200,000 | | | | 208,529 | |
Synchrony Financial | | | 5.15 | | | | 3-19-2029 | | | | 900,000 | | | | 1,028,801 | |
The accompanying notes are an integral part of these financial statements.
8 | Wells Fargo Investment Grade Corporate Bond Portfolio
Portfolio of investments—August 31, 2020 (unaudited)
| | | | | | | | | | | | | | | | |
| | | Interest rate | | | Maturity date | | | Principal | | | Value | |
| | | | |
| Consumer Finance (continued) | | | | | | | | | | | | |
Toyota Motor Credit Corporation | | | 2.60 | % | | | 1-11-2022 | | | $ | 300,000 | | | $ | 309,298 | |
Toyota Motor Credit Corporation | | | 2.63 | | | | 1-10-2023 | | | | 310,000 | | | | 325,449 | |
Toyota Motor Credit Corporation | | | 3.40 | | | | 9-15-2021 | | | | 245,000 | | | | 252,771 | |
| | | | |
| | | | | | | | | | | | | | | 5,509,456 | |
| | | | | | | | | | | | | | | | |
| | | | |
| Diversified Financial Services: 0.08% | | | | | | | | | | | | |
National Rural Utilities Cooperative Finance Corporation | | | 4.02 | | | | 11-1-2032 | | | | 140,000 | | | | 171,590 | |
| | | | | | | | | | | | | | | | |
| | | | |
| Insurance: 4.46% | | | | | | | | | | | | |
Allstate Corporation (3 Month LIBOR +2.12%) ± | | | 6.50 | | | | 5-15-2067 | | | | 140,000 | | | | 180,750 | |
American International Group Incorporated | | | 4.50 | | | | 7-16-2044 | | | | 300,000 | | | | 351,908 | |
American International Group Incorporated | | | 4.88 | | | | 6-1-2022 | | | | 600,000 | | | | 645,495 | |
American International Group Incorporated (3 Month LIBOR +2.87%) ± | | | 5.75 | | | | 4-1-2048 | | | | 200,000 | | | | 220,702 | |
Aon Corporation | | | 6.25 | | | | 9-30-2040 | | | | 70,000 | | | | 103,038 | |
Arch Capital Group Limited | | | 5.14 | | | | 11-1-2043 | | | | 147,000 | | | | 189,301 | |
Berkshire Hathaway Finance Corporation | | | 4.40 | | | | 5-15-2042 | | | | 180,000 | | | | 233,360 | |
Berkshire Hathaway Finance Corporation | | | 5.75 | | | | 1-15-2040 | | | | 175,000 | | | | 266,870 | |
Berkshire Hathaway Incorporated | | | 3.00 | | | | 2-11-2023 | | | | 75,000 | | | | 79,982 | |
Berkshire Hathaway Incorporated | | | 3.13 | | | | 3-15-2026 | | | | 525,000 | | | | 588,063 | |
Berkshire Hathaway Incorporated | | | 3.40 | | | | 1-31-2022 | | | | 175,000 | | | | 182,761 | |
Berkshire Hathaway Incorporated | | | 4.50 | | | | 2-11-2043 | | | | 275,000 | | | | 370,628 | |
Chubb Corporation | | | 6.00 | | | | 5-11-2037 | | | | 196,000 | | | | 289,905 | |
Chubb INA Holdings Incorporated | | | 2.70 | | | | 3-13-2023 | | | | 280,000 | | | | 294,476 | |
Chubb INA Holdings Incorporated | | | 3.15 | | | | 3-15-2025 | | | | 200,000 | | | | 222,831 | |
Chubb INA Holdings Incorporated | | | 3.35 | | | | 5-15-2024 | | | | 350,000 | | | | 385,007 | |
Hartford Financial Services Group Incorporated | | | 4.30 | | | | 4-15-2043 | | | | 30,000 | | | | 35,079 | |
Lincoln National Corporation | | | 4.00 | | | | 9-1-2023 | | | | 175,000 | | | | 191,306 | |
Loews Corporation | | | 2.63 | | | | 5-15-2023 | | | | 105,000 | | | | 110,651 | |
Loews Corporation | | | 4.13 | | | | 5-15-2043 | | | | 140,000 | | | | 158,130 | |
MetLife Incorporated | | | 3.05 | | | | 12-15-2022 | | | | 190,000 | | | | 201,375 | |
MetLife Incorporated | | | 4.13 | | | | 8-13-2042 | | | | 210,000 | | | | 256,409 | |
MetLife Incorporated | | | 4.37 | | | | 9-15-2023 | | | | 400,000 | | | | 446,431 | |
MetLife Incorporated | | | 4.72 | | | | 12-15-2044 | | | | 175,000 | | | | 228,326 | |
MetLife Incorporated | | | 6.38 | | | | 6-15-2034 | | | | 196,000 | | | | 300,599 | |
MetLife Incorporated | | | 6.40 | | | | 12-15-2066 | | | | 200,000 | | | | 249,921 | |
MetLife Incorporated | | | 6.50 | | | | 12-15-2032 | | | | 140,000 | | | | 211,425 | |
Principal Financial Group Incorporated | | | 3.30 | | | | 9-15-2022 | | | | 175,000 | | | | 184,179 | |
Principal Financial Group Incorporated | | | 3.40 | | | | 5-15-2025 | | | | 140,000 | | | | 155,626 | |
Progressive Corporation | | | 6.25 | | | | 12-1-2032 | | | | 252,000 | | | | 373,589 | |
Prudential Financial Incorporated | | | 3.91 | | | | 12-7-2047 | | | | 155,000 | | | | 175,428 | |
Prudential Financial Incorporated | | | 3.94 | | | | 12-7-2049 | | | | 200,000 | | | | 227,296 | |
Prudential Financial Incorporated | | | 4.50 | | | | 11-16-2021 | | | | 175,000 | | | | 183,529 | |
Prudential Financial Incorporated | | | 4.60 | | | | 5-15-2044 | | | | 350,000 | | | | 431,718 | |
Prudential Financial Incorporated (3 Month LIBOR +3.04%) ± | | | 5.20 | | | | 3-15-2044 | | | | 175,000 | | | | 185,184 | |
Prudential Financial Incorporated | | | 5.75 | | | | 7-15-2033 | | | | 350,000 | | | | 483,243 | |
Prudential Financial Incorporated | | | 6.63 | | | | 12-1-2037 | | | | 45,000 | | | | 67,724 | |
Transatlantic Holdings Incorporated | | | 8.00 | | | | 11-30-2039 | | | | 70,000 | | | | 108,874 | |
Travelers Companies Incorporated | | | 5.35 | | | | 11-1-2040 | | | | 245,000 | | | | 342,305 | |
| | | | |
| | | | | | | | | | | | | | | 9,913,424 | |
| | | | | | | | | | | | | | | | |
| | | | |
| Mortgage REITs: 0.69% | | | | | | | | | | | | |
CC Holdings GS V LLC | | | 3.85 | | | | 4-15-2023 | | | | 350,000 | | | | 377,755 | |
ERP Operating LP | | | 4.00 | | | | 8-1-2047 | | | | 400,000 | | | | 488,535 | |
Ventas Realty LP | | | 4.40 | | | | 1-15-2029 | | | | 600,000 | | | | 672,153 | |
| | | | |
| | | | | | | | | | | | | | | 1,538,443 | |
| | | | | | | | | | | | | | | | |
The accompanying notes are an integral part of these financial statements.
Wells Fargo Investment Grade Corporate Bond Portfolio | 9
Portfolio of investments—August 31, 2020 (unaudited)
| | | | | | | | | | | | | | | | |
| | | Interest rate | | | Maturity date | | | Principal | | | Value | |
Health Care: 11.13% | | | | | | | | | | | | | | | | |
| | | | |
| Biotechnology: 2.18% | | | | | | | | | | | | |
AbbVie Incorporated | | | 3.20 | % | | | 5-14-2026 | | | $ | 420,000 | | | $ | 467,251 | |
AbbVie Incorporated 144A | | | 3.85 | | | | 6-15-2024 | | | | 350,000 | | | | 386,121 | |
AbbVie Incorporated | | | 4.45 | | | | 5-14-2046 | | | | 200,000 | | | | 241,085 | |
AbbVie Incorporated 144A | | | 4.85 | | | | 6-15-2044 | | | | 350,000 | | | | 438,254 | |
Amgen Incorporated 144A | | | 2.77 | | | | 9-1-2053 | | | | 319,000 | | | | 311,973 | |
Amgen Incorporated | | | 3.63 | | | | 5-15-2022 | | | | 200,000 | | | | 209,600 | |
Amgen Incorporated | | | 3.63 | | | | 5-22-2024 | | | | 350,000 | | | | 386,031 | |
Amgen Incorporated | | | 3.88 | | | | 11-15-2021 | | | | 165,714 | | | | 171,143 | |
Baxalta Incorporated | | | 5.25 | | | | 6-23-2045 | | | | 280,000 | | | | 385,751 | |
Biogen Incorporated | | | 2.25 | | | | 5-1-2030 | | | | 700,000 | | | | 717,447 | |
Gilead Sciences Incorporated | | | 3.65 | | | | 3-1-2026 | | | | 350,000 | | | | 399,785 | |
Gilead Sciences Incorporated | | | 4.50 | | | | 2-1-2045 | | | | 200,000 | | | | 259,653 | |
Gilead Sciences Incorporated | | | 4.75 | | | | 3-1-2046 | | | | 350,000 | | | | 468,541 | |
| | | | |
| | | | | | | | | | | | | | | 4,842,635 | |
| | | | | | | | | | | | | | | | |
| | | | |
| Health Care Equipment & Supplies: 1.09% | | | | | | | | | | | | |
Abbott Laboratories | | | 6.00 | | | | 4-1-2039 | | | | 105,000 | | | | 161,345 | |
Abbott Laboratories | | | 6.15 | | | | 11-30-2037 | | | | 166,000 | | | | 256,038 | |
Becton Dickinson & Company | | | 2.89 | | | | 6-6-2022 | | | | 500,000 | | | | 519,077 | |
Becton Dickinson & Company | | | 3.13 | | | | 11-8-2021 | | | | 210,000 | | | | 216,184 | |
Boston Scientific Corporation | | | 3.85 | | | | 5-15-2025 | | | | 200,000 | | | | 227,148 | |
Medtronic Incorporated | | | 3.15 | | | | 3-15-2022 | | | | 350,000 | | | | 365,212 | |
Medtronic Incorporated | | | 3.50 | | | | 3-15-2025 | | | | 200,000 | | | | 225,051 | |
Stryker Corporation | | | 4.63 | | | | 3-15-2046 | | | | 350,000 | | | | 458,595 | |
| | | | |
| | | | | | | | | | | | | | | 2,428,650 | |
| | | | | | | | | | | | | | | | |
| | | | |
| Health Care Providers & Services: 4.21% | | | | | | | | | | | | |
Aetna Incorporated | | | 4.13 | | | | 11-15-2042 | | | | 175,000 | | | | 198,482 | |
Aetna Incorporated | | | 4.50 | | | | 5-15-2042 | | | | 200,000 | | | | 238,165 | |
AmerisourceBergen Corporation | | | 4.25 | | | | 3-1-2045 | | | | 175,000 | | | | 201,223 | |
Anthem Incorporated | | | 3.13 | | | | 5-15-2022 | | | | 350,000 | | | | 365,833 | |
Anthem Incorporated | | | 3.30 | | | | 1-15-2023 | | | | 200,000 | | | | 212,991 | |
Anthem Incorporated | | | 4.38 | | | | 12-1-2047 | | | | 200,000 | | | | 250,252 | |
Anthem Incorporated | | | 4.65 | | | | 1-15-2043 | | | | 315,000 | | | | 399,556 | |
Anthem Incorporated | | | 4.65 | | | | 8-15-2044 | | | | 50,000 | | | | 63,669 | |
Anthem Incorporated | | | 5.85 | | | | 1-15-2036 | | | | 200,000 | | | | 270,292 | |
Cardinal Health Incorporated | | | 2.62 | | | | 6-15-2022 | | | | 400,000 | | | | 413,517 | |
Cigna Corporation 144A | | | 3.00 | | | | 7-15-2023 | | | | 300,000 | | | | 320,210 | |
Cigna Corporation 144A | | | 4.80 | | | | 7-15-2046 | | | | 210,000 | | | | 268,878 | |
Cigna Corporation 144A | | | 6.13 | | | | 11-15-2041 | | | | 175,000 | | | | 253,099 | |
CommonSpirit Health | | | 4.35 | | | | 11-1-2042 | | | | 175,000 | | | | 192,268 | |
CVS Caremark Corporation | | | 2.75 | | | | 12-1-2022 | | | | 350,000 | | | | 366,324 | |
CVS Caremark Corporation | | | 5.05 | | | | 3-25-2048 | | | | 1,300,000 | | | | 1,687,517 | |
CVS Caremark Corporation | | | 5.30 | | | | 12-5-2043 | | | | 210,000 | | | | 274,337 | |
HCA Incorporated | | | 5.50 | | | | 6-15-2047 | | | | 500,000 | | | | 631,976 | |
Humana Incorporated | | | 3.15 | | | | 12-1-2022 | | | | 210,000 | | | | 220,896 | |
Kaiser Foundation Hospitals | | | 4.88 | | | | 4-1-2042 | | | | 175,000 | | | | 241,147 | |
Laboratory Corporation of America Holdings | | | 3.75 | | | | 8-23-2022 | | | | 39,000 | | | | 41,172 | |
Laboratory Corporation of America Holdings | | | 4.00 | | | | 11-1-2023 | | | | 105,000 | | | | 115,048 | |
McKesson Corporation | | | 2.85 | | | | 3-15-2023 | | | | 140,000 | | | | 147,024 | |
The Upjohn Company 144A | | | 3.85 | | | | 6-22-2040 | | | | 300,000 | | | | 325,071 | |
Unitedhealth Group Incorporated | | | 4.20 | | | | 1-15-2047 | | | | 200,000 | | | | 252,474 | |
UnitedHealth Group Incorporated | | | 4.25 | | | | 3-15-2043 | | | | 175,000 | | | | 222,378 | |
The accompanying notes are an integral part of these financial statements.
10 | Wells Fargo Investment Grade Corporate Bond Portfolio
Portfolio of investments—August 31, 2020 (unaudited)
| | | | | | | | | | | | | | | | |
| | | Interest rate | | | Maturity date | | | Principal | | | Value | |
| | | | |
| Health Care Providers & Services (continued) | | | | | | | | | | | | |
UnitedHealth Group Incorporated | | | 4.25 | % | | | 4-15-2047 | | | $ | 300,000 | | | $ | 385,250 | |
UnitedHealth Group Incorporated | | | 4.25 | | | | 6-15-2048 | | | | 300,000 | | | | 384,776 | |
UnitedHealth Group Incorporated | | | 5.80 | | | | 3-15-2036 | | | | 175,000 | | | | 252,316 | |
UnitedHealth Group Incorporated | | | 6.63 | | | | 11-15-2037 | | | | 105,000 | | | | 164,495 | |
| | | | |
| | | | | | | | | | | | | | | 9,360,636 | |
| | | | | | | | | | | | | | | | |
| | | | |
| Life Sciences Tools & Services: 0.38% | | | | | | | | | | | | |
Agilent Technologies Incorporated | | | 3.88 | | | | 7-15-2023 | | | | 105,000 | | | | 114,005 | |
Thermo Fisher Scientific Incorporated | | | 3.00 | | | | 4-15-2023 | | | | 200,000 | | | | 212,360 | |
Thermo Fisher Scientific Incorporated | | | 4.15 | | | | 2-1-2024 | | | | 280,000 | | | | 310,886 | |
Thermo Fisher Scientific Incorporated | | | 5.30 | | | | 2-1-2044 | | | | 140,000 | | | | 196,308 | |
| | | | |
| | | | | | | | | | | | | | | 833,559 | |
| | | | | | | | | | | | | | | | |
| | | | |
| Pharmaceuticals: 3.27% | | | | | | | | | | | | |
Bristol-Myers Squibb Company 144A | | | 3.25 | | | | 8-15-2022 | | | | 350,000 | | | | 369,653 | |
Bristol-Myers Squibb Company | | | 3.25 | | | | 11-1-2023 | | | | 109,000 | | | | 118,960 | |
Bristol-Myers Squibb Company | | | 3.25 | | | | 8-1-2042 | | | | 175,000 | | | | 204,284 | |
Bristol-Myers Squibb Company 144A | | | 3.88 | | | | 8-15-2025 | | | | 175,000 | | | | 201,456 | |
Bristol-Myers Squibb Company | | | 4.50 | | | | 3-1-2044 | | | | 200,000 | | | | 271,783 | |
Bristol-Myers Squibb Company | | | 4.63 | | | | 5-15-2044 | | | | 240,000 | | | | 326,356 | |
Eli Lilly & Company | | | 2.75 | | | | 6-1-2025 | | | | 70,000 | | | | 76,986 | |
Eli Lilly & Company | | | 3.95 | | | | 3-15-2049 | | | | 600,000 | | | | 768,702 | |
GlaxoSmithKline Capital Incorporated | | | 2.80 | | | | 3-18-2023 | | | | 140,000 | | | | 148,394 | |
GlaxoSmithKline Capital Incorporated | | | 5.38 | | | | 4-15-2034 | | | | 210,000 | | | | 295,812 | |
Johnson & Johnson | | | 3.38 | | | | 12-5-2023 | | | | 300,000 | | | | 331,366 | |
Johnson & Johnson | | | 3.70 | | | | 3-1-2046 | | | | 175,000 | | | | 216,548 | |
Johnson & Johnson | | | 4.38 | | | | 12-5-2033 | | | | 200,000 | | | | 263,811 | |
Johnson & Johnson | | | 4.85 | | | | 5-15-2041 | | | | 140,000 | | | | 198,093 | |
Johnson & Johnson | | | 4.95 | | | | 5-15-2033 | | | | 126,000 | | | | 174,552 | |
Merck & Company Incorporated | | | 2.35 | | | | 2-10-2022 | | | | 250,000 | | | | 257,635 | |
Merck & Company Incorporated | | | 2.75 | | | | 2-10-2025 | | | | 270,000 | | | | 294,165 | |
Merck & Company Incorporated | | | 3.70 | | | | 2-10-2045 | | | | 200,000 | | | | 242,903 | |
Mylan Incorporated | | | 4.20 | | | | 11-29-2023 | | | | 200,000 | | | | 219,881 | |
Novartis Capital Corporation | | | 2.40 | | | | 9-21-2022 | | | | 350,000 | | | | 364,972 | |
Novartis Capital Corporation | | | 3.70 | | | | 9-21-2042 | | | | 175,000 | | | | 211,546 | |
Pfizer Incorporated | | | 3.00 | | | | 12-15-2026 | | | | 400,000 | | | | 454,918 | |
Pfizer Incorporated | | | 3.90 | | | | 3-15-2039 | | | | 200,000 | | | | 247,016 | |
Pfizer Incorporated | | | 4.30 | | | | 6-15-2043 | | | | 210,000 | | | | 269,939 | |
Schering-Plough Corporation | | | 6.50 | | | | 12-1-2033 | | | | 175,000 | | | | 273,239 | |
Zoetis Incorporated | | | 4.70 | | | | 2-1-2043 | | | | 350,000 | | | | 462,030 | |
| | | | |
| | | | | | | | | | | | | | | 7,265,000 | |
| | | | | | | | | | | | | | | | |
| | | | |
Industrials: 8.67% | | | | | | | | | | | | | | | | |
| | | | |
| Aerospace & Defense: 2.34% | | | | | | | | | | | | |
General Dynamics Corporation | | | 2.25 | | | | 11-15-2022 | | | | 350,000 | | | | 363,067 | |
Lockheed Martin Corporation | | | 3.35 | | | | 9-15-2021 | | | | 97,000 | | | | 100,081 | |
Lockheed Martin Corporation | | | 4.07 | | | | 12-15-2042 | | | | 229,000 | | | | 288,272 | |
Lockheed Martin Corporation | | | 4.70 | | | | 5-15-2046 | | | | 350,000 | | | | 477,080 | |
Lockheed Martin Corporation | | | 6.15 | | | | 9-1-2036 | | | | 122,000 | | | | 181,783 | |
Northrop Grumman Corporation | | | 4.03 | | | | 10-15-2047 | | | | 400,000 | | | | 487,133 | |
Northrop Grumman Corporation | | | 5.05 | | | | 11-15-2040 | | | | 70,000 | | | | 92,950 | |
Northrop Grumman Corporation | | | 7.75 | | | | 2-15-2031 | | | | 210,000 | | | | 320,370 | |
Precision Castparts Corporation | | | 2.50 | | | | 1-15-2023 | | | | 175,000 | | | | 183,046 | |
Precision Castparts Corporation | | | 3.90 | | | | 1-15-2043 | | | | 140,000 | | | | 160,439 | |
The accompanying notes are an integral part of these financial statements.
Wells Fargo Investment Grade Corporate Bond Portfolio | 11
Portfolio of investments—August 31, 2020 (unaudited)
| | | | | | | | | | | | | | | | |
| | | Interest rate | | | Maturity date | | | Principal | | | Value | |
| | | | |
| Aerospace & Defense (continued) | | | | | | | | | | | | |
Raytheon Technologies Corporation 144A | | | 2.50 | % | | | 12-15-2022 | | | $ | 245,000 | | | $ | 255,062 | |
Raytheon Technologies Corporation 144A | | | 3.70 | | | | 12-15-2023 | | | | 245,000 | | | | 267,425 | |
Raytheon Technologies Corporation | | | 3.75 | | | | 11-1-2046 | | | | 200,000 | | | | 230,342 | |
Raytheon Technologies Corporation 144A | | | 4.80 | | | | 12-15-2043 | | | | 175,000 | | | | 224,119 | |
Raytheon Technologies Corporation 144A | | | 7.20 | | | | 8-15-2027 | | | | 84,000 | | | | 114,772 | |
Raytheon Technologies Corporation | | | 7.50 | | | | 9-15-2029 | | | | 400,000 | | | | 583,944 | |
Textron Incorporated | | | 4.30 | | | | 3-1-2024 | | | | 140,000 | | | | 150,867 | |
The Boeing Company | | | 2.60 | | | | 10-30-2025 | | | | 300,000 | | | | 298,831 | |
The Boeing Company | | | 2.80 | | | | 3-1-2023 | | | | 200,000 | | | | 203,984 | |
The Boeing Company | | | 3.20 | | | | 3-1-2029 | | | | 200,000 | | | | 198,191 | |
The Boeing Company | | | 5.88 | | | | 2-15-2040 | | | | 21,000 | | | | 23,873 | |
| | | | |
| | | | | | | | | | | | | | | 5,205,631 | |
| | | | | | | | | | | | | | | | |
| | | | |
| Air Freight & Logistics: 0.99% | | | | | | | | | | | | |
FedEx Corporation | | | 3.88 | | | | 8-1-2042 | | | | 140,000 | | | | 151,098 | |
FedEx Corporation | | | 4.00 | | | | 1-15-2024 | | | | 203,000 | | | | 225,133 | |
FedEx Corporation | | | 4.55 | | | | 4-1-2046 | | | | 350,000 | | | | 414,473 | |
FedEx Corporation | | | 4.90 | | | | 1-15-2034 | | | | 175,000 | | | | 224,008 | |
FedEx Corporation | | | 5.10 | | | | 1-15-2044 | | | | 210,000 | | | | 265,696 | |
United Parcel Service Incorporated | | | 2.35 | | | | 5-16-2022 | | | | 300,000 | | | | 309,631 | |
United Parcel Service Incorporated | | | 2.45 | | | | 10-1-2022 | | | | 280,000 | | | | 292,034 | |
United Parcel Service Incorporated | | | 6.20 | | | | 1-15-2038 | | | | 206,000 | | | | 312,475 | |
| | | | |
| | | | | | | | | | | | | | | 2,194,548 | |
| | | | | | | | | | | | | | | | |
| | | | |
| Airlines: 0.14% | | | | | | | | | | | | |
American Airlines Incorporated | | | 3.20 | | | | 12-15-2029 | | | | 51,584 | | | | 48,282 | |
American Airlines Incorporated | | | 3.38 | | | | 11-1-2028 | | | | 24,076 | | | | 20,111 | |
Delta Air Lines Incorporated | | | 6.82 | | | | 2-10-2024 | | | | 29,321 | | | | 29,282 | |
United Airlines Incorporated | | | 4.30 | | | | 2-15-2027 | | | | 161,645 | | | | 150,476 | |
US Airways Group Incorporated | | | 3.95 | | | | 5-15-2027 | | | | 64,760 | | | | 53,376 | |
| | | | |
| | | | | | | | | | | | | | | 301,527 | |
| | | | | | | | | | | | | | | | |
| | | | |
| Building Products: 0.10% | | | | | | | | | | | | |
Masco Corporation | | | 4.38 | | | | 4-1-2026 | | | | 190,000 | | | | 222,658 | |
| | | | | | | | | | | | | | | | |
| | | | |
| Commercial Services & Supplies: 0.54% | | | | | | | | | | | | |
Cintas Corporation No. 2 | | | 3.25 | | | | 6-1-2022 | | | | 70,000 | | | | 72,897 | |
Republic Services Incorporated | | | 2.90 | | | | 7-1-2026 | | | | 260,000 | | | | 288,940 | |
Republic Services Incorporated | | | 5.25 | | | | 11-15-2021 | | | | 35,000 | | | | 37,011 | |
Waste Management Incorporated | | | 4.10 | | | | 3-1-2045 | | | | 650,000 | | | | 790,643 | |
| | | | |
| | | | | | | | | | | | | | | 1,189,491 | |
| | | | | | | | | | | | | | | | |
| | | | |
| Industrial Conglomerates: 1.02% | | | | | | | | | | | | |
3M Company | | | 5.70 | | | | 3-15-2037 | | | | 227,000 | | | | 330,322 | |
General Electric Company | | | 3.10 | | | | 1-9-2023 | | | | 300,000 | | | | 316,254 | |
General Electric Company | | | 4.13 | | | | 10-9-2042 | | | | 400,000 | | | | 401,182 | |
General Electric Company | | | 4.50 | | | | 3-11-2044 | | | | 200,000 | | | | 206,432 | |
General Electric Company | | | 5.88 | | | | 1-14-2038 | | | | 200,000 | | | | 230,962 | |
Honeywell International Incorporated | | | 3.35 | | | | 12-1-2023 | | | | 140,000 | | | | 153,331 | |
Honeywell International Incorporated | | | 3.81 | | | | 11-21-2047 | | | | 500,000 | | | | 634,553 | |
| | | | |
| | | | | | | | | | | | | | | 2,273,036 | |
| | | | | | | | | | | | | | | | |
| | | | |
| Machinery: 0.96% | | | | | | | | | | | | |
Caterpillar Incorporated | | | 3.80 | | | | 8-15-2042 | | | | 105,000 | | | | 128,588 | |
Caterpillar Incorporated | | | 4.75 | | | | 5-15-2064 | | | | 300,000 | | | | 425,555 | |
The accompanying notes are an integral part of these financial statements.
12 | Wells Fargo Investment Grade Corporate Bond Portfolio
Portfolio of investments—August 31, 2020 (unaudited)
| | | | | | | | | | | | | | | | |
| | | Interest rate | | | Maturity date | | | Principal | | | Value | |
| | | | |
| Machinery (continued) | | | | | | | | | | | | |
Deere & Company | | | 2.60 | % | | | 6-8-2022 | | | $ | 350,000 | | | $ | 362,687 | |
Deere & Company | | | 5.38 | | | | 10-16-2029 | | | | 210,000 | | | | 277,547 | |
Dover Corporation | | | 5.38 | | | | 10-15-2035 | | | | 140,000 | | | | 187,757 | |
Illinois Tool Works Incorporated | | | 3.38 | | | | 9-15-2021 | | | | 84,000 | | | | 85,959 | |
Illinois Tool Works Incorporated | | | 3.90 | | | | 9-1-2042 | | | | 214,000 | | | | 268,078 | |
Parker Hannifin Corporation | | | 3.50 | | | | 9-15-2022 | | | | 70,000 | | | | 74,056 | |
Parker Hannifin Corporation | | | 6.25 | | | | 5-15-2038 | | | | 42,000 | | | | 58,917 | |
Stanley Black & Decker Incorporated | | | 2.90 | | | | 11-1-2022 | | | | 245,000 | | | | 258,228 | |
| | | | |
| | | | | | | | | | | | | | | 2,127,372 | |
| | | | | | | | | | | | | | | | |
| | | | |
| Professional Services: 0.08% | | | | | | | | | | | | |
Verisk Analytics Incorporated | | | 4.13 | | | | 9-12-2022 | | | | 175,000 | | | | 186,971 | |
| | | | | | | | | | | | | | | | |
| | | | |
| Road & Rail: 2.25% | | | | | | | | | | | | |
Burlington Northern Santa Fe LLC | | | 3.00 | | | | 3-15-2023 | | | | 210,000 | | | | 223,063 | |
Burlington Northern Santa Fe LLC | | | 3.40 | | | | 9-1-2024 | | | | 210,000 | | | | 232,802 | |
Burlington Northern Santa Fe LLC | | | 4.55 | | | | 9-1-2044 | | | | 210,000 | | | | 276,938 | |
Burlington Northern Santa Fe LLC | | | 4.95 | | | | 9-15-2041 | | | | 140,000 | | | | 188,457 | |
Burlington Northern Santa Fe LLC | | | 5.15 | | | | 9-1-2043 | | | | 210,000 | | | | 295,265 | |
CSX Corporation | | | 3.40 | | | | 8-1-2024 | | | | 278,000 | | | | 308,475 | |
CSX Corporation | | | 4.50 | | | | 8-1-2054 | | | | 350,000 | | | | 458,715 | |
CSX Corporation | | | 4.75 | | | | 5-30-2042 | | | | 161,000 | | | | 207,594 | |
CSX Corporation | | | 6.22 | | | | 4-30-2040 | | | | 140,000 | | | | 206,581 | |
Kansas City Southern | | | 3.00 | | | | 5-15-2023 | | | | 51,000 | | | | 52,476 | |
Kansas City Southern | | | 4.30 | | | | 5-15-2043 | | | | 140,000 | | | | 144,172 | |
Norfolk Southern Corporation | | | 2.90 | | | | 6-15-2026 | | | | 250,000 | | | | 277,666 | |
Norfolk Southern Corporation | | | 2.90 | | | | 2-15-2023 | | | | 400,000 | | | | 421,382 | |
Norfolk Southern Corporation | | | 3.15 | | | | 6-1-2027 | | | | 300,000 | | | | 332,273 | |
Norfolk Southern Corporation | | | 3.85 | | | | 1-15-2024 | | | | 140,000 | | | | 153,963 | |
Union Pacific Corporation | | | 2.75 | | | | 4-15-2023 | | | | 200,000 | | | | 210,878 | |
Union Pacific Corporation | | | 3.25 | | | | 1-15-2025 | | | | 175,000 | | | | 191,006 | |
Union Pacific Corporation | | | 3.75 | | | | 3-15-2024 | | | | 140,000 | | | | 153,818 | |
Union Pacific Corporation | | | 3.80 | | | | 10-1-2051 | | | | 200,000 | | | | 239,377 | |
Union Pacific Corporation | | | 4.15 | | | | 1-15-2045 | | | | 175,000 | | | | 213,265 | |
Union Pacific Corporation | | | 4.30 | | | | 6-15-2042 | | | | 175,000 | | | | 212,877 | |
| | | | |
| | | | | | | | | | | | | | | 5,001,043 | |
| | | | | | | | | | | | | | | | |
| | | | |
| Trading Companies & Distributors: 0.25% | | | | | | | | | | | | |
Air Lease Corporation | | | 3.25 | | | | 3-1-2025 | | | | 200,000 | | | | 203,229 | |
W.W. Grainger Incorporated | | | 4.60 | | | | 6-15-2045 | | | | 280,000 | | | | 361,650 | |
| | | | |
| | | | | | | | | | | | | | | 564,879 | |
| | | | | | | | | | | | | | | | |
| | | | |
Information Technology: 6.15% | | | | | | | | | | | | | | | | |
| | | | |
| Communications Equipment: 0.48% | | | | | | | | | | | | |
Cisco Systems Incorporated | | | 2.20 | | | | 9-20-2023 | | | | 300,000 | | | | 316,239 | |
Cisco Systems Incorporated | | | 2.95 | | | | 2-28-2026 | | | | 340,000 | | | | 383,659 | |
Cisco Systems Incorporated | | | 3.00 | | | | 6-15-2022 | | | | 340,000 | | | | 356,791 | |
| | | | |
| | | | | | | | | | | | | | | 1,056,689 | |
| | | | | | | | | | | | | | | | |
| | | | |
| Electronic Equipment, Instruments & Components: 0.15% | | | | | | | | | | | | |
Corning Incorporated | | | 5.75 | | | | 8-15-2040 | | | | 105,000 | | | | 141,516 | |
Keysight Technologies Incorporated | | | 4.55 | | | | 10-30-2024 | | | | 175,000 | | | | 197,635 | |
| | | | |
| | | | | | | | | | | | | | | 339,151 | |
| | | | | | | | | | | | | | | | |
The accompanying notes are an integral part of these financial statements.
Wells Fargo Investment Grade Corporate Bond Portfolio | 13
Portfolio of investments—August 31, 2020 (unaudited)
| | | | | | | | | | | | | | | | |
| | | Interest rate | | | Maturity date | | | Principal | | | Value | |
| IT Services: 1.28% | | | | | | | | | | | | |
Fidelity National Information Services Incorporated | | | 3.00 | % | | | 8-15-2026 | | | $ | 400,000 | | | $ | 447,197 | |
Fidelity National Information Services Incorporated | | | 3.50 | | | | 4-15-2023 | | | | 49,000 | | | | 52,297 | |
Fiserv Incorporated | | | 3.85 | | | | 6-1-2025 | | | | 210,000 | | | | 238,220 | |
Global Payments Incoporated | | | 3.75 | | | | 6-1-2023 | | | | 105,000 | | | | 112,844 | |
IBM Corporation | | | 1.88 | | | | 8-1-2022 | | | | 280,000 | | | | 288,648 | |
IBM Corporation | | | 3.38 | | | | 8-1-2023 | | | | 210,000 | | | | 228,126 | |
IBM Corporation | | | 5.88 | | | | 11-29-2032 | | | | 175,000 | | | | 254,589 | |
IBM Corporation | | | 7.00 | | | | 10-30-2025 | | | | 210,000 | | | | 274,873 | |
Mastercard Incorporated | | | 3.50 | | | | 2-26-2028 | | | | 400,000 | | | | 468,487 | |
Visa Incorporated | | | 2.75 | | | | 9-15-2027 | | | | 300,000 | | | | 333,017 | |
Western Union Company | | | 6.20 | | | | 11-17-2036 | | | | 122,000 | | | | 144,833 | |
| | | | |
| | | | | | | | | | | | | | | 2,843,131 | |
| | | | | | | | | | | | | | | | |
| | | | |
| Semiconductors & Semiconductor Equipment: 1.94% | | | | | | | | | | | | |
Analog Devices Incorporated | | | 2.88 | | | | 6-1-2023 | | | | 105,000 | | | | 111,114 | |
Applied Materials Incorporated | | | 5.85 | | | | 6-15-2041 | | | | 140,000 | | | | 214,702 | |
Broadcom Incorporated | | | 3.63 | | | | 10-15-2024 | | | | 1,200,000 | | | | 1,314,999 | |
Broadcom Incorporated | | | 3.88 | | | | 1-15-2027 | | | | 300,000 | | | | 332,440 | |
Intel Corporation | | | 2.60 | | | | 5-19-2026 | | | | 220,000 | | | | 241,764 | |
Intel Corporation | | | 4.10 | | | | 5-19-2046 | | | | 300,000 | | | | 371,374 | |
Intel Corporation | | | 4.25 | | | | 12-15-2042 | | | | 175,000 | | | | 220,160 | |
Intel Corporation | | | 4.90 | | | | 7-29-2045 | | | | 230,000 | | | | 314,258 | |
Qualcomm Incorporated 144A | | | 1.65 | | | | 5-20-2032 | | | | 793,000 | | | | 791,264 | |
Qualcomm Incorporated | | | 3.25 | | | | 5-20-2027 | | | | 200,000 | | | | 225,750 | |
Texas Instruments Incorporated | | | 2.25 | | | | 5-1-2023 | | | | 175,000 | | | | 183,269 | |
| | | | |
| | | | | | | | | | | | | | | 4,321,094 | |
| | | | | | | | | | | | | | | | |
| | | | |
| Software: 1.23% | | | | | | | | | | | | |
Autodesk Incorporated | | | 3.60 | | | | 12-15-2022 | | | | 175,000 | | | | 186,001 | |
Microsoft Corporation | | | 2.53 | | | | 6-1-2050 | | | | 33,000 | | | | 34,524 | |
Microsoft Corporation | | | 4.50 | | | | 2-6-2057 | | | | 750,000 | | | | 1,068,754 | |
Microsoft Corporation | | | 5.20 | | | | 6-1-2039 | | | | 77,000 | | | | 111,647 | |
Oracle Corporation | | | 3.40 | | | | 7-8-2024 | | | | 200,000 | | | | 219,945 | |
Oracle Corporation | | | 4.00 | | | | 7-15-2046 | | | | 350,000 | | | | 410,297 | |
Oracle Corporation | | | 4.30 | | | | 7-8-2034 | | | | 175,000 | | | | 217,879 | |
Oracle Corporation | | | 4.38 | | | | 5-15-2055 | | | | 200,000 | | | | 250,694 | |
Salesforce.com Incorporated | | | 3.70 | | | | 4-11-2028 | | | | 200,000 | | | | 233,878 | |
| | | | |
| | | | | | | | | | | | | | | 2,733,619 | |
| | | | | | | | | | | | | | | | |
| | | | |
| Technology Hardware, Storage & Peripherals: 1.07% | | | | | | | | | | | | |
Apple Incorporated | | | 3.35 | | | | 2-9-2027 | | | | 200,000 | | | | 228,887 | |
Apple Incorporated | | | 3.75 | | | | 11-13-2047 | | | | 400,000 | | | | 482,989 | |
Apple Incorporated | | | 4.38 | | | | 5-13-2045 | | | | 350,000 | | | | 459,370 | |
Apple Incorporated | | | 4.65 | | | | 2-23-2046 | | | | 200,000 | | | | 273,747 | |
Dell International LLC 144A | | | 8.10 | | | | 7-15-2036 | | | | 400,000 | | | | 531,496 | |
Hewlett-Packard Enterprise Company | | | 6.00 | | | | 9-15-2041 | | | | 332,000 | | | | 406,638 | |
| | | | |
| | | | | | | | | | | | | | | 2,383,127 | |
| | | | | | | | | | | | | | | | |
| | | | |
Materials: 2.41% | | | | | | | | | | | | | | | | |
| | | | |
| Chemicals: 1.16% | | | | | | | | | | | | |
Air Products & Chemicals Incorporated | | | 3.00 | | | | 11-3-2021 | | | | 175,000 | | | | 180,346 | |
Dow Chemical Company | | | 3.50 | | | | 10-1-2024 | | | | 200,000 | | | | 218,742 | |
Dow Chemical Company | | | 4.25 | | | | 10-1-2034 | | | | 175,000 | | | | 206,760 | |
Dow Chemical Company | | | 5.25 | | | | 11-15-2041 | | | | 175,000 | | | | 212,783 | |
The accompanying notes are an integral part of these financial statements.
14 | Wells Fargo Investment Grade Corporate Bond Portfolio
Portfolio of investments—August 31, 2020 (unaudited)
| | | | | | | | | | | | | | | | |
| | | Interest rate | | | Maturity date | | | Principal | | | Value | |
| | | | |
| Chemicals (continued) | | | | | | | | | | | | |
Eastman Chemical Company | | | 4.80 | % | | | 9-1-2042 | | | $ | 140,000 | | | $ | 165,667 | |
Ecolab Incorporated | | | 4.35 | | | | 12-8-2021 | | | | 286,000 | | | | 300,419 | |
Mosaic Company | | | 3.75 | | | | 11-15-2021 | | | | 80,000 | | | | 82,101 | |
Mosaic Company | | | 5.63 | | | | 11-15-2043 | | | | 175,000 | | | | 200,969 | |
Praxair Incorporated | | | 2.45 | | | | 2-15-2022 | | | | 140,000 | | | | 143,577 | |
Praxair Incorporated | | | 2.70 | | | | 2-21-2023 | | | | 105,000 | | | | 110,089 | |
The Sherwin-Williams Company | | | 4.50 | | | | 6-1-2047 | | | | 600,000 | | | | 758,252 | |
| | | | |
| | | | | | | | | | | | | | | 2,579,705 | |
| | | | | | | | | | | | | | | | |
| | | | |
| Containers & Packaging: 0.50% | | | | | | | | | | | | |
International Paper Company | | | 3.00 | | | | 2-15-2027 | | | | 200,000 | | | | 220,016 | |
International Paper Company | | | 3.65 | | | | 6-15-2024 | | | | 350,000 | | | | 387,123 | |
International Paper Company | | | 7.30 | | | | 11-15-2039 | | | | 175,000 | | | | 254,059 | |
Packaging Corporation of America | | | 3.65 | | | | 9-15-2024 | | | | 175,000 | | | | 192,035 | |
WestRock MWV LLC | | | 7.95 | | | | 2-15-2031 | | | | 35,000 | | | | 50,316 | |
| | | | |
| | | | | | | | | | | | | | | 1,103,549 | |
| | | | | | | | | | | | | | | | |
| | | | |
| Metals & Mining: 0.67% | | | | | | | | | | | | |
Barrick Gold Finance Company LLC | | | 5.70 | | | | 5-30-2041 | | | | 210,000 | | | | 296,023 | |
Newmont Goldcorp Corporation | | | 3.70 | | | | 3-15-2023 | | | | 210,000 | | | | 221,214 | |
Nucor Corporation | | | 4.00 | | | | 8-1-2023 | | | | 132,000 | | | | 143,922 | |
Nucor Corporation | | | 5.20 | | | | 8-1-2043 | | | | 140,000 | | | | 182,904 | |
Nucor Corporation | | | 6.40 | | | | 12-1-2037 | | | | 140,000 | | | | 200,044 | |
Southern Copper Corporation | | | 6.75 | | | | 4-16-2040 | | | | 308,000 | | | | 442,768 | |
| | | | |
| | | | | | | | | | | | | | | 1,486,875 | |
| | | | | | | | | | | | | | | | |
| | | | |
| Paper & Forest Products: 0.08% | | | | | | | | | | | | |
Georgia-Pacific LLC | | | 8.00 | | | | 1-15-2024 | | | | 140,000 | | | | 174,838 | |
| | | | | | | | | | | | | | | | |
| | | | |
Real Estate: 3.75% | | | | | | | | | | | | | | | | |
| | | | |
| Equity REITs: 3.75% | | | | | | | | | | | | |
Alexandria Real Estate Equities Incorporated | | | 4.70 | | | | 7-1-2030 | | | | 400,000 | | | | 495,509 | |
American Campus Communities Incorporated | | | 3.75 | | | | 4-15-2023 | | | | 70,000 | | | | 73,396 | |
American Tower Corporation | | | 3.50 | | | | 1-31-2023 | | | | 295,000 | | | | 315,178 | |
American Tower Corporation | | | 4.00 | | | | 6-1-2025 | | | | 350,000 | | | | 397,515 | |
American Tower Corporation | | | 5.00 | | | | 2-15-2024 | | | | 245,000 | | | | 279,348 | |
AvalonBay Communities Incorporated | | | 3.45 | | | | 6-1-2025 | | | | 140,000 | | | | 156,902 | |
AvalonBay Communities Incorporated | | | 4.20 | | | | 12-15-2023 | | | | 175,000 | | | | 193,378 | |
Boston Properties LP | | | 2.75 | | | | 10-1-2026 | | | | 500,000 | | | | 539,921 | |
Boston Properties LP | | | 3.13 | | | | 9-1-2023 | | | | 105,000 | | | | 111,509 | |
Boston Properties LP | | | 3.80 | | | | 2-1-2024 | | | | 300,000 | | | | 326,078 | |
Boston Properties LP | | | 3.85 | | | | 2-1-2023 | | | | 200,000 | | | | 213,490 | |
Crown Castle International Corporation | | | 3.70 | | | | 6-15-2026 | | | | 350,000 | | | | 395,733 | |
Crown Castle International Corporation | | | 5.25 | | | | 1-15-2023 | | | | 350,000 | | | | 388,046 | |
Essex Portfolio LP | | | 3.25 | | | | 5-1-2023 | | | | 70,000 | | | | 74,071 | |
Federal Realty Investment Trust | | | 4.50 | | | | 12-1-2044 | | | | 175,000 | | | | 201,082 | |
HCP Incorporated | | | 6.75 | | | | 2-1-2041 | | | | 95,000 | | | | 136,291 | |
Health Care REIT Incorporated | | | 4.00 | | | | 6-1-2025 | | | | 210,000 | | | | 236,490 | |
Health Care REIT Incorporated | | | 4.50 | | | | 1-15-2024 | | | | 140,000 | | | | 153,463 | |
Host Hotels & Resorts Company | | | 3.75 | | | | 10-15-2023 | | | | 70,000 | | | | 72,642 | |
Kilroy Realty Corporation | | | 3.80 | | | | 1-15-2023 | | | | 175,000 | | | | 182,056 | |
Kimco Realty Corporation | | | 2.80 | | | | 10-1-2026 | | | | 350,000 | | | | 367,220 | |
Mid-America Apartments LP | | | 4.30 | | | | 10-15-2023 | | | | 35,000 | | | | 38,263 | |
National Retail Properties Incorporated | | | 3.30 | | | | 4-15-2023 | | | | 70,000 | | | | 73,567 | |
The accompanying notes are an integral part of these financial statements.
Wells Fargo Investment Grade Corporate Bond Portfolio | 15
Portfolio of investments—August 31, 2020 (unaudited)
| | | | | | | | | | | | | | | | |
| | | Interest rate | | | Maturity date | | | Principal | | | Value | |
| | | | |
| Equity REITs (continued) | | | | | | | | | | | | |
Plum Creek Timberlands LP | | | 3.25 | % | | | 3-15-2023 | | | $ | 192,000 | | | $ | 202,629 | |
Realty Income Corporation | | | 4.65 | | | | 8-1-2023 | | | | 210,000 | | | | 233,192 | |
Regency Centers Corporation | | | 3.75 | | | | 11-15-2022 | | | | 175,000 | | | | 186,271 | |
Simon Property Group LP | | | 3.30 | | | | 1-15-2026 | | | | 410,000 | | | | 447,992 | |
Simon Property Group LP | | | 3.75 | | | | 2-1-2024 | | | | 175,000 | | | | 189,787 | |
Simon Property Group LP | | | 4.75 | | | | 3-15-2042 | | | | 175,000 | | | | 205,147 | |
Ventas Realty LP | | | 3.50 | | | | 2-1-2025 | | | | 400,000 | | | | 430,855 | |
VEREIT Operating Partnership LP | | | 4.60 | | | | 2-6-2024 | | | | 98,000 | | | | 105,419 | |
VEREIT Operating Partnership LP | | | 4.88 | | | | 6-1-2026 | | | | 119,000 | | | | 132,788 | |
Welltower Incorporated | | | 4.95 | | | | 9-1-2048 | | | | 400,000 | | | | 481,591 | |
Weyerhaeuser Company | | | 7.38 | | | | 3-15-2032 | | | | 200,000 | | | | 290,623 | |
| | | | |
| | | | | | | | | | | | | | | 8,327,442 | |
| | | | | | | | | | | | | | | | |
| | | | |
Utilities: 8.44% | | | | | | | | | | | | | | | | |
| | | | |
| Electric Utilities: 6.18% | | | | | | | | | | | | |
Alabama Power Company | | | 3.55 | | | | 12-1-2023 | | | | 175,000 | | | | 191,299 | |
Alabama Power Company | | | 3.85 | | | | 12-1-2042 | | | | 140,000 | | | | 165,869 | |
Alabama Power Company | | | 4.15 | | | | 8-15-2044 | | | | 105,000 | | | | 129,021 | |
American Electric Power Company Incorporated | | | 2.95 | | | | 12-15-2022 | | | | 300,000 | | | | 315,015 | |
Appalachian Power Company | | | 3.40 | | | | 6-1-2025 | | | | 175,000 | | | | 192,004 | |
Appalachian Power Company | | | 4.45 | | | | 6-1-2045 | | | | 175,000 | | | | 211,221 | |
Appalachian Power Company | | | 7.00 | | | | 4-1-2038 | | | | 70,000 | | | | 104,584 | |
Arizona Public Service Company | | | 3.15 | | | | 5-15-2025 | | | | 105,000 | | | | 115,805 | |
Arizona Public Service Company | | | 4.50 | | | | 4-1-2042 | | | | 70,000 | | | | 87,402 | |
Baltimore Gas & Electric Company | | | 3.50 | | | | 8-15-2046 | | | | 50,000 | | | | 57,644 | |
Berkshire Hathaway Energy Company | | | 5.95 | | | | 5-15-2037 | | | | 210,000 | | | | 303,551 | |
Berkshire Hathaway Energy Company | | | 6.13 | | | | 4-1-2036 | | | | 140,000 | | | | 202,056 | |
Berkshire Hathaway Energy Company | | | 6.75 | | | | 12-30-2031 | | | | 105,000 | | | | 159,822 | |
Carolina Power & Light Company | | | 2.80 | | | | 5-15-2022 | | | | 175,000 | | | | 181,681 | |
CenterPoint Energy Houston | | | 3.55 | | | | 8-1-2042 | | | | 175,000 | | | | 201,027 | |
CenterPoint Energy Houston | | | 4.50 | | | | 4-1-2044 | | | | 175,000 | | | | 230,644 | |
Commonwealth Edison Company | | | 3.80 | | | | 10-1-2042 | | | | 70,000 | | | | 83,530 | |
Commonwealth Edison Company | | | 5.90 | | | | 3-15-2036 | | | | 175,000 | | | | 254,071 | |
Connecticut Light & Power Company | | | 4.15 | | | | 6-1-2045 | | | | 87,000 | | | | 109,078 | |
Consolidated Edison Company of New York Incorporated Series 07-A | | | 6.30 | | | | 8-15-2037 | | | | 175,000 | | | | 256,759 | |
Consolidated Edison Company of New York Incorporated Series 14-C | | | 4.63 | | | | 12-1-2054 | | | | 300,000 | | | | 389,234 | |
Consolidated Edison Company of New York Incorporated Series 16-C | | | 4.30 | | | | 12-1-2056 | | | | 245,000 | | | | 301,889 | |
DTE Electric Company | | | 3.65 | | | | 3-15-2024 | | | | 105,000 | | | | 115,075 | |
Duke Energy Corporation | | | 3.05 | | | | 8-15-2022 | | | | 70,000 | | | | 73,095 | |
Duke Energy Corporation | | | 3.95 | | | | 10-15-2023 | | | | 140,000 | | | | 153,448 | |
Duke Energy Florida Incorporated | | | 3.85 | | | | 11-15-2042 | | | | 70,000 | | | | 83,260 | |
Duke Energy Indiana Incorporated | | | 4.90 | | | | 7-15-2043 | | | | 105,000 | | | | 140,354 | |
Duke Energy Indiana Incorporated | | | 6.45 | | | | 4-1-2039 | | | | 45,000 | | | | 68,879 | |
Duke Energy Progress Incorporated | | | 4.10 | | | | 3-15-2043 | | | | 105,000 | | | | 127,621 | |
Emera US Finance LP | | | 3.55 | | | | 6-15-2026 | | | | 200,000 | | | | 224,138 | |
Entergy Arkansas Incorporated | | | 3.70 | | | | 6-1-2024 | | | | 175,000 | | | | 193,029 | |
Entergy Gulf States Louisiana LLC | | | 5.59 | | | | 10-1-2024 | | | | 84,000 | | | | 99,939 | |
Evergy Metro Incorporated | | | 3.15 | | | | 3-15-2023 | | | | 140,000 | | | | 148,333 | |
Eversource Energy | | | 2.80 | | | | 5-1-2023 | | | | 122,000 | | | | 128,441 | |
Exelon Corporation | | | 4.95 | | | | 6-15-2035 | | | | 140,000 | | | | 170,594 | |
Exelon Generation Company LLC | | | 4.25 | | | | 6-15-2022 | | | | 157,000 | | | | 166,297 | |
FirstEnergy Corporation | | | 4.25 | | | | 3-15-2023 | | | | 168,000 | | | | 178,189 | |
Florida Power & Light Company | | | 4.05 | | | | 6-1-2042 | | | | 175,000 | | | | 218,661 | |
Florida Power & Light Company | | | 5.95 | | | | 2-1-2038 | | | | 224,000 | | | | 340,182 | |
Florida Power & Light Company | | | 5.96 | | | | 4-1-2039 | | | | 175,000 | | | | 263,163 | |
The accompanying notes are an integral part of these financial statements.
16 | Wells Fargo Investment Grade Corporate Bond Portfolio
Portfolio of investments—August 31, 2020 (unaudited)
| | | | | | | | | | | | | | | | |
| | | Interest rate | | | Maturity date | | | Principal | | | Value | |
| | | | |
| Electric Utilities (continued) | | | | | | | | | | | | |
Florida Power Corporation | | | 5.65 | % | | | 4-1-2040 | | | $ | 87,000 | | | $ | 124,998 | |
Georgia Power Company | | | 4.30 | | | | 3-15-2042 | | | | 175,000 | | | | 206,781 | |
Interstate Power & Light Company | | | 6.25 | | | | 7-15-2039 | | | | 21,000 | | | | 30,490 | |
Northern States Power Company of Minnesota | | | 2.15 | | | | 8-15-2022 | | | | 175,000 | | | | 179,446 | |
Northern States Power Company of Minnesota | | | 2.60 | | | | 5-15-2023 | | | | 105,000 | | | | 109,949 | |
Northern States Power Company of Minnesota | | | 3.40 | | | | 8-15-2042 | | | | 175,000 | | | | 198,973 | |
Northern States Power Company of Minnesota | | | 5.35 | | | | 11-1-2039 | | | | 28,000 | | | | 41,046 | |
NSTAR Electric Company | | | 2.38 | | | | 10-15-2022 | | | | 140,000 | | | | 145,122 | |
NSTAR Electric Company | | | 5.50 | | | | 3-15-2040 | | | | 70,000 | | | | 99,010 | |
Oglethorpe Power Corporation | | | 5.95 | | | | 11-1-2039 | | | | 105,000 | | | | 137,014 | |
Ohio Edison Company | | | 6.88 | | | | 7-15-2036 | | | | 175,000 | | | | 248,399 | |
Ohio Power Company | | | 5.38 | | | | 10-1-2021 | | | | 45,000 | | | | 47,461 | |
Oncor Electric Delivery Company LLC | | | 4.55 | | | | 12-1-2041 | | | | 140,000 | | | | 178,982 | |
Oncor Electric Delivery Company LLC | | | 7.00 | | | | 5-1-2032 | | | | 122,000 | | | | 181,180 | |
PacifiCorp | | | 3.60 | | | | 4-1-2024 | | | | 175,000 | | | | 192,321 | |
PacifiCorp | | | 4.10 | | | | 2-1-2042 | | | | 70,000 | | | | 85,751 | |
PacifiCorp | | | 5.75 | | | | 4-1-2037 | | | | 175,000 | | | | 247,386 | |
Potomac Electric Power Company | | | 3.60 | | | | 3-15-2024 | | | | 175,000 | | | | 190,969 | |
Potomac Electric Power Company | | | 6.50 | | | | 11-15-2037 | | | | 140,000 | | | | 212,345 | |
PPL Electric Utilities | | | 4.75 | | | | 7-15-2043 | | | | 105,000 | | | | 140,979 | |
PPL Electric Utilities | | | 6.25 | | | | 5-15-2039 | | | | 31,000 | | | | 45,865 | |
PSEG Power LLC | | | 8.63 | | | | 4-15-2031 | | | | 75,000 | | | | 110,553 | |
Public Service Company of Colorado | | | 2.25 | | | | 9-15-2022 | | | | 70,000 | | | | 72,011 | |
Public Service Electric & Gas Company | | | 2.38 | | | | 5-15-2023 | | | | 140,000 | | | | 146,456 | |
Public Service Electric & Gas Company | | | 3.65 | | | | 9-1-2042 | | | | 175,000 | | | | 207,428 | |
Public Service Electric & Gas Company | | | 3.80 | | | | 1-1-2043 | | | | 140,000 | | | | 168,158 | |
Public Service Electric & Gas Company | | | 3.95 | | | | 5-1-2042 | | | | 70,000 | | | | 85,723 | |
Public Service Electric & Gas Company | | | 5.80 | | | | 5-1-2037 | | | | 70,000 | | | | 100,739 | |
South Carolina Electric & Gas Company | | | 5.10 | | | | 6-1-2065 | | | | 100,000 | | | | 152,245 | |
Southern California Edison Company | | | 3.90 | | | | 3-15-2043 | | | | 105,000 | | | | 113,127 | |
Southern California Edison Company | | | 5.35 | | | | 7-15-2035 | | | | 126,000 | | | | 167,174 | |
Southern California Edison Company | | | 5.50 | | | | 3-15-2040 | | | | 140,000 | | | | 177,662 | |
Southern California Edison Company | | | 6.00 | | | | 1-15-2034 | | | | 70,000 | | | | 94,552 | |
Southern Company | | | 2.95 | | | | 7-1-2023 | | | | 200,000 | | | | 212,607 | |
Southwestern Electric Power Company | | | 6.20 | | | | 3-15-2040 | | | | 35,000 | | | | 48,103 | |
TXU Electric Delivery Company | | | 7.25 | | | | 1-15-2033 | | | | 52,000 | | | | 79,017 | |
Union Electric Company | | | 3.90 | | | | 9-15-2042 | | | | 175,000 | | | | 206,346 | |
Union Electric Company | | | 8.45 | | | | 3-15-2039 | | | | 56,000 | | | | 94,529 | |
Virginia Electric & Power Company | | | 3.10 | | | | 5-15-2025 | | | | 70,000 | | | | 77,216 | |
Virginia Electric & Power Company | | | 3.45 | | | | 2-15-2024 | | | | 105,000 | | | | 114,054 | |
Virginia Electric & Power Company | | | 4.20 | | | | 5-15-2045 | | | | 105,000 | | | | 133,558 | |
Virginia Electric & Power Company | | | 4.45 | | | | 2-15-2044 | | | | 105,000 | | | | 136,821 | |
Virginia Electric & Power Company | | | 6.00 | | | | 1-15-2036 | | | | 70,000 | | | | 97,882 | |
Westar Energy Incorporated | | | 4.10 | | | | 4-1-2043 | | | | 210,000 | | | | 254,779 | |
Wisconsin Electric Power Company | | | 5.63 | | | | 5-15-2033 | | | | 70,000 | | | | 95,869 | |
Wisconsin Electric Power Company | | | 5.70 | | | | 12-1-2036 | | | | 105,000 | | | | 148,809 | |
Wisconsin Power & Light Company | | | 6.38 | | | | 8-15-2037 | | | | 175,000 | | | | 262,335 | |
| | | | |
| | | | | | | | | | | | | | | 13,738,124 | |
| | | | | | | | | | | | | | | | |
| | | | |
| Gas Utilities: 0.50% | | | | | | | | | | | | |
Atmos Energy Corporation | | | 4.13 | | | | 10-15-2044 | | | | 245,000 | | | | 303,346 | |
Atmos Energy Corporation | | | 5.50 | | | | 6-15-2041 | | | | 42,000 | | | | 59,298 | |
CenterPoint Energy Resources Corporation | | | 5.85 | | | | 1-15-2041 | | | | 77,000 | | | | 104,563 | |
National Fuel Gas Company | | | 3.75 | | | | 3-1-2023 | | | | 218,000 | | | | 225,561 | |
One Gas Incorporated | | | 3.61 | | | | 2-1-2024 | | | | 70,000 | | | | 76,401 | |
One Gas Incorporated | | | 4.66 | | | | 2-1-2044 | | | | 35,000 | | | | 45,183 | |
The accompanying notes are an integral part of these financial statements.
Wells Fargo Investment Grade Corporate Bond Portfolio | 17
Portfolio of investments—August 31, 2020 (unaudited)
| | | | | | | | | | | | | | | | |
| | | Interest rate | | | Maturity date | | | Principal | | | Value | |
| | | | |
| Gas Utilities (continued) | | | | | | | | | | | | |
Piedmont Natural Gas Company | | | 4.65 | % | | | 8-1-2043 | | | $ | 35,000 | | | $ | 44,749 | |
Southern California Gas Company | | | 5.13 | | | | 11-15-2040 | | | | 70,000 | | | | 94,182 | |
Southern Company Gas Capital Corporation | | | 4.40 | | | | 6-1-2043 | | | | 140,000 | | | | 165,638 | |
| | | | |
| | | | | | | | | | | | | | | 1,118,921 | |
| | | | | | | | | | | | | | | | |
| | | | |
| Multi-Utilities: 1.66% | | | | | | | | | | | | |
Black Hills Corporation | | | 4.25 | | | | 11-30-2023 | | | | 210,000 | | | | 230,729 | |
CMS Energy Corporation | | | 5.05 | | | | 3-15-2022 | | | | 245,000 | | | | 258,278 | |
Consumers Energy Company | | | 3.95 | | | | 5-15-2043 | | | | 140,000 | | | | 173,139 | |
Dominion Resources Incorporated | | | 2.75 | | | | 9-15-2022 | | | | 210,000 | | | | 218,105 | |
Dominion Resources Incorporated | | | 4.90 | | | | 8-1-2041 | | | | 42,000 | | | | 54,514 | |
Dominion Resources Incorporated | | | 5.95 | | | | 6-15-2035 | | | | 157,000 | | | | 215,686 | |
DTE Energy Company | | | 3.30 | | | | 6-15-2022 | | | | 70,000 | | | | 72,904 | |
DTE Energy Company | | | 3.85 | | | | 12-1-2023 | | | | 170,000 | | | | 185,750 | |
Entergy Louisiana LLC | | | 4.20 | | | | 4-1-2050 | | | | 500,000 | | | | 648,150 | |
NiSource Finance Corporation | | | 5.65 | | | | 2-1-2045 | | | | 140,000 | | | | 192,754 | |
Puget Energy Incorporated | | | 3.65 | | | | 5-15-2025 | | | | 140,000 | | | | 149,778 | |
Puget Energy Incorporated | | | 6.00 | | | | 9-1-2021 | | | | 175,000 | | | | 184,141 | |
Sempra Energy | | | 2.88 | | | | 10-1-2022 | | | | 140,000 | | | | 145,478 | |
Sempra Energy | | | 3.25 | | | | 6-15-2027 | | | | 300,000 | | | | 332,618 | |
Sempra Energy | | | 4.00 | | | | 2-1-2048 | | | | 400,000 | | | | 463,390 | |
WEC Energy Group Incorporated | | | 3.55 | | | | 6-15-2025 | | | | 140,000 | | | | 157,205 | |
| | | | |
| | | | | | | | | | | | | | | 3,682,619 | |
| | | | | | | | | | | | | | | | |
| | | | |
| Water Utilities: 0.10% | | | | | | | | | | | | |
American Water Capital Corporation | | | 3.40 | | | | 3-1-2025 | | | | 210,000 | | | | 233,194 | |
| | | | | | | | | | | | | | | | |
| | | | |
Total Corporate Bonds and Notes (Cost $155,869,291) | | | | | | | | | | | | | | | 177,788,586 | |
| | | | | | | | | | | | | | | | |
| | | | |
Yankee Corporate Bonds and Notes: 16.45% | | | | | | | | | | | | | | | | |
| | | | |
Communication Services: 1.48% | | | | | | | | | | | | | | | | |
| | | | |
| Diversified Telecommunication Services: 0.51% | | | | | | | | | | | | |
British Telecommunications plc | | | 9.63 | | | | 12-15-2030 | | | | 200,000 | | | | 325,581 | |
Telefonica Emisiones SA | | | 4.90 | | | | 3-6-2048 | | | | 300,000 | | | | 353,815 | |
Telefonica Europe BV | | | 8.25 | | | | 9-15-2030 | | | | 294,000 | | | | 447,977 | |
| | | | |
| | | | | | | | | | | | | | | 1,127,373 | |
| | | | | | | | | | | | | | | | |
| | | | |
| Wireless Telecommunication Services: 0.97% | | | | | | | | | | | | |
America Movil SAB de CV | | | 4.38 | | | | 4-22-2049 | | | | 500,000 | | | | 623,633 | |
Rogers Communications Incorporated | | | 4.35 | | | | 5-1-2049 | | | | 300,000 | | | | 373,290 | |
Vodafone Group plc | | | 2.95 | | | | 2-19-2023 | | | | 190,000 | | | | 201,085 | |
Vodafone Group plc | | | 4.38 | | | | 2-19-2043 | | | | 350,000 | | | | 409,544 | |
Vodafone Group plc | | | 6.25 | | | | 11-30-2032 | | | | 210,000 | | | | 286,708 | |
Vodafone Group plc | | | 7.88 | | | | 2-15-2030 | | | | 175,000 | | | | 256,134 | |
| | | | |
| | | | | | | | | | | | | | | 2,150,394 | |
| | | | | | | | | | | | | | | | |
| | | | |
Consumer Discretionary: 0.51% | | | | | | | | | | | | | | | | |
| | | | |
| Auto Components: 0.09% | | | | | | | | | | | | |
Magna International Incorporated | | | 4.15 | | | | 10-1-2025 | | | | 175,000 | | | | 199,487 | |
| | | | | | | | | | | | | | | | |
| | | | |
| Internet & Direct Marketing Retail: 0.42% | | | | | | | | | | | | |
Alibaba Group Holding Limited | | | 3.13 | | | | 11-28-2021 | | | | 250,000 | | | | 257,395 | |
Alibaba Group Holding Limited | | | 3.40 | | | | 12-6-2027 | | | | 400,000 | | | | 452,587 | |
Alibaba Group Holding Limited | | | 3.60 | | | | 11-28-2024 | | | | 200,000 | | | | 221,138 | |
| | | | |
| | | | | | | | | | | | | | | 931,120 | |
| | | | | | | | | | | | | | | | |
The accompanying notes are an integral part of these financial statements.
18 | Wells Fargo Investment Grade Corporate Bond Portfolio
Portfolio of investments—August 31, 2020 (unaudited)
| | | | | | | | | | | | | | | | |
| | | Interest rate | | | Maturity date | | | Principal | | | Value | |
Consumer Staples: 0.18% | | | | | | | | | | | | | | | | |
| | | | |
| Beverages: 0.18% | | | | | | | | | | | | |
Diageo Capital plc | | | 2.63 | % | | | 4-29-2023 | | | $ | 210,000 | | | $ | 220,812 | |
Diageo Capital plc | | | 5.88 | | | | 9-30-2036 | | | | 122,000 | | | | 175,423 | |
| | | | |
| | | | | | | | | | | | | | | 396,235 | |
| | | | | | | | | | | | | | | | |
| | | | |
Energy: 1.46% | | | | | | | | | | | | | | | | |
| | | | |
| Oil, Gas & Consumable Fuels: 1.46% | | | | | | | | | | | | |
BP Capital Markets plc | | | 3.81 | | | | 2-10-2024 | | | | 350,000 | | | | 386,065 | |
Canadian Natural Resources Limited | | | 3.85 | | | | 6-1-2027 | | | | 200,000 | | | | 216,566 | |
Canadian Natural Resources Limited | | | 3.90 | | | | 2-1-2025 | | | | 210,000 | | | | 228,862 | |
Canadian Natural Resources Limited | | | 4.95 | | | | 6-1-2047 | | | | 200,000 | | | | 232,070 | |
Canadian Natural Resources Limited | | | 6.75 | | | | 2-1-2039 | | | | 110,000 | | | | 142,006 | |
Husky Energy Incorporated | | | 6.80 | | | | 9-15-2037 | | | | 70,000 | | | | 85,817 | |
Petro-Canada | | | 5.95 | | | | 5-15-2035 | | | | 140,000 | | | | 175,218 | |
Suncor Energy Incorporated | | | 5.95 | | | | 12-1-2034 | | | | 52,000 | | | | 63,317 | |
Total Capital Canada Limited | | | 2.75 | | | | 7-15-2023 | | | | 245,000 | | | | 262,176 | |
Total Capital International SA | | | 2.70 | | | | 1-25-2023 | | | | 385,000 | | | | 405,956 | |
Total Capital International SA | | | 2.88 | | | | 2-17-2022 | | | | 175,000 | | | | 181,530 | |
Total Capital International SA | | | 3.75 | | | | 4-10-2024 | | | | 350,000 | | | | 388,990 | |
TransCanada PipeLines Limited | | | 3.75 | | | | 10-16-2023 | | | | 175,000 | | | | 190,933 | |
TransCanada PipeLines Limited | | | 6.10 | | | | 6-1-2040 | | | | 210,000 | | | | 288,090 | |
| | | | |
| | | | | | | | | | | | | | | 3,247,596 | |
| | | | | | | | | | | | | | | | |
| | | | |
Financials: 10.43% | | | | | | | | | | | | | | | | |
| | | | |
| Banks: 7.84% | | | | | | | | | | | | |
Australia & New Zealand Banking Group Limited | | | 2.55 | | | | 11-23-2021 | | | | 250,000 | | | | 256,904 | |
Australia & New Zealand Banking Group Limited | | | 2.63 | | | | 5-19-2022 | | | | 300,000 | | | | 311,942 | |
Bank of Montreal | | | 2.35 | | | | 9-11-2022 | | | | 200,000 | | | | 208,421 | |
Bank of Montreal (USD Swap Semi Annual (vs. 3 Month LIBOR) 5 Year +1.43%) ± | | | 3.80 | | | | 12-15-2032 | | | | 600,000 | | | | 664,992 | |
Bank of Nova Scotia | | | 2.45 | | | | 9-19-2022 | | | | 300,000 | | | | 313,280 | |
Bank of Nova Scotia | | | 4.50 | | | | 12-16-2025 | | | | 500,000 | | | | 581,039 | |
Barclays plc | | | 4.38 | | | | 1-12-2026 | | | | 200,000 | | | | 227,418 | |
Barclays plc | | | 5.25 | | | | 8-17-2045 | | | | 400,000 | | | | 548,358 | |
BNP Paribas | | | 4.25 | | | | 10-15-2024 | | | | 400,000 | | | | 445,635 | |
BPCE SA | | | 2.75 | | | | 12-2-2021 | | | | 330,000 | | | | 339,709 | |
Cooperatieve Rabobank UA | | | 3.75 | | | | 7-21-2026 | | | | 780,000 | | | | 879,303 | |
Credit Suisse Group Funding Limited | | | 4.55 | | | | 4-17-2026 | | | | 950,000 | | | | 1,114,095 | |
Deutsche Bank | | | 3.95 | | | | 2-27-2023 | | | | 300,000 | | | | 316,963 | |
HSBC Holdings plc | | | 4.00 | | | | 3-30-2022 | | | | 200,000 | | | | 210,790 | |
HSBC Holdings plc (3 Month LIBOR +1.53%) ± | | | 4.58 | | | | 6-19-2029 | | | | 400,000 | | | | 466,974 | |
ING Banking Group plc | | | 4.55 | | | | 10-2-2028 | | | | 900,000 | | | | 1,099,257 | |
Lloyds Banking Group plc | | | 4.58 | | | | 12-10-2025 | | | | 250,000 | | | | 281,431 | |
Lloyds Banking Group plc | | | 5.30 | | | | 12-1-2045 | | | | 300,000 | | | | 415,182 | |
Mitsubishi UFJ Financial Group Incorporated | | | 2.19 | | | | 9-13-2021 | | | | 600,000 | | | | 611,135 | |
Mitsubishi UFJ Financial Group Incorporated | | | 3.22 | | | | 3-7-2022 | | | | 1,300,000 | | | | 1,354,098 | |
Mitsubishi UFJ Financial Group Incorporated | | | 3.68 | | | | 2-22-2027 | | | | 200,000 | | | | 227,610 | |
Mizuho Financial Group | | | 3.17 | | | | 9-11-2027 | | | | 600,000 | | | | 665,546 | |
National Australia Bank Limited | | | 2.50 | | | | 7-12-2026 | | | | 800,000 | | | | 872,814 | |
NatWest Group plc | | | 3.88 | | | | 9-12-2023 | | | | 300,000 | | | | 325,527 | |
NatWest Group plc | | | 4.80 | | | | 4-5-2026 | | | | 400,000 | | | | 469,937 | |
Rabobank Nederland NV | | | 3.88 | | | | 2-8-2022 | | | | 250,000 | | | | 262,745 | |
Royal Bank of Canada | | | 4.65 | | | | 1-27-2026 | | | | 700,000 | | | | 828,900 | |
Santander UK plc | | | 4.00 | | | | 3-13-2024 | | | | 200,000 | | | | 221,425 | |
The accompanying notes are an integral part of these financial statements.
Wells Fargo Investment Grade Corporate Bond Portfolio | 19
Portfolio of investments—August 31, 2020 (unaudited)
| | | | | | | | | | | | | | | | |
| | | Interest rate | | | Maturity date | | | Principal | | | Value | |
| | | | |
| Banks (continued) | | | | | | | | | | | | |
Sumitomo Mitsui Banking Corporation | | | 3.95 | % | | | 7-19-2023 | | | $ | 250,000 | | | $ | 272,742 | |
Sumitomo Mitsui Financial Group | | | 3.01 | | | | 10-19-2026 | | | | 655,000 | | | | 725,638 | |
Toronto Dominion Bank | | | 3.50 | | | | 7-19-2023 | | | | 300,000 | | | | 327,548 | |
Toronto Dominion Bank (USD Swap Semi Annual (vs. 3 Month LIBOR) 5 Year +2.21%) ± | | | 3.63 | | | | 9-15-2031 | | | | 525,000 | | | | 597,025 | |
Westpac Banking Corporation | | | 2.50 | | | | 6-28-2022 | | | | 200,000 | | | | 208,028 | |
Westpac Banking Corporation | | | 2.85 | | | | 5-13-2026 | | | | 700,000 | | | | 777,285 | |
| | | | |
| | | | | | | | | | | | | | | 17,429,696 | |
| | | | | | | | | | | | | | | | |
| | | | |
| Capital Markets: 0.09% | | | | | | | | | | | | |
Invesco Finance plc | | | 4.00 | | | | 1-30-2024 | | | | 175,000 | | | | 191,692 | |
| | | | | | | | | | | | | | | | |
| | | | |
| Diversified Financial Services: 2.26% | | | | | | | | | | | | |
AerCap Ireland Capital DAC | | | 3.95 | | | | 2-1-2022 | | | | 520,000 | | | | 526,563 | |
Barrick Australian Finance Proprietary Limited | | | 5.95 | | | | 10-15-2039 | | | | 135,000 | | | | 192,394 | |
BHP Billiton Finance USA Limited | | | 3.85 | | | | 9-30-2023 | | | | 200,000 | | | | 221,160 | |
Brookfield Finance Incorporated | | | 4.25 | | | | 6-2-2026 | | | | 200,000 | | | | 228,217 | |
ConocoPhillips Canada Funding Company | | | 5.95 | | | | 10-15-2036 | | | | 210,000 | | | | 293,129 | |
DH Europe Finance II | | | 3.25 | | | | 11-15-2039 | | | | 900,000 | | | | 1,009,822 | |
GE Capital International Funding Company | | | 3.37 | | | | 11-15-2025 | | | | 550,000 | | | | 582,870 | |
Medtronic Global Holdings Company | | | 3.35 | | | | 4-1-2027 | | | | 300,000 | | | | 343,691 | |
Shell International Finance BV | | | 2.25 | | | | 1-6-2023 | | | | 175,000 | | | | 183,313 | |
Shell International Finance BV | | | 2.38 | | | | 8-21-2022 | | | | 175,000 | | | | 181,949 | |
Shell International Finance BV | | | 2.88 | | | | 5-10-2026 | | | | 230,000 | | | | 255,957 | |
Shell International Finance BV | | | 3.25 | | | | 5-11-2025 | | | | 350,000 | | | | 390,981 | |
Shell International Finance BV | | | 3.40 | | | | 8-12-2023 | | | | 175,000 | | | | 190,089 | |
Shell International Finance BV | | | 3.63 | | | | 8-21-2042 | | | | 175,000 | | | | 193,791 | |
WPP Finance Limited 2010 | | | 3.75 | | | | 9-19-2024 | | | | 200,000 | | | | 219,359 | |
| | | | |
| | | | | | | | | | | | | | | 5,013,285 | |
| | | | | | | | | | | | | | | | |
| | | | |
| Insurance: 0.24% | | | | | | | | | | | | |
Aon plc | | | 3.88 | | | | 12-15-2025 | | | | 200,000 | | | | 229,316 | |
Aon plc | | | 4.00 | | | | 11-27-2023 | | | | 105,000 | | | | 115,126 | |
XLIT Limited | | | 5.25 | | | | 12-15-2043 | | | | 140,000 | | | | 190,521 | |
| | | | |
| | | | | | | | | | | | | | | 534,963 | |
| | | | | | | | | | | | | | | | |
| | | | |
Health Care: 0.77% | | | | | | | | | | | | | | | | |
| | | | |
| Health Care Equipment & Supplies: 0.12% | | | | | | | | | | | | |
Koninklijke Philips Electronics NV | | | 6.88 | | | | 3-11-2038 | | | | 175,000 | | | | 266,665 | |
| | | | | | | | | | | | | | | | |
| | | | |
| Pharmaceuticals: 0.65% | | | | | | | | | | | | |
AstraZeneca plc | | | 3.38 | | | | 11-16-2025 | | | | 500,000 | | | | 563,681 | |
AstraZeneca plc | | | 4.38 | | | | 11-16-2045 | | | | 200,000 | | | | 263,268 | |
Shire plc | | | 3.20 | | | | 9-23-2026 | | | | 560,000 | | | | 627,124 | |
| | | | |
| | | | | | | | | | | | | | | 1,454,073 | |
| | | | | | | | | | | | | | | | |
| | | | |
Industrials: 0.52% | | | | | | | | | | | | | | | | |
| | | | |
| Machinery: 0.17% | | | | | | | | | | | | |
Trane Technologies Luxembourg Finance SA | | | 4.50 | | | | 3-21-2049 | | | | 300,000 | | | | 375,918 | |
| | | | | | | | | | | | | | | | |
| | | | |
| Professional Services: 0.16% | | | | | | | | | | | | |
Thomson Reuters Corporation | | | 4.30 | | | | 11-23-2023 | | | | 210,000 | | | | 230,839 | |
Thomson Reuters Corporation | | | 5.85 | | | | 4-15-2040 | | | | 94,000 | | | | 125,511 | |
| | | | |
| | | | | | | | | | | | | | | 356,350 | |
| | | | | | | | | | | | | | | | |
The accompanying notes are an integral part of these financial statements.
20 | Wells Fargo Investment Grade Corporate Bond Portfolio
Portfolio of investments—August 31, 2020 (unaudited)
| | | | | | | | | | | | | | | | |
| | | Interest rate | | | Maturity date | | | Principal | | | Value | |
| Road & Rail: 0.19% | | | | | | | | | | | | |
Canadian National Railway Company | | | 6.20 | % | | | 6-1-2036 | | | $ | 140,000 | | | $ | 213,317 | |
Canadian Pacific Railway Company | | | 4.45 | | | | 3-15-2023 | | | | 140,000 | | | | 151,789 | |
Canadian Pacific Railway Company | | | 5.95 | | | | 5-15-2037 | | | | 45,000 | | | | 66,599 | |
| | | | |
| | | | | | | | | | | | | | | 431,705 | |
| | | | | | | | | | | | | | | | |
| | | | |
Information Technology: 0.17% | | | | | | | | | | | | | | | | |
| | | | |
| Technology Hardware, Storage & Peripherals: 0.17% | | | | | | | | | | | | |
Seagate HDD | | | 4.75 | | | | 1-1-2025 | | | | 350,000 | | | | 381,670 | |
| | | | | | | | | | | | | | | | |
| | | | |
Materials: 0.93% | | | | | | | | | | | | | | | | |
| | | | |
| Chemicals: 0.55% | | | | | | | | | | | | |
LyondellBasell Industries NV | | | 4.63 | | | | 2-26-2055 | | | | 350,000 | | | | 398,609 | |
Nutrien Limited | | | 3.63 | | | | 3-15-2024 | | | | 200,000 | | | | 218,249 | |
Nutrien Limited | | | 5.00 | | | | 4-1-2049 | | | | 200,000 | | | | 260,580 | |
Nutrien Limited | | | 5.63 | | | | 12-1-2040 | | | | 140,000 | | | | 178,653 | |
Nutrien Limited | | | 6.13 | | | | 1-15-2041 | | | | 115,000 | | | | 152,313 | |
| | | | |
| | | | | | | | | | | | | | | 1,208,404 | |
| | | | | | | | | | | | | | | | |
| | | | |
| Metals & Mining: 0.38% | | | | | | | | | | | | |
Rio Tinto Finance (USA) Limited | | | 4.13 | | | | 8-21-2042 | | | | 175,000 | | | | 222,162 | |
Vale Overseas Limited | | | 6.88 | | | | 11-21-2036 | | | | 382,000 | | | | 507,434 | |
Vale Overseas Limited | | | 6.88 | | | | 11-10-2039 | | | | 91,000 | | | | 122,736 | |
| | | | |
| | | | | | | | | | | | | | | 852,332 | |
| | | | | | | | | | | | | | | | |
| | | | |
Total Yankee Corporate Bonds and Notes (Cost $32,445,253) | | | | | | | | | | | | | | | 36,548,958 | |
| | | | | | | | | | | | | | | | |
| | | | |
| | | | | | | | | | | | | | | | |
| | | Yield | | | | | | Shares | | | | |
| Short-Term Investments: 3.98% | | | | | | | | | | | | | | | | |
| | | | |
| Investment Companies: 3.98% | | | | | | | | | | | | |
Wells Fargo Government Money Market Fund Select Class (l)(u) | | | 0.06 | | | | | | | | 8,837,670 | | | | 8,837,670 | |
| | | | | | | | | | | | | | | | |
| | | | |
Total Short-Term Investments (Cost $8,837,670) | | | | | | | | | | | | | | | 8,837,670 | |
| | | | | | | | | | | | | | | | |
| | | | | | | | |
| Total investments in securities (Cost $197,152,214) | | | 100.43 | % | | | 223,175,214 | |
| | |
Other assets and liabilities, net | | | (0.43 | ) | | | (946,909 | ) |
| | | | | | | | |
| Total net assets | | | 100.00 | % | | $ | 222,228,305 | |
| | | | | | | | |
| 144A | The security may be resold in transactions exempt from registration, normally to qualified institutional buyers, pursuant to Rule 144A under the Securities Act of 1933. |
| ± | Variable rate investment. The rate shown is the rate in effect at period end. |
| (l) | The issuer of the security is an affiliated person of the Portfolio as defined in the Investment Company Act of 1940. |
| (u) | The rate represents the 7-day annualized yield at period end. |
Abbreviations:
| LIBOR | London Interbank Offered Rate |
| REIT | Real estate investment trust |
The accompanying notes are an integral part of these financial statements.
Wells Fargo Investment Grade Corporate Bond Portfolio | 21
Portfolio of investments—August 31, 2020 (unaudited)
Investments in Affiliates
An affiliated investment is an investment in which the Portfolio owns at least 5% of the outstanding voting shares of the issuer or as a result of other relationships, such as the Portfolio and the issuer having the same adviser or investment manager. Transactions with issuers that were either affiliated persons of the Portfolio at the beginning of the period or the end of the period were as follows:
| | | | | | | | | | | | | | | | | | | | | | | | | | | | | | | | |
| | | Value, beginning of period | | | Purchases | | | Sales proceeds | | | Net realized gains (losses) | | | Net change in unrealized gains (losses) | | | Income from affiliated securities | | | Value, end of period | | | % of net assets | |
| | | | | | | | |
| Short-Term Investments | | | | | | | | | | | | | | | | | | | | | | | | |
Investment Companies | | | | | | | | | | | | | | | | | | | | | | | | | | | | | | | | |
Wells Fargo Government Money Market Fund Select Class | | $ | 289,733 | | | $ | 38,780,166 | | | $ | (30,232,229 | ) | | $ | 0 | | | $ | 0 | | | $ | 1,649 | | | $ | 8,837,670 | | | | 3.98 | % |
The accompanying notes are an integral part of these financial statements.
22 | Wells Fargo Investment Grade Corporate Bond Portfolio
Statement of assets and liabilities—August 31, 2020 (unaudited)
| | | | |
| | | | |
| |
Assets | | | | |
Investments in unaffiliated securities, at value (cost $188,314,544) | | $ | 214,337,544 | |
Investments in affiliated securities, at value (cost $8,837,670) | | | 8,837,670 | |
Receivable for investments sold | | | 179,792 | |
Receivable for interest | | | 2,086,923 | |
Prepaid expenses and other assets | | | 4,612 | |
| | | | |
Total assets | | | 225,446,541 | |
| | | | |
| |
Liabilities | | | | |
Payable for investments purchased | | | 3,092,526 | |
Advisory fee payable | | | 992 | |
Trustees’ fees and expenses payable | | | 1,966 | |
Accrued expenses and other liabilities | | | 122,752 | |
| | | | |
Total liabilities | | | 3,218,236 | |
| | | | |
Total net assets | | $ | 222,228,305 | |
| | | | |
The accompanying notes are an integral part of these financial statements.
Wells Fargo Investment Grade Corporate Bond Portfolio | 23
Statement of operations—six months ended August 31, 2020 (unaudited)
| | | | |
| | | | |
| |
Investment income | | | | |
Interest | | $ | 3,736,400 | |
Income from affiliated securities | | | 1,649 | |
| | | | |
Total investment income | | | 3,738,049 | |
| | | | |
| |
Expenses | | | | |
Advisory fee | | | 54,490 | |
Custody and accounting fees | | | 11,345 | |
Professional fees | | | 22,434 | |
Shareholder report expenses | | | 4,253 | |
Trustees’ fees and expenses | | | 9,898 | |
Other fees and expenses | | | 8,311 | |
| | | | |
Total expenses | | | 110,731 | |
Less: Fee waivers and/or expense reimbursements | | | (45,094 | ) |
| | | | |
Net expenses | | | 65,637 | |
| | | | |
Net investment income | | | 3,672,412 | |
| | | | |
| |
Realized and unrealized gains (losses) on investments | | | | |
Net realized gains on investments | | | 1,815,765 | |
Net change in unrealized gains (losses) on investments | | | (130,299 | ) |
| | | | |
Net realized and unrealized gains (losses) on investments | | | 1,685,466 | |
| | | | |
Net increase in net assets resulting from operations | | $ | 5,357,878 | |
| | | | |
The accompanying notes are an integral part of these financial statements.
24 | Wells Fargo Investment Grade Corporate Bond Portfolio
Statement of changes in net assets
| | | | | | | | |
| | | Six months ended
August 31, 2020
(unaudited) | | | Year ended
February 29, 2020 | |
| | |
Operations | | | | | | | | |
Net investment income | | $ | 3,672,412 | | | $ | 9,435,352 | |
Net realized gains on investments | | | 1,815,765 | | | | 3,167,122 | |
Net change in unrealized gains (losses) on investments | | | (130,299 | ) | | | 25,957,585 | |
| | | | |
Net increase in net assets resulting from operations | | | 5,357,878 | | | | 38,560,059 | |
| | | | |
| | |
Capital transactions | | | | | | | | |
Transactions in investors’ beneficial interests | | | | | | | | |
Contributions | | | 25,891,576 | | | | 29,912,651 | |
Withdrawals | | | (70,937,006 | ) | | | (70,686,869 | ) |
| | | | |
Net decrease in net assets resulting from capital transactions | | | (45,045,430 | ) | | | (40,774,218 | ) |
| | | | |
Total decrease in net assets | | | (39,687,552 | ) | | | (2,214,159 | ) |
| | | | |
| | |
Net assets | | | | | | | | |
Beginning of period | | | 261,915,857 | | | | 264,130,016 | |
| | | | |
End of period | | $ | 222,228,305 | | | $ | 261,915,857 | |
| | | | |
The accompanying notes are an integral part of these financial statements.
Wells Fargo Investment Grade Corporate Bond Portfolio | 25
Financial highlights
| | | | | | | | | | | | | | | | |
| | | Six months ended
August 31, 2020
(unaudited) | | | Year ended
February 29, 2020 | | | Year ended February 28 | |
| | | 2019 | | | 20181 | |
Total return2 | | | 2.71 | % | | | 15.72 | % | | | 2.29 | % | | | (0.12 | )% |
Ratios to average net assets (annualized) | | | | | | | | | | | | | | | | |
Gross expenses | | | 0.10 | % | | | 0.10 | % | | | 0.09 | % | | | 0.08 | % |
Net expenses | | | 0.06 | % | | | 0.07 | % | | | 0.08 | % | | | 0.08 | % |
Net investment income | | | 3.37 | % | | | 3.59 | % | | | 3.74 | % | | | 3.48 | % |
Supplemental data | | | | | | | | | | | | | | | | |
Portfolio turnover rate | | | 11 | % | | | 18 | % | | | 25 | % | | | 61 | % |
| 1 | For the period from May 23, 2017 (commencement of operations) to February 28, 2018 |
| 2 | Returns for periods of less than one year are not annualized. |
The accompanying notes are an integral part of these financial statements.
26 | Wells Fargo Investment Grade Corporate Bond Portfolio
Notes to financial statements (unaudited)
1. ORGANIZATION
Wells Fargo Master Trust (the “Trust”), a Delaware statutory trust organized on March 10, 1999, is an open-end management investment company registered under the Investment Company Act of 1940, as amended (the “1940 Act”). As an investment company, the Trust follows the accounting and reporting guidance in Financial Accounting Standards Board (“FASB”) Accounting Standards Codification Topic 946, Financial Services – Investment Companies. These financial statements report on the Wells Fargo Investment Grade Corporate Bond Portfolio (the “Portfolio”) which is a diversified series of the Trust.
Interests in the Portfolio are available solely through private placement transactions that do not involve any “public offering” within the meaning of Section 4(2) of the Investment Company Act of 1933.
2. SIGNIFICANT ACCOUNTING POLICIES
The following significant accounting policies, which are consistently followed in the preparation of the financial statements of the Portfolio, are in conformity with U.S. generally accepted accounting principles which require management to make estimates and assumptions that affect the reported amounts of assets and liabilities, disclosure of contingent assets and liabilities at the date of the financial statements, and the reported amounts of revenues and expenses during the reporting period. Actual results could differ from those estimates.
Securities valuation
All investments are valued each business day as of the close of regular trading on the New York Stock Exchange (generally 4 p.m. Eastern Time), although the Portfolio may deviate from this calculation time under unusual or unexpected circumstances.
Debt securities are valued at the evaluated bid price provided by an independent pricing service (e.g. taking into account various factors, including yields, maturities, or credit ratings) or, if a reliable price is not available, the quoted bid price from an independent broker-dealer.
Investments in registered open-end investment companies are valued at net asset value.
Investments which are not valued using any of the methods discussed above are valued at their fair value, as determined in good faith by the Board of Trustees of the Portfolio. The Board of Trustees has established a Valuation Committee comprised of the Trustees and has delegated to it the authority to take any actions regarding the valuation of portfolio securities that the Valuation Committee deems necessary or appropriate, including determining the fair value of portfolio securities, unless the determination has been delegated to the Wells Fargo Asset Management Pricing Committee at Wells Fargo Funds Management, LLC (“Funds Management”). The Board of Trustees retains the authority to make or ratify any valuation decisions or approve any changes to the Valuation Procedures as it deems appropriate. On a quarterly basis, the Board of Trustees receives reports on any valuation actions taken by the Valuation Committee or the Wells Fargo Asset Management Pricing Committee which may include items for ratification.
Security transactions and income recognition
Securities transactions are recorded on a trade date basis. Realized gains or losses are recorded on the basis of identified cost.
Interest income is accrued daily and bond discounts are accreted and premiums are amortized daily. To the extent debt obligations are placed on non-accrual status, any related interest income may be reduced by writing off interest receivables when the collection of all or a portion of interest has been determined to be doubtful based on consistently applied procedures and the fair value has decreased. If the issuer subsequently resumes interest payments or when the collectability of interest is reasonably assured, the debt obligation is removed from non-accrual status.
Federal and other taxes
The Portfolio is not required to pay federal income taxes on its net investment income and net capital gains as it is treated as a partnership for federal income tax purposes. All income, gains and losses of the Portfolio are deemed to have been “passed through” to the interest holders in proportion to their holdings of the Portfolio regardless of whether income and gains have been distributed by the Portfolio.
The Portfolio’s income tax returns and all financial records supporting those returns for the prior three fiscal years are subject to examination by the federal revenue authority. Management has analyzed the Portfolio’s tax positions taken on federal, state, and foreign tax returns for all open tax years and does not believe that there are any uncertain tax positions that require recognition of a tax liability.
Wells Fargo Investment Grade Corporate Bond Portfolio | 27
Notes to financial statements (unaudited)
As of August 31, 2020, the aggregate cost of all investments for federal income tax purposes was $197,152,214 and the unrealized gains (losses) consisted of:
| | | | |
| |
Gross unrealized gains | | $ | 26,206,855 | |
| |
Gross unrealized losses | | | (183,855 | ) |
| |
Net unrealized gains | | $ | 26,023,000 | |
3. FAIR VALUATION MEASUREMENTS
Fair value measurements of investments are determined within a framework that has established a fair value hierarchy based upon the various data inputs utilized in determining the value of the Portfolio’s investments. The three-level hierarchy gives the highest priority to unadjusted quoted prices in active markets for identical assets or liabilities (Level 1) and the lowest priority to unobservable inputs (Level 3). The Portfolio’s investments are classified within the fair value hierarchy based on the lowest level of input that is significant to the fair value measurement. The inputs are summarized into three broad levels as follows:
| ∎ | | Level 1 – quoted prices in active markets for identical securities |
| ∎ | | Level 2 – other significant observable inputs (including quoted prices for similar securities, interest rates, prepayment speeds, credit risk, etc.) |
| ∎ | | Level 3 – significant unobservable inputs (including the Portfolio’s own assumptions in determining the fair value of investments) |
The inputs or methodologies used for valuing investments in securities are not necessarily an indication of the risk associated with investing in those securities.
The following is a summary of the inputs used in valuing the Portfolio’s assets and liabilities as of August 31, 2020:
| | | | | | | | | | | | | | | | |
| | | | |
| | | Quoted prices (Level 1) | | | Other significant observable inputs (Level 2) | | | Significant unobservable inputs (Level 3) | | | Total | |
| | | | |
Assets | | | | | | | | | | | | | | | | |
Investments in: | | | | | | | | | | | | | | | | |
| | | | |
Corporate bonds and notes | | $ | 0 | | | $ | 177,788,586 | | | $ | 0 | | | $ | 177,788,586 | |
| | | | |
Yankee corporate bonds and notes | | | 0 | | | | 36,548,958 | | | | 0 | | | | 36,548,958 | |
| | | | |
Short-term investments | | | | | | | | | | | | | | | | |
| | | | |
Investment companies | | | 8,837,670 | | | | 0 | | | | 0 | | | | 8,837,670 | |
| | | | |
Total assets | | $ | 8,837,670 | | | $ | 214,337,544 | | | $ | 0 | | | $ | 223,175,214 | |
Additional sector, industry or geographic detail is included in the Portfolio of Investments.
For the six months ended August 31, 2020, the Portfolio did not have any transfers into/out of Level 3.
4. TRANSACTIONS WITH AFFILIATES
Advisory fee
The Trust has entered into an advisory contract with Funds Management, an indirect wholly owned subsidiary of Wells Fargo & Company (“Wells Fargo”). The adviser is responsible for implementing investment policies and guidelines and for supervising the subadviser, who is responsible for day-to-day portfolio management of the Portfolio. Pursuant to the contract, Funds Management is entitled to receive an advisory fee at the following annual rate based on the Portfolio’s average daily net assets:
| | | | |
| |
| Average daily net assets | | Advisory fee | |
| |
First $5 billion | | | 0.05 | % |
| |
Next $5 billion | | | 0.04 | |
| |
Over $10 billion | | | 0.03 | |
For the six months ended August 31, 2020, the advisory fee was equivalent to an annual rate of 0.05% of the Portfolio’s average daily net assets.
28 | Wells Fargo Investment Grade Corporate Bond Portfolio
Notes to financial statements (unaudited)
Funds Management has retained the services of a subadviser to provide daily portfolio management to the Portfolio. The fee for subadvisory services is borne by Funds Management. Wells Capital Management Incorporated, an affiliate of Funds Management and an indirect wholly owned subsidiary of Wells Fargo, is the subadviser to the Portfolio and is entitled to receive a fee from Funds Management at an annual rate starting at 0.04% and declining to 0.03% as the average daily net assets of the Portfolio increase.
Funds Management has voluntarily waived and/or reimbursed advisory fees to reduce the net operating expense ratio of the Portfolio.
Interfund transactions
The Portfolio may purchase or sell portfolio investment securities to certain other Wells Fargo affiliates pursuant to Rule 17a-7 under the 1940 Act and under procedures adopted by the Board of Trustees. The procedures have been designed to ensure that these interfund transactions, which do not incur broker commissions, are effected at current market prices.
5. INVESTMENT PORTFOLIO TRANSACTIONS
Purchases and sales of investments, excluding U.S. government obligations (if any) and short-term securities, for the six months ended August 31, 2020 were $23,049,423 and $67,498,743, respectively.
6. BANK BORROWINGS
The Trust, along with Wells Fargo Variable Trust and Wells Fargo Funds Trust (excluding the money market funds), are parties to a $350,000,000 revolving credit agreement whereby the Portfolio is permitted to use bank borrowings for temporary or emergency purposes, such as to fund shareholder redemption requests. Interest under the credit agreement is charged to the Portfolio based on a borrowing rate equal to the higher of the Federal Funds rate in effect on that day plus 1.25% or the overnight LIBOR rate in effect on that day plus 1.25%. In addition, an annual commitment fee equal to 0.25% of the unused balance is allocated to each participating fund.
For the six months ended August 31, 2020, there were no borrowings by the Portfolio under the agreement.
7. CONCENTRATION RISK
Concentration risks result from exposure to a limited number of sectors. As of the end of the period, the Fund invested a concentration of its portfolio in the financials sector. A portfolio that invests a substantial portion of its assets in any sector may be more affected by changes in that sector than would be a fund whose investments are not heavily weighted in any sector.
8. INDEMNIFICATION
Under the Portfolio’s organizational documents, the officers and Trustees have been granted certain indemnification rights against certain liabilities that may arise out of performance of their duties to the Portfolio. The Portfolio has entered into a separate agreement with each Trustee that converts indemnification rights currently existing under the Portfolio’s organizational documents into contractual rights that cannot be changed in the future without the consent of the Trustee. Additionally, in the normal course of business, the Portfolio may enter into contracts with service providers that contain a variety of indemnification clauses. The Portfolio’s maximum exposure under these arrangements is dependent on future claims that may be made against the Portfolio and, therefore, cannot be estimated.
9. NEW ACCOUNTING PRONOUNCEMENT
In August 2018, FASB issued Accounting Standards Update (“ASU”) No. 2018-13, Fair Value Measurement (Topic 820) Disclosure Framework—Changes to the Disclosure Requirements for Fair Value Measurement. ASU 2018-13 updates the disclosure requirements on fair value measurements in Topic 820, Fair Value Measurements. The amendments are effective for fiscal years, and interim periods within those fiscal years, beginning after December 15, 2019. Management has adopted this guidance which did not have a material impact on the financial statements.
10. CORONAVIRUS (COVID-19) PANDEMIC
On March 11, 2020, the World Health Organization announced that it had made the assessment that coronavirus disease 2019 (“COVID-19”) is a pandemic. The impacts of COVID-19 are adversely affecting the entire global economy, individual companies and investment products, and the market in general. There is significant uncertainty around the extent and duration of business disruptions related to COVID-19 and the impacts may be short term or may last for an extended period of time. The risk of further spreading of COVID-19 has led to significant uncertainty and volatility in the financial markets.
Wells Fargo Investment Grade Corporate Bond Portfolio | 29
Other information (unaudited)
PROXY VOTING INFORMATION
A description of the policies and procedures used to determine how to vote proxies relating to portfolio securities is available, upon request, by calling 1-800-222-8222, visiting our website at wfam.com, or visiting the SEC website at sec.gov. Information regarding how the proxies related to portfolio securities were voted during the most recent 12-month period ended June 30 is available on the website at wfam.com or by visiting the SEC website at sec.gov.
QUARTERLY PORTFOLIO HOLDINGS INFORMATION
The Portfolio files its complete schedule of portfolio holdings with the SEC for the first and third quarters of each fiscal year as an exhibit to its reports on Form N-PORT. Shareholders may view the filed Form N-PORT by visiting the SEC website at sec.gov.
30 | Wells Fargo Investment Grade Corporate Bond Portfolio
Other information (unaudited)
BOARD OF TRUSTEES AND OFFICERS
Each of the Trustees and Officers1 listed in the table below acts in identical capacities for each fund in the Wells Fargo family of funds, which consists of 142 mutual funds comprising the Wells Fargo Funds Trust, Wells Fargo Variable Trust, Wells Fargo Master Trust and four closed-end funds (collectively the “Fund Complex”). This table should be read in conjunction with the Prospectus and the Statement of Additional Information2. The mailing address of each Trustee and Officer is 525 Market Street, 12th Floor, San Francisco, CA 94105. Each Trustee and Officer serves an indefinite term, however, each Trustee serves such term until reaching the mandatory retirement age established by the Trustees.
Independent Trustees
| | | | | | |
Name and year of birth | | Position held and
length of service* | | Principal occupations during past five years or longer | | Current other
public company or
investment
company
directorships |
| | | |
William R. Ebsworth (Born 1957) | | Trustee, since 2015 | | Retired. From 1984 to 2013, equities analyst, portfolio manager, research director and chief investment officer at Fidelity Management and Research Company in Boston, Tokyo, and Hong Kong, and retired in 2013 as Chief Investment Officer of Fidelity Strategic Advisers, Inc. where he led a team of investment professionals managing client assets. Prior thereto, Board member of Hong Kong Securities Clearing Co., Hong Kong Options Clearing Corp., the Thailand International Fund, Ltd., Fidelity Investments Life Insurance Company, and Empire Fidelity Investments Life Insurance Company. Audit Committee Chair and Investment Committee Chair of the Vincent Memorial Hospital Endowment (non-profit organization). Mr. Ebsworth is a CFA® charterholder. | | N/A |
| | | |
Jane A. Freeman (Born 1953) | | Trustee, since 2015; Chair Liaison, since 2018 | | Retired. From 2012 to 2014 and 1999 to 2008, Chief Financial Officer of Scientific Learning Corporation. From 2008 to 2012, Ms. Freeman provided consulting services related to strategic business projects. Prior to 1999, Portfolio Manager at Rockefeller & Co. and Scudder, Stevens & Clark. Board member of the Harding Loevner Funds from 1996 to 2014, serving as both Lead Independent Director and chair of the Audit Committee. Board member of the Russell Exchange Traded Funds Trust from 2011 to 2012 and the chair of the Audit Committee. Ms. Freeman is also an inactive Chartered Financial Analyst. | | N/A |
| | | |
Isaiah Harris, Jr. (Born 1952) | | Trustee, since 2009; Audit Committee Chairman, since 2019 | | Retired. Chairman of the Board of CIGNA Corporation since 2009, and Director since 2005. From 2003 to 2011, Director of Deluxe Corporation. Prior thereto, President and CEO of BellSouth Advertising and Publishing Corp. from 2005 to 2007, President and CEO of BellSouth Enterprises from 2004 to 2005 and President of BellSouth Consumer Services from 2000 to 2003. Emeritus member of the Iowa State University Foundation Board of Governors. Emeritus Member of the Advisory Board of Iowa State University School of Business. Advisory Board Member, Palm Harbor Academy (private school). Mr. Harris is a certified public accountant (inactive status). | | CIGNA Corporation |
| | | |
Judith M. Johnson (Born 1949) | | Trustee, since 2008 | | Retired. Prior thereto, Chief Executive Officer and Chief Investment Officer of Minneapolis Employees Retirement Fund from 1996 to 2008. Ms. Johnson is an attorney, certified public accountant and a certified managerial accountant. | | N/A |
| | | |
David F. Larcker (Born 1950) | | Trustee, since 2009 | | James Irvin Miller Professor of Accounting at the Graduate School of Business (Emeritus), Stanford University, Director of the Corporate Governance Research Initiative and Senior Faculty of The Rock Center for Corporate Governance since 2006. From 2005 to 2008, Professor of Accounting at the Graduate School of Business, Stanford University. Prior thereto, Ernst & Young Professor of Accounting at The Wharton School, University of Pennsylvania from 1985 to 2005. | | N/A |
Wells Fargo Investment Grade Corporate Bond Portfolio | 31
Other information (unaudited)
| | | | | | |
Name and year of birth | | Position held and
length of service* | | Principal occupations during past five years or longer | | Current other
public company or
investment
company
directorships |
| | | |
Olivia S. Mitchell (Born 1953) | | Trustee, since 2006; Nominating and Governance Committee Chair, since 2018 | | International Foundation of Employee Benefit Plans Professor, Wharton School of the University of Pennsylvania since 1993. Director of Wharton’s Pension Research Council and Boettner Center on Pensions & Retirement Research, and Research Associate at the National Bureau of Economic Research. Previously, Cornell University Professor from 1978 to 1993. | | N/A |
| | | |
Timothy J. Penny (Born 1951) | | Trustee, since 1996; Chairman, since 2018 | | President and Chief Executive Officer of Southern Minnesota Initiative Foundation, a non-profit organization, since 2007. Member of the Board of Trustees of NorthStar Education Finance, Inc., a non-profit organization, since 2007. | | N/A |
| | | |
James G. Polisson (Born 1959) | | Trustee, since 2018 | | Retired. Chief Marketing Officer, Source (ETF) UK Services, Ltd, from 2015 to 2017. From 2012 to 2015, Principal of The Polisson Group, LLC, a management consulting, corporate advisory and principal investing company. Chief Executive Officer and Managing Director at Russell Investments, Global Exchange Traded Funds from 2010 to 2012. Managing Director of Barclays Global Investors from 1998 to 2010 and Global Chief Marketing Officer for iShares and Barclays Global Investors from 2000 to 2010. Trustee of the San Francisco Mechanics’ Institute, a non-profit organization, from 2013 to 2015. Board member of the Russell Exchange Traded Fund Trust from 2011 to 2012. Director of Barclays Global Investors Holdings Deutschland GmbH from 2006 to 2009. Mr. Polisson is an attorney and has a retired status with the Massachusetts and District of Columbia Bar Associations. | | N/A |
| | | |
Pamela Wheelock (Born 1959) | | Trustee, since January 2020; previously Trustee from January 2018 to July 2019 | | Board member of the Destination Medical Center Economic Development Agency, Rochester, Minnesota since 2019. Interim President of the McKnight Foundation from January to September 2020. Acting Commissioner, Minnesota Department of Human Services, July 2019 through September 2019. Human Services Manager (part-time), Minnesota Department of Human Services, October 2019 through December 2019. Chief Operating Officer, Twin Cities Habitat for Humanity from 2017 to 2019. Vice President of University Services, University of Minnesota from 2012 to 2016. Prior thereto, on the Board of Directors, Governance Committee and Finance Committee for the Minnesota Philanthropy Partners (Saint Paul Foundation) from 2012 to 2018, Interim Chief Executive Officer of Blue Cross Blue Shield of Minnesota from 2011 to 2012, Chairman of the Board from 2009 to 2012 and Board Director from 2003 to 2015. Vice President, Leadership and Community Engagement, Bush Foundation, Saint Paul, Minnesota (a private foundation) from 2009 to 2011. Executive Vice President and Chief Financial Officer, Minnesota Sports and Entertainment from 2004 to 2009 and Senior Vice President from 2002 to 2004. Executive Vice President of the Minnesota Wild Foundation from 2004 to 2008. Commissioner of Finance, State of Minnesota, from 1999 to 2002. Currently Board Chair of the Minnesota Wild Foundation since 2010. | | N/A |
| * | Length of service dates reflect the Trustee’s commencement of service with the Trust’s predecessor entities, where applicable. |
32 | Wells Fargo Investment Grade Corporate Bond Portfolio
Other information (unaudited)
Officers
| | | | |
Name and year of birth | | Position held and
length of service | | Principal occupations during past five years or longer |
| | |
Andrew Owen (Born 1960) | | President, since 2017 | | Executive Vice President of Wells Fargo & Company and Head of Affiliated Managers, Wells Fargo Asset Management, since 2014. In addition, Mr. Owen is currently President, Chief Executive Officer and Director of Wells Fargo Funds Management, LLC since 2017. Prior thereto, Executive Vice President responsible for marketing, investments and product development for Wells Fargo Funds Management, LLC, from 2009 to 2014. |
| | |
Jeremy DePalma1 (Born 1974) | | Treasurer, since 2012 | | Senior Vice President of Wells Fargo Funds Management, LLC since 2009. Senior Vice President of Evergreen Investment Management Company, LLC from 2008 to 2010 and head of the Fund Reporting and Control Team within Fund Administration from 2005 to 2010. |
| | |
Michelle Rhee (Born 1966) | | Chief Legal Officer, since 2019 | | Secretary of Wells Fargo Funds Management, LLC, Chief Legal Counsel of Wells Fargo Asset Management and Assistant General Counsel of Wells Fargo Bank, N.A. since 2018. Associate General Counsel and Managing Director of Bank of America Corporation from 2004 to 2018. |
| | |
Catherine Kennedy (Born 1969) | | Secretary, since 2019 | | Vice President of Wells Fargo Funds Management, LLC and Senior Counsel of the Wells Fargo Legal Department since 2010. Vice President and Senior Counsel of Evergreen Investment Management Company, LLC from 1998 to 2010. |
| | |
Michael H. Whitaker (Born 1967) | | Chief Compliance Officer, since 2016 | | Chief Compliance Officer of Wells Fargo Asset Management since 2016. Senior Vice President and Chief Compliance Officer for Fidelity Investments from 2007 to 2016. |
| | |
David Berardi (Born 1975) | | Assistant Treasurer, since 2009 | | Vice President of Wells Fargo Funds Management, LLC since 2009. Vice President of Evergreen Investment Management Company, LLC from 2008 to 2010. Manager of Fund Reporting and Control for Evergreen Investment Management Company, LLC from 2004 to 2010. |
| 1 | Jeremy DePalma acts as Treasurer of 77 funds and Assistant Treasurer of 65 funds in the Fund Complex. |
| 2 | The Statement of Additional Information includes additional information about the Trustees and is available, without charge, upon request, by calling 1-800-222-8222 or by visiting the website at wfam.com. |
Wells Fargo Investment Grade Corporate Bond Portfolio | 33
Other information (unaudited)
BOARD CONSIDERATION OF INVESTMENT MANAGEMENT, ADVISORY AND SUB-ADVISORY AGREEMENTS:
Wells Fargo Emerging Markets Bond Fund, Wells Fargo High Yield Corporate Bond Fund, Wells Fargo International Government Bond Fund, Wells Fargo U.S. Core Bond Fund, Wells Fargo Bloomberg Barclays US Aggregate ex-Corporate Credit Portfolio, Wells Fargo Factor Enhanced Emerging Markets Equity Portfolio, Wells Fargo Emerging Markets Bond Portfolio, Wells Fargo Factor Enhanced International Equity Portfolio, Wells Fargo Factor Enhanced U.S. Large Cap Portfolio, Wells Fargo Factor Enhanced U.S. Small Cap Portfolio, Wells Fargo International Government Bond Portfolio, Wells Fargo Investment Grade Corporate Bond Portfolio, Wells Fargo High Yield Corporate Bond Portfolio, Wells Fargo Strategic Retirement Bond Portfolio, and Wells Fargo U.S. REIT Portfolio
Under the Investment Company Act of 1940 (the “1940 Act”), the Board of Trustees (each, a “Board” and collectively, the “Boards”) of each of Wells Fargo Funds Trust (“Funds Trust”) and Wells Fargo Master Trust (“Master Trust”) (collectively, the “Trusts”) must determine annually whether to approve the continuation of the Trusts’ investment management, advisory and sub-advisory agreements, as applicable. In this regard, at a meeting held on May 26, 2020 and May 28, 2020 (together, the “Meeting”), the Board of Funds Trust, all the members of which have no direct or indirect interest in the investment management agreement and are not “interested persons” of the Trusts, as defined in the 1940 Act (the “Independent Trustees”), reviewed and approved for each of the funds of Funds Trust identified in the table below (individually, an “Index Fund” and collectively, the “Index Funds”) an investment management agreement (the “Management Agreement”) with Wells Fargo Funds Management, LLC (“Funds Management”).
|
|
| Index Funds |
|
Wells Fargo Emerging Markets Bond Fund |
|
Wells Fargo High Yield Corporate Bond Fund |
|
Wells Fargo International Government Bond Fund |
|
Wells Fargo U.S. Core Bond Fund |
In addition, the Funds Trust Board reviewed and approved an investment sub-advisory agreement with Wells Capital Management Incorporated (“WellsCap”) for the U.S. Core Bond Fund (the “Core Bond Fund Sub-Advisory Agreement”).
At the Meeting, the Board of Master Trust, all the members of which have no direct or indirect interest in the investment advisory and sub-advisory agreements and are Independent Trustees, reviewed and approved for each of the portfolios of Master Trust identified in the table below (individually, a “Master Portfolio” and collectively, the “Master Portfolios”): (i) an investment advisory agreement (the “Master Portfolio Advisory Agreement”) with Funds Management; and (ii) an investment sub-advisory agreement (each, a “Master Portfolio Sub-Advisory Agreement”, and collectively, the “Master Portfolio Sub-Advisory Agreements”) with the sub-adviser(s) identified in the chart below (each, a “Sub-Adviser”, and collectively, the “Sub-Advisers”) for the corresponding Master Portfolio identified.
| | |
| |
| Master Portfolios | | Sub-Advisers |
| |
Wells Fargo Bloomberg Barclays US Aggregate ex-Corporate Credit Portfolio | | WellsCap |
| |
Wells Fargo Factor Enhanced Emerging Markets Equity Portfolio | | WellsCap |
| |
Wells Fargo Emerging Markets Bond Portfolio | | Wells Fargo Asset Management (International), Limited (“WFAM International”) |
| |
Wells Fargo Factor Enhanced International Equity Portfolio | | WellsCap |
| |
Wells Fargo Factor Enhanced U.S. Large Cap Portfolio | | WellsCap |
| |
Wells Fargo Factor Enhanced U.S. Small Cap Portfolio | | WellsCap |
| |
Wells Fargo International Government Bond Portfolio | | WFAM International |
| |
Wells Fargo Investment Grade Corporate Bond Portfolio | | WellsCap |
| |
Wells Fargo High Yield Corporate Bond Portfolio | | WellsCap |
| |
Wells Fargo Strategic Retirement Bond Portfolio | | WellsCap |
| |
Wells Fargo U.S. REIT Portfolio | | WellsCap |
34 | Wells Fargo Investment Grade Corporate Bond Portfolio
Other information (unaudited)
The Index Funds and the Master Portfolios are collectively referred to as the “Funds.” The Management Agreement, the Core Bond Fund Sub-Advisory Agreement, the Master Portfolio Advisory Agreement and the Master Portfolio Sub-Advisory Agreements are collectively referred to as the “Advisory Agreements.”
The Boards noted that each of the Index Funds is a feeder fund that invests all of its assets in its corresponding Master Portfolio, with the exception of the U.S. Core Bond Fund, which invests in multiple Master Portfolios. Information provided to the Boards regarding the Index Funds is also applicable to the Master Portfolios identified above, as relevant.
At the Meeting, the Boards considered the factors and reached the conclusions described below relating to the selection of Funds Management and the Sub-Advisers and the approval of the Advisory Agreements. Prior to the Meeting, including at a Board meeting held in April 2020, the Trustees conferred extensively among themselves and with representatives of Funds Management about these matters. Also, the Boards have adopted a team-based approach, with each team consisting of a sub-set of Trustees, to assist the full Boards in the discharge of their duties in reviewing investment performance and other matters throughout the year. The Independent Trustees were assisted in their evaluation of the Advisory Agreements by independent legal counsel, from whom they received separate legal advice and with whom they met separately.
In providing information to the Boards, Funds Management and the Sub-Advisers were guided by a detailed set of requests for information submitted to them by independent legal counsel on behalf of the Independent Trustees at the start of the Boards’ annual contract renewal process earlier in 2020. In considering and approving the Advisory Agreements, the Trustees considered the information they believed relevant, including but not limited to the information discussed below. The Boards considered not only the specific information presented in connection with the Meeting, but also the knowledge gained over time through interaction with Funds Management and the Sub-Advisers about various topics. In this regard, the Boards reviewed reports of Funds Management at each of their quarterly meetings, which included, among other things, portfolio reviews and investment performance reports. In addition, the Boards and the teams mentioned above confer with portfolio managers at various times throughout the year. The Boards did not identify any particular information or consideration that was all-important or controlling, and each individual Trustee may have attributed different weights to various factors.
After its deliberations, the Board of Funds Trust unanimously approved the continuation of the Management Agreement and the Core Bond Fund Sub-Advisory Agreement for a one-year period. Additionally, after its deliberations, the Board of Master Trust unanimously approved the continuation of the Master Portfolio Advisory Agreement and each Master Portfolio Sub-Advisory Agreement for a one-year term. The Boards also determined that the compensation or the absence of compensation payable to Funds Management and to each of the Sub-Advisers under each of the Advisory Agreements was reasonable. The Boards considered the approval of the Advisory Agreements for the Funds as part of their consideration of agreements for funds across the complex, but their approvals were made on a fund-by-fund basis. The following summarizes a number of important, but not necessarily all, factors considered by the Boards in support of their approvals.
Nature, extent and quality of services
The Boards received and considered various information regarding the nature, extent and quality of services provided to the Funds by Funds Management and the Sub-Advisers under the Advisory Agreements. This information included a description of the investment advisory services and Fund-level administrative services covered by the Advisory Agreements, as well as, among other things, a summary of the background and experience of senior management of Wells Fargo Asset Management (“WFAM”), of which Funds Management and the Sub-Advisers are a part, and a summary of investments made in the business of WFAM. The Boards also received a description of Funds Management’s and the Sub-Advisers’ business continuity plans and of their approaches to data privacy and cybersecurity, and related testing. The Boards also received and reviewed information about Funds Management’s role as administrator of the Funds’ liquidity risk management program, Funds Management’s approach to risk management, and Funds Management’s intermediary and vendor oversight program.
The Boards also considered the qualifications, background, tenure and responsibilities of each of the portfolio managers primarily responsible for the day-to-day portfolio management of the Funds. The Board of Master Trust noted that each of the Master Portfolios replicates the performance of a proprietary index provided by an affiliate of Funds Management, except that the Wells Fargo Bloomberg Barclays US Aggregate ex-Corporate Credit Portfolio, the Wells Fargo Emerging Markets Bond Portfolio, and the Wells Fargo Strategic Retirement Bond Portfolio track the performance of third-party indexes. The Boards evaluated the ability of Funds Management and the Sub-Advisers to attract and retain qualified investment professionals, including research, advisory and supervisory personnel. The Boards further considered the compliance programs and compliance records of Funds Management and the Sub-Advisers. In addition, the Boards took into account the full range of services provided to the Funds by Funds Management and its affiliates.
Wells Fargo Investment Grade Corporate Bond Portfolio | 35
Other information (unaudited)
Fund investment performance and expenses
The Boards considered the investment performance results for each of the Master Portfolios for the one-year period ended December 31, 2019. The Boards also considered more current results for the one-year period ended March 31, 2020. The Boards considered these results in comparison to the investment performance of funds in a universe that was determined by Broadridge Inc. (“Broadridge”) to be similar to the respective Master Portfolios (each, a “Universe”), and in comparison to each Master Portfolio’s benchmark index and to other comparative data. Broadridge is an independent provider of investment company data. The Boards received a description of the methodology used by Broadridge to select the mutual funds in each performance Universe.
The Boards noted the short performance history of the Master Portfolios. For the one-year period ended December 31, 2019, the Boards noted that the investment performance of each Master Portfolio relative to its respective Universe was as follows: (i) the investment performance of each of the Wells Fargo Bloomberg Barclays US Aggregate ex-Corporate Credit Portfolio, the Wells Fargo Emerging Markets Bond Portfolio, the Wells Fargo Factor Enhanced International Equity Portfolio, the Wells Fargo Factor Enhanced U.S. Large Cap Portfolio, the Wells Fargo High Yield Corporate Bond Portfolio and the Wells Fargo Investment Grade Corporate Bond Portfolio was higher than or in range of the average investment performance of such Master Portfolio’s respective Universe; and (ii) the Wells Fargo Factor Enhanced Emerging Markets Equity Portfolio, the Wells Fargo Factor Enhanced U.S. Small Cap Portfolio, the Wells Fargo International Government Bond Portfolio, the Wells Fargo Strategic Retirement Bond Portfolio and the Wells Fargo U.S. REIT Portfolio was lower than the average investment performance of such Master Portfolio’s respective Universe. For the one-year period ended March 31, 2020, the Boards noted that the investment performance of each Master Portfolio relative to its respective Universe was as follows: (i) the Wells Fargo Emerging Markets Bond Portfolio, the Wells Fargo Factor Enhanced U.S. Large Cap Portfolio, the Wells Fargo Factor Enhanced U.S. Small Cap Portfolio, the Wells Fargo International Government Bond Portfolio, and the Wells Fargo Investment Grade Corporate Bond Portfolio was higher than or in range of the average investment performance of such Master Portfolio’s respective Universe, and (ii) the Wells Fargo Bloomberg Barclays US Aggregate ex-Corporate Credit Portfolio, the Wells Fargo Factor Enhanced Emerging Markets Equity Portfolio, the Wells Fargo Factor Enhanced International Equity Portfolio, the Wells Fargo High Yield Corporate Bond Portfolio, the Wells Fargo Strategic Retirement Bond Portfolio and the Wells Fargo U.S. REIT Portfolio was lower than the average investment performance of such Master Portfolio’s respective Universe.
The Boards also noted that the investment performance of each Master Portfolio to its respective benchmark index for the one-year period ended December 31, 2019, was as follows: (i) the investment performance of each of the Wells Fargo Bloomberg Barclays US Aggregate ex-Corporate Credit Portfolio, the Wells Fargo Factor Enhanced Emerging Markets Equity Portfolio, the Wells Fargo Factor Enhanced U.S. Large Cap Portfolio, the Wells Fargo Factor Enhanced U.S. Small Cap Portfolio, the Wells Fargo High Yield Corporate Bond Portfolio, the Wells Fargo U.S. REIT Portfolio and the Wells Fargo Strategic Retirement Bond Portfolio was higher than or in range of the average investment performance of such Master Portfolio’s respective benchmark, and (ii) the investment performance of each of the Wells Fargo Emerging Markets Bond Portfolio, the Wells Fargo Factor Enhanced International Equity Portfolio, the Wells Fargo International Government Bond Portfolio and the Wells Fargo Investment Grade Corporate Bond Portfolio was lower than the average investment performance of such Master Portfolio’s respective benchmark. For the one-year period ended March 31, 2020, the Boards also noted that the investment performance of each Master Portfolio to its respective benchmark index, was as follows: (i) the investment performance of each of the Wells Fargo Bloomberg Barclays US Aggregate ex-Corporate Credit Portfolio, the Wells Fargo Factor Enhanced Emerging Markets Equity Portfolio, the Wells Fargo Factor Enhanced International Equity Portfolio, the Wells Fargo Factor Enhanced U.S. Large Cap Portfolio, the Wells Fargo Factor Enhanced U.S. Small Cap Portfolio, the Wells Fargo U.S. REIT Portfolio, the Wells Fargo Investment Grade Corporate Bond Portfolio and the Wells Fargo Strategic Retirement Bond Portfolio was higher than, equal to or in range of the average investment performance of such Master Portfolio’s respective benchmark, and (ii) the investment performance of each of the Wells Fargo Emerging Markets Bond Portfolio, the Wells Fargo High Yield Corporate Bond Portfolio and the Wells Fargo International Government Bond Portfolio was lower than the average investment performance of such Master Portfolio’s respective benchmark.
The Boards received information concerning, and discussed factors contributing to, the underperformance of certain Master Portfolios, relative to the Universe and benchmark index, for the periods identified above. The Board took note of the explanations for the relative underperformance during these periods, including with respect to investment decisions and market factors that affected the Fund’s investment performance.
The Board of Funds Trust took note of the investment performance of the Master Portfolios in the context of reviewing the investment performance of the Index Funds. The Board of Funds Trust also received and considered information regarding the “zero fee and expense” structure of each Index Fund. Specifically, the Funds Trust Board noted that each Index Fund’s gross operating expense ratio and each of its various components, including management fees, administration fees, custody fees,
36 | Wells Fargo Investment Grade Corporate Bond Portfolio
Other information (unaudited)
Rule 12b-1 fees, and other fees, are zero. The Funds Trust Board also noted that Funds Management assumes and pays or reimburses all of the ordinary operating expenses of each Index Fund, including acquired fund fees and expenses, pursuant to an agreement with each of the Index Funds (the “Fee and Expense Agreement”). The Funds Trust Board further noted that Funds Management receives a fee from Wells Fargo Wealth and Investment Management (“WIM”) pursuant to an intercompany agreement equal to the Master Portfolio fees and expenses absorbed by Funds Management through its Fee and Expense Agreement with each of the Index Funds.
With respect to the Master Portfolios, the Board of Master Trust received and considered information regarding the fee rates that are payable to Funds Management for investment advisory services (as discussed below), which are the only fees charged at the Master Portfolio level, relative to corresponding class-specific expense groups that were determined by Broadridge to be similar to the Funds (the “Groups”). The Boards received a description of the methodology used by Broadridge to select the mutual funds in the expense Groups and an explanation of how funds comprising expense groups and their expense ratios may vary from year-to-year.
The Boards took into account the Funds’ expense information and the Master Portfolios’ performance information provided to them among the factors considered in deciding to re-approve the Advisory Agreements.
Investment management, advisory and sub-advisory fee rates
The Board of Funds Trust reviewed and considered that the contractual investment management fee rate payable by each Index Fund to Funds Management for investment management services zero, and also reviewed and considered that each Fund’s other expenses would normally be zero, because of Funds Management’s commitment to assume and pay or reimburse all of the ordinary operating expenses of each Fund, including acquired fund fees and expenses, under the Fee and Expense Agreement. The Board of Funds Trust also reviewed and considered that the contractual investment sub-advisory fee rate payable by Funds Management to WellsCap for investment sub-advisory services for the U.S. Core Bond Fund is also zero.
The Board of Master Trust reviewed and considered the contractual fee rates payable by the Master Portfolios to Funds Management under the Master Portfolio Advisory Agreement (the “Advisory Agreement Rates”). The Board of Master Trust also reviewed and considered the contractual investment sub-advisory fee rates that are payable by Funds Management to the Sub-Advisers for investment sub-advisory services (the “Sub-Advisory Agreement Rates”).
The Board of Master Trust reviewed a comparison of the Advisory Agreement Rates of each Master Portfolio with those of other funds in each Master Portfolio’s respective expense Groups at a common asset level. The Board of Master Trust noted that the Advisory Agreement Rates of each Master Portfolio were lower than or equal to the median rate for such Master Portfolio’s expense Groups.
The Boards also received and considered information about the portions of the total management fees that were retained by Funds Management after payment of the fees to the Sub-Advisers for sub-advisory services. In assessing the reasonableness of these amounts, the Boards received and evaluated information about the nature and extent of responsibilities retained and risks assumed by Funds Management and not delegated to or assumed by the Sub-Advisers, and about Funds Management’s on-going oversight services. Given the affiliation between Funds Management and the Sub-Advisers, the Boards ascribed limited relevance to the allocation of fees between them.
The Boards also received and considered information about the nature and extent of services offered and fee rates charged by Funds Management and the Sub-Advisers to other types of clients with investment strategies similar to those of certain Funds. In this regard, the Boards received information about the significantly greater scope of services, and compliance, reporting and other legal burdens and risks of managing proprietary mutual funds compared with those associated with managing assets of other types of clients, including third-party sub-advised fund clients and non-mutual fund clients such as institutional separate accounts.
Based on its consideration of the factors and information it deemed relevant, including those described here, the Board of Fund Trust determined that the compensation received by Funds Management from WIM pursuant to the intercompany agreement, and the absence of compensation payable by the Funds to Funds Management pursuant to the Management Agreement or to WellsCap pursuant to the Core Bond Fund Sub-Advisory Agreement, was reasonable. Based on its consideration of the factors and information it deemed relevant, including those described here, the Board of Master Trust determined that the Advisory Agreement Rates and the Sub-Advisory Agreement Rates for each Master Portfolio were reasonable.
Profitability
The Boards received and considered information concerning the profitability of Funds Management, as well as the profitability of both WFAM and Wells Fargo & Co. (“Wells Fargo”) from providing services to the fund family as a whole. The Boards noted that the Sub-Advisers’ profitability information with respect to providing services to the Funds and other funds in the family was subsumed in the WFAM and Wells Fargo profitability analysis.
Wells Fargo Investment Grade Corporate Bond Portfolio | 37
Other information (unaudited)
Funds Management reported on the methodologies and estimates used in calculating profitability, including a description of the methodology used to allocate certain expenses. Among other things, the Boards noted that the levels of profitability reported on a fund-by-fund basis varied widely, depending on factors such as the size, type and age of fund.
Based on its review, the Boards did not deem the profits reported by Funds Management, WFAM or Wells Fargo from services provided to the Funds to be at a level that would prevent them from approving the continuation of the Advisory Agreements.
Economies of scale
The Boards received and considered information about the potential for Funds Management to experience economies of scale in the provision of management services to the Funds, the difficulties of calculating economies of scale at an individual fund level, and the extent to which potential scale benefits are shared with shareholders. The Boards noted the existence of breakpoints in the each Master Portfolio’s advisory fee structure and each Index Fund’s management fee structure, which operate generally to reduce the Funds’ expense ratios as the Funds grow in size, and the size of the Funds in relation to such breakpoints. The Boards considered that in addition to management fee breakpoints, Funds Management shares potential economies of scale from its management business in a variety of ways, including through fee waiver and expense reimbursement arrangements, services that benefit shareholders, competitive management fee rates set at the outset without regard to breakpoints, and investments in the business intended to enhance services available to shareholders.
The Boards concluded that Funds Management’s arrangements with respect to the Funds, including contractual breakpoints, constituted a reasonable approach to sharing potential economies of scale with the Funds and their shareholders.
Other benefits to Funds Management and the Sub-Advisers
The Boards received and considered information regarding potential “fall-out” or ancillary benefits received by Funds Management and its affiliates, including WellsCap and WFAM International, as a result of their relationships with the Funds. Ancillary benefits could include, among others, benefits directly attributable to other relationships with the Funds and benefits potentially derived from an increase in Funds Management’s and the Sub-Advisers’ business as a result of their relationships with the Funds. The Boards noted that various affiliates of Funds Management may receive distribution-related fees, shareholder servicing payments and sub-transfer agency fees in respect of shares sold or held through them and services provided.
The Boards also reviewed information about soft dollar credits earned and utilized by the Sub-Advisers, fees earned by Funds Management and WellsCap from managing a private investment vehicle for the fund family’s securities lending collateral, and commissions earned by an affiliated broker from portfolio transactions.
Based on their consideration of the factors and information they deemed relevant, including those described here, the Boards did not find that any ancillary benefits received by Funds Management and its affiliates, including WellsCap and WFAM International, were unreasonable.
Conclusion
At the Meeting, after considering the above-described factors and based on its deliberations and its evaluation of the information described above, the Funds Trust Board unanimously approved the continuation of the Management Agreement and the Core Bond Fund Sub-Advisory Agreement for a one-year period. Additionally, after its deliberations, the Master Trust Board unanimously approved the continuation of the Master Portfolio Advisory Agreement and each Master Portfolio Sub-Advisory Agreement for a one-year term. The Boards also determined that the compensation or the absence of compensation payable to Funds Management and to each of the Sub-Advisers was reasonable.
38 | Wells Fargo Investment Grade Corporate Bond Portfolio
Other information (unaudited)
LIQUIDITY RISK MANAGEMENT PROGRAM
In accordance with Rule 22e-4 under the Investment Company Act of 1940, as amended (the “Liquidity Rule”), Wells Fargo Master Trust (the “Trust”) has adopted and implemented a liquidity risk management program (the “Program”) on behalf of each of its series, including each Portfolio, which is reasonably designed to assess and manage the Portfolio’s liquidity risk. “Liquidity risk” is defined as the risk that a Portfolio is unable to meet redemption requests without significantly diluting remaining investors’ interests in the Portfolio. The Trust’s Board of Trustees (the “Board”) previously approved the designation of Wells Fargo Funds Management, LLC (“Funds Management”), each Portfolio’s investment adviser, as the administrator of the Program, and Funds Management has established a Liquidity Risk Management Council composed of personnel from multiple departments within Funds Management and its affiliates to assist Funds Management in the implementation and on-going administration of the Program.
The Program is comprised of various components designed to support the assessment and/or management of liquidity risk, including: (1) the periodic assessment (no less frequently than annually) of certain factors that influence a Portfolio’s liquidity risk; (2) the periodic classification (no less frequently than monthly) of a Portfolio’s investments into one of four liquidity categories that reflect an estimate of their liquidity under current market conditions; (3) a 15% limit on the acquisition of “illiquid investments” (as defined under the Liquidity Rule); (4) to the extent a Portfolio does not invest primarily in “highly liquid investments” (as defined under the Liquidity Rule), the determination of a minimum percentage of the Portfolio’s assets that generally will be invested in highly liquid investments (an “HLIM”); (5) if a Portfolio has established an HLIM, the periodic review (no less frequently than annually) of the HLIM and the adoption of policies and procedures for responding to a shortfall of the Portfolio’s “highly liquid investments” below its HLIM; and (6) periodic reporting to the Board.
At a meeting of the Board held on May 26 and 28, 2020, the Board received a written report (the “Report”) from Funds Management that addressed the operation of the Program and assessed its adequacy and effectiveness of implementation. The Report covered the initial period from December 1, 2018 through December 31, 2019 (the “Reporting Period”). No significant liquidity events impacting any Portfolio were noted in the Report. There were no material changes to the Program during the Reporting Period. The Report concluded that the Program is operating effectively to assess and manage each Portfolio’s liquidity risk, and that the Program has been and continues to be adequately and effectively implemented to monitor and, as applicable, respond to the Portfolio’s liquidity developments.
Wells Fargo Investment Grade Corporate Bond Portfolio | 39
This page is intentionally left blank.

For more information
More information about Wells Fargo Funds is available free upon request. To obtain literature, please write, visit the Portfolio’s website, or call:
Wells Fargo Funds
P.O. Box 219967
Kansas City, MO 64121-9967
Website: wfam.com
Individual investors: 1-800-222-8222
Retail investment professionals: 1-888-877-9275
Institutional investment professionals: 1-866-765-0778
This report and the financial statements contained herein are submitted for the general information of the shareholders of the Portfolio. If this report is used for promotional purposes, distribution of the report must be accompanied or preceded by a current prospectus. Before investing, please consider the investment objectives, risks, charges, and expenses of the investment. For a current prospectus and, if available, a summary prospectus, containing this information, call 1-800-222-8222 or visit the Portfolio’s website at wfam.com. Read the prospectus carefully before you invest or send money.
Wells Fargo Asset Management (WFAM) is the trade name for certain investment advisory/management firms owned by Wells Fargo & Company. These firms include but are not limited to Wells Capital Management Incorporated and Wells Fargo Funds Management, LLC. Certain products managed by WFAM entities are distributed by Wells Fargo Funds Distributor, LLC (a broker-dealer and Member FINRA).
This material is for general informational and educational purposes only and is NOT intended to provide investment advice or a recommendation of any kind—including a recommendation for any specific investment, strategy, or plan.
INVESTMENT PRODUCTS: NOT FDIC INSURED ◾ NO BANK GUARANTEE ◾ MAY LOSE VALUE
© 2020 Wells Fargo & Company. All rights reserved.
Semi-Annual Report
August 31, 2020
Wells Fargo
Strategic Retirement Bond Portfolio
INVESTMENT PRODUCTS: NOT FDIC INSURED ◾ NO BANK GUARANTEE ◾ MAY LOSE VALUE
Wells Fargo Strategic Retirement Bond Portfolio | 1
Portfolio information (unaudited)
Investment objective
The Portfolio seeks to replicate the total return of a blended index that is weighted 50% to the Bloomberg Barclays US Treasury Inflation-Linked 1-10 Year Bond Index and 50% to the Bloomberg Barclays US Intermediate Government Bond Index, before fees and expenses
Adviser
Wells Fargo Funds Management, LLC
Subadviser
Wells Capital Management Incorporated
Portfolio managers
Jay N. Mueller, CFA®‡
Janet S. Rilling, CFA®‡, CPA
Michal Stanczyk
| | | | |
|
| Ten largest holdings (%) as of August 31, 20201 | |
| | |
TIPS, 0.13%, 4-15-2022 | | | 2.72 | |
| | |
TIPS, 0.38%, 1-15-2027 | | | 2.51 | |
| | |
TIPS, 0.13%, 1-15-2023 | | | 2.45 | |
| | |
TIPS, 0.50%, 1-15-2028 | | | 2.42 | |
| | |
TIPS, 0.13%, 7-15-2024 | | | 2.40 | |
| | |
TIPS, 0.38%, 7-15-2025 | | | 2.35 | |
| | |
TIPS, 0.13%, 1-15-2022 | | | 2.35 | |
| | |
TIPS, 2.38%, 1-15-2025 | | | 2.16 | |
| | |
TIPS, 0.13%, 1-15-2030 | | | 2.14 | |
| | |
TIPS, 0.63%, 1-15-2024 | | | 2.13 | |
|
|
| Portfolio composition as of August 31, 20202 |
|
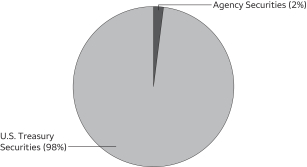
|
| ‡ | CFA® and Chartered Financial Analyst® are trademarks owned by CFA Institute. |
| 1 | The ten largest holdings, excluding cash, cash equivalents and any money market funds, are calculated based on the value of the investments divided by the total net assets of the Portfolio. Holdings are subject to change and may have changed since the date specified. |
| 2 | Amounts are calculated based on the total long-term investments of the Portfolio. These amounts are subject to change and may have changed since the date specified. |
2 | Wells Fargo Strategic Retirement Bond Portfolio
Portfolio of investments—August 31, 2020 (unaudited)
| | | | | | | | | | | | | | | | |
| | | Interest
rate | | | Maturity date | | | Principal | | | Value | |
| Agency Securities: 2.15% | |
FHLB | | | 2.00 | % | | | 9-9-2022 | | | $ | 200,000 | | | $ | 207,498 | |
FHLB | | | 2.13 | | | | 6-9-2023 | | | | 35,000 | | | | 36,798 | |
FHLB | | | 2.38 | | | | 9-10-2021 | | | | 200,000 | | | | 204,585 | |
FHLB | | | 2.75 | | | | 12-13-2024 | | | | 20,000 | | | | 22,006 | |
FHLB | | | 3.25 | | | | 6-9-2023 | | | | 50,000 | | | | 54,093 | |
FNMA | | | 0.38 | | | | 7-21-2025 | | | | 95,000 | | | | 94,738 | |
FNMA | | | 1.38 | | | | 10-7-2021 | | | | 295,000 | | | | 298,931 | |
FNMA | | | 1.88 | | | | 9-24-2026 | | | | 135,000 | | | | 145,634 | |
FNMA | | | 2.13 | | | | 4-24-2026 | | | | 28,000 | | | | 30,571 | |
FNMA | | | 2.63 | | | | 9-6-2024 | | | | 100,000 | | | | 109,335 | |
FNMA | | | 2.88 | | | | 9-12-2023 | | | | 175,000 | | | | 188,977 | |
| |
Total Agency Securities (Cost $1,346,525) | | | | 1,393,166 | |
| | | | | | | | | | | | | | | | |
|
| U.S. Treasury Securities: 97.45% | |
TIPS | | | 0.13 | | | | 1-15-2022 | | | | 1,491,841 | | | | 1,522,144 | |
TIPS | | | 0.13 | | | | 4-15-2022 | | | | 1,725,436 | | | | 1,764,561 | |
TIPS | | | 0.13 | | | | 7-15-2022 | | | | 748,721 | | | | 772,440 | |
TIPS | | | 0.13 | | | | 1-15-2023 | | | | 1,534,305 | | | | 1,590,343 | |
TIPS | | | 0.13 | | | | 7-15-2024 | | | | 1,457,853 | | | | 1,553,895 | |
TIPS | | | 0.13 | | | | 10-15-2024 | | | | 1,150,290 | | | | 1,230,900 | |
TIPS | | | 0.13 | | | | 4-15-2025 | | | | 1,122,604 | | | | 1,206,032 | |
TIPS | | | 0.13 | | | | 7-15-2026 | | | | 658,084 | | | | 720,126 | |
TIPS | | | 0.13 | | | | 1-15-2030 | | | | 1,242,257 | | | | 1,388,222 | |
TIPS | | | 0.13 | | | | 7-15-2030 | | | | 422,230 | | | | 475,726 | |
TIPS | | | 0.25 | | | | 1-15-2025 | | | | 772,643 | | | | 831,271 | |
TIPS | | | 0.25 | | | | 7-15-2029 | | | | 599,552 | | | | 678,032 | |
TIPS | | | 0.38 | | | | 7-15-2023 | | | | 1,129,721 | | | | 1,193,356 | |
TIPS | | | 0.38 | | | | 7-15-2025 | | | | 1,391,232 | | | | 1,523,046 | |
TIPS | | | 0.38 | | | | 1-15-2027 | | | | 1,467,166 | | | | 1,630,188 | |
TIPS | | | 0.38 | | | | 7-15-2027 | | | | 532,113 | | | | 596,788 | |
TIPS | | | 0.50 | | | | 4-15-2024 | | | | 638,738 | | | | 683,387 | |
TIPS | | | 0.50 | | | | 1-15-2028 | | | | 1,384,546 | | | | 1,566,781 | |
TIPS | | | 0.63 | | | | 4-15-2023 | | | | 1,208,897 | | | | 1,272,813 | |
TIPS | | | 0.63 | | | | 1-15-2024 | | | | 1,288,034 | | | | 1,378,674 | |
TIPS | | | 0.63 | | | | 1-15-2026 | | | | 775,603 | | | | 862,162 | |
TIPS | | | 0.75 | | | | 7-15-2028 | | | | 764,988 | | | | 889,822 | |
TIPS | | | 0.88 | | | | 1-15-2029 | | | | 964,647 | | | | 1,134,289 | |
TIPS | | | 1.75 | | | | 1-15-2028 | | | | 725,901 | | | | 891,327 | |
TIPS | | | 2.00 | | | | 1-15-2026 | | | | 863,602 | | | | 1,026,843 | |
TIPS | | | 2.38 | | | | 1-15-2025 | | | | 1,195,116 | | | | 1,401,344 | |
TIPS | | | 2.38 | | | | 1-15-2027 | | | | 585,379 | | | | 729,128 | |
TIPS | | | 2.50 | | | | 1-15-2029 | | | | 582,252 | | | | 768,254 | |
TIPS | | | 3.63 | | | | 4-15-2028 | | | | 79,681 | | | | 110,248 | |
TIPS | | | 3.88 | | | | 4-15-2029 | | | | 744,753 | | | | 1,082,786 | |
U.S. Treasury Bond | | | 1.50 | | | | 2-15-2030 | | | | 475,000 | | | | 511,052 | |
U.S. Treasury Bond | | | 2.88 | | | | 5-15-2028 | | | | 645,000 | | | | 758,127 | |
U.S. Treasury Bond | | | 6.13 | | | | 11-15-2027 | | | | 215,000 | | | | 301,277 | |
U.S. Treasury Bond | | | 6.13 | | | | 8-15-2029 | | | | 115,000 | | | | 170,438 | |
U.S. Treasury Bond | | | 6.38 | | | | 8-15-2027 | | | | 125,000 | | | | 175,693 | |
U.S. Treasury Bond | | | 6.88 | | | | 8-15-2025 | | | | 20,000 | | | | 26,494 | |
U.S. Treasury Note | | | 0.50 | | | | 6-30-2027 | | | | 320,000 | | | | 320,450 | |
U.S. Treasury Note | | | 1.13 | | | | 9-30-2021 | | | | 510,000 | | | | 515,259 | |
U.S. Treasury Note | | | 1.25 | | | | 10-31-2021 | | | | 513,000 | | | | 519,493 | |
U.S. Treasury Note | | | 1.25 | | | | 7-31-2023 | | | | 488,000 | | | | 503,555 | |
U.S. Treasury Note | | | 1.38 | | | | 6-30-2023 | | | | 489,000 | | | | 505,848 | |
The accompanying notes are an integral part of these financial statements.
Wells Fargo Strategic Retirement Bond Portfolio | 3
Portfolio of investments—August 31, 2020 (unaudited)
| | | | | | | | | | | | | | | | |
| | | Interest
rate | | | Maturity date | | | Principal | | | Value | |
|
| U.S. Treasury Securities (continued) | |
U.S. Treasury Note | | | 1.38 | % | | | 8-31-2023 | | | $ | 490,000 | | | $ | 507,896 | |
U.S. Treasury Note | | | 1.38 | | | | 9-30-2023 | | | | 339,000 | | | | 351,660 | |
U.S. Treasury Note | | | 1.38 | | | | 8-31-2026 | | | | 380,000 | | | | 402,102 | |
U.S. Treasury Note | | | 1.50 | | | | 3-31-2023 | | | | 40,000 | | | | 41,398 | |
U.S. Treasury Note | | | 1.50 | | | | 8-15-2026 | | | | 325,000 | | | | 346,176 | |
U.S. Treasury Note | | | 1.63 | | | | 8-15-2022 | | | | 365,000 | | | | 375,594 | |
U.S. Treasury Note | | | 1.63 | | | | 11-15-2022 | | | | 20,000 | | | | 20,653 | |
U.S. Treasury Note | | | 1.63 | | | | 4-30-2023 | | | | 483,000 | | | | 501,999 | |
U.S. Treasury Note | | | 1.63 | | | | 5-31-2023 | | | | 435,000 | | | | 452,655 | |
U.S. Treasury Note | | | 1.63 | | | | 10-31-2023 | | | | 486,000 | | | | 508,421 | |
U.S. Treasury Note | | | 1.63 | | | | 2-15-2026 | | | | 663,000 | | | | 709,151 | |
U.S. Treasury Note | | | 1.63 | | | | 5-15-2026 | | | | 54,000 | | | | 57,850 | |
U.S. Treasury Note | | | 1.63 | | | | 11-30-2026 | | | | 410,000 | | | | 440,462 | |
U.S. Treasury Note | | | 1.75 | | | | 2-28-2022 | | | | 483,000 | | | | 494,584 | |
U.S. Treasury Note | | | 1.75 | | | | 3-31-2022 | | | | 484,000 | | | | 496,232 | |
U.S. Treasury Note | | | 1.75 | | | | 5-31-2022 | | | | 507,000 | | | | 521,200 | |
U.S. Treasury Note | | | 1.75 | | | | 6-30-2022 | | | | 305,000 | | | | 313,936 | |
U.S. Treasury Note | | | 1.75 | | | | 9-30-2022 | | | | 420,000 | | | | 434,126 | |
U.S. Treasury Note | | | 1.75 | | | | 1-31-2023 | | | | 10,000 | | | | 10,389 | |
U.S. Treasury Note | | | 1.75 | | | | 5-15-2023 | | | | 130,000 | | | | 135,601 | |
U.S. Treasury Note | | | 1.75 | | | | 11-15-2029 | | | | 85,000 | | | | 93,354 | |
U.S. Treasury Note | | | 1.88 | | | | 2-28-2022 | | | | 450,000 | | | | 461,637 | |
U.S. Treasury Note | | | 1.88 | | | | 4-30-2022 | | | | 505,000 | | | | 519,499 | |
U.S. Treasury Note | | | 1.88 | | | | 8-31-2022 | | | | 417,000 | | | | 431,448 | |
U.S. Treasury Note | | | 1.88 | | | | 8-31-2024 | | | | 160,000 | | | | 170,569 | |
U.S. Treasury Note | | | 1.88 | | | | 7-31-2026 | | | | 20,000 | | | | 21,748 | |
U.S. Treasury Note | | | 2.00 | | | | 10-31-2021 | | | | 479,000 | | | | 489,254 | |
U.S. Treasury Note | | | 2.00 | | | | 2-15-2022 | | | | 10,000 | | | | 10,267 | |
U.S. Treasury Note | | | 2.00 | | | | 7-31-2022 | | | | 190,000 | | | | 196,746 | |
U.S. Treasury Note | | | 2.00 | | | | 11-30-2022 | | | | 10,000 | | | | 10,417 | |
U.S. Treasury Note | | | 2.00 | | | | 2-15-2023 | | | | 285,000 | | | | 297,981 | |
U.S. Treasury Note | | | 2.00 | | | | 4-30-2024 | | | | 10,000 | | | | 10,657 | |
U.S. Treasury Note | | | 2.00 | | | | 5-31-2024 | | | | 269,000 | | | | 287,042 | |
U.S. Treasury Note | | | 2.00 | | | | 6-30-2024 | | | | 185,000 | | | | 197,661 | |
U.S. Treasury Note | | | 2.00 | | | | 2-15-2025 | | | | 597,000 | | | | 643,431 | |
U.S. Treasury Note | | | 2.00 | | | | 8-15-2025 | | | | 645,000 | | | | 699,649 | |
U.S. Treasury Note | | | 2.00 | | | | 11-15-2026 | | | | 520,000 | | | | 570,436 | |
U.S. Treasury Note | | | 2.13 | | | | 12-31-2021 | | | | 474,000 | | | | 486,424 | |
U.S. Treasury Note | | | 2.13 | | | | 12-31-2022 | | | | 510,000 | | | | 533,508 | |
U.S. Treasury Note | | | 2.13 | | | | 2-29-2024 | | | | 378,000 | | | | 403,530 | |
U.S. Treasury Note | | | 2.13 | | | | 3-31-2024 | | | | 500,000 | | | | 534,531 | |
U.S. Treasury Note | | | 2.13 | | | | 5-15-2025 | | | | 75,000 | | | | 81,524 | |
U.S. Treasury Note | | | 2.25 | | | | 12-31-2023 | | | | 472,000 | | | | 504,468 | |
U.S. Treasury Note | | | 2.25 | | | | 1-31-2024 | | | | 474,000 | | | | 507,384 | |
U.S. Treasury Note | | | 2.25 | | | | 4-30-2024 | | | | 235,000 | | | | 252,625 | |
U.S. Treasury Note | | | 2.25 | | | | 10-31-2024 | | | | 490,000 | | | | 531,191 | |
U.S. Treasury Note | | | 2.25 | | | | 11-15-2024 | | | | 10,000 | | | | 10,848 | |
U.S. Treasury Note | | | 2.25 | | | | 2-15-2027 | | | | 485,000 | | | | 540,908 | |
U.S. Treasury Note | | | 2.25 | | | | 8-15-2027 | | | | 480,000 | | | | 537,975 | |
U.S. Treasury Note | | | 2.25 | | | | 11-15-2027 | | | | 650,000 | | | | 730,285 | |
U.S. Treasury Note | | | 2.38 | | | | 5-15-2027 | | | | 453,000 | | | | 510,191 | |
U.S. Treasury Note | | | 2.50 | | | | 1-15-2022 | | | | 585,000 | | | | 603,807 | |
U.S. Treasury Note | | | 2.50 | | | | 5-15-2024 | | | | 455,000 | | | | 493,728 | |
U.S. Treasury Note | | | 2.63 | | | | 12-31-2023 | | | | 375,000 | | | | 405,454 | |
U.S. Treasury Note | | | 2.63 | | | | 3-31-2025 | | | | 345,000 | | | | 382,303 | |
U.S. Treasury Note | | | 2.63 | | | | 1-31-2026 | | | | 445,000 | | | | 499,930 | |
The accompanying notes are an integral part of these financial statements.
4 | Wells Fargo Strategic Retirement Bond Portfolio
Portfolio of investments—August 31, 2020 (unaudited)
| | | | | | | | | | | | | | | | |
| | | Interest
rate | | | Maturity date | | | Principal | | | Value | |
|
| U.S. Treasury Securities (continued) | |
U.S. Treasury Note | | | 2.75 | % | | | 9-15-2021 | | | $ | 560,000 | | | $ | 575,050 | |
U.S. Treasury Note | | | 2.75 | | | | 8-31-2023 | | | | 15,000 | | | | 16,162 | |
U.S. Treasury Note | | | 2.75 | | | | 11-15-2023 | | | | 76,000 | | | | 82,255 | |
U.S. Treasury Note | | | 2.75 | | | | 2-15-2024 | | | | 585,000 | | | | 636,759 | |
U.S. Treasury Note | | | 2.75 | | | | 8-31-2025 | | | | 325,000 | | | | 364,838 | |
U.S. Treasury Note | | | 2.75 | | | | 2-15-2028 | | | | 520,000 | | | | 604,500 | |
U.S. Treasury Note | | | 2.88 | | | | 4-30-2025 | | | | 470,000 | | | | 527,134 | |
U.S. Treasury Note | | | 2.88 | | | | 5-31-2025 | | | | 490,000 | | | | 550,484 | |
U.S. Treasury Note | | | 2.88 | | | | 11-30-2025 | | | | 125,000 | | | | 141,714 | |
U.S. Treasury Note | | | 2.88 | | | | 8-15-2028 | | | | 390,000 | | | | 459,926 | |
U.S. Treasury Note | | | 3.13 | | | | 11-15-2028 | | | | 370,000 | | | | 445,127 | |
U.S. Treasury Note | | | 6.00 | | | | 2-15-2026 | | | | 146,000 | | | | 190,781 | |
U.S. Treasury Note | | | 6.50 | | | | 11-15-2026 | | | | 30,000 | | | | 41,256 | |
U.S. Treasury Note | | | 6.63 | | | | 2-15-2027 | | | | 235,000 | | | | 327,917 | |
U.S. Treasury Note | | | 6.75 | | | | 8-15-2026 | | | | 220,000 | | | | 302,827 | |
U.S. Treasury Note | | | 8.00 | | | | 11-15-2021 | | | | 331,000 | | | | 362,342 | |
| |
Total U.S. Treasury Securities (Cost $59,178,306) | | | | 63,196,181 | |
| | | | | | | | | | | | | | | | |
| | | | |
| | | | | | | | | | | | | | | | |
| | | Yield | | | | | | Shares | | | | |
| Short-Term Investments: 0.63% | | | | | | | | | | | | | | | | |
| | | | |
| Investment Companies: 0.63% | | | | | | | | | | | | |
Wells Fargo Government Money Market Fund Select Class (l)(u) | | | 0.06 | | | | | | | | 412,639 | | | | 412,639 | |
| | | | | | | | | | | | | | | | |
| | | | |
Total Short-Term Investments (Cost $412,639) | | | | | | | | | | | | | | | 412,639 | |
| | | | | | | | | | | | | | | | |
| | | | | | | | |
| Total investments in securities (Cost $60,937,470) | | | 100.23 | % | | | 65,001,986 | |
| | |
Other assets and liabilities, net | | | (0.23 | ) | | | (150,590 | ) |
| | | | | | | | |
| Total net assets | | | 100.00 | % | | $ | 64,851,396 | |
| | | | | | | | |
| (l) | The issuer of the security is an affiliated person of the Portfolio as defined in the Investment Company Act of 1940. |
| (u) | The rate represents the 7-day annualized yield at period end. |
Abbreviations:
| FHLB | Federal Home Loan Bank |
| FNMA | Federal National Mortgage Association |
| TIPS | Treasury inflation-protected securities |
Investments in Affiliates
An affiliated investment is an investment in which the Portfolio owns at least 5% of the outstanding voting shares of the issuer or as a result of other relationships, such as the Portfolio and the issuer having the same adviser or investment manager. Transactions with issuers that were either affiliated persons of the Portfolio at the beginning of the period or the end of the period were as follows:
| | | | | | | | | | | | | | | | | | | | | | | | | | | | | | | | |
| | | Value,
beginning of
period | | | Purchases | | | Sales proceeds | | | Net
realized
gains
(losses) | | | Net
change in
unrealized
gains
(losses) | | | Income
from
affiliated
securities | | | Value,
end of
period | | | % of
net
assets | |
| | | | | | | | |
| Short-Term Investments | | | | | | | | | | | | | | | | | | | | | | | | |
Investment Companies | | | | | | | | | | | | | | | | | | | | | | | | | | | | | | | | |
Wells Fargo Government Money Market Fund Select Class | | $ | 281,311 | | | $ | 5,032,522 | | | $ | (4,901,194 | ) | | $ | 0 | | | $ | 0 | | | $ | 308 | | | $ | 412,639 | | | | 0.63 | % |
The accompanying notes are an integral part of these financial statements.
Wells Fargo Strategic Retirement Bond Portfolio | 5
Statement of assets and liabilities—August 31, 2020 (unaudited)
| | | | |
| | | | |
| |
Assets | | | | |
Investments in unaffiliated securities, at value (cost $60,524,831) | | $ | 64,589,347 | |
Investments in affiliated securities, at value (cost $412,639) | | | 412,639 | |
Receivable for investments sold | | | 324,094 | |
Receivable for interest | | | 172,533 | |
Receivable from adviser | | | 4,153 | |
Prepaid expenses and other assets | | | 188 | |
| | | | |
Total assets | | | 65,502,954 | |
| | | | |
| |
Liabilities | | | | |
Payable for investments purchased | | | 606,156 | |
Trustees’ fees and expenses payable | | | 1,876 | |
Accrued expenses and other liabilities | | | 43,526 | |
| | | | |
Total liabilities | | | 651,558 | |
| | | | |
Total net assets | | $ | 64,851,396 | |
| | | | |
The accompanying notes are an integral part of these financial statements.
6 | Wells Fargo Strategic Retirement Bond Portfolio
Statement of operations—six months ended August 31, 2020 (unaudited)
| | | | |
| | | | |
| |
Investment income | | | | |
Interest | | $ | 438,939 | |
Income from affiliated securities | | | 308 | |
| | | | |
Total investment income | | | 439,247 | |
| | | | |
| |
Expenses | | | | |
Advisory fee | | | 16,097 | |
Custody and accounting fees | | | 4,560 | |
Professional fees | | | 22,434 | |
Shareholder report expenses | | | 4,107 | |
Trustees’ fees and expenses | | | 9,898 | |
Other fees and expenses | | | 4,165 | |
| | | | |
Total expenses | | | 61,261 | |
Less: Fee waivers and/or expense reimbursements | | | (36,082 | ) |
| | | | |
Net expenses | | | 25,179 | |
| | | | |
Net investment income | | | 414,068 | |
| | | | |
| |
Realized and unrealized gains (losses) on investments | | | | |
Net realized gains on investments | | | 789,425 | |
Net change in unrealized gains (losses) on investments | | | 1,135,903 | |
| | | | |
Net realized and unrealized gains (losses) on investments | | | 1,925,328 | |
| | | | |
Net increase in net assets resulting from operations | | $ | 2,339,396 | |
| | | | |
The accompanying notes are an integral part of these financial statements.
Wells Fargo Strategic Retirement Bond Portfolio | 7
Statement of changes in net assets
| | | | | | | | |
| | | Six months ended
August 31, 2020
(unaudited) | | | Year ended
February 29, 2020 | |
| | |
Operations | | | | | | | | |
Net investment income | | $ | 414,068 | | | $ | 1,640,300 | |
Net realized gains on investments | | | 789,425 | | | | 168,387 | |
Net change in unrealized gains (losses) on investments | | | 1,135,903 | | | | 3,638,073 | |
| | | | |
Net increase in net assets resulting from operations | | | 2,339,396 | | | | 5,446,760 | |
| | | | |
| | |
Capital transactions | | | | | | | | |
Transactions in investors’ beneficial interests | | | | | | | | |
Contributions | | | 6,024,384 | | | | 11,312,659 | |
Withdrawals | | | (19,415,720 | ) | | | (13,995,099 | ) |
| | | | |
Net decrease in net assets resulting from capital transactions | | | (13,391,336 | ) | | | (2,682,440 | ) |
| | | | |
Total increase (decrease) in net assets | | | (11,051,940 | ) | | | 2,764,320 | |
| | | | |
| | |
Net assets | | | | | | | | |
Beginning of period | | | 75,903,336 | | | | 73,139,016 | |
| | | | |
End of period | | $ | 64,851,396 | | | $ | 75,903,336 | |
| | | | |
The accompanying notes are an integral part of these financial statements.
8 | Wells Fargo Strategic Retirement Bond Portfolio
Financial highlights
| | | | | | | | | | | | | | | | |
| | | Six months ended
August 31, 2020
(unaudited) | | | Year ended
February 29, 2020 | | | Year ended February 28 | |
| | | 2019 | | | 20181 | |
Total return2 | | | 3.77 | % | | | 7.75 | % | | | 2.47 | % | | | (1.40 | )% |
Ratios to average net assets (annualized) | | | | | | | | | | | | | | | | |
Gross expenses | | | 0.19 | % | | | 0.18 | % | | | 0.16 | % | | | 0.17 | % |
Net expenses | | | 0.08 | % | | | 0.11 | % | | | 0.14 | % | | | 0.17 | % |
Net investment income | | | 1.29 | % | | | 2.27 | % | | | 2.23 | % | | | 1.45 | % |
Supplemental data | | | | | | | | | | | | | | | | |
Portfolio turnover rate | | | 16 | % | | | 41 | % | | | 23 | % | | | 193 | % |
| 1 | For the period from May 23, 2017 (commencement of operations) to February 28, 2018 |
| 2 | Returns for periods of less than one year are not annualized. |
The accompanying notes are an integral part of these financial statements.
Wells Fargo Strategic Retirement Bond Portfolio | 9
Notes to financial statements (unaudited)
1. ORGANIZATION
Wells Fargo Master Trust (the “Trust”), a Delaware statutory trust organized on March 10, 1999, is an open-end management investment company registered under the Investment Company Act of 1940, as amended (the “1940 Act”). As an investment company, the Trust follows the accounting and reporting guidance in Financial Accounting Standards Board (“FASB”) Accounting Standards Codification Topic 946, Financial Services – Investment Companies. These financial statements report on the Wells Fargo Strategic Retirement Bond Portfolio (the “Portfolio”) which is a diversified series of the Trust.
Interests in the Portfolio are available solely through private placement transactions that do not involve any “public offering” within the meaning of Section 4(2) of the Investment Company Act of 1933.
2. SIGNIFICANT ACCOUNTING POLICIES
The following significant accounting policies, which are consistently followed in the preparation of the financial statements of the Portfolio, are in conformity with U.S. generally accepted accounting principles which require management to make estimates and assumptions that affect the reported amounts of assets and liabilities, disclosure of contingent assets and liabilities at the date of the financial statements, and the reported amounts of revenues and expenses during the reporting period. Actual results could differ from those estimates.
Securities valuation
All investments are valued each business day as of the close of regular trading on the New York Stock Exchange (generally 4 p.m. Eastern Time), although the Portfolio may deviate from this calculation time under unusual or unexpected circumstances.
Debt securities are valued at the evaluated bid price provided by an independent pricing service (e.g. taking into account various factors, including yields, maturities, or credit ratings) or, if a reliable price is not available, the quoted bid price from an independent broker-dealer.
Investments in registered open-end investment companies are valued at net asset value.
Investments which are not valued using any of the methods discussed above are valued at their fair value, as determined in good faith by the Board of Trustees of the Portfolio. The Board of Trustees has established a Valuation Committee comprised of the Trustees and has delegated to it the authority to take any actions regarding the valuation of portfolio securities that the Valuation Committee deems necessary or appropriate, including determining the fair value of portfolio securities, unless the determination has been delegated to the Wells Fargo Asset Management Pricing Committee at Wells Fargo Funds Management, LLC (“Funds Management”). The Board of Trustees retains the authority to make or ratify any valuation decisions or approve any changes to the Valuation Procedures as it deems appropriate. On a quarterly basis, the Board of Trustees receives reports on any valuation actions taken by the Valuation Committee or the Wells Fargo Asset Management Pricing Committee which may include items for ratification.
Security transactions and income recognition
Securities transactions are recorded on a trade date basis. Realized gains or losses are recorded on the basis of identified cost.
Interest income is accrued daily and bond discounts are accreted and premiums are amortized daily. To the extent debt obligations are placed on non-accrual status, any related interest income may be reduced by writing off interest receivables when the collection of all or a portion of interest has been determined to be doubtful based on consistently applied procedures and the fair value has decreased. If the issuer subsequently resumes interest payments or when the collectability of interest is reasonably assured, the debt obligation is removed from non-accrual status.
Federal and other taxes
The Portfolio is not required to pay federal income taxes on its net investment income and net capital gains as it is treated as a partnership for federal income tax purposes. All income, gains and losses of the Portfolio are deemed to have been “passed through” to the interest holders in proportion to their holdings of the Portfolio regardless of whether income and gains have been distributed by the Portfolio.
The Portfolio’s income tax returns and all financial records supporting those returns for the prior three fiscal years are subject to examination by the federal revenue authority. Management has analyzed the Portfolio’s tax positions taken on federal, state, and foreign tax returns for all open tax years and does not believe that there are any uncertain tax positions that require recognition of a tax liability.
10 | Wells Fargo Strategic Retirement Bond Portfolio
Notes to financial statements (unaudited)
As of August 31, 2020, the aggregate cost of all investments for federal income tax purposes was $60,942,500 and the unrealized gains (losses) consisted of:
| | | | |
| |
Gross unrealized gains | | $ | 4,066,639 | |
| |
Gross unrealized losses | | | (7,153 | ) |
| |
Net unrealized gains | | $ | 4,059,486 | |
3. FAIR VALUATION MEASUREMENTS
Fair value measurements of investments are determined within a framework that has established a fair value hierarchy based upon the various data inputs utilized in determining the value of the Portfolio’s investments. The three-level hierarchy gives the highest priority to unadjusted quoted prices in active markets for identical assets or liabilities (Level 1) and the lowest priority to unobservable inputs (Level 3). The Portfolio’s investments are classified within the fair value hierarchy based on the lowest level of input that is significant to the fair value measurement. The inputs are summarized into three broad levels as follows:
| ∎ | | Level 1 – quoted prices in active markets for identical securities |
| ∎ | | Level 2 – other significant observable inputs (including quoted prices for similar securities, interest rates, prepayment speeds, credit risk, etc.) |
| ∎ | | Level 3 – significant unobservable inputs (including the Portfolio’s own assumptions in determining the fair value of investments) |
The inputs or methodologies used for valuing investments in securities are not necessarily an indication of the risk associated with investing in those securities.
The following is a summary of the inputs used in valuing the Portfolio’s assets and liabilities as of August 31, 2020:
| | | | | | | | | | | | | | | | |
| | | | |
| | | Quoted prices
(Level 1) | | | Other significant
observable inputs
(Level 2) | | | Significant
unobservable inputs (Level 3) | | | Total | |
| | | | |
Assets | | | | | | | | | | | | | | | | |
Investments in: | | | | | | | | | | | | | | | | |
| | | | |
Agency securities | | $ | 0 | | | $ | 1,393,166 | | | $ | 0 | | | $ | 1,393,166 | |
| | | | |
U.S. Treasury securities | | | 63,196,181 | | | | 0 | | | | 0 | | | | 63,196,181 | |
| | | | |
Short-term investments | | | | | | | | | | | | | | | | |
| | | | |
Investment companies | | | 412,639 | | | | 0 | | | | 0 | | | | 412,639 | |
| | | | |
Total assets | | $ | 63,608,820 | | | $ | 1,393,166 | | | $ | 0 | | | $ | 65,001,986 | |
Additional sector, industry or geographic detail is included in the Portfolio of Investments.
For the six months ended August 31, 2020, the Portfolio did not have any transfers into/out of Level 3.
4. TRANSACTIONS WITH AFFILIATES
Advisory fee
The Trust has entered into an advisory contract with Funds Management, an indirect wholly owned subsidiary of Wells Fargo & Company (“Wells Fargo”). The adviser is responsible for implementing investment policies and guidelines and for supervising the subadviser, who is responsible for day-to-day portfolio management of the Portfolio. Pursuant to the contract, Funds Management is entitled to receive an advisory fee at the following annual rate based on the Portfolio’s average daily net assets:
| | | | |
| |
| Average daily net assets | | Advisory fee | |
| |
First $5 billion | | | 0.05 | % |
| |
Next $5 billion | | | 0.04 | |
| |
Over $10 billion | | | 0.03 | |
Wells Fargo Strategic Retirement Bond Portfolio | 11
Notes to financial statements (unaudited)
For the six months ended August 31, 2020, the advisory fee was equivalent to an annual rate of 0.05% of the Portfolio’s average daily net assets.
Funds Management has retained the services of a subadviser to provide daily portfolio management to the Portfolio. The fee for subadvisory services is borne by Funds Management. Wells Capital Management Incorporated, an affiliate of Funds Management and an indirect wholly owned subsidiary of Wells Fargo, is the subadviser to the Portfolio and is entitled to receive a fee from Funds Management at an annual rate starting at 0.04% and declining to 0.03% as the average daily net assets of the Portfolio increase.
Funds Management has voluntarily waived and/or reimbursed advisory fees to reduce the net operating expense ratio of the Portfolio.
Interfund transactions
The Portfolio may purchase or sell portfolio investment securities to certain other Wells Fargo affiliates pursuant to Rule 17a-7 under the 1940 Act and under procedures adopted by the Board of Trustees. The procedures have been designed to ensure that these interfund transactions, which do not incur broker commissions, are effected at current market prices.
5. INVESTMENT PORTFOLIO TRANSACTIONS
Purchases and sales of investments, excluding short-term securities, for the six months ended August 31, 2020 were as follows:
| | | | | | |
Purchases at cost | | Sales proceeds |
U.S.
government | | Non-U.S.
government | | U.S.
government | | Non-U.S.
government |
| $10,263,539 | | $94,738 | | $23,287,950 | | $0 |
6. BANK BORROWINGS
The Trust, along with Wells Fargo Variable Trust and Wells Fargo Funds Trust (excluding the money market funds), are parties to a $350,000,000 revolving credit agreement whereby the Portfolio is permitted to use bank borrowings for temporary or emergency purposes, such as to fund shareholder redemption requests. Interest under the credit agreement is charged to the Portfolio based on a borrowing rate equal to the higher of the Federal Funds rate in effect on that day plus 1.25% or the overnight LIBOR rate in effect on that day plus 1.25%. In addition, an annual commitment fee equal to 0.25% of the unused balance is allocated to each participating fund.
For the six months ended August 31, 2020, there were no borrowings by the Portfolio under the agreement.
7. INDEMNIFICATION
Under the Portfolio’s organizational documents, the officers and Trustees have been granted certain indemnification rights against certain liabilities that may arise out of performance of their duties to the Portfolio. The Portfolio has entered into a separate agreement with each Trustee that converts indemnification rights currently existing under the Portfolio’s organizational documents into contractual rights that cannot be changed in the future without the consent of the Trustee. Additionally, in the normal course of business, the Portfolio may enter into contracts with service providers that contain a variety of indemnification clauses. The Portfolio’s maximum exposure under these arrangements is dependent on future claims that may be made against the Portfolio and, therefore, cannot be estimated.
8. NEW ACCOUNTING PRONOUNCEMENT
In August 2018, FASB issued Accounting Standards Update (“ASU”) No. 2018-13, Fair Value Measurement (Topic 820) Disclosure Framework—Changes to the Disclosure Requirements for Fair Value Measurement. ASU 2018-13 updates the disclosure requirements on fair value measurements in Topic 820, Fair Value Measurements. The amendments are effective for fiscal years, and interim periods within those fiscal years, beginning after December 15, 2019. Management has adopted this guidance which did not have a material impact on the financial statements.
9. CORONAVIRUS (COVID-19) PANDEMIC
On March 11, 2020, the World Health Organization announced that it had made the assessment that coronavirus disease 2019 (“COVID-19”) is a pandemic. The impacts of COVID-19 are adversely affecting the entire global economy, individual companies and investment products, and the market in general. There is significant uncertainty around the extent and duration of business disruptions related to COVID-19 and the impacts may be short term or may last for an extended period of time. The risk of further spreading of COVID-19 has led to significant uncertainty and volatility in the financial markets.
12 | Wells Fargo Strategic Retirement Bond Portfolio
Other information (unaudited)
PROXY VOTING INFORMATION
A description of the policies and procedures used to determine how to vote proxies relating to portfolio securities is available, upon request, by calling 1-800-222-8222, visiting our website at wfam.com, or visiting the SEC website at sec.gov. Information regarding how the proxies related to portfolio securities were voted during the most recent 12-month period ended June 30 is available on the website at wfam.com or by visiting the SEC website at sec.gov.
QUARTERLY PORTFOLIO HOLDINGS INFORMATION
The Portfolio files its complete schedule of portfolio holdings with the SEC for the first and third quarters of each fiscal year as an exhibit to its reports on Form N-PORT. Shareholders may view the filed Form N-PORT by visiting the SEC website at sec.gov.
Wells Fargo Strategic Retirement Bond Portfolio | 13
Other information (unaudited)
BOARD OF TRUSTEES AND OFFICERS
Each of the Trustees and Officers1 listed in the table below acts in identical capacities for each fund in the Wells Fargo family of funds, which consists of 142 mutual funds comprising the Wells Fargo Funds Trust, Wells Fargo Variable Trust, Wells Fargo Master Trust and four closed-end funds (collectively the “Fund Complex”). This table should be read in conjunction with the Prospectus and the Statement of Additional Information2. The mailing address of each Trustee and Officer is 525 Market Street, 12th Floor, San Francisco, CA 94105. Each Trustee and Officer serves an indefinite term, however, each Trustee serves such term until reaching the mandatory retirement age established by the Trustees.
Independent Trustees
| | | | | | |
Name and year of birth | | Position held and length of service* | | Principal occupations during past five years or longer | | Current other public company or investment company directorships |
| | | |
William R. Ebsworth (Born 1957) | | Trustee, since 2015 | | Retired. From 1984 to 2013, equities analyst, portfolio manager, research director and chief investment officer at Fidelity Management and Research Company in Boston, Tokyo, and Hong Kong, and retired in 2013 as Chief Investment Officer of Fidelity Strategic Advisers, Inc. where he led a team of investment professionals managing client assets. Prior thereto, Board member of Hong Kong Securities Clearing Co., Hong Kong Options Clearing Corp., the Thailand International Fund, Ltd., Fidelity Investments Life Insurance Company, and Empire Fidelity Investments Life Insurance Company. Audit Committee Chair and Investment Committee Chair of the Vincent Memorial Hospital Endowment (non-profit organization). Mr. Ebsworth is a CFA® charterholder. | | N/A |
| | | |
Jane A. Freeman (Born 1953) | | Trustee, since 2015; Chair Liaison, since 2018 | | Retired. From 2012 to 2014 and 1999 to 2008, Chief Financial Officer of Scientific Learning Corporation. From 2008 to 2012, Ms. Freeman provided consulting services related to strategic business projects. Prior to 1999, Portfolio Manager at Rockefeller & Co. and Scudder, Stevens & Clark. Board member of the Harding Loevner Funds from 1996 to 2014, serving as both Lead Independent Director and chair of the Audit Committee. Board member of the Russell Exchange Traded Funds Trust from 2011 to 2012 and the chair of the Audit Committee. Ms. Freeman is also an inactive Chartered Financial Analyst. | | N/A |
| | | |
Isaiah Harris, Jr. (Born 1952) | | Trustee, since 2009; Audit Committee Chairman, since 2019 | | Retired. Chairman of the Board of CIGNA Corporation since 2009, and Director since 2005. From 2003 to 2011, Director of Deluxe Corporation. Prior thereto, President and CEO of BellSouth Advertising and Publishing Corp. from 2005 to 2007, President and CEO of BellSouth Enterprises from 2004 to 2005 and President of BellSouth Consumer Services from 2000 to 2003. Emeritus member of the Iowa State University Foundation Board of Governors. Emeritus Member of the Advisory Board of Iowa State University School of Business. Advisory Board Member, Palm Harbor Academy (private school). Mr. Harris is a certified public accountant (inactive status). | | CIGNA Corporation |
| | | |
Judith M. Johnson (Born 1949) | | Trustee, since 2008 | | Retired. Prior thereto, Chief Executive Officer and Chief Investment Officer of Minneapolis Employees Retirement Fund from 1996 to 2008. Ms. Johnson is an attorney, certified public accountant and a certified managerial accountant. | | N/A |
| | | |
David F. Larcker (Born 1950) | | Trustee, since 2009 | | James Irvin Miller Professor of Accounting at the Graduate School of Business (Emeritus), Stanford University, Director of the Corporate Governance Research Initiative and Senior Faculty of The Rock Center for Corporate Governance since 2006. From 2005 to 2008, Professor of Accounting at the Graduate School of Business, Stanford University. Prior thereto, Ernst & Young Professor of Accounting at The Wharton School, University of Pennsylvania from 1985 to 2005. | | N/A |
14 | Wells Fargo Strategic Retirement Bond Portfolio
Other information (unaudited)
| | | | | | |
Name and year of birth | | Position held and length of service* | | Principal occupations during past five years or longer | | Current other public company or investment company directorships |
| | | |
Olivia S. Mitchell (Born 1953) | | Trustee, since 2006; Nominating and Governance Committee Chair, since 2018 | | International Foundation of Employee Benefit Plans Professor, Wharton School of the University of Pennsylvania since 1993. Director of Wharton’s Pension Research Council and Boettner Center on Pensions & Retirement Research, and Research Associate at the National Bureau of Economic Research. Previously, Cornell University Professor from 1978 to 1993. | | N/A |
| | | |
Timothy J. Penny (Born 1951) | | Trustee, since 1996; Chairman, since 2018 | | President and Chief Executive Officer of Southern Minnesota Initiative Foundation, a non-profit organization, since 2007. Member of the Board of Trustees of NorthStar Education Finance, Inc., a non-profit organization, since 2007. | | N/A |
| | | |
James G. Polisson (Born 1959) | | Trustee, since 2018 | | Retired. Chief Marketing Officer, Source (ETF) UK Services, Ltd, from 2015 to 2017. From 2012 to 2015, Principal of The Polisson Group, LLC, a management consulting, corporate advisory and principal investing company. Chief Executive Officer and Managing Director at Russell Investments, Global Exchange Traded Funds from 2010 to 2012. Managing Director of Barclays Global Investors from 1998 to 2010 and Global Chief Marketing Officer for iShares and Barclays Global Investors from 2000 to 2010. Trustee of the San Francisco Mechanics’ Institute, a non-profit organization, from 2013 to 2015. Board member of the Russell Exchange Traded Fund Trust from 2011 to 2012. Director of Barclays Global Investors Holdings Deutschland GmbH from 2006 to 2009. Mr. Polisson is an attorney and has a retired status with the Massachusetts and District of Columbia Bar Associations. | | N/A |
| | | |
Pamela Wheelock (Born 1959) | | Trustee, since January 2020; previously Trustee from January 2018 to July 2019 | | Board member of the Destination Medical Center Economic Development Agency, Rochester, Minnesota since 2019. Interim President of the McKnight Foundation from January to September 2020. Acting Commissioner, Minnesota Department of Human Services, July 2019 through September 2019. Human Services Manager (part-time), Minnesota Department of Human Services, October 2019 through December 2019. Chief Operating Officer, Twin Cities Habitat for Humanity from 2017 to 2019. Vice President of University Services, University of Minnesota from 2012 to 2016. Prior thereto, on the Board of Directors, Governance Committee and Finance Committee for the Minnesota Philanthropy Partners (Saint Paul Foundation) from 2012 to 2018, Interim Chief Executive Officer of Blue Cross Blue Shield of Minnesota from 2011 to 2012, Chairman of the Board from 2009 to 2012 and Board Director from 2003 to 2015. Vice President, Leadership and Community Engagement, Bush Foundation, Saint Paul, Minnesota (a private foundation) from 2009 to 2011. Executive Vice President and Chief Financial Officer, Minnesota Sports and Entertainment from 2004 to 2009 and Senior Vice President from 2002 to 2004. Executive Vice President of the Minnesota Wild Foundation from 2004 to 2008. Commissioner of Finance, State of Minnesota, from 1999 to 2002. Currently Board Chair of the Minnesota Wild Foundation since 2010. | | N/A |
| * | Length of service dates reflect the Trustee’s commencement of service with the Trust’s predecessor entities, where applicable. |
Wells Fargo Strategic Retirement Bond Portfolio | 15
Other information (unaudited)
Officers
| | | | |
Name and year of birth | | Position held and length of service | | Principal occupations during past five years or longer |
| | |
Andrew Owen (Born 1960) | | President, since 2017 | | Executive Vice President of Wells Fargo & Company and Head of Affiliated Managers, Wells Fargo Asset Management, since 2014. In addition, Mr. Owen is currently President, Chief Executive Officer and Director of Wells Fargo Funds Management, LLC since 2017. Prior thereto, Executive Vice President responsible for marketing, investments and product development for Wells Fargo Funds Management, LLC, from 2009 to 2014. |
| | |
Jeremy DePalma1 (Born 1974) | | Treasurer, since 2012 | | Senior Vice President of Wells Fargo Funds Management, LLC since 2009. Senior Vice President of Evergreen Investment Management Company, LLC from 2008 to 2010 and head of the Fund Reporting and Control Team within Fund Administration from 2005 to 2010. |
| | |
Michelle Rhee (Born 1966) | | Chief Legal Officer, since 2019 | | Secretary of Wells Fargo Funds Management, LLC, Chief Legal Counsel of Wells Fargo Asset Management and Assistant General Counsel of Wells Fargo Bank, N.A. since 2018. Associate General Counsel and Managing Director of Bank of America Corporation from 2004 to 2018. |
| | |
Catherine Kennedy (Born 1969) | | Secretary, since 2019 | | Vice President of Wells Fargo Funds Management, LLC and Senior Counsel of the Wells Fargo Legal Department since 2010. Vice President and Senior Counsel of Evergreen Investment Management Company, LLC from 1998 to 2010. |
| | |
Michael H. Whitaker (Born 1967) | | Chief Compliance Officer, since 2016 | | Chief Compliance Officer of Wells Fargo Asset Management since 2016. Senior Vice President and Chief Compliance Officer for Fidelity Investments from 2007 to 2016. |
| | |
David Berardi (Born 1975) | | Assistant Treasurer, since 2009 | | Vice President of Wells Fargo Funds Management, LLC since 2009. Vice President of Evergreen Investment Management Company, LLC from 2008 to 2010. Manager of Fund Reporting and Control for Evergreen Investment Management Company, LLC from 2004 to 2010. |
| 1 | Jeremy DePalma acts as Treasurer of 77 funds and Assistant Treasurer of 65 funds in the Fund Complex. |
| 2 | The Statement of Additional Information includes additional information about the Trustees and is available, without charge, upon request, by calling 1-800-222-8222 or by visiting the website at wfam.com. |
16 | Wells Fargo Strategic Retirement Bond Portfolio
Other information (unaudited)
BOARD CONSIDERATION OF INVESTMENT MANAGEMENT, ADVISORY AND SUB-ADVISORY AGREEMENTS:
Wells Fargo Emerging Markets Bond Fund, Wells Fargo High Yield Corporate Bond Fund, Wells Fargo International Government Bond Fund, Wells Fargo U.S. Core Bond Fund, Wells Fargo Bloomberg Barclays US Aggregate ex-Corporate Credit Portfolio, Wells Fargo Factor Enhanced Emerging Markets Equity Portfolio, Wells Fargo Emerging Markets Bond Portfolio, Wells Fargo Factor Enhanced International Equity Portfolio, Wells Fargo Factor Enhanced U.S. Large Cap Portfolio, Wells Fargo Factor Enhanced U.S. Small Cap Portfolio, Wells Fargo International Government Bond Portfolio, Wells Fargo Investment Grade Corporate Bond Portfolio, Wells Fargo High Yield Corporate Bond Portfolio, Wells Fargo Strategic Retirement Bond Portfolio, and Wells Fargo U.S. REIT Portfolio
Under the Investment Company Act of 1940 (the “1940 Act”), the Board of Trustees (each, a “Board” and collectively, the “Boards”) of each of Wells Fargo Funds Trust (“Funds Trust”) and Wells Fargo Master Trust (“Master Trust”) (collectively, the “Trusts”) must determine annually whether to approve the continuation of the Trusts’ investment management, advisory and sub-advisory agreements, as applicable. In this regard, at a meeting held on May 26, 2020 and May 28, 2020 (together, the “Meeting”), the Board of Funds Trust, all the members of which have no direct or indirect interest in the investment management agreement and are not “interested persons” of the Trusts, as defined in the 1940 Act (the “Independent Trustees”), reviewed and approved for each of the funds of Funds Trust identified in the table below (individually, an “Index Fund” and collectively, the “Index Funds”) an investment management agreement (the “Management Agreement”) with Wells Fargo Funds Management, LLC (“Funds Management”).
|
|
| Index Funds |
|
Wells Fargo Emerging Markets Bond Fund |
|
Wells Fargo High Yield Corporate Bond Fund |
|
Wells Fargo International Government Bond Fund |
|
Wells Fargo U.S. Core Bond Fund |
In addition, the Funds Trust Board reviewed and approved an investment sub-advisory agreement with Wells Capital Management Incorporated (“WellsCap”) for the U.S. Core Bond Fund (the “Core Bond Fund Sub-Advisory Agreement”).
At the Meeting, the Board of Master Trust, all the members of which have no direct or indirect interest in the investment advisory and sub-advisory agreements and are Independent Trustees, reviewed and approved for each of the portfolios of Master Trust identified in the table below (individually, a “Master Portfolio” and collectively, the “Master Portfolios”): (i) an investment advisory agreement (the “Master Portfolio Advisory Agreement”) with Funds Management; and (ii) an investment sub-advisory agreement (each, a “Master Portfolio Sub-Advisory Agreement”, and collectively, the “Master Portfolio Sub-Advisory Agreements”) with the sub-adviser(s) identified in the chart below (each, a “Sub-Adviser”, and collectively, the “Sub-Advisers”) for the corresponding Master Portfolio identified.
| | |
| |
| Master Portfolios | | Sub-Advisers |
| |
Wells Fargo Bloomberg Barclays US Aggregate ex-Corporate Credit Portfolio | | WellsCap |
| |
Wells Fargo Factor Enhanced Emerging Markets Equity Portfolio | | WellsCap |
| |
Wells Fargo Emerging Markets Bond Portfolio | | Wells Fargo Asset Management (International), Limited (“WFAM International”) |
| |
Wells Fargo Factor Enhanced International Equity Portfolio | | WellsCap |
| |
Wells Fargo Factor Enhanced U.S. Large Cap Portfolio | | WellsCap |
| |
Wells Fargo Factor Enhanced U.S. Small Cap Portfolio | | WellsCap |
| |
Wells Fargo International Government Bond Portfolio | | WFAM International |
| |
Wells Fargo Investment Grade Corporate Bond Portfolio | | WellsCap |
| |
Wells Fargo High Yield Corporate Bond Portfolio | | WellsCap |
| |
Wells Fargo Strategic Retirement Bond Portfolio | | WellsCap |
| |
Wells Fargo U.S. REIT Portfolio | | WellsCap |
Wells Fargo Strategic Retirement Bond Portfolio | 17
Other information (unaudited)
The Index Funds and the Master Portfolios are collectively referred to as the “Funds.” The Management Agreement, the Core Bond Fund Sub-Advisory Agreement, the Master Portfolio Advisory Agreement and the Master Portfolio Sub-Advisory Agreements are collectively referred to as the “Advisory Agreements.”
The Boards noted that each of the Index Funds is a feeder fund that invests all of its assets in its corresponding Master Portfolio, with the exception of the U.S. Core Bond Fund, which invests in multiple Master Portfolios. Information provided to the Boards regarding the Index Funds is also applicable to the Master Portfolios identified above, as relevant.
At the Meeting, the Boards considered the factors and reached the conclusions described below relating to the selection of Funds Management and the Sub-Advisers and the approval of the Advisory Agreements. Prior to the Meeting, including at a Board meeting held in April 2020, the Trustees conferred extensively among themselves and with representatives of Funds Management about these matters. Also, the Boards have adopted a team-based approach, with each team consisting of a sub-set of Trustees, to assist the full Boards in the discharge of their duties in reviewing investment performance and other matters throughout the year. The Independent Trustees were assisted in their evaluation of the Advisory Agreements by independent legal counsel, from whom they received separate legal advice and with whom they met separately.
In providing information to the Boards, Funds Management and the Sub-Advisers were guided by a detailed set of requests for information submitted to them by independent legal counsel on behalf of the Independent Trustees at the start of the Boards’ annual contract renewal process earlier in 2020. In considering and approving the Advisory Agreements, the Trustees considered the information they believed relevant, including but not limited to the information discussed below. The Boards considered not only the specific information presented in connection with the Meeting, but also the knowledge gained over time through interaction with Funds Management and the Sub-Advisers about various topics. In this regard, the Boards reviewed reports of Funds Management at each of their quarterly meetings, which included, among other things, portfolio reviews and investment performance reports. In addition, the Boards and the teams mentioned above confer with portfolio managers at various times throughout the year. The Boards did not identify any particular information or consideration that was all-important or controlling, and each individual Trustee may have attributed different weights to various factors.
After its deliberations, the Board of Funds Trust unanimously approved the continuation of the Management Agreement and the Core Bond Fund Sub-Advisory Agreement for a one-year period. Additionally, after its deliberations, the Board of Master Trust unanimously approved the continuation of the Master Portfolio Advisory Agreement and each Master Portfolio Sub-Advisory Agreement for a one-year term. The Boards also determined that the compensation or the absence of compensation payable to Funds Management and to each of the Sub-Advisers under each of the Advisory Agreements was reasonable. The Boards considered the approval of the Advisory Agreements for the Funds as part of their consideration of agreements for funds across the complex, but their approvals were made on a fund-by-fund basis. The following summarizes a number of important, but not necessarily all, factors considered by the Boards in support of their approvals.
Nature, extent and quality of services
The Boards received and considered various information regarding the nature, extent and quality of services provided to the Funds by Funds Management and the Sub-Advisers under the Advisory Agreements. This information included a description of the investment advisory services and Fund-level administrative services covered by the Advisory Agreements, as well as, among other things, a summary of the background and experience of senior management of Wells Fargo Asset Management (“WFAM”), of which Funds Management and the Sub-Advisers are a part, and a summary of investments made in the business of WFAM. The Boards also received a description of Funds Management’s and the Sub-Advisers’ business continuity plans and of their approaches to data privacy and cybersecurity, and related testing. The Boards also received and reviewed information about Funds Management’s role as administrator of the Funds’ liquidity risk management program, Funds Management’s approach to risk management, and Funds Management’s intermediary and vendor oversight program.
The Boards also considered the qualifications, background, tenure and responsibilities of each of the portfolio managers primarily responsible for the day-to-day portfolio management of the Funds. The Board of Master Trust noted that each of the Master Portfolios replicates the performance of a proprietary index provided by an affiliate of Funds Management, except that the Wells Fargo Bloomberg Barclays US Aggregate ex-Corporate Credit Portfolio, the Wells Fargo Emerging Markets Bond Portfolio, and the Wells Fargo Strategic Retirement Bond Portfolio track the performance of third-party indexes. The Boards evaluated the ability of Funds Management and the Sub-Advisers to attract and retain qualified investment professionals, including research, advisory and supervisory personnel. The Boards further considered the compliance programs and compliance records of Funds Management and the Sub-Advisers. In addition, the Boards took into account the full range of services provided to the Funds by Funds Management and its affiliates.
18 | Wells Fargo Strategic Retirement Bond Portfolio
Other information (unaudited)
Fund investment performance and expenses
The Boards considered the investment performance results for each of the Master Portfolios for the one-year period ended December 31, 2019. The Boards also considered more current results for the one-year period ended March 31, 2020. The Boards considered these results in comparison to the investment performance of funds in a universe that was determined by Broadridge Inc. (“Broadridge”) to be similar to the respective Master Portfolios (each, a “Universe”), and in comparison to each Master Portfolio’s benchmark index and to other comparative data. Broadridge is an independent provider of investment company data. The Boards received a description of the methodology used by Broadridge to select the mutual funds in each performance Universe.
The Boards noted the short performance history of the Master Portfolios. For the one-year period ended December 31, 2019, the Boards noted that the investment performance of each Master Portfolio relative to its respective Universe was as follows: (i) the investment performance of each of the Wells Fargo Bloomberg Barclays US Aggregate ex-Corporate Credit Portfolio, the Wells Fargo Emerging Markets Bond Portfolio, the Wells Fargo Factor Enhanced International Equity Portfolio, the Wells Fargo Factor Enhanced U.S. Large Cap Portfolio, the Wells Fargo High Yield Corporate Bond Portfolio and the Wells Fargo Investment Grade Corporate Bond Portfolio was higher than or in range of the average investment performance of such Master Portfolio’s respective Universe; and (ii) the Wells Fargo Factor Enhanced Emerging Markets Equity Portfolio, the Wells Fargo Factor Enhanced U.S. Small Cap Portfolio, the Wells Fargo International Government Bond Portfolio, the Wells Fargo Strategic Retirement Bond Portfolio and the Wells Fargo U.S. REIT Portfolio was lower than the average investment performance of such Master Portfolio’s respective Universe. For the one-year period ended March 31, 2020, the Boards noted that the investment performance of each Master Portfolio relative to its respective Universe was as follows: (i) the Wells Fargo Emerging Markets Bond Portfolio, the Wells Fargo Factor Enhanced U.S. Large Cap Portfolio, the Wells Fargo Factor Enhanced U.S. Small Cap Portfolio, the Wells Fargo International Government Bond Portfolio, and the Wells Fargo Investment Grade Corporate Bond Portfolio was higher than or in range of the average investment performance of such Master Portfolio’s respective Universe, and (ii) the Wells Fargo Bloomberg Barclays US Aggregate ex-Corporate Credit Portfolio, the Wells Fargo Factor Enhanced Emerging Markets Equity Portfolio, the Wells Fargo Factor Enhanced International Equity Portfolio, the Wells Fargo High Yield Corporate Bond Portfolio, the Wells Fargo Strategic Retirement Bond Portfolio and the Wells Fargo U.S. REIT Portfolio was lower than the average investment performance of such Master Portfolio’s respective Universe.
The Boards also noted that the investment performance of each Master Portfolio to its respective benchmark index for the one-year period ended December 31, 2019, was as follows: (i) the investment performance of each of the Wells Fargo Bloomberg Barclays US Aggregate ex-Corporate Credit Portfolio, the Wells Fargo Factor Enhanced Emerging Markets Equity Portfolio, the Wells Fargo Factor Enhanced U.S. Large Cap Portfolio, the Wells Fargo Factor Enhanced U.S. Small Cap Portfolio, the Wells Fargo High Yield Corporate Bond Portfolio, the Wells Fargo U.S. REIT Portfolio and the Wells Fargo Strategic Retirement Bond Portfolio was higher than or in range of the average investment performance of such Master Portfolio’s respective benchmark, and (ii) the investment performance of each of the Wells Fargo Emerging Markets Bond Portfolio, the Wells Fargo Factor Enhanced International Equity Portfolio, the Wells Fargo International Government Bond Portfolio and the Wells Fargo Investment Grade Corporate Bond Portfolio was lower than the average investment performance of such Master Portfolio’s respective benchmark. For the one-year period ended March 31, 2020, the Boards also noted that the investment performance of each Master Portfolio to its respective benchmark index, was as follows: (i) the investment performance of each of the Wells Fargo Bloomberg Barclays US Aggregate ex-Corporate Credit Portfolio, the Wells Fargo Factor Enhanced Emerging Markets Equity Portfolio, the Wells Fargo Factor Enhanced International Equity Portfolio, the Wells Fargo Factor Enhanced U.S. Large Cap Portfolio, the Wells Fargo Factor Enhanced U.S. Small Cap Portfolio, the Wells Fargo U.S. REIT Portfolio, the Wells Fargo Investment Grade Corporate Bond Portfolio and the Wells Fargo Strategic Retirement Bond Portfolio was higher than, equal to or in range of the average investment performance of such Master Portfolio’s respective benchmark, and (ii) the investment performance of each of the Wells Fargo Emerging Markets Bond Portfolio, the Wells Fargo High Yield Corporate Bond Portfolio and the Wells Fargo International Government Bond Portfolio was lower than the average investment performance of such Master Portfolio’s respective benchmark.
The Boards received information concerning, and discussed factors contributing to, the underperformance of certain Master Portfolios, relative to the Universe and benchmark index, for the periods identified above. The Board took note of the explanations for the relative underperformance during these periods, including with respect to investment decisions and market factors that affected the Fund’s investment performance.
The Board of Funds Trust took note of the investment performance of the Master Portfolios in the context of reviewing the investment performance of the Index Funds. The Board of Funds Trust also received and considered information regarding the “zero fee and expense” structure of each Index Fund. Specifically, the Funds Trust Board noted that each Index Fund’s gross operating expense ratio and each of its various components, including management fees, administration fees, custody fees, Rule 12b-1 fees, and other fees, are zero. The Funds Trust Board also noted that Funds Management assumes and pays or
Wells Fargo Strategic Retirement Bond Portfolio | 19
Other information (unaudited)
reimburses all of the ordinary operating expenses of each Index Fund, including acquired fund fees and expenses, pursuant to an agreement with each of the Index Funds (the “Fee and Expense Agreement”). The Funds Trust Board further noted that Funds Management receives a fee from Wells Fargo Wealth and Investment Management (“WIM”) pursuant to an intercompany agreement equal to the Master Portfolio fees and expenses absorbed by Funds Management through its Fee and Expense Agreement with each of the Index Funds.
With respect to the Master Portfolios, the Board of Master Trust received and considered information regarding the fee rates that are payable to Funds Management for investment advisory services (as discussed below), which are the only fees charged at the Master Portfolio level, relative to corresponding class-specific expense groups that were determined by Broadridge to be similar to the Funds (the “Groups”). The Boards received a description of the methodology used by Broadridge to select the mutual funds in the expense Groups and an explanation of how funds comprising expense groups and their expense ratios may vary from year-to-year.
The Boards took into account the Funds’ expense information and the Master Portfolios’ performance information provided to them among the factors considered in deciding to re-approve the Advisory Agreements.
Investment management, advisory and sub-advisory fee rates
The Board of Funds Trust reviewed and considered that the contractual investment management fee rate payable by each Index Fund to Funds Management for investment management services zero, and also reviewed and considered that each Fund’s other expenses would normally be zero, because of Funds Management’s commitment to assume and pay or reimburse all of the ordinary operating expenses of each Fund, including acquired fund fees and expenses, under the Fee and Expense Agreement. The Board of Funds Trust also reviewed and considered that the contractual investment sub-advisory fee rate payable by Funds Management to WellsCap for investment sub-advisory services for the U.S. Core Bond Fund is also zero.
The Board of Master Trust reviewed and considered the contractual fee rates payable by the Master Portfolios to Funds Management under the Master Portfolio Advisory Agreement (the “Advisory Agreement Rates”). The Board of Master Trust also reviewed and considered the contractual investment sub-advisory fee rates that are payable by Funds Management to the Sub-Advisers for investment sub-advisory services (the “Sub-Advisory Agreement Rates”).
The Board of Master Trust reviewed a comparison of the Advisory Agreement Rates of each Master Portfolio with those of other funds in each Master Portfolio’s respective expense Groups at a common asset level. The Board of Master Trust noted that the Advisory Agreement Rates of each Master Portfolio were lower than or equal to the median rate for such Master Portfolio’s expense Groups.
The Boards also received and considered information about the portions of the total management fees that were retained by Funds Management after payment of the fees to the Sub-Advisers for sub-advisory services. In assessing the reasonableness of these amounts, the Boards received and evaluated information about the nature and extent of responsibilities retained and risks assumed by Funds Management and not delegated to or assumed by the Sub-Advisers, and about Funds Management’s on-going oversight services. Given the affiliation between Funds Management and the Sub-Advisers, the Boards ascribed limited relevance to the allocation of fees between them.
The Boards also received and considered information about the nature and extent of services offered and fee rates charged by Funds Management and the Sub-Advisers to other types of clients with investment strategies similar to those of certain Funds. In this regard, the Boards received information about the significantly greater scope of services, and compliance, reporting and other legal burdens and risks of managing proprietary mutual funds compared with those associated with managing assets of other types of clients, including third-party sub-advised fund clients and non-mutual fund clients such as institutional separate accounts.
Based on its consideration of the factors and information it deemed relevant, including those described here, the Board of Fund Trust determined that the compensation received by Funds Management from WIM pursuant to the intercompany agreement, and the absence of compensation payable by the Funds to Funds Management pursuant to the Management Agreement or to WellsCap pursuant to the Core Bond Fund Sub-Advisory Agreement, was reasonable. Based on its consideration of the factors and information it deemed relevant, including those described here, the Board of Master Trust determined that the Advisory Agreement Rates and the Sub-Advisory Agreement Rates for each Master Portfolio were reasonable.
Profitability
The Boards received and considered information concerning the profitability of Funds Management, as well as the profitability of both WFAM and Wells Fargo & Co. (“Wells Fargo”) from providing services to the fund family as a whole. The Boards noted that the Sub-Advisers’ profitability information with respect to providing services to the Funds and other funds in the family was subsumed in the WFAM and Wells Fargo profitability analysis.
20 | Wells Fargo Strategic Retirement Bond Portfolio
Other information (unaudited)
Funds Management reported on the methodologies and estimates used in calculating profitability, including a description of the methodology used to allocate certain expenses. Among other things, the Boards noted that the levels of profitability reported on a fund-by-fund basis varied widely, depending on factors such as the size, type and age of fund.
Based on its review, the Boards did not deem the profits reported by Funds Management, WFAM or Wells Fargo from services provided to the Funds to be at a level that would prevent them from approving the continuation of the Advisory Agreements.
Economies of scale
The Boards received and considered information about the potential for Funds Management to experience economies of scale in the provision of management services to the Funds, the difficulties of calculating economies of scale at an individual fund level, and the extent to which potential scale benefits are shared with shareholders. The Boards noted the existence of breakpoints in the each Master Portfolio’s advisory fee structure and each Index Fund’s management fee structure, which operate generally to reduce the Funds’ expense ratios as the Funds grow in size, and the size of the Funds in relation to such breakpoints. The Boards considered that in addition to management fee breakpoints, Funds Management shares potential economies of scale from its management business in a variety of ways, including through fee waiver and expense reimbursement arrangements, services that benefit shareholders, competitive management fee rates set at the outset without regard to breakpoints, and investments in the business intended to enhance services available to shareholders.
The Boards concluded that Funds Management’s arrangements with respect to the Funds, including contractual breakpoints, constituted a reasonable approach to sharing potential economies of scale with the Funds and their shareholders.
Other benefits to Funds Management and the Sub-Advisers
The Boards received and considered information regarding potential “fall-out” or ancillary benefits received by Funds Management and its affiliates, including WellsCap and WFAM International, as a result of their relationships with the Funds. Ancillary benefits could include, among others, benefits directly attributable to other relationships with the Funds and benefits potentially derived from an increase in Funds Management’s and the Sub-Advisers’ business as a result of their relationships with the Funds. The Boards noted that various affiliates of Funds Management may receive distribution-related fees, shareholder servicing payments and sub-transfer agency fees in respect of shares sold or held through them and services provided.
The Boards also reviewed information about soft dollar credits earned and utilized by the Sub-Advisers, fees earned by Funds Management and WellsCap from managing a private investment vehicle for the fund family’s securities lending collateral, and commissions earned by an affiliated broker from portfolio transactions.
Based on their consideration of the factors and information they deemed relevant, including those described here, the Boards did not find that any ancillary benefits received by Funds Management and its affiliates, including WellsCap and WFAM International, were unreasonable.
Conclusion
At the Meeting, after considering the above-described factors and based on its deliberations and its evaluation of the information described above, the Funds Trust Board unanimously approved the continuation of the Management Agreement and the Core Bond Fund Sub-Advisory Agreement for a one-year period. Additionally, after its deliberations, the Master Trust Board unanimously approved the continuation of the Master Portfolio Advisory Agreement and each Master Portfolio Sub-Advisory Agreement for a one-year term. The Boards also determined that the compensation or the absence of compensation payable to Funds Management and to each of the Sub-Advisers was reasonable.
Wells Fargo Strategic Retirement Bond Portfolio | 21
Other information (unaudited)
LIQUIDITY RISK MANAGEMENT PROGRAM
In accordance with Rule 22e-4 under the Investment Company Act of 1940, as amended (the “Liquidity Rule”), Wells Fargo Master Trust (the “Trust”) has adopted and implemented a liquidity risk management program (the “Program”) on behalf of each of its series, including each Portfolio, which is reasonably designed to assess and manage the Portfolio’s liquidity risk. “Liquidity risk” is defined as the risk that a Portfolio is unable to meet redemption requests without significantly diluting remaining investors’ interests in the Portfolio. The Trust’s Board of Trustees (the “Board”) previously approved the designation of Wells Fargo Funds Management, LLC (“Funds Management”), each Portfolio’s investment adviser, as the administrator of the Program, and Funds Management has established a Liquidity Risk Management Council composed of personnel from multiple departments within Funds Management and its affiliates to assist Funds Management in the implementation and on-going administration of the Program.
The Program is comprised of various components designed to support the assessment and/or management of liquidity risk, including: (1) the periodic assessment (no less frequently than annually) of certain factors that influence a Portfolio’s liquidity risk; (2) the periodic classification (no less frequently than monthly) of a Portfolio’s investments into one of four liquidity categories that reflect an estimate of their liquidity under current market conditions; (3) a 15% limit on the acquisition of “illiquid investments” (as defined under the Liquidity Rule); (4) to the extent a Portfolio does not invest primarily in “highly liquid investments” (as defined under the Liquidity Rule), the determination of a minimum percentage of the Portfolio’s assets that generally will be invested in highly liquid investments (an “HLIM”); (5) if a Portfolio has established an HLIM, the periodic review (no less frequently than annually) of the HLIM and the adoption of policies and procedures for responding to a shortfall of the Portfolio’s “highly liquid investments” below its HLIM; and (6) periodic reporting to the Board.
At a meeting of the Board held on May 26 and 28, 2020, the Board received a written report (the “Report”) from Funds Management that addressed the operation of the Program and assessed its adequacy and effectiveness of implementation. The Report covered the initial period from December 1, 2018 through December 31, 2019 (the “Reporting Period”). No significant liquidity events impacting any Portfolio were noted in the Report. There were no material changes to the Program during the Reporting Period. The Report concluded that the Program is operating effectively to assess and manage each Portfolio’s liquidity risk, and that the Program has been and continues to be adequately and effectively implemented to monitor and, as applicable, respond to the Portfolio’s liquidity developments.
22 | Wells Fargo Strategic Retirement Bond Portfolio
This page is intentionally left blank.
This page is intentionally left blank.

For more information
More information about Wells Fargo Funds is available free upon request. To obtain literature, please write, visit the Portfolio’s website, or call:
Wells Fargo Funds
P.O. Box 219967
Kansas City, MO 64121-9967
Website: wfam.com
Individual investors: 1-800-222-8222
Retail investment professionals: 1-888-877-9275
Institutional investment professionals: 1-866-765-0778
This report and the financial statements contained herein are submitted for the general information of the shareholders of the Portfolio. If this report is used for promotional purposes, distribution of the report must be accompanied or preceded by a current prospectus. Before investing, please consider the investment objectives, risks, charges, and expenses of the investment. For a current prospectus and, if available, a summary prospectus, containing this information, call 1-800-222-8222 or visit the Portfolio’s website at wfam.com. Read the prospectus carefully before you invest or send money.
Wells Fargo Asset Management (WFAM) is the trade name for certain investment advisory/management firms owned by Wells Fargo & Company. These firms include but are not limited to Wells Capital Management Incorporated and Wells Fargo Funds Management, LLC. Certain products managed by WFAM entities are distributed by Wells Fargo Funds Distributor, LLC (a broker-dealer and Member FINRA).
This material is for general informational and educational purposes only and is NOT intended to provide investment advice or a recommendation of any kind—including a recommendation for any specific investment, strategy, or plan.
INVESTMENT PRODUCTS: NOT FDIC INSURED ◾ NO BANK GUARANTEE ◾ MAY LOSE VALUE
© 2020 Wells Fargo & Company. All rights reserved.
Semi-Annual Report
August 31, 2020
Wells Fargo U.S. REIT Portfolio
Contents
INVESTMENT PRODUCTS: NOT FDIC INSURED ◾ NO BANK GUARANTEE ◾ MAY LOSE VALUE
Wells Fargo U.S. REIT Portfolio | 1
Portfolio information (unaudited)
Investment objective
The Portfolio seeks to replicate the total return of the Wells Fargo US REIT Index before fees and expenses.
Adviser
Wells Fargo Funds Management, LLC
Subadviser
Wells Capital Management Incorporated
Portfolio manager
Petros N. Bocray, CFA®‡
| | | | |
|
| Ten largest holdings (%) as of August 31, 20201 | |
| | |
Prologis Incorporated | | | 11.20 | |
| | |
Digital Realty Trust Incorporated | | | 6.25 | |
| | |
Public Storage Incorporated | | | 4.82 | |
| | |
Welltower Incorporated | | | 3.67 | |
| | |
AvalonBay Communities Incorporated | | | 3.34 | |
| | |
Alexandria Real Estate Equities Incorporated | | | 3.32 | |
| | |
Equity Residential | | | 3.14 | |
| | |
Simon Property Group Incorporated | | | 3.09 | |
| | |
Invitation Homes Incorporated | | | 2.38 | |
| | |
Ventas Incorporated | | | 2.32 | |
| ‡ | CFA® and Chartered Financial Analyst® are trademarks owned by CFA Institute. |
| 1 | The ten largest holdings, excluding cash, cash equivalents and any money market funds, are calculated based on the value of the investments divided by the total net assets of the Portfolio. Holdings are subject to change and may have changed since the date specified. |
2 | Wells Fargo U.S. REIT Portfolio
Portfolio of investments—August 31, 2020 (unaudited)
| | | | | | | | | | | | | | | | |
| | | | | | | | | Shares | | | Value | |
| Common Stocks: 99.44% | | | | | | | | | | | | | | | | |
| | | | |
Real Estate: 99.44% | | | | | | | | | | | | | | | | |
| | | | |
| Equity REITs: 99.44% | | | | | | | | | | | | |
Acadia Realty Trust | | | | | | | | | | | 3,062 | | | $ | 34,723 | |
Alexandria Real Estate Equities Incorporated | | | | | | | | | | | 4,779 | | | | 804,688 | |
American Assets Trust Incorporated | | | | | | | | | | | 1,777 | | | | 45,402 | |
American Campus Communities Incorporated | | | | | | | | | | | 4,923 | | | | 166,890 | |
American Homes 4 Rent Class A | | | | | | | | | | | 9,263 | | | | 265,292 | |
Americold Realty Trust | | | | | | | | | | | 7,153 | | | | 274,318 | |
Apartment Investment & Management Company Class A | | | | | | | | | | | 5,389 | | | | 194,166 | |
Apple Hospitality REIT Incorporated | | | | | | | | | | | 7,832 | | | | 79,651 | |
AvalonBay Communities Incorporated | | | | | | | | | | | 5,116 | | | | 808,635 | |
Boston Properties Incorporated | | | | | | | | | | | 5,087 | | | | 441,908 | |
Brandywine Realty Trust | | | | | | | | | | | 6,048 | | | | 67,314 | |
Brixmor Property Group Incorporated | | | | | | | | | | | 10,589 | | | | 124,950 | |
Brookfield Property REIT Class A | | | | | | | | | | | 1,885 | | | | 21,734 | |
Camden Property Trust | | | | | | | | | | | 3,594 | | | | 326,838 | |
Colony Capital Incorporated | | | | | | | | | | | 17,120 | | | | 46,395 | |
Columbia Property Trust Incorporated | | | | | | | | | | | 4,035 | | | | 47,613 | |
Community Healthcare Trust Incorporated | | | | | | | | | | | 758 | | | | 35,399 | |
CoreCivic Incorporated | | | | | | | | | | | 4,322 | | | | 40,238 | |
Corporate Office Properties Trust | | | | | | | | | | | 4,031 | | | | 99,324 | |
Cousins Properties Incorporated | | | | | | | | | | | 5,339 | | | | 159,369 | |
CubeSmart | | | | | | | | | | | 7,004 | | | | 221,466 | |
DiamondRock Hospitality | | | | | | | | | | | 7,319 | | | | 38,791 | |
Digital Realty Trust Incorporated | | | | | | | | | | | 9,741 | | | | 1,516,187 | |
Diversified Healthcare Trust | | | | | | | | | | | 8,526 | | | | 32,399 | |
Douglas Emmett Incorporated | | | | | | | | | | | 6,025 | | | | 168,218 | |
Duke Realty Corporation | | | | | | | | | | | 13,466 | | | | 519,114 | |
Easterly Government Properties Incorporated | | | | | | | | | | | 2,694 | | | | 65,168 | |
EastGroup Properties Incorporated | | | | | | | | | | | 1,378 | | | | 183,494 | |
Empire State Realty Trust Incorporated Class A | | | | | | | | | | | 6,404 | | | | 40,345 | |
Equity Commonwealth | | | | | | | | | | | 4,283 | | | | 134,443 | |
Equity Lifestyle Properties Incorporated | | | | | | | | | | | 6,154 | | | | 407,949 | |
Equity Residential | | | | | | | | | | | 13,465 | | | | 760,099 | |
Essential Properties Realty | | | | | | | | | | | 3,283 | | | | 55,713 | |
Essex Property Trust Incorporated | | | | | | | | | | | 2,391 | | | | 517,675 | |
Extra Space Storage Incorporated | | | | | | | | | | | 4,616 | | | | 491,835 | |
Federal Realty Investment Trust | | | | | | | | | | | 2,728 | | | | 216,167 | |
First Industrial Realty Trust Incorporated | | | | | | | | | | | 4,561 | | | | 194,527 | |
Gaming and Leisure Properties Incorporated | | | | | | | | | | | 7,442 | | | | 270,517 | |
Healthcare Realty Trust Incorporated | | | | | | | | | | | 4,943 | | | | 142,606 | |
Healthcare Trust of America Incorporated Class A | | | | | | | | | | | 7,971 | | | | 210,355 | |
Healthpeak Properties Incorporated | | | | | | | | | | | 19,562 | | | | 540,694 | |
Highwoods Properties Incorporated | | | | | | | | | | | 3,717 | | | | 138,495 | |
Host Hotels & Resorts Incorporated | | | | | | | | | | | 25,741 | | | | 289,071 | |
Hudson Pacific Properties Incorporated | | | | | | | | | | | 5,430 | | | | 127,496 | |
Independence Realty Trust Incorporated | | | | | | | | | | | 3,370 | | | | 39,463 | |
Industrial Logistics Properties Trust | | | | | | | | | | | 2,307 | | | | 49,762 | |
Innovative Industrial Properties Incorporated | | | | | | | | | | | 744 | | | | 91,579 | |
Investors Real Estate Trust | | | | | | | | | | | 439 | | | | 31,213 | |
Invitation Homes Incorporated | | | | | | | | | | | 20,137 | | | | 576,522 | |
Iron Mountain Incorporated | | | | | | | | | | | 10,441 | | | | 314,170 | |
JBG Smith Properties | | | | | | | | | | | 4,306 | | | | 119,147 | |
Kilroy Realty Corporation | | | | | | | | | | | 4,096 | | | | 239,698 | |
Kimco Realty Corporation | | | | | | | | | | | 15,185 | | | | 182,068 | |
Kite Realty Group Trust | | | | | | | | | | | 2,994 | | | | 33,653 | |
Lamar Advertising Company Class A | | | | | | | | | | | 3,158 | | | | 218,628 | |
The accompanying notes are an integral part of these financial statements.
Wells Fargo U.S. REIT Portfolio | 3
Portfolio of investments—August 31, 2020 (unaudited)
| | | | | | | | | | | | | | | | |
| | | | | | | | | Shares | | | Value | |
| Equity REITs (continued) | | | | | | | | | | | | |
Life Storage Incorporated | | | | | | | | | | | 1,687 | | | $ | 177,860 | |
LTC Properties Incorporated | | | | | | | | | | | 1,414 | | | | 51,597 | |
Mack-Cali Realty Corporation | | | | | | | | | | | 2,797 | | | | 35,326 | |
Mid-America Apartment Communities Incorporated | | | | | | | | | | | 4,154 | | | | 486,516 | |
National Health Investors Incorporated | | | | | | | | | | | 1,540 | | | | 95,865 | |
National Storage Affiliates Trust | | | | | | | | | | | 1,935 | | | | 66,390 | |
NexPoint Residential Trust Incorporated | | | | | | | | | | | 741 | | | | 30,677 | |
Office Properties Income Trust | | | | | | | | | | | 1,689 | | | | 40,266 | |
Outfront Media Incorporated | | | | | | | | | | | 5,241 | | | | 88,730 | |
Paramount Group Incorporated | | | | | | | | | | | 6,881 | | | | 50,919 | |
Park Hotels & Resorts Incorporated | | | | | | | | | | | 8,728 | | | | 82,829 | |
Pebblebrook Hotel Trust | | | | | | | | | | | 4,830 | | | | 60,955 | |
Piedmont Office Realty Trust Incorporated Class A | | | | | | | | | | | 4,466 | | | | 68,374 | |
Prologis Incorporated | | | | | | | | | | | 26,665 | | | | 2,716,097 | |
PS Business Parks Incorporated | | | | | | | | | | | 730 | | | | 92,126 | |
Public Storage Incorporated | | | | | | | | | | | 5,504 | | | | 1,169,050 | |
Regency Centers Corporation | | | | | | | | | | | 6,030 | | | | 239,451 | |
Retail Opportunity Investment Corporation | | | | | | | | | | | 4,126 | | | | 45,922 | |
Rexford Industrial Realty Incorporated | | | | | | | | | | | 4,473 | | | | 214,615 | |
RLJ Lodging Trust | | | | | | | | | | | 6,141 | | | | 57,971 | |
RPT Realty | | | | | | | | | | | 2,797 | | | | 16,390 | |
Ryman Hospitality Properties Incorporated | | | | | | | | | | | 1,843 | | | | 70,329 | |
Seritage Growth Property Class A † | | | | | | | | | | | 1,204 | | | | 16,892 | |
Service Properties Trust | | | | | | | | | | | 6,051 | | | | 49,679 | |
Simon Property Group Incorporated | | | | | | | | | | | 11,035 | | | | 748,725 | |
SITE Centers Corporation | | | | | | | | | | | 5,430 | | | | 40,779 | |
SL Green Realty Corporation | | | | | | | | | | | 2,648 | | | | 123,820 | |
STAG Industrial Incorporated | | | | | | | | | | | 5,385 | | | | 173,936 | |
Summit Hotel Properties Incorporated | | | | | | | | | | | 3,886 | | | | 22,889 | |
Sun Communities Incorporated | | | | | | | | | | | 3,457 | | | | 515,370 | |
Sunstone Hotel Investors Incorporated | | | | | | | | | | | 7,806 | | | | 65,024 | |
Tanger Factory Outlet Centers Incorporated | | | | | | | | | | | 3,332 | | | | 18,959 | |
Taubman Centers Incorporated | | | | | | | | | | | 2,164 | | | | 82,881 | |
Terreno Realty Corporation | | | | | | | | | | | 2,375 | | | | 141,645 | |
The Geo Group Incorporated | | | | | | | | | | | 4,327 | | | | 48,289 | |
The Macerich Company | | | | | | | | | | | 5,083 | | | | 40,308 | |
UDR Incorporated | | | | | | | | | | | 10,618 | | | | 369,613 | |
Uniti Group Incorporated | | | | | | | | | | | 6,873 | | | | 67,493 | |
Urban Edge Properties | | | | | | | | | | | 4,043 | | | | 42,694 | |
Ventas Incorporated | | | | | | | | | | | 13,622 | | | | 561,363 | |
VICI Properties Incorporated | | | | | | | | | | | 20,544 | | | | 458,953 | |
Vornado Realty Trust | | | | | | | | | | | 6,257 | | | | 224,188 | |
Washington REIT | | | | | | | | | | | 2,939 | | | | 64,482 | |
Weingarten Realty Investors | | | | | | | | | | | 4,387 | | | | 76,641 | |
Welltower Incorporated | | | | | | | | | | | 15,481 | | | | 890,467 | |
Xenia Hotels & Resorts Incorporated | | | | | | | | | | | 4,228 | | | | 37,967 | |
| | | | | | | | | | | | | | | | |
| |
Total Common Stocks (Cost $22,680,320) | | | | 24,104,886 | |
| | | | | | | | | | | | | | | | |
| | | | |
| | | | | | | | | | | | | | | | |
| | | Yield | | | | | | | | | | |
| Short-Term Investments: 0.33% | | | | | | | | | | | | |
| | | | |
Investment Companies: 0.33% | | | | | | | | | | | | | | | | |
Wells Fargo Government Money Market Fund Select Class (l)(u) | | | 0.06 | % | | | | | | | 80,646 | | | | 80,646 | |
| | | | | | | | | | | | | | | | |
| |
Total Short-Term Investments (Cost $80,646) | | | | 80,646 | |
| | | | | | | | | | | | | | | | |
| Total investments in securities (Cost $22,760,966) | | | 99.77 | % | | | | | | | | | | | 24,185,532 | |
| | | | |
Other assets and liabilities, net | | | 0.23 | | | | | | | | | | | | 56,219 | |
| | | | | | | | | | | | | | | | |
| Total net assets | | | 100.00 | % | | | | | | | | | | $ | 24,241,751 | |
| | | | | | | | | | | | | | | | |
The accompanying notes are an integral part of these financial statements.
4 | Wells Fargo U.S. REIT Portfolio
Portfolio of investments—August 31, 2020 (unaudited)
| † | Non-income-earning security |
| (l) | The issuer of the security is an affiliated person of the Portfolio as defined in the Investment Company Act of 1940. |
| (u) | The rate represents the 7-day annualized yield at period end. |
Abbreviations:
| REIT | Real estate investment trust |
Investments in Affiliates
An affiliated investment is an investment in which the Portfolio owns at least 5% of the outstanding voting shares of the issuer or as a result of other relationships, such as the Portfolio and the issuer having the same adviser or investment manager. Transactions with issuers that were either affiliated persons of the Portfolio at the beginning of the period or the end of the period were as follows:
| | | | | | | | | | | | | | | | | | | | | | | | | | | | | | | | |
| | | Value,
beginning of
period | | |
Purchases | | | Sales
proceed | | | Net
realized
gains
(losses) | | | Net
change in
unrealized
gains
(losses) | | | Income
from
affiliated
securities | | | Value,
end of
period | | | % of
net
assets | |
| | | | | | | | |
| Short-Term Investments | | | | | | | | | | | | | | | | | | | | | | | | |
Investment Companies | | | | | | | | | | | | | | | | | | | | | | | | | | | | | | | | |
Wells Fargo Government Money Market Fund Select Class | | $ | 239,974 | | | $ | 10,159,793 | | | $ | (10,319,121 | ) | | $ | 0 | | | $ | 0 | | | $ | 312 | | | $ | 80,646 | | | | 0.33 | % |
| | | | | | | | | | | | | | | | | | | | | | | | | | | | | | | | |
The accompanying notes are an integral part of these financial statements.
Wells Fargo U.S. REIT Portfolio | 5
Statement of assets and liabilities—August 31, 2020 (unaudited)
| | | | |
| | | | |
| |
Assets | | | | |
Investments in unaffiliated securities, at value (cost $22,680,320) | | $ | 24,104,886 | |
Investments in affiliated securities, at value (cost $80,646) | | | 80,646 | |
Receivable for investments sold | | | 59,443 | |
Receivable for dividends | | | 11,529 | |
Receivable from adviser | | | 4,854 | |
Prepaid expenses and other assets | | | 37,409 | |
| | | | |
Total assets | | | 24,298,767 | |
| | | | |
| |
Liabilities | | | | |
Payable for investments purchased | | | 15,526 | |
Professional fees payable | | | 39,614 | |
Trustees’ fees and expenses payable | | | 1,876 | |
| | | | |
Total liabilities | | | 57,016 | |
| | | | |
Total net assets | | $ | 24,241,751 | |
| | | | |
The accompanying notes are an integral part of these financial statements.
6 | Wells Fargo U.S. REIT Portfolio
Statement of operations—six months ended August 31, 2020 (unaudited)
| | | | |
| | | | |
| |
Investment income | | | | |
Dividends | | $ | 465,864 | |
Income from affiliated securities | | | 312 | |
| | | | |
Total investment income | | | 466,176 | |
| | | | |
| |
Expenses | | | | |
Advisory fee | | | 11,984 | |
Custody and accounting fees | | | 13,802 | |
Professional fees | | | 16,411 | |
Shareholder report expenses | | | 3,598 | |
Trustees’ fees and expenses | | | 9,898 | |
Other fees and expenses | | | 2,891 | |
| | | | |
Total expenses | | | 58,584 | |
Less: Fee waivers and/or expense reimbursements | | | (40,258 | ) |
| | | | |
Net expenses | | | 18,326 | |
| | | | |
Net investment income | | | 447,850 | |
| | | | |
| |
Realized and unrealized gains (losses) on investments | | | | |
Net realized losses on investments | | | (1,760,430 | ) |
Net change in unrealized gains (losses) on investments | | | (700,205 | ) |
| | | | |
Net realized and unrealized gains (losses) on investments | | | (2,460,635 | ) |
| | | | |
Net decrease in net assets resulting from operations | | $ | (2,012,785 | ) |
| | | | |
The accompanying notes are an integral part of these financial statements.
Wells Fargo U.S. REIT Portfolio | 7
Statement of changes in net assets
| | | | | | | | |
| | | Six months ended
August 31, 2020
(unaudited) | | | Year ended
February 29, 2020 | |
| | |
Operations | | | | | | | | |
Net investment income | | $ | 447,850 | | | $ | 908,484 | |
Net realized gains (losses) on investments | | | (1,760,430 | ) | | | 3,095,201 | |
Net change in unrealized gains (losses) on investments | | | (700,205 | ) | | | (2,169,132 | ) |
| | | | |
Net increase (decrease) in net assets resulting from operations | | | (2,012,785 | ) | | | 1,834,553 | |
| | | | |
| |
Capital transactions | | | | |
Transactions in investors’ beneficial interests | |
Contributions | | | 7,598,211 | | | | 5,390,330 | |
Withdrawals | | | (6,954,296 | ) | | | (25,181,044 | ) |
| | | | |
Net increase (decrease) in net assets resulting from capital transactions | | | 643,915 | | | | (19,790,714 | ) |
| | | | |
Total decrease in net assets | | | (1,368,870 | ) | | | (17,956,161 | ) |
| | | | |
| |
Net assets | | | | |
Beginning of period | | | 25,610,621 | | | | 43,566,782 | |
| | | | |
End of period | | $ | 24,241,751 | | | $ | 25,610,621 | |
| | | | | | | | |
The accompanying notes are an integral part of these financial statements.
8 | Wells Fargo U.S. REIT Portfolio
Financial highlights
| | | | | | | | | | | | | | | | |
| | | Six months ended
August 31, 2020
(unaudited) | | | Year ended
February 29 2020 | | | Year ended February 28 | |
| | | 2019 | | | 20181 | |
Total return2 | | | (10.60 | )% | | | 2.65 | % | | | 19.52 | % | | | (8.74 | )% |
Ratios to average net assets (annualized) | | | | | | | | | | | | | | | | |
Gross expenses | | | 0.49 | % | | | 0.43 | % | | | 0.26 | % | | | 0.33 | % |
Net expenses | | | 0.15 | % | | | 0.19 | % | | | 0.23 | % | | | 0.32 | % |
Net investment income | | | 3.74 | % | | | 2.73 | % | | | 2.91 | % | | | 2.53 | % |
Supplemental data | | | | | | | | | | | | | | | | |
Portfolio turnover rate | | | 43 | % | | | 26 | % | | | 20 | % | | | 51 | % |
| 1 | For the period from May 23, 2017 (commencement of operations) to February 28, 2018 |
| 2 | Returns for periods of less than one year are not annualized. |
The accompanying notes are an integral part of these financial statements.
Wells Fargo U.S. REIT Portfolio | 9
Notes to financial statements (unaudited)
1. ORGANIZATION
Wells Fargo Master Trust (the “Trust”), a Delaware statutory trust organized on March 10, 1999, is an open-end management investment company registered under the Investment Company Act of 1940, as amended (the “1940 Act”). As an investment company, the Trust follows the accounting and reporting guidance in Financial Accounting Standards Board (“FASB”) Accounting Standards Codification Topic 946, Financial Services – Investment Companies. These financial statements report on the Wells Fargo U.S. REIT Portfolio (the “Portfolio”) which is a diversified series of the Trust.
Interests in the Portfolio are available solely through private placement transactions that do not involve any “public offering” within the meaning of Section 4(2) of the Investment Company Act of 1933.
2. SIGNIFICANT ACCOUNTING POLICIES
The following significant accounting policies, which are consistently followed in the preparation of the financial statements of the Portfolio, are in conformity with U.S. generally accepted accounting principles which require management to make estimates and assumptions that affect the reported amounts of assets and liabilities, disclosure of contingent assets and liabilities at the date of the financial statements, and the reported amounts of revenues and expenses during the reporting period. Actual results could differ from those estimates.
Securities valuation
All investments are valued each business day as of the close of regular trading on the New York Stock Exchange (generally 4 p.m. Eastern Time), although the Portfolio may deviate from this calculation time under unusual or unexpected circumstances.
Equity securities that are listed on a foreign or domestic exchange or market are valued at the official closing price or, if none, the last sales price. If no sale occurs on the principal exchange or market that day, a fair value price will be determined in accordance with the Portfolio’s Valuation Procedures.
Investments in registered open-end investment companies are valued at net asset value.
Investments which are not valued using any of the methods discussed above are valued at their fair value, as determined in good faith by the Board of Trustees of the Portfolio. The Board of Trustees has established a Valuation Committee comprised of the Trustees and has delegated to it the authority to take any actions regarding the valuation of portfolio securities that the Valuation Committee deems necessary or appropriate, including determining the fair value of portfolio securities, unless the determination has been delegated to the Wells Fargo Asset Management Pricing Committee at Wells Fargo Funds Management, LLC (“Funds Management”). The Board of Trustees retains the authority to make or ratify any valuation decisions or approve any changes to the Valuation Procedures as it deems appropriate. On a quarterly basis, the Board of Trustees receives reports on any valuation actions taken by the Valuation Committee or the Wells Fargo Asset Management Pricing Committee which may include items for ratification.
Security transactions and income recognition
Securities transactions are recorded on a trade date basis. Realized gains or losses are recorded on the basis of identified cost.
Dividend income is recognized on the ex-dividend date.
Federal and other taxes
The Portfolio is not required to pay federal income taxes on its net investment income and net capital gains as it is treated as a partnership for federal income tax purposes. All income, gains and losses of the Portfolio are deemed to have been “passed through” to the interest holders in proportion to their holdings of the Portfolio regardless of whether income and gains have been distributed by the Portfolio.
The Portfolio’s income tax returns and all financial records supporting those returns for the prior three fiscal years are subject to examination by the federal revenue authority. Management has analyzed the Portfolio’s tax positions taken on federal, state, and foreign tax returns for all open tax years and does not believe that there are any uncertain tax positions that require recognition of a tax liability.
As of Auguat 31, 2020, the aggregate cost of all investments for federal income tax purposes was $20,195,050 and the unrealized gains (losses) consisted of:
| | | | |
| |
Gross unrealized gains | | $ | 2,781,263 | |
| |
Gross unrealized losses | | | 1,209,219 | |
| |
Net unrealized gains | | $ | 3,990,482 | |
10 | Wells Fargo U.S. REIT Portfolio
Notes to financial statements (unaudited)
3. FAIR VALUATION MEASUREMENTS
Fair value measurements of investments are determined within a framework that has established a fair value hierarchy based upon the various data inputs utilized in determining the value of the Portfolio’s investments. The three-level hierarchy gives the highest priority to unadjusted quoted prices in active markets for identical assets or liabilities (Level 1) and the lowest priority to unobservable inputs (Level 3). The Portfolio’s investments are classified within the fair value hierarchy based on the lowest level of input that is significant to the fair value measurement. The inputs are summarized into three broad levels as follows:
| ∎ | | Level 1 – quoted prices in active markets for identical securities |
| ∎ | | Level 2 – other significant observable inputs (including quoted prices for similar securities, interest rates, prepayment speeds, credit risk, etc.) |
| ∎ | | Level 3 – significant unobservable inputs (including the Portfolio’s own assumptions in determining the fair value of investments) |
The inputs or methodologies used for valuing investments in securities are not necessarily an indication of the risk associated with investing in those securities.
The following is a summary of the inputs used in valuing the Portfolio’s assets and liabilities as of August 31, 2020:
| | | | | | | | | | | | | | | | |
| | | | |
| | | Quoted prices (Level 1) | | | Other significant
observable inputs (Level 2) | | | Significant
unobservable inputs (Level 3) | | | Total | |
| | | | |
Assets | | | | | | | | | | | | | | | | |
Investments in: | | | | | | | | | | | | | | | | |
| | | | |
Common stocks | | | | | | | | | | | | | | | | |
| | | | |
Real estate | | $ | 24,104,886 | | | $ | 0 | | | $ | 0 | | | $ | 24,104,886 | |
| | | | |
Short-term investments | | | | | | | | | | | | | | | | |
| | | | |
Investment companies | | | 80,646 | | | | 0 | | | | 0 | | | | 80,646 | |
| | | | |
Total assets | | $ | 24,185,532 | | | $ | 0 | | | $ | 0 | | | $ | 24,185,532 | |
Additional sector, industry or geographic detail is included in the Portfolio of Investments.
For the six months ended August 31, 2020, the Portfolio did not have any transfers into/out of Level 3.
4. TRANSACTIONS WITH AFFILIATES
Advisory fee
The Trust has entered into an advisory contract with Funds Management, an indirect wholly owned subsidiary of Wells Fargo & Company (“Wells Fargo”). The adviser is responsible for implementing investment policies and guidelines and for supervising the subadviser, who is responsible for day-to-day portfolio management of the Portfolio. Pursuant to the contract, Funds Management is entitled to receive an advisory fee at the following annual rate based on the Portfolio’s average daily net assets:
| | | | |
| |
| Average daily net assets | | Advisory fee | |
| |
First $5 billion | | | 0.10 | % |
| |
Next $5 billion | | | 0.08 | |
| |
Over $10 billion | | | 0.06 | |
For the six months ended August 31, 2020, the advisory fee was equivalent to an annual rate of 0.10% of the Portfolio’s average daily net assets.
Funds Management has retained the services of a subadviser to provide daily portfolio management to the Portfolio. The fee for subadvisory services is borne by Funds Management. Wells Capital Management Incorporated, an affiliate of Funds Management and an indirect wholly owned subsidiary of Wells Fargo, is the subadviser to the Portfolio and is entitled to receive a fee from Funds Management at an annual rate starting at 0.06% and declining to 0.04% as the average daily net assets of the Portfolio increase.
Wells Fargo U.S. REIT Portfolio | 11
Notes to financial statements (unaudited)
Funds Management has voluntarily waived and/or reimbursed advisory fees to reduce the net operating expense ratio of the Portfolio.
Interfund transactions
The Portfolio may purchase or sell portfolio investment securities to certain other Wells Fargo affiliates pursuant to Rule 17a-7 under the 1940 Act and under procedures adopted by the Board of Trustees. The procedures have been designed to ensure that these interfund transactions, which do not incur broker commissions, are effected at current market prices.
5. INVESTMENT PORTFOLIO TRANSACTIONS
Purchases and sales of investments, excluding U.S. government obligations (if any) and short-term securities, for the six months ended August 31, 2020 were $11,560,320 and $10,469,048, respectively.
6. BANK BORROWINGS
The Trust, along with Wells Fargo Variable Trust and Wells Fargo Funds Trust (excluding the money market funds), are parties to a $350,000,000 revolving credit agreement whereby the Portfolio is permitted to use bank borrowings for temporary or emergency purposes, such as to fund shareholder redemption requests. Interest under the credit agreement is charged to the Portfolio based on a borrowing rate equal to the higher of the Federal Funds rate in effect on that day plus 1.25% or the overnight LIBOR rate in effect on that day plus 1.25%. In addition, an annual commitment fee equal to 0.25% of the unused balance is allocated to each participating fund.
For the six months ended August 31, 2020, there were no borrowings by the Portfolio under the agreement.
7. CONCENTRATION RISK
Concentration risks result from exposure to a limited number of sectors. As of the end of the period, the Portfolio invested a concentration of its portfolio in the real estate sector. A portfolio that invests a substantial portion of its assets in any sector may be more affected by changes in that sector than would be a portfolio whose investments are not heavily weighted in any sector.
8. INDEMNIFICATION
Under the Portfolio’s organizational documents, the officers and Trustees have been granted certain indemnification rights against certain liabilities that may arise out of performance of their duties to the Portfolio. The Portfolio has entered into a separate agreement with each Trustee that converts indemnification rights currently existing under the Portfolio’s organizational documents into contractual rights that cannot be changed in the future without the consent of the Trustee. Additionally, in the normal course of business, the Portfolio may enter into contracts with service providers that contain a variety of indemnification clauses. The Portfolio’s maximum exposure under these arrangements is dependent on future claims that may be made against the Portfolio and, therefore, cannot be estimated.
9. NEW ACCOUNTING PRONOUNCEMENT
In August 2018, FASB issued Accounting Standards Update (“ASU”) No. 2018-13, Fair Value Measurement (Topic 820) Disclosure Framework—Changes to the Disclosure Requirements for Fair Value Measurement. ASU 2018-13 updates the disclosure requirements on fair value measurements in Topic 820, Fair Value Measurements. The amendments are effective for fiscal years, and interim periods within those fiscal years, beginning after December 15, 2019. Management has adopted this guidance which did not have a material impact on the financial statements.
10. CORONAVIRUS (COVID-19) PANDEMIC
On March 11, 2020, the World Health Organization announced that it had made the assessment that coronavirus disease 2019 (“COVID-19”) is a pandemic. The impacts of COVID-19 are adversely affecting the entire global economy, individual companies and investment products, and the market in general. There is significant uncertainty around the extent and duration of business disruptions related to COVID-19 and the impacts may be short term or may last for an extended period of time. The risk of further spreading of COVID-19 has led to significant uncertainty and volatility in the financial markets.
12 | Wells Fargo U.S. REIT Portfolio
Other information (unaudited)
PROXY VOTING INFORMATION
A description of the policies and procedures used to determine how to vote proxies relating to portfolio securities is available, upon request, by calling 1-800-222-8222, visiting our website at wfam.com, or visiting the SEC website at sec.gov. Information regarding how the proxies related to portfolio securities were voted during the most recent 12-month period ended June 30 is available on the website at wfam.com or by visiting the SEC website at sec.gov.
QUARTERLY PORTFOLIO HOLDINGS INFORMATION
The Portfolio files its complete schedule of portfolio holdings with the SEC for the first and third quarters of each fiscal year as an exhibit to its reports on Form N-PORT. Shareholders may view the filed Form N-PORT by visiting the SEC website at sec.gov.
Wells Fargo U.S. REIT Portfolio | 13
Other information (unaudited)
BOARD OF TRUSTEES AND OFFICERS
Each of the Trustees and Officers1 listed in the table below acts in identical capacities for each fund in the Wells Fargo family of funds, which consists of 142 mutual funds comprising the Wells Fargo Funds Trust, Wells Fargo Variable Trust, Wells Fargo Master Trust and four closed-end funds (collectively the “Fund Complex”). This table should be read in conjunction with the Prospectus and the Statement of Additional Information2. The mailing address of each Trustee and Officer is 525 Market Street, 12th Floor, San Francisco, CA 94105. Each Trustee and Officer serves an indefinite term, however, each Trustee serves such term until reaching the mandatory retirement age established by the Trustees.
Independent Trustees
| | | | | | |
Name and year of birth | | Position held and length of service* | | Principal occupations during past five years or longer | | Current other public company or investment company directorships |
| | | |
William R. Ebsworth (Born 1957) | | Trustee, since 2015 | | Retired. From 1984 to 2013, equities analyst, portfolio manager, research director and chief investment officer at Fidelity Management and Research Company in Boston, Tokyo, and Hong Kong, and retired in 2013 as Chief Investment Officer of Fidelity Strategic Advisers, Inc. where he led a team of investment professionals managing client assets. Prior thereto, Board member of Hong Kong Securities Clearing Co., Hong Kong Options Clearing Corp., the Thailand International Fund, Ltd., Fidelity Investments Life Insurance Company, and Empire Fidelity Investments Life Insurance Company. Audit Committee Chair and Investment Committee Chair of the Vincent Memorial Hospital Endowment (non-profit organization). Mr. Ebsworth is a CFA® charterholder. | | N/A |
| | | |
Jane A. Freeman (Born 1953) | | Trustee, since 2015; Chair Liaison, since 2018 | | Retired. From 2012 to 2014 and 1999 to 2008, Chief Financial Officer of Scientific Learning Corporation. From 2008 to 2012, Ms. Freeman provided consulting services related to strategic business projects. Prior to 1999, Portfolio Manager at Rockefeller & Co. and Scudder, Stevens & Clark. Board member of the Harding Loevner Funds from 1996 to 2014, serving as both Lead Independent Director and chair of the Audit Committee. Board member of the Russell Exchange Traded Funds Trust from 2011 to 2012 and the chair of the Audit Committee. Ms. Freeman is also an inactive Chartered Financial Analyst. | | N/A |
| | | |
Isaiah Harris, Jr. (Born 1952) | | Trustee, since 2009; Audit Committee Chairman, since 2019 | | Retired. Chairman of the Board of CIGNA Corporation since 2009, and Director since 2005. From 2003 to 2011, Director of Deluxe Corporation. Prior thereto, President and CEO of BellSouth Advertising and Publishing Corp. from 2005 to 2007, President and CEO of BellSouth Enterprises from 2004 to 2005 and President of BellSouth Consumer Services from 2000 to 2003. Emeritus member of the Iowa State University Foundation Board of Governors. Emeritus Member of the Advisory Board of Iowa State University School of Business. Advisory Board Member, Palm Harbor Academy (private school). Mr. Harris is a certified public accountant (inactive status). | | CIGNA Corporation |
| | | |
Judith M. Johnson (Born 1949) | | Trustee, since 2008 | | Retired. Prior thereto, Chief Executive Officer and Chief Investment Officer of Minneapolis Employees Retirement Fund from 1996 to 2008. Ms. Johnson is an attorney, certified public accountant and a certified managerial accountant. | | N/A |
| | | |
David F. Larcker (Born 1950) | | Trustee, since 2009 | | James Irvin Miller Professor of Accounting at the Graduate School of Business (Emeritus), Stanford University, Director of the Corporate Governance Research Initiative and Senior Faculty of The Rock Center for Corporate Governance since 2006. From 2005 to 2008, Professor of Accounting at the Graduate School of Business, Stanford University. Prior thereto, Ernst & Young Professor of Accounting at The Wharton School, University of Pennsylvania from 1985 to 2005. | | N/A |
14 | Wells Fargo U.S. REIT Portfolio
Other information (unaudited)
| | | | | | |
Name and year of birth | | Position held and length of service* | | Principal occupations during past five years or longer | | Current other public company or investment company directorships |
| | | |
Olivia S. Mitchell (Born 1953) | | Trustee, since 2006; Nominating and Governance Committee Chair, since 2018 | | International Foundation of Employee Benefit Plans Professor, Wharton School of the University of Pennsylvania since 1993. Director of Wharton’s Pension Research Council and Boettner Center on Pensions & Retirement Research, and Research Associate at the National Bureau of Economic Research. Previously, Cornell University Professor from 1978 to 1993. | | N/A |
| | | |
Timothy J. Penny (Born 1951) | | Trustee, since 1996; Chairman, since 2018 | | President and Chief Executive Officer of Southern Minnesota Initiative Foundation, a non-profit organization, since 2007. Member of the Board of Trustees of NorthStar Education Finance, Inc., a non-profit organization, since 2007. | | N/A |
| | | |
James G. Polisson (Born 1959) | | Trustee, since 2018 | | Retired. Chief Marketing Officer, Source (ETF) UK Services, Ltd, from 2015 to 2017. From 2012 to 2015, Principal of The Polisson Group, LLC, a management consulting, corporate advisory and principal investing company. Chief Executive Officer and Managing Director at Russell Investments, Global Exchange Traded Funds from 2010 to 2012. Managing Director of Barclays Global Investors from 1998 to 2010 and Global Chief Marketing Officer for iShares and Barclays Global Investors from 2000 to 2010. Trustee of the San Francisco Mechanics’ Institute, a non-profit organization, from 2013 to 2015. Board member of the Russell Exchange Traded Fund Trust from 2011 to 2012. Director of Barclays Global Investors Holdings Deutschland GmbH from 2006 to 2009. Mr. Polisson is an attorney and has a retired status with the Massachusetts and District of Columbia Bar Associations. | | N/A |
| | | |
Pamela Wheelock (Born 1959) | | Trustee, since January 2020; previously Trustee from January 2018 to July 2019 | | Board member of the Destination Medical Center Economic Development Agency, Rochester, Minnesota since 2019. Interim President of the McKnight Foundation from January to September 2020. Acting Commissioner, Minnesota Department of Human Services, July 2019 through September 2019. Human Services Manager (part-time), Minnesota Department of Human Services, October 2019 through December 2019. Chief Operating Officer, Twin Cities Habitat for Humanity from 2017 to 2019. Vice President of University Services, University of Minnesota from 2012 to 2016. Prior thereto, on the Board of Directors, Governance Committee and Finance Committee for the Minnesota Philanthropy Partners (Saint Paul Foundation) from 2012 to 2018, Interim Chief Executive Officer of Blue Cross Blue Shield of Minnesota from 2011 to 2012, Chairman of the Board from 2009 to 2012 and Board Director from 2003 to 2015. Vice President, Leadership and Community Engagement, Bush Foundation, Saint Paul, Minnesota (a private foundation) from 2009 to 2011. Executive Vice President and Chief Financial Officer, Minnesota Sports and Entertainment from 2004 to 2009 and Senior Vice President from 2002 to 2004. Executive Vice President of the Minnesota Wild Foundation from 2004 to 2008. Commissioner of Finance, State of Minnesota, from 1999 to 2002. Currently Board Chair of the Minnesota Wild Foundation since 2010. | | N/A |
| * | Length of service dates reflect the Trustee’s commencement of service with the Trust’s predecessor entities, where applicable. |
Wells Fargo U.S. REIT Portfolio | 15
Other information (unaudited)
Officers
| | | | |
Name and year of birth | | Position held and length of service | | Principal occupations during past five years or longer |
| | |
Andrew Owen (Born 1960) | | President, since 2017 | | Executive Vice President of Wells Fargo & Company and Head of Affiliated Managers, Wells Fargo Asset Management, since 2014. In addition, Mr. Owen is currently President, Chief Executive Officer and Director of Wells Fargo Funds Management, LLC since 2017. Prior thereto, Executive Vice President responsible for marketing, investments and product development for Wells Fargo Funds Management, LLC, from 2009 to 2014. |
| | |
Jeremy DePalma1 (Born 1974) | | Treasurer, since 2012 | | Senior Vice President of Wells Fargo Funds Management, LLC since 2009. Senior Vice President of Evergreen Investment Management Company, LLC from 2008 to 2010 and head of the Fund Reporting and Control Team within Fund Administration from 2005 to 2010. |
| | |
Michelle Rhee (Born 1966) | | Chief Legal Officer, since 2019 | | Secretary of Wells Fargo Funds Management, LLC, Chief Legal Counsel of Wells Fargo Asset Management and Assistant General Counsel of Wells Fargo Bank, N.A. since 2018. Associate General Counsel and Managing Director of Bank of America Corporation from 2004 to 2018. |
| | |
Catherine Kennedy (Born 1969) | | Secretary, since 2019 | | Vice President of Wells Fargo Funds Management, LLC and Senior Counsel of the Wells Fargo Legal Department since 2010. Vice President and Senior Counsel of Evergreen Investment Management Company, LLC from 1998 to 2010. |
| | |
Michael H. Whitaker (Born 1967) | | Chief Compliance Officer, since 2016 | | Chief Compliance Officer of Wells Fargo Asset Management since 2016. Senior Vice President and Chief Compliance Officer for Fidelity Investments from 2007 to 2016. |
| | |
David Berardi (Born 1975) | | Assistant Treasurer, since 2009 | | Vice President of Wells Fargo Funds Management, LLC since 2009. Vice President of Evergreen Investment Management Company, LLC from 2008 to 2010. Manager of Fund Reporting and Control for Evergreen Investment Management Company, LLC from 2004 to 2010. |
| 1 | Jeremy DePalma acts as Treasurer of 77 funds and Assistant Treasurer of 65 funds in the Fund Complex. |
| 2 | The Statement of Additional Information includes additional information about the Trustees and is available, without charge, upon request, by calling 1-800-222-8222 or by visiting the website at wfam.com. |
16 | Wells Fargo U.S. REIT Portfolio
Other information (unaudited)
BOARD CONSIDERATION OF INVESTMENT MANAGEMENT, ADVISORY AND SUB-ADVISORY AGREEMENTS:
Wells Fargo Emerging Markets Bond Fund, Wells Fargo High Yield Corporate Bond Fund, Wells Fargo International Government Bond Fund, Wells Fargo U.S. Core Bond Fund, Wells Fargo Bloomberg Barclays US Aggregate ex-Corporate Credit Portfolio, Wells Fargo Factor Enhanced Emerging Markets Equity Portfolio, Wells Fargo Emerging Markets Bond Portfolio, Wells Fargo Factor Enhanced International Equity Portfolio, Wells Fargo Factor Enhanced U.S. Large Cap Portfolio, Wells Fargo Factor Enhanced U.S. Small Cap Portfolio, Wells Fargo International Government Bond Portfolio, Wells Fargo Investment Grade Corporate Bond Portfolio, Wells Fargo High Yield Corporate Bond Portfolio, Wells Fargo Strategic Retirement Bond Portfolio, and Wells Fargo U.S. REIT Portfolio
Under the Investment Company Act of 1940 (the “1940 Act”), the Board of Trustees (each, a “Board” and collectively, the “Boards”) of each of Wells Fargo Funds Trust (“Funds Trust”) and Wells Fargo Master Trust (“Master Trust”) (collectively, the “Trusts”) must determine annually whether to approve the continuation of the Trusts’ investment management, advisory and sub-advisory agreements, as applicable. In this regard, at a meeting held on May 26, 2020 and May 28, 2020 (together, the “Meeting”), the Board of Funds Trust, all the members of which have no direct or indirect interest in the investment management agreement and are not “interested persons” of the Trusts, as defined in the 1940 Act (the “Independent Trustees”), reviewed and approved for each of the funds of Funds Trust identified in the table below (individually, an “Index Fund” and collectively, the “Index Funds”) an investment management agreement (the “Management Agreement”) with Wells Fargo Funds Management, LLC (“Funds Management”).
|
|
| Index Funds |
|
Wells Fargo Emerging Markets Bond Fund |
|
Wells Fargo High Yield Corporate Bond Fund |
|
Wells Fargo International Government Bond Fund |
|
Wells Fargo U.S. Core Bond Fund |
In addition, the Funds Trust Board reviewed and approved an investment sub-advisory agreement with Wells Capital Management Incorporated (“WellsCap”) for the U.S. Core Bond Fund (the “Core Bond Fund Sub-Advisory Agreement”).
At the Meeting, the Board of Master Trust, all the members of which have no direct or indirect interest in the investment advisory and sub-advisory agreements and are Independent Trustees, reviewed and approved for each of the portfolios of Master Trust identified in the table below (individually, a “Master Portfolio” and collectively, the “Master Portfolios”): (i) an investment advisory agreement (the “Master Portfolio Advisory Agreement”) with Funds Management; and (ii) an investment sub-advisory agreement (each, a “Master Portfolio Sub-Advisory Agreement”, and collectively, the “Master Portfolio Sub-Advisory Agreements”) with the sub-adviser(s) identified in the chart below (each, a “Sub-Adviser”, and collectively, the “Sub-Advisers”) for the corresponding Master Portfolio identified.
| | |
| |
| Master Portfolios | | Sub-Advisers |
| |
Wells Fargo Bloomberg Barclays US Aggregate ex-Corporate Credit Portfolio | | WellsCap |
| |
Wells Fargo Factor Enhanced Emerging Markets Equity Portfolio | | WellsCap |
| |
Wells Fargo Emerging Markets Bond Portfolio | | Wells Fargo Asset Management (International), Limited (“WFAM International”)) |
| |
Wells Fargo Factor Enhanced International Equity Portfolio | | WellsCap |
| |
Wells Fargo Factor Enhanced U.S. Large Cap Portfolio | | WellsCap |
| |
Wells Fargo Factor Enhanced U.S. Small Cap Portfolio | | WellsCap |
| |
Wells Fargo International Government Bond Portfolio | | WFAM International |
| |
Wells Fargo Investment Grade Corporate Bond Portfolio | | WellsCap |
| |
Wells Fargo High Yield Corporate Bond Portfolio | | WellsCap |
| |
Wells Fargo Strategic Retirement Bond Portfolio | | WellsCap |
| |
Wells Fargo U.S. REIT Portfolio | | WellsCap |
Wells Fargo U.S. REIT Portfolio | 17
Other information (unaudited)
The Index Funds and the Master Portfolios are collectively referred to as the “Funds.” The Management Agreement, the Core Bond Fund Sub-Advisory Agreement, the Master Portfolio Advisory Agreement and the Master Portfolio Sub-Advisory Agreements are collectively referred to as the “Advisory Agreements.”
The Boards noted that each of the Index Funds is a feeder fund that invests all of its assets in its corresponding Master Portfolio, with the exception of the U.S. Core Bond Fund, which invests in multiple Master Portfolios. Information provided to the Boards regarding the Index Funds is also applicable to the Master Portfolios identified above, as relevant.
At the Meeting, the Boards considered the factors and reached the conclusions described below relating to the selection of Funds Management and the Sub-Advisers and the approval of the Advisory Agreements. Prior to the Meeting, including at a Board meeting held in April 2020, the Trustees conferred extensively among themselves and with representatives of Funds Management about these matters. Also, the Boards have adopted a team-based approach, with each team consisting of a sub-set of Trustees, to assist the full Boards in the discharge of their duties in reviewing investment performance and other matters throughout the year. The Independent Trustees were assisted in their evaluation of the Advisory Agreements by independent legal counsel, from whom they received separate legal advice and with whom they met separately.
In providing information to the Boards, Funds Management and the Sub-Advisers were guided by a detailed set of requests for information submitted to them by independent legal counsel on behalf of the Independent Trustees at the start of the Boards’ annual contract renewal process earlier in 2020. In considering and approving the Advisory Agreements, the Trustees considered the information they believed relevant, including but not limited to the information discussed below. The Boards considered not only the specific information presented in connection with the Meeting, but also the knowledge gained over time through interaction with Funds Management and the Sub-Advisers about various topics. In this regard, the Boards reviewed reports of Funds Management at each of their quarterly meetings, which included, among other things, portfolio reviews and investment performance reports. In addition, the Boards and the teams mentioned above confer with portfolio managers at various times throughout the year. The Boards did not identify any particular information or consideration that was all-important or controlling, and each individual Trustee may have attributed different weights to various factors.
After its deliberations, the Board of Funds Trust unanimously approved the continuation of the Management Agreement and the Core Bond Fund Sub-Advisory Agreement for a one-year period. Additionally, after its deliberations, the Board of Master Trust unanimously approved the continuation of the Master Portfolio Advisory Agreement and each Master Portfolio Sub-Advisory Agreement for a one-year term. The Boards also determined that the compensation or the absence of compensation payable to Funds Management and to each of the Sub-Advisers under each of the Advisory Agreements was reasonable. The Boards considered the approval of the Advisory Agreements for the Funds as part of their consideration of agreements for funds across the complex, but their approvals were made on a fund-by-fund basis. The following summarizes a number of important, but not necessarily all, factors considered by the Boards in support of their approvals.
Nature, extent and quality of services
The Boards received and considered various information regarding the nature, extent and quality of services provided to the Funds by Funds Management and the Sub-Advisers under the Advisory Agreements. This information included a description of the investment advisory services and Fund-level administrative services covered by the Advisory Agreements, as well as, among other things, a summary of the background and experience of senior management of Wells Fargo Asset Management (“WFAM”), of which Funds Management and the Sub-Advisers are a part, and a summary of investments made in the business of WFAM. The Boards also received a description of Funds Management’s and the Sub-Advisers’ business continuity plans and of their approaches to data privacy and cybersecurity, and related testing. The Boards also received and reviewed information about Funds Management’s role as administrator of the Funds’ liquidity risk management program, Funds Management’s approach to risk management, and Funds Management’s intermediary and vendor oversight program.
The Boards also considered the qualifications, background, tenure and responsibilities of each of the portfolio managers primarily responsible for the day-to-day portfolio management of the Funds. The Board of Master Trust noted that each of the Master Portfolios replicates the performance of a proprietary index provided by an affiliate of Funds Management, except that the Wells Fargo Bloomberg Barclays US Aggregate ex-Corporate Credit Portfolio, the Wells Fargo Emerging Markets Bond Portfolio, and the Wells Fargo Strategic Retirement Bond Portfolio track the performance of third-party indexes. The Boards evaluated the ability of Funds Management and the Sub-Advisers to attract and retain qualified investment professionals, including research, advisory and supervisory personnel. The Boards further considered the compliance programs and compliance records of Funds Management and the Sub-Advisers. In addition, the Boards took into account the full range of services provided to the Funds by Funds Management and its affiliates.
18 | Wells Fargo U.S. REIT Portfolio
Other information (unaudited)
Fund investment performance and expenses
The Boards considered the investment performance results for each of the Master Portfolios for the one-year period ended December 31, 2019. The Boards also considered more current results for the one-year period ended March 31, 2020. The Boards considered these results in comparison to the investment performance of funds in a universe that was determined by Broadridge Inc. (“Broadridge”) to be similar to the respective Master Portfolios (each, a “Universe”), and in comparison to each Master Portfolio’s benchmark index and to other comparative data. Broadridge is an independent provider of investment company data. The Boards received a description of the methodology used by Broadridge to select the mutual funds in each performance Universe.
The Boards noted the short performance history of the Master Portfolios. For the one-year period ended December 31, 2019, the Boards noted that the investment performance of each Master Portfolio relative to its respective Universe was as follows: (i) the investment performance of each of the Wells Fargo Bloomberg Barclays US Aggregate ex-Corporate Credit Portfolio, the Wells Fargo Emerging Markets Bond Portfolio, the Wells Fargo Factor Enhanced International Equity Portfolio, the Wells Fargo Factor Enhanced U.S. Large Cap Portfolio, the Wells Fargo High Yield Corporate Bond Portfolio and the Wells Fargo Investment Grade Corporate Bond Portfolio was higher than or in range of the average investment performance of such Master Portfolio’s respective Universe; and (ii) the Wells Fargo Factor Enhanced Emerging Markets Equity Portfolio, the Wells Fargo Factor Enhanced U.S. Small Cap Portfolio, the Wells Fargo International Government Bond Portfolio, the Wells Fargo Strategic Retirement Bond Portfolio and the Wells Fargo U.S. REIT Portfolio was lower than the average investment performance of such Master Portfolio’s respective Universe. For the one-year period ended March 31, 2020, the Boards noted that the investment performance of each Master Portfolio relative to its respective Universe was as follows: (i) the Wells Fargo Emerging Markets Bond Portfolio, the Wells Fargo Factor Enhanced U.S. Large Cap Portfolio, the Wells Fargo Factor Enhanced U.S. Small Cap Portfolio, the Wells Fargo International Government Bond Portfolio, and the Wells Fargo Investment Grade Corporate Bond Portfolio was higher than or in range of the average investment performance of such Master Portfolio’s respective Universe, and (ii) the Wells Fargo Bloomberg Barclays US Aggregate ex-Corporate Credit Portfolio, the Wells Fargo Factor Enhanced Emerging Markets Equity Portfolio, the Wells Fargo Factor Enhanced International Equity Portfolio, the Wells Fargo High Yield Corporate Bond Portfolio, the Wells Fargo Strategic Retirement Bond Portfolio and the Wells Fargo U.S. REIT Portfolio was lower than the average investment performance of such Master Portfolio’s respective Universe.
The Boards also noted that the investment performance of each Master Portfolio to its respective benchmark index for the one-year period ended December 31, 2019, was as follows: (i) the investment performance of each of the Wells Fargo Bloomberg Barclays US Aggregate ex-Corporate Credit Portfolio, the Wells Fargo Factor Enhanced Emerging Markets Equity Portfolio, the Wells Fargo Factor Enhanced U.S. Large Cap Portfolio, the Wells Fargo Factor Enhanced U.S. Small Cap Portfolio, the Wells Fargo High Yield Corporate Bond Portfolio, the Wells Fargo U.S. REIT Portfolio and the Wells Fargo Strategic Retirement Bond Portfolio was higher than or in range of the average investment performance of such Master Portfolio’s respective benchmark, and (ii) the investment performance of each of the Wells Fargo Emerging Markets Bond Portfolio, the Wells Fargo Factor Enhanced International Equity Portfolio, the Wells Fargo International Government Bond Portfolio and the Wells Fargo Investment Grade Corporate Bond Portfolio was lower than the average investment performance of such Master Portfolio’s respective benchmark. For the one-year period ended March 31, 2020, the Boards also noted that the investment performance of each Master Portfolio to its respective benchmark index, was as follows: (i) the investment performance of each of the Wells Fargo Bloomberg Barclays US Aggregate ex-Corporate Credit Portfolio, the Wells Fargo Factor Enhanced Emerging Markets Equity Portfolio, the Wells Fargo Factor Enhanced International Equity Portfolio, the Wells Fargo Factor Enhanced U.S. Large Cap Portfolio, the Wells Fargo Factor Enhanced U.S. Small Cap Portfolio, the Wells Fargo U.S. REIT Portfolio, the Wells Fargo Investment Grade Corporate Bond Portfolio and the Wells Fargo Strategic Retirement Bond Portfolio was higher than, equal to or in range of the average investment performance of such Master Portfolio’s respective benchmark, and (ii) the investment performance of each of the Wells Fargo Emerging Markets Bond Portfolio, the Wells Fargo High Yield Corporate Bond Portfolio and the Wells Fargo International Government Bond Portfolio was lower than the average investment performance of such Master Portfolio’s respective benchmark.
The Boards received information concerning, and discussed factors contributing to, the underperformance of certain Master Portfolios, relative to the Universe and benchmark index, for the periods identified above. The Board took note of the explanations for the relative underperformance during these periods, including with respect to investment decisions and market factors that affected the Fund’s investment performance.
The Board of Funds Trust took note of the investment performance of the Master Portfolios in the context of reviewing the investment performance of the Index Funds. The Board of Funds Trust also received and considered information regarding the “zero fee and expense” structure of each Index Fund. Specifically, the Funds Trust Board noted that each Index Fund’s gross operating expense ratio and each of its various components, including management fees, administration fees, custody fees, Rule 12b-1 fees, and other fees, are zero. The Funds Trust Board also noted that Funds Management assumes and pays or
Wells Fargo U.S. REIT Portfolio | 19
Other information (unaudited)
reimburses all of the ordinary operating expenses of each Index Fund, including acquired fund fees and expenses, pursuant to an agreement with each of the Index Funds (the “Fee and Expense Agreement”). The Funds Trust Board further noted that Funds Management receives a fee from Wells Fargo Wealth and Investment Management (“WIM”) pursuant to an intercompany agreement equal to the Master Portfolio fees and expenses absorbed by Funds Management through its Fee and Expense Agreement with each of the Index Funds.
With respect to the Master Portfolios, the Board of Master Trust received and considered information regarding the fee rates that are payable to Funds Management for investment advisory services (as discussed below), which are the only fees charged at the Master Portfolio level, relative to corresponding class-specific expense groups that were determined by Broadridge to be similar to the Funds (the “Groups”). The Boards received a description of the methodology used by Broadridge to select the mutual funds in the expense Groups and an explanation of how funds comprising expense groups and their expense ratios may vary from year-to-year.
The Boards took into account the Funds’ expense information and the Master Portfolios’ performance information provided to them among the factors considered in deciding to re-approve the Advisory Agreements.
Investment management, advisory and sub-advisory fee rates
The Board of Funds Trust reviewed and considered that the contractual investment management fee rate payable by each Index Fund to Funds Management for investment management services zero, and also reviewed and considered that each Fund’s other expenses would normally be zero, because of Funds Management’s commitment to assume and pay or reimburse all of the ordinary operating expenses of each Fund, including acquired fund fees and expenses, under the Fee and Expense Agreement. The Board of Funds Trust also reviewed and considered that the contractual investment sub-advisory fee rate payable by Funds Management to WellsCap for investment sub-advisory services for the U.S. Core Bond Fund is also zero.
The Board of Master Trust reviewed and considered the contractual fee rates payable by the Master Portfolios to Funds Management under the Master Portfolio Advisory Agreement (the “Advisory Agreement Rates”). The Board of Master Trust also reviewed and considered the contractual investment sub-advisory fee rates that are payable by Funds Management to the Sub-Advisers for investment sub-advisory services (the “Sub-Advisory Agreement Rates”).
The Board of Master Trust reviewed a comparison of the Advisory Agreement Rates of each Master Portfolio with those of other funds in each Master Portfolio’s respective expense Groups at a common asset level. The Board of Master Trust noted that the Advisory Agreement Rates of each Master Portfolio were lower than or equal to the median rate for such Master Portfolio’s expense Groups.
The Boards also received and considered information about the portions of the total management fees that were retained by Funds Management after payment of the fees to the Sub-Advisers for sub-advisory services. In assessing the reasonableness of these amounts, the Boards received and evaluated information about the nature and extent of responsibilities retained and risks assumed by Funds Management and not delegated to or assumed by the Sub-Advisers, and about Funds Management’s on-going oversight services. Given the affiliation between Funds Management and the Sub-Advisers, the Boards ascribed limited relevance to the allocation of fees between them.
The Boards also received and considered information about the nature and extent of services offered and fee rates charged by Funds Management and the Sub-Advisers to other types of clients with investment strategies similar to those of certain Funds. In this regard, the Boards received information about the significantly greater scope of services, and compliance, reporting and other legal burdens and risks of managing proprietary mutual funds compared with those associated with managing assets of other types of clients, including third-party sub-advised fund clients and non-mutual fund clients such as institutional separate accounts.
Based on its consideration of the factors and information it deemed relevant, including those described here, the Board of Fund Trust determined that the compensation received by Funds Management from WIM pursuant to the intercompany agreement, and the absence of compensation payable by the Funds to Funds Management pursuant to the Management Agreement or to WellsCap pursuant to the Core Bond Fund Sub-Advisory Agreement, was reasonable. Based on its consideration of the factors and information it deemed relevant, including those described here, the Board of Master Trust determined that the Advisory Agreement Rates and the Sub-Advisory Agreement Rates for each Master Portfolio were reasonable.
Profitability
The Boards received and considered information concerning the profitability of Funds Management, as well as the profitability of both WFAM and Wells Fargo & Co. (“Wells Fargo”) from providing services to the fund family as a whole. The Boards noted that the Sub-Advisers’ profitability information with respect to providing services to the Funds and other funds in the family was subsumed in the WFAM and Wells Fargo profitability analysis.
20 | Wells Fargo U.S. REIT Portfolio
Other information (unaudited)
Funds Management reported on the methodologies and estimates used in calculating profitability, including a description of the methodology used to allocate certain expenses. Among other things, the Boards noted that the levels of profitability reported on a fund-by-fund basis varied widely, depending on factors such as the size, type and age of fund.
Based on its review, the Boards did not deem the profits reported by Funds Management, WFAM or Wells Fargo from services provided to the Funds to be at a level that would prevent them from approving the continuation of the Advisory Agreements.
Economies of Scale
The Boards received and considered information about the potential for Funds Management to experience economies of scale in the provision of management services to the Funds, the difficulties of calculating economies of scale at an individual fund level, and the extent to which potential scale benefits are shared with shareholders. The Boards noted the existence of breakpoints in the each Master Portfolio’s advisory fee structure and each Index Fund’s management fee structure, which operate generally to reduce the Funds’ expense ratios as the Funds grow in size, and the size of the Funds in relation to such breakpoints. The Boards considered that in addition to management fee breakpoints, Funds Management shares potential economies of scale from its management business in a variety of ways, including through fee waiver and expense reimbursement arrangements, services that benefit shareholders, competitive management fee rates set at the outset without regard to breakpoints, and investments in the business intended to enhance services available to shareholders.
The Boards concluded that Funds Management’s arrangements with respect to the Funds, including contractual breakpoints, constituted a reasonable approach to sharing potential economies of scale with the Funds and their shareholders.
Other benefits to Funds Management and the Sub-Advisers
The Boards received and considered information regarding potential “fall-out” or ancillary benefits received by Funds Management and its affiliates, including WellsCap and WFAM International, as a result of their relationships with the Funds. Ancillary benefits could include, among others, benefits directly attributable to other relationships with the Funds and benefits potentially derived from an increase in Funds Management’s and the Sub-Advisers’ business as a result of their relationships with the Funds. The Boards noted that various affiliates of Funds Management may receive distribution-related fees, shareholder servicing payments and sub-transfer agency fees in respect of shares sold or held through them and services provided.
The Boards also reviewed information about soft dollar credits earned and utilized by the Sub-Advisers, fees earned by Funds Management and WellsCap from managing a private investment vehicle for the fund family’s securities lending collateral, and commissions earned by an affiliated broker from portfolio transactions.
Based on their consideration of the factors and information they deemed relevant, including those described here, the Boards did not find that any ancillary benefits received by Funds Management and its affiliates, including WellsCap and WFAM International, were unreasonable.
Conclusion
At the Meeting, after considering the above-described factors and based on its deliberations and its evaluation of the information described above, the Funds Trust Board unanimously approved the continuation of the Management Agreement and the Core Bond Fund Sub-Advisory Agreement for a one-year period. Additionally, after its deliberations, the Master Trust Board unanimously approved the continuation of the Master Portfolio Advisory Agreement and each Master Portfolio Sub-Advisory Agreement for a one-year term. The Boards also determined that the compensation or the absence of compensation payable to Funds Management and to each of the Sub-Advisers was reasonable.
Wells Fargo U.S. REIT Portfolio | 21
Other information (unaudited)
LIQUIDITY RISK MANAGEMENT PROGRAM
In accordance with Rule 22e-4 under the Investment Company Act of 1940, as amended (the “Liquidity Rule”), Wells Fargo Master Trust (the “Trust”) has adopted and implemented a liquidity risk management program (the “Program”) on behalf of each of its series, including each Portfolio, which is reasonably designed to assess and manage the Portfolio’s liquidity risk. “Liquidity risk” is defined as the risk that a Portfolio is unable to meet redemption requests without significantly diluting remaining investors’ interests in the Portfolio. The Trust’s Board of Trustees (the “Board”) previously approved the designation of Wells Fargo Funds Management, LLC (“Funds Management”), each Portfolio’s investment adviser, as the administrator of the Program, and Funds Management has established a Liquidity Risk Management Council composed of personnel from multiple departments within Funds Management and its affiliates to assist Funds Management in the implementation and on-going administration of the Program.
The Program is comprised of various components designed to support the assessment and/or management of liquidity risk, including: (1) the periodic assessment (no less frequently than annually) of certain factors that influence a Portfolio’s liquidity risk; (2) the periodic classification (no less frequently than monthly) of a Portfolio’s investments into one of four liquidity categories that reflect an estimate of their liquidity under current market conditions; (3) a 15% limit on the acquisition of “illiquid investments” (as defined under the Liquidity Rule); (4) to the extent a Portfolio does not invest primarily in “highly liquid investments” (as defined under the Liquidity Rule), the determination of a minimum percentage of the Portfolio’s assets that generally will be invested in highly liquid investments (an “HLIM”); (5) if a Portfolio has established an HLIM, the periodic review (no less frequently than annually) of the HLIM and the adoption of policies and procedures for responding to a shortfall of the Portfolio’s “highly liquid investments” below its HLIM; and (6) periodic reporting to the Board.
At a meeting of the Board held on May 26 and 28, 2020, the Board received a written report (the “Report”) from Funds Management that addressed the operation of the Program and assessed its adequacy and effectiveness of implementation. The Report covered the initial period from December 1, 2018 through December 31, 2019 (the “Reporting Period”). No significant liquidity events impacting any Portfolio were noted in the Report. There were no material changes to the Program during the Reporting Period. The Report concluded that the Program is operating effectively to assess and manage each Portfolio’s liquidity risk, and that the Program has been and continues to be adequately and effectively implemented to monitor and, as applicable, respond to the Portfolio’s liquidity developments.
22 | Wells Fargo U.S. REIT Portfolio
This page is intentionally left blank.
This page is intentionally left blank.

For more information
More information about Wells Fargo Funds is available free upon request. To obtain literature, please write, visit the Portfolio’s website, or call:
Wells Fargo Funds
P.O. Box 219967
Kansas City, MO 64121-9967
Website: wfam.com
Individual investors: 1-800-222-8222
Retail investment professionals: 1-888-877-9275
Institutional investment professionals: 1-866-765-0778
This report and the financial statements contained herein are submitted for the general information of the shareholders of the Portfolio. If this report is used for promotional purposes, distribution of the report must be accompanied or preceded by a current prospectus. Before investing, please consider the investment objectives, risks, charges, and expenses of the investment. For a current prospectus and, if available, a summary prospectus, containing this information, call 1-800-222-8222 or visit the Portfolio’s website at wfam.com. Read the prospectus carefully before you invest or send money.
Wells Fargo Asset Management (WFAM) is the trade name for certain investment advisory/management firms owned by Wells Fargo & Company. These firms include but are not limited to Wells Capital Management Incorporated and Wells Fargo Funds Management, LLC. Certain products managed by WFAM entities are distributed by Wells Fargo Funds Distributor, LLC (a broker-dealer and Member FINRA).
This material is for general informational and educational purposes only and is NOT intended to provide investment advice or a recommendation of any kind—including a recommendation for any specific investment, strategy, or plan.
INVESTMENT PRODUCTS: NOT FDIC INSURED ◾ NO BANK GUARANTEE ◾ MAY LOSE VALUE
© 2020 Wells Fargo & Company. All rights reserved.
ITEM 2. CODE OF ETHICS
Not applicable.
ITEM 3. AUDIT COMMITTEE FINANCIAL EXPERT
Not applicable.
ITEM 4. PRINCIPAL ACCOUNTANT FEES AND SERVICES
Not applicable.
ITEM 5. AUDIT COMMITTEE OF LISTED REGISTRANTS
Not applicable.
ITEM 6. INVESTMENTS
A Portfolio of Investments for each series of Wells Fargo Master Trust is included as part of the report to shareholders filed under Item 1 of this Form.
ITEM 7. DISCLOSURE OF PROXY VOTING POLICIES AND PROCEDURES FOR CLOSED-END MANAGEMENT INVESTMENT COMPANIES
Not applicable.
ITEM 8. PORTFOLIO MANAGERS OF CLOSED-END MANAGEMENT INVESTMENT COMPANIES
Not applicable.
ITEM 9. PURCHASES OF EQUITY SECURITIES BY CLOSED-END MANAGEMEENT INVESTMENT COMPANY AND AFFILIATED PURCHASERS
Not applicable.
ITEM 10. SUBMISSION OF MATTERS TO A VOTE OF SECURITY HOLDERS
There have been no material changes to the procedures by which shareholders may recommend nominees to the registrant’s Board of Trustees that have been implemented since the registrant’s last provided disclosure in response to the requirements of this Item.
ITEM 11. CONTROLS AND PROCEDURES
(a) The President and Treasurer have concluded that the Wells Fargo Master Trust disclosure controls and procedures (as defined in Rule 30a-3(c) under the Investment Company Act of 1940) provide reasonable
assurances that material information relating to the registrant is made known to them by the appropriate persons, based on their evaluation of these controls and procedures as of a date within 90 days of the filing of this report.
(b) There were no significant changes in the registrant’s internal controls over financial reporting (as defined in Rule 30a-3(d) under the Investment Company Act of 1940) that occurred during the most recent fiscal half-year of the period covered by this report that materially affected, or is reasonably likely to materially affect, the registrant’s internal control over financial reporting.
ITEM 12. DISCLOSURES OF SECURITIES LENDING ACTIVITES FOR CLOSED-END MANAGEMENT INVESTMENT COMPANIES
Not applicable.
ITEM 13. EXHIBITS
SIGNATURES
Pursuant to the requirements of the Securities Exchange Act of 1934 and the Investment Company Act of 1940, the registrant has duly caused this report to be signed on its behalf by the undersigned, thereunto duly authorized.
| | |
| Wells Fargo Master Trust |
| |
| By: | | |
| | /s/ Andrew Owen |
| |
| | Andrew Owen |
| | President |
| |
| Date: | | October 28, 2020 |
Pursuant to the requirements of the Securities Exchange Act of 1934 and the Investment Company Act of 1940, this report has been signed below by the following persons on behalf of the registrant and in the capacities and on the date indicated.
| | |
| Wells Fargo Master Trust |
| |
| By: | | |
| | /s/ Andrew Owen |
| |
| | Andrew Owen |
| | President |
| |
| | Date: October 28, 2020 |
| |
| By: | | |
| | /s/ Jeremy DePalma |
| |
| | Jeremy DePalma |
| | Treasurer |
| |
| Date: | | October 28, 2020 |