UNITED STATES
SECURITIES AND EXCHANGE COMMISSION
Washington, D.C. 20549
FORM N-CSRS
CERTIFIED SHAREHOLDER REPORT OF REGISTERED
MANAGEMENT INVESTMENT COMPANIES
Investment Company Act file number: 811-09689
Wells Fargo Master Trust
(Exact name of registrant as specified in charter)
525 Market St., San Francisco, CA 94105
(Address of principal executive offices) (Zip code)
��
Matthew Prasse
Wells Fargo Funds Management, LLC
525 Market St., San Francisco, CA 94105
(Name and address of agent for service)
Registrant’s telephone number, including area code: 800-222-8222
Date of fiscal year end: February 28
Registrant is making a filing for 11 of its series:
Wells Fargo Bloomberg Barclays US Aggregate ex-Corporate Portfolio, Wells Fargo Emerging Markets Bond Portfolio, Wells Fargo Factor Enhanced Emerging Markets Equity Portfolio, Wells Fargo Factor Enhanced International Equity Portfolio, Wells Fargo Factor Enhanced U.S. Large Cap Equity Portfolio, Wells Fargo Factor Enhanced U.S. Small Cap Equity Portfolio, Wells Fargo Factor Enhanced U.S. Low Volatility Equity Portfolio, Wells Fargo High Yield Corporate Bond Portfolio, Wells Fargo Investment Grade Corporate Bond Portfolio, Wells Fargo Strategic Retirement Bond Portfolio and Wells Fargo U.S. REIT Portfolio.
Date of reporting period: August 31, 2021
| ITEM 1. | REPORT TO STOCKHOLDERS |
Semi-Annual Report
August 31, 2021
Wells Fargo Bloomberg Barclays
US Aggregate ex-Corporate Portfolio
INVESTMENT PRODUCTS: NOT FDIC INSURED ■ NO BANK GUARANTEE ■ MAY LOSE VALUE
Wells Fargo Bloomberg Barclays US Aggregate ex-Corporate Portfolio | 1
Portfolio information (unaudited)
| Investment objective | The Portfolio seeks to replicate the total return of the Bloomberg U.S. Aggregate ex-Corporate Index, before fees and expenses. |
| Adviser | Wells Fargo Funds Management, LLC |
| Subadviser | Wells Capital Management, LLC |
| Portfolio managers | Manjunath Boraiah, Christopher Y. Kauffman, CFA®‡, Janet S. Rilling, CFA®‡, CPA, Michal Stanczyk |
| Ten largest holdings (%) as of August 31, 20211 |
| FNMA, 2.00%, 9-14-2051 | 6.51 |
| FNMA, 2.50%, 9-14-2051 | 3.54 |
| U.S. Treasury Bond, 3.00%, 5-15-2047 | 2.83 |
| FHLMC, 3.00%, 2-1-2047 | 1.48 |
| GNMA, 2.00%, 9-21-2051 | 1.35 |
| GNMA, 2.50%, 9-21-2051 | 1.30 |
| FHLMC, 3.50%, 2-1-2044 | 1.29 |
| FNMA, 2.00%, 9-16-2036 | 1.21 |
| GNMA, 3.50%, 2-20-2045 | 1.18 |
| U.S. Treasury Note, 1.63%, 2-15-2026 | 1.10 |
| 1 | Figures represent the percentage of the Portfolio's net assets. Holdings are subject to change and may have changed since the date specified. |
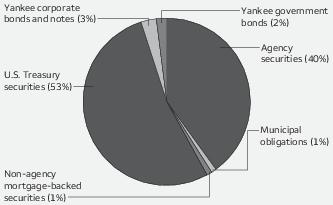
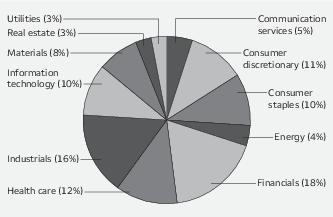
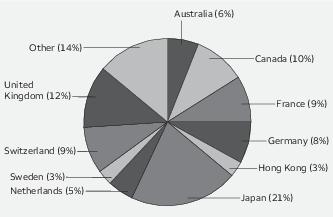
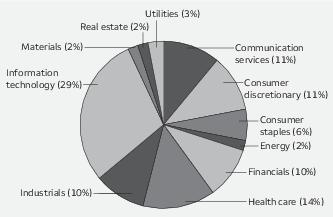
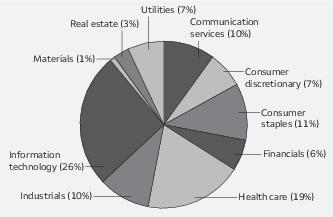
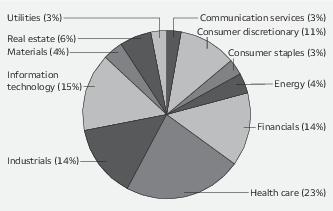
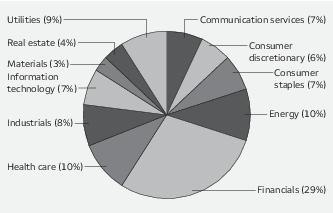
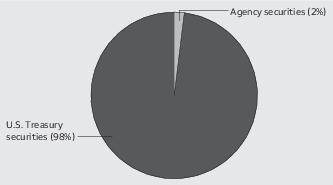
| Portfolio composition as of August 31, 20211 |
| 1 | Figures represent the percentage of the Portfolio's long-term investments. These amounts are subject to change and may have changed since the date specified. |
| ‡ | CFA® and Chartered Financial Analyst® are trademarks owned by CFA Institute. |
2 | Wells Fargo Bloomberg Barclays US Aggregate ex-Corporate Portfolio
Portfolio of investments—August 31, 2021 (unaudited)
| | | Interest
rate | Maturity
date | Principal | Value |
| Agency securities: 39.45% | | | | | | |
| FFCB | | 0.17% | 11-30-2022 | $ | 20,000 | $ 19,991 |
| FFCB | | 0.30 | 3-28-2024 | | 100,000 | 99,804 |
| FFCB | | 0.48 | 9-3-2024 | | 70,000 | 69,860 |
| FFCB | | 0.57 | 7-2-2024 | | 180,000 | 180,008 |
| FFCB | | 1.55 | 7-26-2030 | | 700,000 | 698,289 |
| FHLB | | 1.50 | 8-15-2024 | | 10,000 | 10,331 |
| FHLB | | 2.13 | 3-10-2023 | | 980,000 | 1,009,139 |
| FHLB | | 2.13 | 6-9-2023 | | 70,000 | 72,412 |
| FHLB | | 2.75 | 12-13-2024 | | 10,000 | 10,748 |
| FHLB | | 2.88 | 6-14-2024 | | 430,000 | 459,389 |
| FHLB | | 2.88 | 9-13-2024 | | 60,000 | 64,470 |
| FHLB | | 3.00 | 3-10-2028 | | 10,000 | 11,180 |
| FHLB | | 3.38 | 9-8-2023 | | 30,000 | 31,891 |
| FHLB | | 5.38 | 8-15-2024 | | 420,000 | 480,853 |
| FHLB | | 5.63 | 3-14-2036 | | 10,000 | 14,907 |
| FHLMC | | 0.25 | 11-6-2023 | | 990,000 | 990,030 |
| FHLMC | | 0.32 | 11-24-2023 | | 50,000 | 49,998 |
| FHLMC | | 0.62 | 12-1-2025 | | 900,000 | 896,437 |
| FHLMC | | 1.50 | 11-1-2035 | | 962,055 | 978,135 |
| FHLMC | | 2.50 | 3-1-2032 | | 2,098,874 | 2,204,764 |
| FHLMC | | 2.50 | 2-1-2035 | | 814,025 | 852,304 |
| FHLMC | | 2.75 | 6-19-2023 | | 220,000 | 230,030 |
| FHLMC | | 3.00 | 2-1-2047 | | 8,184,338 | 8,695,116 |
| FHLMC | | 3.00 | 3-1-2048 | | 62,752 | 65,807 |
| FHLMC | | 3.00 | 6-1-2050 | | 1,455,781 | 1,533,732 |
| FHLMC | | 3.00 | 7-1-2050 | | 2,845,680 | 3,005,154 |
| FHLMC | | 3.00 | 8-1-2050 | | 1,375,846 | 1,455,535 |
| FHLMC | | 3.50 | 2-1-2044 | | 6,956,908 | 7,574,035 |
| FHLMC | | 3.50 | 4-1-2045 | | 284,792 | 308,584 |
| FHLMC | | 3.50 | 8-1-2047 | | 2,622,768 | 2,787,597 |
| FHLMC | | 5.50 | 7-15-2036 | | 220,000 | 328,401 |
| FHLMC | | 6.00 | 7-1-2040 | | 1,575,901 | 1,865,220 |
| FHLMC | | 6.75 | 3-15-2031 | | 330,000 | 488,387 |
| FHLMC Series K029 Class A2 ±± | | 3.32 | 2-25-2023 | | 545,000 | 565,864 |
| FHLMC Series K030 Class A2 ±± | | 3.25 | 4-25-2023 | | 305,000 | 317,085 |
| FHLMC Series K032 Class A2 ±± | | 3.31 | 5-25-2023 | | 50,000 | 52,305 |
| FHLMC Series K034 Class A2 ±± | | 3.53 | 7-25-2023 | | 60,000 | 63,140 |
| FHLMC Series K035 Class A2 ±± | | 3.46 | 8-25-2023 | | 55,000 | 57,962 |
| FHLMC Series K048 Class A2 ±± | | 3.28 | 6-25-2025 | | 215,000 | 233,958 |
| FHLMC Series K062 Class A2 | | 3.41 | 12-25-2026 | | 750,000 | 838,477 |
| FHLMC Series K063 Class A2 ±± | | 3.43 | 1-25-2027 | | 45,000 | 50,360 |
| FHLMC Series K070 Class A2 ±± | | 3.30 | 11-25-2027 | | 425,000 | 477,433 |
| FHLMC Series K152 Class A1 | | 2.83 | 5-25-2030 | | 299,284 | 325,423 |
| FHLMC Series K152 Class A2 | | 3.08 | 1-25-2031 | | 125,000 | 141,124 |
| FHLMC Series K153 Class A3 ±± | | 3.12 | 10-25-2031 | | 70,000 | 79,614 |
| FHLMC Series K155 Class A3 | | 3.75 | 4-25-2033 | | 40,000 | 47,753 |
| FNMA | | 0.25 | 5-22-2023 | | 330,000 | 330,478 |
| FNMA | | 0.25 | 7-10-2023 | | 390,000 | 390,373 |
| FNMA | | 0.35 | 8-18-2023 | | 310,000 | 310,501 |
| FNMA | | 0.38 | 7-21-2025 | | 400,000 | 396,594 |
| FNMA | | 0.50 | 11-7-2025 | | 280,000 | 278,246 |
| FNMA | | 0.63 | 4-22-2025 | | 650,000 | 651,745 |
| FNMA %% | | 1.50 | 9-16-2036 | | 2,115,000 | 2,148,844 |
| FNMA %% | | 1.50 | 9-14-2051 | | 6,490,000 | 6,378,200 |
The accompanying notes are an integral part of these financial statements.
Wells Fargo Bloomberg Barclays US Aggregate ex-Corporate Portfolio | 3
Portfolio of investments—August 31, 2021 (unaudited)
| | | Interest
rate | Maturity
date | Principal | Value |
| Agency securities (continued) | | | | | | |
| FNMA %% | | 2.00% | 9-16-2036 | $ | 6,910,000 | $ 7,150,135 |
| FNMA | | 2.00 | 1-1-2041 | | 933,988 | 957,096 |
| FNMA %% | | 2.00 | 9-14-2051 | | 37,860,000 | 38,379,096 |
| FNMA | | 2.13 | 4-24-2026 | | 180,000 | 191,333 |
| FNMA | | 2.50 | 12-1-2027 | | 404,275 | 424,288 |
| FNMA | | 2.50 | 9-1-2031 | | 1,430,009 | 1,501,740 |
| FNMA | | 2.50 | 2-1-2035 | | 1,080,764 | 1,131,216 |
| FNMA | | 2.50 | 11-1-2050 | | 4,339,965 | 4,534,459 |
| FNMA %% | | 2.50 | 9-14-2051 | | 20,115,000 | 20,891,313 |
| FNMA | | 3.00 | 12-1-2026 | | 1,569,249 | 1,655,179 |
| FNMA | | 3.00 | 12-1-2030 | | 304,696 | 323,330 |
| FNMA | | 3.00 | 7-1-2032 | | 1,673,558 | 1,773,232 |
| FNMA | | 3.00 | 1-1-2034 | | 233,413 | 246,615 |
| FNMA | | 3.00 | 8-1-2036 | | 106,957 | 112,777 |
| FNMA | | 3.00 | 2-1-2037 | | 2,118,293 | 2,234,363 |
| FNMA | | 3.00 | 8-1-2043 | | 1,504,723 | 1,605,026 |
| FNMA | | 3.00 | 11-1-2046 | | 1,596,215 | 1,701,361 |
| FNMA | | 3.00 | 12-1-2047 | | 865,896 | 909,274 |
| FNMA | | 3.00 | 9-1-2050 | | 5,154,874 | 5,450,630 |
| FNMA | | 3.50 | 4-1-2034 | | 2,146,997 | 2,300,190 |
| FNMA | | 3.50 | 1-1-2035 | | 108,563 | 117,448 |
| FNMA | | 3.50 | 3-1-2036 | | 1,154,570 | 1,242,181 |
| FNMA | | 3.50 | 4-1-2037 | | 533,048 | 568,670 |
| FNMA | | 3.50 | 6-1-2042 | | 316,343 | 344,432 |
| FNMA | | 3.50 | 7-1-2042 | | 466,538 | 505,070 |
| FNMA | | 3.50 | 9-1-2043 | | 1,065,673 | 1,153,178 |
| FNMA | | 3.50 | 3-1-2048 | | 349,822 | 371,417 |
| FNMA | | 3.50 | 10-1-2050 | | 4,954,165 | 5,240,921 |
| FNMA | | 4.00 | 6-1-2042 | | 5,422,640 | 5,960,060 |
| FNMA | | 4.00 | 6-1-2042 | | 424,395 | 464,996 |
| FNMA | | 4.00 | 8-1-2043 | | 2,462,732 | 2,697,641 |
| FNMA | | 4.00 | 12-1-2047 | | 1,672,160 | 1,798,959 |
| FNMA | | 4.00 | 2-1-2048 | | 1,756,792 | 1,968,881 |
| FNMA | | 4.00 | 6-1-2048 | | 395,222 | 423,699 |
| FNMA | | 4.00 | 8-1-2048 | | 270,858 | 290,240 |
| FNMA | | 4.00 | 2-1-2050 | | 761,375 | 816,050 |
| FNMA | | 4.50 | 5-1-2040 | | 218,466 | 244,027 |
| FNMA | | 4.50 | 9-1-2040 | | 4,614,400 | 5,116,766 |
| FNMA | | 4.50 | 2-1-2047 | | 1,754,287 | 1,921,016 |
| FNMA | | 4.50 | 4-1-2048 | | 507,467 | 552,187 |
| FNMA | | 4.50 | 8-1-2048 | | 32,191 | 34,801 |
| FNMA | | 5.00 | 1-1-2042 | | 189,582 | 218,507 |
| FNMA | | 5.00 | 6-1-2045 | | 827,769 | 947,022 |
| FNMA | | 5.00 | 7-1-2045 | | 1,177,158 | 1,338,215 |
| FNMA | | 5.50 | 9-1-2040 | | 1,623,036 | 1,888,194 |
| FNMA | | 6.00 | 5-1-2041 | | 92,003 | 109,294 |
| FNMA | | 6.21 | 8-6-2038 | | 60,000 | 97,961 |
| FNMA | | 6.25 | 5-15-2029 | | 100,000 | 136,773 |
| FNMA | | 7.13 | 1-15-2030 | | 250,000 | 365,238 |
| FNMA | | 7.25 | 5-15-2030 | | 380,000 | 564,837 |
| FNMA Series 2016-M5 Class A2 | | 2.47 | 4-25-2026 | | 220,000 | 232,889 |
| FNMA Series 2016-M7 Class A2 | | 2.50 | 9-25-2026 | | 151,816 | 158,622 |
| FNMA Series 2017-M1 Class A2 ±± | | 2.50 | 10-25-2026 | | 245,488 | 260,700 |
| FNMA Series 2017-M11 Class A2 | | 2.98 | 8-25-2029 | | 1,370,000 | 1,530,530 |
| FNMA Series 2017-M5 Class A2 ±± | | 3.23 | 4-25-2029 | | 66,047 | 74,057 |
The accompanying notes are an integral part of these financial statements.
4 | Wells Fargo Bloomberg Barclays US Aggregate ex-Corporate Portfolio
Portfolio of investments—August 31, 2021 (unaudited)
| | | Interest
rate | Maturity
date | Principal | Value |
| Agency securities (continued) | | | | | | |
| FNMA Series 2018-M1 Class A2 ±± | | 3.08% | 12-25-2027 | $ | 758,807 | $ 833,548 |
| FNMA Series 2018-M13 Class A2 ±± | | 3.82 | 9-25-2030 | | 90,000 | 106,355 |
| FNMA Series 2019-M4 Class A2 | | 3.61 | 2-25-2031 | | 1,770,000 | 2,079,598 |
| FNMA Series 2019-M7 Class A2 | | 3.14 | 4-25-2029 | | 225,000 | 250,281 |
| FNMA Series 2020 M1 Class A2 | | 2.44 | 10-25-2029 | | 1,100,000 | 1,183,158 |
| GNMA %% | | 2.00 | 9-21-2051 | | 7,815,000 | 7,977,100 |
| GNMA %% | | 2.50 | 9-21-2051 | | 7,390,000 | 7,663,661 |
| GNMA | | 3.00 | 4-20-2045 | | 3,131,597 | 3,319,074 |
| GNMA | | 3.00 | 11-20-2045 | | 249,619 | 264,323 |
| GNMA | | 3.00 | 3-20-2046 | | 546,534 | 579,203 |
| GNMA | | 3.00 | 12-20-2049 | | 1,141,519 | 1,194,205 |
| GNMA | | 3.00 | 10-20-2050 | | 5,929,290 | 6,202,943 |
| GNMA | | 3.50 | 2-20-2045 | | 6,480,804 | 6,955,066 |
| GNMA | | 3.50 | 6-20-2045 | | 1,037,274 | 1,110,458 |
| GNMA | | 3.50 | 11-20-2045 | | 1,202,066 | 1,287,351 |
| GNMA | | 3.50 | 7-20-2047 | | 280,643 | 297,983 |
| GNMA | | 3.50 | 5-20-2048 | | 78,747 | 83,467 |
| GNMA | | 4.00 | 7-20-2044 | | 1,327,382 | 1,451,368 |
| GNMA | | 4.00 | 8-20-2044 | | 657,609 | 718,994 |
| GNMA | | 4.00 | 9-20-2044 | | 1,340,621 | 1,465,289 |
| GNMA | | 4.00 | 12-20-2047 | | 1,779,760 | 1,895,892 |
| TVA | | 2.88 | 2-1-2027 | | 35,000 | 38,599 |
| TVA | | 4.63 | 9-15-2060 | | 55,000 | 83,394 |
| TVA | | 5.38 | 4-1-2056 | | 140,000 | 233,282 |
| TVA | | 5.50 | 6-15-2038 | | 30,000 | 43,976 |
| TVA | | 5.88 | 4-1-2036 | | 80,000 | 119,404 |
| TVA | | 6.75 | 11-1-2025 | | 120,000 | 150,003 |
| Total Agency securities (Cost $228,328,115) | | | | | | 232,494,124 |
| Asset-backed securities: 0.40% | | | | | | |
| Capital One Multi Asset Execution Trust Series 2017-A3 Class A3 | | 2.43 | 1-15-2025 | | 110,000 | 111,349 |
| CarMax Auto Owner Trust Series 2017-3 Class A4 | | 2.22 | 11-15-2022 | | 24,284 | 24,302 |
| CarMax Auto Owner Trust Series 2018-3 Class D | | 3.91 | 1-15-2025 | | 80,000 | 82,366 |
| CenterPoint Energy Transition Restoration Bond Company LLC | | 4.24 | 8-15-2023 | | 32,156 | 33,039 |
| Chase Issuance Trust Series 2012-A7 Class A7 | | 2.16 | 9-15-2024 | | 205,000 | 209,284 |
| Citibank Credit Card Issuance Trust Series 2018-A3 Class A3 | | 3.29 | 5-23-2025 | | 180,000 | 189,354 |
| Citibank Credit Card Issuance Trust Series 2018-A7 Class A7 | | 3.96 | 10-13-2030 | | 130,000 | 152,940 |
| Discover Card Execution Note Trust Series 2017-A2 Class A2 | | 2.39 | 7-15-2024 | | 335,000 | 337,815 |
| Ford Credit Floorplan Master Owner Trust Series 2017-3 Class A | | 2.48 | 9-15-2024 | | 50,000 | 51,153 |
| Ford Credit Floorplan Master Owner Trust Series 2018-2 Class A | | 3.17 | 3-15-2025 | | 100,000 | 104,397 |
| Ford Credit Floorplan Master Owner Trust Series 2018-3 Class A1 | | 3.52 | 10-15-2023 | | 105,000 | 105,431 |
| Ford Credit Floorplan Master Owner Trust Series 2019-2 Class A | | 3.06 | 4-15-2026 | | 65,000 | 69,146 |
| Nissan Auto Receivables Owner Trust Series 2017-C Class A4 | | 2.28 | 2-15-2024 | | 50,284 | 50,507 |
| Nissan Auto Receivables Owner Trust Series 2018-B Class A4 | | 3.16 | 12-16-2024 | | 195,000 | 199,418 |
The accompanying notes are an integral part of these financial statements.
Wells Fargo Bloomberg Barclays US Aggregate ex-Corporate Portfolio | 5
Portfolio of investments—August 31, 2021 (unaudited)
| | | Interest
rate | Maturity
date | Principal | Value |
| Asset-backed securities (continued) | | | | | | |
| Nissan Auto Receivables Owner Trust Series 2018-C Class A4 | | 3.27% | 6-16-2025 | $ | 155,000 | $ 159,505 |
| Santander Drive Auto Receivables Trust Series 2019-1 Class C | | 3.42 | 4-15-2025 | | 59,177 | 59,483 |
| Synchrony Credit Card Master Note Trust Series 2018-2 Class A | | 3.47 | 5-15-2026 | | 105,000 | 110,699 |
| Toyota Auto Receivables Owner Trust Series 2017-D Class A4 | | 2.12 | 2-15-2023 | | 63,199 | 63,323 |
| World Omni Auto Receivables Trust Series 2017-B Class A4 | | 2.25 | 10-16-2023 | | 205,000 | 205,871 |
| World Omni Auto Receivables Trust Series 2018-D Class A4 | | 3.44 | 12-16-2024 | | 28,000 | 28,907 |
| Total Asset-backed securities (Cost $2,298,542) | | | | | | 2,348,289 |
| Municipal obligations: 0.86% | | | | | | |
| California: 0.31% | | | | | | |
| Education revenue: 0.02% | | | | | | |
| California Series B | | 3.90 | 11-1-2047 | | 15,000 | 17,797 |
| University of California Series AD | | 4.86 | 5-15-2112 | | 70,000 | 104,445 |
| | | | | | | 122,242 |
| GO revenue: 0.18% | | | | | | |
| California Build America Bonds Taxable Various Purpose | | 1.75 | 11-1-2030 | | 110,000 | 110,705 |
| California Build America Bonds Taxable Various Purpose | | 7.35 | 11-1-2039 | | 70,000 | 114,018 |
| California Build America Bonds Taxable Various Purpose | | 7.50 | 4-1-2034 | | 100,000 | 157,825 |
| California Build America Bonds Taxable Various Purpose | | 7.55 | 4-1-2039 | | 170,000 | 292,324 |
| California Build America Bonds Taxable Various Purpose | | 7.60 | 11-1-2040 | | 15,000 | 26,600 |
| Los Angeles CA Community College District Build America Bonds | | 6.75 | 8-1-2049 | | 5,000 | 8,728 |
| Los Angeles CA Unified School District Build America Bonds | | 5.75 | 7-1-2034 | | 15,000 | 20,227 |
| Los Angeles CA Unified School District Build America Bonds | | 5.76 | 7-1-2029 | | 60,000 | 75,037 |
| Los Angeles CA Unified School District Build America Bonds | | 6.76 | 7-1-2034 | | 160,000 | 230,705 |
| | | | | | | 1,036,169 |
| Transportation revenue: 0.07% | | | | | | |
| Bay Area CA Toll Authority Series 1 | | 6.26 | 4-1-2049 | | 100,000 | 164,073 |
| Bay Area CA Toll Authority Series 1 | | 6.92 | 4-1-2040 | | 15,000 | 23,112 |
| Bay Area CA Toll Authority Series 1 | | 7.04 | 4-1-2050 | | 140,000 | 252,594 |
| | | | | | | 439,779 |
| Utilities revenue: 0.04% | | | | | | |
| Los Angeles CA Department of Water & Power Build America Bonds Series A | | 5.72 | 7-1-2039 | | 100,000 | 143,625 |
| Los Angeles CA Department of Water & Power Build America Bonds Series D | | 6.57 | 7-1-2045 | | 55,000 | 91,060 |
| | | | | | | 234,685 |
| Florida: 0.03% | | | | | | |
| Miscellaneous revenue: 0.03% | | | | | | |
| Florida Board of Administrative Finance | | 2.15 | 7-1-2030 | | 200,000 | 205,189 |
The accompanying notes are an integral part of these financial statements.
6 | Wells Fargo Bloomberg Barclays US Aggregate ex-Corporate Portfolio
Portfolio of investments—August 31, 2021 (unaudited)
| | | Interest
rate | Maturity
date | Principal | Value |
| Georgia: 0.00% | | | | | | |
| Utilities revenue: 0.00% | | | | | | |
| Municipal Electric Authority of Georgia Build America Bonds | | 7.06% | 4-1-2057 | $ | 10,000 | $ 15,025 |
| Illinois: 0.08% | | | | | | |
| GO revenue: 0.02% | | | | | | |
| Chicago IL Series B | | 6.31 | 1-1-2044 | | 50,000 | 67,556 |
| Illinois Taxable Pension | | 5.10 | 6-1-2033 | | 50,000 | 59,392 |
| | | | | | | 126,948 |
| Miscellaneous revenue: 0.01% | | | | | | |
| Illinois Build America Bonds Series 3 | | 6.73 | 4-1-2035 | | 45,000 | 57,127 |
| Tax revenue: 0.05% | | | | | | |
| Chicago IL Transit Authority Series B | | 6.90 | 12-1-2040 | | 210,000 | 303,822 |
| Kansas: 0.00% | | | | | | |
| Miscellaneous revenue: 0.00% | | | | | | |
| Kansas Development Finance Authority Series H | | 4.93 | 4-15-2045 | | 5,000 | 6,698 |
| Massachusetts: 0.03% | | | | | | |
| GO revenue: 0.03% | | | | | | |
| Massachusetts Build America Bonds Series A | | 4.91 | 5-1-2029 | | 130,000 | 160,880 |
| Massachusetts Build America Bonds Series D | | 4.50 | 8-1-2031 | | 5,000 | 6,195 |
| | | | | | | 167,075 |
| New Jersey: 0.06% | | | | | | |
| Miscellaneous revenue: 0.02% | | | | | | |
| New Jersey EDA Series A (NPFGC Insured) | | 7.43 | 2-15-2029 | | 95,000 | 123,289 |
| Transportation revenue: 0.04% | | | | | | |
| New Jersey Transportation Trust | | 6.56 | 12-15-2040 | | 60,000 | 90,063 |
| New Jersey Turnpike Authority Build America Bonds Series A | | 7.10 | 1-1-2041 | | 70,000 | 113,302 |
| | | | | | | 203,365 |
| New York: 0.17% | | | | | | |
| Airport revenue: 0.08% | | | | | | |
| Port Authority of New York & New Jersey Consolidated Bonds Series 174 | | 4.46 | 10-1-2062 | | 190,000 | 261,130 |
| Port Authority of New York & New Jersey Consolidated Bonds Series 201 | | 4.23 | 10-15-2057 | | 100,000 | 130,738 |
| Port Authority of New York & New Jersey Consolidated Bonds Series 210 | | 4.03 | 9-1-2048 | | 50,000 | 61,757 |
| | | | | | | 453,625 |
| Tax revenue: 0.09% | | | | | | |
| New York Metropolitan Transportation Authority Dedicated Tax Fund Build America Bonds | | 7.34 | 11-15-2039 | | 140,000 | 230,785 |
| New York NY Transitional Finance Authority Build America Bonds Subseries B-1 | | 5.57 | 11-1-2038 | | 130,000 | 174,404 |
| New York NY Transitional Finance Authority Build America Bonds Subseries C-2 | | 5.77 | 8-1-2036 | | 100,000 | 129,081 |
The accompanying notes are an integral part of these financial statements.
Wells Fargo Bloomberg Barclays US Aggregate ex-Corporate Portfolio | 7
Portfolio of investments—August 31, 2021 (unaudited)
| | | Interest
rate | Maturity
date | Principal | Value |
| Tax revenue (continued) | | | | | | |
| | | | | | | 534,270 |
| Water & sewer revenue: 0.00% | | | | | | |
| New York NY Municipal Water Finance Authority Series AA | | 5.44% | 6-15-2043 | $ | 10,000 | $ 14,906 |
| Ohio: 0.04% | | | | | | |
| Education revenue: 0.00% | | | | | | |
| Ohio State University Build America Bonds | | 4.91 | 6-1-2040 | | 5,000 | 6,776 |
| Utilities revenue: 0.04% | | | | | | |
| American Municipal Power Ohio Incorporated Build America Bonds | | 5.94 | 2-15-2047 | | 150,000 | 229,357 |
| Oregon: 0.03% | | | | | | |
| Tax revenue: 0.03% | | | | | | |
| Oregon Department of Transportation Build America Bonds Series A | | 5.83 | 11-15-2034 | | 50,000 | 70,654 |
| Oregon Taxable Pension | | 5.76 | 6-1-2023 | | 75,549 | 80,928 |
| | | | | | | 151,582 |
| Pennsylvania: 0.00% | | | | | | |
| Transportation revenue: 0.00% | | | | | | |
| Pennsylvania Turnpike Commission Series B | | 5.51 | 12-1-2045 | | 5,000 | 7,262 |
| Texas: 0.10% | | | | | | |
| GO revenue: 0.02% | | | | | | |
| Texas Transportation Commission | | 2.56 | 4-1-2042 | | 90,000 | 91,228 |
| Transportation revenue: 0.06% | | | | | | |
| Grand Parkway Transportation Corporation Series 2013E | | 5.18 | 10-1-2042 | | 50,000 | 68,654 |
| Northern Texas Tollway Authority | | 3.01 | 1-1-2043 | | 200,000 | 207,029 |
| Texas Private Activity Bond North Tarrant Express Managed Lanes Project Series B | | 3.92 | 12-31-2049 | | 50,000 | 57,359 |
| | | | | | | 333,042 |
| Utilities revenue: 0.02% | | | | | | |
| San Antonio TX Electric and Gas Revenue | | 4.43 | 2-1-2042 | | 110,000 | 138,441 |
| Wisconsin: 0.01% | | | | | | |
| Tax revenue: 0.01% | | | | | | |
| Wisconsin General Fund Annual Appropriations Series C | | 3.15 | 5-1-2027 | | 80,000 | 88,776 |
| Total Municipal obligations (Cost $4,555,862) | | | | | | 5,090,678 |
| Non-agency mortgage-backed securities: 1.07% | | | | | | |
| Benchmark Mortgage Trust Series 2018-B1 Class A4 | | 3.40 | 1-15-2051 | | 25,000 | 27,391 |
| Benchmark Mortgage Trust Series 2018-B6 Class A4 | | 4.26 | 10-10-2051 | | 135,000 | 157,266 |
| CFCRE Commercial Mortgage Trust Series 2016-C7 Class A3 | | 3.84 | 12-10-2054 | | 20,000 | 22,257 |
| Citigroup Commercial Mortgage Trust Series 2015-GC27 Class A5 | | 3.14 | 2-10-2048 | | 55,000 | 58,697 |
| Citigroup Commercial Mortgage Trust Series 2016 GC37 Class B | | 4.23 | 4-10-2049 | | 110,000 | 117,810 |
| Citigroup Commercial Mortgage Trust Series 2016-GC36 Class B ±± | | 4.91 | 2-10-2049 | | 40,000 | 44,105 |
The accompanying notes are an integral part of these financial statements.
8 | Wells Fargo Bloomberg Barclays US Aggregate ex-Corporate Portfolio
Portfolio of investments—August 31, 2021 (unaudited)
| | | Interest
rate | Maturity
date | Principal | Value |
| Non-agency mortgage-backed securities (continued) | | | | | | |
| Citigroup Commercial Mortgage Trust Series 2016-GC36 Class C ±± | | 4.91% | 2-10-2049 | $ | 95,000 | $ 100,143 |
| Citigroup Commercial Mortgage Trust Series 2016-P4 Class A4 | | 2.90 | 7-10-2049 | | 135,000 | 144,825 |
| Citigroup Commercial Mortgage Trust Series 2017-P8 Class AS ±± | | 3.79 | 9-15-2050 | | 300,000 | 333,799 |
| Citigroup Commercial Mortgage Trust Series 2018-C6 Class A4 | | 4.41 | 11-10-2051 | | 520,000 | 610,621 |
| Commercial Mortgage Trust Series 2013-CR6 Class A4 | | 3.10 | 3-10-2046 | | 60,000 | 61,415 |
| Commercial Mortgage Trust Series 2014 UBS5 Class C ±± | | 4.75 | 9-10-2047 | | 195,000 | 203,813 |
| Commercial Mortgage Trust Series 2014-UBS6 Class C ±± | | 4.59 | 12-10-2047 | | 60,000 | 62,819 |
| Commercial Mortgage Trust Series 2015-CR23 Class A3 | | 3.23 | 5-10-2048 | | 60,000 | 63,748 |
| Commercial Mortgage Trust Series 2016-COR1 Class C ±± | | 4.51 | 10-10-2049 | | 65,000 | 70,296 |
| Commercial Mortgage Trust Series 2016-CR28 Class A4 | | 3.76 | 2-10-2049 | | 215,000 | 237,626 |
| Goldman Sachs Mortgage Securities Trust Series 2012-GCJ9 Class AS | | 3.12 | 11-10-2045 | | 40,000 | 40,930 |
| Goldman Sachs Mortgage Securities Trust Series 2013-GC14 Class A5 | | 4.24 | 8-10-2046 | | 265,000 | 281,210 |
| Goldman Sachs Mortgage Securities Trust Series 2014-GC18 Class B ±± | | 4.89 | 1-10-2047 | | 80,000 | 79,249 |
| Goldman Sachs Mortgage Securities Trust Series 2014-GC26 Class A5 | | 3.63 | 11-10-2047 | | 340,000 | 367,551 |
| Goldman Sachs Mortgage Securities Trust Series 2018-GS10 Class AAB ±± | | 4.11 | 7-10-2051 | | 180,000 | 201,623 |
| Goldman Sachs Mortgage Securities Trust Series 2018-GS9 Class A4 ±± | | 3.99 | 3-10-2051 | | 140,000 | 159,979 |
| JPMorgan Chase Commercial Mortgage Securities Trust Series 2013-C15 Class A4 | | 4.10 | 11-15-2045 | | 12,037 | 12,693 |
| JPMorgan Chase Commercial Mortgage Securities Trust Series 2015-C29 Class A4 | | 3.61 | 5-15-2048 | | 200,000 | 216,895 |
| JPMorgan Chase Commercial Mortgage Securities Trust Series 2015-C31 Class A3 | | 3.80 | 8-15-2048 | | 195,000 | 212,723 |
| Morgan Stanley Bank of America Merrill Lynch Trust Series 2013-C11 Class AS ±± | | 4.50 | 8-15-2046 | | 360,000 | 354,817 |
| Morgan Stanley Bank of America Merrill Lynch Trust Series 2013-C8 Class A4 | | 3.13 | 12-15-2048 | | 50,000 | 51,311 |
| Morgan Stanley Bank of America Merrill Lynch Trust Series 2015-C22 Class A4 | | 3.31 | 4-15-2048 | | 60,000 | 64,428 |
| Morgan Stanley Bank of America Merrill Lynch Trust Series 2015-C22 Class ASB | | 3.04 | 4-15-2048 | | 754,348 | 785,233 |
| Morgan Stanley Bank of America Merrill Lynch Trust Series 2015-C22 Class B ±± | | 3.88 | 4-15-2048 | | 285,000 | 299,326 |
| Morgan Stanley Bank of America Merrill Lynch Trust Series 2015-C24 Class A4 | | 3.73 | 5-15-2048 | | 400,000 | 438,594 |
| Morgan Stanley Bank of America Merrill Lynch Trust Series 2016-C30 Class B ±± | | 3.31 | 9-15-2049 | | 425,000 | 437,510 |
| Total Non-agency mortgage-backed securities (Cost $6,076,747) | | | | | | 6,320,703 |
| U.S. Treasury securities: 52.49% | | | | | | |
| U.S. Treasury Bond | | 1.13 | 5-15-2040 | | 1,595,000 | 1,420,921 |
| U.S. Treasury Bond | | 1.13 | 8-15-2040 | | 1,885,000 | 1,673,379 |
| U.S. Treasury Bond | | 1.25 | 5-15-2050 | | 3,330,000 | 2,822,955 |
| U.S. Treasury Bond | | 1.38 | 11-15-2040 | | 1,350,000 | 1,249,594 |
| U.S. Treasury Bond | | 1.38 | 8-15-2050 | | 2,030,000 | 1,775,616 |
The accompanying notes are an integral part of these financial statements.
Wells Fargo Bloomberg Barclays US Aggregate ex-Corporate Portfolio | 9
Portfolio of investments—August 31, 2021 (unaudited)
| | | Interest
rate | Maturity
date | Principal | Value |
| U.S. Treasury securities (continued) | | | | | | |
| U.S. Treasury Bond | | 1.63% | 11-15-2050 | $ | 2,390,000 | $ 2,223,727 |
| U.S. Treasury Bond | | 1.75 | 8-15-2041 | | 3,105,000 | 3,055,999 |
| U.S. Treasury Bond | | 1.88 | 2-15-2051 | | 2,065,000 | 2,038,542 |
| U.S. Treasury Bond | | 2.00 | 2-15-2050 | | 2,515,000 | 2,555,476 |
| U.S. Treasury Bond | | 2.25 | 8-15-2049 | | 1,725,000 | 1,846,896 |
| U.S. Treasury Bond | | 2.38 | 11-15-2049 | | 1,660,000 | 1,825,546 |
| U.S. Treasury Bond | | 2.50 | 2-15-2046 | | 100,000 | 111,676 |
| U.S. Treasury Bond | | 2.50 | 5-15-2046 | | 200,000 | 223,492 |
| U.S. Treasury Bond | | 2.75 | 8-15-2042 | | 3,085,000 | 3,569,441 |
| U.S. Treasury Bond | | 2.75 | 11-15-2042 | | 2,665,000 | 3,083,592 |
| U.S. Treasury Bond | | 2.88 | 5-15-2043 | | 605,000 | 714,160 |
| U.S. Treasury Bond | | 2.88 | 5-15-2049 | | 2,040,000 | 2,463,539 |
| U.S. Treasury Bond | | 3.00 | 5-15-2042 | | 145,000 | 174,255 |
| U.S. Treasury Bond | | 3.00 | 5-15-2045 | | 105,000 | 127,362 |
| U.S. Treasury Bond | | 3.00 | 11-15-2045 | | 35,000 | 42,573 |
| U.S. Treasury Bond | | 3.00 | 2-15-2047 | | 310,000 | 379,181 |
| U.S. Treasury Bond | | 3.00 | 5-15-2047 | | 13,601,000 | 16,660,162 |
| U.S. Treasury Bond | | 3.00 | 2-15-2048 | | 435,000 | 534,149 |
| U.S. Treasury Bond | | 3.00 | 8-15-2048 | | 10,000 | 12,302 |
| U.S. Treasury Bond | | 3.13 | 11-15-2041 | | 1,090,000 | 1,333,164 |
| U.S. Treasury Bond | | 3.13 | 2-15-2042 | | 370,000 | 453,467 |
| U.S. Treasury Bond | | 3.13 | 2-15-2043 | | 475,000 | 582,061 |
| U.S. Treasury Bond | | 3.13 | 8-15-2044 | | 110,000 | 135,579 |
| U.S. Treasury Bond | | 3.38 | 5-15-2044 | | 20,000 | 25,585 |
| U.S. Treasury Bond | | 3.50 | 2-15-2039 | | 15,000 | 19,211 |
| U.S. Treasury Bond | | 3.63 | 8-15-2043 | | 110,000 | 145,183 |
| U.S. Treasury Bond | | 3.63 | 2-15-2044 | | 35,000 | 46,375 |
| U.S. Treasury Bond | | 3.75 | 8-15-2041 | | 35,000 | 46,595 |
| U.S. Treasury Bond | | 3.75 | 11-15-2043 | | 350,000 | 471,010 |
| U.S. Treasury Bond | | 3.88 | 8-15-2040 | | 1,040,000 | 1,400,384 |
| U.S. Treasury Bond | | 4.25 | 11-15-2040 | | 480,000 | 677,531 |
| U.S. Treasury Bond | | 4.38 | 5-15-2040 | | 800,000 | 1,143,063 |
| U.S. Treasury Bond | | 4.38 | 5-15-2041 | | 1,905,000 | 2,739,182 |
| U.S. Treasury Bond | | 4.50 | 8-15-2039 | | 550,000 | 792,838 |
| U.S. Treasury Bond | | 4.75 | 2-15-2041 | | 120,000 | 180,216 |
| U.S. Treasury Bond | | 5.00 | 5-15-2037 | | 1,574,000 | 2,337,083 |
| U.S. Treasury Bond | | 5.38 | 2-15-2031 | | 1,592,000 | 2,183,652 |
| U.S. Treasury Bond | | 5.50 | 8-15-2028 | | 1,760,000 | 2,287,244 |
| U.S. Treasury Bond | | 6.13 | 11-15-2027 | | 245,000 | 321,687 |
| U.S. Treasury Bond | | 6.38 | 8-15-2027 | | 50,000 | 65,885 |
| U.S. Treasury Bond | | 6.88 | 8-15-2025 | | 335,000 | 417,284 |
| U.S. Treasury Note | | 0.13 | 9-30-2022 | | 3,065,000 | 3,066,197 |
| U.S. Treasury Note | | 0.13 | 10-31-2022 | | 3,110,000 | 3,110,486 |
| U.S. Treasury Note | | 0.13 | 11-30-2022 | | 2,790,000 | 2,790,654 |
| U.S. Treasury Note | | 0.13 | 5-15-2023 | | 2,815,000 | 2,812,801 |
| U.S. Treasury Note | | 0.13 | 7-15-2023 | | 545,000 | 544,383 |
| U.S. Treasury Note | | 0.13 | 8-15-2023 | | 3,190,000 | 3,185,389 |
| U.S. Treasury Note | | 0.13 | 9-15-2023 | | 2,855,000 | 2,849,201 |
| U.S. Treasury Note | | 0.13 | 12-15-2023 | | 2,445,000 | 2,436,977 |
| U.S. Treasury Note | | 0.13 | 1-15-2024 | | 3,080,000 | 3,068,209 |
| U.S. Treasury Note | | 0.13 | 2-15-2024 | | 3,070,000 | 3,057,408 |
| U.S. Treasury Note | | 0.25 | 4-15-2023 | | 1,475,000 | 1,477,189 |
| U.S. Treasury Note | | 0.25 | 6-15-2023 | | 2,925,000 | 2,928,085 |
| U.S. Treasury Note | | 0.25 | 11-15-2023 | | 3,105,000 | 3,105,121 |
| U.S. Treasury Note | | 0.25 | 6-15-2024 | | 2,360,000 | 2,352,625 |
The accompanying notes are an integral part of these financial statements.
10 | Wells Fargo Bloomberg Barclays US Aggregate ex-Corporate Portfolio
Portfolio of investments—August 31, 2021 (unaudited)
| | | Interest
rate | Maturity
date | Principal | Value |
| U.S. Treasury securities (continued) | | | | | | |
| U.S. Treasury Note | | 0.25% | 5-31-2025 | $ | 1,790,000 | $ 1,768,184 |
| U.S. Treasury Note | | 0.25 | 6-30-2025 | | 1,295,000 | 1,278,408 |
| U.S. Treasury Note | | 0.25 | 7-31-2025 | | 3,000,000 | 2,958,867 |
| U.S. Treasury Note | | 0.25 | 8-31-2025 | | 3,060,000 | 3,014,698 |
| U.S. Treasury Note | | 0.25 | 9-30-2025 | | 2,925,000 | 2,879,183 |
| U.S. Treasury Note | | 0.25 | 10-31-2025 | | 1,905,000 | 1,873,225 |
| U.S. Treasury Note | | 0.38 | 12-31-2025 | | 2,315,000 | 2,284,525 |
| U.S. Treasury Note | | 0.38 | 7-31-2027 | | 1,860,000 | 1,801,730 |
| U.S. Treasury Note | | 0.38 | 9-30-2027 | | 2,000,000 | 1,931,719 |
| U.S. Treasury Note | | 0.50 | 3-15-2023 | | 2,915,000 | 2,931,169 |
| U.S. Treasury Note | | 0.50 | 3-31-2025 | | 1,675,000 | 1,673,037 |
| U.S. Treasury Note | | 0.50 | 4-30-2027 | | 220,000 | 215,351 |
| U.S. Treasury Note | | 0.50 | 5-31-2027 | | 1,645,000 | 1,607,923 |
| U.S. Treasury Note | | 0.50 | 6-30-2027 | | 2,225,000 | 2,173,460 |
| U.S. Treasury Note | | 0.50 | 8-31-2027 | | 2,015,000 | 1,963,444 |
| U.S. Treasury Note | | 0.63 | 7-31-2026 | | 3,145,000 | 3,123,378 |
| U.S. Treasury Note | | 0.63 | 3-31-2027 | | 205,000 | 202,317 |
| U.S. Treasury Note | | 0.63 | 11-30-2027 | | 2,840,000 | 2,778,652 |
| U.S. Treasury Note | | 0.63 | 12-31-2027 | | 2,145,000 | 2,096,570 |
| U.S. Treasury Note | | 0.63 | 5-15-2030 | | 2,675,000 | 2,540,519 |
| U.S. Treasury Note | | 0.63 | 8-15-2030 | | 3,160,000 | 2,992,742 |
| U.S. Treasury Note | | 0.75 | 3-31-2026 | | 2,535,000 | 2,538,169 |
| U.S. Treasury Note | | 0.75 | 4-30-2026 | | 2,060,000 | 2,061,609 |
| U.S. Treasury Note | | 0.75 | 5-31-2026 | | 2,860,000 | 2,860,782 |
| U.S. Treasury Note | | 0.75 | 1-31-2028 | | 1,615,000 | 1,589,198 |
| U.S. Treasury Note | | 0.88 | 6-30-2026 | | 1,925,000 | 1,935,678 |
| U.S. Treasury Note | | 0.88 | 11-15-2030 | | 3,240,000 | 3,130,903 |
| U.S. Treasury Note | | 1.13 | 2-28-2025 | | 1,855,000 | 1,894,129 |
| U.S. Treasury Note | | 1.13 | 2-29-2028 | | 2,495,000 | 2,512,835 |
| U.S. Treasury Note | | 1.13 | 8-31-2028 | | 1,840,000 | 1,844,888 |
| U.S. Treasury Note | | 1.13 | 2-15-2031 | | 3,135,000 | 3,092,873 |
| U.S. Treasury Note | | 1.25 | 7-31-2023 | | 630,000 | 642,748 |
| U.S. Treasury Note | | 1.25 | 8-31-2024 | | 1,610,000 | 1,650,690 |
| U.S. Treasury Note | | 1.25 | 3-31-2028 | | 3,080,000 | 3,123,553 |
| U.S. Treasury Note | | 1.25 | 6-30-2028 | | 3,025,000 | 3,062,340 |
| U.S. Treasury Note | | 1.25 | 8-15-2031 | | 1,275,000 | 1,268,426 |
| U.S. Treasury Note | | 1.38 | 6-30-2023 | | 4,245,000 | 4,337,694 |
| U.S. Treasury Note | | 1.38 | 8-31-2023 | | 725,000 | 741,766 |
| U.S. Treasury Note | | 1.38 | 9-30-2023 | | 6,135,000 | 6,281,186 |
| U.S. Treasury Note | | 1.38 | 8-31-2026 | | 2,175,000 | 2,238,891 |
| U.S. Treasury Note | | 1.50 | 1-15-2023 | | 1,695,000 | 1,726,914 |
| U.S. Treasury Note | | 1.50 | 2-28-2023 | | 3,560,000 | 3,632,313 |
| U.S. Treasury Note | | 1.50 | 3-31-2023 | | 1,755,000 | 1,792,431 |
| U.S. Treasury Note | | 1.50 | 9-30-2024 | | 3,215,000 | 3,321,622 |
| U.S. Treasury Note | | 1.50 | 10-31-2024 | | 225,000 | 232,567 |
| U.S. Treasury Note | | 1.50 | 8-15-2026 | | 545,000 | 564,181 |
| U.S. Treasury Note | | 1.50 | 1-31-2027 | | 1,350,000 | 1,397,303 |
| U.S. Treasury Note | | 1.50 | 2-15-2030 | | 2,090,000 | 2,139,393 |
| U.S. Treasury Note | | 1.63 | 4-30-2023 | | 280,000 | 286,825 |
| U.S. Treasury Note | | 1.63 | 5-31-2023 | | 3,090,000 | 3,168,578 |
| U.S. Treasury Note | | 1.63 | 10-31-2023 | | 2,540,000 | 2,615,902 |
| U.S. Treasury Note | | 1.63 | 2-15-2026 | | 6,240,000 | 6,492,525 |
| U.S. Treasury Note | | 1.63 | 5-15-2026 | | 2,720,000 | 2,830,819 |
| U.S. Treasury Note | | 1.63 | 9-30-2026 | | 1,395,000 | 1,452,762 |
| U.S. Treasury Note | | 1.63 | 10-31-2026 | | 915,000 | 952,958 |
The accompanying notes are an integral part of these financial statements.
Wells Fargo Bloomberg Barclays US Aggregate ex-Corporate Portfolio | 11
Portfolio of investments—August 31, 2021 (unaudited)
| | | Interest
rate | Maturity
date | Principal | Value |
| U.S. Treasury securities (continued) | | | | | | |
| U.S. Treasury Note | | 1.63% | 8-15-2029 | $ | 2,005,000 | $ 2,076,037 |
| U.S. Treasury Note | | 1.63 | 5-15-2031 | | 3,040,000 | 3,134,525 |
| U.S. Treasury Note | | 1.75 | 9-30-2022 | | 10,000 | 10,177 |
| U.S. Treasury Note | | 1.75 | 5-15-2023 | | 410,000 | 420,939 |
| U.S. Treasury Note | | 1.75 | 6-30-2024 | | 3,510,000 | 3,646,972 |
| U.S. Treasury Note | | 1.75 | 12-31-2026 | | 2,720,000 | 2,850,900 |
| U.S. Treasury Note | | 1.75 | 11-15-2029 | | 830,000 | 867,350 |
| U.S. Treasury Note | | 1.88 | 10-31-2022 | | 2,775,000 | 2,832,234 |
| U.S. Treasury Note | | 1.88 | 8-31-2024 | | 3,290,000 | 3,434,966 |
| U.S. Treasury Note | | 2.00 | 10-31-2022 | | 1,990,000 | 2,033,687 |
| U.S. Treasury Note | | 2.00 | 11-30-2022 | | 1,300,000 | 1,330,570 |
| U.S. Treasury Note | | 2.00 | 2-15-2023 | | 30,000 | 30,816 |
| U.S. Treasury Note | | 2.00 | 6-30-2024 | | 4,751,000 | 4,969,063 |
| U.S. Treasury Note | | 2.00 | 2-15-2025 | | 340,000 | 357,385 |
| U.S. Treasury Note | | 2.00 | 8-15-2025 | | 1,200,000 | 1,265,391 |
| U.S. Treasury Note | | 2.13 | 12-31-2022 | | 1,700,000 | 1,745,090 |
| U.S. Treasury Note | | 2.13 | 11-30-2023 | | 750,000 | 781,348 |
| U.S. Treasury Note | | 2.13 | 7-31-2024 | | 10,000 | 10,506 |
| U.S. Treasury Note | | 2.13 | 9-30-2024 | | 3,270,000 | 3,440,653 |
| U.S. Treasury Note | | 2.13 | 11-30-2024 | | 995,000 | 1,048,248 |
| U.S. Treasury Note | | 2.13 | 5-15-2025 | | 880,000 | 930,291 |
| U.S. Treasury Note | | 2.25 | 12-31-2023 | | 15,000 | 15,688 |
| U.S. Treasury Note | | 2.25 | 4-30-2024 | | 605,000 | 635,628 |
| U.S. Treasury Note | | 2.25 | 10-31-2024 | | 2,035,000 | 2,150,979 |
| U.S. Treasury Note | | 2.25 | 11-15-2024 | | 640,000 | 676,850 |
| U.S. Treasury Note | | 2.25 | 12-31-2024 | | 1,485,000 | 1,572,186 |
| U.S. Treasury Note | | 2.25 | 11-15-2025 | | 1,805,000 | 1,924,793 |
| U.S. Treasury Note | | 2.25 | 11-15-2027 | | 20,000 | 21,556 |
| U.S. Treasury Note | | 2.38 | 8-15-2024 | | 490,000 | 518,654 |
| U.S. Treasury Note | | 2.38 | 5-15-2027 | | 2,493,000 | 2,699,549 |
| U.S. Treasury Note | | 2.38 | 5-15-2029 | | 100,000 | 109,086 |
| U.S. Treasury Note | | 2.38 | 5-15-2051 | | 1,920,000 | 2,120,400 |
| U.S. Treasury Note | | 2.50 | 8-15-2023 | | 270,000 | 282,076 |
| U.S. Treasury Note | | 2.50 | 1-31-2024 | | 895,000 | 942,512 |
| U.S. Treasury Note | | 2.50 | 5-15-2024 | | 1,150,000 | 1,216,844 |
| U.S. Treasury Note | | 2.50 | 1-31-2025 | | 1,670,000 | 1,783,312 |
| U.S. Treasury Note | | 2.50 | 2-28-2026 | | 800,000 | 863,844 |
| U.S. Treasury Note | | 2.63 | 12-31-2025 | | 2,015,000 | 2,182,497 |
| U.S. Treasury Note | | 2.63 | 2-15-2029 | | 3,060,000 | 3,390,384 |
| U.S. Treasury Note | | 2.75 | 11-15-2023 | | 2,040,000 | 2,151,722 |
| U.S. Treasury Note | | 2.75 | 2-28-2025 | | 90,000 | 96,993 |
| U.S. Treasury Note | | 2.75 | 6-30-2025 | | 1,270,000 | 1,374,130 |
| U.S. Treasury Note | | 2.75 | 2-15-2028 | | 2,685,000 | 2,979,301 |
| U.S. Treasury Note | | 2.88 | 11-30-2023 | | 2,400,000 | 2,541,000 |
| U.S. Treasury Note | | 2.88 | 11-30-2025 | | 1,145,000 | 1,251,226 |
| U.S. Treasury Note | | 2.88 | 5-15-2028 | | 2,295,000 | 2,569,324 |
| U.S. Treasury Note | | 2.88 | 8-15-2028 | | 2,510,000 | 2,814,730 |
| U.S. Treasury Note | | 3.13 | 11-15-2028 | | 1,910,000 | 2,179,788 |
| U.S. Treasury Note | | 6.00 | 2-15-2026 | | 450,000 | 555,258 |
| U.S. Treasury Note | | 6.50 | 11-15-2026 | | 745,000 | 961,719 |
| U.S. Treasury Note | | 7.50 | 11-15-2024 | | 695,000 | 852,298 |
| Total U.S. Treasury securities (Cost $301,052,237) | | | | | | 309,329,566 |
The accompanying notes are an integral part of these financial statements.
12 | Wells Fargo Bloomberg Barclays US Aggregate ex-Corporate Portfolio
Portfolio of investments—August 31, 2021 (unaudited)
| | | Interest
rate | Maturity
date | Principal | Value |
| Yankee corporate bonds and notes: 2.64% | | | | | | |
| Energy: 0.13% | | | | | | |
| Oil, gas & consumable fuels: 0.13% | | | | | | |
| Equinor ASA | | 1.75% | 1-22-2026 | $ | 370,000 | $ 380,890 |
| Equinor ASA | | 3.00 | 4-6-2027 | | 150,000 | 162,810 |
| Equinor ASA | | 3.63 | 4-6-2040 | | 40,000 | 45,666 |
| Equinor ASA | | 4.25 | 11-23-2041 | | 130,000 | 159,384 |
| | | | | | | 748,750 |
| Financials: 2.51% | | | | | | |
| Banks: 2.51% | | | | | | |
| African Development Bank | | 0.75 | 4-3-2023 | | 410,000 | 413,493 |
| Asian Development Bank | | 0.25 | 7-14-2023 | | 160,000 | 159,964 |
| Asian Development Bank | | 0.38 | 9-3-2025 | | 600,000 | 592,929 |
| Asian Development Bank | | 1.50 | 10-18-2024 | | 360,000 | 371,187 |
| Asian Development Bank | | 1.75 | 9-19-2029 | | 160,000 | 166,323 |
| Asian Development Bank | | 1.88 | 1-24-2030 | | 110,000 | 115,274 |
| Asian Development Bank | | 2.00 | 4-24-2026 | | 60,000 | 63,359 |
| Asian Development Bank | | 2.13 | 3-19-2025 | | 260,000 | 274,202 |
| Asian Development Bank | | 2.63 | 1-12-2027 | | 180,000 | 196,210 |
| Asian Development Bank | | 5.82 | 6-16-2028 | | 10,000 | 13,087 |
| Asian Development Bank | | 6.22 | 8-15-2027 | | 80,000 | 102,267 |
| Asian Infrastructure Investment Bank | | 0.50 | 5-28-2025 | | 350,000 | 348,367 |
| European Bank for Reconstruction & Development | | 0.50 | 5-19-2025 | | 430,000 | 428,094 |
| European Investment Bank | | 0.25 | 9-15-2023 | | 470,000 | 470,009 |
| European Investment Bank | | 0.63 | 7-25-2025 | | 160,000 | 159,949 |
| European Investment Bank | | 0.88 | 5-17-2030 | | 50,000 | 48,364 |
| European Investment Bank | | 1.25 | 2-14-2031 | | 440,000 | 436,303 |
| European Investment Bank | | 1.88 | 2-10-2025 | | 110,000 | 114,990 |
| European Investment Bank | | 2.00 | 12-15-2022 | | 100,000 | 102,383 |
| European Investment Bank | | 2.25 | 6-24-2024 | | 640,000 | 672,783 |
| European Investment Bank | | 2.50 | 3-15-2023 | | 200,000 | 207,134 |
| European Investment Bank | | 3.25 | 1-29-2024 | | 20,000 | 21,392 |
| Inter-American Development Bank | | 0.88 | 4-20-2026 | | 470,000 | 471,985 |
| Inter-American Development Bank | | 1.75 | 9-14-2022 | | 250,000 | 254,201 |
| Inter-American Development Bank | | 1.75 | 3-14-2025 | | 170,000 | 176,919 |
| Inter-American Development Bank | | 2.00 | 6-2-2026 | | 260,000 | 274,564 |
| Inter-American Development Bank | | 2.13 | 1-15-2025 | | 150,000 | 157,844 |
| Inter-American Development Bank | | 2.38 | 7-7-2027 | | 30,000 | 32,373 |
| Inter-American Development Bank | | 3.13 | 9-18-2028 | | 250,000 | 283,389 |
| Inter-American Development Bank | | 4.38 | 1-24-2044 | | 60,000 | 84,418 |
| Inter-American Development Bank | | 7.00 | 6-15-2025 | | 50,000 | 62,151 |
| International Bank for Reconstruction & Development | | 0.38 | 7-28-2025 | | 220,000 | 217,752 |
| International Bank for Reconstruction & Development | | 0.50 | 10-28-2025 | | 410,000 | 406,952 |
| International Bank for Reconstruction & Development | | 0.75 | 8-26-2030 | | 130,000 | 123,975 |
| International Bank for Reconstruction & Development | | 1.50 | 8-28-2024 | | 30,000 | 30,930 |
| International Bank for Reconstruction & Development | | 1.88 | 10-7-2022 | | 320,000 | 326,179 |
| International Bank for Reconstruction & Development | | 1.88 | 6-19-2023 | | 470,000 | 484,058 |
| International Bank for Reconstruction & Development | | 2.50 | 3-19-2024 | | 260,000 | 274,040 |
| International Bank for Reconstruction & Development | | 2.50 | 7-29-2025 | | 570,000 | 610,644 |
| International Bank for Reconstruction & Development | | 2.50 | 11-22-2027 | | 370,000 | 403,093 |
| International Finance Corporation | | 1.38 | 10-16-2024 | | 100,000 | 102,688 |
| International Finance Corporation | | 2.13 | 4-7-2026 | | 100,000 | 106,102 |
| KfW ¤ | | 0.00 | 4-18-2036 | | 80,000 | 62,386 |
The accompanying notes are an integral part of these financial statements.
Wells Fargo Bloomberg Barclays US Aggregate ex-Corporate Portfolio | 13
Portfolio of investments—August 31, 2021 (unaudited)
| | | Interest
rate | Maturity
date | Principal | Value |
| Banks (continued) | | | | | | |
| KfW ¤ | | 0.00% | 6-29-2037 | $ | 50,000 | $ 38,075 |
| KfW | | 0.50 | 9-20-2024 | | 540,000 | 540,421 |
| KfW | | 0.75 | 9-30-2030 | | 260,000 | 247,676 |
| KfW | | 2.00 | 5-2-2025 | | 40,000 | 42,037 |
| KfW | | 2.13 | 1-17-2023 | | 870,000 | 893,383 |
| KfW | | 2.88 | 4-3-2028 | | 410,000 | 457,084 |
| Korea Development Bank | | 3.38 | 9-16-2025 | | 410,000 | 449,732 |
| Landwirtschaftliche Rentenbank | | 1.75 | 7-27-2026 | | 10,000 | 10,444 |
| Landwirtschaftliche Rentenbank | | 2.00 | 1-13-2025 | | 150,000 | 157,167 |
| Landwirtschaftliche Rentenbank | | 3.13 | 11-14-2023 | | 350,000 | 371,441 |
| Nordic Investment Bank | | 0.38 | 9-11-2025 | | 370,000 | 365,118 |
| Oesterreichische Kontrollbank AG | | 2.88 | 3-13-2023 | | 260,000 | 270,663 |
| Swedish Export Credit ¤ | | 0.00 | 5-11-2037 | | 65,000 | 44,494 |
| Swedish Export Credit | | 0.50 | 8-26-2025 | | 510,000 | 505,150 |
| | | | | | | 14,817,591 |
| Total Yankee corporate bonds and notes (Cost $15,361,779) | | | | | | 15,566,341 |
| Yankee government bonds: 2.09% | | | | | | |
| Canada Government | | 1.63 | 1-22-2025 | | 235,000 | 243,679 |
| Canada Government | | 2.00 | 11-15-2022 | | 10,000 | 10,229 |
| Export Development Canada | | 2.63 | 2-21-2024 | | 320,000 | 337,463 |
| Export-Import Bank of Korea | | 2.88 | 1-21-2025 | | 400,000 | 426,413 |
| Japan Bank for International Cooperation | | 0.38 | 9-15-2023 | | 560,000 | 560,123 |
| Japan Bank for International Cooperation | | 2.38 | 4-20-2026 | | 320,000 | 341,131 |
| Japan Bank for International Cooperation | | 2.75 | 11-16-2027 | | 360,000 | 393,498 |
| Japan Bank for International Cooperation | | 3.38 | 10-31-2023 | | 270,000 | 287,256 |
| Oriental Republic of Uruguay | | 4.38 | 1-23-2031 | | 75,000 | 87,978 |
| Oriental Republic of Uruguay | | 4.98 | 4-20-2055 | | 200,000 | 262,342 |
| Oriental Republic of Uruguay | | 5.10 | 6-18-2050 | | 35,000 | 46,618 |
| Province of Alberta | | 1.30 | 7-22-2030 | | 210,000 | 204,482 |
| Province of Alberta | | 1.88 | 11-13-2024 | | 210,000 | 218,574 |
| Province of British Columbia | | 2.00 | 10-23-2022 | | 15,000 | 15,311 |
| Province of British Columbia | | 7.25 | 9-1-2036 | | 100,000 | 167,047 |
| Province of Manitoba | | 2.10 | 9-6-2022 | | 120,000 | 122,370 |
| Province of Manitoba | | 3.05 | 5-14-2024 | | 150,000 | 160,364 |
| Province of Ontario | | 2.00 | 10-2-2029 | | 90,000 | 94,302 |
| Province of Ontario | | 2.20 | 10-3-2022 | | 120,000 | 122,689 |
| Province of Ontario | | 2.30 | 6-15-2026 | | 70,000 | 74,536 |
| Province of Ontario | | 2.50 | 4-27-2026 | | 70,000 | 75,136 |
| Province of Ontario | | 3.20 | 5-16-2024 | | 5,000 | 5,364 |
| Province of Ontario | | 3.40 | 10-17-2023 | | 110,000 | 117,148 |
| Province of Quebec | | 1.35 | 5-28-2030 | | 100,000 | 99,073 |
| Province of Quebec | | 2.50 | 4-9-2024 | | 70,000 | 73,767 |
| Province of Quebec | | 2.50 | 4-20-2026 | | 75,000 | 80,700 |
| Province of Quebec | | 2.63 | 2-13-2023 | | 260,000 | 269,087 |
| Province of Quebec | | 7.13 | 2-9-2024 | | 110,000 | 127,436 |
| Province of Quebec | | 7.50 | 7-15-2023 | | 80,000 | 90,494 |
| Republic of Chile | | 2.25 | 10-30-2022 | | 155,000 | 158,129 |
| Republic of Chile | | 3.63 | 10-30-2042 | | 365,000 | 394,123 |
| Republic of Hungary | | 5.38 | 3-25-2024 | | 19,000 | 21,259 |
| Republic of Hungary | | 7.63 | 3-29-2041 | | 112,000 | 190,421 |
| Republic of Indonesia | | 3.50 | 1-11-2028 | | 200,000 | 220,180 |
| Republic of Indonesia | | 4.10 | 4-24-2028 | | 225,000 | 255,858 |
| Republic of Indonesia | | 4.35 | 1-11-2048 | | 205,000 | 237,653 |
The accompanying notes are an integral part of these financial statements.
14 | Wells Fargo Bloomberg Barclays US Aggregate ex-Corporate Portfolio
Portfolio of investments—August 31, 2021 (unaudited)
| | | Interest
rate | Maturity
date | Principal | Value |
| Yankee government bonds (continued) | | | | | | |
| Republic of Italy | | 2.88% | 10-17-2029 | $ | 415,000 | $ 437,517 |
| Republic of Italy | | 5.38 | 6-15-2033 | | 60,000 | 76,579 |
| Republic of Korea | | 3.88 | 9-11-2023 | | 210,000 | 224,583 |
| Republic of Panama | | 2.25 | 9-29-2032 | | 200,000 | 195,084 |
| Republic of Panama | | 3.87 | 7-23-2060 | | 200,000 | 206,830 |
| Republic of Panama | | 8.88 | 9-30-2027 | | 175,000 | 241,770 |
| Republic of Panama | | 9.38 | 4-1-2029 | | 105,000 | 155,626 |
| Republic of Peru | | 2.78 | 1-23-2031 | | 200,000 | 204,318 |
| Republic of Peru | | 2.84 | 6-20-2030 | | 180,000 | 185,873 |
| Republic of Peru | | 3.23 | 7-28-2121 | | 75,000 | 65,711 |
| Republic of Peru | | 5.63 | 11-18-2050 | | 105,000 | 145,766 |
| Republic of Philippines | | 1.65 | 6-10-2031 | | 200,000 | 196,632 |
| Republic of Philippines | | 2.65 | 12-10-2045 | | 200,000 | 193,056 |
| Republic of Philippines | | 3.70 | 2-2-2042 | | 215,000 | 237,838 |
| Republic of Philippines | | 5.50 | 3-30-2026 | | 210,000 | 251,419 |
| Republic of Philippines | | 9.50 | 2-2-2030 | | 55,000 | 87,041 |
| Republic of Poland | | 3.00 | 3-17-2023 | | 215,000 | 223,880 |
| Republic of Poland | | 3.25 | 4-6-2026 | | 10,000 | 11,020 |
| State of Israel | | 3.38 | 1-15-2050 | | 350,000 | 381,290 |
| State of Israel | | 5.50 | 12-4-2023 | | 120,000 | 133,940 |
| State of Israel | | 5.50 | 9-18-2033 | | 6,000 | 8,554 |
| United Mexican States | | 3.60 | 1-30-2025 | | 200,000 | 218,836 |
| United Mexican States | | 4.00 | 10-2-2023 | | 72,000 | 77,353 |
| United Mexican States | | 4.15 | 3-28-2027 | | 205,000 | 233,962 |
| United Mexican States | | 4.35 | 1-15-2047 | | 225,000 | 239,531 |
| United Mexican States | | 4.50 | 1-31-2050 | | 260,000 | 282,571 |
| United Mexican States | | 4.75 | 3-8-2044 | | 54,000 | 60,776 |
| United Mexican States | | 5.55 | 1-21-2045 | | 255,000 | 313,931 |
| United Mexican States | | 5.75 | 10-12-2110 | | 103,000 | 125,631 |
| United Mexican States | | 6.05 | 1-11-2040 | | 40,000 | 51,000 |
| United Mexican States | | 7.50 | 4-8-2033 | | 110,000 | 156,614 |
| United Mexican States | | 8.30 | 8-15-2031 | | 60,000 | 89,280 |
| Total Yankee government bonds (Cost $11,920,573) | | | | | | 12,306,045 |
| | | Yield | | Shares | |
| Short-term investments: 16.25% | | | | | | |
| Investment companies: 16.25% | | | | | | |
| Wells Fargo Government Money Market Fund Select Class ♠∞## | | 0.03 | | | 95,742,605 | 95,742,605 |
| Total Short-term investments (Cost $95,742,605) | | | | | | 95,742,605 |
| Total investments in securities (Cost $665,336,460) | 115.25% | | | | | 679,198,351 |
| Other assets and liabilities, net | (15.25) | | | | | (89,848,165) |
| Total net assets | 100.00% | | | | | $589,350,186 |
| ±± | The coupon of the security is adjusted based on the principal and interest payments received from the underlying pool of mortgages as well as the credit quality and the actual prepayment speed of the underlying mortgages. The rate shown is the rate in effect at period end. |
| ¤ | The security is issued in zero coupon form with no periodic interest payments. |
| ## | All or a portion of this security is segregated for when-issued securities. |
| ♠ | The issuer of the security is an affiliated person of the Portfolio as defined in the Investment Company Act of 1940. |
| ∞ | The rate represents the 7-day annualized yield at period end. |
| %% | The security is purchased on a when-issued basis. |
The accompanying notes are an integral part of these financial statements.
Wells Fargo Bloomberg Barclays US Aggregate ex-Corporate Portfolio | 15
Portfolio of investments—August 31, 2021 (unaudited)
| Abbreviations: |
| EDA | Economic Development Authority |
| FFCB | Federal Farm Credit Banks |
| FHLB | Federal Home Loan Bank |
| FHLMC | Federal Home Loan Mortgage Corporation |
| FNMA | Federal National Mortgage Association |
| GNMA | Government National Mortgage Association |
| GO | General obligation |
| NPFGC | National Public Finance Guarantee Corporation |
| TVA | Tennessee Valley Authority |
Investments in affiliates
An affiliated investment is an investment in which the Portfolio owns at least 5% of the outstanding voting shares of the issuer or as a result of other relationships, such as the Portfolio and the issuer having the same adviser or investment manager. Transactions with issuers that were either affiliates of the Portfolio at the beginning of the period or the end of the period were as follows:
| | Value,
beginning of
period | Purchases | Sales
proceeds | Net
realized
gains
(losses) | Net
change in
unrealized
gains
(losses) | Value,
end of
period | Shares,
end
of period | Income
from
affiliated
securities |
| Short-term investments | | | | | | | |
| Wells Fargo Government Money Market Fund Select Class | $57,676,698 | $81,948,195 | $(43,882,288) | $0 | $0 | $95,742,605 | 95,742,605 | $10,937 |
The accompanying notes are an integral part of these financial statements.
16 | Wells Fargo Bloomberg Barclays US Aggregate ex-Corporate Portfolio
Statement of assets and liabilities—August 31, 2021 (unaudited)
| | |
| Assets | |
Investments in unaffiliated securities, at value (cost $569,593,855)
| $ 583,455,746 |
Investments in affiliated securites, at value (cost $95,742,605)
| 95,742,605 |
Receivable for investments sold
| 13,191,626 |
Receivable for interest
| 1,693,563 |
Total assets
| 694,083,540 |
| Liabilities | |
Payable for when-issued transactions
| 90,796,640 |
Payable for investments purchased
| 13,328,324 |
Overdraft due to custodian bank
| 548,461 |
Advisory fee payable
| 14,572 |
Accrued expenses and other liabilities
| 45,357 |
Total liabilities
| 104,733,354 |
Total net assets
| $589,350,186 |
The accompanying notes are an integral part of these financial statements.
Wells Fargo Bloomberg Barclays US Aggregate ex-Corporate Portfolio | 17
Statement of operations—six months ended August 31, 2021 (unaudited)
| | |
| Investment income | |
Interest
| $ 3,626,776 |
Income from affiliated securities
| 10,937 |
Total investment income
| 3,637,713 |
| Expenses | |
Advisory fee
| 148,016 |
Custody and accounting fees
| 15,891 |
Professional fees
| 27,137 |
Interest holder report expenses
| 5,186 |
Trustees’ fees and expenses
| 9,771 |
Other fees and expenses
| 6,770 |
Total expenses
| 212,771 |
Less: Fee waivers and/or expense reimbursements
| (58,834) |
Net expenses
| 153,937 |
Net investment income
| 3,483,776 |
| Realized and unrealized gains (losses) on investments | |
Net realized gains on investments
| 2,188,647 |
Net change in unrealized gains (losses) on investments
| (142,503) |
Net realized and unrealized gains (losses) on investments
| 2,046,144 |
Net increase in net assets resulting from operations
| $5,529,920 |
The accompanying notes are an integral part of these financial statements.
18 | Wells Fargo Bloomberg Barclays US Aggregate ex-Corporate Portfolio
Statement of changes in net assets
| | | |
| | Six months ended
August 31, 2021
(unaudited) | Year ended
February 28, 2021 |
| Operations | | |
Net investment income
| $ 3,483,776 | $ 8,895,120 |
Net realized gains on investments
| 2,188,647 | 13,824,150 |
Net change in unrealized gains (losses) on investments
| (142,503) | (20,010,769) |
Net increase in net assets resulting from operations
| 5,529,920 | 2,708,501 |
| Capital transactions | | |
| Transactions in investors’ beneficial interests | | |
Contributions
| 43,529,772 | 200,389,400 |
Withdrawals
| (46,871,847) | (281,370,896) |
Net decrease in net assets resulting from capital transactions
| (3,342,075) | (80,981,496) |
Total increase (decrease) in net assets
| 2,187,845 | (78,272,995) |
| Net assets | | |
Beginning of period
| 587,162,341 | 665,435,336 |
End of period
| $589,350,186 | $ 587,162,341 |
The accompanying notes are an integral part of these financial statements.
Wells Fargo Bloomberg Barclays US Aggregate ex-Corporate Portfolio | 19
| | | Year ended February 28 |
| | Six months ended
August 31, 2021
(unaudited) | 2021 | 2020 1 | 2019 | 2018 2 |
Total return3
| 0.94% | 0.52% | 10.34% | 3.23% | (1.39)% |
| Ratios to average net assets (annualized) | | | | | |
Gross expenses
| 0.07% | 0.07% | 0.07% | 0.08% | 0.08% |
Net expenses
| 0.05% * | 0.05% * | 0.06% | 0.07% | 0.07% |
Net investment income
| 1.18% | 1.57% | 2.32% | 2.38% | 2.03% |
| Supplemental data | | | | | |
Portfolio turnover rate
| 94% | 114% | 46% | 72% | 221% |
| * | Ratios reflect expenses which were voluntarily waived by the adviser. Without these voluntary waivers, the net expense ratios would be increased by the following amounts: |
| Six months ended August 31, 2021 (unaudited) | 0.02% |
| Year ended February 28, 2021 | 0.02% |
| 1 | Year ended February 29 |
| 2 | For the period from May 23, 2017 (commencement of operations) to February 28, 2018 |
| 3 | Returns for periods of less than one year are not annualized. |
The accompanying notes are an integral part of these financial statements.
20 | Wells Fargo Bloomberg Barclays US Aggregate ex-Corporate Portfolio
Notes to financial statements (unaudited)
1. ORGANIZATION
Wells Fargo Master Trust (the "Trust"), a Delaware statutory trust organized on March 10, 1999, is an open-end management investment company registered under the Investment Company Act of 1940, as amended (the "1940 Act"). As an investment company, the Trust follows the accounting and reporting guidance in Financial Accounting Standards Board ("FASB") Accounting Standards Codification Topic 946, Financial Services – Investment Companies. These financial statements report on the Wells Fargo Bloomberg Barclays US Aggregate ex-Corporate Portfolio (the "Portfolio") which is a diversified series of the Trust.
Interests in the Portfolio are available solely through private placement transactions that do not involve any "public offering" within the meaning of Section 4(2) of the Investment Company Act of 1933.
On February 23, 2021, Wells Fargo & Company announced that it has entered into a definitive agreement to sell Wells Fargo Asset Management ("WFAM") to GTCR LLC and Reverence Capital Partners, L.P. WFAM is the trade name used by the asset management businesses of Wells Fargo & Company and includes Wells Fargo Funds Management, LLC, the adviser to the Portfolio, Wells Capital Management, LLC and Wells Fargo Asset Management (International) Limited, both registered investment advisers providing subadvisory services to certain funds, and Wells Fargo Funds Distributor, LLC, the Portfolio's principal underwriter. As part of the transaction, Wells Fargo & Company will own a 9.9% equity interest and will continue to serve as an important client and distribution partner.
Consummation of the transaction will result in the automatic termination of the Portfolio’s investment advisory agreement and subadvisory agreements. The Portfolio’s Board of Trustees approved a new investment advisory agreement and a new subadvisory agreement which were subsequently approved on behalf of the feeder funds that were investors in the Portfolio at the close of business on May 28, 2021. The new agreements will take effect upon the closing of the transaction. The transaction is expected to close in the second half of 2021, subject to customary closing conditions.
2. SIGNIFICANT ACCOUNTING POLICIES
The following significant accounting policies, which are consistently followed in the preparation of the financial statements of the Portfolio, are in conformity with U.S. generally accepted accounting principles which require management to make estimates and assumptions that affect the reported amounts of assets and liabilities, disclosure of contingent assets and liabilities at the date of the financial statements, and the reported amounts of income and expenses during the reporting period. Actual results could differ from those estimates.
Securities valuation
All investments are valued each business day as of the close of regular trading on the New York Stock Exchange (generally 4 p.m. Eastern Time), although the Portfolio may deviate from this calculation time under unusual or unexpected circumstances.
Debt securities are valued at the evaluated bid price provided by an independent pricing service (e.g. taking into account various factors, including yields, maturities, or credit ratings) or, if a reliable price is not available, the quoted bid price from an independent broker-dealer.
Investments in registered open-end investment companies are valued at net asset value.
Investments which are not valued using any of the methods discussed above are valued at their fair value, as determined in good faith by the Board of Trustees. The Board of Trustees has established a Valuation Committee comprised of the Trustees and has delegated to it the authority to take any actions regarding the valuation of portfolio securities that the Valuation Committee deems necessary or appropriate, including determining the fair value of portfolio securities, unless the determination has been delegated to the Wells Fargo Asset Management Pricing Committee at Wells Fargo Funds Management, LLC ("Funds Management"). The Board of Trustees retains the authority to make or ratify any valuation decisions or approve any changes to the Valuation Procedures as it deems appropriate. On a quarterly basis, the Board of Trustees receives reports on any valuation actions taken by the Valuation Committee or the Wells Fargo Asset Management Pricing Committee which may include items for ratification.
When-issued transactions
The Portfolio may purchase securities on a forward commitment or when-issued basis. The Portfolio records a when-issued transaction on the trade date and will segregate assets in an amount at least equal in value to the Portfolio's commitment to purchase when-issued securities. Securities purchased on a when-issued basis are marked-to-market daily and the Portfolio begins earning interest on the settlement date. Losses may arise due to changes in the market value of the underlying securities or if the counterparty does not perform under the contract.
Wells Fargo Bloomberg Barclays US Aggregate ex-Corporate Portfolio | 21
Notes to financial statements (unaudited)
Security transactions and income recognition
Securities transactions are recorded on a trade date basis. Realized gains or losses are recorded on the basis of identified cost.
Interest income is accrued daily and bond discounts are accreted and premiums are amortized daily. To the extent debt obligations are placed on non-accrual status, any related interest income may be reduced by writing off interest receivables when the collection of all or a portion of interest has been determined to be doubtful based on consistently applied procedures and the fair value has decreased. If the issuer subsequently resumes interest payments or when the collectability of interest is reasonably assured, the debt obligation is removed from non-accrual status. Paydown gains and losses are included in interest income.
Federal and other taxes
The Portfolio is not required to pay federal income taxes on its net investment income and net capital gains as it is treated as a partnership for federal income tax purposes. All income, gains and losses of the Portfolio are deemed to have been “passed through” to the interest holders in proportion to their holdings of the Portfolio regardless of whether income and gains have been distributed by the Portfolio.
The Portfolio’s income tax returns and all financial records supporting those returns for the prior three fiscal years are subject to examination by the federal revenue authority. Management has analyzed the Portfolio’s tax positions taken on federal, state, and foreign tax returns for all open tax years and does not believe that there are any uncertain tax positions that require recognition of a tax liability.
As of August 31, 2021, the aggregate cost of all investments for federal income tax purposes was $665,184,197 and the unrealized gains (losses) consisted of:
| Gross unrealized gains | $16,993,230 |
| Gross unrealized losses | (2,979,076) |
| Net unrealized gains | $14,014,154 |
3. FAIR VALUATION MEASUREMENTS
Fair value measurements of investments are determined within a framework that has established a fair value hierarchy based upon the various data inputs utilized in determining the value of the Portfolio’s investments. The three-level hierarchy gives the highest priority to unadjusted quoted prices in active markets for identical assets or liabilities (Level 1) and the lowest priority to unobservable inputs (Level 3). The Portfolio’s investments are classified within the fair value hierarchy based on the lowest level of input that is significant to the fair value measurement. The inputs are summarized into three broad levels as follows:
| ■ | Level 1 – quoted prices in active markets for identical securities |
| ■ | Level 2 – other significant observable inputs (including quoted prices for similar securities, interest rates, prepayment speeds, credit risk, etc.) |
| ■ | Level 3 – significant unobservable inputs (including the Portfolio’s own assumptions in determining the fair value of investments) |
The inputs or methodologies used for valuing investments in securities are not necessarily an indication of the risk associated with investing in those securities.
22 | Wells Fargo Bloomberg Barclays US Aggregate ex-Corporate Portfolio
Notes to financial statements (unaudited)
The following is a summary of the inputs used in valuing the Portfolio’s assets and liabilities as of August 31, 2021:
| | Quoted prices
(Level 1) | Other significant
observable inputs
(Level 2) | Significant
unobservable inputs
(Level 3) | Total |
| Assets | | | | |
| Investments in: | | | | |
| Agency securities | $ 0 | $ 232,494,124 | $0 | $ 232,494,124 |
| Asset-backed securities | 0 | 2,348,289 | 0 | 2,348,289 |
| Municipal obligations | 0 | 5,090,678 | 0 | 5,090,678 |
| Non-agency mortgage-backed securities | 0 | 6,320,703 | 0 | 6,320,703 |
| U.S. Treasury securities | 309,329,566 | 0 | 0 | 309,329,566 |
| Yankee corporate bonds and notes | 0 | 15,566,341 | 0 | 15,566,341 |
| Yankee government bonds | 0 | 12,306,045 | 0 | 12,306,045 |
| Short-term investments | | | | |
| Investment companies | 95,742,605 | 0 | 0 | 95,742,605 |
| Total assets | $405,072,171 | $274,126,180 | $0 | $679,198,351 |
Additional sector, industry or geographic detail, if any, is included in the Portfolio of Investments.
For the six months ended August 31, 2021, the Portfolio did not have any transfers into/out of Level 3.
4. TRANSACTIONS WITH AFFILIATES
Advisory fee
The Trust has entered into an advisory contract with Funds Management, an indirect wholly owned subsidiary of Wells Fargo & Company ("Wells Fargo"). The adviser is responsible for implementing investment policies and guidelines and for supervising the subadviser, who is responsible for day-to-day portfolio management of the Portfolio. Pursuant to the contract, Funds Management is entitled to receive an advisory fee at the following annual rate based on the Portfolio’s average daily net assets:
| Average daily net assets | Advisory fee |
| First $5 billion | 0.050% |
| Next $5 billion | 0.040 |
| Over $10 billion | 0.030 |
For the six months ended August 31, 2021, the advisory fee was equivalent to an annual rate of 0.05% of the Portfolio’s average daily net assets.
Funds Management has retained the services of a subadviser to provide daily portfolio management to the Portfolio. The fee for subadvisory services is borne by Funds Management. Wells Capital Management, LLC, an affiliate of Funds Management and an indirect wholly owned subsidiary of Wells Fargo, is the subadviser to the Portfolio and is entitled to receive a fee from Funds Management at an annual rate starting at 0.04% and declining to 0.03% as the average daily net assets of the Portfolio increase.
Funds Management has voluntarily waived and/or reimbursed advisory fees to reduce the net operating expense ratio of the Portfolio. These voluntary waivers may be discontinued at any time.
Interfund transactions
The Portfolio may purchase or sell portfolio investment securities to certain other Wells Fargo affiliates pursuant to Rule 17a-7 under the 1940 Act and under procedures adopted by the Board of Trustees. The procedures have been designed to ensure that these interfund transactions, which do not incur broker commissions, are effected at current market prices.
Wells Fargo Bloomberg Barclays US Aggregate ex-Corporate Portfolio | 23
Notes to financial statements (unaudited)
5. INVESTMENT PORTFOLIO TRANSACTIONS
Purchases and sales of investments, excluding short-term securities, for the six months ended August 31, 2021 were as follows:
| Purchases at cost | | Sales proceeds |
U.S.
government | Non-U.S.
government | | U.S.
government | Non-U.S.
government |
| $569,767,573 | $9,270,701 | | $535,235,024 | $11,267,367 |
6. BANK BORROWINGS
The Trust, along with Wells Fargo Variable Trust and Wells Fargo Funds Trust (excluding the money market funds), are parties to a $350,000,000 revolving credit agreement whereby the Portfolio is permitted to use bank borrowings for temporary or emergency purposes, such as to fund interest holders withdrawal requests. Interest under the credit agreement is charged to the Portfolio based on a borrowing rate equal to the higher of the Federal Funds rate in effect on that day plus 1.25% or the overnight bank funding rate in effect on that day plus 1.25%. In addition, an annual commitment fee equal to 0.25% of the unused balance is allocated to each participating fund.
For the six months ended August 31, 2021, there were no borrowings by the Portfolio under the agreement.
7. INDEMNIFICATION
Under the Portfolio's organizational documents, the officers and Trustees have been granted certain indemnification rights against certain liabilities that may arise out of performance of their duties to the Portfolio. The Portfolio has entered into a separate agreement with each Trustee that converts indemnification rights currently existing under the Portfolio’s organizational documents into contractual rights that cannot be changed in the future without the consent of the Trustee. Additionally, in the normal course of business, the Portfolio may enter into contracts with service providers that contain a variety of indemnification clauses. The Portfolio’s maximum exposure under these arrangements is dependent on future claims that may be made against the Portfolio and, therefore, cannot be estimated.
8. CORONAVIRUS (COVID-19) PANDEMIC
On March 11, 2020, the World Health Organization announced that it had made the assessment that coronavirus disease 2019 (“COVID-19”) is a pandemic. The impacts of COVID-19 are affecting the entire global economy, individual companies and investment products, the funds, and the market in general. There is significant uncertainty around the extent and duration of business disruptions related to COVID-19 and the impacts may last for an extended period of time. COVID-19 has led to significant uncertainty and volatility in the financial markets.
9. SUBSEQUENT EVENTS
Wells Fargo Asset Management ("WFAM") announced that it will be changing its company name to Allspring Global Investments upon the closing of the previously announced sale transaction of WFAM by Wells Fargo & Company to GTCR LLC and Reverence Capital Partners, L.P. The new corporate name is expected to go into effect on the closing date of the transaction, which is anticipated to occur in the second half of 2021, subject to customary closing conditions.
The Board of Trustees of the Wells Fargo Funds approved a change in the Portfolio's name to remove “Wells Fargo” from the Portfolio's name and replace with “Allspring” on December 6, 2021.
Following the closing of the transaction, Wells Fargo Funds Management, LLC, the Portfolio's adviser, Wells Capital Management, LLC and Wells Fargo Asset Management (International) Limited, each subadvisers to certain funds, and Wells Fargo Funds Distributor, LLC will each be rebranded as Allspring.
24 | Wells Fargo Bloomberg Barclays US Aggregate ex-Corporate Portfolio
Other information (unaudited)
PROXY VOTING INFORMATION
A description of the policies and procedures used to determine how to vote proxies relating to portfolio securities is available without charge, upon request, by calling 1-800-222-8222, visiting our website at wfam.com, or visiting the SEC website at sec.gov. Information regarding how the proxies related to portfolio securities were voted during the most recent 12-month period ended June 30 is available on the website at wfam.com or by visiting the SEC website at sec.gov.
QUARTERLY PORTFOLIO HOLDINGS INFORMATION
The Portfolio files its complete schedule of portfolio holdings with the SEC for the first and third quarters of each fiscal year as an exhibit to its reports on Form N-PORT. Interest holders may view the filed Form N-PORT by visiting the SEC website at sec.gov.
Wells Fargo Bloomberg Barclays US Aggregate ex-Corporate Portfolio | 25
Other information (unaudited)
BOARD OF TRUSTEES AND OFFICERS
Each of the Trustees and Officers listed in the table below acts in identical capacities for each fund in the Wells Fargo family of funds, which consists of 139 mutual funds comprising the Wells Fargo Funds Trust, Wells Fargo Variable Trust, Wells Fargo Master Trust and four closed-end funds (collectively the “Fund Complex”). This table should be read in conjunction with the Prospectus and the Statement of Additional Information1. The mailing address of each Trustee and Officer is 525 Market Street, 12th Floor, San Francisco, CA 94105. Each Trustee and Officer serves an indefinite term, however, each Trustee serves such term until reaching the mandatory retirement age established by the Trustees.
Independent Trustees
Name and
year of birth | Position held and
length of service* | Principal occupations during past five years or longer | Current other
public company or
investment
company
directorships |
William R. Ebsworth
(Born 1957) | Trustee,
since 2015 | Retired. From 1984 to 2013, equities analyst, portfolio manager, research director and chief investment officer at Fidelity Management and Research Company in Boston, Tokyo, and Hong Kong, and retired in 2013 as Chief Investment Officer of Fidelity Strategic Advisers, Inc. where he led a team of investment professionals managing client assets. Prior thereto, Board member of Hong Kong Securities Clearing Co., Hong Kong Options Clearing Corp., the Thailand International Fund, Ltd., Fidelity Investments Life Insurance Company, and Empire Fidelity Investments Life Insurance Company. Audit Committee Chair and Investment Committee Chair of the Vincent Memorial Hospital Endowment (non-profit organization). Mr. Ebsworth is a CFA® charterholder. | N/A |
Jane A. Freeman
(Born 1953) | Trustee,
since 2015;
Chair Liaison,
since 2018 | Retired. From 2012 to 2014 and 1999 to 2008, Chief Financial Officer of Scientific Learning Corporation. From 2008 to 2012, Ms. Freeman provided consulting services related to strategic business projects. Prior to 1999, Portfolio Manager at Rockefeller & Co. and Scudder, Stevens & Clark. Board member of the Harding Loevner Funds from 1996 to 2014, serving as both Lead Independent Director and chair of the Audit Committee. Board member of the Russell Exchange Traded Funds Trust from 2011 to 2012 and the chair of the Audit Committee. Ms. Freeman is also an inactive Chartered Financial Analyst. | N/A |
Isaiah Harris, Jr.
(Born 1952) | Trustee,
since 2009; Audit
Committee
Chair,
since 2019 | Retired. Chairman of the Board of CIGNA Corporation since 2009, and Director since 2005. From 2003 to 2011, Director of Deluxe Corporation. Prior thereto, President and CEO of BellSouth Advertising and Publishing Corp. from 2005 to 2007, President and CEO of BellSouth Enterprises from 2004 to 2005 and President of BellSouth Consumer Services from 2000 to 2003. Emeritus member of the Iowa State University Foundation Board of Governors. Emeritus Member of the Advisory Board of Iowa State University School of Business. Advisory Board Member, Palm Harbor Academy (private school). Mr. Harris is a certified public accountant (inactive status). | CIGNA Corporation |
Judith M. Johnson
(Born 1949) | Trustee,
since 2008 | Retired. Prior thereto, Chief Executive Officer and Chief Investment Officer of Minneapolis Employees Retirement Fund from 1996 to 2008. Ms. Johnson is an attorney, certified public accountant and a certified managerial accountant. | N/A |
David F. Larcker
(Born 1950) | Trustee,
since 2009 | James Irvin Miller Professor of Accounting at the Graduate School of Business (Emeritus), Stanford University, Director of the Corporate Governance Research Initiative and Senior Faculty of The Rock Center for Corporate Governance since 2006. From 2005 to 2008, Professor of Accounting at the Graduate School of Business, Stanford University. Prior thereto, Ernst & Young Professor of Accounting at The Wharton School, University of Pennsylvania from 1985 to 2005. | N/A |
26 | Wells Fargo Bloomberg Barclays US Aggregate ex-Corporate Portfolio
Other information (unaudited)
Name and
year of birth | Position held and
length of service* | Principal occupations during past five years or longer | Current other
public company or
investment
company
directorships |
Olivia S. Mitchell
(Born 1953) | Trustee,
since 2006;
Nominating and
Governance
Committee Chair,
since 2018 | International Foundation of Employee Benefit Plans Professor, Wharton School of the University of Pennsylvania since 1993. Director of Wharton’s Pension Research Council and Boettner Center on Pensions & Retirement Research, and Research Associate at the National Bureau of Economic Research. Previously, Cornell University Professor from 1978 to 1993. | N/A |
Timothy J. Penny
(Born 1951) | Trustee,
since 1996;
Chair,
since 2018 | President and Chief Executive Officer of Southern Minnesota Initiative Foundation, a non-profit organization, since 2007. Member of the Board of Trustees of NorthStar Education Finance, Inc., a non-profit organization, since 2007. | N/A |
James G. Polisson
(Born 1959) | Trustee,
since 2018 | Retired. Chief Marketing Officer, Source (ETF) UK Services, Ltd, from 2015 to 2017. From 2012 to 2015, Principal of The Polisson Group, LLC, a management consulting, corporate advisory and principal investing company. Chief Executive Officer and Managing Director at Russell Investments, Global Exchange Traded Funds from 2010 to 2012. Managing Director of Barclays Global Investors from 1998 to 2010 and Global Chief Marketing Officer for iShares and Barclays Global Investors from 2000 to 2010. Trustee of the San Francisco Mechanics’ Institute, a non-profit organization, from 2013 to 2015. Board member of the Russell Exchange Traded Fund Trust from 2011 to 2012. Director of Barclays Global Investors Holdings Deutschland GmbH from 2006 to 2009. Mr. Polisson is an attorney and has a retired status with the Massachusetts and District of Columbia Bar Associations. | N/A |
Pamela Wheelock
(Born 1959) | Trustee,
since January
2020; previously
Trustee from
January 2018 to
July 2019 | Board member of the Destination Medical Center Economic Development Agency, Rochester, Minnesota since 2019. Interim President of the McKnight Foundation from January to September 2020. Acting Commissioner, Minnesota Department of Human Services, July 2019 through September 2019. Human Services Manager (part-time), Minnesota Department of Human Services, October 2019 through December 2019. Chief Operating Officer, Twin Cities Habitat for Humanity from 2017 to 2019. Vice President of University Services, University of Minnesota from 2012 to 2016. Prior thereto, on the Board of Directors, Governance Committee and Finance Committee for the Minnesota Philanthropy Partners (Saint Paul Foundation) from 2012 to 2018, Interim Chief Executive Officer of Blue Cross Blue Shield of Minnesota from 2011 to 2012, Chairman of the Board from 2009 to 2012 and Board Director from 2003 to 2015. Vice President, Leadership and Community Engagement, Bush Foundation, Saint Paul, Minnesota (a private foundation) from 2009 to 2011. Executive Vice President and Chief Financial Officer, Minnesota Sports and Entertainment from 2004 to 2009 and Senior Vice President from 2002 to 2004. Executive Vice President of the Minnesota Wild Foundation from 2004 to 2008. Commissioner of Finance, State of Minnesota, from 1999 to 2002. Currently Board Chair of the Minnesota Wild Foundation since 2010. | N/A |
* Length of service dates reflect the Trustee’s commencement of service with the Trust’s predecessor entities, where applicable.
Wells Fargo Bloomberg Barclays US Aggregate ex-Corporate Portfolio | 27
Other information (unaudited)
Officers
Name and
year of birth | Position held and
length of service | Principal occupations during past five years or longer |
Andrew Owen
(Born 1960) | President,
since 2017 | Executive Vice President of Wells Fargo & Company and Head of Affiliated Managers, Wells Fargo Asset Management, since 2014. In addition, Mr. Owen is currently President, Chief Executive Officer and Director of Wells Fargo Funds Management, LLC since 2017. Prior thereto, Executive Vice President responsible for marketing, investments and product development for Wells Fargo Funds Management, LLC, from 2009 to 2014. |
Jeremy DePalma
(Born 1974) | Treasurer,
since 2012
(for certain funds in
the Fund Complex);
since 2021 (for
the remaining funds in the
Fund Complex) | Senior Vice President of Wells Fargo Funds Management, LLC since 2009. Senior Vice President of Evergreen Investment Management Company, LLC from 2008 to 2010 and head of the Fund Reporting and Control Team within Fund Administration from 2005 to 2010. |
Michelle Rhee
(Born 1966) | Chief Legal Officer,
since 2019 | Secretary of Wells Fargo Funds Management, LLC and Chief Legal Counsel of Wells Fargo Asset Management since 2018. Deputy General Counsel of Wells Fargo Bank, N.A. since 2020 and Assistant General Counsel of Wells Fargo Bank, N.A. from 2018 to 2020. Associate General Counsel and Managing Director of Bank of America Corporation from 2004 to 2018. |
Matthew Prasse
(Born 1983) | Secretary,
since 2021 | Senior Counsel of the Wells Fargo Legal Department since 2018. Previously, Director and Counsel for Barings LLC from 2015 to 2018. Prior to joining Barings, Associate at Morgan, Lewis & Bockius LLP from 2008 to 2015. |
Michael H. Whitaker
(Born 1967) | Chief Compliance Officer,
since 2016 | Chief Compliance Officer of Wells Fargo Asset Management since 2016. Senior Vice President and Chief Compliance Officer for Fidelity Investments from 2007 to 2016. |
1 The Statement of Additional Information includes additional information about the Trustees and is available, without charge, upon request, by calling 1-800-222-8222 or by visiting the website at wfam.com.
28 | Wells Fargo Bloomberg Barclays US Aggregate ex-Corporate Portfolio
Board considerations (unaudited)
BOARD CONSIDERATION OF INVESTMENT ADVISORY AND SUB-ADVISORY AGREEMENTS:
Wells Fargo Bloomberg Barclays US Aggregate ex-Corporate Portfolio, Wells Fargo Emerging Markets Bond Portfolio, Wells Fargo Factor Enhanced Emerging Markets Equity Portfolio, Wells Fargo Factor Enhanced International Equity Portfolio, Wells Fargo Factor Enhanced U.S. Large Cap Equity Portfolio, Wells Fargo Factor Enhanced U.S. Small Cap Equity Portfolio, Wells Fargo High Yield Corporate Bond Portfolio, Wells Fargo Investment Grade Corporate Bond Portfolio, Wells Fargo Factor Enhanced U.S. Low Volatility Equity Portfolio, Wells Fargo Strategic Retirement Bond Portfolio, and Wells Fargo U.S. REIT Portfolio
Board Considerations – Current Agreements
Under the Investment Company Act of 1940 (the “1940 Act”), the Board of Trustees (the “Board”) of Wells Fargo Master Trust (the “Trust”) must determine annually whether to approve the continuation of the Trust’s investment advisory and sub-advisory agreements. In this regard, at a meeting held on May 17-19, 2021 (the “Meeting”), the Board of the Trust, all the members of which have no direct or indirect interest in the investment advisory and sub-advisory agreements and are not “interested persons” of the Trust, as defined in the 1940 Act (the “Independent Trustees”), reviewed and approved for each of the portfolios of the Trust identified in the table below (individually, a “Portfolio” and collectively, the “Portfolios”): (i) an investment advisory agreement (the “Advisory Agreement”) with Wells Fargo Funds Management, LLC (“Funds Management”); and (ii) an investment sub-advisory agreement (each, a “Sub-Advisory Agreement” and collectively, the “Sub-Advisory Agreements”) with the sub-adviser(s) identified in the table below (each, a “Sub-Adviser” and collectively, the “Sub-Advisers”) for the corresponding Portfolio identified. The Advisory Agreement and the Sub-Advisory Agreements are collectively referred to as the “Advisory Agreements.”
| Funds Trust | Master Trust |
| Wells Fargo Bloomberg Barclays US Aggregate ex-Corporate Portfolio | Wells Capital Management Incorporated |
| Wells Fargo Emerging Markets Bond Portfolio | Wells Fargo Asset Management (International) Limited and Wells Capital Management Incorporated |
| Wells Fargo Factor Enhanced Emerging Markets Equity Portfolio | Wells Capital Management Incorporated |
| Wells Fargo Factor Enhanced International Equity Portfolio | Wells Capital Management Incorporated |
| Wells Fargo Factor Enhanced U.S. Large Cap Equity Portfolio | Wells Capital Management Incorporated |
| Wells Fargo Factor Enhanced U.S. Small Cap Equity Portfolio | Wells Capital Management Incorporated |
| Wells Fargo High Yield Corporate Bond Portfolio | Wells Capital Management Incorporated |
| Wells Fargo Investment Grade Corporate Bond Portfolio | Wells Capital Management Incorporated |
| Wells Fargo Factor Enhanced U.S. Low Volatility Equity Portfolio | Wells Capital Management Incorporated |
| Wells Fargo Strategic Retirement Bond Portfolio | Wells Capital Management Incorporated |
| Wells Fargo U.S. REIT Portfolio | Wells Capital Management Incorporated |
The Board noted that Wells Fargo & Company recently announced that it had entered into a definitive agreement to sell Wells Fargo Asset Management (“WFAM”), which includes Funds Management and the Sub-Adviser, to GTCR LLC and Reverence Capital Partners, L.P. and/or their affiliates (the “Transaction”). The Board further noted that the Transaction would result in a change-of-control of Funds Management and the Sub-Advisers, which would be considered to be an assignment that would result in the termination of the Advisory Agreements. In light of the Transaction, the Board separately considered for approval a new investment advisory agreement with Funds Management and a new investment sub-advisory agreement with each of the Sub-Advisers (the “New Agreements”) that would replace the Advisory Agreements upon consummation of the Transaction, subject to approval of the New Agreements by the Portfolios’ shareholders. The Board also considered for approval interim agreements to go into effect in the event shareholders do not approve the New Agreements before the Transaction is completed. The interim agreements would allow the Manager and the Sub-Advisers to continue providing services to the Portfolios while the Portfolios continues to seek shareholder approval of the New Agreements. The Board noted that the terms of the interim agreements would be identical to those of the current Advisory Agreements, except for the term and certain escrow provisions.
At the Meeting, the Board considered the factors and reached the conclusions described below relating to the selection of Funds Management and the Sub-Advisers and the approval of the Advisory Agreements. Prior to the Meeting, including at Board meetings held in April and May 2021, the Trustees conferred extensively among themselves and with representatives of Funds Management about these matters. Also, the Board has adopted a team-based approach, with each team consisting of a sub-set of
Wells Fargo Bloomberg Barclays US Aggregate ex-Corporate Portfolio | 29
Board considerations (unaudited)
Trustees, to assist the full Board in the discharge of its duties in reviewing investment performance and other matters throughout the year. The Independent Trustees were assisted in their evaluation of the Advisory Agreements by independent legal counsel, from whom they received separate legal advice and with whom they met separately.
In providing information to the Board, Funds Management and the Sub-Advisers were guided by a detailed set of requests for information submitted to them by independent legal counsel on behalf of the Independent Trustees at the start of the Board’s annual contract renewal process earlier in 2021. In considering and approving the Advisory Agreements, the Trustees considered the information they believed relevant, including but not limited to the information discussed below. The Board considered not only the specific information presented in connection with the Meeting, but also the knowledge gained over time through interaction with Funds Management and the Sub-Advisers about various topics. In this regard, the Board reviewed reports of Funds Management at each of its quarterly meetings, which included, among other things, portfolio reviews and investment performance reports. In addition, the Board and the teams mentioned above confer with portfolio managers at various times throughout the year. The Board did not identify any particular information or consideration that was all-important or controlling, and each individual Trustee may have attributed different weights to various factors.
After its deliberations, the Board unanimously determined that the compensation or the absence of compensation payable to Funds Management and each of the Sub-Advisers under each of the Advisory Agreements was reasonable, and approved the continuation of the Advisory Agreements for a one-year term. The Board considered the approval of the Advisory Agreements for the Portfolios as part of its consideration of agreements for funds across the complex, but its approvals were made on a fund-by-fund basis. The following summarizes a number of important, but not necessarily all, factors considered by the Board in support of its approvals.
Nature, extent and quality of services
The Board received and considered various information regarding the nature, extent and quality of services provided to the Funds by Funds Management and the Sub-Advisers under the Advisory Agreements. This information included a description of the investment advisory services and Portfolio-level administrative services covered by the Advisory Agreement, as well as, among other things, a summary of the background and experience of senior management of WFAM, of which Funds Management and the Sub-Advisers are a part, and a summary of investments made in the business of WFAM. The Board also received a description of Funds Management’s and the Sub-Advisers’ business continuity plans, including a summary of the performance of such plans and any changes thereto during the COVID-19 pandemic, and of their approaches to data privacy and cybersecurity. The Board also received and reviewed information about Funds Management’s role as administrator of the Portfolios’ liquidity risk management program, Funds Management’s approach to risk management, and Funds Management’s intermediary and vendor oversight program.
The Board also considered the qualifications, background, tenure and responsibilities of each of the portfolio managers primarily responsible for the day-to-day portfolio management of the Portfolios. The Board noted that each of the Portfolios replicates the performance of a proprietary index provided by an affiliate of Funds Management, except that each of Wells Fargo Bloomberg Barclays US Aggregate ex-Corporate Portfolio, Wells Fargo Emerging Markets Bond Portfolio, and Wells Fargo Strategic Retirement Bond Portfolio track the performance of a third party index. The Board evaluated the ability of Funds Management and the Sub-Advisers to attract and retain qualified investment professionals, including research, advisory and supervisory personnel.
The Board further considered the compliance programs and compliance records of Funds Management and the Sub-Advisers. In addition, the Board took into account the full range of services provided to the Portfolios by Funds Management and its affiliates. The Board also considered information about retention and back-up arrangements that have been put into place with respect to key personnel of WFAM in connection with the anticipated Transaction, noting that WFAM provided assurances that the announcement and eventual culmination of the Transaction is not expected to result in any diminution in the nature or quality of services provided to the Portfolios.
Portfolio investment performance and expenses
The Board considered the investment performance results for each of the Portfolios over the one- and three-year periods ended December 31, 2020, except for the Wells Fargo Factor Enhanced U.S. Low Volatility Equity Portfolio, for which the Board considered the investment performance results for the quarter ended December 31, 2020. The Board considered these results in comparison to the investment performance of funds in a universe that was determined by Broadridge Inc. (“Broadridge”) to be similar to each respective Portfolios (each, a “Universe”), and in comparison to each Portfolios’ benchmark index and to other comparative data. Broadridge is an independent provider of investment company data. The Board received a description of the methodology used by Broadridge to select the mutual funds in the performance Universe. The Board noted the short performance history of the Portfolios.
30 | Wells Fargo Bloomberg Barclays US Aggregate ex-Corporate Portfolio
Board considerations (unaudited)
With respect to the investment performance of each Portfolio relative to its respective Universe, the Board noted the following: (i) the investment performance of each of Wells Fargo Factor Enhanced International Equity Portfolio and Wells Fargo Factor Enhanced U.S. Small Cap Equity Portfolio was higher than such Portfolio’s respective Universe for the one- and three-year periods under review; (ii) the investment performance of each of Wells Fargo Bloomberg Barclays US Aggregate ex-Corporate Portfolio, Wells Fargo Emerging Markets Bond Portfolio, and Wells Fargo Investment Grade Corporate Bond Portfolio was higher than such Portfolio’s respective Universe for the three-year period under review, and lower than such Portfolio’s respective Universe for the one-year period under review; (iii) the investment performance of each of Wells Fargo Factor Enhanced Emerging Markets Equity Portfolio, Wells Fargo Factor Enhanced U.S. Large Cap Equity Portfolio, Wells Fargo High Yield Corporate Bond Portfolio, Wells Fargo Strategic Retirement Bond Portfolio, and Wells Fargo U.S. REIT Portfolio was lower than such Portfolio’s respective Universe for the one- and three-year periods under review; and (iv) the Wells Fargo Factor Enhanced U.S. Low Volatility Equity Portfolio launched on July 1, 2020 and, given its short operational history, had no historical performance.
With respect to the investment performance of each Portfolio relative to its respective benchmark index, the Board noted the following: (i) the investment performance of each of Wells Fargo Bloomberg Barclays US Aggregate ex-Corporate Portfolio, Wells Fargo Factor Enhanced International Equity Portfolio, Wells Fargo Investment Grade Corporate Bond Portfolio, Wells Fargo Factor Enhanced U.S. Low Volatility Equity Portfolio, and Wells Fargo Strategic Retirement Bond Portfolio was higher than or in range of such Portfolio’s respective benchmark index for all periods under review; (ii) the investment performance of Wells Fargo U.S. REIT Portfolio was in range of the Portfolio’s benchmark index for the three-year period under review, and was lower than the Portfolio’s benchmark index for the one-year period under review; and (iii) the investment performance of each of Wells Fargo Emerging Markets Bond Portfolio, Wells Fargo Factor Enhanced Emerging Markets Equity Portfolio, Wells Fargo Factor Enhanced U.S. Large Cap Equity Portfolio, Wells Fargo Factor Enhanced U.S. Small Cap Equity Portfolio, and Wells Fargo High Yield Corporate Bond Portfolio was lower than such Portfolio’s respective benchmark index for all periods under review.
The Board received information concerning, and discussed factors contributing to, the underperformance of each of Wells Fargo Factor Enhanced Emerging Markets Equity Portfolio, Wells Fargo Factor Enhanced International Equity Portfolio, Wells Fargo Factor Enhanced U.S. Large Cap Equity Portfolio, Wells Fargo High Yield Corporate Bond Portfolio, Wells Fargo Strategic Retirement Bond Portfolio, and Wells Fargo U.S. REIT Portfolio relative to such Portfolio’s Universe and benchmark index for the periods identified above.
The Board also received and considered information regarding the fee rates that are payable to Funds Management for investment advisory services (as discussed below), which are the only fees charged to the Portfolios, relative to corresponding class-specific expense groups that were determined by Broadridge to be similar to the Portfolios (the “Groups”). The Board received a description of the methodology used by Broadridge to select the mutual funds in the expense Groups and an explanation of how funds comprising expense groups and their expense ratios may vary from year-to-year.
The Board took into account the Portfolios’ investment performance and expense information provided to it among the factors considered in deciding to re-approve the Advisory Agreements.
Investment advisory and sub-advisory fee rates
The Board reviewed and considered the contractual fee rates payable by the Portfolios to Funds Management under the Advisory Agreement. The Board also reviewed and considered the contractual investment sub-advisory fee rates that are payable by Funds Management to the Sub-Advisers for investment sub-advisory services.
Among other information reviewed by the Board was a comparison of the Portfolios’ Management Rates with the average contractual investment management fee rates of funds in the expense Groups at a common asset level as well as transfer agency costs of the Portfolios in the expense Groups. The Board noted that the Management Rates of the Portfolios were lower than, equal to, or in range of the sum of these average rates for the Portfolios’ expense Groups.
The Board also received and considered information about the portions of the total management fees that were retained by Funds Management after payment of the fees to the Sub-Advisers for sub-advisory services. In assessing the reasonableness of these amounts, the Board received and evaluated information about the nature and extent of responsibilities retained and risks assumed by Funds Management and not delegated to or assumed by the Sub-Advisers, and about Funds Management’s on-going oversight services. Given the affiliation between Funds Management and the Sub-Advisers, the Board ascribed limited relevance to the allocation of fees between them.
The Board also received and considered information about the nature and extent of services offered and fee rates charged by Funds Management and the Sub-Advisers to other types of clients with investment strategies similar to those of certain Portfolios. In this regard, the Board received information about the significantly greater scope of services, and compliance,
Wells Fargo Bloomberg Barclays US Aggregate ex-Corporate Portfolio | 31
Board considerations (unaudited)
reporting and other legal burdens and risks of managing proprietary mutual funds compared with those associated with managing assets of other types of clients, including third-party sub-advised fund clients and non-mutual fund clients such as institutional separate accounts.
Based on its consideration of the factors and information it deemed relevant, including those described here, the Board determined that the compensation payable to Funds Management under the Advisory Agreement and to the Sub-Advisers under the Sub-Advisory Agreements was reasonable.
Profitability
The Board received and considered information concerning the profitability of Funds Management, as well as the profitability of both WFAM and Wells Fargo & Co. (“Wells Fargo”) from providing services to the funds family as a whole. The Board noted that the Sub-Advisers’ profitability information with respect to providing services to the Portfolios and other funds in the family was subsumed in the WFAM and Wells Fargo profitability analysis.
Funds Management reported on the methodologies and estimates used in calculating profitability, including a description of the methodology used to allocate certain expenses. Among other things, the Board noted that the levels of profitability reported on a fund-by-fund basis varied widely, depending on factors such as the size, type and age of fund.
Based on its review, the Board did not deem the profits reported by Funds Management, WFAM or Wells Fargo from services provided to the Portfolios to be at a level that would prevent it from approving the continuation of the Advisory Agreements.
Economies of scale
The Board received and considered information about the potential for Funds Management to experience economies of scale in the provision of management services to the Portfolios, the difficulties of calculating economies of scale at an individual fund level, and the extent to which potential scale benefits are shared with shareholders. The Board noted the existence of breakpoints in the Portfolios’ management fee structure, which operate generally to reduce the Portfolios’ expense ratios as the Portfolios grow in size, and the size of the Portfolios in relation to such breakpoints. The Board considered that in addition to management fee breakpoints, Funds Management shares potential economies of scale from its management business in a variety of ways, including through fee waiver and expense reimbursement arrangements, competitive management fee rates set at the outset without regard to breakpoints, and investments in the business intended to enhance services available to shareholders.
The Board concluded that Funds Management’s arrangements with respect to the Portfolios, including contractual breakpoints, constituted a reasonable approach to sharing potential economies of scale with the Portfolios and their shareholders.
Other benefits to Funds Management and the Sub-Advisers
The Board received and considered information regarding potential “fall-out” or ancillary benefits received by Funds Management and its affiliates, including the Sub-Advisers, as a result of their relationships with the Portfolios. Ancillary benefits could include, among others, benefits directly attributable to other relationships with the Portfolios and benefits potentially derived from an increase in Funds Management’s and the Sub-Advisers’ businesses as a result of their relationships with the Portfolios. The Board noted that various affiliates of Funds Management may receive distribution-related fees, shareholder servicing payments and sub-transfer agency fees in respect of shares sold or held through them and services provided.
The Board also reviewed information about soft dollar credits earned and utilized by the Sub-Advisers, fees earned by Funds Management and Wells Capital Management Incorporated from managing a private investment vehicle for the fund family’s securities lending collateral, and commissions earned by an affiliated broker from portfolio transactions.
Based on its consideration of the factors and information it deemed relevant, including those described here, the Board did not find that any ancillary benefits received by Funds Management and its affiliates, including the Sub-Advisers, were unreasonable.
Conclusion
At the Meeting, after considering the above-described factors and based on its deliberations and its evaluation of the information described above, the Board unanimously determined that the compensation payable to Funds Management and the Sub-Advisers under each of the Advisory Agreements was reasonable, and approved the continuation of the Advisory Agreements for a one-year term.
32 | Wells Fargo Bloomberg Barclays US Aggregate ex-Corporate Portfolio
Board considerations (unaudited)
Board Considerations – New Agreements
Overview of the Board evaluation process
At a meeting held on May 17-19, 2021 (the “Board Meeting”), the Board of Trustees (the “Board”) of Wells Fargo Master Trust (the “Trust”, and the series identified below, the “Portfolios”) approved the continuation of each Portfolio’s current Investment Advisory Agreement (the “Current Investment Advisory Agreement”) and the current Sub-Advisory Agreements (the “Current Sub-Advisory Agreements”, and collectively, the “Current Agreements”).
| Wells Fargo Disciplined Large Cap Portfolio |
| Wells Fargo Diversified Large Cap Growth Portfolio |
| Wells Fargo Disciplined International Developed Markets Portfolio |
| Wells Fargo Large Company Value Portfolio |
| Wells Fargo Managed Fixed Income Portfolio |
| Wells Fargo Bloomberg Barclays US Aggregate ex-Corporate Portfolio |
| Wells Fargo Emerging Markets Bond Portfolio |
| Wells Fargo Factor Enhanced Emerging Markets Equity Portfolio |
| Wells Fargo Factor Enhanced International Equity Portfolio |
| Wells Fargo Factor Enhanced U.S. Large Cap Equity Portfolio |
| Wells Fargo Factor Enhanced U.S. Low Volatility Equity Portfolio |
| Wells Fargo Factor Enhanced U.S. Small Cap Equity Portfolio |
| Wells Fargo High Yield Corporate Bond Portfolio |
| Wells Fargo Investment Grade Corporate Bond Portfolio |
| Wells Fargo Strategic Retirement Bond Portfolio |
| Wells Fargo U.S. REIT Portfolio |
Each Trustee on the Board is not an “interested person” (as defined in the Investment Company Act of 1940 (the “1940 Act”)) of the Portfolios (collectively, the “Independent Trustees”). The process followed by the Board in considering and approving the continuation of the Current Agreements is referred to herein as the “2021 Annual Approval Process.”
As noted above, the closing of the sale of Wells Fargo Asset Management (“WFAM”) to a holding company (“NewCo”) affiliated with private funds of GTCR LLC (“GTCR”) and of Reverence Capital Partners, L.P. (“Reverence Capital”, and such transaction, the “Transaction”) will result in a change of control of Wells Fargo Funds Management LLC (“Funds Management”), Wells Capital Management Incorporated (“Wells Capital”) and Wells Fargo Asset Management (International) Limited (“WFAM(I) Ltd.”, and together with Funds Management and Wells Capital, the “Advisers”), which will be considered to be an “assignment” of each Portfolio’s Current Agreements under the 1940 Act that will result in the automatic termination of each Portfolio’s Current Agreements. In light of the expected termination of each Portfolio’s Current Agreements upon the closing, at the Board Meeting the Board also considered and approved: (i) a new Investment Advisory Agreement (the “New Investment Advisory Agreement”) between the Trust, on behalf of each Portfolio, and Funds Management; (ii) a new Sub-Advisory Agreement (the “New Wells Capital Sub-Advisory Agreement”) among the Trust, on behalf of each Portfolio, Funds Management and Wells Capital; and (iii) a new Sub-Advisory Agreement (the “New WFAM(I) Ltd Sub-Advisory Agreement”) among the Trust, on behalf of Emerging Markets Bond Portfolio, Funds Management and WFAM(I) Ltd (“WFAMI”); and (iv) a new Sub-Advisory Agreement (the “New Galliard Sub-Advisory Agreement”, and collectively, the “New Agreements”) among the Trust, on behalf of Managed Fixed Income Portfolio, Funds Management and Galliard Capital Management, LLC (“Galliard”, and together with Wells Capital and WFAMI, the “Sub-Advisers”), each of which is intended to go into effect upon the closing. The process followed by the Board in reviewing and approving the New Agreements is referred to herein as the “New Agreement Approval Process.”
At a series of meetings held in April and May 2021 (collectively, “April and May 2021 Meetings”) and at the Board Meeting, the Trustees conferred extensively among themselves and with senior representatives of Funds Management, GTCR and Reverence Capital about the New Agreements and related matters. The Board reviewed and discussed information furnished by Funds Management, GTCR and Reverence Capital that the Board considered reasonably necessary to evaluate the terms of the New Agreements and the services to be provided. At these meetings, senior representatives from Funds Management, GTCR and Reverence Capital made presentations to, and responded to questions from, the Board.
In providing information to the Board in connection with the 2021 annual approval process for the Current Agreements (the “2021 Annual Approval Process”) and the New Agreement Approval Process, Funds Management, GTCR and Reverence Capital (as applicable) were guided by requests for information submitted by independent legal counsel on behalf of the Independent Trustees. In considering and approving the New Agreements, the Trustees considered the information they believed relevant, including but not limited to the information discussed herein. The Board considered not only the specific information presented in
Wells Fargo Bloomberg Barclays US Aggregate ex-Corporate Portfolio | 33
Board considerations (unaudited)
connection with the April and May 2021 Meetings as well as the Board Meeting, but also the knowledge gained over time through interaction with Funds Management and the Sub-Advisers about various topics. In this regard, the Board reviews reports of Funds Management at each of its regular Board meetings, which includes, among other things, portfolio reviews and investment performance reports. In addition, the Board confers with portfolio managers at various times throughout the year. The Board was assisted in its evaluation of the New Agreements by independent legal counsel, from whom the Independent Trustees received separate legal advice and with whom the Independent Trustees met separately. The Board did not identify any particular information or consideration that was all-important or controlling, and each individual Trustee may have attributed different weights to various factors.
Among other information considered by the Board in connection with the Transaction was:
| ■ | Information regarding the Transaction: information about the structure, financing sources and material terms and conditions of the Transaction, including the expected impact on the businesses conducted by the Advisers and by Wells Fargo Funds Distributor LLC. |
| ■ | Information regarding NewCo, GTCR and Reverence Capital: (i) information about NewCo, including information about its expected financial condition and access to capital, and senior leadership team; (ii) the experience of senior management at GTCR and Reverence Capital in acquiring portfolio companies; (iii) the plan to operationalize NewCo, including the transition of necessary infrastructure services through a transition services agreement with Wells Fargo under which Wells Fargo will continue to provide NewCo with certain services for a specified period of time after the closing; and (iv) information regarding regulatory matters, compliance, and risk management functions at NewCo, including resources to be dedicated thereto. |
| ■ | Impact of the Transaction on WFAM and Service Providers: (i) information regarding any changes to personnel and/or other resources of the Advisers as a result of the Transaction, including assurances regarding comparable and competitive compensation arrangements to attract and retain highly qualified personnel; and (ii) information about the organizational and operating structure with respect to NewCo, the Advisers and the Portfolios. |
| ■ | Impact of the Transaction on the Portfolios and their Shareholders: (i) information regarding anticipated benefits to the Portfolios as a result of the Transaction; (ii) a commitment that the Portfolios would not bear any expenses, directly or indirectly, in connection with the Transaction; (iii) confirmation that the Advisers intend to continue to manage the Portfolios in a manner consistent with each Portfolio’s current investment objectives and principal investments strategies; and (iv) a commitment that neither NewCo nor WFAM will take any steps that would impose any “unfair burden” (as that term is used in section 15(f)(1)(B) of the 1940 Act) on the Portfolios as a result of the Transaction. |
With respect to the New Agreements, the Board considered: (i) a representation that, after the closing, all of the Portfolios will continue to be managed and advised by their current Advisers, and that the same portfolio managers of the Sub-Advisers are expected to continue to manage the Portfolios after the Transaction; (ii) information regarding the terms of the New Agreements, including changes as compared to the Current Agreements; (iii) information confirming that the fee rates payable under the New Agreements will not increase as a result of the Transaction as compared to the rates under the Current Agreements; and (iv) assurances that the Transaction is not expected to cause any diminution with respect to the nature, extent and quality of any of the services currently provided to the Portfolios by the Advisers as a result of the Transaction.
In addition to considering information furnished specifically to evaluate the impact of the Transaction on the Portfolios and their respective shareholders in connection with the New Agreement Approval Process, the Board considered information furnished at prior meetings of the Board and its committees, including detailed information provided in connection with the 2021 Annual Approval Process. In this regard, in connection with the 2021 Annual Approval Process, the Board received information about complex-wide and individual Portfolio performance, fees and expenses, including: (i) a report from an independent data provider comparing the investment performance of each Portfolio to the investment performance of comparable funds and benchmark indices, over various time periods; (ii) a report from an independent data provider comparing each Portfolio’s total expense ratio (and its components) to those of comparable funds; (iii) comparative information concerning the fees charged and services provided by the Advisers to each Portfolio in managing other accounts (which may include other mutual funds, collective investment funds and institutional accounts), if any, that employ investment strategies and techniques similar to those used in managing such Portfolio(s); and (iv) profitability analyses of Funds Management, as well as the profitability of both WFAM and Wells Fargo from providing services to the fund family as a whole.
After its deliberations, the Board unanimously determined that the compensation payable to Funds Management and the Sub-Advisers under the New Agreements is reasonable, approved the New Agreements for a two-year term. The Board considered the approval of the New Agreements as part of its consideration of agreements for funds across the complex, but its approvals were made on a fund-by-fund basis. The following summarizes a number of important, but not necessarily all, factors considered by the Board in support of its approvals.
34 | Wells Fargo Bloomberg Barclays US Aggregate ex-Corporate Portfolio
Board considerations (unaudited)
Nature, extent and quality of services
In connection with the 2021 Annual Approval Process, the Board received and considered various information regarding the nature, extent and quality of services provided to each Portfolio by Funds Management and the Sub-Advisers under the Advisory Agreements. This information included a description of the investment advisory services and administrative services covered by the Current Advisory Agreement, as well as, among other things, a summary of the background and experience of senior management of WFAM, of which Funds Management and the Sub-Advisers are a part, and a summary of investments made in the business of WFAM. The Board also received a description of Funds Management’s and the Sub-Advisers’ business continuity plans, including a summary of the performance of such plans and any changes thereto during the COVID-19 pandemic, and of their approaches to data privacy and cybersecurity. The Board also received and reviewed information about Funds Management’s role as administrator of the Portfolios’ liquidity risk management program, Funds Management’s approach to risk management, and Funds Management’s intermediary and vendor oversight program.
In connection with the 2021 Annual Approval Process, the Board also considered the qualifications, background, tenure and responsibilities of each of the portfolio managers primarily responsible for the day-to-day portfolio management of the Portfolios. The Board evaluated the ability of Funds Management and the Sub-Advisers to attract and retain qualified investment professionals, including research, advisory and supervisory personnel.
In connection with the 2021 Annual Approval Process, the Board further considered the compliance programs and compliance records of Funds Management and the Sub-Advisers. In addition, the Board took into account the full range of services provided to the Portfolios by Funds Management and its affiliates.
In connection with the New Agreement Approval Process, the Board considered, among other information, the structure of the Transaction and expected impact, if any, of the Transaction on the operations, facilities, organization and personnel of the Advisers. The Board received assurances from the Advisers that each Portfolio will continue to be advised by its current Advisers after the closing, and that the same individual portfolio managers are expected to continue to manage the Portfolios after the closing. With respect to the recruitment and retention of key personnel, the Board noted information from GTCR, Reverence Capital and the Advisers regarding the potential benefits for employees of joining NewCo. The Board recognized that the personnel who had been extended offers may not accept such offers and personnel changes may occur in the future in the ordinary course.
In addition, the Board considered information regarding the infrastructure, operational capabilities and support staff in place to assist in the portfolio management and operations of the Portfolios, including the provision of administrative services, and the anticipated impact of the Transaction on such matters. The Board also considered the business-related and other risks to which the Advisers may be subject in managing the Portfolios and in connection with the Transaction. The Board also considered the transition and integration plans as a result of the change in ownership of the Advisers from Wells Fargo to NewCo. The Board considered the resources and infrastructure that NewCo intends to devote to its compliance program to ensure compliance with applicable laws and regulations, as well as its risk management program and cybersecurity program. The Board also took into account assurances received from the Advisers, GTCR and Reverence Capital that the Transaction is not expected to cause any diminution in the nature, extent and quality of services provided by the Advisers to the Portfolios and their shareholders.
Investment performance and expenses
In connection with the 2021 Annual Approval Process, the Board considered the investment performance results for each Portfolio over various time periods ended December 31, 2020. The Board considered these results in comparison to the investment performance of funds in a universe that was determined by Broadridge Inc. (“Broadridge”) to be similar to each Portfolio (the “Universe”), and in comparison to each Portfolio’s benchmark index and to other comparative data. Broadridge is an independent provider of investment company data. The Board received a description of the methodology used by Broadridge to select the mutual funds in the performance Universe. Where applicable, the Board received information concerning, and discussed factors contributing to, underperformance of Portfolios relative to the Universe and benchmark for any underperformance periods.
In connection with the 2021 Annual Approval Process, the Board also reviewed the fee rates that are payable to Funds Management for investment advisory services (as discussed below), which are the only fees charged at the Portfolio level, relative to corresponding expense groups that were determined by Broadridge to be similar to the Portfolios (the “Groups”). The Board received a description of the methodology used by Broadridge to select the mutual funds in the expense Groups and an explanation of how funds comprising expense groups and their expense ratios may vary from year-to-year.
In connection with the New Agreement Approval Process, the Board received a commitment that WFAM will maintain fee and expense commitments for at least two years after the closing. The Board took into account each Fund’s investment performance and expense information among the factors considered in deciding to approve the New Agreements.
Wells Fargo Bloomberg Barclays US Aggregate ex-Corporate Portfolio | 35
Board considerations (unaudited)
Investment advisory and sub-advisory fee rates
In connection with the 2021 Annual Approval Process, the Board reviewed and considered the contractual investment advisory fee rate that is payable by each Portfolio to Funds Management for investment advisory services under the Current Advisory Agreement (the “Advisory Agreement Rate”). The Board also reviewed and considered the contractual investment sub-advisory fee rate that is payable by Funds Management to the applicable Sub-Adviser for investment sub-advisory services (the “Sub-Advisory Agreement Rate”).
Among other information reviewed by the Board in connection with the 2021 Annual Approval Process, was a comparison of each Portfolio’s Advisory Agreement Rate with those of other funds in the Portfolio’s expense Group at a common asset level.
In connection with the 2021 Annual Approval Process, the Board also received and considered information about the portion of the total management fee that was retained by Funds Management after payment of the Sub-Advisory Agreement Rates. In assessing the reasonableness of this amount, the Board received and evaluated information about the nature and extent of responsibilities retained and risks assumed by Funds Management and not delegated to or assumed by the Sub-Advisers, and about Funds Management’s on-going oversight services. Given the affiliation between Funds Management and the Sub-Advisers, the Board ascribed limited relevance to the allocation of fees between them.
In connection with the 2021 Annual Approval Process, the Board also received and considered information about the nature and extent of services offered and fee rates charged by Funds Management and the Sub-Advisers to other types of clients, if any, with investment strategies similar to those of each Portfolio. In this regard, the Board received information about the significantly greater scope of services, and compliance, reporting and other legal burdens and risks of managing proprietary mutual funds compared with those associated with managing assets of other types of clients, including third-party sub-advised fund clients and non-mutual fund clients such as institutional separate accounts.
In connection with the New Agreement Approval Process, the Board noted the assurances received by it that there would be no increases to any of the Advisory Agreement Rates or the Sub-Advisory Agreement Rates as a result of the Transaction. The Board also considered that the New Agreements do not change the computation method for calculating such fees, and there is no present intention to reduce expense waiver and reimbursement arrangements that are currently in effect. Based on its consideration of the factors and information it deemed relevant, including those described here, the Board determined that the compensation payable to Funds Management under the New Advisory Agreement and to each of the Sub-Advisers under the applicable new Sub-Advisory Agreement was reasonable.
Profitability
In connection with the 2021 Annual Approval Process, the Board received and considered information concerning the profitability of Funds Management, as well as the profitability of both WFAM and Wells Fargo from providing services to the fund family as a whole. The Board noted that the Sub-Advisers’ profitability information with respect to providing services to each Fund and other funds in the family was subsumed in the WFAM and Wells Fargo profitability analysis.
Funds Management reported on the methodologies and estimates used in calculating profitability in connection with the 2021 Annual Approval Process, including a description of the methodology used to allocate certain expenses. Among other things, the Board noted that the levels of profitability reported on a fund-by-fund basis varied widely, depending on factors such as the size, type and age of fund.
In connection with the New Agreement Approval Process, the Board received certain information about NewCo’s projected financial condition, and reviewed with senior representatives of Funds Management, GTCR and Reverence Capital the underlying assumptions on which such information was based. The Board considered that NewCo is a newly formed entity, with no historical operations, revenues or expenses, and that it is difficult to predict with any degree of certainty the future profitability of NewCo and the Advisers from advisory activities under the New Agreements. The Board considered that the fee rates payable under the New Agreements will not increase as a result of the Transaction as compared to the rates under the Current Agreements, and that the current contractual expense limitations applicable to each Portfolio will not increase. The Board noted that if the New Agreements are approved by shareholders and the Transaction closes, the Board will have the opportunity in the future to review the profitability of NewCo and the Advisers from advisory activities under the New Agreements.
Economies of scale
In connection with the 2021 Annual Approval Process, the Board received and considered information about the potential for Funds Management to experience economies of scale in the provision of advisory services to the Portfolios, the difficulties of calculating economies of scale at an individual fund level, and the extent to which potential scale benefits are shared with Portfolio shareholders. The Board noted the existence of breakpoints in each Portfolio’s advisory fee structure, which operate generally to reduce the Portfolio’s expense ratios as the Portfolio grows in size, and the size of the Portfolio in relation to such breakpoints. The
36 | Wells Fargo Bloomberg Barclays US Aggregate ex-Corporate Portfolio
Board considerations (unaudited)
Board considered that, in addition to advisory fee breakpoints, Funds Management shares potential economies of scale from its management business in a variety of ways, including through fee waiver and expense reimbursement arrangements, competitive management fee rates set at the outset without regard to breakpoints, and investments in the business intended to enhance services available to shareholders.
In connection with the New Agreement Approval Process, the Board noted that NewCo and the Advisers may benefit from possible growth of the Portfolios resulting from enhanced distribution capabilities for their investing funds. However, the Board noted that other factors could also affect the potential for economies of scale, and that it was not possible to quantify any potential future economies of scale. Based upon the information furnished to the Board in connection with the 2021 Annual Approval Process and the New Agreement Approval Process, the Board concluded that Funds Management’s arrangements with respect to each Portfolio, including contractual breakpoints and expense limitation arrangements, constituted a reasonable approach to sharing potential economies of scale with the Portfolio and its shareholders.
“Fall-out” benefits to Funds Management and the Sub-Advisers
In connection with the 2021 Annual Approval Process, the Board received and considered information regarding potential “fall-out” or ancillary benefits received by Funds Management and its affiliates, including the Sub-Advisers, as a result of their relationships with the Portfolios. Ancillary benefits could include, among others, benefits directly attributable to other relationships with the Portfolios and benefits potentially derived from an increase in Funds Management’s and the Sub-Advisers’ business as a result of their relationships with the Portfolios. The Board noted that various current affiliates of Funds Management may receive distribution-related fees, shareholder servicing payments and sub-transfer agency fees in respect of shares sold or held through them and services provided.
In connection with the 2021 Annual Approval Process, the Board also reviewed information about soft dollar credits earned and utilized by the Sub-Advisers, fees earned by Funds Management and Wells Capital from managing a private investment vehicle for the fund family’s securities lending collateral, and commissions earned by an affiliated broker of Wells Fargo from portfolio transactions.
In connection with the New Agreement Approval Process, the Board received information to the effect that the Transaction is not expected to have a material impact on the fall-out benefits currently realized by Funds Management and its affiliates, including the Sub-Advisers. The information reviewed by the Board also noted that several of the ancillary benefits identified for WFAM would be potential ancillary benefits for NewCo, including that the scale and reputation of the Portfolios might benefit NewCo’s broader reputation, product initiatives, technology investment and talent acquisition. Based on its consideration of the factors and information it deemed relevant, including those described here, the Board did not find that any ancillary benefits expected to be received by Funds Management and its affiliates, including NewCo and the Sub-Advisers, under the New Agreements were unreasonable.
Conclusion
At the Board Meeting, after considering the above-described factors and based on its deliberations and its evaluation of the information described above, the Board unanimously determined that the compensation payable to Funds Management and to each of the Sub-Advisers under the New Agreements is reasonable, approved the New Agreements for a two-year term.
Wells Fargo Bloomberg Barclays US Aggregate ex-Corporate Portfolio | 37
Board considerations (unaudited)
Board Considerations - Interim Agreements
At a meeting held on May 17-19, 2021 (the “Board Meeting”), the Boards of Trustees (each, a “Board”, and collectively, the “Boards”) of Wells Fargo Funds Trust, Wells Fargo Master Trust, Wells Fargo Variable Trust, Wells Fargo Global Dividend Opportunity Fund, Wells Fargo Income Opportunities Fund, Wells Fargo Multi-Sector Income Fund and Wells Fargo Utilities and High Income Fund (each a “Trust”, and the series thereof, a “Fund”) reviewed and approved for the Trusts and Funds, as applicable: (i) interim investment management agreements (the “Interim Management Agreements”) with Wells Fargo Funds Management, LLC (“Funds Management”); (ii) interim investment advisory agreements (the “Interim Advisory Agreements”) with Funds Management; and (iii) interim sub-advisory agreements (the “Interim Sub-Advisory Agreements”) with each of Cooke & Bieler, L.P., Galliard Capital Management LLC (“Galliard”), Peregrine Capital Management Inc., Wells Capital Management, LLC (“WellsCap”), and Wells Fargo Asset Management (International) Limited (“WFAMI”, and collectively, the “Sub-Advisers”). Each Trustee on the Board is not an “interested person” (as defined in the Investment Company Act of 1940 (the “1940 Act”) of the Funds (collectively, the “Independent Trustees”). The Interim Management Agreements, Interim Advisory Agreements, and Interim Sub-Advisory Agreements are collectively referred to as the “Interim Advisory Agreements.”
At the Board Meeting, the Boards reviewed and approved the continuation of existing investment management, advisory and sub-advisory agreements (the “Current Advisory Agreements”) for each Trust and Fund, as applicable. The factors considered and conclusions reached by the Boards in approving the Current Advisory Agreements are summarized in the section entitled “Board Considerations – Current Agreements” of this shareholder report. The Boards noted that Wells Fargo & Company has entered into a definitive agreement to sell Wells Fargo Asset Management (“WFAM”), which includes Funds Management, Galliard, WellsCap and WFAMI (the “Affiliated Sub-Advisers”), to a holding company affiliated with private funds of GTCR LLC and Reverence Capital Partners, L.P. (the “Transaction”). The Boards further noted that the Transaction would result in a change-of-control of Funds Management and the Affiliated Sub-Advisers, which would be considered to be an “assignment” under the 1940 Act that would terminate the Current Advisory Agreements. At the Board Meeting, the Boards also reviewed and approved new investment management, advisory and sub-advisory agreements (the “New Advisory Agreements”) for each Trust and Fund, as applicable, that would replace the Current Advisory Agreements upon consummation of the Transaction, subject to approval of the New Advisory Agreements by the applicable Trust’s or Fund’s shareholders. The factors considered and conclusions reached by the Boards in approving the New Advisory Agreements are summarized in the section entitled “Board Considerations – New Agreements” of this shareholder report.
At the Board Meeting, the Boards also approved the Interim Advisory Agreements, which will go into effect for a Trust or Fund only in the event that shareholders of such Trust or Fund do not approve the New Advisory Agreement(s) for the Trust or Fund by the closing date of the Transaction, when the Current Advisory Agreements will terminate. The Board noted that, in such a circumstance, the Interim Advisory Agreements will permit continuity of management by allowing Funds Management and the Sub-Advisers to continue providing services to the Trust or Fund pursuant to the Interim Advisory Agreements while the Trust or Fund continues to solicit shareholder approval of such New Advisory Agreement(s). The Boards noted that the terms of the Interim Advisory Agreements are identical to those of the Current Advisory Agreements, except for the term and the addition of escrow provisions with respect to the advisory fees. The Boards also noted that the entities that would service the Funds and Trusts under the Interim Advisory Agreements are identical to those that provide services under the Current Advisory Agreements and those that will provide services under the New Advisory Agreements.
In approving the Interim Advisory Agreements, the Boards considered the same factors and reached the same conclusions as they considered and reached with respect to the Boards’ approvals of the Current Advisory Agreements and New Advisory Agreements, as applicable, which are described in separate Board Consideration sections within this shareholder report. Prior to the Board Meeting, including at a series of meetings held in April and May 2021, the Trustees conferred extensively among themselves and with senior representatives of Funds Management, GTCR LLC and Reverence Capital Partners, L.P. about the Interim Advisory Agreements and related matters. The Independent Trustees were assisted in their evaluation of the Interim Advisory Agreements by independent legal counsel, from whom they received separate legal advice and with whom they met separately.
At the Board Meeting, after considering the factors and reaching the conclusions described in the separate Board Consideration sections within this shareholder report, the Boards unanimously determined that the compensation payable to Funds Management and to each Sub-Adviser under each of the Interim Advisory Agreements was reasonable, and approved the Interim Advisory Agreements.
38 | Wells Fargo Bloomberg Barclays US Aggregate ex-Corporate Portfolio
For more information
More information about Wells Fargo Funds is available free upon request. To obtain literature, please write, visit the Portfolio's website, or call:
Wells Fargo Funds
P.O. Box 219967
Kansas City, MO 64121-9967
Website: wfam.com
Individual investors: 1-800-222-8222
Retail investment professionals: 1-888-877-9275
Institutional investment professionals: 1-866-765-0778
This report and the financial statements contained herein are submitted for the general information of the interest holders of the Portfolio. If this report is used for promotional purposes, distribution of the report must be accompanied or preceded by a current prospectus. Before investing, please consider the investment objectives, risks, charges, and expenses of the investment. For a current prospectus and, if available, a summary prospectus, containing this information, call
1-800-222-8222 or visit the Portfolio's website at wfam.com. Read the prospectus carefully before you invest or send money.
Wells Fargo Asset Management (WFAM) is the trade name for certain investment advisory/management firms owned by Wells Fargo & Company. These firms include but are not limited to Wells Capital Management, LLC and Wells Fargo Funds Management, LLC. Certain products managed by WFAM entities are distributed by Wells Fargo Funds Distributor, LLC (a broker-dealer and Member FINRA).
This material is for general informational and educational purposes only and is NOT intended to provide investment advice or a recommendation of any kind - including a recommendation for any specific investment, strategy, or plan.
INVESTMENT PRODUCTS: NOT FDIC INSURED ■ NO BANK GUARANTEE ■ MAY LOSE VALUE
© 2021 Wells Fargo & Company. All rights reserved.
Semi-Annual Report
August 31, 2021
Wells Fargo
Emerging Markets Bond Portfolio
INVESTMENT PRODUCTS: NOT FDIC INSURED ■ NO BANK GUARANTEE ■ MAY LOSE VALUE
Wells Fargo Emerging Markets Bond Portfolio | 1
Portfolio information (unaudited)
| Investment objective | The Portfolio seeks to replicate the total return of the JP Morgan EMBI Global Diversified Index before fees and expenses. |
| Adviser | Wells Fargo Funds Management, LLC |
| Subadvisers | Wells Fargo Asset Management (International) Limited |
| | Wells Capital Management, LLC |
| Portfolio managers | Manjunath Boraiah, Michael Lee, Alex Perrin |
| Ten largest holdings (%) as of August 31, 20211 |
| Qatar Government, 4.63%, 6-2-2046 | 1.50 |
| Ukraine Government, 7.75%, 9-1-2025 | 1.16 |
| Kingdom of Bahrain, 7.00%, 10-12-2028 | 1.16 |
| Federation of Malaysia, 3.18%, 4-27-2026 | 1.15 |
| Federative Republic of Brazil, 4.63%, 1-13-2028 | 1.14 |
| Republic of South Africa, 4.85%, 9-30-2029 | 1.11 |
| Republic of Peru, 6.55%, 3-14-2037 | 1.09 |
| Republic of Panama, 4.50%, 5-15-2047 | 1.06 |
| Oman Government, 6.50%, 3-8-2047 | 1.06 |
| Dominican Republic, 5.95%, 1-25-2027 | 1.04 |
| 1 | Figures represent the percentage of the Portfolio's net assets. Holdings are subject to change and may have changed since the date specified. |
| Portfolio composition as of August 31, 20211 |
| 1 | Figures represent the percentage of the Portfolio's long-term investments. These amounts are subject to change and may have changed since the date specified. |
2 | Wells Fargo Emerging Markets Bond Portfolio
Portfolio of investments—August 31, 2021 (unaudited)
| | | Interest
rate | Maturity
date | | Principal | Value |
| Yankee corporate bonds and notes: 15.14% | | | | | | |
| Azerbaijan: 0.55% | | | | | | |
| State Oil Company of the Azerbaijan Republic (Energy, Oil, gas & consumable fuels) | | 4.75% | 3-13-2023 | $ | 200,000 | $ 210,000 |
| Bahrain: 0.58% | | | | | | |
| Oil & Gas Holding Company (Energy, Oil, gas & consumable fuels) | | 7.63 | 11-7-2024 | | 200,000 | 221,100 |
| Chile: 1.58% | | | | | | |
| Codelco Incorporated (Materials, Metals & mining) | | 4.25 | 7-17-2042 | | 250,000 | 287,705 |
| Codelco Incorporated (Materials, Metals & mining) | | 4.88 | 11-4-2044 | | 250,000 | 310,808 |
| | | | | | | 598,513 |
| China: 2.19% | | | | | | |
| Sinopec Group Overseas Development (2015) Limited (Energy, Oil, gas & consumable fuels) | | 3.00 | 4-12-2022 | | 200,000 | 202,834 |
| Sinopec Group Overseas Development (2015) Limited (Energy, Oil, gas & consumable fuels) | | 3.25 | 4-28-2025 | | 200,000 | 214,363 |
| Sinopec Group Overseas Development (2018) Limited (Energy, Oil, gas & consumable fuels) | | 2.30 | 1-8-2031 | | 200,000 | 201,495 |
| State Grid Overseas Investment (2016) Limited (Utilities, Electric utilities) | | 2.88 | 5-18-2026 | | 200,000 | 213,415 |
| | | | | | | 832,107 |
| Hong Kong: 0.53% | | | | | | |
| CNAC Finbridge Company Limited (Industrials, Chemicals) | | 3.00 | 9-22-2030 | | 200,000 | 202,294 |
| Indonesia: 1.74% | | | | | | |
| PT Indonesia Asahan Aluminium Persero Tbk (Materials, Metals & mining) | | 5.71 | 11-15-2023 | | 200,000 | 219,520 |
| PT Pertamina Persero Tbk (Energy, Oil, gas & consumable fuels) | | 5.63 | 5-20-2043 | | 200,000 | 241,038 |
| PT Perusahaan Listrik Negar Tbk (Utilities, Electric utilities) | | 4.00 | 6-30-2050 | | 200,000 | 199,500 |
| | | | | | | 660,058 |
| Kazakhstan: 1.21% | | | | | | |
| KazMunayGas National Company JSC (Energy, Oil, gas & consumable fuels) | | 3.50 | 4-14-2033 | | 200,000 | 209,228 |
| KazMunayGas National Company JSC (Energy, Oil, gas & consumable fuels) | | 5.75 | 4-19-2047 | | 200,000 | 248,000 |
| | | | | | | 457,228 |
| Malaysia: 1.56% | | | | | | |
| Petronas Capital Limited Bhd (Energy, Oil, gas & consumable fuels) | | 3.50 | 4-21-2030 | | 200,000 | 220,453 |
| Petronas Capital Limited Bhd (Energy, Oil, gas & consumable fuels) | | 4.50 | 3-18-2045 | | 300,000 | 372,869 |
| | | | | | | 593,322 |
| Mexico: 1.60% | | | | | | |
| Petroleos Mexicanos Company (Energy, Oil, gas & consumable fuels) | | 5.50 | 6-27-2044 | | 30,000 | 24,273 |
| Petroleos Mexicanos Company (Energy, Oil, gas & consumable fuels) | | 5.63 | 1-23-2046 | | 100,000 | 81,482 |
The accompanying notes are an integral part of these financial statements.
Wells Fargo Emerging Markets Bond Portfolio | 3
Portfolio of investments—August 31, 2021 (unaudited)
| | | Interest
rate | Maturity
date | | Principal | Value |
| Mexico: 1.60% (continued) | | | | | | |
| Petroleos Mexicanos Company (Energy, Oil, gas & consumable fuels) | | 5.95% | 1-28-2031 | $ | 170,000 | $ 166,649 |
| Petroleos Mexicanos Company (Energy, Oil, gas & consumable fuels) | | 6.35 | 2-12-2048 | | 30,000 | 25,455 |
| Petroleos Mexicanos Company (Energy, Oil, gas & consumable fuels) | | 6.38 | 1-23-2045 | | 30,000 | 25,697 |
| Petroleos Mexicanos Company (Energy, Oil, gas & consumable fuels) | | 6.50 | 6-2-2041 | | 30,000 | 26,940 |
| Petroleos Mexicanos Company (Energy, Oil, gas & consumable fuels) | | 6.63 | 6-15-2035 | | 30,000 | 29,050 |
| Petroleos Mexicanos Company (Energy, Oil, gas & consumable fuels) | | 6.63 | 9-29-2049 | | 60,000 | 51,300 |
| Petroleos Mexicanos Company (Energy, Oil, gas & consumable fuels) | | 6.75 | 9-21-2047 | | 140,000 | 122,990 |
| Petroleos Mexicanos Company (Energy, Oil, gas & consumable fuels) | | 6.95 | 1-28-2060 | | 30,000 | 26,466 |
| Petroleos Mexicanos Company (Energy, Oil, gas & consumable fuels) | | 7.69 | 1-23-2050 | | 30,000 | 28,643 |
| | | | | | | 608,945 |
| Netherlands: 0.74% | | | | | | |
| GMTN BV (Financials, Diversified financial services) | | 3.75 | 4-19-2029 | | 250,000 | 280,313 |
| Peru: 0.55% | | | | | | |
| Petroleos del Peru - Petroperu SA (Energy, Oil, gas & consumable fuels) | | 4.75 | 6-19-2032 | | 200,000 | 209,002 |
| Saudi Arabia: 1.10% | | | | | | |
| KSA Sukuk Limited (Financials, Diversified financial services) | | 2.89 | 4-20-2022 | | 200,000 | 202,868 |
| KSA Sukuk Limited (Financials, Diversified financial services) | | 2.97 | 10-29-2029 | | 200,000 | 213,480 |
| | | | | | | 416,348 |
| South Africa: 0.58% | | | | | | |
| Eskom Holdings SOC Limited (Utilities, Electric utilities) | | 6.35 | 8-10-2028 | | 200,000 | 221,075 |
| United Arab Emirates: 0.63% | | | | | | |
| Abu Dhabi Crude Oil Pipeline LLC (Energy, Oil, gas & consumable fuels) | | 4.60 | 11-2-2047 | | 200,000 | 240,336 |
| Total Yankee corporate bonds and notes (Cost $5,383,319) | | | | | | 5,750,641 |
| Yankee government bonds: 82.14% | | | | | | |
| Abu Dhabi Government | | 2.13 | 9-30-2024 | | 200,000 | 208,566 |
| Abu Dhabi Government | | 2.50 | 10-11-2022 | | 200,000 | 204,664 |
| Abu Dhabi Government | | 3.13 | 9-30-2049 | | 200,000 | 205,748 |
| Abu Dhabi Government | | 3.88 | 4-16-2050 | | 200,000 | 233,634 |
| Arab Republic of Egypt | | 5.88 | 6-11-2025 | | 200,000 | 213,400 |
| Arab Republic of Egypt | | 6.88 | 4-30-2040 | | 100,000 | 97,760 |
| Arab Republic of Egypt | | 7.50 | 1-31-2027 | | 200,000 | 222,794 |
| Arab Republic of Egypt | | 8.50 | 1-31-2047 | | 250,000 | 262,425 |
| Arab Republic of Egypt | | 8.70 | 3-1-2049 | | 200,000 | 211,320 |
| China Development Bank | | 1.63 | 10-27-2030 | | 200,000 | 197,545 |
| China Government | | 0.40 | 10-21-2023 | | 200,000 | 200,066 |
| China Government | | 1.88 | 12-3-2022 | | 200,000 | 203,857 |
| Dominican Republic | | 5.88 | 1-30-2060 | | 200,000 | 203,502 |
| Dominican Republic | | 5.95 | 1-25-2027 | | 350,000 | 396,375 |
The accompanying notes are an integral part of these financial statements.
4 | Wells Fargo Emerging Markets Bond Portfolio
Portfolio of investments—August 31, 2021 (unaudited)
| | | Interest
rate | Maturity
date | | Principal | Value |
| Yankee government bonds: 82.14% (continued) | | | | | | |
| Dominican Republic | | 6.00% | 7-19-2028 | $ | 200,000 | $ 229,002 |
| Dominican Republic | | 6.40 | 6-5-2049 | | 150,000 | 164,402 |
| Export-Import Bank of China | | 4.00 | 11-28-2047 | | 200,000 | 253,970 |
| Export-Import Bank of India | | 4.00 | 1-14-2023 | | 250,000 | 259,943 |
| Federation of Malaysia | | 3.18 | 4-27-2026 | | 400,000 | 435,421 |
| Federative Republic of Brazil | | 2.63 | 1-5-2023 | | 200,000 | 205,820 |
| Federative Republic of Brazil | | 4.50 | 5-30-2029 | | 200,000 | 211,500 |
| Federative Republic of Brazil | | 4.63 | 1-13-2028 | | 400,000 | 431,572 |
| Federative Republic of Brazil | | 5.63 | 1-7-2041 | | 250,000 | 265,910 |
| Federative Republic of Brazil | | 7.13 | 1-20-2037 | | 20,000 | 24,972 |
| Federative Republic of Brazil | | 8.25 | 1-20-2034 | | 20,000 | 27,383 |
| Islamic Republic of Pakistan | | 6.88 | 12-5-2027 | | 200,000 | 204,500 |
| Islamic Republic of Pakistan | | 8.25 | 9-30-2025 | | 200,000 | 217,612 |
| Kingdom of Bahrain | | 6.75 | 9-20-2029 | | 200,000 | 216,643 |
| Kingdom of Bahrain | | 7.00 | 10-12-2028 | | 400,000 | 440,940 |
| Kingdom of Jordan | | 5.85 | 7-7-2030 | | 200,000 | 211,000 |
| Kingdom of Morocco | | 4.25 | 12-11-2022 | | 200,000 | 208,484 |
| Kuwait Government | | 3.50 | 3-20-2027 | | 200,000 | 223,500 |
| Lebanese Republic † | | 6.25 | 11-4-2024 | | 200,000 | 24,863 |
| Lebanese Republic † | | 6.60 | 11-27-2026 | | 300,000 | 36,900 |
| Lebanese Republic † | | 6.65 | 2-26-2030 | | 200,000 | 25,114 |
| Lebanese Republic † | | 7.05 | 11-2-2035 | | 200,000 | 25,121 |
| Oman Government | | 4.75 | 6-15-2026 | | 200,000 | 207,297 |
| Oman Government | | 5.93 | 10-31-2025 | | 200,000 | 221,284 |
| Oman Government | | 6.50 | 3-8-2047 | | 400,000 | 401,332 |
| Oriental Republic of Uruguay | | 4.38 | 10-27-2027 | | 200,000 | 231,932 |
| Oriental Republic of Uruguay | | 4.98 | 4-20-2055 | | 100,000 | 131,171 |
| Oriental Republic of Uruguay | | 5.10 | 6-18-2050 | | 250,000 | 332,985 |
| Oriental Republic of Uruguay | | 7.88 | 1-15-2033 | | 125,000 | 188,420 |
| Perusahaan Penerbit SBSN Indonesia III | | 4.45 | 2-20-2029 | | 200,000 | 232,500 |
| Qatar Government | | 3.25 | 6-2-2026 | | 200,000 | 217,738 |
| Qatar Government | | 3.75 | 4-16-2030 | | 200,000 | 227,847 |
| Qatar Government | | 4.00 | 3-14-2029 | | 200,000 | 230,372 |
| Qatar Government | | 4.63 | 6-2-2046 | | 450,000 | 569,813 |
| Republic of Angola | | 8.25 | 5-9-2028 | | 200,000 | 212,853 |
| Republic of Angola | | 9.50 | 11-12-2025 | | 200,000 | 223,072 |
| Republic of Argentina øø | | 0.50 | 7-9-2030 | | 200,000 | 78,042 |
| Republic of Argentina | | 1.00 | 7-9-2029 | | 93,355 | 38,221 |
| Republic of Argentina øø | | 1.13 | 7-9-2035 | | 310,000 | 108,193 |
| Republic of Argentina øø | | 1.13 | 7-9-2046 | | 318,500 | 112,144 |
| Republic of Argentina øø | | 2.00 | 1-9-2038 | | 150,000 | 61,601 |
| Republic of Argentina øø | | 2.50 | 7-9-2041 | | 135,000 | 52,624 |
| Republic of Armenia | | 3.60 | 2-2-2031 | | 200,000 | 189,984 |
| Republic of Azerbaijan | | 3.50 | 9-1-2032 | | 200,000 | 208,000 |
| Republic of Belarus | | 7.63 | 6-29-2027 | | 200,000 | 194,502 |
| Republic of Chile | | 3.86 | 6-21-2047 | | 200,000 | 226,420 |
| Republic of Colombia | | 3.13 | 4-15-2031 | | 200,000 | 195,402 |
| Republic of Colombia | | 4.13 | 5-15-2051 | | 200,000 | 186,472 |
| Republic of Colombia | | 4.50 | 1-28-2026 | | 200,000 | 217,128 |
| Republic of Colombia | | 5.00 | 6-15-2045 | | 286,000 | 299,471 |
| Republic of Colombia | | 7.38 | 9-18-2037 | | 150,000 | 194,430 |
| Republic of Costa Rica | | 7.00 | 4-4-2044 | | 350,000 | 361,379 |
| Republic of Cote d'Ivoire | | 6.13 | 6-15-2033 | | 200,000 | 218,952 |
| Republic of Croatia | | 6.00 | 1-26-2024 | | 200,000 | 224,854 |
| Republic of Eduador ¤ | | 0.00 | 7-31-2030 | | 90,000 | 50,851 |
The accompanying notes are an integral part of these financial statements.
Wells Fargo Emerging Markets Bond Portfolio | 5
Portfolio of investments—August 31, 2021 (unaudited)
| | | Interest
rate | Maturity
date | | Principal | Value |
| Yankee government bonds: 82.14% (continued) | | | | | | |
| Republic of Eduador øø | | 0.50% | 7-31-2040 | $ | 40,000 | $ 25,600 |
| Republic of Eduador øø | | 1.00 | 7-31-2035 | | 500,000 | 360,005 |
| Republic of Eduador øø | | 5.00 | 7-31-2030 | | 250,000 | 222,503 |
| Republic of El Salvador | | 6.38 | 1-18-2027 | | 60,000 | 52,201 |
| Republic of El Salvador | | 7.65 | 6-15-2035 | | 347,000 | 301,023 |
| Republic of El Salvador | | 8.63 | 2-28-2029 | | 40,000 | 37,000 |
| Republic of Gabon | | 6.38 | 12-12-2024 | | 150,000 | 160,999 |
| Republic of Ghana | | 6.38 | 2-11-2027 | | 200,000 | 195,534 |
| Republic of Ghana | | 7.63 | 5-16-2029 | | 300,000 | 300,120 |
| Republic of Ghana | | 8.63 | 6-16-2049 | | 200,000 | 191,748 |
| Republic of Guatemala | | 4.38 | 6-5-2027 | | 200,000 | 217,002 |
| Republic of Hungary | | 5.38 | 2-21-2023 | | 40,000 | 42,896 |
| Republic of Hungary | | 5.38 | 3-25-2024 | | 200,000 | 223,774 |
| Republic of Hungary | | 7.63 | 3-29-2041 | | 50,000 | 85,010 |
| Republic of Indonesia | | 4.10 | 4-24-2028 | | 300,000 | 341,144 |
| Republic of Indonesia | | 5.13 | 1-15-2045 | | 200,000 | 251,687 |
| Republic of Indonesia | | 7.75 | 1-17-2038 | | 125,000 | 191,435 |
| Republic of Iraq | | 5.80 | 1-15-2028 | | 203,125 | 194,492 |
| Republic of Jamaica | | 8.00 | 3-15-2039 | | 200,000 | 284,002 |
| Republic of Kazakhstan | | 5.13 | 7-21-2025 | | 200,000 | 231,300 |
| Republic of Kazakhstan | | 6.50 | 7-21-2045 | | 200,000 | 295,669 |
| Republic of Kenya | | 6.88 | 6-24-2024 | | 200,000 | 220,209 |
| Republic of Kenya | | 8.25 | 2-28-2048 | | 200,000 | 226,360 |
| Republic of Nigeria | | 7.63 | 11-21-2025 | | 200,000 | 223,692 |
| Republic of Nigeria | | 7.88 | 2-16-2032 | | 300,000 | 322,765 |
| Republic of Panama | | 3.16 | 1-23-2030 | | 200,000 | 211,956 |
| Republic of Panama | | 3.87 | 7-23-2060 | | 200,000 | 206,830 |
| Republic of Panama | | 4.00 | 9-22-2024 | | 200,000 | 216,500 |
| Republic of Panama | | 4.50 | 5-15-2047 | | 350,000 | 402,217 |
| Republic of Paraguay | | 5.00 | 4-15-2026 | | 250,000 | 283,128 |
| Republic of Peru | | 2.78 | 12-1-2060 | | 60,000 | 53,738 |
| Republic of Peru | | 3.23 | 7-28-2121 | | 60,000 | 52,569 |
| Republic of Peru | | 3.55 | 3-10-2051 | | 40,000 | 41,450 |
| Republic of Peru | | 4.13 | 8-25-2027 | | 100,000 | 112,356 |
| Republic of Peru | | 5.63 | 11-18-2050 | | 100,000 | 138,825 |
| Republic of Peru | | 6.55 | 3-14-2037 | | 300,000 | 414,003 |
| Republic of Peru | | 7.35 | 7-21-2025 | | 100,000 | 122,612 |
| Republic of Philippines | | 1.65 | 6-10-2031 | | 200,000 | 196,632 |
| Republic of Philippines | | 2.65 | 12-10-2045 | | 200,000 | 193,056 |
| Republic of Philippines | | 3.70 | 2-2-2042 | | 200,000 | 221,244 |
| Republic of Philippines | | 5.50 | 3-30-2026 | | 150,000 | 179,585 |
| Republic of Philippines | | 6.38 | 1-15-2032 | | 200,000 | 277,574 |
| Republic of Poland | | 3.25 | 4-6-2026 | | 300,000 | 330,595 |
| Republic of Poland | | 4.00 | 1-22-2024 | | 100,000 | 108,378 |
| Republic of Senegal | | 6.25 | 5-23-2033 | | 200,000 | 215,160 |
| Republic of South Africa | | 4.85 | 9-30-2029 | | 400,000 | 423,080 |
| Republic of South Africa | | 6.25 | 3-8-2041 | | 200,000 | 219,248 |
| Republic of Sri Lanka | | 5.75 | 4-18-2023 | | 200,000 | 139,000 |
| Republic of Sri Lanka | | 6.75 | 4-18-2028 | | 300,000 | 191,250 |
| Republic of Sri Lanka | | 7.55 | 3-28-2030 | | 200,000 | 127,250 |
| Republic of Turkey | | 4.88 | 10-9-2026 | | 200,000 | 198,762 |
| Republic of Turkey | | 5.60 | 11-14-2024 | | 200,000 | 207,343 |
| Republic of Turkey | | 6.63 | 2-17-2045 | | 400,000 | 392,000 |
| Republic of Turkey | | 7.25 | 3-5-2038 | | 20,000 | 21,477 |
| Republic of Turkey | | 7.38 | 2-5-2025 | | 200,000 | 218,356 |
The accompanying notes are an integral part of these financial statements.
6 | Wells Fargo Emerging Markets Bond Portfolio
Portfolio of investments—August 31, 2021 (unaudited)
| | | Interest
rate | Maturity
date | | Principal | Value |
| Yankee government bonds: 82.14% (continued) | | | | | | |
| Republic of Turkey | | 7.63% | 4-26-2029 | $ | 200,000 | $ 223,248 |
| Republic of Venezuela † | | 6.00 | 12-9-2020 | | 225,000 | 23,175 |
| Republic of Venezuela † | | 7.00 | 3-31-2038 | | 200,000 | 20,800 |
| Republic of Zambia | | 8.50 | 4-14-2024 | | 200,000 | 158,236 |
| Romania Government | | 4.00 | 2-14-2051 | | 40,000 | 42,403 |
| Romania Government | | 4.38 | 8-22-2023 | | 140,000 | 150,047 |
| Romania Government | | 4.88 | 1-22-2024 | | 150,000 | 164,364 |
| Romania Government | | 5.13 | 6-15-2048 | | 180,000 | 224,632 |
| Russian Federation | | 4.50 | 4-4-2022 | | 200,000 | 204,478 |
| Russian Federation | | 4.88 | 9-16-2023 | | 200,000 | 216,756 |
| Russian Federation | | 5.10 | 3-28-2035 | | 200,000 | 243,738 |
| Russian Federation | | 5.63 | 4-4-2042 | | 200,000 | 265,216 |
| Russian Federation | | 12.75 | 6-24-2028 | | 180,000 | 301,275 |
| Saudi Government | | 2.88 | 3-4-2023 | | 200,000 | 206,632 |
| Saudi Government | | 3.63 | 3-4-2028 | | 200,000 | 221,691 |
| Saudi Government | | 4.50 | 4-17-2030 | | 200,000 | 237,000 |
| Saudi Government | | 4.50 | 10-26-2046 | | 200,000 | 234,962 |
| Saudi Government | | 4.63 | 10-4-2047 | | 200,000 | 239,024 |
| Trinidad & Tobago Government | | 4.50 | 8-4-2026 | | 200,000 | 213,702 |
| Ukraine Government | | 7.38 | 9-25-2032 | | 200,000 | 213,636 |
| Ukraine Government | | 7.75 | 9-1-2023 | | 200,000 | 215,060 |
| Ukraine Government | | 7.75 | 9-1-2025 | | 400,000 | 441,000 |
| United Mexican States | | 2.66 | 5-24-2031 | | 200,000 | 198,778 |
| United Mexican States | | 3.25 | 4-16-2030 | | 200,000 | 209,620 |
| United Mexican States | | 4.13 | 1-21-2026 | | 200,000 | 225,948 |
| United Mexican States | | 4.50 | 1-31-2050 | | 200,000 | 217,362 |
| United Mexican States | | 4.75 | 3-8-2044 | | 40,000 | 45,020 |
| United Mexican States | | 5.55 | 1-21-2045 | | 20,000 | 24,622 |
| United Mexican States | | 5.75 | 10-12-2110 | | 20,000 | 24,394 |
| United Mexican States | | 6.05 | 1-11-2040 | | 20,000 | 25,500 |
| United Mexican States | | 6.75 | 9-27-2034 | | 150,000 | 202,125 |
| Total Yankee government bonds (Cost $30,620,340) | | | | | | 31,202,302 |
| | | Yield | | | Shares | |
| Short-term investments: 1.28% | | | | | | |
| Investment companies: 1.28% | | | | | | |
| Wells Fargo Government Money Market Fund Select Class ♠∞ | | 0.03 | | | 485,782 | 485,782 |
| Total Short-term investments (Cost $485,782) | | | | | | 485,782 |
| Total investments in securities (Cost $36,489,441) | 98.56% | | | | | 37,438,725 |
| Other assets and liabilities, net | 1.44 | | | | | 548,842 |
| Total net assets | 100.00% | | | | | $37,987,567 |
| † | Non-income-earning security |
| øø | The interest rate is determined and reset by the issuer periodically depending upon the terms of the security. The rate shown is the rate in effect at period end. |
| ¤ | The security is issued in zero coupon form with no periodic interest payments. |
| ♠ | The issuer of the security is an affiliated person of the Portfolio as defined in the Investment Company Act of 1940. |
| ∞ | The rate represents the 7-day annualized yield at period end. |
The accompanying notes are an integral part of these financial statements.
Wells Fargo Emerging Markets Bond Portfolio | 7
Portfolio of investments—August 31, 2021 (unaudited)
Investments in affiliates
An affiliated investment is an investment in which the Portfolio owns at least 5% of the outstanding voting shares of the issuer or as a result of other relationships, such as the Portfolio and the issuer having the same adviser or investment manager. Transactions with issuers that were either affiliates of the Portfolio at the beginning of the period or the end of the period were as follows:
| | Value,
beginning of
period | Purchases | Sales
proceeds | Net
realized
gains
(losses) | Net
change in
unrealized
gains
(losses) | Value,
end of
period | Shares,
end
of period | Income
from
affiliated
securities |
| Short-term investments | | | | | | | |
| Wells Fargo Government Money Market Fund Select Class | $654,821 | $4,428,090 | $(4,597,129) | $0 | $0 | $485,782 | 485,782 | $70 |
The accompanying notes are an integral part of these financial statements.
8 | Wells Fargo Emerging Markets Bond Portfolio
Statement of assets and liabilities—August 31, 2021 (unaudited)
| | |
| Assets | |
Investments in unaffiliated securities, at value (cost $36,003,659)
| $ 36,952,943 |
Investments in affiliated securites, at value (cost $485,782)
| 485,782 |
Cash
| 9,975 |
Receivable for interest
| 483,157 |
Receivable for investments sold
| 333,405 |
Receivable from adviser
| 2,496 |
Total assets
| 38,267,758 |
| Liabilities | |
Payable for investments purchased
| 257,697 |
Accrued expenses and other liabilities
| 22,494 |
Total liabilities
| 280,191 |
Total net assets
| $37,987,567 |
The accompanying notes are an integral part of these financial statements.
Wells Fargo Emerging Markets Bond Portfolio | 9
Statement of operations—six months ended August 31, 2021 (unaudited)
| | |
| Investment income | |
Interest
| $ 858,554 |
Income from affiliated securities
| 70 |
Total investment income
| 858,624 |
| Expenses | |
Advisory fee
| 47,383 |
Custody and accounting fees
| 8,296 |
Professional fees
| 30,631 |
Interest holder report expenses
| 10,087 |
Trustees’ fees and expenses
| 9,771 |
Other fees and expenses
| 2,909 |
Total expenses
| 109,077 |
Less: Fee waivers and/or expense reimbursements
| (56,387) |
Net expenses
| 52,690 |
Net investment income
| 805,934 |
| Realized and unrealized gains (losses) on investments | |
Net realized losses on investments
| (570,477) |
Net change in unrealized gains (losses) on investments
| 1,332,584 |
Net realized and unrealized gains (losses) on investments
| 762,107 |
Net increase in net assets resulting from operations
| $1,568,041 |
The accompanying notes are an integral part of these financial statements.
10 | Wells Fargo Emerging Markets Bond Portfolio
Statement of changes in net assets
| | | |
| | Six months ended
August 31, 2021
(unaudited) | Year ended
February 28, 2021 |
| Operations | | |
Net investment income
| $ 805,934 | $ 1,573,994 |
Net realized losses on investments
| (570,477) | (1,594,466) |
Net change in unrealized gains (losses) on investments
| 1,332,584 | (149,379) |
Net increase (decrease) in net assets resulting from operations
| 1,568,041 | (169,851) |
| Capital transactions | | |
| Transactions in investors’ beneficial interests | | |
Contributions
| 3,312,088 | 9,652,126 |
Withdrawals
| (3,810,980) | (15,111,545) |
Net decrease in net assets resulting from capital transactions
| (498,892) | (5,459,419) |
Total increase (decrease) in net assets
| 1,069,149 | (5,629,270) |
| Net assets | | |
Beginning of period
| 36,918,418 | 42,547,688 |
End of period
| $37,987,567 | $ 36,918,418 |
The accompanying notes are an integral part of these financial statements.
Wells Fargo Emerging Markets Bond Portfolio | 11
| | | Year ended February 28 |
| | Six months ended
August 31, 2021
(unaudited) | 2021 | 2020 1 | 2019 | 2018 2 |
Total return3
| 4.23% | (0.31)% | 8.59% | 2.84% | 0.62% |
| Ratios to average net assets (annualized) | | | | | |
Gross expenses
| 0.58% | 0.54% | 0.51% | 0.44% | 0.44% |
Net expenses
| 0.28% * | 0.29% * | 0.35% | 0.40% | 0.43% |
Net investment income
| 4.25% | 4.37% | 4.95% | 4.70% | 4.19% |
| Supplemental data | | | | | |
Portfolio turnover rate
| 15% | 31% | 36% | 38% | 174% |
| * | Ratios reflect expenses which were voluntarily waived by the adviser. Without these voluntary waivers, the net expense ratios would be increased by the following amounts: |
| Six months ended August 31, 2021 (unaudited) | 0.30% |
| Year ended February 28, 2021 | 0.25% |
| 1 | Year ended February 29 |
| 2 | For the period from May 23, 2017 (commencement of operations) to February 28, 2018 |
| 3 | Returns for periods of less than one year are not annualized. |
The accompanying notes are an integral part of these financial statements.
12 | Wells Fargo Emerging Markets Bond Portfolio
Notes to financial statements (unaudited)
1. ORGANIZATION
Wells Fargo Master Trust (the "Trust"), a Delaware statutory trust organized on March 10, 1999, is an open-end management investment company registered under the Investment Company Act of 1940, as amended (the "1940 Act"). As an investment company, the Trust follows the accounting and reporting guidance in Financial Accounting Standards Board ("FASB") Accounting Standards Codification Topic 946, Financial Services – Investment Companies. These financial statements report on the Wells Fargo Emerging Markets Bond Portfolio (the "Portfolio") which is a diversified series of the Trust.
Interests in the Portfolio are available solely through private placement transactions that do not involve any "public offering" within the meaning of Section 4(2) of the Investment Company Act of 1933.
On February 23, 2021, Wells Fargo & Company announced that it has entered into a definitive agreement to sell Wells Fargo Asset Management ("WFAM") to GTCR LLC and Reverence Capital Partners, L.P. WFAM is the trade name used by the asset management businesses of Wells Fargo & Company and includes Wells Fargo Funds Management, LLC, the adviser to the Portfolio, Wells Capital Management, LLC and Wells Fargo Asset Management (International) Limited, both registered investment advisers providing subadvisory services to certain funds, and Wells Fargo Funds Distributor, LLC, the Portfolio's principal underwriter. As part of the transaction, Wells Fargo & Company will own a 9.9% equity interest and will continue to serve as an important client and distribution partner.
Consummation of the transaction will result in the automatic termination of the Portfolio’s investment advisory agreement and subadvisory agreements. The Portfolio’s Board of Trustees approved a new investment advisory agreement and a new subadvisory agreement which were subsequently approved on behalf of the feeder funds that were investors in the Portfolio at the close of business on May 28, 2021. The new agreements will take effect upon the closing of the transaction. The transaction is expected to close in the second half of 2021, subject to customary closing conditions.
2. SIGNIFICANT ACCOUNTING POLICIES
The following significant accounting policies, which are consistently followed in the preparation of the financial statements of the Portfolio, are in conformity with U.S. generally accepted accounting principles which require management to make estimates and assumptions that affect the reported amounts of assets and liabilities, disclosure of contingent assets and liabilities at the date of the financial statements, and the reported amounts of income and expenses during the reporting period. Actual results could differ from those estimates.
Securities valuation
All investments are valued each business day as of the close of regular trading on the New York Stock Exchange (generally 4 p.m. Eastern Time), although the Portfolio may deviate from this calculation time under unusual or unexpected circumstances.
Debt securities are valued at the evaluated bid price provided by an independent pricing service (e.g. taking into account various factors, including yields, maturities, or credit ratings) or, if a reliable price is not available, the quoted bid price from an independent broker-dealer.
Investments in registered open-end investment companies are valued at net asset value.
Investments which are not valued using any of the methods discussed above are valued at their fair value, as determined in good faith by the Board of Trustees. The Board of Trustees has established a Valuation Committee comprised of the Trustees and has delegated to it the authority to take any actions regarding the valuation of portfolio securities that the Valuation Committee deems necessary or appropriate, including determining the fair value of portfolio securities, unless the determination has been delegated to the Wells Fargo Asset Management Pricing Committee at Wells Fargo Funds Management, LLC ("Funds Management"). The Board of Trustees retains the authority to make or ratify any valuation decisions or approve any changes to the Valuation Procedures as it deems appropriate. On a quarterly basis, the Board of Trustees receives reports on any valuation actions taken by the Valuation Committee or the Wells Fargo Asset Management Pricing Committee which may include items for ratification.
Security transactions and income recognition
Securities transactions are recorded on a trade date basis. Realized gains or losses are recorded on the basis of identified cost.
Interest income is accrued daily and bond discounts are accreted and premiums are amortized daily. To the extent debt obligations are placed on non-accrual status, any related interest income may be reduced by writing off interest receivables when the collection of all or a portion of interest has been determined to be doubtful based on consistently applied procedures
Wells Fargo Emerging Markets Bond Portfolio | 13
Notes to financial statements (unaudited)
and the fair value has decreased. If the issuer subsequently resumes interest payments or when the collectability of interest is reasonably assured, the debt obligation is removed from non-accrual status. Paydown gains and losses are included in interest income.
Federal and other taxes
The Portfolio is not required to pay federal income taxes on its net investment income and net capital gains as it is treated as a partnership for federal income tax purposes. All income, gains and losses of the Portfolio are deemed to have been “passed through” to the interest holders in proportion to their holdings of the Portfolio regardless of whether income and gains have been distributed by the Portfolio.
The Portfolio’s income tax returns and all financial records supporting those returns for the prior three fiscal years are subject to examination by the federal revenue authority. Management has analyzed the Portfolio’s tax positions taken on federal, state, and foreign tax returns for all open tax years and does not believe that there are any uncertain tax positions that require recognition of a tax liability.
As of August 31, 2021, the aggregate cost of all investments for federal income tax purposes was $36,504,959 and the unrealized gains (losses) consisted of:
| Gross unrealized gains | $ 2,032,746 |
| Gross unrealized losses | (1,098,980) |
| Net unrealized gains | $ 933,766 |
3. FAIR VALUATION MEASUREMENTS
Fair value measurements of investments are determined within a framework that has established a fair value hierarchy based upon the various data inputs utilized in determining the value of the Portfolio’s investments. The three-level hierarchy gives the highest priority to unadjusted quoted prices in active markets for identical assets or liabilities (Level 1) and the lowest priority to unobservable inputs (Level 3). The Portfolio’s investments are classified within the fair value hierarchy based on the lowest level of input that is significant to the fair value measurement. The inputs are summarized into three broad levels as follows:
| ■ | Level 1 – quoted prices in active markets for identical securities |
| ■ | Level 2 – other significant observable inputs (including quoted prices for similar securities, interest rates, prepayment speeds, credit risk, etc.) |
| ■ | Level 3 – significant unobservable inputs (including the Portfolio’s own assumptions in determining the fair value of investments) |
The inputs or methodologies used for valuing investments in securities are not necessarily an indication of the risk associated with investing in those securities.
The following is a summary of the inputs used in valuing the Portfolio’s assets and liabilities as of August 31, 2021:
| | Quoted prices
(Level 1) | Other significant
observable inputs
(Level 2) | Significant
unobservable inputs
(Level 3) | Total |
| Assets | | | | |
| Investments in: | | | | |
| Yankee corporate bonds and notes | $ 0 | $ 5,750,641 | $0 | $ 5,750,641 |
| Yankee government bonds | 0 | 31,202,302 | 0 | 31,202,302 |
| Short-term investments | | | | |
| Investment companies | 485,782 | 0 | 0 | 485,782 |
| Total assets | $485,782 | $36,952,943 | $0 | $37,438,725 |
Additional sector, industry or geographic detail, if any, is included in the Portfolio of Investments.
For the six months ended August 31, 2021, the Portfolio did not have any transfers into/out of Level 3.
14 | Wells Fargo Emerging Markets Bond Portfolio
Notes to financial statements (unaudited)
4. TRANSACTIONS WITH AFFILIATES
Advisory fee
The Trust has entered into an advisory contract with Funds Management, an indirect wholly owned subsidiary of Wells Fargo & Company ("Wells Fargo"). The adviser is responsible for implementing investment policies and guidelines and for supervising the subadvisers, who are responsible for day-to-day portfolio management of the Portfolio. Pursuant to the contract, Funds Management is entitled to receive an advisory fee at the following annual rate based on the Portfolio’s average daily net assets:
| Average daily net assets | Advisory fee |
| First $5 billion | 0.250% |
| Next $5 billion | 0.230 |
| Over $10 billion | 0.210 |
For the six months ended August 31, 2021, the advisory fee was equivalent to an annual rate of 0.25% of the Portfolio’s average daily net assets.
Funds Management has retained the services of a subadviser to provide daily portfolio management to the Portfolio. The fee for subadvisory services is borne by Funds Management. Wells Fargo Asset Management (International) Limited, ("WFAMI"), an affiliate of Funds Management and an indirect wholly owned subsidiary of Wells Fargo, is the subadviser to the Portfolio and is entitled to receive a fee from Funds Management at an annual rate starting at 0.09% and declining to 0.07% as the average daily net assets of the Portfolio increase. Wells Capital Management, LLC, an affiliate of Funds Management and an indirect wholly owned subsidiary of Wells Fargo, is also a subadviser to the Portfolio and is entitled to receive a fee from WFAMI at an annual rate starting at 0.0045% and declining to 0.0035% as the average daily net assets of the Portfolio increase.
Funds Management has voluntarily waived and/or reimbursed advisory fees to reduce the net operating expense ratio of the Portfolio. These voluntary waivers may be discontinued at any time.
Interfund transactions
The Portfolio may purchase or sell portfolio investment securities to certain other Wells Fargo affiliates pursuant to Rule 17a-7 under the 1940 Act and under procedures adopted by the Board of Trustees. The procedures have been designed to ensure that these interfund transactions, which do not incur broker commissions, are effected at current market prices.
5. INVESTMENT PORTFOLIO TRANSACTIONS
Purchases and sales of investments, excluding U.S. government obligations (if any) and short-term securities, for the six months ended August 31, 2021 were $5,795,715 and $5,405,800, respectively.
6. BANK BORROWINGS
The Trust, along with Wells Fargo Variable Trust and Wells Fargo Funds Trust (excluding the money market funds), are parties to a $350,000,000 revolving credit agreement whereby the Portfolio is permitted to use bank borrowings for temporary or emergency purposes, such as to fund interest holders withdrawal requests. Interest under the credit agreement is charged to the Portfolio based on a borrowing rate equal to the higher of the Federal Funds rate in effect on that day plus 1.25% or the overnight bank funding rate in effect on that day plus 1.25%. In addition, an annual commitment fee equal to 0.25% of the unused balance is allocated to each participating fund.
For the six months ended August 31, 2021, there were no borrowings by the Portfolio under the agreement.
7. INDEMNIFICATION
Under the Portfolio's organizational documents, the officers and Trustees have been granted certain indemnification rights against certain liabilities that may arise out of performance of their duties to the Portfolio. The Portfolio has entered into a separate agreement with each Trustee that converts indemnification rights currently existing under the Portfolio’s organizational documents into contractual rights that cannot be changed in the future without the consent of the Trustee. Additionally, in the normal course of business, the Portfolio may enter into contracts with service providers that contain a variety of indemnification clauses. The Portfolio’s maximum exposure under these arrangements is dependent on future claims that may be made against the Portfolio and, therefore, cannot be estimated.
Wells Fargo Emerging Markets Bond Portfolio | 15
Notes to financial statements (unaudited)
8. CORONAVIRUS (COVID-19) PANDEMIC
On March 11, 2020, the World Health Organization announced that it had made the assessment that coronavirus disease 2019 (“COVID-19”) is a pandemic. The impacts of COVID-19 are affecting the entire global economy, individual companies and investment products, the funds, and the market in general. There is significant uncertainty around the extent and duration of business disruptions related to COVID-19 and the impacts may last for an extended period of time. COVID-19 has led to significant uncertainty and volatility in the financial markets.
9. SUBSEQUENT EVENTS
Wells Fargo Asset Management ("WFAM") announced that it will be changing its company name to Allspring Global Investments upon the closing of the previously announced sale transaction of WFAM by Wells Fargo & Company to GTCR LLC and Reverence Capital Partners, L.P. The new corporate name is expected to go into effect on the closing date of the transaction, which is anticipated to occur in the second half of 2021, subject to customary closing conditions.
The Board of Trustees of the Wells Fargo Funds approved a change in the Portfolio's name to remove “Wells Fargo” from the Portfolio's name and replace with “Allspring” on December 6, 2021.
Following the closing of the transaction, Wells Fargo Funds Management, LLC, the Portfolio's adviser, Wells Capital Management, LLC and Wells Fargo Asset Management (International) Limited, each subadvisers to certain funds, and Wells Fargo Funds Distributor, LLC will each be rebranded as Allspring.
16 | Wells Fargo Emerging Markets Bond Portfolio
Other information (unaudited)
PROXY VOTING INFORMATION
A description of the policies and procedures used to determine how to vote proxies relating to portfolio securities is available without charge, upon request, by calling 1-800-222-8222, visiting our website at wfam.com, or visiting the SEC website at sec.gov. Information regarding how the proxies related to portfolio securities were voted during the most recent 12-month period ended June 30 is available on the website at wfam.com or by visiting the SEC website at sec.gov.
QUARTERLY PORTFOLIO HOLDINGS INFORMATION
The Portfolio files its complete schedule of portfolio holdings with the SEC for the first and third quarters of each fiscal year as an exhibit to its reports on Form N-PORT. Interest holders may view the filed Form N-PORT by visiting the SEC website at sec.gov.
Wells Fargo Emerging Markets Bond Portfolio | 17
Other information (unaudited)
BOARD OF TRUSTEES AND OFFICERS
Each of the Trustees and Officers listed in the table below acts in identical capacities for each fund in the Wells Fargo family of funds, which consists of 139 mutual funds comprising the Wells Fargo Funds Trust, Wells Fargo Variable Trust, Wells Fargo Master Trust and four closed-end funds (collectively the “Fund Complex”). This table should be read in conjunction with the Prospectus and the Statement of Additional Information1. The mailing address of each Trustee and Officer is 525 Market Street, 12th Floor, San Francisco, CA 94105. Each Trustee and Officer serves an indefinite term, however, each Trustee serves such term until reaching the mandatory retirement age established by the Trustees.
Independent Trustees
Name and
year of birth | Position held and
length of service* | Principal occupations during past five years or longer | Current other
public company or
investment
company
directorships |
William R. Ebsworth
(Born 1957) | Trustee,
since 2015 | Retired. From 1984 to 2013, equities analyst, portfolio manager, research director and chief investment officer at Fidelity Management and Research Company in Boston, Tokyo, and Hong Kong, and retired in 2013 as Chief Investment Officer of Fidelity Strategic Advisers, Inc. where he led a team of investment professionals managing client assets. Prior thereto, Board member of Hong Kong Securities Clearing Co., Hong Kong Options Clearing Corp., the Thailand International Fund, Ltd., Fidelity Investments Life Insurance Company, and Empire Fidelity Investments Life Insurance Company. Audit Committee Chair and Investment Committee Chair of the Vincent Memorial Hospital Endowment (non-profit organization). Mr. Ebsworth is a CFA® charterholder. | N/A |
Jane A. Freeman
(Born 1953) | Trustee,
since 2015;
Chair Liaison,
since 2018 | Retired. From 2012 to 2014 and 1999 to 2008, Chief Financial Officer of Scientific Learning Corporation. From 2008 to 2012, Ms. Freeman provided consulting services related to strategic business projects. Prior to 1999, Portfolio Manager at Rockefeller & Co. and Scudder, Stevens & Clark. Board member of the Harding Loevner Funds from 1996 to 2014, serving as both Lead Independent Director and chair of the Audit Committee. Board member of the Russell Exchange Traded Funds Trust from 2011 to 2012 and the chair of the Audit Committee. Ms. Freeman is also an inactive Chartered Financial Analyst. | N/A |
Isaiah Harris, Jr.
(Born 1952) | Trustee,
since 2009; Audit
Committee
Chair,
since 2019 | Retired. Chairman of the Board of CIGNA Corporation since 2009, and Director since 2005. From 2003 to 2011, Director of Deluxe Corporation. Prior thereto, President and CEO of BellSouth Advertising and Publishing Corp. from 2005 to 2007, President and CEO of BellSouth Enterprises from 2004 to 2005 and President of BellSouth Consumer Services from 2000 to 2003. Emeritus member of the Iowa State University Foundation Board of Governors. Emeritus Member of the Advisory Board of Iowa State University School of Business. Advisory Board Member, Palm Harbor Academy (private school). Mr. Harris is a certified public accountant (inactive status). | CIGNA Corporation |
Judith M. Johnson
(Born 1949) | Trustee,
since 2008 | Retired. Prior thereto, Chief Executive Officer and Chief Investment Officer of Minneapolis Employees Retirement Fund from 1996 to 2008. Ms. Johnson is an attorney, certified public accountant and a certified managerial accountant. | N/A |
David F. Larcker
(Born 1950) | Trustee,
since 2009 | James Irvin Miller Professor of Accounting at the Graduate School of Business (Emeritus), Stanford University, Director of the Corporate Governance Research Initiative and Senior Faculty of The Rock Center for Corporate Governance since 2006. From 2005 to 2008, Professor of Accounting at the Graduate School of Business, Stanford University. Prior thereto, Ernst & Young Professor of Accounting at The Wharton School, University of Pennsylvania from 1985 to 2005. | N/A |
18 | Wells Fargo Emerging Markets Bond Portfolio
Other information (unaudited)
Name and
year of birth | Position held and
length of service* | Principal occupations during past five years or longer | Current other
public company or
investment
company
directorships |
Olivia S. Mitchell
(Born 1953) | Trustee,
since 2006;
Nominating and
Governance
Committee Chair,
since 2018 | International Foundation of Employee Benefit Plans Professor, Wharton School of the University of Pennsylvania since 1993. Director of Wharton’s Pension Research Council and Boettner Center on Pensions & Retirement Research, and Research Associate at the National Bureau of Economic Research. Previously, Cornell University Professor from 1978 to 1993. | N/A |
Timothy J. Penny
(Born 1951) | Trustee,
since 1996;
Chair,
since 2018 | President and Chief Executive Officer of Southern Minnesota Initiative Foundation, a non-profit organization, since 2007. Member of the Board of Trustees of NorthStar Education Finance, Inc., a non-profit organization, since 2007. | N/A |
James G. Polisson
(Born 1959) | Trustee,
since 2018 | Retired. Chief Marketing Officer, Source (ETF) UK Services, Ltd, from 2015 to 2017. From 2012 to 2015, Principal of The Polisson Group, LLC, a management consulting, corporate advisory and principal investing company. Chief Executive Officer and Managing Director at Russell Investments, Global Exchange Traded Funds from 2010 to 2012. Managing Director of Barclays Global Investors from 1998 to 2010 and Global Chief Marketing Officer for iShares and Barclays Global Investors from 2000 to 2010. Trustee of the San Francisco Mechanics’ Institute, a non-profit organization, from 2013 to 2015. Board member of the Russell Exchange Traded Fund Trust from 2011 to 2012. Director of Barclays Global Investors Holdings Deutschland GmbH from 2006 to 2009. Mr. Polisson is an attorney and has a retired status with the Massachusetts and District of Columbia Bar Associations. | N/A |
Pamela Wheelock
(Born 1959) | Trustee,
since January
2020; previously
Trustee from
January 2018 to
July 2019 | Board member of the Destination Medical Center Economic Development Agency, Rochester, Minnesota since 2019. Interim President of the McKnight Foundation from January to September 2020. Acting Commissioner, Minnesota Department of Human Services, July 2019 through September 2019. Human Services Manager (part-time), Minnesota Department of Human Services, October 2019 through December 2019. Chief Operating Officer, Twin Cities Habitat for Humanity from 2017 to 2019. Vice President of University Services, University of Minnesota from 2012 to 2016. Prior thereto, on the Board of Directors, Governance Committee and Finance Committee for the Minnesota Philanthropy Partners (Saint Paul Foundation) from 2012 to 2018, Interim Chief Executive Officer of Blue Cross Blue Shield of Minnesota from 2011 to 2012, Chairman of the Board from 2009 to 2012 and Board Director from 2003 to 2015. Vice President, Leadership and Community Engagement, Bush Foundation, Saint Paul, Minnesota (a private foundation) from 2009 to 2011. Executive Vice President and Chief Financial Officer, Minnesota Sports and Entertainment from 2004 to 2009 and Senior Vice President from 2002 to 2004. Executive Vice President of the Minnesota Wild Foundation from 2004 to 2008. Commissioner of Finance, State of Minnesota, from 1999 to 2002. Currently Board Chair of the Minnesota Wild Foundation since 2010. | N/A |
* Length of service dates reflect the Trustee’s commencement of service with the Trust’s predecessor entities, where applicable.
Wells Fargo Emerging Markets Bond Portfolio | 19
Other information (unaudited)
Officers
Name and
year of birth | Position held and
length of service | Principal occupations during past five years or longer |
Andrew Owen
(Born 1960) | President,
since 2017 | Executive Vice President of Wells Fargo & Company and Head of Affiliated Managers, Wells Fargo Asset Management, since 2014. In addition, Mr. Owen is currently President, Chief Executive Officer and Director of Wells Fargo Funds Management, LLC since 2017. Prior thereto, Executive Vice President responsible for marketing, investments and product development for Wells Fargo Funds Management, LLC, from 2009 to 2014. |
Jeremy DePalma
(Born 1974) | Treasurer,
since 2012
(for certain funds in
the Fund Complex);
since 2021 (for
the remaining funds in the
Fund Complex) | Senior Vice President of Wells Fargo Funds Management, LLC since 2009. Senior Vice President of Evergreen Investment Management Company, LLC from 2008 to 2010 and head of the Fund Reporting and Control Team within Fund Administration from 2005 to 2010. |
Michelle Rhee
(Born 1966) | Chief Legal Officer,
since 2019 | Secretary of Wells Fargo Funds Management, LLC and Chief Legal Counsel of Wells Fargo Asset Management since 2018. Deputy General Counsel of Wells Fargo Bank, N.A. since 2020 and Assistant General Counsel of Wells Fargo Bank, N.A. from 2018 to 2020. Associate General Counsel and Managing Director of Bank of America Corporation from 2004 to 2018. |
Matthew Prasse
(Born 1983) | Secretary,
since 2021 | Senior Counsel of the Wells Fargo Legal Department since 2018. Previously, Director and Counsel for Barings LLC from 2015 to 2018. Prior to joining Barings, Associate at Morgan, Lewis & Bockius LLP from 2008 to 2015. |
Michael H. Whitaker
(Born 1967) | Chief Compliance Officer,
since 2016 | Chief Compliance Officer of Wells Fargo Asset Management since 2016. Senior Vice President and Chief Compliance Officer for Fidelity Investments from 2007 to 2016. |
1 The Statement of Additional Information includes additional information about the Trustees and is available, without charge, upon request, by calling 1-800-222-8222 or by visiting the website at wfam.com.
20 | Wells Fargo Emerging Markets Bond Portfolio
Board considerations (unaudited)
BOARD CONSIDERATION OF INVESTMENT ADVISORY AND SUB-ADVISORY AGREEMENTS:
Wells Fargo Bloomberg Barclays US Aggregate ex-Corporate Portfolio, Wells Fargo Emerging Markets Bond Portfolio, Wells Fargo Factor Enhanced Emerging Markets Equity Portfolio, Wells Fargo Factor Enhanced International Equity Portfolio, Wells Fargo Factor Enhanced U.S. Large Cap Equity Portfolio, Wells Fargo Factor Enhanced U.S. Small Cap Equity Portfolio, Wells Fargo High Yield Corporate Bond Portfolio, Wells Fargo Investment Grade Corporate Bond Portfolio, Wells Fargo Factor Enhanced U.S. Low Volatility Equity Portfolio, Wells Fargo Strategic Retirement Bond Portfolio, and Wells Fargo U.S. REIT Portfolio
Board Considerations – Current Agreements
Under the Investment Company Act of 1940 (the “1940 Act”), the Board of Trustees (the “Board”) of Wells Fargo Master Trust (the “Trust”) must determine annually whether to approve the continuation of the Trust’s investment advisory and sub-advisory agreements. In this regard, at a meeting held on May 17-19, 2021 (the “Meeting”), the Board of the Trust, all the members of which have no direct or indirect interest in the investment advisory and sub-advisory agreements and are not “interested persons” of the Trust, as defined in the 1940 Act (the “Independent Trustees”), reviewed and approved for each of the portfolios of the Trust identified in the table below (individually, a “Portfolio” and collectively, the “Portfolios”): (i) an investment advisory agreement (the “Advisory Agreement”) with Wells Fargo Funds Management, LLC (“Funds Management”); and (ii) an investment sub-advisory agreement (each, a “Sub-Advisory Agreement” and collectively, the “Sub-Advisory Agreements”) with the sub-adviser(s) identified in the table below (each, a “Sub-Adviser” and collectively, the “Sub-Advisers”) for the corresponding Portfolio identified. The Advisory Agreement and the Sub-Advisory Agreements are collectively referred to as the “Advisory Agreements.”
| Funds Trust | Master Trust |
| Wells Fargo Bloomberg Barclays US Aggregate ex-Corporate Portfolio | Wells Capital Management Incorporated |
| Wells Fargo Emerging Markets Bond Portfolio | Wells Fargo Asset Management (International) Limited and Wells Capital Management Incorporated |
| Wells Fargo Factor Enhanced Emerging Markets Equity Portfolio | Wells Capital Management Incorporated |
| Wells Fargo Factor Enhanced International Equity Portfolio | Wells Capital Management Incorporated |
| Wells Fargo Factor Enhanced U.S. Large Cap Equity Portfolio | Wells Capital Management Incorporated |
| Wells Fargo Factor Enhanced U.S. Small Cap Equity Portfolio | Wells Capital Management Incorporated |
| Wells Fargo High Yield Corporate Bond Portfolio | Wells Capital Management Incorporated |
| Wells Fargo Investment Grade Corporate Bond Portfolio | Wells Capital Management Incorporated |
| Wells Fargo Factor Enhanced U.S. Low Volatility Equity Portfolio | Wells Capital Management Incorporated |
| Wells Fargo Strategic Retirement Bond Portfolio | Wells Capital Management Incorporated |
| Wells Fargo U.S. REIT Portfolio | Wells Capital Management Incorporated |
The Board noted that Wells Fargo & Company recently announced that it had entered into a definitive agreement to sell Wells Fargo Asset Management (“WFAM”), which includes Funds Management and the Sub-Adviser, to GTCR LLC and Reverence Capital Partners, L.P. and/or their affiliates (the “Transaction”). The Board further noted that the Transaction would result in a change-of-control of Funds Management and the Sub-Advisers, which would be considered to be an assignment that would result in the termination of the Advisory Agreements. In light of the Transaction, the Board separately considered for approval a new investment advisory agreement with Funds Management and a new investment sub-advisory agreement with each of the Sub-Advisers (the “New Agreements”) that would replace the Advisory Agreements upon consummation of the Transaction, subject to approval of the New Agreements by the Portfolios’ shareholders. The Board also considered for approval interim agreements to go into effect in the event shareholders do not approve the New Agreements before the Transaction is completed. The interim agreements would allow the Manager and the Sub-Advisers to continue providing services to the Portfolios while the Portfolios continues to seek shareholder approval of the New Agreements. The Board noted that the terms of the interim agreements would be identical to those of the current Advisory Agreements, except for the term and certain escrow provisions.
At the Meeting, the Board considered the factors and reached the conclusions described below relating to the selection of Funds Management and the Sub-Advisers and the approval of the Advisory Agreements. Prior to the Meeting, including at Board meetings held in April and May 2021, the Trustees conferred extensively among themselves and with representatives of Funds Management about these matters. Also, the Board has adopted a team-based approach, with each team consisting of a sub-set of
Wells Fargo Emerging Markets Bond Portfolio | 21
Board considerations (unaudited)
Trustees, to assist the full Board in the discharge of its duties in reviewing investment performance and other matters throughout the year. The Independent Trustees were assisted in their evaluation of the Advisory Agreements by independent legal counsel, from whom they received separate legal advice and with whom they met separately.
In providing information to the Board, Funds Management and the Sub-Advisers were guided by a detailed set of requests for information submitted to them by independent legal counsel on behalf of the Independent Trustees at the start of the Board’s annual contract renewal process earlier in 2021. In considering and approving the Advisory Agreements, the Trustees considered the information they believed relevant, including but not limited to the information discussed below. The Board considered not only the specific information presented in connection with the Meeting, but also the knowledge gained over time through interaction with Funds Management and the Sub-Advisers about various topics. In this regard, the Board reviewed reports of Funds Management at each of its quarterly meetings, which included, among other things, portfolio reviews and investment performance reports. In addition, the Board and the teams mentioned above confer with portfolio managers at various times throughout the year. The Board did not identify any particular information or consideration that was all-important or controlling, and each individual Trustee may have attributed different weights to various factors.
After its deliberations, the Board unanimously determined that the compensation or the absence of compensation payable to Funds Management and each of the Sub-Advisers under each of the Advisory Agreements was reasonable, and approved the continuation of the Advisory Agreements for a one-year term. The Board considered the approval of the Advisory Agreements for the Portfolios as part of its consideration of agreements for funds across the complex, but its approvals were made on a fund-by-fund basis. The following summarizes a number of important, but not necessarily all, factors considered by the Board in support of its approvals.
Nature, extent and quality of services
The Board received and considered various information regarding the nature, extent and quality of services provided to the Funds by Funds Management and the Sub-Advisers under the Advisory Agreements. This information included a description of the investment advisory services and Portfolio-level administrative services covered by the Advisory Agreement, as well as, among other things, a summary of the background and experience of senior management of WFAM, of which Funds Management and the Sub-Advisers are a part, and a summary of investments made in the business of WFAM. The Board also received a description of Funds Management’s and the Sub-Advisers’ business continuity plans, including a summary of the performance of such plans and any changes thereto during the COVID-19 pandemic, and of their approaches to data privacy and cybersecurity. The Board also received and reviewed information about Funds Management’s role as administrator of the Portfolios’ liquidity risk management program, Funds Management’s approach to risk management, and Funds Management’s intermediary and vendor oversight program.
The Board also considered the qualifications, background, tenure and responsibilities of each of the portfolio managers primarily responsible for the day-to-day portfolio management of the Portfolios. The Board noted that each of the Portfolios replicates the performance of a proprietary index provided by an affiliate of Funds Management, except that each of Wells Fargo Bloomberg Barclays US Aggregate ex-Corporate Portfolio, Wells Fargo Emerging Markets Bond Portfolio, and Wells Fargo Strategic Retirement Bond Portfolio track the performance of a third party index. The Board evaluated the ability of Funds Management and the Sub-Advisers to attract and retain qualified investment professionals, including research, advisory and supervisory personnel.
The Board further considered the compliance programs and compliance records of Funds Management and the Sub-Advisers. In addition, the Board took into account the full range of services provided to the Portfolios by Funds Management and its affiliates. The Board also considered information about retention and back-up arrangements that have been put into place with respect to key personnel of WFAM in connection with the anticipated Transaction, noting that WFAM provided assurances that the announcement and eventual culmination of the Transaction is not expected to result in any diminution in the nature or quality of services provided to the Portfolios.
Portfolio investment performance and expenses
The Board considered the investment performance results for each of the Portfolios over the one- and three-year periods ended December 31, 2020, except for the Wells Fargo Factor Enhanced U.S. Low Volatility Equity Portfolio, for which the Board considered the investment performance results for the quarter ended December 31, 2020. The Board considered these results in comparison to the investment performance of funds in a universe that was determined by Broadridge Inc. (“Broadridge”) to be similar to each respective Portfolios (each, a “Universe”), and in comparison to each Portfolios’ benchmark index and to other comparative data. Broadridge is an independent provider of investment company data. The Board received a description of the methodology used by Broadridge to select the mutual funds in the performance Universe. The Board noted the short performance history of the Portfolios.
22 | Wells Fargo Emerging Markets Bond Portfolio
Board considerations (unaudited)
With respect to the investment performance of each Portfolio relative to its respective Universe, the Board noted the following: (i) the investment performance of each of Wells Fargo Factor Enhanced International Equity Portfolio and Wells Fargo Factor Enhanced U.S. Small Cap Equity Portfolio was higher than such Portfolio’s respective Universe for the one- and three-year periods under review; (ii) the investment performance of each of Wells Fargo Bloomberg Barclays US Aggregate ex-Corporate Portfolio, Wells Fargo Emerging Markets Bond Portfolio, and Wells Fargo Investment Grade Corporate Bond Portfolio was higher than such Portfolio’s respective Universe for the three-year period under review, and lower than such Portfolio’s respective Universe for the one-year period under review; (iii) the investment performance of each of Wells Fargo Factor Enhanced Emerging Markets Equity Portfolio, Wells Fargo Factor Enhanced U.S. Large Cap Equity Portfolio, Wells Fargo High Yield Corporate Bond Portfolio, Wells Fargo Strategic Retirement Bond Portfolio, and Wells Fargo U.S. REIT Portfolio was lower than such Portfolio’s respective Universe for the one- and three-year periods under review; and (iv) the Wells Fargo Factor Enhanced U.S. Low Volatility Equity Portfolio launched on July 1, 2020 and, given its short operational history, had no historical performance.
With respect to the investment performance of each Portfolio relative to its respective benchmark index, the Board noted the following: (i) the investment performance of each of Wells Fargo Bloomberg Barclays US Aggregate ex-Corporate Portfolio, Wells Fargo Factor Enhanced International Equity Portfolio, Wells Fargo Investment Grade Corporate Bond Portfolio, Wells Fargo Factor Enhanced U.S. Low Volatility Equity Portfolio, and Wells Fargo Strategic Retirement Bond Portfolio was higher than or in range of such Portfolio’s respective benchmark index for all periods under review; (ii) the investment performance of Wells Fargo U.S. REIT Portfolio was in range of the Portfolio’s benchmark index for the three-year period under review, and was lower than the Portfolio’s benchmark index for the one-year period under review; and (iii) the investment performance of each of Wells Fargo Emerging Markets Bond Portfolio, Wells Fargo Factor Enhanced Emerging Markets Equity Portfolio, Wells Fargo Factor Enhanced U.S. Large Cap Equity Portfolio, Wells Fargo Factor Enhanced U.S. Small Cap Equity Portfolio, and Wells Fargo High Yield Corporate Bond Portfolio was lower than such Portfolio’s respective benchmark index for all periods under review.
The Board received information concerning, and discussed factors contributing to, the underperformance of each of Wells Fargo Factor Enhanced Emerging Markets Equity Portfolio, Wells Fargo Factor Enhanced International Equity Portfolio, Wells Fargo Factor Enhanced U.S. Large Cap Equity Portfolio, Wells Fargo High Yield Corporate Bond Portfolio, Wells Fargo Strategic Retirement Bond Portfolio, and Wells Fargo U.S. REIT Portfolio relative to such Portfolio’s Universe and benchmark index for the periods identified above.
The Board also received and considered information regarding the fee rates that are payable to Funds Management for investment advisory services (as discussed below), which are the only fees charged to the Portfolios, relative to corresponding class-specific expense groups that were determined by Broadridge to be similar to the Portfolios (the “Groups”). The Board received a description of the methodology used by Broadridge to select the mutual funds in the expense Groups and an explanation of how funds comprising expense groups and their expense ratios may vary from year-to-year.
The Board took into account the Portfolios’ investment performance and expense information provided to it among the factors considered in deciding to re-approve the Advisory Agreements.
Investment advisory and sub-advisory fee rates
The Board reviewed and considered the contractual fee rates payable by the Portfolios to Funds Management under the Advisory Agreement. The Board also reviewed and considered the contractual investment sub-advisory fee rates that are payable by Funds Management to the Sub-Advisers for investment sub-advisory services.
Among other information reviewed by the Board was a comparison of the Portfolios’ Management Rates with the average contractual investment management fee rates of funds in the expense Groups at a common asset level as well as transfer agency costs of the Portfolios in the expense Groups. The Board noted that the Management Rates of the Portfolios were lower than, equal to, or in range of the sum of these average rates for the Portfolios’ expense Groups.
The Board also received and considered information about the portions of the total management fees that were retained by Funds Management after payment of the fees to the Sub-Advisers for sub-advisory services. In assessing the reasonableness of these amounts, the Board received and evaluated information about the nature and extent of responsibilities retained and risks assumed by Funds Management and not delegated to or assumed by the Sub-Advisers, and about Funds Management’s on-going oversight services. Given the affiliation between Funds Management and the Sub-Advisers, the Board ascribed limited relevance to the allocation of fees between them.
The Board also received and considered information about the nature and extent of services offered and fee rates charged by Funds Management and the Sub-Advisers to other types of clients with investment strategies similar to those of certain Portfolios. In this regard, the Board received information about the significantly greater scope of services, and compliance,
Wells Fargo Emerging Markets Bond Portfolio | 23
Board considerations (unaudited)
reporting and other legal burdens and risks of managing proprietary mutual funds compared with those associated with managing assets of other types of clients, including third-party sub-advised fund clients and non-mutual fund clients such as institutional separate accounts.
Based on its consideration of the factors and information it deemed relevant, including those described here, the Board determined that the compensation payable to Funds Management under the Advisory Agreement and to the Sub-Advisers under the Sub-Advisory Agreements was reasonable.
Profitability
The Board received and considered information concerning the profitability of Funds Management, as well as the profitability of both WFAM and Wells Fargo & Co. (“Wells Fargo”) from providing services to the funds family as a whole. The Board noted that the Sub-Advisers’ profitability information with respect to providing services to the Portfolios and other funds in the family was subsumed in the WFAM and Wells Fargo profitability analysis.
Funds Management reported on the methodologies and estimates used in calculating profitability, including a description of the methodology used to allocate certain expenses. Among other things, the Board noted that the levels of profitability reported on a fund-by-fund basis varied widely, depending on factors such as the size, type and age of fund.
Based on its review, the Board did not deem the profits reported by Funds Management, WFAM or Wells Fargo from services provided to the Portfolios to be at a level that would prevent it from approving the continuation of the Advisory Agreements.
Economies of scale
The Board received and considered information about the potential for Funds Management to experience economies of scale in the provision of management services to the Portfolios, the difficulties of calculating economies of scale at an individual fund level, and the extent to which potential scale benefits are shared with shareholders. The Board noted the existence of breakpoints in the Portfolios’ management fee structure, which operate generally to reduce the Portfolios’ expense ratios as the Portfolios grow in size, and the size of the Portfolios in relation to such breakpoints. The Board considered that in addition to management fee breakpoints, Funds Management shares potential economies of scale from its management business in a variety of ways, including through fee waiver and expense reimbursement arrangements, competitive management fee rates set at the outset without regard to breakpoints, and investments in the business intended to enhance services available to shareholders.
The Board concluded that Funds Management’s arrangements with respect to the Portfolios, including contractual breakpoints, constituted a reasonable approach to sharing potential economies of scale with the Portfolios and their shareholders.
Other benefits to Funds Management and the Sub-Advisers
The Board received and considered information regarding potential “fall-out” or ancillary benefits received by Funds Management and its affiliates, including the Sub-Advisers, as a result of their relationships with the Portfolios. Ancillary benefits could include, among others, benefits directly attributable to other relationships with the Portfolios and benefits potentially derived from an increase in Funds Management’s and the Sub-Advisers’ businesses as a result of their relationships with the Portfolios. The Board noted that various affiliates of Funds Management may receive distribution-related fees, shareholder servicing payments and sub-transfer agency fees in respect of shares sold or held through them and services provided.
The Board also reviewed information about soft dollar credits earned and utilized by the Sub-Advisers, fees earned by Funds Management and Wells Capital Management Incorporated from managing a private investment vehicle for the fund family’s securities lending collateral, and commissions earned by an affiliated broker from portfolio transactions.
Based on its consideration of the factors and information it deemed relevant, including those described here, the Board did not find that any ancillary benefits received by Funds Management and its affiliates, including the Sub-Advisers, were unreasonable.
Conclusion
At the Meeting, after considering the above-described factors and based on its deliberations and its evaluation of the information described above, the Board unanimously determined that the compensation payable to Funds Management and the Sub-Advisers under each of the Advisory Agreements was reasonable, and approved the continuation of the Advisory Agreements for a one-year term.
24 | Wells Fargo Emerging Markets Bond Portfolio
Board considerations (unaudited)
Board Considerations – New Agreements
Overview of the Board evaluation process
At a meeting held on May 17-19, 2021 (the “Board Meeting”), the Board of Trustees (the “Board”) of Wells Fargo Master Trust (the “Trust”, and the series identified below, the “Portfolios”) approved the continuation of each Portfolio’s current Investment Advisory Agreement (the “Current Investment Advisory Agreement”) and the current Sub-Advisory Agreements (the “Current Sub-Advisory Agreements”, and collectively, the “Current Agreements”).
| Wells Fargo Disciplined Large Cap Portfolio |
| Wells Fargo Diversified Large Cap Growth Portfolio |
| Wells Fargo Disciplined International Developed Markets Portfolio |
| Wells Fargo Large Company Value Portfolio |
| Wells Fargo Managed Fixed Income Portfolio |
| Wells Fargo Bloomberg Barclays US Aggregate ex-Corporate Portfolio |
| Wells Fargo Emerging Markets Bond Portfolio |
| Wells Fargo Factor Enhanced Emerging Markets Equity Portfolio |
| Wells Fargo Factor Enhanced International Equity Portfolio |
| Wells Fargo Factor Enhanced U.S. Large Cap Equity Portfolio |
| Wells Fargo Factor Enhanced U.S. Low Volatility Equity Portfolio |
| Wells Fargo Factor Enhanced U.S. Small Cap Equity Portfolio |
| Wells Fargo High Yield Corporate Bond Portfolio |
| Wells Fargo Investment Grade Corporate Bond Portfolio |
| Wells Fargo Strategic Retirement Bond Portfolio |
| Wells Fargo U.S. REIT Portfolio |
Each Trustee on the Board is not an “interested person” (as defined in the Investment Company Act of 1940 (the “1940 Act”)) of the Portfolios (collectively, the “Independent Trustees”). The process followed by the Board in considering and approving the continuation of the Current Agreements is referred to herein as the “2021 Annual Approval Process.”
As noted above, the closing of the sale of Wells Fargo Asset Management (“WFAM”) to a holding company (“NewCo”) affiliated with private funds of GTCR LLC (“GTCR”) and of Reverence Capital Partners, L.P. (“Reverence Capital”, and such transaction, the “Transaction”) will result in a change of control of Wells Fargo Funds Management LLC (“Funds Management”), Wells Capital Management Incorporated (“Wells Capital”) and Wells Fargo Asset Management (International) Limited (“WFAM(I) Ltd.”, and together with Funds Management and Wells Capital, the “Advisers”), which will be considered to be an “assignment” of each Portfolio’s Current Agreements under the 1940 Act that will result in the automatic termination of each Portfolio’s Current Agreements. In light of the expected termination of each Portfolio’s Current Agreements upon the closing, at the Board Meeting the Board also considered and approved: (i) a new Investment Advisory Agreement (the “New Investment Advisory Agreement”) between the Trust, on behalf of each Portfolio, and Funds Management; (ii) a new Sub-Advisory Agreement (the “New Wells Capital Sub-Advisory Agreement”) among the Trust, on behalf of each Portfolio, Funds Management and Wells Capital; and (iii) a new Sub-Advisory Agreement (the “New WFAM(I) Ltd Sub-Advisory Agreement”) among the Trust, on behalf of Emerging Markets Bond Portfolio, Funds Management and WFAM(I) Ltd (“WFAMI”); and (iv) a new Sub-Advisory Agreement (the “New Galliard Sub-Advisory Agreement”, and collectively, the “New Agreements”) among the Trust, on behalf of Managed Fixed Income Portfolio, Funds Management and Galliard Capital Management, LLC (“Galliard”, and together with Wells Capital and WFAMI, the “Sub-Advisers”), each of which is intended to go into effect upon the closing. The process followed by the Board in reviewing and approving the New Agreements is referred to herein as the “New Agreement Approval Process.”
At a series of meetings held in April and May 2021 (collectively, “April and May 2021 Meetings”) and at the Board Meeting, the Trustees conferred extensively among themselves and with senior representatives of Funds Management, GTCR and Reverence Capital about the New Agreements and related matters. The Board reviewed and discussed information furnished by Funds Management, GTCR and Reverence Capital that the Board considered reasonably necessary to evaluate the terms of the New Agreements and the services to be provided. At these meetings, senior representatives from Funds Management, GTCR and Reverence Capital made presentations to, and responded to questions from, the Board.
In providing information to the Board in connection with the 2021 annual approval process for the Current Agreements (the “2021 Annual Approval Process”) and the New Agreement Approval Process, Funds Management, GTCR and Reverence Capital (as applicable) were guided by requests for information submitted by independent legal counsel on behalf of the Independent Trustees. In considering and approving the New Agreements, the Trustees considered the information they believed relevant, including but not limited to the information discussed herein. The Board considered not only the specific information presented in
Wells Fargo Emerging Markets Bond Portfolio | 25
Board considerations (unaudited)
connection with the April and May 2021 Meetings as well as the Board Meeting, but also the knowledge gained over time through interaction with Funds Management and the Sub-Advisers about various topics. In this regard, the Board reviews reports of Funds Management at each of its regular Board meetings, which includes, among other things, portfolio reviews and investment performance reports. In addition, the Board confers with portfolio managers at various times throughout the year. The Board was assisted in its evaluation of the New Agreements by independent legal counsel, from whom the Independent Trustees received separate legal advice and with whom the Independent Trustees met separately. The Board did not identify any particular information or consideration that was all-important or controlling, and each individual Trustee may have attributed different weights to various factors.
Among other information considered by the Board in connection with the Transaction was:
| ■ | Information regarding the Transaction: information about the structure, financing sources and material terms and conditions of the Transaction, including the expected impact on the businesses conducted by the Advisers and by Wells Fargo Funds Distributor LLC. |
| ■ | Information regarding NewCo, GTCR and Reverence Capital: (i) information about NewCo, including information about its expected financial condition and access to capital, and senior leadership team; (ii) the experience of senior management at GTCR and Reverence Capital in acquiring portfolio companies; (iii) the plan to operationalize NewCo, including the transition of necessary infrastructure services through a transition services agreement with Wells Fargo under which Wells Fargo will continue to provide NewCo with certain services for a specified period of time after the closing; and (iv) information regarding regulatory matters, compliance, and risk management functions at NewCo, including resources to be dedicated thereto. |
| ■ | Impact of the Transaction on WFAM and Service Providers: (i) information regarding any changes to personnel and/or other resources of the Advisers as a result of the Transaction, including assurances regarding comparable and competitive compensation arrangements to attract and retain highly qualified personnel; and (ii) information about the organizational and operating structure with respect to NewCo, the Advisers and the Portfolios. |
| ■ | Impact of the Transaction on the Portfolios and their Shareholders: (i) information regarding anticipated benefits to the Portfolios as a result of the Transaction; (ii) a commitment that the Portfolios would not bear any expenses, directly or indirectly, in connection with the Transaction; (iii) confirmation that the Advisers intend to continue to manage the Portfolios in a manner consistent with each Portfolio’s current investment objectives and principal investments strategies; and (iv) a commitment that neither NewCo nor WFAM will take any steps that would impose any “unfair burden” (as that term is used in section 15(f)(1)(B) of the 1940 Act) on the Portfolios as a result of the Transaction. |
With respect to the New Agreements, the Board considered: (i) a representation that, after the closing, all of the Portfolios will continue to be managed and advised by their current Advisers, and that the same portfolio managers of the Sub-Advisers are expected to continue to manage the Portfolios after the Transaction; (ii) information regarding the terms of the New Agreements, including changes as compared to the Current Agreements; (iii) information confirming that the fee rates payable under the New Agreements will not increase as a result of the Transaction as compared to the rates under the Current Agreements; and (iv) assurances that the Transaction is not expected to cause any diminution with respect to the nature, extent and quality of any of the services currently provided to the Portfolios by the Advisers as a result of the Transaction.
In addition to considering information furnished specifically to evaluate the impact of the Transaction on the Portfolios and their respective shareholders in connection with the New Agreement Approval Process, the Board considered information furnished at prior meetings of the Board and its committees, including detailed information provided in connection with the 2021 Annual Approval Process. In this regard, in connection with the 2021 Annual Approval Process, the Board received information about complex-wide and individual Portfolio performance, fees and expenses, including: (i) a report from an independent data provider comparing the investment performance of each Portfolio to the investment performance of comparable funds and benchmark indices, over various time periods; (ii) a report from an independent data provider comparing each Portfolio’s total expense ratio (and its components) to those of comparable funds; (iii) comparative information concerning the fees charged and services provided by the Advisers to each Portfolio in managing other accounts (which may include other mutual funds, collective investment funds and institutional accounts), if any, that employ investment strategies and techniques similar to those used in managing such Portfolio(s); and (iv) profitability analyses of Funds Management, as well as the profitability of both WFAM and Wells Fargo from providing services to the fund family as a whole.
After its deliberations, the Board unanimously determined that the compensation payable to Funds Management and the Sub-Advisers under the New Agreements is reasonable, approved the New Agreements for a two-year term. The Board considered the approval of the New Agreements as part of its consideration of agreements for funds across the complex, but its approvals were made on a fund-by-fund basis. The following summarizes a number of important, but not necessarily all, factors considered by the Board in support of its approvals.
26 | Wells Fargo Emerging Markets Bond Portfolio
Board considerations (unaudited)
Nature, extent and quality of services
In connection with the 2021 Annual Approval Process, the Board received and considered various information regarding the nature, extent and quality of services provided to each Portfolio by Funds Management and the Sub-Advisers under the Advisory Agreements. This information included a description of the investment advisory services and administrative services covered by the Current Advisory Agreement, as well as, among other things, a summary of the background and experience of senior management of WFAM, of which Funds Management and the Sub-Advisers are a part, and a summary of investments made in the business of WFAM. The Board also received a description of Funds Management’s and the Sub-Advisers’ business continuity plans, including a summary of the performance of such plans and any changes thereto during the COVID-19 pandemic, and of their approaches to data privacy and cybersecurity. The Board also received and reviewed information about Funds Management’s role as administrator of the Portfolios’ liquidity risk management program, Funds Management’s approach to risk management, and Funds Management’s intermediary and vendor oversight program.
In connection with the 2021 Annual Approval Process, the Board also considered the qualifications, background, tenure and responsibilities of each of the portfolio managers primarily responsible for the day-to-day portfolio management of the Portfolios. The Board evaluated the ability of Funds Management and the Sub-Advisers to attract and retain qualified investment professionals, including research, advisory and supervisory personnel.
In connection with the 2021 Annual Approval Process, the Board further considered the compliance programs and compliance records of Funds Management and the Sub-Advisers. In addition, the Board took into account the full range of services provided to the Portfolios by Funds Management and its affiliates.
In connection with the New Agreement Approval Process, the Board considered, among other information, the structure of the Transaction and expected impact, if any, of the Transaction on the operations, facilities, organization and personnel of the Advisers. The Board received assurances from the Advisers that each Portfolio will continue to be advised by its current Advisers after the closing, and that the same individual portfolio managers are expected to continue to manage the Portfolios after the closing. With respect to the recruitment and retention of key personnel, the Board noted information from GTCR, Reverence Capital and the Advisers regarding the potential benefits for employees of joining NewCo. The Board recognized that the personnel who had been extended offers may not accept such offers and personnel changes may occur in the future in the ordinary course.
In addition, the Board considered information regarding the infrastructure, operational capabilities and support staff in place to assist in the portfolio management and operations of the Portfolios, including the provision of administrative services, and the anticipated impact of the Transaction on such matters. The Board also considered the business-related and other risks to which the Advisers may be subject in managing the Portfolios and in connection with the Transaction. The Board also considered the transition and integration plans as a result of the change in ownership of the Advisers from Wells Fargo to NewCo. The Board considered the resources and infrastructure that NewCo intends to devote to its compliance program to ensure compliance with applicable laws and regulations, as well as its risk management program and cybersecurity program. The Board also took into account assurances received from the Advisers, GTCR and Reverence Capital that the Transaction is not expected to cause any diminution in the nature, extent and quality of services provided by the Advisers to the Portfolios and their shareholders.
Investment performance and expenses
In connection with the 2021 Annual Approval Process, the Board considered the investment performance results for each Portfolio over various time periods ended December 31, 2020. The Board considered these results in comparison to the investment performance of funds in a universe that was determined by Broadridge Inc. (“Broadridge”) to be similar to each Portfolio (the “Universe”), and in comparison to each Portfolio’s benchmark index and to other comparative data. Broadridge is an independent provider of investment company data. The Board received a description of the methodology used by Broadridge to select the mutual funds in the performance Universe. Where applicable, the Board received information concerning, and discussed factors contributing to, underperformance of Portfolios relative to the Universe and benchmark for any underperformance periods.
In connection with the 2021 Annual Approval Process, the Board also reviewed the fee rates that are payable to Funds Management for investment advisory services (as discussed below), which are the only fees charged at the Portfolio level, relative to corresponding expense groups that were determined by Broadridge to be similar to the Portfolios (the “Groups”). The Board received a description of the methodology used by Broadridge to select the mutual funds in the expense Groups and an explanation of how funds comprising expense groups and their expense ratios may vary from year-to-year.
In connection with the New Agreement Approval Process, the Board received a commitment that WFAM will maintain fee and expense commitments for at least two years after the closing. The Board took into account each Fund’s investment performance and expense information among the factors considered in deciding to approve the New Agreements.
Wells Fargo Emerging Markets Bond Portfolio | 27
Board considerations (unaudited)
Investment advisory and sub-advisory fee rates
In connection with the 2021 Annual Approval Process, the Board reviewed and considered the contractual investment advisory fee rate that is payable by each Portfolio to Funds Management for investment advisory services under the Current Advisory Agreement (the “Advisory Agreement Rate”). The Board also reviewed and considered the contractual investment sub-advisory fee rate that is payable by Funds Management to the applicable Sub-Adviser for investment sub-advisory services (the “Sub-Advisory Agreement Rate”).
Among other information reviewed by the Board in connection with the 2021 Annual Approval Process, was a comparison of each Portfolio’s Advisory Agreement Rate with those of other funds in the Portfolio’s expense Group at a common asset level.
In connection with the 2021 Annual Approval Process, the Board also received and considered information about the portion of the total management fee that was retained by Funds Management after payment of the Sub-Advisory Agreement Rates. In assessing the reasonableness of this amount, the Board received and evaluated information about the nature and extent of responsibilities retained and risks assumed by Funds Management and not delegated to or assumed by the Sub-Advisers, and about Funds Management’s on-going oversight services. Given the affiliation between Funds Management and the Sub-Advisers, the Board ascribed limited relevance to the allocation of fees between them.
In connection with the 2021 Annual Approval Process, the Board also received and considered information about the nature and extent of services offered and fee rates charged by Funds Management and the Sub-Advisers to other types of clients, if any, with investment strategies similar to those of each Portfolio. In this regard, the Board received information about the significantly greater scope of services, and compliance, reporting and other legal burdens and risks of managing proprietary mutual funds compared with those associated with managing assets of other types of clients, including third-party sub-advised fund clients and non-mutual fund clients such as institutional separate accounts.
In connection with the New Agreement Approval Process, the Board noted the assurances received by it that there would be no increases to any of the Advisory Agreement Rates or the Sub-Advisory Agreement Rates as a result of the Transaction. The Board also considered that the New Agreements do not change the computation method for calculating such fees, and there is no present intention to reduce expense waiver and reimbursement arrangements that are currently in effect. Based on its consideration of the factors and information it deemed relevant, including those described here, the Board determined that the compensation payable to Funds Management under the New Advisory Agreement and to each of the Sub-Advisers under the applicable new Sub-Advisory Agreement was reasonable.
Profitability
In connection with the 2021 Annual Approval Process, the Board received and considered information concerning the profitability of Funds Management, as well as the profitability of both WFAM and Wells Fargo from providing services to the fund family as a whole. The Board noted that the Sub-Advisers’ profitability information with respect to providing services to each Fund and other funds in the family was subsumed in the WFAM and Wells Fargo profitability analysis.
Funds Management reported on the methodologies and estimates used in calculating profitability in connection with the 2021 Annual Approval Process, including a description of the methodology used to allocate certain expenses. Among other things, the Board noted that the levels of profitability reported on a fund-by-fund basis varied widely, depending on factors such as the size, type and age of fund.
In connection with the New Agreement Approval Process, the Board received certain information about NewCo’s projected financial condition, and reviewed with senior representatives of Funds Management, GTCR and Reverence Capital the underlying assumptions on which such information was based. The Board considered that NewCo is a newly formed entity, with no historical operations, revenues or expenses, and that it is difficult to predict with any degree of certainty the future profitability of NewCo and the Advisers from advisory activities under the New Agreements. The Board considered that the fee rates payable under the New Agreements will not increase as a result of the Transaction as compared to the rates under the Current Agreements, and that the current contractual expense limitations applicable to each Portfolio will not increase. The Board noted that if the New Agreements are approved by shareholders and the Transaction closes, the Board will have the opportunity in the future to review the profitability of NewCo and the Advisers from advisory activities under the New Agreements.
Economies of scale
In connection with the 2021 Annual Approval Process, the Board received and considered information about the potential for Funds Management to experience economies of scale in the provision of advisory services to the Portfolios, the difficulties of calculating economies of scale at an individual fund level, and the extent to which potential scale benefits are shared with Portfolio shareholders. The Board noted the existence of breakpoints in each Portfolio’s advisory fee structure, which operate generally to reduce the Portfolio’s expense ratios as the Portfolio grows in size, and the size of the Portfolio in relation to such breakpoints. The
28 | Wells Fargo Emerging Markets Bond Portfolio
Board considerations (unaudited)
Board considered that, in addition to advisory fee breakpoints, Funds Management shares potential economies of scale from its management business in a variety of ways, including through fee waiver and expense reimbursement arrangements, competitive management fee rates set at the outset without regard to breakpoints, and investments in the business intended to enhance services available to shareholders.
In connection with the New Agreement Approval Process, the Board noted that NewCo and the Advisers may benefit from possible growth of the Portfolios resulting from enhanced distribution capabilities for their investing funds. However, the Board noted that other factors could also affect the potential for economies of scale, and that it was not possible to quantify any potential future economies of scale. Based upon the information furnished to the Board in connection with the 2021 Annual Approval Process and the New Agreement Approval Process, the Board concluded that Funds Management’s arrangements with respect to each Portfolio, including contractual breakpoints and expense limitation arrangements, constituted a reasonable approach to sharing potential economies of scale with the Portfolio and its shareholders.
“Fall-out” benefits to Funds Management and the Sub-Advisers
In connection with the 2021 Annual Approval Process, the Board received and considered information regarding potential “fall-out” or ancillary benefits received by Funds Management and its affiliates, including the Sub-Advisers, as a result of their relationships with the Portfolios. Ancillary benefits could include, among others, benefits directly attributable to other relationships with the Portfolios and benefits potentially derived from an increase in Funds Management’s and the Sub-Advisers’ business as a result of their relationships with the Portfolios. The Board noted that various current affiliates of Funds Management may receive distribution-related fees, shareholder servicing payments and sub-transfer agency fees in respect of shares sold or held through them and services provided.
In connection with the 2021 Annual Approval Process, the Board also reviewed information about soft dollar credits earned and utilized by the Sub-Advisers, fees earned by Funds Management and Wells Capital from managing a private investment vehicle for the fund family’s securities lending collateral, and commissions earned by an affiliated broker of Wells Fargo from portfolio transactions.
In connection with the New Agreement Approval Process, the Board received information to the effect that the Transaction is not expected to have a material impact on the fall-out benefits currently realized by Funds Management and its affiliates, including the Sub-Advisers. The information reviewed by the Board also noted that several of the ancillary benefits identified for WFAM would be potential ancillary benefits for NewCo, including that the scale and reputation of the Portfolios might benefit NewCo’s broader reputation, product initiatives, technology investment and talent acquisition. Based on its consideration of the factors and information it deemed relevant, including those described here, the Board did not find that any ancillary benefits expected to be received by Funds Management and its affiliates, including NewCo and the Sub-Advisers, under the New Agreements were unreasonable.
Conclusion
At the Board Meeting, after considering the above-described factors and based on its deliberations and its evaluation of the information described above, the Board unanimously determined that the compensation payable to Funds Management and to each of the Sub-Advisers under the New Agreements is reasonable, approved the New Agreements for a two-year term.
Wells Fargo Emerging Markets Bond Portfolio | 29
Board considerations (unaudited)
Board Considerations - Interim Agreements
At a meeting held on May 17-19, 2021 (the “Board Meeting”), the Boards of Trustees (each, a “Board”, and collectively, the “Boards”) of Wells Fargo Funds Trust, Wells Fargo Master Trust, Wells Fargo Variable Trust, Wells Fargo Global Dividend Opportunity Fund, Wells Fargo Income Opportunities Fund, Wells Fargo Multi-Sector Income Fund and Wells Fargo Utilities and High Income Fund (each a “Trust”, and the series thereof, a “Fund”) reviewed and approved for the Trusts and Funds, as applicable: (i) interim investment management agreements (the “Interim Management Agreements”) with Wells Fargo Funds Management, LLC (“Funds Management”); (ii) interim investment advisory agreements (the “Interim Advisory Agreements”) with Funds Management; and (iii) interim sub-advisory agreements (the “Interim Sub-Advisory Agreements”) with each of Cooke & Bieler, L.P., Galliard Capital Management LLC (“Galliard”), Peregrine Capital Management Inc., Wells Capital Management, LLC (“WellsCap”), and Wells Fargo Asset Management (International) Limited (“WFAMI”, and collectively, the “Sub-Advisers”). Each Trustee on the Board is not an “interested person” (as defined in the Investment Company Act of 1940 (the “1940 Act”) of the Funds (collectively, the “Independent Trustees”). The Interim Management Agreements, Interim Advisory Agreements, and Interim Sub-Advisory Agreements are collectively referred to as the “Interim Advisory Agreements.”
At the Board Meeting, the Boards reviewed and approved the continuation of existing investment management, advisory and sub-advisory agreements (the “Current Advisory Agreements”) for each Trust and Fund, as applicable. The factors considered and conclusions reached by the Boards in approving the Current Advisory Agreements are summarized in the section entitled “Board Considerations – Current Agreements” of this shareholder report. The Boards noted that Wells Fargo & Company has entered into a definitive agreement to sell Wells Fargo Asset Management (“WFAM”), which includes Funds Management, Galliard, WellsCap and WFAMI (the “Affiliated Sub-Advisers”), to a holding company affiliated with private funds of GTCR LLC and Reverence Capital Partners, L.P. (the “Transaction”). The Boards further noted that the Transaction would result in a change-of-control of Funds Management and the Affiliated Sub-Advisers, which would be considered to be an “assignment” under the 1940 Act that would terminate the Current Advisory Agreements. At the Board Meeting, the Boards also reviewed and approved new investment management, advisory and sub-advisory agreements (the “New Advisory Agreements”) for each Trust and Fund, as applicable, that would replace the Current Advisory Agreements upon consummation of the Transaction, subject to approval of the New Advisory Agreements by the applicable Trust’s or Fund’s shareholders. The factors considered and conclusions reached by the Boards in approving the New Advisory Agreements are summarized in the section entitled “Board Considerations – New Agreements” of this shareholder report.
At the Board Meeting, the Boards also approved the Interim Advisory Agreements, which will go into effect for a Trust or Fund only in the event that shareholders of such Trust or Fund do not approve the New Advisory Agreement(s) for the Trust or Fund by the closing date of the Transaction, when the Current Advisory Agreements will terminate. The Board noted that, in such a circumstance, the Interim Advisory Agreements will permit continuity of management by allowing Funds Management and the Sub-Advisers to continue providing services to the Trust or Fund pursuant to the Interim Advisory Agreements while the Trust or Fund continues to solicit shareholder approval of such New Advisory Agreement(s). The Boards noted that the terms of the Interim Advisory Agreements are identical to those of the Current Advisory Agreements, except for the term and the addition of escrow provisions with respect to the advisory fees. The Boards also noted that the entities that would service the Funds and Trusts under the Interim Advisory Agreements are identical to those that provide services under the Current Advisory Agreements and those that will provide services under the New Advisory Agreements.
In approving the Interim Advisory Agreements, the Boards considered the same factors and reached the same conclusions as they considered and reached with respect to the Boards’ approvals of the Current Advisory Agreements and New Advisory Agreements, as applicable, which are described in separate Board Consideration sections within this shareholder report. Prior to the Board Meeting, including at a series of meetings held in April and May 2021, the Trustees conferred extensively among themselves and with senior representatives of Funds Management, GTCR LLC and Reverence Capital Partners, L.P. about the Interim Advisory Agreements and related matters. The Independent Trustees were assisted in their evaluation of the Interim Advisory Agreements by independent legal counsel, from whom they received separate legal advice and with whom they met separately.
At the Board Meeting, after considering the factors and reaching the conclusions described in the separate Board Consideration sections within this shareholder report, the Boards unanimously determined that the compensation payable to Funds Management and to each Sub-Adviser under each of the Interim Advisory Agreements was reasonable, and approved the Interim Advisory Agreements.
30 | Wells Fargo Emerging Markets Bond Portfolio
For more information
More information about Wells Fargo Funds is available free upon request. To obtain literature, please write, visit the Portfolio's website, or call:
Wells Fargo Funds
P.O. Box 219967
Kansas City, MO 64121-9967
Website: wfam.com
Individual investors: 1-800-222-8222
Retail investment professionals: 1-888-877-9275
Institutional investment professionals: 1-866-765-0778
This report and the financial statements contained herein are submitted for the general information of the interest holders of the Portfolio. If this report is used for promotional purposes, distribution of the report must be accompanied or preceded by a current prospectus. Before investing, please consider the investment objectives, risks, charges, and expenses of the investment. For a current prospectus and, if available, a summary prospectus, containing this information, call
1-800-222-8222 or visit the Portfolio's website at wfam.com. Read the prospectus carefully before you invest or send money.
Wells Fargo Asset Management (WFAM) is the trade name for certain investment advisory/management firms owned by Wells Fargo & Company. These firms include but are not limited to Wells Capital Management, LLC and Wells Fargo Funds Management, LLC. Certain products managed by WFAM entities are distributed by Wells Fargo Funds Distributor, LLC (a broker-dealer and Member FINRA).
This material is for general informational and educational purposes only and is NOT intended to provide investment advice or a recommendation of any kind - including a recommendation for any specific investment, strategy, or plan.
INVESTMENT PRODUCTS: NOT FDIC INSURED ■ NO BANK GUARANTEE ■ MAY LOSE VALUE
© 2021 Wells Fargo & Company. All rights reserved.
Semi-Annual Report
August 31, 2021
Wells Fargo
Factor Enhanced Emerging Markets Equity Portfolio
INVESTMENT PRODUCTS: NOT FDIC INSURED ■ NO BANK GUARANTEE ■ MAY LOSE VALUE
Wells Fargo Factor Enhanced Emerging Markets Equity Portfolio | 1
Portfolio information (unaudited)
| Investment objective | The Portfolio seeks long-term capital appreciation. |
| Adviser | Wells Fargo Funds Management, LLC |
| Subadviser | Wells Capital Management, LLC |
| Portfolio managers | Dennis Beinn, CFA®‡, Harindra de Silva, Ph.D., CFA®‡, Monisha Jayakumar |
| Ten largest holdings (%) as of August 31, 20211 |
| Taiwan Semiconductor Manufacturing Company Limited | 6.32 |
| Tencent Holdings Limited | 4.21 |
| Samsung Electronics Company Limited | 3.60 |
| Alibaba Group Holding Limited ADR | 3.36 |
| Meituan Dianping | 1.42 |
| Infosys Limited | 1.02 |
| Reliance Industries Limited | 0.82 |
| JD.com Incorporated ADR | 0.80 |
| Housing Development Finance Corporation Limited | 0.75 |
| Tata Consultancy Services Limited | 0.69 |
| 1 | Figures represent the percentage of the Portfolio's net assets. Holdings are subject to change and may have changed since the date specified. |
| Sector allocation as of August 31, 20211 |
| 1 | Figures represent the percentage of the Portfolio's long-term investments. These amounts are subject to change and may have changed since the date specified. |
| Country allocation as of August 31, 20211 |
| 1 | Figures represent the percentage of the Portfolio's long-term investments. These amounts are subject to change and may have changed since the date specified. |
| ‡ | CFA® and Chartered Financial Analyst® are trademarks owned by CFA Institute. |
2 | Wells Fargo Factor Enhanced Emerging Markets Equity Portfolio
Portfolio of investments—August 31, 2021 (unaudited)
| | | | | | Shares | Value |
| Common stocks: 93.23% | | | | | | |
| Brazil: 3.09% | | | | | | |
| Ambev SA (Consumer staples, Beverages) | | | | | 69,400 | $ 229,508 |
| Atacadao Distribuicao Comercio e Industria Limitada (Consumer staples, Food & staples retailing) | | | | | 54,600 | 191,651 |
| B3 Brasil Bolsa Balcao SA (Financials, Capital markets) | | | | | 158,200 | 430,470 |
| Banco BTG Pactual SA (Financials, Diversified financial services) | | | | | 95,600 | 522,483 |
| Banco do Brasil SA (Financials, Banks) | | | | | 37,000 | 217,744 |
| Banco Santander Brasil SA (Financials, Banks) | | | | | 36,300 | 294,427 |
| BB Seguridade Participacoes SA (Financials, Insurance) | | | | | 87,800 | 323,638 |
| Braskem SA Class A (Materials, Chemicals) † | | | | | 5,800 | 74,020 |
| BRF SA (Consumer staples, Food products) † | | | | | 25,500 | 115,497 |
| Cia Siderurgica Nacional SA (Materials, Metals & mining) | | | | | 37,500 | 252,814 |
| Cosan SA Industria e Comercio (Energy, Oil, gas & consumable fuels) | | | | | 5,100 | 21,748 |
| CPFL Energia SA (Utilities, Electric utilities) | | | | | 24,000 | 134,788 |
| Engie Brasil Energia SA (Utilities, Energy equipment & services) | | | | | 8,200 | 59,548 |
| Equatorial Energia SA (Utilities, Electric utilities) | | | | | 17,000 | 83,672 |
| Hypermarcas SA (Health care, Pharmaceuticals) | | | | | 10,800 | 74,293 |
| JBS SA (Consumer staples, Food products) | | | | | 58,500 | 352,643 |
| Klabin SA (Materials, Containers & packaging) † | | | | | 11,700 | 59,532 |
| Localiza Rent A Car SA (Industrials, Road & rail) | | | | | 27,560 | 295,598 |
| Lojas Renner SA (Consumer discretionary, Multiline retail) | | | | | 24,400 | 179,598 |
| Magazine Luiza SA (Consumer discretionary, Multiline retail) | | | | | 2,800 | 9,877 |
| Petrobras Distribuidora SA (Consumer discretionary, Specialty retail) | | | | | 78,500 | 412,782 |
| Petróleo Brasileiro SA (Consumer discretionary, Specialty retail) | | | | | 18,100 | 97,732 |
| Raia Drogasil SA (Consumer staples, Food & staples retailing) | | | | | 42,400 | 209,589 |
| Telefonica Brasil SA (Communication services, Diversified telecommunication services) | | | | | 26,455 | 223,733 |
| TIM SA (Communication services, Wireless telecommunication services) | | | | | 69,300 | 166,991 |
| Totvs SA (Information technology, Software) | | | | | 40,400 | 309,399 |
| Ultrapar Participacoes SA (Energy, Oil, gas & consumable fuels) | | | | | 52,596 | 146,880 |
| WEG SA (Industrials, Electrical equipment) | | | | | 33,866 | 232,899 |
| | | | | | | 5,723,554 |
| Chile: 0.55% | | | | | | |
| Banco de Chile (Financials, Banks) | | | | | 790,905 | 77,287 |
| Banco de Credito e Inversiones (Financials, Banks) | | | | | 1,606 | 69,568 |
| Banco Santander Chile SA (Financials, Banks) | | | | | 952,747 | 50,343 |
| Cencosud SA (Consumer staples, Food & staples retailing) | | | | | 159,926 | 301,730 |
| Cencosud Shopping SA (Real estate, Real estate management & development) | | | | | 86,037 | 122,299 |
| Compania Cervecerias Unidas SA (Consumer staples, Beverages) | | | | | 8,123 | 81,981 |
| Empresas Copec SA (Energy, Oil, gas & consumable fuels) | | | | | 6,299 | 58,599 |
| Enel Americas SA (Utilities, Electric utilities) | | | | | 1,315,763 | 184,890 |
| S.A.C.I. Falabella (Consumer discretionary, Multiline retail) | | | | | 16,416 | 65,020 |
| | | | | | | 1,011,717 |
| China: 30.77% | | | | | | |
| 3SBio Incorporated (Health care, Biotechnology) 144A† | | | | | 187,500 | 209,018 |
| Agile Property Holdings Limited (Real estate, Real estate management & development) | | | | | 214,000 | 245,438 |
| Agricultural Bank of China Limited Class H (Financials, Banks) | | | | | 148,000 | 49,667 |
| Air China Limited Class H (Industrials, Airlines) † | | | | | 50,000 | 33,559 |
| Airtac International Group (Industrials, Machinery) | | | | | 5,000 | 152,455 |
The accompanying notes are an integral part of these financial statements.
Wells Fargo Factor Enhanced Emerging Markets Equity Portfolio | 3
Portfolio of investments—August 31, 2021 (unaudited)
| | | | | | Shares | Value |
| China: (continued) | | | | | | |
| Alibaba Group Holding Limited ADR (Consumer discretionary, Internet & direct marketing retail) † | | | | | 37,364 | $ 6,239,414 |
| Alibaba Health Information Technology Limited (Health care, Health care technology) † | | | | | 28,000 | 45,938 |
| Aluminum Corporation of China Limited Class H (Materials, Metals & mining) † | | | | | 405,334 | 293,937 |
| Angel Yeast Company Limited Class A (Consumer staples, Food products) | | | | | 100 | 620 |
| Anhui Conch Cement Company Limited Class H (Materials, Construction materials) | | | | | 26,000 | 140,740 |
| Anhui Gujing Distillery Company Class B (Consumer staples, Beverages) | | | | | 5,413 | 66,112 |
| ANTA Sports Products Limited (Consumer discretionary, Textiles, apparel & luxury goods) | | | | | 18,000 | 370,301 |
| Autohome Incorporated ADR (Communication services, Interactive media & services) | | | | | 1,576 | 69,754 |
| Baidu Incorporated ADR (Communication services, Interactive media & services) † | | | | | 5,902 | 926,732 |
| Bank of Chengdu Company Limited Class A (Financials, Banks) | | | | | 36,900 | 69,139 |
| Bank of China Limited Class H (Financials, Banks) | | | | | 2,328,000 | 817,162 |
| Bank of Communications Company Limited Class H (Financials, Banks) | | | | | 461,000 | 264,954 |
| Bank of Hangzhou Company Limited Class A (Financials, Banks) | | | | | 2,900 | 6,008 |
| Bank of Jiangsu Company Limited Class A (Financials, Banks) | | | | | 29,900 | 29,746 |
| Baoshan Iron & Steel Company Limited Class A (Materials, Metals & mining) | | | | | 31,900 | 50,294 |
| Baozun Incorporated ADR (Consumer discretionary, Internet & direct marketing retail) † | | | | | 4,909 | 118,209 |
| Beijing Enlight Media Company Limited Class A (Communication services, Media) | | | | | 28,100 | 40,477 |
| Beijing Kunlun Tech Company Limited Class A (Communication services, Interactive media & services) | | | | | 38,300 | 99,732 |
| Beijing Tiantan Biological Products Corporation Limited Class A (Health care, Biotechnology) | | | | | 9,300 | 44,635 |
| Beijing Yuanliu Hongyuan Electronic Technology Company Class A (Information technology, Electronic equipment, instruments & components) | | | | | 4,107 | 97,096 |
| BGI Genomics Company Limited (Health care, Biotechnology) | | | | | 1,900 | 27,572 |
| Bilibili Incorporated ADR (Communication services, Entertainment) † | | | | | 1,017 | 81,594 |
| BYD Company Limited Class A (Consumer discretionary, Automobiles) | | | | | 800 | 34,286 |
| BYD Company Limited Class H (Consumer discretionary, Automobiles) | | | | | 16,000 | 541,874 |
| By-Health Company Limited (Health care, Biotechnology) | | | | | 49,100 | 191,061 |
| C&S Paper Company Limited Class A (Consumer staples, Household products) | | | | | 28,300 | 80,260 |
| China Aoyuan Group Limited (Real estate, Real estate management & development) | | | | | 27,000 | 16,178 |
| China Bohai Bank Company Limited Class H (Financials, Banks) | | | | | 88,500 | 35,958 |
| China Cinda Asset Management Company Limited Class H (Financials, Capital markets) | | | | | 2,552,000 | 452,817 |
| China CITIC Bank Class H (Financials, Banks) | | | | | 975,000 | 448,797 |
| China Conch Venture Holdings Limited (Industrials, Construction & engineering) | | | | | 21,000 | 85,864 |
| China Construction Bank Class A (Financials, Banks) | | | | | 47,600 | 43,084 |
| China Construction Bank Class H (Financials, Banks) | | | | | 1,652,000 | 1,193,738 |
| China East Education Holdings Limited (Consumer discretionary, Diversified consumer services) 144A | | | | | 139,000 | 149,054 |
| China Education Group Holdings Limited (Consumer discretionary, Diversified consumer services) | | | | | 42,000 | 79,275 |
| China Feihe Limited (Consumer staples, Food products) 144A | | | | | 105,000 | 190,088 |
| China Galaxy Securities Company Limited Class H (Financials, Capital markets) | | | | | 453,000 | 254,532 |
The accompanying notes are an integral part of these financial statements.
4 | Wells Fargo Factor Enhanced Emerging Markets Equity Portfolio
Portfolio of investments—August 31, 2021 (unaudited)
| | | | | | Shares | Value |
| China: (continued) | | | | | | |
| China Gas Holdings Limited (Utilities, Gas utilities) | | | | | 16,000 | $ 46,391 |
| China Hongqiao Group Limited (Materials, Metals & mining) | | | | | 302,000 | 450,430 |
| China International Capital Corporation Limited Class H (Financials, Capital markets) 144A | | | | | 84,000 | 195,272 |
| China Lesso Group Holdings Limited (Industrials, Building products) | | | | | 4,000 | 8,558 |
| China Life Insurance Company Limited Class H (Financials, Insurance) | | | | | 220,000 | 368,296 |
| China Longyuan Power Group Corporation Class H (Utilities, Independent power & renewable electricity producers) | | | | | 134,000 | 273,257 |
| China Medical System Holding Limited (Health care, Pharmaceuticals) | | | | | 213,000 | 417,376 |
| China MeiDong Auto Holdings Limited (Consumer discretionary, Specialty retail) | | | | | 30,000 | 150,628 |
| China Merchants Bank Company Limited Class A (Financials, Banks) | | | | | 36,500 | 276,495 |
| China Merchants Bank Company Limited Class H (Financials, Banks) | | | | | 126,000 | 1,040,894 |
| China Molybdenum Company Limited Class H (Materials, Metals & mining) | | | | | 219,000 | 171,203 |
| China National Building Material Company Limited Class H (Materials, Construction materials) | | | | | 82,000 | 112,181 |
| China Pacific Insurance Class H (Financials, Insurance) | | | | | 28,200 | 79,406 |
| China Petroleum & Chemical Corporation Class H (Energy, Oil, gas & consumable fuels) | | | | | 1,068,000 | 517,697 |
| China Resources Cement Holdings Limited (Materials, Construction materials) | | | | | 52,000 | 51,014 |
| China Resources Land Limited (Real estate, Real estate management & development) | | | | | 74,000 | 275,450 |
| China Shenhua Energy Company Limited Class H (Energy, Oil, gas & consumable fuels) | | | | | 265,500 | 587,842 |
| China Southern Airlines Company Class H (Industrials, Airlines) † | | | | | 288,000 | 167,747 |
| China Yuhua Education Corporation Limited (Consumer discretionary, Diversified consumer services) 144A | | | | | 374,000 | 199,564 |
| Chongqing Brewery Company Limited Class A (Consumer staples, Beverages) † | | | | | 2,640 | 57,247 |
| Chongqing Rural Commercial Bank Class H (Financials, Banks) | | | | | 258,000 | 98,855 |
| Chongqing Zhifei Biological Products Company Limited (Health care, Biotechnology) | | | | | 5,400 | 147,883 |
| CIFI Holdings Group Company Limited (Real estate, Real estate management & development) | | | | | 96,000 | 64,679 |
| CITIC Securities Company Limited Class H (Financials, Capital markets) | | | | | 15,000 | 37,994 |
| Contemporary Amperex Technology Company Limited Class A (Industrials, Electrical equipment) | | | | | 500 | 38,284 |
| COSCO Shipping Holdings Company Limited Class A (Industrials, Transportation infrastructure) † | | | | | 17,160 | 55,065 |
| COSCO Shipping Holdings Company Limited Class H (Industrials, Transportation infrastructure) † | | | | | 198,675 | 375,512 |
| Country Garden Holdings Company Limited (Real estate, Real estate management & development) | | | | | 184,000 | 203,460 |
| Country Garden Services Holdings Company Limited (Industrials, Commercial services & supplies) | | | | | 11,666 | 88,874 |
| Da An Gene Company Limited of Sun Yat-Sen University Class A (Health care, Health care equipment & supplies) | | | | | 59,040 | 171,095 |
| Dali Foods Group Company Limited (Consumer staples, Food products) 144A | | | | | 248,000 | 139,028 |
| DAQO New Energy Corporation ADR (Information technology, Semiconductors & semiconductor equipment) † | | | | | 3,819 | 234,143 |
| Dongfeng Motor Group Company Limited Class H (Consumer discretionary, Automobiles) | | | | | 268,000 | 293,587 |
| Ecovacs Robotics Company Limited (Consumer discretionary, Household durables) | | | | | 6,900 | 156,604 |
| ENN Energy Holdings Limited (Utilities, Gas utilities) | | | | | 16,300 | 322,544 |
The accompanying notes are an integral part of these financial statements.
Wells Fargo Factor Enhanced Emerging Markets Equity Portfolio | 5
Portfolio of investments—August 31, 2021 (unaudited)
| | | | | | Shares | Value |
| China: (continued) | | | | | | |
| Fangda Carbon New Material Company Limited Class A (Information technology, Electronic equipment, instruments & components) | | | | | 12,300 | $ 24,607 |
| Flat Grass Group Company Limited Class H (Information technology, Semiconductors & semiconductor equipment) | | | | | 8,000 | 46,699 |
| Focus Media Information Technology Company (Communication services, Interactive media & services) | | | | | 5,100 | 5,674 |
| Founder Securities Company Limited (Financials, Diversified financial services) | | | | | 45,700 | 60,314 |
| Fuyao Glass Industry Group Company Limited Class A (Consumer discretionary, Auto components) | | | | | 3,700 | 27,421 |
| Fuyao Glass Industry Group Company Limited Class H (Consumer discretionary, Auto components) | | | | | 34,400 | 211,864 |
| Geely Automobile Holdings Limited (Consumer discretionary, Automobiles) | | | | | 88,000 | 317,945 |
| GF Securities Company Limited Class H (Financials, Capital markets) | | | | | 24,400 | 43,420 |
| Giant Network Group Company Limited Class A (Information technology, Software) | | | | | 30,200 | 47,240 |
| Great Wall Motor Company Limited Class A (Consumer discretionary, Automobiles) | | | | | 1,800 | 18,414 |
| Great Wall Motor Company Limited Class H (Consumer discretionary, Automobiles) | | | | | 96,500 | 444,194 |
| Guangzhou Automobile Group Company Limited Class H (Consumer discretionary, Automobiles) | | | | | 236,400 | 237,997 |
| Guangzhou Baiyunshan Pharmaceutical Holdings Company Limited Class A (Health care, Pharmaceuticals) | | | | | 7,700 | 35,097 |
| Guangzhou R&F Properties Company Limited Class H (Real estate, Real estate management & development) | | | | | 36,800 | 31,418 |
| Guangzhou Tinci Materials Technology Company Limited (Materials, Chemicals) | | | | | 8,480 | 178,713 |
| HaiDiLao International Holding Limited (Consumer discretionary, Hotels, restaurants & leisure) 144A | | | | | 10,000 | 40,759 |
| Haier Smart Home Company Limited Class A (Consumer discretionary, Household durables) | | | | | 19,700 | 82,480 |
| Haier Smart Home Company Limited Class H (Consumer discretionary, Household durables) | | | | | 25,200 | 94,936 |
| Haitong Securities Company Limited Class H (Financials, Capital markets) | | | | | 98,400 | 90,968 |
| Hangzhou Oxygen Plant Group Company Limited Class A (Industrials, Machinery) | | | | | 18,600 | 102,451 |
| Hangzhou Tigermed Consulting Company Limited (Health care, Health care providers & services) | | | | | 1,000 | 17,744 |
| Hengan International Group Company Limited (Consumer staples, Personal products) | | | | | 500 | 2,899 |
| HengTen Networks Group Limited (Consumer discretionary, Internet & direct marketing retail) † | | | | | 164,000 | 80,551 |
| Hongfa Technology Company Limited Class A (Industrials, Machinery) | | | | | 5,700 | 54,970 |
| Hopson Development Holdings Limited (Real estate, Real estate management & development) | | | | | 58,500 | 227,909 |
| Huadong Medicine Company Limited (Health care, Pharmaceuticals) | | | | | 23,100 | 109,903 |
| Hualan Biological Engineering Incorporated Class A (Health care, Biotechnology) | | | | | 12,200 | 55,552 |
| Huaneng Power International Incorporated Class H (Utilities, Independent power & renewable electricity producers) | | | | | 75,334 | 36,323 |
| Humanwell Healthcare Group Company Limited (Health care, Pharmaceuticals) | | | | | 800 | 2,676 |
| Hunan Valin Steel Company Limited Class A (Materials, Metals & mining) | | | | | 51,000 | 61,548 |
| Huya Incorporated ADR (Communication services, Entertainment) † | | | | | 1,713 | 18,312 |
| iFLYTEK Company Limited Class A (Information technology, IT services) | | | | | 19,400 | 157,224 |
| Industrial & Commercial Bank of China Limited Class H (Financials, Banks) | | | | | 1,412,000 | 787,929 |
The accompanying notes are an integral part of these financial statements.
6 | Wells Fargo Factor Enhanced Emerging Markets Equity Portfolio
Portfolio of investments—August 31, 2021 (unaudited)
| | | | | | Shares | Value |
| China: (continued) | | | | | | |
| Industrial Bank Company Limited (Financials, Banks) | | | | | 23,100 | $ 66,121 |
| Industrial Securities Company (Industrials, Professional services) | | | | | 47,500 | 73,052 |
| Intco Medical Technology Company Limited Class A (Health care, Health care equipment & supplies) | | | | | 4,700 | 74,297 |
| Jason Furniture Hangzhou Company (Consumer discretionary, Household durables) | | | | | 4,700 | 50,038 |
| JD.com Incorporated ADR (Consumer discretionary, Internet & direct marketing retail) † | | | | | 18,857 | 1,481,406 |
| Jiangsu Express Company Limited Class H (Industrials, Transportation infrastructure) | | | | | 186,000 | 192,996 |
| Jiangsu Yanghe Brewery Joint-Stock Company Limited (Industrials, Beverages) | | | | | 1,500 | 38,883 |
| Jiangxi Copper Company Limited Class H (Materials, Metals & mining) | | | | | 132,000 | 268,499 |
| Jilin Aodong Pharmaceutical Group Company Limited Class A (Health care, Pharmaceuticals) | | | | | 20,300 | 49,940 |
| Jiumaojiu International Holdings Limited (Consumer discretionary, Hotels, restaurants & leisure) 144A | | | | | 12,000 | 40,270 |
| Joinn Laboratories China Company Limited Class A (Health care, Health care technology) | | | | | 840 | 18,468 |
| Kaisa Group Holdings Limited (Real estate, Real estate management & development) | | | | | 862,571 | 287,248 |
| Kingdee International Software Group Company Limited (Information technology, Software) † | | | | | 14,000 | 50,942 |
| Kingfa Science & Technology Company Limited Class A (Materials, Chemicals) | | | | | 6,500 | 16,302 |
| Kingsoft Corporation Limited (Information technology, Software) | | | | | 27,000 | 108,140 |
| Kunlun Energy Company Limited (Utilities, Gas utilities) | | | | | 76,000 | 80,520 |
| Kweichow Moutai Company Limited Class A (Consumer staples, Beverages) | | | | | 1,500 | 361,586 |
| Lenovo Group Limited (Information technology, Technology hardware, storage & peripherals) | | | | | 392,000 | 434,466 |
| Li Ning Company Limited (Consumer discretionary, Textiles, apparel & luxury goods) | | | | | 41,500 | 557,606 |
| Logan Property Holdings Company Limited (Real estate, Real estate management & development) | | | | | 26,000 | 31,023 |
| Longfor Properties Company Limited (Real estate, Real estate management & development) | | | | | 18,500 | 80,161 |
| Luzhou Laojio Company Limited (Materials, Construction materials) | | | | | 4,500 | 118,362 |
| Meituan Dianping (Consumer discretionary, Internet & direct marketing retail) † | | | | | 82,200 | 2,631,685 |
| Nari Technology Company Limited (Industrials, Electrical equipment) | | | | | 13,080 | 70,852 |
| NetEase Incorporated ADR (Communication services, Entertainment) | | | | | 7,552 | 735,716 |
| Nine Dragons Paper Holdings Limited (Materials, Paper & forest products) | | | | | 33,000 | 45,146 |
| NIO Incorporated ADR Class A (Consumer discretionary, Automobiles) † | | | | | 18,643 | 732,856 |
| Northeast Securities Company Limited Class A (Financials, Diversified financial services) | | | | | 14,500 | 19,159 |
| Oppein Home Group Incorporated Class A (Consumer discretionary, Household durables) | | | | | 1,400 | 33,466 |
| People's Insurance Company Group of China Limited Class H (Financials, Insurance) | | | | | 1,447,000 | 446,522 |
| PetroChina Company Limited Class H (Energy, Oil, gas & consumable fuels) | | | | | 886,000 | 388,464 |
| Pharmaron Beijing Company Limited Class H (Health care, Life sciences tools & services) 144A | | | | | 6,700 | 148,689 |
| PICC Property & Casualty Company Limited Class H (Financials, Insurance) | | | | | 402,000 | 363,366 |
| Pinduoduo Incorporated ADR (Consumer discretionary, Internet & direct marketing retail) † | | | | | 6,880 | 688,138 |
| Ping An Bank Company Limited (Financials, Banks) | | | | | 32,200 | 88,681 |
| Ping An Insurance Group Company Class H (Financials, Insurance) | | | | | 102,000 | 792,136 |
The accompanying notes are an integral part of these financial statements.
Wells Fargo Factor Enhanced Emerging Markets Equity Portfolio | 7
Portfolio of investments—August 31, 2021 (unaudited)
| | | | | | Shares | Value |
| China: (continued) | | | | | | |
| Postal Savings Bank of China Company Limited Class H (Financials, Banks) 144A | | | | | 171,000 | $ 123,345 |
| Powerlong Real Estate Holdings Limited (Real estate, Real estate management & development) | | | | | 364,000 | 295,320 |
| Sailun Group Company Limited Class A (Consumer discretionary, Auto components) | | | | | 72,200 | 111,039 |
| Sangfor Technologies Incorporated Class A (Information technology, IT services) | | | | | 1,900 | 80,078 |
| Sany Heavy Equipment International Holdings Company Limited (Industrials, Machinery) | | | | | 230,000 | 295,727 |
| Sany Heavy Industry Company Limited (Industrials, Machinery) | | | | | 4,400 | 17,857 |
| Seazen Group Limited (Real estate, Real estate management & development) | | | | | 168,000 | 149,046 |
| Shaanxi Coal Industry Company Limited (Materials, Chemicals) | | | | | 46,700 | 99,062 |
| Shandong Hualu-Hengsheng Chemical Company Limited Class A (Materials, Chemicals) | | | | | 17,689 | 99,677 |
| Shandong Linglong Tyre Company Limited (Consumer discretionary, Auto components) | | | | | 14,100 | 65,273 |
| Shanghai Bairun Investment Holding Group Company Limited Class A (Consumer staples, Beverages) | | | | | 4,360 | 48,348 |
| Shanghai Baosight Software Company Limited Class A (Information technology, IT services) | | | | | 4,810 | 52,318 |
| Shanghai Fosun Pharmaceutical Company Limited Class H (Health care, Pharmaceuticals) | | | | | 24,000 | 153,984 |
| Shanghai Jin Jiang International Hotels Company Limited Class A (Consumer discretionary, Hotels, restaurants & leisure) | | | | | 25,900 | 183,254 |
| Shanghai Lujiazui Finance & Trade Zone Development Company Limited (Real estate, Real estate management & development) | | | | | 123,954 | 111,435 |
| Shanghai Pharmaceuticals Holding Company Limited Class A (Health care, Health care providers & services) | | | | | 27,800 | 82,584 |
| Shanghai Pharmaceuticals Holding Company Limited Class H (Health care, Health care providers & services) | | | | | 101,234 | 200,972 |
| Shanxi Coking Coal Energy Group Company Limited (Energy, Oil, gas & consumable fuels) | | | | | 18,800 | 33,538 |
| Shanxi Taigang Stainless Steel Company Limited (Materials, Metals & mining) | | | | | 12,400 | 19,397 |
| Shanxi Xinghuacun Fen Wine Factory Company Limited Class A (Consumer staples, Beverages) | | | | | 1,960 | 84,159 |
| Shenzhen Inovance Technology Company Limited Class A (Information technology, Electronic equipment, instruments & components) | | | | | 5,700 | 62,634 |
| Shenzhen International Holdings Limited Class H (Industrials, Transportation infrastructure) | | | | | 131,500 | 171,446 |
| Shenzhen Overseas Chinese Town Holding Company Class A (Consumer discretionary, Hotels, restaurants & leisure) | | | | | 28,100 | 29,303 |
| Sinopec Shanghai Petrochemical Company Limited Class A (Materials, Chemicals) | | | | | 79,300 | 41,593 |
| Sinopharm Group Company Limited Class H (Health care, Health care providers & services) | | | | | 126,400 | 324,717 |
| Sinotrans Limited Class A (Industrials, Air freight & logistics) | | | | | 307,000 | 236,073 |
| Sunac China Holdings Limited (Real estate, Real estate management & development) | | | | | 41,000 | 104,906 |
| Sungrow Power Supply Company Limited (Energy, Energy equipment & services) | | | | | 5,600 | 136,274 |
| Sunny Optical Technology Group Company Limited (Information technology, Electronic equipment, instruments & components) | | | | | 12,000 | 362,895 |
| Tencent Holdings Limited (Communication services, Interactive media & services) | | | | | 126,200 | 7,808,143 |
The accompanying notes are an integral part of these financial statements.
8 | Wells Fargo Factor Enhanced Emerging Markets Equity Portfolio
Portfolio of investments—August 31, 2021 (unaudited)
| | | | | | Shares | Value |
| China: (continued) | | | | | | |
| Tencent Music Entertainment ADR (Communication services, Entertainment) † | | | | | 4,273 | $ 37,773 |
| The Hello Group Incorporated ADR (Communication services, Interactive media & services) | | | | | 10,712 | 140,756 |
| Thunder Software Technology Company Limited Class A (Industrials, Commercial services & supplies) | | | | | 4,200 | 77,038 |
| Tingyi Holding Corporation (Consumer staples, Food products) | | | | | 62,000 | 110,329 |
| Tongcheng-Elong Holdings Limited (Communication services, Interactive media & services) † | | | | | 177,600 | 413,318 |
| Topsports International Holdings Limited (Consumer discretionary, Specialty retail) | | | | | 151,000 | 199,587 |
| TravelSky Technology Limited Class H (Information technology, IT services) | | | | | 20,000 | 37,493 |
| Trip.com Group Limited ADR (Consumer discretionary, Internet & direct marketing retail) † | | | | | 12,888 | 392,955 |
| Tsingtao Brewery Company Limited Class H (Consumer staples, Beverages) | | | | | 8,000 | 65,523 |
| Uni-President China Holdings Limited (Consumer staples, Food products) | | | | | 126,000 | 119,399 |
| Vipshop Holdings Limited ADR (Consumer discretionary, Internet & direct marketing retail) † | | | | | 20,101 | 297,294 |
| Walvax Biotechnology Company Limited Class A (Health care, Biotechnology) | | | | | 7,400 | 88,962 |
| Want Want China Holdings Limited (Consumer staples, Food products) | | | | | 283,000 | 192,489 |
| Weibo Corporation ADR (Communication services, Interactive media & services) † | | | | | 2,075 | 104,829 |
| Weichai Power Company Limited Class H (Industrials, Machinery) | | | | | 41,000 | 103,430 |
| Winning Health Technology Group Company Limited Class A (Information technology, IT services) | | | | | 34,400 | 75,579 |
| Wuliangye Yibin Company Limited Class A (Consumer staples, Beverages) | | | | | 5,300 | 165,391 |
| WuXi AppTec Company Limited (Health care, Life sciences tools & services) 144A | | | | | 6,136 | 122,287 |
| Wuxi Biologics (Cayman) Incorporated (Health care, Life sciences tools & services) 144A† | | | | | 66,500 | 1,029,463 |
| Xiaomi Corporation Class B (Information technology, Technology hardware, storage & peripherals) 144A† | | | | | 262,600 | 844,107 |
| Xinjiang Goldwind Science & Technology Company Limited (Industrials, Electrical equipment) | | | | | 15,400 | 29,424 |
| Xinyi Solar Holdings Limited (Information technology, Semiconductors & semiconductor equipment) | | | | | 66,333 | 160,343 |
| Yadea Group Holdings Limited (Consumer discretionary, Automobiles) 144A | | | | | 72,000 | 127,939 |
| Yanzhou Coal Mining Company Limited Class H (Energy, Oil, gas & consumable fuels) | | | | | 262,000 | 457,471 |
| Yihai Kerry Arawana Holdings Company Limited (Industrials, Food products) | | | | | 13,300 | 139,087 |
| Youngor Group Company Limited (Consumer discretionary, Specialty retail) | | | | | 82,300 | 82,259 |
| Yum China Holdings Incorporated (Consumer discretionary, Hotels, restaurants & leisure) | | | | | 8,939 | 550,285 |
| Zhangzhou Pientzehuang Pharmaceutical Company (Health care, Pharmaceuticals) | | | | | 2,000 | 107,393 |
| Zhejiang Expressway Company Limited Class H (Industrials, Transportation infrastructure) | | | | | 384,000 | 336,727 |
| Zhejiang Juhua Company Limited Class A (Materials, Chemicals) | | | | | 39,800 | 104,623 |
| Zhejiang NHU Company Limited (Health care, Biotechnology) | | | | | 11,680 | 51,992 |
| Zhejiang Semir Garment Company (Consumer discretionary, Specialty retail) | | | | | 47,200 | 69,085 |
| Zhejiang Weixing New Building Materials Company Limited (Materials, Construction materials) | | | | | 8,400 | 25,681 |
| Zhongsheng Group Holdings Limited (Consumer discretionary, Specialty retail) | | | | | 24,500 | 204,759 |
The accompanying notes are an integral part of these financial statements.
Wells Fargo Factor Enhanced Emerging Markets Equity Portfolio | 9
Portfolio of investments—August 31, 2021 (unaudited)
| | | | | | Shares | Value |
| China: (continued) | | | | | | |
| Zhuzhou CSR Times Electric Company Limited Class H (Industrials, Electrical equipment) † | | | | | 11,000 | $ 66,262 |
| Zijin Mining Group Company Limited Class H (Materials, Metals & mining) | | | | | 208,000 | 296,323 |
| Zoomlion Heavy Industry Science and Technology Company Limited Class A (Industrials, Machinery) | | | | | 27,400 | 33,406 |
| Zoomlion Heavy Industry Science and Technology Company Limited Class H (Industrials, Machinery) | | | | | 172,400 | 164,255 |
| ZTE Corporation Class H (Information technology, Communications equipment) | | | | | 49,000 | 172,312 |
| | | | | | | 57,065,102 |
| Colombia: 0.18% | | | | | | |
| Bancolombia SA (Financials, Banks) | | | | | 14,225 | 117,260 |
| Grupo de Inversiones Suramericana SA (Industrials, Professional services) | | | | | 29,904 | 152,331 |
| Interconexion Electrica SA (Industrials, Electric utilities) | | | | | 10,107 | 60,870 |
| | | | | | | 330,461 |
| Cyprus: 0.14% | | | | | | |
| Ozon Holdings plc (Consumer discretionary, Internet & direct marketing retail) † | | | | | 828 | 43,557 |
| TCS Group Holding plc (Financials, Banks) | | | | | 2,546 | 224,960 |
| | | | | | | 268,517 |
| Czech Republic: 0.09% | | | | | | |
| Komercni Banka AS (Financials, Banks) † | | | | | 3,546 | 136,303 |
| Moneta Money Bank (Financials, Banks) 144A† | | | | | 7,268 | 29,473 |
| | | | | | | 165,776 |
| Greece: 0.35% | | | | | | |
| FF Group (Consumer discretionary, Specialty retail) ♦† | | | | | 3,820 | 0 |
| Hellenic Telecommunications Organization SA (Communication services, Diversified telecommunication services) | | | | | 15,837 | 311,628 |
| OPAP SA (Consumer discretionary, Hotels, restaurants & leisure) | | | | | 21,250 | 333,208 |
| | | | | | | 644,836 |
| Hong Kong: 3.21% | | | | | | |
| Beijing Enterprises Holdings Limited (Utilities, Gas utilities) | | | | | 3,500 | 12,061 |
| Beijing Enterprises Water Group Limited (Utilities, Water utilities) | | | | | 138,000 | 56,957 |
| Brilliance China Automotive Holdings Limited (Consumer discretionary, Automobiles) ♦‡† | | | | | 100,000 | 93,861 |
| BYD Electronic International Company Limited (Information technology, Communications equipment) | | | | | 61,500 | 280,715 |
| China Everbright International Limited (Industrials, Commercial services & supplies) | | | | | 304,000 | 210,290 |
| China Everbright Limited (Financials, Capital markets) | | | | | 148,000 | 185,917 |
| China Mengniu Dairy Company Limited (Consumer staples, Food products) | | | | | 67,334 | 404,742 |
| China Merchants Port Holdings Company Limited (Industrials, Transportation infrastructure) | | | | | 186,000 | 313,290 |
| China Overseas Land & Investment Limited (Real estate, Real estate management & development) | | | | | 22,500 | 51,784 |
| China Power International Development Limited (Utilities, Independent power & renewable electricity producers) | | | | | 1,169,000 | 471,962 |
| China Resources Beer Holdings Company Limited (Consumer staples, Beverages) | | | | | 14,000 | 115,205 |
The accompanying notes are an integral part of these financial statements.
10 | Wells Fargo Factor Enhanced Emerging Markets Equity Portfolio
Portfolio of investments—August 31, 2021 (unaudited)
| | | | | | Shares | Value |
| Hong Kong: (continued) | | | | | | |
| China Resources Pharmaceutical Group Limited (Health care, Pharmaceuticals) | | | | | 668,500 | $ 348,112 |
| China Resources Power Holdings Company (Utilities, Independent power & renewable electricity producers) | | | | | 38,000 | 93,419 |
| China Taiping Insurance Holdings Company Limited (Financials, Insurance) | | | | | 51,800 | 75,661 |
| China Traditional Chinese Medicine Holdings Company Limited (Health care, Pharmaceuticals) | | | | | 412,000 | 196,003 |
| CITIC Pacific Limited (Industrials, Industrial conglomerates) | | | | | 112,000 | 139,398 |
| COSCO Shipping Ports Limited (Industrials, Transportation infrastructure) | | | | | 484,000 | 402,636 |
| CSPC Pharmaceutical Group Limited (Health care, Pharmaceuticals) | | | | | 274,000 | 347,721 |
| Far East Horizon Limited (Financials, Diversified financial services) | | | | | 149,000 | 169,356 |
| Fosun International (Industrials, Industrial conglomerates) | | | | | 121,500 | 153,721 |
| Haitian International Holdings Limited (Industrials, Machinery) | | | | | 14,000 | 53,642 |
| Kingboard Chemicals Holdings Limited (Information technology, Electronic equipment, instruments & components) | | | | | 114,500 | 563,118 |
| Kingboard Laminates Holdings Limited (Information technology, Electronic equipment, instruments & components) | | | | | 20,500 | 40,328 |
| KWG Property Holding Limited (Real estate, Real estate management & development) | | | | | 31,000 | 32,684 |
| Lee & Man Paper Manufacturing Limited (Materials, Paper & forest products) | | | | | 27,000 | 23,711 |
| MMG Limited (Materials, Metals & mining) † | | | | | 204,000 | 98,886 |
| Perennial Energy Holdings Limited (Materials, Metals & mining) | | | | | 50,000 | 10,993 |
| Shenzhen Investment Limited (Real estate, Real estate management & development) | | | | | 472,666 | 140,388 |
| Shenzhou International Group Holdings Limited (Consumer discretionary, Textiles, apparel & luxury goods) | | | | | 11,000 | 239,873 |
| Sinotruk Hong Kong Limited (Industrials, Machinery) | | | | | 41,000 | 80,762 |
| SSY Group Limited (Health care, Pharmaceuticals) | | | | | 36,000 | 22,403 |
| Vinda International Holdings Limited (Consumer staples, Household products) | | | | | 25,000 | 73,610 |
| Wharf Holdings Limited (Real estate, Real estate management & development) | | | | | 29,000 | 98,066 |
| Yuexiu Property Company Limited (Real estate, Real estate management & development) | | | | | 370,400 | 347,185 |
| | | | | | | 5,948,460 |
| Hungary: 0.41% | | | | | | |
| MOL Hungarian Oil & Gas plc (Energy, Oil, gas & consumable fuels) | | | | | 7,236 | 59,335 |
| OTP Bank plc (Financials, Banks) † | | | | | 4,497 | 271,542 |
| Richter Gedeon (Health care, Pharmaceuticals) | | | | | 14,165 | 424,548 |
| | | | | | | 755,425 |
| India: 10.90% | | | | | | |
| ACC Limited (Materials, Construction materials) | | | | | 3,201 | 105,806 |
| Adani Enterprises Limited (Industrials, Trading companies & distributors) | | | | | 7,134 | 155,134 |
| Adani Ports & Special Economic Zone Limited (Industrials, Transportation infrastructure) | | | | | 15,427 | 158,121 |
| Ambuja Cements Limited (Materials, Construction materials) | | | | | 23,179 | 133,678 |
| Apollo Hospitals Enterprise Limited (Health care, Health care providers & services) | | | | | 2,934 | 199,715 |
| Asian Paints Limited (Materials, Chemicals) | | | | | 8,020 | 351,674 |
| Aurobindo Pharma Limited (Health care, Pharmaceuticals) | | | | | 25,801 | 257,029 |
| Axis Bank Limited (Financials, Banks) † | | | | | 52,547 | 566,082 |
| Bajaj Auto Limited (Consumer discretionary, Automobiles) | | | | | 4,285 | 218,797 |
| Bajaj Finance Limited (Financials, Consumer finance) | | | | | 2,388 | 246,119 |
The accompanying notes are an integral part of these financial statements.
Wells Fargo Factor Enhanced Emerging Markets Equity Portfolio | 11
Portfolio of investments—August 31, 2021 (unaudited)
| | | | | | Shares | Value |
| India: (continued) | | | | | | |
| Bajaj Finserv Limited (Financials, Diversified financial services) | | | | | 127 | $ 29,831 |
| Balkrishna Industries Limited (Consumer discretionary, Auto components) | | | | | 1,217 | 38,255 |
| Berger Paints India Limited (Materials, Chemicals) | | | | | 2,972 | 33,413 |
| Bharat Electronics Limited (Industrials, Aerospace & defense) | | | | | 41,758 | 106,758 |
| Bharat Petroleum Corporation Limited (Energy, Oil, gas & consumable fuels) | | | | | 18,704 | 120,833 |
| Biocon Limited (Health care, Biotechnology) † | | | | | 4,717 | 23,185 |
| Cholamandalam Investment & Finance Company Limited (Financials, Consumer finance) | | | | | 25,317 | 192,129 |
| Cipla India Limited (Health care, Pharmaceuticals) | | | | | 24,993 | 324,465 |
| Coal India Limited (Materials, Metals & mining) | | | | | 29,950 | 59,832 |
| Colgate-Palmolive Company India Limited (Consumer staples, Personal products) | | | | | 10,453 | 242,442 |
| Container Corporation of India Limited (Industrials, Transportation infrastructure) | | | | | 27,153 | 252,739 |
| Dabur India Limited (Consumer staples, Personal products) | | | | | 3,408 | 29,012 |
| Divi's Laboratories Limited (Health care, Life sciences tools & services) | | | | | 5,761 | 408,247 |
| DLF Limited (Real estate, Real estate management & development) | | | | | 6,312 | 27,714 |
| Dr. Reddy's Laboratories Limited (Health care, Pharmaceuticals) | | | | | 2,623 | 169,006 |
| Gail India Limited (Utilities, Gas utilities) | | | | | 45,235 | 90,554 |
| Godrej Consumer Products Limited (Consumer staples, Personal products) † | | | | | 2,452 | 36,921 |
| Grasim Industries Limited (Industrials, Industrial conglomerates) | | | | | 7,724 | 158,738 |
| Havells India Limited (Industrials, Electrical equipment) | | | | | 14,892 | 258,737 |
| HCL Technologies Limited (Information technology, IT services) | | | | | 33,683 | 545,470 |
| HDFC Asset Management Company Limited (Financials, Capital markets) 144A | | | | | 1,462 | 61,564 |
| Hero Motorcorp Limited (Consumer discretionary, Automobiles) | | | | | 3,399 | 127,652 |
| Hindalco Industries Limited (Materials, Metals & mining) | | | | | 32,511 | 208,539 |
| Hindustan Petroleum Corporation Limited (Energy, Oil, gas & consumable fuels) | | | | | 93,782 | 342,462 |
| Hindustan Unilever Limited (Consumer staples, Household products) | | | | | 6,105 | 227,793 |
| Housing Development Finance Corporation Limited (Financials, Thrifts & mortgage finance) | | | | | 36,484 | 1,398,493 |
| ICICI Bank Limited (Financials, Banks) | | | | | 118,847 | 1,170,523 |
| Indian Oil Corporation Limited (Energy, Oil, gas & consumable fuels) | | | | | 126,874 | 192,638 |
| Indus Towers Limited (Communication services, Diversified telecommunication services) | | | | | 48,995 | 144,520 |
| Info Edge India Limited (Communication services, Interactive media & services) | | | | | 2,555 | 216,360 |
| Infosys Limited (Information technology, IT services) | | | | | 80,771 | 1,887,911 |
| Ipca Laboratories Limited (Health care, Pharmaceuticals) | | | | | 6,070 | 214,116 |
| ITC Limited (Consumer staples, Tobacco) | | | | | 81,986 | 237,286 |
| JSW Steel Limited (Materials, Metals & mining) | | | | | 28,356 | 267,063 |
| Jubilant Foodworks Limited (Consumer discretionary, Hotels, restaurants & leisure) | | | | | 2,123 | 116,171 |
| Kotak Mahindra Bank Limited (Financials, Banks) | | | | | 8,532 | 204,946 |
| Larsen & Toubro Infotech Limited (Information technology, IT services) 144A | | | | | 4,787 | 348,330 |
| Larsen & Toubro Limited (Industrials, Construction & engineering) | | | | | 2,893 | 66,263 |
| Lupin Limited (Health care, Pharmaceuticals) | | | | | 18,453 | 242,101 |
| Mahindra & Mahindra Limited (Consumer discretionary, Automobiles) | | | | | 10,099 | 109,736 |
| Marico Limited (Consumer staples, Personal products) | | | | | 27,836 | 207,586 |
| Maruti Suzuki India Limited (Consumer discretionary, Automobiles) | | | | | 1,773 | 166,259 |
| Motherson Sumi Systems Limited (Consumer discretionary, Auto components) | | | | | 8,117 | 24,304 |
The accompanying notes are an integral part of these financial statements.
12 | Wells Fargo Factor Enhanced Emerging Markets Equity Portfolio
Portfolio of investments—August 31, 2021 (unaudited)
| | | | | | Shares | Value |
| India: (continued) | | | | | | |
| Nestle India Limited (Consumer staples, Food products) | | | | | 405 | $ 107,995 |
| NTPC Limited (Utilities, Independent power & renewable electricity producers) | | | | | 29,685 | 47,146 |
| Oil & Natural Gas Corporation Limited (Energy, Oil, gas & consumable fuels) | | | | | 58,861 | 97,191 |
| Petronet LNG Limited (Energy, Oil, gas & consumable fuels) | | | | | 29,769 | 92,805 |
| Pidilite Industries Limited (Materials, Chemicals) | | | | | 1,714 | 53,536 |
| Power Grid Corporation of India Limited (Utilities, Electric utilities) | | | | | 73,772 | 177,186 |
| Reliance Industries Limited (Energy, Oil, gas & consumable fuels) | | | | | 49,136 | 1,519,795 |
| Shriram Transport Finance Company Limited (Financials, Consumer finance) | | | | | 6,877 | 127,419 |
| Siemens India Limited (Industrials, Industrial conglomerates) | | | | | 6,430 | 200,137 |
| State Bank of India (Financials, Banks) | | | | | 58,205 | 339,667 |
| Sun Pharmaceutical Industries Limited (Health care, Pharmaceuticals) | | | | | 19,252 | 209,390 |
| Tata Consultancy Services Limited (Information technology, IT services) | | | | | 24,832 | 1,287,883 |
| Tata Motors Limited (Industrials, Automobiles) † | | | | | 46,151 | 181,614 |
| Tata Steel Limited (Materials, Metals & mining) | | | | | 17,992 | 357,400 |
| Tech Mahindra Limited (Information technology, IT services) | | | | | 32,229 | 639,062 |
| Torrent Pharmaceuticals Limited (Health care, Pharmaceuticals) | | | | | 1,598 | 67,982 |
| Ultra Tech Cement Limited (Materials, Construction materials) | | | | | 1,498 | 160,710 |
| UPL Limited (Materials, Chemicals) | | | | | 8,956 | 90,931 |
| Vedanta Limited (Materials, Metals & mining) | | | | | 6,757 | 28,025 |
| Wipro Limited (Information technology, IT services) | | | | | 70,144 | 615,811 |
| Yes Bank Limited (Financials, Banks) † | | | | | 575,772 | 85,174 |
| | | | | | | 20,209,911 |
| Indonesia: 1.21% | | | | | | |
| PT Adaro Energy Tbk (Energy, Oil, gas & consumable fuels) | | | | | 1,586,700 | 140,175 |
| PT Aneka Tambang Tbk (Materials, Metals & mining) | | | | | 980,300 | 164,271 |
| PT Astra International Tbk (Consumer discretionary, Automobiles) | | | | | 370,200 | 135,621 |
| PT Bank Central Asia Tbk (Financials, Banks) | | | | | 177,600 | 407,811 |
| PT Bank Mandiri Persero Tbk (Financials, Banks) | | | | | 440,000 | 188,186 |
| PT Bank Negara Indonesia Persero Tbk (Financials, Banks) | | | | | 284,900 | 107,867 |
| PT Bank Rakyat Indonesia Tbk (Financials, Banks) | | | | | 1,231,100 | 339,227 |
| PT Charoen Pokphand Indonesia Tbk (Consumer staples, Food products) | | | | | 384,700 | 172,626 |
| PT Hanson International Tbk (Real estate, Real estate management & development) ♦† | | | | | 10,045,000 | 0 |
| PT Indah Kiat Pulp & Paper Tbk (Materials, Paper & forest products) | | | | | 22,000 | 12,186 |
| PT Kalbe Farma Tbk (Health care, Pharmaceuticals) | | | | | 1,039,500 | 98,028 |
| PT Telekomunikasi Indonesia Persero Tbk (Communication services, Diversified telecommunication services) | | | | | 1,055,000 | 251,499 |
| PT United Tractors Tbk (Energy, Oil, gas & consumable fuels) | | | | | 161,900 | 227,880 |
| | | | | | | 2,245,377 |
| Kuwait: 0.40% | | | | | | |
| Agility Company (Industrials, Transportation infrastructure) | | | | | 34,208 | 113,647 |
| Kuwait Finance House (Financials, Banks) | | | | | 70,700 | 194,208 |
| Mobile Telecommunications Company (Communication services, Wireless telecommunication services) | | | | | 43,373 | 88,131 |
| National Bank of Kuwait (Financials, Banks) | | | | | 113,182 | 352,306 |
| | | | | | | 748,292 |
| Luxembourg: 0.38% | | | | | | |
| Adecoagro SA (Consumer staples, Food products) † | | | | | 32,337 | 302,351 |
The accompanying notes are an integral part of these financial statements.
Wells Fargo Factor Enhanced Emerging Markets Equity Portfolio | 13
Portfolio of investments—August 31, 2021 (unaudited)
| | | | | | Shares | Value |
| Luxembourg: (continued) | | | | | | |
| Allegro SA (Consumer discretionary, Internet & direct marketing retail) 144A† | | | | | 17,520 | $ 324,816 |
| Globant SA (Information technology, IT services) † | | | | | 253 | 81,537 |
| | | | | | | 708,704 |
| Malaysia: 2.28% | | | | | | |
| AMMB Holdings Bhd (Financials, Banks) † | | | | | 177,533 | 129,402 |
| Axiata Group Bhd (Communication services, Wireless telecommunication services) | | | | | 10,200 | 10,163 |
| CIMB Group Holdings Bhd (Financials, Banks) | | | | | 81,200 | 95,928 |
| Digi.com Bhd (Communication services, Wireless telecommunication services) | | | | | 62,600 | 66,160 |
| Fraser & Neave Holdings Bhd (Consumer staples, Beverages) | | | | | 800 | 5,371 |
| Genting Bhd (Consumer discretionary, Hotels, restaurants & leisure) | | | | | 47,000 | 57,096 |
| Hartalega Holdings Bhd (Health care, Health care equipment & supplies) | | | | | 86,900 | 154,275 |
| Hong Leong Bank Bhd (Financials, Banks) | | | | | 41,500 | 191,477 |
| Hong Leong Financial Group Bhd (Financials, Banks) | | | | | 52,767 | 231,430 |
| IOI Corporation Bhd (Consumer staples, Food products) | | | | | 71,800 | 71,161 |
| Kossan Rubber Industries Bhd (Health care, Health care equipment & supplies) | | | | | 424,000 | 316,190 |
| Kuala Lumpur Kepong Bhd (Consumer staples, Food products) | | | | | 11,400 | 58,577 |
| Malayan Banking Bhd (Financials, Banks) | | | | | 106,700 | 215,555 |
| Nestle Malaysia Bhd (Consumer staples, Food products) | | | | | 4,400 | 142,600 |
| Petronas Chemicals Group Bhd (Materials, Chemicals) | | | | | 49,800 | 99,394 |
| Petronas Dagangan Bhd (Energy, Oil, gas & consumable fuels) | | | | | 29,800 | 143,402 |
| PPB Group Bhd (Consumer staples, Food products) | | | | | 16,700 | 74,401 |
| Press Metal Bhd (Materials, Metals & mining) | | | | | 18,000 | 23,382 |
| Public Bank Bhd (Financials, Banks) | | | | | 397,500 | 399,699 |
| RHB Bank Bhd (Financials, Banks) | | | | | 153,500 | 206,572 |
| Sime Darby Bhd (Industrials, Industrial conglomerates) | | | | | 730,900 | 414,584 |
| Sime Darby Plantation Bhd (Consumer staples, Food products) | | | | | 11,000 | 10,664 |
| Supermax Corporation Bhd (Health care, Health care equipment & supplies) | | | | | 416,253 | 330,439 |
| Telecom Malaysia Bhd (Communication services, Diversified telecommunication services) | | | | | 191,900 | 282,588 |
| Top Glove Corporation Bhd (Health care, Health care equipment & supplies) | | | | | 243,950 | 234,737 |
| Westports Holdings Bhd (Industrials, Transportation infrastructure) | | | | | 252,800 | 267,578 |
| | | | | | | 4,232,825 |
| Mexico: 2.15% | | | | | | |
| America Movil SAB de CV Series L (Communication services, Wireless telecommunication services) | | | | | 789,223 | 773,740 |
| Arca Continental SAB de CV (Consumer staples, Beverages) | | | | | 1,900 | 12,239 |
| Cemex SAB Series CPO (Materials, Construction materials) † | | | | | 297,400 | 245,513 |
| Coca-Cola Femsa SAB de CV (Consumer staples, Beverages) | | | | | 21,890 | 126,900 |
| Fibra Uno Administracion SAB de CV (Real estate, Equity REITs) | | | | | 145,600 | 164,130 |
| Fomento Economico Mexicano SAB de CV (Consumer staples, Beverages) | | | | | 15,300 | 132,942 |
| Gruma SAB de CV Class B (Consumer staples, Food products) | | | | | 2,375 | 27,056 |
| Grupo Aeroportuario del Pacifico SAB de CV Class B (Industrials, Transportation infrastructure) | | | | | 2,915 | 33,943 |
| Grupo Aeroportuario del Sureste SAB de CV Class B (Industrials, Transportation infrastructure) † | | | | | 2,228 | 39,858 |
| Grupo Bimbo SAB Series A (Consumer staples, Food products) | | | | | 37,700 | 95,207 |
| Grupo Financiero Banorte SAB de CV (Financials, Banks) | | | | | 80,300 | 530,042 |
| Grupo Financiero Inbursa SAB de CV (Financials, Banks) † | | | | | 207,300 | 199,208 |
| Grupo Mexico SAB de CV Series B (Materials, Metals & mining) | | | | | 62,100 | 287,928 |
The accompanying notes are an integral part of these financial statements.
14 | Wells Fargo Factor Enhanced Emerging Markets Equity Portfolio
Portfolio of investments—August 31, 2021 (unaudited)
| | | | | | Shares | Value |
| Mexico: (continued) | | | | | | |
| Grupo Televisa SAB de CV Series B (Communication services, Media) | | | | | 34,600 | $ 91,134 |
| Kimberly-Clark de Mexico SAB de CV Class A (Consumer staples, Household products) | | | | | 126,200 | 223,948 |
| Megacable Holdings CPO (Communication services, Media) | | | | | 58,800 | 204,998 |
| Orbia Advance Corporation SAB de CV (Materials, Chemicals) | | | | | 85,500 | 244,316 |
| Walmart de Mexico SAB de CV (Consumer staples, Food & staples retailing) | | | | | 154,939 | 549,816 |
| | | | | | | 3,982,918 |
| Netherlands: 0.20% | | | | | | |
| X5 Retail Group NV (Consumer staples, Food & staples retailing) | | | | | 414 | 13,734 |
| Yandex NV (Communication services, Interactive media & services) † | | | | | 4,631 | 351,503 |
| | | | | | | 365,237 |
| Peru: 0.11% | | | | | | |
| Credicorp Limited (Financials, Banks) † | | | | | 1,743 | 185,856 |
| Southern Copper Corporation (Materials, Metals & mining) | | | | | 350 | 21,907 |
| | | | | | | 207,763 |
| Philippines: 0.77% | | | | | | |
| Bank of the Philippine Islands (Financials, Banks) | | | | | 76,050 | 127,183 |
| BDO Unibank Incorporated (Financials, Banks) | | | | | 54,170 | 119,664 |
| Energy Development Corporation (Utilities, Independent power & renewable electricity producers) ♦† | | | | | 231,800 | 0 |
| Globe Telecom Incorporated (Communication services, Wireless telecommunication services) | | | | | 1,060 | 57,954 |
| GT Capital Holdings Incorporated (Industrials, Industrial conglomerates) | | | | | 16,783 | 182,167 |
| International Container Terminal Services Incorporated (Industrials, Transportation infrastructure) | | | | | 68,230 | 255,228 |
| Jollibee Foods Corporation (Consumer discretionary, Hotels, restaurants & leisure) | | | | | 4,280 | 17,361 |
| Metro Pacific Investments Corporation (Financials, Diversified financial services) | | | | | 1,201,100 | 92,949 |
| Metropolitan Bank & Trust Company (Financials, Banks) | | | | | 317,277 | 288,260 |
| PLDT Incorporated (Communication services, Wireless telecommunication services) | | | | | 6,865 | 202,155 |
| Universal Robina Corporation (Consumer staples, Food products) | | | | | 26,050 | 78,962 |
| | | | | | | 1,421,883 |
| Poland: 0.92% | | | | | | |
| Bank Pekao SA (Financials, Banks) † | | | | | 6,310 | 176,607 |
| Bank Zachodni WBK SA (Financials, Banks) † | | | | | 1,507 | 118,824 |
| CD Projekt SA (Communication services, Entertainment) | | | | | 1,805 | 79,794 |
| Cyfrowy Polsat SA (Communication services, Media) | | | | | 14,982 | 143,008 |
| Dino Polska SA (Consumer staples, Food & staples retailing) 144A† | | | | | 2,194 | 185,939 |
| KGHM Polska Miedz SA (Materials, Metals & mining) | | | | | 5,073 | 236,157 |
| Orange Polska SA (Communication services, Diversified telecommunication services) † | | | | | 91,984 | 198,851 |
| Pacific Gas and Electric Company SA (Utilities, Electric utilities) † | | | | | 28,290 | 74,526 |
| PKO Bank Polski SA (Financials, Banks) † | | | | | 1,426 | 15,656 |
| Polski Koncern Naftowy Orlen SA (Energy, Oil, gas & consumable fuels) | | | | | 6,086 | 118,061 |
| Polskie Gornictwo Naftowe i Gazownictwo SA (Energy, Oil, gas & consumable fuels) | | | | | 139,823 | 229,987 |
| Powszechny Zaklad Ubezpieczen SA (Financials, Insurance) † | | | | | 12,250 | 129,851 |
| | | | | | | 1,707,261 |
The accompanying notes are an integral part of these financial statements.
Wells Fargo Factor Enhanced Emerging Markets Equity Portfolio | 15
Portfolio of investments—August 31, 2021 (unaudited)
| | | | | | Shares | Value |
| Russia: 2.08% | | | | | | |
| Alrosa PJSC (Materials, Metals & mining) | | | | | 52,390 | $ 104,267 |
| Gazprom PJSC (Energy, Oil, gas & consumable fuels) | | | | | 143,160 | 597,339 |
| Inter Rao Ues PJSC (Utilities, Electric utilities) | | | | | 862,002 | 54,392 |
| Lukoil PJSC (Energy, Oil, gas & consumable fuels) | | | | | 9,081 | 772,273 |
| Magnit PJSC (Consumer staples, Food & staples retailing) | | | | | 6,207 | 94,191 |
| MMC Norilsk Nickel PJSC (Materials, Metals & mining) | | | | | 1,287 | 422,124 |
| Mobile TeleSystems PJSC ADR (Communication services, Wireless telecommunication services) | | | | | 8,166 | 76,597 |
| Moscow Exchange MICEX-RTS PJSC (Financials, Capital markets) | | | | | 29,075 | 72,757 |
| Novolipetsk Steel PJSC (Materials, Metals & mining) | | | | | 28,410 | 95,316 |
| Phosagro PJSC (Materials, Chemicals) | | | | | 2,911 | 57,347 |
| Polyus PJSC (Materials, Metals & mining) | | | | | 691 | 123,492 |
| Rosneft Oil Company PJSC (Energy, Oil, gas & consumable fuels) | | | | | 17,010 | 123,916 |
| Sberbank of Russia PJSC (Financials, Banks) | | | | | 212,850 | 955,204 |
| Severstal PJSC (Materials, Metals & mining) | | | | | 4,920 | 115,553 |
| Tatneft PJSC (Energy, Oil, gas & consumable fuels) | | | | | 28,052 | 186,046 |
| VTB Bank PJSC (Financials, Banks) | | | | | 17,390,000 | 12,573 |
| | | | | | | 3,863,387 |
| South Africa: 3.31% | | | | | | |
| Absa Group Limited (Financials, Banks) † | | | | | 30,411 | 330,881 |
| African Rainbow Minerals Limited (Materials, Metals & mining) | | | | | 13,018 | 232,270 |
| Anglo American Platinum Limited (Materials, Metals & mining) | | | | | 279 | 31,661 |
| Aspen Pharmacare Holdings Limited (Health care, Pharmaceuticals) † | | | | | 10,072 | 135,976 |
| Bid Corporation Limited (Consumer staples, Food & staples retailing) † | | | | | 3,939 | 86,740 |
| Capitec Bank Holdings Limited (Financials, Banks) | | | | | 1,300 | 169,831 |
| Clicks Group Limited (Health care, Specialty retail) | | | | | 15,430 | 321,384 |
| Exxaro Resources Limited (Energy, Oil, gas & consumable fuels) | | | | | 15,931 | 202,353 |
| FirstRand Limited (Financials, Diversified financial services) | | | | | 64,144 | 273,290 |
| Impala Platinum Holdings Limited (Materials, Metals & mining) | | | | | 24,670 | 378,552 |
| Kumba Iron Ore Limited (Materials, Metals & mining) | | | | | 4,512 | 202,828 |
| Mr Price Group Limited (Consumer discretionary, Specialty retail) | | | | | 5,978 | 89,681 |
| MTN Group Limited (Communication services, Wireless telecommunication services) † | | | | | 59,956 | 550,764 |
| MultiChoice Group Limited (Communication services, Media) | | | | | 15,781 | 124,825 |
| Nedbank Group Limited (Financials, Banks) † | | | | | 22,592 | 287,722 |
| Northam Platinum Limited (Materials, Metals & mining) † | | | | | 13,105 | 180,423 |
| Old Mutual Limited (Financials, Insurance) | | | | | 159,906 | 169,084 |
| Rand Merchant Investment Holdings Limited (Financials, Insurance) | | | | | 40,098 | 87,449 |
| Remgro Limited (Financials, Diversified financial services) | | | | | 16,093 | 133,840 |
| Shoprite Holdings Limited (Consumer staples, Food & staples retailing) | | | | | 21,354 | 270,265 |
| Sibanye Stillwater Limited (Materials, Metals & mining) | | | | | 87,355 | 354,201 |
| SPAR Group Limited (Consumer staples, Food & staples retailing) | | | | | 12,856 | 183,756 |
| Standard Bank Group Limited (Financials, Banks) | | | | | 29,191 | 298,838 |
| The Bidvest Group Limited (Industrials, Industrial conglomerates) | | | | | 3,346 | 47,220 |
| Tiger Brands Limited (Consumer staples, Food products) | | | | | 24,598 | 314,861 |
| Vodacom Group Limited (Communication services, Wireless telecommunication services) | | | | | 33,806 | 334,307 |
| Woolworths Holdings Limited (Consumer discretionary, Multiline retail) † | | | | | 81,063 | 355,196 |
| | | | | | | 6,148,198 |
| South Korea: 12.46% | | | | | | |
| Amorepacific Corporation (Consumer staples, Personal products) | | | | | 715 | 140,293 |
| Amorepacific Group (Consumer staples, Personal products) | | | | | 136 | 6,780 |
| BGF Retail Company Limited (Consumer staples, Food & staples retailing) | | | | | 1,512 | 232,776 |
The accompanying notes are an integral part of these financial statements.
16 | Wells Fargo Factor Enhanced Emerging Markets Equity Portfolio
Portfolio of investments—August 31, 2021 (unaudited)
| | | | | | Shares | Value |
| South Korea: (continued) | | | | | | |
| Celltrion Healthcare Company Limited (Health care, Health care providers & services) † | | | | | 1,870 | $ 199,508 |
| Celltrion Incorporated (Health care, Pharmaceuticals) † | | | | | 1,365 | 344,944 |
| Cheil Worldwide Incorporated (Communication services, Media) | | | | | 9,421 | 187,697 |
| CJ Cheiljedang Corporation (Consumer staples, Food products) | | | | | 451 | 176,401 |
| CJ Corporation (Industrials, Industrial conglomerates) | | | | | 2,591 | 226,820 |
| CJ ENM Company Limited (Consumer discretionary, Internet & direct marketing retail) | | | | | 3,613 | 477,080 |
| CJ Korea Express Corporation (Industrials, Road & rail) † | | | | | 1,021 | 150,581 |
| Coway Company Limited (Consumer discretionary, Household durables) | | | | | 705 | 47,549 |
| Daelim Industrial Company Limited (Industrials, Construction & engineering) | | | | | 1 | 62 |
| Dongbu Insurance Company Limited (Financials, Insurance) | | | | | 1,528 | 77,359 |
| Doosan Bobcat Incorporated (Industrials, Machinery) † | | | | | 1,082 | 40,454 |
| E-MART Incorporated (Consumer staples, Food & staples retailing) | | | | | 2,063 | 318,493 |
| Fila Korea Limited (Consumer discretionary, Textiles, apparel & luxury goods) | | | | | 1,219 | 47,206 |
| Green Cross Corporation (Health care, Biotechnology) | | | | | 913 | 303,165 |
| GS Engineering & Construction Corporation (Industrials, Construction & engineering) | | | | | 3,643 | 140,605 |
| GS Holdings Corporation (Energy, Oil, gas & consumable fuels) | | | | | 1,902 | 69,718 |
| Hana Financial Group Incorporated (Financials, Banks) | | | | | 11,103 | 431,403 |
| Hankook Tire Company Limited (Consumer discretionary, Auto components) | | | | | 5,146 | 206,825 |
| Hanwha Chem Corporation (Materials, Chemicals) † | | | | | 4,216 | 148,175 |
| Hyundai Engineering & Construction Company Limited (Industrials, Construction & engineering) | | | | | 1,371 | 65,626 |
| Hyundai Glovis Company Limited (Industrials, Air freight & logistics) | | | | | 2,115 | 353,883 |
| Hyundai Merchant Marine Company Limited (Industrials, Marine) † | | | | | 4,616 | 167,210 |
| Hyundai Mobis Company Limited (Consumer discretionary, Auto components) | | | | | 1,167 | 279,307 |
| Hyundai Motor Company Limited (Consumer discretionary, Automobiles) | | | | | 2,627 | 481,468 |
| Hyundai Steel Company Limited (Materials, Metals & mining) | | | | | 2,553 | 112,297 |
| Industrial Bank of Korea (Financials, Banks) | | | | | 10,094 | 89,670 |
| Kakao Corporation (Communication services, Interactive media & services) | | | | | 5,843 | 781,116 |
| KB Financial Group Incorporated (Financials, Banks) | | | | | 9,722 | 443,567 |
| Kia Motors Corporation (Consumer discretionary, Automobiles) | | | | | 7,890 | 579,101 |
| KMW Company Limited (Information technology, Communications equipment) † | | | | | 458 | 16,828 |
| Korea Investment Holdings Company Limited (Financials, Capital markets) | | | | | 840 | 69,043 |
| Korean Air Lines Company Limited (Industrials, Airlines) † | | | | | 789 | 21,300 |
| KT&G Corporation (Consumer staples, Tobacco) | | | | | 3,994 | 281,091 |
| Kumho Petrochemical Company Limited (Materials, Chemicals) | | | | | 2,053 | 344,395 |
| LG Chem Limited (Materials, Chemicals) | | | | | 583 | 381,141 |
| LG Corporation (Industrials, Industrial conglomerates) | | | | | 1,605 | 131,922 |
| LG Display Company Limited (Information technology, Electronic equipment, instruments & components) † | | | | | 17,874 | 316,027 |
| LG Electronics Incorporated (Consumer discretionary, Household durables) | | | | | 3,048 | 373,294 |
| LG Household & Health Care Limited (Consumer staples, Personal products) | | | | | 167 | 210,433 |
| LG Innotek Company Limited (Information technology, Electronic equipment, instruments & components) | | | | | 737 | 136,664 |
| LG Uplus Corporation (Communication services, Diversified telecommunication services) | | | | | 8,581 | 103,983 |
| Lotte Chemical Corporation (Materials, Chemicals) | | | | | 964 | 207,857 |
| Lotte Shopping Company Limited (Consumer discretionary, Multiline retail) | | | | | 1,957 | 181,446 |
The accompanying notes are an integral part of these financial statements.
Wells Fargo Factor Enhanced Emerging Markets Equity Portfolio | 17
Portfolio of investments—August 31, 2021 (unaudited)
| | | | | | Shares | Value |
| South Korea: (continued) | | | | | | |
| Meritz Securities Company Limited (Financials, Capital markets) | | | | | 46,078 | $ 213,013 |
| Mirae Asset Daewoo Company Limited (Financials, Capital markets) | | | | | 25,826 | 196,460 |
| Naver Corporation (Communication services, Interactive media & services) | | | | | 2,689 | 1,018,130 |
| NCSoft Corporation (Communication services, Entertainment) | | | | | 257 | 146,294 |
| NH Investment & Securities Company Limited (Financials, Capital markets) | | | | | 24,718 | 282,473 |
| Pearl Abyss Corporation (Communication services, Entertainment) † | | | | | 1,387 | 112,807 |
| POSCO (Materials, Metals & mining) | | | | | 1,587 | 461,270 |
| S1 Corporation Incorporated (Industrials, Commercial services & supplies) | | | | | 46 | 3,257 |
| Samsung C&T Corporation (Industrials, Industrial conglomerates) | | | | | 544 | 62,402 |
| Samsung Electro-Mechanics Company Limited (Information technology, Electronic equipment, instruments & components) | | | | | 985 | 156,740 |
| Samsung Electronics Company Limited (Information technology, Technology hardware, storage & peripherals) | | | | | 100,841 | 6,670,839 |
| Samsung Engineering Company Limited (Industrials, Construction & engineering) † | | | | | 1,327 | 25,580 |
| Samsung Fire & Marine Insurance Company Limited (Financials, Insurance) | | | | | 307 | 59,840 |
| Samsung Life Insurance Company Limited (Financials, Insurance) | | | | | 1,474 | 94,711 |
| Samsung SDI Company Limited (Information technology, Electronic equipment, instruments & components) | | | | | 877 | 599,820 |
| Samsung SDS Company Limited (Information technology, Software) | | | | | 1,328 | 197,576 |
| Samsung Securities Company Limited (Financials, Capital markets) | | | | | 3,163 | 134,900 |
| Seegene Incorporated (Health care, Biotechnology) | | | | | 4,933 | 279,953 |
| Shinhan Financial Group Company Limited (Financials, Banks) | | | | | 12,274 | 411,268 |
| Shinsegae Company Limited (Consumer discretionary, Multiline retail) | | | | | 1,195 | 277,248 |
| Sillajen Incorporated (Health care, Biotechnology) ♦‡† | | | | | 2,972 | 31,016 |
| SK Hynix Incorporated (Information technology, Semiconductors & semiconductor equipment) | | | | | 11,803 | 1,084,152 |
| SK Telecom Company Limited (Communication services, Wireless telecommunication services) | | | | | 1,324 | 340,292 |
| Soulbrain Company Limited (Materials, Chemicals) † | | | | | 1 | 30 |
| Woori Financial Group Incorporated (Financials, Banks) | | | | | 10,469 | 101,579 |
| Yuhan Corporation (Health care, Pharmaceuticals) | | | | | 807 | 43,501 |
| | | | | | | 23,107,714 |
| Taiwan: 14.38% | | | | | | |
| Accton Technology Corporation (Information technology, Communications equipment) | | | | | 15,000 | 151,821 |
| Acer Incorporated (Information technology, Technology hardware, storage & peripherals) | | | | | 279,000 | 253,696 |
| ASE Technology Holding Company Limited (Information technology, Semiconductors & semiconductor equipment) | | | | | 98,000 | 454,399 |
| Asia Cement Corporation (Materials, Construction materials) | | | | | 51,500 | 83,438 |
| Asustek Computer Incorporated (Information technology, Technology hardware, storage & peripherals) | | | | | 30,000 | 350,732 |
| AU Optronics Corporation (Industrials, Machinery) | | | | | 471,000 | 299,118 |
| Cathay Financial Holding Company (Financials, Insurance) | | | | | 179,000 | 384,953 |
| Chailease Holding Company Limited (Financials, Diversified financial services) | | | | | 30,014 | 288,622 |
| Cheng Shin Rubber Industry Company Limited (Consumer discretionary, Auto components) | | | | | 67,000 | 90,055 |
| China Development Financial Holding Corporation (Financials, Insurance) | | | | | 87,000 | 44,578 |
| China Life Insurance Company - Taiwan Exchange (Financials, Insurance) | | | | | 50,000 | 52,141 |
| China Steel Corporation (Materials, Metals & mining) | | | | | 101,000 | 139,035 |
| Chunghwa Telecom Company Limited (Communication services, Diversified telecommunication services) | | | | | 57,000 | 230,357 |
The accompanying notes are an integral part of these financial statements.
18 | Wells Fargo Factor Enhanced Emerging Markets Equity Portfolio
Portfolio of investments—August 31, 2021 (unaudited)
| | | | | | Shares | Value |
| Taiwan: (continued) | | | | | | |
| Compal Electronic Incorporated (Information technology, Technology hardware, storage & peripherals) | | | | | 387,000 | $ 319,783 |
| CTBC Financial Holding Company Limited (Financials, Banks) | | | | | 461,000 | 382,593 |
| Delta Electronics Incorporated (Information technology, Electronic equipment, instruments & components) | | | | | 41,000 | 400,184 |
| E.SUN Financial Holding Company Limited (Financials, Banks) | | | | | 1 | 1 |
| Eclat Textile Company Limited (Consumer discretionary, Textiles, apparel & luxury goods) | | | | | 6,667 | 133,997 |
| Evergreen Marine Corporation (Taiwan) Limited (Industrials, Marine) | | | | | 52,000 | 255,182 |
| Feng Tay Enterprise Company Limited (Consumer discretionary, Textiles, apparel & luxury goods) | | | | | 13,000 | 101,322 |
| Formosa Chemicals & Fibre Corporation (Materials, Chemicals) | | | | | 66,500 | 201,802 |
| Formosa Plastics Corporation (Materials, Chemicals) | | | | | 65,000 | 240,406 |
| Foxconn Technology Company Limited (Information technology, Electronic equipment, instruments & components) | | | | | 19,000 | 45,454 |
| Fubon Financial Holding Company Limited (Financials, Insurance) | | | | | 174,000 | 533,675 |
| Giant Manufacturing Company Limited (Consumer discretionary, Leisure products) | | | | | 48,000 | 580,223 |
| GlobalWafers Company Limited (Information technology, Semiconductors & semiconductor equipment) | | | | | 5,000 | 156,963 |
| Hon Hai Precision Industry Company Limited (Information technology, Electronic equipment, instruments & components) | | | | | 287,400 | 1,151,114 |
| Innolux Display Corporation (Information technology, Electronic equipment, instruments & components) | | | | | 604,000 | 375,954 |
| Inventec Company Limited (Information technology, Technology hardware, storage & peripherals) | | | | | 44,834 | 39,312 |
| Lite-On Technology Corporation (Information technology, Technology hardware, storage & peripherals) | | | | | 145,000 | 320,205 |
| Mediatek Incorporated (Information technology, Semiconductors & semiconductor equipment) | | | | | 31,000 | 1,007,848 |
| Mega Financial Holding Company Limited (Financials, Banks) | | | | | 127,000 | 150,309 |
| Micro-Star International Company Limited (Information technology, Technology hardware, storage & peripherals) | | | | | 29,000 | 136,558 |
| Nan Ya Plastics Corporation (Materials, Chemicals) | | | | | 99,000 | 320,075 |
| Nan Ya Printed Circuit Board Corporation (Information technology, Electronic equipment, instruments & components) | | | | | 13,000 | 197,720 |
| Nanya Technology Corporation (Information technology, Semiconductors & semiconductor equipment) | | | | | 39,000 | 93,442 |
| Nien Made Enterprise Company Limited (Consumer discretionary, Specialty retail) | | | | | 4,000 | 59,754 |
| Novatek Microelectronics Corporation Limited (Information technology, Semiconductors & semiconductor equipment) | | | | | 27,000 | 437,440 |
| Pegatron Corporation (Information technology, Technology hardware, storage & peripherals) | | | | | 43,000 | 100,543 |
| Pharmally International Holding Company Limited (Health care, Pharmaceuticals) ♦† | | | | | 2,064 | 0 |
| Phison Electronics Corporation (Information technology, Semiconductors & semiconductor equipment) | | | | | 17,000 | 261,930 |
| Pou Chen Corporation (Consumer discretionary, Textiles, apparel & luxury goods) | | | | | 27,000 | 32,102 |
| Powertech Technology Incorporated (Information technology, Semiconductors & semiconductor equipment) | | | | | 43,000 | 174,554 |
| Quanta Computer Incorporated (Information technology, Technology hardware, storage & peripherals) | | | | | 87,000 | 246,118 |
| Realtek Semiconductor Corporation (Information technology, Semiconductors & semiconductor equipment) | | | | | 15,000 | 299,854 |
| Shin Kong Financial Holding Company Limited (Financials, Insurance) | | | | | 152,000 | 52,105 |
The accompanying notes are an integral part of these financial statements.
Wells Fargo Factor Enhanced Emerging Markets Equity Portfolio | 19
Portfolio of investments—August 31, 2021 (unaudited)
| | | | | | Shares | Value |
| Taiwan: (continued) | | | | | | |
| Silergy Corporation (Information technology, Semiconductors & semiconductor equipment) | | | | | 1,000 | $ 143,612 |
| Sinopac Financial Holdings Company Limited (Financials, Banks) | | | | | 298,400 | 153,434 |
| Synnex Technology International Corporation (Information technology, Electronic equipment, instruments & components) | | | | | 241,000 | 467,851 |
| Taishin Financial Holdings Company Limited (Financials, Banks) | | | | | 193,381 | 135,022 |
| Taiwan Cement Corporation (Materials, Construction materials) | | | | | 83,843 | 146,578 |
| Taiwan Semiconductor Manufacturing Company Limited (Information technology, Semiconductors & semiconductor equipment) | | | | | 529,000 | 11,720,136 |
| Unimicron Technology Corporation (Information technology, Electronic equipment, instruments & components) | | | | | 30,000 | 159,669 |
| Uni-President Enterprises Corporation (Consumer staples, Food products) † | | | | | 97,000 | 253,057 |
| United Microelectronics Corporation (Information technology, Semiconductors & semiconductor equipment) | | | | | 351,000 | 799,181 |
| Vanguard International Semiconductor Corporation (Information technology, Semiconductors & semiconductor equipment) | | | | | 52,000 | 277,699 |
| Windbond Electronics Corporation (Information technology, Semiconductors & semiconductor equipment) | | | | | 100,000 | 106,446 |
| WPG Holdings Company Limited (Information technology, Electronic equipment, instruments & components) | | | | | 212,440 | 371,014 |
| Yang Ming Marine Transport Corporation (Industrials, Marine) † | | | | | 41,000 | 197,503 |
| Yuanta Financial Holding Company Limited (Financials, Diversified financial services) | | | | | 114,560 | 103,343 |
| | | | | | | 26,666,012 |
| Thailand: 2.23% | | | | | | |
| Bangkok Dusit Medical Services PCL (Health care, Health care providers & services) | | | | | 87,000 | 63,160 |
| Berli Jucker PCL (Consumer staples, Food & staples retailing) | | | | | 28,500 | 32,052 |
| Bumrungrad Hospital PCL (Health care, Health care providers & services) | | | | | 21,500 | 88,715 |
| Carabao Group PCL (Consumer staples, Beverages) | | | | | 26,200 | 113,798 |
| Charoen Pokphand Foods PCL (Consumer staples, Food products) | | | | | 92,200 | 77,233 |
| CP All PCL (Consumer staples, Food & staples retailing) | | | | | 56,400 | 113,736 |
| Delta Electronics Thailand PCL (Information technology, Electronic equipment, instruments & components) | | | | | 19,500 | 353,308 |
| Electricity Genera PCL (Utilities, Independent power & renewable electricity producers) | | | | | 16,500 | 92,655 |
| Energy Absolute PCL (Utilities, Independent power & renewable electricity producers) | | | | | 2,600 | 5,283 |
| Indorama Ventures PCL (Materials, Chemicals) | | | | | 78,200 | 106,143 |
| Krung Thai Bank PCL (Financials, Banks) | | | | | 570,200 | 198,130 |
| Krungthai Card PCL (Financials, Consumer finance) | | | | | 143,100 | 294,125 |
| Land & Houses PCL (Real estate, Real estate management & development) | | | | | 770,967 | 194,939 |
| Muangthai Leasing PCL (Financials, Consumer finance) | | | | | 3,400 | 6,830 |
| Osotspa PCL (Consumer staples, Beverages) | | | | | 49,100 | 55,601 |
| PTT Exploration & Production PCL (Energy, Oil, gas & consumable fuels) | | | | | 48,900 | 169,157 |
| PTT Global Chemical PCL (Materials, Chemicals) | | | | | 112,200 | 222,781 |
| PTT PCL (Energy, Oil, gas & consumable fuels) | | | | | 225,600 | 267,717 |
| Ratchaburi Electricity Generating Holding PCL (Utilities, Independent power & renewable electricity producers) | | | | | 52,400 | 76,814 |
| SCG Packaging PCL (Consumer staples, Containers & packaging) | | | | | 72,500 | 157,450 |
| Siam Commercial Bank PCL (Financials, Banks) | | | | | 103,200 | 340,985 |
| Sri Trang Gloves Thailand PCL (Health care, Health care equipment & supplies) | | | | | 304,000 | 348,965 |
| Srisawad Power 1979 PCL (Financials, Diversified financial services) | | | | | 78,340 | 174,386 |
The accompanying notes are an integral part of these financial statements.
20 | Wells Fargo Factor Enhanced Emerging Markets Equity Portfolio
Portfolio of investments—August 31, 2021 (unaudited)
| | | | | | Shares | Value |
| Thailand: (continued) | | | | | | |
| Thai Union Group PCL (Consumer staples, Food products) | | | | | 653,200 | $ 403,279 |
| The Siam Cement PCL (Materials, Construction materials) | | | | | 13,300 | 177,430 |
| | | | | | | 4,134,672 |
| Turkey: 0.66% | | | | | | |
| Akbank TAS (Financials, Banks) | | | | | 286,327 | 202,786 |
| Eregli Demir ve Celik Fabrikalari TAS (Materials, Metals & mining) | | | | | 26,965 | 60,891 |
| Ford Otomotiv Sanayi AS (Consumer discretionary, Automobiles) | | | | | 12,987 | 268,282 |
| Turk Sise ve Cam Fabrikalari AS (Industrials, Industrial conglomerates) | | | | | 190,865 | 204,256 |
| Turkcell Iletisim Hizmetleri AS (Communication services, Wireless telecommunication services) | | | | | 68,611 | 135,217 |
| Turkiye Garanti Bankasi AS (Financials, Banks) | | | | | 163,313 | 194,016 |
| Turkiye Is Bankasi Class C AS (Financials, Banks) | | | | | 232,407 | 160,685 |
| | | | | | | 1,226,133 |
| Total Common stocks (Cost $146,319,595) | | | | | | 172,890,135 |
| | | Dividend
yield | | | | |
| Preferred stocks: 2.65% | | | | | | |
| Brazil: 2.12% | | | | | | |
| Banco Bradesco SA (Financials, Banks) | | 2.08% | | | 129,031 | 577,680 |
| Bradespar SA (Financials, Banks) | | 7.52 | | | 26,800 | 327,303 |
| Centrais Elétricas Brasileiras SA-Eletrobras Class B (Utilities, Electric utilities) | | 6.67 | | | 36,400 | 265,883 |
| Companhia Energetica de Minas Gerais SA (Utilities, Electric utilities) | | 1.94 | | | 155,206 | 405,514 |
| Companhia Paranaense de Energia-Copel Class B (Utilities, Electric utilities) | | 1.11 | | | 181,300 | 239,826 |
| Gerdau SA (Materials, Metals & mining) | | 3.78 | | | 78,500 | 429,937 |
| Itau Unibanco Holding SA (Financials, Banks) | | 0.10 | | | 104,470 | 625,107 |
| Itaúsa SA (Financials, Banks) | | 0.69 | | | 241,461 | 539,818 |
| Petroleo Brasileiro SA (Energy, Oil, gas & consumable fuels) | | 8.48 | | | 100,900 | 530,570 |
| | | | | | | 3,941,638 |
| Chile: 0.01% | | | | | | |
| Sociedad Quimica y Minera de Chile SA Class B (Materials, Chemicals) | | 0.49 | | | 208 | 10,881 |
| South Korea: 0.52% | | | | | | |
| Hyundai Motor Company Limited (Consumer discretionary, Automobiles) | | 4.35 | | | 63 | 5,396 |
| LG Household & Health Care Limited (Consumer staples, Personal products) | | 1.71 | | | 142 | 84,138 |
| Samsung Electronics Company Limited (Information technology, Technology hardware, storage & peripherals) | | 2.07 | | | 14,243 | 869,727 |
| | | | | | | 959,261 |
| Total Preferred stocks (Cost $4,078,978) | | | | | | 4,911,780 |
The accompanying notes are an integral part of these financial statements.
Wells Fargo Factor Enhanced Emerging Markets Equity Portfolio | 21
Portfolio of investments—August 31, 2021 (unaudited)
| | | Yield | | | Shares | Value |
| Short-term investments: 3.54% | | | | | | |
| Investment companies: 3.54% | | | | | | |
| Wells Fargo Government Money Market Fund Select Class ♠∞ | | 0.03% | | | 6,566,797 | $ 6,566,797 |
| Total Short-term investments (Cost $6,566,797) | | | | | | 6,566,797 |
| Total investments in securities (Cost $156,965,370) | 99.42% | | | | | 184,368,712 |
| Other assets and liabilities, net | 0.58 | | | | | 1,072,446 |
| Total net assets | 100.00% | | | | | $185,441,158 |
| † | Non-income-earning security |
| 144A | The security may be resold in transactions exempt from registration, normally to qualified institutional buyers, pursuant to Rule 144A under the Securities Act of 1933. |
| ♦ | The security is fair valued in accordance with procedures approved by the Board of Trustees. |
| ‡ | Security is valued using significant unobservable inputs. |
| ♠ | The issuer of the security is an affiliated person of the Portfolio as defined in the Investment Company Act of 1940. |
| ∞ | The rate represents the 7-day annualized yield at period end. |
| Abbreviations: |
| ADR | American depositary receipt |
| REIT | Real estate investment trust |
Investments in affiliates
An affiliated investment is an investment in which the Portfolio owns at least 5% of the outstanding voting shares of the issuer or as a result of other relationships, such as the Portfolio and the issuer having the same adviser or investment manager. Transactions with issuers that were either affiliates of the Portfolio at the beginning of the period or the end of the period were as follows:
| | Value,
beginning of
period | Purchases | Sales
proceeds | Net
realized
gains
(losses) | Net
change in
unrealized
gains
(losses) | Value,
end of
period | Shares,
end
of period | Income
from
affiliated
securities |
| Short-term investments | | | | | | | |
| Wells Fargo Government Money Market Fund Select Class | $5,365,153 | $40,002,340 | $(38,800,696) | $0 | $0 | $6,566,797 | 6,566,797 | $747 |
Futures contracts
| Description | Number of
contracts | Expiration
date | Notional
cost | Notional
value | Unrealized
gains | Unrealized
losses |
| Long | | | | | | |
| MSCI Emerging Markets Index | 123 | 9-17-2021 | $7,849,309 | $7,990,080 | $140,771 | $0 |
The accompanying notes are an integral part of these financial statements.
22 | Wells Fargo Factor Enhanced Emerging Markets Equity Portfolio
Statement of assets and liabilities—August 31, 2021 (unaudited)
| | |
| Assets | |
Investments in unaffiliated securities, at value (cost $150,398,573)
| $ 177,801,915 |
Investments in affiliated securites, at value (cost $6,566,797)
| 6,566,797 |
Cash at broker segregated for futures contracts
| 1,260,340 |
Foreign currency, at value (cost $252,895)
| 254,857 |
Receivable for dividends
| 270,013 |
Receivable for daily variation margin on open futures contracts
| 106,958 |
Receivable from adviser
| 25,573 |
Prepaid expenses and other assets
| 117,769 |
Total assets
| 186,404,222 |
| Liabilities | |
Custodian and accounting fee payable
| 610,699 |
Contingent tax liability
| 321,687 |
Overdraft due to custodian bank
| 28 |
Accrued expenses and other liabilities
| 30,650 |
Total liabilities
| 963,064 |
Total net assets
| $185,441,158 |
The accompanying notes are an integral part of these financial statements.
Wells Fargo Factor Enhanced Emerging Markets Equity Portfolio | 23
Statement of operations—six months ended August 31, 2021 (unaudited)
| | |
| Investment income | |
Dividends (net of foreign withholdings taxes of $371,228)
| $ 2,879,100 |
Income from affiliated securities
| 747 |
Total investment income
| 2,879,847 |
| Expenses | |
Advisory fee
| 135,327 |
Custody and accounting fees
| 276,308 |
Professional fees
| 29,439 |
Interest holder report expenses
| 8,616 |
Trustees’ fees and expenses
| 9,771 |
Other fees and expenses
| 21,468 |
Total expenses
| 480,929 |
Less: Fee waivers and/or expense reimbursements
| (312,221) |
Net expenses
| 168,708 |
Net investment income
| 2,711,139 |
| Realized and unrealized gains (losses) on investments | |
| Net realized gains (losses) on | |
Unaffiliated securities
| 9,702,124 |
Foreign currency and foreign currency translations
| (99,457) |
Futures contracts
| (570,064) |
Net realized gains on investments
| 9,032,603 |
| Net change in unrealized gains (losses) on | |
Unaffiliated securities
| (11,925,997) |
Foreign currency and foreign currency translations
| 4,537 |
Futures contracts
| 485,379 |
Net change in unrealized gains (losses) on investments
| (11,436,081) |
Net realized and unrealized gains (losses) on investments
| (2,403,478) |
Net increase in net assets resulting from operations
| $ 307,661 |
The accompanying notes are an integral part of these financial statements.
24 | Wells Fargo Factor Enhanced Emerging Markets Equity Portfolio
Statement of changes in net assets
| | | |
| | Six months ended
August 31, 2021
(unaudited) | Year ended
February 28, 2021 |
| Operations | | |
Net investment income
| $ 2,711,139 | $ 4,382,426 |
Net realized gains (losses) on investments
| 9,032,603 | (5,841,255) |
Net change in unrealized gains (losses) on investments
| (11,436,081) | 48,370,662 |
Net increase in net assets resulting from operations
| 307,661 | 46,911,833 |
| Capital transactions | | |
| Transactions in investors’ beneficial interests | | |
Contributions
| 26,510,893 | 52,744,158 |
Withdrawals
| (12,542,711) | (145,512,035) |
Net increase (decrease) in net assets resulting from capital transactions
| 13,968,182 | (92,767,877) |
Total increase (decrease) in net assets
| 14,275,843 | (45,856,044) |
| Net assets | | |
Beginning of period
| 171,165,315 | 217,021,359 |
End of period
| $185,441,158 | $ 171,165,315 |
The accompanying notes are an integral part of these financial statements.
Wells Fargo Factor Enhanced Emerging Markets Equity Portfolio | 25
| | | Year ended February 28 |
| | Six months ended
August 31, 20211
(unaudited) | 2021 | 2020 1 | 2019 | 2018 2 |
Total return3
| 0.00% | 23.70% | (6.15)% | (11.16)% | 13.43% |
| Ratios to average net assets (annualized) | | | | | |
Gross expenses
| 0.53% | 0.53% | 0.52% | 0.58% | 0.49% |
Net expenses
| 0.19% * | 0.22% * | 0.39% | 0.45% | 0.49% |
Net investment income
| 3.01% | 2.15% | 2.51% | 2.33% | 1.56% |
| Supplemental data | | | | | |
Portfolio turnover rate
| 42% | 133% | 59% | 81% | 136% |
| * | Ratios reflect expenses which were voluntarily waived by the adviser. Without these voluntary waivers, the net expense ratios would be increased by the following amounts: |
| Six months ended August 31, 2021 (unaudited) | 0.34% |
| Year ended February 28, 2021 | 0.31% |
| 1 | Year ended February 29 |
| 2 | For the period from May 23, 2017 (commencement of operations) to February 28, 2018 |
| 3 | Returns for periods of less than one year are not annualized. |
The accompanying notes are an integral part of these financial statements.
26 | Wells Fargo Factor Enhanced Emerging Markets Equity Portfolio
Notes to financial statements (unaudited)
1. ORGANIZATION
Wells Fargo Master Trust (the "Trust"), a Delaware statutory trust organized on March 10, 1999, is an open-end management investment company registered under the Investment Company Act of 1940, as amended (the "1940 Act"). As an investment company, the Trust follows the accounting and reporting guidance in Financial Accounting Standards Board ("FASB") Accounting Standards Codification Topic 946, Financial Services – Investment Companies. These financial statements report on the Wells Fargo Factor Enhanced Emerging Markets Equity Portfolio (the "Portfolio") which is a diversified series of the Trust.
Interests in the Portfolio are available solely through private placement transactions that do not involve any "public offering" within the meaning of Section 4(2) of the Investment Company Act of 1933.
On February 23, 2021, Wells Fargo & Company announced that it has entered into a definitive agreement to sell Wells Fargo Asset Management ("WFAM") to GTCR LLC and Reverence Capital Partners, L.P. WFAM is the trade name used by the asset management businesses of Wells Fargo & Company and includes Wells Fargo Funds Management, LLC, the adviser to the Portfolio, Wells Capital Management, LLC and Wells Fargo Asset Management (International) Limited, both registered investment advisers providing subadvisory services to certain funds, and Wells Fargo Funds Distributor, LLC, the Portfolio's principal underwriter. As part of the transaction, Wells Fargo & Company will own a 9.9% equity interest and will continue to serve as an important client and distribution partner.
Consummation of the transaction will result in the automatic termination of the Portfolio’s investment advisory agreement and subadvisory agreements. The Portfolio’s Board of Trustees approved a new investment advisory agreement and a new subadvisory agreement which were subsequently approved on behalf of the feeder funds that were investors in the Portfolio at the close of business on May 28, 2021. The new agreements will take effect upon the closing of the transaction. The transaction is expected to close in the second half of 2021, subject to customary closing conditions.
2. SIGNIFICANT ACCOUNTING POLICIES
The following significant accounting policies, which are consistently followed in the preparation of the financial statements of the Portfolio, are in conformity with U.S. generally accepted accounting principles which require management to make estimates and assumptions that affect the reported amounts of assets and liabilities, disclosure of contingent assets and liabilities at the date of the financial statements, and the reported amounts of income and expenses during the reporting period. Actual results could differ from those estimates.
Securities valuation
All investments are valued each business day as of the close of regular trading on the New York Stock Exchange (generally 4 p.m. Eastern Time), although the Portfolio may deviate from this calculation time under unusual or unexpected circumstances.
Equity securities and futures contracts that are listed on a foreign or domestic exchange or market are valued at the official closing price or, if none, the last sales price. If no sale occurs on the principal exchange or market that day, a fair value price will be determined in accordance with the Portfolio’s Valuation Procedures.
The values of securities denominated in foreign currencies are translated into U.S. dollars at rates provided by an independent foreign currency pricing source at a time each business day specified by the Wells Fargo Asset Management Pricing Committee at Wells Fargo Funds Management, LLC ("Funds Management").
Many securities markets and exchanges outside the U.S. close prior to the close of the New York Stock Exchange and therefore may not fully reflect trading or events that occur after the close of the principal exchange in which the foreign securities are traded, but before the close of the New York Stock Exchange. If such trading or events are expected to materially affect the value of such securities, then fair value pricing procedures approved by the Board of Trustees of the Portfolio are applied. These procedures take into account multiple factors including movements in U.S. securities markets after foreign exchanges close. Foreign securities that are fair valued under these procedures are categorized as Level 2 and the application of these procedures may result in transfers between Level 1 and Level 2. Depending on market activity, such fair valuations may be frequent. Such fair value pricing may result in net asset values that are higher or lower than net asset values based on the last reported sales price or latest quoted bid price. On August 31, 2021, such fair value pricing was used in pricing certain foreign securities.
Debt securities are valued at the evaluated bid price provided by an independent pricing service (e.g. taking into account various factors, including yields, maturities, or credit ratings) or, if a reliable price is not available, the quoted bid price from an independent broker-dealer.
Investments in registered open-end investment companies are valued at net asset value.
Wells Fargo Factor Enhanced Emerging Markets Equity Portfolio | 27
Notes to financial statements (unaudited)
Investments which are not valued using any of the methods discussed above are valued at their fair value, as determined in good faith by the Board of Trustees. The Board of Trustees has established a Valuation Committee comprised of the Trustees and has delegated to it the authority to take any actions regarding the valuation of portfolio securities that the Valuation Committee deems necessary or appropriate, including determining the fair value of portfolio securities, unless the determination has been delegated to the Wells Fargo Asset Management Pricing Committee. The Board of Trustees retains the authority to make or ratify any valuation decisions or approve any changes to the Valuation Procedures as it deems appropriate. On a quarterly basis, the Board of Trustees receives reports on any valuation actions taken by the Valuation Committee or the Wells Fargo Asset Management Pricing Committee which may include items for ratification.
Foreign currency translation
The accounting records of the Portfolio are maintained in U.S. dollars. The values of other assets and liabilities denominated in foreign currencies are translated into U.S. dollars at rates provided by an independent foreign currency pricing source at a time each business day specified by the Wells Fargo Asset Management Pricing Committee. Purchases and sales of securities, and income and expenses are converted at the rate of exchange on the respective dates of such transactions. Net realized foreign exchange gains or losses arise from sales of foreign currencies, currency gains or losses realized between the trade and settlement dates on securities transactions, and the difference between the amounts of dividends, interest and foreign withholding taxes recorded and the U.S. dollar equivalent of the amounts actually paid or received. Net unrealized foreign exchange gains and losses arise from changes in the fair value of assets and liabilities other than investments in securities resulting from changes in exchange rates. The changes in net assets arising from changes in exchange rates of securities and the changes in net assets resulting from changes in market prices of securities are not separately presented. Such changes are included in net realized and unrealized gains or losses from investments.
Futures contracts
Futures contracts are agreements between the Portfolio and a counterparty to buy or sell a specific amount of a commodity, financial instrument or currency at a specified price on a specified date. The Portfolio may buy and sell futures contracts in order to gain exposure to, or protect against, changes in security values and is subject to equity price risk. The primary risks associated with the use of futures contracts are the imperfect correlation between changes in market values of securities held by the Portfolio and the prices of futures contracts, and the possibility of an illiquid market. Futures contracts are generally entered into on a regulated futures exchange and cleared through a clearinghouse associated with the exchange. With futures contracts, there is minimal counterparty risk to the Portfolio since futures contracts are exchange traded and the exchange’s clearinghouse, as the counterparty to all exchange traded futures, guarantees the futures contracts against default.
Upon entering into a futures contract, the Portfolio is required to deposit either cash or securities (initial margin) with the broker in an amount equal to a certain percentage of the contract value. Subsequent payments (variation margin) are paid to or from the broker each day equal to the daily changes in the contract value. Such payments are recorded as unrealized gains or losses and, if any, shown as variation margin receivable (payable) in the Statement of Assets and Liabilities. Should the Portfolio fail to make requested variation margin payments, the broker can gain access to the initial margin to satisfy the Portfolio’s payment obligations. When the contracts are closed, a realized gain or loss is recorded in the Statement of Operations.
Security transactions and income recognition
Securities transactions are recorded on a trade date basis. Realized gains or losses are recorded on the basis of identified cost.
Dividend income is recognized on the ex-dividend date, except for certain dividends from foreign securities, which are recorded as soon as the custodian verifies the ex-dividend date. Dividend income is recorded net of foreign taxes withheld where recovery of such taxes is not assured.
Federal and other taxes
The Portfolio is not required to pay federal income taxes on its net investment income and net capital gains as it is treated as a partnership for federal income tax purposes. All income, gains and losses of the Portfolio are deemed to have been “passed through” to the interest holders in proportion to their holdings of the Portfolio regardless of whether income and gains have been distributed by the Portfolio.
The Portfolio’s income tax returns and all financial records supporting those returns for the prior three fiscal years are subject to examination by the federal revenue authority. Management has analyzed the Portfolio’s tax positions taken on federal, state, and foreign tax returns for all open tax years and does not believe that there are any uncertain tax positions that require recognition of a tax liability.
28 | Wells Fargo Factor Enhanced Emerging Markets Equity Portfolio
Notes to financial statements (unaudited)
As of August 31, 2021, the aggregate cost of all investments for federal income tax purposes was $157,157,543 and the unrealized gains (losses) consisted of:
| Gross unrealized gains | $36,695,133 |
| Gross unrealized losses | (9,343,193) |
| Net unrealized gains | $27,351,940 |
3. FAIR VALUATION MEASUREMENTS
Fair value measurements of investments are determined within a framework that has established a fair value hierarchy based upon the various data inputs utilized in determining the value of the Portfolio’s investments. The three-level hierarchy gives the highest priority to unadjusted quoted prices in active markets for identical assets or liabilities (Level 1) and the lowest priority to unobservable inputs (Level 3). The Portfolio’s investments are classified within the fair value hierarchy based on the lowest level of input that is significant to the fair value measurement. The inputs are summarized into three broad levels as follows:
| ■ | Level 1 – quoted prices in active markets for identical securities |
| ■ | Level 2 – other significant observable inputs (including quoted prices for similar securities, interest rates, prepayment speeds, credit risk, etc.) |
| ■ | Level 3 – significant unobservable inputs (including the Portfolio’s own assumptions in determining the fair value of investments) |
The inputs or methodologies used for valuing investments in securities are not necessarily an indication of the risk associated with investing in those securities.
Wells Fargo Factor Enhanced Emerging Markets Equity Portfolio | 29
Notes to financial statements (unaudited)
The following is a summary of the inputs used in valuing the Portfolio’s assets and liabilities as of August 31, 2021:
| | Quoted prices
(Level 1) | Other significant
observable inputs
(Level 2) | Significant
unobservable inputs
(Level 3) | Total |
| Assets | | | | |
| Investments in: | | | | |
| Common stocks | | | | |
| Brazil | $ 5,723,554 | $ 0 | $ 0 | $ 5,723,554 |
| Chile | 1,011,717 | 0 | 0 | 1,011,717 |
| China | 57,065,102 | 0 | 0 | 57,065,102 |
| Colombia | 330,461 | 0 | 0 | 330,461 |
| Cyprus | 268,517 | 0 | 0 | 268,517 |
| Czech Republic | 165,776 | 0 | 0 | 165,776 |
| Greece | 644,836 | 0 | 0 | 644,836 |
| Hong Kong | 5,854,599 | 0 | 93,861 | 5,948,460 |
| Hungary | 755,425 | 0 | 0 | 755,425 |
| India | 20,209,911 | 0 | 0 | 20,209,911 |
| Indonesia | 2,245,377 | 0 | 0 | 2,245,377 |
| Kuwait | 748,292 | 0 | 0 | 748,292 |
| Luxembourg | 708,704 | 0 | 0 | 708,704 |
| Malaysia | 2,319,078 | 1,913,747 | 0 | 4,232,825 |
| Mexico | 3,982,918 | 0 | 0 | 3,982,918 |
| Netherlands | 365,237 | 0 | 0 | 365,237 |
| Peru | 207,763 | 0 | 0 | 207,763 |
| Philippines | 1,421,883 | 0 | 0 | 1,421,883 |
| Poland | 1,707,261 | 0 | 0 | 1,707,261 |
| Russia | 3,863,387 | 0 | 0 | 3,863,387 |
| South Africa | 6,148,198 | 0 | 0 | 6,148,198 |
| South Korea | 23,076,698 | 0 | 31,016 | 23,107,714 |
| Taiwan | 26,666,012 | 0 | 0 | 26,666,012 |
| Thailand | 4,134,672 | 0 | 0 | 4,134,672 |
| Turkey | 1,226,133 | 0 | 0 | 1,226,133 |
| Preferred stocks | | | | |
| Brazil | 3,941,638 | 0 | 0 | 3,941,638 |
| Chile | 10,881 | 0 | 0 | 10,881 |
| South Korea | 959,261 | 0 | 0 | 959,261 |
| Short-term investments | | | | |
| Investment companies | 6,566,797 | 0 | 0 | 6,566,797 |
| | 182,330,088 | 1,913,747 | 124,877 | 184,368,712 |
| Futures contracts | 140,771 | 0 | 0 | 140,771 |
| Total assets | $182,470,859 | $1,913,747 | $124,877 | $184,509,483 |
Futures contracts are reported at their cumulative unrealized gains (losses) at measurement date as reported in the table following the Portfolio of Investments. For futures contracts, the current day’s variation margin is reported on the Statement of Assets and Liabilities. All other assets and liabilities are reported at their market value at measurement date.
Additional sector, industry or geographic detail, if any, is included in the Portfolio of Investments.
For the six months ended August 31, 2021, the Portfolio had no material transfers into/out of Level 3.
4. TRANSACTIONS WITH AFFILIATES
Advisory fee
The Trust has entered into an advisory contract with Funds Management, an indirect wholly owned subsidiary of Wells Fargo & Company ("Wells Fargo"). The adviser is responsible for implementing investment policies and guidelines and for supervising
30 | Wells Fargo Factor Enhanced Emerging Markets Equity Portfolio
Notes to financial statements (unaudited)
the subadviser, who is responsible for day-to-day portfolio management of the Portfolio. Pursuant to the contract, Funds Management is entitled to receive an advisory fee at the following annual rate based on the Portfolio’s average daily net assets:
| Average daily net assets | Advisory fee |
| First $5 billion | 0.150% |
| Next $5 billion | 0.130 |
| Over $10 billion | 0.110 |
For the six months ended August 31, 2021, the advisory fee was equivalent to an annual rate of 0.15% of the Portfolio’s average daily net assets.
Funds Management has retained the services of a subadviser to provide daily portfolio management to the Portfolio. The fee for subadvisory services is borne by Funds Management. Wells Capital Management, LLC, an affiliate of Funds Management and an indirect wholly owned subsidiary of Wells Fargo, is the subadviser to the Portfolio and is entitled to receive a fee from Funds Management at an annual rate starting at 0.08% and declining to 0.05% as the average daily net assets of the Portfolio increase.
Funds Management has voluntarily waived and/or reimbursed advisory fees to reduce the net operating expense ratio of the Portfolio. These voluntary waivers may be discontinued at any time.
Interfund transactions
The Portfolio may purchase or sell portfolio investment securities to certain other Wells Fargo affiliates pursuant to Rule 17a-7 under the 1940 Act and under procedures adopted by the Board of Trustees. The procedures have been designed to ensure that these interfund transactions, which do not incur broker commissions, are effected at current market prices.
5. INVESTMENT PORTFOLIO TRANSACTIONS
Purchases and sales of investments, excluding U.S. government obligations (if any) and short-term securities, for the six months ended August 31, 2021 were $89,045,842 and $72,581,627, respectively.
6. DERIVATIVE TRANSACTIONS
During the six months ended August 31, 2021, the Portfolio entered into futures contracts to gain market exposure. The Portfolio had an average notional amount of $6,777,816 in long futures contracts during the six months ended August 31, 2021.
The fair value, realized gains or losses and change in unrealized gains or losses, if any, on derivative instruments are reflected in the corresponding financial statement captions.
7. BANK BORROWINGS
The Trust, along with Wells Fargo Variable Trust and Wells Fargo Funds Trust (excluding the money market funds), are parties to a $350,000,000 revolving credit agreement whereby the Portfolio is permitted to use bank borrowings for temporary or emergency purposes, such as to fund interest holders withdrawal requests. Interest under the credit agreement is charged to the Portfolio based on a borrowing rate equal to the higher of the Federal Funds rate in effect on that day plus 1.25% or the overnight bank funding rate in effect on that day plus 1.25%. In addition, an annual commitment fee equal to 0.25% of the unused balance is allocated to each participating fund.
For the six months ended August 31, 2021, there were no borrowings by the Portfolio under the agreement.
8. CONCENTRATION RISKS
As of the end of the period, the Portfolio concentrated its portfolio of investments in China. A fund that invests a substantial portion of its assets in any country or geographic region will be more vulnerable than a fund that invests its assets more broadly to the economic, financial, political or other developments affecting that country or region. Such developments may have a significant impact on the Portfolio’s investment performance causing such performance to be more volatile than the investment performance of a more geographically diversified fund.
Wells Fargo Factor Enhanced Emerging Markets Equity Portfolio | 31
Notes to financial statements (unaudited)
9. INDEMNIFICATION
Under the Portfolio's organizational documents, the officers and Trustees have been granted certain indemnification rights against certain liabilities that may arise out of performance of their duties to the Portfolio. The Portfolio has entered into a separate agreement with each Trustee that converts indemnification rights currently existing under the Portfolio’s organizational documents into contractual rights that cannot be changed in the future without the consent of the Trustee. Additionally, in the normal course of business, the Portfolio may enter into contracts with service providers that contain a variety of indemnification clauses. The Portfolio’s maximum exposure under these arrangements is dependent on future claims that may be made against the Portfolio and, therefore, cannot be estimated.
10. CORONAVIRUS (COVID-19) PANDEMIC
On March 11, 2020, the World Health Organization announced that it had made the assessment that coronavirus disease 2019 (“COVID-19”) is a pandemic. The impacts of COVID-19 are affecting the entire global economy, individual companies and investment products, the funds, and the market in general. There is significant uncertainty around the extent and duration of business disruptions related to COVID-19 and the impacts may last for an extended period of time. COVID-19 has led to significant uncertainty and volatility in the financial markets.
11. SUBSEQUENT EVENTS
Wells Fargo Asset Management ("WFAM") announced that it will be changing its company name to Allspring Global Investments upon the closing of the previously announced sale transaction of WFAM by Wells Fargo & Company to GTCR LLC and Reverence Capital Partners, L.P. The new corporate name is expected to go into effect on the closing date of the transaction, which is anticipated to occur in the second half of 2021, subject to customary closing conditions.
The Board of Trustees of the Wells Fargo Funds approved a change in the Portfolio's name to remove “Wells Fargo” from the Portfolio's name and replace with “Allspring” on December 6, 2021.
Following the closing of the transaction, Wells Fargo Funds Management, LLC, the Portfolio's adviser, Wells Capital Management, LLC and Wells Fargo Asset Management (International) Limited, each subadvisers to certain funds, and Wells Fargo Funds Distributor, LLC will each be rebranded as Allspring.
32 | Wells Fargo Factor Enhanced Emerging Markets Equity Portfolio
Other information (unaudited)
PROXY VOTING INFORMATION
A description of the policies and procedures used to determine how to vote proxies relating to portfolio securities is available without charge, upon request, by calling 1-800-222-8222, visiting our website at wfam.com, or visiting the SEC website at sec.gov. Information regarding how the proxies related to portfolio securities were voted during the most recent 12-month period ended June 30 is available on the website at wfam.com or by visiting the SEC website at sec.gov.
QUARTERLY PORTFOLIO HOLDINGS INFORMATION
The Portfolio files its complete schedule of portfolio holdings with the SEC for the first and third quarters of each fiscal year as an exhibit to its reports on Form N-PORT. Interest holders may view the filed Form N-PORT by visiting the SEC website at sec.gov.
Wells Fargo Factor Enhanced Emerging Markets Equity Portfolio | 33
Other information (unaudited)
BOARD OF TRUSTEES AND OFFICERS
Each of the Trustees and Officers listed in the table below acts in identical capacities for each fund in the Wells Fargo family of funds, which consists of 139 mutual funds comprising the Wells Fargo Funds Trust, Wells Fargo Variable Trust, Wells Fargo Master Trust and four closed-end funds (collectively the “Fund Complex”). This table should be read in conjunction with the Prospectus and the Statement of Additional Information1. The mailing address of each Trustee and Officer is 525 Market Street, 12th Floor, San Francisco, CA 94105. Each Trustee and Officer serves an indefinite term, however, each Trustee serves such term until reaching the mandatory retirement age established by the Trustees.
Independent Trustees
Name and
year of birth | Position held and
length of service* | Principal occupations during past five years or longer | Current other
public company or
investment
company
directorships |
William R. Ebsworth
(Born 1957) | Trustee,
since 2015 | Retired. From 1984 to 2013, equities analyst, portfolio manager, research director and chief investment officer at Fidelity Management and Research Company in Boston, Tokyo, and Hong Kong, and retired in 2013 as Chief Investment Officer of Fidelity Strategic Advisers, Inc. where he led a team of investment professionals managing client assets. Prior thereto, Board member of Hong Kong Securities Clearing Co., Hong Kong Options Clearing Corp., the Thailand International Fund, Ltd., Fidelity Investments Life Insurance Company, and Empire Fidelity Investments Life Insurance Company. Audit Committee Chair and Investment Committee Chair of the Vincent Memorial Hospital Endowment (non-profit organization). Mr. Ebsworth is a CFA® charterholder. | N/A |
Jane A. Freeman
(Born 1953) | Trustee,
since 2015;
Chair Liaison,
since 2018 | Retired. From 2012 to 2014 and 1999 to 2008, Chief Financial Officer of Scientific Learning Corporation. From 2008 to 2012, Ms. Freeman provided consulting services related to strategic business projects. Prior to 1999, Portfolio Manager at Rockefeller & Co. and Scudder, Stevens & Clark. Board member of the Harding Loevner Funds from 1996 to 2014, serving as both Lead Independent Director and chair of the Audit Committee. Board member of the Russell Exchange Traded Funds Trust from 2011 to 2012 and the chair of the Audit Committee. Ms. Freeman is also an inactive Chartered Financial Analyst. | N/A |
Isaiah Harris, Jr.
(Born 1952) | Trustee,
since 2009; Audit
Committee
Chair,
since 2019 | Retired. Chairman of the Board of CIGNA Corporation since 2009, and Director since 2005. From 2003 to 2011, Director of Deluxe Corporation. Prior thereto, President and CEO of BellSouth Advertising and Publishing Corp. from 2005 to 2007, President and CEO of BellSouth Enterprises from 2004 to 2005 and President of BellSouth Consumer Services from 2000 to 2003. Emeritus member of the Iowa State University Foundation Board of Governors. Emeritus Member of the Advisory Board of Iowa State University School of Business. Advisory Board Member, Palm Harbor Academy (private school). Mr. Harris is a certified public accountant (inactive status). | CIGNA Corporation |
Judith M. Johnson
(Born 1949) | Trustee,
since 2008 | Retired. Prior thereto, Chief Executive Officer and Chief Investment Officer of Minneapolis Employees Retirement Fund from 1996 to 2008. Ms. Johnson is an attorney, certified public accountant and a certified managerial accountant. | N/A |
David F. Larcker
(Born 1950) | Trustee,
since 2009 | James Irvin Miller Professor of Accounting at the Graduate School of Business (Emeritus), Stanford University, Director of the Corporate Governance Research Initiative and Senior Faculty of The Rock Center for Corporate Governance since 2006. From 2005 to 2008, Professor of Accounting at the Graduate School of Business, Stanford University. Prior thereto, Ernst & Young Professor of Accounting at The Wharton School, University of Pennsylvania from 1985 to 2005. | N/A |
34 | Wells Fargo Factor Enhanced Emerging Markets Equity Portfolio
Other information (unaudited)
Name and
year of birth | Position held and
length of service* | Principal occupations during past five years or longer | Current other
public company or
investment
company
directorships |
Olivia S. Mitchell
(Born 1953) | Trustee,
since 2006;
Nominating and
Governance
Committee Chair,
since 2018 | International Foundation of Employee Benefit Plans Professor, Wharton School of the University of Pennsylvania since 1993. Director of Wharton’s Pension Research Council and Boettner Center on Pensions & Retirement Research, and Research Associate at the National Bureau of Economic Research. Previously, Cornell University Professor from 1978 to 1993. | N/A |
Timothy J. Penny
(Born 1951) | Trustee,
since 1996;
Chair,
since 2018 | President and Chief Executive Officer of Southern Minnesota Initiative Foundation, a non-profit organization, since 2007. Member of the Board of Trustees of NorthStar Education Finance, Inc., a non-profit organization, since 2007. | N/A |
James G. Polisson
(Born 1959) | Trustee,
since 2018 | Retired. Chief Marketing Officer, Source (ETF) UK Services, Ltd, from 2015 to 2017. From 2012 to 2015, Principal of The Polisson Group, LLC, a management consulting, corporate advisory and principal investing company. Chief Executive Officer and Managing Director at Russell Investments, Global Exchange Traded Funds from 2010 to 2012. Managing Director of Barclays Global Investors from 1998 to 2010 and Global Chief Marketing Officer for iShares and Barclays Global Investors from 2000 to 2010. Trustee of the San Francisco Mechanics’ Institute, a non-profit organization, from 2013 to 2015. Board member of the Russell Exchange Traded Fund Trust from 2011 to 2012. Director of Barclays Global Investors Holdings Deutschland GmbH from 2006 to 2009. Mr. Polisson is an attorney and has a retired status with the Massachusetts and District of Columbia Bar Associations. | N/A |
Pamela Wheelock
(Born 1959) | Trustee,
since January
2020; previously
Trustee from
January 2018 to
July 2019 | Board member of the Destination Medical Center Economic Development Agency, Rochester, Minnesota since 2019. Interim President of the McKnight Foundation from January to September 2020. Acting Commissioner, Minnesota Department of Human Services, July 2019 through September 2019. Human Services Manager (part-time), Minnesota Department of Human Services, October 2019 through December 2019. Chief Operating Officer, Twin Cities Habitat for Humanity from 2017 to 2019. Vice President of University Services, University of Minnesota from 2012 to 2016. Prior thereto, on the Board of Directors, Governance Committee and Finance Committee for the Minnesota Philanthropy Partners (Saint Paul Foundation) from 2012 to 2018, Interim Chief Executive Officer of Blue Cross Blue Shield of Minnesota from 2011 to 2012, Chairman of the Board from 2009 to 2012 and Board Director from 2003 to 2015. Vice President, Leadership and Community Engagement, Bush Foundation, Saint Paul, Minnesota (a private foundation) from 2009 to 2011. Executive Vice President and Chief Financial Officer, Minnesota Sports and Entertainment from 2004 to 2009 and Senior Vice President from 2002 to 2004. Executive Vice President of the Minnesota Wild Foundation from 2004 to 2008. Commissioner of Finance, State of Minnesota, from 1999 to 2002. Currently Board Chair of the Minnesota Wild Foundation since 2010. | N/A |
* Length of service dates reflect the Trustee’s commencement of service with the Trust’s predecessor entities, where applicable.
Wells Fargo Factor Enhanced Emerging Markets Equity Portfolio | 35
Other information (unaudited)
Officers
Name and
year of birth | Position held and
length of service | Principal occupations during past five years or longer |
Andrew Owen
(Born 1960) | President,
since 2017 | Executive Vice President of Wells Fargo & Company and Head of Affiliated Managers, Wells Fargo Asset Management, since 2014. In addition, Mr. Owen is currently President, Chief Executive Officer and Director of Wells Fargo Funds Management, LLC since 2017. Prior thereto, Executive Vice President responsible for marketing, investments and product development for Wells Fargo Funds Management, LLC, from 2009 to 2014. |
Jeremy DePalma
(Born 1974) | Treasurer,
since 2012
(for certain funds in
the Fund Complex);
since 2021 (for
the remaining funds in the
Fund Complex) | Senior Vice President of Wells Fargo Funds Management, LLC since 2009. Senior Vice President of Evergreen Investment Management Company, LLC from 2008 to 2010 and head of the Fund Reporting and Control Team within Fund Administration from 2005 to 2010. |
Michelle Rhee
(Born 1966) | Chief Legal Officer,
since 2019 | Secretary of Wells Fargo Funds Management, LLC and Chief Legal Counsel of Wells Fargo Asset Management since 2018. Deputy General Counsel of Wells Fargo Bank, N.A. since 2020 and Assistant General Counsel of Wells Fargo Bank, N.A. from 2018 to 2020. Associate General Counsel and Managing Director of Bank of America Corporation from 2004 to 2018. |
Matthew Prasse
(Born 1983) | Secretary,
since 2021 | Senior Counsel of the Wells Fargo Legal Department since 2018. Previously, Director and Counsel for Barings LLC from 2015 to 2018. Prior to joining Barings, Associate at Morgan, Lewis & Bockius LLP from 2008 to 2015. |
Michael H. Whitaker
(Born 1967) | Chief Compliance Officer,
since 2016 | Chief Compliance Officer of Wells Fargo Asset Management since 2016. Senior Vice President and Chief Compliance Officer for Fidelity Investments from 2007 to 2016. |
1 The Statement of Additional Information includes additional information about the Trustees and is available, without charge, upon request, by calling 1-800-222-8222 or by visiting the website at wfam.com.
36 | Wells Fargo Factor Enhanced Emerging Markets Equity Portfolio
Board considerations (unaudited)
BOARD CONSIDERATION OF INVESTMENT ADVISORY AND SUB-ADVISORY AGREEMENTS:
Wells Fargo Bloomberg Barclays US Aggregate ex-Corporate Portfolio, Wells Fargo Emerging Markets Bond Portfolio, Wells Fargo Factor Enhanced Emerging Markets Equity Portfolio, Wells Fargo Factor Enhanced International Equity Portfolio, Wells Fargo Factor Enhanced U.S. Large Cap Equity Portfolio, Wells Fargo Factor Enhanced U.S. Small Cap Equity Portfolio, Wells Fargo High Yield Corporate Bond Portfolio, Wells Fargo Investment Grade Corporate Bond Portfolio, Wells Fargo Factor Enhanced U.S. Low Volatility Equity Portfolio, Wells Fargo Strategic Retirement Bond Portfolio, and Wells Fargo U.S. REIT Portfolio
Board Considerations – Current Agreements
Under the Investment Company Act of 1940 (the “1940 Act”), the Board of Trustees (the “Board”) of Wells Fargo Master Trust (the “Trust”) must determine annually whether to approve the continuation of the Trust’s investment advisory and sub-advisory agreements. In this regard, at a meeting held on May 17-19, 2021 (the “Meeting”), the Board of the Trust, all the members of which have no direct or indirect interest in the investment advisory and sub-advisory agreements and are not “interested persons” of the Trust, as defined in the 1940 Act (the “Independent Trustees”), reviewed and approved for each of the portfolios of the Trust identified in the table below (individually, a “Portfolio” and collectively, the “Portfolios”): (i) an investment advisory agreement (the “Advisory Agreement”) with Wells Fargo Funds Management, LLC (“Funds Management”); and (ii) an investment sub-advisory agreement (each, a “Sub-Advisory Agreement” and collectively, the “Sub-Advisory Agreements”) with the sub-adviser(s) identified in the table below (each, a “Sub-Adviser” and collectively, the “Sub-Advisers”) for the corresponding Portfolio identified. The Advisory Agreement and the Sub-Advisory Agreements are collectively referred to as the “Advisory Agreements.”
| Master Portfolios | Sub-Advisers |
| Wells Fargo Bloomberg Barclays US Aggregate ex-Corporate Portfolio | Wells Capital Management Incorporated |
| Wells Fargo Emerging Markets Bond Portfolio | Wells Fargo Asset Management (International) Limited and Wells Capital Management Incorporated |
| Wells Fargo Factor Enhanced Emerging Markets Equity Portfolio | Wells Capital Management Incorporated |
| Wells Fargo Factor Enhanced International Equity Portfolio | Wells Capital Management Incorporated |
| Wells Fargo Factor Enhanced U.S. Large Cap Equity Portfolio | Wells Capital Management Incorporated |
| Wells Fargo Factor Enhanced U.S. Small Cap Equity Portfolio | Wells Capital Management Incorporated |
| Wells Fargo High Yield Corporate Bond Portfolio | Wells Capital Management Incorporated |
| Wells Fargo Investment Grade Corporate Bond Portfolio | Wells Capital Management Incorporated |
| Wells Fargo Factor Enhanced U.S. Low Volatility Equity Portfolio | Wells Capital Management Incorporated |
| Wells Fargo Strategic Retirement Bond Portfolio | Wells Capital Management Incorporated |
| Wells Fargo U.S. REIT Portfolio | Wells Capital Management Incorporated |
The Board noted that Wells Fargo & Company recently announced that it had entered into a definitive agreement to sell Wells Fargo Asset Management (“WFAM”), which includes Funds Management and the Sub-Adviser, to GTCR LLC and Reverence Capital Partners, L.P. and/or their affiliates (the “Transaction”). The Board further noted that the Transaction would result in a change-of-control of Funds Management and the Sub-Advisers, which would be considered to be an assignment that would result in the termination of the Advisory Agreements. In light of the Transaction, the Board separately considered for approval a new investment advisory agreement with Funds Management and a new investment sub-advisory agreement with each of the Sub-Advisers (the “New Agreements”) that would replace the Advisory Agreements upon consummation of the Transaction, subject to approval of the New Agreements by the Portfolios’ shareholders. The Board also considered for approval interim agreements to go into effect in the event shareholders do not approve the New Agreements before the Transaction is completed. The interim agreements would allow the Manager and the Sub-Advisers to continue providing services to the Portfolios while the Portfolios continues to seek shareholder approval of the New Agreements. The Board noted that the terms of the interim agreements would be identical to those of the current Advisory Agreements, except for the term and certain escrow provisions.
At the Meeting, the Board considered the factors and reached the conclusions described below relating to the selection of Funds Management and the Sub-Advisers and the approval of the Advisory Agreements. Prior to the Meeting, including at Board meetings held in April and May 2021, the Trustees conferred extensively among themselves and with representatives of Funds Management about these matters. Also, the Board has adopted a team-based approach, with each team consisting of a sub-set of
Wells Fargo Factor Enhanced Emerging Markets Equity Portfolio | 37
Board considerations (unaudited)
Trustees, to assist the full Board in the discharge of its duties in reviewing investment performance and other matters throughout the year. The Independent Trustees were assisted in their evaluation of the Advisory Agreements by independent legal counsel, from whom they received separate legal advice and with whom they met separately.
In providing information to the Board, Funds Management and the Sub-Advisers were guided by a detailed set of requests for information submitted to them by independent legal counsel on behalf of the Independent Trustees at the start of the Board’s annual contract renewal process earlier in 2021. In considering and approving the Advisory Agreements, the Trustees considered the information they believed relevant, including but not limited to the information discussed below. The Board considered not only the specific information presented in connection with the Meeting, but also the knowledge gained over time through interaction with Funds Management and the Sub-Advisers about various topics. In this regard, the Board reviewed reports of Funds Management at each of its quarterly meetings, which included, among other things, portfolio reviews and investment performance reports. In addition, the Board and the teams mentioned above confer with portfolio managers at various times throughout the year. The Board did not identify any particular information or consideration that was all-important or controlling, and each individual Trustee may have attributed different weights to various factors.
After its deliberations, the Board unanimously determined that the compensation or the absence of compensation payable to Funds Management and each of the Sub-Advisers under each of the Advisory Agreements was reasonable, and approved the continuation of the Advisory Agreements for a one-year term. The Board considered the approval of the Advisory Agreements for the Portfolios as part of its consideration of agreements for funds across the complex, but its approvals were made on a fund-by-fund basis. The following summarizes a number of important, but not necessarily all, factors considered by the Board in support of its approvals.
Nature, extent and quality of services
The Board received and considered various information regarding the nature, extent and quality of services provided to the Funds by Funds Management and the Sub-Advisers under the Advisory Agreements. This information included a description of the investment advisory services and Portfolio-level administrative services covered by the Advisory Agreement, as well as, among other things, a summary of the background and experience of senior management of WFAM, of which Funds Management and the Sub-Advisers are a part, and a summary of investments made in the business of WFAM. The Board also received a description of Funds Management’s and the Sub-Advisers’ business continuity plans, including a summary of the performance of such plans and any changes thereto during the COVID-19 pandemic, and of their approaches to data privacy and cybersecurity. The Board also received and reviewed information about Funds Management’s role as administrator of the Portfolios’ liquidity risk management program, Funds Management’s approach to risk management, and Funds Management’s intermediary and vendor oversight program.
The Board also considered the qualifications, background, tenure and responsibilities of each of the portfolio managers primarily responsible for the day-to-day portfolio management of the Portfolios. The Board noted that each of the Portfolios replicates the performance of a proprietary index provided by an affiliate of Funds Management, except that each of Wells Fargo Bloomberg Barclays US Aggregate ex-Corporate Portfolio, Wells Fargo Emerging Markets Bond Portfolio, and Wells Fargo Strategic Retirement Bond Portfolio track the performance of a third party index. The Board evaluated the ability of Funds Management and the Sub-Advisers to attract and retain qualified investment professionals, including research, advisory and supervisory personnel.
The Board further considered the compliance programs and compliance records of Funds Management and the Sub-Advisers. In addition, the Board took into account the full range of services provided to the Portfolios by Funds Management and its affiliates. The Board also considered information about retention and back-up arrangements that have been put into place with respect to key personnel of WFAM in connection with the anticipated Transaction, noting that WFAM provided assurances that the announcement and eventual culmination of the Transaction is not expected to result in any diminution in the nature or quality of services provided to the Portfolios.
Portfolio investment performance and expenses
The Board considered the investment performance results for each of the Portfolios over the one- and three-year periods ended December 31, 2020, except for the Wells Fargo Factor Enhanced U.S. Low Volatility Equity Portfolio, for which the Board considered the investment performance results for the quarter ended December 31, 2020. The Board considered these results in comparison to the investment performance of funds in a universe that was determined by Broadridge Inc. (“Broadridge”) to be similar to each respective Portfolios (each, a “Universe”), and in comparison to each Portfolios’ benchmark index and to other comparative data. Broadridge is an independent provider of investment company data. The Board received a description of the methodology used by Broadridge to select the mutual funds in the performance Universe. The Board noted the short performance history of the Portfolios.
38 | Wells Fargo Factor Enhanced Emerging Markets Equity Portfolio
Board considerations (unaudited)
With respect to the investment performance of each Portfolio relative to its respective Universe, the Board noted the following: (i) the investment performance of each of Wells Fargo Factor Enhanced International Equity Portfolio and Wells Fargo Factor Enhanced U.S. Small Cap Equity Portfolio was higher than such Portfolio’s respective Universe for the one- and three-year periods under review; (ii) the investment performance of each of Wells Fargo Bloomberg Barclays US Aggregate ex-Corporate Portfolio, Wells Fargo Emerging Markets Bond Portfolio, and Wells Fargo Investment Grade Corporate Bond Portfolio was higher than such Portfolio’s respective Universe for the three-year period under review, and lower than such Portfolio’s respective Universe for the one-year period under review; (iii) the investment performance of each of Wells Fargo Factor Enhanced Emerging Markets Equity Portfolio, Wells Fargo Factor Enhanced U.S. Large Cap Equity Portfolio, Wells Fargo High Yield Corporate Bond Portfolio, Wells Fargo Strategic Retirement Bond Portfolio, and Wells Fargo U.S. REIT Portfolio was lower than such Portfolio’s respective Universe for the one- and three-year periods under review; and (iv) the Wells Fargo Factor Enhanced U.S. Low Volatility Equity Portfolio launched on July 1, 2020 and, given its short operational history, had no historical performance.
With respect to the investment performance of each Portfolio relative to its respective benchmark index, the Board noted the following: (i) the investment performance of each of Wells Fargo Bloomberg Barclays US Aggregate ex-Corporate Portfolio, Wells Fargo Factor Enhanced International Equity Portfolio, Wells Fargo Investment Grade Corporate Bond Portfolio, Wells Fargo Factor Enhanced U.S. Low Volatility Equity Portfolio, and Wells Fargo Strategic Retirement Bond Portfolio was higher than or in range of such Portfolio’s respective benchmark index for all periods under review; (ii) the investment performance of Wells Fargo U.S. REIT Portfolio was in range of the Portfolio’s benchmark index for the three-year period under review, and was lower than the Portfolio’s benchmark index for the one-year period under review; and (iii) the investment performance of each of Wells Fargo Emerging Markets Bond Portfolio, Wells Fargo Factor Enhanced Emerging Markets Equity Portfolio, Wells Fargo Factor Enhanced U.S. Large Cap Equity Portfolio, Wells Fargo Factor Enhanced U.S. Small Cap Equity Portfolio, and Wells Fargo High Yield Corporate Bond Portfolio was lower than such Portfolio’s respective benchmark index for all periods under review.
The Board received information concerning, and discussed factors contributing to, the underperformance of each of Wells Fargo Factor Enhanced Emerging Markets Equity Portfolio, Wells Fargo Factor Enhanced International Equity Portfolio, Wells Fargo Factor Enhanced U.S. Large Cap Equity Portfolio, Wells Fargo High Yield Corporate Bond Portfolio, Wells Fargo Strategic Retirement Bond Portfolio, and Wells Fargo U.S. REIT Portfolio relative to such Portfolio’s Universe and benchmark index for the periods identified above.
The Board also received and considered information regarding the fee rates that are payable to Funds Management for investment advisory services (as discussed below), which are the only fees charged to the Portfolios, relative to corresponding class-specific expense groups that were determined by Broadridge to be similar to the Portfolios (the “Groups”). The Board received a description of the methodology used by Broadridge to select the mutual funds in the expense Groups and an explanation of how funds comprising expense groups and their expense ratios may vary from year-to-year.
The Board took into account the Portfolios’ investment performance and expense information provided to it among the factors considered in deciding to re-approve the Advisory Agreements.
Investment advisory and sub-advisory fee rates
The Board reviewed and considered the contractual fee rates payable by the Portfolios to Funds Management under the Advisory Agreement. The Board also reviewed and considered the contractual investment sub-advisory fee rates that are payable by Funds Management to the Sub-Advisers for investment sub-advisory services.
Among other information reviewed by the Board was a comparison of the Portfolios’ Management Rates with the average contractual investment management fee rates of funds in the expense Groups at a common asset level as well as transfer agency costs of the Portfolios in the expense Groups. The Board noted that the Management Rates of the Portfolios were lower than, equal to, or in range of the sum of these average rates for the Portfolios’ expense Groups.
The Board also received and considered information about the portions of the total management fees that were retained by Funds Management after payment of the fees to the Sub-Advisers for sub-advisory services. In assessing the reasonableness of these amounts, the Board received and evaluated information about the nature and extent of responsibilities retained and risks assumed by Funds Management and not delegated to or assumed by the Sub-Advisers, and about Funds Management’s on-going oversight services. Given the affiliation between Funds Management and the Sub-Advisers, the Board ascribed limited relevance to the allocation of fees between them.
The Board also received and considered information about the nature and extent of services offered and fee rates charged by Funds Management and the Sub-Advisers to other types of clients with investment strategies similar to those of certain Portfolios. In this regard, the Board received information about the significantly greater scope of services, and compliance,
Wells Fargo Factor Enhanced Emerging Markets Equity Portfolio | 39
Board considerations (unaudited)
reporting and other legal burdens and risks of managing proprietary mutual funds compared with those associated with managing assets of other types of clients, including third-party sub-advised fund clients and non-mutual fund clients such as institutional separate accounts.
Based on its consideration of the factors and information it deemed relevant, including those described here, the Board determined that the compensation payable to Funds Management under the Advisory Agreement and to the Sub-Advisers under the Sub-Advisory Agreements was reasonable.
Profitability
The Board received and considered information concerning the profitability of Funds Management, as well as the profitability of both WFAM and Wells Fargo & Co. (“Wells Fargo”) from providing services to the funds family as a whole. The Board noted that the Sub-Advisers’ profitability information with respect to providing services to the Portfolios and other funds in the family was subsumed in the WFAM and Wells Fargo profitability analysis.
Funds Management reported on the methodologies and estimates used in calculating profitability, including a description of the methodology used to allocate certain expenses. Among other things, the Board noted that the levels of profitability reported on a fund-by-fund basis varied widely, depending on factors such as the size, type and age of fund.
Based on its review, the Board did not deem the profits reported by Funds Management, WFAM or Wells Fargo from services provided to the Portfolios to be at a level that would prevent it from approving the continuation of the Advisory Agreements.
Economies of scale
The Board received and considered information about the potential for Funds Management to experience economies of scale in the provision of management services to the Portfolios, the difficulties of calculating economies of scale at an individual fund level, and the extent to which potential scale benefits are shared with shareholders. The Board noted the existence of breakpoints in the Portfolios’ management fee structure, which operate generally to reduce the Portfolios’ expense ratios as the Portfolios grow in size, and the size of the Portfolios in relation to such breakpoints. The Board considered that in addition to management fee breakpoints, Funds Management shares potential economies of scale from its management business in a variety of ways, including through fee waiver and expense reimbursement arrangements, competitive management fee rates set at the outset without regard to breakpoints, and investments in the business intended to enhance services available to shareholders.
The Board concluded that Funds Management’s arrangements with respect to the Portfolios, including contractual breakpoints, constituted a reasonable approach to sharing potential economies of scale with the Portfolios and their shareholders.
Other benefits to Funds Management and the Sub-Advisers
The Board received and considered information regarding potential “fall-out” or ancillary benefits received by Funds Management and its affiliates, including the Sub-Advisers, as a result of their relationships with the Portfolios. Ancillary benefits could include, among others, benefits directly attributable to other relationships with the Portfolios and benefits potentially derived from an increase in Funds Management’s and the Sub-Advisers’ businesses as a result of their relationships with the Portfolios. The Board noted that various affiliates of Funds Management may receive distribution-related fees, shareholder servicing payments and sub-transfer agency fees in respect of shares sold or held through them and services provided.
The Board also reviewed information about soft dollar credits earned and utilized by the Sub-Advisers, fees earned by Funds Management and Wells Capital Management Incorporated from managing a private investment vehicle for the fund family’s securities lending collateral, and commissions earned by an affiliated broker from portfolio transactions.
Based on its consideration of the factors and information it deemed relevant, including those described here, the Board did not find that any ancillary benefits received by Funds Management and its affiliates, including the Sub-Advisers, were unreasonable.
Conclusion
At the Meeting, after considering the above-described factors and based on its deliberations and its evaluation of the information described above, the Board unanimously determined that the compensation payable to Funds Management and the Sub-Advisers under each of the Advisory Agreements was reasonable, and approved the continuation of the Advisory Agreements for a one-year term.
40 | Wells Fargo Factor Enhanced Emerging Markets Equity Portfolio
Board considerations (unaudited)
Board Considerations – New Agreements
Overview of the Board evaluation process
At a meeting held on May 17-19, 2021 (the “Board Meeting”), the Board of Trustees (the “Board”) of Wells Fargo Master Trust (the “Trust”, and the series identified below, the “Portfolios”) approved the continuation of each Portfolio’s current Investment Advisory Agreement (the “Current Investment Advisory Agreement”) and the current Sub-Advisory Agreements (the “Current Sub-Advisory Agreements”, and collectively, the “Current Agreements”).
| Wells Fargo Disciplined Large Cap Portfolio |
| Wells Fargo Diversified Large Cap Growth Portfolio |
| Wells Fargo Disciplined International Developed Markets Portfolio |
| Wells Fargo Large Company Value Portfolio |
| Wells Fargo Managed Fixed Income Portfolio |
| Wells Fargo Bloomberg Barclays US Aggregate ex-Corporate Portfolio |
| Wells Fargo Emerging Markets Bond Portfolio |
| Wells Fargo Factor Enhanced Emerging Markets Equity Portfolio |
| Wells Fargo Factor Enhanced International Equity Portfolio |
| Wells Fargo Factor Enhanced U.S. Large Cap Equity Portfolio |
| Wells Fargo Factor Enhanced U.S. Low Volatility Equity Portfolio |
| Wells Fargo Factor Enhanced U.S. Small Cap Equity Portfolio |
| Wells Fargo High Yield Corporate Bond Portfolio |
| Wells Fargo Investment Grade Corporate Bond Portfolio |
| Wells Fargo Strategic Retirement Bond Portfolio |
| Wells Fargo U.S. REIT Portfolio |
Each Trustee on the Board is not an “interested person” (as defined in the Investment Company Act of 1940 (the “1940 Act”)) of the Portfolios (collectively, the “Independent Trustees”). The process followed by the Board in considering and approving the continuation of the Current Agreements is referred to herein as the “2021 Annual Approval Process.”
As noted above, the closing of the sale of Wells Fargo Asset Management (“WFAM”) to a holding company (“NewCo”) affiliated with private funds of GTCR LLC (“GTCR”) and of Reverence Capital Partners, L.P. (“Reverence Capital”, and such transaction, the “Transaction”) will result in a change of control of Wells Fargo Funds Management LLC (“Funds Management”), Wells Capital Management Incorporated (“Wells Capital”) and Wells Fargo Asset Management (International) Limited (“WFAM(I) Ltd.”, and together with Funds Management and Wells Capital, the “Advisers”), which will be considered to be an “assignment” of each Portfolio’s Current Agreements under the 1940 Act that will result in the automatic termination of each Portfolio’s Current Agreements. In light of the expected termination of each Portfolio’s Current Agreements upon the closing, at the Board Meeting the Board also considered and approved: (i) a new Investment Advisory Agreement (the “New Investment Advisory Agreement”) between the Trust, on behalf of each Portfolio, and Funds Management; (ii) a new Sub-Advisory Agreement (the “New Wells Capital Sub-Advisory Agreement”) among the Trust, on behalf of each Portfolio, Funds Management and Wells Capital; and (iii) a new Sub-Advisory Agreement (the “New WFAM(I) Ltd Sub-Advisory Agreement”) among the Trust, on behalf of Emerging Markets Bond Portfolio, Funds Management and WFAM(I) Ltd (“WFAMI”); and (iv) a new Sub-Advisory Agreement (the “New Galliard Sub-Advisory Agreement”, and collectively, the “New Agreements”) among the Trust, on behalf of Managed Fixed Income Portfolio, Funds Management and Galliard Capital Management, LLC (“Galliard”, and together with Wells Capital and WFAMI, the “Sub-Advisers”), each of which is intended to go into effect upon the closing. The process followed by the Board in reviewing and approving the New Agreements is referred to herein as the “New Agreement Approval Process.”
At a series of meetings held in April and May 2021 (collectively, “April and May 2021 Meetings”) and at the Board Meeting, the Trustees conferred extensively among themselves and with senior representatives of Funds Management, GTCR and Reverence Capital about the New Agreements and related matters. The Board reviewed and discussed information furnished by Funds Management, GTCR and Reverence Capital that the Board considered reasonably necessary to evaluate the terms of the New Agreements and the services to be provided. At these meetings, senior representatives from Funds Management, GTCR and Reverence Capital made presentations to, and responded to questions from, the Board.
In providing information to the Board in connection with the 2021 annual approval process for the Current Agreements (the “2021 Annual Approval Process”) and the New Agreement Approval Process, Funds Management, GTCR and Reverence Capital (as applicable) were guided by requests for information submitted by independent legal counsel on behalf of the Independent Trustees. In considering and approving the New Agreements, the Trustees considered the information they believed relevant, including but not limited to the information discussed herein. The Board considered not only the specific information presented in
Wells Fargo Factor Enhanced Emerging Markets Equity Portfolio | 41
Board considerations (unaudited)
connection with the April and May 2021 Meetings as well as the Board Meeting, but also the knowledge gained over time through interaction with Funds Management and the Sub-Advisers about various topics. In this regard, the Board reviews reports of Funds Management at each of its regular Board meetings, which includes, among other things, portfolio reviews and investment performance reports. In addition, the Board confers with portfolio managers at various times throughout the year. The Board was assisted in its evaluation of the New Agreements by independent legal counsel, from whom the Independent Trustees received separate legal advice and with whom the Independent Trustees met separately. The Board did not identify any particular information or consideration that was all-important or controlling, and each individual Trustee may have attributed different weights to various factors.
Among other information considered by the Board in connection with the Transaction was:
| ■ | Information regarding the Transaction: information about the structure, financing sources and material terms and conditions of the Transaction, including the expected impact on the businesses conducted by the Advisers and by Wells Fargo Funds Distributor LLC. |
| ■ | Information regarding NewCo, GTCR and Reverence Capital: (i) information about NewCo, including information about its expected financial condition and access to capital, and senior leadership team; (ii) the experience of senior management at GTCR and Reverence Capital in acquiring portfolio companies; (iii) the plan to operationalize NewCo, including the transition of necessary infrastructure services through a transition services agreement with Wells Fargo under which Wells Fargo will continue to provide NewCo with certain services for a specified period of time after the closing; and (iv) information regarding regulatory matters, compliance, and risk management functions at NewCo, including resources to be dedicated thereto. |
| ■ | Impact of the Transaction on WFAM and Service Providers: (i) information regarding any changes to personnel and/or other resources of the Advisers as a result of the Transaction, including assurances regarding comparable and competitive compensation arrangements to attract and retain highly qualified personnel; and (ii) information about the organizational and operating structure with respect to NewCo, the Advisers and the Portfolios. |
| ■ | Impact of the Transaction on the Portfolios and their Shareholders: (i) information regarding anticipated benefits to the Portfolios as a result of the Transaction; (ii) a commitment that the Portfolios would not bear any expenses, directly or indirectly, in connection with the Transaction; (iii) confirmation that the Advisers intend to continue to manage the Portfolios in a manner consistent with each Portfolio’s current investment objectives and principal investments strategies; and (iv) a commitment that neither NewCo nor WFAM will take any steps that would impose any “unfair burden” (as that term is used in section 15(f)(1)(B) of the 1940 Act) on the Portfolios as a result of the Transaction. |
With respect to the New Agreements, the Board considered: (i) a representation that, after the closing, all of the Portfolios will continue to be managed and advised by their current Advisers, and that the same portfolio managers of the Sub-Advisers are expected to continue to manage the Portfolios after the Transaction; (ii) information regarding the terms of the New Agreements, including changes as compared to the Current Agreements; (iii) information confirming that the fee rates payable under the New Agreements will not increase as a result of the Transaction as compared to the rates under the Current Agreements; and (iv) assurances that the Transaction is not expected to cause any diminution with respect to the nature, extent and quality of any of the services currently provided to the Portfolios by the Advisers as a result of the Transaction.
In addition to considering information furnished specifically to evaluate the impact of the Transaction on the Portfolios and their respective shareholders in connection with the New Agreement Approval Process, the Board considered information furnished at prior meetings of the Board and its committees, including detailed information provided in connection with the 2021 Annual Approval Process. In this regard, in connection with the 2021 Annual Approval Process, the Board received information about complex-wide and individual Portfolio performance, fees and expenses, including: (i) a report from an independent data provider comparing the investment performance of each Portfolio to the investment performance of comparable funds and benchmark indices, over various time periods; (ii) a report from an independent data provider comparing each Portfolio’s total expense ratio (and its components) to those of comparable funds; (iii) comparative information concerning the fees charged and services provided by the Advisers to each Portfolio in managing other accounts (which may include other mutual funds, collective investment funds and institutional accounts), if any, that employ investment strategies and techniques similar to those used in managing such Portfolio(s); and (iv) profitability analyses of Funds Management, as well as the profitability of both WFAM and Wells Fargo from providing services to the fund family as a whole.
After its deliberations, the Board unanimously determined that the compensation payable to Funds Management and the Sub-Advisers under the New Agreements is reasonable, approved the New Agreements for a two-year term. The Board considered the approval of the New Agreements as part of its consideration of agreements for funds across the complex, but its approvals were made on a fund-by-fund basis. The following summarizes a number of important, but not necessarily all, factors considered by the Board in support of its approvals.
42 | Wells Fargo Factor Enhanced Emerging Markets Equity Portfolio
Board considerations (unaudited)
Nature, extent and quality of services
In connection with the 2021 Annual Approval Process, the Board received and considered various information regarding the nature, extent and quality of services provided to each Portfolio by Funds Management and the Sub-Advisers under the Advisory Agreements. This information included a description of the investment advisory services and administrative services covered by the Current Advisory Agreement, as well as, among other things, a summary of the background and experience of senior management of WFAM, of which Funds Management and the Sub-Advisers are a part, and a summary of investments made in the business of WFAM. The Board also received a description of Funds Management’s and the Sub-Advisers’ business continuity plans, including a summary of the performance of such plans and any changes thereto during the COVID-19 pandemic, and of their approaches to data privacy and cybersecurity. The Board also received and reviewed information about Funds Management’s role as administrator of the Portfolios’ liquidity risk management program, Funds Management’s approach to risk management, and Funds Management’s intermediary and vendor oversight program.
In connection with the 2021 Annual Approval Process, the Board also considered the qualifications, background, tenure and responsibilities of each of the portfolio managers primarily responsible for the day-to-day portfolio management of the Portfolios. The Board evaluated the ability of Funds Management and the Sub-Advisers to attract and retain qualified investment professionals, including research, advisory and supervisory personnel.
In connection with the 2021 Annual Approval Process, the Board further considered the compliance programs and compliance records of Funds Management and the Sub-Advisers. In addition, the Board took into account the full range of services provided to the Portfolios by Funds Management and its affiliates.
In connection with the New Agreement Approval Process, the Board considered, among other information, the structure of the Transaction and expected impact, if any, of the Transaction on the operations, facilities, organization and personnel of the Advisers. The Board received assurances from the Advisers that each Portfolio will continue to be advised by its current Advisers after the closing, and that the same individual portfolio managers are expected to continue to manage the Portfolios after the closing. With respect to the recruitment and retention of key personnel, the Board noted information from GTCR, Reverence Capital and the Advisers regarding the potential benefits for employees of joining NewCo. The Board recognized that the personnel who had been extended offers may not accept such offers and personnel changes may occur in the future in the ordinary course.
In addition, the Board considered information regarding the infrastructure, operational capabilities and support staff in place to assist in the portfolio management and operations of the Portfolios, including the provision of administrative services, and the anticipated impact of the Transaction on such matters. The Board also considered the business-related and other risks to which the Advisers may be subject in managing the Portfolios and in connection with the Transaction. The Board also considered the transition and integration plans as a result of the change in ownership of the Advisers from Wells Fargo to NewCo. The Board considered the resources and infrastructure that NewCo intends to devote to its compliance program to ensure compliance with applicable laws and regulations, as well as its risk management program and cybersecurity program. The Board also took into account assurances received from the Advisers, GTCR and Reverence Capital that the Transaction is not expected to cause any diminution in the nature, extent and quality of services provided by the Advisers to the Portfolios and their shareholders.
Investment performance and expenses
In connection with the 2021 Annual Approval Process, the Board considered the investment performance results for each Portfolio over various time periods ended December 31, 2020. The Board considered these results in comparison to the investment performance of funds in a universe that was determined by Broadridge Inc. (“Broadridge”) to be similar to each Portfolio (the “Universe”), and in comparison to each Portfolio’s benchmark index and to other comparative data. Broadridge is an independent provider of investment company data. The Board received a description of the methodology used by Broadridge to select the mutual funds in the performance Universe. Where applicable, the Board received information concerning, and discussed factors contributing to, underperformance of Portfolios relative to the Universe and benchmark for any underperformance periods.
In connection with the 2021 Annual Approval Process, the Board also reviewed the fee rates that are payable to Funds Management for investment advisory services (as discussed below), which are the only fees charged at the Portfolio level, relative to corresponding expense groups that were determined by Broadridge to be similar to the Portfolios (the “Groups”). The Board received a description of the methodology used by Broadridge to select the mutual funds in the expense Groups and an explanation of how funds comprising expense groups and their expense ratios may vary from year-to-year.
In connection with the New Agreement Approval Process, the Board received a commitment that WFAM will maintain fee and expense commitments for at least two years after the closing. The Board took into account each Fund’s investment performance and expense information among the factors considered in deciding to approve the New Agreements.
Wells Fargo Factor Enhanced Emerging Markets Equity Portfolio | 43
Board considerations (unaudited)
Investment advisory and sub-advisory fee rates
In connection with the 2021 Annual Approval Process, the Board reviewed and considered the contractual investment advisory fee rate that is payable by each Portfolio to Funds Management for investment advisory services under the Current Advisory Agreement (the “Advisory Agreement Rate”). The Board also reviewed and considered the contractual investment sub-advisory fee rate that is payable by Funds Management to the applicable Sub-Adviser for investment sub-advisory services (the “Sub-Advisory Agreement Rate”).
Among other information reviewed by the Board in connection with the 2021 Annual Approval Process, was a comparison of each Portfolio’s Advisory Agreement Rate with those of other funds in the Portfolio’s expense Group at a common asset level.
In connection with the 2021 Annual Approval Process, the Board also received and considered information about the portion of the total management fee that was retained by Funds Management after payment of the Sub-Advisory Agreement Rates. In assessing the reasonableness of this amount, the Board received and evaluated information about the nature and extent of responsibilities retained and risks assumed by Funds Management and not delegated to or assumed by the Sub-Advisers, and about Funds Management’s on-going oversight services. Given the affiliation between Funds Management and the Sub-Advisers, the Board ascribed limited relevance to the allocation of fees between them.
In connection with the 2021 Annual Approval Process, the Board also received and considered information about the nature and extent of services offered and fee rates charged by Funds Management and the Sub-Advisers to other types of clients, if any, with investment strategies similar to those of each Portfolio. In this regard, the Board received information about the significantly greater scope of services, and compliance, reporting and other legal burdens and risks of managing proprietary mutual funds compared with those associated with managing assets of other types of clients, including third-party sub-advised fund clients and non-mutual fund clients such as institutional separate accounts.
In connection with the New Agreement Approval Process, the Board noted the assurances received by it that there would be no increases to any of the Advisory Agreement Rates or the Sub-Advisory Agreement Rates as a result of the Transaction. The Board also considered that the New Agreements do not change the computation method for calculating such fees, and there is no present intention to reduce expense waiver and reimbursement arrangements that are currently in effect. Based on its consideration of the factors and information it deemed relevant, including those described here, the Board determined that the compensation payable to Funds Management under the New Advisory Agreement and to each of the Sub-Advisers under the applicable new Sub-Advisory Agreement was reasonable.
Profitability
In connection with the 2021 Annual Approval Process, the Board received and considered information concerning the profitability of Funds Management, as well as the profitability of both WFAM and Wells Fargo from providing services to the fund family as a whole. The Board noted that the Sub-Advisers’ profitability information with respect to providing services to each Fund and other funds in the family was subsumed in the WFAM and Wells Fargo profitability analysis.
Funds Management reported on the methodologies and estimates used in calculating profitability in connection with the 2021 Annual Approval Process, including a description of the methodology used to allocate certain expenses. Among other things, the Board noted that the levels of profitability reported on a fund-by-fund basis varied widely, depending on factors such as the size, type and age of fund.
In connection with the New Agreement Approval Process, the Board received certain information about NewCo’s projected financial condition, and reviewed with senior representatives of Funds Management, GTCR and Reverence Capital the underlying assumptions on which such information was based. The Board considered that NewCo is a newly formed entity, with no historical operations, revenues or expenses, and that it is difficult to predict with any degree of certainty the future profitability of NewCo and the Advisers from advisory activities under the New Agreements. The Board considered that the fee rates payable under the New Agreements will not increase as a result of the Transaction as compared to the rates under the Current Agreements, and that the current contractual expense limitations applicable to each Portfolio will not increase. The Board noted that if the New Agreements are approved by shareholders and the Transaction closes, the Board will have the opportunity in the future to review the profitability of NewCo and the Advisers from advisory activities under the New Agreements.
Economies of scale
In connection with the 2021 Annual Approval Process, the Board received and considered information about the potential for Funds Management to experience economies of scale in the provision of advisory services to the Portfolios, the difficulties of calculating economies of scale at an individual fund level, and the extent to which potential scale benefits are shared with Portfolio shareholders. The Board noted the existence of breakpoints in each Portfolio’s advisory fee structure, which operate generally to reduce the Portfolio’s expense ratios as the Portfolio grows in size, and the size of the Portfolio in relation to such breakpoints. The
44 | Wells Fargo Factor Enhanced Emerging Markets Equity Portfolio
Board considerations (unaudited)
Board considered that, in addition to advisory fee breakpoints, Funds Management shares potential economies of scale from its management business in a variety of ways, including through fee waiver and expense reimbursement arrangements, competitive management fee rates set at the outset without regard to breakpoints, and investments in the business intended to enhance services available to shareholders.
In connection with the New Agreement Approval Process, the Board noted that NewCo and the Advisers may benefit from possible growth of the Portfolios resulting from enhanced distribution capabilities for their investing funds. However, the Board noted that other factors could also affect the potential for economies of scale, and that it was not possible to quantify any potential future economies of scale. Based upon the information furnished to the Board in connection with the 2021 Annual Approval Process and the New Agreement Approval Process, the Board concluded that Funds Management’s arrangements with respect to each Portfolio, including contractual breakpoints and expense limitation arrangements, constituted a reasonable approach to sharing potential economies of scale with the Portfolio and its shareholders.
“Fall-out” benefits to Funds Management and the Sub-Advisers
In connection with the 2021 Annual Approval Process, the Board received and considered information regarding potential “fall-out” or ancillary benefits received by Funds Management and its affiliates, including the Sub-Advisers, as a result of their relationships with the Portfolios. Ancillary benefits could include, among others, benefits directly attributable to other relationships with the Portfolios and benefits potentially derived from an increase in Funds Management’s and the Sub-Advisers’ business as a result of their relationships with the Portfolios. The Board noted that various current affiliates of Funds Management may receive distribution-related fees, shareholder servicing payments and sub-transfer agency fees in respect of shares sold or held through them and services provided.
In connection with the 2021 Annual Approval Process, the Board also reviewed information about soft dollar credits earned and utilized by the Sub-Advisers, fees earned by Funds Management and Wells Capital from managing a private investment vehicle for the fund family’s securities lending collateral, and commissions earned by an affiliated broker of Wells Fargo from portfolio transactions.
In connection with the New Agreement Approval Process, the Board received information to the effect that the Transaction is not expected to have a material impact on the fall-out benefits currently realized by Funds Management and its affiliates, including the Sub-Advisers. The information reviewed by the Board also noted that several of the ancillary benefits identified for WFAM would be potential ancillary benefits for NewCo, including that the scale and reputation of the Portfolios might benefit NewCo’s broader reputation, product initiatives, technology investment and talent acquisition. Based on its consideration of the factors and information it deemed relevant, including those described here, the Board did not find that any ancillary benefits expected to be received by Funds Management and its affiliates, including NewCo and the Sub-Advisers, under the New Agreements were unreasonable.
Conclusion
At the Board Meeting, after considering the above-described factors and based on its deliberations and its evaluation of the information described above, the Board unanimously determined that the compensation payable to Funds Management and to each of the Sub-Advisers under the New Agreements is reasonable, approved the New Agreements for a two-year term.
Wells Fargo Factor Enhanced Emerging Markets Equity Portfolio | 45
Board considerations (unaudited)
Board Considerations - Interim Agreements
At a meeting held on May 17-19, 2021 (the “Board Meeting”), the Boards of Trustees (each, a “Board”, and collectively, the “Boards”) of Wells Fargo Funds Trust, Wells Fargo Master Trust, Wells Fargo Variable Trust, Wells Fargo Global Dividend Opportunity Fund, Wells Fargo Income Opportunities Fund, Wells Fargo Multi-Sector Income Fund and Wells Fargo Utilities and High Income Fund (each a “Trust”, and the series thereof, a “Fund”) reviewed and approved for the Trusts and Funds, as applicable: (i) interim investment management agreements (the “Interim Management Agreements”) with Wells Fargo Funds Management, LLC (“Funds Management”); (ii) interim investment advisory agreements (the “Interim Advisory Agreements”) with Funds Management; and (iii) interim sub-advisory agreements (the “Interim Sub-Advisory Agreements”) with each of Cooke & Bieler, L.P., Galliard Capital Management LLC (“Galliard”), Peregrine Capital Management Inc., Wells Capital Management, LLC (“WellsCap”), and Wells Fargo Asset Management (International) Limited (“WFAMI”, and collectively, the “Sub-Advisers”). Each Trustee on the Board is not an “interested person” (as defined in the Investment Company Act of 1940 (the “1940 Act”) of the Funds (collectively, the “Independent Trustees”). The Interim Management Agreements, Interim Advisory Agreements, and Interim Sub-Advisory Agreements are collectively referred to as the “Interim Advisory Agreements.”
At the Board Meeting, the Boards reviewed and approved the continuation of existing investment management, advisory and sub-advisory agreements (the “Current Advisory Agreements”) for each Trust and Fund, as applicable. The factors considered and conclusions reached by the Boards in approving the Current Advisory Agreements are summarized in the section entitled “Board Considerations – Current Agreements” of this shareholder report. The Boards noted that Wells Fargo & Company has entered into a definitive agreement to sell Wells Fargo Asset Management (“WFAM”), which includes Funds Management, Galliard, WellsCap and WFAMI (the “Affiliated Sub-Advisers”), to a holding company affiliated with private funds of GTCR LLC and Reverence Capital Partners, L.P. (the “Transaction”). The Boards further noted that the Transaction would result in a change-of-control of Funds Management and the Affiliated Sub-Advisers, which would be considered to be an “assignment” under the 1940 Act that would terminate the Current Advisory Agreements. At the Board Meeting, the Boards also reviewed and approved new investment management, advisory and sub-advisory agreements (the “New Advisory Agreements”) for each Trust and Fund, as applicable, that would replace the Current Advisory Agreements upon consummation of the Transaction, subject to approval of the New Advisory Agreements by the applicable Trust’s or Fund’s shareholders. The factors considered and conclusions reached by the Boards in approving the New Advisory Agreements are summarized in the section entitled “Board Considerations – New Agreements” of this shareholder report.
At the Board Meeting, the Boards also approved the Interim Advisory Agreements, which will go into effect for a Trust or Fund only in the event that shareholders of such Trust or Fund do not approve the New Advisory Agreement(s) for the Trust or Fund by the closing date of the Transaction, when the Current Advisory Agreements will terminate. The Board noted that, in such a circumstance, the Interim Advisory Agreements will permit continuity of management by allowing Funds Management and the Sub-Advisers to continue providing services to the Trust or Fund pursuant to the Interim Advisory Agreements while the Trust or Fund continues to solicit shareholder approval of such New Advisory Agreement(s). The Boards noted that the terms of the Interim Advisory Agreements are identical to those of the Current Advisory Agreements, except for the term and the addition of escrow provisions with respect to the advisory fees. The Boards also noted that the entities that would service the Funds and Trusts under the Interim Advisory Agreements are identical to those that provide services under the Current Advisory Agreements and those that will provide services under the New Advisory Agreements.
In approving the Interim Advisory Agreements, the Boards considered the same factors and reached the same conclusions as they considered and reached with respect to the Boards’ approvals of the Current Advisory Agreements and New Advisory Agreements, as applicable, which are described in separate Board Consideration sections within this shareholder report. Prior to the Board Meeting, including at a series of meetings held in April and May 2021, the Trustees conferred extensively among themselves and with senior representatives of Funds Management, GTCR LLC and Reverence Capital Partners, L.P. about the Interim Advisory Agreements and related matters. The Independent Trustees were assisted in their evaluation of the Interim Advisory Agreements by independent legal counsel, from whom they received separate legal advice and with whom they met separately.
At the Board Meeting, after considering the factors and reaching the conclusions described in the separate Board Consideration sections within this shareholder report, the Boards unanimously determined that the compensation payable to Funds Management and to each Sub-Adviser under each of the Interim Advisory Agreements was reasonable, and approved the Interim Advisory Agreements.
46 | Wells Fargo Factor Enhanced Emerging Markets Equity Portfolio
For more information
More information about Wells Fargo Funds is available free upon request. To obtain literature, please write, visit the Portfolio's website, or call:
Wells Fargo Funds
P.O. Box 219967
Kansas City, MO 64121-9967
Website: wfam.com
Individual investors: 1-800-222-8222
Retail investment professionals: 1-888-877-9275
Institutional investment professionals: 1-866-765-0778
This report and the financial statements contained herein are submitted for the general information of the interest holders of the Portfolio. If this report is used for promotional purposes, distribution of the report must be accompanied or preceded by a current prospectus. Before investing, please consider the investment objectives, risks, charges, and expenses of the investment. For a current prospectus and, if available, a summary prospectus, containing this information, call
1-800-222-8222 or visit the Portfolio's website at wfam.com. Read the prospectus carefully before you invest or send money.
Wells Fargo Asset Management (WFAM) is the trade name for certain investment advisory/management firms owned by Wells Fargo & Company. These firms include but are not limited to Wells Capital Management, LLC and Wells Fargo Funds Management, LLC. Certain products managed by WFAM entities are distributed by Wells Fargo Funds Distributor, LLC (a broker-dealer and Member FINRA).
This material is for general informational and educational purposes only and is NOT intended to provide investment advice or a recommendation of any kind - including a recommendation for any specific investment, strategy, or plan.
INVESTMENT PRODUCTS: NOT FDIC INSURED ■ NO BANK GUARANTEE ■ MAY LOSE VALUE
© 2021 Wells Fargo & Company. All rights reserved.
Semi-Annual Report
August 31, 2021
Wells Fargo
Factor Enhanced International Equity Portfolio
INVESTMENT PRODUCTS: NOT FDIC INSURED ■ NO BANK GUARANTEE ■ MAY LOSE VALUE
Wells Fargo Factor Enhanced International Equity Portfolio | 1
Portfolio information (unaudited)
| Investment objective | The Portfolio seeks long-term capital appreciation. |
| Adviser | Wells Fargo Funds Management, LLC |
| Subadviser | Wells Capital Management, LLC |
| Portfolio managers | Dennis Beinn, CFA®‡, Harindra de Silva, Ph.D., CFA®‡, Monisha Jayakumar |
| Ten largest holdings (%) as of August 31, 20211 |
| Nestle SA | 1.80 |
| ASML Holding NV | 1.67 |
| Roche Holding AG | 1.34 |
| Novartis AG | 1.03 |
| LVMH Moët Hennessy Louis Vuitton SE | 0.93 |
| Novo Nordisk AS Class B | 0.92 |
| AstraZeneca plc | 0.88 |
| Toyota Motor Corporation | 0.82 |
| SAP SE | 0.79 |
| Unilever plc (London Exchange) | 0.72 |
| 1 | Figures represent the percentage of the Portfolio's net assets. Holdings are subject to change and may have changed since the date specified. |
| Sector allocation as of August 31, 20211 |
| 1 | Figures represent the percentage of the Portfolio's long-term investments. These amounts are subject to change and may have changed since the date specified. |
| Country allocation as of August 31, 20211 |
| 1 | Figures represent the percentage of the Portfolio's long-term investments. These amounts are subject to change and may have changed since the date specified. |
| ‡ | CFA® and Chartered Financial Analyst® are trademarks owned by CFA Institute. |
2 | Wells Fargo Factor Enhanced International Equity Portfolio
Portfolio of investments—August 31, 2021 (unaudited)
| | | | | | Shares | Value |
| Common stocks: 95.45% | | | | | | |
| Australia: 5.80% | | | | | | |
| Ampol Limited (Energy, Oil, gas & consumable fuels) | | | | | 63,027 | $ 1,270,720 |
| Aristocrat Leisure Limited (Consumer discretionary, Hotels, restaurants & leisure) | | | | | 32,619 | 1,089,797 |
| Aurizon Holdings Limited (Industrials, Road & rail) | | | | | 404,725 | 1,119,169 |
| AusNet Services (Utilities, Electric utilities) | | | | | 71,646 | 101,418 |
| Australia & New Zealand Banking Group Limited (Financials, Banks) | | | | | 106,579 | 2,171,404 |
| BlueScope Steel Limited (Materials, Metals & mining) | | | | | 75,932 | 1,399,811 |
| Brambles Limited (Industrials, Commercial services & supplies) | | | | | 78,263 | 693,337 |
| Coles Group Liimited (Consumer staples, Food & staples retailing) | | | | | 13,150 | 173,927 |
| Commonwealth Bank of Australia (Financials, Banks) | | | | | 58,316 | 4,271,225 |
| Computershare Limited (Information technology, IT services) | | | | | 49,719 | 600,137 |
| Crown Limited (Consumer discretionary, Hotels, restaurants & leisure) † | | | | | 23,531 | 160,263 |
| CSL Limited (Health care, Biotechnology) | | | | | 18,274 | 4,170,120 |
| Dexus Property Group (Real estate, Equity REITs) | | | | | 96,264 | 749,289 |
| Domino's Pizza Enterprises Limited (Consumer discretionary, Hotels, restaurants & leisure) | | | | | 7,871 | 902,513 |
| Endeavour Group Limited (Consumer staples, Food & staples retailing) | | | | | 31,263 | 166,954 |
| Fortescue Metals Group Limited (Materials, Metals & mining) | | | | | 70,966 | 1,090,218 |
| Goodman Group (Real estate, Equity REITs) | | | | | 74,228 | 1,255,993 |
| Lendlease Corporation Limited (Real estate, Real estate management & development) | | | | | 24,982 | 218,210 |
| Macquarie Group Limited (Financials, Capital markets) | | | | | 11,699 | 1,427,028 |
| Magellan Financial Group Limited (Financials, Capital markets) | | | | | 6,614 | 209,699 |
| Medibank Private Limited (Financials, Insurance) | | | | | 385,599 | 1,001,401 |
| Mirvac Group (Real estate, Equity REITs) | | | | | 269,885 | 615,995 |
| National Australia Bank Limited (Financials, Banks) | | | | | 124,113 | 2,517,741 |
| Origin Energy Limited (Energy, Oil, gas & consumable fuels) | | | | | 44,932 | 146,271 |
| Qantas Airways Limited (Industrials, Airlines) † | | | | | 33,233 | 123,746 |
| REA Group Limited (Communication services, Interactive media & services) | | | | | 7,322 | 822,209 |
| Rio Tinto Limited (Materials, Metals & mining) | | | | | 17,782 | 1,457,723 |
| Scentre Group (Real estate, Equity REITs) | | | | | 303,615 | 633,012 |
| SEEK Limited (Communication services, Interactive media & services) | | | | | 20,010 | 476,331 |
| Sonic Healthcare Limited (Health care, Health care providers & services) | | | | | 24,746 | 785,667 |
| South32 Limited (Materials, Metals & mining) | | | | | 218,082 | 500,949 |
| Stockland Corporation Limited (Real estate, Equity REITs) | | | | | 118,853 | 401,695 |
| Suncorp Group Limited (Financials, Insurance) | | | | | 31,729 | 289,678 |
| Sydney Airport Holdings Limited (Industrials, Transportation infrastructure) † | | | | | 62,350 | 363,529 |
| Tabcorp Holdings Limited (Consumer discretionary, Hotels, restaurants & leisure) | | | | | 318,350 | 1,115,538 |
| Telstra Corporation Limited (Communication services, Diversified telecommunication services) | | | | | 163,803 | 460,147 |
| Transurban Group (Industrials, Transportation infrastructure) | | | | | 77,106 | 801,542 |
| Treasury Wine Estates Limited (Consumer staples, Beverages) | | | | | 47,528 | 439,134 |
| Vicinity Centres (Real estate, Equity REITs) | | | | | 493,515 | 624,583 |
| Washington H. Soul Pattinson & Company Limited (Energy, Oil, gas & consumable fuels) | | | | | 3,972 | 104,083 |
| Wesfarmers Limited (Consumer discretionary, Multiline retail) | | | | | 33,189 | 1,455,550 |
| Westpac Banking Corporation (Financials, Banks) | | | | | 144,097 | 2,721,793 |
| Wisetech Global Limited (Information technology, Software) | | | | | 19,446 | 687,671 |
| Woolworths Group Limited (Consumer staples, Food & staples retailing) | | | | | 28,040 | 856,403 |
| | | | | | | 42,643,623 |
The accompanying notes are an integral part of these financial statements.
Wells Fargo Factor Enhanced International Equity Portfolio | 3
Portfolio of investments—August 31, 2021 (unaudited)
| | | | | | Shares | Value |
| Austria: 0.17% | | | | | | |
| Raiffeisen Bank International AG (Financials, Banks) | | | | | 5,243 | $ 125,918 |
| Voestalpine AG (Materials, Metals & mining) | | | | | 25,402 | 1,151,747 |
| | | | | | | 1,277,665 |
| Belgium: 0.89% | | | | | | |
| Ageas NV (Financials, Insurance) | | | | | 23,042 | 1,152,210 |
| Anheuser-Busch InBev SA (Consumer staples, Beverages) | | | | | 26,747 | 1,641,924 |
| Colruyt SA (Consumer staples, Food & staples retailing) | | | | | 5,158 | 288,620 |
| Groupe Bruxelles Lambert SA (Financials, Diversified financial services) | | | | | 1,902 | 218,066 |
| KBC Group NV (Financials, Banks) | | | | | 6,446 | 542,977 |
| Proximus SA (Communication services, Diversified telecommunication services) | | | | | 50,222 | 984,671 |
| Solvay SA (Materials, Chemicals) | | | | | 5,952 | 779,737 |
| UCB SA (Health care, Pharmaceuticals) | | | | | 1,912 | 218,716 |
| Umicore SA (Materials, Chemicals) | | | | | 10,425 | 686,122 |
| | | | | | | 6,513,043 |
| Canada: 9.79% | | | | | | |
| Algonquin Power & Utilities Corporation (Utilities, Multi-utilities) | | | | | 12,100 | 187,880 |
| Alimentation Couche-Tard Incorporated Class B (Consumer staples, Food & staples retailing) | | | | | 27,470 | 1,109,991 |
| Altagas Limited (Energy, Oil, gas & consumable fuels) | | | | | 56,100 | 1,123,645 |
| ATCO Limited Class I (Utilities, Multi-utilities) | | | | | 25,700 | 864,713 |
| B2Gold Corporation (Materials, Metals & mining) | | | | | 94,300 | 364,748 |
| Bank of Montreal (Financials, Banks) | | | | | 24,291 | 2,417,452 |
| Barrick Gold Corporation (Materials, Metals & mining) | | | | | 17,471 | 351,179 |
| Bausch Health Companies Incorporated (Health care, Pharmaceuticals) † | | | | | 34,100 | 993,553 |
| BCE Incorporated (Communication services, Diversified telecommunication services) | | | | | 5,086 | 265,255 |
| Brookfield Asset Management Incorporated Class A (Financials, Capital markets) | | | | | 32,728 | 1,820,773 |
| CAE Incorporated (Industrials, Aerospace & defense) † | | | | | 100 | 2,887 |
| Canadian Apartment Properties (Real estate, Equity REITs) | | | | | 12,400 | 600,613 |
| Canadian Imperial Bank of Commerce (Financials, Banks) | | | | | 16,574 | 1,906,670 |
| Canadian National Railway Company (Industrials, Road & rail) | | | | | 26,437 | 3,109,619 |
| Canadian Natural Resources Limited (Energy, Oil, gas & consumable fuels) | | | | | 39,100 | 1,293,881 |
| Canadian Pacific Railway Limited (Industrials, Road & rail) | | | | | 37,610 | 2,584,244 |
| Canadian Tire Corporation Limited Class A (Consumer discretionary, Multiline retail) | | | | | 7,800 | 1,187,017 |
| Canadian Utilities Limited Class A (Utilities, Multi-utilities) | | | | | 23,100 | 653,827 |
| Cenovus Energy Incorporated (Energy, Oil, gas & consumable fuels) | | | | | 30,100 | 249,790 |
| CGI Incorporated (Information technology, IT services) † | | | | | 14,265 | 1,274,935 |
| Constellation Software Incorporated (Information technology, Software) | | | | | 1,028 | 1,742,210 |
| Emera Incorporated (Utilities, Electric utilities) | | | | | 11,400 | 538,171 |
| Empire Company Limited Class A (Consumer staples, Food & staples retailing) | | | | | 16,400 | 530,353 |
| Enbridge Incorporated (Energy, Oil, gas & consumable fuels) | | | | | 67,300 | 2,648,472 |
| Fairfax Financial Holdings Limited (Financials, Insurance) | | | | | 1,500 | 663,976 |
| First Quantum Minerals Limited (Materials, Metals & mining) | | | | | 12,000 | 249,958 |
| FirstService Corporation (Real estate, Real estate management & development) | | | | | 2,900 | 538,603 |
| Fortis Incorporated (Utilities, Electric utilities) | | | | | 10,744 | 492,215 |
| George Weston Limited (Consumer staples, Food & staples retailing) | | | | | 6,000 | 646,772 |
| Gildan Activewear Incorporated (Consumer discretionary, Textiles, apparel & luxury goods) | | | | | 21,100 | 811,120 |
The accompanying notes are an integral part of these financial statements.
4 | Wells Fargo Factor Enhanced International Equity Portfolio
Portfolio of investments—August 31, 2021 (unaudited)
| | | | | | Shares | Value |
| Canada: (continued) | | | | | | |
| Great-West Lifeco Incorporated (Financials, Insurance) | | | | | 9,400 | $ 290,795 |
| Hydro One Limited (Utilities, Electric utilities) 144A | | | | | 4,900 | 121,951 |
| iA Financial Corporation (Financials, Insurance) | | | | | 11,800 | 654,324 |
| IGM Financial Incorporated (Financials, Capital markets) | | | | | 31,000 | 1,130,512 |
| Imperial Oil Limited (Energy, Oil, gas & consumable fuels) | | | | | 24,500 | 648,401 |
| Intact Financial Corporation (Financials, Insurance) | | | | | 4,375 | 595,852 |
| Keyera Corporation (Energy, Oil, gas & consumable fuels) | | | | | 11,700 | 281,731 |
| Kinross Gold Corporation (Materials, Metals & mining) | | | | | 45,900 | 276,131 |
| Lundin Mining Corporation (Materials, Metals & mining) | | | | | 24,800 | 200,499 |
| Magna International Incorporated (Consumer discretionary, Auto components) | | | | | 19,027 | 1,502,524 |
| Manulife Financial Corporation (Financials, Insurance) | | | | | 73,500 | 1,431,376 |
| Metro Incorporated (Consumer staples, Food & staples retailing) | | | | | 7,930 | 403,964 |
| National Bank of Canada (Financials, Banks) | | | | | 11,908 | 945,165 |
| Northland Power Incorporated (Utilities, Independent power & renewable electricity producers) | | | | | 15,400 | 509,488 |
| Nutrien Limited (Materials, Chemicals) | | | | | 18,400 | 1,118,599 |
| Onex Corporation (Financials, Diversified financial services) | | | | | 9,600 | 672,643 |
| Open Text Corporation (Information technology, Software) | | | | | 8,218 | 450,593 |
| Open Text Corporation (Information technology, Software) | | | | | 3,900 | 213,941 |
| Pan American Silver Corporation (Materials, Metals & mining) | | | | | 7,700 | 199,938 |
| Parkland Corporation (Energy, Oil, gas & consumable fuels) | | | | | 35,500 | 1,059,949 |
| Power Corporation of Canada (Financials, Insurance) | | | | | 26,396 | 910,936 |
| Quebecor Incorporated Class B (Communication services, Media) | | | | | 32,200 | 803,437 |
| Restaurant Brands International Incorporated (Consumer discretionary, Hotels, restaurants & leisure) | | | | | 14,103 | 906,106 |
| RioCan REIT (Real estate, Equity REITs) | | | | | 8,900 | 158,086 |
| Ritchie Bros. Auctioneers Incorporated (Industrials, Commercial services & supplies) | | | | | 5,800 | 363,405 |
| Rogers Communications Incorporated Class B (Communication services, Wireless telecommunication services) | | | | | 13,037 | 664,224 |
| Royal Bank of Canada (Financials, Banks) | | | | | 48,731 | 5,005,776 |
| Saputo Incorporated (Consumer staples, Food products) | | | | | 9,100 | 255,981 |
| Shaw Communications Incorporated Class B (Communication services, Media) | | | | | 9,000 | 264,867 |
| Shopify Incorporated Class A (Information technology, IT services) † | | | | | 3,200 | 4,886,528 |
| Sun Life Financial Incorporated (Financials, Insurance) | | | | | 23,658 | 1,218,106 |
| Suncor Energy Incorporated (Energy, Oil, gas & consumable fuels) | | | | | 42,700 | 797,378 |
| TC Energy Corporation (Energy, Oil, gas & consumable fuels) | | | | | 29,100 | 1,381,596 |
| Tecl Rresources Limited Class B (Materials, Metals & mining) | | | | | 20,000 | 450,997 |
| Telus Corporation (Communication services, Diversified telecommunication services) † | | | | | 5,388 | 124,146 |
| The Bank of Nova Scotia (Financials, Banks) | | | | | 46,208 | 2,862,248 |
| The Toronto-Dominion Bank (Financials, Banks) | | | | | 60,918 | 3,955,940 |
| Thomson Reuters Corporation (Industrials, Professional services) | | | | | 1,400 | 163,586 |
| Toromont Industries Limited (Industrials, Trading companies & distributors) | | | | | 10,100 | 849,212 |
| West Fraser Timber Company Limited (Industrials, Professional services) | | | | | 18,400 | 1,420,781 |
| Wheaton Precious Metals Corporation (Materials, Metals & mining) | | | | | 2,300 | 103,656 |
| WSP Global Incorporated (Industrials, Construction & engineering) | | | | | 2,300 | 300,304 |
| Yamana Gold Incorporated (Materials, Metals & mining) | | | | | 35,200 | 155,403 |
| | | | | | | 71,935,597 |
| Denmark: 2.54% | | | | | | |
| A.P. Moller-Mærsk AS Class B (Industrials, Marine) | | | | | 260 | 737,703 |
| Carlsberg AS Class B (Consumer staples, Beverages) | | | | | 5,437 | 949,157 |
| Coloplast AS Class B (Health care, Health care equipment & supplies) | | | | | 5,444 | 943,032 |
The accompanying notes are an integral part of these financial statements.
Wells Fargo Factor Enhanced International Equity Portfolio | 5
Portfolio of investments—August 31, 2021 (unaudited)
| | | | | | Shares | Value |
| Denmark: (continued) | | | | | | |
| Danske Bank AS (Financials, Banks) | | | | | 20,942 | $ 351,959 |
| DSV Panalpina AS (Industrials, Air freight & logistics) | | | | | 5,235 | 1,334,060 |
| Genmab AS (Health care, Biotechnology) † | | | | | 3,107 | 1,471,067 |
| GN Store Nord AS (Health care, Health care equipment & supplies) | | | | | 10,879 | 818,576 |
| Novo Nordisk AS Class B (Health care, Pharmaceuticals) | | | | | 68,044 | 6,781,496 |
| Novozymes AS Class B (Materials, Chemicals) | | | | | 3,734 | ���301,651 |
| Orsted AS (Utilities, Electric utilities) 144A | | | | | 2,351 | 373,655 |
| Pandora AS (Consumer discretionary, Textiles, apparel & luxury goods) | | | | | 13,721 | 1,642,633 |
| Rockwool International Class A (Industrials, Building products) | | | | | 1,124 | 594,819 |
| Vestas Wind System AS Class A (Industrials, Electrical equipment) | | | | | 38,254 | 1,544,567 |
| William Demant Holding (Health care, Health care equipment & supplies) † | | | | | 15,036 | 852,284 |
| | | | | | | 18,696,659 |
| Finland: 0.93% | | | | | | |
| Elisa Oyj (Communication services, Diversified telecommunication services) | | | | | 2,499 | 160,046 |
| Fortum Oyj (Utilities, Electric utilities) | | | | | 19,576 | 594,502 |
| Kesko Oyj Class B (Consumer staples, Food & staples retailing) | | | | | 23,075 | 952,514 |
| Kone Oyj Class B (Industrials, Machinery) | | | | | 9,228 | 765,333 |
| Neste Oil Oyj (Energy, Oil, gas & consumable fuels) | | | | | 14,642 | 891,052 |
| Nordea Bank AB (Financials, Banks) | | | | | 115,277 | 1,354,825 |
| Orion Oyj Class B (Health care, Pharmaceuticals) | | | | | 16,797 | 684,836 |
| Sampo Oyj Class A (Financials, Insurance) | | | | | 12,183 | 629,204 |
| Stora Enso Oyj (Materials, Paper & forest products) | | | | | 7,370 | 144,238 |
| UPM-Kymmene Oyj (Materials, Paper & forest products) | | | | | 9,459 | 384,539 |
| Wartsila Oyj ABP (Industrials, Machinery) | | | | | 18,769 | 266,049 |
| | | | | | | 6,827,138 |
| France: 8.64% | | | | | | |
| Air Liquide SA (Materials, Chemicals) | | | | | 12,894 | 2,311,398 |
| Amundi SA (Financials, Capital markets) 144A | | | | | 31 | 2,934 |
| Arkema SA (Materials, Chemicals) | | | | | 1,367 | 181,423 |
| Atos Origin SA (Information technology, IT services) | | | | | 22,899 | 1,188,591 |
| AXA SA (Financials, Insurance) | | | | | 57,252 | 1,607,536 |
| bioMerieux (Health care, Health care equipment & supplies) | | | | | 1,511 | 185,280 |
| BNP Paribas SA (Financials, Banks) | | | | | 36,003 | 2,284,092 |
| Bolloré SA (Industrials, Air freight & logistics) | | | | | 166,014 | 982,066 |
| Bouygues SA (Industrials, Construction & engineering) | | | | | 11,749 | 491,508 |
| Bureau Veritas SA (Industrials, Professional services) | | | | | 4,562 | 151,417 |
| Capgemini SE (Information technology, IT services) | | | | | 7,637 | 1,714,657 |
| Carrefour SA (Consumer staples, Food & staples retailing) | | | | | 81,358 | 1,618,670 |
| CNP Assurances SA (Financials, Insurance) | | | | | 40,103 | 686,362 |
| Compagnie de Saint-Gobain SA (Industrials, Building products) | | | | | 22,274 | 1,614,559 |
| Compagnie Generale des Etablissements Michelin SCA (Consumer discretionary, Auto components) | | | | | 5,853 | 947,143 |
| Covivio (Real estate, Equity REITs) | | | | | 2,572 | 244,530 |
| Credit Agricole SA (Financials, Banks) | | | | | 8,583 | 123,741 |
| Danone SA (Consumer staples, Food products) | | | | | 22,644 | 1,654,213 |
| Dassault Aviation SA (Industrials, Aerospace & defense) | | | | | 812 | 915,625 |
| Dassault Systèmes SE (Information technology, Software) | | | | | 19,990 | 1,140,153 |
| Edenred Group (Information technology, IT services) | | | | | 631 | 35,763 |
| Engie SA (Utilities, Multi-utilities) | | | | | 52,738 | 755,465 |
| Essilor International (Compagnie Generale d'Optique) (Consumer discretionary, Textiles, apparel & luxury goods) | | | | | 4,941 | 969,975 |
| Faurecia (Consumer discretionary, Auto components) | | | | | 1,522 | 73,394 |
| Gecina SA (Real estate, Equity REITs) | | | | | 502 | 77,975 |
The accompanying notes are an integral part of these financial statements.
6 | Wells Fargo Factor Enhanced International Equity Portfolio
Portfolio of investments—August 31, 2021 (unaudited)
| | | | | | Shares | Value |
| France: (continued) | | | | | | |
| Groupe Eurotunnel SE (Industrials, Transportation infrastructure) | | | | | 10,765 | $ 173,057 |
| Hermes International SA (Consumer discretionary, Textiles, apparel & luxury goods) | | | | | 852 | 1,251,966 |
| Ipsen SA (Health care, Pharmaceuticals) | | | | | 11,749 | 1,174,735 |
| Kering SA (Consumer discretionary, Textiles, apparel & luxury goods) | | | | | 2,394 | 1,905,207 |
| Klepierre SA (Real estate, Equity REITs) | | | | | 7,373 | 180,207 |
| La Francaise Des Jeux SA (Consumer discretionary, Hotels, restaurants & leisure) 144A | | | | | 19,504 | 1,008,916 |
| Legrand SA (Industrials, Electrical equipment) | | | | | 7,807 | 893,420 |
| L'Oréal SA (Consumer staples, Personal products) | | | | | 9,076 | 4,246,945 |
| LVMH Moët Hennessy Louis Vuitton SE (Consumer discretionary, Textiles, apparel & luxury goods) | | | | | 9,217 | 6,821,450 |
| Orange SA (Communication services, Diversified telecommunication services) | | | | | 94,902 | 1,077,975 |
| Pernod-Ricard SA (Consumer staples, Beverages) | | | | | 5,807 | 1,220,135 |
| Publicis Groupe SA (Communication services, Media) | | | | | 16,526 | 1,083,366 |
| Remy Cointreau SA (Consumer staples, Beverages) † | | | | | 858 | 168,982 |
| Safran SA (Industrials, Aerospace & defense) | | | | | 10,017 | 1,256,798 |
| Sanofi SA (Health care, Pharmaceuticals) | | | | | 42,980 | 4,446,597 |
| Sartorius Stedim Biotech SA (Health care, Life sciences tools & services) | | | | | 966 | 585,815 |
| Schneider Electric SE (Industrials, Electrical equipment) | | | | | 19,586 | 3,498,991 |
| SCOR SE (Financials, Insurance) | | | | | 11,817 | 362,637 |
| Societe Generale SA (Financials, Banks) | | | | | 26,355 | 829,313 |
| Sodexho Alliance SA (Consumer discretionary, Hotels, restaurants & leisure) † | | | | | 13,158 | 1,087,853 |
| Teleperformance SE (Industrials, Professional services) | | | | | 2,168 | 958,414 |
| Thales SA (Industrials, Aerospace & defense) | | | | | 4,584 | 465,155 |
| Total SA (Energy, Oil, gas & consumable fuels) | | | | | 83,710 | 3,691,203 |
| Valeo SA (Consumer discretionary, Auto components) | | | | | 7,364 | 209,377 |
| Veolia Environnement SA (Utilities, Multi-utilities) | | | | | 8,579 | 294,267 |
| Vinci SA (Industrials, Construction & engineering) | | | | | 10,660 | 1,144,014 |
| Vivendi SE (Communication services, Entertainment) | | | | | 39,469 | 1,506,210 |
| | | | | | | 63,501,475 |
| Germany: 7.25% | | | | | | |
| adidas AG (Consumer discretionary, Textiles, apparel & luxury goods) | | | | | 5,651 | 2,004,729 |
| Allianz AG (Financials, Insurance) | | | | | 12,784 | 3,003,546 |
| BASF SE (Materials, Chemicals) | | | | | 28,547 | 2,208,475 |
| Bayer AG (Health care, Pharmaceuticals) | | | | | 35,616 | 1,982,617 |
| Bayerische Motoren Werke AG (Consumer discretionary, Automobiles) | | | | | 13,326 | 1,264,596 |
| Bechtle AG (Information technology, IT services) | | | | | 15,423 | 1,114,860 |
| Beiersdorf AG (Consumer staples, Personal products) | | | | | 2,873 | 348,558 |
| Brenntag AG (Industrials, Trading companies & distributors) | | | | | 9,225 | 930,649 |
| Carl Zeiss Meditec AG (Health care, Health care equipment & supplies) | | | | | 4,308 | 951,717 |
| Continental AG (Consumer discretionary, Auto components) † | | | | | 4,451 | 598,183 |
| Covestro AG (Materials, Chemicals) 144A | | | | | 16,386 | 1,062,193 |
| Daimler AG (Consumer discretionary, Automobiles) | | | | | 37,070 | 3,126,083 |
| Deutsche Bank AG (Financials, Capital markets) † | | | | | 76,485 | 950,781 |
| Deutsche Lufthansa AG (Industrials, Airlines) † | | | | | 15,651 | 156,802 |
| Deutsche Post AG (Industrials, Air freight & logistics) | | | | | 39,018 | 2,744,882 |
| Deutsche Telekom AG (Communication services, Diversified telecommunication services) | | | | | 92,200 | 1,960,444 |
| Deutsche Wohnen AG (Real estate, Real estate management & development) | | | | | 9,191 | 570,396 |
| E.ON SE (Utilities, Multi-utilities) | | | | | 34,896 | 460,572 |
| Evonik Industries AG (Materials, Chemicals) | | | | | 5,319 | 179,620 |
The accompanying notes are an integral part of these financial statements.
Wells Fargo Factor Enhanced International Equity Portfolio | 7
Portfolio of investments—August 31, 2021 (unaudited)
| | | | | | Shares | Value |
| Germany: (continued) | | | | | | |
| Fresenius Medical Care AG & Company KGaA (Health care, Health care providers & services) | | | | | 4,860 | $ 373,229 |
| Fresenius SE & Company KGaA (Health care, Health care providers & services) | | | | | 16,701 | 868,653 |
| GEA Group AG (Industrials, Machinery) | | | | | 14,207 | 656,067 |
| Heidelbergcement AG (Materials, Construction materials) | | | | | 7,044 | 612,146 |
| Hellofresh SE (Consumer discretionary, Internet & direct marketing retail) † | | | | | 20,256 | 2,183,169 |
| Henkel AG & Company KGaA (Consumer staples, Household products) | | | | | 5,754 | 517,706 |
| Infineon Technologies AG (Information technology, Semiconductors & semiconductor equipment) | | | | | 31,200 | 1,328,613 |
| Kion Group AG (Industrials, Machinery) | | | | | 1,008 | 107,856 |
| Knorr Bremse AG (Industrials, Machinery) | | | | | 346 | 41,528 |
| LANXESS AG (Materials, Chemicals) | | | | | 7,853 | 572,480 |
| LEG Immobilien AG (Real estate, Real estate management & development) | | | | | 1,924 | 306,688 |
| Merck KGaA (Health care, Pharmaceuticals) | | | | | 9,817 | 2,332,195 |
| MTU Aero Engines AG (Industrials, Aerospace & defense) | | | | | 992 | 227,643 |
| Muenchener Rueckversicherungs Gesellschaft AG (Financials, Insurance) | | | | | 3,160 | 923,278 |
| Nemetschek SE (Information technology, Software) | | | | | 3,336 | 327,014 |
| Puma AG Rudolf Dassler Sport (Consumer discretionary, Textiles, apparel & luxury goods) | | | | | 4,167 | 505,795 |
| Rational AG (Industrials, Machinery) | | | | | 147 | 168,120 |
| RWE AG (Utilities, Multi-utilities) | | | | | 24,044 | 939,424 |
| SAP SE (Information technology, Software) | | | | | 38,658 | 5,817,969 |
| Siemens AG (Industrials, Industrial conglomerates) | | | | | 26,204 | 4,357,644 |
| Siemens Energy AG (Industrials, Electrical equipment) † | | | | | 16,725 | 485,407 |
| Siemens Healthineers AG (Health care, Health care equipment & supplies) 144A | | | | | 6,823 | 474,514 |
| TeamViewer AG (Information technology, Software) † | | | | | 5,686 | 189,395 |
| Uniper SE (Utilities, Independent power & renewable electricity producers) | | | | | 36,992 | 1,468,902 |
| United Internet AG (Communication services, Diversified telecommunication services) | | | | | 4,473 | 193,356 |
| Vonovia SE (Real estate, Real estate management & development) | | | | | 4,962 | 334,894 |
| Zalando SE (Consumer discretionary, Internet & direct marketing retail) 144A† | | | | | 12,056 | 1,335,255 |
| | | | | | | 53,268,643 |
| Hong Kong: 3.06% | | | | | | |
| AIA Group Limited (Financials, Insurance) | | | | | 396,600 | 4,739,853 |
| Bank of East Asia Limited (Financials, Banks) | | | | | 199,400 | 334,322 |
| BOC Hong Kong (Holdings) Limited (Financials, Banks) | | | | | 137,500 | 417,232 |
| Budweiser Brewing Company APAC Limited (Consumer staples, Beverages) 144A | | | | | 107,166 | 268,141 |
| Chow Tai Fook Jewellery Company Limited (Consumer discretionary, Specialty retail) | | | | | 363,000 | 735,573 |
| CK Asset Holdings Limited (Real estate, Real estate management & development) | | | | | 128,690 | 838,910 |
| CK Hutchison Holdings Limited (Industrials, Industrial conglomerates) | | | | | 201,070 | 1,467,155 |
| CK Infrastructure Holdings Limited (Utilities, Electric utilities) | | | | | 90,500 | 549,811 |
| CLP Holdings Limited (Utilities, Electric utilities) | | | | | 63,000 | 629,802 |
| ESR Cayman Limited (Real estate, Real estate management & development) 144A† | | | | | 1,400 | 4,266 |
| Galaxy Entertainment Group Limited (Consumer discretionary, Hotels, restaurants & leisure) † | | | | | 9,000 | 57,686 |
| Hang Seng Bank Limited (Financials, Banks) | | | | | 28,527 | 510,573 |
| Henderson Land Development Company Limited (Real estate, Real estate management & development) | | | | | 148,198 | 670,730 |
The accompanying notes are an integral part of these financial statements.
8 | Wells Fargo Factor Enhanced International Equity Portfolio
Portfolio of investments—August 31, 2021 (unaudited)
| | | | | | Shares | Value |
| Hong Kong: (continued) | | | | | | |
| Hong Kong & China Gas Company Limited (Utilities, Gas utilities) | | | | | 155,000 | $ 249,516 |
| Hong Kong Exchanges & Clearing Limited (Financials, Capital markets) | | | | | 39,000 | 2,461,115 |
| Hong Kong Land Holdings Limited (Real estate, Real estate management & development) | | | | | 110,200 | 462,840 |
| Hong Kong Telecommunications Trust & Hong Kong Trust Limited (Communication services, Diversified telecommunication services) | | | | | 149,574 | 203,857 |
| Jardine Matheson Holdings Limited (Industrials, Industrial conglomerates) | | | | | 6,200 | 336,784 |
| Link REIT (Real estate, Equity REITs) | | | | | 78,400 | 721,254 |
| MTR Corporation Limited (Industrials, Road & rail) | | | | | 36,500 | 205,556 |
| New World Development Company Limited (Real estate, Real estate management & development) | | | | | 81,493 | 383,499 |
| Power Assets Holdings Limited (Utilities, Electric utilities) | | | | | 83,000 | 521,321 |
| Sino Land Company (Real estate, Real estate management & development) | | | | | 181,899 | 268,026 |
| Sun Hung Kai Properties Limited (Real estate, Real estate management & development) | | | | | 79,000 | 1,113,270 |
| Swire Pacific Limited Class A (Real estate, Real estate management & development) | | | | | 102,978 | 697,779 |
| Swire Properties Limited (Real estate, Real estate management & development) | | | | | 101,800 | 275,526 |
| Techtronic Industries Company Limited (Industrials, Machinery) | | | | | 60,243 | 1,336,160 |
| WH Group Limited (Consumer staples, Food products) 144A | | | | | 1,252,500 | 1,087,037 |
| Xinyi Glass Holdings Limited (Consumer discretionary, Auto components) | | | | | 214,000 | 899,755 |
| | | | | | | 22,447,349 |
| Ireland: 0.65% | | | | | | |
| CRH plc (Materials, Construction materials) | | | | | 33,275 | 1,769,598 |
| DCC plc (Industrials, Industrial conglomerates) | | | | | 6,536 | 555,336 |
| Flutter Entertainment plc (Consumer discretionary, Hotels, restaurants & leisure) † | | | | | 2,602 | 506,164 |
| Kerry Group plc Class A (Consumer staples, Food products) | | | | | 6,993 | 1,025,518 |
| Kingspan Group plc (Industrials, Building products) | | | | | 3,047 | 348,190 |
| Smurfit Kappa Group plc (Materials, Containers & packaging) | | | | | 9,394 | 538,848 |
| | | | | | | 4,743,654 |
| Israel: 0.64% | | | | | | |
| Bank Hapoalim BM (Financials, Banks) | | | | | 56,874 | 489,168 |
| Bank Leumi Le-Israel (Financials, Banks) | | | | | 56,816 | 469,363 |
| Check Point Software Technologies Limited (Information technology, Software) † | | | | | 11,553 | 1,451,403 |
| Elbit Systems Limited (Industrials, Aerospace & defense) | | | | | 726 | 105,580 |
| ICL Group Limited (Materials, Chemicals) | | | | | 53,397 | 377,697 |
| Israel Discount Bank Limited Class A (Financials, Banks) † | | | | | 97,017 | 501,145 |
| Mizrahi Tefahot Bank Limited (Financials, Banks) | | | | | 6,571 | 218,569 |
| Nice Systems Limited ADR (Information technology, Software) † | | | | | 2,131 | 621,669 |
| Wix.com Limited (Information technology, IT services) † | | | | | 1,964 | 436,165 |
| | | | | | | 4,670,759 |
| Italy: 1.50% | | | | | | |
| Amplifon SpA (Health care, Health care providers & services) | | | | | 1,787 | 93,431 |
| Assicurazioni Generali SpA (Financials, Insurance) | | | | | 36,598 | 746,290 |
| Atlantia SpA (Industrials, Transportation infrastructure) † | | | | | 18,156 | 340,324 |
| DiaSorin SpA (Health care, Health care equipment & supplies) | | | | | 1,685 | 384,483 |
| Enel SpA (Utilities, Electric utilities) | | | | | 271,215 | 2,471,271 |
| Eni SpA (Energy, Oil, gas & consumable fuels) | | | | | 81,302 | 1,003,557 |
| Intesa Sanpaolo SpA (Financials, Banks) | | | | | 428,302 | 1,212,458 |
The accompanying notes are an integral part of these financial statements.
Wells Fargo Factor Enhanced International Equity Portfolio | 9
Portfolio of investments—August 31, 2021 (unaudited)
| | | | | | Shares | Value |
| Italy: (continued) | | | | | | |
| Mediobanca SpA (Financials, Banks) † | | | | | 73,066 | $ 861,002 |
| Moncler SpA (Consumer discretionary, Textiles, apparel & luxury goods) | | | | | 5,417 | 346,670 |
| Poste Italiane SpA (Financials, Insurance) 144A | | | | | 9,952 | 134,958 |
| Prysmian SpA (Industrials, Electrical equipment) | | | | | 34,647 | 1,303,785 |
| Recordati SpA (Health care, Pharmaceuticals) | | | | | 7,785 | 510,715 |
| Snam SpA (Utilities, Gas utilities) | | | | | 71,123 | 420,228 |
| Telecom Italia SpA (Communication services, Diversified telecommunication services) | | | | | 2,024,008 | 916,029 |
| Terna SpA (Utilities, Electric utilities) | | | | | 502 | 3,969 |
| UniCredit SpA (Financials, Banks) | | | | | 19,463 | 242,863 |
| | | | | | | 10,992,033 |
| Japan: 19.76% | | | | | | |
| Advantest Corporation (Information technology, Semiconductors & semiconductor equipment) | | | | | 7,000 | 605,736 |
| Aeon Mall Company Limited (Real estate, Real estate management & development) | | | | | 6,400 | 97,616 |
| Aisin Seiki Company Limited (Consumer discretionary, Auto components) | | | | | 4,900 | 187,288 |
| Ajinomoto Company Incorporated (Consumer staples, Food products) | | | | | 26,150 | 771,082 |
| All Nippon Airways Company Limited (Industrials, Airlines) † | | | | | 5,800 | 137,362 |
| Asahi Breweries Limited (Consumer staples, Beverages) | | | | | 6,800 | 316,095 |
| Asahi Glass Company Limited (Industrials, Building products) | | | | | 8,000 | 386,856 |
| Asahi Kasei Corporation (Materials, Chemicals) | | | | | 36,700 | 378,959 |
| Astellas Pharma Incorporated (Health care, Pharmaceuticals) | | | | | 45,500 | 768,018 |
| Azbil Corporation (Information technology, Electronic equipment, instruments & components) | | | | | 10,600 | 460,074 |
| Bandai Namco Holdings Incorporated (Consumer discretionary, Leisure products) | | | | | 10,800 | 750,105 |
| Bridgestone Corporation (Consumer discretionary, Auto components) | | | | | 5,000 | 230,150 |
| Brother Industries Limited (Information technology, Technology hardware, storage & peripherals) | | | | | 8,500 | 174,458 |
| Canon Incorporated (Information technology, Technology hardware, storage & peripherals) | | | | | 4,600 | 109,193 |
| Capcom Company Limited (Communication services, Entertainment) | | | | | 22,200 | 619,497 |
| Central Japan Railway Company (Industrials, Road & rail) | | | | | 2,400 | 351,770 |
| Chiba Bank Limited (Financials, Banks) | | | | | 79,200 | 494,573 |
| Chubu Electric Power Company Incorporated (Utilities, Electric utilities) | | | | | 59,200 | 715,146 |
| Chugai Pharmaceutical Company Limited (Health care, Pharmaceuticals) | | | | | 6,600 | 258,445 |
| Concordia Financial Group Limited (Financials, Banks) | | | | | 138,200 | 536,394 |
| CyberAgent Incorporated (Communication services, Media) | | | | | 12,800 | 235,139 |
| Dai Nippon Printing Company Limited (Industrials, Commercial services & supplies) | | | | | 18,600 | 442,282 |
| Dai-ichi Life Holdings Incorporated (Financials, Insurance) | | | | | 41,000 | 808,522 |
| Daiichi Sankyo Company Limited (Health care, Pharmaceuticals) | | | | | 33,300 | 791,373 |
| Daikin Industries Limited (Industrials, Building products) | | | | | 6,566 | 1,635,606 |
| Daito Trust Construction Company Limited (Real estate, Real estate management & development) | | | | | 11,600 | 1,273,717 |
| Daiwa House Industry Company Limited (Real estate, Real estate management & development) | | | | | 41,000 | 1,250,702 |
| Daiwa Securities Group Incorporated (Financials, Capital markets) | | | | | 102,900 | 582,241 |
| DENSO Corporation (Consumer discretionary, Auto components) | | | | | 10,700 | 749,870 |
| Disco Corporation (Information technology, Semiconductors & semiconductor equipment) | | | | | 1,100 | 320,456 |
| East Japan Railway Company (Industrials, Road & rail) | | | | | 1,000 | 67,545 |
| Eisai Company Limited (Health care, Pharmaceuticals) | | | | | 4,300 | 355,132 |
| ENEOS Holdings Incorporated (Energy, Oil, gas & consumable fuels) | | | | | 372,000 | 1,440,796 |
The accompanying notes are an integral part of these financial statements.
10 | Wells Fargo Factor Enhanced International Equity Portfolio
Portfolio of investments—August 31, 2021 (unaudited)
| | | | | | Shares | Value |
| Japan: (continued) | | | | | | |
| FANUC Corporation (Industrials, Machinery) | | | | | 4,900 | $ 1,068,500 |
| Fast Retailing Company Limited (Consumer discretionary, Specialty retail) | | | | | 1,600 | 1,054,693 |
| Fuji Electric Holdings Company Limited (Industrials, Electrical equipment) | | | | | 23,600 | 1,022,170 |
| FUJIFILM Holdings Incorporated (Information technology, Technology hardware, storage & peripherals) | | | | | 12,900 | 1,063,284 |
| Fujitsu Limited (Information technology, IT services) | | | | | 11,000 | 2,029,723 |
| GLP J-REIT (Real estate, Equity REITs) | | | | | 141 | 255,944 |
| Hakuhodo DY Holdings Incorporated (Communication services, Media) | | | | | 65,800 | 1,035,312 |
| Hamamatsu Photonics (Information technology, Electronic equipment, instruments & components) | | | | | 4,100 | 239,258 |
| Hino Motors Limited (Industrials, Machinery) | | | | | 87,100 | 754,500 |
| Hirose Electric Company Limited (Information technology, Electronic equipment, instruments & components) | | | | | 1,300 | 216,598 |
| Hisamitsu Pharmaceutical Company Incorporated (Health care, Pharmaceuticals) | | | | | 6,600 | 264,564 |
| Hitachi Construction Machinery Company Limited (Industrials, Machinery) | | | | | 1,100 | 31,546 |
| Hitachi Limited (Industrials, Industrial conglomerates) | | | | | 39,700 | 2,195,832 |
| Honda Motor Company Limited (Consumer discretionary, Automobiles) | | | | | 49,500 | 1,503,695 |
| Hoya Corporation (Health care, Health care equipment & supplies) | | | | | 14,000 | 2,262,601 |
| Hulic Company Limited (Real estate, Real estate management & development) | | | | | 10,700 | 125,465 |
| Idemitsu Kosan Company Limited (Energy, Oil, gas & consumable fuels) | | | | | 35,900 | 860,830 |
| Iida Group Holdings Company Limited (Consumer discretionary, Household durables) | | | | | 18,100 | 460,006 |
| Inpex Holdings Incorporated (Energy, Oil, gas & consumable fuels) | | | | | 65,000 | 447,848 |
| Isuzu Motors Limited (Consumer discretionary, Automobiles) | | | | | 30,600 | 387,176 |
| ITO EN Limited (Consumer staples, Beverages) | | | | | 5,200 | 328,973 |
| Itochu Corporation (Industrials, Trading companies & distributors) | | | | | 39,700 | 1,194,807 |
| Itochu Techno-Solutions Corporation (Information technology, IT services) | | | | | 8,400 | 259,983 |
| Japan Airlines Company Limited (Industrials, Airlines) † | | | | | 5,000 | 106,395 |
| Japan Post Hoding Company Limited (Financials, Insurance) | | | | | 39,700 | 719,915 |
| Japan Retail Fund Investment Corporation (Real estate, Equity REITs) | | | | | 277 | 269,157 |
| Japan Tobacco Incorporated (Consumer staples, Tobacco) | | | | | 24,200 | 469,086 |
| JFE Holdings Incorporated (Materials, Metals & mining) | | | | | 68,400 | 1,109,794 |
| JSR Corporation (Materials, Chemicals) | | | | | 6,100 | 211,530 |
| Kajima Corporation (Industrials, Construction & engineering) | | | | | 16,500 | 213,421 |
| Kakaku.com Incorporated (Communication services, Interactive media & services) | | | | | 22,800 | 710,849 |
| Kansai Electric Power Company Incorporated (Utilities, Electric utilities) | | | | | 13,100 | 131,578 |
| Kansai Paint Company Limited (Materials, Chemicals) | | | | | 400 | 10,366 |
| Kao Corporation (Consumer staples, Personal products) | | | | | 11,900 | 718,878 |
| KDDI Corporation (Communication services, Wireless telecommunication services) | | | | | 57,100 | 1,749,098 |
| Keio Corporation (Industrials, Road & rail) | | | | | 3,200 | 172,195 |
| Keyence Corporation (Information technology, Electronic equipment, instruments & components) | | | | | 4,500 | 2,704,949 |
| Kikkoman Corporation (Consumer staples, Food products) | | | | | 1,800 | 135,145 |
| Kintetsu Group Holdings Company Limited (Industrials, Road & rail) † | | | | | 6,500 | 222,152 |
| Kirin Holdings Company Limited (Consumer staples, Beverages) | | | | | 19,200 | 347,996 |
| Kobayashi Pharmaceutical Company Limited (Consumer staples, Personal products) | | | | | 1,200 | 93,914 |
| KOEI TECMO Holdings Company Limited (Communication services, Entertainment) | | | | | 7,400 | 316,475 |
| Koito Manufacturing Company Limited (Consumer discretionary, Auto components) | | | | | 3,800 | 232,459 |
| Komatsu Limited (Industrials, Machinery) | | | | | 42,000 | 1,016,452 |
The accompanying notes are an integral part of these financial statements.
Wells Fargo Factor Enhanced International Equity Portfolio | 11
Portfolio of investments—August 31, 2021 (unaudited)
| | | | | | Shares | Value |
| Japan: (continued) | | | | | | |
| Konami Holdings Corporation (Communication services, Entertainment) | | | | | 10,100 | $ 640,804 |
| KOSE Corporation (Consumer staples, Personal products) | | | | | 2,100 | 253,874 |
| Kubota Corporation (Industrials, Machinery) | | | | | 35,100 | 725,673 |
| Kurita Water Industries Limited (Industrials, Machinery) | | | | | 2,300 | 107,876 |
| Kyocera Corporation (Information technology, Electronic equipment, instruments & components) | | | | | 6,900 | 429,372 |
| Kyowa Hakko Kogyo Company Limited (Health care, Pharmaceuticals) | | | | | 200 | 6,535 |
| LIXIL Corporation (Industrials, Building products) | | | | | 7,000 | 203,927 |
| M3 Incorporated (Health care, Health care technology) | | | | | 16,200 | 1,089,817 |
| Makita Corporation (Industrials, Machinery) | | | | | 7,500 | 430,850 |
| Marubeni Corporation (Industrials, Trading companies & distributors) | | | | | 144,300 | 1,148,471 |
| Mazda Motor Corporation (Consumer discretionary, Automobiles) † | | | | | 73,800 | 640,631 |
| McDonald's Holdings Company Japan Limited (Consumer discretionary, Hotels, restaurants & leisure) | | | | | 7,600 | 362,678 |
| MediPal Holdings Corporation (Health care, Health care providers & services) | | | | | 61,700 | 1,179,431 |
| Meiji Holdings Company Limited (Consumer staples, Food products) | | | | | 3,400 | 208,917 |
| Mercari Incorporated (Consumer discretionary, Internet & direct marketing retail) † | | | | | 2,600 | 128,564 |
| Minebea Company Limited (Industrials, Machinery) | | | | | 12,800 | 329,613 |
| Misumi Group Incorporated (Industrials, Machinery) | | | | | 1,500 | 59,515 |
| Mitsubishi Chemical Holdings Corporation (Materials, Chemicals) | | | | | 78,400 | 688,258 |
| Mitsubishi Corporation (Industrials, Trading companies & distributors) | | | | | 31,200 | 938,992 |
| Mitsubishi Electric Corporation (Industrials, Electrical equipment) | | | | | 104,000 | 1,423,188 |
| Mitsubishi Estate Company Limited (Real estate, Real estate management & development) | | | | | 26,500 | 414,548 |
| Mitsubishi Gas Chemical Company Incorporated (Materials, Chemicals) | | | | | 54,200 | 1,022,270 |
| Mitsubishi Heavy Industries Limited (Industrials, Machinery) | | | | | 22,400 | 592,297 |
| Mitsubishi UFJ Financial Group Incorporated (Financials, Banks) | | | | | 398,800 | 2,154,683 |
| Mitsui & Company Limited (Industrials, Trading companies & distributors) | | | | | 54,800 | 1,209,919 |
| Mitsui Chemicals Incorporated (Materials, Chemicals) | | | | | 29,900 | 1,032,768 |
| Mitsui Fudosan Company Limited (Real estate, Real estate management & development) | | | | | 21,500 | 493,260 |
| Mizuho Financial Group Incorporated (Financials, Banks) | | | | | 83,070 | 1,165,087 |
| MS&AD Insurance Group Holdings Incorporated (Financials, Insurance) | | | | | 14,500 | 468,550 |
| Murata Manufacturing Company Limited (Information technology, Electronic equipment, instruments & components) | | | | | 16,200 | 1,342,797 |
| Nabtesco Corporation (Industrials, Machinery) | | | | | 29,700 | 1,177,039 |
| NEC Corporation (Information technology, IT services) | | | | | 8,900 | 467,591 |
| NGK Insulators Limited (Industrials, Machinery) | | | | | 29,700 | 492,683 |
| NH Foods Limited (Consumer staples, Food products) | | | | | 23,600 | 914,912 |
| Nidec Corporation (Industrials, Electrical equipment) | | | | | 12,300 | 1,410,953 |
| Nintendo Company Limited (Communication services, Entertainment) | | | | | 4,500 | 2,163,796 |
| Nippon Express Company Limited (Industrials, Road & rail) | | | | | 27,300 | 1,858,628 |
| Nippon Shinyaku Company Limited (Health care, Pharmaceuticals) | | | | | 1,800 | 146,107 |
| Nippon Steel Corporation (Materials, Metals & mining) | | | | | 53,800 | 1,099,326 |
| Nippon Telegraph & Telephone Corporation (Communication services, Diversified telecommunication services) | | | | | 52,900 | 1,411,757 |
| Nippon Yusen Kabushiki Kaisha (Industrials, Marine) | | | | | 15,300 | 1,233,568 |
| Nissan Motor Company Limited (Consumer discretionary, Automobiles) † | | | | | 5,900 | 31,024 |
| Nisshin Seifun Group Incorporated (Consumer staples, Food products) | | | | | 13,500 | 221,370 |
| Nitto Denko Corporation (Materials, Chemicals) | | | | | 8,300 | 630,714 |
| Nomura Holdings Incorporated (Financials, Capital markets) | | | | | 112,700 | 546,623 |
| Nomura Real Estate Holding Incorporated (Real estate, Real estate management & development) | | | | | 33,500 | 857,179 |
| Nomura Real Estate Master Fund Incorporated (Real estate, Equity REITs) | | | | | 111 | 171,219 |
The accompanying notes are an integral part of these financial statements.
12 | Wells Fargo Factor Enhanced International Equity Portfolio
Portfolio of investments—August 31, 2021 (unaudited)
| | | | | | Shares | Value |
| Japan: (continued) | | | | | | |
| Nomura Research Institute Limited (Information technology, IT services) | | | | | 31,400 | $ 1,180,194 |
| NSK Limited (Industrials, Machinery) | | | | | 68,500 | 480,680 |
| NTT Data Corporation (Information technology, IT services) | | | | | 62,667 | 1,128,422 |
| Obayashi Corporation (Industrials, Construction & engineering) | | | | | 24,100 | 198,469 |
| OBIC Company Limited (Information technology, IT services) | | | | | 400 | 76,171 |
| Oji Holdings Corporation (Materials, Paper & forest products) | | | | | 102,000 | 534,036 |
| Olympus Corporation (Health care, Health care equipment & supplies) | | | | | 30,200 | 634,525 |
| Omron Corporation (Information technology, Electronic equipment, instruments & components) | | | | | 3,900 | 367,968 |
| Ono Pharmaceutical Company Limited (Health care, Pharmaceuticals) | | | | | 14,200 | 341,270 |
| Oracle Corporation (Japan) (Information technology, Software) | | | | | 1,400 | 115,039 |
| Oriental Land Company Limited (Consumer discretionary, Hotels, restaurants & leisure) | | | | | 1,100 | 166,577 |
| ORIX Corporation (Financials, Diversified financial services) | | | | | 39,000 | 727,251 |
| Osaka Gas Company Limited (Utilities, Gas utilities) | | | | | 7,200 | 135,014 |
| Otsuka Corporation (Information technology, IT services) | | | | | 16,400 | 849,702 |
| Otsuka Holdings Company Limited (Health care, Pharmaceuticals) | | | | | 14,600 | 621,212 |
| Panasonic Corporation (Consumer discretionary, Household durables) | | | | | 70,200 | 837,180 |
| PeptiDream Incorporated (Health care, Biotechnology) † | | | | | 3,500 | 123,438 |
| Persol Holdings Company Limited (Industrials, Professional services) | | | | | 55,800 | 1,304,528 |
| Pigeon Corporation (Consumer staples, Household products) | | | | | 12,000 | 347,407 |
| Pola Orbis Holdings Incorporated (Consumer staples, Personal products) | | | | | 44,300 | 968,024 |
| Recruit Holdings Company Limited (Industrials, Professional services) | | | | | 33,100 | 1,955,642 |
| Renesas Electronics Corporation (Information technology, Semiconductors & semiconductor equipment) † | | | | | 46,500 | 502,554 |
| Resona Holdings Incorporated (Financials, Banks) | | | | | 167,600 | 648,524 |
| Rohm Company Limited (Information technology, Semiconductors & semiconductor equipment) | | | | | 6,900 | 666,073 |
| Santen Pharmaceutical Company Limited (Health care, Pharmaceuticals) | | | | | 15,500 | 231,059 |
| SBI Holdings Incorporated (Financials, Capital markets) | | | | | 8,850 | 214,784 |
| SCSK Corporation (Information technology, IT services) | | | | | 16,500 | 1,042,358 |
| Secom Company Limited (Industrials, Commercial services & supplies) | | | | | 1,800 | 136,536 |
| Seiko Epson Corporation (Information technology, Technology hardware, storage & peripherals) | | | | | 10,900 | 203,109 |
| Sekisui Chemical Company Limited (Consumer discretionary, Household durables) | | | | | 4,500 | 77,062 |
| Sekisui House Limited (Consumer discretionary, Household durables) | | | | | 10,400 | 207,310 |
| Seven & I Holdings Company Limited (Consumer staples, Food & staples retailing) | | | | | 24,400 | 1,067,909 |
| SG Holdings Company Limited (Industrials, Air freight & logistics) | | | | | 7,000 | 190,374 |
| Sharp Corporation (Consumer discretionary, Household durables) | | | | | 9,400 | 124,149 |
| Shimadzu Corporation (Information technology, Electronic equipment, instruments & components) | | | | | 8,800 | 394,746 |
| Shimano Incorporated (Consumer discretionary, Leisure products) | | | | | 300 | 88,079 |
| Shimizu Corporation (Industrials, Construction & engineering) | | | | | 20,400 | 146,489 |
| Shin-Etsu Chemical Company Limited (Materials, Chemicals) | | | | | 10,000 | 1,654,774 |
| Shionogi & Company Limited (Health care, Pharmaceuticals) | | | | | 3,800 | 240,127 |
| Shiseido Company Limited (Consumer staples, Personal products) | | | | | 7,500 | 497,182 |
| Shizuoka Bank Limited (Financials, Banks) | | | | | 75,300 | 589,998 |
| SMC Corporation (Industrials, Machinery) | | | | | 800 | 512,730 |
| SoftBank Corporation (Communication services, Wireless telecommunication services) | | | | | 66,600 | 892,016 |
| SoftBank Group Corporation (Communication services, Wireless telecommunication services) | | | | | 42,900 | 2,410,261 |
| Sohgo Security Services Company Limited (Industrials, Commercial services & supplies) | | | | | 9,600 | 434,995 |
The accompanying notes are an integral part of these financial statements.
Wells Fargo Factor Enhanced International Equity Portfolio | 13
Portfolio of investments—August 31, 2021 (unaudited)
| | | | | | Shares | Value |
| Japan: (continued) | | | | | | |
| Sompo Holdings Incorporated (Financials, Insurance) | | | | | 11,600 | $ 509,065 |
| Sony Corporation (Consumer discretionary, Household durables) | | | | | 36,500 | 3,768,941 |
| Square Enix Company Limited (Communication services, Entertainment) | | | | | 3,100 | 180,621 |
| Stanley Electric Company Limited (Consumer discretionary, Auto components) | | | | | 2,700 | 67,442 |
| Sumco Corporation (Information technology, Semiconductors & semiconductor equipment) | | | | | 14,833 | 313,203 |
| Sumitomo Chemical Company Limited (Materials, Chemicals) | | | | | 106,000 | 537,636 |
| Sumitomo Corporation (Industrials, Trading companies & distributors) | | | | | 19,300 | 272,707 |
| Sumitomo Dainippon Pharma Company Limited (Health care, Pharmaceuticals) | | | | | 9,500 | 170,286 |
| Sumitomo Electric Industries Limited (Industrials, Electrical equipment) | | | | | 36,600 | 489,209 |
| Sumitomo Metal Mining Company Limited (Materials, Metals & mining) | | | | | 19,500 | 748,698 |
| Sumitomo Mitsui Financial Group Incorporated (Financials, Banks) | | | | | 46,600 | 1,610,022 |
| Sumitomo Mitsui Trust Holdings Incorporated (Financials, Banks) | | | | | 12,300 | 402,267 |
| Sumitomo Realty & Development Company Limited (Real estate, Real estate management & development) | | | | | 8,900 | 287,350 |
| Suntory Beverage & Food Limited (Consumer staples, Beverages) | | | | | 1,600 | 64,064 |
| Suzuki Motor Corporation (Consumer discretionary, Automobiles) | | | | | 13,333 | 576,392 |
| Sysmex Corporation (Health care, Health care equipment & supplies) | | | | | 4,500 | 512,112 |
| T&D Holdings Incorporated (Financials, Insurance) | | | | | 20,100 | 243,908 |
| Taisei Corporation (Industrials, Construction & engineering) | | | | | 7,100 | 222,329 |
| Taisho Pharmaceutical (Health care, Pharmaceuticals) | | | | | 1,200 | 70,027 |
| Takeda Pharmaceutical Company Limited (Health care, Pharmaceuticals) | | | | | 48,600 | 1,625,227 |
| TDK Corporation (Information technology, Electronic equipment, instruments & components) | | | | | 4,700 | 494,287 |
| Terumo Corporation (Health care, Health care equipment & supplies) | | | | | 10,100 | 422,031 |
| THK Company Limited (Industrials, Machinery) | | | | | 5,900 | 136,915 |
| TIS Incorporated (Information technology, Software) | | | | | 43,800 | 1,238,177 |
| Tohoku Electric Power Company Incorporated (Utilities, Electric utilities) | | | | | 54,600 | 417,881 |
| Tokio Marine Holdings Incorporated (Financials, Insurance) | | | | | 9,500 | 464,314 |
| Tokyo Electron Limited (Information technology, Semiconductors & semiconductor equipment) | | | | | 6,800 | 2,919,893 |
| Toppan Printing Company Limited (Industrials, Commercial services & supplies) | | | | | 29,800 | 511,948 |
| Toray Industries Incorporated (Materials, Chemicals) | | | | | 50,800 | 342,530 |
| Toshiba Corporation (Industrials, Industrial conglomerates) | | | | | 24,100 | 1,046,016 |
| Tosoh Corporation (Materials, Chemicals) | | | | | 55,500 | 1,007,944 |
| Toyo Suisan Kaisha Limited (Consumer staples, Food products) | | | | | 4,800 | 198,737 |
| Toyota Motor Corporation (Consumer discretionary, Automobiles) | | | | | 68,800 | 5,998,542 |
| Toyota Tsusho Corporation (Industrials, Trading companies & distributors) | | | | | 16,300 | 720,806 |
| Trend Micro Incorporated (Information technology, Software) | | | | | 10,200 | 559,069 |
| Unicharm Corporation (Consumer staples, Household products) | | | | | 2,900 | 129,270 |
| United Urban Investment Corporation (Real estate, Equity REITs) | | | | | 291 | 411,577 |
| USS Company Limited (Consumer discretionary, Specialty retail) | | | | | 16,000 | 264,837 |
| Yamada Denki Company Limited (Consumer discretionary, Specialty retail) | | | | | 139,300 | 598,908 |
| Yamaha Corporation (Consumer discretionary, Leisure products) | | | | | 9,433 | 556,471 |
| Yamaha Motor Company Limited (Consumer discretionary, Automobiles) | | | | | 17,800 | 453,029 |
| Yamato Holdings Company Limited (Industrials, Air freight & logistics) | | | | | 18,000 | 458,119 |
| Yaskawa Electric Corporation (Industrials, Machinery) | | | | | 5,600 | 273,854 |
| Yokogawa Electric Corporation (Information technology, Electronic equipment, instruments & components) | | | | | 8,100 | 126,858 |
| ZOZO Incorporated (Consumer discretionary, Internet & direct marketing retail) | | | | | 45,300 | 1,727,342 |
| | | | | | | 145,171,772 |
The accompanying notes are an integral part of these financial statements.
14 | Wells Fargo Factor Enhanced International Equity Portfolio
Portfolio of investments—August 31, 2021 (unaudited)
| | | | | | Shares | Value |
| Luxembourg: 0.58% | | | | | | |
| ArcelorMittal SA (Materials, Metals & mining) | | | | | 74,734 | $ 2,505,637 |
| Eurofins Scientific SE (Health care, Life sciences tools & services) | | | | | 9,290 | 1,317,178 |
| InPost SA (Industrials, Industrial conglomerates) † | | | | | 13,058 | 254,401 |
| Tenaris SA (Energy, Energy equipment & services) | | | | | 15,600 | 157,231 |
| | | | | | | 4,234,447 |
| Netherlands: 5.01% | | | | | | |
| Adyen NV (Information technology, IT services) 144A† | | | | | 576 | 1,859,767 |
| Aegon NV (Financials, Insurance) | | | | | 169,524 | 839,494 |
| Airbus SE (Industrials, Aerospace & defense) † | | | | | 17,842 | 2,437,446 |
| Akzo Nobel NV (Materials, Chemicals) | | | | | 10,040 | 1,237,634 |
| ASM International NV (Information technology, Semiconductors & semiconductor equipment) | | | | | 2,570 | 997,146 |
| ASML Holding NV (Information technology, Semiconductors & semiconductor equipment) | | | | | 14,754 | 12,272,948 |
| CNH Industrial NV (Industrials, Machinery) | | | | | 17,082 | 282,374 |
| Davide Campari-Milano NV (Consumer staples, Beverages) | | | | | 24,839 | 343,439 |
| Exor NV (Financials, Diversified financial services) | | | | | 9,227 | 769,172 |
| Heineken Holding NV (Consumer staples, Beverages) | | | | | 3,145 | 291,507 |
| Heineken NV (Consumer staples, Beverages) | | | | | 6,208 | 679,500 |
| ING Groep NV (Financials, Banks) | | | | | 133,568 | 1,845,213 |
| Koninklijke Ahold Delhaize NV (Consumer staples, Food & staples retailing) | | | | | 40,210 | 1,356,446 |
| Koninklijke DSM NV (Materials, Chemicals) | | | | | 4,000 | 851,321 |
| Koninklijke KPN NV (Communication services, Diversified telecommunication services) | | | | | 211,767 | 678,619 |
| Koninklijke Philips NV (Health care, Health care equipment & supplies) | | | | | 34,905 | 1,608,998 |
| NN Group NV (Financials, Insurance) | | | | | 20,368 | 1,057,458 |
| Prosus NV (Consumer discretionary, Internet & direct marketing retail) | | | | | 19,617 | 1,734,892 |
| Qiagen NV (Health care, Life sciences tools & services) † | | | | | 2,379 | 131,658 |
| Randstad Holdings NV (Industrials, Professional services) | | | | | 22,680 | 1,668,358 |
| Stellantis NV (Consumer discretionary, Automobiles) | | | | | 112,498 | 2,249,113 |
| STMicroelectronics NV (Information technology, Semiconductors & semiconductor equipment) | | | | | 12,390 | 551,752 |
| Wolters Kluwer NV (Communication services, Media) | | | | | 9,473 | 1,089,667 |
| | | | | | | 36,833,922 |
| New Zealand: 0.24% | | | | | | |
| Auckland International Airport Limited (Industrials, Transportation infrastructure) † | | | | | 46,597 | 236,737 |
| Fisher & Paykel Healthcare Corporation (Health care, Health care equipment & supplies) | | | | | 15,579 | 363,363 |
| Meridian Energy Limited (Utilities, Independent power & renewable electricity producers) | | | | | 67,857 | 251,031 |
| Spark New Zealand Limited (Communication services, Diversified telecommunication services) | | | | | 261,312 | 897,651 |
| | | | | | | 1,748,782 |
| Norway: 0.79% | | �� | | | | |
| DNB Bank ASA (Financials, Banks) | | | | | 47,957 | 1,012,727 |
| Equinor ASA (Energy, Oil, gas & consumable fuels) | | | | | 35,258 | 749,181 |
| Gjensidige Forsikring ASA (Financials, Insurance) | | | | | 22,890 | 535,243 |
| Mowi ASA (Consumer staples, Food products) | | | | | 8,664 | 232,090 |
| Norsk Hydro ASA (Materials, Metals & mining) | | | | | 135,489 | 935,337 |
| Orkla ASA (Consumer staples, Food products) | | | | | 58,104 | 519,138 |
The accompanying notes are an integral part of these financial statements.
Wells Fargo Factor Enhanced International Equity Portfolio | 15
Portfolio of investments—August 31, 2021 (unaudited)
| | | | | | Shares | Value |
| Norway: (continued) | | | | | | |
| Telenor ASA (Communication services, Diversified telecommunication services) | | | | | 59,449 | $ 1,041,729 |
| Yara International ASA (Materials, Chemicals) | | | | | 15,908 | 798,854 |
| | | | | | | 5,824,299 |
| Portugal: 0.14% | | | | | | |
| Energias de Portugal SA (Utilities, Electric utilities) | | | | | 70,733 | 388,526 |
| Galp Energia SGPS SA (Energy, Oil, gas & consumable fuels) | | | | | 41,331 | 423,305 |
| Jeronimo Martins SA (Consumer staples, Food & staples retailing) | | | | | 11,901 | 252,235 |
| | | | | | | 1,064,066 |
| Singapore: 1.15% | | | | | | |
| DBS Group Holdings Limited (Financials, Banks) | | | | | 60,113 | 1,340,018 |
| Genting Singapore Limited (Consumer discretionary, Hotels, restaurants & leisure) | | | | | 217,324 | 123,659 |
| Mapletree Logistics Trust (Real estate, Equity REITs) | | | | | 47,000 | 70,966 |
| Oversea-Chinese Banking Corporation Limited (Financials, Banks) | | | | | 146,096 | 1,242,052 |
| Singapore Exchange Limited (Financials, Capital markets) | | | | | 76,600 | 564,052 |
| Singapore Technologies Engineering Limited (Industrials, Aerospace & defense) | | | | | 320,669 | 901,580 |
| Singapore Telecommunications Limited (Communication services, Diversified telecommunication services) | | | | | 287,500 | 496,114 |
| United Overseas Bank Limited (Financials, Banks) | | | | | 53,986 | 1,027,157 |
| UOL Group Limited (Real estate, Real estate management & development) | | | | | 40,073 | 208,644 |
| Venture Corporation Limited (Information technology, Electronic equipment, instruments & components) | | | | | 121,400 | 1,730,093 |
| Wilmar International Limited (Consumer staples, Food products) | | | | | 229,985 | 708,199 |
| | | | | | | 8,412,534 |
| Spain: 2.30% | | | | | | |
| Actividades de Construccion y Servicios SA (Industrials, Construction & engineering) | | | | | 27,419 | 740,092 |
| Aena SA (Industrials, Transportation infrastructure) 144A† | | | | | 4,780 | 763,067 |
| Amadeus IT Holding SA Class A (Information technology, IT services) † | | | | | 1,746 | 106,625 |
| Banco Bilbao Vizcaya Argentaria SA (Financials, Banks) | | | | | 279,271 | 1,829,120 |
| Banco Santander Central Hispano SA (Financials, Banks) | | | | | 624,182 | 2,304,977 |
| CaixaBank SA (Financials, Banks) | | | | | 195,078 | 606,251 |
| EDP Renováveis SA (Utilities, Independent power & renewable electricity producers) | | | | | 12,175 | 323,739 |
| Enagás SA (Utilities, Gas utilities) | | | | | 19,487 | 443,274 |
| Endesa SA (Utilities, Electric utilities) | | | | | 26,302 | 632,302 |
| Gas Natural SDG SA (Utilities, Gas utilities) | | | | | 27,038 | 695,968 |
| Grifols SA (Health care, Biotechnology) | | | | | 44,323 | 1,082,799 |
| Iberdrola SA (Utilities, Electric utilities) | | | | | 203,767 | 2,525,076 |
| Industria de Diseno Textil SA (Consumer discretionary, Specialty retail) | | | | | 34,405 | 1,174,432 |
| Red Eléctrica Corporacion SA (Utilities, Electric utilities) | | | | | 14,529 | 289,750 |
| Repsol SA (Energy, Oil, gas & consumable fuels) | | | | | 122,003 | 1,398,055 |
| Siemens Gamesa Renewable Energy SA (Industrials, Electrical equipment) † | | | | | 8,516 | 252,488 |
| Telefónica SA (Communication services, Diversified telecommunication services) | | | | | 350,500 | 1,730,526 |
| | | | | | | 16,898,541 |
| Sweden: 3.07% | | | | | | |
| Alfa Laval AB (Industrials, Machinery) | | | | | 11,675 | 473,524 |
| Assa Abloy AB Class B (Industrials, Building products) | | | | | 25,328 | 809,491 |
The accompanying notes are an integral part of these financial statements.
16 | Wells Fargo Factor Enhanced International Equity Portfolio
Portfolio of investments—August 31, 2021 (unaudited)
| | | | | | Shares | Value |
| Sweden: (continued) | | | | | | |
| Atlas Copco AB Class A (Industrials, Machinery) | | | | | 19,953 | $ 1,369,746 |
| Atlas Copco AB Class B (Industrials, Machinery) | | | | | 8,664 | 501,199 |
| Boliden AB (Materials, Metals & mining) | | | | | 14,126 | 492,559 |
| Electrolux AB Class B (Consumer discretionary, Household durables) | | | | | 33,174 | 840,359 |
| Epiroc AB Class A (Industrials, Machinery) | | | | | 35,796 | 785,447 |
| Epiroc AB Class B (Industrials, Machinery) | | | | | 20,544 | 390,313 |
| Ericsson LM Class B (Information technology, Communications equipment) | | | | | 134,818 | 1,598,234 |
| Essity Aktiebolag AB (Consumer staples, Household products) | | | | | 17,019 | 545,905 |
| Evolution Gaming Group (Consumer discretionary, Hotels, restaurants & leisure) 144A | | | | | 7,113 | 1,146,066 |
| Fastighets AB Balder B Shares (Real estate, Real estate management & development) † | | | | | 1,050 | 75,050 |
| Hennes & Mauritz AB Class B (Consumer discretionary, Specialty retail) † | | | | | 4,877 | 97,750 |
| Hexagon AB Class B (Information technology, Electronic equipment, instruments & components) | | | | | 57,637 | 998,526 |
| Husqvarna AB Class B (Consumer discretionary, Household durables) | | | | | 27,719 | 371,805 |
| Industrivarden AB Class A (Financials, Diversified financial services) | | | | | 19,946 | 734,097 |
| Industrivarden AB Class C (Financials, Diversified financial services) | | | | | 5,394 | 188,021 |
| Investor AB (Financials, Diversified financial services) | | | | | 51,694 | 1,236,422 |
| Kinnevik AB (Financials, Diversified financial services) | | | | | 21,463 | 840,916 |
| Lundin Energy AB (Energy, Oil, gas & consumable fuels) | | | | | 20,853 | 636,987 |
| Sandvik AB (Industrials, Machinery) | | | | | 35,375 | 901,854 |
| Securitas AB Class B (Industrials, Commercial services & supplies) | | | | | 71,145 | 1,181,016 |
| Sinch AB (Information technology, Software) 144A† | | | | | 20,801 | 466,666 |
| Skandinaviska Enskilda Banken AB Class A (Financials, Banks) | | | | | 33,044 | 443,806 |
| Skanska AB Class B (Industrials, Construction & engineering) | | | | | 26,555 | 764,697 |
| SKF AB Class B (Industrials, Machinery) | | | | | 29,976 | 764,211 |
| Svenska Handelsbanken AB Class A (Financials, Banks) | | | | | 5,617 | 63,177 |
| Swedbank AB Class A (Financials, Banks) | | | | | 23,061 | 445,269 |
| Swedish Match AB (Consumer staples, Tobacco) | | | | | 52,214 | 482,118 |
| Tele2 AB Class B (Communication services, Wireless telecommunication services) | | | | | 49,727 | 745,376 |
| Telia Company AB (Communication services, Diversified telecommunication services) | | | | | 14,074 | 60,410 |
| Volvo AB Class A (Industrials, Machinery) | | | | | 20,304 | 470,339 |
| Volvo AB Class B (Industrials, Machinery) | | | | | 72,730 | 1,644,662 |
| | | | | | | 22,566,018 |
| Switzerland: 8.57% | | | | | | |
| ABB Limited (Industrials, Electrical equipment) | | | | | 71,347 | 2,642,741 |
| Adecco SA (Industrials, Professional services) | | | | | 21,835 | 1,215,559 |
| Alcon Incorporated (Health care, Health care equipment & supplies) | | | | | 15,444 | 1,272,285 |
| Barry Callebaut AG (Consumer staples, Food products) | | | | | 90 | 229,386 |
| Clariant AG (Materials, Chemicals) | | | | | 5,810 | 122,322 |
| Coca-Cola HBC AG (Consumer staples, Beverages) | | | | | 25,157 | 909,295 |
| Compagnie Financière Richemont SA (Consumer discretionary, Textiles, apparel & luxury goods) | | | | | 15,691 | 1,730,594 |
| Credit Suisse Group AG (Financials, Capital markets) | | | | | 28,972 | 307,326 |
| EMS-Chemie Holdings AG (Materials, Chemicals) | | | | | 253 | 274,204 |
| Geberit AG (Industrials, Building products) | | | | | 1,219 | 1,018,595 |
| Givaudan SA (Materials, Chemicals) | | | | | 125 | 627,218 |
| Julius Bär Gruppe AG (Financials, Capital markets) | | | | | 11,532 | 788,319 |
| Kuehne & Nagel International AG (Industrials, Marine) | | | | | 621 | 227,242 |
| LafargeHolcim Limited (Materials, Construction materials) | | | | | 16,070 | 916,029 |
| Logitech International SA (Information technology, Technology hardware, storage & peripherals) | | | | | 10,052 | 1,027,867 |
The accompanying notes are an integral part of these financial statements.
Wells Fargo Factor Enhanced International Equity Portfolio | 17
Portfolio of investments—August 31, 2021 (unaudited)
| | | | | | Shares | Value |
| Switzerland: (continued) | | | | | | |
| Lonza Group AG (Health care, Life sciences tools & services) | | | | | 2,159 | $ 1,827,164 |
| Nestle SA (Consumer staples, Food products) | | | | | 104,516 | 13,209,590 |
| Novartis AG (Health care, Pharmaceuticals) | | | | | 81,420 | 7,538,741 |
| Partners Group Holding AG (Financials, Capital markets) | | | | | 1,038 | 1,840,799 |
| Roche Holding AG (Health care, Pharmaceuticals) | | | | | 24,591 | 9,875,337 |
| Roche Holding AG (Health care, Pharmaceuticals) | | | | | 2,907 | 1,301,523 |
| Schindler Holding AG (Industrials, Machinery) | | | | | 3,052 | 985,838 |
| Schindler Holding AG (Industrials, Machinery) | | | | | 713 | 222,367 |
| SGS SA (Industrials, Professional services) | | | | | 171 | 537,415 |
| Sika AG (Materials, Chemicals) | | | | | 5,748 | 2,071,979 |
| Sonova Holding AG (Health care, Health care equipment & supplies) | | | | | 2,889 | 1,113,641 |
| Straumann Holding AG (Health care, Health care equipment & supplies) | | | | | 590 | 1,140,377 |
| Swiss Life Holding AG (Financials, Insurance) | | | | | 746 | 389,069 |
| Swiss Prime Site AG (Real estate, Real estate management & development) | | | | | 2,770 | 296,283 |
| Swiss Reinsurance AG (Financials, Insurance) | | | | | 11,819 | 1,087,490 |
| Swisscom AG (Communication services, Diversified telecommunication services) | | | | | 804 | 471,820 |
| Temenos AG (Information technology, Software) | | | | | 1,623 | 257,695 |
| The Swatch Group AG (Consumer discretionary, Textiles, apparel & luxury goods) | | | | | 4,292 | 235,984 |
| The Swatch Group AG Class B (Consumer discretionary, Textiles, apparel & luxury goods) | | | | | 2,654 | 748,308 |
| UBS Group AG (Financials, Capital markets) | | | | | 144,641 | 2,413,447 |
| Zurich Insurance Group AG (Financials, Insurance) | | | | | 4,686 | 2,057,081 |
| | | | | | | 62,930,930 |
| United Kingdom: 11.98% | | | | | | |
| 3i Group plc (Financials, Capital markets) | | | | | 113,577 | 2,088,524 |
| Admiral Group plc (Financials, Insurance) | | | | | 6,890 | 342,060 |
| Anglo American plc (Materials, Metals & mining) | | | | | 54,197 | 2,286,796 |
| Ashtead Group plc (Industrials, Trading companies & distributors) | | | | | 8,390 | 656,341 |
| Associated British Foods plc (Consumer staples, Food products) | | | | | 4,260 | 115,966 |
| AstraZeneca plc (Health care, Pharmaceuticals) | | | | | 55,584 | 6,506,371 |
| Auto Trader Group plc (Communication services, Interactive media & services) 144A | | | | | 123,615 | 1,068,999 |
| Aviva plc (Financials, Insurance) | | | | | 130,767 | 726,511 |
| BAE Systems plc (Industrials, Aerospace & defense) | | | | | 165,887 | 1,296,349 |
| Barclays plc (Financials, Banks) | | | | | 577,594 | 1,468,301 |
| Barratt Developments plc (Consumer discretionary, Household durables) | | | | | 78,528 | 797,856 |
| BHP Group plc (Materials, Metals & mining) | | | | | 82,040 | 2,546,295 |
| BP plc (Energy, Oil, gas & consumable fuels) | | | | | 696,751 | 2,844,568 |
| British American Tobacco plc (Consumer staples, Tobacco) | | | | | 70,842 | 2,657,968 |
| BT Group plc (Communication services, Diversified telecommunication services) † | | | | | 444,667 | 1,038,073 |
| Bunzl plc (Industrials, Trading companies & distributors) | | | | | 9,504 | 344,435 |
| Burberry Group plc (Consumer discretionary, Textiles, apparel & luxury goods) | | | | | 1,873 | 47,884 |
| Coca-Cola European Partners plc (Consumer staples, Beverages) | | | | | 11,858 | 684,681 |
| Compass Group plc (Consumer discretionary, Hotels, restaurants & leisure) † | | | | | 91,434 | 1,886,249 |
| Diageo plc (Consumer staples, Beverages) | | | | | 75,986 | 3,650,160 |
| Direct Line Insurance Group plc (Financials, Insurance) | | | | | 192,197 | 816,508 |
| EVRAZ plc (Materials, Metals & mining) | | | | | 224,031 | 1,818,485 |
| Experian Group Limited plc (Industrials, Professional services) | | | | | 7,370 | 324,650 |
| Ferguson plc (Industrials, Trading companies & distributors) | | | | | 7,058 | 1,019,373 |
| GlaxoSmithKline plc (Health care, Pharmaceuticals) | | | | | 165,211 | 3,320,792 |
The accompanying notes are an integral part of these financial statements.
18 | Wells Fargo Factor Enhanced International Equity Portfolio
Portfolio of investments—August 31, 2021 (unaudited)
| | | | | | Shares | Value |
| United Kingdom: (continued) | | | | | | |
| Glencore plc (Materials, Metals & mining) | | | | | 499,058 | $ 2,246,389 |
| GVC Holdings plc (Consumer discretionary, Hotels, restaurants & leisure) † | | | | | 51,958 | 1,380,828 |
| Halma plc (Information technology, Electronic equipment, instruments & components) | | | | | 11,925 | 492,344 |
| Hikma Pharmaceuticals plc (Health care, Pharmaceuticals) | | | | | 29,388 | 1,025,456 |
| HSBC Holdings plc (Financials, Banks) | | | | | 666,013 | 3,536,310 |
| Imperial Tobacco Group plc (Consumer staples, Tobacco) | | | | | 61,917 | 1,312,226 |
| Intertek Group plc (Industrials, Professional services) | | | | | 8,181 | 592,751 |
| J Sainsbury plc (Consumer staples, Food & staples retailing) | | | | | 263,918 | 1,103,057 |
| JD Sports Fashion plc (Consumer discretionary, Specialty retail) | | | | | 15,371 | 213,336 |
| Johnson Matthey plc (Materials, Chemicals) | | | | | 16,908 | 683,199 |
| Kingfisher plc (Consumer discretionary, Specialty retail) | | | | | 198,586 | 956,410 |
| Land Securities Group plc (Real estate, Equity REITs) | | | | | 53,916 | 525,556 |
| Legal & General Group plc (Financials, Insurance) | | | | | 123,253 | 457,866 |
| Lloyds Banking Group plc (Financials, Banks) | | | | | 2,336,119 | 1,405,971 |
| London Stock Exchange Group plc (Financials, Capital markets) | | | | | 454 | 49,660 |
| M&G plc (Financials, Diversified financial services) | | | | | 157,621 | 446,413 |
| Melrose Industries plc (Industrials, Industrial conglomerates) | | | | | 151,053 | 348,355 |
| Mondi plc (Materials, Paper & forest products) | | | | | 16,895 | 465,723 |
| National Grid plc (Utilities, Multi-utilities) | | | | | 107,017 | 1,384,957 |
| Next plc (Consumer discretionary, Multiline retail) | | | | | 7,438 | 808,887 |
| NMC Health plc (Health care, Health care providers & services) ♦† | | | | | �� 7,509 | 1,539 |
| Pearson plc (Communication services, Media) | | | | | 49,474 | 522,116 |
| Persimmon plc (Consumer discretionary, Household durables) | | | | | 19,905 | 804,572 |
| Prudential plc (Financials, Insurance) | | | | | 83,367 | 1,736,450 |
| Reckitt Benckiser Group plc (Consumer staples, Household products) | | | | | 24,699 | 1,880,902 |
| RELX plc (Industrials, Professional services) | | | | | 44,201 | 1,325,996 |
| Rio Tinto plc (Materials, Metals & mining) | | | | | 43,121 | 3,190,714 |
| Royal Dutch Shell plc Class A (Energy, Oil, gas & consumable fuels) | | | | | 99,755 | 1,963,413 |
| Royal Dutch Shell plc Class B (Energy, Oil, gas & consumable fuels) | | | | | 88,368 | 1,738,561 |
| Schroders plc (Financials, Capital markets) | | | | | 11,056 | 574,573 |
| Segro plc (Real estate, Equity REITs) | | | | | 37,636 | 664,391 |
| Severn Trent plc (Utilities, Water utilities) | | | | | 5,167 | 196,208 |
| Smith & Nephew plc (Health care, Health care equipment & supplies) | | | | | 20,589 | 394,880 |
| Smiths Group plc (Industrials, Industrial conglomerates) | | | | | 3,722 | 73,816 |
| Spirax-Sarco Engineering plc (Industrials, Machinery) | | | | | 2,740 | 606,878 |
| SSE plc (Utilities, Electric utilities) | | | | | 55,668 | 1,249,436 |
| St. James's Place plc (Financials, Capital markets) | | | | | 4,664 | 103,238 |
| Standard Chartered plc (Financials, Banks) | | | | | 81,988 | 512,656 |
| Standard Life Aberdeen plc (Financials, Capital markets) | | | | | 129,965 | 474,402 |
| Tesco plc (Consumer staples, Food & staples retailing) | | | | | 285,631 | 1,001,974 |
| The British Land Company plc (Real estate, Equity REITs) | | | | | 31,969 | 233,037 |
| The Sage Group plc (Information technology, Software) | | | | | 93,572 | 954,822 |
| Unilever plc (London Exchange) (Consumer staples, Personal products) | | | | | 95,428 | 5,308,320 |
| United Utilities Group plc (Utilities, Water utilities) | | | | | 27,570 | 400,841 |
| Vodafone Group plc (Communication services, Wireless telecommunication services) | | | | | 958,694 | 1,607,507 |
| WPP plc (Communication services, Media) | | | | | 49,397 | 667,997 |
| | | | | | | 87,979,128 |
| Total Common stocks (Cost $567,059,033) | | | | | | 701,182,077 |
The accompanying notes are an integral part of these financial statements.
Wells Fargo Factor Enhanced International Equity Portfolio | 19
Portfolio of investments—August 31, 2021 (unaudited)
| | | Dividend
yield | | | Shares | Value |
| Preferred stocks: 0.58% | | | | | | |
| Germany: 0.49% | | | | | | |
| Bayerische Motoren Werke AG (Consumer discretionary, Automobiles) | | 2.77% | | | 4,194 | $ 351,102 |
| Fuchs Petrolub SE (Materials, Chemicals) | | 2.35 | | | 8,158 | 412,852 |
| Henkel AG & Company KGaA (Consumer staples, Household products) | | 2.28 | | | 14,394 | 1,406,226 |
| Porsche Automobil Holding SE (Consumer discretionary, Automobiles) | | 5.15 | | | 9,487 | 960,665 |
| Sartorius AG Vorzug (Health care, Health care equipment & supplies) | | 0.13 | | | 681 | 448,683 |
| | | | | | | 3,579,528 |
| Italy: 0.09% | | | | | | |
| Telecom Italia RSP (Communication services, Diversified telecommunication services) | | 6.79 | | | 1,416,986 | 684,133 |
| Total Preferred stocks (Cost $3,862,838) | | | | | | 4,263,661 |
| | | Yield | | | | |
| Short-term investments: 2.44% | | | | | | |
| Investment companies: 2.44% | | | | | | |
| Wells Fargo Government Money Market Fund Select Class ♠∞ | | 0.03 | | | 17,961,606 | 17,961,606 |
| Total Short-term investments (Cost $17,961,606) | | | | | | 17,961,606 |
| Total investments in securities (Cost $588,883,477) | 98.47% | | | | | 723,407,344 |
| Other assets and liabilities, net | 1.53 | | | | | 11,230,574 |
| Total net assets | 100.00% | | | | | $734,637,918 |
| † | Non-income-earning security |
| 144A | The security may be resold in transactions exempt from registration, normally to qualified institutional buyers, pursuant to Rule 144A under the Securities Act of 1933. |
| ♦ | The security is fair valued in accordance with procedures approved by the Board of Trustees. |
| ♠ | The issuer of the security is an affiliated person of the Portfolio as defined in the Investment Company Act of 1940. |
| ∞ | The rate represents the 7-day annualized yield at period end. |
| Abbreviations: |
| ADR | American depositary receipt |
| REIT | Real estate investment trust |
Investments in affiliates
An affiliated investment is an investment in which the Portfolio owns at least 5% of the outstanding voting shares of the issuer or as a result of other relationships, such as the Portfolio and the issuer having the same adviser or investment manager. Transactions with issuers that were either affiliates of the Portfolio at the beginning of the period or the end of the period were as follows:
| | Value,
beginning of
period | Purchases | Sales
proceeds | Net
realized
gains
(losses) | Net
change in
unrealized
gains
(losses) | Value,
end of
period | Shares,
end
of period | Income
from
affiliated
securities |
| Short-term investments | | | | | | | |
| Wells Fargo Government Money Market Fund Select Class | $13,944,761 | $96,978,935 | $(92,962,090) | $0 | $0 | $17,961,606 | 17,961,606 | $2,219 |
The accompanying notes are an integral part of these financial statements.
20 | Wells Fargo Factor Enhanced International Equity Portfolio
Portfolio of investments—August 31, 2021 (unaudited)
Futures contracts
| Description | Number of
contracts | Expiration
date | Notional
cost | Notional
value | Unrealized
gains | Unrealized
losses |
| Long | | | | | | |
| MSCI EAFE Index | 210 | 9-17-2021 | $24,597,294 | $24,690,750 | $93,456 | $0 |
The accompanying notes are an integral part of these financial statements.
Wells Fargo Factor Enhanced International Equity Portfolio | 21
Statement of assets and liabilities—August 31, 2021 (unaudited)
| | |
| Assets | |
Investments in unaffiliated securities, at value (cost $570,921,871)
| $ 705,445,738 |
Investments in affiliated securites, at value (cost $17,961,606)
| 17,961,606 |
Cash at broker segregated for futures contracts
| 3,374,220 |
Foreign currency, at value (cost $3,858,022)
| 3,834,816 |
Receivable for dividends
| 4,293,573 |
Prepaid expenses and other assets
| 6,076 |
Total assets
| 734,916,029 |
| Liabilities | |
Custodian and accounting fee payable
| 164,988 |
Advisory fee payable
| 67,110 |
Payable for daily variation margin on open futures contracts
| 23,100 |
Professional fees payable
| 22,588 |
Accrued expenses and other liabilities
| 325 |
Total liabilities
| 278,111 |
Total net assets
| $734,637,918 |
The accompanying notes are an integral part of these financial statements.
22 | Wells Fargo Factor Enhanced International Equity Portfolio
Statement of operations—six months ended August 31, 2021 (unaudited)
| | |
| Investment income | |
Dividends (net of foreign withholdings taxes of $1,519,302)
| $ 13,191,581 |
Income from affiliated securities
| 2,219 |
Total investment income
| 13,193,800 |
| Expenses | |
Advisory fee
| 536,802 |
Custody and accounting fees
| 121,515 |
Professional fees
| 27,535 |
Interest holder report expenses
| 9,597 |
Trustees’ fees and expenses
| 9,771 |
Other fees and expenses
| 21,948 |
Total expenses
| 727,168 |
Less: Fee waivers and/or expense reimbursements
| (165,316) |
Net expenses
| 561,852 |
Net investment income
| 12,631,948 |
| Realized and unrealized gains (losses) on investments | |
| Net realized gains (losses) on | |
Unaffiliated securities
| 49,623,803 |
Foreign currency and foreign currency translations
| (99,755) |
Futures contracts
| 2,266,257 |
Net realized gains on investments
| 51,790,305 |
| Net change in unrealized gains (losses) on | |
Unaffiliated securities
| 8,701,020 |
Foreign currency and foreign currency translations
| (2,581) |
Futures contracts
| (255,998) |
Net change in unrealized gains (losses) on investments
| 8,442,441 |
Net realized and unrealized gains (losses) on investments
| 60,232,746 |
Net increase in net assets resulting from operations
| $72,864,694 |
The accompanying notes are an integral part of these financial statements.
Wells Fargo Factor Enhanced International Equity Portfolio | 23
Statement of changes in net assets
| | | |
| | Six months ended
August 31, 2021
(unaudited) | Year ended
February 28, 2021 |
| Operations | | |
Net investment income
| $ 12,631,948 | $ 13,815,670 |
Net realized gains on investments
| 51,790,305 | 7,915,170 |
Net change in unrealized gains (losses) on investments
| 8,442,441 | 114,970,151 |
Net increase in net assets resulting from operations
| 72,864,694 | 136,700,991 |
| Capital transactions | | |
| Transactions in investors’ beneficial interests | | |
Contributions
| 49,950,416 | 220,263,714 |
Withdrawals
| (65,940,580) | (265,046,603) |
Net decrease in net assets resulting from capital transactions
| (15,990,164) | (44,782,889) |
Total increase in net assets
| 56,874,530 | 91,918,102 |
| Net assets | | |
Beginning of period
| 677,763,388 | 585,845,286 |
End of period
| $734,637,918 | $ 677,763,388 |
The accompanying notes are an integral part of these financial statements.
24 | Wells Fargo Factor Enhanced International Equity Portfolio
| | | Year ended February 28 |
| | Six months ended
August 31, 2021
(unaudited) | 2021 | 2020 1 | 2019 | 2018 2 |
Total return3
| 10.91% | 22.14% | 1.23% | (2.91)% | 8.99% |
| Ratios to average net assets (annualized) | | | | | |
Gross expenses
| 0.20% | 0.22% | 0.24% | 0.23% | 0.21% |
Net expenses
| 0.16% * | 0.16% * | 0.19% | 0.20% | 0.21% |
Net investment income
| 3.53% | 2.25% | 2.58% | 3.03% | 1.74% |
| Supplemental data | | | | | |
Portfolio turnover rate
| 41% | 92% | 44% | 47% | 106% |
| * | Ratios reflect expenses which were voluntarily waived by the adviser. Without these voluntary waivers, the net expense ratios would be increased by the following amounts: |
| Six months ended August 31, 2021 (unaudited) | 0.04% |
| Year ended February 28, 2021 | 0.06% |
| 1 | Year ended February 29 |
| 2 | For the period from May 23, 2017 (commencement of operations) to February 28, 2018 |
| 3 | Returns for periods of less than one year are not annualized. |
The accompanying notes are an integral part of these financial statements.
Wells Fargo Factor Enhanced International Equity Portfolio | 25
Notes to financial statements (unaudited)
1. ORGANIZATION
Wells Fargo Master Trust (the "Trust"), a Delaware statutory trust organized on March 10, 1999, is an open-end management investment company registered under the Investment Company Act of 1940, as amended (the "1940 Act"). As an investment company, the Trust follows the accounting and reporting guidance in Financial Accounting Standards Board ("FASB") Accounting Standards Codification Topic 946, Financial Services – Investment Companies. These financial statements report on the Wells Fargo Factor Enhanced International Equity Portfolio (the "Portfolio") which is a diversified series of the Trust.
Interests in the Portfolio are available solely through private placement transactions that do not involve any "public offering" within the meaning of Section 4(2) of the Investment Company Act of 1933.
On February 23, 2021, Wells Fargo & Company announced that it has entered into a definitive agreement to sell Wells Fargo Asset Management ("WFAM") to GTCR LLC and Reverence Capital Partners, L.P. WFAM is the trade name used by the asset management businesses of Wells Fargo & Company and includes Wells Fargo Funds Management, LLC, the adviser to the Portfolio, Wells Capital Management, LLC and Wells Fargo Asset Management (International) Limited, both registered investment advisers providing subadvisory services to certain funds, and Wells Fargo Funds Distributor, LLC, the Portfolio's principal underwriter. As part of the transaction, Wells Fargo & Company will own a 9.9% equity interest and will continue to serve as an important client and distribution partner.
Consummation of the transaction will result in the automatic termination of the Portfolio’s investment advisory agreement and subadvisory agreements. The Portfolio’s Board of Trustees approved a new investment advisory agreement and a new subadvisory agreement which were subsequently approved on behalf of the feeder funds that were investors in the Portfolio at the close of business on May 28, 2021. The new agreements will take effect upon the closing of the transaction. The transaction is expected to close in the second half of 2021, subject to customary closing conditions.
2. SIGNIFICANT ACCOUNTING POLICIES
The following significant accounting policies, which are consistently followed in the preparation of the financial statements of the Portfolio, are in conformity with U.S. generally accepted accounting principles which require management to make estimates and assumptions that affect the reported amounts of assets and liabilities, disclosure of contingent assets and liabilities at the date of the financial statements, and the reported amounts of income and expenses during the reporting period. Actual results could differ from those estimates.
Securities valuation
All investments are valued each business day as of the close of regular trading on the New York Stock Exchange (generally 4 p.m. Eastern Time), although the Portfolio may deviate from this calculation time under unusual or unexpected circumstances.
Equity securities and futures contracts that are listed on a foreign or domestic exchange or market are valued at the official closing price or, if none, the last sales price. If no sale occurs on the principal exchange or market that day, a fair value price will be determined in accordance with the Portfolio’s Valuation Procedures.
The values of securities denominated in foreign currencies are translated into U.S. dollars at rates provided by an independent foreign currency pricing source at a time each business day specified by the Wells Fargo Asset Management Pricing Committee at Wells Fargo Funds Management, LLC ("Funds Management").
Many securities markets and exchanges outside the U.S. close prior to the close of the New York Stock Exchange and therefore may not fully reflect trading or events that occur after the close of the principal exchange in which the foreign securities are traded, but before the close of the New York Stock Exchange. If such trading or events are expected to materially affect the value of such securities, then fair value pricing procedures approved by the Board of Trustees of the Portfolio are applied. These procedures take into account multiple factors including movements in U.S. securities markets after foreign exchanges close. Foreign securities that are fair valued under these procedures are categorized as Level 2 and the application of these procedures may result in transfers between Level 1 and Level 2. Depending on market activity, such fair valuations may be frequent. Such fair value pricing may result in net asset values that are higher or lower than net asset values based on the last reported sales price or latest quoted bid price. On August 31, 2021, such fair value pricing was not used in pricing foreign securities.
Investments in registered open-end investment companies are valued at net asset value.
Investments which are not valued using any of the methods discussed above are valued at their fair value, as determined in good faith by the Board of Trustees. The Board of Trustees has established a Valuation Committee comprised of the Trustees and has delegated to it the authority to take any actions regarding the valuation of portfolio securities that the Valuation
26 | Wells Fargo Factor Enhanced International Equity Portfolio
Notes to financial statements (unaudited)
Committee deems necessary or appropriate, including determining the fair value of portfolio securities, unless the determination has been delegated to the Wells Fargo Asset Management Pricing Committee. The Board of Trustees retains the authority to make or ratify any valuation decisions or approve any changes to the Valuation Procedures as it deems appropriate. On a quarterly basis, the Board of Trustees receives reports on any valuation actions taken by the Valuation Committee or the Wells Fargo Asset Management Pricing Committee which may include items for ratification.
Foreign currency translation
The accounting records of the Portfolio are maintained in U.S. dollars. The values of other assets and liabilities denominated in foreign currencies are translated into U.S. dollars at rates provided by an independent foreign currency pricing source at a time each business day specified by the Wells Fargo Asset Management Pricing Committee. Purchases and sales of securities, and income and expenses are converted at the rate of exchange on the respective dates of such transactions. Net realized foreign exchange gains or losses arise from sales of foreign currencies, currency gains or losses realized between the trade and settlement dates on securities transactions, and the difference between the amounts of dividends, interest and foreign withholding taxes recorded and the U.S. dollar equivalent of the amounts actually paid or received. Net unrealized foreign exchange gains and losses arise from changes in the fair value of assets and liabilities other than investments in securities resulting from changes in exchange rates. The changes in net assets arising from changes in exchange rates of securities and the changes in net assets resulting from changes in market prices of securities are not separately presented. Such changes are included in net realized and unrealized gains or losses from investments.
Futures contracts
Futures contracts are agreements between the Portfolio and a counterparty to buy or sell a specific amount of a commodity, financial instrument or currency at a specified price on a specified date. The Portfolio may buy and sell futures contracts in order to gain exposure to, or protect against, changes in security values and is subject to equity price risk. The primary risks associated with the use of futures contracts are the imperfect correlation between changes in market values of securities held by the Portfolio and the prices of futures contracts, and the possibility of an illiquid market. Futures contracts are generally entered into on a regulated futures exchange and cleared through a clearinghouse associated with the exchange. With futures contracts, there is minimal counterparty risk to the Portfolio since futures contracts are exchange traded and the exchange’s clearinghouse, as the counterparty to all exchange traded futures, guarantees the futures contracts against default.
Upon entering into a futures contract, the Portfolio is required to deposit either cash or securities (initial margin) with the broker in an amount equal to a certain percentage of the contract value. Subsequent payments (variation margin) are paid to or from the broker each day equal to the daily changes in the contract value. Such payments are recorded as unrealized gains or losses and, if any, shown as variation margin receivable (payable) in the Statement of Assets and Liabilities. Should the Portfolio fail to make requested variation margin payments, the broker can gain access to the initial margin to satisfy the Portfolio’s payment obligations. When the contracts are closed, a realized gain or loss is recorded in the Statement of Operations.
Security transactions and income recognition
Securities transactions are recorded on a trade date basis. Realized gains or losses are recorded on the basis of identified cost.
Dividend income is recognized on the ex-dividend date, except for certain dividends from foreign securities, which are recorded as soon as the custodian verifies the ex-dividend date. Dividend income is recorded net of foreign taxes withheld where recovery of such taxes is not assured.
Federal and other taxes
The Portfolio is not required to pay federal income taxes on its net investment income and net capital gains as it is treated as a partnership for federal income tax purposes. All income, gains and losses of the Portfolio are deemed to have been “passed through” to the interest holders in proportion to their holdings of the Portfolio regardless of whether income and gains have been distributed by the Portfolio.
The Portfolio’s income tax returns and all financial records supporting those returns for the prior three fiscal years are subject to examination by the federal revenue authority. Management has analyzed the Portfolio’s tax positions taken on federal, state, and foreign tax returns for all open tax years and does not believe that there are any uncertain tax positions that require recognition of a tax liability.
Wells Fargo Factor Enhanced International Equity Portfolio | 27
Notes to financial statements (unaudited)
As of August 31, 2021, the aggregate cost of all investments for federal income tax purposes was $594,398,803 and the unrealized gains (losses) consisted of:
| Gross unrealized gains | $141,665,515 |
| Gross unrealized losses | (12,563,518) |
| Net unrealized gains | $129,101,997 |
3. FAIR VALUATION MEASUREMENTS
Fair value measurements of investments are determined within a framework that has established a fair value hierarchy based upon the various data inputs utilized in determining the value of the Portfolio’s investments. The three-level hierarchy gives the highest priority to unadjusted quoted prices in active markets for identical assets or liabilities (Level 1) and the lowest priority to unobservable inputs (Level 3). The Portfolio’s investments are classified within the fair value hierarchy based on the lowest level of input that is significant to the fair value measurement. The inputs are summarized into three broad levels as follows:
| ■ | Level 1 – quoted prices in active markets for identical securities |
| ■ | Level 2 – other significant observable inputs (including quoted prices for similar securities, interest rates, prepayment speeds, credit risk, etc.) |
| ■ | Level 3 – significant unobservable inputs (including the Portfolio’s own assumptions in determining the fair value of investments) |
The inputs or methodologies used for valuing investments in securities are not necessarily an indication of the risk associated with investing in those securities.
28 | Wells Fargo Factor Enhanced International Equity Portfolio
Notes to financial statements (unaudited)
The following is a summary of the inputs used in valuing the Portfolio’s assets and liabilities as of August 31, 2021:
| | Quoted prices
(Level 1) | Other significant
observable inputs
(Level 2) | Significant
unobservable inputs
(Level 3) | Total |
| Assets | | | | |
| Investments in: | | | | |
| Common stocks | | | | |
| Australia | $ 42,643,623 | $ 0 | $0 | $ 42,643,623 |
| Austria | 1,277,665 | 0 | 0 | 1,277,665 |
| Belgium | 6,513,043 | 0 | 0 | 6,513,043 |
| Canada | 71,811,451 | 124,146 | 0 | 71,935,597 |
| Denmark | 18,696,659 | 0 | 0 | 18,696,659 |
| Finland | 6,827,138 | 0 | 0 | 6,827,138 |
| France | 63,501,475 | 0 | 0 | 63,501,475 |
| Germany | 53,268,643 | 0 | 0 | 53,268,643 |
| Hong Kong | 22,447,349 | 0 | 0 | 22,447,349 |
| Ireland | 4,743,654 | 0 | 0 | 4,743,654 |
| Israel | 4,670,759 | 0 | 0 | 4,670,759 |
| Italy | 10,992,033 | 0 | 0 | 10,992,033 |
| Japan | 145,171,772 | 0 | 0 | 145,171,772 |
| Luxembourg | 4,234,447 | 0 | 0 | 4,234,447 |
| Netherlands | 36,833,922 | 0 | 0 | 36,833,922 |
| New Zealand | 1,748,782 | 0 | 0 | 1,748,782 |
| Norway | 5,824,299 | 0 | 0 | 5,824,299 |
| Portugal | 1,064,066 | 0 | 0 | 1,064,066 |
| Singapore | 8,412,534 | 0 | 0 | 8,412,534 |
| Spain | 16,898,541 | 0 | 0 | 16,898,541 |
| Sweden | 22,566,018 | 0 | 0 | 22,566,018 |
| Switzerland | 62,930,930 | 0 | 0 | 62,930,930 |
| United Kingdom | 87,977,589 | 1,539 | 0 | 87,979,128 |
| Preferred stocks | | | | |
| Germany | 3,579,528 | 0 | 0 | 3,579,528 |
| Italy | 684,133 | 0 | 0 | 684,133 |
| Short-term investments | | | | |
| Investment companies | 17,961,606 | 0 | 0 | 17,961,606 |
| | 723,281,659 | 125,685 | 0 | 723,407,344 |
| Futures contracts | 93,456 | 0 | 0 | 93,456 |
| Total assets | $723,375,115 | $125,685 | $0 | $723,500,800 |
Futures contracts are reported at their cumulative unrealized gains (losses) at measurement date as reported in the table following the Portfolio of Investments. For futures contracts, the current day’s variation margin is reported on the Statement of Assets and Liabilities. All other assets and liabilities are reported at their market value at measurement date.
Additional sector, industry or geographic detail, if any, is included in the Portfolio of Investments.
For the six months ended August 31, 2021, the Portfolio did not have any transfers into/out of Level 3.
4. TRANSACTIONS WITH AFFILIATES
Advisory fee
The Trust has entered into an advisory contract with Funds Management, an indirect wholly owned subsidiary of Wells Fargo & Company ("Wells Fargo"). The adviser is responsible for implementing investment policies and guidelines and for supervising the subadviser, who is responsible for day-to-day portfolio management of the Portfolio. Pursuant to the contract, Funds Management is entitled to receive an advisory fee at the following annual rate based on the Portfolio’s average daily net assets:
Wells Fargo Factor Enhanced International Equity Portfolio | 29
Notes to financial statements (unaudited)
| Average daily net assets | Advisory fee |
| First $5 billion | 0.150% |
| Next $5 billion | 0.130 |
| Over $10 billion | 0.110 |
For the six months ended August 31, 2021, the advisory fee was equivalent to an annual rate of 0.15% of the Portfolio’s average daily net assets.
Funds Management has retained the services of a subadviser to provide daily portfolio management to the Portfolio. The fee for subadvisory services is borne by Funds Management. Wells Capital Management, LLC, an affiliate of Funds Management and an indirect wholly owned subsidiary of Wells Fargo, is the subadviser to the Portfolio and is entitled to receive a fee from Funds Management at an annual rate starting at 0.08% and declining to 0.05% as the average daily net assets of the Portfolio increase.
Funds Management has voluntarily waived and/or reimbursed advisory fees to reduce the net operating expense ratio of the Portfolio. These voluntary waivers may be discontinued at any time.
Interfund transactions
The Portfolio may purchase or sell portfolio investment securities to certain other Wells Fargo affiliates pursuant to Rule 17a-7 under the 1940 Act and under procedures adopted by the Board of Trustees. The procedures have been designed to ensure that these interfund transactions, which do not incur broker commissions, are effected at current market prices.
5. INVESTMENT PORTFOLIO TRANSACTIONS
Purchases and sales of investments, excluding U.S. government obligations (if any) and short-term securities, for the six months ended August 31, 2021 were $280,842,820 and $285,095,786, respectively.
6. DERIVATIVE TRANSACTIONS
During the six months ended August 31, 2021, the Portfolio entered into futures contracts to gain market exposure. The Portfolio had an average notional amount of $24,143,746 in long futures contracts during the six months ended August 31, 2021.
The fair value, realized gains or losses and change in unrealized gains or losses, if any, on derivative instruments are reflected in the corresponding financial statement captions.
7. BANK BORROWINGS
The Trust, along with Wells Fargo Variable Trust and Wells Fargo Funds Trust (excluding the money market funds), are parties to a $350,000,000 revolving credit agreement whereby the Portfolio is permitted to use bank borrowings for temporary or emergency purposes, such as to fund interest holders withdrawal requests. Interest under the credit agreement is charged to the Portfolio based on a borrowing rate equal to the higher of the Federal Funds rate in effect on that day plus 1.25% or the overnight bank funding rate in effect on that day plus 1.25%. In addition, an annual commitment fee equal to 0.25% of the unused balance is allocated to each participating fund.
For the six months ended August 31, 2021, there were no borrowings by the Portfolio under the agreement.
8. INDEMNIFICATION
Under the Portfolio's organizational documents, the officers and Trustees have been granted certain indemnification rights against certain liabilities that may arise out of performance of their duties to the Portfolio. The Portfolio has entered into a separate agreement with each Trustee that converts indemnification rights currently existing under the Portfolio’s organizational documents into contractual rights that cannot be changed in the future without the consent of the Trustee. Additionally, in the normal course of business, the Portfolio may enter into contracts with service providers that contain a variety of indemnification clauses. The Portfolio’s maximum exposure under these arrangements is dependent on future claims that may be made against the Portfolio and, therefore, cannot be estimated.
9. CORONAVIRUS (COVID-19) PANDEMIC
On March 11, 2020, the World Health Organization announced that it had made the assessment that coronavirus disease 2019 (“COVID-19”) is a pandemic. The impacts of COVID-19 are affecting the entire global economy, individual companies and
30 | Wells Fargo Factor Enhanced International Equity Portfolio
Notes to financial statements (unaudited)
investment products, the funds, and the market in general. There is significant uncertainty around the extent and duration of business disruptions related to COVID-19 and the impacts may last for an extended period of time. COVID-19 has led to significant uncertainty and volatility in the financial markets.
10. SUBSEQUENT EVENTS
Wells Fargo Asset Management ("WFAM") announced that it will be changing its company name to Allspring Global Investments upon the closing of the previously announced sale transaction of WFAM by Wells Fargo & Company to GTCR LLC and Reverence Capital Partners, L.P. The new corporate name is expected to go into effect on the closing date of the transaction, which is anticipated to occur in the second half of 2021, subject to customary closing conditions.
The Board of Trustees of the Wells Fargo Funds approved a change in the Portfolio's name to remove “Wells Fargo” from the Portfolio's name and replace with “Allspring” on December 6, 2021.
Following the closing of the transaction, Wells Fargo Funds Management, LLC, the Portfolio's adviser, Wells Capital Management, LLC and Wells Fargo Asset Management (International) Limited, each subadvisers to certain funds, and Wells Fargo Funds Distributor, LLC will each be rebranded as Allspring.
Wells Fargo Factor Enhanced International Equity Portfolio | 31
Other information (unaudited)
PROXY VOTING INFORMATION
A description of the policies and procedures used to determine how to vote proxies relating to portfolio securities is available without charge, upon request, by calling 1-800-222-8222, visiting our website at wfam.com, or visiting the SEC website at sec.gov. Information regarding how the proxies related to portfolio securities were voted during the most recent 12-month period ended June 30 is available on the website at wfam.com or by visiting the SEC website at sec.gov.
QUARTERLY PORTFOLIO HOLDINGS INFORMATION
The Portfolio files its complete schedule of portfolio holdings with the SEC for the first and third quarters of each fiscal year as an exhibit to its reports on Form N-PORT. Interest holders may view the filed Form N-PORT by visiting the SEC website at sec.gov.
32 | Wells Fargo Factor Enhanced International Equity Portfolio
Other information (unaudited)
BOARD OF TRUSTEES AND OFFICERS
Each of the Trustees and Officers listed in the table below acts in identical capacities for each fund in the Wells Fargo family of funds, which consists of 139 mutual funds comprising the Wells Fargo Funds Trust, Wells Fargo Variable Trust, Wells Fargo Master Trust and four closed-end funds (collectively the “Fund Complex”). This table should be read in conjunction with the Prospectus and the Statement of Additional Information1. The mailing address of each Trustee and Officer is 525 Market Street, 12th Floor, San Francisco, CA 94105. Each Trustee and Officer serves an indefinite term, however, each Trustee serves such term until reaching the mandatory retirement age established by the Trustees.
Independent Trustees
Name and
year of birth | Position held and
length of service* | Principal occupations during past five years or longer | Current other
public company or
investment
company
directorships |
William R. Ebsworth
(Born 1957) | Trustee,
since 2015 | Retired. From 1984 to 2013, equities analyst, portfolio manager, research director and chief investment officer at Fidelity Management and Research Company in Boston, Tokyo, and Hong Kong, and retired in 2013 as Chief Investment Officer of Fidelity Strategic Advisers, Inc. where he led a team of investment professionals managing client assets. Prior thereto, Board member of Hong Kong Securities Clearing Co., Hong Kong Options Clearing Corp., the Thailand International Fund, Ltd., Fidelity Investments Life Insurance Company, and Empire Fidelity Investments Life Insurance Company. Audit Committee Chair and Investment Committee Chair of the Vincent Memorial Hospital Endowment (non-profit organization). Mr. Ebsworth is a CFA® charterholder. | N/A |
Jane A. Freeman
(Born 1953) | Trustee,
since 2015;
Chair Liaison,
since 2018 | Retired. From 2012 to 2014 and 1999 to 2008, Chief Financial Officer of Scientific Learning Corporation. From 2008 to 2012, Ms. Freeman provided consulting services related to strategic business projects. Prior to 1999, Portfolio Manager at Rockefeller & Co. and Scudder, Stevens & Clark. Board member of the Harding Loevner Funds from 1996 to 2014, serving as both Lead Independent Director and chair of the Audit Committee. Board member of the Russell Exchange Traded Funds Trust from 2011 to 2012 and the chair of the Audit Committee. Ms. Freeman is also an inactive Chartered Financial Analyst. | N/A |
Isaiah Harris, Jr.
(Born 1952) | Trustee,
since 2009; Audit
Committee
Chair,
since 2019 | Retired. Chairman of the Board of CIGNA Corporation since 2009, and Director since 2005. From 2003 to 2011, Director of Deluxe Corporation. Prior thereto, President and CEO of BellSouth Advertising and Publishing Corp. from 2005 to 2007, President and CEO of BellSouth Enterprises from 2004 to 2005 and President of BellSouth Consumer Services from 2000 to 2003. Emeritus member of the Iowa State University Foundation Board of Governors. Emeritus Member of the Advisory Board of Iowa State University School of Business. Advisory Board Member, Palm Harbor Academy (private school). Mr. Harris is a certified public accountant (inactive status). | CIGNA Corporation |
Judith M. Johnson
(Born 1949) | Trustee,
since 2008 | Retired. Prior thereto, Chief Executive Officer and Chief Investment Officer of Minneapolis Employees Retirement Fund from 1996 to 2008. Ms. Johnson is an attorney, certified public accountant and a certified managerial accountant. | N/A |
David F. Larcker
(Born 1950) | Trustee,
since 2009 | James Irvin Miller Professor of Accounting at the Graduate School of Business (Emeritus), Stanford University, Director of the Corporate Governance Research Initiative and Senior Faculty of The Rock Center for Corporate Governance since 2006. From 2005 to 2008, Professor of Accounting at the Graduate School of Business, Stanford University. Prior thereto, Ernst & Young Professor of Accounting at The Wharton School, University of Pennsylvania from 1985 to 2005. | N/A |
Wells Fargo Factor Enhanced International Equity Portfolio | 33
Other information (unaudited)
Name and
year of birth | Position held and
length of service* | Principal occupations during past five years or longer | Current other
public company or
investment
company
directorships |
Olivia S. Mitchell
(Born 1953) | Trustee,
since 2006;
Nominating and
Governance
Committee Chair,
since 2018 | International Foundation of Employee Benefit Plans Professor, Wharton School of the University of Pennsylvania since 1993. Director of Wharton’s Pension Research Council and Boettner Center on Pensions & Retirement Research, and Research Associate at the National Bureau of Economic Research. Previously, Cornell University Professor from 1978 to 1993. | N/A |
Timothy J. Penny
(Born 1951) | Trustee,
since 1996;
Chair,
since 2018 | President and Chief Executive Officer of Southern Minnesota Initiative Foundation, a non-profit organization, since 2007. Member of the Board of Trustees of NorthStar Education Finance, Inc., a non-profit organization, since 2007. | N/A |
James G. Polisson
(Born 1959) | Trustee,
since 2018 | Retired. Chief Marketing Officer, Source (ETF) UK Services, Ltd, from 2015 to 2017. From 2012 to 2015, Principal of The Polisson Group, LLC, a management consulting, corporate advisory and principal investing company. Chief Executive Officer and Managing Director at Russell Investments, Global Exchange Traded Funds from 2010 to 2012. Managing Director of Barclays Global Investors from 1998 to 2010 and Global Chief Marketing Officer for iShares and Barclays Global Investors from 2000 to 2010. Trustee of the San Francisco Mechanics’ Institute, a non-profit organization, from 2013 to 2015. Board member of the Russell Exchange Traded Fund Trust from 2011 to 2012. Director of Barclays Global Investors Holdings Deutschland GmbH from 2006 to 2009. Mr. Polisson is an attorney and has a retired status with the Massachusetts and District of Columbia Bar Associations. | N/A |
Pamela Wheelock
(Born 1959) | Trustee,
since January
2020; previously
Trustee from
January 2018 to
July 2019 | Board member of the Destination Medical Center Economic Development Agency, Rochester, Minnesota since 2019. Interim President of the McKnight Foundation from January to September 2020. Acting Commissioner, Minnesota Department of Human Services, July 2019 through September 2019. Human Services Manager (part-time), Minnesota Department of Human Services, October 2019 through December 2019. Chief Operating Officer, Twin Cities Habitat for Humanity from 2017 to 2019. Vice President of University Services, University of Minnesota from 2012 to 2016. Prior thereto, on the Board of Directors, Governance Committee and Finance Committee for the Minnesota Philanthropy Partners (Saint Paul Foundation) from 2012 to 2018, Interim Chief Executive Officer of Blue Cross Blue Shield of Minnesota from 2011 to 2012, Chairman of the Board from 2009 to 2012 and Board Director from 2003 to 2015. Vice President, Leadership and Community Engagement, Bush Foundation, Saint Paul, Minnesota (a private foundation) from 2009 to 2011. Executive Vice President and Chief Financial Officer, Minnesota Sports and Entertainment from 2004 to 2009 and Senior Vice President from 2002 to 2004. Executive Vice President of the Minnesota Wild Foundation from 2004 to 2008. Commissioner of Finance, State of Minnesota, from 1999 to 2002. Currently Board Chair of the Minnesota Wild Foundation since 2010. | N/A |
* Length of service dates reflect the Trustee’s commencement of service with the Trust’s predecessor entities, where applicable.
34 | Wells Fargo Factor Enhanced International Equity Portfolio
Other information (unaudited)
Officers
Name and
year of birth | Position held and
length of service | Principal occupations during past five years or longer |
Andrew Owen
(Born 1960) | President,
since 2017 | Executive Vice President of Wells Fargo & Company and Head of Affiliated Managers, Wells Fargo Asset Management, since 2014. In addition, Mr. Owen is currently President, Chief Executive Officer and Director of Wells Fargo Funds Management, LLC since 2017. Prior thereto, Executive Vice President responsible for marketing, investments and product development for Wells Fargo Funds Management, LLC, from 2009 to 2014. |
Jeremy DePalma
(Born 1974) | Treasurer,
since 2012
(for certain funds in
the Fund Complex);
since 2021 (for
the remaining funds in the
Fund Complex) | Senior Vice President of Wells Fargo Funds Management, LLC since 2009. Senior Vice President of Evergreen Investment Management Company, LLC from 2008 to 2010 and head of the Fund Reporting and Control Team within Fund Administration from 2005 to 2010. |
Michelle Rhee
(Born 1966) | Chief Legal Officer,
since 2019 | Secretary of Wells Fargo Funds Management, LLC and Chief Legal Counsel of Wells Fargo Asset Management since 2018. Deputy General Counsel of Wells Fargo Bank, N.A. since 2020 and Assistant General Counsel of Wells Fargo Bank, N.A. from 2018 to 2020. Associate General Counsel and Managing Director of Bank of America Corporation from 2004 to 2018. |
Matthew Prasse
(Born 1983) | Secretary,
since 2021 | Senior Counsel of the Wells Fargo Legal Department since 2018. Previously, Director and Counsel for Barings LLC from 2015 to 2018. Prior to joining Barings, Associate at Morgan, Lewis & Bockius LLP from 2008 to 2015. |
Michael H. Whitaker
(Born 1967) | Chief Compliance Officer,
since 2016 | Chief Compliance Officer of Wells Fargo Asset Management since 2016. Senior Vice President and Chief Compliance Officer for Fidelity Investments from 2007 to 2016. |
1 The Statement of Additional Information includes additional information about the Trustees and is available, without charge, upon request, by calling 1-800-222-8222 or by visiting the website at wfam.com.
Wells Fargo Factor Enhanced International Equity Portfolio | 35
Board considerations (unaudited)
BOARD CONSIDERATION OF INVESTMENT ADVISORY AND SUB-ADVISORY AGREEMENTS:
Wells Fargo Bloomberg Barclays US Aggregate ex-Corporate Portfolio, Wells Fargo Emerging Markets Bond Portfolio, Wells Fargo Factor Enhanced Emerging Markets Equity Portfolio, Wells Fargo Factor Enhanced International Equity Portfolio, Wells Fargo Factor Enhanced U.S. Large Cap Equity Portfolio, Wells Fargo Factor Enhanced U.S. Small Cap Equity Portfolio, Wells Fargo High Yield Corporate Bond Portfolio, Wells Fargo Investment Grade Corporate Bond Portfolio, Wells Fargo Factor Enhanced U.S. Low Volatility Equity Portfolio, Wells Fargo Strategic Retirement Bond Portfolio, and Wells Fargo U.S. REIT Portfolio
Board Considerations – Current Agreements
Under the Investment Company Act of 1940 (the “1940 Act”), the Board of Trustees (the “Board”) of Wells Fargo Master Trust (the “Trust”) must determine annually whether to approve the continuation of the Trust’s investment advisory and sub-advisory agreements. In this regard, at a meeting held on May 17-19, 2021 (the “Meeting”), the Board of the Trust, all the members of which have no direct or indirect interest in the investment advisory and sub-advisory agreements and are not “interested persons” of the Trust, as defined in the 1940 Act (the “Independent Trustees”), reviewed and approved for each of the portfolios of the Trust identified in the table below (individually, a “Portfolio” and collectively, the “Portfolios”): (i) an investment advisory agreement (the “Advisory Agreement”) with Wells Fargo Funds Management, LLC (“Funds Management”); and (ii) an investment sub-advisory agreement (each, a “Sub-Advisory Agreement” and collectively, the “Sub-Advisory Agreements”) with the sub-adviser(s) identified in the table below (each, a “Sub-Adviser” and collectively, the “Sub-Advisers”) for the corresponding Portfolio identified. The Advisory Agreement and the Sub-Advisory Agreements are collectively referred to as the “Advisory Agreements.”
| Master Portfolios | Sub-Advisers |
| Wells Fargo Bloomberg Barclays US Aggregate ex-Corporate Portfolio | Wells Capital Management Incorporated |
| Wells Fargo Emerging Markets Bond Portfolio | Wells Fargo Asset Management (International) Limited and Wells Capital Management Incorporated |
| Wells Fargo Factor Enhanced Emerging Markets Equity Portfolio | Wells Capital Management Incorporated |
| Wells Fargo Factor Enhanced International Equity Portfolio | Wells Capital Management Incorporated |
| Wells Fargo Factor Enhanced U.S. Large Cap Equity Portfolio | Wells Capital Management Incorporated |
| Wells Fargo Factor Enhanced U.S. Small Cap Equity Portfolio | Wells Capital Management Incorporated |
| Wells Fargo High Yield Corporate Bond Portfolio | Wells Capital Management Incorporated |
| Wells Fargo Investment Grade Corporate Bond Portfolio | Wells Capital Management Incorporated |
| Wells Fargo Factor Enhanced U.S. Low Volatility Equity Portfolio | Wells Capital Management Incorporated |
| Wells Fargo Strategic Retirement Bond Portfolio | Wells Capital Management Incorporated |
| Wells Fargo U.S. REIT Portfolio | Wells Capital Management Incorporated |
The Board noted that Wells Fargo & Company recently announced that it had entered into a definitive agreement to sell Wells Fargo Asset Management (“WFAM”), which includes Funds Management and the Sub-Adviser, to GTCR LLC and Reverence Capital Partners, L.P. and/or their affiliates (the “Transaction”). The Board further noted that the Transaction would result in a change-of-control of Funds Management and the Sub-Advisers, which would be considered to be an assignment that would result in the termination of the Advisory Agreements. In light of the Transaction, the Board separately considered for approval a new investment advisory agreement with Funds Management and a new investment sub-advisory agreement with each of the Sub-Advisers (the “New Agreements”) that would replace the Advisory Agreements upon consummation of the Transaction, subject to approval of the New Agreements by the Portfolios’ shareholders. The Board also considered for approval interim agreements to go into effect in the event shareholders do not approve the New Agreements before the Transaction is completed. The interim agreements would allow the Manager and the Sub-Advisers to continue providing services to the Portfolios while the Portfolios continues to seek shareholder approval of the New Agreements. The Board noted that the terms of the interim agreements would be identical to those of the current Advisory Agreements, except for the term and certain escrow provisions.
At the Meeting, the Board considered the factors and reached the conclusions described below relating to the selection of Funds Management and the Sub-Advisers and the approval of the Advisory Agreements. Prior to the Meeting, including at Board meetings held in April and May 2021, the Trustees conferred extensively among themselves and with representatives of Funds Management about these matters. Also, the Board has adopted a team-based approach, with each team consisting of a sub-set of
36 | Wells Fargo Factor Enhanced International Equity Portfolio
Board considerations (unaudited)
Trustees, to assist the full Board in the discharge of its duties in reviewing investment performance and other matters throughout the year. The Independent Trustees were assisted in their evaluation of the Advisory Agreements by independent legal counsel, from whom they received separate legal advice and with whom they met separately.
In providing information to the Board, Funds Management and the Sub-Advisers were guided by a detailed set of requests for information submitted to them by independent legal counsel on behalf of the Independent Trustees at the start of the Board’s annual contract renewal process earlier in 2021. In considering and approving the Advisory Agreements, the Trustees considered the information they believed relevant, including but not limited to the information discussed below. The Board considered not only the specific information presented in connection with the Meeting, but also the knowledge gained over time through interaction with Funds Management and the Sub-Advisers about various topics. In this regard, the Board reviewed reports of Funds Management at each of its quarterly meetings, which included, among other things, portfolio reviews and investment performance reports. In addition, the Board and the teams mentioned above confer with portfolio managers at various times throughout the year. The Board did not identify any particular information or consideration that was all-important or controlling, and each individual Trustee may have attributed different weights to various factors.
After its deliberations, the Board unanimously determined that the compensation or the absence of compensation payable to Funds Management and each of the Sub-Advisers under each of the Advisory Agreements was reasonable, and approved the continuation of the Advisory Agreements for a one-year term. The Board considered the approval of the Advisory Agreements for the Portfolios as part of its consideration of agreements for funds across the complex, but its approvals were made on a fund-by-fund basis. The following summarizes a number of important, but not necessarily all, factors considered by the Board in support of its approvals.
Nature, extent and quality of services
The Board received and considered various information regarding the nature, extent and quality of services provided to the Funds by Funds Management and the Sub-Advisers under the Advisory Agreements. This information included a description of the investment advisory services and Portfolio-level administrative services covered by the Advisory Agreement, as well as, among other things, a summary of the background and experience of senior management of WFAM, of which Funds Management and the Sub-Advisers are a part, and a summary of investments made in the business of WFAM. The Board also received a description of Funds Management’s and the Sub-Advisers’ business continuity plans, including a summary of the performance of such plans and any changes thereto during the COVID-19 pandemic, and of their approaches to data privacy and cybersecurity. The Board also received and reviewed information about Funds Management’s role as administrator of the Portfolios’ liquidity risk management program, Funds Management’s approach to risk management, and Funds Management’s intermediary and vendor oversight program.
The Board also considered the qualifications, background, tenure and responsibilities of each of the portfolio managers primarily responsible for the day-to-day portfolio management of the Portfolios. The Board noted that each of the Portfolios replicates the performance of a proprietary index provided by an affiliate of Funds Management, except that each of Wells Fargo Bloomberg Barclays US Aggregate ex-Corporate Portfolio, Wells Fargo Emerging Markets Bond Portfolio, and Wells Fargo Strategic Retirement Bond Portfolio track the performance of a third party index. The Board evaluated the ability of Funds Management and the Sub-Advisers to attract and retain qualified investment professionals, including research, advisory and supervisory personnel.
The Board further considered the compliance programs and compliance records of Funds Management and the Sub-Advisers. In addition, the Board took into account the full range of services provided to the Portfolios by Funds Management and its affiliates. The Board also considered information about retention and back-up arrangements that have been put into place with respect to key personnel of WFAM in connection with the anticipated Transaction, noting that WFAM provided assurances that the announcement and eventual culmination of the Transaction is not expected to result in any diminution in the nature or quality of services provided to the Portfolios.
Portfolio investment performance and expenses
The Board considered the investment performance results for each of the Portfolios over the one- and three-year periods ended December 31, 2020, except for the Wells Fargo Factor Enhanced U.S. Low Volatility Equity Portfolio, for which the Board considered the investment performance results for the quarter ended December 31, 2020. The Board considered these results in comparison to the investment performance of funds in a universe that was determined by Broadridge Inc. (“Broadridge”) to be similar to each respective Portfolios (each, a “Universe”), and in comparison to each Portfolios’ benchmark index and to other comparative data. Broadridge is an independent provider of investment company data. The Board received a description of the methodology used by Broadridge to select the mutual funds in the performance Universe. The Board noted the short performance history of the Portfolios.
Wells Fargo Factor Enhanced International Equity Portfolio | 37
Board considerations (unaudited)
With respect to the investment performance of each Portfolio relative to its respective Universe, the Board noted the following: (i) the investment performance of each of Wells Fargo Factor Enhanced International Equity Portfolio and Wells Fargo Factor Enhanced U.S. Small Cap Equity Portfolio was higher than such Portfolio’s respective Universe for the one- and three-year periods under review; (ii) the investment performance of each of Wells Fargo Bloomberg Barclays US Aggregate ex-Corporate Portfolio, Wells Fargo Emerging Markets Bond Portfolio, and Wells Fargo Investment Grade Corporate Bond Portfolio was higher than such Portfolio’s respective Universe for the three-year period under review, and lower than such Portfolio’s respective Universe for the one-year period under review; (iii) the investment performance of each of Wells Fargo Factor Enhanced Emerging Markets Equity Portfolio, Wells Fargo Factor Enhanced U.S. Large Cap Equity Portfolio, Wells Fargo High Yield Corporate Bond Portfolio, Wells Fargo Strategic Retirement Bond Portfolio, and Wells Fargo U.S. REIT Portfolio was lower than such Portfolio’s respective Universe for the one- and three-year periods under review; and (iv) the Wells Fargo Factor Enhanced U.S. Low Volatility Equity Portfolio launched on July 1, 2020 and, given its short operational history, had no historical performance.
With respect to the investment performance of each Portfolio relative to its respective benchmark index, the Board noted the following: (i) the investment performance of each of Wells Fargo Bloomberg Barclays US Aggregate ex-Corporate Portfolio, Wells Fargo Factor Enhanced International Equity Portfolio, Wells Fargo Investment Grade Corporate Bond Portfolio, Wells Fargo Factor Enhanced U.S. Low Volatility Equity Portfolio, and Wells Fargo Strategic Retirement Bond Portfolio was higher than or in range of such Portfolio’s respective benchmark index for all periods under review; (ii) the investment performance of Wells Fargo U.S. REIT Portfolio was in range of the Portfolio’s benchmark index for the three-year period under review, and was lower than the Portfolio’s benchmark index for the one-year period under review; and (iii) the investment performance of each of Wells Fargo Emerging Markets Bond Portfolio, Wells Fargo Factor Enhanced Emerging Markets Equity Portfolio, Wells Fargo Factor Enhanced U.S. Large Cap Equity Portfolio, Wells Fargo Factor Enhanced U.S. Small Cap Equity Portfolio, and Wells Fargo High Yield Corporate Bond Portfolio was lower than such Portfolio’s respective benchmark index for all periods under review.
The Board received information concerning, and discussed factors contributing to, the underperformance of each of Wells Fargo Factor Enhanced Emerging Markets Equity Portfolio, Wells Fargo Factor Enhanced International Equity Portfolio, Wells Fargo Factor Enhanced U.S. Large Cap Equity Portfolio, Wells Fargo High Yield Corporate Bond Portfolio, Wells Fargo Strategic Retirement Bond Portfolio, and Wells Fargo U.S. REIT Portfolio relative to such Portfolio’s Universe and benchmark index for the periods identified above.
The Board also received and considered information regarding the fee rates that are payable to Funds Management for investment advisory services (as discussed below), which are the only fees charged to the Portfolios, relative to corresponding class-specific expense groups that were determined by Broadridge to be similar to the Portfolios (the “Groups”). The Board received a description of the methodology used by Broadridge to select the mutual funds in the expense Groups and an explanation of how funds comprising expense groups and their expense ratios may vary from year-to-year.
The Board took into account the Portfolios’ investment performance and expense information provided to it among the factors considered in deciding to re-approve the Advisory Agreements.
Investment advisory and sub-advisory fee rates
The Board reviewed and considered the contractual fee rates payable by the Portfolios to Funds Management under the Advisory Agreement. The Board also reviewed and considered the contractual investment sub-advisory fee rates that are payable by Funds Management to the Sub-Advisers for investment sub-advisory services.
Among other information reviewed by the Board was a comparison of the Portfolios’ Management Rates with the average contractual investment management fee rates of funds in the expense Groups at a common asset level as well as transfer agency costs of the Portfolios in the expense Groups. The Board noted that the Management Rates of the Portfolios were lower than, equal to, or in range of the sum of these average rates for the Portfolios’ expense Groups.
The Board also received and considered information about the portions of the total management fees that were retained by Funds Management after payment of the fees to the Sub-Advisers for sub-advisory services. In assessing the reasonableness of these amounts, the Board received and evaluated information about the nature and extent of responsibilities retained and risks assumed by Funds Management and not delegated to or assumed by the Sub-Advisers, and about Funds Management’s on-going oversight services. Given the affiliation between Funds Management and the Sub-Advisers, the Board ascribed limited relevance to the allocation of fees between them.
The Board also received and considered information about the nature and extent of services offered and fee rates charged by Funds Management and the Sub-Advisers to other types of clients with investment strategies similar to those of certain Portfolios. In this regard, the Board received information about the significantly greater scope of services, and compliance,
38 | Wells Fargo Factor Enhanced International Equity Portfolio
Board considerations (unaudited)
reporting and other legal burdens and risks of managing proprietary mutual funds compared with those associated with managing assets of other types of clients, including third-party sub-advised fund clients and non-mutual fund clients such as institutional separate accounts.
Based on its consideration of the factors and information it deemed relevant, including those described here, the Board determined that the compensation payable to Funds Management under the Advisory Agreement and to the Sub-Advisers under the Sub-Advisory Agreements was reasonable.
Profitability
The Board received and considered information concerning the profitability of Funds Management, as well as the profitability of both WFAM and Wells Fargo & Co. (“Wells Fargo”) from providing services to the funds family as a whole. The Board noted that the Sub-Advisers’ profitability information with respect to providing services to the Portfolios and other funds in the family was subsumed in the WFAM and Wells Fargo profitability analysis.
Funds Management reported on the methodologies and estimates used in calculating profitability, including a description of the methodology used to allocate certain expenses. Among other things, the Board noted that the levels of profitability reported on a fund-by-fund basis varied widely, depending on factors such as the size, type and age of fund.
Based on its review, the Board did not deem the profits reported by Funds Management, WFAM or Wells Fargo from services provided to the Portfolios to be at a level that would prevent it from approving the continuation of the Advisory Agreements.
Economies of scale
The Board received and considered information about the potential for Funds Management to experience economies of scale in the provision of management services to the Portfolios, the difficulties of calculating economies of scale at an individual fund level, and the extent to which potential scale benefits are shared with shareholders. The Board noted the existence of breakpoints in the Portfolios’ management fee structure, which operate generally to reduce the Portfolios’ expense ratios as the Portfolios grow in size, and the size of the Portfolios in relation to such breakpoints. The Board considered that in addition to management fee breakpoints, Funds Management shares potential economies of scale from its management business in a variety of ways, including through fee waiver and expense reimbursement arrangements, competitive management fee rates set at the outset without regard to breakpoints, and investments in the business intended to enhance services available to shareholders.
The Board concluded that Funds Management’s arrangements with respect to the Portfolios, including contractual breakpoints, constituted a reasonable approach to sharing potential economies of scale with the Portfolios and their shareholders.
Other benefits to Funds Management and the Sub-Advisers
The Board received and considered information regarding potential “fall-out” or ancillary benefits received by Funds Management and its affiliates, including the Sub-Advisers, as a result of their relationships with the Portfolios. Ancillary benefits could include, among others, benefits directly attributable to other relationships with the Portfolios and benefits potentially derived from an increase in Funds Management’s and the Sub-Advisers’ businesses as a result of their relationships with the Portfolios. The Board noted that various affiliates of Funds Management may receive distribution-related fees, shareholder servicing payments and sub-transfer agency fees in respect of shares sold or held through them and services provided.
The Board also reviewed information about soft dollar credits earned and utilized by the Sub-Advisers, fees earned by Funds Management and Wells Capital Management Incorporated from managing a private investment vehicle for the fund family’s securities lending collateral, and commissions earned by an affiliated broker from portfolio transactions.
Based on its consideration of the factors and information it deemed relevant, including those described here, the Board did not find that any ancillary benefits received by Funds Management and its affiliates, including the Sub-Advisers, were unreasonable.
Conclusion
At the Meeting, after considering the above-described factors and based on its deliberations and its evaluation of the information described above, the Board unanimously determined that the compensation payable to Funds Management and the Sub-Advisers under each of the Advisory Agreements was reasonable, and approved the continuation of the Advisory Agreements for a one-year term.
Wells Fargo Factor Enhanced International Equity Portfolio | 39
Board considerations (unaudited)
Board Considerations – New Agreements
Overview of the Board evaluation process
At a meeting held on May 17-19, 2021 (the “Board Meeting”), the Board of Trustees (the “Board”) of Wells Fargo Master Trust (the “Trust”, and the series identified below, the “Portfolios”) approved the continuation of each Portfolio’s current Investment Advisory Agreement (the “Current Investment Advisory Agreement”) and the current Sub-Advisory Agreements (the “Current Sub-Advisory Agreements”, and collectively, the “Current Agreements”).
| Wells Fargo Disciplined Large Cap Portfolio |
| Wells Fargo Diversified Large Cap Growth Portfolio |
| Wells Fargo Disciplined International Developed Markets Portfolio |
| Wells Fargo Large Company Value Portfolio |
| Wells Fargo Managed Fixed Income Portfolio |
| Wells Fargo Bloomberg Barclays US Aggregate ex-Corporate Portfolio |
| Wells Fargo Emerging Markets Bond Portfolio |
| Wells Fargo Factor Enhanced Emerging Markets Equity Portfolio |
| Wells Fargo Factor Enhanced International Equity Portfolio |
| Wells Fargo Factor Enhanced U.S. Large Cap Equity Portfolio |
| Wells Fargo Factor Enhanced U.S. Low Volatility Equity Portfolio |
| Wells Fargo Factor Enhanced U.S. Small Cap Equity Portfolio |
| Wells Fargo High Yield Corporate Bond Portfolio |
| Wells Fargo Investment Grade Corporate Bond Portfolio |
| Wells Fargo Strategic Retirement Bond Portfolio |
| Wells Fargo U.S. REIT Portfolio |
Each Trustee on the Board is not an “interested person” (as defined in the Investment Company Act of 1940 (the “1940 Act”)) of the Portfolios (collectively, the “Independent Trustees”). The process followed by the Board in considering and approving the continuation of the Current Agreements is referred to herein as the “2021 Annual Approval Process.”
As noted above, the closing of the sale of Wells Fargo Asset Management (“WFAM”) to a holding company (“NewCo”) affiliated with private funds of GTCR LLC (“GTCR”) and of Reverence Capital Partners, L.P. (“Reverence Capital”, and such transaction, the “Transaction”) will result in a change of control of Wells Fargo Funds Management LLC (“Funds Management”), Wells Capital Management Incorporated (“Wells Capital”) and Wells Fargo Asset Management (International) Limited (“WFAM(I) Ltd.”, and together with Funds Management and Wells Capital, the “Advisers”), which will be considered to be an “assignment” of each Portfolio’s Current Agreements under the 1940 Act that will result in the automatic termination of each Portfolio’s Current Agreements. In light of the expected termination of each Portfolio’s Current Agreements upon the closing, at the Board Meeting the Board also considered and approved: (i) a new Investment Advisory Agreement (the “New Investment Advisory Agreement”) between the Trust, on behalf of each Portfolio, and Funds Management; (ii) a new Sub-Advisory Agreement (the “New Wells Capital Sub-Advisory Agreement”) among the Trust, on behalf of each Portfolio, Funds Management and Wells Capital; and (iii) a new Sub-Advisory Agreement (the “New WFAM(I) Ltd Sub-Advisory Agreement”) among the Trust, on behalf of Emerging Markets Bond Portfolio, Funds Management and WFAM(I) Ltd (“WFAMI”); and (iv) a new Sub-Advisory Agreement (the “New Galliard Sub-Advisory Agreement”, and collectively, the “New Agreements”) among the Trust, on behalf of Managed Fixed Income Portfolio, Funds Management and Galliard Capital Management, LLC (“Galliard”, and together with Wells Capital and WFAMI, the “Sub-Advisers”), each of which is intended to go into effect upon the closing. The process followed by the Board in reviewing and approving the New Agreements is referred to herein as the “New Agreement Approval Process.”
At a series of meetings held in April and May 2021 (collectively, “April and May 2021 Meetings”) and at the Board Meeting, the Trustees conferred extensively among themselves and with senior representatives of Funds Management, GTCR and Reverence Capital about the New Agreements and related matters. The Board reviewed and discussed information furnished by Funds Management, GTCR and Reverence Capital that the Board considered reasonably necessary to evaluate the terms of the New Agreements and the services to be provided. At these meetings, senior representatives from Funds Management, GTCR and Reverence Capital made presentations to, and responded to questions from, the Board.
In providing information to the Board in connection with the 2021 annual approval process for the Current Agreements (the “2021 Annual Approval Process”) and the New Agreement Approval Process, Funds Management, GTCR and Reverence Capital (as applicable) were guided by requests for information submitted by independent legal counsel on behalf of the Independent Trustees. In considering and approving the New Agreements, the Trustees considered the information they believed relevant, including but not limited to the information discussed herein. The Board considered not only the specific information presented in
40 | Wells Fargo Factor Enhanced International Equity Portfolio
Board considerations (unaudited)
connection with the April and May 2021 Meetings as well as the Board Meeting, but also the knowledge gained over time through interaction with Funds Management and the Sub-Advisers about various topics. In this regard, the Board reviews reports of Funds Management at each of its regular Board meetings, which includes, among other things, portfolio reviews and investment performance reports. In addition, the Board confers with portfolio managers at various times throughout the year. The Board was assisted in its evaluation of the New Agreements by independent legal counsel, from whom the Independent Trustees received separate legal advice and with whom the Independent Trustees met separately. The Board did not identify any particular information or consideration that was all-important or controlling, and each individual Trustee may have attributed different weights to various factors.
Among other information considered by the Board in connection with the Transaction was:
| ■ | Information regarding the Transaction: information about the structure, financing sources and material terms and conditions of the Transaction, including the expected impact on the businesses conducted by the Advisers and by Wells Fargo Funds Distributor LLC. |
| ■ | Information regarding NewCo, GTCR and Reverence Capital: (i) information about NewCo, including information about its expected financial condition and access to capital, and senior leadership team; (ii) the experience of senior management at GTCR and Reverence Capital in acquiring portfolio companies; (iii) the plan to operationalize NewCo, including the transition of necessary infrastructure services through a transition services agreement with Wells Fargo under which Wells Fargo will continue to provide NewCo with certain services for a specified period of time after the closing; and (iv) information regarding regulatory matters, compliance, and risk management functions at NewCo, including resources to be dedicated thereto. |
| ■ | Impact of the Transaction on WFAM and Service Providers: (i) information regarding any changes to personnel and/or other resources of the Advisers as a result of the Transaction, including assurances regarding comparable and competitive compensation arrangements to attract and retain highly qualified personnel; and (ii) information about the organizational and operating structure with respect to NewCo, the Advisers and the Portfolios. |
| ■ | Impact of the Transaction on the Portfolios and their Shareholders: (i) information regarding anticipated benefits to the Portfolios as a result of the Transaction; (ii) a commitment that the Portfolios would not bear any expenses, directly or indirectly, in connection with the Transaction; (iii) confirmation that the Advisers intend to continue to manage the Portfolios in a manner consistent with each Portfolio’s current investment objectives and principal investments strategies; and (iv) a commitment that neither NewCo nor WFAM will take any steps that would impose any “unfair burden” (as that term is used in section 15(f)(1)(B) of the 1940 Act) on the Portfolios as a result of the Transaction. |
With respect to the New Agreements, the Board considered: (i) a representation that, after the closing, all of the Portfolios will continue to be managed and advised by their current Advisers, and that the same portfolio managers of the Sub-Advisers are expected to continue to manage the Portfolios after the Transaction; (ii) information regarding the terms of the New Agreements, including changes as compared to the Current Agreements; (iii) information confirming that the fee rates payable under the New Agreements will not increase as a result of the Transaction as compared to the rates under the Current Agreements; and (iv) assurances that the Transaction is not expected to cause any diminution with respect to the nature, extent and quality of any of the services currently provided to the Portfolios by the Advisers as a result of the Transaction.
In addition to considering information furnished specifically to evaluate the impact of the Transaction on the Portfolios and their respective shareholders in connection with the New Agreement Approval Process, the Board considered information furnished at prior meetings of the Board and its committees, including detailed information provided in connection with the 2021 Annual Approval Process. In this regard, in connection with the 2021 Annual Approval Process, the Board received information about complex-wide and individual Portfolio performance, fees and expenses, including: (i) a report from an independent data provider comparing the investment performance of each Portfolio to the investment performance of comparable funds and benchmark indices, over various time periods; (ii) a report from an independent data provider comparing each Portfolio’s total expense ratio (and its components) to those of comparable funds; (iii) comparative information concerning the fees charged and services provided by the Advisers to each Portfolio in managing other accounts (which may include other mutual funds, collective investment funds and institutional accounts), if any, that employ investment strategies and techniques similar to those used in managing such Portfolio(s); and (iv) profitability analyses of Funds Management, as well as the profitability of both WFAM and Wells Fargo from providing services to the fund family as a whole.
After its deliberations, the Board unanimously determined that the compensation payable to Funds Management and the Sub-Advisers under the New Agreements is reasonable, approved the New Agreements for a two-year term. The Board considered the approval of the New Agreements as part of its consideration of agreements for funds across the complex, but its approvals were made on a fund-by-fund basis. The following summarizes a number of important, but not necessarily all, factors considered by the Board in support of its approvals.
Wells Fargo Factor Enhanced International Equity Portfolio | 41
Board considerations (unaudited)
Nature, extent and quality of services
In connection with the 2021 Annual Approval Process, the Board received and considered various information regarding the nature, extent and quality of services provided to each Portfolio by Funds Management and the Sub-Advisers under the Advisory Agreements. This information included a description of the investment advisory services and administrative services covered by the Current Advisory Agreement, as well as, among other things, a summary of the background and experience of senior management of WFAM, of which Funds Management and the Sub-Advisers are a part, and a summary of investments made in the business of WFAM. The Board also received a description of Funds Management’s and the Sub-Advisers’ business continuity plans, including a summary of the performance of such plans and any changes thereto during the COVID-19 pandemic, and of their approaches to data privacy and cybersecurity. The Board also received and reviewed information about Funds Management’s role as administrator of the Portfolios’ liquidity risk management program, Funds Management’s approach to risk management, and Funds Management’s intermediary and vendor oversight program.
In connection with the 2021 Annual Approval Process, the Board also considered the qualifications, background, tenure and responsibilities of each of the portfolio managers primarily responsible for the day-to-day portfolio management of the Portfolios. The Board evaluated the ability of Funds Management and the Sub-Advisers to attract and retain qualified investment professionals, including research, advisory and supervisory personnel.
In connection with the 2021 Annual Approval Process, the Board further considered the compliance programs and compliance records of Funds Management and the Sub-Advisers. In addition, the Board took into account the full range of services provided to the Portfolios by Funds Management and its affiliates.
In connection with the New Agreement Approval Process, the Board considered, among other information, the structure of the Transaction and expected impact, if any, of the Transaction on the operations, facilities, organization and personnel of the Advisers. The Board received assurances from the Advisers that each Portfolio will continue to be advised by its current Advisers after the closing, and that the same individual portfolio managers are expected to continue to manage the Portfolios after the closing. With respect to the recruitment and retention of key personnel, the Board noted information from GTCR, Reverence Capital and the Advisers regarding the potential benefits for employees of joining NewCo. The Board recognized that the personnel who had been extended offers may not accept such offers and personnel changes may occur in the future in the ordinary course.
In addition, the Board considered information regarding the infrastructure, operational capabilities and support staff in place to assist in the portfolio management and operations of the Portfolios, including the provision of administrative services, and the anticipated impact of the Transaction on such matters. The Board also considered the business-related and other risks to which the Advisers may be subject in managing the Portfolios and in connection with the Transaction. The Board also considered the transition and integration plans as a result of the change in ownership of the Advisers from Wells Fargo to NewCo. The Board considered the resources and infrastructure that NewCo intends to devote to its compliance program to ensure compliance with applicable laws and regulations, as well as its risk management program and cybersecurity program. The Board also took into account assurances received from the Advisers, GTCR and Reverence Capital that the Transaction is not expected to cause any diminution in the nature, extent and quality of services provided by the Advisers to the Portfolios and their shareholders.
Investment performance and expenses
In connection with the 2021 Annual Approval Process, the Board considered the investment performance results for each Portfolio over various time periods ended December 31, 2020. The Board considered these results in comparison to the investment performance of funds in a universe that was determined by Broadridge Inc. (“Broadridge”) to be similar to each Portfolio (the “Universe”), and in comparison to each Portfolio’s benchmark index and to other comparative data. Broadridge is an independent provider of investment company data. The Board received a description of the methodology used by Broadridge to select the mutual funds in the performance Universe. Where applicable, the Board received information concerning, and discussed factors contributing to, underperformance of Portfolios relative to the Universe and benchmark for any underperformance periods.
In connection with the 2021 Annual Approval Process, the Board also reviewed the fee rates that are payable to Funds Management for investment advisory services (as discussed below), which are the only fees charged at the Portfolio level, relative to corresponding expense groups that were determined by Broadridge to be similar to the Portfolios (the “Groups”). The Board received a description of the methodology used by Broadridge to select the mutual funds in the expense Groups and an explanation of how funds comprising expense groups and their expense ratios may vary from year-to-year.
In connection with the New Agreement Approval Process, the Board received a commitment that WFAM will maintain fee and expense commitments for at least two years after the closing. The Board took into account each Fund’s investment performance and expense information among the factors considered in deciding to approve the New Agreements.
42 | Wells Fargo Factor Enhanced International Equity Portfolio
Board considerations (unaudited)
Investment advisory and sub-advisory fee rates
In connection with the 2021 Annual Approval Process, the Board reviewed and considered the contractual investment advisory fee rate that is payable by each Portfolio to Funds Management for investment advisory services under the Current Advisory Agreement (the “Advisory Agreement Rate”). The Board also reviewed and considered the contractual investment sub-advisory fee rate that is payable by Funds Management to the applicable Sub-Adviser for investment sub-advisory services (the “Sub-Advisory Agreement Rate”).
Among other information reviewed by the Board in connection with the 2021 Annual Approval Process, was a comparison of each Portfolio’s Advisory Agreement Rate with those of other funds in the Portfolio’s expense Group at a common asset level.
In connection with the 2021 Annual Approval Process, the Board also received and considered information about the portion of the total management fee that was retained by Funds Management after payment of the Sub-Advisory Agreement Rates. In assessing the reasonableness of this amount, the Board received and evaluated information about the nature and extent of responsibilities retained and risks assumed by Funds Management and not delegated to or assumed by the Sub-Advisers, and about Funds Management’s on-going oversight services. Given the affiliation between Funds Management and the Sub-Advisers, the Board ascribed limited relevance to the allocation of fees between them.
In connection with the 2021 Annual Approval Process, the Board also received and considered information about the nature and extent of services offered and fee rates charged by Funds Management and the Sub-Advisers to other types of clients, if any, with investment strategies similar to those of each Portfolio. In this regard, the Board received information about the significantly greater scope of services, and compliance, reporting and other legal burdens and risks of managing proprietary mutual funds compared with those associated with managing assets of other types of clients, including third-party sub-advised fund clients and non-mutual fund clients such as institutional separate accounts.
In connection with the New Agreement Approval Process, the Board noted the assurances received by it that there would be no increases to any of the Advisory Agreement Rates or the Sub-Advisory Agreement Rates as a result of the Transaction. The Board also considered that the New Agreements do not change the computation method for calculating such fees, and there is no present intention to reduce expense waiver and reimbursement arrangements that are currently in effect. Based on its consideration of the factors and information it deemed relevant, including those described here, the Board determined that the compensation payable to Funds Management under the New Advisory Agreement and to each of the Sub-Advisers under the applicable new Sub-Advisory Agreement was reasonable.
Profitability
In connection with the 2021 Annual Approval Process, the Board received and considered information concerning the profitability of Funds Management, as well as the profitability of both WFAM and Wells Fargo from providing services to the fund family as a whole. The Board noted that the Sub-Advisers’ profitability information with respect to providing services to each Fund and other funds in the family was subsumed in the WFAM and Wells Fargo profitability analysis.
Funds Management reported on the methodologies and estimates used in calculating profitability in connection with the 2021 Annual Approval Process, including a description of the methodology used to allocate certain expenses. Among other things, the Board noted that the levels of profitability reported on a fund-by-fund basis varied widely, depending on factors such as the size, type and age of fund.
In connection with the New Agreement Approval Process, the Board received certain information about NewCo’s projected financial condition, and reviewed with senior representatives of Funds Management, GTCR and Reverence Capital the underlying assumptions on which such information was based. The Board considered that NewCo is a newly formed entity, with no historical operations, revenues or expenses, and that it is difficult to predict with any degree of certainty the future profitability of NewCo and the Advisers from advisory activities under the New Agreements. The Board considered that the fee rates payable under the New Agreements will not increase as a result of the Transaction as compared to the rates under the Current Agreements, and that the current contractual expense limitations applicable to each Portfolio will not increase. The Board noted that if the New Agreements are approved by shareholders and the Transaction closes, the Board will have the opportunity in the future to review the profitability of NewCo and the Advisers from advisory activities under the New Agreements.
Economies of scale
In connection with the 2021 Annual Approval Process, the Board received and considered information about the potential for Funds Management to experience economies of scale in the provision of advisory services to the Portfolios, the difficulties of calculating economies of scale at an individual fund level, and the extent to which potential scale benefits are shared with Portfolio shareholders. The Board noted the existence of breakpoints in each Portfolio’s advisory fee structure, which operate generally to reduce the Portfolio’s expense ratios as the Portfolio grows in size, and the size of the Portfolio in relation to such breakpoints. The
Wells Fargo Factor Enhanced International Equity Portfolio | 43
Board considerations (unaudited)
Board considered that, in addition to advisory fee breakpoints, Funds Management shares potential economies of scale from its management business in a variety of ways, including through fee waiver and expense reimbursement arrangements, competitive management fee rates set at the outset without regard to breakpoints, and investments in the business intended to enhance services available to shareholders.
In connection with the New Agreement Approval Process, the Board noted that NewCo and the Advisers may benefit from possible growth of the Portfolios resulting from enhanced distribution capabilities for their investing funds. However, the Board noted that other factors could also affect the potential for economies of scale, and that it was not possible to quantify any potential future economies of scale. Based upon the information furnished to the Board in connection with the 2021 Annual Approval Process and the New Agreement Approval Process, the Board concluded that Funds Management’s arrangements with respect to each Portfolio, including contractual breakpoints and expense limitation arrangements, constituted a reasonable approach to sharing potential economies of scale with the Portfolio and its shareholders.
“Fall-out” benefits to Funds Management and the Sub-Advisers
In connection with the 2021 Annual Approval Process, the Board received and considered information regarding potential “fall-out” or ancillary benefits received by Funds Management and its affiliates, including the Sub-Advisers, as a result of their relationships with the Portfolios. Ancillary benefits could include, among others, benefits directly attributable to other relationships with the Portfolios and benefits potentially derived from an increase in Funds Management’s and the Sub-Advisers’ business as a result of their relationships with the Portfolios. The Board noted that various current affiliates of Funds Management may receive distribution-related fees, shareholder servicing payments and sub-transfer agency fees in respect of shares sold or held through them and services provided.
In connection with the 2021 Annual Approval Process, the Board also reviewed information about soft dollar credits earned and utilized by the Sub-Advisers, fees earned by Funds Management and Wells Capital from managing a private investment vehicle for the fund family’s securities lending collateral, and commissions earned by an affiliated broker of Wells Fargo from portfolio transactions.
In connection with the New Agreement Approval Process, the Board received information to the effect that the Transaction is not expected to have a material impact on the fall-out benefits currently realized by Funds Management and its affiliates, including the Sub-Advisers. The information reviewed by the Board also noted that several of the ancillary benefits identified for WFAM would be potential ancillary benefits for NewCo, including that the scale and reputation of the Portfolios might benefit NewCo’s broader reputation, product initiatives, technology investment and talent acquisition. Based on its consideration of the factors and information it deemed relevant, including those described here, the Board did not find that any ancillary benefits expected to be received by Funds Management and its affiliates, including NewCo and the Sub-Advisers, under the New Agreements were unreasonable.
Conclusion
At the Board Meeting, after considering the above-described factors and based on its deliberations and its evaluation of the information described above, the Board unanimously determined that the compensation payable to Funds Management and to each of the Sub-Advisers under the New Agreements is reasonable, approved the New Agreements for a two-year term.
44 | Wells Fargo Factor Enhanced International Equity Portfolio
Board considerations (unaudited)
Board Considerations - Interim Agreements
At a meeting held on May 17-19, 2021 (the “Board Meeting”), the Boards of Trustees (each, a “Board”, and collectively, the “Boards”) of Wells Fargo Funds Trust, Wells Fargo Master Trust, Wells Fargo Variable Trust, Wells Fargo Global Dividend Opportunity Fund, Wells Fargo Income Opportunities Fund, Wells Fargo Multi-Sector Income Fund and Wells Fargo Utilities and High Income Fund (each a “Trust”, and the series thereof, a “Fund”) reviewed and approved for the Trusts and Funds, as applicable: (i) interim investment management agreements (the “Interim Management Agreements”) with Wells Fargo Funds Management, LLC (“Funds Management”); (ii) interim investment advisory agreements (the “Interim Advisory Agreements”) with Funds Management; and (iii) interim sub-advisory agreements (the “Interim Sub-Advisory Agreements”) with each of Cooke & Bieler, L.P., Galliard Capital Management LLC (“Galliard”), Peregrine Capital Management Inc., Wells Capital Management, LLC (“WellsCap”), and Wells Fargo Asset Management (International) Limited (“WFAMI”, and collectively, the “Sub-Advisers”). Each Trustee on the Board is not an “interested person” (as defined in the Investment Company Act of 1940 (the “1940 Act”) of the Funds (collectively, the “Independent Trustees”). The Interim Management Agreements, Interim Advisory Agreements, and Interim Sub-Advisory Agreements are collectively referred to as the “Interim Advisory Agreements.”
At the Board Meeting, the Boards reviewed and approved the continuation of existing investment management, advisory and sub-advisory agreements (the “Current Advisory Agreements”) for each Trust and Fund, as applicable. The factors considered and conclusions reached by the Boards in approving the Current Advisory Agreements are summarized in the section entitled “Board Considerations – Current Agreements” of this shareholder report. The Boards noted that Wells Fargo & Company has entered into a definitive agreement to sell Wells Fargo Asset Management (“WFAM”), which includes Funds Management, Galliard, WellsCap and WFAMI (the “Affiliated Sub-Advisers”), to a holding company affiliated with private funds of GTCR LLC and Reverence Capital Partners, L.P. (the “Transaction”). The Boards further noted that the Transaction would result in a change-of-control of Funds Management and the Affiliated Sub-Advisers, which would be considered to be an “assignment” under the 1940 Act that would terminate the Current Advisory Agreements. At the Board Meeting, the Boards also reviewed and approved new investment management, advisory and sub-advisory agreements (the “New Advisory Agreements”) for each Trust and Fund, as applicable, that would replace the Current Advisory Agreements upon consummation of the Transaction, subject to approval of the New Advisory Agreements by the applicable Trust’s or Fund’s shareholders. The factors considered and conclusions reached by the Boards in approving the New Advisory Agreements are summarized in the section entitled “Board Considerations – New Agreements” of this shareholder report.
At the Board Meeting, the Boards also approved the Interim Advisory Agreements, which will go into effect for a Trust or Fund only in the event that shareholders of such Trust or Fund do not approve the New Advisory Agreement(s) for the Trust or Fund by the closing date of the Transaction, when the Current Advisory Agreements will terminate. The Board noted that, in such a circumstance, the Interim Advisory Agreements will permit continuity of management by allowing Funds Management and the Sub-Advisers to continue providing services to the Trust or Fund pursuant to the Interim Advisory Agreements while the Trust or Fund continues to solicit shareholder approval of such New Advisory Agreement(s). The Boards noted that the terms of the Interim Advisory Agreements are identical to those of the Current Advisory Agreements, except for the term and the addition of escrow provisions with respect to the advisory fees. The Boards also noted that the entities that would service the Funds and Trusts under the Interim Advisory Agreements are identical to those that provide services under the Current Advisory Agreements and those that will provide services under the New Advisory Agreements.
In approving the Interim Advisory Agreements, the Boards considered the same factors and reached the same conclusions as they considered and reached with respect to the Boards’ approvals of the Current Advisory Agreements and New Advisory Agreements, as applicable, which are described in separate Board Consideration sections within this shareholder report. Prior to the Board Meeting, including at a series of meetings held in April and May 2021, the Trustees conferred extensively among themselves and with senior representatives of Funds Management, GTCR LLC and Reverence Capital Partners, L.P. about the Interim Advisory Agreements and related matters. The Independent Trustees were assisted in their evaluation of the Interim Advisory Agreements by independent legal counsel, from whom they received separate legal advice and with whom they met separately.
At the Board Meeting, after considering the factors and reaching the conclusions described in the separate Board Consideration sections within this shareholder report, the Boards unanimously determined that the compensation payable to Funds Management and to each Sub-Adviser under each of the Interim Advisory Agreements was reasonable, and approved the Interim Advisory Agreements.
Wells Fargo Factor Enhanced International Equity Portfolio | 45
For more information
More information about Wells Fargo Funds is available free upon request. To obtain literature, please write, visit the Portfolio's website, or call:
Wells Fargo Funds
P.O. Box 219967
Kansas City, MO 64121-9967
Website: wfam.com
Individual investors: 1-800-222-8222
Retail investment professionals: 1-888-877-9275
Institutional investment professionals: 1-866-765-0778
This report and the financial statements contained herein are submitted for the general information of the interest holders of the Portfolio. If this report is used for promotional purposes, distribution of the report must be accompanied or preceded by a current prospectus. Before investing, please consider the investment objectives, risks, charges, and expenses of the investment. For a current prospectus and, if available, a summary prospectus, containing this information, call
1-800-222-8222 or visit the Portfolio's website at wfam.com. Read the prospectus carefully before you invest or send money.
Wells Fargo Asset Management (WFAM) is the trade name for certain investment advisory/management firms owned by Wells Fargo & Company. These firms include but are not limited to Wells Capital Management, LLC and Wells Fargo Funds Management, LLC. Certain products managed by WFAM entities are distributed by Wells Fargo Funds Distributor, LLC (a broker-dealer and Member FINRA).
This material is for general informational and educational purposes only and is NOT intended to provide investment advice or a recommendation of any kind - including a recommendation for any specific investment, strategy, or plan.
INVESTMENT PRODUCTS: NOT FDIC INSURED ■ NO BANK GUARANTEE ■ MAY LOSE VALUE
© 2021 Wells Fargo & Company. All rights reserved.
Semi-Annual Report
August 31, 2021
Wells Fargo
Factor Enhanced U.S. Large Cap Equity Portfolio
INVESTMENT PRODUCTS: NOT FDIC INSURED ■ NO BANK GUARANTEE ■ MAY LOSE VALUE
Wells Fargo Factor Enhanced U.S. Large Cap Equity Portfolio | 1
Portfolio information (unaudited)
| Investment objective | The Portfolio seeks long-term capital appreciation. |
| Adviser | Wells Fargo Funds Management, LLC |
| Subadviser | Wells Capital Management, LLC |
| Portfolio managers | Dennis Beinn, CFA®‡, Harindra de Silva, Ph.D., CFA®‡, Monisha Jayakumar |
| Ten largest holdings (%) as of August 31, 20211 |
| Apple Incorporated | 5.29 |
| Microsoft Corporation | 5.18 |
| Amazon.com Incorporated | 3.36 |
| Facebook Incorporated Class A | 2.04 |
| Alphabet Incorporated Class A | 2.01 |
| Alphabet Incorporated Class C | 1.85 |
| Berkshire Hathaway Incorporated Class B | 1.24 |
| NVIDIA Corporation | 1.08 |
| Tesla Motors Incorporated | 1.06 |
| Johnson & Johnson | 1.04 |
| 1 | Figures represent the percentage of the Portfolio's net assets. Holdings are subject to change and may have changed since the date specified. |
| Sector allocation as of August 31, 20211 |
| 1 | Figures represent the percentage of the Portfolio's long-term investments. These amounts are subject to change and may have changed since the date specified. |
| ‡ | CFA® and Chartered Financial Analyst® are trademarks owned by CFA Institute. |
2 | Wells Fargo Factor Enhanced U.S. Large Cap Equity Portfolio
Portfolio of investments—August 31, 2021 (unaudited)
| | | | | Shares | Value |
| Common stocks: 97.56% | | | | | |
| Communication services: 11.03% | | | | | |
| Diversified telecommunication services: 0.97% | | | | | |
| AT&T Incorporated | | | | 134,241 | $ 3,680,888 |
| Lumen Technologies Incorporated | | | | 40,897 | 503,033 |
| Verizon Communications Incorporated | | | | 75,052 | 4,127,860 |
| | | | | | 8,311,781 |
| Entertainment: 2.00% | | | | | |
| Activision Blizzard Incorporated | | | | 13,190 | 1,086,460 |
| Electronic Arts Incorporated | | | | 4,353 | 632,099 |
| Netflix Incorporated † | | | | 7,990 | 4,547,828 |
| Playtika Holding Corporation † | | | | 40,991 | 1,081,752 |
| Roku Incorporated † | | | | 2,551 | 898,972 |
| Skillz Incorporated † | | | | 9,383 | 110,438 |
| Spotify Technology † | | | | 3,030 | 710,050 |
| Take-Two Interactive Software Incorporated † | | | | 2,698 | 434,972 |
| The Madison Square Garden Company Class A † | | | | 3,198 | 578,134 |
| The Walt Disney Company † | | | | 35,043 | 6,353,296 |
| World Wrestling Entertainment Incorporated Class A | | | | 11,864 | 618,233 |
| Zynga Incorporated Class A † | | | | 281 | 2,487 |
| | | | | | 17,054,721 |
| Interactive media & services: 6.30% | | | | | |
| Alphabet Incorporated Class A † | | | | 5,927 | 17,152,442 |
| Alphabet Incorporated Class C † | | | | 5,446 | 15,843,721 |
| Facebook Incorporated Class A † | | | | 45,918 | 17,420,371 |
| Match Group Incorporated † | | | | 8,461 | 1,162,880 |
| Pinterest Incorporated Class A † | | | | 15,361 | 853,611 |
| TripAdvisor Incorporated † | | | | 11,552 | 404,320 |
| Twitter Incorporated † | | | | 7,420 | 478,590 |
| Zillow Group Incorporated Class A † | | | | 3,376 | 322,746 |
| Zillow Group Incorporated Class C † | | | | 1,738 | 166,448 |
| | | | | | 53,805,129 |
| Media: 1.56% | | | | | |
| Altice USA Incorporated † | | | | 13,886 | 381,032 |
| Charter Communications Incorporated Class A † | | | | 2,370 | 1,935,484 |
| Comcast Corporation Class A | | | | 86,655 | 5,258,225 |
| Discovery Incorporated Class A † | | | | 3,192 | 92,057 |
| DISH Network Corporation Class A † | | | | 456 | 19,877 |
| Fox Corporation Class A | | | | 22,742 | 851,460 |
| Fox Corporation Class B | | | | 2,987 | 103,440 |
| Interpublic Group of Companies Incorporated | | | | 35,434 | 1,319,208 |
| News Corporation Class A | | | | 34,940 | 785,102 |
| News Corporation Class B | | | | 33,664 | 741,618 |
| Nexstar Media Group Incorporated Class A | | | | 3,234 | 484,292 |
| Omnicom Group Incorporated | | | | 9,202 | 673,770 |
| Sirius XM Holdings Incorporated | | | | 27,171 | 170,362 |
| The New York Times Company Class A | | | | 4,101 | 208,249 |
| ViacomCBS Incorporated Class A | | | | 1,923 | 88,420 |
| ViacomCBS Incorporated Class B | | | | 4,706 | 195,064 |
| | | | | | 13,307,660 |
The accompanying notes are an integral part of these financial statements.
Wells Fargo Factor Enhanced U.S. Large Cap Equity Portfolio | 3
Portfolio of investments—August 31, 2021 (unaudited)
| | | | | Shares | Value |
| Wireless telecommunication services: 0.20% | | | | | |
| T-Mobile US Incorporated † | | | | 12,462 | $ 1,707,543 |
| Consumer discretionary: 11.07% | | | | | |
| Auto components: 0.11% | | | | | |
| Lear Corporation | | | | 5,425 | 867,675 |
| Quantumscape Corporation † | | | | 2,332 | 51,304 |
| | | | | | 918,979 |
| Automobiles: 1.45% | | | | | |
| Ford Motor Company † | | | | 94,974 | 1,237,511 |
| General Motors Company † | | | | 31,150 | 1,526,662 |
| Tesla Motors Incorporated | | | | 12,285 | 9,038,320 |
| Thor Industries Incorporated | | | | 4,963 | 562,953 |
| | | | | | 12,365,446 |
| Distributors: 0.06% | | | | | |
| Genuine Parts Company | | | | 2,763 | 337,611 |
| LKQ Corporation † | | | | 3,519 | 185,416 |
| | | | | | 523,027 |
| Diversified consumer services: 0.21% | | | | | |
| Frontdoor Incorporated † | | | | 12,482 | 544,465 |
| H&R Block Incorporated | | | | 37,906 | 972,289 |
| Service Corporation International | | | | 1,027 | 64,455 |
| Terminix Global Holdings Incorporated † | | | | 4,554 | 189,583 |
| | | | | | 1,770,792 |
| Hotels, restaurants & leisure: 2.28% | | | | | |
| Aramark | | | | 25,467 | 885,997 |
| Booking Holdings Incorporated † | | | | 495 | 1,138,337 |
| Boyd Gaming Corporation † | | | | 18,428 | 1,130,926 |
| Chipotle Mexican Grill Incorporated † | | | | 722 | 1,374,204 |
| Choice Hotels International Incorporated | | | | 1,174 | 140,129 |
| Darden Restaurants Incorporated | | | | 6,385 | 961,900 |
| Domino's Pizza Incorporated | | | | 2,557 | 1,321,688 |
| Expedia Group Incorporated † | | | | 3,097 | 447,517 |
| Hilton Worldwide Holdings Incorporated † | | | | 1,178 | 147,085 |
| Marriott International Incorporated Class A † | | | | 4,497 | 607,725 |
| Marriott Vacations Worldwide Corporation † | | | | 3,605 | 539,128 |
| McDonald's Corporation | | | | 14,056 | 3,337,738 |
| Penn National Gaming Incorporated † | | | | 3,345 | 271,280 |
| Six Flags Entertainment Corporation † | | | | 2,769 | 116,963 |
| Starbucks Corporation | | | | 25,473 | 2,992,823 |
| The Wendy's Company | | | | 11,179 | 257,341 |
| Travel Leisure Company | | | | 16,619 | 910,056 |
| Vail Resorts Incorporated † | | | | 306 | 93,284 |
| Wyndham Hotels & Resorts Incorporated | | | | 5,792 | 421,078 |
| Yum China Holdings Incorporated | | | | 15,304 | 942,114 |
| Yum! Brands Incorporated | | | | 11,178 | 1,464,653 |
| | | | | | 19,501,966 |
| Household durables: 0.10% | | | | | |
| D.R. Horton Incorporated | | | | 1,904 | 182,060 |
| Leggett & Platt Incorporated | | | | 942 | 45,583 |
| Lennar Corporation Class A | | | | 1,918 | 205,821 |
The accompanying notes are an integral part of these financial statements.
4 | Wells Fargo Factor Enhanced U.S. Large Cap Equity Portfolio
Portfolio of investments—August 31, 2021 (unaudited)
| | | | | Shares | Value |
| Household durables (continued) | | | | | |
| Tempur-Pedic International Incorporated | | | | 1,891 | $ 84,528 |
| Whirlpool Corporation | | | | 1,512 | 334,953 |
| | | | | | 852,945 |
| Internet & direct marketing retail: 3.55% | | | | | |
| Amazon.com Incorporated † | | | | 8,264 | 28,682,609 |
| eBay Incorporated | | | | 10,382 | 796,715 |
| Wayfair Incorporated Class A † | | | | 2,918 | 819,229 |
| | | | | | 30,298,553 |
| Leisure products: 0.22% | | | | | |
| Mattel Incorporated † | | | | 33,128 | 707,283 |
| Polaris Industries Incorporated | | | | 4,564 | 546,585 |
| The Brunswick Corporation | | | | 6,713 | 650,288 |
| | | | | | 1,904,156 |
| Multiline retail: 0.50% | | | | | |
| Dollar General Corporation | | | | 2,264 | 504,668 |
| Dollar Tree Incorporated † | | | | 2,765 | 250,343 |
| Kohl's Corporation | | | | 9,800 | 562,520 |
| Nordstrom Incorporated † | | | | 4,714 | 134,868 |
| Target Corporation | | | | 11,236 | 2,775,067 |
| | | | | | 4,227,466 |
| Specialty retail: 2.02% | | | | | |
| AutoNation Incorporated † | | | | 16,332 | 1,781,658 |
| Bath & Body Works Incorporated | | | | 9,699 | 654,489 |
| Best Buy Company Incorporated | | | | 5,878 | 684,846 |
| Dick's Sporting Goods Incorporated | | | | 8,342 | 1,174,637 |
| Foot Locker Incorporated | | | | 15,708 | 890,487 |
| Lithia Motors Incorporated Class A | | | | 1,343 | 444,936 |
| Lowe's Companies Incorporated | | | | 11,890 | 2,424,252 |
| Penske Auto Group Incorporated | | | | 20,331 | 1,828,367 |
| The Gap Incorporated | | | | 11,570 | 309,266 |
| The Home Depot Incorporated | | | | 18,521 | 6,041,180 |
| The TJX Companies Incorporated | | | | 8,877 | 645,535 |
| Victoria's Secret Corporation † | | | | 3,233 | 214,348 |
| Williams-Sonoma Incorporated | | | | 1,007 | 188,007 |
| | | | | | 17,282,008 |
| Textiles, apparel & luxury goods: 0.57% | | | | | |
| Capri Holdings Limited † | | | | 3,111 | 175,803 |
| Deckers Outdoor Corporation † | | | | 304 | 127,209 |
| HanesBrands Incorporated | | | | 6,669 | 124,577 |
| Nike Incorporated Class B | | | | 18,526 | 3,051,973 |
| PVH Corporation † | | | | 3,076 | 322,334 |
| Tapestry Incorporated | | | | 5,567 | 224,461 |
| Under Armour Incorporated Class A † | | | | 26,131 | 604,671 |
| Under Armour Incorporated Class C † | | | | 13,627 | 273,358 |
| | | | | | 4,904,386 |
| Consumer staples: 5.98% | | | | | |
| Beverages: 1.32% | | | | | |
| Boston Beer Company Incorporated Class A † | | | | 788 | 449,325 |
The accompanying notes are an integral part of these financial statements.
Wells Fargo Factor Enhanced U.S. Large Cap Equity Portfolio | 5
Portfolio of investments—August 31, 2021 (unaudited)
| | | | | Shares | Value |
| Beverages (continued) | | | | | |
| Constellation Brands Incorporated Class A | | | | 3,407 | $ 719,354 |
| Keurig Dr. Pepper Incorporated | | | | 10,821 | 385,985 |
| Molson Coors Brewing Company Class B | | | | 17,237 | 819,275 |
| Monster Beverage Corporation † | | | | 7,514 | 733,141 |
| PepsiCo Incorporated | | | | 26,926 | 4,210,957 |
| The Coca-Cola Company | | | | 71,035 | 3,999,981 |
| | | | | | 11,318,018 |
| Food & staples retailing: 1.32% | | | | | |
| Albertsons Companies LLC | | | | 25,361 | 769,960 |
| Casey's General Stores Incorporated | | | | 719 | 147,079 |
| Costco Wholesale Corporation | | | | 8,569 | 3,903,094 |
| Sysco Corporation | | | | 5,615 | 447,235 |
| The Kroger Company | | | | 25,433 | 1,170,681 |
| US Foods Holding Corporation † | | | | 4,806 | 163,404 |
| Walgreens Boots Alliance Incorporated | | | | 8,507 | 431,730 |
| Walmart Incorporated | | | | 28,400 | 4,206,040 |
| | | | | | 11,239,223 |
| Food products: 1.30% | | | | | |
| Archer Daniels Midland Company | | | | 30,162 | 1,809,720 |
| Bunge Limited | | | | 24,685 | 1,868,901 |
| Campbell Soup Company | | | | 2,834 | 118,263 |
| ConAgra Foods Incorporated | | | | 4,265 | 141,257 |
| Darling Ingredients Incorporated † | | | | 9,318 | 694,191 |
| Flowers Foods Incorporated | | | | 24,913 | 601,151 |
| General Mills Incorporated | | | | 1,990 | 115,042 |
| Hain Celestial Group Incorporated † | | | | 14,548 | 544,241 |
| Ingredion Incorporated | | | | 2,250 | 197,685 |
| Kellogg Company | | | | 947 | 59,794 |
| Mondelez International Incorporated Class A | | | | 15,601 | 968,354 |
| Pilgrim's Pride Corporation † | | | | 57,606 | 1,603,751 |
| Post Holdings Incorporated † | | | | 583 | 65,244 |
| Seaboard Corporation | | | | 32 | 136,147 |
| The Hershey Company | | | | 2,661 | 472,860 |
| The J.M. Smucker Company | | | | 1,809 | 223,719 |
| The Kraft Heinz Company | | | | 494 | 17,779 |
| Tyson Foods Incorporated Class A | | | | 18,373 | 1,442,648 |
| | | | | | 11,080,747 |
| Household products: 1.23% | | | | | |
| Church & Dwight Company Incorporated | | | | 2,637 | 220,611 |
| Colgate-Palmolive Company | | | | 18,499 | 1,441,997 |
| Kimberly-Clark Corporation | | | | 6,228 | 858,281 |
| Spectrum Brands Holdings Incorporated | | | | 19,170 | 1,496,410 |
| The Clorox Company | | | | 318 | 53,440 |
| The Procter & Gamble Company | | | | 45,197 | 6,435,601 |
| | | | | | 10,506,340 |
| Personal products: 0.23% | | | | | |
| Herbalife Nutrition Limited † | | | | 18,661 | 958,056 |
| The Estee Lauder Companies Incorporated Class A | | | | 2,919 | 993,890 |
| | | | | | 1,951,946 |
The accompanying notes are an integral part of these financial statements.
6 | Wells Fargo Factor Enhanced U.S. Large Cap Equity Portfolio
Portfolio of investments—August 31, 2021 (unaudited)
| | | | | Shares | Value |
| Tobacco: 0.58% | | | | | |
| Altria Group Incorporated | | | | 35,110 | $ 1,763,575 |
| Philip Morris International Incorporated | | | | 30,973 | 3,190,219 |
| | | | | | 4,953,794 |
| Energy: 1.85% | | | | | |
| Energy equipment & services: 0.14% | | | | | |
| Baker Hughes Incorporated | | | | 22,359 | 509,338 |
| Halliburton Company | | | | 1,415 | 28,272 |
| Schlumberger Limited | | | | 21,699 | 608,440 |
| | | | | | 1,146,050 |
| Oil, gas & consumable fuels: 1.71% | | | | | |
| Antero Midstream Corporation | | | | 14,428 | 138,653 |
| APA Corporation | | | | 28,201 | 549,355 |
| Cheniere Energy Incorporated † | | | | 3,205 | 280,309 |
| Chevron Corporation | | | | 33,993 | 3,289,503 |
| ConocoPhillips | | | | 17,244 | 957,559 |
| Devon Energy Corporation | | | | 22,846 | 675,099 |
| Diamondback Energy Incorporated | | | | 2,907 | 224,246 |
| EOG Resources Incorporated | | | | 7,055 | 476,354 |
| Exxon Mobil Corporation | | | | 81,405 | 4,438,201 |
| HollyFrontier Corporation | | | | 23,571 | 762,050 |
| Marathon Petroleum Corporation | | | | 18,628 | 1,104,082 |
| ONEOK Incorporated | | | | 964 | 50,629 |
| Phillips 66 | | | | 8,431 | 599,360 |
| Pioneer Natural Resources Company | | | | 800 | 119,736 |
| Targa Resources Corporation | | | | 6,549 | 287,632 |
| The Williams Companies Incorporated | | | | 6,045 | 149,251 |
| Valero Energy Corporation | | | | 7,864 | 521,462 |
| | | | | | 14,623,481 |
| Financials: 9.39% | | | | | |
| Banks: 2.85% | | | | | |
| Bank of America Corporation | | | | 124,403 | 5,193,825 |
| Bank OZK | | | | 667 | 28,301 |
| BOK Financial Corporation | | | | 1,470 | 129,434 |
| Citigroup Incorporated | | | | 31,408 | 2,258,549 |
| Citizens Financial Group Incorporated | | | | 10,536 | 461,371 |
| Comerica Incorporated | | | | 1,553 | 114,782 |
| Fifth Third Bancorp | | | | 17,661 | 686,306 |
| First Horizon National Corporation | | | | 3,035 | 49,744 |
| FNB Corporation | | | | 20,366 | 237,875 |
| Huntington Bancshares Incorporated | | | | 36,469 | 566,364 |
| JPMorgan Chase & Company | | | | 54,383 | 8,698,561 |
| KeyCorp | | | | 17,497 | 355,539 |
| M&T Bank Corporation | | | | 663 | 92,827 |
| PacWest Bancorp | | | | 8,297 | 353,037 |
| PNC Financial Services Group Incorporated | | | | 6,039 | 1,154,053 |
| Popular Incorporated | | | | 5,539 | 420,632 |
| Regions Financial Corporation | | | | 30,567 | 624,484 |
| SVB Financial Group † | | | | 195 | 109,103 |
| Synovus Financial Corporation | | | | 8,969 | 386,564 |
| Truist Financial Corporation | | | | 18,521 | 1,056,808 |
| Umpqua Holdings Corporation | | | | 4,275 | 83,234 |
The accompanying notes are an integral part of these financial statements.
Wells Fargo Factor Enhanced U.S. Large Cap Equity Portfolio | 7
Portfolio of investments—August 31, 2021 (unaudited)
| | | | | Shares | Value |
| Banks (continued) | | | | | |
| US Bancorp | | | | 20,979 | $ 1,203,985 |
| Webster Financial Corporation | | | | 1,767 | 89,269 |
| Wintrust Financial Corporation | | | | 206 | 15,417 |
| | | | | | 24,370,064 |
| Capital markets: 2.65% | | | | | |
| Affiliated Managers Group Incorporated | | | | 6,090 | 1,035,970 |
| Ameriprise Financial Incorporated | | | | 2,248 | 613,502 |
| BlackRock Incorporated | | | | 2,219 | 2,093,161 |
| Brookfield Asset Management Incorporated Class A | | | | 5,588 | 310,413 |
| Cboe Global Markets Incorporated | | | | 1,750 | 220,763 |
| Evercore Partners Incorporated Class A | | | | 11,032 | 1,540,508 |
| Franklin Resources Incorporated | | | | 10,914 | 354,050 |
| Intercontinental Exchange Incorporated | | | | 272 | 32,512 |
| Invesco Limited | | | | 6,310 | 159,769 |
| Janus Henderson Group plc | | | | 28,979 | 1,256,529 |
| Jefferies Financial Group Incorporated | | | | 22,605 | 835,481 |
| KKR & Company Incorporated Class A | | | | 2,347 | 150,889 |
| LPL Financial Holdings Incorporated | | | | 1,533 | 226,654 |
| Moody's Corporation | | | | 1,287 | 490,051 |
| Morgan Stanley | | | | 17,518 | 1,829,405 |
| MSCI Incorporated | | | | 61 | 38,709 |
| Raymond James Financial Incorporated | | | | 3,447 | 482,235 |
| S&P Global Incorporated | | | | 3,251 | 1,442,859 |
| SEI Investments Company | | | | 11,510 | 722,943 |
| Stifel Financial Corporation | | | | 12,213 | 843,918 |
| T. Rowe Price Group Incorporated | | | | 6,103 | 1,366,279 |
| The Blackstone Group Incorporated Class A | | | | 17,570 | 2,209,076 |
| The Carlyle Group Incorporated | | | | 5,713 | 282,108 |
| The Charles Schwab Corporation | | | | 12,733 | 927,599 |
| The Goldman Sachs Group Incorporated | | | | 4,918 | 2,033,642 |
| The NASDAQ Incorporated | | | | 1,100 | 215,358 |
| VIRTU Financial Incorporated Class A | | | | 36,975 | 905,148 |
| | | | | | 22,619,531 |
| Consumer finance: 0.50% | | | | | |
| Ally Financial Incorporated | | | | 9,513 | 503,238 |
| American Express Company | | | | 6,955 | 1,154,252 |
| Capital One Financial Corporation | | | | 5,445 | 903,707 |
| Discover Financial Services | | | | 645 | 82,702 |
| OneMain Holdings Incorporated | | | | 9,956 | 575,755 |
| SLM Corporation | | | | 24,502 | 459,413 |
| Synchrony Financial | | | | 12,031 | 598,542 |
| | | | | | 4,277,609 |
| Diversified financial services: 1.26% | | | | | |
| Berkshire Hathaway Incorporated Class B † | | | | 37,223 | 10,637,217 |
| Voya Financial Incorporated | | | | 2,082 | 135,288 |
| | | | | | 10,772,505 |
| Insurance: 1.77% | | | | | |
| AFLAC Incorporated | | | | 7,217 | 409,060 |
| Alleghany Corporation † | | | | 816 | 552,179 |
| American Financial Group Incorporated | | | | 1,303 | 179,736 |
| American International Group Incorporated | | | | 3,558 | 194,124 |
The accompanying notes are an integral part of these financial statements.
8 | Wells Fargo Factor Enhanced U.S. Large Cap Equity Portfolio
Portfolio of investments—August 31, 2021 (unaudited)
| | | | | Shares | Value |
| Insurance (continued) | | | | | |
| Aon plc Class A | | | | 2,208 | $ 633,387 |
| Arthur J. Gallagher & Company | | | | 65 | 9,335 |
| Assurant Incorporated | | | | 3,311 | 563,234 |
| Axis Capital Holdings Limited | | | | 7,149 | 365,814 |
| Chubb Limited | | | | 6,332 | 1,164,581 |
| Cincinnati Financial Corporation | | | | 1,358 | 167,577 |
| Erie Indemnity Company Class A | | | | 488 | 86,420 |
| Everest Reinsurance Group Limited | | | | 744 | 197,086 |
| First American Financial Corporation | | | | 9,273 | 654,025 |
| Globe Life Incorporated | | | | 825 | 79,258 |
| Kemper Corporation | | | | 1,097 | 75,254 |
| Marsh & McLennan Companies Incorporated | | | | 8,070 | 1,268,604 |
| Mercury General Corporation | | | | 16,281 | 972,139 |
| MetLife Incorporated | | | | 11,999 | 743,938 |
| Old Republic International Corporation | | | | 26,800 | 696,800 |
| Progressive Corporation | | | | 11,265 | 1,085,270 |
| Prudential Financial Incorporated | | | | 7,994 | 846,405 |
| Reinsurance Group of America Incorporated | | | | 1,285 | 148,829 |
| The Allstate Corporation | | | | 8,047 | 1,088,598 |
| The Hanover Insurance Group Incorporated | | | | 3,283 | 463,921 |
| The Hartford Financial Services Group Incorporated | | | | 8,821 | 592,948 |
| The Travelers Companies Incorporated | | | | 5,628 | 898,848 |
| UnumProvident Corporation | | | | 30,544 | 813,081 |
| W.R. Berkley Corporation | | | | 1,486 | 111,911 |
| Willis Towers Watson plc | | | | 116 | 25,604 |
| | | | | | 15,087,966 |
| Mortgage REITs: 0.33% | | | | | |
| AGNC Investment Corporation | | | | 89,988 | 1,467,704 |
| Annaly Capital Management Incorporated | | | | 145,892 | 1,267,801 |
| New Residential Investment Corporation | | | | 8,383 | 91,542 |
| | | | | | 2,827,047 |
| Thrifts & mortgage finance: 0.03% | | | | | |
| MGIC Investment Corporation | | | | 16,084 | 245,603 |
| Rocket Companies Incorporated Class A | | | | 2,746 | 47,643 |
| | | | | | 293,246 |
| Health care: 13.97% | | | | | |
| Biotechnology: 2.69% | | | | | |
| AbbVie Incorporated | | | | 37,783 | 4,563,431 |
| Amgen Incorporated | | | | 13,608 | 3,069,012 |
| Biogen Incorporated † | | | | 5,948 | 2,015,837 |
| Exelixis Incorporated † | | | | 38,209 | 732,467 |
| Gilead Sciences Incorporated | | | | 35,675 | 2,596,427 |
| Horizon Therapeutics plc † | | | | 10,794 | 1,166,723 |
| Incyte Corporation † | | | | 10,058 | 769,336 |
| Ionis Pharmaceuticals Incorporated † | | | | 5,738 | 228,143 |
| Moderna Incorporated † | | | | 6,556 | 2,469,580 |
| Natera Incorporated † | | | | 1,159 | 137,260 |
| Neurocrine Biosciences Incorporated † | | | | 4,453 | 423,926 |
| Novavax Incorporated † | | | | 1,427 | 340,397 |
| Regeneron Pharmaceuticals Incorporated † | | | | 2,560 | 1,723,904 |
| Sage Therapeutics Incorporated † | | | | 1,005 | 46,441 |
| Seagen Incorporated † | | | | 1,937 | 324,641 |
The accompanying notes are an integral part of these financial statements.
Wells Fargo Factor Enhanced U.S. Large Cap Equity Portfolio | 9
Portfolio of investments—August 31, 2021 (unaudited)
| | | | | Shares | Value |
| Biotechnology (continued) | | | | | |
| United Therapeutics Corporation † | | | | 6,150 | $ 1,321,512 |
| Vertex Pharmaceuticals Incorporated † | | | | 5,313 | 1,064,141 |
| | | | | | 22,993,178 |
| Health care equipment & supplies: 3.56% | | | | | |
| Abbott Laboratories | | | | 33,682 | 4,256,394 |
| Align Technology Incorporated † | | | | 1,489 | 1,055,701 |
| Baxter International Incorporated | | | | 8,335 | 635,294 |
| Becton Dickinson & Company | | | | 4,885 | 1,229,555 |
| Boston Scientific Corporation † | | | | 19,325 | 872,524 |
| Danaher Corporation | | | | 11,037 | 3,577,754 |
| Dentsply Sirona Incorporated | | | | 12,433 | 767,116 |
| Edwards Lifesciences Corporation † | | | | 9,847 | 1,153,871 |
| Envista Holdings Corporation † | | | | 33,401 | 1,429,229 |
| Globus Medical Incorporated Class A † | | | | 5,255 | 428,808 |
| Hill-Rom Holdings Incorporated | | | | 6,041 | 879,449 |
| Hologic Incorporated † | | | | 4,891 | 387,123 |
| ICU Medical Incorporated † | | | | 4,105 | 818,332 |
| IDEXX Laboratories Incorporated † | | | | 2,327 | 1,567,840 |
| Integra LifeSciences Holdings Corporation † | | | | 7,778 | 585,139 |
| Intuitive Surgical Incorporated † | | | | 1,627 | 1,714,142 |
| Medtronic plc | | | | 26,464 | 3,532,415 |
| Novocure Limited † | | | | 1,500 | 201,315 |
| Quidel Corporation † | | | | 713 | 91,941 |
| ResMed Incorporated | | | | 1,476 | 428,822 |
| STERIS plc | | | | 2,319 | 498,608 |
| Stryker Corporation | | | | 6,301 | 1,746,007 |
| Teleflex Incorporated | | | | 108 | 42,710 |
| The Cooper Companies Incorporated | | | | 1,030 | 464,231 |
| West Pharmaceutical Services Incorporated | | | | 2,197 | 992,209 |
| Zimmer Biomet Holdings Incorporated | | | | 7,158 | 1,076,921 |
| | | | | | 30,433,450 |
| Health care providers & services: 2.25% | | | | | |
| Acadia Healthcare Company Incorporated † | | | | 3,555 | 235,057 |
| Anthem Incorporated | | | | 4,712 | 1,767,613 |
| Centene Corporation † | | | | 8,830 | 556,113 |
| Cigna Corporation | | | | 7,535 | 1,594,783 |
| CVS Health Corporation | | | | 28,292 | 2,444,146 |
| DaVita HealthCare Partners Incorporated † | | | | 1,073 | 140,316 |
| HCA Healthcare Incorporated | | | | 5,995 | 1,516,615 |
| Henry Schein Incorporated † | | | | 6,535 | 493,981 |
| Humana Incorporated | | | | 2,542 | 1,030,578 |
| Laboratory Corporation of America Holdings † | | | | 1,751 | 531,218 |
| Molina Healthcare Incorporated † | | | | 3,890 | 1,045,515 |
| UnitedHealth Group Incorporated | | | | 17,885 | 7,444,989 |
| Universal Health Services Incorporated Class B | | | | 2,463 | 383,637 |
| | | | | | 19,184,561 |
| Health care technology: 0.38% | | | | | |
| Cerner Corporation | | | | 18,049 | 1,378,041 |
| Certara Incorporated † | | | | 6,658 | 223,509 |
| Change Healthcare Incorporated † | | | | 38,112 | 831,985 |
| Veeva Systems Incorporated Class A † | | | | 2,343 | 777,829 |
| | | | | | 3,211,364 |
The accompanying notes are an integral part of these financial statements.
10 | Wells Fargo Factor Enhanced U.S. Large Cap Equity Portfolio
Portfolio of investments—August 31, 2021 (unaudited)
| | | | | Shares | Value |
| Life sciences tools & services: 1.66% | | | | | |
| Agilent Technologies Incorporated | | | | 9,111 | $ 1,598,707 |
| Avantor Incorporated † | | | | 30,446 | 1,200,790 |
| Bio-Techne Corporation | | | | 65 | 32,444 |
| Bruker Corporation | | | | 6,518 | 575,605 |
| Charles River Laboratories International Incorporated † | | | | 2,129 | 944,978 |
| Illumina Incorporated † | | | | 688 | 314,526 |
| IQVIA Holdings Incorporated † | | | | 4,731 | 1,228,783 |
| Mettler-Toledo International Incorporated † | | | | 955 | 1,482,953 |
| PerkinElmer Incorporated | | | | 3,025 | 559,020 |
| PPD Incorporated † | | | | 3,090 | 143,098 |
| QIAGEN NV † | | | | 2,074 | 115,771 |
| Syneos Health Incorporated † | | | | 7,390 | 685,644 |
| Thermo Fisher Scientific Incorporated | | | | 7,289 | 4,045,031 |
| Waters Corporation † | | | | 2,954 | 1,223,015 |
| | | | | | 14,150,365 |
| Pharmaceuticals: 3.43% | | | | | |
| Bristol-Myers Squibb Company | | | | 43,636 | 2,917,503 |
| Catalent Incorporated † | | | | 1,001 | 130,570 |
| Eli Lilly & Company | | | | 14,124 | 3,648,088 |
| Jazz Pharmaceuticals plc † | | | | 4,038 | 531,845 |
| Johnson & Johnson | | | | 51,454 | 8,908,231 |
| Merck & Company Incorporated | | | | 48,928 | 3,732,717 |
| Organon & Company | | | | 74,183 | 2,514,062 |
| Perrigo Company plc | | | | 2,583 | 105,774 |
| Pfizer Incorporated | | | | 108,999 | 5,021,584 |
| Viatris Incorporated | | | | 18,821 | 275,351 |
| Zoetis Incorporated | | | | 7,484 | 1,530,927 |
| | | | | | 29,316,652 |
| Industrials: 9.31% | | | | | |
| Aerospace & defense: 1.61% | | | | | |
| BWX Technologies Incorporated | | | | 1,841 | 105,729 |
| Curtiss-Wright Corporation | | | | 5,170 | 629,603 |
| General Dynamics Corporation | | | | 8,689 | 1,740,494 |
| Hexcel Corporation † | | | | 1,994 | 113,080 |
| Howmet Aerospace Incorporated | | | | 25,927 | 823,182 |
| Huntington Ingalls Industries Incorporated | | | | 5,021 | 1,025,138 |
| L3Harris Technologies Incorporated | | | | 3,488 | 812,739 |
| Lockheed Martin Corporation | | | | 6,871 | 2,472,186 |
| Northrop Grumman Corporation | | | | 4,486 | 1,649,502 |
| Raytheon Technologies Corporation | | | | 24,492 | 2,075,942 |
| Textron Incorporated | | | | 11,951 | 868,479 |
| The Boeing Company † | | | | 6,583 | 1,444,969 |
| | | | | | 13,761,043 |
| Air freight & logistics: 0.55% | | | | | |
| C.H. Robinson Worldwide Incorporated | | | | 7,165 | 645,280 |
| Expeditors International of Washington Incorporated | | | | 3,952 | 492,577 |
| FedEx Corporation | | | | 3,620 | 961,798 |
| GXO Logistics Incorporated † | | | | 222 | 18,157 |
| United Parcel Service Incorporated Class B | | | | 13,139 | 2,570,383 |
| XPO Logistics Incorporated | | | | 222 | 19,294 |
| | | | | | 4,707,489 |
The accompanying notes are an integral part of these financial statements.
Wells Fargo Factor Enhanced U.S. Large Cap Equity Portfolio | 11
Portfolio of investments—August 31, 2021 (unaudited)
| | | | | Shares | Value |
| Airlines: 0.11% | | | | | |
| Alaska Air Group Incorporated † | | | | 5,836 | $ 334,636 |
| American Airlines Group Incorporated † | | | | 1,058 | 21,097 |
| Copa Holdings SA Class A † | | | | 620 | 46,655 |
| Delta Air Lines Incorporated † | | | | 6,726 | 271,999 |
| Southwest Airlines Company † | | | | 5,346 | 266,124 |
| | | | | | 940,511 |
| Building products: 0.71% | | | | | |
| A.O. Smith Corporation | | | | 3,491 | 253,866 |
| Builders FirstSource Incorporated † | | | | 13,080 | 697,033 |
| Carlisle Companies Incorporated | | | | 4,731 | 997,011 |
| Carrier Global Corporation | | | | 6,419 | 369,734 |
| Johnson Controls International plc | | | | 16,347 | 1,222,756 |
| Lennox International Incorporated | | | | 2,084 | 698,515 |
| Masco Corporation | | | | 2,765 | 167,891 |
| Owens Corning Incorporated | | | | 8,352 | 798,034 |
| Trane Technologies plc | | | | 4,455 | 884,318 |
| | | | | | 6,089,158 |
| Commercial services & supplies: 0.47% | | | | | |
| Cintas Corporation | | | | 1,494 | 591,280 |
| Clean Harbors Incorporated † | | | | 5,061 | 519,360 |
| Copart Incorporated † | | | | 292 | 42,141 |
| IAA Incorporated † | | | | 639 | 33,944 |
| MSA Safety Incorporated | | | | 2,734 | 445,205 |
| Republic Services Incorporated | | | | 2,433 | 302,008 |
| Rollins Incorporated | | | | 7,270 | 282,948 |
| Stericycle Incorporated † | | | | 9,492 | 660,643 |
| Waste Management Incorporated | | | | 7,451 | 1,155,725 |
| | | | | | 4,033,254 |
| Construction & engineering: 0.00% | | | | | |
| Quanta Services Incorporated | | | | 268 | 27,363 |
| Electrical equipment: 0.92% | | | | | |
| Acuity Brands Incorporated | | | | 2,975 | 548,977 |
| AMETEK Incorporated | | | | 550 | 74,784 |
| Eaton Corporation plc | | | | 9,741 | 1,639,995 |
| Emerson Electric Company | | | | 10,523 | 1,110,177 |
| Generac Holdings Incorporated † | | | | 989 | 432,173 |
| Hubbell Incorporated | | | | 4,177 | 860,921 |
| nVent Electric plc | | | | 10,784 | 370,538 |
| Regal-Beloit Corporation | | | | 6,606 | 987,069 |
| Rockwell Automation Incorporated | | | | 746 | 242,786 |
| Sensata Technologies Holding plc † | | | | 10,478 | 620,088 |
| Vertiv Holdings Company | | | | 34,515 | 972,288 |
| | | | | | 7,859,796 |
| Industrial conglomerates: 0.93% | | | | | |
| 3M Company | | | | 12,797 | 2,492,069 |
| General Electric Company | | | | 22,646 | 2,387,115 |
| Honeywell International Incorporated | | | | 13,002 | 3,015,294 |
| | | | | | 7,894,478 |
The accompanying notes are an integral part of these financial statements.
12 | Wells Fargo Factor Enhanced U.S. Large Cap Equity Portfolio
Portfolio of investments—August 31, 2021 (unaudited)
| | | | | Shares | Value |
| Machinery: 1.47% | | | | | |
| AGCO Corporation | | | | 9,581 | $ 1,318,537 |
| Caterpillar Incorporated | | | | 10,803 | 2,278,029 |
| Cummins Incorporated | | | | 4,044 | 954,303 |
| Deere & Company | | | | 4,654 | 1,759,352 |
| Donaldson Company Incorporated | | | | 3,428 | 232,247 |
| Dover Corporation | | | | 1,655 | 288,566 |
| Flowserve Corporation | | | | 2,713 | 105,454 |
| Gates Industrial Corporation plc † | | | | 10,884 | 178,280 |
| Illinois Tool Works Incorporated | | | | 4,186 | 974,752 |
| Lincoln Electric Holdings Incorporated | | | | 5,614 | 783,771 |
| Oshkosh Corporation | | | | 4,588 | 525,693 |
| Otis Worldwide Corporation | | | | 5,975 | 551,015 |
| PACCAR Incorporated | | | | 6,267 | 513,079 |
| Parker-Hannifin Corporation | | | | 1,153 | 342,061 |
| Pentair plc | | | | 9,191 | 709,178 |
| Snap-on Incorporated | | | | 672 | 151,166 |
| Stanley Black & Decker Incorporated | | | | 1,572 | 303,820 |
| The Timken Company | | | | 4,657 | 342,476 |
| The Toro Company | | | | 2,072 | 227,796 |
| Xylem Incorporated | | | | 116 | 15,812 |
| | | | | | 12,555,387 |
| Professional services: 0.92% | | | | | |
| Booz Allen Hamilton Holding Corporation | | | | 7,592 | 621,861 |
| CACI International Incorporated Class A † | | | | 2,874 | 740,170 |
| FTI Consulting Incorporated † | | | | 5,271 | 736,411 |
| IHS Markit Limited | | | | 22 | 2,653 |
| Jacobs Engineering Group Incorporated | | | | 8,341 | 1,125,701 |
| Leidos Holdings Incorporated | | | | 3,110 | 305,122 |
| Manpower Incorporated | | | | 15,495 | 1,881,403 |
| Nielsen Holdings plc | | | | 24,442 | 524,525 |
| Robert Half International Incorporated | | | | 12,647 | 1,307,700 |
| Science Applications International Corporation | | | | 7,355 | 619,512 |
| | | | | | 7,865,058 |
| Road & rail: 1.39% | | | | | |
| CSX Corporation | | | | 30,227 | 983,284 |
| J.B. Hunt Transport Services Incorporated | | | | 6,261 | 1,110,701 |
| Kansas City Southern | | | | 304 | 85,324 |
| Knight-Swift Transportation Holdings Incorporated | | | | 7,543 | 391,708 |
| Landstar System Incorporated | | | | 12,027 | 2,020,897 |
| Norfolk Southern Corporation | | | | 2,297 | 582,381 |
| Old Dominion Freight Line Incorporated | | | | 2,345 | 677,048 |
| Ryder System Incorporated | | | | 22,474 | 1,786,458 |
| Schneider National Incorporated Class B | | | | 73,580 | 1,658,493 |
| Uber Technologies Incorporated † | | | | 10,170 | 398,054 |
| Union Pacific Corporation | | | | 9,925 | 2,152,137 |
| | | | | | 11,846,485 |
| Trading companies & distributors: 0.23% | | | | | |
| MSC Industrial Direct Company Class A | | | | 2,315 | 194,946 |
| United Rentals Incorporated † | | | | 367 | 129,423 |
| Univar Incorporated † | | | | 37,650 | 888,917 |
The accompanying notes are an integral part of these financial statements.
Wells Fargo Factor Enhanced U.S. Large Cap Equity Portfolio | 13
Portfolio of investments—August 31, 2021 (unaudited)
| | | | | Shares | Value |
| Trading companies & distributors (continued) | | | | | |
| W.W. Grainger Incorporated | | | | 784 | $ 340,021 |
| Watsco Incorporated | | | | 1,500 | 417,630 |
| | | | | | 1,970,937 |
| Information technology: 28.26% | | | | | |
| Communications equipment: 0.77% | | | | | |
| Cisco Systems Incorporated | | | | 71,524 | 4,221,346 |
| CommScope Holdings Incorporated † | | | | 66,099 | 1,044,364 |
| Juniper Networks Incorporated | | | | 3,781 | 109,573 |
| Motorola Solutions Incorporated | | | | 4,761 | 1,162,731 |
| | | | | | 6,538,014 |
| Electronic equipment, instruments & components: 0.73% | | | | | |
| Amphenol Corporation Class A | | | | 1,349 | 103,374 |
| Arrow Electronics Incorporated † | | | | 15,872 | 1,924,004 |
| Avnet Incorporated | | | | 42,085 | 1,702,759 |
| CDW Corporation of Delaware | | | | 3,712 | 744,664 |
| Jabil Circuit Incorporated | | | | 21,146 | 1,306,400 |
| SYNNEX Corporation | | | | 808 | 102,673 |
| Teledyne Technologies Incorporated † | | | | 104 | 48,192 |
| Vontier Corporation | | | | 9,031 | 328,457 |
| | | | | | 6,260,523 |
| IT services: 5.60% | | | | | |
| Accenture plc Class A | | | | 14,424 | 4,854,541 |
| Akamai Technologies Incorporated † | | | | 1,151 | 130,351 |
| Alliance Data Systems Corporation | | | | 14,606 | 1,432,995 |
| Amdocs Limited | | | | 11,564 | 890,775 |
| Automatic Data Processing Incorporated | | | | 7,577 | 1,583,896 |
| Broadridge Financial Solutions Incorporated | | | | 7,784 | 1,340,560 |
| Cloudflare Incorporated Class A † | | | | 756 | 91,279 |
| Cognizant Technology Solutions Corporation Class A | | | | 24,615 | 1,878,371 |
| Concentrix Corporation † | | | | 8,049 | 1,395,616 |
| DXC Technology Company † | | | | 52,990 | 1,945,793 |
| EPAM Systems Incorporated † | | | | 2,319 | 1,467,486 |
| Euronet Worldwide Incorporated † | | | | 984 | 131,098 |
| Fidelity National Information Services Incorporated | | | | 6,515 | 832,422 |
| Fiserv Incorporated † | | | | 7,577 | 892,495 |
| FleetCor Technologies Incorporated † | | | | 1,728 | 454,948 |
| Gartner Incorporated † | | | | 4,582 | 1,414,647 |
| Genpact Limited | | | | 1,287 | 66,770 |
| Global Payments Incorporated | | | | 1,486 | 241,683 |
| Globant SA † | | | | 1,300 | 418,964 |
| GoDaddy Incorporated Class A † | | | | 3,248 | 238,111 |
| International Business Machines Corporation | | | | 17,246 | 2,420,304 |
| Jack Henry & Associates Incorporated | | | | 1,563 | 275,682 |
| MasterCard Incorporated Class A | | | | 14,956 | 5,178,216 |
| Paychex Incorporated | | | | 10,252 | 1,173,546 |
| PayPal Holdings Incorporated † | | | | 20,415 | 5,892,994 |
| Shift4 Payments Incorporated Class A † | | | | 4,455 | 381,838 |
| Solarwinds Corporation | | | | 6,745 | 115,137 |
| Square Incorporated Class A † | | | | 9,071 | 2,431,663 |
| The Western Union Company | | | | 45,742 | 989,857 |
| Twilio Incorporated Class A † | | | | 351 | 125,293 |
| VeriSign Incorporated † | | | | 1,919 | 415,003 |
The accompanying notes are an integral part of these financial statements.
14 | Wells Fargo Factor Enhanced U.S. Large Cap Equity Portfolio
Portfolio of investments—August 31, 2021 (unaudited)
| | | | | Shares | Value |
| IT services (continued) | | | | | |
| Visa Incorporated Class A | | | | 29,163 | $ 6,681,243 |
| WEX Incorporated † | | | | 500 | 91,785 |
| | | | | | 47,875,362 |
| Semiconductors & semiconductor equipment: 4.97% | | | | | |
| Advanced Micro Devices Incorporated † | | | | 22,773 | 2,521,427 |
| Allegro MicroSystems Incorporated † | | | | 27,094 | 814,175 |
| Analog Devices Incorporated | | | | 10,192 | 1,660,853 |
| Applied Materials Incorporated | | | | 17,886 | 2,416,935 |
| Broadcom Incorporated | | | | 7,281 | 3,620,186 |
| Brooks Automation Incorporated | | | | 1,728 | 146,811 |
| Cirrus Logic Incorporated † | | | | 1,123 | 93,961 |
| Entegris Incorporated | | | | 2,548 | 306,117 |
| First Solar Incorporated † | | | | 2,025 | 190,350 |
| Intel Corporation | | | | 70,224 | 3,796,309 |
| KLA Corporation | | | | 3,370 | 1,145,665 |
| Lam Research Corporation | | | | 2,764 | 1,671,722 |
| Marvell Technology Incorporated | | | | 1,844 | 112,834 |
| Microchip Technology Incorporated | | | | 4,581 | 720,866 |
| Micron Technology Incorporated † | | | | 24,384 | 1,797,101 |
| MKS Instruments Incorporated | | | | 1,070 | 157,483 |
| Monolithic Power Systems Incorporated | | | | 71 | 35,140 |
| NVIDIA Corporation | | | | 41,128 | 9,206,503 |
| NXP Semiconductors NV | | | | 7,781 | 1,673,927 |
| ON Semiconductor Corporation † | | | | 30,317 | 1,344,862 |
| Qorvo Incorporated † | | | | 2,983 | 560,893 |
| Qualcomm Incorporated | | | | 23,560 | 3,456,016 |
| Skyworks Solutions Incorporated | | | | 3,187 | 584,687 |
| Teradyne Incorporated | | | | 2,829 | 343,554 |
| Texas Instruments Incorporated | | | | 20,156 | 3,847,982 |
| Xilinx Incorporated | | | | 1,200 | 186,708 |
| | | | | | 42,413,067 |
| Software: 10.68% | | | | | |
| Adobe Incorporated † | | | | 9,227 | 6,123,960 |
| Anaplan Incorporated † | | | | 5,311 | 318,554 |
| ANSYS Incorporated † | | | | 776 | 283,519 |
| Aspen Technology Incorporated † | | | | 3,812 | 493,654 |
| Atlassian Corporation plc Class A † | | | | 2,552 | 936,737 |
| Autodesk Incorporated † | | | | 4,280 | 1,327,185 |
| Bentley Systems Incorporated CLASS B | | | | 4,561 | 294,139 |
| Cadence Design Systems Incorporated † | | | | 7,802 | 1,275,471 |
| CDK Global Incorporated | | | | 30,997 | 1,289,475 |
| Citrix Systems Incorporated | | | | 2,395 | 246,374 |
| Crowdstrike Holdings Incorporated Class A † | | | | 2,149 | 603,869 |
| Datto Holding Corporation † | | | | 25,866 | 659,583 |
| DocuSign Incorporated † | | | | 3,131 | 927,527 |
| Dolby Laboratories Incorporated Class A | | | | 11,402 | 1,130,052 |
| Doubleverify Holdings Incorporated † | | | | 303 | 11,008 |
| Dropbox Incorporated Class A † | | | | 36,616 | 1,161,093 |
| Duck Creek Technologies Incorporated † | | | | 690 | 32,175 |
| Dynatrace Incorporated † | | | | 640 | 43,987 |
| Elastic NV † | | | | 314 | 50,099 |
| Fair Isaac Corporation † | | | | 1,942 | 892,815 |
| FireEye Incorporated † | | | | 34,179 | 621,716 |
| Five9 Incorporated † | | | | 512 | 81,014 |
The accompanying notes are an integral part of these financial statements.
Wells Fargo Factor Enhanced U.S. Large Cap Equity Portfolio | 15
Portfolio of investments—August 31, 2021 (unaudited)
| | | | | Shares | Value |
| Software (continued) | | | | | |
| Fortinet Incorporated † | | | | 3,902 | $ 1,229,676 |
| HubSpot Incorporated † | | | | 854 | 584,537 |
| Intuit Incorporated | | | | 5,597 | 3,168,518 |
| Manhattan Associates Incorporated † | | | | 7,620 | 1,241,984 |
| McAfee Corporation Class A | | | | 895 | 23,771 |
| Microsoft Corporation | | | | 146,694 | 44,283,985 |
| N-able Incorporated † | | | | 5,749 | 77,784 |
| NCR Corporation † | | | | 4,508 | 191,500 |
| New Relic Incorporated † | | | | 1,140 | 91,166 |
| NortonLifeLock Incorporated | | | | 53,371 | 1,417,534 |
| Nutanix Incorporated Class A † | | | | 9,929 | 366,479 |
| Oracle Corporation | | | | 33,420 | 2,978,725 |
| Palantir Technologies Incorporated Class A † | | | | 26,221 | 690,661 |
| Palo Alto Networks Incorporated † | | | | 2,005 | 924,385 |
| Pegasystems Incorporated | | | | 1,253 | 172,450 |
| PTC Incorporated † | | | | 2,050 | 269,903 |
| RingCentral Incorporated Class A † | | | | 480 | 121,085 |
| Salesforce.com Incorporated † | | | | 15,535 | 4,120,969 |
| ServiceNow Incorporated † | | | | 3,660 | 2,355,722 |
| SS&C Technologies Holdings Incorporated | | | | 17,082 | 1,292,424 |
| Synopsys Incorporated † | | | | 4,168 | 1,384,776 |
| Teradata Corporation † | | | | 35,421 | 1,937,174 |
| Tyler Technologies Incorporated † | | | | 600 | 291,420 |
| VMware Incorporated Class A † | | | | 3,823 | 569,130 |
| Workday Incorporated Class A † | | | | 3,722 | 1,016,702 |
| Zendesk Incorporated † | | | | 3,604 | 445,454 |
| Zoom Video Communications Incorporated † | | | | 3,971 | 1,149,605 |
| | | | | | 91,201,525 |
| Technology hardware, storage & peripherals: 5.51% | | | | | |
| Apple Incorporated | | | | 297,462 | 45,163,655 |
| Hewlett Packard Enterprise Company | | | | 8,422 | 130,204 |
| HP Incorporated | | | | 45,396 | 1,350,077 |
| Western Digital Corporation † | | | | 6,236 | 394,115 |
| Xerox Holdings Corporation | | | | 2,970 | 66,855 |
| | | | | | 47,104,906 |
| Materials: 1.98% | | | | | |
| Chemicals: 1.16% | | | | | |
| Ashland Global Holdings Incorporated | | | | 1,053 | 95,939 |
| Axalta Coating Systems Limited † | | | | 1,813 | 55,369 |
| Celanese Corporation Series A | | | | 2,822 | 447,569 |
| Corteva Incorporated | | | | 5,229 | 229,919 |
| Dow Incorporated | | | | 18,431 | 1,159,310 |
| DuPont de Nemours Incorporated | | | | 3,583 | 265,214 |
| Eastman Chemical Company | | | | 4,231 | 478,780 |
| Ecolab Incorporated | | | | 963 | 217,022 |
| Huntsman Corporation | | | | 40,157 | 1,061,350 |
| LyondellBasell Industries NV Class A | | | | 7,109 | 713,388 |
| Olin Corporation | | | | 26,010 | 1,296,338 |
| PPG Industries Incorporated | | | | 3,558 | 567,679 |
| RPM International Incorporated | | | | 1,466 | 120,637 |
| Scotts Miracle-Gro Company Class A | | | | 954 | 149,616 |
| The Chemours Company | | | | 20,556 | 688,832 |
| The Mosaic Company | | | | 20,802 | 669,408 |
The accompanying notes are an integral part of these financial statements.
16 | Wells Fargo Factor Enhanced U.S. Large Cap Equity Portfolio
Portfolio of investments—August 31, 2021 (unaudited)
| | | | | Shares | Value |
| Chemicals (continued) | | | | | |
| The Sherwin-Williams Company | | | | 3,986 | $ 1,210,429 |
| Westlake Chemical Corporation | | | | 5,338 | 466,274 |
| | | | | | 9,893,073 |
| Construction materials: 0.03% | | | | | |
| Eagle Materials Incorporated | | | | 1,825 | 286,233 |
| Martin Marietta Materials Incorporated | | | | 38 | 14,488 |
| | | | | | 300,721 |
| Containers & packaging: 0.34% | | | | | |
| Amcor plc | | | | 7,336 | 94,268 |
| Avery Dennison Corporation | | | | 2,479 | 558,742 |
| Crown Holdings Incorporated | | | | 2,165 | 237,695 |
| Graphic Packaging Holding Company | | | | 3,400 | 69,768 |
| International Paper Company | | | | 13,956 | 838,616 |
| Packaging Corporation of America | | | | 2,161 | 327,824 |
| Sealed Air Corporation | | | | 2,313 | 141,162 |
| WestRock Company | | | | 12,094 | 629,372 |
| | | | | | 2,897,447 |
| Metals & mining: 0.45% | | | | | |
| Alcoa Corporation † | | | | 11,069 | 491,132 |
| Freeport-McMoRan Incorporated | | | | 17,599 | 640,428 |
| Nucor Corporation | | | | 5,584 | 656,455 |
| Reliance Steel & Aluminum Company | | | | 5,396 | 809,616 |
| Steel Dynamics Incorporated | | | | 9,855 | 665,114 |
| United States Steel Corporation | | | | 20,893 | 558,888 |
| | | | | | 3,821,633 |
| Real estate: 2.26% | | | | | |
| Equity REITs: 2.05% | | | | | |
| American Campus Communities Incorporated | | | | 9,078 | 461,616 |
| American Homes 4 Rent Class A | | | | 8,435 | 353,764 |
| American Tower Corporation | | | | 5,560 | 1,624,465 |
| Apartment Income Corporation REIT | | | | 1,138 | 57,833 |
| AvalonBay Communities Incorporated | | | | 1,607 | 368,935 |
| Brixmor Property Group Incorporated | | | | 4,637 | 108,738 |
| Camden Property Trust | | | | 2,661 | 399,256 |
| Crown Castle International Corporation | | | | 5,676 | 1,105,060 |
| CubeSmart | | | | 10,999 | 588,447 |
| Equinix Incorporated | | | | 667 | 562,581 |
| Equity Lifestyle Properties Incorporated | | | | 386 | 32,837 |
| Equity Residential | | | | 3,607 | 303,240 |
| Essex Property Trust Incorporated | | | | 389 | 128,658 |
| Extra Space Storage Incorporated | | | | 4,025 | 752,313 |
| Gaming and Leisure Properties Incorporated | | | | 8,151 | 401,844 |
| Highwoods Properties Incorporated | | | | 733 | 33,491 |
| Invitation Homes Incorporated | | | | 7,324 | 301,602 |
| Iron Mountain Incorporated | | | | 24,228 | 1,156,887 |
| Lamar Advertising Company Class A | | | | 6,979 | 794,420 |
| Life Storage Incorporated | | | | 3,676 | 457,441 |
| Mid-America Apartment Communities Incorporated | | | | 4,186 | 805,261 |
| National Retail Properties Incorporated | | | | 980 | 46,658 |
| Omega Healthcare Investors Incorporated | | | | 6,102 | 204,600 |
The accompanying notes are an integral part of these financial statements.
Wells Fargo Factor Enhanced U.S. Large Cap Equity Portfolio | 17
Portfolio of investments—August 31, 2021 (unaudited)
| | | | | Shares | Value |
| Equity REITs (continued) | | | | | |
| Prologis Incorporated | | | | 6,107 | $ 822,369 |
| Public Storage Incorporated | | | | 4,222 | 1,366,281 |
| Rayonier Incorporated | | | | 4,385 | 161,280 |
| SBA Communications Corporation | | | | 709 | 254,510 |
| Simon Property Group Incorporated | | | | 5,860 | 787,877 |
| SL Green Realty Corporation | | | | 153 | 10,722 |
| Ventas Incorporated | | | | 7,612 | 425,815 |
| VICI Properties Incorporated | | | | 6,487 | 200,513 |
| Welltower Incorporated | | | | 7,054 | 617,437 |
| Weyerhaeuser Company | | | | 51,579 | 1,856,844 |
| | | | | | 17,553,595 |
| Real estate management & development: 0.21% | | | | | |
| Brookfield Properties Limited | | | | 4,021 | 103,822 |
| CBRE Group Incorporated Class A † | | | | 8,272 | 796,594 |
| Jones Lang LaSalle Incorporated † | | | | 3,471 | 841,475 |
| Opendoor Technologies Incorporated † | | | | 2,625 | 46,541 |
| | | | | | 1,788,432 |
| Utilities: 2.46% | | | | | |
| Electric utilities: 1.43% | | | | | |
| Alliant Energy Corporation | | | | 3,308 | 201,093 |
| American Electric Power Company Incorporated | | | | 7,665 | 686,554 |
| Duke Energy Corporation | | | | 14,534 | 1,521,128 |
| Edison International | | | | 6,325 | 365,838 |
| Entergy Corporation | | | | 1,562 | 172,773 |
| Evergy Incorporated | | | | 1,713 | 117,255 |
| Eversource Energy | | | | 1,325 | 120,217 |
| Exelon Corporation | | | | 26,302 | 1,289,324 |
| FirstEnergy Corporation | | | | 6,272 | 243,793 |
| Hawaiian Electric Industries Incorporated | | | | 4,113 | 179,327 |
| IDACORP Incorporated | | | | 1,704 | 179,516 |
| NextEra Energy Incorporated | | | | 29,530 | 2,480,225 |
| NRG Energy Incorporated | | | | 21,906 | 1,000,447 |
| OGE Energy Corporation | | | | 23,972 | 848,849 |
| PG&E Corporation † | | | | 36,192 | 331,881 |
| Pinnacle West Capital Corporation | | | | 1,614 | 124,117 |
| PPL Corporation | | | | 12,304 | 361,122 |
| The Southern Company | | | | 22,231 | 1,461,244 |
| Xcel Energy Incorporated | | | | 7,728 | 531,300 |
| | | | | | 12,216,003 |
| Gas utilities: 0.11% | | | | | |
| National Fuel Gas Company | | | | 823 | 42,640 |
| UGI Corporation | | | | 19,460 | 901,193 |
| | | | | | 943,833 |
| Independent power & renewable electricity producers: 0.15% | | | | | |
| AES Corporation | | | | 40,314 | 962,295 |
| Vistra Energy Corporation | | | | 15,720 | 300,095 |
| | | | | | 1,262,390 |
| Multi-utilities: 0.65% | | | | | |
| Ameren Corporation | | | | 1,034 | 90,702 |
The accompanying notes are an integral part of these financial statements.
18 | Wells Fargo Factor Enhanced U.S. Large Cap Equity Portfolio
Portfolio of investments—August 31, 2021 (unaudited)
| | | | | Shares | Value |
| Multi-utilities (continued) | | | | | |
| CenterPoint Energy Incorporated | | | | 28,853 | $ 723,922 |
| CMS Energy Corporation | | | | 930 | 59,641 |
| Consolidated Edison Incorporated | | | | 4,837 | 364,952 |
| Dominion Energy Incorporated | | | | 7,741 | 602,559 |
| DTE Energy Company | | | | 3,720 | 447,665 |
| MDU Resources Group Incorporated | | | | 47,036 | 1,513,148 |
| NiSource Incorporated | | | | 5,665 | 139,642 |
| Public Service Enterprise Group Incorporated | | | | 10,036 | 641,702 |
| Sempra Energy | | | | 4,841 | 640,755 |
| WEC Energy Group Incorporated | | | | 3,033 | 286,558 |
| | | | | | 5,511,246 |
| Water utilities: 0.12% | | | | | |
| American Water Works Company Incorporated | | | | 5,003 | 911,797 |
| Essential Utilities Incorporated | | | | 3,098 | 153,754 |
| | | | | | 1,065,551 |
| Total Common stocks (Cost $607,784,483) | | | | | 833,291,975 |
| | | Yield | | | |
| Short-term investments: 1.87% | | | | | |
| Investment companies: 1.87% | | | | | |
| Wells Fargo Government Money Market Fund Select Class ♠∞ | | 0.03% | | 15,976,880 | 15,976,880 |
| Total Short-term investments (Cost $15,976,880) | | | | | 15,976,880 |
| Total investments in securities (Cost $623,761,363) | 99.43% | | | | 849,268,855 |
| Other assets and liabilities, net | 0.57 | | | | 4,909,745 |
| Total net assets | 100.00% | | | | $854,178,600 |
| † | Non-income-earning security |
| ♠ | The issuer of the security is an affiliated person of the Portfolio as defined in the Investment Company Act of 1940. |
| ∞ | The rate represents the 7-day annualized yield at period end. |
| Abbreviations: |
| REIT | Real estate investment trust |
Investments in affiliates
An affiliated investment is an investment in which the Portfolio owns at least 5% of the outstanding voting shares of the issuer or as a result of other relationships, such as the Portfolio and the issuer having the same adviser or investment manager. Transactions with issuers that were either affiliates of the Portfolio at the beginning of the period or the end of the period were as follows:
| | Value,
beginning of
period | Purchases | Sales
proceeds | Net
realized
gains
(losses) | Net
change in
unrealized
gains
(losses) | Value,
end of
period | Shares,
end
of period | Income
from
affiliated
securities |
| Short-term investments | | | | | | | |
| Wells Fargo Government Money Market Fund Select Class | $18,864,948 | $89,358,795 | $(92,246,863) | $0 | $0 | $15,976,880 | 15,976,880 | $3,256 |
The accompanying notes are an integral part of these financial statements.
Wells Fargo Factor Enhanced U.S. Large Cap Equity Portfolio | 19
Portfolio of investments—August 31, 2021 (unaudited)
Futures contracts
| Description | Number of
contracts | Expiration
date | Notional
cost | Notional
value | Unrealized
gains | Unrealized
losses |
| Long | | | | | | |
| E-Mini S&P 500 Index | 88 | 9-17-2021 | $19,391,503 | $19,890,200 | $498,697 | $0 |
The accompanying notes are an integral part of these financial statements.
20 | Wells Fargo Factor Enhanced U.S. Large Cap Equity Portfolio
Statement of assets and liabilities—August 31, 2021 (unaudited)
| | |
| Assets | |
Investments in unaffiliated securities, at value (cost $607,784,483)
| $ 833,291,975 |
Investments in affiliated securites, at value (cost $15,976,880)
| 15,976,880 |
Cash at broker segregated for futures contracts
| 3,983,600 |
Receivable for dividends
| 1,047,519 |
Prepaid expenses and other assets
| 12,824 |
Total assets
| 854,312,798 |
| Liabilities | |
Advisory fee payable
| 59,354 |
Custodian and accounting fee payable
| 29,105 |
Payable for daily variation margin on open futures contracts
| 27,839 |
Professional fees payable
| 17,900 |
Total liabilities
| 134,198 |
Total net assets
| $854,178,600 |
The accompanying notes are an integral part of these financial statements.
Wells Fargo Factor Enhanced U.S. Large Cap Equity Portfolio | 21
Statement of operations—six months ended August 31, 2021 (unaudited)
| | |
| Investment income | |
Dividends (net of foreign withholdings taxes of $24,171)
| $ 5,784,174 |
Income from affiliated securities
| 3,256 |
Total investment income
| 5,787,430 |
| Expenses | |
Advisory fee
| 419,435 |
Custody and accounting fees
| 29,624 |
Professional fees
| 27,127 |
Interest holder report expenses
| 7,074 |
Trustees’ fees and expenses
| 9,771 |
Other fees and expenses
| 10,413 |
Total expenses
| 503,444 |
Less: Fee waivers and/or expense reimbursements
| (75,621) |
Net expenses
| 427,823 |
Net investment income
| 5,359,607 |
| Realized and unrealized gains (losses) on investments | |
| Net realized gains on | |
Unaffiliated securities
| 114,734,527 |
Futures contracts
| 3,787,784 |
Net realized gains on investments
| 118,522,311 |
| Net change in unrealized gains (losses) on | |
Unaffiliated securities
| 21,935,318 |
Futures contracts
| 255,005 |
Net change in unrealized gains (losses) on investments
| 22,190,323 |
Net realized and unrealized gains (losses) on investments
| 140,712,634 |
Net increase in net assets resulting from operations
| $146,072,241 |
The accompanying notes are an integral part of these financial statements.
22 | Wells Fargo Factor Enhanced U.S. Large Cap Equity Portfolio
Statement of changes in net assets
| | | |
| | Six months ended
August 31, 2021
(unaudited) | Year ended
February 28, 2021 |
| Operations | | |
Net investment income
| $ 5,359,607 | $ 15,062,223 |
Net realized gains on investments
| 118,522,311 | 109,367,052 |
Net change in unrealized gains (losses) on investments
| 22,190,323 | 68,934,110 |
Net increase in net assets resulting from operations
| 146,072,241 | 193,363,385 |
| Capital transactions | | |
| Transactions in investors’ beneficial interests | | |
Contributions
| 30,124,712 | 187,853,147 |
Withdrawals
| (125,834,046) | (538,830,448) |
Net decrease in net assets resulting from capital transactions
| (95,709,334) | (350,977,301) |
Total increase (decrease) in net assets
| 50,362,907 | (157,613,916) |
| Net assets | | |
Beginning of period
| 803,815,693 | 961,429,609 |
End of period
| $ 854,178,600 | $ 803,815,693 |
The accompanying notes are an integral part of these financial statements.
Wells Fargo Factor Enhanced U.S. Large Cap Equity Portfolio | 23
| | | Year ended February 28 |
| | Six months ended
August 31, 2021
(unaudited) | 2021 | 2020 1 | 2019 | 2018 2 |
Total return3
| 19.19% | 24.03% | 4.00% | 7.60% | 11.92% |
| Ratios to average net assets (annualized) | | | | | |
Gross expenses
| 0.12% | 0.12% | 0.12% | 0.12% | 0.12% |
Net expenses
| 0.10% * | 0.10% * | 0.11% | 0.11% | 0.12% |
Net investment income
| 1.28% | 1.72% | 2.10% | 2.09% | 1.94% |
| Supplemental data | | | | | |
Portfolio turnover rate
| 37% | 71% | 25% | 23% | 75% |
| * | Ratios reflect expenses which were voluntarily waived by the adviser. Without these voluntary waivers, the net expense ratios would be increased by the following amounts: |
| Six months ended August 31, 2021 (unaudited) | 0.02% |
| Year ended February 28, 2021 | 0.02% |
| 1 | Year ended February 29 |
| 2 | For the period from May 23, 2017 (commencement of operations) to February 28, 2018 |
| 3 | Returns for periods of less than one year are not annualized. |
The accompanying notes are an integral part of these financial statements.
24 | Wells Fargo Factor Enhanced U.S. Large Cap Equity Portfolio
Notes to financial statements (unaudited)
1. ORGANIZATION
Wells Fargo Master Trust (the "Trust"), a Delaware statutory trust organized on March 10, 1999, is an open-end management investment company registered under the Investment Company Act of 1940, as amended (the "1940 Act"). As an investment company, the Trust follows the accounting and reporting guidance in Financial Accounting Standards Board ("FASB") Accounting Standards Codification Topic 946, Financial Services – Investment Companies. These financial statements report on the Wells Fargo Factor Enhanced U.S. Large Cap Equity Portfolio (the "Portfolio") which is a diversified series of the Trust.
Interests in the Portfolio are available solely through private placement transactions that do not involve any "public offering" within the meaning of Section 4(2) of the Investment Company Act of 1933.
On February 23, 2021, Wells Fargo & Company announced that it has entered into a definitive agreement to sell Wells Fargo Asset Management ("WFAM") to GTCR LLC and Reverence Capital Partners, L.P. WFAM is the trade name used by the asset management businesses of Wells Fargo & Company and includes Wells Fargo Funds Management, LLC, the adviser to the Portfolio, Wells Capital Management, LLC and Wells Fargo Asset Management (International) Limited, both registered investment advisers providing subadvisory services to certain funds, and Wells Fargo Funds Distributor, LLC, the Portfolio's principal underwriter. As part of the transaction, Wells Fargo & Company will own a 9.9% equity interest and will continue to serve as an important client and distribution partner.
Consummation of the transaction will result in the automatic termination of the Portfolio’s investment advisory agreement and subadvisory agreements. The Portfolio’s Board of Trustees approved a new investment advisory agreement and a new subadvisory agreement which were subsequently approved on behalf of the feeder funds that were investors in the Portfolio at the close of business on May 28, 2021. The new agreements will take effect upon the closing of the transaction. The transaction is expected to close in the second half of 2021, subject to customary closing conditions.
2. SIGNIFICANT ACCOUNTING POLICIES
The following significant accounting policies, which are consistently followed in the preparation of the financial statements of the Portfolio, are in conformity with U.S. generally accepted accounting principles which require management to make estimates and assumptions that affect the reported amounts of assets and liabilities, disclosure of contingent assets and liabilities at the date of the financial statements, and the reported amounts of income and expenses during the reporting period. Actual results could differ from those estimates.
Securities valuation
All investments are valued each business day as of the close of regular trading on the New York Stock Exchange (generally 4 p.m. Eastern Time), although the Portfolio may deviate from this calculation time under unusual or unexpected circumstances.
Equity securities and futures contracts that are listed on a foreign or domestic exchange or market are valued at the official closing price or, if none, the last sales price. If no sale occurs on the principal exchange or market that day, a fair value price will be determined in accordance with the Portfolio’s Valuation Procedures.
Investments in registered open-end investment companies are valued at net asset value.
Investments which are not valued using any of the methods discussed above are valued at their fair value, as determined in good faith by the Board of Trustees. The Board of Trustees has established a Valuation Committee comprised of the Trustees and has delegated to it the authority to take any actions regarding the valuation of portfolio securities that the Valuation Committee deems necessary or appropriate, including determining the fair value of portfolio securities, unless the determination has been delegated to the Wells Fargo Asset Management Pricing Committee at Wells Fargo Funds Management, LLC ("Funds Management"). The Board of Trustees retains the authority to make or ratify any valuation decisions or approve any changes to the Valuation Procedures as it deems appropriate. On a quarterly basis, the Board of Trustees receives reports on any valuation actions taken by the Valuation Committee or the Wells Fargo Asset Management Pricing Committee which may include items for ratification.
Futures contracts
Futures contracts are agreements between the Portfolio and a counterparty to buy or sell a specific amount of a commodity, financial instrument or currency at a specified price on a specified date. The Portfolio may buy and sell futures contracts in order to gain exposure to, or protect against, changes in security values and is subject to equity price risk. The primary risks associated with the use of futures contracts are the imperfect correlation between changes in market values of securities held by the Portfolio and the prices of futures contracts, and the possibility of an illiquid market. Futures contracts are generally entered into on a regulated futures exchange and cleared through a clearinghouse associated with the exchange. With futures
Wells Fargo Factor Enhanced U.S. Large Cap Equity Portfolio | 25
Notes to financial statements (unaudited)
contracts, there is minimal counterparty risk to the Portfolio since futures contracts are exchange traded and the exchange’s clearinghouse, as the counterparty to all exchange traded futures, guarantees the futures contracts against default.
Upon entering into a futures contract, the Portfolio is required to deposit either cash or securities (initial margin) with the broker in an amount equal to a certain percentage of the contract value. Subsequent payments (variation margin) are paid to or from the broker each day equal to the daily changes in the contract value. Such payments are recorded as unrealized gains or losses and, if any, shown as variation margin receivable (payable) in the Statement of Assets and Liabilities. Should the Portfolio fail to make requested variation margin payments, the broker can gain access to the initial margin to satisfy the Portfolio’s payment obligations. When the contracts are closed, a realized gain or loss is recorded in the Statement of Operations.
Security transactions and income recognition
Securities transactions are recorded on a trade date basis. Realized gains or losses are recorded on the basis of identified cost.
Dividend income is recognized on the ex-dividend date. Dividend income is recorded net of foreign taxes withheld where recovery of such taxes is not assured.
Federal and other taxes
The Portfolio is not required to pay federal income taxes on its net investment income and net capital gains as it is treated as a partnership for federal income tax purposes. All income, gains and losses of the Portfolio are deemed to have been “passed through” to the interest holders in proportion to their holdings of the Portfolio regardless of whether income and gains have been distributed by the Portfolio.
The Portfolio’s income tax returns and all financial records supporting those returns for the prior three fiscal years are subject to examination by the federal revenue authority. Management has analyzed the Portfolio’s tax positions taken on federal, state, and foreign tax returns for all open tax years and does not believe that there are any uncertain tax positions that require recognition of a tax liability.
As of August 31, 2021, the aggregate cost of all investments for federal income tax purposes was $627,325,687 and the unrealized gains (losses) consisted of:
| Gross unrealized gains | $233,903,011 |
| Gross unrealized losses | (11,461,146) |
| Net unrealized gains | $222,441,865 |
3. FAIR VALUATION MEASUREMENTS
Fair value measurements of investments are determined within a framework that has established a fair value hierarchy based upon the various data inputs utilized in determining the value of the Portfolio’s investments. The three-level hierarchy gives the highest priority to unadjusted quoted prices in active markets for identical assets or liabilities (Level 1) and the lowest priority to unobservable inputs (Level 3). The Portfolio’s investments are classified within the fair value hierarchy based on the lowest level of input that is significant to the fair value measurement. The inputs are summarized into three broad levels as follows:
| ■ | Level 1 – quoted prices in active markets for identical securities |
| ■ | Level 2 – other significant observable inputs (including quoted prices for similar securities, interest rates, prepayment speeds, credit risk, etc.) |
| ■ | Level 3 – significant unobservable inputs (including the Portfolio’s own assumptions in determining the fair value of investments) |
The inputs or methodologies used for valuing investments in securities are not necessarily an indication of the risk associated with investing in those securities.
26 | Wells Fargo Factor Enhanced U.S. Large Cap Equity Portfolio
Notes to financial statements (unaudited)
The following is a summary of the inputs used in valuing the Portfolio’s assets and liabilities as of August 31, 2021:
| | Quoted prices
(Level 1) | Other significant
observable inputs
(Level 2) | Significant
unobservable inputs
(Level 3) | Total |
| Assets | | | | |
| Investments in: | | | | |
| Common stocks | | | | |
| Communication services | $ 94,186,834 | $0 | $0 | $ 94,186,834 |
| Consumer discretionary | 94,549,724 | 0 | 0 | 94,549,724 |
| Consumer staples | 51,050,068 | 0 | 0 | 51,050,068 |
| Energy | 15,769,531 | 0 | 0 | 15,769,531 |
| Financials | 80,247,968 | 0 | 0 | 80,247,968 |
| Health care | 119,289,570 | 0 | 0 | 119,289,570 |
| Industrials | 79,550,959 | 0 | 0 | 79,550,959 |
| Information technology | 241,393,397 | 0 | 0 | 241,393,397 |
| Materials | 16,912,874 | 0 | 0 | 16,912,874 |
| Real estate | 19,342,027 | 0 | 0 | 19,342,027 |
| Utilities | 20,999,023 | 0 | 0 | 20,999,023 |
| Short-term investments | | | | |
| Investment companies | 15,976,880 | 0 | 0 | 15,976,880 |
| | 849,268,855 | 0 | 0 | 849,268,855 |
| Futures contracts | 498,697 | 0 | 0 | 498,697 |
| Total assets | $849,767,552 | $0 | $0 | $849,767,552 |
Futures contracts are reported at their cumulative unrealized gains (losses) at measurement date as reported in the table following the Portfolio of Investments. For futures contracts, the current day’s variation margin is reported on the Statement of Assets and Liabilities. All other assets and liabilities are reported at their market value at measurement date.
Additional sector, industry or geographic detail, if any, is included in the Portfolio of Investments.
For the six months ended August 31, 2021, the Portfolio did not have any transfers into/out of Level 3.
4. TRANSACTIONS WITH AFFILIATES
Advisory fee
The Trust has entered into an advisory contract with Funds Management, an indirect wholly owned subsidiary of Wells Fargo & Company ("Wells Fargo"). The adviser is responsible for implementing investment policies and guidelines and for supervising the subadviser, who is responsible for day-to-day portfolio management of the Portfolio. Pursuant to the contract, Funds Management is entitled to receive an advisory fee at the following annual rate based on the Portfolio’s average daily net assets:
| Average daily net assets | Advisory fee |
| First $5 billion | 0.100% |
| Next $5 billion | 0.080 |
| Over $10 billion | 0.060 |
For the six months ended August 31, 2021, the advisory fee was equivalent to an annual rate of 0.10% of the Portfolio’s average daily net assets.
Funds Management has retained the services of a subadviser to provide daily portfolio management to the Portfolio. The fee for subadvisory services is borne by Funds Management. Wells Capital Management, LLC, an affiliate of Funds Management and an indirect wholly owned subsidiary of Wells Fargo, is the subadviser to the Portfolio and is entitled to receive a fee from Funds Management at an annual rate starting at 0.06% and declining to 0.04% as the average daily net assets of the Portfolio increase.
Wells Fargo Factor Enhanced U.S. Large Cap Equity Portfolio | 27
Notes to financial statements (unaudited)
Funds Management has voluntarily waived and/or reimbursed advisory fees to reduce the net operating expense ratio of the Portfolio. These voluntary waivers may be discontinued at any time.
Interfund transactions
The Portfolio may purchase or sell portfolio investment securities to certain other Wells Fargo affiliates pursuant to Rule 17a-7 under the 1940 Act and under procedures adopted by the Board of Trustees. The procedures have been designed to ensure that these interfund transactions, which do not incur broker commissions, are effected at current market prices.
5. INVESTMENT PORTFOLIO TRANSACTIONS
Purchases and sales of investments, excluding U.S. government obligations (if any) and short-term securities, for the six months ended August 31, 2021 were $299,168,561 and $376,434,005, respectively.
6. DERIVATIVE TRANSACTIONS
During the six months ended August 31, 2021, the Portfolio entered into futures contracts to gain market exposure. The Portfolio had an average notional amount of $30,158,836 in long futures contracts during the six months ended August 31, 2021.
The fair value, realized gains or losses and change in unrealized gains or losses, if any, on derivative instruments are reflected in the corresponding financial statement captions.
7. BANK BORROWINGS
The Trust, along with Wells Fargo Variable Trust and Wells Fargo Funds Trust (excluding the money market funds), are parties to a $350,000,000 revolving credit agreement whereby the Portfolio is permitted to use bank borrowings for temporary or emergency purposes, such as to fund interest holders withdrawal requests. Interest under the credit agreement is charged to the Portfolio based on a borrowing rate equal to the higher of the Federal Funds rate in effect on that day plus 1.25% or the overnight bank funding rate in effect on that day plus 1.25%. In addition, an annual commitment fee equal to 0.25% of the unused balance is allocated to each participating fund.
For the six months ended August 31, 2021, there were no borrowings by the Portfolio under the agreement.
8. CONCENTRATION RISKS
As of the end of the period, the Portfolio concentrated its portfolio of investments in the information technology sector. A fund that invests a substantial portion of its assets in any sector may be more affected by changes in that sector than would be a fund whose investments are not heavily weighted in any sector.
9. INDEMNIFICATION
Under the Portfolio's organizational documents, the officers and Trustees have been granted certain indemnification rights against certain liabilities that may arise out of performance of their duties to the Portfolio. The Portfolio has entered into a separate agreement with each Trustee that converts indemnification rights currently existing under the Portfolio’s organizational documents into contractual rights that cannot be changed in the future without the consent of the Trustee. Additionally, in the normal course of business, the Portfolio may enter into contracts with service providers that contain a variety of indemnification clauses. The Portfolio’s maximum exposure under these arrangements is dependent on future claims that may be made against the Portfolio and, therefore, cannot be estimated.
10. CORONAVIRUS (COVID-19) PANDEMIC
On March 11, 2020, the World Health Organization announced that it had made the assessment that coronavirus disease 2019 (“COVID-19”) is a pandemic. The impacts of COVID-19 are affecting the entire global economy, individual companies and investment products, the funds, and the market in general. There is significant uncertainty around the extent and duration of business disruptions related to COVID-19 and the impacts may last for an extended period of time. COVID-19 has led to significant uncertainty and volatility in the financial markets.
11. SUBSEQUENT EVENTS
Wells Fargo Asset Management ("WFAM") announced that it will be changing its company name to Allspring Global Investments upon the closing of the previously announced sale transaction of WFAM by Wells Fargo & Company to GTCR LLC and Reverence Capital Partners, L.P. The new corporate name is expected to go into effect on the closing date of the transaction, which is anticipated to occur in the second half of 2021, subject to customary closing conditions.
28 | Wells Fargo Factor Enhanced U.S. Large Cap Equity Portfolio
Notes to financial statements (unaudited)
The Board of Trustees of the Wells Fargo Funds approved a change in the Portfolio's name to remove “Wells Fargo” from the Portfolio's name and replace with “Allspring” on December 6, 2021.
Following the closing of the transaction, Wells Fargo Funds Management, LLC, the Portfolio's adviser, Wells Capital Management, LLC and Wells Fargo Asset Management (International) Limited, each subadvisers to certain funds, and Wells Fargo Funds Distributor, LLC will each be rebranded as Allspring.
Wells Fargo Factor Enhanced U.S. Large Cap Equity Portfolio | 29
Other information (unaudited)
PROXY VOTING INFORMATION
A description of the policies and procedures used to determine how to vote proxies relating to portfolio securities is available without charge, upon request, by calling 1-800-222-8222, visiting our website at wfam.com, or visiting the SEC website at sec.gov. Information regarding how the proxies related to portfolio securities were voted during the most recent 12-month period ended June 30 is available on the website at wfam.com or by visiting the SEC website at sec.gov.
QUARTERLY PORTFOLIO
The Portfolio files its complete schedule of portfolio holdings with the SEC for the first and third quarters of each fiscal year as an exhibit to its reports on Form N-PORT. Interest holders may view the filed Form N-PORT by visiting the SEC website at sec.gov.
30 | Wells Fargo Factor Enhanced U.S. Large Cap Equity Portfolio
Other information (unaudited)
BOARD OF TRUSTEES AND OFFICERS
Each of the Trustees and Officers listed in the table below acts in identical capacities for each fund in the Wells Fargo family of funds, which consists of 139 mutual funds comprising the Wells Fargo Funds Trust, Wells Fargo Variable Trust, Wells Fargo Master Trust and four closed-end funds (collectively the “Fund Complex”). This table should be read in conjunction with the Prospectus and the Statement of Additional Information1. The mailing address of each Trustee and Officer is 525 Market Street, 12th Floor, San Francisco, CA 94105. Each Trustee and Officer serves an indefinite term, however, each Trustee serves such term until reaching the mandatory retirement age established by the Trustees.
Independent Trustees
Name and
year of birth | Position held and
length of service* | Principal occupations during past five years or longer | Current other
public company or
investment
company
directorships |
William R. Ebsworth
(Born 1957) | Trustee,
since 2015 | Retired. From 1984 to 2013, equities analyst, portfolio manager, research director and chief investment officer at Fidelity Management and Research Company in Boston, Tokyo, and Hong Kong, and retired in 2013 as Chief Investment Officer of Fidelity Strategic Advisers, Inc. where he led a team of investment professionals managing client assets. Prior thereto, Board member of Hong Kong Securities Clearing Co., Hong Kong Options Clearing Corp., the Thailand International Fund, Ltd., Fidelity Investments Life Insurance Company, and Empire Fidelity Investments Life Insurance Company. Audit Committee Chair and Investment Committee Chair of the Vincent Memorial Hospital Endowment (non-profit organization). Mr. Ebsworth is a CFA® charterholder. | N/A |
Jane A. Freeman
(Born 1953) | Trustee,
since 2015;
Chair Liaison,
since 2018 | Retired. From 2012 to 2014 and 1999 to 2008, Chief Financial Officer of Scientific Learning Corporation. From 2008 to 2012, Ms. Freeman provided consulting services related to strategic business projects. Prior to 1999, Portfolio Manager at Rockefeller & Co. and Scudder, Stevens & Clark. Board member of the Harding Loevner Funds from 1996 to 2014, serving as both Lead Independent Director and chair of the Audit Committee. Board member of the Russell Exchange Traded Funds Trust from 2011 to 2012 and the chair of the Audit Committee. Ms. Freeman is also an inactive Chartered Financial Analyst. | N/A |
Isaiah Harris, Jr.
(Born 1952) | Trustee,
since 2009; Audit
Committee
Chair,
since 2019 | Retired. Chairman of the Board of CIGNA Corporation since 2009, and Director since 2005. From 2003 to 2011, Director of Deluxe Corporation. Prior thereto, President and CEO of BellSouth Advertising and Publishing Corp. from 2005 to 2007, President and CEO of BellSouth Enterprises from 2004 to 2005 and President of BellSouth Consumer Services from 2000 to 2003. Emeritus member of the Iowa State University Foundation Board of Governors. Emeritus Member of the Advisory Board of Iowa State University School of Business. Advisory Board Member, Palm Harbor Academy (private school). Mr. Harris is a certified public accountant (inactive status). | CIGNA Corporation |
Judith M. Johnson
(Born 1949) | Trustee,
since 2008 | Retired. Prior thereto, Chief Executive Officer and Chief Investment Officer of Minneapolis Employees Retirement Fund from 1996 to 2008. Ms. Johnson is an attorney, certified public accountant and a certified managerial accountant. | N/A |
David F. Larcker
(Born 1950) | Trustee,
since 2009 | James Irvin Miller Professor of Accounting at the Graduate School of Business (Emeritus), Stanford University, Director of the Corporate Governance Research Initiative and Senior Faculty of The Rock Center for Corporate Governance since 2006. From 2005 to 2008, Professor of Accounting at the Graduate School of Business, Stanford University. Prior thereto, Ernst & Young Professor of Accounting at The Wharton School, University of Pennsylvania from 1985 to 2005. | N/A |
Wells Fargo Factor Enhanced U.S. Large Cap Equity Portfolio | 31
Other information (unaudited)
Name and
year of birth | Position held and
length of service* | Principal occupations during past five years or longer | Current other
public company or
investment
company
directorships |
Olivia S. Mitchell
(Born 1953) | Trustee,
since 2006;
Nominating and
Governance
Committee Chair,
since 2018 | International Foundation of Employee Benefit Plans Professor, Wharton School of the University of Pennsylvania since 1993. Director of Wharton’s Pension Research Council and Boettner Center on Pensions & Retirement Research, and Research Associate at the National Bureau of Economic Research. Previously, Cornell University Professor from 1978 to 1993. | N/A |
Timothy J. Penny
(Born 1951) | Trustee,
since 1996;
Chair,
since 2018 | President and Chief Executive Officer of Southern Minnesota Initiative Foundation, a non-profit organization, since 2007. Member of the Board of Trustees of NorthStar Education Finance, Inc., a non-profit organization, since 2007. | N/A |
James G. Polisson
(Born 1959) | Trustee,
since 2018 | Retired. Chief Marketing Officer, Source (ETF) UK Services, Ltd, from 2015 to 2017. From 2012 to 2015, Principal of The Polisson Group, LLC, a management consulting, corporate advisory and principal investing company. Chief Executive Officer and Managing Director at Russell Investments, Global Exchange Traded Funds from 2010 to 2012. Managing Director of Barclays Global Investors from 1998 to 2010 and Global Chief Marketing Officer for iShares and Barclays Global Investors from 2000 to 2010. Trustee of the San Francisco Mechanics’ Institute, a non-profit organization, from 2013 to 2015. Board member of the Russell Exchange Traded Fund Trust from 2011 to 2012. Director of Barclays Global Investors Holdings Deutschland GmbH from 2006 to 2009. Mr. Polisson is an attorney and has a retired status with the Massachusetts and District of Columbia Bar Associations. | N/A |
Pamela Wheelock
(Born 1959) | Trustee,
since January
2020; previously
Trustee from
January 2018 to
July 2019 | Board member of the Destination Medical Center Economic Development Agency, Rochester, Minnesota since 2019. Interim President of the McKnight Foundation from January to September 2020. Acting Commissioner, Minnesota Department of Human Services, July 2019 through September 2019. Human Services Manager (part-time), Minnesota Department of Human Services, October 2019 through December 2019. Chief Operating Officer, Twin Cities Habitat for Humanity from 2017 to 2019. Vice President of University Services, University of Minnesota from 2012 to 2016. Prior thereto, on the Board of Directors, Governance Committee and Finance Committee for the Minnesota Philanthropy Partners (Saint Paul Foundation) from 2012 to 2018, Interim Chief Executive Officer of Blue Cross Blue Shield of Minnesota from 2011 to 2012, Chairman of the Board from 2009 to 2012 and Board Director from 2003 to 2015. Vice President, Leadership and Community Engagement, Bush Foundation, Saint Paul, Minnesota (a private foundation) from 2009 to 2011. Executive Vice President and Chief Financial Officer, Minnesota Sports and Entertainment from 2004 to 2009 and Senior Vice President from 2002 to 2004. Executive Vice President of the Minnesota Wild Foundation from 2004 to 2008. Commissioner of Finance, State of Minnesota, from 1999 to 2002. Currently Board Chair of the Minnesota Wild Foundation since 2010. | N/A |
* Length of service dates reflect the Trustee’s commencement of service with the Trust’s predecessor entities, where applicable.
32 | Wells Fargo Factor Enhanced U.S. Large Cap Equity Portfolio
Other information (unaudited)
Officers
Name and
year of birth | Position held and
length of service | Principal occupations during past five years or longer |
Andrew Owen
(Born 1960) | President,
since 2017 | Executive Vice President of Wells Fargo & Company and Head of Affiliated Managers, Wells Fargo Asset Management, since 2014. In addition, Mr. Owen is currently President, Chief Executive Officer and Director of Wells Fargo Funds Management, LLC since 2017. Prior thereto, Executive Vice President responsible for marketing, investments and product development for Wells Fargo Funds Management, LLC, from 2009 to 2014. |
Jeremy DePalma
(Born 1974) | Treasurer,
since 2012
(for certain funds in
the Fund Complex);
since 2021 (for
the remaining funds in the
Fund Complex) | Senior Vice President of Wells Fargo Funds Management, LLC since 2009. Senior Vice President of Evergreen Investment Management Company, LLC from 2008 to 2010 and head of the Fund Reporting and Control Team within Fund Administration from 2005 to 2010. |
Michelle Rhee
(Born 1966) | Chief Legal Officer,
since 2019 | Secretary of Wells Fargo Funds Management, LLC and Chief Legal Counsel of Wells Fargo Asset Management since 2018. Deputy General Counsel of Wells Fargo Bank, N.A. since 2020 and Assistant General Counsel of Wells Fargo Bank, N.A. from 2018 to 2020. Associate General Counsel and Managing Director of Bank of America Corporation from 2004 to 2018. |
Matthew Prasse
(Born 1983) | Secretary,
since 2021 | Senior Counsel of the Wells Fargo Legal Department since 2018. Previously, Director and Counsel for Barings LLC from 2015 to 2018. Prior to joining Barings, Associate at Morgan, Lewis & Bockius LLP from 2008 to 2015. |
Michael H. Whitaker
(Born 1967) | Chief Compliance Officer,
since 2016 | Chief Compliance Officer of Wells Fargo Asset Management since 2016. Senior Vice President and Chief Compliance Officer for Fidelity Investments from 2007 to 2016. |
1 The Statement of Additional Information includes additional information about the Trustees and is available, without charge, upon request, by calling 1-800-222-8222 or by visiting the website at wfam.com.
Wells Fargo Factor Enhanced U.S. Large Cap Equity Portfolio | 33
Board considerations (unaudited)
BOARD CONSIDERATION OF INVESTMENT ADVISORY AND SUB-ADVISORY AGREEMENTS:
Wells Fargo Bloomberg Barclays US Aggregate ex-Corporate Portfolio, Wells Fargo Emerging Markets Bond Portfolio, Wells Fargo Factor Enhanced Emerging Markets Equity Portfolio, Wells Fargo Factor Enhanced International Equity Portfolio, Wells Fargo Factor Enhanced U.S. Large Cap Equity Portfolio, Wells Fargo Factor Enhanced U.S. Small Cap Equity Portfolio, Wells Fargo High Yield Corporate Bond Portfolio, Wells Fargo Investment Grade Corporate Bond Portfolio, Wells Fargo Factor Enhanced U.S. Low Volatility Equity Portfolio, Wells Fargo Strategic Retirement Bond Portfolio, and Wells Fargo U.S. REIT Portfolio
Board Considerations – Current Agreements
Under the Investment Company Act of 1940 (the “1940 Act”), the Board of Trustees (the “Board”) of Wells Fargo Master Trust (the “Trust”) must determine annually whether to approve the continuation of the Trust’s investment advisory and sub-advisory agreements. In this regard, at a meeting held on May 17-19, 2021 (the “Meeting”), the Board of the Trust, all the members of which have no direct or indirect interest in the investment advisory and sub-advisory agreements and are not “interested persons” of the Trust, as defined in the 1940 Act (the “Independent Trustees”), reviewed and approved for each of the portfolios of the Trust identified in the table below (individually, a “Portfolio” and collectively, the “Portfolios”): (i) an investment advisory agreement (the “Advisory Agreement”) with Wells Fargo Funds Management, LLC (“Funds Management”); and (ii) an investment sub-advisory agreement (each, a “Sub-Advisory Agreement” and collectively, the “Sub-Advisory Agreements”) with the sub-adviser(s) identified in the table below (each, a “Sub-Adviser” and collectively, the “Sub-Advisers”) for the corresponding Portfolio identified. The Advisory Agreement and the Sub-Advisory Agreements are collectively referred to as the “Advisory Agreements.”
| Master Portfolios | Sub-Advisers |
| Wells Fargo Bloomberg Barclays US Aggregate ex-Corporate Portfolio | Wells Capital Management Incorporated |
| Wells Fargo Emerging Markets Bond Portfolio | Wells Fargo Asset Management (International) Limited and Wells Capital Management Incorporated |
| Wells Fargo Factor Enhanced Emerging Markets Equity Portfolio | Wells Capital Management Incorporated |
| Wells Fargo Factor Enhanced International Equity Portfolio | Wells Capital Management Incorporated |
| Wells Fargo Factor Enhanced U.S. Large Cap Equity Portfolio | Wells Capital Management Incorporated |
| Wells Fargo Factor Enhanced U.S. Small Cap Equity Portfolio | Wells Capital Management Incorporated |
| Wells Fargo High Yield Corporate Bond Portfolio | Wells Capital Management Incorporated |
| Wells Fargo Investment Grade Corporate Bond Portfolio | Wells Capital Management Incorporated |
| Wells Fargo Factor Enhanced U.S. Low Volatility Equity Portfolio | Wells Capital Management Incorporated |
| Wells Fargo Strategic Retirement Bond Portfolio | Wells Capital Management Incorporated |
| Wells Fargo U.S. REIT Portfolio | Wells Capital Management Incorporated |
The Board noted that Wells Fargo & Company recently announced that it had entered into a definitive agreement to sell Wells Fargo Asset Management (“WFAM”), which includes Funds Management and the Sub-Adviser, to GTCR LLC and Reverence Capital Partners, L.P. and/or their affiliates (the “Transaction”). The Board further noted that the Transaction would result in a change-of-control of Funds Management and the Sub-Advisers, which would be considered to be an assignment that would result in the termination of the Advisory Agreements. In light of the Transaction, the Board separately considered for approval a new investment advisory agreement with Funds Management and a new investment sub-advisory agreement with each of the Sub-Advisers (the “New Agreements”) that would replace the Advisory Agreements upon consummation of the Transaction, subject to approval of the New Agreements by the Portfolios’ shareholders. The Board also considered for approval interim agreements to go into effect in the event shareholders do not approve the New Agreements before the Transaction is completed. The interim agreements would allow the Manager and the Sub-Advisers to continue providing services to the Portfolios while the Portfolios continues to seek shareholder approval of the New Agreements. The Board noted that the terms of the interim agreements would be identical to those of the current Advisory Agreements, except for the term and certain escrow provisions.
At the Meeting, the Board considered the factors and reached the conclusions described below relating to the selection of Funds Management and the Sub-Advisers and the approval of the Advisory Agreements. Prior to the Meeting, including at Board meetings held in April and May 2021, the Trustees conferred extensively among themselves and with representatives of Funds Management about these matters. Also, the Board has adopted a team-based approach, with each team consisting of a sub-set of
34 | Wells Fargo Factor Enhanced U.S. Large Cap Equity Portfolio
Board considerations (unaudited)
Trustees, to assist the full Board in the discharge of its duties in reviewing investment performance and other matters throughout the year. The Independent Trustees were assisted in their evaluation of the Advisory Agreements by independent legal counsel, from whom they received separate legal advice and with whom they met separately.
In providing information to the Board, Funds Management and the Sub-Advisers were guided by a detailed set of requests for information submitted to them by independent legal counsel on behalf of the Independent Trustees at the start of the Board’s annual contract renewal process earlier in 2021. In considering and approving the Advisory Agreements, the Trustees considered the information they believed relevant, including but not limited to the information discussed below. The Board considered not only the specific information presented in connection with the Meeting, but also the knowledge gained over time through interaction with Funds Management and the Sub-Advisers about various topics. In this regard, the Board reviewed reports of Funds Management at each of its quarterly meetings, which included, among other things, portfolio reviews and investment performance reports. In addition, the Board and the teams mentioned above confer with portfolio managers at various times throughout the year. The Board did not identify any particular information or consideration that was all-important or controlling, and each individual Trustee may have attributed different weights to various factors.
After its deliberations, the Board unanimously determined that the compensation or the absence of compensation payable to Funds Management and each of the Sub-Advisers under each of the Advisory Agreements was reasonable, and approved the continuation of the Advisory Agreements for a one-year term. The Board considered the approval of the Advisory Agreements for the Portfolios as part of its consideration of agreements for funds across the complex, but its approvals were made on a fund-by-fund basis. The following summarizes a number of important, but not necessarily all, factors considered by the Board in support of its approvals.
Nature, extent and quality of services
The Board received and considered various information regarding the nature, extent and quality of services provided to the Funds by Funds Management and the Sub-Advisers under the Advisory Agreements. This information included a description of the investment advisory services and Portfolio-level administrative services covered by the Advisory Agreement, as well as, among other things, a summary of the background and experience of senior management of WFAM, of which Funds Management and the Sub-Advisers are a part, and a summary of investments made in the business of WFAM. The Board also received a description of Funds Management’s and the Sub-Advisers’ business continuity plans, including a summary of the performance of such plans and any changes thereto during the COVID-19 pandemic, and of their approaches to data privacy and cybersecurity. The Board also received and reviewed information about Funds Management’s role as administrator of the Portfolios’ liquidity risk management program, Funds Management’s approach to risk management, and Funds Management’s intermediary and vendor oversight program.
The Board also considered the qualifications, background, tenure and responsibilities of each of the portfolio managers primarily responsible for the day-to-day portfolio management of the Portfolios. The Board noted that each of the Portfolios replicates the performance of a proprietary index provided by an affiliate of Funds Management, except that each of Wells Fargo Bloomberg Barclays US Aggregate ex-Corporate Portfolio, Wells Fargo Emerging Markets Bond Portfolio, and Wells Fargo Strategic Retirement Bond Portfolio track the performance of a third party index. The Board evaluated the ability of Funds Management and the Sub-Advisers to attract and retain qualified investment professionals, including research, advisory and supervisory personnel.
The Board further considered the compliance programs and compliance records of Funds Management and the Sub-Advisers. In addition, the Board took into account the full range of services provided to the Portfolios by Funds Management and its affiliates. The Board also considered information about retention and back-up arrangements that have been put into place with respect to key personnel of WFAM in connection with the anticipated Transaction, noting that WFAM provided assurances that the announcement and eventual culmination of the Transaction is not expected to result in any diminution in the nature or quality of services provided to the Portfolios.
Portfolio investment performance and expenses
The Board considered the investment performance results for each of the Portfolios over the one- and three-year periods ended December 31, 2020, except for the Wells Fargo Factor Enhanced U.S. Low Volatility Equity Portfolio, for which the Board considered the investment performance results for the quarter ended December 31, 2020. The Board considered these results in comparison to the investment performance of funds in a universe that was determined by Broadridge Inc. (“Broadridge”) to be similar to each respective Portfolios (each, a “Universe”), and in comparison to each Portfolios’ benchmark index and to other comparative data. Broadridge is an independent provider of investment company data. The Board received a description of the methodology used by Broadridge to select the mutual funds in the performance Universe. The Board noted the short performance history of the Portfolios.
Wells Fargo Factor Enhanced U.S. Large Cap Equity Portfolio | 35
Board considerations (unaudited)
With respect to the investment performance of each Portfolio relative to its respective Universe, the Board noted the following: (i) the investment performance of each of Wells Fargo Factor Enhanced International Equity Portfolio and Wells Fargo Factor Enhanced U.S. Small Cap Equity Portfolio was higher than such Portfolio’s respective Universe for the one- and three-year periods under review; (ii) the investment performance of each of Wells Fargo Bloomberg Barclays US Aggregate ex-Corporate Portfolio, Wells Fargo Emerging Markets Bond Portfolio, and Wells Fargo Investment Grade Corporate Bond Portfolio was higher than such Portfolio’s respective Universe for the three-year period under review, and lower than such Portfolio’s respective Universe for the one-year period under review; (iii) the investment performance of each of Wells Fargo Factor Enhanced Emerging Markets Equity Portfolio, Wells Fargo Factor Enhanced U.S. Large Cap Equity Portfolio, Wells Fargo High Yield Corporate Bond Portfolio, Wells Fargo Strategic Retirement Bond Portfolio, and Wells Fargo U.S. REIT Portfolio was lower than such Portfolio’s respective Universe for the one- and three-year periods under review; and (iv) the Wells Fargo Factor Enhanced U.S. Low Volatility Equity Portfolio launched on July 1, 2020 and, given its short operational history, had no historical performance.
With respect to the investment performance of each Portfolio relative to its respective benchmark index, the Board noted the following: (i) the investment performance of each of Wells Fargo Bloomberg Barclays US Aggregate ex-Corporate Portfolio, Wells Fargo Factor Enhanced International Equity Portfolio, Wells Fargo Investment Grade Corporate Bond Portfolio, Wells Fargo Factor Enhanced U.S. Low Volatility Equity Portfolio, and Wells Fargo Strategic Retirement Bond Portfolio was higher than or in range of such Portfolio’s respective benchmark index for all periods under review; (ii) the investment performance of Wells Fargo U.S. REIT Portfolio was in range of the Portfolio’s benchmark index for the three-year period under review, and was lower than the Portfolio’s benchmark index for the one-year period under review; and (iii) the investment performance of each of Wells Fargo Emerging Markets Bond Portfolio, Wells Fargo Factor Enhanced Emerging Markets Equity Portfolio, Wells Fargo Factor Enhanced U.S. Large Cap Equity Portfolio, Wells Fargo Factor Enhanced U.S. Small Cap Equity Portfolio, and Wells Fargo High Yield Corporate Bond Portfolio was lower than such Portfolio’s respective benchmark index for all periods under review.
The Board received information concerning, and discussed factors contributing to, the underperformance of each of Wells Fargo Factor Enhanced Emerging Markets Equity Portfolio, Wells Fargo Factor Enhanced International Equity Portfolio, Wells Fargo Factor Enhanced U.S. Large Cap Equity Portfolio, Wells Fargo High Yield Corporate Bond Portfolio, Wells Fargo Strategic Retirement Bond Portfolio, and Wells Fargo U.S. REIT Portfolio relative to such Portfolio’s Universe and benchmark index for the periods identified above.
The Board also received and considered information regarding the fee rates that are payable to Funds Management for investment advisory services (as discussed below), which are the only fees charged to the Portfolios, relative to corresponding class-specific expense groups that were determined by Broadridge to be similar to the Portfolios (the “Groups”). The Board received a description of the methodology used by Broadridge to select the mutual funds in the expense Groups and an explanation of how funds comprising expense groups and their expense ratios may vary from year-to-year.
The Board took into account the Portfolios’ investment performance and expense information provided to it among the factors considered in deciding to re-approve the Advisory Agreements.
Investment advisory and sub-advisory fee rates
The Board reviewed and considered the contractual fee rates payable by the Portfolios to Funds Management under the Advisory Agreement. The Board also reviewed and considered the contractual investment sub-advisory fee rates that are payable by Funds Management to the Sub-Advisers for investment sub-advisory services.
Among other information reviewed by the Board was a comparison of the Portfolios’ Management Rates with the average contractual investment management fee rates of funds in the expense Groups at a common asset level as well as transfer agency costs of the Portfolios in the expense Groups. The Board noted that the Management Rates of the Portfolios were lower than, equal to, or in range of the sum of these average rates for the Portfolios’ expense Groups.
The Board also received and considered information about the portions of the total management fees that were retained by Funds Management after payment of the fees to the Sub-Advisers for sub-advisory services. In assessing the reasonableness of these amounts, the Board received and evaluated information about the nature and extent of responsibilities retained and risks assumed by Funds Management and not delegated to or assumed by the Sub-Advisers, and about Funds Management’s on-going oversight services. Given the affiliation between Funds Management and the Sub-Advisers, the Board ascribed limited relevance to the allocation of fees between them.
The Board also received and considered information about the nature and extent of services offered and fee rates charged by Funds Management and the Sub-Advisers to other types of clients with investment strategies similar to those of certain Portfolios. In this regard, the Board received information about the significantly greater scope of services, and compliance,
36 | Wells Fargo Factor Enhanced U.S. Large Cap Equity Portfolio
Board considerations (unaudited)
reporting and other legal burdens and risks of managing proprietary mutual funds compared with those associated with managing assets of other types of clients, including third-party sub-advised fund clients and non-mutual fund clients such as institutional separate accounts.
Based on its consideration of the factors and information it deemed relevant, including those described here, the Board determined that the compensation payable to Funds Management under the Advisory Agreement and to the Sub-Advisers under the Sub-Advisory Agreements was reasonable.
Profitability
The Board received and considered information concerning the profitability of Funds Management, as well as the profitability of both WFAM and Wells Fargo & Co. (“Wells Fargo”) from providing services to the funds family as a whole. The Board noted that the Sub-Advisers’ profitability information with respect to providing services to the Portfolios and other funds in the family was subsumed in the WFAM and Wells Fargo profitability analysis.
Funds Management reported on the methodologies and estimates used in calculating profitability, including a description of the methodology used to allocate certain expenses. Among other things, the Board noted that the levels of profitability reported on a fund-by-fund basis varied widely, depending on factors such as the size, type and age of fund.
Based on its review, the Board did not deem the profits reported by Funds Management, WFAM or Wells Fargo from services provided to the Portfolios to be at a level that would prevent it from approving the continuation of the Advisory Agreements.
Economies of scale
The Board received and considered information about the potential for Funds Management to experience economies of scale in the provision of management services to the Portfolios, the difficulties of calculating economies of scale at an individual fund level, and the extent to which potential scale benefits are shared with shareholders. The Board noted the existence of breakpoints in the Portfolios’ management fee structure, which operate generally to reduce the Portfolios’ expense ratios as the Portfolios grow in size, and the size of the Portfolios in relation to such breakpoints. The Board considered that in addition to management fee breakpoints, Funds Management shares potential economies of scale from its management business in a variety of ways, including through fee waiver and expense reimbursement arrangements, competitive management fee rates set at the outset without regard to breakpoints, and investments in the business intended to enhance services available to shareholders.
The Board concluded that Funds Management’s arrangements with respect to the Portfolios, including contractual breakpoints, constituted a reasonable approach to sharing potential economies of scale with the Portfolios and their shareholders.
Other benefits to Funds Management and the Sub-Advisers
The Board received and considered information regarding potential “fall-out” or ancillary benefits received by Funds Management and its affiliates, including the Sub-Advisers, as a result of their relationships with the Portfolios. Ancillary benefits could include, among others, benefits directly attributable to other relationships with the Portfolios and benefits potentially derived from an increase in Funds Management’s and the Sub-Advisers’ businesses as a result of their relationships with the Portfolios. The Board noted that various affiliates of Funds Management may receive distribution-related fees, shareholder servicing payments and sub-transfer agency fees in respect of shares sold or held through them and services provided.
The Board also reviewed information about soft dollar credits earned and utilized by the Sub-Advisers, fees earned by Funds Management and Wells Capital Management Incorporated from managing a private investment vehicle for the fund family’s securities lending collateral, and commissions earned by an affiliated broker from portfolio transactions.
Based on its consideration of the factors and information it deemed relevant, including those described here, the Board did not find that any ancillary benefits received by Funds Management and its affiliates, including the Sub-Advisers, were unreasonable.
Conclusion
At the Meeting, after considering the above-described factors and based on its deliberations and its evaluation of the information described above, the Board unanimously determined that the compensation payable to Funds Management and the Sub-Advisers under each of the Advisory Agreements was reasonable, and approved the continuation of the Advisory Agreements for a one-year term.
Wells Fargo Factor Enhanced U.S. Large Cap Equity Portfolio | 37
Board considerations (unaudited)
Board Considerations – New Agreements
Overview of the Board evaluation process
At a meeting held on May 17-19, 2021 (the “Board Meeting”), the Board of Trustees (the “Board”) of Wells Fargo Master Trust (the “Trust”, and the series identified below, the “Portfolios”) approved the continuation of each Portfolio’s current Investment Advisory Agreement (the “Current Investment Advisory Agreement”) and the current Sub-Advisory Agreements (the “Current Sub-Advisory Agreements”, and collectively, the “Current Agreements”).
| Wells Fargo Disciplined Large Cap Portfolio |
| Wells Fargo Diversified Large Cap Growth Portfolio |
| Wells Fargo Disciplined International Developed Markets Portfolio |
| Wells Fargo Large Company Value Portfolio |
| Wells Fargo Managed Fixed Income Portfolio |
| Wells Fargo Bloomberg Barclays US Aggregate ex-Corporate Portfolio |
| Wells Fargo Emerging Markets Bond Portfolio |
| Wells Fargo Factor Enhanced Emerging Markets Equity Portfolio |
| Wells Fargo Factor Enhanced International Equity Portfolio |
| Wells Fargo Factor Enhanced U.S. Large Cap Equity Portfolio |
| Wells Fargo Factor Enhanced U.S. Low Volatility Equity Portfolio |
| Wells Fargo Factor Enhanced U.S. Small Cap Equity Portfolio |
| Wells Fargo High Yield Corporate Bond Portfolio |
| Wells Fargo Investment Grade Corporate Bond Portfolio |
| Wells Fargo Strategic Retirement Bond Portfolio |
| Wells Fargo U.S. REIT Portfolio |
Each Trustee on the Board is not an “interested person” (as defined in the Investment Company Act of 1940 (the “1940 Act”)) of the Portfolios (collectively, the “Independent Trustees”). The process followed by the Board in considering and approving the continuation of the Current Agreements is referred to herein as the “2021 Annual Approval Process.”
As noted above, the closing of the sale of Wells Fargo Asset Management (“WFAM”) to a holding company (“NewCo”) affiliated with private funds of GTCR LLC (“GTCR”) and of Reverence Capital Partners, L.P. (“Reverence Capital”, and such transaction, the “Transaction”) will result in a change of control of Wells Fargo Funds Management LLC (“Funds Management”), Wells Capital Management Incorporated (“Wells Capital”) and Wells Fargo Asset Management (International) Limited (“WFAM(I) Ltd.”, and together with Funds Management and Wells Capital, the “Advisers”), which will be considered to be an “assignment” of each Portfolio’s Current Agreements under the 1940 Act that will result in the automatic termination of each Portfolio’s Current Agreements. In light of the expected termination of each Portfolio’s Current Agreements upon the closing, at the Board Meeting the Board also considered and approved: (i) a new Investment Advisory Agreement (the “New Investment Advisory Agreement”) between the Trust, on behalf of each Portfolio, and Funds Management; (ii) a new Sub-Advisory Agreement (the “New Wells Capital Sub-Advisory Agreement”) among the Trust, on behalf of each Portfolio, Funds Management and Wells Capital; and (iii) a new Sub-Advisory Agreement (the “New WFAM(I) Ltd Sub-Advisory Agreement”) among the Trust, on behalf of Emerging Markets Bond Portfolio, Funds Management and WFAM(I) Ltd (“WFAMI”); and (iv) a new Sub-Advisory Agreement (the “New Galliard Sub-Advisory Agreement”, and collectively, the “New Agreements”) among the Trust, on behalf of Managed Fixed Income Portfolio, Funds Management and Galliard Capital Management, LLC (“Galliard”, and together with Wells Capital and WFAMI, the “Sub-Advisers”), each of which is intended to go into effect upon the closing. The process followed by the Board in reviewing and approving the New Agreements is referred to herein as the “New Agreement Approval Process.”
At a series of meetings held in April and May 2021 (collectively, “April and May 2021 Meetings”) and at the Board Meeting, the Trustees conferred extensively among themselves and with senior representatives of Funds Management, GTCR and Reverence Capital about the New Agreements and related matters. The Board reviewed and discussed information furnished by Funds Management, GTCR and Reverence Capital that the Board considered reasonably necessary to evaluate the terms of the New Agreements and the services to be provided. At these meetings, senior representatives from Funds Management, GTCR and Reverence Capital made presentations to, and responded to questions from, the Board.
In providing information to the Board in connection with the 2021 annual approval process for the Current Agreements (the “2021 Annual Approval Process”) and the New Agreement Approval Process, Funds Management, GTCR and Reverence Capital (as applicable) were guided by requests for information submitted by independent legal counsel on behalf of the Independent Trustees. In considering and approving the New Agreements, the Trustees considered the information they believed relevant, including but not limited to the information discussed herein. The Board considered not only the specific information presented in
38 | Wells Fargo Factor Enhanced U.S. Large Cap Equity Portfolio
Board considerations (unaudited)
connection with the April and May 2021 Meetings as well as the Board Meeting, but also the knowledge gained over time through interaction with Funds Management and the Sub-Advisers about various topics. In this regard, the Board reviews reports of Funds Management at each of its regular Board meetings, which includes, among other things, portfolio reviews and investment performance reports. In addition, the Board confers with portfolio managers at various times throughout the year. The Board was assisted in its evaluation of the New Agreements by independent legal counsel, from whom the Independent Trustees received separate legal advice and with whom the Independent Trustees met separately. The Board did not identify any particular information or consideration that was all-important or controlling, and each individual Trustee may have attributed different weights to various factors.
Among other information considered by the Board in connection with the Transaction was:
| ■ | Information regarding the Transaction: information about the structure, financing sources and material terms and conditions of the Transaction, including the expected impact on the businesses conducted by the Advisers and by Wells Fargo Funds Distributor LLC. |
| ■ | Information regarding NewCo, GTCR and Reverence Capital: (i) information about NewCo, including information about its expected financial condition and access to capital, and senior leadership team; (ii) the experience of senior management at GTCR and Reverence Capital in acquiring portfolio companies; (iii) the plan to operationalize NewCo, including the transition of necessary infrastructure services through a transition services agreement with Wells Fargo under which Wells Fargo will continue to provide NewCo with certain services for a specified period of time after the closing; and (iv) information regarding regulatory matters, compliance, and risk management functions at NewCo, including resources to be dedicated thereto. |
| ■ | Impact of the Transaction on WFAM and Service Providers: (i) information regarding any changes to personnel and/or other resources of the Advisers as a result of the Transaction, including assurances regarding comparable and competitive compensation arrangements to attract and retain highly qualified personnel; and (ii) information about the organizational and operating structure with respect to NewCo, the Advisers and the Portfolios. |
| ■ | Impact of the Transaction on the Portfolios and their Shareholders: (i) information regarding anticipated benefits to the Portfolios as a result of the Transaction; (ii) a commitment that the Portfolios would not bear any expenses, directly or indirectly, in connection with the Transaction; (iii) confirmation that the Advisers intend to continue to manage the Portfolios in a manner consistent with each Portfolio’s current investment objectives and principal investments strategies; and (iv) a commitment that neither NewCo nor WFAM will take any steps that would impose any “unfair burden” (as that term is used in section 15(f)(1)(B) of the 1940 Act) on the Portfolios as a result of the Transaction. |
With respect to the New Agreements, the Board considered: (i) a representation that, after the closing, all of the Portfolios will continue to be managed and advised by their current Advisers, and that the same portfolio managers of the Sub-Advisers are expected to continue to manage the Portfolios after the Transaction; (ii) information regarding the terms of the New Agreements, including changes as compared to the Current Agreements; (iii) information confirming that the fee rates payable under the New Agreements will not increase as a result of the Transaction as compared to the rates under the Current Agreements; and (iv) assurances that the Transaction is not expected to cause any diminution with respect to the nature, extent and quality of any of the services currently provided to the Portfolios by the Advisers as a result of the Transaction.
In addition to considering information furnished specifically to evaluate the impact of the Transaction on the Portfolios and their respective shareholders in connection with the New Agreement Approval Process, the Board considered information furnished at prior meetings of the Board and its committees, including detailed information provided in connection with the 2021 Annual Approval Process. In this regard, in connection with the 2021 Annual Approval Process, the Board received information about complex-wide and individual Portfolio performance, fees and expenses, including: (i) a report from an independent data provider comparing the investment performance of each Portfolio to the investment performance of comparable funds and benchmark indices, over various time periods; (ii) a report from an independent data provider comparing each Portfolio’s total expense ratio (and its components) to those of comparable funds; (iii) comparative information concerning the fees charged and services provided by the Advisers to each Portfolio in managing other accounts (which may include other mutual funds, collective investment funds and institutional accounts), if any, that employ investment strategies and techniques similar to those used in managing such Portfolio(s); and (iv) profitability analyses of Funds Management, as well as the profitability of both WFAM and Wells Fargo from providing services to the fund family as a whole.
After its deliberations, the Board unanimously determined that the compensation payable to Funds Management and the Sub-Advisers under the New Agreements is reasonable, approved the New Agreements for a two-year term. The Board considered the approval of the New Agreements as part of its consideration of agreements for funds across the complex, but its approvals were made on a fund-by-fund basis. The following summarizes a number of important, but not necessarily all, factors considered by the Board in support of its approvals.
Wells Fargo Factor Enhanced U.S. Large Cap Equity Portfolio | 39
Board considerations (unaudited)
Nature, extent and quality of services
In connection with the 2021 Annual Approval Process, the Board received and considered various information regarding the nature, extent and quality of services provided to each Portfolio by Funds Management and the Sub-Advisers under the Advisory Agreements. This information included a description of the investment advisory services and administrative services covered by the Current Advisory Agreement, as well as, among other things, a summary of the background and experience of senior management of WFAM, of which Funds Management and the Sub-Advisers are a part, and a summary of investments made in the business of WFAM. The Board also received a description of Funds Management’s and the Sub-Advisers’ business continuity plans, including a summary of the performance of such plans and any changes thereto during the COVID-19 pandemic, and of their approaches to data privacy and cybersecurity. The Board also received and reviewed information about Funds Management’s role as administrator of the Portfolios’ liquidity risk management program, Funds Management’s approach to risk management, and Funds Management’s intermediary and vendor oversight program.
In connection with the 2021 Annual Approval Process, the Board also considered the qualifications, background, tenure and responsibilities of each of the portfolio managers primarily responsible for the day-to-day portfolio management of the Portfolios. The Board evaluated the ability of Funds Management and the Sub-Advisers to attract and retain qualified investment professionals, including research, advisory and supervisory personnel.
In connection with the 2021 Annual Approval Process, the Board further considered the compliance programs and compliance records of Funds Management and the Sub-Advisers. In addition, the Board took into account the full range of services provided to the Portfolios by Funds Management and its affiliates.
In connection with the New Agreement Approval Process, the Board considered, among other information, the structure of the Transaction and expected impact, if any, of the Transaction on the operations, facilities, organization and personnel of the Advisers. The Board received assurances from the Advisers that each Portfolio will continue to be advised by its current Advisers after the closing, and that the same individual portfolio managers are expected to continue to manage the Portfolios after the closing. With respect to the recruitment and retention of key personnel, the Board noted information from GTCR, Reverence Capital and the Advisers regarding the potential benefits for employees of joining NewCo. The Board recognized that the personnel who had been extended offers may not accept such offers and personnel changes may occur in the future in the ordinary course.
In addition, the Board considered information regarding the infrastructure, operational capabilities and support staff in place to assist in the portfolio management and operations of the Portfolios, including the provision of administrative services, and the anticipated impact of the Transaction on such matters. The Board also considered the business-related and other risks to which the Advisers may be subject in managing the Portfolios and in connection with the Transaction. The Board also considered the transition and integration plans as a result of the change in ownership of the Advisers from Wells Fargo to NewCo. The Board considered the resources and infrastructure that NewCo intends to devote to its compliance program to ensure compliance with applicable laws and regulations, as well as its risk management program and cybersecurity program. The Board also took into account assurances received from the Advisers, GTCR and Reverence Capital that the Transaction is not expected to cause any diminution in the nature, extent and quality of services provided by the Advisers to the Portfolios and their shareholders.
Investment performance and expenses
In connection with the 2021 Annual Approval Process, the Board considered the investment performance results for each Portfolio over various time periods ended December 31, 2020. The Board considered these results in comparison to the investment performance of funds in a universe that was determined by Broadridge Inc. (“Broadridge”) to be similar to each Portfolio (the “Universe”), and in comparison to each Portfolio’s benchmark index and to other comparative data. Broadridge is an independent provider of investment company data. The Board received a description of the methodology used by Broadridge to select the mutual funds in the performance Universe. Where applicable, the Board received information concerning, and discussed factors contributing to, underperformance of Portfolios relative to the Universe and benchmark for any underperformance periods.
In connection with the 2021 Annual Approval Process, the Board also reviewed the fee rates that are payable to Funds Management for investment advisory services (as discussed below), which are the only fees charged at the Portfolio level, relative to corresponding expense groups that were determined by Broadridge to be similar to the Portfolios (the “Groups”). The Board received a description of the methodology used by Broadridge to select the mutual funds in the expense Groups and an explanation of how funds comprising expense groups and their expense ratios may vary from year-to-year.
In connection with the New Agreement Approval Process, the Board received a commitment that WFAM will maintain fee and expense commitments for at least two years after the closing. The Board took into account each Fund’s investment performance and expense information among the factors considered in deciding to approve the New Agreements.
40 | Wells Fargo Factor Enhanced U.S. Large Cap Equity Portfolio
Board considerations (unaudited)
Investment advisory and sub-advisory fee rates
In connection with the 2021 Annual Approval Process, the Board reviewed and considered the contractual investment advisory fee rate that is payable by each Portfolio to Funds Management for investment advisory services under the Current Advisory Agreement (the “Advisory Agreement Rate”). The Board also reviewed and considered the contractual investment sub-advisory fee rate that is payable by Funds Management to the applicable Sub-Adviser for investment sub-advisory services (the “Sub-Advisory Agreement Rate”).
Among other information reviewed by the Board in connection with the 2021 Annual Approval Process, was a comparison of each Portfolio’s Advisory Agreement Rate with those of other funds in the Portfolio’s expense Group at a common asset level.
In connection with the 2021 Annual Approval Process, the Board also received and considered information about the portion of the total management fee that was retained by Funds Management after payment of the Sub-Advisory Agreement Rates. In assessing the reasonableness of this amount, the Board received and evaluated information about the nature and extent of responsibilities retained and risks assumed by Funds Management and not delegated to or assumed by the Sub-Advisers, and about Funds Management’s on-going oversight services. Given the affiliation between Funds Management and the Sub-Advisers, the Board ascribed limited relevance to the allocation of fees between them.
In connection with the 2021 Annual Approval Process, the Board also received and considered information about the nature and extent of services offered and fee rates charged by Funds Management and the Sub-Advisers to other types of clients, if any, with investment strategies similar to those of each Portfolio. In this regard, the Board received information about the significantly greater scope of services, and compliance, reporting and other legal burdens and risks of managing proprietary mutual funds compared with those associated with managing assets of other types of clients, including third-party sub-advised fund clients and non-mutual fund clients such as institutional separate accounts.
In connection with the New Agreement Approval Process, the Board noted the assurances received by it that there would be no increases to any of the Advisory Agreement Rates or the Sub-Advisory Agreement Rates as a result of the Transaction. The Board also considered that the New Agreements do not change the computation method for calculating such fees, and there is no present intention to reduce expense waiver and reimbursement arrangements that are currently in effect. Based on its consideration of the factors and information it deemed relevant, including those described here, the Board determined that the compensation payable to Funds Management under the New Advisory Agreement and to each of the Sub-Advisers under the applicable new Sub-Advisory Agreement was reasonable.
Profitability
In connection with the 2021 Annual Approval Process, the Board received and considered information concerning the profitability of Funds Management, as well as the profitability of both WFAM and Wells Fargo from providing services to the fund family as a whole. The Board noted that the Sub-Advisers’ profitability information with respect to providing services to each Fund and other funds in the family was subsumed in the WFAM and Wells Fargo profitability analysis.
Funds Management reported on the methodologies and estimates used in calculating profitability in connection with the 2021 Annual Approval Process, including a description of the methodology used to allocate certain expenses. Among other things, the Board noted that the levels of profitability reported on a fund-by-fund basis varied widely, depending on factors such as the size, type and age of fund.
In connection with the New Agreement Approval Process, the Board received certain information about NewCo’s projected financial condition, and reviewed with senior representatives of Funds Management, GTCR and Reverence Capital the underlying assumptions on which such information was based. The Board considered that NewCo is a newly formed entity, with no historical operations, revenues or expenses, and that it is difficult to predict with any degree of certainty the future profitability of NewCo and the Advisers from advisory activities under the New Agreements. The Board considered that the fee rates payable under the New Agreements will not increase as a result of the Transaction as compared to the rates under the Current Agreements, and that the current contractual expense limitations applicable to each Portfolio will not increase. The Board noted that if the New Agreements are approved by shareholders and the Transaction closes, the Board will have the opportunity in the future to review the profitability of NewCo and the Advisers from advisory activities under the New Agreements.
Economies of scale
In connection with the 2021 Annual Approval Process, the Board received and considered information about the potential for Funds Management to experience economies of scale in the provision of advisory services to the Portfolios, the difficulties of calculating economies of scale at an individual fund level, and the extent to which potential scale benefits are shared with Portfolio shareholders. The Board noted the existence of breakpoints in each Portfolio’s advisory fee structure, which operate generally to reduce the Portfolio’s expense ratios as the Portfolio grows in size, and the size of the Portfolio in relation to such breakpoints. The
Wells Fargo Factor Enhanced U.S. Large Cap Equity Portfolio | 41
Board considerations (unaudited)
Board considered that, in addition to advisory fee breakpoints, Funds Management shares potential economies of scale from its management business in a variety of ways, including through fee waiver and expense reimbursement arrangements, competitive management fee rates set at the outset without regard to breakpoints, and investments in the business intended to enhance services available to shareholders.
In connection with the New Agreement Approval Process, the Board noted that NewCo and the Advisers may benefit from possible growth of the Portfolios resulting from enhanced distribution capabilities for their investing funds. However, the Board noted that other factors could also affect the potential for economies of scale, and that it was not possible to quantify any potential future economies of scale. Based upon the information furnished to the Board in connection with the 2021 Annual Approval Process and the New Agreement Approval Process, the Board concluded that Funds Management’s arrangements with respect to each Portfolio, including contractual breakpoints and expense limitation arrangements, constituted a reasonable approach to sharing potential economies of scale with the Portfolio and its shareholders.
“Fall-out” benefits to Funds Management and the Sub-Advisers
In connection with the 2021 Annual Approval Process, the Board received and considered information regarding potential “fall-out” or ancillary benefits received by Funds Management and its affiliates, including the Sub-Advisers, as a result of their relationships with the Portfolios. Ancillary benefits could include, among others, benefits directly attributable to other relationships with the Portfolios and benefits potentially derived from an increase in Funds Management’s and the Sub-Advisers’ business as a result of their relationships with the Portfolios. The Board noted that various current affiliates of Funds Management may receive distribution-related fees, shareholder servicing payments and sub-transfer agency fees in respect of shares sold or held through them and services provided.
In connection with the 2021 Annual Approval Process, the Board also reviewed information about soft dollar credits earned and utilized by the Sub-Advisers, fees earned by Funds Management and Wells Capital from managing a private investment vehicle for the fund family’s securities lending collateral, and commissions earned by an affiliated broker of Wells Fargo from portfolio transactions.
In connection with the New Agreement Approval Process, the Board received information to the effect that the Transaction is not expected to have a material impact on the fall-out benefits currently realized by Funds Management and its affiliates, including the Sub-Advisers. The information reviewed by the Board also noted that several of the ancillary benefits identified for WFAM would be potential ancillary benefits for NewCo, including that the scale and reputation of the Portfolios might benefit NewCo’s broader reputation, product initiatives, technology investment and talent acquisition. Based on its consideration of the factors and information it deemed relevant, including those described here, the Board did not find that any ancillary benefits expected to be received by Funds Management and its affiliates, including NewCo and the Sub-Advisers, under the New Agreements were unreasonable.
Conclusion
At the Board Meeting, after considering the above-described factors and based on its deliberations and its evaluation of the information described above, the Board unanimously determined that the compensation payable to Funds Management and to each of the Sub-Advisers under the New Agreements is reasonable, approved the New Agreements for a two-year term.
42 | Wells Fargo Factor Enhanced U.S. Large Cap Equity Portfolio
Board considerations (unaudited)
Board Considerations - Interim Agreements
At a meeting held on May 17-19, 2021 (the “Board Meeting”), the Boards of Trustees (each, a “Board”, and collectively, the “Boards”) of Wells Fargo Funds Trust, Wells Fargo Master Trust, Wells Fargo Variable Trust, Wells Fargo Global Dividend Opportunity Fund, Wells Fargo Income Opportunities Fund, Wells Fargo Multi-Sector Income Fund and Wells Fargo Utilities and High Income Fund (each a “Trust”, and the series thereof, a “Fund”) reviewed and approved for the Trusts and Funds, as applicable: (i) interim investment management agreements (the “Interim Management Agreements”) with Wells Fargo Funds Management, LLC (“Funds Management”); (ii) interim investment advisory agreements (the “Interim Advisory Agreements”) with Funds Management; and (iii) interim sub-advisory agreements (the “Interim Sub-Advisory Agreements”) with each of Cooke & Bieler, L.P., Galliard Capital Management LLC (“Galliard”), Peregrine Capital Management Inc., Wells Capital Management, LLC (“WellsCap”), and Wells Fargo Asset Management (International) Limited (“WFAMI”, and collectively, the “Sub-Advisers”). Each Trustee on the Board is not an “interested person” (as defined in the Investment Company Act of 1940 (the “1940 Act”) of the Funds (collectively, the “Independent Trustees”). The Interim Management Agreements, Interim Advisory Agreements, and Interim Sub-Advisory Agreements are collectively referred to as the “Interim Advisory Agreements.”
At the Board Meeting, the Boards reviewed and approved the continuation of existing investment management, advisory and sub-advisory agreements (the “Current Advisory Agreements”) for each Trust and Fund, as applicable. The factors considered and conclusions reached by the Boards in approving the Current Advisory Agreements are summarized in the section entitled “Board Considerations – Current Agreements” of this shareholder report. The Boards noted that Wells Fargo & Company has entered into a definitive agreement to sell Wells Fargo Asset Management (“WFAM”), which includes Funds Management, Galliard, WellsCap and WFAMI (the “Affiliated Sub-Advisers”), to a holding company affiliated with private funds of GTCR LLC and Reverence Capital Partners, L.P. (the “Transaction”). The Boards further noted that the Transaction would result in a change-of-control of Funds Management and the Affiliated Sub-Advisers, which would be considered to be an “assignment” under the 1940 Act that would terminate the Current Advisory Agreements. At the Board Meeting, the Boards also reviewed and approved new investment management, advisory and sub-advisory agreements (the “New Advisory Agreements”) for each Trust and Fund, as applicable, that would replace the Current Advisory Agreements upon consummation of the Transaction, subject to approval of the New Advisory Agreements by the applicable Trust’s or Fund’s shareholders. The factors considered and conclusions reached by the Boards in approving the New Advisory Agreements are summarized in the section entitled “Board Considerations – New Agreements” of this shareholder report.
At the Board Meeting, the Boards also approved the Interim Advisory Agreements, which will go into effect for a Trust or Fund only in the event that shareholders of such Trust or Fund do not approve the New Advisory Agreement(s) for the Trust or Fund by the closing date of the Transaction, when the Current Advisory Agreements will terminate. The Board noted that, in such a circumstance, the Interim Advisory Agreements will permit continuity of management by allowing Funds Management and the Sub-Advisers to continue providing services to the Trust or Fund pursuant to the Interim Advisory Agreements while the Trust or Fund continues to solicit shareholder approval of such New Advisory Agreement(s). The Boards noted that the terms of the Interim Advisory Agreements are identical to those of the Current Advisory Agreements, except for the term and the addition of escrow provisions with respect to the advisory fees. The Boards also noted that the entities that would service the Funds and Trusts under the Interim Advisory Agreements are identical to those that provide services under the Current Advisory Agreements and those that will provide services under the New Advisory Agreements.
In approving the Interim Advisory Agreements, the Boards considered the same factors and reached the same conclusions as they considered and reached with respect to the Boards’ approvals of the Current Advisory Agreements and New Advisory Agreements, as applicable, which are described in separate Board Consideration sections within this shareholder report. Prior to the Board Meeting, including at a series of meetings held in April and May 2021, the Trustees conferred extensively among themselves and with senior representatives of Funds Management, GTCR LLC and Reverence Capital Partners, L.P. about the Interim Advisory Agreements and related matters. The Independent Trustees were assisted in their evaluation of the Interim Advisory Agreements by independent legal counsel, from whom they received separate legal advice and with whom they met separately.
At the Board Meeting, after considering the factors and reaching the conclusions described in the separate Board Consideration sections within this shareholder report, the Boards unanimously determined that the compensation payable to Funds Management and to each Sub-Adviser under each of the Interim Advisory Agreements was reasonable, and approved the Interim Advisory Agreements.
Wells Fargo Factor Enhanced U.S. Large Cap Equity Portfolio | 43
For more information
More information about Wells Fargo Funds is available free upon request. To obtain literature, please write, visit the Portfolio's website, or call:
Wells Fargo Funds
P.O. Box 219967
Kansas City, MO 64121-9967
Website: wfam.com
Individual investors: 1-800-222-8222
Retail investment professionals: 1-888-877-9275
Institutional investment professionals: 1-866-765-0778
This report and the financial statements contained herein are submitted for the general information of the interest holders of the Portfolio. If this report is used for promotional purposes, distribution of the report must be accompanied or preceded by a current prospectus. Before investing, please consider the investment objectives, risks, charges, and expenses of the investment. For a current prospectus and, if available, a summary prospectus, containing this information, call
1-800-222-8222 or visit the Portfolio's website at wfam.com. Read the prospectus carefully before you invest or send money.
Wells Fargo Asset Management (WFAM) is the trade name for certain investment advisory/management firms owned by Wells Fargo & Company. These firms include but are not limited to Wells Capital Management, LLC and Wells Fargo Funds Management, LLC. Certain products managed by WFAM entities are distributed by Wells Fargo Funds Distributor, LLC (a broker-dealer and Member FINRA).
This material is for general informational and educational purposes only and is NOT intended to provide investment advice or a recommendation of any kind - including a recommendation for any specific investment, strategy, or plan.
INVESTMENT PRODUCTS: NOT FDIC INSURED ■ NO BANK GUARANTEE ■ MAY LOSE VALUE
© 2021 Wells Fargo & Company. All rights reserved.
Semi-Annual Report
August 31, 2021
Wells Fargo
Factor Enhanced U.S. Low Volatility Equity Portfolio
INVESTMENT PRODUCTS: NOT FDIC INSURED ■ NO BANK GUARANTEE ■ MAY LOSE VALUE
Wells Fargo Factor Enhanced U.S. Low Volatility Equity Portfolio | 1
Portfolio information (unaudited)
| Investment objective | The Portfolio seeks long-term capital appreciation. |
| Adviser | Wells Fargo Funds Management, LLC |
| Subadviser | Wells Capital Management, LLC |
| Portfolio managers | Dennis Beinn, CFA®‡, Harindra de Silva, Ph.D., CFA®‡, Monisha Jayakumar |
| Ten largest holdings (%) as of August 31, 20211 |
| Accenture plc Class A | 1.85 |
| Microsoft Corporation | 1.80 |
| The Kroger Company | 1.67 |
| Eli Lilly & Company | 1.65 |
| Waste Management Incorporated | 1.63 |
| Johnson & Johnson | 1.51 |
| Regeneron Pharmaceuticals Incorporated | 1.51 |
| Adobe Incorporated | 1.50 |
| Gilead Sciences Incorporated | 1.45 |
| Republic Services Incorporated | 1.41 |
| 1 | Figures represent the percentage of the Portfolio's net assets. Holdings are subject to change and may have changed since the date specified. |
| Sector allocation as of August 31, 20211 |
| 1 | Figures represent the percentage of the Portfolio's long-term investments. These amounts are subject to change and may have changed since the date specified. |
| ‡ | CFA® and Chartered Financial Analyst® are trademarks owned by CFA Institute. |
2 | Wells Fargo Factor Enhanced U.S. Low Volatility Equity Portfolio
Portfolio of investments—August 31, 2021 (unaudited)
| | | | | Shares | Value |
| Common stocks: 98.05% | | | | | |
| Communication services: 10.03% | | | | | |
| Diversified telecommunication services: 1.67% | | | | | |
| AT&T Incorporated | | | | 5,364 | $ 147,081 |
| Verizon Communications Incorporated | | | | 5,126 | 281,930 |
| | | | | | 429,011 |
| Entertainment: 3.54% | | | | | |
| Activision Blizzard Incorporated | | | | 2,834 | 233,437 |
| Electronic Arts Incorporated | | | | 1,521 | 220,864 |
| Netflix Incorporated † | | | | 84 | 47,812 |
| Roku Incorporated † | | | | 8 | 2,819 |
| Take-Two Interactive Software Incorporated † | | | | 997 | 160,736 |
| The Walt Disney Company † | | | | 1,360 | 246,568 |
| | | | | | 912,236 |
| Interactive media & services: 1.58% | | | | | |
| Alphabet Incorporated Class A † | | | | 8 | 23,152 |
| Alphabet Incorporated Class C † | | | | 115 | 334,563 |
| Facebook Incorporated Class A † | | | | 50 | 18,969 |
| IAC/InterActiveCorp | | | | 229 | 30,239 |
| | | | | | 406,923 |
| Media: 1.85% | | | | | |
| Altice USA Incorporated † | | | | 110 | 3,018 |
| Charter Communications Incorporated Class A † | | | | 142 | 115,966 |
| Comcast Corporation Class A | | | | 2,797 | 169,722 |
| Fox Corporation Class A | | | | 265 | 9,922 |
| Fox Corporation Class B | | | | 374 | 12,952 |
| Interpublic Group of Companies Incorporated | | | | 286 | 10,648 |
| Liberty Global plc Class A † | | | | 379 | 10,892 |
| News Corporation Class A | | | | 4,470 | 100,441 |
| Omnicom Group Incorporated | | | | 581 | 42,541 |
| Sirius XM Holdings Incorporated | | | | 232 | 1,455 |
| | | | | | 477,557 |
| Wireless telecommunication services: 1.39% | | | | | |
| T-Mobile US Incorporated † | | | | 2,605 | 356,937 |
| Consumer discretionary: 7.15% | | | | | |
| Automobiles: 0.01% | | | | | |
| Ford Motor Company † | | | | 252 | 3,284 |
| Hotels, restaurants & leisure: 2.25% | | | | | |
| Domino's Pizza Incorporated | | | | 147 | 75,983 |
| McDonald's Corporation | | | | 1,259 | 298,962 |
| Starbucks Corporation | | | | 1,627 | 191,156 |
| Yum! Brands Incorporated | | | | 107 | 14,020 |
| | | | | | 580,121 |
| Household durables: 0.15% | | | | | |
| Garmin Limited | | | | 213 | 37,154 |
The accompanying notes are an integral part of these financial statements.
Wells Fargo Factor Enhanced U.S. Low Volatility Equity Portfolio | 3
Portfolio of investments—August 31, 2021 (unaudited)
| | | | | Shares | Value |
| Internet & direct marketing retail: 0.39% | | | | | |
| Amazon.com Incorporated † | | | | 22 | $ 76,357 |
| Chewy Incorporated Class A † | | | | 93 | 8,195 |
| eBay Incorporated | | | | 201 | 15,425 |
| | | | | | 99,977 |
| Leisure products: 0.28% | | | | | |
| Peloton Interactive Incorporated Class A † | | | | 706 | 70,734 |
| Multiline retail: 1.96% | | | | | |
| Dollar General Corporation | | | | 615 | 137,090 |
| Dollar Tree Incorporated † | | | | 601 | 54,415 |
| Target Corporation | | | | 1,266 | 312,677 |
| | | | | | 504,182 |
| Specialty retail: 1.59% | | | | | |
| AutoZone Incorporated † | | | | 82 | 127,030 |
| O'Reilly Automotive Incorporated † | | | | 143 | 84,953 |
| The Home Depot Incorporated | | | | 604 | 197,013 |
| | | | | | 408,996 |
| Textiles, apparel & luxury goods: 0.52% | | | | | |
| Nike Incorporated Class B | | | | 819 | 134,922 |
| Consumer staples: 10.77% | | | | | |
| Beverages: 1.57% | | | | | |
| Boston Beer Company Incorporated Class A † | | | | 72 | 41,055 |
| Molson Coors Brewing Company Class B | | | | 34 | 1,616 |
| PepsiCo Incorporated | | | | 2,307 | 360,792 |
| | | | | | 403,463 |
| Food & staples retailing: 2.83% | | | | | |
| Costco Wholesale Corporation | | | | 83 | 37,806 |
| The Kroger Company | | | | 9,359 | 430,795 |
| Walmart Incorporated | | | | 1,761 | 260,804 |
| | | | | | 729,405 |
| Food products: 3.48% | | | | | |
| Archer Daniels Midland Company | | | | 815 | 48,900 |
| Bunge Limited | | | | 399 | 30,208 |
| Campbell Soup Company | | | | 886 | 36,973 |
| General Mills Incorporated | | | | 232 | 13,412 |
| Hormel Foods Corporation | | | | 3,364 | 153,197 |
| Kellogg Company | | | | 1,423 | 89,848 |
| McCormick & Company Incorporated | | | | 138 | 11,908 |
| Mondelez International Incorporated Class A | | | | 1,707 | 105,953 |
| The Hershey Company | | | | 1,832 | 325,546 |
| The J.M. Smucker Company | | | | 478 | 59,114 |
| Tyson Foods Incorporated Class A | | | | 257 | 20,180 |
| | | | | | 895,239 |
| Household products: 2.78% | | | | | |
| Church & Dwight Company Incorporated | | | | 1,078 | 90,185 |
| Colgate-Palmolive Company | | | | 1,528 | 119,108 |
| Kimberly-Clark Corporation | | | | 599 | 82,548 |
The accompanying notes are an integral part of these financial statements.
4 | Wells Fargo Factor Enhanced U.S. Low Volatility Equity Portfolio
Portfolio of investments—August 31, 2021 (unaudited)
| | | | | Shares | Value |
| Household products (continued) | | | | | |
| The Clorox Company | | | | 555 | $ 93,268 |
| The Procter & Gamble Company | | | | 2,317 | 329,918 |
| | | | | | 715,027 |
| Tobacco: 0.11% | | | | | |
| Philip Morris International Incorporated | | | | 268 | 27,604 |
| Energy: 0.19% | | | | | |
| Oil, gas & consumable fuels: 0.19% | | | | | |
| Cheniere Energy Incorporated † | | | | 572 | 50,027 |
| Financials: 6.10% | | | | | |
| Capital markets: 1.55% | | | | | |
| Ameriprise Financial Incorporated | | | | 51 | 13,918 |
| Cboe Global Markets Incorporated | | | | 670 | 84,521 |
| CME Group Incorporated | | | | 569 | 114,779 |
| Intercontinental Exchange Incorporated | | | | 740 | 88,452 |
| Raymond James Financial Incorporated | | | | 31 | 4,337 |
| SEI Investments Company | | | | 287 | 18,026 |
| T. Rowe Price Group Incorporated | | | | 51 | 11,417 |
| The NASDAQ Incorporated | | | | 34 | 6,657 |
| Tradeweb Markets Incorporated Class A | | | | 657 | 57,166 |
| | | | | | 399,273 |
| Diversified financial services: 0.46% | | | | | |
| Berkshire Hathaway Incorporated Class B † | | | | 412 | 117,737 |
| Insurance: 3.92% | | | | | |
| Alleghany Corporation † | | | | 17 | 11,504 |
| Aon plc Class A | | | | 715 | 205,105 |
| Arthur J. Gallagher & Company | | | | 1,140 | 163,727 |
| Assurant Incorporated | | | | 52 | 8,846 |
| Brown & Brown Incorporated | | | | 1,363 | 79,122 |
| Erie Indemnity Company Class A | | | | 90 | 15,938 |
| Everest Reinsurance Group Limited | | | | 16 | 4,238 |
| Marsh & McLennan Companies Incorporated | | | | 1,247 | 196,028 |
| Progressive Corporation | | | | 1,080 | 104,047 |
| The Allstate Corporation | | | | 819 | 110,794 |
| The Travelers Companies Incorporated | | | | 393 | 62,766 |
| W.R. Berkley Corporation | | | | 47 | 3,540 |
| Willis Towers Watson plc | | | | 204 | 45,027 |
| | | | | | 1,010,682 |
| Mortgage REITs: 0.17% | | | | | |
| AGNC Investment Corporation | | | | 1,494 | 24,367 |
| Annaly Capital Management Incorporated | | | | 2,183 | 18,970 |
| | | | | | 43,337 |
| Health care: 18.74% | | | | | |
| Biotechnology: 6.39% | | | | | |
| AbbVie Incorporated | | | | 100 | 12,078 |
| Amgen Incorporated | | | | 413 | 93,144 |
| Biogen Incorporated † | | | | 34 | 11,523 |
| BioMarin Pharmaceutical Incorporated † | | | | 452 | 38,063 |
The accompanying notes are an integral part of these financial statements.
Wells Fargo Factor Enhanced U.S. Low Volatility Equity Portfolio | ��5
Portfolio of investments—August 31, 2021 (unaudited)
| | | | | Shares | Value |
| Biotechnology (continued) | | | | | |
| Gilead Sciences Incorporated | | | | 5,121 | $ 372,706 |
| Horizon Therapeutics plc † | | | | 1,127 | 121,817 |
| Incyte Corporation † | | | | 1,111 | 84,980 |
| Moderna Incorporated † | | | | 501 | 188,722 |
| Regeneron Pharmaceuticals Incorporated † | | | | 577 | 388,552 |
| Seagen Incorporated † | | | | 194 | 32,514 |
| Vertex Pharmaceuticals Incorporated † | | | | 1,501 | 300,634 |
| | | | | | 1,644,733 |
| Health care equipment & supplies: 4.16% | | | | | |
| Abbott Laboratories | | | | 616 | 77,844 |
| Baxter International Incorporated | | | | 1,505 | 114,711 |
| Becton Dickinson & Company | | | | 248 | 62,422 |
| Danaher Corporation | | | | 1,054 | 341,665 |
| Dentsply Sirona Incorporated | | | | 32 | 1,974 |
| IDEXX Laboratories Incorporated † | | | | 5 | 3,369 |
| Masimo Corporation † | | | | 226 | 61,368 |
| Medtronic plc | | | | 2,096 | 279,774 |
| The Cooper Companies Incorporated | | | | 170 | 76,621 |
| West Pharmaceutical Services Incorporated | | | | 107 | 48,323 |
| Zimmer Biomet Holdings Incorporated | | | | 21 | 3,159 |
| | | | | | 1,071,230 |
| Health care providers & services: 1.29% | | | | | |
| Anthem Incorporated | | | | 298 | 111,789 |
| Humana Incorporated | | | | 34 | 13,784 |
| Molina Healthcare Incorporated † | | | | 50 | 13,439 |
| UnitedHealth Group Incorporated | | | | 464 | 193,149 |
| | | | | | 332,161 |
| Health care technology: 0.33% | | | | | |
| Cerner Corporation | | | | 715 | 54,590 |
| Teladoc Incorporated † | | | | 50 | 7,221 |
| Veeva Systems Incorporated Class A † | | | | 70 | 23,239 |
| | | | | | 85,050 |
| Life sciences tools & services: 0.56% | | | | | |
| 10x Genomics Incorporated Class A † | | | | 277 | 48,730 |
| Agilent Technologies Incorporated | | | | 90 | 15,792 |
| Avantor Incorporated † | | | | 56 | 2,209 |
| Bio-Rad Laboratories Incorporated Class A † | | | | 87 | 70,019 |
| Mettler-Toledo International Incorporated † | | | | 5 | 7,764 |
| | | | | | 144,514 |
| Pharmaceuticals: 6.01% | | | | | |
| Bristol-Myers Squibb Company | | | | 1,357 | 90,729 |
| Eli Lilly & Company | | | | 1,642 | 424,112 |
| Jazz Pharmaceuticals plc † | | | | 50 | 6,586 |
| Johnson & Johnson | | | | 2,247 | 389,023 |
| Merck & Company Incorporated | | | | 3,947 | 301,117 |
| Pfizer Incorporated | | | | 5,092 | 234,588 |
| Zoetis Incorporated | | | | 486 | 99,416 |
| | | | | | 1,545,571 |
The accompanying notes are an integral part of these financial statements.
6 | Wells Fargo Factor Enhanced U.S. Low Volatility Equity Portfolio
Portfolio of investments—August 31, 2021 (unaudited)
| | | | | Shares | Value |
| Industrials: 9.25% | | | | | |
| Aerospace & defense: 0.25% | | | | | |
| General Dynamics Corporation | | | | 37 | $ 7,411 |
| Lockheed Martin Corporation | | | | 107 | 38,499 |
| Northrop Grumman Corporation | | | | 46 | 16,914 |
| | | | | | 62,824 |
| Air freight & logistics: 1.34% | | | | | |
| C.H. Robinson Worldwide Incorporated | | | | 1,798 | 161,928 |
| Expeditors International of Washington Incorporated | | | | 1,021 | 127,257 |
| United Parcel Service Incorporated Class B | | | | 284 | 55,559 |
| | | | | | 344,744 |
| Building products: 0.05% | | | | | |
| Carrier Global Corporation | | | | 210 | 12,096 |
| Commercial services & supplies: 4.45% | | | | | |
| Republic Services Incorporated | | | | 2,912 | 361,467 |
| Rollins Incorporated | | | | 1,007 | 39,192 |
| Waste Connections Incorporated | | | | 2,518 | 325,351 |
| Waste Management Incorporated | | | | 2,709 | 420,193 |
| | | | | | 1,146,203 |
| Electrical equipment: 0.71% | | | | | |
| Eaton Corporation plc | | | | 57 | 9,597 |
| Generac Holdings Incorporated † | | | | 343 | 149,884 |
| Sensata Technologies Holding plc † | | | | 408 | 24,145 |
| | | | | | 183,626 |
| Industrial conglomerates: 0.49% | | | | | |
| 3M Company | | | | 85 | 16,553 |
| Honeywell International Incorporated | | | | 474 | 109,925 |
| | | | | | 126,478 |
| Machinery: 0.37% | | | | | |
| Cummins Incorporated | | | | 50 | 11,799 |
| Deere & Company | | | | 186 | 70,314 |
| Otis Worldwide Corporation | | | | 134 | 12,357 |
| | | | | | 94,470 |
| Professional services: 0.54% | | | | | |
| Booz Allen Hamilton Holding Corporation | | | | 940 | 76,995 |
| Jacobs Engineering Group Incorporated | | | | 215 | 29,016 |
| Robert Half International Incorporated | | | | 145 | 14,993 |
| Verisk Analytics Incorporated | | | | 93 | 18,764 |
| | | | | | 139,768 |
| Road & rail: 1.05% | | | | | |
| AMERCO | | | | 83 | 54,875 |
| J.B. Hunt Transport Services Incorporated | | | | 140 | 24,836 |
| Knight-Swift Transportation Holdings Incorporated | | | | 176 | 9,140 |
| Old Dominion Freight Line Incorporated | | | | 631 | 182,182 |
| | | | | | 271,033 |
The accompanying notes are an integral part of these financial statements.
Wells Fargo Factor Enhanced U.S. Low Volatility Equity Portfolio | 7
Portfolio of investments—August 31, 2021 (unaudited)
| | | | | Shares | Value |
| Information technology: 24.98% | | | | | |
| Communications equipment: 2.02% | | | | | |
| Arista Networks Incorporated † | | | | 36 | $ 13,303 |
| Cisco Systems Incorporated | | | | 2,828 | 166,909 |
| Juniper Networks Incorporated | | | | 1,066 | 30,893 |
| Motorola Solutions Incorporated | | | | 1,267 | 309,427 |
| | | | | | 520,532 |
| Electronic equipment, instruments & components: 2.06% | | | | | |
| Amphenol Corporation Class A | | | | 2,053 | 157,321 |
| Arrow Electronics Incorporated † | | | | 570 | 69,095 |
| Keysight Technologies Incorporated † | | | | 1,314 | 235,705 |
| TE Connectivity Limited | | | | 91 | 13,670 |
| Zebra Technologies Corporation Class A † | | | | 91 | 53,432 |
| | | | | | 529,223 |
| IT services: 11.06% | | | | | |
| Accenture plc Class A | | | | 1,418 | 477,242 |
| Akamai Technologies Incorporated † | | | | 1,269 | 143,714 |
| Automatic Data Processing Incorporated | | | | 809 | 169,113 |
| Broadridge Financial Solutions Incorporated | | | | 771 | 132,782 |
| Cloudflare Incorporated Class A † | | | | 647 | 78,119 |
| Cognizant Technology Solutions Corporation Class A | | | | 1,898 | 144,836 |
| EPAM Systems Incorporated † | | | | 255 | 161,367 |
| Fidelity National Information Services Incorporated | | | | 627 | 80,112 |
| Fiserv Incorporated † | | | | 1,451 | 170,913 |
| Gartner Incorporated † | | | | 30 | 9,262 |
| International Business Machines Corporation | | | | 561 | 78,731 |
| Jack Henry & Associates Incorporated | | | | 972 | 171,441 |
| MasterCard Incorporated Class A | | | | 411 | 142,301 |
| Paychex Incorporated | | | | 2,973 | 340,319 |
| The Western Union Company | | | | 6,104 | 132,091 |
| VeriSign Incorporated † | | | | 381 | 82,395 |
| Visa Incorporated Class A | | | | 1,445 | 331,050 |
| | | | | | 2,845,788 |
| Semiconductors & semiconductor equipment: 1.28% | | | | | |
| Analog Devices Incorporated | | | | 43 | 7,083 |
| Broadcom Incorporated | | | | 110 | 54,693 |
| Intel Corporation | | | | 45 | 2,433 |
| ON Semiconductor Corporation † | | | | 39 | 1,730 |
| Qualcomm Incorporated | | | | 86 | 12,615 |
| Texas Instruments Incorporated | | | | 1,317 | 251,428 |
| | | | | | 329,982 |
| Software: 8.46% | | | | | |
| Adobe Incorporated † | | | | 581 | 385,610 |
| Black Knight Incorporated † | | | | 1,477 | 111,765 |
| Citrix Systems Incorporated | | | | 1,534 | 157,803 |
| Dropbox Incorporated Class A † | | | | 313 | 9,925 |
| Fortinet Incorporated † | | | | 107 | 33,720 |
| Intuit Incorporated | | | | 158 | 89,445 |
| Microsoft Corporation | | | | 1,536 | 463,688 |
| NortonLifeLock Incorporated | | | | 1,929 | 51,234 |
| Oracle Corporation | | | | 3,469 | 309,192 |
The accompanying notes are an integral part of these financial statements.
8 | Wells Fargo Factor Enhanced U.S. Low Volatility Equity Portfolio
Portfolio of investments—August 31, 2021 (unaudited)
| | | | | Shares | Value |
| Software (continued) | | | | | |
| Palo Alto Networks Incorporated † | | | | 140 | $ 64,546 |
| SS&C Technologies Holdings Incorporated | | | | 224 | 16,948 |
| Synopsys Incorporated † | | | | 84 | 27,908 |
| Tyler Technologies Incorporated † | | | | 515 | 250,136 |
| VMware Incorporated Class A † | | | | 52 | 7,741 |
| Zoom Video Communications Incorporated † | | | | 361 | 104,510 |
| Zscaler Incorporated † | | | | 339 | 94,357 |
| | | | | | 2,178,528 |
| Technology hardware, storage & peripherals: 0.10% | | | | | |
| Apple Incorporated | | | | 167 | 25,356 |
| Materials: 1.16% | | | | | |
| Chemicals: 0.19% | | | | | |
| Air Products & Chemicals Incorporated | | | | 116 | 31,263 |
| Dow Incorporated | | | | 68 | 4,277 |
| Eastman Chemical Company | | | | 34 | 3,847 |
| LyondellBasell Industries NV Class A | | | | 10 | 1,004 |
| The Mosaic Company | | | | 225 | 7,241 |
| | | | | | 47,632 |
| Metals & mining: 0.97% | | | | | |
| Newmont Corporation | | | | 4,307 | 249,763 |
| Real estate: 2.61% | | | | | |
| Equity REITs: 2.61% | | | | | |
| American Tower Corporation | | | | 122 | 35,645 |
| Camden Property Trust | | | | 28 | 4,201 |
| Crown Castle International Corporation | | | | 710 | 138,230 |
| Extra Space Storage Incorporated | | | | 721 | 134,762 |
| Iron Mountain Incorporated | | | | 139 | 6,637 |
| Mid-America Apartment Communities Incorporated | | | | 53 | 10,196 |
| Public Storage Incorporated | | | | 978 | 316,491 |
| SBA Communications Corporation | | | | 37 | 13,282 |
| Weyerhaeuser Company | | | | 313 | 11,268 |
| | | | | | 670,712 |
| Utilities: 7.07% | | | | | |
| Electric utilities: 4.91% | | | | | |
| Alliant Energy Corporation | | | | 449 | 27,295 |
| American Electric Power Company Incorporated | | | | 1,123 | 100,587 |
| Duke Energy Corporation | | | | 2,476 | 259,138 |
| Evergy Incorporated | | | | 21 | 1,437 |
| Eversource Energy | | | | 454 | 41,191 |
| Exelon Corporation | | | | 155 | 7,598 |
| NextEra Energy Incorporated | | | | 3,989 | 335,036 |
| The Southern Company | | | | 3,898 | 256,216 |
| Xcel Energy Incorporated | | | | 3,438 | 236,363 |
| | | | | | 1,264,861 |
| Gas utilities: 0.05% | | | | | |
| UGI Corporation | | | | 254 | 11,763 |
The accompanying notes are an integral part of these financial statements.
Wells Fargo Factor Enhanced U.S. Low Volatility Equity Portfolio | 9
Portfolio of investments—August 31, 2021 (unaudited)
| | | | | Shares | Value |
| Multi-utilities: 1.91% | | | | | |
| CenterPoint Energy Incorporated | | | | 386 | $ 9,685 |
| CMS Energy Corporation | | | | 908 | 58,230 |
| Consolidated Edison Incorporated | | | | 2,733 | 206,205 |
| Dominion Energy Incorporated | | | | 692 | 53,865 |
| DTE Energy Company | | | | 97 | 11,673 |
| Public Service Enterprise Group Incorporated | | | | 65 | 4,156 |
| WEC Energy Group Incorporated | | | | 1,569 | 148,239 |
| | | | | | 492,053 |
| Water utilities: 0.20% | | | | | |
| American Water Works Company Incorporated | | | | 283 | 51,577 |
| Total Common stocks (Cost $20,537,162) | | | | | 25,236,099 |
| | | Yield | | | |
| Short-term investments: 1.36% | | | | | |
| Investment companies: 1.36% | | | | | |
| Wells Fargo Government Money Market Fund Select Class ♠∞ | | 0.03% | | 351,068 | 351,068 |
| Total Short-term investments (Cost $351,068) | | | | | 351,068 |
| Total investments in securities (Cost $20,888,230) | 99.41% | | | | 25,587,167 |
| Other assets and liabilities, net | 0.59 | | | | 150,735 |
| Total net assets | 100.00% | | | | $25,737,902 |
| † | Non-income-earning security |
| ♠ | The issuer of the security is an affiliated person of the Portfolio as defined in the Investment Company Act of 1940. |
| ∞ | The rate represents the 7-day annualized yield at period end. |
| Abbreviations: |
| REIT | Real estate investment trust |
Investments in affiliates
An affiliated investment is an investment in which the Portfolio owns at least 5% of the outstanding voting shares of the issuer or as a result of other relationships, such as the Portfolio and the issuer having the same adviser or investment manager. Transactions with issuers that were either affiliates of the Portfolio at the beginning of the period or the end of the period were as follows:
| | Value,
beginning of
period | Purchases | Sales
proceeds | Net
realized
gains
(losses) | Net
change in
unrealized
gains
(losses) | Value,
end of
period | Shares,
end
of period | Income
from
affiliated
securities |
| Short-term investments | | | | | | | |
| Wells Fargo Government Money Market Fund Select Class | $302,669 | $3,105,291 | $(3,056,892) | $0 | $0 | $351,068 | 351,068 | $89 |
Futures contracts
| Description | Number of
contracts | Expiration
date | Notional
cost | Notional
value | Unrealized
gains | Unrealized
losses |
| Long | | | | | | |
| E-Mini S&P 500 Index | 2 | 9-17-2021 | $439,330 | $452,050 | $12,720 | $0 |
The accompanying notes are an integral part of these financial statements.
10 | Wells Fargo Factor Enhanced U.S. Low Volatility Equity Portfolio
Statement of assets and liabilities—August 31, 2021 (unaudited)
| | |
| Assets | |
Investments in unaffiliated securities, at value (cost $20,537,162)
| $ 25,236,099 |
Investments in affiliated securites, at value (cost $351,068)
| 351,068 |
Cash at broker segregated for futures contracts
| 140,000 |
Receivable for dividends
| 33,969 |
Receivable from adviser
| 3,730 |
Prepaid expenses and other assets
| 882 |
Total assets
| 25,765,748 |
| Liabilities | |
Professional fees payable
| 17,655 |
Custodian and accounting fee payable
| 7,778 |
Payable for daily variation margin on open futures contracts
| 470 |
Trustees’ fees and expenses payable
| 101 |
Accrued expenses and other liabilities
| 1,842 |
Total liabilities
| 27,846 |
Total net assets
| $25,737,902 |
The accompanying notes are an integral part of these financial statements.
Wells Fargo Factor Enhanced U.S. Low Volatility Equity Portfolio | 11
Statement of operations—six months ended August 31, 2021 (unaudited)
| | |
| Investment income | |
Dividends (net of foreign withholdings taxes of $2,139)
| $ 212,625 |
Income from affiliated securities
| 89 |
Total investment income
| 212,714 |
| Expenses | |
Advisory fee
| 13,084 |
Custody and accounting fees
| 6,174 |
Professional fees
| 26,214 |
Interest holder report expenses
| 5,069 |
Trustees’ fees and expenses
| 9,715 |
Other fees and expenses
| 3,271 |
Total expenses
| 63,527 |
Less: Fee waivers and/or expense reimbursements
| (45,209) |
Net expenses
| 18,318 |
Net investment income
| 194,396 |
| Realized and unrealized gains (losses) on investments | |
| Net realized gains on | |
Unaffiliated securities
| 828,170 |
Futures contracts
| 116,017 |
Net realized gains on investments
| 944,187 |
| Net change in unrealized gains (losses) on | |
Unaffiliated securities
| 3,306,466 |
Futures contracts
| 16,617 |
Net change in unrealized gains (losses) on investments
| 3,323,083 |
Net realized and unrealized gains (losses) on investments
| 4,267,270 |
Net increase in net assets resulting from operations
| $4,461,666 |
The accompanying notes are an integral part of these financial statements.
12 | Wells Fargo Factor Enhanced U.S. Low Volatility Equity Portfolio
Statement of changes in net assets
| | | |
| | Six months ended
August 31, 2021
(unaudited) | Year ended
February 28, 20211 |
| Operations | | |
Net investment income
| $ 194,396 | $ 264,813 |
Net realized gains on investments
| 944,187 | 580,835 |
Net change in unrealized gains (losses) on investments
| 3,323,083 | 1,388,574 |
Net increase in net assets resulting from operations
| 4,461,666 | 2,234,222 |
| Capital transactions | | |
| Transactions in investors’ beneficial interests | | |
Contributions
| 685,498 | 27,817,254 |
Withdrawals
| (4,914,639) | (4,546,099) |
Net increase (decrease) in net assets resulting from capital transactions
| (4,229,141) | 23,271,155 |
Total increase in net assets
| 232,525 | 25,505,377 |
| Net assets | | |
Beginning of period
| 25,505,377 | 0 |
End of period
| $25,737,902 | $25,505,377 |
| 1 | For the period from July 1, 2020 (commencement of operations) to February 28, 2021 |
The accompanying notes are an integral part of these financial statements.
Wells Fargo Factor Enhanced U.S. Low Volatility Equity Portfolio | 13
| | | Year ended February 28 |
| | Six months ended
August 31, 2021
(unaudited) | 2021 1 |
Total return2
| 18.66% | 9.42% |
| Ratios to average net assets (annualized) | | |
Gross expenses
| 0.49% | 0.63% |
Net expenses
| 0.14% * | 0.14% * |
Net investment income
| 1.49% | 1.64% |
| Supplemental data | | |
Portfolio turnover rate
| 15% | 18% |
| * | Ratios reflect expenses which were voluntarily waived by the adviser. Without these voluntary waivers, the net expense ratios would be increased by the following amounts: |
| Six months ended August 31, 2021 (unaudited) | 0.35% |
| Year ended February 28, 2021 | 0.49% |
| 1 | For the period from July 1, 2020 (commencement of operations) to February 28, 2021 |
| 2 | Returns for periods of less than one year are not annualized. |
The accompanying notes are an integral part of these financial statements.
14 | Wells Fargo Factor Enhanced U.S. Low Volatility Equity Portfolio
Notes to financial statements (unaudited)
1. ORGANIZATION
Wells Fargo Master Trust (the "Trust"), a Delaware statutory trust organized on March 10, 1999, is an open-end management investment company registered under the Investment Company Act of 1940, as amended (the "1940 Act"). As an investment company, the Trust follows the accounting and reporting guidance in Financial Accounting Standards Board ("FASB") Accounting Standards Codification Topic 946, Financial Services – Investment Companies. These financial statements report on the Wells Fargo Factor Enhanced U.S. Low Volatility Equity Portfolio (the "Portfolio") which is a diversified series of the Trust that commenced operations on July 1, 2020.
Interests in the Portfolio are available solely through private placement transactions that do not involve any "public offering" within the meaning of Section 4(2) of the Investment Company Act of 1933.
On February 23, 2021, Wells Fargo & Company announced that it has entered into a definitive agreement to sell Wells Fargo Asset Management ("WFAM") to GTCR LLC and Reverence Capital Partners, L.P. WFAM is the trade name used by the asset management businesses of Wells Fargo & Company and includes Wells Fargo Funds Management, LLC, the adviser to the Portfolio, Wells Capital Management, LLC and Wells Fargo Asset Management (International) Limited, both registered investment advisers providing subadvisory services to certain funds, and Wells Fargo Funds Distributor, LLC, the Portfolio's principal underwriter. As part of the transaction, Wells Fargo & Company will own a 9.9% equity interest and will continue to serve as an important client and distribution partner.
Consummation of the transaction will result in the automatic termination of the Portfolio’s investment advisory agreement and subadvisory agreements. The Portfolio’s Board of Trustees approved a new investment advisory agreement and a new subadvisory agreement which were subsequently approved on behalf of the feeder funds that were investors in the Portfolio at the close of business on May 28, 2021. The new agreements will take effect upon the closing of the transaction. The transaction is expected to close in the second half of 2021, subject to customary closing conditions.
2. SIGNIFICANT ACCOUNTING POLICIES
The following significant accounting policies, which are consistently followed in the preparation of the financial statements of the Portfolio, are in conformity with U.S. generally accepted accounting principles which require management to make estimates and assumptions that affect the reported amounts of assets and liabilities, disclosure of contingent assets and liabilities at the date of the financial statements, and the reported amounts of income and expenses during the reporting period. Actual results could differ from those estimates.
Securities valuation
All investments are valued each business day as of the close of regular trading on the New York Stock Exchange (generally 4 p.m. Eastern Time), although the Portfolio may deviate from this calculation time under unusual or unexpected circumstances.
Equity securities and futures contracts that are listed on a foreign or domestic exchange or market are valued at the official closing price or, if none, the last sales price. If no sale occurs on the principal exchange or market that day, a fair value price will be determined in accordance with the Portfolio’s Valuation Procedures.
Investments in registered open-end investment companies are valued at net asset value.
Investments which are not valued using any of the methods discussed above are valued at their fair value, as determined in good faith by the Board of Trustees. The Board of Trustees has established a Valuation Committee comprised of the Trustees and has delegated to it the authority to take any actions regarding the valuation of portfolio securities that the Valuation Committee deems necessary or appropriate, including determining the fair value of portfolio securities, unless the determination has been delegated to the Wells Fargo Asset Management Pricing Committee at Wells Fargo Funds Management, LLC ("Funds Management"). The Board of Trustees retains the authority to make or ratify any valuation decisions or approve any changes to the Valuation Procedures as it deems appropriate. On a quarterly basis, the Board of Trustees receives reports on any valuation actions taken by the Valuation Committee or the Wells Fargo Asset Management Pricing Committee which may include items for ratification.
Futures contracts
Futures contracts are agreements between the Portfolio and a counterparty to buy or sell a specific amount of a commodity, financial instrument or currency at a specified price on a specified date. The Portfolio may buy and sell futures contracts in order to gain exposure to, or protect against, changes in security values and is subject to equity price risk. The primary risks associated with the use of futures contracts are the imperfect correlation between changes in market values of securities held by the Portfolio and the prices of futures contracts, and the possibility of an illiquid market. Futures contracts are generally
Wells Fargo Factor Enhanced U.S. Low Volatility Equity Portfolio | 15
Notes to financial statements (unaudited)
entered into on a regulated futures exchange and cleared through a clearinghouse associated with the exchange. With futures contracts, there is minimal counterparty risk to the Portfolio since futures contracts are exchange traded and the exchange’s clearinghouse, as the counterparty to all exchange traded futures, guarantees the futures contracts against default.
Upon entering into a futures contract, the Portfolio is required to deposit either cash or securities (initial margin) with the broker in an amount equal to a certain percentage of the contract value. Subsequent payments (variation margin) are paid to or from the broker each day equal to the daily changes in the contract value. Such payments are recorded as unrealized gains or losses and, if any, shown as variation margin receivable (payable) in the Statement of Assets and Liabilities. Should the Portfolio fail to make requested variation margin payments, the broker can gain access to the initial margin to satisfy the Portfolio’s payment obligations. When the contracts are closed, a realized gain or loss is recorded in the Statement of Operations.
Security transactions and income recognition
Securities transactions are recorded on a trade date basis. Realized gains or losses are recorded on the basis of identified cost.
Dividend income is recognized on the ex-dividend date. Dividend income is recorded net of foreign taxes withheld where recovery of such taxes is not assured.
Federal and other taxes
The Portfolio is not required to pay federal income taxes on its net investment income and net capital gains as it is treated as a partnership for federal income tax purposes. All income, gains and losses of the Portfolio are deemed to have been “passed through” to the interest holders in proportion to their holdings of the Portfolio regardless of whether income and gains have been distributed by the Portfolio.
The Portfolio’s income tax returns and all financial records supporting those returns for the current fiscal year since commencement of operations are subject to examination by the federal revenue authority. Management has analyzed the Portfolio’s tax positions taken on federal, state, and foreign tax returns for all open tax years and does not believe that there are any uncertain tax positions that require recognition of a tax liability.
As of August 31, 2021, the aggregate cost of all investments for federal income tax purposes was $20,885,443 and the unrealized gains (losses) consisted of:
| Gross unrealized gains | $5,112,167 |
| Gross unrealized losses | (397,723) |
| Net unrealized gains | $4,714,444 |
3. FAIR VALUATION MEASUREMENTS
Fair value measurements of investments are determined within a framework that has established a fair value hierarchy based upon the various data inputs utilized in determining the value of the Portfolio’s investments. The three-level hierarchy gives the highest priority to unadjusted quoted prices in active markets for identical assets or liabilities (Level 1) and the lowest priority to unobservable inputs (Level 3). The Portfolio’s investments are classified within the fair value hierarchy based on the lowest level of input that is significant to the fair value measurement. The inputs are summarized into three broad levels as follows:
| ■ | Level 1 – quoted prices in active markets for identical securities |
| ■ | Level 2 – other significant observable inputs (including quoted prices for similar securities, interest rates, prepayment speeds, credit risk, etc.) |
| ■ | Level 3 – significant unobservable inputs (including the Portfolio’s own assumptions in determining the fair value of investments) |
The inputs or methodologies used for valuing investments in securities are not necessarily an indication of the risk associated with investing in those securities.
16 | Wells Fargo Factor Enhanced U.S. Low Volatility Equity Portfolio
Notes to financial statements (unaudited)
The following is a summary of the inputs used in valuing the Portfolio’s assets and liabilities as of August 31, 2021:
| | Quoted prices
(Level 1) | Other significant
observable inputs
(Level 2) | Significant
unobservable inputs
(Level 3) | Total |
| Assets | | | | |
| Investments in: | | | | |
| Common stocks | | | | |
| Communication services | $ 2,582,664 | $0 | $0 | $ 2,582,664 |
| Consumer discretionary | 1,839,370 | 0 | 0 | 1,839,370 |
| Consumer staples | 2,770,738 | 0 | 0 | 2,770,738 |
| Energy | 50,027 | 0 | 0 | 50,027 |
| Financials | 1,571,029 | 0 | 0 | 1,571,029 |
| Health care | 4,823,259 | 0 | 0 | 4,823,259 |
| Industrials | 2,381,242 | 0 | 0 | 2,381,242 |
| Information technology | 6,429,409 | 0 | 0 | 6,429,409 |
| Materials | 297,395 | 0 | 0 | 297,395 |
| Real estate | 670,712 | 0 | 0 | 670,712 |
| Utilities | 1,820,254 | 0 | 0 | 1,820,254 |
| Short-term investments | | | | |
| Investment companies | 351,068 | 0 | 0 | 351,068 |
| | 25,587,167 | 0 | 0 | 25,587,167 |
| Futures contracts | 12,720 | 0 | 0 | 12,720 |
| Total assets | $25,599,887 | $0 | $0 | $25,599,887 |
Futures contracts are reported at their cumulative unrealized gains (losses) at measurement date as reported in the table following the Portfolio of Investments. For futures contracts, the current day’s variation margin is reported on the Statement of Assets and Liabilities. All other assets and liabilities are reported at their market value at measurement date.
Additional sector, industry or geographic detail, if any, is included in the Portfolio of Investments.
For the six months ended August 31, 2021, the Portfolio did not have any transfers into/out of Level 3.
4. TRANSACTIONS WITH AFFILIATES
Advisory fee
The Trust has entered into an advisory contract with Funds Management, an indirect wholly owned subsidiary of Wells Fargo & Company ("Wells Fargo"). The adviser is responsible for implementing investment policies and guidelines and for supervising the subadviser, who is responsible for day-to-day portfolio management of the Portfolio. Pursuant to the contract, Funds Management is entitled to receive an advisory fee at the following annual rate based on the Portfolio’s average daily net assets:
| Average daily net assets | Advisory fee |
| First $5 billion | 0.100% |
| Next $5 billion | 0.080 |
| Over $10 billion | 0.060 |
For the six months ended August 31, 2021, the advisory fee was equivalent to an annual rate of 0.10% of the Portfolio’s average daily net assets.
Funds Management has retained the services of a subadviser to provide daily portfolio management to the Portfolio. The fee for subadvisory services is borne by Funds Management. Wells Capital Management, LLC, an affiliate of Funds Management and an indirect wholly owned subsidiary of Wells Fargo, is the subadviser to the Portfolio and is entitled to receive a fee from Funds Management at an annual rate starting at 0.06% and declining to 0.04% as the average daily net assets of the Portfolio increase.
Wells Fargo Factor Enhanced U.S. Low Volatility Equity Portfolio | 17
Notes to financial statements (unaudited)
Funds Management has voluntarily waived and/or reimbursed advisory fees to reduce the net operating expense ratio of the Portfolio. These voluntary waivers may be discontinued at any time.
Interfund transactions
The Portfolio may purchase or sell portfolio investment securities to certain other Wells Fargo affiliates pursuant to Rule 17a-7 under the 1940 Act and under procedures adopted by the Board of Trustees. The procedures have been designed to ensure that these interfund transactions, which do not incur broker commissions, are effected at current market prices.
5. BANK BORROWINGS
The Trust, along with Wells Fargo Variable Trust and Wells Fargo Funds Trust (excluding the money market funds), are parties to a $350,000,000 revolving credit agreement whereby the Portfolio is permitted to use bank borrowings for temporary or emergency purposes, such as to fund interest holders withdrawal requests. Interest under the credit agreement is charged to the Portfolio based on a borrowing rate equal to the higher of the Federal Funds rate in effect on that day plus 1.25% or the overnight bank funding rate in effect on that day plus 1.25%. In addition, an annual commitment fee equal to 0.25% of the unused balance is allocated to each participating fund.
For the six months ended August 31, 2021, there were no borrowings by the Portfolio under the agreement.
6. INVESTMENT PORTFOLIO TRANSACTIONS
Purchases and sales of investments, excluding U.S. government obligations (if any) and short-term securities, for the six months ended August 31, 2021 were $3,822,244 and $7,791,530, respectively.
7. DERIVATIVE TRANSACTIONS
During the six months ended August 31, 2021, the Portfolio entered into futures contracts to gain market exposure. The Portfolio had an average notional amount of $699,076 in long futures contracts during the six months ended August 31, 2021.
The fair value, realized gains or losses and change in unrealized gains or losses, if any, on derivative instruments are reflected in the corresponding financial statement captions.
8. CONCENTRATION RISKS
As of the end of the period, the Portfolio concentrated its portfolio of investments in the information technology sector. A fund that invests a substantial portion of its assets in any sector may be more affected by changes in that sector than would be a fund whose investments are not heavily weighted in any sector.
9. INDEMNIFICATION
Under the Portfolio's organizational documents, the officers and Trustees have been granted certain indemnification rights against certain liabilities that may arise out of performance of their duties to the Portfolio. The Portfolio has entered into a separate agreement with each Trustee that converts indemnification rights currently existing under the Portfolio’s organizational documents into contractual rights that cannot be changed in the future without the consent of the Trustee. Additionally, in the normal course of business, the Portfolio may enter into contracts with service providers that contain a variety of indemnification clauses. The Portfolio’s maximum exposure under these arrangements is dependent on future claims that may be made against the Portfolio and, therefore, cannot be estimated.
10. CORONAVIRUS (COVID-19) PANDEMIC
On March 11, 2020, the World Health Organization announced that it had made the assessment that coronavirus disease 2019 (“COVID-19”) is a pandemic. The impacts of COVID-19 are affecting the entire global economy, individual companies and investment products, the funds, and the market in general. There is significant uncertainty around the extent and duration of business disruptions related to COVID-19 and the impacts may last for an extended period of time. COVID-19 has led to significant uncertainty and volatility in the financial markets.
11. SUBSEQUENT EVENTS
Wells Fargo Asset Management ("WFAM") announced that it will be changing its company name to Allspring Global Investments upon the closing of the previously announced sale transaction of WFAM by Wells Fargo & Company to GTCR LLC and Reverence Capital Partners, L.P. The new corporate name is expected to go into effect on the closing date of the transaction, which is anticipated to occur in the second half of 2021, subject to customary closing conditions.
18 | Wells Fargo Factor Enhanced U.S. Low Volatility Equity Portfolio
Notes to financial statements (unaudited)
The Board of Trustees of the Wells Fargo Funds approved a change in the Portfolio's name to remove “Wells Fargo” from the Portfolio's name and replace with “Allspring” on December 6, 2021.
Following the closing of the transaction, Wells Fargo Funds Management, LLC, the Portfolio's adviser, Wells Capital Management, LLC and Wells Fargo Asset Management (International) Limited, each subadvisers to certain funds, and Wells Fargo Funds Distributor, LLC will each be rebranded as Allspring.
Wells Fargo Factor Enhanced U.S. Low Volatility Equity Portfolio | 19
Other information (unaudited)
PROXY VOTING INFORMATION
A description of the policies and procedures used to determine how to vote proxies relating to portfolio securities is available without charge, upon request, by calling 1-800-222-8222, visiting our website at wfam.com, or visiting the SEC website at sec.gov. Information regarding how the proxies related to portfolio securities were voted during the most recent 12-month period ended June 30 is available on the website at wfam.com or by visiting the SEC website at sec.gov.
QUARTERLY PORTFOLIO HOLDINGS INFORMATION
The Portfolio files its complete schedule of portfolio holdings with the SEC for the first and third quarters of each fiscal year as an exhibit to its reports on Form N-PORT. Interest holders may view the filed Form N-PORT by visiting the SEC website at sec.gov.
20 | Wells Fargo Factor Enhanced U.S. Low Volatility Equity Portfolio
Other information (unaudited)
BOARD OF TRUSTEES AND OFFICERS
Each of the Trustees and Officers listed in the table below acts in identical capacities for each fund in the Wells Fargo family of funds, which consists of 139 mutual funds comprising the Wells Fargo Funds Trust, Wells Fargo Variable Trust, Wells Fargo Master Trust and four closed-end funds (collectively the “Fund Complex”). This table should be read in conjunction with the Prospectus and the Statement of Additional Information1. The mailing address of each Trustee and Officer is 525 Market Street, 12th Floor, San Francisco, CA 94105. Each Trustee and Officer serves an indefinite term, however, each Trustee serves such term until reaching the mandatory retirement age established by the Trustees.
Independent Trustees
Name and
year of birth | Position held and
length of service* | Principal occupations during past five years or longer | Current other
public company or
investment
company
directorships |
William R. Ebsworth
(Born 1957) | Trustee,
since 2015 | Retired. From 1984 to 2013, equities analyst, portfolio manager, research director and chief investment officer at Fidelity Management and Research Company in Boston, Tokyo, and Hong Kong, and retired in 2013 as Chief Investment Officer of Fidelity Strategic Advisers, Inc. where he led a team of investment professionals managing client assets. Prior thereto, Board member of Hong Kong Securities Clearing Co., Hong Kong Options Clearing Corp., the Thailand International Fund, Ltd., Fidelity Investments Life Insurance Company, and Empire Fidelity Investments Life Insurance Company. Audit Committee Chair and Investment Committee Chair of the Vincent Memorial Hospital Endowment (non-profit organization). Mr. Ebsworth is a CFA® charterholder. | N/A |
Jane A. Freeman
(Born 1953) | Trustee,
since 2015;
Chair Liaison,
since 2018 | Retired. From 2012 to 2014 and 1999 to 2008, Chief Financial Officer of Scientific Learning Corporation. From 2008 to 2012, Ms. Freeman provided consulting services related to strategic business projects. Prior to 1999, Portfolio Manager at Rockefeller & Co. and Scudder, Stevens & Clark. Board member of the Harding Loevner Funds from 1996 to 2014, serving as both Lead Independent Director and chair of the Audit Committee. Board member of the Russell Exchange Traded Funds Trust from 2011 to 2012 and the chair of the Audit Committee. Ms. Freeman is also an inactive Chartered Financial Analyst. | N/A |
Isaiah Harris, Jr.
(Born 1952) | Trustee,
since 2009; Audit
Committee
Chair,
since 2019 | Retired. Chairman of the Board of CIGNA Corporation since 2009, and Director since 2005. From 2003 to 2011, Director of Deluxe Corporation. Prior thereto, President and CEO of BellSouth Advertising and Publishing Corp. from 2005 to 2007, President and CEO of BellSouth Enterprises from 2004 to 2005 and President of BellSouth Consumer Services from 2000 to 2003. Emeritus member of the Iowa State University Foundation Board of Governors. Emeritus Member of the Advisory Board of Iowa State University School of Business. Advisory Board Member, Palm Harbor Academy (private school). Mr. Harris is a certified public accountant (inactive status). | CIGNA Corporation |
Judith M. Johnson
(Born 1949) | Trustee,
since 2008 | Retired. Prior thereto, Chief Executive Officer and Chief Investment Officer of Minneapolis Employees Retirement Fund from 1996 to 2008. Ms. Johnson is an attorney, certified public accountant and a certified managerial accountant. | N/A |
David F. Larcker
(Born 1950) | Trustee,
since 2009 | James Irvin Miller Professor of Accounting at the Graduate School of Business (Emeritus), Stanford University, Director of the Corporate Governance Research Initiative and Senior Faculty of The Rock Center for Corporate Governance since 2006. From 2005 to 2008, Professor of Accounting at the Graduate School of Business, Stanford University. Prior thereto, Ernst & Young Professor of Accounting at The Wharton School, University of Pennsylvania from 1985 to 2005. | N/A |
Wells Fargo Factor Enhanced U.S. Low Volatility Equity Portfolio | 21
Other information (unaudited)
Name and
year of birth | Position held and
length of service* | Principal occupations during past five years or longer | Current other
public company or
investment
company
directorships |
Olivia S. Mitchell
(Born 1953) | Trustee,
since 2006;
Nominating and
Governance
Committee Chair,
since 2018 | International Foundation of Employee Benefit Plans Professor, Wharton School of the University of Pennsylvania since 1993. Director of Wharton’s Pension Research Council and Boettner Center on Pensions & Retirement Research, and Research Associate at the National Bureau of Economic Research. Previously, Cornell University Professor from 1978 to 1993. | N/A |
Timothy J. Penny
(Born 1951) | Trustee,
since 1996;
Chair,
since 2018 | President and Chief Executive Officer of Southern Minnesota Initiative Foundation, a non-profit organization, since 2007. Member of the Board of Trustees of NorthStar Education Finance, Inc., a non-profit organization, since 2007. | N/A |
James G. Polisson
(Born 1959) | Trustee,
since 2018 | Retired. Chief Marketing Officer, Source (ETF) UK Services, Ltd, from 2015 to 2017. From 2012 to 2015, Principal of The Polisson Group, LLC, a management consulting, corporate advisory and principal investing company. Chief Executive Officer and Managing Director at Russell Investments, Global Exchange Traded Funds from 2010 to 2012. Managing Director of Barclays Global Investors from 1998 to 2010 and Global Chief Marketing Officer for iShares and Barclays Global Investors from 2000 to 2010. Trustee of the San Francisco Mechanics’ Institute, a non-profit organization, from 2013 to 2015. Board member of the Russell Exchange Traded Fund Trust from 2011 to 2012. Director of Barclays Global Investors Holdings Deutschland GmbH from 2006 to 2009. Mr. Polisson is an attorney and has a retired status with the Massachusetts and District of Columbia Bar Associations. | N/A |
Pamela Wheelock
(Born 1959) | Trustee,
since January
2020; previously
Trustee from
January 2018 to
July 2019 | Board member of the Destination Medical Center Economic Development Agency, Rochester, Minnesota since 2019. Interim President of the McKnight Foundation from January to September 2020. Acting Commissioner, Minnesota Department of Human Services, July 2019 through September 2019. Human Services Manager (part-time), Minnesota Department of Human Services, October 2019 through December 2019. Chief Operating Officer, Twin Cities Habitat for Humanity from 2017 to 2019. Vice President of University Services, University of Minnesota from 2012 to 2016. Prior thereto, on the Board of Directors, Governance Committee and Finance Committee for the Minnesota Philanthropy Partners (Saint Paul Foundation) from 2012 to 2018, Interim Chief Executive Officer of Blue Cross Blue Shield of Minnesota from 2011 to 2012, Chairman of the Board from 2009 to 2012 and Board Director from 2003 to 2015. Vice President, Leadership and Community Engagement, Bush Foundation, Saint Paul, Minnesota (a private foundation) from 2009 to 2011. Executive Vice President and Chief Financial Officer, Minnesota Sports and Entertainment from 2004 to 2009 and Senior Vice President from 2002 to 2004. Executive Vice President of the Minnesota Wild Foundation from 2004 to 2008. Commissioner of Finance, State of Minnesota, from 1999 to 2002. Currently Board Chair of the Minnesota Wild Foundation since 2010. | N/A |
* Length of service dates reflect the Trustee’s commencement of service with the Trust’s predecessor entities, where applicable.
22 | Wells Fargo Factor Enhanced U.S. Low Volatility Equity Portfolio
Other information (unaudited)
Officers
Name and
year of birth | Position held and
length of service | Principal occupations during past five years or longer |
Andrew Owen
(Born 1960) | President,
since 2017 | Executive Vice President of Wells Fargo & Company and Head of Affiliated Managers, Wells Fargo Asset Management, since 2014. In addition, Mr. Owen is currently President, Chief Executive Officer and Director of Wells Fargo Funds Management, LLC since 2017. Prior thereto, Executive Vice President responsible for marketing, investments and product development for Wells Fargo Funds Management, LLC, from 2009 to 2014. |
Jeremy DePalma
(Born 1974) | Treasurer,
since 2012
(for certain funds in
the Fund Complex);
since 2021 (for
the remaining funds in the
Fund Complex) | Senior Vice President of Wells Fargo Funds Management, LLC since 2009. Senior Vice President of Evergreen Investment Management Company, LLC from 2008 to 2010 and head of the Fund Reporting and Control Team within Fund Administration from 2005 to 2010. |
Michelle Rhee
(Born 1966) | Chief Legal Officer,
since 2019 | Secretary of Wells Fargo Funds Management, LLC and Chief Legal Counsel of Wells Fargo Asset Management since 2018. Deputy General Counsel of Wells Fargo Bank, N.A. since 2020 and Assistant General Counsel of Wells Fargo Bank, N.A. from 2018 to 2020. Associate General Counsel and Managing Director of Bank of America Corporation from 2004 to 2018. |
Matthew Prasse
(Born 1983) | Secretary,
since 2021 | Senior Counsel of the Wells Fargo Legal Department since 2018. Previously, Director and Counsel for Barings LLC from 2015 to 2018. Prior to joining Barings, Associate at Morgan, Lewis & Bockius LLP from 2008 to 2015. |
Michael H. Whitaker
(Born 1967) | Chief Compliance Officer,
since 2016 | Chief Compliance Officer of Wells Fargo Asset Management since 2016. Senior Vice President and Chief Compliance Officer for Fidelity Investments from 2007 to 2016. |
1 The Statement of Additional Information includes additional information about the Trustees and is available, without charge, upon request, by calling 1-800-222-8222 or by visiting the website at wfam.com.
Wells Fargo Factor Enhanced U.S. Low Volatility Equity Portfolio | 23
Board considerations (unaudited)
BOARD CONSIDERATION OF INVESTMENT ADVISORY AND SUB-ADVISORY AGREEMENTS:
Wells Fargo Bloomberg Barclays US Aggregate ex-Corporate Portfolio, Wells Fargo Emerging Markets Bond Portfolio, Wells Fargo Factor Enhanced Emerging Markets Equity Portfolio, Wells Fargo Factor Enhanced International Equity Portfolio, Wells Fargo Factor Enhanced U.S. Large Cap Equity Portfolio, Wells Fargo Factor Enhanced U.S. Small Cap Equity Portfolio, Wells Fargo High Yield Corporate Bond Portfolio, Wells Fargo Investment Grade Corporate Bond Portfolio, Wells Fargo Factor Enhanced U.S. Low Volatility Equity Portfolio, Wells Fargo Strategic Retirement Bond Portfolio, and Wells Fargo U.S. REIT Portfolio
Board Considerations – Current Agreements
Under the Investment Company Act of 1940 (the “1940 Act”), the Board of Trustees (the “Board”) of Wells Fargo Master Trust (the “Trust”) must determine annually whether to approve the continuation of the Trust’s investment advisory and sub-advisory agreements. In this regard, at a meeting held on May 17-19, 2021 (the “Meeting”), the Board of the Trust, all the members of which have no direct or indirect interest in the investment advisory and sub-advisory agreements and are not “interested persons” of the Trust, as defined in the 1940 Act (the “Independent Trustees”), reviewed and approved for each of the portfolios of the Trust identified in the table below (individually, a “Portfolio” and collectively, the “Portfolios”): (i) an investment advisory agreement (the “Advisory Agreement”) with Wells Fargo Funds Management, LLC (“Funds Management”); and (ii) an investment sub-advisory agreement (each, a “Sub-Advisory Agreement” and collectively, the “Sub-Advisory Agreements”) with the sub-adviser(s) identified in the table below (each, a “Sub-Adviser” and collectively, the “Sub-Advisers”) for the corresponding Portfolio identified. The Advisory Agreement and the Sub-Advisory Agreements are collectively referred to as the “Advisory Agreements.”
| Master Portfolios | Sub-Advisers |
| Wells Fargo Bloomberg Barclays US Aggregate ex-Corporate Portfolio | Wells Capital Management Incorporated |
| Wells Fargo Emerging Markets Bond Portfolio | Wells Fargo Asset Management (International) Limited and Wells Capital Management Incorporated |
| Wells Fargo Factor Enhanced Emerging Markets Equity Portfolio | Wells Capital Management Incorporated |
| Wells Fargo Factor Enhanced International Equity Portfolio | Wells Capital Management Incorporated |
| Wells Fargo Factor Enhanced U.S. Large Cap Equity Portfolio | Wells Capital Management Incorporated |
| Wells Fargo Factor Enhanced U.S. Small Cap Equity Portfolio | Wells Capital Management Incorporated |
| Wells Fargo High Yield Corporate Bond Portfolio | Wells Capital Management Incorporated |
| Wells Fargo Investment Grade Corporate Bond Portfolio | Wells Capital Management Incorporated |
| Wells Fargo Factor Enhanced U.S. Low Volatility Equity Portfolio | Wells Capital Management Incorporated |
| Wells Fargo Strategic Retirement Bond Portfolio | Wells Capital Management Incorporated |
| Wells Fargo U.S. REIT Portfolio | Wells Capital Management Incorporated |
The Board noted that Wells Fargo & Company recently announced that it had entered into a definitive agreement to sell Wells Fargo Asset Management (“WFAM”), which includes Funds Management and the Sub-Adviser, to GTCR LLC and Reverence Capital Partners, L.P. and/or their affiliates (the “Transaction”). The Board further noted that the Transaction would result in a change-of-control of Funds Management and the Sub-Advisers, which would be considered to be an assignment that would result in the termination of the Advisory Agreements. In light of the Transaction, the Board separately considered for approval a new investment advisory agreement with Funds Management and a new investment sub-advisory agreement with each of the Sub-Advisers (the “New Agreements”) that would replace the Advisory Agreements upon consummation of the Transaction, subject to approval of the New Agreements by the Portfolios’ shareholders. The Board also considered for approval interim agreements to go into effect in the event shareholders do not approve the New Agreements before the Transaction is completed. The interim agreements would allow the Manager and the Sub-Advisers to continue providing services to the Portfolios while the Portfolios continues to seek shareholder approval of the New Agreements. The Board noted that the terms of the interim agreements would be identical to those of the current Advisory Agreements, except for the term and certain escrow provisions.
At the Meeting, the Board considered the factors and reached the conclusions described below relating to the selection of Funds Management and the Sub-Advisers and the approval of the Advisory Agreements. Prior to the Meeting, including at Board meetings held in April and May 2021, the Trustees conferred extensively among themselves and with representatives of Funds Management about these matters. Also, the Board has adopted a team-based approach, with each team consisting of a sub-set of
24 | Wells Fargo Factor Enhanced U.S. Low Volatility Equity Portfolio
Board considerations (unaudited)
Trustees, to assist the full Board in the discharge of its duties in reviewing investment performance and other matters throughout the year. The Independent Trustees were assisted in their evaluation of the Advisory Agreements by independent legal counsel, from whom they received separate legal advice and with whom they met separately.
In providing information to the Board, Funds Management and the Sub-Advisers were guided by a detailed set of requests for information submitted to them by independent legal counsel on behalf of the Independent Trustees at the start of the Board’s annual contract renewal process earlier in 2021. In considering and approving the Advisory Agreements, the Trustees considered the information they believed relevant, including but not limited to the information discussed below. The Board considered not only the specific information presented in connection with the Meeting, but also the knowledge gained over time through interaction with Funds Management and the Sub-Advisers about various topics. In this regard, the Board reviewed reports of Funds Management at each of its quarterly meetings, which included, among other things, portfolio reviews and investment performance reports. In addition, the Board and the teams mentioned above confer with portfolio managers at various times throughout the year. The Board did not identify any particular information or consideration that was all-important or controlling, and each individual Trustee may have attributed different weights to various factors.
After its deliberations, the Board unanimously determined that the compensation or the absence of compensation payable to Funds Management and each of the Sub-Advisers under each of the Advisory Agreements was reasonable, and approved the continuation of the Advisory Agreements for a one-year term. The Board considered the approval of the Advisory Agreements for the Portfolios as part of its consideration of agreements for funds across the complex, but its approvals were made on a fund-by-fund basis. The following summarizes a number of important, but not necessarily all, factors considered by the Board in support of its approvals.
Nature, extent and quality of services
The Board received and considered various information regarding the nature, extent and quality of services provided to the Funds by Funds Management and the Sub-Advisers under the Advisory Agreements. This information included a description of the investment advisory services and Portfolio-level administrative services covered by the Advisory Agreement, as well as, among other things, a summary of the background and experience of senior management of WFAM, of which Funds Management and the Sub-Advisers are a part, and a summary of investments made in the business of WFAM. The Board also received a description of Funds Management’s and the Sub-Advisers’ business continuity plans, including a summary of the performance of such plans and any changes thereto during the COVID-19 pandemic, and of their approaches to data privacy and cybersecurity. The Board also received and reviewed information about Funds Management’s role as administrator of the Portfolios’ liquidity risk management program, Funds Management’s approach to risk management, and Funds Management’s intermediary and vendor oversight program.
The Board also considered the qualifications, background, tenure and responsibilities of each of the portfolio managers primarily responsible for the day-to-day portfolio management of the Portfolios. The Board noted that each of the Portfolios replicates the performance of a proprietary index provided by an affiliate of Funds Management, except that each of Wells Fargo Bloomberg Barclays US Aggregate ex-Corporate Portfolio, Wells Fargo Emerging Markets Bond Portfolio, and Wells Fargo Strategic Retirement Bond Portfolio track the performance of a third party index. The Board evaluated the ability of Funds Management and the Sub-Advisers to attract and retain qualified investment professionals, including research, advisory and supervisory personnel.
The Board further considered the compliance programs and compliance records of Funds Management and the Sub-Advisers. In addition, the Board took into account the full range of services provided to the Portfolios by Funds Management and its affiliates. The Board also considered information about retention and back-up arrangements that have been put into place with respect to key personnel of WFAM in connection with the anticipated Transaction, noting that WFAM provided assurances that the announcement and eventual culmination of the Transaction is not expected to result in any diminution in the nature or quality of services provided to the Portfolios.
Portfolio investment performance and expenses
The Board considered the investment performance results for each of the Portfolios over the one- and three-year periods ended December 31, 2020, except for the Wells Fargo Factor Enhanced U.S. Low Volatility Equity Portfolio, for which the Board considered the investment performance results for the quarter ended December 31, 2020. The Board considered these results in comparison to the investment performance of funds in a universe that was determined by Broadridge Inc. (“Broadridge”) to be similar to each respective Portfolios (each, a “Universe”), and in comparison to each Portfolios’ benchmark index and to other comparative data. Broadridge is an independent provider of investment company data. The Board received a description of the methodology used by Broadridge to select the mutual funds in the performance Universe. The Board noted the short performance history of the Portfolios.
Wells Fargo Factor Enhanced U.S. Low Volatility Equity Portfolio | 25
Board considerations (unaudited)
With respect to the investment performance of each Portfolio relative to its respective Universe, the Board noted the following: (i) the investment performance of each of Wells Fargo Factor Enhanced International Equity Portfolio and Wells Fargo Factor Enhanced U.S. Small Cap Equity Portfolio was higher than such Portfolio’s respective Universe for the one- and three-year periods under review; (ii) the investment performance of each of Wells Fargo Bloomberg Barclays US Aggregate ex-Corporate Portfolio, Wells Fargo Emerging Markets Bond Portfolio, and Wells Fargo Investment Grade Corporate Bond Portfolio was higher than such Portfolio’s respective Universe for the three-year period under review, and lower than such Portfolio’s respective Universe for the one-year period under review; (iii) the investment performance of each of Wells Fargo Factor Enhanced Emerging Markets Equity Portfolio, Wells Fargo Factor Enhanced U.S. Large Cap Equity Portfolio, Wells Fargo High Yield Corporate Bond Portfolio, Wells Fargo Strategic Retirement Bond Portfolio, and Wells Fargo U.S. REIT Portfolio was lower than such Portfolio’s respective Universe for the one- and three-year periods under review; and (iv) the Wells Fargo Factor Enhanced U.S. Low Volatility Equity Portfolio launched on July 1, 2020 and, given its short operational history, had no historical performance.
With respect to the investment performance of each Portfolio relative to its respective benchmark index, the Board noted the following: (i) the investment performance of each of Wells Fargo Bloomberg Barclays US Aggregate ex-Corporate Portfolio, Wells Fargo Factor Enhanced International Equity Portfolio, Wells Fargo Investment Grade Corporate Bond Portfolio, Wells Fargo Factor Enhanced U.S. Low Volatility Equity Portfolio, and Wells Fargo Strategic Retirement Bond Portfolio was higher than or in range of such Portfolio’s respective benchmark index for all periods under review; (ii) the investment performance of Wells Fargo U.S. REIT Portfolio was in range of the Portfolio’s benchmark index for the three-year period under review, and was lower than the Portfolio’s benchmark index for the one-year period under review; and (iii) the investment performance of each of Wells Fargo Emerging Markets Bond Portfolio, Wells Fargo Factor Enhanced Emerging Markets Equity Portfolio, Wells Fargo Factor Enhanced U.S. Large Cap Equity Portfolio, Wells Fargo Factor Enhanced U.S. Small Cap Equity Portfolio, and Wells Fargo High Yield Corporate Bond Portfolio was lower than such Portfolio’s respective benchmark index for all periods under review.
The Board received information concerning, and discussed factors contributing to, the underperformance of each of Wells Fargo Factor Enhanced Emerging Markets Equity Portfolio, Wells Fargo Factor Enhanced International Equity Portfolio, Wells Fargo Factor Enhanced U.S. Large Cap Equity Portfolio, Wells Fargo High Yield Corporate Bond Portfolio, Wells Fargo Strategic Retirement Bond Portfolio, and Wells Fargo U.S. REIT Portfolio relative to such Portfolio’s Universe and benchmark index for the periods identified above.
The Board also received and considered information regarding the fee rates that are payable to Funds Management for investment advisory services (as discussed below), which are the only fees charged to the Portfolios, relative to corresponding class-specific expense groups that were determined by Broadridge to be similar to the Portfolios (the “Groups”). The Board received a description of the methodology used by Broadridge to select the mutual funds in the expense Groups and an explanation of how funds comprising expense groups and their expense ratios may vary from year-to-year.
The Board took into account the Portfolios’ investment performance and expense information provided to it among the factors considered in deciding to re-approve the Advisory Agreements.
Investment advisory and sub-advisory fee rates
The Board reviewed and considered the contractual fee rates payable by the Portfolios to Funds Management under the Advisory Agreement. The Board also reviewed and considered the contractual investment sub-advisory fee rates that are payable by Funds Management to the Sub-Advisers for investment sub-advisory services.
Among other information reviewed by the Board was a comparison of the Portfolios’ Management Rates with the average contractual investment management fee rates of funds in the expense Groups at a common asset level as well as transfer agency costs of the Portfolios in the expense Groups. The Board noted that the Management Rates of the Portfolios were lower than, equal to, or in range of the sum of these average rates for the Portfolios’ expense Groups.
The Board also received and considered information about the portions of the total management fees that were retained by Funds Management after payment of the fees to the Sub-Advisers for sub-advisory services. In assessing the reasonableness of these amounts, the Board received and evaluated information about the nature and extent of responsibilities retained and risks assumed by Funds Management and not delegated to or assumed by the Sub-Advisers, and about Funds Management’s on-going oversight services. Given the affiliation between Funds Management and the Sub-Advisers, the Board ascribed limited relevance to the allocation of fees between them.
The Board also received and considered information about the nature and extent of services offered and fee rates charged by Funds Management and the Sub-Advisers to other types of clients with investment strategies similar to those of certain Portfolios. In this regard, the Board received information about the significantly greater scope of services, and compliance,
26 | Wells Fargo Factor Enhanced U.S. Low Volatility Equity Portfolio
Board considerations (unaudited)
reporting and other legal burdens and risks of managing proprietary mutual funds compared with those associated with managing assets of other types of clients, including third-party sub-advised fund clients and non-mutual fund clients such as institutional separate accounts.
Based on its consideration of the factors and information it deemed relevant, including those described here, the Board determined that the compensation payable to Funds Management under the Advisory Agreement and to the Sub-Advisers under the Sub-Advisory Agreements was reasonable.
Profitability
The Board received and considered information concerning the profitability of Funds Management, as well as the profitability of both WFAM and Wells Fargo & Co. (“Wells Fargo”) from providing services to the funds family as a whole. The Board noted that the Sub-Advisers’ profitability information with respect to providing services to the Portfolios and other funds in the family was subsumed in the WFAM and Wells Fargo profitability analysis.
Funds Management reported on the methodologies and estimates used in calculating profitability, including a description of the methodology used to allocate certain expenses. Among other things, the Board noted that the levels of profitability reported on a fund-by-fund basis varied widely, depending on factors such as the size, type and age of fund.
Based on its review, the Board did not deem the profits reported by Funds Management, WFAM or Wells Fargo from services provided to the Portfolios to be at a level that would prevent it from approving the continuation of the Advisory Agreements.
Economies of scale
The Board received and considered information about the potential for Funds Management to experience economies of scale in the provision of management services to the Portfolios, the difficulties of calculating economies of scale at an individual fund level, and the extent to which potential scale benefits are shared with shareholders. The Board noted the existence of breakpoints in the Portfolios’ management fee structure, which operate generally to reduce the Portfolios’ expense ratios as the Portfolios grow in size, and the size of the Portfolios in relation to such breakpoints. The Board considered that in addition to management fee breakpoints, Funds Management shares potential economies of scale from its management business in a variety of ways, including through fee waiver and expense reimbursement arrangements, competitive management fee rates set at the outset without regard to breakpoints, and investments in the business intended to enhance services available to shareholders.
The Board concluded that Funds Management’s arrangements with respect to the Portfolios, including contractual breakpoints, constituted a reasonable approach to sharing potential economies of scale with the Portfolios and their shareholders.
Other benefits to Funds Management and the Sub-Advisers
The Board received and considered information regarding potential “fall-out” or ancillary benefits received by Funds Management and its affiliates, including the Sub-Advisers, as a result of their relationships with the Portfolios. Ancillary benefits could include, among others, benefits directly attributable to other relationships with the Portfolios and benefits potentially derived from an increase in Funds Management’s and the Sub-Advisers’ businesses as a result of their relationships with the Portfolios. The Board noted that various affiliates of Funds Management may receive distribution-related fees, shareholder servicing payments and sub-transfer agency fees in respect of shares sold or held through them and services provided.
The Board also reviewed information about soft dollar credits earned and utilized by the Sub-Advisers, fees earned by Funds Management and Wells Capital Management Incorporated from managing a private investment vehicle for the fund family’s securities lending collateral, and commissions earned by an affiliated broker from portfolio transactions.
Based on its consideration of the factors and information it deemed relevant, including those described here, the Board did not find that any ancillary benefits received by Funds Management and its affiliates, including the Sub-Advisers, were unreasonable.
Conclusion
At the Meeting, after considering the above-described factors and based on its deliberations and its evaluation of the information described above, the Board unanimously determined that the compensation payable to Funds Management and the Sub-Advisers under each of the Advisory Agreements was reasonable, and approved the continuation of the Advisory Agreements for a one-year term.
Wells Fargo Factor Enhanced U.S. Low Volatility Equity Portfolio | 27
Board considerations (unaudited)
Board Considerations – New Agreements
Overview of the Board evaluation process
At a meeting held on May 17-19, 2021 (the “Board Meeting”), the Board of Trustees (the “Board”) of Wells Fargo Master Trust (the “Trust”, and the series identified below, the “Portfolios”) approved the continuation of each Portfolio’s current Investment Advisory Agreement (the “Current Investment Advisory Agreement”) and the current Sub-Advisory Agreements (the “Current Sub-Advisory Agreements”, and collectively, the “Current Agreements”).
| Wells Fargo Disciplined Large Cap Portfolio |
| Wells Fargo Diversified Large Cap Growth Portfolio |
| Wells Fargo Disciplined International Developed Markets Portfolio |
| Wells Fargo Large Company Value Portfolio |
| Wells Fargo Managed Fixed Income Portfolio |
| Wells Fargo Bloomberg Barclays US Aggregate ex-Corporate Portfolio |
| Wells Fargo Emerging Markets Bond Portfolio |
| Wells Fargo Factor Enhanced Emerging Markets Equity Portfolio |
| Wells Fargo Factor Enhanced International Equity Portfolio |
| Wells Fargo Factor Enhanced U.S. Large Cap Equity Portfolio |
| Wells Fargo Factor Enhanced U.S. Low Volatility Equity Portfolio |
| Wells Fargo Factor Enhanced U.S. Small Cap Equity Portfolio |
| Wells Fargo High Yield Corporate Bond Portfolio |
| Wells Fargo Investment Grade Corporate Bond Portfolio |
| Wells Fargo Strategic Retirement Bond Portfolio |
| Wells Fargo U.S. REIT Portfolio |
Each Trustee on the Board is not an “interested person” (as defined in the Investment Company Act of 1940 (the “1940 Act”)) of the Portfolios (collectively, the “Independent Trustees”). The process followed by the Board in considering and approving the continuation of the Current Agreements is referred to herein as the “2021 Annual Approval Process.”
As noted above, the closing of the sale of Wells Fargo Asset Management (“WFAM”) to a holding company (“NewCo”) affiliated with private funds of GTCR LLC (“GTCR”) and of Reverence Capital Partners, L.P. (“Reverence Capital”, and such transaction, the “Transaction”) will result in a change of control of Wells Fargo Funds Management LLC (“Funds Management”), Wells Capital Management Incorporated (“Wells Capital”) and Wells Fargo Asset Management (International) Limited (“WFAM(I) Ltd.”, and together with Funds Management and Wells Capital, the “Advisers”), which will be considered to be an “assignment” of each Portfolio’s Current Agreements under the 1940 Act that will result in the automatic termination of each Portfolio’s Current Agreements. In light of the expected termination of each Portfolio’s Current Agreements upon the closing, at the Board Meeting the Board also considered and approved: (i) a new Investment Advisory Agreement (the “New Investment Advisory Agreement”) between the Trust, on behalf of each Portfolio, and Funds Management; (ii) a new Sub-Advisory Agreement (the “New Wells Capital Sub-Advisory Agreement”) among the Trust, on behalf of each Portfolio, Funds Management and Wells Capital; and (iii) a new Sub-Advisory Agreement (the “New WFAM(I) Ltd Sub-Advisory Agreement”) among the Trust, on behalf of Emerging Markets Bond Portfolio, Funds Management and WFAM(I) Ltd (“WFAMI”); and (iv) a new Sub-Advisory Agreement (the “New Galliard Sub-Advisory Agreement”, and collectively, the “New Agreements”) among the Trust, on behalf of Managed Fixed Income Portfolio, Funds Management and Galliard Capital Management, LLC (“Galliard”, and together with Wells Capital and WFAMI, the “Sub-Advisers”), each of which is intended to go into effect upon the closing. The process followed by the Board in reviewing and approving the New Agreements is referred to herein as the “New Agreement Approval Process.”
At a series of meetings held in April and May 2021 (collectively, “April and May 2021 Meetings”) and at the Board Meeting, the Trustees conferred extensively among themselves and with senior representatives of Funds Management, GTCR and Reverence Capital about the New Agreements and related matters. The Board reviewed and discussed information furnished by Funds Management, GTCR and Reverence Capital that the Board considered reasonably necessary to evaluate the terms of the New Agreements and the services to be provided. At these meetings, senior representatives from Funds Management, GTCR and Reverence Capital made presentations to, and responded to questions from, the Board.
In providing information to the Board in connection with the 2021 annual approval process for the Current Agreements (the “2021 Annual Approval Process”) and the New Agreement Approval Process, Funds Management, GTCR and Reverence Capital (as applicable) were guided by requests for information submitted by independent legal counsel on behalf of the Independent Trustees. In considering and approving the New Agreements, the Trustees considered the information they believed relevant, including but not limited to the information discussed herein. The Board considered not only the specific information presented in
28 | Wells Fargo Factor Enhanced U.S. Low Volatility Equity Portfolio
Board considerations (unaudited)
connection with the April and May 2021 Meetings as well as the Board Meeting, but also the knowledge gained over time through interaction with Funds Management and the Sub-Advisers about various topics. In this regard, the Board reviews reports of Funds Management at each of its regular Board meetings, which includes, among other things, portfolio reviews and investment performance reports. In addition, the Board confers with portfolio managers at various times throughout the year. The Board was assisted in its evaluation of the New Agreements by independent legal counsel, from whom the Independent Trustees received separate legal advice and with whom the Independent Trustees met separately. The Board did not identify any particular information or consideration that was all-important or controlling, and each individual Trustee may have attributed different weights to various factors.
Among other information considered by the Board in connection with the Transaction was:
| ■ | Information regarding the Transaction: information about the structure, financing sources and material terms and conditions of the Transaction, including the expected impact on the businesses conducted by the Advisers and by Wells Fargo Funds Distributor LLC. |
| ■ | Information regarding NewCo, GTCR and Reverence Capital: (i) information about NewCo, including information about its expected financial condition and access to capital, and senior leadership team; (ii) the experience of senior management at GTCR and Reverence Capital in acquiring portfolio companies; (iii) the plan to operationalize NewCo, including the transition of necessary infrastructure services through a transition services agreement with Wells Fargo under which Wells Fargo will continue to provide NewCo with certain services for a specified period of time after the closing; and (iv) information regarding regulatory matters, compliance, and risk management functions at NewCo, including resources to be dedicated thereto. |
| ■ | Impact of the Transaction on WFAM and Service Providers: (i) information regarding any changes to personnel and/or other resources of the Advisers as a result of the Transaction, including assurances regarding comparable and competitive compensation arrangements to attract and retain highly qualified personnel; and (ii) information about the organizational and operating structure with respect to NewCo, the Advisers and the Portfolios. |
| ■ | Impact of the Transaction on the Portfolios and their Shareholders: (i) information regarding anticipated benefits to the Portfolios as a result of the Transaction; (ii) a commitment that the Portfolios would not bear any expenses, directly or indirectly, in connection with the Transaction; (iii) confirmation that the Advisers intend to continue to manage the Portfolios in a manner consistent with each Portfolio’s current investment objectives and principal investments strategies; and (iv) a commitment that neither NewCo nor WFAM will take any steps that would impose any “unfair burden” (as that term is used in section 15(f)(1)(B) of the 1940 Act) on the Portfolios as a result of the Transaction. |
With respect to the New Agreements, the Board considered: (i) a representation that, after the closing, all of the Portfolios will continue to be managed and advised by their current Advisers, and that the same portfolio managers of the Sub-Advisers are expected to continue to manage the Portfolios after the Transaction; (ii) information regarding the terms of the New Agreements, including changes as compared to the Current Agreements; (iii) information confirming that the fee rates payable under the New Agreements will not increase as a result of the Transaction as compared to the rates under the Current Agreements; and (iv) assurances that the Transaction is not expected to cause any diminution with respect to the nature, extent and quality of any of the services currently provided to the Portfolios by the Advisers as a result of the Transaction.
In addition to considering information furnished specifically to evaluate the impact of the Transaction on the Portfolios and their respective shareholders in connection with the New Agreement Approval Process, the Board considered information furnished at prior meetings of the Board and its committees, including detailed information provided in connection with the 2021 Annual Approval Process. In this regard, in connection with the 2021 Annual Approval Process, the Board received information about complex-wide and individual Portfolio performance, fees and expenses, including: (i) a report from an independent data provider comparing the investment performance of each Portfolio to the investment performance of comparable funds and benchmark indices, over various time periods; (ii) a report from an independent data provider comparing each Portfolio’s total expense ratio (and its components) to those of comparable funds; (iii) comparative information concerning the fees charged and services provided by the Advisers to each Portfolio in managing other accounts (which may include other mutual funds, collective investment funds and institutional accounts), if any, that employ investment strategies and techniques similar to those used in managing such Portfolio(s); and (iv) profitability analyses of Funds Management, as well as the profitability of both WFAM and Wells Fargo from providing services to the fund family as a whole.
After its deliberations, the Board unanimously determined that the compensation payable to Funds Management and the Sub-Advisers under the New Agreements is reasonable, approved the New Agreements for a two-year term. The Board considered the approval of the New Agreements as part of its consideration of agreements for funds across the complex, but its approvals were made on a fund-by-fund basis. The following summarizes a number of important, but not necessarily all, factors considered by the Board in support of its approvals.
Wells Fargo Factor Enhanced U.S. Low Volatility Equity Portfolio | 29
Board considerations (unaudited)
Nature, extent and quality of services
In connection with the 2021 Annual Approval Process, the Board received and considered various information regarding the nature, extent and quality of services provided to each Portfolio by Funds Management and the Sub-Advisers under the Advisory Agreements. This information included a description of the investment advisory services and administrative services covered by the Current Advisory Agreement, as well as, among other things, a summary of the background and experience of senior management of WFAM, of which Funds Management and the Sub-Advisers are a part, and a summary of investments made in the business of WFAM. The Board also received a description of Funds Management’s and the Sub-Advisers’ business continuity plans, including a summary of the performance of such plans and any changes thereto during the COVID-19 pandemic, and of their approaches to data privacy and cybersecurity. The Board also received and reviewed information about Funds Management’s role as administrator of the Portfolios’ liquidity risk management program, Funds Management’s approach to risk management, and Funds Management’s intermediary and vendor oversight program.
In connection with the 2021 Annual Approval Process, the Board also considered the qualifications, background, tenure and responsibilities of each of the portfolio managers primarily responsible for the day-to-day portfolio management of the Portfolios. The Board evaluated the ability of Funds Management and the Sub-Advisers to attract and retain qualified investment professionals, including research, advisory and supervisory personnel.
In connection with the 2021 Annual Approval Process, the Board further considered the compliance programs and compliance records of Funds Management and the Sub-Advisers. In addition, the Board took into account the full range of services provided to the Portfolios by Funds Management and its affiliates.
In connection with the New Agreement Approval Process, the Board considered, among other information, the structure of the Transaction and expected impact, if any, of the Transaction on the operations, facilities, organization and personnel of the Advisers. The Board received assurances from the Advisers that each Portfolio will continue to be advised by its current Advisers after the closing, and that the same individual portfolio managers are expected to continue to manage the Portfolios after the closing. With respect to the recruitment and retention of key personnel, the Board noted information from GTCR, Reverence Capital and the Advisers regarding the potential benefits for employees of joining NewCo. The Board recognized that the personnel who had been extended offers may not accept such offers and personnel changes may occur in the future in the ordinary course.
In addition, the Board considered information regarding the infrastructure, operational capabilities and support staff in place to assist in the portfolio management and operations of the Portfolios, including the provision of administrative services, and the anticipated impact of the Transaction on such matters. The Board also considered the business-related and other risks to which the Advisers may be subject in managing the Portfolios and in connection with the Transaction. The Board also considered the transition and integration plans as a result of the change in ownership of the Advisers from Wells Fargo to NewCo. The Board considered the resources and infrastructure that NewCo intends to devote to its compliance program to ensure compliance with applicable laws and regulations, as well as its risk management program and cybersecurity program. The Board also took into account assurances received from the Advisers, GTCR and Reverence Capital that the Transaction is not expected to cause any diminution in the nature, extent and quality of services provided by the Advisers to the Portfolios and their shareholders.
Investment performance and expenses
In connection with the 2021 Annual Approval Process, the Board considered the investment performance results for each Portfolio over various time periods ended December 31, 2020. The Board considered these results in comparison to the investment performance of funds in a universe that was determined by Broadridge Inc. (“Broadridge”) to be similar to each Portfolio (the “Universe”), and in comparison to each Portfolio’s benchmark index and to other comparative data. Broadridge is an independent provider of investment company data. The Board received a description of the methodology used by Broadridge to select the mutual funds in the performance Universe. Where applicable, the Board received information concerning, and discussed factors contributing to, underperformance of Portfolios relative to the Universe and benchmark for any underperformance periods.
In connection with the 2021 Annual Approval Process, the Board also reviewed the fee rates that are payable to Funds Management for investment advisory services (as discussed below), which are the only fees charged at the Portfolio level, relative to corresponding expense groups that were determined by Broadridge to be similar to the Portfolios (the “Groups”). The Board received a description of the methodology used by Broadridge to select the mutual funds in the expense Groups and an explanation of how funds comprising expense groups and their expense ratios may vary from year-to-year.
In connection with the New Agreement Approval Process, the Board received a commitment that WFAM will maintain fee and expense commitments for at least two years after the closing. The Board took into account each Fund’s investment performance and expense information among the factors considered in deciding to approve the New Agreements.
30 | Wells Fargo Factor Enhanced U.S. Low Volatility Equity Portfolio
Board considerations (unaudited)
Investment advisory and sub-advisory fee rates
In connection with the 2021 Annual Approval Process, the Board reviewed and considered the contractual investment advisory fee rate that is payable by each Portfolio to Funds Management for investment advisory services under the Current Advisory Agreement (the “Advisory Agreement Rate”). The Board also reviewed and considered the contractual investment sub-advisory fee rate that is payable by Funds Management to the applicable Sub-Adviser for investment sub-advisory services (the “Sub-Advisory Agreement Rate”).
Among other information reviewed by the Board in connection with the 2021 Annual Approval Process, was a comparison of each Portfolio’s Advisory Agreement Rate with those of other funds in the Portfolio’s expense Group at a common asset level.
In connection with the 2021 Annual Approval Process, the Board also received and considered information about the portion of the total management fee that was retained by Funds Management after payment of the Sub-Advisory Agreement Rates. In assessing the reasonableness of this amount, the Board received and evaluated information about the nature and extent of responsibilities retained and risks assumed by Funds Management and not delegated to or assumed by the Sub-Advisers, and about Funds Management’s on-going oversight services. Given the affiliation between Funds Management and the Sub-Advisers, the Board ascribed limited relevance to the allocation of fees between them.
In connection with the 2021 Annual Approval Process, the Board also received and considered information about the nature and extent of services offered and fee rates charged by Funds Management and the Sub-Advisers to other types of clients, if any, with investment strategies similar to those of each Portfolio. In this regard, the Board received information about the significantly greater scope of services, and compliance, reporting and other legal burdens and risks of managing proprietary mutual funds compared with those associated with managing assets of other types of clients, including third-party sub-advised fund clients and non-mutual fund clients such as institutional separate accounts.
In connection with the New Agreement Approval Process, the Board noted the assurances received by it that there would be no increases to any of the Advisory Agreement Rates or the Sub-Advisory Agreement Rates as a result of the Transaction. The Board also considered that the New Agreements do not change the computation method for calculating such fees, and there is no present intention to reduce expense waiver and reimbursement arrangements that are currently in effect. Based on its consideration of the factors and information it deemed relevant, including those described here, the Board determined that the compensation payable to Funds Management under the New Advisory Agreement and to each of the Sub-Advisers under the applicable new Sub-Advisory Agreement was reasonable.
Profitability
In connection with the 2021 Annual Approval Process, the Board received and considered information concerning the profitability of Funds Management, as well as the profitability of both WFAM and Wells Fargo from providing services to the fund family as a whole. The Board noted that the Sub-Advisers’ profitability information with respect to providing services to each Fund and other funds in the family was subsumed in the WFAM and Wells Fargo profitability analysis.
Funds Management reported on the methodologies and estimates used in calculating profitability in connection with the 2021 Annual Approval Process, including a description of the methodology used to allocate certain expenses. Among other things, the Board noted that the levels of profitability reported on a fund-by-fund basis varied widely, depending on factors such as the size, type and age of fund.
In connection with the New Agreement Approval Process, the Board received certain information about NewCo’s projected financial condition, and reviewed with senior representatives of Funds Management, GTCR and Reverence Capital the underlying assumptions on which such information was based. The Board considered that NewCo is a newly formed entity, with no historical operations, revenues or expenses, and that it is difficult to predict with any degree of certainty the future profitability of NewCo and the Advisers from advisory activities under the New Agreements. The Board considered that the fee rates payable under the New Agreements will not increase as a result of the Transaction as compared to the rates under the Current Agreements, and that the current contractual expense limitations applicable to each Portfolio will not increase. The Board noted that if the New Agreements are approved by shareholders and the Transaction closes, the Board will have the opportunity in the future to review the profitability of NewCo and the Advisers from advisory activities under the New Agreements.
Economies of scale
In connection with the 2021 Annual Approval Process, the Board received and considered information about the potential for Funds Management to experience economies of scale in the provision of advisory services to the Portfolios, the difficulties of calculating economies of scale at an individual fund level, and the extent to which potential scale benefits are shared with Portfolio shareholders. The Board noted the existence of breakpoints in each Portfolio’s advisory fee structure, which operate generally to reduce the Portfolio’s expense ratios as the Portfolio grows in size, and the size of the Portfolio in relation to such breakpoints. The
Wells Fargo Factor Enhanced U.S. Low Volatility Equity Portfolio | 31
Board considerations (unaudited)
Board considered that, in addition to advisory fee breakpoints, Funds Management shares potential economies of scale from its management business in a variety of ways, including through fee waiver and expense reimbursement arrangements, competitive management fee rates set at the outset without regard to breakpoints, and investments in the business intended to enhance services available to shareholders.
In connection with the New Agreement Approval Process, the Board noted that NewCo and the Advisers may benefit from possible growth of the Portfolios resulting from enhanced distribution capabilities for their investing funds. However, the Board noted that other factors could also affect the potential for economies of scale, and that it was not possible to quantify any potential future economies of scale. Based upon the information furnished to the Board in connection with the 2021 Annual Approval Process and the New Agreement Approval Process, the Board concluded that Funds Management’s arrangements with respect to each Portfolio, including contractual breakpoints and expense limitation arrangements, constituted a reasonable approach to sharing potential economies of scale with the Portfolio and its shareholders.
“Fall-out” benefits to Funds Management and the Sub-Advisers
In connection with the 2021 Annual Approval Process, the Board received and considered information regarding potential “fall-out” or ancillary benefits received by Funds Management and its affiliates, including the Sub-Advisers, as a result of their relationships with the Portfolios. Ancillary benefits could include, among others, benefits directly attributable to other relationships with the Portfolios and benefits potentially derived from an increase in Funds Management’s and the Sub-Advisers’ business as a result of their relationships with the Portfolios. The Board noted that various current affiliates of Funds Management may receive distribution-related fees, shareholder servicing payments and sub-transfer agency fees in respect of shares sold or held through them and services provided.
In connection with the 2021 Annual Approval Process, the Board also reviewed information about soft dollar credits earned and utilized by the Sub-Advisers, fees earned by Funds Management and Wells Capital from managing a private investment vehicle for the fund family’s securities lending collateral, and commissions earned by an affiliated broker of Wells Fargo from portfolio transactions.
In connection with the New Agreement Approval Process, the Board received information to the effect that the Transaction is not expected to have a material impact on the fall-out benefits currently realized by Funds Management and its affiliates, including the Sub-Advisers. The information reviewed by the Board also noted that several of the ancillary benefits identified for WFAM would be potential ancillary benefits for NewCo, including that the scale and reputation of the Portfolios might benefit NewCo’s broader reputation, product initiatives, technology investment and talent acquisition. Based on its consideration of the factors and information it deemed relevant, including those described here, the Board did not find that any ancillary benefits expected to be received by Funds Management and its affiliates, including NewCo and the Sub-Advisers, under the New Agreements were unreasonable.
Conclusion
At the Board Meeting, after considering the above-described factors and based on its deliberations and its evaluation of the information described above, the Board unanimously determined that the compensation payable to Funds Management and to each of the Sub-Advisers under the New Agreements is reasonable, approved the New Agreements for a two-year term.
32 | Wells Fargo Factor Enhanced U.S. Low Volatility Equity Portfolio
Board considerations (unaudited)
Board Considerations - Interim Agreements
At a meeting held on May 17-19, 2021 (the “Board Meeting”), the Boards of Trustees (each, a “Board”, and collectively, the “Boards”) of Wells Fargo Funds Trust, Wells Fargo Master Trust, Wells Fargo Variable Trust, Wells Fargo Global Dividend Opportunity Fund, Wells Fargo Income Opportunities Fund, Wells Fargo Multi-Sector Income Fund and Wells Fargo Utilities and High Income Fund (each a “Trust”, and the series thereof, a “Fund”) reviewed and approved for the Trusts and Funds, as applicable: (i) interim investment management agreements (the “Interim Management Agreements”) with Wells Fargo Funds Management, LLC (“Funds Management”); (ii) interim investment advisory agreements (the “Interim Advisory Agreements”) with Funds Management; and (iii) interim sub-advisory agreements (the “Interim Sub-Advisory Agreements”) with each of Cooke & Bieler, L.P., Galliard Capital Management LLC (“Galliard”), Peregrine Capital Management Inc., Wells Capital Management, LLC (“WellsCap”), and Wells Fargo Asset Management (International) Limited (“WFAMI”, and collectively, the “Sub-Advisers”). Each Trustee on the Board is not an “interested person” (as defined in the Investment Company Act of 1940 (the “1940 Act”) of the Funds (collectively, the “Independent Trustees”). The Interim Management Agreements, Interim Advisory Agreements, and Interim Sub-Advisory Agreements are collectively referred to as the “Interim Advisory Agreements.”
At the Board Meeting, the Boards reviewed and approved the continuation of existing investment management, advisory and sub-advisory agreements (the “Current Advisory Agreements”) for each Trust and Fund, as applicable. The factors considered and conclusions reached by the Boards in approving the Current Advisory Agreements are summarized in the section entitled “Board Considerations – Current Agreements” of this shareholder report. The Boards noted that Wells Fargo & Company has entered into a definitive agreement to sell Wells Fargo Asset Management (“WFAM”), which includes Funds Management, Galliard, WellsCap and WFAMI (the “Affiliated Sub-Advisers”), to a holding company affiliated with private funds of GTCR LLC and Reverence Capital Partners, L.P. (the “Transaction”). The Boards further noted that the Transaction would result in a change-of-control of Funds Management and the Affiliated Sub-Advisers, which would be considered to be an “assignment” under the 1940 Act that would terminate the Current Advisory Agreements. At the Board Meeting, the Boards also reviewed and approved new investment management, advisory and sub-advisory agreements (the “New Advisory Agreements”) for each Trust and Fund, as applicable, that would replace the Current Advisory Agreements upon consummation of the Transaction, subject to approval of the New Advisory Agreements by the applicable Trust’s or Fund’s shareholders. The factors considered and conclusions reached by the Boards in approving the New Advisory Agreements are summarized in the section entitled “Board Considerations – New Agreements” of this shareholder report.
At the Board Meeting, the Boards also approved the Interim Advisory Agreements, which will go into effect for a Trust or Fund only in the event that shareholders of such Trust or Fund do not approve the New Advisory Agreement(s) for the Trust or Fund by the closing date of the Transaction, when the Current Advisory Agreements will terminate. The Board noted that, in such a circumstance, the Interim Advisory Agreements will permit continuity of management by allowing Funds Management and the Sub-Advisers to continue providing services to the Trust or Fund pursuant to the Interim Advisory Agreements while the Trust or Fund continues to solicit shareholder approval of such New Advisory Agreement(s). The Boards noted that the terms of the Interim Advisory Agreements are identical to those of the Current Advisory Agreements, except for the term and the addition of escrow provisions with respect to the advisory fees. The Boards also noted that the entities that would service the Funds and Trusts under the Interim Advisory Agreements are identical to those that provide services under the Current Advisory Agreements and those that will provide services under the New Advisory Agreements.
In approving the Interim Advisory Agreements, the Boards considered the same factors and reached the same conclusions as they considered and reached with respect to the Boards’ approvals of the Current Advisory Agreements and New Advisory Agreements, as applicable, which are described in separate Board Consideration sections within this shareholder report. Prior to the Board Meeting, including at a series of meetings held in April and May 2021, the Trustees conferred extensively among themselves and with senior representatives of Funds Management, GTCR LLC and Reverence Capital Partners, L.P. about the Interim Advisory Agreements and related matters. The Independent Trustees were assisted in their evaluation of the Interim Advisory Agreements by independent legal counsel, from whom they received separate legal advice and with whom they met separately.
At the Board Meeting, after considering the factors and reaching the conclusions described in the separate Board Consideration sections within this shareholder report, the Boards unanimously determined that the compensation payable to Funds Management and to each Sub-Adviser under each of the Interim Advisory Agreements was reasonable, and approved the Interim Advisory Agreements.
Wells Fargo Factor Enhanced U.S. Low Volatility Equity Portfolio | 33
For more information
More information about Wells Fargo Funds is available free upon request. To obtain literature, please write, visit the Portfolio's website, or call:
Wells Fargo Funds
P.O. Box 219967
Kansas City, MO 64121-9967
Website: wfam.com
Individual investors: 1-800-222-8222
Retail investment professionals: 1-888-877-9275
Institutional investment professionals: 1-866-765-0778
This report and the financial statements contained herein are submitted for the general information of the interest holders of the Portfolio. If this report is used for promotional purposes, distribution of the report must be accompanied or preceded by a current prospectus. Before investing, please consider the investment objectives, risks, charges, and expenses of the investment. For a current prospectus and, if available, a summary prospectus, containing this information, call
1-800-222-8222 or visit the Portfolio's website at wfam.com. Read the prospectus carefully before you invest or send money.
Wells Fargo Asset Management (WFAM) is the trade name for certain investment advisory/management firms owned by Wells Fargo & Company. These firms include but are not limited to Wells Capital Management, LLC and Wells Fargo Funds Management, LLC. Certain products managed by WFAM entities are distributed by Wells Fargo Funds Distributor, LLC (a broker-dealer and Member FINRA).
This material is for general informational and educational purposes only and is NOT intended to provide investment advice or a recommendation of any kind - including a recommendation for any specific investment, strategy, or plan.
INVESTMENT PRODUCTS: NOT FDIC INSURED ■ NO BANK GUARANTEE ■ MAY LOSE VALUE
© 2021 Wells Fargo & Company. All rights reserved.
Semi-Annual Report
August 31, 2021
Wells Fargo
Factor Enhanced U.S. Small Cap Equity Portfolio
INVESTMENT PRODUCTS: NOT FDIC INSURED ■ NO BANK GUARANTEE ■ MAY LOSE VALUE
Wells Fargo Factor Enhanced U.S. Small Cap Equity Portfolio | 1
Portfolio information (unaudited)
| Investment objective | The Portfolio seeks long-term capital appreciation. |
| Adviser | Wells Fargo Funds Management, LLC |
| Subadviser | Wells Capital Management, LLC |
| Portfolio managers | Dennis Beinn, CFA®‡, Harindra de Silva, Ph.D., CFA®‡, Monisha Jayakumar |
| Holdings (%) as of August 31, 20211 |
| AMC Entertainment Holdings Class A | 0.61 |
| Intellia Therapeutics Incorporated | 0.33 |
| Halozyme Therapeutics Incorporated | 0.27 |
| Tenet Healthcare Corporation | 0.27 |
| Blueprint Medicines Corporation | 0.27 |
| Crocs Incorporated | 0.26 |
| J2 Global Incorporated | 0.25 |
| Alkermes plc | 0.24 |
| Lattice Semiconductor Corporation | 0.24 |
| BJ's Wholesale Club Holdings Incorporated | 0.23 |
| 1 | Figures represent the percentage of the Portfolio's net assets. Holdings are subject to change and may have changed since the date specified. |
| Sector allocation as of August 31, 20211 |
| 1 | Figures represent the percentage of the Portfolio's long-term investments. These amounts are subject to change and may have changed since the date specified. |
| ‡ | CFA® and Chartered Financial Analyst® are trademarks owned by CFA Institute. |
2 | Wells Fargo Factor Enhanced U.S. Small Cap Equity Portfolio
Portfolio of investments—August 31, 2021 (unaudited)
| | | | | Shares | Value |
| Common stocks: 98.27% | | | | | |
| Communication services: 3.38% | | | | | |
| Diversified telecommunication services: 0.69% | | | | | |
| ATN International Incorporated | | | | 195 | $ 8,890 |
| Bandwidth Incorporated Class A † | | | | 548 | 56,389 |
| Cogent Communications Group Incorporated | | | | 2,281 | 165,555 |
| Consolidated Communications Holdings Incorporated † | | | | 5,125 | 47,509 |
| Globalstar Incorporated † | | | | 63,563 | 126,490 |
| IDT Corporation Class B † | | | | 6,949 | 302,143 |
| Intelsat SA † | | | | 4,617 | 999 |
| Iridium Communications Incorporated † | | | | 7,374 | 328,217 |
| Liberty Latin America Class A † | | | | 12,979 | 185,081 |
| Liberty Latin America Class C † | | | | 9,255 | 133,179 |
| Ooma Incorporated † | | | | 3,805 | 72,295 |
| Radius Global Infrastructure Incorporated Class A † | | | | 5,718 | 102,238 |
| | | | | | 1,528,985 |
| Entertainment: 1.01% | | | | | |
| Akazoo SA ♦† | | | | 5,400 | 0 |
| AMC Entertainment Holdings Class A † | | | | 28,407 | 1,338,822 |
| Chicken Soup for the Soul Entertainment Incorporated † | | | | 6,600 | 160,116 |
| Cinemark Holdings Incorporated † | | | | 6,523 | 116,305 |
| CuriosityStream Incorporated † | | | | 1,838 | 22,975 |
| IMAX Corporation † | | | | 3,253 | 51,105 |
| Lions Gate Entertainment Class A † | | | | 15,968 | 206,307 |
| Lions Gate Entertainment Class B † | | | | 19,803 | 232,883 |
| Livexlive Media Incorporated † | | | | 3,595 | 12,331 |
| Marcus Corporation † | | | | 919 | 14,336 |
| The Madison Square Garden Entertainment Corporation † | | | | 920 | 73,775 |
| | | | | | 2,228,955 |
| Interactive media & services: 0.60% | | | | | |
| Actua Corporation ♦† | | | | 9,483 | 0 |
| CarGurus Incorporated † | | | | 9,128 | 277,309 |
| Cars.com Incorporated † | | | | 24,103 | 306,590 |
| Eventbrite Incorporated Class A † | | | | 2,306 | 40,770 |
| EverQuote Incorporated Class A † | | | | 1,283 | 25,262 |
| FuboTV Incorporated † | | | | 4,950 | 144,293 |
| MediaAlpha Incorporated Class A † | | | | 2,993 | 66,385 |
| QuinStreet Incorporated † | | | | 10,356 | 185,476 |
| TrueCar Incorporated † | | | | 17,069 | 71,690 |
| Yelp Incorporated † | | | | 5,689 | 219,083 |
| | | | | | 1,336,858 |
| Media: 0.91% | | | | | |
| Advantage Solutions Incorporated † | | | | 4,187 | 36,469 |
| AMC Networks Incorporated Class A † | | | | 4,640 | 220,539 |
| Audacy Incorporated † | | | | 8,591 | 30,498 |
| Boston Omaha Corporation Class A † | | | | 551 | 19,698 |
| Cardlytics Incorporated † | | | | 377 | 34,224 |
| Entravision Communications Corporation Class A | | | | 18,868 | 131,510 |
| Fluent Incorporated † | | | | 35,836 | 97,474 |
| Gray Television Incorporated | | | | 6,303 | 143,330 |
| Hemisphere Media Group Incorporated † | | | | 1,097 | 13,515 |
| iHeartMedia Incorporated Class A † | | | | 7,646 | 190,232 |
The accompanying notes are an integral part of these financial statements.
Wells Fargo Factor Enhanced U.S. Small Cap Equity Portfolio | 3
Portfolio of investments—August 31, 2021 (unaudited)
| | | | | Shares | Value |
| Media (continued) | | | | | |
| John Wiley & Sons Incorporated Class A | | | | 2,350 | $ 136,535 |
| Magnite Incorporated † | | | | 3,694 | 107,200 |
| Stagwell Incorporated † | | | | 8,632 | 60,251 |
| TechTarget Incorporated † | | | | 1,174 | 99,297 |
| Tegna Incorporated | | | | 22,787 | 403,786 |
| The E.W. Scripps Company Class A | | | | 6,746 | 125,071 |
| Thryv Holdings Incorporated † | | | | 3,122 | 96,751 |
| WideOpenWest Incorporated † | | | | 3,779 | 80,190 |
| | | | | | 2,026,570 |
| Wireless telecommunication services: 0.17% | | | | | |
| Gogo Incorporated † | | | | 4,163 | 55,992 |
| NII Holdings Incorporated ♦‡ | | | | 14,979 | 36,099 |
| Shenandoah Telecommunications Company | | | | 1,261 | 37,616 |
| Telephone & Data Systems Incorporated | | | | 8,776 | 178,328 |
| United States Cellular Corporation † | | | | 2,383 | 76,137 |
| | | | | | 384,172 |
| Consumer discretionary: 10.59% | | | | | |
| Auto components: 1.05% | | | | | |
| Adient plc † | | | | 7,830 | 308,032 |
| American Axle & Manufacturing Holdings Incorporated † | | | | 13,649 | 121,067 |
| Dana Incorporated | | | | 11,654 | 271,072 |
| Dorman Products Incorporated † | | | | 1,062 | 99,679 |
| Fox Factory Holding Corporation † | | | | 1,702 | 261,546 |
| Gentherm Incorporated † | | | | 1,710 | 146,752 |
| LCI Industries | | | | 1,481 | 209,798 |
| Modine Manufacturing Company † | | | | 4,625 | 57,535 |
| Patrick Industries Incorporated | | | | 2,127 | 173,584 |
| Standard Motor Products Incorporated | | | | 1,088 | 46,664 |
| Tenneco Incorporated † | | | | 8,789 | 137,108 |
| The Goodyear Tire & Rubber Company † | | | | 16,601 | 262,960 |
| Visteon Corporation † | | | | 1,241 | 131,149 |
| XL Fleet Corporation † | | | | 2,738 | 18,618 |
| XPEL Incorporated † | | | | 1,111 | 84,414 |
| | | | | | 2,329,978 |
| Automobiles: 0.36% | | | | | |
| Arcimoto Incorporated † | | | | 997 | 12,383 |
| Canoo Incorporated † | | | | 5,828 | 42,020 |
| Fisker Incorporated † | | | | 11,636 | 162,322 |
| Lordstown Motors Corporation Class A † | | | | 8,109 | 53,357 |
| Winnebago Industries Incorporated | | | | 7,263 | 505,650 |
| Workhorse Group Incorporated † | | | | 1,975 | 19,375 |
| | | | | | 795,107 |
| Distributors: 0.03% | | | | | |
| Funko Incorporated Class A † | | | | 3,302 | 65,842 |
| Greenlane Holdings Incorporated † | | | | 323 | 820 |
| | | | | | 66,662 |
| Diversified consumer services: 0.73% | | | | | |
| 2U Incorporated † | | | | 2,378 | 88,057 |
| Adtalem Global Education Incorporated † | | | | 3,631 | 134,347 |
The accompanying notes are an integral part of these financial statements.
4 | Wells Fargo Factor Enhanced U.S. Small Cap Equity Portfolio
Portfolio of investments—August 31, 2021 (unaudited)
| | | | | Shares | Value |
| Diversified consumer services (continued) | | | | | |
| American Public Education Incorporated † | | | | 1,328 | $ 34,926 |
| Carriage Services Incorporated | | | | 4,166 | 192,594 |
| Graham Holdings Company Class B | | | | 556 | 342,946 |
| Houghton Mifflin Harcourt Company † | | | | 14,292 | 192,513 |
| Laureate Education Incorporated Class A † | | | | 8,825 | 140,582 |
| OneSpaWorld Holdings Limited † | | | | 3,032 | 31,836 |
| Perdoceo Education Corporation † | | | | 12,788 | 140,412 |
| StoneMor Incorporated † | | | | 2,188 | 6,345 |
| Strategic Education Incorporated | | | | 883 | 69,121 |
| Stride Incorporated † | | | | 3,376 | 115,594 |
| WW International Incorporated † | | | | 6,234 | 134,966 |
| | | | | | 1,624,239 |
| Hotels, restaurants & leisure: 2.45% | | | | | |
| Bally's Corporation † | | | | 283 | 14,218 |
| Biglari Holdings Incorporated Class B † | | | | 790 | 138,132 |
| BJ's Restaurants Incorporated † | | | | 2,080 | 88,941 |
| Bloomin' Brands Incorporated † | | | | 12,497 | 334,795 |
| Bluegreen Vacations Holding | | | | 6,284 | 143,841 |
| Brinker International Incorporated † | | | | 5,192 | 276,578 |
| Carrols Restaurant Group Incorporated | | | | 2,395 | 9,939 |
| Chuy's Holding Incorporated † | | | | 2,830 | 91,296 |
| Cracker Barrel Old Country Store Incorporated | | | | 1,596 | 229,154 |
| Dave & Buster's Entertainment Incorporated † | | | | 2,148 | 80,378 |
| Del Taco Restaurants Incorporated | | | | 14,891 | 131,041 |
| Denny’s Corporation † | | | | 5,674 | 93,848 |
| Dine Brands Global Incorporated † | | | | 1,553 | 128,464 |
| Drive Shack Incorporated † | | | | 1,517 | 4,141 |
| El Pollo Loco Holdings Incorporated † | | | | 2,109 | 38,257 |
| Everi Holdings Incorporated † | | | | 8,160 | 185,640 |
| Fiesta Restaurant Group Incorporated † | | | | 6,628 | 79,602 |
| Full House Resorts Incorporated † | | | | 9,700 | 83,226 |
| Golden Entertainment Incorporated † | | | | 1,811 | 86,421 |
| Golden Nugget Online Gaming Incorporated † | | | | 718 | 15,509 |
| Hilton Grand Vacations Incorporated † | | | | 3,997 | 174,629 |
| International Game Technology plc † | | | | 8,779 | 188,661 |
| Jack In The Box Incorporated | | | | 2,097 | 222,198 |
| Monarch Casino & Resort Incorporated † | | | | 836 | 52,977 |
| Nathan S Famous Incorporated | | | | 218 | 14,395 |
| Noodles & Company † | | | | 8,429 | 106,121 |
| Papa John's International Incorporated | | | | 2,433 | 310,280 |
| RCI Hospitality Holdings Incorporated | | | | 1,597 | 103,182 |
| Red Robin Gourmet Burgers Incorporated † | | | | 3,836 | 93,905 |
| Red Rock Resorts Incorporated Class A † | | | | 6,717 | 314,423 |
| Rush Street Interactive Incorporated † | | | | 3,751 | 55,815 |
| Ruth's Chris Steak House Incorporated † | | | | 2,141 | 43,869 |
| Scientific Games Corporation † | | | | 5,536 | 400,530 |
| SeaWorld Entertainment Incorporated † | | | | 752 | 36,991 |
| Shake Shack Incorporated Class A † | | | | 1,304 | 113,122 |
| Target Hospitality Corporation † | | | | 3,552 | 14,137 |
| Texas Roadhouse Incorporated | | | | 4,709 | 447,355 |
| The Cheesecake Factory Incorporated † | | | | 4,233 | 197,469 |
| The ONE Group Hospitality Incorporated † | | | | 2,198 | 24,508 |
| Wingstop Incorporated | | | | 1,555 | 267,351 |
| | | | | | 5,435,339 |
The accompanying notes are an integral part of these financial statements.
Wells Fargo Factor Enhanced U.S. Small Cap Equity Portfolio | 5
Portfolio of investments—August 31, 2021 (unaudited)
| | | | | Shares | Value |
| Household durables: 1.58% | | | | | |
| Bassett Furniture Industries Incorporated | | | | 1,135 | $ 24,391 |
| Beazer Homes Incorporated † | | | | 9,291 | 173,835 |
| Cavco Industries Incorporated † | | | | 42 | 10,731 |
| Century Communities Incorporated | | | | 4,269 | 299,257 |
| Flexsteel Industries Incorporated | | | | 1,054 | 36,806 |
| GoPro Incorporated Class A † | | | | 2,914 | 29,053 |
| Green Brick Partners Incorporated † | | | | 4,268 | 106,657 |
| Hamilton Beach Brand Class A | | | | 5,788 | 98,396 |
| Helen of Troy Limited † | | | | 740 | 177,001 |
| Hooker Furniture Corporation | | | | 1,799 | 56,057 |
| Installed Building Products | | | | 771 | 95,743 |
| iRobot Corporation † | | | | 553 | 44,859 |
| KB Home Incorporated | | | | 5,987 | 257,621 |
| La-Z-Boy Incorporated | | | | 1,036 | 36,270 |
| LGI Homes Incorporated † | | | | 1,515 | 242,900 |
| Lifetime Brands Incorporated | | | | 1,636 | 30,021 |
| M/I Homes Incorporated † | | | | 3,609 | 232,384 |
| MDC Holdings Incorporated | | | | 4,531 | 236,745 |
| Meritage Corporation † | | | | 2,760 | 307,850 |
| Skyline Champion Corporation † | | | | 2,424 | 152,033 |
| Sonos Incorporated † | | | | 4,875 | 193,684 |
| Taylor Morrison Home Corporation † | | | | 7,474 | 209,945 |
| TRI Pointe Homes Incorporated † | | | | 10,275 | 244,237 |
| Tupperware Brands Corporation † | | | | 8,215 | 196,092 |
| Voxx International Corporation † | | | | 964 | 10,093 |
| | | | | | 3,502,661 |
| Internet & direct marketing retail: 0.90% | | | | | |
| 1-800-Flowers.com Incorporated Class A † | | | | 5,997 | 190,465 |
| CarParts.com Incorporated † | | | | 3,789 | 65,436 |
| Duluth Holdings Incorporated Class B † | | | | 3,240 | 50,414 |
| Groupon Incorporated † | | | | 2,929 | 72,551 |
| Lands End Incorporated † | | | | 2,451 | 82,966 |
| Liquidity Services Incorporated † | | | | 4,258 | 103,895 |
| Overstock.com Incorporated † | | | | 3,505 | 252,886 |
| PetMed Express Incorporated | | | | 1,475 | 40,622 |
| Porch Group Incorporated † | | | | 5,438 | 108,760 |
| Quotient Technology Incorporated † | | | | 2,431 | 17,649 |
| Revolve Group Incorporated † | | | | 4,337 | 249,204 |
| Shutterstock Incorporated | | | | 2,007 | 231,327 |
| Stamps.com Incorporated † | | | | 1,104 | 363,106 |
| Stitch Fix Incorporated Class A † | | | | 3,996 | 167,472 |
| | | | | | 1,996,753 |
| Leisure products: 0.63% | | | | | |
| Acushnet Holdings Corporation | | | | 2,256 | 112,710 |
| Callaway Golf Company † | | | | 2,964 | 83,170 |
| Clarus Corporation | | | | 567 | 15,360 |
| Escalade Incorporated | | | | 4,571 | 105,590 |
| Johnson Outdoors Incorporated Class A | | | | 333 | 38,225 |
| Malibu Boats Incorporated Class A † | | | | 2,320 | 166,112 |
| Mastercraft Boat Holdings Incorporated † | | | | 7,477 | 186,476 |
| Nautilus Incorporated † | | | | 2,229 | 25,411 |
| Smith & Wesson Brands Incorporated | | | | 9,750 | 235,268 |
The accompanying notes are an integral part of these financial statements.
6 | Wells Fargo Factor Enhanced U.S. Small Cap Equity Portfolio
Portfolio of investments—August 31, 2021 (unaudited)
| | | | | Shares | Value |
| Leisure products (continued) | | | | | |
| Sturm, Ruger & Company Incorporated | | | | 1,609 | $ 125,808 |
| Vista Outdoor Incorporated † | | | | 7,569 | 309,194 |
| | | | | | 1,403,324 |
| Multiline retail: 0.32% | | | | | |
| Big Lots Stores Incorporated | | | | 3,012 | 146,564 |
| Dillard's Incorporated Class A | | | | 864 | 164,557 |
| Macy's Incorporated † | | | | 17,713 | 396,594 |
| | | | | | 707,715 |
| Specialty retail: 1.89% | | | | | |
| Aaron's Incorporated | | | | 456 | 12,093 |
| Abercrombie & Fitch Company Class A † | | | | 3,032 | 108,424 |
| Academy Sports & Outdoors Corporation † | | | | 1,547 | 68,486 |
| American Eagle Outfitters Incorporated | | | | 6,228 | 190,079 |
| America's Car-Mart Incorporated † | | | | 106 | 13,709 |
| Asbury Automotive Group Incorporated † | | | | 1,557 | 289,976 |
| Big 5 Sporting Goods Corporation | | | | 6,694 | 186,093 |
| Boot Barn Holdings Incorporated † | | | | 1,278 | 114,100 |
| Caleres Incorporated | | | | 329 | 8,090 |
| Camping World Holdings Incorporated Class A | | | | 3,555 | 141,987 |
| Children's Place Retail Stores Incorporated † | | | | 31 | 2,692 |
| Citi Trends Incorporated † | | | | 379 | 32,647 |
| Container Store Group Incorporated † | | | | 3,524 | 40,878 |
| Group 1 Automotive Incorporated | | | | 2,153 | 356,192 |
| GrowGeneration Corporation † | | | | 1,627 | 52,048 |
| Guess Incorporated | | | | 2,373 | 57,403 |
| Haverty Furniture Companies Incorporated | | | | 761 | 27,114 |
| Hibbett Sports Incorporated | | | | 2,308 | 220,853 |
| JOANN Incorporated | | | | 2,278 | 31,231 |
| Kirkland's Incorporated † | | | | 6,318 | 120,800 |
| Lazydays Holdings Incorporated † | | | | 6,253 | 153,636 |
| MarineMax Incorporated † | | | | 3,576 | 173,865 |
| Murphy USA Incorporated | | | | 1,322 | 205,280 |
| National Vision Holdings Incorporated † | | | | 2,551 | 153,009 |
| ODP Corporation † | | | | 2,769 | 130,614 |
| Onewater Marine Incorporated Class A | | | | 1,798 | 72,801 |
| Party City Holdco Incorporated † | | | | 6,825 | 46,478 |
| Rent-A-Center Incorporated | | | | 4,896 | 308,840 |
| Sally Beauty Holdings Incorporated † | | | | 3,929 | 73,040 |
| Shoe Carnival Incorporated | | | | 332 | 12,709 |
| Signet Jewelers Limited | | | | 2,220 | 175,824 |
| Sleep Number Corporation † | | | | 1,782 | 164,853 |
| Sonic Automotive Incorporated Class A | | | | 4,054 | 204,889 |
| The Buckle Incorporated | | | | 3,047 | 118,010 |
| Urban Outfitters Incorporated † | | | | 2,183 | 72,083 |
| Winmark Corporation | | | | 153 | 32,073 |
| Zumiez Incorporated † | | | | 617 | 24,797 |
| | | | | | 4,197,696 |
| Textiles, apparel & luxury goods: 0.65% | | | | | |
| Crocs Incorporated † | | | | 4,057 | 579,421 |
| G-III Apparel Group Limited † | | | | 2,920 | 90,316 |
| Kontoor Brands Incorporated | | | | 5,167 | 278,811 |
| PLBY Group Incorporated † | | | | 1,758 | 43,686 |
The accompanying notes are an integral part of these financial statements.
Wells Fargo Factor Enhanced U.S. Small Cap Equity Portfolio | 7
Portfolio of investments—August 31, 2021 (unaudited)
| | | | | Shares | Value |
| Textiles, apparel & luxury goods (continued) | | | | | |
| Rocky Brands Incorporated | | | | 1,692 | $ 84,059 |
| Steven Madden Limited | | | | 3,633 | 147,028 |
| Superior Uniform Group Incorporated | | | | 2,411 | 57,478 |
| Unifi Incorporated † | | | | 1,627 | 37,811 |
| Vera Bradley Incorporated † | | | | 2,296 | 26,312 |
| Wolverine World Wide Incorporated | | | | 2,680 | 96,105 |
| | | | | | 1,441,027 |
| Consumer staples: 3.27% | | | | | |
| Beverages: 0.44% | | | | | |
| Celsius Holdings Incorporated † | | | | 2,959 | 241,928 |
| Coca Cola Bottling Corporation | | | | 690 | 280,250 |
| Duckhorn Portfolio Incorporated † | | | | 961 | 20,652 |
| MGP Ingredients Incorporated | | | | 2,571 | 167,886 |
| National Beverage Corporation | | | | 1,755 | 81,695 |
| Newage Incorporated † | | | | 29,745 | 52,351 |
| Primo Water Corporation | | | | 6,885 | 122,278 |
| | | | | | 967,040 |
| Food & staples retailing: 0.88% | | | | | |
| BJ's Wholesale Club Holdings Incorporated † | | | | 9,171 | 519,629 |
| Ingles Markets Incorporated Class A | | | | 664 | 45,079 |
| MedAvail Holdings Incorporated † | | | | 2,656 | 8,871 |
| Natural Grocers By Vitamin C | | | | 2,213 | 26,755 |
| Performance Food Group Company † | | | | 8,597 | 431,741 |
| PriceSmart Incorporated | | | | 1,275 | 107,878 |
| Rite Aid Corporation † | | | | 3,342 | 59,287 |
| SpartanNash Company | | | | 6,113 | 131,430 |
| Sprouts Farmers Market Incorporated † | | | | 9,273 | 230,898 |
| The Andersons Incorporated | | | | 6,254 | 189,997 |
| United Natural Foods Incorporated † | | | | 5,690 | 209,392 |
| | | | | | 1,960,957 |
| Food products: 0.98% | | | | | |
| AppHarvest Incorporated † | | | | 5,749 | 48,292 |
| B&G Foods Incorporated | | | | 4,587 | 139,261 |
| Calavo Growers Incorporated | | | | 1,221 | 57,289 |
| Fresh Del Monte Produce Incorporated | | | | 5,758 | 189,323 |
| Hostess Brands Incorporated † | | | | 9,281 | 148,125 |
| J & J Snack Foods Corporation | | | | 1,101 | 180,300 |
| John B. Sanfilippo & Son Incorporated | | | | 2,304 | 195,817 |
| Lancaster Colony Corporation | | | | 1,271 | 225,272 |
| Landec Corporation † | | | | 5,488 | 59,435 |
| Mission Produce Incorporated † | | | | 1,825 | 37,851 |
| Sanderson Farms Incorporated | | | | 1,964 | 385,926 |
| Seneca Foods Corporation Class A † | | | | 1,469 | 71,937 |
| Tattooed Chef Incorporated † | | | | 3,575 | 75,683 |
| The Simply Good Foods Company † | | | | 3,967 | 141,305 |
| TreeHouse Foods Incorporated † | | | | 4,519 | 169,327 |
| Vital Farms Incorporated † | | | | 2,568 | 46,173 |
| | | | | | 2,171,316 |
| Household products: 0.23% | | | | | |
| Central Garden & Pet Company † | | | | 3,309 | 152,379 |
The accompanying notes are an integral part of these financial statements.
8 | Wells Fargo Factor Enhanced U.S. Small Cap Equity Portfolio
Portfolio of investments—August 31, 2021 (unaudited)
| | | | | Shares | Value |
| Household products (continued) | | | | | |
| Central Garden & Pet Company Class A † | | | | 1,880 | $ 78,340 |
| Energizer Holdings Incorporated | | | | 2,814 | 110,703 |
| Oil Dri Corporation of America | | | | 1,132 | 40,390 |
| WD-40 Company | | | | 539 | 129,161 |
| | | | | | 510,973 |
| Personal products: 0.61% | | | | | |
| Beauty Health Company † | | | | 6,144 | 157,962 |
| Bellring Brands Incorporated Class A † | | | | 4,063 | 137,208 |
| e.l.f. Beauty Incorporated † | | | | 915 | 28,319 |
| Edgewell Personal Care Company | | | | 3,168 | 134,006 |
| Inter Parfums Incorporated | | | | 1,120 | 81,245 |
| Medifast Incorporated | | | | 1,125 | 256,388 |
| Natures Sunshine Products Incorporated | | | | 4,101 | 70,209 |
| NU Skin Enterprises Incorporated Class A | | | | 6,229 | 315,312 |
| USANA Health Sciences Incorporated † | | | | 1,855 | 179,991 |
| | | | | | 1,360,640 |
| Tobacco: 0.13% | | | | | |
| Turning Point Brands Incorporated | | | | 858 | 42,694 |
| Universal Corporation | | | | 583 | 29,500 |
| Vector Group Limited | | | | 14,608 | 219,412 |
| | | | | | 291,606 |
| Energy: 3.49% | | | | | |
| Energy equipment & services: 0.75% | | | | | |
| Archrock Incorporated | | | | 8,224 | 63,160 |
| Aspen Aerogels Incorporated † | | | | 3,002 | 131,338 |
| Bristow Group Incorporated † | | | | 479 | 15,117 |
| Cactus Incorporated Class A | | | | 4,206 | 157,767 |
| ChampionX Corporation † | | | | 11,597 | 270,558 |
| DMC Global Incorporated † | | | | 1,401 | 56,278 |
| Frank's International NV † | | | | 10,113 | 29,125 |
| FTS International Incorporated Class A † | | | | 3,373 | 74,914 |
| Helix Energy Solutions Group Incorporated † | | | | 4,075 | 15,322 |
| Helmerich & Payne Incorporated | | | | 3,243 | 87,302 |
| Liberty Oilfield Services Class A † | | | | 5,176 | 52,899 |
| National Energy Services Reunited Corporation † | | | | 11,223 | 127,381 |
| Newpark Resources Incorporated † | | | | 11,698 | 30,649 |
| Nextier Oilfield Solutions Incorporated † | | | | 10,512 | 37,843 |
| Oceaneering International Incorporated † | | | | 11,837 | 145,595 |
| Oil States International Incorporated † | | | | 3,559 | 20,856 |
| Patterson-UTI Energy Incorporated | | | | 4,729 | 36,697 |
| ProPetro Holding Corporation † | | | | 9,520 | 73,685 |
| RPC Incorporated † | | | | 8,836 | 33,842 |
| Select Energy Services Incorporated Class A † | | | | 5,737 | 30,693 |
| Solaris Oilfield Infrastructure Incorporated Class A | | | | 941 | 6,992 |
| Tetra Technologies Incorporated † | | | | 37,247 | 120,680 |
| Tidewater Incorporated † | | | | 651 | 7,487 |
| US Silica Holdings Incorporated † | | | | 6,014 | 52,803 |
| | | | | | 1,678,983 |
| Oil, gas & consumable fuels: 2.74% | | | | | |
| Aemetis Incorporated † | | | | 1,804 | 20,060 |
The accompanying notes are an integral part of these financial statements.
Wells Fargo Factor Enhanced U.S. Small Cap Equity Portfolio | 9
Portfolio of investments—August 31, 2021 (unaudited)
| | | | | Shares | Value |
| Oil, gas & consumable fuels (continued) | | | | | |
| Alto Ingredients Incorporated † | | | | 41,806 | $ 212,793 |
| Altus Midstream Company Class A | | | | 2,139 | 139,420 |
| Antero Resources Corporation † | | | | 21,683 | 297,491 |
| Arch Resources Incorporated † | | | | 1,796 | 135,939 |
| Bonanza Creek Energy Incorporated | | | | 2,321 | 90,240 |
| California Resources Corporation † | | | | 6,202 | 212,294 |
| Callon Petroleum Company † | | | | 1,846 | 63,078 |
| Centennial Resource Development Class A † | | | | 23,310 | 118,881 |
| Centrus Energy Corporation Class A † | | | | 2,048 | 59,208 |
| Chesapeake Energy Corporation | | | | 7,992 | 446,034 |
| CNX Resources Corporation † | | | | 15,121 | 171,775 |
| Consol Energy Incorporated † | | | | 4,285 | 97,827 |
| Contango Oil & Gas Company † | | | | 803 | 2,915 |
| Delek US Holdings Incorporated | | | | 2,603 | 44,537 |
| Denbury Incorporated † | | | | 2,141 | 150,577 |
| Dorian LPG Limited | | | | 6,308 | 83,392 |
| Earthstone Energy Incorporated Class A † | | | | 2,430 | 20,096 |
| Equitrans Midstream Corporation | | | | 30,783 | 268,736 |
| Falcon Minerals Corporation | | | | 11,379 | 50,523 |
| Green Plains Renewable Energy Incorporated † | | | | 4,242 | 148,894 |
| HighPeak Energy Incorporated | | | | 2,316 | 22,396 |
| International Seaways Incorporated | | | | 4,224 | 72,653 |
| Kosmos Energy Limited † | | | | 23,033 | 54,358 |
| Laredo Petroleum Incorporated † | | | | 2,056 | 111,086 |
| Magnolia Oil & Gas Corporation | | | | 23,084 | 361,957 |
| Matador Resources Company | | | | 6,818 | 196,018 |
| Murphy Oil Corporation | | | | 4,534 | 96,393 |
| Oasis Petroleum Incorporated | | | | 1,493 | 129,279 |
| Ovintiv Incorporated | | | | 16,832 | 458,840 |
| Par Pacific Holdings Incorporated † | | | | 1,079 | 17,793 |
| PBF Energy Incorporated Class A † | | | | 6,304 | 65,562 |
| PDC Energy Incorporated | | | | 6,091 | 254,299 |
| Peabody Energy Corporation † | | | | 3,915 | 62,562 |
| Penn Virginia Corporation † | | | | 2,349 | 48,624 |
| Range Resources Corporation † | | | | 15,368 | 224,680 |
| Renewable Energy Group Incorporated † | | | | 4,207 | 203,703 |
| Rex American Resources Corporation † | | | | 507 | 42,973 |
| Riley Exploration Permian Incorporated | | | | 156 | 3,151 |
| Scorpio Tankers Incorporated | | | | 2,206 | 35,759 |
| SM Energy Company | | | | 7,617 | 145,485 |
| Southwestern Energy Company † | | | | 46,389 | 211,070 |
| Teekay Tankers Ltd Class A † | | | | 4,705 | 53,872 |
| Tellurian Incorporated † | | | | 12,371 | 39,463 |
| Vine Energy Incorporated Class A † | | | | 2,354 | 35,004 |
| W&T Offshore Incorporated † | | | | 10,793 | 35,185 |
| Whiting Petroleum Corporation † | | | | 2,466 | 115,779 |
| World Fuel Services Corporation | | | | 4,363 | 141,187 |
| | | | | | 6,073,841 |
| Financials: 13.87% | | | | | |
| Banks: 6.63% | | | | | |
| 1st Source Corporation | | | | 1,294 | 60,818 |
| Allegiance Bancshares Incorporated | | | | 528 | 19,626 |
| American National Bankshares Incorporated | | | | 1,191 | 40,708 |
| Ameris Bancorp | | | | 6,052 | 298,000 |
The accompanying notes are an integral part of these financial statements.
10 | Wells Fargo Factor Enhanced U.S. Small Cap Equity Portfolio
Portfolio of investments—August 31, 2021 (unaudited)
| | | | | Shares | Value |
| Banks (continued) | | | | | |
| Associated Banc Corporation | | | | 13,934 | $ 287,319 |
| Atlantic Union Bankshares Corporation | | | | 5,863 | 216,931 |
| Banc of California Incorporated | | | | 3,239 | 58,205 |
| BancFirst Corporation | | | | 891 | 50,395 |
| BancorpSouth Bank | | | | 6,281 | 184,222 |
| Bank of N.T. Butterfield & Son Limited | | | | 3,711 | 123,613 |
| BankUnited Incorporated | | | | 7,719 | 324,430 |
| Banner Corporation | | | | 2,022 | 115,658 |
| Bar Harbor Bankshares | | | | 913 | 25,016 |
| Brookline Bancorp Incorporated | | | | 5,811 | 86,991 |
| Business First Bancshares Incorporated | | | | 1,084 | 25,929 |
| Byline Bancorp Incorporated | | | | 765 | 18,819 |
| Camden National Corporation | | | | 1,019 | 47,557 |
| Capital Bancorp Incorporated | | | | 3,485 | 82,664 |
| Capstar Financial Holdings Class I | | | | 347 | 7,301 |
| Cathay General Bancorp | | | | 5,729 | 227,900 |
| Central Pacific Financial Company | | | | 806 | 20,400 |
| CIT Group Incorporated | | | | 6,357 | 352,305 |
| City Holding Company | | | | 684 | 53,284 |
| Civista Bancshares Incorporated | | | | 1,244 | 29,259 |
| CNB Financial Corporation | | | | 1,533 | 37,681 |
| Columbia Banking System Incorporated | | | | 3,826 | 139,113 |
| Community Bank System Incorporated | | | | 2,833 | 209,642 |
| Community Trust Bancorp | | | | 1,340 | 55,824 |
| ConnectOne Bancorp Incorporated | | | | 4,133 | 118,245 |
| Customers Bancorp Incorporated † | | | | 4,290 | 177,649 |
| CVB Financial Corporation | | | | 6,286 | 127,983 |
| Eagle Bancorp Incorporated | | | | 2,573 | 148,462 |
| Eastern Bankshares Incorporated | | | | 2,741 | 54,217 |
| Enterprise Financial Service | | | | 2,093 | 93,997 |
| Farmers National Banc Corporation | | | | 1,862 | 29,047 |
| FB Financial Corporation | | | | 2,516 | 103,634 |
| Financial Institutions Incorporated | | | | 1,989 | 63,171 |
| First Bancorp of North Carolina | | | | 2,051 | 85,650 |
| First Bancorp of Puerto Rico | | | | 17,759 | 226,072 |
| First Bancshares Incorporated | | | | 613 | 24,839 |
| First Bank | | | | 6,529 | 86,966 |
| First Busey Corporation | | | | 3,916 | 92,809 |
| First Commonwealth Financial Corporation | | | | 11,349 | 153,438 |
| First Financial Bancorp | | | | 7,732 | 181,779 |
| First Financial Bankshares Incorporated | | | | 7,275 | 346,436 |
| First Financial Corporation | | | | 86 | 3,477 |
| First Foundation Incorporated | | | | 2,881 | 69,230 |
| First Internet Bancorp | | | | 3,538 | 105,149 |
| First Interstate BancSystem Class A | | | | 3,494 | 153,946 |
| First Merchants Corporation | | | | 3,421 | 140,774 |
| First Mid-Illinois Bancshares | | | | 72 | 2,945 |
| First of Long Island Corporation | | | | 2,210 | 46,852 |
| Flushing Financial Corporation | | | | 4,071 | 93,348 |
| Fulton Financial Corporation | | | | 11,399 | 180,674 |
| German American Bancorp | | | | 621 | 23,201 |
| Glacier Bancorp Incorporated | | | | 5,649 | 300,866 |
| Great Southern Bancorp Incorporated | | | | 849 | 46,245 |
| Great Western Bancorp Incorporated | | | | 5,534 | 171,333 |
| Guaranty Bancshares Incorporated | | | | 755 | 25,912 |
| Hancock Holding Company | | | | 6,666 | 306,369 |
The accompanying notes are an integral part of these financial statements.
Wells Fargo Factor Enhanced U.S. Small Cap Equity Portfolio | 11
Portfolio of investments—August 31, 2021 (unaudited)
| | | | | Shares | Value |
| Banks (continued) | | | | | |
| Hanmi Financial Corporation | | | | 4,274 | $ 82,403 |
| HarborOne Bancorp Incorporated | | | | 5,612 | 79,298 |
| HBT Financial Incorporated | | | | 3,435 | 56,162 |
| Heartland Financial USA Incorporated | | | | 2,613 | 122,889 |
| Heritage Financial Corporation | | | | 984 | 25,043 |
| Hilltop Holdings Incorporated | | | | 9,600 | 321,312 |
| Home BancShares Incorporated | | | | 11,910 | 263,807 |
| Hometrust Bancshares Incorporated | | | | 623 | 17,332 |
| Hope Bancorp Incorporated | | | | 9,324 | 128,578 |
| Horizon Bancorp Indiana | | | | 3,120 | 55,692 |
| Independent Bank Corporation | | | | 4,246 | 88,911 |
| Independent Bank Corporation | | | | 1,172 | 89,892 |
| Independent Bank Group Incorporated | | | | 3,059 | 215,445 |
| International Bancshares Corporation | | | | 657 | 27,515 |
| Investors Bancorp Incorporated | | | | 17,967 | 257,108 |
| Lakeland Bancorp Incorporated | | | | 3,306 | 55,805 |
| Lakeland Financial Corporation | | | | 922 | 61,230 |
| Live Oak Bancshares Incorporated | | | | 1,681 | 102,894 |
| Macatawa Bank Corporation | | | | 1,815 | 14,901 |
| Metrocity Bankshares Incorporated | | | | 3,797 | 78,636 |
| Metropolitan Bank Holding Corporation † | | | | 692 | 54,184 |
| Mid Penn Bancorp Incorporated | | | | 716 | 19,038 |
| Midland States Bancorp Incorporated | | | | 1,302 | 32,941 |
| Midwestone Financial Group Class I | | | | 1,265 | 37,140 |
| MVB Financial Corporation | | | | 893 | 35,309 |
| National Bank Holdings Corporation Class A | | | | 2,628 | 98,550 |
| NBT Bancorp Incorporated | | | | 2,770 | 99,332 |
| Nicolet Bankshares Incorporated † | | | | 649 | 49,590 |
| Northrim BanCorp Incorporated | | | | 1,282 | 53,806 |
| OceanFirst Financial Corporation | | | | 181 | 3,848 |
| OFG Bancorp | | | | 5,698 | 135,669 |
| Old National Bancorp | | | | 12,009 | 200,070 |
| Old Second Bancorp Incorporated | | | | 7,825 | 92,022 |
| Origin Bancorp Incorporated | | | | 1,269 | 52,219 |
| Orrstown Financial Services Incorporated | | | | 3,794 | 90,525 |
| Pacific Premier Bancorp Incorporated | | | | 3,967 | 158,521 |
| Park National Corporation | | | | 1,449 | 169,881 |
| Peoples Bancorp Incorporated | | | | 1,315 | 41,081 |
| Preferred Bank | | | | 832 | 53,156 |
| Primis Financial Corporation | | | | 837 | 12,547 |
| QCR Holdings Incorporated | | | | 1,748 | 90,809 |
| RBB Bancorp | | | | 2,014 | 51,840 |
| Reliant Bancorp Incorporated | | | | 815 | 23,635 |
| Renasant Corporation | | | | 3,484 | 122,288 |
| Republic Bancorp Incorporated Class A | | | | 494 | 24,764 |
| S&T Bancorp Incorporated | | | | 669 | 19,936 |
| Sandy Spring Bancorp Incorporated | | | | 3,831 | 166,917 |
| Seacoast Banking Corporation | | | | 3,203 | 102,304 |
| ServisFirst Bancshares Incorporated | | | | 2,732 | 200,583 |
| Sierra Bancorp | | | | 2,194 | 55,771 |
| Silvergate Capital Corporation Class A † | | | | 958 | 108,235 |
| Simmons First National Corporation Class A | | | | 7,409 | 215,231 |
| South Plains Financial Incorporated | | | | 1,387 | 32,178 |
| South State Corporation | | | | 3,265 | 223,914 |
| Southern First Bancshares † | | | | 1,138 | 58,015 |
| Southside Bancshares Incorporated | | | | 2,943 | 110,922 |
The accompanying notes are an integral part of these financial statements.
12 | Wells Fargo Factor Enhanced U.S. Small Cap Equity Portfolio
Portfolio of investments—August 31, 2021 (unaudited)
| | | | | Shares | Value |
| Banks (continued) | | | | | |
| Spirit of Texas Bancshares Incorporated | | | | 1,439 | $ 34,032 |
| Summit Financial Group Incorporated | | | | 1,210 | 28,967 |
| Texas Capital Bancshares Incorporated † | | | | 2,956 | 200,978 |
| The Bancorp Incorporated † | | | | 5,300 | 130,698 |
| Tompkins Trust Company Incorporated | | | | 448 | 35,656 |
| Towne Bank | | | | 4,427 | 134,891 |
| TriCo Bancshares | | | | 1,450 | 57,348 |
| Triumph Bancorp Incorporated † | | | | 2,486 | 204,399 |
| Trustmark Corporation | | | | 4,202 | 132,867 |
| UMB Financial Corporation | | | | 2,491 | 228,126 |
| United Bankshares Incorporated | | | | 6,442 | 234,038 |
| United Community Bank | | | | 5,020 | 151,453 |
| Univest Corporation of Pennsylvania | | | | 3,793 | 102,714 |
| Valley National Bancorp | | | | 26,408 | 344,360 |
| Veritex Holdings Incorporated | | | | 3,881 | 139,444 |
| Washington Trust Bancorp | | | | 2,198 | 117,065 |
| WesBanco Incorporated | | | | 5,165 | 175,610 |
| West Bancorporation | | | | 876 | 26,797 |
| Westamerica Bancorporation | | | | 219 | 12,426 |
| | | | | | 14,717,818 |
| Capital markets: 1.30% | | | | | |
| Artisan Partners Asset Management Incorporated Class A | | | | 5,518 | 286,715 |
| Associated Capital Group Incorporated Class A | | | | 776 | 28,611 |
| BGC Partners Incorporated Class A | | | | 24,506 | 126,206 |
| Blucora Incorporated † | | | | 183 | 3,003 |
| BrightSphere Investment Group Incorporated | | | | 4,142 | 112,621 |
| Cohen & Steers Incorporated | | | | 593 | 52,012 |
| Cowen Incorporated Class A | | | | 2,165 | 78,027 |
| Diamond Hill Investment Group | | | | 141 | 25,807 |
| Donnelley Financial Solutions † | | | | 2,339 | 78,006 |
| Federated Investors Incorporated Class B | | | | 5,749 | 194,489 |
| Focus Financial Partners Class A † | | | | 1,497 | 77,664 |
| Gamco Investors Incorporated Class A | | | | 4,748 | 129,668 |
| GCM Grosvenor Incorporated Class A | | | | 3,794 | 42,189 |
| Greenhill & Company Incorporated | | | | 1,357 | 20,002 |
| Hamilton Lane Incorporated Class A | | | | 731 | 62,917 |
| Houlihan Lokey Incorporated | | | | 2,614 | 235,783 |
| Moelis Company Class A | | | | 4,130 | 255,854 |
| Open Lending Corporation Class A † | | | | 2,078 | 76,824 |
| Piper Jaffray Companies Incorporated | | | | 995 | 142,205 |
| PJT Partners Incorporated Class A | | | | 1,486 | 117,364 |
| Pzena Investment Management Class A | | | | 16,451 | 179,480 |
| Sculptor Capital Management Incorporated | | | | 7,056 | 199,685 |
| Stepstone Group Incorporated Class A | | | | 2,061 | 98,660 |
| Stonex Group Incorporated † | | | | 1,217 | 84,813 |
| Virtus Investment Partners Incorporated | | | | 540 | 168,858 |
| | | | | | 2,877,463 |
| Consumer finance: 0.74% | | | | | |
| Atlanticus Holdings Corporation † | | | | 1,034 | 66,383 |
| Curo Group Holdings Corporation | | | | 2,713 | 44,412 |
| Encore Capital Group Incorporated † | | | | 2,094 | 103,046 |
| Enova International Incorporated † | | | | 5,275 | 173,970 |
| FirstCash Financial Services Incorporated | | | | 1,645 | 140,960 |
| LendingClub Corporation † | | | | 2,800 | 86,968 |
The accompanying notes are an integral part of these financial statements.
Wells Fargo Factor Enhanced U.S. Small Cap Equity Portfolio | 13
Portfolio of investments—August 31, 2021 (unaudited)
| | | | | Shares | Value |
| Consumer finance (continued) | | | | | |
| Navient Corporation | | | | 16,545 | $ 384,009 |
| Nelnet Incorporated Class A | | | | 1,782 | 144,128 |
| PRA Group Incorporated † | | | | 711 | 29,862 |
| PROG Holdings Incorporated | | | | 6,763 | 320,025 |
| Regional Management Corporation | | | | 1,539 | 91,463 |
| World Acceptance Corporation † | | | | 340 | 64,556 |
| | | | | | 1,649,782 |
| Diversified financial services: 0.07% | | | | | |
| A-Mark Precious Metals Incorporated | | | | 2,935 | 142,377 |
| Cannae Holdings Incorporated † | | | | 234 | 7,469 |
| | | | | | 149,846 |
| Insurance: 1.62% | | | | | |
| American Equity Investment Life Holding Company | | | | 6,215 | 196,953 |
| Amerisafe Incorporated | | | | 1,552 | 89,318 |
| Argo Group International Holdings Limited | | | | 2,014 | 106,541 |
| CNO Financial Group Incorporated | | | | 14,095 | 344,764 |
| Crawford & Company Class A | | | | 10,053 | 100,228 |
| Donegal Group Incorporated Class A | | | | 4,599 | 69,261 |
| eHealth Incorporated † | | | | 126 | 4,870 |
| Employers Holdings Incorporated | | | | 2,796 | 115,111 |
| Enstar Group Limited † | | | | 1,333 | 307,483 |
| Genworth Financial Incorporated Class A † | | | | 84,930 | 318,488 |
| Goosehead Insurance Incorporated Class A | | | | 297 | 43,594 |
| Greenlight Capital Limited † | | | | 18,344 | 154,640 |
| Heritage Insurance Holdings Incorporated | | | | 1,757 | 12,299 |
| Horace Mann Educators Corporation | | | | 2,384 | 97,744 |
| Kinsale Capital Group Incorporated | | | | 706 | 128,386 |
| Maiden Holdings Limited † | | | | 3,438 | 10,761 |
| Metromile Incorporated † | | | | 2,600 | 10,400 |
| ProAssurance Corporation | | | | 55 | 1,403 |
| RLI Corporation | | | | 2,320 | 253,414 |
| Safety Insurance Group Incorporated | | | | 1,780 | 144,732 |
| Selective Insurance Group Incorporated | | | | 3,821 | 319,321 |
| SelectQuote Incorporated † | | | | 6,002 | 57,319 |
| SiriusPoint Limited † | | | | 13,369 | 131,150 |
| State Auto Financial Corporation | | | | 417 | 21,092 |
| Stewart Information Services Corporation | | | | 4,898 | 308,329 |
| Trean Insurance Group Incorporated † | | | | 4,162 | 42,494 |
| Trupanion Incorporated † | | | | 1,537 | 140,758 |
| Universal Insurance Holdings Company | | | | 3,584 | 51,036 |
| | | | | | 3,581,889 |
| Mortgage REITs: 2.27% | | | | | |
| Apollo Commercial Real Estate Finance Incorporated | | | | 14,523 | 225,833 |
| Arbor Realty Trust Incorporated | | | | 16,708 | 305,422 |
| Ares Commercial Real Estate | | | | 8,138 | 128,418 |
| Armour Residential REIT Incorporated | | | | 18,806 | 204,233 |
| Blackstone Mortgage Trust Incorporated Class A | | | | 8,277 | 271,568 |
| Broadmark Realty Capital Incorporated REIT | | | | 20,613 | 216,643 |
| Capstead Mortgage Corporation | | | | 7,062 | 48,657 |
| Chimera Investment Corporation | | | | 27,001 | 413,655 |
| Dynex Capital Incorporated REIT | | | | 19,632 | 348,664 |
| Ellington Financial Incorporated | | | | 13,814 | 255,835 |
The accompanying notes are an integral part of these financial statements.
14 | Wells Fargo Factor Enhanced U.S. Small Cap Equity Portfolio
Portfolio of investments—August 31, 2021 (unaudited)
| | | | | Shares | Value |
| Mortgage REITs (continued) | | | | | |
| Granite Point Mortgage Trust Incorporated | | | | 7,078 | $ 97,393 |
| Great Ajax Corporation REIT | | | | 9,767 | 138,008 |
| Hannon Armstrong Sustainable Infrastructure Capital Incorporated | | | | 3,966 | 239,427 |
| Invesco Mortgage Capital Incorporated | | | | 12,570 | 39,218 |
| KKR Real Estate Finance Trust | | | | 6,439 | 137,344 |
| Ladder Capital Corporation | | | | 7,741 | 88,325 |
| MFA Financial Incorporated | | | | 79,999 | 383,995 |
| New York Mortgage Trust Incorporated | | | | 67,777 | 299,574 |
| Orchid Island Capital Incorporated REIT | | | | 15,778 | 79,206 |
| PennyMac Mortgage Investment Trust | | | | 14,626 | 283,891 |
| Ready Capital Corporation | | | | 8,741 | 133,825 |
| Redwood Trust Incorporated | | | | 28,958 | 361,106 |
| TPG Real Estate Finance Trust Incorporated | | | | 14,792 | 186,379 |
| Two Harbors Investment Corporation | | | | 23,280 | 153,648 |
| | | | | | 5,040,267 |
| Thrifts & mortgage finance: 1.24% | | | | | |
| Axos Financial Incorporated † | | | | 3,677 | 178,261 |
| Essent Group Limited | | | | 7,158 | 336,999 |
| Federal Agricultural Mortgage Corporation Class C | | | | 233 | 22,811 |
| Flagstar Bancorp Incorporated | | | | 5,027 | 248,635 |
| FS Bancorp Incorporated | | | | 2,458 | 83,990 |
| Home Bancorp Incorporated | | | | 410 | 15,342 |
| Homestreet Incorporated | | | | 2,466 | 100,736 |
| Merchants Bancorp Incorporated | | | | 1,985 | 72,790 |
| Meta Financial Group Incorporated | | | | 1,712 | 84,213 |
| Mr. Cooper Group Incorporated † | | | | 6,901 | 268,311 |
| NMI Holdings Incorporated Class A † | | | | 6,926 | 156,320 |
| Northwest Bancshares Incorporated | | | | 870 | 11,327 |
| Ocwen Financial Corporation † | | | | 3,134 | 88,692 |
| PennyMac Financial Services Incorporated | | | | 2,545 | 169,370 |
| Premier Financial Corporation | | | | 1,768 | 53,747 |
| Provident Financial Services Incorporated | | | | 2,702 | 59,633 |
| Radian Group Incorporated | | | | 13,384 | 316,264 |
| Southern Missouri Bancorp | | | | 281 | 12,679 |
| Velocity Financial Incorporated † | | | | 2,283 | 29,382 |
| Walker & Dunlop Incorporated | | | | 1,834 | 203,666 |
| Washington Federal Incorporated | | | | 906 | 30,170 |
| Waterstone Financial Incorporated | | | | 4,569 | 92,659 |
| WSFS Financial Corporation | | | | 2,550 | 115,796 |
| | | | | | 2,751,793 |
| Health care: 22.30% | | | | | |
| Biotechnology: 10.72% | | | | | |
| 4D Molecular Therapeutics Incorporated † | | | | 673 | 20,560 |
| Acadia Pharmaceuticals Incorporated † | | | | 8,781 | 153,755 |
| Adicet Bio Incorporated † | | | | 1,100 | 9,185 |
| Aduro Biotech Incorporated ♦ | | | | 9,490 | 0 |
| Affimed NV † | | | | 16,806 | 118,314 |
| Agenus Incorporated † | | | | 22,600 | 139,442 |
| Agios Pharmaceuticals Incorporated † | | | | 4,652 | 207,851 |
| Akebia Therapeutics Incorporated † | | | | 11,172 | 32,846 |
| Albireo Pharma Incorporated † | | | | 208 | 6,354 |
| Aldeyra Therapeutics Incorporated † | | | | 4,440 | 42,136 |
The accompanying notes are an integral part of these financial statements.
Wells Fargo Factor Enhanced U.S. Small Cap Equity Portfolio | 15
Portfolio of investments—August 31, 2021 (unaudited)
| | | | | Shares | Value |
| Biotechnology (continued) | | | | | |
| Alector Incorporated † | | | | 3,362 | $ 90,875 |
| Alkermes plc † | | | | 17,345 | 542,205 |
| Allakos Incorporated † | | | | 1,275 | 113,679 |
| Allogene Therapeutics Incorporated † | | | | 697 | 16,623 |
| Alpine Immune Sciences Incorporated † | | | | 4,746 | 45,134 |
| Amicus Therapeutics Incorporated † | | | | 25,866 | 294,614 |
| Anaptysbio Incorporated † | | | | 5,713 | 146,310 |
| Anavex Life Sciences Corporation † | | | | 1,480 | 28,845 |
| Anika Therapeutics Incorporated † | | | | 3,219 | 138,835 |
| Apellis Pharmaceuticals Incorporated † | | | | 4,581 | 301,659 |
| Arbutus Biopharma Corporation † | | | | 37,592 | 128,941 |
| Arcus Biosciences Incorporated † | | | | 3,279 | 95,648 |
| Ardelyx Incorporated † | | | | 5,850 | 8,249 |
| Arena Pharmaceuticals Incorporated † | | | | 1,619 | 85,677 |
| Arrowhead Pharmaceuticals Incorporated † | | | | 6,779 | 455,006 |
| Athenex Incorporated † | | | | 6,012 | 21,944 |
| Avid Bioservices Incorporated † | | | | 11,775 | 285,426 |
| Beam Therapeutics Incorporated † | | | | 1,154 | 128,002 |
| Biocryst Pharmaceuticals Incorporated † | | | | 14,682 | 233,737 |
| Biohaven Pharmaceutical Holding Company † | | | | 3,168 | 415,768 |
| bluebird bio Incorporated † | | | | 1,097 | 20,075 |
| Blueprint Medicines Corporation † | | | | 6,357 | 592,917 |
| Bridgebio Pharma Incorporated † | | | | 5,083 | 254,709 |
| Brooklyn ImmunoTherapeutics Incorporated † | | | | 2,515 | 30,356 |
| C4 Therapeutics Incorporated † | | | | 2,593 | 104,057 |
| CareDx Incorporated † | | | | 4,795 | 351,378 |
| Catalyst Pharmaceuticals Incorporated † | | | | 47,644 | 262,518 |
| Celcuity Incorporated † | | | | 3,208 | 70,576 |
| Celldex Therapeutics Incorporated † | | | | 1,790 | 94,244 |
| Chemocentryx Incorporated † | | | | 2,363 | 37,359 |
| Chimerix Incorporated † | | | | 16,145 | 114,630 |
| Chinook Therapeutics Incorporated † | | | | 4,062 | 55,081 |
| Clene Incorporated † | | | | 1,758 | 14,064 |
| Clovis Oncology Incorporated † | | | | 7,187 | 34,641 |
| Codiak BioSciences Incorporated † | | | | 1,134 | 19,505 |
| Cogent Biosciences Incorporated † | | | | 7,272 | 60,212 |
| Coherus Biosciences Incorporated † | | | | 9,127 | 145,849 |
| Curis Incorporated † | | | | 6,382 | 56,481 |
| Cytokinetics Incorporated † | | | | 5,338 | 175,994 |
| CytomX Therapeutics Incorporated † | | | | 7,883 | 40,361 |
| Deciphera Pharmaceuticals Incorporated † | | | | 2,709 | 85,334 |
| Denali Therapeutics Incorporated † | | | | 8,271 | 440,017 |
| Dermtech Incorporated † | | | | 2,186 | 81,319 |
| Dicerna Pharmaceuticals Incorporated † | | | | 5,310 | 109,280 |
| Dynavax Technologies Corporation † | | | | 19,446 | 378,419 |
| Eagle Pharmaceuticals Incorporated † | | | | 7,285 | 388,800 |
| Editas Medicine Incorporated † | | | | 5,360 | 340,842 |
| Eiger BioPharmaceuticals Incorporated † | | | | 3,461 | 28,173 |
| Emergent BioSolutions Incorporated † | | | | 3,603 | 227,277 |
| Enanta Pharmaceuticals Incorporated † | | | | 1,426 | 81,567 |
| Fate Therapeutics Incorporated † | | | | 5,315 | 389,324 |
| Fibrogen Incorporated † | | | | 7,719 | 89,772 |
| Finch Therapeutics Group Incorporated † | | | | 1,831 | 25,909 |
| Flexion Therapeutics Incorporated † | | | | 4,718 | 28,214 |
| Forte Biosciences Incorporated † | | | | 1,332 | 39,187 |
| Fortress Biotech Incorporated † | | | | 5,353 | 17,611 |
The accompanying notes are an integral part of these financial statements.
16 | Wells Fargo Factor Enhanced U.S. Small Cap Equity Portfolio
Portfolio of investments—August 31, 2021 (unaudited)
| | | | | Shares | Value |
| Biotechnology (continued) | | | | | |
| G1 Therapeutics Incorporated † | | | | 7,987 | $ 120,763 |
| Gemini Therapeutics Incorporated † | | | | 1,574 | 7,744 |
| Global Blood Therapeutics Incorprated † | | | | 4,450 | 127,671 |
| Gritstone bio Incorporated † | | | | 14,434 | 132,793 |
| Halozyme Therapeutics Incorporated † | | | | 14,421 | 605,538 |
| Heron Therapeutics Incorporated † | | | | 12,995 | 151,652 |
| Homology Medicines Incorporated † | | | | 3,999 | 28,753 |
| Hookipa Pharma Incorporated † | | | | 12,164 | 83,810 |
| Humanigen Incorporated † | | | | 1,841 | 30,524 |
| Ideaya Biosciences Incorporated † | | | | 2,092 | 49,162 |
| Immunitybio Incorporated † | | | | 9,881 | 112,446 |
| Immunogen Incorporated † | | | | 32,372 | 195,851 |
| Impel NeuroPharma Incorporated † | | | | 5,694 | 108,129 |
| Infinity Pharmaceuticals Incorporated † | | | | 29,427 | 104,172 |
| Inhibrx Incorporated † | | | | 1,960 | 55,899 |
| Inovio Pharmaceuticals Incorporated † | | | | 5,801 | 50,121 |
| Insmed Incorporated † | | | | 8,470 | 237,499 |
| Intellia Therapeutics Incorporated † | | | | 4,626 | 742,612 |
| Intercept Pharmaceuticals Incorporated † | | | | 8,582 | 127,958 |
| Invitae Corporation † | | | | 11,686 | 346,256 |
| Ironwood Pharmaceuticals Incorporated † | | | | 31,414 | 411,523 |
| Iveric Bio Incorporated † | | | | 313 | 3,308 |
| Jounce Therapeutics Incorporated † | | | | 15,588 | 96,957 |
| KalVista Pharmaceuticals Incorporated † | | | | 7,513 | 153,566 |
| Karuna Therapeutics Incorporated † | | | | 395 | 46,966 |
| Karyopharm Therapeutics Incorporated † | | | | 775 | 4,495 |
| Kodiak Sciences Incorporated † | | | | 1,165 | 109,720 |
| Kronos Bio Incorporated † | | | | 260 | 5,437 |
| Krystal Biotech Incorporated † | | | | 444 | 25,725 |
| Kura Oncology Incorporated † | | | | 721 | 13,310 |
| Kymera Therapeutics Incorporated † | | | | 2,849 | 177,037 |
| Lexicon Pharmaceuticals Incorporated † | | | | 49,884 | 235,452 |
| Ligand Pharmaceuticals Incorporated † | | | | 2,824 | 373,615 |
| Lineage Cell Therapeutics Incorporated † | | | | 56,400 | 142,128 |
| Macrogenics Incorporated † | | | | 7,298 | 172,306 |
| Madrigal Pharmaceuticals Incorporated † | | | | 810 | 67,028 |
| Magenta Therapeutics Incorporated † | | | | 2,187 | 13,997 |
| Mannkind Corporation † | | | | 37,450 | 179,760 |
| Mei Pharma Incorporated † | | | | 3,730 | 10,444 |
| MeiraGTx Holdings plc † | | | | 5,158 | 64,527 |
| MiMedx Group Incorporated † | | | | 23,896 | 352,705 |
| Morphic Holding Incorporated † | | | | 2,401 | 151,287 |
| Myriad Genetics Incorporated † | | | | 12,704 | 454,549 |
| Nurix Therapeutics Incorporated † | | | | 1,349 | 43,424 |
| Ocugen Incorporated † | | | | 13,659 | 103,672 |
| Oncocyte Corporation † | | | | 1,771 | 7,261 |
| Oncternal Therapeutics Incorporated † | | | | 19,585 | 88,524 |
| OPKO Health Incorporated † | | | | 83,134 | 320,897 |
| Organogenesis Holdings Incorporated Class A † | | | | 21,523 | 367,182 |
| PDL BioPharma Incorporated ♦‡ | | | | 91,928 | 304,282 |
| Pfenex Incorporated ♦ | | | | 2,991 | 0 |
| Precigen Incorporated † | | | | 33,872 | 204,926 |
| Precision BioSciences Incorporated † | | | | 10,654 | 133,921 |
| Prometheus Biosciences Incorporated † | | | | 1,309 | 28,562 |
| Protagonist Therapeutics Incorporated † | | | | 3,352 | 162,572 |
| Prothema Corporation plc † | | | | 3,327 | 223,308 |
The accompanying notes are an integral part of these financial statements.
Wells Fargo Factor Enhanced U.S. Small Cap Equity Portfolio | 17
Portfolio of investments—August 31, 2021 (unaudited)
| | | | | Shares | Value |
| Biotechnology (continued) | | | | | |
| PTC Therapeutics Incorporated † | | | | 4,958 | $ 216,417 |
| Puma Biotechnology Incorporated † | | | | 23,826 | 180,363 |
| Radius Health Incorporated † | | | | 18,754 | 259,930 |
| Regenxbio Incorporated † | | | | 3,904 | 126,099 |
| Relay Therapeutics Incorporated † | | | | 4,446 | 142,405 |
| Revolution Medicines Incorporated † | | | | 2,620 | 76,216 |
| Rigel Pharmaceuticals Incorporated † | | | | 12,817 | 48,705 |
| Rocket Pharmaceuticals Incorporated † | | | | 1,297 | 44,370 |
| Rubius Therapeutics Incorporated † | | | | 4,140 | 89,921 |
| Sangamo Therapeutics Incorporated † | | | | 13,139 | 130,207 |
| Scholar Rock Holding Corporation † | | | | 2,154 | 85,148 |
| Selecta Biosciences Incorporated † | | | | 7,206 | 31,274 |
| Seres Therapeutics Incorporated † | | | | 4,774 | 30,601 |
| Sesen Bio Incorporated † | | | | 33,590 | 31,840 |
| Shattuck Labs Incorporated † | | | | 1,455 | 30,744 |
| Sigilon Therapeutics Incorporated † | | | | 6,701 | 39,804 |
| Sorrento Therapeutics Incorporated † | | | | 23,925 | 215,325 |
| Spero Therapeutics Incorporated † | | | | 266 | 5,121 |
| Springworks Therapeutics Incorporated † | | | | 2,590 | 194,509 |
| SQZ Biotechnologies Company † | | | | 4,417 | 58,746 |
| Stoke Therapeutics Incorporated † | | | | 903 | 23,641 |
| Summit Therapeutics Incorporated † | | | | 12,490 | 99,545 |
| Surface Oncology Incorporated † | | | | 32,395 | 205,060 |
| Sutro Biopharma Incorporated † | | | | 8,260 | 179,407 |
| TG Therapeutics Incorporated † | | | | 4,613 | 124,874 |
| Translate Bio Incorporated † | | | | 5,458 | 204,129 |
| Travere Therapeutics Incorporated † | | | | 4,135 | 90,267 |
| Trevena Incorporated † | | | | 5,023 | 6,630 |
| Turning Point Therapeutics Incorporated † | | | | 2,727 | 210,034 |
| Twist Bioscience Corporation † | | | | 3,399 | 384,801 |
| UroGen Pharma Limited † | | | | 4,432 | 78,092 |
| Vanda Pharmaceuticals Incorporated † | | | | 15,236 | 255,051 |
| Vaxart Incorporated † | | | | 2,260 | 20,227 |
| Veracyte Incorporated † | | | | 5,051 | 243,004 |
| Verastem Incorporated † | | | | 30,196 | 80,019 |
| Vericel Corporation † | | | | 7,831 | 424,205 |
| Vincerx Pharma Incorporated † | | | | 3,064 | 48,044 |
| VIR Biotechnology Incorporated † | | | | 2,942 | 151,631 |
| Viracta Therapeutics Incorporated † | | | | 899 | 8,289 |
| VistaGen Therapeutics Incorporated † | | | | 596 | 1,812 |
| XBiotech Incorporated | | | | 9,661 | 154,286 |
| Xencor Incorporated † | | | | 8,111 | 274,720 |
| XOMA Corporation † | | | | 3,570 | 111,098 |
| Y-mAbs Therapeutics Incorporated † | | | | 3,851 | 118,534 |
| | | | | | 23,802,543 |
| Health care equipment & supplies: 4.02% | | | | | |
| Accuray Incorporated † | | | | 24,974 | 101,644 |
| Alphatec Holdings Incorporated † | | | | 8,003 | 115,883 |
| AngioDynamics Incorporated † | | | | 5,649 | 159,867 |
| Apyx Medical Corporation † | | | | 9,839 | 116,199 |
| Asensus Surgical Incorporated † | | | | 11,245 | 24,739 |
| Atricure Incorporated † | | | | 2,249 | 165,571 |
| Atrion Corporation | | | | 229 | 158,940 |
| Avanos Medical Incorporated † | | | | 6,758 | 223,014 |
| Axogen Incorporated † | | | | 5,722 | 97,617 |
The accompanying notes are an integral part of these financial statements.
18 | Wells Fargo Factor Enhanced U.S. Small Cap Equity Portfolio
Portfolio of investments—August 31, 2021 (unaudited)
| | | | | Shares | Value |
| Health care equipment & supplies (continued) | | | | | |
| Axonics Modulation Technologies Incorporated † | | | | 1,907 | $ 142,987 |
| BioLife Solutions Incorporated † | | | | 732 | 42,720 |
| Bioventus Incorporated Class A † | | | | 9,267 | 134,464 |
| Butterfly Network Incorporated † | | | | 2,534 | 31,320 |
| Cardiovascular Systems Incorporated † | | | | 2,137 | 76,483 |
| Cerus Corporation † | | | | 3,939 | 25,407 |
| ClearPoint Neuro Incorporated † | | | | 3,004 | 56,685 |
| Conmed Corporation | | | | 2,908 | 381,937 |
| CryoLife Incorporated † | | | | 3,040 | 79,770 |
| Cryoport Incorporated † | | | | 1,140 | 72,470 |
| Cutera Incorporated † | | | | 2,932 | 145,838 |
| Glaukos Corporation † | | | | 2,377 | 141,741 |
| Haemonetics Corporation † | | | | 4,016 | 252,004 |
| Heska Corporation † | | | | 897 | 237,974 |
| Inari Medical Incorporated † | | | | 2,384 | 195,154 |
| Inogen Incorporated † | | | | 2,431 | 143,891 |
| Integer Holdings Corporation † | | | | 3,423 | 338,158 |
| Intersect ENT Incorporated † | | | | 1,048 | 28,516 |
| Invacare Corporation † | | | | 15,878 | 134,328 |
| IRadimed Corporation † | | | | 1,499 | 50,606 |
| iRhythm Technologies Incorporated † | | | | 1,318 | 63,000 |
| Lantheus Holdings Incorporated † | | | | 4,923 | 129,820 |
| LeMaitre Vascular Incorporated | | | | 3,161 | 178,976 |
| LivaNova plc † | | | | 3,849 | 318,274 |
| Meridian Bioscience Incorporated † | | | | 8,029 | 162,507 |
| Merit Medical Systems Incorporated † | | | | 5,117 | 367,247 |
| Mesa Laboratories Incorporated | | | | 238 | 63,527 |
| Misonix Incorporated † | | | | 386 | 9,804 |
| Natus Medical Incorporated † | | | | 7,273 | 192,880 |
| Neogen Corporation † | | | | 8,373 | 366,570 |
| Neuronetics Incorporated † | | | | 9,694 | 65,144 |
| Nevro Corporation † | | | | 1,701 | 207,522 |
| NuVasive Incorporated † | | | | 3,597 | 223,518 |
| OraSure Technologies Incorporated † | | | | 5,395 | 59,075 |
| Ortho Clinical Diagnostics Holdings plc † | | | | 8,794 | 179,749 |
| Orthofix Medical Incorporated † | | | | 3,285 | 139,284 |
| Outset Medical Incorporated † | | | | 1,140 | 56,191 |
| Retractable Technologies Incorporated † | | | | 11,383 | 146,613 |
| Seaspine Holdings Corporation † | | | | 3,643 | 61,130 |
| Senseonics Holdings Incorporated † | | | | 47,427 | 190,182 |
| Shockwave Medical Incorporated † | | | | 2,153 | 461,194 |
| SI-BONE Incorporated † | | | | 1,502 | 36,664 |
| Sientra Incorporated † | | | | 10,465 | 63,627 |
| Silk Road Medical Incorporated † | | | | 946 | 56,079 |
| STAAR Surgical Company † | | | | 3,314 | 511,914 |
| Stereotaxis Incorporated † | | | | 2,102 | 14,840 |
| Surmodics Incorporated † | | | | 2,282 | 137,080 |
| Tactile Systems Technology Class I † | | | | 2,860 | 127,213 |
| Treace Medical Concepts Incorporated † | | | | 2,258 | 57,015 |
| Utah Medical Products Incorporated | | | | 965 | 85,499 |
| Varex Imaging Corporation † | | | | 5,655 | 164,956 |
| ViewRay Incorporated † | | | | 19,908 | 120,244 |
| Zynex Incorporated † | | | | 2,796 | 37,494 |
| | | | | | 8,930,759 |
The accompanying notes are an integral part of these financial statements.
Wells Fargo Factor Enhanced U.S. Small Cap Equity Portfolio | 19
Portfolio of investments—August 31, 2021 (unaudited)
| | | | | Shares | Value |
| Health care providers & services: 2.72% | | | | | |
| 1Life Healthcare Incorporated † | | | | 535 | $ 13,113 |
| Addus Homecare Corporation † | | | | 705 | 63,394 |
| Agiliti Incorporated † | | | | 2,324 | 49,571 |
| AMN Healthcare Services Incorporated † | | | | 3,784 | 429,560 |
| Apollo Medical Holdings Incorporated † | | | | 2,828 | 214,673 |
| Apria Incorporated † | | | | 2,376 | 84,752 |
| Brookdale Senior Living Incorporated † | | | | 11,471 | 83,738 |
| Community Health Systems Incorporated † | | | | 17,919 | 220,583 |
| CorVel Corporation † | | | | 847 | 139,594 |
| Covetrus Incorporated † | | | | 8,862 | 200,193 |
| Cross Country Healthcare Incorporated † | | | | 12,728 | 276,834 |
| Fulgent Genetics Incorporated † | | | | 2,596 | 236,859 |
| Hanger Incorporated † | | | | 4,100 | 97,908 |
| HealthEquity Incorporated † | | | | 2,444 | 156,831 |
| InfuSystem Holdings Incorporated † | | | | 620 | 8,835 |
| LHC Group Incorporated † | | | | 1,665 | 310,955 |
| Mednax Incorporated † | | | | 5,836 | 187,394 |
| Modivcare Incorporated † | | | | 784 | 154,652 |
| National Healthcare Corporation | | | | 266 | 19,644 |
| Option Care Health Incorporated † | | | | 5,690 | 152,208 |
| Owens & Minor Incorporated | | | | 9,782 | 364,673 |
| Patterson Companies Incorporated | | | | 6,216 | 190,458 |
| Privia Health Group Incorporated † | | | | 493 | 14,696 |
| Progyny Incorporated † | | | | 3,087 | 172,471 |
| R1 RCM Incorporated † | | | | 5,389 | 106,271 |
| RadNet Incorporated † | | | | 2,061 | 64,736 |
| Select Medical Holdings Corporation | | | | 9,403 | 325,062 |
| Sharps Compliance Corporation † | | | | 12,854 | 115,557 |
| Surgery Partners Incorporated † | | | | 1,613 | 79,360 |
| Tenet Healthcare Corporation † | | | | 7,926 | 597,224 |
| The Ensign Group Incorporated | | | | 4,092 | 334,194 |
| The Joint Corporation † | | | | 1,522 | 155,503 |
| The Pennant Group Incorporated † | | | | 838 | 25,618 |
| Tivity Health Incorporated † | | | | 8,046 | 187,070 |
| Triple-S Management Corporation Class B † | | | | 612 | 21,726 |
| U.S. Physical Therapy Incorporated | | | | 1,012 | 118,809 |
| Viemed Healthcare Incorporated † | | | | 8,850 | 56,729 |
| | | | | | 6,031,448 |
| Health care technology: 1.30% | | | | | |
| Allscripts Healthcare Solutions Incorporated † | | | | 17,142 | 263,301 |
| American Well Corporation Class A † | | | | 8,371 | 89,653 |
| Castlight Health Incorporated Class B † | | | | 73,678 | 133,357 |
| Computer Programs & Systems Incorporated | | | | 6,524 | 232,059 |
| Evolent Health Incorporated Class A † | | | | 7,967 | 195,670 |
| Forian Incorporated † | | | | 2,487 | 30,366 |
| Health Catalyst Incorporated † | | | | 1,238 | 67,607 |
| HealthStream Incorporated † | | | | 2,952 | 89,711 |
| Inovalon Holdings Incorporated Class A † | | | | 7,176 | 293,140 |
| Inspire Medical Systems Incorporated † | | | | 1,300 | 290,628 |
| MultiPlan Corporation † | | | | 26,115 | 156,690 |
| Nanthealth Incorporated † | | | | 1,849 | 4,068 |
| NextGen Healthcare Incorporated † | | | | 9,288 | 141,735 |
| Omnicell Incorporated † | | | | 2,825 | 438,638 |
| OptimizeRx Corporation † | | | | 1,613 | 106,748 |
| Phreesia Incorporated † | | | | 1,831 | 131,008 |
The accompanying notes are an integral part of these financial statements.
20 | Wells Fargo Factor Enhanced U.S. Small Cap Equity Portfolio
Portfolio of investments—August 31, 2021 (unaudited)
| | | | | Shares | Value |
| Health care technology (continued) | | | | | |
| Schrodinger Incorporated † | | | | 962 | $ 57,422 |
| Tabula Rasa Healthcare Incorporated † | | | | 1,124 | 35,192 |
| Vocera Communications Incorporated † | | | | 2,461 | 119,334 |
| | | | | | 2,876,327 |
| Life sciences tools & services: 1.17% | | | | | |
| Akoya Biosciences Incorporated † | | | | 6,125 | 97,816 |
| Berkeley Lights Incorporated † | | | | 1,720 | 61,163 |
| Bionano Genomics Incorporated † | | | | 19,042 | 111,015 |
| Cerevel Therapeutics Holdings Incorporated † | | | | 4,565 | 144,528 |
| Chromadex Corporation † | | | | 7,315 | 62,397 |
| Codexis Incorporated † | | | | 5,885 | 159,013 |
| Fluidigm Corporation † | | | | 14,085 | 101,553 |
| Harvard Bioscience Incorporated † | | | | 29,050 | 239,953 |
| Inotiv Incorporated † | | | | 4,270 | 111,148 |
| Medpace Holdings Incorporated † | | | | 2,410 | 439,464 |
| Nanostring Technologies Incorporated † | | | | 2,638 | 153,532 |
| Neogenomics Incorporated † | | | | 6,708 | 326,143 |
| Pacific Biosciences of California † | | | | 12,897 | 403,805 |
| Personalis Incorporated † | | | | 3,816 | 80,823 |
| Quanterix Corporation † | | | | 1,851 | 94,494 |
| | | | | | 2,586,847 |
| Pharmaceuticals: 2.37% | | | | | |
| Aclaris Therapeutics Incorporated † | | | | 11,121 | 180,271 |
| Aerie Pharmaceuticals Incorporated † | | | | 4,641 | 69,197 |
| Amneal Pharmaceuticals Incorporated † | | | | 61,692 | 347,943 |
| Amphastar Pharmaceuticals Incorporated † | | | | 7,896 | 155,235 |
| ANI Pharmaceuticals Incorporated † | | | | 711 | 21,565 |
| Antares Pharma Incorporated † | | | | 56,018 | 220,692 |
| Arvinas Incorporated † | | | | 2,073 | 178,713 |
| Atea Pharmaceuticals Incorporated † | | | | 11,505 | 341,929 |
| BioDelivery Sciences International Incorporated † | | | | 58,983 | 227,674 |
| Cara Therapeutics Incorporated † | | | | 8,942 | 141,105 |
| Collegium Pharmaceutical Incorporated † | | | | 10,111 | 207,579 |
| Corcept Therapeutics Incorporated † | | | | 14,571 | 310,071 |
| Cymabay Therapeutics Incorporated † | | | | 127 | 503 |
| Dova Pharmaceuticals Incorporated ♦ | | | | 2,458 | 0 |
| Durect Corporation † | | | | 7,653 | 10,638 |
| Evolus Incorporated † | | | | 4,728 | 50,117 |
| EyePoint Pharmaceuticals Incorporated † | | | | 5,286 | 57,829 |
| Harmony Biosciences Holdings † | | | | 7,600 | 257,564 |
| Ikena Oncology Incorporated † | | | | 723 | 9,305 |
| Innoviva Incorporated † | | | | 24,616 | 375,640 |
| Intra-Cellular Therapies Incorporated † | | | | 1,805 | 59,926 |
| KemPharm Incorporated † | | | | 2,998 | 27,881 |
| NGM Biopharmaceuticals Incorporated † | | | | 1,522 | 33,225 |
| Nuvation Bio Incorporated † | | | | 8,792 | 81,150 |
| Ocular Therapeutix Incorporated † | | | | 1,397 | 14,752 |
| Omeros Corporation † | | | | 1,427 | 23,260 |
| Pacira Pharmaceuticals Incorporated † | | | | 4,808 | 285,066 |
| Paratek Pharmaceuticals Incorporated † | | | | 23,589 | 131,155 |
| Phibro Animal Health Corporation Class A | | | | 10,917 | 265,174 |
| Prestige Consumer Healthcare Incorporated † | | | | 7,852 | 450,626 |
| Reata Pharmaceuticals Incorporated Class A † | | | | 731 | 77,859 |
| Revance Therapeutics Incorporated † | | | | 1,139 | 30,502 |
The accompanying notes are an integral part of these financial statements.
Wells Fargo Factor Enhanced U.S. Small Cap Equity Portfolio | 21
Portfolio of investments—August 31, 2021 (unaudited)
| | | | | Shares | Value |
| Pharmaceuticals (continued) | | | | | |
| Siga Technologies Incorporated † | | | | 46,538 | $ 303,893 |
| Supernus Pharmaceuticals Incorporated † | | | | 8,419 | 231,775 |
| Tarsus Pharmaceuticals Incorporated † | | | | 146 | 3,869 |
| TherapeuticsMD Incorporated † | | | | 70,669 | 56,182 |
| Verrica Pharmaceuticals Incorporated † | | | | 1,757 | 19,678 |
| | | | | | 5,259,543 |
| Industrials: 13.41% | | | | | |
| Aerospace & defense: 0.63% | | | | | |
| AAR Corporation † | | | | 3,973 | 134,486 |
| Aerojet Rocketdyne Holdings | | | | 4,972 | 206,437 |
| Aerovironment Incorporated † | | | | 1,200 | 122,832 |
| Astronics Corporation † | | | | 1,759 | 23,500 |
| Ducommun Incorporated † | | | | 1,054 | 55,546 |
| Kaman Corporation | | | | 1,093 | 42,714 |
| Kratos Defense & Security Solutions Incorporated † | | | | 5,746 | 142,041 |
| Maxar Technologies Incorporated | | | | 4,674 | 148,586 |
| Moog Incorporated Class A | | | | 2,890 | 229,582 |
| National Presto Industries Incorporated | | | | 137 | 11,445 |
| PAE Incorporated † | | | | 7,580 | 50,710 |
| Park Aerospace Corporation | | | | 3,219 | 46,933 |
| Parsons Corporation † | | | | 732 | 25,935 |
| Triumph Group Incorporated † | | | | 3,013 | 55,620 |
| Vectrus Incorporated † | | | | 1,918 | 96,495 |
| | | | | | 1,392,862 |
| Air freight & logistics: 0.27% | | | | | |
| Atlas Air Worldwide Holdings Incorporated † | | | | 2,485 | 181,827 |
| Echo Global Logistics Incorporated † | | | | 2,530 | 83,186 |
| Forward Air Corporation | | | | 1,302 | 114,797 |
| Hub Group Incorporated Class A † | | | | 1,702 | 119,480 |
| Radiant Logistics Incorporated † | | | | 15,667 | 107,319 |
| | | | | | 606,609 |
| Airlines: 0.38% | | | | | |
| Allegiant Travel Company † | | | | 1,059 | 203,794 |
| Frontier Group Holdings Incorporated † | | | | 3,351 | 51,371 |
| Mesa Air Group Incorporated † | | | | 23,875 | 190,523 |
| SkyWest Incorporated † | | | | 5,133 | 239,454 |
| Spirit Airlines Incorporated † | | | | 4,448 | 109,109 |
| Sun Country Airlines Holding † | | | | 1,330 | 43,079 |
| | | | | | 837,330 |
| Building products: 0.93% | | | | | |
| AAON Incorporated | | | | 888 | 60,482 |
| American Woodmark Corporation † | | | | 1,130 | 79,620 |
| Apogee Enterprises Incorporated | | | | 1,996 | 85,788 |
| Cornerstone Building Brands Incorporated † | | | | 5,148 | 85,560 |
| CSW Industrials Incorporated | | | | 27 | 3,585 |
| Gibraltar Industries Incorporated † | | | | 1,486 | 110,945 |
| Griffon Corporation | | | | 2,416 | 58,467 |
| Insteel Industries Incorporated | | | | 2,756 | 101,972 |
| JELD-WEN Holding Incorporated † | | | | 6,543 | 180,194 |
| Masonite International Corporation † | | | | 1,728 | 206,807 |
The accompanying notes are an integral part of these financial statements.
22 | Wells Fargo Factor Enhanced U.S. Small Cap Equity Portfolio
Portfolio of investments—August 31, 2021 (unaudited)
| | | | | Shares | Value |
| Building products (continued) | | | | | |
| PGT Incorporated † | | | | 2,623 | $ 55,686 |
| Quanex Building Products Corporation | | | | 5,944 | 140,041 |
| Resideo Technologies Incorporated † | | | | 8,243 | 265,754 |
| Simpson Manufacturing Company Incorporated | | | | 2,186 | 247,346 |
| UFP Industries Incorporated | | | | 4,202 | 315,486 |
| View Incorporated † | | | | 14,800 | 74,148 |
| | | | | | 2,071,881 |
| Commercial services & supplies: 1.39% | | | | | |
| ABM Industries Incorporated | | | | 5,482 | 271,469 |
| ACCO Brands Corporation | | | | 5,711 | 53,512 |
| Brady Corporation Class A | | | | 2,779 | 148,204 |
| BrightView Holdings Incorporated † | | | | 2,775 | 42,541 |
| Casella Waste Systems Incorporated Class A † | | | | 1,639 | 121,270 |
| Ceco Environmental Corporation † | | | | 5,395 | 40,732 |
| Cimpress plc † | | | | 642 | 60,977 |
| CompX International Incorporated | | | | 532 | 12,231 |
| Covanta Holding Corporation | | | | 3,488 | 69,934 |
| Deluxe Corporation | | | | 3,096 | 118,732 |
| Ennis Incorporated | | | | 759 | 14,732 |
| Harsco Corporation † | | | | 808 | 14,738 |
| Healthcare Services Group Incorporated | | | | 5,286 | 138,282 |
| Heritage Crystal Clean Incorporated † | | | | 387 | 11,432 |
| Herman Miller Incorporated | | | | 5,371 | 225,743 |
| HNI Corporation | | | | 4,557 | 172,665 |
| Interface Incorporated | | | | 5,190 | 74,632 |
| KAR Auction Services Incorporated † | | | | 4,002 | 67,674 |
| Matthews International Corporation Class A | | | | 4,601 | 170,375 |
| NL Industries | | | | 3,877 | 26,519 |
| Pitney Bowes Incorporated | | | | 13,321 | 99,508 |
| RR Donnelley & Sons Company † | | | | 32,118 | 157,699 |
| Steelcase Incorporated Class A | | | | 5,079 | 71,563 |
| Team Incorporated † | | | | 11,542 | 51,708 |
| Tetra Tech Incorporated | | | | 3,263 | 469,350 |
| The Brink's Company | | | | 2,174 | 169,920 |
| UniFirst Corporation | | | | 657 | 150,499 |
| VSE Corporation | | | | 1,147 | 57,339 |
| | | | | | 3,083,980 |
| Construction & engineering: 1.21% | | | | | |
| Ameresco Incorporated Class A † | | | | 1,179 | 81,528 |
| APi Group Corporation 144A† | | | | 10,893 | 252,609 |
| Arcosa Incorporated | | | | 2,301 | 116,937 |
| Comfort Systems Incorporated | | | | 2,934 | 222,925 |
| Construction Partners Incorporated Class A † | | | | 2,266 | 75,843 |
| Dycom Industries Incorporated † | | | | 2,226 | 167,685 |
| EMCOR Group Incorporated | | | | 3,487 | 423,671 |
| Fluor Corporation † | | | | 10,662 | 177,629 |
| Granite Construction Incorporated | | | | 3,303 | 133,904 |
| Great Lakes Dredge & Dock Company † | | | | 4,258 | 64,338 |
| IES Holdings Incorporated † | | | | 603 | 29,487 |
| Infrastructure and Energy Alternatives Incorporated † | | | | 8,769 | 112,506 |
| Matrix Service Company † | | | | 1,921 | 21,669 |
| MYR Group Incorporated † | | | | 2,479 | 257,841 |
| Northwest Pipe Company † | | | | 1,211 | 31,389 |
| Primoris Services Corporation | | | | 5,927 | 152,324 |
The accompanying notes are an integral part of these financial statements.
Wells Fargo Factor Enhanced U.S. Small Cap Equity Portfolio | 23
Portfolio of investments—August 31, 2021 (unaudited)
| | | | | Shares | Value |
| Construction & engineering (continued) | | | | | |
| Sterling Construction Company Incorporated † | | | | 3,770 | $ 86,936 |
| Tutor Perini Corporation † | | | | 7,431 | 107,155 |
| WillScot Mobile Mini Holdings Corporation † | | | | 5,768 | 170,733 |
| | | | | | 2,687,109 |
| Electrical equipment: 1.22% | | | | | |
| Allied Motion Technologies | | | | 1,458 | 50,388 |
| Array Technologies Incorporated † | | | | 16,274 | 310,345 |
| Atkore International Incorporated † | | | | 4,646 | 431,009 |
| AZZ Incorporated | | | | 3,963 | 212,219 |
| Babcock & Wilcox Enterprises Incorporated † | | | | 15,369 | 112,194 |
| Bloom Energy Corporation Class A † | | | | 7,024 | 150,454 |
| Encore Wire Corporation | | | | 3,060 | 260,131 |
| EnerSys | | | | 3,539 | 299,364 |
| Eos Energy Enterprises Incorporated † | | | | 3,686 | 47,623 |
| FTC Solar Incorporated † | | | | 1,910 | 20,724 |
| Fuelcell Energy Incorporated † | | | | 9,649 | �� 60,210 |
| GrafTech International Limited | | | | 27,984 | 309,783 |
| Powell Industries Incorporated | | | | 670 | 16,951 |
| Preformed Line Products Company | | | | 185 | 12,972 |
| Romeo Power Incorporated † | | | | 3,010 | 14,659 |
| Stem Incorporated † | | | | 7,796 | 194,822 |
| TPI Composites Incorporated † | | | | 3,332 | 120,985 |
| Vicor Corporation † | | | | 575 | 70,938 |
| | | | | | 2,695,771 |
| Machinery: 3.86% | | | | | |
| Alamo Group Incorporated | | | | 724 | 112,227 |
| Albany International Corporation Class A | | | | 1,722 | 134,884 |
| Altra Industrial Motion Corporation | | | | 4,532 | 265,394 |
| Astec Industries Incorporated | | | | 1,656 | 101,248 |
| Barnes Group Incorporated | | | | 2,591 | 123,513 |
| Blue Bird Corporation † | | | | 4,830 | 104,570 |
| Chart Industries Incorporated † | | | | 2,440 | 459,647 |
| Circor International Incorporated † | | | | 1,347 | 48,155 |
| Columbus McKinnon Corporation | | | | 1,115 | 51,346 |
| Commercial Vehicle Group Incorporated † | | | | 17,081 | 179,521 |
| Desktop Metal Incorporated † | | | | 6,170 | 51,211 |
| Douglas Dynamics Incorporated | | | | 722 | 28,692 |
| Energy Recovery Incorporated † | | | | 2,349 | 47,990 |
| Enerpac Tool Group Corporation | | | | 4,141 | 104,188 |
| EnPro Industries Incorporated | | | | 1,013 | 86,622 |
| ESC Briggs & Stratton ♦ | | | | 1,723 | 0 |
| ESCO Technologies Incorporated | | | | 1,091 | 98,321 |
| Evoqua Water Technologies Company † | | | | 7,093 | 276,060 |
| Federal Signal Corporation | | | | 4,828 | 196,162 |
| Franklin Electric Company Incorporated | | | | 4,142 | 351,987 |
| Gorman Rupp Company | | | | 1,186 | 41,593 |
| Helios Technologies Incorporated | | | | 1,736 | 141,692 |
| Hillenbrand Incorporated | | | | 5,387 | 250,065 |
| Hyliion Holdings Corporation † | | | | 8,443 | 74,552 |
| Hyster Yale Materials Handeling Incorporated | | | | 742 | 43,489 |
| Ideanomics Incorporated † | | | | 19,143 | 48,049 |
| John Bean Technologies Corporation | | | | 2,136 | 311,621 |
| Kadant Incorporated | | | | 841 | 175,870 |
| Kennametal Incorporated | | | | 4,443 | 165,191 |
The accompanying notes are an integral part of these financial statements.
24 | Wells Fargo Factor Enhanced U.S. Small Cap Equity Portfolio
Portfolio of investments—August 31, 2021 (unaudited)
| | | | | Shares | Value |
| Machinery (continued) | | | | | |
| Lindsay Manufacturing Company | | | | 940 | $ 154,865 |
| Luxfer Holdings plc | | | | 1,139 | 24,318 |
| Manitowoc Company Incorporated † | | | | 2,314 | 56,115 |
| Mayville Engineering Company Incorporated † | | | | 4,998 | 74,570 |
| Meritor Incorporated † | | | | 9,078 | 215,330 |
| Miller Industries Incorporated | | | | 1,196 | 44,515 |
| Mueller Industries Incorporated | | | | 7,981 | 356,032 |
| Mueller Water Products Incorporated Class A | | | | 12,986 | 215,827 |
| NN Incorporated † | | | | 16,561 | 90,092 |
| Omega Flex Incorporated | | | | 457 | 69,464 |
| Park Ohio Holdings Corporation | | | | 3,158 | 81,413 |
| Proto Labs Incorporated † | | | | 1,130 | 83,801 |
| RBC Bearings Incorporated † | | | | 1,152 | 266,711 |
| REV Group Incorporated | | | | 9,773 | 158,909 |
| Rexnord Corporation | | | | 8,236 | 500,419 |
| SPX Corporation † | | | | 3,041 | 190,002 |
| SPX FLOW Incorporated | | | | 3,527 | 284,029 |
| Standex International Corporation | | | | 1,054 | 104,599 |
| Tennant Company | | | | 1,615 | 119,478 |
| Terex Corporation | | | | 7,606 | 388,286 |
| The Greenbrier Companies Incorporated | | | | 2,382 | 105,046 |
| The Shyft Group Incorporated | | | | 6,520 | 286,945 |
| Titan International Incorporated † | | | | 15,155 | 125,938 |
| Trimas Corporation † | | | | 1,233 | 39,592 |
| Trinity Industries Incorporated | | | | 418 | 12,135 |
| Wabash National Corporation | | | | 3,732 | 57,995 |
| Watts Water Technologies Incorporated | | | | 2,229 | 382,430 |
| | | | | | 8,562,716 |
| Marine: 0.13% | | | | | |
| Matson Incorporated | | | | 3,738 | 295,937 |
| Paper & forest products: 0.12% | | | | | |
| Boise Cascade Company | | | | 4,441 | 256,912 |
| Professional services: 1.50% | | | | | |
| ASGN Incorporated † | | | | 3,427 | 384,475 |
| Atlas Technical Consultants Incorporated † | | | | 3,956 | 40,035 |
| Barrett Business Services Incorporated | | | | 1,132 | 87,730 |
| CBIZ Incorporated † | | | | 2,965 | 101,136 |
| CRA International Incorporated | | | | 460 | 42,775 |
| Exponent Incorporated | | | | 2,180 | 254,842 |
| GP Strategies Corporation † | | | | 9,811 | 202,891 |
| Heidrick & Struggles International Incorporated | | | | 777 | 33,582 |
| HireQuest Incorporated | | | | 1,139 | 21,128 |
| Huron Consulting Group Incorporated † | | | | 982 | 48,481 |
| ICF International Incorporated | | | | 1,184 | 110,893 |
| Insperity Incorporated | | | | 2,797 | 308,621 |
| KBR Incorporated | | | | 8,785 | 342,088 |
| Kelly Services Incorporated Class A | | | | 7,781 | 151,263 |
| Kforce Incorporated | | | | 3,039 | 177,538 |
| Korn Ferry International | | | | 2,505 | 177,078 |
| ManTech International Corporation Class A | | | | 1,884 | 149,156 |
| Mistras Group Incorporated † | | | | 8,814 | 93,517 |
| TriNet Group Incorporated † | | | | 2,321 | 213,718 |
The accompanying notes are an integral part of these financial statements.
Wells Fargo Factor Enhanced U.S. Small Cap Equity Portfolio | 25
Portfolio of investments—August 31, 2021 (unaudited)
| | | | | Shares | Value |
| Professional services (continued) | | | | | |
| TrueBlue Incorporated † | | | | 6,414 | $ 175,295 |
| UPwork Incorporated † | | | | 4,987 | 222,969 |
| | | | | | 3,339,211 |
| Road & rail: 0.54% | | | | | |
| Arcbest Corporation | | | | 3,453 | 230,419 |
| Avis Budget Group Incorporated † | | | | 3,022 | 274,247 |
| Covenant Transport Incorporated Class A † | | | | 4,581 | 111,593 |
| Daseke Incorporated † | | | | 1 | 9 |
| Saia Incorporated † | | | | 1,468 | 352,511 |
| Universal Truckload Services | | | | 1,408 | 30,793 |
| US Xpress Enterprises Incorporated Class A † | | | | 1,976 | 17,270 |
| Werner Enterprises Incorporated | | | | 3,174 | 149,686 |
| Yellow Corporation † | | | | 3,488 | 21,242 |
| | | | | | 1,187,770 |
| Trading companies & distributors: 1.11% | | | | | |
| Applied Industrial Technologies Incorporated | | | | 1,878 | 166,785 |
| Beacon Roofing Supply Incorporated † | | | | 3,563 | 183,423 |
| Bluelinx Holdings Incorporated † | | | | 5,512 | 317,271 |
| GATX Corporation | | | | 1,282 | 117,534 |
| Global Industrial Company | | | | 218 | 8,391 |
| GMS Incorporated † | | | | 2,615 | 129,207 |
| H&E Equipment Services Incorporated | | | | 632 | 21,520 |
| Herc Holdings Incorporated † | | | | 1,720 | 226,094 |
| McGrath RentCorp | | | | 903 | 63,011 |
| Rush Enterprises Incorporated Class A | | | | 5,086 | 224,293 |
| Rush Enterprises Incorporated Class B | | | | 4,401 | 186,558 |
| Textainer Group Holdings Limited † | | | | 2,413 | 80,160 |
| Titan Machinery Incorporated † | | | | 3,676 | 105,575 |
| Triton International Limited | | | | 3,774 | 206,513 |
| Veritiv Corporation † | | | | 2,114 | 189,562 |
| WESCO International Incorporated † | | | | 2,054 | 240,359 |
| | | | | | 2,466,256 |
| Transportation infrastructure: 0.12% | | | | | |
| Macquarie Infrastructure Company LLC | | | | 6,676 | 266,039 |
| Information technology: 15.25% | | | | | |
| Communications equipment: 0.61% | | | | | |
| Adtran Incorporated | | | | 4,552 | 94,044 |
| Aviat Networks Incorporated † | | | | 3,192 | 113,124 |
| Calamp Corporation † | | | | 789 | 8,947 |
| Calix Networks Incorporated † | | | | 3,669 | 170,975 |
| Cambium Networks Corporation † | | | | 2,836 | 106,265 |
| Casa Systems Incorporated † | | | | 574 | 4,041 |
| Clearfield Incorporated † | | | | 1,824 | 82,645 |
| Echostar Corporation † | | | | 2,956 | 79,812 |
| Emcore Corporation † | | | | 8,370 | 62,608 |
| Extreme Networks Incorporated † | | | | 11,681 | 126,505 |
| Infinera Corporation † | | | | 1,156 | 9,791 |
| KVH Industries Incorporated † | | | | 4,548 | 48,072 |
| Netgear Incorporated † | | | | 3,639 | 130,021 |
| NetScout Systems Incorporated † | | | | 1,581 | 43,351 |
The accompanying notes are an integral part of these financial statements.
26 | Wells Fargo Factor Enhanced U.S. Small Cap Equity Portfolio
Portfolio of investments—August 31, 2021 (unaudited)
| | | | | Shares | Value |
| Communications equipment (continued) | | | | | |
| Plantronics Incorporated † | | | | 2,341 | $ 69,715 |
| Viavi Solutions Incorporated † | | | | 12,225 | 199,145 |
| | | | | | 1,349,061 |
| Electronic equipment, instruments & components: 2.26% | | | | | |
| Aeva Technologies Incorporated † | | | | 2,034 | 19,954 |
| Badger Meter Incorporated | | | | 1,842 | 197,260 |
| Belden Incorporated | | | | 4,562 | 261,175 |
| Benchmark Electronics Incorporated | | | | 4,738 | 128,068 |
| CTS Corporation | | | | 3,993 | 140,074 |
| Daktronics Incorporated † | | | | 15,517 | 94,499 |
| ePlus Incorporated † | | | | 1,685 | 182,351 |
| Fabrinet † | | | | 2,551 | 262,804 |
| FARO Technologies Incorporated † | | | | 572 | 39,434 |
| II-VI Incorporated † | | | | 5,462 | 343,997 |
| Insight Enterprises Incorporated † | | | | 3,685 | 379,150 |
| Iteris Incorporated † | | | | 7,379 | 42,060 |
| Itron Incorporated † | | | | 2,002 | 168,188 |
| Kimball Electronics Incorporated † | | | | 7,466 | 180,453 |
| Knowles Corporation † | | | | 6,531 | 130,620 |
| Methode Electronics Incorporated | | | | 2,769 | 128,952 |
| MicroVision Incorporated † | | | | 6,685 | 98,470 |
| Novanta Incorporated † | | | | 2,057 | 315,174 |
| OSI Systems Incorporated † | | | | 1,601 | 158,403 |
| Ouster Incorporated † | | | | 7,274 | 61,102 |
| Par Technology Corporation † | | | | 116 | 7,880 |
| PC Connection Incorporated | | | | 804 | 38,922 |
| Plexus Corporation † | | | | 3,024 | 277,694 |
| Rogers Corporation † | | | | 1,135 | 241,085 |
| Sanmina Corporation † | | | | 9,306 | 367,401 |
| ScanSource Incorporated † | | | | 5,212 | 185,443 |
| TTM Technologies Incorporated † | | | | 11,495 | 160,930 |
| Velodyne Lidar Incorporated † | | | | 5,046 | 33,304 |
| Vishay Intertechnology Incorporated | | | | 16,568 | 363,999 |
| Vishay Precision Group † | | | | 530 | 19,806 |
| | | | | | 5,028,652 |
| IT services: 1.64% | | | | | |
| BigCommerce Holdings Incorporated Series 1 † | | | | 2,194 | 130,631 |
| BM Technologies Incorporated † | | | | 1,827 | 17,795 |
| Brightcove Incorporated † | | | | 7,616 | 86,518 |
| Conduent Incorporated † | | | | 35,432 | 258,654 |
| CSG Systems International Incorporated | | | | 3,174 | 153,019 |
| ESC Incorporated ♦ | | | | 6,981 | 0 |
| Evertec Incorporated | | | | 5,434 | 251,323 |
| EVO Payments Incorporated Class A † | | | | 3,293 | 83,774 |
| ExlService Holdings Incorporated † | | | | 2,841 | 349,841 |
| GreenBox POS † | | | | 12,830 | 125,093 |
| GreenSky Incorporated Class A † | | | | 1,024 | 8,141 |
| Grid Dynamics Holdings Incorporated † | | | | 3,287 | 87,993 |
| Hackett Group Incorporated | | | | 5,090 | 99,764 |
| IBEX Holdings Limited † | | | | 3,508 | 63,074 |
| International Money Express Incorporated † | | | | 9,001 | 164,178 |
| LiveRamp Holdings Incorporated † | | | | 3,265 | 159,985 |
| Maximus Incorporated | | | | 5,214 | 454,087 |
| Moneygram International Incorporated † | | | | 6,696 | 60,197 |
The accompanying notes are an integral part of these financial statements.
Wells Fargo Factor Enhanced U.S. Small Cap Equity Portfolio | 27
Portfolio of investments—August 31, 2021 (unaudited)
| | | | | Shares | Value |
| IT services (continued) | | | | | |
| Paya Holdings Incorporated Class A † | | | | 4,559 | $ 43,994 |
| Perficient Incorporated † | | | | 2,706 | 322,609 |
| Priority Technology Holdings † | | | | 14,221 | 85,753 |
| Rackspace Technology Incorporated † | | | | 1,045 | 14,599 |
| StarTek Incorporated † | | | | 8,744 | 53,076 |
| TTEC Holdings Incorporated | | | | 2,150 | 226,739 |
| Tucows Incorporated Class A † | | | | 906 | 67,144 |
| Unisys Corporation † | | | | 8,303 | 201,016 |
| Verra Mobility Corporation † | | | | 3,978 | 61,699 |
| | | | | | 3,630,696 |
| Semiconductors & semiconductor equipment: 3.15% | | | | | |
| Advanced Energy Industries Incorporated | | | | 2,231 | 201,192 |
| Alpha & Omega Semiconductor † | | | | 7,373 | 214,186 |
| Ambarella Incorporated † | | | | 1,949 | 201,858 |
| Amkor Technology Incorporated | | | | 9,701 | 266,486 |
| Axcelis Technologies Incorporated † | | | | 4,583 | 227,821 |
| AXT Incorporated † | | | | 5,699 | 53,058 |
| Ceva Incorporated † | | | | 1,116 | 53,847 |
| CMC Materials Incorporated | | | | 1,570 | 208,213 |
| Cohu Incorporated † | | | | 6,951 | 248,012 |
| Diodes Incorporated † | | | | 3,792 | 367,179 |
| FormFactor Incorporated † | | | | 5,822 | 226,359 |
| Ichor Holdings Limited † | | | | 3,923 | 173,828 |
| Kopin Corporation † | | | | 5,709 | 33,569 |
| Kulicke and Soffa Industries Incorporated | | | | 6,627 | 465,149 |
| Lattice Semiconductor Corporation † | | | | 8,628 | 535,971 |
| Macom Technology Solutions Holdings Incorporated † | | | | 3,016 | 183,101 |
| Maxlinear Incorporated † | | | | 4,065 | 212,315 |
| Metamaterial Incorporated | | | | 4,491 | 20,883 |
| Neophotonics Corporation † | | | | 1,171 | 10,937 |
| NVE Corporation | | | | 1,285 | 90,220 |
| Onto Innovation Incorporated † | | | | 2,943 | 218,165 |
| Photronics Incorporated † | | | | 8,777 | 132,269 |
| Power Integrations Incorporated | | | | 3,898 | 423,479 |
| Rambus Incorporated † | | | | 6,256 | 148,893 |
| Semtech Corporation † | | | | 4,484 | 313,521 |
| Silicon Laboratories Incorporated † | | | | 2,450 | 386,169 |
| Sitime Corporation † | | | | 394 | 83,859 |
| Smart Global Holdings Incorporated † | | | | 4,223 | 204,647 |
| SunPower Corporation | | | | 11,850 | 255,368 |
| Synaptics Incorporated † | | | | 2,502 | 474,830 |
| Ultra Clean Holdings Incorporated † | | | | 5,931 | 274,249 |
| Veeco Instruments Incorporated † | | | | 3,813 | 86,898 |
| | | | | | 6,996,531 |
| Software: 7.33% | | | | | |
| 8x8 Incorporated † | | | | 8,949 | 216,118 |
| A10 Networks Incorporated † | | | | 13,489 | 187,362 |
| ACI Worldwide Incorporated † | | | | 8,666 | 279,305 |
| Agilysys Incorporated † | | | | 2,479 | 140,882 |
| Alarm.com Holdings Incorporated † | | | | 3,866 | 326,020 |
| Altair Engineering Incorporated Class A † | | | | 5,036 | 372,614 |
| American Software Incorporated Class A | | | | 8,115 | 205,878 |
| AppFolio Incorporated Class A † | | | | 1,361 | 160,734 |
| Appian Corporation † | | | | 2,634 | 282,365 |
The accompanying notes are an integral part of these financial statements.
28 | Wells Fargo Factor Enhanced U.S. Small Cap Equity Portfolio
Portfolio of investments—August 31, 2021 (unaudited)
| | | | | Shares | Value |
| Software (continued) | | | | | |
| Arlo Technologies Incorporated † | | | | 10,252 | $ 63,562 |
| Asana Incorporated Class A † | | | | 3,855 | 291,245 |
| Avaya Holdings Corporation † | | | | 17,598 | 354,952 |
| Benefitfocus Incorporated † | | | | 8,176 | 98,684 |
| Blackbaud Incorporated † | | | | 4,488 | 312,769 |
| BlackLine Incorporated † | | | | 2,822 | 307,880 |
| Bottomline Technologies (DE) Incorporated † | | | | 3,194 | 135,010 |
| Box Incorporated Class A † | | | | 9,549 | 246,173 |
| BTRS Holdings Incorporated † | | | | 8,032 | 87,629 |
| Cerence Incorporated † | | | | 3,017 | 327,163 |
| ChannelAdvisor Corporation † | | | | 6,835 | 175,113 |
| CleanSpark Incorporated † | | | | 6,619 | 91,342 |
| CommVault Systems Incorporated † | | | | 4,739 | 383,717 |
| Cornerstone OnDemand Incorporated † | | | | 3,395 | 194,534 |
| Digimarc Corporation † | | | | 1,040 | 30,410 |
| Digital Turbine Incorporated † | | | | 7,840 | 458,248 |
| Domo Incorporated Class B † | | | | 3,285 | 294,008 |
| Ebix Incorporated | | | | 7,158 | 206,007 |
| eGain Corporation † | | | | 9,540 | 112,381 |
| Envestnet Incorporated † | | | | 3,830 | 305,902 |
| GTY Technology Holdings Incorporated † | | | | 3,704 | 27,336 |
| Intelligent Systems Corporation † | | | | 4,202 | 162,155 |
| InterDigital Incorporated | | | | 4,338 | 312,813 |
| J2 Global Incorporated † | | | | 4,033 | 555,344 |
| JFrog Limited † | | | | 3,511 | 134,963 |
| LivePerson Incorporated † | | | | 3,466 | 222,171 |
| Marathon Digital Holdings Incorporated † | | | | 10,961 | 444,907 |
| MicroStrategy Incorporated Class A † | | | | 555 | 385,337 |
| Mimecast Limited † | | | | 4,713 | 329,015 |
| Mitek Systems Incorporated † | | | | 6,434 | 143,929 |
| Model N Incorporated † | | | | 1,209 | 40,997 |
| Momentive Global Incorporated † | | | | 6,296 | 123,465 |
| ON24 Incorporated † | | | | 2,977 | 67,310 |
| OneSpan Incorporated † | | | | 2,742 | 52,838 |
| Pagerduty Incorporated † | | | | 4,616 | 197,565 |
| Ping Identity Holding Corporation † | | | | 1,911 | 49,590 |
| Progress Software Corporation | | | | 6,349 | 295,609 |
| PROS Holdings Incorporated † | | | | 2,430 | 105,073 |
| Q2 Holdings Incorporated † | | | | 2,753 | 242,512 |
| Qualys Incorporated † | | | | 2,950 | 346,271 |
| Rapid7 Incorporated † | | | | 3,395 | 412,560 |
| Rimini Street Incorporated † | | | | 15,941 | 152,237 |
| Riot Blockchain Incorporated † | | | | 7,762 | 289,678 |
| SailPoint Technologies Holdings Incorporated † | | | | 6,418 | 300,747 |
| Sapiens International Corporation | | | | 5,855 | 167,102 |
| Secureworks Corporation Class A † | | | | 13,341 | 272,957 |
| Shotspotter Incorporated † | | | | 2,889 | 115,069 |
| Smith Micro Software Incorporated † | | | | 11,112 | 55,449 |
| Sprout Social Incorporated Class A † | | | | 3,069 | 373,190 |
| SPS Commerce Incorporated † | | | | 3,301 | 447,385 |
| Sumo Logic Incorporated † | | | | 7,130 | 148,661 |
| Telos Corporation † | | | | 3,253 | 107,349 |
| Tenable Holdings Incorporated † | | | | 6,468 | 286,985 |
| Upland Software Incorporated † | | | | 2,443 | 95,228 |
| Varonis Systems Incorporated † | | | | 5,925 | 408,884 |
| Verint Systems Incorporated | | | | 7,991 | 356,718 |
The accompanying notes are an integral part of these financial statements.
Wells Fargo Factor Enhanced U.S. Small Cap Equity Portfolio | 29
Portfolio of investments—August 31, 2021 (unaudited)
| | | | | Shares | Value |
| Software (continued) | | | | | |
| Veritone Incorporated † | | | | 944 | $ 19,701 |
| Viant Technology † | | | | 6,293 | 86,529 |
| Vonage Holdings Corporation † | | | | 17,672 | 249,175 |
| Workiva Incorporated † | | | | 2,826 | 396,403 |
| Xperi Holding Corporation | | | | 10,481 | 223,979 |
| Yext Incorporated † | | | | 8,830 | 119,382 |
| Zix Corporation † | | | | 18,677 | 144,560 |
| Zuora Incorporated † | | | | 8,660 | 147,047 |
| | | | | | 16,264,182 |
| Technology hardware, storage & peripherals: 0.26% | | | | | |
| 3D Systems Corporation † | | | | 6,476 | 197,129 |
| Avid Technology Incorporated † | | | | 4,545 | 117,306 |
| Corsair Gaming Incorporated † | | | | 1,175 | 34,016 |
| Diebold Nixdorf Incorporated † | | | | 5,111 | 55,608 |
| Super Micro Computer Incorporated † | | | | 3,518 | 128,548 |
| Turtle Beach Corporation † | | | | 1,682 | 47,786 |
| | | | | | 580,393 |
| Materials: 3.86% | | | | | |
| Chemicals: 2.09% | | | | | |
| Advansix Incorporated † | | | | 7,909 | 288,679 |
| American Vanguard Corporation | | | | 1,173 | 17,982 |
| Amyris Incorporated † | | | | 197 | 2,965 |
| Avient Corporation | | | | 5,985 | 311,759 |
| Balchem Corporation | | | | 1,774 | 249,105 |
| Cabot Corporation | | | | 5,672 | 302,885 |
| Danimer Scientific Incorporated † | | | | 4,955 | 96,821 |
| Ecovyst Incorporated | | | | 2,338 | 30,417 |
| Ferro Corporation † | | | | 6,618 | 137,654 |
| GCP Applied Technologies Incorporated † | | | | 3,964 | 94,502 |
| Hawkins Incorporated | | | | 3,067 | 116,178 |
| HB Fuller Company | | | | 3,771 | 254,806 |
| Ingevity Corporation † | | | | 3,145 | 252,827 |
| Innospec Incorporated | | | | 1,645 | 153,972 |
| Intrepid Potash Incorporated † | | | | 236 | 7,318 |
| Kooper Holdings Incorporated † | | | | 6,603 | 217,239 |
| Kraton Performance Polymers Incorporated † | | | | 1,879 | 79,143 |
| Kronos Worldwide Incorporated | | | | 7,279 | 96,374 |
| Livent Corporation † | | | | 6,131 | 152,478 |
| Minerals Technologies Incorporated | | | | 3,187 | 250,626 |
| Orion Engineered Carbons SA † | | | | 9,304 | 164,402 |
| Quaker Chemical Corporation | | | | 392 | 101,575 |
| Rayonier Advanced Materials † | | | | 4,585 | 32,370 |
| Sensient Technologies Corporation | | | | 3,712 | 322,387 |
| Stepan Company | | | | 2,042 | 240,058 |
| Tredegar Corporation | | | | 1,801 | 23,917 |
| Trinseo SA | | | | 5,729 | 297,507 |
| Tronox Holdings plc Class A | | | | 13,647 | 288,361 |
| Valhi Incorporated | | | | 2,363 | 56,050 |
| | | | | | 4,640,357 |
| Construction materials: 0.10% | | | | | |
| Summit Materials Incorporated Class A † | | | | 6,215 | 209,259 |
The accompanying notes are an integral part of these financial statements.
30 | Wells Fargo Factor Enhanced U.S. Small Cap Equity Portfolio
Portfolio of investments—August 31, 2021 (unaudited)
| | | | | Shares | Value |
| Containers & packaging: 0.20% | | | | | |
| Greif Incorporated Class A | | | | 2,936 | $ 185,908 |
| O-I Glass Incorporated † | | | | 15,750 | 238,298 |
| Pactiv Evergreen Incorporated | | | | 1,765 | 24,269 |
| | | | | | 448,475 |
| Metals & mining: 1.44% | | | | | |
| Allegheny Technologies Incorporated † | | | | 6,910 | 123,413 |
| Arconic Corporation † | | | | 7,197 | 248,225 |
| Carpenter Technology | | | | 988 | 32,950 |
| Century Aluminum Company † | | | | 5,416 | 69,433 |
| Coeur d'Alene Mines Corporation † | | | | 20,842 | 146,936 |
| Commercial Metals Company | | | | 10,770 | 351,317 |
| Compass Minerals International Incorporated | | | | 3,693 | 247,172 |
| Constellium SE † | | | | 12,259 | 247,877 |
| Hecla Mining Company | | | | 31,723 | 195,096 |
| Kaiser Aluminum Corporation | | | | 283 | 35,732 |
| Materion Corporation | | | | 927 | 67,699 |
| MP Materials Corporation † | | | | 7,471 | 250,801 |
| Olympic Steel Incorporated | | | | 7,229 | 197,063 |
| Ryerson Holding Corporation | | | | 11,801 | 273,193 |
| Schnitzer Steel Industries Incorporated Class A | | | | 5,104 | 241,470 |
| Suncoke Energy Incorporated | | | | 5,738 | 39,879 |
| TimkenSteel Corporation † | | | | 10,904 | 149,167 |
| Warrior Met Coal Incorporated | | | | 545 | 12,203 |
| Worthington Industries Incorporated | | | | 4,626 | 268,077 |
| | | | | | 3,197,703 |
| Paper & forest products: 0.03% | | | | | |
| Clearwater Paper Corporation † | | | | 287 | 9,325 |
| Schweitzer-Mauduit International Incorporated | | | | 1,521 | 58,209 |
| | | | | | 67,534 |
| Real estate: 6.11% | | | | | |
| Equity REITs: 5.28% | | | | | |
| Acadia Realty Trust | | | | 4,101 | 87,023 |
| Agree Realty Corporation | | | | 3,475 | 259,061 |
| Alexander & Baldwin Incorporated | | | | 6,718 | 140,272 |
| Alexander's Incorporated | | | | 180 | 47,934 |
| American Assets Trust Incorporated | | | | 2,264 | 90,152 |
| American Finance Trust Incorporated | | | | 1,486 | 12,809 |
| Apartment Investment & Management Company Class A | | | | 29,317 | 210,496 |
| Apple Hospitality REIT Incorporated | | | | 11,584 | 171,212 |
| Armada Hoffler Properties Incorporated | | | | 6,150 | 82,595 |
| Brandywine Realty Trust | | | | 19,269 | 267,454 |
| Broadstone Net Lease Incorporated REIT | | | | 9,095 | 249,203 |
| BRT Apartments Corporation REIT | | | | 3,411 | 66,242 |
| CareTrust REIT Incorporated | | | | 11,036 | 242,682 |
| Catchmark Timber Trust Incorporated Class A | | | | 1,749 | 20,183 |
| Chatham Lodging Trust † | | | | 486 | 5,832 |
| City Office REIT Incorporated | | | | 6,683 | 106,728 |
| Clipper Realty Incorporated | | | | 4,169 | 35,186 |
| Columbia Property Trust Incorporated | | | | 6,406 | 107,108 |
| Community Healthcare Trust Incorporated | | | | 1,120 | 54,331 |
| CorePoint Lodging Incorporated † | | | | 3,890 | 56,249 |
The accompanying notes are an integral part of these financial statements.
Wells Fargo Factor Enhanced U.S. Small Cap Equity Portfolio | 31
Portfolio of investments—August 31, 2021 (unaudited)
| | | | | Shares | Value |
| Equity REITs (continued) | | | | | |
| Corporate Office Properties Trust | | | | 7,102 | $ 200,134 |
| CTO Realty Growth Incorporated REIT | | | | 3,433 | 192,557 |
| DiamondRock Hospitality † | | | | 5,811 | 52,531 |
| DigitalBridge Group Incorporated † | | | | 22,792 | 157,265 |
| Diversified Healthcare Trust | | | | 1,423 | 5,336 |
| Easterly Government Properties Incorporated | | | | 1,106 | 23,635 |
| EastGroup Properties Incorporated | | | | 2,632 | 474,444 |
| Empire State Realty Trust Incorporated Class A | | | | 7,858 | 80,702 |
| Equity Commonwealth | | | | 3,188 | 83,972 |
| Essential Properties Realty | | | | 7,593 | 246,089 |
| Farmland Partners REIT Incorporated | | | | 2,004 | 24,549 |
| Four Corners Property Trust Incorporated | | | | 6,401 | 183,133 |
| Franklin Street Properties Corporation | | | | 7,253 | 34,814 |
| Getty Realty Corporation | | | | 3,517 | 111,243 |
| Global Net Lease Incorporated | | | | 3,213 | 54,621 |
| Healthcare Realty Trust Incorporated | | | | 8,602 | 258,318 |
| Independence Realty Trust Incorporated | | | | 9,449 | 193,516 |
| Industrial Logistics Properties Trust | | | | 8,456 | 231,948 |
| Innovative Industrial Properties Incorporated | | | | 1,463 | 359,766 |
| iStar Financial Incorporated | | | | 4,982 | 131,774 |
| Kite Realty Group Trust | | | | 5,720 | 115,887 |
| Lexington Corporate Properties Trust | | | | 21,492 | 290,787 |
| LTC Properties Incorporated | | | | 3,599 | 124,201 |
| Mack-Cali Realty Corporation † | | | | 522 | 9,333 |
| National Health Investors Incorporated | | | | 3,761 | 224,983 |
| National Storage Affiliates Trust | | | | 6,217 | 355,923 |
| New York REIT Liquidating LLC ♦‡ | | | | 4,209 | 74,181 |
| NexPoint Residential Trust Incorporated | | | | 1,099 | 71,204 |
| Office Properties Income Trust | | | | 2,612 | 69,296 |
| One Liberty Properties Incorporated | | | | 1,976 | 62,916 |
| Outfront Media Incorporated | | | | 8,367 | 207,167 |
| Paramount Group Incorporated | | | | 8,771 | 77,711 |
| Pebblebrook Hotel Trust | | | | 3,670 | 80,850 |
| Physicians Realty Trust | | | | 13,307 | 246,313 |
| Piedmont Office Realty Trust Incorporated Class A | | | | 11,275 | 200,921 |
| PotlatchDeltic Corporation | | | | 8,709 | 452,433 |
| PS Business Parks Incorporated | | | | 1,702 | 267,605 |
| QTS Realty Trust Incorporated Class A | | | | 2,776 | 216,472 |
| Retail Opportunity Investment Corporation | | | | 8,402 | 151,908 |
| Retail Properties of America Incorporated Class A | | | | 13,106 | 173,261 |
| RLJ Lodging Trust | | | | 5,399 | 77,908 |
| RPT Realty | | | | 2,270 | 29,374 |
| Ryman Hospitality Properties Incorporated † | | | | 2,896 | 240,571 |
| Sabra Health Care REIT Incorporated | | | | 16,170 | 258,720 |
| Seritage Growth Property Class A † | | | | 464 | 7,503 |
| Service Properties Trust | | | | 6,911 | 78,993 |
| SITE Centers Corporation | | | | 11,794 | 190,001 |
| STAG Industrial Incorporated | | | | 9,768 | 412,698 |
| Sunstone Hotel Investors Incorporated † | | | | 6,648 | 77,050 |
| Tanger Factory Outlet Centers Incorporated | | | | 8,290 | 138,609 |
| Terreno Realty Corporation | | | | 4,550 | 303,986 |
| The Geo Group Incorporated | | | | 29,370 | 227,618 |
| The Macerich Company | | | | 7,607 | 129,928 |
| UMH Properties Incorporated | | | | 4,152 | 98,402 |
| Uniti Group Incorporated | | | | 9,791 | 127,968 |
| Universal Health Realty Income Trust | | | | 117 | 6,930 |
The accompanying notes are an integral part of these financial statements.
32 | Wells Fargo Factor Enhanced U.S. Small Cap Equity Portfolio
Portfolio of investments—August 31, 2021 (unaudited)
| | | | | Shares | Value |
| Equity REITs (continued) | | | | | |
| Urban Edge Properties | | | | 8,175 | $ 154,835 |
| Urstadt Biddle Properties Incorporated | | | | 4,091 | 78,056 |
| Washington REIT | | | | 3,742 | 94,074 |
| Whitestone REIT | | | | 2,723 | 26,713 |
| Xenia Hotels & Resorts Incorporated † | | | | 3,701 | 64,471 |
| | | | | | 11,710,859 |
| Real estate management & development: 0.83% | | | | | |
| Cushman & Wakefield plc † | | | | 10,471 | 189,944 |
| eXp World Holdings Incorporated | | | | 4,625 | 212,056 |
| Fathom Holdings Incorporated † | | | | 443 | 12,661 |
| Forestar Group Incorporated † | | | | 6,342 | 131,850 |
| FRP Holdings Incorporated † | | | | 244 | 14,079 |
| Kennedy Wilson Holdings Incorporated | | | | 5,439 | 119,604 |
| Marcus & Millichap Incorporated † | | | | 2,660 | 104,325 |
| Newmark Group Incorporated Class A | | | | 17,809 | 242,559 |
| RE/MAX Holdings Incorporated Class A | | | | 1,271 | 42,566 |
| Realogy Holdings Corporation † | | | | 18,893 | 331,572 |
| Redfin Corporation † | | | | 4,124 | 200,303 |
| The RMR Group Incorporated Class A | | | | 3,737 | 173,173 |
| The St. Joe Company | | | | 1,557 | 72,042 |
| | | | | | 1,846,734 |
| Utilities: 2.74% | | | | | |
| Electric utilities: 0.56% | | | | | |
| Allete Incorporated | | | | 3,119 | 210,283 |
| MGE Energy Incorporated | | | | 2,049 | 165,026 |
| Otter Tail Corporation | | | | 2,696 | 147,930 |
| PNM Resources Incorporated | | | | 4,988 | 246,906 |
| Portland General Electric Company | | | | 4,980 | 255,723 |
| Via Renewables Incorporated | | | | 18,858 | 211,210 |
| | | | | | 1,237,078 |
| Gas utilities: 0.82% | | | | | |
| Brookfield Infrastructure Corporation Class A | | | | 2,760 | 175,536 |
| Chesapeake Utilities Corporation | | | | 1,777 | 232,254 |
| New Jersey Resources Corporation | | | | 7,129 | 266,197 |
| Northwest Natural Holding Company | | | | 2,223 | 114,373 |
| ONE Gas Incorporated | | | | 3,497 | 251,155 |
| South Jersey Industries Incorporated | | | | 8,907 | 220,983 |
| Southwest Gas Holdings Incorporated | | | | 4,232 | 297,552 |
| Spire Incorporated | | | | 3,837 | 255,928 |
| | | | | | 1,813,978 |
| Independent power & renewable electricity producers: 0.50% | | | | | |
| Clearway Energy Incorporated Class A | | | | 11,780 | 350,337 |
| Clearway Energy Incorporated Class C | | | | 9,186 | 288,349 |
| Ormat Technologies Incorporated | | | | 4,463 | 317,453 |
| Sunnova Energy International Incorporated † | | | | 4,197 | 151,931 |
| | | | | | 1,108,070 |
| Multi-utilities: 0.38% | | | | | |
| Avista Corporation | | | | 5,397 | 225,864 |
| Black Hills Corporation | | | | 4,623 | 325,136 |
The accompanying notes are an integral part of these financial statements.
Wells Fargo Factor Enhanced U.S. Small Cap Equity Portfolio | 33
Portfolio of investments—August 31, 2021 (unaudited)
| | | | | Shares | Value |
| Multi-utilities (continued) | | | | | |
| Northwestern Corporation | | | | 3,834 | $ 243,842 |
| Unitil Corporation | | | | 1,219 | 60,462 |
| | | | | | 855,304 |
| Water utilities: 0.48% | | | | | |
| American States Water Company | | | | 2,528 | 233,107 |
| Artesian Resources Corporation Class A | | | | 2,652 | 104,515 |
| California Water Service Group | | | | 4,254 | 270,342 |
| Global Water Resources Incorporated | | | | 4,594 | 91,880 |
| Middlesex Water Company | | | | 1,449 | 158,535 |
| Pure Cycle Corporation † | | | | 6,453 | 96,472 |
| SJW Corporation | | | | 1,388 | 96,230 |
| York Water Company | | | | 362 | 18,668 |
| | | | | | 1,069,749 |
| Total Common stocks (Cost $173,180,718) | | | | | 218,082,720 |
| | | Interest
rate | Maturity
date | Principal | |
| Corporate bonds and notes: 0.01% | | | | | |
| Financials: 0.01% | | | | | |
| Capital markets: 0.01% | | | | | |
| Gamco Investors Incorporated | | 4.00% | 6-15-2023 | $ 12,000 | 11,999 |
| Total Corporate bonds and notes (Cost $12,000) | | | | | 11,999 |
| | | | Expiration
date | Shares | |
| Rights: 0.00% | | | | | |
| Financials: 0.00% | | | | | |
| Thrifts & mortgage finance: 0.00% | | | | | |
| NewStar Financial Incorporated ♦† | | | 12-26-2027 | 9,129 | 0 |
| Health care: 0.00% | | | | | |
| Pharmaceuticals: 0.00% | | | | | |
| Elanco Animal Health Incorporated ♦† | | | 12-31-2021 | 8,956 | 0 |
| Total Rights (Cost $225) | | | | | 0 |
| | | | | | |
| Warrants: 0.00% | | | | | |
| Energy: 0.00% | | | | | |
| Oil, gas & consumable fuels: 0.00% | | | | | |
| Battalion Oil Corporation ♦† | | | 10-8-2022 | 375 | 0 |
| Battalion Oil Corporation ♦† | | | 10-8-2022 | 300 | 0 |
| Battalion Oil Corporation ♦† | | | 10-8-2022 | 482 | 0 |
| | | | | | 0 |
| Total Warrants (Cost $0) | | | | | 0 |
The accompanying notes are an integral part of these financial statements.
34 | Wells Fargo Factor Enhanced U.S. Small Cap Equity Portfolio
Portfolio of investments—August 31, 2021 (unaudited)
| | | Yield | | Shares | Value |
| Short-term investments: 1.23% | | | | | |
| Investment companies: 1.23% | | | | | |
| Wells Fargo Government Money Market Fund Select Class ♠∞ | | 0.03% | | 2,740,263 | $ 2,740,263 |
| Total Short-term investments (Cost $2,740,263) | | | | | 2,740,263 |
| Total investments in securities (Cost $175,933,206) | 99.51% | | | | 220,834,982 |
| Other assets and liabilities, net | 0.49 | | | | 1,089,824 |
| Total net assets | 100.00% | | | | $221,924,806 |
| † | Non-income-earning security |
| ♦ | The security is fair valued in accordance with procedures approved by the Board of Trustees. |
| ‡ | Security is valued using significant unobservable inputs. |
| 144A | The security may be resold in transactions exempt from registration, normally to qualified institutional buyers, pursuant to Rule 144A under the Securities Act of 1933. |
| ♠ | The issuer of the security is an affiliated person of the Portfolio as defined in the Investment Company Act of 1940. |
| ∞ | The rate represents the 7-day annualized yield at period end. |
| Abbreviations: |
| REIT | Real estate investment trust |
Investments in affiliates
An affiliated investment is an investment in which the Portfolio owns at least 5% of the outstanding voting shares of the issuer or as a result of other relationships, such as the Portfolio and the issuer having the same adviser or investment manager. Transactions with issuers that were either affiliates of the Portfolio at the beginning of the period or the end of the period were as follows:
| | Value,
beginning of
period | Purchases | Sales
proceeds | Net
realized
gains
(losses) | Net
change in
unrealized
gains
(losses) | Value,
end of
period | Shares,
end
of period | Income
from
affiliated
securities |
| Short-term investments | | | | | | | |
| Wells Fargo Government Money Market Fund Select Class | $2,925,181 | $49,580,576 | $(49,765,494) | $0 | $0 | $2,740,263 | 2,740,263 | $1,099 |
Futures contracts
| Description | Number of
contracts | Expiration
date | Notional
cost | Notional
value | Unrealized
gains | Unrealized
losses |
| Long | | | | | | |
| E-Mini Russell 2000 Index | 32 | 9-17-2021 | $3,589,052 | $3,633,920 | $44,868 | $0 |
The accompanying notes are an integral part of these financial statements.
Wells Fargo Factor Enhanced U.S. Small Cap Equity Portfolio | 35
Statement of assets and liabilities—August 31, 2021 (unaudited)
| | |
| Assets | |
Investments in unaffiliated securities, at value (cost $173,192,943)
| $ 218,094,719 |
Investments in affiliated securites, at value (cost $2,740,263)
| 2,740,263 |
Cash at broker segregated for futures contracts
| 1,005,440 |
Receivable for dividends and interest
| 141,009 |
Receivable for daily variation margin on open futures contracts
| 15,679 |
Prepaid expenses and other assets
| 4,821 |
Total assets
| 222,001,931 |
| Liabilities | |
Custodian and accounting fee payable
| 52,475 |
Advisory fee payable
| 16,383 |
Professional fees payable
| 8,267 |
Total liabilities
| 77,125 |
Total net assets
| $221,924,806 |
The accompanying notes are an integral part of these financial statements.
36 | Wells Fargo Factor Enhanced U.S. Small Cap Equity Portfolio
Statement of operations—six months ended August 31, 2021 (unaudited)
| | |
| Investment income | |
Dividends (net of foreign withholdings taxes of $6,676)
| $ 1,118,189 |
Income from affiliated securities
| 1,099 |
Interest
| 96 |
Total investment income
| 1,119,384 |
| Expenses | |
Advisory fee
| 161,983 |
Custody and accounting fees
| 21,059 |
Professional fees
| 25,396 |
Interest holder report expenses
| 7,504 |
Trustees’ fees and expenses
| 9,771 |
Other fees and expenses
| 10,265 |
Total expenses
| 235,978 |
Less: Fee waivers and/or expense reimbursements
| (67,515) |
Net expenses
| 168,463 |
Net investment income
| 950,921 |
| Realized and unrealized gains (losses) on investments | |
| Net realized gains (losses) on | |
Unaffiliated securities
| 42,398,257 |
Futures contracts
| (297,167) |
Net realized gains on investments
| 42,101,090 |
| Net change in unrealized gains (losses) on | |
Unaffiliated securities
| (30,842,703) |
Futures contracts
| 154,816 |
Net change in unrealized gains (losses) on investments
| (30,687,887) |
Net realized and unrealized gains (losses) on investments
| 11,413,203 |
Net increase in net assets resulting from operations
| $ 12,364,124 |
The accompanying notes are an integral part of these financial statements.
Wells Fargo Factor Enhanced U.S. Small Cap Equity Portfolio | 37
Statement of changes in net assets
| | | |
| | Six months ended
August 31, 2021
(unaudited) | Year ended
February 28, 2021 |
| Operations | | |
Net investment income
| $ 950,921 | $ 2,315,241 |
Net realized gains on investments
| 42,101,090 | 13,262,319 |
Net change in unrealized gains (losses) on investments
| (30,687,887) | 80,382,173 |
Net increase in net assets resulting from operations
| 12,364,124 | 95,959,733 |
| Capital transactions | | |
| Transactions in investors’ beneficial interests | | |
Contributions
| 30,709,276 | 90,575,424 |
Withdrawals
| (30,516,217) | (206,734,779) |
Net increase (decrease) in net assets resulting from capital transactions
| 193,059 | (116,159,355) |
Total increase (decrease) in net assets
| 12,557,183 | (20,199,622) |
| Net assets | | |
Beginning of period
| 209,367,623 | 229,567,245 |
End of period
| $221,924,806 | $ 209,367,623 |
The accompanying notes are an integral part of these financial statements.
38 | Wells Fargo Factor Enhanced U.S. Small Cap Equity Portfolio
| | | Year ended February 28 |
| | Six months ended
August 31, 2021
(unaudited) | 2021 | 2020 1 | 2019 | 2018 2 |
Total return3
| 5.56% | 43.18% | (5.94)% | 7.05% | 8.75% |
| Ratios to average net assets (annualized) | | | | | |
Gross expenses
| 0.22% | 0.22% | 0.23% | 0.21% | 0.19% |
Net expenses
| 0.16% * | 0.16% * | 0.18% | 0.19% | 0.19% |
Net investment income
| 0.88% | 1.02% | 1.35% | 1.29% | 1.23% |
| Supplemental data | | | | | |
Portfolio turnover rate
| 62% | 98% | 40% | 37% | 85% |
| * | Ratios reflect expenses which were voluntarily waived by the adviser. Without these voluntary waivers, the net expense ratios would be increased by the following amounts: |
| Six months ended August 31, 2021 (unaudited) | 0.06% |
| Year ended February 28, 2021 | 0.05% |
| 1 | Year ended February 29 |
| 2 | For the period from May 23, 2017 (commencement of operations) to February 28, 2018 |
| 3 | Returns for periods of less than one year are not annualized. |
The accompanying notes are an integral part of these financial statements.
Wells Fargo Factor Enhanced U.S. Small Cap Equity Portfolio | 39
Notes to financial statements (unaudited)
1. ORGANIZATION
Wells Fargo Master Trust (the "Trust"), a Delaware statutory trust organized on March 10, 1999, is an open-end management investment company registered under the Investment Company Act of 1940, as amended (the "1940 Act"). As an investment company, the Trust follows the accounting and reporting guidance in Financial Accounting Standards Board ("FASB") Accounting Standards Codification Topic 946, Financial Services – Investment Companies. These financial statements report on the Wells Fargo Factor Enhanced U.S. Small Cap Equity Portfolio (the "Portfolio") which is a diversified series of the Trust.
Interests in the Portfolio are available solely through private placement transactions that do not involve any "public offering" within the meaning of Section 4(2) of the Investment Company Act of 1933.
On February 23, 2021, Wells Fargo & Company announced that it has entered into a definitive agreement to sell Wells Fargo Asset Management ("WFAM") to GTCR LLC and Reverence Capital Partners, L.P. WFAM is the trade name used by the asset management businesses of Wells Fargo & Company and includes Wells Fargo Funds Management, LLC, the adviser to the Portfolio, Wells Capital Management, LLC and Wells Fargo Asset Management (International) Limited, both registered investment advisers providing subadvisory services to certain funds, and Wells Fargo Funds Distributor, LLC, the Portfolio's principal underwriter. As part of the transaction, Wells Fargo & Company will own a 9.9% equity interest and will continue to serve as an important client and distribution partner.
Consummation of the transaction will result in the automatic termination of the Portfolio’s investment advisory agreement and subadvisory agreements. The Portfolio’s Board of Trustees approved a new investment advisory agreement and a new subadvisory agreement which were subsequently approved on behalf of the feeder funds that were investors in the Portfolio at the close of business on May 28, 2021. The new agreements will take effect upon the closing of the transaction. The transaction is expected to close in the second half of 2021, subject to customary closing conditions.
2. SIGNIFICANT ACCOUNTING POLICIES
The following significant accounting policies, which are consistently followed in the preparation of the financial statements of the Portfolio, are in conformity with U.S. generally accepted accounting principles which require management to make estimates and assumptions that affect the reported amounts of assets and liabilities, disclosure of contingent assets and liabilities at the date of the financial statements, and the reported amounts of income and expenses during the reporting period. Actual results could differ from those estimates.
Securities valuation
All investments are valued each business day as of the close of regular trading on the New York Stock Exchange (generally 4 p.m. Eastern Time), although the Portfolio may deviate from this calculation time under unusual or unexpected circumstances.
Equity securities and futures contracts that are listed on a foreign or domestic exchange or market are valued at the official closing price or, if none, the last sales price. If no sale occurs on the principal exchange or market that day, a fair value price will be determined in accordance with the Portfolio’s Valuation Procedures.
Debt securities are valued at the evaluated bid price provided by an independent pricing service (e.g. taking into account various factors, including yields, maturities, or credit ratings) or, if a reliable price is not available, the quoted bid price from an independent broker-dealer.
Investments in registered open-end investment companies are valued at net asset value.
Investments which are not valued using any of the methods discussed above are valued at their fair value, as determined in good faith by the Board of Trustees. The Board of Trustees has established a Valuation Committee comprised of the Trustees and has delegated to it the authority to take any actions regarding the valuation of portfolio securities that the Valuation Committee deems necessary or appropriate, including determining the fair value of portfolio securities, unless the determination has been delegated to the Wells Fargo Asset Management Pricing Committee at Wells Fargo Funds Management, LLC ("Funds Management"). The Board of Trustees retains the authority to make or ratify any valuation decisions or approve any changes to the Valuation Procedures as it deems appropriate. On a quarterly basis, the Board of Trustees receives reports on any valuation actions taken by the Valuation Committee or the Wells Fargo Asset Management Pricing Committee which may include items for ratification.
Futures contracts
Futures contracts are agreements between the Portfolio and a counterparty to buy or sell a specific amount of a commodity, financial instrument or currency at a specified price on a specified date. The Portfolio may buy and sell futures contracts in order to gain exposure to, or protect against, changes in security values and is subject to equity price risk. The primary risks
40 | Wells Fargo Factor Enhanced U.S. Small Cap Equity Portfolio
Notes to financial statements (unaudited)
associated with the use of futures contracts are the imperfect correlation between changes in market values of securities held by the Portfolio and the prices of futures contracts, and the possibility of an illiquid market. Futures contracts are generally entered into on a regulated futures exchange and cleared through a clearinghouse associated with the exchange. With futures contracts, there is minimal counterparty risk to the Portfolio since futures contracts are exchange traded and the exchange’s clearinghouse, as the counterparty to all exchange traded futures, guarantees the futures contracts against default.
Upon entering into a futures contract, the Portfolio is required to deposit either cash or securities (initial margin) with the broker in an amount equal to a certain percentage of the contract value. Subsequent payments (variation margin) are paid to or from the broker each day equal to the daily changes in the contract value. Such payments are recorded as unrealized gains or losses and, if any, shown as variation margin receivable (payable) in the Statement of Assets and Liabilities. Should the Portfolio fail to make requested variation margin payments, the broker can gain access to the initial margin to satisfy the Portfolio’s payment obligations. When the contracts are closed, a realized gain or loss is recorded in the Statement of Operations.
Security transactions and income recognition
Securities transactions are recorded on a trade date basis. Realized gains or losses are recorded on the basis of identified cost.
Dividend income is recognized on the ex-dividend date.
Interest income is accrued daily and bond discounts are accreted and premiums are amortized daily. To the extent debt obligations are placed on non-accrual status, any related interest income may be reduced by writing off interest receivables when the collection of all or a portion of interest has been determined to be doubtful based on consistently applied procedures and the fair value has decreased. If the issuer subsequently resumes interest payments or when the collectability of interest is reasonably assured, the debt obligation is removed from non-accrual status.
Income is recorded net of foreign taxes withheld where recovery of such taxes is not assured.
Federal and other taxes
The Portfolio is not required to pay federal income taxes on its net investment income and net capital gains as it is treated as a partnership for federal income tax purposes. All income, gains and losses of the Portfolio are deemed to have been “passed through” to the interest holders in proportion to their holdings of the Portfolio regardless of whether income and gains have been distributed by the Portfolio.
The Portfolio’s income tax returns and all financial records supporting those returns for the prior three fiscal years are subject to examination by the federal revenue authority. Management has analyzed the Portfolio’s tax positions taken on federal, state, and foreign tax returns for all open tax years and does not believe that there are any uncertain tax positions that require recognition of a tax liability.
As of August 31, 2021, the aggregate cost of all investments for federal income tax purposes was $177,162,320 and the unrealized gains (losses) consisted of:
| Gross unrealized gains | $51,410,690 |
| Gross unrealized losses | (7,693,160) |
| Net unrealized gains | $43,717,530 |
Wells Fargo Factor Enhanced U.S. Small Cap Equity Portfolio | 41
Notes to financial statements (unaudited)
3. FAIR VALUATION MEASUREMENTS
Fair value measurements of investments are determined within a framework that has established a fair value hierarchy based upon the various data inputs utilized in determining the value of the Portfolio’s investments. The three-level hierarchy gives the highest priority to unadjusted quoted prices in active markets for identical assets or liabilities (Level 1) and the lowest priority to unobservable inputs (Level 3). The Portfolio’s investments are classified within the fair value hierarchy based on the lowest level of input that is significant to the fair value measurement. The inputs are summarized into three broad levels as follows:
| ■ | Level 1 – quoted prices in active markets for identical securities |
| ■ | Level 2 – other significant observable inputs (including quoted prices for similar securities, interest rates, prepayment speeds, credit risk, etc.) |
| ■ | Level 3 – significant unobservable inputs (including the Portfolio’s own assumptions in determining the fair value of investments) |
The inputs or methodologies used for valuing investments in securities are not necessarily an indication of the risk associated with investing in those securities.
The following is a summary of the inputs used in valuing the Portfolio’s assets and liabilities as of August 31, 2021:
| | Quoted prices
(Level 1) | Other significant
observable inputs
(Level 2) | Significant
unobservable inputs
(Level 3) | Total |
| Assets | | | | |
| Investments in: | | | | |
| Common stocks | | | | |
| Communication services | $ 7,469,441 | $ 0 | $ 36,099 | $ 7,505,540 |
| Consumer discretionary | 23,500,501 | 0 | 0 | 23,500,501 |
| Consumer staples | 7,262,532 | 0 | 0 | 7,262,532 |
| Energy | 7,752,824 | 0 | 0 | 7,752,824 |
| Financials | 30,768,858 | 0 | 0 | 30,768,858 |
| Health care | 49,183,185 | 0 | 304,282 | 49,487,467 |
| Industrials | 29,750,383 | 0 | 0 | 29,750,383 |
| Information technology | 33,849,515 | 0 | 0 | 33,849,515 |
| Materials | 8,563,328 | 0 | 0 | 8,563,328 |
| Real estate | 13,483,412 | 0 | 74,181 | 13,557,593 |
| Utilities | 6,084,179 | 0 | 0 | 6,084,179 |
| Corporate bonds and notes | 0 | 11,999 | 0 | 11,999 |
| Rights | | | | |
| Health care | 0 | 0 | 0 | 0 |
| Financials | 0 | 0 | 0 | 0 |
| Warrants | | | | |
| Energy | 0 | 0 | 0 | 0 |
| Short-term investments | | | | |
| Investment companies | 2,740,263 | 0 | 0 | 2,740,263 |
| | 220,408,421 | 11,999 | 414,562 | 220,834,982 |
| Futures contracts | 44,868 | 0 | 0 | 44,868 |
| Total assets | $220,453,289 | $11,999 | $414,562 | $220,879,850 |
Futures contracts are reported at their cumulative unrealized gains (losses) at measurement date as reported in the table following the Portfolio of Investments. For futures contracts, the current day’s variation margin is reported on the Statement of Assets and Liabilities. All other assets and liabilities are reported at their market value at measurement date.
Additional sector, industry or geographic detail, if any, is included in the Portfolio of Investments.
For the six months ended August 31, 2021, the Portfolio did not have any transfers into/out of Level 3.
42 | Wells Fargo Factor Enhanced U.S. Small Cap Equity Portfolio
Notes to financial statements (unaudited)
4. TRANSACTIONS WITH AFFILIATES
Advisory fee
The Trust has entered into an advisory contract with Funds Management, an indirect wholly owned subsidiary of Wells Fargo & Company ("Wells Fargo"). The adviser is responsible for implementing investment policies and guidelines and for supervising the subadviser, who is responsible for day-to-day portfolio management of the Portfolio. Pursuant to the contract, Funds Management is entitled to receive an advisory fee at the following annual rate based on the Portfolio’s average daily net assets:
| Average daily net assets | Advisory fee |
| First $5 billion | 0.150% |
| Next $5 billion | 0.130 |
| Over $10 billion | 0.110 |
For the six months ended August 31, 2021, the advisory fee was equivalent to an annual rate of 0.15% of the Portfolio’s average daily net assets.
Funds Management has retained the services of a subadviser to provide daily portfolio management to the Portfolio. The fee for subadvisory services is borne by Funds Management. Wells Capital Management, LLC, an affiliate of Funds Management and an indirect wholly owned subsidiary of Wells Fargo, is the subadviser to the Portfolio and is entitled to receive a fee from Funds Management at an annual rate starting at 0.08% and declining to 0.05% as the average daily net assets of the Portfolio increase.
Funds Management has voluntarily waived and/or reimbursed advisory fees to reduce the net operating expense ratio of the Portfolio. These voluntary waivers may be discontinued at any time.
Interfund transactions
The Portfolio may purchase or sell portfolio investment securities to certain other Wells Fargo affiliates pursuant to Rule 17a-7 under the 1940 Act and under procedures adopted by the Board of Trustees. The procedures have been designed to ensure that these interfund transactions, which do not incur broker commissions, are effected at current market prices.
5. INVESTMENT PORTFOLIO TRANSACTIONS
Purchases and sales of investments, excluding U.S. government obligations (if any) and short-term securities, for the six months ended August 31, 2021 were $133,094,836 and $128,295,837, respectively.
6. DERIVATIVE TRANSACTIONS
During the six months ended August 31, 2021, the Portfolio entered into futures contracts to gain market exposure. The Portfolio had an average notional amount of $9,653,639 in long futures contracts during the six months ended August 31, 2021.
The fair value, realized gains or losses and change in unrealized gains or losses, if any, on derivative instruments are reflected in the corresponding financial statement captions.
7. BANK BORROWINGS
The Trust, along with Wells Fargo Variable Trust and Wells Fargo Funds Trust (excluding the money market funds), are parties to a $350,000,000 revolving credit agreement whereby the Portfolio is permitted to use bank borrowings for temporary or emergency purposes, such as to fund interest holders withdrawal requests. Interest under the credit agreement is charged to the Portfolio based on a borrowing rate equal to the higher of the Federal Funds rate in effect on that day plus 1.25% or the overnight bank funding rate in effect on that day plus 1.25%. In addition, an annual commitment fee equal to 0.25% of the unused balance is allocated to each participating fund.
For the six months ended August 31, 2021, there were no borrowings by the Portfolio under the agreement.
8. INDEMNIFICATION
Under the Portfolio's organizational documents, the officers and Trustees have been granted certain indemnification rights against certain liabilities that may arise out of performance of their duties to the Portfolio. The Portfolio has entered into a separate agreement with each Trustee that converts indemnification rights currently existing under the Portfolio’s organizational documents into contractual rights that cannot be changed in the future without the consent of the Trustee.
Wells Fargo Factor Enhanced U.S. Small Cap Equity Portfolio | 43
Notes to financial statements (unaudited)
Additionally, in the normal course of business, the Portfolio may enter into contracts with service providers that contain a variety of indemnification clauses. The Portfolio’s maximum exposure under these arrangements is dependent on future claims that may be made against the Portfolio and, therefore, cannot be estimated.
9. CORONAVIRUS (COVID-19) PANDEMIC
On March 11, 2020, the World Health Organization announced that it had made the assessment that coronavirus disease 2019 (“COVID-19”) is a pandemic. The impacts of COVID-19 are affecting the entire global economy, individual companies and investment products, the funds, and the market in general. There is significant uncertainty around the extent and duration of business disruptions related to COVID-19 and the impacts may last for an extended period of time. COVID-19 has led to significant uncertainty and volatility in the financial markets.
10. SUBSEQUENT EVENTS
Wells Fargo Asset Management ("WFAM") announced that it will be changing its company name to Allspring Global Investments upon the closing of the previously announced sale transaction of WFAM by Wells Fargo & Company to GTCR LLC and Reverence Capital Partners, L.P. The new corporate name is expected to go into effect on the closing date of the transaction, which is anticipated to occur in the second half of 2021, subject to customary closing conditions.
The Board of Trustees of the Wells Fargo Funds approved a change in the Portfolio's name to remove “Wells Fargo” from the Portfolio's name and replace with “Allspring” on December 6, 2021.
Following the closing of the transaction, Wells Fargo Funds Management, LLC, the Portfolio's adviser, Wells Capital Management, LLC and Wells Fargo Asset Management (International) Limited, each subadvisers to certain funds, and Wells Fargo Funds Distributor, LLC will each be rebranded as Allspring.
44 | Wells Fargo Factor Enhanced U.S. Small Cap Equity Portfolio
Other information (unaudited)
PROXY VOTING INFORMATION
A description of the policies and procedures used to determine how to vote proxies relating to portfolio securities is available without charge, upon request, by calling 1-800-222-8222, visiting our website at wfam.com, or visiting the SEC website at sec.gov. Information regarding how the proxies related to portfolio securities were voted during the most recent 12-month period ended June 30 is available on the website at wfam.com or by visiting the SEC website at sec.gov.
QUARTERLY PORTFOLIO HOLDINGS INFORMATION
The Portfolio files its complete schedule of portfolio holdings with the SEC for the first and third quarters of each fiscal year as an exhibit to its reports on Form N-PORT. Interest holders may view the filed Form N-PORT by visiting the SEC website at sec.gov.
Wells Fargo Factor Enhanced U.S. Small Cap Equity Portfolio | 45
Other information (unaudited)
BOARD OF TRUSTEES AND OFFICERS
Each of the Trustees and Officers listed in the table below acts in identical capacities for each fund in the Wells Fargo family of funds, which consists of 139 mutual funds comprising the Wells Fargo Funds Trust, Wells Fargo Variable Trust, Wells Fargo Master Trust and four closed-end funds (collectively the “Fund Complex”). This table should be read in conjunction with the Prospectus and the Statement of Additional Information1. The mailing address of each Trustee and Officer is 525 Market Street, 12th Floor, San Francisco, CA 94105. Each Trustee and Officer serves an indefinite term, however, each Trustee serves such term until reaching the mandatory retirement age established by the Trustees.
Independent Trustees
Name and
year of birth | Position held and
length of service* | Principal occupations during past five years or longer | Current other
public company or
investment
company
directorships |
William R. Ebsworth
(Born 1957) | Trustee,
since 2015 | Retired. From 1984 to 2013, equities analyst, portfolio manager, research director and chief investment officer at Fidelity Management and Research Company in Boston, Tokyo, and Hong Kong, and retired in 2013 as Chief Investment Officer of Fidelity Strategic Advisers, Inc. where he led a team of investment professionals managing client assets. Prior thereto, Board member of Hong Kong Securities Clearing Co., Hong Kong Options Clearing Corp., the Thailand International Fund, Ltd., Fidelity Investments Life Insurance Company, and Empire Fidelity Investments Life Insurance Company. Audit Committee Chair and Investment Committee Chair of the Vincent Memorial Hospital Endowment (non-profit organization). Mr. Ebsworth is a CFA® charterholder. | N/A |
Jane A. Freeman
(Born 1953) | Trustee,
since 2015;
Chair Liaison,
since 2018 | Retired. From 2012 to 2014 and 1999 to 2008, Chief Financial Officer of Scientific Learning Corporation. From 2008 to 2012, Ms. Freeman provided consulting services related to strategic business projects. Prior to 1999, Portfolio Manager at Rockefeller & Co. and Scudder, Stevens & Clark. Board member of the Harding Loevner Funds from 1996 to 2014, serving as both Lead Independent Director and chair of the Audit Committee. Board member of the Russell Exchange Traded Funds Trust from 2011 to 2012 and the chair of the Audit Committee. Ms. Freeman is also an inactive Chartered Financial Analyst. | N/A |
Isaiah Harris, Jr.
(Born 1952) | Trustee,
since 2009; Audit
Committee
Chair,
since 2019 | Retired. Chairman of the Board of CIGNA Corporation since 2009, and Director since 2005. From 2003 to 2011, Director of Deluxe Corporation. Prior thereto, President and CEO of BellSouth Advertising and Publishing Corp. from 2005 to 2007, President and CEO of BellSouth Enterprises from 2004 to 2005 and President of BellSouth Consumer Services from 2000 to 2003. Emeritus member of the Iowa State University Foundation Board of Governors. Emeritus Member of the Advisory Board of Iowa State University School of Business. Advisory Board Member, Palm Harbor Academy (private school). Mr. Harris is a certified public accountant (inactive status). | CIGNA Corporation |
Judith M. Johnson
(Born 1949) | Trustee,
since 2008 | Retired. Prior thereto, Chief Executive Officer and Chief Investment Officer of Minneapolis Employees Retirement Fund from 1996 to 2008. Ms. Johnson is an attorney, certified public accountant and a certified managerial accountant. | N/A |
David F. Larcker
(Born 1950) | Trustee,
since 2009 | James Irvin Miller Professor of Accounting at the Graduate School of Business (Emeritus), Stanford University, Director of the Corporate Governance Research Initiative and Senior Faculty of The Rock Center for Corporate Governance since 2006. From 2005 to 2008, Professor of Accounting at the Graduate School of Business, Stanford University. Prior thereto, Ernst & Young Professor of Accounting at The Wharton School, University of Pennsylvania from 1985 to 2005. | N/A |
46 | Wells Fargo Factor Enhanced U.S. Small Cap Equity Portfolio
Other information (unaudited)
Name and
year of birth | Position held and
length of service* | Principal occupations during past five years or longer | Current other
public company or
investment
company
directorships |
Olivia S. Mitchell
(Born 1953) | Trustee,
since 2006;
Nominating and
Governance
Committee Chair,
since 2018 | International Foundation of Employee Benefit Plans Professor, Wharton School of the University of Pennsylvania since 1993. Director of Wharton’s Pension Research Council and Boettner Center on Pensions & Retirement Research, and Research Associate at the National Bureau of Economic Research. Previously, Cornell University Professor from 1978 to 1993. | N/A |
Timothy J. Penny
(Born 1951) | Trustee,
since 1996;
Chair,
since 2018 | President and Chief Executive Officer of Southern Minnesota Initiative Foundation, a non-profit organization, since 2007. Member of the Board of Trustees of NorthStar Education Finance, Inc., a non-profit organization, since 2007. | N/A |
James G. Polisson
(Born 1959) | Trustee,
since 2018 | Retired. Chief Marketing Officer, Source (ETF) UK Services, Ltd, from 2015 to 2017. From 2012 to 2015, Principal of The Polisson Group, LLC, a management consulting, corporate advisory and principal investing company. Chief Executive Officer and Managing Director at Russell Investments, Global Exchange Traded Funds from 2010 to 2012. Managing Director of Barclays Global Investors from 1998 to 2010 and Global Chief Marketing Officer for iShares and Barclays Global Investors from 2000 to 2010. Trustee of the San Francisco Mechanics’ Institute, a non-profit organization, from 2013 to 2015. Board member of the Russell Exchange Traded Fund Trust from 2011 to 2012. Director of Barclays Global Investors Holdings Deutschland GmbH from 2006 to 2009. Mr. Polisson is an attorney and has a retired status with the Massachusetts and District of Columbia Bar Associations. | N/A |
Pamela Wheelock
(Born 1959) | Trustee,
since January
2020; previously
Trustee from
January 2018 to
July 2019 | Board member of the Destination Medical Center Economic Development Agency, Rochester, Minnesota since 2019. Interim President of the McKnight Foundation from January to September 2020. Acting Commissioner, Minnesota Department of Human Services, July 2019 through September 2019. Human Services Manager (part-time), Minnesota Department of Human Services, October 2019 through December 2019. Chief Operating Officer, Twin Cities Habitat for Humanity from 2017 to 2019. Vice President of University Services, University of Minnesota from 2012 to 2016. Prior thereto, on the Board of Directors, Governance Committee and Finance Committee for the Minnesota Philanthropy Partners (Saint Paul Foundation) from 2012 to 2018, Interim Chief Executive Officer of Blue Cross Blue Shield of Minnesota from 2011 to 2012, Chairman of the Board from 2009 to 2012 and Board Director from 2003 to 2015. Vice President, Leadership and Community Engagement, Bush Foundation, Saint Paul, Minnesota (a private foundation) from 2009 to 2011. Executive Vice President and Chief Financial Officer, Minnesota Sports and Entertainment from 2004 to 2009 and Senior Vice President from 2002 to 2004. Executive Vice President of the Minnesota Wild Foundation from 2004 to 2008. Commissioner of Finance, State of Minnesota, from 1999 to 2002. Currently Board Chair of the Minnesota Wild Foundation since 2010. | N/A |
* Length of service dates reflect the Trustee’s commencement of service with the Trust’s predecessor entities, where applicable.
Wells Fargo Factor Enhanced U.S. Small Cap Equity Portfolio | 47
Other information (unaudited)
Officers
Name and
year of birth | Position held and
length of service | Principal occupations during past five years or longer |
Andrew Owen
(Born 1960) | President,
since 2017 | Executive Vice President of Wells Fargo & Company and Head of Affiliated Managers, Wells Fargo Asset Management, since 2014. In addition, Mr. Owen is currently President, Chief Executive Officer and Director of Wells Fargo Funds Management, LLC since 2017. Prior thereto, Executive Vice President responsible for marketing, investments and product development for Wells Fargo Funds Management, LLC, from 2009 to 2014. |
Jeremy DePalma
(Born 1974) | Treasurer,
since 2012
(for certain funds in
the Fund Complex);
since 2021 (for
the remaining funds in the
Fund Complex) | Senior Vice President of Wells Fargo Funds Management, LLC since 2009. Senior Vice President of Evergreen Investment Management Company, LLC from 2008 to 2010 and head of the Fund Reporting and Control Team within Fund Administration from 2005 to 2010. |
Michelle Rhee
(Born 1966) | Chief Legal Officer,
since 2019 | Secretary of Wells Fargo Funds Management, LLC and Chief Legal Counsel of Wells Fargo Asset Management since 2018. Deputy General Counsel of Wells Fargo Bank, N.A. since 2020 and Assistant General Counsel of Wells Fargo Bank, N.A. from 2018 to 2020. Associate General Counsel and Managing Director of Bank of America Corporation from 2004 to 2018. |
Matthew Prasse
(Born 1983) | Secretary,
since 2021 | Senior Counsel of the Wells Fargo Legal Department since 2018. Previously, Director and Counsel for Barings LLC from 2015 to 2018. Prior to joining Barings, Associate at Morgan, Lewis & Bockius LLP from 2008 to 2015. |
Michael H. Whitaker
(Born 1967) | Chief Compliance Officer,
since 2016 | Chief Compliance Officer of Wells Fargo Asset Management since 2016. Senior Vice President and Chief Compliance Officer for Fidelity Investments from 2007 to 2016. |
1 The Statement of Additional Information includes additional information about the Trustees and is available, without charge, upon request, by calling 1-800-222-8222 or by visiting the website at wfam.com.
48 | Wells Fargo Factor Enhanced U.S. Small Cap Equity Portfolio
Board considerations (unaudited)
BOARD CONSIDERATION OF INVESTMENT ADVISORY AND SUB-ADVISORY AGREEMENTS:
Wells Fargo Bloomberg Barclays US Aggregate ex-Corporate Portfolio, Wells Fargo Emerging Markets Bond Portfolio, Wells Fargo Factor Enhanced Emerging Markets Equity Portfolio, Wells Fargo Factor Enhanced International Equity Portfolio, Wells Fargo Factor Enhanced U.S. Large Cap Equity Portfolio, Wells Fargo Factor Enhanced U.S. Small Cap Equity Portfolio, Wells Fargo High Yield Corporate Bond Portfolio, Wells Fargo Investment Grade Corporate Bond Portfolio, Wells Fargo Factor Enhanced U.S. Low Volatility Equity Portfolio, Wells Fargo Strategic Retirement Bond Portfolio, and Wells Fargo U.S. REIT Portfolio
Board Considerations – Current Agreements
Under the Investment Company Act of 1940 (the “1940 Act”), the Board of Trustees (the “Board”) of Wells Fargo Master Trust (the “Trust”) must determine annually whether to approve the continuation of the Trust’s investment advisory and sub-advisory agreements. In this regard, at a meeting held on May 17-19, 2021 (the “Meeting”), the Board of the Trust, all the members of which have no direct or indirect interest in the investment advisory and sub-advisory agreements and are not “interested persons” of the Trust, as defined in the 1940 Act (the “Independent Trustees”), reviewed and approved for each of the portfolios of the Trust identified in the table below (individually, a “Portfolio” and collectively, the “Portfolios”): (i) an investment advisory agreement (the “Advisory Agreement”) with Wells Fargo Funds Management, LLC (“Funds Management”); and (ii) an investment sub-advisory agreement (each, a “Sub-Advisory Agreement” and collectively, the “Sub-Advisory Agreements”) with the sub-adviser(s) identified in the table below (each, a “Sub-Adviser” and collectively, the “Sub-Advisers”) for the corresponding Portfolio identified. The Advisory Agreement and the Sub-Advisory Agreements are collectively referred to as the “Advisory Agreements.”
| Master Portfolios | Sub-Advisers |
| Wells Fargo Bloomberg Barclays US Aggregate ex-Corporate Portfolio | Wells Capital Management Incorporated |
| Wells Fargo Emerging Markets Bond Portfolio | Wells Fargo Asset Management (International) Limited and Wells Capital Management Incorporated |
| Wells Fargo Factor Enhanced Emerging Markets Equity Portfolio | Wells Capital Management Incorporated |
| Wells Fargo Factor Enhanced International Equity Portfolio | Wells Capital Management Incorporated |
| Wells Fargo Factor Enhanced U.S. Large Cap Equity Portfolio | Wells Capital Management Incorporated |
| Wells Fargo Factor Enhanced U.S. Small Cap Equity Portfolio | Wells Capital Management Incorporated |
| Wells Fargo High Yield Corporate Bond Portfolio | Wells Capital Management Incorporated |
| Wells Fargo Investment Grade Corporate Bond Portfolio | Wells Capital Management Incorporated |
| Wells Fargo Factor Enhanced U.S. Low Volatility Equity Portfolio | Wells Capital Management Incorporated |
| Wells Fargo Strategic Retirement Bond Portfolio | Wells Capital Management Incorporated |
| Wells Fargo U.S. REIT Portfolio | Wells Capital Management Incorporated |
The Board noted that Wells Fargo & Company recently announced that it had entered into a definitive agreement to sell Wells Fargo Asset Management (“WFAM”), which includes Funds Management and the Sub-Adviser, to GTCR LLC and Reverence Capital Partners, L.P. and/or their affiliates (the “Transaction”). The Board further noted that the Transaction would result in a change-of-control of Funds Management and the Sub-Advisers, which would be considered to be an assignment that would result in the termination of the Advisory Agreements. In light of the Transaction, the Board separately considered for approval a new investment advisory agreement with Funds Management and a new investment sub-advisory agreement with each of the Sub-Advisers (the “New Agreements”) that would replace the Advisory Agreements upon consummation of the Transaction, subject to approval of the New Agreements by the Portfolios’ shareholders. The Board also considered for approval interim agreements to go into effect in the event shareholders do not approve the New Agreements before the Transaction is completed. The interim agreements would allow the Manager and the Sub-Advisers to continue providing services to the Portfolios while the Portfolios continues to seek shareholder approval of the New Agreements. The Board noted that the terms of the interim agreements would be identical to those of the current Advisory Agreements, except for the term and certain escrow provisions.
At the Meeting, the Board considered the factors and reached the conclusions described below relating to the selection of Funds Management and the Sub-Advisers and the approval of the Advisory Agreements. Prior to the Meeting, including at Board meetings held in April and May 2021, the Trustees conferred extensively among themselves and with representatives of Funds Management about these matters. Also, the Board has adopted a team-based approach, with each team consisting of a sub-set of
Wells Fargo Factor Enhanced U.S. Small Cap Equity Portfolio | 49
Board considerations (unaudited)
Trustees, to assist the full Board in the discharge of its duties in reviewing investment performance and other matters throughout the year. The Independent Trustees were assisted in their evaluation of the Advisory Agreements by independent legal counsel, from whom they received separate legal advice and with whom they met separately.
In providing information to the Board, Funds Management and the Sub-Advisers were guided by a detailed set of requests for information submitted to them by independent legal counsel on behalf of the Independent Trustees at the start of the Board’s annual contract renewal process earlier in 2021. In considering and approving the Advisory Agreements, the Trustees considered the information they believed relevant, including but not limited to the information discussed below. The Board considered not only the specific information presented in connection with the Meeting, but also the knowledge gained over time through interaction with Funds Management and the Sub-Advisers about various topics. In this regard, the Board reviewed reports of Funds Management at each of its quarterly meetings, which included, among other things, portfolio reviews and investment performance reports. In addition, the Board and the teams mentioned above confer with portfolio managers at various times throughout the year. The Board did not identify any particular information or consideration that was all-important or controlling, and each individual Trustee may have attributed different weights to various factors.
After its deliberations, the Board unanimously determined that the compensation or the absence of compensation payable to Funds Management and each of the Sub-Advisers under each of the Advisory Agreements was reasonable, and approved the continuation of the Advisory Agreements for a one-year term. The Board considered the approval of the Advisory Agreements for the Portfolios as part of its consideration of agreements for funds across the complex, but its approvals were made on a fund-by-fund basis. The following summarizes a number of important, but not necessarily all, factors considered by the Board in support of its approvals.
Nature, extent and quality of services
The Board received and considered various information regarding the nature, extent and quality of services provided to the Funds by Funds Management and the Sub-Advisers under the Advisory Agreements. This information included a description of the investment advisory services and Portfolio-level administrative services covered by the Advisory Agreement, as well as, among other things, a summary of the background and experience of senior management of WFAM, of which Funds Management and the Sub-Advisers are a part, and a summary of investments made in the business of WFAM. The Board also received a description of Funds Management’s and the Sub-Advisers’ business continuity plans, including a summary of the performance of such plans and any changes thereto during the COVID-19 pandemic, and of their approaches to data privacy and cybersecurity. The Board also received and reviewed information about Funds Management’s role as administrator of the Portfolios’ liquidity risk management program, Funds Management’s approach to risk management, and Funds Management’s intermediary and vendor oversight program.
The Board also considered the qualifications, background, tenure and responsibilities of each of the portfolio managers primarily responsible for the day-to-day portfolio management of the Portfolios. The Board noted that each of the Portfolios replicates the performance of a proprietary index provided by an affiliate of Funds Management, except that each of Wells Fargo Bloomberg Barclays US Aggregate ex-Corporate Portfolio, Wells Fargo Emerging Markets Bond Portfolio, and Wells Fargo Strategic Retirement Bond Portfolio track the performance of a third party index. The Board evaluated the ability of Funds Management and the Sub-Advisers to attract and retain qualified investment professionals, including research, advisory and supervisory personnel.
The Board further considered the compliance programs and compliance records of Funds Management and the Sub-Advisers. In addition, the Board took into account the full range of services provided to the Portfolios by Funds Management and its affiliates. The Board also considered information about retention and back-up arrangements that have been put into place with respect to key personnel of WFAM in connection with the anticipated Transaction, noting that WFAM provided assurances that the announcement and eventual culmination of the Transaction is not expected to result in any diminution in the nature or quality of services provided to the Portfolios.
Portfolio investment performance and expenses
The Board considered the investment performance results for each of the Portfolios over the one- and three-year periods ended December 31, 2020, except for the Wells Fargo Factor Enhanced U.S. Low Volatility Equity Portfolio, for which the Board considered the investment performance results for the quarter ended December 31, 2020. The Board considered these results in comparison to the investment performance of funds in a universe that was determined by Broadridge Inc. (“Broadridge”) to be similar to each respective Portfolios (each, a “Universe”), and in comparison to each Portfolios’ benchmark index and to other comparative data. Broadridge is an independent provider of investment company data. The Board received a description of the methodology used by Broadridge to select the mutual funds in the performance Universe. The Board noted the short performance history of the Portfolios.
50 | Wells Fargo Factor Enhanced U.S. Small Cap Equity Portfolio
Board considerations (unaudited)
With respect to the investment performance of each Portfolio relative to its respective Universe, the Board noted the following: (i) the investment performance of each of Wells Fargo Factor Enhanced International Equity Portfolio and Wells Fargo Factor Enhanced U.S. Small Cap Equity Portfolio was higher than such Portfolio’s respective Universe for the one- and three-year periods under review; (ii) the investment performance of each of Wells Fargo Bloomberg Barclays US Aggregate ex-Corporate Portfolio, Wells Fargo Emerging Markets Bond Portfolio, and Wells Fargo Investment Grade Corporate Bond Portfolio was higher than such Portfolio’s respective Universe for the three-year period under review, and lower than such Portfolio’s respective Universe for the one-year period under review; (iii) the investment performance of each of Wells Fargo Factor Enhanced Emerging Markets Equity Portfolio, Wells Fargo Factor Enhanced U.S. Large Cap Equity Portfolio, Wells Fargo High Yield Corporate Bond Portfolio, Wells Fargo Strategic Retirement Bond Portfolio, and Wells Fargo U.S. REIT Portfolio was lower than such Portfolio’s respective Universe for the one- and three-year periods under review; and (iv) the Wells Fargo Factor Enhanced U.S. Low Volatility Equity Portfolio launched on July 1, 2020 and, given its short operational history, had no historical performance.
With respect to the investment performance of each Portfolio relative to its respective benchmark index, the Board noted the following: (i) the investment performance of each of Wells Fargo Bloomberg Barclays US Aggregate ex-Corporate Portfolio, Wells Fargo Factor Enhanced International Equity Portfolio, Wells Fargo Investment Grade Corporate Bond Portfolio, Wells Fargo Factor Enhanced U.S. Low Volatility Equity Portfolio, and Wells Fargo Strategic Retirement Bond Portfolio was higher than or in range of such Portfolio’s respective benchmark index for all periods under review; (ii) the investment performance of Wells Fargo U.S. REIT Portfolio was in range of the Portfolio’s benchmark index for the three-year period under review, and was lower than the Portfolio’s benchmark index for the one-year period under review; and (iii) the investment performance of each of Wells Fargo Emerging Markets Bond Portfolio, Wells Fargo Factor Enhanced Emerging Markets Equity Portfolio, Wells Fargo Factor Enhanced U.S. Large Cap Equity Portfolio, Wells Fargo Factor Enhanced U.S. Small Cap Equity Portfolio, and Wells Fargo High Yield Corporate Bond Portfolio was lower than such Portfolio’s respective benchmark index for all periods under review.
The Board received information concerning, and discussed factors contributing to, the underperformance of each of Wells Fargo Factor Enhanced Emerging Markets Equity Portfolio, Wells Fargo Factor Enhanced International Equity Portfolio, Wells Fargo Factor Enhanced U.S. Large Cap Equity Portfolio, Wells Fargo High Yield Corporate Bond Portfolio, Wells Fargo Strategic Retirement Bond Portfolio, and Wells Fargo U.S. REIT Portfolio relative to such Portfolio’s Universe and benchmark index for the periods identified above.
The Board also received and considered information regarding the fee rates that are payable to Funds Management for investment advisory services (as discussed below), which are the only fees charged to the Portfolios, relative to corresponding class-specific expense groups that were determined by Broadridge to be similar to the Portfolios (the “Groups”). The Board received a description of the methodology used by Broadridge to select the mutual funds in the expense Groups and an explanation of how funds comprising expense groups and their expense ratios may vary from year-to-year.
The Board took into account the Portfolios’ investment performance and expense information provided to it among the factors considered in deciding to re-approve the Advisory Agreements.
Investment advisory and sub-advisory fee rates
The Board reviewed and considered the contractual fee rates payable by the Portfolios to Funds Management under the Advisory Agreement. The Board also reviewed and considered the contractual investment sub-advisory fee rates that are payable by Funds Management to the Sub-Advisers for investment sub-advisory services.
Among other information reviewed by the Board was a comparison of the Portfolios’ Management Rates with the average contractual investment management fee rates of funds in the expense Groups at a common asset level as well as transfer agency costs of the Portfolios in the expense Groups. The Board noted that the Management Rates of the Portfolios were lower than, equal to, or in range of the sum of these average rates for the Portfolios’ expense Groups.
The Board also received and considered information about the portions of the total management fees that were retained by Funds Management after payment of the fees to the Sub-Advisers for sub-advisory services. In assessing the reasonableness of these amounts, the Board received and evaluated information about the nature and extent of responsibilities retained and risks assumed by Funds Management and not delegated to or assumed by the Sub-Advisers, and about Funds Management’s on-going oversight services. Given the affiliation between Funds Management and the Sub-Advisers, the Board ascribed limited relevance to the allocation of fees between them.
The Board also received and considered information about the nature and extent of services offered and fee rates charged by Funds Management and the Sub-Advisers to other types of clients with investment strategies similar to those of certain Portfolios. In this regard, the Board received information about the significantly greater scope of services, and compliance,
Wells Fargo Factor Enhanced U.S. Small Cap Equity Portfolio | 51
Board considerations (unaudited)
reporting and other legal burdens and risks of managing proprietary mutual funds compared with those associated with managing assets of other types of clients, including third-party sub-advised fund clients and non-mutual fund clients such as institutional separate accounts.
Based on its consideration of the factors and information it deemed relevant, including those described here, the Board determined that the compensation payable to Funds Management under the Advisory Agreement and to the Sub-Advisers under the Sub-Advisory Agreements was reasonable.
Profitability
The Board received and considered information concerning the profitability of Funds Management, as well as the profitability of both WFAM and Wells Fargo & Co. (“Wells Fargo”) from providing services to the funds family as a whole. The Board noted that the Sub-Advisers’ profitability information with respect to providing services to the Portfolios and other funds in the family was subsumed in the WFAM and Wells Fargo profitability analysis.
Funds Management reported on the methodologies and estimates used in calculating profitability, including a description of the methodology used to allocate certain expenses. Among other things, the Board noted that the levels of profitability reported on a fund-by-fund basis varied widely, depending on factors such as the size, type and age of fund.
Based on its review, the Board did not deem the profits reported by Funds Management, WFAM or Wells Fargo from services provided to the Portfolios to be at a level that would prevent it from approving the continuation of the Advisory Agreements.
Economies of scale
The Board received and considered information about the potential for Funds Management to experience economies of scale in the provision of management services to the Portfolios, the difficulties of calculating economies of scale at an individual fund level, and the extent to which potential scale benefits are shared with shareholders. The Board noted the existence of breakpoints in the Portfolios’ management fee structure, which operate generally to reduce the Portfolios’ expense ratios as the Portfolios grow in size, and the size of the Portfolios in relation to such breakpoints. The Board considered that in addition to management fee breakpoints, Funds Management shares potential economies of scale from its management business in a variety of ways, including through fee waiver and expense reimbursement arrangements, competitive management fee rates set at the outset without regard to breakpoints, and investments in the business intended to enhance services available to shareholders.
The Board concluded that Funds Management’s arrangements with respect to the Portfolios, including contractual breakpoints, constituted a reasonable approach to sharing potential economies of scale with the Portfolios and their shareholders.
Other benefits to Funds Management and the Sub-Advisers
The Board received and considered information regarding potential “fall-out” or ancillary benefits received by Funds Management and its affiliates, including the Sub-Advisers, as a result of their relationships with the Portfolios. Ancillary benefits could include, among others, benefits directly attributable to other relationships with the Portfolios and benefits potentially derived from an increase in Funds Management’s and the Sub-Advisers’ businesses as a result of their relationships with the Portfolios. The Board noted that various affiliates of Funds Management may receive distribution-related fees, shareholder servicing payments and sub-transfer agency fees in respect of shares sold or held through them and services provided.
The Board also reviewed information about soft dollar credits earned and utilized by the Sub-Advisers, fees earned by Funds Management and Wells Capital Management Incorporated from managing a private investment vehicle for the fund family’s securities lending collateral, and commissions earned by an affiliated broker from portfolio transactions.
Based on its consideration of the factors and information it deemed relevant, including those described here, the Board did not find that any ancillary benefits received by Funds Management and its affiliates, including the Sub-Advisers, were unreasonable.
Conclusion
At the Meeting, after considering the above-described factors and based on its deliberations and its evaluation of the information described above, the Board unanimously determined that the compensation payable to Funds Management and the Sub-Advisers under each of the Advisory Agreements was reasonable, and approved the continuation of the Advisory Agreements for a one-year term.
52 | Wells Fargo Factor Enhanced U.S. Small Cap Equity Portfolio
Board considerations (unaudited)
Board Considerations – New Agreements
Overview of the Board evaluation process
At a meeting held on May 17-19, 2021 (the “Board Meeting”), the Board of Trustees (the “Board”) of Wells Fargo Master Trust (the “Trust”, and the series identified below, the “Portfolios”) approved the continuation of each Portfolio’s current Investment Advisory Agreement (the “Current Investment Advisory Agreement”) and the current Sub-Advisory Agreements (the “Current Sub-Advisory Agreements”, and collectively, the “Current Agreements”).
| Wells Fargo Disciplined Large Cap Portfolio |
| Wells Fargo Diversified Large Cap Growth Portfolio |
| Wells Fargo Disciplined International Developed Markets Portfolio |
| Wells Fargo Large Company Value Portfolio |
| Wells Fargo Managed Fixed Income Portfolio |
| Wells Fargo Bloomberg Barclays US Aggregate ex-Corporate Portfolio |
| Wells Fargo Emerging Markets Bond Portfolio |
| Wells Fargo Factor Enhanced Emerging Markets Equity Portfolio |
| Wells Fargo Factor Enhanced International Equity Portfolio |
| Wells Fargo Factor Enhanced U.S. Large Cap Equity Portfolio |
| Wells Fargo Factor Enhanced U.S. Low Volatility Equity Portfolio |
| Wells Fargo Factor Enhanced U.S. Small Cap Equity Portfolio |
| Wells Fargo High Yield Corporate Bond Portfolio |
| Wells Fargo Investment Grade Corporate Bond Portfolio |
| Wells Fargo Strategic Retirement Bond Portfolio |
| Wells Fargo U.S. REIT Portfolio |
Each Trustee on the Board is not an “interested person” (as defined in the Investment Company Act of 1940 (the “1940 Act”)) of the Portfolios (collectively, the “Independent Trustees”). The process followed by the Board in considering and approving the continuation of the Current Agreements is referred to herein as the “2021 Annual Approval Process.”
As noted above, the closing of the sale of Wells Fargo Asset Management (“WFAM”) to a holding company (“NewCo”) affiliated with private funds of GTCR LLC (“GTCR”) and of Reverence Capital Partners, L.P. (“Reverence Capital”, and such transaction, the “Transaction”) will result in a change of control of Wells Fargo Funds Management LLC (“Funds Management”), Wells Capital Management Incorporated (“Wells Capital”) and Wells Fargo Asset Management (International) Limited (“WFAM(I) Ltd.”, and together with Funds Management and Wells Capital, the “Advisers”), which will be considered to be an “assignment” of each Portfolio’s Current Agreements under the 1940 Act that will result in the automatic termination of each Portfolio’s Current Agreements. In light of the expected termination of each Portfolio’s Current Agreements upon the closing, at the Board Meeting the Board also considered and approved: (i) a new Investment Advisory Agreement (the “New Investment Advisory Agreement”) between the Trust, on behalf of each Portfolio, and Funds Management; (ii) a new Sub-Advisory Agreement (the “New Wells Capital Sub-Advisory Agreement”) among the Trust, on behalf of each Portfolio, Funds Management and Wells Capital; and (iii) a new Sub-Advisory Agreement (the “New WFAM(I) Ltd Sub-Advisory Agreement”) among the Trust, on behalf of Emerging Markets Bond Portfolio, Funds Management and WFAM(I) Ltd (“WFAMI”); and (iv) a new Sub-Advisory Agreement (the “New Galliard Sub-Advisory Agreement”, and collectively, the “New Agreements”) among the Trust, on behalf of Managed Fixed Income Portfolio, Funds Management and Galliard Capital Management, LLC (“Galliard”, and together with Wells Capital and WFAMI, the “Sub-Advisers”), each of which is intended to go into effect upon the closing. The process followed by the Board in reviewing and approving the New Agreements is referred to herein as the “New Agreement Approval Process.”
At a series of meetings held in April and May 2021 (collectively, “April and May 2021 Meetings”) and at the Board Meeting, the Trustees conferred extensively among themselves and with senior representatives of Funds Management, GTCR and Reverence Capital about the New Agreements and related matters. The Board reviewed and discussed information furnished by Funds Management, GTCR and Reverence Capital that the Board considered reasonably necessary to evaluate the terms of the New Agreements and the services to be provided. At these meetings, senior representatives from Funds Management, GTCR and Reverence Capital made presentations to, and responded to questions from, the Board.
In providing information to the Board in connection with the 2021 annual approval process for the Current Agreements (the “2021 Annual Approval Process”) and the New Agreement Approval Process, Funds Management, GTCR and Reverence Capital (as applicable) were guided by requests for information submitted by independent legal counsel on behalf of the Independent Trustees. In considering and approving the New Agreements, the Trustees considered the information they believed relevant, including but not limited to the information discussed herein. The Board considered not only the specific information presented in
Wells Fargo Factor Enhanced U.S. Small Cap Equity Portfolio | 53
Board considerations (unaudited)
connection with the April and May 2021 Meetings as well as the Board Meeting, but also the knowledge gained over time through interaction with Funds Management and the Sub-Advisers about various topics. In this regard, the Board reviews reports of Funds Management at each of its regular Board meetings, which includes, among other things, portfolio reviews and investment performance reports. In addition, the Board confers with portfolio managers at various times throughout the year. The Board was assisted in its evaluation of the New Agreements by independent legal counsel, from whom the Independent Trustees received separate legal advice and with whom the Independent Trustees met separately. The Board did not identify any particular information or consideration that was all-important or controlling, and each individual Trustee may have attributed different weights to various factors.
Among other information considered by the Board in connection with the Transaction was:
| ■ | Information regarding the Transaction: information about the structure, financing sources and material terms and conditions of the Transaction, including the expected impact on the businesses conducted by the Advisers and by Wells Fargo Funds Distributor LLC. |
| ■ | Information regarding NewCo, GTCR and Reverence Capital: (i) information about NewCo, including information about its expected financial condition and access to capital, and senior leadership team; (ii) the experience of senior management at GTCR and Reverence Capital in acquiring portfolio companies; (iii) the plan to operationalize NewCo, including the transition of necessary infrastructure services through a transition services agreement with Wells Fargo under which Wells Fargo will continue to provide NewCo with certain services for a specified period of time after the closing; and (iv) information regarding regulatory matters, compliance, and risk management functions at NewCo, including resources to be dedicated thereto. |
| ■ | Impact of the Transaction on WFAM and Service Providers: (i) information regarding any changes to personnel and/or other resources of the Advisers as a result of the Transaction, including assurances regarding comparable and competitive compensation arrangements to attract and retain highly qualified personnel; and (ii) information about the organizational and operating structure with respect to NewCo, the Advisers and the Portfolios. |
| ■ | Impact of the Transaction on the Portfolios and their Shareholders: (i) information regarding anticipated benefits to the Portfolios as a result of the Transaction; (ii) a commitment that the Portfolios would not bear any expenses, directly or indirectly, in connection with the Transaction; (iii) confirmation that the Advisers intend to continue to manage the Portfolios in a manner consistent with each Portfolio’s current investment objectives and principal investments strategies; and (iv) a commitment that neither NewCo nor WFAM will take any steps that would impose any “unfair burden” (as that term is used in section 15(f)(1)(B) of the 1940 Act) on the Portfolios as a result of the Transaction. |
With respect to the New Agreements, the Board considered: (i) a representation that, after the closing, all of the Portfolios will continue to be managed and advised by their current Advisers, and that the same portfolio managers of the Sub-Advisers are expected to continue to manage the Portfolios after the Transaction; (ii) information regarding the terms of the New Agreements, including changes as compared to the Current Agreements; (iii) information confirming that the fee rates payable under the New Agreements will not increase as a result of the Transaction as compared to the rates under the Current Agreements; and (iv) assurances that the Transaction is not expected to cause any diminution with respect to the nature, extent and quality of any of the services currently provided to the Portfolios by the Advisers as a result of the Transaction.
In addition to considering information furnished specifically to evaluate the impact of the Transaction on the Portfolios and their respective shareholders in connection with the New Agreement Approval Process, the Board considered information furnished at prior meetings of the Board and its committees, including detailed information provided in connection with the 2021 Annual Approval Process. In this regard, in connection with the 2021 Annual Approval Process, the Board received information about complex-wide and individual Portfolio performance, fees and expenses, including: (i) a report from an independent data provider comparing the investment performance of each Portfolio to the investment performance of comparable funds and benchmark indices, over various time periods; (ii) a report from an independent data provider comparing each Portfolio’s total expense ratio (and its components) to those of comparable funds; (iii) comparative information concerning the fees charged and services provided by the Advisers to each Portfolio in managing other accounts (which may include other mutual funds, collective investment funds and institutional accounts), if any, that employ investment strategies and techniques similar to those used in managing such Portfolio(s); and (iv) profitability analyses of Funds Management, as well as the profitability of both WFAM and Wells Fargo from providing services to the fund family as a whole.
After its deliberations, the Board unanimously determined that the compensation payable to Funds Management and the Sub-Advisers under the New Agreements is reasonable, approved the New Agreements for a two-year term. The Board considered the approval of the New Agreements as part of its consideration of agreements for funds across the complex, but its approvals were made on a fund-by-fund basis. The following summarizes a number of important, but not necessarily all, factors considered by the Board in support of its approvals.
54 | Wells Fargo Factor Enhanced U.S. Small Cap Equity Portfolio
Board considerations (unaudited)
Nature, extent and quality of services
In connection with the 2021 Annual Approval Process, the Board received and considered various information regarding the nature, extent and quality of services provided to each Portfolio by Funds Management and the Sub-Advisers under the Advisory Agreements. This information included a description of the investment advisory services and administrative services covered by the Current Advisory Agreement, as well as, among other things, a summary of the background and experience of senior management of WFAM, of which Funds Management and the Sub-Advisers are a part, and a summary of investments made in the business of WFAM. The Board also received a description of Funds Management’s and the Sub-Advisers’ business continuity plans, including a summary of the performance of such plans and any changes thereto during the COVID-19 pandemic, and of their approaches to data privacy and cybersecurity. The Board also received and reviewed information about Funds Management’s role as administrator of the Portfolios’ liquidity risk management program, Funds Management’s approach to risk management, and Funds Management’s intermediary and vendor oversight program.
In connection with the 2021 Annual Approval Process, the Board also considered the qualifications, background, tenure and responsibilities of each of the portfolio managers primarily responsible for the day-to-day portfolio management of the Portfolios. The Board evaluated the ability of Funds Management and the Sub-Advisers to attract and retain qualified investment professionals, including research, advisory and supervisory personnel.
In connection with the 2021 Annual Approval Process, the Board further considered the compliance programs and compliance records of Funds Management and the Sub-Advisers. In addition, the Board took into account the full range of services provided to the Portfolios by Funds Management and its affiliates.
In connection with the New Agreement Approval Process, the Board considered, among other information, the structure of the Transaction and expected impact, if any, of the Transaction on the operations, facilities, organization and personnel of the Advisers. The Board received assurances from the Advisers that each Portfolio will continue to be advised by its current Advisers after the closing, and that the same individual portfolio managers are expected to continue to manage the Portfolios after the closing. With respect to the recruitment and retention of key personnel, the Board noted information from GTCR, Reverence Capital and the Advisers regarding the potential benefits for employees of joining NewCo. The Board recognized that the personnel who had been extended offers may not accept such offers and personnel changes may occur in the future in the ordinary course.
In addition, the Board considered information regarding the infrastructure, operational capabilities and support staff in place to assist in the portfolio management and operations of the Portfolios, including the provision of administrative services, and the anticipated impact of the Transaction on such matters. The Board also considered the business-related and other risks to which the Advisers may be subject in managing the Portfolios and in connection with the Transaction. The Board also considered the transition and integration plans as a result of the change in ownership of the Advisers from Wells Fargo to NewCo. The Board considered the resources and infrastructure that NewCo intends to devote to its compliance program to ensure compliance with applicable laws and regulations, as well as its risk management program and cybersecurity program. The Board also took into account assurances received from the Advisers, GTCR and Reverence Capital that the Transaction is not expected to cause any diminution in the nature, extent and quality of services provided by the Advisers to the Portfolios and their shareholders.
Investment performance and expenses
In connection with the 2021 Annual Approval Process, the Board considered the investment performance results for each Portfolio over various time periods ended December 31, 2020. The Board considered these results in comparison to the investment performance of funds in a universe that was determined by Broadridge Inc. (“Broadridge”) to be similar to each Portfolio (the “Universe”), and in comparison to each Portfolio’s benchmark index and to other comparative data. Broadridge is an independent provider of investment company data. The Board received a description of the methodology used by Broadridge to select the mutual funds in the performance Universe. Where applicable, the Board received information concerning, and discussed factors contributing to, underperformance of Portfolios relative to the Universe and benchmark for any underperformance periods.
In connection with the 2021 Annual Approval Process, the Board also reviewed the fee rates that are payable to Funds Management for investment advisory services (as discussed below), which are the only fees charged at the Portfolio level, relative to corresponding expense groups that were determined by Broadridge to be similar to the Portfolios (the “Groups”). The Board received a description of the methodology used by Broadridge to select the mutual funds in the expense Groups and an explanation of how funds comprising expense groups and their expense ratios may vary from year-to-year.
In connection with the New Agreement Approval Process, the Board received a commitment that WFAM will maintain fee and expense commitments for at least two years after the closing. The Board took into account each Fund’s investment performance and expense information among the factors considered in deciding to approve the New Agreements.
Wells Fargo Factor Enhanced U.S. Small Cap Equity Portfolio | 55
Board considerations (unaudited)
Investment advisory and sub-advisory fee rates
In connection with the 2021 Annual Approval Process, the Board reviewed and considered the contractual investment advisory fee rate that is payable by each Portfolio to Funds Management for investment advisory services under the Current Advisory Agreement (the “Advisory Agreement Rate”). The Board also reviewed and considered the contractual investment sub-advisory fee rate that is payable by Funds Management to the applicable Sub-Adviser for investment sub-advisory services (the “Sub-Advisory Agreement Rate”).
Among other information reviewed by the Board in connection with the 2021 Annual Approval Process, was a comparison of each Portfolio’s Advisory Agreement Rate with those of other funds in the Portfolio’s expense Group at a common asset level.
In connection with the 2021 Annual Approval Process, the Board also received and considered information about the portion of the total management fee that was retained by Funds Management after payment of the Sub-Advisory Agreement Rates. In assessing the reasonableness of this amount, the Board received and evaluated information about the nature and extent of responsibilities retained and risks assumed by Funds Management and not delegated to or assumed by the Sub-Advisers, and about Funds Management’s on-going oversight services. Given the affiliation between Funds Management and the Sub-Advisers, the Board ascribed limited relevance to the allocation of fees between them.
In connection with the 2021 Annual Approval Process, the Board also received and considered information about the nature and extent of services offered and fee rates charged by Funds Management and the Sub-Advisers to other types of clients, if any, with investment strategies similar to those of each Portfolio. In this regard, the Board received information about the significantly greater scope of services, and compliance, reporting and other legal burdens and risks of managing proprietary mutual funds compared with those associated with managing assets of other types of clients, including third-party sub-advised fund clients and non-mutual fund clients such as institutional separate accounts.
In connection with the New Agreement Approval Process, the Board noted the assurances received by it that there would be no increases to any of the Advisory Agreement Rates or the Sub-Advisory Agreement Rates as a result of the Transaction. The Board also considered that the New Agreements do not change the computation method for calculating such fees, and there is no present intention to reduce expense waiver and reimbursement arrangements that are currently in effect. Based on its consideration of the factors and information it deemed relevant, including those described here, the Board determined that the compensation payable to Funds Management under the New Advisory Agreement and to each of the Sub-Advisers under the applicable new Sub-Advisory Agreement was reasonable.
Profitability
In connection with the 2021 Annual Approval Process, the Board received and considered information concerning the profitability of Funds Management, as well as the profitability of both WFAM and Wells Fargo from providing services to the fund family as a whole. The Board noted that the Sub-Advisers’ profitability information with respect to providing services to each Fund and other funds in the family was subsumed in the WFAM and Wells Fargo profitability analysis.
Funds Management reported on the methodologies and estimates used in calculating profitability in connection with the 2021 Annual Approval Process, including a description of the methodology used to allocate certain expenses. Among other things, the Board noted that the levels of profitability reported on a fund-by-fund basis varied widely, depending on factors such as the size, type and age of fund.
In connection with the New Agreement Approval Process, the Board received certain information about NewCo’s projected financial condition, and reviewed with senior representatives of Funds Management, GTCR and Reverence Capital the underlying assumptions on which such information was based. The Board considered that NewCo is a newly formed entity, with no historical operations, revenues or expenses, and that it is difficult to predict with any degree of certainty the future profitability of NewCo and the Advisers from advisory activities under the New Agreements. The Board considered that the fee rates payable under the New Agreements will not increase as a result of the Transaction as compared to the rates under the Current Agreements, and that the current contractual expense limitations applicable to each Portfolio will not increase. The Board noted that if the New Agreements are approved by shareholders and the Transaction closes, the Board will have the opportunity in the future to review the profitability of NewCo and the Advisers from advisory activities under the New Agreements.
Economies of scale
In connection with the 2021 Annual Approval Process, the Board received and considered information about the potential for Funds Management to experience economies of scale in the provision of advisory services to the Portfolios, the difficulties of calculating economies of scale at an individual fund level, and the extent to which potential scale benefits are shared with Portfolio shareholders. The Board noted the existence of breakpoints in each Portfolio’s advisory fee structure, which operate generally to reduce the Portfolio’s expense ratios as the Portfolio grows in size, and the size of the Portfolio in relation to such breakpoints. The
56 | Wells Fargo Factor Enhanced U.S. Small Cap Equity Portfolio
Board considerations (unaudited)
Board considered that, in addition to advisory fee breakpoints, Funds Management shares potential economies of scale from its management business in a variety of ways, including through fee waiver and expense reimbursement arrangements, competitive management fee rates set at the outset without regard to breakpoints, and investments in the business intended to enhance services available to shareholders.
In connection with the New Agreement Approval Process, the Board noted that NewCo and the Advisers may benefit from possible growth of the Portfolios resulting from enhanced distribution capabilities for their investing funds. However, the Board noted that other factors could also affect the potential for economies of scale, and that it was not possible to quantify any potential future economies of scale. Based upon the information furnished to the Board in connection with the 2021 Annual Approval Process and the New Agreement Approval Process, the Board concluded that Funds Management’s arrangements with respect to each Portfolio, including contractual breakpoints and expense limitation arrangements, constituted a reasonable approach to sharing potential economies of scale with the Portfolio and its shareholders.
“Fall-out” benefits to Funds Management and the Sub-Advisers
In connection with the 2021 Annual Approval Process, the Board received and considered information regarding potential “fall-out” or ancillary benefits received by Funds Management and its affiliates, including the Sub-Advisers, as a result of their relationships with the Portfolios. Ancillary benefits could include, among others, benefits directly attributable to other relationships with the Portfolios and benefits potentially derived from an increase in Funds Management’s and the Sub-Advisers’ business as a result of their relationships with the Portfolios. The Board noted that various current affiliates of Funds Management may receive distribution-related fees, shareholder servicing payments and sub-transfer agency fees in respect of shares sold or held through them and services provided.
In connection with the 2021 Annual Approval Process, the Board also reviewed information about soft dollar credits earned and utilized by the Sub-Advisers, fees earned by Funds Management and Wells Capital from managing a private investment vehicle for the fund family’s securities lending collateral, and commissions earned by an affiliated broker of Wells Fargo from portfolio transactions.
In connection with the New Agreement Approval Process, the Board received information to the effect that the Transaction is not expected to have a material impact on the fall-out benefits currently realized by Funds Management and its affiliates, including the Sub-Advisers. The information reviewed by the Board also noted that several of the ancillary benefits identified for WFAM would be potential ancillary benefits for NewCo, including that the scale and reputation of the Portfolios might benefit NewCo’s broader reputation, product initiatives, technology investment and talent acquisition. Based on its consideration of the factors and information it deemed relevant, including those described here, the Board did not find that any ancillary benefits expected to be received by Funds Management and its affiliates, including NewCo and the Sub-Advisers, under the New Agreements were unreasonable.
Conclusion
At the Board Meeting, after considering the above-described factors and based on its deliberations and its evaluation of the information described above, the Board unanimously determined that the compensation payable to Funds Management and to each of the Sub-Advisers under the New Agreements is reasonable, approved the New Agreements for a two-year term.
Wells Fargo Factor Enhanced U.S. Small Cap Equity Portfolio | 57
Board considerations (unaudited)
Board Considerations - Interim Agreements
At a meeting held on May 17-19, 2021 (the “Board Meeting”), the Boards of Trustees (each, a “Board”, and collectively, the “Boards”) of Wells Fargo Funds Trust, Wells Fargo Master Trust, Wells Fargo Variable Trust, Wells Fargo Global Dividend Opportunity Fund, Wells Fargo Income Opportunities Fund, Wells Fargo Multi-Sector Income Fund and Wells Fargo Utilities and High Income Fund (each a “Trust”, and the series thereof, a “Fund”) reviewed and approved for the Trusts and Funds, as applicable: (i) interim investment management agreements (the “Interim Management Agreements”) with Wells Fargo Funds Management, LLC (“Funds Management”); (ii) interim investment advisory agreements (the “Interim Advisory Agreements”) with Funds Management; and (iii) interim sub-advisory agreements (the “Interim Sub-Advisory Agreements”) with each of Cooke & Bieler, L.P., Galliard Capital Management LLC (“Galliard”), Peregrine Capital Management Inc., Wells Capital Management, LLC (“WellsCap”), and Wells Fargo Asset Management (International) Limited (“WFAMI”, and collectively, the “Sub-Advisers”). Each Trustee on the Board is not an “interested person” (as defined in the Investment Company Act of 1940 (the “1940 Act”) of the Funds (collectively, the “Independent Trustees”). The Interim Management Agreements, Interim Advisory Agreements, and Interim Sub-Advisory Agreements are collectively referred to as the “Interim Advisory Agreements.”
At the Board Meeting, the Boards reviewed and approved the continuation of existing investment management, advisory and sub-advisory agreements (the “Current Advisory Agreements”) for each Trust and Fund, as applicable. The factors considered and conclusions reached by the Boards in approving the Current Advisory Agreements are summarized in the section entitled “Board Considerations – Current Agreements” of this shareholder report. The Boards noted that Wells Fargo & Company has entered into a definitive agreement to sell Wells Fargo Asset Management (“WFAM”), which includes Funds Management, Galliard, WellsCap and WFAMI (the “Affiliated Sub-Advisers”), to a holding company affiliated with private funds of GTCR LLC and Reverence Capital Partners, L.P. (the “Transaction”). The Boards further noted that the Transaction would result in a change-of-control of Funds Management and the Affiliated Sub-Advisers, which would be considered to be an “assignment” under the 1940 Act that would terminate the Current Advisory Agreements. At the Board Meeting, the Boards also reviewed and approved new investment management, advisory and sub-advisory agreements (the “New Advisory Agreements”) for each Trust and Fund, as applicable, that would replace the Current Advisory Agreements upon consummation of the Transaction, subject to approval of the New Advisory Agreements by the applicable Trust’s or Fund’s shareholders. The factors considered and conclusions reached by the Boards in approving the New Advisory Agreements are summarized in the section entitled “Board Considerations – New Agreements” of this shareholder report.
At the Board Meeting, the Boards also approved the Interim Advisory Agreements, which will go into effect for a Trust or Fund only in the event that shareholders of such Trust or Fund do not approve the New Advisory Agreement(s) for the Trust or Fund by the closing date of the Transaction, when the Current Advisory Agreements will terminate. The Board noted that, in such a circumstance, the Interim Advisory Agreements will permit continuity of management by allowing Funds Management and the Sub-Advisers to continue providing services to the Trust or Fund pursuant to the Interim Advisory Agreements while the Trust or Fund continues to solicit shareholder approval of such New Advisory Agreement(s). The Boards noted that the terms of the Interim Advisory Agreements are identical to those of the Current Advisory Agreements, except for the term and the addition of escrow provisions with respect to the advisory fees. The Boards also noted that the entities that would service the Funds and Trusts under the Interim Advisory Agreements are identical to those that provide services under the Current Advisory Agreements and those that will provide services under the New Advisory Agreements.
In approving the Interim Advisory Agreements, the Boards considered the same factors and reached the same conclusions as they considered and reached with respect to the Boards’ approvals of the Current Advisory Agreements and New Advisory Agreements, as applicable, which are described in separate Board Consideration sections within this shareholder report. Prior to the Board Meeting, including at a series of meetings held in April and May 2021, the Trustees conferred extensively among themselves and with senior representatives of Funds Management, GTCR LLC and Reverence Capital Partners, L.P. about the Interim Advisory Agreements and related matters. The Independent Trustees were assisted in their evaluation of the Interim Advisory Agreements by independent legal counsel, from whom they received separate legal advice and with whom they met separately.
At the Board Meeting, after considering the factors and reaching the conclusions described in the separate Board Consideration sections within this shareholder report, the Boards unanimously determined that the compensation payable to Funds Management and to each Sub-Adviser under each of the Interim Advisory Agreements was reasonable, and approved the Interim Advisory Agreements.
58 | Wells Fargo Factor Enhanced U.S. Small Cap Equity Portfolio
For more information
More information about Wells Fargo Funds is available free upon request. To obtain literature, please write, visit the Portfolio's website, or call:
Wells Fargo Funds
P.O. Box 219967
Kansas City, MO 64121-9967
Website: wfam.com
Individual investors: 1-800-222-8222
Retail investment professionals: 1-888-877-9275
Institutional investment professionals: 1-866-765-0778
This report and the financial statements contained herein are submitted for the general information of the interest holders of the Portfolio. If this report is used for promotional purposes, distribution of the report must be accompanied or preceded by a current prospectus. Before investing, please consider the investment objectives, risks, charges, and expenses of the investment. For a current prospectus and, if available, a summary prospectus, containing this information, call
1-800-222-8222 or visit the Portfolio's website at wfam.com. Read the prospectus carefully before you invest or send money.
Wells Fargo Asset Management (WFAM) is the trade name for certain investment advisory/management firms owned by Wells Fargo & Company. These firms include but are not limited to Wells Capital Management, LLC and Wells Fargo Funds Management, LLC. Certain products managed by WFAM entities are distributed by Wells Fargo Funds Distributor, LLC (a broker-dealer and Member FINRA).
This material is for general informational and educational purposes only and is NOT intended to provide investment advice or a recommendation of any kind - including a recommendation for any specific investment, strategy, or plan.
INVESTMENT PRODUCTS: NOT FDIC INSURED ■ NO BANK GUARANTEE ■ MAY LOSE VALUE
© 2021 Wells Fargo & Company. All rights reserved.
Semi-Annual Report
August 31, 2021
Wells Fargo High Yield
Corporate Bond Portfolio
INVESTMENT PRODUCTS: NOT FDIC INSURED ■ NO BANK GUARANTEE ■ MAY LOSE VALUE
Wells Fargo High Yield Corporate Bond Portfolio | 1
Portfolio information (unaudited)
| Investment objective | The Portfolio seeks to replicate the total return of the Bloomberg U.S. High Yield 2% Issuer Capped Bond Index, before fees and expenses. |
| Adviser | Wells Fargo Funds Management, LLC |
| Subadviser | Wells Capital Management, LLC |
| Portfolio managers | Manjunath Boraiah, Janet S. Rilling, CFA®‡, CPA, Michael J. Schueller, CFA®‡ |
| Ten largest holdings (%) as of August 31, 20211 |
| FirstEnergy Corporation, 5.35%, 7-15-2047 | 0.74 |
| At Home Group Incorporated, 7.13%, 7-15-2029 | 0.74 |
| Boyd Gaming Corporation, 4.75%, 6-15-2031 | 0.73 |
| Compass Group Diversified Holdings LLC, 5.25%, 4-15-2029 | 0.73 |
| Ford Motor Company, 9.00%, 4-22-2025 | 0.72 |
| Clear Channel Outdoor Holdings, 7.75%, 4-15-2028 | 0.72 |
| iHeartCommunications Incorporated, 6.38%, 5-1-2026 | 0.71 |
| Covanta Holding Corporation, 5.00%, 9-1-2030 | 0.70 |
| L Brands Incorporated, 6.88%, 11-1-2035 | 0.66 |
| MGM Growth Properties Operating Partnership LP, 4.50%, 9-1-2026 | 0.65 |
| 1 | Figures represent the percentage of the Portfolio's net assets. Holdings are subject to change and may have changed since the date specified. |
| Credit quality as of August 31, 20211 |

| 1 | The credit quality distribution of portfolio holdings reflected in the chart is based on ratings from Standard & Poor’s, Moody’s Investors Service, and/or Fitch Ratings Ltd. Credit quality ratings apply to the underlying holdings of the Portfolio and not to the Portfolio itself. The percentages of the portfolio with the ratings depicted in the chart are calculated based on the market value of fixed income securities held by the Portfolio. If a security was rated by all three rating agencies, the middle rating was utilized. If rated by two of the three rating agencies, the lower rating was utilized, and if rated by one of the rating agencies, that rating was utilized. Standard & Poor’s rates the creditworthiness of bonds, ranging from AAA (highest) to D (lowest). Ratings from A to CCC may be modified by the addition of a plus (+) or minus (-) sign to show relative standing within the rating categories. Standard & Poor’s rates the creditworthiness of short-term notes from SP-1 (highest) to SP-3 (lowest). Moody’s rates the creditworthiness of bonds, ranging from Aaa (highest) to C (lowest). Ratings Aa to B may be modified by the addition of a number 1 (highest) to 3 (lowest) to show relative standing within the ratings categories. Moody’s rates the creditworthiness of short-term U.S. tax-exempt municipal securities from MIG 1/VMIG 1 (highest) to SG (lowest). Fitch rates the creditworthiness of bonds, ranging from AAA (highest) to D (lowest). Credit quality distribution is subject to change and may have changed since the date specified. |
| ‡ | CFA® and Chartered Financial Analyst® are trademarks owned by CFA Institute. |
2 | Wells Fargo High Yield Corporate Bond Portfolio
Portfolio of investments—August 31, 2021 (unaudited)
| | | Interest
rate | Maturity
date | Principal | Value |
| Corporate bonds and notes: 82.73% | | | | | |
| Communication services: 13.26% | | | | | |
| Diversified telecommunication services: 1.34% | | | | | |
| Century Telephone Enterprises Incorporated | | 6.88% | 1-15-2028 | $ 200,000 | $ 224,784 |
| Level 3 Financing Incorporated 144A | | 3.75 | 7-15-2029 | 200,000 | 195,000 |
| Zayo Group LLC 144A | | 4.00 | 3-1-2027 | 260,000 | 257,062 |
| | | | | | 676,846 |
| Entertainment: 1.80% | | | | | |
| Caesars Resort Collection LLC 144A | | 5.25 | 10-15-2025 | 200,000 | 202,840 |
| Caesars Resort Collection LLC 144A | | 5.75 | 7-1-2025 | 240,000 | 252,180 |
| Live Nation Entertainment Incorporated 144A | | 4.88 | 11-1-2024 | 200,000 | 202,750 |
| Netflix Incorporated | | 4.88 | 4-15-2028 | 220,000 | 257,125 |
| | | | | | 914,895 |
| Media: 9.19% | | | | | |
| CCO Holdings LLC 144A | | 4.50 | 6-1-2033 | 280,000 | 290,150 |
| CCO Holdings LLC 144A | | 4.75 | 3-1-2030 | 200,000 | 211,616 |
| Clear Channel Outdoor Holdings 144A | | 7.75 | 4-15-2028 | 350,000 | 364,875 |
| CSC Holdings LLC 144A | | 5.50 | 4-15-2027 | 200,000 | 209,226 |
| CSC Holdings LLC 144A | | 5.75 | 1-15-2030 | 200,000 | 211,340 |
| Diamond Sports Group LLC 144A | | 5.38 | 8-15-2026 | 270,000 | 179,172 |
| DIRECTV Holdings LLC 144A | | 5.88 | 8-15-2027 | 50,000 | 52,250 |
| DISH DBS Corporation | | 5.88 | 11-15-2024 | 200,000 | 215,000 |
| Gray Television Incorporated | | 5.88 | 7-15-2026 | 200,000 | 206,232 |
| Gray Television Incorporated 144A | | 4.75 | 10-15-2030 | 205,000 | 202,602 |
| iHeartCommunications Incorporated | | 6.38 | 5-1-2026 | 340,000 | 359,125 |
| Lamar Media Corporation | | 3.75 | 2-15-2028 | 200,000 | 205,484 |
| Meredith Corporation | | 6.88 | 2-1-2026 | 161,000 | 166,836 |
| Nexstar Broadcasting Incorporated 144A | | 5.63 | 7-15-2027 | 200,000 | 212,340 |
| Nielsen Finance LLC 144A | | 5.63 | 10-1-2028 | 200,000 | 210,250 |
| Outfront Media Capital Corporation 144A | | 4.63 | 3-15-2030 | 200,000 | 202,500 |
| QVC Incorporated | | 4.75 | 2-15-2027 | 210,000 | 224,975 |
| Radiate Holdco LLC 144A | | 4.50 | 9-15-2026 | 210,000 | 218,658 |
| Sinclair Television Group Incorporated 144A | | 5.50 | 3-1-2030 | 200,000 | 195,980 |
| Sirius XM Radio Incorporated 144A | | 5.00 | 8-1-2027 | 300,000 | 314,625 |
| Univision Communications Incorporated 144A | | 5.13 | 2-15-2025 | 200,000 | 203,500 |
| | | | | | 4,656,736 |
| Wireless telecommunication services: 0.93% | | | | | |
| Frontier Communications 144A | | 5.00 | 5-1-2028 | 200,000 | 209,000 |
| Sprint Capital Corporation | | 6.88 | 11-15-2028 | 200,000 | 260,696 |
| | | | | | 469,696 |
| Consumer discretionary: 14.31% | | | | | |
| Auto components: 2.22% | | | | | |
| Adient Global Holdings Limited 144A | | 4.88 | 8-15-2026 | 200,000 | 205,500 |
| Allison Transmission Incorporated 144A | | 5.88 | 6-1-2029 | 200,000 | 220,000 |
| Clarios Global LP 144A | | 6.25 | 5-15-2026 | 180,000 | 189,675 |
| Dana Incorporated | | 5.63 | 6-15-2028 | 200,000 | 214,984 |
| Goodyear Tire & Rubber Company | | 5.63 | 4-30-2033 | 270,000 | 292,958 |
| | | | | | 1,123,117 |
The accompanying notes are an integral part of these financial statements.
Wells Fargo High Yield Corporate Bond Portfolio | 3
Portfolio of investments—August 31, 2021 (unaudited)
| | | Interest
rate | Maturity
date | Principal | Value |
| Automobiles: 0.72% | | | | | |
| Ford Motor Company | | 9.00% | 4-22-2025 | $ 300,000 | $ 366,510 |
| Diversified consumer services: 0.58% | | | | | |
| Prime Security Services Borrower LLC 144A | | 5.75 | 4-15-2026 | 270,000 | 292,096 |
| Hotels, restaurants & leisure: 5.74% | | | | | |
| Aramark Services Incorporated 144A | | 5.00 | 2-1-2028 | 200,000 | 207,964 |
| Boyd Gaming Corporation 144A | | 4.75 | 6-15-2031 | 360,000 | 371,783 |
| Caesars Entertainment Incorporated 144A | | 8.13 | 7-1-2027 | 210,000 | 232,113 |
| Carnival Corporation 144A | | 5.75 | 3-1-2027 | 195,000 | 199,354 |
| Carnival Corporation 144A | | 9.88 | 8-1-2027 | 230,000 | 265,075 |
| Hilton Domestic Operating Company | | 4.88 | 1-15-2030 | 200,000 | 215,000 |
| Life Time Incorporated 144A | | 8.00 | 4-15-2026 | 200,000 | 209,500 |
| MGM Resorts International | | 4.63 | 9-1-2026 | 154,000 | 162,516 |
| NCL Corporation Limited 144A | | 3.63 | 12-15-2024 | 210,000 | 198,450 |
| Royal Caribbean Group | | 5.25 | 11-15-2022 | 210,000 | 214,988 |
| Scientific Games International Incorporated 144A | | 5.00 | 10-15-2025 | 210,000 | 215,996 |
| Six Flags Entertainment Company 144A | | 4.88 | 7-31-2024 | 200,000 | 202,164 |
| Yum! Brands Incorporated 144A | | 7.75 | 4-1-2025 | 200,000 | 215,478 |
| | | | | | 2,910,381 |
| Household durables: 1.16% | | | | | |
| Newell Brands Incorporated | | 4.35 | 4-1-2023 | 101,000 | 106,537 |
| Taylor Morrison Communities Incorporated 144A | | 5.13 | 8-1-2030 | 210,000 | 229,736 |
| Toll Brothers Finance Corporation | | 3.80 | 11-1-2029 | 230,000 | 250,344 |
| | | | | | 586,617 |
| Multiline retail: 0.43% | | | | | |
| Macy's Retail Holdings LLC 144A | | 5.88 | 4-1-2029 | 200,000 | 218,520 |
| Specialty retail: 2.67% | | | | | |
| ABC Supply Company Incorporated 144A | | 4.00 | 1-15-2028 | 200,000 | 206,580 |
| At Home Group Incorporated 144A | | 7.13 | 7-15-2029 | 375,000 | 375,457 |
| Carvana Company 144A | | 5.50 | 4-15-2027 | 210,000 | 216,747 |
| L Brands Incorporated | | 6.88 | 11-1-2035 | 260,000 | 333,769 |
| The Gap Incorporated 144A | | 8.63 | 5-15-2025 | 200,000 | 218,210 |
| | | | | | 1,350,763 |
| Textiles, apparel & luxury goods: 0.79% | | | | | |
| HanesBrands Incorporated 144A | | 4.63 | 5-15-2024 | 200,000 | 212,250 |
| Wolverine World Wide Incorporated 144A | | 8.50 | 11-15-2024 | 200,000 | 190,000 |
| | | | | | 402,250 |
| Consumer staples: 4.48% | | | | | |
| Food & staples retailing: 1.02% | | | | | |
| Albertsons Companies Incorporated 144A | | 4.63 | 1-15-2027 | 290,000 | 307,038 |
| Performance Food Group Company 144A | | 5.50 | 10-15-2027 | 200,000 | 208,250 |
| | | | | | 515,288 |
| Food products: 2.66% | | | | | |
| CHS Incorporated 144A | | 6.88 | 4-15-2029 | 220,000 | 228,525 |
| Kraft Heinz Foods Company | | 4.38 | 6-1-2046 | 200,000 | 231,893 |
| Kraft Heinz Foods Company | | 5.20 | 7-15-2045 | 175,000 | 224,566 |
| Lamb Weston Holdings Incorporated 144A | | 4.88 | 11-1-2026 | 200,000 | 205,726 |
The accompanying notes are an integral part of these financial statements.
4 | Wells Fargo High Yield Corporate Bond Portfolio
Portfolio of investments—August 31, 2021 (unaudited)
| | | Interest
rate | Maturity
date | Principal | Value |
| Food products (continued) | | | | | |
| Pilgrim's Pride Corporation 144A | | 5.88% | 9-30-2027 | $ 200,000 | $ 213,454 |
| Post Holdings Incorporated 144A | | 5.50 | 12-15-2029 | 230,000 | 246,388 |
| | | | | | 1,350,552 |
| Household products: 0.40% | | | | | |
| Energizer Holdings Incorporated 144A | | 4.38 | 3-31-2029 | 200,000 | 200,574 |
| Tobacco: 0.40% | | | | | |
| Vector Group Limited 144A | | 5.75 | 2-1-2029 | 200,000 | 203,500 |
| Energy: 11.78% | | | | | |
| Energy equipment & services: 0.41% | | | | | |
| USA Compression Partners LP | | 6.88 | 4-1-2026 | 200,000 | 207,810 |
| Oil, gas & consumable fuels: 11.37% | | | | | |
| Antero Midstream Partners LP 144A | | 5.75 | 1-15-2028 | 200,000 | 208,250 |
| Apache Corporation | | 4.38 | 10-15-2028 | 190,000 | 205,008 |
| Archrock Partners LP 144A | | 6.25 | 4-1-2028 | 230,000 | 234,313 |
| Buckeye Partners LP 144A | | 4.50 | 3-1-2028 | 200,000 | 207,332 |
| Cheniere Energy Incorporated | | 4.63 | 10-15-2028 | 200,000 | 211,000 |
| Cheniere Energy Partners LP | | 4.50 | 10-1-2029 | 210,000 | 226,275 |
| Continental Resources Incorporated 144A | | 5.75 | 1-15-2031 | 200,000 | 243,750 |
| CrownRock LP 144A | | 5.63 | 10-15-2025 | 200,000 | 205,986 |
| DCP Midstream Operating LP | | 5.38 | 7-15-2025 | 280,000 | 308,350 |
| Endeavor Energy Resources LP 144A | | 5.50 | 1-30-2026 | 200,000 | 207,044 |
| EnLink Midstream Partners LP | | 5.60 | 4-1-2044 | 270,000 | 256,500 |
| EQM Midstream Partners LP | | 5.50 | 7-15-2028 | 200,000 | 218,246 |
| EQT Corporation | | 3.90 | 10-1-2027 | 200,000 | 215,916 |
| Genesis Energy Company | | 6.25 | 5-15-2026 | 210,000 | 202,125 |
| Moss Creek Resources Holdings Incorporated 144A | | 10.50 | 5-15-2027 | 200,000 | 181,750 |
| Murphy Oil Corporation | | 6.88 | 8-15-2024 | 145,000 | 147,900 |
| Newfield Exploration Company | | 5.38 | 1-1-2026 | 200,000 | 226,116 |
| Occidental Petroleum Corporation | | 5.88 | 9-1-2025 | 200,000 | 225,012 |
| Range Resources Corporation | | 4.88 | 5-15-2025 | 200,000 | 207,000 |
| Renewable Energy Group Incorporated 144A | | 5.88 | 6-1-2028 | 265,000 | 274,408 |
| SM Energy Company | | 6.75 | 9-15-2026 | 200,000 | 201,000 |
| Southwestern Energy Company | | 7.75 | 10-1-2027 | 200,000 | 216,750 |
| Sunoco LP | | 4.50 | 5-15-2029 | 200,000 | 202,500 |
| Targa Resources Partners LP | | 5.88 | 4-15-2026 | 260,000 | 272,025 |
| Weatherford International Limited 144A | | 11.00 | 12-1-2024 | 200,000 | 209,000 |
| Western Midstream Operating LP | | 5.30 | 2-1-2030 | 220,000 | 246,534 |
| | | | | | 5,760,090 |
| Financials: 6.35% | | | | | |
| Banks: 1.00% | | | | | |
| CIT Group Incorporated | | 5.00 | 8-1-2023 | 200,000 | 215,500 |
| Dredsner Funding Trust 144A | | 8.15 | 6-30-2031 | 200,000 | 288,250 |
| | | | | | 503,750 |
| Capital markets: 0.42% | | | | | |
| MSCI Incorporated 144A | | 4.00 | 11-15-2029 | 200,000 | 214,000 |
The accompanying notes are an integral part of these financial statements.
Wells Fargo High Yield Corporate Bond Portfolio | 5
Portfolio of investments—August 31, 2021 (unaudited)
| | | Interest
rate | Maturity
date | Principal | Value |
| Consumer finance: 0.89% | | | | | |
| Navient Corporation | | 7.25% | 9-25-2023 | $ 200,000 | $ 219,726 |
| Springleaf Finance Corporation | | 5.38 | 11-15-2029 | 210,000 | 229,425 |
| | | | | | 449,151 |
| Diversified financial services: 0.73% | | | | | |
| Compass Group Diversified Holdings LLC 144A | | 5.25 | 4-15-2029 | 355,000 | 371,610 |
| Insurance: 1.82% | | | | | |
| Acrisure LLC 144A | | 7.00 | 11-15-2025 | 200,000 | 203,750 |
| Genworth Holdings Incorporated | | 4.90 | 8-15-2023 | 200,000 | 198,118 |
| HUB International Limited 144A | | 7.00 | 5-1-2026 | 200,000 | 206,920 |
| NFP Corporation 144A | | 6.88 | 8-15-2028 | 305,000 | 313,006 |
| | | | | | 921,794 |
| Mortgage REITs: 0.64% | | | | | |
| Apollo Commercial Real Estate Finance Incorporated 144A | | 4.63 | 6-15-2029 | 335,000 | 326,223 |
| Thrifts & mortgage finance: 0.85% | | | | | |
| Nationstar Mortgage Holdings Incorporated 144A | | 6.00 | 1-15-2027 | 210,000 | 221,288 |
| Quicken Loans Incorporated 144A | | 5.25 | 1-15-2028 | 200,000 | 211,000 |
| | | | | | 432,288 |
| Health care: 6.71% | | | | | |
| Health care equipment & supplies: 0.85% | | | | | |
| Avantor Funding Incorporated 144A | | 4.63 | 7-15-2028 | 200,000 | 211,480 |
| Teleflex Incorporated 144A | | 4.25 | 6-1-2028 | 210,000 | 218,663 |
| | | | | | 430,143 |
| Health care providers & services: 4.82% | | | | | |
| Centene Corporation | | 3.00 | 10-15-2030 | 210,000 | 217,659 |
| DaVita Incorporated 144A | | 3.75 | 2-15-2031 | 260,000 | 256,936 |
| Encompass Health Corporation | | 4.63 | 4-1-2031 | 220,000 | 235,910 |
| Envision Healthcare Corporation 144A | | 8.75 | 10-15-2026 | 200,000 | 169,000 |
| HCA Incorporated | | 5.38 | 2-1-2025 | 175,000 | 197,094 |
| HCA Incorporated | | 5.88 | 5-1-2023 | 220,000 | 237,050 |
| Molina Healthcare Incorporated 144A | | 4.38 | 6-15-2028 | 200,000 | 209,750 |
| MPT Operating Partnership LP | | 5.00 | 10-15-2027 | 200,000 | 211,750 |
| RegionalCare Hospital Partners 144A | | 9.75 | 12-1-2026 | 200,000 | 212,750 |
| Tenet Healthcare Corporation 144A | | 4.25 | 6-1-2029 | 260,000 | 265,665 |
| Tenet Healthcare Corporation 144A | | 6.25 | 2-1-2027 | 220,000 | 229,350 |
| | | | | | 2,442,914 |
| Pharmaceuticals: 1.04% | | | | | |
| Bausch Health Companies Incorporated 144A | | 8.50 | 1-31-2027 | 300,000 | 322,635 |
| Organon Finance 1 LLC 144A | | 4.13 | 4-30-2028 | 200,000 | 206,340 |
| | | | | | 528,975 |
| Industrials: 8.33% | | | | | |
| Aerospace & defense: 0.91% | | | | | |
| Howmet Aerospace Incorporated | | 5.95 | 2-1-2037 | 200,000 | 252,250 |
| TransDigm Group Incorporated | | 6.38 | 6-15-2026 | 200,000 | 207,660 |
| | | | | | 459,910 |
The accompanying notes are an integral part of these financial statements.
6 | Wells Fargo High Yield Corporate Bond Portfolio
Portfolio of investments—August 31, 2021 (unaudited)
| | | Interest
rate | Maturity
date | Principal | Value |
| Air freight & logistics: 0.42% | | | | | |
| XPO Logistics Incorporated 144A | | 6.25% | 5-1-2025 | $ 200,000 | $ 211,250 |
| Airlines: 1.79% | | | | | |
| American Airlines Group Incorporated 144A | | 5.75 | 4-20-2029 | 250,000 | 269,966 |
| American Airlines Incorporated 144A | | 11.75 | 7-15-2025 | 175,000 | 217,263 |
| Delta Air Lines Incorporated | | 3.75 | 10-28-2029 | 210,000 | 213,097 |
| United Airlines Incorporated 144A | | 4.38 | 4-15-2026 | 200,000 | 207,480 |
| | | | | | 907,806 |
| Building products: 0.41% | | | | | |
| Builders FirstSource Incorporated 144A | | 6.75 | 6-1-2027 | 197,000 | 210,298 |
| Commercial services & supplies: 3.19% | | | | | |
| ADT Corporation | | 4.13 | 6-15-2023 | 200,000 | 210,250 |
| Allied Universal Security Services 144A | | 9.75 | 7-15-2027 | 200,000 | 218,750 |
| APTIM Corporation 144A | | 7.75 | 6-15-2025 | 200,000 | 168,250 |
| Avis Budget Car Rental LLC 144A | | 5.75 | 7-15-2027 | 210,000 | 219,188 |
| Covanta Holding Corporation | | 5.00 | 9-1-2030 | 345,000 | 353,625 |
| Prime Security One MS Incorporated 144A | | 4.88 | 7-15-2032 | 285,000 | 289,255 |
| West Corporation Company 144A | | 8.50 | 10-15-2025 | 167,000 | 160,320 |
| | | | | | 1,619,638 |
| Construction & engineering: 0.73% | | | | | |
| Fluor Corporation | | 4.25 | 9-15-2028 | 50,000 | 52,375 |
| United Rentals North America Incorporated | | 5.50 | 5-15-2027 | 300,000 | 316,443 |
| | | | | | 368,818 |
| Electronic equipment, instruments & components: 0.46% | | | | | |
| WESCO Distribution Incorporated 144A | | 7.25 | 6-15-2028 | 210,000 | 233,560 |
| Trading companies & distributors: 0.42% | | | | | |
| Herc Holdings Incorporated 144A | | 5.50 | 7-15-2027 | 200,000 | 210,840 |
| Information technology: 4.79% | | | | | |
| Communications equipment: 0.80% | | | | | |
| CommScope Technologies LLC 144A | | 5.00 | 3-15-2027 | 200,000 | 196,908 |
| Viasat Incorporated 144A | | 5.63 | 4-15-2027 | 200,000 | 207,500 |
| | | | | | 404,408 |
| Electronic equipment, instruments & components: 0.58% | | | | | |
| APX Group Incorporated 144A | | 5.75 | 7-15-2029 | 295,000 | 295,738 |
| IT services: 0.86% | | | | | |
| Gartner Incorporated 144A | | 3.75 | 10-1-2030 | 220,000 | 230,208 |
| Square Incorporated 144A | | 3.50 | 6-1-2031 | 200,000 | 208,000 |
| | | | | | 438,208 |
| Software: 1.25% | | | | | |
| IQVIA Incorporated 144A | | 5.00 | 5-15-2027 | 200,000 | 208,986 |
| J2 Global Incorporated 144A | | 4.63 | 10-15-2030 | 200,000 | 211,782 |
| SS&C Technologies Incorporated 144A | | 5.50 | 9-30-2027 | 200,000 | 211,790 |
| | | | | | 632,558 |
The accompanying notes are an integral part of these financial statements.
Wells Fargo High Yield Corporate Bond Portfolio | 7
Portfolio of investments—August 31, 2021 (unaudited)
| | | Interest
rate | Maturity
date | Principal | Value |
| Technology hardware, storage & peripherals: 1.30% | | | | | |
| EMC Corporation | | 3.38% | 6-1-2023 | $ 200,000 | $ 206,500 |
| NCR Corporation 144A | | 6.13 | 9-1-2029 | 210,000 | 228,900 |
| Western Digital Corporation | | 4.75 | 2-15-2026 | 200,000 | 223,500 |
| | | | | | 658,900 |
| Materials: 4.10% | | | | | |
| Chemicals: 0.85% | | | | | |
| Chemours Company | | 5.38 | 5-15-2027 | 200,000 | 217,204 |
| Olin Corporation | | 5.00 | 2-1-2030 | 200,000 | 214,654 |
| | | | | | 431,858 |
| Construction materials: 0.61% | | | | | |
| Standard Industries Incorporated 144A | | 5.00 | 2-15-2027 | 300,000 | 310,125 |
| Containers & packaging: 1.72% | | | | | |
| Ball Corporation | | 5.25 | 7-1-2025 | 200,000 | 226,000 |
| BWAY Holding Company Incorporated 144A | | 5.50 | 4-15-2024 | 210,000 | 211,575 |
| Labl Escrow Issuer LLC 144A | | 6.75 | 7-15-2026 | 200,000 | 210,000 |
| Sealed Air Corporation 144A | | 5.50 | 9-15-2025 | 200,000 | 224,382 |
| | | | | | 871,957 |
| Metals & mining: 0.92% | | | | | |
| Freeport-McMoRan Incorporated | | 5.40 | 11-14-2034 | 200,000 | 250,789 |
| Novelis Corporation 144A | | 4.75 | 1-30-2030 | 200,000 | 213,000 |
| | | | | | 463,789 |
| Real estate: 5.00% | | | | | |
| Equity REITs: 3.30% | | | | | |
| Iron Mountain Incorporated 144A | | 5.00 | 7-15-2028 | 220,000 | 229,900 |
| iStar Incorporated | | 4.25 | 8-1-2025 | 200,000 | 208,500 |
| MGM Growth Properties Operating Partnership LP | | 4.50 | 9-1-2026 | 300,000 | 326,787 |
| SBA Communications Corporation | | 4.88 | 9-1-2024 | 200,000 | 203,000 |
| Service Properties Trust Company | | 4.38 | 2-15-2030 | 210,000 | 201,717 |
| Uniti Group Incorporated 144A | | 6.50 | 2-15-2029 | 250,000 | 260,545 |
| VICI Properties Incorporated 144A | | 4.25 | 12-1-2026 | 230,000 | 241,596 |
| | | | | | 1,672,045 |
| Real estate management & development: 1.70% | | | | | |
| Howard Hughes Corporation 144A | | 4.13 | 2-1-2029 | 200,000 | 201,000 |
| Icahn Enterprises Finance Corporation | | 6.25 | 5-15-2026 | 220,000 | 231,825 |
| Kennedy-Wilson Holdings Incorporated | | 4.75 | 3-1-2029 | 200,000 | 206,861 |
| Realogy Group LLC 144A | | 9.38 | 4-1-2027 | 200,000 | 220,750 |
| | | | | | 860,436 |
| Utilities: 3.62% | | | | | |
| Electric utilities: 1.57% | | | | | |
| FirstEnergy Corporation | | 5.35 | 7-15-2047 | 300,000 | 375,480 |
| NRG Energy Incorporated 144A | | 3.63 | 2-15-2031 | 220,000 | 223,850 |
| PG&E Corporation | | 5.00 | 7-1-2028 | 200,000 | 198,500 |
| | | | | | 797,830 |
The accompanying notes are an integral part of these financial statements.
8 | Wells Fargo High Yield Corporate Bond Portfolio
Portfolio of investments—August 31, 2021 (unaudited)
| | | Interest
rate | Maturity
date | Principal | Value |
| Gas utilities: 0.80% | | | | | |
| Ferellgas Partners LP 144A | | 5.38% | 4-1-2026 | $ 200,000 | $ 196,500 |
| Global Partners LP | | 7.00 | 8-1-2027 | 200,000 | 207,810 |
| | | | | | 404,310 |
| Independent power & renewable electricity producers: 1.25% | | | | | |
| Calpine Corporation 144A | | 5.00 | 2-1-2031 | 190,000 | 193,325 |
| TerraForm Power Operating LLC 144A | | 4.75 | 1-15-2030 | 220,000 | 231,535 |
| Vistra Operations Company LLC 144A | | 5.63 | 2-15-2027 | 200,000 | 208,262 |
| | | | | | 633,122 |
| Total Corporate bonds and notes (Cost $40,532,965) | | | | | 41,924,493 |
| Yankee corporate bonds and notes: 15.04% | | | | | |
| Communication services: 4.07% | | | | | |
| Diversified telecommunication services: 1.87% | | | | | |
| Altice France Holding SA 144A | | 6.00 | 2-15-2028 | 210,000 | 208,163 |
| SFR Group SA 144A | | 7.38 | 5-1-2026 | 200,000 | 207,594 |
| Telecom Italia Capital SpA | | 6.00 | 9-30-2034 | 200,000 | 227,440 |
| Virgin Media Secured Finance plc 144A | | 4.50 | 8-15-2030 | 300,000 | 304,290 |
| | | | | | 947,487 |
| Media: 1.27% | | | | | |
| Altice Finco SA 144A | | 5.00 | 1-15-2028 | 230,000 | 229,816 |
| Videotron Limited 144A | | 5.13 | 4-15-2027 | 200,000 | 208,250 |
| Ziggo BV 144A | | 4.88 | 1-15-2030 | 200,000 | 206,000 |
| | | | | | 644,066 |
| Wireless telecommunication services: 0.93% | | | | | |
| VEON Holdings BV 144A | | 4.00 | 4-9-2025 | 210,000 | 221,193 |
| Vodafone Group plc (USD Swap Semi Annual (vs. 3 Month LIBOR) 5 Year +4.87%) ± | | 7.00 | 4-4-2079 | 200,000 | 247,008 |
| | | | | | 468,201 |
| Consumer discretionary: 2.48% | | | | | |
| Automobiles: 0.82% | | | | | |
| IHO Verwaltungs GmbH (PIK at 6.75%) 144A¥ | | 6.00 | 5-15-2027 | 210,000 | 219,761 |
| Jaguar Land Rover Automotive plc 144A | | 4.50 | 10-1-2027 | 200,000 | 196,520 |
| | | | | | 416,281 |
| Hotels, restaurants & leisure: 1.27% | | | | | |
| International Game Technology plc 144A | | 6.25 | 1-15-2027 | 200,000 | 228,000 |
| Melco Resorts Finance Limited 144A | | 5.38 | 12-4-2029 | 200,000 | 206,939 |
| MGM China Holdings Limited 144A | | 5.38 | 5-15-2024 | 200,000 | 205,000 |
| | | | | | 639,939 |
| Leisure products: 0.39% | | | | | |
| VOC Escrow Limited 144A | | 5.00 | 2-15-2028 | 200,000 | 197,750 |
| Consumer staples: 0.43% | | | | | |
| Food products: 0.43% | | | | | |
| JBS USA LLC 144A | | 6.75 | 2-15-2028 | 200,000 | 219,250 |
The accompanying notes are an integral part of these financial statements.
Wells Fargo High Yield Corporate Bond Portfolio | 9
Portfolio of investments—August 31, 2021 (unaudited)
| | | Interest
rate | Maturity
date | Principal | Value |
| Energy: 0.22% | | | | | |
| Oil, gas & consumable fuels: 0.22% | | | | | |
| Transocean Incorporated 144A | | 11.50% | 1-30-2027 | $ 112,000 | $ 112,827 |
| Financials: 2.13% | | | | | |
| Banks: 0.91% | | | | | |
| Deutsche Bank AG (USD ICE Swap Rate 11:00am NY 5 Year +2.55%) ± | | 4.88 | 12-1-2032 | 220,000 | 240,755 |
| UniCredit SpA (USD ICE Swap Rate 11:00am NY 5 Year +3.70%) 144A± | | 5.86 | 6-19-2032 | 200,000 | 223,200 |
| | | | | | 463,955 |
| Diversified financial services: 1.22% | | | | | |
| New Red Finance Incorporated 144A | | 3.88 | 1-15-2028 | 200,000 | 202,500 |
| New Red Finance Incorporated 144A | | 4.00 | 10-15-2030 | 200,000 | 198,896 |
| Trivium Packaging Finance BV 144A | | 8.50 | 8-15-2027 | 200,000 | 214,750 |
| | | | | | 616,146 |
| Health care: 0.25% | | | | | |
| Pharmaceuticals: 0.25% | | | | | |
| Endo Limited 144A | | 6.00 | 7-15-2023 | 200,000 | 124,000 |
| Industrials: 2.44% | | | | | |
| Aerospace & defense: 0.98% | | | | | |
| Bombardier Incorporated 144A | | 7.50 | 12-1-2024 | 230,000 | 239,729 |
| Bombardier Incorporated 144A | | 7.13 | 6-15-2026 | 245,000 | 258,475 |
| | | | | | 498,204 |
| Commercial services & supplies: 0.56% | | | | | |
| Garda World Security Corporation 144A | | 6.00 | 6-1-2029 | 295,000 | 284,997 |
| Electrical equipment: 0.44% | | | | | |
| Sensata Technologies BV 144A | | 5.00 | 10-1-2025 | 200,000 | 223,574 |
| Professional services: 0.46% | | | | | |
| IHS Markit Limited | | 4.25 | 5-1-2029 | 200,000 | 231,276 |
| Information technology: 1.28% | | | | | |
| Communications equipment: 0.44% | | | | | |
| Nokia OYJ | | 4.38 | 6-12-2027 | 200,000 | 221,888 |
| Software: 0.40% | | | | | |
| Open Text Corporation 144A | | 5.88 | 6-1-2026 | 200,000 | 206,450 |
| Technology hardware, storage & peripherals: 0.44% | | | | | |
| Seagate HDD Cayman 144A | | 4.13 | 1-15-2031 | 210,000 | 221,815 |
| Materials: 1.33% | | | | | |
| Chemicals: 0.45% | | | | | |
| Methanex Corporation | | 5.25 | 12-15-2029 | 210,000 | 229,074 |
| Containers & packaging: 0.41% | | | | | |
| Ardagh Packaging Finance plc 144A | | 5.25 | 8-15-2027 | 200,000 | 207,000 |
The accompanying notes are an integral part of these financial statements.
10 | Wells Fargo High Yield Corporate Bond Portfolio
Portfolio of investments—August 31, 2021 (unaudited)
| | | Interest
rate | Maturity
date | Principal | Value |
| Metals & mining: 0.47% | | | | | |
| Alcoa Europe Holding BV 144A | | 6.13% | 5-15-2028 | $ 220,000 | $ 239,250 |
| Utilities: 0.41% | | | | | |
| Independent power & renewable electricity producers: 0.41% | | | | | |
| Atlantica Sustainable Infrastructure plc 144A | | 4.13 | 6-15-2028 | 200,000 | 209,640 |
| Total Yankee corporate bonds and notes (Cost $7,538,838) | | | | | 7,623,070 |
| | | Yield | | Shares | |
| Short-term investments: 2.02% | | | | | |
| Investment companies: 2.02% | | | | | |
| Wells Fargo Government Money Market Fund Select Class ♠∞ | | 0.03 | | 1,022,172 | 1,022,172 |
| Total Short-term investments (Cost $1,022,172) | | | | | 1,022,172 |
| Total investments in securities (Cost $49,093,975) | 99.79% | | | | 50,569,735 |
| Other assets and liabilities, net | 0.21 | | | | 106,656 |
| Total net assets | 100.00% | | | | $50,676,391 |
| 144A | The security may be resold in transactions exempt from registration, normally to qualified institutional buyers, pursuant to Rule 144A under the Securities Act of 1933. |
| ± | Variable rate investment. The rate shown is the rate in effect at period end. |
| ¥ | A payment-in-kind (PIK) security is a security in which the issuer may make interest or dividend payments in cash or additional securities or a combination of both. The rate shown is the rate in effect at period end. |
| ♠ | The issuer of the security is an affiliated person of the Portfolio as defined in the Investment Company Act of 1940. |
| ∞ | The rate represents the 7-day annualized yield at period end. |
| Abbreviations: |
| LIBOR | London Interbank Offered Rate |
| REIT | Real estate investment trust |
Investments in affiliates
An affiliated investment is an investment in which the Portfolio owns at least 5% of the outstanding voting shares of the issuer or as a result of other relationships, such as the Portfolio and the issuer having the same adviser or investment manager. Transactions with issuers that were either affiliates of the Portfolio at the beginning of the period or the end of the period were as follows:
| | Value,
beginning of
period | Purchases | Sales
proceeds | Net
realized
gains
(losses) | Net
change in
unrealized
gains
(losses) | Value,
end of
period | Shares,
end
of period | Income
from
affiliated
securities |
| Short-term investments | | | | | | | |
| Wells Fargo Government Money Market Fund Select Class | $333,484 | $7,893,578 | $(7,204,890) | $0 | $0 | $1,022,172 | 1,022,172 | $123 |
The accompanying notes are an integral part of these financial statements.
Wells Fargo High Yield Corporate Bond Portfolio | 11
Statement of assets and liabilities—August 31, 2021 (unaudited)
| | |
| Assets | |
Investments in unaffiliated securities, at value (cost $48,071,803)
| $ 49,547,563 |
Investments in affiliated securites, at value (cost $1,022,172)
| 1,022,172 |
Receivable for investments sold
| 2,109,159 |
Receivable for interest
| 669,945 |
Prepaid expenses and other assets
| 9,829 |
Total assets
| 53,358,668 |
| Liabilities | |
Payable for investments purchased
| 2,674,924 |
Advisory fee payable
| 479 |
Accrued expenses and other liabilities
| 6,874 |
Total liabilities
| 2,682,277 |
Total net assets
| $50,676,391 |
The accompanying notes are an integral part of these financial statements.
12 | Wells Fargo High Yield Corporate Bond Portfolio
Statement of operations—six months ended August 31, 2021 (unaudited)
| | |
| Investment income | |
Interest
| $ 1,201,436 |
Income from affiliated securities
| 123 |
Total investment income
| 1,201,559 |
| Expenses | |
Advisory fee
| 63,481 |
Custody and accounting fees
| 5,772 |
Professional fees
| 31,461 |
Interest holder report expenses
| 7,943 |
Trustees’ fees and expenses
| 9,771 |
Other fees and expenses
| 5,123 |
Total expenses
| 123,551 |
Less: Fee waivers and/or expense reimbursements
| (54,991) |
Net expenses
| 68,560 |
Net investment income
| 1,132,999 |
| Realized and unrealized gains (losses) on investments | |
Net realized gains on investments
| 601,490 |
Net change in unrealized gains (losses) on investments
| 44,655 |
Net realized and unrealized gains (losses) on investments
| 646,145 |
Net increase in net assets resulting from operations
| $1,779,144 |
The accompanying notes are an integral part of these financial statements.
Wells Fargo High Yield Corporate Bond Portfolio | 13
Statement of changes in net assets
| | | |
| | Six months ended
August 31, 2021
(unaudited) | Year ended
February 28, 2021 |
| Operations | | |
Net investment income
| $ 1,132,999 | $ 5,865,899 |
Net realized gains on investments
| 601,490 | 2,256,834 |
Net change in unrealized gains (losses) on investments
| 44,655 | 3,105,325 |
Net increase in net assets resulting from operations
| 1,779,144 | 11,228,058 |
| Capital transactions | | |
| Transactions in investors’ beneficial interests | | |
Contributions
| 3,291,568 | 145,893,143 |
Withdrawals
| (4,506,088) | (160,998,466) |
Net decrease in net assets resulting from capital transactions
| (1,214,520) | (15,105,323) |
Total increase (decrease) in net assets
| 564,624 | (3,877,265) |
| Net assets | | |
Beginning of period
| 50,111,767 | 53,989,032 |
End of period
| $50,676,391 | $ 50,111,767 |
The accompanying notes are an integral part of these financial statements.
14 | Wells Fargo High Yield Corporate Bond Portfolio
| | | Year ended February 28 |
| | Six months ended
August 31, 2021
(unaudited) | 2021 | 2020 1 | 2019 | 2018 2 |
Total return3
| 3.60% | 6.34% | 3.97% | 3.70% | 0.49% |
| Ratios to average net assets (annualized) | | | | | |
Gross expenses
| 0.49% | 0.35% | 0.42% | 0.34% | 0.37% |
Net expenses
| 0.27% * | 0.27% * | 0.30% | 0.32% | 0.37% |
Net investment income
| 4.46% | 5.54% | 5.54% | 6.06% | 5.36% |
| Supplemental data | | | | | |
Portfolio turnover rate
| 37% | 169% | 52% | 47% | 122% |
| * | Ratios reflect expenses which were voluntarily waived by the adviser. Without these voluntary waivers, the net expense ratios would be increased by the following amounts: |
| Six months ended August 31, 2021 (unaudited) | 0.22% |
| Year ended February 28, 2021 | 0.08% |
| 1 | Year ended February 29 |
| 2 | For the period from May 23, 2017 (commencement of operations) to February 28, 2018 |
| 3 | Returns for periods of less than one year are not annualized. |
The accompanying notes are an integral part of these financial statements.
Wells Fargo High Yield Corporate Bond Portfolio | 15
Notes to financial statements (unaudited)
1. ORGANIZATION
Wells Fargo Master Trust (the "Trust"), a Delaware statutory trust organized on March 10, 1999, is an open-end management investment company registered under the Investment Company Act of 1940, as amended (the "1940 Act"). As an investment company, the Trust follows the accounting and reporting guidance in Financial Accounting Standards Board ("FASB") Accounting Standards Codification Topic 946, Financial Services – Investment Companies. These financial statements report on the Wells Fargo High Yield Corporate Bond Portfolio (the "Portfolio") which is a diversified series of the Trust.
Interests in the Portfolio are available solely through private placement transactions that do not involve any "public offering" within the meaning of Section 4(2) of the Investment Company Act of 1933.
On February 23, 2021, Wells Fargo & Company announced that it has entered into a definitive agreement to sell Wells Fargo Asset Management ("WFAM") to GTCR LLC and Reverence Capital Partners, L.P. WFAM is the trade name used by the asset management businesses of Wells Fargo & Company and includes Wells Fargo Funds Management, LLC, the adviser to the Portfolio, Wells Capital Management, LLC and Wells Fargo Asset Management (International) Limited, both registered investment advisers providing subadvisory services to certain funds, and Wells Fargo Funds Distributor, LLC, the Portfolio's principal underwriter. As part of the transaction, Wells Fargo & Company will own a 9.9% equity interest and will continue to serve as an important client and distribution partner.
Consummation of the transaction will result in the automatic termination of the Portfolio’s investment advisory agreement and subadvisory agreements. The Portfolio’s Board of Trustees approved a new investment advisory agreement and a new subadvisory agreement which were subsequently approved on behalf of the feeder funds that were investors in the Portfolio at the close of business on May 28, 2021. The new agreements will take effect upon the closing of the transaction. The transaction is expected to close in the second half of 2021, subject to customary closing conditions.
2. SIGNIFICANT ACCOUNTING POLICIES
The following significant accounting policies, which are consistently followed in the preparation of the financial statements of the Portfolio, are in conformity with U.S. generally accepted accounting principles which require management to make estimates and assumptions that affect the reported amounts of assets and liabilities, disclosure of contingent assets and liabilities at the date of the financial statements, and the reported amounts of income and expenses during the reporting period. Actual results could differ from those estimates.
Securities valuation
All investments are valued each business day as of the close of regular trading on the New York Stock Exchange (generally 4 p.m. Eastern Time), although the Portfolio may deviate from this calculation time under unusual or unexpected circumstances.
Debt securities are valued at the evaluated bid price provided by an independent pricing service (e.g. taking into account various factors, including yields, maturities, or credit ratings) or, if a reliable price is not available, the quoted bid price from an independent broker-dealer.
Investments in registered open-end investment companies are valued at net asset value.
Investments which are not valued using any of the methods discussed above are valued at their fair value, as determined in good faith by the Board of Trustees. The Board of Trustees has established a Valuation Committee comprised of the Trustees and has delegated to it the authority to take any actions regarding the valuation of portfolio securities that the Valuation Committee deems necessary or appropriate, including determining the fair value of portfolio securities, unless the determination has been delegated to the Wells Fargo Asset Management Pricing Committee at Wells Fargo Funds Management, LLC ("Funds Management"). The Board of Trustees retains the authority to make or ratify any valuation decisions or approve any changes to the Valuation Procedures as it deems appropriate. On a quarterly basis, the Board of Trustees receives reports on any valuation actions taken by the Valuation Committee or the Wells Fargo Asset Management Pricing Committee which may include items for ratification.
Security transactions and income recognition
Securities transactions are recorded on a trade date basis. Realized gains or losses are recorded on the basis of identified cost.
Interest income is accrued daily and bond discounts are accreted and premiums are amortized daily. To the extent debt obligations are placed on non-accrual status, any related interest income may be reduced by writing off interest receivables when the collection of all or a portion of interest has been determined to be doubtful based on consistently applied procedures and the fair value has decreased. If the issuer subsequently resumes interest payments or when the collectability of interest is reasonably assured, the debt obligation is removed from non-accrual status.
16 | Wells Fargo High Yield Corporate Bond Portfolio
Notes to financial statements (unaudited)
Federal and other taxes
The Portfolio is not required to pay federal income taxes on its net investment income and net capital gains as it is treated as a partnership for federal income tax purposes. All income, gains and losses of the Portfolio are deemed to have been “passed through” to the interest holders in proportion to their holdings of the Portfolio regardless of whether income and gains have been distributed by the Portfolio.
The Portfolio’s income tax returns and all financial records supporting those returns for the prior three fiscal years are subject to examination by the federal revenue authority. Management has analyzed the Portfolio’s tax positions taken on federal, state, and foreign tax returns for all open tax years and does not believe that there are any uncertain tax positions that require recognition of a tax liability.
As of August 31, 2021, the aggregate cost of all investments for federal income tax purposes was $49,178,947 and the unrealized gains (losses) consisted of:
| Gross unrealized gains | $1,918,048 |
| Gross unrealized losses | (527,260) |
| Net unrealized gains | $1,390,788 |
3. FAIR VALUATION MEASUREMENTS
Fair value measurements of investments are determined within a framework that has established a fair value hierarchy based upon the various data inputs utilized in determining the value of the Portfolio’s investments. The three-level hierarchy gives the highest priority to unadjusted quoted prices in active markets for identical assets or liabilities (Level 1) and the lowest priority to unobservable inputs (Level 3). The Portfolio’s investments are classified within the fair value hierarchy based on the lowest level of input that is significant to the fair value measurement. The inputs are summarized into three broad levels as follows:
| ■ | Level 1 – quoted prices in active markets for identical securities |
| ■ | Level 2 – other significant observable inputs (including quoted prices for similar securities, interest rates, prepayment speeds, credit risk, etc.) |
| ■ | Level 3 – significant unobservable inputs (including the Portfolio’s own assumptions in determining the fair value of investments) |
The inputs or methodologies used for valuing investments in securities are not necessarily an indication of the risk associated with investing in those securities.
The following is a summary of the inputs used in valuing the Portfolio’s assets and liabilities as of August 31, 2021:
| | Quoted prices
(Level 1) | Other significant
observable inputs
(Level 2) | Significant
unobservable inputs
(Level 3) | Total |
| Assets | | | | |
| Investments in: | | | | |
| Corporate bonds and notes | $ 0 | $ 41,924,493 | $0 | $ 41,924,493 |
| Yankee corporate bonds and notes | 0 | 7,623,070 | 0 | 7,623,070 |
| Short-term investments | | | | |
| Investment companies | 1,022,172 | 0 | 0 | 1,022,172 |
| Total assets | $1,022,172 | $49,547,563 | $0 | $50,569,735 |
Additional sector, industry or geographic detail, if any, is included in the Portfolio of Investments.
For the six months ended August 31, 2021, the Portfolio did not have any transfers into/out of Level 3.
4. TRANSACTIONS WITH AFFILIATES
Advisory fee
The Trust has entered into an advisory contract with Funds Management, an indirect wholly owned subsidiary of Wells Fargo & Company ("Wells Fargo"). The adviser is responsible for implementing investment policies and guidelines and for supervising
Wells Fargo High Yield Corporate Bond Portfolio | 17
Notes to financial statements (unaudited)
the subadviser, who is responsible for day-to-day portfolio management of the Portfolio. Pursuant to the contract, Funds Management is entitled to receive an advisory fee at the following annual rate based on the Portfolio’s average daily net assets:
| Average daily net assets | Advisory fee |
| First $5 billion | 0.250% |
| Next $5 billion | 0.230 |
| Over $10 billion | 0.210 |
For the six months ended August 31, 2021, the advisory fee was equivalent to an annual rate of 0.25% of the Portfolio’s average daily net assets.
Funds Management has retained the services of a subadviser to provide daily portfolio management to the Portfolio. The fee for subadvisory services is borne by Funds Management. Wells Capital Management, LLC, an affiliate of Funds Management and an indirect wholly owned subsidiary of Wells Fargo, is the subadviser to the Portfolio and is entitled to receive a fee from Funds Management at an annual rate starting at 0.09% and declining to 0.07% as the average daily net assets of the Portfolio increase.
Funds Management has voluntarily waived and/or reimbursed advisory fees to reduce the net operating expense ratio of the Portfolio. These voluntary waivers may be discontinued at any time.
Interfund transactions
The Portfolio may purchase or sell portfolio investment securities to certain other Wells Fargo affiliates pursuant to Rule 17a-7 under the 1940 Act and under procedures adopted by the Board of Trustees. The procedures have been designed to ensure that these interfund transactions, which do not incur broker commissions, are effected at current market prices.
5. INVESTMENT PORTFOLIO TRANSACTIONS
Purchases and sales of investments, excluding U.S. government obligations (if any) and short-term securities, for the six months ended August 31, 2021 were $19,233,883 and $18,173,682, respectively.
6. BANK BORROWINGS
The Trust, along with Wells Fargo Variable Trust and Wells Fargo Funds Trust (excluding the money market funds), are parties to a $350,000,000 revolving credit agreement whereby the Portfolio is permitted to use bank borrowings for temporary or emergency purposes, such as to fund interest holders withdrawal requests. Interest under the credit agreement is charged to the Portfolio based on a borrowing rate equal to the higher of the Federal Funds rate in effect on that day plus 1.25% or the overnight bank funding rate in effect on that day plus 1.25%. In addition, an annual commitment fee equal to 0.25% of the unused balance is allocated to each participating fund.
For the six months ended August 31, 2021, there were no borrowings by the Portfolio under the agreement.
7. INDEMNIFICATION
Under the Portfolio's organizational documents, the officers and Trustees have been granted certain indemnification rights against certain liabilities that may arise out of performance of their duties to the Portfolio. The Portfolio has entered into a separate agreement with each Trustee that converts indemnification rights currently existing under the Portfolio’s organizational documents into contractual rights that cannot be changed in the future without the consent of the Trustee. Additionally, in the normal course of business, the Portfolio may enter into contracts with service providers that contain a variety of indemnification clauses. The Portfolio’s maximum exposure under these arrangements is dependent on future claims that may be made against the Portfolio and, therefore, cannot be estimated.
8. CORONAVIRUS (COVID-19) PANDEMIC
On March 11, 2020, the World Health Organization announced that it had made the assessment that coronavirus disease 2019 (“COVID-19”) is a pandemic. The impacts of COVID-19 are affecting the entire global economy, individual companies and investment products, the funds, and the market in general. There is significant uncertainty around the extent and duration of business disruptions related to COVID-19 and the impacts may last for an extended period of time. COVID-19 has led to significant uncertainty and volatility in the financial markets.
18 | Wells Fargo High Yield Corporate Bond Portfolio
Notes to financial statements (unaudited)
9. SUBSEQUENT EVENTS
Wells Fargo Asset Management ("WFAM") announced that it will be changing its company name to Allspring Global Investments upon the closing of the previously announced sale transaction of WFAM by Wells Fargo & Company to GTCR LLC and Reverence Capital Partners, L.P. The new corporate name is expected to go into effect on the closing date of the transaction, which is anticipated to occur in the second half of 2021, subject to customary closing conditions.
The Board of Trustees of the Wells Fargo Funds approved a change in the Portfolio's name to remove “Wells Fargo” from the Portfolio's name and replace with “Allspring” on December 6, 2021.
Following the closing of the transaction, Wells Fargo Funds Management, LLC, the Portfolio's adviser, Wells Capital Management, LLC and Wells Fargo Asset Management (International) Limited, each subadvisers to certain funds, and Wells Fargo Funds Distributor, LLC will each be rebranded as Allspring.
Wells Fargo High Yield Corporate Bond Portfolio | 19
Other information (unaudited)
PROXY VOTING INFORMATION
A description of the policies and procedures used to determine how to vote proxies relating to portfolio securities is available without charge, upon request, by calling 1-800-222-8222, visiting our website at wfam.com, or visiting the SEC website at sec.gov. Information regarding how the proxies related to portfolio securities were voted during the most recent 12-month period ended June 30 is available on the website at wfam.com or by visiting the SEC website at sec.gov.
QUARTERLY PORTFOLIO HOLDINGS INFORMATION
The Portfolio files its complete schedule of portfolio holdings with the SEC for the first and third quarters of each fiscal year as an exhibit to its reports on Form N-PORT. Interest holders may view the filed Form N-PORT by visiting the SEC website at sec.gov.
20 | Wells Fargo High Yield Corporate Bond Portfolio
Other information (unaudited)
BOARD OF TRUSTEES AND OFFICERS
Each of the Trustees and Officers listed in the table below acts in identical capacities for each fund in the Wells Fargo family of funds, which consists of 139 mutual funds comprising the Wells Fargo Funds Trust, Wells Fargo Variable Trust, Wells Fargo Master Trust and four closed-end funds (collectively the “Fund Complex”). This table should be read in conjunction with the Prospectus and the Statement of Additional Information1. The mailing address of each Trustee and Officer is 525 Market Street, 12th Floor, San Francisco, CA 94105. Each Trustee and Officer serves an indefinite term, however, each Trustee serves such term until reaching the mandatory retirement age established by the Trustees.
Independent Trustees
Name and
year of birth | Position held and
length of service* | Principal occupations during past five years or longer | Current other
public company or
investment
company
directorships |
William R. Ebsworth
(Born 1957) | Trustee,
since 2015 | Retired. From 1984 to 2013, equities analyst, portfolio manager, research director and chief investment officer at Fidelity Management and Research Company in Boston, Tokyo, and Hong Kong, and retired in 2013 as Chief Investment Officer of Fidelity Strategic Advisers, Inc. where he led a team of investment professionals managing client assets. Prior thereto, Board member of Hong Kong Securities Clearing Co., Hong Kong Options Clearing Corp., the Thailand International Fund, Ltd., Fidelity Investments Life Insurance Company, and Empire Fidelity Investments Life Insurance Company. Audit Committee Chair and Investment Committee Chair of the Vincent Memorial Hospital Endowment (non-profit organization). Mr. Ebsworth is a CFA® charterholder. | N/A |
Jane A. Freeman
(Born 1953) | Trustee,
since 2015;
Chair Liaison,
since 2018 | Retired. From 2012 to 2014 and 1999 to 2008, Chief Financial Officer of Scientific Learning Corporation. From 2008 to 2012, Ms. Freeman provided consulting services related to strategic business projects. Prior to 1999, Portfolio Manager at Rockefeller & Co. and Scudder, Stevens & Clark. Board member of the Harding Loevner Funds from 1996 to 2014, serving as both Lead Independent Director and chair of the Audit Committee. Board member of the Russell Exchange Traded Funds Trust from 2011 to 2012 and the chair of the Audit Committee. Ms. Freeman is also an inactive Chartered Financial Analyst. | N/A |
Isaiah Harris, Jr.
(Born 1952) | Trustee,
since 2009; Audit
Committee
Chair,
since 2019 | Retired. Chairman of the Board of CIGNA Corporation since 2009, and Director since 2005. From 2003 to 2011, Director of Deluxe Corporation. Prior thereto, President and CEO of BellSouth Advertising and Publishing Corp. from 2005 to 2007, President and CEO of BellSouth Enterprises from 2004 to 2005 and President of BellSouth Consumer Services from 2000 to 2003. Emeritus member of the Iowa State University Foundation Board of Governors. Emeritus Member of the Advisory Board of Iowa State University School of Business. Advisory Board Member, Palm Harbor Academy (private school). Mr. Harris is a certified public accountant (inactive status). | CIGNA Corporation |
Judith M. Johnson
(Born 1949) | Trustee,
since 2008 | Retired. Prior thereto, Chief Executive Officer and Chief Investment Officer of Minneapolis Employees Retirement Fund from 1996 to 2008. Ms. Johnson is an attorney, certified public accountant and a certified managerial accountant. | N/A |
David F. Larcker
(Born 1950) | Trustee,
since 2009 | James Irvin Miller Professor of Accounting at the Graduate School of Business (Emeritus), Stanford University, Director of the Corporate Governance Research Initiative and Senior Faculty of The Rock Center for Corporate Governance since 2006. From 2005 to 2008, Professor of Accounting at the Graduate School of Business, Stanford University. Prior thereto, Ernst & Young Professor of Accounting at The Wharton School, University of Pennsylvania from 1985 to 2005. | N/A |
Wells Fargo High Yield Corporate Bond Portfolio | 21
Other information (unaudited)
Name and
year of birth | Position held and
length of service* | Principal occupations during past five years or longer | Current other
public company or
investment
company
directorships |
Olivia S. Mitchell
(Born 1953) | Trustee,
since 2006;
Nominating and
Governance
Committee Chair,
since 2018 | International Foundation of Employee Benefit Plans Professor, Wharton School of the University of Pennsylvania since 1993. Director of Wharton’s Pension Research Council and Boettner Center on Pensions & Retirement Research, and Research Associate at the National Bureau of Economic Research. Previously, Cornell University Professor from 1978 to 1993. | N/A |
Timothy J. Penny
(Born 1951) | Trustee,
since 1996;
Chair,
since 2018 | President and Chief Executive Officer of Southern Minnesota Initiative Foundation, a non-profit organization, since 2007. Member of the Board of Trustees of NorthStar Education Finance, Inc., a non-profit organization, since 2007. | N/A |
James G. Polisson
(Born 1959) | Trustee,
since 2018 | Retired. Chief Marketing Officer, Source (ETF) UK Services, Ltd, from 2015 to 2017. From 2012 to 2015, Principal of The Polisson Group, LLC, a management consulting, corporate advisory and principal investing company. Chief Executive Officer and Managing Director at Russell Investments, Global Exchange Traded Funds from 2010 to 2012. Managing Director of Barclays Global Investors from 1998 to 2010 and Global Chief Marketing Officer for iShares and Barclays Global Investors from 2000 to 2010. Trustee of the San Francisco Mechanics’ Institute, a non-profit organization, from 2013 to 2015. Board member of the Russell Exchange Traded Fund Trust from 2011 to 2012. Director of Barclays Global Investors Holdings Deutschland GmbH from 2006 to 2009. Mr. Polisson is an attorney and has a retired status with the Massachusetts and District of Columbia Bar Associations. | N/A |
Pamela Wheelock
(Born 1959) | Trustee,
since January
2020; previously
Trustee from
January 2018 to
July 2019 | Board member of the Destination Medical Center Economic Development Agency, Rochester, Minnesota since 2019. Interim President of the McKnight Foundation from January to September 2020. Acting Commissioner, Minnesota Department of Human Services, July 2019 through September 2019. Human Services Manager (part-time), Minnesota Department of Human Services, October 2019 through December 2019. Chief Operating Officer, Twin Cities Habitat for Humanity from 2017 to 2019. Vice President of University Services, University of Minnesota from 2012 to 2016. Prior thereto, on the Board of Directors, Governance Committee and Finance Committee for the Minnesota Philanthropy Partners (Saint Paul Foundation) from 2012 to 2018, Interim Chief Executive Officer of Blue Cross Blue Shield of Minnesota from 2011 to 2012, Chairman of the Board from 2009 to 2012 and Board Director from 2003 to 2015. Vice President, Leadership and Community Engagement, Bush Foundation, Saint Paul, Minnesota (a private foundation) from 2009 to 2011. Executive Vice President and Chief Financial Officer, Minnesota Sports and Entertainment from 2004 to 2009 and Senior Vice President from 2002 to 2004. Executive Vice President of the Minnesota Wild Foundation from 2004 to 2008. Commissioner of Finance, State of Minnesota, from 1999 to 2002. Currently Board Chair of the Minnesota Wild Foundation since 2010. | N/A |
* Length of service dates reflect the Trustee’s commencement of service with the Trust’s predecessor entities, where applicable.
22 | Wells Fargo High Yield Corporate Bond Portfolio
Other information (unaudited)
Officers
Name and
year of birth | Position held and
length of service | Principal occupations during past five years or longer |
Andrew Owen
(Born 1960) | President,
since 2017 | Executive Vice President of Wells Fargo & Company and Head of Affiliated Managers, Wells Fargo Asset Management, since 2014. In addition, Mr. Owen is currently President, Chief Executive Officer and Director of Wells Fargo Funds Management, LLC since 2017. Prior thereto, Executive Vice President responsible for marketing, investments and product development for Wells Fargo Funds Management, LLC, from 2009 to 2014. |
Jeremy DePalma
(Born 1974) | Treasurer,
since 2012
(for certain funds in
the Fund Complex);
since 2021 (for
the remaining funds in the
Fund Complex) | Senior Vice President of Wells Fargo Funds Management, LLC since 2009. Senior Vice President of Evergreen Investment Management Company, LLC from 2008 to 2010 and head of the Fund Reporting and Control Team within Fund Administration from 2005 to 2010. |
Michelle Rhee
(Born 1966) | Chief Legal Officer,
since 2019 | Secretary of Wells Fargo Funds Management, LLC and Chief Legal Counsel of Wells Fargo Asset Management since 2018. Deputy General Counsel of Wells Fargo Bank, N.A. since 2020 and Assistant General Counsel of Wells Fargo Bank, N.A. from 2018 to 2020. Associate General Counsel and Managing Director of Bank of America Corporation from 2004 to 2018. |
Matthew Prasse
(Born 1983) | Secretary,
since 2021 | Senior Counsel of the Wells Fargo Legal Department since 2018. Previously, Director and Counsel for Barings LLC from 2015 to 2018. Prior to joining Barings, Associate at Morgan, Lewis & Bockius LLP from 2008 to 2015. |
Michael H. Whitaker
(Born 1967) | Chief Compliance Officer,
since 2016 | Chief Compliance Officer of Wells Fargo Asset Management since 2016. Senior Vice President and Chief Compliance Officer for Fidelity Investments from 2007 to 2016. |
1 The Statement of Additional Information includes additional information about the Trustees and is available, without charge, upon request, by calling 1-800-222-8222 or by visiting the website at wfam.com.
Wells Fargo High Yield Corporate Bond Portfolio | 23
Board considerations (unaudited)
BOARD CONSIDERATION OF INVESTMENT ADVISORY AND SUB-ADVISORY AGREEMENTS:
Wells Fargo Bloomberg Barclays US Aggregate ex-Corporate Portfolio, Wells Fargo Emerging Markets Bond Portfolio, Wells Fargo Factor Enhanced Emerging Markets Equity Portfolio, Wells Fargo Factor Enhanced International Equity Portfolio, Wells Fargo Factor Enhanced U.S. Large Cap Equity Portfolio, Wells Fargo Factor Enhanced U.S. Small Cap Equity Portfolio, Wells Fargo High Yield Corporate Bond Portfolio, Wells Fargo Investment Grade Corporate Bond Portfolio, Wells Fargo Factor Enhanced U.S. Low Volatility Equity Portfolio, Wells Fargo Strategic Retirement Bond Portfolio, and Wells Fargo U.S. REIT Portfolio
Board Considerations – Current Agreements
Under the Investment Company Act of 1940 (the “1940 Act”), the Board of Trustees (the “Board”) of Wells Fargo Master Trust (the “Trust”) must determine annually whether to approve the continuation of the Trust’s investment advisory and sub-advisory agreements. In this regard, at a meeting held on May 17-19, 2021 (the “Meeting”), the Board of the Trust, all the members of which have no direct or indirect interest in the investment advisory and sub-advisory agreements and are not “interested persons” of the Trust, as defined in the 1940 Act (the “Independent Trustees”), reviewed and approved for each of the portfolios of the Trust identified in the table below (individually, a “Portfolio” and collectively, the “Portfolios”): (i) an investment advisory agreement (the “Advisory Agreement”) with Wells Fargo Funds Management, LLC (“Funds Management”); and (ii) an investment sub-advisory agreement (each, a “Sub-Advisory Agreement” and collectively, the “Sub-Advisory Agreements”) with the sub-adviser(s) identified in the table below (each, a “Sub-Adviser” and collectively, the “Sub-Advisers”) for the corresponding Portfolio identified. The Advisory Agreement and the Sub-Advisory Agreements are collectively referred to as the “Advisory Agreements.”
| Funds Trust | Master Trust |
| Wells Fargo Bloomberg Barclays US Aggregate ex-Corporate Portfolio | Wells Capital Management Incorporated |
| Wells Fargo Emerging Markets Bond Portfolio | Wells Fargo Asset Management (International) Limited and Wells Capital Management Incorporated |
| Wells Fargo Factor Enhanced Emerging Markets Equity Portfolio | Wells Capital Management Incorporated |
| Wells Fargo Factor Enhanced International Equity Portfolio | Wells Capital Management Incorporated |
| Wells Fargo Factor Enhanced U.S. Large Cap Equity Portfolio | Wells Capital Management Incorporated |
| Wells Fargo Factor Enhanced U.S. Small Cap Equity Portfolio | Wells Capital Management Incorporated |
| Wells Fargo High Yield Corporate Bond Portfolio | Wells Capital Management Incorporated |
| Wells Fargo Investment Grade Corporate Bond Portfolio | Wells Capital Management Incorporated |
| Wells Fargo Factor Enhanced U.S. Low Volatility Equity Portfolio | Wells Capital Management Incorporated |
| Wells Fargo Strategic Retirement Bond Portfolio | Wells Capital Management Incorporated |
| Wells Fargo U.S. REIT Portfolio | Wells Capital Management Incorporated |
The Board noted that Wells Fargo & Company recently announced that it had entered into a definitive agreement to sell Wells Fargo Asset Management (“WFAM”), which includes Funds Management and the Sub-Adviser, to GTCR LLC and Reverence Capital Partners, L.P. and/or their affiliates (the “Transaction”). The Board further noted that the Transaction would result in a change-of-control of Funds Management and the Sub-Advisers, which would be considered to be an assignment that would result in the termination of the Advisory Agreements. In light of the Transaction, the Board separately considered for approval a new investment advisory agreement with Funds Management and a new investment sub-advisory agreement with each of the Sub-Advisers (the “New Agreements”) that would replace the Advisory Agreements upon consummation of the Transaction, subject to approval of the New Agreements by the Portfolios’ shareholders. The Board also considered for approval interim agreements to go into effect in the event shareholders do not approve the New Agreements before the Transaction is completed. The interim agreements would allow the Manager and the Sub-Advisers to continue providing services to the Portfolios while the Portfolios continues to seek shareholder approval of the New Agreements. The Board noted that the terms of the interim agreements would be identical to those of the current Advisory Agreements, except for the term and certain escrow provisions.
At the Meeting, the Board considered the factors and reached the conclusions described below relating to the selection of Funds Management and the Sub-Advisers and the approval of the Advisory Agreements. Prior to the Meeting, including at Board meetings held in April and May 2021, the Trustees conferred extensively among themselves and with representatives of Funds Management about these matters. Also, the Board has adopted a team-based approach, with each team consisting of a sub-set of
24 | Wells Fargo High Yield Corporate Bond Portfolio
Board considerations (unaudited)
Trustees, to assist the full Board in the discharge of its duties in reviewing investment performance and other matters throughout the year. The Independent Trustees were assisted in their evaluation of the Advisory Agreements by independent legal counsel, from whom they received separate legal advice and with whom they met separately.
In providing information to the Board, Funds Management and the Sub-Advisers were guided by a detailed set of requests for information submitted to them by independent legal counsel on behalf of the Independent Trustees at the start of the Board’s annual contract renewal process earlier in 2021. In considering and approving the Advisory Agreements, the Trustees considered the information they believed relevant, including but not limited to the information discussed below. The Board considered not only the specific information presented in connection with the Meeting, but also the knowledge gained over time through interaction with Funds Management and the Sub-Advisers about various topics. In this regard, the Board reviewed reports of Funds Management at each of its quarterly meetings, which included, among other things, portfolio reviews and investment performance reports. In addition, the Board and the teams mentioned above confer with portfolio managers at various times throughout the year. The Board did not identify any particular information or consideration that was all-important or controlling, and each individual Trustee may have attributed different weights to various factors.
After its deliberations, the Board unanimously determined that the compensation or the absence of compensation payable to Funds Management and each of the Sub-Advisers under each of the Advisory Agreements was reasonable, and approved the continuation of the Advisory Agreements for a one-year term. The Board considered the approval of the Advisory Agreements for the Portfolios as part of its consideration of agreements for funds across the complex, but its approvals were made on a fund-by-fund basis. The following summarizes a number of important, but not necessarily all, factors considered by the Board in support of its approvals.
Nature, extent and quality of services
The Board received and considered various information regarding the nature, extent and quality of services provided to the Funds by Funds Management and the Sub-Advisers under the Advisory Agreements. This information included a description of the investment advisory services and Portfolio-level administrative services covered by the Advisory Agreement, as well as, among other things, a summary of the background and experience of senior management of WFAM, of which Funds Management and the Sub-Advisers are a part, and a summary of investments made in the business of WFAM. The Board also received a description of Funds Management’s and the Sub-Advisers’ business continuity plans, including a summary of the performance of such plans and any changes thereto during the COVID-19 pandemic, and of their approaches to data privacy and cybersecurity. The Board also received and reviewed information about Funds Management’s role as administrator of the Portfolios’ liquidity risk management program, Funds Management’s approach to risk management, and Funds Management’s intermediary and vendor oversight program.
The Board also considered the qualifications, background, tenure and responsibilities of each of the portfolio managers primarily responsible for the day-to-day portfolio management of the Portfolios. The Board noted that each of the Portfolios replicates the performance of a proprietary index provided by an affiliate of Funds Management, except that each of Wells Fargo Bloomberg Barclays US Aggregate ex-Corporate Portfolio, Wells Fargo Emerging Markets Bond Portfolio, and Wells Fargo Strategic Retirement Bond Portfolio track the performance of a third party index. The Board evaluated the ability of Funds Management and the Sub-Advisers to attract and retain qualified investment professionals, including research, advisory and supervisory personnel.
The Board further considered the compliance programs and compliance records of Funds Management and the Sub-Advisers. In addition, the Board took into account the full range of services provided to the Portfolios by Funds Management and its affiliates. The Board also considered information about retention and back-up arrangements that have been put into place with respect to key personnel of WFAM in connection with the anticipated Transaction, noting that WFAM provided assurances that the announcement and eventual culmination of the Transaction is not expected to result in any diminution in the nature or quality of services provided to the Portfolios.
Portfolio investment performance and expenses
The Board considered the investment performance results for each of the Portfolios over the one- and three-year periods ended December 31, 2020, except for the Wells Fargo Factor Enhanced U.S. Low Volatility Equity Portfolio, for which the Board considered the investment performance results for the quarter ended December 31, 2020. The Board considered these results in comparison to the investment performance of funds in a universe that was determined by Broadridge Inc. (“Broadridge”) to be similar to each respective Portfolios (each, a “Universe”), and in comparison to each Portfolios’ benchmark index and to other comparative data. Broadridge is an independent provider of investment company data. The Board received a description of the methodology used by Broadridge to select the mutual funds in the performance Universe. The Board noted the short performance history of the Portfolios.
Wells Fargo High Yield Corporate Bond Portfolio | 25
Board considerations (unaudited)
With respect to the investment performance of each Portfolio relative to its respective Universe, the Board noted the following: (i) the investment performance of each of Wells Fargo Factor Enhanced International Equity Portfolio and Wells Fargo Factor Enhanced U.S. Small Cap Equity Portfolio was higher than such Portfolio’s respective Universe for the one- and three-year periods under review; (ii) the investment performance of each of Wells Fargo Bloomberg Barclays US Aggregate ex-Corporate Portfolio, Wells Fargo Emerging Markets Bond Portfolio, and Wells Fargo Investment Grade Corporate Bond Portfolio was higher than such Portfolio’s respective Universe for the three-year period under review, and lower than such Portfolio’s respective Universe for the one-year period under review; (iii) the investment performance of each of Wells Fargo Factor Enhanced Emerging Markets Equity Portfolio, Wells Fargo Factor Enhanced U.S. Large Cap Equity Portfolio, Wells Fargo High Yield Corporate Bond Portfolio, Wells Fargo Strategic Retirement Bond Portfolio, and Wells Fargo U.S. REIT Portfolio was lower than such Portfolio’s respective Universe for the one- and three-year periods under review; and (iv) the Wells Fargo Factor Enhanced U.S. Low Volatility Equity Portfolio launched on July 1, 2020 and, given its short operational history, had no historical performance.
With respect to the investment performance of each Portfolio relative to its respective benchmark index, the Board noted the following: (i) the investment performance of each of Wells Fargo Bloomberg Barclays US Aggregate ex-Corporate Portfolio, Wells Fargo Factor Enhanced International Equity Portfolio, Wells Fargo Investment Grade Corporate Bond Portfolio, Wells Fargo Factor Enhanced U.S. Low Volatility Equity Portfolio, and Wells Fargo Strategic Retirement Bond Portfolio was higher than or in range of such Portfolio’s respective benchmark index for all periods under review; (ii) the investment performance of Wells Fargo U.S. REIT Portfolio was in range of the Portfolio’s benchmark index for the three-year period under review, and was lower than the Portfolio’s benchmark index for the one-year period under review; and (iii) the investment performance of each of Wells Fargo Emerging Markets Bond Portfolio, Wells Fargo Factor Enhanced Emerging Markets Equity Portfolio, Wells Fargo Factor Enhanced U.S. Large Cap Equity Portfolio, Wells Fargo Factor Enhanced U.S. Small Cap Equity Portfolio, and Wells Fargo High Yield Corporate Bond Portfolio was lower than such Portfolio’s respective benchmark index for all periods under review.
The Board received information concerning, and discussed factors contributing to, the underperformance of each of Wells Fargo Factor Enhanced Emerging Markets Equity Portfolio, Wells Fargo Factor Enhanced International Equity Portfolio, Wells Fargo Factor Enhanced U.S. Large Cap Equity Portfolio, Wells Fargo High Yield Corporate Bond Portfolio, Wells Fargo Strategic Retirement Bond Portfolio, and Wells Fargo U.S. REIT Portfolio relative to such Portfolio’s Universe and benchmark index for the periods identified above.
The Board also received and considered information regarding the fee rates that are payable to Funds Management for investment advisory services (as discussed below), which are the only fees charged to the Portfolios, relative to corresponding class-specific expense groups that were determined by Broadridge to be similar to the Portfolios (the “Groups”). The Board received a description of the methodology used by Broadridge to select the mutual funds in the expense Groups and an explanation of how funds comprising expense groups and their expense ratios may vary from year-to-year.
The Board took into account the Portfolios’ investment performance and expense information provided to it among the factors considered in deciding to re-approve the Advisory Agreements.
Investment advisory and sub-advisory fee rates
The Board reviewed and considered the contractual fee rates payable by the Portfolios to Funds Management under the Advisory Agreement. The Board also reviewed and considered the contractual investment sub-advisory fee rates that are payable by Funds Management to the Sub-Advisers for investment sub-advisory services.
Among other information reviewed by the Board was a comparison of the Portfolios’ Management Rates with the average contractual investment management fee rates of funds in the expense Groups at a common asset level as well as transfer agency costs of the Portfolios in the expense Groups. The Board noted that the Management Rates of the Portfolios were lower than, equal to, or in range of the sum of these average rates for the Portfolios’ expense Groups.
The Board also received and considered information about the portions of the total management fees that were retained by Funds Management after payment of the fees to the Sub-Advisers for sub-advisory services. In assessing the reasonableness of these amounts, the Board received and evaluated information about the nature and extent of responsibilities retained and risks assumed by Funds Management and not delegated to or assumed by the Sub-Advisers, and about Funds Management’s on-going oversight services. Given the affiliation between Funds Management and the Sub-Advisers, the Board ascribed limited relevance to the allocation of fees between them.
The Board also received and considered information about the nature and extent of services offered and fee rates charged by Funds Management and the Sub-Advisers to other types of clients with investment strategies similar to those of certain Portfolios. In this regard, the Board received information about the significantly greater scope of services, and compliance,
26 | Wells Fargo High Yield Corporate Bond Portfolio
Board considerations (unaudited)
reporting and other legal burdens and risks of managing proprietary mutual funds compared with those associated with managing assets of other types of clients, including third-party sub-advised fund clients and non-mutual fund clients such as institutional separate accounts.
Based on its consideration of the factors and information it deemed relevant, including those described here, the Board determined that the compensation payable to Funds Management under the Advisory Agreement and to the Sub-Advisers under the Sub-Advisory Agreements was reasonable.
Profitability
The Board received and considered information concerning the profitability of Funds Management, as well as the profitability of both WFAM and Wells Fargo & Co. (“Wells Fargo”) from providing services to the funds family as a whole. The Board noted that the Sub-Advisers’ profitability information with respect to providing services to the Portfolios and other funds in the family was subsumed in the WFAM and Wells Fargo profitability analysis.
Funds Management reported on the methodologies and estimates used in calculating profitability, including a description of the methodology used to allocate certain expenses. Among other things, the Board noted that the levels of profitability reported on a fund-by-fund basis varied widely, depending on factors such as the size, type and age of fund.
Based on its review, the Board did not deem the profits reported by Funds Management, WFAM or Wells Fargo from services provided to the Portfolios to be at a level that would prevent it from approving the continuation of the Advisory Agreements.
Economies of scale
The Board received and considered information about the potential for Funds Management to experience economies of scale in the provision of management services to the Portfolios, the difficulties of calculating economies of scale at an individual fund level, and the extent to which potential scale benefits are shared with shareholders. The Board noted the existence of breakpoints in the Portfolios’ management fee structure, which operate generally to reduce the Portfolios’ expense ratios as the Portfolios grow in size, and the size of the Portfolios in relation to such breakpoints. The Board considered that in addition to management fee breakpoints, Funds Management shares potential economies of scale from its management business in a variety of ways, including through fee waiver and expense reimbursement arrangements, competitive management fee rates set at the outset without regard to breakpoints, and investments in the business intended to enhance services available to shareholders.
The Board concluded that Funds Management’s arrangements with respect to the Portfolios, including contractual breakpoints, constituted a reasonable approach to sharing potential economies of scale with the Portfolios and their shareholders.
Other benefits to Funds Management and the Sub-Advisers
The Board received and considered information regarding potential “fall-out” or ancillary benefits received by Funds Management and its affiliates, including the Sub-Advisers, as a result of their relationships with the Portfolios. Ancillary benefits could include, among others, benefits directly attributable to other relationships with the Portfolios and benefits potentially derived from an increase in Funds Management’s and the Sub-Advisers’ businesses as a result of their relationships with the Portfolios. The Board noted that various affiliates of Funds Management may receive distribution-related fees, shareholder servicing payments and sub-transfer agency fees in respect of shares sold or held through them and services provided.
The Board also reviewed information about soft dollar credits earned and utilized by the Sub-Advisers, fees earned by Funds Management and Wells Capital Management Incorporated from managing a private investment vehicle for the fund family’s securities lending collateral, and commissions earned by an affiliated broker from portfolio transactions.
Based on its consideration of the factors and information it deemed relevant, including those described here, the Board did not find that any ancillary benefits received by Funds Management and its affiliates, including the Sub-Advisers, were unreasonable.
Conclusion
At the Meeting, after considering the above-described factors and based on its deliberations and its evaluation of the information described above, the Board unanimously determined that the compensation payable to Funds Management and the Sub-Advisers under each of the Advisory Agreements was reasonable, and approved the continuation of the Advisory Agreements for a one-year term.
Wells Fargo High Yield Corporate Bond Portfolio | 27
Board considerations (unaudited)
Board Considerations – New Agreements
Overview of the Board evaluation process
At a meeting held on May 17-19, 2021 (the “Board Meeting”), the Board of Trustees (the “Board”) of Wells Fargo Master Trust (the “Trust”, and the series identified below, the “Portfolios”) approved the continuation of each Portfolio’s current Investment Advisory Agreement (the “Current Investment Advisory Agreement”) and the current Sub-Advisory Agreements (the “Current Sub-Advisory Agreements”, and collectively, the “Current Agreements”).
| Wells Fargo Disciplined Large Cap Portfolio |
| Wells Fargo Diversified Large Cap Growth Portfolio |
| Wells Fargo Disciplined International Developed Markets Portfolio |
| Wells Fargo Large Company Value Portfolio |
| Wells Fargo Managed Fixed Income Portfolio |
| Wells Fargo Bloomberg Barclays US Aggregate ex-Corporate Portfolio |
| Wells Fargo Emerging Markets Bond Portfolio |
| Wells Fargo Factor Enhanced Emerging Markets Equity Portfolio |
| Wells Fargo Factor Enhanced International Equity Portfolio |
| Wells Fargo Factor Enhanced U.S. Large Cap Equity Portfolio |
| Wells Fargo Factor Enhanced U.S. Low Volatility Equity Portfolio |
| Wells Fargo Factor Enhanced U.S. Small Cap Equity Portfolio |
| Wells Fargo High Yield Corporate Bond Portfolio |
| Wells Fargo Investment Grade Corporate Bond Portfolio |
| Wells Fargo Strategic Retirement Bond Portfolio |
| Wells Fargo U.S. REIT Portfolio |
Each Trustee on the Board is not an “interested person” (as defined in the Investment Company Act of 1940 (the “1940 Act”)) of the Portfolios (collectively, the “Independent Trustees”). The process followed by the Board in considering and approving the continuation of the Current Agreements is referred to herein as the “2021 Annual Approval Process.”
As noted above, the closing of the sale of Wells Fargo Asset Management (“WFAM”) to a holding company (“NewCo”) affiliated with private funds of GTCR LLC (“GTCR”) and of Reverence Capital Partners, L.P. (“Reverence Capital”, and such transaction, the “Transaction”) will result in a change of control of Wells Fargo Funds Management LLC (“Funds Management”), Wells Capital Management Incorporated (“Wells Capital”) and Wells Fargo Asset Management (International) Limited (“WFAM(I) Ltd.”, and together with Funds Management and Wells Capital, the “Advisers”), which will be considered to be an “assignment” of each Portfolio’s Current Agreements under the 1940 Act that will result in the automatic termination of each Portfolio’s Current Agreements. In light of the expected termination of each Portfolio’s Current Agreements upon the closing, at the Board Meeting the Board also considered and approved: (i) a new Investment Advisory Agreement (the “New Investment Advisory Agreement”) between the Trust, on behalf of each Portfolio, and Funds Management; (ii) a new Sub-Advisory Agreement (the “New Wells Capital Sub-Advisory Agreement”) among the Trust, on behalf of each Portfolio, Funds Management and Wells Capital; and (iii) a new Sub-Advisory Agreement (the “New WFAM(I) Ltd Sub-Advisory Agreement”) among the Trust, on behalf of Emerging Markets Bond Portfolio, Funds Management and WFAM(I) Ltd (“WFAMI”); and (iv) a new Sub-Advisory Agreement (the “New Galliard Sub-Advisory Agreement”, and collectively, the “New Agreements”) among the Trust, on behalf of Managed Fixed Income Portfolio, Funds Management and Galliard Capital Management, LLC (“Galliard”, and together with Wells Capital and WFAMI, the “Sub-Advisers”), each of which is intended to go into effect upon the closing. The process followed by the Board in reviewing and approving the New Agreements is referred to herein as the “New Agreement Approval Process.”
At a series of meetings held in April and May 2021 (collectively, “April and May 2021 Meetings”) and at the Board Meeting, the Trustees conferred extensively among themselves and with senior representatives of Funds Management, GTCR and Reverence Capital about the New Agreements and related matters. The Board reviewed and discussed information furnished by Funds Management, GTCR and Reverence Capital that the Board considered reasonably necessary to evaluate the terms of the New Agreements and the services to be provided. At these meetings, senior representatives from Funds Management, GTCR and Reverence Capital made presentations to, and responded to questions from, the Board.
In providing information to the Board in connection with the 2021 annual approval process for the Current Agreements (the “2021 Annual Approval Process”) and the New Agreement Approval Process, Funds Management, GTCR and Reverence Capital (as applicable) were guided by requests for information submitted by independent legal counsel on behalf of the Independent Trustees. In considering and approving the New Agreements, the Trustees considered the information they believed relevant, including but not limited to the information discussed herein. The Board considered not only the specific information presented in
28 | Wells Fargo High Yield Corporate Bond Portfolio
Board considerations (unaudited)
connection with the April and May 2021 Meetings as well as the Board Meeting, but also the knowledge gained over time through interaction with Funds Management and the Sub-Advisers about various topics. In this regard, the Board reviews reports of Funds Management at each of its regular Board meetings, which includes, among other things, portfolio reviews and investment performance reports. In addition, the Board confers with portfolio managers at various times throughout the year. The Board was assisted in its evaluation of the New Agreements by independent legal counsel, from whom the Independent Trustees received separate legal advice and with whom the Independent Trustees met separately. The Board did not identify any particular information or consideration that was all-important or controlling, and each individual Trustee may have attributed different weights to various factors.
Among other information considered by the Board in connection with the Transaction was:
| ■ | Information regarding the Transaction: information about the structure, financing sources and material terms and conditions of the Transaction, including the expected impact on the businesses conducted by the Advisers and by Wells Fargo Funds Distributor LLC. |
| ■ | Information regarding NewCo, GTCR and Reverence Capital: (i) information about NewCo, including information about its expected financial condition and access to capital, and senior leadership team; (ii) the experience of senior management at GTCR and Reverence Capital in acquiring portfolio companies; (iii) the plan to operationalize NewCo, including the transition of necessary infrastructure services through a transition services agreement with Wells Fargo under which Wells Fargo will continue to provide NewCo with certain services for a specified period of time after the closing; and (iv) information regarding regulatory matters, compliance, and risk management functions at NewCo, including resources to be dedicated thereto. |
| ■ | Impact of the Transaction on WFAM and Service Providers: (i) information regarding any changes to personnel and/or other resources of the Advisers as a result of the Transaction, including assurances regarding comparable and competitive compensation arrangements to attract and retain highly qualified personnel; and (ii) information about the organizational and operating structure with respect to NewCo, the Advisers and the Portfolios. |
| ■ | Impact of the Transaction on the Portfolios and their Shareholders: (i) information regarding anticipated benefits to the Portfolios as a result of the Transaction; (ii) a commitment that the Portfolios would not bear any expenses, directly or indirectly, in connection with the Transaction; (iii) confirmation that the Advisers intend to continue to manage the Portfolios in a manner consistent with each Portfolio’s current investment objectives and principal investments strategies; and (iv) a commitment that neither NewCo nor WFAM will take any steps that would impose any “unfair burden” (as that term is used in section 15(f)(1)(B) of the 1940 Act) on the Portfolios as a result of the Transaction. |
With respect to the New Agreements, the Board considered: (i) a representation that, after the closing, all of the Portfolios will continue to be managed and advised by their current Advisers, and that the same portfolio managers of the Sub-Advisers are expected to continue to manage the Portfolios after the Transaction; (ii) information regarding the terms of the New Agreements, including changes as compared to the Current Agreements; (iii) information confirming that the fee rates payable under the New Agreements will not increase as a result of the Transaction as compared to the rates under the Current Agreements; and (iv) assurances that the Transaction is not expected to cause any diminution with respect to the nature, extent and quality of any of the services currently provided to the Portfolios by the Advisers as a result of the Transaction.
In addition to considering information furnished specifically to evaluate the impact of the Transaction on the Portfolios and their respective shareholders in connection with the New Agreement Approval Process, the Board considered information furnished at prior meetings of the Board and its committees, including detailed information provided in connection with the 2021 Annual Approval Process. In this regard, in connection with the 2021 Annual Approval Process, the Board received information about complex-wide and individual Portfolio performance, fees and expenses, including: (i) a report from an independent data provider comparing the investment performance of each Portfolio to the investment performance of comparable funds and benchmark indices, over various time periods; (ii) a report from an independent data provider comparing each Portfolio’s total expense ratio (and its components) to those of comparable funds; (iii) comparative information concerning the fees charged and services provided by the Advisers to each Portfolio in managing other accounts (which may include other mutual funds, collective investment funds and institutional accounts), if any, that employ investment strategies and techniques similar to those used in managing such Portfolio(s); and (iv) profitability analyses of Funds Management, as well as the profitability of both WFAM and Wells Fargo from providing services to the fund family as a whole.
After its deliberations, the Board unanimously determined that the compensation payable to Funds Management and the Sub-Advisers under the New Agreements is reasonable, approved the New Agreements for a two-year term. The Board considered the approval of the New Agreements as part of its consideration of agreements for funds across the complex, but its approvals were made on a fund-by-fund basis. The following summarizes a number of important, but not necessarily all, factors considered by the Board in support of its approvals.
Wells Fargo High Yield Corporate Bond Portfolio | 29
Board considerations (unaudited)
Nature, extent and quality of services
In connection with the 2021 Annual Approval Process, the Board received and considered various information regarding the nature, extent and quality of services provided to each Portfolio by Funds Management and the Sub-Advisers under the Advisory Agreements. This information included a description of the investment advisory services and administrative services covered by the Current Advisory Agreement, as well as, among other things, a summary of the background and experience of senior management of WFAM, of which Funds Management and the Sub-Advisers are a part, and a summary of investments made in the business of WFAM. The Board also received a description of Funds Management’s and the Sub-Advisers’ business continuity plans, including a summary of the performance of such plans and any changes thereto during the COVID-19 pandemic, and of their approaches to data privacy and cybersecurity. The Board also received and reviewed information about Funds Management’s role as administrator of the Portfolios’ liquidity risk management program, Funds Management’s approach to risk management, and Funds Management’s intermediary and vendor oversight program.
In connection with the 2021 Annual Approval Process, the Board also considered the qualifications, background, tenure and responsibilities of each of the portfolio managers primarily responsible for the day-to-day portfolio management of the Portfolios. The Board evaluated the ability of Funds Management and the Sub-Advisers to attract and retain qualified investment professionals, including research, advisory and supervisory personnel.
In connection with the 2021 Annual Approval Process, the Board further considered the compliance programs and compliance records of Funds Management and the Sub-Advisers. In addition, the Board took into account the full range of services provided to the Portfolios by Funds Management and its affiliates.
In connection with the New Agreement Approval Process, the Board considered, among other information, the structure of the Transaction and expected impact, if any, of the Transaction on the operations, facilities, organization and personnel of the Advisers. The Board received assurances from the Advisers that each Portfolio will continue to be advised by its current Advisers after the closing, and that the same individual portfolio managers are expected to continue to manage the Portfolios after the closing. With respect to the recruitment and retention of key personnel, the Board noted information from GTCR, Reverence Capital and the Advisers regarding the potential benefits for employees of joining NewCo. The Board recognized that the personnel who had been extended offers may not accept such offers and personnel changes may occur in the future in the ordinary course.
In addition, the Board considered information regarding the infrastructure, operational capabilities and support staff in place to assist in the portfolio management and operations of the Portfolios, including the provision of administrative services, and the anticipated impact of the Transaction on such matters. The Board also considered the business-related and other risks to which the Advisers may be subject in managing the Portfolios and in connection with the Transaction. The Board also considered the transition and integration plans as a result of the change in ownership of the Advisers from Wells Fargo to NewCo. The Board considered the resources and infrastructure that NewCo intends to devote to its compliance program to ensure compliance with applicable laws and regulations, as well as its risk management program and cybersecurity program. The Board also took into account assurances received from the Advisers, GTCR and Reverence Capital that the Transaction is not expected to cause any diminution in the nature, extent and quality of services provided by the Advisers to the Portfolios and their shareholders.
Investment performance and expenses
In connection with the 2021 Annual Approval Process, the Board considered the investment performance results for each Portfolio over various time periods ended December 31, 2020. The Board considered these results in comparison to the investment performance of funds in a universe that was determined by Broadridge Inc. (“Broadridge”) to be similar to each Portfolio (the “Universe”), and in comparison to each Portfolio’s benchmark index and to other comparative data. Broadridge is an independent provider of investment company data. The Board received a description of the methodology used by Broadridge to select the mutual funds in the performance Universe. Where applicable, the Board received information concerning, and discussed factors contributing to, underperformance of Portfolios relative to the Universe and benchmark for any underperformance periods.
In connection with the 2021 Annual Approval Process, the Board also reviewed the fee rates that are payable to Funds Management for investment advisory services (as discussed below), which are the only fees charged at the Portfolio level, relative to corresponding expense groups that were determined by Broadridge to be similar to the Portfolios (the “Groups”). The Board received a description of the methodology used by Broadridge to select the mutual funds in the expense Groups and an explanation of how funds comprising expense groups and their expense ratios may vary from year-to-year.
In connection with the New Agreement Approval Process, the Board received a commitment that WFAM will maintain fee and expense commitments for at least two years after the closing. The Board took into account each Fund’s investment performance and expense information among the factors considered in deciding to approve the New Agreements.
30 | Wells Fargo High Yield Corporate Bond Portfolio
Board considerations (unaudited)
Investment advisory and sub-advisory fee rates
In connection with the 2021 Annual Approval Process, the Board reviewed and considered the contractual investment advisory fee rate that is payable by each Portfolio to Funds Management for investment advisory services under the Current Advisory Agreement (the “Advisory Agreement Rate”). The Board also reviewed and considered the contractual investment sub-advisory fee rate that is payable by Funds Management to the applicable Sub-Adviser for investment sub-advisory services (the “Sub-Advisory Agreement Rate”).
Among other information reviewed by the Board in connection with the 2021 Annual Approval Process, was a comparison of each Portfolio’s Advisory Agreement Rate with those of other funds in the Portfolio’s expense Group at a common asset level.
In connection with the 2021 Annual Approval Process, the Board also received and considered information about the portion of the total management fee that was retained by Funds Management after payment of the Sub-Advisory Agreement Rates. In assessing the reasonableness of this amount, the Board received and evaluated information about the nature and extent of responsibilities retained and risks assumed by Funds Management and not delegated to or assumed by the Sub-Advisers, and about Funds Management’s on-going oversight services. Given the affiliation between Funds Management and the Sub-Advisers, the Board ascribed limited relevance to the allocation of fees between them.
In connection with the 2021 Annual Approval Process, the Board also received and considered information about the nature and extent of services offered and fee rates charged by Funds Management and the Sub-Advisers to other types of clients, if any, with investment strategies similar to those of each Portfolio. In this regard, the Board received information about the significantly greater scope of services, and compliance, reporting and other legal burdens and risks of managing proprietary mutual funds compared with those associated with managing assets of other types of clients, including third-party sub-advised fund clients and non-mutual fund clients such as institutional separate accounts.
In connection with the New Agreement Approval Process, the Board noted the assurances received by it that there would be no increases to any of the Advisory Agreement Rates or the Sub-Advisory Agreement Rates as a result of the Transaction. The Board also considered that the New Agreements do not change the computation method for calculating such fees, and there is no present intention to reduce expense waiver and reimbursement arrangements that are currently in effect. Based on its consideration of the factors and information it deemed relevant, including those described here, the Board determined that the compensation payable to Funds Management under the New Advisory Agreement and to each of the Sub-Advisers under the applicable new Sub-Advisory Agreement was reasonable.
Profitability
In connection with the 2021 Annual Approval Process, the Board received and considered information concerning the profitability of Funds Management, as well as the profitability of both WFAM and Wells Fargo from providing services to the fund family as a whole. The Board noted that the Sub-Advisers’ profitability information with respect to providing services to each Fund and other funds in the family was subsumed in the WFAM and Wells Fargo profitability analysis.
Funds Management reported on the methodologies and estimates used in calculating profitability in connection with the 2021 Annual Approval Process, including a description of the methodology used to allocate certain expenses. Among other things, the Board noted that the levels of profitability reported on a fund-by-fund basis varied widely, depending on factors such as the size, type and age of fund.
In connection with the New Agreement Approval Process, the Board received certain information about NewCo’s projected financial condition, and reviewed with senior representatives of Funds Management, GTCR and Reverence Capital the underlying assumptions on which such information was based. The Board considered that NewCo is a newly formed entity, with no historical operations, revenues or expenses, and that it is difficult to predict with any degree of certainty the future profitability of NewCo and the Advisers from advisory activities under the New Agreements. The Board considered that the fee rates payable under the New Agreements will not increase as a result of the Transaction as compared to the rates under the Current Agreements, and that the current contractual expense limitations applicable to each Portfolio will not increase. The Board noted that if the New Agreements are approved by shareholders and the Transaction closes, the Board will have the opportunity in the future to review the profitability of NewCo and the Advisers from advisory activities under the New Agreements.
Economies of scale
In connection with the 2021 Annual Approval Process, the Board received and considered information about the potential for Funds Management to experience economies of scale in the provision of advisory services to the Portfolios, the difficulties of calculating economies of scale at an individual fund level, and the extent to which potential scale benefits are shared with Portfolio shareholders. The Board noted the existence of breakpoints in each Portfolio’s advisory fee structure, which operate generally to reduce the Portfolio’s expense ratios as the Portfolio grows in size, and the size of the Portfolio in relation to such breakpoints. The
Wells Fargo High Yield Corporate Bond Portfolio | 31
Board considerations (unaudited)
Board considered that, in addition to advisory fee breakpoints, Funds Management shares potential economies of scale from its management business in a variety of ways, including through fee waiver and expense reimbursement arrangements, competitive management fee rates set at the outset without regard to breakpoints, and investments in the business intended to enhance services available to shareholders.
In connection with the New Agreement Approval Process, the Board noted that NewCo and the Advisers may benefit from possible growth of the Portfolios resulting from enhanced distribution capabilities for their investing funds. However, the Board noted that other factors could also affect the potential for economies of scale, and that it was not possible to quantify any potential future economies of scale. Based upon the information furnished to the Board in connection with the 2021 Annual Approval Process and the New Agreement Approval Process, the Board concluded that Funds Management’s arrangements with respect to each Portfolio, including contractual breakpoints and expense limitation arrangements, constituted a reasonable approach to sharing potential economies of scale with the Portfolio and its shareholders.
“Fall-out” benefits to Funds Management and the Sub-Advisers
In connection with the 2021 Annual Approval Process, the Board received and considered information regarding potential “fall-out” or ancillary benefits received by Funds Management and its affiliates, including the Sub-Advisers, as a result of their relationships with the Portfolios. Ancillary benefits could include, among others, benefits directly attributable to other relationships with the Portfolios and benefits potentially derived from an increase in Funds Management’s and the Sub-Advisers’ business as a result of their relationships with the Portfolios. The Board noted that various current affiliates of Funds Management may receive distribution-related fees, shareholder servicing payments and sub-transfer agency fees in respect of shares sold or held through them and services provided.
In connection with the 2021 Annual Approval Process, the Board also reviewed information about soft dollar credits earned and utilized by the Sub-Advisers, fees earned by Funds Management and Wells Capital from managing a private investment vehicle for the fund family’s securities lending collateral, and commissions earned by an affiliated broker of Wells Fargo from portfolio transactions.
In connection with the New Agreement Approval Process, the Board received information to the effect that the Transaction is not expected to have a material impact on the fall-out benefits currently realized by Funds Management and its affiliates, including the Sub-Advisers. The information reviewed by the Board also noted that several of the ancillary benefits identified for WFAM would be potential ancillary benefits for NewCo, including that the scale and reputation of the Portfolios might benefit NewCo’s broader reputation, product initiatives, technology investment and talent acquisition. Based on its consideration of the factors and information it deemed relevant, including those described here, the Board did not find that any ancillary benefits expected to be received by Funds Management and its affiliates, including NewCo and the Sub-Advisers, under the New Agreements were unreasonable.
Conclusion
At the Board Meeting, after considering the above-described factors and based on its deliberations and its evaluation of the information described above, the Board unanimously determined that the compensation payable to Funds Management and to each of the Sub-Advisers under the New Agreements is reasonable, approved the New Agreements for a two-year term.
32 | Wells Fargo High Yield Corporate Bond Portfolio
Board considerations (unaudited)
Board Considerations - Interim Agreements
At a meeting held on May 17-19, 2021 (the “Board Meeting”), the Boards of Trustees (each, a “Board”, and collectively, the “Boards”) of Wells Fargo Funds Trust, Wells Fargo Master Trust, Wells Fargo Variable Trust, Wells Fargo Global Dividend Opportunity Fund, Wells Fargo Income Opportunities Fund, Wells Fargo Multi-Sector Income Fund and Wells Fargo Utilities and High Income Fund (each a “Trust”, and the series thereof, a “Fund”) reviewed and approved for the Trusts and Funds, as applicable: (i) interim investment management agreements (the “Interim Management Agreements”) with Wells Fargo Funds Management, LLC (“Funds Management”); (ii) interim investment advisory agreements (the “Interim Advisory Agreements”) with Funds Management; and (iii) interim sub-advisory agreements (the “Interim Sub-Advisory Agreements”) with each of Cooke & Bieler, L.P., Galliard Capital Management LLC (“Galliard”), Peregrine Capital Management Inc., Wells Capital Management, LLC (“WellsCap”), and Wells Fargo Asset Management (International) Limited (“WFAMI”, and collectively, the “Sub-Advisers”). Each Trustee on the Board is not an “interested person” (as defined in the Investment Company Act of 1940 (the “1940 Act”) of the Funds (collectively, the “Independent Trustees”). The Interim Management Agreements, Interim Advisory Agreements, and Interim Sub-Advisory Agreements are collectively referred to as the “Interim Advisory Agreements.”
At the Board Meeting, the Boards reviewed and approved the continuation of existing investment management, advisory and sub-advisory agreements (the “Current Advisory Agreements”) for each Trust and Fund, as applicable. The factors considered and conclusions reached by the Boards in approving the Current Advisory Agreements are summarized in the section entitled “Board Considerations – Current Agreements” of this shareholder report. The Boards noted that Wells Fargo & Company has entered into a definitive agreement to sell Wells Fargo Asset Management (“WFAM”), which includes Funds Management, Galliard, WellsCap and WFAMI (the “Affiliated Sub-Advisers”), to a holding company affiliated with private funds of GTCR LLC and Reverence Capital Partners, L.P. (the “Transaction”). The Boards further noted that the Transaction would result in a change-of-control of Funds Management and the Affiliated Sub-Advisers, which would be considered to be an “assignment” under the 1940 Act that would terminate the Current Advisory Agreements. At the Board Meeting, the Boards also reviewed and approved new investment management, advisory and sub-advisory agreements (the “New Advisory Agreements”) for each Trust and Fund, as applicable, that would replace the Current Advisory Agreements upon consummation of the Transaction, subject to approval of the New Advisory Agreements by the applicable Trust’s or Fund’s shareholders. The factors considered and conclusions reached by the Boards in approving the New Advisory Agreements are summarized in the section entitled “Board Considerations – New Agreements” of this shareholder report.
At the Board Meeting, the Boards also approved the Interim Advisory Agreements, which will go into effect for a Trust or Fund only in the event that shareholders of such Trust or Fund do not approve the New Advisory Agreement(s) for the Trust or Fund by the closing date of the Transaction, when the Current Advisory Agreements will terminate. The Board noted that, in such a circumstance, the Interim Advisory Agreements will permit continuity of management by allowing Funds Management and the Sub-Advisers to continue providing services to the Trust or Fund pursuant to the Interim Advisory Agreements while the Trust or Fund continues to solicit shareholder approval of such New Advisory Agreement(s). The Boards noted that the terms of the Interim Advisory Agreements are identical to those of the Current Advisory Agreements, except for the term and the addition of escrow provisions with respect to the advisory fees. The Boards also noted that the entities that would service the Funds and Trusts under the Interim Advisory Agreements are identical to those that provide services under the Current Advisory Agreements and those that will provide services under the New Advisory Agreements.
In approving the Interim Advisory Agreements, the Boards considered the same factors and reached the same conclusions as they considered and reached with respect to the Boards’ approvals of the Current Advisory Agreements and New Advisory Agreements, as applicable, which are described in separate Board Consideration sections within this shareholder report. Prior to the Board Meeting, including at a series of meetings held in April and May 2021, the Trustees conferred extensively among themselves and with senior representatives of Funds Management, GTCR LLC and Reverence Capital Partners, L.P. about the Interim Advisory Agreements and related matters. The Independent Trustees were assisted in their evaluation of the Interim Advisory Agreements by independent legal counsel, from whom they received separate legal advice and with whom they met separately.
At the Board Meeting, after considering the factors and reaching the conclusions described in the separate Board Consideration sections within this shareholder report, the Boards unanimously determined that the compensation payable to Funds Management and to each Sub-Adviser under each of the Interim Advisory Agreements was reasonable, and approved the Interim Advisory Agreements.
Wells Fargo High Yield Corporate Bond Portfolio | 33
For more information
More information about Wells Fargo Funds is available free upon request. To obtain literature, please write, visit the Portfolio's website, or call:
Wells Fargo Funds
P.O. Box 219967
Kansas City, MO 64121-9967
Website: wfam.com
Individual investors: 1-800-222-8222
Retail investment professionals: 1-888-877-9275
Institutional investment professionals: 1-866-765-0778
This report and the financial statements contained herein are submitted for the general information of the interest holders of the Portfolio. If this report is used for promotional purposes, distribution of the report must be accompanied or preceded by a current prospectus. Before investing, please consider the investment objectives, risks, charges, and expenses of the investment. For a current prospectus and, if available, a summary prospectus, containing this information, call
1-800-222-8222 or visit the Portfolio's website at wfam.com. Read the prospectus carefully before you invest or send money.
Wells Fargo Asset Management (WFAM) is the trade name for certain investment advisory/management firms owned by Wells Fargo & Company. These firms include but are not limited to Wells Capital Management, LLC and Wells Fargo Funds Management, LLC. Certain products managed by WFAM entities are distributed by Wells Fargo Funds Distributor, LLC (a broker-dealer and Member FINRA).
This material is for general informational and educational purposes only and is NOT intended to provide investment advice or a recommendation of any kind - including a recommendation for any specific investment, strategy, or plan.
INVESTMENT PRODUCTS: NOT FDIC INSURED ■ NO BANK GUARANTEE ■ MAY LOSE VALUE
© 2021 Wells Fargo & Company. All rights reserved.
Semi-Annual Report
August 31, 2021
Wells Fargo Investment Grade
Corporate Bond Portfolio
INVESTMENT PRODUCTS: NOT FDIC INSURED ■ NO BANK GUARANTEE ■ MAY LOSE VALUE
Portfolio information (unaudited)
| Investment objective | The Portfolio seeks to replicate the total return of the Bloomberg U.S. Corporate Bond Index, before fees and expenses. |
| Adviser | Wells Fargo Funds Management, LLC |
| Subadviser | Wells Capital Management, LLC |
| Portfolio managers | Manjunath Boraiah†, Mark Clegg, CFA®‡, Janet S. Rilling, CFA®‡, Michael J. Schueller, CFA®‡, Noah M. Wise, CFA®‡ |
| Ten largest holdings (%) as of August 31, 20211 |
| AT&T Incorporated, 4.30%, 12-15-2042 | 0.81 |
| The Boeing Company, 3.20%, 3-1-2029 | 0.75 |
| Bank of Montreal, 3.80%, 12-15-2032 | 0.75 |
| Verizon Communications Incorporated, 4.67%, 3-15-2055 | 0.73 |
| BNP Paribas, 4.25%, 10-15-2024 | 0.66 |
| JPMorgan Chase & Company, 4.26%, 2-22-2048 | 0.65 |
| Bank of America Corporation, 3.95%, 1-23-2049 | 0.64 |
| Goldman Sachs Group Incorporated, 4.75%, 10-21-2045 | 0.64 |
| McDonald's Corporation, 3.50%, 7-1-2027 | 0.62 |
| Comcast Corporation, 4.00%, 11-1-2049 | 0.61 |
| 1 | Figures represent the percentage of the Portfolio's net assets. Holdings are subject to change and may have changed since the date specified. |
| Sector allocation as of August 31, 20211 |
| 1 | Figures represent the percentage of the Portfolio's long-term investments. These amounts are subject to change and may have changed since the date specified. |
| ‡ | CFA® and Chartered Financial Analyst® are trademarks owned by CFA Institute. |
2 | Wells Fargo Investment Grade Corporate Bond Portfolio
Portfolio of investments—August 31, 2021 (unaudited)
| | | Interest
rate | Maturity
date | Principal | Value |
| Corporate bonds and notes: 80.29% | | | | | |
| Communication services: 5.99% | | | | | |
| Diversified telecommunication services: 1.82% | | | | | |
| AT&T Incorporated | | 4.30% | 12-15-2042 | $1,630,000 | $ 1,883,926 |
| AT&T Incorporated | | 4.50 | 5-15-2035 | 335,000 | 397,235 |
| AT&T Incorporated | | 4.90 | 6-15-2042 | 36,000 | 45,015 |
| Verizon Communications Incorporated | | 4.13 | 3-16-2027 | 200,000 | 228,676 |
| Verizon Communications Incorporated | | 4.67 | 3-15-2055 | 1,300,000 | 1,695,445 |
| | | | | | 4,250,297 |
| Entertainment: 0.87% | | | | | |
| Activision Blizzard | | 1.35 | 9-15-2030 | 700,000 | 658,320 |
| Walt Disney Company | | 2.20 | 1-13-2028 | 435,000 | 453,209 |
| Walt Disney Company | | 2.65 | 1-13-2031 | 855,000 | 908,184 |
| | | | | | 2,019,713 |
| Interactive media & services: 0.71% | | | | | |
| Alphabet Incorporated | | 2.25 | 8-15-2060 | 540,000 | 490,798 |
| Alphabet Incorporated | | 3.38 | 2-25-2024 | 1,087,000 | 1,167,613 |
| | | | | | 1,658,411 |
| Media: 2.59% | | | | | |
| CBS Corporation | | 3.70 | 8-15-2024 | 350,000 | 376,879 |
| CBS Corporation | | 4.85 | 7-1-2042 | 140,000 | 172,100 |
| CBS Corporation | | 4.90 | 8-15-2044 | 350,000 | 431,588 |
| Charter Communications Operating LLC | | 4.40 | 12-1-2061 | 260,000 | 284,884 |
| Charter Communications Operating LLC | | 4.91 | 7-23-2025 | 400,000 | 452,598 |
| Charter Communications Operating LLC | | 6.83 | 10-23-2055 | 335,000 | 500,148 |
| Comcast Corporation | | 1.50 | 2-15-2031 | 400,000 | 383,507 |
| Comcast Corporation | | 2.35 | 1-15-2027 | 210,000 | 221,600 |
| Comcast Corporation | | 4.00 | 11-1-2049 | 1,200,000 | 1,426,433 |
| Discovery Communications LLC | | 3.95 | 3-20-2028 | 400,000 | 446,829 |
| Discovery Communications LLC | | 4.00 | 9-15-2055 | 241,000 | 258,008 |
| Fox Corporation | | 5.58 | 1-25-2049 | 220,000 | 302,626 |
| Time Warner Cable Incorporated | | 5.50 | 9-1-2041 | 210,000 | 262,259 |
| Time Warner Cable Incorporated | | 8.38 | 3-15-2023 | 175,000 | 195,671 |
| Time Warner Entertainment Company LP | | 8.38 | 7-15-2033 | 210,000 | 312,727 |
| | | | | | 6,027,857 |
| Consumer discretionary: 4.72% | | | | | |
| Automobiles: 0.20% | | | | | |
| General Motors Company | | 6.25 | 10-2-2043 | 345,000 | 472,308 |
| Hotels, restaurants & leisure: 1.48% | | | | | |
| GLP Capital LP | | 5.30 | 1-15-2029 | 400,000 | 469,688 |
| Marriott International Incorporated | | 4.63 | 6-15-2030 | 400,000 | 459,667 |
| McDonald's Corporation | | 3.38 | 5-26-2025 | 245,000 | 265,085 |
| McDonald's Corporation | | 3.50 | 7-1-2027 | 1,300,000 | 1,443,080 |
| McDonald's Corporation | | 4.60 | 5-26-2045 | 175,000 | 221,622 |
| Starbucks Corporation | | 4.00 | 11-15-2028 | 500,000 | 576,970 |
| | | | | | 3,436,112 |
The accompanying notes are an integral part of these financial statements.
Wells Fargo Investment Grade Corporate Bond Portfolio | 3
Portfolio of investments—August 31, 2021 (unaudited)
| | | Interest
rate | Maturity
date | Principal | Value |
| Household durables: 0.04% | | | | | |
| Whirlpool Corporation | | 4.00% | 3-1-2024 | $ 87,000 | $ 94,011 |
| Internet & direct marketing retail: 0.68% | | | | | |
| Amazon.com Incorporated | | 4.05 | 8-22-2047 | 400,000 | 494,343 |
| Amazon.com Incorporated | | 4.25 | 8-22-2057 | 400,000 | 521,108 |
| Amazon.com Incorporated | | 4.95 | 12-5-2044 | 215,000 | 295,611 |
| eBay Incorporated | | 4.00 | 7-15-2042 | 175,000 | 198,130 |
| Expedia Incorporated | | 4.50 | 8-15-2024 | 70,000 | 76,169 |
| | | | | | 1,585,361 |
| Leisure products: 0.06% | | | | | |
| Hasbro Incorporated | | 6.35 | 3-15-2040 | 108,000 | 151,374 |
| Multiline retail: 0.33% | | | | | |
| Dollar General Corporation | | 3.25 | 4-15-2023 | 245,000 | 254,564 |
| Target Corporation | | 3.63 | 4-15-2046 | 430,000 | 515,924 |
| | | | | | 770,488 |
| Professional services: 0.29% | | | | | |
| University of Pennsylvania | | 3.61 | 2-15-2119 | 570,000 | 664,078 |
| Specialty retail: 1.57% | | | | | |
| AutoZone Incorporated | | 3.13 | 7-15-2023 | 105,000 | 109,620 |
| Home Depot Incorporated | | 2.70 | 4-15-2030 | 1,300,000 | 1,395,340 |
| Home Depot Incorporated | | 3.50 | 9-15-2056 | 380,000 | 435,570 |
| Lowe's Companies Incorporated | | 2.50 | 4-15-2026 | 350,000 | 371,878 |
| Lowe's Companies Incorporated | | 3.88 | 9-15-2023 | 175,000 | 185,666 |
| Lowe's Companies Incorporated | | 4.50 | 4-15-2030 | 300,000 | 356,069 |
| O'Reilly Automotive Incorporated | | 3.80 | 9-1-2022 | 105,000 | 107,682 |
| TJX Companies Incorporated | | 3.88 | 4-15-2030 | 600,000 | 693,201 |
| | | | | | 3,655,026 |
| Textiles, apparel & luxury goods: 0.07% | | | | | |
| Nike Incorporated | | 2.25 | 5-1-2023 | 70,000 | 72,021 |
| Nike Incorporated | | 3.63 | 5-1-2043 | 70,000 | 82,907 |
| | | | | | 154,928 |
| Consumer staples: 6.89% | | | | | |
| Beverages: 1.77% | | | | | |
| Anheuser-Busch InBev Finance Company | | 4.00 | 1-17-2043 | 210,000 | 237,481 |
| Anheuser-Busch InBev Finance Company | | 4.63 | 2-1-2044 | 635,000 | 773,902 |
| Anheuser-Busch InBev Worldwide Incorporated | | 4.75 | 4-15-2058 | 400,000 | 508,544 |
| Constellation Brands Incorporated | | 3.15 | 8-1-2029 | 300,000 | 324,154 |
| Constellation Brands Incorporated | | 4.25 | 5-1-2023 | 360,000 | 381,507 |
| Keurig Dr Pepper Incorporated | | 4.60 | 5-25-2028 | 700,000 | 821,468 |
| Molson Coors Beverage Company | | 4.20 | 7-15-2046 | 210,000 | 237,288 |
| PepsiCo Incorporated | | 3.63 | 3-19-2050 | 285,000 | 338,697 |
| The Coca-Cola Company | | 4.20 | 3-25-2050 | 400,000 | 510,671 |
| | | | | | 4,133,712 |
| Food & staples retailing: 2.33% | | | | | |
| Costco Wholesale Corporation | | 1.60 | 4-20-2030 | 1,000,000 | 992,723 |
| Sysco Corporation | | 3.30 | 7-15-2026 | 1,100,000 | 1,196,970 |
| Sysco Corporation | | 5.38 | 9-21-2035 | 200,000 | 260,232 |
The accompanying notes are an integral part of these financial statements.
4 | Wells Fargo Investment Grade Corporate Bond Portfolio
Portfolio of investments—August 31, 2021 (unaudited)
| | | Interest
rate | Maturity
date | Principal | Value |
| Food & staples retailing (continued) | | | | | |
| The Kroger Company | | 3.85% | 8-1-2023 | $ 175,000 | $ 185,003 |
| The Kroger Company | | 5.00 | 4-15-2042 | 175,000 | 226,361 |
| The Kroger Company | | 5.15 | 8-1-2043 | 205,000 | 270,634 |
| Walgreens Boots Alliance Incorporated | | 3.45 | 6-1-2026 | 200,000 | 218,362 |
| Walgreens Boots Alliance Incorporated | | 3.80 | 11-18-2024 | 200,000 | 217,266 |
| Walgreens Boots Alliance Incorporated | | 4.80 | 11-18-2044 | 180,000 | 219,394 |
| Wal-Mart Stores Incorporated | | 3.40 | 6-26-2023 | 900,000 | 949,201 |
| Wal-Mart Stores Incorporated | | 4.88 | 7-8-2040 | 450,000 | 601,395 |
| Wal-Mart Stores Incorporated | | 5.88 | 4-5-2027 | 70,000 | 87,530 |
| | | | | | 5,425,071 |
| Food products: 1.50% | | | | | |
| Archer Daniels Midland | | 3.75 | 9-15-2047 | 400,000 | 479,380 |
| Conagra Brands Incorporated | | 4.60 | 11-1-2025 | 200,000 | 225,886 |
| Conagra Brands Incorporated | | 8.25 | 9-15-2030 | 584,000 | 863,842 |
| General Mills Incorporated | | 3.65 | 2-15-2024 | 175,000 | 186,488 |
| Mead Johnson Nutrition Company | | 5.90 | 11-1-2039 | 70,000 | 101,336 |
| Mondelez Iternational | | 2.75 | 4-13-2030 | 1,000,000 | 1,058,929 |
| Tyson Foods Incorporated | | 4.35 | 3-1-2029 | 300,000 | 350,704 |
| Tyson Foods Incorporated | | 4.88 | 8-15-2034 | 175,000 | 218,647 |
| | | | | | 3,485,212 |
| Household products: 0.20% | | | | | |
| Clorox Company | | 3.50 | 12-15-2024 | 140,000 | 151,628 |
| Kimberly-Clark Corporation | | 2.40 | 6-1-2023 | 105,000 | 108,829 |
| Kimberly-Clark Corporation | | 6.63 | 8-1-2037 | 140,000 | 218,106 |
| | | | | | 478,563 |
| Personal products: 0.09% | | | | | |
| Estee Lauder Companies Incorporated | | 6.00 | 5-15-2037 | 140,000 | 202,535 |
| Tobacco: 1.00% | | | | | |
| Altria Group Incorporated | | 3.88 | 9-16-2046 | 430,000 | 434,191 |
| Altria Group Incorporated | | 4.00 | 1-31-2024 | 62,000 | 67,092 |
| Altria Group Incorporated | | 4.50 | 5-2-2043 | 175,000 | 192,454 |
| Philip Morris International Incorporated | | 2.63 | 3-6-2023 | 122,000 | 126,177 |
| Philip Morris International Incorporated | | 3.25 | 11-10-2024 | 210,000 | 226,792 |
| Philip Morris International Incorporated | | 4.25 | 11-10-2044 | 210,000 | 246,192 |
| Philip Morris International Incorporated | | 4.50 | 3-20-2042 | 140,000 | 166,853 |
| Reynolds American Incorporated | | 4.45 | 6-12-2025 | 350,000 | 387,842 |
| Reynolds American Incorporated | | 5.70 | 8-15-2035 | 210,000 | 256,739 |
| Reynolds American Incorporated | | 6.15 | 9-15-2043 | 177,000 | 224,443 |
| | | | | | 2,328,775 |
| Energy: 7.03% | | | | | |
| Energy equipment & services: 0.96% | | | | | |
| Baker Hughes LLC | | 3.34 | 12-15-2027 | 1,000,000 | 1,103,123 |
| Halliburton Company | | 3.50 | 8-1-2023 | 350,000 | 367,397 |
| Halliburton Company | | 3.80 | 11-15-2025 | 350,000 | 385,412 |
| Halliburton Company | | 4.50 | 11-15-2041 | 175,000 | 194,773 |
| Halliburton Company | | 4.75 | 8-1-2043 | 175,000 | 199,908 |
| | | | | | 2,250,613 |
The accompanying notes are an integral part of these financial statements.
Wells Fargo Investment Grade Corporate Bond Portfolio | 5
Portfolio of investments—August 31, 2021 (unaudited)
| | | Interest
rate | Maturity
date | Principal | Value |
| Oil, gas & consumable fuels: 6.07% | | | | | |
| Boardwalk Pipelines LP | | 3.38% | 2-1-2023 | $ 70,000 | $ 72,088 |
| BP Capital Markets America Incorporated | | 3.00 | 2-24-2050 | 200,000 | 197,716 |
| BP Capital Markets America Incorporated | | 3.94 | 9-21-2028 | 200,000 | 227,914 |
| Chevron Corporation | | 3.08 | 5-11-2050 | 350,000 | 369,468 |
| Columbia Pipeline Group Incorporated | | 5.80 | 6-1-2045 | 140,000 | 196,054 |
| ConocoPhillips Company 144A | | 2.40 | 2-15-2031 | 800,000 | 823,459 |
| ConocoPhillips Company | | 4.30 | 11-15-2044 | 210,000 | 254,580 |
| ConocoPhillips Company | | 5.90 | 10-15-2032 | 175,000 | 235,190 |
| ConocoPhillips Company | | 6.95 | 4-15-2029 | 210,000 | 284,186 |
| Devon Energy Corporation | | 7.95 | 4-15-2032 | 150,000 | 215,697 |
| Diamondback Energy Incorporated | | 3.50 | 12-1-2029 | 900,000 | 969,083 |
| Enbridge Energy Partners LP | | 5.50 | 9-15-2040 | 140,000 | 183,169 |
| Energy Transfer Partners LP | | 4.90 | 2-1-2024 | 210,000 | 227,148 |
| Energy Transfer Partners LP | | 5.95 | 10-1-2043 | 140,000 | 174,367 |
| Energy Transfer Partners LP | | 7.50 | 7-1-2038 | 70,000 | 98,094 |
| Enterprise Products Operating LLC | | 4.85 | 3-15-2044 | 280,000 | 347,339 |
| Enterprise Products Operating LLC | | 5.70 | 2-15-2042 | 140,000 | 190,083 |
| Enterprise Products Operating LLC | | 5.95 | 2-1-2041 | 70,000 | 97,450 |
| Enterprise Products Operating LLC | | 7.55 | 4-15-2038 | 70,000 | 107,974 |
| Exxon Mobil Corporation | | 2.71 | 3-6-2025 | 465,000 | 494,731 |
| Exxon Mobil Corporation | | 3.04 | 3-1-2026 | 500,000 | 542,221 |
| Hess Corporation | | 7.30 | 8-15-2031 | 269,000 | 365,822 |
| Kinder Morgan Energy Partners LP | | 5.00 | 8-15-2042 | 175,000 | 212,838 |
| Kinder Morgan Energy Partners LP | | 5.00 | 3-1-2043 | 157,000 | 190,319 |
| Kinder Morgan Energy Partners LP | | 5.50 | 3-1-2044 | 210,000 | 267,039 |
| Kinder Morgan Energy Partners LP | | 5.80 | 3-15-2035 | 70,000 | 89,882 |
| Magellan Midstream Partners LP | | 5.15 | 10-15-2043 | 140,000 | 172,675 |
| Marathon Oil Corporation | | 3.85 | 6-1-2025 | 245,000 | 268,924 |
| Marathon Oil Corporation | | 5.20 | 6-1-2045 | 140,000 | 169,283 |
| Marathon Petroleum Corporation | | 3.63 | 9-15-2024 | 350,000 | 376,292 |
| Marathon Petroleum Corporation | | 3.80 | 4-1-2028 | 385,000 | 424,890 |
| MPLX LP | | 4.13 | 3-1-2027 | 200,000 | 224,424 |
| MPLX LP | | 4.88 | 6-1-2025 | 200,000 | 224,973 |
| MPLX LP | | 5.20 | 3-1-2047 | 220,000 | 270,733 |
| ONEOK Incorporated | | 4.00 | 7-13-2027 | 200,000 | 221,959 |
| ONEOK Incorporated | | 4.55 | 7-15-2028 | 500,000 | 570,238 |
| Phillips 66 | | 4.65 | 11-15-2034 | 140,000 | 165,529 |
| Plains All American Pipeline LP | | 3.60 | 11-1-2024 | 210,000 | 223,855 |
| Plains All American Pipeline LP | | 3.85 | 10-15-2023 | 350,000 | 368,880 |
| Plains All American Pipeline LP | | 4.90 | 2-15-2045 | 175,000 | 189,448 |
| Sabine Pass Liquefaction LLC | | 5.00 | 3-15-2027 | 400,000 | 462,732 |
| Sabine Pass Liquefaction LLC | | 5.63 | 3-1-2025 | 200,000 | 227,921 |
| Sabine Pass Liquefaction LLC | | 5.88 | 6-30-2026 | 200,000 | 236,098 |
| Spectra Energy Partners LP | | 3.38 | 10-15-2026 | 300,000 | 325,026 |
| Spectra Energy Partners LP | | 4.75 | 3-15-2024 | 245,000 | 267,047 |
| Sunoco Logistics Partner LP | | 4.95 | 1-15-2043 | 105,000 | 116,043 |
| Sunoco Logistics Partner LP | | 5.35 | 5-15-2045 | 285,000 | 338,165 |
| Tennessee Gas Pipeline Company | | 7.00 | 10-15-2028 | 175,000 | 228,590 |
| Williams Companies Incorporated | | 4.85 | 3-1-2048 | 200,000 | 245,718 |
| Williams Partners LP | | 6.30 | 4-15-2040 | 273,000 | 374,452 |
| | | | | | 14,127,806 |
The accompanying notes are an integral part of these financial statements.
6 | Wells Fargo Investment Grade Corporate Bond Portfolio
Portfolio of investments—August 31, 2021 (unaudited)
| | | Interest
rate | Maturity
date | Principal | Value |
| Financials: 18.39% | | | | | |
| Banks: 6.63% | | | | | |
| Bank of America Corporation (3 Month LIBOR +1.19%) ± | | 3.95% | 1-23-2049 | $1,270,000 | $ 1,497,441 |
| Bank of America Corporation | | 4.18 | 11-25-2027 | 725,000 | 814,798 |
| Bank One Corporation | | 7.63 | 10-15-2026 | 168,000 | 218,716 |
| BB&T Corporation | | 2.85 | 10-26-2024 | 500,000 | 534,051 |
| Citigroup Incorporated (U.S. SOFR +1.15%) ± | | 2.67 | 1-29-2031 | 900,000 | 935,101 |
| Citigroup Incorporated | | 4.13 | 7-25-2028 | 500,000 | 565,534 |
| Citigroup Incorporated | | 4.65 | 7-30-2045 | 625,000 | 813,936 |
| Citizens Financial Group | | 4.30 | 2-11-2031 | 200,000 | 218,796 |
| Compass Bank | | 3.88 | 4-10-2025 | 250,000 | 275,549 |
| Discover Bank | | 4.20 | 8-8-2023 | 1,310,000 | 1,402,839 |
| Discover Bank | | 4.25 | 3-13-2026 | 250,000 | 281,335 |
| Discover Bank | | 4.65 | 9-13-2028 | 250,000 | 293,189 |
| Fifth Third Bancorp | | 3.95 | 3-14-2028 | 400,000 | 460,944 |
| JPMorgan Chase & Company | | 4.13 | 12-15-2026 | 500,000 | 567,675 |
| JPMorgan Chase & Company (3 Month LIBOR +1.58%) ± | | 4.26 | 2-22-2048 | 1,235,000 | 1,521,639 |
| Key Bank NA | | 3.30 | 6-1-2025 | 250,000 | 272,755 |
| KeyCorp Incorporated | | 4.10 | 4-30-2028 | 400,000 | 461,439 |
| PNC Bank NA | | 2.95 | 1-30-2023 | 300,000 | 310,420 |
| PNC Bank NA | | 3.25 | 1-22-2028 | 1,050,000 | 1,163,133 |
| PNC Bank NA | | 4.20 | 11-1-2025 | 250,000 | 282,250 |
| Santander Holdings USA Incorporated | | 4.50 | 7-17-2025 | 350,000 | 388,022 |
| Truist Bank | | 2.20 | 3-16-2023 | 1,100,000 | 1,130,367 |
| Truist Bank | | 3.30 | 5-15-2026 | 400,000 | 439,934 |
| US Bancorp | | 2.38 | 7-22-2026 | 190,000 | 202,131 |
| US Bancorp | | 3.60 | 9-11-2024 | 350,000 | 380,334 |
| | | | | | 15,432,328 |
| Capital markets: 5.22% | | | | | |
| Bank of New York Mellon Corporation | | 2.95 | 1-29-2023 | 300,000 | 310,633 |
| Bank of New York Mellon Corporation | | 3.00 | 10-30-2028 | 700,000 | 769,883 |
| Bank of New York Mellon Corporation | | 3.40 | 1-29-2028 | 300,000 | 334,837 |
| BlackRock Incorporated | | 3.25 | 4-30-2029 | 900,000 | 1,003,226 |
| CME Group Incorporated | | 4.15 | 6-15-2048 | 290,000 | 377,521 |
| Goldman Sachs Group Incorporated | | 3.75 | 5-22-2025 | 350,000 | 381,350 |
| Goldman Sachs Group Incorporated | | 4.75 | 10-21-2045 | 1,125,000 | 1,484,268 |
| Goldman Sachs Group Incorporated | | 6.13 | 2-15-2033 | 200,000 | 271,502 |
| Intercontinental Exchange | | 3.75 | 9-21-2028 | 500,000 | 563,869 |
| Jefferies Group Incorporated | | 5.13 | 1-20-2023 | 175,000 | 185,713 |
| Jefferies Group Incorporated | | 6.45 | 6-8-2027 | 285,000 | 356,035 |
| John Deere Capital Corporation | | 0.45 | 6-7-2024 | 810,000 | 810,313 |
| Legg Mason Incorporated | | 4.75 | 3-15-2026 | 190,000 | 219,824 |
| Moody's Corporation | | 5.25 | 7-15-2044 | 210,000 | 287,701 |
| Morgan Stanley | | 4.30 | 1-27-2045 | 980,000 | 1,220,077 |
| Morgan Stanley | | 5.00 | 11-24-2025 | 200,000 | 230,160 |
| Morgan Stanley | | 6.25 | 8-9-2026 | 300,000 | 369,206 |
| Morgan Stanley | | 7.25 | 4-1-2032 | 329,000 | 480,651 |
| Northern Trust Corporation | | 3.95 | 10-30-2025 | 175,000 | 197,179 |
| PPL Capital Funding Incorporated | | 3.10 | 5-15-2026 | 100,000 | 107,575 |
| S&P Global Incorporated | | 4.00 | 6-15-2025 | 227,000 | 251,696 |
| State Street Corporation | | 2.65 | 5-19-2026 | 1,100,000 | 1,181,291 |
The accompanying notes are an integral part of these financial statements.
Wells Fargo Investment Grade Corporate Bond Portfolio | 7
Portfolio of investments—August 31, 2021 (unaudited)
| | | Interest
rate | Maturity
date | Principal | Value |
| Capital markets (continued) | | | | | |
| TD Ameritrade Holding Corporation | | 3.63% | 4-1-2025 | $ 140,000 | $ 152,858 |
| The Charles Schwab Corporation | | 4.63 | 3-22-2030 | 500,000 | 610,556 |
| | | | | | 12,157,924 |
| Consumer finance: 1.86% | | | | | |
| American Express Company | | 2.65 | 12-2-2022 | 402,000 | 414,116 |
| American Express Company | | 4.20 | 11-6-2025 | 200,000 | 226,886 |
| American Honda Finance Corporation | | 2.90 | 2-16-2024 | 200,000 | 211,253 |
| American Honda Finance Corporation | | 3.45 | 7-14-2023 | 200,000 | 211,120 |
| Capital One Financial Corporation | | 3.75 | 7-28-2026 | 525,000 | 580,889 |
| Caterpillar Financial Services Corporation | | 2.63 | 3-1-2023 | 260,000 | 268,728 |
| Caterpillar Financial Services Corporation | | 3.25 | 12-1-2024 | 200,000 | 217,948 |
| Caterpillar Financial Services Corporation | | 3.75 | 11-24-2023 | 175,000 | 188,585 |
| Discover Financial Services | | 3.95 | 11-6-2024 | 200,000 | 217,702 |
| General Motors Financial Company Incorporated | | 3.70 | 5-9-2023 | 380,000 | 397,189 |
| Synchrony Financial | | 5.15 | 3-19-2029 | 900,000 | 1,065,756 |
| Toyota Motor Credit Corporation | | 2.63 | 1-10-2023 | 310,000 | 319,851 |
| | | | | | 4,320,023 |
| Diversified financial services: 0.55% | | | | | |
| Berkshire Hathaway Incorporated | | 3.00 | 2-11-2023 | 75,000 | 77,976 |
| Berkshire Hathaway Incorporated | | 3.13 | 3-15-2026 | 635,000 | 694,786 |
| Berkshire Hathaway Incorporated | | 4.50 | 2-11-2043 | 275,000 | 353,314 |
| National Rural Utilities Cooperative Finance Corporation | | 4.02 | 11-1-2032 | 140,000 | 166,617 |
| | | | | | 1,292,693 |
| Insurance: 3.28% | | | | | |
| Allstate Corporation (3 Month LIBOR +2.12%) ± | | 6.50 | 5-15-2067 | 230,000 | 308,775 |
| American International Group Incorporated | | 4.50 | 7-16-2044 | 475,000 | 588,630 |
| American International Group Incorporated (3 Month LIBOR +2.87%) ± | | 5.75 | 4-1-2048 | 200,000 | 230,850 |
| Aon Corporation | | 6.25 | 9-30-2040 | 70,000 | 101,603 |
| Arch Capital Group Limited | | 5.14 | 11-1-2043 | 147,000 | 195,550 |
| Chubb Corporation | | 6.00 | 5-11-2037 | 196,000 | 287,720 |
| Hartford Financial Services Group Incorporated | | 4.30 | 4-15-2043 | 30,000 | 36,318 |
| Lincoln National Corporation | | 4.00 | 9-1-2023 | 175,000 | 187,136 |
| Loews Corporation | | 2.63 | 5-15-2023 | 105,000 | 108,450 |
| Loews Corporation | | 4.13 | 5-15-2043 | 140,000 | 168,956 |
| Marsh & McLennan Company Incorporated | | 3.50 | 6-3-2024 | 200,000 | 214,322 |
| Marsh & McLennan Company Incorporated | | 3.88 | 3-15-2024 | 200,000 | 215,803 |
| Marsh & McLennan Company Incorporated | | 4.90 | 3-15-2049 | 110,000 | 151,476 |
| MetLife Incorporated | | 4.13 | 8-13-2042 | 115,000 | 139,190 |
| MetLife Incorporated | | 4.72 | 12-15-2044 | 175,000 | 230,923 |
| MetLife Incorporated | | 6.38 | 6-15-2034 | 196,000 | 281,012 |
| MetLife Incorporated | | 6.40 | 12-15-2066 | 200,000 | 257,062 |
| MetLife Incorporated | | 6.50 | 12-15-2032 | 140,000 | 199,548 |
| Principal Financial Group Incorporated | | 3.30 | 9-15-2022 | 175,000 | 180,287 |
| Principal Financial Group Incorporated | | 3.40 | 5-15-2025 | 140,000 | 151,261 |
| Progressive Corporation | | 6.25 | 12-1-2032 | 252,000 | 349,978 |
| Progressive Corporation | | 7.75 | 3-1-2031 | 865,000 | 1,243,150 |
| Prudential Financial Incorporated | | 3.91 | 12-7-2047 | 155,000 | 183,688 |
| Prudential Financial Incorporated (3 Month LIBOR +3.04%) ± | | 5.20 | 3-15-2044 | 175,000 | 187,987 |
| Prudential Financial Incorporated | | 5.75 | 7-15-2033 | 350,000 | 466,690 |
| Prudential Financial Incorporated | | 6.63 | 12-1-2037 | 45,000 | 66,847 |
The accompanying notes are an integral part of these financial statements.
8 | Wells Fargo Investment Grade Corporate Bond Portfolio
Portfolio of investments—August 31, 2021 (unaudited)
| | | Interest
rate | Maturity
date | Principal | Value |
| Insurance (continued) | | | | | |
| Transatlantic Holdings Incorporated | | 8.00% | 11-30-2039 | $ 70,000 | $ 109,657 |
| Travelers Companies Incorporated | | 4.60 | 8-1-2043 | 600,000 | 788,489 |
| | | | | | 7,631,358 |
| Mortgage REITs: 0.85% | | | | | |
| CC Holdings GS V LLC | | 3.85 | 4-15-2023 | 350,000 | 368,574 |
| ERP Operating LP | | 4.00 | 8-1-2047 | 400,000 | 479,311 |
| Ventas Realty LP | | 3.50 | 2-1-2025 | 400,000 | 430,628 |
| Ventas Realty LP | | 4.40 | 1-15-2029 | 600,000 | 690,896 |
| | | | | | 1,969,409 |
| Health care: 8.96% | | | | | |
| Biotechnology: 2.04% | | | | | |
| AbbVie Incorporated | | 3.20 | 5-14-2026 | 530,000 | 575,419 |
| AbbVie Incorporated | | 4.45 | 5-14-2046 | 500,000 | 612,249 |
| AbbVie Incorporated | | 4.85 | 6-15-2044 | 350,000 | 447,508 |
| Amgen Incorporated | | 2.77 | 9-1-2053 | 584,000 | 559,810 |
| Amgen Incorporated | | 3.63 | 5-22-2024 | 350,000 | 375,666 |
| Baxalta Incorporated | | 5.25 | 6-23-2045 | 280,000 | 384,197 |
| Biogen Incorporated | | 2.25 | 5-1-2030 | 700,000 | 710,747 |
| Gilead Sciences Incorporated | | 3.65 | 3-1-2026 | 350,000 | 385,856 |
| Gilead Sciences Incorporated | | 4.50 | 2-1-2045 | 200,000 | 247,301 |
| Gilead Sciences Incorporated | | 4.75 | 3-1-2046 | 350,000 | 450,265 |
| | | | | | 4,749,018 |
| Health care equipment & supplies: 1.09% | | | | | |
| Abbott Laboratories | | 6.00 | 4-1-2039 | 105,000 | 156,504 |
| Abbott Laboratories | | 6.15 | 11-30-2037 | 166,000 | 245,617 |
| Boston Scientific Corporation | | 3.85 | 5-15-2025 | 200,000 | 220,462 |
| Catholic Health Initiatives | | 4.35 | 11-1-2042 | 175,000 | 206,624 |
| Medtronic Incorporated | | 3.50 | 3-15-2025 | 140,000 | 152,886 |
| Stryker Corporation | | 4.63 | 3-15-2046 | 350,000 | 458,890 |
| Zimmer Biomet Holdings | | 3.55 | 3-20-2030 | 1,000,000 | 1,106,196 |
| | | | | | 2,547,179 |
| Health care providers & services: 2.85% | | | | | |
| Aetna Incorporated | | 4.13 | 11-15-2042 | 75,000 | 87,244 |
| Aetna Incorporated | | 4.50 | 5-15-2042 | 105,000 | 127,408 |
| AmerisourceBergen Corporation | | 4.25 | 3-1-2045 | 175,000 | 205,611 |
| Anthem Incorporated | | 4.38 | 12-1-2047 | 15,000 | 18,570 |
| Ascension Healthcare Company | | 3.11 | 11-15-2039 | 500,000 | 545,918 |
| CIGNA Corporation Company | | 3.00 | 7-15-2023 | 300,000 | 312,800 |
| CIGNA Corporation Company | | 4.80 | 7-15-2046 | 210,000 | 268,739 |
| CIGNA Corporation Company | | 6.13 | 11-15-2041 | 175,000 | 248,681 |
| CVS Health Corporation | | 5.05 | 3-25-2048 | 790,000 | 1,045,696 |
| HCA Incorporated | | 5.50 | 6-15-2047 | 500,000 | 660,533 |
| Kaiser Foundation Hospitals | | 4.88 | 4-1-2042 | 175,000 | 238,569 |
| Laboratory Corporation of America Holdings | | 4.00 | 11-1-2023 | 105,000 | 111,648 |
| McKesson Corporation | | 2.85 | 3-15-2023 | 140,000 | 144,276 |
| Quest Diagnostics Incorporated | | 2.95 | 6-30-2030 | 300,000 | 321,010 |
| UnitedHealth Group Incorporated | | 4.20 | 1-15-2047 | 200,000 | 247,465 |
| UnitedHealth Group Incorporated | | 4.25 | 3-15-2043 | 175,000 | 217,443 |
| UnitedHealth Group Incorporated | | 4.25 | 4-15-2047 | 300,000 | 375,714 |
The accompanying notes are an integral part of these financial statements.
Wells Fargo Investment Grade Corporate Bond Portfolio | 9
Portfolio of investments—August 31, 2021 (unaudited)
| | | Interest
rate | Maturity
date | Principal | Value |
| Health care providers & services (continued) | | | | | |
| UnitedHealth Group Incorporated | | 4.25% | 6-15-2048 | $ 300,000 | $ 378,430 |
| UnitedHealth Group Incorporated | | 6.63 | 11-15-2037 | 105,000 | 160,634 |
| WellPoint Incorporated | | 3.30 | 1-15-2023 | 200,000 | 207,898 |
| WellPoint Incorporated | | 4.65 | 8-15-2044 | 345,000 | 436,518 |
| WellPoint Incorporated | | 5.85 | 1-15-2036 | 200,000 | 271,878 |
| | | | | | 6,632,683 |
| Life sciences tools & services: 0.05% | | | | | |
| Agilent Technologies Incorporated | | 3.88 | 7-15-2023 | 105,000 | 110,875 |
| Pharmaceuticals: 2.93% | | | | | |
| Bristol-Myers Squibb Company | | 3.25 | 11-1-2023 | 109,000 | 115,732 |
| Bristol-Myers Squibb Company | | 3.88 | 8-15-2025 | 285,000 | 315,819 |
| Bristol-Myers Squibb Company | | 4.50 | 3-1-2044 | 200,000 | 262,175 |
| Bristol-Myers Squibb Company | | 4.63 | 5-15-2044 | 240,000 | 316,655 |
| Eli Lilly & Company | | 2.75 | 6-1-2025 | 70,000 | 74,654 |
| Eli Lilly & Company | | 3.95 | 3-15-2049 | 600,000 | 739,507 |
| GlaxoSmithKline Capital Incorporated | | 2.80 | 3-18-2023 | 140,000 | 145,411 |
| GlaxoSmithKline Capital Incorporated | | 5.38 | 4-15-2034 | 210,000 | 284,801 |
| Johnson & Johnson | | 2.45 | 9-1-2060 | 715,000 | 695,134 |
| Johnson & Johnson | | 4.38 | 12-5-2033 | 200,000 | 251,553 |
| Merck & Company Incorporated | | 2.75 | 2-10-2025 | 380,000 | 405,013 |
| Merck & Company Incorporated | | 3.70 | 2-10-2045 | 200,000 | 234,026 |
| Mylan Incorporated | | 4.20 | 11-29-2023 | 200,000 | 213,995 |
| Novartis Capital Corporation | | 2.40 | 9-21-2022 | 350,000 | 358,093 |
| Novartis Capital Corporation | | 2.75 | 8-14-2050 | 600,000 | 621,166 |
| Pfizer Incorporated | | 3.00 | 12-15-2026 | 510,000 | 561,158 |
| Pfizer Incorporated | | 3.90 | 3-15-2039 | 200,000 | 239,415 |
| Pfizer Incorporated | | 4.30 | 6-15-2043 | 210,000 | 264,309 |
| Schering-Plough Corporation | | 6.50 | 12-1-2033 | 175,000 | 261,950 |
| Zoetis Incorporated | | 4.70 | 2-1-2043 | 350,000 | 454,764 |
| | | | | | 6,815,330 |
| Industrials: 7.15% | | | | | |
| Aerospace & defense: 2.87% | | | | | |
| L3Harris Technologies Incorporated | | 2.90 | 12-15-2029 | 900,000 | 957,305 |
| Lockheed Martin Corporation | | 4.07 | 12-15-2042 | 229,000 | 280,996 |
| Lockheed Martin Corporation | | 4.70 | 5-15-2046 | 350,000 | 469,300 |
| Lockheed Martin Corporation | | 6.15 | 9-1-2036 | 122,000 | 175,643 |
| Northrop Grumman Corporation | | 4.03 | 10-15-2047 | 400,000 | 479,362 |
| Northrop Grumman Corporation | | 5.05 | 11-15-2040 | 70,000 | 92,566 |
| Northrop Grumman Corporation | | 7.75 | 2-15-2031 | 210,000 | 308,642 |
| Precision Castparts Corporation | | 2.50 | 1-15-2023 | 175,000 | 179,375 |
| Precision Castparts Corporation | | 3.90 | 1-15-2043 | 140,000 | 162,492 |
| Raytheon Technologies Corporation | | 4.80 | 12-15-2043 | 175,000 | 225,076 |
| Raytheon Technologies Corporation | | 7.20 | 8-15-2027 | 84,000 | 110,468 |
| Textron Incorporated | | 4.30 | 3-1-2024 | 140,000 | 151,325 |
| The Boeing Company | | 2.60 | 10-30-2025 | 300,000 | 313,121 |
| The Boeing Company | | 3.20 | 3-1-2029 | 1,660,000 | 1,747,243 |
| The Boeing Company | | 5.88 | 2-15-2040 | 186,000 | 241,271 |
| United Technologies Corporation | | 3.75 | 11-1-2046 | 200,000 | 227,467 |
| United Technologies Corporation | | 7.50 | 9-15-2029 | 400,000 | 560,563 |
| | | | | | 6,682,215 |
The accompanying notes are an integral part of these financial statements.
10 | Wells Fargo Investment Grade Corporate Bond Portfolio
Portfolio of investments—August 31, 2021 (unaudited)
| | | Interest
rate | Maturity
date | Principal | Value |
| Air freight & logistics: 0.48% | | | | | |
| FedEx Corporation | | 4.55% | 4-1-2046 | $ 250,000 | $ 306,582 |
| FedEx Corporation | | 4.90 | 1-15-2034 | 175,000 | 219,441 |
| FedEx Corporation | | 5.10 | 1-15-2044 | 210,000 | 275,132 |
| United Parcel Service Incorporated | | 6.20 | 1-15-2038 | 206,000 | 306,483 |
| | | | | | 1,107,638 |
| Airlines: 0.09% | | | | | |
| American Airlines Incorporated | | 3.20 | 12-15-2029 | 48,794 | 49,601 |
| United Airlines Incorporated | | 4.30 | 2-15-2027 | 150,180 | 162,170 |
| | | | | | 211,771 |
| Commercial services & supplies: 0.30% | | | | | |
| Republic Services Incorporated | | 2.90 | 7-1-2026 | 260,000 | 278,999 |
| Waste Management Incorporated | | 4.10 | 3-1-2045 | 355,000 | 431,325 |
| | | | | | 710,324 |
| Industrial conglomerates: 0.82% | | | | | |
| 3M Company | | 5.70 | 3-15-2037 | 227,000 | 317,387 |
| General Electric Company | | 3.10 | 1-9-2023 | 300,000 | 310,728 |
| General Electric Company | | 4.50 | 3-11-2044 | 200,000 | 245,944 |
| General Electric Company | | 5.88 | 1-14-2038 | 200,000 | 275,243 |
| Honeywell International Incorporated | | 3.35 | 12-1-2023 | 140,000 | 148,854 |
| Honeywell International Incorporated | | 3.81 | 11-21-2047 | 500,000 | 606,948 |
| | | | | | 1,905,104 |
| Machinery: 0.49% | | | | | |
| Caterpillar Incorporated | | 3.80 | 8-15-2042 | 105,000 | 125,340 |
| Caterpillar Incorporated | | 4.75 | 5-15-2064 | 300,000 | 437,193 |
| Deere & Company | | 5.38 | 10-16-2029 | 210,000 | 268,364 |
| Dover Corporation | | 5.38 | 10-15-2035 | 140,000 | 182,079 |
| Parker Hannifin Corporation | | 3.50 | 9-15-2022 | 70,000 | 72,270 |
| Parker Hannifin Corporation | | 6.25 | 5-15-2038 | 42,000 | 59,265 |
| | | | | | 1,144,511 |
| Road & rail: 1.85% | | | | | |
| Burlington Northern Santa Fe LLC | | 3.00 | 3-15-2023 | 210,000 | 217,400 |
| Burlington Northern Santa Fe LLC | | 3.40 | 9-1-2024 | 210,000 | 226,280 |
| Burlington Northern Santa Fe LLC | | 4.55 | 9-1-2044 | 330,000 | 421,982 |
| CSX Corporation | | 3.40 | 8-1-2024 | 278,000 | 298,824 |
| CSX Corporation | | 4.50 | 8-1-2054 | 350,000 | 449,652 |
| CSX Corporation | | 6.22 | 4-30-2040 | 140,000 | 205,627 |
| Kansas City Southern | | 3.00 | 5-15-2023 | 51,000 | 52,872 |
| Kansas City Southern | | 3.15 | 3-15-2023 | 140,000 | 144,922 |
| Kansas City Southern | | 4.30 | 5-15-2043 | 140,000 | 165,184 |
| Norfolk Southern Corporation | | 2.90 | 6-15-2026 | 250,000 | 270,131 |
| Norfolk Southern Corporation | | 3.15 | 6-1-2027 | 300,000 | 323,819 |
| Norfolk Southern Corporation | | 3.85 | 1-15-2024 | 140,000 | 149,446 |
| Union Pacific Corporation | | 2.75 | 4-15-2023 | 200,000 | 206,571 |
| Union Pacific Corporation | | 2.97 | 9-16-2062 | 175,000 | 172,661 |
| Union Pacific Corporation | | 3.25 | 1-15-2025 | 175,000 | 187,999 |
| Union Pacific Corporation | | 3.75 | 3-15-2024 | 140,000 | 149,986 |
The accompanying notes are an integral part of these financial statements.
Wells Fargo Investment Grade Corporate Bond Portfolio | 11
Portfolio of investments—August 31, 2021 (unaudited)
| | | Interest
rate | Maturity
date | Principal | Value |
| Road & rail (continued) | | | | | |
| Union Pacific Corporation | | 3.80% | 10-1-2051 | $ 200,000 | $ 232,777 |
| Union Pacific Corporation 144A | | 3.80 | 4-6-2071 | 380,000 | 435,520 |
| | | | | | 4,311,653 |
| Trading companies & distributors: 0.25% | | | | | |
| Air Lease Corporation | | 3.25 | 3-1-2025 | 200,000 | 212,553 |
| W.W. Grainger Incorporated | | 4.60 | 6-15-2045 | 280,000 | 367,292 |
| | | | | | 579,845 |
| Information technology: 6.80% | | | | | |
| Communications equipment: 0.29% | | | | | |
| Cisco Systems Incorporated | | 2.20 | 9-20-2023 | 300,000 | 310,934 |
| Cisco Systems Incorporated | | 2.95 | 2-28-2026 | 340,000 | 370,455 |
| | | | | | 681,389 |
| Electronic equipment, instruments & components: 0.14% | | | | | |
| Corning Incorporated | | 5.75 | 8-15-2040 | 105,000 | 144,614 |
| Keysight Technologies Incorporated | | 4.55 | 10-30-2024 | 175,000 | 193,879 |
| | | | | | 338,493 |
| IT services: 1.71% | | | | | |
| Fidelity National Information Service | | 0.60 | 3-1-2024 | 120,000 | 120,030 |
| Fiserv Incorporated | | 3.85 | 6-1-2025 | 210,000 | 230,448 |
| IBM Corporation | | 3.38 | 8-1-2023 | 210,000 | 221,749 |
| IBM Corporation | | 5.88 | 11-29-2032 | 175,000 | 238,236 |
| IBM Corporation | | 7.00 | 10-30-2025 | 210,000 | 261,342 |
| IBM Corporation | | 3.00 | 5-15-2024 | 300,000 | 319,329 |
| Massachusetts Institute of Technology | | 3.89 | 7-1-2116 | 565,000 | 719,746 |
| Mastercard Incorporated | | 3.50 | 2-26-2028 | 400,000 | 451,641 |
| Total System Services Incorporated | | 3.75 | 6-1-2023 | 105,000 | 109,958 |
| Visa Incorporated | | 2.75 | 9-15-2027 | 300,000 | 326,262 |
| Visa Incorporated | | 2.05 | 4-15-2030 | 800,000 | 826,111 |
| Western Union Company | | 6.20 | 11-17-2036 | 122,000 | 152,688 |
| | | | | | 3,977,540 |
| Semiconductors & semiconductor equipment: 2.06% | | | | | |
| Analog Devices Incorporated | | 2.88 | 6-1-2023 | 105,000 | 108,876 |
| Applied Materials Incorporated | | 5.85 | 6-15-2041 | 140,000 | 207,875 |
| Broadcom Incorporated | | 3.13 | 1-15-2025 | 600,000 | 636,996 |
| Broadcom Incorporated | | 3.88 | 1-15-2027 | 1,020,000 | 1,125,580 |
| Intel Corporation | | 2.60 | 5-19-2026 | 220,000 | 236,636 |
| Intel Corporation | | 4.10 | 5-19-2046 | 300,000 | 362,810 |
| Intel Corporation | | 4.25 | 12-15-2042 | 175,000 | 217,075 |
| Intel Corporation | | 4.90 | 7-29-2045 | 230,000 | 308,876 |
| Lam Research Corporation | | 4.88 | 3-15-2049 | 155,000 | 214,109 |
| NVIDIA Corporation | | 2.85 | 4-1-2030 | 900,000 | 974,584 |
| Qualcomm Incorporated | | 3.25 | 5-20-2027 | 200,000 | 220,890 |
| Texas Instruments Incorporated | | 2.25 | 5-1-2023 | 175,000 | 179,912 |
| | | | | | 4,794,219 |
| Software: 1.74% | | | | | |
| Microsoft Corporation | | 4.50 | 2-6-2057 | 750,000 | 1,044,951 |
| Microsoft Corporation | | 5.20 | 6-1-2039 | 77,000 | 110,290 |
The accompanying notes are an integral part of these financial statements.
12 | Wells Fargo Investment Grade Corporate Bond Portfolio
Portfolio of investments—August 31, 2021 (unaudited)
| | | Interest
rate | Maturity
date | Principal | Value |
| Software (continued) | | | | | |
| Oracle Corporation | | 3.40% | 7-8-2024 | $ 110,000 | $ 117,783 |
| Oracle Corporation | | 4.30 | 7-8-2034 | 380,000 | 441,758 |
| Oracle Corporation | | 4.38 | 5-15-2055 | 800,000 | 942,164 |
| Salesforce.com Incorporated | | 3.70 | 4-11-2028 | 200,000 | 227,466 |
| Vmware Incorporated | | 4.65 | 5-15-2027 | 1,000,000 | 1,155,962 |
| | | | | | 4,040,374 |
| Technology hardware, storage & peripherals: 0.86% | | | | | |
| Apple Incorporated | | 3.75 | 11-13-2047 | 400,000 | 472,772 |
| Apple Incorporated | | 4.38 | 5-13-2045 | 350,000 | 448,751 |
| Apple Incorporated | | 4.65 | 2-23-2046 | 345,000 | 458,998 |
| Dell International LLC | | 8.10 | 7-15-2036 | 400,000 | 613,485 |
| | | | | | 1,994,006 |
| Materials: 1.83% | | | | | |
| Chemicals: 1.39% | | | | | |
| Dow Chemical Company | | 4.25 | 10-1-2034 | 175,000 | 205,290 |
| Dow Chemical Company | | 5.25 | 11-15-2041 | 175,000 | 230,702 |
| DuPont de Nemours Incorporated | | 4.73 | 11-15-2028 | 800,000 | 953,115 |
| Eastman Chemical Company | | 4.80 | 9-1-2042 | 140,000 | 173,733 |
| Ecolab Incorporated | | 2.70 | 11-1-2026 | 1,000,000 | 1,075,900 |
| Mosaic Company | | 5.63 | 11-15-2043 | 175,000 | 232,645 |
| Praxair Incorporated | | 2.70 | 2-21-2023 | 105,000 | 108,118 |
| The Sherwin-Williams Company | | 4.50 | 6-1-2047 | 205,000 | 256,803 |
| | | | | | 3,236,306 |
| Containers & packaging: 0.22% | | | | | |
| International Paper Company | | 7.30 | 11-15-2039 | 175,000 | 273,270 |
| MeadWestvaco Corporation | | 7.95 | 2-15-2031 | 35,000 | 50,319 |
| Packaging Corporation of America | | 3.65 | 9-15-2024 | 175,000 | 188,607 |
| | | | | | 512,196 |
| Metals & mining: 0.15% | | | | | |
| Newmont Goldcorp Corporation | | 3.70 | 3-15-2023 | 210,000 | 218,278 |
| Nucor Corporation | | 4.00 | 8-1-2023 | 132,000 | 139,823 |
| | | | | | 358,101 |
| Paper & forest products: 0.07% | | | | | |
| Georgia-Pacific LLC | | 8.00 | 1-15-2024 | 140,000 | 164,326 |
| Real estate: 4.12% | | | | | |
| Equity REITs: 4.12% | | | | | |
| ACE INA Holdings Incorporated | | 2.70 | 3-13-2023 | 280,000 | 290,225 |
| ACE INA Holdings Incorporated | | 3.15 | 3-15-2025 | 200,000 | 216,181 |
| ACE INA Holdings Incorporated | | 3.35 | 5-15-2024 | 350,000 | 375,998 |
| Alexandria Real Estate Equities Incorporated | | 4.70 | 7-1-2030 | 400,000 | 479,929 |
| American Campus Communities Incorporated | | 3.75 | 4-15-2023 | 70,000 | 73,024 |
| American Tower Corporation | | 3.50 | 1-31-2023 | 295,000 | 307,659 |
| American Tower Corporation | | 4.00 | 6-1-2025 | 350,000 | 384,499 |
| AvalonBay Communities Incorporated | | 3.45 | 6-1-2025 | 140,000 | 152,531 |
| AvalonBay Communities Incorporated | | 4.20 | 12-15-2023 | 175,000 | 187,950 |
| Boston Properties LP | | 2.75 | 10-1-2026 | 500,000 | 533,261 |
| Boston Properties LP | | 3.13 | 9-1-2023 | 105,000 | 109,724 |
The accompanying notes are an integral part of these financial statements.
Wells Fargo Investment Grade Corporate Bond Portfolio | 13
Portfolio of investments—August 31, 2021 (unaudited)
| | | Interest
rate | Maturity
date | Principal | Value |
| Equity REITs (continued) | | | | | |
| Boston Properties LP | | 3.80% | 2-1-2024 | $ 300,000 | $ 319,511 |
| Boston Properties LP | | 3.85 | 2-1-2023 | 200,000 | 207,644 |
| Equinix Incorporated | | 1.55 | 3-15-2028 | 1,100,000 | 1,087,917 |
| Essex Portfolio LP | | 3.25 | 5-1-2023 | 70,000 | 72,724 |
| Federal Realty Investment Trust | | 4.50 | 12-1-2044 | 175,000 | 214,089 |
| HCP Incorporated | | 6.75 | 2-1-2041 | 95,000 | 145,421 |
| Health Care REIT Incorporated | | 4.00 | 6-1-2025 | 210,000 | 230,844 |
| Health Care REIT Incorporated | | 4.50 | 1-15-2024 | 140,000 | 151,187 |
| Host Hotels & Resorts Company | | 3.75 | 10-15-2023 | 70,000 | 73,578 |
| Kilroy Realty Corporation | | 3.80 | 1-15-2023 | 175,000 | 181,150 |
| Kimco Realty Corporation | | 2.80 | 10-1-2026 | 350,000 | 371,959 |
| Mid-America Apartments LP | | 4.30 | 10-15-2023 | 35,000 | 37,422 |
| Prologis LP | | 1.25 | 10-15-2030 | 1,100,000 | 1,045,019 |
| Realty Income Corporation | | 4.65 | 8-1-2023 | 810,000 | 866,543 |
| Simon Property Group LP | | 3.30 | 1-15-2026 | 410,000 | 444,300 |
| Simon Property Group LP | | 3.75 | 2-1-2024 | 175,000 | 187,096 |
| Simon Property Group LP | | 4.75 | 3-15-2042 | 175,000 | 219,359 |
| VEREIT Operating Partnership LP | | 4.60 | 2-6-2024 | 98,000 | 106,135 |
| VEREIT Operating Partnership LP | | 4.88 | 6-1-2026 | 119,000 | 137,448 |
| Welltower Incorporated | | 4.95 | 9-1-2048 | 65,000 | 84,051 |
| Weyerhaeuser Company | | 7.38 | 3-15-2032 | 200,000 | 288,597 |
| | | | | | 9,582,975 |
| Utilities: 8.41% | | | | | |
| Electric utilities: 6.96% | | | | | |
| AGL Capital Corporation | | 4.40 | 6-1-2043 | 140,000 | 168,812 |
| Alabama Power Company | | 3.55 | 12-1-2023 | 175,000 | 187,144 |
| Alabama Power Company | | 3.85 | 12-1-2042 | 140,000 | 163,753 |
| American Electric Power Company Incorporated | | 2.95 | 12-15-2022 | 300,000 | 308,065 |
| Appalachian Power Company | | 3.40 | 6-1-2025 | 175,000 | 189,163 |
| Appalachian Power Company | | 4.45 | 6-1-2045 | 175,000 | 215,115 |
| Appalachian Power Company | | 7.00 | 4-1-2038 | 70,000 | 105,506 |
| Arizona Public Service Company | | 3.15 | 5-15-2025 | 105,000 | 112,944 |
| Arizona Public Service Company | | 4.50 | 4-1-2042 | 70,000 | 86,187 |
| Baltimore Gas & Electric Company | | 3.50 | 8-15-2046 | 50,000 | 55,812 |
| Berkshire Hathaway Energy | | 3.65 | 4-15-2029 | 800,000 | 908,325 |
| Berkshire Hathaway Energy | | 6.75 | 12-30-2031 | 105,000 | 149,143 |
| Berkshire Hathaway Finance Corporation | | 4.40 | 5-15-2042 | 180,000 | 227,019 |
| Berkshire Hathaway Finance Corporation | | 5.75 | 1-15-2040 | 175,000 | 255,402 |
| CenterPoint Energy Houston | | 4.50 | 4-1-2044 | 175,000 | 227,284 |
| Commonwealth Edison Company | | 3.80 | 10-1-2042 | 70,000 | 81,674 |
| Connecticut Light & Power Company | | 4.15 | 6-1-2045 | 227,000 | 278,605 |
| Consolidated Edison Company of New York Incorporated Series 07-A | | 6.30 | 8-15-2037 | 175,000 | 248,373 |
| Consolidated Edison Company of New York Incorporated Series 14-C | | 4.63 | 12-1-2054 | 300,000 | 384,003 |
| Consolidated Edison Company of New York Incorporated Series 16-C | | 4.30 | 12-1-2056 | 75,000 | 91,300 |
| DTE Electric Company | | 3.65 | 3-15-2024 | 105,000 | 112,577 |
| Duke Energy Corporation | | 3.95 | 10-15-2023 | 140,000 | 149,187 |
| Duke Energy Florida Incorporated | | 3.85 | 11-15-2042 | 70,000 | 81,802 |
| Duke Energy Indiana Incorporated | | 4.90 | 7-15-2043 | 105,000 | 136,845 |
| Duke Energy Indiana Incorporated | | 6.45 | 4-1-2039 | 45,000 | 66,347 |
| Duke Energy Progress Incorporated | | 4.10 | 3-15-2043 | 105,000 | 127,992 |
The accompanying notes are an integral part of these financial statements.
14 | Wells Fargo Investment Grade Corporate Bond Portfolio
Portfolio of investments—August 31, 2021 (unaudited)
| | | Interest
rate | Maturity
date | Principal | Value |
| Electric utilities (continued) | | | | | |
| Emera US Finance LP | | 3.55% | 6-15-2026 | $ 200,000 | $ 218,393 |
| Entergy Arkansas Incorporated | | 3.70 | 6-1-2024 | 175,000 | 188,456 |
| Entergy Gulf States Louisiana LLC | | 4.20 | 4-1-2050 | 500,000 | 623,746 |
| Entergy Gulf States Louisiana LLC | | 5.59 | 10-1-2024 | 84,000 | 96,224 |
| Exelon Corporation | | 4.70 | 4-15-2050 | 365,000 | 467,086 |
| Exelon Corporation | | 4.95 | 6-15-2035 | 140,000 | 173,953 |
| Florida Power & Light Company | | 5.95 | 2-1-2038 | 224,000 | 324,586 |
| Florida Power & Light Company | | 5.96 | 4-1-2039 | 175,000 | 257,092 |
| Florida Power Corporation | | 5.65 | 4-1-2040 | 87,000 | 122,338 |
| Interstate Power & Light Company | | 6.25 | 7-15-2039 | 21,000 | 30,161 |
| Northeast Utilities | | 2.80 | 5-1-2023 | ��122,000 | 126,005 |
| Northern States Power Company of Minnesota | | 2.60 | 5-15-2023 | 105,000 | 107,851 |
| Northern States Power Company of Minnesota | | 5.35 | 11-1-2039 | 28,000 | 38,949 |
| NSTAR Electric Company | | 5.50 | 3-15-2040 | 70,000 | 97,688 |
| Oglethorpe Power Corporation | | 5.95 | 11-1-2039 | 105,000 | 143,288 |
| Ohio Edison Company | | 6.88 | 7-15-2036 | 175,000 | 254,316 |
| Oncor Electric Delivery Company LLC | | 7.00 | 5-1-2032 | 122,000 | 174,100 |
| Pacific Gas & Electric Company | | 2.50 | 2-1-2031 | 1,300,000 | 1,224,764 |
| PacifiCorp | | 3.60 | 4-1-2024 | 175,000 | 187,350 |
| PacifiCorp | | 4.10 | 2-1-2042 | 70,000 | 81,331 |
| Potomac Electric Power Company | | 3.60 | 3-15-2024 | 175,000 | 187,106 |
| PPL Electric Utilities | | 4.75 | 7-15-2043 | 105,000 | 137,821 |
| PPL Electric Utilities | | 6.25 | 5-15-2039 | 31,000 | 45,957 |
| PSEG Power LLC | | 8.63 | 4-15-2031 | 75,000 | 118,425 |
| Public Service Company of Colorado | | 2.25 | 9-15-2022 | 70,000 | 70,760 |
| Public Service Electric & Gas Company | | 2.38 | 5-15-2023 | 140,000 | 144,155 |
| Public Service Electric & Gas Company | | 3.80 | 1-1-2043 | 140,000 | 163,830 |
| Public Service Electric & Gas Company | | 3.95 | 5-1-2042 | 70,000 | 83,296 |
| Public Service Electric & Gas Company | | 5.80 | 5-1-2037 | 70,000 | 98,639 |
| South Carolina Electric & Gas Company | | 5.10 | 6-1-2065 | 470,000 | 695,366 |
| Southern California Edison Company | | 3.90 | 3-15-2043 | 105,000 | 110,839 |
| Southern California Edison Company | | 5.35 | 7-15-2035 | 126,000 | 160,203 |
| Southern California Edison Company | | 5.50 | 3-15-2040 | 140,000 | 176,469 |
| Southern California Edison Company | | 6.00 | 1-15-2034 | 70,000 | 92,675 |
| Southwestern Electric Power Company | | 6.20 | 3-15-2040 | 35,000 | 49,617 |
| The Southern Company | | 0.60 | 2-26-2024 | 1,415,000 | 1,414,390 |
| The Southern Company | | 2.95 | 7-1-2023 | 200,000 | 208,314 |
| TXU Electric Delivery Company | | 7.25 | 1-15-2033 | 52,000 | 77,727 |
| Union Electric Company | | 3.90 | 9-15-2042 | 175,000 | 203,954 |
| Union Electric Company | | 8.45 | 3-15-2039 | 56,000 | 96,164 |
| Virginia Electric & Power Company | | 3.10 | 5-15-2025 | 70,000 | 74,964 |
| Virginia Electric & Power Company | | 3.45 | 2-15-2024 | 105,000 | 111,608 |
| Virginia Electric & Power Company | | 4.20 | 5-15-2045 | 105,000 | 127,438 |
| Virginia Electric & Power Company | | 4.45 | 2-15-2044 | 105,000 | 131,283 |
| Virginia Electric & Power Company | | 6.00 | 1-15-2036 | 70,000 | 98,617 |
| Westar Energy Incorporated | | 4.10 | 4-1-2043 | 210,000 | 252,878 |
| Wisconsin Electric Power Company | | 5.63 | 5-15-2033 | 70,000 | 93,095 |
| Wisconsin Electric Power Company | | 5.70 | 12-1-2036 | 105,000 | 144,875 |
| XCEL Energy Incorporated | | 3.40 | 6-1-2030 | 700,000 | 775,371 |
| | | | | | 16,201,892 |
| Gas utilities: 0.46% | | | | | |
| Atmos Energy Corporation | | 4.13 | 10-15-2044 | 245,000 | 292,166 |
| Atmos Energy Corporation | | 5.50 | 6-15-2041 | 42,000 | 57,272 |
| CenterPoint Energy Resources Corporation | | 5.85 | 1-15-2041 | 77,000 | 107,127 |
The accompanying notes are an integral part of these financial statements.
Wells Fargo Investment Grade Corporate Bond Portfolio | 15
Portfolio of investments—August 31, 2021 (unaudited)
| | | Interest
rate | Maturity
date | Principal | Value |
| Gas utilities (continued) | | | | | |
| National Fuel Gas Company | | 3.75% | 3-1-2023 | $ 218,000 | $ 225,895 |
| One Gas Incorporated | | 3.61 | 2-1-2024 | 70,000 | 74,207 |
| One Gas Incorporated | | 4.66 | 2-1-2044 | 150,000 | 185,471 |
| Piedmont Natural Gas Company | | 4.65 | 8-1-2043 | 35,000 | 43,567 |
| Southern California Gas Company | | 5.13 | 11-15-2040 | 70,000 | 92,902 |
| | | | | | 1,078,607 |
| Multi-utilities: 0.89% | | | | | |
| Black Hills Corporation | | 4.25 | 11-30-2023 | 210,000 | 224,387 |
| Consumers Energy Company | | 3.95 | 5-15-2043 | 140,000 | 167,726 |
| Dominion Resources Incorporated | | 4.90 | 8-1-2041 | 452,000 | 577,612 |
| Dominion Resources Incorporated | | 5.95 | 6-15-2035 | 157,000 | 213,904 |
| NiSource Finance Corporation | | 5.65 | 2-1-2045 | 140,000 | 196,287 |
| Puget Energy Incorporated | | 3.65 | 5-15-2025 | 140,000 | 150,709 |
| Sempra Energy | | 3.25 | 6-15-2027 | 300,000 | 325,271 |
| Sempra Energy | | 4.00 | 2-1-2048 | 70,000 | 79,176 |
| WEC Energy Group Incorporated | | 3.55 | 6-15-2025 | 118,000 | 128,298 |
| | | | | | 2,063,370 |
| Water utilities: 0.10% | | | | | |
| American Water Capital Corporation | | 3.40 | 3-1-2025 | 210,000 | 227,273 |
| Total Corporate bonds and notes (Cost $171,813,681) | | | | | 186,935,199 |
| Yankee corporate bonds and notes: 18.40% | | | | | |
| Communication services: 0.94% | | | | | |
| Diversified telecommunication services: 0.39% | | | | | |
| Orange SA | | 5.50 | 2-6-2044 | 200,000 | 283,101 |
| Telefonica Emisiones SA | | 4.90 | 3-6-2048 | 150,000 | 183,124 |
| Telefonica Europe BV | | 8.25 | 9-15-2030 | 294,000 | 432,776 |
| | | | | | 899,001 |
| Media: 0.09% | | | | | |
| WPP Finance Limited 2010 | | 3.75 | 9-19-2024 | 200,000 | 216,895 |
| Wireless telecommunication services: 0.46% | | | | | |
| America Movil SAB de CV | | 4.38 | 4-22-2049 | 100,000 | 125,565 |
| Vodafone Group plc | | 4.38 | 2-19-2043 | 350,000 | 414,272 |
| Vodafone Group plc | | 6.25 | 11-30-2032 | 210,000 | 285,330 |
| Vodafone Group plc | | 7.88 | 2-15-2030 | 175,000 | 252,199 |
| | | | | | 1,077,366 |
| Consumer discretionary: 0.93% | | | | | |
| Auto components: 0.09% | | | | | |
| Magna International Incorporated | | 4.15 | 10-1-2025 | 175,000 | 195,837 |
| Hotels, restaurants & leisure: 0.19% | | | | | |
| Sands China Limited | | 5.13 | 8-8-2025 | 400,000 | 444,776 |
| Internet & direct marketing retail: 0.65% | | | | | |
| Alibaba Group Holding Limited | | 3.40 | 12-6-2027 | 800,000 | 871,240 |
| Alibaba Group Holding Limited | | 3.60 | 11-28-2024 | 600,000 | 646,985 |
| | | | | | 1,518,225 |
The accompanying notes are an integral part of these financial statements.
16 | Wells Fargo Investment Grade Corporate Bond Portfolio
Portfolio of investments—August 31, 2021 (unaudited)
| | | Interest
rate | Maturity
date | Principal | Value |
| Consumer staples: 0.17% | | | | | |
| Beverages: 0.17% | | | | | |
| Diageo Capital plc | | 2.63% | 4-29-2023 | $ 210,000 | $ 216,883 |
| Diageo Capital plc | | 5.88 | 9-30-2036 | 122,000 | 174,496 |
| | | | | | 391,379 |
| Energy: 2.31% | | | | | |
| Oil, gas & consumable fuels: 2.31% | | | | | |
| BP Capital Markets plc | | 3.81 | 2-10-2024 | 350,000 | 377,334 |
| Canadian Natural Resources Limited | | 3.85 | 6-1-2027 | 200,000 | 220,393 |
| Canadian Natural Resources Limited | | 3.90 | 2-1-2025 | 210,000 | 227,851 |
| Canadian Natural Resources Limited | | 4.95 | 6-1-2047 | 110,000 | 137,673 |
| Cenovus Energy Incorporated | | 5.38 | 7-15-2025 | 1,000,000 | 1,135,079 |
| Husky Energy Incorporated | | 6.80 | 9-15-2037 | 70,000 | 93,464 |
| Petro-Canada | | 5.95 | 5-15-2035 | 140,000 | 184,784 |
| Shell International Finance BV | | 2.25 | 1-6-2023 | 175,000 | 179,627 |
| Shell International Finance BV | | 2.88 | 5-10-2026 | 230,000 | 248,423 |
| Shell International Finance BV | | 3.25 | 5-11-2025 | 350,000 | 379,218 |
| Shell International Finance BV | | 3.40 | 8-12-2023 | 175,000 | 185,639 |
| Shell International Finance BV | | 3.63 | 8-21-2042 | 730,000 | 823,248 |
| Suncor Energy Incorporated | | 5.95 | 12-1-2034 | 52,000 | 69,175 |
| Total Capital Canada Limited | | 2.75 | 7-15-2023 | 245,000 | 256,101 |
| Total Capital International SA | | 3.75 | 4-10-2024 | 350,000 | 378,540 |
| TransCanada PipeLines Limited | | 3.75 | 10-16-2023 | 175,000 | 185,297 |
| TransCanada PipeLines Limited | | 6.10 | 6-1-2040 | 210,000 | 289,827 |
| | | | | | 5,371,673 |
| Financials: 10.31% | | | | | |
| Banks: 8.54% | | | | | |
| Bank of Montreal (USD Swap Semi Annual (vs. 3 Month LIBOR) 5 Year +1.43%) ± | | 3.80 | 12-15-2032 | 1,575,000 | 1,741,525 |
| Bank of Nova Scotia | | 2.45 | 9-19-2022 | 300,000 | 307,281 |
| Bank of Nova Scotia | | 4.50 | 12-16-2025 | 500,000 | 566,576 |
| Barclays plc | | 4.38 | 1-12-2026 | 200,000 | 224,915 |
| Barclays plc (3 Month LIBOR +1.90%) ± | | 4.97 | 5-16-2029 | 1,100,000 | 1,292,489 |
| Barclays plc | | 5.25 | 8-17-2045 | 400,000 | 542,451 |
| BNP Paribas | | 4.25 | 10-15-2024 | 1,400,000 | 1,537,246 |
| Cooperatieve Rabobank UA | | 3.75 | 7-21-2026 | 780,000 | 862,837 |
| Deutsche Bank | | 3.95 | 2-27-2023 | 1,100,000 | 1,153,245 |
| HSBC Holdings plc (U.S. SOFR +0.71%) ± | | 0.98 | 5-24-2025 | 400,000 | 400,202 |
| HSBC Holdings plc (3 Month LIBOR +1.53%) ± | | 4.58 | 6-19-2029 | 400,000 | 462,102 |
| HSBC Holdings plc | | 4.95 | 3-31-2030 | 400,000 | 483,083 |
| ING Banking Group plc | | 4.55 | 10-2-2028 | 900,000 | 1,060,921 |
| Lloyds Banking Group plc | | 4.55 | 8-16-2028 | 900,000 | 1,049,891 |
| Lloyds Banking Group plc | | 4.58 | 12-10-2025 | 250,000 | 281,616 |
| Mitsubishi UFJ Financial Group Incorporated | | 3.68 | 2-22-2027 | 200,000 | 223,414 |
| Mitsubishi UFJ Financial Group Incorporated | | 4.05 | 9-11-2028 | 600,000 | 690,167 |
| Mizuho Financial Group | | 3.17 | 9-11-2027 | 600,000 | 652,561 |
| National Australia Bank Limited | | 2.50 | 7-12-2026 | 800,000 | 852,999 |
| Royal Bank of Canada | | 0.43 | 1-19-2024 | 125,000 | 124,768 |
| Royal Bank of Canada | | 4.65 | 1-27-2026 | 700,000 | 799,657 |
| Royal Bank of Scotland Group plc | | 3.88 | 9-12-2023 | 300,000 | 319,290 |
| Royal Bank of Scotland Group plc | | 4.80 | 4-5-2026 | 400,000 | 457,683 |
The accompanying notes are an integral part of these financial statements.
Wells Fargo Investment Grade Corporate Bond Portfolio | 17
Portfolio of investments—August 31, 2021 (unaudited)
| | | Interest
rate | Maturity
date | Principal | Value |
| Banks (continued) | | | | | |
| Santander UK plc | | 4.00% | 3-13-2024 | $ 800,000 | $ 868,388 |
| Sumitomo Mitsui Banking Corporation | | 3.95 | 7-19-2023 | 250,000 | 266,648 |
| Sumitomo Mitsui Financial Group | | 3.01 | 10-19-2026 | 655,000 | 711,547 |
| Toronto Dominion Bank | | 3.50 | 7-19-2023 | 300,000 | 318,284 |
| Toronto Dominion Bank (USD Swap Semi Annual (vs. 3 Month LIBOR) 5 Year +2.21%) ± | | 3.63 | 9-15-2031 | 790,000 | 875,355 |
| Westpac Banking Corporation | | 2.85 | 5-13-2026 | 700,000 | 758,789 |
| | | | | | 19,885,930 |
| Capital markets: 0.54% | | | | | |
| Credit Suisse Group Funding Limited | | 4.55 | 4-17-2026 | 950,000 | 1,076,556 |
| Invesco Finance plc | | 4.00 | 1-30-2024 | 175,000 | 188,807 |
| | | | | | 1,265,363 |
| Diversified financial services: 0.95% | | | | | |
| AerCap Capital Corporation | | 3.65 | 7-21-2027 | 300,000 | 319,557 |
| AerCap Capital Corporation | | 4.63 | 10-15-2027 | 600,000 | 669,891 |
| Brookfield Finance Incorporated | | 4.25 | 6-2-2026 | 200,000 | 225,510 |
| GE Capital International Funding Company | | 3.37 | 11-15-2025 | 550,000 | 601,345 |
| Ingersoll-Rand Finance SA | | 4.50 | 3-21-2049 | 40,000 | 50,842 |
| Medtronic Global Holdings Company | | 3.35 | 4-1-2027 | 300,000 | 330,428 |
| | | | | | 2,197,573 |
| Insurance: 0.28% | | | | | |
| Aon plc | | 3.88 | 12-15-2025 | 305,000 | 338,010 |
| Aon plc | | 4.00 | 11-27-2023 | 105,000 | 112,135 |
| XLIT Limited | | 5.25 | 12-15-2043 | 140,000 | 198,353 |
| | | | | | 648,498 |
| Health care: 1.19% | | | | | |
| Health care equipment & supplies: 0.12% | | | | | |
| DH Europe Finance II | | 3.40 | 11-15-2049 | 10,000 | 11,135 |
| Koninklijke Philips Electronics NV | | 6.88 | 3-11-2038 | 175,000 | 265,975 |
| | | | | | 277,110 |
| Pharmaceuticals: 1.07% | | | | | |
| AstraZeneca plc | | 3.38 | 11-16-2025 | 500,000 | 547,921 |
| AstraZeneca plc | | 4.38 | 11-16-2045 | 200,000 | 257,921 |
| Royalty Pharma Company | | 2.20 | 9-2-2030 | 1,100,000 | 1,090,447 |
| Shire plc | | 3.20 | 9-23-2026 | 560,000 | 607,815 |
| | | | | | 2,504,104 |
| Industrials: 1.12% | | | | | |
| Building products: 0.34% | | | | | |
| Johnson Control International plc | | 1.75 | 9-15-2030 | 800,000 | 786,170 |
| Professional services: 0.15% | | | | | |
| Thomson Reuters Corporation | | 4.30 | 11-23-2023 | 210,000 | 225,311 |
| Thomson Reuters Corporation | | 5.85 | 4-15-2040 | 94,000 | 131,258 |
| | | | | | 356,569 |
The accompanying notes are an integral part of these financial statements.
18 | Wells Fargo Investment Grade Corporate Bond Portfolio
Portfolio of investments—August 31, 2021 (unaudited)
| | | Interest
rate | Maturity
date | Principal | Value |
| Road & rail: 0.63% | | | | | |
| Canadian National Railway Company | | 6.20% | 6-1-2036 | $ 140,000 | $ 200,221 |
| Canadian Pacific Railway Company | | 4.45 | 3-15-2023 | 140,000 | 147,122 |
| Canadian Pacific Railway Company | | 5.95 | 5-15-2037 | 810,000 | 1,114,629 |
| | | | | | 1,461,972 |
| Information technology: 0.44% | | | | | |
| Technology hardware, storage & peripherals: 0.44% | | | | | |
| NXP BV 144A | | 4.30 | 6-18-2029 | 900,000 | 1,033,838 |
| Materials: 0.99% | | | | | |
| Chemicals: 0.52% | | | | | |
| LyondellBasell Industries NV | | 4.63 | 2-26-2055 | 350,000 | 438,965 |
| Nutrien Limited | | 3.63 | 3-15-2024 | 200,000 | 213,191 |
| Nutrien Limited | | 5.00 | 4-1-2049 | 295,000 | 397,304 |
| Nutrien Limited | | 6.13 | 1-15-2041 | 115,000 | 167,035 |
| | | | | | 1,216,495 |
| Metals & mining: 0.27% | | | | | |
| Barrick (Australia Pacific Holdings) Proprietary Limited | | 5.95 | 10-15-2039 | 135,000 | 188,994 |
| BHP Billiton Finance (USA) Limited | | 3.85 | 9-30-2023 | 200,000 | 214,466 |
| Rio Tinto Finance (USA) Limited | | 4.13 | 8-21-2042 | 175,000 | 216,850 |
| | | | | | 620,310 |
| Paper & forest products: 0.20% | | | | | |
| Suzano Austria GmbH | | 6.00 | 1-15-2029 | 400,000 | 477,504 |
| Total Yankee corporate bonds and notes (Cost $39,946,612) | | | | | 42,846,588 |
| | | Yield | | Shares | |
| Short-term investments: 1.15% | | | | | |
| Investment companies: 1.15% | | | | | |
| Wells Fargo Government Money Market Fund Select Class ♠∞ | | 0.03 | | 2,666,653 | 2,666,653 |
| Total Short-term investments (Cost $2,666,653) | | | | | 2,666,653 |
| Total investments in securities (Cost $214,426,946) | 99.84% | | | | 232,448,440 |
| Other assets and liabilities, net | 0.16 | | | | 361,246 |
| Total net assets | 100.00% | | | | $232,809,686 |
| 144A | The security may be resold in transactions exempt from registration, normally to qualified institutional buyers, pursuant to Rule 144A under the Securities Act of 1933. |
| ± | Variable rate investment. The rate shown is the rate in effect at period end. |
| ♠ | The issuer of the security is an affiliated person of the Portfolio as defined in the Investment Company Act of 1940. |
| ∞ | The rate represents the 7-day annualized yield at period end. |
| Abbreviations: |
| LIBOR | London Interbank Offered Rate |
| REIT | Real estate investment trust |
| SOFR | Secured Overnight Financing Rate |
The accompanying notes are an integral part of these financial statements.
Wells Fargo Investment Grade Corporate Bond Portfolio | 19
Portfolio of investments—August 31, 2021 (unaudited)
Investments in affiliates
An affiliated investment is an investment in which the Portfolio owns at least 5% of the outstanding voting shares of the issuer or as a result of other relationships, such as the Portfolio and the issuer having the same adviser or investment manager. Transactions with issuers that were either affiliates of the Portfolio at the beginning of the period or the end of the period were as follows:
| | Value,
beginning of
period | Purchases | Sales
proceeds | Net
realized
gains
(losses) | Net
change in
unrealized
gains
(losses) | Value,
end of
period | Shares,
end
of period | Income
from
affiliated
securities |
| Short-term investments | | | | | | | |
| Wells Fargo Government Money Market Fund Select Class | $877,655 | $24,308,316 | $(22,519,318) | $0 | $0 | $2,666,653 | 2,666,653 | $231 |
The accompanying notes are an integral part of these financial statements.
20 | Wells Fargo Investment Grade Corporate Bond Portfolio
Statement of assets and liabilities—August 31, 2021 (unaudited)
| | |
| Assets | |
Investments in unaffiliated securities, at value (cost $211,760,293)
| $ 229,781,787 |
Investments in affiliated securites, at value (cost $2,666,653)
| 2,666,653 |
Receivable for investments sold
| 8,183,943 |
Receivable for interest
| 2,127,661 |
Prepaid expenses and other assets
| 4,442 |
Total assets
| 242,764,486 |
| Liabilities | |
Payable for investments purchased
| 9,915,137 |
Advisory fee payable
| 2,184 |
Accrued expenses and other liabilities
| 37,479 |
Total liabilities
| 9,954,800 |
Total net assets
| $232,809,686 |
The accompanying notes are an integral part of these financial statements.
Wells Fargo Investment Grade Corporate Bond Portfolio | 21
Statement of operations—six months ended August 31, 2021 (unaudited)
| | |
| Investment income | |
Interest
| $ 3,533,003 |
Income from affiliated securities
| 231 |
Total investment income
| 3,533,234 |
| Expenses | |
Advisory fee
| 58,295 |
Custody and accounting fees
| 8,163 |
Professional fees
| 20,849 |
Interest holder report expenses
| 7,179 |
Trustees’ fees and expenses
| 9,771 |
Other fees and expenses
| 6,739 |
Total expenses
| 110,996 |
Less: Fee waivers and/or expense reimbursements
| (46,871) |
Net expenses
| 64,125 |
Net investment income
| 3,469,109 |
| Realized and unrealized gains (losses) on investments | |
Net realized gains on investments
| 2,704,365 |
Net change in unrealized gains (losses) on investments
| (41,395) |
Net realized and unrealized gains (losses) on investments
| 2,662,970 |
Net increase in net assets resulting from operations
| $6,132,079 |
The accompanying notes are an integral part of these financial statements.
22 | Wells Fargo Investment Grade Corporate Bond Portfolio
Statement of changes in net assets
| | | |
| | Six months ended
August 31, 2021
(unaudited) | Year ended
February 28, 2021 |
| Operations | | |
Net investment income
| $ 3,469,109 | $ 7,098,310 |
Net realized gains on investments
| 2,704,365 | 5,454,647 |
Net change in unrealized gains (losses) on investments
| (41,395) | (8,090,410) |
Net increase in net assets resulting from operations
| 6,132,079 | 4,462,547 |
| Capital transactions | | |
| Transactions in investors’ beneficial interests | | |
Contributions
| 19,890,507 | 58,677,235 |
Withdrawals
| (22,995,878) | (95,272,661) |
Net decrease in net assets resulting from capital transactions
| (3,105,371) | (36,595,426) |
Total increase (decrease) in net assets
| 3,026,708 | (32,132,879) |
| Net assets | | |
Beginning of period
| 229,782,978 | 261,915,857 |
End of period
| $232,809,686 | $229,782,978 |
The accompanying notes are an integral part of these financial statements.
Wells Fargo Investment Grade Corporate Bond Portfolio | 23
| | | Year ended February 28 |
| | Six months ended
August 31, 2021
(unaudited) | 2021 | 2020 1 | 2019 | 2018 2 |
Total return3
| 2.65% | 2.46% | 15.72% | 2.29% | (0.12)% |
| Ratios to average net assets (annualized) | | | | | |
Gross expenses
| 0.10% | 0.10% | 0.10% | 0.09% | 0.08% |
Net expenses
| 0.06% * | 0.06% * | 0.07% | 0.08% | 0.08% |
Net investment income
| 2.98% | 3.24% | 3.59% | 3.74% | 3.48% |
| Supplemental data | | | | | |
Portfolio turnover rate
| 22% | 37% | 18% | 25% | 61% |
| * | Ratios reflect expenses which were voluntarily waived by the adviser. Without these voluntary waivers, the net expense ratios would be increased by the following amounts: |
| Six months ended August 31, 2021 (unaudited) | 0.04% |
| Year ended February 28, 2021 | 0.04% |
| 1 | Year ended February 29 |
| 2 | For the period from May 23, 2017 (commencement of operations) to February 28, 2018 |
| 3 | Returns for periods of less than one year are not annualized. |
The accompanying notes are an integral part of these financial statements.
24 | Wells Fargo Investment Grade Corporate Bond Portfolio
Notes to financial statements (unaudited)
1. ORGANIZATION
Wells Fargo Master Trust (the "Trust"), a Delaware statutory trust organized on March 10, 1999, is an open-end management investment company registered under the Investment Company Act of 1940, as amended (the "1940 Act"). As an investment company, the Trust follows the accounting and reporting guidance in Financial Accounting Standards Board ("FASB") Accounting Standards Codification Topic 946, Financial Services – Investment Companies. These financial statements report on the Wells Fargo Investment Grade Corporate Bond Portfolio (the "Portfolio") which is a diversified series of the Trust.
Interests in the Portfolio are available solely through private placement transactions that do not involve any "public offering" within the meaning of Section 4(2) of the Investment Company Act of 1933.
On February 23, 2021, Wells Fargo & Company announced that it has entered into a definitive agreement to sell Wells Fargo Asset Management ("WFAM") to GTCR LLC and Reverence Capital Partners, L.P. WFAM is the trade name used by the asset management businesses of Wells Fargo & Company and includes Wells Fargo Funds Management, LLC, the adviser to the Portfolio, Wells Capital Management, LLC and Wells Fargo Asset Management (International) Limited, both registered investment advisers providing subadvisory services to certain funds, and Wells Fargo Funds Distributor, LLC, the Portfolio's principal underwriter. As part of the transaction, Wells Fargo & Company will own a 9.9% equity interest and will continue to serve as an important client and distribution partner.
Consummation of the transaction will result in the automatic termination of the Portfolio’s investment advisory agreement and subadvisory agreements. The Portfolio’s Board of Trustees approved a new investment advisory agreement and a new subadvisory agreement which were subsequently approved on behalf of the feeder funds that were investors in the Portfolio at the close of business on May 28, 2021. The new agreements will take effect upon the closing of the transaction. The transaction is expected to close in the second half of 2021, subject to customary closing conditions.
2. SIGNIFICANT ACCOUNTING POLICIES
The following significant accounting policies, which are consistently followed in the preparation of the financial statements of the Portfolio, are in conformity with U.S. generally accepted accounting principles which require management to make estimates and assumptions that affect the reported amounts of assets and liabilities, disclosure of contingent assets and liabilities at the date of the financial statements, and the reported amounts of income and expenses during the reporting period. Actual results could differ from those estimates.
Securities valuation
All investments are valued each business day as of the close of regular trading on the New York Stock Exchange (generally 4 p.m. Eastern Time), although the Portfolio may deviate from this calculation time under unusual or unexpected circumstances.
Debt securities are valued at the evaluated bid price provided by an independent pricing service (e.g. taking into account various factors, including yields, maturities, or credit ratings) or, if a reliable price is not available, the quoted bid price from an independent broker-dealer.
Investments in registered open-end investment companies are valued at net asset value.
Investments which are not valued using any of the methods discussed above are valued at their fair value, as determined in good faith by the Board of Trustees. The Board of Trustees has established a Valuation Committee comprised of the Trustees and has delegated to it the authority to take any actions regarding the valuation of portfolio securities that the Valuation Committee deems necessary or appropriate, including determining the fair value of portfolio securities, unless the determination has been delegated to the Wells Fargo Asset Management Pricing Committee at Wells Fargo Funds Management, LLC ("Funds Management"). The Board of Trustees retains the authority to make or ratify any valuation decisions or approve any changes to the Valuation Procedures as it deems appropriate. On a quarterly basis, the Board of Trustees receives reports on any valuation actions taken by the Valuation Committee or the Wells Fargo Asset Management Pricing Committee which may include items for ratification.
Security transactions and income recognition
Securities transactions are recorded on a trade date basis. Realized gains or losses are recorded on the basis of identified cost.
Interest income is accrued daily and bond discounts are accreted and premiums are amortized daily. To the extent debt obligations are placed on non-accrual status, any related interest income may be reduced by writing off interest receivables when the collection of all or a portion of interest has been determined to be doubtful based on consistently applied procedures
Wells Fargo Investment Grade Corporate Bond Portfolio | 25
Notes to financial statements (unaudited)
and the fair value has decreased. If the issuer subsequently resumes interest payments or when the collectability of interest is reasonably assured, the debt obligation is removed from non-accrual status. Paydown gains and losses are included in interest income.
Federal and other taxes
The Portfolio is not required to pay federal income taxes on its net investment income and net capital gains as it is treated as a partnership for federal income tax purposes. All income, gains and losses of the Portfolio are deemed to have been “passed through” to the interest holders in proportion to their holdings of the Portfolio regardless of whether income and gains have been distributed by the Portfolio.
The Portfolio’s income tax returns and all financial records supporting those returns for the prior three fiscal years are subject to examination by the federal revenue authority. Management has analyzed the Portfolio’s tax positions taken on federal, state, and foreign tax returns for all open tax years and does not believe that there are any uncertain tax positions that require recognition of a tax liability.
As of August 31, 2021, the aggregate cost of all investments for federal income tax purposes was $214,803,097 and the unrealized gains (losses) consisted of:
| Gross unrealized gains | $18,771,244 |
| Gross unrealized losses | (1,125,901) |
| Net unrealized gains | $17,645,343 |
3. FAIR VALUATION MEASUREMENTS
Fair value measurements of investments are determined within a framework that has established a fair value hierarchy based upon the various data inputs utilized in determining the value of the Portfolio’s investments. The three-level hierarchy gives the highest priority to unadjusted quoted prices in active markets for identical assets or liabilities (Level 1) and the lowest priority to unobservable inputs (Level 3). The Portfolio’s investments are classified within the fair value hierarchy based on the lowest level of input that is significant to the fair value measurement. The inputs are summarized into three broad levels as follows:
| ■ | Level 1 – quoted prices in active markets for identical securities |
| ■ | Level 2 – other significant observable inputs (including quoted prices for similar securities, interest rates, prepayment speeds, credit risk, etc.) |
| ■ | Level 3 – significant unobservable inputs (including the Portfolio’s own assumptions in determining the fair value of investments) |
The inputs or methodologies used for valuing investments in securities are not necessarily an indication of the risk associated with investing in those securities.
The following is a summary of the inputs used in valuing the Portfolio’s assets and liabilities as of August 31, 2021:
| | Quoted prices
(Level 1) | Other significant
observable inputs
(Level 2) | Significant
unobservable inputs
(Level 3) | Total |
| Assets | | | | |
| Investments in: | | | | |
| Corporate bonds and notes | $ 0 | $ 186,935,199 | $0 | $ 186,935,199 |
| Yankee corporate bonds and notes | 0 | 42,846,588 | 0 | 42,846,588 |
| Short-term investments | | | | |
| Investment companies | 2,666,653 | 0 | 0 | 2,666,653 |
| Total assets | $2,666,653 | $229,781,787 | $0 | $232,448,440 |
Additional sector, industry or geographic detail, if any, is included in the Portfolio of Investments.
For the six months ended August 31, 2021, the Portfolio did not have any transfers into/out of Level 3.
26 | Wells Fargo Investment Grade Corporate Bond Portfolio
Notes to financial statements (unaudited)
4. TRANSACTIONS WITH AFFILIATES
Advisory fee
The Trust has entered into an advisory contract with Funds Management, an indirect wholly owned subsidiary of Wells Fargo & Company ("Wells Fargo"). The adviser is responsible for implementing investment policies and guidelines and for supervising the subadviser, who is responsible for day-to-day portfolio management of the Portfolio. Pursuant to the contract, Funds Management is entitled to receive an advisory fee at the following annual rate based on the Portfolio’s average daily net assets:
| Average daily net assets | Advisory fee |
| First $5 billion | 0.050% |
| Next $5 billion | 0.040 |
| Over $10 billion | 0.030 |
For the six months ended August 31, 2021, the advisory fee was equivalent to an annual rate of 0.05% of the Portfolio’s average daily net assets.
Funds Management has retained the services of a subadviser to provide daily portfolio management to the Portfolio. The fee for subadvisory services is borne by Funds Management. Wells Capital Management, LLC, an affiliate of Funds Management and an indirect wholly owned subsidiary of Wells Fargo, is the subadviser to the Portfolio and is entitled to receive a fee from Funds Management at an annual rate starting at 0.04% and declining to 0.03% as the average daily net assets of the Portfolio increase.
Funds Management has voluntarily waived and/or reimbursed advisory fees to reduce the net operating expense ratio of the Portfolio. These voluntary waivers may be discontinued at any time.
Interfund transactions
The Portfolio may purchase or sell portfolio investment securities to certain other Wells Fargo affiliates pursuant to Rule 17a-7 under the 1940 Act and under procedures adopted by the Board of Trustees. The procedures have been designed to ensure that these interfund transactions, which do not incur broker commissions, are effected at current market prices.
5. INVESTMENT PORTFOLIO TRANSACTIONS
Purchases and sales of investments, excluding U.S. government obligations (if any) and short-term securities, for the six months ended August 31, 2021 were $51,514,795 and $49,482,111, respectively.
6. BANK BORROWINGS
The Trust, along with Wells Fargo Variable Trust and Wells Fargo Funds Trust (excluding the money market funds), are parties to a $350,000,000 revolving credit agreement whereby the Portfolio is permitted to use bank borrowings for temporary or emergency purposes, such as to fund interest holders withdrawal requests. Interest under the credit agreement is charged to the Portfolio based on a borrowing rate equal to the higher of the Federal Funds rate in effect on that day plus 1.25% or the overnight bank funding rate in effect on that day plus 1.25%. In addition, an annual commitment fee equal to 0.25% of the unused balance is allocated to each participating fund.
For the six months ended August 31, 2021, there were no borrowings by the Portfolio under the agreement.
7. CONCENTRATION RISKS
As of the end of the period, the Portfolio concentrated its portfolio of investments in the financials sector. A fund that invests a substantial portion of its assets in any sector may be more affected by changes in that sector than would be a fund whose investments are not heavily weighted in any sector.
8. INDEMNIFICATION
Under the Portfolio's organizational documents, the officers and Trustees have been granted certain indemnification rights against certain liabilities that may arise out of performance of their duties to the Portfolio. The Portfolio has entered into a separate agreement with each Trustee that converts indemnification rights currently existing under the Portfolio’s organizational documents into contractual rights that cannot be changed in the future without the consent of the Trustee. Additionally, in the normal course of business, the Portfolio may enter into contracts with service providers that contain a
Wells Fargo Investment Grade Corporate Bond Portfolio | 27
Notes to financial statements (unaudited)
variety of indemnification clauses. The Portfolio’s maximum exposure under these arrangements is dependent on future claims that may be made against the Portfolio and, therefore, cannot be estimated.
9. CORONAVIRUS (COVID-19) PANDEMIC
On March 11, 2020, the World Health Organization announced that it had made the assessment that coronavirus disease 2019 (“COVID-19”) is a pandemic. The impacts of COVID-19 are affecting the entire global economy, individual companies and investment products, the funds, and the market in general. There is significant uncertainty around the extent and duration of business disruptions related to COVID-19 and the impacts may last for an extended period of time. COVID-19 has led to significant uncertainty and volatility in the financial markets.
10. SUBSEQUENT EVENTS
Wells Fargo Asset Management ("WFAM") announced that it will be changing its company name to Allspring Global Investments upon the closing of the previously announced sale transaction of WFAM by Wells Fargo & Company to GTCR LLC and Reverence Capital Partners, L.P. The new corporate name is expected to go into effect on the closing date of the transaction, which is anticipated to occur in the second half of 2021, subject to customary closing conditions.
The Board of Trustees of the Wells Fargo Funds approved a change in the Portfolio's name to remove “Wells Fargo” from the Portfolio's name and replace with “Allspring” on December 6, 2021.
Following the closing of the transaction, Wells Fargo Funds Management, LLC, the Portfolio's adviser, Wells Capital Management, LLC and Wells Fargo Asset Management (International) Limited, each subadvisers to certain funds, and Wells Fargo Funds Distributor, LLC will each be rebranded as Allspring.
28 | Wells Fargo Investment Grade Corporate Bond Portfolio
Other information (unaudited)
PROXY VOTING INFORMATION
A description of the policies and procedures used to determine how to vote proxies relating to portfolio securities is available without charge, upon request, by calling 1-800-222-8222, visiting our website at wfam.com, or visiting the SEC website at sec.gov. Information regarding how the proxies related to portfolio securities were voted during the most recent 12-month period ended June 30 is available on the website at wfam.com or by visiting the SEC website at sec.gov.
QUARTERLY PORTFOLIO HOLDINGS INFORMATION
The Portfolio files its complete schedule of portfolio holdings with the SEC for the first and third quarters of each fiscal year as an exhibit to its reports on Form N-PORT. Interest holders may view the filed Form N-PORT by visiting the SEC website at sec.gov.
Wells Fargo Investment Grade Corporate Bond Portfolio | 29
Other information (unaudited)
BOARD OF TRUSTEES AND OFFICERS
Each of the Trustees and Officers listed in the table below acts in identical capacities for each fund in the Wells Fargo family of funds, which consists of 139 mutual funds comprising the Wells Fargo Funds Trust, Wells Fargo Variable Trust, Wells Fargo Master Trust and four closed-end funds (collectively the “Fund Complex”). This table should be read in conjunction with the Prospectus and the Statement of Additional Information1. The mailing address of each Trustee and Officer is 525 Market Street, 12th Floor, San Francisco, CA 94105. Each Trustee and Officer serves an indefinite term, however, each Trustee serves such term until reaching the mandatory retirement age established by the Trustees.
Independent Trustees
Name and
year of birth | Position held and
length of service* | Principal occupations during past five years or longer | Current other
public company or
investment
company
directorships |
William R. Ebsworth
(Born 1957) | Trustee,
since 2015 | Retired. From 1984 to 2013, equities analyst, portfolio manager, research director and chief investment officer at Fidelity Management and Research Company in Boston, Tokyo, and Hong Kong, and retired in 2013 as Chief Investment Officer of Fidelity Strategic Advisers, Inc. where he led a team of investment professionals managing client assets. Prior thereto, Board member of Hong Kong Securities Clearing Co., Hong Kong Options Clearing Corp., the Thailand International Fund, Ltd., Fidelity Investments Life Insurance Company, and Empire Fidelity Investments Life Insurance Company. Audit Committee Chair and Investment Committee Chair of the Vincent Memorial Hospital Endowment (non-profit organization). Mr. Ebsworth is a CFA® charterholder. | N/A |
Jane A. Freeman
(Born 1953) | Trustee,
since 2015;
Chair Liaison,
since 2018 | Retired. From 2012 to 2014 and 1999 to 2008, Chief Financial Officer of Scientific Learning Corporation. From 2008 to 2012, Ms. Freeman provided consulting services related to strategic business projects. Prior to 1999, Portfolio Manager at Rockefeller & Co. and Scudder, Stevens & Clark. Board member of the Harding Loevner Funds from 1996 to 2014, serving as both Lead Independent Director and chair of the Audit Committee. Board member of the Russell Exchange Traded Funds Trust from 2011 to 2012 and the chair of the Audit Committee. Ms. Freeman is also an inactive Chartered Financial Analyst. | N/A |
Isaiah Harris, Jr.
(Born 1952) | Trustee,
since 2009; Audit
Committee
Chair,
since 2019 | Retired. Chairman of the Board of CIGNA Corporation since 2009, and Director since 2005. From 2003 to 2011, Director of Deluxe Corporation. Prior thereto, President and CEO of BellSouth Advertising and Publishing Corp. from 2005 to 2007, President and CEO of BellSouth Enterprises from 2004 to 2005 and President of BellSouth Consumer Services from 2000 to 2003. Emeritus member of the Iowa State University Foundation Board of Governors. Emeritus Member of the Advisory Board of Iowa State University School of Business. Advisory Board Member, Palm Harbor Academy (private school). Mr. Harris is a certified public accountant (inactive status). | CIGNA Corporation |
Judith M. Johnson
(Born 1949) | Trustee,
since 2008 | Retired. Prior thereto, Chief Executive Officer and Chief Investment Officer of Minneapolis Employees Retirement Fund from 1996 to 2008. Ms. Johnson is an attorney, certified public accountant and a certified managerial accountant. | N/A |
David F. Larcker
(Born 1950) | Trustee,
since 2009 | James Irvin Miller Professor of Accounting at the Graduate School of Business (Emeritus), Stanford University, Director of the Corporate Governance Research Initiative and Senior Faculty of The Rock Center for Corporate Governance since 2006. From 2005 to 2008, Professor of Accounting at the Graduate School of Business, Stanford University. Prior thereto, Ernst & Young Professor of Accounting at The Wharton School, University of Pennsylvania from 1985 to 2005. | N/A |
30 | Wells Fargo Investment Grade Corporate Bond Portfolio
Other information (unaudited)
Name and
year of birth | Position held and
length of service* | Principal occupations during past five years or longer | Current other
public company or
investment
company
directorships |
Olivia S. Mitchell
(Born 1953) | Trustee,
since 2006;
Nominating and
Governance
Committee Chair,
since 2018 | International Foundation of Employee Benefit Plans Professor, Wharton School of the University of Pennsylvania since 1993. Director of Wharton’s Pension Research Council and Boettner Center on Pensions & Retirement Research, and Research Associate at the National Bureau of Economic Research. Previously, Cornell University Professor from 1978 to 1993. | N/A |
Timothy J. Penny
(Born 1951) | Trustee,
since 1996;
Chair,
since 2018 | President and Chief Executive Officer of Southern Minnesota Initiative Foundation, a non-profit organization, since 2007. Member of the Board of Trustees of NorthStar Education Finance, Inc., a non-profit organization, since 2007. | N/A |
James G. Polisson
(Born 1959) | Trustee,
since 2018 | Retired. Chief Marketing Officer, Source (ETF) UK Services, Ltd, from 2015 to 2017. From 2012 to 2015, Principal of The Polisson Group, LLC, a management consulting, corporate advisory and principal investing company. Chief Executive Officer and Managing Director at Russell Investments, Global Exchange Traded Funds from 2010 to 2012. Managing Director of Barclays Global Investors from 1998 to 2010 and Global Chief Marketing Officer for iShares and Barclays Global Investors from 2000 to 2010. Trustee of the San Francisco Mechanics’ Institute, a non-profit organization, from 2013 to 2015. Board member of the Russell Exchange Traded Fund Trust from 2011 to 2012. Director of Barclays Global Investors Holdings Deutschland GmbH from 2006 to 2009. Mr. Polisson is an attorney and has a retired status with the Massachusetts and District of Columbia Bar Associations. | N/A |
Pamela Wheelock
(Born 1959) | Trustee,
since January
2020; previously
Trustee from
January 2018 to
July 2019 | Board member of the Destination Medical Center Economic Development Agency, Rochester, Minnesota since 2019. Interim President of the McKnight Foundation from January to September 2020. Acting Commissioner, Minnesota Department of Human Services, July 2019 through September 2019. Human Services Manager (part-time), Minnesota Department of Human Services, October 2019 through December 2019. Chief Operating Officer, Twin Cities Habitat for Humanity from 2017 to 2019. Vice President of University Services, University of Minnesota from 2012 to 2016. Prior thereto, on the Board of Directors, Governance Committee and Finance Committee for the Minnesota Philanthropy Partners (Saint Paul Foundation) from 2012 to 2018, Interim Chief Executive Officer of Blue Cross Blue Shield of Minnesota from 2011 to 2012, Chairman of the Board from 2009 to 2012 and Board Director from 2003 to 2015. Vice President, Leadership and Community Engagement, Bush Foundation, Saint Paul, Minnesota (a private foundation) from 2009 to 2011. Executive Vice President and Chief Financial Officer, Minnesota Sports and Entertainment from 2004 to 2009 and Senior Vice President from 2002 to 2004. Executive Vice President of the Minnesota Wild Foundation from 2004 to 2008. Commissioner of Finance, State of Minnesota, from 1999 to 2002. Currently Board Chair of the Minnesota Wild Foundation since 2010. | N/A |
* Length of service dates reflect the Trustee’s commencement of service with the Trust’s predecessor entities, where applicable.
Wells Fargo Investment Grade Corporate Bond Portfolio | 31
Other information (unaudited)
Officers
Name and
year of birth | Position held and
length of service | Principal occupations during past five years or longer |
Andrew Owen
(Born 1960) | President,
since 2017 | Executive Vice President of Wells Fargo & Company and Head of Affiliated Managers, Wells Fargo Asset Management, since 2014. In addition, Mr. Owen is currently President, Chief Executive Officer and Director of Wells Fargo Funds Management, LLC since 2017. Prior thereto, Executive Vice President responsible for marketing, investments and product development for Wells Fargo Funds Management, LLC, from 2009 to 2014. |
Jeremy DePalma
(Born 1974) | Treasurer,
since 2012
(for certain funds in
the Fund Complex);
since 2021 (for
the remaining funds in the
Fund Complex) | Senior Vice President of Wells Fargo Funds Management, LLC since 2009. Senior Vice President of Evergreen Investment Management Company, LLC from 2008 to 2010 and head of the Fund Reporting and Control Team within Fund Administration from 2005 to 2010. |
Michelle Rhee
(Born 1966) | Chief Legal Officer,
since 2019 | Secretary of Wells Fargo Funds Management, LLC and Chief Legal Counsel of Wells Fargo Asset Management since 2018. Deputy General Counsel of Wells Fargo Bank, N.A. since 2020 and Assistant General Counsel of Wells Fargo Bank, N.A. from 2018 to 2020. Associate General Counsel and Managing Director of Bank of America Corporation from 2004 to 2018. |
Matthew Prasse
(Born 1983) | Secretary,
since 2021 | Senior Counsel of the Wells Fargo Legal Department since 2018. Previously, Director and Counsel for Barings LLC from 2015 to 2018. Prior to joining Barings, Associate at Morgan, Lewis & Bockius LLP from 2008 to 2015. |
Michael H. Whitaker
(Born 1967) | Chief Compliance Officer,
since 2016 | Chief Compliance Officer of Wells Fargo Asset Management since 2016. Senior Vice President and Chief Compliance Officer for Fidelity Investments from 2007 to 2016. |
1 The Statement of Additional Information includes additional information about the Trustees and is available, without charge, upon request, by calling 1-800-222-8222 or by visiting the website at wfam.com.
32 | Wells Fargo Investment Grade Corporate Bond Portfolio
Board considerations (unaudited)
BOARD CONSIDERATION OF INVESTMENT ADVISORY AND SUB-ADVISORY AGREEMENTS:
Wells Fargo Bloomberg Barclays US Aggregate ex-Corporate Portfolio, Wells Fargo Emerging Markets Bond Portfolio, Wells Fargo Factor Enhanced Emerging Markets Equity Portfolio, Wells Fargo Factor Enhanced International Equity Portfolio, Wells Fargo Factor Enhanced U.S. Large Cap Equity Portfolio, Wells Fargo Factor Enhanced U.S. Small Cap Equity Portfolio, Wells Fargo High Yield Corporate Bond Portfolio, Wells Fargo Investment Grade Corporate Bond Portfolio, Wells Fargo Factor Enhanced U.S. Low Volatility Equity Portfolio, Wells Fargo Strategic Retirement Bond Portfolio, and Wells Fargo U.S. REIT Portfolio
Board Considerations – Current Agreements
Under the Investment Company Act of 1940 (the “1940 Act”), the Board of Trustees (the “Board”) of Wells Fargo Master Trust (the “Trust”) must determine annually whether to approve the continuation of the Trust’s investment advisory and sub-advisory agreements. In this regard, at a meeting held on May 17-19, 2021 (the “Meeting”), the Board of the Trust, all the members of which have no direct or indirect interest in the investment advisory and sub-advisory agreements and are not “interested persons” of the Trust, as defined in the 1940 Act (the “Independent Trustees”), reviewed and approved for each of the portfolios of the Trust identified in the table below (individually, a “Portfolio” and collectively, the “Portfolios”): (i) an investment advisory agreement (the “Advisory Agreement”) with Wells Fargo Funds Management, LLC (“Funds Management”); and (ii) an investment sub-advisory agreement (each, a “Sub-Advisory Agreement” and collectively, the “Sub-Advisory Agreements”) with the sub-adviser(s) identified in the table below (each, a “Sub-Adviser” and collectively, the “Sub-Advisers”) for the corresponding Portfolio identified. The Advisory Agreement and the Sub-Advisory Agreements are collectively referred to as the “Advisory Agreements.”
| Funds Trust | Master Trust |
| Wells Fargo Bloomberg Barclays US Aggregate ex-Corporate Portfolio | Wells Capital Management Incorporated |
| Wells Fargo Emerging Markets Bond Portfolio | Wells Fargo Asset Management (International) Limited and Wells Capital Management Incorporated |
| Wells Fargo Factor Enhanced Emerging Markets Equity Portfolio | Wells Capital Management Incorporated |
| Wells Fargo Factor Enhanced International Equity Portfolio | Wells Capital Management Incorporated |
| Wells Fargo Factor Enhanced U.S. Large Cap Equity Portfolio | Wells Capital Management Incorporated |
| Wells Fargo Factor Enhanced U.S. Small Cap Equity Portfolio | Wells Capital Management Incorporated |
| Wells Fargo High Yield Corporate Bond Portfolio | Wells Capital Management Incorporated |
| Wells Fargo Investment Grade Corporate Bond Portfolio | Wells Capital Management Incorporated |
| Wells Fargo Factor Enhanced U.S. Low Volatility Equity Portfolio | Wells Capital Management Incorporated |
| Wells Fargo Strategic Retirement Bond Portfolio | Wells Capital Management Incorporated |
| Wells Fargo U.S. REIT Portfolio | Wells Capital Management Incorporated |
The Board noted that Wells Fargo & Company recently announced that it had entered into a definitive agreement to sell Wells Fargo Asset Management (“WFAM”), which includes Funds Management and the Sub-Adviser, to GTCR LLC and Reverence Capital Partners, L.P. and/or their affiliates (the “Transaction”). The Board further noted that the Transaction would result in a change-of-control of Funds Management and the Sub-Advisers, which would be considered to be an assignment that would result in the termination of the Advisory Agreements. In light of the Transaction, the Board separately considered for approval a new investment advisory agreement with Funds Management and a new investment sub-advisory agreement with each of the Sub-Advisers (the “New Agreements”) that would replace the Advisory Agreements upon consummation of the Transaction, subject to approval of the New Agreements by the Portfolios’ shareholders. The Board also considered for approval interim agreements to go into effect in the event shareholders do not approve the New Agreements before the Transaction is completed. The interim agreements would allow the Manager and the Sub-Advisers to continue providing services to the Portfolios while the Portfolios continues to seek shareholder approval of the New Agreements. The Board noted that the terms of the interim agreements would be identical to those of the current Advisory Agreements, except for the term and certain escrow provisions.
At the Meeting, the Board considered the factors and reached the conclusions described below relating to the selection of Funds Management and the Sub-Advisers and the approval of the Advisory Agreements. Prior to the Meeting, including at Board meetings held in April and May 2021, the Trustees conferred extensively among themselves and with representatives of Funds Management about these matters. Also, the Board has adopted a team-based approach, with each team consisting of a sub-set of
Wells Fargo Investment Grade Corporate Bond Portfolio | 33
Board considerations (unaudited)
Trustees, to assist the full Board in the discharge of its duties in reviewing investment performance and other matters throughout the year. The Independent Trustees were assisted in their evaluation of the Advisory Agreements by independent legal counsel, from whom they received separate legal advice and with whom they met separately.
In providing information to the Board, Funds Management and the Sub-Advisers were guided by a detailed set of requests for information submitted to them by independent legal counsel on behalf of the Independent Trustees at the start of the Board’s annual contract renewal process earlier in 2021. In considering and approving the Advisory Agreements, the Trustees considered the information they believed relevant, including but not limited to the information discussed below. The Board considered not only the specific information presented in connection with the Meeting, but also the knowledge gained over time through interaction with Funds Management and the Sub-Advisers about various topics. In this regard, the Board reviewed reports of Funds Management at each of its quarterly meetings, which included, among other things, portfolio reviews and investment performance reports. In addition, the Board and the teams mentioned above confer with portfolio managers at various times throughout the year. The Board did not identify any particular information or consideration that was all-important or controlling, and each individual Trustee may have attributed different weights to various factors.
After its deliberations, the Board unanimously determined that the compensation or the absence of compensation payable to Funds Management and each of the Sub-Advisers under each of the Advisory Agreements was reasonable, and approved the continuation of the Advisory Agreements for a one-year term. The Board considered the approval of the Advisory Agreements for the Portfolios as part of its consideration of agreements for funds across the complex, but its approvals were made on a fund-by-fund basis. The following summarizes a number of important, but not necessarily all, factors considered by the Board in support of its approvals.
Nature, extent and quality of services
The Board received and considered various information regarding the nature, extent and quality of services provided to the Funds by Funds Management and the Sub-Advisers under the Advisory Agreements. This information included a description of the investment advisory services and Portfolio-level administrative services covered by the Advisory Agreement, as well as, among other things, a summary of the background and experience of senior management of WFAM, of which Funds Management and the Sub-Advisers are a part, and a summary of investments made in the business of WFAM. The Board also received a description of Funds Management’s and the Sub-Advisers’ business continuity plans, including a summary of the performance of such plans and any changes thereto during the COVID-19 pandemic, and of their approaches to data privacy and cybersecurity. The Board also received and reviewed information about Funds Management’s role as administrator of the Portfolios’ liquidity risk management program, Funds Management’s approach to risk management, and Funds Management’s intermediary and vendor oversight program.
The Board also considered the qualifications, background, tenure and responsibilities of each of the portfolio managers primarily responsible for the day-to-day portfolio management of the Portfolios. The Board noted that each of the Portfolios replicates the performance of a proprietary index provided by an affiliate of Funds Management, except that each of Wells Fargo Bloomberg Barclays US Aggregate ex-Corporate Portfolio, Wells Fargo Emerging Markets Bond Portfolio, and Wells Fargo Strategic Retirement Bond Portfolio track the performance of a third party index. The Board evaluated the ability of Funds Management and the Sub-Advisers to attract and retain qualified investment professionals, including research, advisory and supervisory personnel.
The Board further considered the compliance programs and compliance records of Funds Management and the Sub-Advisers. In addition, the Board took into account the full range of services provided to the Portfolios by Funds Management and its affiliates. The Board also considered information about retention and back-up arrangements that have been put into place with respect to key personnel of WFAM in connection with the anticipated Transaction, noting that WFAM provided assurances that the announcement and eventual culmination of the Transaction is not expected to result in any diminution in the nature or quality of services provided to the Portfolios.
Portfolio investment performance and expenses
The Board considered the investment performance results for each of the Portfolios over the one- and three-year periods ended December 31, 2020, except for the Wells Fargo Factor Enhanced U.S. Low Volatility Equity Portfolio, for which the Board considered the investment performance results for the quarter ended December 31, 2020. The Board considered these results in comparison to the investment performance of funds in a universe that was determined by Broadridge Inc. (“Broadridge”) to be similar to each respective Portfolios (each, a “Universe”), and in comparison to each Portfolios’ benchmark index and to other comparative data. Broadridge is an independent provider of investment company data. The Board received a description of the methodology used by Broadridge to select the mutual funds in the performance Universe. The Board noted the short performance history of the Portfolios.
34 | Wells Fargo Investment Grade Corporate Bond Portfolio
Board considerations (unaudited)
With respect to the investment performance of each Portfolio relative to its respective Universe, the Board noted the following: (i) the investment performance of each of Wells Fargo Factor Enhanced International Equity Portfolio and Wells Fargo Factor Enhanced U.S. Small Cap Equity Portfolio was higher than such Portfolio’s respective Universe for the one- and three-year periods under review; (ii) the investment performance of each of Wells Fargo Bloomberg Barclays US Aggregate ex-Corporate Portfolio, Wells Fargo Emerging Markets Bond Portfolio, and Wells Fargo Investment Grade Corporate Bond Portfolio was higher than such Portfolio’s respective Universe for the three-year period under review, and lower than such Portfolio’s respective Universe for the one-year period under review; (iii) the investment performance of each of Wells Fargo Factor Enhanced Emerging Markets Equity Portfolio, Wells Fargo Factor Enhanced U.S. Large Cap Equity Portfolio, Wells Fargo High Yield Corporate Bond Portfolio, Wells Fargo Strategic Retirement Bond Portfolio, and Wells Fargo U.S. REIT Portfolio was lower than such Portfolio’s respective Universe for the one- and three-year periods under review; and (iv) the Wells Fargo Factor Enhanced U.S. Low Volatility Equity Portfolio launched on July 1, 2020 and, given its short operational history, had no historical performance.
With respect to the investment performance of each Portfolio relative to its respective benchmark index, the Board noted the following: (i) the investment performance of each of Wells Fargo Bloomberg Barclays US Aggregate ex-Corporate Portfolio, Wells Fargo Factor Enhanced International Equity Portfolio, Wells Fargo Investment Grade Corporate Bond Portfolio, Wells Fargo Factor Enhanced U.S. Low Volatility Equity Portfolio, and Wells Fargo Strategic Retirement Bond Portfolio was higher than or in range of such Portfolio’s respective benchmark index for all periods under review; (ii) the investment performance of Wells Fargo U.S. REIT Portfolio was in range of the Portfolio’s benchmark index for the three-year period under review, and was lower than the Portfolio’s benchmark index for the one-year period under review; and (iii) the investment performance of each of Wells Fargo Emerging Markets Bond Portfolio, Wells Fargo Factor Enhanced Emerging Markets Equity Portfolio, Wells Fargo Factor Enhanced U.S. Large Cap Equity Portfolio, Wells Fargo Factor Enhanced U.S. Small Cap Equity Portfolio, and Wells Fargo High Yield Corporate Bond Portfolio was lower than such Portfolio’s respective benchmark index for all periods under review.
The Board received information concerning, and discussed factors contributing to, the underperformance of each of Wells Fargo Factor Enhanced Emerging Markets Equity Portfolio, Wells Fargo Factor Enhanced International Equity Portfolio, Wells Fargo Factor Enhanced U.S. Large Cap Equity Portfolio, Wells Fargo High Yield Corporate Bond Portfolio, Wells Fargo Strategic Retirement Bond Portfolio, and Wells Fargo U.S. REIT Portfolio relative to such Portfolio’s Universe and benchmark index for the periods identified above.
The Board also received and considered information regarding the fee rates that are payable to Funds Management for investment advisory services (as discussed below), which are the only fees charged to the Portfolios, relative to corresponding class-specific expense groups that were determined by Broadridge to be similar to the Portfolios (the “Groups”). The Board received a description of the methodology used by Broadridge to select the mutual funds in the expense Groups and an explanation of how funds comprising expense groups and their expense ratios may vary from year-to-year.
The Board took into account the Portfolios’ investment performance and expense information provided to it among the factors considered in deciding to re-approve the Advisory Agreements.
Investment advisory and sub-advisory fee rates
The Board reviewed and considered the contractual fee rates payable by the Portfolios to Funds Management under the Advisory Agreement. The Board also reviewed and considered the contractual investment sub-advisory fee rates that are payable by Funds Management to the Sub-Advisers for investment sub-advisory services.
Among other information reviewed by the Board was a comparison of the Portfolios’ Management Rates with the average contractual investment management fee rates of funds in the expense Groups at a common asset level as well as transfer agency costs of the Portfolios in the expense Groups. The Board noted that the Management Rates of the Portfolios were lower than, equal to, or in range of the sum of these average rates for the Portfolios’ expense Groups.
The Board also received and considered information about the portions of the total management fees that were retained by Funds Management after payment of the fees to the Sub-Advisers for sub-advisory services. In assessing the reasonableness of these amounts, the Board received and evaluated information about the nature and extent of responsibilities retained and risks assumed by Funds Management and not delegated to or assumed by the Sub-Advisers, and about Funds Management’s on-going oversight services. Given the affiliation between Funds Management and the Sub-Advisers, the Board ascribed limited relevance to the allocation of fees between them.
The Board also received and considered information about the nature and extent of services offered and fee rates charged by Funds Management and the Sub-Advisers to other types of clients with investment strategies similar to those of certain Portfolios. In this regard, the Board received information about the significantly greater scope of services, and compliance,
Wells Fargo Investment Grade Corporate Bond Portfolio | 35
Board considerations (unaudited)
reporting and other legal burdens and risks of managing proprietary mutual funds compared with those associated with managing assets of other types of clients, including third-party sub-advised fund clients and non-mutual fund clients such as institutional separate accounts.
Based on its consideration of the factors and information it deemed relevant, including those described here, the Board determined that the compensation payable to Funds Management under the Advisory Agreement and to the Sub-Advisers under the Sub-Advisory Agreements was reasonable.
Profitability
The Board received and considered information concerning the profitability of Funds Management, as well as the profitability of both WFAM and Wells Fargo & Co. (“Wells Fargo”) from providing services to the funds family as a whole. The Board noted that the Sub-Advisers’ profitability information with respect to providing services to the Portfolios and other funds in the family was subsumed in the WFAM and Wells Fargo profitability analysis.
Funds Management reported on the methodologies and estimates used in calculating profitability, including a description of the methodology used to allocate certain expenses. Among other things, the Board noted that the levels of profitability reported on a fund-by-fund basis varied widely, depending on factors such as the size, type and age of fund.
Based on its review, the Board did not deem the profits reported by Funds Management, WFAM or Wells Fargo from services provided to the Portfolios to be at a level that would prevent it from approving the continuation of the Advisory Agreements.
Economies of scale
The Board received and considered information about the potential for Funds Management to experience economies of scale in the provision of management services to the Portfolios, the difficulties of calculating economies of scale at an individual fund level, and the extent to which potential scale benefits are shared with shareholders. The Board noted the existence of breakpoints in the Portfolios’ management fee structure, which operate generally to reduce the Portfolios’ expense ratios as the Portfolios grow in size, and the size of the Portfolios in relation to such breakpoints. The Board considered that in addition to management fee breakpoints, Funds Management shares potential economies of scale from its management business in a variety of ways, including through fee waiver and expense reimbursement arrangements, competitive management fee rates set at the outset without regard to breakpoints, and investments in the business intended to enhance services available to shareholders.
The Board concluded that Funds Management’s arrangements with respect to the Portfolios, including contractual breakpoints, constituted a reasonable approach to sharing potential economies of scale with the Portfolios and their shareholders.
Other benefits to Funds Management and the Sub-Advisers
The Board received and considered information regarding potential “fall-out” or ancillary benefits received by Funds Management and its affiliates, including the Sub-Advisers, as a result of their relationships with the Portfolios. Ancillary benefits could include, among others, benefits directly attributable to other relationships with the Portfolios and benefits potentially derived from an increase in Funds Management’s and the Sub-Advisers’ businesses as a result of their relationships with the Portfolios. The Board noted that various affiliates of Funds Management may receive distribution-related fees, shareholder servicing payments and sub-transfer agency fees in respect of shares sold or held through them and services provided.
The Board also reviewed information about soft dollar credits earned and utilized by the Sub-Advisers, fees earned by Funds Management and Wells Capital Management Incorporated from managing a private investment vehicle for the fund family’s securities lending collateral, and commissions earned by an affiliated broker from portfolio transactions.
Based on its consideration of the factors and information it deemed relevant, including those described here, the Board did not find that any ancillary benefits received by Funds Management and its affiliates, including the Sub-Advisers, were unreasonable.
Conclusion
At the Meeting, after considering the above-described factors and based on its deliberations and its evaluation of the information described above, the Board unanimously determined that the compensation payable to Funds Management and the Sub-Advisers under each of the Advisory Agreements was reasonable, and approved the continuation of the Advisory Agreements for a one-year term.
36 | Wells Fargo Investment Grade Corporate Bond Portfolio
Board considerations (unaudited)
Board Considerations – New Agreements
Overview of the Board evaluation process
At a meeting held on May 17-19, 2021 (the “Board Meeting”), the Board of Trustees (the “Board”) of Wells Fargo Master Trust (the “Trust”, and the series identified below, the “Portfolios”) approved the continuation of each Portfolio’s current Investment Advisory Agreement (the “Current Investment Advisory Agreement”) and the current Sub-Advisory Agreements (the “Current Sub-Advisory Agreements”, and collectively, the “Current Agreements”).
| Wells Fargo Disciplined Large Cap Portfolio |
| Wells Fargo Diversified Large Cap Growth Portfolio |
| Wells Fargo Disciplined International Developed Markets Portfolio |
| Wells Fargo Large Company Value Portfolio |
| Wells Fargo Managed Fixed Income Portfolio |
| Wells Fargo Bloomberg Barclays US Aggregate ex-Corporate Portfolio |
| Wells Fargo Emerging Markets Bond Portfolio |
| Wells Fargo Factor Enhanced Emerging Markets Equity Portfolio |
| Wells Fargo Factor Enhanced International Equity Portfolio |
| Wells Fargo Factor Enhanced U.S. Large Cap Equity Portfolio |
| Wells Fargo Factor Enhanced U.S. Low Volatility Equity Portfolio |
| Wells Fargo Factor Enhanced U.S. Small Cap Equity Portfolio |
| Wells Fargo High Yield Corporate Bond Portfolio |
| Wells Fargo Investment Grade Corporate Bond Portfolio |
| Wells Fargo Strategic Retirement Bond Portfolio |
| Wells Fargo U.S. REIT Portfolio |
Each Trustee on the Board is not an “interested person” (as defined in the Investment Company Act of 1940 (the “1940 Act”)) of the Portfolios (collectively, the “Independent Trustees”). The process followed by the Board in considering and approving the continuation of the Current Agreements is referred to herein as the “2021 Annual Approval Process.”
As noted above, the closing of the sale of Wells Fargo Asset Management (“WFAM”) to a holding company (“NewCo”) affiliated with private funds of GTCR LLC (“GTCR”) and of Reverence Capital Partners, L.P. (“Reverence Capital”, and such transaction, the “Transaction”) will result in a change of control of Wells Fargo Funds Management LLC (“Funds Management”), Wells Capital Management Incorporated (“Wells Capital”) and Wells Fargo Asset Management (International) Limited (“WFAM(I) Ltd.”, and together with Funds Management and Wells Capital, the “Advisers”), which will be considered to be an “assignment” of each Portfolio’s Current Agreements under the 1940 Act that will result in the automatic termination of each Portfolio’s Current Agreements. In light of the expected termination of each Portfolio’s Current Agreements upon the closing, at the Board Meeting the Board also considered and approved: (i) a new Investment Advisory Agreement (the “New Investment Advisory Agreement”) between the Trust, on behalf of each Portfolio, and Funds Management; (ii) a new Sub-Advisory Agreement (the “New Wells Capital Sub-Advisory Agreement”) among the Trust, on behalf of each Portfolio, Funds Management and Wells Capital; and (iii) a new Sub-Advisory Agreement (the “New WFAM(I) Ltd Sub-Advisory Agreement”) among the Trust, on behalf of Emerging Markets Bond Portfolio, Funds Management and WFAM(I) Ltd (“WFAMI”); and (iv) a new Sub-Advisory Agreement (the “New Galliard Sub-Advisory Agreement”, and collectively, the “New Agreements”) among the Trust, on behalf of Managed Fixed Income Portfolio, Funds Management and Galliard Capital Management, LLC (“Galliard”, and together with Wells Capital and WFAMI, the “Sub-Advisers”), each of which is intended to go into effect upon the closing. The process followed by the Board in reviewing and approving the New Agreements is referred to herein as the “New Agreement Approval Process.”
At a series of meetings held in April and May 2021 (collectively, “April and May 2021 Meetings”) and at the Board Meeting, the Trustees conferred extensively among themselves and with senior representatives of Funds Management, GTCR and Reverence Capital about the New Agreements and related matters. The Board reviewed and discussed information furnished by Funds Management, GTCR and Reverence Capital that the Board considered reasonably necessary to evaluate the terms of the New Agreements and the services to be provided. At these meetings, senior representatives from Funds Management, GTCR and Reverence Capital made presentations to, and responded to questions from, the Board.
In providing information to the Board in connection with the 2021 annual approval process for the Current Agreements (the “2021 Annual Approval Process”) and the New Agreement Approval Process, Funds Management, GTCR and Reverence Capital (as applicable) were guided by requests for information submitted by independent legal counsel on behalf of the Independent Trustees. In considering and approving the New Agreements, the Trustees considered the information they believed relevant, including but not limited to the information discussed herein. The Board considered not only the specific information presented in
Wells Fargo Investment Grade Corporate Bond Portfolio | 37
Board considerations (unaudited)
connection with the April and May 2021 Meetings as well as the Board Meeting, but also the knowledge gained over time through interaction with Funds Management and the Sub-Advisers about various topics. In this regard, the Board reviews reports of Funds Management at each of its regular Board meetings, which includes, among other things, portfolio reviews and investment performance reports. In addition, the Board confers with portfolio managers at various times throughout the year. The Board was assisted in its evaluation of the New Agreements by independent legal counsel, from whom the Independent Trustees received separate legal advice and with whom the Independent Trustees met separately. The Board did not identify any particular information or consideration that was all-important or controlling, and each individual Trustee may have attributed different weights to various factors.
Among other information considered by the Board in connection with the Transaction was:
| ■ | Information regarding the Transaction: information about the structure, financing sources and material terms and conditions of the Transaction, including the expected impact on the businesses conducted by the Advisers and by Wells Fargo Funds Distributor LLC. |
| ■ | Information regarding NewCo, GTCR and Reverence Capital: (i) information about NewCo, including information about its expected financial condition and access to capital, and senior leadership team; (ii) the experience of senior management at GTCR and Reverence Capital in acquiring portfolio companies; (iii) the plan to operationalize NewCo, including the transition of necessary infrastructure services through a transition services agreement with Wells Fargo under which Wells Fargo will continue to provide NewCo with certain services for a specified period of time after the closing; and (iv) information regarding regulatory matters, compliance, and risk management functions at NewCo, including resources to be dedicated thereto. |
| ■ | Impact of the Transaction on WFAM and Service Providers: (i) information regarding any changes to personnel and/or other resources of the Advisers as a result of the Transaction, including assurances regarding comparable and competitive compensation arrangements to attract and retain highly qualified personnel; and (ii) information about the organizational and operating structure with respect to NewCo, the Advisers and the Portfolios. |
| ■ | Impact of the Transaction on the Portfolios and their Shareholders: (i) information regarding anticipated benefits to the Portfolios as a result of the Transaction; (ii) a commitment that the Portfolios would not bear any expenses, directly or indirectly, in connection with the Transaction; (iii) confirmation that the Advisers intend to continue to manage the Portfolios in a manner consistent with each Portfolio’s current investment objectives and principal investments strategies; and (iv) a commitment that neither NewCo nor WFAM will take any steps that would impose any “unfair burden” (as that term is used in section 15(f)(1)(B) of the 1940 Act) on the Portfolios as a result of the Transaction. |
With respect to the New Agreements, the Board considered: (i) a representation that, after the closing, all of the Portfolios will continue to be managed and advised by their current Advisers, and that the same portfolio managers of the Sub-Advisers are expected to continue to manage the Portfolios after the Transaction; (ii) information regarding the terms of the New Agreements, including changes as compared to the Current Agreements; (iii) information confirming that the fee rates payable under the New Agreements will not increase as a result of the Transaction as compared to the rates under the Current Agreements; and (iv) assurances that the Transaction is not expected to cause any diminution with respect to the nature, extent and quality of any of the services currently provided to the Portfolios by the Advisers as a result of the Transaction.
In addition to considering information furnished specifically to evaluate the impact of the Transaction on the Portfolios and their respective shareholders in connection with the New Agreement Approval Process, the Board considered information furnished at prior meetings of the Board and its committees, including detailed information provided in connection with the 2021 Annual Approval Process. In this regard, in connection with the 2021 Annual Approval Process, the Board received information about complex-wide and individual Portfolio performance, fees and expenses, including: (i) a report from an independent data provider comparing the investment performance of each Portfolio to the investment performance of comparable funds and benchmark indices, over various time periods; (ii) a report from an independent data provider comparing each Portfolio’s total expense ratio (and its components) to those of comparable funds; (iii) comparative information concerning the fees charged and services provided by the Advisers to each Portfolio in managing other accounts (which may include other mutual funds, collective investment funds and institutional accounts), if any, that employ investment strategies and techniques similar to those used in managing such Portfolio(s); and (iv) profitability analyses of Funds Management, as well as the profitability of both WFAM and Wells Fargo from providing services to the fund family as a whole.
After its deliberations, the Board unanimously determined that the compensation payable to Funds Management and the Sub-Advisers under the New Agreements is reasonable, approved the New Agreements for a two-year term. The Board considered the approval of the New Agreements as part of its consideration of agreements for funds across the complex, but its approvals were made on a fund-by-fund basis. The following summarizes a number of important, but not necessarily all, factors considered by the Board in support of its approvals.
38 | Wells Fargo Investment Grade Corporate Bond Portfolio
Board considerations (unaudited)
Nature, extent and quality of services
In connection with the 2021 Annual Approval Process, the Board received and considered various information regarding the nature, extent and quality of services provided to each Portfolio by Funds Management and the Sub-Advisers under the Advisory Agreements. This information included a description of the investment advisory services and administrative services covered by the Current Advisory Agreement, as well as, among other things, a summary of the background and experience of senior management of WFAM, of which Funds Management and the Sub-Advisers are a part, and a summary of investments made in the business of WFAM. The Board also received a description of Funds Management’s and the Sub-Advisers’ business continuity plans, including a summary of the performance of such plans and any changes thereto during the COVID-19 pandemic, and of their approaches to data privacy and cybersecurity. The Board also received and reviewed information about Funds Management’s role as administrator of the Portfolios’ liquidity risk management program, Funds Management’s approach to risk management, and Funds Management’s intermediary and vendor oversight program.
In connection with the 2021 Annual Approval Process, the Board also considered the qualifications, background, tenure and responsibilities of each of the portfolio managers primarily responsible for the day-to-day portfolio management of the Portfolios. The Board evaluated the ability of Funds Management and the Sub-Advisers to attract and retain qualified investment professionals, including research, advisory and supervisory personnel.
In connection with the 2021 Annual Approval Process, the Board further considered the compliance programs and compliance records of Funds Management and the Sub-Advisers. In addition, the Board took into account the full range of services provided to the Portfolios by Funds Management and its affiliates.
In connection with the New Agreement Approval Process, the Board considered, among other information, the structure of the Transaction and expected impact, if any, of the Transaction on the operations, facilities, organization and personnel of the Advisers. The Board received assurances from the Advisers that each Portfolio will continue to be advised by its current Advisers after the closing, and that the same individual portfolio managers are expected to continue to manage the Portfolios after the closing. With respect to the recruitment and retention of key personnel, the Board noted information from GTCR, Reverence Capital and the Advisers regarding the potential benefits for employees of joining NewCo. The Board recognized that the personnel who had been extended offers may not accept such offers and personnel changes may occur in the future in the ordinary course.
In addition, the Board considered information regarding the infrastructure, operational capabilities and support staff in place to assist in the portfolio management and operations of the Portfolios, including the provision of administrative services, and the anticipated impact of the Transaction on such matters. The Board also considered the business-related and other risks to which the Advisers may be subject in managing the Portfolios and in connection with the Transaction. The Board also considered the transition and integration plans as a result of the change in ownership of the Advisers from Wells Fargo to NewCo. The Board considered the resources and infrastructure that NewCo intends to devote to its compliance program to ensure compliance with applicable laws and regulations, as well as its risk management program and cybersecurity program. The Board also took into account assurances received from the Advisers, GTCR and Reverence Capital that the Transaction is not expected to cause any diminution in the nature, extent and quality of services provided by the Advisers to the Portfolios and their shareholders.
Investment performance and expenses
In connection with the 2021 Annual Approval Process, the Board considered the investment performance results for each Portfolio over various time periods ended December 31, 2020. The Board considered these results in comparison to the investment performance of funds in a universe that was determined by Broadridge Inc. (“Broadridge”) to be similar to each Portfolio (the “Universe”), and in comparison to each Portfolio’s benchmark index and to other comparative data. Broadridge is an independent provider of investment company data. The Board received a description of the methodology used by Broadridge to select the mutual funds in the performance Universe. Where applicable, the Board received information concerning, and discussed factors contributing to, underperformance of Portfolios relative to the Universe and benchmark for any underperformance periods.
In connection with the 2021 Annual Approval Process, the Board also reviewed the fee rates that are payable to Funds Management for investment advisory services (as discussed below), which are the only fees charged at the Portfolio level, relative to corresponding expense groups that were determined by Broadridge to be similar to the Portfolios (the “Groups”). The Board received a description of the methodology used by Broadridge to select the mutual funds in the expense Groups and an explanation of how funds comprising expense groups and their expense ratios may vary from year-to-year.
In connection with the New Agreement Approval Process, the Board received a commitment that WFAM will maintain fee and expense commitments for at least two years after the closing. The Board took into account each Fund’s investment performance and expense information among the factors considered in deciding to approve the New Agreements.
Wells Fargo Investment Grade Corporate Bond Portfolio | 39
Board considerations (unaudited)
Investment advisory and sub-advisory fee rates
In connection with the 2021 Annual Approval Process, the Board reviewed and considered the contractual investment advisory fee rate that is payable by each Portfolio to Funds Management for investment advisory services under the Current Advisory Agreement (the “Advisory Agreement Rate”). The Board also reviewed and considered the contractual investment sub-advisory fee rate that is payable by Funds Management to the applicable Sub-Adviser for investment sub-advisory services (the “Sub-Advisory Agreement Rate”).
Among other information reviewed by the Board in connection with the 2021 Annual Approval Process, was a comparison of each Portfolio’s Advisory Agreement Rate with those of other funds in the Portfolio’s expense Group at a common asset level.
In connection with the 2021 Annual Approval Process, the Board also received and considered information about the portion of the total management fee that was retained by Funds Management after payment of the Sub-Advisory Agreement Rates. In assessing the reasonableness of this amount, the Board received and evaluated information about the nature and extent of responsibilities retained and risks assumed by Funds Management and not delegated to or assumed by the Sub-Advisers, and about Funds Management’s on-going oversight services. Given the affiliation between Funds Management and the Sub-Advisers, the Board ascribed limited relevance to the allocation of fees between them.
In connection with the 2021 Annual Approval Process, the Board also received and considered information about the nature and extent of services offered and fee rates charged by Funds Management and the Sub-Advisers to other types of clients, if any, with investment strategies similar to those of each Portfolio. In this regard, the Board received information about the significantly greater scope of services, and compliance, reporting and other legal burdens and risks of managing proprietary mutual funds compared with those associated with managing assets of other types of clients, including third-party sub-advised fund clients and non-mutual fund clients such as institutional separate accounts.
In connection with the New Agreement Approval Process, the Board noted the assurances received by it that there would be no increases to any of the Advisory Agreement Rates or the Sub-Advisory Agreement Rates as a result of the Transaction. The Board also considered that the New Agreements do not change the computation method for calculating such fees, and there is no present intention to reduce expense waiver and reimbursement arrangements that are currently in effect. Based on its consideration of the factors and information it deemed relevant, including those described here, the Board determined that the compensation payable to Funds Management under the New Advisory Agreement and to each of the Sub-Advisers under the applicable new Sub-Advisory Agreement was reasonable.
Profitability
In connection with the 2021 Annual Approval Process, the Board received and considered information concerning the profitability of Funds Management, as well as the profitability of both WFAM and Wells Fargo from providing services to the fund family as a whole. The Board noted that the Sub-Advisers’ profitability information with respect to providing services to each Fund and other funds in the family was subsumed in the WFAM and Wells Fargo profitability analysis.
Funds Management reported on the methodologies and estimates used in calculating profitability in connection with the 2021 Annual Approval Process, including a description of the methodology used to allocate certain expenses. Among other things, the Board noted that the levels of profitability reported on a fund-by-fund basis varied widely, depending on factors such as the size, type and age of fund.
In connection with the New Agreement Approval Process, the Board received certain information about NewCo’s projected financial condition, and reviewed with senior representatives of Funds Management, GTCR and Reverence Capital the underlying assumptions on which such information was based. The Board considered that NewCo is a newly formed entity, with no historical operations, revenues or expenses, and that it is difficult to predict with any degree of certainty the future profitability of NewCo and the Advisers from advisory activities under the New Agreements. The Board considered that the fee rates payable under the New Agreements will not increase as a result of the Transaction as compared to the rates under the Current Agreements, and that the current contractual expense limitations applicable to each Portfolio will not increase. The Board noted that if the New Agreements are approved by shareholders and the Transaction closes, the Board will have the opportunity in the future to review the profitability of NewCo and the Advisers from advisory activities under the New Agreements.
Economies of scale
In connection with the 2021 Annual Approval Process, the Board received and considered information about the potential for Funds Management to experience economies of scale in the provision of advisory services to the Portfolios, the difficulties of calculating economies of scale at an individual fund level, and the extent to which potential scale benefits are shared with Portfolio shareholders. The Board noted the existence of breakpoints in each Portfolio’s advisory fee structure, which operate generally to reduce the Portfolio’s expense ratios as the Portfolio grows in size, and the size of the Portfolio in relation to such breakpoints. The
40 | Wells Fargo Investment Grade Corporate Bond Portfolio
Board considerations (unaudited)
Board considered that, in addition to advisory fee breakpoints, Funds Management shares potential economies of scale from its management business in a variety of ways, including through fee waiver and expense reimbursement arrangements, competitive management fee rates set at the outset without regard to breakpoints, and investments in the business intended to enhance services available to shareholders.
In connection with the New Agreement Approval Process, the Board noted that NewCo and the Advisers may benefit from possible growth of the Portfolios resulting from enhanced distribution capabilities for their investing funds. However, the Board noted that other factors could also affect the potential for economies of scale, and that it was not possible to quantify any potential future economies of scale. Based upon the information furnished to the Board in connection with the 2021 Annual Approval Process and the New Agreement Approval Process, the Board concluded that Funds Management’s arrangements with respect to each Portfolio, including contractual breakpoints and expense limitation arrangements, constituted a reasonable approach to sharing potential economies of scale with the Portfolio and its shareholders.
“Fall-out” benefits to Funds Management and the Sub-Advisers
In connection with the 2021 Annual Approval Process, the Board received and considered information regarding potential “fall-out” or ancillary benefits received by Funds Management and its affiliates, including the Sub-Advisers, as a result of their relationships with the Portfolios. Ancillary benefits could include, among others, benefits directly attributable to other relationships with the Portfolios and benefits potentially derived from an increase in Funds Management’s and the Sub-Advisers’ business as a result of their relationships with the Portfolios. The Board noted that various current affiliates of Funds Management may receive distribution-related fees, shareholder servicing payments and sub-transfer agency fees in respect of shares sold or held through them and services provided.
In connection with the 2021 Annual Approval Process, the Board also reviewed information about soft dollar credits earned and utilized by the Sub-Advisers, fees earned by Funds Management and Wells Capital from managing a private investment vehicle for the fund family’s securities lending collateral, and commissions earned by an affiliated broker of Wells Fargo from portfolio transactions.
In connection with the New Agreement Approval Process, the Board received information to the effect that the Transaction is not expected to have a material impact on the fall-out benefits currently realized by Funds Management and its affiliates, including the Sub-Advisers. The information reviewed by the Board also noted that several of the ancillary benefits identified for WFAM would be potential ancillary benefits for NewCo, including that the scale and reputation of the Portfolios might benefit NewCo’s broader reputation, product initiatives, technology investment and talent acquisition. Based on its consideration of the factors and information it deemed relevant, including those described here, the Board did not find that any ancillary benefits expected to be received by Funds Management and its affiliates, including NewCo and the Sub-Advisers, under the New Agreements were unreasonable.
Conclusion
At the Board Meeting, after considering the above-described factors and based on its deliberations and its evaluation of the information described above, the Board unanimously determined that the compensation payable to Funds Management and to each of the Sub-Advisers under the New Agreements is reasonable, approved the New Agreements for a two-year term.
Wells Fargo Investment Grade Corporate Bond Portfolio | 41
Board considerations (unaudited)
Board Considerations - Interim Agreements
At a meeting held on May 17-19, 2021 (the “Board Meeting”), the Boards of Trustees (each, a “Board”, and collectively, the “Boards”) of Wells Fargo Funds Trust, Wells Fargo Master Trust, Wells Fargo Variable Trust, Wells Fargo Global Dividend Opportunity Fund, Wells Fargo Income Opportunities Fund, Wells Fargo Multi-Sector Income Fund and Wells Fargo Utilities and High Income Fund (each a “Trust”, and the series thereof, a “Fund”) reviewed and approved for the Trusts and Funds, as applicable: (i) interim investment management agreements (the “Interim Management Agreements”) with Wells Fargo Funds Management, LLC (“Funds Management”); (ii) interim investment advisory agreements (the “Interim Advisory Agreements”) with Funds Management; and (iii) interim sub-advisory agreements (the “Interim Sub-Advisory Agreements”) with each of Cooke & Bieler, L.P., Galliard Capital Management LLC (“Galliard”), Peregrine Capital Management Inc., Wells Capital Management, LLC (“WellsCap”), and Wells Fargo Asset Management (International) Limited (“WFAMI”, and collectively, the “Sub-Advisers”). Each Trustee on the Board is not an “interested person” (as defined in the Investment Company Act of 1940 (the “1940 Act”) of the Funds (collectively, the “Independent Trustees”). The Interim Management Agreements, Interim Advisory Agreements, and Interim Sub-Advisory Agreements are collectively referred to as the “Interim Advisory Agreements.”
At the Board Meeting, the Boards reviewed and approved the continuation of existing investment management, advisory and sub-advisory agreements (the “Current Advisory Agreements”) for each Trust and Fund, as applicable. The factors considered and conclusions reached by the Boards in approving the Current Advisory Agreements are summarized in the section entitled “Board Considerations – Current Agreements” of this shareholder report. The Boards noted that Wells Fargo & Company has entered into a definitive agreement to sell Wells Fargo Asset Management (“WFAM”), which includes Funds Management, Galliard, WellsCap and WFAMI (the “Affiliated Sub-Advisers”), to a holding company affiliated with private funds of GTCR LLC and Reverence Capital Partners, L.P. (the “Transaction”). The Boards further noted that the Transaction would result in a change-of-control of Funds Management and the Affiliated Sub-Advisers, which would be considered to be an “assignment” under the 1940 Act that would terminate the Current Advisory Agreements. At the Board Meeting, the Boards also reviewed and approved new investment management, advisory and sub-advisory agreements (the “New Advisory Agreements”) for each Trust and Fund, as applicable, that would replace the Current Advisory Agreements upon consummation of the Transaction, subject to approval of the New Advisory Agreements by the applicable Trust’s or Fund’s shareholders. The factors considered and conclusions reached by the Boards in approving the New Advisory Agreements are summarized in the section entitled “Board Considerations – New Agreements” of this shareholder report.
At the Board Meeting, the Boards also approved the Interim Advisory Agreements, which will go into effect for a Trust or Fund only in the event that shareholders of such Trust or Fund do not approve the New Advisory Agreement(s) for the Trust or Fund by the closing date of the Transaction, when the Current Advisory Agreements will terminate. The Board noted that, in such a circumstance, the Interim Advisory Agreements will permit continuity of management by allowing Funds Management and the Sub-Advisers to continue providing services to the Trust or Fund pursuant to the Interim Advisory Agreements while the Trust or Fund continues to solicit shareholder approval of such New Advisory Agreement(s). The Boards noted that the terms of the Interim Advisory Agreements are identical to those of the Current Advisory Agreements, except for the term and the addition of escrow provisions with respect to the advisory fees. The Boards also noted that the entities that would service the Funds and Trusts under the Interim Advisory Agreements are identical to those that provide services under the Current Advisory Agreements and those that will provide services under the New Advisory Agreements.
In approving the Interim Advisory Agreements, the Boards considered the same factors and reached the same conclusions as they considered and reached with respect to the Boards’ approvals of the Current Advisory Agreements and New Advisory Agreements, as applicable, which are described in separate Board Consideration sections within this shareholder report. Prior to the Board Meeting, including at a series of meetings held in April and May 2021, the Trustees conferred extensively among themselves and with senior representatives of Funds Management, GTCR LLC and Reverence Capital Partners, L.P. about the Interim Advisory Agreements and related matters. The Independent Trustees were assisted in their evaluation of the Interim Advisory Agreements by independent legal counsel, from whom they received separate legal advice and with whom they met separately.
At the Board Meeting, after considering the factors and reaching the conclusions described in the separate Board Consideration sections within this shareholder report, the Boards unanimously determined that the compensation payable to Funds Management and to each Sub-Adviser under each of the Interim Advisory Agreements was reasonable, and approved the Interim Advisory Agreements.
42 | Wells Fargo Investment Grade Corporate Bond Portfolio
For more information
More information about Wells Fargo Funds is available free upon request. To obtain literature, please write, visit the Portfolio's website, or call:
Wells Fargo Funds
P.O. Box 219967
Kansas City, MO 64121-9967
Website: wfam.com
Individual investors: 1-800-222-8222
Retail investment professionals: 1-888-877-9275
Institutional investment professionals: 1-866-765-0778
This report and the financial statements contained herein are submitted for the general information of the interest holders of the Portfolio. If this report is used for promotional purposes, distribution of the report must be accompanied or preceded by a current prospectus. Before investing, please consider the investment objectives, risks, charges, and expenses of the investment. For a current prospectus and, if available, a summary prospectus, containing this information, call
1-800-222-8222 or visit the Portfolio's website at wfam.com. Read the prospectus carefully before you invest or send money.
Wells Fargo Asset Management (WFAM) is the trade name for certain investment advisory/management firms owned by Wells Fargo & Company. These firms include but are not limited to Wells Capital Management, LLC and Wells Fargo Funds Management, LLC. Certain products managed by WFAM entities are distributed by Wells Fargo Funds Distributor, LLC (a broker-dealer and Member FINRA).
This material is for general informational and educational purposes only and is NOT intended to provide investment advice or a recommendation of any kind - including a recommendation for any specific investment, strategy, or plan.
INVESTMENT PRODUCTS: NOT FDIC INSURED ■ NO BANK GUARANTEE ■ MAY LOSE VALUE
© 2021 Wells Fargo & Company. All rights reserved.
Semi-Annual Report
August 31, 2021
Wells Fargo Strategic
Retirement Bond Portfolio
INVESTMENT PRODUCTS: NOT FDIC INSURED ■ NO BANK GUARANTEE ■ MAY LOSE VALUE
Wells Fargo Strategic Retirement Bond Portfolio | 1
Portfolio information (unaudited)
| Investment objective | The Portfolio seeks to replicate the total return of a blended index that is weighted 50% to the Bloomberg U.S. Treasury Inflation-Linked 1-10 Year Bond Index and 50% to the Bloomberg U.S. Intermediate Government Bond Index, before fees and expenses. |
| Adviser | Wells Fargo Funds Management, LLC |
| Subadviser | Wells Capital Management, LLC |
| Portfolio managers | Janet S. Rilling, CFA®‡, CPA, Michal Stanczyk |
| Ten largest holdings (%) as of August 31, 20211 |
| TIPS, 0.38%, 7-15-2023 | 2.92 |
| TIPS, 3.63%, 4-15-2028 | 2.87 |
| TIPS, 0.25%, 1-15-2025 | 2.77 |
| TIPS, 0.13%, 7-15-2024 | 2.63 |
| TIPS, 0.13%, 1-15-2023 | 2.57 |
| TIPS, 0.38%, 7-15-2025 | 2.56 |
| TIPS, 3.88%, 4-15-2029 | 2.42 |
| TIPS, 0.63%, 1-15-2026 | 2.32 |
| TIPS, 0.63%, 4-15-2023 | 2.30 |
| TIPS, 0.13%, 7-15-2030 | 2.22 |
| 1 | Figures represent the percentage of the Portfolio's net assets. Holdings are subject to change and may have changed since the date specified. |
| Portfolio composition as of August 31, 20211 |
| 1 | Figures represent the percentage of the Portfolio's long-term investments. These amounts are subject to change and may have changed since the date specified. |
| ‡ | CFA® and Chartered Financial Analyst® are trademarks owned by CFA Institute. |
2 | Wells Fargo Strategic Retirement Bond Portfolio
Portfolio of investments—August 31, 2021 (unaudited)
| | | Interest
rate | Maturity
date | Principal | Value |
| Agency securities: 2.03% | | | | | |
| FHLB | | 0.80% | 3-4-2026 | $ 410,000 | $ 409,143 |
| FHLB | | 2.00 | 9-9-2022 | 200,000 | 203,931 |
| FHLB | | 2.13 | 6-9-2023 | 35,000 | 36,206 |
| FHLB | | 2.50 | 2-13-2024 | 295,000 | 310,995 |
| FHLB | | 2.75 | 12-13-2024 | 20,000 | 21,495 |
| FHLB | | 3.25 | 6-9-2023 | 50,000 | 52,701 |
| FHLB | | 3.25 | 11-16-2028 | 200,000 | 228,724 |
| FHLMC | | 0.25 | 12-4-2023 | 420,000 | 419,886 |
| FNMA | | 0.38 | 7-21-2025 | 95,000 | 94,191 |
| FNMA | | 0.38 | 8-25-2025 | 485,000 | 480,715 |
| FNMA | | 1.75 | 7-2-2024 | 375,000 | 389,393 |
| FNMA | | 1.88 | 9-24-2026 | 135,000 | 142,164 |
| FNMA | | 2.13 | 4-24-2026 | 28,000 | 29,763 |
| FNMA | | 2.63 | 9-6-2024 | 100,000 | 106,685 |
| FNMA | | 2.88 | 9-12-2023 | 175,000 | 184,386 |
| Total Agency securities (Cost $3,084,381) | | | | | 3,110,378 |
| U.S. Treasury securities: 97.49% | | | | | |
| TIPS | | 0.13 | 1-15-2023 | 3,806,037 | 3,948,416 |
| TIPS | | 0.13 | 7-15-2024 | 3,755,424 | 4,029,403 |
| TIPS | | 0.13 | 10-15-2024 | 1,212,166 | 1,302,652 |
| TIPS | | 0.13 | 4-15-2025 | 2,781,350 | 3,001,504 |
| TIPS | | 0.13 | 10-15-2025 | 617,618 | 673,758 |
| TIPS | | 0.13 | 7-15-2026 | 3,050,413 | 3,359,823 |
| TIPS | | 0.13 | 1-15-2030 | 2,037,501 | 2,271,256 |
| TIPS | | 0.13 | 7-15-2030 | 3,035,124 | 3,401,552 |
| TIPS | | 0.13 | 1-15-2031 | 2,613,584 | 2,918,774 |
| TIPS | | 0.13 | 7-15-2031 | 1,408,640 | 1,579,456 |
| TIPS | | 0.25 | 1-15-2025 | 3,927,653 | 4,245,599 |
| TIPS | | 0.25 | 7-15-2029 | 1,539,683 | 1,737,636 |
| TIPS | | 0.38 | 7-15-2023 | 4,230,883 | 4,471,927 |
| TIPS | | 0.38 | 7-15-2025 | 3,579,250 | 3,931,163 |
| TIPS | | 0.38 | 1-15-2027 | 1,546,091 | 1,725,945 |
| TIPS | | 0.38 | 7-15-2027 | 3,014,627 | 3,393,929 |
| TIPS | | 0.50 | 4-15-2024 | 1,545,423 | 1,657,678 |
| TIPS | | 0.50 | 1-15-2028 | 1,459,024 | 1,653,845 |
| TIPS | | 0.63 | 4-15-2023 | 3,357,045 | 3,526,209 |
| TIPS | | 0.63 | 1-15-2024 | 1,566,852 | 1,678,459 |
| TIPS | | 0.63 | 1-15-2026 | 3,194,992 | 3,557,175 |
| TIPS | | 0.75 | 7-15-2028 | 2,445,456 | 2,838,161 |
| TIPS | | 0.88 | 1-15-2029 | 1,651,184 | 1,936,271 |
| TIPS | | 1.75 | 1-15-2028 | 764,947 | 932,538 |
| TIPS | | 2.00 | 1-15-2026 | 2,367,488 | 2,787,655 |
| TIPS | | 2.38 | 1-15-2025 | 1,259,390 | 1,456,531 |
| TIPS | | 2.38 | 1-15-2027 | 1,243,161 | 1,530,059 |
| TIPS | | 2.50 | 1-15-2029 | 1,043,699 | 1,356,714 |
| TIPS | | 3.63 | 4-15-2028 | 3,249,504 | 4,407,012 |
| TIPS | | 3.88 | 4-15-2029 | 2,618,785 | 3,708,308 |
| U.S. Treasury Bond | | 5.25 | 11-15-2028 | 655,000 | 845,513 |
| U.S. Treasury Bond | | 6.13 | 11-15-2027 | 215,000 | 282,297 |
| U.S. Treasury Bond | | 6.13 | 8-15-2029 | 115,000 | 158,970 |
| U.S. Treasury Bond | | 6.38 | 8-15-2027 | 125,000 | 164,712 |
| U.S. Treasury Bond | | 6.88 | 8-15-2025 | 20,000 | 24,913 |
| U.S. Treasury Note | | 0.13 | 9-30-2022 | 1,230,000 | 1,230,480 |
The accompanying notes are an integral part of these financial statements.
Wells Fargo Strategic Retirement Bond Portfolio | 3
Portfolio of investments—August 31, 2021 (unaudited)
| | | Interest
rate | Maturity
date | Principal | Value |
| U.S. Treasury securities (continued) | | | | | |
| U.S. Treasury Note | | 0.13% | 10-31-2022 | $1,250,000 | $ 1,250,195 |
| U.S. Treasury Note | | 0.13 | 6-30-2023 | 1,300,000 | 1,299,035 |
| U.S. Treasury Note | | 0.13 | 7-15-2023 | 1,135,000 | 1,133,714 |
| U.S. Treasury Note | | 0.13 | 9-15-2023 | 1,210,000 | 1,207,542 |
| U.S. Treasury Note | | 0.13 | 10-15-2023 | 1,230,000 | 1,227,069 |
| U.S. Treasury Note | | 0.13 | 12-15-2023 | 1,335,000 | 1,330,620 |
| U.S. Treasury Note | | 0.13 | 1-15-2024 | 1,180,000 | 1,175,483 |
| U.S. Treasury Note | | 0.25 | 6-15-2023 | 1,110,000 | 1,111,171 |
| U.S. Treasury Note | | 0.25 | 11-15-2023 | 1,275,000 | 1,275,050 |
| U.S. Treasury Note | | 0.25 | 6-30-2025 | 1,180,000 | 1,164,881 |
| U.S. Treasury Note | | 0.25 | 7-31-2025 | 1,200,000 | 1,183,547 |
| U.S. Treasury Note | | 0.25 | 8-31-2025 | 1,225,000 | 1,206,864 |
| U.S. Treasury Note | | 0.25 | 9-30-2025 | 1,245,000 | 1,225,498 |
| U.S. Treasury Note | | 0.25 | 10-31-2025 | 1,250,000 | 1,229,150 |
| U.S. Treasury Note | | 0.38 | 8-15-2024 | 1,105,000 | 1,104,137 |
| U.S. Treasury Note | | 0.38 | 7-31-2027 | 185,000 | 179,204 |
| U.S. Treasury Note | | 0.38 | 9-30-2027 | 1,280,000 | 1,236,300 |
| U.S. Treasury Note | | 0.50 | 6-30-2027 | 320,000 | 312,588 |
| U.S. Treasury Note | | 0.50 | 8-31-2027 | 10,000 | 9,744 |
| U.S. Treasury Note | | 0.50 | 10-31-2027 | 1,245,000 | 1,209,984 |
| U.S. Treasury Note | | 0.63 | 11-30-2027 | 1,295,000 | 1,267,026 |
| U.S. Treasury Note | | 0.63 | 5-15-2030 | 1,575,000 | 1,495,819 |
| U.S. Treasury Note | | 0.63 | 8-15-2030 | 1,780,000 | 1,685,785 |
| U.S. Treasury Note | | 0.88 | 11-15-2030 | 1,135,000 | 1,096,782 |
| U.S. Treasury Note | | 1.00 | 7-31-2028 | 630,000 | 626,850 |
| U.S. Treasury Note | | 1.13 | 2-28-2025 | 1,125,000 | 1,148,730 |
| U.S. Treasury Note | | 1.13 | 2-15-2031 | 915,000 | 902,705 |
| U.S. Treasury Note | | 1.25 | 7-31-2023 | 488,000 | 497,874 |
| U.S. Treasury Note | | 1.25 | 3-31-2028 | 1,315,000 | 1,333,595 |
| U.S. Treasury Note | | 1.25 | 4-30-2028 | 825,000 | 836,183 |
| U.S. Treasury Note | | 1.25 | 5-31-2028 | 1,100,000 | 1,114,438 |
| U.S. Treasury Note | | 1.38 | 6-30-2023 | 489,000 | 499,678 |
| U.S. Treasury Note | | 1.38 | 8-31-2023 | 490,000 | 501,331 |
| U.S. Treasury Note | | 1.38 | 9-30-2023 | 339,000 | 347,078 |
| U.S. Treasury Note | | 1.38 | 8-31-2026 | 380,000 | 391,163 |
| U.S. Treasury Note | | 1.50 | 3-31-2023 | 40,000 | 40,853 |
| U.S. Treasury Note | | 1.50 | 8-15-2026 | 325,000 | 336,438 |
| U.S. Treasury Note | | 1.50 | 2-15-2030 | 475,000 | 486,226 |
| U.S. Treasury Note | | 1.63 | 11-15-2022 | 1,240,000 | 1,262,572 |
| U.S. Treasury Note | | 1.63 | 4-30-2023 | 483,000 | 494,773 |
| U.S. Treasury Note | | 1.63 | 5-31-2023 | 435,000 | 446,062 |
| U.S. Treasury Note | | 1.63 | 10-31-2023 | 486,000 | 500,523 |
| U.S. Treasury Note | | 1.63 | 2-15-2026 | 663,000 | 689,831 |
| U.S. Treasury Note | | 1.63 | 5-15-2026 | 1,144,000 | 1,190,609 |
| U.S. Treasury Note | | 1.63 | 11-30-2026 | 410,000 | 427,025 |
| U.S. Treasury Note | | 1.75 | 9-30-2022 | 420,000 | 427,432 |
| U.S. Treasury Note | | 1.75 | 1-31-2023 | 10,000 | 10,227 |
| U.S. Treasury Note | | 1.75 | 5-15-2023 | 130,000 | 133,468 |
| U.S. Treasury Note | | 1.75 | 6-30-2024 | 1,015,000 | 1,054,609 |
| U.S. Treasury Note | | 1.75 | 11-15-2029 | 85,000 | 88,825 |
| U.S. Treasury Note | | 1.88 | 8-31-2024 | 160,000 | 167,050 |
| U.S. Treasury Note | | 1.88 | 7-31-2026 | 20,000 | 21,070 |
| U.S. Treasury Note | | 2.00 | 11-30-2022 | 1,220,000 | 1,248,689 |
| U.S. Treasury Note | | 2.00 | 2-15-2023 | 285,000 | 292,748 |
| U.S. Treasury Note | | 2.00 | 4-30-2024 | 10,000 | 10,444 |
The accompanying notes are an integral part of these financial statements.
4 | Wells Fargo Strategic Retirement Bond Portfolio
Portfolio of investments—August 31, 2021 (unaudited)
| | | Interest
rate | Maturity
date | Principal | Value |
| U.S. Treasury securities (continued) | | | | | |
| U.S. Treasury Note | | 2.00% | 5-31-2024 | $ 269,000 | $ 281,116 |
| U.S. Treasury Note | | 2.00 | 6-30-2024 | 185,000 | 193,491 |
| U.S. Treasury Note | | 2.00 | 2-15-2025 | 597,000 | 627,526 |
| U.S. Treasury Note | | 2.00 | 8-15-2025 | 645,000 | 680,147 |
| U.S. Treasury Note | | 2.00 | 11-15-2026 | 520,000 | 551,586 |
| U.S. Treasury Note | | 2.13 | 12-31-2022 | 510,000 | 523,527 |
| U.S. Treasury Note | | 2.13 | 2-29-2024 | 378,000 | 395,202 |
| U.S. Treasury Note | | 2.13 | 3-31-2024 | 500,000 | 523,223 |
| U.S. Treasury Note | | 2.13 | 5-15-2025 | 1,190,000 | 1,258,007 |
| U.S. Treasury Note | | 2.25 | 12-31-2023 | 472,000 | 493,664 |
| U.S. Treasury Note | | 2.25 | 1-31-2024 | 474,000 | 496,441 |
| U.S. Treasury Note | | 2.25 | 4-30-2024 | 235,000 | 246,897 |
| U.S. Treasury Note | | 2.25 | 10-31-2024 | 490,000 | 517,926 |
| U.S. Treasury Note | | 2.25 | 11-15-2024 | 1,245,000 | 1,316,685 |
| U.S. Treasury Note | | 2.25 | 11-15-2025 | 1,230,000 | 1,311,632 |
| U.S. Treasury Note | | 2.25 | 2-15-2027 | 485,000 | 521,242 |
| U.S. Treasury Note | | 2.25 | 8-15-2027 | 480,000 | 516,919 |
| U.S. Treasury Note | | 2.25 | 11-15-2027 | 650,000 | 700,578 |
| U.S. Treasury Note | | 2.38 | 8-15-2024 | 1,280,000 | 1,354,850 |
| U.S. Treasury Note | | 2.38 | 5-15-2027 | 1,118,000 | 1,210,628 |
| U.S. Treasury Note | | 2.50 | 5-15-2024 | 455,000 | 481,447 |
| U.S. Treasury Note | | 2.63 | 12-31-2023 | 375,000 | 395,449 |
| U.S. Treasury Note | | 2.63 | 3-31-2025 | 345,000 | 370,605 |
| U.S. Treasury Note | | 2.63 | 1-31-2026 | 445,000 | 482,477 |
| U.S. Treasury Note | | 2.63 | 2-15-2029 | 1,235,000 | 1,368,341 |
| U.S. Treasury Note | | 2.75 | 8-31-2023 | 15,000 | 15,758 |
| U.S. Treasury Note | | 2.75 | 11-15-2023 | 1,206,000 | 1,272,047 |
| U.S. Treasury Note | | 2.75 | 2-15-2024 | 585,000 | 620,123 |
| U.S. Treasury Note | | 2.75 | 8-31-2025 | 325,000 | 352,396 |
| U.S. Treasury Note | | 2.75 | 2-15-2028 | 520,000 | 576,997 |
| U.S. Treasury Note | | 2.88 | 4-30-2025 | 470,000 | 509,620 |
| U.S. Treasury Note | | 2.88 | 5-31-2025 | 490,000 | 531,746 |
| U.S. Treasury Note | | 2.88 | 11-30-2025 | 125,000 | 136,597 |
| U.S. Treasury Note | | 2.88 | 5-15-2028 | 645,000 | 722,098 |
| U.S. Treasury Note | | 2.88 | 8-15-2028 | 390,000 | 437,348 |
| U.S. Treasury Note | | 3.13 | 11-15-2028 | 765,000 | 873,056 |
| U.S. Treasury Note | | 6.00 | 2-15-2026 | 146,000 | 180,150 |
| U.S. Treasury Note | | 6.50 | 11-15-2026 | 30,000 | 38,727 |
| U.S. Treasury Note | | 6.63 | 2-15-2027 | 235,000 | 307,804 |
| U.S. Treasury Note | | 6.75 | 8-15-2026 | 220,000 | 284,049 |
| Total U.S. Treasury securities (Cost $145,428,395) | | | | | 149,550,702 |
| | | Yield | | Shares | |
| Short-term investments: 1.99% | | | | | |
| Investment companies: 1.99% | | | | | |
| Wells Fargo Government Money Market Fund Select Class ♠∞ | | 0.03 | | 3,051,209 | 3,051,209 |
| Total Short-term investments (Cost $3,051,209) | | | | | 3,051,209 |
| Total investments in securities (Cost $151,563,985) | 101.51% | | | | 155,712,289 |
| Other assets and liabilities, net | (1.51) | | | | (2,319,809) |
| Total net assets | 100.00% | | | | $153,392,480 |
The accompanying notes are an integral part of these financial statements.
Wells Fargo Strategic Retirement Bond Portfolio | 5
Portfolio of investments—August 31, 2021 (unaudited)
| ♠ | The issuer of the security is an affiliated person of the Portfolio as defined in the Investment Company Act of 1940. |
| ∞ | The rate represents the 7-day annualized yield at period end. |
| Abbreviations: |
| FHLB | Federal Home Loan Bank |
| FHLMC | Federal Home Loan Mortgage Corporation |
| FNMA | Federal National Mortgage Association |
| TIPS | Treasury inflation-protected securities |
Investments in affiliates
An affiliated investment is an investment in which the Portfolio owns at least 5% of the outstanding voting shares of the issuer or as a result of other relationships, such as the Portfolio and the issuer having the same adviser or investment manager. Transactions with issuers that were either affiliates of the Portfolio at the beginning of the period or the end of the period were as follows:
| | Value,
beginning of
period | Purchases | Sales
proceeds | Net
realized
gains
(losses) | Net
change in
unrealized
gains
(losses) | Value,
end of
period | Shares,
end
of period | Income
from
affiliated
securities |
| Short-term investments | | | | | | | |
| Wells Fargo Government Money Market Fund Select Class | $671,302 | $11,873,785 | $(9,493,878) | $0 | $0 | $3,051,209 | 3,051,209 | $152 |
The accompanying notes are an integral part of these financial statements.
6 | Wells Fargo Strategic Retirement Bond Portfolio
Statement of assets and liabilities—August 31, 2021 (unaudited)
| | |
| Assets | |
Investments in unaffiliated securities, at value (cost $148,512,776)
| $ 152,661,080 |
Investments in affiliated securites, at value (cost $3,051,209)
| 3,051,209 |
Receivable for investments sold
| 1,268,530 |
Receivable for interest
| 345,113 |
Prepaid expenses and other assets
| 701 |
Total assets
| 157,326,633 |
| Liabilities | |
Payable for investments purchased
| 3,923,237 |
Advisory fee payable
| 2,140 |
Accrued expenses and other liabilities
| 8,776 |
Total liabilities
| 3,934,153 |
Total net assets
| $153,392,480 |
The accompanying notes are an integral part of these financial statements.
Wells Fargo Strategic Retirement Bond Portfolio | 7
Statement of operations—six months ended August 31, 2021 (unaudited)
| | |
| Investment income | |
Interest
| $ 2,978,221 |
Income from affiliated securities
| 152 |
Total investment income
| 2,978,373 |
| Expenses | |
Advisory fee
| 38,837 |
Custody and accounting fees
| 4,434 |
Professional fees
| 17,174 |
Interest holder report expenses
| 3,995 |
Trustees’ fees and expenses
| 9,771 |
Other fees and expenses
| 4,334 |
Total expenses
| 78,545 |
Less: Fee waivers and/or expense reimbursements
| (29,610) |
Net expenses
| 48,935 |
Net investment income
| 2,929,438 |
| Realized and unrealized gains (losses) on investments | |
Net realized gains on investments
| 475,279 |
Net change in unrealized gains (losses) on investments
| 598,861 |
Net realized and unrealized gains (losses) on investments
| 1,074,140 |
Net increase in net assets resulting from operations
| $4,003,578 |
The accompanying notes are an integral part of these financial statements.
8 | Wells Fargo Strategic Retirement Bond Portfolio
Statement of changes in net assets
| | | |
| | Six months ended
August 31, 2021
(unaudited) | Year ended
February 28, 2021 |
| Operations | | |
Net investment income
| $ 2,929,438 | $ 933,425 |
Net realized gains on investments
| 475,279 | 1,078,112 |
Net change in unrealized gains (losses) on investments
| 598,861 | 620,830 |
Net increase in net assets resulting from operations
| 4,003,578 | 2,632,367 |
| Capital transactions | | |
| Transactions in investors’ beneficial interests | | |
Contributions
| 6,333,115 | 110,512,241 |
Withdrawals
| (12,059,797) | (33,932,360) |
Net increase (decrease) in net assets resulting from capital transactions
| (5,726,682) | 76,579,881 |
Total increase (decrease) in net assets
| (1,723,104) | 79,212,248 |
| Net assets | | |
Beginning of period
| 155,115,584 | 75,903,336 |
End of period
| $153,392,480 | $155,115,584 |
The accompanying notes are an integral part of these financial statements.
Wells Fargo Strategic Retirement Bond Portfolio | 9
| | | Year ended February 28 |
| | Six months ended
August 31, 2021
(unaudited) | 2021 | 2020 1 | 2019 | 2018 2 |
Total return3
| 2.63% | 3.73% | 7.75% | 2.47% | (1.40)% |
| Ratios to average net assets (annualized) | | | | | |
Gross expenses
| 0.10% | 0.15% | 0.18% | 0.16% | 0.17% |
Net expenses
| 0.06% * | 0.07% * | 0.11% | 0.14% | 0.17% |
Net investment income
| 3.77% | 1.01% | 2.27% | 2.23% | 1.45% |
| Supplemental data | | | | | |
Portfolio turnover rate
| 14% | 44% | 41% | 23% | 193% |
| * | Ratios reflect expenses which were voluntarily waived by the adviser. Without these voluntary waivers, the net expense ratios would be increased by the following amounts: |
| Six months ended August 31, 2021 (unaudited) | 0.04% |
| Year ended February 28, 2021 | 0.08% |
| 1 | Year ended February 29 |
| 2 | For the period from May 23, 2017 (commencement of operations) to February 28, 2018 |
| 3 | Returns for periods of less than one year are not annualized. |
The accompanying notes are an integral part of these financial statements.
10 | Wells Fargo Strategic Retirement Bond Portfolio
Notes to financial statements (unaudited)
1. ORGANIZATION
Wells Fargo Master Trust (the "Trust"), a Delaware statutory trust organized on March 10, 1999, is an open-end management investment company registered under the Investment Company Act of 1940, as amended (the "1940 Act"). As an investment company, the Trust follows the accounting and reporting guidance in Financial Accounting Standards Board ("FASB") Accounting Standards Codification Topic 946, Financial Services – Investment Companies. These financial statements report on the Wells Fargo Strategic Retirement Bond Portfolio (the "Portfolio") which is a diversified series of the Trust.
Interests in the Portfolio are available solely through private placement transactions that do not involve any "public offering" within the meaning of Section 4(2) of the Investment Company Act of 1933.
On February 23, 2021, Wells Fargo & Company announced that it has entered into a definitive agreement to sell Wells Fargo Asset Management ("WFAM") to GTCR LLC and Reverence Capital Partners, L.P. WFAM is the trade name used by the asset management businesses of Wells Fargo & Company and includes Wells Fargo Funds Management, LLC, the adviser to the Portfolio, Wells Capital Management, LLC and Wells Fargo Asset Management (International) Limited, both registered investment advisers providing subadvisory services to certain funds, and Wells Fargo Funds Distributor, LLC, the Portfolio's principal underwriter. As part of the transaction, Wells Fargo & Company will own a 9.9% equity interest and will continue to serve as an important client and distribution partner.
Consummation of the transaction will result in the automatic termination of the Portfolio’s investment advisory agreement and subadvisory agreements. The Portfolio’s Board of Trustees approved a new investment advisory agreement and a new subadvisory agreement which were subsequently approved on behalf of the feeder funds that were investors in the Portfolio at the close of business on May 28, 2021. The new agreements will take effect upon the closing of the transaction. The transaction is expected to close in the second half of 2021, subject to customary closing conditions.
2. SIGNIFICANT ACCOUNTING POLICIES
The following significant accounting policies, which are consistently followed in the preparation of the financial statements of the Portfolio, are in conformity with U.S. generally accepted accounting principles which require management to make estimates and assumptions that affect the reported amounts of assets and liabilities, disclosure of contingent assets and liabilities at the date of the financial statements, and the reported amounts of income and expenses during the reporting period. Actual results could differ from those estimates.
Securities valuation
All investments are valued each business day as of the close of regular trading on the New York Stock Exchange (generally 4 p.m. Eastern Time), although the Portfolio may deviate from this calculation time under unusual or unexpected circumstances.
Debt securities are valued at the evaluated bid price provided by an independent pricing service (e.g. taking into account various factors, including yields, maturities, or credit ratings) or, if a reliable price is not available, the quoted bid price from an independent broker-dealer.
Investments in registered open-end investment companies are valued at net asset value.
Investments which are not valued using any of the methods discussed above are valued at their fair value, as determined in good faith by the Board of Trustees. The Board of Trustees has established a Valuation Committee comprised of the Trustees and has delegated to it the authority to take any actions regarding the valuation of portfolio securities that the Valuation Committee deems necessary or appropriate, including determining the fair value of portfolio securities, unless the determination has been delegated to the Wells Fargo Asset Management Pricing Committee at Wells Fargo Funds Management, LLC ("Funds Management"). The Board of Trustees retains the authority to make or ratify any valuation decisions or approve any changes to the Valuation Procedures as it deems appropriate. On a quarterly basis, the Board of Trustees receives reports on any valuation actions taken by the Valuation Committee or the Wells Fargo Asset Management Pricing Committee which may include items for ratification.
Security transactions and income recognition
Securities transactions are recorded on a trade date basis. Realized gains or losses are recorded on the basis of identified cost.
Interest income is accrued daily and bond discounts are accreted and premiums are amortized daily. To the extent debt obligations are placed on non-accrual status, any related interest income may be reduced by writing off interest receivables when the collection of all or a portion of interest has been determined to be doubtful based on consistently applied procedures and the fair value has decreased. If the issuer subsequently resumes interest payments or when the collectability of interest is reasonably assured, the debt obligation is removed from non-accrual status.
Wells Fargo Strategic Retirement Bond Portfolio | 11
Notes to financial statements (unaudited)
Federal and other taxes
The Portfolio is not required to pay federal income taxes on its net investment income and net capital gains as it is treated as a partnership for federal income tax purposes. All income, gains and losses of the Portfolio are deemed to have been “passed through” to the interest holders in proportion to their holdings of the Portfolio regardless of whether income and gains have been distributed by the Portfolio.
The Portfolio’s income tax returns and all financial records supporting those returns for the prior three fiscal years are subject to examination by the federal revenue authority. Management has analyzed the Portfolio’s tax positions taken on federal, state, and foreign tax returns for all open tax years and does not believe that there are any uncertain tax positions that require recognition of a tax liability.
As of August 31, 2021, the aggregate cost of all investments for federal income tax purposes was $151,560,119 and the unrealized gains (losses) consisted of:
| Gross unrealized gains | $4,566,992 |
| Gross unrealized losses | (414,822) |
| Net unrealized gains | $4,152,170 |
3. FAIR VALUATION MEASUREMENTS
Fair value measurements of investments are determined within a framework that has established a fair value hierarchy based upon the various data inputs utilized in determining the value of the Portfolio’s investments. The three-level hierarchy gives the highest priority to unadjusted quoted prices in active markets for identical assets or liabilities (Level 1) and the lowest priority to unobservable inputs (Level 3). The Portfolio’s investments are classified within the fair value hierarchy based on the lowest level of input that is significant to the fair value measurement. The inputs are summarized into three broad levels as follows:
| ■ | Level 1 – quoted prices in active markets for identical securities |
| ■ | Level 2 – other significant observable inputs (including quoted prices for similar securities, interest rates, prepayment speeds, credit risk, etc.) |
| ■ | Level 3 – significant unobservable inputs (including the Portfolio’s own assumptions in determining the fair value of investments) |
The inputs or methodologies used for valuing investments in securities are not necessarily an indication of the risk associated with investing in those securities.
The following is a summary of the inputs used in valuing the Portfolio’s assets and liabilities as of August 31, 2021:
| | Quoted prices
(Level 1) | Other significant
observable inputs
(Level 2) | Significant
unobservable inputs
(Level 3) | Total |
| Assets | | | | |
| Investments in: | | | | |
| Agency securities | $ 0 | $ 3,110,378 | $0 | $ 3,110,378 |
| U.S. Treasury securities | 149,550,702 | 0 | 0 | 149,550,702 |
| Short-term investments | | | | |
| Investment companies | 3,051,209 | 0 | 0 | 3,051,209 |
| Total assets | $152,601,911 | $3,110,378 | $0 | $155,712,289 |
Additional sector, industry or geographic detail, if any, is included in the Portfolio of Investments.
For the six months ended August 31, 2021, the Portfolio did not have any transfers into/out of Level 3.
4. TRANSACTIONS WITH AFFILIATES
Advisory fee
The Trust has entered into an advisory contract with Funds Management, an indirect wholly owned subsidiary of Wells Fargo & Company ("Wells Fargo"). The adviser is responsible for implementing investment policies and guidelines and for supervising
12 | Wells Fargo Strategic Retirement Bond Portfolio
Notes to financial statements (unaudited)
the subadviser, who is responsible for day-to-day portfolio management of the Portfolio. Pursuant to the contract, Funds Management is entitled to receive an advisory fee at the following annual rate based on the Portfolio’s average daily net assets:
| Average daily net assets | Advisory fee |
| First $5 billion | 0.050% |
| Next $5 billion | 0.040 |
| Over $10 billion | 0.030 |
For the six months ended August 31, 2021, the advisory fee was equivalent to an annual rate of 0.05% of the Portfolio’s average daily net assets.
Funds Management has retained the services of a subadviser to provide daily portfolio management to the Portfolio. The fee for subadvisory services is borne by Funds Management. Wells Capital Management, LLC, an affiliate of Funds Management and an indirect wholly owned subsidiary of Wells Fargo, is the subadviser to the Portfolio and is entitled to receive a fee from Funds Management at an annual rate starting at 0.04% and declining to 0.03% as the average daily net assets of the Portfolio increase.
Funds Management has voluntarily waived and/or reimbursed advisory fees to reduce the net operating expense ratio of the Portfolio. These voluntary waivers may be discontinued at any time.
Interfund transactions
The Portfolio may purchase or sell portfolio investment securities to certain other Wells Fargo affiliates pursuant to Rule 17a-7 under the 1940 Act and under procedures adopted by the Board of Trustees. The procedures have been designed to ensure that these interfund transactions, which do not incur broker commissions, are effected at current market prices.
5. INVESTMENT PORTFOLIO TRANSACTIONS
Purchases and sales of investments in U.S. government obligations, excluding short-term securities, for the six months ended August 31, 2021 were $21,284,147 and $26,378,629, respectively.
6. BANK BORROWINGS
The Trust, along with Wells Fargo Variable Trust and Wells Fargo Funds Trust (excluding the money market funds), are parties to a $350,000,000 revolving credit agreement whereby the Portfolio is permitted to use bank borrowings for temporary or emergency purposes, such as to fund interest holders withdrawal requests. Interest under the credit agreement is charged to the Portfolio based on a borrowing rate equal to the higher of the Federal Funds rate in effect on that day plus 1.25% or the overnight bank funding rate in effect on that day plus 1.25%. In addition, an annual commitment fee equal to 0.25% of the unused balance is allocated to each participating fund.
For the six months ended August 31, 2021, there were no borrowings by the Portfolio under the agreement.
7. INDEMNIFICATION
Under the Portfolio's organizational documents, the officers and Trustees have been granted certain indemnification rights against certain liabilities that may arise out of performance of their duties to the Portfolio. The Portfolio has entered into a separate agreement with each Trustee that converts indemnification rights currently existing under the Portfolio’s organizational documents into contractual rights that cannot be changed in the future without the consent of the Trustee. Additionally, in the normal course of business, the Portfolio may enter into contracts with service providers that contain a variety of indemnification clauses. The Portfolio’s maximum exposure under these arrangements is dependent on future claims that may be made against the Portfolio and, therefore, cannot be estimated.
8. CORONAVIRUS (COVID-19) PANDEMIC
On March 11, 2020, the World Health Organization announced that it had made the assessment that coronavirus disease 2019 (“COVID-19”) is a pandemic. The impacts of COVID-19 are affecting the entire global economy, individual companies and investment products, the funds, and the market in general. There is significant uncertainty around the extent and duration of business disruptions related to COVID-19 and the impacts may last for an extended period of time. COVID-19 has led to significant uncertainty and volatility in the financial markets.
Wells Fargo Strategic Retirement Bond Portfolio | 13
Notes to financial statements (unaudited)
9. SUBSEQUENT EVENTS
Wells Fargo Asset Management ("WFAM") announced that it will be changing its company name to Allspring Global Investments upon the closing of the previously announced sale transaction of WFAM by Wells Fargo & Company to GTCR LLC and Reverence Capital Partners, L.P. The new corporate name is expected to go into effect on the closing date of the transaction, which is anticipated to occur in the second half of 2021, subject to customary closing conditions.
The Board of Trustees of the Wells Fargo Funds approved a change in the Portfolio's name to remove “Wells Fargo” from the Portfolio's name and replace with “Allspring” on December 6, 2021.
Following the closing of the transaction, Wells Fargo Funds Management, LLC, the Portfolio's adviser, Wells Capital Management, LLC and Wells Fargo Asset Management (International) Limited, each subadvisers to certain funds, and Wells Fargo Funds Distributor, LLC will each be rebranded as Allspring.
14 | Wells Fargo Strategic Retirement Bond Portfolio
Other information (unaudited)
PROXY VOTING INFORMATION
A description of the policies and procedures used to determine how to vote proxies relating to portfolio securities is available without charge, upon request, by calling 1-800-222-8222, visiting our website at wfam.com, or visiting the SEC website at sec.gov. Information regarding how the proxies related to portfolio securities were voted during the most recent 12-month period ended June 30 is available on the website at wfam.com or by visiting the SEC website at sec.gov.
QUARTERLY PORTFOLIO HOLDINGS INFORMATION
The Portfolio files its complete schedule of portfolio holdings with the SEC for the first and third quarters of each fiscal year as an exhibit to its reports on Form N-PORT. Interest holders may view the filed Form N-PORT by visiting the SEC website at sec.gov.
Wells Fargo Strategic Retirement Bond Portfolio | 15
Other information (unaudited)
BOARD OF TRUSTEES AND OFFICERS
Each of the Trustees and Officers listed in the table below acts in identical capacities for each fund in the Wells Fargo family of funds, which consists of 139 mutual funds comprising the Wells Fargo Funds Trust, Wells Fargo Variable Trust, Wells Fargo Master Trust and four closed-end funds (collectively the “Fund Complex”). This table should be read in conjunction with the Prospectus and the Statement of Additional Information1. The mailing address of each Trustee and Officer is 525 Market Street, 12th Floor, San Francisco, CA 94105. Each Trustee and Officer serves an indefinite term, however, each Trustee serves such term until reaching the mandatory retirement age established by the Trustees.
Independent Trustees
Name and
year of birth | Position held and
length of service* | Principal occupations during past five years or longer | Current other
public company or
investment
company
directorships |
William R. Ebsworth
(Born 1957) | Trustee,
since 2015 | Retired. From 1984 to 2013, equities analyst, portfolio manager, research director and chief investment officer at Fidelity Management and Research Company in Boston, Tokyo, and Hong Kong, and retired in 2013 as Chief Investment Officer of Fidelity Strategic Advisers, Inc. where he led a team of investment professionals managing client assets. Prior thereto, Board member of Hong Kong Securities Clearing Co., Hong Kong Options Clearing Corp., the Thailand International Fund, Ltd., Fidelity Investments Life Insurance Company, and Empire Fidelity Investments Life Insurance Company. Audit Committee Chair and Investment Committee Chair of the Vincent Memorial Hospital Endowment (non-profit organization). Mr. Ebsworth is a CFA® charterholder. | N/A |
Jane A. Freeman
(Born 1953) | Trustee,
since 2015;
Chair Liaison,
since 2018 | Retired. From 2012 to 2014 and 1999 to 2008, Chief Financial Officer of Scientific Learning Corporation. From 2008 to 2012, Ms. Freeman provided consulting services related to strategic business projects. Prior to 1999, Portfolio Manager at Rockefeller & Co. and Scudder, Stevens & Clark. Board member of the Harding Loevner Funds from 1996 to 2014, serving as both Lead Independent Director and chair of the Audit Committee. Board member of the Russell Exchange Traded Funds Trust from 2011 to 2012 and the chair of the Audit Committee. Ms. Freeman is also an inactive Chartered Financial Analyst. | N/A |
Isaiah Harris, Jr.
(Born 1952) | Trustee,
since 2009; Audit
Committee
Chair,
since 2019 | Retired. Chairman of the Board of CIGNA Corporation since 2009, and Director since 2005. From 2003 to 2011, Director of Deluxe Corporation. Prior thereto, President and CEO of BellSouth Advertising and Publishing Corp. from 2005 to 2007, President and CEO of BellSouth Enterprises from 2004 to 2005 and President of BellSouth Consumer Services from 2000 to 2003. Emeritus member of the Iowa State University Foundation Board of Governors. Emeritus Member of the Advisory Board of Iowa State University School of Business. Advisory Board Member, Palm Harbor Academy (private school). Mr. Harris is a certified public accountant (inactive status). | CIGNA Corporation |
Judith M. Johnson
(Born 1949) | Trustee,
since 2008 | Retired. Prior thereto, Chief Executive Officer and Chief Investment Officer of Minneapolis Employees Retirement Fund from 1996 to 2008. Ms. Johnson is an attorney, certified public accountant and a certified managerial accountant. | N/A |
David F. Larcker
(Born 1950) | Trustee,
since 2009 | James Irvin Miller Professor of Accounting at the Graduate School of Business (Emeritus), Stanford University, Director of the Corporate Governance Research Initiative and Senior Faculty of The Rock Center for Corporate Governance since 2006. From 2005 to 2008, Professor of Accounting at the Graduate School of Business, Stanford University. Prior thereto, Ernst & Young Professor of Accounting at The Wharton School, University of Pennsylvania from 1985 to 2005. | N/A |
16 | Wells Fargo Strategic Retirement Bond Portfolio
Other information (unaudited)
Name and
year of birth | Position held and
length of service* | Principal occupations during past five years or longer | Current other
public company or
investment
company
directorships |
Olivia S. Mitchell
(Born 1953) | Trustee,
since 2006;
Nominating and
Governance
Committee Chair,
since 2018 | International Foundation of Employee Benefit Plans Professor, Wharton School of the University of Pennsylvania since 1993. Director of Wharton’s Pension Research Council and Boettner Center on Pensions & Retirement Research, and Research Associate at the National Bureau of Economic Research. Previously, Cornell University Professor from 1978 to 1993. | N/A |
Timothy J. Penny
(Born 1951) | Trustee,
since 1996;
Chair,
since 2018 | President and Chief Executive Officer of Southern Minnesota Initiative Foundation, a non-profit organization, since 2007. Member of the Board of Trustees of NorthStar Education Finance, Inc., a non-profit organization, since 2007. | N/A |
James G. Polisson
(Born 1959) | Trustee,
since 2018 | Retired. Chief Marketing Officer, Source (ETF) UK Services, Ltd, from 2015 to 2017. From 2012 to 2015, Principal of The Polisson Group, LLC, a management consulting, corporate advisory and principal investing company. Chief Executive Officer and Managing Director at Russell Investments, Global Exchange Traded Funds from 2010 to 2012. Managing Director of Barclays Global Investors from 1998 to 2010 and Global Chief Marketing Officer for iShares and Barclays Global Investors from 2000 to 2010. Trustee of the San Francisco Mechanics’ Institute, a non-profit organization, from 2013 to 2015. Board member of the Russell Exchange Traded Fund Trust from 2011 to 2012. Director of Barclays Global Investors Holdings Deutschland GmbH from 2006 to 2009. Mr. Polisson is an attorney and has a retired status with the Massachusetts and District of Columbia Bar Associations. | N/A |
Pamela Wheelock
(Born 1959) | Trustee,
since January
2020; previously
Trustee from
January 2018 to
July 2019 | Board member of the Destination Medical Center Economic Development Agency, Rochester, Minnesota since 2019. Interim President of the McKnight Foundation from January to September 2020. Acting Commissioner, Minnesota Department of Human Services, July 2019 through September 2019. Human Services Manager (part-time), Minnesota Department of Human Services, October 2019 through December 2019. Chief Operating Officer, Twin Cities Habitat for Humanity from 2017 to 2019. Vice President of University Services, University of Minnesota from 2012 to 2016. Prior thereto, on the Board of Directors, Governance Committee and Finance Committee for the Minnesota Philanthropy Partners (Saint Paul Foundation) from 2012 to 2018, Interim Chief Executive Officer of Blue Cross Blue Shield of Minnesota from 2011 to 2012, Chairman of the Board from 2009 to 2012 and Board Director from 2003 to 2015. Vice President, Leadership and Community Engagement, Bush Foundation, Saint Paul, Minnesota (a private foundation) from 2009 to 2011. Executive Vice President and Chief Financial Officer, Minnesota Sports and Entertainment from 2004 to 2009 and Senior Vice President from 2002 to 2004. Executive Vice President of the Minnesota Wild Foundation from 2004 to 2008. Commissioner of Finance, State of Minnesota, from 1999 to 2002. Currently Board Chair of the Minnesota Wild Foundation since 2010. | N/A |
* Length of service dates reflect the Trustee’s commencement of service with the Trust’s predecessor entities, where applicable.
Wells Fargo Strategic Retirement Bond Portfolio | 17
Other information (unaudited)
Officers
Name and
year of birth | Position held and
length of service | Principal occupations during past five years or longer |
Andrew Owen
(Born 1960) | President,
since 2017 | Executive Vice President of Wells Fargo & Company and Head of Affiliated Managers, Wells Fargo Asset Management, since 2014. In addition, Mr. Owen is currently President, Chief Executive Officer and Director of Wells Fargo Funds Management, LLC since 2017. Prior thereto, Executive Vice President responsible for marketing, investments and product development for Wells Fargo Funds Management, LLC, from 2009 to 2014. |
Jeremy DePalma
(Born 1974) | Treasurer,
since 2012
(for certain funds in
the Fund Complex);
since 2021 (for
the remaining funds in the
Fund Complex) | Senior Vice President of Wells Fargo Funds Management, LLC since 2009. Senior Vice President of Evergreen Investment Management Company, LLC from 2008 to 2010 and head of the Fund Reporting and Control Team within Fund Administration from 2005 to 2010. |
Michelle Rhee
(Born 1966) | Chief Legal Officer,
since 2019 | Secretary of Wells Fargo Funds Management, LLC and Chief Legal Counsel of Wells Fargo Asset Management since 2018. Deputy General Counsel of Wells Fargo Bank, N.A. since 2020 and Assistant General Counsel of Wells Fargo Bank, N.A. from 2018 to 2020. Associate General Counsel and Managing Director of Bank of America Corporation from 2004 to 2018. |
Matthew Prasse
(Born 1983) | Secretary,
since 2021 | Senior Counsel of the Wells Fargo Legal Department since 2018. Previously, Director and Counsel for Barings LLC from 2015 to 2018. Prior to joining Barings, Associate at Morgan, Lewis & Bockius LLP from 2008 to 2015. |
Michael H. Whitaker
(Born 1967) | Chief Compliance Officer,
since 2016 | Chief Compliance Officer of Wells Fargo Asset Management since 2016. Senior Vice President and Chief Compliance Officer for Fidelity Investments from 2007 to 2016. |
1 The Statement of Additional Information includes additional information about the Trustees and is available, without charge, upon request, by calling 1-800-222-8222 or by visiting the website at wfam.com.
18 | Wells Fargo Strategic Retirement Bond Portfolio
Board considerations (unaudited)
BOARD CONSIDERATION OF INVESTMENT ADVISORY AND SUB-ADVISORY AGREEMENTS:
Wells Fargo Bloomberg Barclays US Aggregate ex-Corporate Portfolio, Wells Fargo Emerging Markets Bond Portfolio, Wells Fargo Factor Enhanced Emerging Markets Equity Portfolio, Wells Fargo Factor Enhanced International Equity Portfolio, Wells Fargo Factor Enhanced U.S. Large Cap Equity Portfolio, Wells Fargo Factor Enhanced U.S. Small Cap Equity Portfolio, Wells Fargo High Yield Corporate Bond Portfolio, Wells Fargo Investment Grade Corporate Bond Portfolio, Wells Fargo Factor Enhanced U.S. Low Volatility Equity Portfolio, Wells Fargo Strategic Retirement Bond Portfolio, and Wells Fargo U.S. REIT Portfolio
Board Considerations – Current Agreements
Under the Investment Company Act of 1940 (the “1940 Act”), the Board of Trustees (the “Board”) of Wells Fargo Master Trust (the “Trust”) must determine annually whether to approve the continuation of the Trust’s investment advisory and sub-advisory agreements. In this regard, at a meeting held on May 17-19, 2021 (the “Meeting”), the Board of the Trust, all the members of which have no direct or indirect interest in the investment advisory and sub-advisory agreements and are not “interested persons” of the Trust, as defined in the 1940 Act (the “Independent Trustees”), reviewed and approved for each of the portfolios of the Trust identified in the table below (individually, a “Portfolio” and collectively, the “Portfolios”): (i) an investment advisory agreement (the “Advisory Agreement”) with Wells Fargo Funds Management, LLC (“Funds Management”); and (ii) an investment sub-advisory agreement (each, a “Sub-Advisory Agreement” and collectively, the “Sub-Advisory Agreements”) with the sub-adviser(s) identified in the table below (each, a “Sub-Adviser” and collectively, the “Sub-Advisers”) for the corresponding Portfolio identified. The Advisory Agreement and the Sub-Advisory Agreements are collectively referred to as the “Advisory Agreements.”
| Funds Trust | Master Trust |
| Wells Fargo Bloomberg Barclays US Aggregate ex-Corporate Portfolio | Wells Capital Management Incorporated |
| Wells Fargo Emerging Markets Bond Portfolio | Wells Fargo Asset Management (International) Limited and Wells Capital Management Incorporated |
| Wells Fargo Factor Enhanced Emerging Markets Equity Portfolio | Wells Capital Management Incorporated |
| Wells Fargo Factor Enhanced International Equity Portfolio | Wells Capital Management Incorporated |
| Wells Fargo Factor Enhanced U.S. Large Cap Equity Portfolio | Wells Capital Management Incorporated |
| Wells Fargo Factor Enhanced U.S. Small Cap Equity Portfolio | Wells Capital Management Incorporated |
| Wells Fargo High Yield Corporate Bond Portfolio | Wells Capital Management Incorporated |
| Wells Fargo Investment Grade Corporate Bond Portfolio | Wells Capital Management Incorporated |
| Wells Fargo Factor Enhanced U.S. Low Volatility Equity Portfolio | Wells Capital Management Incorporated |
| Wells Fargo Strategic Retirement Bond Portfolio | Wells Capital Management Incorporated |
| Wells Fargo U.S. REIT Portfolio | Wells Capital Management Incorporated |
The Board noted that Wells Fargo & Company recently announced that it had entered into a definitive agreement to sell Wells Fargo Asset Management (“WFAM”), which includes Funds Management and the Sub-Adviser, to GTCR LLC and Reverence Capital Partners, L.P. and/or their affiliates (the “Transaction”). The Board further noted that the Transaction would result in a change-of-control of Funds Management and the Sub-Advisers, which would be considered to be an assignment that would result in the termination of the Advisory Agreements. In light of the Transaction, the Board separately considered for approval a new investment advisory agreement with Funds Management and a new investment sub-advisory agreement with each of the Sub-Advisers (the “New Agreements”) that would replace the Advisory Agreements upon consummation of the Transaction, subject to approval of the New Agreements by the Portfolios’ shareholders. The Board also considered for approval interim agreements to go into effect in the event shareholders do not approve the New Agreements before the Transaction is completed. The interim agreements would allow the Manager and the Sub-Advisers to continue providing services to the Portfolios while the Portfolios continues to seek shareholder approval of the New Agreements. The Board noted that the terms of the interim agreements would be identical to those of the current Advisory Agreements, except for the term and certain escrow provisions.
At the Meeting, the Board considered the factors and reached the conclusions described below relating to the selection of Funds Management and the Sub-Advisers and the approval of the Advisory Agreements. Prior to the Meeting, including at Board meetings held in April and May 2021, the Trustees conferred extensively among themselves and with representatives of Funds Management about these matters. Also, the Board has adopted a team-based approach, with each team consisting of a sub-set of
Wells Fargo Strategic Retirement Bond Portfolio | 19
Board considerations (unaudited)
Trustees, to assist the full Board in the discharge of its duties in reviewing investment performance and other matters throughout the year. The Independent Trustees were assisted in their evaluation of the Advisory Agreements by independent legal counsel, from whom they received separate legal advice and with whom they met separately.
In providing information to the Board, Funds Management and the Sub-Advisers were guided by a detailed set of requests for information submitted to them by independent legal counsel on behalf of the Independent Trustees at the start of the Board’s annual contract renewal process earlier in 2021. In considering and approving the Advisory Agreements, the Trustees considered the information they believed relevant, including but not limited to the information discussed below. The Board considered not only the specific information presented in connection with the Meeting, but also the knowledge gained over time through interaction with Funds Management and the Sub-Advisers about various topics. In this regard, the Board reviewed reports of Funds Management at each of its quarterly meetings, which included, among other things, portfolio reviews and investment performance reports. In addition, the Board and the teams mentioned above confer with portfolio managers at various times throughout the year. The Board did not identify any particular information or consideration that was all-important or controlling, and each individual Trustee may have attributed different weights to various factors.
After its deliberations, the Board unanimously determined that the compensation or the absence of compensation payable to Funds Management and each of the Sub-Advisers under each of the Advisory Agreements was reasonable, and approved the continuation of the Advisory Agreements for a one-year term. The Board considered the approval of the Advisory Agreements for the Portfolios as part of its consideration of agreements for funds across the complex, but its approvals were made on a fund-by-fund basis. The following summarizes a number of important, but not necessarily all, factors considered by the Board in support of its approvals.
Nature, extent and quality of services
The Board received and considered various information regarding the nature, extent and quality of services provided to the Funds by Funds Management and the Sub-Advisers under the Advisory Agreements. This information included a description of the investment advisory services and Portfolio-level administrative services covered by the Advisory Agreement, as well as, among other things, a summary of the background and experience of senior management of WFAM, of which Funds Management and the Sub-Advisers are a part, and a summary of investments made in the business of WFAM. The Board also received a description of Funds Management’s and the Sub-Advisers’ business continuity plans, including a summary of the performance of such plans and any changes thereto during the COVID-19 pandemic, and of their approaches to data privacy and cybersecurity. The Board also received and reviewed information about Funds Management’s role as administrator of the Portfolios’ liquidity risk management program, Funds Management’s approach to risk management, and Funds Management’s intermediary and vendor oversight program.
The Board also considered the qualifications, background, tenure and responsibilities of each of the portfolio managers primarily responsible for the day-to-day portfolio management of the Portfolios. The Board noted that each of the Portfolios replicates the performance of a proprietary index provided by an affiliate of Funds Management, except that each of Wells Fargo Bloomberg Barclays US Aggregate ex-Corporate Portfolio, Wells Fargo Emerging Markets Bond Portfolio, and Wells Fargo Strategic Retirement Bond Portfolio track the performance of a third party index. The Board evaluated the ability of Funds Management and the Sub-Advisers to attract and retain qualified investment professionals, including research, advisory and supervisory personnel.
The Board further considered the compliance programs and compliance records of Funds Management and the Sub-Advisers. In addition, the Board took into account the full range of services provided to the Portfolios by Funds Management and its affiliates. The Board also considered information about retention and back-up arrangements that have been put into place with respect to key personnel of WFAM in connection with the anticipated Transaction, noting that WFAM provided assurances that the announcement and eventual culmination of the Transaction is not expected to result in any diminution in the nature or quality of services provided to the Portfolios.
Portfolio investment performance and expenses
The Board considered the investment performance results for each of the Portfolios over the one- and three-year periods ended December 31, 2020, except for the Wells Fargo Factor Enhanced U.S. Low Volatility Equity Portfolio, for which the Board considered the investment performance results for the quarter ended December 31, 2020. The Board considered these results in comparison to the investment performance of funds in a universe that was determined by Broadridge Inc. (“Broadridge”) to be similar to each respective Portfolios (each, a “Universe”), and in comparison to each Portfolios’ benchmark index and to other comparative data. Broadridge is an independent provider of investment company data. The Board received a description of the methodology used by Broadridge to select the mutual funds in the performance Universe. The Board noted the short performance history of the Portfolios.
20 | Wells Fargo Strategic Retirement Bond Portfolio
Board considerations (unaudited)
With respect to the investment performance of each Portfolio relative to its respective Universe, the Board noted the following: (i) the investment performance of each of Wells Fargo Factor Enhanced International Equity Portfolio and Wells Fargo Factor Enhanced U.S. Small Cap Equity Portfolio was higher than such Portfolio’s respective Universe for the one- and three-year periods under review; (ii) the investment performance of each of Wells Fargo Bloomberg Barclays US Aggregate ex-Corporate Portfolio, Wells Fargo Emerging Markets Bond Portfolio, and Wells Fargo Investment Grade Corporate Bond Portfolio was higher than such Portfolio’s respective Universe for the three-year period under review, and lower than such Portfolio’s respective Universe for the one-year period under review; (iii) the investment performance of each of Wells Fargo Factor Enhanced Emerging Markets Equity Portfolio, Wells Fargo Factor Enhanced U.S. Large Cap Equity Portfolio, Wells Fargo High Yield Corporate Bond Portfolio, Wells Fargo Strategic Retirement Bond Portfolio, and Wells Fargo U.S. REIT Portfolio was lower than such Portfolio’s respective Universe for the one- and three-year periods under review; and (iv) the Wells Fargo Factor Enhanced U.S. Low Volatility Equity Portfolio launched on July 1, 2020 and, given its short operational history, had no historical performance.
With respect to the investment performance of each Portfolio relative to its respective benchmark index, the Board noted the following: (i) the investment performance of each of Wells Fargo Bloomberg Barclays US Aggregate ex-Corporate Portfolio, Wells Fargo Factor Enhanced International Equity Portfolio, Wells Fargo Investment Grade Corporate Bond Portfolio, Wells Fargo Factor Enhanced U.S. Low Volatility Equity Portfolio, and Wells Fargo Strategic Retirement Bond Portfolio was higher than or in range of such Portfolio’s respective benchmark index for all periods under review; (ii) the investment performance of Wells Fargo U.S. REIT Portfolio was in range of the Portfolio’s benchmark index for the three-year period under review, and was lower than the Portfolio’s benchmark index for the one-year period under review; and (iii) the investment performance of each of Wells Fargo Emerging Markets Bond Portfolio, Wells Fargo Factor Enhanced Emerging Markets Equity Portfolio, Wells Fargo Factor Enhanced U.S. Large Cap Equity Portfolio, Wells Fargo Factor Enhanced U.S. Small Cap Equity Portfolio, and Wells Fargo High Yield Corporate Bond Portfolio was lower than such Portfolio’s respective benchmark index for all periods under review.
The Board received information concerning, and discussed factors contributing to, the underperformance of each of Wells Fargo Factor Enhanced Emerging Markets Equity Portfolio, Wells Fargo Factor Enhanced International Equity Portfolio, Wells Fargo Factor Enhanced U.S. Large Cap Equity Portfolio, Wells Fargo High Yield Corporate Bond Portfolio, Wells Fargo Strategic Retirement Bond Portfolio, and Wells Fargo U.S. REIT Portfolio relative to such Portfolio’s Universe and benchmark index for the periods identified above.
The Board also received and considered information regarding the fee rates that are payable to Funds Management for investment advisory services (as discussed below), which are the only fees charged to the Portfolios, relative to corresponding class-specific expense groups that were determined by Broadridge to be similar to the Portfolios (the “Groups”). The Board received a description of the methodology used by Broadridge to select the mutual funds in the expense Groups and an explanation of how funds comprising expense groups and their expense ratios may vary from year-to-year.
The Board took into account the Portfolios’ investment performance and expense information provided to it among the factors considered in deciding to re-approve the Advisory Agreements.
Investment advisory and sub-advisory fee rates
The Board reviewed and considered the contractual fee rates payable by the Portfolios to Funds Management under the Advisory Agreement. The Board also reviewed and considered the contractual investment sub-advisory fee rates that are payable by Funds Management to the Sub-Advisers for investment sub-advisory services.
Among other information reviewed by the Board was a comparison of the Portfolios’ Management Rates with the average contractual investment management fee rates of funds in the expense Groups at a common asset level as well as transfer agency costs of the Portfolios in the expense Groups. The Board noted that the Management Rates of the Portfolios were lower than, equal to, or in range of the sum of these average rates for the Portfolios’ expense Groups.
The Board also received and considered information about the portions of the total management fees that were retained by Funds Management after payment of the fees to the Sub-Advisers for sub-advisory services. In assessing the reasonableness of these amounts, the Board received and evaluated information about the nature and extent of responsibilities retained and risks assumed by Funds Management and not delegated to or assumed by the Sub-Advisers, and about Funds Management’s on-going oversight services. Given the affiliation between Funds Management and the Sub-Advisers, the Board ascribed limited relevance to the allocation of fees between them.
The Board also received and considered information about the nature and extent of services offered and fee rates charged by Funds Management and the Sub-Advisers to other types of clients with investment strategies similar to those of certain Portfolios. In this regard, the Board received information about the significantly greater scope of services, and compliance,
Wells Fargo Strategic Retirement Bond Portfolio | 21
Board considerations (unaudited)
reporting and other legal burdens and risks of managing proprietary mutual funds compared with those associated with managing assets of other types of clients, including third-party sub-advised fund clients and non-mutual fund clients such as institutional separate accounts.
Based on its consideration of the factors and information it deemed relevant, including those described here, the Board determined that the compensation payable to Funds Management under the Advisory Agreement and to the Sub-Advisers under the Sub-Advisory Agreements was reasonable.
Profitability
The Board received and considered information concerning the profitability of Funds Management, as well as the profitability of both WFAM and Wells Fargo & Co. (“Wells Fargo”) from providing services to the funds family as a whole. The Board noted that the Sub-Advisers’ profitability information with respect to providing services to the Portfolios and other funds in the family was subsumed in the WFAM and Wells Fargo profitability analysis.
Funds Management reported on the methodologies and estimates used in calculating profitability, including a description of the methodology used to allocate certain expenses. Among other things, the Board noted that the levels of profitability reported on a fund-by-fund basis varied widely, depending on factors such as the size, type and age of fund.
Based on its review, the Board did not deem the profits reported by Funds Management, WFAM or Wells Fargo from services provided to the Portfolios to be at a level that would prevent it from approving the continuation of the Advisory Agreements.
Economies of scale
The Board received and considered information about the potential for Funds Management to experience economies of scale in the provision of management services to the Portfolios, the difficulties of calculating economies of scale at an individual fund level, and the extent to which potential scale benefits are shared with shareholders. The Board noted the existence of breakpoints in the Portfolios’ management fee structure, which operate generally to reduce the Portfolios’ expense ratios as the Portfolios grow in size, and the size of the Portfolios in relation to such breakpoints. The Board considered that in addition to management fee breakpoints, Funds Management shares potential economies of scale from its management business in a variety of ways, including through fee waiver and expense reimbursement arrangements, competitive management fee rates set at the outset without regard to breakpoints, and investments in the business intended to enhance services available to shareholders.
The Board concluded that Funds Management’s arrangements with respect to the Portfolios, including contractual breakpoints, constituted a reasonable approach to sharing potential economies of scale with the Portfolios and their shareholders.
Other benefits to Funds Management and the Sub-Advisers
The Board received and considered information regarding potential “fall-out” or ancillary benefits received by Funds Management and its affiliates, including the Sub-Advisers, as a result of their relationships with the Portfolios. Ancillary benefits could include, among others, benefits directly attributable to other relationships with the Portfolios and benefits potentially derived from an increase in Funds Management’s and the Sub-Advisers’ businesses as a result of their relationships with the Portfolios. The Board noted that various affiliates of Funds Management may receive distribution-related fees, shareholder servicing payments and sub-transfer agency fees in respect of shares sold or held through them and services provided.
The Board also reviewed information about soft dollar credits earned and utilized by the Sub-Advisers, fees earned by Funds Management and Wells Capital Management Incorporated from managing a private investment vehicle for the fund family’s securities lending collateral, and commissions earned by an affiliated broker from portfolio transactions.
Based on its consideration of the factors and information it deemed relevant, including those described here, the Board did not find that any ancillary benefits received by Funds Management and its affiliates, including the Sub-Advisers, were unreasonable.
Conclusion
At the Meeting, after considering the above-described factors and based on its deliberations and its evaluation of the information described above, the Board unanimously determined that the compensation payable to Funds Management and the Sub-Advisers under each of the Advisory Agreements was reasonable, and approved the continuation of the Advisory Agreements for a one-year term.
22 | Wells Fargo Strategic Retirement Bond Portfolio
Board considerations (unaudited)
Board Considerations – New Agreements
Overview of the Board evaluation process
At a meeting held on May 17-19, 2021 (the “Board Meeting”), the Board of Trustees (the “Board”) of Wells Fargo Master Trust (the “Trust”, and the series identified below, the “Portfolios”) approved the continuation of each Portfolio’s current Investment Advisory Agreement (the “Current Investment Advisory Agreement”) and the current Sub-Advisory Agreements (the “Current Sub-Advisory Agreements”, and collectively, the “Current Agreements”).
| Wells Fargo Bloomberg Barclays US Aggregate ex-Corporate Portfolio |
| Wells Fargo Emerging Markets Bond Portfolio |
| Wells Fargo Factor Enhanced Emerging Markets Equity Portfolio |
| Wells Fargo Factor Enhanced International Equity Portfolio |
| Wells Fargo Factor Enhanced U.S. Large Cap Equity Portfolio |
| Wells Fargo Factor Enhanced U.S. Small Cap Equity Portfolio |
| Wells Fargo High Yield Corporate Bond Portfolio |
| Wells Fargo Investment Grade Corporate Bond Portfolio |
| Wells Fargo Factor Enhanced U.S. Low Volatility Equity Portfolio |
| Wells Fargo Strategic Retirement Bond Portfolio |
| Wells Fargo U.S. REIT Portfolio |
Each Trustee on the Board is not an “interested person” (as defined in the Investment Company Act of 1940 (the “1940 Act”)) of the Portfolios (collectively, the “Independent Trustees”). The process followed by the Board in considering and approving the continuation of the Current Agreements is referred to herein as the “2021 Annual Approval Process.”
As noted above, the closing of the sale of Wells Fargo Asset Management (“WFAM”) to a holding company (“NewCo”) affiliated with private funds of GTCR LLC (“GTCR”) and of Reverence Capital Partners, L.P. (“Reverence Capital”, and such transaction, the “Transaction”) will result in a change of control of Wells Fargo Funds Management LLC (“Funds Management”), Wells Capital Management Incorporated (“Wells Capital”) and Wells Fargo Asset Management (International) Limited (“WFAM(I) Ltd.”, and together with Funds Management and Wells Capital, the “Advisers”), which will be considered to be an “assignment” of each Portfolio’s Current Agreements under the 1940 Act that will result in the automatic termination of each Portfolio’s Current Agreements. In light of the expected termination of each Portfolio’s Current Agreements upon the closing, at the Board Meeting the Board also considered and approved: (i) a new Investment Advisory Agreement (the “New Investment Advisory Agreement”) between the Trust, on behalf of each Portfolio, and Funds Management; (ii) a new Sub-Advisory Agreement (the “New Wells Capital Sub-Advisory Agreement”) among the Trust, on behalf of each Portfolio, Funds Management and Wells Capital; and (iii) a new Sub-Advisory Agreement (the “New WFAM(I) Ltd Sub-Advisory Agreement”) among the Trust, on behalf of Emerging Markets Bond Portfolio, Funds Management and WFAM(I) Ltd (“WFAMI”); and (iv) a new Sub-Advisory Agreement (the “New Galliard Sub-Advisory Agreement”, and collectively, the “New Agreements”) among the Trust, on behalf of Managed Fixed Income Portfolio, Funds Management and Galliard Capital Management, LLC (“Galliard”, and together with Wells Capital and WFAMI, the “Sub-Advisers”), each of which is intended to go into effect upon the closing. The process followed by the Board in reviewing and approving the New Agreements is referred to herein as the “New Agreement Approval Process.”
At a series of meetings held in April and May 2021 (collectively, “April and May 2021 Meetings”) and at the Board Meeting, the Trustees conferred extensively among themselves and with senior representatives of Funds Management, GTCR and Reverence Capital about the New Agreements and related matters. The Board reviewed and discussed information furnished by Funds Management, GTCR and Reverence Capital that the Board considered reasonably necessary to evaluate the terms of the New Agreements and the services to be provided. At these meetings, senior representatives from Funds Management, GTCR and Reverence Capital made presentations to, and responded to questions from, the Board.
In providing information to the Board in connection with the 2021 annual approval process for the Current Agreements (the “2021 Annual Approval Process”) and the New Agreement Approval Process, Funds Management, GTCR and Reverence Capital (as applicable) were guided by requests for information submitted by independent legal counsel on behalf of the Independent Trustees. In considering and approving the New Agreements, the Trustees considered the information they believed relevant, including but not limited to the information discussed herein. The Board considered not only the specific information presented in connection with the April and May 2021 Meetings as well as the Board Meeting, but also the knowledge gained over time through interaction with Funds Management and the Sub-Advisers about various topics. In this regard, the Board reviews reports of Funds Management at each of its regular Board meetings, which includes, among other things, portfolio reviews and investment performance reports. In addition, the Board confers with portfolio managers at various times throughout the year. The Board was assisted in its evaluation of the New Agreements by independent legal counsel, from whom the Independent Trustees received
Wells Fargo Strategic Retirement Bond Portfolio | 23
Board considerations (unaudited)
separate legal advice and with whom the Independent Trustees met separately. The Board did not identify any particular information or consideration that was all-important or controlling, and each individual Trustee may have attributed different weights to various factors.
Among other information considered by the Board in connection with the Transaction was:
| ■ | Information regarding the Transaction: information about the structure, financing sources and material terms and conditions of the Transaction, including the expected impact on the businesses conducted by the Advisers and by Wells Fargo Funds Distributor LLC. |
| ■ | Information regarding NewCo, GTCR and Reverence Capital: (i) information about NewCo, including information about its expected financial condition and access to capital, and senior leadership team; (ii) the experience of senior management at GTCR and Reverence Capital in acquiring portfolio companies; (iii) the plan to operationalize NewCo, including the transition of necessary infrastructure services through a transition services agreement with Wells Fargo under which Wells Fargo will continue to provide NewCo with certain services for a specified period of time after the closing; and (iv) information regarding regulatory matters, compliance, and risk management functions at NewCo, including resources to be dedicated thereto. |
| ■ | Impact of the Transaction on WFAM and Service Providers: (i) information regarding any changes to personnel and/or other resources of the Advisers as a result of the Transaction, including assurances regarding comparable and competitive compensation arrangements to attract and retain highly qualified personnel; and (ii) information about the organizational and operating structure with respect to NewCo, the Advisers and the Portfolios. |
| ■ | Impact of the Transaction on the Portfolios and their Shareholders: (i) information regarding anticipated benefits to the Portfolios as a result of the Transaction; (ii) a commitment that the Portfolios would not bear any expenses, directly or indirectly, in connection with the Transaction; (iii) confirmation that the Advisers intend to continue to manage the Portfolios in a manner consistent with each Portfolio’s current investment objectives and principal investments strategies; and (iv) a commitment that neither NewCo nor WFAM will take any steps that would impose any “unfair burden” (as that term is used in section 15(f)(1)(B) of the 1940 Act) on the Portfolios as a result of the Transaction. |
With respect to the New Agreements, the Board considered: (i) a representation that, after the closing, all of the Portfolios will continue to be managed and advised by their current Advisers, and that the same portfolio managers of the Sub-Advisers are expected to continue to manage the Portfolios after the Transaction; (ii) information regarding the terms of the New Agreements, including changes as compared to the Current Agreements; (iii) information confirming that the fee rates payable under the New Agreements will not increase as a result of the Transaction as compared to the rates under the Current Agreements; and (iv) assurances that the Transaction is not expected to cause any diminution with respect to the nature, extent and quality of any of the services currently provided to the Portfolios by the Advisers as a result of the Transaction.
In addition to considering information furnished specifically to evaluate the impact of the Transaction on the Portfolios and their respective shareholders in connection with the New Agreement Approval Process, the Board considered information furnished at prior meetings of the Board and its committees, including detailed information provided in connection with the 2021 Annual Approval Process. In this regard, in connection with the 2021 Annual Approval Process, the Board received information about complex-wide and individual Portfolio performance, fees and expenses, including: (i) a report from an independent data provider comparing the investment performance of each Portfolio to the investment performance of comparable funds and benchmark indices, over various time periods; (ii) a report from an independent data provider comparing each Portfolio’s total expense ratio (and its components) to those of comparable funds; (iii) comparative information concerning the fees charged and services provided by the Advisers to each Portfolio in managing other accounts (which may include other mutual funds, collective investment funds and institutional accounts), if any, that employ investment strategies and techniques similar to those used in managing such Portfolio(s); and (iv) profitability analyses of Funds Management, as well as the profitability of both WFAM and Wells Fargo from providing services to the fund family as a whole.
After its deliberations, the Board unanimously determined that the compensation payable to Funds Management and the Sub-Advisers under the New Agreements is reasonable, approved the New Agreements for a two-year term. The Board considered the approval of the New Agreements as part of its consideration of agreements for funds across the complex, but its approvals were made on a fund-by-fund basis. The following summarizes a number of important, but not necessarily all, factors considered by the Board in support of its approvals.
Nature, extent and quality of services
In connection with the 2021 Annual Approval Process, the Board received and considered various information regarding the nature, extent and quality of services provided to each Portfolio by Funds Management and the Sub-Advisers under the Advisory Agreements. This information included a description of the investment advisory services and administrative services covered by
24 | Wells Fargo Strategic Retirement Bond Portfolio
Board considerations (unaudited)
the Current Advisory Agreement, as well as, among other things, a summary of the background and experience of senior management of WFAM, of which Funds Management and the Sub-Advisers are a part, and a summary of investments made in the business of WFAM. The Board also received a description of Funds Management’s and the Sub-Advisers’ business continuity plans, including a summary of the performance of such plans and any changes thereto during the COVID-19 pandemic, and of their approaches to data privacy and cybersecurity. The Board also received and reviewed information about Funds Management’s role as administrator of the Portfolios’ liquidity risk management program, Funds Management’s approach to risk management, and Funds Management’s intermediary and vendor oversight program.
In connection with the 2021 Annual Approval Process, the Board also considered the qualifications, background, tenure and responsibilities of each of the portfolio managers primarily responsible for the day-to-day portfolio management of the Portfolios. The Board evaluated the ability of Funds Management and the Sub-Advisers to attract and retain qualified investment professionals, including research, advisory and supervisory personnel.
In connection with the 2021 Annual Approval Process, the Board further considered the compliance programs and compliance records of Funds Management and the Sub-Advisers. In addition, the Board took into account the full range of services provided to the Portfolios by Funds Management and its affiliates.
In connection with the New Agreement Approval Process, the Board considered, among other information, the structure of the Transaction and expected impact, if any, of the Transaction on the operations, facilities, organization and personnel of the Advisers. The Board received assurances from the Advisers that each Portfolio will continue to be advised by its current Advisers after the closing, and that the same individual portfolio managers are expected to continue to manage the Portfolios after the closing. With respect to the recruitment and retention of key personnel, the Board noted information from GTCR, Reverence Capital and the Advisers regarding the potential benefits for employees of joining NewCo. The Board recognized that the personnel who had been extended offers may not accept such offers and personnel changes may occur in the future in the ordinary course.
In addition, the Board considered information regarding the infrastructure, operational capabilities and support staff in place to assist in the portfolio management and operations of the Portfolios, including the provision of administrative services, and the anticipated impact of the Transaction on such matters. The Board also considered the business-related and other risks to which the Advisers may be subject in managing the Portfolios and in connection with the Transaction. The Board also considered the transition and integration plans as a result of the change in ownership of the Advisers from Wells Fargo to NewCo. The Board considered the resources and infrastructure that NewCo intends to devote to its compliance program to ensure compliance with applicable laws and regulations, as well as its risk management program and cybersecurity program. The Board also took into account assurances received from the Advisers, GTCR and Reverence Capital that the Transaction is not expected to cause any diminution in the nature, extent and quality of services provided by the Advisers to the Portfolios and their shareholders.
Investment performance and expenses
In connection with the 2021 Annual Approval Process, the Board considered the investment performance results for each Portfolio over various time periods ended December 31, 2020. The Board considered these results in comparison to the investment performance of funds in a universe that was determined by Broadridge Inc. (“Broadridge”) to be similar to each Portfolio (the “Universe”), and in comparison to each Portfolio’s benchmark index and to other comparative data. Broadridge is an independent provider of investment company data. The Board received a description of the methodology used by Broadridge to select the mutual funds in the performance Universe. Where applicable, the Board received information concerning, and discussed factors contributing to, underperformance of Portfolios relative to the Universe and benchmark for any underperformance periods.
In connection with the 2021 Annual Approval Process, the Board also reviewed the fee rates that are payable to Funds Management for investment advisory services (as discussed below), which are the only fees charged at the Portfolio level, relative to corresponding expense groups that were determined by Broadridge to be similar to the Portfolios (the “Groups”). The Board received a description of the methodology used by Broadridge to select the mutual funds in the expense Groups and an explanation of how funds comprising expense groups and their expense ratios may vary from year-to-year.
In connection with the New Agreement Approval Process, the Board received a commitment that WFAM will maintain fee and expense commitments for at least two years after the closing. The Board took into account each Fund’s investment performance and expense information among the factors considered in deciding to approve the New Agreements.
Investment advisory and sub-advisory fee rates
In connection with the 2021 Annual Approval Process, the Board reviewed and considered the contractual investment advisory fee rate that is payable by each Portfolio to Funds Management for investment advisory services under the Current Advisory
Wells Fargo Strategic Retirement Bond Portfolio | 25
Board considerations (unaudited)
Agreement (the “Advisory Agreement Rate”). The Board also reviewed and considered the contractual investment sub-advisory fee rate that is payable by Funds Management to the applicable Sub-Adviser for investment sub-advisory services (the “Sub-Advisory Agreement Rate”).
Among other information reviewed by the Board in connection with the 2021 Annual Approval Process, was a comparison of each Portfolio’s Advisory Agreement Rate with those of other funds in the Portfolio’s expense Group at a common asset level.
In connection with the 2021 Annual Approval Process, the Board also received and considered information about the portion of the total management fee that was retained by Funds Management after payment of the Sub-Advisory Agreement Rates. In assessing the reasonableness of this amount, the Board received and evaluated information about the nature and extent of responsibilities retained and risks assumed by Funds Management and not delegated to or assumed by the Sub-Advisers, and about Funds Management’s on-going oversight services. Given the affiliation between Funds Management and the Sub-Advisers, the Board ascribed limited relevance to the allocation of fees between them.
In connection with the 2021 Annual Approval Process, the Board also received and considered information about the nature and extent of services offered and fee rates charged by Funds Management and the Sub-Advisers to other types of clients, if any, with investment strategies similar to those of each Portfolio. In this regard, the Board received information about the significantly greater scope of services, and compliance, reporting and other legal burdens and risks of managing proprietary mutual funds compared with those associated with managing assets of other types of clients, including third-party sub-advised fund clients and non-mutual fund clients such as institutional separate accounts.
In connection with the New Agreement Approval Process, the Board noted the assurances received by it that there would be no increases to any of the Advisory Agreement Rates or the Sub-Advisory Agreement Rates as a result of the Transaction. The Board also considered that the New Agreements do not change the computation method for calculating such fees, and there is no present intention to reduce expense waiver and reimbursement arrangements that are currently in effect. Based on its consideration of the factors and information it deemed relevant, including those described here, the Board determined that the compensation payable to Funds Management under the New Advisory Agreement and to each of the Sub-Advisers under the applicable new Sub-Advisory Agreement was reasonable.
Profitability
In connection with the 2021 Annual Approval Process, the Board received and considered information concerning the profitability of Funds Management, as well as the profitability of both WFAM and Wells Fargo from providing services to the fund family as a whole. The Board noted that the Sub-Advisers’ profitability information with respect to providing services to each Fund and other funds in the family was subsumed in the WFAM and Wells Fargo profitability analysis.
Funds Management reported on the methodologies and estimates used in calculating profitability in connection with the 2021 Annual Approval Process, including a description of the methodology used to allocate certain expenses. Among other things, the Board noted that the levels of profitability reported on a fund-by-fund basis varied widely, depending on factors such as the size, type and age of fund.
In connection with the New Agreement Approval Process, the Board received certain information about NewCo’s projected financial condition, and reviewed with senior representatives of Funds Management, GTCR and Reverence Capital the underlying assumptions on which such information was based. The Board considered that NewCo is a newly formed entity, with no historical operations, revenues or expenses, and that it is difficult to predict with any degree of certainty the future profitability of NewCo and the Advisers from advisory activities under the New Agreements. The Board considered that the fee rates payable under the New Agreements will not increase as a result of the Transaction as compared to the rates under the Current Agreements, and that the current contractual expense limitations applicable to each Portfolio will not increase. The Board noted that if the New Agreements are approved by shareholders and the Transaction closes, the Board will have the opportunity in the future to review the profitability of NewCo and the Advisers from advisory activities under the New Agreements.
Economies of scale
In connection with the 2021 Annual Approval Process, the Board received and considered information about the potential for Funds Management to experience economies of scale in the provision of advisory services to the Portfolios, the difficulties of calculating economies of scale at an individual fund level, and the extent to which potential scale benefits are shared with Portfolio shareholders. The Board noted the existence of breakpoints in each Portfolio’s advisory fee structure, which operate generally to reduce the Portfolio’s expense ratios as the Portfolio grows in size, and the size of the Portfolio in relation to such breakpoints. The Board considered that, in addition to advisory fee breakpoints, Funds Management shares potential economies of scale from its
26 | Wells Fargo Strategic Retirement Bond Portfolio
Board considerations (unaudited)
management business in a variety of ways, including through fee waiver and expense reimbursement arrangements, competitive management fee rates set at the outset without regard to breakpoints, and investments in the business intended to enhance services available to shareholders.
In connection with the New Agreement Approval Process, the Board noted that NewCo and the Advisers may benefit from possible growth of the Portfolios resulting from enhanced distribution capabilities for their investing funds. However, the Board noted that other factors could also affect the potential for economies of scale, and that it was not possible to quantify any potential future economies of scale. Based upon the information furnished to the Board in connection with the 2021 Annual Approval Process and the New Agreement Approval Process, the Board concluded that Funds Management’s arrangements with respect to each Portfolio, including contractual breakpoints and expense limitation arrangements, constituted a reasonable approach to sharing potential economies of scale with the Portfolio and its shareholders.
“Fall-out” benefits to Funds Management and the Sub-Advisers
In connection with the 2021 Annual Approval Process, the Board received and considered information regarding potential “fall-out” or ancillary benefits received by Funds Management and its affiliates, including the Sub-Advisers, as a result of their relationships with the Portfolios. Ancillary benefits could include, among others, benefits directly attributable to other relationships with the Portfolios and benefits potentially derived from an increase in Funds Management’s and the Sub-Advisers’ business as a result of their relationships with the Portfolios. The Board noted that various current affiliates of Funds Management may receive distribution-related fees, shareholder servicing payments and sub-transfer agency fees in respect of shares sold or held through them and services provided.
In connection with the 2021 Annual Approval Process, the Board also reviewed information about soft dollar credits earned and utilized by the Sub-Advisers, fees earned by Funds Management and Wells Capital from managing a private investment vehicle for the fund family’s securities lending collateral, and commissions earned by an affiliated broker of Wells Fargo from portfolio transactions.
In connection with the New Agreement Approval Process, the Board received information to the effect that the Transaction is not expected to have a material impact on the fall-out benefits currently realized by Funds Management and its affiliates, including the Sub-Advisers. The information reviewed by the Board also noted that several of the ancillary benefits identified for WFAM would be potential ancillary benefits for NewCo, including that the scale and reputation of the Portfolios might benefit NewCo’s broader reputation, product initiatives, technology investment and talent acquisition. Based on its consideration of the factors and information it deemed relevant, including those described here, the Board did not find that any ancillary benefits expected to be received by Funds Management and its affiliates, including NewCo and the Sub-Advisers, under the New Agreements were unreasonable.
Conclusion
At the Board Meeting, after considering the above-described factors and based on its deliberations and its evaluation of the information described above, the Board unanimously determined that the compensation payable to Funds Management and to each of the Sub-Advisers under the New Agreements is reasonable, approved the New Agreements for a two-year term.
Wells Fargo Strategic Retirement Bond Portfolio | 27
Board considerations (unaudited)
Board Considerations - Interim Agreements
At a meeting held on May 17-19, 2021 (the “Board Meeting”), the Boards of Trustees (each, a “Board”, and collectively, the “Boards”) of Wells Fargo Funds Trust, Wells Fargo Master Trust, Wells Fargo Variable Trust, Wells Fargo Global Dividend Opportunity Fund, Wells Fargo Income Opportunities Fund, Wells Fargo Multi-Sector Income Fund and Wells Fargo Utilities and High Income Fund (each a “Trust”, and the series thereof, a “Fund”) reviewed and approved for the Trusts and Funds, as applicable: (i) interim investment management agreements (the “Interim Management Agreements”) with Wells Fargo Funds Management, LLC (“Funds Management”); (ii) interim investment advisory agreements (the “Interim Advisory Agreements”) with Funds Management; and (iii) interim sub-advisory agreements (the “Interim Sub-Advisory Agreements”) with each of Cooke & Bieler, L.P., Galliard Capital Management LLC (“Galliard”), Peregrine Capital Management Inc., Wells Capital Management, LLC (“WellsCap”), and Wells Fargo Asset Management (International) Limited (“WFAMI”, and collectively, the “Sub-Advisers”). Each Trustee on the Board is not an “interested person” (as defined in the Investment Company Act of 1940 (the “1940 Act”) of the Funds (collectively, the “Independent Trustees”). The Interim Management Agreements, Interim Advisory Agreements, and Interim Sub-Advisory Agreements are collectively referred to as the “Interim Advisory Agreements.”
At the Board Meeting, the Boards reviewed and approved the continuation of existing investment management, advisory and sub-advisory agreements (the “Current Advisory Agreements”) for each Trust and Fund, as applicable. The factors considered and conclusions reached by the Boards in approving the Current Advisory Agreements are summarized in the section entitled “Board Considerations – Current Agreements” of this shareholder report. The Boards noted that Wells Fargo & Company has entered into a definitive agreement to sell Wells Fargo Asset Management (“WFAM”), which includes Funds Management, Galliard, WellsCap and WFAMI (the “Affiliated Sub-Advisers”), to a holding company affiliated with private funds of GTCR LLC and Reverence Capital Partners, L.P. (the “Transaction”). The Boards further noted that the Transaction would result in a change-of-control of Funds Management and the Affiliated Sub-Advisers, which would be considered to be an “assignment” under the 1940 Act that would terminate the Current Advisory Agreements. At the Board Meeting, the Boards also reviewed and approved new investment management, advisory and sub-advisory agreements (the “New Advisory Agreements”) for each Trust and Fund, as applicable, that would replace the Current Advisory Agreements upon consummation of the Transaction, subject to approval of the New Advisory Agreements by the applicable Trust’s or Fund’s shareholders. The factors considered and conclusions reached by the Boards in approving the New Advisory Agreements are summarized in the section entitled “Board Considerations – New Agreements” of this shareholder report.
At the Board Meeting, the Boards also approved the Interim Advisory Agreements, which will go into effect for a Trust or Fund only in the event that shareholders of such Trust or Fund do not approve the New Advisory Agreement(s) for the Trust or Fund by the closing date of the Transaction, when the Current Advisory Agreements will terminate. The Board noted that, in such a circumstance, the Interim Advisory Agreements will permit continuity of management by allowing Funds Management and the Sub-Advisers to continue providing services to the Trust or Fund pursuant to the Interim Advisory Agreements while the Trust or Fund continues to solicit shareholder approval of such New Advisory Agreement(s). The Boards noted that the terms of the Interim Advisory Agreements are identical to those of the Current Advisory Agreements, except for the term and the addition of escrow provisions with respect to the advisory fees. The Boards also noted that the entities that would service the Funds and Trusts under the Interim Advisory Agreements are identical to those that provide services under the Current Advisory Agreements and those that will provide services under the New Advisory Agreements.
In approving the Interim Advisory Agreements, the Boards considered the same factors and reached the same conclusions as they considered and reached with respect to the Boards’ approvals of the Current Advisory Agreements and New Advisory Agreements, as applicable, which are described in separate Board Consideration sections within this shareholder report. Prior to the Board Meeting, including at a series of meetings held in April and May 2021, the Trustees conferred extensively among themselves and with senior representatives of Funds Management, GTCR LLC and Reverence Capital Partners, L.P. about the Interim Advisory Agreements and related matters. The Independent Trustees were assisted in their evaluation of the Interim Advisory Agreements by independent legal counsel, from whom they received separate legal advice and with whom they met separately.
At the Board Meeting, after considering the factors and reaching the conclusions described in the separate Board Consideration sections within this shareholder report, the Boards unanimously determined that the compensation payable to Funds Management and to each Sub-Adviser under each of the Interim Advisory Agreements was reasonable, and approved the Interim Advisory Agreements.
28 | Wells Fargo Strategic Retirement Bond Portfolio
For more information
More information about Wells Fargo Funds is available free upon request. To obtain literature, please write, visit the Portfolio's website, or call:
Wells Fargo Funds
P.O. Box 219967
Kansas City, MO 64121-9967
Website: wfam.com
Individual investors: 1-800-222-8222
Retail investment professionals: 1-888-877-9275
Institutional investment professionals: 1-866-765-0778
This report and the financial statements contained herein are submitted for the general information of the interest holders of the Portfolio. If this report is used for promotional purposes, distribution of the report must be accompanied or preceded by a current prospectus. Before investing, please consider the investment objectives, risks, charges, and expenses of the investment. For a current prospectus and, if available, a summary prospectus, containing this information, call
1-800-222-8222 or visit the Portfolio's website at wfam.com. Read the prospectus carefully before you invest or send money.
Wells Fargo Asset Management (WFAM) is the trade name for certain investment advisory/management firms owned by Wells Fargo & Company. These firms include but are not limited to Wells Capital Management, LLC and Wells Fargo Funds Management, LLC. Certain products managed by WFAM entities are distributed by Wells Fargo Funds Distributor, LLC (a broker-dealer and Member FINRA).
This material is for general informational and educational purposes only and is NOT intended to provide investment advice or a recommendation of any kind - including a recommendation for any specific investment, strategy, or plan.
INVESTMENT PRODUCTS: NOT FDIC INSURED ■ NO BANK GUARANTEE ■ MAY LOSE VALUE
© 2021 Wells Fargo & Company. All rights reserved.
Semi-Annual Report
August 31, 2021
Wells Fargo U.S. REIT Portfolio
INVESTMENT PRODUCTS: NOT FDIC INSURED ■ NO BANK GUARANTEE ■ MAY LOSE VALUE
Wells Fargo U.S. REIT Portfolio | 1
Portfolio information (unaudited)
| Investment objective | The Portfolio seeks to replicate the total return of the Dow Jones U.S. Select REIT Index before fees and expenses. |
| Adviser | Wells Fargo Funds Management, LLC |
| Subadviser | Wells Capital Management, LLC |
| Portfolio managers | Petros N. Bocray, CFA®‡ |
| Ten largest holdings (%) as of August 31, 20211 |
| Prologis Incorporated | 9.79 |
| Public Storage Incorporated | 4.84 |
| Digital Realty Trust Incorporated | 4.54 |
| Simon Property Group Incorporated | 4.34 |
| Welltower Incorporated | 3.59 |
| AvalonBay Communities Incorporated | 3.15 |
| Equity Residential | 2.84 |
| Alexandria Real Estate Equities Incorporated | 2.78 |
| Realty Income Corporation | 2.65 |
| Extra Space Storage Incorporated | 2.46 |
| 1 | Figures represent the percentage of the Portfolio's net assets. Holdings are subject to change and may have changed since the date specified. |
| ‡ | CFA® and Chartered Financial Analyst® are trademarks owned by CFA Institute. |
2 | Wells Fargo U.S. REIT Portfolio
Portfolio of investments—August 31, 2021 (unaudited)
| | | | | Shares | Value |
| Common stocks: 99.79% | | | | | |
| Real estate: 99.79% | | | | | |
| Equity REITs: 99.79% | | | | | |
| Acadia Realty Trust | | | | 2,231 | $ 47,342 |
| Agree Realty Corporation | | | | 1,762 | 131,354 |
| Alexandria Real Estate Equities Incorporated | | | | 3,548 | 732,201 |
| American Assets Trust Incorporated | | | | 1,297 | 51,647 |
| American Campus Communities Incorporated | | | | 3,564 | 181,229 |
| American Homes 4 Rent Class A | | | | 7,081 | 296,977 |
| Americold Realty Trust | | | | 6,531 | 239,949 |
| Apartment Income Corporation REIT | | | | 4,055 | 206,075 |
| Apartment Investment & Management Company Class A | | | | 3,881 | 27,866 |
| Apple Hospitality REIT Incorporated | | | | 5,378 | 79,487 |
| AvalonBay Communities Incorporated | | | | 3,611 | 829,013 |
| Boston Properties Incorporated | | | | 3,674 | 415,125 |
| Brandywine Realty Trust | | | | 4,418 | 61,322 |
| Brixmor Property Group Incorporated | | | | 7,679 | 180,073 |
| Broadstone Net Lease Incorporated REIT | | | | 4,029 | 110,395 |
| Camden Property Trust | | | | 2,526 | 379,001 |
| CareTrust REIT Incorporated | | | | 2,502 | 55,019 |
| Centerspace REIT | | | | 336 | 33,996 |
| Chatham Lodging Trust † | | | | 1,256 | 15,072 |
| City Office REIT Incorporated | | | | 1,121 | 17,902 |
| Columbia Property Trust Incorporated | | | | 2,970 | 49,658 |
| Community Healthcare Trust Incorporated | | | | 593 | 28,766 |
| Corporate Office Properties Trust | | | | 2,904 | 81,835 |
| Cousins Properties Incorporated | | | | 3,844 | 148,225 |
| CubeSmart | | | | 5,211 | 278,789 |
| DiamondRock Hospitality † | | | | 5,437 | 49,150 |
| Digital Realty Trust Incorporated | | | | 7,283 | 1,193,757 |
| Diversified Healthcare Trust | | | | 6,161 | 23,104 |
| Douglas Emmett Incorporated | | | | 4,265 | 140,788 |
| Duke Realty Corporation | | | | 9,697 | 509,189 |
| Easterly Government Properties Incorporated | | | | 2,168 | 46,330 |
| EastGroup Properties Incorporated | | | | 1,035 | 186,569 |
| Empire State Realty Trust Incorporated Class A | | | | 3,646 | 37,444 |
| EPR Properties | | | | 1,933 | 98,100 |
| Equity Commonwealth | | | | 3,152 | 83,024 |
| Equity Lifestyle Properties Incorporated | | | | 4,384 | 372,947 |
| Equity Residential | | | | 8,898 | 748,055 |
| Essential Properties Realty | | | | 3,038 | 98,462 |
| Essex Property Trust Incorporated | | | | 1,681 | 555,974 |
| Extra Space Storage Incorporated | | | | 3,459 | 646,522 |
| Federal Realty Investment Trust | | | | 1,830 | 222,839 |
| First Industrial Realty Trust Incorporated | | | | 3,338 | 186,895 |
| Four Corners Property Trust Incorporated | | | | 1,969 | 56,333 |
| Franklin Street Properties Corporation | | | | 2,497 | 11,986 |
| Getty Realty Corporation | | | | 964 | 30,491 |
| Global Medical REIT Incorporated | | | | 1,414 | 21,804 |
| Global Net Lease Incorporated | | | | 2,466 | 41,922 |
| Healthcare Realty Trust Incorporated | | | | 3,663 | 110,000 |
| Healthcare Trust of America Incorporated Class A | | | | 5,659 | 171,637 |
| Healthpeak Properties Incorporated | | | | 13,937 | 501,732 |
| Hersha Hospitality Trust † | | | | 950 | 8,911 |
| Highwoods Properties Incorporated | | | | 2,690 | 122,906 |
The accompanying notes are an integral part of these financial statements.
Wells Fargo U.S. REIT Portfolio | 3
Portfolio of investments—August 31, 2021 (unaudited)
| | | | | Shares | Value |
| Equity REITs (continued) | | | | | |
| Host Hotels & Resorts Incorporated † | | | | 18,260 | $ 302,386 |
| Hudson Pacific Properties Incorporated | | | | 3,903 | 102,961 |
| Independence Realty Trust Incorporated | | | | 2,641 | 54,088 |
| Industrial Logistics Properties Trust | | | | 1,688 | 46,302 |
| Innovative Industrial Properties Incorporated | | | | 618 | 151,972 |
| Invitation Homes Incorporated | | | | 14,680 | 604,522 |
| JBG Smith Properties | | | | 2,856 | 86,051 |
| Kilroy Realty Corporation | | | | 2,740 | 179,881 |
| Kimco Realty Corporation | | | | 15,540 | 338,617 |
| Kite Realty Group Trust | | | | 2,184 | 44,248 |
| Lexington Corporate Properties Trust | | | | 7,179 | 97,132 |
| Life Storage Incorporated | | | | 1,988 | 247,387 |
| LTC Properties Incorporated | | | | 1,018 | 35,131 |
| Mack-Cali Realty Corporation † | | | | 2,229 | 39,855 |
| Mid-America Apartment Communities Incorporated | | | | 2,961 | 569,608 |
| Monmouth Real Estate Investment Corporation | | | | 2,541 | 48,228 |
| National Health Investors Incorporated | | | | 1,185 | 70,887 |
| National Retail Properties Incorporated | | | | 4,540 | 216,149 |
| National Storage Affiliates Trust | | | | 2,009 | 115,015 |
| NexPoint Residential Trust Incorporated | | | | 584 | 37,837 |
| Office Properties Income Trust | | | | 1,248 | 33,109 |
| Omega Healthcare Investors Incorporated | | | | 6,086 | 204,064 |
| Paramount Group Incorporated | | | | 4,302 | 38,116 |
| Park Hotels & Resorts Incorporated † | | | | 6,116 | 117,060 |
| Pebblebrook Hotel Trust | | | | 3,397 | 74,836 |
| Piedmont Office Realty Trust Incorporated Class A | | | | 3,207 | 57,149 |
| Prologis Incorporated | | | | 19,132 | 2,576,315 |
| PS Business Parks Incorporated | | | | 520 | 81,760 |
| Public Storage Incorporated | | | | 3,937 | 1,274,053 |
| QTS Realty Trust Incorporated Class A | | | | 1,778 | 138,648 |
| Realty Income Corporation | | | | 9,660 | 697,645 |
| Regency Centers Corporation | | | | 4,085 | 280,313 |
| Retail Opportunity Investment Corporation | | | | 3,071 | 55,524 |
| Retail Properties of America Incorporated Class A | | | | 5,552 | 73,397 |
| Rexford Industrial Realty Incorporated | | | | 3,467 | 214,711 |
| RLJ Lodging Trust | | | | 4,265 | 61,544 |
| RPT Realty | | | | 2,098 | 27,148 |
| Ryman Hospitality Properties Incorporated † | | | | 1,424 | 118,292 |
| Seritage Growth Property Class A † | | | | 1,027 | 16,607 |
| Service Properties Trust | | | | 4,262 | 48,715 |
| Simon Property Group Incorporated | | | | 8,497 | 1,142,422 |
| SITE Centers Corporation | | | | 4,365 | 70,320 |
| SL Green Realty Corporation | | | | 1,793 | 125,653 |
| Spirit Realty Capital Incorporated REIT | | | | 2,972 | 153,860 |
| STAG Industrial Incorporated | | | | 4,129 | 174,450 |
| Store Capital Corporation | | | | 6,295 | 227,061 |
| Summit Hotel Properties Incorporated † | | | | 2,743 | 25,565 |
| Sun Communities Incorporated | | | | 2,892 | 582,709 |
| Sunstone Hotel Investors Incorporated † | | | | 5,591 | 64,800 |
| Tanger Factory Outlet Centers Incorporated | | | | 2,606 | 43,572 |
| Terreno Realty Corporation | | | | 1,798 | 120,124 |
| The Macerich Company | | | | 4,325 | 73,871 |
| UDR Incorporated | | | | 7,676 | 414,658 |
| Universal Health Realty Income Trust | | | | 330 | 19,546 |
| Urban Edge Properties | | | | 2,844 | 53,865 |
| Ventas Incorporated | | | | 9,701 | 542,674 |
The accompanying notes are an integral part of these financial statements.
4 | Wells Fargo U.S. REIT Portfolio
Portfolio of investments—August 31, 2021 (unaudited)
| | | | | Shares | Value |
| Equity REITs (continued) | | | | | |
| VEREIT Incorporated | | | | 5,925 | $ 299,390 |
| Vornado Realty Trust | | | | 4,060 | 170,033 |
| Washington REIT | | | | 2,187 | 54,981 |
| Welltower Incorporated | | | | 10,798 | 945,149 |
| WP Carey Incorporated | | | | 4,602 | 359,508 |
| Xenia Hotels & Resorts Incorporated † | | | | 2,942 | 51,250 |
| Total Common stocks (Cost $17,769,224) | | | | | 26,247,913 |
| | | Yield | | | |
| Short-term investments: 0.09% | | | | | |
| Investment companies: 0.09% | | | | | |
| Wells Fargo Government Money Market Fund Select Class ♠∞ | | 0.03% | | 23,313 | 23,313 |
| Total Short-term investments (Cost $23,313) | | | | | 23,313 |
| Total investments in securities (Cost $17,792,537) | 99.88% | | | | 26,271,226 |
| Other assets and liabilities, net | 0.12 | | | | 32,233 |
| Total net assets | 100.00% | | | | $26,303,459 |
| † | Non-income-earning security |
| ♠ | The issuer of the security is an affiliated person of the Portfolio as defined in the Investment Company Act of 1940. |
| ∞ | The rate represents the 7-day annualized yield at period end. |
| Abbreviations: |
| REIT | Real estate investment trust |
Investments in affiliates
An affiliated investment is an investment in which the Portfolio owns at least 5% of the outstanding voting shares of the issuer or as a result of other relationships, such as the Portfolio and the issuer having the same adviser or investment manager. Transactions with issuers that were either affiliates of the Portfolio at the beginning of the period or the end of the period were as follows:
| | Value,
beginning of
period | Purchases | Sales
proceeds | Net
realized
gains
(losses) | Net
change in
unrealized
gains
(losses) | Value,
end of
period | Shares,
end
of period | Income
from
affiliated
securities |
| Short-term investments | | | | | | | |
| Wells Fargo Government Money Market Fund Select Class | $133,673 | $2,897,882 | $(3,008,242) | $0 | $0 | $23,313 | 23,313 | $17 |
The accompanying notes are an integral part of these financial statements.
Wells Fargo U.S. REIT Portfolio | 5
Statement of assets and liabilities—August 31, 2021 (unaudited)
| | |
| Assets | |
Investments in unaffiliated securities, at value (cost $17,769,224)
| $ 26,247,913 |
Investments in affiliated securites, at value (cost $23,313)
| 23,313 |
Receivable for dividends
| 8,024 |
Receivable from adviser
| 7,438 |
Prepaid expenses and other assets
| 25,247 |
Total assets
| 26,311,935 |
| Liabilities | |
Professional fees payable
| 8,476 |
Total liabilities
| 8,476 |
Total net assets
| $26,303,459 |
The accompanying notes are an integral part of these financial statements.
6 | Wells Fargo U.S. REIT Portfolio
Statement of operations—six months ended August 31, 2021 (unaudited)
| | |
| Investment income | |
Dividends
| $ 410,523 |
Income from affiliated securities
| 17 |
Total investment income
| 410,540 |
| Expenses | |
Advisory fee
| 13,202 |
Custody and accounting fees
| 15,187 |
Professional fees
| 19,690 |
Interest holder report expenses
| 7,980 |
Trustees’ fees and expenses
| 9,771 |
Other fees and expenses
| 2,802 |
Total expenses
| 68,632 |
Less: Fee waivers and/or expense reimbursements
| (50,677) |
Net expenses
| 17,955 |
Net investment income
| 392,585 |
| Realized and unrealized gains (losses) on investments | |
Net realized gains on investments
| 2,287,617 |
Net change in unrealized gains (losses) on investments
| 3,381,124 |
Net realized and unrealized gains (losses) on investments
| 5,668,741 |
Net increase in net assets resulting from operations
| $6,061,326 |
The accompanying notes are an integral part of these financial statements.
Wells Fargo U.S. REIT Portfolio | 7
Statement of changes in net assets
| | | |
| | Six months ended
August 31, 2021
(unaudited) | Year ended
February 28, 2021 |
| Operations | | |
Net investment income
| $ 392,585 | $ 468,359 |
Net realized gains (losses) on investments
| 2,287,617 | (1,599,946) |
Net change in unrealized gains (losses) on investments
| 3,381,124 | 2,960,497 |
Net increase in net assets resulting from operations
| 6,061,326 | 1,828,910 |
| Capital transactions | | |
| Transactions in investors’ beneficial interests | | |
Contributions
| 1,356,989 | 11,785,224 |
Withdrawals
| (6,703,559) | (13,636,052) |
Net decrease in net assets resulting from capital transactions
| (5,346,570) | (1,850,828) |
Total increase (decrease) in net assets
| 714,756 | (21,918) |
| Net assets | | |
Beginning of period
| 25,588,703 | 25,610,621 |
End of period
| $26,303,459 | $ 25,588,703 |
The accompanying notes are an integral part of these financial statements.
8 | Wells Fargo U.S. REIT Portfolio
| | | Year ended February 28 |
| | Six months ended
August 31, 2021
(unaudited) | 2021 | 2020 1 | 2019 | 2018 2 |
Total return3
| 25.71% | 3.45% | 2.65% | 19.52% | (8.74)% |
| Ratios to average net assets (annualized) | | | | | |
Gross expenses
| 0.52% | 0.48% | 0.43% | 0.26% | 0.33% |
Net expenses
| 0.14% * | 0.14% * | 0.19% | 0.23% | 0.32% |
Net investment income
| 2.97% | 1.93% | 2.73% | 2.91% | 2.53% |
| Supplemental data | | | | | |
Portfolio turnover rate
| 22% | 71% | 26% | 20% | 51% |
| * | Ratios reflect expenses which were voluntarily waived by the adviser. Without these voluntary waivers, the net expense ratios would be increased by the following amounts: |
| Six months ended August 31, 2021 (unaudited) | 0.38% |
| Year ended February 28, 2021 | 0.34% |
| 1 | Year ended February 29 |
| 2 | For the period from May 23, 2017 (commencement of operations) to February 28, 2018 |
| 3 | Returns for periods of less than one year are not annualized. |
The accompanying notes are an integral part of these financial statements.
Wells Fargo U.S. REIT Portfolio | 9
Notes to financial statements (unaudited)
1. ORGANIZATION
Wells Fargo Master Trust (the "Trust"), a Delaware statutory trust organized on March 10, 1999, is an open-end management investment company registered under the Investment Company Act of 1940, as amended (the "1940 Act"). As an investment company, the Trust follows the accounting and reporting guidance in Financial Accounting Standards Board ("FASB") Accounting Standards Codification Topic 946, Financial Services – Investment Companies. These financial statements report on the Wells Fargo U.S. REIT Portfolio (the "Portfolio") which is a diversified series of the Trust.
Interests in the Portfolio are available solely through private placement transactions that do not involve any "public offering" within the meaning of Section 4(2) of the Investment Company Act of 1933.
On February 23, 2021, Wells Fargo & Company announced that it has entered into a definitive agreement to sell Wells Fargo Asset Management ("WFAM") to GTCR LLC and Reverence Capital Partners, L.P. WFAM is the trade name used by the asset management businesses of Wells Fargo & Company and includes Wells Fargo Funds Management, LLC, the adviser to the Portfolio, Wells Capital Management, LLC and Wells Fargo Asset Management (International) Limited, both registered investment advisers providing subadvisory services to certain funds, and Wells Fargo Funds Distributor, LLC, the Portfolio's principal underwriter. As part of the transaction, Wells Fargo & Company will own a 9.9% equity interest and will continue to serve as an important client and distribution partner.
Consummation of the transaction will result in the automatic termination of the Portfolio’s investment advisory agreement and subadvisory agreements. The Portfolio’s Board of Trustees approved a new investment advisory agreement and a new subadvisory agreement which were subsequently approved on behalf of the feeder funds that were investors in the Portfolio at the close of business on May 28, 2021. The new agreements will take effect upon the closing of the transaction. The transaction is expected to close in the second half of 2021, subject to customary closing conditions.
2. SIGNIFICANT ACCOUNTING POLICIES
The following significant accounting policies, which are consistently followed in the preparation of the financial statements of the Portfolio, are in conformity with U.S. generally accepted accounting principles which require management to make estimates and assumptions that affect the reported amounts of assets and liabilities, disclosure of contingent assets and liabilities at the date of the financial statements, and the reported amounts of income and expenses during the reporting period. Actual results could differ from those estimates.
Securities valuation
All investments are valued each business day as of the close of regular trading on the New York Stock Exchange (generally 4 p.m. Eastern Time), although the Portfolio may deviate from this calculation time under unusual or unexpected circumstances.
Equity securities that are listed on a foreign or domestic exchange or market are valued at the official closing price or, if none, the last sales price. If no sale occurs on the principal exchange or market that day, a fair value price will be determined in accordance with the Portfolio’s Valuation Procedures.
Investments in registered open-end investment companies are valued at net asset value.
Investments which are not valued using any of the methods discussed above are valued at their fair value, as determined in good faith by the Board of Trustees. The Board of Trustees has established a Valuation Committee comprised of the Trustees and has delegated to it the authority to take any actions regarding the valuation of portfolio securities that the Valuation Committee deems necessary or appropriate, including determining the fair value of portfolio securities, unless the determination has been delegated to the Wells Fargo Asset Management Pricing Committee at Wells Fargo Funds Management, LLC ("Funds Management"). The Board of Trustees retains the authority to make or ratify any valuation decisions or approve any changes to the Valuation Procedures as it deems appropriate. On a quarterly basis, the Board of Trustees receives reports on any valuation actions taken by the Valuation Committee or the Wells Fargo Asset Management Pricing Committee which may include items for ratification.
Security transactions and income recognition
Securities transactions are recorded on a trade date basis. Realized gains or losses are recorded on the basis of identified cost.
Dividend income is recognized on the ex-dividend date.
10 | Wells Fargo U.S. REIT Portfolio
Notes to financial statements (unaudited)
Federal and other taxes
The Portfolio is not required to pay federal income taxes on its net investment income and net capital gains as it is treated as a partnership for federal income tax purposes. All income, gains and losses of the Portfolio are deemed to have been “passed through” to the interest holders in proportion to their holdings of the Portfolio regardless of whether income and gains have been distributed by the Portfolio.
The Portfolio’s income tax returns and all financial records supporting those returns for the prior three fiscal years are subject to examination by the federal revenue authority. Management has analyzed the Portfolio’s tax positions taken on federal, state, and foreign tax returns for all open tax years and does not believe that there are any uncertain tax positions that require recognition of a tax liability.
As of August 31, 2021, the aggregate cost of all investments for federal income tax purposes was $19,242,426 and the unrealized gains (losses) consisted of:
| Gross unrealized gains | $ 8,479,249 |
| Gross unrealized losses | (1,450,449) |
| Net unrealized gains | $ 7,028,800 |
3. FAIR VALUATION MEASUREMENTS
Fair value measurements of investments are determined within a framework that has established a fair value hierarchy based upon the various data inputs utilized in determining the value of the Portfolio’s investments. The three-level hierarchy gives the highest priority to unadjusted quoted prices in active markets for identical assets or liabilities (Level 1) and the lowest priority to unobservable inputs (Level 3). The Portfolio’s investments are classified within the fair value hierarchy based on the lowest level of input that is significant to the fair value measurement. The inputs are summarized into three broad levels as follows:
| ■ | Level 1 – quoted prices in active markets for identical securities |
| ■ | Level 2 – other significant observable inputs (including quoted prices for similar securities, interest rates, prepayment speeds, credit risk, etc.) |
| ■ | Level 3 – significant unobservable inputs (including the Portfolio’s own assumptions in determining the fair value of investments) |
The inputs or methodologies used for valuing investments in securities are not necessarily an indication of the risk associated with investing in those securities.
The following is a summary of the inputs used in valuing the Portfolio’s assets and liabilities as of August 31, 2021:
| | Quoted prices
(Level 1) | Other significant
observable inputs
(Level 2) | Significant
unobservable inputs
(Level 3) | Total |
| Assets | | | | |
| Investments in: | | | | |
| Common stocks | | | | |
| Real estate | $ 26,247,913 | $0 | $0 | $ 26,247,913 |
| Short-term investments | | | | |
| Investment companies | 23,313 | 0 | 0 | 23,313 |
| Total assets | $26,271,226 | $0 | $0 | $26,271,226 |
Additional sector, industry or geographic detail, if any, is included in the Portfolio of Investments.
For the six months ended August 31, 2021, the Portfolio did not have any transfers into/out of Level 3.
4. TRANSACTIONS WITH AFFILIATES
Advisory fee
The Trust has entered into an advisory contract with Funds Management, an indirect wholly owned subsidiary of Wells Fargo & Company ("Wells Fargo"). The adviser is responsible for implementing investment policies and guidelines and for supervising
Wells Fargo U.S. REIT Portfolio | 11
Notes to financial statements (unaudited)
the subadviser, who is responsible for day-to-day portfolio management of the Portfolio. Pursuant to the contract, Funds Management is entitled to receive an advisory fee at the following annual rate based on the Portfolio’s average daily net assets:
| Average daily net assets | Advisory fee |
| First $5 billion | 0.100% |
| Next $5 billion | 0.080 |
| Over $10 billion | 0.060 |
For the six months ended August 31, 2021, the advisory fee was equivalent to an annual rate of 0.10% of the Portfolio’s average daily net assets.
Funds Management has retained the services of a subadviser to provide daily portfolio management to the Portfolio. The fee for subadvisory services is borne by Funds Management. Wells Capital Management, LLC, an affiliate of Funds Management and an indirect wholly owned subsidiary of Wells Fargo, is the subadviser to the Portfolio and is entitled to receive a fee from Funds Management at an annual rate starting at 0.06% and declining to 0.04% as the average daily net assets of the Portfolio increase.
Funds Management has voluntarily waived and/or reimbursed advisory fees to reduce the net operating expense ratio of the Portfolio. These voluntary waivers may be discontinued at any time.
Interfund transactions
The Portfolio may purchase or sell portfolio investment securities to certain other Wells Fargo affiliates pursuant to Rule 17a-7 under the 1940 Act and under procedures adopted by the Board of Trustees. The procedures have been designed to ensure that these interfund transactions, which do not incur broker commissions, are effected at current market prices.
5. INVESTMENT PORTFOLIO TRANSACTIONS
Purchases and sales of investments, excluding U.S. government obligations (if any) and short-term securities, for the six months ended August 31, 2021 were $5,708,193 and $10,571,944, respectively.
6. BANK BORROWINGS
The Trust, along with Wells Fargo Variable Trust and Wells Fargo Funds Trust (excluding the money market funds), are parties to a $350,000,000 revolving credit agreement whereby the Portfolio is permitted to use bank borrowings for temporary or emergency purposes, such as to fund interest holders withdrawal requests. Interest under the credit agreement is charged to the Portfolio based on a borrowing rate equal to the higher of the Federal Funds rate in effect on that day plus 1.25% or the overnight bank funding rate in effect on that day plus 1.25%. In addition, an annual commitment fee equal to 0.25% of the unused balance is allocated to each participating fund.
For the six months ended August 31, 2021, there were no borrowings by the Portfolio under the agreement.
7. CONCENTRATION RISKS
As of the end of the period, the Portfolio concentrated its portfolio of investments in the real estate sector. A fund that invests a substantial portion of its assets in any sector may be more affected by changes in that sector than would be a fund whose investments are not heavily weighted in any sector.
8. INDEMNIFICATION
Under the Portfolio's organizational documents, the officers and Trustees have been granted certain indemnification rights against certain liabilities that may arise out of performance of their duties to the Portfolio. The Portfolio has entered into a separate agreement with each Trustee that converts indemnification rights currently existing under the Portfolio’s organizational documents into contractual rights that cannot be changed in the future without the consent of the Trustee. Additionally, in the normal course of business, the Portfolio may enter into contracts with service providers that contain a variety of indemnification clauses. The Portfolio’s maximum exposure under these arrangements is dependent on future claims that may be made against the Portfolio and, therefore, cannot be estimated.
9. CORONAVIRUS (COVID-19) PANDEMIC
On March 11, 2020, the World Health Organization announced that it had made the assessment that coronavirus disease 2019 (“COVID-19”) is a pandemic. The impacts of COVID-19 are affecting the entire global economy, individual companies and
12 | Wells Fargo U.S. REIT Portfolio
Notes to financial statements (unaudited)
investment products, the funds, and the market in general. There is significant uncertainty around the extent and duration of business disruptions related to COVID-19 and the impacts may last for an extended period of time. COVID-19 has led to significant uncertainty and volatility in the financial markets.
10. SUBSEQUENT EVENTS
Wells Fargo Asset Management ("WFAM") announced that it will be changing its company name to Allspring Global Investments upon the closing of the previously announced sale transaction of WFAM by Wells Fargo & Company to GTCR LLC and Reverence Capital Partners, L.P. The new corporate name is expected to go into effect on the closing date of the transaction, which is anticipated to occur in the second half of 2021, subject to customary closing conditions.
The Board of Trustees of the Wells Fargo Funds approved a change in the Portfolio's name to remove “Wells Fargo” from the Portfolio's name and replace with “Allspring” on December 6, 2021.
Following the closing of the transaction, Wells Fargo Funds Management, LLC, the Portfolio's adviser, Wells Capital Management, LLC and Wells Fargo Asset Management (International) Limited, each subadvisers to certain funds, and Wells Fargo Funds Distributor, LLC will each be rebranded as Allspring.
Wells Fargo U.S. REIT Portfolio | 13
Other information (unaudited)
PROXY VOTING INFORMATION
A description of the policies and procedures used to determine how to vote proxies relating to portfolio securities is available without charge, upon request, by calling 1-800-222-8222, visiting our website at wfam.com, or visiting the SEC website at sec.gov. Information regarding how the proxies related to portfolio securities were voted during the most recent 12-month period ended June 30 is available on the website at wfam.com or by visiting the SEC website at sec.gov.
QUARTERLY PORTFOLIO HOLDINGS INFORMATION
The Portfolio files its complete schedule of portfolio holdings with the SEC for the first and third quarters of each fiscal year as an exhibit to its reports on Form N-PORT. Interest holders may view the filed Form N-PORT by visiting the SEC website at sec.gov.
14 | Wells Fargo U.S. REIT Portfolio
Other information (unaudited)
BOARD OF TRUSTEES AND OFFICERS
Each of the Trustees and Officers listed in the table below acts in identical capacities for each fund in the Wells Fargo family of funds, which consists of 139 mutual funds comprising the Wells Fargo Funds Trust, Wells Fargo Variable Trust, Wells Fargo Master Trust and four closed-end funds (collectively the “Fund Complex”). This table should be read in conjunction with the Prospectus and the Statement of Additional Information1. The mailing address of each Trustee and Officer is 525 Market Street, 12th Floor, San Francisco, CA 94105. Each Trustee and Officer serves an indefinite term, however, each Trustee serves such term until reaching the mandatory retirement age established by the Trustees.
Independent Trustees
Name and
year of birth | Position held and
length of service* | Principal occupations during past five years or longer | Current other
public company or
investment
company
directorships |
William R. Ebsworth
(Born 1957) | Trustee,
since 2015 | Retired. From 1984 to 2013, equities analyst, portfolio manager, research director and chief investment officer at Fidelity Management and Research Company in Boston, Tokyo, and Hong Kong, and retired in 2013 as Chief Investment Officer of Fidelity Strategic Advisers, Inc. where he led a team of investment professionals managing client assets. Prior thereto, Board member of Hong Kong Securities Clearing Co., Hong Kong Options Clearing Corp., the Thailand International Fund, Ltd., Fidelity Investments Life Insurance Company, and Empire Fidelity Investments Life Insurance Company. Audit Committee Chair and Investment Committee Chair of the Vincent Memorial Hospital Endowment (non-profit organization). Mr. Ebsworth is a CFA® charterholder. | N/A |
Jane A. Freeman
(Born 1953) | Trustee,
since 2015;
Chair Liaison,
since 2018 | Retired. From 2012 to 2014 and 1999 to 2008, Chief Financial Officer of Scientific Learning Corporation. From 2008 to 2012, Ms. Freeman provided consulting services related to strategic business projects. Prior to 1999, Portfolio Manager at Rockefeller & Co. and Scudder, Stevens & Clark. Board member of the Harding Loevner Funds from 1996 to 2014, serving as both Lead Independent Director and chair of the Audit Committee. Board member of the Russell Exchange Traded Funds Trust from 2011 to 2012 and the chair of the Audit Committee. Ms. Freeman is also an inactive Chartered Financial Analyst. | N/A |
Isaiah Harris, Jr.
(Born 1952) | Trustee,
since 2009; Audit
Committee
Chair,
since 2019 | Retired. Chairman of the Board of CIGNA Corporation since 2009, and Director since 2005. From 2003 to 2011, Director of Deluxe Corporation. Prior thereto, President and CEO of BellSouth Advertising and Publishing Corp. from 2005 to 2007, President and CEO of BellSouth Enterprises from 2004 to 2005 and President of BellSouth Consumer Services from 2000 to 2003. Emeritus member of the Iowa State University Foundation Board of Governors. Emeritus Member of the Advisory Board of Iowa State University School of Business. Advisory Board Member, Palm Harbor Academy (private school). Mr. Harris is a certified public accountant (inactive status). | CIGNA Corporation |
Judith M. Johnson
(Born 1949) | Trustee,
since 2008 | Retired. Prior thereto, Chief Executive Officer and Chief Investment Officer of Minneapolis Employees Retirement Fund from 1996 to 2008. Ms. Johnson is an attorney, certified public accountant and a certified managerial accountant. | N/A |
David F. Larcker
(Born 1950) | Trustee,
since 2009 | James Irvin Miller Professor of Accounting at the Graduate School of Business (Emeritus), Stanford University, Director of the Corporate Governance Research Initiative and Senior Faculty of The Rock Center for Corporate Governance since 2006. From 2005 to 2008, Professor of Accounting at the Graduate School of Business, Stanford University. Prior thereto, Ernst & Young Professor of Accounting at The Wharton School, University of Pennsylvania from 1985 to 2005. | N/A |
Wells Fargo U.S. REIT Portfolio | 15
Other information (unaudited)
Name and
year of birth | Position held and
length of service* | Principal occupations during past five years or longer | Current other
public company or
investment
company
directorships |
Olivia S. Mitchell
(Born 1953) | Trustee,
since 2006;
Nominating and
Governance
Committee Chair,
since 2018 | International Foundation of Employee Benefit Plans Professor, Wharton School of the University of Pennsylvania since 1993. Director of Wharton’s Pension Research Council and Boettner Center on Pensions & Retirement Research, and Research Associate at the National Bureau of Economic Research. Previously, Cornell University Professor from 1978 to 1993. | N/A |
Timothy J. Penny
(Born 1951) | Trustee,
since 1996;
Chair,
since 2018 | President and Chief Executive Officer of Southern Minnesota Initiative Foundation, a non-profit organization, since 2007. Member of the Board of Trustees of NorthStar Education Finance, Inc., a non-profit organization, since 2007. | N/A |
James G. Polisson
(Born 1959) | Trustee,
since 2018 | Retired. Chief Marketing Officer, Source (ETF) UK Services, Ltd, from 2015 to 2017. From 2012 to 2015, Principal of The Polisson Group, LLC, a management consulting, corporate advisory and principal investing company. Chief Executive Officer and Managing Director at Russell Investments, Global Exchange Traded Funds from 2010 to 2012. Managing Director of Barclays Global Investors from 1998 to 2010 and Global Chief Marketing Officer for iShares and Barclays Global Investors from 2000 to 2010. Trustee of the San Francisco Mechanics’ Institute, a non-profit organization, from 2013 to 2015. Board member of the Russell Exchange Traded Fund Trust from 2011 to 2012. Director of Barclays Global Investors Holdings Deutschland GmbH from 2006 to 2009. Mr. Polisson is an attorney and has a retired status with the Massachusetts and District of Columbia Bar Associations. | N/A |
Pamela Wheelock
(Born 1959) | Trustee,
since January
2020; previously
Trustee from
January 2018 to
July 2019 | Board member of the Destination Medical Center Economic Development Agency, Rochester, Minnesota since 2019. Interim President of the McKnight Foundation from January to September 2020. Acting Commissioner, Minnesota Department of Human Services, July 2019 through September 2019. Human Services Manager (part-time), Minnesota Department of Human Services, October 2019 through December 2019. Chief Operating Officer, Twin Cities Habitat for Humanity from 2017 to 2019. Vice President of University Services, University of Minnesota from 2012 to 2016. Prior thereto, on the Board of Directors, Governance Committee and Finance Committee for the Minnesota Philanthropy Partners (Saint Paul Foundation) from 2012 to 2018, Interim Chief Executive Officer of Blue Cross Blue Shield of Minnesota from 2011 to 2012, Chairman of the Board from 2009 to 2012 and Board Director from 2003 to 2015. Vice President, Leadership and Community Engagement, Bush Foundation, Saint Paul, Minnesota (a private foundation) from 2009 to 2011. Executive Vice President and Chief Financial Officer, Minnesota Sports and Entertainment from 2004 to 2009 and Senior Vice President from 2002 to 2004. Executive Vice President of the Minnesota Wild Foundation from 2004 to 2008. Commissioner of Finance, State of Minnesota, from 1999 to 2002. Currently Board Chair of the Minnesota Wild Foundation since 2010. | N/A |
* Length of service dates reflect the Trustee’s commencement of service with the Trust’s predecessor entities, where applicable.
16 | Wells Fargo U.S. REIT Portfolio
Other information (unaudited)
Officers
Name and
year of birth | Position held and
length of service | Principal occupations during past five years or longer |
Andrew Owen
(Born 1960) | President,
since 2017 | Executive Vice President of Wells Fargo & Company and Head of Affiliated Managers, Wells Fargo Asset Management, since 2014. In addition, Mr. Owen is currently President, Chief Executive Officer and Director of Wells Fargo Funds Management, LLC since 2017. Prior thereto, Executive Vice President responsible for marketing, investments and product development for Wells Fargo Funds Management, LLC, from 2009 to 2014. |
Jeremy DePalma
(Born 1974) | Treasurer,
since 2012
(for certain funds in
the Fund Complex);
since 2021 (for
the remaining funds in the
Fund Complex) | Senior Vice President of Wells Fargo Funds Management, LLC since 2009. Senior Vice President of Evergreen Investment Management Company, LLC from 2008 to 2010 and head of the Fund Reporting and Control Team within Fund Administration from 2005 to 2010. |
Michelle Rhee
(Born 1966) | Chief Legal Officer,
since 2019 | Secretary of Wells Fargo Funds Management, LLC and Chief Legal Counsel of Wells Fargo Asset Management since 2018. Deputy General Counsel of Wells Fargo Bank, N.A. since 2020 and Assistant General Counsel of Wells Fargo Bank, N.A. from 2018 to 2020. Associate General Counsel and Managing Director of Bank of America Corporation from 2004 to 2018. |
Matthew Prasse
(Born 1983) | Secretary,
since 2021 | Senior Counsel of the Wells Fargo Legal Department since 2018. Previously, Director and Counsel for Barings LLC from 2015 to 2018. Prior to joining Barings, Associate at Morgan, Lewis & Bockius LLP from 2008 to 2015. |
Michael H. Whitaker
(Born 1967) | Chief Compliance Officer,
since 2016 | Chief Compliance Officer of Wells Fargo Asset Management since 2016. Senior Vice President and Chief Compliance Officer for Fidelity Investments from 2007 to 2016. |
1 The Statement of Additional Information includes additional information about the Trustees and is available, without charge, upon request, by calling 1-800-222-8222 or by visiting the website at wfam.com.
Wells Fargo U.S. REIT Portfolio | 17
Board considerations (unaudited)
BOARD CONSIDERATION OF INVESTMENT ADVISORY AND SUB-ADVISORY AGREEMENTS:
Wells Fargo Bloomberg Barclays US Aggregate ex-Corporate Portfolio, Wells Fargo Emerging Markets Bond Portfolio, Wells Fargo Factor Enhanced Emerging Markets Equity Portfolio, Wells Fargo Factor Enhanced International Equity Portfolio, Wells Fargo Factor Enhanced U.S. Large Cap Equity Portfolio, Wells Fargo Factor Enhanced U.S. Small Cap Equity Portfolio, Wells Fargo High Yield Corporate Bond Portfolio, Wells Fargo Investment Grade Corporate Bond Portfolio, Wells Fargo Factor Enhanced U.S. Low Volatility Equity Portfolio, Wells Fargo Strategic Retirement Bond Portfolio, and Wells Fargo U.S. REIT Portfolio
Board Considerations – Current Agreements
Under the Investment Company Act of 1940 (the “1940 Act”), the Board of Trustees (the “Board”) of Wells Fargo Master Trust (the “Trust”) must determine annually whether to approve the continuation of the Trust’s investment advisory and sub-advisory agreements. In this regard, at a meeting held on May 17-19, 2021 (the “Meeting”), the Board of the Trust, all the members of which have no direct or indirect interest in the investment advisory and sub-advisory agreements and are not “interested persons” of the Trust, as defined in the 1940 Act (the “Independent Trustees”), reviewed and approved for each of the portfolios of the Trust identified in the table below (individually, a “Portfolio” and collectively, the “Portfolios”): (i) an investment advisory agreement (the “Advisory Agreement”) with Wells Fargo Funds Management, LLC (“Funds Management”); and (ii) an investment sub-advisory agreement (each, a “Sub-Advisory Agreement” and collectively, the “Sub-Advisory Agreements”) with the sub-adviser(s) identified in the table below (each, a “Sub-Adviser” and collectively, the “Sub-Advisers”) for the corresponding Portfolio identified. The Advisory Agreement and the Sub-Advisory Agreements are collectively referred to as the “Advisory Agreements.”
| Funds Trust | Master Trust |
| Wells Fargo Bloomberg Barclays US Aggregate ex-Corporate Portfolio | Wells Capital Management Incorporated |
| Wells Fargo Emerging Markets Bond Portfolio | Wells Fargo Asset Management (International) Limited and Wells Capital Management Incorporated |
| Wells Fargo Factor Enhanced Emerging Markets Equity Portfolio | Wells Capital Management Incorporated |
| Wells Fargo Factor Enhanced International Equity Portfolio | Wells Capital Management Incorporated |
| Wells Fargo Factor Enhanced U.S. Large Cap Equity Portfolio | Wells Capital Management Incorporated |
| Wells Fargo Factor Enhanced U.S. Small Cap Equity Portfolio | Wells Capital Management Incorporated |
| Wells Fargo High Yield Corporate Bond Portfolio | Wells Capital Management Incorporated |
| Wells Fargo Investment Grade Corporate Bond Portfolio | Wells Capital Management Incorporated |
| Wells Fargo Factor Enhanced U.S. Low Volatility Equity Portfolio | Wells Capital Management Incorporated |
| Wells Fargo Strategic Retirement Bond Portfolio | Wells Capital Management Incorporated |
| Wells Fargo U.S. REIT Portfolio | Wells Capital Management Incorporated |
The Board noted that Wells Fargo & Company recently announced that it had entered into a definitive agreement to sell Wells Fargo Asset Management (“WFAM”), which includes Funds Management and the Sub-Adviser, to GTCR LLC and Reverence Capital Partners, L.P. and/or their affiliates (the “Transaction”). The Board further noted that the Transaction would result in a change-of-control of Funds Management and the Sub-Advisers, which would be considered to be an assignment that would result in the termination of the Advisory Agreements. In light of the Transaction, the Board separately considered for approval a new investment advisory agreement with Funds Management and a new investment sub-advisory agreement with each of the Sub-Advisers (the “New Agreements”) that would replace the Advisory Agreements upon consummation of the Transaction, subject to approval of the New Agreements by the Portfolios’ shareholders. The Board also considered for approval interim agreements to go into effect in the event shareholders do not approve the New Agreements before the Transaction is completed. The interim agreements would allow the Manager and the Sub-Advisers to continue providing services to the Portfolios while the Portfolios continues to seek shareholder approval of the New Agreements. The Board noted that the terms of the interim agreements would be identical to those of the current Advisory Agreements, except for the term and certain escrow provisions.
At the Meeting, the Board considered the factors and reached the conclusions described below relating to the selection of Funds Management and the Sub-Advisers and the approval of the Advisory Agreements. Prior to the Meeting, including at Board meetings held in April and May 2021, the Trustees conferred extensively among themselves and with representatives of Funds Management about these matters. Also, the Board has adopted a team-based approach, with each team consisting of a sub-set of
18 | Wells Fargo U.S. REIT Portfolio
Board considerations (unaudited)
Trustees, to assist the full Board in the discharge of its duties in reviewing investment performance and other matters throughout the year. The Independent Trustees were assisted in their evaluation of the Advisory Agreements by independent legal counsel, from whom they received separate legal advice and with whom they met separately.
In providing information to the Board, Funds Management and the Sub-Advisers were guided by a detailed set of requests for information submitted to them by independent legal counsel on behalf of the Independent Trustees at the start of the Board’s annual contract renewal process earlier in 2021. In considering and approving the Advisory Agreements, the Trustees considered the information they believed relevant, including but not limited to the information discussed below. The Board considered not only the specific information presented in connection with the Meeting, but also the knowledge gained over time through interaction with Funds Management and the Sub-Advisers about various topics. In this regard, the Board reviewed reports of Funds Management at each of its quarterly meetings, which included, among other things, portfolio reviews and investment performance reports. In addition, the Board and the teams mentioned above confer with portfolio managers at various times throughout the year. The Board did not identify any particular information or consideration that was all-important or controlling, and each individual Trustee may have attributed different weights to various factors.
After its deliberations, the Board unanimously determined that the compensation or the absence of compensation payable to Funds Management and each of the Sub-Advisers under each of the Advisory Agreements was reasonable, and approved the continuation of the Advisory Agreements for a one-year term. The Board considered the approval of the Advisory Agreements for the Portfolios as part of its consideration of agreements for funds across the complex, but its approvals were made on a fund-by-fund basis. The following summarizes a number of important, but not necessarily all, factors considered by the Board in support of its approvals.
Nature, extent and quality of services
The Board received and considered various information regarding the nature, extent and quality of services provided to the Funds by Funds Management and the Sub-Advisers under the Advisory Agreements. This information included a description of the investment advisory services and Portfolio-level administrative services covered by the Advisory Agreement, as well as, among other things, a summary of the background and experience of senior management of WFAM, of which Funds Management and the Sub-Advisers are a part, and a summary of investments made in the business of WFAM. The Board also received a description of Funds Management’s and the Sub-Advisers’ business continuity plans, including a summary of the performance of such plans and any changes thereto during the COVID-19 pandemic, and of their approaches to data privacy and cybersecurity. The Board also received and reviewed information about Funds Management’s role as administrator of the Portfolios’ liquidity risk management program, Funds Management’s approach to risk management, and Funds Management’s intermediary and vendor oversight program.
The Board also considered the qualifications, background, tenure and responsibilities of each of the portfolio managers primarily responsible for the day-to-day portfolio management of the Portfolios. The Board noted that each of the Portfolios replicates the performance of a proprietary index provided by an affiliate of Funds Management, except that each of Wells Fargo Bloomberg Barclays US Aggregate ex-Corporate Portfolio, Wells Fargo Emerging Markets Bond Portfolio, and Wells Fargo Strategic Retirement Bond Portfolio track the performance of a third party index. The Board evaluated the ability of Funds Management and the Sub-Advisers to attract and retain qualified investment professionals, including research, advisory and supervisory personnel.
The Board further considered the compliance programs and compliance records of Funds Management and the Sub-Advisers. In addition, the Board took into account the full range of services provided to the Portfolios by Funds Management and its affiliates. The Board also considered information about retention and back-up arrangements that have been put into place with respect to key personnel of WFAM in connection with the anticipated Transaction, noting that WFAM provided assurances that the announcement and eventual culmination of the Transaction is not expected to result in any diminution in the nature or quality of services provided to the Portfolios.
Portfolio investment performance and expenses
The Board considered the investment performance results for each of the Portfolios over the one- and three-year periods ended December 31, 2020, except for the Wells Fargo Factor Enhanced U.S. Low Volatility Equity Portfolio, for which the Board considered the investment performance results for the quarter ended December 31, 2020. The Board considered these results in comparison to the investment performance of funds in a universe that was determined by Broadridge Inc. (“Broadridge”) to be similar to each respective Portfolios (each, a “Universe”), and in comparison to each Portfolios’ benchmark index and to other comparative data. Broadridge is an independent provider of investment company data. The Board received a description of the methodology used by Broadridge to select the mutual funds in the performance Universe. The Board noted the short performance history of the Portfolios.
Wells Fargo U.S. REIT Portfolio | 19
Board considerations (unaudited)
With respect to the investment performance of each Portfolio relative to its respective Universe, the Board noted the following: (i) the investment performance of each of Wells Fargo Factor Enhanced International Equity Portfolio and Wells Fargo Factor Enhanced U.S. Small Cap Equity Portfolio was higher than such Portfolio’s respective Universe for the one- and three-year periods under review; (ii) the investment performance of each of Wells Fargo Bloomberg Barclays US Aggregate ex-Corporate Portfolio, Wells Fargo Emerging Markets Bond Portfolio, and Wells Fargo Investment Grade Corporate Bond Portfolio was higher than such Portfolio’s respective Universe for the three-year period under review, and lower than such Portfolio’s respective Universe for the one-year period under review; (iii) the investment performance of each of Wells Fargo Factor Enhanced Emerging Markets Equity Portfolio, Wells Fargo Factor Enhanced U.S. Large Cap Equity Portfolio, Wells Fargo High Yield Corporate Bond Portfolio, Wells Fargo Strategic Retirement Bond Portfolio, and Wells Fargo U.S. REIT Portfolio was lower than such Portfolio’s respective Universe for the one- and three-year periods under review; and (iv) the Wells Fargo Factor Enhanced U.S. Low Volatility Equity Portfolio launched on July 1, 2020 and, given its short operational history, had no historical performance.
With respect to the investment performance of each Portfolio relative to its respective benchmark index, the Board noted the following: (i) the investment performance of each of Wells Fargo Bloomberg Barclays US Aggregate ex-Corporate Portfolio, Wells Fargo Factor Enhanced International Equity Portfolio, Wells Fargo Investment Grade Corporate Bond Portfolio, Wells Fargo Factor Enhanced U.S. Low Volatility Equity Portfolio, and Wells Fargo Strategic Retirement Bond Portfolio was higher than or in range of such Portfolio’s respective benchmark index for all periods under review; (ii) the investment performance of Wells Fargo U.S. REIT Portfolio was in range of the Portfolio’s benchmark index for the three-year period under review, and was lower than the Portfolio’s benchmark index for the one-year period under review; and (iii) the investment performance of each of Wells Fargo Emerging Markets Bond Portfolio, Wells Fargo Factor Enhanced Emerging Markets Equity Portfolio, Wells Fargo Factor Enhanced U.S. Large Cap Equity Portfolio, Wells Fargo Factor Enhanced U.S. Small Cap Equity Portfolio, and Wells Fargo High Yield Corporate Bond Portfolio was lower than such Portfolio’s respective benchmark index for all periods under review.
The Board received information concerning, and discussed factors contributing to, the underperformance of each of Wells Fargo Factor Enhanced Emerging Markets Equity Portfolio, Wells Fargo Factor Enhanced International Equity Portfolio, Wells Fargo Factor Enhanced U.S. Large Cap Equity Portfolio, Wells Fargo High Yield Corporate Bond Portfolio, Wells Fargo Strategic Retirement Bond Portfolio, and Wells Fargo U.S. REIT Portfolio relative to such Portfolio’s Universe and benchmark index for the periods identified above.
The Board also received and considered information regarding the fee rates that are payable to Funds Management for investment advisory services (as discussed below), which are the only fees charged to the Portfolios, relative to corresponding class-specific expense groups that were determined by Broadridge to be similar to the Portfolios (the “Groups”). The Board received a description of the methodology used by Broadridge to select the mutual funds in the expense Groups and an explanation of how funds comprising expense groups and their expense ratios may vary from year-to-year.
The Board took into account the Portfolios’ investment performance and expense information provided to it among the factors considered in deciding to re-approve the Advisory Agreements.
Investment advisory and sub-advisory fee rates
The Board reviewed and considered the contractual fee rates payable by the Portfolios to Funds Management under the Advisory Agreement. The Board also reviewed and considered the contractual investment sub-advisory fee rates that are payable by Funds Management to the Sub-Advisers for investment sub-advisory services.
Among other information reviewed by the Board was a comparison of the Portfolios’ Management Rates with the average contractual investment management fee rates of funds in the expense Groups at a common asset level as well as transfer agency costs of the Portfolios in the expense Groups. The Board noted that the Management Rates of the Portfolios were lower than, equal to, or in range of the sum of these average rates for the Portfolios’ expense Groups.
The Board also received and considered information about the portions of the total management fees that were retained by Funds Management after payment of the fees to the Sub-Advisers for sub-advisory services. In assessing the reasonableness of these amounts, the Board received and evaluated information about the nature and extent of responsibilities retained and risks assumed by Funds Management and not delegated to or assumed by the Sub-Advisers, and about Funds Management’s on-going oversight services. Given the affiliation between Funds Management and the Sub-Advisers, the Board ascribed limited relevance to the allocation of fees between them.
The Board also received and considered information about the nature and extent of services offered and fee rates charged by Funds Management and the Sub-Advisers to other types of clients with investment strategies similar to those of certain Portfolios. In this regard, the Board received information about the significantly greater scope of services, and compliance,
20 | Wells Fargo U.S. REIT Portfolio
Board considerations (unaudited)
reporting and other legal burdens and risks of managing proprietary mutual funds compared with those associated with managing assets of other types of clients, including third-party sub-advised fund clients and non-mutual fund clients such as institutional separate accounts.
Based on its consideration of the factors and information it deemed relevant, including those described here, the Board determined that the compensation payable to Funds Management under the Advisory Agreement and to the Sub-Advisers under the Sub-Advisory Agreements was reasonable.
Profitability
The Board received and considered information concerning the profitability of Funds Management, as well as the profitability of both WFAM and Wells Fargo & Co. (“Wells Fargo”) from providing services to the funds family as a whole. The Board noted that the Sub-Advisers’ profitability information with respect to providing services to the Portfolios and other funds in the family was subsumed in the WFAM and Wells Fargo profitability analysis.
Funds Management reported on the methodologies and estimates used in calculating profitability, including a description of the methodology used to allocate certain expenses. Among other things, the Board noted that the levels of profitability reported on a fund-by-fund basis varied widely, depending on factors such as the size, type and age of fund.
Based on its review, the Board did not deem the profits reported by Funds Management, WFAM or Wells Fargo from services provided to the Portfolios to be at a level that would prevent it from approving the continuation of the Advisory Agreements.
Economies of scale
The Board received and considered information about the potential for Funds Management to experience economies of scale in the provision of management services to the Portfolios, the difficulties of calculating economies of scale at an individual fund level, and the extent to which potential scale benefits are shared with shareholders. The Board noted the existence of breakpoints in the Portfolios’ management fee structure, which operate generally to reduce the Portfolios’ expense ratios as the Portfolios grow in size, and the size of the Portfolios in relation to such breakpoints. The Board considered that in addition to management fee breakpoints, Funds Management shares potential economies of scale from its management business in a variety of ways, including through fee waiver and expense reimbursement arrangements, competitive management fee rates set at the outset without regard to breakpoints, and investments in the business intended to enhance services available to shareholders.
The Board concluded that Funds Management’s arrangements with respect to the Portfolios, including contractual breakpoints, constituted a reasonable approach to sharing potential economies of scale with the Portfolios and their shareholders.
Other benefits to Funds Management and the Sub-Advisers
The Board received and considered information regarding potential “fall-out” or ancillary benefits received by Funds Management and its affiliates, including the Sub-Advisers, as a result of their relationships with the Portfolios. Ancillary benefits could include, among others, benefits directly attributable to other relationships with the Portfolios and benefits potentially derived from an increase in Funds Management’s and the Sub-Advisers’ businesses as a result of their relationships with the Portfolios. The Board noted that various affiliates of Funds Management may receive distribution-related fees, shareholder servicing payments and sub-transfer agency fees in respect of shares sold or held through them and services provided.
The Board also reviewed information about soft dollar credits earned and utilized by the Sub-Advisers, fees earned by Funds Management and Wells Capital Management Incorporated from managing a private investment vehicle for the fund family’s securities lending collateral, and commissions earned by an affiliated broker from portfolio transactions.
Based on its consideration of the factors and information it deemed relevant, including those described here, the Board did not find that any ancillary benefits received by Funds Management and its affiliates, including the Sub-Advisers, were unreasonable.
Conclusion
At the Meeting, after considering the above-described factors and based on its deliberations and its evaluation of the information described above, the Board unanimously determined that the compensation payable to Funds Management and the Sub-Advisers under each of the Advisory Agreements was reasonable, and approved the continuation of the Advisory Agreements for a one-year term.
Wells Fargo U.S. REIT Portfolio | 21
Board considerations (unaudited)
Board Considerations – New Agreements
Overview of the Board evaluation process
At a meeting held on May 17-19, 2021 (the “Board Meeting”), the Board of Trustees (the “Board”) of Wells Fargo Master Trust (the “Trust”, and the series identified below, the “Portfolios”) approved the continuation of each Portfolio’s current Investment Advisory Agreement (the “Current Investment Advisory Agreement”) and the current Sub-Advisory Agreements (the “Current Sub-Advisory Agreements”, and collectively, the “Current Agreements”).
| Wells Fargo Disciplined Large Cap Portfolio |
| Wells Fargo Diversified Large Cap Growth Portfolio |
| Wells Fargo Disciplined International Developed Markets Portfolio |
| Wells Fargo Large Company Value Portfolio |
| Wells Fargo Managed Fixed Income Portfolio |
| Wells Fargo Bloomberg Barclays US Aggregate ex-Corporate Portfolio |
| Wells Fargo Emerging Markets Bond Portfolio |
| Wells Fargo Factor Enhanced Emerging Markets Equity Portfolio |
| Wells Fargo Factor Enhanced International Equity Portfolio |
| Wells Fargo Factor Enhanced U.S. Large Cap Equity Portfolio |
| Wells Fargo Factor Enhanced U.S. Low Volatility Equity Portfolio |
| Wells Fargo Factor Enhanced U.S. Small Cap Equity Portfolio |
| Wells Fargo High Yield Corporate Bond Portfolio |
| Wells Fargo Investment Grade Corporate Bond Portfolio |
| Wells Fargo Strategic Retirement Bond Portfolio |
| Wells Fargo U.S. REIT Portfolio |
Each Trustee on the Board is not an “interested person” (as defined in the Investment Company Act of 1940 (the “1940 Act”)) of the Portfolios (collectively, the “Independent Trustees”). The process followed by the Board in considering and approving the continuation of the Current Agreements is referred to herein as the “2021 Annual Approval Process.”
As noted above, the closing of the sale of Wells Fargo Asset Management (“WFAM”) to a holding company (“NewCo”) affiliated with private funds of GTCR LLC (“GTCR”) and of Reverence Capital Partners, L.P. (“Reverence Capital”, and such transaction, the “Transaction”) will result in a change of control of Wells Fargo Funds Management LLC (“Funds Management”), Wells Capital Management Incorporated (“Wells Capital”) and Wells Fargo Asset Management (International) Limited (“WFAM(I) Ltd.”, and together with Funds Management and Wells Capital, the “Advisers”), which will be considered to be an “assignment” of each Portfolio’s Current Agreements under the 1940 Act that will result in the automatic termination of each Portfolio’s Current Agreements. In light of the expected termination of each Portfolio’s Current Agreements upon the closing, at the Board Meeting the Board also considered and approved: (i) a new Investment Advisory Agreement (the “New Investment Advisory Agreement”) between the Trust, on behalf of each Portfolio, and Funds Management; (ii) a new Sub-Advisory Agreement (the “New Wells Capital Sub-Advisory Agreement”) among the Trust, on behalf of each Portfolio, Funds Management and Wells Capital; and (iii) a new Sub-Advisory Agreement (the “New WFAM(I) Ltd Sub-Advisory Agreement”) among the Trust, on behalf of Emerging Markets Bond Portfolio, Funds Management and WFAM(I) Ltd (“WFAMI”); and (iv) a new Sub-Advisory Agreement (the “New Galliard Sub-Advisory Agreement”, and collectively, the “New Agreements”) among the Trust, on behalf of Managed Fixed Income Portfolio, Funds Management and Galliard Capital Management, LLC (“Galliard”, and together with Wells Capital and WFAMI, the “Sub-Advisers”), each of which is intended to go into effect upon the closing. The process followed by the Board in reviewing and approving the New Agreements is referred to herein as the “New Agreement Approval Process.”
At a series of meetings held in April and May 2021 (collectively, “April and May 2021 Meetings”) and at the Board Meeting, the Trustees conferred extensively among themselves and with senior representatives of Funds Management, GTCR and Reverence Capital about the New Agreements and related matters. The Board reviewed and discussed information furnished by Funds Management, GTCR and Reverence Capital that the Board considered reasonably necessary to evaluate the terms of the New Agreements and the services to be provided. At these meetings, senior representatives from Funds Management, GTCR and Reverence Capital made presentations to, and responded to questions from, the Board.
In providing information to the Board in connection with the 2021 annual approval process for the Current Agreements (the “2021 Annual Approval Process”) and the New Agreement Approval Process, Funds Management, GTCR and Reverence Capital (as applicable) were guided by requests for information submitted by independent legal counsel on behalf of the Independent Trustees. In considering and approving the New Agreements, the Trustees considered the information they believed relevant, including but not limited to the information discussed herein. The Board considered not only the specific information presented in
22 | Wells Fargo U.S. REIT Portfolio
Board considerations (unaudited)
connection with the April and May 2021 Meetings as well as the Board Meeting, but also the knowledge gained over time through interaction with Funds Management and the Sub-Advisers about various topics. In this regard, the Board reviews reports of Funds Management at each of its regular Board meetings, which includes, among other things, portfolio reviews and investment performance reports. In addition, the Board confers with portfolio managers at various times throughout the year. The Board was assisted in its evaluation of the New Agreements by independent legal counsel, from whom the Independent Trustees received separate legal advice and with whom the Independent Trustees met separately. The Board did not identify any particular information or consideration that was all-important or controlling, and each individual Trustee may have attributed different weights to various factors.
Among other information considered by the Board in connection with the Transaction was:
| ■ | Information regarding the Transaction: information about the structure, financing sources and material terms and conditions of the Transaction, including the expected impact on the businesses conducted by the Advisers and by Wells Fargo Funds Distributor LLC. |
| ■ | Information regarding NewCo, GTCR and Reverence Capital: (i) information about NewCo, including information about its expected financial condition and access to capital, and senior leadership team; (ii) the experience of senior management at GTCR and Reverence Capital in acquiring portfolio companies; (iii) the plan to operationalize NewCo, including the transition of necessary infrastructure services through a transition services agreement with Wells Fargo under which Wells Fargo will continue to provide NewCo with certain services for a specified period of time after the closing; and (iv) information regarding regulatory matters, compliance, and risk management functions at NewCo, including resources to be dedicated thereto. |
| ■ | Impact of the Transaction on WFAM and Service Providers: (i) information regarding any changes to personnel and/or other resources of the Advisers as a result of the Transaction, including assurances regarding comparable and competitive compensation arrangements to attract and retain highly qualified personnel; and (ii) information about the organizational and operating structure with respect to NewCo, the Advisers and the Portfolios. |
| ■ | Impact of the Transaction on the Portfolios and their Shareholders: (i) information regarding anticipated benefits to the Portfolios as a result of the Transaction; (ii) a commitment that the Portfolios would not bear any expenses, directly or indirectly, in connection with the Transaction; (iii) confirmation that the Advisers intend to continue to manage the Portfolios in a manner consistent with each Portfolio’s current investment objectives and principal investments strategies; and (iv) a commitment that neither NewCo nor WFAM will take any steps that would impose any “unfair burden” (as that term is used in section 15(f)(1)(B) of the 1940 Act) on the Portfolios as a result of the Transaction. |
With respect to the New Agreements, the Board considered: (i) a representation that, after the closing, all of the Portfolios will continue to be managed and advised by their current Advisers, and that the same portfolio managers of the Sub-Advisers are expected to continue to manage the Portfolios after the Transaction; (ii) information regarding the terms of the New Agreements, including changes as compared to the Current Agreements; (iii) information confirming that the fee rates payable under the New Agreements will not increase as a result of the Transaction as compared to the rates under the Current Agreements; and (iv) assurances that the Transaction is not expected to cause any diminution with respect to the nature, extent and quality of any of the services currently provided to the Portfolios by the Advisers as a result of the Transaction.
In addition to considering information furnished specifically to evaluate the impact of the Transaction on the Portfolios and their respective shareholders in connection with the New Agreement Approval Process, the Board considered information furnished at prior meetings of the Board and its committees, including detailed information provided in connection with the 2021 Annual Approval Process. In this regard, in connection with the 2021 Annual Approval Process, the Board received information about complex-wide and individual Portfolio performance, fees and expenses, including: (i) a report from an independent data provider comparing the investment performance of each Portfolio to the investment performance of comparable funds and benchmark indices, over various time periods; (ii) a report from an independent data provider comparing each Portfolio’s total expense ratio (and its components) to those of comparable funds; (iii) comparative information concerning the fees charged and services provided by the Advisers to each Portfolio in managing other accounts (which may include other mutual funds, collective investment funds and institutional accounts), if any, that employ investment strategies and techniques similar to those used in managing such Portfolio(s); and (iv) profitability analyses of Funds Management, as well as the profitability of both WFAM and Wells Fargo from providing services to the fund family as a whole.
After its deliberations, the Board unanimously determined that the compensation payable to Funds Management and the Sub-Advisers under the New Agreements is reasonable, approved the New Agreements for a two-year term. The Board considered the approval of the New Agreements as part of its consideration of agreements for funds across the complex, but its approvals were made on a fund-by-fund basis. The following summarizes a number of important, but not necessarily all, factors considered by the Board in support of its approvals.
Wells Fargo U.S. REIT Portfolio | 23
Board considerations (unaudited)
Nature, extent and quality of services
In connection with the 2021 Annual Approval Process, the Board received and considered various information regarding the nature, extent and quality of services provided to each Portfolio by Funds Management and the Sub-Advisers under the Advisory Agreements. This information included a description of the investment advisory services and administrative services covered by the Current Advisory Agreement, as well as, among other things, a summary of the background and experience of senior management of WFAM, of which Funds Management and the Sub-Advisers are a part, and a summary of investments made in the business of WFAM. The Board also received a description of Funds Management’s and the Sub-Advisers’ business continuity plans, including a summary of the performance of such plans and any changes thereto during the COVID-19 pandemic, and of their approaches to data privacy and cybersecurity. The Board also received and reviewed information about Funds Management’s role as administrator of the Portfolios’ liquidity risk management program, Funds Management’s approach to risk management, and Funds Management’s intermediary and vendor oversight program.
In connection with the 2021 Annual Approval Process, the Board also considered the qualifications, background, tenure and responsibilities of each of the portfolio managers primarily responsible for the day-to-day portfolio management of the Portfolios. The Board evaluated the ability of Funds Management and the Sub-Advisers to attract and retain qualified investment professionals, including research, advisory and supervisory personnel.
In connection with the 2021 Annual Approval Process, the Board further considered the compliance programs and compliance records of Funds Management and the Sub-Advisers. In addition, the Board took into account the full range of services provided to the Portfolios by Funds Management and its affiliates.
In connection with the New Agreement Approval Process, the Board considered, among other information, the structure of the Transaction and expected impact, if any, of the Transaction on the operations, facilities, organization and personnel of the Advisers. The Board received assurances from the Advisers that each Portfolio will continue to be advised by its current Advisers after the closing, and that the same individual portfolio managers are expected to continue to manage the Portfolios after the closing. With respect to the recruitment and retention of key personnel, the Board noted information from GTCR, Reverence Capital and the Advisers regarding the potential benefits for employees of joining NewCo. The Board recognized that the personnel who had been extended offers may not accept such offers and personnel changes may occur in the future in the ordinary course.
In addition, the Board considered information regarding the infrastructure, operational capabilities and support staff in place to assist in the portfolio management and operations of the Portfolios, including the provision of administrative services, and the anticipated impact of the Transaction on such matters. The Board also considered the business-related and other risks to which the Advisers may be subject in managing the Portfolios and in connection with the Transaction. The Board also considered the transition and integration plans as a result of the change in ownership of the Advisers from Wells Fargo to NewCo. The Board considered the resources and infrastructure that NewCo intends to devote to its compliance program to ensure compliance with applicable laws and regulations, as well as its risk management program and cybersecurity program. The Board also took into account assurances received from the Advisers, GTCR and Reverence Capital that the Transaction is not expected to cause any diminution in the nature, extent and quality of services provided by the Advisers to the Portfolios and their shareholders.
Investment performance and expenses
In connection with the 2021 Annual Approval Process, the Board considered the investment performance results for each Portfolio over various time periods ended December 31, 2020. The Board considered these results in comparison to the investment performance of funds in a universe that was determined by Broadridge Inc. (“Broadridge”) to be similar to each Portfolio (the “Universe”), and in comparison to each Portfolio’s benchmark index and to other comparative data. Broadridge is an independent provider of investment company data. The Board received a description of the methodology used by Broadridge to select the mutual funds in the performance Universe. Where applicable, the Board received information concerning, and discussed factors contributing to, underperformance of Portfolios relative to the Universe and benchmark for any underperformance periods.
In connection with the 2021 Annual Approval Process, the Board also reviewed the fee rates that are payable to Funds Management for investment advisory services (as discussed below), which are the only fees charged at the Portfolio level, relative to corresponding expense groups that were determined by Broadridge to be similar to the Portfolios (the “Groups”). The Board received a description of the methodology used by Broadridge to select the mutual funds in the expense Groups and an explanation of how funds comprising expense groups and their expense ratios may vary from year-to-year.
In connection with the New Agreement Approval Process, the Board received a commitment that WFAM will maintain fee and expense commitments for at least two years after the closing. The Board took into account each Fund’s investment performance and expense information among the factors considered in deciding to approve the New Agreements.
24 | Wells Fargo U.S. REIT Portfolio
Board considerations (unaudited)
Investment advisory and sub-advisory fee rates
In connection with the 2021 Annual Approval Process, the Board reviewed and considered the contractual investment advisory fee rate that is payable by each Portfolio to Funds Management for investment advisory services under the Current Advisory Agreement (the “Advisory Agreement Rate”). The Board also reviewed and considered the contractual investment sub-advisory fee rate that is payable by Funds Management to the applicable Sub-Adviser for investment sub-advisory services (the “Sub-Advisory Agreement Rate”).
Among other information reviewed by the Board in connection with the 2021 Annual Approval Process, was a comparison of each Portfolio’s Advisory Agreement Rate with those of other funds in the Portfolio’s expense Group at a common asset level.
In connection with the 2021 Annual Approval Process, the Board also received and considered information about the portion of the total management fee that was retained by Funds Management after payment of the Sub-Advisory Agreement Rates. In assessing the reasonableness of this amount, the Board received and evaluated information about the nature and extent of responsibilities retained and risks assumed by Funds Management and not delegated to or assumed by the Sub-Advisers, and about Funds Management’s on-going oversight services. Given the affiliation between Funds Management and the Sub-Advisers, the Board ascribed limited relevance to the allocation of fees between them.
In connection with the 2021 Annual Approval Process, the Board also received and considered information about the nature and extent of services offered and fee rates charged by Funds Management and the Sub-Advisers to other types of clients, if any, with investment strategies similar to those of each Portfolio. In this regard, the Board received information about the significantly greater scope of services, and compliance, reporting and other legal burdens and risks of managing proprietary mutual funds compared with those associated with managing assets of other types of clients, including third-party sub-advised fund clients and non-mutual fund clients such as institutional separate accounts.
In connection with the New Agreement Approval Process, the Board noted the assurances received by it that there would be no increases to any of the Advisory Agreement Rates or the Sub-Advisory Agreement Rates as a result of the Transaction. The Board also considered that the New Agreements do not change the computation method for calculating such fees, and there is no present intention to reduce expense waiver and reimbursement arrangements that are currently in effect. Based on its consideration of the factors and information it deemed relevant, including those described here, the Board determined that the compensation payable to Funds Management under the New Advisory Agreement and to each of the Sub-Advisers under the applicable new Sub-Advisory Agreement was reasonable.
Profitability
In connection with the 2021 Annual Approval Process, the Board received and considered information concerning the profitability of Funds Management, as well as the profitability of both WFAM and Wells Fargo from providing services to the fund family as a whole. The Board noted that the Sub-Advisers’ profitability information with respect to providing services to each Fund and other funds in the family was subsumed in the WFAM and Wells Fargo profitability analysis.
Funds Management reported on the methodologies and estimates used in calculating profitability in connection with the 2021 Annual Approval Process, including a description of the methodology used to allocate certain expenses. Among other things, the Board noted that the levels of profitability reported on a fund-by-fund basis varied widely, depending on factors such as the size, type and age of fund.
In connection with the New Agreement Approval Process, the Board received certain information about NewCo’s projected financial condition, and reviewed with senior representatives of Funds Management, GTCR and Reverence Capital the underlying assumptions on which such information was based. The Board considered that NewCo is a newly formed entity, with no historical operations, revenues or expenses, and that it is difficult to predict with any degree of certainty the future profitability of NewCo and the Advisers from advisory activities under the New Agreements. The Board considered that the fee rates payable under the New Agreements will not increase as a result of the Transaction as compared to the rates under the Current Agreements, and that the current contractual expense limitations applicable to each Portfolio will not increase. The Board noted that if the New Agreements are approved by shareholders and the Transaction closes, the Board will have the opportunity in the future to review the profitability of NewCo and the Advisers from advisory activities under the New Agreements.
Economies of scale
In connection with the 2021 Annual Approval Process, the Board received and considered information about the potential for Funds Management to experience economies of scale in the provision of advisory services to the Portfolios, the difficulties of calculating economies of scale at an individual fund level, and the extent to which potential scale benefits are shared with Portfolio shareholders. The Board noted the existence of breakpoints in each Portfolio’s advisory fee structure, which operate generally to reduce the Portfolio’s expense ratios as the Portfolio grows in size, and the size of the Portfolio in relation to such breakpoints. The
Wells Fargo U.S. REIT Portfolio | 25
Board considerations (unaudited)
Board considered that, in addition to advisory fee breakpoints, Funds Management shares potential economies of scale from its management business in a variety of ways, including through fee waiver and expense reimbursement arrangements, competitive management fee rates set at the outset without regard to breakpoints, and investments in the business intended to enhance services available to shareholders.
In connection with the New Agreement Approval Process, the Board noted that NewCo and the Advisers may benefit from possible growth of the Portfolios resulting from enhanced distribution capabilities for their investing funds. However, the Board noted that other factors could also affect the potential for economies of scale, and that it was not possible to quantify any potential future economies of scale. Based upon the information furnished to the Board in connection with the 2021 Annual Approval Process and the New Agreement Approval Process, the Board concluded that Funds Management’s arrangements with respect to each Portfolio, including contractual breakpoints and expense limitation arrangements, constituted a reasonable approach to sharing potential economies of scale with the Portfolio and its shareholders.
“Fall-out” benefits to Funds Management and the Sub-Advisers
In connection with the 2021 Annual Approval Process, the Board received and considered information regarding potential “fall-out” or ancillary benefits received by Funds Management and its affiliates, including the Sub-Advisers, as a result of their relationships with the Portfolios. Ancillary benefits could include, among others, benefits directly attributable to other relationships with the Portfolios and benefits potentially derived from an increase in Funds Management’s and the Sub-Advisers’ business as a result of their relationships with the Portfolios. The Board noted that various current affiliates of Funds Management may receive distribution-related fees, shareholder servicing payments and sub-transfer agency fees in respect of shares sold or held through them and services provided.
In connection with the 2021 Annual Approval Process, the Board also reviewed information about soft dollar credits earned and utilized by the Sub-Advisers, fees earned by Funds Management and Wells Capital from managing a private investment vehicle for the fund family’s securities lending collateral, and commissions earned by an affiliated broker of Wells Fargo from portfolio transactions.
In connection with the New Agreement Approval Process, the Board received information to the effect that the Transaction is not expected to have a material impact on the fall-out benefits currently realized by Funds Management and its affiliates, including the Sub-Advisers. The information reviewed by the Board also noted that several of the ancillary benefits identified for WFAM would be potential ancillary benefits for NewCo, including that the scale and reputation of the Portfolios might benefit NewCo’s broader reputation, product initiatives, technology investment and talent acquisition. Based on its consideration of the factors and information it deemed relevant, including those described here, the Board did not find that any ancillary benefits expected to be received by Funds Management and its affiliates, including NewCo and the Sub-Advisers, under the New Agreements were unreasonable.
Conclusion
At the Board Meeting, after considering the above-described factors and based on its deliberations and its evaluation of the information described above, the Board unanimously determined that the compensation payable to Funds Management and to each of the Sub-Advisers under the New Agreements is reasonable, approved the New Agreements for a two-year term.
26 | Wells Fargo U.S. REIT Portfolio
Board considerations (unaudited)
Board Considerations - Interim Agreements
At a meeting held on May 17-19, 2021 (the “Board Meeting”), the Boards of Trustees (each, a “Board”, and collectively, the “Boards”) of Wells Fargo Funds Trust, Wells Fargo Master Trust, Wells Fargo Variable Trust, Wells Fargo Global Dividend Opportunity Fund, Wells Fargo Income Opportunities Fund, Wells Fargo Multi-Sector Income Fund and Wells Fargo Utilities and High Income Fund (each a “Trust”, and the series thereof, a “Fund”) reviewed and approved for the Trusts and Funds, as applicable: (i) interim investment management agreements (the “Interim Management Agreements”) with Wells Fargo Funds Management, LLC (“Funds Management”); (ii) interim investment advisory agreements (the “Interim Advisory Agreements”) with Funds Management; and (iii) interim sub-advisory agreements (the “Interim Sub-Advisory Agreements”) with each of Cooke & Bieler, L.P., Galliard Capital Management LLC (“Galliard”), Peregrine Capital Management Inc., Wells Capital Management, LLC (“WellsCap”), and Wells Fargo Asset Management (International) Limited (“WFAMI”, and collectively, the “Sub-Advisers”). Each Trustee on the Board is not an “interested person” (as defined in the Investment Company Act of 1940 (the “1940 Act”) of the Funds (collectively, the “Independent Trustees”). The Interim Management Agreements, Interim Advisory Agreements, and Interim Sub-Advisory Agreements are collectively referred to as the “Interim Advisory Agreements.”
At the Board Meeting, the Boards reviewed and approved the continuation of existing investment management, advisory and sub-advisory agreements (the “Current Advisory Agreements”) for each Trust and Fund, as applicable. The factors considered and conclusions reached by the Boards in approving the Current Advisory Agreements are summarized in the section entitled “Board Considerations – Current Agreements” of this shareholder report. The Boards noted that Wells Fargo & Company has entered into a definitive agreement to sell Wells Fargo Asset Management (“WFAM”), which includes Funds Management, Galliard, WellsCap and WFAMI (the “Affiliated Sub-Advisers”), to a holding company affiliated with private funds of GTCR LLC and Reverence Capital Partners, L.P. (the “Transaction”). The Boards further noted that the Transaction would result in a change-of-control of Funds Management and the Affiliated Sub-Advisers, which would be considered to be an “assignment” under the 1940 Act that would terminate the Current Advisory Agreements. At the Board Meeting, the Boards also reviewed and approved new investment management, advisory and sub-advisory agreements (the “New Advisory Agreements”) for each Trust and Fund, as applicable, that would replace the Current Advisory Agreements upon consummation of the Transaction, subject to approval of the New Advisory Agreements by the applicable Trust’s or Fund’s shareholders. The factors considered and conclusions reached by the Boards in approving the New Advisory Agreements are summarized in the section entitled “Board Considerations – New Agreements” of this shareholder report.
At the Board Meeting, the Boards also approved the Interim Advisory Agreements, which will go into effect for a Trust or Fund only in the event that shareholders of such Trust or Fund do not approve the New Advisory Agreement(s) for the Trust or Fund by the closing date of the Transaction, when the Current Advisory Agreements will terminate. The Board noted that, in such a circumstance, the Interim Advisory Agreements will permit continuity of management by allowing Funds Management and the Sub-Advisers to continue providing services to the Trust or Fund pursuant to the Interim Advisory Agreements while the Trust or Fund continues to solicit shareholder approval of such New Advisory Agreement(s). The Boards noted that the terms of the Interim Advisory Agreements are identical to those of the Current Advisory Agreements, except for the term and the addition of escrow provisions with respect to the advisory fees. The Boards also noted that the entities that would service the Funds and Trusts under the Interim Advisory Agreements are identical to those that provide services under the Current Advisory Agreements and those that will provide services under the New Advisory Agreements.
In approving the Interim Advisory Agreements, the Boards considered the same factors and reached the same conclusions as they considered and reached with respect to the Boards’ approvals of the Current Advisory Agreements and New Advisory Agreements, as applicable, which are described in separate Board Consideration sections within this shareholder report. Prior to the Board Meeting, including at a series of meetings held in April and May 2021, the Trustees conferred extensively among themselves and with senior representatives of Funds Management, GTCR LLC and Reverence Capital Partners, L.P. about the Interim Advisory Agreements and related matters. The Independent Trustees were assisted in their evaluation of the Interim Advisory Agreements by independent legal counsel, from whom they received separate legal advice and with whom they met separately.
At the Board Meeting, after considering the factors and reaching the conclusions described in the separate Board Consideration sections within this shareholder report, the Boards unanimously determined that the compensation payable to Funds Management and to each Sub-Adviser under each of the Interim Advisory Agreements was reasonable, and approved the Interim Advisory Agreements.
Wells Fargo U.S. REIT Portfolio | 27
For more information
More information about Wells Fargo Funds is available free upon request. To obtain literature, please write, visit the Portfolio's website, or call:
Wells Fargo Funds
P.O. Box 219967
Kansas City, MO 64121-9967
Website: wfam.com
Individual investors: 1-800-222-8222
Retail investment professionals: 1-888-877-9275
Institutional investment professionals: 1-866-765-0778
This report and the financial statements contained herein are submitted for the general information of the interest holders of the Portfolio. If this report is used for promotional purposes, distribution of the report must be accompanied or preceded by a current prospectus. Before investing, please consider the investment objectives, risks, charges, and expenses of the investment. For a current prospectus and, if available, a summary prospectus, containing this information, call
1-800-222-8222 or visit the Portfolio's website at wfam.com. Read the prospectus carefully before you invest or send money.
Wells Fargo Asset Management (WFAM) is the trade name for certain investment advisory/management firms owned by Wells Fargo & Company. These firms include but are not limited to Wells Capital Management, LLC and Wells Fargo Funds Management, LLC. Certain products managed by WFAM entities are distributed by Wells Fargo Funds Distributor, LLC (a broker-dealer and Member FINRA).
This material is for general informational and educational purposes only and is NOT intended to provide investment advice or a recommendation of any kind - including a recommendation for any specific investment, strategy, or plan.
INVESTMENT PRODUCTS: NOT FDIC INSURED ■ NO BANK GUARANTEE ■ MAY LOSE VALUE
© 2021 Wells Fargo & Company. All rights reserved.
Not applicable.
| ITEM 3. | AUDIT COMMITTEE FINANCIAL EXPERT |
Not applicable.
| ITEM 4. | PRINCIPAL ACCOUNTANT FEES AND SERVICES |
Not applicable.
| ITEM 5. | AUDIT COMMITTEE OF LISTED REGISTRANTS |
Not applicable.
A Portfolio of Investments for each series of Wells Fargo Master Trust is included as part of the report to shareholders filed under Item 1 of this Form.
| ITEM 7. | DISCLOSURE OF PROXY VOTING POLICIES AND PROCEDURES FOR CLOSED-END MANAGEMENT INVESTMENT COMPANIES |
Not applicable.
| ITEM 8. | PORTFOLIO MANAGERS OF CLOSED-END MANAGEMENT INVESTMENT COMPANIES |
Not applicable.
| ITEM 9. | PURCHASES OF EQUITY SECURITIES BY CLOSED-END MANAGEMEENT INVESTMENT COMPANY AND AFFILIATED PURCHASERS |
Not applicable.
| ITEM 10. | SUBMISSION OF MATTERS TO A VOTE OF SECURITY HOLDERS |
There have been no material changes to the procedures by which shareholders may recommend nominees to the registrant’s Board of Trustees that have been implemented since the registrant’s last provided disclosure in response to the requirements of this Item.
| ITEM 11. | CONTROLS AND PROCEDURES |
(a) The President and Treasurer have concluded that the Wells Fargo Master Trust disclosure controls and procedures (as defined in Rule 30a-3(c) under the Investment Company Act of 1940) provide reasonable assurances that material information relating to the registrant is made known to them by the appropriate persons, based on their evaluation of these controls and procedures as of a date within 90 days of the filing of this report.
(b) There were no significant changes in the registrant’s internal controls over financial reporting (as defined in Rule 30a-3(d) under the Investment Company Act of 1940) that occurred during the most recent fiscal half-year of the period covered by this report that materially affected, or is reasonably likely to materially affect, the registrant’s internal control over financial reporting.
| ITEM 12. | DISCLOSURES OF SECURITIES LENDING ACTIVITES FOR CLOSED-END MANAGEMENT INVESTMENT COMPANIES |
Not applicable.
(a)(1) Not applicable.
(a)(2) Certifications pursuant to Section 302 of the Sarbanes-Oxley Act of 2002.
(b) Certifications pursuant to Section 906 of the Sarbanes-Oxley Act of 2002.
SIGNATURES
Pursuant to the requirements of the Securities Exchange Act of 1934 and the Investment Company Act of 1940, the registrant has duly caused this report to be signed on its behalf by the undersigned, thereunto duly authorized.
| | |
| Wells Fargo Master Trust |
| |
| By: | | /s/ Andrew Owen |
| | Andrew Owen |
| | President |
|
| Date: October 27, 2021 |
Pursuant to the requirements of the Securities Exchange Act of 1934 and the Investment Company Act of 1940, this report has been signed below by the following persons on behalf of the registrant and in the capacities and on the date indicated.
| | |
| Wells Fargo Master Trust |
| |
| By: | | /s/ Andrew Owen |
| | Andrew Owen |
| | President |
| Date: October 27, 2021 |
| | |
| By: | | /s/ Jeremy DePalma |
| | Jeremy DePalma |
| | Treasurer |
|
| Date: October 27, 2021 |