UNITED STATES
SECURITIES AND EXCHANGE COMMISSION
Washington, D.C. 20549
FORM N-CSRS
CERTIFIED SHAREHOLDER REPORT OF REGISTERED
MANAGEMENT INVESTMENT COMPANIES
Investment Company Act file number: 811-09689
Allspring Master Trust
(Exact name of registrant as specified in charter)
525 Market St., San Francisco, CA 94105
(Address of principal executive offices) (Zip code)
Matthew Prasse
Allspring Funds Management, LLC
525 Market St., San Francisco, CA 94105
(Name and address of agent for service)
Registrant’s telephone number, including area code: 800-222-8222
Date of fiscal year end: February 28
Registrant is making a filing for 10 of its series:
Allspring Bloomberg US Aggregate ex-Corporate Portfolio, Allspring Emerging Markets Bond Portfolio, Allspring Factor Enhanced Emerging Markets Equity Portfolio, Allspring Factor Enhanced International Equity Portfolio, Allspring Factor Enhanced U.S. Large Cap Equity Portfolio, Allspring Factor Enhanced U.S. Small Cap Equity Portfolio, Allspring High Yield Corporate Bond Portfolio, Allspring Investment Grade Corporate Bond Portfolio, Allspring Strategic Retirement Bond Portfolio and Allspring U.S. REIT Portfolio.
Date of reporting period: August 31, 2022
ITEM 1. REPORT TO STOCKHOLDERS
Semi-Annual Report
August 31, 2022
Allspring Bloomberg US
Aggregate ex-Corporate Portfolio
Allspring Bloomberg US Aggregate ex-Corporate Portfolio | 1
Portfolio information (unaudited)
Investment objectiveThe Portfolio seeks to replicate the total return of the Bloomberg U.S. Aggregate ex-Corporate Index†, before fees and expenses.
| Adviser | Allspring Funds Management, LLC |
| Subadviser | Allspring Global Investments, LLC |
| Portfolio managers | Manjunath Boraiah, Christopher Y. Kauffman, CFA®‡, Janet S. Rilling, CFA®‡, CPA, Michal Stanczyk |
| Ten largest holdings (%) as of August 31, 20221 |
| FNMA, 2.00%, 2-1-2052 | 5.77 |
| FNMA , 2.50%, 1-1-2052 | 4.53 |
| GNMA, 2.00%, 9-21-2052 | 2.07 |
| U.S. Treasury Bond, 3.00%, 5-15-2047 | 1.96 |
| FHLMC, 3.50%, 2-1-2044 | 1.76 |
| GNMA, 2.50%, 3-20-2052 | 1.57 |
| U.S. Treasury Note, 0.13%, 10-15-2023 | 1.47 |
| FNMA, 2.00%, 2-1-2052 | 1.36 |
| U.S. Treasury Note, 0.25%, 8-31-2025 | 1.31 |
| U.S. Treasury Note, 0.25%, 11-15-2023 | 1.08 |
| 1 | Figures represent the percentage of the Portfolio's net assets. Holdings are subject to change and may have changed since the date specified. |
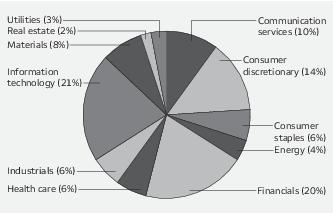
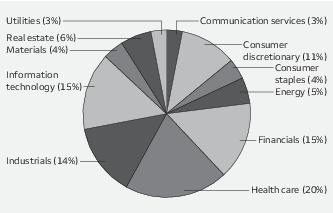
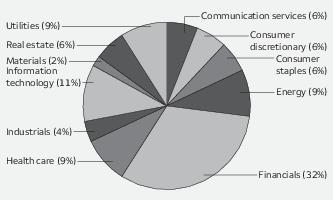
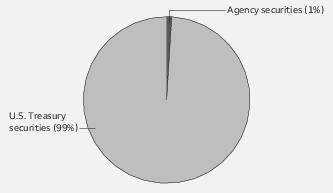
| Portfolio composition as of August 31, 20221 |
| 1 | Figures represent the percentage of the Portfolio's long-term investments. Allocations are subject to change and may have changed since the date specified. |
| † | The Bloomberg U.S. Aggregate ex-Corporate Index is a broad-based benchmark that includes Treasuries, government-related securities, mortgage-backed securities (agency fixed-rate and hybrid adjustable-rate mortgage pass-throughs), asset-backed securities and commercial mortgage-backed securities (agency and non-agency). You cannot invest directly in an index. |
| ‡ | CFA® and Chartered Financial Analyst® are trademarks owned by CFA Institute. |
2 | Allspring Bloomberg US Aggregate ex-Corporate Portfolio
Portfolio of investments—August 31, 2022 (unaudited)
| | | Interest
rate | Maturity
date | Principal | Value |
| Agency securities: 39.43% | | | | | | |
| FFCB | | 0.30% | 3-28-2024 | $ | 100,000 | $ 94,748 |
| FFCB | | 0.48 | 9-3-2024 | | 70,000 | 65,652 |
| FFCB | | 0.57 | 7-2-2024 | | 180,000 | 169,963 |
| FFCB | | 1.55 | 7-26-2030 | | 270,000 | 229,686 |
| FFCB | | 1.57 | 4-5-2028 | | 590,000 | 527,118 |
| FHLB | | 0.38 | 3-15-2024 | | 610,000 | 580,365 |
| FHLB | | 1.50 | 8-15-2024 | | 10,000 | 9,643 |
| FHLB | | 2.13 | 6-9-2023 | | 70,000 | 69,315 |
| FHLB | | 2.50 | 12-8-2023 | | 750,000 | 739,758 |
| FHLB | | 2.75 | 12-13-2024 | | 10,000 | 9,836 |
| FHLB | | 2.88 | 9-13-2024 | | 60,000 | 59,322 |
| FHLB | | 3.00 | 3-10-2028 | | 10,000 | 9,781 |
| FHLB | | 3.38 | 9-8-2023 | | 30,000 | 29,911 |
| FHLB | | 5.50 | 7-15-2036 | | 180,000 | 214,778 |
| FHLB | | 5.63 | 3-14-2036 | | 10,000 | 11,872 |
| FHLMC | | 0.25 | 11-6-2023 | | 650,000 | 625,496 |
| FHLMC | | 0.32 | 11-24-2023 | | 50,000 | 47,916 |
| FHLMC | | 0.38 | 7-21-2025 | | 270,000 | 246,980 |
| FHLMC | | 0.62 | 12-1-2025 | | 460,000 | 416,324 |
| FHLMC | | 1.50 | 11-1-2035 | | 828,267 | 745,228 |
| FHLMC | | 1.50 | 3-1-2037 | | 2,436,350 | 2,191,061 |
| FHLMC | | 1.50 | 6-1-2051 | | 3,092,680 | 2,531,628 |
| FHLMC | | 2.50 | 3-1-2032 | | 1,586,358 | 1,520,990 |
| FHLMC | | 3.00 | 2-1-2047 | | 2,852,546 | 2,690,400 |
| FHLMC | | 3.00 | 3-1-2048 | | 44,728 | 41,984 |
| FHLMC | | 3.00 | 6-1-2050 | | 789,127 | 739,285 |
| FHLMC | | 3.00 | 7-1-2050 | | 2,059,784 | 1,929,692 |
| FHLMC | | 3.00 | 8-1-2050 | | 1,000,823 | 937,604 |
| FHLMC | | 3.50 | 2-1-2044 | | 5,002,994 | 4,874,148 |
| FHLMC | | 3.50 | 4-1-2045 | | 220,345 | 213,940 |
| FHLMC | | 6.00 | 7-1-2040 | | 1,222,736 | 1,318,621 |
| FHLMC | | 6.75 | 3-15-2031 | | 190,000 | 235,628 |
| FHLMC Series K032 Class A2 ±± | | 3.31 | 5-25-2023 | | 50,000 | 49,754 |
| FHLMC Series K034 Class A2 ±± | | 3.53 | 7-25-2023 | | 60,000 | 59,786 |
| FHLMC Series K035 Class A2 ±± | | 3.46 | 8-25-2023 | | 54,668 | 54,404 |
| FHLMC Series K048 Class A2 ±± | | 3.28 | 6-25-2025 | | 215,000 | 211,593 |
| FHLMC Series K063 Class A2 ±± | | 3.43 | 1-25-2027 | | 45,000 | 44,323 |
| FHLMC Series K070 Class A2 ±± | | 3.30 | 11-25-2027 | | 425,000 | 415,419 |
| FHLMC Series K152 Class A1 | | 2.83 | 5-25-2030 | | 279,645 | 268,370 |
| FHLMC Series K152 Class A2 | | 3.08 | 1-25-2031 | | 125,000 | 118,608 |
| FHLMC Series K153 Class A3 ±± | | 3.12 | 10-25-2031 | | 70,000 | 65,981 |
| FHLMC Series K155 Class A3 | | 3.75 | 4-25-2033 | | 40,000 | 39,299 |
| FNMA | | 0.35 | 8-18-2023 | | 210,000 | 203,125 |
| FNMA | | 0.50 | 11-7-2025 | | 280,000 | 254,812 |
| FNMA | | 0.63 | 4-22-2025 | | 650,000 | 601,857 |
| FNMA | | 1.50 | 2-1-2052 | | 683,411 | 559,673 |
| FNMA | | 2.00 | 6-1-2037 | | 714,381 | 659,028 |
| FNMA | | 2.00 | 6-1-2037 | | 2,023,182 | 1,866,544 |
| FNMA | | 2.00 | 1-1-2041 | | 793,592 | 697,953 |
| FNMA | | 2.00 | 2-1-2042 | | 832,268 | 733,380 |
| FNMA | | 2.00 | 2-1-2052 | | 18,546,013 | 15,966,731 |
| FNMA | | 2.00 | 2-1-2052 | | 4,370,979 | 3,762,011 |
| FNMA | | 2.50 | 2-1-2035 | | 762,338 | 722,661 |
| FNMA | | 2.50 | 11-1-2050 | | 3,171,205 | 2,856,609 |
The accompanying notes are an integral part of these financial statements.
Allspring Bloomberg US Aggregate ex-Corporate Portfolio | 3
Portfolio of investments—August 31, 2022 (unaudited)
| | | Interest
rate | Maturity
date | Principal | Value |
| Agency securities (continued) | | | | | | |
| FNMA | | 3.00% | 12-1-2026 | $ | 1,033,976 | $ 1,011,645 |
| FNMA | | 3.00 | 12-1-2030 | | 240,663 | 235,351 |
| FNMA | | 3.00 | 1-1-2034 | | 139,111 | 135,187 |
| FNMA | | 3.00 | 8-1-2036 | | 100,611 | 96,595 |
| FNMA | | 3.00 | 2-1-2037 | | 568,744 | 546,022 |
| FNMA | | 3.00 | 8-1-2043 | | 1,144,671 | 1,086,299 |
| FNMA | | 3.00 | 11-1-2046 | | 1,284,738 | 1,220,440 |
| FNMA | | 3.00 | 12-1-2047 | | 639,521 | 599,946 |
| FNMA | | 3.50 | 4-1-2034 | | 1,364,497 | 1,349,832 |
| FNMA | | 3.50 | 1-1-2035 | | 85,607 | 84,811 |
| FNMA | | 3.50 | 4-1-2037 | | 389,941 | 384,491 |
| FNMA | | 3.50 | 6-1-2042 | | 239,842 | 233,458 |
| FNMA | | 3.50 | 7-1-2042 | | 361,364 | 351,856 |
| FNMA | | 3.50 | 9-1-2043 | | 793,561 | 772,401 |
| FNMA | | 3.50 | 3-1-2048 | | 233,378 | 225,515 |
| FNMA | | 4.00 | 6-1-2042 | | 299,738 | 299,282 |
| FNMA | | 4.00 | 8-1-2043 | | 1,612,484 | 1,609,930 |
| FNMA | | 4.00 | 12-1-2047 | | 948,725 | 939,336 |
| FNMA | | 4.00 | 2-1-2048 | | 1,397,971 | 1,394,677 |
| FNMA | | 4.00 | 6-1-2048 | | 249,957 | 248,524 |
| FNMA | | 4.00 | 8-1-2048 | | 169,940 | 168,192 |
| FNMA | | 4.00 | 2-1-2050 | | 414,775 | 408,677 |
| FNMA | | 4.50 | 5-1-2040 | | 170,195 | 173,693 |
| FNMA | | 4.50 | 2-1-2047 | | 1,171,842 | 1,186,294 |
| FNMA | | 4.50 | 4-1-2048 | | 329,432 | 332,415 |
| FNMA | | 4.50 | 8-1-2048 | | 18,285 | 18,314 |
| FNMA | | 5.00 | 1-1-2042 | | 142,460 | 149,030 |
| FNMA | | 5.00 | 6-1-2045 | | 634,564 | 662,255 |
| FNMA | | 5.00 | 7-1-2045 | | 875,121 | 913,390 |
| FNMA | | 5.50 | 9-1-2040 | | 1,220,120 | 1,293,539 |
| FNMA | | 6.00 | 5-1-2041 | | 72,514 | 78,221 |
| FNMA | | 6.21 | 8-6-2038 | | 60,000 | 76,199 |
| FNMA | | 6.25 | 5-15-2029 | | 100,000 | 117,044 |
| FNMA | | 7.13 | 1-15-2030 | | 250,000 | 310,884 |
| FNMA | | 7.25 | 5-15-2030 | | 130,000 | 163,458 |
| FNMA | | 2.50 | 1-1-2052 | | 14,027,767 | 12,541,287 |
| FNMA Series 2016-M5 Class A2 | | 2.47 | 4-25-2026 | | 220,000 | 209,946 |
| FNMA Series 2016-M7 Class A2 | | 2.50 | 9-25-2026 | | 107,090 | 103,071 |
| FNMA Series 2017-M1 Class A2 ±± | | 2.50 | 10-25-2026 | | 219,574 | 207,834 |
| FNMA Series 2017-M11 Class A2 | | 2.98 | 8-25-2029 | | 865,000 | 823,516 |
| FNMA Series 2017-M5 Class A2 ±± | | 3.20 | 4-25-2029 | | 57,470 | 55,285 |
| FNMA Series 2018-M1 Class A2 ±± | | 3.09 | 12-25-2027 | | 15,937 | 15,395 |
| FNMA Series 2018-M13 Class A2 ±± | | 3.87 | 9-25-2030 | | 76,287 | 76,168 |
| FNMA Series 2019-M4 Class A2 | | 3.61 | 2-25-2031 | | 1,770,000 | 1,747,271 |
| FNMA Series 2019-M7 Class A2 | | 3.14 | 4-25-2029 | | 201,630 | 193,551 |
| GNMA %% | | 2.00 | 9-21-2052 | | 6,495,000 | 5,735,263 |
| GNMA | | 2.50 | 3-20-2052 | | 4,754,879 | 4,342,393 |
| GNMA | | 2.50 | 4-20-2052 | | 937,737 | 855,600 |
| GNMA | | 3.00 | 4-20-2045 | | 2,214,227 | 2,113,948 |
| GNMA | | 3.00 | 11-20-2045 | | 181,252 | 173,040 |
| GNMA | | 3.00 | 3-20-2046 | | 380,229 | 363,020 |
| GNMA | | 3.00 | 12-20-2049 | | 200,628 | 189,102 |
| GNMA | | 3.00 | 10-20-2050 | | 1,411,861 | 1,335,816 |
| GNMA | | 3.50 | 2-20-2045 | | 1,103,289 | 1,081,319 |
| GNMA | | 3.50 | 6-20-2045 | | 731,337 | 716,365 |
The accompanying notes are an integral part of these financial statements.
4 | Allspring Bloomberg US Aggregate ex-Corporate Portfolio
Portfolio of investments—August 31, 2022 (unaudited)
| | | Interest
rate | Maturity
date | Principal | Value |
| Agency securities (continued) | | | | | | |
| GNMA | | 3.50% | 11-20-2045 | $ | 843,600 | $ 824,086 |
| GNMA | | 3.50 | 7-20-2047 | | 184,089 | 179,784 |
| GNMA | | 3.50 | 5-20-2048 | | 51,762 | 50,478 |
| GNMA | | 4.00 | 8-20-2044 | | 481,815 | 480,616 |
| GNMA | | 4.00 | 12-20-2047 | | 1,114,167 | 1,111,399 |
| TVA | | 2.88 | 2-1-2027 | | 35,000 | 34,144 |
| TVA | | 4.63 | 9-15-2060 | | 55,000 | 59,488 |
| TVA | | 4.65 | 6-15-2035 | | 9,000 | 9,593 |
| TVA | | 5.38 | 4-1-2056 | | 50,000 | 60,455 |
| TVA | | 5.50 | 6-15-2038 | | 30,000 | 34,361 |
| TVA | | 5.88 | 4-1-2036 | | 80,000 | 95,332 |
| TVA | | 6.75 | 11-1-2025 | | 120,000 | 131,043 |
| Total Agency securities (Cost $114,505,631) | | | | | | 109,167,766 |
| Asset-backed securities: 0.40% | | | | | | |
| CarMax Auto Owner Trust Series 2018-3 Class D | | 3.91 | 1-15-2025 | | 80,000 | 80,005 |
| Chase Issuance Trust Series 2012-A7 Class A7 | | 2.16 | 9-16-2024 | | 205,000 | 204,965 |
| Citibank Credit Card Issuance Trust Series 2018-A3 Class A3 | | 3.29 | 5-23-2025 | | 180,000 | 179,343 |
| Citibank Credit Card Issuance Trust Series 2018-A7 Class A7 | | 3.96 | 10-13-2030 | | 130,000 | 130,124 |
| Ford Credit Floorplan Master Owner Trust Series 2017-3 Class A | | 2.48 | 9-15-2024 | | 50,000 | 49,987 |
| Ford Credit Floorplan Master Owner Trust Series 2018-2 Class A | | 3.17 | 3-15-2025 | | 100,000 | 99,552 |
| Ford Credit Floorplan Master Owner Trust Series 2019-2 Class A | | 3.06 | 4-15-2026 | | 65,000 | 63,911 |
| Nissan Auto Receivables Owner Trust Series 2018-B Class A4 | | 3.16 | 12-16-2024 | | 68,543 | 68,538 |
| Nissan Auto Receivables Owner Trust Series 2018-C Class A4 | | 3.27 | 6-16-2025 | | 90,899 | 90,907 |
| Synchrony Credit Card Master Note Trust Series 2018-2 Class A | | 3.47 | 5-15-2026 | | 105,000 | 104,780 |
| World Omni Auto Receivables Trust Series 2018-D Class A4 | | 3.44 | 12-16-2024 | | 28,000 | 28,008 |
| Total Asset-backed securities (Cost $1,116,925) | | | | | | 1,100,120 |
| Municipal obligations: 1.08% | | | | | | |
| California: 0.38% | | | | | | |
| Education revenue: 0.03% | | | | | | |
| California Series B | | 3.90 | 11-1-2047 | | 15,000 | 13,859 |
| University of California Series AD | | 4.86 | 5-15-2112 | | 70,000 | 65,304 |
| | | | | | | 79,163 |
| GO revenue: 0.18% | | | | | | |
| California Build America Bonds Various Purpose | | 1.75 | 11-1-2030 | | 110,000 | 92,122 |
| California Build America Bonds Various Purpose | | 7.35 | 11-1-2039 | | 70,000 | 89,416 |
| California Build America Bonds Various Purpose | | 7.50 | 4-1-2034 | | 100,000 | 127,651 |
| California Build America Bonds Various Purpose | | 7.60 | 11-1-2040 | | 15,000 | 20,250 |
| Los Angeles CA Community College District Build America Bonds | | 6.75 | 8-1-2049 | | 5,000 | 6,682 |
| Los Angeles CA Unified School District Build America Bonds | | 5.75 | 7-1-2034 | | 15,000 | 16,352 |
The accompanying notes are an integral part of these financial statements.
Allspring Bloomberg US Aggregate ex-Corporate Portfolio | 5
Portfolio of investments—August 31, 2022 (unaudited)
| | | Interest
rate | Maturity
date | Principal | Value |
| GO revenue (continued) | | | | | | |
| Los Angeles CA Unified School District Build America Bonds | | 5.76% | 7-1-2029 | $ | 60,000 | $ 64,041 |
| Los Angeles CA Unified School District Build America Bonds | | 6.76 | 7-1-2034 | | 80,000 | 93,367 |
| | | | | | | 509,881 |
| Health revenue: 0.06% | | | | | | |
| University of California Series AD | | 3.26 | 5-15-2060 | | 230,000 | 169,310 |
| Transportation revenue: 0.08% | | | | | | |
| Bay Area CA Toll Authority Series 1 | | 6.26 | 4-1-2049 | | 100,000 | 122,348 |
| Bay Area CA Toll Authority Series 1 | | 6.92 | 4-1-2040 | | 15,000 | 18,236 |
| Bay Area CA Toll Authority Series 1 | | 7.04 | 4-1-2050 | | 60,000 | 80,394 |
| | | | | | | 220,978 |
| Utilities revenue: 0.03% | | | | | | |
| Los Angeles CA Department of Water & Power Build America Bonds Series D | | 6.57 | 7-1-2045 | | 55,000 | 69,999 |
| Florida: 0.06% | | | | | | |
| Miscellaneous revenue: 0.06% | | | | | | |
| Florida Board of Administrative Finance Corporation Series A | | 2.15 | 7-1-2030 | | 200,000 | 171,016 |
| Georgia: 0.00% | | | | | | |
| Utilities revenue: 0.00% | | | | | | |
| Municipal Electric Authority of Georgia Build America Bonds | | 7.06 | 4-1-2057 | | 10,000 | 10,889 |
| Illinois: 0.09% | | | | | | |
| GO revenue: 0.02% | | | | | | |
| Illinois Taxable Pension | | 5.10 | 6-1-2033 | | 50,000 | 49,761 |
| Miscellaneous revenue: 0.02% | | | | | | |
| Illinois Build America Bonds Series 3 | | 6.73 | 4-1-2035 | | 45,000 | 47,896 |
| Tax revenue: 0.05% | | | | | | |
| Chicago IL Transit Authority Series B | | 6.90 | 12-1-2040 | | 120,000 | 141,787 |
| Kansas: 0.00% | | | | | | |
| Miscellaneous revenue: 0.00% | | | | | | |
| Kansas Development Finance Authority Series H | | 4.93 | 4-15-2045 | | 5,000 | 5,076 |
| Massachusetts: 0.05% | | | | | | |
| GO revenue: 0.05% | | | | | | |
| Massachusetts Build America Bonds Series A | | 4.91 | 5-1-2029 | | 130,000 | 137,331 |
| Massachusetts Build America Bonds Series D | | 4.50 | 8-1-2031 | | 5,000 | 5,175 |
| | | | | | | 142,506 |
| New Jersey: 0.10% | | | | | | |
| Miscellaneous revenue: 0.04% | | | | | | |
| New Jersey EDA Series A | | 7.43 | 2-15-2029 | | 95,000 | 105,263 |
The accompanying notes are an integral part of these financial statements.
6 | Allspring Bloomberg US Aggregate ex-Corporate Portfolio
Portfolio of investments—August 31, 2022 (unaudited)
| | | Interest
rate | Maturity
date | Principal | Value |
| Transportation revenue: 0.06% | | | | | | |
| New Jersey Transportation Trust | | 6.56% | 12-15-2040 | $ | 60,000 | $ 69,737 |
| New Jersey Turnpike Authority Build America Bonds Series A | | 7.10 | 1-1-2041 | | 70,000 | 88,450 |
| | | | | | | 158,187 |
| New York: 0.17% | | | | | | |
| Airport revenue: 0.05% | | | | | | |
| Port Authority of New York & New Jersey Consolidated Bonds Series 201 | | 4.23 | 10-15-2057 | | 100,000 | 92,498 |
| Port Authority of New York & New Jersey Consolidated Bonds Series 210 | | 4.03 | 9-1-2048 | | 50,000 | 44,879 |
| | | | | | | 137,377 |
| Tax revenue: 0.12% | | | | | | |
| New York Metropolitan Transportation Authority Dedicated Tax Fund Build America Bonds | | 7.34 | 11-15-2039 | | 140,000 | 184,229 |
| New York NY Transitional Finance Authority Build America Bonds Subseries B-1 | | 5.57 | 11-1-2038 | | 130,000 | 140,621 |
| | | | | | | 324,850 |
| Water & sewer revenue: 0.00% | | | | | | |
| New York NY Municipal Water Finance Authority Series AA | | 5.44 | 6-15-2043 | | 10,000 | 11,240 |
| Ohio: 0.00% | | | | | | |
| Education revenue: 0.00% | | | | | | |
| Ohio State University Build America Bonds | | 4.91 | 6-1-2040 | | 5,000 | 5,410 |
| Oregon: 0.04% | | | | | | |
| Tax revenue: 0.04% | | | | | | |
| Oregon Department of Transportation Build America Bonds Series A | | 5.83 | 11-15-2034 | | 50,000 | 56,707 |
| Oregon Taxable Pension | | 5.76 | 6-1-2023 | | 39,914 | 40,533 |
| | | | | | | 97,240 |
| Pennsylvania: 0.00% | | | | | | |
| Transportation revenue: 0.00% | | | | | | |
| Pennsylvania Turnpike Commission Series B | | 5.51 | 12-1-2045 | | 5,000 | 5,465 |
| Texas: 0.16% | | | | | | |
| Airport revenue: 0.05% | | | | | | |
| Dallas Fort Worth TX International Airport Refunding Bonds Series 2021C | | 2.84 | 11-1-2046 | | 170,000 | 130,780 |
| GO revenue: 0.02% | | | | | | |
| Texas Transportation Commission | | 2.56 | 4-1-2042 | | 90,000 | 70,787 |
| Transportation revenue: 0.09% | | | | | | |
| Grand Parkway Transportation Corporation Series 2013E | | 5.18 | 10-1-2042 | | 50,000 | 53,513 |
| Northern Texas Tollway Authority | | 3.01 | 1-1-2043 | | 200,000 | 157,313 |
| Texas Private Activity Bond North Tarrant Express Managed Lanes Project Series B | | 3.92 | 12-31-2049 | | 50,000 | 42,122 |
| | | | | | | 252,948 |
The accompanying notes are an integral part of these financial statements.
Allspring Bloomberg US Aggregate ex-Corporate Portfolio | 7
Portfolio of investments—August 31, 2022 (unaudited)
| | | Interest
rate | Maturity
date | Principal | Value |
| Wisconsin: 0.03% | | | | | | |
| Tax revenue: 0.03% | | | | | | |
| Wisconsin General Fund Annual Appropriations Series C | | 3.15% | 5-1-2027 | $ | 80,000 | $ 77,217 |
| Total Municipal obligations (Cost $3,434,630) | | | | | | 2,995,026 |
| Non-agency mortgage-backed securities: 1.39% | | | | | | |
| Benchmark Mortgage Trust Series 2018-B1 Class A4 | | 3.40 | 1-15-2051 | | 25,000 | 23,705 |
| Benchmark Mortgage Trust Series 2018-B6 Class A4 | | 4.26 | 10-10-2051 | | 135,000 | 133,296 |
| CFCRE Commercial Mortgage Trust Series 2016-C7 Class A3 | | 3.84 | 12-10-2054 | | 20,000 | 19,328 |
| Citigroup Commercial Mortgage Trust Series 2015-GC27 Class A5 | | 3.14 | 2-10-2048 | | 55,000 | 53,298 |
| Citigroup Commercial Mortgage Trust Series 2016-GC36 Class B ±± | | 4.91 | 2-10-2049 | | 40,000 | 37,778 |
| Citigroup Commercial Mortgage Trust Series 2016-GC36 Class C ±± | | 4.91 | 2-10-2049 | | 95,000 | 84,521 |
| Citigroup Commercial Mortgage Trust Series 2016-GC37 Class B | | 4.23 | 4-10-2049 | | 110,000 | 103,516 |
| Citigroup Commercial Mortgage Trust Series 2016-P4 Class A4 | | 2.90 | 7-10-2049 | | 135,000 | 127,475 |
| Citigroup Commercial Mortgage Trust Series 2017-P8 Class AS ±± | | 3.79 | 9-15-2050 | | 300,000 | 282,352 |
| Citigroup Commercial Mortgage Trust Series 2018-C6 Class A4 | | 4.41 | 11-10-2051 | | 520,000 | 517,548 |
| Commercial Mortgage Trust Series 2013-CR6 Class A4 | | 3.10 | 3-10-2046 | | 60,000 | 59,807 |
| Commercial Mortgage Trust Series 2014-UBS5 Class C ±± | | 4.77 | 9-10-2047 | | 195,000 | 179,813 |
| Commercial Mortgage Trust Series 2014-UBS6 Class C ±± | | 4.59 | 12-10-2047 | | 60,000 | 57,276 |
| Commercial Mortgage Trust Series 2015-CR23 Class A3 | | 3.23 | 5-10-2048 | | 60,000 | 58,252 |
| Commercial Mortgage Trust Series 2016-COR1 Class C ±± | | 4.47 | 10-10-2049 | | 65,000 | 60,391 |
| Commercial Mortgage Trust Series 2016-CR28 Class A4 | | 3.76 | 2-10-2049 | | 215,000 | 209,239 |
| Goldman Sachs Mortgage Securities Trust Series 2012-GCJ9 Class AS | | 3.12 | 11-10-2045 | | 40,000 | 39,907 |
| Goldman Sachs Mortgage Securities Trust Series 2014-GC18 Class B ±± | | 4.89 | 1-10-2047 | | 80,000 | 73,367 |
| Goldman Sachs Mortgage Securities Trust Series 2014-GC26 Class A5 | | 3.63 | 11-10-2047 | | 340,000 | 332,896 |
| Goldman Sachs Mortgage Securities Trust Series 2018-GS10 Class AAB ±± | | 4.11 | 7-10-2051 | | 180,000 | 177,011 |
| Goldman Sachs Mortgage Securities Trust Series 2018-GS9 Class A4 ±± | | 3.99 | 3-10-2051 | | 140,000 | 135,998 |
| JPMorgan Chase Commercial Mortgage Securities Trust Series 2013-C15 Class A4 | | 4.10 | 11-15-2045 | | 10,673 | 10,597 |
| JPMorgan Chase Commercial Mortgage Securities Trust Series 2015-C29 Class A4 | | 3.61 | 5-15-2048 | | 200,000 | 194,309 |
| JPMorgan Chase Commercial Mortgage Securities Trust Series 2015-C31 Class A3 | | 3.80 | 8-15-2048 | | 169,285 | 165,513 |
| Morgan Stanley Bank of America Merrill Lynch Trust Series 2013-C11 Class AS ±± | | 4.50 | 8-15-2046 | | 360,000 | 346,446 |
| Morgan Stanley Bank of America Merrill Lynch Trust Series 2013-C8 Class A4 | | 3.13 | 12-15-2048 | | 40,816 | 40,694 |
The accompanying notes are an integral part of these financial statements.
8 | Allspring Bloomberg US Aggregate ex-Corporate Portfolio
Portfolio of investments—August 31, 2022 (unaudited)
| | | Interest
rate | Maturity
date | Principal | Value |
| Non-agency mortgage-backed securities (continued) | | | | | | |
| Morgan Stanley Bank of America Merrill Lynch Trust Series 2015-C22 Class A4 | | 3.31% | 4-15-2048 | $ | 60,000 | $ 58,185 |
| Morgan Stanley Bank of America Merrill Lynch Trust Series 2015-C22 Class B ±± | | 3.88 | 4-15-2048 | | 285,000 | 269,548 |
| Total Non-agency mortgage-backed securities (Cost $4,109,417) | | | | | | 3,852,066 |
| U.S. Treasury securities: 51.74% | | | | | | |
| U.S. Treasury Bond | | 1.38 | 11-15-2040 | | 735,000 | 517,084 |
| U.S. Treasury Bond | | 1.63 | 11-15-2050 | | 440,000 | 301,039 |
| U.S. Treasury Bond | | 1.88 | 2-15-2041 | | 315,000 | 241,332 |
| U.S. Treasury Bond | | 1.88 | 2-15-2051 | | 2,065,000 | 1,506,724 |
| U.S. Treasury Bond | | 2.00 | 2-15-2050 | | 1,865,000 | 1,410,698 |
| U.S. Treasury Bond | | 2.00 | 8-15-2051 | | 2,940,000 | 2,208,675 |
| U.S. Treasury Bond | | 2.25 | 5-15-2041 | | 300,000 | 244,641 |
| U.S. Treasury Bond | | 2.25 | 8-15-2046 | | 390,000 | 305,297 |
| U.S. Treasury Bond | | 2.38 | 5-15-2051 | | 1,920,000 | 1,580,700 |
| U.S. Treasury Bond | | 2.50 | 2-15-2045 | | 555,000 | 458,786 |
| U.S. Treasury Bond | | 2.50 | 2-15-2046 | | 100,000 | 82,434 |
| U.S. Treasury Bond | | 2.50 | 5-15-2046 | | 200,000 | 164,805 |
| U.S. Treasury Bond | | 2.75 | 11-15-2042 | | 340,000 | 298,071 |
| U.S. Treasury Bond | | 2.75 | 8-15-2047 | | 270,000 | 234,615 |
| U.S. Treasury Bond | | 2.75 | 11-15-2047 | | 270,000 | 235,027 |
| U.S. Treasury Bond | | 2.88 | 5-15-2043 | | 605,000 | 539,206 |
| U.S. Treasury Bond | | 2.88 | 8-15-2045 | | 265,000 | 234,308 |
| U.S. Treasury Bond | | 2.88 | 11-15-2046 | | 265,000 | 234,877 |
| U.S. Treasury Bond | | 2.88 | 5-15-2052 | | 645,000 | 594,408 |
| U.S. Treasury Bond | | 3.00 | 5-15-2042 | | 145,000 | 133,247 |
| U.S. Treasury Bond | | 3.00 | 11-15-2044 | | 2,180,000 | 1,971,367 |
| U.S. Treasury Bond | | 3.00 | 5-15-2045 | | 105,000 | 94,869 |
| U.S. Treasury Bond | | 3.00 | 11-15-2045 | | 35,000 | 31,668 |
| U.S. Treasury Bond | | 3.00 | 2-15-2047 | | 310,000 | 281,180 |
| U.S. Treasury Bond | | 3.00 | 5-15-2047 | | 5,961,000 | 5,416,127 |
| U.S. Treasury Bond | | 3.00 | 2-15-2048 | | 435,000 | 398,416 |
| U.S. Treasury Bond | | 3.00 | 2-15-2049 | | 320,000 | 297,500 |
| U.S. Treasury Bond | | 3.13 | 11-15-2041 | | 1,090,000 | 1,026,175 |
| U.S. Treasury Bond | | 3.13 | 2-15-2042 | | 2,055,000 | 1,932,021 |
| U.S. Treasury Bond | | 3.13 | 2-15-2043 | | 475,000 | 441,490 |
| U.S. Treasury Bond | | 3.13 | 8-15-2044 | | 110,000 | 101,720 |
| U.S. Treasury Bond | | 3.13 | 5-15-2048 | | 250,000 | 235,244 |
| U.S. Treasury Bond | | 3.38 | 5-15-2044 | | 20,000 | 19,295 |
| U.S. Treasury Bond | | 3.63 | 8-15-2043 | | 110,000 | 110,533 |
| U.S. Treasury Bond | | 3.63 | 2-15-2044 | | 35,000 | 35,105 |
| U.S. Treasury Bond | | 3.75 | 8-15-2041 | | 35,000 | 36,121 |
| U.S. Treasury Bond | | 3.75 | 11-15-2043 | | 350,000 | 358,367 |
| U.S. Treasury Bond | | 3.88 | 8-15-2040 | | 1,040,000 | 1,100,816 |
| U.S. Treasury Bond | | 4.25 | 11-15-2040 | | 480,000 | 533,269 |
| U.S. Treasury Bond | | 4.38 | 5-15-2041 | | 1,905,000 | 2,146,250 |
| U.S. Treasury Bond | | 5.38 | 2-15-2031 | | 1,735,000 | 2,009,482 |
| U.S. Treasury Bond | | 5.50 | 8-15-2028 | | 275,000 | 306,260 |
| U.S. Treasury Bond | | 6.13 | 11-15-2027 | | 245,000 | 276,611 |
| U.S. Treasury Bond | | 6.38 | 8-15-2027 | | 50,000 | 56,734 |
| U.S. Treasury Bond | | 6.88 | 8-15-2025 | | 335,000 | 366,184 |
| U.S. Treasury Note | | 0.13 | 9-15-2023 | | 2,855,000 | 2,758,198 |
The accompanying notes are an integral part of these financial statements.
Allspring Bloomberg US Aggregate ex-Corporate Portfolio | 9
Portfolio of investments—August 31, 2022 (unaudited)
| | | Interest
rate | Maturity
date | Principal | Value |
| U.S. Treasury securities (continued) | | | | | | |
| U.S. Treasury Note | | 0.13% | 10-15-2023 | $ | 4,220,000 | $ 4,065,212 |
| U.S. Treasury Note | | 0.25 | 11-15-2023 | | 3,105,000 | 2,988,805 |
| U.S. Treasury Note | | 0.25 | 3-15-2024 | | 2,690,000 | 2,560,334 |
| U.S. Treasury Note | | 0.25 | 5-15-2024 | | 1,265,000 | 1,197,896 |
| U.S. Treasury Note | | 0.25 | 5-31-2025 | | 1,790,000 | 1,638,759 |
| U.S. Treasury Note | | 0.25 | 6-30-2025 | | 1,295,000 | 1,183,256 |
| U.S. Treasury Note | | 0.25 | 7-31-2025 | | 3,000,000 | 2,732,344 |
| U.S. Treasury Note | | 0.25 | 8-31-2025 | | 3,980,000 | 3,613,871 |
| U.S. Treasury Note | | 0.25 | 9-30-2025 | | 1,370,000 | 1,241,455 |
| U.S. Treasury Note | | 0.25 | 10-31-2025 | | 1,905,000 | 1,721,197 |
| U.S. Treasury Note | | 0.38 | 12-31-2025 | | 2,315,000 | 2,089,559 |
| U.S. Treasury Note | | 0.50 | 3-31-2025 | | 1,675,000 | 1,552,450 |
| U.S. Treasury Note | | 0.50 | 2-28-2026 | | 460,000 | 415,042 |
| U.S. Treasury Note | | 0.63 | 7-31-2026 | | 3,145,000 | 2,821,900 |
| U.S. Treasury Note | | 0.63 | 11-30-2027 | | 2,840,000 | 2,469,025 |
| U.S. Treasury Note | | 0.63 | 12-31-2027 | | 2,145,000 | 1,860,201 |
| U.S. Treasury Note | | 0.63 | 5-15-2030 | | 870,000 | 717,138 |
| U.S. Treasury Note | | 0.63 | 8-15-2030 | | 1,150,000 | 943,404 |
| U.S. Treasury Note | | 0.75 | 11-15-2024 | | 3,010,000 | 2,836,102 |
| U.S. Treasury Note | | 0.75 | 3-31-2026 | | 2,535,000 | 2,303,384 |
| U.S. Treasury Note | | 0.75 | 4-30-2026 | | 2,060,000 | 1,868,565 |
| U.S. Treasury Note | | 0.75 | 5-31-2026 | | 260,000 | 235,351 |
| U.S. Treasury Note | | 0.75 | 8-31-2026 | | 3,085,000 | 2,776,741 |
| U.S. Treasury Note | | 0.75 | 1-31-2028 | | 1,615,000 | 1,407,510 |
| U.S. Treasury Note | | 0.88 | 6-30-2026 | | 1,925,000 | 1,747,840 |
| U.S. Treasury Note | | 1.00 | 7-31-2028 | | 2,885,000 | 2,522,008 |
| U.S. Treasury Note | | 1.13 | 2-28-2025 | | 1,855,000 | 1,751,163 |
| U.S. Treasury Note | | 1.13 | 8-31-2028 | | 3,010,000 | 2,647,271 |
| U.S. Treasury Note | | 1.25 | 3-31-2028 | | 485,000 | 432,900 |
| U.S. Treasury Note | | 1.25 | 8-15-2031 | | 3,115,000 | 2,651,279 |
| U.S. Treasury Note | | 1.38 | 8-31-2023 | | 725,000 | 709,990 |
| U.S. Treasury Note | | 1.38 | 10-31-2028 | | 1,720,000 | 1,531,203 |
| U.S. Treasury Note | | 1.38 | 11-15-2031 | | 2,455,000 | 2,102,957 |
| U.S. Treasury Note | | 1.50 | 10-31-2024 | | 225,000 | 215,859 |
| U.S. Treasury Note | | 1.50 | 8-15-2026 | | 545,000 | 505,913 |
| U.S. Treasury Note | | 1.50 | 11-30-2028 | | 1,595,000 | 1,429,083 |
| U.S. Treasury Note | | 1.63 | 10-31-2023 | | 2,540,000 | 2,487,216 |
| U.S. Treasury Note | | 1.63 | 2-15-2026 | | 2,600,000 | 2,442,070 |
| U.S. Treasury Note | | 1.63 | 5-15-2026 | | 1,255,000 | 1,175,533 |
| U.S. Treasury Note | | 1.63 | 8-15-2029 | | 1,945,000 | 1,750,044 |
| U.S. Treasury Note | | 1.75 | 6-30-2024 | | 1,655,000 | 1,604,704 |
| U.S. Treasury Note | | 1.88 | 2-15-2032 | | 2,140,000 | 1,913,294 |
| U.S. Treasury Note | | 2.00 | 2-15-2025 | | 340,000 | 328,206 |
| U.S. Treasury Note | | 2.00 | 8-15-2025 | | 10,000 | 9,582 |
| U.S. Treasury Note | | 2.13 | 11-30-2023 | | 750,000 | 737,900 |
| U.S. Treasury Note | | 2.13 | 11-30-2024 | | 995,000 | 965,888 |
| U.S. Treasury Note | | 2.13 | 5-15-2025 | | 880,000 | 848,891 |
| U.S. Treasury Note | | 2.25 | 12-31-2023 | | 15,000 | 14,760 |
| U.S. Treasury Note | | 2.25 | 10-31-2024 | | 2,035,000 | 1,983,648 |
| U.S. Treasury Note | | 2.25 | 11-15-2024 | | 640,000 | 623,575 |
| U.S. Treasury Note | | 2.25 | 12-31-2024 | | 1,485,000 | 1,444,105 |
| U.S. Treasury Note | | 2.25 | 11-15-2025 | | 20,000 | 19,244 |
| U.S. Treasury Note | | 2.25 | 11-15-2027 | | 20,000 | 18,947 |
| U.S. Treasury Note | | 2.38 | 5-15-2029 | | 100,000 | 94,301 |
| U.S. Treasury Note | | 2.50 | 8-15-2023 | | 270,000 | 267,469 |
The accompanying notes are an integral part of these financial statements.
10 | Allspring Bloomberg US Aggregate ex-Corporate Portfolio
Portfolio of investments—August 31, 2022 (unaudited)
| | | Interest
rate | Maturity
date | Principal | Value |
| U.S. Treasury securities (continued) | | | | | | |
| U.S. Treasury Note | | 2.50% | 4-30-2024 | $ | 2,150,000 | $ 2,115,902 |
| U.S. Treasury Note | | 2.50 | 1-31-2025 | | 1,670,000 | 1,631,968 |
| U.S. Treasury Note | | 2.50 | 2-28-2026 | | 800,000 | 774,438 |
| U.S. Treasury Note | | 2.63 | 12-31-2025 | | 95,000 | 92,477 |
| U.S. Treasury Note | | 2.63 | 2-15-2029 | | 3,060,000 | 2,934,731 |
| U.S. Treasury Note | | 2.75 | 11-15-2023 | | 2,040,000 | 2,022,548 |
| U.S. Treasury Note | | 2.75 | 2-28-2025 | | 90,000 | 88,400 |
| U.S. Treasury Note | | 2.75 | 6-30-2025 | | 1,270,000 | 1,244,947 |
| U.S. Treasury Note | | 2.75 | 2-15-2028 | | 2,685,000 | 2,601,094 |
| U.S. Treasury Note | | 2.75 | 5-31-2029 | | 2,170,000 | 2,093,880 |
| U.S. Treasury Note | | 2.88 | 11-30-2025 | | 1,145,000 | 1,123,665 |
| U.S. Treasury Note | | 2.88 | 5-15-2028 | | 2,295,000 | 2,235,832 |
| U.S. Treasury Note | | 2.88 | 8-15-2028 | | 2,510,000 | 2,443,426 |
| U.S. Treasury Note | | 3.13 | 11-15-2028 | | 1,910,000 | 1,885,752 |
| U.S. Treasury Note | | 6.00 | 2-15-2026 | | 450,000 | 486,299 |
| U.S. Treasury Note | | 6.25 | 8-15-2023 | | 550,000 | 564,781 |
| U.S. Treasury Note | | 6.50 | 11-15-2026 | | 745,000 | 834,138 |
| Total U.S. Treasury securities (Cost $157,832,108) | | | | | | 143,257,598 |
| Yankee corporate bonds and notes: 3.50% | | | | | | |
| Energy: 0.14% | | | | | | |
| Oil, gas & consumable fuels: 0.14% | | | | | | |
| Equinor ASA | | 1.75 | 1-22-2026 | | 150,000 | 139,196 |
| Equinor ASA | | 3.00 | 4-6-2027 | | 150,000 | 143,470 |
| Equinor ASA | | 3.63 | 4-6-2040 | | 40,000 | 35,126 |
| Equinor ASA | | 4.25 | 11-23-2041 | | 70,000 | 66,255 |
| | | | | | | 384,047 |
| Financials: 3.36% | | | | | | |
| Banks: 3.36% | | | | | | |
| African Development Bank | | 0.88 | 7-22-2026 | | 220,000 | 198,489 |
| Asian Development Bank | | 0.25 | 10-6-2023 | | 580,000 | 559,409 |
| Asian Development Bank | | 0.38 | 9-3-2025 | | 200,000 | 181,710 |
| Asian Development Bank | | 1.75 | 9-19-2029 | | 160,000 | 143,329 |
| Asian Development Bank | | 1.88 | 1-24-2030 | | 110,000 | 98,669 |
| Asian Development Bank | | 2.00 | 4-24-2026 | | 60,000 | 56,805 |
| Asian Development Bank | | 2.13 | 3-19-2025 | | 60,000 | 57,841 |
| Asian Development Bank | | 2.63 | 1-12-2027 | | 180,000 | 173,890 |
| Asian Development Bank | | 5.82 | 6-16-2028 | | 10,000 | 11,166 |
| Asian Development Bank | | 6.22 | 8-15-2027 | | 80,000 | 88,920 |
| Asian Infrastructure Investment Bank | | 0.50 | 5-28-2025 | | 350,000 | 320,407 |
| European Bank for Reconstruction & Development | | 0.50 | 5-19-2025 | | 120,000 | 110,381 |
| European Investment Bank | | 0.25 | 9-15-2023 | | 470,000 | 454,034 |
| European Investment Bank | | 0.63 | 7-25-2025 | | 160,000 | 147,075 |
| European Investment Bank | | 0.88 | 5-17-2030 | | 50,000 | 41,830 |
| European Investment Bank | | 1.25 | 2-14-2031 | | 170,000 | 144,567 |
| European Investment Bank | | 1.88 | 2-10-2025 | | 20,000 | 19,204 |
| European Investment Bank | | 2.25 | 6-24-2024 | | 640,000 | 625,687 |
| European Investment Bank | | 3.25 | 1-29-2024 | | 20,000 | 19,907 |
| Inter-American Development Bank | | 0.88 | 4-20-2026 | | 470,000 | 427,077 |
| Inter-American Development Bank | | 1.13 | 7-20-2028 | | 280,000 | 244,758 |
| Inter-American Development Bank | | 2.00 | 6-2-2026 | | 260,000 | 245,763 |
The accompanying notes are an integral part of these financial statements.
Allspring Bloomberg US Aggregate ex-Corporate Portfolio | 11
Portfolio of investments—August 31, 2022 (unaudited)
| | | Interest
rate | Maturity
date | Principal | Value |
| Banks (continued) | | | | | | |
| Inter-American Development Bank | | 2.13% | 1-15-2025 | $ | 150,000 | $ 145,002 |
| Inter-American Development Bank | | 2.38 | 7-7-2027 | | 30,000 | 28,516 |
| Inter-American Development Bank | | 3.13 | 9-18-2028 | | 50,000 | 48,917 |
| Inter-American Development Bank | | 4.38 | 1-24-2044 | | 60,000 | 64,331 |
| Inter-American Development Bank | | 7.00 | 6-15-2025 | | 50,000 | 54,303 |
| International Bank for Reconstruction & Development | | 0.38 | 7-28-2025 | | 220,000 | 200,562 |
| International Bank for Reconstruction & Development | | 0.50 | 10-28-2025 | | 410,000 | 372,279 |
| International Bank for Reconstruction & Development | | 0.75 | 8-26-2030 | | 130,000 | 105,876 |
| International Bank for Reconstruction & Development | | 1.50 | 8-28-2024 | | 30,000 | 28,828 |
| International Bank for Reconstruction & Development | | 1.63 | 11-3-2031 | | 190,000 | 164,112 |
| International Bank for Reconstruction & Development | | 1.88 | 6-19-2023 | | 30,000 | 29,609 |
| International Bank for Reconstruction & Development | | 2.50 | 3-19-2024 | | 260,000 | 255,856 |
| International Bank for Reconstruction & Development | | 2.50 | 7-29-2025 | | 350,000 | 339,438 |
| International Bank for Reconstruction & Development | | 2.50 | 11-22-2027 | | 370,000 | 352,606 |
| International Bank for Reconstruction & Development | | 2.50 | 3-29-2032 | | 70,000 | 64,913 |
| International Finance Corporation | | 1.38 | 10-16-2024 | | 100,000 | 95,624 |
| International Finance Corporation | | 2.13 | 4-7-2026 | | 100,000 | 95,122 |
| KfW ¤ | | 0.00 | 4-18-2036 | | 80,000 | 49,873 |
| KfW ¤ | | 0.00 | 6-29-2037 | | 50,000 | 29,882 |
| KfW | | 0.50 | 9-20-2024 | | 540,000 | 507,585 |
| KfW | | 0.63 | 1-22-2026 | | 190,000 | 172,284 |
| KfW | | 0.75 | 9-30-2030 | | 260,000 | 211,705 |
| KfW | | 2.00 | 5-2-2025 | | 40,000 | 38,367 |
| KfW | | 2.88 | 4-3-2028 | | 410,000 | 397,165 |
| Korea Development Bank | | 3.38 | 9-16-2025 | | 210,000 | 205,731 |
| Landwirtschaftliche Rentenbank | | 1.75 | 7-27-2026 | | 10,000 | 9,316 |
| Landwirtschaftliche Rentenbank | | 2.00 | 1-13-2025 | | 30,000 | 28,900 |
| Landwirtschaftliche Rentenbank | | 3.13 | 11-14-2023 | | 200,000 | 198,834 |
| Oesterreichische Kontrollbank AG | | 1.50 | 2-12-2025 | | 210,000 | 199,605 |
| Swedish Export Credit ¤ | | 0.00 | 5-11-2037 | | 65,000 | 34,938 |
| Swedish Export Credit | | 0.25 | 9-29-2023 | | 220,000 | 212,015 |
| Swedish Export Credit | | 0.50 | 8-26-2025 | | 200,000 | 181,767 |
| | | | | | | 9,294,779 |
| Total Yankee corporate bonds and notes (Cost $10,480,301) | | | | | | 9,678,826 |
| Yankee government bonds: 2.28% | | | | | | |
| Canada Government | | 1.63 | 1-22-2025 | | 235,000 | 224,378 |
| Export Development Canada | | 2.63 | 2-21-2024 | | 200,000 | 197,143 |
| Export-Import Bank of Korea | | 2.88 | 1-21-2025 | | 400,000 | 389,169 |
| Japan Bank for International Cooperation | | 0.38 | 9-15-2023 | | 360,000 | 347,476 |
| Japan Bank for International Cooperation | | 2.38 | 4-20-2026 | | 320,000 | 302,724 |
| Japan Bank for International Cooperation | | 2.75 | 11-16-2027 | | 360,000 | 340,922 |
| Oriental Republic of Uruguay | | 4.38 | 1-23-2031 | | 75,000 | 76,771 |
| Oriental Republic of Uruguay | | 4.50 | 8-14-2024 | | 10,000 | 10,135 |
| Oriental Republic of Uruguay | | 4.98 | 4-20-2055 | | 90,000 | 90,455 |
| Oriental Republic of Uruguay | | 5.10 | 6-18-2050 | | 35,000 | 35,688 |
| Province of Alberta | | 1.88 | 11-13-2024 | | 210,000 | 201,931 |
| Province of British Columbia | | 7.25 | 9-1-2036 | | 100,000 | 130,811 |
| Province of Manitoba | | 3.05 | 5-14-2024 | | 150,000 | 148,419 |
| Province of Ontario | | 2.00 | 10-2-2029 | | 90,000 | 80,344 |
| Province of Ontario | | 2.30 | 6-15-2026 | | 70,000 | 66,135 |
| Province of Ontario | | 2.50 | 4-27-2026 | | 70,000 | 66,792 |
| Province of Ontario | | 3.20 | 5-16-2024 | | 5,000 | 4,963 |
| Province of Quebec | | 2.50 | 4-9-2024 | | 70,000 | 68,785 |
The accompanying notes are an integral part of these financial statements.
12 | Allspring Bloomberg US Aggregate ex-Corporate Portfolio
Portfolio of investments—August 31, 2022 (unaudited)
| | | Interest
rate | Maturity
date | Principal | Value |
| Yankee government bonds (continued) | | | | | | |
| Province of Quebec | | 2.50% | 4-20-2026 | $ | 75,000 | $ 71,703 |
| Republic of Chile | | 3.24 | 2-6-2028 | | 210,000 | 195,524 |
| Republic of Chile | | 3.63 | 10-30-2042 | | 175,000 | 135,675 |
| Republic of Hungary | | 5.38 | 3-25-2024 | | 19,000 | 19,098 |
| Republic of Hungary | | 7.63 | 3-29-2041 | | 50,000 | 57,617 |
| Republic of Indonesia | | 4.10 | 4-24-2028 | | 225,000 | 225,144 |
| Republic of Indonesia | | 4.35 | 1-11-2048 | | 205,000 | 184,789 |
| Republic of Italy | | 2.88 | 10-17-2029 | | 415,000 | 353,445 |
| Republic of Panama | | 2.25 | 9-29-2032 | | 200,000 | 155,458 |
| Republic of Panama | | 9.38 | 4-1-2029 | | 185,000 | 225,659 |
| Republic of Peru | | 2.84 | 6-20-2030 | | 180,000 | 156,359 |
| Republic of Peru | | 3.23 | 7-28-2121 | | 75,000 | 46,791 |
| Republic of Peru | | 5.63 | 11-18-2050 | | 200,000 | 207,950 |
| Republic of Philippines | | 3.70 | 2-2-2042 | | 215,000 | 184,866 |
| Republic of Philippines | | 9.50 | 2-2-2030 | | 55,000 | 72,697 |
| Republic of Philippines | | 10.63 | 3-16-2025 | | 55,000 | 64,234 |
| Republic of Poland | | 3.25 | 4-6-2026 | | 10,000 | 9,820 |
| State of Israel | | 3.38 | 1-15-2050 | | 200,000 | 166,250 |
| State of Israel | | 5.50 | 12-4-2023 | | 120,000 | 122,778 |
| State of Israel | | 5.50 | 9-18-2033 | | 6,000 | 6,954 |
| United Mexican States | | 3.60 | 1-30-2025 | | 200,000 | 198,852 |
| United Mexican States | | 4.35 | 1-15-2047 | | 225,000 | 175,927 |
| United Mexican States | | 4.50 | 1-31-2050 | | 260,000 | 205,676 |
| United Mexican States | | 4.75 | 3-8-2044 | | 54,000 | 45,747 |
| United Mexican States | | 5.55 | 1-21-2045 | | 80,000 | 74,737 |
| United Mexican States | | 5.75 | 10-12-2110 | | 163,000 | 139,305 |
| United Mexican States | | 6.05 | 1-11-2040 | | 40,000 | 40,040 |
| Total Yankee government bonds (Cost $7,189,743) | | | | | | 6,326,136 |
| | | Yield | | Shares | |
| Short-term investments: 11.23% | | | | | | |
| Investment companies: 11.23% | | | | | | |
| Allspring Government Money Market Fund Select Class ♠∞## | | 2.09 | | | 31,086,054 | 31,086,054 |
| Total Short-term investments (Cost $31,086,054) | | | | | | 31,086,054 |
| Total investments in securities (Cost $329,754,809) | 111.05% | | | | | 307,463,592 |
| Other assets and liabilities, net | (11.05) | | | | | (30,598,340) |
| Total net assets | 100.00% | | | | | $276,865,252 |
| ±± | The coupon of the security is adjusted based on the principal and/or interest payments received from the underlying pool of mortgages as well as the credit quality and the actual prepayment speed of the underlying mortgages. The rate shown is the rate in effect at period end. |
| ¤ | The security is issued in zero coupon form with no periodic interest payments. |
| ## | All or a portion of this security is segregated for when-issued securities. |
| ♠ | The issuer of the security is an affiliated person of the Portfolio as defined in the Investment Company Act of 1940. |
| ∞ | The rate represents the 7-day annualized yield at period end. |
| %% | The security is purchased on a when-issued basis. |
The accompanying notes are an integral part of these financial statements.
Allspring Bloomberg US Aggregate ex-Corporate Portfolio | 13
Portfolio of investments—August 31, 2022 (unaudited)
| Abbreviations: |
| EDA | Economic Development Authority |
| FFCB | Federal Farm Credit Banks |
| FHLB | Federal Home Loan Bank |
| FHLMC | Federal Home Loan Mortgage Corporation |
| FNMA | Federal National Mortgage Association |
| GNMA | Government National Mortgage Association |
| GO | General obligation |
| TVA | Tennessee Valley Authority |
Investments in affiliates
An affiliated investment is an investment in which the Portfolio owns at least 5% of the outstanding voting shares of the issuer or as a result of other relationships, such as the Portfolio and the issuer having the same adviser or investment manager. Transactions with issuers that were affiliates of the Portfolio at the end of the period were as follows:
| | Value,
beginning of
period | Purchases | Sales
proceeds | Net
realized
gains
(losses) | Net
change in
unrealized
gains
(losses) | Value,
end of
period | Shares,
end
of period | Income
from
affiliated
securities |
| Short-term investments | | | | | | | |
| Allspring Government Money Market Fund Select Class | $100,859,173 | $128,487,821 | $(198,260,940) | $0 | $0 | $31,086,054 | 31,086,054 | $208,325 |
The accompanying notes are an integral part of these financial statements.
14 | Allspring Bloomberg US Aggregate ex-Corporate Portfolio
Statement of assets and liabilities—August 31, 2022 (unaudited)
| | |
| Assets | |
Investments in unaffiliated securities, at value (cost $298,668,755)
| $ 276,377,538 |
Investments in affiliated securities, at value (cost $31,086,054)
| 31,086,054 |
Receivable for investments sold
| 60,324,373 |
Receivable for interest
| 993,692 |
Prepaid expenses and other assets
| 306 |
Total assets
| 368,781,963 |
| Liabilities | |
Payable for when-issued transactions
| 65,710,192 |
Payable for investments purchased
| 26,154,788 |
Advisory fee payable
| 1,906 |
Accrued expenses and other liabilities
| 49,825 |
Total liabilities
| 91,916,711 |
Total net assets
| $276,865,252 |
The accompanying notes are an integral part of these financial statements.
Allspring Bloomberg US Aggregate ex-Corporate Portfolio | 15
Statement of operations—six months ended August 31, 2022 (unaudited)
| | |
| Investment income | |
Interest
| $ 3,319,224 |
Income from affiliated securities
| 208,325 |
Total investment income
| 3,527,549 |
| Expenses | |
Advisory fee
| 102,903 |
Custody and accounting fees
| 15,799 |
Professional fees
| 35,330 |
Interest holder report expenses
| 9,721 |
Trustees’ fees and expenses
| 11,153 |
Other fees and expenses
| 7,932 |
Total expenses
| 182,838 |
Less: Fee waivers and/or expense reimbursements
| (75,819) |
Net expenses
| 107,019 |
Net investment income
| 3,420,530 |
| Realized and unrealized gains (losses) on investments | |
Net realized losses on investments
| (20,742,036) |
Net change in unrealized gains (losses) on investments
| (16,120,977) |
Net realized and unrealized gains (losses) on investments
| (36,863,013) |
Net decrease in net assets resulting from operations
| $(33,442,483) |
The accompanying notes are an integral part of these financial statements.
16 | Allspring Bloomberg US Aggregate ex-Corporate Portfolio
Statement of changes in net assets
| | | |
| | Six months ended
August 31, 2022
(unaudited) | Year ended
February 28, 2022 |
| Operations | | |
Net investment income
| $ 3,420,530 | $ 6,805,107 |
Net realized losses on investments
| (20,742,036) | (430,367) |
Net change in unrealized gains (losses) on investments
| (16,120,977) | (20,174,634) |
Net decrease in net assets resulting from operations
| (33,442,483) | (13,799,894) |
| Capital transactions | | |
| Transactions in investors’ beneficial interests | | |
Contributions
| 38,375,852 | 98,689,236 |
Withdrawals
| (263,191,977) | (136,927,823) |
Net decrease in net assets resulting from capital transactions
| (224,816,125) | (38,238,587) |
Total decrease in net assets
| (258,258,608) | (52,038,481) |
| Net assets | | |
Beginning of period
| 535,123,860 | 587,162,341 |
End of period
| $ 276,865,252 | $ 535,123,860 |
The accompanying notes are an integral part of these financial statements.
Allspring Bloomberg US Aggregate ex-Corporate Portfolio | 17
| | | Year ended February 28 |
| | Six months ended
August 31, 2022
(unaudited) | 2022 | 2021 | 2020 1 | 2019 | 2018 2 |
Total return3
| (7.05)% | (2.47)% | 0.52% | 10.34% | 3.23% | (1.39)% |
| Ratios to average net assets (annualized) | | | | | | |
Gross expenses
| 0.09% | 0.07% | 0.07% | 0.07% | 0.08% | 0.08% |
Net expenses
| 0.05% * | 0.05% * | 0.05% * | 0.06% | 0.07% | 0.07% |
Net investment income
| 1.66% | 1.18% | 1.57% | 2.32% | 2.38% | 2.03% |
| Supplemental data | | | | | | |
Portfolio turnover rate
| 129% | 209% | 114% | 46% | 72% | 221% |
| * | Ratio includes expenses which were voluntarily waived by the adviser. Without these voluntary waivers, the net expense ratios would be increased by the following amounts: |
| Six months ended August 31, 2022 (unaudited) | 0.04% |
| Year ended February 28, 2022 | 0.02% |
| Year ended February 28, 2021 | 0.02% |
| 1 | Year ended February 29 |
| 2 | For the period from May 23, 2017 (commencement of operations) to February 28, 2018 |
| 3 | Returns for periods of less than one year are not annualized. |
The accompanying notes are an integral part of these financial statements.
18 | Allspring Bloomberg US Aggregate ex-Corporate Portfolio
Notes to financial statements (unaudited)
1. ORGANIZATION
Allspring Master Trust (the "Trust"), a Delaware statutory trust organized on March 10, 1999, is an open-end management investment company registered under the Investment Company Act of 1940, as amended (the "1940 Act"). As an investment company, the Trust follows the accounting and reporting guidance in Financial Accounting Standards Board ("FASB") Accounting Standards Codification Topic 946, Financial Services – Investment Companies. These financial statements report on the Allspring Bloomberg US Aggregate ex-Corporate Portfolio (the "Portfolio") which is a diversified series of the Trust.
Interests in the Portfolio are available solely through private placement transactions that do not involve any "public offering" within the meaning of Section 4(a)(2) of the Securities Act of 1933.
2. SIGNIFICANT ACCOUNTING POLICIES
The following significant accounting policies, which are consistently followed in the preparation of the financial statements of the Portfolio, are in conformity with U.S. generally accepted accounting principles which require management to make estimates and assumptions that affect the reported amounts of assets and liabilities, disclosure of contingent assets and liabilities at the date of the financial statements, and the reported amounts of income and expenses during the reporting period. Actual results could differ from those estimates.
Securities valuation
All investments are valued each business day as of the close of regular trading on the New York Stock Exchange (generally 4 p.m. Eastern Time), although the Portfolio may deviate from this calculation time under unusual or unexpected circumstances.
Debt securities are valued at the evaluated bid price provided by an independent pricing service (e.g. taking into account various factors, including yields, maturities, or credit ratings) or, if a reliable price is not available, the quoted bid price from an independent broker-dealer.
Investments in registered open-end investment companies are valued at net asset value.
Investments which are not valued using any of the methods discussed above are valued at their fair value, as determined in good faith by the Board of Trustees. The Board of Trustees has established a Valuation Committee comprised of the Trustees and has delegated to it the authority to take any actions regarding the valuation of portfolio securities that the Valuation Committee deems necessary or appropriate, including determining the fair value of portfolio securities, unless the determination has been delegated to the Allspring Global Investments Pricing Committee at Allspring Funds Management, LLC ("Allspring Funds Management"). The Board of Trustees retains the authority to make or ratify any valuation decisions or approve any changes to the Valuation Procedures as it deems appropriate. On a quarterly basis, the Board of Trustees receives reports on any valuation actions taken by the Valuation Committee or the Allspring Global Investments Pricing Committee which may include items for ratification.
When-issued transactions
The Portfolio may purchase securities on a forward commitment or when-issued basis. The Portfolio records a when-issued transaction on the trade date and will segregate assets in an amount at least equal in value to the Portfolio's commitment to purchase when-issued securities. Securities purchased on a when-issued basis are marked-to-market daily and the Portfolio begins earning interest on the settlement date. Losses may arise due to changes in the market value of the underlying securities or if the counterparty does not perform under the contract.
Security transactions and income recognition
Securities transactions are recorded on a trade date basis. Realized gains or losses are recorded on the basis of identified cost.
Interest income is accrued daily and bond discounts are accreted and premiums are amortized daily. To the extent debt obligations are placed on non-accrual status, any related interest income may be reduced by writing off interest receivables when the collection of all or a portion of interest has been determined to be doubtful based on consistently applied procedures and the fair value has decreased. If the issuer subsequently resumes interest payments or when the collectability of interest is reasonably assured, the debt obligation is removed from non-accrual status. Paydown gains and losses are included in interest income.
Allspring Bloomberg US Aggregate ex-Corporate Portfolio | 19
Notes to financial statements (unaudited)
Federal and other taxes
The Portfolio is not required to pay federal income taxes on its net investment income and net capital gains as it is treated as a partnership for federal income tax purposes. All income, gains and losses of the Portfolio are deemed to have been “passed through” to the interest holders in proportion to their holdings of the Portfolio regardless of whether income and gains have been distributed by the Portfolio.
The Portfolio’s income tax returns and all financial records supporting those returns for the prior three fiscal years are subject to examination by the federal revenue authority. Management has analyzed the Portfolio’s tax positions taken on federal, state, and foreign tax returns, as applicable, for all open tax years and does not believe that there are any uncertain tax positions that require recognition of a tax liability.
As of August 31, 2022, the aggregate cost of all investments for federal income tax purposes was $329,664,964 and the unrealized gains (losses) consisted of:
| Gross unrealized gains | $ 94,266 |
| Gross unrealized losses | (22,295,638) |
| Net unrealized losses | $(22,201,372) |
3. FAIR VALUATION MEASUREMENTS
Fair value measurements of investments are determined within a framework that has established a fair value hierarchy based upon the various data inputs utilized in determining the value of the Portfolio’s investments. The three-level hierarchy gives the highest priority to unadjusted quoted prices in active markets for identical assets or liabilities (Level 1) and the lowest priority to unobservable inputs (Level 3). The Portfolio’s investments are classified within the fair value hierarchy based on the lowest level of input that is significant to the fair value measurement. The inputs are summarized into three broad levels as follows:
| ■ | Level 1 – quoted prices in active markets for identical securities |
| ■ | Level 2 – other significant observable inputs (including quoted prices for similar securities, interest rates, prepayment speeds, credit risk, etc.) |
| ■ | Level 3 – significant unobservable inputs (including the Portfolio’s own assumptions in determining the fair value of investments) |
The inputs or methodologies used for valuing investments in securities are not necessarily an indication of the risk associated with investing in those securities.
The following is a summary of the inputs used in valuing the Portfolio’s assets and liabilities as of August 31, 2022:
| | Quoted prices
(Level 1) | Other significant
observable inputs
(Level 2) | Significant
unobservable inputs
(Level 3) | Total |
| Assets | | | | |
| Investments in: | | | | |
| Agency securities | $ 0 | $ 109,167,766 | $0 | $ 109,167,766 |
| Asset-backed securities | 0 | 1,100,120 | 0 | 1,100,120 |
| Municipal obligations | 0 | 2,995,026 | 0 | 2,995,026 |
| Non-agency mortgage-backed securities | 0 | 3,852,066 | 0 | 3,852,066 |
| U.S. Treasury securities | 143,257,598 | 0 | 0 | 143,257,598 |
| Yankee corporate bonds and notes | 0 | 9,678,826 | 0 | 9,678,826 |
| Yankee government bonds | 0 | 6,326,136 | 0 | 6,326,136 |
| Short-term investments | | | | |
| Investment companies | 31,086,054 | 0 | 0 | 31,086,054 |
| Total assets | $174,343,652 | $133,119,940 | $0 | $307,463,592 |
Additional sector, industry or geographic detail, if any, is included in the Portfolio of Investments.
For the six months ended August 31, 2022, the Portfolio did not have any transfers into/out of Level 3.
20 | Allspring Bloomberg US Aggregate ex-Corporate Portfolio
Notes to financial statements (unaudited)
4. TRANSACTIONS WITH AFFILIATES
Advisory fee
The Trust has entered into an advisory contract with Allspring Funds Management, a wholly owned subsidiary of Allspring Global Investments Holdings, LLC, a holding company indirectly owned by certain private funds of GTCR LLC and Reverence Capital Partners, L.P. The adviser is responsible for implementing investment policies and guidelines and for supervising the subadviser, who is responsible for day-to-day portfolio management of the Portfolio. Pursuant to the contract, Allspring Funds Management is entitled to receive an advisory fee at the following annual rate based on the Portfolio’s average daily net assets:
| Average daily net assets | Advisory fee |
| First $5 billion | 0.050% |
| Next $5 billion | 0.040 |
| Over $10 billion | 0.030 |
For the six months ended August 31, 2022, the advisory fee was equivalent to an annual rate of 0.05% of the Portfolio’s average daily net assets.
Allspring Funds Management has retained the services of a subadviser to provide daily portfolio management to the Portfolio. The fee for subadvisory services is borne by Allspring Funds Management. Allspring Global Investments, LLC, an affiliate of Allspring Funds Management and a wholly owned subsidiary of Allspring Global Investments Holdings, LLC, is the subadviser to the Portfolio and is entitled to receive a fee from Allspring Funds Management at an annual rate starting at 0.04% and declining to 0.03% as the average daily net assets of the Portfolio increase.
Allspring Funds Management has voluntarily waived and/or reimbursed advisory fees to reduce the net operating expense ratio of the Portfolio. These voluntary waivers may be discontinued at any time.
Interfund transactions
The Portfolio may purchase or sell portfolio investment securities to certain affiliates pursuant to Rule 17a-7 under the 1940 Act and under procedures adopted by the Board of Trustees. The procedures have been designed to ensure that these interfund transactions, which do not incur broker commissions, are effected at current market prices.
5. INVESTMENT PORTFOLIO TRANSACTIONS
Purchases and sales of investments, excluding short-term securities, for the six months ended August 31, 2022 were as follows:
| Purchases at cost | | Sales proceeds |
U.S.
government | Non-U.S.
government | | U.S.
government | Non-U.S.
government |
| $464,897,610 | $51,172,681 | | $676,045,847 | $46,155,639 |
6. BANK BORROWINGS
The Trust, along with Allspring Variable Trust and Allspring Funds Trust (excluding the money market funds), are parties to a $350,000,000 revolving credit agreement whereby the Portfolio is permitted to use bank borrowings for temporary or emergency purposes, such as to fund interest holders withdrawal requests. Interest under the credit agreement is charged to the Portfolio based on a borrowing rate equal to the higher of the Federal Funds rate or the overnight bank funding rate in effect on that day plus a spread. In addition, an annual commitment fee equal based on the unused balance is allocated to each participating fund.
For the six months ended August 31, 2022, there were no borrowings by the Portfolio under the agreement.
7. INDEMNIFICATION
Under the Portfolio's organizational documents, the officers and Trustees have been granted certain indemnification rights against certain liabilities that may arise out of performance of their duties to the Portfolio. The Portfolio has entered into a separate agreement with each Trustee that converts indemnification rights currently existing under the Portfolio’s organizational documents into contractual rights that cannot be changed in the future without the consent of the Trustee. Additionally, in the normal course of business, the Portfolio may enter into contracts with service providers that contain a
Allspring Bloomberg US Aggregate ex-Corporate Portfolio | 21
Notes to financial statements (unaudited)
variety of indemnification clauses. The Portfolio’s maximum exposure under these arrangements is dependent on future claims that may be made against the Portfolio and, therefore, cannot be estimated.
8. CORONAVIRUS (COVID-19) PANDEMIC
On March 11, 2020, the World Health Organization announced that it had made the assessment that coronavirus disease 2019 (“COVID-19”) is a pandemic. The impacts of COVID-19 are affecting the entire global economy, individual companies and investment products, the funds, and the market in general. There is significant uncertainty around the extent and duration of business disruptions related to COVID-19 and the impacts may last for an extended period of time. COVID-19 has led to significant uncertainty and volatility in the financial markets.
22 | Allspring Bloomberg US Aggregate ex-Corporate Portfolio
Other information (unaudited)
PROXY VOTING INFORMATION
A description of the policies and procedures used to determine how to vote proxies relating to portfolio securities is available without charge, upon request, by calling 1-800-222-8222, visiting our website at allspringglobal.com, or visiting the SEC website at sec.gov. Information regarding how the proxies related to portfolio securities were voted during the most recent 12-month period ended June 30 is available on the website at allspringglobal.com or by visiting the SEC website at sec.gov.
QUARTERLY PORTFOLIO HOLDINGS INFORMATION
The Portfolio files its complete schedule of portfolio holdings with the SEC for the first and third quarters of each fiscal year as an exhibit to its reports on Form N-PORT. Interest holders may view the filed Form N-PORT by visiting the SEC website at sec.gov.
Allspring Bloomberg US Aggregate ex-Corporate Portfolio | 23
Other information (unaudited)
BOARD OF TRUSTEES AND OFFICERS
Each of the Trustees and Officers listed in the table below acts in identical capacities for each fund in the Allspring family of funds, which consists of 124 mutual funds comprising the Allspring Funds Trust, Allspring Variable Trust, Allspring Master Trust and four closed-end funds (collectively the “Fund Complex”). This table should be read in conjunction with the Prospectus and the Statement of Additional Information1. The mailing address of each Trustee and Officer is 525 Market Street, 12th Floor, San Francisco, CA 94105. Each Trustee and Officer serves an indefinite term, however, each Trustee serves such term until reaching the mandatory retirement age established by the Trustees.
Independent Trustees
Name and
year of birth | Position held and
length of service* | Principal occupations during past five years or longer | Current other
public company or
investment
company
directorships |
William R. Ebsworth
(Born 1957) | Trustee,
since 2015 | Retired. From 1984 to 2013, equities analyst, portfolio manager, research director and chief investment officer at Fidelity Management and Research Company in Boston, Tokyo, and Hong Kong, and retired in 2013 as Chief Investment Officer of Fidelity Strategic Advisers, Inc. where he led a team of investment professionals managing client assets. Prior thereto, Board member of Hong Kong Securities Clearing Co., Hong Kong Options Clearing Corp., the Thailand International Fund, Ltd., Fidelity Investments Life Insurance Company, and Empire Fidelity Investments Life Insurance Company. Audit Committee Chair and Investment Committee Chair of the Vincent Memorial Hospital Endowment (non-profit organization). Mr. Ebsworth is a CFA® charterholder. | N/A |
Jane A. Freeman
(Born 1953) | Trustee,
since 2015;
Chair Liaison,
since 2018 | Retired. From 2012 to 2014 and 1999 to 2008, Chief Financial Officer of Scientific Learning Corporation. From 2008 to 2012, Ms. Freeman provided consulting services related to strategic business projects. Prior to 1999, Portfolio Manager at Rockefeller & Co. and Scudder, Stevens & Clark. Board member of the Harding Loevner Funds from 1996 to 2014, serving as both Lead Independent Director and chair of the Audit Committee. Board member of the Russell Exchange Traded Funds Trust from 2011 to 2012 and the chair of the Audit Committee. Ms. Freeman is also an inactive Chartered Financial Analyst. | N/A |
Isaiah Harris, Jr.
(Born 1952) | Trustee,
since 2009; Audit
Committee
Chair,
since 2019 | Retired. Chairman of the Board of CIGNA Corporation from 2009 to 2021, and Director from 2005 to 2008. From 2003 to 2011, Director of Deluxe Corporation. Prior thereto, President and CEO of BellSouth Advertising and Publishing Corp. from 2005 to 2007, President and CEO of BellSouth Enterprises from 2004 to 2005 and President of BellSouth Consumer Services from 2000 to 2003. Emeritus member of the Iowa State University Foundation Board of Governors. Emeritus Member of the Advisory Board of Iowa State University School of Business. Advisory Board Member, Palm Harbor Academy (private school). Advisory Board Member, Fellowship of Christian Athletes. Mr. Harris is a certified public accountant (inactive status). | N/A |
David F. Larcker
(Born 1950) | Trustee,
since 2009 | James Irvin Miller Professor of Accounting at the Graduate School of Business (Emeritus), Stanford University, Director of the Corporate Governance Research Initiative and Senior Faculty of The Rock Center for Corporate Governance since 2006. From 2005 to 2008, Professor of Accounting at the Graduate School of Business, Stanford University. Prior thereto, Ernst & Young Professor of Accounting at The Wharton School, University of Pennsylvania from 1985 to 2005. | N/A |
24 | Allspring Bloomberg US Aggregate ex-Corporate Portfolio
Other information (unaudited)
Name and
year of birth | Position held and
length of service* | Principal occupations during past five years or longer | Current other
public company or
investment
company
directorships |
Olivia S. Mitchell
(Born 1953) | Trustee,
since 2006;
Nominating and
Governance
Committee Chair,
since 2018 | International Foundation of Employee Benefit Plans Professor since 1993, Wharton School of the University of Pennsylvania. Director of Wharton’s Pension Research Council and Boettner Center on Pensions & Retirement Research, and Research Associate at the National Bureau of Economic Research. Previously taught at Cornell University from 1978 to 1993. | N/A |
Timothy J. Penny
(Born 1951) | Trustee,
since 1996;
Chair,
since 2018 | President and Chief Executive Officer of Southern Minnesota Initiative Foundation, a non-profit organization, since 2007. Vice Chair of the Economic Club of Minnesota, since 2007. Co-Chair of the Committee for a Responsible Federal Budget, since 1995. Member of the Board of Trustees of NorthStar Education Finance, Inc., a non-profit organization, since 2007. Senior Fellow of the University of Minnesota Humphrey Institute from 1995 to 2017. | N/A |
James G. Polisson
(Born 1959) | Trustee,
since 2018 | Retired. Chief Marketing Officer, Source (ETF) UK Services, Ltd, from 2015 to 2017. From 2012 to 2015, Principal of The Polisson Group, LLC, a management consulting, corporate advisory and principal investing company. Chief Executive Officer and Managing Director at Russell Investments, Global Exchange Traded Funds from 2010 to 2012. Managing Director of Barclays Global Investors from 1998 to 2010 and Global Chief Marketing Officer for iShares and Barclays Global Investors from 2000 to 2010. Trustee of the San Francisco Mechanics’ Institute, a non-profit organization, from 2013 to 2015. Board member of the Russell Exchange Traded Fund Trust from 2011 to 2012. Director of Barclays Global Investors Holdings Deutschland GmbH from 2006 to 2009. Mr. Polisson is an attorney and has a retired status with the Massachusetts and District of Columbia Bar Associations. | N/A |
Pamela Wheelock
(Born 1959) | Trustee,
since January
2020; previously
Trustee from
January 2018 to
July 2019 | Retired. Executive and Senior Financial leadership positions in the public, private and nonprofit sectors. Interim President and CEO, McKnight Foundation, 2020. Interim Commissioner, Minnesota Department of Human Services, 2019. Chief Operating Officer, Twin Cities Habitat for Humanity, 2017-2019. Vice President for University Services, University of Minnesota, 2012-2016. Interim President and CEO, Blue Cross and Blue Shield of Minnesota, 2011-2012. Executive Vice-President and Chief Financial Officer, Minnesota Wild, 2002-2008. Commissioner, Minnesota Department of Finance, 1999-2002. Chair of the Board of Directors of Destination Medical Center Corporation. Board member of the Minnesota Wild Foundation. | N/A |
* Length of service dates reflect the Trustee’s commencement of service with the Trust’s predecessor entities, where applicable.
Allspring Bloomberg US Aggregate ex-Corporate Portfolio | 25
Other information (unaudited)
Officers2
Name and
year of birth | Position held and
length of service | Principal occupations during past five years or longer |
Andrew Owen
(Born 1960) | President,
since 2017 | President, Chief Executive Officer and Director of Allspring Funds Management, LLC since 2017 and co-president of Galliard Capital Management, LLC, an affiliate of Allspring Funds Management, LLC, since 2019. Prior thereto, Head of Affiliated Managers, Allspring Global Investments, from 2014 to 2019 and Executive Vice President responsible for marketing, investments and product development for Allspring Funds Management, LLC, from 2009 to 2014. In addition, Mr. Owen was an Executive Vice President of Wells Fargo & Company from 2014 to 2021. |
Jeremy DePalma
(Born 1974) | Treasurer,
since 2012
(for certain funds in
the Fund Complex);
since 2021 (for
the remaining funds in the
Fund Complex) | Senior Vice President of Allspring Funds Management, LLC since 2009. Senior Vice President of Evergreen Investment Management Company, LLC from 2008 to 2010 and head of the Fund Reporting and Control Team within Fund Administration from 2005 to 2010. |
Kate McKinley
(Born 1977) | Chief Legal Officer,
since 2021 | Chief Legal Officer of Allspring Global Investments since 2021. Prior thereto, held various roles at State Street Global Advisors beginning in 2010, including serving as Senior Vice President and General Counsel from 2019 to 2021, and Chief Operating Officer of the Institutional Client Group from 2016 - 2019. Prior to working at State Street Global Advisors served as Assistant General Counsel for Bank of America Corporation from 2005 to 2010 and as an Associate at WilmerHale from 2002 to 2005. |
Christopher Baker
(Born 1976) | Chief Compliance Officer, since 2022 | Global Chief Compliance Officer for Allspring Global Investments since 2022. Prior thereto, Chief Compliance Officer for State Street Global Advisors from 2018 to 2021. Senior Compliance Officer for the State Street divisions of Alternative Investment Solutions, Sector Solutions, and Global Marketing from 2015 to 2018. From 2010 to 2015 Vice President, Global Head of Investment and Marketing Compliance for State Street Global Advisors. |
Matthew Prasse
(Born 1983) | Secretary,
since 2021 | Senior Counsel of the Allspring Legal Department since 2021. Senior Counsel of the Wells Fargo Legal Department from 2018 to 2021. Previously, Counsel for Barings LLC from 2015 to 2018. Prior to joining Barings, Associate at Morgan, Lewis & Bockius LLP from 2008 to 2015. |
1 The Statement of Additional Information includes additional information about the Trustees and is available, without charge, upon request, by calling 1-800-222-8222.
2 For those Officers with tenures at Allspring Global Investments and/or Allspring Funds Management, LLC that began prior to 2021, such tenures include years of service during which these businesses/entities were known as Wells Fargo Asset Management and Wells Fargo Funds Management, LLC, respectively.
26 | Allspring Bloomberg US Aggregate ex-Corporate Portfolio
Other information (unaudited)
LIQUIDITY RISK MANAGEMENT PROGRAM
In accordance with Rule 22e-4 under the Investment Company Act of 1940, as amended (the “Liquidity Rule”), Allspring Master Trust (the “Trust”) has adopted and implemented a liquidity risk management program (the “Program”) on behalf of each of its series, including the Portfolio, which is reasonably designed to assess and manage the Portfolio's liquidity risk. “Liquidity risk” is defined under the Liquidity Rule as the risk that the Portfolio is unable to meet redemption requests without significantly diluting remaining investors’ interests in the Portfolio. The Trust’s Board of Trustees (the “Board”) previously approved the designation of Allspring Funds Management, LLC (“Allspring Funds Management”), the Portfolio's investment adviser, to administer the Program, and Allspring Funds Management has established a Liquidity Risk Management Council (the "Council") composed of personnel from multiple departments within Allspring Funds Management and its affiliates to assist Allspring Funds Management in the administration of the Program.
The Program is comprised of various components designed to support the assessment and/or management of liquidity risk, including: (1) the periodic assessment (no less frequently than annually) of certain factors that influence the Portfolio's liquidity risk; (2) the periodic classification (no less frequently than monthly) of the Portfolio's investments into one of four liquidity categories that reflect an estimate of their liquidity under current market conditions; (3) a 15% limit on the acquisition of “illiquid investments” (as defined under the Liquidity Rule); (4) to the extent the Portfolio does not invest primarily in “highly liquid investments” (as defined under the Liquidity Rule), the determination of a minimum percentage of the Portfolio's assets that generally will be invested in highly liquid investments (an “HLIM”); (5) if the Portfolio has established an HLIM, the periodic review (no less frequently than annually) of the HLIM and the adoption of policies and procedures for responding to a shortfall of the Portfolio's “highly liquid investments” below its HLIM; and (6) periodic reporting to the Board.
At a meeting of the Board held on May 24-25, 2022, the Board received and reviewed a written report (the “Report”) from Allspring Funds Management that, among other things, addressed the operation of the Program and assessed its adequacy and effectiveness for the period from January 1, 2021 through December 31, 2021 (the “Reporting Period”). Other than extended foreign market holidays, no significant liquidity events impacting the Portfolios were noted in the Report. In addition, other than corporate-related changes to the Program, there were no material changes to the Program during the Reporting Period.
Allspring Funds Management determined in the Report that the Program has been implemented and operates effectively to manage the Portfolio’s liquidity risk, and Allspring Funds Management continues to believe that the Program has been and continues to be adequately and effectively implemented to monitor and, as applicable, respond to the Portfolio’s liquidity developments.
There can be no assurance that the Program will achieve its objectives under all circumstances in the future.
Allspring Bloomberg US Aggregate ex-Corporate Portfolio | 27
For more information
More information about Allspring Funds is available free upon request. To obtain literature, please write, visit the Portfolio's website, or call:
Allspring Funds
P.O. Box 219967
Kansas City, MO 64121-9967
Website: allspringglobal.com
Individual investors: 1-800-222-8222
Retail investment professionals: 1-888-877-9275
Institutional investment professionals: 1-800-260-5969
This report and the financial statements contained herein are submitted for the general information of the interest holders of the Portfolio. If this report is used for promotional purposes, distribution of the report must be accompanied or preceded by a current prospectus. Before investing, please consider the investment objectives, risks, charges, and expenses of the investment. For a current prospectus and, if available, a summary prospectus, containing this information, call
1-800-222-8222. Read the prospectus carefully before you invest or send money.
Allspring Global InvestmentsTM is the trade name for the asset management firms of Allspring Global Investments Holdings, LLC, a holding company indirectly owned by certain private funds of GTCR LLC and Reverence Capital Partners, L.P. These firms include but are not limited to Allspring Global Investments, LLC, and Allspring Funds Management, LLC. Certain products managed by Allspring entities are distributed by Allspring Funds Distributor, LLC (a broker-dealer and Member FINRA/SIPC).
This material is for general informational and educational purposes only and is NOT intended to provide investment advice or a recommendation of any kind - including a recommendation for any specific investment, strategy, or plan.
© 2022 Allspring Global Investments Holdings, LLC. All rights reserved.
Semi-Annual Report
August 31, 2022
Allspring
Emerging Markets Bond Portfolio
Allspring Emerging Markets Bond Portfolio | 1
Portfolio information (unaudited)
Investment objectiveThe Portfolio seeks to replicate the total return of the JP Morgan EMBI Global Diversified Index† before fees and expenses.
| Adviser | Allspring Funds Management, LLC |
| Subadvisers | Allspring Global Investments (UK) Limited |
| | Allspring Global Investments, LLC |
| Portfolio managers | Richard Bishop, CFA®‡, Manjunath Boraiah, Michael Lee, Limin Xiao, CFA®‡, Ph.D. |
| Ten largest holdings (%) as of August 31, 20221 |
| Qatar Government, 4.63%, 6-2-2046 | 3.30 |
| State Grid Overseas Investment (2014) Limited, 4.13%, 5-7-2024 | 2.91 |
| Oman Government, 6.50%, 3-8-2047 | 2.53 |
| Dominican Republic, 5.95%, 1-25-2027 | 2.47 |
| Petronas Capital Limited Bhd, 4.50%, 3-18-2045 | 2.16 |
| Republic of Panama, 4.50%, 5-15-2047 | 2.03 |
| Oriental Republic of Uruguay, 5.10%, 6-18-2050 | 1.66 |
| Republic of Philippines, 5.50%, 3-30-2026 | 1.53 |
| Qatar Government, 4.00%, 3-14-2029 | 1.48 |
| Perusahaan Penerbit SBSN Indonesia III, 4.45%, 2-20-2029 | 1.47 |
| 1 | Figures represent the percentage of the Portfolio's net assets. Holdings are subject to change and may have changed since the date specified. |
| Portfolio composition as of August 31, 20221 |
| 1 | Figures represent the percentage of the Portfolio's long-term investments. Allocations are subject to change and may have changed since the date specified. |
| † | The JP Morgan Emerging Markets Bond Index (“EMBI”) Global Diversified Index is a composite index representing an unleveraged investment in emerging market bonds that is broadly based across the spectrum of emerging market bonds and includes reinvestment of income (to represent real assets). You cannot invest directly in an index. |
| ‡ | CFA® and Chartered Financial Analyst® are trademarks owned by CFA Institute. |
2 | Allspring Emerging Markets Bond Portfolio
Portfolio of investments—August 31, 2022 (unaudited)
| | | Interest
rate | Maturity
date | | Principal | Value |
| Yankee corporate bonds and notes: 22.72% | | | | | | |
| Chile: 1.46% | | | | | | |
| Codelco Incorporated (Materials, Metals & mining) | | 4.25% | 7-17-2042 | $ | 250,000 | $ 201,854 |
| China: 5.72% | | | | | | |
| Sinopec Group Overseas Development (2015) Limited (Energy, Oil, gas & consumable fuels) | | 3.25 | 4-28-2025 | | 200,000 | 195,814 |
| State Grid Overseas Investment (2014) Limited (Utilities, Electric utilities) | | 4.13 | 5-7-2024 | | 400,000 | 401,515 |
| State Grid Overseas Investment (2016) Limited (Utilities, Electric utilities) | | 2.88 | 5-18-2026 | | 200,000 | 192,622 |
| | | | | | | 789,951 |
| Indonesia: 2.46% | | | | | | |
| PT Pertamina Persero Tbk (Energy, Oil, gas & consumable fuels) | | 5.63 | 5-20-2043 | | 200,000 | 192,905 |
| PT Perusahaan Listrik Negara Tbk (Utilities, Electric utilities) | | 4.00 | 6-30-2050 | | 200,000 | 146,750 |
| | | | | | | 339,655 |
| Kazakhstan: 1.19% | | | | | | |
| KazMunayGas National Company JSC (Energy, Oil, gas & consumable fuels) | | 5.75 | 4-19-2047 | | 200,000 | 164,336 |
| Malaysia: 3.55% | | | | | | |
| Petronas Capital Limited Bhd (Energy, Oil, gas & consumable fuels) | | 3.50 | 4-21-2030 | | 200,000 | 191,792 |
| Petronas Capital Limited Bhd (Energy, Oil, gas & consumable fuels) | | 4.50 | 3-18-2045 | | 300,000 | 297,856 |
| | | | | | | 489,648 |
| Mexico: 1.58% | | | | | | |
| Petroleos Mexicanos Company (Energy, Oil, gas & consumable fuels) | | 6.35 | 2-12-2048 | | 30,000 | 18,187 |
| Petroleos Mexicanos Company (Energy, Oil, gas & consumable fuels) | | 6.38 | 1-23-2045 | | 30,000 | 18,777 |
| Petroleos Mexicanos Company (Energy, Oil, gas & consumable fuels) | | 6.50 | 6-2-2041 | | 30,000 | 19,152 |
| Petroleos Mexicanos Company (Energy, Oil, gas & consumable fuels) | | 6.75 | 9-21-2047 | | 110,000 | 69,367 |
| Petroleos Mexicanos Company (Energy, Oil, gas & consumable fuels) | | 6.95 | 1-28-2060 | | 50,000 | 31,381 |
| Petroleos Mexicanos Company (Energy, Oil, gas & consumable fuels) | | 7.69 | 1-23-2050 | | 90,000 | 62,010 |
| | | | | | | 218,874 |
| Peru: 1.15% | | | | | | |
| Petroleos del Peru - Petroperu SA (Energy, Oil, gas & consumable fuels) | | 4.75 | 6-19-2032 | | 200,000 | 159,412 |
| Saudi Arabia: 1.39% | | | | | | |
| KSA Sukuk Limited (Financials, Diversified financial services) | | 2.97 | 10-29-2029 | | 200,000 | 191,281 |
| South Africa: 1.37% | | | | | | |
| Eskom Holdings SOC Limited (Utilities, Electric utilities) | | 6.35 | 8-10-2028 | | 200,000 | 189,148 |
The accompanying notes are an integral part of these financial statements.
Allspring Emerging Markets Bond Portfolio | 3
Portfolio of investments—August 31, 2022 (unaudited)
| | | Interest
rate | Maturity
date | | Principal | Value |
| United Arab Emirates: 2.85% | | | | | | |
| Abu Dhabi Crude Oil Pipeline LLC (Energy, Oil, gas & consumable fuels) | | 4.60% | 11-2-2047 | $ | 200,000 | $ 196,100 |
| Mamoura Diversified Global Holding GMTN BV (Financials, Diversified financial services) | | 3.00 | 4-19-2024 | | 200,000 | 197,500 |
| | | | | | | 393,600 |
| Total Yankee corporate bonds and notes (Cost $3,533,560) | | | | | | 3,137,759 |
| Yankee government bonds: 74.37% | | | | | | |
| Abu Dhabi Government | | 3.88 | 4-16-2050 | | 200,000 | 181,271 |
| Arab Republic of Egypt | | 5.88 | 6-11-2025 | | 200,000 | 174,620 |
| Arab Republic of Egypt | | 8.70 | 3-1-2049 | | 200,000 | 126,852 |
| Arab Republic of Egypt | | 8.75 | 9-30-2051 | | 200,000 | 126,430 |
| Dominican Republic | | 5.88 | 1-30-2060 | | 200,000 | 141,338 |
| Dominican Republic | | 5.95 | 1-25-2027 | | 350,000 | 341,803 |
| Federative Republic of Brazil | | 4.50 | 5-30-2029 | | 200,000 | 185,604 |
| Federative Republic of Brazil | | 4.63 | 1-13-2028 | | 200,000 | 191,700 |
| Federative Republic of Brazil | | 5.00 | 1-27-2045 | | 200,000 | 153,896 |
| Federative Republic of Brazil | | 7.13 | 1-20-2037 | | 15,000 | 15,644 |
| Islamic Republic of Pakistan | | 8.25 | 9-30-2025 | | 200,000 | 136,031 |
| Kingdom of Bahrain | | 6.75 | 9-20-2029 | | 200,000 | 196,992 |
| Kingdom of Bahrain | | 7.00 | 10-12-2028 | | 200,000 | 201,162 |
| Lebanese Republic † | | 6.60 | 11-27-2026 | | 250,000 | 16,300 |
| Lebanese Republic † | | 6.65 | 2-26-2030 | | 50,000 | 3,438 |
| Lebanese Republic † | | 7.05 | 11-2-2035 | | 200,000 | 13,040 |
| Oman Government | | 4.75 | 6-15-2026 | | 200,000 | 194,317 |
| Oman Government | | 6.50 | 3-8-2047 | | 400,000 | 349,614 |
| Oriental Republic of Uruguay | | 4.98 | 4-20-2055 | | 100,000 | 100,506 |
| Oriental Republic of Uruguay | | 5.10 | 6-18-2050 | | 225,000 | 229,423 |
| Perusahaan Penerbit SBSN Indonesia III | | 4.45 | 2-20-2029 | | 200,000 | 202,750 |
| Qatar Government | | 4.00 | 3-14-2029 | | 200,000 | 203,802 |
| Qatar Government | | 4.63 | 6-2-2046 | | 450,000 | 455,686 |
| Republic of Angola | | 8.25 | 5-9-2028 | | 200,000 | 173,220 |
| Republic of Argentina øø | | 1.50 | 7-9-2030 | | 100,000 | 23,750 |
| Republic of Argentina øø | | 1.50 | 7-9-2035 | | 175,000 | 39,352 |
| Republic of Argentina øø | | 3.50 | 7-9-2041 | | 145,000 | 38,044 |
| Republic of Argentina øø | | 3.88 | 1-9-2038 | | 215,000 | 60,240 |
| Republic of Chile | | 3.13 | 1-21-2026 | | 200,000 | 191,421 |
| Republic of Chile | | 3.86 | 6-21-2047 | | 200,000 | 159,836 |
| Republic of Colombia | | 4.13 | 5-15-2051 | | 200,000 | 118,370 |
| Republic of Colombia | | 4.50 | 1-28-2026 | | 200,000 | 189,085 |
| Republic of Colombia | | 7.38 | 9-18-2037 | | 150,000 | 142,249 |
| Republic of Ecuador øø | | 2.50 | 7-31-2035 | | 200,000 | 76,962 |
| Republic of Ecuador øø | | 5.50 | 7-31-2030 | | 100,000 | 52,593 |
| Republic of El Salvador | | 5.88 | 1-30-2025 | | 20,000 | 9,952 |
| Republic of El Salvador | | 7.65 | 6-15-2035 | | 60,000 | 20,657 |
| Republic of Ghana | | 6.38 | 2-11-2027 | | 200,000 | 86,000 |
| Republic of Ghana | | 8.13 | 1-18-2026 | | 200,000 | 121,820 |
| Republic of Guatemala | | 4.38 | 6-5-2027 | | 200,000 | 193,866 |
| Republic of Hungary | | 5.38 | 3-25-2024 | | 200,000 | 201,032 |
| Republic of Hungary | | 7.63 | 3-29-2041 | | 80,000 | 92,188 |
| Republic of Iraq | | 5.80 | 1-15-2028 | | 171,875 | 143,045 |
| Republic of Jamaica | | 8.00 | 3-15-2039 | | 100,000 | 118,169 |
| Republic of Kazakhstan | | 6.50 | 7-21-2045 | | 200,000 | 201,140 |
| Republic of Kenya | | 6.88 | 6-24-2024 | | 200,000 | 174,016 |
The accompanying notes are an integral part of these financial statements.
4 | Allspring Emerging Markets Bond Portfolio
Portfolio of investments—August 31, 2022 (unaudited)
| | | Interest
rate | Maturity
date | | Principal | Value |
| Yankee government bonds: 74.37% (continued) | | | | | | |
| Republic of Nigeria | | 7.63% | 11-21-2025 | $ | 200,000 | $ 177,078 |
| Republic of Nigeria | | 7.63 | 11-28-2047 | | 200,000 | 122,500 |
| Republic of Panama | | 3.87 | 7-23-2060 | | 200,000 | 137,693 |
| Republic of Panama | | 4.50 | 5-15-2047 | | 350,000 | 280,444 |
| Republic of Peru | | 2.78 | 12-1-2060 | | 20,000 | 12,466 |
| Republic of Peru | | 3.55 | 3-10-2051 | | 40,000 | 29,790 |
| Republic of Peru | | 4.13 | 8-25-2027 | | 100,000 | 98,021 |
| Republic of Peru | | 5.63 | 11-18-2050 | | 100,000 | 103,975 |
| Republic of Philippines | | 2.65 | 12-10-2045 | | 200,000 | 144,147 |
| Republic of Philippines | | 3.70 | 2-2-2042 | | 200,000 | 171,968 |
| Republic of Philippines | | 5.50 | 3-30-2026 | | 200,000 | 211,558 |
| Republic of Poland | | 4.00 | 1-22-2024 | | 40,000 | 39,918 |
| Republic of South Africa | | 6.25 | 3-8-2041 | | 200,000 | 163,712 |
| Republic of Sri Lanka | | 6.35 | 6-28-2024 | | 200,000 | 65,989 |
| Republic of Turkey | | 4.88 | 10-9-2026 | | 200,000 | 166,158 |
| Republic of Turkey | | 5.60 | 11-14-2024 | | 200,000 | 183,990 |
| Republic of Turkey | | 6.63 | 2-17-2045 | | 200,000 | 134,964 |
| Republic of Turkey | | 7.38 | 2-5-2025 | | 180,000 | 171,115 |
| Republic of Venezuela † | | 6.00 | 12-9-2020 | | 225,000 | 15,750 |
| Republic of Venezuela † | | 7.00 | 3-31-2038 | | 200,000 | 16,500 |
| Romania Government | | 4.00 | 2-14-2051 | | 150,000 | 103,436 |
| Romania Government | | 4.88 | 1-22-2024 | | 60,000 | 60,186 |
| Romania Government | | 5.13 | 6-15-2048 | | 140,000 | 115,410 |
| Saudi Government | | 3.63 | 3-4-2028 | | 200,000 | 198,784 |
| Saudi Government | | 4.50 | 10-26-2046 | | 200,000 | 186,620 |
| Trinidad & Tobago Government | | 4.50 | 8-4-2026 | | 200,000 | 197,678 |
| United Mexican States | | 3.25 | 4-16-2030 | | 200,000 | 178,259 |
| United Mexican States | | 4.75 | 3-8-2044 | | 40,000 | 33,887 |
| United Mexican States | | 5.55 | 1-21-2045 | | 20,000 | 18,684 |
| United Mexican States | | 6.05 | 1-11-2040 | | 20,000 | 20,020 |
| United Mexican States | | 6.75 | 9-27-2034 | | 130,000 | 142,959 |
| Total Yankee government bonds (Cost $12,912,902) | | | | | | 10,272,885 |
| Total investments in securities (Cost $16,446,462) | 97.09% | | | | | 13,410,644 |
| Other assets and liabilities, net | 2.91 | | | | | 401,975 |
| Total net assets | 100.00% | | | | | $13,812,619 |
| † | Non-income-earning security |
| øø | The interest rate is determined and reset by the issuer periodically depending upon the terms of the security. The rate shown is the rate in effect at period end. |
The accompanying notes are an integral part of these financial statements.
Allspring Emerging Markets Bond Portfolio | 5
Portfolio of investments—August 31, 2022 (unaudited)
Investments in affiliates
An affiliated investment is an investment in which the Portfolio owns at least 5% of the outstanding voting shares of the issuer or as a result of other relationships, such as the Portfolio and the issuer having the same adviser or investment manager. Transactions with issuers that were affiliates of the Portfolio at the end of the period were as follows:
| | Value,
beginning of
period | Purchases | Sales
proceeds | Net
realized
gains
(losses) | Net
change in
unrealized
gains
(losses) | Value,
end of
period | Shares,
end
of period | Income
from
affiliated
securities |
Investments in affiliates no longer held
at end of period | | | | | | | | |
| Allspring Government Money Market Fund Select Class | $783,628 | $13,704,631 | $(14,488,259) | $0 | $0 | $0 | 0 | $4,555 |
The accompanying notes are an integral part of these financial statements.
6 | Allspring Emerging Markets Bond Portfolio
Statement of assets and liabilities—August 31, 2022 (unaudited)
| | |
| Assets | |
Investments in unaffiliated securities, at value (cost $16,446,462)
| $ 13,410,644 |
Foreign currency, at value (cost $3)
| 3 |
Receivable for interest
| 236,152 |
Receivable for investments sold
| 227,497 |
Receivable from adviser
| 6,329 |
Prepaid expenses and other assets
| 175 |
Total assets
| 13,880,800 |
| Liabilities | |
Professional fees payable
| 25,065 |
Overdraft due to custodian bank
| 24,878 |
Interest holder report expenses payable
| 10,499 |
Custody and accounting fees payable
| 5,112 |
Trustees’ fees and expenses payable
| 2,611 |
Accrued expenses and other liabilities
| 16 |
Total liabilities
| 68,181 |
Total net assets
| $13,812,619 |
The accompanying notes are an integral part of these financial statements.
Allspring Emerging Markets Bond Portfolio | 7
Statement of operations—six months ended August 31, 2022 (unaudited)
| | |
| Investment income | |
Interest
| $ 712,448 |
Income from affiliated securities
| 4,555 |
Total investment income
| 717,003 |
| Expenses | |
Advisory fee
| 30,999 |
Custody and accounting fees
| 6,685 |
Professional fees
| 35,292 |
Interest holder report expenses
| 13,114 |
Trustees’ fees and expenses
| 11,153 |
Other fees and expenses
| 1,733 |
Total expenses
| 98,976 |
Less: Fee waivers and/or expense reimbursements
| (64,501) |
Net expenses
| 34,475 |
Net investment income
| 682,528 |
| Realized and unrealized gains (losses) on investments | |
Net realized losses on investments
| (3,844,051) |
Net change in unrealized gains (losses) on investments
| 652,525 |
Net realized and unrealized gains (losses) on investments
| (3,191,526) |
Net decrease in net assets resulting from operations
| $(2,508,998) |
The accompanying notes are an integral part of these financial statements.
8 | Allspring Emerging Markets Bond Portfolio
Statement of changes in net assets
| | | |
| | Six months ended
August 31, 2022
(unaudited) | Year ended
February 28, 2022 |
| Operations | | |
Net investment income
| $ 682,528 | $ 1,612,596 |
Net realized losses on investments
| (3,844,051) | (819,137) |
Net change in unrealized gains (losses) on investments
| 652,525 | (3,305,043) |
Net decrease in net assets resulting from operations
| (2,508,998) | (2,511,584) |
| Capital transactions | | |
| Transactions in investors’ beneficial interests | | |
Contributions
| 3,690,556 | 10,033,276 |
Withdrawals
| (20,456,208) | (11,352,841) |
Net decrease in net assets resulting from capital transactions
| (16,765,652) | (1,319,565) |
Total decrease in net assets
| (19,274,650) | (3,831,149) |
| Net assets | | |
Beginning of period
| 33,087,269 | 36,918,418 |
End of period
| $ 13,812,619 | $ 33,087,269 |
The accompanying notes are an integral part of these financial statements.
Allspring Emerging Markets Bond Portfolio | 9
| | | Year ended February 28 |
| | Six months ended
August 31, 2022
(unaudited) | 2022 | 2021 | 2020 1 | 2019 | 2018 2 |
Total return3
| (9.72)% | (7.29)% | (0.31)% | 8.59% | 2.84% | 0.62% |
| Ratios to average net assets (annualized) | | | | | | |
Gross expenses
| 0.80% | 0.62% | 0.54% | 0.51% | 0.44% | 0.44% |
Net expenses
| 0.28% * | 0.28% * | 0.29% * | 0.35% | 0.40% | 0.43% |
Net investment income
| 5.50% | 4.41% | 4.37% | 4.95% | 4.70% | 4.19% |
| Supplemental data | | | | | | |
Portfolio turnover rate
| 6% | 25% | 31% | 36% | 38% | 174% |
| * | Ratio includes expenses which were voluntarily waived by the adviser. Without these voluntary waivers, the net expense ratios would be increased by the following amounts: |
| Six months ended August 31, 2022 (unaudited) | 0.52% |
| Year ended February 28, 2022 | 0.34% |
| Year ended February 28, 2021 | 0.25% |
| 1 | Year ended February 29 |
| 2 | For the period from May 23, 2017 (commencement of operations) to February 28, 2018 |
| 3 | Returns for periods of less than one year are not annualized. |
The accompanying notes are an integral part of these financial statements.
10 | Allspring Emerging Markets Bond Portfolio
Notes to financial statements (unaudited)
1. ORGANIZATION
Allspring Master Trust (the "Trust"), a Delaware statutory trust organized on March 10, 1999, is an open-end management investment company registered under the Investment Company Act of 1940, as amended (the "1940 Act"). As an investment company, the Trust follows the accounting and reporting guidance in Financial Accounting Standards Board ("FASB") Accounting Standards Codification Topic 946, Financial Services – Investment Companies. These financial statements report on the Allspring Emerging Markets Bond Portfolio (the "Portfolio") which is a diversified series of the Trust.
Interests in the Portfolio are available solely through private placement transactions that do not involve any "public offering" within the meaning of Section 4(a)(2) of the Securities Act of 1933.
2. SIGNIFICANT ACCOUNTING POLICIES
The following significant accounting policies, which are consistently followed in the preparation of the financial statements of the Portfolio, are in conformity with U.S. generally accepted accounting principles which require management to make estimates and assumptions that affect the reported amounts of assets and liabilities, disclosure of contingent assets and liabilities at the date of the financial statements, and the reported amounts of income and expenses during the reporting period. Actual results could differ from those estimates.
Securities valuation
All investments are valued each business day as of the close of regular trading on the New York Stock Exchange (generally 4 p.m. Eastern Time), although the Portfolio may deviate from this calculation time under unusual or unexpected circumstances.
Debt securities are valued at the evaluated bid price provided by an independent pricing service (e.g. taking into account various factors, including yields, maturities, or credit ratings) or, if a reliable price is not available, the quoted bid price from an independent broker-dealer.
Investments in registered open-end investment companies are valued at net asset value.
Investments which are not valued using any of the methods discussed above are valued at their fair value, as determined in good faith by the Board of Trustees. The Board of Trustees has established a Valuation Committee comprised of the Trustees and has delegated to it the authority to take any actions regarding the valuation of portfolio securities that the Valuation Committee deems necessary or appropriate, including determining the fair value of portfolio securities, unless the determination has been delegated to the Allspring Global Investments Pricing Committee at Allspring Funds Management, LLC ("Allspring Funds Management"). The Board of Trustees retains the authority to make or ratify any valuation decisions or approve any changes to the Valuation Procedures as it deems appropriate. On a quarterly basis, the Board of Trustees receives reports on any valuation actions taken by the Valuation Committee or the Allspring Global Investments Pricing Committee which may include items for ratification.
Foreign currency translation
The accounting records of the Portfolio are maintained in U.S. dollars. The values of other assets and liabilities denominated in foreign currencies are translated into U.S. dollars at rates provided by an independent foreign currency pricing source at a time each business day specified by the Allspring Global Investments Pricing Committee. Purchases and sales of securities, and income and expenses are converted at the rate of exchange on the respective dates of such transactions. Net realized foreign exchange gains or losses arise from sales of foreign currencies, currency gains or losses realized between the trade and settlement dates on securities transactions, and the difference between the amounts of dividends, interest and foreign withholding taxes recorded and the U.S. dollar equivalent of the amounts actually paid or received. Net unrealized foreign exchange gains and losses arise from changes in the fair value of assets and liabilities other than investments in securities resulting from changes in exchange rates. The changes in net assets arising from changes in exchange rates of securities and the changes in net assets resulting from changes in market prices of securities are not separately presented. Such changes are included in net realized and unrealized gains or losses from investments.
Security transactions and income recognition
Securities transactions are recorded on a trade date basis. Realized gains or losses are recorded on the basis of identified cost.
Interest income is accrued daily and bond discounts are accreted and premiums are amortized daily. To the extent debt obligations are placed on non-accrual status, any related interest income may be reduced by writing off interest receivables when the collection of all or a portion of interest has been determined to be doubtful based on consistently applied procedures
Allspring Emerging Markets Bond Portfolio | 11
Notes to financial statements (unaudited)
and the fair value has decreased. If the issuer subsequently resumes interest payments or when the collectability of interest is reasonably assured, the debt obligation is removed from non-accrual status. Paydown gains and losses are included in interest income.
Federal and other taxes
The Portfolio is not required to pay federal income taxes on its net investment income and net capital gains as it is treated as a partnership for federal income tax purposes. All income, gains and losses of the Portfolio are deemed to have been “passed through” to the interest holders in proportion to their holdings of the Portfolio regardless of whether income and gains have been distributed by the Portfolio.
The Portfolio’s income tax returns and all financial records supporting those returns for the prior three fiscal years are subject to examination by the federal revenue authority. Management has analyzed the Portfolio’s tax positions taken on federal, state, and foreign tax returns, as applicable, for all open tax years and does not believe that there are any uncertain tax positions that require recognition of a tax liability.
As of August 31, 2022, the aggregate cost of all investments for federal income tax purposes was $16,571,800 and the unrealized gains (losses) consisted of:
| Gross unrealized gains | $ 20,484 |
| Gross unrealized losses | (3,181,640) |
| Net unrealized losses | $(3,161,156) |
3. FAIR VALUATION MEASUREMENTS
Fair value measurements of investments are determined within a framework that has established a fair value hierarchy based upon the various data inputs utilized in determining the value of the Portfolio’s investments. The three-level hierarchy gives the highest priority to unadjusted quoted prices in active markets for identical assets or liabilities (Level 1) and the lowest priority to unobservable inputs (Level 3). The Portfolio’s investments are classified within the fair value hierarchy based on the lowest level of input that is significant to the fair value measurement. The inputs are summarized into three broad levels as follows:
| ■ | Level 1 – quoted prices in active markets for identical securities |
| ■ | Level 2 – other significant observable inputs (including quoted prices for similar securities, interest rates, prepayment speeds, credit risk, etc.) |
| ■ | Level 3 – significant unobservable inputs (including the Portfolio’s own assumptions in determining the fair value of investments) |
The inputs or methodologies used for valuing investments in securities are not necessarily an indication of the risk associated with investing in those securities.
The following is a summary of the inputs used in valuing the Portfolio’s assets and liabilities as of August 31, 2022:
| | Quoted prices
(Level 1) | Other significant
observable inputs
(Level 2) | Significant
unobservable inputs
(Level 3) | Total |
| Assets | | | | |
| Investments in: | | | | |
| Yankee corporate bonds and notes | $0 | $ 3,137,759 | $0 | $ 3,137,759 |
| Yankee government bonds | 0 | 10,272,885 | 0 | 10,272,885 |
| Total assets | $0 | $13,410,644 | $0 | $13,410,644 |
Additional sector, industry or geographic detail, if any, is included in the Portfolio of Investments.
For the six months ended August 31, 2022, the Portfolio did not have any transfers into/out of Level 3.
12 | Allspring Emerging Markets Bond Portfolio
Notes to financial statements (unaudited)
4. TRANSACTIONS WITH AFFILIATES
Advisory fee
The Trust has entered into an advisory contract with Allspring Funds Management, a wholly owned subsidiary of Allspring Global Investments Holdings, LLC, a holding company indirectly owned by certain private funds of GTCR LLC and Reverence Capital Partners, L.P. The adviser is responsible for implementing investment policies and guidelines and for supervising the subadvisers, who are responsible for day-to-day portfolio management of the Portfolio. Pursuant to the contract, Allspring Funds Management is entitled to receive an advisory fee at the following annual rate based on the Portfolio’s average daily net assets:
| Average daily net assets | Advisory fee |
| First $5 billion | 0.250% |
| Next $5 billion | 0.230 |
| Over $10 billion | 0.210 |
For the six months ended August 31, 2022, the advisory fee was equivalent to an annual rate of 0.25% of the Portfolio’s average daily net assets.
Allspring Funds Management has retained the services of a subadviser to provide daily portfolio management to the Portfolio. The fee for subadvisory services is borne by Allspring Funds Management. Allspring Global Investments (UK) Limited, ("Allspring UK"), an affiliate of Allspring Funds Management and a wholly owned subsidiary of Allspring Global Investments Holdings, LLC, is the subadviser to the Portfolio and is entitled to receive a fee from Allspring Funds Management at an annual rate starting at 0.09% and declining to 0.07% as the average daily net assets of the Portfolio increase. Allspring Global Investments, LLC, an affiliate of Allspring Funds Management and wholly owned subsidiary ofAllspring Global Investments Holdings, LLC, is also a subadviser to the Portfolio and is entitled to receive a fee from Allspring UK at an annual rate starting at 0.0045% and declining to 0.0035% as the average daily net assets of the Portfolio increase.
Allspring Funds Management has voluntarily waived and/or reimbursed advisory fees to reduce the net operating expense ratio of the Portfolio. These voluntary waivers may be discontinued at any time.
Interfund transactions
The Portfolio may purchase or sell portfolio investment securities to certain affiliates pursuant to Rule 17a-7 under the 1940 Act and under procedures adopted by the Board of Trustees. The procedures have been designed to ensure that these interfund transactions, which do not incur broker commissions, are effected at current market prices.
5. INVESTMENT PORTFOLIO TRANSACTIONS
Purchases and sales of investments, excluding U.S. government obligations (if any) and short-term securities, for the six months ended August 31, 2022 were $1,375,522 and $16,461,969, respectively.
6. BANK BORROWINGS
The Trust, along with Allspring Variable Trust and Allspring Funds Trust (excluding the money market funds), are parties to a $350,000,000 revolving credit agreement whereby the Portfolio is permitted to use bank borrowings for temporary or emergency purposes, such as to fund interest holders withdrawal requests. Interest under the credit agreement is charged to the Portfolio based on a borrowing rate equal to the higher of the Federal Funds rate or the overnight bank funding rate in effect on that day plus a spread. In addition, an annual commitment fee equal based on the unused balance is allocated to each participating fund.
For the six months ended August 31, 2022, there were no borrowings by the Portfolio under the agreement.
7. INDEMNIFICATION
Under the Portfolio's organizational documents, the officers and Trustees have been granted certain indemnification rights against certain liabilities that may arise out of performance of their duties to the Portfolio. The Portfolio has entered into a separate agreement with each Trustee that converts indemnification rights currently existing under the Portfolio’s organizational documents into contractual rights that cannot be changed in the future without the consent of the Trustee. Additionally, in the normal course of business, the Portfolio may enter into contracts with service providers that contain a
Allspring Emerging Markets Bond Portfolio | 13
Notes to financial statements (unaudited)
variety of indemnification clauses. The Portfolio’s maximum exposure under these arrangements is dependent on future claims that may be made against the Portfolio and, therefore, cannot be estimated.
8. CORONAVIRUS (COVID-19) PANDEMIC
On March 11, 2020, the World Health Organization announced that it had made the assessment that coronavirus disease 2019 (“COVID-19”) is a pandemic. The impacts of COVID-19 are affecting the entire global economy, individual companies and investment products, the funds, and the market in general. There is significant uncertainty around the extent and duration of business disruptions related to COVID-19 and the impacts may last for an extended period of time. COVID-19 has led to significant uncertainty and volatility in the financial markets.
14 | Allspring Emerging Markets Bond Portfolio
Other information (unaudited)
PROXY VOTING INFORMATION
A description of the policies and procedures used to determine how to vote proxies relating to portfolio securities is available without charge, upon request, by calling 1-800-222-8222, visiting our website at allspringglobal.com, or visiting the SEC website at sec.gov. Information regarding how the proxies related to portfolio securities were voted during the most recent 12-month period ended June 30 is available on the website at allspringglobal.com or by visiting the SEC website at sec.gov.
QUARTERLY PORTFOLIO HOLDINGS INFORMATION
The Portfolio files its complete schedule of portfolio holdings with the SEC for the first and third quarters of each fiscal year as an exhibit to its reports on Form N-PORT. Interest holders may view the filed Form N-PORT by visiting the SEC website at sec.gov.
Allspring Emerging Markets Bond Portfolio | 15
Other information (unaudited)
BOARD OF TRUSTEES AND OFFICERS
Each of the Trustees and Officers listed in the table below acts in identical capacities for each fund in the Allspring family of funds, which consists of 124 mutual funds comprising the Allspring Funds Trust, Allspring Variable Trust, Allspring Master Trust and four closed-end funds (collectively the “Fund Complex”). This table should be read in conjunction with the Prospectus and the Statement of Additional Information1. The mailing address of each Trustee and Officer is 525 Market Street, 12th Floor, San Francisco, CA 94105. Each Trustee and Officer serves an indefinite term, however, each Trustee serves such term until reaching the mandatory retirement age established by the Trustees.
Independent Trustees
Name and
year of birth | Position held and
length of service* | Principal occupations during past five years or longer | Current other
public company or
investment
company
directorships |
William R. Ebsworth
(Born 1957) | Trustee,
since 2015 | Retired. From 1984 to 2013, equities analyst, portfolio manager, research director and chief investment officer at Fidelity Management and Research Company in Boston, Tokyo, and Hong Kong, and retired in 2013 as Chief Investment Officer of Fidelity Strategic Advisers, Inc. where he led a team of investment professionals managing client assets. Prior thereto, Board member of Hong Kong Securities Clearing Co., Hong Kong Options Clearing Corp., the Thailand International Fund, Ltd., Fidelity Investments Life Insurance Company, and Empire Fidelity Investments Life Insurance Company. Audit Committee Chair and Investment Committee Chair of the Vincent Memorial Hospital Endowment (non-profit organization). Mr. Ebsworth is a CFA® charterholder. | N/A |
Jane A. Freeman
(Born 1953) | Trustee,
since 2015;
Chair Liaison,
since 2018 | Retired. From 2012 to 2014 and 1999 to 2008, Chief Financial Officer of Scientific Learning Corporation. From 2008 to 2012, Ms. Freeman provided consulting services related to strategic business projects. Prior to 1999, Portfolio Manager at Rockefeller & Co. and Scudder, Stevens & Clark. Board member of the Harding Loevner Funds from 1996 to 2014, serving as both Lead Independent Director and chair of the Audit Committee. Board member of the Russell Exchange Traded Funds Trust from 2011 to 2012 and the chair of the Audit Committee. Ms. Freeman is also an inactive Chartered Financial Analyst. | N/A |
Isaiah Harris, Jr.
(Born 1952) | Trustee,
since 2009; Audit
Committee
Chair,
since 2019 | Retired. Chairman of the Board of CIGNA Corporation from 2009 to 2021, and Director from 2005 to 2008. From 2003 to 2011, Director of Deluxe Corporation. Prior thereto, President and CEO of BellSouth Advertising and Publishing Corp. from 2005 to 2007, President and CEO of BellSouth Enterprises from 2004 to 2005 and President of BellSouth Consumer Services from 2000 to 2003. Emeritus member of the Iowa State University Foundation Board of Governors. Emeritus Member of the Advisory Board of Iowa State University School of Business. Advisory Board Member, Palm Harbor Academy (private school). Advisory Board Member, Fellowship of Christian Athletes. Mr. Harris is a certified public accountant (inactive status). | N/A |
David F. Larcker
(Born 1950) | Trustee,
since 2009 | James Irvin Miller Professor of Accounting at the Graduate School of Business (Emeritus), Stanford University, Director of the Corporate Governance Research Initiative and Senior Faculty of The Rock Center for Corporate Governance since 2006. From 2005 to 2008, Professor of Accounting at the Graduate School of Business, Stanford University. Prior thereto, Ernst & Young Professor of Accounting at The Wharton School, University of Pennsylvania from 1985 to 2005. | N/A |
16 | Allspring Emerging Markets Bond Portfolio
Other information (unaudited)
Name and
year of birth | Position held and
length of service* | Principal occupations during past five years or longer | Current other
public company or
investment
company
directorships |
Olivia S. Mitchell
(Born 1953) | Trustee,
since 2006;
Nominating and
Governance
Committee Chair,
since 2018 | International Foundation of Employee Benefit Plans Professor since 1993, Wharton School of the University of Pennsylvania. Director of Wharton’s Pension Research Council and Boettner Center on Pensions & Retirement Research, and Research Associate at the National Bureau of Economic Research. Previously taught at Cornell University from 1978 to 1993. | N/A |
Timothy J. Penny
(Born 1951) | Trustee,
since 1996;
Chair,
since 2018 | President and Chief Executive Officer of Southern Minnesota Initiative Foundation, a non-profit organization, since 2007. Vice Chair of the Economic Club of Minnesota, since 2007. Co-Chair of the Committee for a Responsible Federal Budget, since 1995. Member of the Board of Trustees of NorthStar Education Finance, Inc., a non-profit organization, since 2007. Senior Fellow of the University of Minnesota Humphrey Institute from 1995 to 2017. | N/A |
James G. Polisson
(Born 1959) | Trustee,
since 2018 | Retired. Chief Marketing Officer, Source (ETF) UK Services, Ltd, from 2015 to 2017. From 2012 to 2015, Principal of The Polisson Group, LLC, a management consulting, corporate advisory and principal investing company. Chief Executive Officer and Managing Director at Russell Investments, Global Exchange Traded Funds from 2010 to 2012. Managing Director of Barclays Global Investors from 1998 to 2010 and Global Chief Marketing Officer for iShares and Barclays Global Investors from 2000 to 2010. Trustee of the San Francisco Mechanics’ Institute, a non-profit organization, from 2013 to 2015. Board member of the Russell Exchange Traded Fund Trust from 2011 to 2012. Director of Barclays Global Investors Holdings Deutschland GmbH from 2006 to 2009. Mr. Polisson is an attorney and has a retired status with the Massachusetts and District of Columbia Bar Associations. | N/A |
Pamela Wheelock
(Born 1959) | Trustee,
since January
2020; previously
Trustee from
January 2018 to
July 2019 | Retired. Executive and Senior Financial leadership positions in the public, private and nonprofit sectors. Interim President and CEO, McKnight Foundation, 2020. Interim Commissioner, Minnesota Department of Human Services, 2019. Chief Operating Officer, Twin Cities Habitat for Humanity, 2017-2019. Vice President for University Services, University of Minnesota, 2012-2016. Interim President and CEO, Blue Cross and Blue Shield of Minnesota, 2011-2012. Executive Vice-President and Chief Financial Officer, Minnesota Wild, 2002-2008. Commissioner, Minnesota Department of Finance, 1999-2002. Chair of the Board of Directors of Destination Medical Center Corporation. Board member of the Minnesota Wild Foundation. | N/A |
* Length of service dates reflect the Trustee’s commencement of service with the Trust’s predecessor entities, where applicable.
Allspring Emerging Markets Bond Portfolio | 17
Other information (unaudited)
Officers2
Name and
year of birth | Position held and
length of service | Principal occupations during past five years or longer |
Andrew Owen
(Born 1960) | President,
since 2017 | President, Chief Executive Officer and Director of Allspring Funds Management, LLC since 2017 and co-president of Galliard Capital Management, LLC, an affiliate of Allspring Funds Management, LLC, since 2019. Prior thereto, Head of Affiliated Managers, Allspring Global Investments, from 2014 to 2019 and Executive Vice President responsible for marketing, investments and product development for Allspring Funds Management, LLC, from 2009 to 2014. In addition, Mr. Owen was an Executive Vice President of Wells Fargo & Company from 2014 to 2021. |
Jeremy DePalma
(Born 1974) | Treasurer,
since 2012
(for certain funds in
the Fund Complex);
since 2021 (for
the remaining funds in the
Fund Complex) | Senior Vice President of Allspring Funds Management, LLC since 2009. Senior Vice President of Evergreen Investment Management Company, LLC from 2008 to 2010 and head of the Fund Reporting and Control Team within Fund Administration from 2005 to 2010. |
Kate McKinley
(Born 1977) | Chief Legal Officer,
since 2021 | Chief Legal Officer of Allspring Global Investments since 2021. Prior thereto, held various roles at State Street Global Advisors beginning in 2010, including serving as Senior Vice President and General Counsel from 2019 to 2021, and Chief Operating Officer of the Institutional Client Group from 2016 - 2019. Prior to working at State Street Global Advisors served as Assistant General Counsel for Bank of America Corporation from 2005 to 2010 and as an Associate at WilmerHale from 2002 to 2005. |
Christopher Baker
(Born 1976) | Chief Compliance Officer, since 2022 | Global Chief Compliance Officer for Allspring Global Investments since 2022. Prior thereto, Chief Compliance Officer for State Street Global Advisors from 2018 to 2021. Senior Compliance Officer for the State Street divisions of Alternative Investment Solutions, Sector Solutions, and Global Marketing from 2015 to 2018. From 2010 to 2015 Vice President, Global Head of Investment and Marketing Compliance for State Street Global Advisors. |
Matthew Prasse
(Born 1983) | Secretary,
since 2021 | Senior Counsel of the Allspring Legal Department since 2021. Senior Counsel of the Wells Fargo Legal Department from 2018 to 2021. Previously, Counsel for Barings LLC from 2015 to 2018. Prior to joining Barings, Associate at Morgan, Lewis & Bockius LLP from 2008 to 2015. |
1 The Statement of Additional Information includes additional information about the Trustees and is available, without charge, upon request, by calling 1-800-222-8222.
2 For those Officers with tenures at Allspring Global Investments and/or Allspring Funds Management, LLC that began prior to 2021, such tenures include years of service during which these businesses/entities were known as Wells Fargo Asset Management and Wells Fargo Funds Management, LLC, respectively.
18 | Allspring Emerging Markets Bond Portfolio
Other information (unaudited)
LIQUIDITY RISK MANAGEMENT PROGRAM
In accordance with Rule 22e-4 under the Investment Company Act of 1940, as amended (the “Liquidity Rule”), Allspring Master Trust (the “Trust”) has adopted and implemented a liquidity risk management program (the “Program”) on behalf of each of its series, including the Portfolio, which is reasonably designed to assess and manage the Portfolio's liquidity risk. “Liquidity risk” is defined under the Liquidity Rule as the risk that the Portfolio is unable to meet redemption requests without significantly diluting remaining investors’ interests in the Portfolio. The Trust’s Board of Trustees (the “Board”) previously approved the designation of Allspring Funds Management, LLC (“Allspring Funds Management”), the Portfolio's investment adviser, to administer the Program, and Allspring Funds Management has established a Liquidity Risk Management Council (the "Council") composed of personnel from multiple departments within Allspring Funds Management and its affiliates to assist Allspring Funds Management in the administration of the Program.
The Program is comprised of various components designed to support the assessment and/or management of liquidity risk, including: (1) the periodic assessment (no less frequently than annually) of certain factors that influence the Portfolio's liquidity risk; (2) the periodic classification (no less frequently than monthly) of the Portfolio's investments into one of four liquidity categories that reflect an estimate of their liquidity under current market conditions; (3) a 15% limit on the acquisition of “illiquid investments” (as defined under the Liquidity Rule); (4) to the extent the Portfolio does not invest primarily in “highly liquid investments” (as defined under the Liquidity Rule), the determination of a minimum percentage of the Portfolio's assets that generally will be invested in highly liquid investments (an “HLIM”); (5) if the Portfolio has established an HLIM, the periodic review (no less frequently than annually) of the HLIM and the adoption of policies and procedures for responding to a shortfall of the Portfolio's “highly liquid investments” below its HLIM; and (6) periodic reporting to the Board.
At a meeting of the Board held on May 24-25, 2022, the Board received and reviewed a written report (the “Report”) from Allspring Funds Management that, among other things, addressed the operation of the Program and assessed its adequacy and effectiveness for the period from January 1, 2021 through December 31, 2021 (the “Reporting Period”). Other than extended foreign market holidays, no significant liquidity events impacting the Portfolios were noted in the Report. In addition, other than corporate-related changes to the Program, there were no material changes to the Program during the Reporting Period.
Allspring Funds Management determined in the Report that the Program has been implemented and operates effectively to manage the Portfolio’s liquidity risk, and Allspring Funds Management continues to believe that the Program has been and continues to be adequately and effectively implemented to monitor and, as applicable, respond to the Portfolio’s liquidity developments.
There can be no assurance that the Program will achieve its objectives under all circumstances in the future.
Allspring Emerging Markets Bond Portfolio | 19
For more information
More information about Allspring Funds is available free upon request. To obtain literature, please write, visit the Portfolio's website, or call:
Allspring Funds
P.O. Box 219967
Kansas City, MO 64121-9967
Website: allspringglobal.com
Individual investors: 1-800-222-8222
Retail investment professionals: 1-888-877-9275
Institutional investment professionals: 1-800-260-5969
This report and the financial statements contained herein are submitted for the general information of the interest holders of the Portfolio. If this report is used for promotional purposes, distribution of the report must be accompanied or preceded by a current prospectus. Before investing, please consider the investment objectives, risks, charges, and expenses of the investment. For a current prospectus and, if available, a summary prospectus, containing this information, call
1-800-222-8222. Read the prospectus carefully before you invest or send money.
Allspring Global InvestmentsTM is the trade name for the asset management firms of Allspring Global Investments Holdings, LLC, a holding company indirectly owned by certain private funds of GTCR LLC and Reverence Capital Partners, L.P. These firms include but are not limited to Allspring Global Investments, LLC, and Allspring Funds Management, LLC. Certain products managed by Allspring entities are distributed by Allspring Funds Distributor, LLC (a broker-dealer and Member FINRA/SIPC).
This material is for general informational and educational purposes only and is NOT intended to provide investment advice or a recommendation of any kind - including a recommendation for any specific investment, strategy, or plan.
© 2022 Allspring Global Investments Holdings, LLC. All rights reserved.
Semi-Annual Report
August 31, 2022
Allspring Factor Enhanced Emerging
Markets Equity Portfolio
Allspring Factor Enhanced Emerging Markets Equity Portfolio | 1
Portfolio information (unaudited)
Investment objectiveThe Portfolio seeks long-term capital appreciation.
| Adviser | Allspring Funds Management, LLC |
| Subadviser | Allspring Global Investments, LLC |
| Portfolio managers | Harindra de Silva, Ph.D., CFA®‡, Monisha Jayakumar |
| Ten largest holdings (%) as of August 31, 20221 |
| Taiwan Semiconductor Manufacturing Company Limited | 6.18 |
| Tencent Holdings Limited | 3.86 |
| Samsung Electronics Company Limited | 3.13 |
| Alibaba Group Holding Limited | 2.75 |
| Meituan Dianping | 1.32 |
| Reliance Industries Limited | 1.32 |
| JD.com Incorporated Class A | 1.08 |
| Infosys Limited | 0.99 |
| Baidu Incorporated Class A | 0.81 |
| Vale SA | 0.78 |
| 1 | Figures represent the percentage of the Portfolio's net assets. Holdings are subject to change and may have changed since the date specified. |
| Sector allocation as of August 31, 20221 |
| 1 | Figures represent the percentage of the Portfolio's long-term investments. Allocations are subject to change and may have changed since the date specified. |
| Country allocation as of August 31, 20221 |
| 1 | Figures represent the percentage of the Portfolio's long-term investments. Allocations are subject to change and may have changed since the date specified. |
| ‡ | CFA® and Chartered Financial Analyst® are trademarks owned by CFA Institute. |
2 | Allspring Factor Enhanced Emerging Markets Equity Portfolio
Portfolio of investments—August 31, 2022 (unaudited)
| | | | | | Shares | Value |
| Common stocks: 93.38% | | | | | | |
| Brazil: 3.53% | | | | | | |
| Ambev SA (Consumer staples, Beverages) | | | | | 30,800 | $ 90,404 |
| Americanas SA (Consumer discretionary, Internet & direct marketing retail) | | | | | 31,800 | 99,879 |
| Atacadao Distribuicao Comercio e Industria Limitada (Consumer staples, Food & staples retailing) | | | | | 16,500 | 62,639 |
| B3 Brasil Bolsa Balcao SA (Financials, Capital markets) | | | | | 103,100 | 234,841 |
| Banco BTG Pactual SA (Financials, Capital markets) | | | | | 1,600 | 7,827 |
| Banco do Brasil SA (Financials, Banks) | | | | | 19,800 | 158,669 |
| Banco Santander Brasil SA (Financials, Banks) | | | | | 7,500 | 42,341 |
| BB Seguridade Participacoes SA (Financials, Insurance) | | | | | 50,200 | 272,885 |
| CCR SA (Industrials, Transportation infrastructure) | | | | | 100 | 265 |
| Centrais Electricas Brasileiras SA (Utilities, Electric utilities) | | | | | 14,200 | 125,858 |
| Cia Siderurgica Nacional SA (Materials, Metals & mining) | | | | | 27,300 | 72,417 |
| Companhia de Saneamento Basico do Estado de Sao Paulo SA (Utilities, Water utilities) | | | | | 9,400 | 88,807 |
| CPFL Energia SA (Utilities, Electric utilities) | | | | | 15,400 | 103,517 |
| Energisa SA (Utilities, Electric utilities) | | | | | 11,700 | 95,109 |
| Engie Brasil Energia SA (Utilities, Energy equipment & services) | | | | | 3,500 | 27,247 |
| Equatorial Energia SA (Utilities, Electric utilities) | | | | | 7,600 | 35,324 |
| Hypermarcas SA (Health care, Pharmaceuticals) | | | | | 6,700 | 55,468 |
| JBS SA (Consumer staples, Food products) | | | | | 36,000 | 204,759 |
| Klabin SA (Materials, Containers & packaging) | | | | | 27,800 | 100,622 |
| Localiza Rent A Car SA (Industrials, Road & rail) | | | | | 10,760 | 125,793 |
| Natura & Company Holding SA (Consumer staples, Personal products) | | | | | 5,200 | 14,413 |
| Petróleo Brasileiro SA (Consumer discretionary, Specialty retail) | | | | | 71,600 | 511,566 |
| Raia Drogasil SA (Consumer staples, Food & staples retailing) | | | | | 7,600 | 31,788 |
| Suzano Papel e Celulose SA (Materials, Paper & forest products) | | | | | 11,600 | 98,688 |
| Telefonica Brasil SA (Communication services, Diversified telecommunication services) | | | | | 14,955 | 118,262 |
| TIM SA (Communication services, Wireless telecommunication services) | | | | | 33,100 | 75,268 |
| Totvs SA (Information technology, Software) | | | | | 4,100 | 22,500 |
| Vale SA (Materials, Metals & mining) | | | | | 71,800 | 890,185 |
| Vibra Energia SA (Consumer discretionary, Specialty retail) | | | | | 42,300 | 149,283 |
| WEG SA (Industrials, Electrical equipment) | | | | | 17,900 | 97,338 |
| | | | | | | 4,013,962 |
| Chile: 0.49% | | | | | | |
| Banco de Chile (Financials, Banks) | | | | | 1,490,683 | 141,426 |
| Banco de Credito e Inversiones (Financials, Banks) | | | | | 3,216 | 94,731 |
| Banco Santander Chile SA (Financials, Banks) | | | | | 2,643,121 | 106,167 |
| Cencosud SA (Consumer staples, Food & staples retailing) | | | | | 60,764 | 84,951 |
| Empresas CMPC SA (Materials, Paper & forest products) | | | | | 26,003 | 49,322 |
| Falabella SA (Consumer discretionary, Multiline retail) | | | | | 31,335 | 73,840 |
| | | | | | | 550,437 |
| China: 31.03% | | | | | | |
| 360 DigiTech Incorporated ADR Class A (Financials, Consumer finance) | | | | | 522 | 8,342 |
| 3SBio Incorporated (Health care, Biotechnology) 144A | | | | | 430,000 | 285,889 |
| A Living Services Company Limited Class H (Real estate, Real estate management & development) 144A | | | | | 10,500 | 10,816 |
| Agricultural Bank of China Limited Class H (Financials, Banks) | | | | | 269,000 | 87,899 |
| Airtac International Group (Industrials, Machinery) | | | | | 4,000 | 107,256 |
| Alibaba Group Holding Limited (Consumer discretionary, Internet & direct marketing retail) † | | | | | 261,800 | 3,123,416 |
The accompanying notes are an integral part of these financial statements.
Allspring Factor Enhanced Emerging Markets Equity Portfolio | 3
Portfolio of investments—August 31, 2022 (unaudited)
| | | | | | Shares | Value |
| China: (continued) | | | | | | |
| Aluminum Corporation of China Limited Class A (Materials, Metals & mining) | | | | | 29,000 | $ 18,860 |
| Aluminum Corporation of China Limited Class H (Materials, Metals & mining) | | | | | 485,334 | 179,336 |
| Amlogic Shanghai Company Limited (Industrials, Semiconductors & semiconductor equipment) | | | | | 4,955 | 61,722 |
| Anhui Conch Cement Company Limited Class H (Materials, Construction materials) | | | | | 51,500 | 196,259 |
| Anhui Gujing Distillery Company Class B (Consumer staples, Beverages) | | | | | 11,013 | 168,157 |
| Anhui Kouzi Distillery Company Limited Class A (Consumer discretionary, Beverages) | | | | | 5,400 | 39,491 |
| Anhui Yingjia Distillery Company Limited Class A (Consumer staples, Beverages) | | | | | 15,100 | 116,930 |
| ANTA Sports Products Limited (Consumer discretionary, Textiles, apparel & luxury goods) | | | | | 1,000 | 12,042 |
| Apeloa Pharmaceutical Company Limited Class A (Health care, Pharmaceuticals) | | | | | 15,300 | 39,933 |
| Asia Potash International Investment Guangzhou Company Limited (Materials, Chemicals) | | | | | 8,500 | 41,699 |
| AviChina Industry & Technology Company Limited Class H (Industrials, Aerospace & defense) | | | | | 174,000 | 84,692 |
| Avicopter plc Class A (Industrials, Aerospace & defense) | | | | | 4,300 | 26,238 |
| Baidu Incorporated Class A (Communication services, Interactive media & services) † | | | | | 51,650 | 921,982 |
| Bank of Chengdu Company Limited Class A (Financials, Banks) | | | | | 38,700 | 87,826 |
| Bank of China Limited Class H (Financials, Banks) | | | | | 1,827,000 | 637,565 |
| Bank of Communications Company Limited Class A (Financials, Banks) | | | | | 35,900 | 23,815 |
| Bank of Communications Company Limited Class H (Financials, Banks) | | | | | 374,000 | 213,094 |
| Bank of Nanjing Company Limited Class A (Financials, Banks) | | | | | 13,700 | 21,069 |
| BBMG Corporation (Materials, Building products) | | | | | 51,200 | 19,414 |
| Beijing Easpring Material Technology Company Limited Class A (Industrials, Energy equipment & services) | | | | | 2,100 | 23,769 |
| Beijing Shiji Information Technology Company Limited Class A (Information technology, Software) | | | | | 14,700 | 27,743 |
| Beijing United Information Technology Company Limited Class A (Industrials, Trading companies & distributors) | | | | | 1,390 | 19,922 |
| Beijing Wantai Biological Pharmacy Enterprise Company Limited Class A (Health care, Biotechnology) | | | | | 5,925 | 109,709 |
| Beijing Yuanliu Hongyuan Electronic Technology Company Class A (Information technology, Electronic equipment, instruments & components) | | | | | 907 | 15,552 |
| Bilibili Incorporated (Communication services, Entertainment) | | | | | 1,880 | 46,759 |
| Bloomage Biotechnology Company Limited (Health care, Biotechnology) | | | | | 3,642 | 75,136 |
| BYD Company Limited Class H (Consumer discretionary, Automobiles) | | | | | 10,500 | 323,561 |
| CGN Power Company Limited H Shares (Utilities, Independent power & renewable electricity producers) 144A | | | | | 849,000 | 201,915 |
| Chacha Food Company Limited Class A (Consumer staples, Food products) | | | | | 10,800 | 73,986 |
| Chengtun Mining Group Class A (Materials, Metals & mining) | | | | | 12,200 | 12,634 |
| Chifeng Jilong Gold Mining Company Limited Class A (Materials, Metals & mining) | | | | | 10,600 | 29,785 |
| China Cinda Asset Management Company Limited Class H (Financials, Capital markets) | | | | | 1,165,000 | 159,981 |
| China CITIC Bank Class H (Financials, Banks) | | | | | 553,000 | 237,077 |
| China Coal Energy Company Limited H Shares (Energy, Oil, gas & consumable fuels) | | | | | 157,000 | 139,615 |
| China Communications Services Corporation Limited H Shares (Industrials, Construction & engineering) | | | | | 310,000 | 133,113 |
The accompanying notes are an integral part of these financial statements.
4 | Allspring Factor Enhanced Emerging Markets Equity Portfolio
Portfolio of investments—August 31, 2022 (unaudited)
| | | | | | Shares | Value |
| China: (continued) | | | | | | |
| China Construction Bank Class A (Financials, Banks) | | | | | 68,000 | $ 54,359 |
| China Construction Bank Class H (Financials, Banks) | | | | | 1,204,000 | 744,292 |
| China Evergrande Group (Real estate, Real estate management & development) ♦ | | | | | 83,000 | 9,661 |
| China Galaxy Securities Company Limited Class H (Financials, Capital markets) | | | | | 413,500 | 226,067 |
| China Hongqiao Group Limited (Materials, Metals & mining) | | | | | 109,000 | 105,693 |
| China International Capital Corporation Limited Class H (Financials, Capital markets) 144A | | | | | 56,000 | 98,521 |
| China Jushi Company Limted (Materials, Building products) | | | | | 7,400 | 15,425 |
| China Life Insurance Company Limited Class H (Financials, Insurance) | | | | | 165,000 | 236,564 |
| China Longyuan Power Group Corporation Class H (Utilities, Independent power & renewable electricity producers) | | | | | 96,000 | 155,056 |
| China Medical System Holding Limited (Health care, Pharmaceuticals) | | | | | 3,000 | 4,440 |
| China Meheco Group Limited (Health care, Health care equipment & supplies) | | | | | 16,600 | 30,749 |
| China Merchants Bank Company Limited Class H (Financials, Banks) | | | | | 66,000 | 337,531 |
| China Molybdenum Company Limited Class H (Materials, Metals & mining) | | | | | 219,000 | 97,656 |
| China National Building Material Company Limited Class H (Materials, Construction materials) | | | | | 158,000 | 149,195 |
| China Oilfield Services Limited H Shares (Energy, Energy equipment & services) | | | | | 130,000 | 135,022 |
| China Petroleum & Chemical Corporation Class H (Energy, Oil, gas & consumable fuels) | | | | | 422,000 | 198,443 |
| China Railway Group Limited H Shares (Industrials, Construction & engineering) | | | | | 316,000 | 180,908 |
| China Resources Cement Holdings Limited (Materials, Construction materials) | | | | | 98,000 | 60,408 |
| China Resources Land Limited (Real estate, Real estate management & development) | | | | | 62,000 | 253,843 |
| China Resources Sanjiu Medical & Pharmaceutical Company Limited Class A (Health care, Pharmaceuticals) | | | | | 22,300 | 127,394 |
| China Shenhua Energy Company Limited (Energy, Oil, gas & consumable fuels) | | | | | 3,100 | 13,613 |
| China Shenhua Energy Company Limited Class H (Energy, Oil, gas & consumable fuels) | | | | | 105,500 | 330,877 |
| China State Construction International Holdings (Industrials, Construction & engineering) | | | | | 80,000 | 92,372 |
| China Suntien Green Energy H Shares (Energy, Oil, gas & consumable fuels) | | | | | 7,000 | 3,139 |
| China Tourism Group (Consumer discretionary, Hotels, restaurants & leisure) | | | | | 1,200 | 33,904 |
| China Tower Corporation Limited H Shares (Communication services, Diversified telecommunication services) 144A | | | | | 710,000 | 88,535 |
| China Vanke Company Limited H Shares (Real estate, Real estate management & development) | | | | | 41,400 | 80,822 |
| China Yangtze Power Company Limited Class A (Utilities, Independent power & renewable electricity producers) | | | | | 26,000 | 90,223 |
| China Zhenhua (Group) Science & Technology Company Limited Class A (Information technology, Electronic equipment, instruments & components) | | | | | 6,900 | 111,856 |
| Chinasoft International Limited (Information technology, IT services) | | | | | 16,000 | 12,507 |
| Chongqing Zhifei Biological Products Company Limited (Health care, Biotechnology) | | | | | 9,200 | 125,069 |
| CIFI Ever Sunshine Services Group Limited (Real estate, Real estate management & development) | | | | | 32,000 | 19,667 |
| CIFI Holdings Group Company Limited (Real estate, Real estate management & development) | | | | | 446,400 | 112,981 |
The accompanying notes are an integral part of these financial statements.
Allspring Factor Enhanced Emerging Markets Equity Portfolio | 5
Portfolio of investments—August 31, 2022 (unaudited)
| | | | | | Shares | Value |
| China: (continued) | | | | | | |
| COSCO Shipping Holdings Company Limited Class H (Industrials, Transportation infrastructure) | | | | | 129,175 | $ 192,840 |
| COSCO Shipping Ports Limited (Industrials, Transportation infrastructure) | | | | | 222,000 | 143,651 |
| CRRC Corporation Limited H Shares (Industrials, Machinery) | | | | | 477,000 | 178,345 |
| Da An Gene Company Limited of Sun Yat-Sen University Class A (Health care, Health care equipment & supplies) | | | | | 44,640 | 114,323 |
| Dali Foods Group Company Limited (Consumer staples, Food products) 144A | | | | | 32,500 | 14,857 |
| Daqin Railway Company Limited Class A (Industrials, Transportation infrastructure) | | | | | 39,100 | 36,529 |
| DAQO New Energy Corporation ADR (Information technology, Semiconductors & semiconductor equipment) | | | | | 711 | 47,402 |
| Dong E E Jiao Company Limited Class A (Health care, Pharmaceuticals) | | | | | 3,800 | 18,807 |
| Dongfeng Motor Group Company Limited Class H (Consumer discretionary, Automobiles) | | | | | 286,000 | 181,338 |
| Dongyue Group (Materials, Chemicals) | | | | | 103,000 | 115,601 |
| ENN Energy Holdings Limited (Utilities, Gas utilities) | | | | | 5,300 | 76,995 |
| Fangda Carbon New Material Company Limited Class A (Information technology, Electronic equipment, instruments & components) | | | | | 30,800 | 31,028 |
| Flat Glass Group Company Limited Class H (Information technology, Semiconductors & semiconductor equipment) | | | | | 38,000 | 125,160 |
| Fuyao Glass Industry Group Company Limited Class H (Consumer discretionary, Auto components) | | | | | 9,600 | 45,810 |
| Ganfeng Lithium Company Limited H (Materials, Metals & mining) 144A | | | | | 2,600 | 22,842 |
| G-bits Network Technology (Xiamen) Company Limited Class A (Information technology, Software) | | | | | 3,100 | 127,766 |
| GCL System Integration Technology Company Limited (Energy, Independent power & renewable electricity producers) | | | | | 32,300 | 17,120 |
| GD Power Development Company Limited Class A (Utilities, Independent power & renewable electricity producers) | | | | | 41,500 | 26,091 |
| Geely Automobile Holdings Limited (Consumer discretionary, Automobiles) | | | | | 49,000 | 98,452 |
| Giant Network Group Company Limited Class A (Information technology, Software) | | | | | 58,600 | 72,866 |
| Great Wall Motor Company Limited Class H (Consumer discretionary, Automobiles) | | | | | 47,500 | 71,266 |
| Greentown China Holdings Limited (Real estate, Real estate management & development) | | | | | 33,000 | 62,264 |
| Greentown Service Group Company Limited (Real estate, Real estate management & development) | | | | | 58,000 | 41,902 |
| Guangzhou Automobile Group Company Limited Class H (Consumer discretionary, Automobiles) | | | | | 226,400 | 194,661 |
| Guangzhou Baiyunshan Pharmaceutical Holdings Company Limited Class A (Health care, Pharmaceuticals) | | | | | 12,800 | 50,439 |
| Guangzhou Kingmed Diagnostics Group Company Limited Class A (Health care, Health care providers & services) | | | | | 1,200 | 11,578 |
| Haier Smart Home Company Limited Class A (Consumer discretionary, Household durables) | | | | | 12,500 | 46,672 |
| Haier Smart Home Company Limited Class H (Consumer discretionary, Household durables) | | | | | 70,200 | 229,343 |
| Hangzhou First Applied Material Company Limited (Industrials, Building products) | | | | | 1,120 | 10,474 |
| Hangzhou Tigermed (Health care, Pharmaceuticals) | | | | | 4,100 | 64,105 |
| Hangzhou Tigermed Consulting Company Limited Class H (Health care, Health care providers & services) 144A | | | | | 18,800 | 186,136 |
| Henan Shuanghui Investment & Development Company Limited Class A (Consumer staples, Food products) | | | | | 26,900 | 104,353 |
The accompanying notes are an integral part of these financial statements.
6 | Allspring Factor Enhanced Emerging Markets Equity Portfolio
Portfolio of investments—August 31, 2022 (unaudited)
| | | | | | Shares | Value |
| China: (continued) | | | | | | |
| Hengan International Group Company Limited (Consumer staples, Personal products) | | | | | 18,500 | $ 88,532 |
| HengTen Networks Group Limited (Consumer discretionary, Internet & direct marketing retail) | | | | | 240,000 | 60,904 |
| Hithink RoyalFlush Information Network Company Limited Class A (Financials, Capital markets) | | | | | 1,900 | 23,335 |
| Hongfa Technology Company Limited Class A (Industrials, Machinery) | | | | | 4,340 | 23,622 |
| Hoshine Silicon Industry Company Limited Class A (Materials, Chemicals) | | | | | 700 | 11,345 |
| Huadian Power International Corporation Limited Class A (Utilities, Independent power & renewable electricity producers) | | | | | 7,900 | 6,232 |
| Huadong Medicine Company Limited (Health care, Pharmaceuticals) | | | | | 13,000 | 79,110 |
| Hualan Biological Engineering Incorporated Class A (Health care, Biotechnology) | | | | | 15,300 | 43,642 |
| Huaneng Power International Incorporated Class H (Utilities, Independent power & renewable electricity producers) | | | | | 245,334 | 125,382 |
| Huaxin Cement Company Limited Class A (Materials, Construction materials) | | | | | 22,600 | 56,785 |
| Huayu Automotive Systems Company Limited Class A (Consumer discretionary, Auto components) | | | | | 7,600 | 20,510 |
| Hubei Xingfa Chemicals Group Company Limited Class A (Materials, Chemicals) | | | | | 14,400 | 80,364 |
| Hundsun Technologies Incorporated Class A (Information technology, Software) | | | | | 4,940 | 23,992 |
| IMEIK Technology Development Limited Class A (Health care, Biotechnology) | | | | | 1,600 | 129,099 |
| Industrial & Commercial Bank of China Limited Class H (Financials, Banks) | | | | | 1,114,000 | 565,960 |
| Industrial Bank Company Limited (Financials, Banks) | | | | | 2,500 | 6,179 |
| Inner Mongilia Junzheng Energy & Chemical Industry Group Company Limited Class A (Materials, Chemicals) | | | | | 94,800 | 59,680 |
| Inner Mongolia ERDOS Resources Company Limited (Materials, Textiles, apparel & luxury goods) | | | | | 36,700 | 93,642 |
| Inner Mongolia Yitai Coal Company Limited Class B (Energy, Oil, gas & consumable fuels) | | | | | 147,200 | 247,730 |
| Inner Mongolia Yuan Xing Energy Company Limited Class A (Materials, Chemicals) | | | | | 68,700 | 84,348 |
| Intco Medical Technology Company Limited Class A (Health care, Health care equipment & supplies) | | | | | 14,560 | 46,244 |
| JA Solar Technology Company Limited Class A (Industrials, Construction materials) | | | | | 5,960 | 56,350 |
| Jason Furniture Hangzhou Company (Consumer discretionary, Household durables) | | | | | 11,000 | 76,989 |
| JD Health International Incorporated (Consumer discretionary, Internet & direct marketing retail) 144A | | | | | 4,050 | 27,899 |
| JD.com Incorporated Class A (Consumer discretionary, Internet & direct marketing retail) | | | | | 38,685 | 1,224,579 |
| Jiang King's Luck Brewery Company Limited (Consumer staples, Beverages) | | | | | 3,300 | 22,066 |
| Jiangsu Express Company Limited Class H (Industrials, Transportation infrastructure) | | | | | 140,000 | 119,911 |
| Jiangsu Yangnong Chemical Company Limited Class A (Materials, Chemicals) | | | | | 1,300 | 21,418 |
| Jiangsu Zhongtian Technologies Company Limited (Communication services, Communications equipment) | | | | | 31,900 | 102,467 |
| Jiangxi Copper Company Limited Class H (Materials, Metals & mining) | | | | | 44,000 | 54,040 |
| Jiangxi Special Electric Motor Company Limited (Consumer discretionary, Automobiles) | | | | | 19,700 | 63,032 |
| Jiumaojiu International Holdings Limited (Consumer discretionary, Hotels, restaurants & leisure) 144A | | | | | 31,000 | 60,989 |
The accompanying notes are an integral part of these financial statements.
Allspring Factor Enhanced Emerging Markets Equity Portfolio | 7
Portfolio of investments—August 31, 2022 (unaudited)
| | | | | | Shares | Value |
| China: (continued) | | | | | | |
| Joincare Pharmaceutical Group Industry Company Limited Class A (Health care, Pharmaceuticals) | | | | | 25,400 | $ 40,121 |
| Jointown Pharmaceutical Group Company Limited Class A (Health care, Pharmaceuticals) | | | | | 11,400 | 19,613 |
| Jonjee Hi-Tech Industrial & Commercial Holding Company Limited Class A (Consumer staples, Food products) | | | | | 4,000 | 19,900 |
| Kuaishou Technology (Communication services, Media) 144A | | | | | 16,900 | 146,430 |
| Kunlun Energy Company Limited (Utilities, Gas utilities) | | | | | 166,000 | 144,541 |
| Kweichow Moutai Company Limited Class A (Consumer staples, Beverages) | | | | | 1,000 | 278,530 |
| Lenovo Group Limited (Information technology, Technology hardware, storage & peripherals) | | | | | 180,000 | 148,250 |
| Li Ning Company Limited (Consumer discretionary, Textiles, apparel & luxury goods) | | | | | 31,000 | 282,358 |
| Livzon Pharmaceutical Group Incorporated Class A (Health care, Pharmaceuticals) | | | | | 4,100 | 18,572 |
| Logan Property Holdings Company Limited (Real estate, Real estate management & development) ♦ | | | | | 26,000 | 2,836 |
| Longfor Properties Company Limited (Real estate, Real estate management & development) | | | | | 1,000 | 3,246 |
| LONGi Green Energy Technology Company Limited Class A (Information technology, Semiconductors & semiconductor equipment) | | | | | 4,200 | 30,964 |
| Luxi Chemical Group Company Limited Class A (Materials, Chemicals) | | | | | 6,800 | 13,547 |
| Luzhou Laojio Company Limited (Materials, Construction materials) | | | | | 1,100 | 37,257 |
| Meituan Dianping (Consumer discretionary, Internet & direct marketing retail) † | | | | | 62,600 | 1,503,477 |
| Ming Yang Smart Energy Group Limited (Energy, Independent power & renewable electricity producers) | | | | | 2,000 | 7,744 |
| Montage Technology Company Limited Class A (Industrials, Electronic equipment, instruments & components) | | | | | 2,586 | 20,744 |
| Netease Incorporated (Communication services, Entertainment) | | | | | 35,200 | 628,580 |
| New Oriental Education & Technology Group Incorporated (Information technology, IT services) | | | | | 59,400 | 171,458 |
| Ninbo Orient Wires & Cables Company Limited (Industrials, Electrical equipment) | | | | | 19,900 | 206,174 |
| Nongfu Spring Company Limited Class H (Consumer staples, Beverages) 144A | | | | | 12,000 | 71,350 |
| North Industries Group Red Arrow Company Limited Class A (Industrials, Machinery) | | | | | 14,300 | 63,140 |
| OFILM Group Company Limited Class A (Information technology, Electronic equipment, instruments & components) | | | | | 73,700 | 68,268 |
| Orient Overseas (International) Limited (Industrials, Marine) | | | | | 6,500 | 181,187 |
| Pangang Group Vanadium Titanium and Resources Company Limited Class A (Materials, Metals & mining) | | | | | 36,500 | 30,251 |
| Parade Technologies Limited (Information technology, Semiconductors & semiconductor equipment) | | | | | 6,000 | 167,962 |
| People's Insurance Company Group of China Limited Class H (Financials, Insurance) | | | | | 972,000 | 300,410 |
| Perfect World Company Limited Class A (Information technology, Software) | | | | | 11,400 | 24,362 |
| PetroChina Company Limited Class H (Energy, Oil, gas & consumable fuels) | | | | | 496,000 | 230,649 |
| Pharmaron Beijing Company Limited Class A (Health care, Life sciences tools & services) | | | | | 950 | 9,360 |
| Pharmaron Beijing Company Limited Class H (Health care, Life sciences tools & services) 144A | | | | | 18,550 | 122,702 |
| PICC Property & Casualty Company Limited Class H (Financials, Insurance) | | | | | 322,000 | 348,285 |
| Pinduoduo Incorporated ADR (Consumer discretionary, Internet & direct marketing retail) | | | | | 2,550 | 181,815 |
The accompanying notes are an integral part of these financial statements.
8 | Allspring Factor Enhanced Emerging Markets Equity Portfolio
Portfolio of investments—August 31, 2022 (unaudited)
| | | | | | Shares | Value |
| China: (continued) | | | | | | |
| Ping An Insurance Group Company Class H (Financials, Insurance) | | | | | 56,000 | $ 329,372 |
| Postal Savings Bank of China Company Limited Class H (Financials, Banks) 144A | | | | | 296,000 | 176,703 |
| Proya Cosmetics Company Limited (Consumer discretionary, Specialty retail) | | | | | 6,940 | 160,823 |
| Sailun Group Company Limited Class A (Consumer discretionary, Auto components) | | | | | 10,100 | 16,597 |
| Sany Heavy Equipment International Holdings Company Limited (Industrials, Machinery) | | | | | 51,000 | 52,829 |
| Seazen Group Limited (Real estate, Real estate management & development) | | | | | 340,000 | 112,861 |
| SG Micro Corporation Class A (Information technology, Semiconductors & semiconductor equipment) | | | | | 150 | 3,463 |
| Shaanxi Coal Industry Company Limited (Materials, Chemicals) | | | | | 4,400 | 14,041 |
| Shandong Buchang Pharmaceuticals Company Limited Class A (Health care, Biotechnology) | | | | | 14,300 | 37,195 |
| Shandong Hualu-Hengsheng Chemical Company Limited Class A (Materials, Chemicals) | | | | | 3,089 | 13,037 |
| Shanghai Baosight Software Company Limited Class A (Information technology, Software) | | | | | 5,243 | 28,772 |
| Shanghai Baosight Software Company Limited Class B (Information technology, Software) | | | | | 119,717 | 362,578 |
| Shanghai International Port (Group) Company Limited Class A (Industrials, Transportation infrastructure) | | | | | 17,700 | 13,852 |
| Shanghai Lujiazui Finance & Trade Zone Development Company Limited (Real estate, Real estate management & development) | | | | | 155,454 | 129,504 |
| Shanghai Medicilon Incorporated Class A (Health care, Life sciences tools & services) | | | | | 3,995 | 185,781 |
| Shanghai Pharmaceuticals Holding Company Limited Class A (Health care, Health care providers & services) | | | | | 21,800 | 54,532 |
| Shenzhen New Industries Biomedical Engineering Company Limited Class A (Health care, Health care equipment & supplies) | | | | | 2,800 | 14,488 |
| Shijiazhuang Yiling Pharmaceutical Company Limited Class A (Health care, Pharmaceuticals) | | | | | 11,200 | 34,689 |
| Sichuan Hebang Biotechnology Company Limited Class A (Materials, Chemicals) | | | | | 189,800 | 103,407 |
| Sichuan Kelun Pharmaceutical Company Limited Class A (Health care, Pharmaceuticals) | | | | | 3,600 | 11,183 |
| Sichuan Swellfun Company Limited Class A (Consumer staples, Beverages) | | | | | 400 | 4,221 |
| Sieyuan Electric Company Limited Class A (Industrials, Electrical equipment) | | | | | 6,900 | 40,822 |
| Sinopec Shanghai Petrochemical Company Limited Class A (Materials, Chemicals) | | | | | 211,100 | 96,349 |
| Sinopharm Group Company Limited Class H (Health care, Health care providers & services) | | | | | 99,200 | 220,997 |
| Songcheng Performance Development Company Limited (Industrials, Professional services) | | | | | 72,200 | 132,304 |
| Sunny Optical Technology Group Company Limited (Information technology, Electronic equipment, instruments & components) | | | | | 4,800 | 65,532 |
| Suzhou Dongshan Precision Manufacturing Company Limited (Industrials, Electronic equipment, instruments & components) | | | | | 9,800 | 36,552 |
| Tebian Electric Apparatus Stock Company Limited Class A (Industrials, Electrical equipment) | | | | | 20,100 | 71,921 |
| Tencent Holdings Limited (Communication services, Interactive media & services) | | | | | 106,200 | 4,389,325 |
| Thunder Software Technology Company Limited Class A (Industrials, Commercial services & supplies) | | | | | 1,100 | 19,487 |
The accompanying notes are an integral part of these financial statements.
Allspring Factor Enhanced Emerging Markets Equity Portfolio | 9
Portfolio of investments—August 31, 2022 (unaudited)
| | | | | | Shares | Value |
| China: (continued) | | | | | | |
| Tibet Summit Resources Company Limited Class A (Materials, Metals & mining) | | | | | 14,700 | $ 59,879 |
| Tingyi Holding Corporation (Consumer staples, Food products) | | | | | 34,000 | 60,375 |
| Titan Wind Energy (Suzhou) Company Limited Class A (Industrials, Electrical equipment) | | | | | 31,700 | 63,250 |
| Toly Bread Company Limited (Consumer staples, Food products) | | | | | 14,600 | 29,681 |
| Tongcheng-Elong Holdings Limited (Consumer discretionary, Hotels, restaurants & leisure) | | | | | 18,400 | 37,686 |
| Tongling Nonferrous Metals Group Company Limited Class A (Materials, Metals & mining) | | | | | 99,500 | 41,592 |
| Topsports International Holdings Limited (Consumer discretionary, Specialty retail) 144A | | | | | 149,000 | 117,605 |
| Transfar Zhilian Company Limited Class A (Materials, Chemicals) | | | | | 17,100 | 13,778 |
| TravelSky Technology Limited Class H (Information technology, IT services) | | | | | 16,000 | 27,886 |
| Tsingtao Brewery Company Limited (Consumer staples, Beverages) | | | | | 1,600 | 24,977 |
| Tsingtao Brewery Company Limited Class H (Consumer staples, Beverages) | | | | | 10,000 | 97,110 |
| Uni-President China Holdings Limited (Consumer staples, Food products) | | | | | 52,000 | 44,769 |
| Vipshop Holdings Limited ADR (Consumer discretionary, Internet & direct marketing retail) † | | | | | 9,918 | 115,148 |
| Want Want China Holdings Limited (Consumer staples, Food products) | | | | | 196,000 | 138,067 |
| Weibo Corporation ADR (Communication services, Interactive media & services) † | | | | | 1,227 | 25,387 |
| Weichai Power Company Limited Class H (Industrials, Machinery) | | | | | 74,000 | 98,865 |
| Wuhu Sanqi Interactive Entertainment Network Technology Group Company Limited Class A (Consumer discretionary, Auto components) | | | | | 56,300 | 165,246 |
| WUS Printed Circuit (Kunshan) Company Limited (Industrials, Electronic equipment, instruments & components) | | | | | 24,500 | 42,292 |
| WuXi AppTec Company Limited (Health care, Life sciences tools & services) 144A | | | | | 9,036 | 102,007 |
| Wuxi Biologics (Cayman) Incorporated (Health care, Life sciences tools & services) 144A | | | | | 38,000 | 335,240 |
| Xiamen C&D Incorporated (Real estate, Real estate management & development) | | | | | 15,900 | 27,022 |
| Xiamen Faratronic Company Limited Class A (Information technology, Electronic equipment, instruments & components) | | | | | 2,100 | 53,937 |
| Xiaomi Corporation Class B (Information technology, Technology hardware, storage & peripherals) 144A† | | | | | 50,600 | 73,909 |
| Xinjiang Goldwind Science & Technology Company Limited (Industrials, Electrical equipment) | | | | | 12,800 | 19,074 |
| Xinyi Solar Holdings Limited (Information technology, Semiconductors & semiconductor equipment) | | | | | 40,000 | 55,009 |
| Xtep International Holdings Limited (Consumer discretionary, Textiles, apparel & luxury goods) | | | | | 87,500 | 121,422 |
| Yadea Group Holdings Limited (Consumer discretionary, Automobiles) 144A | | | | | 32,000 | 61,037 |
| Yangzhou Yangjie Technology Company Limited (Industrials, Electronic equipment, instruments & components) | | | | | 1,800 | 15,230 |
| Yanzhou Coal Mining Company Limited Class H (Energy, Oil, gas & consumable fuels) | | | | | 52,000 | 205,837 |
| Yongxing Special Materials Technology Company Limited Class A (Industrials, Construction materials) | | | | | 1,100 | 21,302 |
| Youngor Group Company Limited (Real estate, Real estate management & development) | | | | | 68,300 | 63,280 |
| YTO Express Group Company Limited Class A (Industrials, Air freight & logistics) | | | | | 54,600 | 155,214 |
| Yum China Holdings Incorporated (Consumer discretionary, Hotels, restaurants & leisure) | | | | | 5,376 | 269,391 |
The accompanying notes are an integral part of these financial statements.
10 | Allspring Factor Enhanced Emerging Markets Equity Portfolio
Portfolio of investments—August 31, 2022 (unaudited)
| | | | | | Shares | Value |
| China: (continued) | | | | | | |
| Yunda Holding Company Limited Class A (Industrials, Industrial conglomerates) | | | | | 6,100 | $ 14,846 |
| Yunnan Aluminium Company Limited Class A (Materials, Metals & mining) | | | | | 11,800 | 17,163 |
| Yunnan Tin Company Group Limited Class A (Materials, Metals & mining) | | | | | 13,000 | 26,047 |
| Zhejiang Century Huatong Group (Information technology, IT services) | | | | | 125,700 | 83,040 |
| Zhejiang China Commodities City Group Company Limited Class A (Real estate, Real estate management & development) | | | | | 94,600 | 66,907 |
| Zhejiang Dingli Machinery Company Limited (Industrials, Machinery) | | | | | 4,800 | 27,230 |
| Zhejiang Expressway Company Limited Class H (Industrials, Transportation infrastructure) | | | | | 206,000 | 156,953 |
| Zhejiang Juhua Company Limited Class A (Materials, Chemicals) | | | | | 7,100 | 16,107 |
| Zhejiang NHU Company Limited (Health care, Biotechnology) | | | | | 1,776 | 5,775 |
| Zhejiang Orient Gene Biotech Company Limited (Health care, Biotechnology) | | | | | 13,268 | 170,484 |
| Zhejiang Supor Company Limited Class A (Consumer discretionary, Household durables) | | | | | 15,200 | 100,814 |
| Zhejiang Weixing New Building Materials Company Limited (Materials, Construction materials) | | | | | 10,500 | 31,702 |
| Zhejiang Wolwo Bio-Pharmaceutical Company Limited (Health care, Biotechnology) | | | | | 2,500 | 16,748 |
| Zhongsheng Group Holdings Limited (Consumer discretionary, Specialty retail) | | | | | 2,500 | 11,821 |
| Zhuzhou CSR Times Electric Company Limited Class H (Industrials, Electrical equipment) | | | | | 10,000 | 48,355 |
| Zhuzhou Hongda Electronics Corporation Limited (Industrials, Electronic equipment, instruments & components) | | | | | 4,800 | 32,242 |
| Zibo Qixiang Tengda Chemical Company Limited Class A (Materials, Chemicals) | | | | | 23,300 | 24,647 |
| Zijin Mining Group Company Limited Class H (Materials, Metals & mining) | | | | | 108,000 | 122,037 |
| ZTE Corporation Class H (Information technology, Communications equipment) | | | | | 32,200 | 67,984 |
| | | | | | | 35,248,890 |
| Colombia: 0.13% | | | | | | |
| Bancolombia SA (Financials, Banks) | | | | | 19,479 | 150,414 |
| Czech Republic: 0.07% | | | | | | |
| CEZ AS (Utilities, Electric utilities) | | | | | 245 | 9,925 |
| Moneta Money Bank (Financials, Banks) 144A | | | | | 21,398 | 67,822 |
| | | | | | | 77,747 |
| Egypt: 0.03% | | | | | | |
| Commercial International Bank ADR (Financials, Banks) | | | | | 15,425 | 28,536 |
| Greece: 0.50% | | | | | | |
| Eurobank Ergasias SA (Financials, Banks) | | | | | 70,833 | 65,719 |
| FF Group (Consumer discretionary, Textiles, apparel & luxury goods) ♦† | | | | | 3,820 | 0 |
| Hellenic Telecommunications Organization SA (Communication services, Diversified telecommunication services) | | | | | 8,554 | 136,084 |
| Jumbo SA (Consumer discretionary, Specialty retail) | | | | | 8,656 | 123,744 |
| Mytilineos Holdings SA (Industrials, Industrial conglomerates) | | | | | 421 | 6,583 |
| National Bank of Greece SA (Financials, Banks) | | | | | 31,468 | 101,555 |
| OPAP SA (Consumer discretionary, Hotels, restaurants & leisure) | | | | | 10,389 | 136,843 |
| | | | | | | 570,528 |
The accompanying notes are an integral part of these financial statements.
Allspring Factor Enhanced Emerging Markets Equity Portfolio | 11
Portfolio of investments—August 31, 2022 (unaudited)
| | | | | | Shares | Value |
| Hong Kong: 1.74% | | | | | | |
| Beijing Enterprises Holdings Limited (Utilities, Gas utilities) | | | | | 30,500 | $ 90,720 |
| Bosideng International Holdings Limited (Consumer discretionary, Textiles, apparel & luxury goods) | | | | | 114,000 | 64,010 |
| BYD Electronic International Company Limited (Information technology, Communications equipment) | | | | | 45,000 | 118,896 |
| China Everbright International Limited (Industrials, Commercial services & supplies) | | | | | 89,000 | 43,989 |
| China Jinmao Holdings Group Limited (Real estate, Real estate management & development) | | | | | 164,000 | 34,534 |
| China Mengniu Dairy Company Limited (Consumer staples, Food products) | | | | | 24,334 | 110,191 |
| China Merchants Port Holdings Company Limited (Industrials, Transportation infrastructure) | | | | | 112,000 | 168,142 |
| China Overseas Land & Investment Limited (Real estate, Real estate management & development) | | | | | 93,500 | 251,279 |
| China Overseas Property Holding Limited (Real estate, Real estate management & development) | | | | | 100,000 | 106,123 |
| China Power International Development Limited (Utilities, Independent power & renewable electricity producers) | | | | | 112,000 | 62,524 |
| China Resources Beer Holdings Company Limited (Consumer staples, Beverages) | | | | | 4,000 | 27,884 |
| China Resources Power Holdings Company (Utilities, Independent power & renewable electricity producers) | | | | | 24,000 | 47,720 |
| China Traditional Chinese Medicine Holdings Company Limited (Health care, Pharmaceuticals) | | | | | 272,000 | 117,295 |
| CITIC Pacific Limited (Industrials, Industrial conglomerates) | | | | | 18,000 | 18,556 |
| CSPC Pharmaceutical Group Limited (Health care, Pharmaceuticals) | | | | | 50,000 | 50,721 |
| Far East Horizon Limited (Financials, Diversified financial services) | | | | | 37,000 | 28,029 |
| Kingboard Chemicals Holdings Limited (Information technology, Electronic equipment, instruments & components) | | | | | 47,500 | 149,991 |
| Kingboard Laminates Holdings Limited (Information technology, Electronic equipment, instruments & components) | | | | | 136,000 | 129,732 |
| MMG Limited (Materials, Metals & mining) | | | | | 184,000 | 50,335 |
| Sino Biopharmaceutical Limited (Health care, Pharmaceuticals) | | | | | 236,000 | 123,951 |
| Sinotruk Hong Kong Limited (Industrials, Machinery) | | | | | 84,500 | 84,249 |
| Wharf Holdings Limited (Real estate, Real estate management & development) | | | | | 1,000 | 3,766 |
| Yuexiu Property Company Limited (Real estate, Real estate management & development) | | | | | 77,400 | 96,810 |
| | | | | | | 1,979,447 |
| Hungary: 0.04% | | | | | | |
| MOL Hungarian Oil & Gas plc (Energy, Oil, gas & consumable fuels) | | | | | 6,331 | 43,623 |
| Richter Gedeon (Health care, Pharmaceuticals) | | | | | 61 | 1,230 |
| | | | | | | 44,853 |
| India: 14.07% | | | | | | |
| ACC Limited (Materials, Construction materials) | | | | | 146 | 4,184 |
| Adani Enterprises Limited (Industrials, Trading companies & distributors) | | | | | 1,749 | 69,407 |
| Adani Gas Limited (Utilities, Gas utilities) | | | | | 4,069 | 189,768 |
| Adani Ports & Special Economic Zone Limited (Industrials, Transportation infrastructure) | | | | | 698 | 7,303 |
| Adani Power Limited (Utilities, Independent power & renewable electricity producers) | | | | | 12,356 | 63,098 |
| Adani Transmissions Limited (Utilities, Electric utilities) | | | | | 2,895 | 141,966 |
| Ambuja Cements Limited (Materials, Construction materials) | | | | | 8,606 | 44,130 |
The accompanying notes are an integral part of these financial statements.
12 | Allspring Factor Enhanced Emerging Markets Equity Portfolio
Portfolio of investments—August 31, 2022 (unaudited)
| | | | | | Shares | Value |
| India: (continued) | | | | | | |
| Apollo Hospitals Enterprise Limited (Health care, Health care providers & services) | | | | | 2,752 | $ 147,861 |
| Asian Paints Limited (Materials, Chemicals) | | | | | 3,059 | 128,780 |
| AU Small Finance Bank Limited (Financials, Banks) 144A | | | | | 9,126 | 71,769 |
| Aurobindo Pharma Limited (Health care, Pharmaceuticals) | | | | | 1,013 | 6,897 |
| Avenue Supermarts Limited (Consumer staples, Food & staples retailing) | | | | | 2,122 | 119,282 |
| Axis Bank Limited (Financials, Banks) | | | | | 36,500 | 340,161 |
| Bajaj Auto Limited (Consumer discretionary, Automobiles) | | | | | 2,807 | 142,971 |
| Bajaj Finance Limited (Financials, Consumer finance) | | | | | 3,167 | 285,826 |
| Balkrishna Industries Limited (Consumer discretionary, Auto components) | | | | | 2,769 | 70,341 |
| Bandhan Bank Limited (Financials, Banks) 144A | | | | | 11,114 | 38,356 |
| Bharat Electronics Limited (Industrials, Aerospace & defense) | | | | | 53,086 | 202,841 |
| Bharti Airtel Limited (Communication services, Wireless telecommunication services) | | | | | 33,684 | 305,125 |
| Britannia Industries Limited (Consumer staples, Food products) | | | | | 3,099 | 145,006 |
| Cholamandalam Investment & Finance Company Limited (Financials, Consumer finance) | | | | | 17,371 | 170,186 |
| Cipla India Limited (Health care, Pharmaceuticals) | | | | | 14,547 | 188,505 |
| Coal India Limited (Materials, Metals & mining) | | | | | 39,257 | 114,708 |
| Colgate-Palmolive Company India Limited (Consumer staples, Personal products) | | | | | 8,899 | 186,852 |
| Container Corporation of India Limited (Industrials, Transportation infrastructure) | | | | | 9,130 | 79,198 |
| Divi's Laboratories Limited (Health care, Life sciences tools & services) | | | | | 3,969 | 179,195 |
| DLF Limited (Real estate, Real estate management & development) | | | | | 1,272 | 6,144 |
| Dr. Reddy's Laboratories Limited (Health care, Pharmaceuticals) | | | | | 2,464 | 130,213 |
| Eicher Motors Limited (Consumer discretionary, Automobiles) | | | | | 2,767 | 115,481 |
| Gail India Limited (Utilities, Gas utilities) | | | | | 93,221 | 158,348 |
| Godrej Consumer Products Limited (Consumer staples, Personal products) | | | | | 5,745 | 66,176 |
| Havells India Limited (Industrials, Electrical equipment) | | | | | 4,210 | 72,882 |
| HCL Technologies Limited (Information technology, IT services) | | | | | 27,309 | 317,654 |
| Hero Motorcorp Limited (Consumer discretionary, Automobiles) | | | | | 5,778 | 203,531 |
| Hindalco Industries Limited (Materials, Metals & mining) | | | | | 30,454 | 165,170 |
| Hindustan Petroleum Corporation Limited (Energy, Oil, gas & consumable fuels) | | | | | 16,723 | 50,758 |
| Hindustan Unilever Limited (Consumer staples, Personal products) | | | | | 10,538 | 348,871 |
| ICICI Bank Limited (Financials, Banks) | | | | | 80,453 | 882,195 |
| Indian Oil Corporation Limited (Energy, Oil, gas & consumable fuels) | | | | | 106,203 | 94,766 |
| Indian Railway Catering & Tourism Corporation (Industrials, Commercial services & supplies) | | | | | 11,563 | 101,424 |
| Indus Towers Limited (Communication services, Diversified telecommunication services) | | | | | 30,898 | 76,836 |
| Info Edge India Limited (Communication services, Interactive media & services) | | | | | 4,248 | 228,512 |
| Infosys Limited (Information technology, IT services) | | | | | 60,798 | 1,120,573 |
| ITC Limited (Consumer staples, Tobacco) | | | | | 95,883 | 383,175 |
| Jindal Steel & Power Limited (Materials, Metals & mining) | | | | | 41,681 | 224,274 |
| JSW Steel Limited (Materials, Metals & mining) | | | | | 6,527 | 54,129 |
| Kotak Mahindra Bank Limited (Financials, Banks) | | | | | 8,798 | 208,725 |
| Larsen & Toubro Infotech Limited (Information technology, IT services) 144A | | | | | 870 | 49,784 |
| Larsen & Toubro Limited (Industrials, Construction & engineering) | | | | | 3,828 | 91,364 |
| Mahindra & Mahindra Limited (Consumer discretionary, Automobiles) | | | | | 27,268 | 442,577 |
| Maruti Suzuki India Limited (Consumer discretionary, Automobiles) | | | | | 2,593 | 292,484 |
| Mphasis Limited (Information technology, IT services) | | | | | 4,850 | 127,591 |
| Nestle India Limited (Consumer staples, Food products) | | | | | 714 | 177,771 |
The accompanying notes are an integral part of these financial statements.
Allspring Factor Enhanced Emerging Markets Equity Portfolio | 13
Portfolio of investments—August 31, 2022 (unaudited)
| | | | | | Shares | Value |
| India: (continued) | | | | | | |
| NTPC Limited (Utilities, Independent power & renewable electricity producers) | | | | | 131,841 | $ 270,255 |
| Oil & Natural Gas Corporation Limited (Energy, Oil, gas & consumable fuels) | | | | | 103,203 | 178,656 |
| Page Industries Limited (Consumer discretionary, Textiles, apparel & luxury goods) | | | | | 407 | 259,307 |
| Petronet LNG Limited (Energy, Oil, gas & consumable fuels) | | | | | 36,375 | 100,350 |
| Power Grid Corporation of India Limited (Utilities, Electric utilities) | | | | | 119,679 | 342,649 |
| Reliance Industries Limited (Energy, Oil, gas & consumable fuels) † | | | | | 45,849 | 1,502,015 |
| SBI Life Insurance Company Limited (Financials, Insurance) 144A | | | | | 2,326 | 38,439 |
| Shriram Transport Finance Company Limited (Financials, Consumer finance) | | | | | 3,203 | 53,760 |
| SRF Limited (Materials, Chemicals) | | | | | 4,529 | 142,925 |
| State Bank of India (Financials, Banks) | | | | | 35,082 | 230,979 |
| Sun Pharmaceutical Industries Limited (Health care, Pharmaceuticals) | | | | | 20,588 | 229,767 |
| Tata Consultancy Services Limited (Information technology, IT services) | | | | | 17,025 | 678,984 |
| Tata Elxsi Limited (Information technology, Software) | | | | | 3,182 | 354,933 |
| Tata Motors Limited (Consumer discretionary, Automobiles) | | | | | 40,447 | 235,547 |
| Tata Power Company Limited (Utilities, Electric utilities) | | | | | 33,036 | 96,874 |
| Tata Steel Limited (Materials, Metals & mining) | | | | | 179,274 | 240,694 |
| Tata Tea Limited (Consumer staples, Food products) | | | | | 3,909 | 39,509 |
| Tech Mahindra Limited (Information technology, IT services) | | | | | 17,437 | 232,322 |
| Titan Industries Limited (Consumer discretionary, Textiles, apparel & luxury goods) | | | | | 6,696 | 216,979 |
| Torrent Pharmaceuticals Limited (Health care, Pharmaceuticals) | | | | | 5,113 | 98,797 |
| Trent Limited (Consumer discretionary, Multiline retail) | | | | | 1,866 | 32,637 |
| United Spirits Limited (Consumer staples, Beverages) | | | | | 13,270 | 134,132 |
| UPL Limited (Materials, Chemicals) | | | | | 4,156 | 39,806 |
| Vedanta Limited (Materials, Metals & mining) | | | | | 57,956 | 194,234 |
| Wipro Limited (Information technology, IT services) | | | | | 23,634 | 121,010 |
| Yes Bank Limited (Financials, Banks) | | | | | 1,367,196 | 280,228 |
| | | | | | | 15,980,912 |
| Indonesia: 2.26% | | | | | | |
| PT Adaro Energy Tbk (Energy, Oil, gas & consumable fuels) | | | | | 764,200 | 182,183 |
| PT Adaro Minerals Indonesia Tbk (Materials, Metals & mining) | | | | | 309,200 | 35,659 |
| PT Astra International Tbk (Consumer discretionary, Automobiles) | | | | | 354,100 | 166,150 |
| PT Bank Central Asia Tbk (Financials, Banks) | | | | | 824,200 | 455,142 |
| PT Bank Mandiri Persero Tbk (Financials, Banks) | | | | | 385,400 | 229,346 |
| PT Bank Negara Indonesia Persero Tbk (Financials, Banks) | | | | | 321,600 | 184,459 |
| PT Bank Rakyat Indonesia Tbk (Financials, Banks) | | | | | 1,032,100 | 301,403 |
| PT Charoen Pokphand Indonesia Tbk (Consumer staples, Food products) | | | | | 127,200 | 50,349 |
| PT Gudang Garam Tbk (Consumer staples, Tobacco) | | | | | 10,600 | 16,950 |
| PT Hanson International Tbk (Real estate, Real estate management & development) ♦† | | | | | 10,045,000 | 0 |
| PT Indofood Sukses Makmur Tbk (Consumer staples, Food products) | | | | | 328,300 | 137,727 |
| PT Kalbe Farma Tbk (Health care, Pharmaceuticals) | | | | | 2,124,900 | 240,281 |
| PT Semen Gresik Persero Tbk (Materials, Construction materials) | | | | | 112,400 | 49,912 |
| PT Sumber Alfaria Trijaya Tbk (Consumer staples, Food & staples retailing) | | | | | 282,900 | 41,519 |
| PT Telekomunikasi Indonesia Persero Tbk (Communication services, Diversified telecommunication services) | | | | | 1,086,200 | 332,628 |
| PT Unilever Indonesia Tbk (Consumer staples, Household products) | | | | | 218,500 | 67,522 |
| PT United Tractors Tbk (Energy, Oil, gas & consumable fuels) | | | | | 26,600 | 60,570 |
| PT Vale Indonesia Tbk (Materials, Metals & mining) | | | | | 23,800 | 9,755 |
| | | | | | | 2,561,555 |
The accompanying notes are an integral part of these financial statements.
14 | Allspring Factor Enhanced Emerging Markets Equity Portfolio
Portfolio of investments—August 31, 2022 (unaudited)
| | | | | | Shares | Value |
| Kuwait: 1.29% | | | | | | |
| Boubyan Bank (Financials, Banks) | | | | | 4,329 | $ 11,734 |
| Gulf Bank (Financials, Banks) | | | | | 187,364 | 212,743 |
| Kuwait Finance House (Financials, Banks) | | | | | 119,920 | 350,044 |
| Mabanee Company KPSC (Real estate, Real estate management & development) | | | | | 64,698 | 173,882 |
| Mobile Telecommunications Company (Communication services, Wireless telecommunication services) | | | | | 88,340 | 173,428 |
| National Bank of Kuwait (Financials, Banks) | | | | | 157,923 | 540,225 |
| | | | | | | 1,462,056 |
| Malaysia: 2.16% | | | | | | |
| AMMB Holdings Bhd (Financials, Banks) | | | | | 73,800 | 68,593 |
| CIMB Group Holdings Bhd (Financials, Banks) | | | | | 153,100 | 183,088 |
| Digi.com Bhd (Communication services, Wireless telecommunication services) | | | | | 49,100 | 40,980 |
| Genting Bhd (Consumer discretionary, Hotels, restaurants & leisure) | | | | | 72,900 | 76,194 |
| Genting Malaysia Bhd (Consumer discretionary, Hotels, restaurants & leisure) | | | | | 57,900 | 38,433 |
| Hartalega Holdings Bhd (Health care, Health care equipment & supplies) | | | | | 294,800 | 109,344 |
| Hong Leong Bank Bhd (Financials, Banks) | | | | | 31,500 | 146,618 |
| Hong Leong Financial Group Bhd (Financials, Banks) | | | | | 28,067 | 121,325 |
| IHH Healthcare Bhd (Health care, Health care providers & services) | | | | | 42,600 | 58,795 |
| Inari Amertron Bhd (Information technology, Electronic equipment, instruments & components) | | | | | 59,800 | 35,591 |
| IOI Corporation Bhd (Consumer staples, Food products) | | | | | 129,600 | 122,491 |
| Kuala Lumpur Kepong Bhd (Consumer staples, Food products) | | | | | 20,800 | 107,544 |
| Malayan Banking Bhd (Financials, Banks) | | | | | 100,600 | 201,250 |
| Nestle Malaysia Bhd (Consumer staples, Food products) | | | | | 1,100 | 32,641 |
| Petronas Chemicals Group Bhd (Materials, Chemicals) | | | | | 86,500 | 169,667 |
| Petronas Gas Bhd (Utilities, Gas utilities) | | | | | 28,200 | 108,979 |
| Press Metal Bhd (Materials, Metals & mining) | | | | | 14,800 | 15,686 |
| Public Bank Bhd (Financials, Banks) | | | | | 276,800 | 290,651 |
| RHB Bank Bhd (Financials, Banks) | | | | | 110,400 | 141,067 |
| Sime Darby Bhd (Industrials, Industrial conglomerates) | | | | | 290,500 | 148,010 |
| Sime Darby Plantation Bhd (Consumer staples, Food products) | | | | | 119,700 | 118,982 |
| Supermax Corporation Bhd (Health care, Health care equipment & supplies) | | | | | 1 | 0 |
| Telecom Malaysia Bhd (Communication services, Diversified telecommunication services) | | | | | 29,100 | 38,685 |
| Top Glove Corporation Bhd (Health care, Health care equipment & supplies) | | | | | 466,550 | 83,534 |
| | | | | | | 2,458,148 |
| Mexico: 1.83% | | | | | | |
| Alfa SAB de CV Class A (Industrials, Industrial conglomerates) | | | | | 266,300 | 168,267 |
| America Movil SAB de CV Series L (Communication services, Wireless telecommunication services) | | | | | 444,923 | 378,747 |
| Arca Continental SAB de CV (Consumer staples, Beverages) | | | | | 7,700 | 52,117 |
| Coca-Cola Femsa SAB de CV (Consumer staples, Beverages) | | | | | 16,895 | 103,140 |
| Fomento Economico Mexicano SAB de CV (Consumer staples, Beverages) | | | | | 9,500 | 59,462 |
| Gruma SAB de CV Class B (Consumer staples, Food products) | | | | | 8,085 | 88,389 |
| Grupo Aeroportuario del Pacifico SAB de CV Class B (Industrials, Transportation infrastructure) | | | | | 9,300 | 132,909 |
| Grupo Aeroportuario del Sureste SAB de CV Class B (Industrials, Transportation infrastructure) | | | | | 5,615 | 118,284 |
| Grupo Bimbo SAB de CV Series A (Consumer staples, Food products) | | | | | 35,800 | 120,604 |
| Grupo Financiero Banorte SAB de CV (Financials, Banks) | | | | | 33,600 | 198,466 |
The accompanying notes are an integral part of these financial statements.
Allspring Factor Enhanced Emerging Markets Equity Portfolio | 15
Portfolio of investments—August 31, 2022 (unaudited)
| | | | | | Shares | Value |
| Mexico: (continued) | | | | | | |
| Grupo Financiero Inbursa SAB de CV (Financials, Banks) | | | | | 78,800 | $ 123,442 |
| Grupo Mexico SAB de CV Series B (Materials, Metals & mining) | | | | | 39,600 | 149,189 |
| Operadora De Sites REIT (Communication services, Diversified telecommunication services) | | | | | 20,700 | 20,601 |
| Orbia Advance Corporation SAB de CV (Materials, Chemicals) | | | | | 32,200 | 60,735 |
| Promotora y Operadora de Infraestructura SAB de CV (Industrials, Transportation infrastructure) | | | | | 9,250 | 65,083 |
| Walmart de Mexico SAB de CV (Consumer staples, Food & staples retailing) | | | | | 73,739 | 241,642 |
| | | | | | | 2,081,077 |
| Peru: 0.27% | | | | | | |
| Credicorp Limited (Financials, Banks) | | | | | 2,332 | 300,571 |
| Philippines: 1.28% | | | | | | |
| Aboitiz Equity Ventures Incorporated (Industrials, Industrial conglomerates) | | | | | 98,380 | 98,123 |
| AC Energy Corporation (Utilities, Independent power & renewable electricity producers) | | | | | 5,790 | 771 |
| Bank of the Philippine Islands (Financials, Banks) | | | | | 74,780 | 126,258 |
| BDO Unibank Incorporated (Financials, Banks) | | | | | 77,800 | 177,901 |
| Converge Information & Communications Technology Solutions Incorporated (Communication services, Diversified telecommunication services) | | | | | 225,700 | 69,595 |
| Energy Development Corporation (Utilities, Independent power & renewable electricity producers) ♦† | | | | | 231,800 | 0 |
| Globe Telecom Incorporated (Communication services, Wireless telecommunication services) | | | | | 1,770 | 66,041 |
| GT Capital Holdings Incorporated (Industrials, Industrial conglomerates) | | | | | 8,663 | 74,198 |
| International Container Terminal Services Incorporated (Industrials, Transportation infrastructure) | | | | | 41,590 | 133,947 |
| Jollibee Foods Corporation (Consumer discretionary, Hotels, restaurants & leisure) | | | | | 51,070 | 217,675 |
| Manila Electric Company (Utilities, Electric utilities) | | | | | 13,910 | 74,497 |
| Metro Pacific Investments Corporation (Financials, Diversified financial services) | | | | | 177,100 | 11,751 |
| Metropolitan Bank & Trust Company (Financials, Banks) | | | | | 207,517 | 193,952 |
| PLDT Incorporated (Communication services, Wireless telecommunication services) | | | | | 5,150 | 153,510 |
| SM Prime Holdings Incorporated (Real estate, Real estate management & development) | | | | | 20,300 | 13,646 |
| Universal Robina Corporation (Consumer staples, Food products) | | | | | 21,510 | 46,687 |
| | | | | | | 1,458,552 |
| Poland: 0.50% | | | | | | |
| Allegro SA (Consumer discretionary, Internet & direct marketing retail) 144A | | | | | 32,855 | 172,331 |
| Bank Pekao SA (Financials, Banks) | | | | | 5,503 | 76,129 |
| Dino Polska SA (Consumer staples, Food & staples retailing) 144A | | | | | 562 | 41,000 |
| KGHM Polska Miedz SA (Materials, Metals & mining) | | | | | 2,335 | 43,756 |
| Orange Polska SA (Communication services, Diversified telecommunication services) | | | | | 42,312 | 53,920 |
| PGE SA (Utilities, Electric utilities) | | | | | 42,412 | 64,651 |
| PKO Bank Polski SA (Financials, Banks) | | | | | 14,078 | 70,229 |
| Powszechny Zaklad Ubezpieczen SA (Financials, Insurance) | | | | | 8,077 | 48,348 |
| | | | | | | 570,364 |
The accompanying notes are an integral part of these financial statements.
16 | Allspring Factor Enhanced Emerging Markets Equity Portfolio
Portfolio of investments—August 31, 2022 (unaudited)
| | | | | | Shares | Value |
| Russia: 0.00% | | | | | | |
| Alrosa PJSC (Acquired 5/6/2021, cost $1,726,284) (Materials, Metals & mining) ♦†> | | | | | 52,390 | $ 0 |
| Gazprom PJSC (Acquired 1/29/2019, cost $384,585) (Energy, Oil, gas & consumable fuels) ♦†> | | | | | 143,160 | 0 |
| Inter Rao Ues PJSC (Acquired 5/7/2020, cost $59,563) (Utilities, Electric utilities) ♦†> | | | | | 862,002 | 0 |
| Lukoil PJSC (Acquired 3/18/2020, cost $576,228) (Energy, Oil, gas & consumable fuels) ♦†> | | | | | 8,545 | 0 |
| Magnit PJSC (Acquired 4/29/2013, cost $32,870,257) (Consumer staples, Food & staples retailing) ♦†> | | | | | 1,476 | 0 |
| MMC Norilsk Nickel PJSC (Acquired 6/6/2017, cost $349,985) (Materials, Metals & mining) ♦†> | | | | | 1,210 | 0 |
| Mobile TeleSystems PJSC (Acquired 10/9/2020, cost $54,568) (Communication services, Wireless telecommunication services) ♦†> | | | | | 12,728 | 0 |
| Novolipetsk Steel PJSC (Acquired 5/7/2020, cost $58,368) (Materials, Metals & mining) ♦†> | | | | | 28,410 | 0 |
| Ozon Holdings plc (Acquired 7/8/2021, cost $45,610) (Consumer discretionary, Internet & direct marketing retail) ♦†> | | | | | 828 | 0 |
| PhosAgro PJSC GDR Reg S Depository Receipt (Acquired 4/8/2021, cost $323) (Industrials, Metals & mining) ♦†> | | | | | 18 | 0 |
| PhosAgro PJSC GDR Reg S Depository Receipt (Acquired 4/8/2021, cost $50,199) (Materials, Chemicals) ♦†> | | | | | 912 | 0 |
| Polyus PJSC (Acquired 10/15/2021, cost $135,672) (Materials, Metals & mining) ♦†> | | | | | 772 | 0 |
| Rosneft Oil Company PJSC (Acquired 1/31/2020, cost $125,766) (Energy, Oil, gas & consumable fuels) ♦†> | | | | | 17,010 | 0 |
| Sberbank of Russia PJSC (Acquired 7/31/2019, cost $713,153) (Financials, Banks) ♦†> | | | | | 194,870 | 0 |
| Severstal PJSC (Acquired 7/5/2020, cost $62,518) (Materials, Metals & mining) ♦†> | | | | | 4,920 | 0 |
| Tatneft PJSC (Acquired 5/7/2020, cost $171,025) (Energy, Oil, gas & consumable fuels) ♦†> | | | | | 28,052 | 0 |
| TCS Group Holding plc (Acquired 3/30/2021, cost $149,438) (Financials, Banks) ♦†> | | | | | 2,546 | 0 |
| VTB Bank PJSC (Acquired 7/2/2018, cost $13,240) (Financials, Banks) ♦†> | | | | | 17,390,000 | 0 |
| Yandex NV (Acquired 3/30/2021, cost $399,204) (Communication services, Interactive media & services) ♦†> | | | | | 6,310 | 0 |
| | | | | | | 0 |
| South Africa: 3.05% | | | | | | |
| Absa Group Limited (Financials, Banks) | | | | | 13,519 | 140,018 |
| African Rainbow Minerals Limited (Materials, Metals & mining) | | | | | 5,528 | 76,255 |
| Anglo American Platinum Limited (Materials, Metals & mining) | | | | | 726 | 50,682 |
| Anglogold Ashanti Limited (Materials, Metals & mining) | | | | | 8,251 | 110,189 |
| Aspen Pharmacare Holdings Limited (Health care, Pharmaceuticals) | | | | | 9,026 | 77,459 |
| Bid Corporation Limited (Consumer staples, Food & staples retailing) | | | | | 739 | 14,024 |
| Capitec Bank Holdings Limited (Financials, Banks) | | | | | 605 | 71,938 |
| Clicks Group Limited (Consumer staples, Food & staples retailing) | | | | | 1,572 | 27,351 |
| Exxaro Resources Limited (Energy, Oil, gas & consumable fuels) | | | | | 6,228 | 79,346 |
| FirstRand Limited (Financials, Diversified financial services) | | | | | 61,545 | 229,877 |
| Foschini Limited (Consumer discretionary, Specialty retail) | | | | | 823 | 6,110 |
| Gold Fields Limited (Materials, Metals & mining) | | | | | 16,246 | 131,208 |
| Growthpoint Properties Limited (Real estate, Equity REITs) | | | | | 18,201 | 13,538 |
| Harmony Gold Mining Company Limited (Materials, Metals & mining) | | | | | 13,160 | 33,513 |
| Impala Platinum Holdings Limited (Materials, Metals & mining) | | | | | 14,097 | 147,713 |
| Kumba Iron Ore Limited (Materials, Metals & mining) | | | | | 1,917 | 42,441 |
The accompanying notes are an integral part of these financial statements.
Allspring Factor Enhanced Emerging Markets Equity Portfolio | 17
Portfolio of investments—August 31, 2022 (unaudited)
| | | | | | Shares | Value |
| South Africa: (continued) | | | | | | |
| MTN Group Limited (Communication services, Wireless telecommunication services) | | | | | 23,775 | $ 172,084 |
| MultiChoice Group Limited (Communication services, Media) | | | | | 11,498 | 77,605 |
| Naspers Limited (Consumer discretionary, Internet & direct marketing retail) | | | | | 4,312 | 608,020 |
| Nedbank Group Limited (Financials, Banks) | | | | | 11,109 | 131,125 |
| Northam Platinum Holdings Limited (Materials, Metals & mining) | | | | | 4,491 | 42,265 |
| Old Mutual Limited (Financials, Insurance) | | | | | 59,468 | 35,230 |
| Remgro Limited (Financials, Diversified financial services) | | | | | 12,937 | 95,933 |
| Sasol Limited (Materials, Chemicals) | | | | | 12,817 | 246,505 |
| Shoprite Holdings Limited (Consumer staples, Food & staples retailing) | | | | | 12,120 | 164,347 |
| Sibanye Stillwater Limited (Materials, Metals & mining) | | | | | 61,116 | 136,534 |
| SPAR Group Limited (Consumer staples, Food & staples retailing) | | | | | 12,801 | 117,019 |
| Standard Bank Group Limited (Financials, Banks) | | | | | 18,446 | 164,604 |
| The Bidvest Group Limited (Industrials, Industrial conglomerates) | | | | | 3,496 | 43,872 |
| Vodacom Group Limited (Communication services, Wireless telecommunication services) | | | | | 4,384 | 32,269 |
| Woolworths Holdings Limited (Consumer discretionary, Multiline retail) | | | | | 43,773 | 143,110 |
| | | | | | | 3,462,184 |
| South Korea: 11.86% | | | | | | |
| Amorepacific Group (Consumer staples, Personal products) | | | | | 4,079 | 105,590 |
| Amorepacific Group (Consumer staples, Personal products) | | | | | 475 | 43,292 |
| BGF Retail Company Limited (Consumer staples, Food & staples retailing) | | | | | 2,076 | 248,661 |
| Celltrion Incorporated (Health care, Pharmaceuticals) | | | | | 1,396 | 196,497 |
| Cheil Worldwide Incorporated (Communication services, Media) | | | | | 12,041 | 196,310 |
| CJ Cheiljedang Corporation (Consumer staples, Food products) | | | | | 302 | 91,608 |
| CJ Corporation (Industrials, Industrial conglomerates) | | | | | 248 | 14,429 |
| CJ ENM Company Limited (Communication services, Entertainment) | | | | | 178 | 12,974 |
| CJ Korea Express Corporation (Industrials, Road & rail) | | | | | 1,173 | 103,391 |
| Coway Company Limited (Consumer discretionary, Household durables) | | | | | 4,209 | 199,694 |
| Daelim Industrial Company Limited (Industrials, Construction & engineering) | | | | | 1 | 50 |
| Dongbu Insurance Company Limited (Financials, Insurance) | | | | | 4,698 | 209,220 |
| Doosan Bobcat Incorporated (Industrials, Machinery) | | | | | 4,634 | 119,142 |
| Doosan Heavy Industries & Construction Company Limited (Industrials, Construction & engineering) | | | | | 890 | 13,376 |
| Ecopro BM Company Limited (Industrials, Electrical equipment) | | | | | 966 | 79,930 |
| E-MART Incorporated (Consumer staples, Food & staples retailing) | | | | | 760 | 55,175 |
| F&F Holdings Company Limited (Consumer discretionary, Textiles, apparel & luxury goods) | | | | | 315 | 33,237 |
| Green Cross Corporation (Health care, Biotechnology) | | | | | 1,236 | 150,884 |
| GS Engineering & Construction Corporation (Industrials, Construction & engineering) | | | | | 1,122 | 25,097 |
| GS Holdings Corporation (Energy, Oil, gas & consumable fuels) | | | | | 5,935 | 203,761 |
| Hana Financial Group Incorporated (Financials, Banks) | | | | | 5,398 | 157,334 |
| Hankook Tire Company Limited (Consumer discretionary, Auto components) | | | | | 638 | 17,986 |
| Hanmi Pharm Company Limited (Health care, Pharmaceuticals) | | | | | 121 | 27,728 |
| Hanwha Chem Corporation (Materials, Chemicals) | | | | | 1,979 | 77,165 |
| Hotel Shilla Company Limited (Consumer discretionary, Specialty retail) | | | | | 1,537 | 84,196 |
| Hyundai Glovis Company Limited (Industrials, Air freight & logistics) | | | | | 1,285 | 168,370 |
| Hyundai Merchant Marine Company Limited (Industrials, Marine) | | | | | 6,545 | 107,862 |
| Hyundai Mobis Company Limited (Consumer discretionary, Auto components) | | | | | 940 | 149,905 |
| Hyundai Motor Company Limited (Consumer discretionary, Automobiles) | | | | | 1,756 | 255,116 |
The accompanying notes are an integral part of these financial statements.
18 | Allspring Factor Enhanced Emerging Markets Equity Portfolio
Portfolio of investments—August 31, 2022 (unaudited)
| | | | | | Shares | Value |
| South Korea: (continued) | | | | | | |
| Hyundai Steel Company Limited (Materials, Metals & mining) | | | | | 2,667 | $ 65,034 |
| Iljin Materials Company Limited (Information technology, Electronic equipment, instruments & components) | | | | | 338 | 18,522 |
| Industrial Bank of Korea (Financials, Banks) | | | | | 14,825 | 105,559 |
| Kakao Corporation (Communication services, Interactive media & services) | | | | | 5,756 | 312,572 |
| Kakao Games Corporation (Communication services, Entertainment) | | | | | 566 | 22,077 |
| Kangwon Land Incorporated (Consumer discretionary, Hotels, restaurants & leisure) † | | | | | 3,663 | 72,222 |
| KB Financial Group Incorporated (Financials, Banks) | | | | | 7,911 | 290,404 |
| Kia Corporation (Consumer discretionary, Automobiles) | | | | | 6,106 | 365,980 |
| Korea Aerospace Industries Limited (Industrials, Aerospace & defense) | | | | | 1,809 | 82,085 |
| Korea Investment Holdings Company Limited (Financials, Capital markets) | | | | | 3,140 | 132,398 |
| Korea Zinc Company Limited (Materials, Metals & mining) | | | | | 144 | 72,033 |
| Korean Air Lines Company Limited (Industrials, Airlines) | | | | | 624 | 12,402 |
| Krafton Incorporated (Communication services, Entertainment) | | | | | 362 | 66,128 |
| KT&G Corporation (Consumer staples, Tobacco) | | | | | 1,557 | 96,717 |
| Kumho Petrochemical Company Limited (Materials, Chemicals) | | | | | 1,235 | 119,124 |
| L&F Company Limited (Information technology, Electronic equipment, instruments & components) | | | | | 75 | 12,720 |
| LG Chem Limited (Materials, Chemicals) | | | | | 511 | 239,197 |
| LG Corporation (Industrials, Industrial conglomerates) | | | | | 1,711 | 104,407 |
| LG Display Company Limited (Information technology, Electronic equipment, instruments & components) | | | | | 728 | 8,413 |
| LG Electronics Incorporated (Consumer discretionary, Household durables) | | | | | 1,264 | 94,585 |
| LG Innotek Company Limited (Information technology, Electronic equipment, instruments & components) | | | | | 261 | 66,440 |
| LG Uplus Corporation (Communication services, Diversified telecommunication services) | | | | | 9,854 | 84,390 |
| Lotte Chemical Corporation (Materials, Chemicals) | | | | | 46 | 5,973 |
| Lotte Shopping Company Limited (Consumer discretionary, Multiline retail) | | | | | 1,552 | 113,920 |
| Meritz Financial Group Incorporated (Financials, Diversified financial services) | | | | | 9,891 | 226,704 |
| Meritz Fire & Marine Insurance Company Limited (Financials, Insurance) | | | | | 2,607 | 74,431 |
| Meritz Securities Company Limited (Financials, Capital markets) | | | | | 5,149 | 18,557 |
| Mirae Asset Daewoo Company Limited (Financials, Capital markets) | | | | | 25,091 | 122,365 |
| Naver Corporation (Communication services, Interactive media & services) | | | | | 2,220 | 393,931 |
| NCSoft Corporation (Communication services, Entertainment) | | | | | 292 | 82,056 |
| NH Investment & Securities Company Limited (Financials, Capital markets) | | | | | 9,407 | 69,638 |
| Orion Corporation of Republic of Korea (Consumer staples, Food products) | | | | | 933 | 68,346 |
| Pan Ocean Company Limited (Industrials, Marine) | | | | | 7,043 | 26,949 |
| Pearl Abyss Corporation (Communication services, Entertainment) | | | | | 3,090 | 129,938 |
| POSCO (Materials, Metals & mining) | | | | | 1,094 | 206,947 |
| S1 Corporation Incorporated (Industrials, Commercial services & supplies) | | | | | 977 | 42,421 |
| Samsung Biologics Company Limited (Health care, Life sciences tools & services) | | | | | 144 | 89,562 |
| Samsung C&T Corporation (Industrials, Industrial conglomerates) | | | | | 95 | 8,506 |
| Samsung Electro-Mechanics Company Limited (Information technology, Electronic equipment, instruments & components) | | | | | 1,355 | 140,292 |
| Samsung Electronics Company Limited (Information technology, Technology hardware, storage & peripherals) | | | | | 80,332 | 3,558,767 |
| Samsung Engineering Company Limited (Industrials, Construction & engineering) | | | | | 3,434 | 59,707 |
| Samsung Fire & Marine Insurance Company Limited (Financials, Insurance) | | | | | 835 | 121,354 |
| Samsung Life Insurance Company Limited (Financials, Insurance) | | | | | 241 | 11,123 |
| Samsung SDI Company Limited (Information technology, Electronic equipment, instruments & components) | | | | | 491 | 217,072 |
The accompanying notes are an integral part of these financial statements.
Allspring Factor Enhanced Emerging Markets Equity Portfolio | 19
Portfolio of investments—August 31, 2022 (unaudited)
| | | | | | Shares | Value |
| South Korea: (continued) | | | | | | |
| Samsung Securities Company Limited (Financials, Capital markets) | | | | | 4,535 | $ 114,169 |
| SD Biosensor Incorporated (Health care, Health care equipment & supplies) | | | | | 9,471 | 247,615 |
| Seegene Incorporated (Health care, Biotechnology) | | | | | 12,362 | 289,616 |
| Shinhan Financial Group Company Limited (Financials, Banks) | | | | | 8,757 | 237,258 |
| Sillajen Incorporated (Health care, Biotechnology) ♦‡ | | | | | 2,972 | 7,110 |
| SK Bioscience Company Limited (Health care, Biotechnology) | | | | | 741 | 62,036 |
| SK Company Limited (Industrials, Industrial conglomerates) | | | | | 147 | 25,426 |
| SK Hynix Incorporated (Information technology, Semiconductors & semiconductor equipment) | | | | | 9,834 | 691,408 |
| SK Square Company Limited (Information technology, Semiconductors & semiconductor equipment) † | | | | | 1,800 | 54,088 |
| SK Telecom Company Limited (Communication services, Wireless telecommunication services) | | | | | 756 | 29,330 |
| SKC Company Limited (Materials, Chemicals) | | | | | 351 | 31,541 |
| S-Oil Corporation (Energy, Oil, gas & consumable fuels) | | | | | 895 | 67,886 |
| Soulbrain Company Limited (Materials, Chemicals) | | | | | 1 | 17 |
| Woori Financial Group Incorporated (Financials, Banks) | | | | | 24,511 | 221,725 |
| Yuhan Corporation (Health care, Pharmaceuticals) | | | | | 154 | 6,513 |
| | | | | | | 13,465,686 |
| Taiwan: 14.73% | | | | | | |
| Accton Technology Corporation (Information technology, Communications equipment) | | | | | 8,000 | 73,669 |
| Acer Incorporated (Information technology, Technology hardware, storage & peripherals) | | | | | 77,000 | 55,303 |
| ASE Technology Holding Company Limited (Information technology, Semiconductors & semiconductor equipment) | | | | | 61,000 | 169,703 |
| Asia Cement Corporation (Materials, Construction materials) | | | | | 33,500 | 47,424 |
| ASMedia Technology Incorporated (Information technology, Semiconductors & semiconductor equipment) | | | | | 1,000 | 30,184 |
| Asustek Computer Incorporated (Information technology, Technology hardware, storage & peripherals) | | | | | 9,000 | 74,889 |
| Cathay Financial Holding Company (Financials, Insurance) | | | | | 103,000 | 149,847 |
| Chailease Holding Company Limited (Financials, Diversified financial services) | | | | | 22,814 | 146,482 |
| China Airlines (Industrials, Airlines) | | | | | 168,000 | 124,274 |
| China Development Financial Holding Corporation (Financials, Insurance) | | | | | 386,000 | 168,641 |
| China Steel Corporation (Materials, Metals & mining) | | | | | 67,000 | 63,453 |
| Chunghwa Telecom Company Limited (Communication services, Diversified telecommunication services) | | | | | 64,000 | 253,958 |
| Compal Electronic Incorporated (Information technology, Technology hardware, storage & peripherals) | | | | | 239,000 | 177,951 |
| CTBC Financial Holding Company Limited (Financials, Banks) | | | | | 362,000 | 277,276 |
| Delta Electronics Incorporated (Information technology, Electronic equipment, instruments & components) | | | | | 14,000 | 119,863 |
| E INK Holdings Incorporated (Information technology, Electronic equipment, instruments & components) | | | | | 29,000 | 225,499 |
| E.SUN Financial Holding Company Limited (Financials, Banks) | | | | | 215,614 | 198,669 |
| Eclat Textile Company Limited (Consumer discretionary, Textiles, apparel & luxury goods) | | | | | 3,667 | 53,111 |
| eMemory Technology Incorporated (Information technology, Semiconductors & semiconductor equipment) | | | | | 3,000 | 134,173 |
| Eva Airways Corporation (Industrials, Airlines) | | | | | 116,000 | 126,947 |
| Evergreen Marine Corporation (Taiwan) Limited (Industrials, Marine) | | | | | 47,000 | 134,689 |
| Far Eastern New Century Corporation (Industrials, Industrial conglomerates) | | | | | 11,000 | 11,787 |
The accompanying notes are an integral part of these financial statements.
20 | Allspring Factor Enhanced Emerging Markets Equity Portfolio
Portfolio of investments—August 31, 2022 (unaudited)
| | | | | | Shares | Value |
| Taiwan: (continued) | | | | | | |
| Far EasTone Telecommunications Company Limited (Communication services, Wireless telecommunication services) | | | | | 88,000 | $ 215,825 |
| Feng Tay Enterprise Company Limited (Consumer discretionary, Textiles, apparel & luxury goods) | | | | | 4,000 | 22,441 |
| First Financial Holding Company Limited (Financials, Banks) | | | | | 205,020 | 177,871 |
| Formosa Plastics Corporation (Materials, Chemicals) | | | | | 60,000 | 178,896 |
| Fubon Financial Holding Company Limited (Financials, Insurance) | | | | | 83,400 | 156,379 |
| Giant Manufacturing Company Limited (Consumer discretionary, Leisure products) | | | | | 22,000 | 171,851 |
| Hon Hai Precision Industry Company Limited (Information technology, Electronic equipment, instruments & components) | | | | | 215,400 | 766,992 |
| Hua Nan Financial Holdings Company Limited Class C (Financials, Banks) | | | | | 156,134 | 118,508 |
| Inventec Company Limited (Information technology, Technology hardware, storage & peripherals) | | | | | 180,834 | 136,904 |
| Lite-On Technology Corporation (Information technology, Technology hardware, storage & peripherals) | | | | | 36,000 | 77,473 |
| Mediatek Incorporated (Information technology, Semiconductors & semiconductor equipment) | | | | | 26,000 | 562,555 |
| Mega Financial Holding Company Limited (Financials, Banks) | | | | | 199,875 | 234,439 |
| Micro-Star International Company Limited (Information technology, Technology hardware, storage & peripherals) | | | | | 26,000 | 97,334 |
| Momo.com Incorporated (Consumer discretionary, Internet & direct marketing retail) | | | | | 18,000 | 426,824 |
| Nan Ya Plastics Corporation (Materials, Chemicals) | | | | | 34,000 | 76,371 |
| Nan Ya Printed Circuit Board Corporation (Information technology, Electronic equipment, instruments & components) | | | | | 14,000 | 122,139 |
| Nanya Technology Corporation (Information technology, Semiconductors & semiconductor equipment) | | | | | 20,000 | 34,736 |
| Novatek Microelectronics Corporation Limited (Information technology, Semiconductors & semiconductor equipment) | | | | | 22,000 | 188,217 |
| Pegatron Corporation (Information technology, Technology hardware, storage & peripherals) | | | | | 59,000 | 122,710 |
| Pharmally International Holding Company Limited (Health care, Pharmaceuticals) ♦† | | | | | 2,064 | 0 |
| Pou Chen Corporation (Consumer discretionary, Textiles, apparel & luxury goods) | | | | | 18,000 | 17,051 |
| Powerchip Semiconductor Manufacturing Corporation (Information technology, Semiconductors & semiconductor equipment) | | | | | 68,000 | 76,251 |
| Quanta Computer Incorporated (Information technology, Technology hardware, storage & peripherals) | | | | | 42,000 | 108,881 |
| Realtek Semiconductor Corporation (Information technology, Semiconductors & semiconductor equipment) | | | | | 8,000 | 89,894 |
| Ruentex Development Company Limited (Real estate, Real estate management & development) | | | | | 35,000 | 72,172 |
| Shin Kong Financial Holding Company Limited (Financials, Insurance) | | | | | 169,000 | 48,551 |
| Silergy Corporation (Information technology, Semiconductors & semiconductor equipment) | | | | | 2,000 | 34,287 |
| Sinopac Financial Holdings Company Limited (Financials, Banks) | | | | | 474,094 | 268,770 |
| Synnex Technology International Corporation (Information technology, Electronic equipment, instruments & components) | | | | | 138,000 | 251,544 |
| Taishin Financial Holdings Company Limited (Financials, Banks) | | | | | 115,747 | 57,448 |
| Taiwan Cement Corporation (Materials, Construction materials) | | | | | 38,324 | 49,334 |
| Taiwan Cooperative Financial Holdings Company Limited (Financials, Banks) | | | | | 254,410 | 229,755 |
| Taiwan Mobile Company Limited (Communication services, Wireless telecommunication services) | | | | | 17,000 | 55,567 |
| Taiwan Semiconductor Manufacturing Company Limited (Information technology, Semiconductors & semiconductor equipment) | | | | | 429,000 | 7,022,636 |
The accompanying notes are an integral part of these financial statements.
Allspring Factor Enhanced Emerging Markets Equity Portfolio | 21
Portfolio of investments—August 31, 2022 (unaudited)
| | | | | | Shares | Value |
| Taiwan: (continued) | | | | | | |
| The Shanghai Commercial & Savings Bank Limited (Financials, Banks) | | | | | 122,000 | $ 198,580 |
| Unimicron Technology Corporation (Information technology, Electronic equipment, instruments & components) | | | | | 34,000 | 166,591 |
| Uni-President Enterprises Corporation (Consumer staples, Food products) | | | | | 7,000 | 15,127 |
| United Microelectronics Corporation (Information technology, Semiconductors & semiconductor equipment) | | | | | 213,000 | 283,389 |
| Vanguard International Semiconductor Corporation (Information technology, Semiconductors & semiconductor equipment) | | | | | 62,000 | 149,886 |
| Voltronic Power Technology Corporation (Energy, Electrical equipment) | | | | | 2,000 | 112,857 |
| Walsin Lihwa Corporation (Industrials, Electrical equipment) | | | | | 36,000 | 46,492 |
| Wan Hai Lines Limited (Industrials, Marine) | | | | | 19,550 | 55,100 |
| Windbond Electronics Corporation (Information technology, Semiconductors & semiconductor equipment) | | | | | 136,000 | 97,989 |
| Wiwynn Corporation (Information technology, Technology hardware, storage & peripherals) | | | | | 2,000 | 50,067 |
| WPG Holdings Company Limited (Information technology, Electronic equipment, instruments & components) | | | | | 144,440 | 242,909 |
| Yang Ming Marine Transport Corporation (Industrials, Marine) | | | | | 42,000 | 107,594 |
| Yuanta Financial Holding Company Limited (Financials, Diversified financial services) | | | | | 856 | 568 |
| Zhen Ding Technology Holding (Information technology, Electronic equipment, instruments & components) | | | | | 30,000 | 111,335 |
| | | | | | | 16,726,882 |
| Thailand: 2.04% | | | | | | |
| Advanced Info Service PCL (Communication services, Wireless telecommunication services) | | | | | 26,400 | 138,893 |
| Bangkok Commercial Asset Management PCL NVDR (Financials, Capital markets) | | | | | 308,700 | 155,587 |
| Bangkok Dusit Medical Services PCL (Health care, Health care providers & services) | | | | | 227,900 | 182,651 |
| Bumrungrad Hospital PCL (Health care, Health care providers & services) | | | | | 42,700 | 252,837 |
| Central Pattana PCL (Real estate, Real estate management & development) | | | | | 8,200 | 15,551 |
| Central Retail Corporation PCL (Consumer discretionary, Multiline retail) | | | | | 68,300 | 75,708 |
| Charoen Pokphand Foods PCL (Consumer staples, Food products) | | | | | 35,500 | 25,294 |
| CP All PCL (Consumer staples, Food & staples retailing) | | | | | 26,700 | 45,004 |
| Electricity Genera PCL (Utilities, Independent power & renewable electricity producers) | | | | | 13,300 | 66,687 |
| Energy Absolute PCL (Utilities, Independent power & renewable electricity producers) | | | | | 27,700 | 64,671 |
| Home Product Center PCL (Consumer discretionary, Specialty retail) | | | | | 226,700 | 86,360 |
| Indorama Ventures PCL (Materials, Chemicals) | | | | | 103,000 | 121,984 |
| Intouch Holdings PCL (Communication services, Wireless telecommunication services) | | | | | 45,100 | 89,836 |
| JMT Network Services (Financials, Consumer finance) | | | | | 53,100 | 113,446 |
| Krung Thai Bank PCL (Financials, Banks) | | | | | 435,500 | 201,363 |
| Krungthai Card PCL (Financials, Consumer finance) | | | | | 59,500 | 98,105 |
| Land & Houses PCL (Real estate, Real estate management & development) | | | | | 513,200 | 125,201 |
| Osotspa PCL (Consumer staples, Beverages) | | | | | 104,100 | 89,130 |
| PTT Exploration & Production PCL (Energy, Oil, gas & consumable fuels) | | | | | 25,700 | 118,863 |
| Ratchaburi Electricity Generating Holding PCL (Utilities, Independent power & renewable electricity producers) | | | | | 45,900 | 55,369 |
| Srisawad Power 1979 PCL (Financials, Diversified financial services) | | | | | 110,000 | 146,697 |
The accompanying notes are an integral part of these financial statements.
22 | Allspring Factor Enhanced Emerging Markets Equity Portfolio
Portfolio of investments—August 31, 2022 (unaudited)
| | | | | | Shares | Value |
| Thailand: (continued) | | | | | | |
| Thai Union Group PCL (Consumer staples, Food products) | | | | | 7,400 | $ 3,548 |
| The Siam Cement PCL (Materials, Construction materials) | | | | | 5,000 | 49,050 |
| | | | | | | 2,321,835 |
| Turkey: 0.48% | | | | | | |
| Akbank TAS (Financials, Banks) | | | | | 205,301 | 132,265 |
| Bim Birlesik Magazalar AS (Consumer staples, Food & staples retailing) | | | | | 5,865 | 35,187 |
| Haci Omer Sabanci Holding AS (Financials, Diversified financial services) | | | | | 116,998 | 163,743 |
| Turk Sise ve Cam Fabrikalari AS (Industrials, Industrial conglomerates) | | | | | 87,030 | 118,548 |
| Turkiye Is Bankasi Class C AS (Financials, Banks) | | | | | 230,652 | 99,912 |
| | | | | | | 549,655 |
| Total Common stocks (Cost $112,921,959) | | | | | | 106,064,291 |
| | | Dividend
yield | | | | |
| Preferred stocks: 3.06% | | | | | | |
| Brazil: 2.14% | | | | | | |
| Banco Bradesco SA (Financials, Banks) | | 1.41% | | | 97,694 | 356,043 |
| Braskem SA Class A (Materials, Chemicals) | | 29.33 | | | 28,800 | 168,568 |
| Centrais Elétricas Brasileiras SA-Eletrobras Class B (Utilities, Electric utilities) | | 3.41 | | | 19,500 | 179,542 |
| Companhia Energetica de Minas Gerais SA (Utilities, Electric utilities) | | 1.42 | | | 97,287 | 226,275 |
| Gerdau SA (Materials, Metals & mining) | | 4.31 | | | 49,000 | 219,645 |
| Itau Unibanco Holding SA (Financials, Banks) | | 0.36 | | | 86,670 | 429,985 |
| Itaúsa SA (Financials, Banks) | | 3.04 | | | 146,814 | 258,217 |
| Petroleo Brasileiro SA (Energy, Oil, gas & consumable fuels) | | 29.51 | | | 92,300 | 589,560 |
| | | | | | | 2,427,835 |
| Chile: 0.30% | | | | | | |
| Sociedad Quimica y Minera de Chile SA Class B (Materials, Chemicals) | | 2.88 | | | 3,358 | 335,714 |
| Colombia: 0.16% | | | | | | |
| Bancolombia SA (Financials, Banks) | | 8.45 | | | 26,527 | 183,155 |
| South Korea: 0.46% | | | | | | |
| LG Household & Health Care Limited (Consumer staples, Personal products) | | 3.73 | | | 42 | 11,447 |
| Samsung Electronics Company Limited (Information technology, Technology hardware, storage & peripherals) | | 2.99 | | | 12,761 | 516,210 |
| | | | | | | 527,657 |
| Total Preferred stocks (Cost $3,476,156) | | | | | | 3,474,361 |
| | | Yield | | | | |
| Short-term investments: 5.40% | | | | | | |
| Investment companies: 5.40% | | | | | | |
| Allspring Government Money Market Fund Select Class ♠∞ | | 2.09 | | | 6,136,528 | 6,136,528 |
| Total Short-term investments (Cost $6,136,528) | | | | | | 6,136,528 |
| Total investments in securities (Cost $122,534,643) | 101.84% | | | | | 115,675,180 |
| Other assets and liabilities, net | (1.84) | | | | | (2,084,531) |
| Total net assets | 100.00% | | | | | $113,590,649 |
The accompanying notes are an integral part of these financial statements.
Allspring Factor Enhanced Emerging Markets Equity Portfolio | 23
Portfolio of investments—August 31, 2022 (unaudited)
| 144A | The security may be resold in transactions exempt from registration, normally to qualified institutional buyers, pursuant to Rule 144A under the Securities Act of 1933. |
| † | Non-income-earning security |
| ♦ | The security is fair valued in accordance with procedures approved by the Board of Trustees. |
| > | Restricted security as to resale, excluding Rule 144A securities. The Fund held restricted securities with an aggregate current value of $0 (original aggregate cost of $37,945,986), representing 0.00% of its net assets as of period end. |
| ‡ | Security is valued using significant unobservable inputs. |
| ♠ | The issuer of the security is an affiliated person of the Portfolio as defined in the Investment Company Act of 1940. |
| ∞ | The rate represents the 7-day annualized yield at period end. |
| Abbreviations: |
| ADR | American depositary receipt |
| GDR | Global depositary receipt |
| REIT | Real estate investment trust |
Investments in affiliates
An affiliated investment is an investment in which the Portfolio owns at least 5% of the outstanding voting shares of the issuer or as a result of other relationships, such as the Portfolio and the issuer having the same adviser or investment manager. Transactions with issuers that were affiliates of the Portfolio at the end of the period were as follows:
| | Value,
beginning of
period | Purchases | Sales
proceeds | Net
realized
gains
(losses) | Net
change in
unrealized
gains
(losses) | Value,
end of
period | Shares,
end
of period | Income
from
affiliated
securities |
| Short-term investments | | | | | | | |
| Allspring Government Money Market Fund Select Class | $2,681,400 | $66,847,635 | $(63,392,507) | $0 | $0 | $6,136,528 | 6,136,528 | $18,970 |
Futures contracts
| Description | Number of
contracts | Expiration
date | Notional
cost | Notional
value | Unrealized
gains | Unrealized
losses |
| Long | | | | | | |
| MSCI Emerging Markets Index | 89 | 9-16-2022 | $4,436,160 | $4,369,455 | $0 | $(66,705) |
The accompanying notes are an integral part of these financial statements.
24 | Allspring Factor Enhanced Emerging Markets Equity Portfolio
Statement of assets and liabilities—August 31, 2022 (unaudited)
| | |
| Assets | |
Investments in unaffiliated securities, at value (cost $116,398,115)
| $ 109,538,652 |
Investments in affiliated securities, at value (cost $6,136,528)
| 6,136,528 |
Cash at broker segregated for futures contracts
| 490,000 |
Foreign currency, at value (cost $1,783,027)
| 1,774,643 |
Receivable for investments sold
| 2,675,695 |
Receivable for dividends
| 354,976 |
Prepaid expenses and other assets
| 562 |
Total assets
| 120,971,056 |
| Liabilities | |
Payable for investments purchased
| 6,677,043 |
Custody and accounting fees payable
| 509,729 |
Payable for daily variation margin on open futures contracts
| 12,584 |
Trustees’ fees and expenses payable
| 1,611 |
Accrued expenses and other liabilities
| 179,440 |
Total liabilities
| 7,380,407 |
Total net assets
| $113,590,649 |
The accompanying notes are an integral part of these financial statements.
Allspring Factor Enhanced Emerging Markets Equity Portfolio | 25
Statement of operations—six months ended August 31, 2022 (unaudited)
| | |
| Investment income | |
Dividends (net of foreign withholdings taxes of $367,113)
| $ 2,922,583 |
Income from affiliated securities
| 18,970 |
Total investment income
| 2,941,553 |
| Expenses | |
Advisory fee
| 95,864 |
Custody and accounting fees
| 104,280 |
Professional fees
| 32,957 |
Interest holder report expenses
| 10,846 |
Trustees’ fees and expenses
| 11,153 |
Other fees and expenses
| 25,197 |
Total expenses
| 280,297 |
Less: Fee waivers and/or expense reimbursements
| (160,786) |
Net expenses
| 119,511 |
Net investment income
| 2,822,042 |
| Realized and unrealized gains (losses) on investments | |
| Net realized gains (losses) on | |
Unaffiliated securities
| (10,175,912) |
Foreign currency and foreign currency translations
| (103,937) |
Futures contracts
| 19,801 |
Net realized losses on investments
| (10,260,048) |
| Net change in unrealized gains (losses) on | |
Unaffiliated securities (net of foreign taxes of $(59,599))
| (12,021,610) |
Foreign currency and foreign currency translations
| (3,783) |
Futures contracts
| (14,672) |
Net change in unrealized gains (losses) on investments
| (12,040,065) |
Net realized and unrealized gains (losses) on investments
| (22,300,113) |
Net decrease in net assets resulting from operations
| $(19,478,071) |
The accompanying notes are an integral part of these financial statements.
26 | Allspring Factor Enhanced Emerging Markets Equity Portfolio
Statement of changes in net assets
| | | |
| | Six months ended
August 31, 2022
(unaudited) | Year ended
February 28, 2022 |
| Operations | | |
Net investment income
| $ 2,822,042 | $ 4,685,771 |
Net realized gains (losses) on investments
| (10,260,048) | 12,703,550 |
Net change in unrealized gains (losses) on investments
| (12,040,065) | (33,731,071) |
Net decrease in net assets resulting from operations
| (19,478,071) | (16,341,750) |
| Capital transactions | | |
| Transactions in investors’ beneficial interests | | |
Contributions
| 27,985,277 | 43,860,415 |
Withdrawals
| (53,293,812) | (40,306,725) |
Net increase (decrease) in net assets resulting from capital transactions
| (25,308,535) | 3,553,690 |
Total decrease in net assets
| (44,786,606) | (12,788,060) |
| Net assets | | |
Beginning of period
| 158,377,255 | 171,165,315 |
End of period
| $113,590,649 | $158,377,255 |
The accompanying notes are an integral part of these financial statements.
Allspring Factor Enhanced Emerging Markets Equity Portfolio | 27
| | | Year ended February 28 |
| | Six months ended
August 31, 2022
(unaudited) | 2022 | 2021 | 2020 1 | 2019 | 2018 2 |
Total return3
| (14.27)% | (9.21)% | 23.70% | (6.15)% | (11.16)% | 13.43% |
| Ratios to average net assets (annualized) | | | | | | |
Gross expenses
| 0.44% | 0.43% | 0.53% | 0.52% | 0.58% | 0.49% |
Net expenses
| 0.19% * | 0.19% * | 0.22% * | 0.39% | 0.45% | 0.49% |
Net investment income
| 4.42% | 2.66% | 2.15% | 2.51% | 2.33% | 1.56% |
| Supplemental data | | | | | | |
Portfolio turnover rate
| 42% | 87% | 133% | 59% | 81% | 136% |
| * | Ratio includes expenses which were voluntarily waived by the adviser. Without these voluntary waivers, the net expense ratios would be increased by the following amounts: |
| Six months ended August 31, 2022 (unaudited) | 0.25% |
| Year ended February 28, 2022 | 0.24% |
| Year ended February 28, 2021 | 0.31% |
| 1 | Year ended February 29 |
| 2 | For the period from May 23, 2017 (commencement of operations) to February 28, 2018 |
| 3 | Returns for periods of less than one year are not annualized. |
The accompanying notes are an integral part of these financial statements.
28 | Allspring Factor Enhanced Emerging Markets Equity Portfolio
Notes to financial statements (unaudited)
1. ORGANIZATION
Allspring Master Trust (the "Trust"), a Delaware statutory trust organized on March 10, 1999, is an open-end management investment company registered under the Investment Company Act of 1940, as amended (the "1940 Act"). As an investment company, the Trust follows the accounting and reporting guidance in Financial Accounting Standards Board ("FASB") Accounting Standards Codification Topic 946, Financial Services – Investment Companies. These financial statements report on the Allspring Factor Enhanced Emerging Markets Equity Portfolio (the "Portfolio") which is a diversified series of the Trust.
Interests in the Portfolio are available solely through private placement transactions that do not involve any "public offering" within the meaning of Section 4(a)(2) of the Securities Act of 1933.
2. SIGNIFICANT ACCOUNTING POLICIES
The following significant accounting policies, which are consistently followed in the preparation of the financial statements of the Portfolio, are in conformity with U.S. generally accepted accounting principles which require management to make estimates and assumptions that affect the reported amounts of assets and liabilities, disclosure of contingent assets and liabilities at the date of the financial statements, and the reported amounts of income and expenses during the reporting period. Actual results could differ from those estimates.
Securities valuation
All investments are valued each business day as of the close of regular trading on the New York Stock Exchange (generally 4 p.m. Eastern Time), although the Portfolio may deviate from this calculation time under unusual or unexpected circumstances.
Equity securities and futures contracts that are listed on a foreign or domestic exchange or market are valued at the official closing price or, if none, the last sales price.
The values of securities denominated in foreign currencies are translated into U.S. dollars at rates provided by an independent foreign currency pricing source at a time each business day specified by the Allspring Global Investments Pricing Committee at Allspring Funds Management, LLC ("Allspring Funds Management").
Many securities markets and exchanges outside the U.S. close prior to the close of the New York Stock Exchange and therefore may not fully reflect trading or events that occur after the close of the principal exchange in which the foreign securities are traded, but before the close of the New York Stock Exchange. If such trading or events are expected to materially affect the value of such securities, then fair value pricing procedures approved by the Board of Trustees of the Portfolio are applied. These procedures take into account multiple factors including movements in U.S. securities markets after foreign exchanges close. Foreign securities that are fair valued under these procedures are categorized as Level 2 and the application of these procedures may result in transfers between Level 1 and Level 2. Depending on market activity, such fair valuations may be frequent. Such fair value pricing may result in net asset values that are higher or lower than net asset values based on the last reported sales price or latest quoted bid price. On August 31, 2022, such fair value pricing was used in pricing certain foreign securities.
Investments in registered open-end investment companies are valued at net asset value.
Investments which are not valued using any of the methods discussed above are valued at their fair value, as determined in good faith by the Board of Trustees. The Board of Trustees has established a Valuation Committee comprised of the Trustees and has delegated to it the authority to take any actions regarding the valuation of portfolio securities that the Valuation Committee deems necessary or appropriate, including determining the fair value of portfolio securities, unless the determination has been delegated to the Allspring Global Investments Pricing Committee. The Board of Trustees retains the authority to make or ratify any valuation decisions or approve any changes to the Valuation Procedures as it deems appropriate. On a quarterly basis, the Board of Trustees receives reports on any valuation actions taken by the Valuation Committee or the Allspring Global Investments Pricing Committee which may include items for ratification.
Foreign currency translation
The accounting records of the Portfolio are maintained in U.S. dollars. The values of other assets and liabilities denominated in foreign currencies are translated into U.S. dollars at rates provided by an independent foreign currency pricing source at a time each business day specified by the Allspring Global Investments Pricing Committee. Purchases and sales of securities, and income and expenses are converted at the rate of exchange on the respective dates of such transactions. Net realized foreign exchange gains or losses arise from sales of foreign currencies, currency gains or losses realized between the trade and settlement dates on securities transactions, and the difference between the amounts of dividends, interest and foreign withholding taxes recorded and the U.S. dollar equivalent of the amounts actually paid or received. Net unrealized foreign
Allspring Factor Enhanced Emerging Markets Equity Portfolio | 29
Notes to financial statements (unaudited)
exchange gains and losses arise from changes in the fair value of assets and liabilities other than investments in securities resulting from changes in exchange rates. The changes in net assets arising from changes in exchange rates of securities and the changes in net assets resulting from changes in market prices of securities are not separately presented. Such changes are included in net realized and unrealized gains or losses from investments.
Futures contracts
Futures contracts are agreements between the Portfolio and a counterparty to buy or sell a specific amount of a commodity, financial instrument or currency at a specified price on a specified date. The Portfolio may buy and sell futures contracts in order to gain exposure to, or protect against, changes in security values and is subject to equity price risk. The primary risks associated with the use of futures contracts are the imperfect correlation between changes in market values of securities held by the Portfolio and the prices of futures contracts, and the possibility of an illiquid market. Futures contracts are generally entered into on a regulated futures exchange and cleared through a clearinghouse associated with the exchange. With futures contracts, there is minimal counterparty risk to the Portfolio since futures contracts are exchange traded and the exchange’s clearinghouse, as the counterparty to all exchange traded futures, guarantees the futures contracts against default.
Upon entering into a futures contract, the Portfolio is required to deposit either cash or securities (initial margin) with the broker in an amount equal to a certain percentage of the contract value. Subsequent payments (variation margin) are paid to or from the broker each day equal to the daily changes in the contract value. Such payments are recorded as unrealized gains or losses and, if any, shown as variation margin receivable (payable) in the Statement of Assets and Liabilities. Should the Portfolio fail to make requested variation margin payments, the broker can gain access to the initial margin to satisfy the Portfolio’s payment obligations. When the contracts are closed, a realized gain or loss is recorded in the Statement of Operations.
Security transactions and income recognition
Securities transactions are recorded on a trade date basis. Realized gains or losses are recorded on the basis of identified cost.
Dividend income is recognized on the ex-dividend date, except for certain dividends from foreign securities, which are recorded as soon as the custodian verifies the ex-dividend date. Dividend income is recorded net of foreign taxes withheld where recovery of such taxes is not assured.
Federal and other taxes
The Portfolio is not required to pay federal income taxes on its net investment income and net capital gains as it is treated as a partnership for federal income tax purposes. All income, gains and losses of the Portfolio are deemed to have been “passed through” to the interest holders in proportion to their holdings of the Portfolio regardless of whether income and gains have been distributed by the Portfolio.
The Portfolio’s income tax returns and all financial records supporting those returns for the prior three fiscal years are subject to examination by the federal revenue authority. Management has analyzed the Portfolio’s tax positions taken on federal, state, and foreign tax returns, as applicable, for all open tax years and does not believe that there are any uncertain tax positions that require recognition of a tax liability.
As of August 31, 2022, the aggregate cost of all investments for federal income tax purposes was $121,134,288 and the unrealized gains (losses) consisted of:
| Gross unrealized gains | $ 8,552,728 |
| Gross unrealized losses | (12,303,898) |
| Net unrealized losses | $ (3,751,170) |
30 | Allspring Factor Enhanced Emerging Markets Equity Portfolio
Notes to financial statements (unaudited)
3. FAIR VALUATION MEASUREMENTS
Fair value measurements of investments are determined within a framework that has established a fair value hierarchy based upon the various data inputs utilized in determining the value of the Portfolio’s investments. The three-level hierarchy gives the highest priority to unadjusted quoted prices in active markets for identical assets or liabilities (Level 1) and the lowest priority to unobservable inputs (Level 3). The Portfolio’s investments are classified within the fair value hierarchy based on the lowest level of input that is significant to the fair value measurement. The inputs are summarized into three broad levels as follows:
| ■ | Level 1 – quoted prices in active markets for identical securities |
| ■ | Level 2 – other significant observable inputs (including quoted prices for similar securities, interest rates, prepayment speeds, credit risk, etc.) |
| ■ | Level 3 – significant unobservable inputs (including the Portfolio’s own assumptions in determining the fair value of investments) |
The inputs or methodologies used for valuing investments in securities are not necessarily an indication of the risk associated with investing in those securities.
Allspring Factor Enhanced Emerging Markets Equity Portfolio | 31
Notes to financial statements (unaudited)
The following is a summary of the inputs used in valuing the Portfolio’s assets and liabilities as of August 31, 2022:
| | Quoted prices
(Level 1) | Other significant
observable inputs
(Level 2) | Significant
unobservable inputs
(Level 3) | Total |
| Assets | | | | |
| Investments in: | | | | |
| Common stocks | | | | |
| Brazil | $ 4,013,962 | $ 0 | $ 0 | $ 4,013,962 |
| Chile | 550,437 | 0 | 0 | 550,437 |
| China | 1,000,636 | 34,248,254 | 0 | 35,248,890 |
| Colombia | 150,414 | 0 | 0 | 150,414 |
| Czech Republic | 67,822 | 9,925 | 0 | 77,747 |
| Egypt | 28,536 | 0 | 0 | 28,536 |
| Greece | 0 | 570,528 | 0 | 570,528 |
| Hong Kong | 0 | 1,979,447 | 0 | 1,979,447 |
| Hungary | 0 | 44,853 | 0 | 44,853 |
| India | 0 | 15,980,912 | 0 | 15,980,912 |
| Indonesia | 50,349 | 2,511,206 | 0 | 2,561,555 |
| Kuwait | 11,734 | 1,450,322 | 0 | 1,462,056 |
| Malaysia | 339,379 | 2,118,769 | 0 | 2,458,148 |
| Mexico | 2,081,077 | 0 | 0 | 2,081,077 |
| Peru | 300,571 | 0 | 0 | 300,571 |
| Philippines | 0 | 1,458,552 | 0 | 1,458,552 |
| Poland | 0 | 570,364 | 0 | 570,364 |
| Russia | 0 | 0 | 0 | 0 |
| South Africa | 561,149 | 2,901,035 | 0 | 3,462,184 |
| South Korea | 0 | 13,458,576 | 7,110 | 13,465,686 |
| Taiwan | 0 | 16,726,882 | 0 | 16,726,882 |
| Thailand | 0 | 2,321,835 | 0 | 2,321,835 |
| Turkey | 414,556 | 135,099 | 0 | 549,655 |
| Preferred stocks | | | | |
| Brazil | 2,427,835 | 0 | 0 | 2,427,835 |
| Chile | 335,714 | 0 | 0 | 335,714 |
| Colombia | 183,155 | 0 | 0 | 183,155 |
| South Korea | 0 | 527,657 | 0 | 527,657 |
| Short-term investments | | | | |
| Investment companies | 6,136,528 | 0 | 0 | 6,136,528 |
| Total assets | $18,653,854 | $97,014,216 | $7,110 | $115,675,180 |
| Liabilities | | | | |
| Futures contracts | $ 66,705 | $ 0 | $ 0 | $ 66,705 |
| Total liabilities | $ 66,705 | $ 0 | $ 0 | $ 66,705 |
Futures contracts are reported at their cumulative unrealized gains (losses) at measurement date as reported in the table following the Portfolio of Investments. For futures contracts, the current day’s variation margin is reported on the Statement of Assets and Liabilities. All other assets and liabilities are reported at their market value at measurement date.
Additional sector, industry or geographic detail, if any, is included in the Portfolio of Investments.
For the six months ended August 31, 2022, the Portfolio did not have any transfers into/out of Level 3.
32 | Allspring Factor Enhanced Emerging Markets Equity Portfolio
Notes to financial statements (unaudited)
4. TRANSACTIONS WITH AFFILIATES
Advisory fee
The Trust has entered into an advisory contract with Allspring Funds Management, a wholly owned subsidiary of Allspring Global Investments Holdings, LLC, a holding company indirectly owned by certain private funds of GTCR LLC and Reverence Capital Partners, L.P. The adviser is responsible for implementing investment policies and guidelines and for supervising the subadviser, who is responsible for day-to-day portfolio management of the Portfolio. Pursuant to the contract, Allspring Funds Management is entitled to receive an advisory fee at the following annual rate based on the Portfolio’s average daily net assets:
| Average daily net assets | Advisory fee |
| First $5 billion | 0.150% |
| Next $5 billion | 0.130 |
| Over $10 billion | 0.110 |
For the six months ended August 31, 2022, the advisory fee was equivalent to an annual rate of 0.15% of the Portfolio’s average daily net assets.
Allspring Funds Management has retained the services of a subadviser to provide daily portfolio management to the Portfolio. The fee for subadvisory services is borne by Allspring Funds Management. Allspring Global Investments, LLC, an affiliate of Allspring Funds Management and a wholly owned subsidiary of Allspring Global Investments Holdings, LLC, is the subadviser to the Portfolio and is entitled to receive a fee from Allspring Funds Management at an annual rate starting at 0.08% and declining to 0.05% as the average daily net assets of the Portfolio increase.
Allspring Funds Management has voluntarily waived and/or reimbursed advisory fees to reduce the net operating expense ratio of the Portfolio. These voluntary waivers may be discontinued at any time.
Interfund transactions
The Portfolio may purchase or sell portfolio investment securities to certain affiliates pursuant to Rule 17a-7 under the 1940 Act and under procedures adopted by the Board of Trustees. The procedures have been designed to ensure that these interfund transactions, which do not incur broker commissions, are effected at current market prices.
5. INVESTMENT PORTFOLIO TRANSACTIONS
Purchases and sales of investments, excluding U.S. government obligations (if any) and short-term securities, for the six months ended August 31, 2022 were $50,614,411 and $73,861,148, respectively.
6. DERIVATIVE TRANSACTIONS
During the six months ended August 31, 2022, the Portfolio entered into futures contracts to gain market exposure. The Portfolio had an average notional amount of $6,458,217 in long futures contracts during the six months ended August 31, 2022.
The fair value, realized gains or losses and change in unrealized gains or losses, if any, on derivative instruments are reflected in the corresponding financial statement captions.
7. BANK BORROWINGS
The Trust, along with Allspring Variable Trust and Allspring Funds Trust (excluding the money market funds), are parties to a $350,000,000 revolving credit agreement whereby the Portfolio is permitted to use bank borrowings for temporary or emergency purposes, such as to fund interest holders withdrawal requests. Interest under the credit agreement is charged to the Portfolio based on a borrowing rate equal to the higher of the Federal Funds rate or the overnight bank funding rate in effect on that day plus a spread. In addition, an annual commitment fee equal based on the unused balance is allocated to each participating fund.
For the six months ended August 31, 2022, there were no borrowings by the Portfolio under the agreement.
8. CONCENTRATION RISKS
As of the end of the period, the Portfolio concentrated its portfolio of investments in China. A fund that invests a substantial portion of its assets in any country or geographic region will be more vulnerable than a fund that invests its assets more broadly to the economic, financial, political or other developments affecting that country or region. Such developments may have a
Allspring Factor Enhanced Emerging Markets Equity Portfolio | 33
Notes to financial statements (unaudited)
significant impact on the Portfolio’s investment performance causing such performance to be more volatile than the investment performance of a more geographically diversified fund.
9. MARKET RISKS
Russia launched a large-scale invasion of Ukraine on February 24, 2022. As a result of this military action, the United States and many other countries have instituted various economic sanctions against Russian and Belarus individuals and entities. The situation has led to increased financial market volatility and could have severe adverse effects on regional and global economic markets, including the markets for certain securities and commodities, such as oil and natural gas. The extent and duration of the military action, resulting sanctions imposed, other punitive action taken and the resulting market disruptions cannot be easily predicted. As of August 31, 2022, the Portfolio held Russian securities with no market value and unrealized losses in the amount of $2,238,155.
10. INDEMNIFICATION
Under the Portfolio's organizational documents, the officers and Trustees have been granted certain indemnification rights against certain liabilities that may arise out of performance of their duties to the Portfolio. The Portfolio has entered into a separate agreement with each Trustee that converts indemnification rights currently existing under the Portfolio’s organizational documents into contractual rights that cannot be changed in the future without the consent of the Trustee. Additionally, in the normal course of business, the Portfolio may enter into contracts with service providers that contain a variety of indemnification clauses. The Portfolio’s maximum exposure under these arrangements is dependent on future claims that may be made against the Portfolio and, therefore, cannot be estimated.
11. CORONAVIRUS (COVID-19) PANDEMIC
On March 11, 2020, the World Health Organization announced that it had made the assessment that coronavirus disease 2019 (“COVID-19”) is a pandemic. The impacts of COVID-19 are affecting the entire global economy, individual companies and investment products, the funds, and the market in general. There is significant uncertainty around the extent and duration of business disruptions related to COVID-19 and the impacts may last for an extended period of time. COVID-19 has led to significant uncertainty and volatility in the financial markets.
34 | Allspring Factor Enhanced Emerging Markets Equity Portfolio
Other information (unaudited)
PROXY VOTING INFORMATION
A description of the policies and procedures used to determine how to vote proxies relating to portfolio securities is available without charge, upon request, by calling 1-800-222-8222, visiting our website at allspringglobal.com, or visiting the SEC website at sec.gov. Information regarding how the proxies related to portfolio securities were voted during the most recent 12-month period ended June 30 is available on the website at allspringglobal.com or by visiting the SEC website at sec.gov.
QUARTERLY PORTFOLIO HOLDINGS INFORMATION
The Portfolio files its complete schedule of portfolio holdings with the SEC for the first and third quarters of each fiscal year as an exhibit to its reports on Form N-PORT. Interest holders may view the filed Form N-PORT by visiting the SEC website at sec.gov.
Allspring Factor Enhanced Emerging Markets Equity Portfolio | 35
Other information (unaudited)
BOARD OF TRUSTEES AND OFFICERS
Each of the Trustees and Officers listed in the table below acts in identical capacities for each fund in the Allspring family of funds, which consists of 124 mutual funds comprising the Allspring Funds Trust, Allspring Variable Trust, Allspring Master Trust and four closed-end funds (collectively the “Fund Complex”). This table should be read in conjunction with the Prospectus and the Statement of Additional Information1. The mailing address of each Trustee and Officer is 525 Market Street, 12th Floor, San Francisco, CA 94105. Each Trustee and Officer serves an indefinite term, however, each Trustee serves such term until reaching the mandatory retirement age established by the Trustees.
Independent Trustees
Name and
year of birth | Position held and
length of service* | Principal occupations during past five years or longer | Current other
public company or
investment
company
directorships |
William R. Ebsworth
(Born 1957) | Trustee,
since 2015 | Retired. From 1984 to 2013, equities analyst, portfolio manager, research director and chief investment officer at Fidelity Management and Research Company in Boston, Tokyo, and Hong Kong, and retired in 2013 as Chief Investment Officer of Fidelity Strategic Advisers, Inc. where he led a team of investment professionals managing client assets. Prior thereto, Board member of Hong Kong Securities Clearing Co., Hong Kong Options Clearing Corp., the Thailand International Fund, Ltd., Fidelity Investments Life Insurance Company, and Empire Fidelity Investments Life Insurance Company. Audit Committee Chair and Investment Committee Chair of the Vincent Memorial Hospital Endowment (non-profit organization). Mr. Ebsworth is a CFA® charterholder. | N/A |
Jane A. Freeman
(Born 1953) | Trustee,
since 2015;
Chair Liaison,
since 2018 | Retired. From 2012 to 2014 and 1999 to 2008, Chief Financial Officer of Scientific Learning Corporation. From 2008 to 2012, Ms. Freeman provided consulting services related to strategic business projects. Prior to 1999, Portfolio Manager at Rockefeller & Co. and Scudder, Stevens & Clark. Board member of the Harding Loevner Funds from 1996 to 2014, serving as both Lead Independent Director and chair of the Audit Committee. Board member of the Russell Exchange Traded Funds Trust from 2011 to 2012 and the chair of the Audit Committee. Ms. Freeman is also an inactive Chartered Financial Analyst. | N/A |
Isaiah Harris, Jr.
(Born 1952) | Trustee,
since 2009; Audit
Committee
Chair,
since 2019 | Retired. Chairman of the Board of CIGNA Corporation from 2009 to 2021, and Director from 2005 to 2008. From 2003 to 2011, Director of Deluxe Corporation. Prior thereto, President and CEO of BellSouth Advertising and Publishing Corp. from 2005 to 2007, President and CEO of BellSouth Enterprises from 2004 to 2005 and President of BellSouth Consumer Services from 2000 to 2003. Emeritus member of the Iowa State University Foundation Board of Governors. Emeritus Member of the Advisory Board of Iowa State University School of Business. Advisory Board Member, Palm Harbor Academy (private school). Advisory Board Member, Fellowship of Christian Athletes. Mr. Harris is a certified public accountant (inactive status). | N/A |
David F. Larcker
(Born 1950) | Trustee,
since 2009 | James Irvin Miller Professor of Accounting at the Graduate School of Business (Emeritus), Stanford University, Director of the Corporate Governance Research Initiative and Senior Faculty of The Rock Center for Corporate Governance since 2006. From 2005 to 2008, Professor of Accounting at the Graduate School of Business, Stanford University. Prior thereto, Ernst & Young Professor of Accounting at The Wharton School, University of Pennsylvania from 1985 to 2005. | N/A |
36 | Allspring Factor Enhanced Emerging Markets Equity Portfolio
Other information (unaudited)
Name and
year of birth | Position held and
length of service* | Principal occupations during past five years or longer | Current other
public company or
investment
company
directorships |
Olivia S. Mitchell
(Born 1953) | Trustee,
since 2006;
Nominating and
Governance
Committee Chair,
since 2018 | International Foundation of Employee Benefit Plans Professor since 1993, Wharton School of the University of Pennsylvania. Director of Wharton’s Pension Research Council and Boettner Center on Pensions & Retirement Research, and Research Associate at the National Bureau of Economic Research. Previously taught at Cornell University from 1978 to 1993. | N/A |
Timothy J. Penny
(Born 1951) | Trustee,
since 1996;
Chair,
since 2018 | President and Chief Executive Officer of Southern Minnesota Initiative Foundation, a non-profit organization, since 2007. Vice Chair of the Economic Club of Minnesota, since 2007. Co-Chair of the Committee for a Responsible Federal Budget, since 1995. Member of the Board of Trustees of NorthStar Education Finance, Inc., a non-profit organization, since 2007. Senior Fellow of the University of Minnesota Humphrey Institute from 1995 to 2017. | N/A |
James G. Polisson
(Born 1959) | Trustee,
since 2018 | Retired. Chief Marketing Officer, Source (ETF) UK Services, Ltd, from 2015 to 2017. From 2012 to 2015, Principal of The Polisson Group, LLC, a management consulting, corporate advisory and principal investing company. Chief Executive Officer and Managing Director at Russell Investments, Global Exchange Traded Funds from 2010 to 2012. Managing Director of Barclays Global Investors from 1998 to 2010 and Global Chief Marketing Officer for iShares and Barclays Global Investors from 2000 to 2010. Trustee of the San Francisco Mechanics’ Institute, a non-profit organization, from 2013 to 2015. Board member of the Russell Exchange Traded Fund Trust from 2011 to 2012. Director of Barclays Global Investors Holdings Deutschland GmbH from 2006 to 2009. Mr. Polisson is an attorney and has a retired status with the Massachusetts and District of Columbia Bar Associations. | N/A |
Pamela Wheelock
(Born 1959) | Trustee,
since January
2020; previously
Trustee from
January 2018 to
July 2019 | Retired. Executive and Senior Financial leadership positions in the public, private and nonprofit sectors. Interim President and CEO, McKnight Foundation, 2020. Interim Commissioner, Minnesota Department of Human Services, 2019. Chief Operating Officer, Twin Cities Habitat for Humanity, 2017-2019. Vice President for University Services, University of Minnesota, 2012-2016. Interim President and CEO, Blue Cross and Blue Shield of Minnesota, 2011-2012. Executive Vice-President and Chief Financial Officer, Minnesota Wild, 2002-2008. Commissioner, Minnesota Department of Finance, 1999-2002. Chair of the Board of Directors of Destination Medical Center Corporation. Board member of the Minnesota Wild Foundation. | N/A |
* Length of service dates reflect the Trustee’s commencement of service with the Trust’s predecessor entities, where applicable.
Allspring Factor Enhanced Emerging Markets Equity Portfolio | 37
Other information (unaudited)
Officers2
Name and
year of birth | Position held and
length of service | Principal occupations during past five years or longer |
Andrew Owen
(Born 1960) | President,
since 2017 | President, Chief Executive Officer and Director of Allspring Funds Management, LLC since 2017 and co-president of Galliard Capital Management, LLC, an affiliate of Allspring Funds Management, LLC, since 2019. Prior thereto, Head of Affiliated Managers, Allspring Global Investments, from 2014 to 2019 and Executive Vice President responsible for marketing, investments and product development for Allspring Funds Management, LLC, from 2009 to 2014. In addition, Mr. Owen was an Executive Vice President of Wells Fargo & Company from 2014 to 2021. |
Jeremy DePalma
(Born 1974) | Treasurer,
since 2012
(for certain funds in
the Fund Complex);
since 2021 (for
the remaining funds in the
Fund Complex) | Senior Vice President of Allspring Funds Management, LLC since 2009. Senior Vice President of Evergreen Investment Management Company, LLC from 2008 to 2010 and head of the Fund Reporting and Control Team within Fund Administration from 2005 to 2010. |
Kate McKinley
(Born 1977) | Chief Legal Officer,
since 2021 | Chief Legal Officer of Allspring Global Investments since 2021. Prior thereto, held various roles at State Street Global Advisors beginning in 2010, including serving as Senior Vice President and General Counsel from 2019 to 2021, and Chief Operating Officer of the Institutional Client Group from 2016 - 2019. Prior to working at State Street Global Advisors served as Assistant General Counsel for Bank of America Corporation from 2005 to 2010 and as an Associate at WilmerHale from 2002 to 2005. |
Christopher Baker
(Born 1976) | Chief Compliance Officer, since 2022 | Global Chief Compliance Officer for Allspring Global Investments since 2022. Prior thereto, Chief Compliance Officer for State Street Global Advisors from 2018 to 2021. Senior Compliance Officer for the State Street divisions of Alternative Investment Solutions, Sector Solutions, and Global Marketing from 2015 to 2018. From 2010 to 2015 Vice President, Global Head of Investment and Marketing Compliance for State Street Global Advisors. |
Matthew Prasse
(Born 1983) | Secretary,
since 2021 | Senior Counsel of the Allspring Legal Department since 2021. Senior Counsel of the Wells Fargo Legal Department from 2018 to 2021. Previously, Counsel for Barings LLC from 2015 to 2018. Prior to joining Barings, Associate at Morgan, Lewis & Bockius LLP from 2008 to 2015. |
1 The Statement of Additional Information includes additional information about the Trustees and is available, without charge, upon request, by calling 1-800-222-8222.
2 For those Officers with tenures at Allspring Global Investments and/or Allspring Funds Management, LLC that began prior to 2021, such tenures include years of service during which these businesses/entities were known as Wells Fargo Asset Management and Wells Fargo Funds Management, LLC, respectively.
38 | Allspring Factor Enhanced Emerging Markets Equity Portfolio
Other information (unaudited)
LIQUIDITY RISK MANAGEMENT PROGRAM
In accordance with Rule 22e-4 under the Investment Company Act of 1940, as amended (the “Liquidity Rule”), Allspring Master Trust (the “Trust”) has adopted and implemented a liquidity risk management program (the “Program”) on behalf of each of its series, including the Portfolio, which is reasonably designed to assess and manage the Portfolio's liquidity risk. “Liquidity risk” is defined under the Liquidity Rule as the risk that the Portfolio is unable to meet redemption requests without significantly diluting remaining investors’ interests in the Portfolio. The Trust’s Board of Trustees (the “Board”) previously approved the designation of Allspring Funds Management, LLC (“Allspring Funds Management”), the Portfolio's investment adviser, to administer the Program, and Allspring Funds Management has established a Liquidity Risk Management Council (the "Council") composed of personnel from multiple departments within Allspring Funds Management and its affiliates to assist Allspring Funds Management in the administration of the Program.
The Program is comprised of various components designed to support the assessment and/or management of liquidity risk, including: (1) the periodic assessment (no less frequently than annually) of certain factors that influence the Portfolio's liquidity risk; (2) the periodic classification (no less frequently than monthly) of the Portfolio's investments into one of four liquidity categories that reflect an estimate of their liquidity under current market conditions; (3) a 15% limit on the acquisition of “illiquid investments” (as defined under the Liquidity Rule); (4) to the extent the Portfolio does not invest primarily in “highly liquid investments” (as defined under the Liquidity Rule), the determination of a minimum percentage of the Portfolio's assets that generally will be invested in highly liquid investments (an “HLIM”); (5) if the Portfolio has established an HLIM, the periodic review (no less frequently than annually) of the HLIM and the adoption of policies and procedures for responding to a shortfall of the Portfolio's “highly liquid investments” below its HLIM; and (6) periodic reporting to the Board.
At a meeting of the Board held on May 24-25, 2022, the Board received and reviewed a written report (the “Report”) from Allspring Funds Management that, among other things, addressed the operation of the Program and assessed its adequacy and effectiveness for the period from January 1, 2021 through December 31, 2021 (the “Reporting Period”). Other than extended foreign market holidays, no significant liquidity events impacting the Portfolios were noted in the Report. In addition, other than corporate-related changes to the Program, there were no material changes to the Program during the Reporting Period.
Allspring Funds Management determined in the Report that the Program has been implemented and operates effectively to manage the Portfolio’s liquidity risk, and Allspring Funds Management continues to believe that the Program has been and continues to be adequately and effectively implemented to monitor and, as applicable, respond to the Portfolio’s liquidity developments.
There can be no assurance that the Program will achieve its objectives under all circumstances in the future.
Allspring Factor Enhanced Emerging Markets Equity Portfolio | 39
For more information
More information about Allspring Funds is available free upon request. To obtain literature, please write, visit the Portfolio's website, or call:
Allspring Funds
P.O. Box 219967
Kansas City, MO 64121-9967
Website: allspringglobal.com
Individual investors: 1-800-222-8222
Retail investment professionals: 1-888-877-9275
Institutional investment professionals: 1-800-260-5969
This report and the financial statements contained herein are submitted for the general information of the interest holders of the Portfolio. If this report is used for promotional purposes, distribution of the report must be accompanied or preceded by a current prospectus. Before investing, please consider the investment objectives, risks, charges, and expenses of the investment. For a current prospectus and, if available, a summary prospectus, containing this information, call
1-800-222-8222. Read the prospectus carefully before you invest or send money.
Allspring Global InvestmentsTM is the trade name for the asset management firms of Allspring Global Investments Holdings, LLC, a holding company indirectly owned by certain private funds of GTCR LLC and Reverence Capital Partners, L.P. These firms include but are not limited to Allspring Global Investments, LLC, and Allspring Funds Management, LLC. Certain products managed by Allspring entities are distributed by Allspring Funds Distributor, LLC (a broker-dealer and Member FINRA/SIPC).
This material is for general informational and educational purposes only and is NOT intended to provide investment advice or a recommendation of any kind - including a recommendation for any specific investment, strategy, or plan.
© 2022 Allspring Global Investments Holdings, LLC. All rights reserved.
Semi-Annual Report
August 31, 2022
Allspring Factor Enhanced International Equity Portfolio
Allspring Factor Enhanced International Equity Portfolio | 1
Portfolio information (unaudited)
Investment objectiveThe Portfolio seeks long-term capital appreciation.
| Adviser | Allspring Funds Management, LLC |
| Subadviser | Allspring Global Investments, LLC |
| Portfolio managers | Harindra de Silva, Ph.D., CFA®‡, Monisha Jayakumar |
| Ten largest holdings (%) as of August 31, 20221 |
| Nestle SA | 1.95 |
| Roche Holding AG | 1.39 |
| Shell plc | 1.24 |
| Novo Nordisk AS Class B | 1.19 |
| Novartis AG | 1.18 |
| ASML Holding NV | 1.10 |
| LVMH Moët Hennessy Louis Vuitton SE | 0.96 |
| AstraZeneca plc | 0.95 |
| HSBC Holdings plc | 0.83 |
| BHP Billiton Limited | 0.83 |
| 1 | Figures represent the percentage of the Portfolio's net assets. Holdings are subject to change and may have changed since the date specified. |
| Sector allocation as of August 31, 20221 |
| 1 | Figures represent the percentage of the Portfolio's long-term investments. Allocations are subject to change and may have changed since the date specified. |
| Country allocation as of August 31, 20221 |
| 1 | Figures represent the percentage of the Portfolio's long-term investments. Allocations are subject to change and may have changed since the date specified. |
| ‡ | CFA® and Chartered Financial Analyst® are trademarks owned by CFA Institute. |
2 | Allspring Factor Enhanced International Equity Portfolio
Portfolio of investments—August 31, 2022 (unaudited)
| | | | | | Shares | Value |
| Common stocks: 95.16% | | | | | | |
| Australia: 6.44% | | | | | | |
| Ampol Limited (Energy, Oil, gas & consumable fuels) | | | | | 20,580 | $ 483,720 |
| Aristocrat Leisure Limited (Consumer discretionary, Hotels, restaurants & leisure) | | | | | 15,215 | 367,236 |
| ASX Limited (Financials, Capital markets) | | | | | 7,351 | 391,310 |
| Aurizon Holdings Limited (Industrials, Road & rail) | | | | | 52,714 | 133,321 |
| Australia & New Zealand Banking Group Limited (Financials, Banks) | | | | | 64,767 | 1,001,204 |
| BHP Billiton Limited (Materials, Metals & mining) | | | | | 138,950 | 3,790,556 |
| BlueScope Steel Limited (Materials, Metals & mining) | | | | | 23,493 | 263,587 |
| Brambles Limited (Industrials, Commercial services & supplies) | | | | | 70,135 | 590,272 |
| Cochlear Limited (Health care, Health care equipment & supplies) | | | | | 1,691 | 246,171 |
| Coles Group Limited (Consumer staples, Food & staples retailing) | | | | | 46,558 | 557,261 |
| Commonwealth Bank of Australia (Financials, Banks) | | | | | 37,419 | 2,472,730 |
| Computershare Limited (Information technology, IT services) | | | | | 42,324 | 705,867 |
| CSL Limited (Health care, Biotechnology) | | | | | 12,363 | 2,472,818 |
| Dexus Property Group (Real estate, Equity REITs) | | | | | 81,219 | 480,408 |
| Domino's Pizza Enterprises Limited (Consumer discretionary, Hotels, restaurants & leisure) | | | | | 10,537 | 454,167 |
| Endeavour Group Limited (Consumer staples, Food & staples retailing) | | | | | 47,810 | 236,603 |
| Fortescue Metals Group Limited (Materials, Metals & mining) | | | | | 63,831 | 793,264 |
| Goodman Group (Real estate, Equity REITs) | | | | | 40,107 | 533,342 |
| IDP Education Limited (Consumer discretionary, Diversified consumer services) | | | | | 5,987 | 117,864 |
| Lottery Corporation Limited (Consumer discretionary, Hotels, restaurants & leisure) † | | | | | 265,686 | 798,570 |
| Macquarie Group Limited (Financials, Capital markets) | | | | | 6,876 | 822,736 |
| Medibank Private Limited (Financials, Insurance) | | | | | 294,233 | 741,163 |
| Mineral Resources Limited (Materials, Metals & mining) | | | | | 3,862 | 164,550 |
| Mirvac Group (Real estate, Equity REITs) | | | | | 15,838 | 22,555 |
| National Australia Bank Limited (Financials, Banks) | | | | | 71,291 | 1,478,299 |
| Orica Limited (Materials, Chemicals) | | | | | 27,006 | 282,487 |
| Origin Energy Limited (Energy, Oil, gas & consumable fuels) | | | | | 120,611 | 513,689 |
| Qantas Airways Limited (Industrials, Airlines) † | | | | | 150,616 | 541,273 |
| QBE Insurance Group Limited (Financials, Insurance) | | | | | 28,464 | 233,369 |
| Rio Tinto Limited (Materials, Metals & mining) | | | | | 12,495 | 793,600 |
| Scentre Group (Real estate, Equity REITs) | | | | | 244,914 | 486,716 |
| SEEK Limited (Communication services, Interactive media & services) | | | | | 6,686 | 94,331 |
| Sonic Healthcare Limited (Health care, Health care providers & services) | | | | | 20,088 | 464,535 |
| South32 Limited (Materials, Metals & mining) | | | | | 272,422 | 750,170 |
| Stockland Corporation Limited (Real estate, Equity REITs) | | | | | 153,276 | 377,038 |
| Suncorp Group Limited (Financials, Insurance) | | | | | 2,619 | 19,342 |
| The GPT Group (Real estate, Equity REITs) | | | | | 208,126 | 593,056 |
| Treasury Wine Estates Limited (Consumer staples, Beverages) | | | | | 7,341 | 65,851 |
| Vicinity Centres (Real estate, Equity REITs) | | | | | 444,282 | 581,658 |
| Wesfarmers Limited (Consumer discretionary, Multiline retail) | | | | | 16,115 | 515,502 |
| Westpac Banking Corporation (Financials, Banks) | | | | | 69,997 | 1,027,382 |
| Wisetech Global Limited (Information technology, Software) | | | | | 8,162 | 322,395 |
| Woodside Energy Group Limited (Energy, Oil, gas & consumable fuels) | | | | | 47,924 | 1,113,203 |
| Woolworths Group Limited (Consumer staples, Food & staples retailing) | | | | | 21,628 | 533,189 |
| | | | | | | 29,428,360 |
| Austria: 0.07% | | | | | | |
| Erste Bank Der Oesterreichischen Sparkassen AG (Financials, Banks) | | | | | 5,505 | 123,795 |
The accompanying notes are an integral part of these financial statements.
Allspring Factor Enhanced International Equity Portfolio | 3
Portfolio of investments—August 31, 2022 (unaudited)
| | | | | | Shares | Value |
| Austria: (continued) | | | | | | |
| Verbund AG (Utilities, Electric utilities) | | | | | 465 | $ 44,434 |
| Voestalpine AG (Materials, Metals & mining) | | | | | 8,579 | 172,631 |
| | | | | | | 340,860 |
| Belgium: 1.01% | | | | | | |
| Ageas NV (Financials, Insurance) | | | | | 14,940 | 606,198 |
| Anheuser-Busch InBev SA (Consumer staples, Beverages) | | | | | 26,298 | 1,270,049 |
| D'Ieteren Group SA (Consumer discretionary, Distributors) | | | | | 629 | 94,823 |
| Elia System Operator SA/NV (Utilities, Electric utilities) | | | | | 428 | 62,176 |
| KBC Group NV (Financials, Banks) | | | | | 8,091 | 385,880 |
| Proximus SA (Communication services, Diversified telecommunication services) | | | | | 41,610 | 529,654 |
| Solvay SA (Materials, Chemicals) | | | | | 843 | 68,052 |
| UCB SA (Health care, Pharmaceuticals) | | | | | 6,491 | 456,102 |
| Umicore SA (Materials, Chemicals) | | | | | 18,376 | 584,101 |
| Warehouses De Pauw SCA (Real estate, Equity REITs) | | | | | 18,274 | 556,024 |
| | | | | | | 4,613,059 |
| Canada: 11.17% | | | | | | |
| Agnico-Eagle Mines Limited (Materials, Metals & mining) | | | | | 700 | 28,867 |
| Alimentation Couche-Tard Incorporated (Consumer staples, Food & staples retailing) | | | | | 28,870 | 1,240,662 |
| Altagas Limited (Utilities, Gas utilities) | | | | | 3,600 | 77,627 |
| Arc Resources Limited (Energy, Oil, gas & consumable fuels) | | | | | 3,300 | 45,555 |
| Bank of Montreal (Financials, Banks) | | | | | 17,691 | 1,633,254 |
| Barrick Gold Corporation (Materials, Metals & mining) | | | | | 43,500 | 645,867 |
| Bausch Health Companies Incorporated (Health care, Pharmaceuticals) † | | | | | 93,000 | 557,993 |
| Brookfield Asset Management Incorporated Class A (Financials, Capital markets) | | | | | 38,528 | 1,853,428 |
| BRP Incorporated (Consumer discretionary, Leisure products) | | | | | 12,100 | 839,220 |
| Canadian Apartment Properties (Real estate, Equity REITs) | | | | | 13,500 | 459,165 |
| Canadian Imperial Bank of Commerce (Financials, Banks) | | | | | 20,048 | 948,096 |
| Canadian National Railway Company (Industrials, Road & rail) | | | | | 21,737 | 2,585,070 |
| Canadian Natural Resources Limited (Energy, Oil, gas & consumable fuels) | | | | | 33,900 | 1,858,454 |
| Canadian Pacific Railway Limited (Industrials, Road & rail) | | | | | 26,110 | 1,954,647 |
| Canadian Tire Corporation Limited Class A (Consumer discretionary, Multiline retail) | | | | | 4,000 | 470,461 |
| Canadian Utilities Limited Class A (Utilities, Multi-utilities) | | | | | 12,800 | 391,597 |
| Cenovus Energy Incorporated (Energy, Oil, gas & consumable fuels) | | | | | 34,700 | 651,013 |
| CGI Incorporated (Information technology, IT services) † | | | | | 13,765 | 1,090,006 |
| Constellation Software Incorporated (Information technology, Software) | | | | | 528 | 794,812 |
| Dollarama Incorporated (Consumer discretionary, Multiline retail) | | | | | 14,000 | 852,568 |
| Emera Incorporated (Utilities, Electric utilities) | | | | | 6,600 | 305,389 |
| Empire Company Limited Class A (Consumer staples, Food & staples retailing) | | | | | 23,500 | 669,384 |
| Enbridge Incorporated (Energy, Oil, gas & consumable fuels) | | | | | 37,200 | 1,534,056 |
| Fairfax Financial Holdings Limited (Financials, Insurance) | | | | | 2,000 | 997,053 |
| First Quantum Minerals Limited (Materials, Metals & mining) | | | | | 15,100 | 267,198 |
| Fortis Incorporated (Utilities, Electric utilities) | | | | | 10,644 | 469,573 |
| George Weston Limited (Consumer staples, Food & staples retailing) | | | | | 4,700 | 537,332 |
| Gildan Activewear Incorporated (Consumer discretionary, Textiles, apparel & luxury goods) | | | | | 48,300 | 1,428,387 |
| Hydro One Limited (Utilities, Electric utilities) 144A | | | | | 6,100 | 165,162 |
| iA Financial Corporation (Financials, Insurance) | | | | | 1,800 | 96,692 |
| IGM Financial Incorporated (Financials, Capital markets) | | | | | 13,000 | 353,866 |
The accompanying notes are an integral part of these financial statements.
4 | Allspring Factor Enhanced International Equity Portfolio
Portfolio of investments—August 31, 2022 (unaudited)
| | | | | | Shares | Value |
| Canada: (continued) | | | | | | |
| Imperial Oil Limited (Energy, Oil, gas & consumable fuels) | | | | | 15,700 | $ 770,565 |
| Intact Financial Corporation (Financials, Insurance) | | | | | 2,875 | 416,468 |
| Loblaw Companies Limited (Consumer staples, Food & staples retailing) | | | | | 10,800 | 954,472 |
| Lundin Mining Corporation (Materials, Metals & mining) | | | | | 96,100 | 499,762 |
| Magna International Incorporated (Consumer discretionary, Auto components) | | | | | 7,027 | 405,938 |
| Manulife Financial Corporation (Financials, Insurance) | | | | | 55,000 | 951,460 |
| Metro Incorporated (Consumer staples, Food & staples retailing) | | | | | 10,530 | 553,860 |
| National Bank of Canada (Financials, Banks) | | | | | 6,008 | 397,484 |
| Nutrien Limited (Materials, Chemicals) | | | | | 22,200 | 2,038,036 |
| Nuvei Corporation Subordinate Voting Shares (Information technology, IT services) † | | | | | 8,100 | 247,869 |
| Onex Corporation (Financials, Capital markets) | | | | | 11,700 | 578,608 |
| Open Text Corporation (Toronto Exchange) (Information technology, Software) | | | | | 25,618 | 806,957 |
| Parkland Corporation (Energy, Oil, gas & consumable fuels) | | | | | 3,100 | 76,099 |
| Pembina Pipeline Corporation (Energy, Oil, gas & consumable fuels) | | | | | 600 | 21,189 |
| Quebecor Incorporated Class B (Communication services, Media) | | | | | 4,500 | 97,206 |
| Restaurant Brands International Incorporated (Consumer discretionary, Hotels, restaurants & leisure) | | | | | 8,703 | 513,758 |
| RioCan REIT (Real estate, Equity REITs) | | | | | 33,800 | 518,060 |
| Ritchie Bros. Auctioneers Incorporated (Industrials, Commercial services & supplies) | | | | | 600 | 41,564 |
| Rogers Communications Incorporated Class B (Communication services, Wireless telecommunication services) | | | | | 9,837 | 423,560 |
| Royal Bank of Canada (Financials, Banks) | | | | | 37,431 | 3,480,754 |
| Saputo Incorporated (Consumer staples, Food products) | | | | | 4,100 | 104,112 |
| Shopify Incorporated Class A (Information technology, IT services) † | | | | | 24,100 | 762,994 |
| Sun Life Financial Incorporated (Financials, Insurance) | | | | | 9,958 | 438,702 |
| Suncor Energy Incorporated (Energy, Oil, gas & consumable fuels) | | | | | 43,300 | 1,400,858 |
| TC Energy Corporation (Energy, Oil, gas & consumable fuels) | | | | | 7,000 | 337,328 |
| Teck Resources Limited Class B (Materials, Metals & mining) | | | | | 16,800 | 568,976 |
| TFI International Incorporated (Industrials, Road & rail) | | | | | 11,700 | 1,167,283 |
| The Bank of Nova Scotia (Financials, Banks) | | | | | 33,208 | 1,836,194 |
| The Toronto-Dominion Bank (Financials, Banks) | | | | | 50,118 | 3,224,175 |
| Thomson Reuters Corporation (Industrials, Professional services) | | | | | 3,800 | 418,438 |
| TMX Group Limited (Financials, Capital markets) | | | | | 1,700 | 170,731 |
| Toromont Industries Limited (Industrials, Trading companies & distributors) | | | | | 4,500 | 348,323 |
| Tourmaline Oil Corporation (Energy, Oil, gas & consumable fuels) | | | | | 8,200 | 484,814 |
| West Fraser Timber Company Limited (Materials, Paper & forest products) | | | | | 1,700 | 152,092 |
| | | | | | | 51,011,143 |
| Denmark: 2.56% | | | | | | |
| A.P. Moller-Mærsk AS Class B (Industrials, Marine) | | | | | 264 | 633,376 |
| Carlsberg AS Class B (Consumer staples, Beverages) | | | | | 3,324 | 431,622 |
| Coloplast AS Class B (Health care, Health care equipment & supplies) | | | | | 6,806 | 777,456 |
| Danske Bank AS (Financials, Banks) | | | | | 45,738 | 610,735 |
| DSV Panalpina AS (Industrials, Air freight & logistics) | | | | | 3,911 | 577,921 |
| Genmab AS (Health care, Biotechnology) † | | | | | 2,135 | 759,988 |
| GN Store Nord AS (Health care, Health care equipment & supplies) | | | | | 15,272 | 431,932 |
| Novo Nordisk AS Class B (Health care, Pharmaceuticals) | | | | | 50,678 | 5,418,178 |
| Pandora AS (Consumer discretionary, Textiles, apparel & luxury goods) | | | | | 19,628 | 1,179,183 |
| Rockwool International Class A (Industrials, Building products) | | | | | 2,000 | 411,669 |
The accompanying notes are an integral part of these financial statements.
Allspring Factor Enhanced International Equity Portfolio | 5
Portfolio of investments—August 31, 2022 (unaudited)
| | | | | | Shares | Value |
| Denmark: (continued) | | | | | | |
| Vestas Wind System AS Class A (Industrials, Electrical equipment) | | | | | 4,877 | $ 122,028 |
| William Demant Holding (Health care, Health care equipment & supplies) † | | | | | 10,452 | 321,966 |
| | | | | | | 11,676,054 |
| Finland: 0.86% | | | | | | |
| Elisa Oyj (Communication services, Diversified telecommunication services) | | | | | 3,150 | 168,457 |
| Kesko Oyj Class B (Consumer staples, Food & staples retailing) | | | | | 104 | 2,188 |
| Kone Oyj Class B (Industrials, Machinery) | | | | | 7,354 | 294,105 |
| Nokia Oyj (Information technology, Communications equipment) | | | | | 118,301 | 596,162 |
| Nordea Bank Abp (Financials, Banks) | | | | | 80,545 | 746,801 |
| Orion Oyj Class B (Health care, Pharmaceuticals) | | | | | 24,564 | 1,113,734 |
| Sampo Oyj Class A (Financials, Insurance) | | | | | 12,344 | 558,447 |
| Stora Enso Oyj (Materials, Paper & forest products) | | | | | 8,505 | 126,605 |
| UPM-Kymmene Oyj (Materials, Paper & forest products) | | | | | 1,935 | 65,740 |
| Wartsila Oyj Abp (Industrials, Machinery) | | | | | 30,730 | 253,376 |
| | | | | | | 3,925,615 |
| France: 8.20% | | | | | | |
| Aeroports de Paris SA (Industrials, Transportation infrastructure) † | | | | | 158 | 21,635 |
| Air Liquide SA (Materials, Chemicals) | | | | | 11,031 | 1,382,326 |
| Amundi SA (Financials, Capital markets) 144A | | | | | 5,524 | 280,087 |
| Arkema SA (Materials, Chemicals) | | | | | 6,797 | 573,814 |
| AXA SA (Financials, Insurance) | | | | | 63,001 | 1,483,776 |
| BioMerieux Incorporated (Health care, Health care equipment & supplies) | | | | | 5,830 | 533,152 |
| BNP Paribas SA (Financials, Banks) | | | | | 33,469 | 1,555,311 |
| Bolloré SA (Industrials, Air freight & logistics) | | | | | 11,682 | 55,826 |
| Bouygues SA (Industrials, Construction & engineering) | | | | | 6,395 | 187,853 |
| Bureau Veritas SA (Industrials, Professional services) | | | | | 12,140 | 301,314 |
| Capgemini SE (Information technology, IT services) | | | | | 6,531 | 1,128,413 |
| Carrefour SA (Consumer staples, Food & staples retailing) | | | | | 59,158 | 987,376 |
| Compagnie de Saint-Gobain SA (Industrials, Building products) | | | | | 16,617 | 669,295 |
| Compagnie Generale des Etablissements Michelin SCA (Consumer discretionary, Auto components) | | | | | 15,837 | 385,176 |
| Covivio (Real estate, Equity REITs) | | | | | 7,549 | 421,442 |
| Credit Agricole SA (Financials, Banks) | | | | | 14,803 | 136,242 |
| Danone SA (Consumer staples, Food products) | | | | | 8,923 | 469,531 |
| Dassault Avation SA (Industrials, Aerospace & defense) | | | | | 2,125 | 291,825 |
| Dassault Systèmes SE (Information technology, Software) | | | | | 18,403 | 709,678 |
| Edenred Group (Information technology, IT services) | | | | | 1,631 | 82,495 |
| Eiffage SA (Industrials, Construction & engineering) | | | | | 2,378 | 209,157 |
| Engie SA (Utilities, Multi-utilities) | | | | | 53,615 | 636,791 |
| Essilor International (Consumer discretionary, Textiles, apparel & luxury goods) | | | | | 4,890 | 728,304 |
| Eurazeo SA (Financials, Diversified financial services) | | | | | 3,974 | 237,328 |
| Gecina SA (Real estate, Equity REITs) | | | | | 2,413 | 214,752 |
| Hermes International SA (Consumer discretionary, Textiles, apparel & luxury goods) | | | | | 494 | 632,698 |
| Ipsen SA (Health care, Pharmaceuticals) | | | | | 5,254 | 503,528 |
| Kering SA (Consumer discretionary, Textiles, apparel & luxury goods) | | | | | 1,422 | 713,492 |
| Klepierre SA (Real estate, Equity REITs) | | | | | 33,983 | 697,068 |
| La Francaise des Jeux SA (Consumer discretionary, Hotels, restaurants & leisure) 144A | | | | | 5,387 | 174,723 |
| Legrand SA (Industrials, Electrical equipment) | | | | | 5,005 | 362,135 |
| L'Oréal SA (Consumer staples, Personal products) | | | | | 6,667 | 2,289,743 |
The accompanying notes are an integral part of these financial statements.
6 | Allspring Factor Enhanced International Equity Portfolio
Portfolio of investments—August 31, 2022 (unaudited)
| | | | | | Shares | Value |
| France: (continued) | | | | | | |
| LVMH Moët Hennessy Louis Vuitton SE (Consumer discretionary, Textiles, apparel & luxury goods) | | | | | 6,803 | $ 4,389,750 |
| Orange SA (Communication services, Diversified telecommunication services) | | | | | 89,422 | 905,610 |
| Pernod-Ricard SA (Consumer staples, Beverages) | | | | | 4,465 | 819,276 |
| Publicis Groupe SA (Communication services, Media) | | | | | 1,984 | 96,869 |
| Renault SA (Consumer discretionary, Automobiles) † | | | | | 6,135 | 174,743 |
| Safran SA (Industrials, Aerospace & defense) | | | | | 1,830 | 186,577 |
| Sanofi SA (Health care, Pharmaceuticals) | | | | | 33,357 | 2,726,928 |
| Sartorius Stedim Biotech SA (Health care, Life sciences tools & services) | | | | | 316 | 115,581 |
| Schneider Electric SE (Industrials, Electrical equipment) | | | | | 14,012 | 1,665,429 |
| Societe Generale SA (Financials, Banks) | | | | | 44,160 | 973,525 |
| Sodexho Alliance SA (Consumer discretionary, Hotels, restaurants & leisure) | | | | | 8,189 | 626,294 |
| Teleperformance SE (Industrials, Professional services) | | | | | 802 | 228,415 |
| Thales SA (Industrials, Aerospace & defense) | | | | | 2,294 | 276,566 |
| Total SA (Energy, Oil, gas & consumable fuels) | | | | | 70,171 | 3,552,736 |
| Ubisoft Entertainment SA (Communication services, Entertainment) † | | | | | 2,616 | 120,637 |
| Valeo SA (Consumer discretionary, Auto components) | | | | | 9,291 | 177,474 |
| Veolia Environnement SA (Utilities, Multi-utilities) | | | | | 10,655 | 237,472 |
| Vinci SA (Industrials, Construction & engineering) | | | | | 7,372 | 680,092 |
| Vivendi SE (Communication services, Media) | | | | | 13,854 | 125,579 |
| Wendel SA (Financials, Diversified financial services) | | | | | 4,014 | 315,388 |
| | | | | | | 37,451,227 |
| Germany: 5.47% | | | | | | |
| adidas AG (Consumer discretionary, Textiles, apparel & luxury goods) | | | | | 2,345 | 347,724 |
| Allianz AG (Financials, Insurance) | | | | | 8,699 | 1,470,448 |
| BASF SE (Materials, Chemicals) | | | | | 31,603 | 1,336,771 |
| Bayer AG (Health care, Pharmaceuticals) | | | | | 28,553 | 1,510,111 |
| Bayerische Motoren Werke AG (Consumer discretionary, Automobiles) | | | | | 11,950 | 880,460 |
| Bechtle AG (Information technology, IT services) | | | | | 7,103 | 272,113 |
| Beiersdorf AG (Consumer staples, Personal products) | | | | | 932 | 94,076 |
| Brenntag AG (Industrials, Trading companies & distributors) | | | | | 2,474 | 162,214 |
| Continental AG (Consumer discretionary, Auto components) | | | | | 2,854 | 164,317 |
| Covestro AG (Materials, Chemicals) 144A | | | | | 9,252 | 278,966 |
| Daimler Truck Holding AG (Industrials, Machinery) † | | | | | 32,429 | 829,172 |
| Deutsche Bank AG (Financials, Capital markets) | | | | | 117,765 | 982,499 |
| Deutsche Boerse AG (Financials, Capital markets) | | | | | 6,196 | 1,047,586 |
| Deutsche Lufthansa AG (Industrials, Airlines) † | | | | | 105,498 | 627,216 |
| Deutsche Post AG (Industrials, Air freight & logistics) | | | | | 25,760 | 940,218 |
| Deutsche Telekom AG (Communication services, Diversified telecommunication services) | | | | | 57,364 | 1,081,152 |
| Evonik Industries AG (Materials, Chemicals) | | | | | 4,386 | 81,777 |
| Fresenius Medical Care AG & Company KGaA (Health care, Health care providers & services) | | | | | 5,715 | 195,678 |
| Fresenius SE & Company KGaA (Health care, Health care providers & services) | | | | | 15,185 | 375,651 |
| GEA Group AG (Industrials, Machinery) | | | | | 13,572 | 472,127 |
| Heidelbergcement AG (Materials, Construction materials) | | | | | 4,845 | 218,788 |
| Hellofresh SE (Consumer staples, Food & staples retailing) † | | | | | 13,375 | 319,341 |
| Henkel AG & Company KGaA (Consumer staples, Household products) | | | | | 1,894 | 118,450 |
| Infineon Technologies AG (Information technology, Semiconductors & semiconductor equipment) | | | | | 30,080 | 736,023 |
| Kion Group AG (Industrials, Machinery) | | | | | 2,011 | 80,353 |
| Knorr Bremse AG (Industrials, Machinery) | | | | | 2,021 | 97,948 |
| Mercedes Benz Group AG (Consumer discretionary, Automobiles) | | | | | 25,984 | 1,456,811 |
The accompanying notes are an integral part of these financial statements.
Allspring Factor Enhanced International Equity Portfolio | 7
Portfolio of investments—August 31, 2022 (unaudited)
| | | | | | Shares | Value |
| Germany: (continued) | | | | | | |
| Merck KGaA (Health care, Pharmaceuticals) | | | | | 4,624 | $ 794,311 |
| Muenchener Rueckversicherungs Gesellschaft AG (Financials, Insurance) | | | | | 3,403 | 813,047 |
| Nemetschek SE (Information technology, Software) | | | | | 9,265 | 545,802 |
| Rheinmetall AG (Industrials, Aerospace & defense) | | | | | 6,458 | 1,025,175 |
| RWE AG (Utilities, Independent power & renewable electricity producers) | | | | | 3,646 | 139,195 |
| SAP SE (Information technology, Software) | | | | | 30,814 | 2,624,409 |
| Scout24 AG (Communication services, Interactive media & services) 144A | | | | | 6,927 | 399,085 |
| Siemens AG (Industrials, Industrial conglomerates) | | | | | 19,515 | 1,976,755 |
| Siemens Energy AG (Industrials, Electrical equipment) | | | | | 8,216 | 120,852 |
| Siemens Healthineers AG (Health care, Health care equipment & supplies) 144A | | | | | 1,751 | 85,565 |
| United Internet AG (Communication services, Diversified telecommunication services) | | | | | 5,302 | 119,934 |
| Zalando SE (Consumer discretionary, Internet & direct marketing retail) 144A† | | | | | 6,206 | 143,687 |
| | | | | | | 24,965,807 |
| Hong Kong: 2.73% | | | | | | |
| AIA Group Limited (Financials, Insurance) | | | | | 264,000 | 2,540,006 |
| BOC Hong Kong (Holdings) Limited (Financials, Banks) | | | | | 84,000 | 289,111 |
| Budweiser Brewing Company APAC Limited (Consumer staples, Beverages) 144A | | | | | 25,600 | 75,250 |
| Chow Tai Fook Jewellery Company Limited (Consumer discretionary, Specialty retail) | | | | | 128,400 | 258,432 |
| CK Asset Holdings Limited (Real estate, Real estate management & development) | | | | | 68,190 | 460,266 |
| CK Hutchison Holdings Limited (Industrials, Industrial conglomerates) | | | | | 132,070 | 852,862 |
| CK Infrastructure Holdings Limited (Utilities, Electric utilities) | | | | | 114,500 | 696,276 |
| CLP Holdings Limited (Utilities, Electric utilities) | | | | | 9,000 | 77,547 |
| Galaxy Entertainment Group Limited (Consumer discretionary, Hotels, restaurants & leisure) | | | | | 32,000 | 178,870 |
| Hang Seng Bank Limited (Financials, Banks) | | | | | 2,027 | 31,736 |
| Henderson Land Development Company Limited (Real estate, Real estate management & development) | | | | | 37,198 | 124,432 |
| Hong Kong Exchanges & Clearing Limited (Financials, Capital markets) | | | | | 17,300 | 697,095 |
| Hong Kong Telecommunications Trust & Hong Kong Trust Limited (Communication services, Diversified telecommunication services) | | | | | 161,574 | 216,764 |
| Jardine Matheson Holdings Limited (Industrials, Industrial conglomerates) | | | | | 13,800 | 731,837 |
| Link REIT (Real estate, Equity REITs) | | | | | 61,300 | 474,402 |
| MTR Corporation Limited (Industrials, Road & rail) | | | | | 76,000 | 389,220 |
| New World Development Company Limited (Real estate, Real estate management & development) | | | | | 26,000 | 84,723 |
| Power Assets Holdings Limited (Utilities, Electric utilities) | | | | | 68,500 | 409,713 |
| Sino Land Company (Real estate, Real estate management & development) | | | | | 647,899 | 947,438 |
| Sun Hung Kai Properties Limited (Real estate, Real estate management & development) | | | | | 39,500 | 464,055 |
| Swire Pacific Limited Class A (Real estate, Real estate management & development) | | | | | 54,978 | 380,271 |
| Swire Properties Limited (Real estate, Real estate management & development) | | | | | 112,000 | 258,129 |
| Techtronic Industries Company Limited (Industrials, Machinery) | | | | | 27,500 | 324,341 |
| WH Group Limited (Consumer staples, Food products) 144A | | | | | 1,406,500 | 958,281 |
The accompanying notes are an integral part of these financial statements.
8 | Allspring Factor Enhanced International Equity Portfolio
Portfolio of investments—August 31, 2022 (unaudited)
| | | | | | Shares | Value |
| Hong Kong: (continued) | | | | | | |
| Wharf Real Estate Investment Company Limited (Real estate, Real estate management & development) | | | | | 66,000 | $ 300,312 |
| Xinyi Glass Holdings Limited (Industrials, Building products) | | | | | 141,000 | 260,412 |
| | | | | | | 12,481,781 |
| Ireland: 0.51% | | | | | | |
| CRH plc (Materials, Construction materials) | | | | | 30,857 | 1,139,475 |
| DCC plc (Industrials, Industrial conglomerates) | | | | | 6,125 | 352,520 |
| Flutter Entertainment plc (Consumer discretionary, Hotels, restaurants & leisure) † | | | | | 1,942 | 243,331 |
| Kerry Group plc Class A (Consumer staples, Food products) | | | | | 548 | 56,511 |
| Kingspan Group plc (Industrials, Building products) | | | | | 6,349 | 359,473 |
| Smurfit Kappa Group plc (Materials, Containers & packaging) | | | | | 5,791 | 194,170 |
| | | | | | | 2,345,480 |
| Israel: 0.91% | | | | | | |
| Bank Hapoalim BM (Financials, Banks) | | | | | 36,193 | 375,229 |
| Bank Leumi Le-Israel (Financials, Banks) | | | | | 64,804 | 685,057 |
| Check Point Software Technologies Limited (Information technology, Software) † | | | | | 10,600 | 1,274,532 |
| Elbit Systems Limited (Industrials, Aerospace & defense) | | | | | 449 | 95,855 |
| ICL Group Limited (Materials, Chemicals) | | | | | 57,862 | 552,505 |
| Israel Discount Bank Limited Class A (Financials, Banks) | | | | | 61,926 | 378,594 |
| Mizrahi Tefahot Bank Limited (Financials, Banks) | | | | | 3,260 | 132,586 |
| Nice Systems Limited ADR (Information technology, Software) † | | | | | 551 | 117,728 |
| Wix.com Limited (Information technology, IT services) † | | | | | 1,615 | 102,213 |
| ZIM Integrated Shipping Services Limited (Industrials, Marine) | | | | | 12,891 | 465,236 |
| | | | | | | 4,179,535 |
| Italy: 1.31% | | | | | | |
| Assicurazioni Generali SpA (Financials, Insurance) | | | | | 38,999 | 571,988 |
| DiaSorin SpA (Health care, Health care equipment & supplies) | | | | | 2,185 | 286,636 |
| Enel SpA (Utilities, Electric utilities) | | | | | 97,228 | 456,881 |
| Eni SpA (Energy, Oil, gas & consumable fuels) | | | | | 81,296 | 960,344 |
| Intesa Sanpaolo SpA (Financials, Banks) | | | | | 464,416 | 799,488 |
| Mediobanca SpA (Financials, Banks) | | | | | 17,211 | 136,240 |
| Poste Italiane SpA (Financials, Insurance) 144A | | | | | 32,242 | 257,678 |
| Prysmian SpA (Industrials, Electrical equipment) | | | | | 21,507 | 659,894 |
| Recordati SpA (Health care, Pharmaceuticals) | | | | | 2,914 | 118,891 |
| Snam SpA (Utilities, Gas utilities) | | | | | 97,643 | 464,088 |
| Telecom Italia SpA (Communication services, Diversified telecommunication services) † | | | | | 20 | 4 |
| Terna SpA (Utilities, Electric utilities) | | | | | 77,331 | 549,762 |
| UniCredit SpA (Financials, Banks) | | | | | 72,572 | 710,181 |
| | | | | | | 5,972,075 |
| Japan: 19.55% | | | | | | |
| Advantest Corporation (Information technology, Semiconductors & semiconductor equipment) | | | | | 6,600 | 373,793 |
| Aisin Seiki Company Limited (Consumer discretionary, Auto components) | | | | | 20,500 | 609,561 |
| Ajinomoto Company Incorporated (Consumer staples, Food products) | | | | | 12,750 | 352,408 |
| Asahi Breweries Limited (Consumer staples, Beverages) | | | | | 16,700 | 559,922 |
| Asahi Glass Company Limited (Industrials, Building products) | | | | | 20,200 | 685,567 |
| Astellas Pharma Incorporated (Health care, Pharmaceuticals) | | | | | 59,100 | 837,907 |
The accompanying notes are an integral part of these financial statements.
Allspring Factor Enhanced International Equity Portfolio | 9
Portfolio of investments—August 31, 2022 (unaudited)
| | | | | | Shares | Value |
| Japan: (continued) | | | | | | |
| Azbil Corporation (Information technology, Electronic equipment, instruments & components) | | | | | 7,900 | $ 225,098 |
| Bandai Namco Holdings Incorporated (Consumer discretionary, Leisure products) | | | | | 2,000 | 150,073 |
| Bridgestone Corporation (Consumer discretionary, Auto components) | | | | | 15,800 | 606,312 |
| Brother Industries Limited (Information technology, Technology hardware, storage & peripherals) | | | | | 21,000 | 401,888 |
| Canon Incorporated (Information technology, Technology hardware, storage & peripherals) | | | | | 32,700 | 783,142 |
| Capcom Company Limited (Communication services, Entertainment) | | | | | 21,800 | 595,025 |
| CyberAgent Incorporated (Communication services, Media) | | | | | 17,700 | 172,562 |
| Dai Nippon Printing Company Limited (Industrials, Commercial services & supplies) | | | | | 36,300 | 764,073 |
| Dai-ichi Life Holdings Incorporated (Financials, Insurance) | | | | | 54,200 | 936,468 |
| Daiichi Sankyo Company Limited (Health care, Pharmaceuticals) | | | | | 33,000 | 991,709 |
| Daikin Industries Limited (Industrials, Building products) | | | | | 3,066 | 535,223 |
| Daito Trust Construction Company Limited (Real estate, Real estate management & development) | | | | | 6,700 | 659,129 |
| Daiwa House Industry Company Limited (Real estate, Real estate management & development) | | | | | 14,700 | 328,651 |
| Daiwa Securities Group Incorporated (Financials, Capital markets) | | | | | 51,100 | 223,063 |
| DENSO Corporation (Consumer discretionary, Auto components) | | | | | 1,400 | 76,413 |
| Dentsu Incorporated (Communication services, Media) | | | | | 7,700 | 247,979 |
| Disco Corporation (Information technology, Semiconductors & semiconductor equipment) | | | | | 1,400 | 339,934 |
| ENEOS Holdings Incorporated (Energy, Oil, gas & consumable fuels) | | | | | 135,600 | 512,422 |
| FANUC Corporation (Industrials, Machinery) | | | | | 1,800 | 289,979 |
| Fast Retailing Company Limited (Consumer discretionary, Specialty retail) | | | | | 800 | 467,785 |
| Fuji Electric Holdings Company Limited (Industrials, Electrical equipment) | | | | | 20,600 | 889,964 |
| FUJIFILM Holdings Incorporated (Information technology, Technology hardware, storage & peripherals) | | | | | 7,200 | 365,521 |
| Fujitsu Limited (Information technology, IT services) | | | | | 12,300 | 1,447,380 |
| Hakuhodo DY Holdings Incorporated (Communication services, Media) | | | | | 10,400 | 92,784 |
| Hankyu Hanshin Holdings Incorporated (Industrials, Road & rail) | | | | | 5,700 | 170,935 |
| Hirose Electric Company Limited (Information technology, Electronic equipment, instruments & components) | | | | | 1,600 | 226,716 |
| Hitachi Construction Machinery Company Limited (Industrials, Machinery) | | | | | 22,900 | 470,770 |
| Hitachi Limited (Industrials, Industrial conglomerates) | | | | | 21,200 | 1,059,195 |
| Honda Motor Company Limited (Consumer discretionary, Automobiles) | | | | | 52,100 | 1,387,020 |
| Hoya Corporation (Health care, Health care equipment & supplies) | | | | | 11,300 | 1,152,337 |
| Ibiden Company Limited (Information technology, Electronic equipment, instruments & components) | | | | | 9,600 | 304,695 |
| Idemitsu Kosan Company Limited (Energy, Oil, gas & consumable fuels) | | | | | 27,400 | 722,463 |
| Iida Group Holdings Company Limited (Consumer discretionary, Household durables) | | | | | 44,100 | 671,769 |
| Inpex Holdings Incorporated (Energy, Oil, gas & consumable fuels) | | | | | 74,200 | 852,901 |
| Isuzu Motors Limited (Consumer discretionary, Automobiles) | | | | | 42,100 | 522,868 |
| Itochu Corporation (Industrials, Trading companies & distributors) | | | | | 34,600 | 952,217 |
| Itochu Techno-Solutions Corporation (Information technology, IT services) | | | | | 25,300 | 638,498 |
| Japan Post Holdings Company Limited (Financials, Insurance) | | | | | 11,100 | 76,576 |
| Japan Post Insurance Company Limited (Financials, Insurance) | | | | | 14,100 | 215,978 |
| JFE Holdings Incorporated (Materials, Metals & mining) | | | | | 61,800 | 663,952 |
| Kajima Corporation (Industrials, Construction & engineering) | | | | | 48,600 | 511,395 |
| Kakaku.com Incorporated (Communication services, Interactive media & services) | | | | | 38,600 | 710,544 |
| Kao Corporation (Consumer staples, Personal products) | | | | | 12,100 | 523,933 |
The accompanying notes are an integral part of these financial statements.
10 | Allspring Factor Enhanced International Equity Portfolio
Portfolio of investments—August 31, 2022 (unaudited)
| | | | | | Shares | Value |
| Japan: (continued) | | | | | | |
| KDDI Corporation (Communication services, Wireless telecommunication services) | | | | | 49,000 | $ 1,499,455 |
| Keisei Electric Railway Company Limited (Industrials, Road & rail) | | | | | 5,800 | 161,799 |
| Keyence Corporation (Information technology, Electronic equipment, instruments & components) | | | | | 3,400 | 1,276,611 |
| Kintetsu Group Holdings Company Limited (Industrials, Road & rail) | | | | | 4,800 | 162,992 |
| Kirin Holdings Company Limited (Consumer staples, Beverages) | | | | | 39,000 | 642,009 |
| Kobayashi Pharmaceutical Company Limited (Consumer staples, Personal products) | | | | | 4,800 | 272,023 |
| Kobe Bussan Company Limited (Consumer staples, Food & staples retailing) | | | | | 9,800 | 249,561 |
| KOEI TECMO Holdings Company Limited (Communication services, Entertainment) | | | | | 4,500 | 150,869 |
| Komatsu Limited (Industrials, Machinery) | | | | | 36,600 | 765,626 |
| Konami Holdings Corporation (Communication services, Entertainment) | | | | | 9,400 | 477,047 |
| KOSE Corporation (Consumer staples, Personal products) | | | | | 2,000 | 188,348 |
| Kubota Corporation (Industrials, Machinery) | | | | | 21,300 | 330,794 |
| Kyocera Corporation (Information technology, Electronic equipment, instruments & components) | | | | | 6,200 | 344,619 |
| LIXIL Corporation (Industrials, Building products) | | | | | 14,500 | 252,147 |
| M3 Incorporated (Health care, Health care technology) | | | | | 15,800 | 506,103 |
| Marubeni Corporation (Industrials, Trading companies & distributors) | | | | | 73,100 | 761,869 |
| Mazda Motor Corporation (Consumer discretionary, Automobiles) | | | | | 58,600 | 518,968 |
| McDonald's Holdings Company Japan Limited (Consumer discretionary, Hotels, restaurants & leisure) | | | | | 12,800 | 457,508 |
| Meiji Holdings Company Limited (Consumer staples, Food products) | | | | | 3,100 | 147,681 |
| Minebea Company Limited (Industrials, Machinery) | | | | | 7,100 | 122,028 |
| Misumi Group Incorporated (Industrials, Machinery) | | | | | 11,300 | 277,371 |
| Mitsubishi Corporation (Industrials, Trading companies & distributors) | | | | | 36,400 | 1,191,759 |
| Mitsubishi Electric Corporation (Industrials, Electrical equipment) | | | | | 63,500 | 641,994 |
| Mitsubishi Estate Company Limited (Real estate, Real estate management & development) | | | | | 17,000 | 228,937 |
| Mitsubishi Heavy Industries Limited (Industrials, Machinery) | | | | | 30,100 | 1,160,373 |
| Mitsubishi UFJ Financial Group Incorporated (Financials, Banks) | | | | | 272,400 | 1,412,107 |
| Mitsubishi UFJ Lease & Finance Company Limited (Financials, Diversified financial services) | | | | | 35,100 | 170,104 |
| Mitsui & Company Limited (Industrials, Trading companies & distributors) | | | | | 45,200 | 1,060,804 |
| Mitsui Chemicals Incorporated (Materials, Chemicals) | | | | | 31,100 | 698,678 |
| Mitsui Fudosan Company Limited (Real estate, Real estate management & development) | | | | | 18,300 | 370,403 |
| Mitsui OSK Lines Limited (Industrials, Marine) | | | | | 7,900 | 205,823 |
| Mizuho Financial Group Incorporated (Financials, Banks) | | | | | 28,370 | 324,847 |
| MS&AD Insurance Group Holdings Incorporated (Financials, Insurance) | | | | | 8,300 | 247,638 |
| Murata Manufacturing Company Limited (Information technology, Electronic equipment, instruments & components) | | | | | 15,600 | 840,004 |
| NEC Corporation (Information technology, IT services) | | | | | 8,900 | 324,598 |
| Nexon Company Limited (Communication services, Entertainment) | | | | | 32,100 | 639,178 |
| NGK Insulators Limited (Industrials, Machinery) | | | | | 40,700 | 581,093 |
| Nidec Corporation (Industrials, Electrical equipment) | | | | | 5,500 | 365,376 |
| Nintendo Company Limited (Communication services, Entertainment) | | | | | 3,200 | 1,309,910 |
| Nippon Express Holdings Incorporated (Industrials, Air freight & logistics) | | | | | 30,100 | 1,656,183 |
| Nippon Steel Corporation (Materials, Metals & mining) | | | | | 43,700 | 690,290 |
| Nippon Telegraph & Telephone Corporation (Communication services, Diversified telecommunication services) | | | | | 52,100 | 1,412,133 |
| Nippon Yusen Kabushiki Kaisha (Industrials, Marine) | | | | | 4,400 | 335,606 |
| Nissan Chemical Industries Limited (Materials, Chemicals) | | | | | 4,300 | 216,645 |
| Nitto Denko Corporation (Materials, Chemicals) | | | | | 8,100 | 499,225 |
The accompanying notes are an integral part of these financial statements.
Allspring Factor Enhanced International Equity Portfolio | 11
Portfolio of investments—August 31, 2022 (unaudited)
| | | | | | Shares | Value |
| Japan: (continued) | | | | | | |
| Nomura Real Estate Holding Incorporated (Real estate, Real estate management & development) | | | | | 18,300 | $ 449,592 |
| Nomura Research Institute Limited (Information technology, IT services) | | | | | 1,200 | 32,297 |
| NTT Data Corporation (Information technology, IT services) | | | | | 41,767 | 587,760 |
| Obayashi Corporation (Industrials, Construction & engineering) | | | | | 38,500 | 266,289 |
| Oji Holdings Corporation (Materials, Paper & forest products) | | | | | 7,400 | 29,525 |
| Olympus Corporation (Health care, Health care equipment & supplies) | | | | | 37,000 | 787,998 |
| Omron Corporation (Information technology, Electronic equipment, instruments & components) | | | | | 3,900 | 205,242 |
| Ono Pharmaceutical Company Limited (Health care, Pharmaceuticals) | | | | | 16,800 | 401,019 |
| Open House Group Company Limited (Consumer discretionary, Household durables) | | | | | 1,800 | 70,448 |
| Oracle Corporation (Japan) (Information technology, Software) | | | | | 4,400 | 262,113 |
| ORIX Corporation (Financials, Diversified financial services) | | | | | 32,100 | 527,640 |
| Osaka Gas Company Limited (Utilities, Gas utilities) | | | | | 18,000 | 303,181 |
| Otsuka Corporation (Information technology, IT services) | | | | | 20,400 | 659,408 |
| Otsuka Holdings Company Limited (Health care, Pharmaceuticals) | | | | | 11,600 | 378,886 |
| Pan Pacific International Holdings (Consumer discretionary, Multiline retail) | | | | | 500 | 8,978 |
| Persol Holdings Company Limited (Industrials, Professional services) | | | | | 55,900 | 1,122,148 |
| Recruit Holdings Company Limited (Industrials, Professional services) | | | | | 31,000 | 985,508 |
| Renesas Electronics Corporation (Information technology, Semiconductors & semiconductor equipment) † | | | | | 34,100 | 322,877 |
| Ricoh Company Limited (Information technology, Technology hardware, storage & peripherals) | | | | | 33,100 | 260,148 |
| Rohm Company Limited (Information technology, Semiconductors & semiconductor equipment) | | | | | 2,900 | 216,972 |
| SBI Holdings Incorporated (Financials, Capital markets) | | | | | 6,800 | 133,621 |
| SCSK Corporation (Information technology, IT services) | | | | | 41,800 | 680,642 |
| Secom Company Limited (Industrials, Commercial services & supplies) | | | | | 1,300 | 82,822 |
| Seiko Epson Corporation (Information technology, Technology hardware, storage & peripherals) | | | | | 9,100 | 142,996 |
| Sekisui House Limited (Consumer discretionary, Household durables) | | | | | 35,500 | 603,664 |
| Seven & I Holdings Company Limited (Consumer staples, Food & staples retailing) | | | | | 3,900 | 154,929 |
| SG Holdings Company Limited (Industrials, Air freight & logistics) | | | | | 16,600 | 275,340 |
| Shimadzu Corporation (Information technology, Electronic equipment, instruments & components) | | | | | 700 | 20,444 |
| Shimano Incorporated (Consumer discretionary, Leisure products) | | | | | 500 | 88,455 |
| Shin-Etsu Chemical Company Limited (Materials, Chemicals) | | | | | 6,600 | 766,476 |
| Shionogi & Company Limited (Health care, Pharmaceuticals) | | | | | 5,600 | 273,419 |
| Shiseido Company Limited (Consumer staples, Personal products) | | | | | 4,000 | 151,095 |
| SMC Corporation (Industrials, Machinery) | | | | | 800 | 379,543 |
| SoftBank Corporation (Communication services, Wireless telecommunication services) | | | | | 22,300 | 244,480 |
| SoftBank Group Corporation (Communication services, Wireless telecommunication services) | | | | | 20,400 | 808,075 |
| Sompo Holdings Incorporated (Financials, Insurance) | | | | | 8,300 | 355,873 |
| Sony Corporation (Consumer discretionary, Household durables) | | | | | 23,500 | 1,868,328 |
| Square Enix Company Limited (Communication services, Entertainment) | | | | | 19,000 | 824,999 |
| Subaru Corporation (Consumer discretionary, Automobiles) | | | | | 19,200 | 349,006 |
| Sumco Corporation (Information technology, Semiconductors & semiconductor equipment) | | | | | 7,533 | 102,244 |
| Sumitomo Chemical Company Limited (Materials, Chemicals) | | | | | 11,900 | 46,842 |
| Sumitomo Corporation (Industrials, Trading companies & distributors) | | | | | 42,900 | 603,414 |
| Sumitomo Metal Mining Company Limited (Materials, Metals & mining) | | | | | 4,200 | 132,160 |
| Sumitomo Mitsui Financial Group Incorporated (Financials, Banks) | | | | | 20,000 | 603,265 |
The accompanying notes are an integral part of these financial statements.
12 | Allspring Factor Enhanced International Equity Portfolio
Portfolio of investments—August 31, 2022 (unaudited)
| | | | | | Shares | Value |
| Japan: (continued) | | | | | | |
| Sumitomo Realty & Development Company Limited (Real estate, Real estate management & development) | | | | | 8,200 | $ 200,538 |
| Suntory Beverage & Food Limited (Consumer staples, Beverages) | | | | | 20,000 | 730,533 |
| Sysmex Corporation (Health care, Health care equipment & supplies) | | | | | 2,000 | 122,254 |
| T&D Holdings Incorporated (Financials, Insurance) | | | | | 13,900 | 151,805 |
| Taisei Corporation (Industrials, Construction & engineering) | | | | | 13,900 | 421,441 |
| Takeda Pharmaceutical Company Limited (Health care, Pharmaceuticals) | | | | | 28,400 | 784,977 |
| TDK Corporation (Information technology, Electronic equipment, instruments & components) | | | | | 11,500 | 402,065 |
| Terumo Corporation (Health care, Health care equipment & supplies) | | | | | 12,300 | 394,850 |
| TIS Incorporated (Information technology, Software) | | | | | 24,300 | 691,984 |
| Tobu Railway Company Limited (Industrials, Road & rail) | | | | | 8,300 | 196,097 |
| Toho Company Limited Tokyo (Communication services, Entertainment) | | | | | 9,500 | 360,798 |
| Tokio Marine Holdings Incorporated (Financials, Insurance) | | | | | 20,600 | 1,141,639 |
| Tokyo Electron Limited (Information technology, Semiconductors & semiconductor equipment) † | | | | | 6,100 | 1,913,185 |
| Tokyo Gas Company Limited (Utilities, Gas utilities) | | | | | 17,400 | 326,445 |
| Tokyu Corporation (Industrials, Road & rail) | | | | | 36,900 | 438,658 |
| Toppan Printing Company Limited (Industrials, Commercial services & supplies) | | | | | 29,600 | 464,857 |
| Toray Industries Incorporated (Materials, Chemicals) | | | | | 29,900 | 170,622 |
| Toshiba Corporation (Industrials, Industrial conglomerates) | | | | | 16,600 | 614,764 |
| Tosoh Corporation (Materials, Chemicals) | | | | | 41,100 | 531,416 |
| Toyota Motor Corporation (Consumer discretionary, Automobiles) | | | | | 237,700 | 3,557,194 |
| Toyota Tsusho Corporation (Industrials, Trading companies & distributors) | | | | | 8,300 | 290,567 |
| Trend Micro Incorporated (Information technology, Software) | | | | | 16,200 | 997,402 |
| Unicharm Corporation (Consumer staples, Household products) | | | | | 8,700 | 302,340 |
| USS Company Limited (Consumer discretionary, Specialty retail) | | | | | 21,400 | 377,643 |
| Yakult Honsha Company Limited (Consumer staples, Food products) | | | | | 3,800 | 224,754 |
| Yamaha Motor Company Limited (Consumer discretionary, Automobiles) | | | | | 22,700 | 470,441 |
| Yamato Holdings Company Limited (Industrials, Air freight & logistics) | | | | | 11,200 | 174,597 |
| Yokogawa Electric Corporation (Information technology, Electronic equipment, instruments & components) | | | | | 28,000 | 488,693 |
| ZOZO Incorporated (Consumer discretionary, Internet & direct marketing retail) | | | | | 57,400 | 1,268,725 |
| | | | | | | 89,287,078 |
| Luxembourg: 0.42% | | | | | | |
| ArcelorMittal SA (Materials, Metals & mining) | | | | | 43,710 | 1,037,418 |
| Eurofins Scientific SE (Health care, Life sciences tools & services) | | | | | 12,571 | 869,765 |
| Tenaris SA (Energy, Energy equipment & services) | | | | | 1,897 | 25,950 |
| | | | | | | 1,933,133 |
| Netherlands: 4.60% | | | | | | |
| ABN AMRO Group NV (Financials, Banks) 144A | | | | | 2,895 | 27,812 |
| Adyen NV (Information technology, IT services) 144A† | | | | | 337 | 520,040 |
| Aegon NV (Financials, Insurance) | | | | | 121,948 | 544,988 |
| Airbus SE (Industrials, Aerospace & defense) | | | | | 13,407 | 1,313,793 |
| ASM International NV (Information technology, Semiconductors & semiconductor equipment) | | | | | 1,858 | 505,170 |
| ASML Holding NV (Information technology, Semiconductors & semiconductor equipment) | | | | | 10,327 | 5,040,767 |
| CNH Industrial NV (Industrials, Machinery) | | | | | 11,771 | 143,313 |
| Exor NV (Financials, Diversified financial services) | | | | | 17,179 | 1,034,264 |
| Heineken Holding NV (Consumer staples, Beverages) | | | | | 2,318 | 164,434 |
The accompanying notes are an integral part of these financial statements.
Allspring Factor Enhanced International Equity Portfolio | 13
Portfolio of investments—August 31, 2022 (unaudited)
| | | | | | Shares | Value |
| Netherlands: (continued) | | | | | | |
| Heineken NV (Consumer staples, Beverages) | | | | | 5,219 | $ 469,079 |
| ING Groep NV (Financials, Banks) | | | | | 114,385 | 1,002,521 |
| JDE Peet's NV (Consumer staples, Food products) | | | | | 871 | 26,858 |
| Koninklijke Ahold Delhaize NV (Consumer staples, Food & staples retailing) | | | | | 50,100 | 1,378,091 |
| Koninklijke DSM NV (Materials, Chemicals) | | | | | 1,749 | 223,025 |
| Koninklijke KPN NV (Communication services, Diversified telecommunication services) | | | | | 215,891 | 686,986 |
| Koninklijke Philips NV (Health care, Health care equipment & supplies) | | | | | 11,172 | 185,545 |
| NN Group NV (Financials, Insurance) | | | | | 19,620 | 806,342 |
| OCI NV (Materials, Chemicals) | | | | | 27,185 | 1,020,602 |
| Prosus NV (Consumer discretionary, Internet & direct marketing retail) | | | | | 38,190 | 2,360,503 |
| Qiagen NV (Health care, Life sciences tools & services) † | | | | | 6,869 | 311,554 |
| Randstad Holdings NV (Industrials, Professional services) | | | | | 15,590 | 726,038 |
| Stellantis NV (Consumer discretionary, Automobiles) | | | | | 86,933 | 1,157,994 |
| STMicroelectronics NV (Information technology, Semiconductors & semiconductor equipment) | | | | | 11,853 | 413,079 |
| Universal Music Group NV (Communication services, Entertainment) | | | | | 29,028 | 576,437 |
| Wolters Kluwer NV (Communication services, Media) | | | | | 3,571 | 349,218 |
| | | | | | | 20,988,453 |
| New Zealand: 0.28% | | | | | | |
| Auckland International Airport Limited (Industrials, Transportation infrastructure) † | | | | | 127,861 | 589,665 |
| Fisher & Paykel Healthcare Corporation (Health care, Health care equipment & supplies) | | | | | 10,158 | 121,608 |
| Spark New Zealand Limited (Communication services, Diversified telecommunication services) | | | | | 177,298 | 586,487 |
| | | | | | | 1,297,760 |
| Norway: 0.98% | | | | | | |
| Aker BP ASA (Energy, Oil, gas & consumable fuels) | | | | | 18,461 | 646,704 |
| DNB Bank ASA (Financials, Banks) | | | | | 13,482 | 256,347 |
| Equinor ASA (Energy, Oil, gas & consumable fuels) | | | | | 31,620 | 1,227,192 |
| Kongsberg Gruppen ASA (Industrials, Aerospace & defense) | | | | | 14,221 | 486,083 |
| Mowi ASA (Consumer staples, Food products) | | | | | 19,957 | 409,153 |
| Norsk Hydro ASA (Materials, Metals & mining) | | | | | 70,014 | 481,073 |
| Orkla ASA (Consumer staples, Food products) | | | | | 25,495 | 213,493 |
| Salmar ASA (Consumer staples, Food products) | | | | | 887 | 58,655 |
| Telenor ASA (Communication services, Diversified telecommunication services) | | | | | 11,366 | 124,378 |
| Yara International ASA (Materials, Chemicals) | | | | | 13,363 | 565,221 |
| | | | | | | 4,468,299 |
| Portugal: 0.18% | | | | | | |
| Galp Energia SGPS SA (Energy, Oil, gas & consumable fuels) | | | | | 32,753 | 353,699 |
| Jeronimo Martins SA (Consumer staples, Food & staples retailing) | | | | | 20,407 | 452,459 |
| | | | | | | 806,158 |
| Singapore: 1.51% | | | | | | |
| Ascendas REIT (Real estate, Equity REITs) | | | | | 73,000 | 147,125 |
| CapitaLand Investments Limited (Real estate, Real estate management & development) | | | | | 363,000 | 955,698 |
| CapitaLand Mall Trust (Real estate, Equity REITs) | | | | | 133,200 | 197,006 |
| City Developments Limited (Real estate, Real estate management & development) | | | | | 31,900 | 185,218 |
The accompanying notes are an integral part of these financial statements.
14 | Allspring Factor Enhanced International Equity Portfolio
Portfolio of investments—August 31, 2022 (unaudited)
| | | | | | Shares | Value |
| Singapore: (continued) | | | | | | |
| DBS Group Holdings Limited (Financials, Banks) | | | | | 47,513 | $ 1,106,268 |
| Genting Singapore Limited (Consumer discretionary, Hotels, restaurants & leisure) | | | | | 348,024 | 192,599 |
| Keppel Corporation Limited (Industrials, Industrial conglomerates) | | | | | 124,200 | 645,035 |
| Mapletree Commercial Trust (Real estate, Equity REITs) | | | | | 10,200 | 13,413 |
| Oversea-Chinese Banking Corporation Limited (Financials, Banks) | | | | | 88,096 | 759,312 |
| Singapore Exchange Limited (Financials, Capital markets) | | | | | 2,100 | 14,251 |
| Singapore Technologies Engineering Limited (Industrials, Aerospace & defense) | | | | | 97,169 | 258,931 |
| Singapore Telecommunications Limited (Communication services, Diversified telecommunication services) | | | | | 119,700 | 224,720 |
| United Overseas Bank Limited (Financials, Banks) | | | | | 33,286 | 649,059 |
| UOL Group Limited (Real estate, Real estate management & development) | | | | | 43,773 | 216,580 |
| Venture Corporation Limited (Information technology, Electronic equipment, instruments & components) | | | | | 69,000 | 901,474 |
| Wilmar International Limited (Consumer staples, Food products) | | | | | 155,685 | 449,369 |
| | | | | | | 6,916,058 |
| Spain: 2.24% | | | | | | |
| Acciona SA (Utilities, Electric utilities) | | | | | 550 | 107,726 |
| Actividades de Construccion y Servicios SA (Industrials, Construction & engineering) | | | | | 12,754 | 284,154 |
| Aena SA (Industrials, Transportation infrastructure) 144A† | | | | | 1,347 | 165,441 |
| Banco Bilbao Vizcaya Argentaria SA (Financials, Banks) | | | | | 327,576 | 1,469,897 |
| Banco Santander Central Hispano SA (Financials, Banks) | | | | | 640,411 | 1,550,241 |
| CaixaBank SA (Financials, Banks) | | | | | 163,821 | 494,658 |
| EDP Renováveis SA (Utilities, Independent power & renewable electricity producers) | | | | | 549 | 13,314 |
| Enagás SA (Utilities, Gas utilities) | | | | | 14,288 | 260,900 |
| Endesa SA (Utilities, Electric utilities) | | | | | 9,440 | 161,915 |
| Grifols SA (Health care, Biotechnology) † | | | | | 8,266 | 99,924 |
| Iberdrola SA (Utilities, Electric utilities) | | | | | 138,416 | 1,441,145 |
| Industria de Diseno Textil SA (Consumer discretionary, Specialty retail) | | | | | 30,634 | 661,432 |
| Naturgy Energy Group SA (Utilities, Gas utilities) | | | | | 10,608 | 292,512 |
| Red Eléctrica Corporacion SA (Utilities, Electric utilities) | | | | | 27,342 | 499,888 |
| Repsol SA (Energy, Oil, gas & consumable fuels) | | | | | 98,565 | 1,280,170 |
| Telefónica SA (Communication services, Diversified telecommunication services) | | | | | 353,962 | 1,460,806 |
| | | | | | | 10,244,123 |
| Sweden: 2.82% | | | | | | |
| Alfa Laval AB (Industrials, Machinery) | | | | | 6,997 | 186,592 |
| Alleima AB (Materials, Metals & mining) ♦† | | | | | 6,770 | 27,183 |
| Assa Abloy AB Class B (Industrials, Building products) | | | | | 9,446 | 191,319 |
| Atlas Copco AB Class A (Industrials, Machinery) | | | | | 57,983 | 588,587 |
| Atlas Copco AB Class B (Industrials, Machinery) | | | | | 21,568 | 196,394 |
| Boliden AB (Materials, Metals & mining) | | | | | 13,628 | 436,398 |
| Electrolux AB (Consumer discretionary, Household durables) | | | | | 6,274 | 79,335 |
| Epiroc AB Class A (Industrials, Machinery) | | | | | 31,175 | 477,003 |
| Epiroc AB Class B (Industrials, Machinery) | | | | | 24,608 | 335,009 |
| EQT AB (Financials, Capital markets) | | | | | 8,230 | 184,334 |
| Ericsson LM Class B (Information technology, Communications equipment) | | | | | 95,808 | 716,493 |
| Essity Aktiebolag AB (Consumer staples, Household products) | | | | | 22,797 | 505,712 |
| Evolution Gaming Group (Consumer discretionary, Hotels, restaurants & leisure) 144A | | | | | 5,158 | 412,657 |
The accompanying notes are an integral part of these financial statements.
Allspring Factor Enhanced International Equity Portfolio | 15
Portfolio of investments—August 31, 2022 (unaudited)
| | | | | | Shares | Value |
| Sweden: (continued) | | | | | | |
| Fastighets AB (Real estate, Real estate management & development) † | | | | | 51,416 | $ 283,930 |
| Getinge AB Class B (Health care, Health care equipment & supplies) | | | | | 43,455 | 804,854 |
| Hennes & Mauritz AB Class B (Consumer discretionary, Specialty retail) | | | | | 34,117 | 354,316 |
| Hexagon AB Class B (Information technology, Electronic equipment, instruments & components) | | | | | 6,605 | 67,497 |
| Husqvarna AB Class B (Industrials, Machinery) | | | | | 98,235 | 660,967 |
| Industrivarden AB Class A (Financials, Diversified financial services) | | | | | 12,646 | 280,260 |
| Indutrade AB (Industrials, Machinery) | | | | | 2,286 | 42,328 |
| Investor AB (Financials, Diversified financial services) | | | | | 41,062 | 647,186 |
| Investor AB Class A (Financials, Diversified financial services) | | | | | 7,734 | 128,544 |
| Kinnevik AB (Financials, Diversified financial services) † | | | | | 55,157 | 784,940 |
| Sagax AB Class B (Real estate, Real estate management & development) | | | | | 7,191 | 154,657 |
| Sandvik AB (Industrials, Machinery) | | | | | 33,852 | 527,770 |
| Securitas AB Class B (Industrials, Commercial services & supplies) | | | | | 8,865 | 77,628 |
| Sinch AB (Information technology, Software) 144A† | | | | | 15,513 | 29,992 |
| Skandinaviska Enskilda Banken AB Class A (Financials, Banks) | | | | | 13,858 | 138,146 |
| SKF AB Class B (Industrials, Machinery) | | | | | 11,679 | 175,098 |
| Swedbank AB Class A (Financials, Banks) | | | | | 14,773 | 190,940 |
| Swedish Orphan Biovitrum AB (Health care, Biotechnology) † | | | | | 42,373 | 935,673 |
| Tele2 AB Class B (Communication services, Wireless telecommunication services) | | | | | 40,194 | 428,057 |
| Telia Company AB (Communication services, Diversified telecommunication services) | | | | | 87,631 | 308,438 |
| Volvo AB Class A (Industrials, Machinery) | | | | | 20,273 | 337,395 |
| Volvo AB Class B (Industrials, Machinery) | | | | | 66,004 | 1,045,522 |
| Volvo Car AB Series B (Consumer discretionary, Automobiles) † | | | | | 19,852 | 120,927 |
| | | | | | | 12,862,081 |
| Switzerland: 8.49% | | | | | | |
| ABB Limited (Industrials, Electrical equipment) | | | | | 66,811 | 1,841,553 |
| Adecco SA (Industrials, Professional services) | | | | | 8,589 | 272,276 |
| Alcon Incorporated (Health care, Health care equipment & supplies) | | | | | 11,874 | 781,819 |
| Bachem Holding AG (Health care, Life sciences tools & services) | | | | | 1,041 | 72,086 |
| Baloise Holding AG (Financials, Insurance) | | | | | 2,056 | 296,719 |
| Barry Callebaut AG (Consumer staples, Food products) | | | | | 92 | 188,244 |
| Chocoladefabriken Lindt & Sprungli AG (Participation Certificates) (Consumer staples, Food products) | | | | | 10 | 105,764 |
| Clariant AG (Materials, Chemicals) † | | | | | 20,510 | 378,683 |
| Coca-Cola HBC AG (Consumer staples, Beverages) | | | | | 7,899 | 180,250 |
| Compagnie Financière Richemont SA (Consumer discretionary, Textiles, apparel & luxury goods) | | | | | 13,343 | 1,492,127 |
| Credit Suisse Group AG (Financials, Capital markets) | | | | | 170 | 877 |
| Geberit AG (Industrials, Building products) | | | | | 596 | 275,379 |
| Givaudan SA (Materials, Chemicals) | | | | | 47 | 149,957 |
| Julius Bär Gruppe AG (Financials, Capital markets) | | | | | 9,582 | 462,999 |
| LafargeHolcim Limited (Materials, Construction materials) | | | | | 8,057 | 357,131 |
| Lonza Group AG (Health care, Life sciences tools & services) | | | | | 1,715 | 914,643 |
| Nestle SA (Consumer staples, Food products) | | | | | 76,214 | 8,918,785 |
| Novartis AG (Health care, Pharmaceuticals) | | | | | 66,681 | 5,393,694 |
| Partners Group Holding AG (Financials, Capital markets) | | | | | 645 | 622,588 |
| Roche Holding AG (Health care, Pharmaceuticals) | | | | | 19,644 | 6,330,109 |
| Roche Holding AG (Bearer Shares) (Health care, Pharmaceuticals) | | | | | 2,014 | 769,264 |
| Schindler Holding AG (Industrials, Machinery) | | | | | 368 | 62,152 |
| Schindler Holding AG Participation Certificate (Industrials, Machinery) | | | | | 1,278 | 222,636 |
| SGS SA (Industrials, Professional services) | | | | | 99 | 218,016 |
| Sika AG (Materials, Chemicals) | | | | | 2,151 | 483,964 |
The accompanying notes are an integral part of these financial statements.
16 | Allspring Factor Enhanced International Equity Portfolio
Portfolio of investments—August 31, 2022 (unaudited)
| | | | | | Shares | Value |
| Switzerland: (continued) | | | | | | |
| Sonova Holding AG (Health care, Health care equipment & supplies) | | | | | 2,120 | $ 558,564 |
| Straumann Holding AG (Health care, Health care equipment & supplies) | | | | | 1,283 | 140,595 |
| Swiss Life Holding AG (Financials, Insurance) | | | | | 715 | 373,714 |
| Swiss Prime Site AG (Real estate, Real estate management & development) | | | | | 2,110 | 181,464 |
| Swiss Reinsurance AG (Financials, Insurance) | | | | | 11,811 | 918,372 |
| Swisscom AG (Communication services, Diversified telecommunication services) | | | | | 898 | 464,293 |
| Temenos AG (Information technology, Software) | | | | | 4,818 | 394,566 |
| The Swatch Group AG (Bearer Shares) (Consumer discretionary, Textiles, apparel & luxury goods) | | | | | 2,233 | 541,492 |
| The Swatch Group AG (Registered Shares) (Consumer discretionary, Textiles, apparel & luxury goods) | | | | | 512 | 23,285 |
| UBS Group AG (Financials, Capital markets) | | | | | 134,096 | 2,124,981 |
| VAT Group AG (Industrials, Machinery) 144A | | | | | 1,662 | 397,395 |
| Zurich Insurance Group AG (Financials, Insurance) | | | | | 4,166 | 1,849,285 |
| | | | | | | 38,759,721 |
| United Kingdom: 12.85% | | | | | | |
| 3i Group plc (Financials, Capital markets) | | | | | 74,130 | 1,043,475 |
| Aberdeen plc (Financials, Capital markets) | | | | | 60,651 | 103,073 |
| Anglo American plc (Materials, Metals & mining) | | | | | 38,794 | 1,246,624 |
| Ashtead Group plc (Industrials, Trading companies & distributors) | | | | | 1,692 | 83,124 |
| Associated British Foods plc (Consumer staples, Food products) | | | | | 3,238 | 57,186 |
| AstraZeneca plc (Health care, Pharmaceuticals) | | | | | 35,041 | 4,334,303 |
| Auto Trader Group plc (Communication services, Interactive media & services) 144A | | | | | 179,485 | 1,355,234 |
| Aviva plc (Financials, Insurance) | | | | | 70,394 | 341,498 |
| BAE Systems plc (Industrials, Aerospace & defense) | | | | | 140,191 | 1,262,574 |
| Barclays plc (Financials, Banks) | | | | | 565,913 | 1,079,021 |
| Barratt Developments plc (Consumer discretionary, Household durables) | | | | | 16,371 | 81,049 |
| Berkeley Group Holdings (Consumer discretionary, Household durables) | | | | | 150 | 6,350 |
| BP plc (Energy, Oil, gas & consumable fuels) | | | | | 527,100 | 2,693,442 |
| British American Tobacco plc (Consumer staples, Tobacco) | | | | | 54,525 | 2,183,876 |
| BT Group plc (Communication services, Diversified telecommunication services) | | | | | 290,168 | 507,591 |
| Bunzl plc (Industrials, Trading companies & distributors) | | | | | 8,788 | 291,447 |
| Burberry Group plc (Consumer discretionary, Textiles, apparel & luxury goods) | | | | | 23,212 | 469,548 |
| Compass Group plc (Consumer discretionary, Hotels, restaurants & leisure) | | | | | 65,939 | 1,418,417 |
| Diageo plc (Consumer staples, Beverages) | | | | | 57,776 | 2,510,158 |
| Entain plc (Consumer discretionary, Hotels, restaurants & leisure) | | | | | 21,661 | 318,690 |
| Experian Group Limited plc (Industrials, Professional services) | | | | | 7,732 | 234,631 |
| Ferguson plc (Industrials, Trading companies & distributors) | | | | | 7,706 | 892,417 |
| Glencore plc (Materials, Metals & mining) | | | | | 360,044 | 1,968,562 |
| GSK plc (Health care, Pharmaceuticals) | | | | | 127,624 | 2,040,071 |
| Haleon plc (Consumer staples, Personal products) † | | | | | 86,317 | 259,561 |
| Halma plc (Information technology, Electronic equipment, instruments & components) | | | | | 4,355 | 104,759 |
| Hargreaves Lansdown plc (Financials, Capital markets) | | | | | 45,088 | 426,856 |
| HSBC Holdings plc (Financials, Banks) | | | | | 621,988 | 3,810,823 |
| Imperial Tobacco Group plc (Consumer staples, Tobacco) | | | | | 35,959 | 790,805 |
| Intercontinental Hotels Group plc (Consumer discretionary, Hotels, restaurants & leisure) | | | | | 9,859 | 535,207 |
| Intertek Group plc (Industrials, Professional services) | | | | | 1,521 | 69,812 |
| J Sainsbury plc (Consumer staples, Food & staples retailing) | | | | | 72,758 | 171,735 |
| JD Sports Fashion plc (Consumer discretionary, Specialty retail) | | | | | 66,125 | 86,494 |
The accompanying notes are an integral part of these financial statements.
Allspring Factor Enhanced International Equity Portfolio | 17
Portfolio of investments—August 31, 2022 (unaudited)
| | | | | | Shares | Value |
| United Kingdom: (continued) | | | | | | |
| Johnson Matthey plc (Materials, Chemicals) | | | | | 28,258 | $ 659,282 |
| Kingfisher plc (Consumer discretionary, Specialty retail) | | | | | 200,651 | 539,002 |
| Land Securities Group plc (Real estate, Equity REITs) | | | | | 57,043 | 430,242 |
| Legal & General Group plc (Financials, Insurance) | | | | | 63,954 | 187,326 |
| Lloyds Banking Group plc (Financials, Banks) | | | | | 1,839,994 | 932,428 |
| London Stock Exchange Group plc (Financials, Capital markets) | | | | | 1,727 | 161,995 |
| Melrose Industries plc (Industrials, Industrial conglomerates) | | | | | 91,547 | 144,466 |
| Mondi plc (Materials, Paper & forest products) | | | | | 512 | 8,691 |
| National Grid plc (Utilities, Multi-utilities) | | | | | 89,330 | 1,112,324 |
| NatWest Group plc (Financials, Banks) | | | | | 152,572 | 435,389 |
| Next plc (Consumer discretionary, Multiline retail) | | | | | 984 | 66,264 |
| NMC Health plc (Health care, Health care providers & services) ♦† | | | | | 7,509 | 15 |
| Persimmon plc (Consumer discretionary, Household durables) | | | | | 8,937 | 152,922 |
| Prudential plc (Financials, Insurance) | | | | | 60,739 | 637,466 |
| Reckitt Benckiser Group plc (Consumer staples, Household products) | | | | | 19,134 | 1,476,410 |
| RELX plc (Industrials, Professional services) | | | | | 51,871 | 1,360,323 |
| Rio Tinto plc (Materials, Metals & mining) | | | | | 31,024 | 1,712,844 |
| Segro plc (Real estate, Equity REITs) | | | | | 36,348 | 396,665 |
| Severn Trent plc (Utilities, Water utilities) | | | | | 3,193 | 103,139 |
| Shell plc (Energy, Oil, gas & consumable fuels) | | | | | 213,601 | 5,653,600 |
| Smith & Nephew plc (Health care, Health care equipment & supplies) | | | | | 30,095 | 354,000 |
| SSE plc (Utilities, Electric utilities) | | | | | 36,290 | 695,415 |
| Standard Chartered plc (Financials, Banks) | | | | | 111,104 | 769,523 |
| Taylor Wimpey plc (Consumer discretionary, Household durables) | | | | | 163,612 | 205,257 |
| Tesco plc (Consumer staples, Food & staples retailing) | | | | | 350,330 | 1,011,848 |
| The British Land Company plc (Real estate, Equity REITs) | | | | | 112,198 | 559,667 |
| The Sage Group plc (Information technology, Software) | | | | | 119,262 | 988,526 |
| Unilever plc (London Exchange) (Consumer staples, Personal products) | | | | | 72,326 | 3,280,875 |
| United Utilities Group plc (Utilities, Water utilities) | | | | | 18,704 | 229,242 |
| Vodafone Group plc (Communication services, Wireless telecommunication services) | | | | | 897,070 | 1,201,044 |
| WPP plc (Communication services, Media) | | | | | 49,199 | 423,753 |
| | | | | | | 58,668,356 |
| Total Common stocks (Cost $437,488,490) | | | | | | 434,622,216 |
| | | Dividend
yield | | | | |
| Preferred stocks: 0.29% | | | | | | |
| Germany: 0.29% | | | | | | |
| Bayerische Motoren Werke AG (Consumer discretionary, Automobiles) | | 4.22% | | | 2,709 | 188,341 |
| Henkel AG & Company KGaA (Consumer staples, Household products) | | 3.13 | | | 4,296 | 277,236 |
| Volkswagen AG ADR (Consumer discretionary, Automobiles) | | 5.53 | | | 6,016 | 855,711 |
| Total Preferred stocks (Cost $1,472,066) | | | | | | 1,321,288 |
The accompanying notes are an integral part of these financial statements.
18 | Allspring Factor Enhanced International Equity Portfolio
Portfolio of investments—August 31, 2022 (unaudited)
| | | Yield | | | Shares | Value |
| Short-term investments: 4.94% | | | | | | |
| Investment companies: 4.94% | | | | | | |
| Allspring Government Money Market Fund Select Class ♠∞ | | 2.09% | | | 22,559,088 | $ 22,559,088 |
| Total Short-term investments (Cost $22,559,088) | | | | | | 22,559,088 |
| Total investments in securities (Cost $461,519,644) | 100.39% | | | | | 458,502,592 |
| Other assets and liabilities, net | (0.39) | | | | | (1,783,656) |
| Total net assets | 100.00% | | | | | $456,718,936 |
| † | Non-income-earning security |
| 144A | The security may be resold in transactions exempt from registration, normally to qualified institutional buyers, pursuant to Rule 144A under the Securities Act of 1933. |
| ♦ | The security is fair valued in accordance with procedures approved by the Board of Trustees. |
| ♠ | The issuer of the security is an affiliated person of the Portfolio as defined in the Investment Company Act of 1940. |
| ∞ | The rate represents the 7-day annualized yield at period end. |
| Abbreviations: |
| ADR | American depositary receipt |
| REIT | Real estate investment trust |
Investments in affiliates
An affiliated investment is an investment in which the Portfolio owns at least 5% of the outstanding voting shares of the issuer or as a result of other relationships, such as the Portfolio and the issuer having the same adviser or investment manager. Transactions with issuers that were affiliates of the Portfolio at the end of the period were as follows:
| | Value,
beginning of
period | Purchases | Sales
proceeds | Net
realized
gains
(losses) | Net
change in
unrealized
gains
(losses) | Value,
end of
period | Shares,
end
of period | Income
from
affiliated
securities |
| Short-term investments | | | | | | | |
| Allspring Government Money Market Fund Select Class | $7,971,045 | $185,881,076 | $(171,293,033) | $0 | $0 | $22,559,088 | 22,559,088 | $69,396 |
Futures contracts
| Description | Number of
contracts | Expiration
date | Notional
cost | Notional
value | Unrealized
gains | Unrealized
losses |
| Long | | | | | | |
| MSCI EAFE Index | 193 | 9-16-2022 | $18,224,759 | $17,631,515 | $0 | $(593,244) |
The accompanying notes are an integral part of these financial statements.
Allspring Factor Enhanced International Equity Portfolio | 19
Statement of assets and liabilities—August 31, 2022 (unaudited)
| | |
| Assets | |
Investments in unaffiliated securities, at value (cost $438,960,556)
| $ 435,943,504 |
Investments in affiliated securities, at value (cost $22,559,088)
| 22,559,088 |
Cash at broker segregated for futures contracts
| 1,350,000 |
Foreign currency, at value (cost $3,666,208)
| 3,555,070 |
Receivable for dividends
| 3,179,098 |
Prepaid expenses and other assets
| 3,054 |
Total assets
| 466,589,814 |
| Liabilities | |
Payable for investments purchased
| 9,467,894 |
Payable for daily variation margin on open futures contracts
| 133,170 |
Advisory fee payable
| 34,615 |
Trustees’ fees and expenses payable
| 3,647 |
Accrued expenses and other liabilities
| 231,552 |
Total liabilities
| 9,870,878 |
Total net assets
| $456,718,936 |
The accompanying notes are an integral part of these financial statements.
20 | Allspring Factor Enhanced International Equity Portfolio
Statement of operations—six months ended August 31, 2022 (unaudited)
| | |
| Investment income | |
Dividends (net of foreign withholdings taxes of $1,551,921)
| $ 11,059,459 |
Income from affiliated securities
| 69,396 |
Total investment income
| 11,128,855 |
| Expenses | |
Advisory fee
| 392,956 |
Custody and accounting fees
| 91,200 |
Professional fees
| 28,793 |
Interest holder report expenses
| 10,869 |
Trustees’ fees and expenses
| 10,982 |
Other fees and expenses
| 22,065 |
Total expenses
| 556,865 |
Less: Fee waivers and/or expense reimbursements
| (145,571) |
Net expenses
| 411,294 |
Net investment income
| 10,717,561 |
| Realized and unrealized gains (losses) on investments | |
| Net realized losses on | |
Unaffiliated securities
| (4,574,360) |
Foreign currency and foreign currency translations
| (346,511) |
Futures contracts
| (426,703) |
Net realized losses on investments
| (5,347,574) |
| Net change in unrealized gains (losses) on | |
Unaffiliated securities
| (74,559,677) |
Foreign currency and foreign currency translations
| (150,158) |
Futures contracts
| (243,798) |
Net change in unrealized gains (losses) on investments
| (74,953,633) |
Net realized and unrealized gains (losses) on investments
| (80,301,207) |
Net decrease in net assets resulting from operations
| $(69,583,646) |
The accompanying notes are an integral part of these financial statements.
Allspring Factor Enhanced International Equity Portfolio | 21
Statement of changes in net assets
| | | |
| | Six months ended
August 31, 2022
(unaudited) | Year ended
February 28, 2022 |
| Operations | | |
Net investment income
| $ 10,717,561 | $ 19,181,627 |
Net realized gains (losses) on investments
| (5,347,574) | 74,172,092 |
Net change in unrealized gains (losses) on investments
| (74,953,633) | (55,198,377) |
Net increase (decrease) in net assets resulting from operations
| (69,583,646) | 38,155,342 |
| Capital transactions | | |
| Transactions in investors’ beneficial interests | | |
Contributions
| 74,337,368 | 111,767,336 |
Withdrawals
| (184,566,163) | (191,154,689) |
Net decrease in net assets resulting from capital transactions
| (110,228,795) | (79,387,353) |
Total decrease in net assets
| (179,812,441) | (41,232,011) |
| Net assets | | |
Beginning of period
| 636,531,377 | 677,763,388 |
End of period
| $ 456,718,936 | $ 636,531,377 |
The accompanying notes are an integral part of these financial statements.
22 | Allspring Factor Enhanced International Equity Portfolio
| | | Year ended February 28 |
| | Six months ended
August 31, 2022
(unaudited) | 2022 | 2021 | 2020 1 | 2019 | 2018 2 |
Total return3
| (13.28)% | 5.25% | 22.14% | 1.23% | (2.91)% | 8.99% |
| Ratios to average net assets (annualized) | | | | | | |
Gross expenses
| 0.21% | 0.20% | 0.22% | 0.24% | 0.23% | 0.21% |
Net expenses
| 0.16% * | 0.16% * | 0.16% * | 0.19% | 0.20% | 0.21% |
Net investment income
| 4.09% | 2.72% | 2.25% | 2.58% | 3.03% | 1.74% |
| Supplemental data | | | | | | |
Portfolio turnover rate
| 22% | 70% | 92% | 44% | 47% | 106% |
| * | Ratio includes expenses which were voluntarily waived by the adviser. Without these voluntary waivers, the net expense ratios would be increased by the following amounts: |
| Six months ended August 31, 2022 (unaudited) | 0.05% |
| Year ended February 28, 2022 | 0.04% |
| Year ended February 28, 2021 | 0.06% |
| 1 | Year ended February 29 |
| 2 | For the period from May 23, 2017 (commencement of operations) to February 28, 2018 |
| 3 | Returns for periods of less than one year are not annualized. |
The accompanying notes are an integral part of these financial statements.
Allspring Factor Enhanced International Equity Portfolio | 23
Notes to financial statements (unaudited)
1. ORGANIZATION
Allspring Master Trust (the "Trust"), a Delaware statutory trust organized on March 10, 1999, is an open-end management investment company registered under the Investment Company Act of 1940, as amended (the "1940 Act"). As an investment company, the Trust follows the accounting and reporting guidance in Financial Accounting Standards Board ("FASB") Accounting Standards Codification Topic 946, Financial Services – Investment Companies. These financial statements report on the Allspring Factor Enhanced International Equity Portfolio (the "Portfolio") which is a diversified series of the Trust.
Interests in the Portfolio are available solely through private placement transactions that do not involve any "public offering" within the meaning of Section 4(a)(2) of the Securities Act of 1933.
2. SIGNIFICANT ACCOUNTING POLICIES
The following significant accounting policies, which are consistently followed in the preparation of the financial statements of the Portfolio, are in conformity with U.S. generally accepted accounting principles which require management to make estimates and assumptions that affect the reported amounts of assets and liabilities, disclosure of contingent assets and liabilities at the date of the financial statements, and the reported amounts of income and expenses during the reporting period. Actual results could differ from those estimates.
Securities valuation
All investments are valued each business day as of the close of regular trading on the New York Stock Exchange (generally 4 p.m. Eastern Time), although the Portfolio may deviate from this calculation time under unusual or unexpected circumstances.
Equity securities and futures contracts that are listed on a foreign or domestic exchange or market are valued at the official closing price or, if none, the last sales price.
The values of securities denominated in foreign currencies are translated into U.S. dollars at rates provided by an independent foreign currency pricing source at a time each business day specified by the Allspring Global Investments Pricing Committee at Allspring Funds Management, LLC ("Allspring Funds Management").
Many securities markets and exchanges outside the U.S. close prior to the close of the New York Stock Exchange and therefore may not fully reflect trading or events that occur after the close of the principal exchange in which the foreign securities are traded, but before the close of the New York Stock Exchange. If such trading or events are expected to materially affect the value of such securities, then fair value pricing procedures approved by the Board of Trustees of the Portfolio are applied. These procedures take into account multiple factors including movements in U.S. securities markets after foreign exchanges close. Foreign securities that are fair valued under these procedures are categorized as Level 2 and the application of these procedures may result in transfers between Level 1 and Level 2. Depending on market activity, such fair valuations may be frequent. Such fair value pricing may result in net asset values that are higher or lower than net asset values based on the last reported sales price or latest quoted bid price. On August 31, 2022, such fair value pricing was used in pricing certain foreign securities.
Investments in registered open-end investment companies are valued at net asset value.
Investments which are not valued using any of the methods discussed above are valued at their fair value, as determined in good faith by the Board of Trustees. The Board of Trustees has established a Valuation Committee comprised of the Trustees and has delegated to it the authority to take any actions regarding the valuation of portfolio securities that the Valuation Committee deems necessary or appropriate, including determining the fair value of portfolio securities, unless the determination has been delegated to the Allspring Global Investments Pricing Committee. The Board of Trustees retains the authority to make or ratify any valuation decisions or approve any changes to the Valuation Procedures as it deems appropriate. On a quarterly basis, the Board of Trustees receives reports on any valuation actions taken by the Valuation Committee or the Allspring Global Investments Pricing Committee which may include items for ratification.
Foreign currency translation
The accounting records of the Portfolio are maintained in U.S. dollars. The values of other assets and liabilities denominated in foreign currencies are translated into U.S. dollars at rates provided by an independent foreign currency pricing source at a time each business day specified by the Allspring Global Investments Pricing Committee. Purchases and sales of securities, and income and expenses are converted at the rate of exchange on the respective dates of such transactions. Net realized foreign exchange gains or losses arise from sales of foreign currencies, currency gains or losses realized between the trade and settlement dates on securities transactions, and the difference between the amounts of dividends, interest and foreign withholding taxes recorded and the U.S. dollar equivalent of the amounts actually paid or received. Net unrealized foreign
24 | Allspring Factor Enhanced International Equity Portfolio
Notes to financial statements (unaudited)
exchange gains and losses arise from changes in the fair value of assets and liabilities other than investments in securities resulting from changes in exchange rates. The changes in net assets arising from changes in exchange rates of securities and the changes in net assets resulting from changes in market prices of securities are not separately presented. Such changes are included in net realized and unrealized gains or losses from investments.
Futures contracts
Futures contracts are agreements between the Portfolio and a counterparty to buy or sell a specific amount of a commodity, financial instrument or currency at a specified price on a specified date. The Portfolio may buy and sell futures contracts in order to gain exposure to, or protect against, changes in security values and is subject to equity price risk. The primary risks associated with the use of futures contracts are the imperfect correlation between changes in market values of securities held by the Portfolio and the prices of futures contracts, and the possibility of an illiquid market. Futures contracts are generally entered into on a regulated futures exchange and cleared through a clearinghouse associated with the exchange. With futures contracts, there is minimal counterparty risk to the Portfolio since futures contracts are exchange traded and the exchange’s clearinghouse, as the counterparty to all exchange traded futures, guarantees the futures contracts against default.
Upon entering into a futures contract, the Portfolio is required to deposit either cash or securities (initial margin) with the broker in an amount equal to a certain percentage of the contract value. Subsequent payments (variation margin) are paid to or from the broker each day equal to the daily changes in the contract value. Such payments are recorded as unrealized gains or losses and, if any, shown as variation margin receivable (payable) in the Statement of Assets and Liabilities. Should the Portfolio fail to make requested variation margin payments, the broker can gain access to the initial margin to satisfy the Portfolio’s payment obligations. When the contracts are closed, a realized gain or loss is recorded in the Statement of Operations.
Security transactions and income recognition
Securities transactions are recorded on a trade date basis. Realized gains or losses are recorded on the basis of identified cost.
Dividend income is recognized on the ex-dividend date, except for certain dividends from foreign securities, which are recorded as soon as the custodian verifies the ex-dividend date. Dividend income is recorded net of foreign taxes withheld where recovery of such taxes is not assured.
Federal and other taxes
The Portfolio is not required to pay federal income taxes on its net investment income and net capital gains as it is treated as a partnership for federal income tax purposes. All income, gains and losses of the Portfolio are deemed to have been “passed through” to the interest holders in proportion to their holdings of the Portfolio regardless of whether income and gains have been distributed by the Portfolio.
The Portfolio’s income tax returns and all financial records supporting those returns for the prior three fiscal years are subject to examination by the federal revenue authority. Management has analyzed the Portfolio’s tax positions taken on federal, state, and foreign tax returns, as applicable, for all open tax years and does not believe that there are any uncertain tax positions that require recognition of a tax liability.
As of August 31, 2022, the aggregate cost of all investments for federal income tax purposes was $479,762,706 and the unrealized gains (losses) consisted of:
| Gross unrealized gains | $ 38,645,374 |
| Gross unrealized losses | (60,498,732) |
| Net unrealized losses | $(21,853,358) |
Allspring Factor Enhanced International Equity Portfolio | 25
Notes to financial statements (unaudited)
3. FAIR VALUATION MEASUREMENTS
Fair value measurements of investments are determined within a framework that has established a fair value hierarchy based upon the various data inputs utilized in determining the value of the Portfolio’s investments. The three-level hierarchy gives the highest priority to unadjusted quoted prices in active markets for identical assets or liabilities (Level 1) and the lowest priority to unobservable inputs (Level 3). The Portfolio’s investments are classified within the fair value hierarchy based on the lowest level of input that is significant to the fair value measurement. The inputs are summarized into three broad levels as follows:
| ■ | Level 1 – quoted prices in active markets for identical securities |
| ■ | Level 2 – other significant observable inputs (including quoted prices for similar securities, interest rates, prepayment speeds, credit risk, etc.) |
| ■ | Level 3 – significant unobservable inputs (including the Portfolio’s own assumptions in determining the fair value of investments) |
The inputs or methodologies used for valuing investments in securities are not necessarily an indication of the risk associated with investing in those securities.
26 | Allspring Factor Enhanced International Equity Portfolio
Notes to financial statements (unaudited)
The following is a summary of the inputs used in valuing the Portfolio’s assets and liabilities as of August 31, 2022:
| | Quoted prices
(Level 1) | Other significant
observable inputs
(Level 2) | Significant
unobservable inputs
(Level 3) | Total |
| Assets | | | | |
| Investments in: | | | | |
| Common stocks | | | | |
| Australia | $ 0 | $ 29,428,360 | $0 | $ 29,428,360 |
| Austria | 0 | 340,860 | 0 | 340,860 |
| Belgium | 0 | 4,613,059 | 0 | 4,613,059 |
| Canada | 51,011,143 | 0 | 0 | 51,011,143 |
| Denmark | 0 | 11,676,054 | 0 | 11,676,054 |
| Finland | 0 | 3,925,615 | 0 | 3,925,615 |
| France | 0 | 37,451,227 | 0 | 37,451,227 |
| Germany | 0 | 24,965,807 | 0 | 24,965,807 |
| Hong Kong | 0 | 12,481,781 | 0 | 12,481,781 |
| Ireland | 0 | 2,345,480 | 0 | 2,345,480 |
| Israel | 1,841,981 | 2,337,554 | 0 | 4,179,535 |
| Italy | 0 | 5,972,075 | 0 | 5,972,075 |
| Japan | 0 | 89,287,078 | 0 | 89,287,078 |
| Luxembourg | 0 | 1,933,133 | 0 | 1,933,133 |
| Netherlands | 0 | 20,988,453 | 0 | 20,988,453 |
| New Zealand | 0 | 1,297,760 | 0 | 1,297,760 |
| Norway | 0 | 4,468,299 | 0 | 4,468,299 |
| Portugal | 0 | 806,158 | 0 | 806,158 |
| Singapore | 0 | 6,916,058 | 0 | 6,916,058 |
| Spain | 0 | 10,244,123 | 0 | 10,244,123 |
| Sweden | 0 | 12,862,081 | 0 | 12,862,081 |
| Switzerland | 0 | 38,759,721 | 0 | 38,759,721 |
| United Kingdom | 259,561 | 58,408,795 | 0 | 58,668,356 |
| Preferred stocks | | | | |
| Germany | 0 | 1,321,288 | 0 | 1,321,288 |
| Short-term investments | | | | |
| Investment companies | 22,559,088 | 0 | 0 | 22,559,088 |
| Total assets | $75,671,773 | $382,830,819 | $0 | $458,502,592 |
| Liabilities | | | | |
| Futures contracts | $ 593,244 | $ 0 | $0 | $ 593,244 |
| Total liabilities | $ 593,244 | $ 0 | $0 | $ 593,244 |
Futures contracts are reported at their cumulative unrealized gains (losses) at measurement date as reported in the table following the Portfolio of Investments. For futures contracts, the current day’s variation margin is reported on the Statement of Assets and Liabilities. All other assets and liabilities are reported at their market value at measurement date.
Additional sector, industry or geographic detail, if any, is included in the Portfolio of Investments.
For the six months ended August 31, 2022, the Portfolio did not have any transfers into/out of Level 3.
4. TRANSACTIONS WITH AFFILIATES
Advisory fee
The Trust has entered into an advisory contract with Allspring Funds Management, a wholly owned subsidiary of Allspring Global Investments Holdings, LLC, a holding company indirectly owned by certain private funds of GTCR LLC and Reverence Capital Partners, L.P. The adviser is responsible for implementing investment policies and guidelines and for supervising the
Allspring Factor Enhanced International Equity Portfolio | 27
Notes to financial statements (unaudited)
subadviser, who is responsible for day-to-day portfolio management of the Portfolio. Pursuant to the contract, Allspring Funds Management is entitled to receive an advisory fee at the following annual rate based on the Portfolio’s average daily net assets:
| Average daily net assets | Advisory fee |
| First $5 billion | 0.150% |
| Next $5 billion | 0.130 |
| Over $10 billion | 0.110 |
For the six months ended August 31, 2022, the advisory fee was equivalent to an annual rate of 0.15% of the Portfolio’s average daily net assets.
Allspring Funds Management has retained the services of a subadviser to provide daily portfolio management to the Portfolio. The fee for subadvisory services is borne by Allspring Funds Management. Allspring Global Investments, LLC, an affiliate of Allspring Funds Management and a wholly owned subsidiary of Allspring Global Investments Holdings, LLC, is the subadviser to the Portfolio and is entitled to receive a fee from Allspring Funds Management at an annual rate starting at 0.08% and declining to 0.05% as the average daily net assets of the Portfolio increase.
Allspring Funds Management has voluntarily waived and/or reimbursed advisory fees to reduce the net operating expense ratio of the Portfolio. These voluntary waivers may be discontinued at any time.
Interfund transactions
The Portfolio may purchase or sell portfolio investment securities to certain affiliates pursuant to Rule 17a-7 under the 1940 Act and under procedures adopted by the Board of Trustees. The procedures have been designed to ensure that these interfund transactions, which do not incur broker commissions, are effected at current market prices.
5. INVESTMENT PORTFOLIO TRANSACTIONS
Purchases and sales of investments, excluding U.S. government obligations (if any) and short-term securities, for the six months ended August 31, 2022 were $110,061,284 and $214,510,536, respectively.
6. DERIVATIVE TRANSACTIONS
During the six months ended August 31, 2022, the Portfolio entered into futures contracts to gain market exposure. The Portfolio had an average notional amount of $83,861,616 in long futures contracts during the six months ended August 31, 2022.
The fair value, realized gains or losses and change in unrealized gains or losses, if any, on derivative instruments are reflected in the corresponding financial statement captions.
7. BANK BORROWINGS
The Trust, along with Allspring Variable Trust and Allspring Funds Trust (excluding the money market funds), are parties to a $350,000,000 revolving credit agreement whereby the Portfolio is permitted to use bank borrowings for temporary or emergency purposes, such as to fund interest holders withdrawal requests. Interest under the credit agreement is charged to the Portfolio based on a borrowing rate equal to the higher of the Federal Funds rate or the overnight bank funding rate in effect on that day plus a spread. In addition, an annual commitment fee equal based on the unused balance is allocated to each participating fund.
For the six months ended August 31, 2022, there were no borrowings by the Portfolio under the agreement.
8. INDEMNIFICATION
Under the Portfolio's organizational documents, the officers and Trustees have been granted certain indemnification rights against certain liabilities that may arise out of performance of their duties to the Portfolio. The Portfolio has entered into a separate agreement with each Trustee that converts indemnification rights currently existing under the Portfolio’s organizational documents into contractual rights that cannot be changed in the future without the consent of the Trustee. Additionally, in the normal course of business, the Portfolio may enter into contracts with service providers that contain a variety of indemnification clauses. The Portfolio’s maximum exposure under these arrangements is dependent on future claims that may be made against the Portfolio and, therefore, cannot be estimated.
28 | Allspring Factor Enhanced International Equity Portfolio
Notes to financial statements (unaudited)
9. CORONAVIRUS (COVID-19) PANDEMIC
On March 11, 2020, the World Health Organization announced that it had made the assessment that coronavirus disease 2019 (“COVID-19”) is a pandemic. The impacts of COVID-19 are affecting the entire global economy, individual companies and investment products, the funds, and the market in general. There is significant uncertainty around the extent and duration of business disruptions related to COVID-19 and the impacts may last for an extended period of time. COVID-19 has led to significant uncertainty and volatility in the financial markets.
Allspring Factor Enhanced International Equity Portfolio | 29
Other information (unaudited)
PROXY VOTING INFORMATION
A description of the policies and procedures used to determine how to vote proxies relating to portfolio securities is available without charge, upon request, by calling 1-800-222-8222, visiting our website at allspringglobal.com, or visiting the SEC website at sec.gov. Information regarding how the proxies related to portfolio securities were voted during the most recent 12-month period ended June 30 is available on the website at allspringglobal.com or by visiting the SEC website at sec.gov.
QUARTERLY PORTFOLIO HOLDINGS INFORMATION
The Portfolio files its complete schedule of portfolio holdings with the SEC for the first and third quarters of each fiscal year as an exhibit to its reports on Form N-PORT. Interest holders may view the filed Form N-PORT by visiting the SEC website at sec.gov.
30 | Allspring Factor Enhanced International Equity Portfolio
Other information (unaudited)
BOARD OF TRUSTEES AND OFFICERS
Each of the Trustees and Officers listed in the table below acts in identical capacities for each fund in the Allspring family of funds, which consists of 124 mutual funds comprising the Allspring Funds Trust, Allspring Variable Trust, Allspring Master Trust and four closed-end funds (collectively the “Fund Complex”). This table should be read in conjunction with the Prospectus and the Statement of Additional Information1. The mailing address of each Trustee and Officer is 525 Market Street, 12th Floor, San Francisco, CA 94105. Each Trustee and Officer serves an indefinite term, however, each Trustee serves such term until reaching the mandatory retirement age established by the Trustees.
Independent Trustees
Name and
year of birth | Position held and
length of service* | Principal occupations during past five years or longer | Current other
public company or
investment
company
directorships |
William R. Ebsworth
(Born 1957) | Trustee,
since 2015 | Retired. From 1984 to 2013, equities analyst, portfolio manager, research director and chief investment officer at Fidelity Management and Research Company in Boston, Tokyo, and Hong Kong, and retired in 2013 as Chief Investment Officer of Fidelity Strategic Advisers, Inc. where he led a team of investment professionals managing client assets. Prior thereto, Board member of Hong Kong Securities Clearing Co., Hong Kong Options Clearing Corp., the Thailand International Fund, Ltd., Fidelity Investments Life Insurance Company, and Empire Fidelity Investments Life Insurance Company. Audit Committee Chair and Investment Committee Chair of the Vincent Memorial Hospital Endowment (non-profit organization). Mr. Ebsworth is a CFA® charterholder. | N/A |
Jane A. Freeman
(Born 1953) | Trustee,
since 2015;
Chair Liaison,
since 2018 | Retired. From 2012 to 2014 and 1999 to 2008, Chief Financial Officer of Scientific Learning Corporation. From 2008 to 2012, Ms. Freeman provided consulting services related to strategic business projects. Prior to 1999, Portfolio Manager at Rockefeller & Co. and Scudder, Stevens & Clark. Board member of the Harding Loevner Funds from 1996 to 2014, serving as both Lead Independent Director and chair of the Audit Committee. Board member of the Russell Exchange Traded Funds Trust from 2011 to 2012 and the chair of the Audit Committee. Ms. Freeman is also an inactive Chartered Financial Analyst. | N/A |
Isaiah Harris, Jr.
(Born 1952) | Trustee,
since 2009; Audit
Committee
Chair,
since 2019 | Retired. Chairman of the Board of CIGNA Corporation from 2009 to 2021, and Director from 2005 to 2008. From 2003 to 2011, Director of Deluxe Corporation. Prior thereto, President and CEO of BellSouth Advertising and Publishing Corp. from 2005 to 2007, President and CEO of BellSouth Enterprises from 2004 to 2005 and President of BellSouth Consumer Services from 2000 to 2003. Emeritus member of the Iowa State University Foundation Board of Governors. Emeritus Member of the Advisory Board of Iowa State University School of Business. Advisory Board Member, Palm Harbor Academy (private school). Advisory Board Member, Fellowship of Christian Athletes. Mr. Harris is a certified public accountant (inactive status). | N/A |
David F. Larcker
(Born 1950) | Trustee,
since 2009 | James Irvin Miller Professor of Accounting at the Graduate School of Business (Emeritus), Stanford University, Director of the Corporate Governance Research Initiative and Senior Faculty of The Rock Center for Corporate Governance since 2006. From 2005 to 2008, Professor of Accounting at the Graduate School of Business, Stanford University. Prior thereto, Ernst & Young Professor of Accounting at The Wharton School, University of Pennsylvania from 1985 to 2005. | N/A |
Allspring Factor Enhanced International Equity Portfolio | 31
Other information (unaudited)
Name and
year of birth | Position held and
length of service* | Principal occupations during past five years or longer | Current other
public company or
investment
company
directorships |
Olivia S. Mitchell
(Born 1953) | Trustee,
since 2006;
Nominating and
Governance
Committee Chair,
since 2018 | International Foundation of Employee Benefit Plans Professor since 1993, Wharton School of the University of Pennsylvania. Director of Wharton’s Pension Research Council and Boettner Center on Pensions & Retirement Research, and Research Associate at the National Bureau of Economic Research. Previously taught at Cornell University from 1978 to 1993. | N/A |
Timothy J. Penny
(Born 1951) | Trustee,
since 1996;
Chair,
since 2018 | President and Chief Executive Officer of Southern Minnesota Initiative Foundation, a non-profit organization, since 2007. Vice Chair of the Economic Club of Minnesota, since 2007. Co-Chair of the Committee for a Responsible Federal Budget, since 1995. Member of the Board of Trustees of NorthStar Education Finance, Inc., a non-profit organization, since 2007. Senior Fellow of the University of Minnesota Humphrey Institute from 1995 to 2017. | N/A |
James G. Polisson
(Born 1959) | Trustee,
since 2018 | Retired. Chief Marketing Officer, Source (ETF) UK Services, Ltd, from 2015 to 2017. From 2012 to 2015, Principal of The Polisson Group, LLC, a management consulting, corporate advisory and principal investing company. Chief Executive Officer and Managing Director at Russell Investments, Global Exchange Traded Funds from 2010 to 2012. Managing Director of Barclays Global Investors from 1998 to 2010 and Global Chief Marketing Officer for iShares and Barclays Global Investors from 2000 to 2010. Trustee of the San Francisco Mechanics’ Institute, a non-profit organization, from 2013 to 2015. Board member of the Russell Exchange Traded Fund Trust from 2011 to 2012. Director of Barclays Global Investors Holdings Deutschland GmbH from 2006 to 2009. Mr. Polisson is an attorney and has a retired status with the Massachusetts and District of Columbia Bar Associations. | N/A |
Pamela Wheelock
(Born 1959) | Trustee,
since January
2020; previously
Trustee from
January 2018 to
July 2019 | Retired. Executive and Senior Financial leadership positions in the public, private and nonprofit sectors. Interim President and CEO, McKnight Foundation, 2020. Interim Commissioner, Minnesota Department of Human Services, 2019. Chief Operating Officer, Twin Cities Habitat for Humanity, 2017-2019. Vice President for University Services, University of Minnesota, 2012-2016. Interim President and CEO, Blue Cross and Blue Shield of Minnesota, 2011-2012. Executive Vice-President and Chief Financial Officer, Minnesota Wild, 2002-2008. Commissioner, Minnesota Department of Finance, 1999-2002. Chair of the Board of Directors of Destination Medical Center Corporation. Board member of the Minnesota Wild Foundation. | N/A |
* Length of service dates reflect the Trustee’s commencement of service with the Trust’s predecessor entities, where applicable.
32 | Allspring Factor Enhanced International Equity Portfolio
Other information (unaudited)
Officers2
Name and
year of birth | Position held and
length of service | Principal occupations during past five years or longer |
Andrew Owen
(Born 1960) | President,
since 2017 | President, Chief Executive Officer and Director of Allspring Funds Management, LLC since 2017 and co-president of Galliard Capital Management, LLC, an affiliate of Allspring Funds Management, LLC, since 2019. Prior thereto, Head of Affiliated Managers, Allspring Global Investments, from 2014 to 2019 and Executive Vice President responsible for marketing, investments and product development for Allspring Funds Management, LLC, from 2009 to 2014. In addition, Mr. Owen was an Executive Vice President of Wells Fargo & Company from 2014 to 2021. |
Jeremy DePalma
(Born 1974) | Treasurer,
since 2012
(for certain funds in
the Fund Complex);
since 2021 (for
the remaining funds in the
Fund Complex) | Senior Vice President of Allspring Funds Management, LLC since 2009. Senior Vice President of Evergreen Investment Management Company, LLC from 2008 to 2010 and head of the Fund Reporting and Control Team within Fund Administration from 2005 to 2010. |
Kate McKinley
(Born 1977) | Chief Legal Officer,
since 2021 | Chief Legal Officer of Allspring Global Investments since 2021. Prior thereto, held various roles at State Street Global Advisors beginning in 2010, including serving as Senior Vice President and General Counsel from 2019 to 2021, and Chief Operating Officer of the Institutional Client Group from 2016 - 2019. Prior to working at State Street Global Advisors served as Assistant General Counsel for Bank of America Corporation from 2005 to 2010 and as an Associate at WilmerHale from 2002 to 2005. |
Christopher Baker
(Born 1976) | Chief Compliance Officer, since 2022 | Global Chief Compliance Officer for Allspring Global Investments since 2022. Prior thereto, Chief Compliance Officer for State Street Global Advisors from 2018 to 2021. Senior Compliance Officer for the State Street divisions of Alternative Investment Solutions, Sector Solutions, and Global Marketing from 2015 to 2018. From 2010 to 2015 Vice President, Global Head of Investment and Marketing Compliance for State Street Global Advisors. |
Matthew Prasse
(Born 1983) | Secretary,
since 2021 | Senior Counsel of the Allspring Legal Department since 2021. Senior Counsel of the Wells Fargo Legal Department from 2018 to 2021. Previously, Counsel for Barings LLC from 2015 to 2018. Prior to joining Barings, Associate at Morgan, Lewis & Bockius LLP from 2008 to 2015. |
1 The Statement of Additional Information includes additional information about the Trustees and is available, without charge, upon request, by calling 1-800-222-8222.
2 For those Officers with tenures at Allspring Global Investments and/or Allspring Funds Management, LLC that began prior to 2021, such tenures include years of service during which these businesses/entities were known as Wells Fargo Asset Management and Wells Fargo Funds Management, LLC, respectively.
Allspring Factor Enhanced International Equity Portfolio | 33
Other information (unaudited)
LIQUIDITY RISK MANAGEMENT PROGRAM
In accordance with Rule 22e-4 under the Investment Company Act of 1940, as amended (the “Liquidity Rule”), Allspring Master Trust (the “Trust”) has adopted and implemented a liquidity risk management program (the “Program”) on behalf of each of its series, including the Portfolio, which is reasonably designed to assess and manage the Portfolio's liquidity risk. “Liquidity risk” is defined under the Liquidity Rule as the risk that the Portfolio is unable to meet redemption requests without significantly diluting remaining investors’ interests in the Portfolio. The Trust’s Board of Trustees (the “Board”) previously approved the designation of Allspring Funds Management, LLC (“Allspring Funds Management”), the Portfolio's investment adviser, to administer the Program, and Allspring Funds Management has established a Liquidity Risk Management Council (the "Council") composed of personnel from multiple departments within Allspring Funds Management and its affiliates to assist Allspring Funds Management in the administration of the Program.
The Program is comprised of various components designed to support the assessment and/or management of liquidity risk, including: (1) the periodic assessment (no less frequently than annually) of certain factors that influence the Portfolio's liquidity risk; (2) the periodic classification (no less frequently than monthly) of the Portfolio's investments into one of four liquidity categories that reflect an estimate of their liquidity under current market conditions; (3) a 15% limit on the acquisition of “illiquid investments” (as defined under the Liquidity Rule); (4) to the extent the Portfolio does not invest primarily in “highly liquid investments” (as defined under the Liquidity Rule), the determination of a minimum percentage of the Portfolio's assets that generally will be invested in highly liquid investments (an “HLIM”); (5) if the Portfolio has established an HLIM, the periodic review (no less frequently than annually) of the HLIM and the adoption of policies and procedures for responding to a shortfall of the Portfolio's “highly liquid investments” below its HLIM; and (6) periodic reporting to the Board.
At a meeting of the Board held on May 24-25, 2022, the Board received and reviewed a written report (the “Report”) from Allspring Funds Management that, among other things, addressed the operation of the Program and assessed its adequacy and effectiveness for the period from January 1, 2021 through December 31, 2021 (the “Reporting Period”). Other than extended foreign market holidays, no significant liquidity events impacting the Portfolios were noted in the Report. In addition, other than corporate-related changes to the Program, there were no material changes to the Program during the Reporting Period.
Allspring Funds Management determined in the Report that the Program has been implemented and operates effectively to manage the Portfolio’s liquidity risk, and Allspring Funds Management continues to believe that the Program has been and continues to be adequately and effectively implemented to monitor and, as applicable, respond to the Portfolio’s liquidity developments.
There can be no assurance that the Program will achieve its objectives under all circumstances in the future.
34 | Allspring Factor Enhanced International Equity Portfolio
For more information
More information about Allspring Funds is available free upon request. To obtain literature, please write, visit the Portfolio's website, or call:
Allspring Funds
P.O. Box 219967
Kansas City, MO 64121-9967
Website: allspringglobal.com
Individual investors: 1-800-222-8222
Retail investment professionals: 1-888-877-9275
Institutional investment professionals: 1-800-260-5969
This report and the financial statements contained herein are submitted for the general information of the interest holders of the Portfolio. If this report is used for promotional purposes, distribution of the report must be accompanied or preceded by a current prospectus. Before investing, please consider the investment objectives, risks, charges, and expenses of the investment. For a current prospectus and, if available, a summary prospectus, containing this information, call
1-800-222-8222. Read the prospectus carefully before you invest or send money.
Allspring Global InvestmentsTM is the trade name for the asset management firms of Allspring Global Investments Holdings, LLC, a holding company indirectly owned by certain private funds of GTCR LLC and Reverence Capital Partners, L.P. These firms include but are not limited to Allspring Global Investments, LLC, and Allspring Funds Management, LLC. Certain products managed by Allspring entities are distributed by Allspring Funds Distributor, LLC (a broker-dealer and Member FINRA/SIPC).
This material is for general informational and educational purposes only and is NOT intended to provide investment advice or a recommendation of any kind - including a recommendation for any specific investment, strategy, or plan.
© 2022 Allspring Global Investments Holdings, LLC. All rights reserved.
Semi-Annual Report
August 31, 2022
Allspring Factor Enhanced U.S. Large Cap Equity Portfolio
Allspring Factor Enhanced U.S. Large Cap Equity Portfolio | 1
Portfolio information (unaudited)
Investment objectiveThe Portfolio seeks long-term capital appreciation.
| Adviser | Allspring Funds Management, LLC |
| Subadviser | Allspring Global Investments, LLC |
| Portfolio managers | Harindra de Silva, Ph.D., CFA®‡, Monisha Jayakumar |
| Ten largest holdings (%) as of August 31, 20221 |
| Apple Incorporated | 6.01 |
| Microsoft Corporation | 5.02 |
| Amazon.com Incorporated | 2.83 |
| Alphabet Incorporated Class A | 1.70 |
| Tesla Motors Incorporated | 1.70 |
| Alphabet Incorporated Class C | 1.56 |
| Berkshire Hathaway Incorporated Class B | 1.34 |
| UnitedHealth Group Incorporated | 1.17 |
| Exxon Mobil Corporation | 1.08 |
| Johnson & Johnson | 1.04 |
| 1 | Figures represent the percentage of the Portfolio's net assets. Holdings are subject to change and may have changed since the date specified. |
| Sector allocation as of August 31, 20221 |
| 1 | Figures represent the percentage of the Portfolio's long-term investments. Allocations are subject to change and may have changed since the date specified. |
| ‡ | CFA® and Chartered Financial Analyst® are trademarks owned by CFA Institute. |
2 | Allspring Factor Enhanced U.S. Large Cap Equity Portfolio
Portfolio of investments—August 31, 2022 (unaudited)
| | | | | Shares | Value |
| Common stocks: 95.95% | | | | | |
| Communication services: 7.54% | | | | | |
| Diversified telecommunication services: 0.79% | | | | | |
| AT&T Incorporated | | | | 81,507 | $ 1,429,633 |
| Lumen Technologies Incorporated | | | | 54,302 | 540,848 |
| Verizon Communications Incorporated | | | | 42,588 | 1,780,604 |
| | | | | | 3,751,085 |
| Entertainment: 1.31% | | | | | |
| Electronic Arts Incorporated | | | | 3,356 | 425,776 |
| Live Nation Entertainment Incorporated † | | | | 3,394 | 306,682 |
| Netflix Incorporated † | | | | 5,170 | 1,155,805 |
| Playtika Holding Corporation | | | | 13,390 | 140,997 |
| Spotify Technology SA † | | | | 1,188 | 128,482 |
| Take-Two Interactive Software Incorporated † | | | | 1,932 | 236,786 |
| The Madison Square Garden Company Class A | | | | 1,274 | 204,184 |
| The Walt Disney Company † | | | | 18,330 | 2,054,426 |
| Warner Bros. Discovery Incorporated † | | | | 7,460 | 98,770 |
| World Wrestling Entertainment Incorporated Class A | | | | 22,315 | 1,517,643 |
| | | | | | 6,269,551 |
| Interactive media & services: 4.39% | | | | | |
| Alphabet Incorporated Class A † | | | | 75,134 | 8,131,001 |
| Alphabet Incorporated Class C † | | | | 68,416 | 7,467,606 |
| IAC/InterActiveCorp | | | | 702 | 45,118 |
| Match Group Incorporated † | | | | 1,307 | 73,885 |
| Meta Platforms Incorporated Class A † | | | | 28,140 | 4,584,850 |
| Pinterest Incorporated Class A † | | | | 3,057 | 70,433 |
| TripAdvisor Incorporated † | | | | 12,871 | 306,330 |
| Zillow Group Incorporated Class A | | | | 5,648 | 188,643 |
| Zillow Group Incorporated Class C | | | | 3,475 | 116,274 |
| | | | | | 20,984,140 |
| Media: 0.83% | | | | | |
| Altice USA Incorporated | | | | 10,375 | 103,750 |
| Charter Communications Incorporated Class A † | | | | 1,000 | 412,630 |
| Comcast Corporation Class A | | | | 42,655 | 1,543,684 |
| Fox Corporation Class A | | | | 6,564 | 224,358 |
| Interpublic Group of Companies Incorporated | | | | 705 | 19,486 |
| Nexstar Media Group Incorporated Class A | | | | 4,768 | 912,214 |
| Omnicom Group Incorporated | | | | 5,746 | 384,407 |
| Sirius XM Holdings Incorporated | | | | 46,760 | 284,768 |
| ViacomCBS Incorporated Class A | | | | 3,815 | 100,792 |
| | | | | | 3,986,089 |
| Wireless telecommunication services: 0.22% | | | | | |
| T-Mobile US Incorporated † | | | | 7,408 | 1,066,456 |
| Consumer discretionary: 12.02% | | | | | |
| Auto components: 0.32% | | | | | |
| Aptiv plc † | | | | 3,166 | 295,799 |
| BorgWarner Incorporated | | | | 7,776 | 293,155 |
The accompanying notes are an integral part of these financial statements.
Allspring Factor Enhanced U.S. Large Cap Equity Portfolio | 3
Portfolio of investments—August 31, 2022 (unaudited)
| | | | | Shares | Value |
| Auto components (continued) | | | | | |
| Gentex Corporation | | | | 2,865 | $ 78,186 |
| Lear Corporation | | | | 6,050 | 838,772 |
| | | | | | 1,505,912 |
| Automobiles: 2.74% | | | | | |
| Ford Motor Company | | | | 120,713 | 1,839,666 |
| General Motors Company | | | | 31,917 | 1,219,549 |
| Harley-Davidson Incorporated | | | | 31,457 | 1,213,296 |
| Tesla Motors Incorporated † | | | | 29,439 | 8,113,683 |
| Thor Industries Incorporated | | | | 8,963 | 726,093 |
| | | | | | 13,112,287 |
| Distributors: 0.08% | | | | | |
| Genuine Parts Company | | | | 1,439 | 224,498 |
| LKQ Corporation | | | | 3,097 | 164,822 |
| | | | | | 389,320 |
| Diversified consumer services: 0.26% | | | | | |
| Grand Canyon Education Incorporated † | | | | 2,257 | 183,675 |
| H&R Block Incorporated | | | | 23,796 | 1,070,820 |
| | | | | | 1,254,495 |
| Hotels, restaurants & leisure: 2.33% | | | | | |
| Aramark | | | | 27,327 | 975,847 |
| Booking Holdings Incorporated † | | | | 256 | 480,207 |
| Boyd Gaming Corporation | | | | 14,735 | 802,026 |
| Chipotle Mexican Grill Incorporated † | | | | 85 | 135,728 |
| Choice Hotels International Incorporated | | | | 5,679 | 651,438 |
| Churchill Downs Incorporated | | | | 433 | 85,340 |
| Darden Restaurants Incorporated | | | | 2,263 | 279,956 |
| Domino's Pizza Incorporated | | | | 1,834 | 681,991 |
| Expedia Group Incorporated † | | | | 1,189 | 122,051 |
| Hilton Worldwide Holdings Incorporated | | | | 4,213 | 536,568 |
| Marriott International Incorporated Class A | | | | 4,487 | 689,831 |
| Marriott Vacations Worldwide Corporation | | | | 425 | 60,529 |
| McDonald's Corporation | | | | 8,071 | 2,036,152 |
| Six Flags Entertainment Corporation | | | | 6,304 | 139,634 |
| Starbucks Corporation | | | | 11,540 | 970,168 |
| The Wendy's Company | | | | 2,161 | 41,448 |
| Travel Leisure Company | | | | 20,873 | 885,015 |
| Wyndham Hotels & Resorts Incorporated | | | | 8,625 | 563,558 |
| Yum! Brands Incorporated | | | | 9,233 | 1,027,079 |
| | | | | | 11,164,566 |
| Household durables: 0.14% | | | | | |
| D.R. Horton Incorporated | | | | 512 | 36,429 |
| Newell Rubbermaid Incorporated | | | | 357 | 6,372 |
| PulteGroup Incorporated | | | | 3,832 | 155,809 |
| Toll Brothers Incorporated | | | | 5,903 | 258,492 |
| Whirlpool Corporation | | | | 1,332 | 208,591 |
| | | | | | 665,693 |
| Internet & direct marketing retail: 3.01% | | | | | |
| Amazon.com Incorporated † | | | | 106,734 | 13,530,669 |
| eBay Incorporated | | | | 7,089 | 312,838 |
The accompanying notes are an integral part of these financial statements.
4 | Allspring Factor Enhanced U.S. Large Cap Equity Portfolio
Portfolio of investments—August 31, 2022 (unaudited)
| | | | | Shares | Value |
| Internet & direct marketing retail (continued) | | | | | |
| Etsy Incorporated † | | | | 1,507 | $ 159,154 |
| Wayfair Incorporated Class A | | | | 7,796 | 410,927 |
| | | | | | 14,413,588 |
| Leisure products: 0.21% | | | | | |
| Hasbro Incorporated | | | | 4,125 | 325,133 |
| Mattel Incorporated | | | | 13,932 | 308,176 |
| Polaris Industries Incorporated | | | | 3,161 | 358,046 |
| | | | | | 991,355 |
| Multiline retail: 0.32% | | | | | |
| Dollar General Corporation | | | | 779 | 184,950 |
| Dollar Tree Incorporated † | | | | 1,223 | 165,937 |
| Kohl's Corporation | | | | 1,579 | 44,875 |
| Macy's Incorporated | | | | 40,835 | 707,262 |
| Nordstrom Incorporated | | | | 11,047 | 189,014 |
| Target Corporation | | | | 1,519 | 243,556 |
| | | | | | 1,535,594 |
| Specialty retail: 2.37% | | | | | |
| AutoNation Incorporated † | | | | 11,578 | 1,442,619 |
| AutoZone Incorporated † | | | | 220 | 466,226 |
| Bath & Body Works Incorporated | | | | 2,917 | 108,892 |
| Best Buy Company Incorporated | | | | 2,401 | 169,727 |
| Dick's Sporting Goods Incorporated | | | | 2,447 | 260,287 |
| Lithia Motors Incorporated Class A | | | | 412 | 109,361 |
| Lowe's Companies Incorporated | | | | 7,853 | 1,524,581 |
| O'Reilly Automotive Incorporated † | | | | 598 | 416,878 |
| Penske Auto Group Incorporated | | | | 7,726 | 910,973 |
| Petco Health & Wellness Company † | | | | 1,900 | 28,348 |
| The Home Depot Incorporated | | | | 10,906 | 3,145,509 |
| The TJX Companies Incorporated | | | | 12,001 | 748,262 |
| Tractor Supply Company | | | | 1,371 | 253,841 |
| Ulta Beauty Incorporated † | | | | 1,340 | 562,626 |
| Victoria's Secret Corporation | | | | 21,950 | 734,008 |
| Williams-Sonoma Incorporated | | | | 3,180 | 473,025 |
| | | | | | 11,355,163 |
| Textiles, apparel & luxury goods: 0.24% | | | | | |
| Capri Holdings Limited | | | | 5,166 | 243,732 |
| Carter's Incorporated | | | | 472 | 34,857 |
| HanesBrands Incorporated | | | | 18,685 | 162,746 |
| Nike Incorporated Class B | | | | 5,066 | 539,276 |
| PVH Corporation | | | | 797 | 44,831 |
| Under Armour Incorporated Class A † | | | | 9,323 | 78,500 |
| Under Armour Incorporated Class C | | | | 2,650 | 20,114 |
| | | | | | 1,124,056 |
| Consumer staples: 6.30% | | | | | |
| Beverages: 1.53% | | | | | |
| Brown-Forman Corporation Class A | | | | 312 | 22,018 |
| Brown-Forman Corporation Class B | | | | 1,542 | 112,103 |
| Constellation Brands Incorporated Class A | | | | 1,809 | 445,104 |
| Keurig Dr. Pepper Incorporated | | | | 4,744 | 180,841 |
The accompanying notes are an integral part of these financial statements.
Allspring Factor Enhanced U.S. Large Cap Equity Portfolio | 5
Portfolio of investments—August 31, 2022 (unaudited)
| | | | | Shares | Value |
| Beverages (continued) | | | | | |
| Molson Coors Brewing Company Class B | | | | 12,090 | $ 624,690 |
| PepsiCo Incorporated | | | | 18,242 | 3,142,549 |
| The Coca-Cola Company | | | | 45,319 | 2,796,635 |
| | | | | | 7,323,940 |
| Food & staples retailing: 1.48% | | | | | |
| Albertsons Companies LLC | | | | 20,106 | 553,116 |
| BJ's Wholesale Club Holdings Incorporated | | | | 8,117 | 604,635 |
| Costco Wholesale Corporation | | | | 4,510 | 2,354,671 |
| Sysco Corporation | | | | 7,922 | 651,347 |
| The Kroger Company | | | | 18,544 | 888,999 |
| US Foods Holding Corporation | | | | 2,792 | 85,491 |
| Walgreens Boots Alliance Incorporated | | | | 2,228 | 78,114 |
| Walmart Incorporated | | | | 14,231 | 1,886,319 |
| | | | | | 7,102,692 |
| Food products: 1.37% | | | | | |
| Archer Daniels Midland Company | | | | 9,704 | 852,885 |
| Bunge Limited | | | | 8,569 | 849,788 |
| Campbell Soup Company | | | | 10,462 | 527,076 |
| ConAgra Foods Incorporated | | | | 4,517 | 155,294 |
| Flowers Foods Incorporated | | | | 25,331 | 691,536 |
| General Mills Incorporated | | | | 10,402 | 798,874 |
| Ingredion Incorporated | | | | 2,216 | 192,947 |
| Kellogg Company | | | | 4,191 | 304,853 |
| Lamb Weston Holdings Incorporated | | | | 1,494 | 118,818 |
| Mondelez International Incorporated Class A | | | | 5,488 | 339,488 |
| Pilgrim's Pride Corporation † | | | | 18,037 | 513,513 |
| The Hershey Company | | | | 1,125 | 252,754 |
| The J.M. Smucker Company | | | | 894 | 125,151 |
| Tyson Foods Incorporated Class A | | | | 10,703 | 806,792 |
| | | | | | 6,529,769 |
| Household products: 1.16% | | | | | |
| Church & Dwight Company Incorporated | | | | 557 | 46,626 |
| Colgate-Palmolive Company | | | | 10,816 | 845,919 |
| Kimberly-Clark Corporation | | | | 4,505 | 574,478 |
| Reynolds Consumer Products Incorporated | | | | 14,303 | 399,483 |
| The Clorox Company | | | | 260 | 37,528 |
| The Procter & Gamble Company | | | | 26,525 | 3,658,859 |
| | | | | | 5,562,893 |
| Personal products: 0.21% | | | | | |
| Coty Incorporated Class A | | | | 78,901 | 592,547 |
| The Estee Lauder Companies Incorporated Class A | | | | 1,552 | 394,798 |
| | | | | | 987,345 |
| Tobacco: 0.55% | | | | | |
| Altria Group Incorporated | | | | 27,364 | 1,234,664 |
| Philip Morris International Incorporated | | | | 14,736 | 1,407,141 |
| | | | | | 2,641,805 |
The accompanying notes are an integral part of these financial statements.
6 | Allspring Factor Enhanced U.S. Large Cap Equity Portfolio
Portfolio of investments—August 31, 2022 (unaudited)
| | | | | Shares | Value |
| Energy: 4.30% | | | | | |
| Energy equipment & services: 0.13% | | | | | |
| Baker Hughes Incorporated | | | | 7,031 | $ 177,603 |
| Schlumberger Limited | | | | 11,518 | 439,412 |
| | | | | | 617,015 |
| Oil, gas & consumable fuels: 4.17% | | | | | |
| Antero Resources Corporation | | | | 6,735 | 269,939 |
| APA Corporation | | | | 23,446 | 916,973 |
| Cheniere Energy Incorporated | | | | 5,457 | 874,102 |
| Chevron Corporation | | | | 22,123 | 3,496,761 |
| ConocoPhillips | | | | 9,784 | 1,070,859 |
| Devon Energy Corporation | | | | 3,553 | 250,913 |
| EOG Resources Incorporated | | | | 7,255 | 880,032 |
| Exxon Mobil Corporation | | | | 54,026 | 5,164,345 |
| HF Sinclair Corporation | | | | 1,844 | 97,050 |
| Marathon Oil Corporation | | | | 20,580 | 526,642 |
| Marathon Petroleum Corporation | | | | 10,040 | 1,011,530 |
| Occidental Petroleum Corporation | | | | 13,759 | 976,889 |
| Ovintiv Incorporated | | | | 23,064 | 1,225,621 |
| Phillips 66 | | | | 10,699 | 957,133 |
| Targa Resources Corporation | | | | 16,245 | 1,108,396 |
| Valero Energy Corporation | | | | 9,803 | 1,148,127 |
| | | | | | 19,975,312 |
| Financials: 8.91% | | | | | |
| Banks: 2.48% | | | | | |
| Bank of America Corporation | | | | 69,372 | 2,331,593 |
| Bank OZK | | | | 13,374 | 542,048 |
| BOK Financial Corporation | | | | 806 | 71,629 |
| Citigroup Incorporated | | | | 16,014 | 781,643 |
| Citizens Financial Group Incorporated | | | | 4,974 | 182,446 |
| Comerica Incorporated | | | | 3,455 | 277,437 |
| Fifth Third Bancorp | | | | 11,697 | 399,453 |
| FNB Corporation | | | | 15,658 | 186,643 |
| JPMorgan Chase & Company | | | | 29,597 | 3,366,067 |
| KeyCorp | | | | 10,073 | 178,191 |
| M&T Bank Corporation | | | | 3,209 | 583,332 |
| PNC Financial Services Group Incorporated | | | | 1,786 | 282,188 |
| Popular Incorporated | | | | 6,662 | 514,440 |
| Regions Financial Corporation | | | | 12,396 | 268,621 |
| Synovus Financial Corporation | | | | 5,751 | 230,960 |
| Truist Financial Corporation | | | | 13,217 | 619,084 |
| US Bancorp | | | | 11,693 | 533,318 |
| Wintrust Financial Corporation | | | | 4,008 | 338,035 |
| Zions Bancorporation | | | | 3,484 | 191,725 |
| | | | | | 11,878,853 |
| Capital markets: 2.67% | | | | | |
| Affiliated Managers Group Incorporated | | | | 4,268 | 543,572 |
| Ameriprise Financial Incorporated | | | | 1,780 | 477,058 |
| Bank of New York Mellon Corporation | | | | 9,278 | 385,315 |
| BlackRock Incorporated | | | | 1,790 | 1,192,838 |
| Blue Owl Capital Incorporated | | | | 8,874 | 98,501 |
| Cboe Global Markets Incorporated | | | | 3,482 | 410,772 |
The accompanying notes are an integral part of these financial statements.
Allspring Factor Enhanced U.S. Large Cap Equity Portfolio | 7
Portfolio of investments—August 31, 2022 (unaudited)
| | | | | Shares | Value |
| Capital markets (continued) | | | | | |
| Evercore Partners Incorporated Class A | | | | 3,490 | $ 326,978 |
| FactSet Research Systems Incorporated | | | | 1,495 | 647,843 |
| Franklin Resources Incorporated | | | | 11,120 | 289,898 |
| Intercontinental Exchange Incorporated | | | | 1,226 | 123,642 |
| Invesco Limited | | | | 4,484 | 73,851 |
| Janus Henderson Group plc | | | | 1,692 | 39,593 |
| Jefferies Financial Group Incorporated | | | | 11,469 | 368,040 |
| LPL Financial Holdings Incorporated | | | | 6,483 | 1,434,882 |
| Moody's Corporation | | | | 90 | 25,607 |
| Morgan Stanley | | | | 9,631 | 820,754 |
| Morningstar Incorporated | | | | 1,989 | 453,472 |
| Northern Trust Corporation | | | | 469 | 44,597 |
| Raymond James Financial Incorporated | | | | 4,112 | 429,169 |
| S&P Global Incorporated | | | | 1,272 | 447,973 |
| SEI Investments Company | | | | 1,253 | 68,539 |
| State Street Corporation | | | | 2,492 | 170,328 |
| Stifel Financial Corporation | | | | 3,286 | 194,893 |
| T. Rowe Price Group Incorporated | | | | 2,711 | 325,320 |
| The Blackstone Group Incorporated Class A | | | | 8,334 | 782,896 |
| The Carlyle Group Incorporated | | | | 2,512 | 81,715 |
| The Charles Schwab Corporation | | | | 8,602 | 610,312 |
| The Goldman Sachs Group Incorporated | | | | 2,564 | 852,966 |
| Virtu Financial Incorporated Class A | | | | 46,538 | 1,068,512 |
| | | | | | 12,789,836 |
| Consumer finance: 0.49% | | | | | |
| Ally Financial Incorporated | | | | 2,714 | 90,105 |
| American Express Company | | | | 5,104 | 775,808 |
| Credit Acceptance Corporation | | | | 692 | 368,199 |
| Discover Financial Services | | | | 2,472 | 248,411 |
| SLM Corporation | | | | 41,377 | 632,241 |
| Synchrony Financial | | | | 5,368 | 175,802 |
| Upstart Holdings Incorporated | | | | 1,037 | 26,858 |
| | | | | | 2,317,424 |
| Diversified financial services: 1.51% | | | | | |
| Apollo Global Management Incorporated | | | | 1,105 | 61,416 |
| Berkshire Hathaway Incorporated Class B † | | | | 22,785 | 6,398,028 |
| Equitable Holdings Incorporated | | | | 2,553 | 75,952 |
| Voya Financial Incorporated | | | | 10,827 | 666,185 |
| | | | | | 7,201,581 |
| Insurance: 1.68% | | | | | |
| AFLAC Incorporated | | | | 3,826 | 227,341 |
| American Financial Group Incorporated | | | | 6,643 | 848,178 |
| American International Group Incorporated | | | | 3,608 | 186,714 |
| Aon plc Class A | | | | 1,035 | 289,034 |
| Arch Capital Group Limited † | | | | 892 | 40,782 |
| Assurant Incorporated | | | | 4,529 | 717,801 |
| Axis Capital Holdings Limited | | | | 7,549 | 401,229 |
| Chubb Limited | | | | 3,357 | 634,641 |
| Erie Indemnity Company Class A | | | | 302 | 64,909 |
| Everest Reinsurance Group Limited | | | | 904 | 243,221 |
| Marsh & McLennan Companies Incorporated | | | | 4,455 | 718,903 |
| MetLife Incorporated | | | | 6,368 | 409,653 |
The accompanying notes are an integral part of these financial statements.
8 | Allspring Factor Enhanced U.S. Large Cap Equity Portfolio
Portfolio of investments—August 31, 2022 (unaudited)
| | | | | Shares | Value |
| Insurance (continued) | | | | | |
| Old Republic International Corporation | | | | 1,062 | $ 23,194 |
| Progressive Corporation | | | | 6,852 | 840,398 |
| Prudential Financial Incorporated | | | | 931 | 89,143 |
| RenaissanceRe Holdings Limited | | | | 1,167 | 157,848 |
| The Allstate Corporation | | | | 3,126 | 376,683 |
| The Hanover Insurance Group Incorporated | | | | 432 | 55,896 |
| The Hartford Financial Services Group Incorporated | | | | 3,972 | 255,439 |
| The Travelers Companies Incorporated | | | | 2,874 | 464,553 |
| UnumProvident Corporation | | | | 14,030 | 531,036 |
| W.R. Berkley Corporation | | | | 5,184 | 335,923 |
| Willis Towers Watson plc | | | | 661 | 136,715 |
| | | | | | 8,049,234 |
| Mortgage REITs: 0.05% | | | | | |
| AGNC Investment Corporation | | | | 16,803 | 200,796 |
| New Residential Investment Corporation | | | | 5,261 | 49,611 |
| | | | | | 250,407 |
| Thrifts & mortgage finance: 0.03% | | | | | |
| Rocket Companies Incorporated Class A | | | | 2,269 | 17,925 |
| UWM Holdings Corporation | | | | 29,119 | 105,411 |
| | | | | | 123,336 |
| Health care: 13.91% | | | | | |
| Biotechnology: 2.69% | | | | | |
| AbbVie Incorporated | | | | 28,064 | 3,773,485 |
| Amgen Incorporated | | | | 9,662 | 2,321,779 |
| Biogen Incorporated | | | | 2,148 | 419,676 |
| BioMarin Pharmaceutical Incorporated | | | | 4,492 | 400,686 |
| Exelixis Incorporated † | | | | 23,192 | 411,426 |
| Gilead Sciences Incorporated | | | | 23,275 | 1,477,264 |
| Horizon Therapeutics plc † | | | | 1,427 | 84,493 |
| Incyte Corporation | | | | 2,214 | 155,932 |
| Ionis Pharmaceuticals Incorporated † | | | | 5,346 | 227,312 |
| Moderna Incorporated † | | | | 4,200 | 555,534 |
| Novavax Incorporated | | | | 17,243 | 569,709 |
| Regeneron Pharmaceuticals Incorporated † | | | | 1,533 | 890,765 |
| United Therapeutics Corporation † | | | | 1,949 | 441,682 |
| Vertex Pharmaceuticals Incorporated † | | | | 4,034 | 1,136,620 |
| | | | | | 12,866,363 |
| Health care equipment & supplies: 2.42% | | | | | |
| Abbott Laboratories | | | | 23,188 | 2,380,248 |
| Baxter International Incorporated | | | | 6,252 | 359,240 |
| Becton Dickinson & Company | | | | 4,396 | 1,109,638 |
| Boston Scientific Corporation † | | | | 15,218 | 613,438 |
| Dentsply Sirona Incorporated | | | | 9,584 | 314,068 |
| DexCom Incorporated † | | | | 1,142 | 93,884 |
| Edwards Lifesciences Corporation † | | | | 5,671 | 510,957 |
| Envista Holdings Corporation | | | | 16,239 | 602,305 |
| Globus Medical Incorporated Class A † | | | | 1,235 | 73,100 |
| Hologic Incorporated † | | | | 6,119 | 413,400 |
| ICU Medical Incorporated † | | | | 2,513 | 399,567 |
| IDEXX Laboratories Incorporated † | | | | 1,007 | 350,053 |
The accompanying notes are an integral part of these financial statements.
Allspring Factor Enhanced U.S. Large Cap Equity Portfolio | 9
Portfolio of investments—August 31, 2022 (unaudited)
| | | | | Shares | Value |
| Health care equipment & supplies (continued) | | | | | |
| Integra LifeSciences Holdings Corporation | | | | 5,324 | $ 254,008 |
| Intuitive Surgical Incorporated † | | | | 1,477 | 303,878 |
| Masimo Corporation † | | | | 2,650 | 389,259 |
| Medtronic plc | | | | 14,277 | 1,255,234 |
| Quidlelothro Corporation | | | | 616 | 48,824 |
| ResMed Incorporated | | | | 2,206 | 485,144 |
| Stryker Corporation | | | | 3,957 | 811,976 |
| Tandem Diabetes Care Incorporated | | | | 505 | 23,099 |
| Teleflex Incorporated | | | | 1,753 | 396,634 |
| Zimmer Biomet Holdings Incorporated | | | | 3,791 | 403,059 |
| | | | | | 11,591,013 |
| Health care providers & services: 2.98% | | | | | |
| Acadia Healthcare Company Incorporated | | | | 692 | 56,696 |
| Centene Corporation † | | | | 9,436 | 846,787 |
| Chemed Corporation | | | | 913 | 434,761 |
| Cigna Corporation | | | | 4,922 | 1,395,141 |
| CVS Health Corporation | | | | 25,726 | 2,525,007 |
| DaVita HealthCare Partners Incorporated † | | | | 693 | �� 59,106 |
| Elevance Health Incorporated | | | | 3,172 | 1,538,769 |
| HCA Healthcare Incorporated | | | | 728 | 144,049 |
| Henry Schein Incorporated † | | | | 1,646 | 120,833 |
| Humana Incorporated | | | | 1,478 | 712,071 |
| Molina Healthcare Incorporated † | | | | 1,029 | 347,154 |
| Quest Diagnostics Incorporated | | | | 2,300 | 288,213 |
| Tenet Healthcare Corporation | | | | 3,450 | 194,925 |
| UnitedHealth Group Incorporated | | | | 10,804 | 5,610,841 |
| | | | | | 14,274,353 |
| Health care technology: 0.11% | | | | | |
| Certara Incorporated | | | | 5,017 | 78,616 |
| Definitive Healthcare Corporation | | | | 17,004 | 341,440 |
| Veeva Systems Incorporated Class A † | | | | 392 | 78,133 |
| | | | | | 498,189 |
| Life sciences tools & services: 1.96% | | | | | |
| Agilent Technologies Incorporated | | | | 4,828 | 619,191 |
| Avantor Incorporated † | | | | 7,334 | 182,690 |
| Bruker Corporation | | | | 3,618 | 202,608 |
| Charles River Laboratories International Incorporated † | | | | 384 | 78,816 |
| Danaher Corporation | | | | 7,324 | 1,976,821 |
| IQVIA Holdings Incorporated † | | | | 4,309 | 916,352 |
| Mettler-Toledo International Incorporated † | | | | 448 | 543,182 |
| PerkinElmer Incorporated | | | | 2,565 | 346,429 |
| QIAGEN NV † | | | | 9,599 | 436,083 |
| Syneos Health Incorporated † | | | | 9,957 | 598,515 |
| Thermo Fisher Scientific Incorporated | | | | 4,790 | 2,612,083 |
| Waters Corporation † | | | | 2,026 | 604,964 |
| West Pharmaceutical Services Incorporated | | | | 896 | 265,834 |
| | | | | | 9,383,568 |
| Pharmaceuticals: 3.75% | | | | | |
| Bristol-Myers Squibb Company | | | | 34,876 | 2,350,991 |
| Eli Lilly & Company | | | | 10,263 | 3,091,523 |
| Johnson & Johnson | | | | 30,776 | 4,965,400 |
The accompanying notes are an integral part of these financial statements.
10 | Allspring Factor Enhanced U.S. Large Cap Equity Portfolio
Portfolio of investments—August 31, 2022 (unaudited)
| | | | | Shares | Value |
| Pharmaceuticals (continued) | | | | | |
| Merck & Company Incorporated | | | | 31,157 | $ 2,659,562 |
| Organon & Company | | | | 17,594 | 501,957 |
| Perrigo Company plc | | | | 1,626 | 60,845 |
| Pfizer Incorporated | | | | 72,373 | 3,273,431 |
| Viatris Incorporated | | | | 43,689 | 417,230 |
| Zoetis Incorporated | | | | 3,930 | 615,163 |
| | | | | | 17,936,102 |
| Industrials: 8.26% | | | | | |
| Aerospace & defense: 1.61% | | | | | |
| BWX Technologies Incorporated | | | | 2,384 | 124,278 |
| Curtiss-Wright Corporation | | | | 1,042 | 153,372 |
| General Dynamics Corporation | | | | 4,590 | 1,050,789 |
| Howmet Aerospace Incorporated | | | | 14,419 | 510,865 |
| Huntington Ingalls Industries Incorporated | | | | 1,192 | 274,470 |
| L3Harris Technologies Incorporated | | | | 3,501 | 798,893 |
| Lockheed Martin Corporation | | | | 3,511 | 1,475,006 |
| Northrop Grumman Corporation | | | | 3,162 | 1,511,404 |
| Raytheon Technologies Corporation | | | | 17,248 | 1,548,008 |
| The Boeing Company † | | | | 1,527 | 244,702 |
| | | | | | 7,691,787 |
| Air freight & logistics: 0.68% | | | | | |
| C.H. Robinson Worldwide Incorporated | | | | 6,083 | 694,374 |
| FedEx Corporation | | | | 1,983 | 418,036 |
| GXO Logistics Incorporated † | | | | 1,266 | 56,185 |
| United Parcel Service Incorporated Class B | | | | 8,057 | 1,567,167 |
| XPO Logistics Incorporated | | | | 9,801 | 513,768 |
| | | | | | 3,249,530 |
| Airlines: 0.10% | | | | | |
| Copa Holdings SA Class A † | | | | 2,995 | 213,244 |
| Delta Air Lines Incorporated † | | | | 8,975 | 278,853 |
| | | | | | 492,097 |
| Building products: 0.39% | | | | | |
| A.O. Smith Corporation | | | | 1,572 | 88,739 |
| Builders FirstSource Incorporated † | | | | 7,145 | 418,768 |
| Carlisle Companies Incorporated | | | | 619 | 183,014 |
| Carrier Global Corporation | | | | 3,359 | 131,404 |
| Johnson Controls International plc | | | | 8,122 | 439,725 |
| Masco Corporation | | | | 2,792 | 142,029 |
| Owens Corning Incorporated | | | | 2,922 | 238,815 |
| Trane Technologies plc | | | | 1,465 | 225,713 |
| | | | | | 1,868,207 |
| Commercial services & supplies: 0.56% | | | | | |
| Cintas Corporation | | | | 1,446 | 588,291 |
| Clean Harbors Incorporated | | | | 1,960 | 230,143 |
| Republic Services Incorporated | | | | 5,263 | 751,135 |
| Rollins Incorporated | | | | 3,566 | 120,388 |
| Tetra Tech Incorporated | | | | 876 | 118,970 |
| Waste Management Incorporated | | | | 5,225 | 883,182 |
| | | | | | 2,692,109 |
The accompanying notes are an integral part of these financial statements.
Allspring Factor Enhanced U.S. Large Cap Equity Portfolio | 11
Portfolio of investments—August 31, 2022 (unaudited)
| | | | | Shares | Value |
| Construction & engineering: 0.14% | | | | | |
| AECOM Technology Corporation | | | | 8,468 | $ 619,434 |
| Quanta Services Incorporated | | | | 385 | 54,401 |
| | | | | | 673,835 |
| Electrical equipment: 0.82% | | | | | |
| Acuity Brands Incorporated | | | | 5,359 | 878,501 |
| AMETEK Incorporated | | | | 101 | 12,136 |
| Eaton Corporation plc | | | | 4,064 | 555,305 |
| Emerson Electric Company | | | | 6,887 | 562,943 |
| Hubbell Incorporated | | | | 3,505 | 723,082 |
| nVent Electric plc | | | | 24,373 | 803,334 |
| Regal Rexnord Corporation | | | | 639 | 87,920 |
| Rockwell Automation Incorporated | | | | 239 | 56,629 |
| Sensata Technologies Holding plc | | | | 1,857 | 74,800 |
| Vertiv Holdings Company | | | | 14,799 | 170,632 |
| | | | | | 3,925,282 |
| Industrial conglomerates: 0.66% | | | | | |
| 3M Company | | | | 6,624 | 823,694 |
| General Electric Company | | | | 14,795 | 1,086,545 |
| Honeywell International Incorporated | | | | 6,539 | 1,238,160 |
| | | | | | 3,148,399 |
| Machinery: 1.30% | | | | | |
| AGCO Corporation | | | | 4,990 | 542,463 |
| Allison Transmission Holdings Incorporated | | | | 11,442 | 414,887 |
| Caterpillar Incorporated | | | | 5,835 | 1,077,783 |
| Crane Holdings Company | | | | 5,997 | 565,877 |
| Cummins Incorporated | | | | 2,300 | 495,351 |
| Deere & Company | | | | 2,506 | 915,317 |
| ESAB Corporation | | | | 9,084 | 373,262 |
| Flowserve Corporation | | | | 3,117 | 94,975 |
| Illinois Tool Works Incorporated | | | | 2,045 | 398,427 |
| ITT Incorporated | | | | 2,257 | 163,700 |
| Lincoln Electric Holdings Incorporated | | | | 1,239 | 169,359 |
| Otis Worldwide Corporation | | | | 971 | 70,126 |
| PACCAR Incorporated | | | | 7,669 | 671,114 |
| Parker-Hannifin Corporation | | | | 56 | 14,840 |
| Snap-on Incorporated | | | | 654 | 142,480 |
| The Timken Company | | | | 312 | 19,653 |
| Wabtec Corporation | | | | 995 | 87,212 |
| | | | | | 6,216,826 |
| Professional services: 0.94% | | | | | |
| Booz Allen Hamilton Holding Corporation | | | | 5,364 | 513,335 |
| CACI International Incorporated Class A | | | | 1,471 | 413,160 |
| FTI Consulting Incorporated † | | | | 4,831 | 775,859 |
| Jacobs Solutions Incorporated | | | | 1,286 | 160,210 |
| KBR Incorporated | | | | 12,533 | 605,344 |
| Leidos Holdings Incorporated | | | | 4,656 | 442,553 |
| Manpower Incorporated | | | | 1,761 | 129,117 |
| Robert Half International Incorporated | | | | 6,145 | 472,981 |
| Science Applications International Corporation | | | | 10,647 | 969,622 |
| | | | | | 4,482,181 |
The accompanying notes are an integral part of these financial statements.
12 | Allspring Factor Enhanced U.S. Large Cap Equity Portfolio
Portfolio of investments—August 31, 2022 (unaudited)
| | | | | Shares | Value |
| Road & rail: 0.80% | | | | | |
| Avis Budget Group Incorporated | | | | 92 | $ 15,399 |
| CSX Corporation | | | | 4,060 | 128,499 |
| Hertz Global Holdings | | | | 434 | 8,012 |
| J.B. Hunt Transport Services Incorporated | | | | 1,654 | 287,829 |
| Landstar System Incorporated | | | | 4,167 | 611,007 |
| Old Dominion Freight Line Incorporated | | | | 130 | 35,283 |
| Ryder System Incorporated | | | | 9,524 | 728,015 |
| Schneider National Incorporated Class B | | | | 43,786 | 1,000,948 |
| Union Pacific Corporation | | | | 4,632 | 1,039,930 |
| | | | | | 3,854,922 |
| Trading companies & distributors: 0.26% | | | | | |
| MSC Industrial Direct Company Class A | | | | 550 | 43,566 |
| Univar Incorporated | | | | 20,612 | 519,835 |
| W.W. Grainger Incorporated | | | | 1,025 | 568,814 |
| WESCO International Incorporated † | | | | 703 | 92,571 |
| | | | | | 1,224,786 |
| Information technology: 27.05% | | | | | |
| Communications equipment: 1.08% | | | | | |
| Ciena Corporation † | | | | 5,222 | 264,964 |
| Cisco Systems Incorporated | | | | 49,490 | 2,213,193 |
| CommScope Holdings Incorporated † | | | | 114,370 | 1,292,381 |
| F5 Networks Incorporated † | | | | 105 | 16,491 |
| Juniper Networks Incorporated | | | | 26,683 | 758,331 |
| Lumentum Holdings Incorporated † | | | | 2,570 | 214,724 |
| Motorola Solutions Incorporated | | | | 1,698 | 413,310 |
| | | | | | 5,173,394 |
| Electronic equipment, instruments & components: 0.91% | | | | | |
| Arrow Electronics Incorporated † | | | | 10,902 | 1,142,639 |
| Avnet Incorporated | | | | 26,683 | 1,171,117 |
| CDW Corporation of Delaware | | | | 3,566 | 608,716 |
| Jabil Circuit Incorporated | | | | 14,643 | 882,973 |
| Keysight Technologies Incorporated † | | | | 387 | 63,425 |
| TD SYNNEX Corporation | | | | 4,423 | 425,846 |
| Vontier Corporation | | | | 1,832 | 40,157 |
| | | | | | 4,334,873 |
| IT services: 4.84% | | | | | |
| Accenture plc Class A | | | | 8,297 | 2,393,353 |
| Akamai Technologies Incorporated † | | | | 3,001 | 270,930 |
| Amdocs Limited | | | | 8,549 | 730,683 |
| Automatic Data Processing Incorporated | | | | 3,119 | 762,315 |
| Broadridge Financial Solutions Incorporated | | | | 475 | 81,306 |
| Cognizant Technology Solutions Corporation Class A | | | | 21,483 | 1,357,081 |
| Concentrix Corporation | | | | 7,635 | 960,330 |
| DXC Technology Company † | | | | 29,397 | 728,458 |
| EPAM Systems Incorporated † | | | | 835 | 356,128 |
| Euronet Worldwide Incorporated | | | | 2,351 | 208,440 |
| Fidelity National Information Services Incorporated | | | | 4,528 | 413,723 |
| Fiserv Incorporated † | | | | 5,468 | 553,307 |
| Gartner Incorporated † | | | | 2,322 | 662,513 |
| Genpact Limited | | | | 6,471 | 304,008 |
The accompanying notes are an integral part of these financial statements.
Allspring Factor Enhanced U.S. Large Cap Equity Portfolio | 13
Portfolio of investments—August 31, 2022 (unaudited)
| | | | | Shares | Value |
| IT services (continued) | | | | | |
| Global Payments Incorporated | | | | 2,141 | $ 265,976 |
| Globant SA † | | | | 366 | 77,142 |
| International Business Machines Corporation | | | | 14,576 | 1,872,287 |
| Jack Henry & Associates Incorporated | | | | 4,273 | 821,271 |
| Kyndryl Holdings Incorporated | | | | 111,789 | 1,164,841 |
| MasterCard Incorporated Class A | | | | 8,744 | 2,836,291 |
| Paychex Incorporated | | | | 3,184 | 392,715 |
| PayPal Holdings Incorporated † | | | | 9,414 | 879,644 |
| SS&C Technologies Holdings Incorporated | | | | 1,976 | 110,182 |
| The Western Union Company | | | | 37,889 | 561,515 |
| Thoughtworks Holding Incorporated † | | | | 51,102 | 672,502 |
| Toast Incorporated Class A | | | | 17,918 | 339,188 |
| VeriSign Incorporated † | | | | 560 | 102,043 |
| Visa Incorporated Class A | | | | 16,535 | 3,285,670 |
| | | | | | 23,163,842 |
| Semiconductors & semiconductor equipment: 4.08% | | | | | |
| Advanced Micro Devices Incorporated † | | | | 15,436 | 1,310,053 |
| Allegro MicroSystems Incorporated † | | | | 8,505 | 198,337 |
| Analog Devices Incorporated | | | | 1,076 | 163,046 |
| Applied Materials Incorporated | | | | 11,253 | 1,058,570 |
| Broadcom Incorporated | | | | 4,967 | 2,479,079 |
| Cirrus Logic Incorporated † | | | | 5,819 | 446,259 |
| Entegris Incorporated | | | | 1,757 | 166,704 |
| First Solar Incorporated | | | | 121 | 15,434 |
| GlobalFoundries Incorporated | | | | 2,888 | 172,760 |
| Intel Corporation | | | | 42,153 | 1,345,524 |
| KLA Corporation | | | | 2,091 | 719,576 |
| Lam Research Corporation | | | | 2,191 | 959,461 |
| Lattice Semiconductor Corporation | | | | 5,996 | 323,184 |
| Microchip Technology Incorporated | | | | 12,069 | 787,502 |
| Micron Technology Incorporated | | | | 13,247 | 748,853 |
| MKS Instruments Incorporated | | | | 654 | 65,145 |
| Monolithic Power Systems Incorporated | | | | 34 | 15,408 |
| NVIDIA Corporation | | | | 25,448 | 3,841,121 |
| ON Semiconductor Corporation † | | | | 15,961 | 1,097,638 |
| Qorvo Incorporated † | | | | 1,166 | 104,683 |
| Qualcomm Incorporated | | | | 14,301 | 1,891,593 |
| Teradyne Incorporated | | | | 1,914 | 162,001 |
| Texas Instruments Incorporated | | | | 8,873 | 1,465,908 |
| | | | | | 19,537,839 |
| Software: 9.97% | | | | | |
| Adobe Incorporated † | | | | 5,551 | 2,072,970 |
| Alteryx Incorporated Class A | | | | 3,914 | 243,920 |
| AppLovin Corporation | | | | 4,716 | 116,155 |
| Aspen Technology Incorporated | | | | 3,029 | 637,907 |
| Atlassian Corporation plc Class A † | | | | 1,890 | 468,077 |
| Autodesk Incorporated † | | | | 2,018 | 407,111 |
| Cadence Design Systems Incorporated † | | | | 6,375 | 1,107,784 |
| CCC Intelligent Solutions | | | | 55,412 | 529,739 |
| Crowdstrike Holdings Incorporated Class A † | | | | 1,183 | 216,028 |
| Datadog Incorporated Class A † | | | | 2,487 | 261,011 |
| DocuSign Incorporated | | | | 2,374 | 138,214 |
| Dolby Laboratories Incorporated Class A | | | | 9,420 | 689,921 |
| Doubleverify Holdings Incorporated † | | | | 294 | 7,600 |
The accompanying notes are an integral part of these financial statements.
14 | Allspring Factor Enhanced U.S. Large Cap Equity Portfolio
Portfolio of investments—August 31, 2022 (unaudited)
| | | | | Shares | Value |
| Software (continued) | | | | | |
| Dropbox Incorporated Class A | | | | 47,328 | $ 1,012,346 |
| Dynatrace Incorporated † | | | | 2,426 | 92,625 |
| Fair Isaac Corporation † | | | | 1,378 | 619,273 |
| Fortinet Incorporated † | | | | 18,618 | 906,510 |
| Guidewire Software Incorporated | | | | 3,268 | 234,348 |
| Informatica Incorporated | | | | 15,910 | 351,134 |
| Intuit Incorporated | | | | 2,916 | 1,259,070 |
| Jamf Holding Corporation † | | | | 2,636 | 63,132 |
| Manhattan Associates Incorporated | | | | 3,412 | 481,979 |
| Microsoft Corporation | | | | 91,811 | 24,005,822 |
| NCR Corporation † | | | | 19,683 | 611,157 |
| New Relic Incorporated | | | | 15,510 | 941,612 |
| NortonLifeLock Incorporated | | | | 6,928 | 156,504 |
| Nutanix Incorporated Class A † | | | | 2,490 | 43,077 |
| Oracle Corporation | | | | 24,569 | 1,821,791 |
| Palantir Technologies Incorporated Class A | | | | 26,622 | 205,522 |
| Palo Alto Networks Incorporated † | | | | 2,141 | 1,192,130 |
| Paycor HCM Incorporated † | | | | 237 | 7,022 |
| Pegasystems Incorporated | | | | 519 | 19,001 |
| PTC Incorporated † | | | | 1,272 | 146,140 |
| RingCentral Incorporated Class A | | | | 15,247 | 656,231 |
| Roper Technologies Incorporated | | | | 1,095 | 440,825 |
| Salesforce.com Incorporated † | | | | 8,954 | 1,397,898 |
| ServiceNow Incorporated † | | | | 2,223 | 966,160 |
| Smartsheet Incorporated Class A | | | | 11,306 | 376,151 |
| Synopsys Incorporated † | | | | 3,042 | 1,052,593 |
| Teradata Corporation | | | | 23,206 | 763,477 |
| The Trade Desk Incorporated † | | | | 3,721 | 233,307 |
| Workday Incorporated Class A | | | | 2,366 | 389,349 |
| Zoom Video Communications Incorporated † | | | | 3,304 | 265,642 |
| Zscaler Incorporated | | | | 499 | 79,461 |
| | | | | | 47,687,726 |
| Technology hardware, storage & peripherals: 6.17% | | | | | |
| Apple Incorporated | | | | 182,875 | 28,751,608 |
| Hewlett Packard Enterprise Company | | | | 6,638 | 90,277 |
| HP Incorporated | | | | 21,191 | 608,394 |
| Western Digital Corporation † | | | | 1,687 | 71,293 |
| | | | | | 29,521,572 |
| Materials: 2.66% | | | | | |
| Chemicals: 1.50% | | | | | |
| Ashland Global Holdings Incorporated | | | | 2,386 | 242,799 |
| Celanese Corporation Series A | | | | 887 | 98,333 |
| CF Industries Holdings Incorporated | | | | 9,333 | 965,592 |
| Corteva Incorporated | | | | 3,476 | 213,531 |
| Dow Incorporated | | | | 13,057 | 665,907 |
| DuPont de Nemours Incorporated | | | | 1,756 | 97,704 |
| Eastman Chemical Company | | | | 1,524 | 138,684 |
| Huntsman Corporation | | | | 11,536 | 323,239 |
| Linde plc | | | | 4,218 | 1,193,103 |
| LyondellBasell Industries NV Class A | | | | 6,942 | 576,186 |
| Olin Corporation | | | | 5,800 | 317,028 |
| RPM International Incorporated | | | | 191 | 17,794 |
| The Chemours Company | | | | 15,105 | 509,492 |
The accompanying notes are an integral part of these financial statements.
Allspring Factor Enhanced U.S. Large Cap Equity Portfolio | 15
Portfolio of investments—August 31, 2022 (unaudited)
| | | | | Shares | Value |
| Chemicals (continued) | | | | | |
| The Mosaic Company | | | | 11,617 | $ 625,808 |
| The Sherwin-Williams Company | | | | 1,473 | 341,883 |
| Valvoline Incorporated | | | | 18,979 | 551,720 |
| Westlake Chemical Corporation | | | | 3,190 | 314,630 |
| | | | | | 7,193,433 |
| Construction materials: 0.16% | | | | | |
| Eagle Materials Incorporated | | | | 6,193 | 740,807 |
| Containers & packaging: 0.42% | | | | | |
| Amcor plc | | | | 18,057 | 216,865 |
| Berry Global Group Incorporated † | | | | 8,404 | 456,589 |
| Crown Holdings Incorporated | | | | 4,120 | 373,231 |
| Graphic Packaging Holding Company | | | | 5,796 | 129,077 |
| International Paper Company | | | | 4,496 | 187,124 |
| Packaging Corporation of America | | | | 549 | 75,169 |
| Sealed Air Corporation | | | | 1,751 | 94,221 |
| Silgan Holdings Incorporated | | | | 5,088 | 231,758 |
| Sonoco Products Company | | | | 4,027 | 253,782 |
| | | | | | 2,017,816 |
| Metals & mining: 0.58% | | | | | |
| Alcoa Corporation | | | | 10,244 | 506,873 |
| Cleveland-Cliffs Incorporated † | | | | 5,862 | 101,237 |
| Newmont Corporation | | | | 4,279 | 176,979 |
| Nucor Corporation | | | | 4,094 | 544,256 |
| Reliance Steel & Aluminum Company | | | | 2,834 | 532,735 |
| Steel Dynamics Incorporated | | | | 6,202 | 500,625 |
| United States Steel Corporation | | | | 17,093 | 390,917 |
| | | | | | 2,753,622 |
| Real estate: 2.44% | | | | | |
| Equity REITs: 2.27% | | | | | |
| American Tower Corporation | | | | 3,215 | 816,771 |
| AvalonBay Communities Incorporated | | | | 258 | 51,835 |
| Boston Properties Incorporated | | | | 2,206 | 175,223 |
| Brixmor Property Group Incorporated | | | | 14,908 | 320,224 |
| Crown Castle International Corporation | | | | 5,634 | 962,456 |
| Digital Realty Trust Incorporated | | | | 2,501 | 309,199 |
| EPR Properties | | | | 10,774 | 468,561 |
| Equinix Incorporated | | | | 773 | 508,147 |
| Equity Residential | | | | 1,160 | 84,889 |
| Essex Property Trust Incorporated | | | | 301 | 79,783 |
| Extra Space Storage Incorporated | | | | 1,853 | 368,247 |
| Federal Realty Investment Trust | | | | 763 | 77,269 |
| Gaming and Leisure Properties Incorporated | | | | 1,930 | 93,161 |
| Healthpeak Properties Incorporated | | | | 3,952 | 103,740 |
| Host Hotels & Resorts Incorporated | | | | 17,706 | 314,636 |
| Invitation Homes Incorporated | | | | 1,198 | 43,463 |
| Iron Mountain Incorporated | | | | 11,944 | 628,374 |
| Lamar Advertising Company Class A | | | | 1,207 | 113,325 |
| Life Storage Incorporated | | | | 1,625 | 206,781 |
| Mid-America Apartment Communities Incorporated | | | | 1,743 | 288,763 |
| Omega Healthcare Investors Incorporated | | | | 6,667 | 217,744 |
| Orion Office Incorporated | | | | 551 | 5,438 |
The accompanying notes are an integral part of these financial statements.
16 | Allspring Factor Enhanced U.S. Large Cap Equity Portfolio
Portfolio of investments—August 31, 2022 (unaudited)
| | | | | Shares | Value |
| Equity REITs (continued) | | | | | |
| Park Hotels & Resorts Incorporated | | | | 44,890 | $ 628,460 |
| Prologis Incorporated | | | | 6,630 | 825,501 |
| Public Storage Incorporated | | | | 1,307 | 432,395 |
| Rayonier Incorporated | | | | 5,370 | 190,742 |
| Regency Centers Corporation | | | | 11,549 | 702,641 |
| SBA Communications Corporation | | | | 1,051 | 341,838 |
| Simon Property Group Incorporated | | | | 4,005 | 408,430 |
| SL Green Realty Corporation | | | | 768 | 33,923 |
| Ventas Incorporated | | | | 2,463 | 117,879 |
| VICI Properties Incorporated | | | | 3,305 | 109,032 |
| Welltower Incorporated | | | | 2,617 | 200,593 |
| Weyerhaeuser Company | | | | 15,924 | 543,964 |
| WP Carey Incorporated | | | | 971 | 81,593 |
| | | | | | 10,855,020 |
| Real estate management & development: 0.17% | | | | | |
| CBRE Group Incorporated Class A † | | | | 4,015 | 317,024 |
| Jones Lang LaSalle Incorporated | | | | 2,957 | 511,561 |
| | | | | | 828,585 |
| Utilities: 2.56% | | | | | |
| Electric utilities: 1.56% | | | | | |
| Alliant Energy Corporation | | | | 1,300 | 79,352 |
| American Electric Power Company Incorporated | | | | 4,504 | 451,301 |
| Constellation Energy Corporation | | | | 2,400 | 195,816 |
| Duke Energy Corporation | | | | 6,719 | 718,328 |
| Edison International | | | | 5,901 | 399,911 |
| Entergy Corporation | | | | 708 | 81,632 |
| Eversource Energy | | | | 649 | 58,209 |
| Exelon Corporation | | | | 17,015 | 747,129 |
| FirstEnergy Corporation | | | | 6,598 | 260,951 |
| Hawaiian Electric Industries Incorporated | | | | 2,837 | 110,983 |
| IDACORP Incorporated | | | | 297 | 32,444 |
| NextEra Energy Incorporated | | | | 13,039 | 1,109,097 |
| NRG Energy Incorporated | | | | 13,946 | 575,691 |
| OGE Energy Corporation | | | | 12,178 | 493,696 |
| PG&E Corporation | | | | 44,243 | 545,516 |
| PPL Corporation | | | | 16,955 | 493,051 |
| The Southern Company | | | | 10,224 | 787,964 |
| Xcel Energy Incorporated | | | | 4,251 | 315,637 |
| | | | | | 7,456,708 |
| Gas utilities: 0.02% | | | | | |
| National Fuel Gas Company | | | | 1,545 | 110,112 |
| Independent power & renewable electricity producers: 0.20% | | | | | |
| AES Corporation | | | | 19,349 | 492,432 |
| Vistra Energy Corporation | | | | 18,459 | 456,860 |
| | | | | | 949,292 |
| Multi-utilities: 0.70% | | | | | |
| CenterPoint Energy Incorporated | | | | 611 | 19,265 |
| CMS Energy Corporation | | | | 5,668 | 382,817 |
| Consolidated Edison Incorporated | | | | 5,124 | 500,820 |
| Dominion Energy Incorporated | | | | 7,438 | 608,428 |
The accompanying notes are an integral part of these financial statements.
Allspring Factor Enhanced U.S. Large Cap Equity Portfolio | 17
Portfolio of investments—August 31, 2022 (unaudited)
| | | | | Shares | Value |
| Multi-utilities (continued) | | | | | |
| DTE Energy Company | | | | 5,769 | $ 751,931 |
| NiSource Incorporated | | | | 8,183 | 241,480 |
| Public Service Enterprise Group Incorporated | | | | 6,069 | 390,601 |
| Sempra Energy | | | | 1,730 | 285,398 |
| WEC Energy Group Incorporated | | | | 1,779 | 183,486 |
| | | | | | 3,364,226 |
| Water utilities: 0.08% | | | | | |
| American Water Works Company Incorporated | | | | 2,473 | 367,117 |
| Total Common stocks (Cost $392,396,906) | | | | | 459,046,325 |
| | | Yield | | | |
| Short-term investments: 3.73% | | | | | |
| Investment companies: 3.73% | | | | | |
| Allspring Government Money Market Fund Select Class ♠∞ | | 2.09% | | 17,829,605 | 17,829,605 |
| Total Short-term investments (Cost $17,829,605) | | | | | 17,829,605 |
| Total investments in securities (Cost $410,226,511) | 99.68% | | | | 476,875,930 |
| Other assets and liabilities, net | 0.32 | | | | 1,525,950 |
| Total net assets | 100.00% | | | | $478,401,880 |
| † | Non-income-earning security |
| ♠ | The issuer of the security is an affiliated person of the Portfolio as defined in the Investment Company Act of 1940. |
| ∞ | The rate represents the 7-day annualized yield at period end. |
| Abbreviations: |
| REIT | Real estate investment trust |
Investments in affiliates
An affiliated investment is an investment in which the Portfolio owns at least 5% of the outstanding voting shares of the issuer or as a result of other relationships, such as the Portfolio and the issuer having the same adviser or investment manager. Transactions with issuers that were affiliates of the Portfolio at the end of the period were as follows:
| | Value,
beginning of
period | Purchases | Sales
proceeds | Net
realized
gains
(losses) | Net
change in
unrealized
gains
(losses) | Value,
end of
period | Shares,
end
of period | Income
from
affiliated
securities |
| Short-term investments | | | | | | | |
| Allspring Government Money Market Fund Select Class | $16,689,254 | $289,802,810 | $(288,662,459) | $0 | $0 | $17,829,605 | 17,829,605 | $55,628 |
Futures contracts
| Description | Number of
contracts | Expiration
date | Notional
cost | Notional
value | Unrealized
gains | Unrealized
losses |
| Long | | | | | | |
| E-Mini S&P 500 Index | 91 | 9-16-2022 | $18,588,122 | $18,002,075 | $0 | $(586,047) |
The accompanying notes are an integral part of these financial statements.
18 | Allspring Factor Enhanced U.S. Large Cap Equity Portfolio
Statement of assets and liabilities—August 31, 2022 (unaudited)
| | |
| Assets | |
Investments in unaffiliated securities, at value (cost $392,396,906)
| $ 459,046,325 |
Investments in affiliated securities, at value (cost $17,829,605)
| 17,829,605 |
Cash at broker segregated for futures contracts
| 1,000,000 |
Receivable for dividends
| 738,268 |
Prepaid expenses and other assets
| 10,487 |
Total assets
| 478,624,685 |
| Liabilities | |
Payable for daily variation margin on open futures contracts
| 134,579 |
Advisory fee payable
| 29,125 |
Custody and accounting fees payable
| 28,907 |
Professional fees payable
| 19,126 |
Trustees’ fees and expenses payable
| 1,611 |
Accrued expenses and other liabilities
| 9,457 |
Total liabilities
| 222,805 |
Total net assets
| $478,401,880 |
The accompanying notes are an integral part of these financial statements.
Allspring Factor Enhanced U.S. Large Cap Equity Portfolio | 19
Statement of operations—six months ended August 31, 2022 (unaudited)
| | |
| Investment income | |
Dividends (net of foreign withholdings taxes of $19,795)
| $ 4,354,822 |
Income from affiliated securities
| 55,628 |
Total investment income
| 4,410,450 |
| Expenses | |
Advisory fee
| 286,556 |
Custody and accounting fees
| 22,391 |
Professional fees
| 28,279 |
Interest holder report expenses
| 8,814 |
Trustees’ fees and expenses
| 11,153 |
Other fees and expenses
| 11,002 |
Total expenses
| 368,195 |
Less: Fee waivers and/or expense reimbursements
| (75,908) |
Net expenses
| 292,287 |
Net investment income
| 4,118,163 |
| Realized and unrealized gains (losses) on investments | |
| Net realized gains (losses) on | |
Unaffiliated securities
| 55,266,148 |
Futures contracts
| (2,759,976) |
Net realized gains on investments
| 52,506,172 |
| Net change in unrealized gains (losses) on | |
Unaffiliated securities
| (103,898,001) |
Futures contracts
| 424,104 |
Net change in unrealized gains (losses) on investments
| (103,473,897) |
Net realized and unrealized gains (losses) on investments
| (50,967,725) |
Net decrease in net assets resulting from operations
| $ (46,849,562) |
The accompanying notes are an integral part of these financial statements.
20 | Allspring Factor Enhanced U.S. Large Cap Equity Portfolio
Statement of changes in net assets
| | | |
| | Six months ended
August 31, 2022
(unaudited) | Year ended
February 28, 2022 |
| Operations | | |
Net investment income
| $ 4,118,163 | $ 10,050,800 |
Net realized gains on investments
| 52,506,172 | 148,144,573 |
Net change in unrealized gains (losses) on investments
| (103,473,897) | (34,278,597) |
Net increase (decrease) in net assets resulting from operations
| (46,849,562) | 123,916,776 |
| Capital transactions | | |
| Transactions in investors’ beneficial interests | | |
Contributions
| 77,683,664 | 80,236,932 |
Withdrawals
| (303,170,313) | (257,231,310) |
Net decrease in net assets resulting from capital transactions
| (225,486,649) | (176,994,378) |
Total decrease in net assets
| (272,336,211) | (53,077,602) |
| Net assets | | |
Beginning of period
| 750,738,091 | 803,815,693 |
End of period
| $ 478,401,880 | $ 750,738,091 |
The accompanying notes are an integral part of these financial statements.
Allspring Factor Enhanced U.S. Large Cap Equity Portfolio | 21
| | | Year ended February 28 |
| | Six months ended
August 31, 2022
(unaudited) | 2022 | 2021 | 2020 1 | 2019 | 2018 2 |
Total return3
| (8.49)% | 15.65% | 24.03% | 4.00% | 7.60% | 11.92% |
| Ratios to average net assets (annualized) | | | | | | |
Gross expenses
| 0.13% | 0.12% | 0.12% | 0.12% | 0.12% | 0.12% |
Net expenses
| 0.10% * | 0.10% * | 0.10% * | 0.11% | 0.11% | 0.12% |
Net investment income
| 1.44% | 1.23% | 1.72% | 2.10% | 2.09% | 1.94% |
| Supplemental data | | | | | | |
Portfolio turnover rate
| 30% | 50% | 71% | 25% | 23% | 75% |
| * | Ratio includes expenses which were voluntarily waived by the adviser. Without these voluntary waivers, the net expense ratios would be increased by the following amounts: |
| Six months ended August 31, 2022 (unaudited) | 0.03% |
| Year ended February 28, 2022 | 0.02% |
| Year ended February 28, 2021 | 0.02% |
| 1 | Year ended February 29 |
| 2 | For the period from May 23, 2017 (commencement of operations) to February 28, 2018 |
| 3 | Returns for periods of less than one year are not annualized. |
The accompanying notes are an integral part of these financial statements.
22 | Allspring Factor Enhanced U.S. Large Cap Equity Portfolio
Notes to financial statements (unaudited)
1. ORGANIZATION
Allspring Master Trust (the "Trust"), a Delaware statutory trust organized on March 10, 1999, is an open-end management investment company registered under the Investment Company Act of 1940, as amended (the "1940 Act"). As an investment company, the Trust follows the accounting and reporting guidance in Financial Accounting Standards Board ("FASB") Accounting Standards Codification Topic 946, Financial Services – Investment Companies. These financial statements report on the Allspring Factor Enhanced U.S. Large Cap Equity Portfolio (the "Portfolio") which is a diversified series of the Trust.
Interests in the Portfolio are available solely through private placement transactions that do not involve any "public offering" within the meaning of Section 4(a)(2) of the Securities Act of 1933.
2. SIGNIFICANT ACCOUNTING POLICIES
The following significant accounting policies, which are consistently followed in the preparation of the financial statements of the Portfolio, are in conformity with U.S. generally accepted accounting principles which require management to make estimates and assumptions that affect the reported amounts of assets and liabilities, disclosure of contingent assets and liabilities at the date of the financial statements, and the reported amounts of income and expenses during the reporting period. Actual results could differ from those estimates.
Securities valuation
All investments are valued each business day as of the close of regular trading on the New York Stock Exchange (generally 4 p.m. Eastern Time), although the Portfolio may deviate from this calculation time under unusual or unexpected circumstances.
Equity securities and futures contracts that are listed on a foreign or domestic exchange or market are valued at the official closing price or, if none, the last sales price.
Investments in registered open-end investment companies are valued at net asset value.
Investments which are not valued using any of the methods discussed above are valued at their fair value, as determined in good faith by the Board of Trustees. The Board of Trustees has established a Valuation Committee comprised of the Trustees and has delegated to it the authority to take any actions regarding the valuation of portfolio securities that the Valuation Committee deems necessary or appropriate, including determining the fair value of portfolio securities, unless the determination has been delegated to the Allspring Global Investments Pricing Committee at Allspring Funds Management, LLC ("Allspring Funds Management"). The Board of Trustees retains the authority to make or ratify any valuation decisions or approve any changes to the Valuation Procedures as it deems appropriate. On a quarterly basis, the Board of Trustees receives reports on any valuation actions taken by the Valuation Committee or the Allspring Global Investments Pricing Committee which may include items for ratification.
Futures contracts
Futures contracts are agreements between the Portfolio and a counterparty to buy or sell a specific amount of a commodity, financial instrument or currency at a specified price on a specified date. The Portfolio may buy and sell futures contracts in order to gain exposure to, or protect against, changes in security values and is subject to equity price risk. The primary risks associated with the use of futures contracts are the imperfect correlation between changes in market values of securities held by the Portfolio and the prices of futures contracts, and the possibility of an illiquid market. Futures contracts are generally entered into on a regulated futures exchange and cleared through a clearinghouse associated with the exchange. With futures contracts, there is minimal counterparty risk to the Portfolio since futures contracts are exchange traded and the exchange’s clearinghouse, as the counterparty to all exchange traded futures, guarantees the futures contracts against default.
Upon entering into a futures contract, the Portfolio is required to deposit either cash or securities (initial margin) with the broker in an amount equal to a certain percentage of the contract value. Subsequent payments (variation margin) are paid to or from the broker each day equal to the daily changes in the contract value. Such payments are recorded as unrealized gains or losses and, if any, shown as variation margin receivable (payable) in the Statement of Assets and Liabilities. Should the Portfolio fail to make requested variation margin payments, the broker can gain access to the initial margin to satisfy the Portfolio’s payment obligations. When the contracts are closed, a realized gain or loss is recorded in the Statement of Operations.
Security transactions and income recognition
Securities transactions are recorded on a trade date basis. Realized gains or losses are recorded on the basis of identified cost.
Dividend income is recognized on the ex-dividend date. Dividend income is recorded net of foreign taxes withheld where recovery of such taxes is not assured.
Allspring Factor Enhanced U.S. Large Cap Equity Portfolio | 23
Notes to financial statements (unaudited)
Federal and other taxes
The Portfolio is not required to pay federal income taxes on its net investment income and net capital gains as it is treated as a partnership for federal income tax purposes. All income, gains and losses of the Portfolio are deemed to have been “passed through” to the interest holders in proportion to their holdings of the Portfolio regardless of whether income and gains have been distributed by the Portfolio.
The Portfolio’s income tax returns and all financial records supporting those returns for the prior three fiscal years are subject to examination by the federal revenue authority. Management has analyzed the Portfolio’s tax positions taken on federal, state, and foreign tax returns, as applicable, for all open tax years and does not believe that there are any uncertain tax positions that require recognition of a tax liability.
As of August 31, 2022, the aggregate cost of all investments for federal income tax purposes was $410,213,482 and the unrealized gains (losses) consisted of:
| Gross unrealized gains | $ 90,638,149 |
| Gross unrealized losses | (24,561,748) |
| Net unrealized gains | $ 66,076,401 |
3. FAIR VALUATION MEASUREMENTS
Fair value measurements of investments are determined within a framework that has established a fair value hierarchy based upon the various data inputs utilized in determining the value of the Portfolio’s investments. The three-level hierarchy gives the highest priority to unadjusted quoted prices in active markets for identical assets or liabilities (Level 1) and the lowest priority to unobservable inputs (Level 3). The Portfolio’s investments are classified within the fair value hierarchy based on the lowest level of input that is significant to the fair value measurement. The inputs are summarized into three broad levels as follows:
| ■ | Level 1 – quoted prices in active markets for identical securities |
| ■ | Level 2 – other significant observable inputs (including quoted prices for similar securities, interest rates, prepayment speeds, credit risk, etc.) |
| ■ | Level 3 – significant unobservable inputs (including the Portfolio’s own assumptions in determining the fair value of investments) |
The inputs or methodologies used for valuing investments in securities are not necessarily an indication of the risk associated with investing in those securities.
24 | Allspring Factor Enhanced U.S. Large Cap Equity Portfolio
Notes to financial statements (unaudited)
The following is a summary of the inputs used in valuing the Portfolio’s assets and liabilities as of August 31, 2022:
| | Quoted prices
(Level 1) | Other significant
observable inputs
(Level 2) | Significant
unobservable inputs
(Level 3) | Total |
| Assets | | | | |
| Investments in: | | | | |
| Common stocks | | | | |
| Communication services | $ 36,057,321 | $0 | $0 | $ 36,057,321 |
| Consumer discretionary | 57,512,029 | 0 | 0 | 57,512,029 |
| Consumer staples | 30,148,444 | 0 | 0 | 30,148,444 |
| Energy | 20,592,327 | 0 | 0 | 20,592,327 |
| Financials | 42,610,671 | 0 | 0 | 42,610,671 |
| Health care | 66,549,588 | 0 | 0 | 66,549,588 |
| Industrials | 39,519,961 | 0 | 0 | 39,519,961 |
| Information technology | 129,419,246 | 0 | 0 | 129,419,246 |
| Materials | 12,705,678 | 0 | 0 | 12,705,678 |
| Real estate | 11,683,605 | 0 | 0 | 11,683,605 |
| Utilities | 12,247,455 | 0 | 0 | 12,247,455 |
| Short-term investments | | | | |
| Investment companies | 17,829,605 | 0 | 0 | 17,829,605 |
| Total assets | $476,875,930 | $0 | $0 | $476,875,930 |
| Liabilities | | | | |
| Futures contracts | $ 586,047 | $0 | $0 | $ 586,047 |
| Total liabilities | $ 586,047 | $0 | $0 | $ 586,047 |
Futures contracts are reported at their cumulative unrealized gains (losses) at measurement date as reported in the table following the Portfolio of Investments. For futures contracts, the current day’s variation margin is reported on the Statement of Assets and Liabilities. All other assets and liabilities are reported at their market value at measurement date.
Additional sector, industry or geographic detail, if any, is included in the Portfolio of Investments.
For the six months ended August 31, 2022, the Portfolio did not have any transfers into/out of Level 3.
4. TRANSACTIONS WITH AFFILIATES
Advisory fee
The Trust has entered into an advisory contract with Allspring Funds Management, a wholly owned subsidiary of Allspring Global Investments Holdings, LLC, a holding company indirectly owned by certain private funds of GTCR LLC and Reverence Capital Partners, L.P. The adviser is responsible for implementing investment policies and guidelines and for supervising the subadviser, who is responsible for day-to-day portfolio management of the Portfolio. Pursuant to the contract, Allspring Funds Management is entitled to receive an advisory fee at the following annual rate based on the Portfolio’s average daily net assets:
| Average daily net assets | Advisory fee |
| First $5 billion | 0.100% |
| Next $5 billion | 0.080 |
| Over $10 billion | 0.060 |
For the six months ended August 31, 2022, the advisory fee was equivalent to an annual rate of 0.10% of the Portfolio’s average daily net assets.
Allspring Funds Management has retained the services of a subadviser to provide daily portfolio management to the Portfolio. The fee for subadvisory services is borne by Allspring Funds Management. Allspring Global Investments, LLC, an affiliate of Allspring Funds Management and a wholly owned subsidiary of Allspring Global Investments Holdings, LLC, is the subadviser to
Allspring Factor Enhanced U.S. Large Cap Equity Portfolio | 25
Notes to financial statements (unaudited)
the Portfolio and is entitled to receive a fee from Allspring Funds Management at an annual rate starting at 0.06% and declining to 0.04% as the average daily net assets of the Portfolio increase.
Allspring Funds Management has voluntarily waived and/or reimbursed advisory fees to reduce the net operating expense ratio of the Portfolio. These voluntary waivers may be discontinued at any time.
Interfund transactions
The Portfolio may purchase or sell portfolio investment securities to certain affiliates pursuant to Rule 17a-7 under the 1940 Act and under procedures adopted by the Board of Trustees. The procedures have been designed to ensure that these interfund transactions, which do not incur broker commissions, are effected at current market prices.
5. INVESTMENT PORTFOLIO TRANSACTIONS
Purchases and sales of investments, excluding U.S. government obligations (if any) and short-term securities, for the six months ended August 31, 2022 were $168,273,445 and $389,855,622, respectively.
6. DERIVATIVE TRANSACTIONS
During the six months ended August 31, 2022, the Portfolio entered into futures contracts to gain market exposure. The Portfolio had an average notional amount of $55,980,923 in long futures contracts during the six months ended August 31, 2022.
The fair value, realized gains or losses and change in unrealized gains or losses, if any, on derivative instruments are reflected in the corresponding financial statement captions.
7. BANK BORROWINGS
The Trust, along with Allspring Variable Trust and Allspring Funds Trust (excluding the money market funds), are parties to a $350,000,000 revolving credit agreement whereby the Portfolio is permitted to use bank borrowings for temporary or emergency purposes, such as to fund interest holders withdrawal requests. Interest under the credit agreement is charged to the Portfolio based on a borrowing rate equal to the higher of the Federal Funds rate or the overnight bank funding rate in effect on that day plus a spread. In addition, an annual commitment fee equal based on the unused balance is allocated to each participating fund.
For the six months ended August 31, 2022, there were no borrowings by the Portfolio under the agreement.
8. CONCENTRATION RISKS
As of the end of the period, the Portfolio concentrated its portfolio of investments in the information technology sector. A fund that invests a substantial portion of its assets in any sector may be more affected by changes in that sector than would be a fund whose investments are not heavily weighted in any sector.
9. INDEMNIFICATION
Under the Portfolio's organizational documents, the officers and Trustees have been granted certain indemnification rights against certain liabilities that may arise out of performance of their duties to the Portfolio. The Portfolio has entered into a separate agreement with each Trustee that converts indemnification rights currently existing under the Portfolio’s organizational documents into contractual rights that cannot be changed in the future without the consent of the Trustee. Additionally, in the normal course of business, the Portfolio may enter into contracts with service providers that contain a variety of indemnification clauses. The Portfolio’s maximum exposure under these arrangements is dependent on future claims that may be made against the Portfolio and, therefore, cannot be estimated.
10. CORONAVIRUS (COVID-19) PANDEMIC
On March 11, 2020, the World Health Organization announced that it had made the assessment that coronavirus disease 2019 (“COVID-19”) is a pandemic. The impacts of COVID-19 are affecting the entire global economy, individual companies and investment products, the funds, and the market in general. There is significant uncertainty around the extent and duration of business disruptions related to COVID-19 and the impacts may last for an extended period of time. COVID-19 has led to significant uncertainty and volatility in the financial markets.
26 | Allspring Factor Enhanced U.S. Large Cap Equity Portfolio
Other information (unaudited)
PROXY VOTING INFORMATION
A description of the policies and procedures used to determine how to vote proxies relating to portfolio securities is available without charge, upon request, by calling 1-800-222-8222, visiting our website at allspringglobal.com, or visiting the SEC website at sec.gov. Information regarding how the proxies related to portfolio securities were voted during the most recent 12-month period ended June 30 is available on the website at allspringglobal.com or by visiting the SEC website at sec.gov.
QUARTERLY PORTFOLIO
The Portfolio files its complete schedule of portfolio holdings with the SEC for the first and third quarters of each fiscal year as an exhibit to its reports on Form N-PORT. Interest holders may view the filed Form N-PORT by visiting the SEC website at sec.gov.
Allspring Factor Enhanced U.S. Large Cap Equity Portfolio | 27
Other information (unaudited)
BOARD OF TRUSTEES AND OFFICERS
Each of the Trustees and Officers listed in the table below acts in identical capacities for each fund in the Allspring family of funds, which consists of 124 mutual funds comprising the Allspring Funds Trust, Allspring Variable Trust, Allspring Master Trust and four closed-end funds (collectively the “Fund Complex”). This table should be read in conjunction with the Prospectus and the Statement of Additional Information1. The mailing address of each Trustee and Officer is 525 Market Street, 12th Floor, San Francisco, CA 94105. Each Trustee and Officer serves an indefinite term, however, each Trustee serves such term until reaching the mandatory retirement age established by the Trustees.
Independent Trustees
Name and
year of birth | Position held and
length of service* | Principal occupations during past five years or longer | Current other
public company or
investment
company
directorships |
William R. Ebsworth
(Born 1957) | Trustee,
since 2015 | Retired. From 1984 to 2013, equities analyst, portfolio manager, research director and chief investment officer at Fidelity Management and Research Company in Boston, Tokyo, and Hong Kong, and retired in 2013 as Chief Investment Officer of Fidelity Strategic Advisers, Inc. where he led a team of investment professionals managing client assets. Prior thereto, Board member of Hong Kong Securities Clearing Co., Hong Kong Options Clearing Corp., the Thailand International Fund, Ltd., Fidelity Investments Life Insurance Company, and Empire Fidelity Investments Life Insurance Company. Audit Committee Chair and Investment Committee Chair of the Vincent Memorial Hospital Endowment (non-profit organization). Mr. Ebsworth is a CFA® charterholder. | N/A |
Jane A. Freeman
(Born 1953) | Trustee,
since 2015;
Chair Liaison,
since 2018 | Retired. From 2012 to 2014 and 1999 to 2008, Chief Financial Officer of Scientific Learning Corporation. From 2008 to 2012, Ms. Freeman provided consulting services related to strategic business projects. Prior to 1999, Portfolio Manager at Rockefeller & Co. and Scudder, Stevens & Clark. Board member of the Harding Loevner Funds from 1996 to 2014, serving as both Lead Independent Director and chair of the Audit Committee. Board member of the Russell Exchange Traded Funds Trust from 2011 to 2012 and the chair of the Audit Committee. Ms. Freeman is also an inactive Chartered Financial Analyst. | N/A |
Isaiah Harris, Jr.
(Born 1952) | Trustee,
since 2009; Audit
Committee
Chair,
since 2019 | Retired. Chairman of the Board of CIGNA Corporation from 2009 to 2021, and Director from 2005 to 2008. From 2003 to 2011, Director of Deluxe Corporation. Prior thereto, President and CEO of BellSouth Advertising and Publishing Corp. from 2005 to 2007, President and CEO of BellSouth Enterprises from 2004 to 2005 and President of BellSouth Consumer Services from 2000 to 2003. Emeritus member of the Iowa State University Foundation Board of Governors. Emeritus Member of the Advisory Board of Iowa State University School of Business. Advisory Board Member, Palm Harbor Academy (private school). Advisory Board Member, Fellowship of Christian Athletes. Mr. Harris is a certified public accountant (inactive status). | N/A |
David F. Larcker
(Born 1950) | Trustee,
since 2009 | James Irvin Miller Professor of Accounting at the Graduate School of Business (Emeritus), Stanford University, Director of the Corporate Governance Research Initiative and Senior Faculty of The Rock Center for Corporate Governance since 2006. From 2005 to 2008, Professor of Accounting at the Graduate School of Business, Stanford University. Prior thereto, Ernst & Young Professor of Accounting at The Wharton School, University of Pennsylvania from 1985 to 2005. | N/A |
28 | Allspring Factor Enhanced U.S. Large Cap Equity Portfolio
Other information (unaudited)
Name and
year of birth | Position held and
length of service* | Principal occupations during past five years or longer | Current other
public company or
investment
company
directorships |
Olivia S. Mitchell
(Born 1953) | Trustee,
since 2006;
Nominating and
Governance
Committee Chair,
since 2018 | International Foundation of Employee Benefit Plans Professor since 1993, Wharton School of the University of Pennsylvania. Director of Wharton’s Pension Research Council and Boettner Center on Pensions & Retirement Research, and Research Associate at the National Bureau of Economic Research. Previously taught at Cornell University from 1978 to 1993. | N/A |
Timothy J. Penny
(Born 1951) | Trustee,
since 1996;
Chair,
since 2018 | President and Chief Executive Officer of Southern Minnesota Initiative Foundation, a non-profit organization, since 2007. Vice Chair of the Economic Club of Minnesota, since 2007. Co-Chair of the Committee for a Responsible Federal Budget, since 1995. Member of the Board of Trustees of NorthStar Education Finance, Inc., a non-profit organization, since 2007. Senior Fellow of the University of Minnesota Humphrey Institute from 1995 to 2017. | N/A |
James G. Polisson
(Born 1959) | Trustee,
since 2018 | Retired. Chief Marketing Officer, Source (ETF) UK Services, Ltd, from 2015 to 2017. From 2012 to 2015, Principal of The Polisson Group, LLC, a management consulting, corporate advisory and principal investing company. Chief Executive Officer and Managing Director at Russell Investments, Global Exchange Traded Funds from 2010 to 2012. Managing Director of Barclays Global Investors from 1998 to 2010 and Global Chief Marketing Officer for iShares and Barclays Global Investors from 2000 to 2010. Trustee of the San Francisco Mechanics’ Institute, a non-profit organization, from 2013 to 2015. Board member of the Russell Exchange Traded Fund Trust from 2011 to 2012. Director of Barclays Global Investors Holdings Deutschland GmbH from 2006 to 2009. Mr. Polisson is an attorney and has a retired status with the Massachusetts and District of Columbia Bar Associations. | N/A |
Pamela Wheelock
(Born 1959) | Trustee,
since January
2020; previously
Trustee from
January 2018 to
July 2019 | Retired. Executive and Senior Financial leadership positions in the public, private and nonprofit sectors. Interim President and CEO, McKnight Foundation, 2020. Interim Commissioner, Minnesota Department of Human Services, 2019. Chief Operating Officer, Twin Cities Habitat for Humanity, 2017-2019. Vice President for University Services, University of Minnesota, 2012-2016. Interim President and CEO, Blue Cross and Blue Shield of Minnesota, 2011-2012. Executive Vice-President and Chief Financial Officer, Minnesota Wild, 2002-2008. Commissioner, Minnesota Department of Finance, 1999-2002. Chair of the Board of Directors of Destination Medical Center Corporation. Board member of the Minnesota Wild Foundation. | N/A |
* Length of service dates reflect the Trustee’s commencement of service with the Trust’s predecessor entities, where applicable.
Allspring Factor Enhanced U.S. Large Cap Equity Portfolio | 29
Other information (unaudited)
Officers2
Name and
year of birth | Position held and
length of service | Principal occupations during past five years or longer |
Andrew Owen
(Born 1960) | President,
since 2017 | President, Chief Executive Officer and Director of Allspring Funds Management, LLC since 2017 and co-president of Galliard Capital Management, LLC, an affiliate of Allspring Funds Management, LLC, since 2019. Prior thereto, Head of Affiliated Managers, Allspring Global Investments, from 2014 to 2019 and Executive Vice President responsible for marketing, investments and product development for Allspring Funds Management, LLC, from 2009 to 2014. In addition, Mr. Owen was an Executive Vice President of Wells Fargo & Company from 2014 to 2021. |
Jeremy DePalma
(Born 1974) | Treasurer,
since 2012
(for certain funds in
the Fund Complex);
since 2021 (for
the remaining funds in the
Fund Complex) | Senior Vice President of Allspring Funds Management, LLC since 2009. Senior Vice President of Evergreen Investment Management Company, LLC from 2008 to 2010 and head of the Fund Reporting and Control Team within Fund Administration from 2005 to 2010. |
Kate McKinley
(Born 1977) | Chief Legal Officer,
since 2021 | Chief Legal Officer of Allspring Global Investments since 2021. Prior thereto, held various roles at State Street Global Advisors beginning in 2010, including serving as Senior Vice President and General Counsel from 2019 to 2021, and Chief Operating Officer of the Institutional Client Group from 2016 - 2019. Prior to working at State Street Global Advisors served as Assistant General Counsel for Bank of America Corporation from 2005 to 2010 and as an Associate at WilmerHale from 2002 to 2005. |
Christopher Baker
(Born 1976) | Chief Compliance Officer, since 2022 | Global Chief Compliance Officer for Allspring Global Investments since 2022. Prior thereto, Chief Compliance Officer for State Street Global Advisors from 2018 to 2021. Senior Compliance Officer for the State Street divisions of Alternative Investment Solutions, Sector Solutions, and Global Marketing from 2015 to 2018. From 2010 to 2015 Vice President, Global Head of Investment and Marketing Compliance for State Street Global Advisors. |
Matthew Prasse
(Born 1983) | Secretary,
since 2021 | Senior Counsel of the Allspring Legal Department since 2021. Senior Counsel of the Wells Fargo Legal Department from 2018 to 2021. Previously, Counsel for Barings LLC from 2015 to 2018. Prior to joining Barings, Associate at Morgan, Lewis & Bockius LLP from 2008 to 2015. |
1 The Statement of Additional Information includes additional information about the Trustees and is available, without charge, upon request, by calling 1-800-222-8222.
2 For those Officers with tenures at Allspring Global Investments and/or Allspring Funds Management, LLC that began prior to 2021, such tenures include years of service during which these businesses/entities were known as Wells Fargo Asset Management and Wells Fargo Funds Management, LLC, respectively.
30 | Allspring Factor Enhanced U.S. Large Cap Equity Portfolio
Other information (unaudited)
LIQUIDITY RISK MANAGEMENT PROGRAM
In accordance with Rule 22e-4 under the Investment Company Act of 1940, as amended (the “Liquidity Rule”), Allspring Master Trust (the “Trust”) has adopted and implemented a liquidity risk management program (the “Program”) on behalf of each of its series, including the Portfolio, which is reasonably designed to assess and manage the Portfolio's liquidity risk. “Liquidity risk” is defined under the Liquidity Rule as the risk that the Portfolio is unable to meet redemption requests without significantly diluting remaining investors’ interests in the Portfolio. The Trust’s Board of Trustees (the “Board”) previously approved the designation of Allspring Funds Management, LLC (“Allspring Funds Management”), the Portfolio's investment adviser, to administer the Program, and Allspring Funds Management has established a Liquidity Risk Management Council (the "Council") composed of personnel from multiple departments within Allspring Funds Management and its affiliates to assist Allspring Funds Management in the administration of the Program.
The Program is comprised of various components designed to support the assessment and/or management of liquidity risk, including: (1) the periodic assessment (no less frequently than annually) of certain factors that influence the Portfolio's liquidity risk; (2) the periodic classification (no less frequently than monthly) of the Portfolio's investments into one of four liquidity categories that reflect an estimate of their liquidity under current market conditions; (3) a 15% limit on the acquisition of “illiquid investments” (as defined under the Liquidity Rule); (4) to the extent the Portfolio does not invest primarily in “highly liquid investments” (as defined under the Liquidity Rule), the determination of a minimum percentage of the Portfolio's assets that generally will be invested in highly liquid investments (an “HLIM”); (5) if the Portfolio has established an HLIM, the periodic review (no less frequently than annually) of the HLIM and the adoption of policies and procedures for responding to a shortfall of the Portfolio's “highly liquid investments” below its HLIM; and (6) periodic reporting to the Board.
At a meeting of the Board held on May 24-25, 2022, the Board received and reviewed a written report (the “Report”) from Allspring Funds Management that, among other things, addressed the operation of the Program and assessed its adequacy and effectiveness for the period from January 1, 2021 through December 31, 2021 (the “Reporting Period”). Other than extended foreign market holidays, no significant liquidity events impacting the Portfolios were noted in the Report. In addition, other than corporate-related changes to the Program, there were no material changes to the Program during the Reporting Period.
Allspring Funds Management determined in the Report that the Program has been implemented and operates effectively to manage the Portfolio’s liquidity risk, and Allspring Funds Management continues to believe that the Program has been and continues to be adequately and effectively implemented to monitor and, as applicable, respond to the Portfolio’s liquidity developments.
There can be no assurance that the Program will achieve its objectives under all circumstances in the future.
Allspring Factor Enhanced U.S. Large Cap Equity Portfolio | 31
For more information
More information about Allspring Funds is available free upon request. To obtain literature, please write, visit the Portfolio's website, or call:
Allspring Funds
P.O. Box 219967
Kansas City, MO 64121-9967
Website: allspringglobal.com
Individual investors: 1-800-222-8222
Retail investment professionals: 1-888-877-9275
Institutional investment professionals: 1-800-260-5969
This report and the financial statements contained herein are submitted for the general information of the interest holders of the Portfolio. If this report is used for promotional purposes, distribution of the report must be accompanied or preceded by a current prospectus. Before investing, please consider the investment objectives, risks, charges, and expenses of the investment. For a current prospectus and, if available, a summary prospectus, containing this information, call
1-800-222-8222. Read the prospectus carefully before you invest or send money.
Allspring Global InvestmentsTM is the trade name for the asset management firms of Allspring Global Investments Holdings, LLC, a holding company indirectly owned by certain private funds of GTCR LLC and Reverence Capital Partners, L.P. These firms include but are not limited to Allspring Global Investments, LLC, and Allspring Funds Management, LLC. Certain products managed by Allspring entities are distributed by Allspring Funds Distributor, LLC (a broker-dealer and Member FINRA/SIPC).
This material is for general informational and educational purposes only and is NOT intended to provide investment advice or a recommendation of any kind - including a recommendation for any specific investment, strategy, or plan.
© 2022 Allspring Global Investments Holdings, LLC. All rights reserved.
Semi-Annual Report
August 31, 2022
Allspring Factor Enhanced U.S. Small Cap Equity Portfolio
Allspring Factor Enhanced U.S. Small Cap Equity Portfolio ��| 1
Portfolio information (unaudited)
Investment objectiveThe Portfolio seeks long-term capital appreciation.
| Adviser | Allspring Funds Management, LLC |
| Subadviser | Allspring Global Investments, LLC |
| Portfolio managers | Harindra de Silva, Ph.D., CFA®‡, Monisha Jayakumar |
| Ten largest holdings (%) as of August 31, 20221 |
| Shockwave Medical Incorporated | 0.41 |
| Qualys Incorporated | 0.35 |
| Siga Technologies Incorporated | 0.32 |
| ExlService Holdings Incorporated | 0.29 |
| Lantheus Holdings Incorporated | 0.28 |
| Halozyme Therapeutics Incorporated | 0.27 |
| Ironwood Pharmaceuticals Incorporated | 0.27 |
| Karuna Therapeutics Incorporated | 0.27 |
| Alpha Metallurgical Resource Incorporated | 0.26 |
| AMN Healthcare Services Incorporated | 0.26 |
| 1 | Figures represent the percentage of the Portfolio's net assets. Holdings are subject to change and may have changed since the date specified. |
| Sector allocation as of August 31, 20221 |
| 1 | Figures represent the percentage of the Portfolio's long-term investments. Allocations are subject to change and may have changed since the date specified. |
| ‡ | CFA® and Chartered Financial Analyst® are trademarks owned by CFA Institute. |
2 | Allspring Factor Enhanced U.S. Small Cap Equity Portfolio
Portfolio of investments—August 31, 2022 (unaudited)
| | | | | Shares | Value |
| Common stocks: 95.85% | | | | | |
| Communication services: 2.82% | | | | | |
| Diversified telecommunication services: 0.75% | | | | | |
| ATN International Incorporated | | | | 269 | $ 12,603 |
| Charge Enterprises Incorporated † | | | | 39,207 | 95,273 |
| Cogent Communications Group Incorporated | | | | 2,484 | 132,273 |
| Consolidated Communications Holdings Incorporated † | | | | 3,470 | 19,918 |
| Echostar Corporation Class A † | | | | 8,520 | 156,853 |
| Globalstar Incorporated † | | | | 16,700 | 33,400 |
| IDT Corporation Class B † | | | | 2,689 | 68,758 |
| Iridium Communications Incorporated † | | | | 5,186 | 230,207 |
| Liberty Latin America Class A † | | | | 14,843 | 103,901 |
| Liberty Latin America Class C † | | | | 467 | 3,255 |
| Ooma Incorporated † | | | | 3,978 | 48,134 |
| Radius Global Infrastructure Incorporated Class A † | | | | 350 | 4,820 |
| | | | | | 909,395 |
| Entertainment: 0.26% | | | | | |
| Akazoo SA ♦† | | | | 5,400 | 0 |
| Chicken Soup for the Soul Entertainment Incorporated † | | | | 28 | 241 |
| Cinemark Holdings Incorporated † | | | | 6,067 | 85,423 |
| IMAX Corporation † | | | | 4,619 | 72,426 |
| Lions Gate Entertainment Class A † | | | | 2,908 | 28,644 |
| Lions Gate Entertainment Class B † | | | | 2,957 | 27,589 |
| Marcus Corporation | | | | 5,676 | 91,327 |
| The Madison Square Garden Entertainment Corporation † | | | | 204 | 11,334 |
| | | | | | 316,984 |
| Interactive media & services: 0.93% | | | | | |
| Actua Corporation ♦† | | | | 9,483 | 0 |
| Arena Group Holdings Incorporated † | | | | 7,141 | 75,123 |
| Bumble Incorporated Class A † | | | | 3,728 | 93,386 |
| CarGurus Incorporated † | | | | 4,566 | 85,384 |
| Cars.com Incorporated † | | | | 12,816 | 163,404 |
| DHI Group Incorporated † | | | | 21,129 | 107,758 |
| Eventbrite Incorporated Class A † | | | | 1,738 | 12,357 |
| EverQuote Incorporated Class A † | | | | 6,895 | 59,642 |
| FuboTV Incorporated † | | | | 6,816 | 24,674 |
| Leafly Holdings Incorporated † | | | | 12,721 | 20,099 |
| Outbrain Incorporated † | | | | 6,269 | 27,646 |
| QuinStreet Incorporated † | | | | 4,163 | 49,998 |
| TrueCar Incorporated † | | | | 19,518 | 42,549 |
| Yelp Incorporated † | | | | 4,123 | 140,883 |
| Ziff Davis Incorporated | | | | 2,057 | 158,965 |
| Ziprecruiter Incorporated Class A † | | | | 3,769 | 62,867 |
| | | | | | 1,124,735 |
| Media: 0.81% | | | | | |
| AdTheorent Holding Company Incorporated † | | | | 884 | 2,334 |
| AMC Networks Incorporated Class A † | | | | 2,855 | 76,485 |
| Audacy Incorporated † | | | | 107,240 | 59,154 |
| Clear Channel Outdoor Holdings † | | | | 11,152 | 17,843 |
| Entravision Communications Corporation Class A | | | | 23,141 | 117,556 |
| Gannett Company Incorporated † | | | | 27,552 | 63,921 |
| Gray Television Incorporated | | | | 1,265 | 24,162 |
The accompanying notes are an integral part of these financial statements.
Allspring Factor Enhanced U.S. Small Cap Equity Portfolio | 3
Portfolio of investments—August 31, 2022 (unaudited)
| | | | | Shares | Value |
| Media (continued) | | | | | |
| iHeartMedia Incorporated Class A † | | | | 5,495 | $ 48,631 |
| John Wiley & Sons Incorporated Class A | | | | 701 | 32,267 |
| Loyalty Ventures Incorporated † | | | | 56,863 | 119,981 |
| PubMatic Incorporated Class A † | | | | 1,947 | 38,103 |
| Scholastic Corporation | | | | 619 | 28,418 |
| Sinclair Broadcast Group Incorporated Class A | | | | 6,674 | 147,429 |
| TechTarget Incorporated † | | | | 179 | 11,617 |
| Thryv Holdings Incorporated † | | | | 3,815 | 97,588 |
| Urban One Incorporated Class A † | | | | 10,909 | 59,563 |
| Urban One Incorporated Class D † | | | | 7,771 | 32,560 |
| | | | | | 977,612 |
| Wireless telecommunication services: 0.07% | | | | | |
| Gogo Incorporated † | | | | 3,329 | 49,469 |
| NII Holdings Incorporated ♦‡ | | | | 14,979 | 7,490 |
| Telephone & Data Systems Incorporated | | | | 2,147 | 34,932 |
| | | | | | 91,891 |
| Consumer discretionary: 10.15% | | | | | |
| Auto components: 1.20% | | | | | |
| Adient plc † | | | | 6,787 | 225,328 |
| American Axle & Manufacturing Holdings Incorporated † | | | | 15,879 | 164,348 |
| Dana Incorporated | | | | 5,738 | 88,767 |
| Dorman Products Incorporated † | | | | 739 | 66,990 |
| Fox Factory Holding Corporation † | | | | 711 | 66,272 |
| Gentherm Incorporated † | | | | 1,447 | 86,675 |
| LCI Industries | | | | 1,197 | 138,696 |
| Modine Manufacturing Company † | | | | 3,597 | 53,883 |
| Patrick Industries Incorporated | | | | 1,385 | 73,363 |
| Standard Motor Products Incorporated | | | | 2,245 | 82,392 |
| The Goodyear Tire & Rubber Company † | | | | 15,077 | 211,530 |
| Visteon Corporation † | | | | 1,395 | 167,163 |
| XPEL Incorporated † | | | | 401 | 27,481 |
| | | | | | 1,452,888 |
| Automobiles: 0.48% | | | | | |
| Canoo Incorporated † | | | | 14,691 | 46,864 |
| Cenntro Electric Group Limited † | | | | 29,940 | 39,521 |
| Fisker Incorporated † | | | | 5,818 | 52,537 |
| Lordstown Motors Corporation Class A † | | | | 2 | 4 |
| Mullen Automotive Incorporated † | | | | 156,656 | 104,490 |
| Winnebago Industries Incorporated | | | | 4,355 | 250,761 |
| Workhorse Group Incorporated † | | | | 26,152 | 81,856 |
| | | | | | 576,033 |
| Distributors: 0.10% | | | | | |
| Funko Incorporated Class A † | | | | 5,370 | 119,590 |
| Diversified consumer services: 0.81% | | | | | |
| Adtalem Global Education Incorporated † | | | | 873 | 32,903 |
| American Public Education Incorporated † | | | | 377 | 3,894 |
| Beachbody Company Incorporated † | | | | 2,284 | 2,649 |
| Carriage Services Incorporated | | | | 3,557 | 125,953 |
| Frontdoor Incorporated † | | | | 2,454 | 57,620 |
| Graham Holdings Company Class B | | | | 194 | 109,693 |
The accompanying notes are an integral part of these financial statements.
4 | Allspring Factor Enhanced U.S. Small Cap Equity Portfolio
Portfolio of investments—August 31, 2022 (unaudited)
| | | | | Shares | Value |
| Diversified consumer services (continued) | | | | | |
| Laureate Education Incorporated Class A | | | | 12,830 | $ 141,387 |
| Perdoceo Education Corporation † | | | | 8,611 | 99,715 |
| Powerschool Holdings Incorporated Class A † | | | | 2,382 | 42,876 |
| Strategic Education Incorporated | | | | 1,135 | 73,435 |
| Stride Incorporated † | | | | 4,642 | 177,046 |
| Universal Technical Institute Incorporated † | | | | 8,787 | 60,279 |
| Vivint Smart Home Incorporated † | | | | 6,012 | 37,635 |
| WW International Incorporated † | | | | 3,251 | 16,970 |
| | | | | | 982,055 |
| Hotels, restaurants & leisure: 2.59% | | | | | |
| Accel Entertainment Incorporated † | | | | 4,820 | 45,356 |
| Biglari Holdings Incorporated Class B † | | | | 772 | 104,112 |
| BJ's Restaurants Incorporated † | | | | 956 | 23,976 |
| Bloomin' Brands Incorporated | | | | 8,928 | 180,524 |
| Bluegreen Vacations Holding | | | | 8,243 | 171,784 |
| Bowlero Corporation † | | | | 3,269 | 38,640 |
| Brinker International Incorporated † | | | | 2,511 | 61,545 |
| Cracker Barrel Old Country Store Incorporated | | | | 1,069 | 115,388 |
| Dave & Buster's Entertainment Incorporated † | | | | 2,071 | 85,615 |
| Denny’s Corporation † | | | | 2,767 | 26,148 |
| Dine Brands Global Incorporated | | | | 1,901 | 126,607 |
| El Pollo Loco Holdings Incorporated † | | | | 8,067 | 73,006 |
| Everi Holdings Incorporated † | | | | 7,914 | 146,409 |
| Full House Resorts Incorporated † | | | | 1,510 | 10,177 |
| Golden Entertainment Incorporated † | | | | 2,832 | 108,352 |
| Hilton Grand Vacations Incorporated † | | | | 1,917 | 78,175 |
| Inspirato Incorporated † | | | | 4,364 | 12,176 |
| Inspired Entertainment Incorporated † | | | | 3,272 | 34,258 |
| International Game Technology plc | | | | 7,945 | 142,533 |
| Jack In The Box Incorporated | | | | 541 | 43,204 |
| Krispy Kreme Incorporated | | | | 2,736 | 32,148 |
| Monarch Casino & Resort Incorporated † | | | | 1,064 | 64,255 |
| Noodles & Company † | | | | 1,996 | 9,481 |
| Papa John's International Incorporated | | | | 2,220 | 179,443 |
| Portillo's Incorporated Class A † | | | | 1,403 | 30,894 |
| RCI Hospitality Holdings Incorporated | | | | 715 | 46,625 |
| Red Rock Resorts Incorporated Class A | | | | 4,895 | 187,087 |
| Ruth's Hospitality Group Incorporated | | | | 6,844 | 124,698 |
| Scientific Games Corporation † | | | | 3,352 | 165,019 |
| SeaWorld Entertainment Incorporated † | | | | 3,322 | 166,931 |
| Target Hospitality Corporation † | | | | 3,498 | 46,488 |
| Texas Roadhouse Incorporated | | | | 2,354 | 208,941 |
| The Cheesecake Factory Incorporated | | | | 2,259 | 69,171 |
| The ONE Group Hospitality Incorporated † | | | | 14,570 | 104,030 |
| Wingstop Incorporated | | | | 439 | 49,985 |
| Xponential Fitness Incorporated Class A † | | | | 1,318 | 24,159 |
| | | | | | 3,137,340 |
| Household durables: 1.21% | | | | | |
| Beazer Homes Incorporated † | | | | 6,940 | 98,826 |
| Cavco Industries Incorporated † | | | | 239 | 55,928 |
| Century Communities Incorporated | | | | 1,965 | 91,746 |
| Dream Finders Homes Incorporated † | | | | 966 | 11,930 |
| Ethan Allen Interiors Incorporated | | | | 2,065 | 49,085 |
The accompanying notes are an integral part of these financial statements.
Allspring Factor Enhanced U.S. Small Cap Equity Portfolio | 5
Portfolio of investments—August 31, 2022 (unaudited)
| | | | | Shares | Value |
| Household durables (continued) | | | | | |
| GoPro Incorporated Class A † | | | | 6,655 | $ 40,529 |
| Green Brick Partners Incorporated † | | | | 1,850 | 45,066 |
| Helen of Troy Limited † | | | | 490 | 60,579 |
| Hovnanian Enterprises Incorporated Class A † | | | | 253 | 10,143 |
| KB Home Incorporated | | | | 3,399 | 97,381 |
| La-Z-Boy Incorporated | | | | 936 | 24,701 |
| Legacy Housing Corporation † | | | | 3,014 | 51,509 |
| LGI Homes Incorporated † | | | | 426 | 40,432 |
| Lifetime Brands Incorporated | | | | 3,093 | 27,590 |
| M/I Homes Incorporated † | | | | 854 | 36,927 |
| MDC Holdings Incorporated | | | | 1,614 | 50,163 |
| Meritage Corporation † | | | | 1,397 | 109,455 |
| Purple Innovation Incorporated † | | | | 2,154 | 6,160 |
| Skyline Champion Corporation † | | | | 2,297 | 130,171 |
| Snap One Holdings Corporation † | | | | 523 | 5,852 |
| Sonos Incorporated † | | | | 2,807 | 42,217 |
| Taylor Morrison Home Corporation † | | | | 6,163 | 154,753 |
| The Lovesac Company † | | | | 1,438 | 44,362 |
| TRI Pointe Homes Incorporated † | | | | 4,775 | 82,751 |
| Tupperware Brands Corporation † | | | | 7,454 | 83,783 |
| Vizio Holding Corporation Class A † | | | | 913 | 9,787 |
| | | | | | 1,461,826 |
| Internet & direct marketing retail: 0.92% | | | | | |
| 1-800-Flowers.com Incorporated Class A † | | | | 8,574 | 74,422 |
| A.K.A. Brands Holding Corporation † | | | | 11,124 | 23,138 |
| BARK Incorporated † | | | | 30,335 | 70,377 |
| CarParts.com Incorporated † | | | | 5,239 | 33,949 |
| ContextLogic Incorporated Class A † | | | | 35,619 | 46,305 |
| Duluth Holdings Incorporated Class B † | | | | 12,641 | 112,126 |
| Groupon Incorporated † | | | | 12,482 | 123,697 |
| Lands End Incorporated † | | | | 4,178 | 57,740 |
| Liquidity Services Incorporated † | | | | 4,779 | 83,585 |
| LuLu's Fashion Lounge Holdings Incorporated † | | | | 7,007 | 44,705 |
| Overstock.com Incorporated † | | | | 3,580 | 93,438 |
| PetMed Express Incorporated | | | | 2,725 | 56,053 |
| Porch Group Incorporated † | | | | 5,154 | 11,081 |
| Quotient Technology Incorporated † | | | | 19,468 | 36,210 |
| Revolve Group Incorporated † | | | | 1,801 | 42,305 |
| RumbleOn Incorporated Class B † | | | | 3,592 | 78,485 |
| Shutterstock Incorporated | | | | 1,270 | 70,371 |
| Stitch Fix Incorporated Class A † | | | | 8,652 | 43,433 |
| The RealReal Incorporated † | | | | 3,282 | 7,023 |
| ThredUp Incorporated Class A † | | | | 2,162 | 5,210 |
| | | | | | 1,113,653 |
| Leisure products: 0.50% | | | | | |
| Acushnet Holdings Corporation | | | | 1,366 | 65,090 |
| Latham Group Incorporated † | | | | 9,493 | 54,205 |
| Malibu Boats Incorporated Class A † | | | | 1,246 | 74,797 |
| Mastercraft Boat Holdings Incorporated † | | | | 3,959 | 95,372 |
| Smith & Wesson Brands Incorporated | | | | 9,262 | 123,185 |
| Solo Brands Incorporated Class A † | | | | 16,630 | 69,015 |
The accompanying notes are an integral part of these financial statements.
6 | Allspring Factor Enhanced U.S. Small Cap Equity Portfolio
Portfolio of investments—August 31, 2022 (unaudited)
| | | | | Shares | Value |
| Leisure products (continued) | | | | | |
| Sturm, Ruger & Company Incorporated | | | | 996 | $ 52,041 |
| Vista Outdoor Incorporated † | | | | 2,517 | 70,778 |
| | | | | | 604,483 |
| Multiline retail: 0.09% | | | | | |
| Dillard's Incorporated Class A | | | | 311 | 92,131 |
| Franchise Group Incorporated | | | | 682 | 23,113 |
| | | | | | 115,244 |
| Specialty retail: 1.74% | | | | | |
| Abercrombie & Fitch Company Class A † | | | | 3,002 | 43,199 |
| Academy Sports & Outdoors Corporation | | | | 4,446 | 191,534 |
| ARKO Corporation | | | | 1,183 | 11,274 |
| Asbury Automotive Group Incorporated † | | | | 627 | 109,399 |
| Big 5 Sporting Goods Corporation | | | | 870 | 10,649 |
| Boot Barn Holdings Incorporated † | | | | 749 | 49,898 |
| Build-A-Bear Workshop Incorporated | | | | 5,028 | 77,029 |
| Caleres Incorporated | | | | 2,933 | 74,850 |
| Chico's FAS Incorporated † | | | | 6,142 | 34,887 |
| Children's Place Retail Stores Incorporated † | | | | 237 | 9,997 |
| Citi Trends Incorporated † | | | | 3,361 | 67,892 |
| Conn's Incorporated † | | | | 3,512 | 33,750 |
| Designer Brands Incorporated Class A | | | | 2,811 | 47,956 |
| Destination XL Group Incorporated † | | | | 16,027 | 88,309 |
| Express Incorporated † | | | | 58,045 | 88,228 |
| Foot Locker Incorporated | | | | 660 | 24,314 |
| Genesco Incorporated † | | | | 222 | 12,561 |
| Group 1 Automotive Incorporated | | | | 810 | 144,658 |
| Hibbett Incorporated | | | | 1,620 | 94,932 |
| Murphy USA Incorporated | | | | 730 | 211,824 |
| ODP Corporation † | | | | 1,481 | 52,946 |
| Onewater Marine Incorporated Class A † | | | | 1,346 | 53,638 |
| Party City Holdco Incorporated † | | | | 84,003 | 165,486 |
| Rent-A-Center Incorporated | | | | 180 | 4,651 |
| Sally Beauty Holdings Incorporated † | | | | 4,775 | 71,052 |
| Signet Jewelers Limited | | | | 2,498 | 163,263 |
| Sonic Automotive Incorporated Class A | | | | 831 | 44,201 |
| The Buckle Incorporated | | | | 1,352 | 43,643 |
| Tilly's Incorporated Class A | | | | 2,159 | 16,193 |
| TravelCenters of America Incorporated † | | | | 1,107 | 59,867 |
| Zumiez Incorporated † | | | | 324 | 8,411 |
| | | | | | 2,110,491 |
| Textiles, apparel & luxury goods: 0.51% | | | | | |
| Crocs Incorporated † | | | | 2,707 | 199,506 |
| Fossil Group Incorporated † | | | | 6,401 | 27,076 |
| Kontoor Brands Incorporated | | | | 1,599 | 59,531 |
| Movado Group Incorporated | | | | 3,205 | 102,207 |
| Oxford Industries Incorporated | | | | 1,220 | 130,211 |
| Rocky Brands Incorporated | | | | 321 | 8,388 |
| Steven Madden Limited | | | | 2,603 | 75,773 |
| Superior Uniform Group Incorporated | | | | 388 | 4,311 |
| Unifi Incorporated † | | | | 638 | 7,248 |
| Wolverine World Wide Incorporated | | | | 225 | 4,397 |
| | | | | | 618,648 |
The accompanying notes are an integral part of these financial statements.
Allspring Factor Enhanced U.S. Small Cap Equity Portfolio | 7
Portfolio of investments—August 31, 2022 (unaudited)
| | | | | Shares | Value |
| Consumer staples: 3.50% | | | | | |
| Beverages: 0.64% | | | | | |
| Celsius Holdings Incorporated † | | | | 1,872 | $ 193,733 |
| Coca Cola Bottling Corporation | | | | 268 | 127,120 |
| Duckhorn Portfolio Incorporated † | | | | 1,207 | 22,016 |
| MGP Ingredients Incorporated | | | | 1,313 | 143,721 |
| National Beverage Corporation | | | | 2,409 | 133,603 |
| Primo Water Corporation | | | | 5,730 | 75,292 |
| Vita Coco Company Incorporated † | | | | 5,135 | 76,974 |
| | | | | | 772,459 |
| Food & staples retailing: 0.41% | | | | | |
| Ingles Markets Incorporated Class A | | | | 458 | 40,089 |
| SpartanNash Company | | | | 3,718 | 113,139 |
| Sprouts Farmers Market Incorporated † | | | | 5,784 | 167,158 |
| The Andersons Incorporated | | | | 944 | 34,956 |
| The Chef's Warehouse Incorporated † | | | | 121 | 4,034 |
| United Natural Foods Incorporated † | | | | 3,172 | 139,822 |
| | | | | | 499,198 |
| Food products: 1.36% | | | | | |
| Alico Incorporated | | | | 1,555 | 52,792 |
| B&G Foods Incorporated | | | | 3,076 | 66,626 |
| BRC Incorporated † | | | | 1,158 | 11,291 |
| Calavo Growers Incorporated | | | | 1,101 | 46,286 |
| Cal-Maine Foods Incorporated | | | | 3,768 | 202,002 |
| Fresh Del Monte Produce Incorporated | | | | 4,365 | 119,339 |
| Hain Celestial Group Incorporated † | | | | 3,447 | 69,836 |
| Hostess Brands Incorporated † | | | | 9,494 | 220,071 |
| J & J Snack Foods Corporation | | | | 598 | 89,120 |
| John B. Sanfilippo & Son Incorporated | | | | 719 | 58,045 |
| Lancaster Colony Corporation | | | | 547 | 92,197 |
| Landec Corporation † | | | | 7,271 | 76,346 |
| Seneca Foods Corporation Class A † | | | | 1,131 | 59,751 |
| SunOpta Incorporated † | | | | 12,173 | 120,878 |
| Tattooed Chef Incorporated † | | | | 2,118 | 14,106 |
| The Simply Good Foods Company † | | | | 5,074 | 155,011 |
| Tootsie Roll Industries Incorporated | | | | 1,686 | 60,409 |
| TreeHouse Foods Incorporated † | | | | 2,887 | 134,534 |
| | | | | | 1,648,640 |
| Household products: 0.16% | | | | | |
| Central Garden & Pet Company † | | | | 1,843 | 73,573 |
| Energizer Holdings Incorporated | | | | 1,648 | 46,309 |
| WD-40 Company | | | | 375 | 70,935 |
| | | | | | 190,817 |
| Personal products: 0.75% | | | | | |
| Beauty Health Company † | | | | 1,183 | 13,723 |
| Bellring Brands Incorporated † | | | | 5,659 | 134,062 |
| e.l.f. Beauty Incorporated † | | | | 2,975 | 113,437 |
| Edgewell Personal Care Company | | | | 3,717 | 144,814 |
| Herbalife Nutrition Limited † | | | | 7,229 | 188,605 |
| Inter Parfums Incorporated | | | | 412 | 32,350 |
| Medifast Incorporated | | | | 515 | 64,622 |
The accompanying notes are an integral part of these financial statements.
8 | Allspring Factor Enhanced U.S. Small Cap Equity Portfolio
Portfolio of investments—August 31, 2022 (unaudited)
| | | | | Shares | Value |
| Personal products (continued) | | | | | |
| Natures Sunshine Products Incorporated † | | | | 7,074 | $ 68,618 |
| NU Skin Enterprises Incorporated Class A | | | | 2,308 | 94,490 |
| Thorne Healthtech Incorporated † | | | | 6,077 | 28,440 |
| USANA Health Sciences Incorporated † | | | | 341 | 22,001 |
| | | | | | 905,162 |
| Tobacco: 0.18% | | | | | |
| Universal Corporation | | | | 1,234 | 62,983 |
| Vector Group Limited | | | | 16,047 | 157,261 |
| | | | | | 220,244 |
| Energy: 4.87% | | | | | |
| Energy equipment & services: 1.17% | | | | | |
| Archrock Incorporated | | | | 3,241 | 23,951 |
| Borr Drilling Limited † | | | | 6,516 | 26,129 |
| Bristow Group Incorporated † | | | | 1,134 | 32,897 |
| Cactus Incorporated Class A | | | | 3,330 | 133,034 |
| ChampionX Corporation | | | | 7,122 | 155,331 |
| Helmerich & Payne Incorporated | | | | 3,302 | 141,161 |
| Liberty Oilfield Services Class A † | | | | 4,226 | 63,390 |
| Nabors Industries Limited † | | | | 100 | 13,251 |
| Nextier Oilfield Solutions Incorporated † | | | | 8,440 | 79,083 |
| Noble Corporation † | | | | 1,811 | 54,964 |
| Oceaneering International Incorporated † | | | | 1,878 | 16,620 |
| Oil States International Incorporated † | | | | 113 | 554 |
| Patterson-UTI Energy Incorporated | | | | 10,578 | 157,612 |
| ProPetro Holding Corporation † | | | | 8,365 | 76,623 |
| RPC Incorporated | | | | 2,081 | 16,544 |
| Select Energy Services Incorporated Class A † | | | | 437 | 3,107 |
| Solaris Oilfield Infrastructure Incorporated Class A | | | | 1,809 | 19,356 |
| Tetra Technologies Incorporated † | | | | 25,299 | 100,690 |
| Tidewater Incorporated † | | | | 1,547 | 34,282 |
| US Silica Holdings Incorporated † | | | | 2,883 | 40,448 |
| Valaris Limited † | | | | 2,490 | 126,940 |
| Weatherford International plc † | | | | 3,379 | 95,085 |
| | | | | | 1,411,052 |
| Oil, gas & consumable fuels: 3.70% | | | | | |
| Aemetis Incorporated † | | | | 1,339 | 12,212 |
| Alto Ingredients Incorporated † | | | | 9,028 | 39,001 |
| Arch Resources Incorporated | | | | 1,192 | 173,531 |
| Ardmore Shipping Corporation † | | | | 5,506 | 53,078 |
| Berry Corporation | | | | 7,743 | 70,848 |
| Brigham Minerals Incorporated Class A | | | | 1,949 | 57,983 |
| California Resources Corporation | | | | 3,912 | 195,444 |
| Callon Petroleum Company † | | | | 3,475 | 147,896 |
| Centrus Energy Corporation Class A † | | | | 2,413 | 120,192 |
| Chord Energy Corporation | | | | 1,675 | 237,096 |
| Civitas Resources Incorporated | | | | 1,325 | 89,027 |
| CNX Resources Corporation † | | | | 2,463 | 43,521 |
| Comstock Resources Incorporated † | | | | 2,555 | 50,078 |
| Consol Energy Incorporated | | | | 2,932 | 210,459 |
| CVR Energy Incorporated | | | | 3,475 | 113,494 |
| Delek US Holdings Incorporated | | | | 1,675 | 47,319 |
| Denbury Incorporated † | | | | 2,318 | 206,140 |
The accompanying notes are an integral part of these financial statements.
Allspring Factor Enhanced U.S. Small Cap Equity Portfolio | 9
Portfolio of investments—August 31, 2022 (unaudited)
| | | | | Shares | Value |
| Oil, gas & consumable fuels (continued) | | | | | |
| DHT Holdings Incorporated | | | | 3,553 | $ 27,749 |
| Dorian LPG Limited | | | | 4,067 | 59,175 |
| Earthstone Energy Incorporated Class A † | | | | 1,433 | 21,782 |
| Equitrans Midstream Corporation | | | | 7,286 | 67,541 |
| Flex LNG Limited | | | | 1,345 | 44,479 |
| Golar LNG Limited † | | | | 314 | 8,563 |
| Gulfport Energy Corporation † | | | | 37 | 3,617 |
| Kosmos Energy Limited † | | | | 25,693 | 181,650 |
| Laredo Petroleum Incorporated † | | | | 1,588 | 123,245 |
| Magnolia Oil & Gas Corporation Class A | | | | 9,318 | 222,421 |
| Matador Resources Company | | | | 4,712 | 280,835 |
| Murphy Oil Corporation | | | | 8,079 | 314,839 |
| Northern Oil and Gas Incorporated | | | | 3,395 | 107,418 |
| Par Pacific Holdings Incorporated † | | | | 1,242 | 23,350 |
| PBF Energy Incorporated Class A † | | | | 4,487 | 153,276 |
| Peabody Energy Corporation † | | | | 7,181 | 177,083 |
| Permian Resources Corporation † | | | | 8,692 | 71,535 |
| Ranger Oil Corporation Class A | | | | 304 | 11,853 |
| Rex American Resources Corporation † | | | | 789 | 23,907 |
| Riley Exploration Permian Incorporated | | | | 977 | 24,562 |
| Ring Energy Incorporated † | | | | 3,976 | 12,882 |
| Sandridge Energy Incorporated † | | | | 344 | 7,217 |
| Scorpio Tankers Incorporated | | | | 1,520 | 63,232 |
| SFL Corporation Limited | | | | 11,016 | 117,871 |
| Sitio Royalties Corporation | | | | 528 | 13,432 |
| SM Energy Company | | | | 4,336 | 191,088 |
| Southwestern Energy Company † | | | | 29,519 | 221,097 |
| Talos Energy Incorporated † | | | | 537 | 11,132 |
| Teekay Tankers Limited Class A † | | | | 616 | 15,154 |
| Vaalco Energy Incorporated | | | | 2,764 | 13,848 |
| | | | | | 4,483,152 |
| Financials: 14.81% | | | | | |
| Banks: 8.28% | | | | | |
| 1st Source Corporation | | | | 569 | 26,851 |
| Amalgamated Financial Corporation | | | | 1,743 | 39,218 |
| Amerant Bancorp Incorporated Class A | | | | 1,374 | 35,985 |
| American National Bankshares Incorporated | | | | 963 | 31,712 |
| Ameris Bancorp | | | | 2,258 | 105,403 |
| Associated Banc Corporation | | | | 7,481 | 149,919 |
| Atlantic Union Bankshares Corporation | | | | 3,695 | 119,903 |
| Banc of California Incorporated | | | | 2,708 | 45,711 |
| BancFirst Corporation | | | | 1,309 | 141,189 |
| Bank First Corporation | | | | 301 | 24,462 |
| Bank of N.T. Butterfield & Son Limited | | | | 2,174 | 70,916 |
| BankUnited Incorporated | | | | 3,414 | 126,489 |
| Bankwell Financial Group Incorporated | | | | 1,768 | 55,727 |
| Banner Corporation | | | | 1,628 | 98,917 |
| Bar Harbor Bankshares | | | | 745 | 21,106 |
| Baycom Corporation | | | | 3,445 | 64,111 |
| BCB Bancorp Incorporated | | | | 4,770 | 85,860 |
| Berkshire Hills Bancorp Incorporated | | | | 2,409 | 67,958 |
| Brookline Bancorp Incorporated | | | | 6,612 | 82,452 |
| Business First Bancshares Incorporated | | | | 415 | 9,790 |
| Byline Bancorp Incorporated | | | | 1,650 | 35,987 |
The accompanying notes are an integral part of these financial statements.
10 | Allspring Factor Enhanced U.S. Small Cap Equity Portfolio
Portfolio of investments—August 31, 2022 (unaudited)
| | | | | Shares | Value |
| Banks (continued) | | | | | |
| Cadence Bank | | | | 5,362 | $ 136,624 |
| Cambridge Bancorp | | | | 156 | 12,828 |
| Camden National Corporation | | | | 625 | 28,269 |
| Capital Bancorp Incorporated | | | | 870 | 21,550 |
| Capital City Bank Group Incorporated | | | | 1,221 | 38,987 |
| Carter Bankshares Incorporated † | | | | 7,242 | 119,276 |
| Cathay General Bancorp | | | | 3,957 | 165,957 |
| Central Pacific Financial Company | | | | 612 | 13,335 |
| City Holding Company | | | | 1,104 | 93,851 |
| Civista Bancshares Incorporated | | | | 672 | 14,213 |
| CNB Financial Corporation | | | | 2,711 | 71,354 |
| Coastal Financial Corporation † | | | | 588 | 23,638 |
| Columbia Banking System Incorporated | | | | 1,419 | 42,499 |
| Community Bank System Incorporated | | | | 1,061 | 69,368 |
| Community Trust Bancorp | | | | 1,570 | 66,333 |
| ConnectOne Bancorp Incorporated | | | | 2,915 | 72,962 |
| CrossFirst Bankshares Incorporated † | | | | 3,586 | 47,263 |
| Customers Bancorp Incorporated † | | | | 1,432 | 49,676 |
| CVB Financial Corporation | | | | 6,381 | 167,437 |
| Eagle Bancorp Incorporated | | | | 552 | 26,789 |
| Eastern Bankshares Incorporated | | | | 3,560 | 69,064 |
| Enterprise Financial Service Corporation | | | | 394 | 18,014 |
| Equity Bancshares Incorporated Class A | | | | 301 | 9,400 |
| Esquire Financial Holdings Class I | | | | 1,664 | 62,200 |
| Farmers & Merchants Banco | | | | 1,062 | 30,331 |
| Farmers National Banc Corporation | | | | 1,461 | 20,878 |
| FB Financial Corporation | | | | 171 | 6,775 |
| Financial Institutions Incorporated | | | | 966 | 25,145 |
| First Bancorp Incorporated | | | | 161 | 4,669 |
| First Bancorp of North Carolina | | | | 138 | 5,025 |
| First Bancorp of Puerto Rico | | | | 10,688 | 152,838 |
| First Bank | | | | 5,674 | 85,053 |
| First Busey Corporation | | | | 771 | 17,733 |
| First Business Financial Services Incorporated | | | | 2,825 | 94,016 |
| First Commonwealth Financial Corporation | | | | 6,809 | 91,785 |
| First Financial Bancorp | | | | 3,807 | 82,155 |
| First Financial Bankshares Incorporated | | | | 2,008 | 85,360 |
| First Financial Corporation | | | | 1,697 | 78,911 |
| First Foundation Incorporated | | | | 346 | 6,560 |
| First Guaranty Bancshares Incorporated | | | | 2,605 | 58,039 |
| First Internet Bancorp | | | | 627 | 22,992 |
| First Interstate BancSystem Class A | | | | 1,237 | 49,802 |
| First Merchants Corporation | | | | 1,544 | 61,482 |
| First of Long Island Corporation | | | | 625 | 11,506 |
| First Western Financial Incorporated † | | | | 368 | 9,763 |
| Five Star Bancorp | | | | 1,517 | 38,577 |
| Flushing Financial Corporation | | | | 1,113 | 22,983 |
| Fulton Financial Corporation | | | | 7,558 | 122,666 |
| Glacier Bancorp Incorporated | | | | 2,556 | 129,538 |
| Great Southern Bancorp Incorporated | | | | 1,840 | 108,155 |
| Guaranty Bancshares Incorporated | | | | 1,172 | 40,610 |
| Hancock Whitney Corporation | | | | 3,898 | 188,001 |
| Hanmi Financial Corporation | | | | 4,920 | 121,622 |
| HarborOne Bancorp Incorporated | | | | 3,080 | 42,011 |
| HBT Financial Incorporated | | | | 2,114 | 38,221 |
| Heartland Financial USA Incorporated | | | | 1,203 | 53,738 |
The accompanying notes are an integral part of these financial statements.
Allspring Factor Enhanced U.S. Small Cap Equity Portfolio | 11
Portfolio of investments—August 31, 2022 (unaudited)
| | | | | Shares | Value |
| Banks (continued) | | | | | |
| Heritage Commerce Corporation | | | | 1,154 | $ 13,029 |
| Heritage Financial Corporation | | | | 1,962 | 50,992 |
| Hilltop Holdings Incorporated | | | | 1,975 | 52,140 |
| Home BancShares Incorporated | | | | 6,987 | 164,404 |
| Homestreet Incorporated | | | | 825 | 28,718 |
| Hometrust Bancshares Incorporated | | | | 1,938 | 45,000 |
| Hope Bancorp Incorporated | | | | 8,408 | 121,664 |
| Horizon Bancorp Indiana | | | | 2,684 | 50,781 |
| Independent Bank Corporation | | | | 1,644 | 33,735 |
| Independent Bank Corporation | | | | 1,324 | 103,577 |
| Independent Bank Group Incorporated | | | | 1,282 | 86,356 |
| International Bancshares Corporation | | | | 1,235 | 51,537 |
| Lakeland Bancorp Incorporated | | | | 355 | 5,783 |
| Lakeland Financial Corporation | | | | 509 | 38,348 |
| Live Oak Bancshares Incorporated | | | | 1,530 | 55,447 |
| Macatawa Bank Corporation | | | | 3,298 | 31,397 |
| Mercantile Bank Corporation | | | | 1,025 | 33,907 |
| Meta Financial Group Incorporated | | | | 1,322 | 43,573 |
| Metrocity Bankshares Incorporated | | | | 855 | 17,091 |
| Metropolitan Bank Holding Corporation † | | | | 574 | 41,093 |
| Mid Penn Bancorp Incorporated | | | | 376 | 10,938 |
| Midland States Bancorp Incorporated | | | | 2,562 | 64,281 |
| MidWestOne Financial Group Incorporated | | | | 1,404 | 42,822 |
| National Bank Holdings Corporation Class A | | | | 1,343 | 53,895 |
| NBT Bancorp Incorporated | | | | 2,815 | 109,166 |
| Nicolet Bankshares Incorporated † | | | | 106 | 8,117 |
| Northeast Bank | | | | 325 | 12,600 |
| Northwest Bancshares Incorporated | | | | 5,357 | 75,373 |
| OceanFirst Financial Corporation | | | | 4,019 | 78,129 |
| OFG Bancorp | | | | 5,844 | 158,957 |
| Old National Bancorp | | | | 6,852 | 114,360 |
| Old Second Bancorp Incorporated | | | | 339 | 4,651 |
| Origin Bancorp Incorporated | | | | 1,013 | 41,381 |
| Orrstown Financial Services Incorporated | | | | 3,592 | 92,422 |
| Pacific Premier Bancorp Incorporated | | | | 3,115 | 102,047 |
| Park National Corporation | | | | 845 | 111,396 |
| Parke Bancorp Incorporated | | | | 1,388 | 30,786 |
| PCB Bancorp | | | | 4,252 | 79,853 |
| Peapack-Gladstone Financial Corporation | | | | 1,324 | 44,579 |
| Peoples Financial Services | | | | 1,167 | 56,810 |
| Preferred Bank | | | | 1,409 | 95,587 |
| Premier Financial Corporation | | | | 2,742 | 74,089 |
| QCR Holdings Incorporated | | | | 2,065 | 115,330 |
| RBB Bancorp | | | | 50 | 1,105 |
| Renasant Corporation | | | | 365 | 12,169 |
| Republic Bancorp Incorporated Class A | | | | 405 | 17,213 |
| Republic First Bancorp Incorporated † | | | | 6,872 | 21,853 |
| S&T Bancorp Incorporated | | | | 1,772 | 52,522 |
| Sandy Spring Bancorp Incorporated | | | | 3,031 | 116,754 |
| Seacoast Banking Corporation | | | | 2,107 | 68,098 |
| ServisFirst Bancshares Incorporated | | | | 1,412 | 119,116 |
| Sierra Bancorp | | | | 1,134 | 23,496 |
| Silvergate Capital Corporation Class A † | | | | 1,132 | 103,148 |
| Simmons First National Corporation Class A | | | | 3,399 | 80,182 |
| South Plains Financial Incorporated | | | | 2,096 | 56,864 |
| South State Corporation | | | | 2,874 | 224,287 |
The accompanying notes are an integral part of these financial statements.
12 | Allspring Factor Enhanced U.S. Small Cap Equity Portfolio
Portfolio of investments—August 31, 2022 (unaudited)
| | | | | Shares | Value |
| Banks (continued) | | | | | |
| Southern First Bancshares † | | | | 32 | $ 1,380 |
| Southside Bancshares Incorporated | | | | 2,402 | 90,507 |
| Stock Yards Bancorp Incorporated | | | | 423 | 28,028 |
| Summit Financial Group Incorporated | | | | 2,916 | 83,164 |
| Texas Capital Bancshares Incorporated † | | | | 2,044 | 120,657 |
| The Bancorp Incorporated † | | | | 4,752 | 112,717 |
| Tompkins Trust Company Incorporated | | | | 433 | 31,020 |
| Towne Bank | | | | 1,686 | 48,034 |
| TriCo Bancshares | | | | 1,264 | 59,648 |
| Triumph Bancorp Incorporated † | | | | 1,103 | 68,287 |
| Trustmark Corporation | | | | 1,953 | 61,598 |
| UMB Financial Corporation | | | | 918 | 82,133 |
| United Bankshares Incorporated | | | | 4,500 | 166,950 |
| United Community Bank | | | | 3,735 | 125,235 |
| Unity Bancorp Incorporated | | | | 4,118 | 115,428 |
| Univest Financial Corporation | | | | 899 | 22,295 |
| USCB Financial Holdings Incorporated † | | | | 3,556 | 46,228 |
| Valley National Bancorp | | | | 14,177 | 164,737 |
| Veritex Holdings Incorporated | | | | 2,498 | 75,215 |
| Washington Trust Bancorp | | | | 1,027 | 51,997 |
| WesBanco Incorporated | | | | 3,050 | 104,341 |
| Westamerica Bancorporation | | | | 585 | 32,731 |
| | | | | | 10,022,771 |
| Capital markets: 1.24% | | | | | |
| Artisan Partners Asset Management Incorporated Class A | | | | 3,093 | 104,420 |
| Associated Capital Group Incorporated Class A | | | | 471 | 18,647 |
| BGC Partners Incorporated Class A | | | | 9,424 | 37,884 |
| Blucora Incorporated † | | | | 2,900 | 58,232 |
| BrightSphere Investment Group Incorporated | | | | 4,562 | 77,965 |
| Cohen & Steers Incorporated | | | | 19 | 1,356 |
| Diamond Hill Investment Group | | | | 52 | 8,895 |
| Donnelley Financial Solutions † | | | | 1,513 | 64,227 |
| Federated Hermes Incorporated | | | | 4,458 | 151,839 |
| Focus Financial Partners Class A † | | | | 1,028 | 40,246 |
| GCM Grosvenor Incorporated Class A | | | | 9,983 | 78,367 |
| Hamilton Lane Incorporated Class A | | | | 513 | 35,695 |
| Houlihan Lokey Incorporated | | | | 1,745 | 136,983 |
| Moelis Company Class A | | | | 2,185 | 91,027 |
| Open Lending Corporation Class A † | | | | 1,925 | 18,692 |
| Piper Sandler Companies | | | | 805 | 92,229 |
| PJT Partners Incorporated Class A | | | | 1,463 | 101,269 |
| Sculptor Capital Management Incorporated | | | | 5,717 | 53,911 |
| Silvercrest Asset Management Group Incorporated Class A | | | | 1,667 | 29,789 |
| Stepstone Group Incorporated Class A | | | | 1,637 | 44,674 |
| Stonex Group Incorporated † | | | | 1,586 | 147,244 |
| Value Line Incorporated | | | | 609 | 49,944 |
| Virtus Investment Partners Incorporated | | | | 340 | 65,025 |
| | | | | | 1,508,560 |
| Consumer finance: 0.63% | | | | | |
| Atlanticus Holdings Corporation † | | | | 1,162 | 33,082 |
| Consumer Portfolio Services † | | | | 6,623 | 77,092 |
| Encore Capital Group Incorporated † | | | | 1,423 | 77,810 |
| Enova International Incorporated † | | | | 1,474 | 51,502 |
| Ezcorp Incorporated † | | | | 6,893 | 60,314 |
The accompanying notes are an integral part of these financial statements.
Allspring Factor Enhanced U.S. Small Cap Equity Portfolio | 13
Portfolio of investments—August 31, 2022 (unaudited)
| | | | | Shares | Value |
| Consumer finance (continued) | | | | | |
| FirstCash Holdings Incorporated | | | | 465 | $ 36,251 |
| LendingClub Corporation † | | | | 2,156 | 28,179 |
| Navient Corporation | | | | 5,097 | 78,443 |
| Nelnet Incorporated Class A | | | | 858 | 72,278 |
| Oportun Financial Corporation † | | | | 48 | 245 |
| OppFi Incorporated † | | | | 13,301 | 36,046 |
| PRA Group Incorporated † | | | | 1,148 | 42,407 |
| PROG Holdings Incorporated † | | | | 9,043 | 167,657 |
| Regional Management Corporation | | | | 7 | 236 |
| | | | | | 761,542 |
| Diversified financial services: 0.25% | | | | | |
| A-Mark Precious Metals Incorporated | | | | 4,636 | 143,299 |
| Jackson Financial Incorporation Class A | | | | 5,117 | 159,957 |
| | | | | | 303,256 |
| Insurance: 2.01% | | | | | |
| American Equity Investment Life Holding Company | | | | 3,926 | 149,188 |
| Amerisafe Incorporated | | | | 2,586 | 123,663 |
| Argo Group International Holdings Limited | | | | 1,604 | 31,487 |
| BRP Group Incorporated Class A † | | | | 2,020 | 63,428 |
| CNO Financial Group Incorporated | | | | 7,605 | 140,008 |
| Crawford & Company Class A | | | | 3,508 | 21,329 |
| Donegal Group Incorporated Class A | | | | 2,755 | 40,003 |
| eHealth Incorporated † | | | | 3,356 | 21,478 |
| Employers Holdings Incorporated | | | | 3,367 | 131,852 |
| Enstar Group Limited † | | | | 288 | 54,504 |
| Genworth Financial Incorporated Class A † | | | | 58,227 | 245,718 |
| Goosehead Insurance Incorporated Class A † | | | | 274 | 14,248 |
| Greenlight Capital Limited † | | | | 11,679 | 92,147 |
| Horace Mann Educators Corporation | | | | 1,691 | 60,487 |
| Investors Title Company | | | | 192 | 28,291 |
| James River Group Holdings Limited | | | | 580 | 13,781 |
| Kinsale Capital Group Incorporated | | | | 866 | 219,600 |
| National Western Life Group Class A | | | | 28 | 5,329 |
| Palomar Holdings Incorporated † | | | | 477 | 37,821 |
| ProAssurance Corporation | | | | 2,551 | 54,566 |
| RLI Corporation | | | | 1,532 | 168,152 |
| Safety Insurance Group Incorporated | | | | 1,311 | 118,056 |
| Selective Insurance Group Incorporated | | | | 2,784 | 221,105 |
| SelectQuote Incorporated † | | | | 12,061 | 13,388 |
| SiriusPoint Limited † | | | | 1,990 | 8,895 |
| Stewart Information Services Corporation | | | | 2,744 | 138,956 |
| Trean Insurance Group Incorporated † | | | | 7,924 | 35,262 |
| Trupanion Incorporated † | | | | 1,286 | 90,766 |
| United Fire Group Incorporated | | | | 2,816 | 82,875 |
| Universal Insurance Holdings Company | | | | 1,210 | 14,447 |
| | | | | | 2,440,830 |
| Mortgage REITs: 1.46% | | | | | |
| Apollo Commercial Real Estate Finance Incorporated | | | | 5,701 | 66,417 |
| Arbor Realty Trust Incorporated | | | | 5,966 | 89,371 |
| Ares Commercial Real Estate | | | | 2,827 | 37,288 |
| Blackstone Mortgage Trust Incorporated Class A | | | | 6,187 | 179,299 |
| Broadmark Realty Capital Incorporated | | | | 5,921 | 38,190 |
The accompanying notes are an integral part of these financial statements.
14 | Allspring Factor Enhanced U.S. Small Cap Equity Portfolio
Portfolio of investments—August 31, 2022 (unaudited)
| | | | | Shares | Value |
| Mortgage REITs (continued) | | | | | |
| Chicago Atlantic Real Estate Incorporated | | | | 6,295 | $ 96,125 |
| Chimera Investment Corporation | | | | 25,819 | 219,462 |
| Claros Mortgage Trust Incorporated | | | | 2,561 | 43,767 |
| Dynex Capital Incorporated | | | | 5,556 | 86,174 |
| Ellington Financial Incorporated | | | | 7,762 | 113,946 |
| Granite Point Mortgage Trust Incorporated | | | | 5,095 | 47,995 |
| Hannon Armstrong Sustainable Infrastructure Capital Incorporated | | | | 1,605 | 63,430 |
| Invesco Mortgage Capital REIT | | | | 4,692 | 74,556 |
| KKR Real Estate Finance Trust | | | | 2,767 | 53,292 |
| Ladder Capital Corporation | | | | 10,147 | 112,226 |
| MFA Financial Incorporated | | | | 5,226 | 57,120 |
| NexPoint Real Estate Finance REIT | | | | 3,205 | 65,767 |
| PennyMac Mortgage Investment Trust | | | | 873 | 12,964 |
| Ready Capital Corporation | | | | 4,970 | 65,107 |
| Redwood Trust Incorporated | | | | 5,611 | 43,485 |
| TPG Real Estate Finance Trust Incorporated | | | | 2,486 | 23,020 |
| Two Harbors Investment Corporation | | | | 36,550 | 177,268 |
| | | | | | 1,766,269 |
| Thrifts & mortgage finance: 0.94% | | | | | |
| Axos Financial Incorporated † | | | | 1,740 | 72,697 |
| Enact Holdings Incorporated | | | | 109 | 2,769 |
| Essent Group Limited | | | | 3,790 | 151,562 |
| Federal Agricultural Mortgage Corporation Class C | | | | 365 | 39,873 |
| Merchants Bancorp Incorporated | | | | 1,046 | 28,211 |
| Mr. Cooper Group Incorporated † | | | | 3,869 | 163,659 |
| NMI Holdings Incorporated Class A † | | | | 3,979 | 81,689 |
| PennyMac Financial Services Incorporated | | | | 1,368 | 72,668 |
| Provident Financial Services Incorporated | | | | 1,991 | 46,251 |
| Radian Group Incorporated | | | | 7,801 | 164,679 |
| Sterling Bancorp Incorporated † | | | | 1,759 | 10,361 |
| Velocity Financial Incorporated † | | | | 4,188 | 47,827 |
| Walker & Dunlop Incorporated | | | | 1,335 | 134,114 |
| Washington Federal Incorporated | | | | 2,417 | 77,368 |
| WSFS Financial Corporation | | | | 889 | 42,983 |
| | | | | | 1,136,711 |
| Health care: 19.01% | | | | | |
| Biotechnology: 8.39% | | | | | |
| Acadia Pharmaceuticals Incorporated † | | | | 7,334 | 120,498 |
| Adicet Bio Incorporated † | | | | 3,941 | 55,805 |
| ADMA Biologics Incorporated † | | | | 18,666 | 50,398 |
| Aduro Biotech Incorporated ♦† | | | | 9,490 | 0 |
| Agenus Incorporated † | | | | 16,801 | 45,363 |
| Akero Therapeutics Incorporated † | | | | 1,566 | 18,401 |
| Albireo Pharma Incorporated † | | | | 1,022 | 17,885 |
| Alector Incorporated † | | | | 2,672 | 27,655 |
| Alkermes plc † | | | | 9,401 | 222,522 |
| Allogene Therapeutics Incorporated † | | | | 3,228 | 44,256 |
| Alpine Immune Sciences Incorporated † | | | | 4,551 | 34,178 |
| Amicus Therapeutics Incorporated † | | | | 13,196 | 148,191 |
| Anaptysbio Incorporated † | | | | 900 | 20,898 |
| Anika Therapeutics Incorporated † | | | | 2,081 | 47,031 |
| Apellis Pharmaceuticals Incorporated † | | | | 3,805 | 230,241 |
| Arbutus Biopharma Corporation † | | | | 1,022 | 2,269 |
The accompanying notes are an integral part of these financial statements.
Allspring Factor Enhanced U.S. Small Cap Equity Portfolio | 15
Portfolio of investments—August 31, 2022 (unaudited)
| | | | | Shares | Value |
| Biotechnology (continued) | | | | | |
| Arcturus Therapeutics Holdings Incorporated † | | | | 1,152 | $ 16,174 |
| Arcus Biosciences Incorporated † | | | | 3,767 | 90,709 |
| Arrowhead Pharmaceuticals Incorporated † | | | | 3,317 | 131,718 |
| Atara Biotherapeutics Incorporated † | | | | 9,704 | 38,913 |
| Aurinia Pharmaceuticals Incorporated † | | | | 7,611 | 56,017 |
| Avid Bioservices Incorporated † | | | | 6,183 | 106,471 |
| Avidity Biosciences Incorporated † | | | | 1,064 | 20,876 |
| Beam Therapeutics Incorporated † | | | | 2,158 | 117,827 |
| Biocryst Pharmaceuticals Incorporated † | | | | 11,822 | 164,326 |
| bluebird bio Incorporated | | | | 24,090 | 140,686 |
| Blueprint Medicines Corporation † | | | | 2,719 | 199,085 |
| Bridgebio Pharma Incorporated † | | | | 5,855 | 61,478 |
| C4 Therapeutics Incorporated † | | | | 741 | 7,469 |
| CareDx Incorporated † | | | | 2,522 | 49,406 |
| Caribou Biosciences Incorporated † | | | | 676 | 6,672 |
| Catalyst Pharmaceuticals Incorporated † | | | | 20,314 | 275,052 |
| Celldex Therapeutics Incorporated † | | | | 604 | 18,362 |
| Celularity Incorporated † | | | | 14,759 | 39,997 |
| Chimerix Incorporated † | | | | 12,449 | 27,388 |
| Chinook Therapeutics Incorporated † | | | | 3,310 | 68,848 |
| Cogent Biosciences Incorporated † | | | | 1,320 | 21,767 |
| Coherus Biosciences Incorporated † | | | | 9,121 | 101,973 |
| Cytokinetics Incorporated † | | | | 3,953 | 209,351 |
| Deciphera Pharmaceuticals Incorporated † | | | | 15,434 | 250,494 |
| Denali Therapeutics Incorporated † | | | | 3,313 | 91,671 |
| Design Therapeutics Incorporated † | | | | 206 | 4,174 |
| Dynavax Technologies Corporation † | | | | 13,802 | 158,309 |
| Eagle Pharmaceuticals Incorporated † | | | | 4,601 | 150,775 |
| Editas Medicine Incorporated † | | | | 1,892 | 27,812 |
| Emergent BioSolutions Incorporated † | | | | 3,517 | 84,478 |
| Enanta Pharmaceuticals Incorporated † | | | | 2,659 | 161,880 |
| Enochian Biosciences Incorporated † | | | | 37,061 | 91,541 |
| Fate Therapeutics Incorporated † | | | | 1,913 | 50,006 |
| Fibrogen Incorporated † | | | | 8,841 | 109,982 |
| Gelesis Holdings Incorporated † | | | | 25,957 | 31,408 |
| Geron Corporation † | | | | 38,149 | 100,713 |
| Gossamer Bio Incorporated † | | | | 8,542 | 119,161 |
| GreenLight Biosciences Holdings † | | | | 24,275 | 68,941 |
| Halozyme Therapeutics Incorporated † | | | | 8,162 | 332,438 |
| Heron Therapeutics Incorporated † | | | | 4,843 | 19,808 |
| Ideaya Biosciences Incorporated † | | | | 1,749 | 17,193 |
| IGM Biosciences Incorporated † | | | | 2,729 | 52,970 |
| Immunogen Incorporated † | | | | 11,312 | 65,723 |
| Inhibrx Incorporated † | | | | 204 | 3,619 |
| Insmed Incorporated † | | | | 6,132 | 150,970 |
| Intellia Therapeutics Incorporated † | | | | 2,500 | 150,150 |
| Intercept Pharmaceuticals Incorporated † | | | | 9,415 | 163,539 |
| Ironwood Pharmaceuticals Incorporated † | | | | 30,190 | 324,844 |
| Iteos Therapeutics Incorporated † | | | | 5,561 | 123,343 |
| Iveric Bio Incorporated † | | | | 5,393 | 53,067 |
| Jounce Therapeutics Incorporated † | | | | 770 | 2,818 |
| Karuna Therapeutics Incorporated † | | | | 1,263 | 322,141 |
| Karyopharm Therapeutics Incorporated † | | | | 15,309 | 77,464 |
| Keros Therapeutics Incorporated † | | | | 2,149 | 76,010 |
| Kezar Life Sciences Incorporated † | | | | 2,294 | 23,582 |
| Kiniksa Pharmaceuticals Limited Class A † | | | | 3,029 | 35,500 |
The accompanying notes are an integral part of these financial statements.
16 | Allspring Factor Enhanced U.S. Small Cap Equity Portfolio
Portfolio of investments—August 31, 2022 (unaudited)
| | | | | Shares | Value |
| Biotechnology (continued) | | | | | |
| Krystal Biotech Incorporated † | | | | 981 | $ 68,778 |
| Kura Oncology Incorporated † | | | | 766 | 10,617 |
| Kymera Therapeutics Incorporated † | | | | 1,891 | 53,459 |
| Lexicon Pharmaceuticals Incorporated † | | | | 8,339 | 22,932 |
| Ligand Pharmaceuticals Incorporated † | | | | 1,622 | 149,857 |
| Lyell Immunopharma Incorporated † | | | | 1,613 | 10,807 |
| Macrogenics Incorporated † | | | | 2,830 | 11,235 |
| Madrigal Pharmaceuticals Incorporated † | | | | 970 | 69,956 |
| Mannkind Corporation † | | | | 20,228 | 73,832 |
| MeiraGTx Holdings plc † | | | | 7,120 | 59,096 |
| MiMedx Group Incorporated † | | | | 39,030 | 137,776 |
| Morphic Holding Incorporated † | | | | 1,299 | 35,748 |
| Myriad Genetics Incorporated † | | | | 3,831 | 85,585 |
| Nkarta Incorporated † | | | | 591 | 8,504 |
| Nurix Therapeutics Incorporated † | | | | 921 | 14,487 |
| OPKO Health Incorporated † | | | | 18,657 | 40,672 |
| Organogenesis Holdings Incorporated Class A † | | | | 3,296 | 11,833 |
| Pardes Biosciences Incorporated † | | | | 75,519 | 265,072 |
| PDL BioPharma Incorporated ♦‡† | | | | 91,928 | 246,367 |
| PepGen Incorporated † | | | | 484 | 4,598 |
| PMV Pharmaceuticals Incorporated † | | | | 1,146 | 15,952 |
| Precigen Incorporated † | | | | 4,145 | 9,160 |
| Prometheus Biosciences Incorporated † | | | | 1,406 | 73,548 |
| Protagonist Therapeutics Incorporated † | | | | 6,033 | 52,608 |
| Prothena Corporation plc † | | | | 3,992 | 110,059 |
| PTC Therapeutics Incorporated † | | | | 4,568 | 228,126 |
| Rallybio Corporation † | | | | 1,028 | 11,359 |
| Recursion Pharmaceuticals Class A † | | | | 753 | 7,914 |
| Regenxbio Incorporated † | | | | 3,482 | 102,719 |
| Relay Therapeutics Incorporated † | | | | 1,138 | 26,140 |
| Revolution Medicines Incorporated † | | | | 1,805 | 37,598 |
| Rigel Pharmaceuticals Incorporated † | | | | 28,714 | 40,774 |
| Rocket Pharmaceuticals Incorporated † | | | | 1,766 | 27,214 |
| Sana Biotechnology Incorporated † | | | | 719 | 4,896 |
| Sangamo Therapeutics Incorporated † | | | | 6,006 | 32,432 |
| Seres Therapeutics Incorporated † | | | | 6,990 | 35,929 |
| Sorrento Therapeutics Incorporated † | | | | 46,630 | 95,592 |
| Springworks Therapeutics Incorporated † | | | | 1,826 | 50,708 |
| Sutro Biopharma Incorporated † | | | | 9,281 | 52,530 |
| Syndax Pharmaceuticals Incorporated † | | | | 4,337 | 102,397 |
| Tango Therapeutics Incorporated † | | | | 29,358 | 120,368 |
| TG Therapeutics Incorporated † | | | | 6,603 | 47,079 |
| Travere Therapeutics Incorporated † | | | | 5,650 | 151,194 |
| Twist Bioscience Corporation † | | | | 3,023 | 121,283 |
| Vanda Pharmaceuticals Incorporated † | | | | 2,882 | 30,492 |
| Vaxcyte Incorporated † | | | | 4,359 | 114,031 |
| Veracyte Incorporated † | | | | 3,177 | 64,811 |
| Vericel Corporation † | | | | 2,750 | 68,613 |
| Verve Therapeutics Incorporated † | | | | 128 | 4,910 |
| VIR Biotechnology Incorporated † | | | | 7,159 | 170,026 |
| Xencor Incorporated † | | | | 5,076 | 133,956 |
| Y-mAbs Therapeutics Incorporated † | | | | 1,737 | 27,931 |
| Zentalis Pharmaceuticals Incorporated † | | | | 1,841 | 49,357 |
| | | | | | 10,155,597 |
The accompanying notes are an integral part of these financial statements.
Allspring Factor Enhanced U.S. Small Cap Equity Portfolio | 17
Portfolio of investments—August 31, 2022 (unaudited)
| | | | | Shares | Value |
| Health care equipment & supplies: 4.14% | | | | | |
| AngioDynamics Incorporated † | | | | 3,100 | $ 68,634 |
| Artivion Incorporated † | | | | 1,243 | 27,545 |
| Atricure Incorporated † | | | | 3,335 | 152,143 |
| Atrion Corporation | | | | 180 | 108,711 |
| Avanos Medical Incorporated † | | | | 4,354 | 107,239 |
| Axonics Incorporated † | | | | 1,456 | 105,196 |
| BioLife Solutions Incorporated † | | | | 1,218 | 28,757 |
| Bioventus Incorporated Class A † | | | | 1,012 | 7,398 |
| Cardiovascular Systems Incorporated † | | | | 3,249 | 42,919 |
| Cerus Corporation † | | | | 6,731 | 27,664 |
| Conmed Corporation | | | | 1,425 | 126,212 |
| Cryoport Incorporated † | | | | 1,642 | 53,628 |
| Cue Health Incorporated † | | | | 13,464 | 44,835 |
| Cutera Incorporated † | | | | 1,897 | 90,582 |
| EMBECTA Corporation | | | | 6,797 | 216,960 |
| Figs Incorporated Class A † | | | | 329 | 3,803 |
| Glaukos Corporation † | | | | 1,883 | 91,420 |
| Haemonetics Corporation † | | | | 2,676 | 200,780 |
| Inari Medical Incorporated † | | | | 1,249 | 86,618 |
| Inogen Incorporated † | | | | 3,693 | 105,731 |
| Integer Holdings Corporation † | | | | 2,011 | 126,834 |
| IRadimed Corporation | | | | 2,562 | 85,955 |
| iRhythm Technologies Incorporated † | | | | 1,659 | 244,620 |
| Lantheus Holdings Incorporated † | | | | 4,342 | 342,150 |
| LeMaitre Vascular Incorporated | | | | 1,759 | 86,859 |
| LivaNova plc † | | | | 3,097 | 174,206 |
| Merit Medical Systems Incorporated † | | | | 3,187 | 188,766 |
| Mesa Laboratories Incorporated | | | | 98 | 16,744 |
| Neogen Corporation † | | | | 3,571 | 74,634 |
| Nevro Corporation † | | | | 1,649 | 74,733 |
| NuVasive Incorporated † | | | | 3,877 | 164,811 |
| Omnicell Incorporated † | | | | 1,124 | 114,974 |
| OraSure Technologies Incorporated † | | | | 3,590 | 14,683 |
| Orthofix Medical Incorporated † | | | | 1,444 | 28,736 |
| Orthopediatrics Corporation † | | | | 697 | 34,216 |
| Outset Medical Incorporated † | | | | 899 | 16,443 |
| Owlet Incorporated † | | | | 1,721 | 2,788 |
| Senseonics Holdings Incorporated † | | | | 29,567 | 52,629 |
| Shockwave Medical Incorporated † | | | | 1,661 | 493,084 |
| SI-BONE Incorporated † | | | | 552 | 9,108 |
| Silk Road Medical Incorporated † | | | | 2,687 | 107,023 |
| STAAR Surgical Company † | | | | 2,324 | 219,827 |
| Tactile Systems Technology Class I † | | | | 6,663 | 54,970 |
| TransMedics Group Incorporated † | | | | 1,296 | 67,431 |
| UFP Technologies Incorporated † | | | | 1,374 | 127,768 |
| Utah Medical Products Incorporated | | | | 911 | 83,721 |
| Varex Imaging Corporation † | | | | 5,393 | 113,738 |
| Vicarious Surgical Incorporated † | | | | 1,639 | 6,113 |
| ViewRay Incorporated † | | | | 3,514 | 12,018 |
| ZIMVIE Incorporated † | | | | 5,912 | 89,981 |
| Zynex Incorporated | | | | 10,221 | 91,376 |
| | | | | | 5,017,714 |
| Health care providers & services: 2.65% | | | | | |
| 23andMe Holding Company † | | | | 2,101 | 7,080 |
| AdaptHealth Corporation † | | | | 4,274 | 76,804 |
The accompanying notes are an integral part of these financial statements.
18 | Allspring Factor Enhanced U.S. Small Cap Equity Portfolio
Portfolio of investments—August 31, 2022 (unaudited)
| | | | | Shares | Value |
| Health care providers & services (continued) | | | | | |
| Addus Homecare Corporation † | | | | 1,146 | $ 102,246 |
| Agiliti Incorporated † | | | | 794 | 12,752 |
| Airsculpt Technologies Incorporated | | | | 9,225 | 80,442 |
| AMN Healthcare Services Incorporated † | | | | 3,079 | 316,029 |
| Apollo Medical Holdings Incorporated † | | | | 2,680 | 115,588 |
| ATI Physical Therapy Incorporated † | | | | 2,810 | 2,529 |
| Aveanna Healthcare Holdings † | | | | 2,216 | 4,033 |
| Brookdale Senior Living Incorporated † | | | | 13,142 | 57,825 |
| Cano Health Incorporated † | | | | 12,189 | 75,206 |
| CareMax Incorporated † | | | | 2,876 | 19,672 |
| Clover Health Investments Corporation † | | | | 8,467 | 22,099 |
| Community Health Systems Incorporated † | | | | 27,727 | 73,754 |
| CorVel Corporation † | | | | 850 | 132,073 |
| Cross Country Healthcare Incorporated † | | | | 8,683 | 220,375 |
| Fulgent Genetics Incorporated † | | | | 1,644 | 71,465 |
| HealthEquity Incorporated † | | | | 2,693 | 177,953 |
| Innovage Holding Corporation † | | | | 942 | 3,457 |
| Mednax Incorporated † | | | | 6,912 | 123,172 |
| Modivcare Incorporated † | | | | 440 | 47,661 |
| National Healthcare Corporation | | | | 820 | 56,949 |
| Oncology Institute Incorporated † | | | | 10,919 | 69,336 |
| Option Care Health Incorporated † | | | | 7,946 | 246,008 |
| Owens & Minor Incorporated | | | | 3,758 | 110,899 |
| P3 Health Partners Incorporated † | | | | 4,588 | 22,573 |
| Patterson Companies Incorporated | | | | 7,108 | 198,242 |
| PetIQ Incorporated † | | | | 4,817 | 44,991 |
| Progyny Incorporated † | | | | 2,875 | 115,604 |
| R1 RCM Incorporated † | | | | 1,848 | 40,379 |
| RadNet Incorporated † | | | | 56 | 1,125 |
| Select Medical Holdings Corporation | | | | 6,709 | 172,019 |
| Surgery Partners Incorporated † | | | | 1,379 | 37,964 |
| The Ensign Group Incorporated | | | | 2,610 | 222,633 |
| The Joint Corporation † | | | | 729 | 13,297 |
| The Pennant Group Incorporated † | | | | 4,412 | 69,136 |
| U.S. Physical Therapy Incorporated | | | | 623 | 51,466 |
| | | | | | 3,214,836 |
| Health care technology: 0.94% | | | | | |
| Allscripts Healthcare Solutions Incorporated † | | | | 9,377 | 159,409 |
| Computer Programs & Systems Incorporated † | | | | 3,620 | 110,446 |
| Evolent Health Incorporated Class A † | | | | 6,018 | 221,162 |
| HealthStream Incorporated † | | | | 1,377 | 30,473 |
| Inspire Medical Systems Incorporated † | | | | 1,279 | 244,916 |
| MultiPlan Corporation † | | | | 23,280 | 81,946 |
| NextGen Healthcare Incorporated † | | | | 9,445 | 161,887 |
| OptimizeRx Corporation † | | | | 818 | 12,982 |
| Phreesia Incorporated † | | | | 836 | 21,452 |
| Simulations Plus Incorporated | | | | 1,511 | 90,736 |
| | | | | | 1,135,409 |
| Life sciences tools & services: 0.93% | | | | | |
| Abcellera Biologics Incorporated † | | | | 16,268 | 173,742 |
| Adaptive Biotechnologies Corporation † | | | | 8,601 | 76,721 |
| Akoya Biosciences Incorporated † | | | | 133 | 1,516 |
| Alpha Teknova Incorporated † | | | | 6,980 | 31,480 |
| Berkeley Lights Incorporated † | | | | 4,700 | 17,249 |
The accompanying notes are an integral part of these financial statements.
Allspring Factor Enhanced U.S. Small Cap Equity Portfolio | 19
Portfolio of investments—August 31, 2022 (unaudited)
| | | | | Shares | Value |
| Life sciences tools & services (continued) | | | | | |
| Cerevel Therapeutics Holdings Incorporated † | | | | 468 | $ 13,619 |
| Codexis Incorporated † | | | | 9,449 | 66,237 |
| Cytek Biosciences Incorporated † | | | | 4,949 | 57,656 |
| Inotiv Incorporated † | | | | 4,354 | 85,208 |
| Medpace Holdings Incorporated † | | | | 2,002 | 295,515 |
| Nanostring Technologies Incorporated † | | | | 2,285 | 30,985 |
| Neogenomics Incorporated † | | | | 6,095 | 61,255 |
| Pacific Biosciences of California † | | | | 7,997 | 46,862 |
| Quanterix Corporation † | | | | 2,592 | 24,235 |
| Quantum-Si Incorporated † | | | | 7,015 | 21,887 |
| Science 37 Holdings Incorporated † | | | | 25,638 | 40,508 |
| Seer Incorporated † | | | | 1,606 | 16,221 |
| Somalogic Incorporated † | | | | 17,849 | 65,684 |
| | | | | | 1,126,580 |
| Pharmaceuticals: 1.96% | | | | | |
| Amneal Pharmaceuticals Incorporated † | | | | 46,696 | 101,330 |
| Amphastar Pharmaceuticals Incorporated † | | | | 5,391 | 159,574 |
| Atea Pharmaceuticals Incorporated † | | | | 3,368 | 25,260 |
| Axsome Therapeutics Incorporated † | | | | 1,979 | 126,260 |
| Collegium Pharmaceutical Incorporated † | | | | 2,004 | 35,230 |
| Corcept Therapeutics Incorporated † | | | | 5,740 | 148,207 |
| Dova Pharmaceuticals Incorporated ♦† | | | | 2,458 | 0 |
| Evolus Incorporated † | | | | 2 | 19 |
| Harmony Biosciences Holdings † | | | | 1,534 | 67,358 |
| Innoviva Incorporated † | | | | 16,099 | 211,863 |
| Intra-Cellular Therapies Incorporated † | | | | 4,036 | 202,849 |
| Liquidia Technologies Incorporated † | | | | 4,890 | 28,215 |
| Pacira Biosciences Incorporated † | | | | 2,415 | 126,739 |
| Phibro Animal Health Corporation Class A | | | | 7,303 | 108,157 |
| Prestige Consumer Healthcare Incorporated † | | | | 5,950 | 300,951 |
| Revance Therapeutics Incorporated † | | | | 3,914 | 77,889 |
| Siga Technologies Incorporated | | | | 25,373 | 382,625 |
| Supernus Pharmaceuticals Incorporated † | | | | 2,476 | 84,753 |
| Theravance Biopharma Incorporated † | | | | 10,929 | 98,470 |
| Tricida Incorporated † | | | | 7,133 | 89,305 |
| | | | | | 2,375,054 |
| Industrials: 13.82% | | | | | |
| Aerospace & defense: 0.99% | | | | | |
| AAR Corporation † | | | | 5,144 | 220,575 |
| Aerojet Rocketdyne Holdings † | | | | 3,571 | 153,803 |
| Aerovironment Incorporated † | | | | 619 | 54,874 |
| Aersale Corporation † | | | | 5,993 | 115,545 |
| Astronics Corporation † | | | | 3,597 | 33,128 |
| Cadre Holdings Incorporated | | | | 682 | 17,391 |
| Ducommun Incorporated † | | | | 662 | 29,128 |
| Kaman Corporation | | | | 1,447 | 45,899 |
| Kratos Defense & Security Solutions Incorporated † | | | | 1,112 | 13,944 |
| Maxar Technologies Incorporated | | | | 5,482 | 130,636 |
| Momentus Incorporated † | | | | 15,034 | 26,610 |
| Moog Incorporated Class A | | | | 2,158 | 161,807 |
| Park Aerospace Corporation | | | | 3,372 | 38,812 |
| Parsons Corporation † | | | | 358 | 14,814 |
| Redwire Corporation † | | | | 949 | 2,619 |
The accompanying notes are an integral part of these financial statements.
20 | Allspring Factor Enhanced U.S. Small Cap Equity Portfolio
Portfolio of investments—August 31, 2022 (unaudited)
| | | | | Shares | Value |
| Aerospace & defense (continued) | | | | | |
| Rocket Lab USA Incorporated † | | | | 2,899 | $ 15,945 |
| Triumph Group Incorporated † | | | | 4,401 | 57,169 |
| Vectrus Incorporated † | | | | 1,965 | 68,107 |
| | | | | | 1,200,806 |
| Air freight & logistics: 0.17% | | | | | |
| Air Transport Services Group † | | | | 1,183 | 35,644 |
| Forward Air Corporation | | | | 517 | 50,170 |
| Hub Group Incorporated Class A † | | | | 1,301 | 103,833 |
| Radiant Logistics Incorporated † | | | | 1,712 | 11,984 |
| | | | | | 201,631 |
| Airlines: 0.29% | | | | | |
| Allegiant Travel Company † | | | | 717 | 69,191 |
| Blade Air Mobility Incorporated † | | | | 1,160 | 5,986 |
| Frontier Group Holdings Incorporated † | | | | 696 | 8,978 |
| Hawaiian Holdings Incorporated † | | | | 2,439 | 36,561 |
| Joby Aviation Incorporated † | | | | 6,697 | 35,494 |
| SkyWest Incorporated † | | | | 7,216 | 153,629 |
| Sun Country Airlines Holding † | | | | 1,521 | 30,298 |
| Wheels Up Experience Incorporated † | | | | 5,126 | 9,586 |
| | | | | | 349,723 |
| Building products: 0.90% | | | | | |
| AAON Incorporated | | | | 458 | 26,326 |
| American Woodmark Corporation † | | | | 206 | 10,677 |
| Apogee Enterprises Incorporated | | | | 2,340 | 95,566 |
| Griffon Corporation | | | | 2,724 | 85,397 |
| Insteel Industries Incorporated | | | | 900 | 26,010 |
| Janus International Group Incorporated † | | | | 1,343 | 13,873 |
| JELD-WEN Holding Incorporated † | | | | 3,929 | 43,808 |
| Masonite International Corporation † | | | | 859 | 70,283 |
| Quanex Building Products Corporation | | | | 3,576 | 79,745 |
| Resideo Technologies Incorporated † | | | | 6,616 | 137,745 |
| Simpson Manufacturing Company Incorporated | | | | 1,446 | 133,957 |
| UFP Industries Incorporated | | | | 2,664 | 211,495 |
| Zurn Water Solutions Corporation | | | | 5,781 | 159,440 |
| | | | | | 1,094,322 |
| Commercial services & supplies: 1.29% | | | | | |
| ABM Industries Incorporated | | | | 3,096 | 143,654 |
| ACCO Brands Corporation | | | | 5,535 | 32,823 |
| Brady Corporation Class A | | | | 1,357 | 63,155 |
| Casella Waste Systems Incorporated Class A † | | | | 1,548 | 126,828 |
| CompX International Incorporated | | | | 1,294 | 31,017 |
| CoreCivic Incorporated † | | | | 13,101 | 124,853 |
| Ennis Incorporated | | | | 4,031 | 85,578 |
| Harsco Corporation † | | | | 3,072 | 17,418 |
| Healthcare Services Group Incorporated | | | | 3,426 | 48,204 |
| Heritage Crystal Clean Incorporated † | | | | 1,064 | 34,654 |
| HNI Corporation | | | | 1,964 | 62,848 |
| Interface Incorporated | | | | 2,716 | 30,338 |
| KAR Auction Services Incorporated † | | | | 2,551 | 37,245 |
| Matthews International Corporation Class A | | | | 1,420 | 35,514 |
| Montrose Environmental Group † | | | | 168 | 6,755 |
The accompanying notes are an integral part of these financial statements.
Allspring Factor Enhanced U.S. Small Cap Equity Portfolio | 21
Portfolio of investments—August 31, 2022 (unaudited)
| | | | | Shares | Value |
| Commercial services & supplies (continued) | | | | | |
| NL Industries | | | | 10,804 | $ 95,183 |
| Pitney Bowes Incorporated | | | | 8,036 | 23,224 |
| Quad Graphics Incorporated † | | | | 34,573 | 109,251 |
| SP Plus Corporation † | | | | 3,145 | 104,225 |
| Steelcase Incorporated Class A | | | | 5,156 | 57,644 |
| The Brink's Company | | | | 1,590 | 87,895 |
| The Geo Group Incorporated † | | | | 15,387 | 125,866 |
| UniFirst Corporation | | | | 303 | 54,619 |
| Viad Corporation † | | | | 747 | 28,520 |
| | | | | | 1,567,311 |
| Construction & engineering: 1.13% | | | | | |
| Ameresco Incorporated Class A † | | | | 1,672 | 115,117 |
| APi Group Corporation † | | | | 6,306 | 98,058 |
| Arcosa Incorporated | | | | 1,076 | 62,892 |
| Argan Incorporated | | | | 389 | 13,456 |
| Comfort Systems Incorporated | | | | 1,472 | 147,700 |
| Dycom Industries Incorporated † | | | | 1,655 | 185,559 |
| EMCOR Group Incorporated | | | | 1,431 | 170,175 |
| Fluor Corporation † | | | | 6,861 | 181,405 |
| Granite Construction Incorporated | | | | 1,330 | 39,873 |
| Great Lakes Dredge & Dock Company † | | | | 2,184 | 20,901 |
| IES Holdings Incorporated † | | | | 253 | 7,689 |
| MYR Group Incorporated † | | | | 869 | 80,765 |
| Northwest Pipe Company † | | | | 239 | 7,567 |
| NV5 Global Incorporated † | | | | 179 | 25,196 |
| Primoris Services Corporation | | | | 1,623 | 32,898 |
| Sterling Construction Company Incorporated † | | | | 4,054 | 102,526 |
| Tutor Perini Corporation † | | | | 1,894 | 12,841 |
| WillScot Mobile Mini Holdings Corporation † | | | | 1,526 | 61,254 |
| | | | | | 1,365,872 |
| Electrical equipment: 1.74% | | | | | |
| Allied Motion Technologies | | | | 629 | 22,028 |
| Array Technologies Incorporated † | | | | 7,209 | 150,668 |
| Atkore Incorporated † | | | | 3,508 | 296,110 |
| AZZ Incorporated | | | | 1,197 | 51,004 |
| Babcock & Wilcox Enterprises Incorporated † | | | | 8,254 | 65,867 |
| Bloom Energy Corporation Class A † | | | | 8,201 | 208,387 |
| Encore Wire Corporation | | | | 2,423 | 315,232 |
| Energy Vault Holdings Incorporated † | | | | 9,663 | 53,243 |
| EnerSys | | | | 1,947 | 121,434 |
| Enovix Corporation † | | | | 2,620 | 57,954 |
| Fluence Energy Incorporated † | | | | 1,606 | 32,040 |
| FTC Solar Incorporated † | | | | 4,616 | 19,110 |
| Fuelcell Energy Incorporated † | | | | 9,480 | 39,721 |
| GrafTech International Limited | | | | 13,094 | 76,993 |
| Nuscale Power Corporation † | | | | 4,107 | 56,348 |
| Powell Industries Incorporated | | | | 4,496 | 110,871 |
| Preformed Line Products Company | | | | 653 | 50,803 |
| Shoals Technologies Group Class A † | | | | 4,708 | 124,150 |
| Stem Incorporated † | | | | 7,091 | 111,471 |
| TPI Composites Incorporated † | | | | 2,231 | 41,474 |
| Vicor Corporation † | | | | 1,372 | 97,604 |
| | | | | | 2,102,512 |
The accompanying notes are an integral part of these financial statements.
22 | Allspring Factor Enhanced U.S. Small Cap Equity Portfolio
Portfolio of investments—August 31, 2022 (unaudited)
| | | | | Shares | Value |
| Industrial conglomerates: 0.05% | | | | | |
| Brookfield Business Corporation Class A | | | | 2,468 | $ 60,022 |
| Machinery: 3.71% | | | | | |
| Alamo Group Incorporated | | | | 653 | 85,386 |
| Albany International Corporation Class A | | | | 1,903 | 167,826 |
| Altra Industrial Motion Corporation | | | | 602 | 22,846 |
| Astec Industries Incorporated | | | | 1,472 | 56,201 |
| Barnes Group Incorporated | | | | 2,396 | 74,396 |
| Blue Bird Corporation † | | | | 4,356 | 51,706 |
| Briggs & Stratton Corporation ♦† | | | | 1,723 | 0 |
| Chart Industries Incorporated † | | | | 1,409 | 273,149 |
| Circor International Incorporated † | | | | 2,686 | 43,782 |
| Columbus McKinnon Corporation | | | | 67 | 2,052 |
| Douglas Dynamics Incorporated | | | | 2,063 | 60,033 |
| Energy Recovery Incorporated † | | | | 974 | 22,344 |
| Enerpac Tool Group Corporation | | | | 2,942 | 57,075 |
| EnPro Industries Incorporated | | | | 1,402 | 126,965 |
| ESCO Technologies Incorporated | | | | 894 | 72,798 |
| Evoqua Water Technologies Company † | | | | 5,992 | 210,199 |
| Fathom Digital Manufacturing † | | | | �� 2,839 | 10,788 |
| Federal Signal Corporation | | | | 3,336 | 133,006 |
| Franklin Electric Company Incorporated | | | | 2,046 | 177,695 |
| Gorman Rupp Company | | | | 1,033 | 27,282 |
| Helios Technologies Incorporated | | | | 1,521 | 83,077 |
| Hillenbrand Incorporated | | | | 5,844 | 243,519 |
| Hydrofarm Holdings Group Incorporated † | | | | 1,844 | 6,270 |
| Hyster Yale Materials Handeling Incorporated | | | | 662 | 19,284 |
| John Bean Technologies Corporation | | | | 1,265 | 130,624 |
| Kadant Incorporated | | | | 789 | 141,570 |
| Kennametal Incorporated | | | | 3,803 | 89,142 |
| Lightning Emotors Incorporated † | | | | 2,103 | 5,973 |
| Lindsay Manufacturing Company | | | | 627 | 100,546 |
| Luxfer Holdings plc | | | | 899 | 14,789 |
| Manitowoc Company Incorporated † | | | | 1,750 | 16,713 |
| Microvast Holdings Incorporated † | | | | 2,009 | 4,942 |
| Mueller Industries Incorporated | | | | 4,890 | 308,901 |
| Mueller Water Products Incorporated Class A | | | | 7,257 | 81,859 |
| Proterra Incorporated † | | | | 870 | 5,255 |
| Proto Labs Incorporated † | | | | 827 | 31,757 |
| RBC Bearings Incorporated † | | | | 563 | 135,503 |
| REV Group Incorporated | | | | 7,943 | 91,503 |
| SPX Technologies Incorporated † | | | | 1,477 | 84,278 |
| Standex International Corporation | | | | 774 | 69,977 |
| Tennant Company | | | | 1,376 | 83,042 |
| Terex Corporation | | | | 5,241 | 174,106 |
| The Greenbrier Companies Incorporated | | | | 1,839 | 52,430 |
| The Shyft Group Incorporated | | | | 4,984 | 119,367 |
| Titan International Incorporated † | | | | 10,946 | 153,572 |
| Trinity Industries Incorporated | | | | 6,489 | 158,202 |
| Wabash National Corporation | | | | 9,377 | 154,252 |
| Watts Water Technologies Incorporated | | | | 1,888 | 261,526 |
| | | | | | 4,497,508 |
| Marine: 0.04% | | | | | |
| Matson Incorporated | | | | 583 | 42,944 |
The accompanying notes are an integral part of these financial statements.
Allspring Factor Enhanced U.S. Small Cap Equity Portfolio | 23
Portfolio of investments—August 31, 2022 (unaudited)
| | | | | Shares | Value |
| Professional services: 1.71% | | | | | |
| ASGN Incorporated † | | | | 2,152 | $ 208,098 |
| Atlas Technical Consultants Incorporated † | | | | 3,570 | 30,416 |
| Barrett Business Services Incorporated | | | | 1,119 | 90,236 |
| CBIZ Incorporated † | | | | 3,286 | 143,467 |
| CRA International Incorporated | | | | 1,413 | 129,162 |
| Exponent Incorporated | | | | 1,449 | 136,003 |
| First Advantage Corporation † | | | | 1,594 | 22,061 |
| Forrester Research Incorporated † | | | | 532 | 22,126 |
| Franklin Covey Company † | | | | 744 | 35,392 |
| Heidrick & Struggles International Incorporated | | | | 990 | 28,175 |
| HireRight Holdings Corporation † | | | | 2,426 | 39,447 |
| Huron Consulting Group Incorporated † | | | | 2,209 | 147,782 |
| ICF International Incorporated | | | | 1,328 | 134,872 |
| Insperity Incorporated | | | | 1,911 | 208,337 |
| Kelly Services Incorporated Class A | | | | 4,983 | 80,276 |
| Kforce Incorporated | | | | 1,124 | 61,505 |
| Korn Ferry International | | | | 2,144 | 130,612 |
| Resources Connection Incorporated | | | | 9,825 | 191,981 |
| Sterling Check Corporation † | | | | 384 | 8,172 |
| TriNet Group Incorporated † | | | | 1,837 | 151,369 |
| TrueBlue Incorporated † | | | | 3,370 | 69,220 |
| | | | | | 2,068,709 |
| Road & rail: 0.66% | | | | | |
| Arcbest Corporation | | | | 2,176 | 175,233 |
| Covenant Logistics Group Incorporated | | | | 3,958 | 111,299 |
| Daseke Incorporated † | | | | 12,717 | 77,065 |
| Marten Transport Limited | | | | 4,524 | 89,620 |
| P.A.M. Transportation Services Incorporated † | | | | 2,831 | 84,109 |
| Saia Incorporated † | | | | 917 | 189,663 |
| Universal Logistics Holdings Incorporated | | | | 1,975 | 72,107 |
| Werner Enterprises Incorporated | | | | 21 | 836 |
| | | | | | 799,932 |
| Trading companies & distributors: 1.14% | | | | | |
| Applied Industrial Technologies Incorporated | | | | 1,485 | 157,440 |
| Beacon Roofing Supply Incorporated † | | | | 2,133 | 117,123 |
| Bluelinx Holdings Incorporated † | | | | 1,191 | 83,489 |
| Boise Cascade Company | | | | 2,604 | 162,307 |
| GATX Corporation | | | | 470 | 45,407 |
| GMS Incorporated † | | | | 1,427 | 68,781 |
| MRC Global Incorporated † | | | | 2,765 | 26,903 |
| NOW Incorporated † | | | | 2,071 | 25,101 |
| Rush Enterprises Incorporated Class A | | | | 2,418 | 113,791 |
| Rush Enterprises Incorporated Class B | | | | 1,216 | 61,578 |
| Textainer Group Holdings Limited | | | | 364 | 11,058 |
| Titan Machinery Incorporated † | | | | 1,435 | 44,169 |
| Triton International Limited | | | | 1,701 | 101,363 |
| Veritiv Corporation † | | | | 1,308 | 155,901 |
| WESCO International Incorporated † | | | | 1,577 | 207,659 |
| | | | | | 1,382,070 |
The accompanying notes are an integral part of these financial statements.
24 | Allspring Factor Enhanced U.S. Small Cap Equity Portfolio
Portfolio of investments—August 31, 2022 (unaudited)
| | | | | Shares | Value |
| Information technology: 14.26% | | | | | |
| Communications equipment: 0.63% | | | | | |
| Calix Incorporated † | | | | 2,552 | $ 150,185 |
| Cambium Networks Corporation † | | | | 79 | 1,537 |
| Clearfield Incorporated † | | | | 1,166 | 135,384 |
| CommScope Holdings Incorporated † | | | | 8,374 | 94,626 |
| DZS Incorporated † | | | | 829 | 11,034 |
| Extreme Networks Incorporated † | | | | 8,367 | 119,899 |
| Harmonic Incorporated † | | | | 4,289 | 48,294 |
| Infinera Corporation † | | | | 6,775 | 37,127 |
| Inseego Corporation † | | | | 13,802 | 37,265 |
| NetScout Systems Incorporated † | | | | 1,413 | 44,849 |
| Ribbon Communications Incorporated † | | | | 2,316 | 8,129 |
| Viavi Solutions Incorporated † | | | | 5,483 | 77,201 |
| | | | | | 765,530 |
| Electronic equipment, instruments & components: 2.51% | | | | | |
| Advanced Energy Industries Incorporated | | | | 1,392 | 124,988 |
| Badger Meter Incorporated | | | | 1,106 | 104,727 |
| Belden Incorporated | | | | 3,625 | 237,365 |
| Benchmark Electronics Incorporated | | | | 4,167 | 114,384 |
| CTS Corporation | | | | 2,140 | 90,565 |
| ePlus Incorporated † | | | | 2,804 | 132,124 |
| Fabrinet † | | | | 2,110 | 216,992 |
| Identiv Incorporated † | | | | 5,505 | 82,135 |
| Insight Enterprises Incorporated † | | | | 2,618 | 238,552 |
| Itron Incorporated † | | | | 2,136 | 101,631 |
| Kimball Electronics Incorporated † | | | | 1,853 | 39,914 |
| Knowles Corporation † | | | | 4,163 | 63,069 |
| Methode Electronics Incorporated | | | | 1,673 | 67,690 |
| Mirion Technologies Incorporated † | | | | 9,539 | 72,210 |
| Napco Security Technologies Incorporated † | | | | 3,793 | 112,500 |
| Novanta Incorporated † | | | | 1,202 | 160,695 |
| OSI Systems Incorporated † | | | | 887 | 73,905 |
| PC Connection Incorporated | | | | 2,103 | 104,477 |
| Plexus Corporation † | | | | 1,554 | 145,656 |
| Sanmina Corporation † | | | | 5,143 | 249,538 |
| ScanSource Incorporated † | | | | 6,240 | 180,773 |
| TTM Technologies Incorporated † | | | | 7,734 | 121,656 |
| Vishay Intertechnology Incorporated | | | | 9,043 | 177,876 |
| Vishay Precision Group † | | | | 562 | 19,282 |
| | | | | | 3,032,704 |
| IT services: 2.62% | | | | | |
| Alliance Data Systems Corporation | | | | 5,498 | 211,288 |
| BM Technologies Incorporated † | | | | 1,827 | 11,547 |
| Brightcove Incorporated † | | | | 5,632 | 37,396 |
| Cantaloupe Incorporated † | | | | 3,605 | 22,964 |
| Conduent Incorporated † | | | | 37,950 | 155,216 |
| Core Scientific Incorporated † | | | | 31,825 | 70,015 |
| CSG Systems International Incorporated | | | | 3,560 | 205,946 |
| Cyxtera Technologies Incorporated † | | | | 2,553 | 16,186 |
| DigitalOcean Holdings Incorporated † | | | | 3,301 | 138,939 |
| ESC Incorporated ♦† | | | | 6,981 | 0 |
| Evertec Incorporated | | | | 3,504 | 117,734 |
| ExlService Holdings Incorporated † | | | | 2,098 | 351,856 |
The accompanying notes are an integral part of these financial statements.
Allspring Factor Enhanced U.S. Small Cap Equity Portfolio | 25
Portfolio of investments—August 31, 2022 (unaudited)
| | | | | Shares | Value |
| IT services (continued) | | | | | |
| Flywire Corporation † | | | | 1,518 | $ 37,737 |
| Grid Dynamics Holdings Incorporated † | | | | 2,952 | 59,660 |
| Hackett Group Incorporated | | | | 8,857 | 181,834 |
| I3 Verticals Incorporated Class A † | | | | 1,700 | 39,712 |
| IBEX Holdings Limited † | | | | 3,882 | 65,489 |
| Information Services Group Incorporated | | | | 23,268 | 134,256 |
| International Money Express Incorporated † | | | | 8,485 | 190,064 |
| Limelight Networks Incorporated † | | | | 6,373 | 23,453 |
| Marqeta Incorporated Class A † | | | | 13,850 | 107,892 |
| Maximus Incorporated | | | | 930 | 56,349 |
| Paya Holdings Incorporated Class A † | | | | 5,740 | 35,990 |
| Payoneer Global Incorporated † | | | | 6,566 | 43,467 |
| Paysafe Limited † | | | | 14,818 | 24,450 |
| Perficient Incorporated † | | | | 2,849 | 222,507 |
| PFSweb Incorporated † | | | | 3,057 | 28,919 |
| Priority Technology Holdings † | | | | 874 | 3,496 |
| Rackspace Technology Incorporated † | | | | 2,728 | 12,167 |
| Repay Holdings Corporation † | | | | 385 | 3,577 |
| Sabre Corporation † | | | | 23,229 | 167,017 |
| StoneCo Limited Class A † | | | | 11,018 | 104,451 |
| TTEC Holdings Incorporated | | | | 623 | 32,614 |
| Unisys Corporation † | | | | 7,691 | 71,603 |
| Verra Mobility Corporation † | | | | 11,545 | 184,027 |
| | | | | | 3,169,818 |
| Semiconductors & semiconductor equipment: 2.49% | | | | | |
| Acm Research Incorporated Class A † | | | | 851 | 14,373 |
| Alpha & Omega Semiconductor † | | | | 5,475 | 211,664 |
| Ambarella Incorporated † | | | | 1,438 | 97,611 |
| Amkor Technology Incorporated | | | | 5,629 | 113,312 |
| Axcelis Technologies Incorporated † | | | | 3,140 | 210,192 |
| Cohu Incorporated † | | | | 2,261 | 60,663 |
| Diodes Incorporated † | | | | 3,136 | 223,189 |
| FormFactor Incorporated † | | | | 3,669 | 107,428 |
| Ichor Holdings Limited † | | | | 1,299 | 39,905 |
| Impinj Incorporated † | | | | 508 | 45,354 |
| Kulicke and Soffa Industries Incorporated | | | | 2,674 | 112,415 |
| Macom Technology Solutions Holdings Incorporated † | | | | 1,924 | 106,109 |
| Maxlinear Incorporated † | | | | 3,359 | 120,689 |
| Onto Innovation Incorporated † | | | | 2,511 | 178,256 |
| PDF Solutions Incorporated † | | | | 1,153 | 30,416 |
| Photronics Incorporated † | | | | 6,612 | 111,082 |
| Power Integrations Incorporated | | | | 2,499 | 178,753 |
| Rambus Incorporated † | | | | 5,007 | 129,131 |
| Semtech Corporation † | | | | 2,958 | 136,630 |
| Silicon Laboratories Incorporated † | | | | 700 | 87,731 |
| Sitime Corporation † | | | | 772 | 82,149 |
| Skywater Technology Incorporated † | | | | 1,752 | 22,776 |
| Smart Global Holdings Incorporated † | | | | 5,951 | 109,201 |
| SunPower Corporation † | | | | 5,296 | 127,104 |
| Synaptics Incorporated † | | | | 1,923 | 222,318 |
| Ultra Clean Holdings Incorporated † | | | | 2,178 | 63,750 |
| Veeco Instruments Incorporated † | | | | 3,212 | 67,902 |
| | | | | | 3,010,103 |
The accompanying notes are an integral part of these financial statements.
26 | Allspring Factor Enhanced U.S. Small Cap Equity Portfolio
Portfolio of investments—August 31, 2022 (unaudited)
| | | | | Shares | Value |
| Software: 5.60% | | | | | |
| 8x8 Incorporated † | | | | 14,224 | $ 74,107 |
| A10 Networks Incorporated | | | | 12,205 | 169,650 |
| ACI Worldwide Incorporated † | | | | 8,605 | 203,939 |
| Agilysys Incorporated † | | | | 467 | 24,177 |
| Alarm.com Holdings Incorporated † | | | | 1,706 | 113,620 |
| Altair Engineering Incorporated Class A † | | | | 2,478 | 128,881 |
| American Software Incorporated Class A | | | | 7,117 | 120,491 |
| AppFolio Incorporated Class A † | | | | 733 | 74,312 |
| Appian Corporation † | | | | 2,785 | 130,617 |
| Applied Blockchain Incorporated † | | | | 9,486 | 22,482 |
| Arlo Technologies Incorporated † | | | | 15,455 | 94,121 |
| Arteris Incorporated † | | | | 3,979 | 28,330 |
| Asana Incorporated Class A † | | | | 7,606 | 145,655 |
| Avaya Holdings Corporation † | | | | 88,928 | 141,396 |
| Benefitfocus Incorporated † | | | | 2,550 | 18,896 |
| Blackbaud Incorporated † | | | | 1,882 | 98,429 |
| BlackLine Incorporated † | | | | 592 | ��40,220 |
| Box Incorporated Class A † | | | | 6,687 | 172,190 |
| BTRS Holdings Incorporated † | | | | 4,654 | 31,461 |
| C3.ai Incorporated † | | | | 104 | 1,872 |
| Cerence Incorporated † | | | | 6,153 | 123,122 |
| ChannelAdvisor Corporation † | | | | 5,398 | 81,456 |
| CleanSpark Incorporated † | | | | 29,030 | 124,248 |
| Clear Secure Incorporated Class A † | | | | 1,385 | 31,772 |
| CommVault Systems Incorporated † | | | | 2,106 | 114,335 |
| Concensus Cloud Solution † | | | | 5,529 | 278,385 |
| Couchbase Incorporated † | | | | 204 | 3,384 |
| CS Disco Incorporated † | | | | 223 | 3,077 |
| Cvent Holding Corporation † | | | | 1,874 | 9,482 |
| Digital Turbine Incorporated † | | | | 8,403 | 155,203 |
| Domo Incorporated Class B † | | | | 2,069 | 39,849 |
| Duck Creek Technologies Incorporated † | | | | 3,300 | 39,270 |
| E2open Parent Holding Incorporated † | | | | 1,113 | 7,646 |
| Ebix Incorporated | | | | 1,246 | 32,421 |
| eGain Corporation † | | | | 7,867 | 72,455 |
| Enfusion Incorporated Class A † | | | | 1,228 | 15,215 |
| EngageSmart Incorporated † | | | | 1,518 | 30,314 |
| Envestnet Incorporated † | | | | 2,830 | 148,207 |
| EverCommerce Incorporated † | | | | 1,887 | 21,965 |
| ForgeRock Incorporated Class A † | | | | 1,225 | 20,899 |
| Greenidge Generation Holdings † | | | | 30,555 | 74,249 |
| Instructure Holdings Incorporated † | | | | 2,333 | 53,029 |
| Intapp Incorporated † | | | | 1,005 | 14,562 |
| InterDigital Incorporated | | | | 1,429 | 71,679 |
| IronNet Incorporated † | | | | 14,667 | 29,627 |
| Kaleyra Incorporated † | | | | 22,340 | 35,521 |
| LivePerson Incorporated † | | | | 3,888 | 45,101 |
| LiveRamp Holdings Incorporated † | | | | 1,759 | 34,916 |
| LiveVox Holdings Incorporated † | | | | 16,074 | 34,398 |
| Marathon Digital Holdings Incorporated † | | | | 4,824 | 57,164 |
| Matterport Incorporated † | | | | 10,730 | 49,465 |
| MeridianLink Incorporated † | | | | 953 | 16,554 |
| MicroStrategy Incorporated Class A † | | | | 441 | 102,118 |
| Mitek Systems Incorporated † | | | | 1,191 | 12,172 |
| Model N Incorporated † | | | | 2,420 | 72,358 |
| N-able Incorporated † | | | | 8,078 | 80,457 |
The accompanying notes are an integral part of these financial statements.
Allspring Factor Enhanced U.S. Small Cap Equity Portfolio | 27
Portfolio of investments—August 31, 2022 (unaudited)
| | | | | Shares | Value |
| Software (continued) | | | | | |
| OneSpan Incorporated † | | | | 1,724 | $ 19,843 |
| Pagerduty Incorporated † | | | | 3,381 | 88,041 |
| Progress Software Corporation | | | | 4,033 | 194,108 |
| PROS Holdings Incorporated † | | | | 2,497 | 52,062 |
| Q2 Holdings Incorporated † | | | | 795 | 31,577 |
| Qualys Incorporated † | | | | 2,774 | 421,371 |
| Rapid7 Incorporated † | | | | 2,676 | 153,870 |
| Rimini Street Incorporated † | | | | 2,264 | 11,411 |
| Riot Blockchain Incorporated † | | | | 5,678 | 40,711 |
| Secureworks Corporation Class A † | | | | 10,622 | 110,469 |
| Sprout Social Incorporated Class A † | | | | 3,270 | 196,331 |
| SPS Commerce Incorporated † | | | | 2,171 | 265,123 |
| Telos Corporation † | | | | 6,520 | 64,548 |
| Tenable Holdings Incorporated † | | | | 4,822 | 190,999 |
| TeraWulf Incorporated † | | | | 21,626 | 32,223 |
| Upland Software Incorporated † | | | | 6,713 | 70,285 |
| UserTesting Incorporated † | | | | 6,012 | 25,010 |
| Varonis Systems Incorporated † | | | | 4,207 | 115,061 |
| Verint Systems Incorporated † | | | | 6,440 | 312,276 |
| Veritone Incorporated † | | | | 1,385 | 10,180 |
| Viant Technology † | | | | 6,919 | 31,274 |
| Weave Communications Incorporated † | | | | 335 | 1,933 |
| WM Technology Incorporated † | | | | 2,914 | 7,635 |
| Workiva Incorporated † | | | | 2,166 | 147,050 |
| Xperi Holding Corporation | | | | 8,829 | 140,469 |
| Yext Incorporated † | | | | 6,379 | 28,387 |
| Zuora Incorporated † | | | | 6,486 | 49,812 |
| | | | | | 6,782,980 |
| Technology hardware, storage & peripherals: 0.41% | | | | | |
| 3D Systems Corporation † | | | | 1,914 | 19,389 |
| Avid Technology Incorporated † | | | | 3,520 | 96,272 |
| CompoSecure Incorporated † | | | | 13,061 | 75,493 |
| Diebold Nixdorf Incorporated † | | | | 19,958 | 69,454 |
| Super Micro Computer Incorporated † | | | | 2,636 | 171,551 |
| Turtle Beach Corporation † | | | | 711 | 6,676 |
| Xerox Holdings Corporation | | | | 3,767 | 62,608 |
| | | | | | 501,443 |
| Materials: 3.85% | | | | | |
| Chemicals: 2.05% | | | | | |
| Advansix Incorporated | | | | 4,550 | 164,983 |
| American Vanguard Corporation | | | | 2,725 | 54,309 |
| Avient Corporation | | | | 4,224 | 185,138 |
| Balchem Corporation | | | | 1,108 | 146,057 |
| Cabot Corporation | | | | 2,684 | 193,167 |
| Ecovyst Incorporated | | | | 6,781 | 62,656 |
| Futurefuel Corporation | | | | 13,532 | 98,648 |
| Hawkins Incorporated | | | | 1,642 | 62,921 |
| HB Fuller Company | | | | 2,276 | 147,621 |
| Hudson Technologies Incorporated † | | | | 571 | 4,739 |
| Ingevity Corporation † | | | | 1,287 | 90,270 |
| Innospec Incorporated | | | | 1,269 | 118,601 |
| Intrepid Potash Incorporated † | | | | 1,263 | 59,020 |
| Kooper Holdings Incorporated | | | | 3,324 | 75,887 |
The accompanying notes are an integral part of these financial statements.
28 | Allspring Factor Enhanced U.S. Small Cap Equity Portfolio
Portfolio of investments—August 31, 2022 (unaudited)
| | | | | Shares | Value |
| Chemicals (continued) | | | | | |
| Kronos Worldwide Incorporated | | | | 6,843 | $ 88,138 |
| Livent Corporation † | | | | 6,424 | 206,724 |
| LSB Industries Incorporated † | | | | 3,713 | 58,591 |
| Minerals Technologies Incorporated | | | | 585 | 34,082 |
| Orion Engineered Carbons SA | | | | 6,329 | 106,707 |
| Quaker Chemical Corporation | | | | 52 | 9,065 |
| Rayonier Advanced Materials † | | | | 4 | 18 |
| Sensient Technologies Corporation | | | | 1,628 | 129,703 |
| Stepan Company | | | | 681 | 70,981 |
| Tredegar Corporation | | | | 2,746 | 28,037 |
| Trinseo plc | | | | 1,604 | 42,554 |
| Tronox Holdings plc Class A | | | | 10,830 | 158,443 |
| Valhi Incorporated | | | | 2,452 | 85,673 |
| | | | | | 2,482,733 |
| Construction materials: 0.11% | | | | | |
| Summit Materials Incorporated Class A † | | | | 4,947 | 140,594 |
| Containers & packaging: 0.21% | | | | | |
| Greif Incorporated Class A | | | | 1,645 | 110,297 |
| O-I Glass Incorporated † | | | | 8,625 | 112,211 |
| Pactiv Evergreen Incorporated | | | | 2,470 | 27,417 |
| | | | | | 249,925 |
| Metals & mining: 1.42% | | | | | |
| Allegheny Technologies Incorporated † | | | | 4,053 | 121,306 |
| Alpha Metallurgical Resource Incorporated | | | | 2,028 | 318,700 |
| Arconic Corporation † | | | | 3,102 | 78,201 |
| Carpenter Technology | | | | 263 | 8,934 |
| Century Aluminum Company † | | | | 2,371 | 18,304 |
| Commercial Metals Company | | | | 5,452 | 220,861 |
| Compass Minerals International Incorporated | | | | 1,464 | 59,277 |
| Constellium SE † | | | | 5,047 | 67,226 |
| Hecla Mining Company | | | | 12,294 | 48,438 |
| Materion Corporation | | | | 1,347 | 116,260 |
| MP Materials Corporation † | | | | 521 | 18,230 |
| Olympic Steel Incorporated | | | | 3,792 | 99,805 |
| Ramaco Resources Incorporated | | | | 8,538 | 89,991 |
| Ryerson Holding Corporation | | | | 5,541 | 157,919 |
| Schnitzer Steel Industries Incorporated Class A | | | | 1,198 | 39,582 |
| Suncoke Energy Incorporated | | | | 8,272 | 54,512 |
| TimkenSteel Corporation † | | | | 2,144 | 32,889 |
| Warrior Met Coal Incorporated | | | | 5,077 | 165,256 |
| Worthington Industries Incorporated | | | | 12 | 612 |
| | | | | | 1,716,303 |
| Paper & forest products: 0.06% | | | | | |
| Clearwater Paper Corporation † | | | | 1,041 | 44,284 |
| Sylvamo Corporation | | | | 594 | 26,397 |
| | | | | | 70,681 |
| Real estate: 5.92% | | | | | |
| Equity REITs: 5.36% | | | | | |
| Acadia Realty Trust | | | | 2,751 | 43,823 |
| Agree Realty Corporation | | | | 2,114 | 159,226 |
The accompanying notes are an integral part of these financial statements.
Allspring Factor Enhanced U.S. Small Cap Equity Portfolio | 29
Portfolio of investments—August 31, 2022 (unaudited)
| | | | | Shares | Value |
| Equity REITs (continued) | | | | | |
| Alexander & Baldwin Incorporated | | | | 6,378 | $ 119,460 |
| Alexander's Incorporated | | | | 108 | 25,585 |
| American Assets Trust Incorporated | | | | 805 | 22,347 |
| Apartment Investment & Management Company Class A † | | | | 15,948 | 140,980 |
| Apple Hospitality REIT Incorporated | | | | 12,345 | 196,409 |
| Armada Hoffler Properties Incorporated | | | | 5,405 | 70,968 |
| Ashford Hospitality Trust Incorporated † | | | | 1,590 | 14,596 |
| Braemar Hotels & Resorts Incorporated | | | | 2,820 | 14,523 |
| Broadstone Net Lease Incorporated REIT | | | | 9,692 | 185,505 |
| BRT Apartments Corporation REIT | | | | 583 | 13,916 |
| CareTrust REIT Incorporated | | | | 4,250 | 91,545 |
| CBL & Associates Properties Incorporated | | | | 2,512 | 72,697 |
| Centerspace REIT | | | | 49 | 3,694 |
| Chatham Lodging Trust † | | | | 1,861 | 22,630 |
| City Office REIT Incorporated | | | | 10,994 | 126,981 |
| Clipper Realty Incorporated | | | | 9,612 | 80,837 |
| Corporate Office Properties Trust | | | | 5,077 | 131,190 |
| CTO Realty Growth Incorporated REIT | | | | 4,254 | 89,802 |
| DiamondRock Hospitality † | | | | 14,231 | 124,237 |
| Diversified Healthcare Trust | | | | 14,873 | 21,715 |
| Easterly Government Properties Incorporated | | | | 1,226 | 22,007 |
| Equity Commonwealth † | | | | 4,903 | 128,998 |
| Essential Properties Realty | | | | 2,744 | 62,124 |
| Farmland Partners REIT Incorporated | | | | 4,963 | 72,013 |
| Four Corners Property Trust Incorporated | | | | 3,484 | 93,685 |
| Franklin Street Properties Corporation | | | | 24,952 | 70,115 |
| Getty Realty Corporation | | | | 1,639 | 49,301 |
| Gladstone Commercial Corporation | | | | 1,099 | 20,958 |
| Gladstone Land REIT Corporation | | | | 1,110 | 26,096 |
| Global Medical REIT Incorporated | | | | 3,459 | 37,496 |
| Hersha Hospitality Trust † | | | | 2,571 | 24,939 |
| Independence Realty Trust Incorporated | | | | 7,003 | 136,208 |
| Innovative Industrial Properties Incorporated | | | | 1,269 | 116,393 |
| Inventrust Properties Corporation REIT | | | | 4,202 | 110,345 |
| iStar Financial Incorporated | | | | 9,424 | 129,768 |
| Kite Realty Group Trust | | | | 2,460 | 47,626 |
| Lexington Corporate Properties Trust | | | | 14,186 | 142,711 |
| LTC Properties Incorporated | | | | 2,703 | 121,338 |
| National Health Investors Incorporated | | | | 2,205 | 144,450 |
| New York REIT Incorporated ♦‡ | | | | 4,209 | 72,150 |
| NexPoint Residential Trust Incorporated | | | | 1,279 | 67,557 |
| One Liberty Properties Incorporated | | | | 4,852 | 117,176 |
| Outfront Media Incorporated | | | | 8,307 | 147,034 |
| Paramount Group Incorporated | | | | 7,738 | 53,624 |
| Pebblebrook Hotel Trust | | | | 5,206 | 91,730 |
| Philips Edison & Company Incorporated | | | | 5,548 | 181,253 |
| Physicians Realty Trust | | | | 8,839 | 147,258 |
| Plymouth Industrial Incorporated | | | | 1,628 | 33,000 |
| PotlatchDeltic Corporation | | | | 3,399 | 157,782 |
| Retail Opportunity Investment Corporation | | | | 6,050 | 101,338 |
| RLJ Lodging Trust | | | | 7,118 | 85,843 |
| RPT Realty | | | | 12,909 | 124,314 |
| Ryman Hospitality Properties Incorporated † | | | | 2,420 | 198,972 |
| Sabra Health Care REIT Incorporated | | | | 6,238 | 93,383 |
| Saul Centers Incorporated | | | | 456 | 20,196 |
| Seritage Growth Property Class A † | | | | 1,145 | 14,358 |
The accompanying notes are an integral part of these financial statements.
30 | Allspring Factor Enhanced U.S. Small Cap Equity Portfolio
Portfolio of investments—August 31, 2022 (unaudited)
| | | | | Shares | Value |
| Equity REITs (continued) | | | | | |
| SITE Centers Corporation | | | | 9,121 | $ 118,208 |
| STAG Industrial Incorporated | | | | 5,331 | 164,195 |
| Sunstone Hotel Investors Incorporated † | | | | 12,478 | 135,885 |
| Tanger Factory Outlet Centers Incorporated | | | | 6,637 | 102,343 |
| Terreno Realty Corporation | | | | 2,479 | 151,194 |
| The Macerich Company | | | | 7,914 | 75,737 |
| UMH Properties Incorporated | | | | 1,185 | 21,377 |
| Uniti Group Incorporated | | | | 7,938 | 74,538 |
| Universal Health Realty Income Trust | | | | 1,317 | 67,022 |
| Urban Edge Properties | | | | 8,852 | 139,242 |
| Urstadt Biddle Properties Incorporated | | | | 4,858 | 81,226 |
| Veris Residential Incorporated † | | | | 2,672 | 35,912 |
| Washington REIT | | | | 3,696 | 72,479 |
| Whitestone REIT | | | | 9,409 | 92,585 |
| Xenia Hotels & Resorts Incorporated † | | | | 7,309 | 115,921 |
| | | | | | 6,484,069 |
| Real estate management & development: 0.56% | | | | | |
| Compass Incorporated Class A † | | | | 5,883 | 16,825 |
| Cushman & Wakefield plc † | | | | 7,043 | 105,363 |
| DigitalBridge Group Incorporated † | | | | 5,149 | 91,652 |
| Douglas Elliman Incorporated | | | | 3,461 | 15,955 |
| eXp World Holdings Incorporated | | | | 2,907 | 37,588 |
| Forestar Group Incorporated † | | | | 178 | 2,214 |
| Kennedy Wilson Holdings Incorporated | | | | 5,653 | 99,267 |
| Marcus & Millichap Incorporated | | | | 1,947 | 72,779 |
| Newmark Group Incorporated Class A | | | | 7,122 | 73,001 |
| Realogy Holdings Corporation † | | | | 6,910 | 67,511 |
| The RMR Group Incorporated Class A | | | | 3,703 | 96,426 |
| The St. Joe Company | | | | 100 | 3,820 |
| | | | | | 682,401 |
| Utilities: 2.84% | | | | | |
| Electric utilities: 0.51% | | | | | |
| Allete Incorporated | | | | 1,657 | 98,061 |
| MGE Energy Incorporated | | | | 947 | 72,938 |
| Otter Tail Corporation | | | | 2,401 | 181,372 |
| Portland General Electric Company | | | | 3,026 | 156,353 |
| Via Renewables Incorporated | | | | 12,457 | 106,258 |
| | | | | | 614,982 |
| Gas utilities: 0.99% | | | | | |
| Brookfield Infrastructure Corporation Class A | | | | 4,156 | 197,826 |
| Chesapeake Utilities Corporation | | | | 1,159 | 146,382 |
| New Jersey Resources Corporation | | | | 5,838 | 257,689 |
| Northwest Natural Holding Company | | | | 1,567 | 74,605 |
| ONE Gas Incorporated | | | | 2,192 | 171,568 |
| Southwest Gas Holdings Incorporated | | | | 1,845 | 143,633 |
| Spire Incorporated | | | | 2,885 | 201,633 |
| | | | | | 1,193,336 |
| Independent power & renewable electricity producers: 0.61% | | | | | |
| Altus Power Incorporated † | | | | 2,764 | 28,967 |
| Clearway Energy Incorporated Class A | | | | 2,776 | 95,716 |
The accompanying notes are an integral part of these financial statements.
Allspring Factor Enhanced U.S. Small Cap Equity Portfolio | 31
Portfolio of investments—August 31, 2022 (unaudited)
| | | | | Shares | Value |
| Independent power & renewable electricity producers (continued) | | | | | |
| Clearway Energy Incorporated Class C | | | | 5,091 | $ 188,876 |
| Montauk Renewables Incorporated † | | | | 8,375 | 148,656 |
| Ormat Technologies Incorporated | | | | 2,139 | 199,954 |
| Sunnova Energy International Incorporated † | | | | 3,089 | 77,905 |
| | | | | | 740,074 |
| Multi-utilities: 0.43% | | | | | |
| Avista Corporation | | | | 3,342 | 135,785 |
| Black Hills Corporation | | | | 3,238 | 244,404 |
| Northwestern Corporation | | | | 2,002 | 106,066 |
| Unitil Corporation | | | | 741 | 38,599 |
| | | | | | 524,854 |
| Water utilities: 0.30% | | | | | |
| American States Water Company | | | | 1,180 | 97,905 |
| Artesian Resources Corporation Class A | | | | 1,568 | 85,660 |
| California Water Service Group | | | | 1,715 | 100,379 |
| Middlesex Water Company | | | | 475 | 42,166 |
| Pure Cycle Corporation † | | | | 1 | 10 |
| SJW Corporation | | | | 650 | 41,795 |
| | | | | | 367,915 |
| Total Common stocks (Cost $112,565,541) | | | | | 116,072,528 |
| | | | Expiration
date | | |
| Warrants: 0.00% | | | | | |
| Energy: 0.00% | | | | | |
| Oil, gas & consumable fuels: 0.00% | | | | | |
| Battalion Oil Corporation ♦† | | | 10-8-2022 | 375 | 0 |
| Battalion Oil Corporation ♦† | | | 10-8-2022 | 300 | 0 |
| Battalion Oil Corporation ♦† | | | 10-8-2022 | 482 | 0 |
| | | | | | 0 |
| Total Warrants (Cost $0) | | | | | 0 |
| | | Yield | | Shares | |
| Short-term investments: 3.83% | | | | | |
| Investment companies: 3.83% | | | | | |
| Allspring Government Money Market Fund Select Class ♠∞ | | 2.09% | | 4,633,874 | 4,633,874 |
| Total Short-term investments (Cost $4,633,874) | | | | | 4,633,874 |
| Total investments in securities (Cost $117,199,415) | 99.68% | | | | 120,706,402 |
| Other assets and liabilities, net | 0.32 | | | | 393,159 |
| Total net assets | 100.00% | | | | $121,099,561 |
| † | Non-income-earning security |
| ♦ | The security is fair valued in accordance with procedures approved by the Board of Trustees. |
| ‡ | Security is valued using significant unobservable inputs. |
| ♠ | The issuer of the security is an affiliated person of the Portfolio as defined in the Investment Company Act of 1940. |
| ∞ | The rate represents the 7-day annualized yield at period end. |
The accompanying notes are an integral part of these financial statements.
32 | Allspring Factor Enhanced U.S. Small Cap Equity Portfolio
Portfolio of investments—August 31, 2022 (unaudited)
| Abbreviations: |
| REIT | Real estate investment trust |
Investments in affiliates
An affiliated investment is an investment in which the Portfolio owns at least 5% of the outstanding voting shares of the issuer or as a result of other relationships, such as the Portfolio and the issuer having the same adviser or investment manager. Transactions with issuers that were affiliates of the Portfolio at the end of the period were as follows:
| | Value,
beginning of
period | Purchases | Sales
proceeds | Net
realized
gains
(losses) | Net
change in
unrealized
gains
(losses) | Value,
end of
period | Shares,
end
of period | Income
from
affiliated
securities |
| Short-term investments | | | | | | | |
| Allspring Government Money Market Fund Select Class | $4,940,136 | $76,300,189 | $(76,606,451) | $0 | $0 | $4,633,874 | 4,633,874 | $18,902 |
Futures contracts
| Description | Number of
contracts | Expiration
date | Notional
cost | Notional
value | Unrealized
gains | Unrealized
losses |
| Long | | | | | | |
| E-Mini Russell 2000 Index | 51 | 9-16-2022 | $4,918,763 | $4,703,730 | $0 | $(215,033) |
The accompanying notes are an integral part of these financial statements.
Allspring Factor Enhanced U.S. Small Cap Equity Portfolio | 33
Statement of assets and liabilities—August 31, 2022 (unaudited)
| | |
| Assets | |
Investments in unaffiliated securities, at value (cost $112,565,541)
| $ 116,072,528 |
Investments in affiliated securities, at value (cost $4,633,874)
| 4,633,874 |
Cash at broker segregated for futures contracts
| 370,000 |
Receivable for dividends
| 111,841 |
Prepaid expenses and other assets
| 2,265 |
Total assets
| 121,190,508 |
| Liabilities | |
Custody and accounting fees payable
| 30,201 |
Payable for daily variation margin on open futures contracts
| 27,383 |
Professional fees payable
| 21,291 |
Trustees’ fees and expenses payable
| 2,611 |
Advisory fee payable
| 2,563 |
Accrued expenses and other liabilities
| 6,898 |
Total liabilities
| 90,947 |
Total net assets
| $121,099,561 |
The accompanying notes are an integral part of these financial statements.
34 | Allspring Factor Enhanced U.S. Small Cap Equity Portfolio
Statement of operations—six months ended August 31, 2022 (unaudited)
| | |
| Investment income | |
Dividends (net of foreign withholdings taxes of $2,324)
| $ 1,254,447 |
Income from affiliated securities
| 18,902 |
Total investment income
| 1,273,349 |
| Expenses | |
Advisory fee
| 109,275 |
Custody and accounting fees
| 22,245 |
Professional fees
| 29,972 |
Interest holder report expenses
| 9,483 |
Trustees’ fees and expenses
| 11,153 |
Other fees and expenses
| 10,257 |
Total expenses
| 192,385 |
Less: Fee waivers and/or expense reimbursements
| (78,739) |
Net expenses
| 113,646 |
Net investment income
| 1,159,703 |
| Realized and unrealized gains (losses) on investments | |
| Net realized gains on | |
Unaffiliated securities
| 2,174,797 |
Futures contracts
| 54,529 |
Net realized gains on investments
| 2,229,326 |
| Net change in unrealized gains (losses) on | |
Unaffiliated securities
| (17,230,013) |
Futures contracts
| (419,643) |
Net change in unrealized gains (losses) on investments
| (17,649,656) |
Net realized and unrealized gains (losses) on investments
| (15,420,330) |
Net decrease in net assets resulting from operations
| $(14,260,627) |
The accompanying notes are an integral part of these financial statements.
Allspring Factor Enhanced U.S. Small Cap Equity Portfolio | 35
Statement of changes in net assets
| | | |
| | Six months ended
August 31, 2022
(unaudited) | Year ended
February 28, 2022 |
| Operations | | |
Net investment income
| $ 1,159,703 | $ 1,619,069 |
Net realized gains on investments
| 2,229,326 | 49,133,871 |
Net change in unrealized gains (losses) on investments
| (17,649,656) | (54,692,921) |
Net decrease in net assets resulting from operations
| (14,260,627) | (3,939,981) |
| Capital transactions | | |
| Transactions in investors’ beneficial interests | | |
Contributions
| 24,777,129 | 57,032,871 |
Withdrawals
| (81,386,342) | (70,491,112) |
Net decrease in net assets resulting from capital transactions
| (56,609,213) | (13,458,241) |
Total decrease in net assets
| (70,869,840) | (17,398,222) |
| Net assets | | |
Beginning of period
| 191,969,401 | 209,367,623 |
End of period
| $121,099,561 | $191,969,401 |
The accompanying notes are an integral part of these financial statements.
36 | Allspring Factor Enhanced U.S. Small Cap Equity Portfolio
| | | Year ended February 28 |
| | Six months ended
August 31, 2022
(unaudited) | 2022 | 2021 | 2020 1 | 2019 | 2018 2 |
Total return3
| (9.46)% | (2.87)% | 43.18% | (5.94)% | 7.05% | 8.75% |
| Ratios to average net assets (annualized) | | | | | | |
Gross expenses
| 0.27% | 0.22% | 0.22% | 0.23% | 0.21% | 0.19% |
Net expenses
| 0.16% * | 0.16% * | 0.16% * | 0.18% | 0.19% | 0.19% |
Net investment income
| 1.59% | 0.77% | 1.02% | 1.35% | 1.29% | 1.23% |
| Supplemental data | | | | | | |
Portfolio turnover rate
| 40% | 92% | 98% | 40% | 37% | 85% |
| * | Ratio includes expenses which were voluntarily waived by the adviser. Without these voluntary waivers, the net expense ratios would be increased by the following amounts: |
| Six months ended August 31, 2022 (unaudited) | 0.11% |
| Year ended February 28, 2022 | 0.06% |
| Year ended February 28, 2021 | 0.06% |
| 1 | Year ended February 29 |
| 2 | For the period from May 23, 2017 (commencement of operations) to February 28, 2018 |
| 3 | Returns for periods of less than one year are not annualized. |
The accompanying notes are an integral part of these financial statements.
Allspring Factor Enhanced U.S. Small Cap Equity Portfolio | 37
Notes to financial statements (unaudited)
1. ORGANIZATION
Allspring Master Trust (the "Trust"), a Delaware statutory trust organized on March 10, 1999, is an open-end management investment company registered under the Investment Company Act of 1940, as amended (the "1940 Act"). As an investment company, the Trust follows the accounting and reporting guidance in Financial Accounting Standards Board ("FASB") Accounting Standards Codification Topic 946, Financial Services – Investment Companies. These financial statements report on the Allspring Factor Enhanced U.S. Small Cap Equity Portfolio (the "Portfolio") which is a diversified series of the Trust.
Interests in the Portfolio are available solely through private placement transactions that do not involve any "public offering" within the meaning of Section 4(a)(2) of the Securities Act of 1933.
2. SIGNIFICANT ACCOUNTING POLICIES
The following significant accounting policies, which are consistently followed in the preparation of the financial statements of the Portfolio, are in conformity with U.S. generally accepted accounting principles which require management to make estimates and assumptions that affect the reported amounts of assets and liabilities, disclosure of contingent assets and liabilities at the date of the financial statements, and the reported amounts of income and expenses during the reporting period. Actual results could differ from those estimates.
Securities valuation
All investments are valued each business day as of the close of regular trading on the New York Stock Exchange (generally 4 p.m. Eastern Time), although the Portfolio may deviate from this calculation time under unusual or unexpected circumstances.
Equity securities and futures contracts that are listed on a foreign or domestic exchange or market are valued at the official closing price or, if none, the last sales price.
Investments in registered open-end investment companies are valued at net asset value.
Investments which are not valued using any of the methods discussed above are valued at their fair value, as determined in good faith by the Board of Trustees. The Board of Trustees has established a Valuation Committee comprised of the Trustees and has delegated to it the authority to take any actions regarding the valuation of portfolio securities that the Valuation Committee deems necessary or appropriate, including determining the fair value of portfolio securities, unless the determination has been delegated to the Allspring Global Investments Pricing Committee at Allspring Funds Management, LLC ("Allspring Funds Management"). The Board of Trustees retains the authority to make or ratify any valuation decisions or approve any changes to the Valuation Procedures as it deems appropriate. On a quarterly basis, the Board of Trustees receives reports on any valuation actions taken by the Valuation Committee or the Allspring Global Investments Pricing Committee which may include items for ratification.
Futures contracts
Futures contracts are agreements between the Portfolio and a counterparty to buy or sell a specific amount of a commodity, financial instrument or currency at a specified price on a specified date. The Portfolio may buy and sell futures contracts in order to gain exposure to, or protect against, changes in security values and is subject to equity price risk. The primary risks associated with the use of futures contracts are the imperfect correlation between changes in market values of securities held by the Portfolio and the prices of futures contracts, and the possibility of an illiquid market. Futures contracts are generally entered into on a regulated futures exchange and cleared through a clearinghouse associated with the exchange. With futures contracts, there is minimal counterparty risk to the Portfolio since futures contracts are exchange traded and the exchange’s clearinghouse, as the counterparty to all exchange traded futures, guarantees the futures contracts against default.
Upon entering into a futures contract, the Portfolio is required to deposit either cash or securities (initial margin) with the broker in an amount equal to a certain percentage of the contract value. Subsequent payments (variation margin) are paid to or from the broker each day equal to the daily changes in the contract value. Such payments are recorded as unrealized gains or losses and, if any, shown as variation margin receivable (payable) in the Statement of Assets and Liabilities. Should the Portfolio fail to make requested variation margin payments, the broker can gain access to the initial margin to satisfy the Portfolio’s payment obligations. When the contracts are closed, a realized gain or loss is recorded in the Statement of Operations.
Security transactions and income recognition
Securities transactions are recorded on a trade date basis. Realized gains or losses are recorded on the basis of identified cost.
Dividend income is recognized on the ex-dividend date. Dividend income is recorded net of foreign taxes withheld where recovery of such taxes is not assured.
38 | Allspring Factor Enhanced U.S. Small Cap Equity Portfolio
Notes to financial statements (unaudited)
Federal and other taxes
The Portfolio is not required to pay federal income taxes on its net investment income and net capital gains as it is treated as a partnership for federal income tax purposes. All income, gains and losses of the Portfolio are deemed to have been “passed through” to the interest holders in proportion to their holdings of the Portfolio regardless of whether income and gains have been distributed by the Portfolio.
The Portfolio’s income tax returns and all financial records supporting those returns for the prior three fiscal years are subject to examination by the federal revenue authority. Management has analyzed the Portfolio’s tax positions taken on federal, state, and foreign tax returns, as applicable, for all open tax years and does not believe that there are any uncertain tax positions that require recognition of a tax liability.
As of August 31, 2022, the aggregate cost of all investments for federal income tax purposes was $118,025,663 and the unrealized gains (losses) consisted of:
| Gross unrealized gains | $ 16,670,040 |
| Gross unrealized losses | (14,204,334) |
| Net unrealized gains | $ 2,465,706 |
3. FAIR VALUATION MEASUREMENTS
Fair value measurements of investments are determined within a framework that has established a fair value hierarchy based upon the various data inputs utilized in determining the value of the Portfolio’s investments. The three-level hierarchy gives the highest priority to unadjusted quoted prices in active markets for identical assets or liabilities (Level 1) and the lowest priority to unobservable inputs (Level 3). The Portfolio’s investments are classified within the fair value hierarchy based on the lowest level of input that is significant to the fair value measurement. The inputs are summarized into three broad levels as follows:
| ■ | Level 1 – quoted prices in active markets for identical securities |
| ■ | Level 2 – other significant observable inputs (including quoted prices for similar securities, interest rates, prepayment speeds, credit risk, etc.) |
| ■ | Level 3 – significant unobservable inputs (including the Portfolio’s own assumptions in determining the fair value of investments) |
The inputs or methodologies used for valuing investments in securities are not necessarily an indication of the risk associated with investing in those securities.
Allspring Factor Enhanced U.S. Small Cap Equity Portfolio | 39
Notes to financial statements (unaudited)
The following is a summary of the inputs used in valuing the Portfolio’s assets and liabilities as of August 31, 2022:
| | Quoted prices
(Level 1) | Other significant
observable inputs
(Level 2) | Significant
unobservable inputs
(Level 3) | Total |
| Assets | | | | |
| Investments in: | | | | |
| Common stocks | | | | |
| Communication services | $ 3,413,127 | $0 | $ 7,490 | $ 3,420,617 |
| Consumer discretionary | 12,292,251 | 0 | 0 | 12,292,251 |
| Consumer staples | 4,236,520 | 0 | 0 | 4,236,520 |
| Energy | 5,894,204 | 0 | 0 | 5,894,204 |
| Financials | 17,939,939 | 0 | 0 | 17,939,939 |
| Health care | 22,778,823 | 0 | 246,367 | 23,025,190 |
| Industrials | 16,733,362 | 0 | 0 | 16,733,362 |
| Information technology | 17,262,578 | 0 | 0 | 17,262,578 |
| Materials | 4,660,236 | 0 | 0 | 4,660,236 |
| Real estate | 7,094,320 | 0 | 72,150 | 7,166,470 |
| Utilities | 3,441,161 | 0 | 0 | 3,441,161 |
| Warrants | | | | |
| Energy | 0 | 0 | 0 | 0 |
| Short-term investments | | | | |
| Investment companies | 4,633,874 | 0 | 0 | 4,633,874 |
| Total assets | $120,380,395 | $0 | $326,007 | $120,706,402 |
| Liabilities | | | | |
| Futures contracts | $ 215,033 | $0 | $ 0 | $ 215,033 |
| Total liabilities | $ 215,033 | $0 | $ 0 | $ 215,033 |
Futures contracts are reported at their cumulative unrealized gains (losses) at measurement date as reported in the table following the Portfolio of Investments. For futures contracts, the current day’s variation margin is reported on the Statement of Assets and Liabilities. All other assets and liabilities are reported at their market value at measurement date.
Additional sector, industry or geographic detail, if any, is included in the Portfolio of Investments.
For the six months ended August 31, 2022, the Portfolio did not have any transfers into/out of Level 3.
4. TRANSACTIONS WITH AFFILIATES
Advisory fee
The Trust has entered into an advisory contract with Allspring Funds Management, a wholly owned subsidiary of Allspring Global Investments Holdings, LLC, a holding company indirectly owned by certain private funds of GTCR LLC and Reverence Capital Partners, L.P. The adviser is responsible for implementing investment policies and guidelines and for supervising the subadviser, who is responsible for day-to-day portfolio management of the Portfolio. Pursuant to the contract, Allspring Funds Management is entitled to receive an advisory fee at the following annual rate based on the Portfolio’s average daily net assets:
| Average daily net assets | Advisory fee |
| First $5 billion | 0.150% |
| Next $5 billion | 0.130 |
| Over $10 billion | 0.110 |
For the six months ended August 31, 2022, the advisory fee was equivalent to an annual rate of 0.15% of the Portfolio’s average daily net assets.
Allspring Funds Management has retained the services of a subadviser to provide daily portfolio management to the Portfolio. The fee for subadvisory services is borne by Allspring Funds Management. Allspring Global Investments, LLC, an affiliate of
40 | Allspring Factor Enhanced U.S. Small Cap Equity Portfolio
Notes to financial statements (unaudited)
Allspring Funds Management and a wholly owned subsidiary of Allspring Global Investments Holdings, LLC, is the subadviser to the Portfolio and is entitled to receive a fee from Allspring Funds Management at an annual rate starting at 0.08% and declining to 0.05% as the average daily net assets of the Portfolio increase.
Allspring Funds Management has voluntarily waived and/or reimbursed advisory fees to reduce the net operating expense ratio of the Portfolio. These voluntary waivers may be discontinued at any time.
Interfund transactions
The Portfolio may purchase or sell portfolio investment securities to certain affiliates pursuant to Rule 17a-7 under the 1940 Act and under procedures adopted by the Board of Trustees. The procedures have been designed to ensure that these interfund transactions, which do not incur broker commissions, are effected at current market prices.
5. INVESTMENT PORTFOLIO TRANSACTIONS
Purchases and sales of investments, excluding U.S. government obligations (if any) and short-term securities, for the six months ended August 31, 2022 were $56,312,685 and $111,379,267, respectively.
6. DERIVATIVE TRANSACTIONS
During the six months ended August 31, 2022, the Portfolio entered into futures contracts to gain market exposure. The Portfolio had an average notional amount of $12,310,338 in long futures contracts during the six months ended August 31, 2022.
The fair value, realized gains or losses and change in unrealized gains or losses, if any, on derivative instruments are reflected in the corresponding financial statement captions.
7. BANK BORROWINGS
The Trust, along with Allspring Variable Trust and Allspring Funds Trust (excluding the money market funds), are parties to a $350,000,000 revolving credit agreement whereby the Portfolio is permitted to use bank borrowings for temporary or emergency purposes, such as to fund interest holders withdrawal requests. Interest under the credit agreement is charged to the Portfolio based on a borrowing rate equal to the higher of the Federal Funds rate or the overnight bank funding rate in effect on that day plus a spread. In addition, an annual commitment fee equal based on the unused balance is allocated to each participating fund.
For the six months ended August 31, 2022, there were no borrowings by the Portfolio under the agreement.
8. INDEMNIFICATION
Under the Portfolio's organizational documents, the officers and Trustees have been granted certain indemnification rights against certain liabilities that may arise out of performance of their duties to the Portfolio. The Portfolio has entered into a separate agreement with each Trustee that converts indemnification rights currently existing under the Portfolio’s organizational documents into contractual rights that cannot be changed in the future without the consent of the Trustee. Additionally, in the normal course of business, the Portfolio may enter into contracts with service providers that contain a variety of indemnification clauses. The Portfolio’s maximum exposure under these arrangements is dependent on future claims that may be made against the Portfolio and, therefore, cannot be estimated.
9. CORONAVIRUS (COVID-19) PANDEMIC
On March 11, 2020, the World Health Organization announced that it had made the assessment that coronavirus disease 2019 (“COVID-19”) is a pandemic. The impacts of COVID-19 are affecting the entire global economy, individual companies and investment products, the funds, and the market in general. There is significant uncertainty around the extent and duration of business disruptions related to COVID-19 and the impacts may last for an extended period of time. COVID-19 has led to significant uncertainty and volatility in the financial markets.
Allspring Factor Enhanced U.S. Small Cap Equity Portfolio | 41
Other information (unaudited)
PROXY VOTING INFORMATION
A description of the policies and procedures used to determine how to vote proxies relating to portfolio securities is available without charge, upon request, by calling 1-800-222-8222, visiting our website at allspringglobal.com, or visiting the SEC website at sec.gov. Information regarding how the proxies related to portfolio securities were voted during the most recent 12-month period ended June 30 is available on the website at allspringglobal.com or by visiting the SEC website at sec.gov.
QUARTERLY PORTFOLIO HOLDINGS INFORMATION
The Portfolio files its complete schedule of portfolio holdings with the SEC for the first and third quarters of each fiscal year as an exhibit to its reports on Form N-PORT. Interest holders may view the filed Form N-PORT by visiting the SEC website at sec.gov.
42 | Allspring Factor Enhanced U.S. Small Cap Equity Portfolio
Other information (unaudited)
BOARD OF TRUSTEES AND OFFICERS
Each of the Trustees and Officers listed in the table below acts in identical capacities for each fund in the Allspring family of funds, which consists of 124 mutual funds comprising the Allspring Funds Trust, Allspring Variable Trust, Allspring Master Trust and four closed-end funds (collectively the “Fund Complex”). This table should be read in conjunction with the Prospectus and the Statement of Additional Information1. The mailing address of each Trustee and Officer is 525 Market Street, 12th Floor, San Francisco, CA 94105. Each Trustee and Officer serves an indefinite term, however, each Trustee serves such term until reaching the mandatory retirement age established by the Trustees.
Independent Trustees
Name and
year of birth | Position held and
length of service* | Principal occupations during past five years or longer | Current other
public company or
investment
company
directorships |
William R. Ebsworth
(Born 1957) | Trustee,
since 2015 | Retired. From 1984 to 2013, equities analyst, portfolio manager, research director and chief investment officer at Fidelity Management and Research Company in Boston, Tokyo, and Hong Kong, and retired in 2013 as Chief Investment Officer of Fidelity Strategic Advisers, Inc. where he led a team of investment professionals managing client assets. Prior thereto, Board member of Hong Kong Securities Clearing Co., Hong Kong Options Clearing Corp., the Thailand International Fund, Ltd., Fidelity Investments Life Insurance Company, and Empire Fidelity Investments Life Insurance Company. Audit Committee Chair and Investment Committee Chair of the Vincent Memorial Hospital Endowment (non-profit organization). Mr. Ebsworth is a CFA® charterholder. | N/A |
Jane A. Freeman
(Born 1953) | Trustee,
since 2015;
Chair Liaison,
since 2018 | Retired. From 2012 to 2014 and 1999 to 2008, Chief Financial Officer of Scientific Learning Corporation. From 2008 to 2012, Ms. Freeman provided consulting services related to strategic business projects. Prior to 1999, Portfolio Manager at Rockefeller & Co. and Scudder, Stevens & Clark. Board member of the Harding Loevner Funds from 1996 to 2014, serving as both Lead Independent Director and chair of the Audit Committee. Board member of the Russell Exchange Traded Funds Trust from 2011 to 2012 and the chair of the Audit Committee. Ms. Freeman is also an inactive Chartered Financial Analyst. | N/A |
Isaiah Harris, Jr.
(Born 1952) | Trustee,
since 2009; Audit
Committee
Chair,
since 2019 | Retired. Chairman of the Board of CIGNA Corporation from 2009 to 2021, and Director from 2005 to 2008. From 2003 to 2011, Director of Deluxe Corporation. Prior thereto, President and CEO of BellSouth Advertising and Publishing Corp. from 2005 to 2007, President and CEO of BellSouth Enterprises from 2004 to 2005 and President of BellSouth Consumer Services from 2000 to 2003. Emeritus member of the Iowa State University Foundation Board of Governors. Emeritus Member of the Advisory Board of Iowa State University School of Business. Advisory Board Member, Palm Harbor Academy (private school). Advisory Board Member, Fellowship of Christian Athletes. Mr. Harris is a certified public accountant (inactive status). | N/A |
David F. Larcker
(Born 1950) | Trustee,
since 2009 | James Irvin Miller Professor of Accounting at the Graduate School of Business (Emeritus), Stanford University, Director of the Corporate Governance Research Initiative and Senior Faculty of The Rock Center for Corporate Governance since 2006. From 2005 to 2008, Professor of Accounting at the Graduate School of Business, Stanford University. Prior thereto, Ernst & Young Professor of Accounting at The Wharton School, University of Pennsylvania from 1985 to 2005. | N/A |
Allspring Factor Enhanced U.S. Small Cap Equity Portfolio | 43
Other information (unaudited)
Name and
year of birth | Position held and
length of service* | Principal occupations during past five years or longer | Current other
public company or
investment
company
directorships |
Olivia S. Mitchell
(Born 1953) | Trustee,
since 2006;
Nominating and
Governance
Committee Chair,
since 2018 | International Foundation of Employee Benefit Plans Professor since 1993, Wharton School of the University of Pennsylvania. Director of Wharton’s Pension Research Council and Boettner Center on Pensions & Retirement Research, and Research Associate at the National Bureau of Economic Research. Previously taught at Cornell University from 1978 to 1993. | N/A |
Timothy J. Penny
(Born 1951) | Trustee,
since 1996;
Chair,
since 2018 | President and Chief Executive Officer of Southern Minnesota Initiative Foundation, a non-profit organization, since 2007. Vice Chair of the Economic Club of Minnesota, since 2007. Co-Chair of the Committee for a Responsible Federal Budget, since 1995. Member of the Board of Trustees of NorthStar Education Finance, Inc., a non-profit organization, since 2007. Senior Fellow of the University of Minnesota Humphrey Institute from 1995 to 2017. | N/A |
James G. Polisson
(Born 1959) | Trustee,
since 2018 | Retired. Chief Marketing Officer, Source (ETF) UK Services, Ltd, from 2015 to 2017. From 2012 to 2015, Principal of The Polisson Group, LLC, a management consulting, corporate advisory and principal investing company. Chief Executive Officer and Managing Director at Russell Investments, Global Exchange Traded Funds from 2010 to 2012. Managing Director of Barclays Global Investors from 1998 to 2010 and Global Chief Marketing Officer for iShares and Barclays Global Investors from 2000 to 2010. Trustee of the San Francisco Mechanics’ Institute, a non-profit organization, from 2013 to 2015. Board member of the Russell Exchange Traded Fund Trust from 2011 to 2012. Director of Barclays Global Investors Holdings Deutschland GmbH from 2006 to 2009. Mr. Polisson is an attorney and has a retired status with the Massachusetts and District of Columbia Bar Associations. | N/A |
Pamela Wheelock
(Born 1959) | Trustee,
since January
2020; previously
Trustee from
January 2018 to
July 2019 | Retired. Executive and Senior Financial leadership positions in the public, private and nonprofit sectors. Interim President and CEO, McKnight Foundation, 2020. Interim Commissioner, Minnesota Department of Human Services, 2019. Chief Operating Officer, Twin Cities Habitat for Humanity, 2017-2019. Vice President for University Services, University of Minnesota, 2012-2016. Interim President and CEO, Blue Cross and Blue Shield of Minnesota, 2011-2012. Executive Vice-President and Chief Financial Officer, Minnesota Wild, 2002-2008. Commissioner, Minnesota Department of Finance, 1999-2002. Chair of the Board of Directors of Destination Medical Center Corporation. Board member of the Minnesota Wild Foundation. | N/A |
* Length of service dates reflect the Trustee’s commencement of service with the Trust’s predecessor entities, where applicable.
44 | Allspring Factor Enhanced U.S. Small Cap Equity Portfolio
Other information (unaudited)
Officers2
Name and
year of birth | Position held and
length of service | Principal occupations during past five years or longer |
Andrew Owen
(Born 1960) | President,
since 2017 | President, Chief Executive Officer and Director of Allspring Funds Management, LLC since 2017 and co-president of Galliard Capital Management, LLC, an affiliate of Allspring Funds Management, LLC, since 2019. Prior thereto, Head of Affiliated Managers, Allspring Global Investments, from 2014 to 2019 and Executive Vice President responsible for marketing, investments and product development for Allspring Funds Management, LLC, from 2009 to 2014. In addition, Mr. Owen was an Executive Vice President of Wells Fargo & Company from 2014 to 2021. |
Jeremy DePalma
(Born 1974) | Treasurer,
since 2012
(for certain funds in
the Fund Complex);
since 2021 (for
the remaining funds in the
Fund Complex) | Senior Vice President of Allspring Funds Management, LLC since 2009. Senior Vice President of Evergreen Investment Management Company, LLC from 2008 to 2010 and head of the Fund Reporting and Control Team within Fund Administration from 2005 to 2010. |
Kate McKinley
(Born 1977) | Chief Legal Officer,
since 2021 | Chief Legal Officer of Allspring Global Investments since 2021. Prior thereto, held various roles at State Street Global Advisors beginning in 2010, including serving as Senior Vice President and General Counsel from 2019 to 2021, and Chief Operating Officer of the Institutional Client Group from 2016 - 2019. Prior to working at State Street Global Advisors served as Assistant General Counsel for Bank of America Corporation from 2005 to 2010 and as an Associate at WilmerHale from 2002 to 2005. |
Christopher Baker
(Born 1976) | Chief Compliance Officer, since 2022 | Global Chief Compliance Officer for Allspring Global Investments since 2022. Prior thereto, Chief Compliance Officer for State Street Global Advisors from 2018 to 2021. Senior Compliance Officer for the State Street divisions of Alternative Investment Solutions, Sector Solutions, and Global Marketing from 2015 to 2018. From 2010 to 2015 Vice President, Global Head of Investment and Marketing Compliance for State Street Global Advisors. |
Matthew Prasse
(Born 1983) | Secretary,
since 2021 | Senior Counsel of the Allspring Legal Department since 2021. Senior Counsel of the Wells Fargo Legal Department from 2018 to 2021. Previously, Counsel for Barings LLC from 2015 to 2018. Prior to joining Barings, Associate at Morgan, Lewis & Bockius LLP from 2008 to 2015. |
1 The Statement of Additional Information includes additional information about the Trustees and is available, without charge, upon request, by calling 1-800-222-8222.
2 For those Officers with tenures at Allspring Global Investments and/or Allspring Funds Management, LLC that began prior to 2021, such tenures include years of service during which these businesses/entities were known as Wells Fargo Asset Management and Wells Fargo Funds Management, LLC, respectively.
Allspring Factor Enhanced U.S. Small Cap Equity Portfolio | 45
Other information (unaudited)
LIQUIDITY RISK MANAGEMENT PROGRAM
In accordance with Rule 22e-4 under the Investment Company Act of 1940, as amended (the “Liquidity Rule”), Allspring Master Trust (the “Trust”) has adopted and implemented a liquidity risk management program (the “Program”) on behalf of each of its series, including the Portfolio, which is reasonably designed to assess and manage the Portfolio's liquidity risk. “Liquidity risk” is defined under the Liquidity Rule as the risk that the Portfolio is unable to meet redemption requests without significantly diluting remaining investors’ interests in the Portfolio. The Trust’s Board of Trustees (the “Board”) previously approved the designation of Allspring Funds Management, LLC (“Allspring Funds Management”), the Portfolio's investment adviser, to administer the Program, and Allspring Funds Management has established a Liquidity Risk Management Council (the "Council") composed of personnel from multiple departments within Allspring Funds Management and its affiliates to assist Allspring Funds Management in the administration of the Program.
The Program is comprised of various components designed to support the assessment and/or management of liquidity risk, including: (1) the periodic assessment (no less frequently than annually) of certain factors that influence the Portfolio's liquidity risk; (2) the periodic classification (no less frequently than monthly) of the Portfolio's investments into one of four liquidity categories that reflect an estimate of their liquidity under current market conditions; (3) a 15% limit on the acquisition of “illiquid investments” (as defined under the Liquidity Rule); (4) to the extent the Portfolio does not invest primarily in “highly liquid investments” (as defined under the Liquidity Rule), the determination of a minimum percentage of the Portfolio's assets that generally will be invested in highly liquid investments (an “HLIM”); (5) if the Portfolio has established an HLIM, the periodic review (no less frequently than annually) of the HLIM and the adoption of policies and procedures for responding to a shortfall of the Portfolio's “highly liquid investments” below its HLIM; and (6) periodic reporting to the Board.
At a meeting of the Board held on May 24-25, 2022, the Board received and reviewed a written report (the “Report”) from Allspring Funds Management that, among other things, addressed the operation of the Program and assessed its adequacy and effectiveness for the period from January 1, 2021 through December 31, 2021 (the “Reporting Period”). Other than extended foreign market holidays, no significant liquidity events impacting the Portfolios were noted in the Report. In addition, other than corporate-related changes to the Program, there were no material changes to the Program during the Reporting Period.
Allspring Funds Management determined in the Report that the Program has been implemented and operates effectively to manage the Portfolio’s liquidity risk, and Allspring Funds Management continues to believe that the Program has been and continues to be adequately and effectively implemented to monitor and, as applicable, respond to the Portfolio’s liquidity developments.
There can be no assurance that the Program will achieve its objectives under all circumstances in the future.
46 | Allspring Factor Enhanced U.S. Small Cap Equity Portfolio
For more information
More information about Allspring Funds is available free upon request. To obtain literature, please write, visit the Portfolio's website, or call:
Allspring Funds
P.O. Box 219967
Kansas City, MO 64121-9967
Website: allspringglobal.com
Individual investors: 1-800-222-8222
Retail investment professionals: 1-888-877-9275
Institutional investment professionals: 1-800-260-5969
This report and the financial statements contained herein are submitted for the general information of the interest holders of the Portfolio. If this report is used for promotional purposes, distribution of the report must be accompanied or preceded by a current prospectus. Before investing, please consider the investment objectives, risks, charges, and expenses of the investment. For a current prospectus and, if available, a summary prospectus, containing this information, call
1-800-222-8222. Read the prospectus carefully before you invest or send money.
Allspring Global InvestmentsTM is the trade name for the asset management firms of Allspring Global Investments Holdings, LLC, a holding company indirectly owned by certain private funds of GTCR LLC and Reverence Capital Partners, L.P. These firms include but are not limited to Allspring Global Investments, LLC, and Allspring Funds Management, LLC. Certain products managed by Allspring entities are distributed by Allspring Funds Distributor, LLC (a broker-dealer and Member FINRA/SIPC).
This material is for general informational and educational purposes only and is NOT intended to provide investment advice or a recommendation of any kind - including a recommendation for any specific investment, strategy, or plan.
© 2022 Allspring Global Investments Holdings, LLC. All rights reserved.
Semi-Annual Report
August 31, 2022
Allspring High Yield Corporate
Bond Portfolio
Allspring High Yield Corporate Bond Portfolio | 1
Portfolio information (unaudited)
Investment objectiveThe Portfolio seeks to replicate the total return of the Bloomberg U.S. High Yield 2% Issuer Capped Bond Index†, before fees and expenses.
| Adviser | Allspring Funds Management, LLC |
| Subadviser | Allspring Global Investments, LLC |
| Portfolio managers | Manjunath Boraiah, Brian Prucyk, Janet S. Rilling, CFA®‡, CPA, Michael J. Schueller, CFA®‡ |
| Ten largest holdings (%) as of August 31, 20221 |
| Mauser Packaging Solutions, 5.50%, 4-15-2024 | 1.48 |
| Sealed Air Corporation, 5.50%, 9-15-2025 | 1.44 |
| SM Energy Company, 6.75%, 9-15-2026 | 1.43 |
| Ithaca Energy plc, 9.00%, 7-15-2026 | 1.42 |
| Bombardier Incorporated , 7.13%, 6-15-2026 | 1.42 |
| Range Resources Corporation, 4.88%, 5-15-2025 | 1.41 |
| Cheniere Energy Partners LP, 4.50%, 10-1-2029 | 1.40 |
| Moss Creek Resources Holdings Incorporated, 10.50%, 5-15-2027 | 1.40 |
| Univision Communications Incorporated, 5.13%, 2-15-2025 | 1.40 |
| TransDigm Group Incorporated, 6.38%, 6-15-2026 | 1.39 |
| 1 | Figures represent the percentage of the Portfolio's net assets. Holdings are subject to change and may have changed since the date specified. |
| Credit quality as of August 31, 20221 |
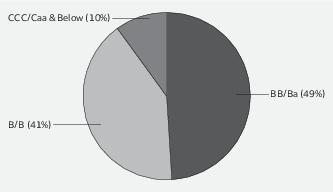
| 1 | The credit quality distribution of portfolio holdings reflected in the chart is based on ratings from Standard & Poor’s, Moody’s Investors Service, and/or Fitch Ratings Ltd. Credit quality ratings apply to the underlying holdings of the Portfolio and not to the Portfolio itself. The percentages of the portfolio with the ratings depicted in the chart are calculated based on the market value of fixed income securities held by the Portfolio. If a security was rated by all three rating agencies, the middle rating was utilized. If rated by two of the three rating agencies, the lower rating was utilized, and if rated by one of the rating agencies, that rating was utilized. Standard & Poor’s rates the creditworthiness of bonds, ranging from AAA (highest) to D (lowest). Ratings from A to CCC may be modified by the addition of a plus (+) or minus (-) sign to show relative standing within the rating categories. Standard & Poor’s rates the creditworthiness of short-term notes from SP-1 (highest) to SP-3 (lowest). Moody’s rates the creditworthiness of bonds, ranging from Aaa (highest) to C (lowest). Ratings Aa to B may be modified by the addition of a number 1 (highest) to 3 (lowest) to show relative standing within the ratings categories. Moody’s rates the creditworthiness of short-term U.S. tax-exempt municipal securities from MIG 1/VMIG 1 (highest) to SG (lowest). Fitch rates the creditworthiness of bonds, ranging from AAA (highest) to D (lowest). Credit quality distribution is subject to change and may have changed since the date specified. |
| † | The Bloomberg U.S. High Yield 2% Issuer Capped Bond Index is composed of fixed-rate, publicly issued, non-investment-grade debt with at least one year remaining to maturity as well as an outstanding par value of $100 million. You cannot invest directly in an index. |
| ‡ | CFA® and Chartered Financial Analyst® are trademarks owned by CFA Institute. |
2 | Allspring High Yield Corporate Bond Portfolio
Portfolio of investments—August 31, 2022 (unaudited)
| | | Interest
rate | Maturity
date | Principal | Value |
| Corporate bonds and notes: 81.08% | | | | | |
| Communication services: 15.33% | | | | | |
| Diversified telecommunication services: 2.47% | | | | | |
| Level 3 Financing Incorporated 144A | | 3.75% | 7-15-2029 | $200,000 | $ 160,576 |
| Lumen Technologies Incorporated 144A | | 4.50 | 1-15-2029 | 240,000 | 179,038 |
| | | | | | 339,614 |
| Media: 11.59% | | | | | |
| CCO Holdings LLC 144A | | 4.50 | 6-1-2033 | 80,000 | 62,800 |
| Clear Channel Outdoor Holdings 144A | | 7.75 | 4-15-2028 | 165,000 | 134,195 |
| CSC Holdings LLC 144A | | 5.50 | 4-15-2027 | 200,000 | 189,556 |
| CSC Holdings LLC 144A | | 5.75 | 1-15-2030 | 200,000 | 154,888 |
| DIRECTV Financing LLC 144A | | 5.88 | 8-15-2027 | 190,000 | 173,850 |
| Gray Television Incorporated 144A | | 4.75 | 10-15-2030 | 205,000 | 168,920 |
| Lamar Media Corporation | | 3.75 | 2-15-2028 | 200,000 | 179,374 |
| Outfront Media Capital Corporation 144A | | 4.63 | 3-15-2030 | 200,000 | 166,859 |
| QVC Incorporated | | 4.75 | 2-15-2027 | 210,000 | 173,445 |
| Univision Communications Incorporated 144A | | 5.13 | 2-15-2025 | 200,000 | 193,185 |
| | | | | | 1,597,072 |
| Wireless telecommunication services: 1.27% | | | | | |
| Frontier Communications 144A | | 5.00 | 5-1-2028 | 200,000 | 175,292 |
| Consumer discretionary: 15.58% | | | | | |
| Auto components: 3.96% | | | | | |
| Allison Transmission Incorporated 144A | | 5.88 | 6-1-2029 | 200,000 | 188,016 |
| Dana Incorporated | | 5.63 | 6-15-2028 | 200,000 | 179,458 |
| The Goodyear Tire & Rubber Company | | 5.25 | 4-30-2031 | 205,000 | 178,763 |
| | | | | | 546,237 |
| Hotels, restaurants & leisure: 7.28% | | | | | |
| Carnival Corporation 144A | | 5.75 | 3-1-2027 | 195,000 | 151,613 |
| Hilton Domestic Operating Company | | 4.88 | 1-15-2030 | 200,000 | 182,760 |
| MGM Resorts International | | 4.63 | 9-1-2026 | 154,000 | 140,105 |
| NCL Corporation Limited 144A | | 3.63 | 12-15-2024 | 210,000 | 181,980 |
| Royal Caribbean Cruises Limited 144A | | 5.50 | 4-1-2028 | 205,000 | 154,775 |
| Six Flags Entertainment Company 144A | | 4.88 | 7-31-2024 | 200,000 | 191,892 |
| | | | | | 1,003,125 |
| Specialty retail: 3.56% | | | | | |
| ABC Supply Company Incorporated 144A | | 4.00 | 1-15-2028 | 200,000 | 180,904 |
| Carvana Company 144A | | 5.50 | 4-15-2027 | 210,000 | 136,112 |
| Staples Incorporated 144A | | 7.50 | 4-15-2026 | 205,000 | 173,237 |
| | | | | | 490,253 |
| Textiles, apparel & luxury goods: 0.78% | | | | | |
| WESCO Aircraft Holdings 144A | | 8.50 | 11-15-2024 | 198,000 | 106,918 |
| Consumer staples: 2.55% | | | | | |
| Food & staples retailing: 1.37% | | | | | |
| Performance Food Group Company 144A | | 5.50 | 10-15-2027 | 200,000 | 188,526 |
The accompanying notes are an integral part of these financial statements.
Allspring High Yield Corporate Bond Portfolio | 3
Portfolio of investments—August 31, 2022 (unaudited)
| | | Interest
rate | Maturity
date | Principal | Value |
| Household products: 1.18% | | | | | |
| Energizer Holdings Incorporated 144A | | 4.38% | 3-31-2029 | $200,000 | $ 162,684 |
| Energy: 14.10% | | | | | |
| Energy equipment & services: 1.37% | | | | | |
| USA Compression Partners LP | | 6.88 | 4-1-2026 | 200,000 | 187,570 |
| Oil, gas & consumable fuels: 12.73% | | | | | |
| Antero Midstream Partners LP 144A | | 5.75 | 1-15-2028 | 200,000 | 189,596 |
| Buckeye Partners LP 144A | | 4.50 | 3-1-2028 | 200,000 | 177,072 |
| Cheniere Energy Partners LP | | 4.50 | 10-1-2029 | 210,000 | 193,373 |
| EQM Midstream Partners LP | | 5.50 | 7-15-2028 | 200,000 | 182,852 |
| Moss Creek Resources Holdings Incorporated 144A | | 10.50 | 5-15-2027 | 200,000 | 193,200 |
| Occidental Petroleum Corporation | | 7.88 | 9-15-2031 | 90,000 | 103,730 |
| Range Resources Corporation | | 4.88 | 5-15-2025 | 200,000 | 194,000 |
| SM Energy Company | | 6.75 | 9-15-2026 | 200,000 | 196,688 |
| Sunoco LP | | 4.50 | 5-15-2029 | 200,000 | 169,918 |
| Weatherford International Limited 144A | | 11.00 | 12-1-2024 | 151,000 | 153,310 |
| | | | | | 1,753,739 |
| Financials: 8.15% | | | | | |
| Capital markets: 1.29% | | | | | |
| MSCI Incorporated 144A | | 4.00 | 11-15-2029 | 200,000 | 178,022 |
| Consumer finance: 3.31% | | | | | |
| Navient Corporation | | 5.50 | 3-15-2029 | 200,000 | 162,008 |
| Navient Corporation | | 7.25 | 9-25-2023 | 120,000 | 120,202 |
| OneMain Finance Corporation | | 5.38 | 11-15-2029 | 210,000 | 173,924 |
| | | | | | 456,134 |
| Diversified financial services: 2.18% | | | | | |
| CHS Incorporation 144A | | 4.75 | 2-15-2031 | 210,000 | 155,064 |
| Compass Group Diversified Holdings LLC 144A | | 5.25 | 4-15-2029 | 170,000 | 144,713 |
| | | | | | 299,777 |
| Insurance: 1.37% | | | | | |
| Acrisure LLC 144A | | 7.00 | 11-15-2025 | 200,000 | 188,462 |
| Health care: 6.52% | | | | | |
| Health care equipment & supplies: 1.32% | | | | | |
| Avantor Funding Incorporated 144A | | 4.63 | 7-15-2028 | 200,000 | 181,976 |
| Health care providers & services: 3.90% | | | | | |
| Centene Corporation | | 3.00 | 10-15-2030 | 210,000 | 175,518 |
| Encompass Health Corporation | | 4.63 | 4-1-2031 | 220,000 | 181,701 |
| MPT Operating Partnership LP | | 5.00 | 10-15-2027 | 200,000 | 179,414 |
| | | | | | 536,633 |
| Pharmaceuticals: 1.30% | | | | | |
| Organon Finance 1 LLC 144A | | 4.13 | 4-30-2028 | 200,000 | 179,434 |
| Industrials: 5.04% | | | | | |
| Aerospace & defense: 1.39% | | | | | |
| TransDigm Group Incorporated | | 6.38 | 6-15-2026 | 200,000 | 192,000 |
The accompanying notes are an integral part of these financial statements.
4 | Allspring High Yield Corporate Bond Portfolio
Portfolio of investments—August 31, 2022 (unaudited)
| | | Interest
rate | Maturity
date | Principal | Value |
| Airlines: 2.57% | | | | | |
| Delta Air Lines Incorporated | | 3.75% | 10-28-2029 | $210,000 | $ 171,675 |
| United Airlines Incorporated 144A | | 4.38 | 4-15-2026 | 200,000 | 182,350 |
| | | | | | 354,025 |
| Commercial services & supplies: 1.08% | | | | | |
| Allied Universal Holdco LLC 144A | | 6.00 | 6-1-2029 | 200,000 | 148,439 |
| Information technology: 2.34% | | | | | |
| Communications equipment: 1.15% | | | | | |
| CommScope Technologies LLC 144A | | 5.00 | 3-15-2027 | 200,000 | 157,843 |
| IT services: 1.19% | | | | | |
| Block Incorporated | | 3.50 | 6-1-2031 | 200,000 | 164,546 |
| Materials: 5.52% | | | | | |
| Chemicals: 1.34% | | | | | |
| Chemours Company | | 5.38 | 5-15-2027 | 200,000 | 184,472 |
| Containers & packaging: 2.92% | | | | | |
| Mauser Packaging Solutions 144A | | 5.50 | 4-15-2024 | 210,000 | 203,296 |
| Sealed Air Corporation 144A | | 5.50 | 9-15-2025 | 200,000 | 199,000 |
| | | | | | 402,296 |
| Metals & mining: 1.26% | | | | | |
| Novelis Corporation 144A | | 4.75 | 1-30-2030 | 200,000 | 174,000 |
| Real estate: 3.53% | | | | | |
| Equity REITs: 1.12% | | | | | |
| Service Properties Trust Company | | 4.38 | 2-15-2030 | 210,000 | 153,941 |
| Real estate management & development: 2.41% | | | | | |
| Howard Hughes Corporation 144A | | 4.13 | 2-1-2029 | 200,000 | 165,078 |
| Kennedy-Wilson Holdings Incorporated | | 4.75 | 3-1-2029 | 200,000 | 166,876 |
| | | | | | 331,954 |
| Utilities: 2.42% | | | | | |
| Gas utilities: 1.26% | | | | | |
| Ferellgas Partners LP 144A | | 5.38 | 4-1-2026 | 200,000 | 174,000 |
| Independent power & renewable electricity producers: 1.16% | | | | | |
| Calpine Corporation 144A | | 5.00 | 2-1-2031 | 190,000 | 159,021 |
| Total Corporate bonds and notes (Cost $12,911,765) | | | | | 11,168,005 |
| Yankee corporate bonds and notes: 16.40% | | | | | |
| Communication services: 4.60% | | | | | |
| Diversified telecommunication services: 1.03% | | | | | |
| Altice France Holding SA 144A | | 6.00 | 2-15-2028 | 210,000 | 142,400 |
The accompanying notes are an integral part of these financial statements.
Allspring High Yield Corporate Bond Portfolio | 5
Portfolio of investments—August 31, 2022 (unaudited)
| | | Interest
rate | Maturity
date | Principal | Value |
| Media: 2.59% | | | | | |
| Videotron Limited 144A | | 5.13% | 4-15-2027 | $200,000 | $ 187,500 |
| Ziggo BV 144A | | 4.88 | 1-15-2030 | 200,000 | 168,840 |
| | | | | | 356,340 |
| Wireless telecommunication services: 0.98% | | | | | |
| VEON Holdings BV 144A | | 4.00 | 4-9-2025 | 210,000 | 135,450 |
| Consumer discretionary: 2.62% | | | | | |
| Auto components: 1.34% | | | | | |
| Adient Global Holdings Limited 144A | | 4.88 | 8-15-2026 | 200,000 | 185,088 |
| Hotels, restaurants & leisure: 1.28% | | | | | |
| MGM China Holdings Limited 144A | | 5.38 | 5-15-2024 | 200,000 | 176,475 |
| Energy: 1.42% | | | | | |
| Oil, gas & consumable fuels: 1.42% | | | | | |
| Ithaca Energy plc 144A | | 9.00 | 7-15-2026 | 200,000 | 195,500 |
| Financials: 2.47% | | | | | |
| Diversified financial services: 2.47% | | | | | |
| New Red Finance Incorporated 144A | | 3.88 | 1-15-2028 | 200,000 | 177,782 |
| New Red Finance Incorporated 144A | | 4.00 | 10-15-2030 | 200,000 | 162,313 |
| | | | | | 340,095 |
| Health care: 0.06% | | | | | |
| Pharmaceuticals: 0.06% | | | | | |
| Endo Limited 144A | | 6.00 | 6-30-2028 | 145,000 | 7,975 |
| Industrials: 1.42% | | | | | |
| Aerospace & defense: 1.42% | | | | | |
| Bombardier Incorporated 144A | | 7.13 | 6-15-2026 | 205,000 | 195,340 |
| Information technology: 1.25% | | | | | |
| Technology hardware, storage & peripherals: 1.25% | | | | | |
| Seagate HDD Cayman | | 4.13 | 1-15-2031 | 210,000 | 172,074 |
| Materials: 1.26% | | | | | |
| Chemicals: 1.26% | | | | | |
| Cerdia Finanz GmbH 144A | | 10.50 | 2-15-2027 | 200,000 | 173,468 |
| Utilities: 1.30% | | | | | |
| Independent power & renewable electricity producers: 1.30% | | | | | |
| Atlantica Sustainable Infrastructure plc 144A | | 4.13 | 6-15-2028 | 200,000 | 179,000 |
| Total Yankee corporate bonds and notes (Cost $2,715,863) | | | | | 2,259,205 |
The accompanying notes are an integral part of these financial statements.
6 | Allspring High Yield Corporate Bond Portfolio
Portfolio of investments—August 31, 2022 (unaudited)
| | | Yield | | Shares | Value |
| Short-term investments: 0.94% | | | | | |
| Investment companies: 0.94% | | | | | |
| Allspring Government Money Market Fund Select Class ♠∞ | | 2.09% | | 129,900 | $ 129,900 |
| Total Short-term investments (Cost $129,900) | | | | | 129,900 |
| Total investments in securities (Cost $15,757,528) | 98.42% | | | | 13,557,110 |
| Other assets and liabilities, net | 1.58 | | | | 217,997 |
| Total net assets | 100.00% | | | | $13,775,107 |
| 144A | The security may be resold in transactions exempt from registration, normally to qualified institutional buyers, pursuant to Rule 144A under the Securities Act of 1933. |
| ♠ | The issuer of the security is an affiliated person of the Portfolio as defined in the Investment Company Act of 1940. |
| ∞ | The rate represents the 7-day annualized yield at period end. |
| Abbreviations: |
| REIT | Real estate investment trust |
Investments in affiliates
An affiliated investment is an investment in which the Portfolio owns at least 5% of the outstanding voting shares of the issuer or as a result of other relationships, such as the Portfolio and the issuer having the same adviser or investment manager. Transactions with issuers that were affiliates of the Portfolio at the end of the period were as follows:
| | Value,
beginning of
period | Purchases | Sales
proceeds | Net
realized
gains
(losses) | Net
change in
unrealized
gains
(losses) | Value,
end of
period | Shares,
end
of period | Income
from
affiliated
securities |
| Short-term investments | | | | | | | |
| Allspring Government Money Market Fund Select Class | $1,168,782 | $10,498,901 | $(11,537,783) | $0 | $0 | $129,900 | 129,900 | $4,069 |
The accompanying notes are an integral part of these financial statements.
Allspring High Yield Corporate Bond Portfolio | 7
Statement of assets and liabilities—August 31, 2022 (unaudited)
| | |
| Assets | |
Investments in unaffiliated securities, at value (cost $15,627,628)
| $ 13,427,210 |
Investments in affiliated securities, at value (cost $129,900)
| 129,900 |
Receivable for interest
| 246,671 |
Receivable from adviser
| 8,899 |
Prepaid expenses and other assets
| 253 |
Total assets
| 13,812,933 |
| Liabilities | |
Professional fees payable
| 25,045 |
Interest holder report expenses payable
| 5,756 |
Custody and accounting fees payable
| 4,471 |
Trustees’ fees and expenses payable
| 1,111 |
Accrued expenses and other liabilities
| 1,443 |
Total liabilities
| 37,826 |
Total net assets
| $13,775,107 |
The accompanying notes are an integral part of these financial statements.
8 | Allspring High Yield Corporate Bond Portfolio
Statement of operations—six months ended August 31, 2022 (unaudited)
| | |
| Investment income | |
Interest
| $ 694,866 |
Income from affiliated securities
| 4,069 |
Total investment income
| 698,935 |
| Expenses | |
Advisory fee
| 31,172 |
Custody and accounting fees
| 5,822 |
Professional fees
| 50,226 |
Interest holder report expenses
| 10,518 |
Trustees’ fees and expenses
| 11,153 |
Other fees and expenses
| 3,274 |
Total expenses
| 112,165 |
Less: Fee waivers and/or expense reimbursements
| (78,499) |
Net expenses
| 33,666 |
Net investment income
| 665,269 |
| Realized and unrealized gains (losses) on investments | |
Net realized losses on investments
| (1,608,272) |
Net change in unrealized gains (losses) on investments
| (1,006,146) |
Net realized and unrealized gains (losses) on investments
| (2,614,418) |
Net decrease in net assets resulting from operations
| $(1,949,149) |
The accompanying notes are an integral part of these financial statements.
Allspring High Yield Corporate Bond Portfolio | 9
Statement of changes in net assets
| | | |
| | Six months ended
August 31, 2022
(unaudited) | Year ended
February 28, 2022 |
| Operations | | |
Net investment income
| $ 665,269 | $ 2,227,495 |
Net realized gains (losses) on investments
| (1,608,272) | 791,670 |
Net change in unrealized gains (losses) on investments
| (1,006,146) | (2,625,377) |
Net increase (decrease) in net assets resulting from operations
| (1,949,149) | 393,788 |
| Capital transactions | | |
| Transactions in investors’ beneficial interests | | |
Contributions
| 1,685,364 | 6,966,904 |
Withdrawals
| (20,131,673) | (23,301,894) |
Net decrease in net assets resulting from capital transactions
| (18,446,309) | (16,334,990) |
Total decrease in net assets
| (20,395,458) | (15,941,202) |
| Net assets | | |
Beginning of period
| 34,170,565 | 50,111,767 |
End of period
| $ 13,775,107 | $ 34,170,565 |
The accompanying notes are an integral part of these financial statements.
10 | Allspring High Yield Corporate Bond Portfolio
| | | Year ended February 28 |
| | Six months ended
August 31, 2022
(unaudited) | 2022 | 2021 | 2020 1 | 2019 | 2018 2 |
Total return3
| (7.28)% | (0.21)% | 6.34% | 3.97% | 3.70% | 0.49% |
| Ratios to average net assets (annualized) | | | | | | |
Gross expenses
| 0.90% | 0.53% | 0.35% | 0.42% | 0.34% | 0.37% |
Net expenses
| 0.27% * | 0.27% * | 0.27% * | 0.30% | 0.32% | 0.37% |
Net investment income
| 5.61% | 4.64% | 5.54% | 5.54% | 6.06% | 5.36% |
| Supplemental data | | | | | | |
Portfolio turnover rate
| 15% | 73% | 169% | 52% | 47% | 122% |
| * | Ratio includes expenses which were voluntarily waived by the adviser. Without these voluntary waivers, the net expense ratios would be increased by the following amounts: |
| Six months ended August 31, 2022 (unaudited) | 0.63% |
| Year ended February 28, 2022 | 0.26% |
| Year ended February 28, 2021 | 0.08% |
| 1 | Year ended February 29 |
| 2 | For the period from May 23, 2017 (commencement of operations) to February 28, 2018 |
| 3 | Returns for periods of less than one year are not annualized. |
The accompanying notes are an integral part of these financial statements.
Allspring High Yield Corporate Bond Portfolio | 11
Notes to financial statements (unaudited)
1. ORGANIZATION
Allspring Master Trust (the "Trust"), a Delaware statutory trust organized on March 10, 1999, is an open-end management investment company registered under the Investment Company Act of 1940, as amended (the "1940 Act"). As an investment company, the Trust follows the accounting and reporting guidance in Financial Accounting Standards Board ("FASB") Accounting Standards Codification Topic 946, Financial Services – Investment Companies. These financial statements report on the Allspring High Yield Corporate Bond Portfolio (the "Portfolio") which is a diversified series of the Trust.
Interests in the Portfolio are available solely through private placement transactions that do not involve any "public offering" within the meaning of Section 4(a)(2) of the Securities Act of 1933.
2. SIGNIFICANT ACCOUNTING POLICIES
The following significant accounting policies, which are consistently followed in the preparation of the financial statements of the Portfolio, are in conformity with U.S. generally accepted accounting principles which require management to make estimates and assumptions that affect the reported amounts of assets and liabilities, disclosure of contingent assets and liabilities at the date of the financial statements, and the reported amounts of income and expenses during the reporting period. Actual results could differ from those estimates.
Securities valuation
All investments are valued each business day as of the close of regular trading on the New York Stock Exchange (generally 4 p.m. Eastern Time), although the Portfolio may deviate from this calculation time under unusual or unexpected circumstances.
Debt securities are valued at the evaluated bid price provided by an independent pricing service (e.g. taking into account various factors, including yields, maturities, or credit ratings) or, if a reliable price is not available, the quoted bid price from an independent broker-dealer.
Investments in registered open-end investment companies are valued at net asset value.
Investments which are not valued using any of the methods discussed above are valued at their fair value, as determined in good faith by the Board of Trustees. The Board of Trustees has established a Valuation Committee comprised of the Trustees and has delegated to it the authority to take any actions regarding the valuation of portfolio securities that the Valuation Committee deems necessary or appropriate, including determining the fair value of portfolio securities, unless the determination has been delegated to the Allspring Global Investments Pricing Committee at Allspring Funds Management, LLC ("Allspring Funds Management"). The Board of Trustees retains the authority to make or ratify any valuation decisions or approve any changes to the Valuation Procedures as it deems appropriate. On a quarterly basis, the Board of Trustees receives reports on any valuation actions taken by the Valuation Committee or the Allspring Global Investments Pricing Committee which may include items for ratification.
Security transactions and income recognition
Securities transactions are recorded on a trade date basis. Realized gains or losses are recorded on the basis of identified cost.
Interest income is accrued daily and bond discounts are accreted and premiums are amortized daily. To the extent debt obligations are placed on non-accrual status, any related interest income may be reduced by writing off interest receivables when the collection of all or a portion of interest has been determined to be doubtful based on consistently applied procedures and the fair value has decreased. If the issuer subsequently resumes interest payments or when the collectability of interest is reasonably assured, the debt obligation is removed from non-accrual status.
Federal and other taxes
The Portfolio is not required to pay federal income taxes on its net investment income and net capital gains as it is treated as a partnership for federal income tax purposes. All income, gains and losses of the Portfolio are deemed to have been “passed through” to the interest holders in proportion to their holdings of the Portfolio regardless of whether income and gains have been distributed by the Portfolio.
The Portfolio’s income tax returns and all financial records supporting those returns for the prior three fiscal years are subject to examination by the federal revenue authority. Management has analyzed the Portfolio’s tax positions taken on federal, state, and foreign tax returns, as applicable, for all open tax years and does not believe that there are any uncertain tax positions that require recognition of a tax liability.
12 | Allspring High Yield Corporate Bond Portfolio
Notes to financial statements (unaudited)
As of August 31, 2022, the aggregate cost of all investments for federal income tax purposes was $15,864,978 and the unrealized gains (losses) consisted of:
| Gross unrealized gains | $ 397 |
| Gross unrealized losses | (2,308,265) |
| Net unrealized losses | $(2,307,868) |
3. FAIR VALUATION MEASUREMENTS
Fair value measurements of investments are determined within a framework that has established a fair value hierarchy based upon the various data inputs utilized in determining the value of the Portfolio’s investments. The three-level hierarchy gives the highest priority to unadjusted quoted prices in active markets for identical assets or liabilities (Level 1) and the lowest priority to unobservable inputs (Level 3). The Portfolio’s investments are classified within the fair value hierarchy based on the lowest level of input that is significant to the fair value measurement. The inputs are summarized into three broad levels as follows:
| ■ | Level 1 – quoted prices in active markets for identical securities |
| ■ | Level 2 – other significant observable inputs (including quoted prices for similar securities, interest rates, prepayment speeds, credit risk, etc.) |
| ■ | Level 3 – significant unobservable inputs (including the Portfolio’s own assumptions in determining the fair value of investments) |
The inputs or methodologies used for valuing investments in securities are not necessarily an indication of the risk associated with investing in those securities.
The following is a summary of the inputs used in valuing the Portfolio’s assets and liabilities as of August 31, 2022:
| | Quoted prices
(Level 1) | Other significant
observable inputs
(Level 2) | Significant
unobservable inputs
(Level 3) | Total |
| Assets | | | | |
| Investments in: | | | | |
| Corporate bonds and notes | $ 0 | $ 11,168,005 | $0 | $ 11,168,005 |
| Yankee corporate bonds and notes | 0 | 2,259,205 | 0 | 2,259,205 |
| Short-term investments | | | | |
| Investment companies | 129,900 | 0 | 0 | 129,900 |
| Total assets | $129,900 | $13,427,210 | $0 | $13,557,110 |
Additional sector, industry or geographic detail, if any, is included in the Portfolio of Investments.
For the six months ended August 31, 2022, the Portfolio did not have any transfers into/out of Level 3.
4. TRANSACTIONS WITH AFFILIATES
Advisory fee
The Trust has entered into an advisory contract with Allspring Funds Management, a wholly owned subsidiary of Allspring Global Investments Holdings, LLC, a holding company indirectly owned by certain private funds of GTCR LLC and Reverence Capital Partners, L.P. The adviser is responsible for implementing investment policies and guidelines and for supervising the subadviser, who is responsible for day-to-day portfolio management of the Portfolio. Pursuant to the contract, Allspring Funds Management is entitled to receive an advisory fee at the following annual rate based on the Portfolio’s average daily net assets:
| Average daily net assets | Advisory fee |
| First $5 billion | 0.250% |
| Next $5 billion | 0.230 |
| Over $10 billion | 0.210 |
Allspring High Yield Corporate Bond Portfolio | 13
Notes to financial statements (unaudited)
For the six months ended August 31, 2022, the advisory fee was equivalent to an annual rate of 0.25% of the Portfolio’s average daily net assets.
Allspring Funds Management has retained the services of a subadviser to provide daily portfolio management to the Portfolio. The fee for subadvisory services is borne by Allspring Funds Management. Allspring Global Investments, LLC, an affiliate of Allspring Funds Management and a wholly owned subsidiary of Allspring Global Investments Holdings, LLC, is the subadviser to the Portfolio and is entitled to receive a fee from Allspring Funds Management at an annual rate starting at 0.09% and declining to 0.07% as the average daily net assets of the Portfolio increase.
Allspring Funds Management has voluntarily waived and/or reimbursed advisory fees to reduce the net operating expense ratio of the Portfolio. These voluntary waivers may be discontinued at any time.
Interfund transactions
The Portfolio may purchase or sell portfolio investment securities to certain affiliates pursuant to Rule 17a-7 under the 1940 Act and under procedures adopted by the Board of Trustees. The procedures have been designed to ensure that these interfund transactions, which do not incur broker commissions, are effected at current market prices.
5. INVESTMENT PORTFOLIO TRANSACTIONS
Purchases and sales of investments, excluding U.S. government obligations (if any) and short-term securities, for the six months ended August 31, 2022 were $4,126,756 and $20,679,397, respectively.
6. BANK BORROWINGS
The Trust, along with Allspring Variable Trust and Allspring Funds Trust (excluding the money market funds), are parties to a $350,000,000 revolving credit agreement whereby the Portfolio is permitted to use bank borrowings for temporary or emergency purposes, such as to fund interest holders withdrawal requests. Interest under the credit agreement is charged to the Portfolio based on a borrowing rate equal to the higher of the Federal Funds rate or the overnight bank funding rate in effect on that day plus a spread. In addition, an annual commitment fee equal based on the unused balance is allocated to each participating fund.
For the six months ended August 31, 2022, there were no borrowings by the Portfolio under the agreement.
7. INDEMNIFICATION
Under the Portfolio's organizational documents, the officers and Trustees have been granted certain indemnification rights against certain liabilities that may arise out of performance of their duties to the Portfolio. The Portfolio has entered into a separate agreement with each Trustee that converts indemnification rights currently existing under the Portfolio’s organizational documents into contractual rights that cannot be changed in the future without the consent of the Trustee. Additionally, in the normal course of business, the Portfolio may enter into contracts with service providers that contain a variety of indemnification clauses. The Portfolio’s maximum exposure under these arrangements is dependent on future claims that may be made against the Portfolio and, therefore, cannot be estimated.
8. CORONAVIRUS (COVID-19) PANDEMIC
On March 11, 2020, the World Health Organization announced that it had made the assessment that coronavirus disease 2019 (“COVID-19”) is a pandemic. The impacts of COVID-19 are affecting the entire global economy, individual companies and investment products, the funds, and the market in general. There is significant uncertainty around the extent and duration of business disruptions related to COVID-19 and the impacts may last for an extended period of time. COVID-19 has led to significant uncertainty and volatility in the financial markets.
14 | Allspring High Yield Corporate Bond Portfolio
Other information (unaudited)
PROXY VOTING INFORMATION
A description of the policies and procedures used to determine how to vote proxies relating to portfolio securities is available without charge, upon request, by calling 1-800-222-8222, visiting our website at allspringglobal.com, or visiting the SEC website at sec.gov. Information regarding how the proxies related to portfolio securities were voted during the most recent 12-month period ended June 30 is available on the website at allspringglobal.com or by visiting the SEC website at sec.gov.
QUARTERLY PORTFOLIO HOLDINGS INFORMATION
The Portfolio files its complete schedule of portfolio holdings with the SEC for the first and third quarters of each fiscal year as an exhibit to its reports on Form N-PORT. Interest holders may view the filed Form N-PORT by visiting the SEC website at sec.gov.
Allspring High Yield Corporate Bond Portfolio | 15
Other information (unaudited)
BOARD OF TRUSTEES AND OFFICERS
Each of the Trustees and Officers listed in the table below acts in identical capacities for each fund in the Allspring family of funds, which consists of 124 mutual funds comprising the Allspring Funds Trust, Allspring Variable Trust, Allspring Master Trust and four closed-end funds (collectively the “Fund Complex”). This table should be read in conjunction with the Prospectus and the Statement of Additional Information1. The mailing address of each Trustee and Officer is 525 Market Street, 12th Floor, San Francisco, CA 94105. Each Trustee and Officer serves an indefinite term, however, each Trustee serves such term until reaching the mandatory retirement age established by the Trustees.
Independent Trustees
Name and
year of birth | Position held and
length of service* | Principal occupations during past five years or longer | Current other
public company or
investment
company
directorships |
William R. Ebsworth
(Born 1957) | Trustee,
since 2015 | Retired. From 1984 to 2013, equities analyst, portfolio manager, research director and chief investment officer at Fidelity Management and Research Company in Boston, Tokyo, and Hong Kong, and retired in 2013 as Chief Investment Officer of Fidelity Strategic Advisers, Inc. where he led a team of investment professionals managing client assets. Prior thereto, Board member of Hong Kong Securities Clearing Co., Hong Kong Options Clearing Corp., the Thailand International Fund, Ltd., Fidelity Investments Life Insurance Company, and Empire Fidelity Investments Life Insurance Company. Audit Committee Chair and Investment Committee Chair of the Vincent Memorial Hospital Endowment (non-profit organization). Mr. Ebsworth is a CFA® charterholder. | N/A |
Jane A. Freeman
(Born 1953) | Trustee,
since 2015;
Chair Liaison,
since 2018 | Retired. From 2012 to 2014 and 1999 to 2008, Chief Financial Officer of Scientific Learning Corporation. From 2008 to 2012, Ms. Freeman provided consulting services related to strategic business projects. Prior to 1999, Portfolio Manager at Rockefeller & Co. and Scudder, Stevens & Clark. Board member of the Harding Loevner Funds from 1996 to 2014, serving as both Lead Independent Director and chair of the Audit Committee. Board member of the Russell Exchange Traded Funds Trust from 2011 to 2012 and the chair of the Audit Committee. Ms. Freeman is also an inactive Chartered Financial Analyst. | N/A |
Isaiah Harris, Jr.
(Born 1952) | Trustee,
since 2009; Audit
Committee
Chair,
since 2019 | Retired. Chairman of the Board of CIGNA Corporation from 2009 to 2021, and Director from 2005 to 2008. From 2003 to 2011, Director of Deluxe Corporation. Prior thereto, President and CEO of BellSouth Advertising and Publishing Corp. from 2005 to 2007, President and CEO of BellSouth Enterprises from 2004 to 2005 and President of BellSouth Consumer Services from 2000 to 2003. Emeritus member of the Iowa State University Foundation Board of Governors. Emeritus Member of the Advisory Board of Iowa State University School of Business. Advisory Board Member, Palm Harbor Academy (private school). Advisory Board Member, Fellowship of Christian Athletes. Mr. Harris is a certified public accountant (inactive status). | N/A |
David F. Larcker
(Born 1950) | Trustee,
since 2009 | James Irvin Miller Professor of Accounting at the Graduate School of Business (Emeritus), Stanford University, Director of the Corporate Governance Research Initiative and Senior Faculty of The Rock Center for Corporate Governance since 2006. From 2005 to 2008, Professor of Accounting at the Graduate School of Business, Stanford University. Prior thereto, Ernst & Young Professor of Accounting at The Wharton School, University of Pennsylvania from 1985 to 2005. | N/A |
16 | Allspring High Yield Corporate Bond Portfolio
Other information (unaudited)
Name and
year of birth | Position held and
length of service* | Principal occupations during past five years or longer | Current other
public company or
investment
company
directorships |
Olivia S. Mitchell
(Born 1953) | Trustee,
since 2006;
Nominating and
Governance
Committee Chair,
since 2018 | International Foundation of Employee Benefit Plans Professor since 1993, Wharton School of the University of Pennsylvania. Director of Wharton’s Pension Research Council and Boettner Center on Pensions & Retirement Research, and Research Associate at the National Bureau of Economic Research. Previously taught at Cornell University from 1978 to 1993. | N/A |
Timothy J. Penny
(Born 1951) | Trustee,
since 1996;
Chair,
since 2018 | President and Chief Executive Officer of Southern Minnesota Initiative Foundation, a non-profit organization, since 2007. Vice Chair of the Economic Club of Minnesota, since 2007. Co-Chair of the Committee for a Responsible Federal Budget, since 1995. Member of the Board of Trustees of NorthStar Education Finance, Inc., a non-profit organization, since 2007. Senior Fellow of the University of Minnesota Humphrey Institute from 1995 to 2017. | N/A |
James G. Polisson
(Born 1959) | Trustee,
since 2018 | Retired. Chief Marketing Officer, Source (ETF) UK Services, Ltd, from 2015 to 2017. From 2012 to 2015, Principal of The Polisson Group, LLC, a management consulting, corporate advisory and principal investing company. Chief Executive Officer and Managing Director at Russell Investments, Global Exchange Traded Funds from 2010 to 2012. Managing Director of Barclays Global Investors from 1998 to 2010 and Global Chief Marketing Officer for iShares and Barclays Global Investors from 2000 to 2010. Trustee of the San Francisco Mechanics’ Institute, a non-profit organization, from 2013 to 2015. Board member of the Russell Exchange Traded Fund Trust from 2011 to 2012. Director of Barclays Global Investors Holdings Deutschland GmbH from 2006 to 2009. Mr. Polisson is an attorney and has a retired status with the Massachusetts and District of Columbia Bar Associations. | N/A |
Pamela Wheelock
(Born 1959) | Trustee,
since January
2020; previously
Trustee from
January 2018 to
July 2019 | Retired. Executive and Senior Financial leadership positions in the public, private and nonprofit sectors. Interim President and CEO, McKnight Foundation, 2020. Interim Commissioner, Minnesota Department of Human Services, 2019. Chief Operating Officer, Twin Cities Habitat for Humanity, 2017-2019. Vice President for University Services, University of Minnesota, 2012-2016. Interim President and CEO, Blue Cross and Blue Shield of Minnesota, 2011-2012. Executive Vice-President and Chief Financial Officer, Minnesota Wild, 2002-2008. Commissioner, Minnesota Department of Finance, 1999-2002. Chair of the Board of Directors of Destination Medical Center Corporation. Board member of the Minnesota Wild Foundation. | N/A |
* Length of service dates reflect the Trustee’s commencement of service with the Trust’s predecessor entities, where applicable.
Allspring High Yield Corporate Bond Portfolio | 17
Other information (unaudited)
Officers2
Name and
year of birth | Position held and
length of service | Principal occupations during past five years or longer |
Andrew Owen
(Born 1960) | President,
since 2017 | President, Chief Executive Officer and Director of Allspring Funds Management, LLC since 2017 and co-president of Galliard Capital Management, LLC, an affiliate of Allspring Funds Management, LLC, since 2019. Prior thereto, Head of Affiliated Managers, Allspring Global Investments, from 2014 to 2019 and Executive Vice President responsible for marketing, investments and product development for Allspring Funds Management, LLC, from 2009 to 2014. In addition, Mr. Owen was an Executive Vice President of Wells Fargo & Company from 2014 to 2021. |
Jeremy DePalma
(Born 1974) | Treasurer,
since 2012
(for certain funds in
the Fund Complex);
since 2021 (for
the remaining funds in the
Fund Complex) | Senior Vice President of Allspring Funds Management, LLC since 2009. Senior Vice President of Evergreen Investment Management Company, LLC from 2008 to 2010 and head of the Fund Reporting and Control Team within Fund Administration from 2005 to 2010. |
Kate McKinley
(Born 1977) | Chief Legal Officer,
since 2021 | Chief Legal Officer of Allspring Global Investments since 2021. Prior thereto, held various roles at State Street Global Advisors beginning in 2010, including serving as Senior Vice President and General Counsel from 2019 to 2021, and Chief Operating Officer of the Institutional Client Group from 2016 - 2019. Prior to working at State Street Global Advisors served as Assistant General Counsel for Bank of America Corporation from 2005 to 2010 and as an Associate at WilmerHale from 2002 to 2005. |
Christopher Baker
(Born 1976) | Chief Compliance Officer, since 2022 | Global Chief Compliance Officer for Allspring Global Investments since 2022. Prior thereto, Chief Compliance Officer for State Street Global Advisors from 2018 to 2021. Senior Compliance Officer for the State Street divisions of Alternative Investment Solutions, Sector Solutions, and Global Marketing from 2015 to 2018. From 2010 to 2015 Vice President, Global Head of Investment and Marketing Compliance for State Street Global Advisors. |
Matthew Prasse
(Born 1983) | Secretary,
since 2021 | Senior Counsel of the Allspring Legal Department since 2021. Senior Counsel of the Wells Fargo Legal Department from 2018 to 2021. Previously, Counsel for Barings LLC from 2015 to 2018. Prior to joining Barings, Associate at Morgan, Lewis & Bockius LLP from 2008 to 2015. |
1 The Statement of Additional Information includes additional information about the Trustees and is available, without charge, upon request, by calling 1-800-222-8222.
2 For those Officers with tenures at Allspring Global Investments and/or Allspring Funds Management, LLC that began prior to 2021, such tenures include years of service during which these businesses/entities were known as Wells Fargo Asset Management and Wells Fargo Funds Management, LLC, respectively.
18 | Allspring High Yield Corporate Bond Portfolio
Other information (unaudited)
LIQUIDITY RISK MANAGEMENT PROGRAM
In accordance with Rule 22e-4 under the Investment Company Act of 1940, as amended (the “Liquidity Rule”), Allspring Master Trust (the “Trust”) has adopted and implemented a liquidity risk management program (the “Program”) on behalf of each of its series, including the Portfolio, which is reasonably designed to assess and manage the Portfolio's liquidity risk. “Liquidity risk” is defined under the Liquidity Rule as the risk that the Portfolio is unable to meet redemption requests without significantly diluting remaining investors’ interests in the Portfolio. The Trust’s Board of Trustees (the “Board”) previously approved the designation of Allspring Funds Management, LLC (“Allspring Funds Management”), the Portfolio's investment adviser, to administer the Program, and Allspring Funds Management has established a Liquidity Risk Management Council (the "Council") composed of personnel from multiple departments within Allspring Funds Management and its affiliates to assist Allspring Funds Management in the administration of the Program.
The Program is comprised of various components designed to support the assessment and/or management of liquidity risk, including: (1) the periodic assessment (no less frequently than annually) of certain factors that influence the Portfolio's liquidity risk; (2) the periodic classification (no less frequently than monthly) of the Portfolio's investments into one of four liquidity categories that reflect an estimate of their liquidity under current market conditions; (3) a 15% limit on the acquisition of “illiquid investments” (as defined under the Liquidity Rule); (4) to the extent the Portfolio does not invest primarily in “highly liquid investments” (as defined under the Liquidity Rule), the determination of a minimum percentage of the Portfolio's assets that generally will be invested in highly liquid investments (an “HLIM”); (5) if the Portfolio has established an HLIM, the periodic review (no less frequently than annually) of the HLIM and the adoption of policies and procedures for responding to a shortfall of the Portfolio's “highly liquid investments” below its HLIM; and (6) periodic reporting to the Board.
At a meeting of the Board held on May 24-25, 2022, the Board received and reviewed a written report (the “Report”) from Allspring Funds Management that, among other things, addressed the operation of the Program and assessed its adequacy and effectiveness for the period from January 1, 2021 through December 31, 2021 (the “Reporting Period”). Other than extended foreign market holidays, no significant liquidity events impacting the Portfolios were noted in the Report. In addition, other than corporate-related changes to the Program, there were no material changes to the Program during the Reporting Period.
Allspring Funds Management determined in the Report that the Program has been implemented and operates effectively to manage the Portfolio’s liquidity risk, and Allspring Funds Management continues to believe that the Program has been and continues to be adequately and effectively implemented to monitor and, as applicable, respond to the Portfolio’s liquidity developments.
There can be no assurance that the Program will achieve its objectives under all circumstances in the future.
Allspring High Yield Corporate Bond Portfolio | 19
For more information
More information about Allspring Funds is available free upon request. To obtain literature, please write, visit the Portfolio's website, or call:
Allspring Funds
P.O. Box 219967
Kansas City, MO 64121-9967
Website: allspringglobal.com
Individual investors: 1-800-222-8222
Retail investment professionals: 1-888-877-9275
Institutional investment professionals: 1-800-260-5969
This report and the financial statements contained herein are submitted for the general information of the interest holders of the Portfolio. If this report is used for promotional purposes, distribution of the report must be accompanied or preceded by a current prospectus. Before investing, please consider the investment objectives, risks, charges, and expenses of the investment. For a current prospectus and, if available, a summary prospectus, containing this information, call
1-800-222-8222. Read the prospectus carefully before you invest or send money.
Allspring Global InvestmentsTM is the trade name for the asset management firms of Allspring Global Investments Holdings, LLC, a holding company indirectly owned by certain private funds of GTCR LLC and Reverence Capital Partners, L.P. These firms include but are not limited to Allspring Global Investments, LLC, and Allspring Funds Management, LLC. Certain products managed by Allspring entities are distributed by Allspring Funds Distributor, LLC (a broker-dealer and Member FINRA/SIPC).
This material is for general informational and educational purposes only and is NOT intended to provide investment advice or a recommendation of any kind - including a recommendation for any specific investment, strategy, or plan.
© 2022 Allspring Global Investments Holdings, LLC. All rights reserved.
Semi-Annual Report
August 31, 2022
Allspring Investment Grade
Corporate Bond Portfolio
Portfolio information (unaudited)
Investment objectiveThe Portfolio seeks to replicate the total return of the Bloomberg U.S. Corporate Bond Index†, before fees and expenses.
| Adviser | Allspring Funds Management, LLC |
| Subadviser | Allspring Global Investments, LLC |
| Portfolio managers | Manjunath Boraiah, Mark Clegg, CFA®‡, Brian Prucyk, Janet S. Rilling, CFA®‡ |
| Ten largest holdings (%) as of August 31, 20221 |
| Visa Incorporated , 2.05%, 4-15-2030 | 0.94 |
| Amazon.com Incorporated, 1.00%, 5-12-2026 | 0.93 |
| NVIDIA Corporation , 2.85%, 4-1-2030 | 0.93 |
| Berkshire Hathaway Incorporated, 3.13%, 3-15-2026 | 0.93 |
| Verizon Communications, 3.15%, 3-22-2030 | 0.93 |
| Johnson & Johnson, 4.38%, 12-5-2033 | 0.90 |
| John Deere Capital Corporation , 0.45%, 6-7-2024 | 0.88 |
| Walt Disney Company, 2.65%, 1-13-2031 | 0.87 |
| Toronto Dominion Bank, 3.63%, 9-15-2031 | 0.86 |
| National Australia Bank Limited, 2.50%, 7-12-2026 | 0.86 |
| 1 | Figures represent the percentage of the Portfolio's net assets. Holdings are subject to change and may have changed since the date specified. |
| Sector allocation as of August 31, 20221 |
| 1 | Figures represent the percentage of the Portfolio's long-term investments. Allocations are subject to change and may have changed since the date specified. |
| † | The Bloomberg U.S. Corporate Bond Index measures the investment grade, fixed-rate, taxable corporate bond market. It includes USD-denominated securities publicly issued by US and non-US industrial, utility and financial issuers. You cannot invest directly in an index. |
| ‡ | CFA® and Chartered Financial Analyst® are trademarks owned by CFA Institute. |
2 | Allspring Investment Grade Corporate Bond Portfolio
Portfolio of investments—August 31, 2022 (unaudited)
| | | Interest
rate | Maturity
date | Principal | Value |
| Corporate bonds and notes: 79.51% | | | | | |
| Communication services: 5.33% | | | | | |
| Diversified telecommunication services: 2.12% | | | | | |
| AT&T Incorporated | | 3.55% | 9-15-2055 | $ 255,000 | $ 186,709 |
| AT&T Incorporated | | 3.80 | 12-1-2057 | 235,000 | 177,888 |
| AT&T Incorporated | | 3.85 | 6-1-2060 | 145,000 | 109,988 |
| T-Mobile USA Incorporated | | 3.75 | 4-15-2027 | 580,000 | 556,162 |
| Verizon Communications | | 3.15 | 3-22-2030 | 905,000 | 810,552 |
| | | | | | 1,841,299 |
| Entertainment: 0.87% | | | | | |
| Walt Disney Company | | 2.65 | 1-13-2031 | 855,000 | 753,707 |
| Interactive media & services: 0.09% | | | | | |
| Alphabet Incorporated | | 2.25 | 8-15-2060 | 125,000 | 79,683 |
| Media: 2.01% | | | | | |
| CBS Corporation | | 4.85 | 7-1-2042 | 140,000 | 113,874 |
| CBS Corporation | | 4.90 | 8-15-2044 | 140,000 | 111,423 |
| Charter Communications Operating LLC | | 3.85 | 4-1-2061 | 165,000 | 105,532 |
| Charter Communications Operating LLC | | 4.40 | 12-1-2061 | 215,000 | 151,208 |
| Charter Communications Operating LLC | | 6.83 | 10-23-2055 | 165,000 | 164,908 |
| Comcast Corporation | | 2.35 | 1-15-2027 | 210,000 | 195,532 |
| Discovery Communications LLC | | 3.95 | 3-20-2028 | 400,000 | 367,433 |
| Discovery Communications LLC | | 4.00 | 9-15-2055 | 1,000 | 663 |
| Magallanes Incorporated 144A | | 5.14 | 3-15-2052 | 125,000 | 100,050 |
| Magallanes Incorporated 144A | | 5.39 | 3-15-2062 | 295,000 | 236,797 |
| Time Warner Cable LLC | | 4.50 | 9-15-2042 | 270,000 | 204,079 |
| | | | | | 1,751,499 |
| Wireless telecommunication services: 0.24% | | | | | |
| T-Mobile USA Incorporated | | 3.60 | 11-15-2060 | 295,000 | 212,316 |
| Consumer discretionary: 4.58% | | | | | |
| Automobiles: 0.38% | | | | | |
| General Motors Company | | 6.25 | 10-2-2043 | 345,000 | 332,414 |
| Diversified consumer services: 0.20% | | | | | |
| Ford Foundation | | 2.82 | 6-1-2070 | 260,000 | 176,012 |
| Hotels, restaurants & leisure: 1.15% | | | | | |
| GLP Capital LP | | 5.30 | 1-15-2029 | 120,000 | 115,849 |
| Marriott International Incorporated | | 4.63 | 6-15-2030 | 410,000 | 391,579 |
| Starbucks Corporation | | 4.00 | 11-15-2028 | 500,000 | 488,632 |
| | | | | | 996,060 |
| Household durables: 0.10% | | | | | |
| Whirlpool Corporation | | 4.00 | 3-1-2024 | 87,000 | 87,122 |
| Internet & direct marketing retail: 1.10% | | | | | |
| Amazon.com Incorporated | | 1.00 | 5-12-2026 | 900,000 | 814,897 |
| eBay Incorporated | | 4.00 | 7-15-2042 | 175,000 | 145,285 |
| | | | | | 960,182 |
The accompanying notes are an integral part of these financial statements.
Allspring Investment Grade Corporate Bond Portfolio | 3
Portfolio of investments—August 31, 2022 (unaudited)
| | | Interest
rate | Maturity
date | Principal | Value |
| Multiline retail: 0.24% | | | | | |
| Target Corporation | | 3.63% | 4-15-2046 | $ 250,000 | $ 212,356 |
| Specialty retail: 1.34% | | | | | |
| Lowe's Companies Incorporated | | 3.88 | 9-15-2023 | 175,000 | 175,063 |
| Lowe's Companies Incorporated | | 4.45 | 4-1-2062 | 130,000 | 109,786 |
| Lowe's Companies Incorporated | | 4.50 | 4-15-2030 | 300,000 | 295,633 |
| TJX Companies Incorporated | | 3.88 | 4-15-2030 | 600,000 | 582,336 |
| | | | | | 1,162,818 |
| Textiles, apparel & luxury goods: 0.07% | | | | | |
| Nike Incorporated | | 3.63 | 5-1-2043 | 70,000 | 61,162 |
| Consumer staples: 5.35% | | | | | |
| Beverages: 2.09% | | | | | |
| Anheuser-Busch InBev Finance Company | | 4.00 | 1-17-2043 | 230,000 | 192,410 |
| Anheuser-Busch InBev Worldwide Incorporated | | 4.60 | 6-1-2060 | 105,000 | 93,142 |
| Anheuser-Busch InBev Worldwide Incorporated | | 4.90 | 2-1-2046 | 295,000 | 280,061 |
| Anheuser-Busch InBev Worldwide Incorporated | | 5.80 | 1-23-2059 | 75,000 | 79,992 |
| Coca Cola Company | | 2.75 | 6-1-2060 | 280,000 | 199,498 |
| Constellation Brands Incorporated | | 3.15 | 8-1-2029 | 300,000 | 269,710 |
| Keurig Dr Pepper Incorporated | | 4.60 | 5-25-2028 | 700,000 | 702,218 |
| | | | | | 1,817,031 |
| Food & staples retailing: 0.19% | | | | | |
| The Kroger Company | | 5.00 | 4-15-2042 | 175,000 | 167,792 |
| Food products: 1.08% | | | | | |
| Kraft Heinz Food Company | | 5.50 | 6-1-2050 | 180,000 | 179,206 |
| Mead Johnson Nutrition Company | | 5.90 | 11-1-2039 | 70,000 | 76,391 |
| Mondelez International | | 2.75 | 4-13-2030 | 440,000 | 388,617 |
| Tyson Foods Incorporated | | 4.35 | 3-1-2029 | 300,000 | 295,996 |
| | | | | | 940,210 |
| Household products: 0.19% | | | | | |
| Kimberly-Clark Corporation | | 6.63 | 8-1-2037 | 140,000 | 169,258 |
| Personal products: 0.18% | | | | | |
| Estee Lauder Companies Incorporated | | 6.00 | 5-15-2037 | 140,000 | 158,144 |
| Tobacco: 1.62% | | | | | |
| Altria Group Incorporated | | 4.00 | 1-31-2024 | 62,000 | 61,928 |
| Altria Group Incorporated | | 4.00 | 2-4-2061 | 200,000 | 133,703 |
| Altria Group Incorporated | | 4.50 | 5-2-2043 | 175,000 | 133,113 |
| BAT Capital Corporation | | 4.54 | 8-15-2047 | 140,000 | 102,192 |
| Philip Morris International Incorporated | | 3.25 | 11-10-2024 | 210,000 | 207,237 |
| Philip Morris International Incorporated | | 4.13 | 3-4-2043 | 390,000 | 306,728 |
| Philip Morris International Incorporated | | 4.50 | 3-20-2042 | 140,000 | 115,524 |
| Reynolds American Incorporated | | 4.45 | 6-12-2025 | 350,000 | 346,692 |
| | | | | | 1,407,117 |
The accompanying notes are an integral part of these financial statements.
4 | Allspring Investment Grade Corporate Bond Portfolio
Portfolio of investments—August 31, 2022 (unaudited)
| | | Interest
rate | Maturity
date | Principal | Value |
| Energy: 6.57% | | | | | |
| Energy equipment & services: 0.89% | | | | | |
| Baker Hughes LLC | | 3.34% | 12-15-2027 | $ 670,000 | $ 626,693 |
| Halliburton Company | | 4.50 | 11-15-2041 | 175,000 | 150,895 |
| | | | | | 777,588 |
| Oil, gas & consumable fuels: 5.68% | | | | | |
| BP Capital Markets America Incorporated | | 3.94 | 9-21-2028 | 200,000 | 195,222 |
| ConocoPhillips Company | | 5.90 | 10-15-2032 | 175,000 | 194,214 |
| Consolidated Edison Company of New York Incorporated | | 4.13 | 5-15-2049 | 370,000 | 322,512 |
| Enbridge Energy Partners LP | | 5.50 | 9-15-2040 | 140,000 | 138,806 |
| Energy Transfer Partners LP | | 5.95 | 10-1-2043 | 140,000 | 131,713 |
| Enterprise Products Operating LLC | | 5.70 | 2-15-2042 | 140,000 | 142,446 |
| Enterprise Products Operating LLC | | 5.95 | 2-1-2041 | 200,000 | 208,543 |
| Enterprise Products Operating LLC | | 7.55 | 4-15-2038 | 70,000 | 82,386 |
| Exxon Mobil Corporation | | 2.71 | 3-6-2025 | 345,000 | 335,707 |
| Kinder Morgan Energy Partners LP | | 5.00 | 8-15-2042 | 175,000 | 155,488 |
| Kinder Morgan Energy Partners LP | | 5.50 | 3-1-2044 | 210,000 | 196,058 |
| Kinder Morgan Energy Partners LP | | 5.80 | 3-15-2035 | 70,000 | 70,609 |
| Marathon Petroleum Corporation | | 3.80 | 4-1-2028 | 385,000 | 363,291 |
| ONEOK Incorporated | | 4.55 | 7-15-2028 | 500,000 | 484,564 |
| Phillips 66 | | 4.65 | 11-15-2034 | 140,000 | 135,311 |
| Plains All American Pipeline LP | | 3.60 | 11-1-2024 | 210,000 | 204,993 |
| Plains All American Pipeline LP | | 3.85 | 10-15-2023 | 350,000 | 348,562 |
| Sabine Pass Liquefaction LLC | | 5.00 | 3-15-2027 | 400,000 | 398,611 |
| Spectra Energy Partners LP | | 3.38 | 10-15-2026 | 300,000 | 285,812 |
| Sunoco Logistics Partner LP | | 4.95 | 1-15-2043 | 105,000 | 87,788 |
| Sunoco Logistics Partner LP | | 5.35 | 5-15-2045 | 185,000 | 163,034 |
| Williams Partners LP | | 6.30 | 4-15-2040 | 273,000 | 291,014 |
| | | | | | 4,936,684 |
| Financials: 20.87% | | | | | |
| Banks: 6.12% | | | | | |
| Bank of America Corporation (U.S. SOFR +1.56%) ± | | 2.97 | 7-21-2052 | 125,000 | 87,274 |
| Citigroup Incorporated (3 Month LIBOR +1.39%) ± | | 3.67 | 7-24-2028 | 325,000 | 306,086 |
| Citigroup Incorporated | | 4.65 | 7-30-2045 | 625,000 | 573,331 |
| Citizens Financial Group (5 Year Treasury Constant Maturity +2.50%) ± | | 4.30 | 2-11-2031 | 200,000 | 189,012 |
| Compass Bank | | 3.88 | 4-10-2025 | 250,000 | 247,243 |
| Deutsche Bank | | 1.69 | 3-19-2026 | 150,000 | 134,717 |
| Deutsche Bank (U.S. SOFR +1.22%) ± | | 2.31 | 11-16-2027 | 450,000 | 382,288 |
| Discover Bank | | 4.25 | 3-13-2026 | 250,000 | 244,579 |
| Fifth Third Bancorp | | 2.25 | 2-1-2027 | 250,000 | 230,094 |
| Fifth Third Bancorp | | 3.95 | 3-14-2028 | 400,000 | 388,087 |
| JPMorgan Chase & Company (U.S. SOFR +2.44%) ± | | 3.11 | 4-22-2051 | 320,000 | 230,958 |
| JPMorgan Chase & Company (3 Month LIBOR +1.22%) ± | | 3.90 | 1-23-2049 | 740,000 | 617,065 |
| Key Bank NA | | 3.30 | 6-1-2025 | 250,000 | 243,702 |
| Santander Holdings USA Incorporated | | 4.50 | 7-17-2025 | 350,000 | 348,319 |
| Truist Bank | | 3.30 | 5-15-2026 | 600,000 | 576,016 |
| US Bancorp | | 2.38 | 7-22-2026 | 190,000 | 179,200 |
| US Bancorp | | 3.60 | 9-11-2024 | 350,000 | 349,015 |
| | | | | | 5,326,986 |
The accompanying notes are an integral part of these financial statements.
Allspring Investment Grade Corporate Bond Portfolio | 5
Portfolio of investments—August 31, 2022 (unaudited)
| | | Interest
rate | Maturity
date | Principal | Value |
| Capital markets: 5.88% | | | | | |
| Ares Capital Corporation | | 3.20% | 11-15-2031 | $ 240,000 | $ 187,197 |
| Bain Capital Specialty Finance | | 2.55 | 10-13-2026 | 185,000 | 156,568 |
| Bank of New York Mellon Corporation | | 3.00 | 10-30-2028 | 570,000 | 522,061 |
| BlackRock Incorporated | | 3.25 | 4-30-2029 | 785,000 | 744,561 |
| Goldman Sachs Group Incorporated (3 Month LIBOR +1.16%) ± | | 3.81 | 4-23-2029 | 415,000 | 388,339 |
| Goldman Sachs Group Incorporated (3 Month LIBOR +1.43%) ± | | 4.41 | 4-23-2039 | 125,000 | 113,740 |
| Goldman Sachs Group Incorporated | | 4.75 | 10-21-2045 | 360,000 | 339,311 |
| Intercontinental Exchange | | 3.75 | 9-21-2028 | 500,000 | 482,977 |
| Moody's Corporation | | 5.25 | 7-15-2044 | 210,000 | 213,523 |
| Morgan Stanley (U.S. SOFR +1.36%) ± | | 2.48 | 9-16-2036 | 575,000 | 442,626 |
| Morgan Stanley | | 4.30 | 1-27-2045 | 290,000 | 259,138 |
| Northern Trust Corporation | | 3.95 | 10-30-2025 | 175,000 | 174,333 |
| PPL Capital Funding Incorporated | | 3.10 | 5-15-2026 | 100,000 | 94,808 |
| Prospect Capital Corporation | | 3.44 | 10-15-2028 | 115,000 | 89,068 |
| S +P Global Incorporated 144A | | 3.90 | 3-1-2062 | 130,000 | 111,976 |
| The Charles Schwab Corporation | | 3.63 | 4-1-2025 | 140,000 | 138,485 |
| The Charles Schwab Corporation | | 4.63 | 3-22-2030 | 650,000 | 658,277 |
| | | | | | 5,116,988 |
| Consumer finance: 2.57% | | | | | |
| Ally Financial Incorporated | | 8.00 | 11-1-2031 | 225,000 | 250,378 |
| American Honda Finance Corporation | | 2.90 | 2-16-2024 | 200,000 | 197,259 |
| Capital One Financial Corporation | | 3.75 | 7-28-2026 | 525,000 | 505,754 |
| Caterpillar Financial Services Corporation | | 3.25 | 12-1-2024 | 200,000 | 197,418 |
| Caterpillar Financial Services Corporation | | 3.75 | 11-24-2023 | 175,000 | 175,336 |
| General Motors Financial Company Incorporated | | 5.65 | 1-17-2029 | 140,000 | 139,734 |
| John Deere Capital Corporation | | 0.45 | 6-7-2024 | 810,000 | 766,992 |
| | | | | | 2,232,871 |
| Diversified financial services: 1.69% | | | | | |
| Berkshire Hathaway Finance Corporation | | 5.75 | 1-15-2040 | 240,000 | 268,161 |
| Berkshire Hathaway Incorporated | | 3.13 | 3-15-2026 | 830,000 | 811,254 |
| Blackstone Private Credit Fund | | 3.25 | 3-15-2027 | 215,000 | 184,460 |
| British American Tobacco Capital Corporation | | 5.28 | 4-2-2050 | 95,000 | 76,528 |
| National Rural Utilities Cooperative Finance Corporation | | 4.02 | 11-1-2032 | 140,000 | 133,921 |
| | | | | | 1,474,324 |
| Insurance: 3.63% | | | | | |
| Allstate Corporation (3 Month LIBOR +2.12%) ± | | 6.50 | 5-15-2067 | 115,000 | 116,878 |
| American International Group Incorporated (3 Month LIBOR +2.87%) ± | | 5.75 | 4-1-2048 | 200,000 | 189,487 |
| Aon Corporation | | 6.25 | 9-30-2040 | 70,000 | 76,646 |
| Arch Capital Group Limited | | 5.14 | 11-1-2043 | 147,000 | 140,902 |
| Chubb Corporation | | 6.00 | 5-11-2037 | 196,000 | 222,053 |
| Hartford Financial Services Group Incorporated | | 4.30 | 4-15-2043 | 30,000 | 26,133 |
| Loews Corporation | | 4.13 | 5-15-2043 | 140,000 | 118,070 |
| Marsh & McLennan Company Incorporated | | 3.50 | 6-3-2024 | 200,000 | 198,766 |
| Marsh & McLennan Company Incorporated | | 3.88 | 3-15-2024 | 200,000 | 199,804 |
| Marsh & McLennan Company Incorporated | | 4.90 | 3-15-2049 | 110,000 | 109,559 |
| MetLife Incorporated | | 6.38 | 6-15-2034 | 196,000 | 223,339 |
| Principal Financial Group Incorporated | | 3.40 | 5-15-2025 | 140,000 | 136,912 |
| Progressive Corporation | | 6.25 | 12-1-2032 | 252,000 | 286,918 |
| Progressive Corporation | | 7.75 | 3-1-2031 | 365,000 | 422,847 |
| Prudential Financial Incorporated (3 Month LIBOR +3.04%) ± | | 5.20 | 3-15-2044 | 175,000 | 169,976 |
| Prudential Financial Incorporated | | 5.75 | 7-15-2033 | 350,000 | 376,057 |
The accompanying notes are an integral part of these financial statements.
6 | Allspring Investment Grade Corporate Bond Portfolio
Portfolio of investments—August 31, 2022 (unaudited)
| | | Interest
rate | Maturity
date | Principal | Value |
| Insurance (continued) | | | | | |
| Prudential Financial Incorporated | | 6.63% | 12-1-2037 | $ 45,000 | $ 52,008 |
| Transatlantic Holdings Incorporated | | 8.00 | 11-30-2039 | 70,000 | 88,509 |
| | | | | | 3,154,864 |
| Mortgage REITs: 0.98% | | | | | |
| Ventas Realty LP | | 3.50 | 2-1-2025 | 400,000 | 390,401 |
| Ventas Realty LP | | 4.40 | 1-15-2029 | 485,000 | 466,559 |
| | | | | | 856,960 |
| Health care: 7.59% | | | | | |
| Biotechnology: 1.43% | | | | | |
| AbbVie Incorporated | | 4.85 | 6-15-2044 | 350,000 | 332,225 |
| Biogen Incorporated | | 2.25 | 5-1-2030 | 700,000 | 571,816 |
| Gilead Sciences Incorporated | | 3.65 | 3-1-2026 | 350,000 | 343,646 |
| | | | | | 1,247,687 |
| Health care equipment & supplies: 0.51% | | | | | |
| Abbott Laboratories | | 6.15 | 11-30-2037 | 166,000 | 197,055 |
| Catholic Health Initiatives | | 4.35 | 11-1-2042 | 175,000 | 156,018 |
| Stryker Corporation | | 4.63 | 3-15-2046 | 95,000 | 89,801 |
| | | | | | 442,874 |
| Health care providers & services: 3.19% | | | | | |
| Aetna Incorporated | | 4.13 | 11-15-2042 | 75,000 | 63,315 |
| Aetna Incorporated | | 4.50 | 5-15-2042 | 105,000 | 93,559 |
| AmerisourceBergen Corporation | | 4.25 | 3-1-2045 | 175,000 | 151,983 |
| Anthem Incorporated | | 4.38 | 12-1-2047 | 15,000 | 13,786 |
| Ascension Healthcare Company | | 3.95 | 11-15-2046 | 95,000 | 86,525 |
| Baptist Health South Florida | | 3.12 | 11-15-2071 | 295,000 | 195,486 |
| CIGNA Corporation Company | | 4.80 | 7-15-2046 | 210,000 | 196,228 |
| CIGNA Corporation Company | | 6.13 | 11-15-2041 | 175,000 | 188,464 |
| CVS Health Corporation | | 5.05 | 3-25-2048 | 420,000 | 404,381 |
| HCA Incorporated 144A | | 4.38 | 3-15-2042 | 180,000 | 146,994 |
| HCA Incorporated 144A | | 4.63 | 3-15-2052 | 160,000 | 132,404 |
| Quest Diagnostics Incorporated | | 2.95 | 6-30-2030 | 300,000 | 265,032 |
| UnitedHealth Group Incorporated | | 4.20 | 1-15-2047 | 200,000 | 184,123 |
| UnitedHealth Group Incorporated | | 4.25 | 3-15-2043 | 175,000 | 163,045 |
| UnitedHealth Group Incorporated | | 4.25 | 4-15-2047 | 300,000 | 278,140 |
| WellPoint Incorporated | | 5.85 | 1-15-2036 | 200,000 | 214,265 |
| | | | | | 2,777,730 |
| Pharmaceuticals: 2.46% | | | | | |
| Bristol-Myers Squibb Company | | 3.25 | 11-1-2023 | 109,000 | 108,538 |
| Bristol-Myers Squibb Company | | 3.90 | 3-15-2062 | 175,000 | 146,861 |
| Eli Lilly & Company | | 2.75 | 6-1-2025 | 70,000 | 68,658 |
| GlaxoSmithKline Capital Incorporated | | 5.38 | 4-15-2034 | 210,000 | 224,761 |
| Johnson & Johnson | | 4.38 | 12-5-2033 | 770,000 | 786,099 |
| Merck & Company Incorporated | | 2.75 | 2-10-2025 | 380,000 | 371,488 |
| Mylan Incorporated | | 4.20 | 11-29-2023 | 200,000 | 199,848 |
| Zoetis Incorporated | | 4.70 | 2-1-2043 | 240,000 | 229,657 |
| | | | | | 2,135,910 |
The accompanying notes are an integral part of these financial statements.
Allspring Investment Grade Corporate Bond Portfolio | 7
Portfolio of investments—August 31, 2022 (unaudited)
| | | Interest
rate | Maturity
date | Principal | Value |
| Industrials: 3.70% | | | | | |
| Aerospace & defense: 1.43% | | | | | |
| Lockheed Martin Corporation | | 6.15% | 9-1-2036 | $ 122,000 | $ 139,389 |
| Northrop Grumman Corporation | | 5.05 | 11-15-2040 | 70,000 | 70,304 |
| Precision Castparts Corporation | | 3.90 | 1-15-2043 | 140,000 | 121,342 |
| Textron Incorporated | | 4.30 | 3-1-2024 | 140,000 | 140,484 |
| The Boeing Company | | 2.60 | 10-30-2025 | 120,000 | 112,907 |
| The Boeing Company | | 5.88 | 2-15-2040 | 186,000 | 182,075 |
| United Technologies Corporation | | 3.75 | 11-1-2046 | 570,000 | 474,153 |
| | | | | | 1,240,654 |
| Air freight & logistics: 0.28% | | | | | |
| United Parcel Service Incorporated | | 6.20 | 1-15-2038 | 206,000 | 242,174 |
| Airlines: 0.20% | | | | | |
| American Airlines Incorporated | | 3.20 | 12-15-2029 | 46,004 | 39,809 |
| United Airlines Incorporated | | 4.30 | 2-15-2027 | 138,715 | 130,361 |
| | | | | | 170,170 |
| Electrical equipment: 0.12% | | | | | |
| Rockwell Automation Incorporated | | 2.80 | 8-15-2061 | 160,000 | 104,513 |
| Industrial conglomerates: 0.34% | | | | | |
| Honeywell International Incorporated | | 3.35 | 12-1-2023 | 140,000 | 139,768 |
| Honeywell International Incorporated | | 3.81 | 11-21-2047 | 175,000 | 160,800 |
| | | | | | 300,568 |
| Machinery: 0.34% | | | | | |
| Deere & Company | | 5.38 | 10-16-2029 | 105,000 | 112,185 |
| Dover Corporation | | 5.38 | 10-15-2035 | 140,000 | 139,619 |
| Parker Hannifin Corporation | | 6.25 | 5-15-2038 | 42,000 | 45,037 |
| | | | | | 296,841 |
| Road & rail: 0.22% | | | | | |
| CSX Corporation | | 4.25 | 11-1-2066 | 140,000 | 119,527 |
| Norfolk Southern Corporation | | 5.10 | 12-31-2049 | 80,000 | 71,692 |
| | | | | | 191,219 |
| Trading companies & distributors: 0.53% | | | | | |
| Air Lease Corporation | | 3.25 | 3-1-2025 | 200,000 | 190,906 |
| W.W. Grainger Incorporated | | 4.60 | 6-15-2045 | 280,000 | 271,167 |
| | | | | | 462,073 |
| Transportation infrastructure: 0.24% | | | | | |
| Burlington Northern Santa Fe LLC | | 2.88 | 6-15-2052 | 285,000 | 210,209 |
| Information technology: 9.65% | | | | | |
| Communications equipment: 0.72% | | | | | |
| Cisco Systems Incorporated | | 2.20 | 9-20-2023 | 300,000 | 295,965 |
| Cisco Systems Incorporated | | 2.95 | 2-28-2026 | 340,000 | 332,730 |
| | | | | | 628,695 |
| Electronic equipment, instruments & components: 0.90% | | | | | |
| Corning Incorporated | | 5.45 | 11-15-2079 | 390,000 | 361,246 |
The accompanying notes are an integral part of these financial statements.
8 | Allspring Investment Grade Corporate Bond Portfolio
Portfolio of investments—August 31, 2022 (unaudited)
| | | Interest
rate | Maturity
date | Principal | Value |
| Electronic equipment, instruments & components (continued) | | | | | |
| Dell International LLC | | 6.10% | 7-15-2027 | $ 230,000 | $ 241,847 |
| Keysight Technologies Incorporated | | 4.55 | 10-30-2024 | 175,000 | 176,003 |
| | | | | | 779,096 |
| IT services: 2.59% | | | | | |
| Fiserv Incorporated | | 3.85 | 6-1-2025 | 210,000 | 206,548 |
| IBM Corporation | | 3.00 | 5-15-2024 | 300,000 | 296,305 |
| Mastercard Incorporated | | 3.50 | 2-26-2028 | 400,000 | 393,969 |
| Mastercard Incorporated | | 3.95 | 2-26-2048 | 140,000 | 128,468 |
| Visa Incorporated | | 2.75 | 9-15-2027 | 300,000 | 286,511 |
| Visa Incorporated | | 2.05 | 4-15-2030 | 930,000 | 814,974 |
| Western Union Company | | 6.20 | 11-17-2036 | 122,000 | 120,730 |
| | | | | | 2,247,505 |
| Semiconductors & semiconductor equipment: 2.11% | | | | | |
| Applied Materials Incorporated | | 5.85 | 6-15-2041 | 380,000 | 432,361 |
| Intel Corporation | | 2.60 | 5-19-2026 | 220,000 | 210,441 |
| Intel Corporation | | 4.25 | 12-15-2042 | 175,000 | 157,124 |
| Intel Corporation | | 4.90 | 7-29-2045 | 230,000 | 225,255 |
| NVIDIA Corporation | | 2.85 | 4-1-2030 | 900,000 | 812,018 |
| | | | | | 1,837,199 |
| Software: 2.29% | | | | | |
| CDW LLC | | 3.57 | 12-1-2031 | 230,000 | 193,186 |
| Microsoft Corporation | | 2.68 | 6-1-2060 | 155,000 | 110,073 |
| Microsoft Corporation | | 2.88 | 2-6-2024 | 240,000 | 237,514 |
| Microsoft Corporation | | 3.04 | 3-17-2062 | 180,000 | 137,304 |
| Microsoft Corporation | | 5.20 | 6-1-2039 | 77,000 | 85,880 |
| Oracle Corporation | | 3.40 | 7-8-2024 | 110,000 | 108,400 |
| Salesforce.com Incorporated | | 3.05 | 7-15-2061 | 245,000 | 176,866 |
| Salesforce.com Incorporated | | 3.70 | 4-11-2028 | 200,000 | 198,131 |
| Vmware Incorporated | | 4.65 | 5-15-2027 | 755,000 | 747,730 |
| | | | | | 1,995,084 |
| Technology hardware, storage & peripherals: 1.04% | | | | | |
| Apple Incorporated | | 2.80 | 2-8-2061 | 155,000 | 109,476 |
| Apple Incorporated | | 2.85 | 8-5-2061 | 440,000 | 312,409 |
| Apple Incorporated | | 3.00 | 2-9-2024 | 380,000 | 376,819 |
| Apple Incorporated | | 4.65 | 2-23-2046 | 105,000 | 107,349 |
| | | | | | 906,053 |
| Materials: 1.76% | | | | | |
| Chemicals: 0.69% | | | | | |
| DuPont de Nemours Incorporated | | 5.42 | 11-15-2048 | 140,000 | 137,492 |
| Eastman Chemical Company | | 4.80 | 9-1-2042 | 140,000 | 123,483 |
| LYB International Finance III LLC | | 3.80 | 10-1-2060 | 150,000 | 105,950 |
| Westlake Chemical Corporation | | 3.38 | 8-15-2061 | 355,000 | 233,418 |
| | | | | | 600,343 |
| Containers & packaging: 0.05% | | | | | |
| MeadWestvaco Corporation | | 7.95 | 2-15-2031 | 35,000 | 40,991 |
The accompanying notes are an integral part of these financial statements.
Allspring Investment Grade Corporate Bond Portfolio | 9
Portfolio of investments—August 31, 2022 (unaudited)
| | | Interest
rate | Maturity
date | Principal | Value |
| Metals & mining: 1.02% | | | | | |
| Freeport-McMoRan Incorporated | | 4.25% | 3-1-2030 | $ 325,000 | $ 294,334 |
| Newmont Mining Corporation | | 2.60 | 7-15-2032 | 730,000 | 597,420 |
| | | | | | 891,754 |
| Real estate: 5.74% | | | | | |
| Equity REITs: 5.74% | | | | | |
| ACE INA Holdings Incorporated | | 3.35 | 5-15-2024 | 350,000 | 347,705 |
| Alexandria Real Estate Equities Incorporated | | 4.70 | 7-1-2030 | 615,000 | 604,999 |
| AvalonBay Communities Incorporated | | 4.20 | 12-15-2023 | 175,000 | 175,569 |
| Boston Properties LP | | 2.75 | 10-1-2026 | 500,000 | 465,510 |
| Boston Properties LP | | 3.80 | 2-1-2024 | 300,000 | 297,848 |
| Equinix Incorporated | | 1.55 | 3-15-2028 | 775,000 | 657,193 |
| HCP Incorporated | | 6.75 | 2-1-2041 | 95,000 | 105,451 |
| Health Care REIT Incorporated | | 4.00 | 6-1-2025 | 210,000 | 207,341 |
| Health Care REIT Incorporated | | 4.50 | 1-15-2024 | 140,000 | 140,434 |
| Kimco Realty Corporation | | 2.80 | 10-1-2026 | 350,000 | 327,994 |
| Mid-America Apartments LP | | 4.30 | 10-15-2023 | 35,000 | 35,000 |
| Prologis LP | | 1.25 | 10-15-2030 | 885,000 | 706,950 |
| Realty Income Corporation | | 4.88 | 6-1-2026 | 119,000 | 121,191 |
| Simon Property Group LP | | 3.30 | 1-15-2026 | 410,000 | 397,646 |
| Simon Property Group LP | | 3.75 | 2-1-2024 | 175,000 | 174,419 |
| Welltower Incorporated | | 4.95 | 9-1-2048 | 240,000 | 225,773 |
| | | | | | 4,991,023 |
| Utilities: 8.37% | | | | | |
| Electric utilities: 7.00% | | | | | |
| Appalachian Power Company | | 3.40 | 6-1-2025 | 175,000 | 171,337 |
| Appalachian Power Company | | 4.45 | 6-1-2045 | 175,000 | 152,266 |
| Appalachian Power Company | | 7.00 | 4-1-2038 | 70,000 | 81,923 |
| Arizona Public Service Company | | 3.15 | 5-15-2025 | 105,000 | 101,735 |
| Arizona Public Service Company | | 4.50 | 4-1-2042 | 70,000 | 61,070 |
| Baltimore Gas & Electric Company | | 3.50 | 8-15-2046 | 300,000 | 246,473 |
| Berkshire Hathaway Energy | | 3.65 | 4-15-2029 | 685,000 | 663,856 |
| Commonwealth Edison Company | | 3.80 | 10-1-2042 | 70,000 | 60,403 |
| Consolidated Edison Company of New York Incorporated Series 16-C | | 4.30 | 12-1-2056 | 30,000 | 26,055 |
| Duke Energy Incorporated | | 4.10 | 3-15-2043 | 210,000 | 187,293 |
| Duke Energy Indiana Incorporated | | 4.90 | 7-15-2043 | 105,000 | 99,609 |
| Entergy Arkansas Incorporated | | 4.20 | 4-1-2049 | 280,000 | 254,887 |
| Entergy Gulf States Louisiana LLC | | 5.59 | 10-1-2024 | 84,000 | 86,368 |
| Exelon Corporation | | 4.95 | 6-15-2035 | 140,000 | 137,009 |
| Florida Power & Light Company | | 5.95 | 2-1-2038 | 224,000 | 249,641 |
| Florida Power & Light Company | | 5.96 | 4-1-2039 | 175,000 | 196,860 |
| Florida Power Corporation | | 5.65 | 4-1-2040 | 87,000 | 93,651 |
| Interstate Power & Light Company | | 6.25 | 7-15-2039 | 21,000 | 22,997 |
| NSTAR Electric Company | | 5.50 | 3-15-2040 | 70,000 | 74,167 |
| Oglethorpe Power Corporation | | 5.95 | 11-1-2039 | 105,000 | 107,690 |
| Oncor Electric Delivery Company LLC | | 7.00 | 5-1-2032 | 122,000 | 146,127 |
| Pacific Gas & Electric Company | | 2.50 | 2-1-2031 | 895,000 | 684,344 |
| PacifiCorp | | 3.60 | 4-1-2024 | 175,000 | 174,610 |
| PPL Electric Utilities | | 4.75 | 7-15-2043 | 105,000 | 102,573 |
| PPL Electric Utilities | | 6.25 | 5-15-2039 | 31,000 | 34,935 |
| Public Service Electric & Gas Company | | 3.80 | 1-1-2043 | 140,000 | 120,142 |
The accompanying notes are an integral part of these financial statements.
10 | Allspring Investment Grade Corporate Bond Portfolio
Portfolio of investments—August 31, 2022 (unaudited)
| | | Interest
rate | Maturity
date | Principal | Value |
| Electric utilities (continued) | | | | | |
| Public Service Electric & Gas Company | | 3.95% | 5-1-2042 | $ 70,000 | $ 62,915 |
| Public Service Electric & Gas Company | | 5.80 | 5-1-2037 | 70,000 | 76,986 |
| South Carolina Electric & Gas Company | | 5.10 | 6-1-2065 | 30,000 | 30,618 |
| Southern California Edison Company | | 3.90 | 3-15-2043 | 105,000 | 85,199 |
| Southern California Edison Company | | 5.35 | 7-15-2035 | 126,000 | 125,319 |
| Southern California Edison Company | | 5.50 | 3-15-2040 | 140,000 | 138,573 |
| Southern California Edison Company | | 6.00 | 1-15-2034 | 70,000 | 74,218 |
| Southwestern Electric Power Company | | 6.20 | 3-15-2040 | 35,000 | 37,114 |
| The Southern Company | | 4.40 | 7-1-2046 | 185,000 | 163,070 |
| TXU Electric Delivery Company | | 7.25 | 1-15-2033 | 237,000 | 291,206 |
| Union Electric Company | | 8.45 | 3-15-2039 | 56,000 | 74,073 |
| Virginia Electric & Power Company | | 3.10 | 5-15-2025 | 70,000 | 68,372 |
| Virginia Electric & Power Company | | 4.20 | 5-15-2045 | 105,000 | 93,520 |
| Virginia Electric & Power Company | | 4.45 | 2-15-2044 | 105,000 | 97,159 |
| Virginia Electric & Power Company | | 6.00 | 1-15-2036 | 70,000 | 76,548 |
| Westar Energy Incorporated | | 4.10 | 4-1-2043 | 210,000 | 183,217 |
| Wisconsin Electric Power Company | | 5.63 | 5-15-2033 | 70,000 | 75,147 |
| | | | | | 6,091,275 |
| Gas utilities: 0.39% | | | | �� | |
| CenterPoint Energy Incorporated | | 4.50 | 4-1-2044 | 175,000 | 166,622 |
| One Gas Incorporated | | 3.61 | 2-1-2024 | 70,000 | 69,369 |
| Piedmont Natural Gas Company | | 4.65 | 8-1-2043 | 35,000 | 31,665 |
| Southern California Gas Company | | 5.13 | 11-15-2040 | 70,000 | 69,413 |
| | | | | | 337,069 |
| Multi-utilities: 0.98% | | | | | |
| Ameren Illinois Company | | 3.70 | 12-1-2047 | 165,000 | 140,121 |
| Consumers Energy Company | | 4.05 | 5-15-2048 | 290,000 | 263,458 |
| Dominion Resources Incorporated | | 5.95 | 6-15-2035 | 157,000 | 166,547 |
| Sempra Energy | | 3.25 | 6-15-2027 | 300,000 | 283,861 |
| | | | | | 853,987 |
| Total Corporate bonds and notes (Cost $77,134,561) | | | | | 69,186,143 |
| Non-agency mortgage-backed securities: 0.13% | | | | | |
| Peco Energy Company 1st Mortgage | | 2.85 | 9-15-2051 | 160,000 | 116,461 |
| Total Non-agency mortgage-backed securities (Cost $130,519) | | | | | 116,461 |
| Yankee corporate bonds and notes: 17.23% | | | | | |
| Communication services: 0.78% | | | | | |
| Diversified telecommunication services: 0.16% | | | | | |
| Bell Canada Company | | 4.46 | 4-1-2048 | 150,000 | 137,636 |
| Wireless telecommunication services: 0.62% | | | | | |
| America Movil SAB de CV | | 4.38 | 4-22-2049 | 100,000 | 92,250 |
| Rogers Communications Incorporated | | 3.70 | 11-15-2049 | 105,000 | 79,558 |
| Rogers Communications Incorporated 144A | | 4.55 | 3-15-2052 | 200,000 | 175,556 |
| Vodafone Group plc | | 4.38 | 2-19-2043 | 230,000 | 197,825 |
| | | | | | 545,189 |
The accompanying notes are an integral part of these financial statements.
Allspring Investment Grade Corporate Bond Portfolio | 11
Portfolio of investments—August 31, 2022 (unaudited)
| | | Interest
rate | Maturity
date | Principal | Value |
| Consumer discretionary: 0.90% | | | | | |
| Internet & direct marketing retail: 0.90% | | | | | |
| Alibaba Group Holding Limited | | 3.40% | 12-6-2027 | $ 200,000 | $ 188,856 |
| Alibaba Group Holding Limited | | 3.60 | 11-28-2024 | 600,000 | 591,142 |
| | | | | | 779,998 |
| Consumer staples: 0.16% | | | | | |
| Beverages: 0.16% | | | | | |
| Diageo Capital plc | | 5.88 | 9-30-2036 | 122,000 | 135,189 |
| Energy: 1.98% | | | | | |
| Oil, gas & consumable fuels: 1.98% | | | | | |
| Canadian Natural Resources Limited | | 4.95 | 6-1-2047 | 110,000 | 104,031 |
| Husky Energy Incorporated | | 6.80 | 9-15-2037 | 70,000 | 76,112 |
| Petro-Canada | | 5.95 | 5-15-2035 | 140,000 | 143,076 |
| Shell International Finance BV | | 2.88 | 5-10-2026 | 230,000 | 221,800 |
| Shell International Finance BV | | 3.25 | 5-11-2025 | 350,000 | 344,176 |
| Total Capital International SA | | 3.39 | 6-29-2060 | 105,000 | 80,820 |
| Total Capital International SA | | 3.75 | 4-10-2024 | 350,000 | 350,365 |
| TransCanada PipeLines Limited | | 3.75 | 10-16-2023 | 175,000 | 174,437 |
| TransCanada PipeLines Limited | | 6.10 | 6-1-2040 | 210,000 | 224,010 |
| | | | | | 1,718,827 |
| Financials: 10.16% | | | | | |
| Banks: 8.36% | | | | | |
| Banco Santander SA | | 2.75 | 12-3-2030 | 200,000 | 155,296 |
| Bank of Nova Scotia | | 4.50 | 12-16-2025 | 500,000 | 498,677 |
| Barclays plc (3 Month LIBOR +1.90%) ± | | 4.97 | 5-16-2029 | 300,000 | 286,259 |
| Cooperatieve Rabobank UA | | 3.75 | 7-21-2026 | 280,000 | 267,027 |
| HSBC Holdings plc (U.S. SOFR +1.19%) ± | | 2.80 | 5-24-2032 | 200,000 | 158,671 |
| HSBC Holdings plc (3 Month LIBOR +1.53%) ± | | 4.58 | 6-19-2029 | 200,000 | 188,145 |
| HSBC Holdings plc | | 4.95 | 3-31-2030 | 400,000 | 388,076 |
| ING Banking Group plc (U.S. SOFR +1.83%) ± | | 4.02 | 3-28-2028 | 200,000 | 189,610 |
| ING Banking Group plc | | 4.55 | 10-2-2028 | 500,000 | 483,989 |
| Lloyds Banking Group plc | | 4.55 | 8-16-2028 | 700,000 | 678,700 |
| National Australia Bank Limited | | 2.50 | 7-12-2026 | 800,000 | 751,213 |
| Natwest Group plc | | 3.88 | 9-12-2023 | 300,000 | 298,290 |
| Royal Bank of Canada | | 0.43 | 1-19-2024 | 125,000 | 119,286 |
| Royal Bank of Canada | | 4.65 | 1-27-2026 | 700,000 | 705,284 |
| Sumitomo Mitsui Financial Group | | 3.01 | 10-19-2026 | 655,000 | 616,315 |
| Toronto Dominion Bank (USD Swap Semi Annual (vs. 3 Month LIBOR) 5 Year +2.21%) ± | | 3.63 | 9-15-2031 | 790,000 | 752,463 |
| Westpac Banking Corporation | | 2.15 | 6-3-2031 | 305,000 | 256,013 |
| Westpac Banking Corporation | | 2.85 | 5-13-2026 | 500,000 | 478,601 |
| | | | | | 7,271,915 |
| Capital markets: 0.20% | | | | | |
| Invesco Finance plc | | 4.00 | 1-30-2024 | 175,000 | 174,183 |
| Diversified financial services: 1.43% | | | | | |
| AerCap Ireland Capital | | 3.30 | 1-30-2032 | 150,000 | 121,055 |
| Brookfield Finance Incorporated | | 3.63 | 2-15-2052 | 155,000 | 112,995 |
| Brookfield Finance Incorporated | | 4.25 | 6-2-2026 | 200,000 | 197,451 |
The accompanying notes are an integral part of these financial statements.
12 | Allspring Investment Grade Corporate Bond Portfolio
Portfolio of investments—August 31, 2022 (unaudited)
| | | Interest
rate | Maturity
date | Principal | Value |
| Diversified financial services (continued) | | | | | |
| GE Capital International Funding Company | | 3.37% | 11-15-2025 | $ 550,000 | $ 536,500 |
| Shell International Finance BV | | 3.75 | 9-12-2046 | 145,000 | 124,271 |
| Shell International Finance BV | | 4.00 | 5-10-2046 | 175,000 | 155,891 |
| | | | | | 1,248,163 |
| Insurance: 0.17% | | | | | |
| XLIT Limited | | 5.25 | 12-15-2043 | 140,000 | 147,544 |
| Health care: 1.46% | | | | | |
| Health care equipment & supplies: 0.11% | | | | | |
| DH Europe Finance II | | 3.40 | 11-15-2049 | 125,000 | 101,055 |
| Pharmaceuticals: 1.35% | | | | | |
| AstraZeneca plc | | 3.38 | 11-16-2025 | 500,000 | 490,822 |
| AstraZeneca plc | | 4.38 | 11-16-2045 | 200,000 | 192,101 |
| Royalty Pharma Company | | 2.20 | 9-2-2030 | 605,000 | 490,511 |
| | | | | | 1,173,434 |
| Industrials: 0.45% | | | | | |
| Professional services: 0.35% | | | | | |
| Thomson Reuters Corporation | | 4.30 | 11-23-2023 | 210,000 | 210,680 |
| Thomson Reuters Corporation | | 5.85 | 4-15-2040 | 94,000 | 97,052 |
| | | | | | 307,732 |
| Road & rail: 0.10% | | | | | |
| Canadian National Railway Company | | 3.65 | 2-3-2048 | 100,000 | 84,944 |
| Information technology: 0.86% | | | | | |
| Semiconductors & semiconductor equipment: 0.86% | | | | | |
| NXP BV | | 4.30 | 6-18-2029 | 785,000 | 745,532 |
| Materials: 0.48% | | | | | |
| Chemicals: 0.48% | | | | | |
| LyondellBasell Industries NV | | 4.63 | 2-26-2055 | 350,000 | 293,613 |
| Nutrien Limited | | 6.13 | 1-15-2041 | 115,000 | 124,520 |
| | | | | | 418,133 |
| Total Yankee corporate bonds and notes (Cost $16,368,625) | | | | | 14,989,474 |
| | | Yield | | Shares | |
| Short-term investments: 2.01% | | | | | |
| Investment companies: 2.01% | | | | | |
| Allspring Government Money Market Fund Select Class ♠∞ | | 2.09 | | 1,745,523 | 1,745,523 |
| Total Short-term investments (Cost $1,745,523) | | | | | 1,745,523 |
| Total investments in securities (Cost $95,379,228) | 98.88% | | | | 86,037,601 |
| Other assets and liabilities, net | 1.12 | | | | 971,902 |
| Total net assets | 100.00% | | | | $87,009,503 |
The accompanying notes are an integral part of these financial statements.
Allspring Investment Grade Corporate Bond Portfolio | 13
Portfolio of investments—August 31, 2022 (unaudited)
| 144A | The security may be resold in transactions exempt from registration, normally to qualified institutional buyers, pursuant to Rule 144A under the Securities Act of 1933. |
| ± | Variable rate investment. The rate shown is the rate in effect at period end. |
| ♠ | The issuer of the security is an affiliated person of the Portfolio as defined in the Investment Company Act of 1940. |
| ∞ | The rate represents the 7-day annualized yield at period end. |
| Abbreviations: |
| LIBOR | London Interbank Offered Rate |
| REIT | Real estate investment trust |
| SOFR | Secured Overnight Financing Rate |
Investments in affiliates
An affiliated investment is an investment in which the Portfolio owns at least 5% of the outstanding voting shares of the issuer or as a result of other relationships, such as the Portfolio and the issuer having the same adviser or investment manager. Transactions with issuers that were affiliates of the Portfolio at the end of the period were as follows:
| | Value,
beginning of
period | Purchases | Sales
proceeds | Net
realized
gains
(losses) | Net
change in
unrealized
gains
(losses) | Value,
end of
period | Shares,
end
of period | Income
from
affiliated
securities |
| Short-term investments | | | | | | | |
| Allspring Government Money Market Fund Select Class | $5,000,151 | $61,519,758 | $(64,774,386) | $0 | $0 | $1,745,523 | 1,745,523 | $17,405 |
The accompanying notes are an integral part of these financial statements.
14 | Allspring Investment Grade Corporate Bond Portfolio
Statement of assets and liabilities—August 31, 2022 (unaudited)
| | |
| Assets | |
Investments in unaffiliated securities, at value (cost $93,633,705)
| $ 84,292,078 |
Investments in affiliated securities, at value (cost $1,745,523)
| 1,745,523 |
Receivable for interest
| 1,000,200 |
Receivable from adviser
| 6,066 |
Prepaid expenses and other assets
| 1,677 |
Total assets
| 87,045,544 |
| Liabilities | |
Professional fees payable
| 22,086 |
Interest holder report expenses payable
| 5,084 |
Custody and accounting fees payable
| 4,957 |
Trustees’ fees and expenses payable
| 3,701 |
Accrued expenses and other liabilities
| 213 |
Total liabilities
| 36,041 |
Total net assets
| $87,009,503 |
The accompanying notes are an integral part of these financial statements.
Allspring Investment Grade Corporate Bond Portfolio | 15
Statement of operations—six months ended August 31, 2022 (unaudited)
| | |
| Investment income | |
Interest
| $ 2,497,745 |
Income from affiliated securities
| 17,405 |
Total investment income
| 2,515,150 |
| Expenses | |
Advisory fee
| 38,227 |
Custody and accounting fees
| 7,482 |
Professional fees
| 36,480 |
Interest holder report expenses
| 9,160 |
Trustees’ fees and expenses
| 11,153 |
Other fees and expenses
| 6,485 |
Total expenses
| 108,987 |
Less: Fee waivers and/or expense reimbursements
| (66,938) |
Net expenses
| 42,049 |
Net investment income
| 2,473,101 |
| Realized and unrealized gains (losses) on investments | |
Net realized losses on investments
| (11,324,934) |
Net change in unrealized gains (losses) on investments
| (7,170,451) |
Net realized and unrealized gains (losses) on investments
| (18,495,385) |
Net decrease in net assets resulting from operations
| $(16,022,284) |
The accompanying notes are an integral part of these financial statements.
16 | Allspring Investment Grade Corporate Bond Portfolio
Statement of changes in net assets
| | | |
| | Six months ended
August 31, 2022
(unaudited) | Year ended
February 28, 2022 |
| Operations | | |
Net investment income
| $ 2,473,101 | $ 6,628,499 |
Net realized gains (losses) on investments
| (11,324,934) | 5,904,063 |
Net change in unrealized gains (losses) on investments
| (7,170,451) | (20,234,065) |
Net decrease in net assets resulting from operations
| (16,022,284) | (7,701,503) |
| Capital transactions | | |
| Transactions in investors’ beneficial interests | | |
Contributions
| 16,613,789 | 41,021,656 |
Withdrawals
| (124,001,009) | (52,684,124) |
Net decrease in net assets resulting from capital transactions
| (107,387,220) | (11,662,468) |
Total decrease in net assets
| (123,409,504) | (19,363,971) |
| Net assets | | |
Beginning of period
| 210,419,007 | 229,782,978 |
End of period
| $ 87,009,503 | $210,419,007 |
The accompanying notes are an integral part of these financial statements.
Allspring Investment Grade Corporate Bond Portfolio | 17
| | | Year ended February 28 |
| | Six months ended
August 31, 2022
(unaudited) | 2022 | 2021 | 2020 1 | 2019 | 2018 2 |
Total return3
| (9.08)% | (3.73)% | 2.46% | 15.72% | 2.29% | (0.12)% |
| Ratios to average net assets (annualized) | | | | | | |
Gross expenses
| 0.14% | 0.10% | 0.10% | 0.10% | 0.09% | 0.08% |
Net expenses
| 0.06% * | 0.06% * | 0.06% * | 0.07% | 0.08% | 0.08% |
Net investment income
| 3.29% | 2.94% | 3.24% | 3.59% | 3.74% | 3.48% |
| Supplemental data | | | | | | |
Portfolio turnover rate
| 18% | 46% | 37% | 18% | 25% | 61% |
| * | Ratio includes expenses which were voluntarily waived by the adviser. Without these voluntary waivers, the net expense ratios would be increased by the following amounts: |
| Six months ended August 31, 2022 (unaudited) | 0.08% |
| Year ended February 28, 2022 | 0.04% |
| Year ended February 28, 2021 | 0.04% |
| 1 | Year ended February 29 |
| 2 | For the period from May 23, 2017 (commencement of operations) to February 28, 2018 |
| 3 | Returns for periods of less than one year are not annualized. |
The accompanying notes are an integral part of these financial statements.
18 | Allspring Investment Grade Corporate Bond Portfolio
Notes to financial statements (unaudited)
1. ORGANIZATION
Allspring Master Trust (the "Trust"), a Delaware statutory trust organized on March 10, 1999, is an open-end management investment company registered under the Investment Company Act of 1940, as amended (the "1940 Act"). As an investment company, the Trust follows the accounting and reporting guidance in Financial Accounting Standards Board ("FASB") Accounting Standards Codification Topic 946, Financial Services – Investment Companies. These financial statements report on the Allspring Investment Grade Corporate Bond Portfolio (the "Portfolio") which is a diversified series of the Trust.
Interests in the Portfolio are available solely through private placement transactions that do not involve any "public offering" within the meaning of Section 4(a)(2) of the Securities Act of 1933.
2. SIGNIFICANT ACCOUNTING POLICIES
The following significant accounting policies, which are consistently followed in the preparation of the financial statements of the Portfolio, are in conformity with U.S. generally accepted accounting principles which require management to make estimates and assumptions that affect the reported amounts of assets and liabilities, disclosure of contingent assets and liabilities at the date of the financial statements, and the reported amounts of income and expenses during the reporting period. Actual results could differ from those estimates.
Securities valuation
All investments are valued each business day as of the close of regular trading on the New York Stock Exchange (generally 4 p.m. Eastern Time), although the Portfolio may deviate from this calculation time under unusual or unexpected circumstances.
Debt securities are valued at the evaluated bid price provided by an independent pricing service (e.g. taking into account various factors, including yields, maturities, or credit ratings) or, if a reliable price is not available, the quoted bid price from an independent broker-dealer.
Investments in registered open-end investment companies are valued at net asset value.
Investments which are not valued using any of the methods discussed above are valued at their fair value, as determined in good faith by the Board of Trustees. The Board of Trustees has established a Valuation Committee comprised of the Trustees and has delegated to it the authority to take any actions regarding the valuation of portfolio securities that the Valuation Committee deems necessary or appropriate, including determining the fair value of portfolio securities, unless the determination has been delegated to the Allspring Global Investments Pricing Committee at Allspring Funds Management, LLC ("Allspring Funds Management"). The Board of Trustees retains the authority to make or ratify any valuation decisions or approve any changes to the Valuation Procedures as it deems appropriate. On a quarterly basis, the Board of Trustees receives reports on any valuation actions taken by the Valuation Committee or the Allspring Global Investments Pricing Committee which may include items for ratification.
Security transactions and income recognition
Securities transactions are recorded on a trade date basis. Realized gains or losses are recorded on the basis of identified cost.
Interest income is accrued daily and bond discounts are accreted and premiums are amortized daily. To the extent debt obligations are placed on non-accrual status, any related interest income may be reduced by writing off interest receivables when the collection of all or a portion of interest has been determined to be doubtful based on consistently applied procedures and the fair value has decreased. If the issuer subsequently resumes interest payments or when the collectability of interest is reasonably assured, the debt obligation is removed from non-accrual status. Paydown gains and losses are included in interest income.
Federal and other taxes
The Portfolio is not required to pay federal income taxes on its net investment income and net capital gains as it is treated as a partnership for federal income tax purposes. All income, gains and losses of the Portfolio are deemed to have been “passed through” to the interest holders in proportion to their holdings of the Portfolio regardless of whether income and gains have been distributed by the Portfolio.
The Portfolio’s income tax returns and all financial records supporting those returns for the prior three fiscal years are subject to examination by the federal revenue authority. Management has analyzed the Portfolio’s tax positions taken on federal, state, and foreign tax returns, as applicable, for all open tax years and does not believe that there are any uncertain tax positions that require recognition of a tax liability.
Allspring Investment Grade Corporate Bond Portfolio | 19
Notes to financial statements (unaudited)
As of August 31, 2022, the aggregate cost of all investments for federal income tax purposes was $95,328,089 and the unrealized gains (losses) consisted of:
| Gross unrealized gains | $ 439,591 |
| Gross unrealized losses | (9,730,079) |
| Net unrealized losses | $(9,290,488) |
3. FAIR VALUATION MEASUREMENTS
Fair value measurements of investments are determined within a framework that has established a fair value hierarchy based upon the various data inputs utilized in determining the value of the Portfolio’s investments. The three-level hierarchy gives the highest priority to unadjusted quoted prices in active markets for identical assets or liabilities (Level 1) and the lowest priority to unobservable inputs (Level 3). The Portfolio’s investments are classified within the fair value hierarchy based on the lowest level of input that is significant to the fair value measurement. The inputs are summarized into three broad levels as follows:
| ■ | Level 1 – quoted prices in active markets for identical securities |
| ■ | Level 2 – other significant observable inputs (including quoted prices for similar securities, interest rates, prepayment speeds, credit risk, etc.) |
| ■ | Level 3 – significant unobservable inputs (including the Portfolio’s own assumptions in determining the fair value of investments) |
The inputs or methodologies used for valuing investments in securities are not necessarily an indication of the risk associated with investing in those securities.
The following is a summary of the inputs used in valuing the Portfolio’s assets and liabilities as of August 31, 2022:
| | Quoted prices
(Level 1) | Other significant
observable inputs
(Level 2) | Significant
unobservable inputs
(Level 3) | Total |
| Assets | | | | |
| Investments in: | | | | |
| Corporate bonds and notes | $ 0 | $ 69,186,143 | $0 | $ 69,186,143 |
| Non-agency mortgage-backed securities | 0 | 116,461 | 0 | 116,461 |
| Yankee corporate bonds and notes | 0 | 14,989,474 | 0 | 14,989,474 |
| Short-term investments | | | | |
| Investment companies | 1,745,523 | 0 | 0 | 1,745,523 |
| Total assets | $1,745,523 | $84,292,078 | $0 | $86,037,601 |
Additional sector, industry or geographic detail, if any, is included in the Portfolio of Investments.
For the six months ended August 31, 2022, the Portfolio did not have any transfers into/out of Level 3.
4. TRANSACTIONS WITH AFFILIATES
Advisory fee
The Trust has entered into an advisory contract with Allspring Funds Management, a wholly owned subsidiary of Allspring Global Investments Holdings, LLC, a holding company indirectly owned by certain private funds of GTCR LLC and Reverence Capital Partners, L.P. The adviser is responsible for implementing investment policies and guidelines and for supervising the subadviser, who is responsible for day-to-day portfolio management of the Portfolio. Pursuant to the contract, Allspring Funds Management is entitled to receive an advisory fee at the following annual rate based on the Portfolio’s average daily net assets:
20 | Allspring Investment Grade Corporate Bond Portfolio
Notes to financial statements (unaudited)
| Average daily net assets | Advisory fee |
| First $5 billion | 0.050% |
| Next $5 billion | 0.040 |
| Over $10 billion | 0.030 |
For the six months ended August 31, 2022, the advisory fee was equivalent to an annual rate of 0.05% of the Portfolio’s average daily net assets.
Allspring Funds Management has retained the services of a subadviser to provide daily portfolio management to the Portfolio. The fee for subadvisory services is borne by Allspring Funds Management. Allspring Global Investments, LLC, an affiliate of Allspring Funds Management and a wholly owned subsidiary of Allspring Global Investments Holdings, LLC, is the subadviser to the Portfolio and is entitled to receive a fee from Allspring Funds Management at an annual rate starting at 0.04% and declining to 0.03% as the average daily net assets of the Portfolio increase.
Allspring Funds Management has voluntarily waived and/or reimbursed advisory fees to reduce the net operating expense ratio of the Portfolio. These voluntary waivers may be discontinued at any time.
Interfund transactions
The Portfolio may purchase or sell portfolio investment securities to certain affiliates pursuant to Rule 17a-7 under the 1940 Act and under procedures adopted by the Board of Trustees. The procedures have been designed to ensure that these interfund transactions, which do not incur broker commissions, are effected at current market prices.
5. INVESTMENT PORTFOLIO TRANSACTIONS
Purchases and sales of investments, excluding U.S. government obligations (if any) and short-term securities, for the six months ended August 31, 2022 were $25,990,451 and $124,314,271, respectively.
6. BANK BORROWINGS
The Trust, along with Allspring Variable Trust and Allspring Funds Trust (excluding the money market funds), are parties to a $350,000,000 revolving credit agreement whereby the Portfolio is permitted to use bank borrowings for temporary or emergency purposes, such as to fund interest holders withdrawal requests. Interest under the credit agreement is charged to the Portfolio based on a borrowing rate equal to the higher of the Federal Funds rate or the overnight bank funding rate in effect on that day plus a spread. In addition, an annual commitment fee equal based on the unused balance is allocated to each participating fund.
For the six months ended August 31, 2022, there were no borrowings by the Portfolio under the agreement.
7. CONCENTRATION RISKS
As of the end of the period, the Portfolio concentrated its portfolio of investments in the financials sector. A fund that invests a substantial portion of its assets in any sector may be more affected by changes in that sector than would be a fund whose investments are not heavily weighted in any sector.
8. INDEMNIFICATION
Under the Portfolio's organizational documents, the officers and Trustees have been granted certain indemnification rights against certain liabilities that may arise out of performance of their duties to the Portfolio. The Portfolio has entered into a separate agreement with each Trustee that converts indemnification rights currently existing under the Portfolio’s organizational documents into contractual rights that cannot be changed in the future without the consent of the Trustee. Additionally, in the normal course of business, the Portfolio may enter into contracts with service providers that contain a variety of indemnification clauses. The Portfolio’s maximum exposure under these arrangements is dependent on future claims that may be made against the Portfolio and, therefore, cannot be estimated.
9. CORONAVIRUS (COVID-19) PANDEMIC
On March 11, 2020, the World Health Organization announced that it had made the assessment that coronavirus disease 2019 (“COVID-19”) is a pandemic. The impacts of COVID-19 are affecting the entire global economy, individual companies and investment products, the funds, and the market in general. There is significant uncertainty around the extent and duration of business disruptions related to COVID-19 and the impacts may last for an extended period of time. COVID-19 has led to significant uncertainty and volatility in the financial markets.
Allspring Investment Grade Corporate Bond Portfolio | 21
Other information (unaudited)
PROXY VOTING INFORMATION
A description of the policies and procedures used to determine how to vote proxies relating to portfolio securities is available without charge, upon request, by calling 1-800-222-8222, visiting our website at allspringglobal.com, or visiting the SEC website at sec.gov. Information regarding how the proxies related to portfolio securities were voted during the most recent 12-month period ended June 30 is available on the website at allspringglobal.com or by visiting the SEC website at sec.gov.
QUARTERLY PORTFOLIO HOLDINGS INFORMATION
The Portfolio files its complete schedule of portfolio holdings with the SEC for the first and third quarters of each fiscal year as an exhibit to its reports on Form N-PORT. Interest holders may view the filed Form N-PORT by visiting the SEC website at sec.gov.
22 | Allspring Investment Grade Corporate Bond Portfolio
Other information (unaudited)
BOARD OF TRUSTEES AND OFFICERS
Each of the Trustees and Officers listed in the table below acts in identical capacities for each fund in the Allspring family of funds, which consists of 124 mutual funds comprising the Allspring Funds Trust, Allspring Variable Trust, Allspring Master Trust and four closed-end funds (collectively the “Fund Complex”). This table should be read in conjunction with the Prospectus and the Statement of Additional Information1. The mailing address of each Trustee and Officer is 525 Market Street, 12th Floor, San Francisco, CA 94105. Each Trustee and Officer serves an indefinite term, however, each Trustee serves such term until reaching the mandatory retirement age established by the Trustees.
Independent Trustees
Name and
year of birth | Position held and
length of service* | Principal occupations during past five years or longer | Current other
public company or
investment
company
directorships |
William R. Ebsworth
(Born 1957) | Trustee,
since 2015 | Retired. From 1984 to 2013, equities analyst, portfolio manager, research director and chief investment officer at Fidelity Management and Research Company in Boston, Tokyo, and Hong Kong, and retired in 2013 as Chief Investment Officer of Fidelity Strategic Advisers, Inc. where he led a team of investment professionals managing client assets. Prior thereto, Board member of Hong Kong Securities Clearing Co., Hong Kong Options Clearing Corp., the Thailand International Fund, Ltd., Fidelity Investments Life Insurance Company, and Empire Fidelity Investments Life Insurance Company. Audit Committee Chair and Investment Committee Chair of the Vincent Memorial Hospital Endowment (non-profit organization). Mr. Ebsworth is a CFA® charterholder. | N/A |
Jane A. Freeman
(Born 1953) | Trustee,
since 2015;
Chair Liaison,
since 2018 | Retired. From 2012 to 2014 and 1999 to 2008, Chief Financial Officer of Scientific Learning Corporation. From 2008 to 2012, Ms. Freeman provided consulting services related to strategic business projects. Prior to 1999, Portfolio Manager at Rockefeller & Co. and Scudder, Stevens & Clark. Board member of the Harding Loevner Funds from 1996 to 2014, serving as both Lead Independent Director and chair of the Audit Committee. Board member of the Russell Exchange Traded Funds Trust from 2011 to 2012 and the chair of the Audit Committee. Ms. Freeman is also an inactive Chartered Financial Analyst. | N/A |
Isaiah Harris, Jr.
(Born 1952) | Trustee,
since 2009; Audit
Committee
Chair,
since 2019 | Retired. Chairman of the Board of CIGNA Corporation from 2009 to 2021, and Director from 2005 to 2008. From 2003 to 2011, Director of Deluxe Corporation. Prior thereto, President and CEO of BellSouth Advertising and Publishing Corp. from 2005 to 2007, President and CEO of BellSouth Enterprises from 2004 to 2005 and President of BellSouth Consumer Services from 2000 to 2003. Emeritus member of the Iowa State University Foundation Board of Governors. Emeritus Member of the Advisory Board of Iowa State University School of Business. Advisory Board Member, Palm Harbor Academy (private school). Advisory Board Member, Fellowship of Christian Athletes. Mr. Harris is a certified public accountant (inactive status). | N/A |
David F. Larcker
(Born 1950) | Trustee,
since 2009 | James Irvin Miller Professor of Accounting at the Graduate School of Business (Emeritus), Stanford University, Director of the Corporate Governance Research Initiative and Senior Faculty of The Rock Center for Corporate Governance since 2006. From 2005 to 2008, Professor of Accounting at the Graduate School of Business, Stanford University. Prior thereto, Ernst & Young Professor of Accounting at The Wharton School, University of Pennsylvania from 1985 to 2005. | N/A |
Allspring Investment Grade Corporate Bond Portfolio | 23
Other information (unaudited)
Name and
year of birth | Position held and
length of service* | Principal occupations during past five years or longer | Current other
public company or
investment
company
directorships |
Olivia S. Mitchell
(Born 1953) | Trustee,
since 2006;
Nominating and
Governance
Committee Chair,
since 2018 | International Foundation of Employee Benefit Plans Professor since 1993, Wharton School of the University of Pennsylvania. Director of Wharton’s Pension Research Council and Boettner Center on Pensions & Retirement Research, and Research Associate at the National Bureau of Economic Research. Previously taught at Cornell University from 1978 to 1993. | N/A |
Timothy J. Penny
(Born 1951) | Trustee,
since 1996;
Chair,
since 2018 | President and Chief Executive Officer of Southern Minnesota Initiative Foundation, a non-profit organization, since 2007. Vice Chair of the Economic Club of Minnesota, since 2007. Co-Chair of the Committee for a Responsible Federal Budget, since 1995. Member of the Board of Trustees of NorthStar Education Finance, Inc., a non-profit organization, since 2007. Senior Fellow of the University of Minnesota Humphrey Institute from 1995 to 2017. | N/A |
James G. Polisson
(Born 1959) | Trustee,
since 2018 | Retired. Chief Marketing Officer, Source (ETF) UK Services, Ltd, from 2015 to 2017. From 2012 to 2015, Principal of The Polisson Group, LLC, a management consulting, corporate advisory and principal investing company. Chief Executive Officer and Managing Director at Russell Investments, Global Exchange Traded Funds from 2010 to 2012. Managing Director of Barclays Global Investors from 1998 to 2010 and Global Chief Marketing Officer for iShares and Barclays Global Investors from 2000 to 2010. Trustee of the San Francisco Mechanics’ Institute, a non-profit organization, from 2013 to 2015. Board member of the Russell Exchange Traded Fund Trust from 2011 to 2012. Director of Barclays Global Investors Holdings Deutschland GmbH from 2006 to 2009. Mr. Polisson is an attorney and has a retired status with the Massachusetts and District of Columbia Bar Associations. | N/A |
Pamela Wheelock
(Born 1959) | Trustee,
since January
2020; previously
Trustee from
January 2018 to
July 2019 | Retired. Executive and Senior Financial leadership positions in the public, private and nonprofit sectors. Interim President and CEO, McKnight Foundation, 2020. Interim Commissioner, Minnesota Department of Human Services, 2019. Chief Operating Officer, Twin Cities Habitat for Humanity, 2017-2019. Vice President for University Services, University of Minnesota, 2012-2016. Interim President and CEO, Blue Cross and Blue Shield of Minnesota, 2011-2012. Executive Vice-President and Chief Financial Officer, Minnesota Wild, 2002-2008. Commissioner, Minnesota Department of Finance, 1999-2002. Chair of the Board of Directors of Destination Medical Center Corporation. Board member of the Minnesota Wild Foundation. | N/A |
* Length of service dates reflect the Trustee’s commencement of service with the Trust’s predecessor entities, where applicable.
24 | Allspring Investment Grade Corporate Bond Portfolio
Other information (unaudited)
Officers2
Name and
year of birth | Position held and
length of service | Principal occupations during past five years or longer |
Andrew Owen
(Born 1960) | President,
since 2017 | President, Chief Executive Officer and Director of Allspring Funds Management, LLC since 2017 and co-president of Galliard Capital Management, LLC, an affiliate of Allspring Funds Management, LLC, since 2019. Prior thereto, Head of Affiliated Managers, Allspring Global Investments, from 2014 to 2019 and Executive Vice President responsible for marketing, investments and product development for Allspring Funds Management, LLC, from 2009 to 2014. In addition, Mr. Owen was an Executive Vice President of Wells Fargo & Company from 2014 to 2021. |
Jeremy DePalma
(Born 1974) | Treasurer,
since 2012
(for certain funds in
the Fund Complex);
since 2021 (for
the remaining funds in the
Fund Complex) | Senior Vice President of Allspring Funds Management, LLC since 2009. Senior Vice President of Evergreen Investment Management Company, LLC from 2008 to 2010 and head of the Fund Reporting and Control Team within Fund Administration from 2005 to 2010. |
Kate McKinley
(Born 1977) | Chief Legal Officer,
since 2021 | Chief Legal Officer of Allspring Global Investments since 2021. Prior thereto, held various roles at State Street Global Advisors beginning in 2010, including serving as Senior Vice President and General Counsel from 2019 to 2021, and Chief Operating Officer of the Institutional Client Group from 2016 - 2019. Prior to working at State Street Global Advisors served as Assistant General Counsel for Bank of America Corporation from 2005 to 2010 and as an Associate at WilmerHale from 2002 to 2005. |
Christopher Baker
(Born 1976) | Chief Compliance Officer, since 2022 | Global Chief Compliance Officer for Allspring Global Investments since 2022. Prior thereto, Chief Compliance Officer for State Street Global Advisors from 2018 to 2021. Senior Compliance Officer for the State Street divisions of Alternative Investment Solutions, Sector Solutions, and Global Marketing from 2015 to 2018. From 2010 to 2015 Vice President, Global Head of Investment and Marketing Compliance for State Street Global Advisors. |
Matthew Prasse
(Born 1983) | Secretary,
since 2021 | Senior Counsel of the Allspring Legal Department since 2021. Senior Counsel of the Wells Fargo Legal Department from 2018 to 2021. Previously, Counsel for Barings LLC from 2015 to 2018. Prior to joining Barings, Associate at Morgan, Lewis & Bockius LLP from 2008 to 2015. |
1 The Statement of Additional Information includes additional information about the Trustees and is available, without charge, upon request, by calling 1-800-222-8222.
2 For those Officers with tenures at Allspring Global Investments and/or Allspring Funds Management, LLC that began prior to 2021, such tenures include years of service during which these businesses/entities were known as Wells Fargo Asset Management and Wells Fargo Funds Management, LLC, respectively.
Allspring Investment Grade Corporate Bond Portfolio | 25
Other information (unaudited)
LIQUIDITY RISK MANAGEMENT PROGRAM
In accordance with Rule 22e-4 under the Investment Company Act of 1940, as amended (the “Liquidity Rule”), Allspring Master Trust (the “Trust”) has adopted and implemented a liquidity risk management program (the “Program”) on behalf of each of its series, including the Portfolio, which is reasonably designed to assess and manage the Portfolio's liquidity risk. “Liquidity risk” is defined under the Liquidity Rule as the risk that the Portfolio is unable to meet redemption requests without significantly diluting remaining investors’ interests in the Portfolio. The Trust’s Board of Trustees (the “Board”) previously approved the designation of Allspring Funds Management, LLC (“Allspring Funds Management”), the Portfolio's investment adviser, to administer the Program, and Allspring Funds Management has established a Liquidity Risk Management Council (the "Council") composed of personnel from multiple departments within Allspring Funds Management and its affiliates to assist Allspring Funds Management in the administration of the Program.
The Program is comprised of various components designed to support the assessment and/or management of liquidity risk, including: (1) the periodic assessment (no less frequently than annually) of certain factors that influence the Portfolio's liquidity risk; (2) the periodic classification (no less frequently than monthly) of the Portfolio's investments into one of four liquidity categories that reflect an estimate of their liquidity under current market conditions; (3) a 15% limit on the acquisition of “illiquid investments” (as defined under the Liquidity Rule); (4) to the extent the Portfolio does not invest primarily in “highly liquid investments” (as defined under the Liquidity Rule), the determination of a minimum percentage of the Portfolio's assets that generally will be invested in highly liquid investments (an “HLIM”); (5) if the Portfolio has established an HLIM, the periodic review (no less frequently than annually) of the HLIM and the adoption of policies and procedures for responding to a shortfall of the Portfolio's “highly liquid investments” below its HLIM; and (6) periodic reporting to the Board.
At a meeting of the Board held on May 24-25, 2022, the Board received and reviewed a written report (the “Report”) from Allspring Funds Management that, among other things, addressed the operation of the Program and assessed its adequacy and effectiveness for the period from January 1, 2021 through December 31, 2021 (the “Reporting Period”). Other than extended foreign market holidays, no significant liquidity events impacting the Portfolios were noted in the Report. In addition, other than corporate-related changes to the Program, there were no material changes to the Program during the Reporting Period.
Allspring Funds Management determined in the Report that the Program has been implemented and operates effectively to manage the Portfolio’s liquidity risk, and Allspring Funds Management continues to believe that the Program has been and continues to be adequately and effectively implemented to monitor and, as applicable, respond to the Portfolio’s liquidity developments.
There can be no assurance that the Program will achieve its objectives under all circumstances in the future.
26 | Allspring Investment Grade Corporate Bond Portfolio
For more information
More information about Allspring Funds is available free upon request. To obtain literature, please write, visit the Portfolio's website, or call:
Allspring Funds
P.O. Box 219967
Kansas City, MO 64121-9967
Website: allspringglobal.com
Individual investors: 1-800-222-8222
Retail investment professionals: 1-888-877-9275
Institutional investment professionals: 1-800-260-5969
This report and the financial statements contained herein are submitted for the general information of the interest holders of the Portfolio. If this report is used for promotional purposes, distribution of the report must be accompanied or preceded by a current prospectus. Before investing, please consider the investment objectives, risks, charges, and expenses of the investment. For a current prospectus and, if available, a summary prospectus, containing this information, call
1-800-222-8222. Read the prospectus carefully before you invest or send money.
Allspring Global InvestmentsTM is the trade name for the asset management firms of Allspring Global Investments Holdings, LLC, a holding company indirectly owned by certain private funds of GTCR LLC and Reverence Capital Partners, L.P. These firms include but are not limited to Allspring Global Investments, LLC, and Allspring Funds Management, LLC. Certain products managed by Allspring entities are distributed by Allspring Funds Distributor, LLC (a broker-dealer and Member FINRA/SIPC).
This material is for general informational and educational purposes only and is NOT intended to provide investment advice or a recommendation of any kind - including a recommendation for any specific investment, strategy, or plan.
© 2022 Allspring Global Investments Holdings, LLC. All rights reserved.
Semi-Annual Report
August 31, 2022
Allspring Strategic Retirement
Bond Portfolio
Allspring Strategic Retirement Bond Portfolio | 1
Portfolio information (unaudited)
| Investment objective | The Portfolio seeks to replicate the total return of a blended index that is weighted 50% to the Bloomberg U.S. Treasury Inflation-Linked 1-10 Year Bond Index† and 50% to the Bloomberg U.S. Government Intermediate Bond Index††, before fees and expenses. |
| Adviser | Allspring Funds Management, LLC |
| Subadviser | Allspring Global Investments, LLC |
| Portfolio managers | Manjunath Boraiah#, Brian Prucyk#, Janet S. Rilling, CFA®‡, CPA, Michal Stanczyk, Nick Toporkov, Ph.D., CFA®‡# |
| Ten largest holdings (%) as of August 31, 20221 |
| TIPS, 0.13%, 1-15-2030 | 5.89 |
| TIPS, 0.50%, 4-15-2024 | 5.71 |
| TIPS, 0.38%, 7-15-2027 | 5.43 |
| TIPS, 0.50%, 1-15-2028 | 5.36 |
| TIPS, 0.13%, 7-15-2026 | 5.08 |
| TIPS, 2.38%, 1-15-2027 | 4.96 |
| TIPS, 2.38%, 1-15-2025 | 4.86 |
| TIPS, 0.13%, 7-15-2031 | 3.30 |
| TIPS, 3.88%, 4-15-2029 | 2.95 |
| U.S. Treasury Note, 1.13%, 2-15-2031 | 2.66 |
| 1 | Figures represent the percentage of the Portfolio's net assets. Holdings are subject to change and may have changed since the date specified. |
| Portfolio composition as of August 31, 20221 |
| 1 | Figures represent the percentage of the Portfolio's long-term investments. Allocations are subject to change and may have changed since the date specified. |
| † | The Bloomberg U.S. Treasury Inflation-Linked 1-10 Year Bond Index measures the performance of the U.S. Treasury Inflation-Protected Securities (TIPS) market with maturities of more than 1 year and less than 10 years. Federal Reserve holdings of U.S. TIPS are not index-eligible and are excluded from the face amount outstanding of each bond in the index. You cannot invest directly in an index. |
| †† | The Bloomberg U.S. Government Intermediate Bond Index is an unmanaged index composed of U.S. government securities with maturities in the 1- to 10-year range, including securities issued by the U.S. Treasury and U.S. government agencies. You cannot invest directly in an index. |
| ‡ | CFA® and Chartered Financial Analyst® are trademarks owned by CFA Institute. |
| # | Mr. Boraiah, Mr. Prucyk and Mr. Toporkov became portfolio managers of the Portfolio on October 31, 2022. |
2 | Allspring Strategic Retirement Bond Portfolio
Portfolio of investments—August 31, 2022 (unaudited)
| | | Interest
rate | Maturity
date | Principal | Value |
| Agency securities: 1.28% | | | | | |
| FHLB | | 0.80% | 3-4-2026 | $ 75,000 | $ 67,722 |
| FHLB | | 2.50 | 2-13-2024 | 10,000 | 9,874 |
| FHLB | | 2.75 | 12-13-2024 | 20,000 | 19,672 |
| FHLB | | 3.25 | 11-16-2028 | 35,000 | 34,838 |
| FHLMC | | 0.38 | 7-21-2025 | 95,000 | 86,901 |
| FNMA | | 0.38 | 8-25-2025 | 60,000 | 54,729 |
| FNMA | | 1.88 | 9-24-2026 | 10,000 | 9,409 |
| FNMA | | 2.13 | 4-24-2026 | 28,000 | 26,708 |
| FNMA | | 2.88 | 9-12-2023 | 65,000 | 64,521 |
| Total Agency securities (Cost $401,473) | | | | | 374,374 |
| U.S. Treasury securities: 98.35% | | | | | |
| TIPS | | 0.13 | 7-15-2024 | 278,161 | 273,902 |
| TIPS | | 0.13 | 10-15-2024 | 519,485 | 511,154 |
| TIPS | | 0.13 | 10-15-2025 | 673,479 | 660,132 |
| TIPS | | 0.13 | 7-15-2026 | 1,516,118 | 1,484,394 |
| TIPS | | 0.13 | 4-15-2027 | 645,135 | 626,071 |
| TIPS | | 0.13 | 1-15-2030 | 1,801,612 | 1,719,978 |
| TIPS | | 0.13 | 7-15-2030 | 745,098 | 712,296 |
| TIPS | | 0.13 | 1-15-2031 | 11,378 | 10,817 |
| TIPS | | 0.13 | 7-15-2031 | 1,016,664 | 965,335 |
| TIPS | | 0.13 | 1-15-2032 | 753,271 | 711,665 |
| TIPS | | 0.25 | 1-15-2025 | 37,514 | 36,917 |
| TIPS | | 0.25 | 7-15-2029 | 17,368 | 16,862 |
| TIPS | | 0.38 | 7-15-2025 | 43,713 | 43,159 |
| TIPS | | 0.38 | 1-15-2027 | 190,049 | 186,842 |
| TIPS | | 0.38 | 7-15-2027 | 1,610,351 | 1,585,965 |
| TIPS | | 0.50 | 4-15-2024 | 1,685,192 | 1,667,123 |
| TIPS | | 0.50 | 1-15-2028 | 1,590,981 | 1,566,515 |
| TIPS | | 0.63 | 1-15-2024 | 356,690 | 353,304 |
| TIPS | | 0.75 | 7-15-2028 | 448,373 | 449,915 |
| TIPS | | 0.88 | 1-15-2029 | 598,220 | 602,333 |
| TIPS | | 2.38 | 1-15-2025 | 1,373,299 | 1,418,467 |
| TIPS | | 2.38 | 1-15-2027 | 1,355,592 | 1,447,535 |
| TIPS | | 2.50 | 1-15-2029 | 41,386 | 45,760 |
| TIPS | | 3.38 | 4-15-2032 | 166,863 | 206,548 |
| TIPS | | 3.63 | 4-15-2028 | 18,312 | 21,117 |
| TIPS | | 3.88 | 4-15-2029 | 720,664 | 862,389 |
| U.S. Treasury Bond | | 6.13 | 11-15-2027 | 215,000 | 242,740 |
| U.S. Treasury Bond | | 6.13 | 8-15-2029 | 115,000 | 135,192 |
| U.S. Treasury Bond | | 6.38 | 8-15-2027 | 125,000 | 141,836 |
| U.S. Treasury Bond | | 6.88 | 8-15-2025 | 20,000 | 21,862 |
| U.S. Treasury Note | | 0.13 | 2-15-2024 | 345,000 | 328,693 |
| U.S. Treasury Note | | 0.25 | 9-30-2023 | 345,000 | 333,275 |
| U.S. Treasury Note | | 0.25 | 7-31-2025 | 470,000 | 428,067 |
| U.S. Treasury Note | | 0.38 | 7-31-2027 | 185,000 | 160,408 |
| U.S. Treasury Note | | 0.50 | 6-30-2027 | 320,000 | 279,463 |
| U.S. Treasury Note | | 0.50 | 8-31-2027 | 10,000 | 8,699 |
| U.S. Treasury Note | | 0.63 | 10-15-2024 | 240,000 | 226,106 |
| U.S. Treasury Note | | 0.63 | 5-15-2030 | 30,000 | 24,729 |
| U.S. Treasury Note | | 0.63 | 8-15-2030 | 45,000 | 36,916 |
| U.S. Treasury Note | | 0.75 | 3-31-2026 | 50,000 | 45,432 |
| U.S. Treasury Note | | 0.88 | 11-15-2030 | 265,000 | 221,513 |
| U.S. Treasury Note | | 1.00 | 7-31-2028 | 630,000 | 550,733 |
The accompanying notes are an integral part of these financial statements.
Allspring Strategic Retirement Bond Portfolio | 3
Portfolio of investments—August 31, 2022 (unaudited)
| | | Interest
rate | Maturity
date | Principal | Value |
| U.S. Treasury securities (continued) | | | | | |
| U.S. Treasury Note | | 1.13% | 2-15-2031 | $ 915,000 | $ 778,000 |
| U.S. Treasury Note | | 1.25 | 4-30-2028 | 120,000 | 106,964 |
| U.S. Treasury Note | | 1.38 | 8-31-2026 | 380,000 | 351,025 |
| U.S. Treasury Note | | 1.38 | 10-31-2028 | 205,000 | 182,498 |
| U.S. Treasury Note | | 1.50 | 8-15-2026 | 325,000 | 301,691 |
| U.S. Treasury Note | | 1.50 | 2-15-2030 | 140,000 | 124,184 |
| U.S. Treasury Note | | 1.63 | 11-30-2026 | 410,000 | 381,508 |
| U.S. Treasury Note | | 1.75 | 11-15-2029 | 85,000 | 77,161 |
| U.S. Treasury Note | | 1.88 | 8-31-2024 | 160,000 | 155,138 |
| U.S. Treasury Note | | 1.88 | 7-31-2026 | 20,000 | 18,868 |
| U.S. Treasury Note | | 1.88 | 2-28-2029 | 445,000 | 407,888 |
| U.S. Treasury Note | | 2.00 | 4-30-2024 | 10,000 | 9,764 |
| U.S. Treasury Note | | 2.00 | 5-31-2024 | 269,000 | 262,349 |
| U.S. Treasury Note | | 2.00 | 6-30-2024 | 185,000 | 180,230 |
| U.S. Treasury Note | | 2.00 | 2-15-2025 | 37,000 | 35,717 |
| U.S. Treasury Note | | 2.13 | 2-29-2024 | 378,000 | 370,602 |
| U.S. Treasury Note | | 2.25 | 12-31-2023 | 272,000 | 267,644 |
| U.S. Treasury Note | | 2.25 | 1-31-2024 | 24,000 | 23,592 |
| U.S. Treasury Note | | 2.25 | 4-30-2024 | 235,000 | 230,383 |
| U.S. Treasury Note | | 2.25 | 8-15-2027 | 40,000 | 37,984 |
| U.S. Treasury Note | | 2.25 | 11-15-2027 | 50,000 | 47,367 |
| U.S. Treasury Note | | 2.63 | 12-31-2023 | 375,000 | 370,972 |
| U.S. Treasury Note | | 2.63 | 3-31-2025 | 345,000 | 337,709 |
| U.S. Treasury Note | | 2.63 | 1-31-2026 | 445,000 | 432,832 |
| U.S. Treasury Note | | 2.63 | 2-15-2029 | 85,000 | 81,520 |
| U.S. Treasury Note | | 2.63 | 7-31-2029 | 95,000 | 91,066 |
| U.S. Treasury Note | | 2.75 | 11-15-2023 | 16,000 | 15,863 |
| U.S. Treasury Note | | 2.75 | 2-15-2024 | 35,000 | 34,638 |
| U.S. Treasury Note | | 2.75 | 8-31-2025 | 325,000 | 318,132 |
| U.S. Treasury Note | | 2.88 | 4-30-2025 | 10,000 | 9,839 |
| U.S. Treasury Note | | 2.88 | 5-31-2025 | 490,000 | 481,942 |
| U.S. Treasury Note | | 2.88 | 11-30-2025 | 125,000 | 122,671 |
| U.S. Treasury Note | | 6.00 | 2-15-2026 | 146,000 | 157,777 |
| U.S. Treasury Note | | 6.50 | 11-15-2026 | 30,000 | 33,589 |
| U.S. Treasury Note | | 6.63 | 2-15-2027 | 235,000 | 265,734 |
| U.S. Treasury Note | | 6.75 | 8-15-2026 | 220,000 | 247,079 |
| Total U.S. Treasury securities (Cost $30,548,929) | | | | | 28,724,079 |
| | | Yield | | Shares | |
| Short-term investments: 0.17% | | | | | |
| Investment companies: 0.17% | | | | | |
| Allspring Government Money Market Fund Select Class ♠∞ | | 2.09 | | 50,296 | 50,296 |
| Total Short-term investments (Cost $50,296) | | | | | 50,296 |
| Total investments in securities (Cost $31,000,698) | 99.80% | | | | 29,148,749 |
| Other assets and liabilities, net | 0.20 | | | | 57,177 |
| Total net assets | 100.00% | | | | $29,205,926 |
| ♠ | The issuer of the security is an affiliated person of the Portfolio as defined in the Investment Company Act of 1940. |
| ∞ | The rate represents the 7-day annualized yield at period end. |
The accompanying notes are an integral part of these financial statements.
4 | Allspring Strategic Retirement Bond Portfolio
Portfolio of investments—August 31, 2022 (unaudited)
| Abbreviations: |
| FHLB | Federal Home Loan Bank |
| FHLMC | Federal Home Loan Mortgage Corporation |
| FNMA | Federal National Mortgage Association |
| TIPS | Treasury Inflation-Protected Securities |
Investments in affiliates
An affiliated investment is an investment in which the Portfolio owns at least 5% of the outstanding voting shares of the issuer or as a result of other relationships, such as the Portfolio and the issuer having the same adviser or investment manager. Transactions with issuers that were affiliates of the Portfolio at the end of the period were as follows:
| | Value,
beginning of
period | Purchases | Sales
proceeds | Net
realized
gains
(losses) | Net
change in
unrealized
gains
(losses) | Value,
end of
period | Shares,
end
of period | Income
from
affiliated
securities |
| Short-term investments | | | | | | | |
| Allspring Government Money Market Fund Select Class | $331,202 | $14,930,246 | $(15,211,152) | $0 | $0 | $50,296 | 50,296 | $6,195 |
The accompanying notes are an integral part of these financial statements.
Allspring Strategic Retirement Bond Portfolio | 5
Statement of assets and liabilities—August 31, 2022 (unaudited)
| | |
| Assets | |
Investments in unaffiliated securities, at value (cost $30,950,402)
| $ 29,098,453 |
Investments in affiliated securities, at value (cost $50,296)
| 50,296 |
Receivable for interest
| 69,052 |
Receivable from adviser
| 10,676 |
Prepaid expenses and other assets
| 943 |
Total assets
| 29,229,420 |
| Liabilities | |
Professional fees payable
| 9,844 |
Interest holder report expenses payable
| 5,652 |
Custody and accounting fees payable
| 3,375 |
Trustees’ fees and expenses payable
| 2,611 |
Accrued expenses and other liabilities
| 2,012 |
Total liabilities
| 23,494 |
Total net assets
| $29,205,926 |
The accompanying notes are an integral part of these financial statements.
6 | Allspring Strategic Retirement Bond Portfolio
Statement of operations—six months ended August 31, 2022 (unaudited)
| | |
| Investment income | |
Interest
| $ 1,606,816 |
Income from affiliated securities
| 6,195 |
Total investment income
| 1,613,011 |
| Expenses | |
Advisory fee
| 12,013 |
Custody and accounting fees
| 5,258 |
Professional fees
| 48,285 |
Interest holder report expenses
| 8,249 |
Trustees’ fees and expenses
| 11,153 |
Other fees and expenses
| 2,655 |
Total expenses
| 87,613 |
Less: Fee waivers and/or expense reimbursements
| (72,477) |
Net expenses
| 15,136 |
Net investment income
| 1,597,875 |
| Realized and unrealized gains (losses) on investments | |
Net realized losses on investments
| (976,544) |
Net change in unrealized gains (losses) on investments
| (2,827,762) |
Net realized and unrealized gains (losses) on investments
| (3,804,306) |
Net decrease in net assets resulting from operations
| $(2,206,431) |
The accompanying notes are an integral part of these financial statements.
Allspring Strategic Retirement Bond Portfolio | 7
Statement of changes in net assets
| | | |
| | Six months ended
August 31, 2022
(unaudited) | Year ended
February 28, 2022 |
| Operations | | |
Net investment income
| $ 1,597,875 | $ 4,596,973 |
Net realized gains (losses) on investments
| (976,544) | 79,947 |
Net change in unrealized gains (losses) on investments
| (2,827,762) | (2,573,630) |
Net increase (decrease) in net assets resulting from operations
| (2,206,431) | 2,103,290 |
| Capital transactions | | |
| Transactions in investors’ beneficial interests | | |
Contributions
| 2,696,722 | 19,610,330 |
Withdrawals
| (37,176,606) | (110,936,963) |
Net decrease in net assets resulting from capital transactions
| (34,479,884) | (91,326,633) |
Total decrease in net assets
| (36,686,315) | (89,223,343) |
| Net assets | | |
Beginning of period
| 65,892,241 | 155,115,584 |
End of period
| $ 29,205,926 | $ 65,892,241 |
The accompanying notes are an integral part of these financial statements.
8 | Allspring Strategic Retirement Bond Portfolio
| | | Year ended February 28 |
| | Six months ended
August 31, 2022
(unaudited) | 2022 | 2021 | 2020 1 | 2019 | 2018 2 |
Total return3
| (4.19)% | 1.82% | 3.73% | 7.75% | 2.47% | (1.40)% |
| Ratios to average net assets (annualized) | | | | | | |
Gross expenses
| 0.36% | 0.12% | 0.15% | 0.18% | 0.16% | 0.17% |
Net expenses
| 0.06% * | 0.06% * | 0.07% * | 0.11% | 0.14% | 0.17% |
Net investment income
| 6.65% | 3.21% | 1.01% | 2.27% | 2.23% | 1.45% |
| Supplemental data | | | | | | |
Portfolio turnover rate
| 10% | 27% | 44% | 41% | 23% | 193% |
| * | Ratio includes expenses which were voluntarily waived by the adviser. Without these voluntary waivers, the net expense ratios would be increased by the following amounts: |
| Six months ended August 31, 2022 (unaudited) | 0.30% |
| Year ended February 28, 2022 | 0.06% |
| Year ended February 28, 2021 | 0.08% |
| 1 | Year ended February 29 |
| 2 | For the period from May 23, 2017 (commencement of operations) to February 28, 2018 |
| 3 | Returns for periods of less than one year are not annualized. |
The accompanying notes are an integral part of these financial statements.
Allspring Strategic Retirement Bond Portfolio | 9
Notes to financial statements (unaudited)
1. ORGANIZATION
Allspring Master Trust (the "Trust"), a Delaware statutory trust organized on March 10, 1999, is an open-end management investment company registered under the Investment Company Act of 1940, as amended (the "1940 Act"). As an investment company, the Trust follows the accounting and reporting guidance in Financial Accounting Standards Board ("FASB") Accounting Standards Codification Topic 946, Financial Services – Investment Companies. These financial statements report on the Allspring Strategic Retirement Bond Portfolio (the "Portfolio") which is a diversified series of the Trust.
Interests in the Portfolio are available solely through private placement transactions that do not involve any "public offering" within the meaning of Section 4(a)(2) of the Securities Act of 1933.
2. SIGNIFICANT ACCOUNTING POLICIES
The following significant accounting policies, which are consistently followed in the preparation of the financial statements of the Portfolio, are in conformity with U.S. generally accepted accounting principles which require management to make estimates and assumptions that affect the reported amounts of assets and liabilities, disclosure of contingent assets and liabilities at the date of the financial statements, and the reported amounts of income and expenses during the reporting period. Actual results could differ from those estimates.
Securities valuation
All investments are valued each business day as of the close of regular trading on the New York Stock Exchange (generally 4 p.m. Eastern Time), although the Portfolio may deviate from this calculation time under unusual or unexpected circumstances.
Debt securities are valued at the evaluated bid price provided by an independent pricing service (e.g. taking into account various factors, including yields, maturities, or credit ratings) or, if a reliable price is not available, the quoted bid price from an independent broker-dealer.
Investments in registered open-end investment companies are valued at net asset value.
Investments which are not valued using any of the methods discussed above are valued at their fair value, as determined in good faith by the Board of Trustees. The Board of Trustees has established a Valuation Committee comprised of the Trustees and has delegated to it the authority to take any actions regarding the valuation of portfolio securities that the Valuation Committee deems necessary or appropriate, including determining the fair value of portfolio securities, unless the determination has been delegated to the Allspring Global Investments Pricing Committee at Allspring Funds Management, LLC ("Allspring Funds Management"). The Board of Trustees retains the authority to make or ratify any valuation decisions or approve any changes to the Valuation Procedures as it deems appropriate. On a quarterly basis, the Board of Trustees receives reports on any valuation actions taken by the Valuation Committee or the Allspring Global Investments Pricing Committee which may include items for ratification.
Security transactions and income recognition
Securities transactions are recorded on a trade date basis. Realized gains or losses are recorded on the basis of identified cost.
Interest income is accrued daily and bond discounts are accreted and premiums are amortized daily. To the extent debt obligations are placed on non-accrual status, any related interest income may be reduced by writing off interest receivables when the collection of all or a portion of interest has been determined to be doubtful based on consistently applied procedures and the fair value has decreased. If the issuer subsequently resumes interest payments or when the collectability of interest is reasonably assured, the debt obligation is removed from non-accrual status.
Federal and other taxes
The Portfolio is not required to pay federal income taxes on its net investment income and net capital gains as it is treated as a partnership for federal income tax purposes. All income, gains and losses of the Portfolio are deemed to have been “passed through” to the interest holders in proportion to their holdings of the Portfolio regardless of whether income and gains have been distributed by the Portfolio.
The Portfolio’s income tax returns and all financial records supporting those returns for the prior three fiscal years are subject to examination by the federal revenue authority. Management has analyzed the Portfolio’s tax positions taken on federal, state, and foreign tax returns, as applicable, for all open tax years and does not believe that there are any uncertain tax positions that require recognition of a tax liability.
10 | Allspring Strategic Retirement Bond Portfolio
Notes to financial statements (unaudited)
As of August 31, 2022, the aggregate cost of all investments for federal income tax purposes was $30,993,187 and the unrealized gains (losses) consisted of:
| Gross unrealized gains | $ 10,363 |
| Gross unrealized losses | (1,854,801) |
| Net unrealized losses | $(1,844,438) |
3. FAIR VALUATION MEASUREMENTS
Fair value measurements of investments are determined within a framework that has established a fair value hierarchy based upon the various data inputs utilized in determining the value of the Portfolio’s investments. The three-level hierarchy gives the highest priority to unadjusted quoted prices in active markets for identical assets or liabilities (Level 1) and the lowest priority to unobservable inputs (Level 3). The Portfolio’s investments are classified within the fair value hierarchy based on the lowest level of input that is significant to the fair value measurement. The inputs are summarized into three broad levels as follows:
| ■ | Level 1 – quoted prices in active markets for identical securities |
| ■ | Level 2 – other significant observable inputs (including quoted prices for similar securities, interest rates, prepayment speeds, credit risk, etc.) |
| ■ | Level 3 – significant unobservable inputs (including the Portfolio’s own assumptions in determining the fair value of investments) |
The inputs or methodologies used for valuing investments in securities are not necessarily an indication of the risk associated with investing in those securities.
The following is a summary of the inputs used in valuing the Portfolio’s assets and liabilities as of August 31, 2022:
| | Quoted prices
(Level 1) | Other significant
observable inputs
(Level 2) | Significant
unobservable inputs
(Level 3) | Total |
| Assets | | | | |
| Investments in: | | | | |
| Agency securities | $ 0 | $ 374,374 | $0 | $ 374,374 |
| U.S. Treasury securities | 28,724,079 | 0 | 0 | 28,724,079 |
| Short-term investments | | | | |
| Investment companies | 50,296 | 0 | 0 | 50,296 |
| Total assets | $28,774,375 | $374,374 | $0 | $29,148,749 |
Additional sector, industry or geographic detail, if any, is included in the Portfolio of Investments.
For the six months ended August 31, 2022, the Portfolio did not have any transfers into/out of Level 3.
4. TRANSACTIONS WITH AFFILIATES
Advisory fee
The Trust has entered into an advisory contract with Allspring Funds Management, a wholly owned subsidiary of Allspring Global Investments Holdings, LLC, a holding company indirectly owned by certain private funds of GTCR LLC and Reverence Capital Partners, L.P. The adviser is responsible for implementing investment policies and guidelines and for supervising the subadviser, who is responsible for day-to-day portfolio management of the Portfolio. Pursuant to the contract, Allspring Funds Management is entitled to receive an advisory fee at the following annual rate based on the Portfolio’s average daily net assets:
| Average daily net assets | Advisory fee |
| First $5 billion | 0.050% |
| Next $5 billion | 0.040 |
| Over $10 billion | 0.030 |
Allspring Strategic Retirement Bond Portfolio | 11
Notes to financial statements (unaudited)
For the six months ended August 31, 2022, the advisory fee was equivalent to an annual rate of 0.05% of the Portfolio’s average daily net assets.
Allspring Funds Management has retained the services of a subadviser to provide daily portfolio management to the Portfolio. The fee for subadvisory services is borne by Allspring Funds Management. Allspring Global Investments, LLC, an affiliate of Allspring Funds Management and a wholly owned subsidiary of Allspring Global Investments Holdings, LLC, is the subadviser to the Portfolio and is entitled to receive a fee from Allspring Funds Management at an annual rate starting at 0.04% and declining to 0.03% as the average daily net assets of the Portfolio increase.
Allspring Funds Management has voluntarily waived and/or reimbursed advisory fees to reduce the net operating expense ratio of the Portfolio. These voluntary waivers may be discontinued at any time.
Interfund transactions
The Portfolio may purchase or sell portfolio investment securities to certain affiliates pursuant to Rule 17a-7 under the 1940 Act and under procedures adopted by the Board of Trustees. The procedures have been designed to ensure that these interfund transactions, which do not incur broker commissions, are effected at current market prices.
5. INVESTMENT PORTFOLIO TRANSACTIONS
Purchases and sales of investments in U.S. government obligations, excluding short-term securities, for the six months ended August 31, 2022 were $4,747,646 and $38,553,227, respectively.
6. BANK BORROWINGS
The Trust, along with Allspring Variable Trust and Allspring Funds Trust (excluding the money market funds), are parties to a $350,000,000 revolving credit agreement whereby the Portfolio is permitted to use bank borrowings for temporary or emergency purposes, such as to fund interest holders withdrawal requests. Interest under the credit agreement is charged to the Portfolio based on a borrowing rate equal to the higher of the Federal Funds rate or the overnight bank funding rate in effect on that day plus a spread. In addition, an annual commitment fee equal based on the unused balance is allocated to each participating fund.
For the six months ended August 31, 2022, there were no borrowings by the Portfolio under the agreement.
7. INDEMNIFICATION
Under the Portfolio's organizational documents, the officers and Trustees have been granted certain indemnification rights against certain liabilities that may arise out of performance of their duties to the Portfolio. The Portfolio has entered into a separate agreement with each Trustee that converts indemnification rights currently existing under the Portfolio’s organizational documents into contractual rights that cannot be changed in the future without the consent of the Trustee. Additionally, in the normal course of business, the Portfolio may enter into contracts with service providers that contain a variety of indemnification clauses. The Portfolio’s maximum exposure under these arrangements is dependent on future claims that may be made against the Portfolio and, therefore, cannot be estimated.
8. CORONAVIRUS (COVID-19) PANDEMIC
On March 11, 2020, the World Health Organization announced that it had made the assessment that coronavirus disease 2019 (“COVID-19”) is a pandemic. The impacts of COVID-19 are affecting the entire global economy, individual companies and investment products, the funds, and the market in general. There is significant uncertainty around the extent and duration of business disruptions related to COVID-19 and the impacts may last for an extended period of time. COVID-19 has led to significant uncertainty and volatility in the financial markets.
12 | Allspring Strategic Retirement Bond Portfolio
Other information (unaudited)
PROXY VOTING INFORMATION
A description of the policies and procedures used to determine how to vote proxies relating to portfolio securities is available without charge, upon request, by calling 1-800-222-8222, visiting our website at allspringglobal.com, or visiting the SEC website at sec.gov. Information regarding how the proxies related to portfolio securities were voted during the most recent 12-month period ended June 30 is available on the website at allspringglobal.com or by visiting the SEC website at sec.gov.
QUARTERLY PORTFOLIO HOLDINGS INFORMATION
The Portfolio files its complete schedule of portfolio holdings with the SEC for the first and third quarters of each fiscal year as an exhibit to its reports on Form N-PORT. Interest holders may view the filed Form N-PORT by visiting the SEC website at sec.gov.
Allspring Strategic Retirement Bond Portfolio | 13
Other information (unaudited)
BOARD OF TRUSTEES AND OFFICERS
Each of the Trustees and Officers listed in the table below acts in identical capacities for each fund in the Allspring family of funds, which consists of 124 mutual funds comprising the Allspring Funds Trust, Allspring Variable Trust, Allspring Master Trust and four closed-end funds (collectively the “Fund Complex”). This table should be read in conjunction with the Prospectus and the Statement of Additional Information1. The mailing address of each Trustee and Officer is 525 Market Street, 12th Floor, San Francisco, CA 94105. Each Trustee and Officer serves an indefinite term, however, each Trustee serves such term until reaching the mandatory retirement age established by the Trustees.
Independent Trustees
Name and
year of birth | Position held and
length of service* | Principal occupations during past five years or longer | Current other
public company or
investment
company
directorships |
William R. Ebsworth
(Born 1957) | Trustee,
since 2015 | Retired. From 1984 to 2013, equities analyst, portfolio manager, research director and chief investment officer at Fidelity Management and Research Company in Boston, Tokyo, and Hong Kong, and retired in 2013 as Chief Investment Officer of Fidelity Strategic Advisers, Inc. where he led a team of investment professionals managing client assets. Prior thereto, Board member of Hong Kong Securities Clearing Co., Hong Kong Options Clearing Corp., the Thailand International Fund, Ltd., Fidelity Investments Life Insurance Company, and Empire Fidelity Investments Life Insurance Company. Audit Committee Chair and Investment Committee Chair of the Vincent Memorial Hospital Endowment (non-profit organization). Mr. Ebsworth is a CFA® charterholder. | N/A |
Jane A. Freeman
(Born 1953) | Trustee,
since 2015;
Chair Liaison,
since 2018 | Retired. From 2012 to 2014 and 1999 to 2008, Chief Financial Officer of Scientific Learning Corporation. From 2008 to 2012, Ms. Freeman provided consulting services related to strategic business projects. Prior to 1999, Portfolio Manager at Rockefeller & Co. and Scudder, Stevens & Clark. Board member of the Harding Loevner Funds from 1996 to 2014, serving as both Lead Independent Director and chair of the Audit Committee. Board member of the Russell Exchange Traded Funds Trust from 2011 to 2012 and the chair of the Audit Committee. Ms. Freeman is also an inactive Chartered Financial Analyst. | N/A |
Isaiah Harris, Jr.
(Born 1952) | Trustee,
since 2009; Audit
Committee
Chair,
since 2019 | Retired. Chairman of the Board of CIGNA Corporation from 2009 to 2021, and Director from 2005 to 2008. From 2003 to 2011, Director of Deluxe Corporation. Prior thereto, President and CEO of BellSouth Advertising and Publishing Corp. from 2005 to 2007, President and CEO of BellSouth Enterprises from 2004 to 2005 and President of BellSouth Consumer Services from 2000 to 2003. Emeritus member of the Iowa State University Foundation Board of Governors. Emeritus Member of the Advisory Board of Iowa State University School of Business. Advisory Board Member, Palm Harbor Academy (private school). Advisory Board Member, Fellowship of Christian Athletes. Mr. Harris is a certified public accountant (inactive status). | N/A |
David F. Larcker
(Born 1950) | Trustee,
since 2009 | James Irvin Miller Professor of Accounting at the Graduate School of Business (Emeritus), Stanford University, Director of the Corporate Governance Research Initiative and Senior Faculty of The Rock Center for Corporate Governance since 2006. From 2005 to 2008, Professor of Accounting at the Graduate School of Business, Stanford University. Prior thereto, Ernst & Young Professor of Accounting at The Wharton School, University of Pennsylvania from 1985 to 2005. | N/A |
14 | Allspring Strategic Retirement Bond Portfolio
Other information (unaudited)
Name and
year of birth | Position held and
length of service* | Principal occupations during past five years or longer | Current other
public company or
investment
company
directorships |
Olivia S. Mitchell
(Born 1953) | Trustee,
since 2006;
Nominating and
Governance
Committee Chair,
since 2018 | International Foundation of Employee Benefit Plans Professor since 1993, Wharton School of the University of Pennsylvania. Director of Wharton’s Pension Research Council and Boettner Center on Pensions & Retirement Research, and Research Associate at the National Bureau of Economic Research. Previously taught at Cornell University from 1978 to 1993. | N/A |
Timothy J. Penny
(Born 1951) | Trustee,
since 1996;
Chair,
since 2018 | President and Chief Executive Officer of Southern Minnesota Initiative Foundation, a non-profit organization, since 2007. Vice Chair of the Economic Club of Minnesota, since 2007. Co-Chair of the Committee for a Responsible Federal Budget, since 1995. Member of the Board of Trustees of NorthStar Education Finance, Inc., a non-profit organization, since 2007. Senior Fellow of the University of Minnesota Humphrey Institute from 1995 to 2017. | N/A |
James G. Polisson
(Born 1959) | Trustee,
since 2018 | Retired. Chief Marketing Officer, Source (ETF) UK Services, Ltd, from 2015 to 2017. From 2012 to 2015, Principal of The Polisson Group, LLC, a management consulting, corporate advisory and principal investing company. Chief Executive Officer and Managing Director at Russell Investments, Global Exchange Traded Funds from 2010 to 2012. Managing Director of Barclays Global Investors from 1998 to 2010 and Global Chief Marketing Officer for iShares and Barclays Global Investors from 2000 to 2010. Trustee of the San Francisco Mechanics’ Institute, a non-profit organization, from 2013 to 2015. Board member of the Russell Exchange Traded Fund Trust from 2011 to 2012. Director of Barclays Global Investors Holdings Deutschland GmbH from 2006 to 2009. Mr. Polisson is an attorney and has a retired status with the Massachusetts and District of Columbia Bar Associations. | N/A |
Pamela Wheelock
(Born 1959) | Trustee,
since January
2020; previously
Trustee from
January 2018 to
July 2019 | Retired. Executive and Senior Financial leadership positions in the public, private and nonprofit sectors. Interim President and CEO, McKnight Foundation, 2020. Interim Commissioner, Minnesota Department of Human Services, 2019. Chief Operating Officer, Twin Cities Habitat for Humanity, 2017-2019. Vice President for University Services, University of Minnesota, 2012-2016. Interim President and CEO, Blue Cross and Blue Shield of Minnesota, 2011-2012. Executive Vice-President and Chief Financial Officer, Minnesota Wild, 2002-2008. Commissioner, Minnesota Department of Finance, 1999-2002. Chair of the Board of Directors of Destination Medical Center Corporation. Board member of the Minnesota Wild Foundation. | N/A |
* Length of service dates reflect the Trustee’s commencement of service with the Trust’s predecessor entities, where applicable.
Allspring Strategic Retirement Bond Portfolio | 15
Other information (unaudited)
Officers2
Name and
year of birth | Position held and
length of service | Principal occupations during past five years or longer |
Andrew Owen
(Born 1960) | President,
since 2017 | President, Chief Executive Officer and Director of Allspring Funds Management, LLC since 2017 and co-president of Galliard Capital Management, LLC, an affiliate of Allspring Funds Management, LLC, since 2019. Prior thereto, Head of Affiliated Managers, Allspring Global Investments, from 2014 to 2019 and Executive Vice President responsible for marketing, investments and product development for Allspring Funds Management, LLC, from 2009 to 2014. In addition, Mr. Owen was an Executive Vice President of Wells Fargo & Company from 2014 to 2021. |
Jeremy DePalma
(Born 1974) | Treasurer,
since 2012
(for certain funds in
the Fund Complex);
since 2021 (for
the remaining funds in the
Fund Complex) | Senior Vice President of Allspring Funds Management, LLC since 2009. Senior Vice President of Evergreen Investment Management Company, LLC from 2008 to 2010 and head of the Fund Reporting and Control Team within Fund Administration from 2005 to 2010. |
Kate McKinley
(Born 1977) | Chief Legal Officer,
since 2021 | Chief Legal Officer of Allspring Global Investments since 2021. Prior thereto, held various roles at State Street Global Advisors beginning in 2010, including serving as Senior Vice President and General Counsel from 2019 to 2021, and Chief Operating Officer of the Institutional Client Group from 2016 - 2019. Prior to working at State Street Global Advisors served as Assistant General Counsel for Bank of America Corporation from 2005 to 2010 and as an Associate at WilmerHale from 2002 to 2005. |
Christopher Baker
(Born 1976) | Chief Compliance Officer, since 2022 | Global Chief Compliance Officer for Allspring Global Investments since 2022. Prior thereto, Chief Compliance Officer for State Street Global Advisors from 2018 to 2021. Senior Compliance Officer for the State Street divisions of Alternative Investment Solutions, Sector Solutions, and Global Marketing from 2015 to 2018. From 2010 to 2015 Vice President, Global Head of Investment and Marketing Compliance for State Street Global Advisors. |
Matthew Prasse
(Born 1983) | Secretary,
since 2021 | Senior Counsel of the Allspring Legal Department since 2021. Senior Counsel of the Wells Fargo Legal Department from 2018 to 2021. Previously, Counsel for Barings LLC from 2015 to 2018. Prior to joining Barings, Associate at Morgan, Lewis & Bockius LLP from 2008 to 2015. |
1 The Statement of Additional Information includes additional information about the Trustees and is available, without charge, upon request, by calling 1-800-222-8222.
2 For those Officers with tenures at Allspring Global Investments and/or Allspring Funds Management, LLC that began prior to 2021, such tenures include years of service during which these businesses/entities were known as Wells Fargo Asset Management and Wells Fargo Funds Management, LLC, respectively.
16 | Allspring Strategic Retirement Bond Portfolio
Other information (unaudited)
LIQUIDITY RISK MANAGEMENT PROGRAM
In accordance with Rule 22e-4 under the Investment Company Act of 1940, as amended (the “Liquidity Rule”), Allspring Master Trust (the “Trust”) has adopted and implemented a liquidity risk management program (the “Program”) on behalf of each of its series, including the Portfolio, which is reasonably designed to assess and manage the Portfolio's liquidity risk. “Liquidity risk” is defined under the Liquidity Rule as the risk that the Portfolio is unable to meet redemption requests without significantly diluting remaining investors’ interests in the Portfolio. The Trust’s Board of Trustees (the “Board”) previously approved the designation of Allspring Funds Management, LLC (“Allspring Funds Management”), the Portfolio's investment adviser, to administer the Program, and Allspring Funds Management has established a Liquidity Risk Management Council (the "Council") composed of personnel from multiple departments within Allspring Funds Management and its affiliates to assist Allspring Funds Management in the administration of the Program.
The Program is comprised of various components designed to support the assessment and/or management of liquidity risk, including: (1) the periodic assessment (no less frequently than annually) of certain factors that influence the Portfolio's liquidity risk; (2) the periodic classification (no less frequently than monthly) of the Portfolio's investments into one of four liquidity categories that reflect an estimate of their liquidity under current market conditions; (3) a 15% limit on the acquisition of “illiquid investments” (as defined under the Liquidity Rule); (4) to the extent the Portfolio does not invest primarily in “highly liquid investments” (as defined under the Liquidity Rule), the determination of a minimum percentage of the Portfolio's assets that generally will be invested in highly liquid investments (an “HLIM”); (5) if the Portfolio has established an HLIM, the periodic review (no less frequently than annually) of the HLIM and the adoption of policies and procedures for responding to a shortfall of the Portfolio's “highly liquid investments” below its HLIM; and (6) periodic reporting to the Board.
At a meeting of the Board held on May 24-25, 2022, the Board received and reviewed a written report (the “Report”) from Allspring Funds Management that, among other things, addressed the operation of the Program and assessed its adequacy and effectiveness for the period from January 1, 2021 through December 31, 2021 (the “Reporting Period”). Other than extended foreign market holidays, no significant liquidity events impacting the Portfolios were noted in the Report. In addition, other than corporate-related changes to the Program, there were no material changes to the Program during the Reporting Period.
Allspring Funds Management determined in the Report that the Program has been implemented and operates effectively to manage the Portfolio’s liquidity risk, and Allspring Funds Management continues to believe that the Program has been and continues to be adequately and effectively implemented to monitor and, as applicable, respond to the Portfolio’s liquidity developments.
There can be no assurance that the Program will achieve its objectives under all circumstances in the future.
Allspring Strategic Retirement Bond Portfolio | 17
For more information
More information about Allspring Funds is available free upon request. To obtain literature, please write, visit the Portfolio's website, or call:
Allspring Funds
P.O. Box 219967
Kansas City, MO 64121-9967
Website: allspringglobal.com
Individual investors: 1-800-222-8222
Retail investment professionals: 1-888-877-9275
Institutional investment professionals: 1-800-260-5969
This report and the financial statements contained herein are submitted for the general information of the interest holders of the Portfolio. If this report is used for promotional purposes, distribution of the report must be accompanied or preceded by a current prospectus. Before investing, please consider the investment objectives, risks, charges, and expenses of the investment. For a current prospectus and, if available, a summary prospectus, containing this information, call
1-800-222-8222. Read the prospectus carefully before you invest or send money.
Allspring Global InvestmentsTM is the trade name for the asset management firms of Allspring Global Investments Holdings, LLC, a holding company indirectly owned by certain private funds of GTCR LLC and Reverence Capital Partners, L.P. These firms include but are not limited to Allspring Global Investments, LLC, and Allspring Funds Management, LLC. Certain products managed by Allspring entities are distributed by Allspring Funds Distributor, LLC (a broker-dealer and Member FINRA/SIPC).
This material is for general informational and educational purposes only and is NOT intended to provide investment advice or a recommendation of any kind - including a recommendation for any specific investment, strategy, or plan.
© 2022 Allspring Global Investments Holdings, LLC. All rights reserved.
Semi-Annual Report
August 31, 2022
Allspring U.S. REIT Portfolio
Allspring U.S. REIT Portfolio | 1
Portfolio information (unaudited)
Investment objectiveThe Portfolio seeks to replicate the total return of the Dow Jones U.S. Select REIT Index†, before fees and expenses.
| Adviser | Allspring Funds Management, LLC |
| Subadviser | Allspring Global Investments, LLC |
| Portfolio managers | Petros N. Bocray, CFA®‡FRM |
| Ten largest holdings (%) as of August 31, 20221 |
| Prologis Incorporated | 9.51 |
| Equinix Incorporated | 6.17 |
| Public Storage Incorporated | 5.21 |
| Realty Income Corporation | 4.24 |
| Digital Realty Trust Incorporated | 3.63 |
| Welltower Incorporated | 3.59 |
| Simon Property Group Incorporated | 3.46 |
| AvalonBay Communities Incorporated | 2.90 |
| Extra Space Storage Incorporated | 2.75 |
| Equity Residential | 2.58 |
| 1 | Figures represent the percentage of the Portfolio's net assets. Holdings are subject to change and may have changed since the date specified. |
| † | The Dow Jones U.S. Select REIT Index tracks the performance of publicly traded REITs and REIT-like securities and is designed to serve as a proxy for direct real estate investment, in part by excluding companies whose performance may be driven by factors other than the value of real estate. You cannot invest directly in an index. |
| ‡ | CFA® and Chartered Financial Analyst® are trademarks owned by CFA Institute. |
2 | Allspring U.S. REIT Portfolio
Portfolio of investments—August 31, 2022 (unaudited)
| | | | | Shares | Value |
| Common stocks: 99.27% | | | | | |
| Real estate: 99.27% | | | | | |
| Equity REITs: 99.27% | | | | | |
| Acadia Realty Trust | | | | 1,649 | $ 26,269 |
| Agree Realty Corporation | | | | 1,306 | 98,368 |
| Alexandria Real Estate Equities Incorporated | | | | 2,579 | 395,619 |
| American Assets Trust Incorporated | | | | 915 | 25,400 |
| American Homes 4 Rent Class A | | | | 5,135 | 182,601 |
| Americold Realty Trust | | | | 4,678 | 137,627 |
| Apartment Income REIT Corporation | | | | 2,729 | 111,480 |
| Apartment Investment & Management Company Class A † | | | | 2,652 | 23,444 |
| Apple Hospitality REIT Incorporated | | | | 3,698 | 58,835 |
| Ashford Hospitality Trust Incorporated † | | | | 599 | 5,499 |
| AvalonBay Communities Incorporated | | | | 2,428 | 487,809 |
| Boston Properties Incorporated | | | | 2,478 | 196,828 |
| Brandywine Realty Trust | | | | 2,977 | 23,905 |
| Brixmor Property Group Incorporated | | | | 5,205 | 111,803 |
| Broadstone Net Lease Incorporated REIT | | | | 2,942 | 56,310 |
| Camden Property Trust | | | | 1,850 | 237,744 |
| CareTrust REIT Incorporated | | | | 1,686 | 36,316 |
| Centerspace REIT | | | | 267 | 20,126 |
| Chatham Lodging Trust † | | | | 848 | 10,312 |
| City Office REIT Incorporated | | | | 757 | 8,743 |
| Community Healthcare Trust Incorporated | | | | 410 | 15,125 |
| Corporate Office Properties Trust | | | | 1,953 | 50,466 |
| Cousins Properties Incorporated | | | | 2,585 | 69,407 |
| CubeSmart | | | | 3,900 | 179,595 |
| DiamondRock Hospitality † | | | | 3,664 | 31,987 |
| Digital Realty Trust Incorporated | | | | 4,946 | 611,474 |
| Diversified Healthcare Trust | | | | 4,154 | 6,065 |
| Douglas Emmett Incorporated | | | | 3,054 | 59,614 |
| Duke Realty Corporation | | | | 6,680 | 393,118 |
| Easterly Government Properties Incorporated | | | | 1,577 | 28,307 |
| EastGroup Properties Incorporated | | | | 723 | 119,317 |
| Empire State Realty Trust Incorporated Class A | | | | 2,374 | 16,547 |
| EPR Properties | | | | 1,303 | 56,667 |
| Equinix Incorporated | | | | 1,580 | 1,038,645 |
| Equity Commonwealth † | | | | 1,957 | 51,489 |
| Equity Lifestyle Properties Incorporated | | | | 3,006 | 210,721 |
| Equity Residential | | | | 5,946 | 435,128 |
| Essential Properties Realty | | | | 2,410 | 54,562 |
| Essex Property Trust Incorporated | | | | 1,134 | 300,578 |
| Extra Space Storage Incorporated | | | | 2,332 | 463,438 |
| Federal Realty Investment Trust | | | | 1,242 | 125,777 |
| First Industrial Realty Trust Incorporated | | | | 2,293 | 116,209 |
| Four Corners Property Trust Incorporated | | | | 1,396 | 37,538 |
| Franklin Street Properties Corporation | | | | 1,614 | 4,535 |
| Getty Realty Corporation | | | | 706 | 21,236 |
| Global Medical REIT Incorporated | | | | 1,070 | 11,599 |
| Global Net Lease Incorporated | | | | 1,801 | 24,800 |
| Healthcare Realty Trust Incorporated | | | | 6,615 | 160,877 |
| Healthpeak Properties Incorporated | | | | 9,374 | 246,068 |
| Hersha Hospitality Trust † | | | | 575 | 5,578 |
| Highwoods Properties Incorporated | | | | 1,827 | 55,559 |
| Host Hotels & Resorts Incorporated | | | | 12,419 | 220,686 |
The accompanying notes are an integral part of these financial statements.
Allspring U.S. REIT Portfolio | 3
Portfolio of investments—August 31, 2022 (unaudited)
| | | | | Shares | Value |
| Equity REITs (continued) | | | | | |
| Hudson Pacific Properties Incorporated | | | | 2,512 | $ 33,184 |
| Independence Realty Trust Incorporated | | | | 3,838 | 74,649 |
| Industrial Logistics Properties Trust | | | | 1,137 | 8,516 |
| Innovative Industrial Properties Incorporated | | | | 399 | 36,596 |
| Invitation Homes Incorporated | | | | 10,604 | 384,713 |
| JBG Smith Properties | | | | 1,889 | 41,501 |
| Kilroy Realty Corporation | | | | 1,825 | 89,005 |
| Kimco Realty Corporation | | | | 10,737 | 226,336 |
| Kite Realty Group Trust | | | | 3,806 | 73,684 |
| Lexington Corporate Properties Trust | | | | 4,980 | 50,099 |
| Life Storage Incorporated | | | | 1,464 | 186,294 |
| LTC Properties Incorporated | | | | 686 | 30,795 |
| Medical Properties Trust Incorporated | | | | 10,426 | 152,324 |
| Mid-America Apartment Communities Incorporated | | | | 2,005 | 332,168 |
| National Health Investors Incorporated | | | | 796 | 52,146 |
| National Retail Properties Incorporated | | | | 3,057 | 137,259 |
| National Storage Affiliates Trust | | | | 1,462 | 73,860 |
| NETSTREIT Corporation REIT | | | | 833 | 16,377 |
| NexPoint Residential Trust Incorporated | | | | 401 | 21,181 |
| Office Properties Income Trust | | | | 841 | 14,776 |
| Omega Healthcare Investors Incorporated | | | | 4,086 | 133,449 |
| Orion Office Incorporated | | | | 984 | 9,712 |
| Paramount Group Incorporated | | | | 2,856 | 19,792 |
| Park Hotels & Resorts Incorporated | | | | 4,054 | 56,756 |
| Pebblebrook Hotel Trust | | | | 2,282 | 40,209 |
| Piedmont Office Realty Trust Incorporated Class A | | | | 2,142 | 25,233 |
| Plymouth Industrial Incorporated | | | | 697 | 14,128 |
| Prologis Incorporated | | | | 12,862 | 1,601,443 |
| Public Storage Incorporated | | | | 2,653 | 877,692 |
| Realty Income Corporation | | | | 10,453 | 713,731 |
| Regency Centers Corporation | | | | 2,695 | 163,964 |
| Retail Opportunity Investment Corporation | | | | 2,158 | 36,147 |
| Rexford Industrial Realty Incorporated | | | | 2,867 | 178,356 |
| RLJ Lodging Trust | | | | 2,899 | 34,962 |
| RPT Realty | | | | 1,478 | 14,233 |
| Ryman Hospitality Properties Incorporated † | | | | 958 | 78,767 |
| Service Properties Trust | | | | 2,868 | 19,617 |
| Simon Property Group Incorporated | | | | 5,705 | 581,796 |
| SITE Centers Corporation | | | | 3,158 | 40,928 |
| SL Green Realty Corporation | | | | 1,114 | 49,205 |
| Spirit Realty Capital Incorporated REIT | | | | 2,333 | 95,303 |
| STAG Industrial Incorporated | | | | 3,114 | 95,911 |
| Store Capital Corporation | | | | 4,387 | 118,361 |
| Summit Hotel Properties Incorporated | | | | 1,860 | 14,620 |
| Sun Communities Incorporated | | | | 2,112 | 324,636 |
| Sunstone Hotel Investors Incorporated † | | | | 3,739 | 40,718 |
| Tanger Factory Outlet Centers Incorporated | | | | 1,814 | 27,972 |
| Terreno Realty Corporation | | | | 1,312 | 80,019 |
| The Macerich Company | | | | 3,729 | 35,687 |
| The Necessity Retail REIT Incorporated | | | | 2,312 | 17,248 |
| UDR Incorporated | | | | 5,200 | 233,324 |
| UMH Properties Incorporated | | | | 877 | 15,821 |
| Universal Health Realty Income Trust | | | | 222 | 11,298 |
| Urban Edge Properties | | | | 1,918 | 30,170 |
| Ventas Incorporated | | | | 6,944 | 332,340 |
| Veris Residential Incorporated † | | | | 1,392 | 18,708 |
The accompanying notes are an integral part of these financial statements.
4 | Allspring U.S. REIT Portfolio
Portfolio of investments—August 31, 2022 (unaudited)
| | | | | Shares | Value |
| Equity REITs (continued) | | | | | |
| Vornado Realty Trust | | | | 2,765 | $ 72,498 |
| Washington REIT | | | | 1,519 | 29,788 |
| Welltower Incorporated | | | | 7,887 | 604,539 |
| WP Carey Incorporated | | | | 3,351 | 281,585 |
| Xenia Hotels & Resorts Incorporated † | | | | 1,987 | 31,514 |
| Total Common stocks (Cost $14,624,292) | | | | | 16,715,393 |
| | | Yield | | | |
| Short-term investments: 0.76% | | | | | |
| Investment companies: 0.76% | | | | | |
| Allspring Government Money Market Fund Select Class ♠∞ | | 2.09% | | 128,122 | 128,122 |
| Total Short-term investments (Cost $128,122) | | | | | 128,122 |
| Total investments in securities (Cost $14,752,414) | 100.03% | | | | 16,843,515 |
| Other assets and liabilities, net | (0.03) | | | | ���(5,017) |
| Total net assets | 100.00% | | | | $16,838,498 |
| † | Non-income-earning security |
| ♠ | The issuer of the security is an affiliated person of the Portfolio as defined in the Investment Company Act of 1940. |
| ∞ | The rate represents the 7-day annualized yield at period end. |
| Abbreviations: |
| REIT | Real estate investment trust |
Investments in affiliates
An affiliated investment is an investment in which the Portfolio owns at least 5% of the outstanding voting shares of the issuer or as a result of other relationships, such as the Portfolio and the issuer having the same adviser or investment manager. Transactions with issuers that were affiliates of the Portfolio at the end of the period were as follows:
| | Value,
beginning of
period | Purchases | Sales
proceeds | Net
realized
gains
(losses) | Net
change in
unrealized
gains
(losses) | Value,
end of
period | Shares,
end
of period | Income
from
affiliated
securities |
| Short-term investments | | | | | | | |
| Allspring Government Money Market Fund Select Class | $102,224 | $6,574,425 | $(6,548,527) | $0 | $0 | $128,122 | 128,122 | $1,109 |
The accompanying notes are an integral part of these financial statements.
Allspring U.S. REIT Portfolio | 5
Statement of assets and liabilities—August 31, 2022 (unaudited)
| | |
| Assets | |
Investments in unaffiliated securities, at value (cost $14,624,292)
| $ 16,715,393 |
Investments in affiliated securities, at value (cost $128,122)
| 128,122 |
Receivable for dividends
| 10,862 |
Receivable from adviser
| 8,304 |
Total assets
| 16,862,681 |
| Liabilities | |
Professional fees payable
| 9,526 |
Custody and accounting fees payable
| 7,680 |
Interest holder report expenses payable
| 5,322 |
Accrued expenses and other liabilities
| 1,655 |
Total liabilities
| 24,183 |
Total net assets
| $16,838,498 |
The accompanying notes are an integral part of these financial statements.
6 | Allspring U.S. REIT Portfolio
Statement of operations—six months ended August 31, 2022 (unaudited)
| | |
| Investment income | |
Dividends
| $ 341,794 |
Income from affiliated securities
| 1,109 |
Total investment income
| 342,903 |
| Expenses | |
Advisory fee
| 8,902 |
Custody and accounting fees
| 18,570 |
Professional fees
| 25,646 |
Interest holder report expenses
| 9,089 |
Trustees’ fees and expenses
| 11,153 |
Other fees and expenses
| 1,837 |
Total expenses
| 75,197 |
Less: Fee waivers and/or expense reimbursements
| (63,090) |
Net expenses
| 12,107 |
Net investment income
| 330,796 |
| Realized and unrealized gains (losses) on investments | |
Net realized gains on investments
| 3,036,762 |
Net change in unrealized gains (losses) on investments
| (4,728,806) |
Net realized and unrealized gains (losses) on investments
| (1,692,044) |
Net decrease in net assets resulting from operations
| $(1,361,248) |
The accompanying notes are an integral part of these financial statements.
Allspring U.S. REIT Portfolio | 7
Statement of changes in net assets
| | | |
| | Six months ended
August 31, 2022
(unaudited) | Year ended
February 28, 2022 |
| Operations | | |
Net investment income
| $ 330,796 | $ 471,946 |
Net realized gains on investments
| 3,036,762 | 3,936,717 |
Net change in unrealized gains (losses) on investments
| (4,728,806) | 1,722,342 |
Net increase (decrease) in net assets resulting from operations
| (1,361,248) | 6,131,005 |
| Capital transactions | | |
| Transactions in investors’ beneficial interests | | |
Contributions
| 5,419,715 | 5,084,311 |
Withdrawals
| (11,724,552) | (12,299,436) |
Net decrease in net assets resulting from capital transactions
| (6,304,837) | (7,215,125) |
Total decrease in net assets
| (7,666,085) | (1,084,120) |
| Net assets | | |
Beginning of period
| 24,504,583 | 25,588,703 |
End of period
| $ 16,838,498 | $ 24,504,583 |
The accompanying notes are an integral part of these financial statements.
8 | Allspring U.S. REIT Portfolio
| | | Year ended February 28 |
| | Six months ended
August 31, 2022
(unaudited) | 2022 | 2021 | 2020 1 | 2019 | 2018 2 |
Total return3
| (10.62)% | 25.46% | 3.45% | 2.65% | 19.52% | (8.74)% |
| Ratios to average net assets (annualized) | | | | | | |
Gross expenses
| 0.84% | 0.67% | 0.48% | 0.43% | 0.26% | 0.33% |
Net expenses
| 0.14% * | 0.14% * | 0.14% * | 0.19% | 0.23% | 0.32% |
Net investment income
| 3.72% | 1.85% | 1.93% | 2.73% | 2.91% | 2.53% |
| Supplemental data | | | | | | |
Portfolio turnover rate
| 34% | 41% | 71% | 26% | 20% | 51% |
| * | Ratio includes expenses which were voluntarily waived by the adviser. Without these voluntary waivers, the net expense ratios would be increased by the following amounts: |
| Six months ended August 31, 2022 (unaudited) | 0.70% |
| Year ended February 28, 2022 | 0.53% |
| Year ended February 28, 2021 | 0.34% |
| 1 | Year ended February 29 |
| 2 | For the period from May 23, 2017 (commencement of operations) to February 28, 2018 |
| 3 | Returns for periods of less than one year are not annualized. |
The accompanying notes are an integral part of these financial statements.
Allspring U.S. REIT Portfolio | 9
Notes to financial statements (unaudited)
1. ORGANIZATION
Allspring Master Trust (the "Trust"), a Delaware statutory trust organized on March 10, 1999, is an open-end management investment company registered under the Investment Company Act of 1940, as amended (the "1940 Act"). As an investment company, the Trust follows the accounting and reporting guidance in Financial Accounting Standards Board ("FASB") Accounting Standards Codification Topic 946, Financial Services – Investment Companies. These financial statements report on the Allspring U.S. REIT Portfolio (the "Portfolio") which is a diversified series of the Trust.
Interests in the Portfolio are available solely through private placement transactions that do not involve any "public offering" within the meaning of Section 4(a)(2) of the Securities Act of 1933.
2. SIGNIFICANT ACCOUNTING POLICIES
The following significant accounting policies, which are consistently followed in the preparation of the financial statements of the Portfolio, are in conformity with U.S. generally accepted accounting principles which require management to make estimates and assumptions that affect the reported amounts of assets and liabilities, disclosure of contingent assets and liabilities at the date of the financial statements, and the reported amounts of income and expenses during the reporting period. Actual results could differ from those estimates.
Securities valuation
All investments are valued each business day as of the close of regular trading on the New York Stock Exchange (generally 4 p.m. Eastern Time), although the Portfolio may deviate from this calculation time under unusual or unexpected circumstances.
Equity securities that are listed on a foreign or domestic exchange or market are valued at the official closing price or, if none, the last sales price.
Investments in registered open-end investment companies are valued at net asset value.
Investments which are not valued using any of the methods discussed above are valued at their fair value, as determined in good faith by the Board of Trustees. The Board of Trustees has established a Valuation Committee comprised of the Trustees and has delegated to it the authority to take any actions regarding the valuation of portfolio securities that the Valuation Committee deems necessary or appropriate, including determining the fair value of portfolio securities, unless the determination has been delegated to the Allspring Global Investments Pricing Committee at Allspring Funds Management, LLC ("Allspring Funds Management"). The Board of Trustees retains the authority to make or ratify any valuation decisions or approve any changes to the Valuation Procedures as it deems appropriate. On a quarterly basis, the Board of Trustees receives reports on any valuation actions taken by the Valuation Committee or the Allspring Global Investments Pricing Committee which may include items for ratification.
Security transactions and income recognition
Securities transactions are recorded on a trade date basis. Realized gains or losses are recorded on the basis of identified cost.
Dividend income is recognized on the ex-dividend date.
Federal and other taxes
The Portfolio is not required to pay federal income taxes on its net investment income and net capital gains as it is treated as a partnership for federal income tax purposes. All income, gains and losses of the Portfolio are deemed to have been “passed through” to the interest holders in proportion to their holdings of the Portfolio regardless of whether income and gains have been distributed by the Portfolio.
The Portfolio’s income tax returns and all financial records supporting those returns for the prior three fiscal years are subject to examination by the federal revenue authority. Management has analyzed the Portfolio’s tax positions taken on federal, state, and foreign tax returns, as applicable, for all open tax years and does not believe that there are any uncertain tax positions that require recognition of a tax liability.
As of August 31, 2022, the aggregate cost of all investments for federal income tax purposes was $15,991,751 and the unrealized gains (losses) consisted of:
| Gross unrealized gains | $ 2,387,483 |
| Gross unrealized losses | (1,535,719) |
| Net unrealized gains | $ 851,764 |
10 | Allspring U.S. REIT Portfolio
Notes to financial statements (unaudited)
3. FAIR VALUATION MEASUREMENTS
Fair value measurements of investments are determined within a framework that has established a fair value hierarchy based upon the various data inputs utilized in determining the value of the Portfolio’s investments. The three-level hierarchy gives the highest priority to unadjusted quoted prices in active markets for identical assets or liabilities (Level 1) and the lowest priority to unobservable inputs (Level 3). The Portfolio’s investments are classified within the fair value hierarchy based on the lowest level of input that is significant to the fair value measurement. The inputs are summarized into three broad levels as follows:
| ■ | Level 1 – quoted prices in active markets for identical securities |
| ■ | Level 2 – other significant observable inputs (including quoted prices for similar securities, interest rates, prepayment speeds, credit risk, etc.) |
| ■ | Level 3 – significant unobservable inputs (including the Portfolio’s own assumptions in determining the fair value of investments) |
The inputs or methodologies used for valuing investments in securities are not necessarily an indication of the risk associated with investing in those securities.
The following is a summary of the inputs used in valuing the Portfolio’s assets and liabilities as of August 31, 2022:
| | Quoted prices
(Level 1) | Other significant
observable inputs
(Level 2) | Significant
unobservable inputs
(Level 3) | Total |
| Assets | | | | |
| Investments in: | | | | |
| Common stocks | | | | |
| Real estate | $ 16,715,393 | $0 | $0 | $ 16,715,393 |
| Short-term investments | | | | |
| Investment companies | 128,122 | 0 | 0 | 128,122 |
| Total assets | $16,843,515 | $0 | $0 | $16,843,515 |
Additional sector, industry or geographic detail, if any, is included in the Portfolio of Investments.
For the six months ended August 31, 2022, the Portfolio did not have any transfers into/out of Level 3.
4. TRANSACTIONS WITH AFFILIATES
Advisory fee
The Trust has entered into an advisory contract with Allspring Funds Management, a wholly owned subsidiary of Allspring Global Investments Holdings, LLC, a holding company indirectly owned by certain private funds of GTCR LLC and Reverence Capital Partners, L.P. The adviser is responsible for implementing investment policies and guidelines and for supervising the subadviser, who is responsible for day-to-day portfolio management of the Portfolio. Pursuant to the contract, Allspring Funds Management is entitled to receive an advisory fee at the following annual rate based on the Portfolio’s average daily net assets:
| Average daily net assets | Advisory fee |
| First $5 billion | 0.100% |
| Next $5 billion | 0.080 |
| Over $10 billion | 0.060 |
For the six months ended August 31, 2022, the advisory fee was equivalent to an annual rate of 0.10% of the Portfolio’s average daily net assets.
Allspring Funds Management has retained the services of a subadviser to provide daily portfolio management to the Portfolio. The fee for subadvisory services is borne by Allspring Funds Management. Allspring Global Investments, LLC, an affiliate of Allspring Funds Management and a wholly owned subsidiary of Allspring Global Investments Holdings, LLC, is the subadviser to the Portfolio and is entitled to receive a fee from Allspring Funds Management at an annual rate starting at 0.06% and declining to 0.04% as the average daily net assets of the Portfolio increase.
Allspring U.S. REIT Portfolio | 11
Notes to financial statements (unaudited)
Allspring Funds Management has voluntarily waived and/or reimbursed advisory fees to reduce the net operating expense ratio of the Portfolio. These voluntary waivers may be discontinued at any time.
Interfund transactions
The Portfolio may purchase or sell portfolio investment securities to certain affiliates pursuant to Rule 17a-7 under the 1940 Act and under procedures adopted by the Board of Trustees. The procedures have been designed to ensure that these interfund transactions, which do not incur broker commissions, are effected at current market prices.
5. INVESTMENT PORTFOLIO TRANSACTIONS
Purchases and sales of investments, excluding U.S. government obligations (if any) and short-term securities, for the six months ended August 31, 2022 were $6,085,524 and $12,032,297, respectively.
6. BANK BORROWINGS
The Trust, along with Allspring Variable Trust and Allspring Funds Trust (excluding the money market funds), are parties to a $350,000,000 revolving credit agreement whereby the Portfolio is permitted to use bank borrowings for temporary or emergency purposes, such as to fund interest holders withdrawal requests. Interest under the credit agreement is charged to the Portfolio based on a borrowing rate equal to the higher of the Federal Funds rate or the overnight bank funding rate in effect on that day plus a spread. In addition, an annual commitment fee equal based on the unused balance is allocated to each participating fund.
For the six months ended August 31, 2022, there were no borrowings by the Portfolio under the agreement.
7. CONCENTRATION RISKS
As of the end of the period, the Portfolio concentrated its portfolio of investments in the real estate sector. A fund that invests a substantial portion of its assets in any sector may be more affected by changes in that sector than would be a fund whose investments are not heavily weighted in any sector.
8. INDEMNIFICATION
Under the Portfolio's organizational documents, the officers and Trustees have been granted certain indemnification rights against certain liabilities that may arise out of performance of their duties to the Portfolio. The Portfolio has entered into a separate agreement with each Trustee that converts indemnification rights currently existing under the Portfolio’s organizational documents into contractual rights that cannot be changed in the future without the consent of the Trustee. Additionally, in the normal course of business, the Portfolio may enter into contracts with service providers that contain a variety of indemnification clauses. The Portfolio’s maximum exposure under these arrangements is dependent on future claims that may be made against the Portfolio and, therefore, cannot be estimated.
9. CORONAVIRUS (COVID-19) PANDEMIC
On March 11, 2020, the World Health Organization announced that it had made the assessment that coronavirus disease 2019 (“COVID-19”) is a pandemic. The impacts of COVID-19 are affecting the entire global economy, individual companies and investment products, the funds, and the market in general. There is significant uncertainty around the extent and duration of business disruptions related to COVID-19 and the impacts may last for an extended period of time. COVID-19 has led to significant uncertainty and volatility in the financial markets.
12 | Allspring U.S. REIT Portfolio
Other information (unaudited)
PROXY VOTING INFORMATION
A description of the policies and procedures used to determine how to vote proxies relating to portfolio securities is available without charge, upon request, by calling 1-800-222-8222, visiting our website at allspringglobal.com, or visiting the SEC website at sec.gov. Information regarding how the proxies related to portfolio securities were voted during the most recent 12-month period ended June 30 is available on the website at allspringglobal.com or by visiting the SEC website at sec.gov.
QUARTERLY PORTFOLIO HOLDINGS INFORMATION
The Portfolio files its complete schedule of portfolio holdings with the SEC for the first and third quarters of each fiscal year as an exhibit to its reports on Form N-PORT. Interest holders may view the filed Form N-PORT by visiting the SEC website at sec.gov.
Allspring U.S. REIT Portfolio | 13
Other information (unaudited)
BOARD OF TRUSTEES AND OFFICERS
Each of the Trustees and Officers listed in the table below acts in identical capacities for each fund in the Allspring family of funds, which consists of 124 mutual funds comprising the Allspring Funds Trust, Allspring Variable Trust, Allspring Master Trust and four closed-end funds (collectively the “Fund Complex”). This table should be read in conjunction with the Prospectus and the Statement of Additional Information1. The mailing address of each Trustee and Officer is 525 Market Street, 12th Floor, San Francisco, CA 94105. Each Trustee and Officer serves an indefinite term, however, each Trustee serves such term until reaching the mandatory retirement age established by the Trustees.
Independent Trustees
Name and
year of birth | Position held and
length of service* | Principal occupations during past five years or longer | Current other
public company or
investment
company
directorships |
William R. Ebsworth
(Born 1957) | Trustee,
since 2015 | Retired. From 1984 to 2013, equities analyst, portfolio manager, research director and chief investment officer at Fidelity Management and Research Company in Boston, Tokyo, and Hong Kong, and retired in 2013 as Chief Investment Officer of Fidelity Strategic Advisers, Inc. where he led a team of investment professionals managing client assets. Prior thereto, Board member of Hong Kong Securities Clearing Co., Hong Kong Options Clearing Corp., the Thailand International Fund, Ltd., Fidelity Investments Life Insurance Company, and Empire Fidelity Investments Life Insurance Company. Audit Committee Chair and Investment Committee Chair of the Vincent Memorial Hospital Endowment (non-profit organization). Mr. Ebsworth is a CFA® charterholder. | N/A |
Jane A. Freeman
(Born 1953) | Trustee,
since 2015;
Chair Liaison,
since 2018 | Retired. From 2012 to 2014 and 1999 to 2008, Chief Financial Officer of Scientific Learning Corporation. From 2008 to 2012, Ms. Freeman provided consulting services related to strategic business projects. Prior to 1999, Portfolio Manager at Rockefeller & Co. and Scudder, Stevens & Clark. Board member of the Harding Loevner Funds from 1996 to 2014, serving as both Lead Independent Director and chair of the Audit Committee. Board member of the Russell Exchange Traded Funds Trust from 2011 to 2012 and the chair of the Audit Committee. Ms. Freeman is also an inactive Chartered Financial Analyst. | N/A |
Isaiah Harris, Jr.
(Born 1952) | Trustee,
since 2009; Audit
Committee
Chair,
since 2019 | Retired. Chairman of the Board of CIGNA Corporation from 2009 to 2021, and Director from 2005 to 2008. From 2003 to 2011, Director of Deluxe Corporation. Prior thereto, President and CEO of BellSouth Advertising and Publishing Corp. from 2005 to 2007, President and CEO of BellSouth Enterprises from 2004 to 2005 and President of BellSouth Consumer Services from 2000 to 2003. Emeritus member of the Iowa State University Foundation Board of Governors. Emeritus Member of the Advisory Board of Iowa State University School of Business. Advisory Board Member, Palm Harbor Academy (private school). Advisory Board Member, Fellowship of Christian Athletes. Mr. Harris is a certified public accountant (inactive status). | N/A |
David F. Larcker
(Born 1950) | Trustee,
since 2009 | James Irvin Miller Professor of Accounting at the Graduate School of Business (Emeritus), Stanford University, Director of the Corporate Governance Research Initiative and Senior Faculty of The Rock Center for Corporate Governance since 2006. From 2005 to 2008, Professor of Accounting at the Graduate School of Business, Stanford University. Prior thereto, Ernst & Young Professor of Accounting at The Wharton School, University of Pennsylvania from 1985 to 2005. | N/A |
14 | Allspring U.S. REIT Portfolio
Other information (unaudited)
Name and
year of birth | Position held and
length of service* | Principal occupations during past five years or longer | Current other
public company or
investment
company
directorships |
Olivia S. Mitchell
(Born 1953) | Trustee,
since 2006;
Nominating and
Governance
Committee Chair,
since 2018 | International Foundation of Employee Benefit Plans Professor since 1993, Wharton School of the University of Pennsylvania. Director of Wharton’s Pension Research Council and Boettner Center on Pensions & Retirement Research, and Research Associate at the National Bureau of Economic Research. Previously taught at Cornell University from 1978 to 1993. | N/A |
Timothy J. Penny
(Born 1951) | Trustee,
since 1996;
Chair,
since 2018 | President and Chief Executive Officer of Southern Minnesota Initiative Foundation, a non-profit organization, since 2007. Vice Chair of the Economic Club of Minnesota, since 2007. Co-Chair of the Committee for a Responsible Federal Budget, since 1995. Member of the Board of Trustees of NorthStar Education Finance, Inc., a non-profit organization, since 2007. Senior Fellow of the University of Minnesota Humphrey Institute from 1995 to 2017. | N/A |
James G. Polisson
(Born 1959) | Trustee,
since 2018 | Retired. Chief Marketing Officer, Source (ETF) UK Services, Ltd, from 2015 to 2017. From 2012 to 2015, Principal of The Polisson Group, LLC, a management consulting, corporate advisory and principal investing company. Chief Executive Officer and Managing Director at Russell Investments, Global Exchange Traded Funds from 2010 to 2012. Managing Director of Barclays Global Investors from 1998 to 2010 and Global Chief Marketing Officer for iShares and Barclays Global Investors from 2000 to 2010. Trustee of the San Francisco Mechanics’ Institute, a non-profit organization, from 2013 to 2015. Board member of the Russell Exchange Traded Fund Trust from 2011 to 2012. Director of Barclays Global Investors Holdings Deutschland GmbH from 2006 to 2009. Mr. Polisson is an attorney and has a retired status with the Massachusetts and District of Columbia Bar Associations. | N/A |
Pamela Wheelock
(Born 1959) | Trustee,
since January
2020; previously
Trustee from
January 2018 to
July 2019 | Retired. Executive and Senior Financial leadership positions in the public, private and nonprofit sectors. Interim President and CEO, McKnight Foundation, 2020. Interim Commissioner, Minnesota Department of Human Services, 2019. Chief Operating Officer, Twin Cities Habitat for Humanity, 2017-2019. Vice President for University Services, University of Minnesota, 2012-2016. Interim President and CEO, Blue Cross and Blue Shield of Minnesota, 2011-2012. Executive Vice-President and Chief Financial Officer, Minnesota Wild, 2002-2008. Commissioner, Minnesota Department of Finance, 1999-2002. Chair of the Board of Directors of Destination Medical Center Corporation. Board member of the Minnesota Wild Foundation. | N/A |
* Length of service dates reflect the Trustee’s commencement of service with the Trust’s predecessor entities, where applicable.
Allspring U.S. REIT Portfolio | 15
Other information (unaudited)
Officers2
Name and
year of birth | Position held and
length of service | Principal occupations during past five years or longer |
Andrew Owen
(Born 1960) | President,
since 2017 | President, Chief Executive Officer and Director of Allspring Funds Management, LLC since 2017 and co-president of Galliard Capital Management, LLC, an affiliate of Allspring Funds Management, LLC, since 2019. Prior thereto, Head of Affiliated Managers, Allspring Global Investments, from 2014 to 2019 and Executive Vice President responsible for marketing, investments and product development for Allspring Funds Management, LLC, from 2009 to 2014. In addition, Mr. Owen was an Executive Vice President of Wells Fargo & Company from 2014 to 2021. |
Jeremy DePalma
(Born 1974) | Treasurer,
since 2012
(for certain funds in
the Fund Complex);
since 2021 (for
the remaining funds in the
Fund Complex) | Senior Vice President of Allspring Funds Management, LLC since 2009. Senior Vice President of Evergreen Investment Management Company, LLC from 2008 to 2010 and head of the Fund Reporting and Control Team within Fund Administration from 2005 to 2010. |
Kate McKinley
(Born 1977) | Chief Legal Officer,
since 2021 | Chief Legal Officer of Allspring Global Investments since 2021. Prior thereto, held various roles at State Street Global Advisors beginning in 2010, including serving as Senior Vice President and General Counsel from 2019 to 2021, and Chief Operating Officer of the Institutional Client Group from 2016 - 2019. Prior to working at State Street Global Advisors served as Assistant General Counsel for Bank of America Corporation from 2005 to 2010 and as an Associate at WilmerHale from 2002 to 2005. |
Christopher Baker
(Born 1976) | Chief Compliance Officer, since 2022 | Global Chief Compliance Officer for Allspring Global Investments since 2022. Prior thereto, Chief Compliance Officer for State Street Global Advisors from 2018 to 2021. Senior Compliance Officer for the State Street divisions of Alternative Investment Solutions, Sector Solutions, and Global Marketing from 2015 to 2018. From 2010 to 2015 Vice President, Global Head of Investment and Marketing Compliance for State Street Global Advisors. |
Matthew Prasse
(Born 1983) | Secretary,
since 2021 | Senior Counsel of the Allspring Legal Department since 2021. Senior Counsel of the Wells Fargo Legal Department from 2018 to 2021. Previously, Counsel for Barings LLC from 2015 to 2018. Prior to joining Barings, Associate at Morgan, Lewis & Bockius LLP from 2008 to 2015. |
1 The Statement of Additional Information includes additional information about the Trustees and is available, without charge, upon request, by calling 1-800-222-8222.
2 For those Officers with tenures at Allspring Global Investments and/or Allspring Funds Management, LLC that began prior to 2021, such tenures include years of service during which these businesses/entities were known as Wells Fargo Asset Management and Wells Fargo Funds Management, LLC, respectively.
16 | Allspring U.S. REIT Portfolio
Other information (unaudited)
LIQUIDITY RISK MANAGEMENT PROGRAM
In accordance with Rule 22e-4 under the Investment Company Act of 1940, as amended (the “Liquidity Rule”), Allspring Master Trust (the “Trust”) has adopted and implemented a liquidity risk management program (the “Program”) on behalf of each of its series, including the Portfolio, which is reasonably designed to assess and manage the Portfolio's liquidity risk. “Liquidity risk” is defined under the Liquidity Rule as the risk that the Portfolio is unable to meet redemption requests without significantly diluting remaining investors’ interests in the Portfolio. The Trust’s Board of Trustees (the “Board”) previously approved the designation of Allspring Funds Management, LLC (“Allspring Funds Management”), the Portfolio's investment adviser, to administer the Program, and Allspring Funds Management has established a Liquidity Risk Management Council (the "Council") composed of personnel from multiple departments within Allspring Funds Management and its affiliates to assist Allspring Funds Management in the administration of the Program.
The Program is comprised of various components designed to support the assessment and/or management of liquidity risk, including: (1) the periodic assessment (no less frequently than annually) of certain factors that influence the Portfolio's liquidity risk; (2) the periodic classification (no less frequently than monthly) of the Portfolio's investments into one of four liquidity categories that reflect an estimate of their liquidity under current market conditions; (3) a 15% limit on the acquisition of “illiquid investments” (as defined under the Liquidity Rule); (4) to the extent the Portfolio does not invest primarily in “highly liquid investments” (as defined under the Liquidity Rule), the determination of a minimum percentage of the Portfolio's assets that generally will be invested in highly liquid investments (an “HLIM”); (5) if the Portfolio has established an HLIM, the periodic review (no less frequently than annually) of the HLIM and the adoption of policies and procedures for responding to a shortfall of the Portfolio's “highly liquid investments” below its HLIM; and (6) periodic reporting to the Board.
At a meeting of the Board held on May 24-25, 2022, the Board received and reviewed a written report (the “Report”) from Allspring Funds Management that, among other things, addressed the operation of the Program and assessed its adequacy and effectiveness for the period from January 1, 2021 through December 31, 2021 (the “Reporting Period”). Other than extended foreign market holidays, no significant liquidity events impacting the Portfolios were noted in the Report. In addition, other than corporate-related changes to the Program, there were no material changes to the Program during the Reporting Period.
Allspring Funds Management determined in the Report that the Program has been implemented and operates effectively to manage the Portfolio’s liquidity risk, and Allspring Funds Management continues to believe that the Program has been and continues to be adequately and effectively implemented to monitor and, as applicable, respond to the Portfolio’s liquidity developments.
There can be no assurance that the Program will achieve its objectives under all circumstances in the future.
Allspring U.S. REIT Portfolio | 17
For more information
More information about Allspring Funds is available free upon request. To obtain literature, please write, visit the Portfolio's website, or call:
Allspring Funds
P.O. Box 219967
Kansas City, MO 64121-9967
Website: allspringglobal.com
Individual investors: 1-800-222-8222
Retail investment professionals: 1-888-877-9275
Institutional investment professionals: 1-800-260-5969
This report and the financial statements contained herein are submitted for the general information of the interest holders of the Portfolio. If this report is used for promotional purposes, distribution of the report must be accompanied or preceded by a current prospectus. Before investing, please consider the investment objectives, risks, charges, and expenses of the investment. For a current prospectus and, if available, a summary prospectus, containing this information, call
1-800-222-8222. Read the prospectus carefully before you invest or send money.
Allspring Global InvestmentsTM is the trade name for the asset management firms of Allspring Global Investments Holdings, LLC, a holding company indirectly owned by certain private funds of GTCR LLC and Reverence Capital Partners, L.P. These firms include but are not limited to Allspring Global Investments, LLC, and Allspring Funds Management, LLC. Certain products managed by Allspring entities are distributed by Allspring Funds Distributor, LLC (a broker-dealer and Member FINRA/SIPC).
This material is for general informational and educational purposes only and is NOT intended to provide investment advice or a recommendation of any kind - including a recommendation for any specific investment, strategy, or plan.
© 2022 Allspring Global Investments Holdings, LLC. All rights reserved.
ITEM 2. CODE OF ETHICS
Not applicable.
ITEM 3. AUDIT COMMITTEE FINANCIAL EXPERT
Not applicable.
ITEM 4. PRINCIPAL ACCOUNTANT FEES AND SERVICES
Not applicable.
ITEM 5. AUDIT COMMITTEE OF LISTED REGISTRANTS
Not applicable.
ITEM 6. INVESTMENTS
A Portfolio of Investments for each series of Allspring Master Trust is included as part of the report to shareholders filed under Item 1 of this Form.
ITEM 7. DISCLOSURE OF PROXY VOTING POLICIES AND PROCEDURES FOR CLOSED-END MANAGEMENT INVESTMENT COMPANIES
Not applicable.
ITEM 8. PORTFOLIO MANAGERS OF CLOSED-END MANAGEMENT INVESTMENT COMPANIES
Not applicable.
ITEM 9. PURCHASES OF EQUITY SECURITIES BY CLOSED-END MANAGEMEENT INVESTMENT COMPANY AND AFFILIATED PURCHASERS
Not applicable.
ITEM 10. SUBMISSION OF MATTERS TO A VOTE OF SECURITY HOLDERS
There have been no material changes to the procedures by which shareholders may recommend nominees to the registrant’s Board of Trustees that have been implemented since the registrant’s last provided disclosure in response to the requirements of this Item.
ITEM 11. CONTROLS AND PROCEDURES
(a) The President and Treasurer have concluded that the Allspring Master Trust disclosure controls and procedures (as defined in Rule 30a-3(c) under the Investment Company Act of 1940) provide reasonable assurances that material information relating to the registrant is made known to them by the appropriate persons, based on their evaluation of these controls and procedures as of a date within 90 days of the filing of this report.
(b) There were no significant changes in the registrant’s internal controls over financial reporting (as defined in Rule 30a-3(d) under the Investment Company Act of 1940) that occurred during the most recent fiscal half-year of the period covered by this report that materially affected, or is reasonably likely to materially affect, the registrant’s internal control over financial reporting.
ITEM 12. DISCLOSURES OF SECURITIES LENDING ACTIVITES FOR CLOSED-END MANAGEMENT INVESTMENT COMPANIES
Not applicable.
ITEM 13. EXHIBITS
(a)(1) Not applicable.
(a)(2) Certifications pursuant to Section 302 of the Sarbanes-Oxley Act of 2002.
(b) Certifications pursuant to Section 906 of the Sarbanes-Oxley Act of 2002.
SIGNATURES
Pursuant to the requirements of the Securities Exchange Act of 1934 and the Investment Company Act of 1940, the registrant has duly caused this report to be signed on its behalf by the undersigned, thereunto duly authorized.
| | |
| Allspring Master Trust |
| |
| By: | | |
| | /s/ Andrew Owen |
| |
| | Andrew Owen |
| | President |
| |
| Date: | | October 27, 2022 |
Pursuant to the requirements of the Securities Exchange Act of 1934 and the Investment Company Act of 1940, this report has been signed below by the following persons on behalf of the registrant and in the capacities and on the date indicated.
| | |
| Allspring Master Trust |
| |
| By: | | |
| | /s/ Andrew Owen |
| |
| | Andrew Owen |
| | President |
| |
| Date: | | October 27, 2022 |
| | |
| By: | | |
| | /s/ Jeremy DePalma |
| |
| | Jeremy DePalma |
| | Treasurer |
| |
| Date: | | October 27, 2022 |